| | |
OMB APPROVAL |
OMB Number: | | 3235-0570 |
| |
Expires: | | October 31, 2006 |
|
Estimated average burden |
hours per response | | 19.3 |
UNITED STATES
SECURITIES AND EXCHANGE COMMISSION
Washington, D.C. 20549
FORM N-CSR
CERTIFIED SHAREHOLDER REPORT OF REGISTERED
MANAGEMENT INVESTMENT COMPANIES
Investment Company Act file number 811-06719
BB&T Funds
(Exact name of registrant as specified in charter)
| | |
| 3435 Stelzer Road Columbus, OH | | 43219 |
|
| (Address of principal executive offices) | | (Zip code) |
BISYS Fund Services, 3435 Stelzer Road, Columbus, OH 43219
(Name and address of agent for service)
Registrant’s telephone number, including area code: (800) 228-1872
Date of fiscal year end: September 30, 2004
Date of reporting period: September 30, 2004
Form N-CSR is to be used by management investment companies to file reports with the Commission not later than 10 days after the transmission to stockholders of any report that is required to be transmitted to stockholders under Rule 30e-1 under the Investment Company Act of 1940 (17 CFR 270.30e-1). The Commission may use the information provided on Form N-CSR in its regulatory, disclosure review, inspection, and policymaking roles.
A registrant is required to disclose the information specified by Form N-CSR, and the Commission will make this information public. A registrant is not required to respond to the collection of information contained in Form N-CSR unless the Form displays a currently valid Office of Management and Budget (“OMB”) control number. Please direct comments concerning the accuracy of the information collection burden estimate and any suggestions for reducing the burden to Secretary, Securities and Exchange Commission, 450 Fifth Street, NW, Washington, DC 20549-0609. The OMB has reviewed this collection of information under the clearance requirements of 44 U.S.C. § 3507.
Item 1. Reports to Stockholders.
Include a copy of the report transmitted to stockholders pursuant to Rule 30e-1 under the Act (17 CFR 270.30e-1).

BB&T FUNDS
TABLEOF CONTENTS
LETTER FROMTHE PRESIDENTANDTHE INVESTMENT ADVISOR
Dear Shareholders:
We are pleased to send you this annual report for the 12 months ended September 30, 2004, a period of challenges and opportunities in the securities markets, and one which demonstrated the benefits of active portfolio management.
In a letter such as this one, it can be instructive to look back at our last annual report. A year ago, we wrote that the markets were being driven by geopolitical events, Federal Reserve activity, conflicting economic data and investors’ appetite for risk.
As we survey the global and economic landscape this year, we see that many of the same factors are in play, and are having a significant impact on the financial markets. The situation in Iraq is far from settled, concerns over terrorism remain, the Federal Reserve (“the Fed”) has begun to tighten credit and the economic recovery has not been without some rough patches. One noteworthy difference from last year is the shifting of investor sentiment away from low-quality, high-risk securities and toward the type of higher-quality stocks and bonds favored by our funds.
However, while stocks performed particularly well during the first quarter of our period, they have been generally flat during the last nine months. Corporate earnings are up, but sharply higher energy costs have impacted businesses and consumers alike, compromising economic activity. Durable-goods orders have risen and the housing market has remained strong, but consumer confidence has waned. Buffeted by opposing forces, stock prices have merely treaded water since the beginning of 2004.
This good news/bad news cycle also has led to volatility in the bond market. Although the yield on the 10-year Treasury bond rose just 18 basis points (0.18%) for the fiscal year as a whole, there were periods of sharp volatility. Intermediate- and long-term rates were driven higher or lower as uncertainty about global events spiked or subsided. When fears of terrorist attacks escalated, for example, investors rushed to the relative safety of Treasury securities, temporarily driving bond prices higher and yields lower.
At other times, expectations that the Fed would begin to raise interest rates—the Fed did hike rates in June, August and September which pushed yields higher, and bond prices lower.
While inflation expectations moderated and longer-term rates showed little net movement, the two-year Treasury note’s yield jumped 115 basis points (1.15%). The effect of this activity was to “flatten” the yield curve, as short-term rates rose closer to the static level of long-term rates.
For the 12-month period as a whole, the S&P 500 Index1 rose 13.86%, while the Nasdaq Composite Index1 added 6.15%. Bond prices, for the most part, were modestly higher.
Looking ahead over the next year, we believe stocks offer better relative value than bonds, and based on our analysis and expectations, we have taken the following steps:
| | • | Our equity managers, who have always operated with an emphasis on quality fundamentals, have continued to focus on stocks with particularly attractive valuations. We believe that, especially in uncertain markets, high-quality portfolios could potentially perform well, although there are no guarantees. |
| | • | On a sector basis, we have pursued the stocks of companies with high earnings visibility and above-average earnings potential. This has led us to favor shares in the industrial and energy sectors, and the non-biotech portion of the health care area. Recently, we’ve also been easing into the technology sector, where some good stocks have been oversold. |
| | • | Anticipating higher interest rates all along the yield curve, we have shortened the durations and average maturities of our bond funds, and selectively boosted credit quality. |
With the securities markets far from calm and quiet, we believe the active portfolio management we provide shareholders can be especially productive. The world is a very uncertain place right now, and the members of our investment management team are keenly aware of the trust you have placed in their hands.
As always, if you have any questions or concerns about the BB&T Funds, please feel free to speak with your Investment Professional, or call us at 1-800-453-7348.
Sincerely,
|
|
 |
| George O. Martinez |
| President |
BB&T Funds |
|
 |
| Keith F. Karlawish, CFA |
| President |
BB&T Asset Management, Inc. |
|
 |
| Jeffrey J. Schappe, CFA |
| Chief Investment Officer |
BB&T Asset Management, Inc. |
| 1 | The S&P 500 Index is an unmanaged index representative of the U.S. stock market. The S&P 500 Index® is a registered trademark of Standard & Poor’s, a division of The McGraw-Hill Companies. All rights reserved. The Nasdaq Composite Index is an unmanaged index representative of U.S. small-company stocks. Performance for the Nasdaq Composite Index is price-only (no dividend reinvestment). Source: Lipper, Inc., October 2004. Investors cannot invest directly in an index, though they can invest in the underlying securities. |
This report is authorized for distribution only when preceded or accompanied by a prospectus. Please read the prospectus carefully before investing or sending money. The BB&T Mutual Funds are distributed by BISYS Fund Services Limited Partnership d/b/a BISYS Fund Services. The BB&T Mutual Funds are NOT FDIC INSURED and are not deposits or obligations or guaranteed or endorsed by, Branch Banking and Trust Company or its affiliates. Investment products involve investment risk, including the possible loss of principal.
The foregoing information and opinions are for general information only. BB&T Asset Management, Inc. does not guarantee their accuracy or completeness, nor assume liability for any loss, which may result from the reliance by any person upon any such information or opinions. Such information and opinions are subject to change without notice, are for general information only and are not intended as an offer or solicitation with respect to the purchase or sale of any security or offering individual or personalized investment advice.
1
BB&T LARGE COMPANY VALUE FUND
PORTFOLIO MANAGER
Richard B. Jones, CFA
The BB&T Large Company Value Fund is managed by Richard B. Jones, CFA, Director of Value Equity Portfolio Management for BB&T Asset Management, Inc. A graduate of Miami (Ohio) University, where he earned a B.S. in Business, Mr. Jones also earned an M.B.A. from The Ohio State University, and has been managing investors’ money since 1984. He is supported by the BB&T Value Equity Portfolio Management Team, which includes Eric Farls, CFA; Robert A. Gowen; John T. Kvantas, CFA; and Buel S. Sears, CFA. The team brings to the Fund six decades of combined investment management experience, along with a broad range of equity management skills.
INVESTMENT CONCERNS
Equity securities (stocks) are more volatile and carry more risk than other forms of investments, including investments in high-grade fixed income securities. The net asset value per share of this Fund will fluctuate as the value of the securities in the portfolio changes. Common stocks, and funds investing in common stocks, generally provide greater return potential when compared with other types of investments. Value-based investments are subject to the risk that the broad market may not recognize their intrinsic value.
PORTFOLIO MANAGERS’ PERSPECTIVE
“Our investment process is straight forward and disciplined. It relies on both quantitative and qualitative techniques. We screen roughly 2,000 large companies to find about 100 top-quality names that meet our financial quality and value criteria; from this list, we normally own about 70 stocks, each of which plays a distinct role in enabling us to build a diversified portfolio. We are long-term investors, approaching each purchase with the intent of owning it for three to five years, if all goes well. Consequently, the Fund’s turnover rate is low, 10-30%, which makes the Fund very efficient for taxable accounts.”
For the 12 months ended September 30, 2004, the Fund produced a total return of 17.86% (Institutional Shares), compared to 20.52% for its benchmark, the Russell 1000® Value Index.
Value stocks did well last year
With the backdrop of solid economic growth, strong earnings growth and low interest rates, the stock market registered good gains over the last twelve months. The best performance was centered in the stocks of lower quality economically sensitive companies.
The Fund generated solid, absolute (double-digit total returns) and relative to peer (Lipper Large Company Value1 category median return 16.26%), performance. But our performance did lag our unmanaged index.
Our full positions in some of the better performing economically sensitive sectors, such as industrials and energy, helped performance. We also benefited, in the second half of the fiscal year, as the market began to reward higher quality financially strong companies.2
On the issue of stock quality, the BB&T Large Company Value Fund invests only in what we deem as high quality companies. We want our companies to have the financial flexibility to be able to weather challenges as well as take advantage of opportunities. This disciplined focus on quality reduces portfolio volatility. Of course, there will be periods of time when low quality stocks will show significant outperformance, such as we experienced in 2003 and the first quarter of 2004, and during these periods our portfolio will tend to generate lower relative returns.
The portfolio’s overweighting in the healthcare sector has hurt performance over the last 12 months. Near term political and industry (pipeline, patent expiration) issues have weighed on these stocks. We still believe there are a disproportionate number of opportunities in this sector, given the combination of favorable long-term demographic trends and reasonable valuations. Therefore, we continue to hold our overweighted position.2
As of September 30, 2004, the top five equity holdings in the Fund (as a percentage of net assets) were2:
| | | |
ConocoPhilips | | 3.2 | % |
Bank of America | | 2.4 | % |
Emerson Electric Co. | | 2.4 | % |
Cox Communications, Inc.-Class A | | 2.4 | % |
ChevronTexaco Corp. | | 2.3 | % |
It’s a pretty decent environment for stocks
Looking out over the next six to 12 months, we think the economy looks pretty solid, as do the prospects for stocks. We believe the manufacturing sector looks strong. Granted we haven’t seen the job growth we’ve been looking for, to confirm that the economy is in a self-sustaining mode. Still, Gross Domestic Product3 figures are good, interest rates are still historically low and corporate earnings should be higher next year. Overall, we believe it’s a pretty decent environment for stocks.
As always, we will continue to invest on a stock-by-stock, bottom-up basis. While we are aware of the external, macro conditions, we will maintain the same value driven investment approach: buy stocks of financially solid companies at reasonable levels of valuation.
Past performance does not guarantee future results. The performance data quoted represents past performance and current returns may be lower or higher. Total return figures include change in share price, reinvestment of dividends and capital gains and do not reflect taxes that a shareholder would pay on fund distributions or on the redemption of fund shares. The investment return and principal value will fluctuate so that an investor’s shares, when redeemed may be worth more or less than the original cost. To obtain performance information current to the most recent month end, please visit www.bbtfunds.com.
| 1 | The Lipper Large Cap Value Funds Average consists of mutual funds that, by portfolio practice, invest at least 75% of their equity assets in companies with market capitalizations (on a three-year weighted basis) greater than 300% of the dollar-weighted median market capitalization of the middle 1,000 securities of the S&P SuperComposite 1500 Index. Large-cap value funds typically have a below-average price-to-earnings ratio, price-to-book ratio, and three-year sales-per-share growth value, compared to the S&P 500 Index. |
| 2 | Portfolio composition is as of September 30, 2004 and is subject to change. |
2
BB&T LARGE COMPANY VALUE FUND

Past performance does not guarantee future results. The performance data quoted represents past performance and current returns may be lower or higher. Total return figures include change in share price, reinvestment of dividends and capital gains and do not reflect taxes that a shareholder would pay on fund distributions or on the redemption of fund shares. The investment return and principal value will fluctuate so that an investor’s shares, when redeemed may be worth more or less than the original cost. To obtain performance information current to the most recent month end, please visit www.bbtfunds.com.
The chart above represents a comparison of a hypothetical $10,000 investment in the indicated share class versus a similar investment in the Fund’s benchmark, and represents the reinvestment of dividends and capital gains.
| 3 | Class B Shares were not in existence prior to 1/1/96. Performance for periods prior to that is based on the historical performance of the Class A Shares, and has been adjusted for the maximum CDSC applicable to the Class B Shares, but does not include the Class B Shares 12b-1 fees, which, if reflected, performance would have been lower. Class C Shares were not in existence prior to 2/1/01. Performance for periods prior to that is based on the historical performance of the Class A Shares, and has been adjusted for the maximum CDSC applicable to Class C Shares, but does not include the Class C Shares 12b-1 fees, which, if reflected, performance would have been lower. |
The Fund is measured against the Russell 1000® Value Index an unmanaged index which consists of 1,000 of the largest capitalized U.S. domiciled companies. Companies in this index generally have low price-to-book and price-to-earnings ratios, higher dividend yields, and lower forecasted growth values. The index does not reflect the deduction of expenses associated with a mutual fund, such as investment management and fund accounting fees. The Fund’s performance reflects the deduction of fees for these services. Investors cannot invest directly in an index, although they can invest in its underlying securities.
A portion of the Fund’s fees has been waived. If the fees had not been waived, the Fund’s total return for the period would have been lower.
3
BB&T LARGE COMPANY GROWTH FUND
PORTFOLIO MANAGER
Paige C. Henderson, CFA, CPA
The BB&T Large Company Growth Fund is managed by Paige C. Henderson, CFA, CPA, Director of Core Equity for BB&T Asset Management, Inc. Ms. Henderson graduated from the University of North Carolina at Chapel Hill, where she received a B.S. in Business Administration and an M.B.A. and has been actively engaged in investment management since 1991. Ms. Henderson is supported by the BB&T Growth Equity Portfolio Management Team, which includes Brandon Carl; Raiford Garrabrant, CFA; David Nolan; Zack Schroeder; and Michele Holmes Van Dyke. The team brings to the Fund six decades of combined investment management experience, along with a broad range of growth-stock investing skills.
INVESTMENT CONCERNS
Equity securities (stocks) are more volatile and carry more risk than other forms of investments, including investments in high-grade fixed income securities. The net asset value per share of this Fund will fluctuate as the value of the securities in the portfolio changes. Common stocks, and funds investing in common stocks, generally provide greater return potential when compared with other types of investments.
PORTFOLIO MANAGERS’ PERSPECTIVE
“We use quantitative screening to target the most attractive stocks among large, established growth companies in the market’s fastest-growing sectors. Our multifactor scoring model evaluates and ranks several thousand companies with market capitalizations greater than $4 billion. We then take a closer look at the companies in the top third of our rankings, clarifying data and identify how a particular stock could enhance our portfolio, which normally is comprised of 65—75 issues. All the while, we are careful not to overpay for any particular stock. The price we are willing to pay for growth is based on our evaluation of whether a stock’s growth potential will be delivered.”
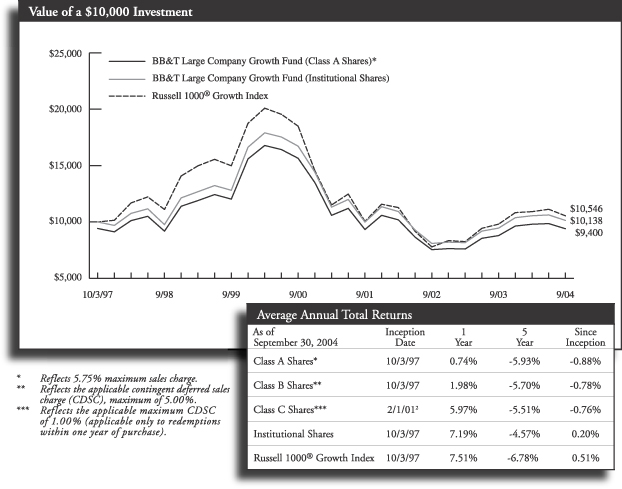
For the 12 months ended September 30, 2004, the Fund produced a total return of 7.19% (Institutional Shares), compared to 7.51% for its benchmark, the Russell 1000® Growth Index.
Paige C. Henderson, CFA, CPA, assumed management of the Fund on July 1, 2004.
Strong returns in first fiscal quarter gave way to more challenging environment
There was a significant difference in market activity and performance between the last calendar quarter of 2003 and the first nine months of 2004. At the end of last year, the technology sector was still strong, earnings expectations were solid and small-company stocks were doing particularly well.
Things have changed, however, in the last few quarters. The market is now being driven by a number of macro factors, such as sharply higher energy prices—which is why growth is underperforming value—and we’re also seeing sharp differences among companies in the same industries and sectors. Some historically stable companies—which you’d think of as relatively safe havens in volatile times—have stumbled recently. As growth investors are often unforgiving of negative developments, this has added to pressure in key industries in the large-cap growth arena.
On a sector basis, we finished the period with a significant overweighting in industrial stocks, which was a positive factor in the Fund’s performance.1
Our health-care positions have also proven productive, as we’ve de-emphasized big pharmaceutical stocks where many companies have experienced problems, and focused on bio-tech companies such as Gilead Sciences (1.9% of the portfolio’s net assets) and Genentech, Inc. (1.28%); and health-service providers such as UnitedHealth Group, Inc. (2.1%) and Quest Diagnostics, Inc. (1.8%).1
As of September 30, 2004, the top five equity holdings in the Fund (as a percentage of net assets) were1:
| | | |
Microsoft Corp. | | 3.8 | % |
Johnson & Johnson | | 3.5 | % |
Procter & Gamble Co. | | 2.9 | % |
Intel Corp. | | 2.5 | % |
Home Depot, Inc. | | 2.5 | % |
Technology could rebound in the coming months
Looking ahead, if energy prices stabilize—maybe fall from their current $55-a-barrel level to about $40—that could help the stock market. In any case, we think we’ll see continued strength in industrial earnings, what some people might call “old-economy companies.” The consumer has been carrying the economy for years, and now it’s time for the manufacturing sector to take the lead. Corporate cash levels are at historic highs. Hopefully, uncertainty should be reduced once the U.S. elections are over and we possibly see an improvement in the global political situation. In such an improving environment, we believe there could be an upsurge in technology spending. As information technology has become an integral part of our daily lives, technology purchases have become more connected to job growth. For knowledge workers, as companies create new positions, they have to buy new computers and system licenses for each worker. This differs from the more industrially oriented cycles. If you’re pushing more steel through a mill, even if you are adding workers, you don’t necessarily need to invest in more equipment.
As we move forward, we are closely monitoring those companies that will benefit from increased spending from Corporate American and are likely to increase investments in companies with improving order trends such as semiconductor and communication equipment stocks.1
Past performance does not guarantee future results. The performance data quoted represents past performance and current returns may be lower or higher. Total return figures include change in share price, reinvestment of dividends and capital gains and do not reflect taxes that a shareholder would pay on fund distributions or on the redemption of fund shares. The investment return and principal value will fluctuate so that an investor’s shares, when redeemed may be worth more or less than the original cost. To obtain performance information current to the most recent month end, please visit www.bbtfunds.com.
| 1 | Portfolio composition is as of September 30, 2004 and is subject to change. |
4
BB&T LARGE COMPANY GROWTH FUND
Past performance does not guarantee future results. The performance data quoted represents past performance and current returns may be lower or higher. Total return figures include change in share price, reinvestment of dividends and capital gains and do not reflect taxes that a shareholder would pay on fund distributions or on the redemption of fund shares. The investment return and principal value will fluctuate so that an investor’s shares, when redeemed may be worth more or less than the original cost. To obtain performance information current to the most recent month end, please visit www.bbtfunds.com.
The chart above represents a comparison of a hypothetical $10,000 investment in the indicated share class versus a similar investment in the Fund’s benchmark, and represents the reinvestment of dividends and capital gains.
| 2 | Class C Shares were not in existence prior to 2/1/01. Performance for periods prior to that is based on the historical performance of the Class B Shares, and has been adjusted for the maximum CDSC applicable to Class C Shares. |
The Fund is measured against the Russell 1000® Growth Index an unmanaged index which is comprised of 1,000 of the largest capitalized U.S. domiciled companies with higher price-to-book ratios and higher forecasted growth values whose common stock is traded in the United States on the New York Stock Exchange, American Stock Exchange and NASDAQ. The index does not reflect the deduction of expenses associated with a mutual fund, such as investment management and fund accounting fees. The Fund’s performance reflects the deduction of fees for these services. Investors cannot invest directly in an index, although they can invest in its underlying securities.
A portion of the Fund’s fees has been waived. If the fees had not been waived, the Fund’s total returns for the period would have been lower.
5
BB&T MID CAP VALUE FUND
PORTFOLIO MANAGER
Buel S. Sears, CFA
The BB&T Mid Cap Value Fund is managed by Buel S. Sears, CFA, who has been managing investors’ money since 1982. Mr. Sears is supported by the BB&T Value Equity Portfolio Management Team, which includes Eric Farls, CFA; Robert A. Gowen; Richard B. Jones, CFA; and John T. Kvantas, CFA. The team brings to the Fund six decades of combined investment management experience, along with a broad range of equity management skills.
INVESTMENT CONCERNS
Mid-capitalization funds typically carry additional risks since smaller companies generally have a higher risk of failure, and historically, their stocks have experienced a greater degree of market volatility than stocks on average.
Equity securities (stocks) are more volatile and carry more risk than other forms of investments, including investments in high-grade fixed income securities. The net asset value per share of this Fund will fluctuate as the value of the securities in the portfolio changes. Common stocks, and funds investing in common stocks, generally provide greater return potential when compared with other types of investments. Value-based investments are subject to the risk that the broad market may not recognize their intrinsic value.
PORTFOLIO MANAGERS’ PERSPECTIVE
“We seek to provide our shareholders with three important investment benefits: current income, long-term growth of capital and a commitment to controlling volatility. We diversify among economic sectors, industries and individual companies, with no more than 5% of the portfolio invested in any single security. We take a hard look at how companies in different industries can have similar risk profiles and we build our portfolio with an awareness of these correlations. We also strive to provide value to our shareholders by stressing low turnover, which may both reduce costs and improve tax efficiency.”
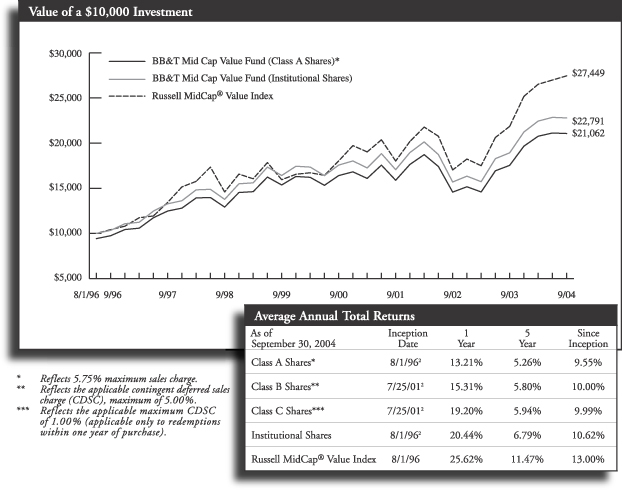
For the 12 months ended September 30, 2004, the Fund produced a total return of 20.44% (Institutional Shares), compared to 25.62% for its benchmark, the Russell MidCap® Value Index.
We were in the market’s ‘sweet spot’
The Fund experienced historically strong performance partly due to judicious stock selection, but also because the mid-cap value arena was the right place to be for much of the last year.
At the start of our fiscal year, investors were enamored of the type of low-quality stocks to which we are not attracted, and we missed some of the overall market’s upsurge. But as the period unfolded, the “junk rally” began to wane, and the market rotated toward higher-quality names. Further, mid-capitalization stocks outperformed large-capitalization stocks, and the value stocks did much better than their growth cousins.
We also benefited from a number of earnings surprises from such companies as Genuine Parts Co. (1.9% of the portfolio’s net assets), C.R. Bard, Inc. (1.2%) and Compass Bancshares, Inc. (2.6%).1
As always, we kept a close watch on the stocks we owned. One of the most significant portfolio moves we made during the period was our decision to sell our stake in Caremark RX, Inc., a pharmaceutical services company whose stock price had risen to what we considered to be a fully valued level. We took our profits from Caremark and bought into AmerisourceBergen Corp. (1.3%), a drug distributor which offers a different type of access into the health care sector.1
However, in the third quarter of 2004, the Fund’s final fiscal quarter, some of our technology names came under pressure when reported earnings didn’t quite live up to investors’ expectations. Consequently, we lost some ground relative to our benchmark.
As of September 30, 2004, the top five equity holdings in the Fund (as a percentage of net assets) were:1
| | | |
First American Corp. | | 2.8 | % |
Kerr-McGee Corp. | | 2.7 | % |
Jefferson-Pilot Corp. | | 2.6 | % |
Compass Bancshares, Inc. | | 2.6 | % |
Arthur J. Gallagher & Co. | | 2.5 | % |
We are encouraged by market opportunities
Looking to the future, we are optimistic about the prospects for stocks. We acknowledge that the economy is in a state of constant change, the presidential election comes around every four years and there are significant cycles in capital spending, employment statistics and interest rates. But in the current cycle, as in all cycles, we believe there are numerous, attractive opportunities in the market. The upward trend in earnings and cash flow growth that we see in our own holdings could continue for the foreseeable future.
Over the next six to 12 months, we will remain as fully invested as is feasible and we will continue to search for fundamentally strong, well-positioned companies whose stocks are available at reasonable prices.
Past performance does not guarantee future results. The performance data quoted represents past performance and current returns may be lower or higher. Total return figures include change in share price, reinvestment of dividends and capital gains and do not reflect taxes that a shareholder would pay on fund distributions or on the redemption of fund shares. The investment return and principal value will fluctuate so that an investor’s shares, when redeemed may be worth more or less than the original cost. To obtain performance information current to the most recent month end, please visit www.bbtfunds.com.
| 1 | Portfolio composition is as of September 30, 2004 and is subject to change. |
6
BB&T MID CAP VALUE FUND
Past performance does not guarantee future results. The performance data quoted represents past performance and current returns may be lower or higher. Total return figures include change in share price, reinvestment of dividends and capital gains and do not reflect taxes that a shareholder would pay on fund distributions or on the redemption of fund shares. The investment return and principal value will fluctuate so that an investor’s shares, when redeemed may be worth more or less than the original cost. To obtain performance information current to the most recent month end, please visit www.bbtfunds.com.
The chart above represents a comparison of a hypothetical $10,000 investment in the indicated share class versus a similar investment in the Fund’s benchmark, and represents the reinvestment of dividends and capital gains.
| 2 | Performance shown for Class A and Institutional Shares includes the performance of the OVB Equity Income Portfolio for the periods prior to its consolidation with the BB&T Mid Cap Value Fund on 7/23/01. The performance shown reflects reinvestment of all dividend and capital gains distributions. Class B and C Shares were not in existence prior to 7/25/01. Performance for periods prior to 7/25/01 is based on the historical performance of the Class A Shares, and has been adjusted for the maximum CDSC applicable to Class B and C Shares, respectively, but such performance does not reflect Class B and C Shares’ 12b-1 fees and expenses. With those adjustments, performance would be lower than that shown. |
The Fund is measured against the the Russell MidCap® Value Index which measures the performance of those securities in the Russell 1000 with lower price-to-book ratios or lower forecasted growth values. The index is unmanaged and does not reflect the deduction of expenses associated with a mutual fund, such as investment management and fund accounting fees. The Fund’s performance reflects the deduction of fees for these services. Investors cannot invest directly in an index, although they can invest in its underlying securities.
A portion of the Fund’s fees has been waived. If fees had not been waived, the Fund’s total return for the period would have been lower.
7
BB&T MID CAP GROWTH FUND
PORTFOLIO MANAGER
David P. Nolan
The BB&T Mid Cap Growth Fund is managed by David P. Nolan. A graduate of Wake Forest University, where he received a B.S. in Business, Mr. Nolan managed common and collective trust funds from 1985 to 1993 and has managed the Mid Cap Growth Fund since its inception in 1993. He is supported by the BB&T Growth Equity Portfolio Management Team, which includes Brandon Carl; Raiford Garrabrant, CFA; Paige C. Henderson, CFA, CPA; Zack Schroeder; and Michele Holmes Van Dyke. The team brings to the Fund more than six decades of combined investment management experience, along with a broad range of growth-stock investing skills.
INVESTMENT CONCERNS
Mid-capitalization funds typically carry additional risks since smaller companies generally have a higher risk of failure, and historically, their stocks have experienced a greater degree of market volatility than stocks on average.
Equity securities (stocks) are more volatile and carry more risk than other forms of investments, including investments in high-grade fixed income securities. The net asset value per share of this Fund will fluctuate as the value of the securities in the portfolio changes. Common stocks, and funds investing in common stocks, generally provide greater return potential when compared with other types of investments.
PORTFOLIO MANAGERS’ PERSPECTIVE
“We believe that companies situated in the mid-capitalization sector—which we define as between $2–10 billion in market cap—may achieve the most striking growth rates in their respective life cycles. This is the ‘sweet spot’ for many companies, which have survived the challenges of their early years and are now reaching the point where their businesses are expanding rapidly. They also may have an edge over larger companies, whose businesses have matured and who struggle to maintain double-digit growth rates. For these reasons, well-managed mid-cap companies potentially offer outstanding investment opportunities for our shareholders.”
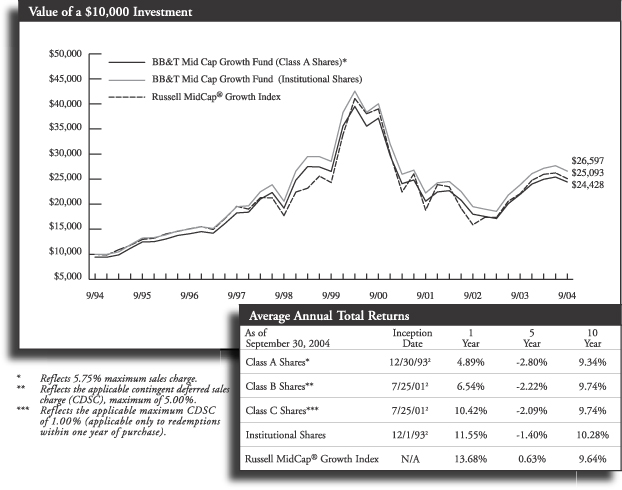
For the 12 months ended September 30, 2004, the Fund produced a total return of 11.55% (Institutional Shares), compared to 13.68% for its benchmark, the Russell MidCap® Growth Index.
The Fund underperformed its benchmark index for the first quarter of the year due to the Fund’s underweighting in the low-quality, low-priced stocks that outperformed in the period. The Fund did however, outperform the index in the final three quarters of the year.
Energy and telecommunications stocks were big winners
This past year, we saw the market experience a great deal of “churn”—as stocks spiked up and then fell—with investor sentiment rotating from low-quality, high-risk names to higher-quality stocks. The mid-cap growth sector was no exception, and these circumstances presented challenges throughout the period. We were gratified, nonetheless, that the Fund produced historically solid returns for the fiscal year.
On a sector basis, energy stocks represented a superior group during the year, and the Fund’s performance was enhanced in the second half of the period by our overweighting in energy stocks. Also, despite the fact that semiconductor stocks were inconsistent—this area did very well early on in the period, and then fell sharply—a number of technology companies were winners for us: AutoDesk, Inc. (2.1% of the portfolio’s net assets), a supplier of PC software; Symantec Corp. (2.0%) a provider of Internet security technology; and Research In Motion, Ltd. (1.5%), the manufacturer of the BlackBerry wireless devices; all were strong performers for us.1
In telecommunications, two names that did well for us were Russian cellular phone and service providers: Mobile Telesystems-ADR (0.6%) and VimpelCom-ADR (0.6%). These companies have done very well, as cell-phone usage in Russia has experienced explosive growth, first in Moscow, and now in outlying areas.1
As of September 30, 2004, the top five equity holdings in the Fund (as a percentage of net assets) were:1
| | | |
AutoDesk, Inc. | | 2.1 | % |
Urban Outfitters, Inc. | | 2.1 | % |
Symantec Corp. | | 2.0 | % |
Apple Computer, Inc. | | 2.0 | % |
Starwood Hotels & Resorts Worldwide, Inc. | | 2.0 | % |
We will invest in ‘individual stories’
Looking ahead, as we always do, we certainly are conscious of the overall macro picture, and how it might drive some specific sectors, such as energy. But the primary focus of our investment process remains finding the right individual stocks that meet our criteria. Especially when we’re in “range-bound” market—that is, a market whose indices bounce back and forth between fairly fixed ranges—we have found that strong performance can come from selecting individual names that meet specific investing themes. Our shareholders can rest assured that we will continue to invest the way we always have.
Past performance does not guarantee future results. The performance data quoted represents past performance and current returns may be lower or higher. Total return figures include change in share price, reinvestment of dividends and capital gains and do not reflect taxes that a shareholder would pay on fund distributions or on the redemption of fund shares. The investment return and principal value will fluctuate so that an investor’s shares, when redeemed may be worth more or less than the original cost. To obtain performance information current to the most recent month end, please visit www.bbtfunds.com.
| 1 | Portfolio composition is as of September 30, 2004 and is subject to change. |
8
BB&T MID CAP GROWTH FUND
Past performance does not guarantee future results. The performance data quoted represents past performance and current returns may be lower or higher. Total return figures include change in share price, reinvestment of dividends and capital gains and do not reflect taxes that a shareholder would pay on fund distributions or on the redemption of fund shares. The investment return and principal value will fluctuate so that an investor’s shares, when redeemed may be worth more or less than the original cost. To obtain performance information current to the most recent month end, please visit www.bbtfunds.com.
The chart above represents a comparison of a hypothetical $10,000 investment in the indicated share class versus a similar investment in the Fund’s benchmark, and represents the reinvestment of dividends and capital gains.
| 2 | Fund performance as shown for Class A and Institutional Shares includes the performance of the OVB Capital Appreciation Portfolio for the periods prior to its consolidation with the BB&T Mid Cap Growth Fund on 7/23/01. The performance shown reflects reinvestment of all dividend and capital gains distributions. The Class B and C Shares were not in existence prior to 7/25/01. Performance for periods prior to 7/25/01 is based on the historical performance of the Class A Shares and has been adjusted for the maximum CDSC applicable to Class B and C Shares, respectively, but such performance does not reflect Class B and C Shares’ 12b-1 fees and expenses. With those adjustments, performance would be lower. |
The Fund is measured against the Russell MidCap Growth Index an unmanged index which measures the performance of those securities in the Russell 1000 Index with higher price-to-book ratios and lower forecasted growth values. The index does not reflect the deduction of expenses associated with a mutual fund, such as investment management and fund accounting fees. The Fund’s performance reflects the deduction of fees for services. Investors cannot invest directly in an index, although they can invest in its underlying securities.
A portion of the Fund’s fees has been waived. If the fees had not been waived, the Fund’s total returns for the period would have been lower.
9
BB&T SMALL COMPANY VALUE FUND
PORTFOLIO MANAGER
John T. Kvantas, CFA
The BB&T Small Company Value Fund is managed by John T. Kvantas, CFA. A graduate of the University of Illinois Champaign-Urbana, where he received a B.S. in Accountancy, Mr. Kvantas also earned an M.B.A. from the Fuqua School of Business at Duke University, and has been managing investors’ money since 1995. He is supported by the BB&T Value Equity Portfolio Management Team, which includes Robert Gowen; Eric Farls, CFA; Richard B. Jones, CFA; and Buel S. Sears, CFA. The team brings to the Fund six decades of combined investment management experience, along with a broad range of equity management skills.
INVESTMENT CONCERNS
Small-capitalization funds typically carry additional risks since smaller companies generally have a higher risk of failure, and historically, their stocks have experienced a greater degree of market volatility than stocks on average.
Equity securities (stocks) are more volatile and carry more risk than other forms of investments, including investments in high-grade fixed income securities. The net asset value per share of this Fund will fluctuate as the value of the securities in the portfolio changes. Common stocks, and funds investing in common stocks, generally provide greater return potential when compared with other types of investments. Value-based investments are subject to the risk that the broad market may not recognize their intrinsic value.
PORTFOLIO MANAGERS’ PERSPECTIVE
“We use disciplined, bottom-up analysis to uncover fundamentally strong, attractively priced value stocks in a very specific universe: stocks with market capitalizations between $100 million and $3 billion. At the BB&T Funds, we believe that diversification can be a very useful tool for long-term investors, and shareholders can use our small-cap value fund to diversify their portfolios beyond the large-cap and mid-cap arenas. While small-cap stocks may be more volatile than their larger counterparts, they provide the benefit of generally not moving in tandem with the overall market. At the same time, on a year-to-year basis, value stocks may produce returns that are very dissimilar to the performance of growth stocks. Consequently, we believe that many BB&T shareholders will appreciate how our Fund can add a strong dose of diversification to their portfolios.”
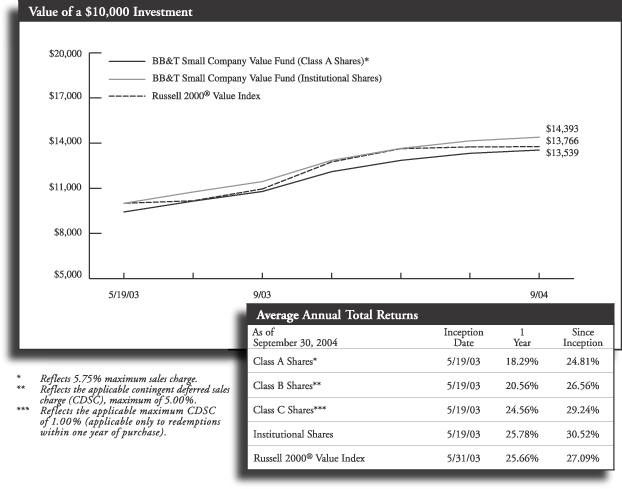
For the 12 months ended September 30, 2004, the Fund produced a total return of 25.78% (Institutional Shares), compared to 25.66% for its benchmark, the Russell 2000® Value Index.
A rotation toward quality helped the Fund’s performance
The small-cap value sector’s outperformance, relative to the overall market, continued a trend that we’ve seen over the last three or four years. When the market was soaring during the bull market in the late 1990s, small-company stocks didn’t do as well as large-company names. But the reversal since then has been truly dramatic, and during the last 12 months, small-cap value once again was the place to be for equity investors.
The Fund was also helped by a rotation away from lower-quality, riskier stocks—which dominated the market through much of 2003—and into the type of high-quality companies we like to buy. This move was driven, in part, by a perception that the Fed would start raising short-term interest rates; the Fed did, indeed, tighten credit starting in June. In such an environment, investors not surprisingly turn toward relatively more stable securities, the kind we hold in the portfolio. Small-cap stocks can be more volatile than larger stocks, and we believe our bias toward quality can be productive for our investors over time.
Another positive factor for the Fund was the performance of our energy holdings. We were overweighted in energy and when the sector took off, the stocks we owned followed suit. We also benefited from being underweighted in technology stocks, which did not do well as a group during the period.1
As of September 30, 2004, the top five equity holdings in the Fund (as a percentage of net assets) were:1
| | | |
Hilb, Rogal & Hamilton Co. | | 1.7 | % |
Imation Corp. | | 1.7 | % |
Protective Life Crop. | | 1.7 | % |
Teekay Shipping Corp. | | 1.6 | % |
CNA Surety Corp. | | 1.6 | % |
We will continue to employ our disciplined investment process
There are a lot of “macro” issues affecting the securities markets, such as global instability, high energy prices and the Fed’s decision to start raising interest rates.
But while we acknowledge the influence those factors have on short-term stock price volatility, over the long-term it is nearly impossible to predict changes in the macro factors. Going forward, we will not change our investment approach; we will continue to run our quantitative and qualitative screens, look for high-quality companies whose stock prices are significantly below our estimates of fair value, evaluate their fundamentals and buy those stocks whose prospects we like for the long-term.
We can’t know what’s going to happen in the economy or the markets over the next six to 12 months. What we do know is that we’re going to continue with the same investment approach we’ve always used.
Past performance does not guarantee future results. The performance data quoted represents past performance and current returns may be lower or higher. Total return figures include change in share price, reinvestment of dividends and capital gains and do not reflect taxes that a shareholder would pay on fund distributions or on the redemption of fund shares. The investment return and principal value will fluctuate so that an investor’s shares, when redeemed may be worth more or less than the original cost. To obtain performance information current to the most recent month end, please visit www.bbtfunds.com.
| 1 | Portfolio composition is as of September 30, 2004 and is subject to change. |
10
BB&T SMALL COMPANY VALUE FUND
Past performance does not guarantee future results. The performance data quoted represents past performance and current returns may be lower or higher. Total return figures include change in share price, reinvestment of dividends and capital gains and do not reflect taxes that a shareholder would pay on fund distributions or on the redemption of fund shares. The investment return and principal value will fluctuate so that an investor’s shares, when redeemed may be worth more or less than the original cost. To obtain performance information current to the most recent month end, please visit www.bbtfunds.com.
The chart above represents a comparison of a hypothetical $10,000 investment in the indicated share class versus a similar investment in the Fund’s benchmark, and represents the reinvestment of dividends and capital gains.
The Fund is measured against the Russell 2000® Value Index an unmanaged index which is comprised of the securities found in the Russell 2000® with lower price-to-book ratios and lower forecasted growth values. The index does not reflect the deduction of expenses associated with a mutual fund, such as investment management and fund accounting fees. The Fund’s performance reflects the deduction of fees for these services. Investors cannot invest directly in an index, although they can invest in its underlying securities.
A portion of the Fund’s fees has been voluntarily waived. If the fees had not been waived, the Fund’s total return for the period would have been lower.
11
BB&T SMALL COMPANY GROWTH FUND
PORTFOLIO MANAGER
Raiford Garrabrant, CFA
The BB&T Small Company Growth Fund is managed by Raiford Garrabrant, CFA. Mr. Garrabrant graduated from the University of North Carolina at Chapel Hill with a B.S. in Business Administration and has been managing investors’ money since 1992. Mr. Garrabrant is supported by the BB&T Growth Equity Portfolio Management Team, which includes Brandon Carl; Paige C. Henderson, CFA, CPA; David Nolan; Zach Schroeder; and Michele Holmes Van Dyke. The team brings to the Fund six decades of combined investment management experience, along with a broad range of growth-stock investing skills.
INVESTMENT CONCERNS
Small-capitalization funds typically carry additional risks since smaller companies generally have a higher risk of failure, and historically, their stocks have experienced a greater degree of market volatility than stocks on average.
Equity securities (stocks) are more volatile and carry more risk than other forms of investments, including investments in high-grade fixed income securities. The net asset value per share of this Fund will fluctuate as the value of the securities in the portfolio changes. Common stocks, and funds investing in common stocks, generally provide greater return potential when compared with other types of investments.
PORTFOLIO MANAGERS’ PERSPECTIVE
“Small companies are vastly different, in many ways, from larger corporations, and successfully investing in the small-cap sector— which we define as companies having market capitalizations under $3 billion— requires special care and discipline. With small stocks, for example, the risk we confront is more company-specific than market-related; these stocks tend to move more on news about their individual company or on industry dynamics than do larger stocks. There also is less efficiency in the pricing of small-company stocks. All these factors make small-company stocks more risky, yet they are laden with enormous opportunities for long-term growth and stock-price appreciation. Investors should never forget that from small companies with promising ideas, come large companies with dominant market positions.”
For the 12 months ended September 30, 2004, the Fund produced a total return of 4.22% (Institutional Shares), compared to 11.92% for its benchmark, the Russell 2000® Growth Index.
The Fund’s underperformance relative to its benchmark was primarily a result of two factors. First, during the first fiscal quarter, the Fund’s emphasis on owning higher quality companies had a negative impact on performance, as lower-quality, higher-beta1 shares propelled the benchmark returns. Second, in the second and third fiscal quarters, the Fund suffered from an unusually high number of companies failing to achieve their state financial goals, resulting in steep price declines for those holdings.
Multiple factors pressured our sector
As we entered our reporting period, small-company stocks had outperformed the overall market for several years; even in down markets, small caps generally did better than large-company stocks. However, in early calendar ‘04, the strength of economic recovery caused observers to turn their attention to the likelihood that the Fed would start raising interest rates (The Fed has raised short-term rates three times in recent months.)
In a rising-rate environment, investors are prone to leave higher-risk small caps and return to large- company stocks, which are perceived to be more stable. This defensive shift was a major factor in the relatively weak performance of small-cap stocks during the latter half of our fiscal year. At the same time, the growth sector underperformed the value area.
Further, the traditional growth sectors of technology, consumer discretionary and health care normally do not do well in periods of rising interest rates.
All of these factors combined to put pressure on the Fund’s performance for the full 12-month period.
Nevertheless, the Fund posted a positive return for the period. And we continued to actively manage the portfolio to respond to prevailing market conditions and to take advantage of attractive growth opportunities.
For example, last spring we began to pare back positions in the information technology and consumer discretionary sectors. We also overweighted our portfolio allocation to health care stocks, though we avoided high-risk biotech names and focused on companies in the health care services area, whose earnings we expected to hold up better in a slowing economy. In addition, we took steps to raise the Fund’s average market capitalization and lower its beta, or measure of risk relative to our benchmark, the Russell 2000® Growth Index. This more defensive posture served us well when the small-cap growth sector began to sputter this summer.1
As of September 30, 2004, the top five equity holdings in the Fund (as a percentage of net assets) were:2
| | | |
Anteon International Corp. | | 2.2 | % |
Waste Connections, Inc. | | 2.1 | % |
Forward Air Corp. | | 1.9 | % |
SFBC International, Inc. | | 1.8 | % |
UTI Worldwide, Inc. | | 1.8 | % |
We see selected buying opportunities in the near term
As we look into 2005, we are increasingly optimistic about the prospects for small-cap growth stocks.
The economy is slowing and energy costs are high, which may convince the Fed to not raise interest rates aggressively. Furthermore, if energy prices correct to more normal levels, as we believe they will, market conditions could be similar to those we saw in 1995, which was a very good year for small-cap growth stocks.
Consequently, we plan to start adding gradually to our information technology holdings. We are also looking to add some leaders in the consumer discretionary sector in the coming months.
Past performance does not guarantee future results. The performance data quoted represents past performance and current returns may be lower or higher. Total return figures include change in share price, reinvestment of dividends and capital gains and do not reflect taxes that a shareholder would pay on fund distributions or on the redemption of fund shares. The investment return and principal value will fluctuate so that an investor’s shares, when redeemed may be worth more or less than the original cost. To obtain performance information current to the most recent month end, please visit www.bbtfunds.com.
| 1 | Beta rating attempts to measure relative risk. A beta rating of higher than one indicates greater relative volatility than the market. A beta rating lower than one indicates lower volatility than the market. |
| 2 | Portfolio composition is as of September 30, 2004 and is subject to change. |
12
BB&T SMALL COMPANY GROWTH FUND

Past performance does not guarantee future results. The performance data quoted represents past performance and current returns may be lower or higher. Total return figures include change in share price, reinvestment of dividends and capital gains and do not reflect taxes that a shareholder would pay on fund distributions or on the redemption of fund shares. The investment return and principal value will fluctuate so that an investor’s shares, when redeemed may be worth more or less than the original cost. To obtain performance information current to the most recent month end, please visit www.bbtfunds.com.
The chart above represents a comparison of a hypothetical $10,000 investment in the indicated share class versus a similar investment in the Fund’s benchmark, and represents the reinvestment of dividends and capital gains.
| 2 | Class B Shares were not in existence prior to 1/1/96. Performance for periods prior to that is based on the historical performance of the Class A Shares, and has been adjusted for the maximum CDSC applicable to the Class B Shares, but does not include the Class B Shares 12b-1 fees, which if reflected, would have lowered performance. Class C Shares were not in existence before 2/1/01. Performance for periods prior to that is based on the historical performance of the Class A Shares and has been adjusted for the maximum CDSC applicable to Class C Shares, but does not reflect the Class C Shares 12b-1 fees, which if reflected, performance would have been lower. |
The Fund is measured against the Russell 2000® Growth Index, an unmanaged index which is comprised of the securities in the Russell 2000® Index which have a greater-than-average growth orientation. Securities in this index tend to exhibit higher price-to-book and price-to-earnings ratios. The index does not reflect the deduction of expenses associated with a mutual fund, such as investment management and fund accounting fees. The Fund’s performance reflects the deduction of fees for these services. Investors cannot invest directly in an index, although they can invest in its underlying securities.
A portion of the Fund’s fees has been voluntarily waived. If the fees had not been waived, the Fund’s total return for the period would have been lower.
13
BB&T SPECIAL OPPORTUNITIES EQUITY FUND
PORTFOLIO MANAGER
George F. Shipp, CFA
The BB&T Special Opportunities Equity Fund is managed by George F. Shipp, CFA, chief investment officer of Scott & Stringfellow, Inc., subadvisor to the Fund. Mr. Shipp, who joined Scott & Stringfellow in 1982, holds a B.A. from the University of Virginia and an MBA from the Darden Graduate School of Business at the University of Virginia. Mr. Shipp is supported by an investment management team from Scott & Stringfellow, which includes Meghann A. Cohen; R. Griffith Jones, Jr.; and Farley C. Shiner, CPA. The team brings to the Fund more than three decades of combined investment management experience, along with a broad range of investing skills.
INVESTMENT CONCERNS
Equity securities (stocks) are more volatile and carry more risk than other forms of investments, including investments in high-grade fixed income securities. The net asset value per share of this Fund will fluctuate as the value of the securities in the portfolio changes. Common stocks, and funds investing in common stocks, generally provide greater return potential when compared with other types of investments. A concentrated portfolio may add a measure of volatility to performance, as major fluctuations in any one holding will likely affect the fund more than a fund with greater diversification.
PORTFOLIO MANAGERS’ PERSPECTIVE
“We aggressively pursue attractive opportunities wherever they can be found, limiting ourselves to neither a particular sector nor a single investing style. From a universe of 6,000 publicly traded companies, we build a concentrated portfolio that normally holds no more than 30 securities — blending relatively young growth stocks marked by above-average revenue and earnings growth, with larger, more-established value stocks that are out of favor for reasons we believe to be only temporary. This balanced approach enables us to act upon our investment team’s very best ideas and build a portfolio marked by diversification, above-average fundamentals and below-market risk characteristics.”
For the 12 months ended September 30, 2004, the Fund produced a total return of 25.44% (Institutional Shares), compared to 13.86% for its benchmark, the S&P 500 Index. We were pleased to generate a positive return in all four quarters.
The Fund’s out-performance was due to fortunate stock selection
By that, we admit our bias against taking too seriously “top-down” forecasts of macroeconomic factors such as interest rate changes, currency fluctuations, GDP growth rates, or other imponderables. We build our portfolio one company at a time. The Fund, at its essence, is a stock-picker’s fund that attempts to assemble perceived above-average companies at below-average valuations.
Because we are not limited by investment style or market capitalization, we own both “value” and “growth” stocks; in fact, we’d assert our holdings have both characteristics. We have the flexibility to own both large and small-capitalization stocks, allowing us to search for the perceived best risk/reward opportunities, regardless of a company’s size.
We’re also relatively concentrated, with the portfolio owning between 25 and 30 names; as of September 30, 2004, the Fund held just 28 separate securities.1 That gives us the opportunity to beat the Market averages when we are more often “right” than wrong, but of course we should alert our shareholders to the alternative possibility.
Throughout the period, we had an overweighting in energy, which helped our performance. We identified a structural change in energy, fairly early in the game. Admittedly, we could not know that oil prices would climb to $50 a barrel, but looking back a year, we believed oil stocks were cheap based on then-prevailing commodity price quotes. Our domestic economy was growing, China’s rapid economic expansion pointed to its greater appetite for energy and, certainly in North America, a decades-long underinvestment in energy production was constricting supply.
We continue to own the same three energy stocks we’ve held for some time: Pioneer Natural Resources Co. (3.7% of the portfolio’s net assets), Apache Corp. (3.6%) and XTO Energy, Inc. (3.4%). We do not wish to overstay our welcome, but we believe demand for oil and natural gas continues to outstrip supply. Each of our companies has been able to expand reserves and production at well above-average rates, while materially strengthening their finances during the period of high prices.1
On the flip side, we were underweighted in technology stocks for the entire 12 months. This decision did not help our performance during the first half of the period, when tech stocks did well, but we avoided some of the sector’s broad decline in the spring and summer months. Because the economic upturn has fostered significant improvement in corporate America’s profitability and liquidity, we believe that, looking into 2005, business capital spending ought to remain relatively strong. Technology spending therefore may be poised to outgrow the consumer sector, prompting us to add storage software leader Veritas to the portfolio in July, after industry valuations became far more favorable.
As of September 30, 2004, the top five equity holdings in the Fund (as a percentage of net assets) were:1
| | | |
Veritas Software Corp. | | 3.8 | % |
Pioneer Natural Resources Co. | | 3.7 | % |
Internet Security Systems, Inc. | | 3.7 | % |
Manor Care, Inc. | | 3.7 | % |
Markel Corp. | | 3.6 | % |
We believe we are positioned to exploit future opportunities
We’ve consistently held a higher position in cash than the typical equity mutual fund. Part of this cash is due to much-appreciated inflows of new shareholder money that we tend to invest carefully, rather than automatically. We believe flexibility to take advantage of the stock market’s periodic dips is an under-appreciated asset. Shareholders should recognize that an above-average cash position can hurt our future relative performance, however, should we experience a sharply rising stock market.
We believe it is unlikely, now that the Fed is nudging short-term interest rates upward, given a backdrop of higher oil prices, that the economy accelerates over the next year. Our current portfolio positioning therefore tends to emphasize companies that may be able to prosper in a slower-growth environment.
We like to focus on themes that appear to transcend economic ups and downs. Notwithstanding negative headlines currently facing major pharmaceutical companies, healthcare continues to look like a growth business to us, driven by the aging of America. We are attempting to participate by owning a leading generic drug-maker, clinical lab, nursing and home health provider, managed care provider, and a specialty operator of cardiovascular hospitals. In a low-inflation world, we remain attuned to companies that enjoy a degree of pricing power. We believe “security” in all its forms is an investable trend. We remain at least as attracted to companies that are skilled users of ever-improving technology, as to those that make and sell it.
As always, we will go stock by stock, and build the portfolio from the bottom up—focusing on valuations, financial strength, underlying earnings growth, valuation, and dividends.
Past performance does not guarantee future results. The performance data quoted represents past performance and current returns may be lower or higher. Total return figures include change in share price, reinvestment of dividends and capital gains and do not reflect taxes that a shareholder would pay on fund distributions or on the redemption of fund shares. The investment return and principal value will fluctuate so that an investor’s shares, when redeemed may be worth more or less than the original cost. To obtain performance information current to the most recent month end, please visit www.bbtfunds.com.
| 1 | Portfolio composition is as of September 30, 2004 and is subject to change. |
14
BB&T SPECIAL OPPORTUNITIES EQUITY FUND

Past performance does not guarantee future results. The performance data quoted represents past performance and current returns may be lower or higher. Total return figures include change in share price, reinvestment of dividends and capital gains and do not reflect taxes that a shareholder would pay on fund distributions or on the redemption of fund shares. The investment return and principal value will fluctuate so that an investor’s shares, when redeemed may be worth more or less than the original cost. To obtain performance information current to the most recent month end, please visit www.bbtfunds.com.
The chart above represents a comparison of a hypothetical $10,000 investment in the indicated share class versus a similar investment in the Fund’s benchmark and represents the reinvestment of dividends and capital gains.
The Fund is measured against the S&P 500 index which is generally considered to be representative of the performance of the stock market as a whole. The index does not reflect the deduction of expenses associated with a mutual fund, such as investment management and fund accounting fees. The Fund’s performance reflects the deduction of fees for these services. Investors cannot invest directly in an index, although they can invest in its underlying securities.
A portion of the Fund’s fees has been voluntarily waived. If the fees had not been waived, the Fund’s total return for the period would have been lower.
15
BB&T INTERNATIONAL EQUITY FUND
PORTFOLIO MANAGER
UBS Global Asset Management
The BB&T International Equity Fund is managed by a team of portfolio managers at UBS Global Asset Management, subadviser to the Fund. Key team members include Bruno Bertocci, executive director and global portfolio manager; Thomas P. Madsen, CFA, managing director and global head of equities; and Lydia J. Miller, managing director and global portfolio manager. Mr. Bertocci received a B.A. degree from Oberlin College and an M.B.A. from the Harvard Graduate School of Business and has 24 years of investing experience. Mr. Madsen earned B.B.A. and M.S. degrees from the University of Wisconsin and also has 24 years of investing experience. Ms. Miller earned a B.S. from the Pennsylvania State University and an M.B.A. from the University of Chicago, and brings 18 years of investing experience to the team.
INVESTMENT CONCERNS
There are risks associated with investing in foreign companies, such as erratic market conditions, economic and political instability and fluctuations in currency and exchange rates.
Equity securities (stocks) are more volatile and carry more risk than other forms of investments, including investments in high-grade fixed income securities. The net asset value per share of this Fund will fluctuate as the value of the securities in the portfolio changes. Common stocks, and funds investing in common stocks, generally provide greater return potential when compared with other types of investments.
PORTFOLIO MANAGERS’ PERSPECTIVE
“Our investment philosophy focuses on a stock’s price, relative to its intrinsic (or fundamental) value. We identify discrepancies between a security’s intrinsic value and its observed market price—both across and within global equity markets. We attempt to exploit these discrepancies using a disciplined fundamental approach. Our research teams evaluate companies in their markets around the world and assign relative price /value rankings based on the present value of each company’s expected future cash flows. Our equity strategy team utilizes a global network of resources to systematically develop portfolio strategy in the context of integrated global capital markets. Currency strategies are developed separately and coordinated with country allocations. The result is a diversified portfolio of international stocks that we believe could provide solid, long-term performance while potentially managing risk.”
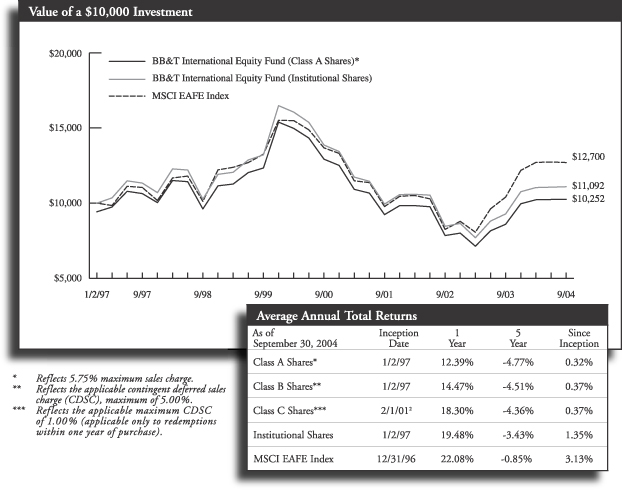
For the 12 months ended September 30, 2004, the Fund produced a total return of 19.48 % (Institutional Shares), compared to 22.08% for its benchmark, the Morgan Stanley Capital International Europe, Australasia, and Far East Index (the “MSCI EAFE”).
The majority of underperformance relative to the EAFE index occurred in the consumer discretionary sector. This was driven by durables and media, where we have been underweight the auto sector and have been overweight more traditional media versus internet-reltaed media.
We have focused on selected stocks in all regions
Throughout the period, economic growth abroad was pretty strong, though parts of Continental Europe seemed to struggle. Germany, in particular, continued to have a rough time economically. China, which has been a huge economic story for some time, also is starting to show slower growth.
Our underweighting in Japan is due to that country’s dependence on China, and our feeling that Japanese companies will feel the pinch from China’s slowdown. That’s not to say we’re not investing in Japan, but we prefer companies with strong international presences, such as Honda Motor Co. Ltd (2.0% of the portfolio’s net assets), Canon, Inc. (1.7%) and Kao Corp. (1.2%); these are companies that should benefit from a global recovery.1
We are overweighted in the United Kingdom, not because of a macro view that the U.K. is a particularly productive place to be, but because we are finding some attractively valued stocks there. We like a lot of the banking stocks, particularly Royal Bank of Scotland Group PLC (2.7%) and Barclays PLC (2.1%). We’re also drawn to a lot of the consumer staple stocks, which were ignored during the bull market of 2003 and early 2004. Some of our favorites in this sector are Diageo PLC (2.2%), which produces premium alcoholic beverages; retailer Tesco, PLC (1.7%); and Kingfisher PLC (1.3%), which owns home improvement stores. These companies are fundamentally solid and they shouldn’t be too adversely affected by what we perceive to be the U.K.’s overleveraged consumers.1
As of September 30, 2004, 39.0% of the Fund’s holdings (as a percentage of net assets) was invested in Continental Europe, 33.6% in the Great Britain, 18.7% in Japan, 3.6% in other Pacific Basin countries, 3.4% in the world’s emerging markets and 1.7% in cash and cash equivalents.1
The Fund’s top five equity holdings (as a percentage of net assets) were:1
| | | |
Vodafone Group PLC | | 3.5 | % |
BP PLC | | 3.0 | % |
Total SA | | 2.8 | % |
Royal Bank of Scotland Group PLC | | 2.7 | % |
Shell Transportation & Trading Co. PLC | | 2.6 | % |
We favor telecom in the months ahead
Looking out six to 12 months, on a sector basis we like telecommunications stocks a lot — that is, companies that provide telecom services, not telecom equipment. There has been some concern about pricing pressure government regulation in the telecom sector and many good stocks have been hit pretty hard.
We think the selling has been overdone; the stocks we like appear to be selling below their intrinsic value. Some of our favorite names in this area are Vodafone Group PLC (3.5%), NTT DoCoMo, Inc. (1.7%) and France Telecom SA (1.3%).1
Past performance does not guarantee future results. The performance data quoted represents past performance and current returns may be lower or higher. Total return figures include change in share price, reinvestment of dividends and capital gains and do not reflect taxes that a shareholder would pay on fund distributions or on the redemption of fund shares. The investment return and principal value will fluctuate so that an investor’s shares, when redeemed may be worth more or less than the original cost. To obtain performance information current to the most recent month end, please visit www.bbtfunds.com.
| 1 | Portfolio composition is as of September 30, 2004 and is subject to change. |
16
BB&T INTERNATIONAL EQUITY FUND
Past performance does not guarantee future results. The performance data quoted represents past performance and current returns may be lower or higher. Total return figures include change in share price, reinvestment of dividends and capital gains and do not reflect taxes that a shareholder would pay on fund distributions or on the redemption of fund shares. The investment return and principal value will fluctuate so that an investor’s shares, when redeemed may be worth more or less than the original cost. To obtain performance information current to the most recent month end, please visit www.bbtfunds.com.
The chart above represents a comparison of a hypothetical $10,000 investment in the indicated share class versus a similar investment in the Fund’s benchmark, and represents the reinvestment of dividends and capital gains.
| 2 | Class C Shares were not in existence prior to 2/1/01. Performance for periods prior to that is based on the historical performance of the Class B Shares, and has been adjusted for the maximum CDSC applicable to Class C Shares. |
The Fund is measured against the MSCI EAFE Index, an unmanaged index which is generally representative of the performance of stock markets in that region. The index does not reflect the deduction of expenses associated with a mutual fund, such as investment management and fund accounting fees. The Fund’s performance reflects the deduction of fees for these services. Investors cannot invest directly in an index, although they can invest in its underlying securities.
A portion of the Fund’s fees has been waived. If the fees had not been waived, the Fund’s total return for the period would have been lower.
17
BB&T SHORT U.S. GOVERNMENT FUND
PORTFOLIO MANAGER
Kevin E. McNair, CFA
The BB&T Short U.S. Government Fund is managed by Kevin E. McNair, CFA. Mr. McNair received a B.A. in Economics from the University of North Carolina-Chapel Hill and a Master’s of Economics from North Carolina State University, and has been managing investors’ money since 1994. Mr. McNair is supported by the BB&T Fixed Income Portfolio Management Team, which includes R. Ron Elmer, CFA, CPA, CFP™; Brad D. Eppard, CFA; David T. Johnson; Robert E. Millikan, CFA; Michael D. Nichols, CFA; and Dickinson B. Phillips, CFP™. The team brings to the Fund nine decades of combined investment management experience, along with a broad range of specialized skills encompassing a cross-section of fixed-income sectors.
INVESTMENT CONCERNS
Bonds offer a relatively stable level of income, although bond prices will fluctuate providing the potential for principal gain or loss. Intermediate-term, higher-quality bonds generally offer less risk than longer-term bonds and a lower rate of return.
The Fund is subject to the risk that principal value reacts in opposition to the movement of interests rates and that a rising interest rate environment increases the risk of loss of principal.
PORTFOLIO MANAGERS’ PERSPECTIVE
“This high-quality bond fund is geared toward investors looking for current income to meet their short-term needs, with limited fluctuations in principal. We seek to provide value by rotating among different sectors of the taxable, fixed-income market — Treasuries, mortgage-backed securities, agency paper and corporate debt — purchasing securities that offer the most potential for relative outperformance, and limiting movements in the portfolio’s duration within a relatively tight range.”
For the 12 months ended September 30, 2004, the Fund produced a total return of 0.96% (Institutional Shares), compared to 1.31% for its benchmark, the Merrill Lynch 1-5 Year U.S. Treasury Index.
Short-term rates climbed sharply
While yields on intermediate- and long-term bonds barely budged for the full period, short-term yields rose significantly; the two-year Treasury note’s yield was up 115 basis points (1.15%). This increase was attributable to improving economic growth and to an expectation that the Fed would begin hiking up the fed funds target rate at the front end of the yield curve. In fact, the Fed did start raising rates this past June, but the market factored in such moves earlier in the period.
The rise in short-term rates certainly impacted the Fund, which operates in the short end of the yield curve. The sharply higher rates pressured bond prices—rates and prices move in opposite directions—and presented a continuous challenge throughout the period.
In response, we maintained a duration (interest-rate sensitivity) shorter than our benchmark’s, and therefore, more defensive. We also emphasized “spread product”: securities other than basic Treasuries that offer higher yields. For example, we were overweighted in callable agency securities. Because these securities can be “called away,” or redeemed by the issuer before maturity, they are sold with a yield premium. But in a rising-rate environment, early redemption isn’t likely, and we believe we can pick up the extra yield with little “call risk.”1
As of September 30, 2004, the effective duration of the Short U.S. Government Fund was 1.66. Approximately 43.0% of the portfolio (as a percentage of net assets) was invested in U.S. government agency securities, 30.7% in mortgage-backed securities, 13.8% in securities issued by the U.S. Treasury, 7.8% in corporate debt, 1.5% in municipal debt and 3.0% in cash and cash equivalents. The portfolio’s average credit quality was Aaa (as rated by Moody’s).1,2
We believe the economy is on solid footing
Looking ahead, we’re still positive on the economy. Even though job growth has not been extremely strong, the unemployment rate has fallen during the last year. We’re also seeing increases in such data as personal income and wages, which is constructive for consumer spending. Business spending has been picking up, which also bodes well for the economy.
So we’re anticipating sustained economic growth
That said, we believe interest rates could continue to rise, and we’re structuring the portfolio to take into account higher rates over the next six to 12 months.
Past performance does not guarantee future results. The performance data quoted represents past performance and current returns may be lower or higher. Total return figures include change in share price, reinvestment of dividends and capital gains and do not reflect taxes that a shareholder would pay on fund distributions or on the redemption of fund shares. The investment return and principal value will fluctuate so that an investor’s shares, when redeemed may be worth more or less than the original cost. To obtain performance information current to the most recent month end, please visit www.bbtfunds.com.
| 1 | Portfolio composition is as of September 30, 2004 and is subject to change. |
| 2 | Moody’s Fund Ratings represent an opinion only, not a recommendation to buy or sell. |
18
BB&T SHORT U.S. GOVERNMENT FUND
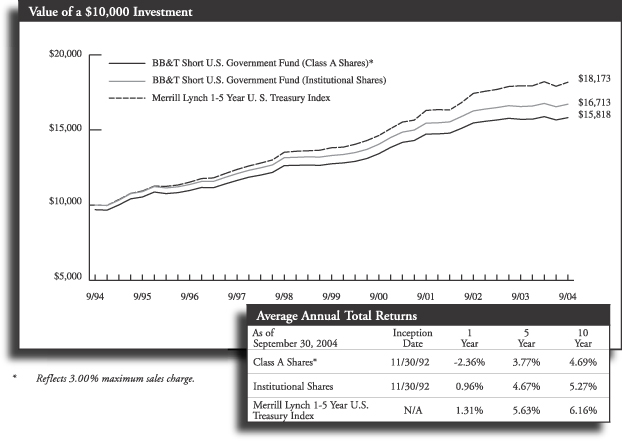
Past performance does not guarantee future results. The performance data quoted represents past performance and current returns may be lower or higher. Total return figures include change in share price, reinvestment of dividends and capital gains and do not reflect taxes that a shareholder would pay on fund distributions or on the redemption of fund shares. The investment return and principal value will fluctuate so that an investor’s shares, when redeemed may be worth more or less than the original cost. To obtain performance information current to the most recent month end, please visit www.bbtfunds.com.
The chart above represents a comparison of a hypothetical $10,000 investment in the indicated share class versus a similar investment in the Fund’s benchmark, and represents the reinvestment of dividends and capital gains.
The Fund is measured against the Merrill Lynch 1-5 Year U.S. Treasury Index, an unmanaged index which measures the performance of U.S. Government bonds in that maturity range. The index does not reflect the deduction of expenses associated with a mutual fund, such as investment management and fund accounting fees. The Fund’s performance reflects the deduction of fees for these services. Investors cannot invest directly in an index, although they can invest in its underlying securities.
A portion of the Fund’s fees has been voluntarily waived. If the fees had not been waived, the Fund’s total return for the period would have been lower.
19
BB&T INTERMEDIATE U.S. GOVERNMENT FUND
PORTFOLIO MANAGER
Brad D. Eppard, CFA
The BB&T Intermediate U.S. Government Fund is managed by Brad D. Eppard, CFA. Mr. Eppard received a B.S. in Business Administration/Accounting from Radford University and has been managing investors’ money since 1986. Mr. Eppard is supported by the BB&T Fixed Income Portfolio Management Team, which includes R. Ron Elmer, CFA, CPA, CFP™; David T. Johnson; Kevin E. McNair, CFA; Robert F. Millikan, CFA; Michael D. Nichols, CFA; and Dickinson B. Phillips, CFP™. The team brings to the Fund nine decades of combined investment management experience, along with a broad range of specialized skills encompassing a cross-section of fixed-income sectors.
INVESTMENT CONCERNS
Bonds offer a relatively stable level of income, although bond prices will fluctuate providing the potential for principal gain or loss. Intermediate-term, higher-quality bonds generally offer less risk than longer-term bonds and a lower rate of return.
The Fund is subject to the risk that principal value reacts in opposition to the movement of interests rates and that a rising interest rate environment increases the risk of loss of principal.
PORTFOLIO MANAGERS’ PERSPECTIVE
“This high-quality bond fund should be attractive to investors seeking to capture the total return available from intermediate-term U.S. government bonds. Our process attempts to identify those securities and sectors that are most attractively priced and offer the best potential for relative outperformance. We seek to provide value by strategically investing along the yield curve and rotating among sectors—Treasuries, mortgage-backed securities, agency paper and corporate debt—while keeping movements in the portfolio’s duration within a relatively tight range.”
For the 12 months ended September 30, 2004, the Fund produced a total return of 1.56% (Institutional Shares), compared to 3.44% for its benchmark, the Lehman Brothers U.S. Government/Mortgage Bond Index.
Mortgage-backed securities were among the best performing sectors during the period. Although we had a significant weighting in this security sector, we were underweight relative to our benchmark. Thus, this differential was a primary cause for funds relative underperformance to its benchmark.
Various factors conspired to keep returns low
Entering the period, we expected a couple of things: first, interest rates would rise across the board; and second, short-term rates would move up faster than longer rates, thereby flattening the yield curve.
The yield curve did flatten during our fiscal year, but we were somewhat surprised to see intermediate- and long-term rates rise hardly at all. The 10-year Treasury Note yield rose just 18 basis points (0.18%), while the 30-year Treasury Bond ticked up by just a single basis point (0.01%) — though there was considerable volatility at various times within the period.
Another significant factor that had an impact on the bond market was the release of data pointing to a strengthening economy. Stronger data often precedes rising inflation, and while inflation in general remained under control, the specter of higher prices—energy costs certainly spiked up in our last fiscal quarter—dampened bonds across sectors and maturities.
Further, the Fed did reverse field and began to raise short-term raises over the summer. While a fed funds rate of 1.75% (at the end of our period) is not high by historical standards, the prospect of a less-accommodating Fed did not make fixed-income investors overly optimistic.
The Fund’s performance was helped somewhat by periodic “flights to quality,” when particularly bad news abroad or concerns over terrorism led investors to seek the relatively safety and stability of Treasury securities.
As of September 30, 2004, the effective duration of the Intermediate U.S. Government Fund was 3.37.1 Approximately 39.2% of the portfolio (as a percentage of net assets) was invested in U.S. government agency securities, 36.6% in mortgage-backed securities, 14.4% in securities issued by the U.S. Treasury, 9.2% in corporate debt securities and 0.1% in cash and cash equivalents. The portfolio’s average credit quality was Aaa (as rated by Moody’s).2,3
Bonds are likely to tread water for a while
Our approach is to move cautiously and gradually in all of our bond portfolios; during the last 12 months, we shortened the Fund’s duration, but did so slowly.
Looking ahead, we intend to remain modestly defensive, as we believe rates are more likely to rise gradually than to decline, and an overly aggressive stance could prove costly. At the same time, we are going to take steps to enhance income where we can. The agency sector is one of our favorites, and we believe we could boost the Fund’s yield through callable agency securities.
Past performance does not guarantee future results. The performance data quoted represents past performance and current returns may be lower or higher. Total return figures include change in share price, reinvestment of dividends and capital gains and do not reflect taxes that a shareholder would pay on fund distributions or on the redemption of fund shares. The investment return and principal value will fluctuate so that an investor’s shares, when redeemed may be worth more or less than the original cost. To obtain performance information current to the most recent month end, please visit www.bbtfunds.com.
| 1 | Duration is a measure of a bond’s or a bond fund’s price risk that is adjusted for any optionality. |
| 2 | Portfolio composition is as of September 30, 2004 and is subject to change. |
| 3 | Moody’s Fund Ratings represent an opinion only, not a recommendation to buy or sell. |
20
BB&T INTERMEDIATE U.S. GOVERNMENT FUND
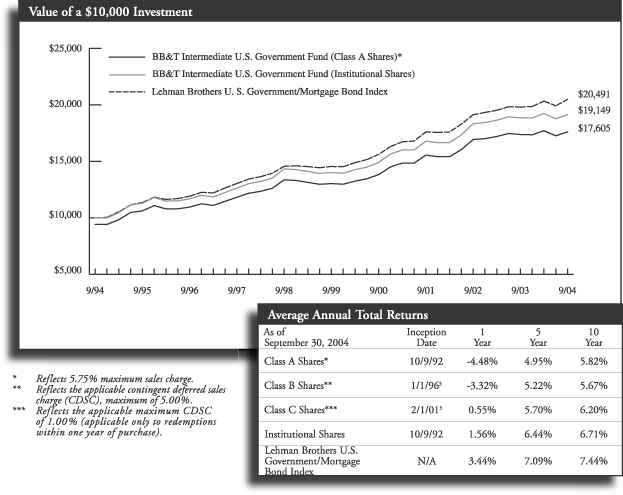
Past performance does not guarantee future results. The performance data quoted represents past performance and current returns may be lower or higher. Total return figures include change in share price, reinvestment of dividends and capital gains and do not reflect taxes that a shareholder would pay on fund distributions or on the redemption of fund shares. The investment return and principal value will fluctuate so that an investor’s shares, when redeemed may be worth more or less than the original cost. To obtain performance information current to the most recent month end, please visit www.bbtfunds.com.
The chart above represents a comparison of a hypothetical $10,000 investment in the indicated share class versus a similar investment in the Fund’s benchmark and represents the reinvestment of dividends and capital gains.
| 3 | Class B Shares were not in existence prior to 1/1/96. Performance for periods prior to that is based on the historical performance of the Class A Shares, and has been adjusted for the maximum CDSC applicable to the Class B Shares, but does not include the Class B Shares 12b-1 fees, which, if reflected, would have lowered performance. Class C Shares were not in existence prior to 2/1/01. Performance for periods prior to that is based on the historical performance of the Class A Shares, and has been adjusted for the maximum CDSC applicable to Class C Shares, but does not include the Class C Shares 12b-1 fees, which if reflected, would have lowered performance. |
The Fund is measured by the Lehman Brothers U.S. Government/Mortgage Bond Index an unmanaged index which is widely used as a broad measure of the performance of U.S. Government bonds with maturities of less than 10 years, and agency mortgage backed securities. The index does not reflect the deduction of expenses associated with a mutual fund, such as investment management and fund accounting fees. The Fund’s performance reflects the deduction of fees for these services. Investors cannot invest directly in an index, although they can invest in its underlying securities.
A portion of the Fund’s fees has been waived. If the fees had not been waived, the Fund’s total return for the period would have been lower.
21
BB&T INTERMEDIATE CORPORATE BOND FUND
PORTFOLIO MANAGER
Brad D. Eppard, CFA
The BB&T Intermediate Corporate Bond Fund is managed by Brad D. Eppard, CFA. Mr. Eppard graduated from Radford University, where he received a B.S. in Business Administration/Accounting. Mr. Eppard is supported by the BB&T Fixed Income Portfolio Management Team, which includes R. Ron Elmer, CFA, CPA, CFP™; David T. Johnson; Kevin E. McNair, CFA; Robert E. Millikan, CFA; Michael D. Nichols, CFA; and Dickinson B. Phillips, CFP™. The team brings to the Fund nine decades of combined investment management experience, along with a broad range of specialized skills encompassing a cross-section of fixed-income sectors.
INVESTMENT CONCERNS
Bonds offer a relatively stable level of income, although bond prices will fluctuate providing the potential for principal gain or loss. Intermediate-term, higher-quality bonds generally offer less risk than longer-term bonds and a lower rate of return.
The Fund is subject to the risk that principal value reacts in opposition to the movement of interests rates and that a rising interest rate environment increases the risk of loss of principal.
PORTFOLIO MANAGERS’ PERSPECTIVE
“The majority of the issues we hold are intermediate-term, investment-grade corporate bonds. We expect this type of portfolio to generate more income than is available from short-term corporate securities or from intermediate U.S. government securities. At the same time, this is not a pure income fund with minimal price fluctuations. Because we also pursue long-term capital gains, the Fund will experience short-term volatility from time to time. However, with volatility comes the opportunity to produce an attractive total return, in addition to a relatively generous yield. Therefore, we believe the Fund can benefit both income investors and long-term growth investors seeking to balance the equity portions of their individual portfolios.”
For the 12 months ended September 30, 2004, the Fund produced a total return of 3.47% (Institutional Shares), compared to 4.44% for its benchmark, the Lehman Brothers U.S. Credit Index.
Spreads between corporate and Treasury securities contracted
As we began our fiscal year, corporate securities offered significantly higher yield “spreads” over Treasuries, and we positioned the Fund to take advantage of this disparity. As the period unfolded, these spreads narrowed significantly, and lower-quality, investment-grade debt didn’t appear to offer adequate yield for the additional risk. In response, we gradually raised the quality of the portfolio, while moderately shortening its average life and duration. We should note that this narrowing of spreads added to the Fund’s underperformance.
The bond market in general reacted to data pointing to a strengthening economy. Stronger data often precedes rising inflation, and while inflation in general remained under control, the specter of higher prices—energy costs certainly spiked up in our last fiscal quarter—dampened bonds across sectors and maturities.
Further, the Fed reversed field and began to raise short-term raises over the summer. While a fed funds rate of 1.75% (at the end of our period) is not high by historical standards, the prospect of a less-accommodating Fed did not make fixed-income investors overly optimistic.
Still, buoyed by relatively higher yields, corporate bonds outperformed Treasury securities.
As of September 30, 2004, the Fund’s effective duration was 4.59.1 Approximately 86.6% of the portfolio (as a percentage of net assets) was invested in corporate obligations, 9.4% in U.S. Treasury and agency securities, 0.8% in real estate investment trust securities and 2.3% in cash and cash equivalents. The Fund’s average credit quality was A3 (as rated by Moody’s).2,3
We don’t anticipate dramatic economic activity
Looking ahead, we’re probably not as optimistic about the economy as we were a year ago. It’s not that we believe the economy is going to tank, but it’s more likely to just bump along for awhile. Growth could continue, but we don’t think we’ll see the growth spurts of the last 12 months.
In uncertain environments, an emphasis on high-quality securities, which is always a favorite theme of ours, could best serve our shareholders’ interests. As we move into 2005, we also might modify our yield curve structure, especially if the Fed stops raising rates.
Past performance does not guarantee future results. The performance data quoted represents past performance and current returns may be lower or higher. Total return figures include change in share price, reinvestment of dividends and capital gains and do not reflect taxes that a shareholder would pay on fund distributions or on the redemption of fund shares. The investment return and principal value will fluctuate so that an investor’s shares, when redeemed may be worth more or less than the original cost. To obtain performance information current to the most recent month end, please visit www.bbtfunds.com.
| 1 | Duration is a measure of a bond’s or a bond fund’s price risk that is adjusted for any optionality. |
| 2 | Portfolio composition is as of September 30, 2004 and is subject to change. |
| 3 | Moody’s Fund Ratings represent an opinion only, not a recommendation to buy or sell. |
22
BB&T INTERMEDIATE CORPORATE BOND FUND
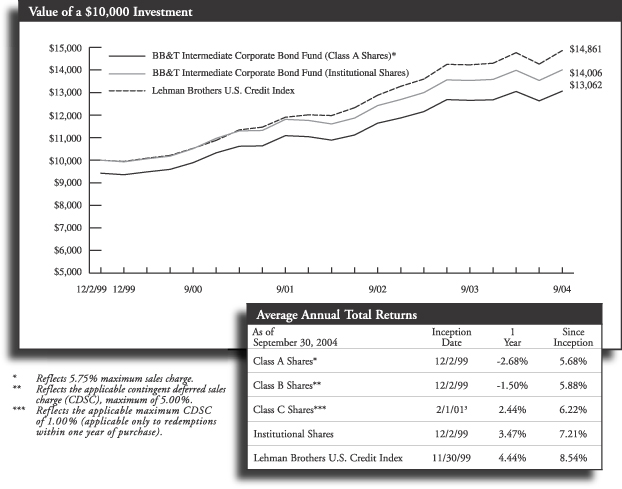
Past performance does not guarantee future results. The performance data quoted represents past performance and current returns may be lower or higher. Total return figures include change in share price, reinvestment of dividends and capital gains and do not reflect taxes that a shareholder would pay on fund distributions or on the redemption of fund shares. The investment return and principal value will fluctuate so that an investor’s shares, when redeemed may be worth more or less than the original cost. To obtain performance information current to the most recent month end, please visit www.bbtfunds.com.
The chart above represents a comparison of a hypothetical $10,000 investment in the indicated share class versus a similar investment in the Fund’s benchmark, and represents the reinvestment of dividends and capital gains.
| 3 | Class C Shares were not in existence prior to 2/1/01. Performance for periods prior to that is based on the historical performance of the Class B Shares, and has been adjusted for the maximum CDSC applicable to Class C Shares. |
The Fund is measured against the Lehman Brothers U.S. Credit Index, an unmanaged index which is generally representative of fixed-rate, non-convertible domestic corporate debt securities. The index does not reflect the deduction of expenses associated with a mutual fund, such as investment management and fund accounting fees. The Fund’s performance reflects the deduction of fees for these services. Investors cannot invest directly in an index, although they can invest in its underlying securities.
A portion of the Fund’s fees has been waived. If the fees had not been waived, the Fund’s total return for the period would have been lower.
23
BB&T KENTUCKY INTERMEDIATE TAX-FREE FUND
PORTFOLIO MANAGER
Robert F. Millikan, CFA
The BB&T Kentucky Intermediate Tax-Free Fund is managed by Robert F. Millikan, CFA, Director of Fixed Income Management for BB&T Asset Management, Inc. Mr. Millikan received a B.A. in Economics from Wake Forest University, and is a past president of the North Carolina Society of Financial Analysts and chairman of the board of directors of the Carolinas Municipal Advisory Council. Mr. Millikan has been managing investors’ money since 1990. He is supported by the BB&T Fixed Income Portfolio Management Team, which includes R. Ron Elmer, CFA, CPA, CFP™; Brad D. Eppard, CFA; David’ T. Johnson; Kevin E. McNair, CFA; Michael D. Nichols, CFA; and Dickinson B. Phillips, CFP™. The team brings to the Fund nine decades of combined investment management experience, along with a broad range of specialized skills encompassing a cross-section of fixed-income sectors.
INVESTMENT CONCERNS
Because the Fund is non-diversified and invests primarily in Kentucky municipal securities, the Fund is particularly susceptible to any economic, political, or regulatory developments affecting a particular issuer of Kentucky municipal securities. Bonds offer a relatively stable level of income, although bond prices will fluctuate providing the potential for principal gain or loss. Intermediate-term, higher-quality bonds generally offer less risk than longer-term bonds and a lower rate of return. The Fund is subject to the risk that principal value reacts in opposition to the movement of interests rates and that a rising interest rate environment increases the risk of loss of principal. The Fund’s income may be subject to certain state and local taxes and, depending on a investors tax status, to the Federal alternative minimum tax.
PORTFOLIO MANAGERS’ PERSPECTIVE
“The goal of this Fund is to maximize total return while providing high current income that is exempt from both federal and state income taxes (the latter for Kentucky residents). We are municipal bond value investors. We compare the historical relationships among sectors of the municipal market—such as general obligation bonds, revenue bonds and certificate of participation bonds—and allocate greater portions of our assets to sectors that offer the best relative value. The Fund focuses on intermediate-term securities, maintaining an average duration between 3.5 and 8.0, which historically have offered investors the highest-possible yield for the given level of risk.”
For the 12 months ended September 30, 2004, the Fund produced a total return of 2.61% (Institutional Shares), compared to 3.32% for its benchmark, the Lehman Brothers 7-Year Municipal Bond Index.
Our defensive position hurt us as 10-year municipal yields actually fell 12 basis points (0.12%) for the year instead of rising. A shorter duration position also hurt from an income standpoint as shorter bonds yield less than longer ones.
The municipal market was unusually volatile
Interest rates are a key driver in the fixed-income market. During the period, there was significant volatility among intermediate-term rates, which required us to remain alert and nimble. Despite a range of 75 basis points (0.75%) at the end of our fiscal year 10-year municipal yields showed little net movement, falling just 12 basis points (0.12%).
Outside the interest-rate sphere, questions about the economy’s strength and ability to sustain growth led many people to fixed-income securities for their perceived safety and stability. Concerns over potential terrorist attacks also made bonds more attractive than stocks at certain times during the period. Further, because the yield curve was extremely steep and cash instruments offered very poor rates, some investors turned to bonds for their higher yields.
One new trend in the municipal bond arena over the last few years has been the heavy involvement of large hedge funds and arbitrageurs in municipal securities. Consequently, volatility in the municipal market, which normally is much quieter than the Treasury market, has picked up considerably.
Unlike arbitrage players, we are not gamblers. Still, the upswing in activity demands that we not completely ignore short-term momentum when buying securities with our long-term approach. This is one area where we add value to our relationship with shareholders, since most individual investors would find it difficult to keep a close eye on market activity.
As of September 30, 2004, 95.0% of the Fund’s bond holdings were debt instruments issued by government entities in Kentucky, and 0.8% were securities issued in Puerto Rico. Approximately 70.1% was invested in revenue bonds, 17.5% in pre-refunded securities, 4.8% in general obligation bonds, 4.4% escrowed to maturity and 3.2% in cash and cash equivalents.
The effective duration of the portfolio was 4.501 and the average credit quality was Aa1 (as rated by Moody ‘s).2,3
Municipals could outperform Treasuries
One constant we see in most geographic areas is that tax receipts are coming in higher than expected, which means that the need for new issuance to fund future projects is declining. Most municipalities have taken advantage of refunding opportunities at low rates, and we don’t expect to see a pickup in refundings for the foreseeable future. As a result, we expect to see less supply in the coming months, which should be positive for existing municipal securities.
Over the next six to 12 months, we believe municipal bonds could outperform Treasury securities of like maturities. The combination of rising interest rates and dwindling supply may help municipals perform relatively well in the coming year.
Past performance does not guarantee future results. The performance data quoted represents past performance and current returns may be lower or higher. Total return figures include change in share price, reinvestment of dividends and capital gains and do not reflect taxes that a shareholder would pay on fund distributions or on the redemption of fund shares. The investment return and principal value will fluctuate so that an investor’s shares, when redeemed may be worth more or less than the original cost. To obtain performance information current to the most recent month end, please visit www.bbtfunds.com.
| 1 | Duration is a measure of a bond’s or a bond fund’s price risk that is adjusted for any optionality. |
| 2 | Portfolio composition is as of September 30, 2004 and is subject to change. |
| 3 | Moody’s Fund Ratings represent an opinion only, not a recommendation to buy or sell. |
24
BB&T KENTUCKY INTERMEDIATE TAX-FREE FUND
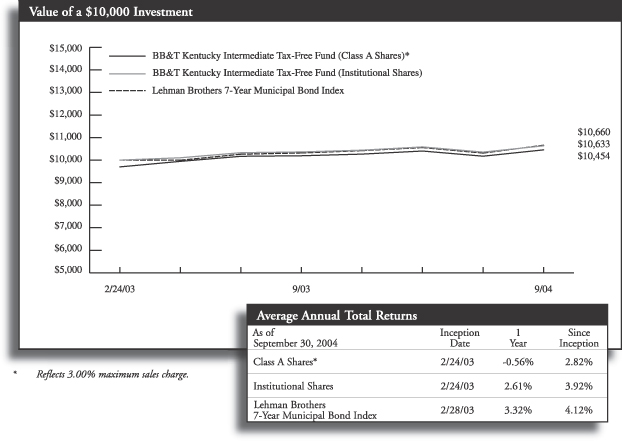
Past performance does not guarantee future results. The performance data quoted represents past performance and current returns may be lower or higher. Total return figures include change in share price, reinvestment of dividends and capital gains and do not reflect taxes that a shareholder would pay on fund distributions or on the redemption of fund shares. The investment return and principal value will fluctuate so that an investor’s shares, when redeemed may be worth more or less than the original cost. To obtain performance information current to the most recent month end, please visit www.bbtfunds.com.
The chart above represents a comparison of a hypothetical $10,000 investment in the indicated share class versus a similar investment in the Fund’s benchmark, and represents the reinvestment of dividends and capital gains.
The Fund is measured against the Lehman Brothers 7-Year Municipal Bond Index an unmanaged index which is representative of municipal bonds with a minimum credit rating of at least Baa, have a maturity value of at least $5 million and a maturity range of 6-8 years. The index does not reflect the deduction of expenses associated with a mutual fund, such as investment management and fund accounting fees. The Fund performance reflects the deduction of fees for these services. Investors cannot invest directly in an index, although they can invest in its underlying securities.
A portion of the Fund’s fees has been waived. If the fees had not been waived, the Fund’s total return for the period would have been lower.
25
BB&T MARYLAND INTERMEDIATE TAX-FREE FUND
PORTFOLIO MANAGER
Robert F. Millikan, CFA
The BB&T Maryland Intermediate Tax-Free Fund is managed by Robert F. Millikan, CFA, Director of Fixed Income Management for BB&T Asset Management, Inc. Mr. Millikan received a B.A. in Economics from Wake Forest University, and is past president of the North Carolina Society of Financial Analysts and chairman of the board of directors of the Carolinas Municipal Advisory Council. Mr. Millikan has been managing money since 1990. He is supported by the BB&T Fixed Income Portfolio Management Team, which includes R. Ron Elmer, CFA, CPA, CFP™; Brad D. Eppard, CFA; David T. Johnson; Kevin E. McNair, CFA; Michael D. Nichols, CFA; and Dickinson B. Phillips, CFP™. The team brings to the Fund nine decades of combined investment management experience, along with a broad range of specialized skills encompassing a cross-section of fixed-income sectors.
INVESTMENT CONCERNS
Because the Fund is non-diversified and invests primarily in Kentucky municipal securities, the Fund is particularly susceptible to any economic, political, or regulatory developments affecting a particular issuer of Kentucky municipal securities. Bonds offer a relatively stable level of income, although bond prices will fluctuate providing the potential for principal gain or loss. Intermediate-term, higher-quality bonds generally offer less risk than longer-term bonds and a lower rate of return. The Fund is subject to the risk that principal value reacts in opposition to the movement of interests rates and that a rising interest rate environment increases the risk of loss of principal. The Fund’s income may be subject to certain state and local taxes and, depending on a investors tax status, to the Federal alternative minimum tax.
PORTFOLIO MANAGERS’ PERSPECTIVE
“The goal of this Fund is to maximize total return while providing high current income that is exempt from both federal and state income taxes (the latter for Maryland residents). We are municipal bond value investors. We compare the historical relationships among sectors of the municipal market—such as general obligation bonds, revenue bonds and certificate of participation bonds—and allocate greater portions of our assets to sectors that offer the best relative value. The Fund focuses on intermediate-term securities, maintaining an average duration between 3.5 and 8.0, which historically have offered investors the highest-possible yield for the given level of risk.”
For the 12 months ended September 30, 2004, the Fund produced a total return of 2.52% (Institutional Shares), compared to 3.32% for its benchmark, the Lehman Brothers 7-Year Municipal Bond Index.
Our defensive position hurt us as 10-year municipal yields actually fell 12 basis points (0.12%) for the year instead of rising. A shorter duration position also hurt from an income standpoint as shorter bonds yield less than longer ones.
The municipal market was unusually volatile
Interest rates are a key driver in the fixed-income market. During the period, there was significant volatility among intermediate-term rates, which required us to remain alert and nimble. Despite a range of 75 basis points (0.75%) at the end of our fiscal year 10-year municipal yields showed little net movement, falling just 12 basis points (0.12%).
Outside the interest-rate sphere, questions about the economy’s strength and ability to sustain growth led many people to fixed-income securities for their perceived safety and stability. Concerns over potential terrorist attacks also made bonds more attractive than stocks at certain times during the period. Further, because the yield curve was extremely steep and cash instruments offered very poor rates, some investors turned to bonds for their higher yields.
One new trend in the municipal bond arena over the last few years has been the heavy involvement of large hedge funds and arbitrageurs in municipal securities. Consequently, volatility in the municipal market, which normally is much quieter than the Treasury market, has picked up considerably.
Unlike arbitrage players, we are not gamblers. Still, the upswing in activity demands that we not completely ignore short-term momentum when buying securities with our long-term approach. This is one area where we add value to our relationship with shareholders, since most individual investors would find it difficult to keep a close eye on market activity.
As of September 30, 2004, 95.6% of the Fund’s holdings were debt instruments issued by government entities in Maryland, and 1.3% were securities issued in Puerto Rico. Approximately 59.3% was invested in general obligation bonds, 27.6% in revenue bonds, 6.2% in pre-refunded securities, 1.6% escrowed to maturity, 1.1% in certificates of participation and 4.2% in cash and cash equivalents. The effective duration of the portfolio was 4.671 and the average credit quality was Aa1 (as rated by Moody’s).2,3
Municipals could outperform Treasuries
One constant we see in most geographic areas is that tax receipts are coming in higher than expected, which means that the need for new issuance to fund future projects is declining. Most municipalities have taken advantage of refunding opportunities at low rates, and we don’t expect to see a pickup in refundings for the foreseeable future. As a result, we expect to see less supply in the coming months, which should be positive for existing municipal securities.
Over the next six to 12 months, we expect municipal bonds to outperform Treasury securities of like maturities. The combination of rising interest rates and dwindling supply should help municipals perform relatively well in the coming year.
Past performance does not guarantee future results. The performance data quoted represents past performance and current returns may be lower or higher. Total return figures include change in share price, reinvestment of dividends and capital gains and do not reflect taxes that a shareholder would pay on fund distributions or on the redemption of fund shares. The investment return and principal value will fluctuate so that an investor’s shares, when redeemed may be worth more or less than the original cost. To obtain performance information current to the most recent month end, please visit www.bbtfunds.com.
| 1 | Duration is a measure of a bond’s or a bond fund’s price risk that is adjusted for any optionality. |
| 2 | Portfolio composition is as of September 30, 2004 and is subject to change. |
| 3 | Moody’s Fund Ratings represent an opinion only, not a recommendation to buy or sell. |
26
BB&T MARYLAND INTERMEDIATE TAX-FREE FUND
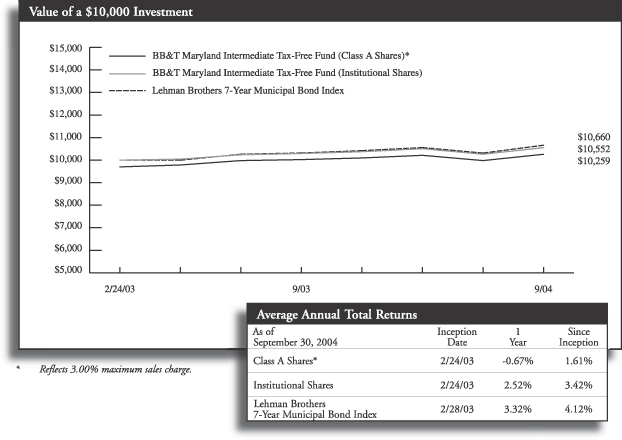
Past performance does not guarantee future results. The performance data quoted represents past performance and current returns may be lower or higher. Total return figures include change in share price, reinvestment of dividends and capital gains and do not reflect taxes that a shareholder would pay on fund distributions or on the redemption of fund shares. The investment return and principal value will fluctuate so that an investor’s shares, when redeemed may be worth more or less than the original cost. To obtain performance information current to the most recent month end, please visit www.bbtfunds.com.
The chart above represents a comparison of a hypothetical $10,000 investment in the indicated share class versus a similar investment in the Fund’s benchmark, and represents the reinvestment of dividends and capital gains.
The Fund is measured against the Lehman Brothers 7-Year Municipal Bond Index an unmanaged index which is representative of municipal bonds with a minimum credit rating of at least Baa, have a maturity value of at least $5 million and a maturity range of 6-8 years. The index does not reflect the deduction of expenses associated with a mutual fund, such as investment management and fund accounting fees. The Fund’s performance reflects the deduction of fees for these services. Investors cannot invest directly in an index, although they can invest in its underlying securities.
A portion of the Fund’s fees has been waived. If the fees had not been waived, the Fund’s total return for the period would have been lower.
27
BB&T NORTH CAROLINA INTERMEDIATE TAX-FREE FUND
PORTFOLIO MANAGER
Robert F. Millikan, CFA
The BB&T North Carolina Intermediate Tax-Free Fund is managed by Robert F. Millikan, CFA, Director of Fixed Income Management for BB&T Asset Management, Inc. Mr. Millikan received a B.A. in Economics from Wake Forest University, and is past president of the North Carolina Society of Financial Analysts and chairman of the board of directors of the Carolinas Municipal Advisory Council. Mr. Millikan has been managing investors’ money since 1990. He is supported by the BB&T Fixed Income Portfolio Management Team, which includes R. Ron Elmer, CFA, CPA, CFP™; Brad D. Eppard, CFA; David T. Johnson; Kevin E. McNair, CFA; Michael D. Nichols, CFA; and Dickinson B. Phillips, CFP™. The team brings to the Fund more than nine decades of combined investment management experience, along with a broad range of specialized skills encompassing a cross-section of fixed-income sectors.
INVESTMENT CONCERNS
Because the Fund is non-diversified and invests primarily in Kentucky municipal securities, the Fund is particularly susceptible to any economic, political, or regulatory developments affecting a particular issuer of Kentucky municipal securities. Bonds offer a relatively stable level of income, although bond prices will fluctuate providing the potential for principal gain or loss. Intermediate-term, higher-quality bonds generally offer less risk than longer-term bonds and a lower rate of return. The Fund is subject to the risk that principal value reacts in opposition to the movement of interests rates and that a rising interest rate environment increases the risk of loss of principal. The Fund’s income may be subject to certain state and local taxes and, depending on a investors tax status, to the Federal alternative minimum tax.
PORTFOLIO MANAGERS’ PERSPECTIVE
“The goal of this Fund is to maximize total return while providing high current income that is exempt from both federal and state income taxes (the latter for North Carolina residents). We are municipal bond value investors. We compare the historical relationships among sectors of the municipal market—such as general obligation bonds, revenue bonds and certificate of participation bonds—and allocate greater portions of our assets to sectors that offer the best relative value. The Fund focuses on intermediate-term securities, maintaining an average duration between 3.5 and 8.0, which historically have offered investors the highest-possible yield for the given level of risk.”
For the 12 months ended September 30, 2004, the Fund produced a total return of 2.15% (Institutional Shares), compared to 3.32% for its benchmark, the Lehman Brothers 7-Year Municipal Bond Index.
Our defensive position hurt us as 10-year municipal yields actually fell 12 basis points (0.12%) for the year instead of rising. A shorter duration position also hurt from an income standpoint as shorter bonds yield less than longer ones.
The municipal market was unusually volatile
Interest rates are a key driver in the fixed-income market. During the period, there was significant volatility among intermediate-term rates, which required us to remain alert and nimble. Despite a range of 75 basis points (0.75%) at the end of our fiscal year 10-year municipal yields showed little net movement, falling just 12 basis points (0.12%).
Outside the interest-rate sphere, questions about the economy’s strength and ability to sustain growth led many people to fixed-income securities for their perceived safety and stability. Concerns over potential terrorist attacks also made bonds more attractive than stocks at certain times during the period. Further, because the yield curve was extremely steep and cash instruments offered very poor rates, some investors turned to bonds for their higher yields.
One new trend in the municipal bond arena over the last few years has been the heavy involvement of large hedge funds and arbitrageurs in municipal securities. Consequently, volatility in the municipal market, which normally is much quieter than the Treasury market, has picked up considerably.
Unlike arbitrage players, we are not gamblers. Still, the upswing in activity demands that we not completely ignore short-term momentum when buying securities with our long-term approach. This is one area where we add value to our relationship with shareholders, since most individual investors would find it difficult to keep a close eye on market activity.
As of September 30, 2004, 100% of the Fund’s bond holdings were debt instruments issued by government entities in North Carolina. Approximately 48.9% was invested in revenue bonds, 22.2% in general obligation bonds, 11.6% in pre-refunded securities, 10.7% escrowed to maturity, 4.7% in certificates of participation and 1.9% in cash and cash equivalents. The effective duration of the portfolio was 4.721 and the average credit quality was Aa1 (as rated by Moody’s).2,3
Municipals could outperform Treasuries
One constant we see in most geographic areas is that tax receipts are coming in higher than expected, which means that the need for new issuance to fund future projects is declining. Most municipalities have taken advantage of refunding opportunities at low rates, and we don’t expect to see a pickup in refundings for the foreseeable future. As a result, we expect to see less supply in the coming months, which should be positive for existing municipal securities.
Over the next six to 12 months, we expect municipal bonds to outperform Treasury securities of like maturities. The combination of rising interest rates and dwindling supply should help municipals perform relatively well in the coming year.
Past performance does not guarantee future results. The performance data quoted represents past performance and current returns may be lower or higher. Total return figures include change in share price, reinvestment of dividends and capital gains and do not reflect taxes that a shareholder would pay on fund distributions or on the redemption of fund shares. The investment return and principal value will fluctuate so that an investor’s shares, when redeemed may be worth more or less than the original cost. To obtain performance information current to the most recent month end, please visit www.bbtfunds.com.
| 1 | Duration is a measure of a bond’s or a bond fund’s price risk that is adjusted for any optionality. |
| 2 | Portfolio composition is as of September 30, 2004 and is subject to change. |
| 3 | Moody’s Fund Ratings represent an opinion only, not a recommendation to buy or sell. |
28
BB&T NORTH CAROLINA INTERMEDIATE TAX-FREE FUND
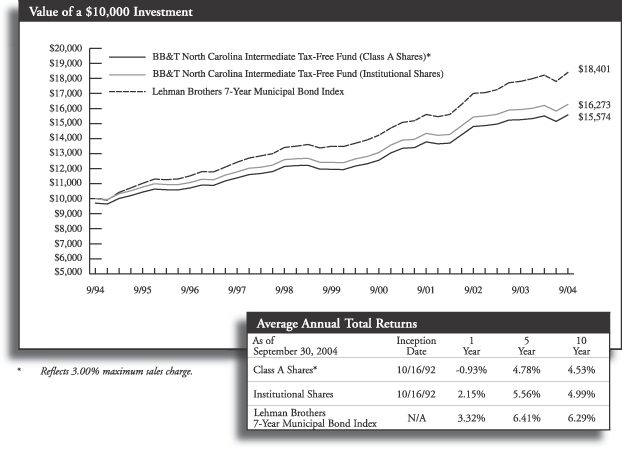
Past performance does not guarantee future results. The performance data quoted represents past performance and current returns may be lower or higher. Total return figures include change in share price, reinvestment of dividends and capital gains and do not reflect taxes that a shareholder would pay on fund distributions or on the redemption of fund shares. The investment return and principal value will fluctuate so that an investor’s shares, when redeemed may be worth more or less than the original cost. To obtain performance information current to the most recent month end, please visit www.bbtfunds.com.
The chart above represents a comparison of a hypothetical $10,000 investment in the indicated share class versus a similar investment in the Fund’s benchmark, and represents the reinvestment of dividends and capital gains.
The Fund is measured against the Lehman Brothers 7-Year Municipal Bond Index, an unmanaged index which is representative of municipal bonds with a minimum credit rating of at least Baa, have a maturity value of at least $5 million and a maturity range of 6-8 years. The index does not reflect the deduction of expenses associated with a mutual fund, such as investment management and fund accounting fees. The Fund’s performance reflects the deduction of fees for these services. Investors cannot invest directly in an index, although they can invest in its underlying securities.
A portion of the Fund’s fees has been waived. If the fees had not been waived, the Fund’s total return for the period would have been lower.
29
BB&T SOUTH CAROLINA INTERMEDIATE TAX-FREE FUND
PORTFOLIO MANAGER
Robert F. Millikan, CFA
The BB&T South Carolina Intermediate Tax-Free Fund is managed by Robert F. Millikan, CFA, Director of Fixed Income Management for BB&T Asset Management, Inc. Mr. Millikan received a B.A. in Economics from Wake Forest University, and is past president of the North Carolina Society of Financial Analysts and chairman of the board of directors of the Carolinas Municipal Advisory Council. Mr. Millikan has been managing investors’ money since 1990. He is supported by the BB&T Fixed Income Portfolio Management Team, which includes R. Ron Elmer, CFA, CPA, CFP™; Brad D. Eppard, CFA; David T. Johnson; Kevin E. McNair, CFA; Michael D. Nichols, CFA; and Dickinson B. Phillips, CFP™. The team brings to the Fund nine decades of combined investment management experience, along with a broad range of specialized skills encompassing a cross-section of fixed-income sectors.
INVESTMENT CONCERNS
Because the Fund is non-diversified and invests primarily in Kentucky municipal securities, the Fund is particularly susceptible to any economic, political, or regulatory developments affecting a particular issuer of Kentucky municipal securities. Bonds offer a relatively stable level of income, although bond prices will fluctuate providing the potential for principal gain or loss. Intermediate-term, higher-quality bonds generally offer less risk than longer-term bonds and a lower rate of return. The Fund is subject to the risk that principal value reacts in opposition to the movement of interests rates and that a rising interest rate environment increases the risk of loss of principal. The Fund’s income may be subject to certain state and local taxes and, depending on a investors tax status, to the Federal alternative minimum tax.
PORTFOLIO MANAGERS’ PERSPECTIVE
“The goal of this Fund is to maximize total return while providing high current income that is exempt from both federal and state income taxes (the latter for South Carolina residents). We are municipal bond value investors. We compare the historical relationships among sectors of the municipal market—such as general obligation bonds, revenue bonds and certificate of participation bonds—and allocate greater portions of our assets to sectors that offer the best relative value. The Fund focuses on intermediate-term securities, maintaining an average duration between 3.5 and 8.0, which historically have offered investors the highest-possible yield for the given level of risk.”
For the 12 months ended September 30, 2004, the Fund produced a total return of 2.77% (Institutional Shares), compared to 3.32% for its benchmark, the Lehman Brothers 7-Year Municipal Bond Index.
Our defensive position hurt us as 10-year municipal yields actually fell 12 basis points (0.12%) for the year instead of rising. A shorter duration position also hurt from an income standpoint as shorter bonds yield less than longer ones.
The municipal market was unusually volatile
Interest rates are a key driver in the fixed-income market. During the period, there was significant volatility among intermediate-term rates, which required us to remain alert and nimble. Despite a range of 75 basis points (0.75%) at the end of our fiscal year 10-year municipal yields showed little net movement, falling just 12 basis points (0.12%).
Outside the interest-rate sphere, questions about the economy’s strength and ability to sustain growth led many people to fixed-income securities for their perceived safety and stability. Concerns over potential terrorist attacks also made bonds more attractive than stocks at certain times during the period. Further, because the yield curve was extremely steep and cash instruments offered very poor rates, some investors turned to bonds for their higher yields.
One new trend in the municipal bond arena over the last few years has been the heavy involvement of large hedge funds and arbitrageurs in municipal securities. Consequently, volatility in the municipal market, which normally is much quieter than the Treasury market, has picked up considerably.
Unlike arbitrage players, we are not gamblers. Still, the upswing in activity demands that we not completely ignore short-term momentum when buying securities with our long-term approach. This is one area where we add value to our relationship with shareholders, since most individual investors would find it difficult to keep a close eye on market activity.
As of September 30, 2004, 100% of the Fund’s bond holdings were debt instruments issued by government entities in South Carolina. Approximately 51.0% was invested in revenue bonds, 40.8% in general obligation bonds, 4.3% in pre-refunded securities, 2.5% escrowed to maturity and 1.4% in cash and cash equivalents. The effective duration of the portfolio was 4.641 and the average credit quality was Aa1 (as rated by Moody’s).2,3
Municipals could outperform Treasuries
One constant we see in most geographic areas is that tax receipts are coming in higher than expected, which means that the need for new issuance to fund future projects is declining. Most municipalities have taken advantage of refunding opportunities at low rates, and we don’t expect to see a pickup in refundings for the foreseeable future. As a result, we expect to see less supply in the coming months, which should be positive for existing municipal securities.
Over the next six to 12 months, we expect municipal bonds to outperform Treasury securities of like maturities. The combination of rising interest rates and dwindling supply should help municipals perform relatively well in the coming year.
Past performance does not guarantee future results. The performance data quoted represents past performance and current returns may be lower or higher. Total return figures include change in share price, reinvestment of dividends and capital gains and do not reflect taxes that a shareholder would pay on fund distributions or on the redemption of fund shares. The investment return and principal value will fluctuate so that an investor’s shares, when redeemed may be worth more or less than the original cost. To obtain performance information current to the most recent month end, please visit www.bbtfunds.com.
| 1 | Duration is a measure of a bond’s or a bond fund’s price risk that is adjusted for any optionality. |
| 2 | Portfolio composition is as of September 30, 2004 and is subject to change. |
| 3 | Moody’s Fund Ratings represent an opinion only, not a recommendation to buy or sell. |
30
BB&T SOUTH CAROLINA INTERMEDIATE TAX-FREE FUND
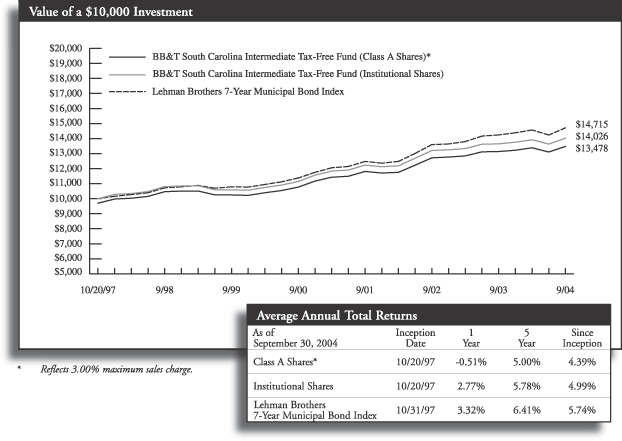
Past performance does not guarantee future results. The performance data quoted represents past performance and current returns may be lower or higher. Total return figures include change in share price, reinvestment of dividends and capital gains and do not reflect taxes that a shareholder would pay on fund distributions or on the redemption of fund shares. The investment return and principal value will fluctuate so that an investor’s shares, when redeemed may be worth more or less than the original cost. To obtain performance information current to the most recent month end, please visit www.bbtfunds.com.
The chart above represents a comparison of a hypothetical $10,000 investment in the indicated share class versus a similar investment in the Fund’s benchmark, and represents the reinvestment of dividends and capital gains.
The Fund is measured against the Lehman Brothers 7-Year Municipal Bond Index, an unmanaged index which is representative of municipal bonds with a minimum credit rating of at least Baa, have a maturity value of at least $5 million and a maturity range of 6-8 years. The index does not reflect the deduction of expenses associated with a mutual fund, such as investment management and fund accounting fees. The Fund’s performance reflects the deduction of fees for these services. Investors cannot invest directly in an index, although they can invest in its underlying securities.
A portion of the Fund’s fees has been waived. If the fees had not been waived, the Fund’s total return for the period would have been lower.
31
BB&T VIRGINIA INTERMEDIATE TAX-FREE FUND
PORTFOLIO MANAGER
Robert F. Millikan, CFA
The BB&T Virginia Intermediate Tax-Free Fund is managed by Robert F. Millikan, CFA, Director of Fixed Income Management for BB&T Asset Management, Inc. Mr. Millikan received a B.A. in Economics from Wake Forest University, and is past president of the North Carolina Society of Financial Analysts and chairman of the board of directors of the Carolinas Municipal Advisory Council. Mr. Millikan has been managing investors’ money since 1990. He is supported by the BB&T Fixed Income Portfolio Management Team, which includes R. Ron Elmer, CFA, CPA, CFP™; Brad D. Eppard, CFA; David T. Johnson; Kevin E. McNair, CFA; Michael D. Nichols, CFA; and Dickinson B. Phillips, CFP™. The team brings to the Fund nine decades of combined investment management experience, along with a broad range of specialized skills encompassing a cross-section of fixed-income sectors.
INVESTMENT CONCERNS
Because the Fund is non-diversified and invests primarily in Kentucky municipal securities, the Fund is particularly susceptible to any economic, political, or regulatory developments affecting a particular issuer of Kentucky municipal securities. Bonds offer a relatively stable level of income, although bond prices will fluctuate providing the potential for principal gain or loss. Intermediate-term, higher-quality bonds generally offer less risk than longer-term bonds and a lower rate of return. The Fund is subject to the risk that principal value reacts in opposition to the movement of interests rates and that a rising interest rate environment increases the risk of loss of principal. The Fund’s income may be subject to certain state and local taxes and, depending on a investors tax status, to the Federal alternative minimum tax.
PORTFOLIO MANAGERS’ PERSPECTIVE
“The goal of this Fund is to maximize total return while providing high current income that is exempt from both federal and state income taxes (the latter for Virginia residents). We are municipal bond value investors. We compare the historical relationships among sectors of the municipal market—such as general obligation bonds, revenue bonds and certificate of participation bonds—and allocate greater portions of our assets to sectors that offer the best relative value. The Fund focuses on intermediate-term securities, maintaining an average duration between 3.5 and 8.0, which historically have offered investors the highest-possible yield for the given level of risk.”
For the 12 months ended September 30, 2004, the Fund produced a total return of 2.29% (Institutional Shares), compared to 3.32% for its benchmark, the Lehman Brothers 7-Year Municipal Bond Index.
Our defensive position hurt us as 10-year municipal yields actually fell 12 basis points (0.12%) for the year instead of rising. A shorter duration position also hurt from an income standpoint as shorter bonds yield less than longer ones.
The municipal market was unusually volatile
Interest rates are a key driver in the fixed-income market. During the period, there was significant volatility among intermediate-term rates, which required us to remain alert and nimble. Despite a range of 75 basis points (0.75%) at the end of our fiscal year 10-year municipal yields showed little net movement, falling just 12 basis points (0.12%).
Outside the interest-rate sphere, questions about the economy’s strength and ability to sustain growth led many people to fixed-income securities for their perceived safety and stability. Concerns over potential terrorist attacks also made bonds more attractive than stocks at certain times during the period. Further, because the yield curve was extremely steep and cash instruments offered very poor rates, some investors turned to bonds for their higher yields.
One new trend in the municipal bond arena over the last few years has been the heavy involvement of large hedge funds and arbitrageurs in municipal securities. Consequently, volatility in the municipal market, which normally is much quieter than the Treasury market, has picked up considerably.
Unlike arbitrage players, we are not gamblers. Still, the upswing in activity demands that we not completely ignore short-term momentum when buying securities with our long-term approach. This is one area where we add value to our relationship with shareholders, since most individual investors would find it difficult to keep a close eye on market activity.
As of September 30, 2004, 100% of the Fund’s bond holdings were debt instruments issued by government entities in Virginia. Approximately 49.2% was invested in revenue bonds, 39.3% in general obligation bonds, 8.2% in pre-refunded securities and 3.3% in cash and cash equivalents. The effective duration of the portfolio was 4.511 and the average credit quality was Aa1 (as rated by Moody’s).2,3
Municipals could outperform Treasuries
One constant we see in most geographic areas is that tax receipts are coming in higher than expected, which means that the need for new issuance to fund future projects is declining. Most municipalities have taken advantage of refunding opportunities at low rates, and we don’t expect to see a pickup in refundings for the foreseeable future. As a result, we expect to see less supply in the coming months, which should be positive for existing municipal securities.
Over the next six to 12 months, we expect municipal bonds to outperform Treasury securities of like maturities. The combination of rising interest rates and dwindling supply should help municipals perform relatively well in the coming year.
Past performance does not guarantee future results. The performance data quoted represents past performance and current returns may be lower or higher. Total return figures include change in share price, reinvestment of dividends and capital gains and do not reflect taxes that a shareholder would pay on fund distributions or on the redemption of fund shares. The investment return and principal value will fluctuate so that an investor’s shares, when redeemed may be worth more or less than the original cost. To obtain performance information current to the most recent month end, please visit www.bbtfunds.com.
| 1 | Duration is a measure of a bond’s or a bond fund’s price risk that is adjusted for any optionality. |
| 2 | Portfolio composition is as of September 30, 2004 and is subject to change. |
| 3 | Moody’s Fund Ratings represent an opinion only, not a recommendation to buy or sell. |
32
BB&T VIRGINIA INTERMEDIATE TAX-FREE FUND
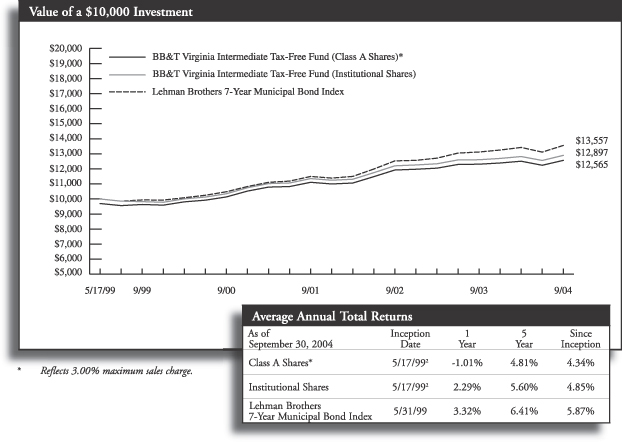
Post performance does not guarantee future results. The performance data quoted represents past performance and current returns may be lower or higher. Total return figures include change in share price, reinvestment of dividends and capital gains and do not reflect taxes that a shareholder would pay on fund distributions or on the redemption of fund shares. The investment return and principal value will fluctuate so that an investor’s shares, when redeemed may be worth more or less than the original cost. To obtain performance information current to the most recent month end, please visit www.bbtfunds.com.
The chart above represents a comparison of a hypothetical $10,000 investment in the indicated share class versus a similar investment in the Fund’s benchmark, and represents the reinvestment of dividends and capital gains.
The Fund is measured against the Lehman Brothers 7-Year Municipal Bond Index an unmanaged index which is representative of municipal bonds with a minimum credit rating of at least Baa, have a maturity value of at least $5 million and a maturity range of 6-8 years. The index does not reflect the deduction of expenses associated with a mutual fund, such as investment management and fund accounting fees. The Fund’s performance reflects the deduction of fees for these services. Investors cannot invest directly in an index, although they can invest in its underlying securities.
A portion of the Fund’s fees has been waived. If the fees had not been waived, the Fund’s total return for the period would have been lower.
33
BB&T WEST VIRGINIA INTERMEDIATE TAX-FREE FUND
PORTFOLIO MANAGER
Robert F. Millikan, CFA
The BB&T West Virginia Intermediate Tax-Free Fund is managed by Robert F. Millikan, CFA, Director of Fixed Income Management for BB&T Asset Management, Inc. Mr. Millikan received a B.A. in Economics from Wake Forest University, and is a past president of the North Carolina Society of Financial Analysts and chairman of the board of directors of the Carolinas Municipal Advisory Council. R. Ron Elmer, CFA, CPA, CFP™; Brad D. Eppard, CFA; David T. Johnson; Kevin E. McNair, CFA; Michael D. Nichols, CFA; and Dickinson B. Phillips, CFP™. The team brings to the Fund nine decades of combined investment management experience, along with a broad range of specialized skills encompassing a cross-section of fixed-income sectors.
INVESTMENT CONCERNS
Because the Fund is non-diversified and invests primarily in Kentucky municipal securities, the Fund is particularly susceptible to any economic, political, or regulatory developments affecting a particular issuer of Kentucky municipal securities. Bonds offer a relatively stable level of income, although bond prices will fluctuate providing the potential for principal gain or loss. Intermediate-term, higher-quality bonds generally offer less risk than longer-term bonds and a lower rate of return. The Fund is subject to the risk that principal value reacts in opposition to the movement of interests rates and that a rising interest rate environment increases the risk of loss of principal. The Fund’s income may be subject to certain state and local taxes and, depending on a investors tax status, to the Federal alternative minimum tax.
PORTFOLIO MANAGERS’ PERSPECTIVE
“The goal of this Fund is to maximize total return while providing high current income that is exempt from both federal and state income taxes (the latter for West Virginia residents). We are municipal bond value investors. We compare the historical relationships among sectors of the municipal market—such as general obligation bonds, revenue bonds and certificate of participation bonds—and allocate greater portions of our assets to sectors that offer the best relative value. The Fund focuses on intermediate-term securities, maintaining an average duration between 3.5 and 8.0, which historically have offered investors the highest-possible yield for the given level of risk.”
For the 12 months ended September 30, 2004, the Fund produced a total return of 2.76% (Institutional Shares), compared to 3.32% for its benchmark, the Lehman Brothers 7-Year Municipal Bond Index.
Our defensive position hurt us as 10-year municipal yields actually fell 12 basis points (0.12%) for the year instead of rising. A shorter duration position also hurt from an income standpoint as shorter bonds yield less than longer ones.
The municipal market was unusually volatile
Interest rates are a key driver in the fixed-income market. During the period, there was significant volatility among intermediate-term rates, which required us to remain alert and nimble. Despite a range of 75 basis points (0.75%) at the end of our fiscal year 10-year municipal yields showed little net movement, falling just 12 basis points (0.12%).
Outside the interest-rate sphere, questions about the economy’s strength and ability to sustain growth led many people to fixed-income securities for their perceived safety and stability. Concerns over potential terrorist attacks also made bonds more attractive than stocks at certain times during the period. Further, because the yield curve was extremely steep and cash instruments offered very poor rates, some investors turned to bonds for their higher yields.
One new trend in the municipal bond arena over the last few years has been the heavy involvement of large hedge funds and arbitrageurs in municipal securities. Consequently, volatility in the municipal market, which normally is much quieter than the Treasury market, has picked up considerably.
Unlike arbitrage players, we are not gamblers. Still, the upswing in activity demands that we not completely ignore short-term momentum when buying securities with our long-term approach. This is one area where we add value to our relationship with shareholders, since most individual investors would find it difficult to keep a close eye on market activity.
As of September 30, 2004, 100% of the Fund’s bond holdings were debt instruments issued by government entities in West Virginia. Approximately 74.7% was invested in revenue bonds, 19.1% in general obligation bonds, 5.1% escrowed to maturity and 1.1% in cash and cash equivalents. The effective duration of the portfolio was 4.661 and the average credit quality was Aa1 (as rated by Moody’s).2,3
Municipals could outperform Treasuries
One constant we see in most geographic areas is that tax receipts are coming in higher than expected, which means that the need for new issuance to fund future projects is declining. Most municipalities have taken advantage of refunding opportunities at low rates, and we don’t expect to see a pickup in refundings for the foreseeable future. As a result, we expect to see less supply in the coming months, which should be positive for existing municipal securities.
Over the next six to 12 months, we expect municipal bonds to outperform Treasury securities of like maturities. The combination of rising interest rates and dwindling supply should help municipals perform relatively well in the coming year.
Past performance does not guarantee future results. The performance data quoted represents past performance and current returns may be lower or higher. Total return figures include change in share price, reinvestment of dividends and capital gains and do not reflect taxes that a shareholder would pay on fund distributions or on the redemption of fund shares. The investment return and principal value will fluctuate so that an investor’s shares, when redeemed may be worth more or less than the original cost. To obtain performance information current to the most recent month end, please visit www.bbtfunds.com.
| 1 | Duration is a measure of a bond’s or a bond fund’s price risk that is adjusted for any optionality. |
| 2 | Portfolio composition is as of September 30, 2004 and is subject to change. |
| 3 | Moody’s Fund Ratings represent an opinion only, not a recommendation to buy or sell. |
34
BB&T WEST VIRGINIA INTERMEDIATE TAX-FREE FUND
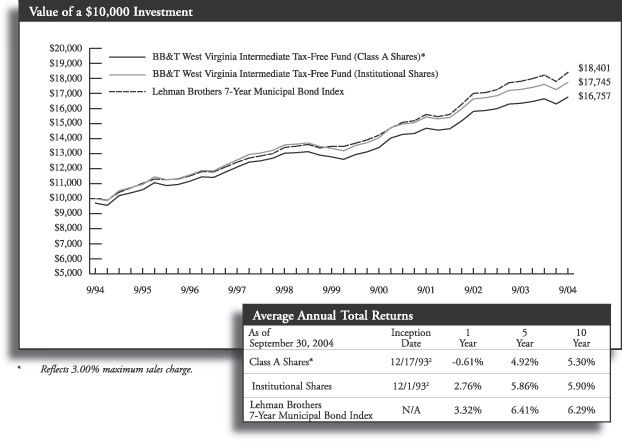
Past performance does not guarantee future results. The performance data quoted represents past performance and current returns may be lower or higher. Total return figures include change in share price, reinvestment of dividends and capital gains and do not reflect taxes that a shareholder would pay on fund distributions or on the redemption of fund shares. The investment return and principal value will fluctuate so that an investor’s shares, when redeemed may be worth more or less than the original cost. To obtain performance information current to the most recent month end, please visit www.bbtfunds.com.
The chart above represents a comparison of a hypothetical $10,000 investment in the indicated share class versus a similar investment in the Fund’s benchmark, and represents the reinvestment of dividends and capital gains.
| 2 | Fund performance as shown for Class A and Institutional Shares includes the performance of the OVB West Virginia Tax-Exempt Income Portfolio for the periods prior to its consolidation with the BB&T West Virginia Intermediate Tax-Free Fund on 7/23/01. |
The Fund is measured against the Lehman Brothers 7-Year Municipal Bond Index an unmanaged index, which is representative of municipal bonds with a minimum credit rating of at least Baa, have a maturity value of at least $5 million and a maturity range of 6-8 years. The index does not reflect the deduction of expenses associated with a mutual fund, such as investment management and fund accounting fees. The Fund’s performance reflects the deduction of fees for these services. Investors cannot invest directly in an index, although they can invest in its underlying securities.
A portion of the Fund’s fees has been waived. If the fees had not been waived, the Fund’s total return for the period would have been lower.
35
BB&T PRIME MONEY MARKET FUND
PORTFOLIO MANAGER
Federated Investment Management Company
The BB&T Prime Money Market Fund is managed by a team from Federated Investment Management Company, subadvisor to the Fund. The team is comprised of Deborah A. Cunningham, CFA (senior portfolio manager), Paige Wilhelm (co-portfolio manager), William Jamison, Natalie F. Metz, Mary Ellen Tesla and Mark F. Weiss, CFA, and a group of eight money-market traders. On average, team members bring more than a decade of investment management experience to the Fund, with specialization in money market portfolio management and credit analysis.
INVESTMENT CONCERNS
Investments in the BB&T Prime Money Market Fund are neither insured nor guaranteed by the Federal Deposit Insurance Corporation or any government agency. Although the Fund seeks to preserve the value of your investments at a $1.00 per share, it is possible to lose money by investing in the Fund.
PORTFOLIO MANAGERS’ PERSPECTIVE
“The Fund’s key objective is to provide high current income while maintaining the stability of our investors’ principal. We also strive to deliver higher income than would be expected from a government money-market fund. To achieve these goals, we employ a ‘barbell’ maturity structure, utilizing floating-rate positions at the very short end of the yield curve and buying longer-term debt with maturities in the range of six to 13 months. We find that this strategy can enable us to remain nimble in a market that is driven, sometimes with challenging volatility, by interest-rate activity.”
Yields began to rise in the last six months
Through the first half of our fiscal year, we saw flat, short-term interest rates, kept low by an historically low Fed Funds rate of 1 percent. In June, the Fed began to raise rates, but even before then, anticipating Fed action, short-term market rates began to climb.
With the yield curve beginning to steepen, short-term rates became nominally more attractive in the second half of our reporting period, though the Funds’ returns for the full 12 months were low by historical standards - reflecting trends in the entire money market sector.
Low rates, while generally positive for many types of fixed-income securities, are not positive for money market investors, and the funds’ managers actively sought to generate competitive yields, while remaining focused on quality and stability. Our efforts did not go unrewarded, as yields picked up appreciably in the second half of our fiscal year.
As of September 30, 2004, 39.5% of the BB&T Prime Money Market Fund’s portfolio (as a percentage of net assets) was invested in variable rate instruments, 23.5% in commercial paper, 17.0% in corporate bonds, 7.3% in certificates of deposit, 6.5% in repurchase agreements, 4.8% in U.S. government agency securities and 1.4% in municipal bonds. The average days to maturity of the Fund’s holdings was 47 days, and the average portfolio short-term credit quality was A-1/P-1 (as rated by the NAIC).1,2
| 1 | Portfolio composition is as of September 30, 2004, and is subject to change. |
| 2 | NAIC Approved. The NAIC allows an insurance company to reclassify its money market funds that were classified as Schedule D and rescheduled as Schedule DA part 1. Standard and Poor’s Fund Ratings represent an opinion only, not a recommendation to buy or sell. |
Past performance does not guarantee future results. The performance data quoted represents past performance and current returns may be lower or higher. Total return figures include change in share price, reinvestment of dividends and capital gains and do not reflect taxes that a shareholder would pay on fund distributions or on the redemption of fund shares. The investment return and principal value will fluctuate so that an investor’s shares, when redeemed may be worth more or less than the original cost. To obtain performance information current to the most recent month end, please visit www.bbtfunds.com.
A portion of the Fund’s fees has been waived. If the fees had not been waived, the Fund’s total return for the period would have been lower.
36
BB&T U.S. TREASURY MONEY MARKET FUND
PORTFOLIO MANAGER
Kevin E. McNair, CFA
The BB&T U.S. Treasury Money Market Fund is managed by Kevin E. McNair, CFA. Mr. McNair received a B.A. in Economics from the University of North Carolina at Chapel Hill and a Master’s of Economics from North Carolina State University, and has been managing investors’ money since 1994. Mr. McNair is supported by the BB&T Fixed Income Portfolio Management Team, which includes R. Ron Elmer, CFA, CPA, CFP™; Brad D. Eppard, CFA; David T. Johnson; Robert E. Millikan, CFA; Michael D. Nichols, CFA; and Dickinson B. Phillips, CFP™. The team brings to the Fund nine decades of combined investment management experience, along with a broad range of specialized skills encompassing a cross-section of fixed-income sectors.
INVESTMENT CONCERNS
Investments in the BB&T U.S. Treasury Money Market Fund are neither insured nor guaranteed by the Federal Deposit Insurance Corporation or any government agency. Although the Fund seeks to preserve the value of your investments at a $1.00 per share, it is possible to lose money by investing in the Fund.
PORTFOLIO MANAGERS’ PERSPECTIVE
“The Fund is designed for investors who seek current income, liquidity and stability, but with an added measure of safety offered by a portfolio that invests exclusively in U.S. Government securities. We have found that conservatively laddering the portfolio with Treasury securities and overnight repurchase agreements allows us to take advantage of higher yields along the yield curve. Laddering also provides us with the flexibility to react swiftly to changes in government policy, which can affect money market instruments. An added benefit is the state and local tax exemption provided by the income earned on the portfolio’s Treasury securities. Tax-exempt income boosts the Fund’s after-tax yields for investors, especially those who live in high-tax states.”
Yields began to rise in the last six months
Through the first half of our fiscal year, we saw flat, short-term interest rates, kept low by an historically low Fed Funds rate of 1 percent. In June, the Fed began to raise rates, but even before then, anticipating Fed action, short-term market rates began to climb.
With the yield curve beginning to steepen, short-term rates became nominally more attractive in the second half of our reporting period, though the Funds’ returns for the full 12 months were low by historical standards—reflecting trends in the entire money market sector.
Low rates, while generally positive for many types of fixed-income securities, are not positive for money market investors, and the funds’ managers actively sought to generate competitive yields, while remaining focused on quality and stability. Our efforts did not go unrewarded, as yields picked up appreciably in the second half of our fiscal year.
As of September 30, 2004 55.6% of the BB&T U.S. Treasury Money Market Fund’s portfolio (as a percentage of net assets) was invested in repurchase agreements, 32.5% in U.S. Treasury Notes and 11.9% in U.S. Treasury Bills. The average days to maturity of the Fund’s holdings was 46 days, and the average credit quality was AAA (as rated by Standard & Poor’s).1,2
| 1 | Portfolio composition is as of September 30, 2004, and is subject to change. |
| 2 | Standard and Poor’s Fund Ratings represent an opinion only, not a recommendation to buy or sell. |
Past performance does not guarantee future results. The performance data quoted represents past performance and current returns may be lower or higher. Total return figures include change in share price, reinvestment of dividends and capital gains and do not reflect taxes that a shareholder would pay on fund distributions or on the redemption of fund shares. The investment return and principal value will fluctuate so that an investor’s shares, when redeemed may be worth more or less than the original cost. To obtain performance information current to the most recent month end, please visit www.bbtfunds.com.
A portion of the Fund’s fees has been waived. If the fees had not been waived, the Fund’s total return for the period would have been lower.
37
BB&T CAPITAL MANAGER FUNDS
PORTFOLIO MANAGER
The BB&T Capital Manager Funds are managed by the BB&T Balanced Portfolio Management Team, which includes Eric Farls, CFA; Paige C. Henderson, CFA, CPA; Richard B. Jones, CFA; Robert F. Millikan, CFA; and Jeffrey J. Schappe, CFA. The team brings to the Fund eight decades of combined investment management experience, along with a broad range of specialized skills encompassing value stocks, growth stocks and fixed-income securities.
INVESTMENT CONCERNS
Equity securities (stocks) are more volatile and carry more risk than other forms of investments, including investments in high-grade fixed income securities. The net asset value per share of these Funds will fluctuate as the value of the securities in the portfolio changes. Common stocks, and funds investing in common stocks, generally provide greater return potential when compared with other types of investments.
Bonds offer a relatively stable level of income, although bond prices will fluctuate providing the potential for principal gain or loss. Intermediate-term, higher-quality bonds generally offer less risk than longer-term bonds and a lower rate of return.
PORTFOLIO MANAGERS’ PERSPECTIVE
“The great appeal, and principal benefit, of all of our Capital Manager Funds is that, by investing in underlying portfolios of multiple BB&T Funds, they are very broadly diversified among various, distinct asset classes and sectors. This enables investors who might be overwhelmed by the challenges of staying abreast of the financial markets, to take advantage of active professional management. We constantly monitor events in stock and bond markets in all domestic sectors and around the world, and we periodically rebalance each Capital Manager Fund back to predetermined allocation targets. With the Capital Manager Equity Fund, for example, nearly all of our assets normally will be invested in stock funds, but the precise composition of the portfolio will be based on prevailing market conditions.”
Capital Manager Conservative Growth Fund
Capital Manager Moderate Growth Fund
Capital Manager Growth Fund
Capital Manager Equity Fund
We emphasized stocks over bonds throughout the year.
While the bond market showed some strength in isolated patches during the period, bond returns in general were on the weak side. Stocks, on the other hand, displayed their usual volatility, but delivered much higher returns than bonds for the fiscal year as a whole. Consequently, our decision to maintain a full allocation to equities in each of our four Capital Manager Funds proved to be astute. As would be expected in such an environment, our more aggressive funds provided higher returns than our more conservative funds.
What drove the markets were a number of complementary factors: an accommodating stance by the Federal Reserve, which left short-term interest rates at historical lows for much of the period; an economy that maintained a strong pace of growth (though that pace has slowed moderately in recent months); positive corporate earnings reports; and low inflation. While these factors were not necessarily unconstructive for bonds, they were more productive for stocks.
Specifically, all of the Funds benefited from our strategic overweighting to our value equity funds, as value stocks generally outperformed growth stocks during the period. Our strategic overweighting to our small- and mid-cap funds also added to this period’s performance.
All the same, we did not shun fixed-income securities. Our asset allocation strategy calls for a mix of stocks and bonds in three of our four funds. Our bond fund holdings were particularly helpful during the last few months of the period, when stocks stumbled, and falling intermediate-term interest rates fueled higher bond prices.
As of September 30, 2004, these were the stock/ bond/cash allocations for each of the four Capital Manager Funds:1
| | | | | | | | | |
| | | Common Stocks
| | | Bonds
| | | Cash/Cash Equivalents
| |
Capital Manager Conservative Growth Fund | | 45.1 | % | | 51.7 | % | | 3.2 | % |
Capital Manager Moderate Growth Fund | | 70.0 | % | | 26.8 | % | | 3.2 | % |
Capital Manager Growth Fund | | 84.8 | % | | 11.9 | % | | 3.3 | % |
Capital Manager Equity Fund | | 96.7 | % | | 0.0 | % | | 3.3 | % |
Stocks still appear more attractive than bonds
Going forward, we remain moderately bullish on stocks. We acknowledge some potential hurdles: the prospect of higher rates, a slowing economy and terrorism activity. Nonetheless, equity valuations are not excessive, and the managers of our underlying funds still report finding attractively priced stocks. While we acknowledge the risks of sustained high energy prices, at this point we are not overly worried about inflation.
For now, keeping our bias toward stocks over bonds appears to be a sensible course of action.
| 1 | Portfolio composition is as of September 30, 2004, and is subject to change. |
38
BB&T CAPITAL MANAGER CONSERVATIVE GROWTH FUND

Past performance does not guarantee future results. The performance data quoted represents past performance and current returns may be lower or higher. Total return figures include change in share price, reinvestment of dividends and capital gains and do not reflect taxes that a shareholder would pay on fund distributions or on the redemption of fund shares. The investment return and principal value will fluctuate so that an investor’s shares, when redeemed may be worth more or less than the original cost. To obtain performance information current to the most recent month end, please visit www.bbtfunds.com.
The chart above represents a comparison of a hypothetical $10,000 investment in the indicated share class versus a similar investment in the Fund’s benchmarks, and represents the reinvestment of dividends and capital gains.
| 2 | Class A Shares were not in existence prior to 1/29/98. Performance for periods prior to that is based on the historical performance of the Institutional Shares, and has been adjusted for the maximum sales charge applicable to the Class A Shares, but does not include the Class A Shares 12b-1 fees, which, if reflected, performance would have been lower. |
| 3 | Class B Shares were not in existence prior to 1/29/99. Performance for periods prior to that is based on the historical performance of the Class A Shares, and has been adjusted for the maximum CDSC applicable to the Class B Shares, but does not include the Class B Shares 12b-1 fees, which, if reflected, performance would have been lower. |
| 4 | Class C Shares were not in existence prior to 2/1/01. Performance for periods prior to that is based on the historical performance of the Class A Shares, and has been adjusted for the maximum CDSC applicable to the Class C Shares, but does not include the Class C Shares 12b-1 fees, which if reflected, performance would have been lower. |
The Fund is measured against the S&P 500 Index, which is generally considered to be representative of the performance of the stock market as a whole, and against the Lehman Brothers Intermediate Government Bond Index, which is widely used as a broad measure of the performance of U.S. Government Bonds with maturities of less than 10 years. The indices are unmanaged and do not reflect the deduction of expenses associated with a mutual fund, such as investment management and, fund accounting fees. The Fund’s performance reflects the deduction of fees for these services. Investors cannot invest directly in an index, although they can invest in its underlying securities.
A portion of the Fund’s fees have been voluntarily waived. If the fees had not been waived, the Fund’s total return for the period would have been lower.
39
BB&T CAPITAL MANAGER MODERATE GROWTH FUND
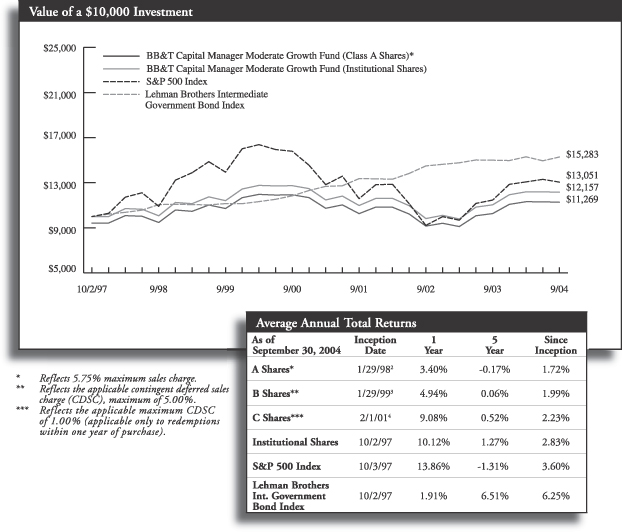
Past performance does not guarantee future results. The performance data quoted represents past performance and current returns may be lower or higher. Total return figures include change in share price, reinvestment of dividends and capital gains and do not reflect taxes that a shareholder would pay on fund distributions or on the redemption of fund shares. The investment return and principal value will fluctuate so that an investor’s shares, when redeemed may be worth more or less than the original cost. To obtain performance information current to the most recent month end, please visit www.bbtfunds.com.
The chart above represents a comparison of a hypothetical $10,000 investment in the indicated share class versus a similar investment in the Fund’s benchmarks, and represents the reinvestment of dividends and capital gains.
| 2 | Class A Shares were not in existence prior to 1/29/98. Performance for periods prior to that is based on the historical performance of the Institutional Shares, and has been adjusted for the maximum sales charge applicable to the Class A Shares, but does not include the Class A Shares 12b-1 fees, which, if reflected, performance would have been lower. |
| 3 | Class B Shares were not in existence prior to 1/29/99. Performance for periods prior to that is based on the historical performance of the Class A Shares, and has been adjusted for the maximum CDSC applicable to the Class B Shares, but does not include the Class B Shares 12b-1 fees, which, if reflected, performance would have been lower. |
| 4 | Class C Shares were not in existence prior to 2/1/01. Performance for periods prior to that is based on the historical performance of the Class A Shares, and has been adjusted for the maximum CDSC applicable to the Class C Shares, but does not include the Class C Shares 12b-1 fees, which if reflected, performance would have been lower. |
The Fund is measured against the S&P 500 Index, which is generally considered to be representative of the performance of the stock market as a whole, and against the Lehman Brothers Intermediate Government Bond Index, which is widely used as a broad measure of the performance of U.S. Government Bonds with maturities of less than 10 years. The indices are unmanaged and do not reflect the deduction of expenses associated with a mutual fund, such as investment management and, fund accounting fees. The Fund’s performance reflects the deduction of fees for these services. Investors cannot invest directly in an index, although they can invest in its underlying securities.
A portion of the Fund’s fees have been voluntarily waived. If the fees had not been waived, the Fund’s total return for the period would have been lower.
40
BB&T CAPITAL MANAGER GROWTH FUND

Past performance does not guarantee future results. The performance data quoted represents past performance and current returns may be lower or higher. Total return figures include change in share price, reinvestment of dividends and capital gains and do not reflect taxes that a shareholder would pay on fund distributions or on the redemption of fund shares. The investment return and principal value will fluctuate so that an investor’s shares, when redeemed may be worth more or less than the original cost. To obtain performance information current to the most recent month end, please visit www.bbtfunds.com.
The chart above represents a comparison of a hypothetical $10,000 investment in the indicated share class versus a similar investment in the Fund’s benchmarks, and represents the reinvestment of dividends and capital gains.
| 2 | Class A Shares were not in existence prior to 1/29/98. Performance for periods prior to that is based on the historical performance of the Institutional Shares, and has been adjusted for the maximum sales charge applicable to the Class A Shares, but does not include the Class A Shares 12b-1 fees, which, if reflected, performance would have been lower. |
| 3 | Class B Shares were not in existence prior to 1/29/99. Performance for periods prior to that is based on the historical performance of the Class A Shares, and has been adjusted for the maximum CDSC applicable to the Class B Shares, but does not include the Class B Shares 12b-1 fees, which, if reflected, performance would have been lower. |
| 4 | Class C Shares were not in existence prior to 2/1/01. Performance for periods prior to that is based on the historical performance of the Class A Shares, and has been adjusted for the maximum CDSC applicable to the Class C Shares, but does not include the Class C Shares 12b-1 fees, which if reflected, performance would have been lower. |
The Fund is measured against the S&P 500 Index, which is generally considered to be representative of the performance of the stock market as a whole, and against the Lehman Brothers Intermediate Government Bond Index, which is widely used as a broad measure of the performance of U.S. Government Bonds with maturities of less than 10 years. The indices are unmanaged and do not reflect the deduction of expenses associated with a mutual fund, such as investment management and, fund accounting fees. The Fund’s performance reflects the deduction of fees for these services. Investors cannot invest directly in an index, although they can invest in its underlying securities.
A portion of the Fund’s fees have been voluntarily waived. If the fees had not been waived, the Fund’s total return for the period would have been lower.
41
BB&T CAPITAL MANAGER EQUITY FUND
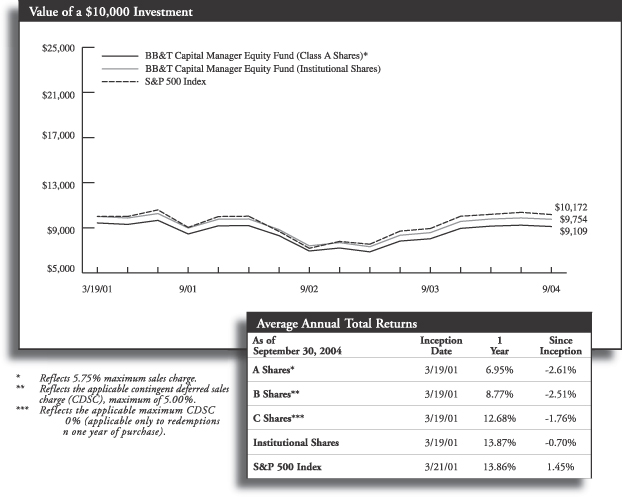
Past performance does not guarantee future results. The performance data quoted represents past performance and current returns may be lower or higher. Total return figures include change in share price, reinvestment of dividends and capital gains and do not reflect taxes that a shareholder would pay on fund distributions or on the redemption of fund shares. The investment return and principal value will fluctuate so that an investor’s shares, when redeemed may be worth more or less than the original cost. To obtain performance information current to the most recent month end, please visit www.bbtfunds.com.
The chart above represents a comparison of a hypothetical $10,000 investment in the indicated share class versus a similar investment in the Fund’s benchmark, and represents the reinvestment of dividends and capital gains.
The Fund is measured against the S&P 500 Index, an unmanaged index generally considered to be representative of the performance of the stock market as a whole. The index does not reflect the deduction of expenses associated with a mutual fund, such as investment management and fund accounting fees. The Fund’s performance reflects the deduction of fees for these services. Investors cannot invest directly in an index, although they can invest in its underlying securities.
A portion of the Fund’s fees have been voluntarily waived. If the fees had not been waived, the Fund’s total return for the period would have been lower.
42
The BB&T Funds invested, as a percentage of net assets, in the following industries or countries, as of September 30, 2004.
| | | |
| Equity Income Fund | | Percent of
net assets | |
Consumer Discretionary | | 4.0 | % |
Consumer Staples | | 13.0 | |
Energy | | 14.1 | |
Financials | | 34.1 | |
Health Care | | 3.4 | |
Industrials | | 10.2 | |
Information Technology | | 3.9 | |
Investment Companies | | 7.2 | |
Telecommunications | | 3.5 | |
U.S. Treasury Bills | | 3.2 | |
Utilities | | 3.2 | |
|
|
| | | 99.8 | % |
|
|
| |
| Large Company Value Fund | | Percent of
net assets | |
Consumer Discretionary | | 10.0 | % |
Consumer Staples | | 5.6 | |
Energy | | 11.8 | |
Financials | | 27.3 | |
Health Care | | 8.9 | |
Industrials | | 11.1 | |
Information Technology | | 7.9 | |
Investment Companies | | 2.8 | |
Materials | | 4.6 | |
Telecommunication Services | | 4.7 | |
Utilities | | 4.9 | |
Short-Term Investments* | | 31.6 | |
|
|
| | | 131.2 | % |
|
|
| |
| Large Company Growth Fund | | Percent of
net assets | |
Consumer Discretionary | | 11.6 | % |
Consumer Staples | | 12.8 | |
Energy | | 2.9 | |
Financials | | 9.9 | |
Health Care | | 24.4 | |
Industrials | | 12.4 | |
Information Technology | | 23.5 | |
Investment Companies | | 1.1 | |
Materials | | 1.4 | |
Short-Term Investments* | | 38.5 | |
|
|
| | | 138.5 | % |
|
|
| |
| Mid Cap Value Fund | | Percent of
net assets | |
Consumer Discretionary | | 10.1 | % |
Consumer Staples | | 5.0 | |
Energy | | 9.0 | |
Financials | | 25.9 | |
Health Care | | 8.6 | |
Industrials | | 12.7 | |
Information Technology | | 9.8 | |
Investment Companies | | 6.0 | |
Materials | | 8.8 | |
Telecommunication Services | | 0.9 | |
Utilities | | 7.4 | |
Short-Term Investments* | | 27.4 | |
|
|
| | | 131.6 | % |
|
|
| | | |
| Mid Cap Growth Fund | | Percent of
net assets | |
Consumer Discretionary | | 20.4 | % |
Consumer Staples | | 1.7 | |
Energy | | 8.1 | |
Financials | | 5.9 | |
Health Care | | 17.0 | |
Industrials | | 11.4 | |
Information Technology | | 27.8 | |
Investment Companies | | 0.4 | |
Telecommunication Services | | 4.4 | |
Short-Term Investments* | | 48.9 | |
|
|
| | | 146.0 | % |
|
|
| |
| Small Company Value Fund | | Percent of
net assets | |
Consumer Discretionary | | 17.1 | % |
Consumer Staples | | 2.1 | |
Energy | | 8.5 | |
Exchange Traded Funds | | 1.7 | |
Financials | | 25.3 | |
Health Care | | 6.9 | |
Industrials | | 18.0 | |
Information Technology | | 6.6 | |
Investment Companies | | 5.8 | |
Materials | | 4.9 | |
Utilities | | 3.9 | |
Short-Term Investments* | | 20.6 | |
|
|
| | | 121.4 | % |
|
|
| |
| Small Company Growth Fund | | Percent of
net assets | |
Consumer Discretionary | | 8.9 | % |
Consumer Staples | | 1.1 | |
Energy | | 6.3 | |
Financials | | 9.2 | |
Health Care | | 25.5 | |
Industrials | | 19.1 | |
Information Technology | | 16.8 | |
Investment Companies | | 2.2 | |
Materials | | 3.9 | |
Technology | | 4.7 | |
Telecommunication Services | | 3.0 | |
Short-Term Investments* | | 27.7 | |
|
|
| | | 128.4 | % |
|
|
| |
| Special Opportunities Equity Fund | | Percent of
net assets | |
Commercial Services | | 8.7 | % |
Consumer Discretionary | | 19.3 | |
Energy | | 10.7 | |
Financials | | 9.7 | |
Health Care | | 13.7 | |
Industrials | | 3.3 | |
Information Technology | | 14.6 | |
Insurance | | 7.1 | |
Investment Companies | | 7.2 | |
U.S. Treasury Bills | | 5.1 | |
|
|
| | | 99.4 | % |
|
|
43
| | | |
| International Equity Fund | | Percent of
net assets | |
Australia | | 3.6 | % |
Austria | | 0.5 | |
Belgium | | 1.2 | |
Brazil | | 0.6 | |
Finland | | 2.0 | |
France | | 8.0 | |
Germany | | 0.4 | |
Great Britain | | 33.6 | |
Hong Kong | | 1.5 | |
Ireland | | 3.0 | |
Israel | | 0.2 | |
Italy | | 2.4 | |
Japan | | 18.7 | |
Netherlands | | 7.6 | |
Portugal | | 0.8 | |
Russia | | 0.6 | |
South Korea | | 1.1 | |
Spain | | 0.9 | |
Sweden | | 4.0 | |
Switzerland | | 7.6 | |
United States | | 0.4 | |
|
|
| | | 98.7 | % |
|
|
| |
| Short U.S. Government Fund | | Percent of
net assets | |
Corporate Bonds | | 7.8 | % |
Federal Home Loan Bank | | 13.8 | |
Federal Home Loan Mortgage Corporation | | 28.1 | |
Federal National Mortgage Association | | 29.2 | |
Government National Mortgage Association | | 1.1 | |
Investment Company | | 3.0 | |
Municipal Bonds | | 1.5 | |
Student Loan Marketing Association | | 1.5 | |
U.S. Treasury Notes | | 13.8 | |
Short-Term Investments* | | 45.1 | |
|
|
| | | 144.9 | % |
|
|
| |
| Intermediate U.S. Government Fund | | Percent of
net assets | |
Corporate Bonds | | 9.2 | % |
Federal Farm Credit Bank | | 7.5 | |
Federal Home Loan Bank | | 11.2 | |
Federal Home Loan Mortgage Corporation | | 17.6 | |
Federal National Mortgage Association | | 29.5 | |
Government National Mortgage Association | | 6.9 | |
Investment Company | | 0.1 | |
Sovereign Agency | | 3.1 | |
U.S. Treasury Notes | | 14.4 | |
Short-Term Investments* | | 37.8 | |
|
|
| | | 137.3 | % |
|
|
| | | |
| Intermediate Corporate Bond Fund | | Percent of
net assets | |
Auto — Cars/Light Trucks | | 1.5 | % |
Banking & Financial Services | | 30.2 | |
Chemicals | | 0.4 | |
Coal & Other Minerals & Ores | | 0.3 | |
Consumer Discretionary | | 5.0 | |
Consumer Staples | | 1.1 | |
Energy | | 0.3 | |
Engineering — Research & Development Services | | 0.4 | |
Exchange Traded Funds | | 0.4 | |
Federal Farm Credit Bank | | 2.8 | |
Federal National Mortgage Association | | 0.3 | |
Food Processing | | 0.8 | |
Foreign Government | | 2.6 | |
Health Care | | 7.2 | |
Industrials | | 5.4 | |
Information Technology | | 4.1 | |
Investment Companies | | 1.9 | |
Linen Supply & Related Items | | 0.4 | |
Media | | 3.5 | |
Metals | | 2.8 | |
Motors & Generators | | 0.5 | |
Natural Gas Transmission | | 0.3 | |
Oil & Gas | | 3.6 | |
Oil & Gas Exploration Products & Services | | 1.7 | |
Oil Company — Exploration & Production | | 1.1 | |
Petroleum Refining | | 0.7 | |
Plastic Foam Products | | 0.4 | |
Railroads | | 0.3 | |
Real Estate Investment Trust | | 0.8 | |
Student Loan Marketing Association | | 1.1 | |
Telecommunication Services | | 7.3 | |
U.S. Treasury Bills | | 3.5 | |
U.S. Treasury Notes | | 1.7 | |
Utilities | | 4.7 | |
Short-Term Investments* | | 22.8 | |
|
|
| | | 121.9 | % |
|
|
| |
| Kentucky Intermediate Tax-Free Fund | | Percent of
net assets | |
Commission Bonds | | 37.8 | % |
Education Bonds | | 15.8 | |
General Obligations | | 6.0 | |
Health Care Bonds | | 3.4 | |
Housing Bonds | | 0.7 | |
Investment Company | | 3.2 | |
Transportation Bonds | | 9.9 | |
Urban & Community Development | | 8.1 | |
Utility Bonds | | 14.1 | |
|
|
| | | 99.0 | % |
|
|
| |
| Maryland Intermediate Tax-Free Fund | | Percent of
net assets | |
Education Bonds | | 8.8 | % |
General Obligations | | 63.1 | |
Housing Bonds | | 15.8 | |
Investment Company | | 4.2 | |
Pollution Control Bonds | | 6.1 | |
Transportation Bonds | | 2.9 | |
|
|
| | | 100.9 | % |
|
|
44
| | | |
| North Carolina Intermediate Tax-Free Fund | | Percent of
net assets | |
Correctional Institutions | | 3.7 | % |
Education Bonds | | 5.3 | |
General Obligation Bonds | | 40.7 | |
Health Care Bonds | | 21.6 | |
Investment Company | | 1.9 | |
Transportation Bonds | | 1.3 | |
Urban & Community Development | | 2.1 | |
Utility Bonds | | 23.6 | |
|
|
| | | 100.2 | % |
|
|
| |
| South Carolina Intermediate Tax-Free Fund | | Percent of
net assets | |
General Obligation Bonds | | 45.6 | % |
Health Care Bonds | | 19.8 | |
Housing Bonds | | 0.5 | |
Investment Company | | 1.4 | |
Pollution Control Bonds | | 1.7 | |
Transportation Bonds | | 3.6 | |
Utility Bonds | | 26.6 | |
|
|
| | | 99.2 | % |
|
|
| |
| Virginia Intermediate Tax-Free Fund | | Percent of
net assets | |
Education Bonds | | 13.2 | % |
General Obligation Bonds | | 43.8 | |
Health Care Bonds | | 11.0 | |
Housing Bonds | | 2.6 | |
Investment Company | | 3.3 | |
Transportation Bonds | | 16.4 | |
Utility Bonds | | 9.2 | |
|
|
| | | 99.5 | % |
|
|
| |
| West Virginia Intermediate Tax-Free Fund | | Percent of
net assets | |
Commission Bonds | | 9.4 | % |
Education Bonds | | 18.9 | |
General Obligation Bonds | | 18.8 | |
Health Care Bonds | | 12.7 | |
Housing Bonds | | 3.8 | |
Investment Company | | 1.1 | |
Pollution Control Bonds | | 7.0 | |
Transportation Bonds | | 19.4 | |
Utility Bonds | | 7.6 | |
|
|
| | | 98.7 | % |
|
|
| |
| Prime Money Market Fund | | Percent of
net assets | |
Certificates of Deposit | | 7.4 | % |
Commercial Paper | | 23.1 | |
Corporate Bonds | | 10.9 | |
U.S. Government Agencies | | 2.0 | |
Variable Rate Notes | | 42.6 | |
Collateralized Loan Agreements | | 15.0 | |
|
|
| | | 101.0 | % |
|
|
| | | |
| U.S. Treasury Money Market Fund | | Percent of
net assets | |
Repurchase Agreements | | 55.6 | % |
U.S. Treasury Bills | | 11.9 | |
U.S. Treasury Bonds & Notes | | 32.4 | |
|
|
| | | 99.9 | % |
|
|
| |
| Capital Manager Conservative Growth Fund | | Percent of
net assets | |
Large Company Equity | | 29.4 | % |
Mid Cap Equity | | 5.5 | |
Small Company Equity | | 3.5 | |
International Equity | | 6.8 | |
Fixed Income | | 51.9 | |
Money Market | | 3.2 | |
| |
|
|
| | | 100.3 | % |
|
|
| |
| Capital Manager Moderate Growth Fund | | Percent of
net assets | |
Large Company Equity | | 45.8 | % |
Mid Cap Equity | | 8.4 | |
Small Company Equity | | 5.4 | |
International Equity | | 10.5 | |
Fixed Income | | 26.8 | |
Money Market | | 3.2 | |
| |
|
|
| | | 100.1 | % |
|
|
| |
| Capital Manager Growth Fund | | Percent of
net assets | |
Large Company Equity | | 55.5 | % |
Mid Cap Equity | | 10.1 | |
Small Company Equity | | 6.5 | |
International Equity | | 12.7 | |
Fixed Income | | 11.9 | |
Money Market | | 3.3 | |
| |
|
|
| | | 100.0 | % |
| |
|
|
| |
| Capital Manager Equity Fund | | Percent of
net assets | |
Large Company Equity | | 63.1 | % |
Mid Cap Equity | | 11.6 | |
Small Company Equity | | 7.5 | |
International Equity | | 14.5 | |
Money Market | | 3.3 | |
| |
|
|
| | | 100.0 | % |
| |
|
|
| * | Short-term investments represents the invested cash collateral received in connection with securities lending (see Note 2). |
45
As a shareholder of the BB&T Funds, you incur two types of costs: (1) transaction costs, including sales charges (loads) on purchases and redemption fees and (2) ongoing costs, including management fees; distribution fees; and other Fund expenses.
This example is intended to help you understand your ongoing costs (in dollars) of investing in the BB&T Funds and to compare these costs with the ongoing costs of investing in other mutual funds.
The Example is based on an investment of $1,000 invested at the beginning of the period and held for the entire period from April 1, 2004 through September 30, 2004.
Because the Equity Income Fund commenced operations on July 2, 2004, it does not have a record of performance for a full six months to compare against other investment companies.
Actual Returns
The table below provides information about actual account values and actual expenses. You may use the information below, together with the amount you invested, to estimate the expenses that you paid over the period. Simply divide your account value by $1,000 (for example, an $8,600 account value divided by $1,000 = 8.6), then multiply the result by the number in the table under the heading entitled “Expenses Paid During Period” to estimate the expenses you paid on your account during this period.
| | | | | | | | | | | | |
| | | Beginning
Account Value
4/1/04
| | Ending
Account Value
9/30/04
| | Expense Paid
During Period*
4/1/04 - 9/30/04
| | Expense Ratio
During Period
4/1/04 - 9/30/04
| |
Large Company Value Fund | | | | | | | | | | | | |
Class A Shares | | $ | 1,000.00 | | $ | 1,018.20 | | $ | 6.11 | | 1.21 | % |
Class B Shares | | | 1,000.00 | | | 1,014.60 | | | 9.87 | | 1.96 | % |
Class C Shares | | | 1,000.00 | | | 1,014.70 | | | 9.87 | | 1.96 | % |
Institutional Shares | | | 1,000.00 | | | 1,019.40 | | | 4.85 | | 0.96 | % |
Large Company Growth Fund | | | | | | | | | | | | |
Class A Shares | | | 1,000.00 | | | 959.20 | | | 5.98 | | 1.22 | % |
Class B Shares | | | 1,000.00 | | | 954.70 | | | 9.63 | | 1.97 | % |
Class C Shares | | | 1,000.00 | | | 954.80 | | | 9.68 | | 1.98 | % |
Institutional Shares | | | 1,000.00 | | | 960.90 | | | 4.76 | | 0.97 | % |
Mid Cap Value Fund | | | | | | | | | | | | |
Class A Shares | | | 1,000.00 | | | 1,014.40 | | | 6.30 | | 1.25 | % |
Class B Shares | | | 1,000.00 | | | 1,010.60 | | | 10.05 | | 2.00 | % |
Class C Shares | | | 1,000.00 | | | 1,010.50 | | | 10.05 | | 2.00 | % |
Institutional Shares | | | 1,000.00 | | | 1,015.60 | | | 5.04 | | 1.00 | % |
Mid Cap Growth Fund | | | | | | | | | | | | |
Class A Shares | | | 1,000.00 | | | 978.60 | | | 6.23 | | 1.26 | % |
Class B Shares | | | 1,000.00 | | | 975.40 | | | 9.88 | | 2.00 | % |
Class C Shares | | | 1,000.00 | | | 975.40 | | | 9.88 | | 2.00 | % |
Institutional Shares | | | 1,000.00 | | | 979.40 | | | 5.00 | | 1.01 | % |
Small Company Value Fund | | | | | | | | | | | | |
Class A Shares | | | 1,000.00 | | | 1,053.30 | | | 7.19 | | 1.40 | % |
Class B Shares | | | 1,000.00 | | | 1,049.30 | | | 10.96 | | 2.14 | % |
Class C Shares | | | 1,000.00 | | | 1,050.00 | | | 11.07 | | 2.16 | % |
Institutional Shares | | | 1,000.00 | | | 1,054.60 | | | 5.91 | | 1.15 | % |
Small Company Growth Fund | | | | | | | | | | | | |
Class A Shares | | | 1,000.00 | | | 940.30 | | | 7.32 | | 1.51 | % |
Class B Shares | | | 1,000.00 | | | 937.10 | | | 10.94 | | 2.26 | % |
Class C Shares | | | 1,000.00 | | | 937.20 | | | 10.90 | | 2.25 | % |
Institutional Shares | | | 1,000.00 | | | 941.40 | | | 6.12 | | 1.26 | % |
Special Opportunities Equity Fund | | | | | | | | | | | | |
Class A Shares | | | 1,000.00 | | | 1,038.10 | | | 7.54 | | 1.48 | % |
Class B Shares | | | 1,000.00 | | | 1,034.30 | | | 11.34 | | 2.23 | % |
Class C Shares | | | 1,000.00 | | | 1,034.30 | | | 11.34 | | 2.23 | % |
Institutional Shares | | | 1,000.00 | | | 1,039.60 | | | 6.32 | | 1.24 | % |
International Equity Fund | | | | | | | | | | | | |
Class A Shares | | | 1,000.00 | | | 1,002.60 | | | 7.61 | | 1.52 | % |
Class B Shares | | | 1,000.00 | | | 1,000.40 | | | 11.35 | | 2.27 | % |
Class C Shares | | | 1,000.00 | | | 1,000.50 | | | 11.40 | | 2.28 | % |
Institutional Shares | | | 1,000.00 | | | 1,005.00 | | | 6.37 | | 1.27 | % |
46
| | | | | | | | | | | | |
| | | Beginning
Account Value
4/1/04
| | Ending
Account Value
9/30/04
| | Expense Paid
During Period*
4/1/04 - 9/30/04
| | Expense Ratio
During Period
4/1/04 - 9/30/04
| |
Short U.S. Government Fund | | | | | | | | | | | | |
Class A Shares | | $ | 1,000.00 | | $ | 995.70 | | $ | 4.89 | | 0.98 | % |
Institutional Shares | | | 1,000.00 | | | 997.00 | | | 3.64 | | 0.73 | % |
Intermediate U.S. Government Fund | | | | | | | | | | | | |
Class A Shares | | | 1,000.00 | | | 994.00 | | | 5.18 | | 1.04 | % |
Class B Shares | | | 1,000.00 | | | 990.20 | | | 8.91 | | 1.79 | % |
Class C Shares | | | 1,000.00 | | | 989.30 | | | 8.95 | | 1.80 | % |
Institutional Shares | | | 1,000.00 | | | 995.20 | | | 3.94 | | 0.79 | % |
Intermediate Corporate Bond Fund | | | | | | | | | | | | |
Class A Shares | | | 1,000.00 | | | 1,001.10 | | | 5.30 | | 1.06 | % |
Class B Shares | | | 1,000.00 | | | 996.40 | | | 9.03 | | 1.81 | % |
Class C Shares | | | 1,000.00 | | | 996.30 | | | 9.03 | | 1.81 | % |
Institutional Shares | | | 1,000.00 | | | 1,001.40 | | | 4.05 | | 0.81 | % |
Kentucky Intermediate Tax-Free Fund | | | | | | | | | | | | |
Class A Shares | | | 1,000.00 | | | 1,004.80 | | | 4.41 | | 0.88 | % |
Institutional Shares | | | 1,000.00 | | | 1,004.60 | | | 3.71 | | 0.74 | % |
Maryland Intermediate Tax-Free Fund | | | | | | | | | | | | |
Class A Shares | | | 1,000.00 | | | 1,004.60 | | | 4.01 | | 0.80 | % |
Institutional Shares | | | 1,000.00 | | | 1,004.40 | | | 3.21 | | 0.64 | % |
North Carolina Intermediate Tax-Free Fund | | | | | | | | | | | | |
Class A Shares | | | 1,000.00 | | | 1,004.40 | | | 4.46 | | 0.89 | % |
Institutional Shares | | | 1,000.00 | | | 1,004.20 | | | 3.71 | | 0.74 | % |
South Carolina Intermediate Tax-Free Fund | | | | | | | | | | | | |
Class A Shares | | | 1,000.00 | | | 1,006.70 | | | 4.52 | | 0.90 | % |
Institutional Shares | | | 1,000.00 | | | 1,007.50 | | | 3.81 | | 0.76 | % |
Virginia Intermediate Tax-Free Fund | | | | | | | | | | | | |
Class A Shares | | | 1,000.00 | | | 1,004.40 | | | 4.56 | | 0.91 | % |
Institutional Shares | | | 1,000.00 | | | 1,006.00 | | | 3.81 | | 0.76 | % |
West Virginia Intermediate Tax-Free Fund | | | | | | | | | | | | |
Class A Shares | | | 1,000.00 | | | 1,006.70 | | | 5.07 | | 1.01 | % |
Institutional Shares | | | 1,000.00 | | | 1,007.90 | | | 3.82 | | 0.76 | % |
Prime Money Market Fund | | | | | | | | | | | | |
Class A Shares | | | 1,000.00 | | | 1,002.60 | | | 4.16 | | 0.83 | % |
Class B Shares | | | 1,000.00 | | | 1,000.30 | | | 6.40 | | 1.28 | % |
Class C Shares | | | 1,000.00 | | | 1,000.30 | | | 6.40 | | 1.28 | % |
Institutional Shares | | | 1,000.00 | | | 1,004.00 | | | 2.76 | | 0.55 | % |
U.S. Treasury Money Market Fund | | | | | | | | | | | | |
Class A Shares | | | 1,000.00 | | | 1,002.20 | | | 3.85 | | 0.77 | % |
Class B Shares | | | 1,000.00 | | | 1,000.30 | | | 5.80 | | 1.16 | % |
Class C Shares | | | 1,000.00 | | | 1,000.30 | | | 5.50 | | 1.10 | % |
Institutional Shares | | | 1,000.00 | | | 1,003.40 | | | 2.70 | | 0.54 | % |
Capital Manager Conservative Growth Fund | | | | | | | | | | | | |
Class A Shares | | | 1,000.00 | | | 994.60 | | | 3.44 | | 0.69 | % |
Class B Shares | | | 1,000.00 | | | 991.00 | | | 7.17 | | 1.44 | % |
Class C Shares | | | 1,000.00 | | | 991.70 | | | 7.22 | | 1.45 | % |
Institutional Shares | | | 1,000.00 | | | 995.80 | | | 2.20 | | 0.44 | % |
Capital Manager Moderate Growth Fund | | | | | | | | | | | | |
Class A Shares | | | 1,000.00 | | | 995.80 | | | 3.74 | | 0.75 | % |
Class B Shares | | | 1,000.00 | | | 991.00 | | | 7.47 | | 1.50 | % |
Class C Shares | | | 1,000.00 | | | 992.90 | | | 7.47 | | 1.50 | % |
Institutional Shares | | | 1,000.00 | | | 997.00 | | | 2.50 | | 0.50 | % |
Capital Manager Growth Fund | | | | | | | | | | | | |
Class A Shares | | | 1,000.00 | | | 995.60 | | | 3.74 | | 0.75 | % |
Class B Shares | | | 1,000.00 | | | 991.90 | | | 7.47 | | 1.50 | % |
Class C Shares | | | 1,000.00 | | | 991.90 | | | 7.47 | | 1.50 | % |
Institutional Shares | | | 1,000.00 | | | 996.80 | | | 2.50 | | 0.50 | % |
Capital Manager Equity Fund | | | | | | | | | | | | |
Class A Shares | | | 1,000.00 | | | 996.10 | | | 3.64 | | 0.73 | % |
Class B Shares | | | 1,000.00 | | | 992.60 | | | 7.37 | | 1.48 | % |
Class C Shares | | | 1,000.00 | | | 992.60 | | | 7.37 | | 1.48 | % |
Institutional Shares | | | 1,000.00 | | | 997.80 | | | 2.40 | | 0.48 | % |
| * | Expenses are equal to the average account value times the Fund’s annualized expense ratio multiplied by the number of days in the most recent fiscal half-year divided by the number of days in the fiscal year. |
47
Hypothetical Example for Comparison Purposes
The table below provides information about hypothetical account values and hypothetical expenses based on each BB&T Funds’ actual expense ratio and an assumed rate of return of 5% per year before expenses, which is not the Fund’s actual return. The hypothetical account values and expenses may not be used to estimate the actual ending account balance or expenses you paid for the period. You may use this information to compare this 5% hypothetical example with the 5% hypothetical examples that appear in the shareholder reports of other funds.
Please note that the expenses shown in the table are meant to highlight your ongoing costs only and do not reflect any transactional costs, such as sales charges (loads), redemption fees, or exchange fees. Therefore, the table is useful in comparing ongoing costs only, and will not help you determine the relative total costs of owning different funds. In addition, if these transactional costs were included, your costs would have been higher.
| | | | | | | | | | | | |
| | | Beginning
Account Value
4/1/04
| | Ending
Account Value
9/30/04
| | Expense Paid
During Period*
4/1/04 - 9/30/04
| | Expense Ratio
During Period
4/1/04 - 9/30/04
| |
Large Company Value Fund | | | | | | | | | | | | |
Class A Shares | | $ | 1,000.00 | | $ | 1,018.95 | | $ | 6.11 | | 1.21 | % |
Class B Shares | | | 1,000.00 | | | 1,015.20 | | | 9.87 | | 1.96 | % |
Class C Shares | | | 1,000.00 | | | 1,015.20 | | | 9.87 | | 1.96 | % |
Institutional Shares | | | 1,000.00 | | | 1,020.20 | | | 4.85 | | 0.96 | % |
Large Company Growth Fund | | | | | | | | | | | | |
Class A Shares | | | 1,000.00 | | | 1,018.90 | | | 6.16 | | 1.22 | % |
Class B Shares | | | 1,000.00 | | | 1,015.15 | | | 9.92 | | 1.97 | % |
Class C Shares | | | 1,000.00 | | | 1,015.10 | | | 9.97 | | 1.98 | % |
Institutional Shares | | | 1,000.00 | | | 1,020.15 | | | 4.90 | | 0.97 | % |
Mid Cap Value Fund | | | | | | | | | | | | |
Class A Shares | | | 1,000.00 | | | 1,018.75 | | | 6.31 | | 1.25 | % |
Class B Shares | | | 1,000.00 | | | 1,015.00 | | | 10.08 | | 2.00 | % |
Class C Shares | | | 1,000.00 | | | 1,015.00 | | | 10.08 | | 2.00 | % |
Institutional Shares | | | 1,000.00 | | | 1,020.00 | | | 5.05 | | 1.00 | % |
Mid Cap Growth Fund | | | | | | | | | | | | |
Class A Shares | | | 1,000.00 | | | 1,018.70 | | | 6.36 | | 1.26 | % |
Class B Shares | | | 1,000.00 | | | 1,015.00 | | | 10.08 | | 2.00 | % |
Class C Shares | | | 1,000.00 | | | 1,015.00 | | | 10.08 | | 2.00 | % |
Institutional Shares | | | 1,000.00 | | | 1,019.95 | | | 5.10 | | 1.01 | % |
Small Company Value Fund | | | | | | | | | | | | |
Class A Shares | | | 1,000.00 | | | 1,018.00 | | | 7.06 | | 1.40 | % |
Class B Shares | | | 1,000.00 | | | 1,014.30 | | | 10.78 | | 2.14 | % |
Class C Shares | | | 1,000.00 | | | 1,014.20 | | | 10.88 | | 2.16 | % |
Institutional Shares | | | 1,000.00 | | | 1,019.25 | | | 5.81 | | 1.15 | % |
Small Company Growth Fund | | | | | | | | | | | | |
Class A Shares | | | 1,000.00 | | | 1,017.45 | | | 7.62 | | 1.51 | % |
Class B Shares | | | 1,000.00 | | | 1,013.70 | | | 11.38 | | 2.26 | % |
Class C Shares | | | 1,000.00 | | | 1,013.75 | | | 11.33 | | 2.25 | % |
Institutional Shares | | | 1,000.00 | | | 1,018.70 | | | 6.36 | | 1.26 | % |
Special Opportunities Equity Fund | | | | | | | | | | | | |
Class A Shares | | | 1,000.00 | | | 1,017.60 | | | 7.47 | | 1.48 | % |
Class B Shares | | | 1,000.00 | | | 1,013.85 | | | 11.23 | | 2.23 | % |
Class C Shares | | | 1,000.00 | | | 1,013.85 | | | 11.23 | | 2.23 | % |
Institutional Shares | | | 1,000.00 | | | 1,018.80 | | | 6.26 | | 1.24 | % |
International Equity Fund | | | | | | | | | | | | |
Class A Shares | | | 1,000.00 | | | 1,017.40 | | | 7.67 | | 1.52 | % |
Class B Shares | | | 1,000.00 | | | 1,013.65 | | | 11.43 | | 2.27 | % |
Class C Shares | | | 1,000.00 | | | 1,013.60 | | | 11.48 | | 2.28 | % |
Institutional Shares | | | 1,000.00 | | | 1,018.65 | | | 6.41 | | 1.27 | % |
Short U.S. Government Fund | | | | | | | | | | | | |
Class A Shares | | | 1,000.00 | | | 1,020.10 | | | 4.95 | | 0.98 | % |
Institutional Shares | | | 1,000.00 | | | 1,021.35 | | | 3.69 | | 0.73 | % |
Intermediate U.S. Government Fund | | | | | | | | | | | | |
Class A Shares | | | 1,000.00 | | | 1,019.80 | | | 5.25 | | 1.04 | % |
Class B Shares | | | 1,000.00 | | | 1,016.05 | | | 9.02 | | 1.79 | % |
Class C Shares | | | 1,000.00 | | | 1,016.00 | | | 9.07 | | 1.80 | % |
Institutional Shares | | | 1,000.00 | | | 1,021.05 | | | 3.99 | | 0.79 | % |
48
| | | | | | | | | | | | |
| | | Beginning
Account Value
4/1/04
| | Ending
Account Value
9/30/04
| | Expense Paid
During Period*
4/1/04 - 9/30/04
| | Expense Ratio
During Period
4/1/04 - 9/30/04
| |
Intermediate Corporate Bond Fund | | | | | | | | | | | | |
Class A Shares | | $ | 1,000.00 | | $ | 1,019.70 | | $ | 5.35 | | 1.06 | % |
Class B Shares | | | 1,000.00 | | | 1,015.95 | | | 9.12 | | 1.81 | % |
Class C Shares | | | 1,000.00 | | | 1,015.95 | | | 9.12 | | 1.81 | % |
Institutional Shares | | | 1,000.00 | | | 1,020.95 | | | 4.09 | | 0.81 | % |
Kentucky Intermediate Tax-Free Fund | | | | | | | | | | | | |
Class A Shares | | | 1,000.00 | | | 1,020.60 | | | 4.45 | | 0.88 | % |
Institutional Shares | | | 1,000.00 | | | 1,021.30 | | | 3.74 | | 0.74 | % |
Maryland Intermediate Tax-Free Fund | | | | | | | | | | | | |
Class A Shares | | | 1,000.00 | | | 1,021.00 | | | 4.04 | | 0.80 | % |
Institutional Shares | | | 1,000.00 | | | 1,021.80 | | | 3.23 | | 0.64 | % |
North Carolina Intermediate Tax-Free Fund | | | | | | | | | | | | |
Class A Shares | | | 1,000.00 | | | 1,020.55 | | | 4.50 | | 0.89 | % |
Institutional Shares | | | 1,000.00 | | | 1,021.30 | | | 3.74 | | 0.74 | % |
South Carolina Intermediate Tax-Free Fund | | | | | | | | | | | | |
Class A Shares | | | 1,000.00 | | | 1,020.50 | | | 4.55 | | 0.90 | % |
Institutional Shares | | | 1,000.00 | | | 1,021.20 | | | 3.84 | | 0.76 | % |
Virginia Intermediate Tax-Free Fund | | | | | | | | | | | | |
Class A Shares | | | 1,000.00 | | | 1,020.45 | | | 4.60 | | 0.91 | % |
Institutional Shares | | | 1,000.00 | | | 1,021.20 | | | 3.84 | | 0.76 | % |
West Virginia Intermediate Tax-Free Fund | | | | | | | | | | | | |
Class A Shares | | | 1,000.00 | | | 1,019.95 | | | 5.10 | | 1.01 | % |
Institutional Shares | | | 1,000.00 | | | 1,021.20 | | | 3.84 | | 0.76 | % |
Prime Money Market Fund | | | | | | | | | | | | |
Class A Shares | | | 1,000.00 | | | 1,020.85 | | | 4.19 | | 0.83 | % |
Class B Shares | | | 1,000.00 | | | 1,018.60 | | | 6.46 | | 1.28 | % |
Class C Shares | | | 1,000.00 | | | 1,018.60 | | | 6.46 | | 1.28 | % |
Institutional Shares | | | 1,000.00 | | | 1,022.25 | | | 2.78 | | 0.55 | % |
U.S. Treasury Money Market Fund | | | | | | | | | | | | |
Class A Shares | | | 1,000.00 | | | 1,021.15 | | | 3.89 | | 0.77 | % |
Class B Shares | | | 1,000.00 | | | 1,019.20 | | | 5.86 | | 1.16 | % |
Class C Shares | | | 1,000.00 | | | 1,019.50 | | | 5.55 | | 1.10 | % |
Institutional Shares | | | 1,000.00 | | | 1,022.30 | | | 2.73 | | 0.54 | % |
Capital Manager Conservative Growth Fund | | | | | | | | | | | | |
Class A Shares | | | 1,000.00 | | | 1,021.55 | | | 3.49 | | 0.69 | % |
Class B Shares | | | 1,000.00 | | | 1,017.80 | | | 7.26 | | 1.44 | % |
Class C Shares | | | 1,000.00 | | | 1,017.75 | | | 7.31 | | 1.45 | % |
Institutional Shares | | | 1,000.00 | | | 1,022.80 | | | 2.23 | | 0.44 | % |
Capital Manager Moderate Growth Fund | | | | | | | | | | | | |
Class A Shares | | | 1,000.00 | | | 1,021.25 | | | 3.79 | | 0.75 | % |
Class B Shares | | | 1,000.00 | | | 1,017.50 | | | 7.57 | | 1.50 | % |
Class C Shares | | | 1,000.00 | | | 1,017.50 | | | 7.57 | | 1.50 | % |
Institutional Shares | | | 1,000.00 | | | 1,022.50 | | | 2.53 | | 0.50 | % |
Capital Manager Growth Fund | | | | | | | | | | | | |
Class A Shares | | | 1,000.00 | | | 1,021.25 | | | 3.79 | | 0.75 | % |
Class B Shares | | | 1,000.00 | | | 1,017.50 | | | 7.57 | | 1.50 | % |
Class C Shares | | | 1,000.00 | | | 1,017.50 | | | 7.57 | | 1.50 | % |
Institutional Shares | | | 1,000.00 | | | 1,022.50 | | | 2.53 | | 0.50 | % |
Capital Manager Equity Fund | | | | | | | | | | | | |
Class A Shares | | | 1,000.00 | | | 1,021.35 | | | 3.69 | | 0.73 | % |
Class B Shares | | | 1,000.00 | | | 1,017.60 | | | 7.47 | | 1.48 | % |
Class C Shares | | | 1,000.00 | | | 1,017.60 | | | 7.47 | | 1.48 | % |
Institutional Shares | | | 1,000.00 | | | 1,022.60 | | | 2.43 | | 0.48 | % |
| * | | Expenses are equal to the average account value times the Fund’s annualized expense ratio multiplied by the number of days in the most recent fiscal half-year divided by the number of days in the fiscal year. |
49
Equity Income Fund
Schedule of Portfolio Investments September 30, 2004 |
| | | | | |
| | | Shares
| | Fair Value
|
Common Stocks (89.4%) | | | | | |
Consumer Discretionary (4.0%) | | | | | |
Diageo PLC — ADR | | 24,395 | | $ | 1,230,240 |
| | | | |
|
|
Consumer Staples (13.0%) | | | | | |
Altria Group, Inc. | | 24,500 | | | 1,152,480 |
General Mills, Inc. | | 23,500 | | | 1,055,150 |
Limited Brands | | 52,000 | | | 1,159,080 |
ServiceMaster Co. (The) | | 50,800 | | | 653,288 |
| | | | |
|
|
| | | | | | 4,019,998 |
| | | | |
|
|
Energy (14.1%) | | | | | |
ChevronTexaco Corp. | | 21,000 | | | 1,126,440 |
ConocoPhillips | | 14,900 | | | 1,234,465 |
Kinder Morgan, Inc. | | 16,700 | | | 1,049,094 |
PPL Corp. | | 20,500 | | | 967,190 |
| | | | |
|
|
| | | | | | 4,377,189 |
| | | | |
|
|
Financials (34.1%) | | | | | |
ACE, Ltd. | | 27,600 | | | 1,105,656 |
Alliance Capital Management Holding L.P. | | 29,100 | | | 1,033,050 |
Cincinnati Financial Corp. | | 28,264 | | | 1,165,041 |
Equity One, Inc. | | 51,200 | | | 1,004,544 |
First Industrial Realty Trust, Inc. | | 26,700 | | | 985,230 |
GreenPoint Financial Corp. | | 24,800 | | | 1,150,968 |
Marsh & McLennan Companies, Inc. | | 22,500 | | | 1,029,600 |
St. Paul Travelers Companies, Inc. (The) | | 32,895 | | | 1,087,509 |
U.S. Bancorp | | 32,700 | | | 945,030 |
Weingarten Realty Investors | | 31,800 | | | 1,049,718 |
| | | | |
|
|
| | | | | | 10,556,346 |
| | | | |
|
|
Health Care (3.4%) | | | | | |
Abbott Laboratories | | 25,200 | | | 1,067,472 |
| | | | |
|
|
| | | | | | |
| | | Shares or
Principal
Amount
| | Fair
Value
|
Common Stocks, continued | | | | | | |
Industrials (10.2%) | | | | | | |
Bemis Company, Inc. | | | 41,300 | | $ | 1,097,754 |
General Electric Co. | | | 31,400 | | | 1,054,412 |
Sonoco Products Co. | | | 38,600 | | | 1,020,584 |
| | | | | |
|
|
| | | | | | | 3,172,750 |
| | | | | |
|
|
Information Technology (3.9%) | | | | | | |
Nokia Corp. — ADR | | | 88,500 | | | 1,214,220 |
| | | | | |
|
|
| | | | | | | 1,214,220 |
| | | | | |
|
|
Utilities (3.2%) | | | | | | |
Pinnacle West Capital Corp. | | | 23,500 | | | 975,250 |
| | | | | |
|
|
Telecommunication Services (3.5%) | | | | | | |
Verizon Communications, Inc. | | | 27,200 | | | 1,071,136 |
| | | | | |
|
|
Total Common Stocks
(Cost $26,699,013) | | | | | | 27,684,601 |
| | | | | |
|
|
U.S. Treasury Bills* (3.2%) | | | | | | |
1.41%, 10/28/04 | | $ | 1,000,000 | | | 998,906 |
| | | | | |
|
|
Total U.S. Treasury Bills
(Cost $998,945) | | | | | | 998,906 |
| | | | | |
|
|
Investment Companies (7.2%) | | | | | | |
Federated Prime Cash Obligations Fund —Institutional Class | | | 1,486,470 | | | 1,486,470 |
Federated Prime Obligations Fund — Institutional Class | | | 665,458 | | | 665,458 |
Van Kampen Municipal Trust | | | 4,400 | | | 65,164 |
| | | | | |
|
|
Total Investment Companies
(Cost $2,213,167) | | | | | | 2,217,092 |
| | | | | |
|
|
Total Investments
(Cost $29,911,125) (a) — 99.8% | | | | | | 30,900,599 |
Net other assets (liabilities) — 0.2% | | | | | | 58,086 |
| | | | | |
|
|
Net Assets — 100.0% | | | | | $ | 30,958,685 |
| | | | | |
|
|
| (a) | | Represents cost for financial reporting purposes, is substantially the same for federal income tax purposes, and differs from fair value by net unrealized appreciation/depreciation of securities as follows: |
| | | | |
Unrealized appreciation | | $ | 1,406,940 | |
Unrealized depreciation | | | (417,466 | ) |
| | |
|
|
|
Net unrealized appreciation | | $ | 989,474 | |
| | |
|
|
|
ADR — American Depository Receipt.
| * | | Discount note. Rate disclosed represents the effective yield at September 30, 2004. |
See accompanying notes to the financial statements.
50
Large Company Value Fund
Schedule of Portfolio Investments September 30, 2004 |
| | | | | |
| | | Shares
| | Fair Value
|
Common Stocks (96.8%) | | | | | |
Consumer Discretionary (10.0%) | | | | | |
Cox Communications, Inc. — Class A (b) | | 488,000 | | $ | 16,167,440 |
Gannett Company, Inc. (c) | | 181,000 | | | 15,160,560 |
Mattel, Inc. (c) | | 399,800 | | | 7,248,374 |
May Department Stores Co. (c) | | 268,250 | | | 6,875,248 |
V.F. Corp. | | 52,500 | | | 2,596,125 |
Walt Disney Co. (The) (c) | | 645,000 | | | 14,544,750 |
Whirlpool Corp. (c) | | 88,000 | | | 5,287,920 |
| | | | |
|
|
| | | | | | 67,880,417 |
| | | | |
|
|
Consumer Staples (5.6%) | | | | | |
Albertson’s, Inc. (c) | | 357,720 | | | 8,560,240 |
Altria Group, Inc. | | 223,590 | | | 10,517,673 |
Kimberly-Clark Corp. (c) | | 154,500 | | | 9,979,155 |
Sara Lee Corp. | | 377,010 | | | 8,618,449 |
| | | | |
|
|
| | | | | | 37,675,517 |
| | | | |
|
|
Energy (11.8%) | | | | | |
Anadarko Petroleum Corp. (c) | | 209,500 | | | 13,902,420 |
ChevronTexaco Corp. (c) | | 287,460 | | | 15,419,354 |
ConocoPhillips | | 259,417 | | | 21,492,699 |
Exxon Mobil Corp. | | 185,000 | | | 8,941,050 |
Royal Dutch Petroleum Co. — NY Shares (c) | | 272,600 | | | 14,066,160 |
Schlumberger, Ltd. (c) | | 101,000 | | | 6,798,310 |
| | | | |
|
|
| | | | | | 80,619,993 |
| | | | |
|
|
Financials (27.3%) | | | | | |
American Express Co. | | 137,500 | | | 7,075,750 |
American International Group, Inc. | | 85,000 | | | 5,779,150 |
Aon Corp. (c) | | 430,762 | | | 12,380,100 |
Bank of America Corp. (c) | | 374,600 | | | 16,231,417 |
Citigroup, Inc. | | 256,666 | | | 11,324,104 |
Equity Residential | | 179,000 | | | 5,549,000 |
Fannie Mae (c) | | 116,000 | | | 7,354,400 |
Franklin Resources, Inc. | | 126,000 | | | 7,025,760 |
ING Groep NV — ADR | | 306,680 | | | 7,752,870 |
J.P. Morgan Chase & Co. | | 197,772 | | | 7,857,482 |
Lincoln National Corp. | | 133,900 | | | 6,293,300 |
Merrill Lynch & Company, Inc. | | 135,000 | | | 6,712,200 |
Northern Trust Corp. (c) | | 287,718 | | | 11,738,894 |
Old Republic International Corp. | | 248,000 | | | 6,207,440 |
PNC Financial Services Group | | 252,500 | | | 13,660,250 |
St. Paul Companies, Inc. | | 398,500 | | | 13,174,410 |
SunTrust Banks, Inc. (c) | | 166,000 | | | 11,688,060 |
Washington Mutual, Inc. (c) | | 333,000 | | | 13,013,640 |
Wells Fargo & Co. | | 248,000 | | | 14,788,240 |
| | | | |
|
|
| | | | | | 185,606,467 |
| | | | |
|
|
Health Care (8.9%) | | | | | |
Abbott Laboratories | | 256,000 | | | 10,844,160 |
Becton, Dickinson & Co. (c) | | 140,600 | | | 7,269,020 |
Bristol-Myers Squibb Co. | | 208,080 | | | 4,925,254 |
Cigna Corp. | | 139,700 | | | 9,727,311 |
HCA, Inc. (c) | | 165,800 | | | 6,325,270 |
Johnson & Johnson (c) | | 112,600 | | | 6,342,758 |
Merck & Company, Inc. | | 318,000 | | | 10,494,000 |
Schering-Plough Corp. (c) | | 242,400 | | | 4,620,144 |
| | | | |
|
|
| | | | | | 60,547,917 |
| | | | |
|
|
Industrials (11.1%) | | | | | |
CSX Corp. | | 310,200 | | | 10,298,640 |
Emerson Electric Co. | | 261,370 | | | 16,176,189 |
| | | | | | | |
| | | Shares or
Principal
Amount
| | Fair Value
| |
Common Stocks, continued | | | | | | | |
Industrials, continued | | | | | | | |
General Electric Co. (c) | | | 210,000 | | $ | 7,051,800 | |
H & R Block, Inc. (c) | | | 141,000 | | | 6,968,220 | |
Parker-Hannifin Corp. (c) | | | 117,000 | | | 6,886,620 | |
Pitney Bowes, Inc. (c) | | | 323,800 | | | 14,279,580 | |
Raytheon Co. | | | 362,500 | | | 13,767,750 | |
| | | | | |
|
|
|
| | | | | | | 75,428,799 | |
| | | | | |
|
|
|
Information Technology (7.9%) | | | | | | | |
Agilent Technologies, Inc. (b)(c) | | | 280,419 | | | 6,048,638 | |
Automatic Data Processing, Inc. | | | 272,400 | | | 11,255,568 | |
First Data Corp. | | | 172,000 | | | 7,482,000 | |
Hewlett-Packard Co. (c) | | | 435,000 | | | 8,156,250 | |
IBM Corp. | | | 62,800 | | | 5,384,472 | |
Microsoft Corp. | | | 268,000 | | | 7,410,200 | |
Nokia Corp. — ADR (c) | | | 550,000 | | | 7,546,000 | |
| | | | | |
|
|
|
| | | | | | | 53,283,128 | |
| | | | | |
|
|
|
Materials (4.6%) | | | | | | | |
Air Products & Chemicals, Inc. | | | 144,700 | | | 7,868,786 | |
Alcoa, Inc. (c) | | | 236,000 | | | 7,927,240 | |
E.I. DuPont de Nemours & Co. | | | 115,600 | | | 4,947,680 | |
Weyerhaeuser Co. (c) | | | 155,500 | | | 10,337,640 | |
| | | | | |
|
|
|
| | | | | | | 31,081,346 | |
| | | | | |
|
|
|
Telecommunication Services (4.7%) | | | | | | | |
AT&T Corp. | | | 113,824 | | | 1,629,960 | |
BellSouth Corp. | | | 460,000 | | | 12,475,200 | |
SBC Communications, Inc. | | | 420,400 | | | 10,909,380 | |
Sprint Corp. (c) | | | 348,400 | | | 7,013,291 | |
| | | | | |
|
|
|
| | | | | | | 32,027,831 | |
| | | | | |
|
|
|
Utilities (4.9%) | | | | | | | |
Dominion Resources, Inc. (c) | | | 109,000 | | | 7,112,250 | |
Duke Energy Corp. (c) | | | 262,000 | | | 5,997,180 | |
NiSource, Inc. (c) | | | 473,100 | | | 9,939,831 | |
TXU Corp. (c) | | | 141,800 | | | 6,795,056 | |
Xcel Energy, Inc. | | | 191,275 | | | 3,312,883 | |
| | | | | |
|
|
|
| | | | | | | 33,157,200 | |
| | | | | |
|
|
|
Total Common Stocks
(Cost $524,974,585) | | | | | | 657,308,615 | |
| | | | | |
|
|
|
Investment Company (2.8%) | | | | | | | |
Federated Prime Cash Obligations Fund — Institutional Class | | | 18,677,833 | | | 18,677,833 | |
| | | | | |
|
|
|
Total Investment Company
(Cost $18,677,833) | | | | | | 18,677,833 | |
| | | | | |
|
|
|
Securities Held as Collateral for Securities on Loan (31.6%) | | | | | | | |
Pool of various securities for BB&T Funds — Note 2 — Security Loans | | $ | 214,201,090 | | | 214,201,090 | �� |
| | | | | |
|
|
|
Total Securities Held as Collateral for Securities on Loan
(Cost $214,201,090) | | | | | | 214,201,090 | |
| | | | | |
|
|
|
Total Investments
(Cost $757,853,508) (a) — 131.2% | | | | | | 890,187,538 | |
Net other assets (liabilities) — (31.2%) | | | | | | (211,752,560 | ) |
| | | | | |
|
|
|
Net Assets — 100.0% | | | | | $ | 678,434,978 | |
| | | | | |
|
|
|
Continued
51
Large Company Value Fund
Schedule of Portfolio Investments, continued September 30, 2004 |
| (a) | | Represents cost for financial reporting purposes, is substantially the same for federal income tax purposes, and differs from fair value by net unrealized appreciation/depreciation of securities as follows: |
| | | | |
Unrealized appreciation | | $ | 143,957,344 | |
Unrealized depreciation | | | (11,623,314 | ) |
| | |
|
|
|
Net unrealized appreciation | | $ | 132,334,030 | |
| | |
|
|
|
| (b) | | Represents non-income producing securities. |
| (c) | | Represents the security or a portion of the security was on loan as of September 30, 2004. |
ADR — American Depository Receipt.
See accompanying notes to the financial statements.
52
Large Company Growth Fund
Schedule of Portfolio Investments September 30, 2004 |
| | | | | |
| | | Shares
| | Fair
Value
|
Common Stocks (98.9%) | | | | | |
Consumer Discretionary (11.6%) | | | | | |
Best Buy, Inc. (b)(c) | | 70,000 | | $ | 3,796,800 |
Coach, Inc. (b)(c) | | 85,000 | | | 3,605,700 |
eBay, Inc. (b)(c) | | 62,000 | | | 5,700,280 |
Harley-Davidson, Inc. (c) | | 100,000 | | | 5,944,000 |
Home Depot, Inc. (c) | | 238,700 | | | 9,357,040 |
News Corp., Ltd. — ADR (c) | | 200,000 | | | 6,574,000 |
Target Corp. | | 170,000 | | | 7,692,500 |
| | | | |
|
|
| | | | | | 42,670,320 |
| | | | |
|
|
Consumer Staples (12.8%) | | | | | |
Estee Lauder Co., Inc. (The) — Class A | | 193,000 | | | 8,067,400 |
Gillette Co. | | 84,600 | | | 3,531,203 |
PepsiCo, Inc. | | 176,900 | | | 8,606,185 |
Procter & Gamble Co. | | 199,700 | | | 10,807,764 |
Sysco Corp. (c) | | 275,000 | | | 8,228,000 |
Wal-Mart Stores, Inc. | | 150,000 | | | 7,980,000 |
| | | | |
|
|
| | | | | | 47,220,552 |
| | | | |
|
|
Energy (2.9%) | | | | | |
Anadarko Petroleum Corp. (c) | | 57,500 | | | 3,815,700 |
Apache Corp. | | 66,500 | | | 3,332,315 |
Baker Hughes, Inc. (c) | | 37,500 | | | 1,639,500 |
Devon Energy Corp. | | 26,000 | | | 1,846,260 |
| | | | |
|
|
| | | | | | 10,633,775 |
| | | | |
|
|
Financials (9.9%) | | | | | |
American Express Co. (c) | | 110,000 | | | 5,660,600 |
American International Group, Inc. | | 125,000 | | | 8,498,750 |
Citigroup, Inc. | | 90,000 | | | 3,970,800 |
Fannie Mae | | 79,000 | | | 5,008,600 |
J.P. Morgan Chase & Co. | | 95,000 | | | 3,774,350 |
Morgan Stanley (c) | | 67,000 | | | 3,303,100 |
PNC Financial Services Group | | 48,500 | | | 2,623,850 |
Wachovia Corp. (c) | | 75,000 | | | 3,521,250 |
| | | | |
|
|
| | | | | | 36,361,300 |
| | | | |
|
|
Health Care (24.4%) | | | | | |
Amgen, Inc. (b)(c) | | 115,000 | | | 6,518,200 |
Becton, Dickinson & Co. (c) | | 150,000 | | | 7,755,000 |
Boston Scientific Corp. (b)(c) | | 90,045 | | | 3,577,488 |
Bristol-Myers Squibb Co. (c) | | 75,000 | | | 1,775,250 |
Genentech, Inc. (b)(c) | | 90,000 | | | 4,717,800 |
Genzyme Corp. (b)(c) | | 80,000 | | | 4,352,800 |
Gilead Sciences, Inc. (b)(c) | | 190,000 | | | 7,102,200 |
GlaxoSmithKline plc-ADR (c) | | 176,300 | | | 7,709,599 |
Johnson & Johnson (c) | | 227,000 | | | 12,786,910 |
Medtronic, Inc. (c) | | 90,000 | | | 4,671,000 |
Merck & Company, Inc. | | 80,000 | | | 2,640,000 |
Pfizer, Inc. | | 200,000 | | | 6,120,000 |
Quest Diagnostics, Inc. (c) | | 77,000 | | | 6,792,940 |
St. Jude Medical, Inc. (b) | | 37,500 | | | 2,822,625 |
Teva Pharmaceutical Industries, Ltd. — ADR | | 115,000 | | | 2,984,250 |
UnitedHealth Group, Inc. | | 105,000 | | | 7,742,700 |
| | | | |
|
|
| | | | | | 90,068,762 |
| | | | |
|
|
| | | | | | | |
| | | Shares or
Principal
Amount
| | Fair
Value
| |
Common Stocks, continued | | | | | | | |
Industrials (12.4%) | | | | | | | |
Danaher Corp. (c) | | | 90,000 | | $ | 4,615,200 | |
FedEx Corp. (c) | | | 103,000 | | | 8,826,070 | |
General Electric Co. (c) | | | 206,000 | | | 6,917,480 | |
Honeywell International, Inc. | | | 150,000 | | | 5,379,000 | |
Illinois Tool Works, Inc. (c) | | | 54,000 | | | 5,031,180 | |
Tyco International, Ltd. (c) | | | 218,000 | | | 6,683,880 | |
United Technologies Corp. | | | 90,000 | | | 8,404,200 | |
| | | | | |
|
|
|
| | | | | | | 45,857,010 | |
| | | | | |
|
|
|
Information Technology (23.5%) | | | | | | | |
Adobe Systems, Inc. (c) | | | 100,000 | | | 4,947,000 | |
Affiliated Computer Services, Inc. —
Class A (b)(c) | | | 159,000 | | | 8,851,530 | |
Analog Devices, Inc. (c) | | | 80,000 | | | 3,102,400 | |
Cisco Systems, Inc. (b) | | | 486,000 | | | 8,796,600 | |
Dell, Inc. (b)(c) | | | 241,000 | | | 8,579,600 | |
First Data Corp. (c) | | | 100,000 | | | 4,350,000 | |
Flextronics International, Ltd. (b)(c) | | | 175,000 | | | 2,318,750 | |
Intel Corp. | | | 466,500 | | | 9,357,990 | |
Linear Technology Corp. (c) | | | 100,000 | | | 3,624,000 | |
Microsoft Corp. (c) | | | 507,500 | | | 14,032,375 | |
Motorola, Inc. | | | 170,000 | | | 3,066,800 | |
Oracle Corp. (b) | | | 350,000 | | | 3,948,000 | |
SAP — ADR (c) | | | 175,000 | | | 6,816,250 | |
Texas Instruments, Inc. | | | 230,000 | | | 4,894,400 | |
| | | | | |
|
|
|
| | | | | | | 86,685,695 | |
| | | | | |
|
|
|
Materials (1.4%) | | | | | | | |
Alcoa, Inc. (c) | | | 65,000 | | | 2,183,350 | |
Phelps Dodge Corp. (b)(c) | | | 30,000 | | | 2,760,900 | |
| | | | | |
|
|
|
| | | | | | | 4,944,250 | |
| | | | | |
|
|
|
Total Common Stocks
(Cost $321,831,422) | | | | | | 364,441,664 | |
| | | | | |
|
|
|
Investment Company (1.1%) | | | | | | | |
Federated Prime Cash Obligations Fund — Institutional Class | | | 4,058,375 | | | 4,058,375 | |
| | | | | |
|
|
|
Total Investment Company
(Cost $4,058,375) | | | | | | 4,058,375 | |
| | | | | |
|
|
|
Securities Held as Collateral for Securities on Loan (38.5%) | | | | | | | |
Pool of various securities for BB&T Funds — Note 2 — Security Loans | | $ | 142,033,534 | | | 142,033,534 | |
| | | | | |
|
|
|
Total Securities Held as Collateral for Securities on Loan
(Cost $142,033,534) | | | | | | 142,033,534 | |
| | | | | |
|
|
|
Total Investments
(Cost $467,923,331) (a) — 138.5% | | | | | | 510,533,573 | |
Net other assets ( liabilities) — (38.5)% | | | | | | (141,818,861 | ) |
| | | | | |
|
|
|
Net Assets — 100.0% | | | | | $ | 368,714,712 | |
| | | | | |
|
|
|
| (a) | | Represents cost for financial reporting purposes, is substantially the same for federal income tax purposes, and differs from fair value by net unrealized appreciation/depreciation of securities as follows: |
| | | | |
Unrealized appreciation | | $ | 53,204,447 | |
Unrealized depreciation | | | (10,594,205 | ) |
| | |
|
|
|
Net unrealized appreciation | | $ | 42,610,242 | |
| | |
|
|
|
| (b) | | Represents non-income producing securities. |
| (c) | | Represents the security or a portion of the security was on loan as of September 30, 2004. |
ADR — American Depository Receipt.
See accompanying notes to the financial statements.
53
Mid Cap Value Fund
Schedule of Portfolio Investments September 30, 2004 |
| | | | | |
| | | Shares
| | Fair Value
|
Common Stocks (98.2%) | | | | | |
Consumer Discretionary (10.1%) | | | | | |
Advance Auto Parts, Inc. (b) | | 30,000 | | $ | 1,032,000 |
American Greetings Corp. — Class A (c) | | 100,000 | | | 2,512,000 |
Cato Corp. — Class A | | 66,000 | | | 1,468,500 |
Circuit City Stores, Inc. | | 150,000 | | | 2,301,000 |
Genuine Parts Co. (c) | | 99,000 | | | 3,799,620 |
Knight-Ridder, Inc. | | 36,000 | | | 2,356,200 |
Media General, Inc. — Class A (c) | | 22,900 | | | 1,281,255 |
Outback Steakhouse, Inc. (c) | | 69,000 | | | 2,865,570 |
Pier 1 Imports, Inc. | | 120,000 | | | 2,169,600 |
| | | | |
|
|
| | | | | | 19,785,745 |
| | | | |
|
|
Consumer Staples (5.0%) | | | | | |
BJ’s Wholesale Club, Inc. (b) | | 37,000 | | | 1,011,580 |
Ruddick Corp. | | 80,000 | | | 1,571,200 |
Sensient Technologies Corp. (c) | | 115,000 | | | 2,488,600 |
SUPERVALU, Inc. | | 95,000 | | | 2,617,250 |
UST, Inc. | | 52,000 | | | 2,093,520 |
| | | | |
|
|
| | | | | | 9,782,150 |
| | | | |
|
|
Energy (9.0%) | | | | | |
Burlington Resources, Inc. (c) | | 94,000 | | | 3,835,200 |
EOG Resources, Inc. (c) | | 36,000 | | | 2,370,600 |
Kerr-McGee Corp. (c) | | 91,000 | | | 5,209,750 |
Sunoco, Inc. (c) | | 61,900 | | | 4,579,362 |
Tidewater, Inc. | | 50,000 | | | 1,627,500 |
| | | | |
|
|
| | | | | | 17,622,412 |
| | | | |
|
|
Financials (25.9%) | | | | | |
Ambac Financial Group, Inc. | | 30,000 | | | 2,398,500 |
American Capital Strategies, Ltd. | | 44,000 | | | 1,378,960 |
Arthur J. Gallagher & Co. | | 150,000 | | | 4,969,500 |
Banknorth Group, Inc. | | 55,000 | | | 1,925,000 |
City Holding Co. | | 50,000 | | | 1,644,500 |
Commerce Bancshares, Inc. | | 48,000 | | | 2,308,320 |
Compass Bancshares, Inc. | | 115,000 | | | 5,039,300 |
Edwards (A.G.), Inc. (c) | | 50,000 | | | 1,731,000 |
Equity Inns, Inc., REIT | | 140,000 | | | 1,383,200 |
Erie Indemnity Co. — Class A | | 42,000 | | | 2,142,840 |
First American Corp. | | 180,000 | | | 5,549,400 |
First Industrial Realty Trust, REIT | | 36,000 | | | 1,328,400 |
Hibernia Corp. — Class A | | 39,000 | | | 1,029,990 |
Jefferson-Pilot Corp. | | 103,000 | | | 5,114,980 |
Mercantile Bankshares Corp. | | 90,000 | | | 4,316,400 |
Nuveen Investments — Class A | | 66,000 | | | 1,953,600 |
ProLogis Trust, REIT | | 70,000 | | | 2,466,800 |
SouthTrust Corp. | | 60,000 | | | 2,499,600 |
Sovran Self Storage, Inc., REIT | | 50,000 | | | 1,959,000 |
| | | | |
|
|
| | | | | | 51,139,290 |
| | | | |
|
|
Health Care (8.6%) | | | | | |
AmerisourceBergen Corp. (c) | | 48,000 | | | 2,578,080 |
Becton, Dickinson & Co. | | 53,000 | | | 2,740,100 |
C.R. Bard, Inc. | | 40,000 | | | 2,265,200 |
Mentor Corp. | | 100,000 | | | 3,368,000 |
Mylan Laboratories, Inc. | | 135,000 | | | 2,430,000 |
Perrigo Co. | | 115,000 | | | 2,363,250 |
Watson Pharmaceuticals, Inc. (b)(c) | | 36,000 | | | 1,060,560 |
| | | | |
|
|
| | | | | | 16,805,190 |
| | | | |
|
|
Industrials (12.7%) | | | | | |
American Power Conversion Corp. (c) | | 150,000 | | | 2,608,500 |
Banta Corp. (c) | | 57,000 | | | 2,265,750 |
Burlington Northern Santa Fe Corp. (c) | | 60,000 | | | 2,298,600 |
Griffon Corp. (b)(c) | | 80,000 | | | 1,688,000 |
L-3 Communications Holdings, Inc. | | 42,100 | | | 2,820,700 |
| | | | | | | |
| | | Shares or
Principal
Amount
| | Fair Value
| |
Common Stocks, continued | | | | | | | |
Industrials, continued | | | | | | | |
Lincoln Electric Holdings, Inc. | | | 70,000 | | $ | 2,195,200 | |
Northrop Grumman Corp. (c) | | | 44,000 | | | 2,346,520 | |
Pall Corp. | | | 50,000 | | | 1,224,000 | |
Parker-Hannifin Corp. | | | 50,000 | | | 2,943,000 | |
R.R. Donnelley & Sons Co. (c) | | | 80,000 | | | 2,505,600 | |
SPX Corp. (c) | | | 59,000 | | | 2,088,600 | |
| | | | | |
|
|
|
| | | | | | | 24,984,470 | |
| | | | | |
|
|
|
Information Technology (9.8%) | | | | | | | |
Activision, Inc. (b) | | | 164,250 | | | 2,278,148 | |
Andrew Corp. (b)(c) | | | 199,000 | | | 2,435,760 | |
AVX Corp. | | | 130,000 | | | 1,540,500 | |
Check Point Software Technologies, Ltd. (b) | | | 75,000 | | | 1,272,750 | |
Checkpoint Systems, Inc. (b) | | | 99,000 | | | 1,541,430 | |
Imation Corp. | | | 30,000 | | | 1,067,700 | |
National Semiconductor Corp. (b) | | | 120,000 | | | 1,858,800 | |
Paychex, Inc. | | | 44,000 | | | 1,326,600 | |
Storage Technology Corp. (b) | | | 42,100 | | | 1,063,446 | |
SunGard Data Systems, Inc. (b) | | | 115,000 | | | 2,733,550 | |
Sybase, Inc. (b) | | | 70,000 | | | 965,300 | |
VERITAS Software Corp. (b) | | | 61,000 | | | 1,085,800 | |
| | | | | |
|
|
|
| | | | | | | 19,169,784 | |
| | | | | |
|
|
|
Materials (8.8%) | | | | | | | |
Albemarle Corp. (c) | | | 103,000 | | | 3,614,270 | |
Martin Marietta Materials, Inc. | | | 44,000 | | | 1,991,880 | |
Praxair, Inc. | | | 100,000 | | | 4,274,000 | |
Rayonier, Inc. | | | 49,000 | | | 2,216,760 | |
Sonoco Products Co. | | | 75,000 | | | 1,983,000 | |
Worthington Industries, Inc. | | | 150,000 | | | 3,202,500 | |
| | | | | |
|
|
|
| | | | | | | 17,282,410 | |
| | | | | |
|
|
|
Telecommunication Services (0.9%) | | | | | | | |
UTStarcom, Inc. (b) | | | 62,000 | | | 998,820 | |
Wireless Facilities, Inc. (b)(c) | | | 109,000 | | | 759,730 | |
| | | | | |
|
|
|
| | | | | | | 1,758,550 | |
| | | | | |
|
|
|
Utilities (7.4%) | | | | | | | |
Consolidated Edison, Inc. (c) | | | 69,000 | | | 2,900,760 | |
FPL Group, Inc. (c) | | | 48,000 | | | 3,279,360 | |
National Fuel Gas Co. | | | 111,000 | | | 3,144,630 | |
NiSource, Inc. (c) | | | 119,000 | | | 2,500,190 | |
Piedmont Natural Gas Company, Inc. (c) | | | 61,900 | | | 2,719,886 | |
| | | | | |
|
|
|
| | | | | | | 14,544,826 | |
| | | | | |
|
|
|
Total Common Stocks
(Cost $150,532,050) | | | | | | 192,874,827 | |
| | | | | |
|
|
|
Investment Companies (6.0%) | | | | | | | |
Federated Prime Cash Obligations Fund — Institutional Class | | | 7,541,736 | | | 7,541,736 | |
Federated Prime Obligations Fund — Institutional Class | | | 4,228,710 | | | 4,228,710 | |
| | | | | |
|
|
|
Total Investment Companies
(Cost $11,770,446) | | | | | | 11,770,446 | |
| | | | | |
|
|
|
Securities Held as Collateral for Securities on Loan (27.4%) | | | | | | | |
Pool of various securities for BB&T Funds — Note 2 — Security Loans | | $ | 53,754,118 | | | 53,754,118 | |
| | | | | |
|
|
|
Total Securities Held as Collateral for Securities on Loan
(Cost $53,754,118) | | | | | | 53,754,118 | |
| | | | | |
|
|
|
Total Investments
(Cost $216,056,614) (a) — 131.6% | | | | | | 258,399,391 | |
Net other assets (liabilities) — (31.6)% | | | | | | (62,080,308 | ) |
| | | | | |
|
|
|
Net Assets — 100.0% | | | | | $ | 196,319,083 | |
| | | | | |
|
|
|
Continued
54
Mid Cap Value Fund
Schedule of Portfolio Investments, continued September 30, 2004 |
| (a) | | Represents cost for financial reporting purposes, is substantially the same for federal income tax purposes, and differs from fair value by net unrealized appreciation/depreciation of securities as follows: |
| | | | |
Unrealized appreciation | | $ | 43,896,608 | |
Unrealized depreciation | | | (1,553,831 | ) |
| | |
|
|
|
Net unrealized appreciation | | $ | 42,342,777 | |
| | |
|
|
|
| (b) | | Represents non-income producing securities. |
| (c) | | Represents the security or a portion of the security was on loan as of September 30, 2004. |
| REIT | | — Real Estate Investment Trust |
See accompanying notes to the financial statements.
55
Mid Cap Growth Fund
Schedule of Portfolio Investments September 30, 2004 |
| | | | | |
| | | Shares
| | Fair Value
|
Common Stocks (96.7%) | | | | | |
Consumer Discretionary (20.4%) | | | | | |
Coach, Inc. (b)(c) | | 60,000 | | $ | 2,545,200 |
Florida Rock Industries, Inc. | | 33,000 | | | 1,616,670 |
Harman International Industries, Inc. (c) | | 22,000 | | | 2,370,500 |
Michaels Stores, Inc. (c) | | 26,500 | | | 1,569,065 |
MSC Industrial Direct Company, Inc. — Class A | | 65,000 | | | 2,215,200 |
PETsMART, Inc. (b)(c) | | 79,000 | | | 2,242,810 |
Pulte Homes, Inc. (c) | | 25,500 | | | 1,564,935 |
Royal Caribbean Cruises, Ltd. (c) | | 37,000 | | | 1,613,200 |
Staples, Inc. | | 41,000 | | | 1,222,620 |
Starbucks Corp. (b)(c) | | 28,500 | | | 1,295,610 |
Starwood Hotels & Resorts Worldwide, Inc. | | 55,000 | | | 2,553,100 |
Toll Brothers, Inc. (b) | | 28,000 | | | 1,297,240 |
Urban Outfitters, Inc. (b)(c) | | 78,000 | | | 2,683,200 |
Washington Post Co. (The) Class B | | 1,450 | | | 1,334,000 |
| | | | |
|
|
| | | | | | 26,123,350 |
| | | | |
|
|
Consumer Staples (1.7%) | | | | | |
United Natural Foods, Inc. (b)(c) | | 81,000 | | | 2,154,600 |
| | | | |
|
|
Energy (8.1%) | | | | | |
Baker Hughes, Inc. (c) | | 23,000 | | | 1,005,560 |
BJ Services Co. (c) | | 37,000 | | | 1,939,170 |
Chesapeake Energy Corp. (c) | | 120,000 | | | 1,899,600 |
Massey Energy Co. (c) | | 34,500 | | | 998,085 |
Peabody Energy Corp. | | 17,000 | | | 1,011,500 |
Smith International, Inc. (b)(c) | | 21,000 | | | 1,275,330 |
Weatherford International, Ltd. (b)(c) | | 20,000 | | | 1,020,400 |
XTO Energy, Inc. (c) | | 40,000 | | | 1,299,200 |
| | | | |
|
|
| | | | | | 10,448,845 |
| | | | |
|
|
Financials (5.9%) | | | | | |
Brown & Brown, Inc. (c) | | 35,000 | | | 1,599,500 |
Doral Financial Corp. (c) | | 45,000 | | | 1,866,150 |
Legg Mason, Inc. (c) | | 18,000 | | | 958,860 |
Providian Financial Corp. (b)(c) | | 115,000 | | | 1,787,100 |
T. Rowe Price Group, Inc. (c) | | 27,000 | | | 1,375,380 |
| | | | |
|
|
| | | | | | 7,586,990 |
| | | | |
|
|
Health Care (17.0%) | | | | | |
Biogen Idec, Inc. (b)(c) | | 23,500 | | | 1,437,495 |
Caremark Rx, Inc. (b)(c) | | 42,500 | | | 1,362,975 |
Celgene Corp. (b)(c) | | 27,000 | | | 1,572,210 |
Cooper Companies, Inc. (The) (c) | | 14,000 | | | 959,700 |
Covance, Inc. (b) | | 42,500 | | | 1,698,725 |
Coventry Health Care, Inc. (b)(c) | | 31,000 | | | 1,654,470 |
Dade Behring Holdings, Inc. (b) | | 23,000 | | | 1,281,514 |
Fisher Scientific International, Inc. (b)(c) | | 38,000 | | | 2,216,540 |
Genzyme Corp. (b)(c) | | 29,500 | | | 1,605,095 |
Gilead Sciences, Inc. (b)(c) | | 49,000 | | | 1,831,620 |
Kinetic Concepts, Inc. (b)(c) | | 25,500 | | | 1,340,025 |
Patterson Companies, Inc. (b)(c) | | 16,500 | | | 1,263,240 |
Renal Care Group, Inc. (b) | | 36,750 | | | 1,184,453 |
Varian Medical Systems, Inc. (b) | | 35,000 | | | 1,209,950 |
Zimmer Holdings, Inc. (b) | | 15,000 | | | 1,185,600 |
| | | | |
|
|
| | | | | | 21,803,612 |
| | | | |
|
|
Industrials (11.4%) | | | | | |
Amphenol Corp. — Class A (b) | | 61,000 | | | 2,089,860 |
Cummins, Inc. | | 20,500 | | | 1,514,745 |
Fastenal Co. (c) | | 26,000 | | | 1,497,600 |
Gen-Probe, Inc. (b)(c) | | 36,000 | | | 1,435,320 |
Goodrich Corp. | | 42,000 | | | 1,317,120 |
| | | | | | | |
| | | Shares or
Principal
Amount
| | Fair Value
| |
Common Stocks, continued | | | | | | | |
Industrials, continued | | | | | | | |
J.B. Hunt Transport Services, Inc. (c) | | | 44,500 | | $ | 1,652,730 | |
National-Oilwell, Inc. (b)(c) | | | 39,000 | | | 1,281,540 | |
Rockwell Automation, Inc. (c) | | | 57,000 | | | 2,205,900 | |
Yellow Roadway Corp. (b)(c) | | | 35,000 | | | 1,641,150 | |
| | | | | |
|
|
|
| | | | | | | 14,635,965 | |
| | | | | |
|
|
|
Information Technology (27.8%) | | | | | | | |
Activision, Inc. (b) | | | 86,000 | | | 1,192,820 | |
Adobe Systems, Inc. (c) | | | 27,500 | | | 1,360,425 | |
Apple Computer, Inc. (b) | | | 66,000 | | | 2,557,500 | |
Ask Jeeves, Inc. (b) | | | 49,000 | | | 1,602,790 | |
ATI Technologies, Inc. (b) | | | 41,000 | | | 628,530 | |
AutoDesk, Inc. (c) | | | 56,000 | | | 2,723,279 | |
Cerner Corp. (b)(c) | | | 37,000 | | | 1,600,620 | |
Cognizant Technology Solutions
Corp. (b)(c) | | | 67,000 | | | 2,044,170 | |
Comverse Technology, Inc. (b) | | | 52,000 | | | 979,160 | |
Expeditor International of Washington,
Inc. (c) | | | 32,000 | | | 1,654,400 | |
FLIR Systems, Inc. (b)(c) | | | 21,500 | | | 1,257,750 | |
Getty Images, Inc. (b) | | | 24,000 | | | 1,327,200 | |
InfoSpace, Inc. (b)(c) | | | 45,000 | | | 2,132,550 | |
ITT Industries, Inc. | | | 16,500 | | | 1,319,835 | |
Juniper Networks, Inc. (b)(c) | | | 69,000 | | | 1,628,400 | |
Marvell Technology Group, Ltd. (b)(c) | | | 75,000 | | | 1,959,750 | |
Microchip Technology, Inc. (c) | | | 56,000 | | | 1,503,040 | |
Network Appliance, Inc. (b) | | | 55,500 | | | 1,276,500 | |
Research in Motion, Ltd. (b)(c) | | | 25,000 | | | 1,908,500 | |
Symantec Corp. (b)(c) | | | 47,000 | | | 2,579,360 | |
Zebra Technologies Corp. —
Class A (b)(c) | | | 38,000 | | | 2,318,380 | |
| | | | | |
|
|
|
| | | | | | | 35,554,959 | |
| | | | | |
|
|
|
Telecommunication Services (4.4%) | | | | | | | |
American Tower Corp. — Class A (b)(c) | | | 70,000 | | | 1,074,500 | |
Mobile Telesystems — ADR (c) | | | 5,400 | | | 782,946 | |
Spectrasit, Inc. (b) | | | 28,000 | | | 1,302,000 | |
VimpelCom — ADR (b) | | | 7,200 | | | 783,360 | |
XM Satellite Radio Holdings, Inc.
Class A (b)(c) | | | 55,000 | | | 1,706,100 | |
| | | | | |
|
|
|
| | | | | | | 5,648,906 | |
| | | | | |
|
|
|
Total Common Stocks
(Cost $100,214,674) | | | | | | 123,957,227 | |
| | | | | |
|
|
|
Investment Company (0.4%) | | | | | | | |
Federated Prime Cash Obligations Fund — Institutional Class | | | 547,540 | | | 547,540 | |
| | | | | |
|
|
|
Total Investment Company
(Cost $547,540) | | | | | | 547,540 | |
| | | | | |
|
|
|
Securities Held as Collateral for Securities on Loan (48.9%) | | | | | | | |
Pool of various securities for BB&T Funds — Note 2 — Security Loans | | $ | 62,731,209 | | | 62,731,209 | |
| | | | | |
|
|
|
Total Securities Held as Collateral for Securities on Loan
(Cost $62,731,209) | | | | | | 62,731,209 | |
| | | | | |
|
|
|
Total Investments
(Cost $163,493,423) (a) — 146.0% | | | | | | 187,235,976 | |
Net other assets (liabilities) — (46.0%) | | | | | | (58,964,571 | ) |
| | | | | |
|
|
|
Net Assets — 100.0% | | | | | $ | 128,271,405 | |
| | | | | |
|
|
|
Continued
56
Mid Cap Growth Fund
Schedule of Portfolio Investments, continued September 30, 2004 |
| (a) | | Represents cost for financial reporting purposes, is substantially the same for federal income tax purposes, and differs from fair value by net unrealized appreciation/depreciation of securities as follows: |
| | | | |
Unrealized appreciation | | $ | 24,328,866 | |
Unrealized depreciation | | | (586,313 | ) |
| | |
|
|
|
Net unrealized appreciation | | $ | 23,742,553 | |
| | |
|
|
|
| (b) | | Represents non-income producing securities. |
| (c) | | Represents the security or a portion of the security was on loan as of September 30, 2004. |
ADR — American Depository Receipt.
See accompanying notes to the financial statements.
57
Small Company Value Fund
Schedule of Portfolio Investments September 30, 2004 |
| | | | | |
| | | Shares
| | Fair Value
|
Common Stocks (93.3%) | | | | | |
Consumer Discretionary (17.1%) | | | | | |
American Eagle Outfitters, Inc. (b)(c) | | 12,965 | | $ | 477,760 |
BorgWarner, Inc. | | 15,420 | | | 667,532 |
CEC Entertainment, Inc. (b) | | 19,287 | | | 708,797 |
Deb Shops, Inc. | | 32,284 | | | 787,730 |
Inter Parfums, Inc. | | 40,800 | | | 556,920 |
Lone Star Steakhouse & Saloon, Inc. | | 13,000 | | | 335,790 |
M.D.C. Holdings, Inc. | | 8,085 | | | 591,014 |
Michaels Stores, Inc. | | 8,427 | | | 498,963 |
Nautilus Group, Inc. (The) (c) | | 37,696 | | | 851,552 |
OshKosh B’Gosh, Inc. — Class A | | 19,811 | | | 400,182 |
Payless ShoeSource, Inc. (b)(c) | | 54,300 | | | 550,059 |
Polaris Industries, Inc. (c) | | 10,616 | | | 592,585 |
Saucony, Inc. — Class B | | 26,995 | | | 659,218 |
Standard Motor Products, Inc. | | 39,800 | | | 601,378 |
Stanley Furniture Company, Inc. | | 19,137 | | | 842,028 |
Strattec Security Corp. (b) | | 16,207 | | | 1,009,047 |
Talbots, Inc. (The) | | 20,883 | | | 517,690 |
Visteon Corp. (c) | | 60,000 | | | 479,400 |
Zale Corp. (b) | | 12,696 | | | 356,758 |
| | | | |
|
|
| | | | | | 11,484,403 |
| | | | |
|
|
Consumer Staples (2.1%) | | | | | |
American Italian Pasta Co. — Class A (c) | | 13,500 | | | 353,025 |
Fresh Del Monte Produce, Inc. (c) | | 25,321 | | | 630,746 |
Sensient Technologies Corp. (c) | | 18,800 | | | 406,832 |
| | | | |
|
|
| | | | | | 1,390,603 |
| | | | |
|
|
Energy (8.5%) | | | | | |
Berry Petroleum Co. — Class A | | 15,868 | | | 582,832 |
Cabot Oil & Gas Corp. | | 16,244 | | | 729,356 |
Forest Oil Corp. (b)(c) | | 28,606 | | | 861,613 |
Newfield Exploration Co. (b) | | 14,075 | | | 861,953 |
Oceaneering International, Inc. (b)(c) | | 22,712 | | | 836,710 |
Oil States International, Inc. (b)(c) | | 40,919 | | | 765,185 |
Teekay Shipping Corp. | | 25,232 | | | 1,087,246 |
| | | | |
|
|
| | | | | | 5,724,895 |
| | | | |
|
|
Financials (25.3%) | | | | | |
AmerUs Group Co. (c) | | 21,948 | | | 899,868 |
Assured Guaranty, Ltd. | | 37,500 | | | 624,750 |
BRE Properties, Inc. — Class A (c) | | 23,870 | | | 915,415 |
CNA Surety Corp. (b) | | 100,840 | | | 1,068,904 |
Colonial BancGroup, Inc. (c) | | 42,960 | | | 878,532 |
Dime Community Bancshares | | 47,832 | | | 803,578 |
Downey Financial Corp. | | 12,280 | | | 674,909 |
First State Bancorp | | 23,308 | | | 734,901 |
FirstFed Financial Corp. (b) | | 13,749 | | | 672,051 |
Getty Realty Corp., REIT | | 10,570 | | | 277,145 |
Heritage Property Investment Trust, REIT | | 23,680 | | | 690,746 |
Hilb, Rogal & Hamilton Co. (c) | | 32,092 | | | 1,162,372 |
Hub International, Ltd. | | 40,076 | | | 724,574 |
InnKeepers USA Trust, REIT | | 68,492 | | | 852,040 |
Investment Technology Group, Inc. (b) | | 51,010 | | | 780,453 |
IPC Holdings, Ltd. | | 21,150 | | | 803,912 |
Midland Co. (The) | | 22,842 | | | 624,729 |
Mills Corp. (The), REIT | | 15,944 | | | 827,015 |
Peoples Bancorp, Inc. | | 26,534 | | | 698,375 |
Phoenix Companies, Inc. (The) (c) | | 46,500 | | | 484,530 |
Protective Life Corp. | | 28,582 | | | 1,123,558 |
Triad Guaranty, Inc. (b) | | 12,920 | | | 716,802 |
| | | | |
|
|
| | | | | | 17,039,159 |
| | | | |
|
|
| | | | | |
| | | Shares
| | Fair Value
|
Common Stocks, continued | | | | | |
Health Care (6.9%) | | | | | |
AMERIGROUP Corp. (b) | | 15,912 | | $ | 895,050 |
Analogic Corp. (c) | | 10,232 | | | 426,572 |
Invacare Corp. | | 17,004 | | | 782,184 |
Owens & Minor, Inc. | | 29,743 | | | 755,472 |
Pediatrix Medical Group, Inc. (b) | | 7,184 | | | 394,042 |
Renal Care Group, Inc. (b) | | 25,182 | | | 811,616 |
Sierra Health Services, Inc. (b)(c) | | 12,005 | | | 575,400 |
| | | | |
|
|
| | | | | | 4,640,336 |
| | | | |
|
|
Industrials (18.0%) | | | | | |
Briggs & Stratton Corp. (c) | | 6,962 | | | 565,314 |
Curtiss-Wright Corp. | | 15,140 | | | 866,462 |
EMCOR Group, Inc (b) | | 8,502 | | | 319,845 |
Esterline Technologies Corp. (b) | | 17,700 | | | 541,443 |
Gardner Denver, Inc. (b) | | 23,040 | | | 635,213 |
Genlyte Group, Inc. (b) | | 12,166 | | | 783,369 |
Gorman-Rupp Co. | | 20,225 | | | 411,781 |
Granite Construction, Inc. (c) | | 30,260 | | | 723,214 |
Insituform Technologies, Inc. — Class A (b) | | 24,732 | | | 461,746 |
Kaydon Corp. (c) | | 21,355 | | | 614,383 |
Moog, Inc. — Class A (b) | | 19,900 | | | 722,370 |
Mueller Industries, Inc. | | 22,035 | | | 946,403 |
Oshkosh Truck Corp. | | 13,420 | | | 765,745 |
Regal-Beloit Corp. | | 40,738 | | | 985,452 |
Universal Forest Products, Inc. | | 21,984 | | | 751,853 |
USF Corp. | | 29,750 | | | 1,067,729 |
Woodward Governor Co. | | 13,932 | | | 940,271 |
| | | | |
|
|
| | | | | | 12,102,593 |
| | | | |
|
|
Information Technology (6.6%) | | | | | |
Exar Corp. (b)(c) | | 28,912 | | | 409,394 |
Helix Technology Corp. | | 3,075 | | | 41,805 |
Imation Corp. | | 32,155 | | | 1,144,396 |
Intersil Corp. — Class A | | 14,530 | | | 231,463 |
Ixia (b) | | 10,320 | | | 100,310 |
KEMET Corp. (b) | | 22,288 | | | 180,310 |
Perot Systems Corp. — Class A (b) | | 43,900 | | | 705,034 |
Register.com, Inc. (b) | | 117,023 | | | 636,605 |
Rimage Corp. (b) | | 31,720 | | | 444,080 |
SBS Technologies, Inc. (b) | | 25,720 | | | 313,784 |
Standard Microsystems Corp. (b) | | 800 | | | 14,008 |
Take-Two Interactive Software, Inc. (b)(c) | | 6,908 | | | 226,928 |
| | | | |
|
|
| | | | | | 4,448,117 |
| | | | |
|
|
Materials (4.9%) | | | | | |
Cambrex Corp. | | 12,468 | | | 273,673 |
Gibraltar Steel Corp. | | 24,418 | | | 882,955 |
Glatfelter | | 56,645 | | | 701,832 |
Minerals Technologies, Inc. | | 9,968 | | | 586,716 |
Spartech Corp. | | 32,440 | | | 814,244 |
| | | | |
|
|
| | | | | | 3,259,420 |
| | | | |
|
|
Utilities (3.9%) | | | | | |
AGL Resources, Inc. | | 17,610 | | | 541,860 |
Empire District Electric Co. (The) (c) | | 31,760 | | | 652,665 |
Laclede Group, Inc. (The) | | 15,368 | | | 449,207 |
Nicor, Inc. (c) | | 9,830 | | | 360,761 |
UIL Holdings Corp. | | 12,666 | | | 623,041 |
| | | | |
|
|
| | | | | | 2,627,534 |
| | | | |
|
|
Total Common Stocks
(Cost $48,654,470) | | | | | 62,717,060 |
| | | | |
|
|
Continued
58
Small Company Value Fund
Schedule of Portfolio Investments, continued September 30, 2004 |
| | | | | |
| | | Shares
| | Fair Value
|
Exchange Traded Funds (1.7%) | | | | | |
iShares Russell 2000 Index Fund (c) | | 4,800 | | $ | 547,296 |
iShares Russell 2000 Value Fund | | 3,500 | | | 598,850 |
| | | | |
|
|
Total Exchange Traded Funds
(Cost $1,106,401) | | | | | 1,146,146 |
| | | | |
|
|
Investment Companies (5.8%) | | | | | |
Federated Prime Cash Obligations Fund — Institutional Class | | 2,454,322 | | | 2,454,322 |
Federated Prime Obligations Fund — Institutional Class | | 1,465,230 | | | 1,465,230 |
| | | | |
|
|
Total Investment Companies
(Cost $3,919,552) | | | | | 3,919,552 |
| | | | |
|
|
| | | | | | | |
| | | Principal
Amount
| | Fair Value
| |
Securities Held as Collateral for Securities on Loan (20.6%) | | | | | | | |
Pool of various securities for BB&T Funds — Note 2 — Security Loans | | $ | 13,885,225 | | $ | 13,885,225 | |
| | | | | |
|
|
|
Total Securities Held as Collateral for Securities on Loan
(Cost $13,885,225) | | | | | | 13,885,225 | |
| | | | | |
|
|
|
Total Investments
(Cost $67,565,648) (a) — 121.4% | | | | | | 81,667,983 | |
Net other assets (liabilities) — (21.4%) | | | | | | (14,375,117 | ) |
| | | | | |
|
|
|
Net Assets — 100.0% | | | | | $ | 67,292,866 | |
| | | | | |
|
|
|
| (a) | | Represents cost for financial reporting purposes, is substantially the same for federal income tax purposes, and differs from fair value by net unrealized appreciation/depreciation of securities as follows: |
| | | | |
Unrealized appreciation | | $ | 14,888,965 | |
Unrealized depreciation | | | (786,630 | ) |
| | |
|
|
|
Net unrealized appreciation | | $ | 14,102,335 | |
| | |
|
|
|
| (b) | | Represents non-income producing securities. |
| (c) | | Represents the security or a portion of the security was on loan as of September 30, 2004. |
| REIT | | — Real Estate Investment Trust |
See accompanying notes to the financial statements.
59
Small Company Growth Fund
Schedule of Portfolio Investments September 30, 2004 |
| | | | | |
| | | Shares
| | Fair Value
|
Common Stocks (98.5%) | | | | | |
Consumer Discretionary (8.9%) | | | | | |
Aaron Rents, Inc. (c) | | 58,732 | | $ | 1,278,008 |
Aeropostale, Inc. (b) | | 34,242 | | | 897,140 |
Aztar Corp. (b)(c) | | 64,040 | | | 1,697,060 |
Finish Line, Inc. (The) — Class A | | 36,289 | | | 1,122,056 |
Fossil, Inc. (b)(c) | | 34,000 | | | 1,051,960 |
Quiksilver, Inc. (b)(c) | | 20,539 | | | 522,101 |
RARE Hospitality International, Inc. (b) | | 63,880 | | | 1,702,402 |
Red Robin Gourmet Burgers, Inc. (b) | | 15,000 | | | 655,050 |
Sonic Corp. (b) | | 8,539 | | | 218,855 |
| | | | |
|
|
| | | | | | 9,144,632 |
| | | | |
|
|
Consumer Staples (1.1%) | | | | | |
United Natural Foods, Inc. (b)(c) | | 42,693 | | | 1,135,634 |
| | | | |
|
|
Energy (6.3%) | | | | | |
Atwood Oceanics, Inc. (b) | | 39,020 | | | 1,855,011 |
Core Laboratories N.V. (b) | | 72,579 | | | 1,784,718 |
KCS Energy, Inc. (b) | | 85,387 | | | 1,187,733 |
Oceaneering International, Inc. (b)(c) | | 45,000 | | | 1,657,800 |
| | | | |
|
|
| | | | | | 6,485,262 |
| | | | |
|
|
Financials (9.2%) | | | | | |
Fidelity Bankshares, Inc. | | 40,020 | | | 1,488,343 |
Harbor Florida Bancshares, Inc. | | 21,347 | | | 663,892 |
Hilb, Rogal & Hobbs Co. (c) | | 32,020 | | | 1,159,764 |
Horace Mann Educators Corp. | | 73,232 | | | 1,287,419 |
InnKeepers USA Trust | | 90,000 | | | 1,119,600 |
NewAlliance Bancshares, Inc. | | 80,050 | | | 1,148,718 |
Prosperity Bancshares, Inc. | | 50,994 | | | 1,362,560 |
Texas Regional Bancshares, Inc. — Class A | | 40,024 | | | 1,244,346 |
| | | | |
|
|
| | | | | | 9,474,642 |
| | | | |
|
|
Health Care (25.5%) | | | | | |
Amedisys, Inc. (b) | | 47,000 | | | 1,407,650 |
AMERIGROUP Corp. (b) | | 31,818 | | | 1,789,762 |
AtheroGenics, Inc. (b)(c) | | 22,693 | | | 747,734 |
Bone Care International, Inc. (b) | | 30,000 | | | 729,000 |
Centene Corp. (b) | | 38,020 | | | 1,618,892 |
Chemed Corp. | | 12,000 | | | 668,880 |
Connetics Corp. (b)(c) | | 37,357 | | | 1,009,386 |
DOV Pharmaceutical, Inc. (b) | | 30,000 | | | 514,200 |
EPIX Pharmaceuticals, Inc. (b) | | 53,367 | | | 1,030,517 |
INAMED Corporation (b) | | 34,000 | | | 1,620,780 |
Inveresk Research Group, Inc. (b) | | 28,676 | | | 1,057,858 |
Kyphon, Inc. (b) | | 53,367 | | | 1,322,434 |
LabOne, Inc. (b)(c) | | 37,020 | | | 1,082,095 |
LifePoint Hospitals, Inc. (b)(c) | | 39,673 | | | 1,190,587 |
Medical Resources, Inc. (b) | | 269 | | | — |
Palomar Medical Technologies, Inc. (b) | | 28,926 | | | 634,058 |
Pediatrix Medical Group, Inc. (b) | | 16,938 | | | 929,049 |
Renal Care Group, Inc. (b) | | 45,000 | | | 1,450,350 |
Respironics, Inc. (b) | | 20,000 | | | 1,068,800 |
Salix Pharmaceuticals, Inc. (b)(c) | | 65,641 | | | 1,412,594 |
Serologicals Corp. (b)(c) | | 65,305 | | | 1,523,566 |
SFBC International, Inc. (b) | | 72,045 | | | 1,895,503 |
Sierra Health Services, Inc. (b)(c) | | 21,347 | | | 1,023,162 |
Telik, Inc. (b) | | 20,000 | | | 446,000 |
| | | | |
|
|
| | | | | | 26,172,857 |
| | | | |
|
|
Industrials (19.1%) | | | | | |
A.S.V., Inc. (b) | | 34,000 | | | 1,272,620 |
Bowne & Company, Inc. | | 74,714 | | | 970,535 |
| | | | | |
| | | Shares
| | Fair Value
|
Common Stocks, continued | | | | | |
Industrials, continued | | | | | |
Cummins, Inc. | | 10,000 | | $ | 738,900 |
Esterline Technologies Corp. (b) | | 15,000 | | | 458,850 |
Forward Air Corp. (b)(c) | | 48,030 | | | 1,922,161 |
II-VI, Inc. (b) | | 37,636 | | | 1,317,636 |
Insituform Technologies, Inc. — Class A (b) | | 60,000 | | | 1,120,200 |
Kennametal, Inc. (c) | | 28,818 | | | 1,301,133 |
Labor Ready, Inc. (b) | | 70,000 | | | 981,400 |
Moog, Inc. — Class A (b) | | 27,000 | | | 980,100 |
Standard Pacific Corp. | | 21,347 | | | 1,203,330 |
Steel Dynamics, Inc. (c) | | 40,000 | | | 1,544,800 |
Techne Corp. (b) | | 5,337 | | | 203,767 |
Tessera Technologies, Inc. (b) | | 47,000 | | | 1,038,700 |
Toro Co. (The) (c) | | 3,736 | | | 255,169 |
UTI Worldwide, Inc. | | 32,020 | | | 1,883,096 |
Varian, Inc. (b) | | 6,404 | | | 242,519 |
Waste Connections, Inc. (b) | | 67,395 | | | 2,135,074 |
| | | | |
|
|
| | | | | | 19,569,990 |
| | | | |
|
|
Information Technology (16.8%) | | | | | |
Activision, Inc. (b) | | 75,000 | | | 1,040,250 |
ANSYS, Inc. (b) | | 28,212 | | | 1,402,983 |
Anteon International Corp. (b) | | 61,906 | | | 2,268,855 |
Ask Jeeves, Inc. (b) | | 20,000 | | | 654,200 |
Digital Insight Corp. (b)(c) | | 13,367 | | | 182,192 |
EarthLink, Inc. (b) | | 41,347 | | | 425,874 |
Equinix, Inc. (b) | | 10,000 | | | 307,700 |
Exar Corp. (b)(c) | | 60,000 | | | 849,600 |
F5 Networks, Inc. (b)(c) | | 58,310 | | | 1,776,123 |
Greenfield Online, Inc. (b) | | 15,000 | | | 304,650 |
Hyperion Solutions Corp. (b)(c) | | 32,751 | | | 1,113,206 |
Kronos, Inc. (b) | | 5,337 | | | 236,376 |
MICROS Systems, Inc. (b) | | 26,077 | | | 1,305,675 |
NETGEAR, Inc. (b)(c) | | 15,000 | | | 183,300 |
RADWARE Ltd. (b) | | 20,000 | | | 440,000 |
RSA Security, Inc. (b)(c) | | 86,734 | | | 1,673,966 |
Semtech Corp. (b)(c) | | 20,000 | | | 383,400 |
THQ, Inc. (b)(c) | | 83,704 | | | 1,628,880 |
Trimble Navigation, Ltd. (b) | | 33,548 | | | 1,060,117 |
| | | | |
|
|
| | | | | | 17,237,347 |
| | | | |
|
|
Materials (3.9%) | | | | | |
Airgas, Inc. (c) | | 69,232 | | | 1,666,414 |
Cytec Industries, Inc. | | 20,000 | | | 979,000 |
Hercules, Inc. (b)(c) | | 54,000 | | | 769,500 |
Spartech Corp. | | 22,000 | | | 552,200 |
| | | | |
|
|
| | | | | | 3,967,114 |
| | | | |
|
|
Technology (4.7%) | | | | | |
AMIS Holdings, Inc. (b) | | 91,367 | | | 1,235,282 |
Benchmark Electronics, Inc. (b)(c) | | 49,000 | | | 1,460,199 |
Intermagnetics General Corp. (b) | | 48,030 | | | 1,111,895 |
Overland Storage, Inc. (b) | | 75,000 | | | 1,049,250 |
| | | | |
|
|
| | | | | | 4,856,626 |
| | | | |
|
|
Telecommunication Services (3.0%) | | | | | |
Alamosa Holdings, Inc. (b)(c) | | 126,060 | | | 963,097 |
Comtech Telecommunications Corp. (b) | | 20,000 | | | 542,000 |
InfoSpace, Inc. (b)(c) | | 33,000 | | | 1,563,870 |
| | | | |
|
|
| | | | | | 3,068,967 |
| | | | |
|
|
Total Common Stocks
(Cost $88,931,972) | | | | | 101,113,071 |
| | | | |
|
|
Continued
60
Small Company Growth Fund
Schedule of Portfolio Investments, continued September 30, 2004 |
| | | | | | | |
| | | Shares or
Principal
Amount
| | Fair Value
| |
Investment Company (2.2%) | | | | | | | |
Federated Prime Cash Obligations Fund — Institutional Class | | | 2,260,538 | | $ | 2,260,538 | |
| | | | | |
|
|
|
Total Investment Company
(Cost $2,260,538) | | | | | | 2,260,538 | |
| | | | | |
|
|
|
Securities Held as Collateral for Securities
on Loan (27.7%) | | | | | | | |
Pool of various securities for BB&T Funds — Note 2 — Security Loans | | $ | 28,371,625 | | | 28,371,625 | |
| | | | | |
|
|
|
Total Securities Held as Collateral for Securities on Loan (Cost $28,371,625) | | | | | | 28,371,625 | |
| | | | | |
|
|
|
Total Investments
(Cost $119,564,135) (a) — 128.4% | | | | | | 131,745,234 | |
Net other assets (liabilities) — (28.4)% | | | | | | (29,138,943 | ) |
| | | | | |
|
|
|
Net Assets — 100.0% | | | | | $ | 102,606,291 | |
| | | | | |
|
|
|
| (a) | | Represents cost for financial reporting purposes, is substantially the same for federal income tax purposes, and differs from fair value by net unrealized appreciation/depreciation of securities as follows: |
| | | | |
Unrealized appreciation | | $ | 14,000,555 | |
Unrealized depreciation | | | (1,819,456 | ) |
| | |
|
|
|
Net unrealized appreciation | | $ | 12,181,099 | |
| �� | |
|
|
|
| (b) | | Represents non-income producing securities. |
| (c) | | Represents the security or a portion of the security was on loan as of September 30, 2004. |
See accompanying notes to the financial statements.
61
Special Opportunities Equity Fund
Schedule of Portfolio Investments September 30, 2004 |
| | | | | |
| | | Shares
| | Fair Value
|
Common Stocks (87.1%) | | | | | |
Commercial Services (8.7%) | | | | | |
Cendant Corp. | | 151,500 | | $ | 3,272,400 |
ChoicePoint, Inc. (b) | | 56,360 | | | 2,403,754 |
WCI Communities, Inc. (b) | | 122,240 | | | 2,848,192 |
| | | | |
|
|
| | | | | | 8,524,346 |
| | | | |
|
|
Consumer Discretionary (19.3%) | | | | | |
Anheuser-Busch Cos., Inc. | | 60,150 | | | 3,004,493 |
Costco Wholesale Corp. (b) | | 61,941 | | | 2,574,268 |
Fox Entertainment Group, Inc. — Class A (b) | | 124,365 | | | 3,449,885 |
Hain Celestial Group, Inc. (b) | | 171,818 | | | 3,037,742 |
Smithfield Foods, Inc. (b) | | 132,200 | | | 3,305,000 |
YUM! Brands, Inc. | | 81,450 | | | 3,311,757 |
| | | | |
|
|
| | | | | | 18,683,145 |
| | | | |
|
|
Energy (10.7%) | | | | | |
Apache Corp. | | 69,900 | | | 3,502,689 |
Pioneer Natural Resources Co. | | 106,035 | | | 3,656,087 |
XTO Energy, Inc. | | 101,725 | | | 3,304,028 |
| | | | |
|
|
| | | | | | 10,462,804 |
| | | | |
|
|
Financials (9.7%) | | | | | |
Allstate Corp. | | 67,200 | | | 3,224,928 |
MBIA, Inc. | | 56,700 | | | 3,300,507 |
Wells Fargo & Co. | | 50,000 | | | 2,981,500 |
| | | | |
|
|
| | | | | | 9,506,935 |
| | | | |
|
|
Health Care (13.7%) | | | | | |
Laboratory Corporation of America Holdings (b) | | 78,700 | | | 3,440,764 |
Manor Care, Inc. | | 119,860 | | | 3,591,005 |
MedCath Corp. (b) | | 203,040 | | | 3,212,093 |
STERIS Corp. (b) | | 68,602 | | | 1,505,128 |
Watson Pharmaceuticals, Inc. (b) | | 54,880 | | | 1,616,765 |
| | | | |
|
|
| | | | | | 13,365,755 |
| | | | |
|
|
Industrials (3.3%) | | | | | |
L-3 Communications Holdings, Inc. | | 47,750 | | | 3,199,250 |
| | | | |
|
|
| | | | | | |
| | | Shares or
Principal
Amount
| | Fair Value
|
Common Stocks, continued | | | | | | |
Information Technology (14.6%) | | | | | | |
AVX Corp. | | | 15,459 | | $ | 183,189 |
CACI International, Inc. — Class A (b) | | | 66,645 | | | 3,517,523 |
Comcast Corp. — Class A (b) | | | 111,245 | | | 3,141,559 |
Internet Security Systems, Inc. (b) | | | 214,240 | | | 3,642,080 |
VERITAS Software Corp. (b) | | | 210,585 | | | 3,748,413 |
| | | | | |
|
|
| | | | | | | 14,232,764 |
| | | | | |
|
|
Insurance (7.1%) | | | | | | |
Coventry Health Care, Inc. (b) | | | 64,500 | | | 3,442,365 |
Markel Corp. (b) | | | 11,410 | | | 3,518,844 |
| | | | | |
|
|
| | | | | | | 6,961,209 |
| | | | | |
|
|
Total Common Stocks
(Cost $71,932,335) | | | | | | 84,936,208 |
| | | | | |
|
|
U.S. Treasury Bills* (5.1%) | | | | | | |
1.55%, 10/28/04 | | $ | 2,000,000 | | | 1,997,812 |
1.58%, 12/2/04 | | | 3,000,000 | | | 2,991,780 |
| | | | | |
|
|
Total U.S. Treasury Bills
(Cost $4,989,526) | | | | | | 4,989,592 |
| | | | | |
|
|
Investment Companies (7.2%) | | | | | | |
Federated Prime Cash Obligations Fund — Institutional Class | | | 4,656,811 | | | 4,656,811 |
Federated Prime Obligations Fund — Institutional Class | | | 1,745,812 | | | 1,745,812 |
Morgan Stanley Quality Municipal Income Trust | | | 35,800 | | | 491,534 |
Van Kampen Trust for Investment Grade Municipals | | | 10,000 | | | 153,600 |
| | | | | |
|
|
Total Investment Companies
(Cost $7,015,265) | | | | | | 7,047,757 |
| | | | | |
|
|
Total Investments
(Cost $83,937,126) (a) — 99.4% | | | | | | 96,973,557 |
Net other assets (liabilities) — 0.6% | | | | | | 570,672 |
| | | | | |
|
|
Net Assets — 100.0% | | | | | $ | 97,544,229 |
| | | | | |
|
|
| (a) | | Represents cost for financial reporting purposes, is substantially the same for federal income tax purposes, and differs from fair value by net unrealized appreciation/depreciation of securities as follows: |
| | | | |
Unrealized appreciation | | $ | 13,611,699 | |
Unrealized depreciation | | | (575,268 | ) |
| | |
|
|
|
Net unrealized appreciation | | $ | 13,036,431 | |
| | |
|
|
|
| (b) | | Represents non-income producing securities. |
| * | | Discount note. Rate disclosed represents the effective yield at September 30, 2004. |
See accompanying notes to the financial statements.
62
International Equity Fund
Schedule of Portfolio Investments September 30, 2004 |
| | | | | |
| | | Shares
| | Fair Value
|
Common Stocks (97.9%) | | | | | |
Australia (3.6%) | | | | | |
Banks (1.1%) | | | | | |
Australia & New Zeland Banking Group, Ltd. | | 114,157 | | $ | 1,580,078 |
National Australia Bank, Ltd. | | 44,411 | | | 871,964 |
| | | | |
|
|
| | | | | | 2,452,042 |
| | | | |
|
|
Gas — Distribution (0.4%) | | | | | |
Australian Gas Light Company, Ltd. | | 88,737 | | | 862,089 |
| | | | |
|
|
Media (0.6%) | | | | | |
News Corp., Ltd. | | 162,647 | | | 1,287,777 |
| | | | |
|
|
Property & Casualty Insurance (1.0%) | | | | | |
QBE Insurance Group, Ltd. | | 245,116 | | | 2,336,732 |
| | | | |
|
|
Specialty Retail & Food Products (0.3%) | | | | | |
Woolworths, Ltd. | | 79,614 | | | 789,101 |
| | | | |
|
|
Transportation (0.3%) | | | | | |
Qantas Airways, Ltd. (c) | | 310,266 | | | 778,967 |
| | | | |
|
|
| | | | | | 8,506,708 |
| | | | |
|
|
Austria (0.5%) | | | | | |
Telecommunications (0.5%) | | | | | |
Telekom Austria AG | | 78,148 | | | 1,096,337 |
| | | | |
|
|
Belgium — (1.2%) | | | | | |
Banking & Insurance Services (1.0%) | | | | | |
Fortis | | 100,095 | | | 2,385,200 |
| | | | |
|
|
Chemicals (0.2%) | | | | | |
Solvay SA | | 6,234 | | | 577,617 |
| �� | | | |
|
|
| | | | | | 2,962,817 |
| | | | |
|
|
Brazil (0.6%) | | | | | |
Banks (0.3%) | | | | | |
Banco Bradesco SA — ADR | | 11,700 | | | 616,590 |
| | | | |
|
|
Oil & Gas (0.3%) | | | | | |
Petroleo Brasileiro SA — ADR | | 20,200 | | | 712,050 |
| | | | |
|
|
| | | | | | 1,328,640 |
| | | | |
|
|
Finland (2.0%) | | | | | |
Paper & Related Products (0.7%) | | | | | |
UPM — Kymmene, Oyj | | 90,400 | | | 1,723,564 |
| | | | |
|
|
Telecommunications (1.3%) | | | | | |
Nokia, Oyj | | 219,900 | | | 3,030,275 |
| | | | |
|
|
| | | | | | 4,753,839 |
| | | | |
|
|
France (8.0%) | | | | | |
Banks (1.1%) | | | | | |
BNP Paribas SA | | 40,649 | | | 2,628,876 |
| | | | |
|
|
Computer Services (0.4%) | | | | | |
Cap Gemini SA (b) | | 33,935 | | | 798,942 |
| | | | |
|
|
Oil & Gas (2.8%) | | | | | |
Total SA | | 32,422 | | | 6,613,032 |
| | | | |
|
|
Pharmaceuticals (1.7%) | | | | | |
Sanofi-Aventis SA | | 55,120 | | | 4,003,492 |
| | | | |
|
|
Real Estate (0.7%) | | | | | |
Unibail | | 13,817 | | | 1,666,013 |
| | | | |
|
|
Telecommunications (1.3%) | | | | | |
France Telecom SA | | 126,630 | | | 3,159,254 |
| | | | |
|
|
| | | | | | 18,869,609 |
| | | | |
|
|
Germany (0.4%) | | | | | |
Automobiles & Trucks (2.2%) | | | | | |
Volkswagen AG | | 24,159 | | | 929,343 |
| | | | |
|
|
| | | | | |
| | | Shares
| | Fair Value
|
Common Stocks, continued | | | | | |
Great Britain (33.6%) | | | | | |
Banks (8.2%) | | | | | |
Abbey National PLC | | 15,486 | | $ | 157,147 |
Barclays PLC | | 513,760 | | | 4,934,181 |
Credit Suisse Group | | 123,261 | | | 3,945,025 |
HBOS PLC | | 131,792 | | | 1,781,586 |
HSBC Holdings PLC | | 135,690 | | | 2,156,385 |
Royal Bank of Scotland Group PLC | | 222,447 | | | 6,433,368 |
| | | | |
|
|
| | | | | | 19,407,692 |
| | | | |
|
|
Beverages — Wine/Spirits (2.2%) | | | | | |
Diageo PLC | | 422,095 | | | 5,277,622 |
| | | | |
|
|
Building & Construction (0.3%) | | | | | |
Balfour Beatty PLC | | 115,462 | | | 582,698 |
| | | | |
|
|
Diversified Chemicals (0.7%) | | | | | |
BOC Group PLC | | 60,440 | | | 968,179 |
Clariant AG | | 56,774 | | | 681,689 |
| | | | |
|
|
| | | | | | 1,649,868 |
| | | | |
|
|
Distribution/Wholesale (0.3%) | | | | | |
Wolseley PLC | | 38,811 | | | 663,553 |
| | | | |
|
|
Diversified Operations/Commercial (0.6%) | | | | | |
Rentokil Initial PLC | | 523,853 | | | 1,428,647 |
| | | | |
|
|
Diversified Telecommunication Services (1.0%) | | | | | |
BT Group PLC | | 716,822 | | | 2,334,851 |
| | | | |
|
|
Electric — Distribution (2.4%) | | | | | |
National Grid Transco PLC | | 353,918 | | | 2,990,202 |
Scottish & Southern Energy PLC | | 198,711 | | | 2,805,035 |
| | | | |
|
|
| | | | | | 5,795,237 |
| | | | |
|
|
Electronic Parts — Distribution (0.4%) | | | | | |
Electrocomponents PLC | | 179,057 | | | 1,009,092 |
| | | | |
|
|
Food & Beverage (1.0%) | | | | | |
Cadbury Schweppes PLC | | 321,396 | | | 2,475,189 |
| | | | |
|
|
Food Service — Catering (0.3%) | | | | | |
Compass Group PLC | | 191,562 | | | 765,415 |
| | | | |
|
|
Gas — Distribution (0.5%) | | | | | |
Centrica PLC | | 266,020 | | | 1,209,949 |
| | | | |
|
|
Insurance (0.1%) | | | | | |
Prudential Corp. PLC | | 22,749 | | | 185,710 |
| | | | |
|
|
Media (0.8%) | | | | | |
ITV PLC | | 346,316 | | | 676,190 |
Reuters Group PLC | | 205,260 | | | 1,158,621 |
| | | | |
|
|
| | | | | | 1,834,811 |
| | | | |
|
|
Oil & Gas (5.6%) | | | | | |
BP PLC | | 752,503 | | | 7,192,993 |
Shell Transportation & Trading Co. PLC | | 828,223 | | | 6,085,792 |
| | | | |
|
|
| | | | | | 13,278,785 |
| | | | |
|
|
Pharmaceuticals (1.4%) | | | | | |
AstraZeneca Group PLC | | 80,355 | | | 3,298,071 |
| | | | |
|
|
Retail — Building (1.3%) | | | | | |
Kingfisher PLC | | 551,193 | | | 3,078,830 |
| | | | |
|
|
Retail — Food (2.1%) | | | | | |
William Morrison Supermarkets PLC | | 276,498 | | | 964,499 |
Tesco PLC | | 771,161 | | | 3,986,114 |
| | | | |
|
|
| | | | | | 4,950,613 |
| | | | |
|
|
Continued
63
International Equity Fund
Schedule of Portfolio Investments, continued September 30, 2004 |
| | | | | |
| | | Shares
| | Fair Value
|
Common Stocks, continued | | | | | |
Great Britain, continued | | | | | |
Telecommunications (3.5%) | | | | | |
Vodafone Group PLC | | 3,427,543 | | $ | 8,214,054 |
| | | | |
|
|
Tobacco (0.9%) | | | | | |
Gallaher Group PLC | | 194,140 | | | 2,262,064 |
| | | | |
|
|
| | | | | | 79,702,751 |
| | | | |
|
|
Hong Kong (1.5%) | | | | | |
Broadcasting (0.1%) | | | | | |
Television Broadcasts, Ltd. | | 65,000 | | | 290,945 |
| | | | |
|
|
Real Estate (1.1%) | | | | | |
Cheung Kong, Ltd. | | 146,000 | | | 1,249,904 |
Sun Hung Kai Properties, Ltd. | | 138,000 | | | 1,300,885 |
| | | | |
|
|
| | | | | | 2,550,789 |
| | | | |
|
|
Telecommunications (0.3%) | | | | | |
China Mobile (Hong Kong), Ltd. — ADR | | 47,900 | | | 732,870 |
| | | | |
|
|
| | | | | | 3,574,604 |
| | | | |
|
|
Ireland (3.0%) | | | | | |
Banking & Finance (1.8%) | | | | | |
Bank of Ireland | | 317,274 | | | 4,281,355 |
| | | | |
|
|
Building & Construction (1.2%) | | | | | |
CRH PLC | | 119,379 | | | 2,835,817 |
| | | | |
|
|
| | | | | | 7,117,172 |
| | | | |
|
|
Israel (0.2%) | | | | | |
Pharmaceuticals (0.2%) | | | | | |
Teva Pharmaceutical Industries, Ltd. — ADR | | 19,000 | | | 493,050 |
| | | | |
|
|
Italy (2.4%) | | | | | |
Banking & Finance (1.3%) | | | | | |
UniCredito Italiano S.p.A. | | 613,119 | | | 3,095,906 |
| | | | |
|
|
Oil & Gas (1.1%) | | | | | |
Eni S.p.A. | | 117,433 | | | 2,634,776 |
| | | | |
|
|
| | | | | | 5,730,682 |
| | | | |
|
|
Japan (18.3%) | | | | | |
Automobiles & Trucks (4.0%) | | | | | |
Honda Motor Company, Ltd. | | 100,100 | | | 4,858,738 |
Mitsubishi Corp. | | 142,000 | | | 1,537,263 |
NGK Spark Plug Company, Ltd. | | 104,000 | | | 1,085,234 |
Nissan Motor Company, Ltd. | | 176,800 | | | 1,928,464 |
Toyota Motor Corp. | | 1,200 | | | 46,031 |
| | | | |
|
|
| | | | | | 9,455,730 |
| | | | |
|
|
Banks (1.6%) | | | | | |
Sumitomo Mitsui Financial Group, Inc. | | 210 | | | 1,202,563 |
Sumitomo Trust & Banking Company, Ltd. | | 198,000 | | | 1,173,440 |
Takefuji Corp. | | 21,290 | | | 1,364,309 |
| | | | |
|
|
| | | | | | 3,740,312 |
| | | | |
|
|
Broadcasting (0.2%) | | | | | |
SKY Perfect Communications, Inc. (b) | | 448 | | | 525,310 |
| | | | |
|
|
Building — Residential/Commercial (0.5%) | | | | | |
Sekisui House, Ltd. | | 123,000 | | | 1,176,167 |
| | | | |
|
|
Computers (0.2%) | | | | | |
Meitec Corp. | | 14,900 | | | 536,327 |
| | | | |
|
|
Cosmetics & Toiletries (1.2%) | | | | | |
Kao Corp. | | 133,000 | | | 2,943,735 |
| | | | |
|
|
| | | | | |
| | | Shares
| | Fair Value
|
Common Stocks, continued | | | | | |
Japan, continued | | | | | |
Diversified Chemicals (1.3%) | | | | | |
Nitto Denko Corp. | | 43,600 | | $ | 2,009,289 |
Shin-Etsu Chemical Company, Ltd. | | 26,600 | | | 957,469 |
| | | | |
|
|
| | | | | | 2,966,758 |
| | | | |
|
|
Electric Products (0.7%) | | | | | |
Funai Electric Company, Ltd. | | 12,200 | | | 1,647,884 |
Yokogawa Electric Corp. | | 9,000 | | | 103,650 |
| | | | |
|
|
| | | | | | 1,751,534 |
| | | | |
|
|
Electronic Components (1.2%) | | | | | |
Rohm Company, Ltd. | | 29,300 | | | 2,950,907 |
| | | | |
|
|
Machinery (0.4%) | | | | | |
Toyota Industries Corp. | | 36,000 | | | 819,706 |
| | | | |
|
|
Office Equipment (1.7%) | | | | | |
Canon, Inc. | | 86,400 | | | 4,068,100 |
| | | | |
|
|
Paper & Related Products (0.5%) | | | | | |
Nippon Unipac Holding | | 278 | | | 1,220,506 |
| | | | |
|
|
Pharmaceuticals (1.5%) | | | | | |
Takeda Chemical Industries, Ltd. | | 78,500 | | | 3,567,695 |
| | | | |
|
|
Photographic Products (0.6%) | | | | | |
Fuji Photo Film Company, Ltd. | | 41,000 | | | 1,349,089 |
| | | | |
|
|
Property & Casualty Insurance (0.8%) | | | | | |
Sompo Japan Insurance, Inc. | | 231,000 | | | 1,961,133 |
| | | | |
|
|
Telecommunications (1.9%) | | | | | |
Nippon Telegraph & Telephone Corp. | | 73 | | | 291,297 |
NTT DoCoMo, Inc. | | 2,413 | | | 4,101,540 |
| | | | |
|
|
| | | | | | 4,392,837 |
| | | | |
|
|
| | | | | | 43,425,846 |
| | | | |
|
|
Netherlands (7.6%) | | | | | |
Air Freight & Logistics (1.4%) | | | | | |
TPG NV | | 135,110 | | | 3,305,284 |
| | | | |
|
|
Banking & Finance (1.8%) | | | | | |
ABN AMRO Holding NV | | 191,040 | | | 4,345,652 |
| | | | |
|
|
Electronics (0.6%) | | | | | |
Koninklijke (Royal) Philips Electronics NV | | 60,059 | | | 1,377,387 |
| | | | |
|
|
Publishing (2.5%) | | | | | |
Reed Elsevier NV | | 227,769 | | | 2,937,584 |
VNU NV | | 111,334 | | | 2,866,257 |
| | | | |
|
|
| | | | | | 5,803,841 |
| | | | |
|
|
Telecommunications (1.3%) | | | | | |
Koninklijke (Royal) KPN NV | | 412,388 | | | 3,092,718 |
| | | | |
|
|
| | | | | | 17,924,882 |
| | | | |
|
|
Portugal (0.8%) | | | | | |
Electric Integrated (0.2%) | | | | | |
Electricidade de Portugal SA | | 162,391 | | | 474,621 |
| | | | |
|
|
Telecommunications (0.6%) | | | | | |
Portugal Telecom SGPS SA | | 139,696 | | | 1,541,077 |
| | | | |
|
|
| | | | | | 2,015,698 |
| | | | |
|
|
Russia (0.6%) | | | | | |
Oil Comp-Intergrated (0.3%) | | | | | |
LUKOIL — ADR | | 5,400 | | | 669,600 |
| | | | |
|
|
Telecommunications (0.3%) | | | | | |
VimpelCom — ADR (b) | | 6,500 | | | 707,200 |
| | | | |
|
|
| | | | | | 1,376,800 |
| | | | |
|
|
Continued
64
International Equity Fund
Schedule of Portfolio Investments, continued September 30, 2004 |
| | | | | |
| | | Shares
| | Fair Value
|
Common Stocks, continued | | | | | |
South Korea (1.1%) | | | | | |
Banks (0.4%) | | | | | |
Kookmin Bank — ADR | | 31,900 | | $ | 1,015,696 |
| | | | |
|
|
Steel (0.5%) | | | | | |
POSCO | | 7,550 | | | 1,123,980 |
| | | | |
|
|
Telecommunications (0.2%) | | | | | |
SK Telecom Company, Ltd. — ADR | | 27,800 | | | 540,710 |
| | | | |
|
|
| | | | | | 2,680,386 |
| | | | |
|
|
Spain (0.9%) | | | | | |
Banking & Finance (0.9%) | | | | | |
Banco Bilbao Vizcaya Argentaria SA | | 59,912 | | | 825,602 |
Banco Santander Central Hispano SA | | 129,555 | | | 1,266,466 |
| | | | |
|
|
| | | | | | 2,092,068 |
| | | | |
|
|
Sweden (4.0%) | | | | | |
Appliances (0.4%) | | | | | |
Electrolux AB — Class B | | 54,700 | | | 999,286 |
| | | | |
|
|
Banking & Finance (0.5%) | | | | | |
Svenska Handelsbanken AB — Class A | | 59,800 | | | 1,252,627 |
| | | | |
|
|
Building Materials/Services (0.6%) | | | | | |
Sandvik Ab | | 42,900 | | | 1,481,993 |
| | | | |
|
|
Paper & Related Products (1.0%) | | | | | |
Svenska Cellulosa AB — Class B | | 61,800 | | | 2,402,291 |
| | | | |
|
|
Specialty Retail (0.7%) | | | | | |
Hennes & Mauritz AB — Class B | | 55,650 | | | 1,532,605 |
| | | | |
|
|
Tobacco (0.8%) | | | | | |
Swedish Match AB — Class B | | 179,500 | | | 1,898,479 |
| | | | |
|
|
| | | | | | 9,567,281 |
| | | | |
|
|
Switzerland (7.6%) | | | | | |
Building Materials/Services (0.9%) | | | | | |
Holcim, Ltd. | | 40,716 | | | 2,153,360 |
| | | | |
|
|
| | | | | |
| | | Shares or
Principal
Amount
| | Fair Value
|
Common Stocks, continued | | | | | |
Switzerland, continued | | | | | |
Commercial Services & Supplies (0.8%) | | | | | |
Adecco SA | | 38,144 | | $ | 1,899,388 |
| | | | |
|
|
Food Products (1.5%) | | | | | |
Nestle SA | | 15,712 | | | 3,609,053 |
| | | | |
|
|
Insurance (0.6%) | | | | | |
Swiss Re | | 25,552 | | | 1,474,509 |
| | | | |
|
|
Medical Products (0.4% ) | | | | | |
Nobel Biocare Holding AG | | 5,323 | | | 828,312 |
| | | | |
|
|
Pharmaceuticals (3.4%) | | | | | |
Actelion, Ltd. (b) | | 14,652 | | | 1,506,269 |
Novartis AG | | 15,210 | | | 710,965 |
Roche Holding AG | | 56,722 | | | 5,876,747 |
| | | | |
|
|
| | | | | | 8,093,981 |
| | | | |
|
|
| | | | | | 18,058,603 |
| | | | |
|
|
Total Common Stocks
(Cost $200,623,671) | | | | | 232,207,116 |
| | | | |
|
|
Convertible Bond (0.4%) | | | | | |
Japan (0.4%) | | | | | |
Finance (0.4%) | | | | | |
SMFG Finance, Ltd., 2.25%, 7/11/05 (d) | | 51,000,000 | | | 933,732 |
| | | | |
|
|
Total Convertible Bond
(Cost $386,382) | | | | | |
Investment Company — 0.4% | | | | | |
Bank of New York, Brussels | | 997,321 | | | 997,321 |
| | | | |
|
|
Total Investment Company
(Cost $997,321) | | | | | |
Total Investments
(Cost $202,007,374) (a) — 98.7% | | | | | 234,138,169 |
Net other assets (liabilities) — 1.3% | | | | | 2,965,404 |
| | | | |
|
|
Net Assets — 100.0% | | | | $ | 237,103,573 |
| | | | |
|
|
| (a) | | Represents cost for financial reporting purposes, is substantially the same for federal income tax purposes, and differs from fair value by net unrealized appreciation/depreciation of securities as follows: |
| | | | |
Unrealized appreciation | | $ | 36,178,510 | |
Unrealized depreciation | | | (4,047,715 | ) |
| | |
|
|
|
Net unrealized appreciation | | $ | 32,130,795 | |
| | |
|
|
|
| (b) | | Represents non-income producing securities. |
| (c) | | Rule 144A, Section 4(2) or other security which is restricted as to resale to institutional investors. The Investment Advisor, using board approved procedures, has deemed these securities to be liquid. |
| (d) | | Principal amount is disclosed as the face amount of the security in its local currency. |
ADR — American Depository Receipt.
At September 30, 2004 the Fund’s foreign currency exchange contracts were as follows:
| | | | | | | | | | | | | | |
Currency
| | Delivery
Date
| | Contract Amount
in Local
Currency
| | Contract
Value
In USD
| | Fair
Value
| | Unrealized
Appreciation
(Depreciation)
| |
Short | | | | | | | | | | | | | | |
British Sterling Pound | | 12/17/2004 | | 9,800,000.00 | | $ | 17,593,940 | | $ | 17,657,041 | | $ | (63,101 | ) |
British Sterling Pound | | 12/17/2004 | | 600,000.00 | | | 1,079,880 | | | 1,081,043 | | | (1,163 | ) |
| | |
| |
| |
|
| |
|
| |
|
|
|
Total Short Contracts | | | | | | $ | 18,673,820 | | $ | 18,738,084 | | $ | (64,264 | ) |
| | | | | | |
|
| |
|
| |
|
|
|
Long | | | | | | | | | | | | | | |
British Sterling Pound | | 12/17/2004 | | 1,100,000.00 | | $ | 2,002,990 | | $ | 1,981,913 | | $ | (21,077 | ) |
British Sterling Pound | | 12/27/2004 | | 1,200,000.00 | | | 2,132,160 | | | 2,162,087 | | | 29,927 | |
Swedish Krona | | 10/4/2004 | | 3,800,000.00 | | | 530,242 | | | 530,197 | | | (45 | ) |
| | |
| |
| |
|
| |
|
| |
|
|
|
Total Long Contracts | | | | | | $ | 4,665,392 | | $ | 4,674,197 | | $ | 8,805 | |
| | | | | | |
|
| |
|
| |
|
|
|
See accompanying notes to the financial statements.
65
Short U.S. Government Fund
Schedule of Portfolio Investments September 30, 2004 |
| | | | | | |
| | | Principal
Amount
| | Fair
Value
|
Corporate Bonds (7.8%) | | | | | | |
Consumer Staples (1.8%) | | | | | | |
Amoco Co., 6.25%, 10/15/04 (b) | | $ | 745,000 | | $ | 745,858 |
Wal-Mart Stores, Inc., 1.70%, 2/22/05* | | | 3,000,000 | | | 2,999,562 |
| | | | | |
|
|
| | | | | | | 3,745,420 |
| | | | | |
|
|
Financial Services (6.0%) | | | | | | |
BP Capital Markets, 2.625%, 3/15/07 (b) | | | 3,000,000 | | | 2,973,732 |
Citigroup, Inc., 1.78%, 2/7/05* (b) | | | 3,000,000 | | | 3,000,711 |
General Electric Capital Corp., 5.375%,
3/15/07 (b) | | | 2,000,000 | | | 2,104,894 |
Lehman Brothers Holdings, 4.00%, 1/22/08 | | | 1,000,000 | | | 1,015,781 |
Verizon Global Funding Corp., 6.75%, 12/1/05 | | | 3,000,000 | | | 3,140,547 |
| | | | | |
|
|
| | | | | | | 12,235,665 |
| | | | | |
|
|
Total Corporate Bonds
(Cost $15,767,894) | | | | | | 15,981,085 |
| | | | | |
|
|
Mortgage-Backed Securities (30.7%) | | | | | | |
Federal Home Loan Mortgage Corp. (13.3%) | | | | | | |
5.00%, 12/1/08, Pool # M80714 | | | 1,095,151 | | | 1,119,468 |
4.50%, 12/1/09, Pool # M80791 | | | 5,624,879 | | | 5,703,698 |
4.50%, 1/1/10, Pool # M80792 | | | 2,964,195 | | | 3,005,206 |
3.50%, 1/15/10, Pool # 2663 | | | 1,925,919 | | | 1,937,052 |
4.00%, 3/1/10, Pool # M80806 | | | 3,800,563 | | | 3,803,174 |
4.50%, 1/15/11, Pool # 2782 | | | 4,666,685 | | | 4,739,876 |
5.00%, 3/15/12, Series 2776 EK, CMO | | | 2,252,789 | | | 2,277,939 |
6.50%, 5/1/13, Pool # E00548 | | | 507,707 | | | 537,794 |
2.25%, 4/15/16, Series 2613,
Class — BM, CMO* | | | 2,787,612 | | | 2,769,784 |
6.00%, 9/1/16, Pool # E01049 | | | 1,275,625 | | | 1,337,785 |
| | | | | |
|
|
| | | | | | | 27,231,776 |
| | | | | |
|
|
Federal National Mortgage Assoc. (16.3%) | | | | | | |
3.50%, 3/25/09, Series 2003-92,
Class — PA, CMO | | | 4,811,514 | | | 4,837,748 |
4.50%, 8/25/09, Series 2003-3,
Class — PA, CMO | | | 1,574,789 | | | 1,586,650 |
4.50%, 1/1/10, Pool # 254626 | | | 2,509,680 | | | 2,548,734 |
2.00%, 1/25/11, Series 2003-83,
Class — AP, CMO | | | 3,676,000 | | | 3,652,185 |
4.50%, 9/25/12, Series 2002-82,
Class — XJ | | | 4,300,605 | | | 4,343,784 |
6.50%, 8/1/13, Pool # 251901 | | | 1,144,918 | | | 1,213,742 |
3.50%, 11/25/14, Series 2003-99,
Class — TA | | | 1,505,780 | | | 1,504,663 |
6.00%, 3/1/16, Pool # 253702 | | | 841,402 | | | 883,072 |
6.00%, 4/1/16, Pool # 535846 | | | 829,325 | | | 870,398 |
6.50%, 4/1/16, Pool # 253706 | | | 1,430,888 | | | 1,515,824 |
6.00%, 8/1/16, Pool # 545125 | | | 591,669 | | | 620,829 |
5.00%, 11/1/17, Pool # 254510 | | | 2,778,924 | | | 2,831,154 |
5.00%, 12/1/17, Pool # 254545 | | | 2,965,800 | | | 3,021,541 |
4.50%, 3/1/18, Pool # 555292 | | | 4,007,064 | | | 4,004,785 |
| | | | | |
|
|
| | | | | | | 33,435,109 |
| | | | | |
|
|
Government National Mortgage Assoc. (1.1%) | | | | | | |
3.50%, 5/20/22, Series 2003-95,
Class — PU, CMO | | | 2,161,403 | | | 2,167,468 |
| | | | | |
|
|
Total Mortgage-Backed Securities
(Cost $62,816,613) | | | | | | 62,834,353 |
| | | | | |
|
|
U.S. Government Agencies (43.0%) | | | | | | |
Federal Home Loan Bank (13.8%) | | | | | | |
4.625%, 4/15/05, Series 306 (b) | | | 2,000,000 | | | 2,026,426 |
| | | | | | | |
| | | Shares or Principal
Amount
| | Fair
Value
| |
U.S. Government Agencies, continued | | | | | | | |
Federal Home Loan Bank, continued | | | | | | | |
1.79%, 6/17/05 | | $ | 3,000,000 | | $ | 2,990,571 | |
2.25%, 12/15/05 (b) | | | 3,000,000 | | | 2,992,233 | |
5.125%, 3/6/06 (b) | | | 4,000,000 | | | 4,144,108 | |
2.875%, 9/15/06 (b) | | | 5,000,000 | | | 5,009,055 | |
2.50%, 4/5/07 | | | 3,000,000 | | | 2,960,826 | |
3.625%, 11/14/08 (b) | | | 8,000,000 | | | 8,033,776 | |
| | | | | |
|
|
|
| | | | | | | 28,156,995 | |
| | | | | |
|
|
|
Federal Home Loan Mortgage Corp. (14.8%) | | | | | | | |
1.51%, 2/2/05* | | | 2,000,000 | | | 1,997,388 | |
4.25%, 6/15/05 (b) | | | 4,000,000 | | | 4,056,016 | |
2.00%, 2/23/06, Series MTN, Callable 2/23/05 @ 100 | | | 4,000,000 | | | 3,968,736 | |
4.875%, 3/15/07 (b) | | | 6,000,000 | | | 6,267,815 | |
4.00%, 10/29/17, Callable 10/29/04 @ 100 | | | 5,000,000 | | | 5,006,835 | |
3.25%, 2/25/08, Callable 2/25/05 @ 100 | | | 4,000,000 | | | 3,964,392 | |
3.50%, 4/1/08 (b) | | | 5,000,000 | | | 4,976,285 | |
| | | | | |
|
|
|
| | | | | | | 30,237,467 | |
| | | | | |
|
|
|
Federal National Mortgage Assoc. (12.9%) | | | | | | | |
7.00%, 7/15/05 (b) | | | 450,000 | | | 466,533 | |
4.75%, 1/02/07 (b) | | | 5,000,000 | | | 5,184,325 | |
2.625%, 1/19/07, Callable 1/19/05 @100 (b) | | | 4,000,000 | | | 3,961,720 | |
3.75%, 5/17/07, Callable 5/17/05
@ 100 (b) | | | 8,000,000 | | | 8,041,096 | |
6.625%, 10/15/07 (b) | | | 8,000,000 | | | 8,782,032 | |
| | | | | |
|
|
|
| | | | | | | 26,435,706 | |
| | | | | |
|
|
|
Student Loan Marketing Assoc. (1.5%) | | | | | | | |
1.83%, Series MTN, 4/25/06 * (b) | | | 3,000,000 | | | 3,006,588 | |
| | | | | |
|
|
|
Total U.S. Government Agencies
(Cost $87,907,201 ) | | | | | | 87,836,756 | |
| | | | | |
|
|
|
U.S. Treasury Notes (13.8%) | | | | | | | |
2.125%, 10/31/04 (b) | | | 1,000,000 | | | 1,000,391 | |
2.00%, 5/15/06 (b) | | | 10,000,000 | | | 9,931,640 | |
2.625%, 11/15/06 (b) | | | 1,500,000 | | | 1,499,472 | |
5.50%, 2/15/08 (b) | | | 10,000,000 | | | 10,800,780 | |
3.25%, 8/15/08 | | | 3,000,000 | | | 3,014,181 | |
3.875%, 1/15/09 (b) | | | 1,732,445 | | | 1,950,286 | |
| | | | | |
|
|
|
Total U.S. Treasury Notes
(Cost $28,210,800) | | | | | | 28,196,750 | |
| | | | | |
|
|
|
Municipal Bonds (1.5%) | | | | | | | |
New York City, 2.50%, 8/1/05 | | | 3,000,000 | | | 2,993,400 | |
| | | | | |
|
|
|
Total Municipal Bonds
(Cost $3,001,716) | | | | | | 2,993,400 | |
| | | | | |
|
|
|
Investment Company (3.0%) | | | | | | | |
Federated Government Obligations Fund — Institutional Class | | | 6,037,562 | | | 6,037,562 | |
| | | | | |
|
|
|
Total Investment Company
(Cost $6,037,562) | | | | | | 6,037,562 | |
| | | | | |
|
|
|
Securities Held as Collateral for Securities on Loan (45.1%) | | | | | | | |
Pool of Various Securities for BB&T Funds — Note 2 — Security Loans | | $ | 92,254,937 | | | 92,254,937 | |
| | | | | |
|
|
|
Total Securities Held as Collateral for Securities on Loan
(Cost $92,254,937) | | | | | | 92,254,937 | |
| | | | | |
|
|
|
Total Investments
(Cost $295,996,723) (a) — 144.9% | | | | | | 296,134,843 | |
Net other assets (liabilities) — (44.9%) | | | | | | (91,758,830 | ) |
| | | | | |
|
|
|
Net Assets — 100.0% | | | | | $ | 204,376,013 | |
| | | | | |
|
|
|
Continued
66
Short U.S. Government Fund
Schedule of Portfolio Investments, continued September 30, 2004 |
| (a) | | Represents cost for financial reporting purposes, is substantially the same for federal income tax purposes, and differs from fair value by net unrealized appreciation/depreciation as follows: |
| | | | |
Unrealized appreciation | | $ | 991,217 | |
Unrealized depreciation | | | (853,097 | ) |
| | |
|
|
|
Net unrealized appreciation | | $ | 138,120 | |
| | |
|
|
|
| (b) | | Represents the security or a portion of the security was on loan as of September 30, 2004. |
CMO — Collateralized Mortgage Obligation.
| * | | The interest rate for this variable rate note, which will change periodically, is based either on the prime rate or an index of market rates. The rate reflected is the rate in effect as of September 30, 2004. The maturity date reflected is the final maturity date. |
See accompanying notes to the financial statements.
67
Intermediate U.S. Government Fund
Schedule of Portfolio Investments September 30, 2004 |
| | | | | | |
| | | Principal
Amount
| | Fair Value
|
Corporate Bonds (9.2%) | | | | | | |
Banking & Financial Services (5.9%) | | | | | | |
Bank of America Corp., 7.125%, 9/15/06 (b) | | $ | 1,000,000 | | $ | 1,077,717 |
Barclays Bank PLC, 7.40%, 12/15/09 (b) | | | 500,000 | | | 578,410 |
Citicorp, Series C, 7.00%, 7/1/07 | | | 750,000 | | | 822,380 |
Citigroup, Inc., 7.25%, 10/1/10 | | | 4,000,000 | | | 4,695,411 |
Fleet Boston Financial Corp., 3.85%, 2/15/08 | | | 4,170,000 | | | 4,218,364 |
General Electric Capital Corp., 5.375%, 3/15/07 (b) | | | 3,000,000 | | | 3,157,341 |
General Electric Capital Corp., Series MTNA, 6.50%, 12/10/07 (b) | | | 300,000 | | | 327,291 |
General Electric Capital Corp., Series MTNA, 7.50%, 6/15/09 | | | 500,000 | | | 578,020 |
Goldman Sachs Group, Inc., 4.125%, 1/15/08 (b) | | | 1,500,000 | | | 1,528,907 |
Goldman Sachs Group, Inc., Series
EMTN, 7.80%, 1/28/10 | | | 500,000 | | | 581,143 |
Mercantile Bankshares Corp., Series B, 4.625%, 4/15/13 | | | 1,150,000 | | | 1,123,238 |
Merrill Lynch & Company, Inc., 6.00%, 7/15/05 | | | 500,000 | | | 512,735 |
Merrill Lynch & Company, Inc., 6.56%, 12/16/07 | | | 125,000 | | | 136,578 |
Morgan Stanley Dean Witter, 6.50%, 11/1/05 | | | 500,000 | | | 521,315 |
Morgan Stanley Dean Witter, 6.10%, 4/15/06 | | | 2,000,000 | | | 2,094,804 |
Morgan Stanley Dean Witter, 5.30%, 3/1/13 (b) | | | 1,000,000 | | | 1,024,934 |
Private Export Funding, Series J, 7.65%, 5/15/06 | | | 7,900,000 | | | 8,517,495 |
Toyota Motor Credit Co., 5.50%, 12/15/08 | | | 375,000 | | | 401,220 |
Wells Fargo & Co., Series J, 6.55%, 12/1/06 | | | 600,000 | | | 646,009 |
| | | | | |
|
|
| | | | | | | 32,543,312 |
| | | | | |
|
|
Chemicals (0.0%) | | | | | | |
E.I. du Pont de Nemours & Co., 6.875%, 10/15/09 | | | 200,000 | | | 226,939 |
| | | | | |
|
|
Consumer Discretionary (0.5%) | | | | | | |
Anheuser-Busch Cos., Inc., 5.375%, 9/15/08 | | | 350,000 | | | 370,813 |
Anheuser-Busch Cos., Inc., 5.125%, 10/1/08 | | | 600,000 | | | 629,846 |
Anheuser-Busch Cos., Inc., 4.375%, 1/15/13 | | | 2,000,000 | | | 1,982,760 |
| | | | | |
|
|
| | | | | | | 2,983,419 |
| | | | | |
|
|
Consumer Staples (0.7%) | | | | | | |
Coco-Cola Co., 5.75%, 3/15/11 | | | 1,000,000 | | | 1,088,955 |
Procter & Gamble Co., 6.875%, 9/15/09 | | | 850,000 | | | 967,353 |
Sara Lee Corp, Series MTNC, 5.95%, 1/9/06 | | | 650,000 | | | 673,245 |
Wal-Mart Stores, Inc., 5.875%, 10/15/05 (b) | | | 1,000,000 | | | 1,033,671 |
Wal-Mart Stores, Inc., 5.45%, 8/1/06 (b) | | | 300,000 | | | 313,558 |
| | | | | |
|
|
| | | | | | | 4,076,782 |
| | | | | |
|
|
| | | | | | |
| | | Principal
Amount
| | Fair Value
|
Corporate Bonds, continued | | | | | | |
Energy (0.3%) | | | | | | |
ChevronTexaco Capital Co., 3.50%,
9/17/07 (b) | | $ | 500,000 | | $ | 504,671 |
ChevronTexaco Capital Co., 3.375%, 2/15/08 | | | 1,170,000 | | | 1,173,184 |
| | | | | |
|
|
| | | | | | | 1,677,855 |
| | | | | |
|
|
Health Care (0.1%) | | | | | | |
Abbott Laboratories, 5.625%, 7/1/06 (b) | | | 500,000 | | | 523,441 |
| | | | | |
|
|
Information Technology (0.4%) | | | | | | |
IBM Corp., 6.45%, 8/1/07 | | | 500,000 | | | 543,067 |
IBM Corp., Series MTN, 5.40%, 10/1/08 | | | 500,000 | | | 530,488 |
IBM Corp., 5.375%, 2/1/09 (b) | | | 900,000 | | | 959,655 |
| | | | | |
|
|
| | | | | | | 2,033,210 |
| | | | | |
|
|
Materials (0.1%) | | | | | | |
Alcoa, Inc., 7.375%, 8/1/10 (b) | | | 500,000 | | | 583,019 |
| | | | | |
|
|
Printing & Publishing (0.1%) | | | | | | |
Washington Post Co., 5.50%, 2/15/09 | | | 500,000 | | | 531,155 |
| | | | | |
|
|
Telecommunications (0.9%) | | | | | | |
GTE North, Inc., 6.90%, 11/1/08 | | | 500,000 | | | 553,973 |
Verizon Pennsylvania, Series A, 5.65%, 11/15/11 (b) | | | 4,000,000 | | | 4,222,532 |
| | | | | |
|
|
| | | | | | | 4,776,505 |
| | | | | |
|
|
Utilities (0.2%) | | | | | | |
WPS Resources Corp., 7.00%, 11/1/09 | | | 750,000 | | | 850,500 |
| | | | | |
|
|
Total Corporate Bonds
(Cost $47,970,893) | | | | | | 50,806,137 |
| | | | | |
|
|
Mortgage-Backed Securities (36.6%) | | | | | | |
Federal Home Loan Mortgage Corp. (8.9%) | | | | | | |
6.00%, 9/1/08, Pool # M80700 | | | 561,122 | | | 576,662 |
5.00%, 11/1/09, Pool # M80779 | | | 4,168,445 | | | 4,260,992 |
6.50%, 5/1/13, Pool # E00548 | | | 507,707 | | | 537,794 |
6.00%, 9/1/16, Pool # E01049 | | | 1,766,249 | | | 1,852,317 |
6.00%, 5/1/17, Pool # E89746 | | | 2,554,819 | | | 2,679,128 |
4.50%, 2/1/18, Pool # E94445 | | | 11,179,381 | | | 11,168,972 |
4.50%, 8/15/22, Series 2649, Class — VJ, CMO | | | 6,049,000 | | | 5,651,039 |
5.50%, 12/15/22, Series 2542, Class — DJ, CMO | | | 5,000,000 | | | 5,121,916 |
5.00%, 7/15/23, Series 2638, Class — DH, CMO | | | 2,302,000 | | | 2,264,662 |
7.00%, 8/15/23, Series 1644, Class — l, CMO | | | 2,556,768 | | | 2,651,767 |
5.50%, 2/1/29, Pool # A18613 | | | 9,860,639 | | | 10,042,705 |
6.00%, 2/1/31, Pool # CO1153 | | | 844,018 | | | 873,349 |
6.50%, 12/1/31, Pool # C01271 | | | 1,160,718 | | | 1,218,576 |
6.50%, 2/1/32, Pool # C01297 | | | 334,642 | | | 351,323 |
| | | | | |
|
|
| | | | | | | 49,251,202 |
| | | | | |
|
|
Federal National Mortgage Assoc. (20.8%) | | | | | | |
6.00%, 10/1/08, Pool # 254041 | | | 354,951 | | | 363,542 |
6.00%, 2/1/09, Pool # 254243 | | | 759,481 | | | 779,399 |
6.00%, 4/1/13, Pool # 251656 | | | 491,564 | | | 516,734 |
6.00%, 11/1/13, Pool # 323363 | | | 730,979 | | | 768,409 |
6.50%, 12/1/13, Pool # 555005 | | | 549,483 | | | 582,676 |
6.00%, 3/1/16, Pool # 253702 | | | 336,561 | | | 353,229 |
6.00%, 4/1/16, Pool # 535846 | | | 1,658,651 | | | 1,740,796 |
6.50%, 5/1/16, Pool # 253799 | | | 1,723,962 | | | 1,826,294 |
6.00%, 8/1/16, Pool # 545125 | | | 788,892 | | | 827,772 |
Continued
68
Intermediate U.S. Government Fund
Schedule of Portfolio Investments, continued September 30, 2004 |
| | | | | | |
| | | Principal
Amount
| | Fair Value
|
Mortgage-Backed Securities, continued | | | | | | |
Federal National Mortgage Assoc., continued | | | | | | |
5.50%, 9/15/17, Series 2501, Class — MC, CMO | | $ | 18,663,910 | | $ | 19,398,539 |
5.00%, 11/1/17, Pool # 254510 | | | 2,778,924 | | | 2,831,154 |
5.00%, 12/1/17, Pool # 254545 | | | 2,965,800 | | | 3,021,541 |
5.00%, 1/1/18, Pool # 650205 | | | 9,539,127 | | | 9,711,774 |
4.50%, 1/25/18, Series 2002-94, Class — HM, CMO | | | 8,000,000 | | | 7,727,001 |
4.50%, 2/1/18, Pool # 683346 | | | 4,315,601 | | | 4,305,602 |
4.50%, 3/1/18, Pool # 555292 | | | 8,014,129 | | | 8,009,571 |
6.00%, 1/1/23, Pool # 254633 | | | 4,173,712 | | | 4,351,797 |
5.00%, 7/25/25, Series 2003-9, Class — JB, CMO | | | 6,827,077 | | | 7,030,616 |
6.00%, 1/1/29, Pool # 252211 | | | 959,361 | | | 995,677 |
6.50%, 5/15/32, Pool # 569804 | | | 2,465,032 | | | 2,603,421 |
5.50%, 8/1/32, Pool # 555954 | | | 2,199,055 | | | 2,257,977 |
5.00%, 10/15/32, Series # 2553, Class — DJ, CMO | | | 5,000,000 | | | 4,852,117 |
5.50%, 1/1/33, Pool # 678321 | | | 3,181,221 | | | 3,232,497 |
3.15%, 6/25/33, Series 2003-48, Class — KF, CMO* | | | 1,984,010 | | | 1,988,687 |
5.00%, 7/1/33, Pool # 724965 | | | 4,787,092 | | | 4,747,428 |
5.00%, 8/1/33, Pool # 724635 | | | 2,176,243 | | | 2,160,835 |
5.00%, 8/1/33, Pool # 738751 | | | 2,698,602 | | | 2,677,912 |
5.00%, 10/1/33, Pool #753298 | | | 1,878,770 | | | 1,864,345 |
5.50%, 1/1/34, Pool # 757571 | | | 4,153,852 | | | 4,214,012 |
4.50%, 9/1/34, Pool #725866 | | | 9,999,010 | | | 9,544,367 |
| | | | | |
|
|
| | | | | | | 115,285,721 |
| | | | | |
|
|
Government National Mortgage Assoc. (6.9%) | | | | | | |
7.00%, 7/15/29, Pool # 510099 | | | 583,629 | | | 622,969 |
7.00%, 8/20/29, Pool # 2796 | | | 374,509 | | | 398,818 |
6.50%, 3/20/31, Pool # 3053 | | | 1,154,793 | | | 1,217,642 |
6.50%, 4/20/31, Pool # 3068 | | | 1,123,593 | | | 1,184,744 |
6.50%, 2/15/32, Pool # 538313 | | | 1,065,398 | | | 1,125,210 |
5.50%, 7/16/32, Series 2003-1, Class — PE, CMO | | | 5,000,000 | | | 4,983,604 |
5.50%, 7/15/33, Pool #615287 | | | 28,320,439 | | | 28,871,084 |
| | | | | |
|
|
| | | | | | | 38,404,071 |
| | | | | |
|
|
Total Mortgage-Backed Securities
(Cost $202,225,104) | | | | | | 202,940,994 |
| | | | | |
|
|
U.S. Government Agencies (39.2%) | | | | | | |
Federal Farm Credit Bank (7.5%) | | | | | | |
5.35%, 7/26/06, Series MTN | | | 10,000,000 | | | 10,450,850 |
3.10%, 8/27/07 | | | 11,190,000 | | | 11,162,775 |
5.69%, 1/10/08 | | | 2,000,000 | | | 2,146,560 |
3.00%, 4/15/08 (b) | | | 13,000,000 | | | 12,874,043 |
4.35%, 11/6/09 (b) | | | 5,000,000 | | | 5,113,815 |
| | | | | |
|
|
| | | | | | | 41,748,043 |
| | | | | |
|
|
Federal Home Loan Bank (11.2%) | | | | | | |
6.05%, 2/23/05, Series KCO5 | | | 750,000 | | | 762,150 |
6.05%, 2/25/05, Series KE05 | | | 500,000 | | | 508,215 |
3.20%, 8/26/05, Series WY05 (b) | | | 1,650,000 | | | 1,662,860 |
5.615%, 3/1/06, Series KY06 (b) | | | 1,000,000 | | | 1,041,986 |
5.25%, 8/15/06, Series EY06 (b) | | | 1,250,000 | | | 1,305,291 |
2.00%, 2/23/07, Callable 2/23/05 @ 100 (b) | | | 13,000,000 | | | 12,981,540 |
| | | | | | |
| | | Principal
Amount
| | Fair Value
|
U.S. Government Agencies, continued | | | | | | |
Federal Home Loan Bank, continued | | | | | | |
2.45%, 3/23/07 (b) | | $ | 6,030,000 | | $ | 5,946,889 |
3.125%, 8/15/07 | | | 10,000,000 | | | 9,988,460 |
3.50%, 4/22/08, Callable 10/22/04 @ 100 | | | 6,000,000 | | | 5,958,312 |
6.00%, 6/11/08, Series FJ08 (b) | | | 1,100,000 | | | 1,199,289 |
3.375%, 7/21/08, Callable 1/21/05 @ 100 (b) | | | 5,000,000 | | | 4,972,395 |
3.875%, 8/22/08, Callable 2/22/05
@ 100 (b) | | | 1,250,000 | | | 1,255,013 |
6.12%, 5/21/09, Series FN09 | | | 500,000 | | | 553,087 |
7.375%, 2/12/10, Series BZ10 (b) | | | 12,000,000 | | | 13,993,979 |
| | | | | |
|
|
| | | | | | | 62,129,466 |
| | | | | |
|
|
Federal Home Loan Mortgage Corp. (8.7%) | | | | | | |
6.50%, 11/18/04 (b) | | | 1,300,000 | | | 1,307,710 |
5.95%, 1/19/06 | | | 400,000 | | | 417,392 |
2.375%, 5/19/06, Series MTN (b) | | | 8,625,000 | | | 8,585,385 |
2.80%, 1/26/07, Series MTN | | | 9,500,000 | | | 9,466,570 |
2.75%, 1/30/07, Series MTN1 (b) | | | 10,000,000 | | | 9,963,040 |
3.50%, 9/15/07 (b) | | | 1,000,000 | | | 1,010,440 |
3.50%, 3/12/08, Series MTN, Callable 3/12/05 @ 100 (b) | | | 2,600,000 | | | 2,607,379 |
4.00%, 11/12/08, Callable 11/12/04
@ 100 | | | 5,000,000 | | | 5,009,430 |
3.00%, 1/7/11, Series MTN, Callable 1/7/05 @ 100 (b) | | | 10,000,000 | | | 10,005,870 |
| | | | | |
|
|
| | | | | | | 48,373,216 |
| | | | | |
|
|
Federal National Mortgage Assoc. (8.7%) | | | | | | |
6.00%, 12/15/05 (b) | | | 1,500,000 | | | 1,563,704 |
5.875%, 2/2/06 (b) | | | 1,000,000 | | | 1,042,554 |
2.75%, 8/11/06 (b) | | | 5,000,000 | | | 5,000,885 |
2.00%, 11/9/06, Callable 11/9/04 @ 100* (b) | | | 15,000,000 | | | 14,997,405 |
6.00%, 5/15/08 (b) | | | 500,000 | | | 543,813 |
7.25%, 1/15/10, Series B (b) | | | 15,000,000 | | | 17,394,795 |
4.75%, 11/26/10, Callable 11/26/04 @ 100 (b) | | | 6,100,000 | | | 6,116,421 |
6.08%, 12/15/10, Series MTN | | | 500,000 | | | 553,913 |
6.00%, 12/21/11, Callable 12/21/04 @ 100 | | | 1,000,000 | | | 1,008,315 |
| | | | | |
|
|
| | | | | | | 48,221,805 |
| | | | | |
|
|
Sovereign Agencies (3.1%) | | | | | | |
Financing Corp., 8.60%, 9/26/19 | | | 500,000 | | | 683,737 |
Tennessee Valley Authority, Series A,
5.625%, 1/18/11 | | | 7,000,000 | | | 7,589,834 |
Tennessee Valley Authority, Series A, 6.79%, 5/23/12 | | | 5,000,000 | | | 5,778,225 |
Tennessee Valley Authority, 7.14%, 5/23/12 | | | 2,400,000 | | | 2,827,570 |
| | | | | |
|
|
| | | | | | | 16,879,366 |
| | | | | |
|
|
Total U.S. Government Agencies
(Cost $217,120,544) | | | | | | 217,351,896 |
| | | | | |
|
|
U.S. Treasury Notes (14.4%) | | | | | | |
1.625%, 10/31/05 (b) | | | 55,000,000 | | | 54,656,249 |
2.00%, 5/15/06 (b) | | | 1,450,000 | | | 1,440,088 |
4.625%, 5/15/06 (b) | | | 250,000 | | | 258,643 |
3.50%, 11/15/06 (b) | | | 250,000 | | | 254,385 |
6.25%, 2/15/07 (b) | | | 1,250,000 | | | 1,350,879 |
Continued
69
Intermediate U.S. Government Fund
Schedule of Portfolio Investments, continued September 30, 2004 |
| | | | | | | |
| | | Shares or
Principal
Amount
| | Fair Value
| |
U.S. Treasury Notes, continued | | | | | | | |
6.00%, 8/15/09 (b) | | $ | 500,000 | | $ | 558,946 | |
5.50%, 8/15/28 | | | 20,000,000 | | | 21,499,219 | |
| | | | | |
|
|
|
Total U.S. Treasury Notes
(Cost $80,102,413) | | | | | | 80,018,409 | |
| | | | | |
|
|
|
Investment Company (0.1%) | | | | | | | |
Federated Government Obligations Fund — Institutional Class | | | 578,758 | | | 578,758 | |
| | | | | |
|
|
|
Total Investment Company
(Cost $578,758) | | | | | | 578,758 | |
| | | | | |
|
|
|
Securities Held as Collateral for Securities on Loan (37.8%) | | | | | | | |
Pool of various securities for BB&T Funds — Note 2 — Security Loans | | | 209,338,787 | | | 209,338,787 | |
| | | | | |
|
|
|
Total Securities Held as Collateral for Securities on Loan
(Cost $209,338,787) | | | | | | 209,338,787 | |
| | | | | |
|
|
|
Total Investments
(Cost $757,336,499) (a) — 137.3% | | | | | | 761,034,981 | |
Net other assets (liabilities) — (37.3%) | | | | | | (206,903,913 | ) |
| | | | | |
|
|
|
Net Assets — 100.0% | | | | | $ | 554,131,068 | |
| | | | | |
|
|
|
| (a) | | Represents cost for financial reporting purposes, is substantially the same for federal income tax purposes, and differs from fair value by net unrealized appreciation/depreciation of securities as follows: |
| | | | |
Unrealized appreciation | | $ | 5,309,259 | |
Unrealized depreciation | | | (1,610,777 | ) |
| | |
|
|
|
Net unrealized appreciation | | $ | 3,698,482 | |
| | |
|
|
|
| (b) | | Represents the security or a portion of the security was on loan as of September 30, 2004. |
CMO — Collateralized Mortgage Obligation.
| * | | The interest rate for this variable rate note, which will change periodically, is based either on the prime rate or an index of market rates. The rate reflected is the rate in effect at September 30, 2004. The maturity date reflected is the final maturity date. |
See accompanying notes to the financial statements.
70
Intermediate Corporate Bond Fund
Schedule of Portfolio Investments September 30, 2004 |
| | | | | | |
| | | Principal
Amount
| | Fair Value
|
Corporate Bonds (86.6%) | | | | | | |
Auto-Cars/Light Trucks (1.5%) | | | | | | |
DaimlerChrysler Holdings, 2.34%,
5/24/06 * | | $ | 1,000,000 | | $ | 1,003,702 |
DaimlerChrysler Holdings, 4.75%, 1/15/08 | | | 2,000,000 | | | 2,059,762 |
Lear Corp., Series B, 8.11%, 5/15/09 | | | 1,000,000 | | | 1,154,595 |
| | | | | |
|
|
| | | | | | | 4,218,059 |
| | | | | |
|
|
Banking & Financial Services (30.2%) | | | | | | |
AIG SunAmerica Global Financial, 5.85%, 8/1/08, (b) | | | 2,000,000 | | | 2,156,062 |
Bank of America Corp., 7.40%,
1/15/11 (c) | | | 2,000,000 | | | 2,330,890 |
Bank of America Corp., 5.125%,
11/15/14 (c) | | | 2,000,000 | | | 2,040,846 |
Bank One Corp., 5.25%, 1/30/13 | | | 2,000,000 | | | 2,055,914 |
Bear Stearns Company Inc., 1.98%,
1/30/09* (c) | | | 1,000,000 | | | 1,002,107 |
Bear Stearns Company Inc., 5.70%,
11/15/14 (c) | | | 1,000,000 | | | 1,052,030 |
Berkshire Hathaway, Inc., 3.375%,
10/15/08 (c) | | | 3,000,000 | | | 2,976,414 |
Capital One Bank, 4.25%, 12/1/08 (c) | | | 1,000,000 | | | 1,011,906 |
Citigroup, Inc., 5.625%, 8/27/12 (c) | | | 4,000,000 | | | 4,275,379 |
Citigroup, Inc., 5.875%, 2/22/33 (c) | | | 1,000,000 | | | 996,499 |
Countrywide Home Loan, 4.25%, 12/19/07 | | | 1,000,000 | | | 1,018,534 |
Dun & Bradstreet Corp., Series B, 6.625%, 3/15/06 | | | 2,000,000 | | | 2,081,538 |
ERAC USA Finance Co., 7.35%,
6/15/08 (b) | | | 2,000,000 | | | 2,238,126 |
First Tennessee Bank, 4.625%,
5/15/13 (c) | | | 1,000,000 | | | 985,313 |
FMR Corp., 7.57%, 6/15/29 (b) | | | 1,000,000 | | | 1,212,595 |
Ford Motor Credit Co., 6.50%,
1/25/07 (c) | | | 3,000,000 | | | 3,177,543 |
Ford Motor Credit Co., 5.625%,
10/1/08 (c) | | | 2,000,000 | | | 2,068,028 |
General Electric Capital Corp., 5.00%, 2/15/07 (c) | | | 2,000,000 | | | 2,084,856 |
General Electric Capital Corp., 1.98%, 6/22/07* (c) | | | 2,000,000 | | | 2,000,640 |
General Motors Acceptance Corp, 4.50%, 7/15/06 (c) | | | 1,000,000 | | | 1,015,662 |
General Motors Acceptance Corp., 2.60%, 5/18/06* (c) | | | 1,000,000 | | | 1,002,267 |
General Motors Acceptance Corp., 6.125%, 9/15/06 (c) | | | 2,000,000 | | | 2,090,826 |
General Motors Acceptance Corp., 5.625%, 5/15/09 (c) | | | 1,000,000 | | | 1,019,416 |
General Motors Acceptance Corp., 6.875%, 8/28/12 (c) | | | 1,000,000 | | | 1,039,111 |
Genworth Financial, Inc., 2.03%,
6/15/07* | | | 1,000,000 | | | 1,000,788 |
Goldman Sachs Group, Inc., 4.75%, 7/15/13 | | | 4,000,000 | | | 3,924,540 |
Household Finance Corp., 6.50%, 11/15/08 | | | 2,000,000 | | | 2,200,714 |
Household Finance Corp., 6.375%, 11/27/12 | | | 2,000,000 | | | 2,216,090 |
International Lease Finance Corp., 4.35%, 9/15/08 | | | 1,000,000 | | | 1,019,362 |
| | | | | | |
| | | Principal
Amount
| | Fair Value
|
Corporate Bonds, continued | | | | | | |
Banking & Financial Services, continued | | | | | | |
J.P. Morgan Chase & Co., 4.50%,
11/15/10 (c) | | $ | 1,000,000 | | $ | 1,013,240 |
J.P. Morgan Chase & Co., 4.875%,
3/15/14 (c) | | | 2,000,000 | | | 1,981,316 |
John Hancock Global Funding, 7.90%, 7/2/10 (b) | | | 2,000,000 | | | 2,362,268 |
Key Bank, 7.00%, 2/1/11 | | | 1,000,000 | | | 1,120,375 |
Legg Mason, Inc., 6.75%, 7/02/08 | | | 2,140,000 | | | 2,356,776 |
Lehman Brothers Holdings, 3.50%,
8/07/08 (c) | | | 1,000,000 | | | 992,042 |
Manufacturers & Traders Trust Co., 8.00%, 10/1/10 | | | 2,000,000 | | | 2,395,154 |
MBNA America Bank, Series BKNT, 5.375%, 1/15/08 (c) | | | 1,000,000 | | | 1,048,552 |
Merrill Lynch & Co., 4.00%,
11/15/07 (c) | | | 1,000,000 | | | 1,016,826 |
Morgan Stanley, 4.75%, 4/1/14 | | | 1,000,000 | | | 968,076 |
Morgan Stanley, 6.75%, 4/15/11 | | | 3,000,000 | | | 3,361,662 |
Pemex Finance, Ltd., 9.69%, 8/15/09 | | | 1,000,000 | | | 1,145,290 |
State Street Corp., 7.65%, 6/15/10 | | | 2,000,000 | | | 2,371,800 |
Synovus Financial, 7.25%, 12/15/05 | | | 3,000,000 | | | 3,153,270 |
US Bancorp, 3.125%, 3/15/08 | | | 1,000,000 | | | 984,458 |
Wachovia Corp., 3.50%, 8/15/08 | | | 1,000,000 | | | 996,952 |
Wachovia Corp., 4.875%, 2/15/14 | | | 1,000,000 | | | 996,597 |
Washington Mutual, Inc., 7.50%, 8/15/06 | | | 1,000,000 | | | 1,079,357 |
Wells Fargo Bank, 6.45%, 2/1/11 | | | 2,000,000 | | | 2,242,578 |
Wells Fargo Bank, 5.00%, 11/15/14 | | | 1,000,000 | | | 1,015,127 |
| | | | | |
|
|
| | | | | | | 85,895,712 |
| | | | | |
|
|
Chemicals (0.4%) | | | | | | |
Cabot Corp., 5.25%, 9/1/13 (b) | | | 1,000,000 | | | 1,007,845 |
| | | | | |
|
|
Coal & Other Minerals & Ores (0.3%) | | | | | | |
BHP Billiton Finance, 4.80%,
4/15/13 (c) | | | 1,000,000 | | | 1,012,427 |
| | | | | |
|
|
Consumer Discretionary (5.0%) | | | | | | |
Gap, Inc., 6.90%, 9/15/07 | | | 2,000,000 | | | 2,175,000 |
GTECH Holdings Corp., 4.75%, 10/15/10 | | | 1,000,000 | | | 1,007,954 |
Harley Davidson Funding, 3.625%, 12/15/08 (b)(c) | | | 1,000,000 | | | 997,071 |
International Speedway Corp., 4.20%, 4/15/09 | | | 500,000 | | | 499,800 |
Kroger Co., 7.625%, 9/15/06 | | | 1,000,000 | | | 1,081,705 |
Limited Brands, 6.125%, 12/01/12 | | | 1,000,000 | | | 1,080,072 |
MDC Holdings, Inc., 5.50%, 5/15/13 | | | 1,000,000 | | | 1,016,387 |
YUM Brands, Inc., 8.50%, 4/15/06 | | | 1,000,000 | | | 1,080,027 |
YUM Brands, Inc., 8.875%, 4/15/11 | | | 1,000,000 | | | 1,243,359 |
Wal-Mart Stores, 4.125%, 2/15/11 | | | 2,000,000 | | | 2,002,940 |
Wendy’s International, 6.25%, 11/15/11 | | | 1,000,000 | | | 1,101,945 |
Woolworth Corp., 8.50%, 1/15/22 | | | 845,000 | | | 899,925 |
| | | | | |
|
|
| | | | | | | 14,186,185 |
| | | | | |
|
|
Consumer Staples (1.1%) | | | | | | |
Anheuser-Busch Cos., Inc.,
5.95%, 1/15/33 (c) | | | 1,000,000 | | | 1,055,167 |
Pepsico, Inc., 3.20%, 5/15/07 | | | 2,000,000 | | | 2,008,368 |
| | | | | |
|
|
| | | | | | | 3,063,535 |
| | | | | |
|
|
Energy (0.3%) | | | | | | |
Engelhard Corp., 4.25%, 5/15/13 | | | 1,000,000 | | | 969,078 |
| | | | | |
|
|
Continued
71
Intermediate Corporate Bond Fund
Schedule of Portfolio Investments, continued September 30, 2004 |
| | | | | | |
| | | Principal
Amount
| | Fair Value
|
Corporate Bonds, continued | | | | | | |
Engineering — Research & Development Services (0.4%) | | | | | | |
Science Applications Institute, 7.125%, 7/1/32 | | $ | 1,000,000 | | $ | 1,160,786 |
| | | | | |
|
|
Food Processing (0.8%) | | | | | | |
ConAgra Foods, Inc., 6.00%, 9/15/06 | | | 1,000,000 | | | 1,051,911 |
Kraft Foods, Inc., 6.25%, 6/1/12 | | | 1,000,000 | | | 1,092,525 |
| | | | | |
|
|
| | | | | | | 2,144,436 |
| | | | | |
|
|
Foreign Government (2.6%) | | | | | | |
Ontario Province, 5.50%, 10/1/08, | | | 1,000,000 | | | 1,073,083 |
People’s Republic of China, 4.75%, 10/29/13 | | | 1,000,000 | | | 994,222 |
Republic of Chile, 5.50%, 1/15/13 | | | 1,000,000 | | | 1,042,000 |
United Mexican States, 2.29%, 1/13/09* | | | 1,000,000 | | | 1,009,500 |
United Mexican States, 6.375%, 1/16/13 | | | 3,000,000 | | | 3,159,000 |
| | | | | |
|
|
| | | | | | | 7,277,805 |
| | | | | |
|
|
Health Care (7.2%) | | | | | | |
Abbott Laboratories, 3.75%, 3/15/11 (c) | | | 2,000,000 | | | 1,952,746 |
AstraZeneca PLC, 5.40%, 6/1/14 (c) | | | 2,000,000 | | | 2,117,246 |
Bausch & Lomb, Inc., 7.125%, 8/1/28 | | | 1,000,000 | | | 1,057,376 |
Becton, Dickinson, & Co., 7.00%, 8/1/27 | | | 1,650,000 | | | 1,919,443 |
Boston Scientific, 5.45%, 6/15/14 (c) | | | 500,000 | | | 523,742 |
Bristol-Myers Squibb Co., 4.75%, 10/1/06 | | | 2,000,000 | | | 2,066,672 |
Caremark Rx, Inc., 7.375%, 10/1/06 | | | 2,000,000 | | | 2,138,868 |
Guidant Corp., 6.15%, 2/15/06 | | | 2,450,000 | | | 2,552,329 |
HCA, Inc., 6.25%, 2/15/13 | | | 1,000,000 | | | 1,030,729 |
Hospira, Inc., 5.90%, 6/15/14 | | | 1,000,000 | | | 1,049,577 |
Laboratory Corporation of America, 5.50%, 2/1/13 | | | 1,679,000 | | | 1,744,721 |
Quest Diagnostic, Inc., 7.50%, 7/12/11 | | | 1,000,000 | | | 1,159,374 |
Schering-Plough Corp., 6.50%, 12/1/33 | | | 1,000,000 | | | 1,082,765 |
| | | | | |
|
|
| | | | | | | 20,395,588 |
| | | | | |
|
|
Industrials (5.4%) | | | | | | |
Archer Daniels Midland Co., 8.125%, 6/1/12 (c) | | | 2,000,000 | | | 2,469,232 |
Briggs & Stratton Corp., 8.875%, 3/15/11 | | | 1,000,000 | | | 1,193,750 |
Brunswick Corp., 5.00%, 6/1/11 | | | 1,000,000 | | | 1,034,231 |
Donnelley (R.R.) & Sons, 3.75%, 4/1/09 (b)(c) | | | 1,000,000 | | | 984,973 |
FedEx Corp., 9.65%, 6/15/12 | | | 1,000,000 | | | 1,303,978 |
General Electric Co., 5.00%, 2/1/13 | | | 3,000,000 | | | 3,085,323 |
Republic Services, Inc., 6.75%, 8/15/11 | | | 2,775,000 | | | 3,110,842 |
Thermo Electron, 7.625%, 10/30/08 | | | 1,000,000 | | | 1,116,160 |
Tyco International Group SA, 6.375%, 10/15/11 | | | 1,000,000 | | | 1,105,920 |
| | | | | |
|
|
| | | | | | | 15,404,409 |
| | | | | |
|
|
Information Technology (4.1%) | | | | | | |
Applied Materials, Inc., 6.75%, 10/15/07 | | | 2,250,000 | | | 2,470,786 |
Dell, Inc., 6.55%, 4/15/08 | | | 2,970,000 | | | 3,266,017 |
First Data Corp., 4.70%, 11/1/06 (c) | | | 2,000,000 | | | 2,071,234 |
IBM Corp., 8.375%, 11/1/19 | | | 1,000,000 | | | 1,316,901 |
Oracle Corp., 6.91%, 2/15/07 | | | 1,500,000 | | | 1,616,882 |
SunGard Data Systems, Inc., 4.875%, 1/15/14 | | | 1,000,000 | | | 982,008 |
| | | | | |
|
|
| | | | | | | 11,723,828 |
| | | | | |
|
|
| | | | | | |
| | | Principal
Amount
| | Fair Value
|
Corporate Bonds, continued | | | | | | |
Linen Supply & Related Items (0.4%) | | | | | | |
Cintas Corp. No. 2, 6.00%, 6/1/12 | | $ | 1,000,000 | | $ | 1,098,153 |
| | | | | |
|
|
Media (3.5%) | | | | | | |
AOL Time Warner, Inc., 7.625%, 4/15/31 (c) | | | 3,000,000 | | | 3,452,997 |
Comcast Corp., 5.50%, 3/15/11 (c) | | | 2,000,000 | | | 2,084,742 |
Comcast Corp., 5.30%, 1/15/14 (c) | | | 1,000,000 | | | 1,002,167 |
Harman International 7.125%, 2/15/07 | | | 1,495,000 | | | 1,611,311 |
Liberty Media Corp., 3.38%, 9/17/06* | | | 1,000,000 | | | 1,010,710 |
Viacom, Inc., 5.50%, 5/15/33 | | | 1,000,000 | | | 930,663 |
| | | | | |
|
|
| | | | | | | 10,092,590 |
| | | | | |
|
|
Metals (2.8%) | | | | | | |
Alcan, Inc., 6.125%, 12/15/33 (c) | | | 1,000,000 | | | 1,038,172 |
Barrick Gold Finance, Inc., 7.50%, 5/1/07 | | | 3,000,000 | | | 3,298,068 |
Newmont Mining, 8.625%, 5/15/11 | | | 2,000,000 | | | 2,448,992 |
Placer Dome, Inc., 6.45%, 10/15/35 | | | 1,000,000 | | | 1,052,642 |
| | | | | |
|
|
| | | | | | | 7,837,874 |
| | | | | |
|
|
Motors & Generators (0.5%) | | | | | | |
Ametek, Inc., 7.20%, 7/15/08 | | | 1,255,000 | | | 1,370,533 |
| | | | | |
|
|
Natural Gas Transmission (0.3%) | | | | | | |
Trans Canada Pipelines, 4.00%, 6/15/13 | | | 1,000,000 | | | 950,522 |
| | | | | |
|
|
Oil & Gas (3.6%) | | | | | | |
BP Canada Finance, 3.375%, 10/31/07 | | | 1,000,000 | | | 1,004,451 |
ConocoPhillips, 6.95%, 4/15/29 | | | 2,000,000 | | | 2,307,616 |
Encana Holdings Finance Corp., 5.80%, 5/1/14 | | | 1,000,000 | | | 1,061,869 |
Marathon Oil, 6.80%, 3/15/32 (c) | | | 1,000,000 | | | 1,115,688 |
Murphy Oil Corp., 6.375%, 5/1/12 | | | 1,000,000 | | | 1,100,950 |
Occidental Petroleum, 7.65%, 2/15/06 | | | 2,585,000 | | | 2,747,074 |
Pacific Gas & Electric, 3.60%, 3/1/09 | | | 1,000,000 | | | 988,336 |
| | | | | |
|
|
| | | | | | | 10,325,984 |
| | | | | |
|
|
Oil & Gas Exploration Products & Services (1.7%) | | | | | | |
Cooper Cameron Corp., 2.65%, 4/15/07 | | | 1,000,000 | | | 979,728 |
Devon Financing Corp., 6.875%, 9/30/11 | | | 1,000,000 | | | 1,128,267 |
Noble Corp., 6.95%, 3/15/09 | | | 1,500,000 | | | 1,672,685 |
XTO Energy, Inc., 4.90%, 2/1/14 | | | 1,000,000 | | | 994,022 |
| | | | | |
|
|
| | | | | | | 4,774,702 |
| | | | | |
|
|
Oil Company — Exploration & Production (1.1%) | | | | | | |
EOG Resources Canada, 4.75%, 3/15/14 (b) | | | 1,000,000 | | | 988,813 |
Pemex Project Funding Master Trust, 6.125%, 8/15/08 | | | 1,000,000 | | | 1,050,000 |
Pemex Project Funding Master Trust, 7.375%, 12/15/14 | | | 1,000,000 | | | 1,090,000 |
| | | | | |
|
|
| | | | | | | 3,128,813 |
| | | | | |
|
|
Petroleum Refining (0.7%) | | | | | | |
Valero Energy Corp., 3.50%, 4/1/09 | | | 2,000,000 | | | 1,947,250 |
| | | | | |
|
|
Plastics Foam Products (0.4%) | | | | | | |
Sealed Air Corp., 5.375%, 4/15/08 (b) | | | 1,000,000 | | | 1,044,126 |
| | | | | |
|
|
Railroads (0.3%) | | | | | | |
Union Pacific Corp., 5.375%, 5/1/14 | | | 1,000,000 | | | 1,008,521 |
| | | | | |
|
|
Continued
72
Intermediate Corporate Bond Fund
Schedule of Portfolio Investments, continued September 30, 2004 |
| | | | | | |
| | | Shares or
Principal
Amount
| | Fair Value
|
Corporate Bonds, continued | | | | | | |
Telecommunication Services (7.3%) | | | | | | |
AT&T Wireless Services, Inc., 7.875%, 3/1/11 | | $ | 1,500,000 | | $ | 1,777,188 |
British Telecom PLC, 8.375%, 12/15/10 | | | 1,000,000 | | | 1,205,855 |
Deutsche Telekom, 8.50%, 6/15/10 (c) | | | 1,000,000 | | | 1,198,588 |
Deutsche Telekom, 5.25%, 7/22/13 (c) | | | 500,000 | | | 511,666 |
France Telecom, 8.20%, 3/1/06* | | | 1,000,000 | | | 1,068,246 |
Koninklijke KPN NV, 8.00%, 10/01/10 | | | 1,000,000 | | | 1,189,173 |
News America, Inc., 4.75%, 3/15/10 | | | 1,000,000 | | | 1,017,469 |
Pacific Bell, 6.125%, 2/15/08 | | | | | | |
Sprint Capital Corp., 7.625%, 1/30/11 | | | 2,000,000 | | | 2,310,661 |
Telecom Italia Capital, 5.25%, 11/15/13 | | | 1,000,000 | | | 1,018,793 |
Univision Communications, Inc., 3.875%, 10/15/08 | | | 1,000,000 | | | 995,750 |
USA Interactive, 7.00%, 1/15/13 | | | 1,000,000 | | | 1,094,386 |
Verizon Maryland, Inc., 6.125%, 3/1/12 | | | 2,000,000 | | | 2,153,224 |
Verizon Virginia, Inc., 4.625%, 3/15/13 | | | 1,000,000 | | | 976,482 |
Verizon Wireless, Inc., 5.375%, 12/15/06 | | | 2,000,000 | | | 2,093,500 |
Vodafone Airtouch PLC, 7.75%, 2/15/10 | | | 1,000,000 | | | 1,173,053 |
| | | | | |
|
|
| | | | | | | 20,860,946 |
| | | | | |
|
|
Utilities (4.7%) | | | | | | |
Alabama Power Co., 5.375%, 10/1/08 | | | 2,000,000 | | | 2,121,646 |
Appalachian Power Co., 4.80%, 6/15/05 | | | 2,650,000 | | | 2,685,947 |
Carolina Power & Light, 6.125%, 9/15/33 | | | 1,000,000 | | | 1,046,582 |
Centerpoint Energy Resources, Series B, 7.875%, 4/1/13 | | | 1,000,000 | | | 1,178,770 |
Constellation Energy Group, 6.35%, 4/1/07 (c) | | | 1,000,000 | | | 1,069,853 |
FirstEnergy Corp., 5.50%, 11/15/06 (c) | | | 1,000,000 | | | 1,040,920 |
NiSource Finance Corp., 5.40%, 7/15/14 | | | 1,000,000 | | | 1,024,338 |
Southern Cal Edison, 6.00%, 1/15/34 | | | 1,000,000 | | | 1,039,311 |
TXU Corp., 7.00%, 3/15/13 | | | 1,000,000 | | | 1,129,083 |
Virginia Electric & Power, 4.50%, 12/15/10 | | | 1,000,000 | | | 1,001,710 |
| | | | | |
|
|
| | | | | | | 13,338,160 |
| | | | | |
|
|
Total Corporate Bonds
(Cost $237,763,200) | | | | | | 246,237,867 |
| | | | | |
|
|
Exchange Traded Funds (0.4%) | | | | | | |
iShares GS Investop Index Fund | | | 9,000 | | | 1,005,840 |
| | | | | |
|
|
Total Exchange Traded Funds
(Cost $1,026,862) | | | | | | |
| | | | | | | |
| | | Shares or
Principal
Amount
| | Fair Value
| |
Government Bond (2.8%) | | | | | | | |
Federal Farm Credit Bank (2.8%) | | | | | | | |
2.625%, 12/15/05 | | $ | 7,820,000 | | $ | 7,833,435 | |
| | | | | |
|
|
|
Total Government Bond
(Cost $7,840,599) | | | | | | | |
Real Estate Investment Trust (0.8%) | | | | | | | |
Spieker Properties LP, 7.25%, 5/1/09 | | | 2,000,000 | | | 2,251,800 | |
| | | | | |
|
|
|
Total Real Estate Investment Trust
(Cost $1,999,440) | | | | | | | |
U.S. Treasury Bills** (3.5%) | | | | | | | |
1.50%, 10/21/04 | | | 10,000,000 | | | 9,991,990 | |
| | | | | |
|
|
|
Total U.S. Treasury Bills
(Cost $9,991,637) | | | | | | | |
U.S. Government Agencies (1.4%) | | | | | | | |
Federal National Mortgage Assoc. (0.3%) | | | | | | | |
4.625%, 5/1/13 (c) | | | 1,000,000 | | | 991,120 | |
| | | | | |
|
|
|
Student Loan Marketing Association (1.1%) | | | | | | | |
Series MTN, 1.83%, 4/25/06* | | | 2,000,000 | | | 2,004,392 | |
Series MTNA, 4.00%, 1/15/09 | | | 1,000,000 | | | 1,002,272 | |
| | | | | |
|
|
|
| | | | | | | 3,006,664 | |
| | | | | |
|
|
|
Total U.S. Government Agencies
(Cost $3,986,430) | | | | | | 3,997,784 | |
| | | | | |
|
|
|
U.S. Treasury Notes (1.7%) | | | | | | | |
1.625%, 10/31/05 | | | 5,000,000 | | | 4,968,750 | |
| | | | | |
|
|
|
Total U.S. Treasury Notes
(Cost $4,973,340) | | | | | | | |
Investment Companies (1.9%) | | | | | | | |
Federated High Yield Fund —
Institutional Class | | | 322,056 | | | 1,964,542 | |
Federated Prime Cash Obligations Fund — Institutional Class | | | 3,462,976 | | | 3,462,976 | |
| | | | | |
|
|
|
Total Investment Companies
(Cost $5,109,526) | | | | | | 5,427,518 | |
| | | | | |
|
|
|
Securities Held as Collateral for Securities on Loan (22.8%) | | | | | | | |
Pool of various securities for BB&T Funds — Note 2 — Security Loans | | $ | 64,919,944 | | | 64,919,944 | |
| | | | | |
|
|
|
Total Securities Held as Collateral for Securities on Loan
(Cost $64,919,944) | | | | | | 64,919,944 | |
| | | | | |
|
|
|
Total Investments
(Cost $337,610,978) (a) — 121.9% | | | | | | 346,634,928 | |
Net other assets (liabilities) — (21.9)% | | | | | | (62,241,539 | ) |
| | | | | |
|
|
|
Net Assets — 100.0% | | | | | $ | 284,393,389 | |
| | | | | |
|
|
|
| (a) | | Represents cost for financial reporting purposes, is substantially the same for federal income tax purposes, and differs from fair value by net unrealized appreciation/depreciation of securities as follows: |
| | | | |
Unrealized appreciation | | $ | 9,801,071 | |
Unrealized depreciation | | | (777,121 | ) |
| | |
|
|
|
Net unrealized appreciation | | $ | 9,023,950 | |
| | |
|
|
|
| (b) | | Rule 144A, Section 4(2) or other security which is restricted as to resale to institutional investors. The Investment Advisor, using Board approved procedures, has deemed these securities to be liquid. |
| (c) | | Represents securities was on loan as of September 30, 2004. |
| * | | The interest rate for this variable rate note, which will change periodically, is based either on the prime rate or an index of market rates. The rate reflected is the rate in effect as of September 30, 2004. The maturity date reflected is the final maturity date. |
| ** | | Discount note. Rate disclosed represents the effective yield at September 30, 2004. |
See accompanying notes to the financial statements.
73
Kentucky Intermediate Tax-Free Fund
Schedule of Portfolio Investments September 30, 2004 |
| | | | | | |
| | | Principal
Amount
| | Fair Value
|
Municipal Bonds (95.8%) | | | | | | |
Kentucky (95.0%) | | | | | | |
Education Bonds (15.8%) | | | | | | |
Allen County, Kentucky, School District, 5.25%, 4/1/10, Callable 4/1/07 @ 102 | | $ | 455,000 | | $ | 496,992 |
Bullitt County, Kentucky, School District, Second Series, 3.90%, 5/1/07 | | | 100,000 | | | 104,671 |
Fayette County, Kentucky, School District,
Series A, 5.35%, 1/1/12, Callable 1/1/07
@ 102 | | | 200,000 | | | 217,248 |
Floyd County, Kentucky, School District, 4.10%, 4/1/10 | | | 220,000 | | | 232,454 |
Jefferson County, Kentucky, School District, Series A, 5.25%, 1/1/11, Callable 7/1/09 @ 101, FSA | | | 200,000 | | | 221,742 |
Jessamine County, Kentucky, School District, 5.00%, 6/1/05 | | | 110,000 | | | 112,446 |
Louisville & Jefferson County Kentucky, 5.00%, 5/15/10 | | | 500,000 | | | 552,290 |
Somerset, Kentucky, Independent School District Finance Corporation, 4.00%, 10/1/08 | | | 175,000 | | | 183,577 |
University of Kentucky, Series M, 4.55%, 5/1/09, Callable 5/1/08 @ 101 | | | 150,000 | | | 160,698 |
University of Kentucky, Series Q, 5.00%, 5/1/10 | | | 250,000 | | | 276,848 |
| | | | | |
|
|
| | | | | | | 2,558,966 |
| | | | | |
|
|
Commission Bonds (37.8%) | | | | | | |
Kentucky State Property & Buildings Commission, Project # 68, 5.50%, 10/1/06, FSA | | | 100,000 | | | 106,980 |
Kentucky State Property & Buildings Commission, Project # 69, Series C, 5.50%, 8/1/07, FSA | | | 200,000 | | | 218,524 |
Kentucky State Property & Buildings Commission, Project # 55, 6.25%, 9/1/07, FSA | | | 100,000 | | | 111,407 |
Kentucky State Property & Buildings Commission, Project # 74, 5.375%, 2/1/09, FSA | | | 350,000 | | | 388,857 |
Kentucky State Property & Buildings Commission, Project # 74, 5.375%, 8/1/09, FSA | | | 150,000 | | | 167,732 |
Kentucky State Property & Buildings Commission, Project # 74, 5.375%, 2/1/10, FSA | | | 305,000 | | | 341,435 |
Kentucky State Property & Buildings Commission, Project # 69, Series A, 5.50%, 8/1/11, FSA | | | 540,000 | | | 615,762 |
Kentucky State Property & Buildings Commission, Project # 71, 4.40%, 8/1/12, FSA | | | 395,000 | | | 422,575 |
Kentucky State Property & Buildings Commission, Project # 64, 5.375%, 5/1/13, Callable 11/1/09 @ 100, MBIA | | | 500,000 | | | 562,470 |
Kentucky State Property & Buildings Commission, Project # 67, 5.00%, 9/1/13, Callable 9/1/10 @ 100 | | | 405,000 | | | 449,781 |
Kentucky State Property & Buildings Commission, Project # 67, 5.625%, 9/1/13, Callable 9/1/10 @ 100 | | | 300,000 | | | 343,287 |
Kentucky State Property & Buildings Commission, Project # 74, 5.375%, 2/1/14, Callable 2/1/12 @ 100, FSA | | | 500,000 | | | 568,730 |
| | | | | | |
| | | Principal
Amount
| | Fair Value
|
Municipal Bonds, continued | | | | | | |
Commission Bonds, continued | | | | | | |
Kentucky State Property & Buildings Commission, Project # 81, 5.00%, 11/1/16, Callable 11/1/13 @ 100, AMBAC | | $ | 500,000 | | $ | 545,320 |
Kentucky State Property & Buildings Commission, Project # 73, 5.50%, Second Series 11/1/16, Callable 11/1/12 @ 100, FSA | | | 400,000 | | | 454,396 |
Kentucky State Property & Buildings Commission, Project # 65, 5.95%, 2/1/17, Callable 2/1/10 @ 100 | | | 350,000 | | | 403,081 |
Louisville, Kentucky, Parking Authority, 7.50%, 7/1/09, Callable 1/1/05 @ 100 | | | 350,000 | | | 424,967 |
| | | | | |
|
|
| | | | | | | 6,125,304 |
| | | | | |
|
|
General Obligations (5.2%) | | | | | | |
Boone County, Kentucky, 3.75%, 4/1/07 | | | 250,000 | | | 260,380 |
Bowling Green, Kentucky, Economic & Tourism Development, 5.25%, 12/1/05, Callable 12/1/04 @ 100 | | | 190,000 | | | 194,967 |
Hopkins County, Kentucky, Detention Facilities, 5.375%, 2/1/09, FGIC | | | 350,000 | | | 389,011 |
| | | | | |
|
|
| | | | | | | 844,358 |
| | | | | |
|
|
Healthcare Bonds (3.4%) | | | | | | |
Kentucky Economic Development Financial Authority, Catholic Health Initiatives, Series A, 5.75%, 12/1/15, Callable 6/1/10 @ 101 | | | 500,000 | | | 556,265 |
| | | | | |
|
|
| | | | | | | 1,400,623 |
| | | | | |
|
|
Housing Bonds (0.7%) | | | | | | |
Kentucky Housing Corporation, Series D, 5.20%, 7/1/07, Callable 7/1/06 @ 102, FHA | | | 100,000 | | | 106,248 |
| | | | | |
|
|
Transportation Bonds (9.9%) | | | | | | |
Kentucky State Turnpike Authority, Revitalization Projects, 6.50%, 7/1/08, AMBAC | | | 350,000 | | | 400,106 |
Kentucky State Turnpike Authority, Revitalization Projects, 5.50%, 7/1/09, AMBAC | | | 250,000 | | | 280,660 |
Kentucky State Turnpike Authority, Revitalization Projects, Series A, 5.50%, 7/1/12, AMBAC | | | 500,000 | | | 572,835 |
Kentucky State Turnpike Authority, Revitalization Projects, Series A, 5.50%, 7/1/15, AMBAC | | | 300,000 | | | 348,396 |
| | | | | |
|
|
| | | | | | | 1,601,997 |
| | | | | |
|
|
Urban & Community Development (8.1%) | | | | | | |
Bell County, Kentucky, Judicial Center Project, 5.40%, 9/1/13, Callable 3/1/11 @ 102 | | | 160,000 | | | 178,330 |
Daviess County, Kentucky, Court Facilities Project, Series A, 5.60%, 10/1/06, Callable 10/1/04 @ 102 | | | 245,000 | | | 253,773 |
Jefferson County, Kentucky, Capital Projects, 5.20%, 6/1/08, Callable 6/1/07 @ 102, MBIA | | | 295,000 | | | 321,473 |
Kenton County, Kentucky, Series A, 5.35%, 12/1/08, Callable 12/1/06 @ 101 | | | 250,000 | | | 268,560 |
Paducah Kentucky Public Housing Authority, 5.00%, 10/1/06, Callable 10/1/04 @ 101, U.S. Government Guaranteed | | | 270,000 | | | 285,495 |
| | | | | |
|
|
| | | | | | | 1,307,632 |
| | | | | |
|
|
Continued
74
Kentucky Intermediate Tax-Free Fund
Schedule of Portfolio Investments, continued September 30, 2004 |
| | | | | | |
| | | Principal
Amount
| | Fair Value
|
Municipal Bonds, continued | | | | | | |
Utility Bonds (14.1%) | | | | | | |
Bardstown, Kentucky, Combined Utilities, 4.375%, 12/1/11, Callable 12/1/10 @ 101, MBIA | | $ | 200,000 | | $ | 213,516 |
Kentucky Infrastructure Authority, Series A, 4.00%, 6/1/08 | | | 300,000 | | | 316,572 |
Kentucky Rural Water Finance, Series A, 4.00%, 2/1/07 | | | 205,000 | | | 214,098 |
Lexington-Fayette Urban County, Kentucky, Sewer Systems, 5.50%, 7/1/11 | | | 450,000 | | | 512,676 |
Louisville, Kentucky, Louisville Water Company, 4.70%, 11/15/14, Callable 11/15/10 @ 100 | | | 550,000 | | | 588,201 |
Northern Kentucky, Water Distribution, 4.50%, 2/1/08, FGIC | | | 250,000 | | | 267,250 |
Owensboro, Kentucky Electric Light & Power, Series B, 2.36%, 1/1/06, AMBAC* | | | 60,000 | | | 58,603 |
Owensboro, Kentucky Electric Light & Power, Series B, 2.73%, 1/1/09, AMBAC* | | | 45,000 | | | 39,681 |
Owensboro, Kentucky Electric Light & Power, Series B, 2.93%, 1/1/10, AMBAC* | | | 80,000 | | | 67,154 |
| | | | | |
|
|
Total Kentucky Bonds | | | | | | 2,277,751 |
| | | | | |
|
|
| | | | | | |
| | | Shares or
Principal
Amount
| | Fair Value
|
Municipal Bonds, continued | | | | | | |
Puerto Rico (0.8%) | | | | | | |
General Obligation (0.8%) | | | | | | |
Puerto Rico Commonwealth, 6.50%, 7/1/14, MBIA | | $ | 100,000 | | $ | 124,835 |
| | | | | |
|
|
Total Municipal Bonds
(Cost $15,035,803) | | | | | | 15,503,356 |
| | | | | |
|
|
Investment Company (3.2%) | | | | | | |
Federated Tax Exempt Money Market Fund | | | 516,091 | | | 516,091 |
| | | | | |
|
|
Total Investment Company
(Cost $516,091) | | | | | | 516,091 |
| | | | | |
|
|
Total Investments
(Cost $15,551,894) (a) — 99.0% | | | | | | 16,019,447 |
Net other assets (liabilities) — 1.0% | | | | | | 166,890 |
| | | | | |
|
|
Net Assets — 100% | | | | | $ | 16,186,337 |
| | | | | |
|
|
| (a) | | Represents cost for financial reporting purposes, is substantially the same for federal income tax purposes, and differs from fair value by net unrealized appreciation/depreciation of securities as follows: |
| | | | |
Unrealized appreciation | | $ | 471,835 | |
Unrealized depreciation | | | (4,282 | ) |
| | |
|
|
|
Net unrealized appreciation | | $ | 467,553 | |
| | |
|
|
|
| * | | Discount note. Rate disclosed represents the effective yield at September 30, 2004. |
AMBAC — Insured by the AMBAC Indemnity Corporation.
FGIC — Insured by the Financial Guarantee Insurance Corporation.
FHA — Insured by the Federal Housing Administration.
FSA — Insured by the Financial Security Assurance.
MBIA — Insured by the Municipal Bond Insurance Association.
See accompanying notes to the financial statements.
75
Maryland Intermediate Tax-Free Fund
Schedule of Portfolio Investments September 30, 2004 |
| | | | | | |
| | | Principal
Amount
| | Fair
Value
|
Municipal Bonds (96.9%) | | | | | | |
Maryland (95.6%) | | | | | | |
Education Bonds (8.8%) | | | | | | |
Maryland State Authority for American Physics, 5.25%, 12/15/13, Callable 12/15/11 @ 100, GTY-AGMT | | $ | 150,000 | | $ | 167,448 |
Maryland State Health & Higher Education, 4.625%, 7/1/10 | | | 100,000 | | | 105,518 |
Maryland State Health & Higher Education, 5.125%, 7/1/10, AMBAC | | | 150,000 | | | 167,139 |
Maryland State Health & Higher Education, 6.00%, 7/1/39 | | | 100,000 | | | 115,648 |
Maryland State Health & Higher Education, 5.00%, 5/15/13, Callable 5/15/11 @ 100 | | | 175,000 | | | 189,364 |
Maryland State Health & Higher Education, Series A, 5.75%, 1/1/15, Callable 1/1/13 @ 101 | | | 100,000 | | | 111,419 |
| | | | | |
|
|
| | | | | | | 856,536 |
| | | | | |
|
|
General Obligations (61.8%) | | | | | | |
Allegany County, Maryland, 4.50%, 8/1/11, Callable 8/1/08 @ 101, AMBAC | | | 50,000 | | | 52,885 |
Anne Arundel County, Maryland, 5.00%, 5/15/10, Callable 5/15/09 @ 101 | | | 100,000 | | | 109,914 |
Anne Arundel County, Maryland, 5.25%, 3/1/11 | | | 200,000 | | | 225,398 |
Anne Arundel County, Maryland, 5.375%, 3/1/13 | | | 400,000 | | | 454,115 |
Baltimore County, Maryland, 5.00%, 9/1/05 | | | 100,000 | | | 103,067 |
Baltimore County, Maryland, 5.00%, 7/1/08 | | | 100,000 | | | 109,500 |
Baltimore County, Maryland, 7.00%, 10/15/09, MBIA | | | 100,000 | | | 119,525 |
Baltimore County, Maryland, 5.50%, 6/1/12, Callable 6/1/11 @ 101 | | | 100,000 | | | 114,909 |
Calvert County, Maryland, 5.00%, 7/15/11 | | | 100,000 | | | 111,331 |
Carroll County, Maryland, 5.00%, 11/1/09 | | | 100,000 | | | 110,624 |
Frederick County, Maryland, Public Facilities, 5.00%, 12/1/04 | | | 250,000 | | | 251,445 |
Harford County, Maryland, 4.00%, 12/1/05 | | | 50,000 | | | 51,349 |
Harford County, Maryland, 5.00%, 12/1/09 | | | 200,000 | | | 221,906 |
Howard County, Maryland, 4.00%, 8/15/05 | | | 100,000 | | | 102,063 |
Howard County, Maryland, 5.00%, 8/15/05 | | | 100,000 | | | 102,928 |
Howard County, Maryland, 5.00%, 8/15/11 | | | 200,000 | | | 223,334 |
Maryland State & Local Facilities, Series 2, 5.25%, 6/15/07, Callable 6/15/06 @ 100 | | | 100,000 | | | 105,444 |
Maryland State & Local Facilities, 5.50%, 3/1/10 | | | 125,000 | | | 141,549 |
Maryland State & Local Facilities, Series 2, 5.00%, 8/1/11 | | | 350,000 | | | 390,942 |
Maryland State & Local Facilities, Series 2, 5.00%, 10/15/08, Callable 10/15/05 @ 101 | | | 50,000 | | | 52,137 |
Maryland State, Series B, 5.00%, 7/15/08 | | | 100,000 | | | 109,564 |
Maryland State, 5.25%, 3/1/09 | | | 100,000 | | | 111,158 |
Montgomery County, Maryland, Series A, 4.00%, 2/1/08 | | | 250,000 | | | 264,088 |
Montgomery County, Maryland, Series A, 5.30%, 1/1/13, Callable 1/1/10 @ 101 | | | 100,000 | | | 112,731 |
Montgomery County, Maryland, Series A, 5.00%, 2/1/16, Callable 2/1/12 @ 101 | | | 150,000 | | | 163,973 |
Montgomery County, Maryland, Certificates of Participation, 4.50%, 6/1/06, | | | 100,000 | | | 104,344 |
Montgomery County, Maryland, 5.25%, 10/1/14, Callable 10/1/11 @ 101 | | | 100,000 | | | 112,861 |
| | | | | | |
| | | Principal
Amount
| | Fair
Value
|
Municipal Bonds, continued | | | | | | |
General Obligations, continued | | | | | | |
Ocean City, Maryland, 5.00%, 3/1/10, MBIA | | $ | 150,000 | | $ | 165,720 |
Prince Georges County, Maryland, 5.50%, 5/15/12 | | | 100,000 | | | 115,047 |
Prince Georges County, Maryland, Series A, 5.00%, 10/1/07 | | | 250,000 | | | 270,763 |
Prince Georges County, Maryland, 5.125%, 10/1/08 | | | 100,000 | | | 110,180 |
Prince Georges County, Maryland, 5.50%, 10/1/08, FSA | | | 55,000 | | | 61,381 |
Prince Georges County, Maryland, Series B, 5.00%, 10/1/12 | | | 340,000 | | | 380,486 |
Rockville, Maryland, 4.00%, 3/15/08 | | | 310,000 | | | 327,834 |
Saint Mary’s County, Maryland, 5.00%, 7/1/05 | | | 100,000 | | | 102,539 |
Washington County, Maryland, 5.375%, 1/1/16 | | | 100,000 | | | 111,951 |
Washington Suburban Sanitation District, Maryland, 5.00%, 6/1/06, | | | 100,000 | | | 105,298 |
Washington Suburban Sanitation District, Maryland, Sewage Disposal, 5.25%, 6/1/08 | | | 150,000 | | | 165,386 |
| | | | | |
|
|
| | | | | | | 6,049,669 |
| | | | | |
|
|
Housing Bonds 15.8% | | | | | | |
Baltimore, Maryland, Public Housing Authority, 5.75%, 7/1/09, Callable 1/1/05 @ 101 | | | 235,000 | | | 263,192 |
Maryland State, Community Development Administration, Series 1, 4.05%, 4/1/07 | | | 250,000 | | | 261,103 |
Maryland State, Community Development Administration, Series A, 4.25%, 5/15/09 | | | 80,000 | | | 84,680 |
Maryland State, Community Development Administration, Series E, 4.35%, 9/1/09 | | | 150,000 | | | 159,639 |
Maryland State, Community Development Administration, Single Family Program, Series 1, 4.50%, 4/1/11, Callable 10/1/10 @ 100 | | | 200,000 | | | 213,198 |
Maryland State, Community Development Administration, 4.50%, 5/15/11 | | | 105,000 | | | 112,511 |
Maryland State, Community Development Administration, Series A, 4.65%, 9/1/12 Callable 9/1/10 @ 100 | | | 150,000 | | | 159,164 |
Maryland State, Community Development Administration, 4.60%, 4/1/13, Callable 4/1/11 @ 100 | | | 200,000 | | | 211,242 |
Montgomery County, Maryland, Community Housing Opportunities, Series A, 4.50%, 7/1/09, Callable 7/1/08 @ 101 | | | 75,000 | | | 79,880 |
| | | | | |
|
|
| | | | | | | 1,544,609 |
| | | | | |
|
|
Pollution Control Bonds (6.1%) | | | | | | |
Baltimore, Maryland Project, Series A, 5.00%, 7/1/24 | | | 200,000 | | | 216,268 |
Baltimore, Maryland Project, 5.00%, 7/1/24 | | | 250,000 | | | 270,335 |
Montgomery County Solid Waste Systems, 5.00%, 6/1/13, AMBAC | | | 100,000 | | | 111,421 |
| | | | | |
|
|
| | | | | | | 598,024 |
| | | | | |
|
|
Transportation Bonds 2.9% | | | | | | |
Maryland State Transit Department, 6.80%, 7/1/16 | | | 25,000 | | | 29,734 |
Washington, D.C., Metro Area Transportation Authority, Series B, 5.00%, 7/1/10, MBIA | | | 100,000 | | | 110,937 |
Washington, D.C., Metro Area Transportation Authority, 6.00%, 7/1/09, FGIC | | | 125,000 | | | 143,277 |
| | | | | |
|
|
| | | | | | | 283,948 |
| | | | | |
|
|
Continued
76
Maryland Intermediate Tax-Free Fund
Schedule of Portfolio Investments, continued September 30, 2004 |
| | | | | | | |
| | | Shares or
Principal
Amount
| | Fair
Value
| |
Municipal Bonds, continued | | | | | | | |
Puerto Rico (1.3%) | | | | | | | |
General Obligation (1.3%) | | | | | | | |
Puerto Rico Commonwealth, 6.50%, 7/1/14, MBIA | | $ | 100,000 | | $ | 124,835 | |
| | | | | |
|
|
|
Total Puerto Rico | | | | | | 124,835 | |
| | | | | |
|
|
|
Total Municipal Bonds
(Cost $9,270,244) | | | | | | 9,457,621 | |
| | | | | |
|
|
|
Investment Company (4.2%) | | | | | | | |
Federated Maryland Municipal Cash Trust | | | 406,450 | | | 406,450 | |
| | | | | |
|
|
|
Total Investment Company
(Cost $406,450) | | | | | | 406,450 | |
| | | | | |
|
|
|
Total Investments
(Cost $9,676,694) (a) — 100.9% | | | | | | 9,864,071 | |
Net other assets (liabilities) — (0.9%) | | | | | | (89,771 | ) |
| | | | | |
|
|
|
Net Assets — 100% | | | | | $ | 9,774,300 | |
| | | | | |
|
|
|
| (a) | | Represents cost for financial reporting purposes, is substantially the same for federal income tax purposes, and differs from fair value by net unrealized appreciation/depreciation of securities as follows: |
| | | | |
Unrealized appreciation | | $ | 193,923 | |
Unrealized depreciation | | | (6,546 | ) |
| | |
|
|
|
Net unrealized appreciation | | $ | 187,377 | |
| | |
|
|
|
AMBAC — Insured by the AMBAC Indemnity Corporation.
FGIC — Insured by the Financial Guarantee Insurance Corporation.
FSA — Insured by the Financial Security Assurance.
GTY — AGMT- Insured by Guarantor Agreement.
MBIA — Insured by the Municipal Bond Insurance Association.
See accompanying notes to the financial statements.
77
North Carolina Intermediate Tax-Free Fund
Schedule of Portfolio Investments September 30, 2004 |
| | | | | | |
| | | Principal
Amount
| | Fair Value
|
Municipal Bonds (98.3%) | | | | | | |
Correctional Institutions (3.7%) | | | | | | |
North Carolina Infrastructure Financial Corp., 5.00%, 10/1/11 | | $ | 3,000,000 | | $ | 3,327,450 |
North Carolina Infrastructure Financial Corp., 5.00%, 10/1/17, Callable 10/1/13 @ 100 | | | 1,000,000 | | | 1,081,260 |
| | | | | |
|
|
| | | | | | | 4,408,710 |
| | | | | |
|
|
Education Bonds (5.3%) | | | | | | |
Johnston County, North Carolina, School & Museum Project, 5.50%, 8/1/10, Callable 8/1/09 @ 101, FSA | | | 1,000,000 | | | 1,123,490 |
North Carolina Capital Facilities Finance Agency, 5.25%, 5/1/15, Callable 5/1/06 @ 102 (b) | | | 2,439,646 | | | 2,495,709 |
North Carolina State University, Series A, 5.00%, 10/1/13 | | | 1,000,000 | | | 1,118,260 |
University of North Carolina, System Pool Revenue, Series C, 5.00%, 4/1/29, Callable 4/1/14 @ 100, AMBAC | | | 1,500,000 | | | 1,537,635 |
| | | | | |
|
|
| | | | | | | 6,275,094 |
| | | | | |
|
|
General Obligation Bonds (40.7%) | | | | | | |
Bladen County, North Carolina, 5.60%, 5/1/13, Callable 5/1/10 @ 101.5, FSA | | | 1,150,000 | | | 1,314,105 |
Buncombe County, North Carolina, 5.10%, 3/1/07 | | | 1,000,000 | | | 1,073,430 |
Buncombe County, North Carolina, Certificate of Participation, 5.00%, 12/1/05, AMBAC | | | 1,000,000 | | | 1,037,200 |
Cabarrus County, North Carolina, 5.30%, 2/1/11, Callable 2/1/07 @ 102, MBIA | | | 1,000,000 | | | 1,093,920 |
Cabarrus County, North Carolina, Certificate of Participation, 5.25%, 2/1/12, AMBAC | | | 1,285,000 | | | 1,441,693 |
Cary, North Carolina, Public Improvement, Certificate of Participation, Series A, 5.00%, 12/1/16, Callable 12/1/12 @ 100 | | | 1,050,000 | | | 1,133,895 |
Catawba County, North Carolina, 4.60%, 6/1/05 | | | 240,000 | | | 244,702 |
Charlotte, North Carolina, 5.25%, 2/1/05 | | | 250,000 | | | 253,070 |
Charlotte, North Carolina, 5.50%, 6/1/09 | | | 1,460,000 | | | 1,642,661 |
Charlotte, North Carolina, Certificate of Participation, Series G, 5.00%, 6/1/16, Callable 6/1/13 @ 100 | | | 1,000,000 | | | 1,078,680 |
Craven County, North Carolina, 5.00%, 5/1/18, Callable 5/1/12 @ 101, AMBAC | | | 1,230,000 | | | 1,328,929 |
Cumberland County, North Carolina, 5.50%, 3/1/09 | | | 1,055,000 | | | 1,180,387 |
Currituck County, North Carolina, 5.00%, 6/1/12 | | | 1,160,000 | | | 1,294,270 |
Durham, North Carolina, 5.00%, 2/1/13 | | | 1,650,000 | | | 1,844,601 |
Forsyth County, North Carolina, Certificate of Participation, 5.00%, 10/1/06 | | | 1,000,000 | | | 1,059,010 |
Forsyth County, North Carolina, 1.67%, 3/1/25* | | | 2,000,000 | | | 2,000,000 |
Guilford County, North Carolina, Public Improvement, Series B, 5.00%, 10/1/09 | | | 2,500,000 | | | 2,769,849 |
Guilford County, North Carolina, Series B, 5.25%, 10/1/15, Callable 10/1/10 @ 102 | | | 2,030,000 | | | 2,275,203 |
Haywood County, North Carolina, Certificate of Participation, Series A, 5.00%, 10/1/12, AMBAC | | | 1,515,000 | | | 1,679,665 |
| | | | | | |
| | | Principal
Amount
| | Fair Value
|
Municipal Bonds, continued | | | | | | |
General Obligation Bonds, continued | | | | | | |
Haywood County, North Carolina, Certificate of Participation, Series A, 5.00%, 10/1/16, Callable 10/1/13 @ 101, AMBAC | | $ | 1,985,000 | | $ | 2,168,195 |
High Point, North Carolina, Public Improvement, Series B, 5.40%, 6/1/07 | | | 1,350,000 | | | 1,467,815 |
High Point, North Carolina, Public Improvement, Series B, 5.40%, 6/1/08 | | | 1,350,000 | | | 1,493,546 |
Johnston County, North Carolina, 5.50%, 3/1/12, Callable 3/1/10 @ 101, FGIC | | | 1,000,000 | | | 1,130,530 |
Mecklenburg County, North Carolina, 5.00%, 4/1/07 | | | 1,500,000 | | | 1,610,850 |
New Hanover County, North Carolina, Public Improvement, 5.30%, 11/1/08 | | | 1,500,000 | | | 1,665,405 |
Newton, North Carolina, 4.00%, 4/1/06 | | | 165,000 | | | 170,234 |
North Carolina Capital Facilities Agency, Johnson & Wales University, Series A, 5.00%, 4/1/12, XLCA | | | 1,000,000 | | | 1,099,610 |
North Carolina State, 5.10%, 6/1/08, Callable 6/1/06 @ 101 | | | 2,000,000 | | | 2,126,399 |
North Carolina State, 5.10%, 6/1/09, Callable 6/1/06 @ 101.5 | | | 1,000,000 | | | 1,068,050 |
Orange County, North Carolina, Public Improvement, 5.25%, 4/1/08 | | | 1,300,000 | | | 1,428,817 |
Randolph County, North Carolina, Certificate of Participation, 5.20%, 6/1/09, FSA | | | 1,175,000 | | | 1,297,905 |
Randolph County, North Carolina, Certificate of Participation, 5.30%, 6/1/13, Callable 6/1/09 @ 101, FSA | | | 1,750,000 | | | 1,965,618 |
Rutherford County, North Carolina, Certificate of Participation, 5.00%, 9/1/18, Callable 9/1/12 @ 101 | | | 1,595,000 | | | 1,711,148 |
Salisbury, North Carolina, 4.40%, 6/1/06 | | | 160,000 | | | 166,709 |
Wake County, North Carolina, Series B, 4.50%, 2/1/08 | | | 1,000,000 | | | 1,072,000 |
Wake County, North Carolina, 5.30%, 2/1/11, Callable 2/1/10 @ 100.5 | | | 1,000,000 | | | 1,117,120 |
| | | | | |
|
|
| | | | | | | 48,505,221 |
| | | | | |
|
|
Health Care Bonds (21.6%) | | | | | | |
Charlotte-Mecklenberg Hospital Authority, North Carolina, Health Care System, Series A, 5.50%, 1/15/08, Callable 1/15/06 @ 102 | | | 1,720,000 | | | 1,825,849 |
Charlotte-Mecklenberg Hospital Authority, North Carolina, Health Care System, Series A, 5.00%, 1/15/13, Callable 1/15/07 @ 102 | | | 1,600,000 | | | 1,723,360 |
Charlotte-Mecklenberg Hospital Authority, North Carolina, Health Care System, Series A, 5.00%, 1/15/14, Callable 1/15/07 @ 102 | | | 1,000,000 | | | 1,077,100 |
Cumberland County, North Carolina, Hospital Facilities, 5.25%, 10/1/10, Callable 10/1/09 @ 101 | | | 1,035,000 | | | 1,130,251 |
New Hanover County, North Carolina, Regional Medical Center Project, 5.25%, 10/1/12, Callable 10/1/09 @ 101, MBIA | | | 1,000,000 | | | 1,108,130 |
North Carolina Medical Care Community Hospital, Northeast Medical Center Project, 5.75%, 11/1/06, AMBAC | | | 1,150,000 | | | 1,239,378 |
Continued
78
North Carolina Intermediate Tax-Free Fund
Schedule of Portfolio Investments, continued September 30, 2004 |
| | | | | | |
| | | Principal
Amount
| | Fair Value
|
Municipal Bonds, continued | | | | | | |
Health Care Bonds, continued | | | | | | |
North Carolina Medical Care Community Hospital, Carolina Medicorp Project, 5.25%, 5/1/09, Callable 5/1/07 @ 100 | | $ | 1,325,000 | | $ | 1,416,147 |
North Carolina Medical Care Community Hospital, Series A, 2.00%, 11/1/05 | | | 500,000 | | | 497,190 |
North Carolina Medical Care Community Hospital, Stanley Memorial Hospital, 5.45%, 10/1/08, Callable 10/1/06 @ 102, AMBAC | | | 750,000 | | | 811,238 |
North Carolina Medical Care Community Hospital, Gaston Memorial Hospital Project, 5.40%, 2/15/11 | | | 525,000 | | | 556,285 |
North Carolina Medical Care Community Hospital, Gaston Health Care, 4.625%, 2/15/07 | | | 1,100,000 | | | 1,156,144 |
North Carolina Medical Care Community Hospital, Gaston Memorial Hospital, 5.50%, 2/15/15, Callable 2/15/06 @ 102 | | | 1,980,000 | | | 2,100,661 |
North Carolina Medical Care Community Hospital, Halifax Regional Medical Center, 4.60%, 8/15/07 | | | 1,795,000 | | | 1,862,833 |
North Carolina Medical Care Community Hospital, Pitt County Memorial Hospital, Series A, 5.00%, 12/1/07 | | | 1,625,000 | | | 1,757,291 |
North Carolina Medical Care Community Hospital, Pitt County Memorial Hospital, Series A, 5.25%, 12/1/10, Callable 12/1/08 @ 101 | | | 1,220,000 | | | 1,335,009 |
Pitt County, North Carolina, Memorial Hospital, 5.50%, 12/1/15, Callable 12/1/05 @ 102 | | | 3,090,000 | | | 3,275,431 |
Wake County, North Carolina, Hospital, 5.125%, 10/1/13, MBIA | | | 2,630,000 | | | 2,968,428 |
| | | | | |
|
|
| | | | | | | 25,840,725 |
| | | | | |
|
|
Transportation Bonds (1.3%) | | | | | | |
Piedmont, North Carolina, Triad Airport Authority, Series A, 6.375%, 7/1/16, Callable 7/1/09 @ 101, FSA | | | 1,385,000 | | | 1,595,908 |
| | | | | |
|
|
Urban and Community Development (2.1%) | | | | | | |
Charlotte, North Carolina, New Public Housing Authority, 5.00%, 2/1/09, Callable 2/1/05 @ 101 | | | 485,000 | | | 523,737 |
Charlotte, North Carolina, New Public Housing Authority, 5.00%, 2/1/10, Callable 2/1/05 @ 101 | | | 580,000 | | | 628,743 |
Charlotte, North Carolina, New Public Housing Authority, 5.00%, 2/1/11 | | | 350,000 | | | 380,002 |
Durham, North Carolina, Public Housing Authority, 5.00%, 2/1/09, Callable 2/1/05 @ 101 | | | 510,000 | | | 550,734 |
Durham, North Carolina, New Public Housing Authority, 5.125%, 6/1/10, Callable 12/1/04 @ 101, U.S. Government Guaranteed | | | 160,000 | | | 175,238 |
Durham, North Carolina, New Public Housing Authority, 5.00%, 2/1/11, Callable 2/1/05 @ 101 | | | 200,000 | | | 217,144 |
| | | | | |
|
|
| | | | | | | 2,475,598 |
| | | | | |
|
|
| | | | | | | |
| | | Shares or
Principal
Amount
| | Fair Value
| |
Municipal Bonds, continued | | | | | | | |
Utility Bonds (23.6%) | | | | | | | |
Brunswick County, North Carolina, Enterprise System Revenue, 5.25%, 4/1/16, Callable 4/1/14 @ 100 | | $ | 1,000,000 | | $ | 1,119,830 | |
Charlotte, North Carolina, Water & Sewer System, 5.25%, 7/1/13 | | | 1,000,000 | | | 1,137,360 | |
Charlotte, North Carolina, Water & Sewer System, 5.00%, 6/1/23, Callable 6/1/09 @ 102 | | | 550,000 | | | 578,743 | |
Charlotte, North Carolina Water & Sewer System, 5.25%, 6/1/25, Callable 6/1/10 @ 101 | | | 3,000,000 | | | 3,386,941 | |
Durham, North Carolina, Water & Sewer Utility Systems, 5.00%, 6/1/12, Callable 6/1/11 @ 101 | | | 1,000,000 | | | 1,107,120 | |
Gastonia, North Carolina, Utilities System, 5.00%, 5/1/09 | | | 1,155,000 | | | 1,269,576 | |
Gastonia, North Carolina, Utilities System, 5.00%, 5/1/10, MBIA | | | 1,000,000 | | | 1,104,680 | |
Greenville, North Carolina, Enterprise Systems, 5.50%, 9/1/10, FSA | | | 1,455,000 | | | 1,652,007 | |
Greenville, North Carolina, Utilities, Series A, 5.60%, 9/1/20, Callable 3/1/09 @ 101, MBIA | | | 150,000 | | | 165,465 | |
North Carolina, Eastern Municipal Power, Series A, 5.00%, 1/1/17 | | | 190,000 | | | 210,647 | |
North Carolina, Eastern Municipal Power, 6.40%, 1/1/21 | | | 2,595,000 | | | 3,257,607 | |
North Carolina Eastern Municipal Power, Series A, 6.00%, 1/1/26, Callable 1/1/22 @ 100 | | | 1,020,000 | | | 1,242,258 | |
North Carolina Enterprise System Revenue, Series A, 5.25%, 4/1/17, Callable 4/1/14 @ 100 | | | 1,000,000 | | | 1,114,750 | |
North Carolina Municipal Power Agency, Series A, 3.00%, 1/1/05 | | | 3,000,000 | | | 3,008,280 | |
North Carolina, Municipal Power Agency,
No. 1, Catawba Electric Revenue, 5.50%, 1/1/13, AMBAC | | | 1,610,000 | | | 1,846,445 | |
North Carolina, Municipal Power Agency, No. 1, Catawba Electric Revenue, 5.50%, 1/1/13 | | | 1,035,000 | | | 1,187,000 | |
Orange Water & Sewer Authority, North Carolina, Water & Sewer System, Series A, 5.25%, 7/1/16, Callable 7/1/14 @ 100 | | | 1,475,000 | | | 1,658,092 | |
Orange Water & Sewage Authority, North Carolina, Water & Sewage System, Series A, 5.25%, 7/1/18, Callable 7/1/14 @ 100 | | | 1,690,000 | | | 1,880,767 | |
Raleigh, North Carolina, 5.00%, 3/1/13 | | | 1,180,000 | | | 1,315,086 | |
| | | | | |
|
|
|
| | | | | | | 28,242,654 | |
| | | | | |
|
|
|
Total Municipal Bonds
(Cost $111,189,528) | | | | | | 117,343,910 | |
| | | | | |
|
|
|
Investment Company (1.9%) | | | | | | | |
PNC North Carolina Blackrock Fund —
Institutional Class | | | 2,289,897 | | | 2,289,897 | |
| | | | | |
|
|
|
Total Investment Company
(Cost $2,289,897) | | | | | | 2,289,897 | |
| | | | | |
|
|
|
Total Investments
(Cost $113,479,425) (a) — 100.2% | | | | | | 119,633,807 | |
Net other assets ( liabilities) — (0.2)% | | | | | | (207,040 | ) |
| | | | | |
|
|
|
Net Assets — 100.0% | | | | | $ | 119,426,767 | |
| | | | | |
|
|
|
Continued
79
North Carolina Intermediate Tax-Free Fund
Schedule of Portfolio Investments, continued September 30, 2004 |
| (a) | | Represents cost for financial reporting purposes, is substantially the same for federal income tax purposes, and differs from fair value by net unrealized appreciation/depreciation as follows: |
| | | | |
Unrealized appreciation | | $ | 6,182,773 | |
Unrealized depreciation | | | (28,391 | ) |
| | |
|
|
|
Net unrealized appreciation | | $ | 6,154,382 | |
| | |
|
|
|
| (b) | | Rule 144A, Section 4(2) or other security which is restricted as to resale to institutional investors. The Investment Advisor, using Board approved procedures has deemed these securities to be illiquid. Represents 2.1% of net assets. |
AMBAC — Insured by the AMBAC Indemnity Corporation.
FGIC — Insured by the Financial Guaranty Insurance Corporation.
FSA — Insured by the Financial Security Assurance.
MBIA — Insured by the Municipal Bond Insurance Association.
XLCA — Insured by the XL Capital Assurance.
| * | | The interest rate for this variable rate note, which will change periodically, is based either on the prime rate or an index of market rates. The rate reflected is the rate in effect as of September 30, 2004. The maturity date reflected is the final maturity date. |
See accompanying notes to the financial statements.
80
South Carolina Intermediate Tax-Free Fund
Schedule of Portfolio Investments September 30, 2004 |
| | | | | | |
| | | Principal
Amount
| | Fair Value
|
Municipal Bonds (97.8%) | | | | | | |
General Obligation Bonds (45.6%) | | | | | | |
Anderson County, South Carolina, School District, Series B, 6.00%, 3/1/12, SCSDE | | $ | 500,000 | | $ | 579,569 |
Beaufort County, South Carolina, School District, Series C, 5.00%, 3/1/09 | | | 500,000 | | | 548,625 |
Berkeley County, South Carolina, School District, 5.375%, 4/1/09, Callable 4/1/08 @ 102, SCSDE | | | 750,000 | | | 829,477 |
Berkeley County, South Carolina, School District, 5.375%, 4/1/10, Callable 4/1/08 @ 102, SCSDE | | | 500,000 | | | 555,940 |
Charleston County, South Carolina, School District, 5.00%, 2/1/11 | | | 500,000 | | | 554,490 |
Charleston County, South Carolina, School District, 5.00%, 12/1/11, FGIC | | | 300,000 | | | 329,058 |
Charleston County, South Carolina, School District, Series B, 5.00%, 2/1/19, SCSDE | | | 250,000 | | | 265,583 |
Georgetown County, South Carolina, School District, 5.50%, 3/1/08, SCSDE | | | 500,000 | | | 552,090 |
Horry County, South Carolina, School District, Series A, 5.00%, 3/1/11, SCSDE | | | 500,000 | | | 555,120 |
Horry County, South Carolina, School District, 5.125%, 3/1/14, Callable 3/1/13 @ 100, SCDSC | | | 500,000 | | | 555,635 |
Kershaw County, South Carolina, School District, 6.375%, 2/1/10, SCSDE | | | 50,000 | | | 58,358 |
Kershaw County, South Carolina, School District, 6.125%, 2/1/16, Callable 2/1/10 @ 100, SCSDE | | | 500,000 | | | 575,160 |
Lancaster County, South Carolina, School District, 5.00%, 3/1/11, Callable 3/1/10 @ 101, SCSDE | | | 500,000 | | | 550,935 |
Lexington County, South Carolina, 5.00%, 2/1/14, Callable 2/1/12 @ 100, FGIC | | | 500,000 | | | 547,175 |
South Carolina Educational Facilities Authority, 2.50%, 3/1/05 | | | 190,000 | | | 190,144 |
South Carolina, State School Facilities, Series A, 5.75%, 1/1/10, State Aid Withholding | | | 500,000 | | | 570,250 |
South Carolina State School Facilities, Series A, 5.00%, 3/1/13, Callable 3/1/10 @ 101, State Aid Withholding | | | 335,000 | | | 367,137 |
Spartanburg County, South Carolina, School District, 5.25%, 5/1/10, SCSDE | | | 500,000 | | | 560,645 |
York County, South Carolina, School District, Series A, 5.00%, 3/1/11, Callable 3/1/09 @ 101, SCSDE | | | 500,000 | | | 548,555 |
York County, South Carolina, School District, Series A, 5.80%, 3/1/13, Callable 3/1/09 @ 101, SCSDE, FSA | | | 500,000 | | | 570,030 |
| | | | | |
|
|
| | | | | | | 9,863,976 |
| | | | | |
|
|
Health Care Bonds (19.8%) | | | | | | |
Florence County, South Carolina, Regional Medical Center Project, Series A, 5.00%, 11/1/09, FSA | | | 500,000 | | | 549,630 |
Florence County, South Carolina, Regional Medical Center Project, Series A, 5.25%, 11/1/11, Callable 11/1/08 @ 102, MBIA | | | 500,000 | | | 554,410 |
| | | | | | |
| | | Principal
Amount
| | Fair Value
|
Municipal Bonds, continued | | | | | | |
Health Care Bonds, continued | | | | | | |
Greenville, South Carolina, Hospital Systems, Series A, 5.25%, 5/1/06, GTY AGMT | | $ | 500,000 | | $ | 524,305 |
Lexington County, South Carolina, Health Services District, 4.75%, 11/1/09 | | | 500,000 | | | 531,750 |
Medical University of South Carolina Facilities, 6.00%, 8/15/12 | | | 500,000 | | | 559,825 |
Medical University of South Carolina Facilities, 6.00%, 7/1/14, Callable 7/1/09 @ 101 | | | 200,000 | | | 230,328 |
South Carolina Jobs Economic Development Authority Hospital Facilities, Series A, 2.75%, 4/1/05 | | | 500,000 | | | 500,310 |
South Carolina Jobs Economic Development Authority Hospital Facilities, 6.00%, 8/1/12 | | | 250,000 | | | 276,113 |
South Carolina Jobs Economic Development Authority Hospital Facilities, Anderson Area Medical Center, 5.50%, 2/1/11, Callable 2/1/09 @ 101, FSA | | | 500,000 | | | 556,850 |
| | | | | |
|
|
| | | | | | | 4,283,521 |
| | | | | |
|
|
Housing Bonds (0.5%) | | | | | | |
Florence, South Carolina, New Public Housing Authority, 5.75%, 8/1/10, Callable 2/1/05 @ 101, FHA | | | 100,000 | | | 113,074 |
| | | | | |
|
|
Pollution Control Bonds 1.7% | | | | | | |
Georgetown County, South Carolina, Pollution Control, Series A, 5.125%, 2/1/12 | | | 360,000 | | | 381,517 |
| | | | | |
|
|
Transportation Bonds (3.6%) | | | | | | |
South Carolina, Transportation Infrastructure, 5.25%, 10/1/08, AMBAC | | | 700,000 | | | 773,451 |
| | | | | |
|
|
Utility Bonds (26.5%) | | | | | | |
Charleston, South Carolina, Waterworks & Sewer, 5.125%, 1/1/12 | | | 425,000 | | | 475,809 |
Charleston, South Carolina, Waterworks & Sewer, 5.25%, 1/1/14 | | | 600,000 | | | 669,780 |
Florence, South Carolina, Waterworks & Sewer, 7.50%, 3/1/11, Callable 3/1/10 @ 101 AMBAC | | | 590,000 | | | 727,222 |
Piedmont, South Carolina, Municipal Power Agency, 5.40%, 1/1/07, MBIA | | | 500,000 | | | 537,365 |
Piedmont, South Carolina, Municipal Power Agency, 4.50%, 1/1/09, Callable 1/1/05 @ 100, FGIC | | | 500,000 | | | 503,665 |
Piedmont, South Carolina, Municipal Power Agency, Series A, 6.50%, 1/1/14, FGIC | | | 500,000 | | | 606,630 |
Rock Hill South Carolina Utility System,
Series A, 5.375%, 1/1/19, Callable 1/1/13
@ 100, FSA | | | 500,000 | | | 551,210 |
South Carolina State Public Service Authority, Series A, 5.50%, 1/1/09, MBIA | | | 500,000 | | | 557,575 |
Spartanburg, South Carolina, Water Works, 5.25%, 6/1/11, FSA | | | 500,000 | | | 562,120 |
Western Carolina, Sewer Authority, 5.25%, 3/1/10, FSA | | | 500,000 | | | 557,565 |
| | | | | |
|
|
| | | | | | | 5,748,941 |
| | | | | |
|
|
Total Municipal Bonds
(Cost $19,889,917) | | | | | | 21,164,480 |
| | | | | |
|
|
Continued
81
South Carolina Intermediate Tax-Free Fund
Schedule of Portfolio Investments, continued September 30, 2004 |
| | | | | |
| | | Shares
| | Fair Value
|
Investment Company (1.4%) | | | | | |
Federated Tax Exempt Money Market Fund | | 303,340 | | $ | 303,340 |
| | | | |
|
|
Total Investment Company
(Cost $303,340) | | | | | 303,340 |
| | | | |
|
|
Total Investments
(Cost $20,193,257) (a) — 99.2% | | | | | 21,467,820 |
Net other assets (liabilities) — 0.8% | | | | | 168,778 |
| | | | |
|
|
Net Assets — 100.0% | | | | $ | 21,636,598 |
| | | | |
|
|
| (a) | | Represents cost for financial reporting purposes, is substantially the same for federal tax purposes, and differs from fair value by net unrealized appreciation/depreciation of securities as follows: |
| | | | |
Unrealized appreciation | | $ | 1,278,443 | |
Unrealized depreciation | | | (3,880 | ) |
| | |
|
|
|
Net unrealized appreciation | | $ | 1,274,563 | |
| | |
|
|
|
AMBAC — Insured by the AMBAC Indemnity Corporation.
FGIC — Insured by the Financial Guarantee Insurance Corporation.
FHA — Insured by the Federal Housing Administration.
FSA — Insured by the Financial Security Assurance.
GTY AGMT — Insured by the Guaranty Agreement.
MBIA — Insured by the Municipal Bond Insurance Association.
SCSDE — Insured by the South Carolina School District Enhancement.
See accompanying notes to the financial statements.
82
Virginia Intermediate Tax-Free Fund
Schedule of Portfolio Investments September 30, 2004 |
| | | | | | |
| | | Principal
Amount
| | Fair Value
|
Municipal Bonds (96.2%) | | | | | | |
Education Bonds (13.2%) | | | | | | |
University of Virginia, General Revenue, Series B, 5.00%, 6/1/22, Callable 6/1/13 @ 100 | | $ | 750,000 | | $ | 792,623 |
Virginia College Building Authority, 5.50%, 4/1/10 | | | 1,000,000 | | | 1,122,710 |
Virginia College Building Authority, 5.25%, 1/1/31, MBIA | | | 1,255,000 | | | 1,378,492 |
Virginia State Public School Authority, Series I, 5.25%, 8/1/10 | | | 2,050,000 | | | 2,300,079 |
Virginia State Public School Authority, Series B, 5.25%, 8/1/10, Callable 8/1/09 @ 101 | | | 1,000,000 | | | 1,123,970 |
Virginia State Public School Authority, Series I, 5.00%, 8/1/11, Callable 8/1/07 @ 101 | | | 1,125,000 | | | 1,216,181 |
Virginia State Public School Authority, Series D, 5.25%, 2/1/12, State Aid Withholding | | | 1,145,000 | | | 1,292,556 |
Virginia State Public School Authority, Series C, 5.00%, 8/1/28, State Aid Withholding | | | 1,500,000 | | | 1,542,090 |
| | | | | |
|
|
| | | | | | | 10,768,701 |
| | | | | |
|
|
General Obligation Bonds (43.8%) | | | | | | |
Alexandria, Virginia, 5.00%, 1/1/13 | | | 1,850,000 | | | 2,069,836 |
Alexandria, Virginia, Public Improvement, 5.00%, 6/15/08 | | | 1,000,000 | | | 1,094,370 |
Arlington County, Virginia, 5.00%, 5/15/12, State Aid Withholding | | | 1,000,000 | | | 1,120,540 |
Arlington County, Virginia, 5.00%, 5/15/13, State Aid Withholding | | | 1,295,000 | | | 1,452,627 |
Arlington County, Virginia, 5.00%, 5/15/15, Callable 5/15/14 @ 100, State Aid Withholding | | | 1,795,000 | | | 2,000,904 |
Arlington County, Virginia, 5.125%, 6/1/11, Callable 6/1/09 @ 100 | | | 1,000,000 | | | 1,108,130 |
Chesapeake, Virginia, 5.50%, 5/1/09, Callable 5/1/05 @ 102 | | | 1,000,000 | | | 1,042,680 |
Fairfax County, Virginia, Public Improvement, Series B, 5.50%, 12/1/07 | | | 1,000,000 | | | 1,102,400 |
Fairfax County, Virginia, Public Improvement, Series A, 5.00%, 6/1/09, Callable 6/1/08 @ 102 | | | 2,000,000 | | | 2,200,740 |
Henrico County Virginia, Public Improvement, 5.00%, 7/15/10 | | | 1,545,000 | | | 1,718,164 |
Manassas, Virginia, 5.25%, 1/1/11, Callable 1/1/08 @ 102 | | | 1,200,000 | | | 1,324,116 |
Newport News, Virginia, 5.00%, 3/1/11 | | | 2,000,000 | | | 2,181,920 |
Newport News, Virginia, Series A, 5.50%, 5/1/13, Callable 5/1/10 @ 102 | | | 1,845,000 | | | 2,119,739 |
Newport News, Virginia, Series A, 5.00%, 7/1/22, Callable 7/1/13 @ 100, State Aid Withholding | | | 1,250,000 | | | 1,317,850 |
Pittsylvania County, Virginia, 5.625%, 3/1/15 | | | 1,315,000 | | | 1,515,985 |
Richmond, Virginia, 5.25%, 1/15/09 | | | 1,500,000 | | | 1,662,435 |
Richmond, Virginia, Public Improvement, Series A, 5.45%, 1/15/08 | | | 1,500,000 | | | 1,649,010 |
Roanoke, Virginia, Public Improvement, 5.00%,10/1/17, Callable 10/1/14 @ 101 | | | 1,000,000 | | | 1,106,830 |
Spotsylvania County, Virginia, 5.50%, 7/15/12, FSA | | | 2,925,000 | | | 3,380,305 |
Virginia Beach, Virginia, Public Improvement, 5.25%, 3/1/08 | | | 1,000,000 | | | 1,095,660 |
Virginia Beach, Virginia, Public Improvement, 5.25%, 3/1/11, Callable 3/1/10 @ 101 | | | 3,205,000 | | | 3,568,126 |
| | | | | |
|
|
| | | | | | | 35,832,367 |
| | | | | |
|
|
| | | | | | |
| | | Principal
Amount
| | Fair Value
|
Municipal Bonds, continued | | | | | | |
Health Care Bonds (11.0%) | | | | | | |
Danville, Virginia, Industrial Development Authority, Regional Medical Center, 5.00%, 10/1/07, AMBAC | | $ | 1,160,000 | | $ | 1,250,724 |
Fredericksburg, Virginia, Industrial Development Authority, Hospital Facilities Revenue, Medicorp Health Systems, 5.00%, 8/15/08 | | | 1,430,000 | | | 1,541,225 |
Norfolk, Virginia, Industrial Development Authority, Daughters Charity Hospital, 6.50%, 12/1/07, Callable 12/1/04 @ 100 | �� | | 800,000 | | | 805,976 |
Virginia Beach, Virginia, Industrial Development Authority, Sentara Health Systems, 5.25%, 11/1/09, Callable 11/1/08 @ 101, MBIA | | | 1,000,000 | | | 1,097,300 |
Virginia Biotechnology Research Authority Lease Revenue, Biotech Two Project, 5.15%, 9/1/10 | | | 1,100,000 | | | 1,173,689 |
Virginia Biotechnology Research Authority Lease Revenue, Biotech Two Project, 5.25%, 9/1/12, Callable 9/1/06 @ 101 | | | 1,500,000 | | | 1,603,290 |
Winchester, Virginia, Industrial Development Authority, Winchester Medical Center, 5.25%, 1/1/06, Callable 12/2/04 @ 102, AMBAC | | | 1,500,000 | | | 1,534,050 |
| | | | | |
|
|
| | | | | | | 9,006,254 |
| | | | | |
|
|
Housing Bonds (2.6%) | | | | | | |
Suffolk, Virginia Redevelopment & Housing Authority, 4.85%, 7/1/31 | | | 1,050,000 | | | 1,133,234 |
Virginia Gateway Community Development Authority, 6.375%, 3/1/30, Callable 3/1/13 @ 102 (b) | | | 1,000,000 | | | 1,005,600 |
| | | | | |
|
|
| | | | | | | 2,138,834 |
| | | | | |
|
|
Transportation Bonds (14.1%) | | | | | | |
Chesapeake Bay Bridge & Tunnel, Virginia, 5.50%, 7/1/06, Callable 7/1/05 @ 102, FGIC | | | 2,400,000 | | | 2,513,376 |
Chesapeake Bay Bridge & Tunnel, Virginia, 5.25%, 7/1/19, Callable 7/1/05 @ 102, MBIA | | | 1,075,000 | | | 1,125,880 |
Fairfax County, Virginia, Economic Development Authority, 1st Series, 5.25%, 9/1/10, Callable 9/1/09 @ 102 | | | 1,000,000 | | | 1,117,490 |
Fairfax County, Virginia, Economic Development Authority, 5.00%, 4/1/21, Callable 4/1/14 @ 100, MBIA | | | 1,000,000 | | | 1,064,570 |
Northern Virginia Community Commuter Rail, 5.375%, 7/1/14 | | | 1,000,000 | | | 1,114,520 |
Virginia Commonwealth, 5.75%, 5/15/09 | | | 1,035,000 | | | 1,172,603 |
Virginia Commonwealth Transportation Board, 5.50%, 5/15/15, Callable 5/15/09 @101 | | | 1,185,000 | | | 1,332,177 |
Virginia State Transportation Board, Transportation Contract Revenue, Series A, 5.125%, 5/15/12, Callable 5/15/06 @ 101 | | | 2,000,000 | | | 2,117,800 |
| | | | | |
|
|
| | | | | | | 11,558,416 |
| | | | | |
|
|
Utility Bonds (9.2%) | | | | | | |
Chesterfield County, Virginia, Pollution Control Authority, 5.50%, 10/1/09, Callable 11/8/06 @ 101 | | | 2,500,000 | | | 2,670,100 |
Continued
83
Virginia Intermediate Tax-Free Fund
Schedule of Portfolio Investments, continued September 30, 2004 |
| | | | | | |
| | | Principal
Amount
| | Fair Value
|
Municipal Bonds, continued | | | | | | |
Utility Bonds, continued | | | | | | |
Henrico County, Virginia, Water & Sewer, 5.25%, 5/1/11, Callable 5/1/09 @ 102 | | $ | 1,310,000 | | $ | 1,456,301 |
Loudoun County, Virginia, Water & Sewer, 5.75%, 1/1/11, FSA | | | 1,000,000 | | | 1,147,080 |
Norfolk, Virginia, Water Revenue, 5.125%, 11/1/11, Callable 11/1/08 @ 101, FSA | | | 1,030,000 | | | 1,139,994 |
Prince William County, Virginia, Service Authority Water & Sewer System Revenue, 5.00%, 7/1/14, Callable 7/1/13 @ 102 | | | 1,000,000 | | | 1,116,410 |
| | | | | |
|
|
| | | | | | | 7,529,885 |
| | | | | |
|
|
Washington, DC (2.3%) | | | | | | |
Washington DC, Metropolitan Transportation Authority, 6.00%, 7/1/09, FGIC | | | 1,600,000 | | | 1,833,952 |
| | | | | |
|
|
Total Municipal Bonds
(Cost $73,908,725) | | | | | | 78,668,409 |
| | | | | |
|
|
| | | | | |
| | | Shares
| | Fair Value
|
Investment Company (3.3%) | | | | | |
PNC Virginia Blackrock Fund — Institutional Class | | 2,693,370 | | $ | 2,693,370 |
| | | | |
|
|
Total Investment Company
(Cost $2,693,370) | | | | | 2,693,370 |
| | | | |
|
|
Total Investments
(Cost $76,602,095) (a) — 99.5% | | | | | 81,361,779 |
Net other assets (liabilities) — 0.5% | | | | | 428,517 |
| | | | |
|
|
Net Assets — 100.0% | | | | $ | 81,790,296 |
| | | | |
|
|
| (a) | | Represents cost for financial reporting purposes, is substantially the same for federal income tax purposes, and differs from fair value by net unrealized appreciation of securities as follows: |
| | | | |
Unrealized appreciation | | $ | 4,772,147 | |
Unrealized depreciation | | | (12,463 | ) |
| | |
|
|
|
Net unrealized appreciation | | $ | 4,759,684 | |
| | |
|
|
|
| (b) | | Rule 144A, Section 4(2) or other security which is restricted as to resale to institutional investors. The Investment Advisor, using Board approved procedures has deemed these securities to be illiquid. Represents 1.2% of net assets. |
AMBAC — Insured by the AMBAC Indemnity Corporation.
FGIC — Insured by the Financial Guaranty Insurance Corporation.
FSA — Insured by the Financial Security Assurance.
MBIA — Insured by the Municipal Bond Insurance Association.
See accompanying notes to the financial statements.
84
West Virginia Intermediate Tax-Free Fund
Schedule of Portfolio Investments September 30, 2004 |
| | | | | | |
| | | Principal
Amount
| | Fair Value
|
Municipal Bonds (97.6%) | | | | | | |
Commission Bonds (9.4%) | | | | | | |
Harrison County, West Virginia, Building Commission, 5.15%, 4/1/18, Callable 4/1/08 @ 102, AMBAC | | $ | 1,000,000 | | $ | 1,068,590 |
West Virginia State Building Commission, Series A, 5.25%, 7/1/09, Callable 7/1/07 @ 102, MBIA | | | 1,000,000 | | | 1,096,430 |
West Virginia State Building Commission, Series A, 5.25%, 7/1/10, AMBAC | | | 2,000,000 | | | 2,231,580 |
West Virginia State Building Commission, Series A, 5.25%, 7/1/11, AMBAC | | | 1,000,000 | | | 1,120,340 |
Wood County, West Virginia, Building Commission, 6.875%, 1/1/08, Callable 7/1/05 @ 100 | | | 1,290,000 | | | 1,461,738 |
| | | | | |
|
|
| | | | | | | 6,978,678 |
| | | | | |
|
|
Education Bonds (18.9%) | | | | | | |
West Virginia Higher Education, Series A, 5.00%, 4/1/11, MBIA | | | 2,000,000 | | | 2,216,640 |
West Virginia Higher Education, Series A, 5.00%, 4/1/12, MBIA | | | 2,000,000 | | | 2,222,939 |
West Virginia Higher Education, Series B, 5.00%, 4/1/29, FGIC | | | 2,000,000 | | | 2,048,640 |
West Virginia School Building Authority, 6.00%, 7/1/08, Callable 7/1/07 @ 102, AMBAC | | | 560,000 | | | 625,458 |
West Virginia School Building Authority, 5.40%, 7/1/10, Callable 7/1/07 @ 102, AMBAC | | | 750,000 | | | 825,308 |
West Virginia University, 5.75%, 4/1/16, Callable 4/1/06 @ 101, AMBAC | | | 1,000,000 | | | 1,068,040 |
West Virginia University, Series A, 5.00%, 4/1/08, MBIA | | | 500,000 | | | 544,130 |
West Virginia University, Series A, 5.50%, 4/1/10, MBIA | | | 1,405,000 | | | 1,586,133 |
West Virginia University, Series A, Series A, 5.50%, 4/1/11, MBIA | | | 1,485,000 | | | 1,689,217 |
West Virginia University, Series A, 5.25%, 4/1/13, Callable 4/1/08 @ 102, AMBAC | | | 1,125,000 | | | 1,242,608 |
| | | | | |
|
|
| | | | | | | 14,069,113 |
| | | | | |
|
|
General Obligation Bonds (18.8%) | | | | | | |
Ohio County, West Virginia, Board of Education, 5.00%, 6/1/13, Callable 6/1/08 @ 102, MBIA | | | 800,000 | | | 873,000 |
Ohio County, West Virginia, Board of Education, 5.50%, 6/1/14, MBIA | | | 880,000 | | | 1,019,366 |
West Virginia State, 5.50%, 6/1/09, FSA | | | 3,000,000 | | | 3,365,520 |
West Virginia State, 5.50%, 6/1/10, FSA | | | 1,500,000 | | | 1,697,280 |
West Virginia State, 5.25%, 6/1/12, Callable 6/1/08 @ 101, FGIC | | | 830,000 | | | 914,212 |
West Virginia State, Series D, 5.25%, 11/1/12, Callable 11/1/06 @ 102, FGIC | | | 1,495,000 | | | 1,618,352 |
West Virginia State, 5.75%, 6/1/14, Callable 6/1/09 @ 101 | | | 2,000,000 | | | 2,259,020 |
West Virginia State, 5.75%, 6/1/15, Callable 6/1/09 @ 101 | | | 1,000,000 | | | 1,126,710 |
West Virginia State, 5.625%, 6/1/19 Callable 6/1/10 @ 101, FGIC | | | 1,000,000 | | | 1,125,370 |
| | | | | |
|
|
| | | | | | | 13,998,830 |
| | | | | |
|
|
| | | | | | |
| | | Principal
Amount
| | Fair Value
|
Municipal Bonds, continued | | | | | | |
Health Care Bonds (12.7%) | | | | | | |
Logan County, West Virginia, Logan County Health, 8.00%, 12/1/16 | | $ | 690,000 | | $ | 940,953 |
South Charleston, West Virginia, 5.50%, 10/1/09, Callable 10/1/04 @ 100, MBIA | | | 520,000 | | | 521,518 |
Weirton, West Virginia, Municipal Hospital Building, Series A, 5.25%, 12/1/11 | | | 2,580,000 | | | 2,707,453 |
West Virginia State Hospital Finance Authority, 5.60%, 1/1/05, AMBAC | | | 200,000 | | | 201,998 |
West Virginia State Hospital Finance Authority, 5.90%, 1/1/06, Callable 1/1/05 @ 100, MBIA | | | 680,000 | | | 682,203 |
West Virginia State Hospital Finance Authority, 5.00%, 8/1/09, Callable 8/1/07 @ 100, FSA | | | 800,000 | | | 852,592 |
West Virginia State Hospital Finance Authority, 6.00%, 9/1/12, Callable 9/1/10 @ 101 | | | 590,000 | | | 658,175 |
West Virginia State Hospital Finance Authority, Series A, 6.50%, 9/1/16 | | | 465,000 | | | 583,412 |
West Virginia State Hospital Finance Authority, 6.10%, 1/1/18, Callable 1/1/05 @ 100, MBIA | | | 1,300,000 | | | 1,304,173 |
West Virginia State Hospital Finance Authority, 5.50%, 3/1/22, Callable 3/1/14 @ 100 | | | 970,000 | | | 992,135 |
| | | | | |
|
|
| | | | | | | 9,444,612 |
| | | | | |
|
|
Housing Bonds (3.8%) | | | | | | |
Cabell, Putnam & Wayne Counties, West Virginia, Single Family Residential Mortgage, 7.375%, 4/1/11, FGIC | | | 640,000 | | | 782,701 |
Webster County, West Virginia, Housing Development Corporate Mortgage, 6.50%, 4/1/18, Callable 10/1/04 @ 101, FHA | | | 1,010,000 | | | 1,021,544 |
West Virginia State Housing Development Fund, Series A, 5.60%, 5/1/16, Callable 5/1/06 @ 102 | | | 985,000 | | | 1,025,710 |
| | | | | |
|
|
| | | | | | | 2,829,955 |
| | | | | |
|
|
Pollution Control Bonds (7.0%) | | | | | | |
Marshall County, West Virginia, Pollution Control, 5.45%, 7/1/14, Callable 1/1/05 @ 101, MBIA | | | 950,000 | | | 971,793 |
Monongalia County, West Virginia, Pollution Control, 5.95%, 4/1/13, Callable 4/1/05 @ 101, MBIA | | | 2,000,000 | | | 2,054,660 |
Pleasants County, West Virginia, Pollution Control, Series C, 6.15%, 5/1/15, Callable 5/1/05 @ 102, AMBAC | | | 1,100,000 | | | 1,148,147 |
Pleasants County, West Virginia, Pollution Control, Series C, 6.15%, 5/1/15, Callable 5/1/05 @ 102, AMBAC, MBIA | | | 1,000,000 | | | 1,043,770 |
| | | | | |
|
|
| | | | | | | 5,218,370 |
| | | | | |
|
|
Transportation Bonds (19.4%) | | | | | | |
Charleston, West Virginia, Series A, 7.00%, 6/1/16, Callable 12/1/04 @ 102, LOC — Bank One West Virginia | | | 580,000 | | | 596,379 |
Charleston, West Virginia, Urban Renewal Authority, 5.25%, 12/15/18, Callable 12/15/09 @ 103, FSA | | | 1,060,000 | | | 1,170,929 |
Continued
85
West Virginia Intermediate Tax-Free Fund
Schedule of Portfolio Investments, continued September 30, 2004 |
| | | | | | |
| | | Principal
Amount
| | Fair Value
|
Municipal Bonds, continued | | | | | | |
Transportation Bonds, continued | | | | | | |
West Virginia Economic Development Authority, Series A, 5.50%, 6/1/12, MBIA | | $ | 2,000,000 | | $ | 2,291,519 |
West Virginia Economic Development Authority, Series A, 5.50%, 6/1/15, Callable 6/1/12 @ 101, MBIA | | | 1,000,000 | | | 1,126,020 |
West Virginia Economic Development Authority, Series A, 5.00%, 10/1/15, Callable 10/1/11 @ 101 | | | 1,250,000 | | | 1,351,875 |
West Virginia Economic Development Authority, 5.50%, 6/1/18, Callable 6/1/12, MBIA | | | 1,000,000 | | | 1,126,310 |
West Virginia Economic Development, Department of Environmental Protection, 4.75%, 11/1/10 | | | 750,000 | | | 813,810 |
West Virginia Economic Development, Department of Environmental Protection, 4.75%, 11/1/11 | | | 785,000 | | | 851,521 |
West Virginia Economic Development, Department of Environmental Protection, 4.75%, 11/1/12 | | | 815,000 | | | 882,009 |
West Virginia State Parkways Economic Development and Tourism Authority, 5.00%, 5/15/10, FGIC | | | 2,055,000 | | | 2,271,022 |
West Virginia State Parkways Economic Development and Tourism Authority, 5.25%, 5/15/12, FGIC | | | 1,000,000 | | | 1,128,670 |
West Virginia State Parkways Economic Development & Tourism Authority, 5.25%, 5/15/17, FGIC | | | 700,000 | | | 795,725 |
| | | | | |
|
|
| | | | | | | 14,405,789 |
| | | | | |
|
|
| | | | | | |
| | | Shares or
Principal
Amount
| | Fair Value
|
Municipal Bonds, continued | | | | | | |
Utility Bonds (7.6%) | | | | | | |
Fairmont, West Virginia, Waterworks, 5.375%, 7/1/13, Callable 7/1/07 @ 102, MBIA | | $ | 680,000 | | $ | 747,823 |
Harrison County, West Virginia, County Commission Solid Waste Disposal, 6.30%, 5/1/23, Callable 5/1/05 @ 102, AMBAC | | | 860,000 | | | 871,567 |
Parkersburg, West Virginia, Waterworks & Sewer Systems, 5.80%, 9/1/19, Callable 9/1/06 @ 102, FSA | | | 2,660,000 | | | 2,888,760 |
West Virginia State Water Development Authority, Series A, 5.50%, 11/1/18, Callable 11/1/09 @ 102, AMBAC | | | 1,000,000 | | | 1,121,860 |
| | | | | |
|
|
| | | | | | | 5,630,010 |
| | | | | |
|
|
Total Municipal Bonds
(Cost $69,146,023) | | | | | | 72,575,357 |
| | | | | |
|
|
Investment Company (1.1%) | | | | | | |
Federated Tax Exempt Money
Market Fund | | | 783,900 | | | 783,900 |
| | | | | |
|
|
Total Investment Company
(Cost $783,900) | | | | | | |
Total Investments
(Cost $69,929,923) (a) — 98.7% | | | | | | 73,359,257 |
Net other assets (liabilities) — 1.3% | | | | | | 973,414 |
| | | | | |
|
|
Net Assets — 100% | | | | | $ | 74,332,671 |
| | | | | |
|
|
| (a) | | Represents cost for financial reporting purposes, is substantially the same for federal income tax purposes, and differs from value by net unrealized appreciation/depreciation of securities as follows: |
| | | | |
Unrealized appreciation | | $ | 3,444,566 | |
Unrealized depreciation | | | (15,232 | ) |
| | |
|
|
|
Net unrealized appreciation | | $ | 3,429,334 | |
| | |
|
|
|
AMBAC — Insured by the AMBAC Indemnity Corporation.
FGIC — Insured by the Financial Guaranty Insurance Corporation.
FHA — Insured by the Federal Housing Administration.
FSA — Insured by the Financial Security Assurance.
LOC — Line of Credit.
MBIA — Insured by the Municipal Bond Insurance Association.
See accompanying notes to the financial statements.
86
Prime Money Market Fund
Schedule of Portfolio Investments September 30, 2004 |
| | | | | | |
| | | Principal
Amount
| | Amortized
Cost
|
Certificates of Deposit (7.4%) | | | | | | |
Banking (7.4%) | | | | | | |
Credit Agricole Indosuez, 1.62%, 11/15/04 | | $ | 4,000,000 | | $ | 4,000,000 |
Credit Agricole Indosuez, 1.225%, 12/31/04 | | | 2,000,000 | | | 2,000,519 |
Deutsche Bank AG, 1.25%, 12/29/04 | | | 6,500,000 | | | 6,500,666 |
Regions Bank, Alabama, 1.16%, 10/15/04 | | | 4,000,000 | | | 4,000,000 |
Royal Bank Of Canada, Montreal, 1.40%, 2/28/05 | | | 12,000,000 | | | 12,000,000 |
U.S. Bank NA, Minneapolis, 1.28%, 2/23/05 | | | 5,000,000 | | | 4,999,703 |
Wilmington Trust Corp., 1.77%, 11/12/04 | | | 15,000,000 | | | 15,000,000 |
Wilmington Trust Corp., 1.74%, 11/19/04 | | | 22,500,000 | | | 22,500,000 |
| | | | | |
|
|
Total Certificates of Deposit
(Amortized Cost $71,000,888) | | | | | | 71,000,888 |
| | | | | |
|
|
Commercial Paper* (23.1%) | | | | | | |
Automobiles (1.0%) | | | | | | |
Volkswagen Of America, 1.82%, 11/1/04 (b) | | | 9,700,000 | | | 9,684,798 |
| | | | | |
|
|
Banking (5.8%) | | | | | | |
Bank Of Ireland, 1.16%, 10/22/04 (b) | | | 4,900,000 | | | 4,896,684 |
Bank Of Ireland, 1.28%, 10/28/04 (b) | | | 3,000,000 | | | 2,997,120 |
Bavaria TRR, (SWP Bayerische Hypotheken-und), 1.58%, Series, 10/15/04 (b) | | | 14,000,000 | | | 13,991,398 |
Blue Spice LLC, (SWP Deutsche Bank AG), 1.53%, 10/4/04 (b) | | | 9,000,000 | | | 8,998,856 |
Blue Spice LLC, (SWP Deutsche Bank AG), 1.59%, 10/22/04 (b) | | | 2,000,000 | | | 1,998,145 |
KBC Financial Products International, Ltd, (KBC Bank NV) 1.85%, 2/8/05 (b) | | | 7,000,000 | | | 6,953,236 |
Long Lane Master Trust IV, Series A, 1.54%, 10/12/04 (b) | | | 13,000,000 | | | 12,993,898 |
UBS Finance (Delaware), Inc., 1.25%, 12/28/04 | | | 3,000,000 | | | 2,990,833 |
| | | | | |
|
|
| | | | | | | 55,820,170 |
| | | | | |
|
|
Department Stores (0.9%) | | | | | | |
May Department Stores Co., 1.86%,
11/16/04 (b) | | | 9,000,000 | | | 8,978,610 |
| | | | | |
|
|
Financial Securities (7.9%) | | | | | | |
Aspen Funding Corp., 1.85%, 2/14/05 (b) | | | 8,000,000 | | | 7,944,089 |
Fairway Finance Co. LLC, 1.88%, 2/18/05 (b) | | | 1,000,000 | | | 992,689 |
Fountain Square Commercial Funding Corp., (SA Fifth Third Bank) 1.71%, 12/10/04 | | | 5,000,000 | | | 4,983,375 |
Galaxy Funding, Inc., 1.62%, 11/16/04 (b) | | | 10,000,000 | | | 9,979,300 |
GE Capital Funding, Inc., 1.99%, 3/9/05 | | | 5,000,000 | | | 4,956,054 |
Georgetown Funding LLC, 1.92%, 12/28/04 (b) | | | 5,000,000 | | | 4,976,533 |
Georgetown Funding LLC, 1.96%, 12/28/04 (b) | | | 5,000,000 | | | 4,976,044 |
Grampian Funding LLC, 1.15%, 10/8/04 (b) | | | 7,000,000 | | | 6,998,435 |
John Deere Credit, Ltd., (GTD John Deere Capital Corp.), 1.86%, 11/8/04 | | | 5,600,000 | | | 5,589,006 |
John Deere Credit, Ltd., (GTD John Deere Capital Corp.), 1.88%, 11/8/04 | | | 4,200,000 | | | 4,191,665 |
Paradigm Funding LLC, 1.79%, 1/10/05 (b) | | | 4,000,000 | | | 3,979,912 |
Picaros Funding LLC., 2.03%, 3/14/05 (b) | | | 5,000,000 | | | 4,953,761 |
Prefco-Preferred Receivables Funding Co., 1.15%, 10/13/04 (b) | | | 9,529,000 | | | 9,525,347 |
K2 (USA) LLC, (GTD K2 Corp.), 2.11%, 3/31/05 (b) | | | 2,000,000 | | | 1,978,783 |
| | | | | |
|
|
| | | | | | | 76,024,993 |
| | | | | |
|
|
| | | | | | |
| | | Principal
Amount
| | Amortized
Cost
|
Financial Services — Auto (6.2%) | | | | | | |
Daimler Chrysler NA Holding Corp, 1.70%, 10/14/04 | | $ | 200,000 | | $ | 199,877 |
Daimler Chrysler NA Holding Corp, 1.70%, 10/12/04 | | | 500,000 | | | 499,740 |
Daimler Chrysler NA Holding Corp, 1.73%, 10/19/04 | | | 6,000,000 | | | 5,994,810 |
Daimler Chrysler NA Holding Corp, 1.86%, 11/15/04 | | | 2,900,000 | | | 2,893,258 |
FCAR Auto Loan Trust, 1.56%, 10/15/04 | | | 20,000,000 | | | 19,987,867 |
FCAR Auto Loan Trust, 1.87%, 2/15/05 | | | 10,000,000 | | | 9,928,836 |
FCAR Auto Loan Trust, 2.01%, 3/8/05 | | | 2,000,000 | | | 1,982,357 |
New Center Asset Trust, 1.69%, 12/10/04 | | | 8,500,000 | | | 8,472,068 |
New Center Asset Trust, 2.03%, 3/8/05 | | | 3,000,000 | | | 2,973,272 |
New Center Asset Trust, 2.07%, 3/11/05 | | | 6,000,000 | | | 5,944,455 |
| | | | | |
|
|
| | | | | | | 58,876,540 |
| | | | | |
|
|
Food Products (1.0%) | | | | | | |
Sara Lee Corp., 1.82% 11/12/04 (b) | | | 10,000,000 | | | 9,980,789 |
| | | | | |
|
|
Insurance (0.2%) | | | | | | |
Aegon Funding Corp., 1.53%, 10/1/04 | | | 2,000,000 | | | 2,000,000 |
| | | | | |
|
|
Total Commercial Paper
(Amortized Cost $222,365,900) | | | | | | 222,365,900 |
| | | | | |
|
|
Corporate Bonds (10.9%) | | | | | | |
Asset Backed Securities (3.3%) | | | | | | |
Capital One Prime Auto Receivables Trust, Series 2004-2, 1.69%, 7/15/05 | | | 3,983,687 | | | 3,983,687 |
CIT Equipment Collateral, Series 2004 EF-1, 1.63%, 7/15/05 | | | 2,506,798 | | | 2,506,798 |
CNH Equipment Trust, Series 2004-A, 2.00%, 10/14/05 | | | 20,500,000 | | | 20,500,000 |
Daimler Chrysler Auto Trust, Series 2004-B, 1.72%, 8/8/05 | | | 2,240,093 | | | 2,240,093 |
Onyx Acceptance Auto Trust, Series 2004-B, 1.40%, 6/15/05 | | | 918,149 | | | 918,149 |
USAA Auto Owner Trust, Series 2004-2, 1.66%, 7/15/05 | | | 2,304,559 | | | 2,304,559 |
| | | | | |
|
|
| | | | | | | 32,453,286 |
| | | | | |
|
|
Banking (0.5%) | | | | | | |
U.S. Bank NA, Cincinnati, 1.20%, 12/30/04 | | | 4,600,000 | | | 4,600,000 |
| | | | | |
|
|
Financial Services (3.1%) | | | | | | |
Beta Finance, Inc., (GTD Beta Finance Corp.), 1.30%, 10/25/04 (b) | | | 13,800,000 | | | 13,800,000 |
Beta Finance, Inc., (GTD Beta Finance Corp.), 1.43%, 10/27/04 (b) | | | 1,750,000 | | | 1,749,975 |
Beta Finance, Inc., (GTD Beta Finance Corp.), 1.295%, 1/24/05 (b) | | | 4,500,000 | | | 4,499,930 |
Sigma Finance, Inc., 1.71%, 5/18/05 (b) | | | 5,000,000 | | | 4,999,369 |
Sigma Finance, Inc., 1.71%, 5/18/05 (b) | | | 5,000,000 | | | 4,999,374 |
| | | | | |
|
|
| | | | | | | 30,048,648 |
| | | | | |
|
|
Financial Services — Diversified (1.0%) | | | | | | |
General Motors Acceptance Corp., (GTD General Motors Acceptance Corp.), 2.23%, 10/1/04 | | | 8,500,000 | | | 8,500,000 |
GMAC Residential Holding Corp., 2.15%, 10/1/04 | | | 1,000,000 | | | 1,000,000 |
| | | | | |
|
|
| | | | | | | 9,500,000 |
| | | | | |
|
|
Pharmaceuticals (0.3%) | | | | | | |
Merck & Co., 4.48%, 2/22/05 (b) | | | 3,000,000 | | | 3,037,586 |
| | | | | |
|
|
Continued
87
Prime Money Market Fund
Schedule of Portfolio Investments, continued September 30, 2004 |
| | | | | | |
| | | Principal
Amount
| | Amortized
Cost
|
Corporate Bonds, continued | | | | | | |
Public Building & Related Furniture (1.0%) | | | | | | |
Johnson Controls, Inc., 1.74%, 11/30/04 | | $ | 10,000,000 | | $ | 10,000,000 |
| | | | | |
|
|
Security Brokers & Dealers (1.6%) | | | | | | |
Goldman Sachs Group, Inc., 1.55%, 10/25/04 | | | 5,000,000 | | | 5,000,000 |
Goldman Sachs Group, Inc., 2.06%,
3/10/05 ( c) | | | 10,000,000 | | | 10,000,000 |
| | | | | |
|
|
| | | | | | | 15,000,000 |
| | | | | |
|
|
Total Corporate Bonds
(Amortized Cost $103,639,520) | | | | | | 103,639,520 |
| | | | | |
|
|
U.S. Government Agencies (2.0%) | | | | | | |
Federal Home Loan Bank (1.6%) | | | | | | |
1.47%, 2/28/05 | | | 3,000,000 | | | 3,000,000 |
1.36%, 4/1/05 | | | 2,000,000 | | | 2,000,000 |
1.50%, 5/4/05, Callable 10/7/04 @ 100 | | | 8,000,000 | | | 8,000,000 |
1.60%, 5/16/05, Callable 10/21/04 @ 100 | | | 2,500,000 | | | 2,500,000 |
| | | | | |
|
|
| | | | | | | 15,500,000 |
| | | | | |
|
|
Federal Home Loan Mortgage Corp. (0.4%) | | | | | | |
3.875%, 2/15/05 | | | 4,000,000 | | | 4,037,820 |
| | | | | |
|
|
Total U.S. Government Agencies
(Amortized Cost $19,537,820) | | | | | | 19,537,820 |
| | | | | |
|
|
Variable Rate Notes** (42.6%) | | | | | | |
Banking & Financial Services (21.3%) | | | | | | |
Anchor Holdings, (LCD U.S. Bank NA), 1.84%, 10/7/04 | | | 1,840,000 | | | 1,840,000 |
Bartlett, Illinois, Redevelopement Project, 2.03%, 10/6/04 | | | 5,000,000 | | | 5,000,000 |
Becker, Minnesota Pollution Control, (SWP Bank of New York) 1.97%, 10/6/04 | | | 8,700,000 | | | 8,700,000 |
Blue Heron Funding Ltd., Series 3A, Class A, (GTD WestLB AG) 1.85%, 10/29/04 ( c) | | | 30,000,000 | | | 30,000,000 |
Christian Life Assembly of the Assemblies of God, (LCD Fulton Bank) 1.99%, 10/7/04 | | | 3,400,000 | | | 3,400,000 |
Guilford Capital, LLC, Series 2002-A,
(LCD Regions Bank, Alabama) 1.99%, 10/7/04 | | | 1,725,000 | | | 1,725,000 |
H.C. Equities, (LCD Wachovia Bank NA), 1.84%, 10/7/04 | | | 4,955,000 | | | 4,955,000 |
HBOS Treasury Services, PLC, 1.75%, 10/25/04 (b) | | | 8,000,000 | | | 8,000,000 |
HBOS Treasury Services, PLC, 1.96%, 10/25/04 | | | 10,000,000 | | | 10,000,000 |
HBOS Treasury Services, PLC, 1.64%, 10/25/04 | | | 25,000,000 | | | 25,000,000 |
Indian Hills Country Club, (LCD Amsouth Bank NA, Birmingham) 1.94%, 10/7/04 | | | 3,435,000 | | | 3,435,000 |
J.W. Harris Company, Inc., (LCD Fifth Third Bank, Cincinnati) 1.84%, 10/7/04 | | | 3,635,000 | | | 3,635,000 |
Maryland Economic Development Corp., (LCD Manufacturers & Traders Trust Co.), 1.99%, 10/5/04 | | | 7,000,000 | | | 7,000,000 |
Monet Trust, (SWP Dresdner Bank AG), 2.03%, 10/28/04 (b)(c) | | | 25,000,000 | | | 25,000,000 |
Monet Trust, (SWP Dresdner Bank AG), 2.03%, 10/28/04 (b)(c) | | | 5,000,000 | | | 5,000,000 |
New Keibler Thompson Co., (LCD Manufacturers & Traders Trust Co.), 1.99%, 10/8/04 | | | 8,705,000 | | | 8,705,000 |
| | | | | | |
| | | Principal
Amount
| | Amortized
Cost
|
Variable Rate Notes**, continued | | | | | | |
Banking & Financial Services, continued | | | | | | |
Quality Synthetic Rubber Co., (LCD U.S. Bank NA), 1.84%, 10/7/04 | | $ | 858,000 | | $ | 858,000 |
Seven Hills School, (LCD Fifth Third Bank, Cincinnati), 1.84%, 10/7/04 | | | 1,225,000 | | | 1,225,000 |
Societe Generale, 1.51%, 12/10/04 | | | 5,000,000 | | | 4,999,662 |
Spira Millenium, 1.88%, (LCD Fleet National Bank), 10/7/04 | | | 3,855,000 | | | 3,855,000 |
Stone Creek, (LCD Columbus Bank and Trust Co.), 1.90%, 10/7/04 | | | 14,485,000 | | | 14,485,000 |
Suntrust Bank, 1.60%, 10/4/04 | | | 4,000,000 | | | 4,001,495 |
TOG Properties, Inc., 1.94%, 10/7/04 | | | 8,000,000 | | | 8,000,000 |
Wells Fargo & Co., 1.83%, 10/14/04 | | | 3,000,000 | | | 3,000,000 |
Wells Fargo & Co., 1.69%, 10/4/04 | | | 6,000,000 | | | 6,000,000 |
World Wildlife Fund, Inc., (AMBAC Financial Group, Inc.) 1.87%, 10/7/04 | | | 4,870,000 | | | 4,870,000 |
YSR LLC, 1.91%, 10/7/04, (LCD Amsouth Bank, NA) | | | 2,139,000 | | | 2,139,000 |
| | | | | |
|
|
| | | | | | | 204,828,157 |
| | | | | |
|
|
Broker/Dealer (4.5%) | | | | | | |
Merrill Lynch & Company, Inc., 1.70%, 10/4/04 | | | 10,000,000 | | | 10,000,000 |
Merrill Lynch & Company, Inc., 1.88%, 10/11/04 (b) | | | 12,000,000 | | | 12,000,000 |
Merrill Lynch & Company, Inc., 1.91%, 12/14/04 | | | 1,000,000 | | | 1,001,383 |
Morgan Stanley, 1.85%, 10/1/04 | | | 7,000,000 | | | 7,000,000 |
Morgan Stanley, 1.70%, 10/4/04 | | | 5,000,000 | | | 5,000,000 |
Morgan Stanley, 1.85%, 10/27/04 | | | 8,000,000 | | | 8,000,000 |
| | | | | |
|
|
| | | | | | | 43,001,383 |
| | | | | |
|
|
Federal Home Loan Mortgage Corp. (2.8%) | | | | | | |
1.83%, 9/9/05 | | | 27,000,000 | | | 27,000,000 |
| | | | | |
|
|
Financial Services (4.9%) | | | | | | |
Compass Securitization, 1.67%, 10/8/04 (b) | | | 14,000,000 | | | 13,998,615 |
Depfa Bank PLC, 1.76%, 6/15/05 (b) | | | 15,000,000 | | | 15,000,000 |
General Electric Capital Assurance Corp., 1.84%, 10/12/04 (b) | | | 7,000,000 | | | 7,000,000 |
General Electric Capital Assurance Corp., 1.68%, 10/18/04 (b) | | | 7,000,000 | | | 7,000,000 |
General Electric Capital Assurance Corp., 1.815%, 11/8/04 ( c) | | | 5,000,000 | | | 5,000,000 |
| | | | | |
|
|
| | | | | | | 47,998,615 |
| | | | | |
|
|
Financial, Speciality (6.3%) | | | | | | |
K2 (USA) LLC, (KBC Bank NV), 1.86%, 10/1/04 (b) | | | 8,000,000 | | | 8,001,692 |
K2 (USA) LLC, (GTD K2 Corp.), 1.625%, 10/4/04 (b) | | | 10,000,000 | | | 9,999,980 |
K2 (USA) LLC, (KBC Bank NV), 1.71%, 10/15/04 (b) | | | 2,000,000 | | | 1,999,751 |
K2 (USA) LLC, (KBC Bank NV), 1.84%, 10/25/04 (b) | | | 1,000,000 | | | 1,000,117 |
K2 (USA) LLC, (KBC Bank NV), 1.69%, 11/8/04 (b) | | | 6,000,000 | | | 6,001,215 |
K2 (USA) LLC, (KBC Bank NV), 1.81%, 12/15/04 (b) | | | 4,000,000 | | | 3,999,235 |
Paradigm Funding LLC, 1.66%, 10/5/04 (b) | | | 11,800,000 | | | 11,800,000 |
Paradigm Funding LLC, 1.79%, 10/22/04 (b) | | | 8,000,000 | | | 8,000,000 |
Paradigm Funding LLC, 1.80%, 10/28/04 (b) | | | 10,000,000 | | | 10,000,000 |
| | | | | |
|
|
| | | | | | | 60,801,990 |
| | | | | |
|
|
Continued
88
Prime Money Market Fund
Schedule of Portfolio Investments, continued September 30, 2004 |
| | | | | | |
| | | Principal
Amount
| | Amortized
Cost or Fair
Value
|
Variable Rate Notes**, continued | | | | | | |
Insurance (2.1%) | | | | | | |
Allstate Life Insurance Co., 1.93%,
12/1/04 ( c) | | $ | 2,000,000 | | $ | 2,000,000 |
Jackson National Life Insurance Co., 1.92%, 10/22/04 ( c) | | | 3,000,000 | | | 3,000,000 |
Metropolitan Life Insurance Co., 1.85%, 11/1/04 ( c) | | | 5,000,000 | | | 5,000,000 |
New York Life Insurance Co., 1.89%,
11/26/04 ( c) | | | 5,000,000 | | | 5,000,000 |
Travelers Insurance Co., 1.83%,
11/19/04 ( c) | | | 5,000,000 | | | 5,000,000 |
| | | | | |
|
|
| | | | | | | 20,000,000 |
| | | | | |
|
|
Religious Organizations (0.3%) | | | | | | |
Vestavia Hills Baptist, 1.94%, 10/7/04, (LCD Amsouth Bank, NA) | | | 3,100,000 | | | 3,100,000 |
| | | | | |
|
|
Restaurants (0.2%) | | | | | | |
McDonalds Corp., 4.545%, 3/7/05 (b) | | | 2,000,000 | | | 2,026,483 |
| | | | | |
|
|
Total Variable Rate Notes
(Amortized Cost $408,756,628) | | | | | | 408,756,628 |
| | | | | |
|
|
Collateralized Loan Agreements (12.5%) | | | | | | |
Bear Stearns Companies, Inc., 2.025%, dated 9/30/04 maturing 10/1/04, with maturity value of $25,001,406 (collateralized fully by various U.S. Government Agencies) | | | 25,000,000 | | | 25,000,000 |
Greenwich Capital Marketing., 2.00%, dated 9/30/04 maturing 10/1/04, with maturity value of $25,001,387 (collateralized fully by various U.S. Government Agencies) | | | 25,000,000 | | | 25,000,000 |
Goldman Sachs Group, Inc., 2.025%, dated 9/30/04 maturing 10/1/04, with maturity value of $10,000,563 (collateralized fully by various U.S. Government Agencies) | | | 10,000,000 | | | 10,000,000 |
| | | | | | | |
| | | Principal
Amount
| | Amortized
Cost or Fair
Value
| |
Collateralized Loan Agreements, continued | | | | | | | |
J.P. Morgan Chase, 1.98%, dated 9/30/04 maturing 10/1/04, with maturity value of $15,000,825 (collateralized fully by various U.S. Government Agencies) | | $ | 15,000,000 | | $ | 15,000,000 | |
Lehman Brothers Holdings, Inc., 2.025%, dated 9/30/04 maturing 10/1/04, with maturity value of $20,001,125 (collateralized fully by various U.S. Government Agencies) | | | 20,000,000 | | | 20,000,000 | |
Merrill Lynch & Company, Inc., 2.025%, dated 9/30/04 maturing 10/1/04, with maturity value of $25,001,406 (collateralized fully by various U.S. Government Agencies) | | | 25,000,000 | | | 25,000,000 | |
| | | | | |
|
|
|
Total Collateralized Loan Agreements (Amortized Cost $120,000,000) | | | | | | 120,000,000 | |
| | | | | |
|
|
|
Repurchase Agreement (2.5%) | | | | | | | |
Wachovia Bank, 1.91%, dated 9/30/04 maturing 10/1/04, with maturity value of $23,341,238 (collateralized fully by various U.S. Government Agencies) | | | 23,340,000 | | | 23,340,000 | |
| | | | | |
|
|
|
Total Repurchase Agreement (Amortized Cost $23,340,000) | | | | | | 23,340,000 | |
| | | | | |
|
|
|
Total Investments
(Amortized Cost $968,640,756)
(a) — 101.0% | | | | | | 968,640,756 | |
Net other assets (liabilities) — (1.0%) | | | | | | (9,841,522 | ) |
| | | | | |
|
|
|
Net Assets — 100.0% | | | | | $ | 958,799,234 | |
| | | | | |
|
|
|
| (a) | | Cost for federal income tax and financial reporting purposes are the same. |
| (b) | | Rule 144A, Section 4(2) or other security which is restricted as to resale to institutional investors. The Investment Advisor, using Board approved procedures, has deemed these securities or a portion of these securities to be liquid. |
| (c) | | Rule 144A, Section 4(2) or other security which is restricted as to resale to institutional investors. The Investment Advisor, using Board approved procedures, has deemed these securities or a portion of these securities to be illiquid. Represents 9.9% of net assets. |
GTD — Guaranteed
INS — Insurance
LCD — Letter of Credit
LLC — Limited Liability Company
SWP — Swap
| * | | Discount note. Rate disclosed represents the effective yield at September 30, 2004. |
| ** | | The interest rate for this variable rate note, which will change periodically, is based either on the prime rate or an index of market rates. The reflected rate is the rate in effect as of September 30, 2004. The maturity date reflected is the next reset date. |
See accompanying notes to the financial statements.
89
U.S. Treasury Money Market Fund
Schedule of Portfolio Investments September 30, 2004 |
| | | | | | |
| | | Principal
Amount
| | Amortized
Cost or
Fair Value
|
U.S. Treasury Bills* (11.9%) | | | | | | |
1.51%, 10/7/04 | | $ | 125,000,000 | | $ | 124,968,439 |
| | | | | |
|
|
Total U.S. Treasury Bills (Amortized Cost $124,968,439) | | | | | | 124,968,439 |
| | | | | |
|
|
U.S. Treasury Bonds & Notes (32.4%) | | | | | | |
2.125%, 10/31/04 | | | 100,000,000 | | | 100,057,415 |
2.000%, 11/30/04 | | | 30,000,000 | | | 30,032,618 |
1.750%, 12/31/04 | | | 25,000,000 | | | 25,018,742 |
1.625%, 1/31/05 | | | 25,000,000 | | | 25,008,618 |
1.500%, 2/28/05 | | | 25,000,000 | | | 24,981,881 |
1.625%, 3/31/05 | | | 25,000,000 | | | 24,972,137 |
1.625%, 4/30/05 | | | 30,000,000 | | | 29,957,329 |
6.500%, 5/15/05 | | | 25,000,000 | | | 25,701,023 |
1.125%, 6/30/05 | | | 30,000,000 | | | 29,826,319 |
1.500%, 7/31/05 | | | 25,000,000 | | | 24,901,997 |
| | | | | |
|
|
Total U.S. Treasury Bonds & Notes (Amortized Cost $340,458,079) | | | | | | 340,458,079 |
| | | | | |
|
|
Repurchase Agreements (55.6%) | | | | | | |
Bank of America Corp., 1.67%, dated 9/30/04, maturing 10/1/04, with maturity value of $183,008,489 (Collateralized fully by U.S. Treasury Bills) | | | 183,000,000 | | | 183,000,000 |
| | | | | | |
| | | Principal
Amount
| | Amortized
Cost or
Fair Value
|
Repurchase Agreements, continued | | | | | | |
First Boston, 1.73%, dated 9/30/04, maturing 10/1/04, with maturity value of $45,002,163 (Collateralized fully by U.S. Treasury Notes) | | $ | 45,000,000 | | $ | 45,000,000 |
Goldman Sachs Group, Inc., 1.67%, dated 9/30/04, maturing 10/1/04, with maturity value of $200,093,970 (Collateralized fully by U.S. Treasury Notes) | | | 200,084,688 | | | 200,084,688 |
Lehman Brothers, 1.74%, dated 9/30/04, maturing 10/1/04, with maturity value of $110,005,317 (Collateralized fully by U.S. Treasury Bills) | | | 110,000,000 | | | 110,000,000 |
Merrill Lynch & Company, Inc., 1.55%, dated 9/30/04, maturing 10/1/04, with maturity value of $45,001,938 (Collateralized fully by U.S. Treasury Bills) | | | 45,000,000 | | | 45,000,000 |
| | | | | |
|
|
Total Repurchase Agreements
(Cost $583,084,688) | | | | | | 583,084,688 |
| | | | | |
|
|
Total Investments (Amortized Cost $1,048,511,206) (a) — 99.9% | | | | | | 1,048,511,206 |
Net other assets (liabilities) — 0.1% | | | | | | 1,043,431 |
| | | | | |
|
|
Net Assets — 100.0% | | | | | $ | 1,049,554,637 |
| | | | | |
|
|
| (a) | | Cost and value for federal income tax and financial reporting purposes are the same. |
| * | | Discount note. Rate disclosed represents the effective yield at September 30, 2004. |
See accompanying notes to the financial statements.
90
Capital Manager Conservative Growth Fund
Schedule of Portfolio Investments September 30, 2004 |
| | | | | |
| | | Shares
| | Fair
Value
|
Investment Companies (100.3%) | | | | | |
BB&T Intermediate Corporate Bond Fund — Institutional Class | | 1,152,554 | | $ | 12,205,547 |
BB&T Intermediate U.S. Government Fund — Institutional Class | | 2,175,045 | | | 22,294,210 |
BB&T International Equity Fund —
Institutional Class | | 642,139 | | | 5,291,229 |
BB&T Large Company Growth Fund — Institutional Class (b) | | 1,097,049 | | | 9,160,356 |
BB&T Large Company Value Fund — Institutional Class | | 801,114 | | | 13,851,269 |
BB&T Mid Cap Growth Fund —
Institutional Class (b) | | 151,606 | | | 1,728,305 |
BB&T Mid Cap Value Fund —
Institutional Class | | 165,846 | | | 2,555,687 |
| | | | | | |
| | | Shares
| | Fair
Value
| |
Investment Companies, continued | | | | | | |
BB&T Short U.S. Government Fund — Institutional Class | | 625,738 | | $ | 6,075,914 | |
BB&T Small Company Growth Fund — Institutional Class (b) | | 90,009 | | | 1,112,507 | |
BB&T Small Company Value Fund — Institutional Class | | 116,241 | | | 1,654,116 | |
BB&T U.S. Treasury Money Market Fund — Institutional Class | | 2,487,236 | | | 2,487,236 | |
| | | | |
|
|
|
Total Investment Companies
(Cost $75,909,194) | | | | | 78,416,376 | |
| | | | |
|
|
|
Total Investments in Affiliates
(Cost $75,909,194) (a) — 100.3% | | | | | 78,416,376 | |
Net other assets (liabilities) — (0.3%) | | | | | (211,745 | ) |
| | | | |
|
|
|
Net Assets — 100.0% | | | | $ | 78,204,631 | |
| | | | |
|
|
|
| (a) | | Represents cost for financial reporting purposes, is substantially the same for federal income tax purposes, and differs from fair value by net unrealized appreciation/depreciation of securities as follows: |
| | | | |
Unrealized appreciation | | $ | 3,031,001 | |
Unrealized depreciation | | | (523,819 | ) |
| | |
|
|
|
Net unrealized appreciation | | $ | 2,507,182 | |
| | |
|
|
|
| (b) | | Represents non-income producing securities. |
See accompanying notes to the financial statements.
91
Capital Manager Moderate Growth Fund
Schedule of Portfolio Investments September 30, 2004 |
| | | | | |
| | | Shares
| | Fair
Value
|
Investment Companies (100.1%) | | | | | |
BB&T Intermediate Corporate Bond Fund — Institutional Class | | 558,699 | | $ | 5,916,626 |
BB&T Intermediate U.S. Government Fund — Institutional Class | | 1,060,131 | | | 10,866,341 |
BB&T International Equity Fund —
Institutional Class | | 940,893 | | | 7,752,959 |
BB&T Large Company Growth Fund — Institutional Class (b) | | 1,618,150 | | | 13,511,550 |
BB&T Large Company Value Fund — Institutional Class | | 1,164,779 | | | 20,139,031 |
BB&T Mid Cap Growth Fund —
Institutional Class (b) | | 216,613 | | | 2,469,389 |
BB&T Mid Cap Value Fund —
Institutional Class | | 240,036 | | | 3,698,949 |
| | | | | | |
| | | Shares
| | Fair
Value
| |
Investment Companies, continued | | | | | | |
BB&T Short U.S. Government Fund — Institutional Class | | 305,760 | | $ | 2,968,928 | |
BB&T Small Company Growth Fund — Institutional Class (b) | | 128,514 | | | 1,588,436 | |
BB&T Small Company Value Fund — Institutional Class | | 167,134 | | | 2,378,320 | |
BB&T U.S. Treasury Money Market Fund — Institutional Class | | 2,391,233 | | | 2,391,233 | |
| | | | |
|
|
|
Total Investment Companies
(Cost $73,558,479) | | | | | 73,681,762 | |
| | | | |
|
|
|
Total Investments In Affiliates
(Cost $73,558,479) (a) — 100.1% | | | | | 73,681,762 | |
Net other assets (liabilities) — (0.1%) | | | | | (56,266 | ) |
| | | | |
|
|
|
Net Assets — 100.0% | | | | $ | 73,625,496 | |
| | | | |
|
|
|
| (a) | | Represents cost for financial reporting purposes, is substantially the same for federal income tax purposes, and differs from fair value by net unrealized appreciation/depreciation of securities as follows: |
| | | | |
Unrealized appreciation | | $ | 2,044,375 | |
Unrealized depreciation | | | (1,921,092 | ) |
| | |
|
|
|
Net unrealized appreciation | | $ | 123,283 | |
| | |
|
|
|
| (b) | | Represents non-income producing securities. |
See accompanying notes to the financial statements.
92
Capital Manager Growth Fund
Schedule of Portfolio Investments September 30, 2004 |
| | | | | |
| | | Shares
| | Fair
Value
|
Investment Companies (100.0%) | | | | | |
BB&T Intermediate Corporate Bond Fund — Institutional Class | | 183,457 | | $ | 1,942,815 |
BB&T Intermediate U.S. Government Fund — Institutional Class | | 347,831 | | | 3,565,271 |
BB&T International Equity Fund —
Institutional Class | | 840,725 | | | 6,927,573 |
BB&T Large Company Growth Fund — Institutional Class (b) | | 1,448,168 | | | 12,092,200 |
BB&T Large Company Value Fund — Institutional Class | | 1,043,867 | | | 18,048,457 |
BB&T Mid Cap Growth Fund —
Institutional Class (b) | | 193,435 | | | 2,205,155 |
BB&T Mid Cap Value Fund —
Institutional Class | | 215,330 | | | 3,318,232 |
BB&T Short U.S. Government Fund — Institutional Class | | 100,278 | | | 973,701 |
| | | | | |
| | | Shares
| | Fair
Value
|
Investment Companies, continued | | | | | |
BB&T Small Company Growth Fund — Institutional Class (b) | | 115,657 | | $ | 1,429,519 |
BB&T Small Company Value Fund — Institutional Class | | 149,802 | | | 2,131,688 |
BB&T U.S. Treasury Money Market Fund — Institutional Class | | 1,815,646 | | | 1,815,646 |
| | | | |
|
|
Total Investment Companies
(Cost $56,246,964) | | | | | 54,450,257 |
| | | | |
|
|
Total Investments In Affiliates
(Cost $56,246,964) (a) — 100.0% | | | | | 54,450,257 |
Net other assets (liabilities) — 0.0% | | | | | 9,357 |
| | | | |
|
|
Net Assets — 100.0% | | | | $ | 54,459,614 |
| | | | |
|
|
| (a) | | Represents cost for financial reporting purposes, is substantially the same for federal income tax purposes, and differs from fair value by net unrealized appreciation/depreciation of securities as follows: |
| | | | |
Unrealized appreciation | | $ | 1,061,488 | |
Unrealized depreciation | | | (2,858,195 | ) |
| | |
|
|
|
Net unrealized depreciation | | $ | (1,796,707 | ) |
| | |
|
|
|
| (b) | | Represents non-income producing securities. |
See accompanying notes to the financial statements.
93
Capital Manager Equity Fund
Schedule of Portfolio Investments September 30, 2004 |
| | | | | |
| | | Shares
| | Fair
Value
|
Investment Companies (100.0%) | | | | | |
BB&T International Equity Fund — Institutional Class | | 535,821 | | $ | 4,415,165 |
BB&T Large Company Growth Fund — Institutional Class (b) | | 922,827 | | | 7,705,604 |
BB&T Large Company Value Fund — Institutional Class | | 665,290 | | | 11,502,871 |
BB&T Mid Cap Growth Fund —
Institutional Class (b) | | 123,325 | | | 1,405,904 |
BB&T Mid Cap Value Fund —
Institutional Class | | 137,250 | | | 2,115,026 |
BB&T Small Company Growth Fund — Institutional Class (b) | | 73,700 | | | 910,931 |
| | | | | |
| | | Shares
| | Fair
Value
|
Investment Companies, continued | | | | | |
BB&T Small Company Value Fund — Institutional Class | | 95,469 | | $ | 1,358,525 |
BB&T U.S. Treasury Money Market Fund — Institutional Class | | 996,994 | | | 996,994 |
| | | | |
|
|
Total Investment Companies
(Cost $29,714,443) | | | | | 30,411,020 |
| | | | |
|
|
Total Investments in Affiliates
(Cost $29,714,443) (a) — 100.0% | | | | | 30,411,020 |
Net other assets (liabilities) — 0.0% | | | | | 1,473 |
| | | | |
|
|
Net assets — 100.0% | | | | $ | 30,412,493 |
| | | | |
|
|
| (a) | | Represents cost for financial reporting purposes, is substantially the same for federal income tax purposes, and differs from fair value by net unrealized appreciation/depreciation of securities as follows: |
| | | | |
Unrealized appreciation | | $ | 1,303,306 | |
Unrealized depreciation | | | (606,729 | ) |
| | |
|
|
|
Net unrealized appreciation | | $ | 696,577 | |
| | |
|
|
|
| (b) | | Represents non-income producing securities. |
See accompanying notes to the financial statements.
94
[THIS PAGE IS INTENTIONALLY LEFT BLANK]
95
BB&T Funds
Statements of Assets and Liabilities September 30, 2004 |
| | | | | | | | |
| | | Equity Income
Fund
| | | Large
Company
Value Fund
| |
Assets | | | | | | | | |
Investments, at cost | | $ | 29,911,125 | | | $ | 757,853,508 | |
Unrealized appreciation (depreciation) | | | 989,474 | | | | 132,334,030 | |
| | |
|
|
| |
|
|
|
Investments, at value* | | | 30,900,599 | | | | 890,187,538 | |
Interest and dividends receivable | | | 71,493 | | | | 1,039,121 | |
Receivable for capital shares issued | | | 185,038 | | | | — | |
Receivable for investments sold | | | — | | | | 4,458,165 | |
Prepaid expenses | | | 40,157 | | | | 11,808 | |
| | |
|
|
| |
|
|
|
Total Assets: | | | 31,197,287 | | | | 895,696,632 | |
| | |
|
|
| |
|
|
|
Liabilities | | | | | | | | |
Covered options written (premiums received $13,207; $0; $0; $0; $0; $0; $0; $301,055) | | | 13,275 | | | | — | |
Dividends payable | | | 122,769 | | | | 586,096 | |
Payable for investments purchased | | | 85,020 | | | | 2,006,740 | |
Payable for capital shares redeemed | | | — | | | | — | |
Payable for collateral received on loaned securities | | | — | | | | 214,201,090 | |
Accrued expenses and other payables | | | | | | | | |
Investment advisory fees | | | 9,690 | | | | 372,738 | |
Administration, transfer agency and fund accounting fees | | | 600 | | | | 13,364 | |
Distribution fees | | | 3,676 | | | | 28,311 | |
Other | | | 3,572 | | | | 53,315 | |
| | |
|
|
| |
|
|
|
Total Liabilities: | | | 238,602 | | | | 217,261,654 | |
| | |
|
|
| |
|
|
|
Net Assets | | | | | | | | |
Capital | | | 29,936,324 | | | | 548,919,169 | |
Undistributed (distributions in excess of) net investment income | | | 8,099 | | | | 2 | |
Undistributed realized gains (losses) from investment transactions | | | 24,856 | | | | (2,818,223 | ) |
Net unrealized appreciation (depreciation) of investments | | | 989,406 | | | | 132,334,030 | |
| | |
|
|
| |
|
|
|
Net Assets | | $ | 30,958,685 | | | $ | 678,434,978 | |
| | |
|
|
| |
|
|
|
Net Assets | | | | | | | | |
Class A Shares | | $ | 6,341,814 | | | $ | 31,783,233 | |
Class B Shares | | | 1,672,467 | | | | 26,309,079 | |
Class C Shares | | | 1,816,012 | | | | 156,978 | |
Institutional Shares | | | 21,128,392 | | | | 620,185,688 | |
| | |
|
|
| |
|
|
|
Total | | $ | 30,958,685 | | | $ | 678,434,978 | |
| | |
|
|
| |
|
|
|
Outstanding Units of Beneficial Interest (Shares) | | | | | | | | |
Class A Shares | | | 612,865 | | | | 1,841,692 | |
Class B Shares | | | 161,687 | | | | 1,536,851 | |
Class C Shares | | | 175,569 | | | | 9,185 | |
Institutional Shares | | | 2,041,126 | | | | 35,860,227 | |
| | |
|
|
| |
|
|
|
Total | | | 2,991,247 | | | | 39,247,955 | |
| | |
|
|
| |
|
|
|
Net Asset Value | | | | | | | | |
Class A Shares — redemption price per share | | $ | 10.35 | | | $ | 17.26 | |
| | |
|
|
| |
|
|
|
Class B Shares — offering price per share** | | $ | 10.34 | | | $ | 17.12 | |
| | |
|
|
| |
|
|
|
Class C Shares — offering price per share** | | $ | 10.34 | | | $ | 17.09 | |
| | |
|
|
| |
|
|
|
Institutional Shares — offering and redemption price per share | | $ | 10.35 | | | $ | 17.29 | |
| | |
|
|
| |
|
|
|
Maximum Sales Charge — Class A Shares | | | 5.75 | % | | | 5.75 | % |
| | |
|
|
| |
|
|
|
Maximum Offering Price (100%/(100% — Maximum Sales Charge) of net asset value adjusted to the nearest cent) per share — Class A Shares† | | $ | 10.98 | | | $ | 18.31 | |
| | |
|
|
| |
|
|
|
| * | The Large Company Value Fund, Large Company Growth Fund, Mid Cap Value Fund, Mid Cap Growth Fund, Small Company Value Fund, and Small Company Growth Fund include securities on loan of $207,370,816; $137,945,282; $52,192,156; $61,029,724, $13,331,216, and $27,515,248, respectively. |
| ** | Redemption price per share varies by length of time shares are held. |
| † | Maximum offering price may not recalculate due to the rounding of the NAV. |
See accompanying notes to the financial statements.
96
| | | | | | | | | | | | | | | | | | | | | | |
Large
Company
Growth Fund
| | | Mid Cap
Value Fund
| | | Mid Cap
Growth Fund
| | | Small
Company
Value Fund
| | | Small
Company
Growth Fund
| | | Special
Opportunities
Equity Fund
| |
| | | | | | | | | | | | | | | | | | | | | | | |
| $ | 467,923,331 | | | $ | 216,056,614 | | | $ | 163,493,423 | | | $ | 67,565,648 | | | $ | 119,564,135 | | | $ | 83,937,126 | |
| | 42,610,242 | | | | 42,342,777 | | | | 23,742,553 | | | | 14,102,335 | | | | 12,181,099 | | | | 13,036,431 | |
|
|
| |
|
|
| |
|
|
| |
|
|
| |
|
|
| |
|
|
|
| | 510,533,573 | | | | 258,399,391 | | | | 187,235,976 | | | | 81,667,983 | | | | 131,745,234 | | | | 96,973,557 | |
| | 217,636 | | | | 431,580 | | | | 121,093 | | | | 72,473 | | | | 25,358 | | | | 55,832 | |
| | — | | | | — | | | | — | | | | — | | | | — | | | | 417,914 | |
| | 3,202,896 | | | | — | | | | 4,636,313 | | | | — | | | | 2,651,083 | | | | 1,040,383 | |
| | 5,463 | | | | 4,624 | | | | 3,239 | | | | 6,107 | | | | 5,556 | | | | 8,757 | |
|
|
| |
|
|
| |
|
|
| |
|
|
| |
|
|
| |
|
|
|
| | 513,959,568 | | | | 258,835,595 | | | | 191,996,621 | | | | 81,746,563 | | | | 134,427,231 | | | | 98,496,443 | |
|
|
| |
|
|
| |
|
|
| |
|
|
| |
|
|
| |
|
|
|
| | | | | | | | | | | | | | | | | | | | | | | |
| | — | | | | — | | | | — | | | | — | | | | — | | | | 248,420 | |
| | — | | | | 383,557 | | | | — | | | | 51,651 | | | | — | | | | — | |
| | 2,940,318 | | | | 8,242,553 | | | | 903,709 | | | | 464,986 | | | | 3,344,296 | | | | 578,078 | |
| | 150 | | | | — | | | | — | | | | — | | | | 2,139 | | | | 20,632 | |
| | 142,033,534 | | | | 53,754,118 | | | | 62,731,209 | | | | 13,885,225 | | | | 28,371,625 | | | | — | |
| | | | | | | | | | | | | | | | | | | | | | | |
| | 201,909 | | | | 106,274 | | | | 69,451 | | | | 43,225 | | | | 69,914 | | | | 61,013 | |
| | 7,227 | | | | 3,826 | | | | 2,506 | | | | 1,311 | | | | 1,990 | | | | 1,891 | |
| | 13,301 | | | | 5,184 | | | | 3,356 | | | | 181 | | | | 6,305 | | | | 27,796 | |
| | 48,417 | | | | 21,000 | | | | 14,985 | | | | 7,118 | | | | 24,671 | | | | 14,384 | |
|
|
| |
|
|
| |
|
|
| |
|
|
| |
|
|
| |
|
|
|
| | 145,244,856 | | | | 62,516,512 | | | | 63,725,216 | | | | 14,453,697 | | | | 31,820,940 | | | | 952,214 | |
|
|
| |
|
|
| |
|
|
| |
|
|
| |
|
|
| |
|
|
|
| | | | | | | | | | | | | | | | | | | | | | | |
| | 375,043,624 | | | | 152,865,179 | | | | 103,041,935 | | | | 51,451,359 | | | | 174,671,962 | | | | 83,512,351 | |
| | — | | | | (19,349 | ) | | | — | | | | (6,278 | ) | | | — | | | | — | |
| | (48,939,154 | ) | | | 1,130,476 | | | | 1,486,917 | | | | 1,745,450 | | | | (84,246,770 | ) | | | 942,312 | |
| | 42,610,242 | | | | 42,342,777 | | | | 23,742,553 | | | | 14,102,335 | | | | 12,181,099 | | | | 13,089,566 | |
|
|
| |
|
|
| |
|
|
| |
|
|
| |
|
|
| |
|
|
|
| $ | 368,714,712 | | | $ | 196,319,083 | | | $ | 128,271,405 | | | $ | 67,292,866 | | | $ | 102,606,291 | | | $ | 97,544,229 | |
|
|
| |
|
|
| |
|
|
| |
|
|
| |
|
|
| |
|
|
|
| | | | | | | | | | | | | | | | | | | | | | | |
| $ | 8,784,002 | | | $ | 9,423,366 | | | $ | 8,079,219 | | | $ | 353,300 | | | $ | 5,958,288 | | | $ | 28,902,719 | |
| | 13,845,325 | | | | 3,581,926 | | | | 1,972,638 | | | | 136,394 | | | | 6,271,620 | | | | 13,214,977 | |
| | 24,617 | | | | 522,592 | | | | 207,503 | | | | 1,420 | | | | 44,717 | | | | 15,610,524 | |
| | 346,060,768 | | | | 182,791,199 | | | | 118,012,045 | | | | 66,801,752 | | | | 90,331,666 | | | | 39,816,009 | |
|
|
| |
|
|
| |
|
|
| |
|
|
| |
|
|
| |
|
|
|
| $ | 368,714,712 | | | $ | 196,319,083 | | | $ | 128,271,405 | | | $ | 67,292,866 | | | $ | 102,606,291 | | | $ | 97,544,229 | |
|
|
| |
|
|
| |
|
|
| |
|
|
| |
|
|
| |
|
|
|
| | | | | | | | | | | | | | | | | | | | | | | |
| | 1,069,095 | | | | 611,837 | | | | 737,680 | | | | 24,856 | | | | 498,297 | | | | 2,209,276 | |
| | 1,775,055 | | | | 234,044 | | | | 184,382 | | | | 9,698 | | | | 568,742 | | | | 1,020,701 | |
| | 3,152 | | | | 34,149 | | | | 19,396 | | | | 101 | | | | 4,052 | | | | 1,205,210 | |
| | 41,468,612 | | | | 11,859,735 | | | | 10,348,626 | | | | 4,692,913 | | | | 7,306,730 | | | | 3,034,611 | |
|
|
| |
|
|
| |
|
|
| |
|
|
| |
|
|
| |
|
|
|
| | 44,315,914 | | | | 12,739,765 | | | | 11,290,084 | | | | 4,727,568 | | | | 8,377,821 | | | | 7,469,798 | |
|
|
| |
|
|
| |
|
|
| |
|
|
| |
|
|
| |
|
|
|
| | | | | | | | | | | | | | | | | | | | | | | |
| $ | 8.22 | | | $ | 15.40 | | | $ | 10.95 | | | $ | 14.21 | | | $ | 11.96 | | | $ | 13.08 | |
|
|
| |
|
|
| |
|
|
| |
|
|
| |
|
|
| |
|
|
|
| $ | 7.80 | | | $ | 15.30 | | | $ | 10.70 | | | $ | 14.06 | | | $ | 11.03 | | | $ | 12.95 | |
|
|
| |
|
|
| |
|
|
| |
|
|
| |
|
|
| |
|
|
|
| $ | 7.81 | | | $ | 15.30 | | | $ | 10.70 | | | $ | 14.06 | | | $ | 11.04 | | | $ | 12.95 | |
|
|
| |
|
|
| |
|
|
| |
|
|
| |
|
|
| |
|
|
|
| $ | 8.35 | | | $ | 15.41 | | | $ | 11.40 | | | $ | 14.23 | | | $ | 12.36 | | | $ | 13.12 | |
|
|
| |
|
|
| |
|
|
| |
|
|
| |
|
|
| |
|
|
|
| | 5.75 | % | | | 5.75 | % | | | 5.75 | % | | | 5.75 | % | | | 5.75 | % | | | 5.75 | % |
|
|
| |
|
|
| |
|
|
| |
|
|
| |
|
|
| |
|
|
|
$ |
8.72 |
| | $ | 16.34 | | | $ | 11.62 | | | $ | 15.08 | | | $ | 12.70 | | | $ | 13.88 | |
|
|
| |
|
|
| |
|
|
| |
|
|
| |
|
|
| |
|
|
|
See accompanying notes to the financial statements.
97
BB&T Funds
Statements of Assets and Liabilities September 30, 2004 |
| | | | | | | | |
| | | International
Equity Fund
| | | Short U.S.
Government
Fund
| |
Assets | | | | | | | | |
Investments: | | | | | | | | |
Investments, at cost | | $ | 202,007,374 | | | $ | 295,996,723 | |
Unrealized appreciation (depreciation) | | | 32,130,795 | | | | 138,120 | |
| | |
|
|
| |
|
|
|
Investments, at value* | | | 234,138,169 | | | | 296,134,843 | |
Foreign currency, at value** | | | 1,213,851 | | | | — | |
Interest and dividends receivable | | | 721,923 | | | | 1,552,010 | |
Receivable for capital shares issued | | | — | | | | 41,998 | |
Receivable for forward currency contracts | | | 29,927 | | | | — | |
Receivable for investments sold | | | 4,016,634 | | | | — | |
Reclaims receivable | | | 262,624 | | | | — | |
Prepaid expenses | | | 5,249 | | | | 3,761 | |
| | |
|
|
| |
|
|
|
Total Assets | | | 240,388,377 | | | | 297,732,612 | |
| | |
|
|
| |
|
|
|
Liabilities: | | | | | | | | |
Dividends payable | | | 645,953 | | | | 500,792 | |
Payable for forward foreign currency contracts | | | 85,386 | | | | — | |
Payable for collateral received on loaned securities | | | — | | | | 92,254,937 | |
Payable for investments purchased | | | 2,351,992 | | | | — | |
Payable for capital shares redeemed | | | — | | | | 500,002 | |
Accrued expenses and other payables: | | | | | | | | |
Investment advisory fees | | | 173,836 | | | | 75,487 | |
Administration, transfer agency and fund accounting fees | | | 4,645 | | | | 4,016 | |
Distribution fees | | | 2,056 | | | | 1,814 | |
Other | | | 20,936 | | | | 19,551 | |
| | |
|
|
| |
|
|
|
Total Liabilities | | | 3,284,804 | | | | 93,356,599 | |
| | |
|
|
| |
|
|
|
Net Assets | | | | | | | | |
Capital | | | 251,460,780 | | | | 208,060,722 | |
Undistributed (distribution in excess of) net investment income | | | (868,449 | ) | | | 196,983 | |
Undistributed realized gains (losses) from investment and foreign currency transactions | | | (45,632,288 | ) | | | (4,019,812 | ) |
Net unrealized appreciation (depreciation) of investments and translation of assets and liabilities in foreign currency | | | 32,143,530 | | | | 138,120 | |
| | |
|
|
| |
|
|
|
Net Assets | | $ | 237,103,573 | | | $ | 204,376,013 | |
| | |
|
|
| |
|
|
|
Net Assets | | | | | | | | |
Class A Shares | | $ | 1,685,885 | | | $ | 8,456,292 | |
Class B Shares | | | 2,140,126 | | | | — | |
Class C Shares | | | 2,172 | | | | — | |
Institutional Shares | | | 233,275,390 | | | | 195,919,721 | |
| | |
|
|
| |
|
|
|
Total | | $ | 237,103,573 | | | $ | 204,376,013 | |
| | |
|
|
| |
|
|
|
Outstanding Units of Beneficial Interest (Shares) | | | | | | | | |
Class A Shares | | | 207,522 | | | | 871,514 | |
Class B Shares | | | 276,601 | | | | — | |
Class C Shares | | | 281 | | | | — | |
Institutional Shares | | | 28,314,055 | | | | 20,167,725 | |
| | |
|
|
| |
|
|
|
Total | | | 28,798,459 | | | | 21,039,239 | |
| | |
|
|
| |
|
|
|
Net Asset Value† | | | | | | | | |
Class A Shares — redemption price per share | | $ | 8.12 | | | $ | 9.70 | |
| | |
|
|
| |
|
|
|
Class B Shares — offering price per share*** | | $ | 7.74 | | | $ | — | |
| | |
|
|
| |
|
|
|
Class C Shares — offering price per share*** | | $ | 7.74 | | | $ | — | |
| | |
|
|
| |
|
|
|
Institutional Shares — offering and redemption price per share | | $ | 8.24 | | | $ | 9.71 | |
| | |
|
|
| |
|
|
|
Maximum Sales Charge — Class A Shares | | | 5.75 | % | | | 3.00 | % |
| | |
|
|
| |
|
|
|
Maximum Offering Price (100%/(100% — Maximum Sales Charge) of net asset value adjusted to the nearest cent) per share — Class A Shares | | $ | 8.62 | | | $ | 10.00 | |
| | |
|
|
| |
|
|
|
| * | The Short U.S. Government Fund, Intermediate U.S. Government Fund, and Intermediate Corporate Bond Fund include securities on loan of $89,846,550; $204,703,087; and $63,316,678, respectively. |
| ** | The International Equity Fund includes foreign currency at cost of $1,188,190. |
| *** | Redemption price per share varies by length of time shares are held |
| † | Net assets divided by shares outstanding may not recalculate due to the rounding of net assets and/or shares outstanding. |
See accompanying notes to the financial statements.
98
| | | | | | |
Intermediate
U.S. Government
Fund
| | | Intermediate
Corporate
Bond Fund
| |
| | | | | | | |
| | | | | | | |
| $ | 757,336,499 | | | $ | 337,610,978 | |
| | 3,698,482 | | | | 9,023,950 | |
|
|
| |
|
|
|
| | 761,034,981 | | | | 346,634,928 | |
| | — | | | | — | |
| | 4,239,336 | | | | 3,832,116 | |
| | — | | | | — | |
| | — | | | | — | |
| | — | | | | — | |
| | — | | | | — | |
| | 5,563 | | | | 3,719 | |
|
|
| |
|
|
|
| | 765,279,880 | | | | 350,470,763 | |
|
|
| |
|
|
|
| | | | | | | |
| | 1,498,264 | | | | 997,859 | |
| | — | | | | — | |
| | 209,338,787 | | | | 64,919,944 | |
| | — | | | | — | |
| | — | | | | 1,502 | |
| | | | | | | |
| | 228,256 | | | | 115,745 | |
| | 10,934 | | | | 5,604 | |
| | 8,636 | | | | 6,521 | |
| | 63,935 | | | | 30,199 | |
|
|
| |
|
|
|
| | 211,148,812 | | | | 66,077,374 | |
|
|
| |
|
|
|
| | | | | | | |
| | 548,768,232 | | | | 275,866,705 | |
| | 151,002 | | | | 236,222 | |
| | 1,513,352 | | | | (733,488 | ) |
|
3,698,482 |
| | | 9,023,950 | |
|
|
| |
|
|
|
| $ | 554,131,068 | | | $ | 284,393,389 | |
|
|
| |
|
|
|
| | | | | | | |
| $ | 11,959,166 | | | $ | 4,785,505 | |
| | 6,882,910 | | | | 6,601,928 | |
| | 606,513 | | | | 256,655 | |
| | 534,682,479 | | | | 272,749,301 | |
|
|
| |
|
|
|
| $ | 554,131,068 | | | $ | 284,393,389 | |
|
|
| |
|
|
|
| | | | | | | |
| | 1,167,816 | | | | 452,070 | |
| | 674,564 | | | | 623,284 | |
| | 59,439 | | | | 24,225 | |
| | 52,167,410 | | | | 25,753,213 | |
|
|
| |
|
|
|
| | 54,069,229 | | | | 26,852,792 | |
|
|
| |
|
|
|
| | | | | | | |
| $ | 10.24 | | | $ | 10.59 | |
|
|
| |
|
|
|
| $ | 10.20 | | | $ | 10.59 | |
|
|
| |
|
|
|
| $ | 10.20 | | | $ | 10.59 | |
|
|
| |
|
|
|
| $ | 10.25 | | | $ | 10.59 | |
|
|
| |
|
|
|
| | 5.75 | % | | | 5.75 | % |
|
|
| |
|
|
|
$ |
10.86 |
| | $ | 11.24 | |
|
|
| |
|
|
|
See accompanying notes to the financial statements.
99
BB&T Funds
Statements of Assets and Liabilities September 30, 2004 |
| | | | | | | | |
| | | Kentucky
Intermediate
Tax-Free Fund
| | | Maryland
Intermediate
Tax-Free Fund
| |
Assets | | | | | | | | |
Investments: | | | | | | | | |
Investments, at cost | | $ | 15,551,894 | | | $ | 9,676,694 | |
Unrealized appreciation (depreciation) | | | 467,553 | | | | 187,377 | |
| | |
|
|
| |
|
|
|
Investments, at value | | | 16,019,447 | | | | 9,864,071 | |
Interest and dividends receivable | | | 208,569 | | | | 120,882 | |
Receivable for investments sold | | | — | | | | — | |
Prepaid expenses | | | 157 | | | | 375 | |
| | |
|
|
| |
|
|
|
Total Assets | | | 16,228,173 | | | | 9,985,328 | |
| | |
|
|
| |
|
|
|
Liabilities | | | | | | | | |
Dividends payable | | | 36,337 | | | | 19,175 | |
Payable for investments purchased | | | — | | | | 189,887 | |
Accrued expenses and other payables | | | | | | | | |
Investment advisory fees | | | 4,123 | | | | 238 | |
Administration, transfer agency and fund accounting fees | | | 319 | | | | 193 | |
Distribution fees | | | 331 | | | | 77 | |
Other | | | 726 | | | | 1,458 | |
| | |
|
|
| |
|
|
|
Total Liabilities | | | 41,836 | | | | 211,028 | |
| | |
|
|
| |
|
|
|
Net Assets | | | | | | | | |
Capital | | | 15,774,565 | | | | 9,717,842 | |
Undistributed (distributions in excess of) net investment income | | | 1,920 | | | | 300 | |
Undistributed realized gains (losses) from investment transactions | | | (57,701 | ) | | | (131,219 | ) |
Net unrealized appreciation (depreciation) of investments | | | 467,553 | | | | 187,377 | |
| | |
|
|
| |
|
|
|
Net Assets | | $ | 16,186,337 | | | $ | 9,774,300 | |
| | |
|
|
| |
|
|
|
Net Assets | | | | | | | | |
Class A Shares | | $ | 2,745,787 | | | $ | 666,783 | |
Institutional Shares | | | 13,440,550 | | | | 9,107,517 | |
| | |
|
|
| |
|
|
|
Total | | $ | 16,186,337 | | | $ | 9,774,300 | |
| | |
|
|
| |
|
|
|
Outstanding Units of Beneficial Interest (Shares) | | | | | | | | |
Class A Shares | | | 268,743 | | | | 65,717 | |
Institutional Shares | | | 1,317,061 | | | | 896,197 | |
| | |
|
|
| |
|
|
|
Total | | | 1,585,804 | | | | 961,914 | |
| | |
|
|
| |
|
|
|
Net Asset Value | | | | | | | | |
Class A Shares — redemption price per share | | $ | 10.22 | | | $ | 10.15 | |
| | |
|
|
| |
|
|
|
Institutional Shares — offering and redemption price per share | | $ | 10.20 | | | $ | 10.16 | |
| | |
|
|
| |
|
|
|
Maximum Sales Charge — Class A Shares | | | 3.00 | % | | | 3.00 | % |
| | |
|
|
| |
|
|
|
Maximum Offering Price (100%/(100% — Maximum Sales Charge) of net asset value adjusted to the nearest cent) per share — Class A Shares | | $ | 10.54 | | | $ | 10.46 | |
| | |
|
|
| |
|
|
|
See accompanying notes to the financial statements.
100
| | | | | | | | | | | | | | |
North Carolina
Intermediate
Tax-Free Fund
| | | South Carolina
Intermediate
Tax-Free Fund
| | | Virginia
Intermediate
Tax-Free Fund
| | | West Virginia
Intermediate
Tax-Free Fund
| |
| | | | | | | | | | | | | | | |
| | | | | | | | | | | | | | | |
| $ | 113,479,425 | | | $ | 20,193,257 | | | $ | 76,602,095 | | | $ | 69,929,923 | |
| | 6,154,382 | | | | 1,274,563 | | | | 4,759,684 | | | | 3,429,334 | |
|
|
| |
|
|
| |
|
|
| |
|
|
|
| | 119,633,807 | | | | 21,467,820 | | | | 81,361,779 | | | | 73,359,257 | |
| | 1,725,709 | | | | 236,469 | | | | 950,995 | | | | 1,267,719 | |
| | — | | | | — | | | | 1,124,674 | | | | 2,232,532 | |
| | 647 | | | | 1,286 | | | | 283 | | | | 1,998 | |
|
|
| |
|
|
| |
|
|
| |
|
|
|
| | 121,360,163 | | | | 21,705,575 | | | | 83,437,731 | | | | 76,861,506 | |
|
|
| |
|
|
| |
|
|
| |
|
|
|
| | | | | | | | | | | | | | | |
| | 320,583 | | | | 58,439 | | | | 228,313 | | | | 216,891 | |
| | 1,549,185 | | | | — | | | | 1,378,492 | | | | 2,274,183 | |
| | | | | | | | | | | | | | | |
| | 44,246 | | | | 8,004 | | | | 30,299 | | | | 27,470 | |
| | 2,372 | | | | 428 | | | | 1,619 | | | | 1,468 | |
| | 2,793 | | | | 524 | | | | 1,576 | | | | 2,204 | |
| | 14,217 | | | | 1,582 | | | | 7,136 | | | | 6,619 | |
|
|
| |
|
|
| |
|
|
| |
|
|
|
| | 1,933,396 | | | | 68,977 | | | | 1,647,435 | | | | 2,528,835 | |
|
|
| |
|
|
| |
|
|
| |
|
|
|
| | | | | | | | | | | | | | | |
| | 112,989,731 | | | | 20,200,104 | | | | 76,839,330 | | | | 70,342,415 | |
| | 47,165 | | | | 15,729 | | | | 34,726 | | | | (14,320 | ) |
| | 235,489 | | | | 146,202 | | | | 156,556 | | | | 575,242 | |
| | 6,154,382 | | | | 1,274,563 | | | | 4,759,684 | | | | 3,429,334 | |
|
|
| |
|
|
| |
|
|
| |
|
|
|
| $ | 119,426,767 | | | $ | 21,636,598 | | | $ | 81,790,296 | | | $ | 74,332,671 | |
|
|
| |
|
|
| |
|
|
| |
|
|
|
| | | | | | | | | | | | | | | |
| $ | 22,688,744 | | | $ | 4,148,899 | | | $ | 13,004,743 | | | $ | 10,814,505 | |
| | 96,738,023 | | | | 17,487,699 | | | | 68,785,553 | | | | 63,518,166 | |
|
|
| |
|
|
| |
|
|
| |
|
|
|
| $ | 119,426,767 | | | $ | 21,636,598 | | | $ | 81,790,296 | | | $ | 74,332,671 | |
|
|
| |
|
|
| |
|
|
| |
|
|
|
| | | | | | | | | | | | | | | |
| | 2,127,134 | | | | 383,941 | | | | 1,107,950 | | | | 1,072,997 | |
| | 9,071,169 | | | | 1,628,720 | | | | 5,861,425 | | | | 6,296,272 | |
|
|
| |
|
|
| |
|
|
| |
|
|
|
| | 11,198,303 | | | | 2,012,661 | | | | 6,969,375 | | | | 7,369,269 | |
|
|
| |
|
|
| |
|
|
| |
|
|
|
| | | | | | | | | | | | | | | |
| $ | 10.67 | | | $ | 10.81 | | | $ | 11.74 | | | $ | 10.08 | |
|
|
| |
|
|
| |
|
|
| |
|
|
|
| $ | 10.66 | | | $ | 10.74 | | | $ | 11.74 | | | $ | 10.09 | |
|
|
| |
|
|
| |
|
|
| |
|
|
|
| | 3.00 | % | | | 3.00 | % | | | 3.00 | % | | | 3.00 | % |
|
|
| |
|
|
| |
|
|
| |
|
|
|
$ |
11.00 |
| | $ | 11.14 | | | $ | 12.10 | | | $ | 10.39 | |
|
|
| |
|
|
| |
|
|
| |
|
|
|
See accompanying notes to the financial statements.
101
BB&T Funds
Statements of Assets and Liabilities September 30, 2004 |
| | | | | | |
| | | Prime Money
Market Fund
| | U.S. Treasury
Money Market
Fund
|
Assets | | | | | | |
Investments: | | | | | | |
Unaffiliated investments, at cost | | $ | 825,300,756 | | $ | 465,426,518 |
Investment in affiliates, at cost | | | — | | | — |
| | |
|
| |
|
|
Total investments, at cost | | | 825,300,756 | | | 465,426,518 |
Unrealized appreciation (depreciation) | | | — | | | — |
| | |
|
| |
|
|
Investments, at value | | | 825,300,756 | | | 465,426,518 |
Repurchase agreements, at cost | | | 23,340,000 | | | 583,084,688 |
Collateralized loan agreements, at cost | | | 120,000,000 | | | — |
Cash | | | 1,167 | | | — |
Interest and dividends receivable | | | 1,408,450 | | | 2,300,385 |
Receivable for capital shares issued | | | — | | | — |
Prepaid expenses | | | 8,442 | | | 8,785 |
| | |
|
| |
|
|
Total Assets | | | 970,058,815 | | | 1,050,820,376 |
| | |
|
| |
|
|
Liabilities | | | | | | |
Dividends payable | | | 837,361 | | | 871,265 |
Payable for investments purchased | | | 9,980,789 | | | — |
Payable for capital shares redeemed | | | — | | | — |
Accrued expenses and other payables: | | | | | | |
Investment advisory fees | | | 238,411 | | | 234,982 |
Administration, transfer agency and fund accounting fees | | | 15,862 | | | 16,986 |
Distribution fees | | | 88,954 | | | 26,560 |
Other | | | 98,204 | | | 115,946 |
| | |
|
| |
|
|
Total Liabilities | | | 11,259,581 | | | 1,265,739 |
| | |
|
| |
|
|
Net Assets | | | | | | |
Capital | | | 958,789,862 | | | 1,049,554,391 |
Undistributed (distributions in excess of) net investment income | | | 9,372 | | | 246 |
Undistributed realized gains (losses) from investment transactions | | | — | | | — |
Net unrealized appreciation (depreciation) of investments | | | — | | | — |
| | |
|
| |
|
|
Net Assets | | $ | 958,799,234 | | $ | 1,049,554,637 |
| | |
|
| |
|
|
Net Assets | | | | | | |
Class A Shares | | $ | 426,216,796 | | $ | 122,500,444 |
Class B Shares | | | 2,280,176 | | | 886,948 |
Class C Shares | | | 453,132 | | | 4,979 |
Institutional Shares | | | 529,849,130 | | | 926,162,266 |
| | |
|
| |
|
|
Total | | $ | 958,799,234 | | $ | 1,049,554,637 |
| | |
|
| |
|
|
Outstanding Units of Beneficial Interest (Shares) | | | | | | |
Class A Shares | | | 426,213,798 | | | 122,500,687 |
Class B Shares | | | 2,280,150 | | | 886,946 |
Class C Shares | | | 453,128 | | | 4,979 |
Institutional Shares | | | 529,858,220 | | | 926,162,054 |
| | |
|
| |
|
|
Total | | | 958,805,296 | | | 1,049,554,666 |
| | |
|
| |
|
|
Net Asset Value | | | | | | |
Class A Shares — redemption price per share | | $ | 1.00 | | $ | 1.00 |
| | |
|
| |
|
|
Class B Shares — offering price per share* | | $ | 1.00 | | $ | 1.00 |
| | |
|
| |
|
|
Class C Shares — offering price per share* | | $ | 1.00 | | $ | 1.00 |
| | |
|
| |
|
|
Institutional Shares — offering and redemption price per share | | $ | 1.00 | | $ | 1.00 |
| | |
|
| |
|
|
Maximum Sales Charge — Class A Shares | | | NA | | | NA |
| | |
|
| |
|
|
Maximum Offering Price (100%/(100% — Maximum Sales Charge) of net asset value adjusted to the nearest cent) per share — Class A Shares | | $ | 1.00 | | $ | 1.00 |
| | |
|
| |
|
|
| * | Redemption price per share varies by length of time shares are held. |
See accompanying notes to the financial statements.
102
| | | | | | | | | | | | | | |
Capital Manager
Conservative
Growth Fund
| | | Capital Manager
Moderate
Growth Fund
| | | Capital Manager
Growth Fund
| | | Capital Manager
Equity Fund
| |
| | | | | | | | | | | | | | | |
| | | | | | | | | | | | | | | |
| $ | — | | | $ | — | | | $ | — | | | $ | — | |
| | 75,909,194 | | | | 73,558,479 | | | | 56,246,964 | | | | 29,714,443 | |
|
|
| |
|
|
| |
|
|
| |
|
|
|
| | 75,909,194 | | | | 73,558,479 | | | | 56,246,964 | | | | 29,714,443 | |
| | 2,507,182 | | | | 123,283 | | | | (1,796,707 | ) | | | 696,577 | |
|
|
| |
|
|
| |
|
|
| |
|
|
|
| | 78,416,376 | | | | 73,681,762 | | | | 54,450,257 | | | | 30,411,020 | |
| | — | | | | — | | | | — | | | | — | |
| | — | | | | — | | | | — | | | | — | |
| | — | | | | — | | | | — | | | | — | |
| | 153,695 | | | | 108,102 | | | | 63,963 | | | | 28,967 | |
| | — | | | | 23,335 | | | | 21,701 | | | | — | |
| | 2,852 | | | | 3,121 | | | | 4,247 | | | | 3,379 | |
|
|
| |
|
|
| |
|
|
| |
|
|
|
| | 78,572,923 | | | | 73,816,320 | | | | 54,540,168 | | | | 30,443,366 | |
|
|
| |
|
|
| |
|
|
| |
|
|
|
| | | | | | | | | | | | | | | |
| | 337,070 | | | | 134,060 | | | | 50,853 | | | | 14,482 | |
| | — | | | | — | | | | — | | | | — | |
| | 330 | | | | 15,347 | | | | — | | | | 2,021 | |
| | | | | | | | | | | | | | | |
| | 9,602 | | | | 8,974 | | | | 4,791 | | | | 733 | |
| | 1,282 | | | | 1,202 | | | | 885 | | | | 493 | |
| | 5,202 | | | | 19,856 | | | | 13,610 | | | | 5,387 | |
| | 14,806 | | | | 11,385 | | | | 10,415 | | | | 7,757 | |
|
|
| |
|
|
| |
|
|
| |
|
|
|
| | 368,292 | | | | 190,824 | | | | 80,554 | | | | 30,873 | |
|
|
| |
|
|
| |
|
|
| |
|
|
|
| | | | | | | | | | | | | | | |
| | 78,724,064 | | | | 75,240,090 | | | | 58,271,330 | | | | 29,902,378 | |
| | — | | | | — | | | | — | | | | — | |
| | (3,026,615 | ) | | | (1,737,877 | ) | | | (2,015,009 | ) | | | (186,462 | ) |
| | 2,507,182 | | | | 123,283 | | | | (1,796,707 | ) | | | 696,577 | |
|
|
| |
|
|
| |
|
|
| |
|
|
|
| $ | 78,204,631 | | | $ | 73,625,496 | | | $ | 54,459,614 | | | $ | 30,412,493 | |
|
|
| |
|
|
| |
|
|
| |
|
|
|
| | | | | | | | | | | | | | | |
| $ | 5,241,723 | | | $ | 20,428,103 | | | $ | 12,006,556 | | | $ | 3,557,298 | |
| | 4,857,407 | | | | 19,048,659 | | | | 13,729,727 | | | | 5,719,932 | |
| | 180,101 | | | | 177,829 | | | | 63,245 | | | | 84,679 | |
| | 67,925,400 | | | | 33,970,905 | | | | 28,660,086 | | | | 21,050,584 | |
|
|
| |
|
|
| |
|
|
| |
|
|
|
| $ | 78,204,631 | | | $ | 73,625,496 | | | $ | 54,459,614 | | | $ | 30,412,493 | |
|
|
| |
|
|
| |
|
|
| |
|
|
|
| | | | | | | | | | | | | | | |
| | 563,664 | | | | 2,268,199 | | | | 1,380,253 | | | | 371,154 | |
| | 522,272 | | | | 2,148,817 | | | | 1,604,935 | | | | 611,151 | |
| | 19,425 | | | | 19,964 | | | | 7,392 | | | | 9,072 | |
| | 7,253,624 | | | | 3,759,670 | | | | 3,292,432 | | | | 2,183,784 | |
|
|
| |
|
|
| |
|
|
| |
|
|
|
| | 8,358,985 | | | | 8,196,650 | | | | 6,285,012 | | | | 3,175,161 | |
|
|
| |
|
|
| |
|
|
| |
|
|
|
| | | | | | | | | | | | | | | |
| $ | 9.30 | | | $ | 9.01 | | | $ | 8.70 | | | $ | 9.58 | |
|
|
| |
|
|
| |
|
|
| |
|
|
|
| $ | 9.30 | | | $ | 8.86 | | | $ | 8.55 | | | $ | 9.36 | |
|
|
| |
|
|
| |
|
|
| |
|
|
|
| $ | 9.27 | | | $ | 8.91 | | | $ | 8.56 | | | $ | 9.33 | |
|
|
| |
|
|
| |
|
|
| |
|
|
|
| $ | 9.36 | | | $ | 9.04 | | | $ | 8.70 | | | $ | 9.64 | |
|
|
| |
|
|
| |
|
|
| |
|
|
|
| | 5.75 | % | | | 5.75 | % | | | 5.75 | % | | | 5.75 | % |
|
|
| |
|
|
| |
|
|
| |
|
|
|
$ |
9.87 |
| | $ | 9.56 | | | $ | 9.23 | | | $ | 10.16 | |
|
|
| |
|
|
| |
|
|
| |
|
|
|
See accompanying notes to the financial statements.
103
BB&T Funds
Statements of Operations For the Year Ended September 30, 2004 |
| | | | | | | | |
| | | Equity Income
Fund (a)
| | | Large
Company
Value Fund
| |
Investment Income: | | | | | | | | |
Interest income | | $ | 7,899 | | | $ | — | |
Dividend income | | | 211,384 | | | | 15,851,032 | |
Income from securities lending | | | — | | | | 38,602 | |
| | |
|
|
| |
|
|
|
Total Investment Income | | | 219,283 | | | | 15,889,634 | |
| | |
|
|
| |
|
|
|
Expenses: | | | | | | | | |
Investment advisory fees | | | 47,254 | | | | 4,659,602 | |
Administration, transfer agency and fund accounting fees | | | 31,000 | | | | 1,753,245 | |
Distribution fees — Class A Shares | | | 5,289 | | | | 145,129 | |
Distribution fees — Class B Shares | | | 2,919 | | | | 278,729 | |
Distribution fees — Class C Shares | | | 2,812 | | | | 1,394 | |
Custodian fees | | | 1,101 | | | | 123,982 | |
Other | | | 32,030 | | | | 155,753 | |
| | |
|
|
| |
|
|
|
Total expenses before waivers | | | 122,405 | | | | 7,117,834 | |
Less expenses waived by the Investment Advisor | | | (20,252 | ) | | | (576,267 | ) |
Less expenses waived by the Administrator and its affiliates | | | (5,639 | ) | | | (217,246 | ) |
| | |
|
|
| |
|
|
|
Net Expenses | | | 96,514 | | | | 6,324,321 | |
| | |
|
|
| |
|
|
|
Net Investment Income (Loss) | | | 122,769 | | | | 9,565,313 | |
| | |
|
|
| |
|
|
|
Realized/Unrealized Gains (Losses) on Investments: | | | | | | | | |
Net increase from payments by affiliates on investment restriction violations | | | — | | | | — | |
Net realized gains on option transactions | | | — | | | | — | |
Net realized gains (losses) from investment transactions | | | 24,856 | | | | 5,198,282 | |
Change in unrealized appreciation/depreciation of investments | | | 989,406 | | | | 80,925,301 | |
| | |
|
|
| |
|
|
|
Net realized/unrealized gains (losses) on investments | | | 1,014,262 | | | | 86,123,583 | |
| | |
|
|
| |
|
|
|
Change in net assets from operations | | $ | 1,137,031 | | | $ | 95,688,896 | |
| | |
|
|
| |
|
|
|
| (a) | From the commencement of operations on June 30, 2004 through September 30, 2004. |
See accompanying notes to the financial statements.
104
| | | | | | | | | | | | | | | | | | | | | | |
Large
Company
Growth Fund
| | | Mid Cap
Value Fund
| | | Mid Cap
Growth Fund
| | | Small
Company
Value Fund
| | | Small
Company
Growth Fund
| | | Special
Opportunities
Equity Fund
| |
| | | | | | | | | | | | | | | | | | | | | | | |
| $ | 53 | | | $ | — | | | $ | — | | | $ | 5 | | | $ | 1,153 | | | $ | 17,020 | |
| | 3,029,364 | | | | 4,463,055 | | | | 400,331 | | | | 793,310 | | | | 304,024 | | | | 399,789 | |
| | 75,201 | | | | 11,640 | | | | 28,969 | | | | 13,275 | | | | 77,223 | | | | — | |
|
|
| |
|
|
| |
|
|
| |
|
|
| |
|
|
| |
|
|
|
| | 3,104,618 | | | | 4,474,695 | | | | 429,300 | | | | 806,590 | | | | 382,400 | | | | 416,809 | |
|
|
| |
|
|
| |
|
|
| |
|
|
| |
|
|
| |
|
|
|
| | | | | | | | | | | | | | | | | | | | | | | |
| | 2,593,386 | | | | 1,352,081 | | | | 921,829 | | | | 572,499 | | | | 1,190,739 | | | | 524,342 | |
| | 1,020,018 | | | | 553,131 | | | | 400,966 | | | | 208,479 | | | | 425,815 | | | | 264,234 | |
| | 42,364 | | | | 20,830 | | | | 19,119 | | | | 1,173 | | | | 30,890 | | | | 73,964 | |
| | 149,154 | | | | 29,708 | | | | 16,778 | | | | 735 | | | | 72,991 | | | | 85,195 | |
| | 274 | | | | 5,261 | | | | 1,973 | | | | 14 | | | | 425 | | | | 90,703 | |
| | 70,655 | | | | 37,776 | | | | 24,960 | | | | 11,122 | | | | 23,782 | | | | 15,173 | |
| | 99,801 | | | | 60,228 | | | | 37,664 | | | | 22,458 | | | | 35,684 | | | | 54,107 | |
|
|
| |
|
|
| |
|
|
| |
|
|
| |
|
|
| |
|
|
|
| | 3,975,652 | | | | 2,059,015 | | | | 1,423,289 | | | | 816,480 | | | | 1,780,326 | | | | 1,107,718 | |
| | (320,811 | ) | | | (167,725 | ) | | | (115,682 | ) | | | (80,664 | ) | | | (105,016 | ) | | | (93,561 | ) |
| | (101,204 | ) | | | (41,666 | ) | | | (27,750 | ) | | | (14,082 | ) | | | (38,916 | ) | | | (53,846 | ) |
|
|
| |
|
|
| |
|
|
| |
|
|
| |
|
|
| |
|
|
|
| | 3,553,637 | | | | 1,849,624 | | | | 1,279,857 | | | | 721,734 | | | | 1,636,394 | | | | 960,311 | |
|
|
| |
|
|
| |
|
|
| |
|
|
| |
|
|
| |
|
|
|
| | (449,019 | ) | | | 2,625,071 | | | | (850,557 | ) | | | 84,856 | | | | (1,253,994 | ) | | | (543,502 | ) |
|
|
| |
|
|
| |
|
|
| |
|
|
| |
|
|
| |
|
|
|
| | | | | | | | | | | | | | | | | | | | | | | |
| | — | | | | — | | | | — | | | | — | | | | 8,277 | | | | — | |
| | — | | | | — | | | | — | | | | — | | | | — | | | | 79,792 | |
| | 28,592,255 | | | | 9,278,490 | | | | 13,005,024 | | | | 1,796,842 | | | | 19,661,946 | | | | 1,567,376 | |
| | (8,268,748 | ) | | | 20,135,708 | | | | 284,704 | | | | 10,522,224 | | | | (8,365,717 | ) | | | 11,687,812 | |
|
|
| |
|
|
| |
|
|
| |
|
|
| |
|
|
| |
|
|
|
| | 20,323,507 | | | | 29,414,198 | | | | 13,289,728 | | | | 12,319,066 | | | | 11,304,506 | | | | 13,334,980 | |
|
|
| |
|
|
| |
|
|
| |
|
|
| |
|
|
| |
|
|
|
| $ | 19,874,488 | | | $ | 32,039,269 | | | $ | 12,439,171 | | | $ | 12,403,922 | | | $ | 10,050,512 | | | $ | 12,791,478 | |
|
|
| |
|
|
| |
|
|
| |
|
|
| |
|
|
| |
|
|
|
See accompanying notes to the financial statements.
105
BB&T Funds
Statements of Operations For the Year Ended September 30, 2004 |
| | | | | | | | |
| | | International
Equity Fund
| | | Short U.S.
Government
Fund
| |
Investment Income: | | | | | | | | |
Interest income | | $ | 74,712 | | | $ | 5,806,050 | |
Dividend income | | | 6,624,056 | | | | 55,354 | |
Foreign tax withholding | | | (732,047 | ) | | | — | |
Income from securities lending | | | — | | | | 51,498 | |
| | |
|
|
| |
|
|
|
Total Investment Income: | | | 5,966,721 | | | | 5,912,902 | |
| | |
|
|
| |
|
|
|
Expenses: | | | | | | | | |
Investment advisory fees | | | 2,272,619 | | | | 1,250,173 | |
Administration, transfer agency and fund accounting fees | | | 682,255 | | | | 556,677 | |
Distribution fees — Class A Shares | | | 8,791 | | | | 44,572 | |
Distribution fees — Class B Shares | | | 21,609 | | | | — | |
Distribution fees — Class C Shares | | | 21 | | | | — | |
Custodian fees | | | 194,372 | | | | 40,158 | |
Other fees | | | 88,651 | | | | 49,350 | |
| | |
|
|
| |
|
|
|
Total expenses before waivers | | | 3,268,318 | | | | 1,940,930 | |
Less expenses waived by the Investment Advisor | | | (175,993 | ) | | | (277,956 | ) |
Less expenses waived by the Administrator and its affiliates | | | (56,000 | ) | | | (99,199 | ) |
| | |
|
|
| |
|
|
|
Net Expenses | | | 3,036,325 | | | | 1,563,775 | |
| | |
|
|
| |
|
|
|
Net Investment Income (Loss) | | | 2,930,396 | | | | 4,349,127 | |
| | |
|
|
| |
|
|
|
Realized/Unrealized Gains (Losses) on Investments: | | | | | | | | |
Net realized gains (losses) from investment transactions | | | 20,934,244 | | | | (502,785 | ) |
Change in unrealized appreciation/depreciation of investments | | | 13,545,842 | | | | (1,991,679 | ) |
| | |
|
|
| |
|
|
|
Net realized/unrealized gains (losses) on investments | | | 34,480,086 | | | | (2,494,464 | ) |
| | |
|
|
| |
|
|
|
Change in net assets from operations | | $ | 37,410,482 | | | $ | 1,854,663 | |
| | |
|
|
| |
|
|
|
See accompanying notes to the financial statements.
106
| | | | | | |
Intermediate
U.S. Government
Fund
| | | Intermediate
Corporate
Bond Fund
| |
| | | | | | | |
| $ | 20,284,955 | | | $ | 12,100,223 | |
| | 129,891 | | | | 567,847 | |
| | — | | | | — | |
| | 88,120 | | | | 24,051 | |
|
|
| |
|
|
|
| | 20,502,966 | | | | 12,692,121 | |
|
|
| |
|
|
|
| | | �� | | | | |
| | 3,113,158 | | | | 1,553,066 | |
| | 1,425,053 | | | | 743,966 | |
| | 55,169 | | | | 21,228 | |
| | 76,636 | | | | 64,455 | |
| | 7,327 | | | | 2,500 | |
| | 105,448 | | | | 52,075 | |
| | 149,407 | | | | 81,470 | |
|
|
| |
|
|
|
| | 4,932,198 | | | | 2,518,760 | |
| | (518,815 | ) | | | (258,823 | ) |
| | (146,685 | ) | | | (70,390 | ) |
|
|
| |
|
|
|
| | 4,266,698 | | | | 2,189,547 | |
|
|
| |
|
|
|
| | 16,236,268 | | | | 10,502,574 | |
|
|
| |
|
|
|
| | | | | | | |
| | 4,021,401 | | | | 2,319,802 | |
| | (13,559,131 | ) | | | (4,182,899 | ) |
|
|
| |
|
|
|
| | (9,537,730 | ) | | | (1,863,097 | ) |
|
|
| |
|
|
|
| $ | 6,698,538 | | | $ | 8,639,477 | |
|
|
| |
|
|
|
See accompanying notes to the financial statements.
107
BB&T Funds
Statements of Operations For the Year Ended September 30, 2004 |
| | | | | | | | |
| | | Kentucky
Intermediate
Tax-Free Fund
| | | Maryland
Intermediate
Tax-Free Fund
| |
Investment Income: | | | | | | | | |
Interest income | | $ | 568,483 | | | $ | 229,360 | |
Dividend income | | | 3,911 | | | | 1,473 | |
| | |
|
|
| |
|
|
|
Total Investment Income: | | | 572,394 | | | | 230,833 | |
| | |
|
|
| |
|
|
|
Expenses: | | | | | | | | |
Investment advisory fees | | | 100,822 | | | | 45,175 | |
Administration, transfer agency and fund accounting fees | | | 70,362 | | | | 46,721 | |
Distribution fees — Class A Shares | | | 12,013 | | | | 2,911 | |
Custodian fees | | | 3,459 | | | | 1,334 | |
Other | | | 5,698 | | | | 4,227 | |
| | |
|
|
| |
|
|
|
Total expenses before waivers | | | 192,354 | | | | 100,368 | |
Less expenses waived and/or reimbursed by the Investment Advisor | | | (65,908 | ) | | | (48,651 | ) |
Less expenses waived by the Administrator and its affiliates | | | (17,420 | ) | | | (5,781 | ) |
| | |
|
|
| |
|
|
|
Net Expenses | | | 109,026 | | | | 45,936 | |
| | |
|
|
| |
|
|
|
Net Investment Income (Loss) | | | 463,368 | | | | 184,897 | |
| | |
|
|
| |
|
|
|
Realized/Unrealized Gains (Losses) on Investments: | | | | | | | | |
Net realized gains (losses) from investment transactions | | | (6,703 | ) | | | (112,876 | ) |
Change in unrealized appreciation /depreciation of investments | | | (23,374 | ) | | | 112,593 | |
| | |
|
|
| |
|
|
|
Net realized/unrealized gains (losses) on investments | | | (30,077 | ) | | | (283 | ) |
| | |
|
|
| |
|
|
|
Change in net assets from operations | | $ | 433,291 | | | $ | 184,614 | |
| | |
|
|
| |
|
|
|
See accompanying notes to the financial statements.
108
| | | | | | | | | | | | | | |
North Carolina
Intermediate
Tax-Free Fund
| | | South Carolina
Intermediate
Tax-Free Fund
| | | Virginia
Intermediate
Tax-Free Fund
| | | West Virginia
Intermediate
Tax-Free Fund
| |
| | | | | | | | | | | | | | | |
| $ | 4,781,035 | | | $ | 902,448 | | | $ | 3,383,947 | | | $ | 3,374,762 | |
| | 25,217 | | | | 3,956 | | | | 14,434 | | | | 11,419 | |
|
|
| |
|
|
| |
|
|
| |
|
|
|
| | 4,806,252 | | | | 906,404 | | | | 3,398,381 | | | | 3,386,181 | |
|
|
| |
|
|
| |
|
|
| |
|
|
|
| | | | | | | | | | | | | | | |
| | 733,350 | | | | 135,988 | | | | 494,154 | | | | 358,251 | |
| | 345,070 | | | | 63,909 | | | | 237,254 | | | | 232,382 | |
| | 121,358 | | | | 22,953 | | | | 50,578 | | | | 27,841 | |
| | 24,432 | | | | 3,663 | | | | 15,424 | | | | 15,061 | |
| | 26,837 | | | | 8,382 | | | | 17,495 | | | | 17,195 | |
|
|
| |
|
|
| |
|
|
| |
|
|
|
| | 1,251,047 | | | | 234,895 | | | | 814,905 | | | | 650,730 | |
| | (162,887 | ) | | | (33,997 | ) | | | (109,661 | ) | | | — | |
| | (130,130 | ) | | | (24,457 | ) | | | (66,051 | ) | | | (16,908 | ) |
|
|
| |
|
|
| |
|
|
| |
|
|
|
| | 958,030 | | | | 176,441 | | | | 639,193 | | | | 633,822 | |
|
|
| |
|
|
| |
|
|
| |
|
|
|
| | 3,848,222 | | | | 729,963 | | | | 2,759,188 | | | | 2,752,359 | |
|
|
| |
|
|
| |
|
|
| |
|
|
|
| | | | | | | | | | | | | | | |
| | 192,951 | | | | 145,469 | | | | 206,599 | | | | 598,661 | |
| | (1,534,991 | ) | | | (287,972 | ) | | | (1,330,941 | ) | | | (1,405,834 | ) |
|
|
| |
|
|
| |
|
|
| |
|
|
|
| | (1,342,040 | ) | | | (142,503 | ) | | | (1,124,342 | ) | | | (807,173 | ) |
|
|
| |
|
|
| |
|
|
| |
|
|
|
| $ | 2,506,182 | | | $ | 587,460 | | | $ | 1,634,846 | | | $ | 1,945,186 | |
|
|
| |
|
|
| |
|
|
| |
|
|
|
See accompanying notes to the financial statements.
109
BB&T Funds
Statements of Operations For the Year Ended September 30, 2004 |
| | | | | | | | |
| | | Prime Money
Market Fund
| | | U.S. Treasury
Money Market
Fund
| |
Investment Income | | | | | | | | |
Interest income | | $ | 13,118,624 | | | $ | 12,580,868 | |
Dividend income from affiliates | | | — | | | | — | |
Income from securities lending | | | — | | | | 72,786 | |
| | |
|
|
| |
|
|
|
Total Investment Income | | | 13,118,624 | | | | 12,653,654 | |
| | |
|
|
| |
|
|
|
Expenses: | | | | | | | | |
Investment advisory fees | | | 4,162,094 | | | | 4,629,047 | |
Administration, transfer agency and fund accounting fees | | | 2,715,846 | | | | 3,020,976 | |
Distribution fees — Class A Shares | | | 2,214,238 | | | | 665,001 | |
Distribution fees — Class B Shares | | | 24,202 | | | | 9,167 | |
Distribution fees — Class C Shares | | | 5,159 | | | | 74 | |
Custodian fees | | | 139,199 | | | | 233,143 | |
Other | | | 255,187 | | | | 338,758 | |
| | |
|
|
| |
|
|
|
Total expenses before waivers | | | 9,515,925 | | | | 8,896,166 | |
Less expenses waived by the Investment Advisor | | | (1,040,444 | ) | | | (1,307,050 | ) |
Less expenses waived by the Administrator and its affiliates | | | (1,271,429 | ) | | | (720,563 | ) |
| | |
|
|
| |
|
|
|
Net Expenses | | | 7,204,052 | | | | 6,868,553 | |
| | |
|
|
| |
|
|
|
Net Investment Income (Loss) | | | 5,914,572 | | | | 5,785,101 | |
| | |
|
|
| |
|
|
|
Realized/Unrealized Gains (Losses) on Investments: | | | | | | | | |
Net realized gains (losses) from investment transactions | | | 3,370 | | | | — | |
Net realized gain distributions from underlying funds | | | — | | | | — | |
Change in unrealized appreciation/depreciation from investments | | | — | | | | — | |
| | |
|
|
| |
|
|
|
Net realized/unrealized gains (losses) on investments | | | 3,370 | | | | — | |
| | |
|
|
| |
|
|
|
Change in net assets from operations | | $ | 5,917,942 | | | $ | 5,785,101 | |
| | |
|
|
| |
|
|
|
See accompanying notes to the financial statements.
110
| | | | | | | | | | | | | | |
Capital Manager
Conservative
Growth Fund
| | | Capital Manager
Moderate
Growth Fund
| | | Capital Manager
Growth Fund
| | | Capital Manager
Equity Fund
| |
| | | | | | | | | | | | | | | |
| $ | — | | | $ | — | | | $ | — | | | $ | — | |
| | 1,756,930 | | | | 1,054,868 | | | | 592,394 | | | | 245,639 | |
| | — | | | | — | | | | — | | | | — | |
|
|
| |
|
|
| |
|
|
| |
|
|
|
| | 1,756,930 | | | | 1,054,868 | | | | 592,394 | | | | 245,639 | |
|
|
| |
|
|
| |
|
|
| |
|
|
|
| | | | | | | | | | | | | | | |
| | 185,180 | | | | 157,379 | | | | 116,144 | | | | 64,527 | |
| | 242,167 | | | | 234,173 | | | | 188,514 | | | | 120,494 | |
| | 19,824 | | | | 81,425 | | | | 44,442 | | | | 11,368 | |
| | 42,153 | | | | 157,835 | | | | 121,934 | | | | 43,774 | |
| | 1,815 | | | | 2,370 | | | | 648 | | | | 766 | |
| | 15,190 | | | | 12,439 | | | | 9,324 | | | | 5,327 | |
| | 32,561 | | | | 33,649 | | | | 26,273 | | | | 18,184 | |
|
|
| |
|
|
| |
|
|
| |
|
|
|
| | 538,890 | | | | 679,270 | | | | 507,279 | | | | 264,440 | |
| | (74,068 | ) | | | (62,949 | ) | | | (59,675 | ) | | | (47,688 | ) |
| | (85,220 | ) | | | (104,631 | ) | | | (69,437 | ) | | | (31,900 | ) |
|
|
| |
|
|
| |
|
|
| |
|
|
|
| | 379,602 | | | | 511,690 | | | | 378,167 | | | | 184,852 | |
|
|
| |
|
|
| |
|
|
| |
|
|
|
| | 1,377,328 | | | | 543,178 | | | | 214,227 | | | | 60,787 | |
|
|
| |
|
|
| |
|
|
| |
|
|
|
| | | | | | | | | | | | | | | |
| | (446,201 | ) | | | (14,859 | ) | | | (29,962 | ) | | | (73,449 | ) |
| | 243,148 | | | | 93,661 | | | | 31,778 | | | | — | |
| | 3,404,031 | | | | 4,029,560 | | | | 4,164,246 | | | | 2,836,612 | |
|
|
| |
|
|
| |
|
|
| |
|
|
|
| | 3,200,978 | | | | 4,108,362 | | | | 4,166,062 | | | | 2,763,163 | |
|
|
| |
|
|
| |
|
|
| |
|
|
|
| $ | 4,578,306 | | | $ | 4,651,540 | | | $ | 4,380,289 | | | $ | 2,823,950 | |
|
|
| |
|
|
| |
|
|
| |
|
|
|
See accompanying notes to the financial statements.
111
BB&T Funds
Statements of Changes in Net Assets
| | | | |
| | | Equity Income
Fund
| |
| | | For the Period
June 30, 2004
through
September 30, 2004 (a)
| |
From Investment Activities | | | | |
Operations: | | | | |
Net investment income (loss) | | $ | 122,769 | |
Net realized gains (losses) from investment transactions | | | 24,856 | |
Change in unrealized appreciation/depreciation of investments | | | 989,406 | |
| | |
|
|
|
Change in net assets from operations | | | 1,137,031 | |
| | |
|
|
|
Dividends to Class A Shareholders: | | | | |
Net investment income | | | (23,764 | ) |
Dividends to Class B Shareholders: | | | | |
Net investment income | | | (4,198 | ) |
Dividends to Class C Shareholders: | | | | |
Net investment income | | | (4,779 | ) |
Dividends to Institutional Class Shareholders: | | | | |
Net investment income | | | (90,028 | ) |
| | |
|
|
|
Change in net assets from shareholder dividends | | | (122,769 | ) |
| | |
|
|
|
Capital Transactions: | | | | |
Change in net assets from capital transactions | | | 29,944,423 | |
| | |
|
|
|
Change in net assets | | | 30,958,685 | |
Net Assets: | | | | |
Beginning of period | | | — | |
| | |
|
|
|
End of period | | $ | 30,958,685 | |
| | |
|
|
|
Undistributed (distributions in excess of) net investment income | | $ | 8,099 | |
| | |
|
|
|
| (a) | Period from commencement of operations. |
See accompanying notes to the financial statements.
112
| | | | | | | | | | | | | | | | | | | | | | |
Large Company
Value Fund
| | | Large Company
Growth Fund
| | | Mid Cap
Value Fund
| |
For the
Year Ended
September 30, 2004
| | | For the
Year Ended
September 30, 2003
| | | For the
Year Ended
September 30, 2004
| | | For the
Year Ended
September 30, 2003
| | | For the
Year Ended
September 30, 2004
| | | For the
Year Ended
September 30, 2003
| |
| | | | | | | | | | | | | | | | | | | | | | | |
| | | | | | | | | | | | | | | | | | | | | | | |
| $ | 9,565,313 | | | $ | 7,958,472 | | | $ | (449,019 | ) | | $ | (393,818 | ) | | $ | 2,625,071 | | | $ | 1,898,342 | |
| | 5,198,282 | | | | (4,530,796 | ) | | | 28,592,255 | | | | (12,100,245 | ) | | | 9,278,490 | | | | (3,245,571 | ) |
| | 80,925,301 | | | | 66,469,069 | | | | (8,268,748 | ) | | | 47,065,553 | | | | 20,135,708 | | | | 25,313,731 | |
|
|
| |
|
|
| |
|
|
| |
|
|
| |
|
|
| |
|
|
|
| | 95,688,896 | | | | 69,896,745 | | | | 19,874,488 | | | | 34,571,490 | | | | 32,039,269 | | | | 23,966,502 | |
|
|
| |
|
|
| |
|
|
| |
|
|
| |
|
|
| |
|
|
|
| | | | | | | | | | | | | | | | | | | | | | | |
| | (381,077 | ) | | | (395,381 | ) | | | — | | | | — | | | | (104,105 | ) | | | (75,198 | ) |
| | | | | | | | | | | | | | | | | | | | | | | |
| | (163,264 | ) | | | (234,495 | ) | | | — | | | | — | | | | (19,630 | ) | | | (11,787 | ) |
| | | | | | | | | | | | | | | | | | | | | | | |
| | (839 | ) | | | (719 | ) | | | — | | | | — | | | | (3,445 | ) | | | (2,747 | ) |
| | | | | | | | | | | | | | | | | | | | | | | |
| | (8,969,901 | ) | | | (7,377,663 | ) | | | — | | | | — | | | | (2,497,891 | ) | | | (1,807,190 | ) |
|
|
| |
|
|
| |
|
|
| |
|
|
| |
|
|
| |
|
|
|
| | (9,515,081 | ) | | | (8,008,258 | ) | | | — | | | | — | | | | (2,625,071 | ) | | | (1,896,922 | ) |
|
|
| |
|
|
| |
|
|
| |
|
|
| |
|
|
| |
|
|
|
| | | | | | | | | | | | | | | | | | | | | | | |
| | 65,237,760 | | | | 98,041,490 | | | | 54,587,746 | | | | 79,430,346 | | | | 15,228,716 | | | | 38,065,412 | |
|
|
| |
|
|
| |
|
|
| |
|
|
| |
|
|
| |
|
|
|
| | 151,411,575 | | | | 159,929,977 | | | | 74,462,234 | | | | 114,001,836 | | | | 44,642,914 | | | | 60,134,992 | |
| | | | | | | | | | | | | | | | | | | | | | | |
| | 527,023,403 | | | | 367,093,426 | | | | 294,252,478 | | | | 180,250,642 | | | | 151,676,169 | | | | 91,541,177 | |
|
|
| |
|
|
| |
|
|
| |
|
|
| |
|
|
| |
|
|
|
| $ | 678,434,978 | | | $ | 527,023,403 | | | $ | 368,714,712 | | | $ | 294,252,478 | | | $ | 196,319,083 | | | $ | 151,676,169 | |
|
|
| |
|
|
| |
|
|
| |
|
|
| |
|
|
| |
|
|
|
| $ | 2 | | | $ | (50,230 | ) | | $ | — | | | $ | — | | | $ | (19,349 | ) | | $ | — | |
|
|
| |
|
|
| |
|
|
| |
|
|
| |
|
|
| |
|
|
|
See accompanying notes to the financial statements.
113
BB&T Funds
Statements of Changes in Net Assets, continued
| | | | |
| | | Equity Income
Fund
| |
| | | For the Period
June 30, 2004
through
September 30, 2004 (a)
| |
Capital Transactions: | | | | |
Class A Shares: | | | | |
Proceeds from shares issued | | $ | 6,230,797 | |
Dividends reinvested | | | — | |
Value of shares redeemed | | | (71,757 | ) |
| | |
|
|
|
Change in net assets from Class A Share transactions | | | 6,159,040 | |
Class B Shares: | | | | |
Proceeds from shares issued | | | 1,667,563 | |
Dividends reinvested | | | — | |
Value of shares redeemed | | | (51,128 | ) |
| | |
|
|
|
Change in net assets from Class B Share transactions | | | 1,616,435 | |
Class C Shares: | | | | |
Proceeds from shares issued | | | 1,766,442 | |
Dividends reinvested | | | — | |
Value of shares redeemed | | | — | |
| | |
|
|
|
Change in net assets from Class C Share transactions | | | 1,766,442 | |
Institutional Shares: | | | | |
Proceeds from shares issued | | | 20,402,506 | |
Proceeds from shares issued in conversion | | | — | |
Dividends reinvested | | | — | |
Value of shares redeemed | | | — | |
| | |
|
|
|
Change in net assets from Institutional Share transactions | | | 20,402,506 | |
| | |
|
|
|
Change in net assets from capital transactions | | $ | 29,944,423 | |
| | |
|
|
|
Share Transactions: | | | | |
Class A Shares: | | | | |
Issued | | | 619,851 | |
Reinvested | | | — | |
Redeemed | | | (6,986 | ) |
| | |
|
|
|
Change in Class A Shares | | | 612,865 | |
Class B Shares: | | | | |
Issued | | | 166,636 | |
Reinvested | | | — | |
Redeemed | | | (4,949 | ) |
| | |
|
|
|
Change in Class B Shares | | | 161,687 | |
Class C Shares: | | | | |
Issued | | | 175,569 | |
Reinvested | | | — | |
Redeemed | | | — | |
| | |
|
|
|
Change in Class C Shares | | | 175,569 | |
Institutional Shares: | | | | |
Issued | | | 2,041,126 | |
Issued in conversion | | | — | |
Reinvested | | | — | |
Redeemed | | | — | |
| | |
|
|
|
Change in Institutional Shares | | | 2,041,126 | |
| | |
|
|
|
Change in Shares | | | 2,991,247 | |
| | |
|
|
|
| (a) | Period from commencement of operations. |
See accompanying notes to the financial statements.
114
| | | | | | | | | | | | | | | | | | | | | | |
Large Company
Value Fund
| | | Large Company
Growth Fund
| | | Mid Cap
Value Fund
| |
For the
Year Ended
September 30, 2004
| | | For the
Year Ended
September 30, 2003
| | | For the
Year Ended
September 30, 2004
| | | For the
Year Ended
September 30, 2003
| | | For the
Year Ended
September 30, 2004
| | | For the
Year Ended
September 30, 2003
| |
| | | | | | | | | | | | | | | | | | | | | | | |
| | | | | | | | | | | | | | | | | | | | | | | |
| $ | 7,058,368 | | | $ | 4,803,034 | | | $ | 3,499,118 | | | $ | 1,517,399 | | | $ | 2,322,516 | | | $ | 1,625,215 | |
| | 359,865 | | | | 377,384 | | | | — | | | | — | | | | 100,431 | | | | 71,871 | |
| | (5,050,171 | ) | | | (5,457,503 | ) | | | (2,146,132 | ) | | | (1,728,442 | ) | | | (1,150,047 | ) | | | (907,058 | ) |
|
|
| |
|
|
| |
|
|
| |
|
|
| |
|
|
| |
|
|
|
| | 2,368,062 | | | | (277,085 | ) | | | 1,352,986 | | | | (211,043 | ) | | | 1,272,900 | | | | 790,028 | |
| | | | | | | | | | | | | | | | | | | | | | | |
| | 2,595,030 | | | | 1,920,190 | | | | 1,596,467 | | | | 1,111,934 | | | | 1,444,562 | | | | 838,577 | |
| | 164,313 | | | | 233,253 | | | | — | | | | — | | | | 21,600 | | | | 11,135 | |
| | (6,769,650 | ) | | | (4,451,704 | ) | | | (2,843,372 | ) | | | (1,874,763 | ) | | | (387,235 | ) | | | (209,954 | ) |
|
|
| |
|
|
| |
|
|
| |
|
|
| |
|
|
| |
|
|
|
| | (4,010,307 | ) | | | (2,298,261 | ) | | | (1,246,905 | ) | | | (762,829 | ) | | | 1,078,927 | | | | 639,758 | |
| | | | | | | | | | | | | | | | | | | | | | | |
| | 55,126 | | | | 78,799 | | | | 7,424 | | | | 14,408 | | | | 102,563 | | | | 209,376 | |
| | 846 | | | | 731 | | | | — | | | | — | | | | 3,530 | | | | 2,508 | |
| | (38,311 | ) | | | (17,716 | ) | | | (15,941 | ) | | | (24,891 | ) | | | (150,717 | ) | | | (91,167 | ) |
|
|
| |
|
|
| |
|
|
| |
|
|
| |
|
|
| |
|
|
|
| | 17,661 | | | | 61,814 | | | | (8,517 | ) | | | (10,483 | ) | | | (44,624 | ) | | | 120,717 | |
| | | | | | | | | | | | | | | | | | | | | | | |
| | 78,755,785 | | | | 167,017,338 | | | | 63,041,668 | | | | 114,951,958 | | | | 44,210,775 | | | | 58,120,095 | |
| | 63,782,610 | | | | 46,561,908 | | | | 42,521,740 | | | | 31,041,272 | | | | — | | | | — | |
| | 4,462,727 | | | | 3,398,813 | | | | — | | | | — | | | | 978,956 | | | | 591,861 | |
| | (80,138,778 | ) | | | (116,423,037 | ) | | | (51,073,226 | ) | | | (65,578,529 | ) | | | (32,268,218 | ) | | | (22,197,047 | ) |
|
|
| |
|
|
| |
|
|
| |
|
|
| |
|
|
| |
|
|
|
| | 66,862,344 | | | | 100,555,022 | | | | 54,490,182 | | | | 80,414,701 | | | | 12,921,513 | | | | 36,514,909 | |
|
|
| |
|
|
| |
|
|
| |
|
|
| |
|
|
| |
|
|
|
| $ | 65,237,760 | | | $ | 98,041,490 | | | $ | 54,587,746 | | | $ | 79,430,346 | | | $ | 15,228,716 | | | $ | 38,065,412 | |
|
|
| |
|
|
| |
|
|
| |
|
|
| |
|
|
| |
|
|
|
| | | | | | | | | | | | | | | | | | | | | | | |
| | | | | | | | | | | | | | | | | | | | | | | |
| | 416,816 | | | | 335,063 | | | | 410,119 | | | | 206,187 | | | | 156,828 | | | | 136,905 | |
| | 21,652 | | | | 26,906 | | | | — | | | | — | | | | 6,856 | | | | 6,222 | |
| | (304,624 | ) | | | (384,295 | ) | | | (256,999 | ) | | | (235,995 | ) | | | (79,080 | ) | | | (79,703 | ) |
|
|
| |
|
|
| |
|
|
| |
|
|
| |
|
|
| |
|
|
|
| | 133,844 | | | | (22,326 | ) | | | 153,120 | | | | (29,808 | ) | | | 84,604 | | | | 63,424 | |
| | | | | | | | | | | | | | | | | | | | | | | |
| | 155,272 | | | | 136,747 | | | | 198,744 | | | | 161,634 | | | | 98,622 | | | | 71,054 | |
| | 9,969 | | | | 16,683 | | | | — | | | | — | | | | 1,481 | | | | 968 | |
| | (405,281 | ) | | | (325,204 | ) | | | (356,687 | ) | | | (278,511 | ) | | | (26,445 | ) | | | (17,919 | ) |
|
|
| |
|
|
| |
|
|
| |
|
|
| |
|
|
| |
|
|
|
| | (240,040 | ) | | | (171,774 | ) | | | (157,943 | ) | | | (116,877 | ) | | | 73,658 | | | | 54,103 | |
| | | | | | | | | | | | | | | | | | | | | | | |
| | 3,252 | | | | 5,466 | | | | 935 | | | | 2,016 | | | | 7,088 | | | | 17,755 | |
| | 51 | | | | 52 | | | | — | | | | — | | | | 244 | | | | 219 | |
| | (2,394 | ) | | | (1,303 | ) | | | (2,040 | ) | | | (3,577 | ) | | | (10,628 | ) | | | (8,048 | ) |
|
|
| |
|
|
| |
|
|
| |
|
|
| |
|
|
| |
|
|
|
| | 909 | | | | 4,215 | | | | (1,105 | ) | | | (1,561 | ) | | | (3,296 | ) | | | 9,926 | |
| | | | | | | | | | | | | | | | | | | | | | | |
| | 4,689,596 | | | | 11,843,335 | | | | 7,449,612 | | | | 15,803,468 | | | | 3,006,926 | | | | 5,039,767 | |
| | 3,756,814 | | | | 3,126,165 | | | | 5,005,398 | | | | 3,972,894 | | | | — | | | | — | |
| | 267,577 | | | | 241,471 | | | | — | | | | — | | | | 66,632 | | | | 50,888 | |
| | (4,759,811 | ) | | | (8,167,879 | ) | | | (6,033,687 | ) | | | (8,855,868 | ) | | | (2,175,502 | ) | | | (1,906,323 | ) |
|
|
| |
|
|
| |
|
|
| |
|
|
| |
|
|
| |
|
|
|
| | 3,954,176 | | | | 7,043,092 | | | | 6,421,323 | | | | 10,920,494 | | | | 898,056 | | | | 3,184,332 | |
|
|
| |
|
|
| |
|
|
| |
|
|
| |
|
|
| |
|
|
|
| | 3,848,889 | | | | 6,853,207 | | | | 6,415,395 | | | | 10,772,248 | | | | 1,053,022 | | | | 3,311,785 | |
|
|
| |
|
|
| |
|
|
| |
|
|
| |
|
|
| |
|
|
|
See accompanying notes to the financial statements.
115
BB&T Funds
Statements of Changes in Net Assets
| | | | | | | | |
| | | Mid Cap
Growth Fund
| |
| | |
For the
Year Ended
September 30, 2004
| | | For the
Year Ended
September 30, 2003
| |
From Investment Activities | | | | | | | | |
Operations: | | | | | | | | |
Net investment income (loss) | | $ | (850,557 | ) | | $ | (654,730 | ) |
Net realized gains (losses) from investment transactions | | | 13,005,024 | | | | (1,658,602 | ) |
Change in unrealized appreciation/depreciation of investments | | | 284,704 | | | | 21,876,296 | |
| | |
|
|
| |
|
|
|
Change in net assets from operations | | | 12,439,171 | | | | 19,562,964 | |
| | |
|
|
| |
|
|
|
Dividends to Class A Shareholders: | | | | | | | | |
Net investment income | | | — | | | | — | |
Net realized gains from investment transactions | | | — | | | | — | |
Dividends to Class B Shareholders: | | | | | | | | |
Net realized gains from investment transactions | | | — | | | | — | |
Dividends to Class C Shareholders: | | | | | | | | |
Net realized gains from investment transactions | | | — | | | | — | |
Dividends to Institutional Class Shareholders: | | | | | | | | |
Net investment income | | | — | | | | — | |
Net realized gains from investment transactions | | | — | | | | — | |
| | |
|
|
| |
|
|
|
Change in net assets from shareholder dividends | | | — | | | | — | |
| | |
|
|
| |
|
|
|
Capital Transactions: | | | | | | | | |
Change in net assets from capital transactions | | | 7,924,772 | | | | 12,185,805 | |
| | |
|
|
| |
|
|
|
Change in net assets | | | 20,363,943 | | | | 31,748,769 | |
Net Assets: | | | | | | | | |
Beginning of period | | | 107,907,462 | | | | 76,158,693 | |
| | |
|
|
| |
|
|
|
End of period | | $ | 128,271,405 | | | $ | 107,907,462 | |
| | |
|
|
| |
|
|
|
Undistributed (distributions in excess of) net investment income | | $ | — | | | $ | — | |
| | |
|
|
| |
|
|
|
| (a) | Period from commencement of operations. |
See accompanying notes to the financial statements.
116
| | | | | | | | | | | | | | | | | | | | | | |
Small Company
Value Fund
| | | Small Company
Growth Fund
| | | Special Opportunities
Equity Fund
| |
For the
Year Ended
September 30, 2004
| | | For the Period
May 19, 2003
through
September 30, 2003 (a)
| | | For the
Year Ended
September 30, 2004
| | | For the
Year Ended
September 30, 2003
| | | For the
Year Ended
September 30, 2004
| | | For the Period
June 2, 2003
through
September 30, 2003 (a)
| |
| | | | | | | | | | | | | | | | | | | | | | | |
| | | | | | | | | | | | | | | | | | | | | | | |
| $ | 84,856 | | | $ | (23,108 | ) | | $ | (1,253,994 | ) | | $ | (1,227,350 | ) | | $ | (543,502 | ) | | $ | (29,356 | ) |
| | 1,796,842 | | | | 468,751 | | | | 19,670,223 | | | | 3,341,323 | | | | 1,647,168 | | | | 191,332 | |
| | 10,522,224 | | | | 3,580,111 | | | | (8,365,717 | ) | | | 23,890,382 | | | | 11,687,812 | | | | 1,401,754 | |
|
|
| |
|
|
| |
|
|
| |
|
|
| |
|
|
| |
|
|
|
| | 12,403,922 | | | | 4,025,754 | | | | 10,050,512 | | | | 26,004,355 | | | | 12,791,478 | | | | 1,563,730 | |
|
|
| |
|
|
| |
|
|
| |
|
|
| |
|
|
| |
|
|
|
| | | | | | | | | | | | | | | | | | | | | | | |
| | (246 | ) | | | — | | | | — | | | | — | | | | — | | | | — | |
| | (1,480 | ) | | | — | | | | — | | | | — | | | | (54,699 | ) | | | — | |
| | | | | | | | | | | | | | | | | | | | | | | |
| | (468 | ) | | | — | | | | — | | | | — | | | | (37,967 | ) | | | — | |
| | | | | | | | | | | | | | | | | | | | | | | |
| | (12 | ) | | | — | | | | — | | | | — | | | | (40,629 | ) | | | — | |
| | | | | | | | | | | | | | | | | | | | | | | |
| | (84,610 | ) | | | (8,175 | ) | | | — | | | | — | | | | — | | | | (1,758 | ) |
| | (493,765 | ) | | | — | | | | — | | | | — | | | | (197,041 | ) | | | — | |
|
|
| |
|
|
| |
|
|
| |
|
|
| |
|
|
| |
|
|
|
| | (580,581 | ) | | | (8,175 | ) | | | — | | | | — | | | | (330,336 | ) | | | (1,758 | ) |
|
|
| |
|
|
| |
|
|
| |
|
|
| |
|
|
| |
|
|
|
| | | | | | | | | | | | | | | | | | | | | | | |
| | 11,865,489 | | | | 39,586,457 | | | | (50,980,633 | ) | | | 11,735,791 | | | | 44,851,713 | | | | 38,669,402 | |
|
|
| |
|
|
| |
|
|
| |
|
|
| |
|
|
| |
|
|
|
| | 23,688,830 | | | | 43,604,036 | | | | (40,930,121 | ) | | | 37,740,146 | | | | 57,312,855 | | | | 40,231,374 | |
| | | | | | | | | | | | | | | | | | | | | | | |
| | 43,604,036 | | | | — | | | | 143,536,412 | | | | 105,796,266 | | | | 40,231,374 | | | | — | |
|
|
| |
|
|
| |
|
|
| |
|
|
| |
|
|
| |
|
|
|
| $ | 67,292,866 | | | $ | 43,604,036 | | | $ | 102,606,291 | | | $ | 143,536,412 | | | $ | 97,544,229 | | | $ | 40,231,374 | |
|
|
| |
|
|
| |
|
|
| |
|
|
| |
|
|
| |
|
|
|
| $ | (6,278 | ) | | $ | — | | | $ | — | | | $ | — | | | $ | — | | | $ | — | |
|
|
| |
|
|
| |
|
|
| |
|
|
| |
|
|
| |
|
|
|
See accompanying notes to the financial statements.
117
BB&T Funds
Statements of Changes in Net Assets, continued
| | | | | | | | |
| | | Mid Cap
Growth Fund
| |
| | |
For the
Year Ended
September 30, 2004
| | | For the
Year Ended
September 30, 2003
| |
Capital Transactions: | | | | | | | | |
Class A Shares: | | | | | | | | |
Proceeds from shares issued | | $ | 1,765,027 | | | $ | 699,239 | |
Dividends reinvested | | | — | | | | — | |
Value of shares redeemed | | | (905,874 | ) | | | (872,144 | ) |
| | |
|
|
| |
|
|
|
Change in net assets from Class A Share transactions | | | 859,153 | | | | (172,905 | ) |
Class B Shares: | | | | | | | | |
Proceeds from shares issued | | | 1,030,904 | | | | 456,754 | |
Dividends reinvested | | | — | | | | — | |
Value of shares redeemed | | | (187,337 | ) | | | (83,058 | ) |
| | |
|
|
| |
|
|
|
Change in net assets from Class B Share transactions | | | 843,567 | | | | 373,696 | |
Class C Shares: | | | | | | | | |
Proceeds from shares issued | | | 59,095 | | | | 21,338 | |
Dividends reinvested | | | — | | | | — | |
Value of shares redeemed | | | (32,090 | ) | | | (30,120 | ) |
| | |
|
|
| |
|
|
|
Change in net assets from Class C Share transactions | | | 27,005 | | | | (8,782 | ) |
Institutional Shares: | | | | | | | | |
Proceeds from shares issued | | | 42,714,265 | | | | 41,087,531 | |
Dividends reinvested | | | — | | | | — | |
Value of shares redeemed | | | (36,519,218 | ) | | | (29,093,735 | ) |
| | |
|
|
| |
|
|
|
Change in net assets from Institutional Share transactions | | | 6,195,047 | | | | 11,993,796 | |
| | |
|
|
| |
|
|
|
Change in net assets from capital transactions | | $ | 7,924,772 | | | $ | 12,185,805 | |
| | |
|
|
| |
|
|
|
Share Transactions: | | | | | | | | |
Class A Shares: | | | | | | | | |
Issued | | | 161,946 | | | | 79,843 | |
Reinvested | | | — | | | | — | |
Redeemed | | | (83,185 | ) | | | (106,587 | ) |
| | |
|
|
| |
|
|
|
Change in Class A Shares | | | 78,761 | | | | (26,744 | ) |
Class B Shares: | | | | | | | | |
Issued | | | 95,646 | | | | 52,778 | |
Reinvested | | | — | | | | — | |
Redeemed | | | (17,657 | ) | | | (9,815 | ) |
| | |
|
|
| |
|
|
|
Change in Class B Shares | | | 77,989 | | | | 42,963 | |
Class C Shares: | | | | | | | | |
Issued | | | 5,456 | | | | 2,575 | |
Reinvested | | | — | | | | — | |
Redeemed | | | (3,019 | ) | | | (3,465 | ) |
| | |
|
|
| |
|
|
|
Change in Class C Shares | | | 2,437 | | | | (890 | ) |
Institutional Shares: | | | | | | | | |
Issued | | | 3,794,635 | | | | 4,637,332 | |
Reinvested | | | — | | | | — | |
Redeemed | | | (3,250,066 | ) | | | (3,206,388 | ) |
| | |
|
|
| |
|
|
|
Change in Institutional Shares | | | 544,569 | | | | 1,430,944 | |
| | |
|
|
| |
|
|
|
Change in Shares | | | 703,756 | | | | 1,446,273 | |
| | |
|
|
| |
|
|
|
| (a) | Period from commencement of operations. |
See accompanying notes to the financial statements.
118
| | | | | | | | | | | | | | | | | | | | | | |
Small Company
Value Fund
| | | Small Company
Growth Fund
| | | Special Opportunities
Equity Fund
| |
For the
Year Ended
September 30, 2004
| | | For the Period
May 19, 2003
through
September 30, 2003 (a)
| | | For the
Year Ended
September 30, 2004
| | | For the
Year Ended
September 30, 2003
| | | For the
Year Ended
September 30, 2004
| | | For the Period
June 2, 2003
through
September 30, 2003 (a)
| |
| | | | | | | | | | | | | | | | | | | | | | | |
| | | | | | | | | | | | | | | | | | | | | | | |
| $ | 236,188 | | | $ | 113,973 | | | $ | 1,484,623 | | | $ | 662,373 | | | $ | 22,172,687 | | | $ | 5,380,995 | |
| | 1,524 | | | | — | | | | — | | | | — | | | | 54,594 | | | | — | |
| | (40,436 | ) | | | — | | | | (1,755,351 | ) | | | (862,321 | ) | | | (1,330,485 | ) | | | (9,520 | ) |
|
|
| |
|
|
| |
|
|
| |
|
|
| |
|
|
| |
|
|
|
| | 197,276 | | | | 113,973 | | | | (270,728 | ) | | | (199,948 | ) | | | 20,896,796 | | | | 5,371,475 | |
| | | | | | | | | | | | | | | | | | | | | | | |
| | 96,442 | | | | 28,548 | | | | 530,262 | | | | 534,878 | | | | 7,745,169 | | | | 4,289,785 | |
| | 468 | | | | — | | | | — | | | | — | | | | 36,319 | | | | — | |
| | (3,672 | ) | | | — | | | | (2,040,393 | ) | | | (1,050,295 | ) | | | (420,674 | ) | | | (12,863 | ) |
|
|
| |
|
|
| |
|
|
| |
|
|
| |
|
|
| |
|
|
|
| | 93,238 | | | | 28,548 | | | | (1,510,131 | ) | | | (515,417 | ) | | | 7,360,814 | | | | 4,276,922 | |
| | | | | | | | | | | | | | | | | | | | | | | |
| | — | | | | 1,000 | | | | 17,631 | | | | 17,045 | | | | 10,242,149 | | | | 3,996,847 | |
| | 12 | | | | — | | | | — | | | | — | | | | 40,343 | | | | — | |
| | — | | | | — | | | | (26,442 | ) | | | (6,173 | ) | | | (322,709 | ) | | | — | |
|
|
| |
|
|
| |
|
|
| |
|
|
| |
|
|
| |
|
|
|
| | 12 | | | | 1,000 | | | | (8,811 | ) | | | 10,872 | | | | 9,959,783 | | | | 3,996,847 | |
| | | | | | | | | | | | | | | | | | | | | | | |
| | 16,472,429 | | | | 40,351,862 | | | | 32,214,214 | | | | 57,253,384 | | | | 6,531,453 | | | | 25,022,400 | |
| | 376,374 | | | | 6,898 | | | | — | | | | — | | | | 197,041 | | | | 1,758 | |
| | (5,273,840 | ) | | | (915,824 | ) | | | (81,405,177 | ) | | | (44,813,100 | ) | | | (94,174 | ) | | | — | |
|
|
| |
|
|
| |
|
|
| |
|
|
| |
|
|
| |
|
|
|
| | 11,574,963 | | | | 39,442,936 | | | | (49,190,963 | ) | | | 12,440,284 | | | | 6,634,320 | | | | 25,024,158 | |
|
|
| |
|
|
| |
|
|
| |
|
|
| |
|
|
| |
|
|
|
| $ | 11,865,489 | | | $ | 39,586,457 | | | $ | (50,980,633 | ) | | $ | 11,735,791 | | | $ | 44,851,713 | | | $ | 38,669,402 | |
|
|
| |
|
|
| |
|
|
| |
|
|
| |
|
|
| |
|
|
|
| | | | | | | | | | | | | | | | | | | | | | | |
| | | | | | | | | | | | | | | | | | | | | | | |
| | 18,005 | | | | 9,800 | | | | 120,223 | | | | 63,814 | | | | 1,793,122 | | | | 519,441 | |
| | 122 | | | | — | | | | — | | | | — | | | | 4,756 | | | | — | |
| | (3,071 | ) | | | — | | | | (144,410 | ) | | | (89,691 | ) | | | (107,143 | ) | | | (900 | ) |
|
|
| |
|
|
| |
|
|
| |
|
|
| |
|
|
| |
|
|
|
| | 15,056 | | | | 9,800 | | | | (24,187 | ) | | | (25,877 | ) | | | 1,690,735 | | | | 518,541 | |
| | | | | | | | | | | | | | | | | | | | | | | |
| | 7,406 | | | | 2,542 | | | | 46,190 | | | | 57,045 | | | | 635,504 | | | | 416,587 | |
| | 38 | | | | — | | | | — | | | | — | | | | 3,178 | | | | — | |
| | (288 | ) | | | — | | | | (181,395 | ) | | | (116,464 | ) | | | (33,339 | ) | | | (1,229 | ) |
|
|
| |
|
|
| |
|
|
| |
|
|
| |
|
|
| |
|
|
|
| | 7,156 | | | | 2,542 | | | | (135,205 | ) | | | (59,419 | ) | | | 605,343 | | | | 415,358 | |
| | | | | | | | | | | | | | | | | | | | | | | |
| | — | | | | 100 | | | | 1,591 | | | | 1,865 | | | | 841,676 | | | | 385,871 | |
| | 1 | | | | — | | | | — | | | | — | | | | 3,526 | | | | — | |
| | — | | | | — | | | | (2,204 | ) | | | (728 | ) | | | (25,863 | ) | | | — | |
|
|
| |
|
|
| |
|
|
| |
|
|
| |
|
|
| |
|
|
|
| | 1 | | | | 100 | | | | (613 | ) | | | 1,137 | | | | 819,339 | | | | 385,871 | |
| | | | | | | | | | | | | | | | | | | | | | | |
| | 1,261,368 | | | | 3,881,504 | | | | 2,525,797 | | | | 5,603,935 | | | | 522,216 | | | | 2,502,086 | |
| | 30,123 | | | | 642 | | | | — | | | | — | | | | 17,149 | | | | 176 | |
| | (397,940 | ) | | | (82,784 | ) | | | (6,181,271 | ) | | | (4,377,960 | ) | | | (7,016 | ) | | | — | |
|
|
| |
|
|
| |
|
|
| |
|
|
| |
|
|
| |
|
|
|
| | 893,551 | | | | 3,799,362 | | | | (3,655,474 | ) | | | 1,225,975 | | | | 532,349 | | | | 2,502,262 | |
|
|
| |
|
|
| |
|
|
| |
|
|
| |
|
|
| |
|
|
|
| | 915,764 | | | | 3,811,804 | | | | (3,815,479 | ) | | | 1,141,816 | | | | 3,647,766 | | | | 3,822,032 | |
|
|
| |
|
|
| |
|
|
| |
|
|
| |
|
|
| |
|
|
|
See accompanying notes to the financial statements.
119
BB&T Funds
Statements of Changes in Net Assets
| | | | | | | | |
| | | International
Equity Fund
| |
| | | For the
Year Ended
September 30, 2004
| | | For the
Year Ended
September 30, 2003
| |
From Investment Activities: | | | | | | | | |
Operations: | | | | | | | | |
Net investment income (loss) | | $ | 2,930,396 | | | $ | 1,309,849 | |
Net realized gains (losses) from investment transactions | | | 20,934,244 | | | | (22,362,508 | ) |
Change in unrealized appreciation/depreciation of investments | | | 13,545,842 | | | | 42,728,385 | |
| | |
|
|
| |
|
|
|
Change in net assets from operations | | | 37,410,482 | | | | 21,675,726 | |
| | |
|
|
| |
|
|
|
Dividends to Class A Shareholders: | | | | | | | | |
Net investment income | | | (17,470 | ) | | | (29,705 | ) |
Net realized gains from investment transactions | | | — | | | | — | |
Dividends to Class B Shareholders: | | | | | | | | |
Net investment income | | | (12,177 | ) | | | (6,877 | ) |
Net realized gains from investment transactions | | | — | | | | — | |
Dividends to Class C Shareholders: | | | | | | | | |
Net investment income | | | (12 | ) | | | (7 | ) |
Net realized gains from investment transactions | | | — | | | | — | |
Dividends to Institutional Class Shareholders: | | | | | | | | |
Net investment income | | | (2,829,313 | ) | | | (1,373,843 | ) |
Net realized gains from investment transactions | | | — | | | | — | |
| | |
|
|
| |
|
|
|
Change in net assets from shareholder dividends | | | (2,858,972 | ) | | | (1,410,432 | ) |
| | |
|
|
| |
|
|
|
Capital Transactions: | | | | | | | | |
Change in net assets from capital transactions | | | 11,062,159 | | | | 44,419,662 | |
| | |
|
|
| |
|
|
|
Change in net assets | | | 45,613,669 | | | | 64,684,956 | |
Net Assets: | | | | | | | | |
Beginning of period | | | 191,489,904 | | | | 126,804,948 | |
| | |
|
|
| |
|
|
|
End of period | | $ | 237,103,573 | | | $ | 191,489,904 | |
| | |
|
|
| |
|
|
|
Undistributed net investment income (loss) | | $ | (868,449 | ) | | $ | 235,107 | |
| | |
|
|
| |
|
|
|
See accompanying notes to the financial statements.
120
| | | | | | | | | | | | | | | | | | | | | | |
Short U.S.
Government Fund
| | | Intermediate U.S.
Government Fund
| | | Intermediate Corporate
Bond Fund
| |
For the
Year Ended
September 30, 2004
| | | For the
Year Ended
September 30, 2003
| | | For the
Year Ended
September 30, 2004
| | | For the
Year Ended
September 30, 2003
| | | For the
Year Ended
September 30, 2004
| | | For the
Year Ended
September 30, 2003
| |
| | | | | | | | | | | | | | | | | | | | | | | |
| | | | | | | | | | | | | | | | | | | | | | | |
| $ | 4,349,127 | | | $ | 5,320,247 | | | $ | 16,236,268 | | | $ | 13,882,703 | | | $ | 10,502,574 | | | $ | 8,554,890 | |
| | (502,785 | ) | | | 1,193,020 | | | | 4,021,401 | | | | 9,283,305 | | | | 2,319,802 | | | | 2,351,694 | |
| | (1,991,679 | ) | | | (3,210,112 | ) | | | (13,559,131 | ) | | | (11,153,865 | ) | | | (4,182,899 | ) | | | 5,266,169 | |
|
|
| |
|
|
| |
|
|
| |
|
|
| |
|
|
| |
|
|
|
| | 1,854,663 | | | | 3,303,155 | | | | 6,698,538 | | | | 12,012,143 | | | | 8,639,477 | | | | 16,172,753 | |
|
|
| |
|
|
| |
|
|
| |
|
|
| |
|
|
| |
|
|
|
| | | | | | | | | | | | | | | | | | | | | | | |
| | (235,791 | ) | | | (299,881 | ) | | | (355,727 | ) | | | (307,837 | ) | | | (186,374 | ) | | | (133,729 | ) |
| | — | | | | — | | | | (123,200 | ) | | | (57,869 | ) | | | — | | | | — | |
| | | | | | | | | | | | | | | | | | | | | | | |
| | — | | | | — | | | | (190,203 | ) | | | (206,626 | ) | | | (234,687 | ) | | | (210,685 | ) |
| | — | | | | — | | | | (103,252 | ) | | | (52,140 | ) | | | — | | | | — | |
| | | | | | | | | | | | | | | | | | | | | | | |
| | — | | | | — | | | | (18,223 | ) | | | (35,115 | ) | | | (9,084 | ) | | | (10,428 | ) |
| | — | | | | — | | | | (8,796 | ) | | | (11,170 | ) | | | — | | | | — | |
| | | | | | | | | | | | | | | | | | | | | | | |
| | (5,760,811 | ) | | | (6,607,223 | ) | | | (17,340,793 | ) | | | (15,144,049 | ) | | | (11,506,858 | ) | | | (8,686,640 | ) |
| | — | | | | — | | | | (5,651,229 | ) | | | (2,797,661 | ) | | | — | | | | — | |
|
|
| |
|
|
| |
|
|
| |
|
|
| |
|
|
| |
|
|
|
| | (5,996,602 | ) | | | (6,907,104 | ) | | | (23,791,423 | ) | | | (18,612,467 | ) | | | (11,937,003 | ) | | | (9,041,482 | ) |
|
|
| |
|
|
| |
|
|
| |
|
|
| |
|
|
| |
|
|
|
| | | | | | | | | | | | | | | | | | | | | | | |
| | (1,080,790 | ) | | | 26,119,601 | | | | 105,207,139 | | | | 118,639,193 | | | | 61,742,880 | | | | 69,482,655 | |
|
|
| |
|
|
| |
|
|
| |
|
|
| |
|
|
| |
|
|
|
| | (5,222,729 | ) | | | 22,515,652 | | | | 88,114,254 | | | | 112,038,869 | | | | 58,445,354 | | | | 76,613,926 | |
| | | | | | | | | | | | | | | | | | | | | | | |
| | 209,598,742 | | | | 187,083,090 | | | | 466,016,814 | | | | 353,977,945 | | | | 225,948,035 | | | | 149,334,109 | |
|
|
| |
|
|
| |
|
|
| |
|
|
| |
|
|
| |
|
|
|
| $ | 204,376,013 | | | $ | 209,598,742 | | | $ | 554,131,068 | | | $ | 466,016,814 | | | $ | 284,393,389 | | | $ | 225,948,035 | |
|
|
| |
|
|
| |
|
|
| |
|
|
| |
|
|
| |
|
|
|
| $ | 196,983 | | | $ | (55,347 | ) | | $ | 151,002 | | | $ | (72,568 | ) | | $ | 236,222 | | | $ | 77,466 | |
|
|
| |
|
|
| |
|
|
| |
|
|
| |
|
|
| |
|
|
|
See accompanying notes to the financial statements.
121
BB&T Funds
Statements of Changes in Net Assets, continued
| | | | | | | | |
| | | International
Equity Fund
| |
| | | For the
Year Ended
September 30, 2004
| | | For the
Year Ended
September 30, 2003
| |
Capital Transactions: | | | | | | | | |
Class A Shares: | | | | | | | | |
Proceeds from shares issued | | $ | 3,517,644 | | | $ | 165,798,828 | |
Dividends reinvested | | | 12,920 | | | | 18,801 | |
Value of shares redeemed | | | (4,334,463 | ) | | | (167,259,736 | ) |
| | |
|
|
| |
|
|
|
Change in net assets from Class A Share transactions | | | (803,899 | ) | | | (1,262,107 | ) |
Class B Shares: | | | | | | | | |
Proceeds from shares issued | | | 242,060 | | | | 109,250 | |
Dividends reinvested | | | 11,138 | | | | 6,849 | |
Value of shares redeemed | | | (468,139 | ) | | | (314,613 | ) |
| | |
|
|
| |
|
|
|
Change in net assets from Class B Share transactions | | | (214,941 | ) | | | (198,514 | ) |
Class C Shares: | | | | | | | | |
Proceeds from shares issued | | | 1,400 | | | | 99,793 | |
Dividends reinvested | | | 11 | | | | 10 | |
Value of shares redeemed | | | (1,722 | ) | | | (104,516 | ) |
| | |
|
|
| |
|
|
|
Change in net assets from Class C Share transactions | | | (311 | ) | | | (4,713 | ) |
Institutional Shares: | | | | | | | | |
Proceeds from shares issued | | | 54,058,092 | | | | 368,472,114 | |
Proceeds from shares issued in conversion | | | — | | | | — | |
Dividends reinvested | | | 1,309,291 | | | | 545,409 | |
Value of shares redeemed | | | (43,286,073 | ) | | | (323,132,527 | ) |
| | |
|
|
| |
|
|
|
Change in net assets from Institutional Share transactions | | | 12,081,310 | | | | 45,884,996 | |
| | |
|
|
| |
|
|
|
Change in net assets from capital transactions | | $ | 11,062,159 | | | $ | 44,419,662 | |
| | |
|
|
| |
|
|
|
Share Transactions: | | | | | | | | |
Class A Shares: | | | | | | | | |
Issued | | | 484,092 | | | | 26,150,880 | |
Reinvested | | | 1,588 | | | | 2,879 | |
Redeemed | | | (592,221 | ) | | | (26,063,526 | ) |
| | |
|
|
| |
|
|
|
Change in Class A Shares | | | (106,541 | ) | | | 90,233 | |
Class B Shares: | | | | | | | | |
Issued | | | 31,684 | | | | 17,868 | |
Reinvested | | | 1,439 | | | | 1,096 | |
Redeemed | | | (62,510 | ) | | | (51,685 | ) |
| | |
|
|
| |
|
|
|
Change in Class B Shares | | | (29,387 | ) | | | (32,721 | ) |
Class C Shares: | | | | | | | | |
Issued | | | 180 | | | | 17,711 | |
Reinvested | | | 1 | | | | 2 | |
Redeemed | | | (221 | ) | | | (18,555 | ) |
| | |
|
|
| |
|
|
|
Change in Class C Shares | | | (40 | ) | | | (842 | ) |
Institutional Shares: | | | | | | | | |
Issued | | | 6,721,929 | | | | 57,732,721 | |
Issued in conversion | | | — | | | | — | |
Reinvested | | | 161,225 | | | | 82,339 | |
Redeemed | | | (5,415,973 | ) | | | (50,196,708 | ) |
| | |
|
|
| |
|
|
|
Change in Institutional Shares | | | 1,467,181 | | | | 7,618,352 | |
| | |
|
|
| |
|
|
|
Change in Shares | | | 1,331,213 | | | | 7,675,022 | |
| | |
|
|
| |
|
|
|
See accompanying notes to the financial statements.
122
| | | | | | | | | | | | | | | | | | | | | | |
Short U.S.
Government Fund
| | | Intermediate U.S.
Government Fund
| | | Intermediate Corporate
Bond Fund
| |
For the
Year Ended
September 30, 2004
| | | For the
Year Ended
September 30, 2003
| | | For the
Year Ended
September 30, 2004
| | | For the
Year Ended
September 30, 2003
| | | For the
Year Ended
September 30, 2004
| | | For the
Year Ended
September 30, 2003
| |
| | | | | | | | | | | | | | | | | | | | | | | |
| | | | | | | | | | | | | | | | | | | | | | | |
| $ | 2,786,910 | | | $ | 59,681,049 | | | $ | 5,795,781 | | | $ | 16,712,428 | | | $ | 2,688,080 | | | $ | 2,787,383 | |
| | 185,926 | | | | 211,564 | | | | 436,436 | | | | 317,747 | | | | 141,678 | | | | 106,388 | |
| | (3,971,460 | ) | | | (55,372,833 | ) | | | (3,576,849 | ) | | | (13,726,227 | ) | | | (2,264,599 | ) | | | (707,688 | ) |
|
|
| |
|
|
| |
|
|
| |
|
|
| |
|
|
| |
|
|
|
| | (998,624 | ) | | | 4,519,780 | | | | 2,655,368 | | | | 3,303,948 | | | | 565,159 | | | | 2,186,083 | |
| | | | | | | | | | | | | | | | | | | | | | | |
| | — | | | | — | | | | 1,339,897 | | | | 3,208,464 | | | | 1,339,646 | | | | 2,427,474 | |
| | — | | | | — | | | | 273,254 | | | | 238,909 | | | | 209,214 | | | | 181,234 | |
| | — | | | | — | | | | (2,344,506 | ) | | | (1,423,013 | ) | | | (1,225,553 | ) | | | (910,901 | ) |
|
|
| |
|
|
| |
|
|
| |
|
|
| |
|
|
| |
|
|
|
| | — | | | | — | | | | (731,355 | ) | | | 2,024,360 | | | | 323,307 | | | | 1,697,807 | |
| | | | | | | | | | | | | | | | | | | | | | | |
| | — | | | | — | | | | 269,291 | | | | 509,821 | | | | 55,729 | | | | 114,696 | |
| | — | | | | — | | | | 23,447 | | | | 46,524 | | | | 7,776 | | | | 10,179 | |
| | — | | | | — | | | | (497,795 | ) | | | (1,014,518 | ) | | | (85,312 | ) | | | (166,830 | ) |
|
|
| |
|
|
| |
|
|
| |
|
|
| |
|
|
| |
|
|
|
| | — | | | | — | | | | (205,057 | ) | | | (458,173 | ) | | | (21,807 | ) | | | (41,955 | ) |
| | | | | | | | | | | | | | | | | | | | | | | |
| | 59,178,543 | | | | 131,967,870 | | | | 117,429,900 | | | | 257,450,874 | | | | 91,849,207 | | | | 96,149,703 | |
| | — | | | | — | | | | 62,847,783 | | | | 23,999,684 | | | | — | | | | — | |
| | 1,611,731 | | | | 1,777,466 | | | | 11,031,034 | | | | 8,948,523 | | | | 4,122,426 | | | | 3,003,207 | |
| | (60,872,440 | ) | | | (112,145,515 | ) | | | (87,820,534 | ) | | | (176,630,023 | ) | | | (35,095,412 | ) | | | (33,512,190 | ) |
|
|
| |
|
|
| |
|
|
| |
|
|
| |
|
|
| |
|
|
|
| | (82,166 | ) | | | 21,599,821 | | | | 103,488,183 | | | | 113,769,058 | | | | 60,876,221 | | | | 65,640,720 | |
|
|
| |
|
|
| |
|
|
| |
|
|
| |
|
|
| |
|
|
|
| $ | (1,080,790 | ) | | $ | 26,119,601 | | | $ | 105,207,139 | | | $ | 118,639,193 | | | $ | 61,742,880 | | | $ | 69,482,655 | |
|
|
| |
|
|
| |
|
|
| |
|
|
| |
|
|
| |
|
|
|
| | | | | | | | | | | | | | | | | | | | | | | |
| | | | | | | | | | | | | | | | | | | | | | | |
| | 286,471 | | | | 5,967,951 | | | | 559,069 | | | | 1,583,843 | | | | 253,878 | | | | 261,906 | |
| | 18,998 | | | | 21,161 | | | | 42,333 | | | | 29,992 | | | | 13,415 | | | | 10,151 | |
| | (406,758 | ) | | | (5,540,847 | ) | | | (346,084 | ) | | | (1,300,703 | ) | | | (217,247 | ) | | | (67,810 | ) |
|
|
| |
|
|
| |
|
|
| |
|
|
| |
|
|
| |
|
|
|
| | (101,289 | ) | | | 448,265 | | | | 255,318 | | | | 313,132 | | | | 50,046 | | | | 204,247 | |
| | | | | | | | | | | | | | | | | | | | | | | |
| | — | | | | — | | | | 129,793 | | | | 302,737 | | | | 126,456 | | | | 230,859 | |
| | — | | | | — | | | | 26,583 | | | | 22,621 | | | | 19,782 | | | | 17,281 | |
| | — | | | | — | | | | (228,928 | ) | | | (135,434 | ) | | | (115,852 | ) | | | (87,069 | ) |
|
|
| |
|
|
| |
|
|
| |
|
|
| |
|
|
| |
|
|
|
| | — | | | | — | | | | (72,552 | ) | | | 189,924 | | | | 30,386 | | | | 161,071 | |
| | | | | | | | | | | | | | | | | | | | | | | |
| | — | | | | — | | | | 26,144 | | | | 48,248 | | | | 5,231 | | | | 10,743 | |
| | — | | | | — | | | | 2,281 | | | | 4,399 | | | | 735 | | | | 972 | |
| | — | | | | — | | | | (48,364 | ) | | | (95,592 | ) | | | (8,034 | ) | | | (16,207 | ) |
|
|
| |
|
|
| |
|
|
| |
|
|
| |
|
|
| |
|
|
|
| | — | | | | — | | | | (19,939 | ) | | | (42,945 | ) | | | (2,068 | ) | | | (4,492 | ) |
| | | | | | | | | | | | | | | | | | | | | | | |
| | 6,032,307 | | | | 13,219,464 | | | | 11,318,895 | | | | 24,290,586 | | | | 8,639,759 | | | | 9,169,728 | |
| | — | | | | — | | | | 5,988,154 | | | | 2,273,958 | | | | — | | | | — | |
| | 164,714 | | | | 177,557 | | | | 1,068,952 | | | | 843,184 | | | | 390,424 | | | | 286,130 | |
| | (6,230,793 | ) | | | (11,218,314 | ) | | | (8,520,599 | ) | | | (16,660,182 | ) | | | (3,328,809 | ) | | | (3,194,346 | ) |
|
|
| |
|
|
| |
|
|
| |
|
|
| |
|
|
| |
|
|
|
| | (33,772 | ) | | | 2,178,707 | | | | 9,855,402 | | | | 10,747,546 | | | | 5,701,374 | | | | 6,261,512 | |
|
|
| |
|
|
| |
|
|
| |
|
|
| |
|
|
| |
|
|
|
| | (135,061 | ) | | | 2,626,972 | | | | 10,018,229 | | | | 11,207,657 | | | | 5,779,738 | | | | 6,622,338 | |
|
|
| |
|
|
| |
|
|
| |
|
|
| |
|
|
| |
|
|
|
See accompanying notes to the financial statements.
123
BB&T Funds
Statements of Changes in Net Assets
| | | | | | | | | | | | | | | | |
| | | Kentucky Intermediate
Tax-Free Fund
| | | Maryland Intermediate
Tax-Free Fund
| |
| | | For the
Year Ended
September 30,
2004
| | | For the Period
February 24, 2003
through
September 30,
2003 (a)
| | | For the
Year Ended
September 30,
2004
| | | For the Period
February 24, 2003
through
September 30,
2003 (a)
| |
From Investment Activities | | | | | | | | | | | | | | | | |
Operations: | | | | | | | | | | | | | | | | |
Net investment income (loss) | | $ | 463,368 | | | $ | 182,917 | | | $ | 184,897 | | | $ | 58,786 | |
Net realized gains (losses) from investment transactions | | | (6,703 | ) | | | (52,491 | ) | | | (112,876 | ) | | | (18,344 | ) |
Change in unrealized appreciation /depreciation of investments | | | (23,374 | ) | | | 27,863 | | | | 112,593 | | | | 74,784 | |
| | |
|
|
| |
|
|
| |
|
|
| |
|
|
|
Change in net assets from operations | | | 433,291 | | | | 158,289 | | | | 184,614 | | | | 115,226 | |
| | |
|
|
| |
|
|
| |
|
|
| |
|
|
|
Dividends to Class A Shareholders: | | | | | | | | | | | | | | | | |
Net investment income | | | (62,659 | ) | | | (12,300 | ) | | | (13,572 | ) | | | (4,066 | ) |
Net realized gains from investment transactions | | | — | | | | — | | | | — | | | | — | |
Dividends to Institutional Class Shareholders: | | | | | | | | | | | | | | | | |
Net investment income | | | (399,249 | ) | | | (168,861 | ) | | | (171,480 | ) | | | (54,476 | ) |
Net realized gains from investment transactions | | | — | | | | — | | | | — | | | | — | |
| | |
|
|
| |
|
|
| |
|
|
| |
|
|
|
Change in net assets from shareholder dividends | | | (461,908 | ) | | | (181,161 | ) | | | (185,052 | ) | | | (58,542 | ) |
| | |
|
|
| |
|
|
| |
|
|
| |
|
|
|
Capital Transactions: | | | | | | | | | | | | | | | | |
Change in net assets from capital transactions | | | (421,848 | ) | | | 16,659,674 | | | | 4,395,597 | | | | 5,322,457 | |
| | |
|
|
| |
|
|
| |
|
|
| |
|
|
|
Change in net assets | | | (450,465 | ) | | | 16,636,802 | | | | 4,395,159 | | | | 5,379,141 | |
Net Assets: | | | | | | | | | | | | | | | | |
Beginning of period | | | 16,636,802 | | | | — | | | | 5,379,141 | | | | — | |
| | |
|
|
| |
|
|
| |
|
|
| |
|
|
|
End of period | | $ | 16,186,337 | | | $ | 16,636,802 | | | $ | 9,774,300 | | | $ | 5,379,141 | |
| | |
|
|
| |
|
|
| |
|
|
| |
|
|
|
Undistributed net investment income (loss) | | $ | 1,920 | | | $ | 1,953 | | | $ | 300 | | | $ | 455 | |
| | |
|
|
| |
|
|
| |
|
|
| |
|
|
|
| (a) | Period from commencement of operations. |
See accompanying notes to the financial statements.
124
| | | | | | | | | | | | | | | | | | | | | | | | | | | | | | |
North Carolina Intermediate
Tax-Free Fund
| | | South Carolina Intermediate
Tax-Free Fund
| | | Virginia Intermediate
Tax-Free Fund
| | | West Virginia Intermediate
Tax-Free Fund
| |
For the
Year Ended
September 30,
2004
| | | For the
Year Ended
September 30,
2003
| | | For the
Year Ended
September 30,
2004
| | | For the
Year Ended
September 30,
2003
| | | For the
Year Ended
September 30,
2004
| | | For the
Year Ended
September 30,
2003
| | | For the
Year Ended
September 30,
2004
| | | For the
Year Ended
September 30,
2003
| |
| | | | | | | | | | | | | | | | | | | | | | | | | | | | | | | |
| | | | | | | | | | | | | | | | | | | | | | | | | | | | | | | |
| $ | 3,848,222 | | | $ | 3,871,182 | | | $ | 729,963 | | | $ | 757,071 | | | $ | 2,759,188 | | | $ | 2,735,659 | | | $ | 2,752,359 | | | $ | 3,020,066 | |
| | 192,951 | | | | 435,136 | | | | 145,469 | | | | 97,299 | | | | 206,599 | | | | 614,561 | | | | 598,661 | | | | 418,773 | |
| | (1,534,991 | ) | | | (673,661 | ) | | | (287,972 | ) | | | (64,254 | ) | | | (1,330,941 | ) | | | (596,321 | ) | | | (1,405,834 | ) | | | (225,664 | ) |
|
|
| |
|
|
| |
|
|
| |
|
|
| |
|
|
| |
|
|
| |
|
|
| |
|
|
|
| | 2,506,182 | | | | 3,632,657 | | | | 587,460 | | | | 790,116 | | | | 1,634,846 | | | | 2,753,899 | | | | 1,945,186 | | | | 3,213,175 | |
|
|
| |
|
|
| |
|
|
| |
|
|
| |
|
|
| |
|
|
| |
|
|
| |
|
|
|
| | | | | | | | | | | | | | | | | | | | | | | | | | | | | | | |
| | (733,637 | ) | | | (800,765 | ) | | | (141,269 | ) | | | (140,645 | ) | | | (326,525 | ) | | | (172,729 | ) | | | (361,091 | ) | | | (337,731 | ) |
| | (91,123 | ) | | | (86,776 | ) | | | (6,420 | ) | | | — | | | | (50,046 | ) | | | (11,117 | ) | | | (47,292 | ) | | | (161,014 | ) |
| | | | | | | | | | | | | | | | | | | | | | | | | | | | | | | |
| | (3,104,006 | ) | | | (3,058,242 | ) | | | (586,865 | ) | | | (616,122 | ) | | | (2,429,810 | ) | | | (2,561,530 | ) | | | (2,386,992 | ) | | | (2,677,779 | ) |
| | (344,009 | ) | | | (325,838 | ) | | | (24,355 | ) | | | — | | | | (498,539 | ) | | | (246,961 | ) | | | (291,906 | ) | | | (1,216,422 | ) |
|
|
| |
|
|
| |
|
|
| |
|
|
| |
|
|
| |
|
|
| |
|
|
| |
|
|
|
| | (4,272,775 | ) | | | (4,271,621 | ) | | | (758,909 | ) | | | (756,767 | ) | | | (3,304,920 | ) | | | (2,992,337 | ) | | | (3,087,281 | ) | | | (4,392,946 | ) |
|
|
| |
|
|
| |
|
|
| |
|
|
| |
|
|
| |
|
|
| |
|
|
| |
|
|
|
| | | | | | | | | | | | | | | | | | | | | | | | | | | | | | | |
| | 257,310 | | | | 3,890,400 | | | | (1,169,409 | ) | | | 856,780 | | | | (1,564,175 | ) | | | 538,914 | | | | (15,426,745 | ) | | | 3,882,054 | |
|
|
| |
|
|
| |
|
|
| |
|
|
| |
|
|
| |
|
|
| |
|
|
| |
|
|
|
| | (1,509,283 | ) | | | 3,251,436 | | | | (1,340,858 | ) | | | 890,129 | | | | (3,234,249 | ) | | | 300,476 | | | | (16,568,840 | ) | | | 2,702,283 | |
| | | | | | | | | | | | | | | | | | | | | | | | | | | | | | | |
| | 120,936,050 | | | | 117,684,614 | | | | 22,977,456 | | | | 22,087,327 | | | | 85,024,545 | | | | 84,724,069 | | | | 90,901,511 | | | | 88,199,228 | |
|
|
| |
|
|
| |
|
|
| |
|
|
| |
|
|
| |
|
|
| |
|
|
| |
|
|
|
| $ | 119,426,767 | | | $ | 120,936,050 | | | $ | 21,636,598 | | | $ | 22,977,456 | | | $ | 81,790,296 | | | $ | 85,024,545 | | | $ | 74,332,671 | | | $ | 90,901,511 | |
|
|
| |
|
|
| |
|
|
| |
|
|
| |
|
|
| |
|
|
| |
|
|
| |
|
|
|
| $ | 47,165 | | | $ | 49,460 | | | $ | 15,729 | | | $ | 14,088 | | | $ | 34,726 | | | $ | 34,784 | | | $ | (14,320 | ) | | $ | (14,621 | ) |
|
|
| |
|
|
| |
|
|
| |
|
|
| |
|
|
| |
|
|
| |
|
|
| |
|
|
|
See accompanying notes to the financial statements.
125
BB&T Funds
Statements of Changes in Net Assets, continued
| | | | | | | | | | | | | | | | |
| | | Kentucky Intermediate
Tax-Free Fund
| | | Maryland Intermediate
Tax-Free Fund
| |
| | | For the
Year Ended
September 30,
2004
| | | For the Period
February 24, 2003
through
September 30,
2003 (a)
| | | For the
Year Ended
September 30,
2004
| | | For the Period
February 24, 2003
through
September 30,
2003 (a)
| |
Capital Transactions: | | | | | | | | | | | | | | | | |
Class A Shares: | | | | | | | | | | | | | | | | |
Proceeds from shares issued | | $ | 1,994,114 | | | $ | 2,093,145 | | | $ | 350,207 | | | $ | 569,512 | |
Dividends reinvested | | | 49,595 | | | | 5,351 | | | | 9,711 | | | | 2,620 | |
Value of shares redeemed | | | (1,181,364 | ) | | | (231,028 | ) | | | (174,263 | ) | | | (89,868 | ) |
| | |
|
|
| |
|
|
| |
|
|
| |
|
|
|
Change in net assets from Class A Share transactions | | | 862,345 | | | | 1,867,468 | | | | 185,655 | | | | 482,264 | |
Institutional Shares: | | | | | | | | | | | | | | | | |
Proceeds from shares issued | | | 4,267,628 | | | | 10,042,199 | | | | 6,103,188 | | | | 5,218,530 | |
Proceeds from shares issued in conversion | | | — | | | | 7,798,122 | | | | — | | | | — | |
Dividends reinvested | | | 987 | | | | 236 | | | | 1,063 | | | | 50 | |
Value of shares redeemed | | | (5,552,808 | ) | | | (3,048,351 | ) | | | (1,894,309 | ) | | | (378,387 | ) |
| | |
|
|
| |
|
|
| |
|
|
| |
|
|
|
Change in net assets from Institutional Share transactions | | | (1,284,193 | ) | | | 14,792,206 | | | | 4,209,942 | | | | 4,840,193 | |
| | |
|
|
| |
|
|
| |
|
|
| |
|
|
|
Change in net assets from capital transactions | | $ | (421,848 | ) | | $ | 16,659,674 | | | $ | 4,395,597 | | | $ | 5,322,457 | |
| | |
|
|
| |
|
|
| |
|
|
| |
|
|
|
Share Transactions: | | | | | | | | | | | | | | | | |
Class A Shares: | | | | | | | | | | | | | | | | |
Issued | | | 195,701 | | | | 205,729 | | | | 34,756 | | | | 56,126 | |
Reinvested | | | 4,876 | | | | 532 | | | | 962 | | | | 262 | |
Redeemed | | | (115,307 | ) | | | (22,788 | ) | | | (17,478 | ) | | | (8,911 | ) |
| | |
|
|
| |
|
|
| |
|
|
| |
|
|
|
Change in Class A Shares | | | 85,270 | | | | 183,473 | | | | 18,240 | | | | 47,477 | |
Institutional Shares: | | | | | | | | | | | | | | | | |
Issued | | | 419,214 | | | | 993,183 | | | | 602,112 | | | | 519,861 | |
Issued in conversion | | | — | | | | 752,950 | | | | — | | | | — | |
Reinvested | | | 98 | | | | 23 | | | | 105 | | | | 5 | |
Redeemed | | | (546,461 | ) | | | (301,946 | ) | | | (187,931 | ) | | | (37,955 | ) |
| | |
|
|
| |
|
|
| |
|
|
| |
|
|
|
Change in Institutional Shares | | | (127,149 | ) | | | 1,444,210 | | | | 414,286 | | | | 481,911 | |
| | |
|
|
| |
|
|
| |
|
|
| |
|
|
|
Change in Shares | | | (41,879 | ) | | | 1,627,683 | | | | 432,526 | | | | 529,388 | |
| | |
|
|
| |
|
|
| |
|
|
| |
|
|
|
| (a) | Period from commencement of operations. |
See accompanying notes to the financial statements.
126
| | | | | | | | | | | | | | | | | | | | | | | | | | | | | | |
North Carolina Intermediate
Tax-Free Fund
| | | South Carolina Intermediate
Tax-Free Fund
| | | Virginia Intermediate
Tax-Free Fund
| | | West Virginia Intermediate
Tax-Free Fund
| |
| | | | | | | |
For the
Year Ended
September 30,
2004
| | | For the
Year Ended
September 30,
2003
| | | For the
Year Ended
September 30,
2004
| | | For the
Year Ended
September 30,
2003
| | | For the
Year Ended
September 30,
2004
| | | For the
Year Ended
September 30,
2003
| | | For the
Year Ended
September 30,
2004
| | | For the
Year Ended
September 30,
2003
| |
| | | | | | | | | | | | | | | | | | | | | | | | | | | | | | | |
| | | | | | | | | | | | | | | | | | | | | | | | | | | | | | | |
| $ | 2,276,612 | | | $ | 6,272,803 | | | $ | 766,900 | | | $ | 1,516,905 | | | $ | 7,524,363 | | | $ | 4,989,491 | | | $ | 1,307,707 | | | $ | 3,872,714 | |
| | 645,576 | | | | 683,843 | | | | 126,182 | | | | 123,418 | | | | 202,711 | | | | 112,394 | | | | 284,086 | | | | 325,192 | |
| | (5,173,439 | ) | | | (5,332,328 | ) | | | (1,384,125 | ) | | | (1,091,369 | ) | | | (2,003,586 | ) | | | (707,752 | ) | | | (2,164,703 | ) | | | (2,550,651 | ) |
|
|
| |
|
|
| |
|
|
| |
|
|
| |
|
|
| |
|
|
| |
|
|
| |
|
|
|
| | (2,251,251 | ) | | | 1,624,318 | | | | (491,043 | ) | | | 548,954 | | | | 5,723,488 | | | | 4,394,133 | | | | (572,910 | ) | | | 1,647,255 | |
| | | | | | | | | | | | | | | | | | | | | | | | | | | | | | | |
| | 24,489,202 | | | | 16,979,329 | | | | 2,128,909 | | | | 4,039,879 | | | | 14,835,458 | | | | 8,978,249 | | | | 5,479,391 | | | | 10,321,787 | |
| | — | | | | — | | | | — | | | | — | | | | — | | | | — | | | | — | | | | — | |
| | 3,334 | | | | 3,054 | | | | 29 | | | | 11 | | | | 30,243 | | | | 2,015 | | | | 7,942 | | | | 6,057 | |
| | (21,983,975 | ) | | | (14,716,301 | ) | | | (2,807,304 | ) | | | (3,732,064 | ) | | | (22,153,364 | ) | | | (12,835,483 | ) | | | (20,341,168 | ) | | | (8,093,045 | ) |
|
|
| |
|
|
| |
|
|
| |
|
|
| |
|
|
| |
|
|
| |
|
|
| |
|
|
|
| | 2,508,561 | | | | 2,266,082 | | | | (678,366 | ) | | | 307,826 | | | | (7,287,663 | ) | | | (3,855,219 | ) | | | (14,853,835 | ) | | | 2,234,799 | |
|
|
| |
|
|
| |
|
|
| |
|
|
| |
|
|
| |
|
|
| |
|
|
| |
|
|
|
| $ | 257,310 | | | $ | 3,890,400 | | | $ | (1,169,409 | ) | | $ | 856,780 | | | $ | (1,564,175 | ) | | $ | 538,914 | | | $ | (15,426,745 | ) | | $ | 3,882,054 | |
|
|
| |
|
|
| |
|
|
| |
|
|
| |
|
|
| |
|
|
| |
|
|
| |
|
|
|
| | | | | | | | | | | | | | | | | | | | | | | | | | | | | | | |
| | | | | | | | | | | | | | | | | | | | | | | | | | | | | | | |
| | 212,128 | | | | 583,343 | | | | 70,588 | | | | 140,424 | | | | 639,390 | | | | 418,968 | | | | 129,767 | | | | 379,623 | |
| | 60,465 | | | | 63,724 | | | | 11,700 | | | | 11,435 | | | | 17,233 | | | | 9,474 | | | | 28,194 | | | | 32,181 | |
| | (488,778 | ) | | | (498,545 | ) | | | (128,564 | ) | | | (101,195 | ) | | | (171,476 | ) | | | (59,265 | ) | | | (215,933 | ) | | | (249,953 | ) |
|
|
| |
|
|
| |
|
|
| |
|
|
| |
|
|
| |
|
|
| |
|
|
| |
|
|
|
| | (216,185 | ) | | | 148,522 | | | | (46,276 | ) | | | 50,664 | | | | 485,147 | | | | 369,177 | | | | (57,972 | ) | | | 161,851 | |
| | | | | | | | | | | | | | | | | | | | | | | | | | | | | | | |
| | 2,287,594 | | | | 1,577,188 | | | | 199,047 | | | | 379,329 | | | | 1,258,132 | | | | 759,063 | | | | 541,672 | | | | 1,018,365 | |
| | — | | | | — | | | | — | | | | — | | | | — | | | | — | | | | — | | | | — | |
| | 313 | | | | 285 | | | | 3 | | | | 1 | | | | 2,574 | | | | 172 | | | | 782 | | | | 599 | |
| | (2,062,895 | ) | | | (1,375,261 | ) | | | (263,103 | ) | | | (348,700 | ) | | | (1,890,161 | ) | | | (1,081,350 | ) | | | (2,016,614 | ) | | | (797,898 | ) |
|
|
| |
|
|
| |
|
|
| |
|
|
| |
|
|
| |
|
|
| |
|
|
| |
|
|
|
| | 225,012 | | | | 202,212 | | | | (64,053 | ) | | | 30,630 | | | | (629,455 | ) | | | (322,115 | ) | | | (1,474,160 | ) | | | 221,066 | |
|
|
| |
|
|
| |
|
|
| |
|
|
| |
|
|
| |
|
|
| |
|
|
| |
|
|
|
| | 8,827 | | | | 350,734 | | | | (110,329 | ) | | | 81,294 | | | | (144,308 | ) | | | 47,062 | | | | (1,532,132 | ) | | | 382,917 | |
|
|
| |
|
|
| |
|
|
| |
|
|
| |
|
|
| |
|
|
| |
|
|
| |
|
|
|
See accompanying notes to the financial statements.
127
BB&T Funds
Statements of Changes in Net Assets
| | | | | | | | | | | | | | | | |
| | | Prime Money
Market Fund
| | | U.S. Treasury
Money Market Fund
| |
| | | For the
Year Ended
September 30,
2004
| | | For the
Year Ended
September 30,
2003
| | | For the
Year Ended
September 30,
2004
| | | For the
Year Ended
September 30,
2003
| |
From Investment Activities | | | | | | | | | | | | | | | | |
Operations: | | | | | | | | | | | | | | | | |
Net investment income (loss) | | $ | 5,914,572 | | | $ | 6,915,376 | | | $ | 5,785,101 | | | $ | 6,615,706 | |
Net realized gains (losses) on investments | | | 3,370 | | | | — | | | | — | | | | — | |
Net realized gain distribution from underlying funds | | | — | | | | — | | | | — | | | | — | |
Change in unrealized appreciation/depreciation from investments | | | — | | | | — | | | | — | | | | — | |
| | |
|
|
| |
|
|
| |
|
|
| |
|
|
|
Change in net assets from operations | | | 5,917,942 | | | | 6,915,376 | | | | 5,785,101 | | | | 6,615,706 | |
| | |
|
|
| |
|
|
| |
|
|
| |
|
|
|
Dividends to Class A Shareholders: | | | | | | | | | | | | | | | | |
Net investment income | | | (1,799,024 | ) | | | (2,074,611 | ) | | | (403,491 | ) | | | (506,047 | ) |
Net realized gains from investment transactions | | | — | | | | — | | | | — | | | | — | |
Dividends to Class B Shareholders: | | | | | | | | | | | | | | | | |
Net investment income | | | (1,420 | ) | | | (4,355 | ) | | | (489 | ) | | | (1,907 | ) |
Net realized gains from investment transactions | | | — | | | | — | | | | — | | | | — | |
Dividends to Class C Shareholders: | | | | | | | | | | | | | | | | |
Net investment income | | | (300 | ) | | | (621 | ) | | | (4 | ) | | | (18 | ) |
Net realized gains from investment transactions | | | — | | | | — | | | | — | | | | — | |
Dividends to Institutional Class Shareholders: | | | | | | | | | | | | | | | | |
Net investment income | | | (4,113,828 | ) | | | (4,835,789 | ) | | | (5,381,117 | ) | | | (6,107,734 | ) |
Net realized gains from investment transactions | | | — | | | | — | | | | — | | | | — | |
| | |
|
|
| |
|
|
| |
|
|
| |
|
|
|
Change in net assets from shareholder dividends | | | (5,914,572 | ) | | | (6,915,376 | ) | | | (5,785,101 | ) | | | (6,615,706 | ) |
| | |
|
|
| |
|
|
| |
|
|
| |
|
|
|
Capital Transactions: | | | | | | | | | | | | | | | | |
Change in net assets from capital transactions | | | (171,211,509 | ) | | | 177,715,936 | | | | 75,339,100 | | | | (139,758,717 | ) |
| | |
|
|
| |
|
|
| |
|
|
| |
|
|
|
Change in net assets | | | (171,208,139 | ) | | | 177,715,936 | | | | 75,339,100 | | | | (139,758,717 | ) |
Net Assets: | | | | | | | | | | | | | | | | |
Beginning of period | | | 1,130,007,373 | | | | 952,291,437 | | | | 974,215,537 | | | | 1,113,974,254 | |
| | |
|
|
| |
|
|
| |
|
|
| |
|
|
|
End of period | | $ | 958,799,234 | | | $ | 1,130,007,373 | | | $ | 1,049,554,637 | | | $ | 974,215,537 | |
| | |
|
|
| |
|
|
| |
|
|
| |
|
|
|
Undistributed net investment income (loss) | | $ | 9,372 | | | $ | 6,002 | | | $ | 246 | | | $ | 246 | |
| | |
|
|
| |
|
|
| |
|
|
| |
|
|
|
See accompanying notes to the financial statements.
128
| | | | | | | | | | | | | | | | | | | | | | | | | | | | | | |
Capital Manager
Conservative Growth fund
| | | Capital Manager
Moderate Growth Fund
| | | Capital Manager
Growth Fund
| | | Capital Manager
Equity Fund
| |
For the
Year Ended
September 30,
2004
| | | For the
Year Ended
September 30,
2003
| | | For the
Year Ended
September 30,
2004
| | | For the
Year Ended
September 30,
2003
| | | For the
Year Ended
September 30,
2004
| | | For the
Year Ended
September 30,
2003
| | | For the
Year Ended
September 30,
2004
| | | For the
Year Ended
September 30,
2003
| |
| | | | | | | | | | | | | | | | | | | | | | | | | | | | | | | |
| | | | | | | | | | | | | | | | | | | | | | | | | | | | | | | |
| $ | 1,377,328 | | | $ | 660,544 | | | $ | 543,178 | | | $ | 398,785 | | | $ | 214,227 | | | $ | 166,302 | | | $ | 60,787 | | | $ | 28,080 | |
| | (446,201 | ) | | | (2,763,861 | ) | | | (14,859 | ) | | | (1,662,195 | ) | | | (29,962 | ) | | | (1,880,674 | ) | | | (73,449 | ) | | | (113,013 | ) |
| | 243,148 | | | | 39,836 | | | | 93,661 | | | | 24,499 | | | | 31,778 | | | | 9,222 | | | | — | | | | — | |
| | 3,404,031 | | | | 5,055,638 | | | | 4,029,560 | | | | 5,254,630 | | | | 4,164,246 | | | | 5,642,636 | | | | 2,836,612 | | | | 2,472,894 | |
|
|
| |
|
|
| |
|
|
| |
|
|
| |
|
|
| |
|
|
| |
|
|
| |
|
|
|
| | 4,578,306 | | | | 2,992,157 | | | | 4,651,540 | | | | 4,015,719 | | | | 4,380,289 | | | | 3,937,486 | | | | 2,823,950 | | | | 2,387,961 | |
|
|
| |
|
|
| |
|
|
| |
|
|
| |
|
|
| |
|
|
| |
|
|
| |
|
|
|
| | | | | | | | | | | | | | | | | | | | | | | | | | | | | | | |
| | (71,265 | ) | | | (36,478 | ) | | | (155,491 | ) | | | (64,755 | ) | | | (41,773 | ) | | | (18,379 | ) | | | (4,248 | ) | | | (741 | ) |
| | — | | | | (6,453 | ) | | | — | | | | (5,016 | ) | | | — | | | | — | | | | — | | | | (4,879 | ) |
| | | | | | | | | | | | | | | | | | | | | | | | | | | | | | | |
| | (42,978 | ) | | | (27,914 | ) | | | (34,776 | ) | | | (84,827 | ) | | | — | | | | (5,747 | ) | | | — | | | | — | |
| | — | | | | (8,408 | ) | | | — | | | | (5,198 | ) | | | — | | | | — | | | | — | | | | (8,971 | ) |
| | | | | | | | | | | | | | | | | | | | | | | | | | | | | | | |
| | (1,642 | ) | | | (1,295 | ) | | | (397 | ) | | | (1,659 | ) | | | — | | | | (45 | ) | | | — | | | | — | |
| | — | | | | (297 | ) | | | — | | | | (359 | ) | | | — | | | | — | | | | — | | | | (5 | ) |
| | | | | | | | | | | | | | | | | | | | | | | | | | | | | | | |
| | (1,259,434 | ) | | | (594,858 | ) | | | (348,866 | ) | | | (247,545 | ) | | | (167,367 | ) | | | (142,132 | ) | | | (56,538 | ) | | | (27,340 | ) |
| | — | | | | (124,086 | ) | | | — | | | | (22,201 | ) | | | — | | | | — | | | | — | | | | (79,280 | ) |
|
|
| |
|
|
| |
|
|
| |
|
|
| |
|
|
| |
|
|
| |
|
|
| |
|
|
|
| | (1,375,319 | ) | | | (799,789 | ) | | | (539,530 | ) | | | (431,560 | ) | | | (209,140 | ) | | | (166,303 | ) | | | (60,786 | ) | | | (121,216 | ) |
|
|
| |
|
|
| |
|
|
| |
|
|
| |
|
|
| |
|
|
| |
|
|
| |
|
|
|
| | | | | | | | | | | | | | | | | | | | | | | | | | | | | | | |
| | 37,376,959 | | | | 6,142,386 | | | | 26,180,674 | | | | 10,886,904 | | | | 14,951,428 | | | | 5,161,203 | | | | 7,845,203 | | | | 4,237,424 | |
|
|
| |
|
|
| |
|
|
| |
|
|
| |
|
|
| |
|
|
| |
|
|
| |
|
|
|
| | 40,579,946 | | | | 8,334,754 | | | | 30,292,684 | | | | 14,471,063 | | | | 19,122,577 | | | | 8,932,386 | | | | 10,608,367 | | | | 6,504,169 | |
| | | | | | | | | | | | | | | | | | | | | | | | | | | | | | | |
| | 37,624,685 | | | | 29,289,931 | | | | 43,332,812 | | | | 28,861,749 | | | | 35,337,037 | | | | 26,404,651 | | | | 19,804,126 | | | | 13,299,957 | |
|
|
| |
|
|
| |
|
|
| |
|
|
| |
|
|
| |
|
|
| |
|
|
| |
|
|
|
| $ | 78,204,631 | | | $ | 37,624,685 | | | $ | 73,625,496 | | | $ | 43,332,812 | | | $ | 54,459,614 | | | $ | 35,337,037 | | | $ | 30,412,493 | | | $ | 19,804,126 | |
|
|
| |
|
|
| |
|
|
| |
|
|
| |
|
|
| |
|
|
| |
|
|
| |
|
|
|
| $ | — | | | $ | (2,009 | ) | | $ | — | | | $ | (3,648 | ) | | $ | — | | | $ | (5,087 | ) | | $ | — | | | $ | (1 | ) |
|
|
| |
|
|
| |
|
|
| |
|
|
| |
|
|
| |
|
|
| |
|
|
| |
|
|
|
See accompanying notes to the financial statements.
129
BB&T Funds
Statements of Changes in Net Assets, continued
| | | | | | | | | | | | | | | | |
| | | Prime Money
Market Fund
| | |
U.S. Treasury Money
Market Fund
| |
| | | For the
Year Ended
September 30,
2004
| | | For the
Year Ended
September 30,
2003
| | | For the
Year Ended
September 30,
2004
| | | For the
Year Ended
September 30,
2003
| |
Capital Transactions: | | | | | | | | | | | | | | | | |
Class A Shares: | | | | | | | | | | | | | | | | |
Proceeds from shares issued | | $ | 440,070,030 | | | $ | 589,581,110 | | | $ | 126,660,874 | | | $ | 148,259,819 | |
Dividends reinvested | | | 1,586,850 | | | | 2,291,903 | | | | 338,965 | | | | 605,871 | |
Cost of shares redeemed | | | (474,816,710 | ) | | | (549,280,266 | ) | | | (139,558,435 | ) | | | (211,636,359 | ) |
| | |
|
|
| |
|
|
| |
|
|
| |
|
|
|
Change in net assets from Class A Share transactions | | | (33,159,830 | ) | | | 42,592,747 | | | | (12,558,596 | ) | | | (62,770,669 | ) |
Class B Shares: | | | | | | | | | | | | | | | | |
Proceeds from shares issued | | | 1,428,628 | | | | 1,452,053 | | | | 549,783 | | | | 692,662 | |
Dividends reinvested | | | 1,209 | | | | 5,074 | | | | 459 | | | | 1,949 | |
Cost of shares redeemed | | | (1,692,677 | ) | | | (1,644,033 | ) | | | (789,788 | ) | | | (689,166 | ) |
| | |
|
|
| |
|
|
| |
|
|
| |
|
|
|
Change in net assets from Class B Share transactions | | | (262,840 | ) | | | (186,906 | ) | | | (239,546 | ) | | | 5,445 | |
Class C Shares: | | | | | | | | | | | | | | | | |
Proceeds from shares issued | | | 187,921 | | | | 513,778 | | | | 941 | | | | 6,483 | |
Dividends reinvested | | | 257 | | | | 685 | | | | 4 | | | | 19 | |
Cost of shares redeemed | | | (290,420 | ) | | | (273,476 | ) | | | (4,000 | ) | | | (8,485 | ) |
| | |
|
|
| |
|
|
| |
|
|
| |
|
|
|
Change in net assets from Class C Share transactions | | | (102,242 | ) | | | 240,987 | | | | (3,055 | ) | | | (1,983 | ) |
Institutional Shares: | | | | | | | | | | | | | | | | |
Proceeds from shares issued | | | 1,179,817,262 | | | | 1,190,383,065 | | | | 1,304,889,906 | | | | 1,471,766,366 | |
Dividends reinvested | | | 317,579 | | | | 272,801 | | | | 858,110 | | | | 1,027,743 | |
Cost of shares redeemed | | | (1,317,821,438 | ) | | | (1,055,586,758 | ) | | | (1,217,607,719 | ) | | | (1,549,785,619 | ) |
| | |
|
|
| |
|
|
| |
|
|
| |
|
|
|
Change in net assets from Institutional Share transactions | | | (137,686,597 | ) | | | 135,069,108 | | | | 88,140,297 | | | | (76,991,510 | ) |
| | |
|
|
| |
|
|
| |
|
|
| |
|
|
|
Change in net assets from capital transactions | | $ | (171,211,509 | ) | | $ | 177,715,936 | | | $ | 75,339,100 | | | $ | (139,758,717 | ) |
| | |
|
|
| |
|
|
| |
|
|
| |
|
|
|
Share Transactions: | | | | | | | | | | | | | | | | |
Class A Shares: | | | | | | | | | | | | | | | | |
Issued | | | 440,070,030 | | | | 589,581,110 | | | | 126,660,874 | | | | 148,259,994 | |
Reinvested | | | 1,586,851 | | | | 2,291,903 | | | | 338,965 | | | | 605,871 | |
Redeemed | | | (474,816,710 | ) | | | (549,280,266 | ) | | | (139,558,435 | ) | | | (211,636,359 | ) |
| | |
|
|
| |
|
|
| |
|
|
| |
|
|
|
Change in Class A Shares | | | (33,159,829 | ) | | | 42,592,747 | | | | (12,558,596 | ) | | | (62,770,494 | ) |
Class B Shares: | | | | | | | | | | | | | | | | |
Issued | | | 1,428,628 | | | | 1,452,053 | | | | 549,783 | | | | 692,662 | |
Reinvested | | | 1,209 | | | | 5,074 | | | | 459 | | | | 1,949 | |
Redeemed | | | (1,692,677 | ) | | | (1,644,033 | ) | | | (789,788 | ) | | | (689,166 | ) |
| | |
|
|
| |
|
|
| |
|
|
| |
|
|
|
Change in Class B Shares | | | (262,840 | ) | | | (186,906 | ) | | | (239,546 | ) | | | 5,445 | |
Class C Shares: | | | | | | | | | | | | | | | | |
Issued | | | 187,921 | | | | 513,778 | | | | 941 | | | | 6,483 | |
Reinvested | | | 257 | | | | 685 | | | | 4 | | | | 19 | |
Redeemed | | | (290,420 | ) | | | (273,476 | ) | | | (4,000 | ) | | | (8,485 | ) |
| | |
|
|
| |
|
|
| |
|
|
| |
|
|
|
Change in Class C Shares | | | (102,242 | ) | | | 240,987 | | | | (3,055 | ) | | | (1,983 | ) |
Institutional Shares: | | | | | | | | | | | | | | | | |
Issued | | | 1,179,817,262 | | | | 1,190,383,065 | | | | 1,304,889,907 | | | | 1,471,766,366 | |
Reinvested | | | 317,579 | | | | 272,801 | | | | 858,110 | | | | 1,027,743 | |
Redeemed | | | (1,317,821,438 | ) | | | (1,055,586,733 | ) | | | (1,217,607,719 | ) | | | (1,549,785,619 | ) |
| | |
|
|
| |
|
|
| |
|
|
| |
|
|
|
Change in Institutional Shares | | | (137,686,597 | ) | | | 135,069,133 | | | | 88,140,298 | | | | (76,991,510 | ) |
| | |
|
|
| |
|
|
| |
|
|
| |
|
|
|
Change in Shares | | | (171,211,508 | ) | | | 177,715,961 | | | | 75,339,101 | | | | (139,758,542 | ) |
| | |
|
|
| |
|
|
| |
|
|
| |
|
|
|
See accompanying notes to the financial statements.
130
| | | | | | | | | | | | | | | | | | | | | | | | | | | | | | |
Capital Manager
Conservative
Growth fund
| | | Capital Manager
Moderate
Growth Fund
| | | Capital Manager
Growth Fund
| | | Capital Manager
Equity Fund
| |
For the
Year Ended
September 30,
2004
| | | For the
Year Ended
September 30,
2003
| | | For the
Year Ended
September 30,
2004
| | | For the
Year Ended
September 30,
2003
| | | For the
Year Ended
September 30,
2004
| | | For the
Year Ended
September 30,
2003
| | | For the
Year Ended
September 30,
2004
| | | For the
Year Ended
September 30,
2003
| |
| | | | | | | | | | | | | | | | | | | | | | | | | | | | | | | |
| | | | | | | | | | | | | | | | | | | | | | | | | | | | | | | |
| $ | 3,060,724 | | | $ | 2,845,223 | | | $ | 13,749,502 | | | $ | 5,526,075 | | | $ | 8,574,252 | | | $ | 2,075,569 | | | $ | 2,729,313 | | | $ | 589,031 | |
| | 58,956 | | | | 35,236 | | | | 136,043 | | | | 54,786 | | | | 41,639 | | | | 10,270 | | | | 3,269 | | | | 5,021 | |
| | (604,237 | ) | | | (1,618,794 | ) | | | (2,404,988 | ) | | | (1,190,812 | ) | | | (1,864,313 | ) | | | (548,649 | ) | | | (589,944 | ) | | | (143,655 | ) |
|
|
| |
|
|
| |
|
|
| |
|
|
| |
|
|
| |
|
|
| |
|
|
| |
|
|
|
| | 2,515,443 | | | | 1,261,665 | | | | 11,480,557 | | | | 4,390,049 | | | | 6,751,578 | | | | 1,537,190 | | | | 2,142,638 | | | | 450,397 | |
| | | | | | | | | | | | | | | | | | | | | | | | | | | | | | | |
| | 2,055,678 | | | | 1,812,680 | | | | 11,269,623 | | | | 4,832,465 | | | | 5,224,498 | | | | 3,347,863 | | | | 3,402,316 | | | | 1,082,357 | |
| | 40,687 | | | | 33,109 | | | | 74,747 | | | | 51,352 | | | | 5,683 | | | | — | | | | — | | | | 8,955 | |
| | (560,737 | ) | | | (545,717 | ) | | | (2,071,061 | ) | | | (967,788 | ) | | | (1,694,346 | ) | | | (781,806 | ) | | | (524,039 | ) | | | (150,991 | ) |
|
|
| |
|
|
| |
|
|
| |
|
|
| |
|
|
| |
|
|
| |
|
|
| |
|
|
|
| | 1,535,628 | | | | 1,300,072 | | | | 9,273,309 | | | | 3,916,029 | | | | 3,535,835 | | | | 2,566,057 | | | | 2,878,277 | | | | 940,321 | |
| | | | | | | | | | | | | | | | | | | | | | | | | | | | | | | |
| | 77,234 | | | | 93,873 | | | | 148,787 | | | | 159,853 | | | | 11,372 | | | | 40,219 | | | | 50,300 | | | | 24,081 | |
| | 1,686 | | | | 1,428 | | | | 1,335 | | | | 1,883 | | | | 45 | | | | — | | | | — | | | | 5 | |
| | (53,910 | ) | | | (19,259 | ) | | | (168,312 | ) | | | (309,259 | ) | | | (5,664 | ) | | | (4,866 | ) | | | — | | | | — | |
|
|
| |
|
|
| |
|
|
| |
|
|
| |
|
|
| |
|
|
| |
|
|
| |
|
|
|
| | 25,010 | | | | 76,042 | | | | (18,190 | ) | | | (147,523 | ) | | | 5,753 | | | | 35,353 | | | | 50,300 | | | | 24,086 | |
| | | | | | | | | | | | | | | | | | | | | | | | | | | | | | | |
| | 37,741,696 | | | | 5,369,994 | | | | 7,658,209 | | | | 3,639,246 | | | | 6,245,339 | | | | 2,652,882 | | | | 4,662,355 | | | | 3,454,968 | |
| | 1,094,503 | | | | 706,281 | | | | 319,085 | | | | 284,608 | | | | 185,899 | | | | 105,982 | | | | 59,351 | | | | 88,889 | |
| | (5,535,321 | ) | | | (2,571,668 | ) | | | (2,532,296 | ) | | | (1,195,505 | ) | | | (1,772,976 | ) | | | (1,736,261 | ) | | | (1,947,718 | ) | | | (721,237 | ) |
|
|
| |
|
|
| |
|
|
| |
|
|
| |
|
|
| |
|
|
| |
|
|
| |
|
|
|
| | 33,300,878 | | | | 3,504,607 | | | | 5,444,998 | | | | 2,728,349 | | | | 4,658,262 | | | | 1,022,603 | | | | 2,773,988 | | | | 2,822,620 | |
|
|
| |
|
|
| |
|
|
| |
|
|
| |
|
|
| |
|
|
| |
|
|
| |
|
|
|
| $ | 37,376,959 | | | $ | 6,142,386 | | | $ | 26,180,674 | | | $ | 10,886,904 | | | $ | 14,951,428 | | | $ | 5,161,203 | | | $ | 7,845,203 | | | $ | 4,237,424 | |
|
|
| |
|
|
| |
|
|
| |
|
|
| |
|
|
| |
|
|
| |
|
|
| |
|
|
|
| | | | | | | | | | | | | | | | | | | | | | | | | | | | | | | |
| | | | | | | | | | | | | | | | | | | | | | | | | | | | | | | |
| | 331,104 | | | | 331,500 | | | | 1,550,101 | | | | 694,668 | | | | 995,302 | | | | 279,076 | | | | 287,563 | | | | 74,235 | |
| | 6,385 | | | | 4,174 | | | | 15,315 | | | | 7,123 | | | | 4,912 | | | | 1,433 | | | | 346 | | | | 658 | |
| | (65,401 | ) | | | (188,711 | ) | | | (270,428 | ) | | | (156,364 | ) | | | (216,626 | ) | | | (76,971 | ) | | | (61,758 | ) | | | (17,486 | ) |
|
|
| |
|
|
| |
|
|
| |
|
|
| |
|
|
| |
|
|
| |
|
|
| |
|
|
|
| | 272,088 | | | | 146,963 | | | | 1,294,988 | | | | 545,427 | | | | 783,588 | | | | 203,538 | | | | 226,151 | | | | 57,407 | |
| | | | | | | | | | | | | | | | | | | | | | | | | | | | | | | |
| | 222,779 | | | | 213,090 | | | | 1,280,673 | | | | 624,335 | | | | 619,536 | | | | 458,927 | | | | 370,075 | | | | 137,799 | |
| | 4,413 | | | | 3,927 | | | | 8,858 | | | | 6,554 | | | | 738 | | | | — | | | | — | | | | 1,171 | |
| | (60,839 | ) | | | (64,023 | ) | | | (236,127 | ) | | | (127,145 | ) | | | (201,963 | ) | | | (112,243 | ) | | | (57,119 | ) | | | (19,669 | ) |
|
|
| |
|
|
| |
|
|
| |
|
|
| |
|
|
| |
|
|
| |
|
|
| |
|
|
|
| | 166,353 | | | | 152,994 | | | | 1,053,404 | | | | 503,744 | | | | 418,311 | | | | 346,684 | | | | 312,956 | | | | 119,301 | |
| | | | | | | | | | | | | | | | | | | | | | | | | | | | | | | |
| | 8,383 | | | | 11,277 | | | | 16,722 | | | | 21,259 | | | | 1,342 | | | | 5,608 | | | | 5,728 | | | | 3,243 | |
| | 184 | | | | 170 | | | | 159 | | | | 244 | | | | 6 | | | | — | | | | — | | | | 1 | |
| | (5,899 | ) | | | (2,191 | ) | | | (19,156 | ) | | | (40,601 | ) | | | (659 | ) | | | (728 | ) | | | — | | | | — | |
|
|
| |
|
|
| |
|
|
| |
|
|
| |
|
|
| |
|
|
| |
|
|
| |
|
|
|
| | 2,668 | | | | 9,256 | | | | (2,275 | ) | | | (19,098 | ) | | | 689 | | | | 4,880 | | | | 5,728 | | | | 3,244 | |
| | | | | | | | | | | | | | | | | | | | | | | | | | | | | | | |
| | 4,165,574 | | | | 618,079 | | | | 858,360 | | | | 456,686 | | | | 729,087 | | | | 346,915 | | | | 491,569 | | | | 433,952 | |
| | 117,491 | | | | 83,419 | | | | 35,906 | | | | 37,351 | | | | 22,136 | | | | 14,887 | | | | 6,380 | | | | 11,478 | |
| | (595,643 | ) | | | (296,854 | ) | | | (287,406 | ) | | | (149,186 | ) | | | (209,184 | ) | | | (228,937 | ) | | | (208,251 | ) | | | (88,233 | ) |
|
|
| |
|
|
| |
|
|
| |
|
|
| |
|
|
| |
|
|
| |
|
|
| |
|
|
|
| | 3,687,422 | | | | 404,644 | | | | 606,860 | | | | 344,851 | | | | 542,039 | | | | 132,865 | | | | 289,698 | | | | 357,197 | |
|
|
| |
|
|
| |
|
|
| |
|
|
| |
|
|
| |
|
|
| |
|
|
| |
|
|
|
| | 4,128,531 | | | | 713,857 | | | | 2,952,977 | | | | 1,374,924 | | | | 1,744,627 | | | | 687,967 | | | | 834,533 | | | | 537,149 | |
|
|
| |
|
|
| |
|
|
| |
|
|
| |
|
|
| |
|
|
| |
|
|
| |
|
|
|
See accompanying notes to the financial statements.
131
BB&T Funds
Financial Highlights, Class A Shares
Selected data for a share of beneficial interest outstanding throughout the periods indicated.
| | | | | | | | | | | | | | | | | | | | | |
| | | | | Investment Activities
| | | Dividends
| |
| | | Net Asset
Value,
Beginning
of Period
| | Net
investment
income
(loss)
| | |
Net realized/
unrealized
gains (losses)
on investments
| | | Total from
Investment
Activities
| | | Net
investment
income
| | | Net realized
gains on
investments
| | | Total
Dividends
| |
Equity Income Fund | | | | | | | | | | | | | | | | | | | | | |
June 30, 2004 to September 30, 2004 (a) | | $ | 10.00 | | 0.05 | (c) | | 0.34 | | | 0.39 | | | (0.04 | ) | | — | | | (0.04 | ) |
Large Company Value Fund | | | | | | | | | | | | | | | | | | | | | |
Year Ended September 30, 2004 | | $ | 14.87 | | 0.23 | | | 2.38 | | | 2.61 | | | (0.22 | ) | | — | | | (0.22 | ) |
Year Ended September 30, 2003 | | $ | 12.84 | | 0.23 | | | 2.03 | | | 2.26 | | | (0.23 | ) | | — | | | (0.23 | ) |
Year Ended September 30, 2002 | | $ | 16.79 | | 0.18 | | | (3.47 | ) | | (3.29 | ) | | (0.18 | ) | | (0.48 | ) | | (0.66 | ) |
Year Ended September 30, 2001 | | $ | 18.57 | | 0.22 | | | (0.89 | ) | | (0.67 | ) | | (0.22 | ) | | (0.89 | ) | | (1.11 | ) |
Year Ended September 30, 2000 | | $ | 19.60 | | 0.49 | | | 0.56 | | | 1.05 | | | (0.49 | ) | | (1.59 | ) | | (2.08 | ) |
Large Company Growth Fund | | | | | | | | | | | | | | | | | | | | | |
Year Ended September 30, 2004 | | $ | 7.69 | | (0.01 | ) | | 0.54 | | | 0.53 | | | — | | | — | | | — | |
Year Ended September 30, 2003 | | $ | 6.60 | | (0.02 | ) | | 1.11 | | | 1.09 | | | — | | | — | | | — | |
Year Ended September 30, 2002 | | $ | 8.16 | | (0.06 | ) | | (1.50 | ) | | (1.56 | ) | | — | | | — | | | — | |
Year Ended September 30, 2001 | | $ | 14.75 | | (0.05 | ) | | (5.56 | ) | | (5.61 | ) | | — | | | (0.98 | ) | | (0.98 | ) |
Year Ended September 30, 2000 | | $ | 11.96 | | (0.06 | ) | | 3.59 | | | 3.53 | | | — | | | (0.74 | ) | | (0.74 | ) |
Mid Cap Value Fund | | | | | | | | | | | | | | | | | | | | | |
Year Ended September 30, 2004 | | $ | 12.98 | | 0.18 | (c) | | 2.42 | | | 2.60 | | | (0.18 | ) | | — | | | (0.18 | ) |
Year Ended September 30, 2003 | | $ | 10.93 | | 0.16 | (c) | | 2.04 | | | 2.20 | | | (0.15 | ) | | — | | | (0.15 | ) |
Year Ended September 30, 2002 | | $ | 13.12 | | 0.17 | (c) | | (1.04 | ) | | (0.87 | ) | | (0.17 | ) | | (1.15 | ) | | (1.32 | ) |
February 1, 2001 to September 30, 2001 (b) | | $ | 14.26 | | 0.15 | | | (1.15 | ) | | (1.00 | ) | | (0.14 | ) | | — | | | (0.14 | ) |
Year Ended January 31, 2001 | | $ | 14.10 | | 0.22 | | | 0.94 | | | 1.16 | | | (0.21 | ) | | (0.79 | ) | | (1.00 | ) |
Year Ended January 31, 2000 | | $ | 13.44 | | 0.24 | | | 0.89 | | | 1.13 | | | (0.19 | ) | | (0.28 | ) | | (0.47 | ) |
Mid Cap Growth Fund | | | | | | | | | | | | | | | | | | | | | |
Year Ended September 30, 2004 | | $ | 9.84 | | (0.08 | ) | | 1.19 | | | 1.11 | | | — | | | — | | | — | |
Year Ended September 30, 2003 | | $ | 8.07 | | (0.09 | ) | | 1.86 | | | 1.77 | | | — | | | — | | | — | |
Year Ended September 30, 2002 | | $ | 9.80 | | (0.08 | ) | | (1.02 | ) | | (1.10 | ) | | — | | | (0.63 | ) | | (0.63 | ) |
February 1, 2001 to September 30, 2001 (b) | | $ | 14.42 | | (0.07 | ) | | (4.55 | ) | | (4.62 | ) | | — | | | — | | | — | |
Year Ended January 31, 2001 | | $ | 20.36 | | (0.13 | ) | | (1.99 | ) | | (2.12 | ) | | — | | | (3.82 | ) | | (3.82 | ) |
Year Ended January 31, 2000 | | $ | 17.61 | | (0.17 | ) | | 5.01 | | | 4.84 | | | — | | | (2.09 | ) | | (2.09 | ) |
Small Company Value Fund | | | | | | | | | | | | | | | | | | | | | |
Year Ended September 30, 2004 | | $ | 11.44 | | — | (c) | | 2.90 | | | 2.90 | | | (0.01 | ) | | (0.12 | ) | | (0.13 | ) |
May 19, 2003 to September 30, 2003 (a) | | $ | 10.00 | | 0.01 | (c) | | 1.43 | | | 1.44 | | | — | (d) | | — | | | — | (d) |
Small Company Growth Fund | | | | | | | | | | | | | | | | | | | | | |
Year Ended September 30, 2004 | | $ | 11.50 | | (0.15 | )(c) | | 0.61 | | | 0.46 | | | — | | | — | | | — | |
Year Ended September 30, 2003 | | $ | 9.38 | | (0.14 | ) | | 2.26 | | | 2.12 | | | — | | | — | | | — | |
Year Ended September 30, 2002 | | $ | 12.13 | | (0.17 | )(c) | | (2.58 | ) | | (2.75 | ) | | — | | | — | | | — | |
Year Ended September 30, 2001 | | $ | 34.87 | | (0.20 | ) | | (16.20 | ) | | (16.40 | ) | | — | | | (6.34 | ) | | (6.34 | ) |
Year Ended September 30, 2000 | | $ | 24.92 | | (0.25 | ) | | 13.20 | | | 12.95 | | | — | | | (3.00 | ) | | (3.00 | ) |
Special Opportunities Equity Fund | | | | | | | | | | | | | | | | | | | | | |
Year Ended September 30, 2004 | | $ | 10.53 | | (0.06 | ) | | 2.69 | | | 2.63 | | | — | | | (0.08 | ) | | (0.08 | ) |
June 2, 2003 to September 30, 2003 (a) | | $ | 10.00 | | (0.01 | ) | | 0.54 | | | 0.53 | | | — | | | — | | | — | |
| * | During the period certain fees were reduced. If such reductions had not occurred, the ratios would have been as indicated. |
| ** | Portfolio Turnover is calculated on the basis of the Fund as a whole without distinguishing between classes of shares issued. |
| (a) | Period from commencement of operations. |
| (b) | For the period from February 1, 2001 to September 30, 2001. Upon reorganizing as Funds of the BB&T Funds, the Mid Cap Value Fund and Mid Cap Growth Fund changed their fiscal year end from January 31 to September 30. The Financial Highlights for the periods prior to February 1, 2001 represent the OVB Equity Income Portfolio and OVB Capital Appreciation Portfolio, respectively. |
| (c) | Per share net investment income (loss) has been calculated using the average daily shares method. |
| (d) | Amount is less than $0.005. |
| (e) | Not annualized for periods less than one year. |
| (f) | Annualized for periods less than one year. |
See accompanying notes to the financial statements.
132
| | | | | | | | | | | | | | | | | | | |
| | | | | | Ratios/Supplementary Data
| |
Net Asset
Value,
End of
Period
| | Total
Return
(excludes
sales charge) (e)
| | | Net Assets,
End of
Period
(000)
| | Ratio of
expenses to
average
net assets (f)
| | | Ratio of net
investment
income
(loss) to
average net
assets (f)
| | | Ratio of
expenses to
average
net assets* (f)
| | | Portfolio
turnover**
| |
| | | | | | | | | | | | | | | | | | | | |
| $ | 10.35 | | 3.89 | % | | $ | 6,342 | | 1.54 | % | | 1.79 | % | | 2.14 | % | | 1.65 | % |
| | | | | | | | | | | | | | | | | | | | |
| $ | 17.26 | | 17.61 | % | | $ | 31,783 | | 1.20 | % | | 1.32 | % | | 1.56 | % | | 16.40 | % |
| $ | 14.87 | | 17.73 | % | | $ | 25,397 | | 1.17 | % | | 1.67 | % | | 1.55 | % | | 18.89 | % |
| $ | 12.84 | | (20.57 | )% | | $ | 22,222 | | 1.23 | % | | 1.11 | % | | 1.62 | % | | 23.02 | % |
| $ | 16.79 | | (3.77 | )% | | $ | 29,942 | | 1.24 | % | | 1.23 | % | | 1.63 | % | | 24.20 | % |
| $ | 18.57 | | 5.69 | % | | $ | 33,004 | | 1.17 | % | | 2.62 | % | | 1.60 | % | | 23.85 | % |
| | | | | | | | | | | | | | | | | | | | |
| $ | 8.22 | | 6.89 | % | | $ | 8,784 | | 1.22 | % | | (0.33 | )% | | 1.58 | % | | 127.47 | % |
| $ | 7.69 | | 16.52 | % | | $ | 7,042 | | 1.18 | % | | (0.35 | )% | | 1.57 | % | | 91.73 | % |
| $ | 6.60 | | (19.12 | )% | | $ | 6,240 | | 1.28 | % | | (0.57 | )% | | 1.67 | % | | 100.46 | % |
| $ | 8.16 | | (40.36 | )% | | $ | 8,146 | | 1.30 | % | | (0.48 | )% | | 1.69 | % | | 96.41 | % |
| $ | 14.75 | | 30.08 | % | | $ | 13,156 | | 1.24 | % | | (0.43 | )% | | 1.66 | % | | 76.76 | % |
| | | | | | | | | | | | | | | | | | | | |
| $ | 15.40 | | 20.10 | % | | $ | 9,423 | | 1.23 | % | | 1.22 | % | | 1.35 | % | | 19.17 | % |
| $ | 12.98 | | 20.31 | % | | $ | 6,841 | | 1.20 | % | | 1.33 | % | | 1.35 | % | | 18.28 | % |
| $ | 10.93 | | (8.24 | )% | | $ | 5,070 | | 1.15 | % | | 1.29 | % | | 1.38 | % | | 18.20 | % |
| $ | 13.12 | | (7.09 | )% | | $ | 4,554 | | 1.20 | % | | 1.45 | % | | 1.37 | % | | 27.04 | % |
| $ | 14.26 | | 8.76 | % | | $ | 5,691 | | 1.21 | % | | 1.54 | % | | 1.36 | % | | 59.00 | % |
| $ | 14.10 | | 8.23 | % | | $ | 5,965 | | 1.21 | % | | 1.39 | % | | 1.32 | % | | 15.00 | % |
| | | | | | | | | | | | | | | | | | | | |
| $ | 10.95 | | 11.28 | % | | $ | 8,079 | | 1.25 | % | | (0.90 | )% | | 1.36 | % | | 138.61 | % |
| $ | 9.84 | | 21.93 | % | | $ | 6,486 | | 1.19 | % | | (0.96 | )% | | 1.36 | % | | 125.97 | % |
| $ | 8.07 | | (12.54 | )% | | $ | 5,533 | | 1.17 | % | | (0.88 | )% | | 1.44 | % | | 117.06 | % |
| $ | 9.80 | | (32.04 | )% | | $ | 7,386 | | 1.25 | % | | (0.52 | )% | | 1.47 | % | | 90.11 | % |
| $ | 14.42 | | (10.84 | )% | | $ | 12,285 | | 1.27 | % | | (0.37 | )% | | 1.48 | % | | 63.00 | % |
| $ | 20.36 | | 28.47 | % | | $ | 23,668 | | 1.27 | % | | (0.59 | )% | | 1.55 | % | | 54.00 | % |
| | | | | | | | | | | | | | | | | | | | |
| $ | 14.21 | | 25.53 | % | | $ | 353 | | 1.48 | % | | (0.03 | )% | | 1.91 | % | | 11.25 | % |
| $ | 11.44 | | 14.43 | % | | $ | 112 | | 2.04 | % | | 0.35 | % | | 2.29 | % | | 48.84 | % |
| | | | | | | | | | | | | | | | | | | | |
| $ | 11.96 | | 4.00 | % | | $ | 5,958 | | 1.55 | % | | (1.22 | )% | | 1.91 | % | | 211.60 | % |
| $ | 11.50 | | 22.60 | % | | $ | 6,007 | | 1.62 | % | | (1.20 | )% | | 1.87 | % | | 197.85 | % |
| $ | 9.38 | | (22.67 | )% | | $ | 5,145 | | 1.73 | % | | (1.43 | )% | | 1.98 | % | | 292.94 | % |
| $ | 12.13 | | (54.95 | )% | | $ | 8,333 | | 1.72 | % | | (0.86 | )% | | 1.97 | % | | 286.49 | % |
| $ | 34.87 | | 54.34 | % | | $ | 28,936 | | 1.66 | % | | (0.74 | )% | | 1.91 | % | | 206.16 | % |
| | | | | | | | | | | | | | | | | | | | |
| $ | 13.08 | | 25.06 | % | | $ | 28,903 | | 1.42 | % | | (0.77 | )% | | 1.80 | % | | 32.06 | % |
| $ | 10.53 | | 5.30 | % | | $ | 5,460 | | 1.06 | % | | (0.42 | )% | | 2.02 | % | | 13.24 | % |
See accompanying notes to the financial statements.
133
BB&T Funds
Financial Highlights, Class A Shares
Selected data for a share of beneficial interest outstanding throughout the periods indicated.
| | | | | | | | | | | | | | | | | | | | | |
| | | | | Investment Activities
| | | Dividends
| |
| | | Net Asset
Value,
Beginning
of Period
| | Net
investment
income
(loss)
| | | Net realized/
unrealized
gains (losses)
on investments
and foreign
currencies
| | | Total from
Investment
Activities
| | | Net
investment
income
| | | Net realized
gains on
investments
and foreign
currencies
| | | Total
Dividends
| |
International Equity Fund | | | | | | | | | | | | | | | | | | | | | |
Year Ended September 30, 2004 | | $ | 6.88 | | 0.07 | (b) | | 1.25 | | | 1.32 | | | (0.08 | ) | | — | | | (0.08 | ) |
Year Ended September 30, 2003 | | $ | 6.31 | | 0.06 | (b) | | 0.54 | | | 0.60 | | | (0.03 | ) | | — | | | (0.03 | ) |
Year Ended September 30, 2002 | | $ | 7.43 | | (0.02 | )(b) | | (1.10 | ) | | (1.12 | ) | | — | | | — | | | — | |
Year Ended September 30, 2001 | | $ | 12.49 | | (0.05 | ) | | (2.99 | ) | | (3.04 | ) | | — | | | (2.02 | ) | | (2.02 | ) |
Year Ended September 30, 2000 | | $ | 12.48 | | (0.04 | ) | | 0.68 | | | 0.64 | | | — | | | (0.63 | ) | | (0.63 | ) |
Short U.S. Government Fund | | | | | | | | | | | | | | | | | | | | | |
Year Ended September 30, 2004 | | $ | 9.89 | | 0.17 | | | (0.10 | ) | | 0.07 | | | (0.26 | ) | | — | | | (0.26 | ) |
Year Ended September 30, 2003 | | $ | 10.08 | | 0.27 | | | (0.11 | ) | | 0.16 | | | (0.35 | ) | | — | | | (0.35 | ) |
Year Ended September 30, 2002 | | $ | 10.04 | | 0.43 | (c) | | 0.06 | (c) | | 0.49 | | | (0.45 | ) | | — | | | (0.45 | ) |
Year Ended September 30, 2001 | | $ | 9.63 | | 0.51 | | | 0.41 | | | 0.92 | | | (0.51 | ) | | — | | | (0.51 | ) |
Year Ended September 30, 2000 | | $ | 9.65 | | 0.50 | | | (0.01 | ) | | 0.49 | | | (0.51 | ) | | — | | | (0.51 | ) |
Intermediate U.S. Government Fund | | | | | | | | | | | | | | | | | | | | | |
Year Ended September 30, 2004 | | $ | 10.57 | | 0.32 | | | (0.19 | ) | | 0.13 | | | (0.33 | ) | | (0.13 | ) | | (0.46 | ) |
Year Ended September 30, 2003 | | $ | 10.77 | | 0.35 | | | (0.07 | ) | | 0.28 | | | (0.39 | ) | | (0.09 | ) | | (0.48 | ) |
Year Ended September 30, 2002 | | $ | 10.38 | | 0.47 | (d) | | 0.42 | (d) | | 0.89 | | | (0.50 | ) | | — | | | (0.50 | ) |
Year Ended September 30, 2001 | | $ | 9.71 | | 0.51 | | | 0.68 | | | 1.19 | | | (0.52 | ) | | — | | | (0.52 | ) |
Year Ended September 30, 2000 | | $ | 9.70 | | 0.52 | | | 0.05 | | | 0.57 | | | (0.53 | ) | | (0.03 | ) | | (0.56 | ) |
Intermediate Corporate Bond Fund | | | | | | | | | | | | | | | | | | | | | |
Year Ended September 30, 2004 | | $ | 10.72 | | 0.41 | | | (0.08 | ) | | 0.33 | | | (0.46 | ) | | — | | | (0.46 | ) |
Year Ended September 30, 2003 | | $ | 10.33 | | 0.47 | | | 0.41 | | | 0.88 | | | (0.49 | ) | | — | | | (0.49 | ) |
Year Ended September 30, 2002 | | $ | 10.56 | | 0.53 | (e) | | (0.04 | )(e) | | 0.49 | | | (0.55 | ) | | (0.17 | ) | | (0.72 | ) |
Year Ended September 30, 2001 | | $ | 9.98 | | 0.60 | | | 0.58 | | | 1.18 | | | (0.60 | ) | | — | | | (0.60 | ) |
December 2, 1999 to September 30, 2000 (a) | | $ | 10.00 | | 0.50 | | | (0.02 | ) | | 0.48 | | | (0.50 | ) | | — | | | (0.50 | ) |
| * | During the period certain fees were reduced. If such reductions had not occurred, the ratios would have been as indicated. |
| ** | Portfolio Turnover is calculated on the basis of the Fund as a whole without distinguishing between classes of shares issued. |
| (a) | Period from commencement of operations. |
| (b) | Per share net investment income (loss) has been calculated using the average daily shares method. |
| (c) | Without the adoption of the change in amortization method as required by the November 2000 revised version of the AICPA Audit and Accounting Guide for Investment Companies, the amounts for net investment income, net realized/unrealized gains (losses), and the net investment income ratio would have been: $0.47, $0.02, 4.38%, respectively. |
| (d) | Without the adoption of the change in amortization method as required by the November 2000 revised version of the AICPA Audit and Accounting Guide for Investment Companies, the amounts for net investment income, net realized/unrealized gains (losses), and the net investment income ratio would have been: $0.49, $0.40, 4.74%, respectively. |
| (e) | Without the adoption of the change in amortization method as required by the November 2000 revised version of the AICPA Audit and Accounting Guide for Investment Companies, the amounts for net investment income, net realized/unrealized gains (losses), and the net investment income ratio would have been: $0.54, $(0.05), 5.23%, respectively. |
| (f) | Not annualized for periods less than one year. |
| (g) | Annualized for periods less than one year. |
See accompanying notes to the financial statements.
134
| | | | | | | | | | | | | | | | | | | |
| | | | Ratios/Supplementary Data
| |
Net Asset
Value,
End of
Period
| | Total
Return
(excludes
sales charge) (f)
| | | Net Assets,
End of
Period
(000)
| | Ratio of
expenses to
average
net assets (g)
| | | Ratio of net
investment
income
(loss) to
average net
assets (g)
| | | Ratio of
expenses to
average
net assets* (g)
| | | Portfolio
turnover**
| |
| | | | | | | | | | | | | | | | | | | | |
| $ | 8.12 | | 19.25 | % | | $ | 1,686 | | 1.58 | % | | 0.91 | % | | 1.92 | % | | 50.68 | % |
| $ | 6.88 | | 9.58 | % | | $ | 2,162 | | 1.63 | % | | 0.95 | % | | 1.90 | % | | 199.78 | % |
| $ | 6.31 | | (15.07 | )% | | $ | 1,412 | | 1.68 | % | | (0.24 | )% | | 1.93 | % | | 95.86 | % |
| $ | 7.43 | | (28.52 | )% | | $ | 2,557 | | 1.74 | % | | (0.33 | )% | | 1.99 | % | | 144.35 | % |
| $ | 12.49 | | 4.75 | % | | $ | 2,681 | | 1.76 | % | | (0.26 | )% | | 2.01 | % | | 179.44 | % |
| | | | | | | | | | | | | | | | | | | | |
| $ | 9.70 | | 0.71 | % | | $ | 8,456 | | 0.99 | % | | 1.85 | % | | 1.41 | % | | 62.59 | % |
| $ | 9.89 | | 1.56 | % | | $ | 9,619 | | 1.00 | % | | 2.48 | % | | 1.40 | % | | 93.86 | % |
| $ | 10.08 | | 5.03 | % | | $ | 5,286 | | 1.03 | % | | 4.03 | %(c) | | 1.43 | % | | 73.93 | % |
| $ | 10.04 | | 9.73 | % | | $ | 3,530 | | 1.03 | % | | 5.12 | % | | 1.43 | % | | 101.28 | % |
| $ | 9.63 | | 5.24 | % | | $ | 3,270 | | 1.01 | % | | 5.27 | % | | 1.41 | % | | 101.07 | % |
| | | | | | | | | | | | | | | | | | | | |
| $ | 10.24 | | 1.30 | % | | $ | 11,959 | | 1.05 | % | | 2.90 | % | | 1.42 | % | | 98.35 | % |
| $ | 10.57 | | 2.62 | % | | $ | 9,646 | | 1.07 | % | | 3.13 | % | | 1.42 | % | | 209.07 | % |
| $ | 10.77 | | 8.85 | % | | $ | 6,453 | | 1.10 | % | | 4.56 | %(d) | | 1.45 | % | | 79.36 | % |
| $ | 10.38 | | 12.53 | % | | $ | 4,450 | | 1.11 | % | | 5.12 | % | | 1.46 | % | | 84.76 | % |
| $ | 9.71 | | 6.09 | % | | $ | 2,579 | | 1.08 | % | | 5.46 | % | | 1.43 | % | | 103.41 | % |
| | | | | | | | | | | | | | | | | | | | |
| $ | 10.59 | | 3.22 | % | | $ | 4,786 | | 1.07 | % | | 3.84 | % | | 1.44 | % | | 31.95 | % |
| $ | 10.72 | | 8.69 | % | | $ | 4,308 | | 1.08 | % | | 4.34 | % | | 1.44 | % | | 43.98 | % |
| $ | 10.33 | | 4.98 | % | | $ | 2,042 | | 1.11 | % | | 5.11 | %(e) | | 1.50 | % | | 69.15 | % |
| $ | 10.56 | | 12.10 | % | | $ | 426 | | 1.06 | % | | 5.76 | % | | 1.45 | % | | 142.35 | % |
| $ | 9.98 | | 4.97 | % | | $ | 236 | | 1.03 | % | | 6.06 | % | | 1.59 | % | | 186.79 | % |
See accompanying notes to the financial statements.
135
BB&T Funds
Financial Highlights, Class A Shares
Selected data for a share of beneficial interest outstanding throughout the periods indicated.
| | | | | | | | | | | | | | | | | | | | | |
| | | | | Investment Activities
| | | Dividends
| |
| | | Net Asset
Value,
Beginning
of Period
| | Net
investment
income
(loss)
| | |
Net realized/
unrealized
gains (losses)
on investments
| | | Total from
Investment
Activities
| | | Net
investment
income
| | | Net realized
gains on
investments
| | | Total
Dividends
| |
Kentucky Intermediate Tax-Free Fund | | | | | | | | | | | | | | | | | | | | | |
Year Ended September 30, 2004 | | $ | 10.23 | | 0.27 | (c) | | (0.01 | ) | | 0.26 | | | (0.27 | ) | | — | | | (0.27 | ) |
February 24, 2003 to September 30, 2003 (a) | | $ | 10.00 | | 0.15 | (c) | | 0.35 | | | 0.50 | | | (0.27 | ) | | — | | | (0.27 | ) |
Maryland Intermediate Tax-Free Fund | | | | | | | | | | | | | | | | | | | | | |
Year Ended September 30, 2004 | | $ | 10.15 | | 0.24 | | | (0.00 | ) | | 0.24 | | | (0.24 | ) | | — | | | (0.24 | ) |
February 24, 2003 to September 30, 2003 (a) | | $ | 10.00 | | 0.18 | | | 0.15 | | | 0.33 | | | (0.18 | ) | | — | | | (0.18 | ) |
North Carolina Intermediate Tax-Free Fund | | | | | | | | | | | | | | | | | | | | | |
Year Ended September 30, 2004 | | $ | 10.81 | | 0.32 | | | (0.10 | ) | | 0.22 | | | (0.32 | ) | | (0.04 | ) | | (0.36 | ) |
Year Ended September 30, 2003 | | $ | 10.86 | | 0.33 | | | (0.01 | ) | | 0.32 | | | (0.33 | ) | | (0.04 | ) | | (0.37 | ) |
Year Ended September 30, 2002 | | $ | 10.54 | | 0.36 | | | 0.40 | | | 0.76 | | | (0.36 | ) | | (0.08 | ) | | (0.44 | ) |
Year Ended September 30, 2001 | | $ | 9.97 | | 0.38 | | | 0.57 | | | 0.95 | | | (0.38 | ) | | — | | | (0.38 | ) |
Year Ended September 30, 2000 | | $ | 9.89 | | 0.40 | | | 0.08 | | | 0.48 | | | (0.40 | ) | | — | | | (0.40 | ) |
South Carolina Intermediate Tax-Free Fund | | | | | | | | | | | | | | | | | | | | | |
Year Ended September 30, 2004 | | $ | 10.88 | | 0.34 | | | (0.07 | ) | | 0.27 | | | (0.33 | ) | | (0.01 | ) | | (0.34 | ) |
Year Ended September 30, 2003 | | $ | 10.87 | | 0.34 | | | 0.01 | | | 0.35 | | | (0.34 | ) | | — | | | (0.34 | ) |
Year Ended September 30, 2002 | | $ | 10.46 | | 0.37 | | | 0.41 | | | 0.78 | | | (0.37 | ) | | — | | | (0.37 | ) |
Year Ended September 30, 2001 | | $ | 9.90 | | 0.38 | | | 0.56 | | | 0.94 | | | (0.38 | ) | | — | | | (0.38 | ) |
Year Ended September 30, 2000 | | $ | 9.80 | | 0.39 | | | 0.10 | | | 0.49 | | | (0.39 | ) | | — | | | (0.39 | ) |
Virginia Intermediate Tax-Free Fund | | | | | | | | | | | | | | | | | | | | | |
Year Ended September 30, 2004 | | $ | 11.96 | | 0.38 | | | (0.14 | ) | | 0.24 | | | (0.38 | ) | | (0.08 | ) | | (0.46 | ) |
Year Ended September 30, 2003 | | $ | 11.99 | | 0.37 | | | 0.01 | | | 0.38 | | | (0.37 | ) | | (0.04 | ) | | (0.41 | ) |
Year Ended September 30, 2002 | | $ | 11.57 | | 0.41 | | | 0.42 | | | 0.83 | | | (0.41 | ) | | — | | | (0.41 | ) |
Year Ended September 30, 2001 | | $ | 10.96 | | 0.42 | | | 0.61 | | | 1.03 | | | (0.42 | ) | | — | | | (0.42 | ) |
Year Ended September 30, 2000 | | $ | 10.86 | | 0.45 | | | 0.10 | | | 0.55 | | | (0.45 | ) | | — | | | (0.45 | ) |
West Virginia Intermediate Tax-Free Fund | | | | | | | | | | | | | | | | | | | | | |
Year Ended September 30, 2004 | | $ | 10.20 | | 0.32 | | | (0.07 | ) | | 0.25 | | | (0.33 | ) | | (0.04 | ) | | (0.37 | ) |
Year Ended September 30, 2003 | | $ | 10.35 | | 0.33 | (c) | | 0.01 | | | 0.34 | | | (0.33 | ) | | (0.16 | ) | | (0.49 | ) |
Year Ended September 30, 2002 | | $ | 10.01 | | 0.43 | | | 0.31 | | | 0.74 | | | (0.38 | ) | | (0.02 | ) | | (0.40 | ) |
February 1, 2001 to September 30, 2001 (b) | | $ | 9.92 | | 0.29 | | | 0.09 | | | 0.38 | | | (0.29 | ) | | — | | | (0.29 | ) |
Year Ended January 31, 2001 | | $ | 9.18 | | 0.46 | | | 0.74 | | | 1.20 | | | (0.46 | ) | | — | | | (0.46 | ) |
Year Ended January 31, 2000 | | $ | 10.26 | | 0.44 | | | (0.98 | ) | | (0.54 | ) | | (0.49 | ) | | (0.05 | ) | | (0.54 | ) |
| * | During the period certain fees were reduced. If such reductions had not occurred, the ratios would have been as indicated |
| ** | Portfolio Turnover is calculated on the basis of the Fund as a whole without distinguishing between classes of shares issued. |
| (a) | Period from commencement of operations. |
| (b) | For the period from February 1, 2001 to September 30, 2001. Upon reorganizing as a Fund of the BB&T Funds, the West Virginia Intermediate Tax-Free Fund changed its fiscal year end from January 31 to September 30. The Financial Highlights for the periods prior to February 1, 2001 represent the OVB West Virginia Tax-Exempt Income Portfolio. |
| (c) | Per share net investment income (loss) has been calculated using the average daily shares method. |
| (d) | Not annualized for periods less than one year. |
| (e) | Annualized for periods less than one year. |
See accompanying notes to the financial statements.
136
| | | | | | | | | | | | | | | | | | | |
| | | | | | Ratios/Supplementary Data
| |
Net Asset
Value,
End of
Period
| | Total
Return
(excludes
sales charge) (d)
| | | Net Assets,
End of
Period
(000)
| | Ratio of
expenses to
average
net assets (e)
| | | Ratio of net
investment
income
(loss) to
average net
assets (e)
| | | Ratio of
expenses to
average
net assets* (e)
| | | Portfolio
turnover**
| |
| | | | | | | | | | | | | | | | | | | | |
| $ | 10.22 | | 2.55 | % | | $ | 2,746 | | 0.78 | % | | 2.63 | % | | 1.57 | % | | 24.78 | % |
| $ | 10.23 | | 5.09 | % | | $ | 1,877 | | 0.62 | % | | 2.50 | % | | 1.65 | % | | 42.87 | % |
| | | | | | | | | | | | | | | | | | | | |
| $ | 10.15 | | 2.37 | % | | $ | 667 | | 0.75 | % | | 2.32 | % | | 1.73 | % | | 55.18 | % |
| $ | 10.15 | | 3.32 | % | | $ | 482 | | 0.72 | % | | 2.22 | % | | 2.24 | % | | 40.16 | % |
| | | | | | | | | | | | | | | | | | | | |
| $ | 10.67 | | 2.10 | % | | $ | 22,689 | | 0.90 | % | | 3.03 | % | | 1.42 | % | | 67.80 | % |
| $ | 10.81 | | 3.04 | % | | $ | 25,323 | | 0.92 | % | | 3.11 | % | | 1.42 | % | | 44.56 | % |
| $ | 10.86 | | 7.46 | % | | $ | 23,828 | | 0.93 | % | | 3.41 | % | | 1.43 | % | | 20.39 | % |
| $ | 10.54 | | 9.69 | % | | $ | 18,718 | | 0.93 | % | | 3.66 | % | | 1.43 | % | | 47.35 | % |
| $ | 9.97 | | 5.04 | % | | $ | 11,403 | | 0.95 | % | | 4.12 | % | | 1.46 | % | | 80.33 | % |
| | | | | | | | | | | | | | | | | | | | |
| $ | 10.81 | | 2.60 | % | | $ | 4,149 | | 0.90 | % | | 3.11 | % | | 1.44 | % | | 32.63 | % |
| $ | 10.88 | | 3.29 | % | | $ | 4,680 | | 0.86 | % | | 3.14 | % | | 1.43 | % | | 32.04 | % |
| $ | 10.87 | | 7.67 | % | | $ | 4,128 | | 0.83 | % | | 3.52 | % | | 1.48 | % | | 21.81 | % |
| $ | 10.46 | | 9.67 | % | | $ | 2,143 | | 0.87 | % | | 3.73 | % | | 1.52 | % | | 36.67 | % |
| $ | 9.90 | | 5.10 | % | | $ | 1,251 | | 0.90 | % | | 3.97 | % | | 1.72 | % | | 84.20 | % |
| | | | | | | | | | | | | | | | | | | | |
| $ | 11.74 | | 2.05 | % | | $ | 13,005 | | 0.91 | % | | 3.22 | % | | 1.43 | % | | 45.07 | % |
| $ | 11.96 | | 3.24 | % | | $ | 7,447 | | 0.92 | % | | 3.14 | % | | 1.42 | % | | 34.17 | % |
| $ | 11.99 | | 7.36 | % | | $ | 3,041 | | 0.96 | % | | 3.45 | % | | 1.46 | % | | 13.12 | % |
| $ | 11.57 | | 9.58 | % | | $ | 714 | | 0.90 | % | | 3.71 | % | | 1.40 | % | | 31.28 | % |
| $ | 10.96 | | 5.22 | % | | $ | 180 | | 0.93 | % | | 4.15 | % | | 1.40 | % | | 64.45 | % |
| | | | | | | | | | | | | | | | | | | | |
| $ | 10.08 | | 2.51 | % | | $ | 10,815 | | 1.01 | % | | 3.24 | % | | 1.03 | % | | 16.24 | % |
| $ | 10.20 | | 3.41 | % | | $ | 11,541 | | 0.98 | % | | 3.23 | % | | 1.01 | % | | 25.59 | % |
| $ | 10.35 | | 7.61 | % | | $ | 10,029 | | 0.97 | % | | 3.78 | % | | 1.13 | % | | 61.44 | % |
| $ | 10.01 | | 3.67 | % | | $ | 7,992 | | 0.88 | % | | 4.40 | % | | 1.05 | % | | 15.75 | % |
| $ | 9.92 | | 13.42 | % | | $ | 9,235 | | 0.97 | % | | 4.86 | % | | 1.08 | % | | 7.00 | % |
| $ | 9.18 | | (5.39 | )% | | $ | 8,790 | | 0.97 | % | | 4.65 | % | | 1.02 | % | | 10.00 | % |
See accompanying notes to the financial statements.
137
BB&T Funds
Financial Highlights, Class A Shares
Selected data for a share of beneficial interest outstanding throughout the periods indicated.
| | | | | | | | | | | | | | | | | | | | | |
| | | | | Investment Activities
| | | Dividends
| |
| | | Net Asset
Value,
Beginning
of Period
| | Net
investment
income
(loss)
| | |
Net realized/
unrealized
gains (losses)
on investments
| | | Total from
Investment
Activities
| | | Net
investment
income
| | | Net realized
gains on
investments
| | | Total
Dividends
| |
Prime Money Market Fund | | | | | | | | | | | | | | | | | | | | | |
Year Ended September 30, 2004 | | $ | 1.00 | | — | (c) | | — | (c) | | — | (c) | | — | (c) | | — | | | — | (c) |
Year Ended September 30, 2003 | | $ | 1.00 | | — | (c) | | — | | | — | (c) | | — | (c) | | — | | | — | (c) |
Year Ended September 30, 2002 | | $ | 1.00 | | 0.01 | | | — | | | 0.01 | | | (0.01 | ) | | — | | | (0.01 | ) |
Year Ended September 30, 2001 | | $ | 1.00 | | 0.04 | | | — | | | 0.04 | | | (0.04 | ) | | — | | | (0.04 | ) |
Year Ended September 30, 2000 | | $ | 1.00 | | 0.05 | | | — | | | 0.05 | | | (0.05 | ) | | — | | | (0.05 | ) |
U.S. Treasury Money Market Fund | | | | | | | | | | | | | | | | | | | | | |
Year Ended September 30, 2004 | | $ | 1.00 | | — | (c) | | — | | | — | (c) | | — | (c) | | — | | | — | (c) |
Year Ended September 30, 2003 | | $ | 1.00 | | — | (c) | | — | | | — | (c) | | — | (c) | | — | | | — | (c) |
Year Ended September 30, 2002 | | $ | 1.00 | | 0.01 | | | — | (c) | | 0.01 | | | (0.01 | ) | | — | | | (0.01 | ) |
Year Ended September 30, 2001 | | $ | 1.00 | | 0.04 | | | — | | | 0.04 | | | (0.04 | ) | | — | | | (0.04 | ) |
Year Ended September 30, 2000 | | $ | 1.00 | | 0.05 | | | — | | | 0.05 | | | (0.05 | ) | | — | | | (0.05 | ) |
Capital Manager Conservative Growth Fund | | | | | | | | | | | | | | | | | | | | | |
Year Ended September 30, 2004 | | $ | 8.84 | | 0.16 | (b) | | 0.46 | | | 0.62 | | | (0.16 | ) | | — | | | (0.16 | ) |
Year Ended September 30, 2003 | | $ | 8.29 | | 0.18 | | | 0.57 | | | 0.75 | | | (0.16 | ) | | (0.04 | ) | | (0.20 | ) |
Year Ended September 30, 2002 | | $ | 9.12 | | 0.23 | | | (0.68 | ) | | (0.45 | ) | | (0.20 | ) | | (0.18 | ) | | (0.38 | ) |
Year Ended September 30, 2001 | | $ | 10.71 | | 0.28 | | | (0.99 | ) | | (0.71 | ) | | (0.30 | ) | | (0.58 | ) | | (0.88 | ) |
Year Ended September 30, 2000 | | $ | 10.39 | | 0.38 | | | 0.54 | | | 0.92 | | | (0.38 | ) | | (0.22 | ) | | (0.60 | ) |
Capital Manager Moderate Growth Fund | | | | | | | | | | | | | | | | | | | | | |
Year Ended September 30, 2004 | | $ | 8.28 | | 0.08 | (b) | | 0.73 | | | 0.81 | | | (0.08 | ) | | — | | | (0.08 | ) |
Year Ended September 30, 2003 | | $ | 7.47 | | 0.08 | | | 0.82 | | | 0.90 | | | (0.08 | ) | | (0.01 | ) | | (0.09 | ) |
Year Ended September 30, 2002 | | $ | 8.82 | | 0.12 | | | (0.99 | ) | | (0.87 | ) | | (0.11 | ) | | (0.37 | ) | | (0.48 | ) |
Year Ended September 30, 2001 | | $ | 11.25 | | 0.23 | | | (1.70 | ) | | (1.47 | ) | | (0.24 | ) | | (0.72 | ) | | (0.96 | ) |
Year Ended September 30, 2000 | | $ | 10.65 | | 0.31 | | | 0.89 | | | 1.20 | | | (0.31 | ) | | (0.29 | ) | | (0.60 | ) |
Capital Manager Growth Fund | | | | | | | | | | | | | | | | | | | | | |
Year Ended September 30, 2004 | | $ | 7.81 | | 0.05 | (b) | | 0.88 | | | 0.93 | | | (0.04 | ) | | — | | | (0.04 | ) |
Year Ended September 30, 2003 | | $ | 6.87 | | 0.04 | | | 0.94 | | | 0.98 | | | (0.04 | ) | | — | | | (0.04 | ) |
Year Ended September 30, 2002 | | $ | 8.46 | | 0.03 | | | (1.20 | ) | | (1.17 | ) | | (0.02 | ) | | (0.40 | ) | | (0.42 | ) |
Year Ended September 30, 2001 | | $ | 11.66 | | 0.16 | | | (2.43 | ) | | (2.27 | ) | | (0.16 | ) | | (0.77 | ) | | (0.93 | ) |
Year Ended September 30, 2000 | | $ | 10.79 | | 0.25 | | | 1.24 | | | 1.49 | | | (0.26 | ) | | (0.36 | ) | | (0.62 | ) |
Capital Manager Equity Fund | | | | | | | | | | | | | | | | | | | | | |
Year Ended September 30, 2004 | | $ | 8.45 | | 0.02 | (b) | | 1.12 | | | 1.14 | | | (0.01 | ) | | — | | | (0.01 | ) |
Year Ended September 30, 2003 | | $ | 7.36 | | — | (b)(c) | | 1.15 | | | 1.15 | | | (0.01 | ) | | (0.05 | ) | | (0.06 | ) |
Year Ended September 30, 2002 | | $ | 8.96 | | (0.02 | ) | | (1.58 | ) | | (1.60 | ) | | — | | | — | | | — | |
March 19, 2001 to September 30, 2001 (a) | | $ | 10.00 | | — | (c) | | (1.03 | ) | | (1.03 | ) | | (0.01 | ) | | — | | | (0.01 | ) |
| * | During the period certain fees were voluntarily reduced. If such reductions had not occurred, the ratios would have been as indicated. |
| ** | Portfolio Turnover is calculated on the basis of the Fund as a whole without distinguishing between classes of shares issued. |
| (a) | Period from commencement of operations. |
| (b) | Per share net investment income (loss) has been calculated using the average daily shares method. |
| (c) | Amount is less than $0.005. |
| (d) | Not annualized for periods less than one year. |
| (e) | Annualized for periods less than one year. |
See accompanying notes to the financial statements.
138
| | | | | | | | | | | | | | | | | | | |
| | | | Ratios/Supplementary Data
| |
Net Asset
Value,
End of
Period
| | Total Return
(excludes
sales charge) (d)
| | | Net Assets,
End of
Period
(000)
| | Ratio of
expenses to
average
net assets (e)
| | | Ratio of net
investment
income
(loss) to
average net
assets (e)
| | | Ratio of
expenses to
average
net assets* (e)
| | | Portfolio
turnover**
| |
| | | | | | | | | | | | | | | | | | | | |
| $ | 1.00 | | 0.41 | % | | $ | 426,217 | | 0.86 | % | | 0.40 | % | | 1.20 | % | | — | |
| $ | 1.00 | | 0.48 | % | | $ | 459,375 | | 0.98 | % | | 0.47 | % | | 1.19 | % | | — | |
| $ | 1.00 | | 1.21 | % | | $ | 416,782 | | 1.05 | % | | 1.20 | % | | 1.23 | % | | — | |
| $ | 1.00 | | 4.42 | % | | $ | 396,119 | | 1.01 | % | | 4.22 | % | | 1.24 | % | | — | |
| $ | 1.00 | | 5.35 | % | | $ | 277,219 | | 1.00 | % | | 5.68 | % | | 1.25 | % | | — | |
| | | | | | | | | | | | | | | | | | | | |
| $ | 1.00 | | 0.31 | % | | $ | 122,500 | | 0.79 | % | | 0.31 | % | | 1.21 | % | | — | |
| $ | 1.00 | | 0.30 | % | | $ | 135,059 | | 0.99 | % | | 0.32 | % | | 1.20 | % | | — | |
| $ | 1.00 | | 1.01 | % | | $ | 197,830 | | 1.05 | % | | 1.01 | % | | 1.24 | % | | — | |
| $ | 1.00 | | 4.20 | % | | $ | 208,914 | | 1.03 | % | | 4.08 | % | | 1.23 | % | | — | |
| $ | 1.00 | | 4.98 | % | | $ | 170,380 | | 1.00 | % | | 5.11 | % | | 1.23 | % | | — | |
| | | | | | | | | | | | | | | | | | | | |
| $ | 9.30 | | 6.97 | % | | $ | 5,242 | | 0.69 | % | | 1.68 | % | | 1.14 | % | | 2.47 | % |
| $ | 8.84 | | 9.09 | % | | $ | 2,579 | | 0.78 | % | | 1.86 | % | | 1.23 | % | | 33.03 | % |
| $ | 8.29 | | (5.18 | )% | | $ | 1,198 | | 0.79 | % | | 2.25 | % | | 1.24 | % | | 6.29 | % |
| $ | 9.12 | | (7.10 | )% | | $ | 555 | | 0.78 | % | | 2.87 | % | | 1.23 | % | | 35.75 | % |
| $ | 10.71 | | 9.08 | % | | $ | 293 | | 0.66 | % | | 3.55 | % | | 1.10 | % | | 38.27 | % |
| | | | | | | | | | | | | | | | | | | | |
| $ | 9.01 | | 9.77 | % | | $ | 20,428 | | 0.74 | % | | 0.92 | % | | 1.19 | % | | 0.17 | % |
| $ | 8.28 | | 12.13 | % | | $ | 8,054 | | 0.75 | % | | 1.11 | % | | 1.20 | % | | 21.46 | % |
| $ | 7.47 | | (10.76 | )% | | $ | 3,194 | | 0.81 | % | | 1.26 | % | | 1.26 | % | | 14.56 | % |
| $ | 8.82 | | (14.00 | )% | | $ | 2,206 | | 0.78 | % | | 2.14 | % | | 1.23 | % | | 24.24 | % |
| $ | 11.25 | | 11.35 | % | | $ | 1,318 | | 0.74 | % | | 2.67 | % | | 1.19 | % | | 46.69 | % |
| | | | | | | | | | | | | | | | | | | | |
| $ | 8.70 | | 11.85 | % | | $ | 12,007 | | 0.75 | % | | 0.52 | % | | 1.23 | % | | 0.19 | % |
| $ | 7.81 | | 14.22 | % | | $ | 4,660 | | 0.80 | % | | 0.59 | % | | 1.25 | % | | 17.80 | % |
| $ | 6.87 | | (14.82 | )% | | $ | 2,700 | | 0.87 | % | | 0.39 | % | | 1.32 | % | | 8.38 | % |
| $ | 8.46 | | (20.86 | )% | | $ | 2,511 | | 0.84 | % | | 1.35 | % | | 1.29 | % | | 27.33 | % |
| $ | 11.66 | | 14.02 | % | | $ | 1,606 | | 0.70 | % | | 2.24 | % | | 1.14 | % | | 43.28 | % |
| | | | | | | | | | | | | | | | | | | | |
| $ | 9.58 | | 13.53 | % | | $ | 3,557 | | 0.77 | % | | 0.22 | % | | 1.31 | % | | 3.10 | % |
| $ | 8.45 | | 15.61 | % | | $ | 1,225 | | 0.95 | % | | 0.05 | % | | 1.40 | % | | 8.30 | % |
| $ | 7.36 | | (17.86 | )% | | $ | 645 | | 0.90 | % | | (0.15 | )% | | 1.35 | % | | 5.75 | % |
| $ | 8.96 | | (10.35 | )% | | $ | 185 | | 1.12 | % | | (0.28 | )% | | 1.57 | % | | 10.10 | % |
See accompanying notes to the financial statements.
139
BB&T Funds
Financial Highlights, Class B Shares
Selected data for a share of beneficial interest outstanding throughout the periods indicated.
| | | | | | | | | | | | | | | | | | | | | |
| | | | | Investment Activities
| | | Dividends
| |
| | | Net Asset
Value,
Beginning
of Period
| | Net
investment
income
(loss)
| | |
Net realized/
unrealized
gains (losses)
on investments
| | | Total from
Investment
Activities
| | | Net
investment
income
| | | Net realized
gains on
investments
| | | Total
Dividends
| |
Equity Income Fund | | | | | | | | | | | | | | | | | | | | | |
June 30, 2004 to September 30, 2004 (a) | | $ | 10.00 | | 0.03 | (b) | | 0.34 | | | 0.37 | | | (0.03 | ) | | — | | | (0.03 | ) |
Large Company Value Fund | | | | | | | | | | | | | | | | | | | | | |
Year Ended September 30, 2004 | | $ | 14.75 | | 0.09 | | | 2.38 | | | 2.47 | | | (0.10 | ) | | — | | | (0.10 | ) |
Year Ended September 30, 2003 | | $ | 12.75 | | 0.12 | | | 2.01 | | | 2.13 | | | (0.13 | ) | | — | | | (0.13 | ) |
Year Ended September 30, 2002 | | $ | 16.68 | | 0.06 | | | (3.44 | ) | | (3.38 | ) | | (0.07 | ) | | (0.48 | ) | | (0.55 | ) |
Year Ended September 30, 2001 | | $ | 18.47 | | 0.09 | | | (0.89 | ) | | (0.80 | ) | | (0.10 | ) | | (0.89 | ) | | (0.99 | ) |
Year Ended September 30, 2000 | | $ | 19.51 | | 0.35 | | | 0.56 | | | 0.91 | | | (0.36 | ) | | (1.59 | ) | | (1.95 | ) |
Large Company Growth Fund | | | | | | | | | | | | | | | | | | | | | |
Year Ended September 30, 2004 | | $ | 7.36 | | (0.13 | ) | | 0.57 | | | 0.44 | | | — | | | — | | | — | |
Year Ended September 30, 2003 | | $ | 6.36 | | (0.08 | )(b) | | 1.08 | | | 1.00 | | | — | | | — | | | — | |
Year Ended September 30, 2002 | | $ | 7.93 | | (0.12 | ) | | (1.45 | ) | | (1.57 | ) | | — | | | — | | | — | |
Year Ended September 30, 2001 | | $ | 14.47 | | (0.11 | ) | | (5.45 | ) | | (5.56 | ) | | — | | | (0.98 | ) | | (0.98 | ) |
Year Ended September 30, 2000 | | $ | 11.82 | | (0.17 | ) | | 3.56 | | | 3.39 | | | — | | | (0.74 | ) | | (0.74 | ) |
Mid Cap Value Fund | | | | | | | | | | | | | | | | | | | | | |
Year Ended September 30, 2004 | | $ | 12.91 | | 0.07 | (b) | | 2.42 | | | 2.49 | | | (0.10 | ) | | — | | | (0.10 | ) |
Year Ended September 30, 2003 | | $ | 10.90 | | 0.07 | | | 2.03 | | | 2.10 | | | (0.09 | ) | | — | | | (0.09 | ) |
Year Ended September 30, 2002 | | $ | 13.10 | | 0.08 | | | (1.03 | ) | | (0.95 | ) | | (0.10 | ) | | (1.15 | ) | | (1.25 | ) |
July 25, 2001 to September 30, 2001 (a) | | $ | 14.14 | | 0.03 | | | (1.02 | ) | | (0.99 | ) | | (0.05 | ) | | — | | | (0.05 | ) |
Mid Cap Growth Fund | | | | | | | | | | | | | | | | | | | | | |
Year Ended September 30, 2004 | | $ | 9.68 | | (0.16 | ) | | 1.18 | | | 1.02 | | | — | | | — | | | — | |
Year Ended September 30, 2003 | | $ | 8.00 | | (0.13 | ) | | 1.81 | | | 1.68 | | | — | | | — | | | — | |
Year Ended September 30, 2002 | | $ | 9.79 | | (0.14 | )(b) | | (1.02 | ) | | (1.16 | ) | | — | | | (0.63 | ) | | (0.63 | ) |
July 25, 2001 to September 30, 2001 (a) | | $ | 11.20 | | (0.01 | ) | | (1.40 | ) | | (1.41 | ) | | — | | | — | | | — | |
Small Company Value Fund | �� | | | | | | | | | | | | | | | | | | | | |
Year Ended September 30, 2004 | | $ | 11.40 | | (0.10 | )(b) | | 2.88 | | | 2.78 | | | — | | | (0.12 | ) | | (0.12 | ) |
May 19, 2003 to September 30, 2003 (a) | | $ | 10.00 | | (0.04 | )(b) | | 1.44 | | | 1.40 | | | — | | | — | | | — | |
Small Company Growth Fund | | | | | | | | | | | | | | | | | | | | | |
Year Ended September 30, 2004 | | $ | 10.68 | | (0.22 | )(b) | | 0.57 | | | 0.35 | | | — | | | — | | | — | |
Year Ended September 30, 2003 | | $ | 8.78 | | (0.18 | )(b) | | 2.08 | | | 1.90 | | | — | | | — | | | — | |
Year Ended September 30, 2002 | | $ | 11.43 | | (0.25 | )(b) | | (2.40 | ) | | (2.65 | ) | | — | | | — | | | — | |
Year Ended September 30, 2001 | | $ | 33.53 | | (0.31 | ) | | (15.45 | ) | | (15.76 | ) | | — | | | (6.34 | ) | | (6.34 | ) |
Year Ended September 30, 2000 | | $ | 24.21 | | (0.49 | ) | | 12.81 | | | 12.32 | | | — | | | (3.00 | ) | | (3.00 | ) |
Special Opportunities Equity Fund | | | | | | | | | | | | | | | | | | | | | |
Year Ended September 30, 2004 | | $ | 10.50 | | (0.12 | ) | | 2.65 | | | 2.53 | | | — | | | (0.08 | ) | | (0.08 | ) |
June 2, 2003 to September 30, 2003 (a) | | $ | 10.00 | | (0.02 | ) | | 0.52 | | | 0.50 | | | — | | | — | | | — | |
| * | During the period certain fees were reduced. If such reductions had not occurred, the ratios would have been as indicated. |
| ** | Portfolio Turnover is calculated on the basis of the Fund as a whole without distinguishing between classes of shares issued. |
| (a) | Period from commencement of operations. |
| (b) | Per share net investment income (loss) has been calculated using the average daily shares method. |
| (c) | Not annualized for periods less than one year. |
| (d) | Annualized for periods less than one year. |
See accompanying notes to the financial statements.
140
| | | | | | | | | | | | | | | | | | | |
| | | | Ratios/Supplementary Data
| |
Net Asset
Value,
End of
Period
| | Total Return
(excludes
sales charge) (c)
| | | Net Assets,
End of
Period
(000)
| | Ratio of
expenses to
average
net assets (d)
| | | Ratio of net
investment
income
(loss) to
average net
assets (d)
| | | Ratio of
expenses to
average
net assets* (d)
| | | Portfolio
turnover**
| |
| | | | | | | | | | | | | | | | | | | | |
| $ | 10.34 | | 3.66 | % | | $ | 1,672 | | 2.29 | % | | 1.07 | % | | 2.65 | % | | 1.65 | % |
| | | | | | | | | | | | | | | | | | | | |
| $ | 17.12 | | 16.75 | % | | $ | 26,309 | | 1.95 | % | | 0.58 | % | | 2.06 | % | | 16.40 | % |
| $ | 14.75 | | 16.74 | % | | $ | 26,215 | | 1.91 | % | | 0.92 | % | | 2.05 | % | | 18.89 | % |
| $ | 12.75 | | (21.14 | )% | | $ | 24,849 | | 1.98 | % | | 0.36 | % | | 2.12 | % | | 23.02 | % |
| $ | 16.68 | | (4.51 | )% | | $ | 33,489 | | 1.99 | % | | 0.48 | % | | 2.13 | % | | 24.20 | % |
| $ | 18.47 | | 4.88 | % | | $ | 36,078 | | 1.92 | % | | 1.90 | % | | 2.10 | % | | 23.85 | % |
| | | | | | | | | | | | | | | | | | | | |
| $ | 7.80 | | 5.98 | % | | $ | 13,845 | | 1.96 | % | | (1.08 | )% | | 2.08 | % | | 127.47 | % |
| $ | 7.36 | | 15.72 | % | | $ | 14,217 | | 1.93 | % | | (1.10 | )% | | 2.07 | % | | 91.73 | % |
| $ | 6.36 | | (19.80 | )% | | $ | 13,040 | | 2.03 | % | | (1.32 | )% | | 2.17 | % | | 100.46 | % |
| $ | 7.93 | | (40.82 | )% | | $ | 17,089 | | 2.05 | % | | (1.24 | )% | | 2.19 | % | | 96.41 | % |
| $ | 14.47 | | 29.22 | % | | $ | 27,172 | | 1.99 | % | | (1.18 | )% | | 2.16 | % | | 76.76 | % |
| | | | | | | | | | | | | | | | | | | | |
| $ | 15.30 | | 19.31 | % | | $ | 3,582 | | 1.98 | % | | 0.47 | % | | 2.10 | % | | 19.17 | % |
| $ | 12.91 | | 19.31 | % | | $ | 2,071 | | 1.95 | % | | 0.58 | % | | 2.10 | % | | 18.28 | % |
| $ | 10.90 | | (8.80 | )% | | $ | 1,158 | | 1.91 | % | | 0.63 | % | | 2.12 | % | | 18.20 | % |
| $ | 13.10 | | (6.56 | )% | | $ | 99 | | 1.87 | % | | 2.22 | % | | 2.21 | % | | 27.04 | % |
| | | | | | | | | | | | | | | | | | | | |
| $ | 10.70 | | 10.54 | % | | $ | 1,973 | | 2.00 | % | | (1.65 | )% | | 2.11 | % | | 138.61 | % |
| $ | 9.68 | | 21.00 | % | | $ | 1,030 | | 1.95 | % | | (1.73 | )% | | 2.11 | % | | 125.97 | % |
| $ | 8.00 | | (13.20 | )% | | $ | 507 | | 1.76 | % | | (1.52 | )% | | 2.07 | % | | 117.06 | % |
| $ | 9.79 | | (12.59 | )% | | $ | 48 | | 2.11 | % | | (1.91 | )% | | 2.33 | % | | 90.11 | % |
| | | | | | | | | | | | | | | | | | | | |
| $ | 14.06 | | 24.56 | % | | $ | 136 | | 2.22 | % | | (0.75 | )% | | 2.41 | % | | 11.25 | % |
| $ | 11.40 | | 14.00 | % | | $ | 29 | | 2.69 | % | | (0.93 | )% | | 2.69 | % | | 48.84 | % |
| | | | | | | | | | | | | | | | | | | | |
| $ | 11.03 | | 3.28 | % | | $ | 6,272 | | 2.30 | % | | (1.98 | )% | | 2.41 | % | | 211.60 | % |
| $ | 10.68 | | 21.64 | % | | $ | 7,520 | | 2.37 | % | | (1.95 | )% | | 2.37 | % | | 197.85 | % |
| $ | 8.78 | | (23.18 | )% | | $ | 6,703 | | 2.48 | % | | (2.18 | )% | | 2.48 | % | | 292.94 | % |
| $ | 11.43 | | (55.33 | )% | | $ | 9,356 | | 2.48 | % | | (1.62 | )% | | 2.48 | % | | 286.49 | % |
| $ | 33.53 | | 53.29 | % | | $ | 20,707 | | 2.41 | % | | (1.49 | )% | | 2.41 | % | | 206.16 | % |
| | | | | | | | | | | | | | | | | | | | |
| $ | 12.95 | | 24.17 | % | | $ | 13,215 | | 2.15 | % | | (1.51 | )% | | 2.30 | % | | 32.06 | % |
| $ | 10.50 | | 5.00 | % | | $ | 4,360 | | 1.80 | % | | (1.16 | )% | | 2.50 | % | | 13.24 | % |
See accompanying notes to the financial statements.
141
BB&T Funds
Financial Highlights, Class B Shares
Selected data for a share of beneficial interest outstanding throughout the periods indicated.
| | | | | | | | | | | | | | | | | | | | | |
| | | | | Investment Activities
| | | Dividends
| |
| | | Net Asset
Value,
Beginning
of Period
| | Net
investment
income
(loss)
| | | Net realized/
unrealized
gains (losses)
on investments
and foreign
currencies
| | | Total from
Investment
Activities
| | | Net
investment
income
| | | Net realized
gains on
investments
and foreign
currencies
| | | Total
Dividends
| |
International Equity Fund | | | | | | | | | | | | | | | | | | | | | |
Year Ended September 30, 2004 | | $ | 6.57 | | 0.02 | (b) | | 1.19 | | | 1.21 | | | (0.04 | ) | | — | | | (0.04 | ) |
Year Ended September 30, 2003 | | $ | 6.07 | | (0.02 | )(b) | | 0.54 | | | 0.52 | | | (0.02 | ) | | — | | | (0.02 | ) |
Year Ended September 30, 2002 | | $ | 7.19 | | (0.07 | )(b) | | (1.05 | ) | | (1.12 | ) | | — | | | — | | | — | |
Year Ended September 30, 2001 | | $ | 12.24 | | (0.07 | ) | | (2.96 | ) | | (3.03 | ) | | — | | | (2.02 | ) | | (2.02 | ) |
Year Ended September 30, 2000 | | $ | 12.34 | | (0.15 | ) | | 0.68 | | | 0.53 | | | — | | | (0.63 | ) | | (0.63 | ) |
Intermediate U.S. Government Fund | | | | | | | | | | | | | | | | | | | | | |
Year Ended September 30, 2004 | | $ | 10.53 | | 0.21 | | | (0.16 | ) | | 0.05 | | | (0.25 | ) | | (0.13 | ) | | (0.38 | ) |
Year Ended September 30, 2003 | | $ | 10.73 | | 0.27 | | | (0.07 | ) | | 0.20 | | | (0.31 | ) | | (0.09 | ) | | (0.40 | ) |
Year Ended September 30, 2002 | | $ | 10.35 | | 0.39 | (c) | | 0.41 | (c) | | 0.80 | | | (0.42 | ) | | — | | | (0.42 | ) |
Year Ended September 30, 2001 | | $ | 9.69 | | 0.45 | | | 0.65 | | | 1.10 | | | (0.44 | ) | | — | | | (0.44 | ) |
Year Ended September 30, 2000 | | $ | 9.68 | | 0.45 | | | 0.04 | | | 0.49 | | | (0.45 | ) | | (0.03 | ) | | (0.48 | ) |
Intermediate Corporate Bond Fund | | | | | | | | | | | | | | | | | | | | | |
Year Ended September 30, 2004 | | $ | 10.72 | | 0.32 | | | (0.07 | ) | | 0.25 | | | (0.38 | ) | | — | | | (0.38 | ) |
Year Ended September 30, 2003 | | $ | 10.34 | | 0.39 | | | 0.40 | | | 0.79 | | | (0.41 | ) | | — | | | (0.41 | ) |
Year Ended September 30, 2002 | | $ | 10.57 | | 0.45 | (d) | | (0.04 | )(d) | | 0.41 | | | (0.47 | ) | | (0.17 | ) | | (0.64 | ) |
Year Ended September 30, 2001 | | $ | 9.98 | | 0.52 | | | 0.59 | | | 1.11 | | | (0.52 | ) | | — | | | (0.52 | ) |
December 2, 1999 to September 30, 2000 (a) | | $ | 10.00 | | 0.44 | | | (0.02 | ) | | 0.42 | | | (0.44 | ) | | — | | | (0.44 | ) |
| * | During the period certain fees were reduced. If such reductions had not occurred, the ratios would have been as indicated. |
| ** | Portfolio Turnover is calculated on the basis of the Fund as a whole without distinguishing between classes of shares issued. |
| (a) | Period from commencement of operations. |
| (b) | Per share net investment income (loss) has been calculated using the average daily shares method. |
| (c) | Without the adoption of the change in amortization method as required by the November 2000 revised version of the AICPA Audit and Accounting Guide for Investment Companies, the amounts for net investment income, net realized/unrealized gains (losses), and the net investment income ratio would have been; $0.41, $0.39, 3.99%, respectively. |
| (d) | Without the adoption of the change in amortization method as required by the November 2000 revised version of the AICPA Audit and Accounting Guide for Investment Companies, the amounts for net investment income, net realized/unrealized gains (losses), and the net investment income ratio would have been; $0.46, $(0.05), and 4.51%, respectively. |
| (e) | Not annualized for periods less than one year. |
| (f) | Annualized for periods less than one year. |
See accompanying notes to the financial statements.
142
| | | | | | | | | | | | | | | | | | | |
| | | | Ratios/Supplementary Data
| |
Net Asset
Value,
End of
Period
| | Total Return
(excludes
sales charge) (e)
| | | Net Assets,
End of
Period
(000)
| | Ratio of
expenses to
average
net assets (f)
| | | Ratio of net
investment
income
(loss) to
average net
assets (f)
| | | Ratio of
expenses to
average
net assets* (f)
| | | Portfolio
turnover**
| |
| | | | | | | | | | | | | | | | | | | | |
| $ | 7.74 | | 18.47 | % | | $ | 2,140 | | 2.33 | % | | 0.24 | % | | 2.42 | % | | 50.68 | % |
| $ | 6.57 | | 8.63 | % | | $ | 2,012 | | 2.40 | % | | (0.37 | )% | | 2.41 | % | | 199.78 | % |
| $ | 6.07 | | (15.58 | )% | | $ | 2,056 | | 2.43 | % | | (1.01 | )% | | 2.43 | % | | 95.86 | % |
| $ | 7.19 | | (29.11 | )% | | $ | 2,680 | | 2.49 | % | | (1.19 | )% | | 2.49 | % | | 144.35 | % |
| $ | 12.24 | | 3.88 | % | | $ | 3,861 | | 2.51 | % | | (0.99 | )% | | 2.51 | % | | 179.44 | % |
| | | | | | | | | | | | | | | | | | | | |
| $ | 10.20 | | 0.55 | % | | $ | 6,883 | | 1.80 | % | | 2.15 | % | | 1.92 | % | | 98.35 | % |
| $ | 10.53 | | 1.86 | % | | $ | 7,869 | | 1.82 | % | | 2.42 | % | | 1.92 | % | | 209.97 | % |
| $ | 10.73 | | 7.96 | % | | $ | 5,981 | | 1.85 | % | | 3.81 | %(c) | | 1.95 | % | | 79.36 | % |
| $ | 10.35 | | 11.61 | % | | $ | 4,310 | | 1.86 | % | | 4.38 | % | | 1.96 | % | | 84.76 | % |
| $ | 9.69 | | 5.31 | % | | $ | 2,329 | | 1.83 | % | | 4.71 | % | | 1.93 | % | | 103.41 | % |
| | | | | | | | | | | | | | | | | | | | |
| $ | 10.59 | | 2.45 | % | | $ | 6,602 | | 1.82 | % | | 3.09 | % | | 1.94 | % | | 31.95 | % |
| $ | 10.72 | | 7.77 | % | | $ | 6,358 | | 1.83 | % | | 3.61 | % | | 1.94 | % | | 43.98 | % |
| $ | 10.34 | | 4.18 | % | | $ | 4,465 | | 1.84 | % | | 4.39 | %(d) | | 1.99 | % | | 69.15 | % |
| $ | 10.57 | | 11.41 | % | | $ | 1,976 | | 1.73 | % | | 4.95 | % | | 1.90 | % | | 142.35 | % |
| $ | 9.98 | | 4.41 | % | | $ | 70 | | 1.75 | % | | 5.34 | % | | 2.03 | % | | 186.79 | % |
See accompanying notes to the financial statements.
143
BB&T Funds
Financial Highlights, Class B Shares
Selected data for a share of beneficial interest outstanding throughout the periods indicated.
| | | | | | | | | | | | | | | | | | | | | |
| | | | | Investment Activities
| | | Dividends
| |
| | | Net Asset
Value,
Beginning
of Period
| | Net
investment
income
(loss)
| | |
Net realized/
unrealized
gains (losses)
on investments
| | | Total from
Investment
Activities
| | | Net
investment
income
| | | Net realized
gains on
investments
| | | Total
Dividends
| |
Prime Money Market Fund | | | | | | | | | | | | | | | | | | | | | |
Year Ended September 30, 2004 | | $ | 1.00 | | — | (c) | | — | (c) | | — | (c) | | — | (c) | | — | | | — | (c) |
Year Ended September 30, 2003 | | $ | 1.00 | | — | (c) | | — | | | — | (c) | | — | (c) | | — | | | — | (c) |
Year Ended September 30, 2002 | | $ | 1.00 | | 0.01 | | | — | | | 0.01 | | | (0.01 | ) | | — | | | (0.01 | ) |
Year Ended September 30, 2001 | | $ | 1.00 | | 0.04 | | | — | | | 0.04 | | | (0.04 | ) | | — | | | (0.04 | ) |
Year Ended September 30, 2000 | | $ | 1.00 | | 0.05 | | | — | | | 0.05 | | | (0.05 | ) | | — | | | (0.05 | ) |
U.S. Treasury Money Market Fund | | | | | | | | | | | | | | | | | | | | | |
Year Ended September 30, 2004 | | $ | 1.00 | | — | (c) | | — | | | — | (c) | | — | (c) | | — | | | — | (c) |
Year Ended September 30, 2003 | | $ | 1.00 | | — | (c) | | — | | | — | (c) | | — | (c) | | — | | | — | (c) |
Year Ended September 30, 2002 | | $ | 1.00 | | 0.01 | | | — | | | 0.01 | | | (0.01 | ) | | — | | | (0.01 | ) |
Year Ended September 30, 2001 | | $ | 1.00 | | 0.04 | | | — | | | 0.04 | | | (0.04 | ) | | — | | | (0.04 | ) |
Year Ended September 30, 2000 | | $ | 1.00 | | 0.04 | | | — | | | 0.04 | | | (0.04 | ) | | — | | | (0.04 | ) |
Capital Manager Conservative Growth Fund | | | | | | | | | | | | | | | | | | | | | |
Year Ended September 30, 2004 | | $ | 8.85 | | 0.09 | (b) | | 0.45 | | | 0.54 | | | (0.09 | ) | | — | | | (0.09 | ) |
Year Ended September 30, 2003 | | $ | 8.29 | | 0.11 | | | 0.59 | | | 0.70 | | | (0.10 | ) | | (0.04 | ) | | (0.14 | ) |
Year Ended September 30, 2002 | | $ | 9.13 | | 0.15 | | | (0.67 | ) | | (0.52 | ) | | (0.14 | ) | | (0.18 | ) | | (0.32 | ) |
Year Ended September 30, 2001 | | $ | 10.71 | | 0.22 | | | (0.98 | ) | | (0.76 | ) | | (0.24 | ) | | (0.58 | ) | | (0.82 | ) |
Year Ended September 30, 2000 | | $ | 10.39 | | 0.29 | | | 0.56 | | | 0.85 | | | (0.31 | ) | | (0.22 | ) | | (0.53 | ) |
Capital Manager Moderate Growth Fund | | | | | | | | | | | | | | | | | | | | | |
Year Ended September 30, 2004 | | $ | 8.15 | | 0.02 | (b) | | 0.71 | | | 0.73 | | | (0.02 | ) | | — | | | (0.02 | ) |
Year Ended September 30, 2003 | | $ | 7.41 | | 0.04 | | | 0.80 | | | 0.84 | | | (0.09 | ) | | (0.01 | ) | | (0.10 | ) |
Year Ended September 30, 2002 | | $ | 8.75 | | 0.05 | | | (0.97 | ) | | (0.92 | ) | | (0.05 | ) | | (0.37 | ) | | (0.42 | ) |
Year Ended September 30, 2001 | | $ | 11.21 | | 0.19 | | | (1.74 | ) | | (1.55 | ) | | (0.19 | ) | | (0.72 | ) | | (0.91 | ) |
Year Ended September 30, 2000 | | $ | 10.64 | | 0.22 | | | 0.88 | | | 1.10 | | | (0.24 | ) | | (0.29 | ) | | (0.53 | ) |
Capital Manager Growth Fund | | | | | | | | | | | | | | | | | | | | | |
Year Ended September 30, 2004 | | $ | 7.70 | | (0.02 | )(b) | | 0.87 | | | 0.85 | | | — | | | — | | | — | |
Year Ended September 30, 2003 | | $ | 6.80 | | (0.01 | ) | | 0.91 | | | 0.90 | | | — | (c) | | — | | | — | (c) |
Year Ended September 30, 2002 | | $ | 8.42 | | (0.01 | ) | | (1.21 | ) | | (1.22 | ) | | — | | | (0.40 | ) | | (0.40 | ) |
Year Ended September 30, 2001 | | $ | 11.64 | | 0.09 | | | (2.42 | ) | | (2.33 | ) | | (0.12 | ) | | (0.77 | ) | | (0.89 | ) |
Year Ended September 30, 2000 | | $ | 10.79 | | 0.17 | | | 1.24 | | | 1.41 | | | (0.20 | ) | | (0.36 | ) | | (0.56 | ) |
Capital Manager Equity Fund | | | | | | | | | | | | | | | | | | | | | |
Year Ended September 30, 2004 | | $ | 8.30 | | (0.05 | )(b) | | 1.11 | | | 1.06 | | | — | | | — | | | — | |
Year Ended September 30, 2003 | | $ | 7.28 | | (0.05 | )(b) | | 1.12 | | | 1.07 | | | — | | | (0.05 | ) | | (0.05 | ) |
Year Ended September 30, 2002 | | $ | 8.93 | | (0.04 | ) | | (1.61 | ) | | (1.65 | ) | | — | | | — | | | — | |
March 19, 2001 to September 30, 2001 (a) | | $ | 10.00 | | (0.02 | ) | | (1.05 | ) | | (1.07 | ) | | — | | | — | | | — | |
| * | During the period certain fees were reduced. If such reductions had not occurred, the ratios would have been as indicated. |
| ** | Portfolio Turnover is calculated on the basis of the Fund as a whole without distinguishing between classes of shares issued. |
| (a) | Period from commencement of operations. |
| (b) | Per share net investment income (loss) has been calculated using the average daily shares method. |
| (c) | Amount is less than $0.005 |
| (d) | Not annualized for periods less than one year. |
| (e) | Annualized for periods less than one year. |
See accompanying notes to the financial statements.
144
| | | | | | | | | | | | | | | | | | | |
| | | | | | Ratios/Supplementary Data
| |
Net Asset
Value,
End of
Period
| | Total
Return
(excludes
sales charge) (d)
| | | Net Assets,
End of
Period
(000)
| | Ratio of
expenses to
average
net assets (e)
| | | Ratio of net
investment
income
(loss) to
average net
assets (e)
| | | Ratio of
expenses to
average
net assets* (e)
| | | Portfolio
turnover**
| |
| | | | | | | | | | | | | | | | | | | | |
| $ | 1.00 | | 0.06 | % | | $ | 2,280 | | 1.20 | % | | 0.06 | % | | 1.70 | % | | — | |
| $ | 1.00 | | 0.15 | % | | $ | 2,543 | | 1.32 | % | | 0.16 | % | | 1.69 | % | | — | |
| $ | 1.00 | | 0.60 | % | | $ | 2,730 | | 1.67 | % | | 0.70 | % | | 1.77 | % | | — | |
| $ | 1.00 | | 3.80 | % | | $ | 84,446 | | 1.61 | % | | 3.58 | % | | 1.74 | % | | — | |
| $ | 1.00 | | 4.65 | % | | $ | 41,644 | | 1.63 | % | | 4.76 | % | | 1.80 | % | | — | |
| | | | | | | | | | | | | | | | | | | | |
| $ | 1.00 | | 0.05 | % | | $ | 887 | | 1.05 | % | | 0.05 | % | | 1.71 | % | | — | |
| $ | 1.00 | | 0.16 | % | | $ | 1,126 | | 1.12 | % | | 0.15 | % | | 1.70 | % | | — | |
| $ | 1.00 | | 0.39 | % | | $ | 1,121 | | 1.69 | % | | 0.48 | % | | 1.77 | % | | — | |
| $ | 1.00 | | 3.56 | % | | $ | 18,449 | | 1.63 | % | | 3.36 | % | | 1.73 | % | | — | |
| $ | 1.00 | | 4.28 | % | | $ | 10,425 | | 1.63 | % | | 4.43 | % | | 1.73 | % | | — | |
| | | | | | | | | | | | | | | | | | | | |
| $ | 9.30 | | 6.10 | % | | $ | 4,857 | | 1.44 | % | | 0.93 | % | | 1.64 | % | | 2.47 | % |
| $ | 8.85 | | 8.45 | % | | $ | 3,150 | | 1.53 | % | | 1.07 | % | | 1.73 | % | | 33.03 | % |
| $ | 8.29 | | (5.94 | )% | | $ | 1,682 | | 1.53 | % | | 1.49 | % | | 1.73 | % | | 6.29 | % |
| $ | 9.13 | | (7.50 | )% | | $ | 916 | | 1.58 | % | | 1.85 | % | | 1.78 | % | | 35.75 | % |
| $ | 10.71 | | 8.31 | % | | $ | 150 | | 1.41 | % | | 2.75 | % | | 1.60 | % | | 38.27 | % |
| | | | | | | | | | | | | | | | | | | | |
| $ | 8.86 | | 8.94 | % | | $ | 19,049 | | 1.49 | % | | 0.17 | % | | 1.69 | % | | 0.17 | % |
| $ | 8.15 | | 11.29 | % | | $ | 8,929 | | 1.50 | % | | 0.35 | % | | 1.70 | % | | 21.46 | % |
| $ | 7.41 | | (11.35 | )% | | $ | 4,384 | | 1.56 | % | | 0.52 | % | | 1.76 | % | | 14.56 | % |
| $ | 8.75 | | (14.82 | )% | | $ | 3,096 | | 1.55 | % | | 1.05 | % | | 1.75 | % | | 24.24 | % |
| $ | 11.21 | | 10.45 | % | | $ | 542 | | 1.54 | % | | 1.94 | % | | 1.69 | % | | 46.69 | % |
| | | | | | | | | | | | | | | | | | | | |
| $ | 8.55 | | 11.04 | % | | $ | 13,730 | | 1.50 | % | | (0.23 | )% | | 1.73 | % | | 0.19 | % |
| $ | 7.70 | | 13.31 | % | | $ | 9,142 | | 1.55 | % | | (0.16 | )% | | 1.75 | % | | 17.80 | % |
| $ | 6.80 | | (15.53 | )% | | $ | 5,712 | | 1.62 | % | | (0.35 | )% | | 1.82 | % | | 8.38 | % |
| $ | 8.42 | | (21.44 | )% | | $ | 4,720 | | 1.60 | % | | 0.45 | % | | 1.80 | % | | 27.33 | % |
| $ | 11.64 | | 13.23 | % | | $ | 1,993 | | 1.45 | % | | 1.49 | % | | 1.64 | % | | 43.28 | % |
| | | | | | | | | | | | | | | | | | | | |
| $ | 9.36 | | 12.77 | % | | $ | 5,720 | | 1.52 | % | | (0.54 | )% | | 1.81 | % | | 3.10 | % |
| $ | 8.30 | | 14.74 | % | | $ | 2,475 | | 1.70 | % | | (0.69 | )% | | 1.90 | % | | 8.30 | % |
| $ | 7.28 | | (18.48 | )% | | $ | 1,302 | | 1.67 | % | | (0.94 | )% | | 1.87 | % | | 5.75 | % |
| $ | 8.93 | | (10.70 | )% | | $ | 754 | | 1.93 | % | | (1.05 | )% | | 2.13 | % | | 10.10 | % |
See accompanying notes to the financial statements.
145
BB&T Funds
Financial Highlights, Class C Shares
Selected data for a share of beneficial interest outstanding throughout the periods indicated.
| | | | | | | | | | | | | | | | | | | | | |
| | | | | Investment Activities
| | | Dividends
| |
| | | Net Asset
Value,
Beginning
of Period
| | Net
investment
income
(loss)
| | |
Net realized/
unrealized
gains (losses)
on investments
| | | Total from
Investment
Activities
| | | Net
investment
income
| | | Net realized
gains on
investments
| | | Total
Dividends
| |
Equity Income Fund | | | | | | | | | | | | | | | | | | | | | |
June 30, 2004 to September 30, 2004 (a) | | $ | 10.00 | | 0.03 | (b) | | 0.34 | | | 0.37 | | | (0.03 | ) | | — | | | (0.03 | ) |
Large Company Value Fund | | | | | | | | | | | | | | | | | | | | | |
Year Ended September 30, 2004 | | $ | 14.73 | | 0.09 | | | 2.37 | | | 2.46 | | | (0.10 | ) | | — | | | (0.10 | ) |
Year Ended September 30, 2003 | | $ | 12.74 | | 0.13 | | | 1.99 | | | 2.12 | | | (0.13 | ) | | — | | | (0.13 | ) |
Year Ended September 30, 2002 | | $ | 16.67 | | 0.08 | | | (3.45 | ) | | (3.37 | ) | | (0.08 | ) | | (0.48 | ) | | (0.56 | ) |
February 1, 2001 to September 30, 2001 (a) | | $ | 18.15 | | 0.06 | | | (1.47 | ) | | (1.41 | ) | | (0.07 | ) | | — | | | (0.07 | ) |
Large Company Growth Fund | | | | | | | | | | | | | | | | | | | | | |
Year Ended September 30, 2004 | | $ | 7.37 | | (0.12 | ) | | 0.56 | | | 0.44 | | | — | | | — | | | — | |
Year Ended September 30, 2003 | | $ | 6.37 | | (0.08 | )(b) | | 1.08 | | | 1.00 | | | — | | | — | | | — | |
Year Ended September 30, 2002 | | $ | 7.94 | | (0.10 | )(b) | | (1.47 | ) | | (1.57 | ) | | — | | | — | | | — | |
February 1, 2001 to September 30, 2001 (a) | | $ | 11.75 | | (0.06 | ) | | (3.75 | ) | | (3.81 | ) | | — | | | — | | | — | |
Mid Cap Value Fund | | | | | | | | | | | | | | | | | | | | | |
Year Ended September 30, 2004 | | $ | 12.92 | | 0.07 | (b) | | 2.41 | | | 2.48 | | | (0.10 | ) | | — | | | (0.10 | ) |
Year Ended September 30, 2003 | | $ | 10.90 | | 0.07 | (b) | | 2.04 | | | 2.11 | | | (0.09 | ) | | — | | | (0.09 | ) |
Year Ended September 30, 2002 | | $ | 13.11 | | 0.08 | | | (1.04 | ) | | (0.96 | ) | | (0.10 | ) | | (1.15 | ) | | (1.25 | ) |
July 25, 2001 to September 30, 2001 (a) | | $ | 14.14 | | 0.03 | | | (1.03 | ) | | (1.00 | ) | | (0.03 | ) | | — | | | (0.03 | ) |
Mid Cap Growth Fund | | | | | | | | | | | | | | | | | | | | | |
Year Ended September 30, 2004 | | $ | 9.69 | | (0.16 | ) | | 1.17 | | | 1.01 | | | — | | | — | | | — | |
Year Ended September 30, 2003 | | $ | 8.00 | | (0.15 | ) | | 1.84 | | | 1.69 | | | — | | | — | | | — | |
Year Ended September 30, 2002 | | $ | 9.79 | | (0.15 | )(b) | | (1.01 | ) | | (1.16 | ) | | — | | | (0.63 | ) | | (0.63 | ) |
July 25, 2001 to September 30, 2001 (a) | | $ | 11.20 | | (0.01 | ) | | (1.40 | ) | | (1.41 | ) | | — | | | — | | | — | |
Small Company Value Fund | | | | | | | | | | | | | | | | | | | | | |
Year Ended September 30, 2004 | | $ | 11.40 | | (0.12 | )(b) | | 2.90 | | | 2.78 | | | — | | | (0.12 | ) | | (0.12 | ) |
May 19, 2003 to September 30, 2003 (a) | | $ | 10.00 | | (0.05 | )(b) | | 1.45 | | | 1.40 | | | — | | | — | | | — | |
Small Company Growth Fund | | | | | | | | | | | | | | | | | | | | | |
Year Ended September 30, 2004 | | $ | 10.70 | | (0.22 | )(b) | | 0.56 | | | 0.34 | | | — | | | — | | | — | |
Year Ended September 30, 2003 | | $ | 8.79 | | (0.18 | )(b) | | 2.09 | | | 1.91 | | | — | | | — | | | — | |
Year Ended September 30, 2002 | | $ | 11.45 | | (0.23 | )(b) | | (2.43 | ) | | (2.66 | ) | | — | | | — | | | — | |
February 1, 2001 to September 30, 2001 (a) | | $ | 19.98 | | (0.08 | ) | | (8.45 | ) | | (8.53 | ) | | — | | | — | | | — | |
Special Opportunities Equity Fund | | | | | | | | | | | | | | | | | | | | | |
Year Ended September 30, 2004 | | $ | 10.50 | | (0.11 | ) | | 2.64 | | | 2.53 | | | — | | | (0.08 | ) | | (0.08 | ) |
June 2, 2003 to September 30, 2003 (a) | | $ | 10.00 | | (0.02 | ) | | 0.52 | | | 0.50 | | | — | | | — | | | — | |
| * | During the period certain fees were reduced. If such reductions had not occurred, the ratios would have been as indicated. |
| ** | Portfolio Turnover is calculated on the basis of the Fund as a whole without distinguishing between classes of shares issued. |
| (a) | Period from commencement of operations. |
| (b) | Per share net investment income (loss) has been calculated using the average daily shares method. |
| (c) | Not annualized for periods less than one year. |
| (d) | Annualized for periods less than one year. |
See accompanying notes to the financial statements.
146
| | | | | | | | | | | | | | | | | | | |
| | | | | | Ratios/Supplementary Data
| |
Net Asset
Value,
End of
Period
| | Total
Return
(excludes
sales charge) (c)
| | | Net Assets,
End of
Period
(000)
| | Ratio of
expenses to
average
net assets (d)
| | | Ratio of net
investment
income
(loss) to
average net
assets (d)
| | | Ratio of
expenses to
average
net assets* (d)
| | | Portfolio
turnover**
| |
| | | | | | | | | | | | | | | | | | | | |
| $ | 10.34 | | 3.66 | % | | $ | 1,816 | | 2.29 | % | | 1.14 | % | | 2.65 | % | | 1.65 | % |
| | | | | | | | | | | | | | | | | | | | |
| $ | 17.09 | | 16.72 | % | | $ | 157 | | 1.95 | % | | 0.57 | % | | 2.07 | % | | 16.40 | % |
| $ | 14.73 | | 16.72 | % | | $ | 122 | | 1.92 | % | | 0.90 | % | | 2.06 | % | | 18.89 | % |
| $ | 12.74 | | (21.10 | )% | | $ | 52 | | 1.94 | % | | 0.41 | % | | 2.08 | % | | 23.02 | % |
| $ | 16.67 | | (7.80 | )% | | $ | 13 | | 2.03 | % | | 0.36 | % | | 2.16 | % | | 24.20 | % |
| | | | | | | | | | | | | | | | | | | | |
| $ | 7.81 | | 5.97 | % | | $ | 25 | | 1.96 | % | | (1.08 | )% | | 2.08 | % | | 127.47 | % |
| $ | 7.37 | | 15.70 | % | | $ | 31 | | 1.93 | % | | (1.10 | )% | | 2.06 | % | | 91.73 | % |
| $ | 6.37 | | (19.77 | )% | | $ | 37 | | 1.98 | % | | (1.23 | )% | | 2.12 | % | | 100.46 | % |
| $ | 7.94 | | (32.43 | )% | | $ | 8 | | 2.04 | % | | (1.34 | )% | | 2.18 | % | | 96.41 | % |
| | | | | | | | | | | | | | | | | | | | |
| $ | 15.30 | | 19.20 | % | | $ | 523 | | 1.98 | % | | 0.45 | % | | 2.10 | % | | 19.17 | % |
| $ | 12.92 | | 19.40 | % | | $ | 484 | | 1.95 | % | | 0.61 | % | | 2.10 | % | | 18.28 | % |
| $ | 10.90 | | (8.86 | )% | | $ | 300 | | 1.91 | % | | 0.65 | % | | 2.12 | % | | 18.20 | % |
| $ | 13.11 | | (7.07 | )% | | $ | 1 | | 2.15 | % | | 1.08 | % | | 2.52 | % | | 27.04 | % |
| | | | | | | | | | | | | | | | | | | | |
| $ | 10.70 | | 10.42 | % | | $ | 208 | | 2.00 | % | | (1.65 | )% | | 2.11 | % | | 138.61 | % |
| $ | 9.69 | | 21.13 | % | | $ | 164 | | 1.95 | % | | (1.71 | )% | | 2.11 | % | | 125.97 | % |
| $ | 8.00 | | (13.20 | )% | | $ | 143 | | 1.81 | % | | (1.58 | )% | | 2.13 | % | | 117.06 | % |
| $ | 9.79 | | (13.13 | )% | | $ | 1 | | 2.19 | % | | (1.91 | )% | | 2.49 | % | | 90.11 | % |
| | | | | | | | | | | | | | | | | | | | |
| $ | 14.06 | | 24.56 | % | | $ | 1 | | 2.25 | % | | (0.89 | )% | | 2.44 | % | | 11.25 | % |
| $ | 11.40 | | 14.00 | % | | $ | 1 | | 2.64 | % | | (1.15 | )% | | 2.64 | % | | 48.84 | % |
| | | | | | | | | | | | | | | | | | | | |
| $ | 11.04 | | 3.18 | % | | $ | 45 | | 2.30 | % | | (1.98 | )% | | 2.41 | % | | 211.60 | % |
| $ | 10.70 | | 21.73 | % | | $ | 50 | | 2.37 | % | | (1.95 | )% | | 2.37 | % | | 197.85 | % |
| $ | 8.79 | | (23.23 | )% | | $ | 31 | | 2.47 | % | | (2.11 | )% | | 2.47 | % | | 292.94 | % |
| $ | 11.45 | | (42.69 | )% | | $ | 8 | | 2.42 | % | | (1.99 | )% | | 2.42 | % | | 286.49 | % |
| | | | | | | | | | | | | | | | | | | | |
| $ | 12.95 | | 24.17 | % | | $ | 15,611 | | 2.15 | % | | (1.51 | )% | | 2.30 | % | | 32.06 | % |
| $ | 10.50 | | 5.00 | % | | $ | 4,052 | | 1.80 | % | | (1.17 | )% | | 2.52 | % | | 13.24 | % |
See accompanying notes to the financial statements.
147
BB&T Funds
Financial Highlights, Class C Shares
Selected data for a share of beneficial interest outstanding throughout the periods indicated.
| | | | | | | | | | | | | | | | | | | | | |
| | | | | Investment Activities
| | | Dividends
| |
| | | Net Asset
Value,
Beginning
of Period
| | Net
investment
income
(loss)
| | | Net realized/
unrealized
gains (losses)
on investments
and foreign
currencies
| | | Total from
Investment
Activities
| | | Net
investment
income
| | | Net realized
gains on
investments
and foreign
currencies
| | | Total
Dividends
| |
International Equity Fund | | | | | | | | | | | | | | | | | | | | | |
Year Ended September 30, 2004 | | $ | 6.58 | | 0.00 | (b) | | 1.20 | | | 1.20 | | | (0.04 | ) | | — | | | (0.04 | ) |
Year Ended September 30, 2003 | | $ | 6.07 | | (0.07 | )(b) | | 0.60 | | | 0.53 | | | (0.02 | ) | | — | | | (0.02 | ) |
Year Ended September 30, 2002 | | $ | 7.20 | | (0.07 | ) | | (1.06 | ) | | (1.13 | ) | | — | | | — | | | — | |
February 1, 2001 to September 30, 2001 (a) | | $ | 10.03 | | (0.02 | ) | | (2.81 | ) | | (2.83 | ) | | — | | | — | | | — | |
Intermediate U.S. Government Fund | | | | | | | | | | | | | | | | | | | | | |
Year Ended September 30, 2004 | | $ | 10.53 | | 0.17 | | | (0.12 | ) | | 0.05 | | | (0.25 | ) | | (0.13 | ) | | (0.38 | ) |
Year Ended September 30, 2003 | | $ | 10.74 | | 0.26 | | | (0.07 | ) | | 0.19 | | | (0.31 | ) | | (0.09 | ) | | (0.40 | ) |
Year Ended September 30, 2002 | | $ | 10.35 | | 0.38 | (c) | | 0.43 | (c) | | 0.81 | | | (0.42 | ) | | — | | | (0.42 | ) |
February 1, 2001 to September 30, 2001 (a) | | $ | 10.10 | | 0.35 | | | 0.25 | | | 0.60 | | | (0.35 | ) | | — | | | (0.35 | ) |
Intermediate Corporate Bond Fund | | | | | | | | | | | | | | | | | | | | | |
Year Ended September 30, 2004 | | $ | 10.72 | | 0.33 | | | (0.08 | ) | | 0.25 | | | (0.38 | ) | | — | | | (0.38 | ) |
Year Ended September 30, 2003 | | $ | 10.33 | | 0.39 | | | 0.41 | | | 0.80 | | | (0.41 | ) | | — | | | (0.41 | ) |
Year Ended September 30, 2002 | | $ | 10.56 | | 0.43 | (b)(d) | | — | (d) | | 0.43 | | | (0.49 | ) | | (0.17 | ) | | (0.66 | ) |
February 1, 2001 to September 30, 2001 (a) | | $ | 10.39 | | 0.35 | | | 0.17 | | | 0.52 | | | (0.35 | ) | | — | | | (0.35 | ) |
| * | During the period certain fees were reduced. If such reductions had not occurred, the ratios would have been as indicated. |
| ** | Portfolio Turnover is calculated on the basis of the Fund as a whole without distinguishing between classes of shares issued. |
| (a) | Period from commencement of operations. |
| (b) | Per share net investment income (loss) has been calculated using the average daily shares method. |
| (c) | Without the adoption of the change in amortization method as required by the November 2000 revised version of the AICPA Audit and Accounting Guide for Investment Companies, the amounts for net investment income, net realized/unrealized gains (losses), and the net investment income ratio would have been: $0.40%, $0.41% and 3.99%, respectively. |
| (d) | Without the adoption of the change in amortization method as required by the November 2000 revised version of the AICPA Audit and Accounting Guide for Investment Companies, the amounts for net investment income, net realized/unrealized gains (losses), and the net investment income ratio would have been: $0.44, $(0.01) and 4.40%, respectively. |
| (e) | Not annualized for periods less than one year. |
| (f) | Annualized for periods less than one year. |
See accompanying notes to the financial statements.
148
| | | | | | | | | | | | | | | | | | | |
| | | | | | Ratios/Supplementary Data
| |
Net Asset
Value,
End of
Period
| | Total
Return
(excludes
sales charge) (e)
| | | Net Assets,
End of
Period
(000)
| | Ratio of
expenses to
average
net assets (f)
| | | Ratio of net
investment
income
(loss) to
average net
assets (f)
| | | Ratio of
expenses to
average
net assets* (f)
| | | Portfolio
turnover**
| |
| | | | | | | | | | | | | | | | | | | | |
| $ | 7.74 | | 18.30 | % | | $ | 2 | | 2.32 | % | | (0.04 | )% | | 2.42 | % | | 50.68 | % |
| $ | 6.58 | | 8.80 | % | | $ | 2 | | 2.40 | % | | (1.06 | )% | | 2.40 | % | | 199.78 | % |
| $ | 6.07 | | (15.69 | )% | | $ | 7 | | 2.43 | % | | (0.98 | )% | | 2.43 | % | | 95.86 | % |
| $ | 7.20 | | (28.22 | )% | | $ | 6 | | 2.40 | % | | (1.35 | )% | | 2.40 | % | | 144.35 | % |
| | | | | | | | | | | | | | | | | | | | |
| $ | 10.20 | | 0.55 | % | | $ | 607 | | 1.80 | % | | 2.15 | % | | 1.92 | % | | 98.35 | % |
| $ | 10.53 | | 1.77 | % | | $ | 836 | | 1.82 | % | | 2.57 | % | | 1.92 | % | | 209.07 | % |
| $ | 10.74 | | 8.05 | % | | $ | 1,313 | | 1.79 | % | | 3.81 | %(c) | | 1.89 | % | | 79.36 | % |
| $ | 10.35 | | 6.01 | % | | $ | 40 | | 1.98 | % | | 4.26 | % | | 2.05 | % | | 84.76 | % |
| | | | | | | | | | | | | | | | | | | | |
| $ | 10.59 | | 2.44 | % | | $ | 257 | | 1.82 | % | | 3.09 | % | | 1.94 | % | | 31.95 | % |
| $ | 10.72 | | 7.86 | % | | $ | 282 | | 1.83 | % | | 3.61 | % | | 1.94 | % | | 43.98 | % |
| $ | 10.33 | | 4.37 | % | | $ | 318 | | 1.89 | % | | 4.28 | %(d) | | 2.03 | % | | 69.15 | % |
| $ | 10.56 | | 5.07 | % | | $ | 11 | | 1.71 | % | | 4.94 | % | | 1.85 | % | | 142.35 | % |
See accompanying notes to the financial statements.
149
BB&T Funds
Financial Highlights, Class C Shares
Selected data for a share of beneficial interest outstanding throughout the periods indicated.
| | | | | | | | | | | | | | | | | | | | | |
| | | | | Investment Activities
| | | Dividends
| |
| | | Net Asset
Value,
Beginning
of Period
| | Net
investment
income
(loss)
| | |
Net realized/
unrealized
gains (losses)
on investments
| | | Total from
Investment
Activities
| | | Net
investment
income
| | | Net realized
gains on
investments
| | | Total
Dividends
| |
Prime Money Market Fund | | | | | | | | | | | | | | | | | | | | | |
Year Ended September 30, 2004 | | $ | 1.00 | | — | (c) | | — | (c) | | — | (c) | | — | (c) | | — | | | — | (c) |
Year Ended September 30, 2003 | | $ | 1.00 | | — | (c) | | — | | | — | (c) | | — | (c) | | — | | | — | (c) |
January 30, 2002 to September 30, 2002 (a) | | $ | 1.00 | | 0.01 | | | — | | | 0.01 | | | (0.01 | ) | | — | | | (0.01 | ) |
U.S. Treasury Money Market Fund | | | | | | | | | | | | | | | | | | | | | |
Year Ended September 30, 2004 | | $ | 1.00 | | — | (c) | | — | | | — | (c) | | — | (c) | | — | | | — | (c) |
Year Ended September 30, 2003 | | $ | 1.00 | | — | (c) | | — | | | — | (c) | | — | (c) | | — | | | — | (c) |
January 30, 2002 to September 30, 2002 (a) | | $ | 1.00 | | — | (c) | | — | | | — | (c) | | — | (c) | | — | | | — | (c) |
Capital Manager Conservative Growth Fund | | | | | | | | | | | | | | | | | | | | | |
Year Ended September 30, 2004 | | $ | 8.82 | | 0.09 | (b) | | 0.44 | | | 0.53 | | | (0.08 | ) | | — | | | (0.08 | ) |
Year Ended September 30, 2003 | | $ | 8.26 | | 0.09 | | | 0.61 | | | 0.70 | | | (0.10 | ) | | (0.04 | ) | | (0.14 | ) |
Year Ended September 30, 2002 | | $ | 9.10 | | 0.17 | | | (0.69 | ) | | (0.52 | ) | | (0.14 | ) | | (0.18 | ) | | (0.32 | ) |
February 1, 2001 to September 30, 2001 (a) | | $ | 10.06 | | 0.10 | | | (0.93 | ) | | (0.83 | ) | | (0.13 | ) | | — | | | (0.13 | ) |
Capital Manager Moderate Growth Fund | | | | | | | | | | | | | | | | | | | | | |
Year Ended September 30, 2004 | | $ | 8.18 | | 0.01 | (b) | | 0.73 | | | 0.74 | | | (0.01 | ) | | — | | | (0.01 | ) |
Year Ended September 30, 2003 | | $ | 7.42 | | 0.03 | | | 0.82 | | | 0.85 | | | (0.08 | ) | | (0.01 | ) | | (0.09 | ) |
Year Ended September 30, 2002 | | $ | 8.77 | | 0.04 | | | (0.97 | ) | | (0.93 | ) | | (0.05 | ) | | (0.37 | ) | | (0.42 | ) |
February 1, 2001 to September 30, 2001 (a) | | $ | 10.23 | | 0.05 | | | (1.45 | ) | | (1.40 | ) | | (0.06 | ) | | — | | | (0.06 | ) |
Capital Manager Growth Fund | | | | | | | | | | | | | | | | | | | | | |
Year Ended September 30, 2004 | | $ | 7.71 | | (0.02 | )(b) | | 0.87 | | | 0.85 | | | — | | | — | | | — | |
Year Ended September 30, 2003 | | $ | 6.80 | | (0.01 | )(b) | | 0.93 | | | 0.92 | | | (0.01 | ) | | — | | | (0.01 | ) |
Year Ended September 30, 2002 | | $ | 8.41 | | (0.02 | ) | | (1.19 | ) | | (1.21 | ) | | — | | | (0.40 | ) | | (0.40 | ) |
February 1, 2001 to September 30, 2001 (a) | | $ | 10.41 | | (0.01 | ) | | (1.98 | ) | | (1.99 | ) | | (0.01 | ) | | — | | | (0.01 | ) |
Capital Manager Equity Fund | | | | | | | | | | | | | | | | | | | | | |
Year Ended September 30, 2004 | | $ | 8.28 | | (0.05 | )(b) | | 1.10 | | | 1.05 | | | — | | | — | | | — | |
Year Ended September 30, 2003 | | $ | 7.26 | | (0.05 | )(b) | | 1.12 | | | 1.07 | | | — | (c) | | (0.05 | ) | | (0.05 | ) |
Year Ended September 30, 2002 | | $ | 8.92 | | (0.12 | ) | | (1.54 | ) | | (1.66 | ) | | — | | | — | | | — | |
March 19, 2001 to September 30, 2001 (a) | | $ | 10.00 | | (0.06 | ) | | (1.02 | ) | | (1.08 | ) | | — | | | — | | | — | |
| * | During the period certain fees were reduced. If such reductions had not occurred, the ratios would have been as indicated. |
| ** | Portfolio Turnover is calculated on the basis of the Fund as a whole without distinguishing between classes of shares issued. |
| (a) | Period from commencement of operations. |
| (b) | Per share net investment income (loss) has been calculated using the average daily shares method. |
| (c) | Amount is less than $0.005 |
| (d) | Not annualized for periods less than one year. |
| (e) | Annualized for periods less than one year. |
See accompanying notes to the financial statements.
150
| | | | | | | | | | | | | | | | | | | |
| | | | Ratios/Supplementary Data
| |
Net Asset
Value,
End of
Period
| | Total Return
(excludes
sales charge) (d)
| | | Net Assets,
End of
Period
(000)
| | Ratio of
expenses to
average
net assets (e)
| | | Ratio of net
investment
income
(loss) to
average net
assets (e)
| | | Ratio of
expenses to
average
net assets* (e)
| | | Portfolio
turnover**
| |
| | | | | | | | | | | | | | | | | | | | |
| $ | 1.00 | | 0.06 | % | | $ | 453 | | 1.20 | % | | 0.06 | % | | 1.70 | % | | — | |
| $ | 1.00 | | 0.15 | % | | $ | 555 | | 1.30 | % | | 0.14 | % | | 1.69 | % | | — | |
| $ | 1.00 | | 0.28 | % | | $ | 314 | | 1.60 | % | | 0.40 | % | | 1.65 | % | | — | |
| | | | | | | | | | | | | | | | | | | | |
| $ | 1.00 | | 0.05 | % | | $ | 5 | | 1.02 | % | | 0.05 | % | | 1.71 | % | | — | |
| $ | 1.00 | | 0.16 | % | | $ | 8 | | 1.12 | % | | 0.17 | % | | 1.70 | % | | — | |
| $ | 1.00 | | 0.18 | % | | $ | 10 | | 1.60 | % | | 0.27 | % | | 1.64 | % | | — | |
| | | | | | | | | | | | | | | | | | | | |
| $ | 9.27 | | 6.06 | % | | $ | 180 | | 1.44 | % | | 0.93 | % | | 1.64 | % | | 2.47 | % |
| $ | 8.82 | | 8.50 | % | | $ | 148 | | 1.53 | % | | 1.05 | % | | 1.73 | % | | 33.03 | % |
| $ | 8.26 | | (5.98 | )% | | $ | 62 | | 1.52 | % | | 1.45 | % | | 1.72 | % | | 6.29 | % |
| $ | 9.10 | | (8.30 | )% | | $ | 2 | | 1.71 | % | | 1.58 | % | | 1.73 | % | | 35.75 | % |
| | | | | | | | | | | | | | | | | | | | |
| $ | 8.91 | | 9.08 | % | | $ | 178 | | 1.49 | % | | 0.17 | % | | 1.69 | % | | 0.17 | % |
| $ | 8.18 | | 11.39 | % | | $ | 182 | | 1.51 | % | | 0.40 | % | | 1.71 | % | | 21.46 | % |
| $ | 7.42 | | (11.40 | )% | | $ | 307 | | 1.58 | % | | 0.53 | % | | 1.78 | % | | 14.56 | % |
| $ | 8.77 | | (13.75 | )% | | $ | 178 | | 1.55 | % | | 0.74 | % | | 1.75 | % | | 24.24 | % |
| | | | | | | | | | | | | | | | | | | | |
| $ | 8.56 | | 11.02 | % | | $ | 63 | | 1.50 | % | | (0.23 | )% | | 1.73 | % | | 0.19 | % |
| $ | 7.71 | | 13.48 | % | | $ | 52 | | 1.54 | % | | (0.14 | )% | | 1.74 | % | | 17.80 | % |
| $ | 6.80 | | (15.43 | )% | | $ | 12 | | 1.61 | % | | (0.34 | )% | | 1.81 | % | | 8.38 | % |
| $ | 8.41 | | (19.16 | )% | | $ | 8 | | 1.68 | % | | (0.30 | )% | | 1.86 | % | | 27.33 | % |
| | | | | | | | | | | | | | | | | | | | |
| $ | 9.33 | | 12.68 | % | | $ | 85 | | 1.52 | % | | (0.54 | )% | | 1.81 | % | | 3.10 | % |
| $ | 8.28 | | 14.78 | % | | $ | 28 | | 1.73 | % | | (0.66 | )% | | 1.92 | % | | 8.30 | % |
| $ | 7.26 | | (18.61 | )% | | $ | 1 | | 1.94 | % | | (1.31 | )% | | 1.94 | % | | 5.75 | % |
| $ | 8.92 | | (10.80 | )% | | $ | 1 | | 1.87 | % | | (1.12 | )% | | 1.87 | % | | 10.10 | % |
See accompanying notes to the financial statements.
151
BB&T Funds
Financial Highlights, Institutional Shares
Selected data for a share of beneficial interest outstanding throughout the periods indicated.
| | | | | | | | | | | | | | | | | | | | | |
| | | | | Investment Activities
| | | Dividends
| |
| | | Net Asset
Value,
Beginning
of Period
| | Net
investment
income
(loss)
| | |
Net realized/
unrealized
gains (losses)
on investments
| | | Total from
Investment
Activities
| | | Net
investment
income
| | | Net realized
gains on
investments
| | | Total
Dividends
| |
Equity Income Fund | | | | | | | | | | | | | | | | | | | | | |
June 30, 2004 to September 30, 2004 (a) | | $ | 10.00 | | 0.05 | (c) | | 0.34 | | | 0.39 | | | (0.04 | ) | | — | | | (0.04 | ) |
Large Company Value Fund | | | | | | | | | | | | | | | | | | | | | |
Year Ended September 30, 2004 | | $ | 14.90 | | 0.26 | | | 2.39 | | | 2.65 | | | (0.26 | ) | | — | | | (0.26 | ) |
Year Ended September 30, 2003 | | $ | 12.87 | | 0.27 | | | 2.03 | | | 2.30 | | | (0.27 | ) | | — | | | (0.27 | ) |
Year Ended September 30, 2002 | | $ | 16.82 | | 0.22 | | | (3.47 | ) | | (3.25 | ) | | (0.22 | ) | | (0.48 | ) | | (0.70 | ) |
Year Ended September 30, 2001 | | $ | 18.60 | | 0.26 | | | (0.89 | ) | | (0.63 | ) | | (0.26 | ) | | (0.89 | ) | | (1.15 | ) |
Year Ended September 30, 2000 | | $ | 19.64 | | 0.54 | | | 0.55 | | | 1.09 | | | (0.54 | ) | | (1.59 | ) | | (2.13 | ) |
Large Company Growth Fund | | | | | | | | | | | | | | | | | | | | | |
Year Ended September 30, 2004 | | $ | 7.79 | | (0.01 | ) | | 0.57 | | | 0.56 | | | — | | | — | | | — | |
Year Ended September 30, 2003 | | $ | 6.67 | | (0.01 | )(c) | | 1.13 | | | 1.12 | | | — | | | — | | | — | |
Year Ended September 30, 2002 | | $ | 8.23 | | (0.03 | ) | | (1.53 | ) | | (1.56 | ) | | — | | | — | | | — | |
Year Ended September 30, 2001 | | $ | 14.84 | | (0.03 | ) | | (5.60 | ) | | (5.63 | ) | | — | | | (0.98 | ) | | (0.98 | ) |
Year Ended September 30, 2000 | | $ | 11.99 | | (0.03 | ) | | 3.62 | | | 3.59 | | | — | | | (0.74 | ) | | (0.74 | ) |
Mid Cap Value Fund | | | | | | | | | | | | | | | | | | | | | |
Year Ended September 30, 2004 | | $ | 12.98 | | 0.22 | (c) | | 2.42 | | | 2.64 | | | (0.21 | ) | | — | | | (0.21 | ) |
Year Ended September 30, 2003 | | $ | 10.93 | | 0.19 | (c) | | 2.04 | | | 2.23 | | | (0.18 | ) | | — | | | (0.18 | ) |
Year Ended September 30, 2002 | | $ | 13.12 | | 0.20 | | | (1.04 | ) | | (0.84 | ) | | (0.20 | ) | | (1.15 | ) | | (1.35 | ) |
February 1, 2001 to September 30, 2001 (b) | | $ | 14.26 | | 0.15 | | | (1.13 | ) | | (0.98 | ) | | (0.16 | ) | | — | | | (0.16 | ) |
Year Ended January 31, 2001 | | $ | 14.10 | | 0.25 | | | 0.95 | | | 1.20 | | | (0.25 | ) | | (0.79 | ) | | (1.04 | ) |
Year Ended January 31, 2000 | | $ | 13.44 | | 0.23 | | | 0.93 | | | 1.16 | | | (0.22 | ) | | (0.28 | ) | | (0.50 | ) |
Mid Cap Growth Fund | | | | | | | | | | | | | | | | | | | | | |
Year Ended September 30, 2004 | | $ | 10.22 | | (0.08 | ) | | 1.26 | | | 1.18 | | | — | | | — | | | — | |
Year Ended September 30, 2003 | | $ | 8.36 | | (0.06 | ) | | 1.92 | | | 1.86 | | | — | | | — | | | — | |
Year Ended September 30, 2002 | | $ | 10.10 | | (0.06 | ) | | (1.05 | ) | | (1.11 | ) | | — | | | (0.63 | ) | | (0.63 | ) |
February 1, 2001 to September 30, 2001 (b) | | $ | 14.84 | | (0.02 | ) | | (4.72 | ) | | (4.74 | ) | | — | | | — | | | — | |
Year Ended January 31, 2001 | | $ | 20.78 | | (0.04 | ) | | (2.08 | ) | | (2.12 | ) | | — | | | (3.82 | ) | | (3.82 | ) |
Year Ended January 31, 2000 | | $ | 17.89 | | (0.06 | ) | | 5.04 | | | 4.98 | | | — | | | (2.09 | ) | | (2.09 | ) |
Small Company Value Fund | | | | | | | | | | | | | | | | | | | | | |
Year Ended September 30, 2004 | | $ | 11.44 | | 0.02 | (c) | | 2.91 | | | 2.93 | | | (0.02 | ) | | (0.12 | ) | | (0.14 | ) |
May 19, 2003 to September 30, 2003 (a) | | $ | 10.00 | | (0.01 | )(c) | | 1.45 | | | 1.44 | | | — | (d) | | — | | | — | (d) |
Small Company Growth Fund | | | | | | | | | | | | | | | | | | | | | |
Year Ended September 30, 2004 | | $ | 11.86 | | (0.12 | )(c) | | 0.62 | | | 0.50 | | | — | | | — | | | — | |
Year Ended September 30, 2003 | | $ | 9.65 | | (0.11 | ) | | 2.32 | | | 2.21 | | | — | | | — | | | — | |
Year Ended September 30, 2002 | | $ | 12.44 | | (0.14 | ) | | (2.65 | ) | | (2.79 | ) | | — | | | — | | | — | |
Year Ended September 30, 2001 | | $ | 35.49 | | (0.15 | ) | | (16.56 | ) | | (16.71 | ) | | — | | | (6.34 | ) | | (6.34 | ) |
Year Ended September 30, 2000 | | $ | 25.25 | | (0.17 | ) | | 13.41 | | | 13.24 | | | — | | | (3.00 | ) | | (3.00 | ) |
Special Opportunities Equity Fund | | | | | | | | | | | | | | | | | | | | | |
Year Ended September 30, 2004 | | $ | 10.53 | | (0.05 | ) | | 2.72 | | | 2.67 | | | — | | | (0.08 | ) | | (0.08 | ) |
June 2, 2003 to September 30, 2003 (a) | | $ | 10.00 | | — | (d) | | 0.53 | | | 0.53 | | | — | (d) | | — | | | — | (d) |
| * | During the period certain fees were reduced. If such reductions had not occurred, the ratios would have been as indicated. |
| ** | Portfolio Turnover is calculated on the basis of the Fund as a whole without distinguishing between classes of shares issued. |
| (a) | Period from commencement of operations. |
| (b) | For the period from February 1, 2001 to September 30, 2001. Upon reorganizing as Funds of the BB&T Funds, the Mid Cap Value Fund and Mid Cap Growth Fund changed their fiscal year end from January 31 to September 30. The Financial Highlights for the periods prior to February 1, 2001 represent the OVB Equity Income Portfolio and OVB Capital Appreciation Portfolio, respectively. |
| (c) | Per share net investment income (loss) has been calculated using the average daily shares method. |
| (d) | Amount is less than $0.005. |
| (e) | Not annualized for periods less than one year. |
| (f) | Annualized for periods less than one year. |
See accompanying notes to the financial statements.
152
| | | | | | | | | | | | | | | | | | | |
| | | | Ratios/Supplementary Data
| |
Net Asset
Value,
End of
Period
| | Total Return (e)
| | | Net
Assets,
End of
Period
(000)
| | Ratio of
expenses to
average
net assets (f)
| | | Ratio of net
investment
income
(loss) to
average net
assets (f)
| | | Ratio of
expenses to
average
net assets* (f)
| | | Portfolio
turnover**
| |
| | | | | | | | | | | | | | | | | | | | |
| $ | 10.35 | | 3.94 | % | | $ | 21,128 | | 1.29 | % | | 1.91 | % | | 1.63 | % | | 1.65 | % |
| | | | | | | | | | | | | | | | | | | | |
| $ | 17.29 | | 17.86 | % | | $ | 620,186 | | 0.95 | % | | 1.58 | % | | 1.06 | % | | 16.40 | % |
| $ | 14.90 | | 17.98 | % | | $ | 475,289 | | 0.92 | % | | 1.90 | % | | 1.06 | % | | 18.89 | % |
| $ | 12.87 | | (20.33 | )% | | $ | 319,971 | | 0.98 | % | | 1.37 | % | | 1.12 | % | | 23.02 | % |
| $ | 16.82 | | (3.53 | )% | | $ | 360,847 | | 0.99 | % | | 1.48 | % | | 1.13 | % | | 24.20 | % |
| $ | 18.60 | | 5.89 | % | | $ | 333,567 | | 0.92 | % | | 2.90 | % | | 1.10 | % | | 23.85 | % |
| | | | | | | | | | | | | | | | | | | | |
| $ | 8.35 | | 7.19 | % | | $ | 346,061 | | 0.97 | % | | (0.08 | )% | | 1.08 | % | | 127.47 | % |
| $ | 7.79 | | 16.79 | % | | $ | 272,961 | | 0.93 | % | | (0.11 | )% | | 1.07 | % | | 91.73 | % |
| $ | 6.67 | | (18.96 | )% | | $ | 160,933 | | 1.02 | % | | (0.30 | )% | | 1.16 | % | | 100.46 | % |
| $ | 8.23 | | (40.24 | )% | | $ | 151,601 | | 1.05 | % | | (0.25 | )% | | 1.19 | % | | 96.41 | % |
| $ | 14.84 | | 30.52 | % | | $ | 145,538 | | 0.99 | % | | (0.18 | )% | | 1.16 | % | | 76.76 | % |
| | | | | | | | | | | | | | | | | | | | |
| $ | 15.41 | | 20.44 | % | | $ | 182,791 | | 0.98 | % | | 1.47 | % | | 1.10 | % | | 19.17 | % |
| $ | 12.98 | | 20.60 | % | | $ | 142,280 | | 0.95 | % | | 1.57 | % | | 1.10 | % | | 18.28 | % |
| $ | 10.93 | | (8.01 | )% | | $ | 85,013 | | 0.90 | % | | 1.54 | % | | 1.13 | % | | 18.20 | % |
| $ | 13.12 | | (6.93 | )% | | $ | 74,070 | | 0.94 | % | | 1.75 | % | | 1.12 | % | | 27.04 | % |
| $ | 14.26 | | 9.03 | % | | $ | 64,423 | | 0.96 | % | | 1.79 | % | | 1.11 | % | | 59.00 | % |
| $ | 14.10 | | 8.49 | % | | $ | 62,863 | | 0.96 | % | | 1.63 | % | | 1.07 | % | | 15.00 | % |
| | | | | | | | | | | | | | | | | | | | |
| $ | 11.40 | | 11.55 | % | | $ | 118,012 | | 1.00 | % | | (0.65 | )% | | 1.11 | % | | 138.61 | % |
| $ | 10.22 | | 22.25 | % | | $ | 100,226 | | 0.95 | % | | (0.72 | )% | | 1.12 | % | | 125.97 | % |
| $ | 8.36 | | (12.26 | )% | | $ | 69,975 | | 0.89 | % | | (0.62 | )% | | 1.17 | % | | 117.06 | % |
| $ | 10.10 | | (31.94 | )% | | $ | 90,424 | | 1.02 | % | | (0.32 | )% | | 1.25 | % | | 90.11 | % |
| $ | 14.84 | | (10.61 | )% | | $ | 129,433 | | 1.02 | % | | (0.16 | )% | | 1.23 | % | | 63.00 | % |
| $ | 20.78 | | 28.81 | % | | $ | 154,385 | | 1.02 | % | | (0.34 | )% | | 1.30 | % | | 54.00 | % |
| | | | | | | | | | | | | | | | | | | | |
| $ | 14.23 | | 25.78 | % | | $ | 66,802 | | 1.26 | % | | 0.15 | % | | 1.42 | % | | 11.25 | % |
| $ | 11.44 | | 14.43 | % | | $ | 43,462 | | 1.69 | % | | (0.17 | )% | | 1.69 | % | | 48.84 | % |
| | | | | | | | | | | | | | | | | | | | |
| $ | 12.36 | | 4.22 | % | | $ | 90,332 | | 1.30 | % | | (0.98 | )% | | 1.41 | % | | 211.60 | % |
| $ | 11.86 | | 22.90 | % | | $ | 129,960 | | 1.37 | % | | (0.94 | )% | | 1.37 | % | | 197.85 | % |
| $ | 9.65 | | (22.43 | )% | | $ | 93,918 | | 1.48 | % | | (1.17 | )% | | 1.48 | % | | 292.94 | % |
| $ | 12.44 | | (54.85 | )% | | $ | 102,260 | | 1.47 | % | | (0.64 | )% | | 1.41 | % | | 286.49 | % |
| $ | 35.49 | | 54.82 | % | | $ | 197,795 | | 1.41 | % | | (0.49 | )% | | 1.41 | % | | 206.16 | % |
| | | | | | | | | | | | | | | | | | | | |
| $ | 13.12 | | 25.44 | % | | $ | 39,816 | | 1.12 | % | | (0.49 | )% | | 1.32 | % | | 32.06 | % |
| $ | 10.53 | | 5.31 | % | | $ | 26,360 | | 0.82 | % | | (0.11 | )% | | 1.64 | % | | 13.24 | % |
See accompanying notes to the financial statements.
153
BB&T Funds
Financial Highlights, Institutional Shares
Selected data for a share of beneficial interest outstanding throughout the periods indicated.
| | | | | | | | | | | | | | | | | | | | | |
| | | | | Investment Activities
| | | Dividends
| |
| | | Net Asset
Value,
Beginning
of Period
| | Net
investment
income
(loss)
| | | Net realized/
unrealized
gains (losses)
on investments
and foreign
currencies
| | | Total from
Investment
Activities
| | | Net
investment
income
| | | Net realized
gains on
investments
and foreign
currencies
| | | Total
Dividends
| |
International Equity Fund | | | | | | | | | | | | | | | | | | | | | |
Year Ended September 30, 2004 | | $ | 6.98 | | 0.10 | (b) | | 1.26 | | | 1.36 | | | (0.10 | ) | | — | | | (0.10 | ) |
Year Ended September 30, 2003 | | $ | 6.41 | | 0.05 | (b) | | 0.57 | | | 0.62 | | | (0.05 | ) | | — | | | (0.05 | ) |
Year Ended September 30, 2002 | | $ | 7.53 | | — | | | (1.12 | ) | | (1.12 | ) | | — | (f) | | — | | | — | (f) |
Year Ended September 30, 2001 | | $ | 12.60 | | (0.05 | ) | | (3.00 | ) | | (3.05 | ) | | — | | | (2.02 | ) | | (2.02 | ) |
Year Ended September 30, 2000 | | $ | 12.56 | | (0.01 | ) | | 0.68 | | | 0.67 | | | — | | | (0.63 | ) | | (0.63 | ) |
Short U.S. Government Fund | | | | | | | | | | | | | | | | | | | | | |
Year Ended September 30, 2004 | | $ | 9.90 | | 0.20 | | | (0.11 | ) | | 0.09 | | | (0.28 | ) | | — | | | (0.28 | ) |
Year Ended September 30, 2003 | | $ | 10.09 | | 0.29 | | | (0.11 | ) | | 0.18 | | | (0.37 | ) | | — | | | (0.37 | ) |
Year Ended September 30, 2002 | | $ | 10.05 | | 0.45 | (c) | | 0.06 | (c) | | 0.51 | | | (0.47 | ) | | — | | | (0.47 | ) |
Year Ended September 30, 2001 | | $ | 9.64 | | 0.53 | | | 0.41 | | | 0.94 | | | (0.53 | ) | | — | | | (0.53 | ) |
Year Ended September 30, 2000 | | $ | 9.65 | | 0.52 | | | — | | | 0.52 | | | (0.53 | ) | | — | | | (0.53 | ) |
Intermediate U.S. Government Fund | | | | | | | | | | | | | | | | | | | | | |
Year Ended September 30, 2004 | | $ | 10.58 | | 0.34 | | | (0.18 | ) | | 0.16 | | | (0.36 | ) | | (0.13 | ) | | (0.49 | ) |
Year Ended September 30, 2003 | | $ | 10.78 | | 0.37 | | | (0.07 | ) | | 0.30 | | | (0.41 | ) | | (0.09 | ) | | (0.50 | ) |
Year Ended September 30, 2002 | | $ | 10.39 | | 0.49 | (d) | | 0.42 | (d) | | 0.91 | | | (0.52 | ) | | — | | | (0.52 | ) |
Year Ended September 30, 2001 | | $ | 9.73 | | 0.54 | | | 0.66 | | | 1.20 | | | (0.54 | ) | | — | | | (0.54 | ) |
Year Ended September 30, 2000 | | $ | 9.72 | | 0.55 | | | 0.04 | | | 0.59 | | | (0.55 | ) | | (0.03 | ) | | (0.58 | ) |
Intermediate Corporate Bond Fund | | | | | | | | | | | | | | | | | | | | | |
Year Ended September 30, 2004 | | $ | 10.72 | | 0.44 | | | (0.08 | ) | | 0.36 | | | (0.49 | ) | | — | | | (0.49 | ) |
Year Ended September 30, 2003 | | $ | 10.33 | | 0.49 | | | 0.41 | | | 0.90 | | | (0.51 | ) | | — | | | (0.51 | ) |
Year Ended September 30, 2002 | | $ | 10.56 | | 0.55 | (e) | | (0.04 | )(e) | | 0.51 | | | (0.57 | ) | | (0.17 | ) | | (0.74 | ) |
Year Ended September 30, 2001 | | $ | 9.98 | | 0.62 | | | 0.58 | | | 1.20 | | | (0.62 | ) | | — | | | (0.62 | ) |
December 2, 1999 to September 30, 2000 (a) | | $ | 10.00 | | 0.51 | | | (0.02 | ) | | 0.49 | | | (0.51 | ) | | — | | | (0.51 | ) |
| * | During the period certain fees were reduced. If such reductions had not occurred, the ratios would have been as indicated. |
| ** | Portfolio Turnover is calculated on the basis of the Fund as a whole without distinguishing between classes of shares issued. |
| (a) | Period from commencement of operations. |
| (b) | Per share net investment income (loss) has been calculated using the average daily shares method. |
| (c) | Without the adoption of the change in amortization method as required by the November 2000 revised version of the AICPA Audit and Accounting Guide for Investment Companies, the amounts for net investment income, net realized/unrealized gains (losses), and the net investment income ratio would have been: $0.49, $0.02, and 4.65%, respectively. |
| (d) | Without the adoption of the change in amortization method as required by the November 2000 revised version of the AICPA Audit and Accounting Guide for Investment Companies, the amounts for net investment income, net realized/unrealized gains (losses), and the net investment income ratio would have been: $0.51, $0.40, and 4.99%, respectively. |
| (e) | Without the adoption of the change in amortization method as required by the November 2000 revised version of the AICPA Audit and Accounting Guide for Investment Companies, the amounts for net investment income, net realized/unrealized gains (losses), and the net investment income ratio would have been: $0.56, $(0.05), and 5.54%, respectively. |
| (f) | Amount is less than $0.005 |
| (g) | Not annualized for periods less than one year. |
| (h) | Annualized for periods less than one year. |
See accompanying notes to the financial statements.
154
| | | | | | | | | | | | | | | | | | | |
| | | | | | Ratios/Supplementary Data
| |
Net Asset
Value,
End of
Period
| | Total
Return (g)
| | | Net
Assets,
End of
Period
(000)
| | Ratio of
expenses to
average
net assets (h)
| | | Ratio of net
investment
income
(loss) to
average net
assets (h)
| | | Ratio of
expenses to
average
net assets* (h)
| | | Portfolio
turnover**
| |
| | | | | | | | | | | | | | | | | | | | |
| $ | 8.24 | | 19.48 | % | | $ | 233,275 | | 1.32 | % | | 1.30 | % | | 1.42 | % | | 50.68 | % |
| $ | 6.98 | | 9.72 | % | | $ | 187,315 | | 1.40 | % | | 0.78 | % | | 1.41 | % | | 199.78 | % |
| $ | 6.41 | | (14.85 | )% | | $ | 123,330 | | 1.43 | % | | 0.03 | % | | 1.43 | % | | 95.86 | % |
| $ | 7.53 | | (28.33 | )% | | $ | 115,405 | | 1.48 | % | | (0.14 | )% | | 1.48 | % | | 144.35 | % |
| $ | 12.60 | | 4.96 | % | | $ | 119,326 | | 1.51 | % | | (0.04 | )% | | 1.51 | % | | 179.44 | % |
| | | | | | | | | | | | | | | | | | | | |
| $ | 9.71 | | 0.96 | % | | $ | 195,920 | | 0.74 | % | | 2.10 | % | | 0.91 | % | | 62.59 | % |
| $ | 9.90 | | 1.78 | % | | $ | 199,980 | | 0.76 | % | | 2.81 | % | | 0.91 | % | | 93.86 | % |
| $ | 10.09 | | 5.27 | % | | $ | 181,797 | | 0.78 | % | | 4.30 | %(c) | | 0.93 | % | | 73.93 | % |
| $ | 10.05 | | 9.99 | % | | $ | 169,839 | | 0.78 | % | | 5.38 | % | | 0.93 | % | | 101.28 | % |
| $ | 9.64 | | 5.62 | % | | $ | 170,362 | | 0.76 | % | | 5.52 | % | | 0.91 | % | | 101.07 | % |
| | | | | | | | | | | | | | | | | | | | |
| $ | 10.25 | | 1.56 | % | | $ | 534,682 | | 0.80 | % | | 3.15 | % | | 0.92 | % | | 98.35 | % |
| $ | 10.58 | | 2.88 | % | | $ | 447,665 | | 0.82 | % | | 3.43 | % | | 0.92 | % | | 209.07 | % |
| $ | 10.78 | | 9.11 | % | | $ | 340,231 | | 0.85 | % | | 4.81 | %(d) | | 0.95 | % | | 79.36 | % |
| $ | 10.39 | | 12.68 | % | | $ | 279,046 | | 0.85 | % | | 5.38 | % | | 0.95 | % | | 84.76 | % |
| $ | 9.73 | | 6.36 | % | | $ | 182,899 | | 0.83 | % | | 5.71 | % | | 0.93 | % | | 103.41 | % |
| | | | | | | | | | | | | | | | | | | | |
| $ | 10.59 | | 3.47 | % | | $ | 272,749 | | 0.82 | % | | 4.09 | % | | 0.94 | % | | 31.95 | % |
| $ | 10.72 | | 8.95 | % | | $ | 215,000 | | 0.83 | % | | 4.61 | % | | 0.94 | % | | 43.98 | % |
| $ | 10.33 | | 5.19 | % | | $ | 142,509 | | 0.83 | % | | 5.42 | %(e) | | 0.98 | % | | 69.15 | % |
| $ | 10.56 | | 12.34 | % | | $ | 120,361 | | 0.81 | % | | 6.03 | % | | 0.96 | % | | 142.35 | % |
| $ | 9.98 | | 5.13 | % | | $ | 89,101 | | 0.75 | % | | 6.30 | % | | 1.09 | % | | 186.79 | % |
See accompanying notes to the financial statements.
155
BB&T Funds
Financial Highlights, Institutional Shares
Selected data for a share of beneficial interest outstanding throughout the periods indicated.
| | | | | | | | | | | | | | | | | | | | | |
| | | | | Investment Activities
| | | Dividends
| |
| | | Net Asset
Value,
Beginning
of Period
| | Net
investment
income
(loss)
| | |
Net realized/
unrealized
gains (losses)
on investments
| | | Total from
Investment
Activities
| | | Net
investment
income
| | | Net realized
gains on
investments
| | | Total
Dividends
| |
Kentucky Intermediate Tax-Free Fund | | | | | | | | | | | | | | | | | | | | | |
Year Ended September 30, 2004 | | $ | 10.22 | | 0.28 | (c) | | (0.02 | ) | | 0.26 | | | (0.28 | ) | | — | | | (0.28 | ) |
February 24, 2003 to September 30, 2003 (a) | | $ | 10.00 | | 0.16 | (c) | | 0.20 | | | 0.36 | | | (0.14 | ) | | — | | | (0.14 | ) |
Maryland Intermediate Tax-Free Fund | | | | | | | | | | | | | | | | | | | | | |
Year Ended September 30, 2004 | | $ | 10.16 | | 0.25 | | | 0.00 | | | 0.25 | | | (0.25 | ) | | — | | | (0.25 | ) |
February 24, 2003 to September 30, 2003 (a) | | $ | 10.00 | | 0.13 | | | 0.16 | | | 0.29 | | | (0.13 | ) | | — | | | (0.13 | ) |
North Carolina Intermediate Tax-Free Fund | | | | | | | | | | | | | | | | | | | | | |
Year Ended September 30, 2004 | | $ | 10.81 | | 0.35 | | | (0.12 | ) | | 0.23 | | | (0.34 | ) | | (0.04 | ) | | (0.38 | ) |
Year Ended September 30, 2003 | | $ | 10.86 | | 0.35 | | | (0.01 | ) | | 0.34 | | | (0.35 | ) | | (0.04 | ) | | (0.39 | ) |
Year Ended September 30, 2002 | | $ | 10.54 | | 0.38 | | | 0.39 | | | 0.77 | | | (0.37 | ) | | (0.08 | ) | | (0.45 | ) |
Year Ended September 30, 2001 | | $ | 9.98 | | 0.40 | | | 0.56 | | | 0.96 | | | (0.40 | ) | | — | | | (0.40 | ) |
Year Ended September 30, 2000 | | $ | 9.89 | | 0.42 | | | 0.09 | | | 0.51 | | | (0.42 | ) | | — | | | (0.42 | ) |
South Carolina Intermediate Tax-Free Fund | | | | | | | | | | | | | | | | | | | | | |
Year Ended September 30, 2004 | | $ | 10.81 | | 0.35 | | | (0.06 | ) | | 0.29 | | | (0.35 | ) | | (0.01 | ) | | (0.36 | ) |
Year Ended September 30, 2003 | | $ | 10.81 | | 0.35 | | | — | (d) | | 0.35 | | | (0.35 | ) | | — | | | (0.35 | ) |
Year Ended September 30, 2002 | | $ | 10.39 | | 0.39 | | | 0.41 | | | 0.80 | | | (0.38 | ) | | — | | | (0.38 | ) |
Year Ended September 30, 2001 | | $ | 9.84 | | 0.40 | | | 0.55 | | | 0.95 | | | (0.40 | ) | | — | | | (0.40 | ) |
Year Ended September 30, 2000 | | $ | 9.74 | | 0.40 | | | 0.10 | | | 0.50 | | | (0.40 | ) | | — | | | (0.40 | ) |
Virginia Intermediate Tax-Free Fund | | | | | | | | | | | | | | | | | | | | | |
Year Ended September 30, 2004 | | $ | 11.95 | | 0.40 | | | (0.13 | ) | | 0.27 | | | (0.40 | ) | | (0.08 | ) | | (0.48 | ) |
Year Ended September 30, 2003 | | $ | 11.99 | | 0.39 | | | — | (d) | | 0.39 | | | (0.39 | ) | | (0.04 | ) | | (0.43 | ) |
Year Ended September 30, 2002 | | $ | 11.57 | | 0.43 | | | 0.41 | | | 0.84 | | | (0.42 | ) | | — | | | (0.42 | ) |
Year Ended September 30, 2001 | | $ | 10.96 | | 0.44 | | | 0.61 | | | 1.05 | | | (0.44 | ) | | — | | | (0.44 | ) |
Year Ended September 30, 2000 | | $ | 10.86 | | 0.46 | | | 0.10 | | | 0.56 | | | (0.46 | ) | | — | | | (0.46 | ) |
West Virginia Intermediate Tax-Free Fund | | | | | | | | | | | | | | | | | | | | | |
Year Ended September 30, 2004 | | $ | 10.21 | | 0.36 | | | (0.09 | ) | | 0.27 | | | (0.35 | ) | | (0.04 | ) | | (0.39 | ) |
Year Ended September 30, 2003 | | $ | 10.35 | | 0.35 | | | 0.02 | | | 0.37 | | | (0.35 | ) | | (0.16 | ) | | (0.51 | ) |
Year Ended September 30, 2002 | | $ | 10.02 | | 0.41 | | | 0.34 | | | 0.75 | | | (0.40 | ) | | (0.02 | ) | | (0.42 | ) |
February 1, 2001 to September 30, 2001 (b) | | $ | 9.93 | | 0.30 | | | 0.09 | | | 0.39 | | | (0.30 | ) | | — | | | (0.30 | ) |
Year Ended January 31, 2001 | | $ | 9.20 | | 0.49 | | | 0.73 | | | 1.22 | | | (0.49 | ) | | — | | | (0.49 | ) |
Year Ended January 31, 2000 | | $ | 10.27 | | 0.48 | | | (0.98 | ) | | (0.50 | ) | | (0.52 | ) | | (0.05 | ) | | (0.57 | ) |
| * | During the period certain fees were reduced. If such reductions had not occurred, the ratios would have been as indicated |
| ** | Portfolio Turnover is calculated on the basis of the Fund as a whole without distinguishing between classes of shares issued. |
| (a) | Period from commencement of operations. |
| (b) | For the period from February 1, 2001 to September 30, 2001. Upon reorganizing as a Fund of the BB&T Funds, the West Virginia Intermediate Tax-Free Fund changed its fiscal year end from January 31 to September 30. The Financial Highlights for the periods prior to February 1, 2001 represent the OVB West Virginia Tax-Exempt Income Portfolio. |
| (c) | Per share net investment income (loss) has been calculated using the average daily shares method. |
| (d) | Amount is less than $0.005. |
| (e) | Not annualized for periods less than one year. |
| (f) | Annualized for periods less than one year. |
See accompanying notes to the financial statements.
156
| | | | | | | | | | | | | | | | | | | |
| | | | Ratios/Supplementary Data
| |
Net Asset
Value,
End of
Period
| | Total
Return (e)
| | | Net Assets,
End of
Period
(000)
| | Ratio of
expenses to
average
net assets (f)
| | | Ratio of net
investment
income
(loss) to
average net
assets (f)
| | | Ratio of
expenses to
average
net assets* (f)
| | | Portfolio
turnover**
| |
| | | | | | | | | | | | | | | | | | | | |
| $ | 10.20 | | 2.61 | % | | $ | 13,441 | | 0.63 | % | | 2.78 | % | | 1.07 | % | | 24.78 | % |
| $ | 10.22 | | 3.63 | % | | $ | 14,759 | | 0.53 | % | | 2.56 | % | | 1.23 | % | | 42.87 | % |
| | | | | | | | | | | | | | | | | | | | |
| $ | 10.16 | | 2.52 | % | | $ | 9,108 | | 0.60 | % | | 2.47 | % | | 1.23 | % | | 55.18 | % |
| $ | 10.16 | | 2.93 | % | | $ | 4,897 | | 0.61 | % | | 2.27 | % | | 1.65 | % | | 40.16 | % |
| | | | | | | | | | | | | | | | | | | | |
| $ | 10.66 | | 2.15 | % | | $ | 96,738 | | 0.75 | % | | 3.18 | % | | 0.92 | % | | 67.80 | % |
| $ | 10.81 | | 3.19 | % | | $ | 95,613 | | 0.77 | % | | 3.26 | % | | 0.92 | % | | 44.56 | % |
| $ | 10.86 | | 7.62 | % | | $ | 93,856 | | 0.78 | % | | 3.57 | % | | 0.93 | % | | 20.39 | % |
| $ | 10.54 | | 9.73 | % | | $ | 90,679 | | 0.79 | % | | 3.84 | % | | 0.93 | % | | 47.35 | % |
| $ | 9.98 | | 5.31 | % | | $ | 81,510 | | 0.80 | % | | 4.27 | % | | 0.96 | % | | 80.33 | % |
| | | | | | | | | | | | | | | | | | | | |
| $ | 10.74 | | 2.77 | % | | $ | 17,488 | | 0.75 | % | | 3.26 | % | | 0.94 | % | | 32.63 | % |
| $ | 10.81 | | 3.35 | % | | $ | 18,297 | | 0.72 | % | | 3.31 | % | | 0.93 | % | | 32.04 | % |
| $ | 10.81 | | 7.94 | % | | $ | 17,960 | | 0.67 | % | | 3.70 | % | | 0.97 | % | | 21.81 | % |
| $ | 10.39 | | 9.76 | % | | $ | 15,411 | | 0.73 | % | | 3.89 | % | | 1.03 | % | | 36.67 | % |
| $ | 9.84 | | 5.27 | % | | $ | 14,386 | | 0.75 | % | | 4.11 | % | | 1.22 | % | | 84.20 | % |
| | | | | | | | | | | | | | | | | | | | |
| $ | 11.74 | | 2.29 | % | | $ | 68,786 | | 0.76 | % | | 3.37 | % | | 0.93 | % | | 45.07 | % |
| $ | 11.95 | | 3.31 | % | | $ | 77,577 | | 0.78 | % | | 3.28 | % | | 0.92 | % | | 34.17 | % |
| $ | 11.99 | | 7.48 | % | | $ | 81,683 | | 0.78 | % | | 3.66 | % | | 0.93 | % | | 13.12 | % |
| $ | 11.57 | | 9.72 | % | | $ | 76,284 | | 0.78 | % | | 3.87 | % | | 0.93 | % | | 31.28 | % |
| $ | 10.96 | | 5.35 | % | | $ | 77,727 | | 0.78 | % | | 4.30 | % | | 0.90 | % | | 64.45 | % |
| | | | | | | | | | | | | | | | | | | | |
| $ | 10.09 | | 2.76 | % | | $ | 63,518 | | 0.76 | % | | 3.49 | % | | 0.78 | % | | 16.24 | % |
| $ | 10.21 | | 3.77 | % | | $ | 79,361 | | 0.73 | % | | 3.48 | % | | 0.76 | % | | 25.59 | % |
| $ | 10.35 | | 7.78 | % | | $ | 78,170 | | 0.72 | % | | 4.04 | % | | 0.82 | % | | 61.44 | % |
| $ | 10.02 | | 4.03 | % | | $ | 75,332 | | 0.62 | % | | 4.60 | % | | 0.79 | % | | 15.75 | % |
| $ | 9.93 | | 13.57 | % | | $ | 72,553 | | 0.72 | % | | 5.11 | % | | 0.83 | % | | 7.00 | % |
| $ | 9.20 | | (5.04 | )% | | $ | 74,709 | | 0.72 | % | | 4.90 | % | | 0.77 | % | | 10.00 | % |
See accompanying notes to the financial statements.
157
BB&T Funds
Financial Highlights, Institutional Shares
Selected data for a share of beneficial interest outstanding throughout the periods indicated.
| | | | | | | | | | | | | | | | | | | | | |
| | | | | Investment Activities
| | | Dividends
| |
| | | Net Asset
Value,
Beginning
of Period
| | Net
investment
income
(loss)
| | |
Net realized/
unrealized
gains (losses)
on investments
| | | Total from
Investment
Activities
| | | Net
investment
income
| | | Net realized
gains on
investments
| | | Total
Dividends
| |
Prime Money Market Fund | | | | | | | | | | | | | | | | | | | | | |
Year Ended September 30, 2004 | | $ | 1.00 | | 0.01 | | | — | | | 0.01 | | | (0.01 | ) | | — | | | (0.01 | ) |
Year Ended September 30, 2003 | | $ | 1.00 | | 0.01 | | | — | | | 0.01 | | | (0.01 | ) | | — | | | (0.01 | ) |
Year Ended September 30, 2002 | | $ | 1.00 | | 0.02 | | | — | (c) | | 0.02 | | | (0.02 | ) | | — | | | (0.02 | ) |
Year Ended September 30, 2001 | | $ | 1.00 | | 0.05 | | | — | | | 0.05 | | | (0.05 | ) | | — | | | (0.05 | ) |
Year Ended September 30, 2000 | | $ | 1.00 | | 0.06 | | | — | | | 0.06 | | | (0.06 | ) | | — | | | (0.06 | ) |
U.S. Treasury Money Market Fund | | | | | | | | | | | | | | | | | | | | | |
Year Ended September 30, 2004 | | $ | 1.00 | | 0.01 | | | — | | | 0.01 | | | (0.01 | ) | | — | | | (0.01 | ) |
Year Ended September 30, 2003 | | $ | 1.00 | | 0.01 | | | — | | | 0.01 | | | (0.01 | ) | | — | | | (0.01 | ) |
Year Ended September 30, 2002 | | $ | 1.00 | | 0.02 | | | — | | | 0.02 | | | (0.02 | ) | | — | | | (0.02 | ) |
Year Ended September 30, 2001 | | $ | 1.00 | | 0.05 | | | — | | | 0.05 | | | (0.05 | ) | | — | | | (0.05 | ) |
Year Ended September 30, 2000 | | $ | 1.00 | | 0.05 | | | — | | | 0.05 | | | (0.05 | ) | | — | | | (0.05 | ) |
Capital Manager Conservative Growth Fund | | | | | | | | | | | | | | | | | | | | | |
Year Ended September 30, 2004 | | $ | 8.90 | | 0.18 | (b) | | 0.46 | | | 0.64 | | | (0.18 | ) | | — | | | (0.18 | ) |
Year Ended September 30, 2003 | | $ | 8.33 | | 0.18 | | | 0.61 | | | 0.79 | | | (0.18 | ) | | (0.04 | ) | | (0.22 | ) |
Year Ended September 30, 2002 | | $ | 9.17 | | 0.22 | | | (0.66 | ) | | (0.44 | ) | | (0.22 | ) | | (0.18 | ) | | (0.40 | ) |
Year Ended September 30, 2001 | | $ | 10.75 | | 0.32 | | | (1.00 | ) | | (0.68 | ) | | (0.32 | ) | | (0.58 | ) | | (0.90 | ) |
Year Ended September 30, 2000 | | $ | 10.43 | | 0.40 | | | 0.55 | | | 0.95 | | | (0.41 | ) | | (0.22 | ) | | (0.63 | ) |
Capital Manager Moderate Growth Fund | | | | | | | | | | | | | | | | | | | | | |
Year Ended September 30, 2004 | | $ | 8.30 | | 0.10 | (b) | | 0.74 | | | 0.84 | | | (0.10 | ) | | — | | | (0.10 | ) |
Year Ended September 30, 2003 | | $ | 7.47 | | 0.10 | | | 0.82 | | | 0.92 | | | (0.08 | ) | | (0.01 | ) | | (0.09 | ) |
Year Ended September 30, 2002 | | $ | 8.82 | | 0.14 | | | (0.99 | ) | | (0.85 | ) | | (0.13 | ) | | (0.37 | ) | | (0.50 | ) |
Year Ended September 30, 2001 | | $ | 11.25 | | 0.26 | | | (1.71 | ) | | (1.45 | ) | | (0.26 | ) | | (0.72 | ) | | (0.98 | ) |
Year Ended September 30, 2000 | | $ | 10.65 | | 0.34 | | | 0.89 | | | 1.23 | | | (0.34 | ) | | (0.29 | ) | | (0.63 | ) |
Capital Manager Growth Fund | | | | | | | | | | | | | | | | | | | | | |
Year Ended September 30, 2004 | | $ | 7.81 | | 0.07 | (b) | | 0.88 | | | 0.95 | | | (0.06 | ) | | — | | | (0.06 | ) |
Year Ended September 30, 2003 | | $ | 6.87 | | 0.06 | (b) | | 0.93 | | | 0.99 | | | (0.05 | ) | | — | | | (0.05 | ) |
Year Ended September 30, 2002 | | $ | 8.46 | | 0.05 | | | (1.20 | ) | | (1.15 | ) | | (0.04 | ) | | (0.40 | ) | | (0.44 | ) |
Year Ended September 30, 2001 | | $ | 11.66 | | 0.18 | | | (2.43 | ) | | (2.25 | ) | | (0.18 | ) | | (0.77 | ) | | (0.95 | ) |
Year Ended September 30, 2000 | | $ | 10.79 | | 0.29 | | | 1.23 | | | 1.52 | | | (0.29 | ) | | (0.36 | ) | | (0.65 | ) |
Capital Manager Equity Fund | | | | | | | | | | | | | | | | | | | | | |
Year Ended September 30, 2004 | | $ | 8.49 | | 0.04 | (b) | | 1.14 | | | 1.18 | | | (0.03 | ) | | — | | | (0.03 | ) |
Year Ended September 30, 2003 | | $ | 7.39 | | 0.02 | (b) | | 1.15 | | | 1.17 | | | (0.02 | ) | | (0.05 | ) | | (0.07 | ) |
Year Ended September 30, 2002 | | $ | 8.97 | | (0.01 | ) | | (1.57 | ) | | (1.58 | ) | | — | (c) | | — | | | — | |
March 19, 2001 to September 30, 2001 (a) | | $ | 10.00 | | 0.01 | | | (1.03 | ) | | (1.02 | ) | | (0.01 | ) | | — | (c) | | (0.01 | ) |
| * | During the period certain fees were reduced. If such reductions had not occurred, the ratios would have been as indicated. |
| ** | Portfolio Turnover is calculated on the basis of the Fund as a whole without distinguishing between classes of shares issued. |
| (a) | Period from commencement of operations. |
| (b) | Per share net investment income (loss) has been calculated using the average daily shares method. |
| (c) | Amount is less than $0.005. |
| (d) | Not annualized for periods less than one year. |
| (e) | Annualized for periods less than one year. |
See accompanying notes to the financial statements.
158
| | | | | | | | | | | | | | | | | | | |
| | | | | | Ratios/Supplementary Data
| |
Net Asset
Value,
End of
Period
| | Total
Return (d)
| | | Net Assets,
End of
Period
(000)
| | Ratio of
expenses to
average
net assets (e)
| | | Ratio of net
investment
income
(loss) to
average net
assets (e)
| | | Ratio of
expenses to
average
net assets* (e)
| | | Portfolio
turnover**
| |
| | | | | | | | | | | | | | | | | | | | |
| $ | 1.00 | | 0.70 | % | | $ | 529,849 | | 0.57 | % | | 0.69 | % | | 0.70 | % | | — | |
| $ | 1.00 | | 0.87 | % | | $ | 667,534 | | 0.60 | % | | 0.86 | % | | 0.69 | % | | — | |
| $ | 1.00 | | 1.61 | % | | $ | 532,465 | | 0.64 | % | | 1.54 | % | | 0.71 | % | | — | |
| $ | 1.00 | | 4.84 | % | | $ | 265,472 | | 0.61 | % | | 4.34 | % | | 0.75 | % | | — | |
| $ | 1.00 | | 5.70 | % | | $ | 78,331 | | 0.63 | % | | 5.62 | % | | 0.80 | % | | — | |
| | | | | | | | | | | | | | | | | | | | |
| $ | 1.00 | | 0.54 | % | | $ | 926,162 | | 0.57 | % | | 0.53 | % | | 0.71 | % | | — | |
| $ | 1.00 | | 0.67 | % | | $ | 838,022 | | 0.61 | % | | 0.67 | % | | 0.70 | % | | — | |
| $ | 1.00 | | 1.40 | % | | $ | 915,013 | | 0.65 | % | | 1.35 | % | | 0.72 | % | | — | |
| $ | 1.00 | | 4.59 | % | | $ | 494,773 | | 0.63 | % | | 4.46 | % | | 0.73 | % | | — | |
| $ | 1.00 | | 5.33 | % | | $ | 395,617 | | 0.63 | % | | 5.24 | % | | 0.73 | % | | — | |
| | | | | | | | | | | | | | | | | | | | |
| $ | 9.36 | | 7.16 | % | | $ | 67,925 | | 0.44 | % | | 1.93 | % | | 0.64 | % | | 2.47 | % |
| $ | 8.90 | | 9.55 | % | | $ | 31,748 | | 0.53 | % | | 2.09 | % | | 0.73 | % | | 33.03 | % |
| $ | 8.33 | | (5.05 | )% | | $ | 26,347 | | 0.54 | % | | 2.47 | % | | 0.74 | % | | 6.29 | % |
| $ | 9.17 | | (6.77 | )% | | $ | 27,691 | | 0.51 | % | | 3.26 | % | | 0.71 | % | | 35.75 | % |
| $ | 10.75 | | 9.31 | % | | $ | 31,808 | | 0.41 | % | | 3.75 | % | | 0.60 | % | | 38.27 | % |
| | | | | | | | | | | | | | | | | | | | |
| $ | 9.04 | | 10.12 | % | | $ | 33,971 | | 0.49 | % | | 1.17 | % | | 0.69 | % | | 0.17 | % |
| $ | 8.30 | | 12.40 | % | | $ | 26,168 | | 0.50 | % | | 1.35 | % | | 0.70 | % | | 21.46 | % |
| $ | 7.47 | | (10.55 | )% | | $ | 20,977 | | 0.58 | % | | 1.48 | % | | 0.78 | % | | 14.56 | % |
| $ | 8.82 | | (13.81 | )% | | $ | 25,040 | | 0.51 | % | | 2.67 | % | | 0.71 | % | | 24.24 | % |
| $ | 11.25 | | 11.63 | % | | $ | 26,616 | | 0.49 | % | | 2.98 | % | | 0.69 | % | | 46.69 | % |
| | | | | | | | | | | | | | | | | | | | |
| $ | 8.70 | | 12.10 | % | | $ | 28,660 | | 0.50 | % | | 0.77 | % | | 0.73 | % | | 0.19 | % |
| $ | 7.81 | | 14.49 | % | | $ | 21,484 | | 0.56 | % | | 0.82 | % | | 0.76 | % | | 17.80 | % |
| $ | 6.87 | | (14.61 | )% | | $ | 17,981 | | 0.62 | % | | 0.63 | % | | 0.82 | % | | 8.38 | % |
| $ | 8.46 | | (20.68 | )% | | $ | 20,855 | | 0.57 | % | | 1.93 | % | | 0.77 | % | | 27.33 | % |
| $ | 11.66 | | 14.28 | % | | $ | 26,538 | | 0.45 | % | | 2.49 | % | | 0.64 | % | | 43.28 | % |
| | | | | | | | | | | | | | | | | | | | |
| $ | 9.64 | | 13.87 | % | | $ | 21,051 | | 0.52 | % | | 0.42 | % | | 0.81 | % | | 3.10 | % |
| $ | 8.49 | | 15.82 | % | | $ | 16,077 | | 0.70 | % | �� | 0.29 | % | | 0.90 | % | | 8.30 | % |
| $ | 7.39 | | (17.61 | )% | | $ | 11,352 | | 0.83 | % | | (0.15 | )% | | 1.03 | % | | 5.75 | % |
| $ | 8.97 | | (10.22 | )% | | $ | 13,464 | | 0.72 | % | | 0.08 | % | | 0.92 | % | | 10.10 | % |
See accompanying notes to the financial statements.
159
BB&T Funds
Notes to Financial Statements September 30, 2004 |
The BB&T Funds commenced operations on October 5, 1992 and are registered under the Investment Company Act of 1940, as amended (“the 1940 Act”), as a diversified, open-end investment company established as a Massachusetts business trust.
The BB&T Funds offer shares of the Equity Income Fund, the Large Company Value Fund, the Large Company Growth Fund, the Mid Cap Value Fund, the Mid Cap Growth Fund, the Small Company Value Fund, the Small Company Growth Fund, the International Equity Fund, the Special Opportunities Equity Fund, the Short U.S. Government Fund, the Intermediate U.S. Government Fund, the Intermediate Corporate Bond Fund, the Kentucky Intermediate Tax-Free Fund, the Maryland Intermediate Tax-Free Fund, the North Carolina Intermediate Tax-Free Fund, the South Carolina Intermediate Tax-Free Fund, the Virginia Intermediate Tax-Free Fund, the West Virginia Intermediate Tax-Free Fund, the Prime Money Market Fund, the U.S. Treasury Money Market Fund, the Capital Manager Conservative Growth Fund, the Capital Manager Moderate Growth Fund, the Capital Manager Growth Fund and the Capital Manager Equity Fund (referred to individually as a “Fund” and collectively as the “Funds”). The Kentucky Intermediate Tax-Free Fund, the Maryland Intermediate Tax-Free Fund, the North Carolina Intermediate Tax-Free Fund, the South Carolina Intermediate Tax-Free Fund, the Virginia Intermediate Tax-Free Fund and the West Virginia Intermediate Tax-Free Fund are referred to as the “Tax-Free Funds”. The Prime Money Market Fund and the U.S. Treasury Money Market Fund are referred to as the “Money Market Funds”. The Capital Manager Conservative Growth Fund, the Capital Manager Moderate Growth Fund, the Capital Manager Growth Fund and the Capital Manager Equity Fund are referred to as the “Fund of Funds”. The Funds, excluding the Money Market Funds and the Fund of Funds, are referred to as the “Variable Net Asset Value Funds”. The Fund of Funds invest in other Fund Portfolios as opposed to individual securities.
The BB&T Funds are authorized to issue an unlimited amount of shares without par value. The Funds offer up to four classes of shares: Class A Shares, Class B Shares, Class C Shares and Institutional Shares. As of September 30, 2004, Class B Shares and Class C Shares of the Short U.S. Government Fund and the Tax-Free Funds were not yet being offered.
Each class of shares has identical rights and privileges except with respect to the fees paid under the distribution plan, voting rights on matters affecting a single class of shares and the exchange privilege of each class of shares.
Under the Funds’ organizational documents, its’ Officers and Trustees are indemnified against certain liabilities arising out of the performance of their duties to the Funds. In addition, in the normal course of business, the Funds enter into contracts with their vendors and others that provide for general indemnifications. The Funds’ maximum exposure under these arrangements is unknown as this would involve future claims that may be made against the Funds. However, based on experience, the Funds expect that risk of loss to be remote.
| 2. | Significant Accounting Policies: |
The following is a summary of significant accounting policies followed by the Funds in the preparation of their financial statements. The policies are in conformity with accounting principles generally accepted in the United States of America. The preparation of financial statements requires management to make estimates and assumptions that affect the reported amounts of assets and liabilities and disclosure of contingent assets and liabilities at the date of the financial statements and the reported amounts of income and expenses for the period. Actual results could differ from those estimates.
Securities Valuation:
Investments of the Money Market Funds are valued in accordance with Rule 2a-7 of the 1940 Act, at amortized cost, which approximates fair value. Under the amortized cost method, discount or premium is amortized on a constant basis to the maturity of the security.
Investments in common stocks, commercial paper, corporate bonds, municipal securities, U.S. Government securities, and U.S. Government agency securities of the Variable Net Asset Value Funds, the principal market for which is a securities exchange or an over-the-counter market, are valued at their latest available sale price (except for those securities that are traded on NASDAQ, which will be valued at the NASDAQ official closing price) or in the absence of such a price, by reference to the latest available bid quotations in the principal market in which such securities are normally traded. TheVariable Net Asset Value
Continued
160
BB&T Funds
Notes to Financial Statements, continued September 30, 2004 |
Funds may also use an independent pricing service approved by the Board of Trustees to value certain securities. Such prices reflect fair values which may be established through the use of electronic and matrix techniques. Short-term obligations that mature in 60 days or less are valued at either amortized cost or original cost plus interest, which approximates fair value. Investments in open-end investment companies, including the Fund of Funds, are valued at their respective net asset values as reported by such companies. Investments in closed-end investment companies are valued at their fair values based upon the latest available bid prices in the principal market in which such securities are normally traded. The differences between cost and fair values of investments are reflected as either unrealized appreciation or depreciation. Securities for which market quotations are not readily available will be valued at fair value using methods determined in good faith by the Pricing Committee under the supervision of the Board of Trustees.
Fair value pricing may be used for significant events such as securities whose trading has been suspended, whose price has become stale or for which there is no currently available price. Effective February 1, 2004, the International Equity Fund began utilizing a Fair Value Pricing Service to determine the fair value of securities when certain significant events occur.
Foreign Currency Translation:
The accounting records of the International Equity Fund are maintained in U.S. dollars. Foreign currency amounts are translated into U.S. dollars at the current rate of exchange to determine the fair value of investments, assets and liabilities. Purchases and sales of securities, and income and expenses are translated at the prevailing rate of exchange, on the respective dates of such transactions. The International Equity Fund does not isolate that portion of the results of operations resulting from changes in foreign exchange rates on investments from fluctuations arising from changes in market prices of securities held. Such fluctuations are included with the net realized and unrealized gain or loss from investments and foreign currencies.
Risks Associated with Foreign Securities and Currencies:
Investments in securities of foreign issuers carry certain risks not ordinarily associated with investments in securities of domestic issuers. Such risks include future political and economic developments, and the possible imposition of exchange controls or other foreign governmental laws and restrictions. In addition, with respect to certain countries, there is the possibility of expropriation of assets, confiscatory taxation, political or social instability or diplomatic developments which could adversely affect investments in those countries.
Forward Foreign Currency Exchange Contracts:
The International Equity Fund may enter into forward foreign currency exchange contracts in connection with planned purchases or sales of securities or to hedge the U.S. dollar value of Fund securities denominated in a particular currency. The Fund could be exposed to risks if the counter-parties to the contracts are unable to meet the terms of their contracts and from unanticipated movements in the value of a foreign currency relative to the U.S. dollar. The forward foreign currency exchange contracts are adjusted by the daily exchange rate of the underlying currency and any gains or losses are recorded for financial statement purposes as unrealized gains or losses until the contract settlement date.
Futures Contracts:
The Variable Net Asset Value Funds may invest in financial futures contracts for the purpose of hedging their existing securities or securities it intends to purchase against fluctuations in fair value caused by changes in prevailing markets. Upon entering into a financial futures contract, the Fund is required to pledge to the broker an amount of cash and/or other assets equal to a certain percentage of the contract amount (initial margin deposit). Subsequent payments, known as “variation margin,” are made or received by the Fund each day, depending on the daily fluctuations in the fair value of the underlying security. The Fund recognizes a gain or loss equal to the daily variation margin. Should market conditions move unexpectedly, the Fund may not achieve the anticipated benefits of the financial futures contracts and may realize a loss. The use of futures transactions involves the risk of imperfect correlation in movements in the price of futures contracts and the underlying hedged assets. The Funds held no financial futures contracts as of September 30, 2004.
Securities Transactions and Related Income:
Securities transactions are accounted for no later than one business day after trade date. However, for financial reporting purposes security transactions are accounted for on trade date. Interest income is recognized on the accrual basis and includes, where
Continued
161
BB&T Funds
Notes to Financial Statements, continued September 30, 2004 |
applicable, the pro rata amortization/accretion of premium or discount. Dividend income is recorded on the ex-dividend date. Gains or losses realized from sales of securities are determined by comparing the identified cost of the security lot sold with the net sales proceeds.
When-Issued and Forward Commitments:
The Funds, with the exception of the U.S. Treasury Money Market Fund, may purchase securities on a “when-issued” basis. The Equity Income Fund, the Large Company Value Fund, the Large Company Growth Fund, the Mid Cap Value Fund, the Mid Cap Growth Fund, the Small Company Value Fund, the Small Company Growth Fund, the International Equity Fund, the Special Opportunities Equity Fund and the Prime Money Market Fund may also purchase or sell securities on a forward commitment basis. The Funds record when-issued securities on the trade date and pledge assets with a value equal to the purchase commitment for payment of the securities purchased. The value of the securities underlying when-issued or forward commitments to purchase securities, and any subsequent fluctuation in their value, is taken into account when determining the net asset value of the Funds commencing with the date the Funds agree to purchase the securities. The Funds do not accrue interest or dividends on “when-issued” securities until the underlying securities are received. The Funds held no when-issued securities as of September 30, 2004.
Repurchase Agreements and Collateralized Loan Agreements:
The Funds may enter into agreements with member banks of the Federal Deposit Insurance Corporation and with registered broker/dealers that BB&T deems creditworthy under guidelines approved by the Board of Trustees, subject to the seller’s agreement to repurchase such securities at a mutually agreed-upon date and price. The repurchase price generally equals the price paid by the Fund plus interest negotiated on the basis of current short-term rates, which may be more or less than the rate on the underlying Fund securities. The seller, under these types of agreements, is required to maintain the value of collateral held pursuant to the agreement at not less than the repurchase price (including accrued interest). Securities subject to repurchase are held by the Funds’ custodian, another qualified custodian, or in the Federal Reserve/Treasury book-entry system. In the event of counterparty default, the Fund has the right to use the collateral to offset losses incurred. There is potential for loss to the Fund in the event the Fund is delayed or prevented from exercising its rights to dispose of the collateral securities, including the risk of a possible decline in the fair value of the underlying securities during the period while the Fund seeks to assert its rights.
Written Options:
Each Variable Net Asset Value Fund may write covered call options and purchase put options that are traded on recognized U.S. exchanges and enter into closing transactions with respect to such options. The Funds may also purchase put and call options. The Variable Net Asset Value Funds may enter into options transactions for hedging purposes, and will not use these instruments for speculation. The Equity Income Fund and Special Opportunities Equity Fund had the following transactions in written covered call options during the period ended September 30, 2004:
| | | | | | | | | | | | |
| | | Equity Income Fund
| | Special Opportunities
Equity Fund
| |
Covered Call Options
| | Contracts
| | Premiums
| | Contracts
| | | Premiums
| |
Balance at beginning of period | | — | | $ | — | | — | | | $ | — | |
Options written | | 885 | | | 13,207 | | 3,590 | | | | 381,347 | |
Options closed | | — | | | — | | — | | | | — | |
Options expired | | — | | | — | | (1,542 | ) | | | (79,792 | ) |
Options exercised | | — | | | — | | — | | | | — | |
| | |
| |
|
| |
|
| |
|
|
|
Options outstanding at end of period | | 885 | | $ | 13,207 | | 2,048 | | | $ | 301,555 | |
| | |
| |
|
| |
|
| |
|
|
|
Continued
162
BB&T Funds
Notes to Financial Statements, continued September 30, 2004 |
The following is a summary of options outstanding as of September 30, 2004:
| | | | | |
Security
| | Contracts
| | Fair Value
|
Equity Income Fund | | | | | |
Nokia Corp. — ADR, $17.50, 1/22/05 | | 885 | | $ | 13,275 |
| | | | |
|
|
Special Opportunities Equity Fund | | | | | |
XTO Energy, Inc. $35.00, 2/19/05 | | 276 | | $ | 44,160 |
L-3 Communications Holdings, Inc., $75.00, 1/22/05 | | 477 | | | 33,660 |
CACI International, Inc. — Class A $55.00, 12/18/04 | | 660 | | | 145,200 |
Coventry Health Care, Inc. $55.00, 10/16/04 | | 635 | | | 25,400 |
| | | | |
|
|
| | | | | $ | 248,420 |
| | | | |
|
|
Security Loans:
To generate additional income, the Funds may lend up to 33 1/3% of their respective assets pursuant to agreements requiring that the loan be continuously secured by any combination of cash, U.S. Government or U.S. Government agency securities, equal at all times to at least 100% of the fair value. The cash collateral received by the Funds was pooled and at September 30, 2004 was invested in Commercial Paper, Corporate Bonds, Mutual Funds, and Repurchase Agreements (with interest rates ranging from 0.75% to 1.92% and maturity dates ranging from October 2004 through September 2005). The Funds receive payments from borrowers equivalent to the dividends and interest that would have been earned on securities lent while simultaneously seeking to earn income on the investment of collateral. Collateral is marked to market daily to provide a level of collateral at least equal to the fair value of securities lent. There may be risks of delay in recovery of the securities or even loss of rights in the collateral should the borrower of the securities fail financially. However, loans will be made only to borrowers, such as broker-dealers, banks or institutional borrowers of securities, deemed by BB&T to be of good standing and creditworthy under guidelines established by the Board of Trustees and when, in the judgement of BB&T, the consideration which can be earned currently from such securities loans justifies the attendant risks. Loans are subject to termination by the Funds or the borrower at any time and are, therefore, not considered to be illiquid investments. As of September 30, 2004, the following Funds had loans outstanding:
| | | | | | | | | | |
| | | Value of Collateral
| | Value of Loaned Securities
| | Average Value on Loan for the
period ended
September 30,
2004
| |
Large Company Value Fund | | $ | 214,201,090 | | $ | 207,370,816 | | $ | 179,092,740 | (1) |
Large Company Growth Fund | | | 142,033,534 | | | 137,945,282 | | | 152,620,085 | |
Mid Cap Value Fund | | | 53,754,118 | | | 52,192,156 | | | 52,625,011 | (1) |
Mid Cap Growth Fund | | | 62,731,209 | | | 61,029,724 | | | 58,914,108 | |
Small Company Value Fund | | | 13,885,225 | | | 13,331,216 | | | 10,106,196 | |
Small Company Growth Fund | | | 28,371,625 | | | 27,515,248 | | | 28,789,043 | |
Short U.S. Government Fund | | | 92,254,937 | | | 89,846,550 | | | 95,078,704 | |
Intermediate U.S. Government Fund | | | 209,338,787 | | | 204,703,087 | | | 232,274,342 | |
Intermediate Corporate Bond Fund | | | 64,919,944 | | | 63,316,678 | | | 41,078,905 | |
U.S. Treasury Money Market Fund | | | — | | | — | | | 157,574,767 | |
| (1) | Large Company Value Fund and Mid Cap Value Fund began loaning securities in March 2004. The average disclosed is for the time period that securities were lent. |
Expense Allocation:
Expenses directly attributable to a Fund are charged to that Fund. Expenses not directly attributable to a Fund are allocated proportionately among all Funds daily in relation to the net assets of each Fund or on another reasonable basis. Each class of shares bears its pro-rata portion of expenses attributable to its series, except that each class separately bears expenses related specifically to that class, such as distribution fees.
Continued
163
BB&T Funds
Notes to Financial Statements, continued September 30, 2004 |
Dividends to Shareholders:
Dividends from net investment income are declared daily and paid monthly for the Short U.S. Government Fund, the Intermediate U.S. Government Fund, the Intermediate Corporate Bond Fund, the Tax-Free Funds and the Money Market Funds. Dividends from net investment income are declared and paid monthly for the Large Company Value Fund, the Mid Cap Value Fund and the Small Company Value Fund. Dividends from net investment income are declared and paid quarterly for the Equity Income Fund, the Large Company Growth Fund, the Mid Cap Growth Fund, the Small Company Growth Fund, the International Equity Fund, the Special Opportunities Equity Fund and the Fund of Funds. Distributable net realized gains, if any, are declared and distributed at least annually.
The character of income and gains distributed are determined in accordance with federal income tax regulations, which may differ from accounting principles generally accepted in the United States of America. These “book/tax” differences are either considered temporary or permanent in nature. To the extent these differences are permanent in nature (i.e. reclass of market discounts, gain/loss, paydowns, and distributions), such amounts are reclassified within the composition of net assets based on their federal tax-basis treatment; temporary differences do not require reclassification. Dividends to shareholders which exceed net investment income and net realized gains for tax purposes are reported as distributions of capital.
Redemption Fees:
For the BB&T Funds, certain shares purchased on or after January 1, 2004, that were redeemed or exchanged in less than 30 days were assessed a fee of 2% of the total redemption amount. The fee is applied to shares redeemed or exchanged in the order in which they were purchased and is retained by the Funds for the benefit of remaining shareholders to defray Fund portfolio transaction expenses and facilitate portfolio management. For financial statement purposes, these amounts are included in the Statement of Changes in Net Assets as “Proceeds from Shares Issued”. Fees for the Funds during the period January 1, 2004 through September 30, 2004 were as follows:
| | | |
Fund
| | Amount
|
Equity Income Fund | | $ | — |
Large Company Value Fund | | | 24 |
Large Company Growth Fund | | | 92 |
Mid Cap Value Fund | | | 61 |
Mid Cap Growth Fund | | | 428 |
Small Company Value Fund | | | — |
Small Company Growth Fund | | | 450 |
International Equity Fund | | | 6,587 |
Special Opportunities Equity Fund | | | 54 |
Short U.S. Government Fund | | | 1,733 |
Intermediate U.S. Government Fund | | | 2,209 |
Intermediate Corporate Bond Fund | | | 1,394 |
Kentucky Intermediate Tax-Free Fund | | | — |
Maryland Intermediate Tax-Free Fund | | | — |
North Carolina Intermediate Tax-Free Fund | | | — |
South Carolina Intermediate Tax-Free Fund | | | — |
Virginia Intermediate Tax-Free Fund | | | — |
West Virginia Intermediate Tax-Free Fund | | | — |
Prime Money Market Fund | | | — |
U.S. Treasury Money Market Fund | | | — |
Capital Manager Conservative Growth Fund | | | 91 |
Capital Manager Moderate Growth Fund | | | 512 |
Capital Manager Growth Fund | | | 214 |
Capital Manager Equity Fund | | | 30 |
Continued
164
BB&T Funds
Notes to Financial Statements, continued September 30, 2004 |
| 3. | Conversion of Common Trust Funds |
On March 19, 2004, net assets of certain common trust funds managed by BB&T Asset Management, Inc. (“BB&T”) were exchanged in a tax-free conversion for Institutional shares of the corresponding BB&T Funds. The following is a summary of shares issued, net assets converted, net asset value per share issued and unrealized appreciation/depreciation of assets acquired as of the conversion date:
| | | | | | | | | | | |
March 19, 2004
| | Shares Issued
| | Net Assets
Converted
| | Net Asset
Value Per
Share Issued
| | Unrealized Appreciation
|
Large Company Value Fund | | 3,756,814 | | $ | 63,782,610 | | $ | 16.98 | | $ | 10,237,168 |
Large Company Growth Fund | | 5,005,398 | | | 42,521,740 | | | 8.50 | | | 18,117,068 |
Intermediate U.S. Government Fund | | 5,988,154 | | | 62,847,783 | | | 10.50 | | | 3,072,834 |
| 4. | Purchase and Sales of Securities |
Purchase and sales of securities (excluding short-term and U.S. Government securities) for the year ended September 30, 2004 are as follows:
| | | | | | |
| | | Purchases
| | Sales
|
Equity Income Fund | | $ | 27,157,897 | | $ | 422,669 |
Large Company Value Fund | | | 102,244,476 | | | 99,229,220 |
Large Company Growth Fund | | | 454,585,702 | | | 437,619,063 |
Mid Cap Value Fund | | | 53,706,534 | | | 33,705,134 |
Mid Cap Growth Fund | | | 175,983,455 | | | 168,375,632 |
Small Company Value Fund | | | 15,171,853 | | | 6,132,898 |
Small Company Growth Fund | | | 242,976,696 | | | 291,013,330 |
Special Opportunities Equity Fund | | | 55,169,744 | | | 19,284,848 |
International Equity Fund | | | 118,313,475 | | | 112,277,915 |
Short U.S. Government Fund | | | 3,002,070 | | | 4,998,380 |
Intermediate U.S. Government Fund | | | 20,797,789 | | | 16,200,398 |
Intermediate Corporate Bond Fund | | | 113,534,508 | | | 64,868,924 |
Kentucky Intermediate Tax-Free Fund | | | 4,016,223 | | | 4,404,149 |
Maryland Intermediate Tax-Free Fund | | | 8,113,415 | | | 3,930,109 |
North Carolina Intermediate Tax-Free Fund | | | 80,133,277 | | | 82,226,786 |
South Carolina Intermediate Tax-Free Fund | | | 7,172,516 | | | 8,293,028 |
Virginia Intermediate Tax-Free Fund | | | 36,045,423 | | | 38,540,897 |
West Virginia Intermediate Tax-Free Fund | | | 12,701,949 | | | 29,911,865 |
Capital Manager Conservative Growth Fund | | | 38,197,504 | | | 1,713,500 |
Capital Manager Moderate Growth Fund | | | 25,636,754 | | | 98,000 |
Capital Manager Growth Fund | | | 14,435,235 | | | 85,000 |
Capital Manager Equity Fund | | | 8,358,661 | | | 757,861 |
Purchases and sales of long-term U.S. Government Securities for the year ended September 30, 2004 are as follows:
| | | | | | |
| | | Purchases
| | Sales
|
Short U.S. Government Fund | | $ | 121,784,417 | | $ | 112,460,396 |
Intermediate U.S. Government Fund | | | 526,204,586 | | | 468,965,753 |
Intermediate Corporate Bond Fund | | | 11,819,786 | | | 11,974,744 |
Continued
165
BB&T Funds
Notes to Financial Statements, continued September 30, 2004 |
Restricted Securities:
A restricted security is a security which has been purchased through a private offering and cannot be resold to the general public without prior registration under the Securities Act of 1933 (the “1933 Act”) or pursuant to the resale limitations provided by Rule 144 under the 1933 Act, or an exemption from the registration requirements of the 1933 Act. Whether a restricted security is illiquid is determined pursuant to guidelines established by the Board of Trustees. Not all restricted securities are considered illiquid. At September 30, 2004, BB&T North Carolina Intermediate Tax-Free Fund, BB&T Virginia Intermediate Tax-Free Fund, and BB&T Prime Money Market Fund held restricted securities representing 2.1%, 1.2%, and 9.9% of net assets, respectively. The restricted securities held as of September 30, 2004 are identified below:
| | | | | | | | |
Security
| | Acquisition
Date
| | Acquisition
Cost
| | Principal
Amount
| | Fair Value
|
BB&T North Carolina Intermediate Tax-Free Fund | | | | | | | | |
North Carolina Capital Facilities Finance Agency, 5.25%, 5/1/15, Callable 5/1/06 @ 102 | | 5/15/2003 | | 2,443,866 | | 2,439,646 | | 2,495,709 |
BB&T Virginia Intermediate Tax-Free Fund | | | | | | | | |
Virginia Gateway Community Development Authority, 6.375%, 3/1/30, Callable 3/1/13 @ 102 | | 12/2/2003 | | 1,000,000 | | 1,000,000 | | 1,005,600 |
BB&T Prime Money Market Fund | | | | | | | | |
Allstate Life Insurance Co., 1.93%, 12/1/04 | | 12/7/2000 | | 2,000,000 | | 2,000,000 | | 2,000,000 |
Blue Heron Funding, Ltd., Series 3A, Class A, 1.85%, 10/29/04 | | 10/29/2002 | | 30,000,000 | | 30,000,000 | | 30,000,000 |
General Electric Capital Assurance Corp., 1.815%, 11/8/04 | | 5/21/2003 | | 5,000,000 | | 5,000,000 | | 5,000,000 |
Goldman Sachs Group, Inc., 2.06%, 3/10/05 | | 5/9/2003 | | 10,000,000 | | 10,000,000 | | 10,000,000 |
Jackson National Life Insurance Co., 1.92%, 10/22/04 | | 10/23/2000 | | 3,000,000 | | 3,000,000 | | 3,000,000 |
Metropolitan Life Insurance Co., 1.85%, 11/1/04 | | 2/10/2003 | | 5,000,000 | | 5,000,000 | | 5,000,000 |
Monet Trust, 2000-1, 2.03%, 10/28/04 | | 12/23/2003 | | 25,000,000 | | 25,000,000 | | 25,000,000 |
Monet Trust, 2000-1, 2.03%, 10/28/04 | | 3/28/2003 | | 5,000,000 | | 5,000,000 | | 5,000,000 |
New York Life Insurance Co., 1.89%, 11/26/04 | | 8/28/2003 | | 5,000,000 | | 5,000,000 | | 5,000,000 |
Travelers Insurance Co., 1.83%, 11/19/04 | | 8/20/2003 | | 5,000,000 | | 5,000,000 | | 5,000,000 |
Continued
166
BB&T Funds
Notes to Financial Statements, continued September 30, 2004 |
| 5. | Related Party Transactions: |
Investment advisory services are provided to the Funds by BB&T. Under the terms of the Investment Advisory Agreement, BB&T is entitled to receive fees based on a percentage of the average daily net assets of each of the Funds.
Information regarding these transactions is as follows for the year ended September 30, 2004:
| | | | | | |
| | | Annual
Fee Rate
| | | Contractual
Fee Rate*
| |
Equity Income Fund | | 0.70 | % | | 0.40 | % |
Large Company Value Fund | | 0.74 | % | | 0.67 | % |
Large Company Growth Fund | | 0.74 | % | | 0.67 | % |
Mid Cap Value Fund | | 0.74 | % | | 0.67 | % |
Mid Cap Growth Fund | | 0.74 | % | | 0.67 | % |
Small Company Value Fund | | 1.00 | % | | 0.80 | % |
Small Company Growth Fund | | 1.00 | % | | 0.85 | % |
Special Opportunities Equity Fund | | 0.80 | % | | 0.80 | % |
International Equity Fund | | 1.00 | % | | 0.90 | % |
Short U.S. Government Fund | | 0.60 | % | | 0.45 | % |
Intermediate U.S. Government Fund | | 0.60 | % | | 0.50 | % |
Intermediate Corporate Bond Fund | | 0.60 | % | | 0.50 | % |
Kentucky Intermediate Tax-Free Fund | | 0.60 | % | | 0.45 | % |
Maryland Intermediate Tax-Free Fund | | 0.60 | % | | 0.45 | % |
North Carolina Intermediate Tax-Free Fund | | 0.60 | % | | 0.45 | % |
South Carolina Intermediate Tax-Free Fund | | 0.60 | % | | 0.45 | % |
Virginia Intermediate Tax-Free Fund | | 0.60 | % | | 0.45 | % |
West Virginia Intermediate Tax-Free Fund | | 0.45 | % | | 0.45 | % |
Prime Money Market Fund | | 0.40 | % | | 0.30 | % |
U.S. Treasury Money Market Fund | | 0.40 | % | | 0.28 | % |
Capital Manager Conservative Growth Fund | | 0.25 | % | | 0.15 | % |
Capital Manager Moderate Growth Fund | | 0.25 | % | | 0.15 | % |
Capital Manager Growth Fund | | 0.25 | % | | 0.15 | % |
Capital Manager Equity Fund | | 0.25 | % | | 0.15 | % |
| * | Effective February 1, 2004, BB&T has contractually agreed to waive a portion of the investment advisory fees as disclosed in the table above. For the period ended September 30, 2004, BB&T voluntarily agreed to waive an additional portion of the investment advisory fees. All contractual and voluntary investment advisory fee waivers are not subject to recoupment in subsequent fiscal periods. |
Pursuant to a Sub-Advisory agreement with BB&T, UBS Global Asset Management (Americas), Inc. (“UBS”) serves as the Sub-Advisor to the International Equity Fund. Under the agreement, UBS manages the International Equity Fund subject to the general supervision of the Funds’ Board of Trustees and BB&T. Pursuant to a Sub-Advisory agreement with BB&T, Federated Investment Management Company (“Federated”) serves as the Sub-Advisor to the Prime Money Market Fund. Under the agreement, Federated manages the Prime Money Market Fund subject to the general supervision of the Funds’ Board of Trustees and BB&T. Pursuant to a Sub-Advisory agreement with BB&T, Scott & Stringfellow, Inc. serves as the Sub-Advisor to the Equity Income Fund and the Special Opportunities Equity Fund. Under the agreement, Scott & Stringfellow, Inc. manages the Equity Income Fund and the Special Opportunities Equity Fund subject to the general supervision of the Funds’ Board of Trustees and BB&T. For their services, Sub-Advisors are entitled to a fee, payable by BB&T.
BISYS Fund Services Limited Partnership d/b/a BISYS Fund Services (“BISYS”), an Ohio Limited Partnership, and BISYS Fund Services Ohio, Inc. (“BISYS Ohio”) are subsidiaries of the BISYS Group, Inc. BISYS, with whom certain officers of the Funds are affiliated, serves the Funds as administrator and distributor. Such officers are paid no fees directly by the Funds for serving as officers of the Funds. BISYS Ohio serves the Funds as fund accountant and transfer agent. BISYS and BISYS Ohio
Continued
167
BB&T Funds
Notes to Financial Statements, continued September 30, 2004 |
receive compensation for providing administration, fund accounting and transfer agency services at a rate of 0.25% of the average daily net assets of each Fund. The fee is accrued daily and payable on a monthly basis. BISYS Ohio may directly or through an affiliate, use their fee revenue, past profits, or other revenue sources to pay promotional, administrative, shareholder support, and other expenses to third parties, including broker dealers, in connection with the offer, sale and administration of shares of the Funds. In addition, BISYS provides an employee to serve as Chief Compliance Officer for the Fund including providing certain related services, for which it receives an additional fee.
The Funds have adopted a Distribution and Shareholder Services Plan (the “Plan”) in accordance with Rule 12b-1 under the 1940 Act. The Plan provides for payments to the distributor of up to 0.50%, 1.00% and 1.00% of the average daily net assets of the Class A Shares, Class B Shares, and Class C Shares, respectively, with exception of the Mid Cap Value Fund, the Mid Cap Growth Fund and the West Virginia Intermediate Tax-Free Fund which receives payments of up to 0.25% of the average daily net assets per Class A. The fees may be used by BISYS to pay banks, including the advisor, broker dealers and other institutions. As distributor, BISYS, is entitled to receive commissions on sales of shares of the Variable Net Asset Value Funds. For the period ended September 30, 2004, BISYS received $3,311,334 from commissions earned on sales of shares of the Funds’ Variable Net Asset Value Funds, of which $2,923,159 was allowed to affiliated broker/dealers of the Funds.
BISYS has voluntarily agreed to waive a portion of the administration and distribution fees throughout the year. Effective February 1, 2004 and through January 31, 2005, BISYS has contractually agreed to waive 0.25% of the distribution fees of the Funds except for the Mid Cap Value Fund, Mid Cap Growth Fund, West Virginia Intermediate Tax-Free Fund, Prime Money Market Fund and the U.S. Treasury Money Market Fund. All contractual and voluntary administration and distribution fee waivers are not subject to recoupment in subsequent fiscal periods.
Certain Officers and Trustees of the Trust are affiliated with the Adviser or the Administrator. Such Officers and Trustees receive no compensation from the Funds for serving in their respective roles, except the Chief Compliance Officer. Each of the five non-interested Trustees who served both on the Board and the audit committee will be compensated $28,000 ($140,000 in total) in meeting & retainer fees, plus reimbursement for certain expenses. During the year ended September 30, 2004, actual Trustee compensation was $157,000 in total. The difference relates to changes in the composition of the Board itself and a change in the meeting & retainer base fee.
Custody services are provided to the Funds, with the exception of the International Equity Fund and the Prime Money Market Fund, by BB&T. Under the terms of the Custody agreement, BB&T is entitled to receive compensation at a rate of 0.02% of the average daily net assets of each of the Funds, except for the exceptions noted above. The fee is accrued daily and payable on a monthly basis.
Pursuant to a Sub-Custody agreement with BB&T, U.S. Bank NA (“U.S. Bank”) serves as the Sub-Custodian to the Funds, with the exception of the International Equity Fund and the Prime Money Market Fund. Under the agreement, U.S. Bank serves as custodian, subject to the general supervision of the Funds’ Board of Trustees and BB&T. For these services, U.S. Bank is entitled to a fee, payable by BB&T.
| 6. | Concentration of Credit Risk: |
The Tax-Free Funds invest primarily in debt instruments of municipal issuers in their respective states. The issuers’ abilities to meet their obligations may be affected by economic developments in a specific state or region.
| 7. | Federal Income Tax Information: |
It is the policy of the Funds to qualify or continue to qualify as a regulated investment company by complying with the provisions available to certain investment companies, as defined in applicable sections of the Internal Revenue Code, and to make distributions of net investment income and net realized capital gains sufficient to relieve it from all, or substantially all, federal income taxes. Accordingly, no provision for federal income tax is required.
Continued
168
BB&T Funds
Notes to Financial Statements, continued September 30, 2004 |
At September 30, 2004, the following Funds have net capital loss carryforwards to offset future net capital gains, if any, to the extent provided by the Treasury regulations. To the extent that these carryforwards are used to offset future capital gains, it is probable that the gains that are offset will not be distributed to shareholders.
| | | | | |
| | | Amount
| | Expires
|
Large Company Value Fund | | $ | 2,046,161 | | 2011 |
Large Company Growth Fund | | | 14,940,532 | | 2010 |
Large Company Growth Fund | | | 32,172,081 | | 2011 |
Small Company Growth Fund | | | 50,452,181 | | 2010 |
Small Company Growth Fund | | | 33,735,633 | | 2011 |
International Equity Fund | | | 24,798,262 | | 2010 |
International Equity Fund | | | 18,261,749 | | 2011 |
Short U.S. Government Fund | | | 349,217 | | 2008 |
Short U.S. Government Fund | | | 498,342 | | 2009 |
Short U.S. Government Fund | | | 118,919 | | 2012 |
Kentucky Intermediate Tax-Free Fund | | | 50,859 | | 2011 |
Maryland Intermediate Tax-Free Fund | | | 18,343 | | 2011 |
Capital Manager Conservative Growth Fund | | | 2,499,567 | | 2012 |
Capital Manager Moderate Growth Fund | | | 1,485,767 | | 2012 |
Capital Manager Growth Fund | | | 64,089 | | 2011 |
Capital Manager Growth Fund | | | 1,210,366 | | 2012 |
Capital Manager Equity Fund | | | 85,258 | | 2012 |
The tax characteristics of dividends paid to shareholders during the fiscal year ended September 30, 2004, were as follows:
| | | | | | | | | | | | | | | | | | |
| | | Distributions paid from
| | | | | | | | |
| | | Ordinary
Income
| | Net
Long-Term
Gains
| | Total Taxable
Distributions
| | Tax Exempt
Distributions
| | Tax
Return
of
Capital
| | Total
Distributions
Paid
|
Large Company Value Fund | | $ | 9,481,337 | | $ | — | | $ | 9,481,337 | | $ | — | | $ | — | | $ | 9,481,337 |
Mid Cap Value Fund | | | 2,529,734 | | | — | | | 2,529,734 | | | — | | | — | | | 2,529,734 |
Small Company Value Fund | | | 528,930 | | | — | | | 528,930 | | | — | | | — | | | 528,930 |
Special Opportunities Equity Fund | | | 330,336 | | | — | | | 330,336 | | | — | | | — | | | 330,336 |
International Equity Fund | | | 2,454,968 | | | — | | | 2,454,968 | | | — | | | — | | | 2,454,968 |
Short U.S. Government Fund | | | 5,989,108 | | | — | | | 5,989,108 | | | — | | | — | | | 5,989,108 |
Intermediate U.S. Government Fund | | | 17,695,365 | | | 5,843,582 | | | 23,538,947 | | | — | | | — | | | 23,538,947 |
Intermediate Corporate Bond Fund | | | 11,797,025 | | | — | | | 11,797,025 | | | — | | | — | | | 11,797,025 |
Kentucky Intermediate Tax-Free Fund | | | — | | | — | | | — | | | 465,524 | | | — | | | 465,524 |
Maryland Intermediate Tax-Free Fund | | | 53 | | | — | | | 53 | | | 177,263 | | | — | | | 177,316 |
North Carolina Intermediate Tax-Free Fund | | | 5 | | | 435,140 | | | 435,145 | | | 3,839,938 | | | — | | | 4,275,083 |
South Carolina Intermediate Tax-Free Fund | | | 1,523 | | | 30,775 | | | 32,298 | | | 730,130 | | | — | | | 762,428 |
Virginia Intermediate Tax-Free Fund | | | 185,821 | | | 362,764 | | | 548,585 | | | 2,759,247 | | | — | | | 3,307,832 |
West Virginia Intermediate Tax-Free Fund | | | 24,763 | | | 314,435 | | | 339,198 | | | 2,785,207 | | | — | | | 3,124,405 |
Prime Money Market Fund | | | 5,479,216 | | | — | | | 5,479,216 | | | — | | | — | | | 5,479,216 |
U.S. Treasury Money Market Fund | | | 5,194,991 | | | — | | | 5,194,991 | | | — | | | — | | | 5,194,991 |
Capital Manager Conservative Growth Fund | | | 1,227,491 | | | — | | | 1,227,491 | | | — | | | — | | | 1,227,491 |
Capital Manager Moderate Growth Fund | | | 544,168 | | | — | | | 544,168 | | | — | | | — | | | 544,168 |
Capital Manager Growth Fund | | | 239,253 | | | — | | | 239,253 | | | — | | | — | | | 239,253 |
Capital Manager Equity Fund | | | 64,429 | | | — | | | 64,429 | | | — | | | — | | | 64,429 |
Continued
169
BB&T Funds
Notes to Financial Statements, continued September 30, 2004 |
The tax characteristics of dividends paid to shareholders during the fiscal year ended September 30, 2003, were as follows:
| | | | | | | | | | | | | | | | | | |
| | | Distributions paid from
| | | | | | | | |
| | | Ordinary
Income
| | Net
Long-Term
Gains
| | Total Taxable
Distributions
| | Tax Exempt
Distributions
| | Tax
Return
of
Capital
| | Total
Distributions
Paid
|
Large Company Value Fund | | $ | 7,837,698 | | $ | — | | $ | 7,837,698 | | $ | — | | $ | — | | $ | 7,837,698 |
Mid Cap Value Fund | | | 1,803,734 | | | — | | | 1,803,734 | | | — | | | — | | | 1,803,734 |
Small Company Value Fund | | | 8,175 | | | — | | | 8,175 | | | — | | | — | | | 8,175 |
Special Opportunities Equity Fund | | | 1,758 | | | — | | | 1,758 | | | — | | | — | | | 1,758 |
International Equity Fund | | | 1,168,483 | | | — | | | 1,168,483 | | | — | | | — | | | 1,168,483 |
Short U.S. Government Income Fund | | | 7,081,609 | | | — | | | 7,081,609 | | | — | | | — | | | 7,081,609 |
Intermediate U.S. Government Bond Fund | | | 16,689,502 | | | 2,004,127 | | | 18,693,629 | | | — | | | — | | | 18,693,629 |
Intermediate Corporate Bond Fund | | | 8,792,307 | | | — | | | 8,792,307 | | | — | | | — | | | 8,792,307 |
Kentucky Intermediate Tax-Free Fund | | | 237 | | | — | | | 237 | | | 140,971 | | | — | | | 141,208 |
Maryland Intermediate Tax-Free Fund | | | 305 | | | — | | | 305 | | | 46,798 | | | — | | | 47,103 |
North Carolina Intermediate Tax-Free Fund | | | — | | | 412,630 | | | 412,630 | | | 3,846,335 | | | — | | | 4,258,965 |
South Carolina Intermediate Tax-Free Fund | | | — | | | — | | | — | | | 752,387 | | | — | | | 752,387 |
Virginia Intermediate Tax-Free Fund | | | 70,870 | | | 187,208 | | | 258,078 | | | 2,730,127 | | | — | | | 2,988,205 |
West Virginia Intermediate Tax-Free Fund | | | 378,991 | | | 999,953 | | | 1,378,944 | | | 3,027,087 | | | — | | | 4,406,031 |
Prime Money Market Fund | | | 7,457,684 | | | — | | | 7,457,684 | | | — | | | — | | | 7,457,684 |
U.S. Treasury Money Market Fund | | | 7,296,879 | | | — | | | 7,296,879 | | | — | | | — | | | 7,296,879 |
Capital Manager Conservative Growth Fund | | | 653,123 | | | 139,243 | | | 792,366 | | | — | | | — | | | 792,366 |
Capital Manager Moderate Growth Fund | | | 362,588 | | | 32,773 | | | 395,361 | | | — | | | — | | | 395,361 |
Capital Manager Growth Fund | | | 121,741 | | | — | | | 121,741 | | | — | | | — | | | 121,741 |
Capital Manager Equity Fund | | | 9,956 | | | 93,135 | | | 103,091 | | | — | | | — | | | 103,091 |
As of September 30, 2004 the components of accumulated earnings (deficit) on a tax basis was as follows:
| | | | | | | | | | | | | | | | | | | | | | | | | |
| | | Undistributed
Ordinary
Income/Tax
Exempt
Income
| | Undistributed
Long Term
Capital Gains
(Losses)
| | Accumulated
Earnings
| | Dividends
Payable
| | | Accumulated
Capital and
Other Losses
| | | Unrealized
Appreciation
(Depreciation)
| | | Total
Accumulated
Earnings
(Deficit)
| |
Equity Income Fund | | $ | 155,724 | | $ | — | | $ | 155,724 | | $ | (122,769 | ) | | $ | — | | | $ | 989,406 | | | $ | 1,022,361 | |
Large Company Value Fund | | | 586,096 | | | — | | | 586,096 | | | (586,096 | ) | | | (2,046,161 | ) | | | 131,561,970 | | | | 129,515,809 | |
Large Company Growth Fund | | | — | | | — | | | — | | | — | | | | (47,112,613 | ) | | | 40,783,701 | | | | (6,328,912 | ) |
Mid Cap Value Fund | | | 297,590 | | | 1,130,476 | | | 1,428,066 | | | (383,557 | ) | | | — | | | | 42,409,395 | | | | 43,453,904 | |
Mid Cap Growth Fund | | | — | | | 1,527,270 | | | 1,527,270 | | | — | | | | — | | | | 23,702,200 | | | | 25,229,470 | |
Small Company Value Fund | | | 1,098,094 | | | 655,305 | | | 1,753,399 | | | (51,651 | ) | | | — | | | | 14,139,759 | | | | 15,841,507 | |
Small Company Growth Fund | | | — | | | — | | | — | | | — | | | | (84,187,814 | ) | | | 12,122,143 | | | | (72,065,671 | ) |
International Equity Fund | | | 645,953 | | | — | | | 645,953 | | | (645,953 | ) | | | (43,983,919 | ) | | | 29,626,706 | | | | (14,357,207 | ) |
Special Opportunities Equity Fund | | | 1,015,243 | | | — | | | 1,015,243 | | | — | | | | (72,931 | ) | | | 13,089,566 | | | | 14,031,878 | |
Short U.S. Government Fund | | | 697,775 | | | — | | | 697,775 | | | (500,792 | ) | | | (2,990,019 | ) | | | (891,671 | ) | | | (3,684,709 | ) |
Intermediate U.S. Government Fund | | | 1,649,266 | | | 2,537,308 | | | 4,186,574 | | | (1,498,264 | ) | | | — | | | | 2,674,527 | | | | 5,362,836 | |
Intermediate Corporate Bond Fund | | | 1,234,081 | | | 894,705 | | | 2,128,786 | | | (997,859 | ) | | | — | | | | 7,395,757 | | | | 8,526,684 | |
Kentucky Intermediate Tax-Free Fund | | | 38,257 | | | — | | | 38,257 | | | (36,337 | ) | | | (59,194 | ) | | | 469,046 | | | | 411,772 | |
Maryland Intermediate Tax-Free Fund | | | 19,475 | | | — | | | 19,475 | | | (19,175 | ) | | | (131,219 | ) | | | 187,377 | | | | 56,458 | |
North Carolina Intermediate Tax-Free Fund | | | 367,748 | | | 192,982 | | | 560,730 | | | (320,583 | ) | | | — | | | | 6,196,889 | | | | 6,437,036 | |
South Carolina Intermediate Tax-Free Fund | | | 74,168 | | | 145,469 | | | 219,637 | | | (58,439 | ) | | | — | | | | 1,275,296 | | | | 1,436,494 | |
Virginia Intermediate Tax-Free Fund | | | 263,038 | | | 144,374 | | | 407,412 | | | (228,313 | ) | | | — | | | | 4,771,866 | | | | 4,950,966 | |
West Virginia Intermediate Tax-Free Fund | | | 202,570 | | | 555,579 | | | 758,149 | | | (216,891 | ) | | | — | | | | 3,448,997 | | | | 3,990,256 | |
Prime Money Market Fund | | | 846,733 | | | — | | | 846,733 | | | (837,361 | ) | | | — | | | | — | | | | 9,372 | |
U.S. Treasury Money Market Fund | | | 871,511 | | | — | | | 871,511 | | | (871,265 | ) | | | — | | | | — | | | | 246 | |
Capital Manager Conservative Growth Fund | | | 337,070 | | | — | | | 337,070 | | | (337,070 | ) | | | (2,663,783 | ) | | | 2,144,352 | | | | (519,433 | ) |
Capital Manager Moderate Growth Fund | | | 134,060 | | | — | | | 134,060 | | | (134,060 | ) | | | (1,485,767 | ) | | | (128,827 | ) | | | (1,614,594 | ) |
Capital Manager Growth Fund | | | 50,853 | | | — | | | 50,853 | | | (50,853 | ) | | | (1,274,526 | ) | | | (2,537,189 | ) | | | (3,811,716 | ) |
Capital Manager Equity Fund | | | 14,482 | | | — | | | 14,482 | | | (14,482 | ) | | | (94,151 | ) | | | 604,266 | | | | 510,115 | |
Continued
170
BB&T Funds
Notes to Financial Statements, continued September 30, 2004 |
Under current tax law, capital losses realized after October 31 of a Fund’s fiscal year may be deferred and treated as occurring on the first business day of the following fiscal year for tax purposes. The following Funds had deferred post October capital and currency losses, which will be treated as arising on the first business day of the fiscal year ending September 30, 2005:
| | | |
| | | Post-October
Losses
|
Special Opportunities Equity Fund | | $ | 72,931 |
International Equity Fund | | | 923,908 |
Short U.S. Government Fund | | | 2,023,541 |
Kentucky Intermediate Tax-Free Fund | | | 8,335 |
Maryland Intermediate Tax-Free Fund | | | 112,876 |
Capital Manager Conservative Growth Fund | | | 164,216 |
Capital Manager Growth Fund | | | 71 |
Capital Manager Equity Fund | | | 8,893 |
| 8. | Other Federal Income Tax Information (Unaudited): |
For the fiscal year ended September 30, 2004, certain dividends paid by the Funds may be subject to a maximum tax rate of 15% as provided for by the Jobs and Growth Tax Reconciliation Act of 2003. The Funds intend to designate the maximum amount allowable as taxed at a maximum rate of 15%. Complete information will be reported in conjunction with your 2004 Form 1099-DIV.
For the period ended September 30, 2004, the following Funds paid qualified dividend income of:
| | | |
| | | Qualified
Dividend Income
|
Large Company Value Fund | | $ | 9,481,337 |
Mid Cap Value Fund | | | 2,529,375 |
Small Company Value Fund | | | 468,080 |
Special Opportunities Equity Fund | | | 330,336 |
International Equity Fund | | | 2,454,968 |
Capital Manager Conservative Growth Fund | | | 263,232 |
Capital Manager Moderate Growth Fund | | | 373,109 |
Capital Manager Growth Fund | | | 239,253 |
Capital Manager Equity Fund | | | 64,429 |
For corporate shareholders, the following percentage of the total ordinary income dividends paid during the fiscal year ended September 30, 2004, qualify for the corporate dividends received deduction for the following Funds:
| | | |
| | | Dividends
Received
Deduction
| |
Large Company Value Fund | | 100.00 | % |
Mid Cap Value Fund | | 100.00 | % |
Small Company Value Fund | | 33.98 | % |
Special Opportunities Equity Fund | | 15.11 | % |
Capital Manager Conservative Growth Fund | | 17.21 | % |
Capital Manager Moderate Growth Fund | | 53.49 | % |
Capital Manager Growth Fund | | 100.00 | % |
Capital Manager Equity Fund | | 100.00 | % |
Continued
171
BB&T Funds
Notes to Financial Statements, continued September 30, 2004 |
During the fiscal year ended September 30, 2004 the following Funds declared tax-exempt income distributions:
| | | |
| | | Tax Exempt
Distribution
|
Kentucky Intermediate Tax-Free Fund | | $ | 465,524 |
Maryland Intermediate Tax-Free Fund | | | 177,263 |
North Carolina Intermediate Tax-Free Fund | | | 3,839,938 |
South Carolina Intermediate Tax-Free Fund | | | 730,130 |
Virginia Intermediate Tax-Free Fund | | | 2,759,247 |
West Virginia Intermediate Tax-Free Fund | | | 2,785,207 |
OTHER INFORMATION
A description of the policies and procedures that the Funds use to determine how to vote proxies relating to portfolio securities is available (i) without charge, upon request, by calling 1-800-228-1872 and (ii) on the Securities and Exchange Commission’s website at http://www.sec.gov.
Information regarding how the Funds voted proxies relating to portfolio securities during the most recent 12-month period ended June 30, 2004 is available (I) without charge, upon request, by calling 1-800-228-1872 and (ii) on the Commission’s website at http://www.sec.gov.
Schedules of Portfolio Investments for periods ending December 31 and June 30 will be available starting March 1, 2005, without charge, on the Securities and Exchange Commission’s website at http://www.sec.gov.
172
Report of Independent Registered Public Accounting Firm
| To | the Shareholders and Board of Trustees of BB&T Funds: |
We have audited the accompanying statements of assets and liabilities of BB&T Funds — Equity Income Fund, Large Company Value Fund, Large Company Growth Fund, Mid Cap Value Fund, Mid Cap Growth Fund, Small Company Value Fund, Small Company Growth Fund, Special Opportunities Equity Fund, International Equity Fund, Short U.S. Government Fund, Intermediate U.S. Government Fund, Intermediate Corporate Bond Fund, Kentucky Intermediate Tax-Free Fund, Maryland Intermediate Tax-Free Fund, North Carolina Intermediate Tax-Free Fund, South Carolina Intermediate Tax-Free Fund, Virginia Intermediate Tax-Free Fund, West Virginia Intermediate Tax-Free Fund, Prime Money Market Fund, U.S. Treasury Money Market Fund, Capital Manager Conservative Growth Fund, Capital Manager Moderate Growth Fund, Capital Manager Growth Fund, and Capital Manager Equity Fund (collectively, the Funds), including the schedules of portfolio investments, as of September 30, 2004, and the related statements of operations for the year then ended, the statements of changes in net assets for each year in the two-year period then ended, and the financial highlights for each year in the five-year period then ended (for the period February 1, 2001 through September 30, 2001 and each year in the three-year period ended September 30, 2004 for the Mid Cap Growth Fund, Mid Cap Value Fund and West Virginia Intermediate Tax-Free Fund). These financial statements and financial highlights are the responsibility of the Funds’ management. Our responsibility is to express an opinion on these financial statements and financial highlights based on our audits. The accompanying financial highlights for the Mid Cap Growth Fund, Mid Cap Value Fund and West Virginia Intermediate Tax-Free Fund for the periods ended January 31, 2001 and prior were audited by other auditors whose report thereon dated March 14, 2001 expressed an unqualified opinion on the financial statements and financial highlights.
We conducted our audits in accordance with the standards of the Public Company Accounting Oversight Board (United States). Those standards require that we plan and perform the audit to obtain reasonable assurance about whether the financial statements and financial highlights are free of material misstatement. An audit includes examining, on a test basis, evidence supporting the amounts and disclosures in the financial statements. Our procedures included confirmation of securities owned as of September 30, 2004, by correspondence with the custodian and brokers. An audit also includes assessing the accounting principles used and significant estimates made by management, as well as evaluating the overall financial statement presentation. We believe that our audits provide a reasonable basis for our opinion.
In our opinion, the financial statements and financial highlights referred to above present fairly, in all material respects, the financial position of the Funds as of September 30, 2004, the results of their operations for the year then ended, the changes in their net assets for each year in the two-year period then ended, and the financial highlights for each year in the five-year period then ended (for the period February 1, 2001 through September 30, 2001, and each year in the three-year period ended September 30, 2004 for the Mid Cap Growth Fund, Mid Cap Value Fund and West Virginia Intermediate Tax-Free Fund), in conformity with accounting principles generally accepted in the United States of America.
KPMG LLP
Columbus, Ohio
November 17, 2004
173
BB&T Funds
Information about Trustees, and Officers (Unaudited)
Overall responsibility for the management of the Funds rests with its Board of Trustees’, who are elected by the Shareholders of the Funds. The Trustees’ elect the officers of the Funds to supervise actively its day-to-day operations. The names of the Trustees’, their addresses, ages, length of tenure, principal occupations during the past five years, number of portfolios overseen and directorships held outside of the Funds are set below:
Independent Trustees
| | | | | | | | | | |
Name, Address and Age
| | Position(s)
Held With
the Funds
| | Term of
Office and
Length of
Time Served
| | Principal Occupation During the Last 5 Years
| | Number of
Portfolios
in Fund
Complex
Overseen
by Trustee
| | Other
Directorships Held
by Trustee
|
Thomas W. Lambeth
700 Yorkshire Road
Winston-Salem, NC 27106
Birthdate: 1/35 | | Trustee | | Indefinite, 8/92 – Present | | From January 2004 to present, Senior Fellow, Z. Smith Reynolds Foundation; from 1978 to January 2001, Executive Director, Z. Smith Reynolds Foundation. | | 26 | | None |
| | | | | |
Robert W. Stewart
201 Huntington Road
Greenville, SC 29615
Birthdate: 5/32 | | Trustee | | Indefinite, 2/94 – Present | | Retired; Chairman and Chief Executive Officer of Engineered Custom Plastics Corporation from 1969 to 1990. | | 26 | | None |
| | | | | |
Drew T. Kagan
Montecito Advisors, Inc.
810 N. Jefferson St.,
Ste 101
Lewisburg, WV 24901
Birthdate: 2/48 | | Trustee | | Indefinite, 8/00 – Present | | From December 2003 to present, President and Director, Montecito Advisors, Inc.; from March 1996 to December 2003, President, Investment Affiliate, Inc.; March 1992 to March 1996, President, Provident Securities & Investment Co. | | 26 | | None |
| | | | | |
Laura C. Bingham
Peace College
Office of the President
15 East Peace Street
Raleigh, NC 27604-1194 Birthdate: 11/56 | | Trustee | | Indefinite, 2/01 – Present | | From July 1998 to present, President of Peace College; November 1997 to May 1998, Senior Vice President of Philanthropy and President of Fort Sanders Foundation Covenant Health; 1992 to 1997, Vice President Hollins College. | | 26 | | None |
| | | | | |
Douglas Van Scoy
841 Middle St.
Sullivans Island, SC 26481 Birthdate: 11/43 | | Trustee | | Indefinite, 5/04– Present | | Retired: From November 1974 to July 2001, Deputy Director of Private Client Group and Senior Executive Vice President of Smith Barney (investment banking). | | 26 | | None |
| | | | | |
James L. Roberts
7 Kittansett Court
Skillman, NJ 08558
Birthdate: 11/42 | | Nominee for Trustee | | N/A | | Retired: From January 1999 to December 2003, President CEO and Director, Covest Bancshares, Inc. | | N/A | | None |
174
BB&T Funds
Information about Trustees, and Officers (Unaudited), continued
Interested Trustees
| | | | | | | | | | |
Name, Address and Age
| | Position(s)
Held With
the Funds
| | Term of
Office and
Length of
Time Served
| | Principal Occupation During the Last 5 Years
| | Number of
Portfolios
in Fund
Complex
Overseen
by Trustee
| | Other
Directorships Held
by Trustee
|
| | | | | |
*Kenneth L. Miller
200 W. Second Street,
16th Floor
Winston-Salem, NC 27101 Birthdate: 9/46 | | Trustee | | Indefinite, 11/02 – Present | | From August 1998 to present, Executive Vice President Branch Banking and Trust Company; employee of Branch Banking and Trust Company since 1989. | | 26 | | None |
| * | Mr. Miller is treated by the Funds as an “interested person” (as defined in Section 2(a)(19) of the 1940 Act) of the Funds. Mr. Miller is an “interested person” because he owns shares of BB&T Corporation, the publicly traded indirect parent of the Adviser. |
| | | | | | |
| Officers |
Name, Address and Age
| | Position(s)
Held With the Funds
| | Term of Office and Length of Time
Served
| | Principal Occupation(s) During the Past 5 Years
|
| | | |
George O. Martinez Birthdate: 3/59 | | President | | Indefinite, 11/03 – Present | | From August 2002 to present, Senior Vice President-Client Services, BISYS Fund Services; from June 2001 to August 2002, CEO and President, Fund Watch Dog Services LLC; from June 2000 to June 2001, Senior Vice President and Senior Managing Counsel, State Street Corporation; from March 1998 to May 2000, National Director of Investment Management and Regulatory Consulting, Arthur Andersen. |
| | | |
James T. Gillespie Birthdate: 11/66 | | Vice President | | Indefinite, 5/02 – Present | | From February 1992 present, employee of BISYS Fund Services. |
| | | |
E.G. Purcell, III Birthdate: 1/55 | | Vice President | | Indefinite, 11/00 – Present | | From 1995 to present, Senior Vice President, BB&T Asset Management, Inc. and its predecessors. |
| | | |
Troy A. Sheets Birthdate: 5/71 | | Treasurer | | Indefinite, 5/02 – Present | | From April 2002 to present, employee of BISYS Fund Services; from September 1993 to April 2002, employee of KPMG LLP. |
175
BB&T Funds
Information about Trustees, and Officers (Unaudited), continued
| | | | | | |
| Officers |
Name, Address and Age
| | Position(s)
Held With the Funds
| | Term of Office and Length of Time
Served
| | Principal Occupation(s) During the Past 5 Years
|
| | | |
Frank J. Pavlak Birthdate: 3/47 | | Vice President, Chief Compliance and AML Officer | | Indefinite, 9/04 – Present | | From September 2004 to present, Senior Vice President and Chief Inc.; Compliance Officer, The BISYS Group, from 1999 to 2004, Director of Compliance, Oppenheiner Funds, Inc.; from 1981 to 1999, Branch Chief, U.S. Securities and Exchange Commission. |
| | | |
Alaina V. Metz Birthdate: 4/67 | | Assistant Secretary | | Indefinite, 9/95 – Present | | From June 1995 to present, employee, BISYS Fund Services. |
| | | |
Chris Sabato Birthdate: 12/68 | | Assistant Treasurer | | Indefinite 11/02 – Present | | From February 1993 to present, employee of BISYS Fund Services. |
The Funds Statement of Additional Information includes information about the Fund’s Trustees. To receive your free copy of the Statement of Additional Information, call toll free: 1-800-453-7348.
176

Item 2. Code of Ethics.
Disclose whether, as of the end of the period covered by the report, the registrant has adopted a code of ethics that applies to the registrant’s principal executive officer, principal financial officer, principal accounting officer or controller, or persons performing similar functions, regardless of whether these individuals are employed by the registrant or a third party. If the registrant has not adopted such a code of ethics, explain why it has not done so.
The registrant has adopted a code of ethics that applies to the registrant’s principal executive officer, principal financial officer, principal accounting officer or controller, or persons performing similar functions. This code of ethics is included as Exhibit 11 (a)(1).
The registrant must briefly describe the nature of any amendment, during the period covered by the report, to a provision of its code of ethics that applies to the registrant’s principal executive officer, principal financial officer, principal accounting officer or controller, or persons performing similar functions, regardless of whether these individuals are employed by the registrant or a third party, and that relates to any element of the code of ethics definition enumerated in paragraph (b) of this Item. The registrant must file a copy of any such amendment as an exhibit pursuant to Item 11(a)(1), unless the registrant has elected to satisfy paragraph (f) of this Item by posting its code of ethics on its website pursuant to paragraph (f)(2) of this Item, or by undertaking to provide its code of ethics to any person without charge, upon request, pursuant to paragraph (f)(3) of this Item.
If the registrant has, during the period covered by the report, granted a waiver, including an implicit waiver, from a provision of the code of ethics that applies to the registrant’s principal executive officer, principal financial officer, principal accounting officer or controller, or persons performing similar functions, regardless of whether these individuals are employed by the registrant or a third party, that relates to one or more items set forth in paragraph (b) of this Item, the registrant must briefly describe the nature of the waiver, the name of the person to whom the waiver was granted, and the date of the waiver.
During the period covered by the report, with respect to the registrant’s code of ethics that applies to its principal executive officer, principal financial officer, principal accounting officer or controller, or persons performing similar functions; there have been no amendments to, nor any waivers granted from, a provision that relates to any element of the code of ethics definition enumerated in paragraph (b) of this Item 2.
Item 3. Audit Committee Financial Expert.
(a) (1) Disclose that the registrant’s board of directors has determined that the registrant either:
(i) Has at least one audit committee financial expert serving on its audit committee; or
(ii) Does not have an audit committee financial expert serving on its audit committee.
(2) If the registrant provides the disclosure required by paragraph (a)(1)(i) of this Item, it must disclose the name of the audit committee financial expert and whether that person is “independent.” In order to be considered “independent” for purposes of this Item, a member of an audit committee may not, other than in his or her capacity as a member of the audit committee, the board of directors, or any other board committee:
(i) Accept directly or indirectly any consulting, advisory, or other compensatory fee from the issuer; or
(ii) Be an “interested person” of the investment company as defined in Section 2(a)(19) of the Act (15 U.S.C. 80a-
2(a)(19)).
(3) If the registrant provides the disclosure required by paragraph (a)(1)(ii) of this Item, it must explain why it does not have an audit committee financial expert.
3(a)(1) The registrant’s board of directors has determined that the registrant has at least one audit committee financial expert serving on its audit committee.
3(a)(2) The audit committee financial expert is Drew Kagan, who is “independent” for purposes of this Item 3 of Form N-CSR.
Item 4. Principal Accountant Fees and Services.
(a) Disclose, under the caption Audit Fees, the aggregate fees billed for each of the last two fiscal years for professional services rendered by the principal accountant for the audit of the registrant’s annual financial statements or services that are normally provided by the accountant in connection with statutory and regulatory filings or engagements for those fiscal years.
2003 $151,410
2004 $161,575
(b) Disclose, under the caption Audit-Related Fees, the aggregate fees billed in each of the last two fiscal years for assurance and related services by the principal accountant that are reasonably related to the performance of the audit of the registrant’s financial statements and are not reported under paragraph (a) of this Item. Registrants shall describe the nature of the services comprising the fees disclosed under this category.
2003 $33,070
2004 $35,340
2003 - Fees of $29,320 relate to the preparation and review of the Funds’ 17f-2 filings while $3,750 related to the consent of the annual N-1A filing.
2004 - Fees of $31,290 relate to the preparation and review of the Funds’ 17f-2 filings while $4,050 related to the consent of the annual N-1A filing.
(c) Disclose, under the caption Tax Fees, the aggregate fees billed in each of the last two fiscal years for professional services rendered by the principal accountant for tax compliance, tax advice, and tax planning. Registrants shall describe the nature of the services comprising the fees disclosed under this category.
2003 $56,000
2004 $62,040
Fees for both 2003 & 2004 relate to the preparation of federal income & excise tax returns and review of the excise tax calculations.
(d) Disclose, under the caption All Other Fees, the aggregate fees billed in each of the last two fiscal years for products and services provided by the principal accountant, other than the services reported in paragraphs (a) through (c) of this Item. Registrants shall describe the nature of the services comprising the fees disclosed under this category.
2003 $0
2004 $0
(e) (1) Disclose the audit committee’s pre-approval policies and procedures described in paragraph (c)(7) of Rule 2-01 of Regulation S-X.
Except as permitted by Rule 2-01(c)(7)(i)(C) of Regulation S-X, the Trust’s Audit Committee must pre-approve all audit and non-audit services provided by the independent accountants relating to the operations or financial reporting of the funds. Prior to the commencement of any audit or non-audit services to a fund, the Audit Committee reviews the services to determine whether they are appropriate and permissible under applicable law.
(2) Disclose the percentage of services described in each of paragraphs (b) through (d) of this Item that were approved by the audit committee pursuant to paragraph (c)(7)(i)(C) of Rule 2-01 of Regulation S-X.
None of the services summarized in (b)-(d), above, were approved by the Audit Committee pursuant to Rule 2-01(c)(7)(i)(C) of Regulation S-X.
(f) If greater than 50 percent, disclose the percentage of hours expended on the principal accountant’s engagement to audit the registrant’s financial statements for the most recent fiscal year that were attributed to work performed by persons other than the principal accountant’s full-time, permanent employees.
Not applicable.
(g) Disclose the aggregate non-audit fees billed by the registrant’s accountant for services rendered to the registrant, and rendered to the registrant’s investment adviser (not including any sub-adviser whose role is primarily portfolio management and is subcontracted with or overseen by another investment adviser), and any entity controlling, controlled by, or under common control with the adviser that provides ongoing services to the registrant for each of the last two fiscal years of the registrant.
2003 $5,000,000
2004 $165,000
(h) Disclose whether the registrant’s audit committee of the board of directors has considered whether the provision of nonaudit services that were rendered to the registrant’s investment adviser (not including any subadviser whose role is primarily portfolio management and is subcontracted with or overseen by another investment adviser), and any entity controlling, controlled by, or under common control with the investment adviser that provides ongoing services to the registrant that were not pre-approved pursuant to paragraph (c)(7)(ii) of Rule 2-01 of Regulation S-X is compatible with maintaining the principal accountant’s independence.
In regards to Item 4 (g), the audit committee considered the nonaudit services rendered to the registrant’s investment adviser and any entity controlling, controlled by, or under common control with the investment adviser, and believes the principal accountants independence has not been compromised.
Item 5. Audit Committee of Listed Registrants.
| | (a) | If the registrant is a listed issuer as defined in Rule 10A-3 under the Exchange Act (17CFR 240.10A-3), state whether or not the registrant has a separately-designated standing audit committee established in accordance with Section 3(a)(58)(A) of the Exchange Act (15 U.S.C. 78c(a)(58)(A)). If the registrant has such a committee, however designated, identify each committee member. If the entire board of directors is acting as the registrant’s audit committee as specified in Section 3(a)(58)(B) of the Exchange Act (15 U.S.C. 78c(a)(58)(B)), so state. |
| | (b) | If applicable, provide the disclosure required by Rule 10A-3(d) under the Exchange Act (17CFR 240.10A-3(d)) regarding an exemption from the listing standards for all audit committees. |
Not applicable.
Item 6. Schedule of Investments.
File Schedule I – Investments in securities of unaffiliated issuers as of the close of the reporting period as set forth in § 210.12-12 of Regulation S-X, unless the schedule is included as part of the report to shareholders filed under Item 1 of this Form.
Not applicable.
Item 7. Disclosure of Proxy Voting Policies and Procedures for Closed-End Management Investment Companies.
A closed-end management investment company that is filing an annual report on this Form N-CSR must, unless it invests exclusively in non-voting securities, describe the policies and procedures that it uses to determine how to vote proxies relating to portfolio securities, including the procedures that the company uses when a vote presents a conflict between the interests of its shareholders, on the one hand, and those of the company’s investment adviser; principal underwriter; or any affiliated person (as defined in Section 2(a)(3) of the Investment Company Act of 1940 (15 U.S.C. 80a-2(a)(3)) and the rules thereunder) of the company, its investment adviser, or its principal underwriter, on the other. Include any policies and procedures of the company’s investment adviser, or any other third party, that the company uses, or that are used on the company’s behalf, to determine how to vote proxies relating to portfolio securities.
Not applicable.
Item 8. Purchases of Equity Securities by Closed-End Management Investment Company and Affiliated Purchasers.
If the registrant is a closed-end management investment company, provide the information specified in paragraph (b) of this Item with respect to any purchase made by or on behalf of the registrant or any “affiliated purchaser,” as defined in Rule 10b-18(a)(3) under the Exchange Act (17 CFR 240.10b-18(a)(3)), of shares or other units of any class of the registrant’s equity securities that is registered by the registrant pursuant to Section 12 of the Exchange Act (15 U.S.C. 781).
Not applicable.
Item 9. Submission of Matters to a Vote of Security Holders.
Describe any material changes to the procedures by which shareholders may recommend nominees to the registrant’s board of directors, where those changes were implemented after the registrant last provided disclosure in response to the requirements of Item 7(d)(2)(ii)(G) of Schedule 14A (17 CFR 240.14a-101), or this Item.
During the period covered by the report, with respect to the registrant’s procedures by which shareholders may recommend nominees to the registrant’s board of directors, there have been no amendments to, nor any waivers granted from, a provision that relates to any elements of this Item 9.
Item 10. Controls and Procedures.
(a) Disclose the conclusions of the registrant’s principal executive and principal financial officers, or persons performing similar functions, regarding the effectiveness of the registrant’s disclosure controls and procedures (as defined in Rule 30a-3(c) under the Act (17 CFR 270.30a-3(c))) as of a date within 90 days of the filing date of the report that includes the disclosure required by this paragraph, based on the evaluation of these controls and procedures required by Rule 30a-3(b) under the Act (17 CFR 270.30a-3(b)) and Rules 13a-15(b) or 15d-15(b) under the Exchange Act (17 CFR 240.13a-15(b) or 240.15d-15(b)).
The registrant’s principal executive officer and principal financial officer have concluded, based on their evaluation of the registrant’s disclosure controls and procedures as conducted within 90 days of the filing date of this report, that these disclosure controls and procedures are adequately designed and are operating effectively to ensure that information required to be disclosed by the registrant on Form N-CSR is (i) accumulated and communicated to the investment company’s management, including its certifying officers, to allow timely decisions regarding required disclosure; and (ii) recorded, processed, summarized and reported within the time periods specified in the Securities and Exchange Commission’s rules and forms.
(b) Disclose any change in the registrant’s internal control over financial reporting (as defined in Rule 30a-3(d) under the Act (17 CFR 270.30a-3(d)) that occurred during the registrant’s last fiscal half-year (the registrant’s second fiscal half-year in the case of an annual report) that has materially affected, or is reasonably likely to materially affect, the registrant’s internal control over financial reporting.
There were no changes in the registrant’s internal control over financial reporting that occurred during the registrant’s most recent fiscal half-year (the registrant’s second fiscal half-year in the case of an annual report) that have materially affected or are reasonably likely to materially affect, the registrant’s internal control over financial reporting.
Item 11. Exhibits.
(a) File the exhibits listed below as part of this Form. Letter or number the exhibits in the sequence indicated.
(a)(1) Any code of ethics, or amendment thereto, that is the subject of the disclosure required by Item 2, to the extent that the registrant intends to satisfy the Item 2 requirements through filing of an exhibit. The code of ethics that is the subject of the disclosure required by Item 2 is attached hereto.
(a)(2) A separate certification for each principal executive officer and principal financial officer of the registrant as required by Rule 30a-2(a) under the Act (17 CFR 270.30a-2). Certifications pursuant to Rule 30a-2(a) are attached hereto.
(a)(3) Any written solicitation to purchase securities under Rule 23c-1 under the Act (17 CFR 270.23c-1) sent or given during the period covered by the report by or on behalf of the registrant to 10 or more persons. Not applicable.
(b) If the report is filed under Section 13(a) or 15(d) of the Exchange Act, provide the certifications required by rule 30a-2(b) under the Act as an exhibit. A certification furnished pursuant to this paragraph will not be deemed “filed” for purposes of Section 18 of the Exchange Act, or otherwise subject to the liability of that section. Such certification will not be deemed to be incorporated by reference into any filing under the Securities Act of 1933 or the Exchange Act, except to the extent that the registrant incorporates it by reference. Certifications pursuant to Rule 30a-2(b) are furnished herewith.
SIGNATURES
Pursuant to the requirements of the Securities Exchange Act of 1934 and the Investment Company Act of 1940, the registrant has duly caused this report to be signed on its behalf by the undersigned, thereunto duly authorized.
| | | | |
| (Registrant) | | BB&T Funds | | |
| | |
| By (Signature and Title)* | | /s/ Troy A. Sheets
| | Troy A. Sheets, Treasurer |
| Date | | December 2, 2004 | | |
Pursuant to the requirements of the Securities Exchange Act of 1934 and the Investment Company Act of 1940, this report has been signed below by the following persons on behalf of the registrant and in the capacities and on the dates indicated.
| | | | |
| By (Signature and Title)* | | /s/ George O. Martinez
| | George O. Martinez, President |
| Date | | December 2, 2004 | | |
| | |
| By (Signature and Title)* | | /s/ Troy A. Sheets
| | Troy A. Sheets, Treasurer |
| Date | | December 2, 2004 | | |
| * | Print the name and title of each signing officer under his or her signature. |