| | |
OMB APPROVAL |
OMB Number: | | 3235-0570 |
| |
Expires: | | October 31, 2006 |
|
Estimated average burden |
hours per response....... | | 19.3 |
UNITED STATES
SECURITIES AND EXCHANGE COMMISSION
Washington, D.C. 20549
FORM N-CSR
CERTIFIED SHAREHOLDER REPORT OF REGISTERED
MANAGEMENT INVESTMENT COMPANIES
Investment Company Act file number 811-06719
BB&T Funds.
(Exact name of registrant as specified in charter)
| | |
3435 Stelzer Road Columbus, OH 43219 | | |
| (Address of principal executive offices) | | (Zip code) |
Bisys Fund Services
3435 Stelzer Road.
Columbus, OH 43219
(Name and address of agent for service)
Registrant’s telephone number, including area code: (800) 228-1872
Date of fiscal year end: December 31, 2004
Date of reporting period: December 31, 2004
Form N-CSR is to be used by management investment companies to file reports with the Commission not later than 10 days after the transmission to stockholders of any report that is required to be transmitted to stockholders under Rule 30e-1 under the Investment Company Act of 1940 (17 CFR 270.30e-1). The Commission may use the information provided on Form N-CSR in its regulatory, disclosure review, inspection, and policymaking roles.
A registrant is required to disclose the information specified by Form N-CSR, and the Commission will make this information public. A registrant is not required to respond to the collection of information contained in Form N-CSR unless the Form displays a currently valid Office of Management and Budget (“OMB”) control number. Please direct comments concerning the accuracy of the information collection burden estimate and any suggestions for reducing the burden to Secretary, Securities and Exchange Commission, 450 Fifth Street, NW, Washington, DC 20549-0609. The OMB has reviewed this collection of information under the clearance requirements of 44 U.S.C. § 3507.
| Item 1. | Reports to Stockholders. |
Include a copy of the report transmitted to stockholders pursuant to Rule 30e-1 under the Act (17 CFR 270.30e-1).

ANNUAL REPORT
EQUITY INDEX FUND
| | | | |
| CLASS | | A | | SHARES |
| CLASS | | B | | SHARES |
| CLASS | | C | | SHARES |
DECEMBER 31, 2004
LETTER FROMTHE PRESIDENTANDTHE INVESTMENTADVISOR
Dear Shareholders:
We are pleased to send you this annual report for the BB&T Equity Index Fund. Buoyed by a fourth-quarter surge in most sectors, stocks posted solid gains in 2004. However, as the year began, the economic picture was murky. Unstable economic indicators and lack of job growth spurred concerns surrounding the sustainability of an economic recovery, which, in turn, dampened investor confidence. Continued geopolitical concerns also weighed on investor sentiment.
As the reporting period progressed, the economic outlook changed. In early April, employment data for March came in stronger than expected. May and June brought upward revisions to labor figures, suggesting that the “jobless recovery” might no longer be jobless. As economic indicators improved, concerns about sluggish economic growth were replaced with worries about inflation. In June, the Federal Reserve Board began raising its key, short-term interest rate for the first time in four years. (After five increases, the rate stood at 2.25% at the end of the year.)
Going forward, we believe that earnings growth rates for stocks could decelerate from the rapid pace of 2004; rising interest rates and a further decline in the dollar could also pressure stock prices. However, a number of indicators point to continuing strength in the U.S. economy, and large-capitalization stocks, as represented by the Standard & Poor’s 500® Stock Index (“S&P 500® Stock Index”)1, may continue to do moderately well by historical standards.
|
Sincerely, |
|
 |
Keith F. Karlawish, CFA President BB&T Mutual Funds Group |
|
 |
Jeffrey J. Schappe, CFA Chief Investment Officer BB&T Asset Management, Inc. |
This report is authorized for distribution only when preceded or accompanied by a prospectus. Please read the prospectus carefully before investing or sending money. The BB&T Mutual Funds are distributed by BISYS Fund Services. The BB&T Mutual Funds are NOT FDIC INSURED and are not deposits or obligations or guaranteed or endorsed by, Branch Banking and Trust Company or its affiliates. Investment products involve investment risk, including the possible loss of principal.
The foregoing information and opinions are for general information only. BB&T Asset Management, Inc. does not assume liability for any loss, which may result from the reliance by any person upon any such information or opinions. Such information and opinions are subject to change without notice, are for general information only and are not intended as an offer or solicitation with respect to the purchase or sale of any security or offering individual or personalized investment advice.
“S&P 500®” is a registered service mark of Standard & Poor’s Corporation, which does not sponsor and is in no way affiliated with the Fund or Master Portfolio.
1
BB&T EQUITY INDEX FUND
MASTER PORTFOLIO MANAGER
Barclays Global Fund Advisors, a subsidiary of Barclays Global Investors,
N.A. (S&P 500® Index Master Portfolio)
BB&T Asset Management, Inc. (BB&T Equity Index Fund)
Unlike many traditional, actively managed investment funds, there is no single portfolio manager who makes investment decisions for the BB&T Equity Index Fund. Instead, the Fund invests substantially all its assets in the S&P 500® Index Master Portfolio which is managed by a team of investment professionals from Barclays, who use a specially designed software program to maintain a close match to the characteristics of the S&P 500 Index.
INVESTMENT CONCERNS
Equity securities (stocks) are more volatile and carry more risk than other forms of investments, including investments in high-grade fixed income securities. The net asset value per share of this Fund will fluctuate as the value of the securities in the portfolio changes. Common stocks, and funds investing in common stocks, generally provide greater return potential when compared with other types of investments.
The performance of the Fund is expected to be lower than that of the S&P 500 Index because of Fund fees and expenses.
PORTFOLIO MANAGERS’ PERSPECTIVE
“Investing in an index fund such as ours is based on the belief that it’s very difficult to ‘beat the market’ on a consistent basis. Our approach, then, is to take advantage of the stock market’s long-term growth potential, while managing costs, to help shareholders potentially build wealth over time. We believe the Fund is an excellent diversification tool for novice and experienced investors alike, and can serve as the foundation of most equity investors’ asset allocation strategies.”
The BB&T Equity Index Fund (the “Fund”) seeks to provide investment results that correspond as closely as practicable, before fees and expenses, to the total return of the broad range of stocks represented in the S&P 500® Stock Index. The Fund employs a two-tier structure, commonly referred to as “master-feeder”. The Fund invests all of its investable assets in the S&P 500® Index Master portfolio (“Master Portfolio”). For simplicity sake, all discussion of the Fund’s investment objective, strategies, risks and holdings refer also to the Master Portfolio’s objectives, strategies, risks, and holdings unless otherwise indicated.
The Fund seeks to approximate as closely as practicable, before fees and expenses, the capitalization-weighted total rate of return of the S&P 500 Stock Index. For the 12 months ended December 31, 2004, the Fund returned 10.23% (Class A Shares without sales charge)2 and the Index returned 10.88%.
An index is a statistical composite that tracks a specified financial market or sector. Unlike a fund, an index does not actually hold a portfolio of securities and therefore does not incur the management, administration, distribution, transaction or other expenses incurred by a fund. These expenses negatively impact the performance of a fund, and were the basis for the Fund’s slight underperformance compared to its benchmark.
Equity markets generally posted gains during the reporting period. As the reporting period opened, unstable economic indicators and lack of job growth spurred concerns surrounding the sustainability of economic recovery, in turn dampening investor confidence. Continued geopolitical concerns also weighed on investor sentiment. As the reporting period progressed, the economic picture changed. In early April, employment data for March came in stronger than expected. May and June brought upward revisions to labor figures, suggesting that the “jobless recovery” might no longer be jobless. As economic indicators improved, concerns about sluggish economic growth were replaced with worries about inflation. Uncertainty surrounding the upcoming presidential election also appeared to compound investor pessimism, and, by mid-October, the S&P 500 Stock Index posted a loss for the year. During the last two months of the year, however, markets appeared to shrug off uncertainties to deliver positive returns for the year. During the reporting period, the Federal Reserve Board raised its federal funds interest rate for the first time in four years. The rate increased five times over the course of the reporting period, overall from 1.00% to 2.25%.
The S&P 500 Stock Index is composed of 500 selected common stocks, most of which are listed on the New York Stock Exchange. The weightings of stocks in the S&P 500
| 2 | Please refer to page 4 for additional performance information. |
Past performance does not guarantee future results. The performance data quoted represents past performance and current returns may be lower or higher. Total return figures include change in share price, reinvestment of dividends and capital gains and do not reflect taxes that a shareholder would pay on fund distributions or on the redemption of fund shares. The investment return and principal value will fluctuate so that an investor’s shares, when redeemed may be worth more or less than the original cost. To obtain performance information current to the most recent month end, please visit www.bbtfunds.com.
2
BB&T EQUITY INDEX FUND, CONTINUED
Stock Index are based on each stock’s relative total market capitalization. The percentage of the Fund’s assets invested in a given stock is approximately the same as the percentage such stock represents in the S&P 500 Stock Index.
During the reporting period, the best performing sector in the S&P 500 Stock Index was energy, which benefited from higher oil prices during the reporting period. Utilities and telecommunications services both posted healthy gains, as did industrials and consumer discretionary. Health care was the worst performing sector, although it did manage to finish the reporting period with a slight gain.
The Fund’s ten largest holdings as of December 31, 2004, oil giant Exxon Mobil Corp. (2.9% of the Fund’s assets) posted the strongest gains for the reporting period, thanks in part to higher oil prices. Health-care company Johnson & Johnson (1.7%) also performed well, as did the Fund’s largest holding, General Electric Co. (3.4%). Among financial stocks, Bank of America Corp. (1.7%) gained, while American International Group Inc. (1.5%) posted a slight decline. Pharmaceutical company Pfizer, Inc. (1.8%) posted the steepest decline among the Fund’s 10 largest holdings for the reporting period†
| † | The composition of the Master Portfolio is subject to change. |
3
BB&T EQUITY INDEX FUND
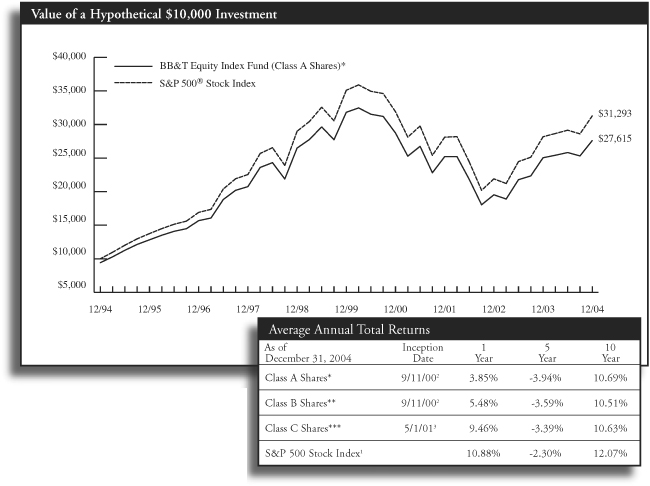
| * | Reflects 5.75% maximum sales charge. |
| ** | Reflects the applicable contingent deferred sales charge (CDSC), maximum of 5.00%. |
| *** | Reflects the applicable maximum CDSC of 1.00% (applicable only to redemptions within one year of purchase). |
Past performance does not guarantee future results. The performance data quoted represents past performance and current returns may be lower or higher. Total return figures include change in share price, reinvestment of dividends and capital gains and do not reflect taxes that a shareholder would pay on fund distributions or on the redemption of fund shares. The investment return and principal value will fluctuate so that an investor’s shares, when redeemed may be worth more or less than the original cost. To obtain performance information current to the most recent month end, please visit www.bbtfunds.com.
| 1 | The Fund is measured against the S&P 500 Stock Index, an unmanaged index which is generally considered to be representative of the performance of the stock market as a whole. The index does not reflect the deduction of expenses associated with a mutual fund, such as investment management and fund accounting fees. The Fund’s performance reflects the deduction of fees for these services. Investors cannot invest directly in an index, although they can invest in its underlying securities. |
| 2 | The performance of the BB&T Equity Index Fund, prior to its commencement date, on 9/11/00, is based on the historical performance of the “master portfolio”, which commenced operations on 7/2/93. The performance shown reflects the reinvestment of all dividend and capital gains distributions but does not reflect the deduction of taxes that a shareholder would have paid on Fund distributions or redemptions. The performance has been adjusted to reflect the deduction of fees for services associated with the Fund, such as investment management and fund accounting fees. |
| 3 | Performance for Class C Shares prior to their inception date, on 5/1/01 is based on the historical performance of Class B Shares and has been adjusted for the maximum CDSC applicable to Class C Shares. |
A portion of the Fund’s fees have been voluntarily waived. If the fees had not been waived, the Fund’s total return would have been lower.
4
Portfolio Holdings Summary (Unaudited)
| | | |
Investment Type
| | % of
Investment
| |
S&P 500 Index Master Portfolio | | 100 | % |
| | |
|
|
| Total | | 100 | % |
For a summary of the S&P 500 Index Master Portfolio holdings, please see the accompanying financial statements of the Master Portfolio.
Expense Example
As a shareholder of the BB&T Equity Index Fund, you incur two types of costs: (1) transaction costs, including sales charges (loads) on purchases, and redemption fees (2) ongoing costs, including master portfolio fees; distribution fees; and other Fund expenses.
This example is intended to help you understand your ongoing costs (in dollars) of investing in the BB&T Equity Index Fund and to compare these costs with the ongoing costs of investing in other mutual funds.
The example is based on an investment of $1,000 invested at the beginning of the period and held for the entire period from July 1, 2004 through December 31, 2004.
Actual Return
The table below provides information about actual account values and actual expenses. You may use the information below, together with the amount you invested, to estimate the expenses that you paid over the period. Simply divide your account value by $1,000 (for example, an $8,600 account value divided by $1,000 = 8.6), then multiply the result by the number in the table under the heading entitled “Expenses Paid During Period” to estimate the expenses you paid on your account during this period.
| | | | | | | | | | | | |
| | | Beginning
Account Value
7/1/04
| | Ending
Account Value
12/31/04
| | Expense Paid
During Period*
7/1/04 - 12/31/04
| | Expense Ratio
During Period
7/1/04 - 12/31/04
| |
BB&T Equity Index Fund | | | | | | | | | | | | |
A Class | | $ | 1,000.00 | | $ | 1,069.40 | | $ | 2.65 | | 0.51 | % |
B Class | | | 1,000.00 | | | 1,065.30 | | | 6.54 | | 1.26 | % |
C Class | | | 1,000.00 | | | 1,065.80 | | | 6.54 | | 1.26 | % |
Hypothetical Return for Comparison Purposes
The table below provides information about hypothetical account values and hypothetical expenses based on the BB&T Equity Index Fund’s actual expense ratio and an assumed rate of return of 5% per year before expenses, which is not the Fund’s actual return. The hypothetical account values and expenses may not be used to estimate the actual ending account balance or expenses you paid for the period. You may use this information to compare this 5% hypothetical example with the 5% hypothetical examples that appear in the shareholder reports of other funds.
Please note that the expenses shown in the table are meant to highlight your ongoing costs only and do not reflect any transactional costs, such as sales charges (loads), redemption fees, or exchange fees. Therefore, the table is useful in comparing ongoing costs only, and will not help you determine the relative total costs of owning different funds. In addition, if these transactional costs were included, your costs would have been higher.
| | | | | | | | | | | | |
| | | Beginning
Account Value
7/1/04
| | Ending
Account Value
12/31/04
| | Expense Paid
During Period*
7/1/04 - 12/31/04
| | Expense Ratio
During Period
7/1/04 - 12/31/04
| |
BB&T Equity Index Fund | | | | | | | | | | | | |
A Class | | $ | 1,000.00 | | $ | 1,022.57 | | $ | 2.59 | | 0.51 | % |
B Class | | | 1,000.00 | | | 1,018.80 | | | 6.39 | | 1.26 | % |
C Class | | | 1,000.00 | | | 1,018.80 | | | 6.39 | | 1.26 | % |
| * | Expenses are equal to the average account value times the Fund’s annualized expense ratio multiplied by the number of days in the most recent fiscal half-year divided by the number of days in the fiscal year. |
5
BB&T FUNDS
Equity Index Fund
| | | | |
| Statement of Assets and Liabilities | | | |
| December 31, 2004 | |
Assets: | | | | |
Investment in S&P 500 Index Master Portfolio, at value (Note 1) | | $ | 155,990,287 | |
Receivable for capital shares issued | | | 408,100 | |
Prepaid expenses and other | | | 7,325 | |
| | |
|
|
|
Total Assets | | | 156,405,712 | |
| | |
|
|
|
Liabilities: | | | | |
Dividends payable | | | 59,719 | |
Payable for capital shares redeemed | | | 404,876 | |
Accrued expenses and other payables: | | | | |
Distribution fees | | | 42,520 | |
Other | | | 51,055 | |
| | |
|
|
|
Total Liabilities | | | 558,170 | |
| | |
|
|
|
Net Assets: | | | | |
Capital stock | | | 155,619,693 | |
Undistributed (distributions in excess of) net investment income | | | (546 | ) |
Undistributed realized losses from investment transactions | | | (8,291,467 | ) |
Net unrealized appreciation on investments | | | 8,519,862 | |
| | |
|
|
|
Net Assets | | $ | 155,847,542 | |
| | |
|
|
|
Net Assets | | | | |
Class A | | $ | 139,833,062 | |
Class B | | | 15,206,920 | |
Class C | | | 807,560 | |
| | |
|
|
|
Total | | $ | 155,847,542 | |
| | |
|
|
|
Outstanding Units of Beneficial Interests (Shares) | | | | |
Class A | | | 17,169,445 | |
Class B | | | 1,896,985 | |
Class C | | | 99,964 | |
| | |
|
|
|
Total | | | 19,166,394 | |
| | |
|
|
|
Net Asset Value | | | | |
Class A — redemption price per share | | $ | 8.14 | |
Class B — offering price per share* | | | 8.02 | |
Class C — offering price per share* | | | 8.08 | |
| | |
|
|
|
Maximum Sales Charge — Class A | | | 5.75 | % |
| | |
|
|
|
Maximum Offering Price (100%/(100% – Maximum Sales Charge) of net asset value adjusted to the nearest cent per share — Class A Shares | | $ | 8.64 | |
| | |
|
|
|
| * | Redemption price per share varies by length of time shares are held. |
| | | | |
| Statement of Operations | | | |
| For the Year Ended December 31, 2004 | |
Net Investment Income Allocated from Master Portfolio: | | | | |
Dividend income | | $ | 2,654,043 | |
Interest income | | | 176,008 | |
Expenses | | | (69,007 | ) |
| | |
|
|
|
Net Investment Income Allocated from Master Portfolio | | | 2,761,044 | |
| | |
|
|
|
Expenses: | | | | |
Administration and transfer agent fees (Note 3) | | | 349,503 | |
Distribution fees — Class A | | | 619,621 | |
Distribution fees — Class B | | | 141,377 | |
Distribution fees — Class C | | | 8,643 | |
Fund accounting fees | | | 30,100 | |
Printing fees | | | 33,091 | |
Professional fees | | | 80,667 | |
Custodian fees | | | 6,117 | |
Other | | | 50,719 | |
| | |
|
|
|
Gross expenses | | | 1,319,838 | |
Expenses waived by the Administrator | | | (302,563 | ) |
Expenses waived by the Distributor | | | (306,317 | ) |
| | |
|
|
|
Total Expenses | | | 710,958 | |
| | |
|
|
|
Net Investment Income | | | 2,050,086 | |
| | |
|
|
|
Realized/Unrealized Gains (Losses) Allocated
from Master Portfolio | | | | |
Net realized gains from investment transactions | | | 11,334,020 | |
Change in unrealized appreciation from investments | | | 706,798 | |
| | |
|
|
|
Net realized/unrealized gains allocated from Master Portfolio | | | 12,040,818 | |
| | |
|
|
|
Change in net assets from operations | | $ | 14,090,904 | |
| | |
|
|
|
See accompanying notes to the financial statements.
6
BB&T FUNDS
Equity Index Fund
| | | | | | | | |
| Statements of Changes in Net Assets | | | | | | |
| | | For the
Year Ended
December 31,
2004
| | | For the
Year Ended
December 31,
2003
| |
From Investment Activities: | | | | | | | | |
Operations: | | | | | | | | |
Net investment income | | $ | 2,050,086 | | | $ | 1,197,756 | |
Net realized gains (losses) from investment transactions | | | 11,334,020 | | | | (327,323 | ) |
Change in unrealized appreciation from investments | | | 706,798 | | | | 26,606,785 | |
| | |
|
|
| |
|
|
|
Change in net assets from operations | | | 14,090,904 | | | | 27,477,218 | |
| | |
|
|
| |
|
|
|
Dividends to Class A Shareholders: | | | | | | | | |
Net investment income | | | (1,894,023 | ) | | | (1,150,351 | ) |
Dividends to Class B Shareholders: | | | | | | | | |
Net investment income | | | (111,354 | ) | | | (61,649 | ) |
Dividends to Class C Shareholders: | | | | | | | | |
Net investment income | | | (5,395 | ) | | | (4,698 | ) |
| | |
|
|
| |
|
|
|
Change in net assets from shareholder dividends | | | (2,010,772 | ) | | | (1,216,698 | ) |
| | |
|
|
| |
|
|
|
Capital Transactions: | | | | | | | | |
Proceeds from shares issued | | | | | | | | |
Class A | | | 34,150,250 | | | | 78,665,773 | |
Class B | | | 2,707,915 | | | | 3,158,939 | |
Class C | | | 228,965 | | | | 446,509 | |
Dividends Reinvested | | | | | | | | |
Class A | | | 2,875,377 | | | | 568,436 | |
Class B | | | 171,521 | | | | 27,337 | |
Class C | | | 10,117 | | | | 4,118 | |
Value of shares redeemed | | | | | | | | |
Class A | | | (17,293,053 | ) | | | (50,111,791 | ) |
Class B | | | (1,928,923 | ) | | | (1,368,404 | ) |
Class C | | | (305,421 | ) | | | (615,639 | ) |
| | |
|
|
| |
|
|
|
Change in net assets from capital transactions | | | 20,616,748 | | | | 30,775,278 | |
| | |
|
|
| |
|
|
|
Change in net assets | | | 32,696,880 | | | | 57,035,798 | |
Net Assets: | | | | | | | | |
Beginning of Year | | | 123,150,662 | | | | 66,114,864 | |
| | |
|
|
| |
|
|
|
End of Year | | $ | 155,847,542 | | | $ | 123,150,662 | |
| | |
|
|
| |
|
|
|
Undistributed (distributions in excess of) net investment income | | $ | (546 | ) | | $ | (28,438 | ) |
| | |
|
|
| |
|
|
|
Share Transactions: | | | | | | | | |
Issued | | | | | | | | |
Class A | | | 4,459,349 | | | | 12,756,540 | |
Class B | | | 361,065 | | | | 492,868 | |
Class C | | | 30,130 | | | | 70,088 | |
Reinvested | | | | | | | | |
Class A | | | 368,943 | | | | 96,345 | |
Class B | | | 22,255 | | | | 4,689 | |
Class C | | | 1,313 | | | | 703 | |
Redeemed | | | | | | | | |
Class A | | | (2,261,105 | ) | | | (7,846,114 | ) |
Class B | | | (256,679 | ) | | | (215,293 | ) |
Class C | | | (41,024 | ) | | | (93,669 | ) |
| | |
|
|
| |
|
|
|
Change in shares | | | 2,684,247 | | | | 5,266,157 | |
| | |
|
|
| |
|
|
|
See accompanying notes to the financial statements.
7
BB&T FUNDS
Equity Index Fund
| | | | | | | | | | | | | | | | | | | | |
| Financial Highlights, Class A Shares | | | | | | | | | | | | | | | |
| Selected data for a share of beneficial interest outstanding throughout the periods indicated. | |
| | | For the
Year Ended
December 31,
2004
| | | For the
Year Ended
December 31,
2003
| | | For the
Year Ended
December 31,
2002
| | | For the
Year Ended
December 31,
2001
| | | September 11,
2000 thru
December 31,
2000(a)
| |
Net Asset Value, Beginning of Period | | $ | 7.48 | | | $ | 5.90 | | | $ | 7.70 | | | $ | 8.83 | | | $ | 10.00 | |
| | |
|
|
| |
|
|
| |
|
|
| |
|
|
| |
|
|
|
Investment Activities | | | | | | | | | | | | | | | | | | | | |
Net investment income(e) | | | 0.11 | | | | 0.08 | | | | 0.06 | | | | 0.05 | | | | 0.02 | |
Net realized and unrealized gains (losses) from investments(e) | | | 0.66 | | | | 1.58 | | | | (1.80 | ) | | | (1.13 | ) | | | (1.17 | ) |
| | |
|
|
| |
|
|
| |
|
|
| |
|
|
| |
|
|
|
Total from Investment Activities | | | 0.77 | | | | 1.66 | | | | (1.74 | ) | | | (1.08 | ) | | | (1.15 | ) |
| | |
|
|
| |
|
|
| |
|
|
| |
|
|
| |
|
|
|
Dividends: | | | | | | | | | | | | | | | | | | | | |
Net investment income | | | (0.11 | ) | | | (0.08 | ) | | | (0.06 | ) | | | (0.05 | ) | | | (0.02 | ) |
| | |
|
|
| |
|
|
| |
|
|
| |
|
|
| |
|
|
|
Total Dividends | | | (0.11 | ) | | | (0.08 | ) | | | (0.06 | ) | | | (0.05 | ) | | | (0.02 | ) |
| | |
|
|
| |
|
|
| |
|
|
| |
|
|
| |
|
|
|
Net Asset Value — End of Period | | $ | 8.14 | | | $ | 7.48 | | | $ | 5.90 | | | $ | 7.70 | | | $ | 8.83 | |
| | |
|
|
| |
|
|
| |
|
|
| |
|
|
| |
|
|
|
Total Return (excludes sales charge)(b) | | | 10.23 | % | | | 28.28 | % | | | (22.56 | )% | | | (12.24 | )% | | | (11.50 | )% |
| | | | | |
Ratios/Supplementary Data: | | | | | | | | | | | | | | | | | | | | |
Net Assets, End of Period (000’s) | | $ | 139,833 | | | $ | 109,282 | | | $ | 56,661 | | | $ | 39,700 | | | $ | 13,632 | |
Ratio of expenses to average net assets(c)(e) | | | 0.49 | % | | | 0.48 | % | | | 0.55 | % | | | 0.54 | % | | | 0.55 | % |
Ratio of net investment income to average net assets(c)(e) | | | 1.57 | % | | | 1.31 | % | | | 1.08 | % | | | 0.74 | % | | | 1.42 | % |
Ratio of expenses to average net assets*(c)(e) | | | 0.96 | % | | | 0.95 | % | | | 1.05 | % | | | 1.10 | % | | | 1.31 | % |
Portfolio turnover(d) | | | 14 | % | | | 8 | % | | | 12 | % | | | 9 | % | | | 10 | % |
| * | During the period certain fees were reduced. If such fee reductions had not occurred, the ratios would have been as indicated. |
| (a) | Period from the commencement of operations. |
| (b) | Not annualized for periods less than one year. |
| (c) | Annualized for periods less than one year. |
| (d) | This rate represents the portfolio turnover rate of the S&P 500 Index Master Portfolio. |
| (e) | The per share amounts and percentages reflect income and expenses assuming inclusion of the Fund’s proportionate share of the income and expenses of the S&P 500 Index Master Portfolio. |
See accompanying notes to the financial statements.
8
BB&T FUNDS
Equity Index Fund
| | | | | | | | | | | | | | | | | | | | |
| Financial Highlights, Class B Shares | |
| Selected data for a share of beneficial interest outstanding throughout the periods indicated. | | | | |
| | | For the
Year Ended
December 31,
2004
| | | For the
Year Ended
December 31,
2003
| | | For the
Year Ended
December 31,
2002
| | | For the
Year Ended
December 31,
2001
| | | September 11,
2000 thru
December 31,
2000(a)
| |
Net Asset Value, Beginning of Period | | $ | 7.37 | | | $ | 5.83 | | | $ | 7.60 | | | $ | 8.82 | | | $ | 10.00 | |
| | |
|
|
| |
|
|
| |
|
|
| |
|
|
| |
|
|
|
Investment Activities | | | | | | | | | | | | | | | | | | | | |
Net investment income(f) | | | 0.06 | | | | 0.03 | | | | 0.02 | | | | — | (b) | | | 0.02 | |
Net realized and unrealized gains (losses) from investments(f) | | | 0.65 | | | | 1.54 | | | | (1.77 | ) | | | (1.18 | ) | | | (1.18 | ) |
| | |
|
|
| |
|
|
| |
|
|
| |
|
|
| |
|
|
|
Total from Investment Activities | | | 0.71 | | | | 1.57 | | | | (1.75 | ) | | | (1.18 | ) | | | (1.16 | ) |
| | |
|
|
| |
|
|
| |
|
|
| |
|
|
| |
|
|
|
Dividends | | | | | | | | | | | | | | | | | | | | |
Net investment income | | | (0.06 | ) | | | (0.03 | ) | | | (0.02 | ) | | | (0.04 | ) | | | (0.02 | ) |
| | |
|
|
| |
|
|
| |
|
|
| |
|
|
| |
|
|
|
Total Dividends | | | (0.06 | ) | | | (0.03 | ) | | | (0.02 | ) | | | (0.04 | ) | | | (0.02 | ) |
| | |
|
|
| |
|
|
| |
|
|
| |
|
|
| |
|
|
|
Net Asset Value — End of Period | | $ | 8.02 | | | $ | 7.37 | | | $ | 5.83 | | | $ | 7.60 | | | $ | 8.82 | |
| | |
|
|
| |
|
|
| |
|
|
| |
|
|
| |
|
|
|
Total Return (excludes sales charge)(c) | | | 9.48 | % | | | 27.18 | % | | | (23.05 | )% | | | (13.37 | )% | | | (11.61 | )% |
| | | | | |
Ratios/Supplementary Data: | | | | | | | | | | | | | | | | | | | | |
Net Assets, End of Period (000’s) | | $ | 15,207 | | | $ | 13,055 | | | $ | 8,678 | | | $ | 8,067 | | | $ | 929 | |
Ratio of expenses to average net assets(d)(f) | | | 1.23 | % | | | 1.23 | % | | | 1.30 | % | | | 1.17 | % | | | 1.30 | % |
Ratio of net investment income to average net assets(d)(f) | | | 0.81 | % | | | 0.54 | % | | | 0.34 | % | | | 0.74 | % | | | 1.92 | % |
Ratio of expenses to average net assets*(d)(f) | | | 1.45 | % | | | 1.45 | % | | | 1.56 | % | | | 1.37 | % | | | 1.81 | % |
Portfolio turnover(e) | | | 14 | % | | | 8 | % | | | 12 | % | | | 9 | % | | | 10 | % |
| * | During the period certain fees were reduced. If such fee reductions had not occurred, the ratios would have been as indicated. |
| (a) | Period from commencement of operations. |
| (b) | Amount less than $0.005. |
| (c) | Not annualized for periods less than one year. |
| (d) | Annualized for periods less than one year. |
| (e) | This rate represents the portfolio turnover rate of the S&P 500 Index Master Portfolio |
| (f) | The per share amounts and percentages reflect income and expenses assuming inclusion of the Fund’s proportionate share of the income and expenses of the S&P 500 Index Master Portfolio. |
See accompanying notes to the financial statements.
9
BB&T FUNDS
Equity Index Fund
| | | | | | | | | | | | | | | | |
| Financial Highlights, Class C Shares | | | | | | | | | | | | |
| Selected data for a share of beneficial interest outstanding throughout the periods indicated. | |
| | | For the
Year Ended
December 31,
2004
| | | For the
Year Ended
December 31,
2003
| | | For the
Year Ended
December 31,
2002
| | | May 1, 2001
thru
December 31,
2001(a)
| |
Net Asset Value, Beginning of Period | | $ | 7.42 | | | $ | 5.86 | | | $ | 7.56 | | | $ | 8.34 | |
| | |
|
|
| |
|
|
| |
|
|
| |
|
|
|
Investment Activities | | | | | | | | | | | | | | | | |
Net investment income(g) | | | 0.07 | | | | 0.04 | | | | 0.03 | (b) | | | — | (c) |
Net realized and unrealized gains (losses) from investments(g) | | | 0.64 | | | | 1.56 | | | | (1.70 | ) | | | (0.72 | ) |
| | |
|
|
| |
|
|
| |
|
|
| |
|
|
|
Total from Investment Activities | | | 0.71 | | | | 1.60 | | | | (1.67 | ) | | | (0.72 | ) |
| | |
|
|
| |
|
|
| |
|
|
| |
|
|
|
Dividends | | | | | | | | | | | | | | | | |
Net investment income | | | (0.05 | ) | | | (0.04 | ) | | | (0.03 | ) | | | (0.06 | ) |
| | |
|
|
| |
|
|
| |
|
|
| |
|
|
|
Total Dividends | | | (0.05 | ) | | | (0.04 | ) | | | (0.03 | ) | | | (0.06 | ) |
| | |
|
|
| |
|
|
| |
|
|
| |
|
|
|
Net Asset Value — End of Period | | $ | 8.08 | | | $ | 7.42 | | | $ | 5.86 | | | $ | 7.56 | |
| | |
|
|
| |
|
|
| |
|
|
| |
|
|
|
Total Return (excludes sales charge)(d) | | | 9.46 | % | | | 27.35 | % | | | (22.08 | )% | | | (8.68 | )% |
| | | | |
Ratios/Supplementary Data: | | | | | | | | | | | | | | | | |
Net Assets, End of Period (000’s) | | $ | 808 | | | $ | 813 | | | $ | 776 | | | $ | 107 | |
Ratio of expenses to average net assets(e)(g) | | | 1.23 | % | | | 1.23 | % | | | 1.30 | % | | | 1.01 | % |
Ratio of net investment income to average net assets(e)(g) | | | 0.76 | % | | | 0.52 | % | | | 0.41 | % | | | 1.09 | % |
Ratio of expenses to average net assets*(e)(g) | | | 1.45 | % | | | 1.45 | % | | | 1.56 | % | | | 1.52 | % |
Portfolio turnover(f) | | | 14 | % | | | 8 | % | | | 12 | % | | | 9 | % |
| * | During the period certain fees were reduced. If such fee reductions had not occurred, the ratios would have been as indicated. |
| (a) | Period from commencement of operations. |
| (b) | Per share net investment income has been calculated using the daily average shares method. |
| (c) | Amount less than $0.005. |
| (d) | Not annualized for periods less than one year. |
| (e) | Annualized for periods less than one year. |
| (f) | This rate represents the portfolio turnover rate of the S&P 500 Index Master Portfolio. |
| (g) | The per share amounts and percentages reflect income and expenses assuming inclusion of the Fund’s proportionate share of the income and expenses of the S&P 500 Index Master Portfolio. |
See accompanying notes to the financial statements.
10
BB&T FUNDS
Notes to Financial Statements
December 31, 2004
The BB&T Equity Index Fund (the “Fund”) commenced operations on September 11, 2000 and is registered under the Investment Company Act of 1940, as amended (the “1940 Act”), as a diversified open-end investment company. The Fund is a separate series of the BB&T Funds (“Trust”), a Massachusetts business trust organized in 1992. The Fund invests all of its assets in the S&P 500 Index Master Portfolio (the “Master Portfolio”) of the Master Investment Portfolio (“MIP”), a diversified open-end management investment company registered under the Investment Company Act of 1940, rather than in a portfolio of securities. The Master Portfolio has substantially the same investment objective as the Fund. Barclays Global Fund Advisors serves as Investment Advisor for the Master Portfolio. The financial statements of the Master Portfolio, including the schedule of investments in securities, are contained elsewhere in this report and should be read in conjunction with the Fund’s financial statements.
The Fund is authorized to issue an unlimited number of shares without par value. The Fund offers three classes of shares: Class A Shares, Class B Shares and Class C Shares.
Each class of shares has identical rights and privileges except with respect to the fees paid under the distribution plan, voting rights on matters affecting a single class of shares and the exchange privilege of each class of shares.
Under the Fund’s organizational documents, its Officers and Trustees are indemnified against certain liabilities arising out of the performance of their duties to the Fund. In addition, in the normal course of business, the Fund enters into contracts with their vendors and others that provide for general indemnifications. The Fund’s maximum exposure under these arrangements is unknown as this would involve future claims that may be made against the Fund. However, based on experience, the Fund expects that risk of loss to be remote.
| 2. | Significant Accounting Policies: |
The following is a summary of significant accounting policies followed by the Fund in the preparation of its financial statements. The policies are in conformity with accounting principles generally accepted in the United States of America (GAAP). The preparation of financial statements requires management to make estimates and assumptions that affect the reported amounts of assets and liabilities and disclosure of contingent assets and liabilities at the date of the financial statements and the reported amounts of income and expenses for the period. Actual results could differ from those estimates.
| | (A) | Security Valuation—The value of the Fund’s investment in the Master Portfolio reflects the Fund’s interest of approximately 6% in the net assets of the Master Portfolio at December 31, 2004. Valuation of securities held by the Master Portfolio is discussed in Note 1 of the Master Portfolio’s Notes to Financial Statements, which are included elsewhere in this report. |
| | (B) | Distributions to Shareholders—Dividends from net investment income are declared and paid quarterly by the Fund. Distributable net realized capital gains, if any, are declared and distributed at least annually. The amount of dividends from net investment income and of distributions from net realized gains are determined in accordance with federal income tax regulations, which may differ from GAAP. These “book/tax” differences are either considered temporary or permanent in nature. To the extent these differences are permanent in nature (i.e. reclass of market discounts, gain/loss, paydowns, and distributions), such amounts are reclassified within the composition of net assets based on their federal tax-basis treatment; temporary differences do not require reclassification. |
| | (C) | Allocation Methodology—The investment income, expenses (other than class specific expenses) and realized and unrealized gains and losses on investments are allocated to each class of shares based on their relative net assets on the date the income is earned, expenses are accrued, or realized and unrealized gains and losses are incurred. |
| | (D) | Expenses—Expenses directly attributable to a class of shares are charged directly to that class. |
| | (E) | Securities Transactions and Income Recognition—The Fund records daily, its proportionate interest in the net investment income and realized/unrealized capital gains and losses of the Master Portfolio. The performance of the Fund is directly affected by the performance of the Master Portfolio. |
Continued
11
BB&T FUNDS
Notes to Financial Statements, Continued
December 31, 2004
| | (F) | Redemption Fees—For the Fund, certain shares purchased on or after January 1, 2004, that were redeemed or exchanged in less than 30 days were assessed a fee of 2% of the total redemption amount. The fee is applied to shares redeemed or exchanged in the order in which they were purchased and is retained by the Fund for the benefit of remaining shareholders to defray Fund portfolio transaction expenses and facilitate portfolio management. For financial statement purposes, these amounts are included in the Statement of Changes in Net Assets as “Proceeds from Shares Issued”. |
| 3. | Related Party Transactions: |
Under its Investment Advisory Agreement with respect to the Fund, BB&T Asset Management, Inc. (“BB&T” or “Adviser”) exercises general oversight over the investment performance of the Fund. BB&T will advise the Board of Trustees if investment of all of the Fund’s assets in shares of the Master Portfolio is no longer an appropriate means of achieving the Fund’s investment objective. For periods in which all the Fund’s assets are not invested in the Master Portfolio, BB&T will receive an investment advisory fee from the Fund. For the period ended December 31, 2004, all of the Fund’s assets were invested in the Master Portfolio and BB&T received no fees.
BISYS Fund Services Limited Partnership d/b/a BISYS Fund Services (“BISYS”), an Ohio Limited Partnership, and BISYS Fund Services Ohio, Inc. (“BISYS Ohio”) are subsidiaries of the BISYS Group, Inc. BISYS, with whom certain Trustees and Officers of the Fund are affiliated, serves the Fund as Administrator, Distributor and Transfer Agent. BISYS, Administrator for the Fund, and BISYS Ohio, Transfer Agent for the Fund, receives compensation at a rate of 0.22% of the average net assets of the Fund. The fee is accrued daily and payable on a monthly basis. BISYS Ohio may directly or through an affiliate, use their fee revenue, past profits, or other revenue sources to pay promotional, administrative, shareholder support, and other expenses to third parties, including broker dealers, in connection with the offer, sale and administration of shares of the Fund. For the period ended December 31, 2004, BISYS had voluntarily agreed to waive all of its fee for the Fund, the amount of such waiver was $302,563. In addition, BISYS provides an employee to serve as Chief Compliance Officer for the Fund, including providing certain related services, for which it receives an additional fee.
The Fund has adopted a Distribution and Shareholder Services Plan (the “Plan”) in accordance with Rule 12b-1 under the 1940 Act. The Plan provides for payments to the distributor of up to 0.50%, 1.00% and 1.00% for Class A Shares, Class B Shares and Class C Shares, respectively. The fees may be used by BISYS to pay banks, including the advisor, broker dealers and other institutions. As distributor, BISYS is entitled to receive commissions on sales of shares of the Fund. BISYS voluntarily waived fees totaling $306,317 for distribution for year ended December 31, 2004.
Certain Officers and Trustees of the Trust are affiliated with the Adviser or the Administrator. Such Officers and Trustees receive no compensation from the Trust for serving in their respective roles, except the Chief Compliance Officer. Each of the non-interested Trustees who served both on the Board and the Audit Committee will be compensated $7,000 per meeting for meeting and retainer fees, plus reimbursement for certain expenses. During the year ended December 31, 2004, actual Trustee compensation was $159,000 in total from the Trust, of which $5,204 was allocated to the Fund.
At December 31, 2004 the Fund had net capital loss carryforwards to offset future net capital gains, if any, to the extent provided by the Treasury regulations. To the extent that these carryforwards are used to offset future capital gains, it is probable that the gains that are offset will not be distributed to shareholders.
| | | |
Amount
| | Expires
|
| $ | 10,695 | | 2008 |
| | 740,335 | | 2009 |
| | 3,648,463 | | 2010 |
| | 715,833 | | 2011 |
| | 175,416 | | 2012 |
Continued
12
BB&T FUNDS
Notes to Financial Statements, Continued
December 31, 2004
The tax characteristics of dividends paid to shareholders during the fiscal year ended December 31, 2004, were as follows:
| | | | | | | | | | | | | | | | | | |
| | | Distributions paid from
| | Total Taxable
Distributions
| | Tax Exempt
Distributions
| | Tax
Return
of Capital
| | Total
Distributions
Paid
|
| | | Ordinary
Income
| | Net
Long-Term
Gains
| | | | |
BB&T Equity Index Fund | | $ | 3,165,550 | | $ | — | | $ | 3,165,550 | | $ | — | | $ | — | | $ | 3,165,550 |
The tax characteristics of dividends paid to shareholders during the fiscal year ended December 31, 2003, were as follows:
| | | | | | | | | | | | | | | | | | |
| | | Distributions paid from
| | Total Taxable
Distributions
| | Tax Exempt
Distributions
| | Tax
Return
of Capital
| | Total
Distributions
Paid
|
| | | Ordinary
Income
| | Net
Long-Term
Gains
| | | | |
BB&T Equity Index Fund | | $ | 635,919 | | $ | — | | $ | 635,919 | | $ | — | | $ | — | | $ | 635,919 |
Total Distributions paid differ from the Statement of Changes in Net Assets because dividends are recognized when paid for tax purposes.
As of December 31, 2004 the components of accumulated earnings (deficit) on a tax basis was as follows:
| | | | | | | | | | | | | | | | | | | | | | | |
| | | Undistributed
Ordinary
Income/Tax
Exempt Income
| | Undistributed
LongTerm
Capital
Gains (Losses)
| | Accumulated
Earnings
| | Dividends
Payable
| | | Accumulated
Capital and
Other Losses
| | | Unrealized
Appreciation
(Depreciation)
| | Total
Accumulated
Earning
(Deficit)
|
BB&T Equity Index Fund | | $ | 51,325 | | $ | — | | $ | 51,325 | | $ | (59,719 | ) | | $ | (5,415,912 | ) | | $ | 5,652,155 | | $ | 227,849 |
Under current tax law, capital losses realized after October 31 of a Fund’s fiscal year may be deferred and treated as occurring on the first business day of the following fiscal year for tax purposes. The Fund had deferred post October capital losses of $125,170, which will be treated as arising on the first business day of the fiscal year ending December 31, 2005.
| 5. | Other Federal Tax Information (Unaudited) |
For the period ended December 31, 2004, certain dividends paid by the Funds may be subject to a maximum tax rate of 15% a provided by the Jobs an Growth Relief Reconciliation Act of 2003. The Funds intend to designate the maximum amount allowable as taxes at a maximum rate of 15%. Complete information will be reported in conjunction with your 2004 Form 1099-DIV. For the period ended December 31, 2004, the Fund paid qualified dividend income of $2,010,772.
For corporate shareholders, 100% of the total ordinary income dividends paid during the fiscal year ended December 31, 2004 qualify for the corporate dividends received deduction.
| 6. | Other Information (Unaudited) |
A description of the policies and procedures that the Fund use to determine how to vote proxies relating to portfolio securities is available (i) without charge, upon request, by calling 1-800-228-1872 and (ii) on the Securities and Exchange Commission’s website at http://www.sec.gov.
Information regarding how the Fund voted proxies relating to portfolio securities during the most recent 12-month period ended June 30, 2004 is available (i) without charge, upon request, by calling 1-800-228-1872 and (ii) on the Securities and Exchange Commission’s website at http://www.sec.gov.
Schedule of Portfolio Investments for quarters ending March 31 and September 30 will be available starting September 30, 2004, without charge, on the Securities and Exchange Commission’s website at http://www.sec.gov.
13
Report of Independent Registered Public Accounting Firm
To the Shareholders and the Board of Trustees of
BB&T Funds:
We have audited the accompanying statement of assets and liabilities of the BB&T Equity Index Fund (the “Fund”), a series of BB&T Funds, as of December 31, 2004, and the related statement of operations for the year then ended, the statements of changes in net assets for each of the two years in the period then ended, and the financial highlights for each of the years or periods in the five-year period then ended. These financial statements and financial highlights are the responsibility of the Fund’s management. Our responsibility is to express an opinion on these financial statements and financial highlights based on our audits.
We conducted our audits in accordance with auditing standards generally accepted in the United States of America. Those standards require that we plan and perform the audit to obtain reasonable assurance about whether the financial statements and financial highlights are free of material misstatement. An audit includes examining, on a test basis, evidence supporting the amounts and disclosures in the financial statements. Our procedures included confirmation of the Fund’s investment at December 31, 2004 by correspondence with the underlying portfolio’s fund accounting agent. An audit also includes assessing the accounting principles used and significant estimates made by management, as well as evaluating the overall financial statement presentation. We believe that our audits provide a reasonable basis for our opinion.
In our opinion, the financial statements and financial highlights referred to above present fairly, in all material respects, the financial position of the BB&T Equity Index Fund as of December 31, 2004, the results of its operations for the year then ended, the changes in its net assets for each of the two years in the period then ended, and the financial highlights for each of the five years or periods then ended in conformity with accounting principles generally accepted in the United States of America.

Boston, Massachusetts
February 28, 2005
14
Information about Trustees and Officers (Unaudited)
Overall responsibility for the management of the Fund rests with its Board of Trustees, who are elected by the Shareholders of the Trust. The Trustees elect the Officers of the Trust to supervise actively its day-to-day operations. The names of the Trustees, their addresses, ages, length of tenure, principal occupations during the past five years, number of portfolios overseen and directorships held outside of the Trust are set below:
Independent Trustees
| | | | | | | | | | |
Name, Address and Date of Birth
| | Position(s)
Held With
the Funds
| | Term of
Office and
Length of
Time Served
| | Principal Occupation During the Last 5 Years
| | Number of
Portfolios
in Fund
Complex
Overseen
by Trustee
| | Other
Directorships Held
by Trustee
|
Thomas W. Lambeth 700 Yorkshire Road Winston-Salem, NC 27106 Birthdate: 1/35 | | Trustee | | Indefinite, 8/92 – Present | | From January 2004 to present,
Senior Fellow, Z. Smith Reynolds Foundation; from 1978 to January 2001, Executive Director, Z. Smith Reynolds Foundation. | | 25 | | None |
| | | | | |
Robert W. Stewart 201 Huntington Road Greenville, SC 29615 Birthdate: 5/32 | | Trustee | | Indefinite, 2/94 – Present | | Retired; Chairman and Chief
Executive Officer of Engineered Custom Plastics Corporation from
1969 to 1990. | | 25 | | None |
| | | | | |
Drew T. Kagan Montecito Advisors, Inc. 810 N. Jefferson St., Ste 101 Lewisburg, WV 24901 Birthdate: 2/48 | | Trustee | | Indefinite, 8/00 – Present | | From December 2003 to present, President and Director, Montecito Advisors, Inc.; from March 1996 to December 2003, President,
Investment Affiliate, Inc.; March
1992 to March 1996, President, Provident Securities & Investment
Co. | | 25 | | None |
| | | | | |
Laura C. Bingham Peace College Office of the President 15 East Peace Street Raleigh, NC 27604-1194 Birthdate: 11/56 | | Trustee | | Indefinite, 2/01 – Present | | From July 1998 to present, President
of Peace College; November 1997 to May 1998, Senior Vice President of Philanthropy and President of Fort Sanders Foundation Covenant
Health; 1992 to 1997, Vice President Hollins College. | | 25 | | None |
| | | | | |
Douglas Van Scoy 841 Middle St. Sullivans Island, SC 26481 Birthdate: 11/43 | | Trustee | | Indefinite, 5/04 – Present | | Retired: From November 1974 to
July 2001, Deputy Director of
Private Client Group and Senior Executive Vice President of Smith Barney (investment banking). | | 25 | | None |
| | | | | |
James L. Roberts 7 Kittansett Court Skillman, NJ 08558 Birthdate: 11/42 | | Trustee | | Indefinite, 11/04 – present | | Retired: From January 1999 to December 2003, President CEO and Director, Covest Bancshares, Inc. | | 25 | | None |
Interested Trustees
| | | | | | | | | | |
Name, Address and Date of Birth
| | Position(s)
Held With
the Funds
| | Term of
Office and
Length of
Time Served
| | Principal Occupation During the Last 5 Years
| | Number of
Portfolios
in Fund
Complex
Overseen
by Trustee
| | Other
Directorships Held
by Trustee
|
*Kenneth L. Miller 200 W. Second Street, 16th Floor Winston-Salem, NC 27101 Birthdate: 9/46 | | Trustee | | Indefinite, 11/02 – Present | | From August 1998 to present, Executive Vice President Branch Banking and Trust Company;
employee of Branch Banking and
Trust Company since 1989. | | 25 | | None |
| * | Mr. Miller is treated by the Funds as an “interested person” (as defined in Section 2(a)(19) of the 1940 Act) of the Fund. Mr. Miller is an “interested person” because he owns shares of BB&T Corporation and is an Executive Vice President of Branch Banking and Trust Company, the parent of the Adviser. |
15
| | | | | | |
Officers |
Name, Address and Date of Birth
| | Position(s)
Held With the
Funds
| | Term of Office and Length of Time Served
| | Principal Occupation(s) During the Past 5 Years
|
| | | |
Keith F. Karlawish1 3435 Stelzer Road Columbus, Ohio 43219 Birthdate: 8/64 | | President | | Indefinite, 2/05 – Present | | From May 2002 to present, President, BB&T Asset Management, Inc.; from 1996 to 2002, Senior Vice President and Director of Fixed Income, BB&T Asset Management, Inc. |
| | | |
E.G. Purcell, III 3435 Stelzer Road Columbus, Ohio 43219 Birthdate: 1/55 | | Vice President | | Indefinite, 11/00 – Present | | From 1995 to present, Senior Vice President, BB&T Asset Management, Inc. and its predecessors. |
| | | |
James T. Gillespie 3435 Stelzer Road Columbus, Ohio 43219 Birthdate: 11/66 | | Vice President | | Indefinite, 5/02 – Present | | From February 2005 to present, Vice President, BB&T Asset Management, Inc. from February 1992 to February 2005, Director of BISYS Fund Services; |
| | | |
George O. Martinez 3435 Stelzer Road Columbus, Ohio 43219 Birthdate: 3/59 | | Vice President President | | Indefinite, 2/05 – Present 11/03 – 1/05 | | From August 2002 to present, Senior Vice President — Client Services, BISYS Fund Services; from June 2001 to August 2002, CEO and President, Fund Watch Dog Services LLC; from June 2000 to June 2001, Senior Vice President and Senior Managing Counsel, State Street Corporation; from March 1998 to May 2000, National Director of Investment Management and Regulatory Consulting, Arthur Andersen. |
| | | |
Troy A. Sheets 3435 Stelzer Road Columbus, Ohio 43219 Birthdate: 5/71 | | Treasurer | | Indefinite, 5/02 – Present | | From April 2002 to present, Vice President of BISYS Fund Services; from September 1993 to April 2002, Senior Audit Manager of KPMG LLP. |
| | | |
Frank J. Pavlak 3435 Stelzer Road Columbus, Ohio 43219 Birthdate: 3/47 | | Chief Compliance and AML Officer | | Indefinite, 9/04 – Present | | From September 2004 to present, Senior Vice President, The BISYS Group; from 1999 to 2004, Director of Compliance, Oppenheiner Funds, Inc.; from 1981 to 1999, Branch Chief, U.S. Securities and Exchange Commission. |
| | | |
Alaina V. Metz 3435 Stelzer Road Columbus, Ohio 43219 Birthdate: 4/67 | | Assistant Secretary | | Indefinite, 9/95 – Present | | From June 1995 to present, Vice president, BISYS Fund Services. |
| | | |
Chris Sabato 3435 Stelzer Road Columbus, Ohio 43219 Birthdate: 12/68 | | Assistant Treasurer | | Indefinite 11/02 – Present | | From February 1993 to present, Director of BISYS Fund Services. |
The Fund’s Statement of Additional Information includes information about the Fund’s Trustees. To receive your free copy of the Statement of Additional Information, call toll free: 1-800-453-7348.
| 1 | Mr. Karlawish was elected President on February 1, 2005. |
16
| | |
| S&P 500 Index Master Portfolio | | Schedule of Investments December 31, 2004 |
| | | | | |
| Common Stocks (99.01)%: | | | | |
Security
| | Shares
| | Value
|
Advertising (0.19)%: | | | | | |
Interpublic Group of Companies Inc.(1)(2) | | 88,895 | | $ | 1,191,192 |
Omnicom Group Inc.(2) | | 39,270 | | | 3,311,246 |
| | | | |
|
|
| | | | | | 4,502,438 |
| | | | |
|
|
Aerospace & Defense (1.74%): | | | | | |
Boeing Co. (The) | | 177,123 | | | 9,169,658 |
General Dynamics Corp. | | 42,230 | | | 4,417,258 |
Goodrich (B.F.) Co. | | 25,452 | | | 830,753 |
L-3 Communications Holdings Inc. | | 24,375 | | | 1,785,225 |
Lockheed Martin Corp. | | 93,351 | | | 5,185,648 |
Northrop Grumman Corp. | | 77,635 | | | 4,220,239 |
Raytheon Co.(2) | | 95,294 | | | 3,700,266 |
Rockwell Collins Inc. | | 37,142 | | | 1,464,880 |
United Technologies Corp. | | 107,820 | | | 11,143,197 |
| | | | |
|
|
| | | | | | 41,917,124 |
| | | | |
|
|
Agriculture (1.40%): | | | | | |
Altria Group Inc. | | 433,160 | | | 26,466,076 |
Monsanto Co. | | 55,720 | | | 3,095,246 |
Reynolds American Inc.(2) | | 31,084 | | | 2,443,202 |
UST Inc. | | 35,067 | | | 1,687,073 |
| | | | |
|
|
| | | | | | 33,691,597 |
| | | | |
|
|
Airlines (0.12%): | | | | | |
Delta Air Lines Inc.(1)(2) | | 26,197 | | | 195,954 |
Southwest Airlines Co. | | 164,243 | | | 2,673,876 |
| | | | |
|
|
| | | | | | 2,869,830 |
| | | | |
|
|
Apparel (0.46%): | | | | | |
Coach Inc.(1) | | 39,790 | | | 2,244,156 |
Jones Apparel Group Inc. | | 25,894 | | | 946,944 |
Liz Claiborne Inc. | | 22,912 | | | 967,116 |
Nike Inc. Class B | | 55,348 | | | 5,019,510 |
Reebok International Ltd.(2) | | 12,457 | | | 548,108 |
VF Corp. | | 23,356 | | | 1,293,455 |
| | | | |
|
|
| | | | | | 11,019,289 |
| | | | |
|
|
Auto Manufacturers (0.58%): | | | | | |
Ford Motor Co. | | 385,864 | | | 5,649,049 |
General Motors Corp.(2) | | 119,097 | | | 4,771,026 |
Navistar International Corp.(1) | | 15,078 | | | 663,130 |
PACCAR Inc. | | 36,607 | | | 2,946,131 |
| | | | |
|
|
| | | | | | 14,029,336 |
| | | | |
|
|
Auto Parts & Equipment (0.22%): | | | | | |
Cooper Tire & Rubber Co.(2) | | 15,666 | | | 337,602 |
Dana Corp. | | 32,185 | | | 557,766 |
Delphi Corp.(2) | | 117,899 | | | 1,063,449 |
Goodyear Tire & Rubber Co. (The)(1)(2) | | 37,185 | | | 545,132 |
Johnson Controls Inc. | | 40,100 | | | 2,543,944 |
Visteon Corp. | | 27,718 | | | 270,805 |
| | | | |
|
|
| | | | | | 5,318,698 |
| | | | |
|
|
Banks (6.51%): | | | | | |
AmSouth Bancorp | | 75,383 | | | 1,952,420 |
Bank of America Corp. | | 852,448 | | | 40,056,532 |
Bank of New York Co. Inc. (The) | | 163,837 | | | 5,475,433 |
BB&T Corp. | | 116,474 | | | 4,897,732 |
Comerica Inc. | | 36,216 | | | 2,209,900 |
Compass Bancshares Inc. | | 25,793 | | | 1,255,345 |
Fifth Third Bancorp | | 124,816 | | | 5,901,300 |
First Horizon National Corp.(2) | | 26,102 | | | 1,125,257 |
| | | | | |
| Common Stocks, continued | | | | |
Security
| | Shares
| | Value
|
Banks, continued | | | | | |
Huntington Bancshares Inc.(2) | | 48,582 | | $ | 1,203,862 |
KeyCorp | | 85,683 | | | 2,904,654 |
M&T Bank Corp.(2) | | 24,469 | | | 2,638,737 |
Marshall & Ilsley Corp. | | 47,438 | | | 2,096,760 |
Mellon Financial Corp. | | 89,244 | | | 2,776,381 |
National City Corp.(2) | | 142,880 | | | 5,365,144 |
North Fork Bancorp Inc. | | 99,172 | | | 2,861,112 |
Northern Trust Corp. | | 46,548 | | | 2,261,302 |
PNC Financial Services Group | | 59,572 | | | 3,421,816 |
Regions Financial Corp. | | 97,967 | | | 3,486,646 |
State Street Corp.(2) | | 70,274 | | | 3,451,859 |
SunTrust Banks Inc. | | 78,194 | | | 5,776,973 |
Synovus Financial Corp. | | 65,730 | | | 1,878,563 |
U.S. Bancorp | | 393,949 | | | 12,338,483 |
Wachovia Corp. | | 338,390 | | | 17,799,314 |
Wells Fargo & Co. | | 357,026 | | | 22,189,166 |
Zions Bancorporation(2) | | 19,027 | | | 1,294,407 |
| | | | |
|
|
| | | | | | 156,619,098 |
| | | | |
|
|
Beverages (2.23%): | | | | | |
Anheuser-Busch Companies Inc. | | 166,665 | | | 8,454,915 |
Brown-Forman Corp. Class B | | 25,814 | | | 1,256,626 |
Coca-Cola Co. (The) | | 510,556 | | | 21,254,446 |
Coca-Cola Enterprises Inc.(2) | | 99,620 | | | 2,077,077 |
Coors (Adolph) Co. Class B(2) | | 8,030 | | | 607,630 |
Pepsi Bottling Group Inc.(2) | | 52,607 | | | 1,422,493 |
PepsiCo Inc. | | 355,452 | | | 18,554,594 |
| | | | |
|
|
| | | | | | 53,627,781 |
| | | | |
|
|
Biotechnology (1.17%): | | | | | |
Amgen Inc.(1) | | 268,013 | | | 17,193,034 |
Biogen Idec Inc.(1)(2) | | 70,332 | | | 4,684,815 |
Chiron Corp.(1)(2) | | 39,289 | | | 1,309,502 |
Genzyme Corp.(1) | | 52,233 | | | 3,033,170 |
MedImmune Inc.(1) | | 52,766 | | | 1,430,486 |
Millipore Corp.(1) | | 10,656 | | | 530,775 |
| | | | |
|
|
| | | | | | 28,181,782 |
| | �� | | |
|
|
Building Materials (0.27%): | | | | | |
American Standard Companies Inc.(1) | | 45,162 | | | 1,866,094 |
Masco Corp.(2) | | 94,428 | | | 3,449,455 |
Vulcan Materials Co. | | 21,527 | | | 1,175,589 |
| | | | |
|
|
| | | | | | 6,491,138 |
| | | | |
|
|
Chemicals (1.61%): | | | | | |
Air Products & Chemicals Inc. | | 47,896 | | | 2,776,531 |
Ashland Inc. | | 14,918 | | | 870,913 |
Dow Chemical Co. (The) | | 198,937 | | | 9,849,371 |
Du Pont (E.I.) de Nemours and Co.(2) | | 209,535 | | | 10,277,692 |
Eastman Chemical Co.(2) | | 16,365 | | | 944,751 |
Ecolab Inc. | | 54,705 | | | 1,921,787 |
Engelhard Corp. | | 25,890 | | | 794,046 |
Great Lakes Chemical Corp.(2) | | 10,732 | | | 305,755 |
Hercules Inc.(1)(2) | | 23,527 | | | 349,376 |
International Flavors & Fragrances Inc. | | 19,778 | | | 847,290 |
PPG Industries Inc. | | 36,211 | | | 2,468,142 |
Praxair Inc. | | 68,431 | | | 3,021,229 |
Rohm & Haas Co.(2) | | 47,349 | | | 2,094,246 |
Sherwin-Williams Co. (The) | | 29,980 | | | 1,338,007 |
Sigma-Aldrich Corp. | | 14,493 | | | 876,247 |
| | | | |
|
|
| | | | | | 38,735,383 |
| | | | |
|
|
Continued
17
| | |
| S&P 500 Index Master Portfolio | | Schedule of Investments December 31, 2004 |
| | | | | |
| Common Stocks, continued | | | | |
Security
| | Shares
| | Value
|
Commercial Services (0.89%): | | | | | |
Apollo Group Inc. Class A(1) | | 39,038 | | $ | 3,150,757 |
Block (H & R) Inc.(2) | | 34,957 | | | 1,712,893 |
Cendant Corp. | | 222,011 | | | 5,190,617 |
Convergys Corp.(1) | | 30,301 | | | 454,212 |
Donnelley (R.R.) & Sons Co.(2) | | 46,214 | | | 1,630,892 |
Equifax Inc.(2) | | 28,757 | | | 808,072 |
McKesson Corp. | | 61,882 | | | 1,946,808 |
Moody’s Corp.(2) | | 31,161 | | | 2,706,333 |
Paychex Inc. | | 79,685 | | | 2,715,665 |
Robert Half International Inc. | | 37,064 | | | 1,090,794 |
| | | | |
|
|
| | | | | | 21,407,043 |
| | | | |
|
|
Computers (4.26%): | | | | | |
Affiliated Computer Services Inc. Class A(1)(2) | | 27,278 | | | 1,641,863 |
Apple Computer Inc.(1) | | 84,787 | | | 5,460,283 |
Computer Sciences Corp.(1) | | 40,187 | | | 2,265,341 |
Dell Inc.(1) | | 524,248 | | | 22,091,811 |
Electronic Data Systems Corp.(2) | | 108,252 | | | 2,500,621 |
EMC Corp.(1) | | 505,449 | | | 7,516,027 |
Gateway Inc.(1) | | 80,466 | | | 483,601 |
Hewlett-Packard Co. | | 637,184 | | | 13,361,748 |
International Business Machines Corp. | | 351,319 | | | 34,633,027 |
Lexmark International Inc.(1) | | 27,412 | | | 2,330,020 |
NCR Corp.(1)(2) | | 19,769 | | | 1,368,608 |
Network Appliance Inc.(1) | | 76,193 | | | 2,531,131 |
Sun Microsystems Inc.(1) | | 708,949 | | | 3,814,146 |
SunGard Data Systems Inc.(1) | | 60,800 | | | 1,722,464 |
Unisys Corp.(1) | | 71,972 | | | 732,675 |
| | | | |
|
|
| | | | | | 102,453,366 |
| | | | |
|
|
Cosmetics & Personal Care (2.33%): | | | |
Alberto-Culver Co.(2) | | 19,110 | | | 928,173 |
Avon Products Inc. | | 99,702 | | | 3,858,467 |
Colgate-Palmolive Co. | | 111,831 | | | 5,721,274 |
Gillette Co. (The) | | 209,446 | | | 9,378,992 |
Kimberly-Clark Corp. | | 102,871 | | | 6,769,940 |
Procter & Gamble Co. | | 535,332 | | | 29,486,087 |
| | | | |
|
|
| | | | | | 56,142,933 |
| | | | |
|
|
Distribution & Wholesale (0.12%): | | | | | |
Genuine Parts Co.(2) | | 37,057 | | | 1,632,731 |
Grainger (W.W.) Inc. | | 19,103 | | | 1,272,642 |
| | | | |
|
|
| | | | | | 2,905,373 |
| | | | |
|
|
Diversified Financial Services (8.33%): | | | |
American Express Co. | | 264,847 | | | 14,929,425 |
Bear Stearns Companies Inc. (The) | | 21,923 | | | 2,242,942 |
Capital One Financial Corp.(2) | | 51,173 | | | 4,309,278 |
CIT Group Inc. | | 44,620 | | | 2,044,488 |
Citigroup Inc. | | 1,095,303 | | | 52,771,699 |
Countrywide Financial Corp. | | 122,378 | | | 4,529,210 |
E*TRADE Financial Corp.(1) | | 79,293 | | | 1,185,430 |
Federal Home Loan Mortgage Corp. | | 145,476 | | | 10,721,581 |
Federal National Mortgage Association | | 204,227 | | | 14,543,005 |
Federated Investors Inc. Class B | | 23,112 | | | 702,605 |
Franklin Resources Inc. | | 52,569 | | | 3,661,431 |
Goldman Sachs Group Inc. (The) | | 102,151 | | | 10,627,790 |
Janus Capital Group Inc.(2) | | 50,033 | | | 841,055 |
| | | | | |
| Common Stocks, continued | | | | |
Security
| | Shares
| | Value
|
Diversified Financial Services, continued | | | |
JP Morgan Chase & Co. | | 751,807 | | $ | 29,327,991 |
Lehman Brothers Holdings Inc. | | 56,811 | | | 4,969,826 |
MBNA Corp. | | 269,507 | | | 7,597,402 |
Merrill Lynch & Co. Inc. | | 196,513 | | | 11,745,582 |
Morgan Stanley | | 230,944 | | | 12,822,011 |
Providian Financial Corp.(1) | | 61,514 | | | 1,013,136 |
Schwab (Charles) Corp. (The) | | 283,903 | | | 3,395,480 |
SLM Corp. | | 90,634 | | | 4,838,949 |
T. Rowe Price Group Inc. | | 26,971 | | | 1,677,596 |
| | | | |
|
|
| | | | | | 200,497,912 |
| | | | |
|
|
Electric (2.74%): | | | | | |
AES Corp. (The)(1) | | 137,716 | | | 1,882,578 |
Allegheny Energy Inc.(1)(2) | | 29,089 | | | 573,344 |
Ameren Corp. | | 41,356 | | | 2,073,590 |
American Electric Power Co. Inc. | | 83,382 | | | 2,863,338 |
Calpine Corp.(1)(2) | | 113,056 | | | 445,441 |
CenterPoint Energy Inc.(2) | | 64,541 | | | 729,313 |
Cinergy Corp. | | 38,140 | | | 1,587,768 |
CMS Energy Corp.(1)(2) | | 39,938 | | | 417,352 |
Consolidated Edison Inc.(2) | | 51,390 | | | 2,248,312 |
Constellation Energy Group Inc. | | 37,317 | | | 1,631,126 |
Dominion Resources Inc. | | 69,886 | | | 4,734,078 |
DTE Energy Co.(2) | | 36,912 | | | 1,592,015 |
Duke Energy Corp.(2) | | 201,731 | | | 5,109,846 |
Edison International | | 69,181 | | �� | 2,215,867 |
Entergy Corp. | | 47,112 | | | 3,184,300 |
Exelon Corp. | | 139,736 | | | 6,158,166 |
FirstEnergy Corp. | | 69,497 | | | 2,745,826 |
FPL Group Inc.(2) | | 39,108 | | | 2,923,323 |
NiSource Inc.(2) | | 56,856 | | | 1,295,180 |
PG&E Corp.(1) | | 84,943 | | | 2,826,903 |
Pinnacle West Capital Corp.(2) | | 19,219 | | | 853,516 |
PPL Corp. | | 40,138 | | | 2,138,553 |
Progress Energy Inc.(2) | | 52,462 | | | 2,373,381 |
Public Service Enterprise Group Inc.(2) | | 50,081 | | | 2,592,693 |
Southern Co. (The)(2) | | 155,982 | | | 5,228,517 |
TECO Energy Inc. | | 42,922 | | | 658,423 |
TXU Corp.(2) | | 50,629 | | | 3,268,608 |
Xcel Energy Inc. | | 84,946 | | | 1,546,017 |
| | | | |
|
|
| | | | | | 65,897,374 |
| | | | |
|
|
Electrical Components & Equipment (0.35%): | | | |
American Power Conversion Corp. | | 40,939 | | | 876,095 |
Emerson Electric Co. | | 88,523 | | | 6,205,462 |
Molex Inc.(2) | | 40,254 | | | 1,207,620 |
Power-One Inc.(1) | | 17,671 | | | 157,625 |
| | | | |
|
|
| | | | | | 8,446,802 |
| | | | |
|
|
Electronics (0.59%): | | | | | |
Agilent Technologies Inc.(1) | | 103,128 | | | 2,485,385 |
Applera Corp. — Applied Biosystems Group(2) | | 41,513 | | | 868,037 |
Fisher Scientific International Inc.(1)(2) | | 24,678 | | | 1,539,414 |
Jabil Circuit Inc.(1) | | 42,340 | | | 1,083,057 |
Parker Hannifin Corp. | | 25,362 | | | 1,920,918 |
PerkinElmer Inc. | | 27,585 | | | 620,387 |
Sanmina-SCI Corp.(1) | | 109,404 | | | 926,652 |
Solectron Corp.(1) | | 207,543 | | | 1,106,204 |
Continued
18
| | |
| S&P 500 Index Master Portfolio | | Schedule of Investments December 31, 2004 |
| | | | | |
| Common Stocks, continued | | | | |
Security
| | Shares
| | Value
|
Electronics, continued | | | | | |
Symbol Technologies Inc. | | 51,099 | | $ | 884,013 |
Tektronix Inc. | | 19,472 | | | 588,249 |
Thermo Electron Corp.(1) | | 34,249 | | | 1,033,977 |
Waters Corp.(1) | | 25,716 | | | 1,203,252 |
| | | | |
|
|
| | | | | | 14,259,545 |
| | | | |
|
|
Engineering & Construction (0.04%): | | | | | |
Fluor Corp.(2) | | 17,942 | | | 978,018 |
| | | | |
|
|
| | | | | | 978,018 |
| | | | |
|
|
Entertainment (0.10%): | | | | | |
International Game Technology Inc. | | 72,601 | | | 2,496,022 |
| | | | |
|
|
| | | | | | 2,496,022 |
| | | | |
|
|
Environmental Control (0.18%): | | | | | |
Allied Waste Industries Inc.(1)(2) | | 67,834 | | | 629,500 |
Waste Management Inc. | | 120,598 | | | 3,610,704 |
| | | | |
|
|
| | | | | | 4,240,204 |
| | | | |
|
|
Food (1.80%): | | | | | |
Albertson’s Inc.(2) | | 78,122 | | | 1,865,553 |
Archer-Daniels-Midland Co. | | 137,932 | | | 3,077,263 |
Campbell Soup Co. | | 86,687 | | | 2,591,074 |
ConAgra Foods Inc. | | 108,388 | | | 3,192,027 |
General Mills Inc. | | 76,808 | | | 3,818,126 |
Heinz (H.J.) Co. | | 73,609 | | | 2,870,015 |
Hershey Foods Corp. | | 51,854 | | | 2,879,971 |
Kellogg Co. | | 87,045 | | | 3,887,430 |
Kroger Co.(1) | | 155,721 | | | 2,731,346 |
McCormick & Co. Inc. NVS | | 28,982 | | | 1,118,705 |
Safeway Inc.(1) | | 94,988 | | | 1,875,063 |
Sara Lee Corp. | | 165,451 | | | 3,993,987 |
SUPERVALU Inc. | | 28,446 | | | 981,956 |
Sysco Corp. | | 134,914 | | | 5,149,667 |
Wrigley (William Jr.) Co. | | 47,303 | | | 3,272,895 |
| | | | |
|
|
| | | | | | 43,305,078 |
| | | | |
|
|
Forest Products & Paper (0.53%): | | | | | |
Georgia-Pacific Corp. | | 54,791 | | | 2,053,567 |
International Paper Co.(2) | | 102,589 | | | 4,308,738 |
Louisiana-Pacific Corp. | | 23,502 | | | 628,443 |
MeadWestvaco Corp. | | 42,630 | | | 1,444,731 |
Temple-Inland Inc. | | 11,955 | | | 817,722 |
Weyerhaeuser Co.(2) | | 50,557 | | | 3,398,442 |
| | | | |
|
|
| | | | | | 12,651,643 |
| | | | |
|
|
Gas (0.16%): | | | | | |
KeySpan Corp.(2) | | 33,775 | | | 1,332,424 |
Nicor Inc.(2) | | 9,338 | | | 344,946 |
Peoples Energy Corp. | | 8,113 | | | 356,566 |
Sempra Energy | | 49,131 | | | 1,802,125 |
| | | | |
|
|
| | | | | | 3,836,061 |
| | | | |
|
|
Hand & Machine Tools (0.12%): | | | | | |
Black & Decker Corp. | | 16,987 | | | 1,500,462 |
Snap-On Inc. | | 12,351 | | | 424,380 |
Stanley Works (The) | | 17,634 | | | 863,890 |
| | | | |
|
|
| | | | | | 2,788,732 |
| | | | |
|
|
Health Care-Products (3.61%): | | | | | |
Bard (C.R.) Inc. | | 22,200 | | | 1,420,356 |
Bausch & Lomb Inc.(2) | | 11,436 | | | 737,165 |
Baxter International Inc. | | 129,974 | | | 4,489,302 |
| | | | | |
| Common Stocks, continued | | | | |
Security
| | Shares
| | Value
|
Health Care-Products, continued | | | | | |
Becton, Dickinson & Co. | | 53,376 | | $ | 3,031,757 |
Biomet Inc.(2) | | 53,756 | | | 2,332,473 |
Boston Scientific Corp.(1) | | 178,111 | | | 6,331,846 |
Guidant Corp. | | 67,172 | | | 4,843,101 |
Johnson & Johnson | | 626,323 | | | 39,721,405 |
Medtronic Inc. | | 255,028 | | | 12,667,241 |
St. Jude Medical Inc.(1) | | 75,353 | | | 3,159,551 |
Stryker Corp. | | 84,754 | | | 4,089,380 |
Zimmer Holdings Inc.(1) | | 51,717 | | | 4,143,566 |
| | | | |
|
|
| | | | | | 86,967,143 |
| | | | |
|
|
Health Care-Services (1.42%): | | | | | |
Aetna Inc.(2) | | 31,127 | | | 3,883,093 |
HCA Inc.(2) | | 88,784 | | | 3,547,809 |
Health Management Associates Inc. Class A(2) | | 51,163 | | | 1,162,423 |
Humana Inc.(1) | | 33,483 | | | 994,110 |
Laboratory Corp. of America Holdings(1)(2) | | 29,348 | | | 1,462,117 |
Manor Care Inc. | | 18,624 | | | 659,848 |
Quest Diagnostics Inc.(2) | | 21,485 | | | 2,052,892 |
Tenet Healthcare Corp.(1) | | 98,042 | | | 1,076,501 |
UnitedHealth Group Inc. | | 137,906 | | | 12,139,865 |
WellPoint Inc.(1) | | 62,258 | | | 7,159,670 |
| | | | |
|
|
| | | | | | 34,138,328 |
| | | | |
|
|
Home Builders (0.18%): | | | | | |
Centex Corp. | | 26,153 | | | 1,558,196 |
KB Home | | 9,886 | | | 1,032,098 |
Pulte Homes Inc. | | 26,847 | | | 1,712,839 |
| | | | |
|
|
| | | | | | 4,303,133 |
| | | | |
|
|
Home Furnishings (0.10%): | | | | | |
Leggett & Platt Inc.(2) | | 40,771 | | | 1,159,120 |
Maytag Corp.(2) | | 16,656 | | | 351,442 |
Whirlpool Corp. | | 14,110 | | | 976,553 |
| | | | |
|
|
| | | | | | 2,487,115 |
| | | | |
|
|
Household Products & Wares (0.23%): | | | |
Avery Dennison Corp. | | 23,432 | | | 1,405,217 |
Clorox Co. | | 31,999 | | | 1,885,701 |
Fortune Brands Inc. | | 30,611 | | | 2,362,557 |
| | | | |
|
|
| | | | | | 5,653,475 |
| | | | |
|
|
Housewares (0.06%): | | | | | |
Newell Rubbermaid Inc. | | 58,293 | | | 1,410,108 |
| | | | |
|
|
| | | | | | 1,410,108 |
| | | | |
|
|
Insurance (4.49%): | | | | | |
ACE Ltd. | | 59,872 | | | 2,559,528 |
AFLAC Inc. | | 106,677 | | | 4,250,012 |
Allstate Corp. (The) | | 144,745 | | | 7,486,211 |
Ambac Financial Group Inc. | | 23,068 | | | 1,894,575 |
American International Group Inc. | | 549,675 | | | 36,097,157 |
AON Corp.(2) | | 67,147 | | | 1,602,127 |
Chubb Corp. | | 40,369 | | | 3,104,376 |
CIGNA Corp.(2) | | 28,508 | | | 2,325,398 |
Cincinnati Financial Corp. | | 35,658 | | | 1,578,223 |
Hartford Financial Services Group Inc.(2) | | 61,923 | | | 4,291,883 |
Jefferson-Pilot Corp.(2) | | 28,965 | | | 1,505,021 |
Lincoln National Corp. | | 36,749 | | | 1,715,443 |
Continued
19
| | |
| S&P 500 Index Master Portfolio | | Schedule of Investments December 31, 2004 |
| | | | | |
| Common Stocks, continued | | | | |
Security
| | Shares
| | Value
|
Insurance, continued | | | | | |
Loews Corp. | | 39,084 | | $ | 2,747,605 |
Marsh & McLennan Companies Inc. | | 111,069 | | | 3,654,170 |
MBIA Inc. | | 29,627 | | | 1,874,797 |
MetLife Inc. | | 156,989 | | | 6,359,624 |
MGIC Investment Corp. | | 20,530 | | | 1,414,722 |
Principal Financial Group Inc.(2) | | 64,673 | | | 2,647,713 |
Progressive Corp. (The)(2) | | 42,200 | | | 3,580,248 |
Prudential Financial Inc. | | 108,191 | | | 5,946,177 |
SAFECO Corp.(2) | | 26,809 | | | 1,400,502 |
St. Paul Travelers Companies Inc. | | 141,174 | | | 5,233,320 |
Torchmark Corp.(2) | | 22,928 | | | 1,310,106 |
UNUMProvident Corp.(2) | | 62,307 | | | 1,117,788 |
XL Capital Ltd. Class A(2) | | 29,443 | | | 2,286,249 |
| | | | |
|
|
| | | | | | 107,982,975 |
| | | | |
|
|
Internet (1.31%): | | | | | |
eBay Inc.(1) | | 139,879 | | | 16,265,130 |
Monster Worldwide Inc.(1)(2) | | 25,438 | | | 855,734 |
Symantec Corp.(1) | | 133,665 | | | 3,443,210 |
Yahoo! Inc.(1)(2) | | 290,056 | | | 10,929,310 |
| | | | |
|
|
| | | | | | 31,493,384 |
| | | | |
|
|
Iron & Steel (0.14%): | | | | | |
Allegheny Technologies Inc. | | 20,567 | | | 445,687 |
Nucor Corp. | | 33,769 | | | 1,767,469 |
United States Steel Corp. | | 23,907 | | | 1,225,234 |
| | | | |
|
|
| | | | | | 3,438,390 |
| | | | |
|
|
Leisure Time (0.54%): | | | | | |
Brunswick Corp. | | 20,554 | | | 1,017,423 |
Carnival Corp.(2) | | 133,583 | | | 7,698,388 |
Harley-Davidson Inc. | | 61,933 | | | 3,762,430 |
Sabre Holdings Corp. | | 29,215 | | | 647,404 |
| | | | |
|
|
| | | | | | 13,125,645 |
| | | | |
|
|
Lodging (0.37%): | | | | | |
Harrah’s Entertainment Inc. | | 23,582 | | | 1,577,400 |
Hilton Hotels Corp. | | 81,940 | | | 1,863,316 |
Marriott International Inc. Class A | | 47,122 | | | 2,967,744 |
Starwood Hotels & Resorts Worldwide Inc.(2) | | 43,669 | | | 2,550,270 |
| | | | |
|
|
| | | | | | 8,958,730 |
| | | | |
|
|
Machinery (0.57%): | | | | | |
Caterpillar Inc. | | 71,976 | | | 7,018,380 |
Cummins Inc.(2) | | 9,697 | | | 812,512 |
Deere & Co.(2) | | 52,313 | | | 3,892,087 |
Rockwell Automation Inc. | | 39,100 | | | 1,937,405 |
| | | | |
|
|
| | | | | | 13,660,384 |
| | | | |
|
|
Manufacturing (5.85%): | | | | | |
Cooper Industries Ltd.(2) | | 19,300 | | | 1,310,277 |
Danaher Corp.(2) | | 65,056 | | | 3,734,865 |
Dover Corp. | | 43,163 | | | 1,810,256 |
Eastman Kodak Co.(2) | | 60,858 | | | 1,962,670 |
Eaton Corp. | | 32,255 | | | 2,333,972 |
General Electric Co. | | 2,231,333 | | | 81,443,654 |
Honeywell International Inc. | | 181,422 | | | 6,424,153 |
Illinois Tool Works Inc. | | 62,360 | | | 5,779,525 |
Ingersoll-Rand Co. Class A(2) | | 36,290 | | | 2,914,087 |
ITT Industries Inc. | | 19,429 | | | 1,640,779 |
| | | | | |
| Common Stocks, continued | | | | |
Security
| | Shares
| | Value
|
Manufacturing, continued | | | | | |
Pall Corp. | | 26,245 | | $ | 759,793 |
Textron Inc. | | 29,199 | | | 2,154,886 |
3M Co. | | 164,267 | | | 13,481,393 |
Tyco International Ltd.(2) | | 424,456 | | | 15,170,057 |
| | | | |
|
|
| | | | | | 140,920,367 |
| | | | |
|
|
Media (3.75%): | | | | | |
Clear Channel Communications Inc. | | 120,913 | | | 4,049,376 |
Comcast Corp. Class A(1) | | 468,407 | | | 15,588,585 |
Dow Jones & Co. Inc.(2) | | 17,184 | | | 739,943 |
Gannett Co. Inc.(2) | | 53,816 | | | 4,396,767 |
Knight Ridder Inc.(2) | | 16,182 | | | 1,083,223 |
McGraw-Hill Companies Inc. (The) | | 40,029 | | | 3,664,255 |
Meredith Corp. | | 10,464 | | | 567,149 |
New York Times Co. Class A | | 30,502 | | | 1,244,482 |
News Corp. Inc. Class A(1) | | 551,207 | | | 10,285,523 |
Time Warner Inc.(1)(2) | | 966,534 | | | 18,789,421 |
Tribune Co. | | 66,945 | | | 2,821,062 |
Univision Communications Inc.
Class A(1)(2) | | 68,613 | | | 2,008,303 |
Viacom Inc. Class B | | 359,749 | | | 13,091,266 |
Walt Disney Co. (The) | | 431,104 | | | 11,984,691 |
| | | | |
|
|
| | | | | | 90,314,046 |
| | | | |
|
|
Mining (0.55%): | | | | | |
Alcoa Inc. | | 183,580 | | | 5,768,084 |
Freeport-McMoRan Copper & Gold Inc.(2) | | 37,555 | | | 1,435,728 |
Newmont Mining Corp. | | 93,588 | | | 4,156,243 |
Phelps Dodge Corp. | | 20,250 | | | 2,003,130 |
| | | | |
|
|
| | | | | | 13,363,185 |
| | | | |
|
|
Office & Business Equipment (0.24%): | | | |
Pitney Bowes Inc. | | 48,970 | | | 2,266,332 |
Xerox Corp.(1) | | 200,990 | | | 3,418,840 |
| | | | |
|
|
| | | | | | 5,685,172 |
| | | | |
|
|
Oil & Gas (6.14%): | | | | | |
Amerada Hess Corp. | | 19,286 | | | 1,588,781 |
Anadarko Petroleum Corp. | | 52,131 | | | 3,378,610 |
Apache Corp. | | 68,812 | | | 3,479,823 |
Burlington Resources Inc. | | 82,521 | | | 3,589,663 |
ChevronTexaco Corp. | | 447,084 | | | 23,476,381 |
ConocoPhillips | | 145,632 | | | 12,645,227 |
Devon Energy Corp. | | 102,460 | | | 3,987,743 |
EOG Resources Inc. | | 24,960 | | | 1,781,146 |
Exxon Mobil Corp. | | 1,361,583 | | | 69,794,745 |
Kerr-McGee Corp. | | 31,934 | | | 1,845,466 |
Marathon Oil Corp. | | 73,019 | | | 2,746,245 |
Nabors Industries Ltd.(1) | | 31,462 | | | 1,613,686 |
Noble Corp.(1) | | 28,686 | | | 1,426,842 |
Occidental Petroleum Corp. | | 83,231 | | | 4,857,361 |
Rowan Companies Inc.(1)(2) | | 22,856 | | | 591,970 |
Sunoco Inc. | | 15,375 | | | 1,256,291 |
Transocean Inc.(1)(2) | | 67,758 | | | 2,872,262 |
Unocal Corp. | | 55,888 | | | 2,416,597 |
Valero Energy Corp. | | 54,500 | | | 2,474,300 |
XTO Energy Inc. | | 54,811 | | | 1,939,213 |
| | | | |
|
|
| | | | | | 147,762,352 |
| | | | |
|
|
Continued
20
| | |
| S&P 500 Index Master Portfolio | | Schedule of Investments December 31, 2004 |
| | | | | |
| Common Stocks, continued | | | | |
Security
| | Shares
| | Value
|
Oil & Gas Services (0.69%): | | | | | |
Baker Hughes Inc. | | 70,694 | | $ | 3,016,513 |
BJ Services Co. | | 34,271 | | | 1,594,972 |
Halliburton Co. | | 93,165 | | | 3,655,795 |
Schlumberger Ltd. | | 124,193 | | | 8,314,721 |
| | | | |
|
|
| | | | | | 16,582,001 |
| | | | |
|
|
Packaging & Containers (0.14%): | | | | | |
Ball Corp. | | 23,886 | | | 1,050,506 |
Bemis Co. Inc.(2) | | 23,090 | | | 671,688 |
Pactiv Corp.(1) | | 31,422 | | | 794,662 |
Sealed Air Corp.(1) | | 17,826 | | | 949,591 |
| | | | |
|
|
| | | | | | 3,466,447 |
| | | | |
|
|
Pharmaceuticals (5.90%): | | | | | |
Abbott Laboratories | | 328,615 | | | 15,329,890 |
Allergan Inc. | | 27,878 | | | 2,260,069 |
AmerisourceBergen Corp. | | 22,103 | | | 1,297,004 |
Bristol-Myers Squibb Co. | | 410,472 | | | 10,516,293 |
Cardinal Health Inc. | | 91,115 | | | 5,298,337 |
Caremark Rx Inc.(1) | | 95,824 | | | 3,778,340 |
Express Scripts Inc.(1)(2) | | 15,975 | | | 1,221,129 |
Forest Laboratories Inc.(1) | | 77,653 | | | 3,483,514 |
Gilead Sciences Inc.(1) | | 91,239 | | | 3,192,453 |
Hospira Inc.(1) | | 33,090 | | | 1,108,515 |
King Pharmaceuticals Inc.(1) | | 52,131 | | | 646,424 |
Lilly (Eli) & Co. | | 238,771 | | | 13,550,254 |
Medco Health Solutions Inc.(1) | | 57,866 | | | 2,407,226 |
Merck & Co. Inc. | | 467,917 | | | 15,038,852 |
Mylan Laboratories Inc.(2) | | 56,525 | | | 999,362 |
Pfizer Inc. | | 1,589,391 | | | 42,738,724 |
Schering-Plough Corp. | | 310,627 | | | 6,485,892 |
Watson Pharmaceuticals Inc.(1)(2) | | 23,515 | | | 771,527 |
Wyeth | | 281,496 | | | 11,988,915 |
| | | | |
|
|
| | | | | | 142,112,720 |
| | | | |
|
|
Pipelines (0.23%): | | | | | |
Dynegy Inc. Class A(1)(2) | | 79,259 | | | 366,177 |
El Paso Corp.(2) | | 135,298 | | | 1,407,099 |
Kinder Morgan Inc. | | 26,080 | | | 1,907,230 |
Williams Companies Inc. | | 118,122 | | | 1,924,207 |
| | | | |
|
|
| | | | | | 5,604,713 |
| | | | |
|
|
Real Estate Investment Trusts (0.55%): | | | |
Apartment Investment & Management Co. Class A | | 20,330 | | | 783,518 |
Archstone-Smith Trust | | 41,334 | | | 1,583,092 |
Equity Office Properties Trust(2) | | 84,947 | | | 2,473,657 |
Equity Residential(2) | | 59,550 | | | 2,154,519 |
Plum Creek Timber Co. Inc. | | 38,949 | | | 1,497,200 |
ProLogis | | 38,702 | | | 1,676,958 |
Simon Property Group Inc. | | 46,607 | | | 3,014,075 |
| | | | |
|
|
| | | | | | 13,183,019 |
| | | | |
|
|
Retail (6.86%): | | | | | |
AutoNation Inc.(1)(2) | | 55,586 | | | 1,067,807 |
AutoZone Inc.(1)(2) | | 16,787 | | | 1,532,821 |
Bed Bath & Beyond Inc.(1) | | 63,397 | | | 2,525,102 |
Best Buy Co. Inc.(2) | | 68,388 | | | 4,063,615 |
Big Lots Inc.(1)(2) | | 24,776 | | | 300,533 |
Circuit City Stores Inc. | | 40,940 | | | 640,302 |
Costco Wholesale Corp. | | 98,907 | | | 4,788,088 |
CVS Corp. | | 84,335 | | | 3,800,978 |
| | | | | |
| Common Stocks, continued | | | | |
Security
| | Shares
| | Value
|
Retail, continued | | | | | |
Darden Restaurants Inc. | | 33,302 | | $ | 923,797 |
Dillard’s Inc. Class A(2) | | 17,668 | | | 474,739 |
Dollar General Corp. | | 69,509 | | | 1,443,702 |
Family Dollar Stores Inc.(2) | | 35,543 | | | 1,110,008 |
Federated Department Stores Inc. | | 35,628 | | | 2,058,942 |
Gap Inc. (The) | | 184,825 | | | 3,903,504 |
Home Depot Inc. | | 463,388 | | | 19,805,203 |
Kohl’s Corp.(1)(2) | | 72,315 | | | 3,555,729 |
Limited Brands Inc.(2) | | 85,569 | | | 1,969,798 |
Lowe’s Companies Inc. | | 163,023 | | | 9,388,495 |
May Department Stores Co. (The) | | 61,973 | | | 1,822,006 |
McDonald’s Corp. | | 265,210 | | | 8,502,633 |
Nordstrom Inc. | | 29,713 | | | 1,388,488 |
Office Depot Inc.(1) | | 66,231 | | | 1,149,770 |
OfficeMax Inc. | | 19,882 | | | 623,897 |
Penney (J.C.) Co. Inc. (Holding Co.) | | 60,165 | | | 2,490,831 |
RadioShack Corp. | | 33,300 | | | 1,094,904 |
Sears, Roebuck and Co. | | 43,916 | | | 2,241,033 |
Staples Inc.(2) | | 104,948 | | | 3,537,797 |
Starbucks Corp.(1)(2) | | 84,347 | | | 5,259,879 |
Target Corp. | | 188,905 | | | 9,809,837 |
Tiffany & Co.(2) | | 30,830 | | | 985,635 |
TJX Companies Inc. | | 101,515 | | | 2,551,072 |
Toys R Us Inc.(1) | | 45,151 | | | 924,241 |
Walgreen Co. | | 215,585 | | | 8,271,996 |
Wal-Mart Stores Inc. | | 893,764 | | | 47,208,614 |
Wendy’s International Inc. | | 24,090 | | | 945,773 |
Yum! Brands Inc. | | 61,726 | | | 2,912,233 |
| | | | |
|
|
| | | | | | 165,073,802 |
| | | | |
|
|
Savings & Loans (0.56%): | | | | | |
Golden West Financial Corp. | | 64,552 | | | 3,964,784 |
Sovereign Bancorp Inc. | | 72,645 | | | 1,638,145 |
Washington Mutual Inc. | | 184,166 | | | 7,786,538 |
| | | | |
|
|
| | | | | | 13,389,467 |
| | | | |
|
|
Semiconductors (3.04%): | | | | | |
Advanced Micro Devices Inc.(1)(2) | | 81,702 | | | 1,799,078 |
Altera Corp.(1) | | 78,342 | | | 1,621,679 |
Analog Devices Inc. | | 79,195 | | | 2,923,879 |
Applied Materials Inc.(1) | | 358,161 | | | 6,124,553 |
Applied Micro Circuits Corp.(1)(2) | | 67,370 | | | 283,628 |
Broadcom Corp. Class A(1) | | 69,838 | | | 2,254,371 |
Freescale Semiconductor Inc.
Class B(1) | | 82,008 | | | 1,505,660 |
Intel Corp. | | 1,334,391 | | | 31,211,405 |
KLA-Tencor Corp.(1) | | 41,149 | | | 1,916,720 |
Linear Technology Corp. | | 64,681 | | | 2,507,036 |
LSI Logic Corp.(1)(2) | | 82,538 | | | 452,308 |
Maxim Integrated Products Inc. | | 68,534 | | | 2,905,156 |
Micron Technology Inc.(1) | | 129,942 | | | 1,604,784 |
National Semiconductor Corp. | | 76,302 | | | 1,369,621 |
Novellus Systems Inc. | | 29,594 | | | 825,377 |
NVIDIA Corp.(1) | | 34,870 | | | 821,537 |
PMC-Sierra Inc.(1) | | 38,146 | | | 429,142 |
QLogic Corp.(1) | | 19,463 | | | 714,876 |
Teradyne Inc.(1)(2) | | 41,881 | | | 714,909 |
Texas Instruments Inc. | | 364,512 | | | 8,974,285 |
Xilinx Inc. | | 73,355 | | | 2,174,976 |
| | | | |
|
|
| | | | | | 73,134,980 |
| | | | |
|
|
Continued
21
| | |
| S&P 500 Index Master Portfolio | | Schedule of Investments December 31, 2004 |
| | | | | |
| Common Stocks, continued | | | | |
Security
| | Shares
| | Value
|
Software (4.74%): | | | | | |
Adobe Systems Inc. | | 50,291 | | $ | 3,155,257 |
Autodesk Inc. | | 48,315 | | | 1,833,554 |
Automatic Data Processing Inc. | | 122,849 | | | 5,448,353 |
BMC Software Inc.(1) | | 46,583 | | | 866,444 |
Citrix Systems Inc.(1) | | 35,955 | | | 881,976 |
Computer Associates International Inc.(2) | | 123,455 | | | 3,834,512 |
Compuware Corp.(1) | | 83,406 | | | 539,637 |
Electronic Arts Inc.(1)(2) | | 64,370 | | | 3,970,342 |
First Data Corp. | | 175,042 | | | 7,446,287 |
Fiserv Inc.(1)(2) | | 41,508 | | | 1,668,207 |
IMS Health Inc. | | 49,177 | | | 1,141,398 |
Intuit Inc.(1) | | 39,453 | | | 1,736,327 |
Mercury Interactive Corp.(1)(2) | | 17,987 | | | 819,308 |
Microsoft Corp. | | 2,294,492 | | | 61,285,881 |
Novell Inc.(1)(2) | | 80,370 | | | 542,497 |
Oracle Corp.(1) | | 1,082,119 | | | 14,846,673 |
Parametric Technology Corp.(1) | | 56,499 | | | 332,779 |
Siebel Systems Inc.(1) | | 106,774 | | | 1,121,127 |
Veritas Software Corp.(1) | | 88,924 | | | 2,538,780 |
| | | | |
|
|
| | | | | | 114,009,339 |
| | | | |
|
|
Telecommunications (5.90%): | | | | | |
ADC Telecommunications Inc.(1)(2) | | 174,720 | | | 468,250 |
Alltel Corp.(2) | | 64,032 | | | 3,762,520 |
Andrew Corp.(1)(2) | | 34,692 | | | 472,852 |
AT&T Corp. | | 167,735 | | | 3,197,029 |
Avaya Inc.(1) | | 96,347 | | | 1,657,168 |
BellSouth Corp. | | 386,458 | | | 10,739,668 |
CenturyTel Inc.(2) | | 28,264 | | | 1,002,524 |
CIENA Corp.(1) | | 121,735 | | | 406,595 |
Cisco Systems Inc.(1) | | 1,389,593 | | | 26,819,145 |
Citizens Communications Co. | | 71,619 | | | 987,626 |
Comverse Technology Inc.(1) | | 42,240 | | | 1,032,768 |
Corning Inc.(1) | | 295,558 | | | 3,478,718 |
JDS Uniphase Corp.(1)(2) | | 303,198 | | | 961,138 |
Lucent Technologies Inc.(1)(2) | | 931,774 | | | 3,503,470 |
Motorola Inc. | | 513,558 | | | 8,833,198 |
Nextel Communications Inc.
Class A(1)(2) | | 234,398 | | | 7,031,940 |
QUALCOMM Inc. | | 345,851 | | | 14,664,082 |
Qwest Communications International Inc.(1) | | 385,417 | | | 1,711,251 |
SBC Communications Inc. | | 699,600 | | | 18,028,692 |
Scientific-Atlanta Inc. | | 32,214 | | | 1,063,384 |
Sprint Corp. (FON Group) | | 310,283 | | | 7,710,533 |
Tellabs Inc.(1) | | 98,186 | | | 843,418 |
Verizon Communications Inc. | | 584,327 | | | 23,671,087 |
| | | | |
|
|
| | | | | | 142,047,056 |
| | | | |
|
|
Textiles (0.07%): | | | | | |
Cintas Corp.(2) | | 36,423 | | | 1,597,513 |
| | | | |
|
|
| | | | | | 1,597,513 |
| | | | |
|
|
Toys, Games & Hobbies (0.10%): | | | | | |
Hasbro Inc. | | 38,090 | | | 738,184 |
Mattel Inc. | | 87,338 | | | 1,702,218 |
| | | | |
|
|
| | | | | | 2,440,402 |
| | | | |
|
|
Transportation (1.64%): | | | | | |
Burlington Northern Santa Fe Corp. | | 79,243 | | | 3,748,986 |
CSX Corp. | | 45,599 | | | 1,827,608 |
| | | | | | |
| Common Stocks, continued | | | | |
Security
| | Shares
| | Value
|
Transportation, continued | | | | | | |
FedEx Corp. | | | 63,393 | | $ | 6,243,577 |
Norfolk Southern Corp. | | | 83,453 | | | 3,020,164 |
Ryder System Inc. | | | 13,748 | | | 656,742 |
Union Pacific Corp.(2) | | | 54,718 | | | 3,679,785 |
United Parcel Service Inc.
Class B(2) | | | 236,510 | | | 20,212,145 |
| | | | | |
|
|
| | | | | | | 39,389,007 |
| | | | | |
|
|
Total Common Stocks
(Cost: $2,392,924,361) | | | | | | 2,383,003,998 |
| | | | | |
|
|
| Short-Term Investments (7.59%): | | | | |
Security
| | Principal
| | Value
|
Commercial Paper (1.70%): | | | | | | |
Alpine Securitization Corp. | | | | | | |
2.28%, 01/06/05(3) | | $ | 454,089 | | | 453,996 |
Amsterdam Funding Corp. | | | | | | |
2.25%, 01/04/05(3) | | | 227,045 | | | 227,030 |
2.33%, 01/10/05(3) | | | 454,089 | | | 453,883 |
Barton Capital Corp. | | | | | | |
2.27%, 01/04/05(3) | | | 929,521 | | | 929,462 |
2.27%, 01/10/05(3) | | | 1,009,858 | | | 1,009,412 |
2.30%, 01/21/05(3) | | | 367,122 | | | 366,700 |
Cancara Asset Securitisation LLC | | | | | | |
2.25%, 01/05/05(3) | | | 1,112,537 | | | 1,112,398 |
2.29%, 01/07/05(3) | | | 908,178 | | | 907,947 |
Cantabric Finance LLC | | | | | | |
2.27%, 01/03/05(3) | | | 472,253 | | | 472,253 |
2.28%, 01/03/05(3) | | | 526,743 | | | 526,743 |
2.38%, 01/20/05(3) | | | 908,178 | | | 907,158 |
Chariot Funding LLC | | | | | | |
2.31%, 01/11/05(3) | | | 692,150 | | | 691,795 |
Corporate Asset Funding | | | | | | |
2.21%, 02/07/05(3) | | | 681,134 | | | 679,674 |
2.26%, 02/03/05(3) | | | 908,178 | | | 906,411 |
CRC Funding LLC | | | | | | |
2.21%, 02/07/05(3) | | | 227,045 | | | 226,558 |
Den Danske Bank NY | | | | | | |
2.25%, 01/03/05(3) | | | 227,045 | | | 227,045 |
DEPFA Bank PLC | | | | | | |
2.28%, 05/03/05(3) | | | 454,089 | | | 450,646 |
Edison Asset Securitization | | | | | | |
2.26%, 05/04/05(3) | | | 1,135,223 | | | 1,126,600 |
Fairway Finance Corp. | | | | | | |
2.55%, 01/03/05(3) | | | 875,711 | | | 875,711 |
Falcon Asset Securitization Corp. | | | | | | |
2.27%, 01/13/05(3) | | | 181,636 | | | 181,521 |
2.30%, 02/02/05(3) | | | 908,178 | | | 906,438 |
2.31%, 01/11/05(3) | | | 919,195 | | | 918,723 |
2.33%, 01/12/05(3) | | | 423,329 | | | 423,083 |
Ford Credit Auto Receivables | | | | | | |
1.85%, 01/14/05(3) | | | 454,089 | | | 453,832 |
2.28%, 04/27/05(3) | | | 681,134 | | | 676,216 |
Fortis Funding LLC | | | | | | |
2.35%, 05/09/05(3) | | | 1,271,450 | | | 1,260,993 |
Gemini Securitization Corp. | | | | | | |
2.31%, 01/10/05(3) | | | 454,089 | | | 453,886 |
General Electric Capital Corp. | | | | | | |
2.24%, 02/02/05(3) | | | 2,724,535 | | | 2,719,449 |
2.26%, 01/05/05(3) | | | 908,178 | | | 908,064 |
2.29%, 01/24/05(3) | | | 227,045 | | | 226,741 |
Continued
22
| | |
| S&P 500 Index Master Portfolio | | Schedule of Investments December 31, 2004 |
| | | | | | |
| Short-Term Investments, continued | | | | |
Security
| | Principal
| | Value
|
Commercial Paper, continued | | | | | | |
Georgetown Funding Co. LLC | | | | | | |
2.27%, 01/20/05(3) | | $ | 317,862 | | $ | 317,522 |
2.38%, 01/19/05(3) | | | 363,271 | | | 362,887 |
Giro Funding US Corp. | | | | | | |
2.20%, 02/08/05(3) | | | 504,248 | | | 503,139 |
2.30%, 02/02/05(3) | | | 227,045 | | | 226,609 |
2.33%, 02/03/05(3) | | | 227,045 | | | 226,589 |
Grampian Funding LLC | | | | | | |
2.27%, 02/01/05(3) | | | 681,134 | | | 679,888 |
Jupiter Securitization Corp. | | | | | | |
2.30%, 01/10/05(3) | | | 378,274 | | | 378,105 |
2.30%, 02/01/05(3) | | | 454,089 | | | 453,248 |
Kitty Hawk Funding Corp. | | | | | | |
2.33%, 01/12/05(3) | | | 764,214 | | | 763,769 |
Liberty Street Funding Corp. | | | | | | |
2.31%, 01/10/05(3) | | | 527,434 | | | 527,197 |
Mont Blanc Capital Corp. | | | | | | |
2.27%, 01/07/05(3) | | | 309,798 | | | 309,720 |
2.32%, 01/10/05(3) | | | 467,040 | | | 466,830 |
Mortgage Interest Networking Trust | | | | | | |
2.24%, 02/01/05(3) | | | 590,316 | | | 589,251 |
Nationwide Building Society | | | | | | |
2.21%, 02/10/05(3) | | | 908,178 | | | 906,060 |
New Center Asset Trust | | | | | | |
2.25%, 02/02/05(3) | | | 853,688 | | | 852,087 |
Park Avenue Receivables Corp. | | | | | | |
2.31%, 01/19/05(3) | | | 455,887 | | | 455,419 |
Preferred Receivables Funding Corp. | | | | | | |
2.30%, 01/19/05(3) | | | 454,089 | | | 453,625 |
2.30%, 02/02/05(3) | | | 454,089 | | | 453,219 |
2.34%, 01/20/05(3) | | | 681,134 | | | 680,382 |
Scaldis Capital LLC | | | | | | |
2.28%, 01/07/05(3) | | | 817,361 | | | 817,153 |
Solitaire Funding Ltd. | | | | | | |
2.28%, 01/04/05(3) | | | 546,033 | | | 545,999 |
2.28%, 02/02/05(3) | | | 578,927 | | | 577,828 |
Sydney Capital Corp. | | | | | | |
2.25%, 01/18/05(3) | | | 454,089 | | | 453,663 |
2.29%, 01/06/05(3) | | | 667,693 | | | 667,565 |
Tulip Funding Corp. | | | | | | |
2.25%, 01/14/05(3) | | | 454,089 | | | 453,777 |
2.35%, 01/13/05(3) | | | 1,323,089 | | | 1,322,225 |
2.36%, 01/24/05(3) | | | 908,178 | | | 906,928 |
UBS Finance (Delaware) | | | | | | |
2.33%, 01/04/05(3) | | | 1,816,357 | | | 1,816,239 |
Variable Funding Capital Corp. | | | | | | |
2.26%, 01/05/05(3) | | | 454,089 | | | 454,032 |
2.30%, 01/07/05(3) | | | 454,089 | | | 453,973 |
2.32%, 01/14/05(3) | | | 454,089 | | | 453,767 |
Yorktown Capital LLC | | | | | | |
2.32%, 01/10/05(3) | | | 454,089 | | | 453,884 |
2.34%, 01/13/05(3) | | | 227,045 | | | 226,898 |
| | | | | |
|
|
| | | | | | | 40,889,845 |
| | | | | |
|
|
Floating Rate Notes (2.41%): | | | | | | |
American Express Credit Corp. | | | | | | |
2.43%, 10/26/05(3) | | | 1,816,357 | | | 1,817,095 |
Bank of Nova Scotia | | | | | | |
2.34%, 09/26/05(3) | | | 227,045 | | | 226,971 |
Beta Finance Inc. | | | | | | |
2.27%, 05/04/05(3)(4) | | | 544,907 | | | 544,871 |
| | | | | | |
| Short-Term Investments, continued | | | | |
Security
| | Principal
| | Value
|
Floating Rate Notes, continued | | | | | | |
2.32%, 09/23/05(3)(4) | | $ | 817,361 | | $ | 817,125 |
2.32%, 09/27/05(3)(4) | | | 726,543 | | | 726,330 |
2.44%, 03/15/05(3)(4) | | | 454,089 | | | 454,162 |
2.47%, 10/27/05(3)(4) | | | 862,769 | | | 863,543 |
Canadian Imperial Bank of Commerce | | | | | | |
2.32%, 09/13/05(3) | | | 1,362,268 | | | 1,361,960 |
2.34%, 12/14/05(3) | | | 817,361 | | | 817,109 |
2.36%, 10/31/05(3) | | | 908,178 | | | 907,984 |
Cancara Asset Securitisation LLC | | | | | | |
2.80%, 02/15/05(3) | | | 1,607,476 | | | 1,607,476 |
CC USA Inc. | | | | | | |
2.06%, 07/29/05(3)(4) | | | 908,178 | | | 908,024 |
2.27%, 05/04/05(3)(4) | | | 908,178 | | | 908,118 |
Commodore CDO Ltd. | | | | | | |
2.55%, 12/12/05(3) | | | 227,045 | | | 227,045 |
Den Danske Bank NY | | | | | | |
2.32%, 08/12/05(3) | | | 908,178 | | | 908,013 |
2.33%, 10/17/05(3) | | | 908,178 | | | 907,965 |
2.35%, 08/26/05(3) | | | 908,178 | | | 908,003 |
DEPFA Bank PLC | | | | | | |
2.47%, 09/15/05(3) | | | 908,178 | | | 908,178 |
Dorada Finance Inc. | | | | | | |
2.06%, 07/29/05(3)(4) | | | 753,788 | | | 753,659 |
Fairway Finance LLC | | | | | | |
2.35%, 03/14/05(3) | | | 908,178 | | | 908,178 |
2.37%, 01/20/05(3) | | | 454,089 | | | 454,089 |
Fifth Third Bancorp | | | | | | |
2.38%, 11/23/05(3)(4) | | | 1,816,357 | | | 1,816,357 |
Five Finance Inc. | | | | | | |
2.37%, 04/29/05(3)(4) | | | 726,543 | | | 726,520 |
General Electric Commercial Equipment Financing LLC | | | | | | |
2.37%, 11/20/05(3) | | | 520,885 | | | 520,885 |
HBOS Treasury Services PLC | | | | | | |
2.55%, 04/22/05(3) | | | 908,178 | | | 908,178 |
K2 USA LLC | | | | | | |
2.05%, 07/25/05(3)(4) | | | 454,089 | | | 454,039 |
2.33%, 06/10/05(3)(4) | | | 908,178 | | | 908,130 |
2.33%, 09/12/05(3)(4) | | | 908,178 | | | 908,054 |
2.39%, 10/20/05(3)(4) | | | 908,178 | | | 908,203 |
Links Finance LLC | | | | | | |
2.12%, 04/25/05(3) | | | 908,178 | | | 908,362 |
2.35%, 04/15/05(3)(4) | | | 908,178 | | | 908,128 |
2.36%, 11/16/05(3)(4) | | | 454,089 | | | 454,010 |
National City Bank (Ohio) | | | | | | |
2.29%, 08/09/05(3) | | | 908,178 | | | 908,016 |
2.35%, 06/23/05(3) | | | 908,178 | | | 908,051 |
2.36%, 06/10/05(3) | | | 454,089 | | | 454,151 |
Nationwide Building Society | | | | | | |
2.40%, 01/06/06(3)(4) | | | 908,178 | | | 908,178 |
2.58%, 01/27/06(3)(4) | | | 1,543,903 | | | 1,544,077 |
Norddeutsche Landesbank | | | | | | |
2.04%, 07/27/05(3) | | | 908,178 | | | 907,999 |
Northern Rock PLC | | | | | | |
2.02%, 01/13/05(3) | | | 862,769 | | | 862,769 |
2.39%, 10/25/05(3) | | | 1,816,357 | | | 1,816,357 |
Permanent Financing PLC | | | | | | |
2.32%, 03/10/05(3) | | | 908,178 | | | 908,178 |
2.34%, 09/12/05(3) | | | 1,135,223 | | | 1,135,223 |
2.35%, 06/10/05(3) | | | 408,680 | | | 408,680 |
Continued
23
| | |
| S&P 500 Index Master Portfolio | | Schedule of Investments December 31, 2004 |
| | | | | |
| Short-Term Investments, continued | | | | |
Security
| | Shares or
Principal
| | Value
|
Floating Rate Notes, continued | | | | | |
Sedna Finance Inc. | | | | | |
2.37%, 01/10/06(3) | | $ 181,636 | | $ | 181,590 |
Sigma Finance Inc. | | | | | |
2.01%, 01/09/06(3) | | 908,178 | | | 907,980 |
2.28%, 12/06/05(3)(4) | | 908,178 | | | 907,913 |
2.34%, 10/07/05(3)(4) | | 317,862 | | | 317,788 |
2.39%, 08/17/05(3) | | 454,089 | | | 454,114 |
2.39%, 09/15/05(3) | | 1,135,223 | | | 1,135,296 |
2.47%, 11/28/05(3)(4) | | 908,178 | | | 908,916 |
Tango Finance Corp. | | | | | |
2.24%, 05/17/05(3)(4) | | 753,788 | | | 753,774 |
2.30%, 04/07/05(3)(4) | | 333,301 | | | 333,293 |
2.33%, 02/25/05(3)(4) | | 508,580 | | | 508,565 |
2.36%, 01/18/05(3)(4) | | 399,598 | | | 399,597 |
2.37%, 09/15/05(3)(4) | | 799,197 | | | 799,109 |
2.39%, 07/25/05(3)(4) | | 908,178 | | | 908,128 |
Wachovia Asset Securitization Inc. | | | | | |
2.40%, 01/25/05(3) | | 1,362,268 | | | 1,362,268 |
2.40%, 01/25/05(3) | | 1,362,268 | | | 1,362,268 |
WhistleJacket Capital LLC | | | | | |
2.32%, 12/08/05(3)(4) | | 590,316 | | | 590,227 |
2.36%, 07/15/05(3)(4) | | 681,134 | | | 681,061 |
2.36%, 09/15/05(3) | | 681,134 | | | 681,038 |
2.36%, 10/14/05(3)(4) | | 454,089 | | | 454,054 |
2.38%, 01/17/06(3)(4) | | 317,862 | | | 317,859 |
2.45%, 06/15/05(3)(4) | | 454,089 | | | 454,043 |
White Pine Finance LLC | | | | | |
2.02%, 07/11/05(3) | | 227,045 | | | 227,031 |
2.24%, 11/01/05(3)(4) | | 463,171 | | | 463,048 |
2.27%, 07/05/05(3) | | 454,089 | | | 454,039 |
2.29%, 05/20/05(3) | | 408,680 | | | 408,665 |
2.35%, 04/15/05(3)(4) | | 681,134 | | | 681,096 |
2.37%, 06/15/05(3)(4) | | 372,353 | | | 372,353 |
2.37%, 01/13/06(3)(4) | | 908,178 | | | 908,078 |
2.38%, 03/29/05(3) | | 390,517 | | | 390,496 |
2.38%, 06/28/05(3) | | 608,479 | | | 608,419 |
2.38%, 08/26/05(3)(4) | | 454,089 | | | 454,031 |
Winston Funding Ltd. | | | | | |
2.16%, 01/23/05(3)(4) | | 648,439 | | | 648,439 |
| | | | |
|
|
| | | | | | 58,153,019 |
| | | | |
|
|
Medium-Term Notes (0.12%): | | | | | |
CC USA Inc. | | | | | |
1.29%, 04/15/05(3)(4) | | 908,178 | | | 908,153 |
1.51%, 02/15/05(3)(4) | | 590,316 | | | 590,424 |
Dorada Finance Inc. | | | | | |
1.48%, 01/18/05(3)(4) | | 681,134 | | | 681,132 |
K2 USA LLC | | | | | |
1.46%, 01/12/05(3)(4) | | 454,089 | | | 454,088 |
WhistleJacket Capital LLC | | | | | |
1.32%, 02/04/05(3)(4) | | 227,045 | | | 227,041 |
| | | | |
|
|
| | | | | | 2,860,838 |
| | | | |
|
|
Money Market Funds (1.65%): | | | | | |
Barclays Global Investors Funds Government Money Market Fund, Institutional Shares(3)(5) | | 3,632,713 | | | 3,632,713 |
Barclays Global Investors Funds Institutional Money Market Fund, Institutional Shares(3)(5) | | 26,533,912 | | | 26,533,912 |
| | | | | | |
| Short-Term Investments, continued | | | | |
Security
| | Shares or
Principal
| | Value
|
Money Market Funds, continued | | | | | | |
Barclays Global Investors Funds Prime Money Market Fund, Institutional Shares(3)(5) | | | 9,081,783 | | $ | 9,081,783 |
BlackRock Temp Cash Money Market Fund(3) | | | 169,368 | | | 169,368 |
Short Term Investment Co. — Prime Money Market Portfolio, Institutional Shares(3) | | | 342,679 | | | 342,679 |
| | | | | |
|
|
| | | | | | | 39,760,455 |
| | | | | |
|
|
Repurchase Agreements (0.57%): | | | |
Goldman Sachs & Co. | | | | | | |
2.29%, 01/03/05(3)(6) | | $ | 9,081,783 | | | 9,081,783 |
Merrill Lynch Government Securities Inc. | | | | | | |
2.30%, 01/03/05(3)(6) | | | 4,540,892 | | | 4,540,892 |
| | | | | |
|
|
| | | | | | | 13,622,675 |
| | | | | |
|
|
Time Deposits (0.84%): | | | | | | |
Abbey National Treasury
Services PLC | | | | | | |
1.25%, 01/06/05(3) | | | 908,178 | | | 908,178 |
1.33%, 02/10/05(3) | | | 454,089 | | | 454,082 |
1.39%, 02/02/05(3) | | | 454,089 | | | 454,084 |
1.39%, 04/08/05(3) | | | 635,725 | | | 635,700 |
2.63%, 01/04/05(3) | | | 908,178 | | | 908,178 |
Bank of America N.A. | | | | | | |
1.50%, 01/03/05(3) | | | 929,327 | | | 929,327 |
Credit Suisse First Boston | | | | | | |
2.34%, 01/14/05(3) | | | 1,362,268 | | | 1,362,268 |
Fifth Third Bancorp | | | | | | |
2.18%, 01/03/05(3) | | | 908,178 | | | 908,178 |
HBOS Treasury Services PLC | | | | | | |
1.24%, 04/01/05(3) | | | 581,234 | | | 581,220 |
Natexis Banques | | | | | | |
2.32%, 02/02/05(3) | | | 227,045 | | | 227,046 |
National City Bank (Ohio) | | | | | | |
1.25%, 01/06/05(3) | | | 908,178 | | | 908,179 |
Norddeutsche Landesbank | | | | | | |
2.11%, 06/07/05(3) | | | 908,178 | | | 908,102 |
Toronto-Dominion Bank | | | | | | |
1.22%, 03/23/05(3) | | | 1,589,312 | | | 1,589,252 |
1.34%, 02/10/05(3) | | | 363,271 | | | 363,266 |
1.77%, 05/10/05(3) | | | 454,089 | | | 454,073 |
1.90%, 05/11/05(3) | | | 454,089 | | | 454,073 |
2.25%, 01/31/05(3) | | | 454,089 | | | 454,089 |
2.30%, 05/12/05(3) | | | 227,045 | | | 226,988 |
2.66%, 11/09/05(3) | | | 908,178 | | | 908,064 |
UBS Finance (Connecticut) | | | | | | |
2.32%, 01/07/05(3) | | | 908,178 | | | 908,179 |
2.67%, 11/09/05(3) | | | 363,271 | | | 363,241 |
Washington Mutual Bank | | | | | | |
2.27%, 02/02/05(3) | | | 363,271 | | | 363,271 |
2.35%, 02/02/05(3) | | | 1,453,085 | | | 1,453,073 |
Wells Fargo Bank N.A. | | | | | | |
2.34%, 01/26/05(3) | | | 3,632,713 | | | 3,632,713 |
| | | | | |
|
|
| | | | | | | 20,354,824 |
| | | | | |
|
|
Continued
24
| | |
| S&P 500 Index Master Portfolio | | Schedule of Investments December 31, 2004 |
| | | | | | | |
| Short-Term Investments, continued | | | | | |
Security
| | Principal
| | Value
| |
U.S. Government Agency Notes (0.14%): | |
Federal Home Loan Mortgage Corp. | | | | | | | |
1.63%, 04/15/05(3) | | $ | 635,725 | | $ | 636,294 | |
1.80%, 01/18/05(3) | | | 422,303 | | | 421,987 | |
1.80%, 01/19/05(3) | | | 454,089 | | | 453,726 | |
2.06%, 05/31/05(3) | | | 452,754 | | | 448,920 | |
Federal National Mortgage Association | | | | | | | |
2.33%, 07/22/05(3) | | | 1,362,268 | | | 1,344,672 | |
| | | | | |
|
|
|
| | | | | | | 3,305,599 | |
| | | | | |
|
|
|
U.S. Treasury Obligations (0.16%): | | | | |
U.S. Treasury Bill | | | | | | | |
2.12%(7), 03/24/05(8) | | | 3,800,000 | | | 3,781,760 | |
| | | | | |
|
|
|
| | | | | | | 3,781,760 | |
| | | | | |
|
|
|
Total Short-Term Investments
(Cost: $182,728,559) | | | | | | 182,729,015 | |
| | | | | |
|
|
|
Total Investments in
Securities (106.60%)
(Cost: $2,575,652,920) | | | | | | 2,565,733,013 | |
| | | | | |
|
|
|
Other Assets, Less
Liabilities (6.60%) | | | | | | (158,930,464 | ) |
| | | | | |
|
|
|
Net Assets (100.00%) | | | | | $ | 2,406,802,549 | |
| | | | | |
|
|
|
| (1) | Non-income earning security. |
| (2) | All or a portion of this security represents a security on loan. See Note 4. |
| (3) | All or a portion of this security represents an investment of securities lending collateral. See Note 4. |
| (4) | Security exempt from registration pursuant to Rule 144A of the Securities Act of 1933. These securities may be resold in transactions exempt from registration, normally to qualified institutional buyers. |
| (5) | The Master Portfolio’s investment adviser is an affiliate of the issuer. See Note 2. |
| (6) | Repurchase agreements held as collateral for securities on loan are fully collateralized by U.S. Government securities, with interest rates ranging from 2.79% to 10.00% and maturity dates ranging from 2/1/07 to 8/1/42. |
| (8) | This U.S. Treasury Bill is held in a segregated account in connection with the Master Portfolio’s holdings of futures contracts. See Note 1. |
As of December 31, 2004, the open futures contracts held by the Master Portfolio were as follows:
| | | | | | | | |
Futures Contracts
(Expiration Date)
| | Number of
Contracts
| | Notional
Contract Value
| | Net Unrealized
Appreciation
|
S&P 500 Index (03/18/05) | | 393 | | $ | 23,287,917 | | $ | 561,288 |
| | | | | | | |
|
|
| | | | | | | | $ | 561,288 |
| | | | | | | |
|
|
The accompanying notes are an integral part of these financial statements.
25
| | |
| S&P 500 Index Master Portfolio | | Portfolio Allocation (Unaudited) December 31, 2004 |
| | | | | | |
Sector
| | Value
| | % of
Net Assets
| |
Consumer Non-Cyclical | | $ | 505,227,880 | | 20.99 | % |
Financial | | | 491,672,471 | | 20.43 | |
Technology | | | 295,282,857 | | 12.27 | |
Industrial | | | 276,557,768 | | 11.49 | |
Communications | | | 268,356,924 | | 11.15 | |
Consumer Cyclical | | | 238,034,996 | | 9.89 | |
Energy | | | 169,949,066 | | 7.06 | |
Utilities | | | 69,733,435 | | 2.90 | |
Basic Materials | | | 68,188,601 | | 2.83 | |
Short-Term and Other Net Assets | | | 23,798,551 | | 0.99 | |
| | |
|
| |
|
|
TOTAL | | $ | 2,406,802,549 | | 100.00 | % |
| | |
|
| |
|
|
This table is not part of the financial statements.
26
S&P 500 Index Master Portfolio
| | | |
| Statement of Assets and Liabilities |
| December 31, 2004 |
Assets: | | | |
Investments in securities, at value (including securities on loan(a))(Note 1): | | | |
Unaffiliated issuers (Cost: $2,536,404,512) | | $ | 2,526,484,605 |
Affiliated issuers(b) (Cost: $39,248,408) | | | 39,248,408 |
Receivables: | | | |
Dividends and interest | | | 3,289,395 |
| | |
|
|
Total Assets | | | 2,569,022,408 |
| | |
|
|
Liabilities: | | | |
Payables: | | | |
Investment securities purchased | | | 525,108 |
Due to broker — variation margin | | | 11,268 |
Collateral for securities loaned (Note 4) | | | 161,481,075 |
Investment advisory fees (Note 2) | | | 202,408 |
| | |
|
|
Total Liabilities | | | 162,219,859 |
| | |
|
|
Net Assets | | $ | 2,406,802,549 |
| | |
|
|
| (a) | Securities on loan with market value of $156,838,580. See Note 4. |
| (b) | The Master Portfolio’s investment adviser is an affiliate of the issuers. See Note 2. |
| | | | |
| Statement of Operations | | | |
| For the Year Ended December 31, 2004 | |
Net Investment Income: | | | | |
Dividends | | $ | 53,771,322 | |
Interest | | | 68,138 | |
Interest from affiliated issuers(a) | | | 969,234 | |
Securities lending income(b) | | | 167,844 | |
| | |
|
|
|
Total investment income | | | 54,976,538 | |
| | |
|
|
|
Expenses (Note 2): | | | | |
Investment advisory fees | | | 1,401,018 | |
| | |
|
|
|
Total expenses | | | 1,401,018 | |
| | |
|
|
|
Net investment income | | | 53,575,520 | |
| | |
|
|
|
Realized and Unrealized Gain (loss): | | | | |
Net realized loss on sale of investments | | | (23,883,394 | ) |
Net realized gain from in-kind redemptions | | | 559,588,129 | |
Net realized gain on futures contracts | | | 2,918,725 | |
Net change in unrealized appreciation (depreciation) of investments | | | (290,192,162 | ) |
Net change in unrealized appreciation (depreciation) of futures contracts | | | (641,245 | ) |
| | |
|
|
|
Net realized and unrealized gain | | | 247,790,053 | |
| | |
|
|
|
Net Increase in Net Assets Resulting From Operations | | $ | 301,365,573 | |
| | |
|
|
|
| (a) | The Master Portfolio’s investment adviser is an affiliate of the issuers. See Note 2. |
| (b) | Includes income earned from issuers of which the Master Portfolio’s investment adviser is an affiliate. See Note 2. |
The accompanying notes are an integral part of these financial statements.
27
S&P 500 Index Master Portfolio
| | | | | | | | |
| Statements of Changes in Net Assets | | | | | | |
| | | For the Year Ended
December 31, 2004
| | | For the Year Ended
December 31,
2003
| |
Increase (decrease) In Net Assets | | | | | | | | |
Operations: | | | | | | | | |
Net investment income | | $ | 53,575,520 | | | $ | 49,900,066 | |
Net realized gain | | | 538,623,460 | | | | 16,069,488 | |
Net change in unrealized appreciation (depreciation) | | | (290,833,407 | ) | | | 686,078,250 | |
| | |
|
|
| |
|
|
|
Net increase in net assets resulting from operations | | | 301,365,573 | | | | 752,047,804 | |
| | |
|
|
| |
|
|
|
Interestholder transactions: | | | | | | | | |
Contributions | | | 820,705,368 | | | | 1,247,904,502 | |
Withdrawals | | | (2,346,660,989 | ) | | | (708,478,794 | ) |
| | |
|
|
| |
|
|
|
Net increase (decrease) in net assets resulting from interestholder transactions | | | (1,525,955,621 | ) | | | 539,425,708 | |
| | |
|
|
| |
|
|
|
Increase (decrease) in net assets | | | (1,224,590,048 | ) | | | 1,291,473,512 | |
Net Assets: | | | | | | | | |
Beginning of year | | | 3,631,392,597 | | | | 2,339,919,085 | |
| | |
|
|
| |
|
|
|
End of year | | $ | 2,406,802,549 | | | $ | 3,631,392,597 | |
| | |
|
|
| |
|
|
|
The accompanying notes are an integral part of these financial statements.
28
S&P 500 Index Master Portfolio
Notes to the Financial Statements
December 31, 2004
| 1. | Significant Accounting Policies |
Master Investment Portfolio (“MIP”) is registered under the Investment Company Act of 1940, as amended (the “1940 Act”), as an open-end management investment company organized as a Delaware statutory trust. As of December 31, 2004, MIP offered the following separate portfolios: Active Stock, Bond Index, CoreAlpha Bond, Government Money Market, International Index, LifePath Retirement, LifePath 2010, LifePath 2020, LifePath 2030, LifePath 2040, Money Market, Prime Money Market, Russell 2000 Index, S&P 500 Index and Treasury Money Market Master Portfolios.
These financial statements relate only to the S&P 500 Index Master Portfolio (the “Master Portfolio”).
Under MIP’s organizational documents, the Master Portfolio’s officers and trustees are indemnified against certain liabilities that may arise out of the performance of their duties to the Master Portfolio. Additionally, in the normal course of business, the Master Portfolio enters into contracts with service providers that contain general indemnification clauses. The Master Portfolio’s maximum exposure under these arrangements is unknown, as this would involve future claims that may be made against the Master Portfolio that have not yet occurred.
The following significant accounting policies are consistently followed by MIP in the preparation of its financial statements. Such policies are in conformity with accounting principles generally accepted in the United States of America (“U.S. GAAP”) for investment companies. The preparation of financial statements in conformity with U.S. GAAP requires management to make estimates and assumptions that affect the reported amounts of assets and liabilities and disclosures of contingent assets and liabilities at the date of the financial statements and the reported amounts of revenue and expenses during the reporting period. Actual results could differ from those estimates.
Security Valuation
Investments of the Master Portfolio for which the primary market is a national securities or commodities exchange or a recognized foreign securities or commodities exchange are valued at the last reported sales price on the principal exchange on which such securities are traded, or in the absence of any sale on the valuation date, at the last quoted bid price. Securities for which the primary market is the National Association of Securities Dealers Automated Quotations National Market System (“NASDAQ”) are valued at the NASDAQ official closing price, or in the absence of any sale on the valuation date, at the last quoted bid price. U.S. Government securities and all other securities for which current over-the-counter market quotations are readily available are valued at the last quoted bid price. If quoted prices are unavailable or inaccurate, market values are determined based on quotes obtained from brokers, dealers and/or based on averages of prices obtained from independent pricing sources. Debt securities maturing in 60 days or less and short-term investments are valued at amortized cost.
Securities held under a repurchase agreement are valued at a price equal to the amount of cash investment at the time of the valuation on the valuation date. The market values of the underlying securities are determined in accordance with the above discussed valuation methods, as appropriate, for the purposes of determining the adequacy of collateral.
Securities of investment companies, other than investment companies whose shares are traded on an exchange, are valued at the investment company’s published net asset value per share.
Any securities or other assets for which market quotations are not readily available are valued in accordance with fair value pricing policies approved by the Board of Trustees of MIP (the “Board”).
Security Transactions and Income Recognition
Security transactions are accounted for on trade date. Dividend income is recognized on the ex-dividend date and interest income is accrued daily. Realized gains and losses on investment transactions are determined using the specific identification method. The Master Portfolio amortizes premium and accretes discount on debt securities purchased, using a constant yield to maturity method.
Continued
29
S&P 500 Index Master Portfolio
Notes to the Financial Statements, Continued
December 31, 2004
Federal Income Taxes
In general, MIP believes that the Master Portfolio has and will continue to be operated in a manner so as to qualify it as a non-publicly traded partnership for federal income tax purposes. Provided that the Master Portfolio so qualifies, it will not be subject to any federal income tax on its income and gain (if any). However, each interestholder in such a Master Portfolio will be taxed on its distributive share of the Master Portfolio’s taxable income in determining its federal income tax liability. As a non-publicly traded partnership for federal income tax purposes, the Master Portfolio will be deemed to have “passed through” to its interestholders any interest, dividends, gains or losses of the Master Portfolio for such purposes. The determination of such share will be made in accordance with the Internal Revenue Code of 1986, as amended (the “Code”), and regulations promulgated thereunder.
It is intended that the Master Portfolio’s assets, income and distributions will be managed in such a way that an entity electing and qualifying as a “regulated investment company” under the Code can continue to qualify by investing substantially all of its assets through the Master Portfolio, provided that the regulated investment company meets other requirements for such qualifications not within the control of the Master Portfolio (e.g., distributing at least 90% of the regulated investment company’s “investment company taxable income” annually).
As of December 31, 2004, the cost of investments for federal income tax purposes for the Master Portfolio was $2,627,063,821. Net unrealized depreciation aggregated $61,330,808 of which $286,471,213 represented gross unrealized appreciation on securities and $347,802,021 represented gross unrealized depreciation on securities.
Futures Contracts
The Master Portfolio may purchase futures contracts to gain exposure to market changes as this may be more efficient or cost effective than actually buying the securities. A futures contract is an agreement between two parties to buy and sell a security at a set price on a future date and is exchange-traded. Upon entering into a futures contract, the Master Portfolio is required to pledge to the broker an amount of cash, U.S. Government securities or other high-quality debt and equity securities equal to the minimum “initial margin” requirements of the exchange. Pursuant to the contract, the Master Portfolio agrees to receive from or pay to the broker an amount of cash equal to the daily fluctuation in the value of the contract. Such receipts or payments are known as “variation margin” and are recorded by the Master Portfolio as receivables or payables in the accompanying Statement of Assets and Liabilities. When the contract is closed, the Master Portfolio records a “realized gain (loss) on futures contracts” in its Statement of Operations, equal to the difference between the value of the contract at the time it was opened and the value at the time it was closed. Pursuant to regulations and/or published positions of the U.S. Securities and Exchange Commission (“SEC”), the Master Portfolio is required to segregate cash, U.S. Government securities or high-quality, liquid debt instruments and equities in connection with futures transactions. Risks of entering into futures contracts include the possibility that there may be an illiquid market and that a change in the value of the contracts may not correlate with changes in the value of the underlying securities. The amount at risk for futures contracts may exceed the amount reflected in the financial statements.
The Master Portfolio has pledged to brokers U.S. Treasury Bills with a total face amount of $3,800,000 for initial margin requirements.
Repurchase Agreements
The Master Portfolio may enter into repurchase agreements with banks and securities dealers. These transactions involve the purchase of securities with a simultaneous commitment to resell the securities to the bank or the dealer at an agreed-upon date and price. A repurchase agreement is accounted for as an investment by the Master Portfolio, collateralized by securities, which are delivered to the Master Portfolio’s custodian, or to an agent bank under a tri-party agreement. The securities are marked-to-market daily and additional securities are acquired as needed, to ensure that their value equals or exceeds the repurchase price plus accrued interest. As of December 31, 2004, a portion of the cash collateral for securities on loan for the Master Portfolio was invested in repurchase agreements as disclosed in the Master Portfolio’s Schedule of Investments. For further information, see Note 4, below.
| 2. | Agreements and other Transactions with Affiliates |
Pursuant to an Investment Advisory Contract with the Master Portfolio, Barclays Global Fund Advisors (“BGFA”) provides investment advisory services to the Master Portfolio. BGFA is a California corporation indirectly owned by Barclays Bank PLC.
Continued
30
S&P 500 Index Master Portfolio
Notes to the Financial Statements, Continued
December 31, 2004
BGFA is entitled to receive an annual fee of 0.05% of the average daily net assets of the Master Portfolio as compensation for investment advisory services.
Investors Bank & Trust Company (“IBT”) serves as the custodian and sub-administrator of the Master Portfolio. IBT will not be entitled to receive fees for its custodial services so long as it is entitled to receive a separate fee from Barclays Global Investors, N.A. (“BGI”) for its services as sub-administrator of the Master Portfolio.
BGI serves as securities lending agent for MIP. BGI is an affiliate of BGFA, the Master Portfolio’s investment adviser. As securities lending agent, BGI receives, as fees, a share of the income earned on investment of the cash collateral received for the loan of securities. For the year ended December 31, 2004, BGI earned $167,844 in securities lending agent fees.
SEI Investment Distribution Company (“SEI”) is the sponsor and placement agent for the Master Portfolio. SEI does not receive any fee from the Master Portfolio for acting as placement agent.
MIP has entered into an administration services arrangement with BGI, which has agreed to provide general administration services, such as managing and coordinating third-party service relationships, to the Master Portfolio. BGI is not entitled to compensation for providing administration services to the Master Portfolio for so long as BGI is entitled to compensation for providing administration services to corresponding feeder funds that invest substantially all of their assets in the Master Portfolio, or BGI (or an affiliate) receives investment advisory fees from the Master Portfolio. BGI may delegate certain of its administration duties to sub-administrators.
Barclays Global Investors Services (“BGIS”), a subsidiary of BGI, may serve as a broker-dealer for the Master Portfolio. For the year ended December 31, 2004, BGIS did not receive any brokerage commissions from the Master Portfolio.
Pursuant to Rule 17a-7 under the 1940 Act, the Master Portfolio executed cross trades for the year ended December 31, 2004. Cross trading is the buying or selling of portfolio securities between funds to which BGFA (or an affiliate) serves as investment adviser. The Board reviewed all such transactions executed during the first three quarters of the fiscal year and concluded that they were in compliance with the requirements and restrictions set forth by Rule 17a-7. The Board is scheduled at its next meeting to review all such transactions executed during the fourth quarter of the fiscal year.
Pursuant to an exemptive order issued by the SEC, the Master Portfolio may invest in the Institutional Shares of the Government Money Market Fund (“GMMF”), Institutional Money Market Fund (“IMMF”) and Prime Money Market Fund (“PMMF”) of Barclays Global Investors Funds. The GMMF, IMMF and PMMF are feeder funds in a master/feeder fund structure that invest substantially all of their assets in the Government Money Market Master Portfolio, Money Market Master Portfolio and Prime Money Market Master Portfolio, respectively, which are managed by BGFA, the Master Portfolio’s investment advisor. The GMMF, IMMF and PMMF are open-end money market funds available to institutional and accredited investors, including other investment companies managed by BGFA. The GMMF, IMMF and PMMF seek a high level of income consistent with liquidity and the preservation of capital. While the GMMF, IMMF and PMMF do not directly charge an advisory fee, the Master Portfolios in which they invest do charge an investment advisory fee. Income distributions from the GMMF, IMMF and PMMF are declared daily and paid monthly from net investment income. Income distributions earned by the Master Portfolio from temporary cash investments or from investment of securities lending collateral are recorded as either interest income or securities lending income, respectively, in the accompanying Statement of Operations.
The following table provides information about the investment of the Master Portfolio in shares of issuers of which BGFA is an affiliate, for the year ended December 31, 2004, including income earned from these affiliated issuers.
| | | | | | | | | | | | | | |
Name of Affiliated Issuer
| | Number of
Shares Held
Beginning of
Year (in 000s)
| | Gross
Additions
(in 000s)
| | Gross
Reductions
(in 000s)
| | Number of
Shares Held
End of Year
(in 000s)
| | Value at End
of Year
| | Interest
Income
|
IMMF | | 42,866 | | 13,498,164 | | 13,523,564 | | 17,466 | | $ | 17,466,180 | | $ | 969,234 |
Continued
31
S&P 500 Index Master Portfolio
Notes to the Financial Statements, Continued
December 31, 2004
The Master Portfolio invested cash collateral from securities on loan in the GMMF, IMMF, and PMMF. Due to the nature of the structure of the joint account used for the investment of the collateral for securities on loan, the information reported above for the Master Portfolio does not include the Master Portfolio’s holdings of the GMMF, IMMF, and PMMF in connection with the investment of collateral for securities on loan.
Certain officers and trustees of MIP are also officers of BGI. As of December 31, 2004, these officers of BGI collectively owned less than 1% of MIP’s outstanding beneficial interests.
| 3. | Investment Portfolio Transactions |
Investment transactions (excluding short-term investments) for the Master Portfolio for the year ended December 31, 2004, were as follows:
| | | |
Purchases at cost | | $ | 376,384,180 |
Sales proceeds | | | 1,820,491,929 |
For the year ended December 31, 2004, the Master Portfolio paid in-kind redemption proceeds of portfolio securities in the amount of $1,690,310,761. In-kind redemptions are transactions in which an interestholder in the Master Portfolio redeems interests in the Master Portfolio and the Master Portfolio pays the proceeds of that redemption in the form of portfolio securities, rather than cash. Because capital gains or losses resulting from in-kind redemptions are not taxable to the Master Portfolio, and are not allocated to the other interestholders, the gains or losses are reclassified from accumulated net realized gains or losses to paid-in-capital at the end of the Master Portfolio’s tax year. The net realized gains from in-kind redemptions for the year ended December 31, 2004 are disclosed in the Master Portfolio’s Statement of Operations.
| 4. | Portfolio Securities Loaned |
The Master Portfolio may lend its investment securities to approved borrowers, such as brokers, dealers, and other financial institutions. The borrower pledges and maintains with the Master Portfolio collateral consisting of cash, an irrevocable letter of credit issued by a bank, or securities issued or guaranteed by the U.S. Government. The initial collateral received by the Master Portfolio is required to have a value of at least 102% of the market value of the loaned securities. The collateral is maintained thereafter, at a value equal to at least 100% of the current market value of the securities on loan. The risks to the Master Portfolio of securities lending are that the borrower may not provide additional collateral when required, or may not return the securities when due.
As of December 31, 2004, the Master Portfolio had loaned securities which were collateralized by cash. The cash collateral received was invested in a joint account with other funds managed by BGFA, which invests in securities with remaining maturities of 397 days or less, repurchase agreements and money market mutual funds, including money market funds managed by BGFA. Repurchase agreements held in the joint account are fully collateralized by U.S. Government securities. Income from the joint account is allocated daily to the Master Portfolio, based on the Master Portfolio’s portion of the total cash collateral received. The market value of the securities on loan as of December 31, 2004 and the value of the related collateral are disclosed in the Master Portfolio’s Statement of Assets and Liabilities. Securities lending income, which is disclosed in the Master Portfolio’s Statement of Operations, is presented net of rebates paid to, or fees paid by, borrowers.
Financial highlights for the Master Portfolio were as follows:
| | | | | | | | | | | | | | | |
| | | Year Ended
December 31,
2004
| | | Year Ended
December 31,
2003
| | | Year Ended
December 31,
2002
| | | Year Ended
December 31,
2001
| | | Year Ended
December 31,
2000
| |
Ratio of expenses to average net assets | | 0.05 | % | | 0.05 | % | | 0.05 | % | | 0.05 | % | | 0.05 | % |
Ratio of net investment income to average net assets | | 1.91 | % | | 1.74 | % | | 1.57 | % | | 1.31 | % | | 1.22 | % |
Portfolio turnover rate(a) | | 14 | % | | 8 | % | | 12 | % | | 9 | % | | 10 | % |
Total return | | 10.82 | % | | 28.52 | % | | (22.05 | )% | | (11.96 | )% | | (9.19 | )% |
| (a) | Portfolio turnover rates include in-kind transactions, if any. |
32
Report of Independent Registered Public Accounting Firm
To the Interestholders and Board of Trustees of
Master Investment Portfolio:
In our opinion, the accompanying statement of assets and liabilities, including the schedule of investments, and the related statements of operations and of changes in net assets present fairly, in all material respects, the financial position of the S&P 500 Index Master Portfolio, a portfolio of Master Investment Portfolio (the “Master Portfolio”), at December 31, 2004, the results of its operations for the year then ended, the changes in its net assets for each of the two years in the period then ended and its financial highlights for each of the four years in the period then ended, in conformity with accounting principles generally accepted in the United States of America. These financial statements and financial highlights (hereafter referred to as “financial statements”) are the responsibility of the Master Portfolio’s management; our responsibility is to express an opinion on these financial statements based on our audits. We conducted our audits in accordance with the standards of the Public Company Accounting Oversight Board (United States). Those standards require that we plan and perform the audits to obtain reasonable assurance about whether the financial statements are free of material misstatement. An audit includes examining, on a test basis, evidence supporting the amounts and disclosures in the financial statements, assessing the accounting principles used and significant estimates made by management, and evaluating the overall financial statement presentation. We believe that our audits, which included confirmation of securities at by correspondence with the custodian and brokers, provide a reasonable basis for our opinion.
The financial highlights of the Master Portfolio at December 31, 2000 and for the year then ended were audited by other auditors, whose report dated February 9, 2001 expressed an unqualified opinion on those financial highlights.
PricewaterhouseCoopers LLP
San Francisco, California
February 11, 2005
33
Master Investment Portfolio
Trustee Information — Unaudited
The Board of Trustees has responsibility for the overall management and operations of the Master Portfolio. Each Trustee serves until he or she resigns, retires, or his or her successor is elected and qualified. Each Officer serves until his or her successor is chosen and qualified.
Master Investment Portfolio (“MIP”), Barclays Global Investors Funds (“BGIF”), iShares Trust and iShares, Inc. are considered to be members of the same fund complex, as defined in Form N-1A under the 1940 Act. Each Trustee of MIP also serves as a Trustee for BGIF and oversees 27 portfolios within the fund complex. In addition, Lee T. Kranefuss and Richard K. Lyons each serves as a Trustee for iShares Trust and as a Director for iShares, Inc. and oversees 125 portfolios within the fund complex.
Unless otherwise noted in the tables below, the address for each Trustee is 45 Fremont Street, San Francisco, CA 94105. Additional information about the Master Portfolio’s Trustees may be found in Part B of the Master Portfolio’s Registration Statement, which is available without charge, upon request, by calling toll-free 1-877-244-1544.
Interested Trustees and Officers
| | | | | | |
Name, Year of Birth
| | Position(s),
Length of
Service
| | Principal Occupation
During Past Five Years
| | Other Public
Company and
Investment
Company
Directorships
|
Lee T. Kranefuss, *1961 | | Trustee since November 16, 2001, President and Chief Executive Officer | | Chief Executive Officer of Intermediary Investor Business of Barclays Global Investors, N.A. (“BGI”). | | Trustee of BGIF; Director, iShares, Inc. (since June 18, 2003); Trustee, iShares Trust (since June 18, 2003). |
| | | |
Michael A. Latham, 1965 | | Secretary, Treasurer and Chief Financial Officer | | Chief Operating Officer of Intermediary Investor Business of BGI (since 2004); Director of Mutual Fund Delivery of Intermediary Investor Business of BGI (2000-2004); Head of Operations, BGI Europe (1997-2000). | | None. |
| * | Lee T. Kranefuss is deemed to be an “interested person” of the Trust because he serves as Chief Executive Officer of the Intermediary Investor Business of BGI, the administrator of the Master Portfolio and the parent company of BGFA, the investment adviser of the Master Portfolio. |
Independent Trustees
| | | | | | |
Name, Year of Birth
| | Position(s),
Length of
Service
| | Principal Occupation
During Past Five Years
| | Other Public
Company and
Investment
Company
Directorships
|
Mary G. F. Bitterman, 1944 | | Trustee since November 16, 2001 | | President, Osher Lifelong Learning Institutes, The Bernard Osher Foundation (since May 2004); President and Chief Executive Officer of The James Irvine Foundation (non-profit foundation) (2002-2003); President and Chief Executive Officer of KQED, Inc. (public television and radio) (1993-2002). | | Trustee of BGIF; Director, Bank of Hawaii. |
| | | |
Jack S. Euphrat, 1922 | | Trustee since October 20, 1993 | | Private Investor. | | Trustee of BGIF. |
| | | |
Richard K. Lyons, 1961 | | Trustee since November 16, 2001 | | Acting Dean and Professor, University of California, Berkeley: Haas School of Business; Sylvan Coleman Professor of Finance; Member, Council on Foreign Relations. | | Trustee of BGIF; Director (Chairman), Matthews Asian Funds (oversees 6 portfolios); Director, iShares, Inc. (since 2001); Trustee, iShares Trust (since 2001). |
| | | |
Leo Soong, 1946 | | Trustee since February 9, 2000 | | President of Trinity Products LLC (beverages); Managing Director of CG Roxane LLC (water company); Co-Founder of Crystal Geyser Water Co. (President through 1999). | | Trustee of BGIF; Vice Chairman of the California Pacific Medical Center; Director of the California State Automobile Association; Director of the American Automobile Association. |
34
03/05
Disclose whether, as of the end of the period covered by the report, the registrant has adopted a code of ethics that applies to the registrant’s principal executive officer, principal financial officer, principal accounting officer or controller, or persons performing similar functions, regardless of whether these individuals are employed by the registrant or a third party. If the registrant has not adopted such a code of ethics, explain why it has not done so.
The registrant has adopted a code of ethics that applies to the registrant’s principal executive officer, principal financial officer, principal accounting officer or controller, or persons performing similar functions. This code of ethics is included as Exhibit 11 (a)(1).
The registrant must briefly describe the nature of any amendment, during the period covered by the report, to a provision of its code of ethics that applies to the registrant’s principal executive officer, principal financial officer, principal accounting officer or controller, or persons performing similar functions, regardless of whether these individuals are employed by the registrant or a third party, and that relates to any element of the code of ethics definition enumerated in paragraph (b) of this Item. The registrant must file a copy of any such amendment as an exhibit pursuant to Item 11(a)(1), unless the registrant has elected to satisfy paragraph (f) of this Item by posting its code of ethics on its website pursuant to paragraph (f)(2) of this Item, or by undertaking to provide its code of ethics to any person without charge, upon request, pursuant to paragraph (f)(3) of this Item.
If the registrant has, during the period covered by the report, granted a waiver, including an implicit waiver, from a provision of the code of ethics that applies to the registrant’s principal executive officer, principal financial officer, principal accounting officer or controller, or persons performing similar functions, regardless of whether these individuals are employed by the registrant or a third party, that relates to one or more items set forth in paragraph (b) of this Item, the registrant must briefly describe the nature of the waiver, the name of the person to whom the waiver was granted, and the date of the waiver.
During the period covered by the report, with respect to the registrant’s code of ethics that applies to its principal executive officer, principal financial officer, principal accounting officer or controller, or persons performing similar functions; there have been no amendments to, nor any waivers granted from, a provision that relates to any element of the code of ethics definition enumerated in paragraph (b) of this Item 2.
However, effective February 1, 2005, Keith F. Karlawish replaced George O. Martinez as the President of the registrant.
| Item 3. | Audit Committee Financial Expert. |
| | (a) | (1) Disclose that the registrant’s board of directors has determined that the registrant either: |
(i) Has at least one audit committee financial expert serving on its audit committee; or
(ii) Does not have an audit committee financial expert serving on its audit committee.
(2) If the registrant provides the disclosure required by paragraph (a)(1)(i) of this Item, it must disclose the name of the audit committee financial expert and whether that person is “independent.” In order to be considered “independent” for purposes of this Item, a member of an audit committee may not, other than in his or her capacity as a member of the audit committee, the board of directors, or any other board committee:
(i) Accept directly or indirectly any consulting, advisory, or other compensatory fee from the issuer; or
(ii) Be an “interested person” of the investment company as defined in Section 2(a)(19) of the Act (15 U.S.C. 80a- 2(a)(19)).
(3) If the registrant provides the disclosure required by paragraph (a)(1)(ii) of this Item, it must explain why it does not have an audit committee financial expert.
3(a)(1) The registrant’s board of directors has determined that the registrant has at least one audit committee financial expert serving on its audit committee.
3(a)(2) The audit committee financial expert is Drew Kagan, who is “independent” for purposes of this Item 3 of Form N-CSR.
| Item 4. | Principal Accountant Fees and Services. |
(a) Disclose, under the caption Audit Fees, the aggregate fees billed for each of the last two fiscal years for professional services rendered by the principal accountant for the audit of the registrant’s annual financial statements or services that are normally provided by the accountant in connection with statutory and regulatory filings or engagements for those fiscal years.
(b) Disclose, under the caption Audit-Related Fees, the aggregate fees billed in each of the last two fiscal years for assurance and related services by the principal accountant that are reasonably related to the performance of the audit of the registrant’s financial statements and are not reported under paragraph (a) of this Item. Registrants shall describe the nature of the services comprising the fees disclosed under this category.
Fees for both years relate to the review of the annual N-1A filing.
(c) Disclose, under the caption Tax Fees, the aggregate fees billed in each of the last two fiscal years for professional services rendered by the principal accountant for tax compliance, tax advice, and tax planning. Registrants shall describe the nature of the services comprising the fees disclosed under this category.
Fees for both years relate to the preparation of the Fund’s tax returns and review of the excise tax calculation and capital gain distribution.
(d) Disclose, under the caption All Other Fees, the aggregate fees billed in each of the last two fiscal years for products and services provided by the principal accountant, other than the services reported in paragraphs (a) through (c) of this Item. Registrants shall describe the nature of the services comprising the fees disclosed under this category.
(e) (1) Disclose the audit committee’s pre-approval policies and procedures described in paragraph (c)(7) of Rule 2-01 of Regulation S-X.
Except as permitted by Rule 2-01(c)(7)(i)(C) of Regulation S-X, the Trust’s Audit Committee pre-approves all audit and non-audit services provided by the independent accountants relating to the operations or financial reporting of the funds.
(2) Disclose the percentage of services described in each of paragraphs (b) through (d) of this Item that were approved by the audit committee pursuant to paragraph (c)(7)(i)(C) of Rule 2-01 of Regulation S-X.
None of the services summarized in (b)-(d), above, were approved by the Audit Committee pursuant to Rule 2-01(c)(7)(i)(C) of Regulation S-X.
(f) If greater than 50 percent, disclose the percentage of hours expended on the principal accountant’s engagement to audit the registrant’s financial statements for the most recent fiscal year that were attributed to work performed by persons other than the principal accountant’s full-time, permanent employees.
Not applicable.
(g) Disclose the aggregate non-audit fees billed by the registrant’s accountant for services rendered to the registrant, and rendered to the registrant’s investment adviser (not including any sub-adviser whose role is primarily portfolio management and is subcontracted with or overseen by another investment adviser), and any entity controlling, controlled by, or under common control with the adviser that provides ongoing services to the registrant for each of the last two fiscal years of the registrant.
(h) Disclose whether the registrant’s audit committee of the board of directors has considered whether the provision of nonaudit services that were rendered to the registrant’s investment adviser (not including any subadviser whose role is primarily portfolio management and is subcontracted with or overseen by another investment adviser), and any entity controlling, controlled by, or under common control with the investment adviser that provides ongoing services to the registrant that were not pre-approved pursuant to paragraph (c)(7)(ii) of Rule 2-01 of Regulation S-X is compatible with maintaining the principal accountant’s independence.
In regards to Item 4 (g), the audit committee considered the non-audit services rendered to the registrant’s investment adviser and any entity controlling, controlled by, or under common control with the investment adviser, and believes the principal accountants independence has not been compromised.
| Item 5. | Audit Committee of Listed Registrants. |
(a) If the registrant is a listed issuer as defined in Rule 10A-3 under the Exchange Act (17CFR 240.10A-3), state whether or not the registrant has a separately-designated standing audit committee established in accordance with Section
3(a)(58)(A) of the Exchange Act (15 U.S.C. 78c(a)(58)(A)). If the registrant has such a committee, however designated, identify each committee member. If the entire board of directors is acting as the registrant’s audit committee as specified in Section 3(a)(58)(B) of the Exchange Act (15 U.S.C. 78c(a)(58)(B)), so state.
(b) If applicable, provide the disclosure required by Rule 10A-3(d) under the Exchange Act (17CFR 240.10A-3(d)) regarding an exemption from the listing standards for all audit committees.
Not applicable.
| Item 6. | Schedule of Investments. |
File Schedule I – Investments in securities of unaffiliated issuers as of the close of the reporting period as set forth in § 210.12-12 of Regulation S-X, unless the schedule is included as part of the report to shareholders filed under Item 1 of this Form.
Not applicable.
| Item 7. | Disclosure of Proxy Voting Policies and Procedures for Closed-End Management Investment Companies. |
A closed-end management investment company that is filing an annual report on this Form N-CSR must, unless it invests exclusively in non-voting securities, describe the policies and procedures that it uses to determine how to vote proxies relating to portfolio securities, including the procedures that the company uses when a vote presents a conflict between the interests of its shareholders, on the one hand, and those of the company’s investment adviser; principal underwriter; or any affiliated person (as defined in Section 2(a)(3) of the Investment Company Act of 1940 (15 U.S.C. 80a-2(a)(3)) and the rules thereunder) of the company, its investment adviser, or its principal underwriter, on the other. Include any policies and procedures of the company’s investment adviser, or any other third party, that the company uses, or that are used on the company’s behalf, to determine how to vote proxies relating to portfolio securities.
Not applicable.
| Item 8. | Portfolio Managers of Closed-End Management Investment Companies. |
If the registrant is a closed-end management investment company that is filing an annual report on this Form N-CSR, provide the information specified in paragraphs (a) and (b) of this Item with respect to portfolio managers.
Not applicable.
| Item 9. | Purchases of Equity Securities by Closed-End Management Investment Company and Affiliated Purchasers. |
If the registrant is a closed-end management investment company, provide the information specified in paragraph (b) of this Item with respect to any purchase made by or on behalf of the registrant or any “affiliated purchaser,” as defined in Rule 10b-18(a)(3) under the Exchange Act (17 CFR 240.10b-18(a)(3)), of shares or other units of any class of the registrant’s equity securities that is registered by the registrant pursuant to Section 12 of the Exchange Act (15 U.S.C. 781).
Not applicable.
| Item 10. | Submission of Matters to a Vote of Security Holders. |
Describe any material changes to the procedures by which shareholders may recommend nominees to the registrant’s board of directors, where those changes were implemented after the registrant last provided disclosure in response to the requirements of Item 7(d)(2)(ii)(G) of Schedule 14A (17 CFR 240.14a-101), or this Item.
During the period covered by the report, with respect to the registrant’s procedures by which shareholders may recommend nominees to the registrant’s board of directors, there have been no amendments to, nor any waivers granted from, a provision that relates to any elements of this Item 10.
| Item 11. | Controls and Procedures. |
(a) Disclose the conclusions of the registrant’s principal executive and principal financial officers, or persons performing similar functions, regarding the effectiveness of the registrant’s disclosure controls and procedures (as defined in Rule 30a-3(c) under the Act (17 CFR 270.30a-3(c))) as of a date within 90 days of the filing date of the report that includes the disclosure required by this paragraph, based on the evaluation of these controls and procedures required by Rule 30a-3(b) under the Act (17 CFR 270.30a-3(b)) and Rules 13a-15(b) or 15d-15(b) under the Exchange Act (17 CFR 240.13a-15(b) or 240.15d-15(b)).
The registrant’s principal executive officer and principal financial officer have concluded, based on their evaluation of the registrant’s disclosure controls and procedures as conducted within 90 days of the filing date of this report, that these
disclosure controls and procedures are adequately designed and are operating effectively to ensure that information required to be disclosed by the registrant on Form N-CSR is (i) accumulated and communicated to the investment company’s management, including its certifying officers, to allow timely decisions regarding required disclosure; and (ii) recorded, processed, summarized and reported within the time periods specified in the Securities and Exchange Commission’s rules and forms.
(b) Disclose any change in the registrant’s internal control over financial reporting (as defined in Rule 30a-3(d) under the Act (17 CFR 270.30a-3(d)) that occurred during the second fiscal quarter of the period covered by this report that has materially affected, or is reasonably likely to materially affect, the registrant’s internal control over financial reporting.
There were no changes in the registrant’s internal control over financial reporting that occurred during the second fiscal quarter of the period covered by this report that have materially affected or are reasonably likely to materially affect, the registrant’s internal control over financial reporting.
(a) File the exhibits listed below as part of this Form. Letter or number the exhibits in the sequence indicated.
(a)(1) Any code of ethics, or amendment thereto, that is the subject of the disclosure required by Item 2, to the extent that the registrant intends to satisfy the Item 2 requirements through filing of an exhibit. The code of ethics that is the subject of the disclosure required by Item 2 is attached hereto.
(a)(2) A separate certification for each principal executive officer and principal financial officer of the registrant as required by Rule 30a-2(a) under the Act (17 CFR 270.30a-2). Certifications pursuant to Rule 30a-2(a) are attached hereto.
(a)(3) Any written solicitation to purchase securities under Rule 23c-1 under the Act (17 CFR 270.23c-1) sent or given during the period covered by the report by or on behalf of the registrant to 10 or more persons. Not applicable.
(b) If the report is filed under Section 13(a) or 15(d) of the Exchange Act, provide the certifications required by rule 30a-2(b) under the Act as an exhibit. A certification furnished pursuant to this paragraph will not be deemed “filed” for purposes of Section 18 of the Exchange Act, or otherwise subject to the liability of that section. Such certification will not be deemed to be incorporated by reference into any filing under the Securities Act of 1933 or the Exchange Act, except to the extent that the registrant incorporates it by reference. Certifications pursuant to Rule 30a-2(b) are furnished herewith.
SIGNATURES
Pursuant to the requirements of the Securities Exchange Act of 1934 and the Investment Company Act of 1940, the registrant has duly caused this report to be signed on its behalf by the undersigned, thereunto duly authorized.
| | |
(Registrant) | | BB&T Funds |
| |
By (Signature and Title)* | | /s/ Troy A. Sheets |
| | | Troy A. Sheets, Treasurer |
Date | | March 7, 2005 |
Pursuant to the requirements of the Securities Exchange Act of 1934 and the Investment Company Act of 1940, this report has been signed below by the following persons on behalf of the registrant and in the capacities and on the dates indicated.
| | |
| |
By (Signature and Title)* | | /s/ Keith F. Karlawish |
| | | Keith F. Karlawish, President |
Date | | March 7, 2005 |
| | |
| |
By (Signature and Title)* | | /s/ Troy A. Sheets |
| | | Troy A. Sheets, Treasurer |
Date | | March 7, 2005 |
| * | Print the name and title of each signing officer under his or her signature. |