UNITED STATES
SECURITIES AND EXCHANGE COMMISSION
Washington, D.C. 20549
FORM N-CSR
CERTIFIED SHAREHOLDER REPORT OF REGISTERED
MANAGEMENT INVESTMENT COMPANIES
Investment Company Act file number 811-06719
BB&T Funds
(Exact name of registrant as specified in charter)
| | |
| 434 Fayetteville Street, 5th Floor, Raleigh, NC | | 27626-0575 |
| |
|
| (Address of principal executive offices) | | (Zip code) |
BISYS Fund Services Ohio, Inc. , 3435 Stelzer Road, Columbus, OH 43219
(Name and address of agent for service)
Registrant’s telephone number, including area code: (800) 228-1872
Date of fiscal year end: September 30
Date of reporting period: September 30, 2006
Item 1. Reports to Stockholders.
BB&T FUNDS
TABLEOF CONTENTS
LETTER FROMTHE PRESIDENTANDTHE INVESTMENT ADVISOR
Dear Shareholders:
We are pleased to present this annual report for the 12-month period ended September 30, 2006. The economy generated healthy growth during that time, despite a number of headwinds. Stocks overcame a spring correction to turn in solid returns, while the fixed-income markets posted small gains. The S&P 500 Index gained 10.79% during the period under review, while the Russell 2000 Index of small-cap stocks returned 9.92% and the Lehman Aggregate Bond Index gained 3.67%.
A resilient economy
Solid consumer and corporate spending helped the economy generate healthy growth during the 12-month period as a whole, despite a number of negative factors.
The destruction wreaked by Gulf Coast hurricanes during August and September of 2005 contributed to a considerable slowdown in GDP1 growth during the fourth quarter of 2005. The economy rebounded strongly in early 2006, however, due in part to a strong housing market. The housing sector subsequently slowed dramatically, weighing on the economy during the second half of the period.
High energy prices also dragged on the economy. The price of a barrel of crude oil climbed steeply to exceed $78 in July, marking an all-time high. Oil prices declined substantially during the final weeks of the period, to less than $60 per barrel.
The Federal Reserve raised the Fed funds rate six times, to 5.25%—a policy designed to forestall higher inflation by restraining economic growth.
Stocks overcome a spring swoon
Equities performed well early in the period. Energy and materials stocks led a rally, as companies in those sectors benefited from rising commodity prices. Small caps and foreign stocks also generated strong returns, as investors favored stocks that were likely to benefit from strong global economic growth.
Stocks fell significantly between May and July. The market subsequently rebounded, however, led by shares of large, high-quality firms. Energy stocks fell precipitously after oil prices declined late in the period, causing the energy sector to lag the broad market for the 12-month period as a whole. Stocks in the telecommunications, technology, utilities, health care and financials sectors posted good returns after the spring downturn.
Bond yields rise, then fall
Bonds generated slight gains during the fiscal year. Tightening by the Federal Reserve Board and concerns about higher inflation contributed to higher yields during the first three-quarters of the period. The Fed’s inaction at its August and September meetings then allowed short-term bond yields to fall, as investors began to anticipate a cut in interest rates during 2007. Meanwhile, relatively benign inflationary data pushed down yields on the long end of the yield curve.
Corporate bonds modestly outperformed Treasury issues during the fiscal year as a whole. The spread between yields on Treasury and corporate securities widened modestly late in the period, however, as investors began to anticipate slower economic growth.
Looking ahead
We saw earlier in 2006 that inflation had peaked. We continue to witness further signs of reduced inflationary pressure, due primarily to lower oil prices and a slowing housing market. As a result, we think the Federal Reserve has finished raising interest rates for this cycle. We believe weakening consumer spending will cause the economy to slow during the coming months, although we expect GDP growth to remain positive.
That backdrop appears favorable for stocks, which we believe offer greater potential returns than bonds during the coming months. High-quality large cap stocks in particular appear attractively valued, especially multi-national companies that can benefit from a declining dollar. Valuation multiples are already expanding as the markets discount receding inflationary pressures and attendant lower interest rates.
Because of the slowing economy, led by the housing correction, we favor sectors and industries less dependent upon consumer discretionary income, such as consumer staples, pharmaceuticals and healthcare equipment. Business spending should remain healthier, so we like communications equipment, data processing, and energy producers and refiners.
We believe that continued weak economic data, lower inflation and eventually a more accommodative Federal Reserve policy will lead to a decline in bond yields and further gains in the bond market. Thus, we would tend to favor portfolio durations slightly above benchmarks for all fixed-income portfolios. In addition, we expect short-term rates to decline most when the Fed eases its policy, benefiting bonds in the two-to-five year maturity range.
Meanwhile, with the Federal Reserve on hold, there may be a period of relative stability in the bond market. Sectors such as mortgage-backed securities and agency bonds, which provide an income advantage over their benchmarks, may provide superior performance in such an environment.
The dynamic nature of the financial markets makes predicting future performance difficult, however. We therefore recommend maintaining well-balanced portfolios comprised of funds that invest in various types of stocks, bonds and cash investments. The BB&T Funds offer a wide variety of investment vehicles with which you can construct such portfolios. We encourage you to use them as part of a disciplined, long-term investment strategy designed to maximize your chances of reaching your unique financial objectives.
We encourage you to call us with any questions at 1-800-228-1872, and we thank you for your trust in the BB&T Funds.
|
 |
| Keith F. Karlawish, CFA |
| President |
BB&T Funds |
|
 |
| Jeffrey J. Schappe, CFA |
| Chief Investment Officer |
BB&T Asset Management, Inc. |
Past performance does not guarantee future results.
| 1 | Gross Domestic Product (“GDP”) measures the monetary value of all the goods and services produced by an economy over a specified period. It includes consumption, government purchases, investments, and exports minus imports. |
This report is authorized for distribution only when preceded or accompanied by a prospectus. Please read the prospectus carefully before investing or sending money. BB&T Asset Management, Inc., a wholly owned subsidiary of BB&T Corporation, serves as investment adviser to the BB&T Funds and is paid a fee for its services. Shares of the BB&T Funds are not deposits or obligations of, or guaranteed or endorsed by, Branch Banking and Trust Company or its affiliates. The Funds are not insured by the FDIC or any other government agency. The Funds currently are distributed by BB&T Funds Distributor, Inc. The distributors are not affiliated with Branch Banking and Trust Company or its affiliates.
The foregoing information and opinions are for general information only. BB&T Asset Management, Inc. does not guarantee their accuracy or completeness, nor assume liability for any loss, which may result from the reliance by any person upon any such information or opinions. Such information and opinions are subject to change without notice, are for general information only and are not intended as an offer or solicitation with respect to the purchase or sale of any security or offering individual or personalized investment advice.
1
BB&T LARGE CAP FUND (formerly the Large Company Value Fund)
PORTFOLIO MANAGER
Ronald T. Rimkus, CFA
The BB&T Large Cap Fund is managed by Ronald T. Rimkus, a chartered financial analyst and Director of Core Equity at BB&T Asset Management, Inc. Mr. Rimkus has more than 13 years of investment experience, including hands on management of both growth and value equity portfolios. Most recently, he spent six years overseeing large-company core equity portfolios. Mr. Rimkus holds a BA from Brown University and an MBA from UCLA. He is supported by the BB&T Large Cap Core Equity Portfolio Management Team.
INVESTMENT CONCERNS
Equity securities (stocks) are more volatile and carry more risk than other forms of investments, including investments in high-grade fixed income securities. The net asset value per share of this Fund will fluctuate as the value of the securities in the portfolio changes. Value-based investments are subject to the risk that the broad market may not recognize their intrinsic value.
Q. How did the Fund perform during the 12-month period between October 1, 2005 and September 30, 2006?
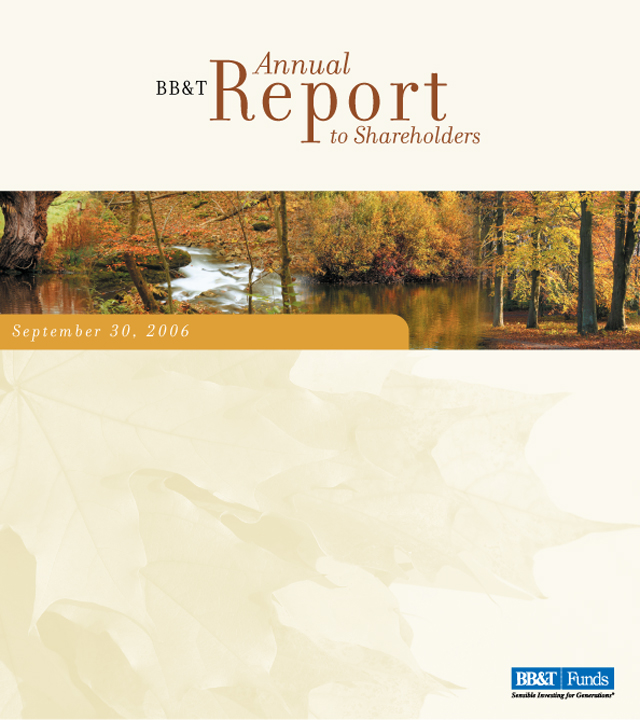
A. The Fund gained 14.59% (Institutional Shares). That compared to a 10.79% return for its benchmark, the S&P 500 Index.
Q. What factors affected the Fund’s performance?
A. This Fund seeks to invest in under valued shares of companies that have sustainable competitive advantages, good management and strong returns on invested capital. Those types of stocks performed well during this fiscal year, helping the Fund post strong absolute returns. In particular, the health of the global industrial economy and high commodity prices led to strong demand for industrial stocks, boosting the Fund’s gain.1
The Fund’s security-selection process helped it outperform its benchmark during this 12-month period. We held a relatively large position in health care stocks, and especially in shares of pharmaceutical companies. Shares in that industry were attractively valued following a long period of weak performance, making them compelling given the firms’ strong businesses, healthy balance sheets and good cash flows. Large drug stocks performed very well during this period, boosting returns against the index.1
An overweight stake in information technology stocks also lifted relative performance, as strength in enterprise technology spending buoyed shares of a number of large software firms. Strong stock selection in the technology sector also helped the Fund’s relative returns. For example, we bought shares of a large semiconductor maker after they posted large losses, and the Fund’s relative gains benefited from that stock’s rebound. 1
An underweight position in materials stocks weighed on returns versus the Fund’s benchmark. Few materials stocks met our selection criteria, but materials shares performed well during the period on the strength of high commodity prices. Selection among utilities stocks also dragged modestly on relative performance.1
Past performance does not guarantee future results. The performance data quoted represents past performance and current returns may be lower or higher. Total return figures include change in share price, reinvestment of dividends and capital gains and do not reflect taxes that a shareholder would pay on fund distributions or on the redemption of fund shares. The investment return and principal value will fluctuate so that an investor’s shares, when redeemed may be worth more or less than the original cost. To obtain performance information current to the most recent month end, please visit www.bbtfunds.com.
| 1 | Portfolio composition is as of September 30, 2006 and is subject to change. |
2
BB&T LARGE CAP FUND
The chart above represents a comparison of a hypothetical $10,000 investment in the indicated share class versus a similar investment in the Fund’s benchmark, and represents the reinvestment of dividends and capital gains.
| 4 | Class C Shares were not in existence prior to 2/1/01. Performance for periods prior to that is based on the historical performance of the Class A Shares, and has been adjusted for the maximum CDSC applicable to Class C Shares, but does not include the Class C Shares 12b-1 fees, which, if reflected, performance would have been lower. |
Effective March 14, 2006, the standardized benchmark performance index for the Fund was changed from the Russell 1000® Value Index to the S&P 500 Index in order to better represent the Fund’s investment strategies for comparison purposes. The Fund is measured against the S&P 500 Index. The S&P 500 Index is generally considered to be representative of the performance of the stock market as a whole. The Russell 1000® Value Index consists of 1,000 of the largest capitalized U.S. domiciled companies. Companies in this index generally have low price-to-book and price-to-earnings ratios, higher dividend yields, and lower forecasted growth values. These indices are unmanaged and do not reflect the deduction of expenses associated with a mutual fund, such as investment management and fund accounting fees. The Fund’s performance reflects the deduction of fees for these services. Investors cannot invest directly in an index, although they can invest in its underlying securities.
A portion of the Fund’s fees has been waived. If the fees had not been waived, the Fund’s total return for the period would have been lower.
3
BB&T LARGE CAP GROWTH FUND (formerly the Large Company Growth Fund)
PORTFOLIO MANAGER
David P. Nolan
The BB&T Large Cap Growth Fund is managed by David P. Nolan. A graduate of Wake Forest University, where he received a BS in Business, Mr. Nolan managed common and collective trust funds from 1985 to 1993. Mr. Nolan is supported by the BB&T Growth Equity Portfolio Management Team, which includes Brian Baker, Brandon Carl and Michele Holmes Van Dyke. The team brings to the Fund more than six decades of combined investment management experience, along with a broad range of growth-stock investing skills.
INVESTMENT CONCERNS
Equity securities (stocks) are more volatile and carry more risk than other forms of investments, including investments in high-grade fixed income securities. The net asset value per share of this Fund will fluctuate as the value of the securities in the portfolio changes.
Q. How did the Fund perform during the 12-month period between October 1, 2005 and September 30, 2006?
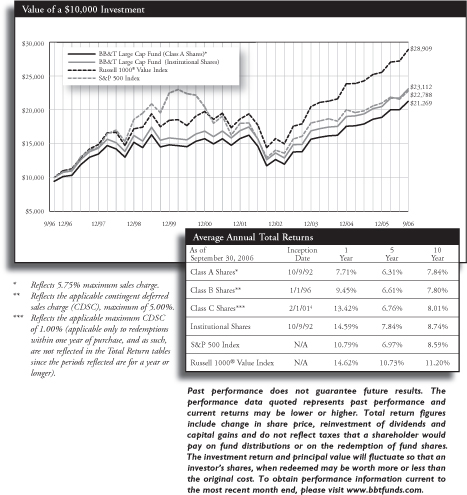
A. The Fund returned -0.10% (Institutional Shares). That compared to a 6.04% return for its benchmark, the Russell 1000® Growth Index.
Q. What factors affected the Fund’s performance?
A. This Fund invests in stocks of fast-growing firms. Such stocks posted strong gains early in the period, but performed very poorly between May and September as investors fled from relatively volatile stocks amid concerns about slower economic growth. Losses during the second half of the period offset the Fund’s earlier gains, leading to a virtually flat return for the fiscal year as a whole.1
The Fund’s emphasis on fast-growing stocks was the primary reason it lagged its benchmark for the 12-month period. Investors favored defensive shares of slow-growing firms across the 10 economic sectors. We typically invest in many of the fastest-growing stocks in each sector, so such stocks’ weak performance led to stock selection that weighed on relative returns.1
For example, the Fund had very little exposure to pharmaceutical stocks, because drug companies generally did not offer the revenue and earnings growth we seek. Many large pharmaceutical stocks performed extremely well during this period, however, causing the Fund’s small weighting in that group to drag on relative returns. The Fund’s selection within the information technology, industrials and energy sectors also weighed down performance versus the benchmark.1
We maintained an overweight position in the energy sector throughout the period. That weighting boosted relative returns during the first half of the period, as high energy prices led to strong gains by energy shares. Investor sentiment turned against the sector during the second half of the period, however, causing the Fund’s relatively large energy stake to drag on performance against the benchmark for the fiscal year as a whole.1
Certain factors did boost returns relative to the large-cap growth index, despite investors’ bias against fast-growing stocks. Selection among telecommunications services stocks helped the Fund’s performance versus its benchmark, as did selection within consumer discretionary stocks.1
Past performance does not guarantee future results. The performance data quoted represents past performance and current returns may be lower or higher. Total return figures include change in share price, reinvestment of dividends and capital gains and do not reflect taxes that a shareholder would pay on fund distributions or on the redemption of fund shares. The investment return and principal value will fluctuate so that an investor’s shares, when redeemed may be worth more or less than the original cost. To obtain performance information current to the most recent month end, please visit www.bbtfunds.com.
| 1 | Portfolio composition is as of September 30, 2006 and is subject to change. |
4
BB&T LARGE CAP GROWTH FUND
The chart above represents a comparison of a hypothetical $10,000 investment in the indicated share class versus a similar investment in the Fund’s benchmark, and represents the reinvestment of dividends and capital gains.
| 2 | Class C Shares were not in existence prior to 2/1/01. Performance for periods prior to that is based on the historical performance of the Class B Shares, and has been adjusted for the maximum CDSC applicable to Class C Shares. |
The Fund is measured against the Russell 1000® Growth Index, an unmanaged index which is comprised of 1,000 of the largest capitalized U.S. domiciled companies with higher price-to-book ratios and higher forecasted growth values whose common stock is traded in the United States on the New York Stock Exchange, American Stock Exchange and NASDAQ. The index does not reflect the deduction of expenses associated with a mutual fund, such as investment management and fund accounting fees. The Fund’s performance reflects the deduction of fees for these services. Investors cannot invest directly in an index, although they can invest in its underlying securities.
A portion of the Fund’s fees has been waived. If the fees had not been waived, the Fund’s total returns for the period would have been lower.
5
BB&T MID CAP VALUE FUND
PORTFOLIO MANAGER
Timothy P. Beyer, CFA
The BB&T Mid Cap Value Fund is managed by Timothy P. Beyer, CFA, portfolio manager for Sterling Capital Management LLC, sub-adviser to the Fund. Mr. Beyer, who joined Sterling in 2004, is a graduate of East Carolina University, where he received his BSBA in Finance, and has 16 years of investment management experience. Mr. Beyer is supported by Eduardo Brea, CFA; Robert Bridges, CFA; Lee D. Houser, CFA; Patrick W. Rau, CFA; and Brian Walton, CFA.
INVESTMENT CONCERNS
Mid-capitalization funds typically carry additional risks since smaller companies generally have a higher risk of failure, and historically, their stocks have experienced a greater degree of market volatility than stocks on average.
Equity securities (stocks) are more volatile and carry more risk than other forms of investments, including investments in high-grade fixed income securities. The net asset value per share of this Fund will fluctuate as the value of the securities in the portfolio changes. Value-based investments are subject to the risk that the broad market may not recognize their intrinsic value.
Q. How did the Fund perform during the 12-month period between October 1, 2005 and September 30, 2006?
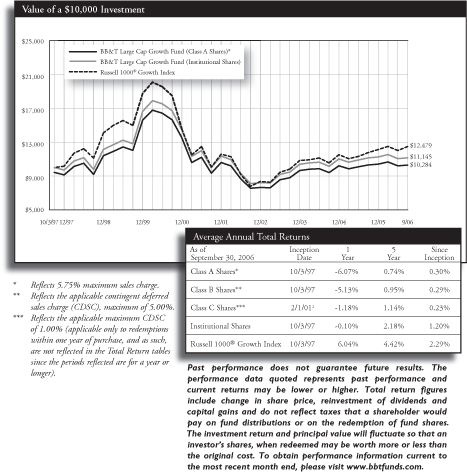
A. The Fund posted a return of 13.52% (Institutional Shares). That compared to a 12.27% return for its benchmark, the Russell Midcap® Value Index.
Q. What factors affected the Fund’s performance?
A. Both mid-cap value stocks in general and the Fund in particular generated strong performance during this period.
The Fund’s focus on quality and valuation helped it outperform its benchmark. We held a relatively large position in financial services stocks, so strong performance from that sector boosted the Fund’s returns against the index. Good stock selection in the financials sector also helped relative performance.1
The Fund maintained a significantly smaller position than the index in shares of utilities and Real Estate Investment Trusts (REITs), despite the high yields such shares offered. Those stocks sported very high valuations, in our estimation, as a result of investors’ pursuit of yield rather than fundamental strength. The underweight position in utilities stocks added to the Fund’s relative gains, but holding a smaller stake than the benchmark in REITs weighed on relative returns.1
We held a significantly underweight position in energy stocks throughout the period. We believe it is extremely difficult to create durable competitive advantages in the energy industry. Furthermore, the capital- and investment-intensive nature of the industry often results in low returns on investment and poor free cash flow. The Fund’s small stake in energy weighed on relative returns early in the period, but significantly boosted performance against the benchmark during the second half of the fiscal year. The energy under-weight had little effect on relative returns for the period as a whole. We also maintained a much smaller position than the benchmark in commodities stocks, and that under-weighting boosted relative performance as shares in that sector posted weak returns.1
Stock selection in the producer durables and technology sectors also boosted performance against the benchmark. We increased the Fund’s stakes in several technology stocks during the year, which added significantly to the funds returns. We were able to buy shares of what we consider to be high-quality technology companies with excellent free cash flow at extremely attractive prices.1
Shares of a particular auto-parts maker dragged on relative returns. The stock performed poorly as investors became concerned about a lack of liquidity and a generally difficult environment for the industry. We eliminated the Fund’s position in that stock during the period.1
Past performance does not guarantee future results. The performance data quoted represents past performance and current returns may be lower or higher. Total return figures include change in share price, reinvestment of dividends and capital gains and do not reflect taxes that a shareholder would pay on fund distributions or on the redemption of fund shares. The investment return and principal value will fluctuate so that an investor’s shares, when redeemed may be worth more or less than the original cost. To obtain performance information current to the most recent month end, please visit www.bbtfunds.com.
| 1 | Portfolio composition is as of September 30, 2006 and is subject to change. |
6
BB&T MID CAP VALUE FUND
| | The chart above represents a comparison of a hypothetical $10,000 investment in the indicated share class versus a similar investment in the Fund’s benchmark, and represents the reinvestment of dividends and capital gains. |
| 3 | Performance shown for Class A and Institutional Shares includes the performance of the OVB Equity Income Portfolio for the periods prior to its consolidation with the BB&T Mid Cap Value Fund on 7/23/01. The performance shown reflects reinvestment of all dividend and capital gains distributions. Class B and C Shares were not in existence prior to 7/25/01. Performance for periods prior to 7/25/01 is based on the historical performance of the Class A Shares, and has been adjusted for the maximum CDSC applicable to Class B and C Shares, respectively, but such performance does not reflect Class B and C Shares’ 12b-1 fees and expenses. With those adjustments, performance would be lower than that shown. |
| | The Fund is measured against the Russell Midcap® Value Index, an unmanaged index which measures the performance of those securities in the Russell 1000 with lower price-to-book ratios or lower forecasted growth values. The index is unmanaged and does not reflect the deduction of expenses associated with a mutual fund, such as investment management and fund accounting fees. The Fund’s performance reflects the deduction of fees for these services. Investors cannot invest directly in an index, although they can invest in its underlying securities. |
| | A portion of the Fund’s fees has been waived. If fees had not been waived, the Fund’s total return for the period would have been lower. |
7
BB&T MID CAP GROWTH FUND
PORTFOLIO MANAGER
David P. Nolan
The BB&T Mid Cap Growth Fund is managed by David P. Nolan. A graduate of Wake Forest University, where he received a BS in Business, Mr. Nolan managed common and collective trust funds from 1985 to 1993 and has managed the Mid Cap Growth Fund since its inception in 1993. He is supported by the BB&T Growth Equity Portfolio Management Team, which includes Brian Baker, Brandon Carl and Michele Holmes Van Dyke. The team brings to the Fund six decades of combined investment management experience, along with a broad range of growth-stock investing skills.
INVESTMENT CONCERNS
Mid-capitalization funds typically carry additional risks since smaller companies generally have a higher risk of failure, and historically, their stocks have experienced a greater degree of market volatility than stocks on average.
Equity securities (stocks) are more volatile and carry more risk than other forms of investments, including investments in high-grade fixed income securities. The net asset value per share of this Fund will fluctuate as the value of the securities in the portfolio changes.
Q. How did the Fund perform during the 12-month period between October 1, 2005 and September 30, 2006?
A. The Fund posted a return of -0.15% (Institutional Shares). That compared to a 7.03% return for its benchmark, the Russell Midcap® Growth Index.
Q. What factors affected the Fund’s performance?
A. We seek to invest in shares of firms that could potentially provide earnings growth of 20% per year or greater. Such stocks performed well early in this 12-month period, but then declined as investors concerned about slower economic growth rotated out of fast-growing stocks. That environment caused this Fund to post a loss for the period as a whole.1
During the second half of this period, stocks of firms with earnings-growth rates faster than 20% dramatically underperformed shares of companies with slower growth. In fact, stocks of medium-sized companies with the slowest earnings growth posted the best performance between April and September. The kinds of fast-growing stocks in which this Fund invests tend to experience relatively high volatility, so they typically lag their peers during periods such as this one when investors favor defensive stocks. The weak performance of stocks with rapid earnings growth was the primary reason that the Fund lagged its benchmark during this period.1
Investors’ aversion to high-growth stocks was consistent across various types of stocks, causing the Fund’s security selection to weigh on relative performance in most sectors. That dynamic was especially acute among information technology and consumer discretionary stocks. We typically hold a very small weighting in consumer staples stocks, because companies in that sector rarely produce the rapid earnings growth we seek. That underweight position also dragged on performance against the benchmark, as consumer staples stocks posted strong returns.1
The Fund’s relative returns did benefit from stock selection in the energy sector. An overweight stake in telecommunications services shares also boosted returns as did selection within that sector. Likewise, an underweight position in consumer discretionary stocks helped the Fund’s relative performance.1
Past performance does not guarantee future results. The performance data quoted represents past performance and current returns may be lower or higher. Total return figures include change in share price, reinvestment of dividends and capital gains and do not reflect taxes that a shareholder would pay on fund distributions or on the redemption of fund shares. The investment return and principal value will fluctuate so that an investor’s shares, when redeemed may be worth more or less than the original cost. To obtain performance information current to the most recent month end, please visit www.bbtfunds.com.
| 1 | Portfolio composition is as of September 30, 2006 and is subject to change. |
8
BB&T MID CAP GROWTH FUND
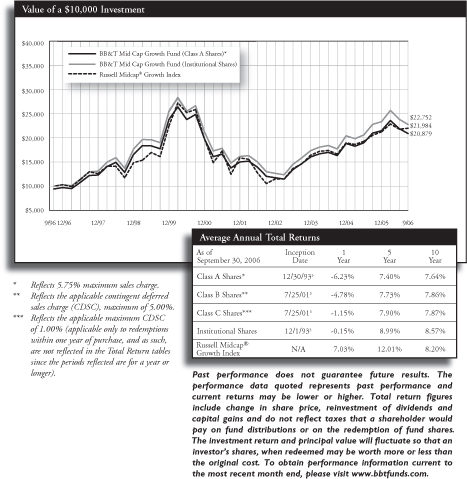
| | The chart above represents a comparison of a hypothetical $10,000 investment in the indicated share class versus a similar investment in the Fund’s benchmark, and represents the reinvestment of dividends and capital gains. |
| 3 | Fund performance as shown for Class A and Institutional Shares includes the performance of the OVB Capital Appreciation Portfolio for the periods prior to its consolidation with the BB&T Mid Cap Growth Fund on 7/23/01. The performance shown reflects reinvestment of all dividend and capital gains distributions. The Class B and C Shares were not in existence prior to 7/25/01. Performance for periods prior to 7/25/01 is based on the historical performance of the Class A Shares and has been adjusted for the maximum CDSC applicable to Class B and C Shares, respectively, but such performance does not reflect Class B and C Shares’ 12b-1 fees and expenses. With those adjustments, performance would be lower. |
| | The Fund is measured against the Russell Midcap® Growth Index, an unmanaged index which measures the performance of those securities in the Russell 1000® Index with higher price-to-book ratios and lower forecasted growth values. The index does not reflect the deduction of expenses associated with a mutual fund, such as investment management and fund accounting fees. The Fund’s performance reflects the deduction of fees for services. Investors cannot invest directly in an index, although they can invest in its underlying securities. |
| | A portion of the Fund’s fees has been waived. If the fees had not been waived, the Fund’s total returns for the period would have been lower. |
9
BB&T SMALL CAP FUND (formerly the Small Company Value Fund)
PORTFOLIO MANAGER
John T. Kvantas, CFA
The BB&T Small Cap Fund is managed by John T. Kvantas, CFA. A graduate of the University of Illinois Champaign-Urbana, where he received a BS in Accountancy, Mr. Kvantas also earned an MBA from the Fuqua School of Business at Duke University, and has been managing investors’ money since 1995. He is supported by the BB&T Small Cap Portfolio Management Team, which includes Dan Kane and Brian Baker.
INVESTMENT CONCERNS
Small-capitalization funds typically carry additional risks since smaller companies generally have a higher risk of failure, and historically, their stocks have experienced a greater degree of market volatility than stocks on average.
Equity securities (stocks) are more volatile and carry more risk than other forms of investments, including investments in high-grade fixed income securities. The net asset value per share of this Fund will fluctuate as the value of the securities in the portfolio changes. Value-based investments are subject to the risk that the broad market may not recognize their intrinsic value.
Diversification does not guarantee a profit nor protect against a loss.
Q. How did the Fund perform during the 12-month period between October 1, 2005 and September 30, 2006?
A. The Fund gained 7.23% (Institutional Shares). That compared to a 9.92% return for its benchmark, the Russell 2000® Index of small-cap stocks.
Q. What factors affected the Fund’s performance?
A. Small-cap stocks posted solid gains during the period, as strong returns during the first and third calendar quarters of 2006 more than offset a downturn in the spring. That environment allowed this Fund and its benchmark to post healthy returns for the 12-month period.1
Strong stock selection in the industrials sector boosted returns relative to the Fund’s benchmark, as shares of particular firms in the machinery manufacturing, construction and engineering industries benefited from strong economic growth. Selection in the information technology sector lifted the Fund’s relative returns as well, in part because two of the companies represented in the Fund’s portfolio were acquired at substantial premiums to their market values. A significantly smaller weighting in health care stocks than the benchmark also contributed to relative gains, as shares of small health care firms lagged the index.1
The Fund’s sector weightings as a whole dragged on performance versus the benchmark. An overweight position in shares of savings and loan and thrift stocks weighed on relative returns, as narrowing interest margins hurt profits at those firms. That said, our stock selection within those industries partially offset the negative effects of the Fund’s overweight position. An underweight stake in telecommunications stocks also hurt relative performance. Small telecommunications companies typically do not offer the high-quality financial characteristics we seek. Shares of such firms performed well during the period, however.1
Finally, security selection within the consumer discretionary sector weighed on returns against the index, as certain of the Fund’s holdings in the restaurant and clothing industries underperformed the benchmark.1
Past performance does not guarantee future results. The performance data quoted represents past performance and current returns may be lower or higher. Total return figures include change in share price, reinvestment of dividends and capital gains and do not reflect taxes that a shareholder would pay on fund distributions or on the redemption of fund shares. The investment return and principal value will fluctuate so that an investor’s shares, when redeemed may be worth more or less than the original cost. To obtain performance information current to the most recent month end, please visit www.bbtfunds.com.
| 1 | Portfolio composition is as of September 30, 2006 and is subject to change. |
10
BB&T SMALL CAP FUND
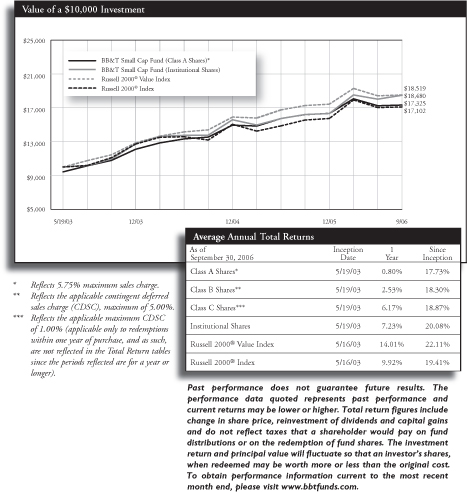
The chart above represents a comparison of a hypothetical $10,000 investment in the indicated share class versus a similar investment in the Fund’s benchmark, and represents the reinvestment of dividends and capital gains.
The benchmark index for the Fund has changed from the Russell 2000® Value Index to the Russell 2000® Index in order to provide a better comparison for the Fund’s investment policies. The Russell 2000® Index is a widely recognized index of common stocks that measure the performance of small- to mid-sized companies. The Russell 2000® Value Index is comprised of the securities found in the Russell 2000® Index with lower price-to-book ratios and lower forecasted growth values. The indices are unmanaged and do not reflect the deduction of expenses associated with a mutual fund, such as investment management and fund accounting fees. The Fund’s performance reflects the deduction of fees for these services. Investors cannot invest directly in an index, although they can invest in its underlying securities.
A portion of the Fund’s fees has been waived. If the fees had not been waived, the Fund’s total return for the period would have been lower.
11
BB&T INTERNATIONAL EQUITY FUND
PORTFOLIO MANAGER
UBS Global Asset Management
The BB&T International Equity Fund is managed by a team of portfolio managers at UBS Global Asset Management, subadviser to the Fund. Thomas P. Madsen, CFA, Managing Director and Global Head of Equities is the lead portfolio manager. Mr. Madsen earned BBA and MS degrees from the University of Wisconsin-Madison and has 26 years experience. Mr. Madsen has access to certain members of the International Equity investment management team, each of whom is allocated a specified portion of the portfolio over which he or she has independent responsibility for research, security selection, and portfolio construction. The team members also have access to additional portfolio managers and analysts within the various asset classes and markets in which the Fund invests. Mr. Madsen has responsibility for allocating the portfolio among the various managers and analysts, occasionally implementing trades on behalf of analysts on the team and reviewing the overall composition of the portfolio to ensure its compliance with its stated investment objectives and strategies.
INVESTMENT CONCERNS
There are risks associated with investing in foreign companies, such as erratic market conditions, economic and political instability and fluctuations in currency and exchange rates.
Equity securities (stocks) are more volatile and carry more risk than other forms of investments, including investments in high-grade fixed income securities. The net asset value per share of this Fund will fluctuate as the value of the securities in the portfolio changes.
Q. How did the Fund perform during the 12-month period between October 1, 2005 and September 30, 2006?
A. The Fund gained 17.38% (Institutional Shares). That compared to a 19.65% return for its benchmark, the MSCI EAFE (Europe, Australasia and Far East) Index.
Q. What factors affected the Fund’s performance?
A. Stocks in markets outside of the United States posted strong returns during this 12-month period. Investors encouraged by stronger-than-expected economic growth in Europe and Japan bid foreign stocks higher, while U.S. investors also benefited from foreign currencies’ appreciation against the dollar. Those dynamics helped this Fund and its benchmark generate strong gains for the fiscal year.
We employ a bottom-up approach to stock selection for this Fund, and do not base investment decisions based on top-down, macroeconomic factors. As a result, the Fund’s geographic allocations reflect the areas where we find attractive investment opportunities.
The Fund held a larger position than the benchmark in bank stocks during this 12-month period. That relatively large allocation boosted performance against the index. Shares of banks, particularly those in Europe, had been depressed leading into this period, but they benefited during the fiscal year from better-than-expected earnings results. An overweight stake in insurance stocks also lifted the Fund’s relative returns. Like banks, insurance companies posted stronger-than-expected earnings, due to strong management and better risk management by firms in that industry.1
Selection among pharmaceuticals stocks helped the Fund’s relative performance as well. The Fund’s pharmaceuticals holdings benefited from improving sentiment in that industry. Moreover, the Fund’s returns benefited from consolidation in the industry, as one of the Fund’s holdings was acquired by a large European drug-maker.1
The Fund’s positions in Japanese consumer finance companies weighed on performance against the benchmark. Those stocks suffered after Japan enacted more stringent lending requirements. An underweight position in the metals and mining industry also weighed on relative returns, as those stocks benefited from high commodity prices. Selection among telecommunications stocks dragged on relative performance as well, as poor performance by two large telecommunications stocks more than offset strong returns among smaller holdings in that sector.1
Past performance does not guarantee future results. The performance data quoted represents past performance and current returns may be lower or higher. Total return figures include change in share price, reinvestment of dividends and capital gains and do not reflect taxes that a shareholder would pay on fund distributions or on the redemption of fund shares. The investment return and principal value will fluctuate so that an investor’s shares, when redeemed may be worth more or less than the original cost. To obtain performance information current to the most recent month end, please visit www.bbtfunds.com.
| 1 | Portfolio composition is as of September 30, 2006 and is subject to change. |
12
BB&T INTERNATIONAL EQUITY FUND
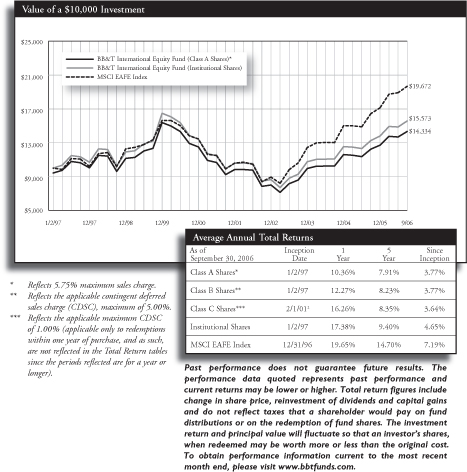
| | The chart above represents a comparison of a hypothetical $10,000 investment in the indicated share class versus a similar investment in the Fund’s benchmark, and represents the reinvestment of dividends and capital gains. |
| 2 | Class C Shares were not in existence prior to 2/1/01. Performance for periods prior to that is based on the historical performance of the Class B Shares, and has been adjusted for the maximum CDSC applicable to Class C Shares. |
| | The Fund is measured against the Morgan Stanley Capital International (“MSCI”) Europe, Australasia and Far East (“EAFE”) Index, an unmanaged index which is generally representative of the performance of stock markets in that region. The index does not reflect the deduction of expenses associated with a mutual fund, such as investment management and fund accounting fees. The Fund’s performance reflects the deduction of fees for these services. Investors cannot invest directly in an index, although they can invest in its underlying securities. |
| | A portion of the Fund’s fees has been waived. If the fees had not been waived, the Fund’s total return for the period would have been lower. |
13
BB&T SPECIAL OPPORTUNITIES EQUITY FUND
PORTFOLIO MANAGER
George F. Shipp, CFA
The BB&T Special Opportunities Equity Fund is managed by George F. Shipp, CFA, chief investment officer of Scott & Stringfellow, Inc., subadvisor to the Fund. Mr. Shipp, who joined Scott & Stringfellow in 1982, holds a BA from the University of Virginia and an MBA from the Darden Graduate School of Business at the University of Virginia. Mr. Shipp is supported by an investment management team from Scott & Stringfellow, which includes Meghann A. Cohen; Joshua L. Haggarty, CFA; R. Griffith Jones, Jr.; and Farley C. Shiner, CPA. The team brings to the Fund more than four decades of combined investment management experience, along with a broad range of investing skills.
INVESTMENT CONCERNS
Equity securities (stocks) are more volatile and carry more risk than other forms of investments, including investments in high-grade fixed income securities. The net asset value per share of this Fund will fluctuate as the value of the securities in the portfolio changes. A concentrated portfolio may add a measure of volatility to performance, as major fluctuations in any one holding will likely affect the fund more than a fund with greater diversification.
Q. How did the Fund perform during the 12-month period between October 1, 2005 and September 30, 2006?
A. The Fund gained 11.50% (Institutional Shares). That compared to a 10.79% return for its benchmark, the S&P 500 Index.
Q. What factors affected the Fund’s performance?
A. Stocks posted solid gains during the 12-month period, helping this Fund generate a strong return. Double-digit corporate profit growth helped convince investors to buy equities despite a backdrop of global tensions, rising interest rates and uncertainty about the direction of the economy.1
The Fund held a total of 39 different stocks during the 12-month period. Of those stocks, 20 produced gains that exceeded those of the S&P 500, seven generated positive but market-lagging returns, and 12 posted losses.1
The largest contributor to the Fund’s relative gains was favorable stock selection within the health care sector. Our investments in health care stocks fared well: Four of the Fund’s six best-performing investments were health care stocks, with each posting returns of at least 30%. Those strong returns came even as the health care stocks in the benchmark lagged the broad market.1
The Fund held a larger position in energy stocks than did the benchmark index. The S&P energy sector as a whole gained only about 4% during the 12-month period, despite historically high commodity prices, so the Fund’s overweight stake weighed on returns against the benchmark. We generally maintained the Fund’s energy exposure, due to the industry’s exceptional current cash flows and reasonable valuations that we believed offered the potential for merger or share-buyback activity.1
Late in the period we modestly reduced the Fund’s exposure to sectors typically considered defensive, such as health care, financials and consumer staples, because rallies in those stocks left them with more-limited upside potential. We concurrently added positions in technology and industrials stocks, which offered valuations we found compelling. Such moves reflect the Fund’s flexible, long-term strategy.1
Past performance does not guarantee future results. The performance data quoted represents past performance and current returns may be lower or higher. Total return figures include change in share price, reinvestment of dividends and capital gains and do not reflect taxes that a shareholder would pay on fund distributions or on the redemption of fund shares. The investment return and principal value will fluctuate so that an investor’s shares, when redeemed may be worth more or less than the original cost. To obtain performance information current to the most recent month end, please visit www.bbtfunds.com.
| 1 | Portfolio composition is as of September 30, 2006 and is subject to change. |
14
BB&T SPECIAL OPPORTUNITIES EQUITY FUND
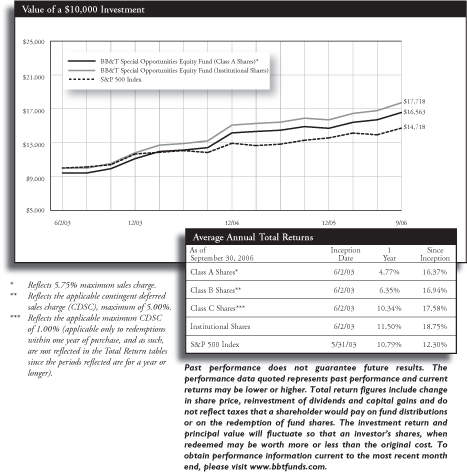
The chart above represents a comparison of a hypothetical $10,000 investment in the indicated share class versus a similar investment in the Fund’s benchmark and represents the reinvestment of dividends and capital gains.
The Fund is measured against the S&P 500 Index, an unmanaged index which is generally considered to be representative of the performance of the stock market as a whole. The index does not reflect the deduction of expenses associated with a mutual fund, such as investment management and fund accounting fees. The Fund’s performance reflects the deduction of fees for these services. Investors cannot invest directly in an index, although they can invest in its underlying securities.
A portion of the Fund’s fees has been waived. If the fees had not been waived, the Fund’s total return for the period would have been lower.
15
BB&T EQUITY INCOME FUND
PORTFOLIO MANAGER
George F. Shipp, CFA
The BB&T Equity Income Fund is managed by George F. Shipp, CFA, Chief Investment Officer of Scott & Stringfellow, Inc., subadvisor to the Fund. Mr. Shipp, who joined Scott & Stringfellow in 1982, holds a BA from the University of Virginia and an MBA from the Darden Graduate School of Business at the University of Virginia. Mr. Shipp is supported by an investment management team from Scott & Stringfellow, which includes Meghann A. Cohen; Joshua L. Haggarty, CFA; R. Griffith Jones, Jr.; and Farley C. Shiner, CPA. The team brings to the Fund more than four decades of combined investment management experience, along with a broad range of investing skills.
INVESTMENT CONCERNS
Equity securities (stocks) are more volatile and carry more risk than other forms of investments, including investments in high-grade fixed income securities. The net asset value per share of this Fund will fluctuate as the value of the securities in the portfolio changes. A concentrated portfolio may add a measure of volatility to performance, as major fluctuations in any one holding will likely affect the fund more than a fund with greater diversification.
Q. How did the Fund perform during the 12-month period between October 1, 2005 and September 30, 2006?
The Fund gained 16.04% (Institutional Shares). That compared to a 10.79% return for its benchmark, the S&P 500 Index.
Q. What factors affected the Fund’s performance?
Stocks posted solid gains during the 12-month period, and large-cap value stocks that pay high dividends performed particularly well. The BB&T Equity Income Fund seeks stocks with those characteristics, so strong performance by such stocks boosted the Fund’s returns. An environment characterized by global tensions, rising interest rates, high energy prices and the prospect of a slowing economy led investors to prize shares of firms that offered reliable earnings growth and dividend payments. The Fund held a total of 40 stocks during this 12-month period, of which 31 posted gains. The Fund outperformed its benchmark largely on the strength of good stock selection across a variety of sectors. The Fund’s top-five performing stocks included shares of firms in the telecommunications, health care, financial, consumer and energy sectors, highlighting the breadth of the Fund’s positive contributors.1
The Fund held a substantially underweight position in information technology stocks during most of the period, largely because the majority of companies in that sector do not pay dividends. That relatively small technology stake proved fortuitous for the Fund’s returns against its benchmark, as the S&P Technology sector gained less than 4% over the 12 months. The Fund tripled its exposure to technology stocks near the end of the period by purchasing shares of two well-established, debt-free industry leaders. We cannot know yet whether the Fund’s new positions will prove profitable, but we are pleased to increase the portfolio’s diversification while owning shares of companies that offer above-average yields, at valuations we believe to be favorable.1
The Fund also benefited from an emphasis on financial stocks, including a significant stake in Real Estate Investment Trusts. Such stocks offer relatively high dividend payments, which helped make them attractive to this income-oriented Fund. The S&P Financial sector appreciated by more than 21% during the 12-month period, so the Fund’s overweight stake in financial stocks boosted its relative returns.1
The Fund’s return exceeded that of its benchmark despite an overweight position in energy stocks, which weighed on relative performance. The S&P Energy sector gained less than 4% for the 12-month period, despite high commodity prices throughout the fiscal year.1
Past performance does not guarantee future results. The performance data quoted represents past performance and current returns may be lower or higher. Total return figures include change in share price, reinvestment of dividends and capital gains and do not reflect taxes that a shareholder would pay on fund distributions or on the redemption of fund shares. The investment return and principal value will fluctuate so that an investor’s shares, when redeemed may be worth more or less than the original cost. To obtain performance information current to the most recent month end, please visit www.bbtfunds.com.
| 1 | Portfolio composition is as of September 30, 2006 and is subject to change. |
16
BB&T EQUITY INCOME FUND
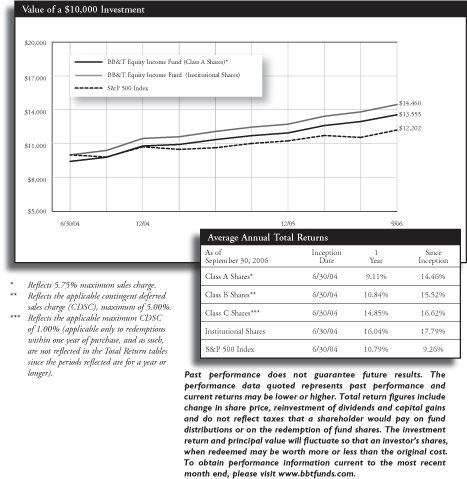
The chart above represents a comparison of a hypothetical $10,000 investment in the indicated share class versus a similar investment in the Fund’s benchmark, and represents the reinvestment of dividends and capital gains.
The Fund is measured against the S&P 500 Index, an unmanaged index which is generally considered to be representative of the performance of the stock market as a whole. The index does not reflect the deduction of expenses associated with a mutual fund, such as investment management and fund accounting fees. The Fund’s performance reflects the deduction of fees for these services. Investors cannot invest directly in an index, although they can invest in its underlying securities.
A portion of the Fund’s fees has been waived. If the fees had not been waived, the Fund’s total return for the period would have been lower.
17
BB&T SHORT U.S. GOVERNMENT FUND
PORTFOLIO MANAGER
Kevin E. McNair, CFA
The BB&T Short U.S. Government Fund is managed by Kevin E. McNair, CFA. Mr. McNair received a BA in Economics from the University of North Carolina-Chapel Hill and a Master’s of Economics from North Carolina State University, and has been managing investors’ money since 1994. Mr. McNair is supported by the BB&T Fixed Income Portfolio Management Team, which includes Carrie R. Breswitz; Brad D. Eppard, CFA; David T. Johnson; Robert F. Millikan, CFA; Justin B. Nicholson; and Michael D. Nichols, CFA. The team brings to the Fund six decades of combined investment management experience, along with a broad range of specialized skills encompassing a cross-section of fixed-income sectors.
INVESTMENT CONCERNS
Bonds offer a relatively stable level of income, although bond prices will fluctuate providing the potential for principal gain or loss. Intermediate-term, higher-quality bonds generally offer less risk than longer-term bonds and a lower rate of return.
The Fund is subject to the risk that principal value reacts in opposition to the movement of interests rates and that a rising interest rate environment increases the risk of loss of principal.
Q. How did the Fund perform during the 12-month period between October 1, 2005 and September 30, 2006?
A. The Fund gained 3.37% (Institutional Shares). That compared to a 3.70% return for its benchmark, the Merrill Lynch 1-5 Year U.S. Treasuries/Agencies Index.
Q. What factors affected the Fund’s performance?
A. Short-term bonds’ yields rose during the 12-month period under review, causing their prices to fall. The Federal Reserve increased its target short-term interest rate six times, for a total increase of 1.50 percentage points. That development led to higher yields on short-term bonds during the first nine months of the period. Yields on short-term bonds fell between July and September, causing prices to rise.1
The Fund maintained a duration significantly shorter than that of the benchmark throughout the 12-month period. That duration strategy helped the Fund post positive returns against the index during the first nine months of the period, because we were able to reinvest maturing bonds’ principal more rapidly as interest rates increased. We lengthened the Fund’s duration late in the period in order to capture additional yield, although we kept the duration shorter than the benchmark’s. However, the Fund’s relatively short duration weighed on relative performance during the last three months of the fiscal year.1
The Fund held an overweight position in agency bonds and mortgage-backed securities throughout the fiscal year. Low volatility in the fixed-income markets helped such issues outperform Treasury securities, so the Fund’s investments in those sectors helped returns relative to the Treasury-heavy index.1
Past performance does not guarantee future results. The performance data quoted represents past performance and current returns may be lower or higher. Total return figures include change in share price, reinvestment of dividends and capital gains and do not reflect taxes that a shareholder would pay on fund distributions or on the redemption of fund shares. The investment return and principal value will fluctuate so that an investor’s shares, when redeemed may be worth more or less than the original cost. To obtain performance information current to the most recent month end, please visit www.bbtfunds.com.
| 1 | Portfolio composition is as of September 30, 2006 and is subject to change. |
18
BB&T SHORT U.S. GOVERNMENT FUND
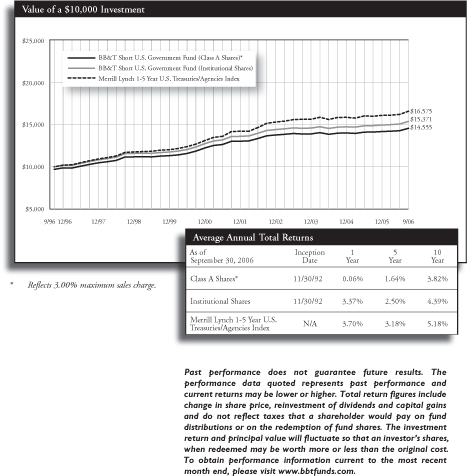
The chart above represents a comparison of a hypothetical $10,000 investment in the indicated share class versus a similar investment in the Fund’s benchmark, and represents the reinvestment of dividends and capital gains.
The Fund is measured against the Merrill Lynch 1-5 Year U.S. Treasuries/Agencies Index an unmanaged index which includes U.S. government and agency bonds that have a minimum issue size of $150 million and is a widely-recognized, capitalization weighted (companies with larger market capitalizations have more influence than those with smaller market capitalizations) index of U.S. Treasury securities with maturities of 1 year or greater and no more than 5 years. The index does not reflect the deduction of expenses associated with a mutual fund, such as investment management and fund accounting fees. The Fund’s performance reflects the deduction of fees for these services. Investors cannot invest directly in an index, although they can invest in its underlying securities.
A portion of the Fund’s fees has been waived. If the fees had not been waived, the Fund’s total return for the period would have been lower.
19
BB&T INTERMEDIATE U.S. GOVERNMENT FUND
PORTFOLIO MANAGER
Brad D. Eppard, CFA
The BB&T Intermediate U.S. Government Fund is managed by Brad D. Eppard, CFA. Mr. Eppard received a BS in Business Administration/ Accounting from Radford University and has been managing investors’ money since 1986. Mr. Eppard is supported by the BB&T Fixed Income Portfolio Management Team, which includes Carrie R. Breswitz; David T. Johnson; Kevin E. McNair, CFA; Robert F. Millikan, CFA; Justin B. Nicholson; and Michael D. Nichols, CFA. The team brings to the Fund six decades of combined investment management experience, along with a broad range of specialized skills encompassing a cross-section of fixed-income sectors.
INVESTMENT CONCERNS
Bonds offer a relatively stable level of income, although bond prices will fluctuate providing the potential for principal gain or loss. Intermediate-term, higher-quality bonds generally offer less risk than longer-term bonds and a lower rate of return.
The Fund is subject to the risk that principal value reacts in opposition to the movement of interests rates and that a rising interest rate environment increases the risk of loss of principal.
Q. How did the Fund perform during the 12-month period between October 1, 2005 and September 30, 2006?
A. The Fund gained 3.23% (Institutional Shares). That compared to a 3.74% return for its benchmark, the Lehman Brothers U.S. Government/Mortgage Bond Index.
Q. What factors affected the Fund’s performance?
A. Investors concerned about the potential for higher inflation and further interest rate increases by the Federal Reserve demanded greater income payouts from new bonds during the first nine months of the period, causing bond yields to rise. Those rising yields pushed down prices on existing bonds. Bond yields declined during the last three months of the period, leading to higher prices on existing bonds. Bond prices fell for the period as a whole, however, causing the Fund to generate a total return that was lower than its average yield.1
The Fund held an average duration slightly longer than that of its benchmark throughout the 12-month period. That positioning weighed on returns against the benchmark while yields rose between October and June, and boosted relative returns when yields fell during the last three months of the period. The strong relative performance that duration strategy produced during the last quarter of the fiscal year offset the strategy’s negative impact during the first nine months of the period.1
The Fund began the period with relatively large stakes in short- and long-term bonds and less exposure to intermediate-term bonds—a structure known as a “barbell”. We increased the Fund’s stake in intermediate-term bonds as the period progressed. That change weighed modestly on relative returns for the period as a whole, as intermediate-term bonds lagged bonds of other durations. The Fund held larger positions than the benchmark in government agency debt and mortgage-backed securities, and an underweight stake in Treasury securities. That positioning boosted the Fund’s relative returns, because agency and mortgage issues generated greater total returns than Treasury securities during this period.1
Past performance does not guarantee future results. The performance data quoted represents past performance and current returns may be lower or higher. Total return figures include change in share price, reinvestment of dividends and capital gains and do not reflect taxes that a shareholder would pay on fund distributions or on the redemption of fund shares. The investment return and principal value will fluctuate so that an investor’s shares, when redeemed may be worth more or less than the original cost. To obtain performance information current to the most recent month end, please visit www.bbtfunds.com.
| 1 | Portfolio composition is as of September 30, 2006 and is subject to change. |
20
BB&T INTERMEDIATE U.S. GOVERNMENT FUND
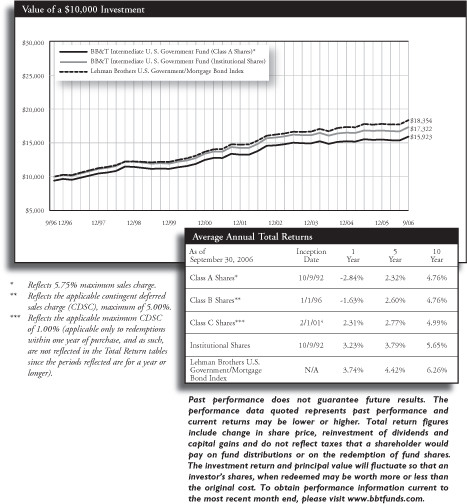
| | The chart above represents a comparison of a hypothetical $10,000 investment in the indicated share class versus a similar investment in the Fund’s benchmark and represents the reinvestment of dividends and capital gains. |
| 4 | Class C Shares were not in existence prior to 2/1/01. Performance for periods prior to that is based on the historical performance of the Class A Shares, and has been adjusted for the maximum CDSC applicable to Class C Shares, but does not include the Class C Shares 12b-1 fees, which if reflected, would have lowered performance. |
| | The Fund is measured by the Lehman Brothers U.S. Government/Mortgage Bond Index, an unmanaged index which is widely used as a broad measure of the performance of U.S. Government bonds with maturities of less than 10 years, and agency mortgage backed securities. The index does not reflect the deduction of expenses associated with a mutual fund, such as investment management and fund accounting fees. The Fund’s performance reflects the deduction of fees for these services. Investors cannot invest directly in an index, although they can invest in its underlying securities. |
| | A portion of the Fund’s fees has been waived. If the fees had not been waived, the Fund’s total return for the period would have been lower. |
21
BB&T TOTAL RETURN BOND FUND
PORTFOLIO MANAGER
David M. Ralston
The BB&T Total Return Bond Fund is managed by David M. Ralston, portfolio manager for Sterling Capital Management LLC, sub-adviser to the Fund. Mr. Ralston co-founded Trinity Capital Advisors in 1989, which merged into Sterling Capital Management in 1991. He is a graduate of Appalachian State University where he received his BSBA in Finance and has 25 years of investment management experience. Mr. Ralston is supported by Hung Bui, CFA; Howard Buznitsky, CFA; Neil Grant, CFA; Mitchell Kaczmarek; Mark Montgomery, CFA; and Kevin Stoll, CFA.
INVESTMENT CONCERNS
Bonds offer a relatively stable level of income, although bond prices will fluctuate providing the potential for principal gain or loss. Intermediate-term, higher-quality bonds generally offer less risk than longer-term bonds and a lower rate of return.
The Fund is subject to the risk that principal value reacts in opposition to the movement of interests rates and that a rising interest rate environment increases the risk of loss of principal.
Q. How did the Fund perform during the 12-month period between October 1, 2005 and September 30, 2006?
A. The Fund gained 3.30% (Institutional Shares). That compared to a 3.67% return for its benchmark, the Lehman Brothers U.S. Aggregate Bond Index.
Q. What factors affected the Fund’s performance?
A. The Federal Reserve raised its target short-term interest rate six times during the 12-month period, boosting the federal funds rate from 3.75% to 5.25%. The increase in interest rates led to higher bond yields, with the yield on the 10-year Treasury bond increasing from 4.33% to 4.63%. Rising yields led to lower bond prices, which caused the Fund to generate a total return lower than its yield.
We kept the Fund’s duration shorter than that of its benchmark in order to help preserve shareholders’ capital. That duration strategy helped the Fund’s performance relative to the index, as yields across the yield curve rose between 25 and 50 basis points (0.25% and 0.50%) during the 12-month period. The Fund’s relative returns also benefited from an overweight stake in floating-rate notes, which increased their yield payments as short-term interest rates rose.1
The bond market exhibited low volatility during this period. That trend benefited “spread products” such as asset-backed securities, mortgage-backed securities and commercial mortgage-backed securities, which typically outperform Treasury securities during periods of low volatility. The Fund held overweight positions in those bond sectors, thereby helping the Fund’s portfolio generate a higher yield than the benchmark index. In addition, the Fund maintained an average credit quality slightly higher than that of the benchmark. This approach helped the Fund avoid problems related to leveraged transactions among a number of credit issues, and thus lifted the Fund’s performance against the index.1
The Fund held an underweight position in corporate bonds, due to our concern about the risk leveraged buyout offers posed to corporate securities. The corporate debt sector as a whole modestly outperformed Treasury and agency securities for this period. As a result, this conservative underweight position in corporate issues dragged on performance relative to the benchmark.1
Past performance does not guarantee future results. The performance data quoted represents past performance and current returns may be lower or higher. Total return figures include change in share price, reinvestment of dividends and capital gains and do not reflect taxes that a shareholder would pay on fund distributions or on the redemption of fund shares. The investment return and principal value will fluctuate so that an investor’s shares, when redeemed may be worth more or less than the original cost. To obtain performance information current to the most recent month end, please visit www.bbtfunds.com.
| 1 | Portfolio composition is as of September 30, 2006 and is subject to change. |
22
BB&T Total Return Bond Fund
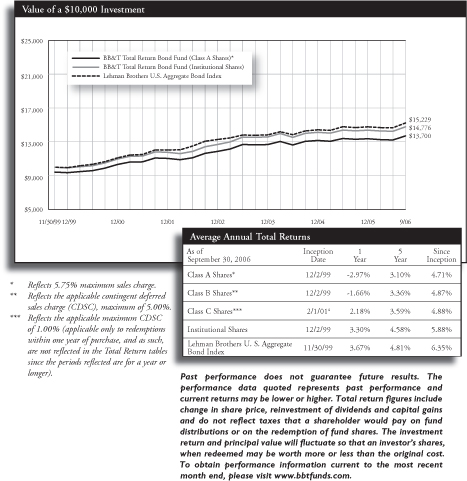
| | The chart above represents a comparison of a hypothetical $10,000 investment in the indicated share class versus a similar investment in the Fund’s benchmark, and represents the reinvestment of dividends and capital gains. |
| 4 | Class C Shares were not in existence prior to 2/1/01. Performance for periods prior to that is based on the historical performance of the Class B Shares, and has been adjusted for the maximum CDSC applicable to Class C Shares. |
| | The Fund is measured against the Lehman Brothers U.S. Aggregate Bond Index, an unmanaged index which is a market value-weighted performance benchmark for investment-grade fixed-rate debt issues, including government, corporate, asset-backed, and mortgage-backed securities, with maturities of at least one year. The index is unmanaged and does not reflect the deduction of expenses associated with a mutual fund, such as investment management and fund accounting fees. The Fund’s performance reflects the deduction of fees for these services. Investors cannot invest directly in an index, although they can invest in its underlying securities. |
| | A portion of the Fund’s fees has been waived. If the fees had not been waived, the Fund’s total return for the period would have been lower. |
23
BB&T KENTUCKY INTERMEDIATE TAX-FREE FUND
PORTFOLIO MANAGER
Robert F. Millikan, CFA
The BB&T Kentucky Intermediate Tax-Free Fund is managed by Robert F. Millikan, CFA, Director of Fixed Income Management for BB&T Asset Management, Inc. Mr. Millikan received a BA in Economics from Wake Forest University, and is a past president of the North Carolina Society of Financial Analysts and chairman of the board of directors of the Carolinas Municipal Advisory Council. Mr. Millikan has been managing investors’ money since 1990. He is supported by the BB&T Fixed Income Portfolio Management Team, which includes Carrie R. Breswitz; Brad D. Eppard, CFA; David T. Johnson; Kevin E. McNair, CFA; Justin B. Nicholson; and Michael D. Nichols, CFA. The team brings to the Fund six decades of combined investment management experience, along with a broad range of specialized skills encompassing a cross-section of fixed-income sectors.
INVESTMENT CONCERNS
Because the Fund is non-diversified and invests primarily in Kentucky municipal securities, the Fund is particularly susceptible to any economic, political, or regulatory developments affecting a particular issuer of Kentucky municipal securities. Bonds offer a relatively stable level of income, although bond prices will fluctuate providing the potential for principal gain or loss. Intermediate-term, higher-quality bonds generally offer less risk than longer-term bonds and a lower rate of return. The Fund is subject to the risk that principal value reacts in opposition to the movement of interests rates and that a rising interest rate environment increases the risk of loss of principal. The Fund’s income may be subject to certain state and local taxes and, depending on a investors tax status, to the Federal alternative minimum tax.
Q. How did the Fund perform during the 12-month period between October 1, 2005 and September 30, 2006?
A. The Fund gained 4.04% (Institutional Shares). That compared to a 3.81% return for the Lehman Brothers 7-Year Municipal Bond Index.
Q. What factors affected the Fund’s performance?
A. The Federal Reserve Board’s interest rate increases boosted yields on short-term bonds, while expectations for low inflation depressed yields on long-term bonds. Those developments caused yields to fall for municipal securities with maturities of approximately eight years or longer, and to rise for municipal bonds with shorter maturities. Meanwhile, a combination of low supply and strong demand also pushed down municipal bond yields. Lower yields increased the prices of the longer-term securities in the Fund’s portfolio. Those gains combined with the bonds’ interest income to generate a strong total return for Fund shareholders.1
The Fund’s benchmark holds municipal bonds with an average maturity of seven years. We kept the Fund’s duration longer than that of its benchmark throughout the period in order to capture higher yield for shareholders. That strategy boosted the Fund’s returns against its benchmark, as securities with longer durations experienced greater price increases and generated more interest income than shorter-term issues.1
The benchmark index also is restricted to municipal bonds with maturities of between six- and eight-years. The Fund’s portfolio held a number of securities with maturities of longer than eight years, but also held bonds with maturities shorter than six years. Those shorter-term bonds performed poorly compared to the bonds represented in the benchmark, and weighed on relative returns as a result.1
Past performance does not guarantee future results. The performance data quoted represents past performance and current returns may be lower or higher. Total return figures include change in share price, reinvestment of dividends and capital gains and do not reflect taxes that a shareholder would pay on fund distributions or on the redemption of fund shares. The investment return and principal value will fluctuate so that an investor’s shares, when redeemed may be worth more or less than the original cost. To obtain performance information current to the most recent month end, please visit www.bbtfunds.com.
| 1 | Portfolio composition is as of September 30, 2006 and is subject to change. |
24
BB&T KENTUCKY INTERMEDIATE TAX-FREE FUND
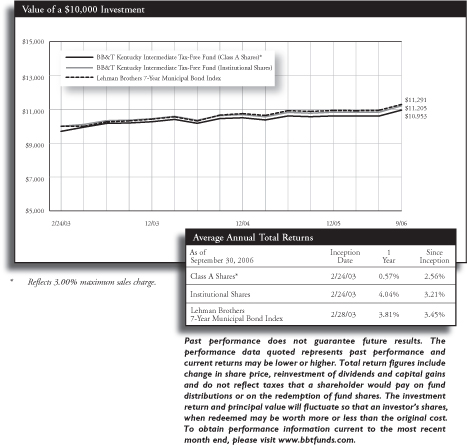
The chart above represents a comparison of a hypothetical $10,000 investment in the indicated share class versus a similar investment in the Fund’s benchmark, and represents the reinvestment of dividends and capital gains.
The Fund is measured against the Lehman Brothers 7-Year Municipal Bond Index, an unmanaged index which is representative of municipal bonds with a minimum credit rating of at least Baa, have a maturity value of at least $5 million and a maturity range of 6-8 years. The index does not reflect the deduction of expenses associated with a mutual fund, such as investment management and fund accounting fees. The Fund performance reflects the deduction of fees for these services. Investors cannot invest directly in an index, although they can invest in its underlying securities.
A portion of the Fund’s fees has been waived. If the fees had not been waived, the Fund’s total return for the period would have been lower.
25
BB&T MARYLAND INTERMEDIATE TAX-FREE FUND
PORTFOLIO MANAGER
Robert F. Millikan, CFA
The BB&T Maryland Intermediate Tax-Free Fund is managed by Robert F. Millikan, CFA, Director of Fixed Income Management for BB&T Asset Management, Inc. Mr. Millikan received a BA in Economics from Wake Forest University, and is a past president of the North Carolina Society of Financial Analysts and chairman of the board of directors of the Carolinas Municipal Advisory Council. Mr. Millikan has been managing investors’ money since 1990. He is supported by the BB&T Fixed Income Portfolio Management Team, which includes Carrie R. Breswitz; Brad D. Eppard, CFA; David T. Johnson; Kevin E. McNair, CFA; Justin B. Nicholson; and Michael D. Nichols, CFA. The team brings to the Fund six decades of combined investment management experience, along with a broad range of specialized skills encompassing a cross-section of fixed-income sectors.
INVESTMENT CONCERNS
Because the Fund is non-diversified and invests primarily in Maryland municipal securities, the Fund is particularly susceptible to any economic, political, or regulatory developments affecting a particular issuer of Maryland municipal securities. Bonds offer a relatively stable level of income, although bond prices will fluctuate providing the potential for principal gain or loss. Intermediate-term, higher-quality bonds generally offer less risk than longer-term bonds and a lower rate of return. The Fund is subject to the risk that principal value reacts in opposition to the movement of interests rates and that a rising interest rate environment increases the risk of loss of principal. The Fund’s income may be subject to certain state and local taxes and, depending on a investors tax status, to the Federal alternative minimum tax.
Q. How did the Fund perform during the 12-month period between October 1, 2005 and September 30, 2006?
A. The Fund gained 4.10% (Institutional Shares). That compared to a 3.81% return for the Lehman Brothers 7-Year Municipal Bond Index.
Q. What factors affected the Fund’s performance?
A. Federal Reserve interest-rate increases boosted yields on short-term municipal bonds, while investors’ expectations for low inflation depressed yields on long-term municipal bonds. Yields fell for municipal securities with maturities of longer than approximately eight years and rose for municipal bonds with shorter maturities, with the largest increases coming on securities at the short end of the yield curve. Low supply and strong demand for municipal bonds also pushed down yields.
Those developments caused prices to rise on the longer-term bonds in which this Fund invested. Rising prices and the bonds’ interest income combined to generate a strong return for Fund shareholders.
The Fund’s benchmark holds municipal bonds with maturities of between six- and eight-years, with an average maturity of seven years. We held the Fund’s duration longer than that of its benchmark throughout the period in order to capture higher yield for shareholders. That strategy boosted the Fund’s relative returns, as securities with longer durations generated more interest income and benefited more from higher prices.1
The Fund’s portfolio held a number of securities with maturities of longer than eight years, but also held bonds with maturities of less than six years. Those shorter-term bonds, which are not represented in the benchmark, performed relatively poorly. As a result, the shorter-term bonds in the Fund’s portfolio weighed on returns against the benchmark.1
Past performance does not guarantee future results. The performance data quoted represents past performance and current returns may be lower or higher. Total return figures include change in share price, reinvestment of dividends and capital gains and do not reflect taxes that a shareholder would pay on fund distributions or on the redemption of fund shares. The investment return and principal value will fluctuate so that an investor’s shares, when redeemed may be worth more or less than the original cost. To obtain performance information current to the most recent month end, please visit www.bbtfunds.com.
| 1 | Portfolio composition is as of September 30, 2006 and is subject to change. |
26
BB&T MARYLAND INTERMEDIATE TAX-FREE FUND
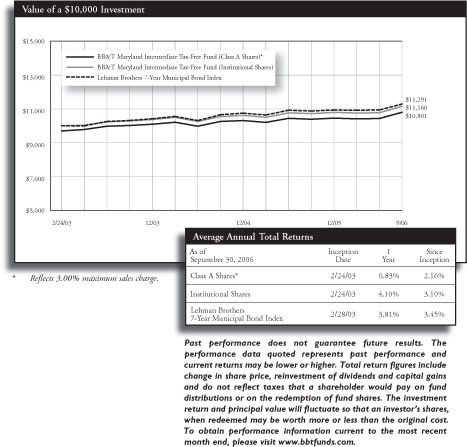
The chart above represents a comparison of a hypothetical $10,000 investment in the indicated share class versus a similar investment in the Fund’s benchmark, and represents the reinvestment of dividends and capital gains.
The Fund is measured against the Lehman Brothers 7-Year Municipal Bond Index, an unmanaged index which is representative of municipal bonds with a minimum credit rating of at least Baa, have a maturity value of at least $5 million and a maturity range of 6-8 years. The index does not reflect the deduction of expenses associated with a mutual fund, such as investment management and fund accounting fees. The Fund’s performance reflects the deduction of fees for these services. Investors cannot invest directly in an index, although they can invest in its underlying securities.
A portion of the Fund’s fees has been waived. If the fees had not been waived, the Fund’s total return for the period would have been lower.
27
BB&T NORTH CAROLINA INTERMEDIATE TAX-FREE FUND
PORTFOLIO MANAGER
Robert F. Millikan, CFA
The BB&T North Carolina Intermediate Tax-Free Fund is managed by Robert F. Millikan, CFA, Director of Fixed Income Management for BB&T Asset Management, Inc. Mr. Millikan received a BA in Economics from Wake Forest University, and is a past president of the North Carolina Society of Financial Analysts and chairman of the board of directors of the Carolinas Municipal Advisory Council. Mr. Millikan has been managing investors’ money since 1990. He is supported by the BB&T Fixed Income Portfolio Management Team, which includes Carrie R. Breswitz; Brad D. Eppard, CFA; David T. Johnson; Kevin E. McNair, CFA; Justin B. Nicholson; and Michael D. Nichols, CFA. The team brings to the Fund six decades of combined investment management experience, along with a broad range of specialized skills encompassing a cross-section of fixed-income sectors.
INVESTMENT CONCERNS
Because the Fund is non-diversified and invests primarily in North Carolina municipal securities, the Fund is particularly susceptible to any economic, political, or regulatory developments affecting a particular issuer of North Carolina municipal securities. Bonds offer a relatively stable level of income, although bond prices will fluctuate providing the potential for principal gain or loss. Intermediate-term, higher-quality bonds generally offer less risk than longer-term bonds and a lower rate of return. The Fund is subject to the risk that principal value reacts in opposition to the movement of interests rates and that a rising interest rate environment increases the risk of loss of principal. The Fund’s income may be subject to certain state and local taxes and, depending on a investors tax status, to the Federal alternative minimum tax.
Q. How did the Fund perform during the 12-month period between October 1, 2005 and September 30, 2006?
A. The Fund gained 3.84%. That compared to a 3.81% return for the Lehman Brothers 7-Year Municipal Bond Index.
Q. What factors affected the Fund’s performance?
A. Yields fell for municipal securities with maturities of longer than eight years and rose for municipal bonds with shorter maturities, with larger yield increases coming on shorter-term securities. Those developments came about as a result of two primary factors: The Federal Reserve increased its target short-term interest rate, boosting yields on short-term municipal bonds, while investors expecting low inflation bought long-term municipal bonds. Low supply and strong demand for municipal bonds also pushed down yields on tax-free bonds.
This Fund maintained an average duration longer than that of the benchmark throughout the period. Lower yields increased the prices of the longer-term securities in the Fund’s portfolio, and together with the bonds’ interest income generated solid returns for Fund shareholders.1
The Fund’s benchmark includes municipal bonds with maturities of between six- and eight-years, and an average maturity of seven years. The Fund’s average maturity was longer than that of its benchmark throughout the period, as we sought to capture the higher yields offered by longer-term municipal bonds. That strategy boosted the Fund’s relative return, as securities with longer durations generated more interest income and gained in price.1
Despite its relatively long duration, the Fund’s portfolio held a number of securities with durations of less than six years. The benchmark does not include bonds with durations shorter than six years, so the relatively weak performance of those shorter-term municipal securities weighed on performance versus the benchmark.1
Past performance does not guarantee future results. The performance data quoted represents past performance and current returns may be lower or higher. Total return figures include change in share price, reinvestment of dividends and capital gains and do not reflect taxes that a shareholder would pay on fund distributions or on the redemption of fund shares. The investment return and principal value will fluctuate so that an investor’s shares, when redeemed may be worth more or less than the original cost. To obtain performance information current to the most recent month end, please visit www.bbtfunds.com.
| 1 | Portfolio composition is as of September 30, 2006 and is subject to change. |
28
BB&T NORTH CAROLINA INTERMEDIATE TAX-FREE FUND
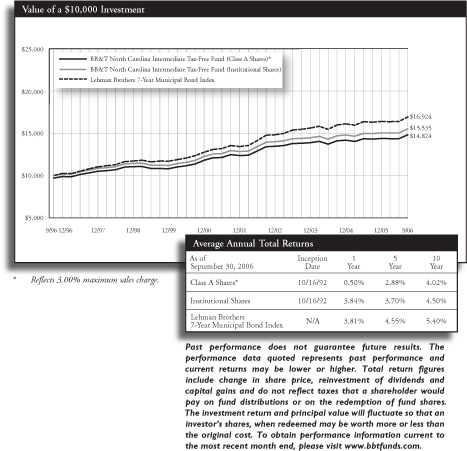
The chart above represents a comparison of a hypothetical $10,000 investment in the indicated share class versus a similar investment in the Fund’s benchmark, and represents the reinvestment of dividends and capital gains.
The Fund is measured against the Lehman Brothers 7-Year Municipal Bond Index, an unmanaged index which is representative of municipal bonds with a minimum credit rating of at least Baa, have a maturity value of at least $5 million and a maturity range of 6-8 years. The index does not reflect the deduction of expenses associated with a mutual fund, such as investment management and fund accounting fees. The Fund’s performance reflects the deduction of fees for these services. Investors cannot invest directly in an index, although they can invest in its underlying securities.
A portion of the Fund’s fees has been waived. If the fees had not been waived, the Fund’s total return for the period would have been lower.
29
BB&T SOUTH CAROLINA INTERMEDIATE TAX-FREE FUND
PORTFOLIO MANAGER
Robert F. Millikan, CFA
The BB&T South Carolina Intermediate Tax-Free Fund is managed by Robert F. Millikan, CFA, Director of Fixed Income Management for BB&T Asset Management, Inc. Mr. Millikan received a BA in Economics from Wake Forest University, and is a past president of the North Carolina Society of Financial Analysts and chairman of the board of directors of the Carolinas Municipal Advisory Council. Mr. Millikan has been managing investors’ money since 1990. He is supported by the BB&T Fixed Income Portfolio Management Team, which includes Carrie R. Breswitz; Brad D. Eppard, CFA; David T. Johnson; Kevin E. McNair, CFA; Justin B. Nicholson; and Michael D. Nichols, CFA. The team brings to the Fund six decades of combined investment management experience, along with a broad range of specialized skills encompassing a cross-section of fixed-income sectors.
INVESTMENT CONCERNS
Because the Fund is non-diversified and invests primarily in South Carolina municipal securities, the Fund is particularly susceptible to any economic, political, or regulatory developments affecting a particular issuer of South Carolina municipal securities. Bonds offer a relatively stable level of income, although bond prices will fluctuate providing the potential for principal gain or loss. Intermediate-term, higher-quality bonds generally offer less risk than longer-term bonds and a lower rate of return. The Fund is subject to the risk that principal value reacts in opposition to the movement of interests rates and that a rising interest rate environment increases the risk of loss of principal. The Fund’s income may be subject to certain state and local taxes and, depending on a investors tax status, to the Federal alternative minimum tax.
Q. How did the Fund perform during the 12-month period between October 1, 2005 and September 30, 2006?
A. The Fund gained 3.66%. That compared to a 3.81% return for the Lehman Brothers 7-Year Municipal Bond Index.
Q. What factors affected the Fund’s performance?
A. Interest-rate increases by the Federal Reserve supported higher yields on short-term municipal bonds, while investor expectations for low inflation pushed down yields on long-term municipal bonds. As a result, municipal securities with maturities of longer than approximately eight years experienced falling yields during the period under review, while yields rose on municipal bonds with maturities shorter than roughly eight years. Bonds with the shortest maturities generally experienced the largest yield increases. Meanwhile weak supplies and strong demand for municipal bonds pushed down yields on tax-free bonds.
That environment caused prices to rise for many of the securities in the Fund’s portfolio. Higher prices combined with the bonds’ interest income to produce solid absolute returns for Fund shareholders.
The Fund’s benchmark index includes municipal bonds with maturities of between six- and eight-years, and an average maturity of seven years. The Fund’s relative returns benefited from holding a duration longer than that of its benchmark, because municipal bonds with longer durations offered greater yield and price appreciation.1
Despite the Fund’s long duration, however, its portfolio held a number of securities with maturities of less than six years—in part because low supply in the South Carolina market made it difficult to find as many longer-term municipal securities as we would have liked. The benchmark does not include bonds with maturities shorter than six years, so relatively weak performance by those shorter-term bonds pulled down the Fund’s performance against its benchmark.1
Past performance does not guarantee future results. The performance data quoted represents past performance and current returns may be lower or higher. Total return figures include change in share price, reinvestment of dividends and capital gains and do not reflect taxes that a shareholder would pay on fund distributions or on the redemption of fund shares. The investment return and principal value will fluctuate so that an investor’s shares, when redeemed may be worth more or less than the original cost. To obtain performance information current to the most recent month end, please visit www.bbtfunds.com.
| 1 | Portfolio composition is as of September 30, 2006 and is subject to change. |
30
BB&T SOUTH CAROLINA INTERMEDIATE TAX-FREE FUND
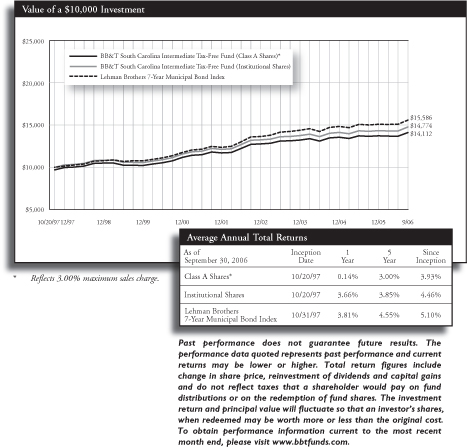
The chart above represents a comparison of a hypothetical $10,000 investment in the indicated share class versus a similar investment in the Fund’s benchmark, and represents the reinvestment of dividends and capital gains.
The Fund is measured against the Lehman Brothers 7-Year Municipal Bond Index, an unmanaged index which is representative of municipal bonds with a minimum credit rating of at least Baa, have a maturity value of at least $5 million and a maturity range of 6-8 years. The index does not reflect the deduction of expenses associated with a mutual fund, such as investment management and fund accounting fees. The Fund’s performance reflects the deduction of fees for these services. Investors cannot invest directly in an index, although they can invest in its underlying securities.
A portion of the Fund’s fees has been waived. If the fees had not been waived, the Fund’s total return for the period would have been lower.
31
BB&T VIRGINIA INTERMEDIATE TAX-FREE FUND
PORTFOLIO MANAGER
Robert F. Millikan, CFA
The BB&T Virginia Intermediate Tax-Free Fund is managed by Robert F. Millikan, CFA, Director of Fixed Income Management for BB&T Asset Management, Inc. Mr. Millikan received a BA in Economics from Wake Forest University, and is a past president of the North Carolina Society of Financial Analysts and chairman of the board of directors of the Carolinas Municipal Advisory Council. Mr. Millikan has been managing investors’ money since 1990. He is supported by the BB&T Fixed Income Portfolio Management Team, which includes Carrie R. Breswitz; Brad D. Eppard, CFA; David T. Johnson; Kevin E. McNair, CFA; Justin B. Nicholson; and Michael D. Nichols, CFA. The team brings to the Fund six decades of combined investment management experience, along with a broad range of specialized skills encompassing a cross-section of fixed-income sectors.
INVESTMENT CONCERNS
Because the Fund is non-diversified and invests primarily in Virginia municipal securities, the Fund is particularly susceptible to any economic, political, or regulatory developments affecting a particular issuer of Virginia municipal securities. Bonds offer a relatively stable level of income, although bond prices will fluctuate providing the potential for principal gain or loss. Intermediate-term, higher-quality bonds generally offer less risk than longer-term bonds and a lower rate of return. The Fund is subject to the risk that principal value reacts in opposition to the movement of interests rates and that a rising interest rate environment increases the risk of loss of principal. The Fund’s income may be subject to certain state and local taxes and, depending on a investors tax status, to the Federal alternative minimum tax.
Q. How did the Fund perform during the 12-month period between October 1, 2005 and September 30, 2006?
A. The Fund gained 3.49% (Institutional Shares). That compared to a 3.81% return for the Lehman Brothers 7-Year Municipal Bond Index.
Q. What factors affected the Fund’s performance?
A. The Federal Reserve increased its target short-term interest rate, which pushed up yields on short-term municipal bonds. Meanwhile investors expecting low inflation bought long-term municipal bonds, causing yields on those securities to fall. In that environment municipal bonds with longer maturities generated greater price appreciation and interest income than did shorter-term securities. Demand for municipal bond outstripped supplies during the period, which put downward pressure on yields across the tax-free bond market. Higher prices and the strong interest income from the longer-term municipal securities in the Fund’s portfolio combined to produce a solid absolute return.
The Fund’s benchmark index has an average maturity of seven years, and includes only municipal bonds with maturities of between six- and eight-years. We held the Fund’s duration longer than that of the benchmark throughout the period. Municipal bonds with longer durations paid higher yields and experienced greater price appreciation, so our duration strategy boosted returns relative to the index.1
That said, the Fund’s portfolio did include a number of securities with maturities shorter than six years. Those holdings in part reflected weak supplies of longer-term Virginia municipal bonds. The benchmark does not include any bonds with maturities shorter than six years, so relatively weak performance by the shorter-term bonds in the Fund’s portfolio weighed on returns against its benchmark.1
Past performance does not guarantee future results. The performance data quoted represents past performance and current returns may be lower or higher. Total return figures include change in share price, reinvestment of dividends and capital gains and do not reflect taxes that a shareholder would pay on fund distributions or on the redemption of fund shares. The investment return and principal value will fluctuate so that an investor’s shares, when redeemed may be worth more or less than the original cost. To obtain performance information current to the most recent month end, please visit www.bbtfunds.com.
| 1 | Portfolio composition is as of September 30, 2006 and is subject to change. |
32
BB&T VIRGINIA INTERMEDIATE TAX-FREE FUND
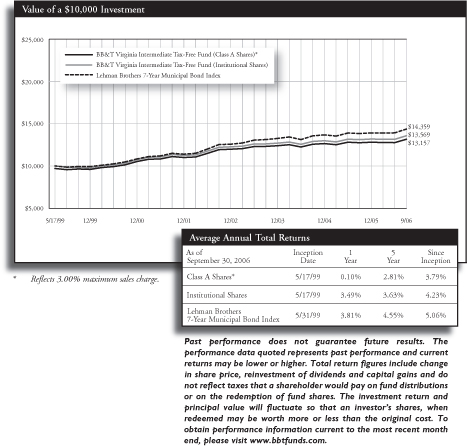
The chart above represents a comparison of a hypothetical $10,000 investment in the indicated share class versus a similar investment in the Fund’s benchmark, and represents the reinvestment of dividends and capital gains.
The Fund is measured against the Lehman Brothers 7-Year Municipal Bond Index, an unmanaged index which is representative of municipal bonds with a minimum credit rating of at least Baa, have a maturity value of at least $5 million and a maturity range of 6-8 years. The index does not reflect the deduction of expenses associated with a mutual fund, such as investment management and fund accounting fees. The Fund’s performance reflects the deduction of fees for these services. Investors cannot invest directly in an index, although they can invest in its underlying securities.
A portion of the Fund’s fees has been waived. If the fees had not been waived, the Fund’s total return for the period would have been lower.
33
BB&T WEST VIRGINIA INTERMEDIATE TAX-FREE FUND
PORTFOLIO MANAGER
Robert F. Millikan, CFA
The BB&T West Virginia Intermediate Tax-Free Fund is managed by Robert F. Millikan, CFA, Director of Fixed Income Management for BB&T Asset Management, Inc. Mr. Millikan received a BA in Economics from Wake Forest University, and is a past president of the North Carolina Society of Financial Analysts and chairman of the board of directors of the Carolinas Municipal Advisory Council. Mr. Millikan has been managing investors’ money since 1990. He is supported by the BB&T Fixed Income Portfolio Management Team, which includes Carrie R. Breswitz; Brad D. Eppard, CFA; David T. Johnson; Kevin E. McNair, CFA; Justin B. Nicholson; and Michael D. Nichols, CFA. The team brings to the Fund six decades of combined investment management experience, along with a broad range of specialized skills encompassing a cross-section of fixed-income sectors.
INVESTMENT CONCERNS
Because the Fund is non-diversified and invests primarily in West Virginia municipal securities, the Fund is particularly susceptible to any economic, political, or regulatory developments affecting a particular issuer of West Virginia municipal securities. Bonds offer a relatively stable level of income, although bond prices will fluctuate providing the potential for principal gain or loss. Intermediate-term, higher-quality bonds generally offer less risk than longer-term bonds and a lower rate of return. The Fund is subject to the risk that principal value reacts in opposition to the movement of interests rates and that a rising interest rate environment increases the risk of loss of principal. The Fund’s income may be subject to certain state and local taxes and, depending on a investors tax status, to the Federal alternative minimum tax.
Q. How did the Fund perform during the 12-month period between October 1, 2005 and September 30, 2006?
A. The Fund gained 4.10% (Institutional Shares. That compared to a 3.81% return for the Lehman Brothers 7-Year Municipal Bond Index.
Q. What factors affected the Fund’s performance?
A. Federal Reserve interest-rate increases supported higher yields on short-term municipal bonds, while investor expectations for low inflation pushed down yields on long-term municipal bonds. Yields rose furthest on securities with the shortest maturities, and yields fell on municipal bonds with maturities of approximately eight years or longer. Supply of municipal bonds was generally weak, while demand was strong. That supply-demand dynamic put downward pressure on yields of tax-free bonds.
The environment in the municipal bond market led to higher prices for the longer-term securities in the Fund’s portfolio. Higher prices and the bonds’ interest income combined to produce strong absolute returns for Fund shareholders.1
The Fund’s benchmark index includes municipal bonds with maturities of between six- and eight-years, and an average maturity of seven years. We held the Fund’s duration longer than that of the benchmark throughout the period. Municipal bonds with longer durations paid higher yields and experienced greater price appreciation than securities with shorter durations, so that duration strategy boosted returns relative to the index.1
Nevertheless, the Fund’s portfolio included a number of securities with maturities of less than six years. The benchmark does not include any bonds with maturities shorter than six years, so relatively weak performance by those shorter-term bonds weighed on the Fund’s returns against its benchmark.1
Past performance does not guarantee future results. The performance data quoted represents past performance and current returns may be lower or higher. Total return figures include change in share price, reinvestment of dividends and capital gains and do not reflect taxes that a shareholder would pay on fund distributions or on the redemption of fund shares. The investment return and principal value will fluctuate so that an investor’s shares, when redeemed may be worth more or less than the original cost. To obtain performance information current to the most recent month end, please visit www.bbtfunds.com.
| 1 | Portfolio composition is as of September 30, 2006 and is subject to change. |
34
BB&T WEST VIRGINIA INTERMEDIATE TAX-FREE FUND
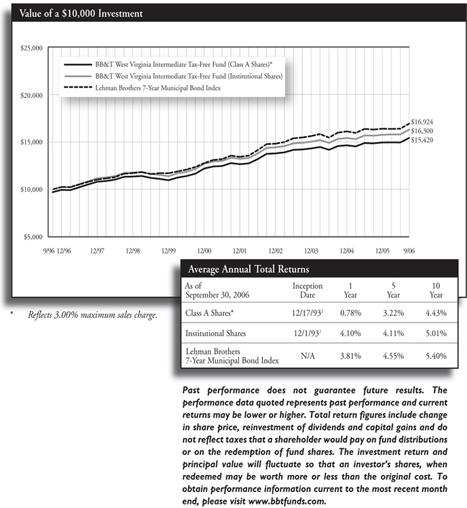
The chart above represents a comparison of a hypothetical $10,000 investment in the indicated share class versus a similar investment in the Fund’s benchmark, and represents the reinvestment of dividends and capital gains.
| 2 | Fund performance as shown for Class A and Institutional Shares includes the performance of the OVB West Virginia Tax-Exempt Income Portfolio for the periods prior to its consolidation with the BB&T West Virginia Intermediate Tax-Free Fund on 7/23/01. |
The Fund is measured against the Lehman Brothers 7-Year Municipal Bond Index, an unmanaged index which is representative of municipal bonds with a minimum credit rating of at least Baa, have a maturity value of at least $5 million and a maturity range of 6-8 years. The index does not reflect the deduction of expenses associated with a mutual fund, such as investment management and fund accounting fees. The Fund’s performance reflects the deduction of fees for these services. Investors cannot invest directly in an index, although they can invest in its underlying securities.
A portion of the Fund’s fees has been waived. If the fees had not been waived, the Fund’s total return for the period would have been lower.
35
BB&T PRIME MONEY MARKET FUND
PORTFOLIO MANAGER
Federated Investment Management Company
The BB&T Prime Money Market Fund is managed by Deborah A. Cunningham and Paige Wilhelm, portfolio managers for Federated Investment Management Company “Federated IMC”, subadviser to the Fund. Mrs. Cunningham and Mrs. Wilhelm are primarily responsible for the day-today management of the portfolio. They are supported by an investment management team from Federated IMC which includes William Jamison, Natalie F. Metz, Mary Ellen Tesla, Mark F. Weiss, CFA, and a group of eight money market traders. On average, team members bring more than a decade of investment management experience to the Fund, with specialization in money market portfolio management and credit analysis.
INVESTMENT CONCERNS
Investments in the BB&T Prime Money Market Fund are neither insured nor guaranteed by the Federal Deposit Insurance Corporation or any government agency. Although the Fund seeks to preserve the value of your investments at a $1.00 per share, it is possible to lose money by investing in the Fund.
Q. What factors affected the Fund’s yield during the 12-month period between October 1, 2005 and September 30, 2006?
A. The Federal Reserve increased the federal funds rate six times during the first nine months of the period. Those actions raised the target short-term interest rate from 3.75% to 5.25%. The Fed then left rates unchanged at meetings in August and September. Rising interest rates led to higher yields on money market securities, allowing this Fund to offer higher yield as the fiscal year progressed.
This Fund invests in money market securities such as commercial paper and corporate notes, repurchase agreements, bank instruments and variable-rate securities. We typically maintain an average maturity of between 20 and 60 days. We held the Fund’s average maturity relatively short between October and August, at between 30 and 40 days, so that we could reinvest maturing securities’ principal at higher interest rates following Federal Reserve meetings. In August we extended the Fund’s average maturity to between 35 and 45 days, because we expected the Federal Reserve to stop raising interest rates. Then in early September we lengthened again, to 40 to 50 days. Lengthening the Fund’s average maturity allowed us to lock in higher yield for shareholders.1
We began the period with a relatively large position in variable-rate securities, which accounted for 35% of assets as of October 1, 2005. Those securities adjust the yields they pay based on the general level of interest rates, so they helped boost the Fund’s yield as rates rose during the first nine months of the period. We modestly reduced the Fund’s stake in variable-rate securities late in the period.1
As of September 30, 2006, the Fund held approximately 41% of its assets in commercial paper and corporate notes, 31% in variable-rate securities, 18% in repurchase agreements and 10% in bank instruments. The Fund’s average maturity was 44 days.1
| 1 | Portfolio composition is as of September 30, 2006, and is subject to change. |
Past performance does not guarantee future results. The performance data quoted represents past performance and current returns may be lower or higher. Total return figures include change in share price, reinvestment of dividends and capital gains and do not reflect taxes that a shareholder would pay on fund distributions or on the redemption of fund shares. The investment return and principal value will fluctuate so that an investor’s shares, when redeemed may be worth more or less than the original cost. To obtain performance information current to the most recent month end, please visit www.bbtfunds.com.
A portion of the Fund’s fees has been waived. If the fees had not been waived, the Fund’s total return for the period would have been lower.
36
BB&T U.S. TREASURY MONEY MARKET FUND
PORTFOLIO MANAGER
Kevin E. McNair, CFA
The BB&T U.S. Treasury Money Market Fund is managed by Kevin E. McNair, CFA. Mr. McNair received a BA in Economics from the University of North Carolina at Chapel Hill and a Master’s of Economics from North Carolina State University, and has been managing investors’ money since 1994. Mr. McNair is supported by the BB&T Fixed Income Portfolio Management Team, which includes Brad D. Eppard, CFA; David T. Johnson; Robert F. Millikan, CFA; and Michael D. Nichols, CFA. The team brings to the Fund six decades of combined investment management experience, along with a broad range of specialized skills encompassing a cross-section of fixed-income sectors.
INVESTMENT CONCERNS
Investments in the BB&T U.S. Treasury Money Market Fund are neither insured nor guaranteed by the Federal Deposit Insurance Corporation or any government agency. Although the Fund seeks to preserve the value of your investments at a $1.00 per share, it is possible to lose money by investing in the Fund.
Q. What factors affected the Fund’s yield during the 12-month period between October 1, 2005 and September 30, 2006?
A. The Federal Reserve increased its target short-term interest rate six times during the first nine months of the period, bringing the federal funds rate from 3.75% to 5.25%, and then left the rate unchanged at meetings in August and September. The Fed’s rate hikes boosted yields on money market securities.
We held the Fund’s average maturity shorter than its historical average, bringing it as low as 22 days. That strategy allowed us to reinvest the securities’ principal more rapidly, which enabled us to capture higher yield as interest rates increased. We increased the Fund’s average maturity late in the period, as it appeared that the Federal Reserve was nearing the end of its monetary tightening cycle.2
The Fund’s yield also benefited from a significant position in repurchase agreements, which comprised between 60% and 70% of assets during most of the period. Repurchase agreements offered higher yields than Treasury bills, and allowed us to reinvest principal on a daily basis.2
As of September 30, 2006, the Fund held 67.9% of its assets in repurchase agreements, 19.9% in Treasury notes and 12.2% in Treasury bills. The Fund’s average maturity was 26 days, and its credit quality as rated by Standard & Poor’s was Aaa.1,2
| 1 | Moody’s Fund Ratings represent an opinion only, not a recommendation to buy or sell. |
| 2 | Portfolio composition is as of September 30, 2006, and is subject to change. |
Past performance does not guarantee future results. The performance data quoted represents past performance and current returns may be lower or higher. Total return figures include change in share price, reinvestment of dividends and capital gains and do not reflect taxes that a shareholder would pay on fund distributions or on the redemption of fund shares. The investment return and principal value will fluctuate so that an investor’s shares, when redeemed may be worth more or less than the original cost. To obtain performance information current to the most recent month end, please visit www.bbtfunds.com.
A portion of the Fund’s fees has been waived. If the fees had not been waived, the Fund’s total return for the period would have been lower.
37
BB&T CAPITAL MANAGER FUNDS
PORTFOLIO MANAGER
The BB&T Capital Manager Equity Fund is managed by the BB&T Balanced Portfolio Management Team, which includes Jeffrey J. Schappe, CFA; Will Gholston, CFA; Robert F. Millikan, CFA; and Ronald T. Rimkus, CFA. The team brings to the Fund over eight decades of combined investment management experience, along with abroad range of specialized skills encompassing value stocks, growth stocks and fixed-income securities.
INVESTMENT CONCERNS
Equity securities (stocks) are more volatile and carry more risk than other forms of investments, including investments in high-grade fixed income securities. The net asset value per share of this Fund will fluctuate as the value of the securities in the portfolio changes.
Bonds offer a relatively stable level of income, although bond prices will fluctuate providing the potential for principal gain or loss. Intermediate-term, higher-quality bonds generally offer less risk than longer-term bonds and a lower rate of return.
Capital Manager Conservative Growth Fund
Capital Manager Moderate Growth Fund
Capital Manager Growth Fund
Capital Manager Equity Fund
Q. What factors affected the Funds’ performance?
A. The Capital Manager Funds invest in a combination of the BB&T Large Cap Fund, the BB&T Large Cap Growth Fund, the BB&T Mid Cap Value Fund, the BB&T Mid Cap Growth Fund, the BB&T International Equity Fund, the BB&T Small Cap Fund and the BB&T U.S. Treasury Money Market Fund. The three Capital Manager Funds with fixed-income allocations also hold exposure to the BB&T Total Return Bond Fund. The stock and bond markets posted healthy returns during the period under review, helping all of the Capital Manager Funds generate solid gains.1,2
The Funds’ equity sleeves held larger positions in value stocks than did the S&P 500 stock benchmark. Value stocks significantly outperformed growth stocks, so the Funds’ relatively large value allocations boosted returns relative to their benchmarks. An allocation of 15% of each Fund’s equity position to international equities also contributed to relative gains, as international stocks (as measured by the MSCI EAFE) outperformed the S&P 500 over the period. The relative returns of the Capital Manager Growth Fund and the Capital Manager Moderate Growth Fund also benefited from overweight stakes in stocks, which outperformed bonds. Those Funds held equity allocations roughly five percentage points larger than their neutral equity weightings of 75% and 60%, respectively.2
The Funds held approximately 24% of their domestic equity allocations in small- and mid-cap stocks during this period. Exposure to those stocks weighed on the Funds’ returns against their benchmarks, because small- and mid-cap stocks trailed the large-cap stocks that make up the S&P 500.2
Past performance does not guarantee future results. The performance data quoted represents past performance and current returns may be lower or higher. Total return figures include change in share price, reinvestment of dividends and capital gains and do not reflect taxes that a shareholder would pay on fund distributions or on the redemption of fund shares. The investment return and principal value will fluctuate so that an investor’s shares, when redeemed may be worth more or less than the original cost. To obtain performance information current to the most recent month end, please visit www.bbtfunds.com.
| 1 | Prior to February 1, 2006, the BB&T Large Cap Fund and the BB&T Large Cap Growth Fund were known as the BB&T Large Company Value Fund and the BB&T Large Company Growth Fund, respectively. |
| 2 | Portfolio composition is as of September 30, 2006, and is subject to change. |
38
BB&T CAPITAL MANAGER CONSERVATIVE GROWTH FUND
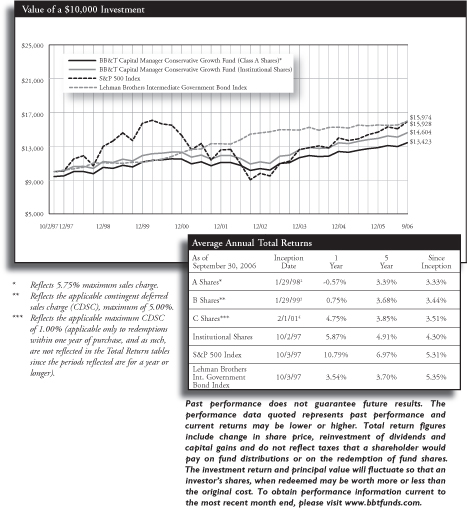
| | The chart above represents a comparison of a hypothetical $10,000 investment in the indicated share class versus a similar investment in the Fund’s benchmarks, and represents the reinvestment of dividends and capital gains. |
| 2 | Class A Shares were not in existence prior to 1/29/98. Performance for periods prior to that is based on the historical performance of the Institutional Shares, and has been adjusted for the maximum sales charge applicable to the Class A Shares, but does not include the Class A Shares 12b-1 fees, which, if reflected, performance would have been lower. |
| 3 | Class B Shares were not in existence prior to 1/29/99. Performance for periods prior to that is based on the historical performance of the Class A Shares, and has been adjusted for the maximum CDSC applicable to the Class B Shares, but does not include the Class B Shares 12b-1 fees, which, if reflected, performance would have been lower. |
| 4 | Class C Shares were not in existence prior to 2/1/01. Performance for periods prior to that is based on the historical performance of the Class A Shares, and has been adjusted for the maximum CDSC applicable to the Class C Shares, but does not include the Class C Shares 12b-1 fees, which if reflected, performance would have been lower. |
| | The Fund is measured against the S&P 500 Index, which is generally considered to be representative of the performance of the stock market as a whole, and against the Lehman Brothers Intermediate Government Bond Index, which is widely used as a broad measure of the performance of U.S. Government Bonds with maturities of less than 10 years. The indices are unmanaged and do not reflect the deduction of expenses associated with a mutual fund, such as investment management and, fund accounting fees. The Fund’s performance reflects the deduction of fees for these services. Investors cannot invest directly in an index, although they can invest in its underlying securities. |
| | A portion of the Fund’s fees have been waived. If the fees had not been waived, the Fund’s total return for the period would have been lower. |
39
BB&T CAPITAL MANAGER MODERATE GROWTH FUND
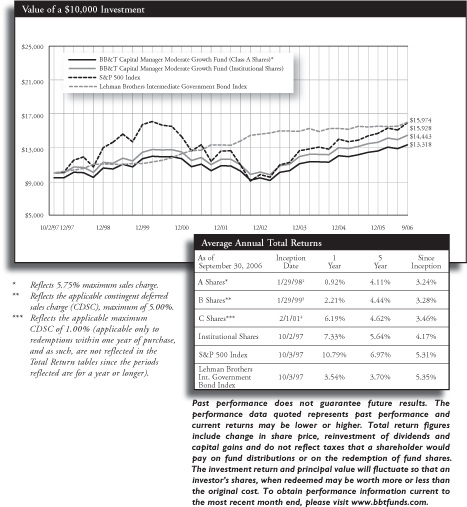
| | The chart above represents a comparison of a hypothetical $10,000 investment in the indicated share class versus a similar investment in the Fund’s benchmarks, and represents the reinvestment of dividends and capital gains. |
| 2 | Class A Shares were not in existence prior to 1/29/98. Performance for periods prior to that is based on the historical performance of the Institutional Shares, and has been adjusted for the maximum sales charge applicable to the Class A Shares, but does not include the Class A Shares 12b-1 fees, which, if reflected, performance would have been lower. |
| 3 | Class B Shares were not in existence prior to 1/29/99. Performance for periods prior to that is based on the historical performance of the Class A Shares, and has been adjusted for the maximum CDSC applicable to the Class B Shares, but does not include the Class B Shares 12b-1 fees, which, if reflected, performance would have been lower. |
| 4 | Class C Shares were not in existence prior to 2/1/01. Performance for periods prior to that is based on the historical performance of the Class A Shares, and has been adjusted for the maximum CDSC applicable to the Class C Shares, but does not include the Class C Shares 12b-1 fees, which if reflected, performance would have been lower. |
| | The Fund is measured against the S&P 500 Index, which is generally considered to be representative of the performance of the stock market as a whole, and against the Lehman Brothers Intermediate Government Bond Index, which is widely used as a broad measure of the performance of U.S. Government Bonds with maturities of less than 10 years. The indices are unmanaged and do not reflect the deduction of expenses associated with a mutual fund, such as investment management and, fund accounting fees. The Fund’s performance reflects the deduction of fees for these services. Investors cannot invest directly in an index, although they can invest in its underlying securities. |
| | A portion of the Fund’s fees have been waived. If the fees had not been waived, the Fund’s total return for the period would have been lower. |
40
BB&T CAPITAL MANAGER GROWTH FUND
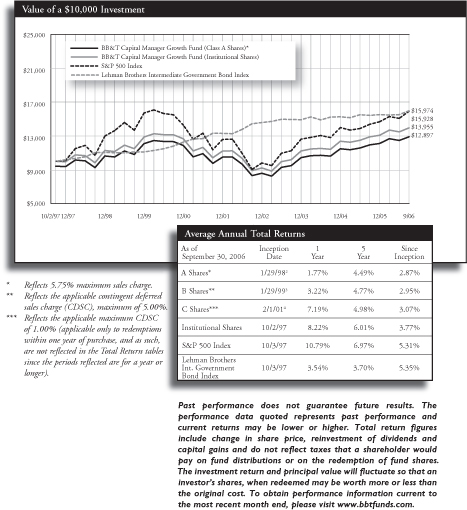
| | The chart above represents a comparison of a hypothetical $10,000 investment in the indicated share class versus a similar investment in the Fund’s benchmarks, and represents the reinvestment of dividends and capital gains. |
| 2 | Class A Shares were not in existence prior to 1/29/98. Performance for periods prior to that is based on the historical performance of the Institutional Shares, and has been adjusted for the maximum sales charge applicable to the Class A Shares, but does not include the Class A Shares 12b-1 fees, which, if reflected, performance would have been lower. |
| 3 | Class B Shares were not in existence prior to 1/29/99. Performance for periods prior to that is based on the historical performance of the Class A Shares, and has been adjusted for the maximum CDSC applicable to the Class B Shares, but does not include the Class B Shares 12b-1 fees, which, if reflected, performance would have been lower. |
| 4 | Class C Shares were not in existence prior to 2/1/01. Performance for periods prior to that is based on the historical performance of the Class A Shares, and has been adjusted for the maximum CDSC applicable to the Class C Shares, but does not include the Class C Shares 12b-1 fees, which if reflected, performance would have been lower. |
| | The Fund is measured against the S&P 500 Index, which is generally considered to be representative of the performance of the stock market as a whole, and against the Lehman Brothers Intermediate Government Bond Index, which is widely used as a broad measure of the performance of U.S. Government Bonds with maturities of less than 10 years. The indices are unmanaged and do not reflect the deduction of expenses associated with a mutual fund, such as investment management and, fund accounting fees. The Fund’s performance reflects the deduction of fees for these services. Investors cannot invest directly in an index, although they can invest in its underlying securities. |
| | A portion of the Fund’s fees have been waived. If the fees had not been waived, the Fund’s total return for the period would have been lower. |
41
BB&T CAPITAL MANAGER EQUITY FUND
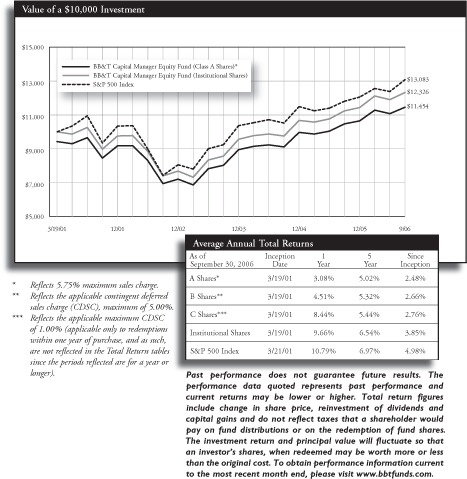
The chart above represents a comparison of a hypothetical $10,000 investment in the indicated share class versus a similar investment in the Fund’s benchmark, and represents the reinvestment of dividends and capital gains.
The Fund is measured against the S&P 500 Index, an unmanaged index generally considered to be representative of the performance of the stock market as a whole. The index does not reflect the deduction of expenses associated with a mutual fund, such as investment management and fund accounting fees. The Fund’s performance reflects the deduction of fees for these services. Investors cannot invest directly in an index, although they can invest in its underlying securities.
A portion of the Fund’s fees have been waived. If the fees had not been waived, the Fund’s total return for the period would have been lower.
42
BB&T Funds
Summary of Portfolio Holdings, (unaudited)
The BB&T Funds invested, as a percentage of net assets, in the following industry sectors, countries, states, funds or security types, as of September 30, 2006.
| | | |
| Large Cap Fund | | Percent of
net assets | |
Consumer Discretionary | | 11.7 | % |
Consumer Staples | | 5.2 | |
Energy | | 11.0 | |
Financials | | 21.8 | |
Health Care | | 14.5 | |
Industrials | | 3.3 | |
Information Technology | | 14.1 | |
Materials | | 3.7 | |
Telecommunication Services | | 6.6 | |
Utilities | | 2.8 | |
Warrants | | 0.0 | |
Short-Term Investments* | | 22.8 | |
| | |
| | 117.5 | % |
| | |
| | | |
| Large Cap Growth Fund | | Percent of
net assets | |
Consumer Discretionary | | 12.6 | % |
Consumer Staples | | 6.3 | |
Energy | | 3.6 | |
Exchange Traded Funds | | 4.5 | |
Financials | | 9.4 | |
Health Care | | 18.5 | |
Industrials | | 7.7 | |
Information Technology | | 24.6 | |
Telecommunication Services | | 7.0 | |
Utilities | | 1.5 | |
Short-Term Investments* | | 47.7 | |
| | |
| | 143.4 | % |
| | |
| | | |
| Mid Cap Value Fund | | Percent of
net assets | |
Advertising | | 3.0 | % |
Computer Software | | 14.9 | |
Consumer Discretionary | | 11.9 | |
Energy | | 1.6 | |
Financials | | 32.3 | |
Health Care | | 7.2 | |
Industrials | | 11.4 | |
Information Technology | | 6.8 | |
Telecommunication Services | | 5.6 | |
Short-Term Investments* | | 32.9 | |
| | |
| | 127.6 | % |
| | |
| | | |
| Mid Cap Growth Fund | | Percent of
net assets | |
Consumer Discretionary | | 19.5 | % |
Consumer Staples | | 1.6 | |
Energy | | 4.4 | |
Exchange Traded Funds | | 4.0 | |
Financials | | 16.5 | |
Health Care | | 14.4 | |
Industrials | | 7.6 | |
Information Technology | | 19.9 | |
Materials | | 2.3 | |
Telecommunication Services | | 4.8 | |
Utilities | | 1.7 | |
Short-Term Investments* | | 39.5 | |
| | |
| | 136.2 | % |
| | |
| | | |
| Small Cap Fund | | Percent of
net assets | |
Consumer Discretionary | | 13.7 | % |
Consumer Staples | | 1.7 | |
Corporate Bonds | | 0.1 | |
Energy | | 5.6 | |
Exchange Traded Funds | | 4.2 | |
Financials | | 15.7 | |
Health Care | | 3.6 | |
Industrials | | 20.4 | |
Information Technology | | 21.0 | |
Materials | | 4.3 | |
Utilities | | 2.4 | |
Short-Term Investments* | | 30.4 | |
| | |
| | 123.1 | % |
| | |
| | | |
| International Equity Fund | | Percent of
net assets | |
Australia | | 2.9 | % |
Austria | | 0.4 | |
Belgium | | 1.5 | |
Currency Contracts | | 0.0 | |
Exchange Traded Funds | | 2.3 | |
Finland | | 1.6 | |
France | | 7.6 | |
Germany | | 7.4 | |
Great Britain | | 22.4 | |
Hong Kong | | 1.7 | |
Ireland | | 2.8 | |
Italy | | 1.7 | |
Japan | | 19.9 | |
Netherlands | | 10.1 | |
Norway | | 0.5 | |
Singapore | | 0.1 | |
Spain | | 3.0 | |
Sweden | | 1.8 | |
Switzerland | | 9.7 | |
| | |
| | 97.4 | % |
| | |
| | | |
| Special Opportunities Equity Fund | | Percent of
net assets | |
Consumer Discretionary | | 18.9 | % |
Consumer Staples | | 3.9 | |
Energy | | 17.6 | |
Financials | | 6.7 | |
Health Care | | 15.7 | |
Industrials | | 14.2 | |
Information Technology | | 16.1 | |
Investment Company | | 0.2 | |
Option Contracts | | (0.2 | ) |
Short-Term Investments* | | 36.4 | |
| | |
| | 129.5 | % |
| | |
43
BB&T Funds
Summary of Portfolio Holdings, continued (unaudited)
| | | |
| Equity Income Fund | | Percent of
net assets | |
Consumer Discretionary | | 3.5 | % |
Consumer Staples | | 10.0 | |
Energy | | 18.8 | |
Financials | | 24.2 | |
Health Care | | 8.2 | |
Industrials | | 3.6 | |
Information Technology | | 11.1 | |
Materials | | 3.4 | |
Option Contracts | | (0.0 | ) |
Telecommunication Services | | 3.8 | |
Utilities | | 7.4 | |
Short-Term Investments* | | 31.4 | |
| | |
| | 125.4 | % |
| | |
| | | |
| Short U.S. Government Fund | | Percent of
net assets | |
Federal Farm Credit Bank | | 8.2 | % |
Federal Home Loan Bank | | 12.1 | |
Federal Home Loan Mortgage Corporation | | 12.1 | |
Federal Home Loan Mortgage Corp. — Mortgage-Backed Securities | | 10.4 | |
Federal National Mortgage Association | | 15.0 | |
Federal National Mortgage Assoc. — Mortgage-Backed Securities | | 18.1 | |
U.S. Treasury Notes | | 19.7 | |
Short-Term Investments* | | 50.9 | |
| | |
| | 146.5 | % |
| | |
| | | |
| Intermediate U.S. Government Fund | | Percent of
net assets | |
Federal Home Loan Mortgage Corp. — Mortgage-Backed Securities | | 17.7 | % |
Federal Home Loan Mortgage Corp. — U.S. Government Agencies | | 11.4 | |
Federal National Mortgage Assoc. — Mortgage-Backed Securities | | 26.1 | |
Federal National Mortgage Assoc. — U.S. Government Agencies | | 1.9 | |
Sovereign | | 2.0 | |
U.S. Treasury Notes | | 31.9 | |
U.S. Government Backed Securities | | 7.9 | |
Short-Term Investments* | | 14.3 | |
| | |
| | 113.2 | % |
| | |
| | | |
| Total Return Bond Fund | | Percent of
net assets | |
Corporate Bonds | | 40.3 | % |
Federal Home Loan Bank | | 1.7 | |
Federal Home Loan Mortgage Corp. — Mortgage-Backed Securities | | 13.7 | |
Federal Home Loan Mortgage Corp. — U.S. Government Agencies | | 2.8 | |
Federal National Mortgage Assoc. — Mortgage-Backed Securities | | 18.9 | |
Federal National Mortgage Assoc. — U.S. Government Agencies | | 5.5 | |
Government National Mortgage Assoc. | | 3.2 | |
Municipal | | 6.1 | |
U.S. Treasury Bonds | | 3.3 | |
U.S. Treasury Notes | | 16.9 | |
Short-Term Investments* | | 29.1 | |
| | |
| | 141.5 | % |
| | |
| | | |
| Kentucky Intermediate Tax-Free Fund | | Percent of
net assets | |
Investment Company | | 2.2 | % |
Kentucky Municipal Bonds | | 101.0 | |
| | |
| | 103.2 | % |
| | |
| | | |
| Maryland Intermediate Tax-Free Fund | | Percent of
net assets | |
Investment Company | | 4.1 | % |
Maryland Municipal Bonds | | 95.2 | |
| | |
| | 99.3 | % |
| | |
| | | |
| North Carolina Intermediate Tax-Free Fund | | Percent of
net assets | |
Investment Company | | 2.5 | % |
North Carolina Municipal Bonds | | 98.1 | |
| | |
| | 100.6 | % |
| | |
| | | |
| South Carolina Intermediate Tax-Free Fund | | Percent of
net assets | |
Investment Company | | 2.1 | % |
South Carolina Municipal Bonds | | 97.6 | |
| | |
| | 99.7 | % |
| | |
| | | |
| Virginia Intermediate Tax-Free Fund | | Percent of
net assets | |
District of Columbia Municipal Bonds | | 2.2 | % |
Investment Company | | 2.5 | |
Virginia Municipal Bonds | | 94.9 | |
| | |
| | 99.6 | % |
| | |
| | | |
| West Virginia Intermediate Tax-Free Fund | | Percent of
net assets | |
Investment Company | | 1.1 | % |
West Virginia Municipal Bonds | | 97.5 | |
| | |
| | 98.6 | % |
| | |
| | | |
| Prime Money Market Fund | | Percent of
net assets | |
Bankers Acceptance | | 0.4 | % |
Certificates of Deposit | | 9.9 | |
Collateralized Loan Agreements | | 15.0 | |
Commercial Paper | | 32.4 | |
Corporate Bonds | | 6.6 | |
Municipal Bonds | | 1.2 | |
Repurchase Agreement | | 5.9 | |
Variable Rate Notes | | 28.6 | |
| | |
| | 100.0 | % |
| | |
| | | |
| U.S. Treasury Money Market Fund | | Percent of
net assets | |
Repurchase Agreements | | 67.9 | % |
U.S. Treasury Bills | | 12.2 | |
U.S. Treasury Notes | | 19.9 | |
| | |
| | 100.0 | % |
| | |
44
BB&T Funds
Summary of Portfolio Holdings, continued (unaudited)
| | | |
| National Tax-Free Money Market Fund | | Percent of
net assets | |
Alabama | | 4.3 | % |
Alaska | | 1.8 | |
Arizona | | 3.8 | |
Colorado | | 1.7 | |
Florida | | 8.1 | |
Illinois | | 15.2 | |
Indiana | | 2.1 | |
Kentucky | | 3.1 | |
Louisiana | | 2.2 | |
Maryland | | 1.5 | |
Massachusetts | | 3.9 | |
Michigan | | 2.1 | |
Minnesota | | 8.5 | |
Missouri | | 3.1 | |
Nevada | | 2.6 | |
New Jersey | | 4.0 | |
New York | | 6.1 | |
Ohio | | 0.9 | |
Pennsylvania | | 3.1 | |
Texas | | 5.0 | |
Virginia | | 5.7 | |
Wisconsin | | 9.0 | |
Commercial Paper | | 2.1 | |
Investment Company | | 0.0 | |
| | |
| | 99.9 | % |
| | |
| | | |
| Capital Manager Conservative Growth Fund | | Percent of
net assets | |
International Equity | | 6.0 | % |
Large Cap | | 26.60 | |
Mid Cap | | 4.8 | |
Small Cap | | 3.1 | |
Total Return Bond | | 56.6 | |
U.S. Treasury | | 3.0 | |
| | |
| | 100.1 | % |
| | |
| | | |
| Capital Manager Moderate Growth Fund | | Percent of
net assets | |
International Equity | | 9.8 | % |
Large Cap | | 42.9 | |
Mid Cap | | 7.7 | |
Small Cap | | 5.0 | |
Total Return Bond | | 31.6 | |
U.S. Treasury | | 2.9 | |
| | |
| | 99.9 | % |
| | |
| | | |
| Capital Manager Growth Fund | | Percent of
net assets | |
International Equity | | 11.9 | % |
Large Cap | | 52.3 | |
Mid Cap | | 9.4 | |
Small Cap | | 6.0 | |
Total Return | | 16.6 | |
U.S. Treasury | | 3.6 | |
| | |
| | 99.8 | % |
| | |
| | | |
| Capital Manager Equity Fund | | Percent of
net assets | |
International Equity | | 14.2 | % |
Large Cap | | 62.8 | |
Mid Cap | | 11.3 | |
Small Cap | | 7.2 | |
U.S. Treasury | | 4.5 | |
| | |
| | 100.0 | % |
| | |
| * | Short-Term Investments represents the Repurchase Agreement and the invested cash collateral received in connection with securities lending (see Note 2). |
45
BB&T Funds
Expense Example (unaudited)
As a shareholder of the BB&T Funds (the “Funds”), you incur two types of costs: (1) transaction costs, including sales charges (loads) on purchases and (2) ongoing costs, including management fees; distribution fees; and other Fund expenses.
These examples are intended to help you understand your ongoing costs (in dollars) of investing in the Funds’ and to compare these costs with the ongoing costs of investing in other mutual funds.”
These examples are based on an investment of $1,000 invested at the beginning of the period and held for the entire period from April 1, 2006 through September 30, 2006.
Actual Example
The table below provides information about actual account values and actual expenses. You may use the information below, together with the amount you invested, to estimate the expenses that you paid over the period. Simply divide your account value by $1,000 (for example, an $8,600 account value divided by $1,000 = 8.6), then multiply the result by the number in the table under the heading entitled “Expenses Paid During Period” to estimate the expenses you paid on your account during this period.
| | | | | | | | | | | | |
| | | Beginning
Account Value
4/1/06 | | Ending
Account Value
9/30/06 | | Expenses Paid
During Period*
4/1/06 - 9/30/06 | | Annualized
Expense Ratio
During Period
4/1/06 - 9/30/06 | |
Large Cap Fund | | | | | | | | | | | | |
Class A Shares | | $ | 1,000.00 | | $ | 1,062.60 | | $ | 5.89 | | 1.14 | % |
Class B Shares | | | 1,000.00 | | | 1,058.60 | | | 9.75 | | 1.89 | % |
Class C Shares | | | 1,000.00 | | | 1,058.80 | | | 9.75 | | 1.89 | % |
Institutional Shares | | | 1,000.00 | | | 1,063.70 | | | 4.60 | | 0.89 | % |
Large Cap Growth Fund | | | | | | | | | | | | |
Class A Shares | | | 1,000.00 | | | 963.90 | | | 5.61 | | 1.14 | % |
Class B Shares | | | 1,000.00 | | | 959.90 | | | 9.29 | | 1.89 | % |
Class C Shares | | | 1,000.00 | | | 959.90 | | | 9.29 | | 1.89 | % |
Institutional Shares | | | 1,000.00 | | | 965.30 | | | 4.38 | | 0.89 | % |
Mid Cap Value Fund | | | | | | | | | | | | |
Class A Shares | | | 1,000.00 | | | 1,027.40 | | | 5.79 | | 1.14 | % |
Class B Shares | | | 1,000.00 | | | 1,024.00 | | | 9.59 | | 1.89 | % |
Class C Shares | | | 1,000.00 | | | 1,024.00 | | | 9.59 | | 1.89 | % |
Institutional Shares | | | 1,000.00 | | | 1,029.00 | | | 4.53 | | 0.89 | % |
Mid Cap Growth Fund | | | | | | | | | | | | |
Class A Shares | | | 1,000.00 | | | 885.50 | | | 5.39 | | 1.14 | % |
Class B Shares | | | 1,000.00 | | | 881.90 | | | 8.92 | | 1.89 | % |
Class C Shares | | | 1,000.00 | | | 882.70 | | | 8.92 | | 1.89 | % |
Institutional Shares | | | 1,000.00 | | | 886.90 | | | 4.21 | | 0.89 | % |
Small Cap Fund | | | | | | | | | | | | |
Class A Shares | | | 1,000.00 | | | 959.10 | | | 6.29 | | 1.28 | % |
Class B Shares | | | 1,000.00 | | | 955.30 | | | 9.95 | | 2.03 | % |
Class C Shares | | | 1,000.00 | | | 955.20 | | | 9.95 | | 2.03 | % |
Institutional Shares | | | 1,000.00 | | | 960.10 | | | 5.06 | | 1.03 | % |
International Equity Fund | | | | | | | | | | | | |
Class A Shares | | | 1,000.00 | | | 1,041.90 | | | 7.06 | | 1.38 | % |
Class B Shares | | | 1,000.00 | | | 1,038.20 | | | 10.88 | | 2.13 | % |
Class C Shares | | | 1,000.00 | | | 1,037.90 | | | 10.93 | | 2.14 | % |
Institutional Shares | | | 1,000.00 | | | 1,043.40 | | | 5.79 | | 1.13 | % |
Special Opportunities Equity Fund | | | | | | | | | | | | |
Class A Shares | | | 1,000.00 | | | 1,075.30 | | | 6.66 | | 1.28 | % |
Class B Shares | | | 1,000.00 | | | 1,071.00 | | | 10.54 | | 2.03 | % |
Class C Shares | | | 1,000.00 | | | 1,070.90 | | | 10.54 | | 2.03 | % |
Institutional Shares | | | 1,000.00 | | | 1,076.70 | | | 5.36 | | 1.03 | % |
Equity Income Fund | | | | | | | | | | | | |
Class A Shares | | | 1,000.00 | | | 1,075.60 | | | 6.24 | | 1.20 | % |
Class B Shares | | | 1,000.00 | | | 1,071.20 | | | 10.12 | | 1.95 | % |
Class C Shares | | | 1,000.00 | | | 1,071.20 | | | 10.12 | | 1.95 | % |
Institutional Shares | | | 1,000.00 | | | 1,076.90 | | | 4.95 | | 0.95 | % |
Short U.S. Government Fund | | | | | | | | | | | | |
Class A Shares | | | 1,000.00 | | | 1,024.10 | | | 4.52 | | 0.89 | % |
Institutional Shares | | | 1,000.00 | | | 1,025.40 | | | 3.25 | | 0.64 | % |
Intermediate U.S. Government Fund | | | | | | | | | | | | |
Class A Shares | | | 1,000.00 | | | 1,034.40 | | | 4.64 | | 0.91 | % |
Class B Shares | | | 1,000.00 | | | 1,030.70 | | | 8.45 | | 1.66 | % |
Class C Shares | | | 1,000.00 | | | 1,029.60 | | | 8.45 | | 1.66 | % |
Institutional Shares | | | 1,000.00 | | | 1,034.60 | | | 3.37 | | 0.66 | % |
46
BB&T Funds
Expense Example, continued (unaudited)
| | | | | | | | | | | | |
| | | Beginning
Account Value
4/1/06 | | Ending
Account Value
9/30/06 | | Expenses Paid
During Period*
4/1/06 - 9/30/06 | | Annualized
Expense Ratio
During Period
4/1/06 - 9/30/06 | |
Total Return Bond Fund | | | | | | | | | | | | |
Class A Shares | | $ | 1,000.00 | | $ | 1,033.10 | | $ | 4.69 | | 0.92 | % |
Class B Shares | | | 1,000.00 | | | 1,029.00 | | | 8.49 | | 1.67 | % |
Class C Shares | | | 1,000.00 | | | 1,029.10 | | | 8.49 | | 1.67 | % |
Institutional Shares | | | 1,000.00 | | | 1,034.30 | | | 3.37 | | 0.66 | % |
Kentucky Intermediate Tax-Free Fund | | | | | | | | | | | | |
Class A Shares | | | 1,000.00 | | | 1,032.80 | | | 4.74 | | 0.93 | % |
Institutional Shares | | | 1,000.00 | | | 1,034.20 | | | 3.47 | | 0.68 | % |
Maryland Intermediate Tax-Free Fund | | | | | | | | | | | | |
Class A Shares | | | 1,000.00 | | | 1,036.90 | | | 4.39 | | 0.86 | % |
Institutional Shares | | | 1,000.00 | | | 1,037.10 | | | 3.06 | | 0.60 | % |
North Carolina Intermediate Tax-Free Fund | | | | | | | | | | | | |
Class A Shares | | | 1,000.00 | | | 1,032.30 | | | 4.53 | | 0.89 | % |
Institutional Shares | | | 1,000.00 | | | 1,033.60 | | | 3.26 | | 0.64 | % |
South Carolina Intermediate Tax-Free Fund | | | | | | | | | | | | |
Class A Shares | | | 1,000.00 | | | 1,030.80 | | | 4.73 | | 0.93 | % |
Institutional Shares | | | 1,000.00 | | | 1,033.30 | | | 3.47 | | 0.68 | % |
Virginia Intermediate Tax-Free Fund | | | | | | | | | | | | |
Class A Shares | | | 1,000.00 | | | 1,030.50 | | | 4.58 | | 0.90 | % |
Institutional Shares | | | 1,000.00 | | | 1,031.80 | | | 3.31 | | 0.65 | % |
West Virginia Intermediate Tax-Free Fund | | | | | | | | | | | | |
Class A Shares | | | 1,000.00 | | | 1,030.90 | | | 4.58 | | 0.90 | % |
Institutional Shares | | | 1,000.00 | | | 1,032.10 | | | 3.31 | | 0.65 | % |
Prime Money Market Fund | | | | | | | | | | | | |
Class A Shares | | | 1,000.00 | | | 1,021.40 | | | 4.92 | | 0.97 | % |
Class B Shares | | | 1,000.00 | | | 1,019.10 | | | 7.44 | | 1.47 | % |
Class C Shares | | | 1,000.00 | | | 1,018.90 | | | 7.44 | | 1.47 | % |
Institutional Shares | | | 1,000.00 | | | 1,024.00 | | | 2.38 | | 0.47 | % |
U.S. Treasury Money Market Fund | | | | | | | | | | | | |
Class A Shares | | | 1,000.00 | | | 1,020.40 | | | 4.76 | | 0.94 | % |
Class B Shares | | | 1,000.00 | | | 1,017.90 | | | 7.33 | | 1.45 | % |
Class C Shares | | | 1,000.00 | | | 1,017.90 | | | 7.28 | | 1.44 | % |
Institutional Shares | | | 1,000.00 | | | 1,023.00 | | | 2.28 | | 0.45 | % |
National Tax-Free Money Market Fund** | | | | | | | | | | | | |
Class A Shares | | | 1,000.00 | | | 1,005.10 | | | 1.04 | | 0.62 | % |
Class B Shares | | | 1,000.00 | | | 1,003.60 | | | 2.33 | | 1.39 | % |
Class C Shares | | | 1,000.00 | | | 1,003.60 | | | 2.33 | | 1.39 | % |
Institutional Shares | | | 1,000.00 | | | 1,005.30 | | | 0.67 | | 0.40 | % |
Capital Manager Conservative Growth Fund | | | | | | | | | | | | |
Class A Shares | | | 1,000.00 | | | 1,025.60 | | | 1.68 | | 0.33 | % |
Class B Shares | | | 1,000.00 | | | 1,020.70 | | | 5.47 | | 1.08 | % |
Class C Shares | | | 1,000.00 | | | 1,020.80 | | | 5.47 | | 1.08 | % |
Institutional Shares | | | 1,000.00 | | | 1,026.70 | | | 0.41 | | 0.08 | % |
Capital Manager Moderate Growth Fund | | | | | | | | | | | | |
Class A Shares | | | 1,000.00 | | | 1,020.80 | | | 1.77 | | 0.35 | % |
Class B Shares | | | 1,000.00 | | | 1,017.30 | | | 5.56 | | 1.10 | % |
Class C Shares | | | 1,000.00 | | | 1,017.30 | | | 5.56 | | 1.10 | % |
Institutional Shares | | | 1,000.00 | | | 1,023.00 | | | 0.51 | | 0.10 | % |
Capital Manager Growth Fund | | | | | | | | | | | | |
Class A Shares | | | 1,000.00 | | | 1,017.90 | | | 1.82 | | 0.36 | % |
Class B Shares | | | 1,000.00 | | | 1,014.50 | | | 5.61 | | 1.11 | % |
Class C Shares | | | 1,000.00 | | | 1,014.50 | | | 5.61 | | 1.11 | % |
Institutional Shares | | | 1,000.00 | | | 1,019.20 | | | 0.56 | | 0.11 | % |
Capital Manager Equity Fund | | | | | | | | | | | | |
Class A Shares | | | 1,000.00 | | | 1,015.20 | | | 1.82 | | 0.36 | % |
Class B Shares | | | 1,000.00 | | | 1,012.00 | | | 5.60 | | 1.11 | % |
Class C Shares | | | 1,000.00 | | | 1,012.10 | | | 5.60 | | 1.11 | % |
Institutional Shares | | | 1,000.00 | | | 1,017.00 | | | 0.56 | | 0.11 | % |
| * | Expenses are equal to the average account value over the period multiplied by the Fund’s annualized expense ratio, multiplied by the number of days in the most recent fiscal half-year divided by the number of days in the fiscal year (to reflect the one-half year period). |
| ** | Information shown reflects values using the expense ratios and rates of return for the period from August 1, 2006 (date of commencement of operations) to September 30, 2006. |
47
BB&T Funds
Expense Example, continued (unaudited)
Hypothetical Example for Comparison Purposes
The table below provides information about hypothetical account values and hypothetical expenses based on the Funds’ actual expense ratio and an assumed rate of return of 5% per year before expenses, which is not the Fund’s actual return. The hypothetical account values and expenses may not be used to estimate the actual ending account balance or expenses you paid for the period. You may use this information to compare this 5% hypothetical example with the 5% hypothetical examples that appear in the shareholder reports of other funds.
Please note that the expenses shown in the table are meant to highlight your ongoing costs only and do not reflect any transactional costs, such as sales charges (loads), redemption fees, or exchange fees. Therefore, the table is useful in comparing ongoing costs only, and will not help you determine the relative total costs of owning different funds. In addition, if these transactional costs were included, your costs would have been higher.
| | | | | | | | | | | | |
| | | Beginning
Account Value
4/1/06 | | Ending
Account Value
9/30/06 | | Expenses Paid
During Period*
4/1/06 - 9/30/06 | | Annualized
Expense Ratio
During Period
4/1/06 - 9/30/06 | |
Large Cap Fund | | | | | | | | | | | | |
Class A Shares | | $ | 1,000.00 | | $ | 1,019.35 | | $ | 5.77 | | 1.14 | % |
Class B Shares | | | 1,000.00 | | | 1,015.59 | | | 9.55 | | 1.89 | % |
Class C Shares | | | 1,000.00 | | | 1,015.59 | | | 9.55 | | 1.89 | % |
Institutional Shares | | | 1,000.00 | | | 1,020.61 | | | 4.51 | | 0.89 | % |
Large Cap Growth Fund | | | | | | | | | | | | |
Class A Shares | | | 1,000.00 | | | 1,019.35 | | | 5.77 | | 1.14 | % |
Class B Shares | | | 1,000.00 | | | 1,015.59 | | | 9.55 | | 1.89 | % |
Class C Shares | | | 1,000.00 | | | 1,015.59 | | | 9.55 | | 1.89 | % |
Institutional Shares | | | 1,000.00 | | | 1,020.61 | | | 4.51 | | 0.89 | % |
Mid Cap Value Fund | | | | | | | | | | | | |
Class A Shares | | | 1,000.00 | | | 1,019.35 | | | 5.77 | | 1.14 | % |
Class B Shares | | | 1,000.00 | | | 1,015.59 | | | 9.55 | | 1.89 | % |
Class C Shares | | | 1,000.00 | | | 1,015.59 | | | 9.55 | | 1.89 | % |
Institutional Shares | | | 1,000.00 | | | 1,020.61 | | | 4.51 | | 0.89 | % |
Mid Cap Growth Fund | | | | | | | | | | | | |
Class A Shares | | | 1,000.00 | | | 1,019.35 | | | 5.77 | | 1.14 | % |
Class B Shares | | | 1,000.00 | | | 1,015.59 | | | 9.55 | | 1.89 | % |
Class C Shares | | | 1,000.00 | | | 1,015.59 | | | 9.55 | | 1.89 | % |
Institutional Shares | | | 1,000.00 | | | 1,020.61 | | | 4.51 | | 0.89 | % |
Small Cap Fund | | | | | | | | | | | | |
Class A Shares | | | 1,000.00 | | | 1,018.65 | | | 6.48 | | 1.28 | % |
Class B Shares | | | 1,000.00 | | | 1,014.89 | | | 10.25 | | 2.03 | % |
Class C Shares | | | 1,000.00 | | | 1,014.89 | | | 10.25 | | 2.03 | % |
Institutional Shares | | | 1,000.00 | | | 1,019.90 | | | 5.22 | | 1.03 | % |
International Equity Fund | | | | | | | | | | | | |
Class A Shares | | | 1,000.00 | | | 1,018.15 | | | 6.98 | | 1.38 | % |
Class B Shares | | | 1,000.00 | | | 1,014.39 | | | 10.76 | | 2.13 | % |
Class C Shares | | | 1,000.00 | | | 1,014.34 | | | 10.81 | | 2.14 | % |
Institutional Shares | | | 1,000.00 | | | 1,019.40 | | | 5.72 | | 1.13 | % |
Special Opportunities Equity Fund | | | | | | | | | | | | |
Class A Shares | | | 1,000.00 | | | 1,018.65 | | | 6.48 | | 1.28 | % |
Class B Shares | | | 1,000.00 | | | 1,014.89 | | | 10.25 | | 2.03 | % |
Class C Shares | | | 1,000.00 | | | 1,014.89 | | | 10.25 | | 2.03 | % |
Institutional Shares | | | 1,000.00 | | | 1,019.90 | | | 5.22 | | 1.03 | % |
Equity Income Fund | | | | | | | | | | | | |
Class A Shares | | | 1,000.00 | | | 1,019.05 | | | 6.07 | | 1.20 | % |
Class B Shares | | | 1,000.00 | | | 1,015.29 | | | 9.85 | | 1.95 | % |
Class C Shares | | | 1,000.00 | | | 1,015.29 | | | 9.85 | | 1.95 | % |
Institutional Shares | | | 1,000.00 | | | 1,020.31 | | | 4.81 | | 0.95 | % |
Short U.S. Government Fund | | | | | | | | | | | | |
Class A Shares | | | 1,000.00 | | | 1,020.61 | | | 4.51 | | 0.89 | % |
Institutional Shares | | | 1,000.00 | | | 1,021.86 | | | 3.24 | | 0.64 | % |
Intermediate U.S. Government Fund | | | | | | | | | | | | |
Class A Shares | | | 1,000.00 | | | 1,020.51 | | | 4.61 | | 0.91 | % |
Class B Shares | | | 1,000.00 | | | 1,016.75 | | | 8.39 | | 1.66 | % |
Class C Shares | | | 1,000.00 | | | 1,016.75 | | | 8.39 | | 1.66 | % |
Institutional Shares | | | 1,000.00 | | | 1,021.76 | | | 3.35 | | 0.66 | % |
Total Return Bond Fund | | | | | | | | | | | | |
Class A Shares | | | 1,000.00 | | | 1,020.46 | | | 4.66 | | 0.92 | % |
Class B Shares | | | 1,000.00 | | | 1,016.70 | | | 8.44 | | 1.67 | % |
Class C Shares | | | 1,000.00 | | | 1,016.70 | | | 8.44 | | 1.67 | % |
Institutional Shares | | | 1,000.00 | | | 1,021.76 | | | 3.35 | | 0.66 | % |
48
BB&T Funds
Expense Example, continued (unaudited)
| | | | | | | | | | | | |
| | | Beginning
Account Value
4/1/06 | | Ending
Account Value
9/30/06 | | Expenses Paid
During Period*
4/1/06 - 9/30/06 | | Annualized
Expense Ratio
During Period
4/1/06 - 9/30/06 | |
Kentucky Intermediate Tax-Free Fund | | | | | | | | | | | | |
Class A Shares | | $ | 1,000.00 | | $ | 1,020.41 | | $ | 4.71 | | 0.93 | % |
Institutional Shares | | | 1,000.00 | | | 1,021.66 | | | 3.45 | | 0.68 | % |
Maryland Intermediate Tax-Free Fund | | | | | | | | | | | | |
Class A Shares | | | 1,000.00 | | | 1,020.76 | | | 4.36 | | 0.86 | % |
Institutional Shares | | | 1,000.00 | | | 1,022.06 | | | 3.04 | | 0.60 | % |
North Carolina Intermediate Tax-Free Fund | | | | | | | | | | | | |
Class A Shares | | | 1,000.00 | | | 1,020.61 | | | 4.51 | | 0.89 | % |
Institutional Shares | | | 1,000.00 | | | 1,021.86 | | | 3.24 | | 0.64 | % |
South Carolina Intermediate Tax-Free Fund | | | | | | | | | | | | |
Class A Shares | | | 1,000.00 | | | 1,020.41 | | | 4.71 | | 0.93 | % |
Institutional Shares | | | 1,000.00 | | | 1,021.66 | | | 3.45 | | 0.68 | % |
Virginia Intermediate Tax-Free Fund | | | | | | | | | | | | |
Class A Shares | | | 1,000.00 | | | 1,020.56 | | | 4.56 | | 0.90 | % |
Institutional Shares | | | 1,000.00 | | | 1,021.81 | | | 3.29 | | 0.65 | % |
West Virginia Intermediate Tax-Free Fund | | | | | | | | | | | | |
Class A Shares | | | 1,000.00 | | | 1,020.56 | | | 4.56 | | 0.90 | % |
Institutional Shares | | | 1,000.00 | | | 1,021.81 | | | 3.29 | | 0.65 | % |
Prime Money Market Fund | | | | | | | | | | | | |
Class A Shares | | | 1,000.00 | | | 1,020.21 | | | 4.91 | | 0.97 | % |
Class B Shares | | | 1,000.00 | | | 1,017.70 | | | 7.44 | | 1.47 | % |
Class C Shares | | | 1,000.00 | | | 1,017.70 | | | 7.44 | | 1.47 | % |
Institutional Shares | | | 1,000.00 | | | 1,022.71 | | | 2.38 | | 0.47 | % |
U.S. Treasury Money Market Fund | | | | | | | | | | | | |
Class A Shares | | | 1,000.00 | | | 1,020.36 | | | 4.76 | | 0.94 | % |
Class B Shares | | | 1,000.00 | | | 1,017.80 | | | 7.33 | | 1.45 | % |
Class C Shares | | | 1,000.00 | | | 1,017.85 | | | 7.28 | | 1.44 | % |
Institutional Shares | | | 1,000.00 | | | 1,022.81 | | | 2.28 | | 0.45 | % |
National Tax-Free Money Market Fund ** | | | | | | | | | | | | |
Class A Shares | | | 1,000.00 | | | 1,021.96 | | | 3.14 | | 0.62 | % |
Class B Shares | | | 1,000.00 | | | 1,018.10 | | | 7.03 | | 1.39 | % |
Class C Shares | | | 1,000.00 | | | 1,018.10 | | | 7.03 | | 1.39 | % |
Institutional Shares | | | 1,000.00 | | | 1,023.06 | | | 2.03 | | 0.40 | % |
Capital Manager Conservative Growth Fund | | | | | | | | | | | | |
Class A Shares | | | 1,000.00 | | | 1,023.41 | | | 1.67 | | 0.33 | % |
Class B Shares | | | 1,000.00 | | | 1,019.65 | | | 5.47 | | 1.08 | % |
Class C Shares | | | 1,000.00 | | | 1,019.65 | | | 5.47 | | 1.08 | % |
Institutional Shares | | | 1,000.00 | | | 1,024.67 | | | 0.41 | | 0.08 | % |
Capital Manager Moderate Growth Fund | | | | | | | | | | | | |
Class A Shares | | | 1,000.00 | | | 1,023.31 | | | 1.78 | | 0.35 | % |
Class B Shares | | | 1,000.00 | | | 1,019.55 | | | 5.57 | | 1.10 | % |
Class C Shares | | | 1,000.00 | | | 1,019.55 | | | 5.57 | | 1.10 | % |
Institutional Shares | | | 1,000.00 | | | 1,024.57 | | | 0.51 | | 0.10 | % |
Capital Manager Growth Fund | | | | | | | | | | | | |
Class A Shares | | | 1,000.00 | | | 1,023.26 | | | 1.83 | | 0.36 | % |
Class B Shares | | | 1,000.00 | | | 1,019.50 | | | 5.62 | | 1.11 | % |
Class C Shares | | | 1,000.00 | | | 1,019.50 | | | 5.62 | | 1.11 | % |
Institutional Shares | | | 1,000.00 | | | 1,024.52 | | | 0.56 | | 0.11 | % |
Capital Manager Equity Fund | | | | | | | | | | | | |
Class A Shares | | | 1,000.00 | | | 1,023.26 | | | 1.83 | | 0.36 | % |
Class B Shares | | | 1,000.00 | | | 1,019.50 | | | 5.62 | | 1.11 | % |
Class C Shares | | | 1,000.00 | | | 1,019.50 | | | 5.62 | | 1.11 | % |
Institutional Shares | | | 1,000.00 | | | 1,024.52 | | | 0.56 | | 0.11 | % |
| * | Expenses are equal to the average account value over the period multiplied by the Fund’s annualized expense ratio, multiplied by the number of days in the most recent fiscal half-year divided by the number of days in the fiscal year (to reflect the one-half year period). |
| ** | Information shown reflects values using the expense ratios for the period from August 1, 2006 (date of commencement of operations) to September 30, 2006 and has been adjusted to reflect values for the period from April 1, 2006 through September 30, 2006. |
49
Large Cap Fund
Schedule of Portfolio Investments | September 30, 2006 |
| | | | | |
| | | Shares | |
Fair
Value |
Common Stocks (94.7%) | | | | | |
Consumer Discretionary (11.7%) | | | | | |
Gannett Co., Inc. (b) | | 282,000 | | $ | 16,026,060 |
Mattel, Inc. | | 434,800 | | | 8,565,560 |
Target Corp. (b) | | 168,111 | | | 9,288,133 |
Tiffany & Co. (b) | | 706,381 | | | 23,451,848 |
V.F. Corp. | | 103,250 | | | 7,532,088 |
Walt Disney Co. (The) | | 650,000 | | | 20,091,500 |
| | | | | |
| | | | | 84,955,189 |
| | | | | |
Consumer Staples (5.2%) | | | | | |
Altria Group, Inc. | | 138,590 | | | 10,609,065 |
Kimberly-Clark Corp. (b) | | 276,500 | | | 18,072,039 |
Sara Lee Corp. | | 568,010 | | | 9,127,921 |
| | | | | |
| | | | | 37,809,025 |
| | | | | |
Energy (11.0%) | | | | | |
Anadarko Petroleum Corp. (b) | | 219,000 | | | 9,598,770 |
ChevronTexaco Corp. | | 329,460 | | | 21,368,776 |
ConocoPhillips | | 265,347 | | | 15,796,107 |
Duke Energy Corp. (b) | | 242,000 | | | 7,308,400 |
Exxon Mobil Corp. (b) | | 290,000 | | | 19,459,000 |
Schlumberger, Ltd. (b) | | 96,000 | | | 5,954,880 |
| | | | | |
| | | | | 79,485,933 |
| | | | | |
Financials (21.8%) | | | | | |
AMBAC Financial Group, Inc. | | 93,100 | | | 7,704,025 |
American International Group, Inc. | | 182,000 | | | 12,059,320 |
Bank of New York Co., Inc. (The) | | 250,000 | | | 8,815,000 |
CitiGroup, Inc. | | 405,666 | | | 20,149,430 |
Fannie Mae (b) | | 206,000 | | | 11,517,460 |
JPMorgan Chase & Co. | | 507,772 | | | 23,844,973 |
Lincoln National Corp. | | 118,600 | | | 7,362,688 |
Merrill Lynch & Co., Inc. (b) | | 190,000 | | | 14,861,800 |
Northern Trust Corp. (b) | | 257,718 | | | 15,058,463 |
St. Paul Travelers Cos., Inc. (The) | | 298,500 | | | 13,996,665 |
Washington Mutual, Inc. (b) | | 318,000 | | | 13,823,460 |
Wells Fargo & Co. | | 217,600 | | | 7,872,768 |
| | | | | |
| | | | | 157,066,052 |
| | | | | |
Health Care (14.5%) | | | | | |
Abbott Laboratories | | 186,000 | | | 9,032,160 |
Amgen, Inc. (a) (b) | | 312,984 | | | 22,387,745 |
Bristol-Myers Squibb Co. | | 233,080 | | | 5,808,354 |
Johnson & Johnson | | 285,806 | | | 18,560,242 |
Merck & Co., Inc. (b) | | 507,821 | | | 21,277,699 |
Pfizer, Inc. | | 724,402 | | | 20,544,041 |
Wyeth | | 145,000 | | | 7,371,800 |
| | | | | |
| | | | | 104,982,041 |
| | | | | |
Industrials (3.3%) | | | | | |
Emerson Electric Co. (The) | | 41,370 | | | 3,469,288 |
General Electric Co. | | 105,000 | | | 3,706,500 |
Parker-Hannifin Corp. | | 117,000 | | | 9,094,410 |
Pitney Bowes, Inc. (b) | | 176,800 | | | 7,844,616 |
| | | | | |
| | | | | 24,114,814 |
| | | | | |
Information Technology (14.1%) | | | | | |
Automatic Data Processing, Inc. | | 142,400 | | | 6,741,216 |
Cisco Systems, Inc. (a) (b) | | 1,046,516 | | | 24,069,868 |
Dell, Inc. (a) (b) | | 844,202 | | | 19,281,574 |
| | | | | | | |
| | | Shares or
Principal
Amount | | Fair
Value | |
Common Stocks, continued | | | | | | | |
Information Technology, continued | | | | | | | |
First Data Corp. | | | 152,000 | | $ | 6,384,000 | |
Intel Corp. | | | 1,407,693 | | | 28,956,245 | |
Microsoft Corp. | | | 243,000 | | | 6,641,190 | |
Time Warner, Inc. | | | 564,000 | | | 10,281,720 | |
| | | | | | | |
| | | | | | 102,355,813 | |
| | | | | | | |
Materials (3.7%) | | | | | | | |
Air Products & Chemicals, Inc. | | | 129,700 | | | 8,608,189 | |
Alcoa, Inc. | | | 252,000 | | | 7,066,080 | |
Weyerhaeuser Co. (b) | | | 186,500 | | | 11,475,345 | |
| | | | | | | |
| | | | | | 27,149,614 | |
| | | | | | | |
Telecommunication Services (6.6%) | | | | | | | |
AT&T, Inc. (b) | | | 421,837 | | | 13,735,013 | |
BellSouth Corp. | | | 180,000 | | | 7,695,000 | |
Nokia Corp., ADR (b) | | | 550,000 | | | 10,829,500 | |
Verizon Communications, Inc. | | | 427,000 | | | 15,854,510 | |
| | | | | | | |
| | | | | | 48,114,023 | |
| | | | | | | |
Utilities (2.8%) | | | | | | | |
NiSource, Inc. (b) | | | 538,100 | | | 11,698,294 | |
SCANA Corp. (b) | | | 87,467 | | | 3,522,296 | |
Xcel Energy, Inc. | | | 231,275 | | | 4,775,829 | |
| | | | | | | |
| | | | | | 19,996,419 | |
Total Common Stocks
(Cost $525,464,176) | | | | | | 686,028,923 | |
| | | | | | | |
Warrant (0.0%) | | | | | | | |
Raytheon Co. (a) | | | 7,110 | | | 101,460 | |
| | | | | | | |
Total Warrant (Cost $0) | | | | | | 101,460 | |
| | | | | | | |
Repurchase Agreement (5.3%) | | | | | | | |
U.S. Bank N.A., 5.05%, dated 9/29/06, maturing 10/2/06, with a maturity value of $38,421,643 (Collateralized fully by U.S. Government Agencies) | | $ | 38,405,481 | | | 38,405,481 | |
| | | | | | | |
Total Repurchase Agreement
(Cost $38,405,481) | | | | | | 38,405,481 | |
| | | | | | | |
Securities Held as Collateral for Securities on Loan (17.5%) | | | | | | | |
Pool of Various Securities for BB&T Funds — Note 2 — Security Loans | | | 126,591,112 | | | 126,591,112 | |
| | | | | | | |
Total Securities Held as Collateral for Securities on Loan
(Cost $126,591,112) | | | | | | 126,591,112 | |
| | | | | | | |
Total Investments
(Cost $690,460,769) — 117.5% | | | | | | 851,126,976 | |
Net other assets (liabilities) — (17.5)% | | | | | | (126,835,316 | ) |
| | | | | | | |
Net Assets — 100.0% | | | | | $ | 724,291,660 | |
| | | | | | | |
See page 86 for footnote legend to the Schedules of Portfolio Investments.
See accompanying notes to the financial statements.
50
Large Cap Growth Fund
Schedule of Portfolio Investments | September 30, 2006 |
| | | | | |
| | | Shares | |
Fair
Value |
Common Stocks (91.3%) | | | | | |
Consumer Discretionary (12.6%) | | | | | |
American Eagle Outfitters, Inc. (b) | | 65,600 | | $ | 2,875,248 |
Best Buy , Inc. (b) | | 59,800 | | | 3,202,888 |
Coach, Inc. (a) (b) | | 113,100 | | | 3,890,640 |
Comcast Corp., Class A (a) (b) | | 98,800 | | | 3,640,780 |
Federated Department Stores, Inc. (b) | | 68,200 | | | 2,946,922 |
Hilton Hotels Corp. (b) | | 120,900 | | | 3,367,065 |
J. C. Penney, Inc. (b) | | 42,200 | | | 2,886,058 |
Polo Ralph Lauren Corp. | | 38,300 | | | 2,477,627 |
Starbucks Corp. (a) (b) | | 93,600 | | | 3,187,080 |
| | | | | |
| | | | | 28,474,308 |
| | | | | |
Consumer Staples (6.3%) | | | | | |
Archer-Daniels-Midland Co. | | 85,800 | | | 3,250,104 |
Fomento Economico Mexicano SA, ADR | | 29,900 | | | 2,898,506 |
Hansen Natural Corp. (a) (b) | | 85,100 | | | 2,764,048 |
PepsiCo, Inc. | | 43,500 | | | 2,838,810 |
Procter & Gamble Co. | | 39,600 | | | 2,454,408 |
| | | | | |
| | | | | 14,205,876 |
| | | | | |
Energy (3.6%) | | | | | |
Cameco Corp. (b) | | 81,900 | | | 2,995,083 |
McDermott International, Inc. (a) | | 66,300 | | | 2,771,340 |
Schlumberger Ltd. (b) | | 39,600 | | | 2,456,388 |
| | | | | |
| | | | | 8,222,811 |
| | | | | |
Financials (9.4%) | | | | | |
Affiliated Managers Group, Inc. (a) (b) | | 33,800 | | | 3,383,718 |
American International Group, Inc. | | 39,300 | | | 2,604,018 |
Bear Stearns Cos., Inc. (The) (b) | | 18,200 | | | 2,549,820 |
Charles Schwab Corp. (The) (b) | | 139,700 | | | 2,500,630 |
Chicago Mercantile Exchange Holdings,
Inc. (b) | | 7,400 | | | 3,539,050 |
Goldman Sachs Group, Inc. (The) (b) | | 20,000 | | | 3,383,400 |
Merrill Lynch & Co., Inc. | | 43,000 | | | 3,363,460 |
| | | | | |
| | | | | 21,324,096 |
| | | | | |
Health Care (18.5%) | | | | | |
AmerisourceBergen Corp. (b) | | 52,600 | | | 2,377,520 |
Amgen, Inc. (a) (b) | | 31,762 | | | 2,271,936 |
Amylin Pharmaceuticals, Inc. (a) (b) | | 72,800 | | | 3,208,296 |
Celgene Corp. (a) (b) | | 80,600 | | | 3,489,980 |
Fisher Scientific International, Inc. (a) | | 33,100 | | | 2,589,744 |
Genentech, Inc. (a) (b) | | 29,900 | | | 2,472,730 |
Gilead Sciences, Inc. (a) | | 53,000 | | | 3,641,100 |
Humana, Inc. (a) | | 65,600 | | | 4,335,504 |
Medco Health Solutions, Inc. (a) | | 37,500 | | | 2,254,125 |
Novartis AG, ADR | | 74,100 | | | 4,330,404 |
Schering-Plough Corp. | | 104,000 | | | 2,297,360 |
Stericycle, Inc. (a) (b) | | 41,900 | | | 2,924,201 |
Wellpoint, Inc. (a) | | 29,200 | | | 2,249,860 |
Wyeth | | 64,700 | | | 3,289,348 |
| | | | | |
| | | | | 41,732,108 |
| | | | | |
Industrials (7.7%) | | | | | |
Danaher Corp. (b) | | 53,481 | | | 3,672,540 |
FedEx Corp. | | 23,812 | | | 2,587,888 |
General Electric Co. | | 68,200 | | | 2,407,460 |
Monster Worldwide, Inc. (a) | | 76,000 | | | 2,750,440 |
Precision Castparts Corp. (b) | | 39,000 | | | 2,463,240 |
United Technologies Corp. | | 56,500 | | | 3,579,275 |
| | | | | |
| | | | | 17,460,843 |
| | | | | |
| | | | | | | |
| | | Shares or
Principal
Amount | | Fair
Value | |
Common Stocks, continued | | | | | | | |
Information Technology (24.6%) | | | | | | | |
Advanced Micro Devices, Inc. (a) (b) | | | 91,000 | | $ | 2,261,350 | |
Agilent Technologies, Inc. (a) | | | 68,900 | | | 2,252,341 | |
Akamai Technologies, Inc. (a) (b) | | | 75,000 | | | 3,749,250 | |
Amphenol Corp., Class A (b) | | | 74,700 | | | 4,626,171 | |
Apple Computer, Inc. (a) (b) | | | 49,400 | | | 3,805,282 | |
Cisco Systems, Inc. (a) | | | 112,400 | | | 2,585,200 | |
Cognizant Technology Solutions Corp., Class A (a) | | | 47,800 | | | 3,540,068 | |
Google, Inc. (a) (b) | | | 6,800 | | | 2,732,920 | |
Hewlett-Packard Co. | | | 123,000 | | | 4,512,870 | |
MEMC Electronic Materials, Inc. (a) (b) | | | 100,100 | | | 3,666,663 | |
Micron Technology, Inc. (a) (b) | | | 245,000 | | | 4,263,000 | |
Microsoft Corp. | | | 128,000 | | | 3,498,240 | |
Motorola, Inc. | | | 143,000 | | | 3,575,000 | |
Nokia Corp., ADR | | | 160,500 | | | 3,160,245 | |
Oracle Corp. (a) (b) | | | 291,200 | | | 5,165,889 | |
QUALCOMM, Inc. | | | 57,800 | | | 2,101,030 | |
| | | | | | | |
| | | | | | 55,495,519 | |
| | | | | | | |
Telecommunication Services (7.1%) | | | | | | | |
America Movil SA de CV, Series L, ADR (b) | | | 111,100 | | | 4,374,007 | |
American Tower Corp., Class A (a) (b) | | | 108,500 | | | 3,960,250 | |
AT&T, Inc. (b) | | | 94,600 | | | 3,080,176 | |
NII Holdings, Inc. (a) (b) | | | 72,800 | | | 4,525,248 | |
| | | | | | | |
| | | | | | 15,939,681 | |
| | | | | | | |
Utilities (1.5%) | | | | | | | |
FirstEnergy Corp. (b) | | | 29,900 | | | 1,670,214 | |
FPL Group, Inc. (b) | | | 37,700 | | | 1,696,500 | |
| | | | | | | |
| | | | | | 3,366,714 | |
| | | | | | | |
Total Common Stocks
(Cost $173,798,922) | | | | | | 206,221,956 | |
| | | | | | | |
Exchange Traded Funds (4.5%) | | | | | | | |
iShares Russell 1000 Growth Index Fund (b) | | | 195,000 | | | 10,171,200 | |
| | | | | | | |
Total Exchange Traded Funds
(Cost $9,911,034) | | | | | | 10,171,200 | |
| | | | | | | |
Repurchase Agreement (3.1%) | | | | | | | |
U.S. Bank N.A., 5.05%, dated 9/29/06, maturing 10/2/06, with a maturity value of $6,883,073 (Collateralized fully by U.S. Government Agencies) | | $ | 6,880,178 | | | 6,880,178 | |
| | | | | | | |
Total Repurchase Agreement
(Cost $6,880,178) | | | | | | 6,880,178 | |
| | | | | | | |
Securities Held as Collateral for Securities on Loan (44.7%) | | | | | | | |
Pool of Various Securities for BB&T Funds — Note 2 — Security Loans | | | 101,006,062 | | | 101,006,062 | |
| | | | | | | |
Total Securities Held as Collateral for Securities on Loan
(Cost $101,006,062) | | | | | | 101,006,062 | |
| | | | | | | |
Total Investments
(Cost $291,596,196) — 143.6% | | | | | | 324,279,396 | |
Net other assets (liabilities) — (43.6)% | | | | | | (98,443,084 | ) |
| | | | | | | |
Net Assets — 100.0% | | | | | $ | 225,836,312 | |
| | | | | | | |
See page 86 for footnote legend to the Schedules of Portfolio Investments.
See accompanying notes to the financial statements.
51
Mid Cap Value Fund
Schedule of Portfolio Investments | September 30, 2006 |
| | | | | |
| | | Shares | |
Fair
Value |
Common Stocks (94.7%) | | | | | |
Advertising (3.0%) | | | | | |
Interpublic Group of Cos., Inc. (a) (b) | | 701,550 | | $ | 6,945,345 |
| | | | | |
Computer Software (14.9%) | | | | | |
BMC Software, Inc. (a) (b) | | 226,650 | | | 6,169,413 |
CA, Inc. (b) | | 483,850 | | | 11,462,407 |
Computer Sciences Corp. (a) | | 129,150 | | | 6,343,848 |
CSG Systems International, Inc. (a) (b) | | 189,400 | | | 5,005,842 |
Progress Software Corp. (a) | | 202,550 | | | 5,266,300 |
| | | | | |
| | | | | 34,247,810 |
| | | | | |
Consumer Discretionary (11.9%) | | | | | |
Gannett Co., Inc. (b) | | 93,300 | | | 5,302,239 |
International Speedway Corp. | | 104,900 | | | 5,228,216 |
Kohl’s Corp. (a) (b) | | 150,350 | | | 9,760,722 |
Lexmark International, Inc. (a) (b) | | 116,900 | | | 6,740,454 |
Universal Technical Institute Inc. (a) | | 10,900 | | | 195,001 |
| | | | | |
| | | | | 27,226,632 |
| | | | | |
Energy (1.6%) | | | | | |
Forest Oil Corp. (a) (b) | | 117,600 | | | 3,714,984 |
| | | | | |
Financials (32.3%) | | | | | |
Annaly Mortgage Management, Inc., REIT | | 154,400 | | | 2,028,816 |
Aon Corp. (b) | | 154,050 | | | 5,217,674 |
Endurance Specialty Holdings, Ltd. | | 190,045 | | | 6,700,987 |
Fidelity National Financial, Inc. | | 179,300 | | | 7,467,844 |
Hudson City Bancorp, Inc. | | 105,750 | | | 1,401,188 |
KeyCorp (b) | | 128,050 | | | 4,794,192 |
Leucadia National Corp. | | 190,600 | | | 4,988,002 |
MBIA, Inc. (b) | | 73,550 | | | 4,518,912 |
Mercury General Corp. (b) | | 171,250 | | | 8,495,712 |
MoneyGram International, Inc. | | 82,450 | | | 2,395,997 |
Popular Inc. | | 168,600 | | | 3,277,584 |
Protective Life Corp. | | 74,350 | | | 3,401,513 |
StanCorp Financial Group, Inc. | | 193,350 | | | 8,629,210 |
Waddell and Reed Financial, Inc. | | 339,100 | | | 8,392,724 |
Washington Federal, Inc. | | 93,250 | | | 2,092,530 |
| | | | | |
| | | | | 73,802,885 |
| | | | | |
Health Care (7.2%) | | | | | |
King Pharmaceuticals, Inc. (a) (b) | | 204,900 | | | 3,489,447 |
Par Pharmaceutical Cos., Inc. (a) | | 122,400 | | | 2,232,576 |
STERIS Corp. | | 133,750 | | | 3,218,025 |
Watson Pharmaceuticals, Inc. (a) (b) | | 115,200 | | | 3,014,784 |
Zimmer Holdings, Inc. (a) (b) | | 67,900 | | | 4,583,250 |
| | | | | |
| | | | | 16,538,082 |
| | | | | |
| | | | | | | |
| | | Shares or
Principal
Amount | | Fair
Value | |
Common Stocks, continued | | | | | | | |
Industrials (11.4%) | | | | | | | |
Crane Co. | | | 144,100 | | $ | 6,023,380 | |
Leggett & Platt, Inc. | | | 328,325 | | | 8,217,975 | |
R.H. Donnelley Corp. (b) | | | 131,750 | | | 6,969,575 | |
Valspar Corp. | | | 186,250 | | | 4,954,250 | |
| | | | | | | |
| | | | | | 26,165,180 | |
| | | | | | | |
Information Technology (6.8%) | | | | | | | |
Affiliated Computer Services, Inc.,
Class A (a) | | | 40,600 | | | 2,105,516 | |
Polycom, Inc. (a) (b) | | | 177,150 | | | 4,345,490 | |
Serono SA, ADR (b) | | | 213,250 | | | 4,582,742 | |
Synopsys, Inc. (a) (b) | | | 225,450 | | | 4,445,874 | |
| | | | | | | |
| | | | | | 15,479,622 | |
| | | | | | | |
Telecommunication Services (5.6%) | | | | | | | |
Clear Channel Communications, Inc. (b) | | | 223,350 | | | 6,443,648 | |
Discovery Holding Co., Class A (a) (b) | | | 449,750 | | | 6,503,385 | |
| | | | | | | |
| | | | | | 12,947,034 | |
| | | | | | | |
Total Common Stocks (Cost $198,604,571) | | | | | | 217,067,574 | |
| | | | | | | |
Repurchase Agreement (5.8%) | | | | | | | |
U.S. Bank N.A., 5.05%, dated 9/29/06, maturing 10/2/06, with a maturity value of $13,185,650 (Collateralized fully by U.S. Government Agencies) | | $ | 13,180,103 | | | 13,180,103 | |
| | | | | | | |
Total Repurchase Agreement
(Cost $13,180,103) | | | | | | 13,180,103 | |
| | | | | | | |
Securities Held as Collateral for Securities on Loan (27.1%) | | | | | | | |
Pool of Various Securities for BB&T
Funds — Note 2 — Security Loans | | | 62,152,094 | | | 62,152,094 | |
| | | | | | | |
Total Securities Held as Collateral for Securities on Loan
(Cost $62,152,094) | | | | | | 62,152,094 | |
| | | | | | | |
Total Investments
(Cost $273,936,768) — 127.6% | | | | | | 292,399,771 | |
Net other assets (liabilities) — (27.6)% | | | | | | (63,188,741 | ) |
| | | | | | | |
Net Assets — 100.0% | | | | | $ | 229,211,030 | |
| | | | | | | |
See page 86 for footnote legend to the Schedules of Portfolio Investments.
See accompanying notes to the financial statements.
52
Mid Cap Growth Fund
Schedule of Portfolio Investments | September 30, 2006 |
| | | | | |
| | | Shares | |
Fair
Value |
Common Stocks (92.7%) | | | | | |
Consumer Discretionary (19.5%) | | | | | |
AnnTaylor Stores Corp. (a) (b) | | 55,000 | | $ | 2,302,300 |
Circuit City Stores, Inc. (b) | | 91,200 | | | 2,290,032 |
Coach, Inc. (a) (b) | | 85,000 | | | 2,924,000 |
Coldwater Creek, Inc. (a) | | 103,000 | | | 2,962,280 |
Crocs, Inc. (a) | | 66,000 | | | 2,240,700 |
Focus Media Holding, Ltd., ADR (a) | | 26,000 | | | 1,505,920 |
GameStop Corp., Class A (a) (b) | | 79,000 | | | 3,656,120 |
Guess?, Inc. (a) (b) | | 54,000 | | | 2,620,620 |
Hilton Hotels Corp. (b) | | 90,000 | | | 2,506,500 |
Nutri/System, Inc. (a) (b) | | 59,000 | | | 3,675,110 |
Tween Brands, Inc. (a) (b) | | 45,500 | | | 1,710,800 |
| | | | | |
| | | | | 28,394,382 |
| | | | | |
Consumer Staples (1.6%) | | | | | |
Corn Products International, Inc. | | 72,500 | | | 2,359,150 |
| | | | | |
Energy (4.4%) | | | | | |
Cameco Corp. (b) | | 56,000 | | | 2,047,920 |
Cameron International Corp. (a) (b) | | 32,000 | | | 1,545,920 |
McDermott International, Inc. (a) | | 35,500 | | | 1,483,900 |
TETRA Technologies, Inc. (a) | | 57,000 | | | 1,377,120 |
| | | | | |
| | | | | 6,454,860 |
| | | | | |
Financials (16.5%) | | | | | |
Affiliated Managers Group, Inc. (a) (b) | | 37,000 | | | 3,704,070 |
AllianceBernstein Holding L.P. | | 61,000 | | | 4,208,390 |
Amvescap PLC, ADR | | 100,000 | | | 2,192,000 |
Bear Stearns Cos., Inc. (The) (b) | | 11,600 | | | 1,625,160 |
Chicago Mercantile Exchange Holdings, Inc. (b) | | 4,900 | | | 2,343,425 |
Host Marriott Corp. (b) | | 95,000 | | | 2,178,350 |
International Securities Exchange | | 58,000 | | | 2,719,620 |
Holdings, Inc. (b) | | | | | |
Legg Mason, Inc. (b) | | 22,000 | | | 2,218,920 |
NASDAQ Stock Market, Inc. (a) | | 94,000 | | | 2,842,560 |
| | | | | |
| | | | | 24,032,495 |
| | | | | |
Health Care (14.4%) | | | | | |
Celgene Corp. (a) (b) | | 55,000 | | | 2,381,500 |
Covance, Inc. (a) | | 42,700 | | | 2,834,426 |
Express Scripts, Inc. (a) | | 14,200 | | | 1,071,958 |
Humana, Inc. (a) | | 55,000 | | | 3,634,950 |
Intuitive Surgical, Inc. (a) (b) | | 14,000 | | | 1,476,300 |
Medco Health Solutions, Inc. (a) (b) | | 19,200 | | | 1,154,112 |
Pharmaceutical Product Development, Inc. | | 61,000 | | | 2,177,090 |
ResMed, Inc. (a) (b) | | 37,500 | | | 1,509,375 |
Respironics, Inc. (a) | | 76,000 | | | 2,934,360 |
Wellcare Health Plans, Inc. (a) | | 30,500 | | | 1,727,215 |
| | | | | |
| | | | | 20,901,286 |
| | | | | |
Industrials (7.6%) | | | | | |
Corrections Corporation of America (a) | | 65,250 | | | 2,822,063 |
Gol-Linhas Aereas Inteligentes, ADR (b) | | 77,000 | | | 2,644,950 |
Manitowoc Company, Inc. | | 50,400 | | | 2,257,416 |
Precision Castparts Corp. | | 25,000 | | | 1,579,000 |
Tam SA ADR (a) | | 55,000 | | | 1,754,500 |
| | | | | |
| | | | | 11,057,929 |
| | | | | |
| | | | | | | |
| | | Shares or
Principal
Amount | | Fair
Value | |
Common Stocks, continued | | | | | | | |
Information Technology (19.9%) | | | | | | | |
Activision, Inc. (a) | | | 146,000 | | $ | 2,204,600 | |
Amdocs, Ltd. (a) | | | 64,000 | | | 2,534,400 | |
Amphenol Corp., Class A (b) | | | 49,000 | | | 3,034,570 | |
Anixter International, Inc. (b) | | | 38,000 | | | 2,145,860 | |
Cognizant Technology Solutions Corp., Class A (a) | | | 37,000 | | | 2,740,220 | |
Harris Corp. (b) | | | 46,500 | | | 2,068,784 | |
MEMC Electronic Materials, Inc. (a) (b) | | | 65,000 | | | 2,380,950 | |
Micron Technology, Inc. (a) (b) | | | 159,000 | | | 2,766,600 | |
MICROS Systems, Inc. (a) | | | 44,000 | | | 2,152,480 | |
Spansion, Inc., Class A (a) (b) | | | 145,000 | | | 2,417,150 | |
THQ Inc. (a) (b) | | | 76,000 | | | 2,216,920 | |
Varian Semiconductor Equipment Associates, Inc. (a) | | | 60,000 | | | 2,202,000 | |
| | | | | | | |
| | | | | | 28,864,534 | |
| | | | | | | |
Materials (2.3%) | | | | | | | |
Airgas, Inc. | | | 44,000 | | | 1,591,480 | |
Titanium Metals Corp. (a) | | | 67,000 | | | 1,693,760 | |
| | | | | | | |
| | | | | | 3,285,240 | |
| | | | | | | |
Telecommunication Services (4.8%) | | | | | | | |
American Tower Corp., Class A (a) (b) | | | 85,000 | | | 3,102,500 | |
NII Holdings, Inc. (a) (b) | | | 63,000 | | | 3,916,080 | |
| | | | | | | |
| | | | | | 7,018,580 | |
| | | | | | | |
Utilities (1.7%) | | | | | | | |
Allegheny Energy, Inc. (a) | | | 62,000 | | | 2,490,540 | |
| | | | | | | |
Total Common Stocks
(Cost $114,009,190) | | | | | | 134,858,996 | |
| | | | | | | |
Exchange Traded Funds (4.0%) | | | | | | | |
iShares Russell Midcap Growth Index Fund (b) | | | 60,000 | | | 5,791,800 | |
| | | | | | | |
Total Exchange Traded Funds
(Cost $5,683,253) | | | | | | 5,791,800 | |
| | | | | | | |
Repurchase Agreement (1.2%) | | | | | | | |
U.S. Bank N.A. 5.05%, dated 9/29/06, maturing 10/2/06, with a maturity value of $1,779,035 (Collateralized fully by U.S. Government Agencies) | | $ | 1,778,287 | | | 1,778,287 | |
| | | | | | | |
Total Repurchase Agreement
(Cost $1,778,287) | | | | | | 1,778,287 | |
| | | | | | | |
Securities Held as Collateral for Securities on Loan (38.3%) | | | | | | | |
Pool of Various Securities for BB&T Funds — Note 2 — Security Loans | | | 55,773,608 | | | 55,773,608 | |
| | | | | | | |
Total Securities Held as Collateral for Securities on Loan (Cost $55,773,608) | | | | | | 55,773,608 | |
| | | | | | | |
Total Investments
(Cost $177,244,338) — 136.2% | | | | | | 198,202,691 | |
Net other assets (liabilities) — (36.2)% | | | | | | (52,734,846 | ) |
| | | | | | | |
Net Assets — 100.0% | | | | | | 145,467,845 | |
| | | | | | | |
See page 86 for footnote legend to the Schedules of Portfolio Investments.
See accompanying notes to the financial statements.
53
Small Cap Fund
Schedule of Portfolio Investments | September 30, 2006 |
| | | | | |
| | | Shares | | Fair Value |
Common Stocks (88.4%) | | | | | |
Consumer Discretionary (13.7%) | | | | | |
BorgWarner, Inc. (b) | | 12,220 | | $ | 698,617 |
CEC Entertainment, Inc. (a) | | 37,287 | | | 1,174,913 |
Charlotte Russe Holding, Inc. (a) | | 53,900 | | | 1,484,406 |
Deb Shops, Inc. | | 24,684 | | | 632,898 |
Emmis Communication Corp., Class A (a) | | 95,300 | | | 1,167,425 |
Hartmarx Corp. (a) | | 233,176 | | | 1,578,602 |
Jos. A. Bank Clothiers, Inc. (a) (b) | | 32,304 | | | 967,828 |
Lone Star Steakhouse & Saloon, Inc. | | 12,200 | | | 338,794 |
M.D.C. Holdings, Inc. (b) | | 12,610 | | | 585,735 |
Michaels Stores, Inc. | | 4,554 | | | 198,281 |
P.F. Chang’s China Bistro, Inc. (a) (b) | | 75,200 | | | 2,610,192 |
Polaris Industries, Inc. (b) | | 37,016 | | | 1,523,208 |
Stanley Furniture Co., Inc. | | 49,673 | | | 1,058,532 |
Steak n Shake Co. (The) (a) (b) | | 124,600 | | | 2,104,494 |
Strattec Security Corp. (a) | | 12,407 | | | 474,816 |
Zale Corp. (a) | | 16,896 | | | 468,695 |
| | | | | |
| | | | | 17,067,436 |
| | | | | |
Consumer Staples (1.7%) | | | | | |
Inter Parfums, Inc. | | 66,600 | | | 1,268,064 |
Sanderson Farms, Inc. (b) | | 26,600 | | | 860,776 |
| | | | | |
| | | | | 2,128,840 |
| | | | | |
Energy (5.6%) | | | | | |
Berry Petroleum Co., Class A (b) | | 19,536 | | | 550,134 |
Cabot Oil & Gas Corp. | | 7,366 | | | 353,052 |
Forest Oil Corp. (a) | | 39,106 | | | 1,235,359 |
Oceaneering International, Inc. (a) | | 15,224 | | | 468,899 |
Oil States International, Inc. (a) (b) | | 41,119 | | | 1,130,773 |
Pioneer Drilling Co. (a) (b) | | 154,111 | | | 1,978,784 |
Teekay Shipping Corp. | | 29,732 | | | 1,222,283 |
| | | | | |
| | | | | 6,939,284 |
| | | | | |
Financials (15.7%) | | | | | |
AmerUs Group Co. (b) | | 11,248 | | | 764,976 |
Assured Guaranty, Ltd. | | 35,800 | | | 928,294 |
BRE Properties, Inc., Class A, REIT (b) | | 10,270 | | | 613,427 |
CNA Surety Corp. (a) | | 44,035 | | | 889,507 |
Colonial BancGroup, Inc. | | 50,260 | | | 1,231,370 |
Dime Community Bancshares | | 86,432 | | | 1,273,143 |
First State Bancorp | | 23,324 | | | 605,724 |
Heritage Property Investment Trust, REIT (b) | | 13,480 | | | 491,481 |
Hilb, Rogal & Hobbs Co. (b) | | 32,692 | | | 1,394,314 |
Hub International, Ltd. | | 24,676 | | | 713,630 |
InnKeepers USA Trust, REIT (b) | | 68,492 | | | 1,115,735 |
Investment Technology Group, Inc. (a) | | 13,710 | | | 613,523 |
Midland Co. (The) | | 17,542 | | | 759,919 |
NewAlliance Bancshares, Inc. (b) | | 120,706 | | | 1,768,344 |
Peoples Bancorp, Inc. | | 24,834 | | | 725,898 |
Phoenix Cos., Inc. (The) | | 76,680 | | | 1,073,520 |
Protective Life Corp. | | 10,982 | | | 502,427 |
Stewart Information Services Corp. | | 36,124 | | | 1,256,031 |
Triad Guaranty, Inc. (a) | | 27,920 | | | 1,428,666 |
Wintrust Financial Corp. | | 26,675 | | | 1,337,751 |
| | | | | |
| | | | | 19,487,680 |
| | | | | |
Health Care (3.6%) | | | | | |
American Medical Systems Holdings, Inc. (a) (b) | | 110,100 | | | 2,029,143 |
Greatbatch, Inc. (a) | | 49,000 | | | 1,108,380 |
| | | | | |
| | | Shares | | Fair Value |
Common Stocks, continued | | | | | |
Health Care, continued | | | | | |
Owens & Minor, Inc. | | 13,843 | | $ | 455,296 |
Pediatrix Medical Group, Inc. (a) | | 9,368 | | | 427,181 |
West Pharmaceutical Services, Inc. | | 10,000 | | | 392,700 |
| | | | | |
| | | | | 4,412,700 |
| | | | | |
Industrials (20.4%) | | | | | |
Briggs & Stratton Corp. (b) | | 50,624 | | | 1,394,691 |
Curtiss-Wright Corp. (b) | | 46,280 | | | 1,404,598 |
Esterline Technologies Corp. (a) | | 62,700 | | | 2,116,752 |
Gardner Denver, Inc. (a) | | 36,480 | | | 1,206,758 |
Genlyte Group, Inc. (a) (b) | | 15,440 | | | 1,099,328 |
Gorman-Rupp Co. | | 29,563 | | | 966,710 |
Granite Construction, Inc. | | 10,260 | | | 547,371 |
Kaydon Corp. (b) | | 41,355 | | | 1,530,962 |
LaBarge, Inc. (a) | | 226,848 | | | 2,359,219 |
Moog, Inc., Class A (a) | | 52,680 | | | 1,825,889 |
Mueller Industries, Inc. (b) | | 30,635 | | | 1,077,433 |
Navigant Consulting Co. (a) | | 50,257 | | | 1,008,155 |
Oshkosh Truck Corp. | | 40,540 | | | 2,046,054 |
Regal-Beloit Corp. | | 46,738 | | | 2,033,103 |
TBS International, Ltd., Class A (a) | | 108,448 | | | 830,712 |
Universal Forest Products, Inc. (b) | | 18,984 | | | 931,165 |
Watson Wyatt Worldwide, Inc., Class A (b) | | 30,800 | | | 1,260,336 |
Woodward Governor Co. (b) | | 48,740 | | | 1,634,740 |
| | | | | |
| | | | | 25,273,976 |
| | | | | |
Information Technology (21.0%) | | | | | |
Avocent Corp (a) | | 92,900 | | | 2,798,148 |
Commscope, Inc. (a) (b) | | 16,700 | | | 548,762 |
Comtech Telecommunications Corp. (a) (b) | | 77,873 | | | 2,607,188 |
Exar Corp. (a) | | 171,259 | | | 2,276,032 |
Imation Corp. (b) | | 44,855 | | | 1,800,928 |
Intersil Corp., Class A | | 13,630 | | | 334,617 |
Ixia (a) (b) | | 323,863 | | | 2,885,619 |
j2 Global Communications, Inc. (a) (b) | | 33,400 | | | 907,478 |
KEMET Corp. (a) | | 95,688 | | | 772,202 |
Kronos, Inc. (a) | | 107,500 | | | 3,664,676 |
M-Systems Flash Disk Pioneers, Ltd. (a) (b) | | 12,500 | | | 503,000 |
Perot Systems Corp., Class A (a) | | 122,600 | | | 1,690,654 |
Richardson Electronics, Ltd. | | 166,283 | | | 1,501,535 |
Rimage Corp. (a) | | 48,585 | | | 1,089,276 |
TNS, Inc. (a) (b) | | 86,300 | | | 1,299,678 |
Varian Semiconductor Equipment Associates, Inc. (a) (b) | | 25,500 | | | 935,850 |
ViaSat, Inc. (a) | | 20,000 | | | 501,600 |
| | | | | |
| | | | | 26,117,243 |
| | | | | |
Materials (4.3%) | | | | | |
Gibraltar Industries, Inc. | | 62,427 | | | 1,384,631 |
Glatfelter (b) | | 62,445 | | | 846,130 |
IAMGOLD Corp. (b) | | 60,000 | | | 509,400 |
Minerals Technologies, Inc. (b) | | 26,915 | | | 1,437,260 |
Sensient Technologies Corp. | | 15,500 | | | 303,335 |
Spartech Corp. (b) | | 32,740 | | | 876,450 |
| | | | | |
| | | | | 5,357,206 |
| | | | | |
Utilities (2.4%) | | | | | |
AGL Resources, Inc. (b) | | 19,710 | | | 719,415 |
Empire District Electric Co. (The) (b) | | 29,760 | | | 666,029 |
Laclede Group, Inc. (The) | | 14,368 | | | 460,925 |
Continued
54
Small Cap Fund
Schedule of Portfolio Investments, continued | September 30, 2006 |
| | | | | | |
| | | Shares or
Principal
Amount | | Fair Value |
Common Stocks, continued | | | | | | |
Utilities, continued | | | | | | |
Nicor, Inc. (b) | | | 9,230 | | $ | 394,675 |
UIL Holdings Corp. | | | 19,776 | | | 741,600 |
| | | | | | |
| | | | | | 2,982,644 |
| | | | | | |
Total Common Stocks
(Cost $96,419,005) | | | | | | 109,767,009 |
| | | | | | |
Corporate Bonds (0.1%) | | | | | | |
Industrials (0.1%) | | | | | | |
Mueller Industries, Inc., 6.00%, 11/1/14 | | $ | 175,000 | | | 161,000 |
| | | | | | |
Total Corporate Bonds
(Cost $175,000) | | | | | | 161,000 |
| | | | | | |
Exchange Traded Funds (4.2%) | | | | | | |
iShares Russell 2000 Growth Index Fund (b) | | | 10,600 | | | 766,698 |
iShares Russell 2000 Index Fund (a) (b) | | | 42,500 | | | 3,058,725 |
iShares S&P SmallCap 600 Index Fund | | | 11,600 | | | 711,892 |
iShares S&P SmallCap 600 Growth Index Fund (b) | | | 5,800 | | | 693,100 |
| | | | | | |
Total Exchange Traded Funds
(Cost $5,025,632) | | | | | | 5,230,415 |
| | | | | | |
| | | | | | | |
| | |
Principal
Amount | | Fair Value | |
Repurchase Agreement (7.2%) | | | | | | | |
U.S. Bank N.A., 5.05%, dated 9/29/06, maturing 10/2/06, with a maturity value of $8,941,721 (Collateralized fully by U.S. Government Agencies) | | $ | 8,937,960 | | $ | 8,937,960 | |
| | | | | | | |
Total Repurchase Agreement
(Cost $8,937,960) | | | | | | 8,937,960 | |
| | | | | | | |
Securities Held as Collateral for Securities on Loan (23.2%) | | | | | | | |
Pool of Various Securities for BB&T Funds — Note 2 — Security Loans | | | 28,786,261 | | | 28,786,261 | |
| | | | | | | |
Total Securities Held as Collateral for Securities on Loan (Cost $28,786,261) | | | | | | 28,786,261 | |
| | | | | | | |
Total Investments
(Cost $139,343,858) — 123.1% | | | | | | 152,882,645 | |
Net other assets (liabilities) — (23.1)% | | | | | | (28,696,778 | ) |
| | | | | | | |
Net Assets — 100.0% | | | | | $ | 124,185,867 | |
| | | | | | | |
See page 86 for footnote legend to the Schedules of Portfolio Investments.
See accompanying notes to the financial statements.
55
International Equity Fund
Schedule of Portfolio Investments | September 30, 2006 |
| | | | | |
| | | Shares | | Fair
Value |
Common Stocks (95.1%) | | | | | |
Australia (2.9%) | | | | | |
Banks (0.8%) | | | | | |
National Australia Bank, Ltd. | | 76,288 | | $ | 2,086,111 |
| | | | | |
Property & Causulty Insurance (1.1%) | | | | | |
QBE Insurance Group, Ltd. | | 163,663 | | | 2,987,664 |
| | | | | |
Transportation (1.0%) | | | | | |
Qantas Airways, Ltd. | | 889,400 | | | 2,591,129 |
| | | | | |
| | | | | 7,664,904 |
| | | | | |
Austria (0.4%) | | | | | |
Telecommunications (0.4%) | | | | | |
Telekom Austria AG | | 45,628 | | | 1,151,243 |
| | | | | |
Belgium (1.5%) | | | | | |
Banking & Insurance Services (1.1%) | | | | | |
KBC Groep SA | | 27,203 | | | 2,864,436 |
| | | | | |
Chemicals (0.4%) | | | | | |
Solvay SA | | 8,401 | | | 1,086,460 |
| | | | | |
| | | | | 3,950,896 |
| | | | | |
Finland (1.6%) | | | | | |
Paper & Related Products (1.0%) | | | | | |
UPM — Kymmene, Oyj | | 106,100 | | | 2,520,969 |
| | | | | |
Telecommunications (0.6%) | | | | | |
Nokia OYJ | | 77,650 | | | 1,541,757 |
| | | | | |
| | | | | 4,062,726 |
| | | | | |
France (7.6%) | | | | | |
Insurance (1.7%) | | | | | |
Axa | | 118,475 | | | 4,368,213 |
| | | | | |
Oil & Gas (2.4%) | | | | | |
Total SA | | 95,046 | | | 6,236,297 |
| | | | | |
Pharmaceuticals (1.2%) | | | | | |
Sanofi-Aventis SA | | 36,375 | | | 3,237,597 |
| | | | | |
Real Estate (0.5%) | | | | | |
Unibail | | 5,624 | | | 1,181,546 |
| | | | | |
Telecommunications (1.8%) | | | | | |
France Telecom SA | | 207,619 | | | 4,764,621 |
| | | | | |
| | | | | 19,788,274 |
| | | | | |
Germany (7.4%) | | | | | |
Automobiles & Trucks (0.5%) | | | | | |
Bayerische Motoren Werke AG | | 23,422 | | | 1,255,275 |
| | | | | |
Banking & Finance (1.5%) | | | | | |
Deutsche Postbank AG | | 37,403 | | | 2,839,689 |
IKB Deutsche Industriebank AG | | 33,699 | | | 1,178,403 |
| | | | | |
| | | | | 4,018,092 |
| | | | | |
Diversified Products (0.5%) | | | | | |
Siemens AG | | 13,519 | | | 1,179,448 |
| | | | | |
Electric Utilities (1.5%) | | | | | |
E.On AG | | 33,389 | | | 3,967,090 |
| | | | | |
Insurance (0.3%) | | | | | |
Hannover Rueckversicherungs AG (a) | | 16,304 | | | 685,475 |
| | | | | |
Insurance-Multi-Line (2.0%) | | | | | |
Allianz AG | | 29,242 | | | 5,060,095 |
| | | | | |
Manufacturing (0.4%) | | | | | |
Man AG | | 13,026 | | | 1,100,433 |
| | | | | |
| | | | | |
| | | Shares | | Fair
Value |
Common Stocks, continued | | | | | |
Germany, continued | | | | | |
Retail (0.6%) | | | | | |
Metro AG | | 27,792 | | $ | 1,621,268 |
| | | | | |
Telecommunications (0.1%) | | | | | |
Premiere AG (a) | | 19,316 | | | 255,927 |
| | | | | |
| | | | | 19,143,103 |
| | | | | |
Great Britain (22.4%) | | | | | |
Advertising/Marketing (0.4%) | | | | | |
WPP Group PLC | | 93,182 | | | 1,154,832 |
| | | | | |
Banks (4.9%) | | | | | |
Barclays PLC | | 510,815 | | | 6,445,434 |
Royal Bank of Scotland Group PLC | | 177,779 | | | 6,120,555 |
| | | | | |
| | | | | 12,565,989 |
| | | | | |
Beverages — Wine & Spirits (2.2%) | | | | | |
Cadbury Schweppes PLC | | 122,336 | | | 1,302,007 |
Diageo PLC | | 246,618 | | | 4,356,075 |
| | | | | |
| | | | | 5,658,082 |
| | | | | |
Building & Construction (0.3%) | | | | | |
Balfour Beatty PLC | | 95,013 | | | 732,395 |
| | | | | |
Distribution/Wholesale (0.9%) | | | | | |
Wolseley PLC | | 113,178 | | | 2,385,773 |
| | | | | |
Diversified Operations/Commercial (0.2%) | | | | | |
Rentokil Initial PLC | | 198,694 | | | 544,943 |
| | | | | |
Electric — Distribution (0.6%) | | | | | |
Scottish & Southern Energy PLC | | 62,100 | | | 1,532,271 |
| | | | | |
Insurance (1.8%) | | | | | |
Prudential Corp. PLC | | 383,033 | | | 4,757,795 |
| | | | | |
Media (0.2%) | | | | | |
ITV PLC | | 284,224 | | | 514,802 |
| | | | | |
Oil & Gas (2.5%) | | | | | |
BP PLC | | 594,623 | | | 6,478,781 |
| | | | | |
Pharmaceuticals (1.2%) | | | | | |
AstraZeneca PLC | | 16,877 | | | 1,054,655 |
GlaxoSmithKline PLC | | 74,996 | | | 1,996,486 |
| | | | | |
| | | | | 3,051,141 |
| | | | | |
Research & Development (0.4%) | | | | | |
Taylor Nelson Sofres PLC | | 247,843 | | | 992,931 |
| | | | | |
Retail — Apparel (0.4%) | | | | | |
GUS PLC | | 62,462 | | | 1,129,592 |
| | | | | |
Retail — Building (0.8%) | | | | | |
Kingfisher PLC | | 439,317 | | | 2,017,045 |
| | | | | |
Retail — Consumer Electronics (0.5%) | | | | | |
Kesa Electricals PLC | | 193,780 | | | 1,181,740 |
| | | | | |
Retail — Food (1.5%) | | | | | |
Tesco PLC | | 560,640 | | | 3,778,463 |
| | | | | |
Telecommunication Services (2.4%) | | | | | |
Vodafone Group PLC | | 2,761,487 | | | 6,320,050 |
| | | | | |
Tobacco (1.2%) | | | | | |
Gallaher Group PLC | | 188,860 | | | 3,090,154 |
| | | | | |
| | | | | 57,886,779 |
| | | | | |
Hong Kong (1.7%) | | | | | |
Manufacturing — Consumer Goods (0.3%) | | | | | |
Yue Yuen Industrial Holdings, Ltd. | | 237,000 | | | 736,214 |
| | | | | |
Continued
56
International Equity Fund
Schedule of Portfolio Investments, continued | September 30, 2006 |
| | | | | |
| | | Shares | | Fair
Value |
Common Stocks, continued | | | | | |
Hong Kong, continued | | | | | |
Real Estate (0.5%) | | | | | |
Sun Hung Kai Properties, Ltd. | | 109,000 | | $ | 1,189,984 |
| | | | | |
Retail — Diversified (0.5%) | | | | | |
Esprit Asia Holdings, Ltd. | | 142,500 | | | 1,299,628 |
| | | | | |
Telecommunications (0.4%) | | | | | |
Hutchison Telecommunications (a) | | 644,000 | | | 1,139,135 |
| | | | | |
| | | | | 4,364,961 |
| | | | | |
Ireland (2.8%) | | | | | |
Banking & Finance (2.1%) | | | | | |
Bank of Ireland | | 201,526 | | | 3,940,018 |
Depfa Bank PLC | | 86,071 | | | 1,591,098 |
| | | | | |
| | | | | 5,531,116 |
| | | | | |
Building & Construction (0.7%) | | | | | |
CRH PLC | | 53,723 | | | 1,813,903 |
| | | | | |
| | | | | 7,345,019 |
| | | | | |
Italy (1.7%) | | | | | |
Banking & Finance (0.9%) | | | | | |
UniCredito Italiano S.p.A. | | 296,195 | | | 2,457,933 |
| | | | | |
Oil & Gas (0.8%) | | | | | |
Eni S.p.A. | | 68,254 | | | 2,022,411 |
| | | | | |
| | | | | 4,480,344 |
| | | | | |
Japan (19.9%) | | | | | |
Automobiles & Trucks (3.8%) | | | | | |
Honda Motor Co., Ltd. | | 73,600 | | | 2,473,897 |
Mitsubishi Corp. | | 114,400 | | | 2,150,267 |
Nissan Motors Co., Inc. | | 227,200 | | | 2,544,963 |
Toyota Motor Corp. | | 51,000 | | | 2,772,162 |
| | | | | |
| | | | | 9,941,289 |
| | | | | |
Banks (2.8%) | | | | | |
Bank of Yokohama, Ltd. (The) | | 199,000 | | | 1,566,929 |
Sumitomo Mitsui Financial Group, Inc. | | 296 | | | 3,107,612 |
Sumitomo Trust & Banking Co., Ltd. | | 162,000 | | | 1,695,301 |
Takefuji Corp. | | 22,130 | | | 1,015,533 |
| | | | | |
| | | | | 7,385,375 |
| | | | | |
Brewery (0.6%) | | | | | |
Asahi Breweries, Ltd. | | 113,700 | | | 1,657,704 |
| | | | | |
Diversified Chemicals (1.6%) | | | | | |
Nitto Denko Corp. | | 35,300 | | | 2,092,117 |
Shin-Etsu Chemical Co., Ltd. | | 31,900 | | | 2,036,458 |
| | | | | |
| | | | | 4,128,575 |
| | | | | |
Diversified Financials (0.4%) | | | | | |
Nomura Holdings, Inc. | | 64,400 | | | 1,134,129 |
| | | | | |
Drugs (0.3%) | | | | | |
Tanabe Seiyaku Co., Ltd. | | 72,000 | | | 902,210 |
| | | | | |
Electric Products (0.8%) | | | | | |
Funai Electric Co., Ltd. | | 9,400 | | | 885,801 |
Yokogawa Electric Corp. | | 86,000 | | | 1,130,066 |
| | | | | |
| | | | | 2,015,867 |
| | | | | |
Electronic Components (1.2%) | | | | | |
Murata Manufacturing Co., Ltd. | | 12,400 | | | 860,892 |
Rohm Co., Ltd. | | 23,300 | | | 2,164,093 |
| | | | | |
| | | | | 3,024,985 |
| | | | | |
| | | | | |
| | | Shares | | Fair
Value |
Common Stocks, continued | | | | | |
Japan, continued | | | | | |
Finance Services (0.4%) | | | | | |
Aiful Corp. | | 26,350 | | $ | 1,019,554 |
| | | | | |
Industrial (1.0%) | | | | | |
East Japan Railway Co. | | 224 | | | 1,566,540 |
SMC Corp. | | 7,800 | | | 1,032,207 |
| | | | | |
| | | | | 2,598,747 |
| | | | | |
Insurance (0.9%) | | | | | |
Mitsui Sumitomo Insurance Co., Ltd. | | 181,000 | | | 2,263,458 |
| | | | | |
Manufacturing (0.3%) | | | | | |
NTN Corp. | | 108,000 | | | 854,051 |
| | | | | |
Manufacturing-Diversified (0.4%) | | | | | |
NOK Corp. | | 40,200 | | | 992,151 |
| | | | | |
Office Equipment (1.1%) | | | | | |
Canon, Inc. | | 54,100 | | | 2,821,573 |
| | | | | |
Oil & Gas (0.4%) | | | | | |
Tokyo Gas Co., Ltd. | | 203,000 | | | 1,017,492 |
| | | | | |
Property & Causulty Insurance (0.4%) | | | | | |
Sompo Japan Insurance, Inc. | | 78,000 | | | 1,021,641 |
| | | | | |
Real Estate (0.4%) | | | | | |
Mitsui Fudosan Co., Ltd. | | 42,000 | | | 954,788 |
| | | | | |
Retail (0.6%) | | | | | |
AEON Co., Ltd. | | 66,800 | | | 1,637,338 |
| | | | | |
Retail — Automobile (0.8%) | | | | | |
Bridgestone Corp. | | 109,200 | | | 2,205,080 |
| | | | | |
Telecommunications (1.2%) | | | | | |
KDDI Corp. | | 146 | | | 909,796 |
NTT DoCoMo, Inc. | | 1,409 | | | 2,171,179 |
| | | | | |
| | | | | 3,080,975 |
| | | | | |
Tobacco (0.5%) | | | | | |
Japan Tobacco, Inc. | | 304 | | | 1,181,407 |
| | | | | |
| | | | | 51,838,389 |
| | | | | |
Netherlands (10.1%) | | | | | |
Air Freight & Logistics (1.1%) | | | | | |
TNT NV | | 74,637 | | | 2,830,435 |
| | | | | |
Banking & Finance (3.8%) | | | | | |
ABN AMRO Holding NV | | 302,134 | | | 8,810,694 |
ING Groep NV | | 30,370 | | | 1,335,770 |
| | | | | |
| | | | | 10,146,464 |
| | | | | |
Electronic Equipment (0.8%) | | | | | |
ASML Holding NV (a) | | 93,987 | | | 2,197,411 |
| | | | | |
Electronics (1.0%) | | | | | |
Koninklijke (Royal) Philips Electronics NV | | 71,476 | | | 2,507,564 |
| | | | | |
Multi-Line Insurance (1.5%) | | | | | |
Aegon NV | | 207,643 | | | 3,893,751 |
| | | | | |
Publishing (1.1%) | | | | | |
Reed Elsevier NV | | 166,144 | | | 2,770,085 |
| | | | | |
Telecommunications (0.8%) | | | | | |
Koninklijke (Royal) KPN NV | | 157,762 | | | 2,012,255 |
| | | | | |
| | | | | 26,357,965 |
| | | | | |
Norway (0.5%) | | | | | |
Telecommunications (0.5%) | | | | | |
Telenor ASA | | 102,300 | | | 1,334,457 |
| | | | | |
Continued
57
International Equity Fund
Schedule of Portfolio Investments, continued | September 30, 2006 |
| | | | | |
| | | Shares | | Fair
Value |
Common Stocks, continued | | | | | |
Singapore (0.1%) | | | | | |
Retail (0.1%) | | | | | |
Jardine Cycle & Carriage, Ltd. | | 28,908 | | $ | 218,462 |
| | | | | |
Spain (3.0%) | | | | | |
Banking & Finance (2.2%) | | | | | |
Banco Santander Central Hispano SA | | 358,373 | | | 5,666,102 |
| | | | | |
Petroleum (0.8%) | | | | | |
Repsol-YPF SA | | 67,638 | | | 2,012,735 |
| | | | | |
| | | | | 7,678,837 |
| | | | | |
Sweden (1.8%) | | | | | |
Appliances (0.4%) | | | | | |
Electrolux AB, Class B | | 62,800 | | | 1,020,135 |
| | | | | |
Machinery & Equipment (0.5%) | | | | | |
Sandvik AB | | 130,100 | | | 1,491,789 |
| | | | | |
Manufacturing (0.3%) | | | | | |
Husqvarna AB (a) | | 62,800 | | | 739,383 |
| | | | | |
Telecommunications (0.6%) | | | | | |
Telefonaktiebolaget LM Ericsson, B Shares | | 425,000 | | | 1,473,579 |
| | | | | |
| | | | | 4,724,886 |
Switzerland (9.7%) | | | | | |
Banks (2.8%) | | | | | |
Credit Suisse Group | | 125,036 | | | 7,236,505 |
| | | | | |
Biotechnology (0.4%) | | | | | |
Straumann Holding AG | | 4,714 | | | 1,015,314 |
| | | | | |
Building Materials (0.9%) | | | | | |
Holcim, Ltd. | | 29,168 | | | 2,384,585 |
| | | | | |
| | | | | |
| | | Shares | | Fair
Value |
Common Stocks, continued | | | | | |
Switzerland, continued | | | | | |
Chemicals (0.4%) | | | | | |
Clariant AG | | 67,634 | | $ | 914,339 |
| | | | | |
Food Products (1.0%) | | | | | |
Nestle SA | | 7,699 | | | 2,685,196 |
| | | | | |
Insurance (0.6%) | | | | | |
Swiss Re | | 21,880 | | | 1,674,999 |
| | | | | |
Pharmaceuticals (3.6%) | | | | | |
Novartis AG | | 67,910 | | | 3,965,627 |
Roche Holding AG | | 31,361 | | | 5,423,764 |
| | | | | |
| | | | | 9,389,391 |
| | | | | |
| | | | | 25,300,329 |
| | | | | |
Total Common Stocks
(Cost $182,608,966) | | | | | 247,291,574 |
| | | | | |
Exchange Traded Funds (2.3%) | | | | | |
United States (2.3%) | | | | | |
iShares MSCI EAFE Index | | 87,000 | | | 5,891,640 |
| | | | | |
Total Exchange Traded Funds
(Cost $5,845,333) | | | | | 5,891,640 |
| | | | | |
Total Investments
(Cost $188,454,299) — 97.4% | | | | | 253,183,214 |
Net other assets (liabilities) — 2.6% | | | | | 6,715,867 |
| | | | | |
Net Assets — 100.0% | | | | $ | 259,899,081 |
| | | | | |
| | | | | | | | | | | | | | |
Currency | | Delivery
Date | | Contract
Amount
in Local
Currency | | Contract
Value
in US Dollar | | Fair
Value | | Unrealized
Appreciation
(Depreciation) | |
Short | | | | | | | | | | | | | | |
British Sterling Pound vs. U.S. Dollar | | 11/27/06 | | £ 675,000 | | $ | 1,248,109 | | $ | 1,264,517 | | $ | (16,408 | ) |
British Sterling Pound vs. U.S. Dollar | | 11/27/06 | | 3,790,000 | | | 7,167,080 | | | 7,100,029 | | | 67,051 | |
British Sterling Pound vs. U.S. Dollar | | 11/27/06 | | 2,475,000 | | | 4,709,057 | | | 4,636,561 | | | 72,496 | |
| | | | | | | | | | | | | | |
Total Short Contracts | | | | | | $ | 13,124,246 | | $ | 13,001,107 | | $ | 123,139 | |
| | | | | | | | | | | | | | |
Long | | | | | | | | | | | | | | |
British Sterling Pound vs. U.S. Dollar | | 11/27/06 | | £ 935,000 | | $ | 1,728,020 | | $ | 1,751,590 | | $ | 23,570 | |
| | | | | | | | | | | | | | |
Total Long Contracts | | | | | | $ | 1,728,020 | | $ | 1,751,590 | | $ | 23,570 | |
| | | | | | | | | | | | | | |
See page 86 for footnote legend to the Schedules of Portfolio Investments.
See accompanying notes to the financial statements.
58
Special Opportunities Equity Fund
Schedule of Portfolio Investments | September 30, 2006 |
| | | | | |
| | | Shares | | Fair
Value |
Common Stocks (93.1%) | | | | | |
Consumer Discretionary (18.9%) | | | | | |
Comcast Corp., Class A (a) (b) | | 255,500 | | $ | 9,415,174 |
Costco Wholesale Corp. (b) | | 109,500 | | | 5,439,960 |
Laureate Education, Inc. (a) (b) | | 138,587 | | | 6,632,774 |
News Corp., Class A | | 423,500 | | | 8,321,775 |
WCI Communities, Inc. (a) (b) | | 108,700 | | | 1,895,728 |
YUM! Brands, Inc. | | 137,900 | | | 7,177,695 |
| | | | | |
| | | | | 38,883,106 |
| | | | | |
Consumer Staples (3.9%) | | | | | |
Smithfield Foods, Inc. (a) | | 295,540 | | | 7,985,491 |
| | | | | |
Energy (17.6%) | | | | | |
Apache Corp. (b) | | 131,000 | | | 8,279,200 |
CONSOL Energy, Inc. | | 238,500 | | | 7,567,605 |
Noble Corp. (b) | | 123,000 | | | 7,894,140 |
Pioneer Natural Resources Co. (b) | | 134,000 | | | 5,242,080 |
Weatherford International, Ltd. (a) | | 178,000 | | | 7,426,160 |
| | | | | |
| | | | | 36,409,185 |
| | | | | |
Financials (6.7%) | | | | | |
Markel Corp. (a) | | 14,600 | | | 5,995,636 |
Wells Fargo & Co. | | 217,500 | | | 7,869,150 |
| | | | | |
| | | | | 13,864,786 |
| | | | | |
Health Care (15.7%) | | | | | |
C.R. Bard, Inc. (b) | | 88,400 | | | 6,630,000 |
Emdeon Corp. (a) | | 626,500 | | | 7,336,315 |
KOS Pharmaceuticals, Inc. (a) | | 191,000 | | | 9,439,220 |
MedCath Corp. (a) (b) | | 160,900 | | | 4,841,481 |
UnitedHealth Group, Inc. | | 83,200 | | | 4,093,440 |
| | | | | |
| | | | | 32,340,456 |
| | | | | |
Industrials (14.2%) | | | | | |
J.B. Hunt Transport Services, Inc. (b) | | 201,500 | | | 4,185,155 |
L-3 Communications Holdings, Inc. | | 103,800 | | | 8,130,654 |
Nalco Holdings Co. (a) | | 451,500 | | | 8,361,780 |
PACCAR, Inc. | | 150,000 | | | 8,553,000 |
| | | | | |
| | | | | 29,230,589 |
| | | | | |
| | | | | | | |
| | | Shares or
Principal
Amount | | Fair
Value | |
Common Stocks, continued | | | | | | | |
Information Technology (16.1%) | | | | | | | |
Activision, Inc. (a) (b) | | | 295,000 | | $ | 4,454,500 | |
ATI Technologies, Inc. (a) | | | 207,000 | | | 4,440,150 | |
Checkfree Corp. (a) | | | 113,500 | | | 4,689,820 | |
Digital Insight Corp. (a) | | | 102,500 | | | 3,005,300 | |
Fair Issac Corp. (b) | | | 193,000 | | | 7,058,010 | |
Symantec Corp. (a) (b) | | | 451,500 | | | 9,607,920 | |
| | | | | | | |
| | | | | | 33,255,700 | |
| | | | | | | |
Total Common Stocks
(Cost $154,279,456) | | | | | | 191,969,313 | |
| | | | | | | |
Investment Company (0.2%) | | | | | | | |
Morgan Stanley Quality Municipal Income Trust (b) | | | 33,800 | | | 494,832 | |
| | | | | | | |
Total Investment Company (Cost $445,097) | | | | | | 494,832 | |
| | | | | | | |
Repurchase Agreement (6.5%) | | | | | | | |
U.S. Bank N.A., 5.05%, dated 9/29/06, maturing 10/2/06, with a maturity value of $13,500,699 (Collateralized fully by U.S. Government Agencies) | | $ | 13,495,020 | | | 13,495,020 | |
| | | | | | | |
Total Repurchase Agreement
(Cost $13,495,020) | | | | | | 13,495,020 | |
| | | | | | | |
Securities Held as Collateral for Securities on Loan (29.9%) | | | | | | | |
Pool of Various Securities for BB&T Funds — Note 2 — Security Loans | | | 61,799,055 | | | 61,799,055 | |
| | | | | | | |
Total Securities Held as Collateral for Securities on Loan (Cost $61,799,055) | | | | | | 61,799,055 | |
| | | | | | | |
Total Investments
(Cost $230,018,628) — 129.7% | | | | | | 267,758,220 | |
Net other assets (liabilities) — (29.7)% | | | | | | (61,324,221 | ) |
| | | | | | | |
Net Assets — 100.0% | | | | | $ | 206,433,999 | |
| | | | | | | |
See page 86 for footnote legend to the Schedules of Portfolio Investments.
See accompanying notes to the financial statements.
59
Equity Income Fund
Schedule of Portfolio Investments | September 30, 2006 |
| | | | | |
| | | Shares | |
Fair Value |
Common Stocks (94.0%) | | | | | |
Consumer Discretionary (3.5%) | | | | | |
KB Home (b) | | 95,000 | | $ | 4,161,000 |
| | | | | |
Consumer Staples (10.0%) | | | | | |
Altria Group, Inc. | | 31,420 | | | 2,405,201 |
Diageo PLC, ADR | | 28,500 | | | 2,024,640 |
General Mills, Inc. | | 54,000 | | | 3,056,400 |
Kimberly-Clark Corp. (b) | | 67,000 | | | 4,379,120 |
| | | | | |
| | | | | 11,865,361 |
| | | | | |
Energy (18.8%) | | | | | |
ChevronTexaco Corp. (b) | | 72,500 | | | 4,702,350 |
ConocoPhillips | | 64,500 | | | 3,839,685 |
Kinder Morgan Management, LLC (a) (b) | | 120,479 | | | 5,086,623 |
Natural Resource Partners L.P. | | 7,800 | | | 391,482 |
Natural Resource Partners L.P. | | 90,800 | | | 4,631,708 |
Petroleo Brasileiro SA, ADR | | 45,000 | | | 3,772,350 |
| | | | | |
| | | | | 22,424,198 |
| | | | | |
Financials (24.2%) | | | | | |
CitiGroup, Inc. | | 72,885 | | | 3,620,198 |
Endurance Specialty Holdings, Ltd. | | 137,000 | | | 4,830,620 |
Equity Inns, Inc., REIT | | 234,400 | | | 3,731,648 |
First Industrial Realty Trust, REIT | | 110,000 | | | 4,840,000 |
Mills Corp. (The), REIT (b) | | 49,000 | | | 818,790 |
U.S. Bancorp | | 99,000 | | | 3,288,780 |
Washington Real Estate Investment Trust, REIT (b) | | 93,500 | | | 3,721,300 |
Weingarten Realty Investors, REIT (b) | | 89,500 | | | 3,850,290 |
| | | | | |
| | | | | 28,701,626 |
| | | | | |
Health Care (8.2%) | | | | | |
Abbott Laboratories | | 96,500 | | | 4,686,040 |
Pfizer, Inc. | | 179,500 | | | 5,090,620 |
| | | | | |
| | | | | 9,776,660 |
| | | | | |
Industrials (3.6%) | | | | | |
General Electric Co. | | 122,900 | | | 4,338,370 |
| | | | | |
| | | | | | | |
| | | Shares or
Principal
Amount | | Fair Value | |
Common Stocks, continued | | | | | | | |
Information Technology (11.1%) | | | | | | | |
Microchip Technology, Inc. | | | 139,000 | | $ | 4,506,380 | |
Nokia Corp., ADR (b) | | | 214,000 | | | 4,213,660 | |
Taiwan Semiconductor Manufacturing Co., Ltd., ADR (b) | | | 473,000 | | | 4,540,800 | |
| | | | | | | |
| | | | | | 13,260,840 | |
| | | | | | | |
Materials (3.4%) | | | | | | | |
E.I. DuPont de Nemours & Co. | | | 95,000 | | | 4,069,800 | |
| | | | | | | |
Telecommunication Services (3.8%) | | | | | | | |
AT&T, Inc. (b) | | | 140,500 | | | 4,574,680 | |
| | | | | | | |
Utilities (7.4%) | | | | | | | |
Dominion Resources, Inc., Virginia (b) | | | 57,500 | | | 4,398,175 | |
Pinnacle West Capital Corp. (b) | | | 98,000 | | | 4,414,900 | |
| | | | | | | |
| | | | | | 8,813,075 | |
| | | | | | | |
Total Common Stocks
(Cost $96,350,118) | | | | | | 111,985,610 | |
| | | | | | | |
Repurchase Agreement (5.6%) | | | | | | | |
U.S. Bank N.A., 5.05%, dated 9/29/06, maturing 10/2/06, with a maturity value of $6,676,368 (Collateralized fully by U.S. Government Agencies) | | $ | 6,673,560 | | | 6,673,560 | |
| | | | | | | |
Total Repurchase Agreement
(Cost $6,673,560) | | | | | | 6,673,560 | |
| | | | | | | |
Securities Held as Collateral for Securities on Loan (25.8%) | | | | | | | |
Pool of Various Securities for BB&T Funds — Note 2 — Security Loans | | | 30,739,802 | | | 30,739,802 | |
| | | | | | | |
Total Securities Held as Collateral for Securities on Loan (Cost $30,739,802) | | | | | | 30,739,802 | |
| | | | | | | |
Total Investments
(Cost $133,763,480) — 125.4% | | | | | | 149,398,972 | |
Net other assets (liabilities) — (25.4)% | | | | | | (30,282,293 | ) |
| | | | | | | |
Net Assets — 100.0% | | | | | $ | 119,116,679 | |
| | | | | | | |
See page 86 for footnote legend to the Schedules of Portfolio Investments.
See accompanying notes to the financial statements.
60
Short U.S. Government Fund
Schedule of Portfolio Investments | September 30, 2006 |
| | | | | | |
| | | Principal
Amount | | Fair
Value |
U.S. Government Agencies (47.4%) | | | | | | |
Federal Farm Credit Bank (8.2%) | | | | | | |
4.13%, 4/15/09 | | $ | 5,000,000 | | $ | 4,900,500 |
5.38%, 7/18/11 | | | 1,000,000 | | | 1,017,733 |
| | | | | | |
| | | | | | 5,918,233 |
| | | | | | |
Federal Home Loan Bank (12.1%) | | | | | | |
3.25%, 12/17/07 (b) | | | 3,000,000 | | | 2,936,154 |
3.63%, 11/14/08 (b) | | | 4,000,000 | | | 3,891,256 |
4.63%, 2/18/11, Series 616 | | | 2,000,000 | | | 1,976,440 |
| | | | | | |
| | | | | | 8,803,850 |
| | | | | | |
Federal Home Loan Mortgage Corporation (12.1%) | | | |
3.25%, 2/25/08 (b) | | | 4,000,000 | | | 3,899,916 |
3.50%, 4/1/08 | | | 5,000,000 | | | 4,889,590 |
| | | | | | |
| | | | | | 8,789,506 |
| | | | | | |
Federal National Mortgage Assoc. (15.0%) | | | | | | |
3.88%, 5/15/07 (b) | | | 4,000,000 | | | 3,966,116 |
4.63%, 1/15/08 (b) | | | 7,000,000 | | | 6,962,270 |
| | | | | | |
| | | | | | 10,928,386 |
| | | | | | |
Total U.S. Government Agencies
(Cost $34,707,587) | | | | | | 34,439,975 |
| | | | | | |
Mortgage-Backed Securities (28.5%) | | | | | | |
Federal Home Loan Mortgage Corporation (10.4%) | | | |
5.00%, 12/1/08, Pool # M80714 | | | 524,043 | | | 519,703 |
4.50%, 1/1/10, Pool # M80792 | | | 1,715,348 | | | 1,689,902 |
3.50%, 10/15/10, Series 2786, Class PA | | | 1,528,738 | | | 1,519,412 |
4.50%, 1/15/11, Pool # 2782 | | | 1,625,463 | | | 1,615,091 |
6.50%, 5/1/13, Pool # E00548 | | | 255,546 | | | 260,186 |
3.50%, 8/15/16, Series 2866, Class WE | | | 1,206,637 | | | 1,195,075 |
6.00%, 9/1/16, Pool # E01049 | | | 718,873 | | | 729,281 |
| | | | | | |
| | | | | | 7,528,650 |
| | | | | | |
Federal National Mortgage Assoc. (18.1%) | | | | | | |
4.50%, 1/1/10, Pool # 254626 | | | 1,388,965 | | | 1,360,449 |
4.50%, 9/25/12, Series 2002-82, Class XJ | | | 104,143 | | | 103,808 |
6.50%, 8/1/13, Pool # 251901 | | | 578,687 | | | 591,696 |
6.00%, 3/1/16, Pool # 253702 | | | 446,496 | | | 453,502 |
6.00%, 4/1/16, Pool # 535846 | | | 443,903 | | | 450,868 |
| | | | | | | |
| | | Principal
Amount | | Fair
Value | |
Mortgage-Backed Securities, continued | | | | | | | |
Federal National Mortgage Assoc., continued | | | | | | | |
6.50%, 4/1/16, Pool # 253706 | | $ | 742,722 | | $ | 759,315 | |
6.00%, 8/1/16, Pool # 545125 | | | 320,875 | | | 325,895 | |
5.00%, 11/1/17, Pool # 254510 | | | 1,815,035 | | | 1,789,647 | |
5.00%, 12/1/17, Pool # 254545 | | | 1,948,644 | | | 1,921,388 | |
4.50%, 3/1/18, Pool # 555292 | | | 2,815,546 | | | 2,724,900 | |
6.00%, 4/25/18, Series 2002-27, Class VB | | | 2,500,922 | | | 2,498,575 | |
2.75%, 6/25/34, Series 2004-W4, Class AI | | | 149,702 | | | 149,194 | |
| | | | | | | |
| | | | | | 13,129,237 | |
| | | | | | | |
Total Mortgage-Backed Securities
(Cost $20,963,699) | | | | | | 20,657,887 | |
| | | | | | | |
U.S. Treasury Notes (19.7%) | | | | | | | |
4.38%, 1/31/08 | | | 2,000,000 | | | 1,988,124 | |
3.75%, 5/15/08 (b) | | | 1,500,000 | | | 1,476,621 | |
4.00%, 4/15/10 (b) | | | 2,000,000 | | | 1,961,484 | |
4.25%, 10/15/10 (b) | | | 9,000,000 | | | 8,888,202 | |
| | | | | | | |
Total U.S. Treasury Notes
(Cost $14,368,890) | | | | | | 14,314,431 | |
| | | | | | | |
Repurchase Agreement (3.2%) | | | | | | | |
U.S. Bank N.A., 5.05%, dated 9/29/06, maturing 10/2/06, with a maturity value of $2,303,694 (Collateralized fully by U.S. Government Agencies) | | | 2,302,725 | | | 2,302,725 | |
| | | | | | | |
Total Repurchase Agreement
(Cost $2,302,725) | | | | | | 2,302,725 | |
| | | | | | | |
Securities Held as Collateral for Securities on Loan (47.7%) | | | | | | | |
Pool of Various Securities for BB&T Funds — Note 2 — Security Loans | | | 34,618,745 | | | 34,618,745 | |
| | | | | | | |
Total Securities Held as Collateral for Securities on Loan (Cost $34,618,745) | | | | | | 34,618,745 | |
| | | | | | | |
Total Investments
(Cost $106,961,646) —146.5% | | | | | | 106,333,763 | |
Net other assets (liabilities) — (46.5)% | | | | | | (33,729,534 | ) |
| | | | | | | |
Net Assets — 100.0% | | | | | $ | 72,604,229 | |
| | | | | | | |
See page 86 for footnote legend to the Schedules of Portfolio Investments.
See accompanying notes to the financial statements.
61
Intermediate U.S. Government Fund
Schedule of Portfolio Investments | September 30, 2006 |
| | | | | | |
| | | Principal
Amount | | Fair
Value |
Mortgage-Backed Securities (43.8%) | | | | | | |
Federal Home Loan Mortgage Corp. (17.7%) | | | | | | |
5.13%, 10/15/15, Series R003, Class AG | | $ | 22,269,077 | | $ | 22,075,328 |
4.50%, 5/1/34, Pool # A21214 | | | 9,064,433 | | | 8,490,680 |
4.50%, 2/1/18, Pool # E94445 | | | 7,689,143 | | | 7,428,973 |
5.50%, 2/1/29, Pool # A18613 | | | 6,921,981 | | | 6,863,891 |
5.00%, 7/15/23, Series 2638, Class DH | | | 2,302,000 | | | 2,222,988 |
| | | | | | |
| | | | | | 47,081,860 |
| | | | | | |
Federal National Mortgage Assoc. (26.1%) | | | | | | |
5.00%, 1/1/18, Pool # 650205 | | | 6,440,624 | | | 6,346,350 |
4.50%, 3/1/18, Pool # 555292 | | | 5,631,093 | | | 5,449,802 |
5.50%, 1/1/33, Pool # 678321 | | | 2,156,487 | | | 2,131,923 |
5.00%, 7/1/33, Pool # 724965 | | | 3,826,185 | | | 3,689,618 |
5.00%, 8/1/33, Pool # 738751 | | | 1,660,403 | | | 1,601,340 |
5.00%, 8/1/33, Pool # 724365 | | | 1,249,017 | | | 1,204,683 |
5.00%, 10/1/33, Pool # 753298 | | | 1,006,976 | | | 971,328 |
4.50%, 9/1/34, Pool # 725866 | | | 8,507,447 | | | 7,947,496 |
6.50%, 11/1/34, Pool # 783476 | | | 3,791,327 | | | 3,863,504 |
5.50%, 5/1/35, Pool # 825530 | | | 15,930,935 | | | 15,695,747 |
5.50%, 9/1/35, Pool # 835787 | | | 10,972,779 | | | 10,810,788 |
7.00%, 8/1/36, Pool # 256360 | | | 9,762,660 | | | 10,028,503 |
| | | | | | |
| | | | | | 69,741,082 |
| | | | | | |
Total Mortgage-Backed Securities
(Cost $118,702,277) | | | | | | 116,822,942 |
| | | | | | |
U.S. Treasury Bonds & Notes (31.9%) | | | | | | |
3.38%, 1/15/07 | | | 5,000,000 | | | 6,366,457 |
4.88%, 7/31/11 | | | 54,000,000 | | | 54,626,508 |
4.00%, 2/15/15 | | | 25,000,000 | | | 23,930,675 |
| | | | | | |
Total U.S. Treasury Bonds & Notes
(Cost $84,707,318) | | | | | | 84,923,640 |
| | | | | | |
U.S. Government Agencies (15.3%) | | | | | | |
Federal Home Loan Mortgage Corp. (11.4%) | | | | | | |
5.88%, 3/21/11 (b) | | | 15,000,000 | | | 15,465,450 |
5.00%, 11/13/14, Series MTN, Callable 11/13/06 @100 (b) | | | 15,000,000 | | | 14,829,705 |
| | | | | | |
| | | | | | 30,295,155 |
| | | | | | |
| | | | | | | |
| | | Principal
Amount | | Fair
Value | |
U.S. Government Agencies, continued | | | | | | | |
Federal National Mortgage Assoc. (1.9%) | | | | | | | |
5.13%, 1/2/14 (b) | | $ | 5,000,000 | | $ | 4,986,130 | |
| | | | | | | |
Sovereign (2.0%) | | | | | | | |
Tennessee Valley Authority, 6.79%, 5/23/12 | | | 5,000,000 | | | 5,450,100 | |
| | | | | | | |
Total U.S. Government Agencies
(Cost $41,279,881) | | | | | | 40,731,385 | |
| | | | | | | |
U.S. Government Backed Securities (7.9%) | | | | | | | |
Banking & Financial Services (7.9%) | | | | | | | |
Private Export Funding, 4.97%, 8/15/13 | | | 4,350,000 | | | 4,363,607 | |
Private Export Funding, 4.55%, 5/15/15 | | | 10,000,000 | | | 9,716,450 | |
Private Export Funding, 4.95%, 11/15/15 | | | 7,000,000 | | | 7,002,751 | |
| | | | | | | |
Total U.S. Government Backed Securities (Cost $21,638,756) | | | | | | 21,082,808 | |
| | | | | | | |
Repurchase Agreement (0.8%) | | | | | | | |
U.S. Bank N.A., 5.05%, dated 9/29/06, maturing 10/2/06, with a maturity value of $2,047,349 (Collateralized fully by U.S. Government Agencies) | | | 2,046,488 | | | 2,046,488 | |
| | | | | | | |
Total Repurchase Agreement
(Cost $2,046,488) | | | | | | 2,046,488 | |
| | | | | | | |
Securities Held as Collateral for Securities on Loan (13.5%) | | | | | | | |
Pool of Various Securities for BB&T Funds — Note 2 —Security Loans | | | 35,975,000 | | | 35,975,000 | |
| | | | | | | |
Total Securities Held as Collateral for Securities on Loan (Cost $35,975,000) | | | | | | 35,975,000 | |
| | | | | | | |
Total Investments
(Cost $304,349,720) — 113.2% | | | | | | 301,582,263 | |
Net other assets (liabilities) — (13.2)% | | | | | | (35,205,721 | ) |
| | | | | | | |
Net Assets — 100.0% | | | | | $ | 266,376,542 | |
| | | | | | | |
See page 86 for footnote legend to the Schedules of Portfolio Investments.
See accompanying notes to the financial statements.
62
Total Return Bond Fund
Schedule of Portfolio Investments | September 30, 2006 |
| | | | | | |
| | | Principal
Amount | | Fair
Value |
Corporate Bonds (40.3%) | | | | | | |
Aerospace & Defense (0.4%) | | | | | | |
Raytheon Co., 6.15%, 11/1/08 | | $ | 1,425,000 | | $ | 1,449,581 |
| | | | | | |
Airlines (0.8%) | | | | | | |
Southwest Airlines Co., 5.25%, 10/1/14 | | | 2,980,000 | | | 2,907,792 |
| | | | | | |
Auto — Cars/Light Trucks (0.6%) | | | | | | |
DaimlerChrysler, 4.88%, 6/15/10 | | | 2,230,000 | | | 2,166,675 |
| | | | | | |
Banking & Financial Services (29.8%) | | | | | | |
Accredited Mortgage Loan Trust, Series 2005-4, Class A2B, 5.47%, 12/25/35 (d)* | | | 2,070,000 | | | 2,070,910 |
American Express Credit Account Master Trust, 5.33%, 3/15/11 (d)* | | | 3,840,000 | | | 3,834,382 |
Bank of America Commercial Mortgage, Inc., 4.81%, 12/10/42, Series 2004-6, Class A5 | | | 1,863,000 | | | 1,799,015 |
Bank of America Corp., 4.25%, 10/1/10 (d) | | | 975,000 | | | 945,013 |
Bank of America Corp., 5.39%, Series 2006-5 Class A3, 2/10/14 (f) | | | 2,427,000 | | | 2,439,236 |
Boeing Capital Corp., 7.38%, 9/27/10 | | | 3,010,000 | | | 3,244,931 |
Chase Credit Card Master Trust, Series 2003-3, Class A, 5.44%, 10/15/10 (d) | | | 1,730,000 | | | 1,733,167 |
Chase Funding Mortgage Loan Asset-Backed, 5.42%, 5/25/33, Series 2003-4, Class 1A5 | | | 5,295,000 | | | 5,257,460 |
CIT Group, Inc., 5.00%, 2/13/14 | | | 1,378,000 | | | 1,332,117 |
CitiGroup Credit Card Issuance Trust, 5.61%, Series 2003-A1, Class A1, 1/15/10 (d)* | | | 330,000 | | | 330,478 |
Countrywide Asset-Backed Certificates, 5.70%, 8/25/34, Series 2004-3, Class 3A3 (d)* | | | 7,960,000 | | | 7,989,445 |
Countrywide Asset-Backed Certificates, 5.53%, 10/25/35, Series 2005-4, Class 3AV2 (d)* | | | 3,628,751 | | | 3,632,167 |
Credit-Based Asset Servicing and Securitization, 4.83%, 8/25/35, Series 2005-CB5, Class AF2* | | | 4,150,000 | | | 4,096,742 |
CS First Boston Mortgage Securities Corp., 3.52%, 1/15/37, Series 2004-C1, Class A2 | | | 3,910,000 | | | 3,795,055 |
ERP Operating LP, 5.13%, 3/15/16 | | | 1,950,000 | | | 1,883,710 |
Gatx Financial Corp., 5.13%, 4/15/10 | | | 3,599,000 | | | 3,555,567 |
General Electric Capital Commercial Mortgage Corp., 3.92%, 11/10/38, Series 2004-C1, Class A2 | | | 5,560,000 | | | 5,368,958 |
Goldman Sachs Group, Inc., 5.125%, 1/15/15 | | | 1,995,000 | | | 1,934,147 |
JPMorgan Chase Commercial Mortgage Securities, 5.41%, Series 2005-A816 11/25/35, Class 1A1 | | | 5,509,493 | | | 5,438,041 |
JPMorgan Chase Commercial Mortgage Securities, 5.58%, Series 2006-CB16, 5/12/45, Class A3B | | | 3,100,000 | | | 3,135,704 |
Lehman Brothers Holdings, Inc., 4.80%, 3/13/14, Series MTNG | | | 3,642,000 | | | 3,493,672 |
MBNA Credit Card Master Note Trust, 5.45%, 8/16/10, Series 2003-A3, Class A3 (d)* | | | 2,240,000 | | | 2,243,847 |
MBNA Credit Card Master Note Trust, Series 00-D, Class A, 5.53%, 8/16/10* | | | 3,460,000 | | | 3,464,149 |
Merrill Lynch & Co., 6.00%, 2/17/09 (b) | | | 3,435,000 | | | 3,492,018 |
Merrill Lynch/Countrywide Commercial Mortgage, 5.39%, 7/12/46 | | | 2,700,000 | | | 2,714,732 |
Morgan Stanley, 4.25%, 5/15/10 (b) | | | 3,614,000 | | | 3,494,810 |
Residential Asset Mortgage Products, Inc., 4.02%, 3/25/33, Series 2003-RS4, Class AI6 | | | 3,923,865 | | | 3,763,754 |
| | | | | | |
| | | Principal
Amount | | Fair
Value |
Corporate Bonds, continued | | | | | | |
Banking & Financial Services, continued | | | | | | |
Residential Asset Mortgage Products, Inc., 5.58%, 11/25/35, Series 2005-RZ4, Class A2 (d)* | | $ | 3,031,000 | | $ | 3,036,564 |
Residential Asset Securities Corp., 5.48%, 7/25/35, Series 2005-KS6, Class A2 (d)* | | | 6,632,000 | | | 6,634,893 |
Structured Asset Investment Loan Trust, 5.54%, 1/25/36, Series 2005-11, Class A6 (d)* | | | 5,531,000 | | | 5,542,543 |
Synovus Financial Corp., 4.88%, 2/15/13 | | | 2,280,000 | | | 2,226,119 |
Wachovia Corp., 4.38%, 6/1/10 (b) | | | 1,827,000 | | | 1,783,581 |
Wells Fargo Co., 5.30%, 8/26/11 (b) | | | 3,840,000 | | | 3,865,647 |
Wells Fargo Home Equity Trust, Series 2004-2, Class AI3, 3.97%, 9/25/24 | | | 3,162,000 | | | 3,095,459 |
| | | | | | |
| | | | | | 112,668,033 |
| | | | | | |
Correctional Institutions (0.5%) | | | | | | |
Corrections Corp. of America, 6.25%, 3/15/13, Callable 3/15/09 @ 103.125 | | | 1,840,000 | | | 1,803,200 |
| | | | | | |
Information Technology (2.4%) | | | | | | |
Cisco Systems Inc., 5.50%, 2/1/16 | | | 1,940,000 | | | 1,955,429 |
Electric Data Systems, Series B, 6.50%, 8/1/13 | | | 3,481,000 | | | 3,531,217 |
Oracle Corp., 5.00%, 1/15/11 (b) | | | 3,605,000 | | | 3,570,561 |
| | | | | | |
| | | | | | 9,057,207 |
| | | | | | |
Office Automation & Equipment (0.2%) | | | | | | |
Xerox Corp., 6.40%, 3/15/16 | | | 920,000 | | | 915,400 |
| | | | | | |
Oil — Field Services (0.2%) | | | | | | |
Halliburton Co., 8.75%, 2/15/21 | | | 475,000 | | | 603,249 |
| | | | | | |
Paper & Related Products (0.8%) | | | | | | |
International Paper Co., 6.75%, 9/1/11 | | | 3,013,000 | | | 3,199,460 |
| | | | | | |
Retail (0.4%) | | | | | | |
Lowe’s Companies, Inc., 8.25%, 6/1/10 | | | 1,468,000 | | | 1,617,840 |
| | | | | | |
Telecommunications (1.4%) | | | | | | |
America Movil SA de CV, 5.75%, 1/15/15 (b) | | | 1,314,000 | | | 1,294,098 |
Motorola, Inc., 7.50%, 5/15/25 (b) | | | 3,570,000 | | | 4,127,359 |
| | | | | | |
| | | | | | 5,421,457 |
| | | | | | |
Utilities (2.8%) | | | | | | |
American Electric Power, 5.38%, 3/15/10, Series C | | | 4,620,000 | | | 4,620,707 |
FirstEnergy Corp., 6.45%, 11/15/11 (b) | | | 1,910,000 | | | 1,992,466 |
General Electric Capital Corp., 5.00%, 1/8/16 (b) | | | 2,005,000 | | | 1,963,338 |
General Electric Co., 5.00%, 2/1/13 (b) | | | 2,140,000 | | | 2,115,820 |
| | | | | | |
| | | | | | 10,692,331 |
| | | | | | |
Total Corporate Bonds
(Cost $153,153,664) | | | | | | 152,502,225 |
| | | | | | |
Mortgage-Backed Securities (35.8%) | | | | | | |
Federal Home Loan Mortgage Corp. (13.7%) | | | | | | |
6.00%, 10/1/19, Pool # G11679 | | | 2,389,928 | | | 2,423,614 |
5.00%, 5/1/20, Pool # B19275 | | | 3,360,401 | | | 3,302,233 |
5.50%, 11/1/20, Pool # J02711 | | | 1,612,820 | | | 1,611,864 |
5.50%, 3/1/21, Pool # J01432 | | | 560,735 | | | 560,633 |
5.00%, 7/1/25, Pool # C90908 | | | 2,880,002 | | | 2,797,985 |
4.50%, 6/1/35, Pool # G01842 | | | 2,289,596 | | | 2,140,531 |
5.50%, 6/1/35, Pool # A35148 | | | 5,466,473 | | | 5,393,620 |
5.50%, 7/1/35, Pool # A36540 | | | 3,412,036 | | | 3,366,564 |
Continued
63
Total Return Bond Fund
Schedule of Portfolio Investments, continued | September 30, 2006 |
| | | | | | |
| | | Principal
Amount | | Fair
Value |
Mortgage-Backed Securities, continued | | | | | | |
Federal Home Loan Mortgage Corp., continued | | | |
6.00%, 7/1/35, Pool # A36304 | | $ | 1,537,383 | | $ | 1,545,434 |
5.50%, 8/1/35, Pool # A36652 | | | 1,373,016 | | | 1,354,718 |
5.00%, 9/1/35, Pool # A37961 | | | 1,835,253 | | | 1,766,047 |
5.50%, 9/1/35, Pool # G08080 | | | 1,031,649 | | | 1,017,900 |
5.50%, 12/1/35, Pool # A40359 | | | 1,614,462 | | | 1,592,946 |
5.50%, 4/1/36, Pool # A44445 | | | 4,206,145 | | | 4,148,492 |
6.50%, 5/1/36, Pool # A48509 | | | 2,263,085 | | | 2,305,347 |
5.00%, 7/1/36, Pool # G02291 | | | 686,034 | | | 659,827 |
5.92%, 7/1/36, Pool # 1G2448 | | | 3,074,887 | | | 3,084,387 |
5.87%, 8/1/36, Pool # 1B7116 | | | 3,636,137 | | | 3,642,800 |
5.87%, 8/1/36, Pool # 1G1094 | | | 3,654,371 | | | 3,662,810 |
5.56%, 10/15/36, Pool # 10036 (f) | | | 5,910,000 | | | 5,682,831 |
| | | | | | |
| | | | | | 52,060,583 |
| | | | | | |
Federal National Mortgage Assoc. (18.9%) | | | | | | |
6.00%, 10/1/13, Pool # 252061 | | | 154,046 | | | 156,410 |
5.50%, 4/1/18, Pool # 685496 | | | 238,400 | | | 238,292 |
4.50%, 6/1/19, Pool # 780349 | | | 3,290,488 | | | 3,174,860 |
5.00%, 8/1/20, Pool # 832058 | | | 389,336 | | | 382,589 |
5.00%, 8/1/20, Pool # 838787 | | | 600,494 | | | 590,089 |
5.50%, 11/1/20, Pool # 843972 | | | 1,407,255 | | | 1,406,618 |
5.50%, 12/1/20, Pool # 831138 | | | 1,758,840 | | | 1,758,044 |
5.50%, 5/1/21, Pool # 895628 | | | 3,226,917 | | | 3,225,455 |
5.00%, 9/1/25, Pool # 255892 | | | 1,737,390 | | | 1,686,598 |
6.50%, 1/1/35, Pool # 809198 | | | 1,351,088 | | | 1,375,897 |
5.50%, 3/1/35, Pool # 787561 | | | 6,500,895 | | | 6,404,923 |
5.50%, 4/1/35, Pool # 822982 | | | 4,928,171 | | | 4,864,585 |
6.00%, 4/1/35, Pool # 735503 (b) | | | 501,284 | | | 503,596 |
7.00%, 6/1/35, Pool # 255820 | | | 1,148,337 | | | 1,179,608 |
7.00%, 6/1/35, Pool # 830686 | | | 1,365,792 | | | 1,402,984 |
5.00%, 9/1/35, Pool # 757857 | | | 1,448,078 | | | 1,391,684 |
5.50%, 10/1/35, Pool # 817568 | | | 2,670,588 | | | 2,632,368 |
6.00%, 10/1/35 (f) | | | 14,637,000 | | | 14,701,038 |
5.00%, 11/1/35, Pool # 844280 | | | 4,516,350 | | | 4,340,465 |
5.50%, 2/1/36, Pool #256101 | | | 2,237,810 | | | 2,205,784 |
5.50%, 2/1/36, Pool # 831295 | | | 1,310,480 | | | 1,291,726 |
6.50%, 3/1/36, Pool # 866062 | | | 2,428,640 | | | 2,473,234 |
5.62%, 5/1/36, Pool # 871259 | | | 3,329,329 | | | 3,299,124 |
6.50%, 7/1/36, Pool # 887293 | | | 2,206,428 | | | 2,246,942 |
5.95%, 8/1/36, Pool # 900502 | | | 3,713,846 | | | 3,731,941 |
5.56%, 10/25/36 (f) | | | 4,840,000 | | | 4,650,940 |
| | | | | | |
| | | | | | 71,315,794 |
| | | | | | |
Government National Mortgage Assoc. (3.2%) | | | |
5.00%, 10/1/35 (f) | | | 12,549,862 | | | 12,189,053 |
| | | | | | |
Total Mortgage-Backed Securities
(Cost $136,272,217) | | | | | | 135,565,430 |
| | | | | | |
U.S. Treasury Notes (16.9%) | | | | | | |
2.00%, 1/15/14 | | | 8,774,000 | | | 9,478,572 |
2.00%, 1/15/16 | | | 2,021,000 | | | 2,024,556 |
7.25%, 5/15/16 (b) | | | 5,145,000 | | | 6,166,365 |
8.88%, 8/15/17 (b) | | | 25,907,000 | | | 35,000,771 |
7.88%, 2/15/21 (b) | | | 8,532,000 | | | 11,212,251 |
| | | | | | |
Total U.S. Treasury Notes
(Cost $62,104,796) | | | | | | 63,882,515 |
| | | | | | |
U.S. Government Agencies (10.0%) | | | | | | |
Federal Home Loan Bank (1.7%) | | | | | | |
4.85%, 8/10/10, Callable 2/10/07 @ 100 (b) | | | 4,130,000 | | | 4,075,484 |
| | | | | | |
| | | Principal
Amount | | Fair
Value |
U.S. Government Agencies, continued | | | | | | |
Federal Home Loan Bank, continued | | | | | | |
Series FB11, 5.88%, 2/15/11 (b) | | $ | 2,335,000 | | $ | 2,409,879 |
| | | | | | |
| | | | | | 6,485,363 |
| | | | | | |
Federal Home Loan Mortgage Corp. (2.8%) | | | | | | |
Series MTN, 4.50%, 6/15/10, Callable 6/15/06 @ 100 (b) | | | 1,995,000 | | | 1,956,894 |
4.88%, 11/15/13 | | | 5,202,000 | | | 5,175,069 |
5.50%, 7/15/16, Series 3061 Class VU (b) | | | 3,614,127 | | | 3,639,970 |
| | | | | | |
| | | | | | 10,771,933 |
| | | | | | |
Federal National Mortgage Assoc. (5.5%) | | | | | | |
7.25%, 1/15/10, Series B (b) | | | 6,440,000 | | | 6,892,725 |
6.13%, 3/15/12 (b) | | | 4,328,000 | | | 4,572,878 |
5.50%, 11/25/16, Series 2005-120 Class VA | | | 5,110,391 | | | 5,118,954 |
5.50%, 10/25/24, Series 2006-18, Class CA | | | 3,426,994 | | | 3,436,265 |
4.40%, 11/25/33, Series 2003-W16, Class AF5 | | | 690,000 | | | 680,691 |
| | | | | | |
| | | | | | 20,701,513 |
| | | | | | |
Total U.S. Government Agencies
(Cost $37,429,350) | | | | | | 37,958,809 |
| | | | | | |
Municipal Bonds (6.1%) | | | | | | |
California (1.4%) | | | | | | |
Fresno County, California, Pension Obligation, Series A, 4.20%, 8/15/13, FGIC | | | 4,060,000 | | | 3,854,117 |
San Bernardino County, California, Financing Authority, Pension Obligation Revenue, 6.87%, 8/1/08, MBIA | | | 1,685,000 | | | 1,737,454 |
| | | | | | |
| | | | | | 5,591,571 |
| | | | | | |
Florida (1.4%) | | | | | | |
Gainesville, Florida, Post Employment Benefits Obligation, 4.68%, 10/1/13 | | | 1,235,000 | | | 1,202,631 |
Gainesville, Florida, Post Employment Benefits Obligation, 4.71%, 10/1/14 | | | 2,580,000 | | | 2,507,941 |
Palm Beach County, Florida, 5.74%, 6/1/12 | | | 690,000 | | | 711,017 |
Palm Beach County, Florida, 5.78%, 6/1/13 | | | 985,000 | | | 1,019,977 |
| | | | | | |
| | | | | | 5,441,566 |
| | | | | | |
Illinois (1.0%) | | | | | | |
Chicago, Illinois, Series B, 5.25%, 1/1/12, XLCA | | | 2,185,000 | | | 2,199,771 |
Illinois State, 3.75%, 6/1/12 | | | 1,535,000 | | | 1,433,383 |
| | | | | | |
| | | | | | 3,633,154 |
| | | | | | |
New York (1.3%) | | | | | | |
New York State, Series D, 5.20%, 4/15/11 | | | 2,230,000 | | | 2,238,875 |
New York State, Series D, 5.21%, 4/15/12 | | | 855,000 | | | 863,328 |
Sales Tax Asset Receivables Corp., Series B, 4.06%, 10/15/10, FGIC | | | 1,735,000 | | | 1,674,431 |
| | | | | | |
| | | | | | 4,776,634 |
| | | | | | |
Texas (0.6%) | | | | | | |
Brownsville, Texas, Utility System, Series B, 4.92%, 9/1/14, AMBAC | | | 2,470,000 | | | 2,435,544 |
| | | | | | |
Continued
64
Total Return Bond Fund
Schedule of Portfolio Investments, continued | September 30, 2006 |
| | | | | | |
| | | Principal
Amount | | Fair
Value |
Municipal Bonds, continued | | | | | | |
Wisconsin (0.4%) | | | | | | |
Wisconsin State General Revenue, Series A, 4.80%, 5/1/13 | | $ | 1,380,000 | | $ | 1,353,986 |
| | | | | | |
Total Municipal Bonds
(Cost $23,020,949) | | | | | | 23,232,455 |
| | | | | | |
U.S. Treasury Bonds (3.3%) | | | | | | |
8.75%, 5/15/17 (b) | | | 9,380,000 | | | 12,524,495 |
| | | | | | |
Total U.S. Treasury Bonds
(Cost $12,405,511) | | | | | | 12,524,495 |
| | | | | | |
Repurchase Agreement (3.3%) | | | | | | |
U.S. Bank N.A., 5.05%, dated 9/29/06, maturing 10/2/06, with a maturity value of $12,554,812 (Collateralized fully by U.S. Government Agencies) | | | 12,549,531 | | | 12,549,531 |
| | | | | | |
Total Repurchase Agreement
(Cost $12,549,531) | | | | | | 12,549,531 |
| | | | | | |
| | | | | | | |
| | | Principal
Amount | | Fair
Value | |
Securities Held as Collateral for Securities on Loan (25.8%) | | | | | | | |
Pool of Various Securities for BB&T Funds — Note 2 — Security Loans | | $ | 97,576,279 | | $ | 97,576,279 | |
| | | | | | | |
Total Securities Held as Collateral for Securities on Loan (Cost $97,576,279) | | | | | | 97,576,279 | |
| | | | | | | |
Total Investments
(Cost $534,512,297) — 141.5% | | | | | | 535,791,739 | |
Net other assets (liabilities) — (41.5)% | | | | | | (157,043,365 | ) |
| | | | | | | |
Net Assets — 100.0% | | | | | $ | 378,748,374 | |
| | | | | | | |
See page 86 for footnote legend to the Schedules of Portfolio Investments.
See accompanying notes to the financial statements.
65
Kentucky Intermediate Tax-Free Fund
Schedule of Portfolio Investments | September 30, 2006 |
| | | | | | |
| | | Principal
Amount | | Fair
Value |
Municipal Bonds (101.0%) | | | | | | |
Kentucky (101.0%) | | | | | | |
Allen County, KY, School District Finance Corp., Revenue, 5.25%, 4/1/10, Prerefunded 4/1/07 @ 102 | | $ | 455,000 | | $ | 467,945 |
Bell County, KY, Public Properties Corp., Revenue, 5.40%, 9/1/13, Prerefunded 3/1/11 @ 102 | | | 160,000 | | | 174,336 |
Daviess County, KY, Public Improvements Corp., Refunding Revenue, Series A, 5.60%, 10/1/06, OID | | | 245,000 | | | 245,012 |
Harlan County, KY, School District, School Building Revenue, 4.25%, 7/1/16, MBIA | | | 500,000 | | | 517,760 |
Hopkins County, KY, Correctional Facilities Improvements, G.O., 5.38%, 2/1/09, FGIC | | | 180,000 | | | 187,371 |
Jefferson County, KY, Capital Projects Corp., Revenue, 5.20%, 6/1/08, Callable 6/1/07 @ 102, MBIA | | | 295,000 | | | 302,481 |
Kentucky Area Development District Finance Trust Revenue, Series E, 5.40%, 6/1/14, Callable 6/1/10 @ 102, Wachovia Bank N.A. | | | 220,000 | | | 234,995 |
Kentucky Area Development District Financing, Certificates of Participation, Series L, 5.15%, 5/1/36, Callable 5/1/16 @ 100 | | | 505,000 | | | 528,972 |
Kentucky Area Development District Financing, Certificates of Participation, Series M, 4.30%, 8/1/09, Callable 8/1/07 @ 100 | | | 250,000 | | | 250,250 |
Kentucky Asset/Liability Commission General Receipts Revenue, 5.00%, 10/1/15 | | | 480,000 | | | 525,691 |
Kentucky Economic Development Finance Authority Revenue, Series A, 5.75%, 12/1/15, Prerefunded 6/1/10 @ 101, OID | | | 500,000 | | | 532,840 |
Kentucky Housing Corp., Revenue, Series D, 5.20%, 7/1/07, FHA | | | 65,000 | | | 65,543 |
Kentucky State Property & Buildings Commission Refunding Revenue, Project No. 76, 5.50%, 8/1/21, AMBAC | | | 620,000 | | | 724,805 |
Kentucky State Property & Buildings Commission Refunding Revenue, Project No. 83, 5.00%, 10/1/18, AMBAC | | | 250,000 | | | 276,163 |
Kentucky State Property & Buildings Commission Revenue, 5.15%, 2/1/22, FSA | | | 30,000 | | | 32,264 |
Kentucky State Property & Buildings Commission Revenue, 5.00%, 10/1/22, Prerefunded 10/1/13 @ 100, FSA | | | 465,000 | | | 502,898 |
Kentucky State Property & Buildings Commission Revenue, Project No. 67, 5.50%, 9/1/12, Prerefunded 9/1/10 @ 100 | | | 500,000 | | | 535,450 |
Kentucky State Property & Buildings Commission Revenue, Project No. 69, Series A, 5.50%, 8/1/11, FSA | | | 540,000 | | | 586,089 |
Kentucky State Property & Buildings Commission Revenue, Project No. 73, 5.25%, 11/1/11 | | | 400,000 | | | 429,600 |
Kentucky State Property & Buildings Commission Revenue, Project No. 74, 5.38%, 2/1/14, Prerefunded 2/1/12 @ 100, FSA | | | 500,000 | | | 543,165 |
Kentucky State Property & Buildings Commission Revenue, Project No. 81, 5.00%, 11/1/16, Callable 11/1/13 @ 100, AMBAC | | | 500,000 | | | 539,220 |
| | | | | | | |
| | | Shares or
Principal
Amount | | Fair
Value | |
Municipal Bonds, continued | | | | | | | |
Kentucky, continued | | | | | | | |
Kentucky State Turnpike Authority Refunding Revenue, Revitalization Project, Series A, 5.50%, 7/1/11, AMBAC | | $ | 200,000 | | $ | 216,824 | |
Kentucky State Turnpike Authority Refunding Revenue, Revitalization Project, Series A, 5.50%, 7/1/12, AMBAC | | | 500,000 | | | 548,415 | |
Kentucky State Turnpike Authority Refunding Revenue, Revitalization Project, Series A, 5.50%, 7/1/15, AMBAC | | | 270,000 | | | 304,757 | |
Kentucky State Turnpike Authority Revenue, Series B, 5.00%, 7/1/16, AMBAC | | | 500,000 | | | 548,075 | |
Larue County, KY, School District, School Building Revenue, 4.25%, 7/1/15, MBIA | | | 245,000 | | | 253,874 | |
Leslie County, KY, Detention Facilities Improvement Project, G.O., 4.75%, 12/1/35, Callable 12/1/15 @ 100, OID | | | 600,000 | | | 599,964 | |
Louisville & Jefferson Counties, KY, Metropolitan Sewer District Revenue, Series A, 5.00%, 5/15/10, MBIA | | | 55,000 | | | 57,728 | |
Louisville & Jefferson County, KY, Metropolitan Government Health Systems Revenue, Norton Healthcare, Inc., 5.00%, 10/1/26, Callable 10/1/16 @ 100 | | | 500,000 | | | 515,895 | |
Louisville & Jefferson County, KY, Metropolitan Sewer District Revenue, Series A, 5.00%, 5/15/36, Callable 11/15/11 @ 101, MBIA, OID | | | 835,000 | | | 879,764 | |
Louisville & Jefferson County, KY, Metropolitan Sewer District Revenue, Series A, 5.00%, 5/15/38, Callable 5/15/14 @ 101, FGIC | | | 340,000 | | | 358,006 | |
Louisville & Jefferson County, KY, Waterworks & Water Systems Revenue, 5.00%, 11/15/16 | | | 495,000 | | | 543,787 | |
Louisville & Jefferson County, KY, Waterworks & Water Systems Revenue, 4.00%, 11/15/12 | | | 35,000 | | | 35,730 | |
Louisville, KY, Parking Authority Revenue, 7.50%, 7/1/09, Callable 1/1/07 @ 100, ETM | | | 350,000 | | | 386,057 | |
Paducah, KY, Public Housing Authority Revenue, 5.00%, 10/1/06, U.S. Government Guaranteed | | | 270,000 | | | 270,010 | |
Somerset, KY, Independent School District Finance Corp., Revenue, 4.00%, 10/1/08 | | | 65,000 | | | 65,649 | |
University of KY, University & College Improvements Revenue, Series Q, 5.00%, 5/1/10, ETM | | | 250,000 | | | 261,763 | |
| | | | | | | |
Total Municipal Bonds
(Cost $13,746,702) | | | | | | 14,049,148 | |
| | | | | | | |
Investment Company (2.2%) | | | | | | | |
Federated Tax-Free Obligations Fund, Institutional Service Class | | | 303,924 | | | 303,924 | |
| | | | | | | |
Total Investment Company
(Cost $303,924) | | | | | | 303,924 | |
| | | | | | | |
Total Investments
(Cost $14,050,626) — 103.2% | | | | | | 14,353,072 | |
Net other assets (liabilities) — (3.2)% | | | | | | (448,522 | ) |
| | | | | | | |
Net Assets — 100.0% | | | | | $ | 13,904,550 | |
| | | | | | | |
See page 86 for footnote legend to the Schedules of Portfolio Investments.
See accompanying notes to the financial statements.
66
Maryland Intermediate Tax-Free Fund
Schedule of Portfolio Investments | September 30, 2006 |
| | | | | | |
| | | Principal
Amount | | Fair
Value |
Municipal Bonds (95.2%) | | | | | | |
Maryland (95.2%) | | | | | | |
Anne Arundel County, MD, Water Utility Improvements, G.O., 5.38%, 3/1/13, Prerefunded 3/1/12 @ 100 | | $ | 400,000 | | $ | 435,768 |
Baltimore County, MD, Refunding, G.O., 4.25%, 9/1/25, Callable 9/1/16 @ 100, OID | | | 350,000 | | | 348,187 |
Baltimore County, MD, Water Utility Improvements, Metropolitan District, 70th Issue, G.O., 5.00%, 9/1/16 | | | 385,000 | | | 425,464 |
Baltimore, MD, Water Project, Unrefunded Revenue, Series A, 5.00%, 7/1/24, ETM, FGIC, OID | | | 305,000 | | | 338,956 |
Charles County, MD, Construction & Public Improvements Refunding, G.O., 5.00%, 3/1/11 | | | 400,000 | | | 424,156 |
Frederick County, MD, Public Facilities Refunding, G.O., 5.00%, 8/1/14 | | | 645,000 | | | 703,081 |
Frederick County, MD, Public Facilities, G.O., 5.00%, 12/1/15 | | | 500,000 | | | 549,405 |
Maryland State Department of Transportation Revenue, 4.25%, 2/15/17, Callable 2/15/16 @ 100 | | | 250,000 | | | 258,558 |
Maryland State Department of Transportation Revenue, Second Issue, 5.00%, 6/1/15 | | | 100,000 | | | 109,463 |
Maryland State Health & Higher Educational Facilities Authority Refunding Revenue, Doctors Hospital, Inc., 5.50%, 7/1/24, Callable 7/1/07 @ 100, OID | | | 240,000 | | | 240,180 |
Maryland State Health & Higher Educational Facilities Authority Refunding Revenue, Medstar Health, Inc., 5.00%, 4.375% | | | 145,000 | | | 149,750 |
Maryland State Health & Higher Educational Facilities Authority Refunding Revenue, Medstar Health, Inc., 5.00%, 8/15/12 | | | 275,000 | | | 289,974 |
Maryland State Health & Higher Educational Facilities Authority Revenue, 5.13%, 7/1/33, Callable 7/1/08 @ 101, FSA, OID | | | 120,000 | | | 123,626 |
Maryland State Health & Higher Educational Facilities Authority Revenue, Carroll County General Hospital, 4.63%, 7/1/10, OID | | | 75,000 | | | 76,879 |
Maryland State Health & Higher Educational Facilities Authority Revenue, Helix Health Issue, 5.13%, 7/1/11, AMBAC | | | 25,000 | | | 26,753 |
Maryland State Health & Higher Educational Facilities Authority Revenue, Helix Health Issue, 5.13%, 7/1/12, AMBAC, OID | | | 380,000 | | | 410,476 |
Maryland State Health & Higher Educational Facilities Authority Revenue, Helix Health Issue, 5.00%, 7/1/27, AMBAC, OID | | | 230,000 | | | 252,039 |
| | | | | | |
| | | Shares or
Principal
Amount | | Fair
Value |
Municipal Bonds, continued | | | | | | |
Maryland, continued | | | | | | |
Maryland State Health & Higher Educational Facilities Authority Revenue, Howard County General Hospital, 5.50%, 7/1/13, Callable 7/1/07 @ 100, OID | | $ | 45,000 | | $ | 45,882 |
Maryland State, MD, State & Local Facilities Second Series, G.O., 5.00%, 8/1/17, Callable 8/1/16 @ 100 | | | 300,000 | | | 330,291 |
Maryland State, MD, State & Local Facilities, First Series, G.O., 5.00%, 3/1/10, Callable 3/1/08 @ 101 | | | 350,000 | | | 360,546 |
Maryland State, MD, State & Local Facilities, Second Series, G.O., 5.00%, 8/1/11 | | | 380,000 | | | 405,118 |
Montgomery County, MD, Construction & Public Improvements, Series A, G.O., 5.00%, 7/1/17 | | | 500,000 | | | 554,404 |
Montgomery County, MD, Construction & Public Improvements, Series A, G.O., 5.00%, 2/1/21, Callable 2/1/12 @ 101 | | | 240,000 | | | 259,097 |
Montgomery County, MD, Construction & Public Improvements, Series A, G.O., 5.00%, 2/1/22, Callable 2/1/12 @ 101 | | | 500,000 | | | 539,785 |
Prince Georges County, MD, Construction & Public Improvements Refunding G.O., Series B, 5.00%, 10/1/12 | | | 690,000 | | | 742,715 |
Prince Georges County, MD, Construction & Public Improvements, G.O., 5.00%, 9/15/13 | | | 250,000 | | | 271,250 |
University of MD, System Auxiliary Facility & Tuition Revenue, Series A, 5.00%, 10/1/23, Callable 10/1/16 @ 100 | | | 400,000 | | | 432,032 |
Washington County, MD, Public Improvements, G.O., 4.80%, 1/1/08, Callable 1/1/07 @ 100, FGIC | | | 100,000 | | | 100,092 |
Washington Suburban Sanitation District Refunding, G.O., 5.00%, 6/1/12 | | | 275,000 | | | 295,485 |
| | | | | | |
Total Municipal Bonds
(Cost $9,356,423) | | | | | | 9,499,412 |
| | | | | | |
Investment Company (4.1%) | | | | | | |
Federated Maryland Municipal Cash Trust | | | 404,752 | | | 404,752 |
| | | | | | |
Total Investment Company
(Cost $404,752) | | | | | | 404,752 |
| | | | | | |
Total Investments
(Cost $9,761,175) — 99.3% | | | | | | 9,904,164 |
Net other assets (liabilities) — 0.7% | | | | | | 64,914 |
| | | | | | |
Net Assets — 100.0% | | | | | $ | 9,969,078 |
| | | | | | |
See page 86 for footnote legend to the Schedules of Portfolio Investments.
See accompanying notes to the financial statements.
67
North Carolina Intermediate Tax-Free Fund
Schedule of Portfolio Investments | September 30, 2006 |
| | | | | | |
| | | Principal
Amount | | Fair
Value |
Municipal Bonds (98.1%) | | | | | | |
North Carolina (98.1%) | | | | | | |
Alamance County, NC, School Improvements, G.O., 5.00%, 2/1/19, Callable 2/1/16 @ 100 | | $ | 1,000,000 | | $ | 1,090,180 |
Appalachian State University of North Carolina Refunding Revenue, 5.25%, 7/15/20, Callable 7/15/15 @ 100, MBIA | | | 1,000,000 | | | 1,101,200 |
Appalachian State University of North Carolina, Refunding Revenue, 5.00%, 7/15/18, Callable 7/15/15 @ 100, MBIA | | | 1,380,000 | | | 1,495,768 |
Asheville, NC, Water Systems Revenue, Refunding Bonds, 5.00%, 8/1/21, Callable 8/1/15 @ 100, FSA | | | 1,410,000 | | | 1,518,387 |
Bladen County, NC, G.O., 5.60%, 5/1/13, Callable 5/1/10 @ 101.5, FSA | | | 1,150,000 | | | 1,244,760 |
Broad River, NC, Water Authority Water System Revenue. 5.00%, 6/1/19 | | | 1,050,000 | | | 1,125,926 |
Brunswick County, NC, Enterprise Systems Revenue, Series A, 5.25%, 4/1/17, Callable 4/1/14 @ 100, FSA | | | 1,000,000 | | | 1,095,280 |
Cabarrus County, NC, Certificates of Participation, 5.25%, 2/1/12, AMBAC | | | 1,285,000 | | | 1,382,429 |
Cabarrus County, NC, Refunding, G.O., 5.00%, 2/1/16 | | | 1,000,000 | | | 1,095,030 |
Charlotte, NC, Mecklenberg County Hospital Authority Revenue, Health Care System, Series A, 5.00%, 1/15/13, Callable 1/15/07 @ 102 | | | 1,600,000 | | | 1,637,248 |
Charlotte, NC, Public Improvements, G.O., 5.50%, 6/1/09 | | | 1,460,000 | | | 1,534,942 |
Charlotte, NC, Storm Water Fee Revenue, 5.00%, 6/1/34, Callable 6/1/14 @ 100 | | | 1,405,000 | | | 1,474,224 |
Cumberland County, NC, School Improvements, G.O., 5.50%, 3/1/09 | | | 1,055,000 | | | 1,103,066 |
Durham, NC, Refunding Bonds, G.O., 5.00%, 2/1/13 | | | 1,585,000 | | | 1,711,372 |
Durham, NC, Water & Sewer Utility Systems Revenue, 5.00%, 6/1/12, Callable 6/1/11 @ 101 | | | 1,000,000 | | | 1,067,770 |
Franklin County, NC, School Improvements, G.O., 4.50%, 8/1/16, FSA | | | 265,000 | | | 281,396 |
Gastonia, NC, Combined Utilities System Revenue, 5.00%, 5/1/16, Callable 5/1/15 @ 100, AMBAC | | | 1,060,000 | | | 1,151,870 |
Gastonia, NC, Combined Utilities Systems Revenue, 5.00%, 5/1/10, MBIA | | | 1,000,000 | | | 1,050,150 |
Greenville, NC, Combined Enterprise Systems Revenue, 5.50%, 9/1/10, FSA | | | 1,455,000 | | | 1,560,575 |
Guilford County, NC, Public Improvements, G.O., Series B, 5.00%, 10/1/09 | | | 2,000,000 | | | 2,088,940 |
Guilford County, NC, Public Improvements, G.O., Series B, 5.25%, 10/1/15, Callable 10/1/10 @ 102, OID | | | 2,030,000 | | | 2,195,445 |
High Point, NC, Combined Enterprise System Revenue, 4.20%, 11/1/18, Callable 11/1/16 @ 100, FSA | | | 725,000 | | | 741,030 |
High Point, NC, Public Improvements, G.O., Series B, 5.40%, 6/1/08 | | | 1,350,000 | | | 1,391,243 |
Johnston County, NC, Finance Corp. Revenue, 5.50%, 8/1/10, Callable 8/1/09 @ 101, FSA | | | 1,070,000 | | | 1,134,307 |
| | | | | | |
| | | Principal
Amount | | Fair
Value |
Municipal Bonds, continued | | | | | | |
North Carolina, continued | | | | | | |
Johnston County, NC, G.O., 5.50%, 3/1/12, Callable 3/1/10 @ 101, FGIC | | $ | 1,000,000 | | $ | 1,071,820 |
Johnston County, NC, Refunding, G.O., 5.00%, 2/1/16, Callable 2/1/15 @ 100, FGIC | | | 1,070,000 | | | 1,162,416 |
Lincoln County, NC, Certificates of Participation, 4.00%, 6/1/10, FSA | | | 90,000 | | | 91,193 |
Lincoln County, NC, Certificates of Participation, 5.00%, 6/1/12, FSA | | | 535,000 | | | 570,321 |
Lincoln County, NC, Certificates of Participation, 5.00%, 6/1/13, FSA | | | 590,000 | | | 633,583 |
Lincoln County, NC, Certificates of Participation, 5.00%, 6/1/16, FSA | | | 635,000 | | | 690,905 |
Lincolnton, NC, Combined Enterprise Systems Refunding Revenue, 5.00%, 5/1/16, Callable 5/1/15 @ 100, XLCA | | | 140,000 | | | 151,600 |
Mecklenburg County, NC, Public Improvements, G.O., Series D, 5.00%, 4/1/11, Prerefunded 4/1/10 @ 100.5 | | | 1,000,000 | | | 1,053,170 |
Municipal Power Agency No. 1, Catawba Electric Revenue, 5.50%, 1/1/13, AMBAC-TCRS, ETM | | | 1,185,000 | | | 1,289,505 |
New Hanover County, NC, Hospital Revenue, Regional Medical Center Project, 5.25%, 10/1/12, Callable 10/1/09 @ 101, MBIA | | | 1,000,000 | | | 1,052,370 |
New Hanover County, NC, Public Improvements, G.O., 5.30%, 11/1/08 | | | 1,500,000 | | | 1,554,495 |
New Hanover County, NC, Refunding, G.O., 5.25%, 2/1/18 | | | 1,000,000 | | | 1,124,660 |
North Carolina Capital Facilities Finance Agency Revenue, Pfeiffer University Project, 5.25%, 5/1/15, Callable 11/1/06 @ 102 (d)(e) | | | 2,092,897 | | | 2,134,755 |
North Carolina Eastern Municipal Power Agency, Refunding Revenue, Series A, 4.50%, 1/1/24, Callable 1/1/22 @ 100 | | | 2,810,000 | | | 2,935,156 |
North Carolina Eastern Municipal Power Agency, Power System Revenue, Series A, 5.00%, 1/1/17, ETM, OID | | | 670,000 | | | 731,613 |
North Carolina Eastern Municipal Power Agency, Power System Revenue, Series A, 6.40%, 1/1/21, OID (d) | | | 4,000,000 | | | 4,888,559 |
North Carolina Eastern Municipal Power Agency, Power System Revenue, Series A, 6.00%, 1/1/26, Prerefunded 1/1/22 @ 100, OID | | | 1,305,000 | | | 1,594,084 |
North Carolina Medical Care Commission Health Care Facilities Revenue, Carolina Medicorp Project, 5.25%, 5/1/09, Callable 5/1/07 @ 100, OID | | | 1,325,000 | | | 1,336,117 |
North Carolina Medical Care Commission Health Care Facilities Revenue, Stanley Memorial Hospital Project, 5.45%, 10/1/08, Callable 10/1/06 @ 102, AMBAC | | | 750,000 | | | 765,960 |
North Carolina Medical Care Commission Hospital Revenue, Gaston Memorial Hospital Project, 5.40%, 2/15/11, Callable 2/15/07 @ 101 | | | 565,000 | | | 577,600 |
Continued
68
North Carolina Intermediate Tax-Free Fund
Schedule of Portfolio Investments, continued | September 30, 2006 |
| | | | | | |
| | | Principal
Amount | | Fair
Value |
Municipal Bonds, continued | | | | | | |
North Carolina, continued | | | | | | |
North Carolina Medical Care Commission Hospital Revenue, Gaston Memorial Hospital Project, 5.50%, 2/15/15, Callable 2/15/07 @ 101, OID | | $ | 2,130,000 | | $ | 2,189,448 |
North Carolina Medical Care Commission Hospital Revenue, Halifax Regional Medical Center, 4.60%, 8/15/07, OID (d)(e) | | | 1,795,000 | | | 1,798,734 |
North Carolina Medical Care Commission Hospital Revenue, Pitt County Memorial Hospital, Series A, 5.25%, 12/1/10, Prerefunded 12/1/08 @ 101 | | | 1,155,000 | | | 1,206,340 |
North Carolina Medical Care Commission Revenue, Health Care and Housing, ARC Projects, Series A, 4.65%, 10/1/14 | | | 1,265,000 | | | 1,284,430 |
North Carolina Medicare Common Revenue, 4.75%, 9/1/24, Callable 9/1/14 @ 100 | | | 1,000,000 | | | 1,033,300 |
North Carolina State University, G.O., Series A, 5.00%, 6/1/20, Callable 6/1/16 @ 100 | | | 2,000,000 | | | 2,180,800 |
North Carolina State University, Water Utility Improvements, G.O., Series A, 5.00%, 3/1/17, Callable 3/1/16 @ 100 | | | 1,625,000 | | | 1,781,829 |
North Carolina, Municipal Power Agency Revenue, 5.00%, 1/1/20, OID | | | 420,000 | | | 465,864 |
Onslow County, NC, Certificates of Participation, 4.38%, 6/1/14, XLCA | | | 305,000 | | | 317,450 |
Onslow County, NC, Certificates of Participation, 4.50%, 6/1/15, XLCA | | | 280,000 | | | 294,182 |
Onslow County, NC, Certificates of Participation, 5.00%, 6/1/15, MBIA | | | 1,000,000 | | | 1,091,920 |
Onslow County, NC, Certificates of Participation, 4.50%, 6/1/16, XLCA | | | 170,000 | | | 178,733 |
Onslow County, NC, Certificates of Participation, 4.50%, 6/1/24, Callable 6/1/16 @ 100, MBIA, OID | | | 1,580,000 | | | 1,613,496 |
Onslow County, NC, Hospital Authority Revenue, Onslow Memorial Hospital Project, 4.75%, 10/1/12, MBIA FHA | | | 240,000 | | | 252,732 |
Onslow County, NC, Schools, Certificates of Participation, 5.00%, 6/1/19, Callable 6/1/16 @ 100, MBIA | | | 2,920,000 | | | 3,175,617 |
Orange County, NC, Public Improvements Project, Series A, Certificates of Participation, 5.00%, 4/1/23, Callable 4/1/16 @ 100, AMBAC | | | 1,000,000 | | | 1,069,450 |
Orange Water & Sewer Authority, Water & Sewer System Revenue, Series A, 5.25%, 7/1/16, Callable 7/1/14 @ 100 | | | 1,475,000 | | | 1,618,444 |
Orange Water & Sewer Authority, Water & Sewer System Revenue, Series A, 5.25%, 7/1/18, Callable 7/1/14 @ 100 | | | 1,690,000 | | | 1,842,506 |
Piedmont-Triad, NC, Airport Authority Revenue, Series A, 6.38%, 7/1/16, Prerefunded 7/1/09 @ 101, FSA | | | 1,385,000 | | | 1,499,512 |
Pitt County, NC, Revenue, Memorial Hospital Project, 5.50%, 12/1/15, Callable 12/1/06 @ 101, ETM (d) | | | 2,425,000 | | | 2,560,679 |
| | | | | | | |
| | | Shares or
Principal
Amount | | Fair
Value | |
Municipal Bonds, continued | | | | | | | |
North Carolina, continued | | | | | | | |
Raleigh, NC, Combined Enterprise System Refunding Revenue, Series B, 4.00%, 3/1/20, OID (f) | | $ | 1,500,000 | | $ | 1,484,595 | |
Raleigh, NC, Combined Enterprise System Revenue, Series A, 5.00%, 3/1/20 (f) | | | 500,000 | | | 541,365 | |
Randolph County, NC, Certificates of Participation, 5.30%, 6/1/13, Callable 6/1/09 @ 101, FSA (d) | | | 1,750,000 | | | 1,844,185 | |
Rowan County, NC, Schools, G.O., 5.00%, 4/1/17, Callable 4/1/15 @ 100, AMBAC | | | 1,645,000 | | | 1,784,216 | |
Rutherford County, NC, Certificates of Participation, 5.00%, 9/1/18, Callable 9/1/12 @ 101 | | | 1,595,000 | | | 1,704,481 | |
University of North Carolina Charlotte Revenue, 4.75%, 10/1/35, Callable 10/1/16 @ 100, AMBAC | | | 425,000 | | | 435,897 | |
University of North Carolina Refunding Revenue, Series A, 4.75%, 12/1/34, Callable 12/1/15 @ 100 | | | 1,075,000 | | | 1,103,079 | |
University of North Carolina Wilmington, Certificates of Participation, Student Housing Project, 5.00%, 6/1/25, Callable 6/1/16 @ 100, FGIC | | | 1,000,000 | | | 1,065,450 | |
Wake County, NC, G.O., 5.30%, 2/1/11, Prerefunded 2/1/10 @ 100.5 | | | 1,000,000 | | | 1,059,690 | |
Wake County, NC, Hospital Authority Revenue, 5.13%, 10/1/13, MBIA, ETM | | | 2,425,000 | | | 2,641,212 | |
Wake County, NC, Schools, G.O., 5.00%, 5/1/21, Callable 5/1/15 @ 100 | | | 1,900,000 | | | 2,051,240 | |
Wilmington, NC, Certificates of Participation, Series A, 5.00%, 6/1/19, Callable 6/1/16 @ 100 | | | 1,095,000 | | | 1,179,873 | |
Wilmington, NC, Certificates of Participation, Series A, 5.00%, 6/1/22, Callable 6/1/16 @ 100 | | | 625,000 | | | 667,963 | |
Winston-Salem Water & Sewer System Refunding Revenue, 5.00%, 6/1/24, Callable 6/1/15 @ 100 | | | 1,935,000 | | | 2,071,127 | |
Winston-Salem Water & Sewer Systems Revenue, 5.00%, 6/1/20, Callable 6/1/15 @ 100 | | | 1,170,000 | | | 1,261,190 | |
| | | | | | | |
Total Municipal Bonds
(Cost $101,918,839) | | | | | | 105,033,449 | |
| | | | | | | |
Investment Company (2.5%) | | | | | | | |
PNC North Carolina Blackrock Fund, Institutional Class | | | 2,631,486 | | | 2,631,486 | |
| | | | | | | |
Total Investment Company
(Cost $2,631,486) | | | | | | 2,631,486 | |
| | | | | | | |
Total Investments
(Cost $104,550,325) — 100.6% | | | | | | 107,664,935 | |
Net other assets (liabilities) — (0.6)% | | | | | | (647,891 | ) |
| | | | | | | |
Net Assets — 100.0% | | | | | $ | 107,017,044 | |
| | | | | | | |
See page 86 for footnote legend to the Schedules of Portfolio Investments.
See accompanying notes to the financial statements.
69
South Carolina Intermediate Tax-Free Fund
Schedule of Portfolio Investments | September 30, 2006 |
| | | | | | |
| | | Principal
Amount | | Fair
Value |
Municipal Bonds (97.6%) | | | | | | |
South Carolina (97.6%) | | | | | | |
Aiken County, SC, G.O., 4.00%, 2/1/12, MBIA | | $ | 240,000 | | $ | 244,826 |
Aiken County, SC, G.O., 4.00%, 2/1/14, MBIA | | | 165,000 | | | 168,437 |
Anderson County, SC, School District No 2, G.O., Series B, 6.00%, 3/1/12, Callable 3/1/10 @ 101, SCSDE | | | 500,000 | | | 543,565 |
Anderson County, SC, School District No. 2, G.O., Series B, 5.13%, 3/1/25, Callable 3/1/10 @ 101, MBIA, SCSDE | | | 850,000 | | | 888,377 |
Anderson County, SC. School District No. 4, G.O., 4.50%, 3/1/23, Callable 3/1/16 @ 100, FSA, SCSDE | | | 365,000 | | | 372,012 |
Beaufort County, SC, Public Improvements, G.O., 5.00%, 2/1/24, Callable 2/1/14 @ 100, MBIA, State Aid Withholding | | | 180,000 | | | 190,519 |
Beaufort County, SC, School District Refunding, G.O., Series A, 5.00%, 3/1/13, SCSDE | | | 125,000 | | | 134,780 |
Beaufort County, SC, School District Refunding, G.O., Series A, 5.00%, 3/1/19, Callable 3/1/15 @ 100, SCSDE | | | 465,000 | | | 500,991 |
Berkeley County, SC, Water & Sewer Revenue, Series A, 5.00%, 6/1/24, Callable 6/1/15 @ 100, FSA | | | 350,000 | | | 372,512 |
Berkley County, SC, Water & Sewer Revenue, Series A, 5.00%, 6/1/21, Callable 6/1/15 @ 100, FSA | | | 395,000 | | | 423,085 |
Charleston County, SC, G.O., 4.625%, 11/1/27, Callable 11/1/15 @ 100, State Aid Withholding | | | 500,000 | | | 512,480 |
Charleston County, SC, School District Refunding, G.O., Series B, 5.00%, 2/1/19, Callable 2/1/12 @ 100, SCSDE | | | 250,000 | | | 263,865 |
Charleston, SC, Waterworks & Sewer Refunding Revenue, 5.13%, 1/1/12 | | | 425,000 | | | 456,178 |
Charleston, SC, Waterworks & Sewer Refunding Revenue, 5.25%, 1/1/14, Callable 1/1/11 @ 101 | | | 600,000 | | | 641,651 |
Florence County, SC, Hospital Revenue, Regional Medical Center Project, Series A, 5.25%, 11/1/11, Callable 11/1/08 @ 102, MBIA | | | 500,000 | | | 525,100 |
Florence, SC, New Public Housing Authority Revenue, 5.75%, 8/1/10, Callable 2/1/07 @ 100, U.S. Government Guaranteed | | | 100,000 | | | 106,936 |
Greenville, SC, Stormwater System Revenue, 5.00%, 4/1/22, Callable 4/1/11 @ 101, FSA | | | 350,000 | | | 368,025 |
Greenville, SC, Waterworks Revenue, 5.25%, 2/1/19, Callable 2/1/13 @ 100 | | | 380,000 | | | 413,888 |
Horry County, SC, School District, G.O., Series A, 5.00%, 3/1/11, SCSDE | | | 500,000 | | | 530,195 |
Horry County, SC, School District, G.O., Series A, 4.00%, 3/1/14, FSA, SCSDE | | | 285,000 | | | 290,925 |
Horry County, SC, School District, G.O., Series A, 5.38%, 3/1/15, Callable 3/1/12 @ 100, SCSDE | | | 250,000 | | | 270,778 |
Jasper County, SC, School District, G.O., 4.00%, 3/1/16, Callable 3/1/15 @ 100, MBIA, SCSDE, OID | | | 100,000 | | | 101,334 |
| | | | | | |
| | | Principal
Amount | | Fair
Value |
Municipal Bonds, continued | | | | | | |
South Carolina, continued | | | | | | |
Kershaw County, SC, School District, G.O., 6.13%, 2/1/16, Prerefunded 2/1/10 @ 100, SCSDE | | $ | 500,000 | | $ | 539,570 |
Lancaster County, SC, Assessment Revenue, 5.75%, 12/1/37, Callable 12/1/16 @ 100 | | | 500,000 | | | 529,345 |
Laurens County, SC, School District No. 55 Installment Purchase Revenue, 5.25%, 12/1/24, Callable 12/1/15 @ 100 | | | 225,000 | | | 236,345 |
Laurens County, SC, School District No. 56, G.O., 4.13%, 3/1/15, MBIA, SCSDE | | | 245,000 | | | 251,346 |
Lexington County, SC, Public Improvements, G.O., 5.00%, 2/1/14, Callable 2/1/12 @ 100, FGIC, State Aid Withholding | | | 500,000 | | | 532,200 |
Newberry County, SC, County School Project Revenue, 5.25%, 12/1/21, Callable 12/1/15 @ 100 | | | 225,000 | | | 247,311 |
Orangeburg County, SC, G.O., Series A, 4.00%, 4/1/13, FGIC | | | 250,000 | | | 254,953 |
Richland County, SC, School District No. 1 Refunding, G.O., 5.00%, 3/1/19, Callable 3/1/15 @ 100, FSA, SCSDE | | | 400,000 | | | 430,960 |
Richland County, SC, School District No. 1, G.O., Series A, 5.25%, 3/1/20, Callable 3/1/12, SCSDE | | | 300,000 | | | 321,126 |
Rock Hill, SC, Utility Systems Refunding Revenue, Series A, 5.38%, 1/1/19, Callable 1/1/13 @ 100, FSA | | | 585,000 | | | 636,176 |
South Carolina Jobs Economic Development Authority Hospital Facilities Revenue, 5.50%, 2/1/11, Callable 2/1/09 @ 101, FSA | | | 500,000 | | | 525,010 |
South Carolina Jobs Economic Development Authority Hospital Facilities Revenue, 6.00%, 8/1/12 | | | 200,000 | | | 220,612 |
South Carolina State Economic Development, G.O. Series A, 4.00%, 3/1/16, Callable 3/1/14 @ 100 | | | 40,000 | | | 40,634 |
South Carolina State Economic Development, G.O., Series A, 5.00%, 8/1/16, Callable 8/1/15 @ 100 | | | 350,000 | | | 382,309 |
South Carolina State Economic Development, G.O., Series C, 5.25%, 8/1/11 | | | 760,000 | | | 817,569 |
South Carolina State University, Wade Hampton State Office Building, G.O., Series A, 5.00%, 11/1/15 | | | 350,000 | | | 384,073 |
South Carolina State University, Wade Hampton State Office Building, G.O., Series A, 4.00%, 11/1/17, Callable 11/1/15 @ 100, OID | | | 100,000 | | | 101,468 |
South Carolina State, Public Services Authority Revenue, Series A, 5.00%, 1/1/20, Callable 1/1/14 @ 100, AMBAC | | | 600,000 | | | 638,201 |
South Carolina State, Public Service Authority Revenue, Series A, 5.00%, 1/1/17, Callable 1/1/14 @ 100, FSA | | | 450,000 | | | 482,756 |
South Carolina Transportation Infrastructure Bank Refunding Revenue, 5.25%, 10/1/15, AMBAC | | | 500,000 | | | 555,860 |
Spartanburg County, SC, School District No. 5, G.O., 5.25%, 5/1/10, SCSDE | | | 525,000 | | | 556,080 |
Spartanburg, SC, Water Works Refunding Revenue, 5.25%, 6/1/11, FSA | | | 500,000 | | | 536,095 |
Continued
70
South Carolina Intermediate Tax-Free Fund
Schedule of Portfolio Investments, continued | September 30, 2006 |
| | | | | | |
| | | Principal
Amount | | Fair
Value |
Municipal Bonds, continued | | | | | | |
South Carolina, continued | | | | | | |
University of South Carolina Medical Facilities Refunding Revenue, 6.00%, 8/15/12 | | $ | 500,000 | | $ | 562,755 |
Western Carolina Regional Sewer Authority, Sewage System Revenue, 5.25%, 3/1/10, FSA | | | 550,000 | | | 580,228 |
York County, SC, School District No. 3, G.O., Series A, 5.00%, 3/1/11, Callable 3/1/09 @ 101, SCSDE | | | 275,000 | | | 286,696 |
| | | | | | |
Total Municipal Bonds
(Cost $18,444,845) | | | | | | 18,970,137 |
| | | | | | |
| | | | | |
| | | Shares | | Fair
Value |
Investment Company (2.1%) | | | | | |
Federated Tax-Free Obligations Fund, Institutional Service Class | | 400,376 | | $ | 400,376 |
| | | | | |
Total Investment Company
(Cost $400,376) | | | | | 400,376 |
| | | | | |
Total Investments
(Cost $18,845,221) — 99.7% | | | | | 19,370,513 |
Net other assets (liabilities) — 0.3% | | | | | 57,158 |
| | | | | |
Net Assets — 100.0% | | | | $ | 19,427,671 |
| | | | | |
See page 86 for footnote legend to the Schedules of Portfolio Investments.
See accompanying notes to the financial statements.
71
Virginia Intermediate Tax-Free Fund
Schedule of Portfolio Investments | September 30, 2006 |
| | | | | | |
| | | Principal
Amount | | Fair
Value |
Municipal Bonds (97.2%) | | | | | | |
District of Columbia (2.2%) | | | | | | |
Washington, D.C., Metropolitan Transportation Authority Refunding Revenue, 6.00%, 7/1/09, FGIC | | $ | 1,600,000 | | $ | 1,703,232 |
| | | | | | |
Virginia (95.0%) | | | | | | |
Alexandria, VA, Construction & Public Improvements, G.O., 5.00%, 6/15/08, State Aid Withholding | | | 1,000,000 | | | 1,025,490 |
Alexandria, VA, Construction & Public Improvements, G.O., 5.00%, 1/1/13 | | | 1,425,000 | | | 1,538,259 |
Alexandria, VA, G.O., Series A, 5.00%, 6/15/16 | | | 1,000,000 | | | 1,102,700 |
Amherst Industrial Development Authority Refunding Revenue, 4.50%, 9/1/18, Callable 9/1/16 @ 100 | | | 40,000 | | | 40,672 |
Arlington County, VA, Public Improvement, G.O., 5.13%, 6/1/11, Prerefunded 6/1/09 @ 100, State Aid Withholding | | | 1,000,000 | | | 1,041,060 |
Arlington County, VA, Public Improvement, G.O., 5.00%, 5/15/25, Callable 5/15/15 @ 100, State Aid Withholding | | | 1,175,000 | | | 1,259,964 |
Arlington County, VA, Refunding, G.O., 5.00%, 5/15/15, Callable 5/15/14 @ 100 | | | 1,495,000 | | | 1,624,422 |
Chesapeake, VA, Refunding, G.O., 5.00%, 6/1/13 | | | 1,000,000 | | | 1,080,610 |
Chesterfield County, VA, Pollution Control Authority Revenue, 5.50%, 10/1/09, Callable 11/27/06 @ 101 | | | 2,500,000 | | | 2,528,650 |
Fairfax County, VA, Economic Development Authority Refunding Revenue, Series A, 4.10%, 10/1/13 | | | 305,000 | | | 304,539 |
Fairfax County, VA, Economic Development Authority Refunding Revenue, Series A, 4.15%, 10/1/14 | | | 490,000 | | | 489,339 |
Fairfax County, VA, Economic Development Authority Refunding Revenue, Series A, 4.20%, 10/1/15 | | | 225,000 | | | 224,465 |
Fairfax County, VA, Economic Development Authority Refunding Revenue, Series A, 4.25%, 10/1/16 | | | 260,000 | | | 259,727 |
Fairfax County, VA, Economic Development Authority Revenue, First Series, 5.25%, 9/1/10, Prerefunded 9/1/09 @ 102, OID | | | 1,000,000 | | | 1,065,880 |
Henrico County, VA, Water & Sewer Refunding Revenue, 5.25%, 5/1/11, Callable 5/1/09 @ 102 | | | 1,000,000 | | | 1,058,900 |
Lessburg, VA, Public Utilities, G.O., 4.75%, 7/1/23, Callable 7/1/16 @ 100 | | | 1,275,000 | | | 1,342,065 |
Loudoun County, VA, Public Improvements, G.O., Series B, 5.00%, 12/1/14 | | | 1,000,000 | | | 1,094,750 |
Loudoun County, VA, Water & Sewer Refunding Revenue, 5.00%, 1/1/29, Callable 1/1/15 @ 100 | | | 1,455,000 | | | 1,538,532 |
Loudoun County, VA, Water & Sewer Revenue, 5.75%, 1/1/11, FSA | | | 1,000,000 | | | 1,086,540 |
Manassas, VA, Water Utility Improvements, G.O., Series A, 5.25%, 1/1/11, Prerefunded 1/1/08 @ 102 | | | 1,200,000 | | | 1,248,180 |
New Port Community Development Authority Special Assessment, 5.50%, 9/1/26, Callable 9/1/16 @ 101 | | | 1,325,000 | | | 1,358,854 |
| | | | | | |
| | | Principal
Amount | | Fair
Value |
Municipal Bonds, continued | | | | | | |
Virginia, continued | | | | | | |
Newport News, VA, G.O., Series A, 5.50%, 5/1/13, Prerefunded 5/1/10 @ 102, OID | | $ | 1,845,000 | | $ | 2,002,065 |
Newport News, VA, G.O., Series A, 5.00%, 7/1/22, Callable 7/1/13 @ 100, State Aid Withholding | | | 1,250,000 | | | 1,324,038 |
Norfolk, VA, Water Revenue, 5.13%, 11/1/11, Callable 11/1/08 @ 101, FSA | | | 1,030,000 | | | 1,071,921 |
Pittsylvania County, VA, G.O., Series B, 5.63%, 3/1/15, Callable 3/1/11 @ 102, MBIA | | | 1,315,000 | | | 1,443,120 |
Portsmouth, VA, Public Utility Refunding, G.O., Series B, 5.00%, 4/1/21, Callable 4/1/15 @ 100, MBIA | | | 2,135,000 | | | 2,294,015 |
Portsmouth, VA, Public Utility Refunding, G.O., Series B, 5.00%, 4/1/22, Callable 4/1/15 @ 100, MBIA | | | 1,375,000 | | | 1,475,361 |
Prince William County, VA, Service Authority Water & Sewer System Revenue, 5.00%, 7/1/14, Callable 7/1/13 @ 102 | | | 1,000,000 | | | 1,087,600 |
Richmond, VA, G.O., 5.25%, 1/15/09, FSA | | | 1,500,000 | | | 1,557,645 |
Roanoke, VA, Public Improvement, G.O., 5.00%, 10/1/17, Callable 10/1/14 @ 101 | | | 1,000,000 | | | 1,089,200 |
Roanoke, VA, Public Improvement, G.O., 5.00%, 2/1/18, Callable 2/1/15 @ 101, State Aid Withholding | | | 1,000,000 | | | 1,090,010 |
Spotsylvania County, VA, Public Improvements, G.O., 5.00%, 1/15/17, Callable 1/15/16 @ 100 | | | 1,645,000 | | | 1,800,831 |
Spotsylvania County, VA, Refunding, G.O., 5.50%, 7/15/12, FSA | | | 2,925,000 | | | 3,221,039 |
University of VA, General Revenue, 5.00%, 6/1/22, Callable 6/1/13 @ 100 | | | 540,000 | | | 572,945 |
Upper Occoquan Sewer Authority, Regional Sewer Refunding Revenue, 5.00%, 7/1/25, Callable 7/1/15 @ 100, FSA | | | 1,000,000 | | | 1,066,340 |
Virginia Beach, VA, Industrial Development Authority Revenue, Sentara Health Systems, 5.25%, 11/1/09, Callable 11/1/08 @ 101, MBIA | | | 1,000,000 | | | 1,041,960 |
Virginia Beach, VA, Public Improvement, G.O., 5.25%, 3/1/08, State Aid Withholding | | | 1,000,000 | | | 1,023,900 |
Virginia Beach, VA, Public Improvement, G.O., 5.25%, 3/1/11, Prerefunded 3/1/10 @ 101, State Aid Withholding, OID | | | 3,205,000 | | | 3,414,606 |
Virginia College Building Authority, Educational Facilities Revenue, 5.50%, 4/1/10 | | | 1,000,000 | | | 1,062,560 |
Virginia College Building Authority, Educational Facilities Revenue, 5.00%, 9/1/19, Callable 9/1/11 @ 100 | | | 1,090,000 | | | 1,147,181 |
Virginia College Building Authority, Educational Facilities Revenue, Series A, 5.00%, 9/1/22, Callable 9/1/15 @ 100 | | | 1,000,000 | | | 1,073,610 |
Virginia College Building Authority, Educational Facilities Revenue, 5.25%, 1/1/31, MBIA | | | 1,755,000 | | | 2,036,484 |
Virginia Commonwealth Transportation Board Refunding Revenue, Series B, 4.25%, 5/15/16 | | | 15,000 | | | 15,555 |
Virginia Commonwealth Transportation Board Revenue, Series B, 5.75%, 5/15/09 | | | 1,035,000 | | | 1,092,401 |
Continued
72
Virginia Intermediate Tax-Free Fund
Schedule of Portfolio Investments, continued | September 30, 2006 |
| | | | | | |
| | |
| | | Principal
Amount | | Fair
Value |
Municipal Bonds, continued | | | | | | |
Virginia, continued | | | | | | |
Virginia Commonwealth Transportation Board Revenue, Series B, 5.50%, 5/15/15, Prerefunded 5/15/09 @ 101, OID | | $ | 1,185,000 | | $ | 1,254,157 |
Virginia State Authority, Water Revenue, 5.25%, 10/1/15 | | | 1,040,000 | | | 1,160,401 |
Virginia State Public Building Authority Revenue, Series A, 5.00%, 8/1/15 | | | 1,500,000 | | | 1,640,835 |
Virginia State Public Building Authority, Public Facilities Revenue, Series A, 5.00%, 8/1/14 | | | 2,000,000 | | | 2,175,840 |
Virginia State Public School Authority Refunding Revenue, Series A, 5.25%, 8/1/17, State Aid Withholding | | | 280,000 | | | 314,140 |
Virginia State Public School Authority Refunding Revenue, Series D, 5.25%, 2/1/12, State Aid Withholding | | | 1,145,000 | | | 1,237,001 |
Virginia State Public School Authority Revenue, Series C, 5.00%, 8/1/28, Callable 8/1/13 @ 100, State Aid Withholding | | | 1,510,000 | | | 1,585,651 |
Virginia State Public School Authority, G.O., Series B, 5.25%, 8/1/10, Prerefunded 8/1/09 @ 101, State Aid Withholding, OID | | | 1,000,000 | | | 1,055,440 |
Virginia State Public School Authority, G.O., Series B, 3.00%, 8/1/20, Callable 8/1/11 @ 101, OID | | | 3,815,000 | | | 3,338,087 |
| | | | | | |
| | | Shares or
Principal
Amount | | Fair
Value |
Municipal Bonds, continued | | | | | | |
Virginia, continued | | | | | | |
Virginia State Public School Authority, School Financing Revenue, Series A, 5.25%, 8/1/10, Callable 8/1/09 @ 101, OID | | $ | 2,040,000 | | $ | 2,165,440 |
Virginia State Resources Authority Infrastructure Revenue, 4.00%, 11/1/16 | | | 25,000 | | | 25,422 |
Winchester, VA, Public Improvements, G.O., 5.00%, 11/1/22, Callable 11/1/15 @ 100, FGIC | | | 2,210,000 | | | 2,380,436 |
| | | | | | |
| | | | | | 73,650,835 |
| | | | | | |
Total Municipal Bonds
(Cost $72,892,964) | | | | | | 75,354,067 |
| | | | | | |
Investment Company (2.5%) | | | | | | |
PNC Virginia Blackrock Fund, Institutional Class | | | 1,899,615 | | | 1,899,615 |
| | | | | | |
Total Investment Company
(Cost $1,899,615) | | | | | | 1,899,615 |
| | | | | | |
Total Investments
(Cost $74,792,579) — 99.7% | | | | | | 77,253,682 |
Net other assets (liabilities) — 0.3% | | | | | | 263,903 |
| | | | | | |
Net Assets — 100.0% | | | | | $ | 77,517,585 |
| | | | | | |
See page 86 for footnote legend to the Schedules of Portfolio Investments.
See accompanying notes to the financial statements.
73
West Virginia Intermediate Tax-Free Fund
Schedule of Portfolio Investments | September 30, 2006 |
| | | | | | |
| | | Principal
Amount | | Fair
Value |
Municipal Bonds (97.5%) | | | | | | |
West Virginia (97.5%) | | | | | | |
Cabell County, WV, Board of Education, G.O., 5.00%, 5/1/16, MBIA | | $ | 2,000,000 | | $ | 2,188,440 |
Cabell, Putnam & Wayne Counties, West Virginia, Single Family Residential Mortgage Revenue, 7.38%, 4/1/11, FGIC, ETM | | | 640,000 | | | 731,366 |
Charleston, WV, Urban Renewal Authority Revenue, 5.25%, 12/15/18, Callable 12/15/09 @ 103, FSA | | | 1,080,000 | | | 1,156,928 |
Clarksburg, WV, Water Refunding Revenue, 5.25%, 9/1/19, Callable 9/1/12 @ 101, FGIC | | | 1,190,000 | | | 1,290,222 |
Fairmont State College, WV, Student Activity Revenue, Series B, 5.00%, 6/1/32, Callable 6/1/13 @ 100, FGIC | | | 1,400,000 | | | 1,460,368 |
Fairmont, WV, Waterworks Refunding Revenue, 5.38%, 7/1/13, Callable 7/1/07 @ 102, MBIA, OID | | | 680,000 | | | 701,753 |
Harrison County, WV, Building Commission Revenue, 5.15%, 4/1/18, Prerefunded 4/1/08 @ 102, AMBAC, OID | | | 1,000,000 | | | 1,042,070 |
Harrison County, WV, County Commission Solid Waste Disposal Revenue, Series B, 6.30%, 5/1/23, Callable 5/1/07 @ 100, AMBAC — TCRS | | | 860,000 | | | 870,535 |
Logan County, WV, Logan County Health Revenue, 8.00%, 12/1/16, ETM | | | 690,000 | | | 901,168 |
Monongalia County, WV, Building Commission Hospital Revenue, Monongalia General Hospital Project, 5.00%, 7/1/30, Callable 7/1/15 @ 100 | | | 1,700,000 | | | 1,738,590 |
Monongalia County, WV, Pollution Control Refunding Revenue, Series B, 5.95%, 4/1/13, Callable 4/1/07 @ 100, MBIA | | | 2,000,000 | | | 2,017,300 |
Ohio County, WV, Board of Education Refunding, G.O., 5.00%, 6/1/13, Callable 6/1/08 @ 102, MBIA, OID | | | 800,000 | | | 832,120 |
Ohio County, WV, Commission Special District Excise Tax Revenue, Fort Henry Economic Development, Series B, 5.63%, 3/1/36 | | | 640,000 | | | 661,715 |
Ohio County, WV, Commission Tax Increment Revenue, Fort Henry Centre Financing District, Series A, 5.63%, 6/1/34, Callable 12/1/15 @ 100 | | | 1,000,000 | | | 1,050,410 |
Parkersburg, WV, Waterworks & Sewage System Refunding Revenue, Series C, 5.00%, 9/1/14, FGIC | | | 1,190,000 | | | 1,293,399 |
Parkersburg, WV, Waterworks & Sewage System Refunding Revenue, Series C, 5.00%, 9/1/15, FGIC | | | 1,330,000 | | | 1,452,613 |
Parkersburg, WV, Waterworks & Sewage System Refunding Revenue, Series C, 4.00%, 9/1/16, Callable 9/1/15 @ 100, FGIC | | | 640,000 | | | 648,480 |
Parkersburg, WV, Waterworks & Sewage Systems Refunding Revenue, Series A, 4.50%, 8/1/22, Callable 8/1/15 @ 100, FGIC | | | 965,000 | | | 979,726 |
Pleasants County, WV, Pollution Control Refunding Revenue, Series C, 6.15%, 5/1/15, Callable 5/1/07 @ 100, AMBAC, MBIA | | | 1,000,000 | | | 1,018,310 |
Pleasants County, WV, Pollution Control Refunding Revenue, Series C, 6.15%, 5/1/15, Callable 5/1/07 @ 100, AMBAC | | | 1,100,000 | | | 1,120,141 |
| | | | | | |
| | | Principal
Amount | | Fair
Value |
Municipal Bonds, continued | | | | | | |
West Virginia, continued | | | | | | |
South Charleston, WV, Hospital Refunding Revenue, Series A, 5.50%, 10/1/09, Callable 10/1/06 @ 100, MBIA | | $ | 520,000 | | $ | 522,371 |
Weirton, WV, Municipal Hospital Building Revenue, Series A, 5.25%, 12/1/11, OID | | | 1,500,000 | | | 1,521,840 |
West Virginia Economic Development Authority Lease Revenue, State Energy Savings Project, 4.50%, 6/1/17, Callable 6/1/15 @ 100 | | | 360,000 | | | 368,078 |
West Virginia Economic Development Authority Lease Revenue, State Energy Savings Project, 4.75%, 6/1/21, Callable 6/1/15 @ 100 | | | 1,035,000 | | | 1,064,580 |
West Virginia Economic Development Authority Revenue, Department of Environmental Protection, 4.75%, 11/1/11 | | | 535,000 | | | 563,285 |
West Virginia Economic Development Authority Revenue, Series A, 5.50%, 6/1/12, MBIA | | | 2,000,000 | | | 2,191,360 |
West Virginia Economic Development Authority Revenue, Series A, 5.50%, 6/1/15, Callable 6/1/12 @ 101, MBIA | | | 1,000,000 | | | 1,102,100 |
West Virginia Economic Development Authority Revenue, Series A, 5.00%, 10/1/15, Callable 10/1/11 @ 101 | | | 1,250,000 | | | 1,328,138 |
West Virginia Economic Development Authority Revenue, Series A, 5.50%, 6/1/18, Callable 6/1/12 @ 101, MBIA | | | 1,000,000 | | | 1,095,640 |
West Virginia Higher Education Policy Commission Revenue Higher Education Facilities, Series B, 5.00%, 4/1/34 | | | 1,135,000 | | | 1,186,983 |
West Virginia Higher Educational Facilities Revenue, Series B, 5.00%, 4/1/14, FGIC | | | 250,000 | | | 270,618 |
West Virginia Higher Educational Facilities Revenue, Series B, 5.00%, 4/1/23, Callable 4/1/14 @ 100, FGIC | | | 5,490,000 | | | 5,833,728 |
West Virginia State Building Commission Refunding Revenue, Series A, 5.25%, 7/1/10, AMBAC | | | 1,950,000 | | | 2,062,671 |
West Virginia State Capital Appreciation, Infrastructure, G.O., Series A, 3.15%, 11/1/24, FGIC, OID, Zero Coupon** | | | 500,000 | | | 225,135 |
West Virginia State Hospital Finance Authority Refunding Revenue, 5.00%, 8/1/09, Callable 8/1/07 @ 100, FSA | | | 800,000 | | | 807,880 |
West Virginia State Hospital Finance Authority Revenue, 6.10%, 1/1/18, Callable 1/1/07 @ 100, MBIA | | | 1,300,000 | | | 1,320,709 |
West Virginia State Hospital Finance Authority Revenue, 5.50%, 3/1/22, Callable 3/1/14 @ 100 | | | 970,000 | | | 1,022,458 |
West Virginia State Hospital Finance Authority Revenue, Series A, 6.50%, 9/1/16, ETM, OID | | | 620,000 | | | 740,429 |
West Virginia State Housing Development Fund Revenue, Marion Unity Apartments Project, Series A, 5.40%, 1/1/16, Callable 7/1/11 @ 100 | | | 400,000 | | | 402,128 |
West Virginia State Housing Development Fund Revenue, Marion Unity Apartments Project, Series A, 5.75%, 1/1/29, Callable 7/1/11 @ 100, OID | | | 515,000 | | | 519,419 |
Continued
74
West Virginia Intermediate Tax-Free Fund
Schedule of Portfolio Investments, continued | September 30, 2006 |
| | | | | | |
| | |
| | | Principal
Amount | | Fair
Value |
Municipal Bonds, continued | | | | | | |
West Virginia, continued | | | | | | |
West Virginia State Parkways Economic Development & Tourism Authority Refunding Revenue, 5.00%, 5/15/10, FGIC | | $ | 1,165,000 | | $ | 1,222,784 |
West Virginia State Parkways Economic Development & Tourism Authority Refunding Revenue, 5.25%, 5/15/12, FGIC | | | 1,000,000 | | | 1,082,440 |
West Virginia State Parkways Economic Development & Tourism Authority Refunding Revenue, 5.25%, 5/15/17, FGIC | | | 700,000 | | | 782,383 |
West Virginia State School Building Authority Revenue, 5.25%, 1/1/14, MBIA | | | 500,000 | | | 548,890 |
West Virginia State School Building Authority Revenue, 5.25%, 7/1/14, MBIA | | | 615,000 | | | 677,853 |
West Virginia State Water Development Authority Revenue, Series A, 5.50%, 11/1/18, Prerefunded 11/1/09 @ 102, AMBAC | | | 1,000,000 | | | 1,074,780 |
West Virginia State Water Development Authority Revenue, Series A, 5.00%, 11/1/44, Callable 11/1/15 @ 100, FSA | | | 1,000,000 | | | 1,046,800 |
West Virginia State, Highway Improvements, G.O., 5.50%, 6/1/10, FSA | | | 1,395,000 | | | 1,488,312 |
West Virginia State, State Road Improvements, G.O., 5.00%, 6/1/16, Callable 6/1/15 @ 100, FGIC | | | 2,000,000 | | | 2,174,560 |
| | | | | | |
| | | Shares or
Principal
Amount | | Fair
Value |
Municipal Bonds, continued | | | | | | |
West Virginia, continued | | | | | | |
West Virginia University, School Improvements Revenue, Series A, 5.50%, 4/1/11, MBIA | | $ | 1,485,000 | | $ | 1,604,275 |
West Virginia University, School Improvements Revenue, Series C, 5.00%, 10/1/25, Callable 10/1/14 @ 100, FGIC | | | 2,155,000 | | | 2,283,201 |
West Virginia Water Development Authority Revenue Series A, 5.00%, 10/1/28, Callable 10/1/13 @ 101, OID | | | 2,115,000 | | | 2,230,500 |
Wheeling, WV, Waterworks & Sewer Systems Revenue, Series A, 4.75%, 6/1/36, Callable 6/1/16 @ 100, FSA | | | 1,500,000 | | | 1,534,965 |
| | | | | | |
Total Municipal Bonds
(Cost $63,334,706) | | | | | | 65,056,947 |
| | | | | | |
Investment Company (1.1%) | | | | | | |
Federated Tax-Free Obligations Fund, Institutional Service Class | | | 727,776 | | | 727,776 |
| | | | | | |
Total Investment Company
(Cost $727,776) | | | | | | 727,776 |
| | | | | | |
Total Investments
(Cost $64,062,482) — 98.6% | | | | | | 65,784,723 |
Net other assets (liabilities) — 1.4% | | | | | | 904,360 |
| | | | | | |
Net Assets — 100.0% | | | | | $ | 66,689,083 |
| | | | | | |
See page 86 for footnote legend to the Schedules of Portfolio Investments.
See accompanying notes to the financial statements.
75
Prime Money Market Fund
Schedule of Portfolio Investments | September 30, 2006 |
| | | | | | |
| | | Principal
Amount | | Amortized
Cost |
Bankers Acceptance (0.4%) | | | | | | |
Banking (0.4%) | | | | | | |
Wachovia Bank NA, 5.45%, 12/22/06 | | $ | 6,000,000 | | $ | 5,925,517 |
| | | | | | |
Total Bankers Acceptance
(Cost $5,925,517) | | | | | | 5,925,517 |
| | | | | | |
Certificates of Deposit (9.9%) | | | | | | |
Banking (9.9%) | | | | | | |
Barclays Bank PLC, 5.38%, 10/4/06 | | | 25,000,000 | | | 25,000,000 |
Barclays Bank PLC, 4.75%, 10/17/06 | | | 5,000,000 | | | 5,000,005 |
Calyon Bank, Paris, 5.36%, 4/30/07 | | | 5,000,000 | | | 5,000,139 |
Citizens Bank of Pennsylvania, 5.37%, 11/27/06 | | | 5,000,000 | | | 5,000,078 |
Credit Suisse, Zurich, 4.78%, 10/27/06 | | | 14,000,000 | | | 14,000,000 |
Credit Suisse, Zurich, 5.25%, 11/20/06 | | | 3,000,000 | | | 3,000,000 |
Credit Suisse, Zurich, 4.92%, 2/5/07 | | | 5,000,000 | | | 5,000,000 |
Credit Suisse, Zurich, 5.21%, 3/29/07 | | | 5,000,000 | | | 5,000,000 |
Depfa Bank PLC, 5.26%, 4/9/07 | | | 5,000,000 | | | 5,000,000 |
Deutsche Bank AG, 4.50%, 10/13/06 | | | 6,000,000 | | | 6,000,000 |
First Tennessee Bank, 5.31%, 12/26/06 | | | 12,000,000 | | | 12,000,000 |
Huntington National Bank, 5.45%, 12/4/06 | | | 10,000,000 | | | 10,000,000 |
Royal Bank of Scotland PLC, Edinburgh, 4.40%, 10/4/06 | | | 5,000,000 | | | 5,000,000 |
Societe General, Paris, 5.41%, 2/20/07 | | | 10,000,000 | | | 10,000,000 |
Toronto Dominion Bank, 5.42%, 2/12/07 | | | 12,000,000 | | | 12,000,000 |
Toronto Dominion Bank, 5.295%, 4/13/07 | | | 2,000,000 | | | 2,000,000 |
Toronto Dominion Bank, 5.60%, 6/18/07 | | | 4,000,000 | | | 4,000,000 |
Toronto Dominion Bank, 5.51%, 8/3/07 | | | 2,500,000 | | | 2,501,365 |
| | | | | | |
Total Certificates of Deposit
(Cost $135,501,587) | | | | | | 135,501,587 |
| | | | | | |
Commercial Paper** (32.4%) | | | | | | |
Financial Services (30.8%) | | | | | | |
Amsterdam Funding Corp., 5.27%, 11/27/06 (c) | | | 15,000,000 | | | 14,874,838 |
Amsterdam Funding Corp., 5.29%, 2/9/07 (c) | | | 8,000,000 | | | 7,846,148 |
Bank of America Corp., 5.28%, 10/16/06 | | | 25,000,000 | | | 24,944,999 |
CIT Group, Inc., 5.01%, 10/3/06 | | | 2,000,000 | | | 1,999,440 |
DaimlerChrysler North America Holding Corp., 5.41%, 11/13/06 | | | 5,100,000 | | | 5,067,079 |
DaimlerChrysler North America Holding Corp., 5.37%, 11/20/06 | | | 2,300,000 | | | 2,282,846 |
DaimlerChrysler North America Holding Corp., 5.38%, 12/20/06 | | | 700,000 | �� | | 691,631 |
DaimlerChrysler North America Holding Corp., 5.36%, 12/27/06 | | | 5,700,000 | | | 5,626,166 |
DaimlerChrysler Revolving Corp., 5.24%, 12/27/06 | | | 20,000,000 | | | 19,746,733 |
Danske Corp., Inc., 4.98%, 4/10/07 | | | 4,000,000 | | | 3,894,228 |
Dresdner US Finance, 5.28%, 11/20/06 | | | 10,000,000 | | | 9,926,667 |
Edison Asset Securitization, 5.38%, 10/5/06 (c) | | | 10,000,000 | | | 9,994,022 |
FCAR Auto Loan Trust, 5.27%, 11/7/06 | | | 10,000,000 | | | 9,945,836 |
FCAR Auto Loan Trust, 5.11%, 11/13/06 | | | 8,000,000 | | | 7,951,171 |
| | | | | | |
| | | Principal
Amount | | Amortized
Cost |
Commercial Paper**, continued | | | | | | |
Financial Services, continued | | | | | | |
FCAR Auto Loan Trust, 5.28%, 12/11/06 | | $ | 1,750,000 | | $ | 1,731,777 |
FCAR Auto Loan Trust, 5.29%, 2/5/07 | | | 8,000,000 | | | 7,850,704 |
FCAR Auto Loan Trust, 5.28%, 2/6/07 | | | 8,000,000 | | | 7,849,813 |
FCAR Auto Loan Trust, 5.31%, 2/12/07 | | | 10,000,000 | | | 9,802,350 |
FCAR Auto Loan Trust, 5.31%, 2/15/07 | | | 10,000,000 | | | 9,797,925 |
FCAR Auto Loan Trust, 5.25%, 3/7/07 | | | 6,000,000 | | | 5,862,625 |
Fountain Square Commercial Funding Corp., 5.34%, 11/1/06 (c) | | | 8,000,000 | | | 7,963,213 |
Fountain Square Commercial Funding Corp., 5.28%, 11/16/06 (c) | | | 20,000,000 | | | 19,865,067 |
Fountain Square Commercial Funding Corp., 5.27%, 12/15/06 (c) | | | 15,000,000 | | | 14,835,313 |
Galaxy Funding, Inc., 5.24%,
12/29/06 (c) | | | 8,000,000 | | | 7,896,364 |
Georgetown Funding Co., LLC, 5.30%, 10/24/06 (c) | | | 25,000,000 | | | 24,915,346 |
Grampian Funding LLC, 5.37%, 10/25/06 (c) | | | 10,000,000 | | | 9,964,200 |
Grampian Funding LLC, 5.28%,
2/5/07 (c) | | | 7,000,000 | | | 6,869,737 |
Grampian Funding LLC, 5.27%,
2/6/07 (c) | | | 4,000,000 | | | 3,925,120 |
Grampian Funding LLC, 5.29%,
2/7/07 (c) | | | 8,000,000 | | | 7,848,497 |
Grampian Funding LLC, 5.24%,
3/12/07 (c) | | | 3,500,000 | | | 3,417,470 |
Greenwich Capital Holdings, 5.29%, 10/13/06*** | | | 6,000,000 | | | 6,000,000 |
Greenwich Capital Holdings, 5.24%, 12/19/06 | | | 15,000,000 | | | 14,827,517 |
Klio II Funding, Ltd., 5.28%,
10/18/06 (c) | | | 15,000,000 | | | 14,962,600 |
Klio II Funding, Ltd., 5.15%, 10/19/06 (c) | | | 20,000,000 | | | 19,947,250 |
Nissan Motor Acceptance Corp., 5.33%, 10/30/06 (c) | | | 7,671,000 | | | 7,638,064 |
Paradigm Funding LLC, 5.28%, 11/29/06 (c) | | | 10,000,000 | | | 9,913,467 |
Paradigm Funding LLC, 5.23%, 3/21/07 (c) | | | 13,000,000 | | | 12,677,048 |
Picaros Funding LLC, 5.39%,
10/6/06 (c) | | | 5,000,000 | | | 4,996,257 |
Picaros Funding LLC, 5.34%, 10/11/06 (c) | | | 6,500,000 | | | 6,490,250 |
Picaros Funding LLC, 5.11%,
10/20/06 (c) | | | 20,000,000 | | | 19,944,267 |
Picaros Funding LLC, 5.25%, 2/8/07 (c) | | | 10,000,000 | | | 9,809,514 |
Societe Generale Northern American, 5.27%, 2/12/07 | | | 8,000,000 | | | 7,843,220 |
Volkswagen of America, Inc., 5.33%, 10/20/06 (c) | | | 13,200,000 | | | 13,162,868 |
| | | | | | |
| | | | | | 423,399,647 |
| | | | | | |
Retail (1.6%) | | | | | | |
Fortune Brands, Inc., 5.47%, 10/3/06 (c) | | | 2,000,000 | | | 1,999,392 |
Fortune Brands, Inc., 5.37%, 10/20/06 (c) | | | 6,000,000 | | | 5,982,995 |
Heinz (H.J) Finance Co., 5.34%, 10/26/06 (c) | | | 13,500,000 | | | 13,449,938 |
| | | | | | |
| | | | | | 21,432,325 |
| | | | | | |
Total Commercial Paper
(Cost $444,831,972) | | | | | | 444,831,972 |
| | | | | | |
Continued
76
Prime Money Market Fund
Schedule of Portfolio Investments, continued | September 30, 2006 |
| | | | | | |
| | | Principal
Amount | | Amortized
Cost |
Corporate Bonds (6.6%) | | | | | | |
Asset Backed Securities (1.8%) | | | | | | |
CNH Equipment Trust, Series 2006-A, Class A-1, 4.99%, 4/5/07 | | $ | 1,744,247 | | $ | 1,744,247 |
CNH Equipment Trust, Series 2006-B, Class A-1, 5.39%, 10/5/07 | | | 10,000,000 | | | 10,000,000 |
Ford Credit Auto Owner Trust, Series 2006-B, Class A-1, 5.40%, 9/15/07 (c) | | | 4,111,431 | | | 4,111,431 |
GS Auto Loans Trust, Series 2006-1, Class A-1, 5.51%, 8/15/07 | | | 5,982,009 | | | 5,982,009 |
Household Automotive Trust, Series 2006-1, Class A-1, 5.275%, 6/18/07 | | | 2,644,534 | | | 2,644,534 |
| | | | | | |
| | | | | | 24,482,221 |
| | | | | | |
Financial Services (4.8%) | | | | | | |
Dupont Teijin Films U.K., 5.32%, 10/31/06 | | | 25,000,000 | | | 25,000,000 |
Federal Home Loan Mortgage Corp., 5.41%, 6/18/07, Callable 11/22/06 @ 100 | | | 3,000,000 | | | 3,000,000 |
Huntington National Bank, 2.75%, 10/16/06 | | | 2,660,000 | | | 2,657,024 |
K2 (USA) LLC, 5.00%, 3/12/07 (c) | | | 6,700,000 | | | 6,700,000 |
Merrill Lynch & Co., Inc., Series 1, 5.31%, 8/24/07 | | | 8,000,000 | | | 8,000,000 |
Royal Bank of Canada, Montreal, 5.49%, 10/2/07 | | | 4,000,000 | | | 4,000,000 |
Sigma Finance, Inc., 4.91%, 1/26/07 (c) | | | 3,000,000 | | | 3,000,000 |
Sigma Finance, Inc., 4.83%, 1/30/07 (c) | | | 3,000,000 | | | 3,000,000 |
Sigma Finance, Inc., 5.00%, 3/8/07 (c) | | | 4,000,000 | | | 4,000,000 |
Sigma Finance, Inc., 5.25%, 4/30/07 (c) | | | 3,000,000 | | | 3,000,000 |
Sigma Finance, Inc., 5.75%, 7/25/07 (c) | | | 4,000,000 | | | 4,000,000 |
| | | | | | |
| | | | | | 66,357,024 |
| | | | | | |
Total Corporate Bonds
(Cost $90,839,245) | | | | | | 90,839,245 |
| | | | | | |
Municipal Bonds (1.2%) | | | | | | |
Economic Development (0.9%) | | | | | | |
Florida Hurricane Catastrophe Finance Corp., Series B, 5.34%, 8/15/07, Callable 7/15/07 @ 100* | | | 12,000,000 | | | 12,000,000 |
| | | | | | |
Industrial Revenue (0.3%) | | | | | | |
Kansas City, Missouri, Industrial Development Authority Revenue, West Edge Project, 5.34%, 10/4/06* | | | 4,000,000 | | | 4,000,000 |
| | | | | | |
Total Municipal Bonds
(Cost $16,000,000) | | | | | | 16,000,000 |
| | | | | | |
Variable Rate Notes* (28.6%) | | | | | | |
Banking & Financial Services (12.7%) | | | | | | |
Anchor Holdings, 5.38%, 10/4/06, (LCD U.S. Bank N.A.) | | | 1,760,000 | | | 1,760,000 |
Barclays Bank PLC, 5.27%, 1/29/07 | | | 4,000,000 | | | 3,999,725 |
Bartlett, Illinois, Redevelopment Project, 5.38%, 10/4/06, (LCD LaSalle Bank) | | | 5,000,000 | | | 5,000,000 |
Christian Life Assembly of the Assemblies of God, 5.47%, 10/4/06, (LCD Fulton Bank) | | | 3,265,000 | | | 3,265,000 |
Damascus Co., Series 1998, 5.38%, 10/4/06 | | | 3,045,000 | | | 3,045,000 |
Depfa Bank PLC, Series EXL, 5.43%, 6/15/07 (c) | | | 15,000,000 | | | 15,000,000 |
| | | | | | |
| | | Principal
Amount | | Amortized
Cost |
Variable Rate Notes*, continued | | | | | | |
Banking & Financial Services, continued | | | | | | |
Franklin County, Ohio, Edison Welding, Series 1995, 5.38%, 10/5/06, (LCD Huntington Bank) | | $ | 4,775,000 | | $ | 4,775,000 |
Guilford Capital LLC, Series 2002-A, 5.42%, 10/4/06, (LCD Regions Bank) | | | 1,620,000 | | | 1,620,000 |
H.C. Equities, 5.33%, 10/4/06, (LCD Wachovia Bank NA) | | | 4,910,000 | | | 4,910,000 |
HBOS Treasury Services PLC, 5.00%, 7/24/07 | | | 10,000,000 | | | 10,000,000 |
HBOS Treasury Services PLC, 5.38%, 8/1/07 | | | 23,300,000 | | | 23,300,000 |
HBOS Treasury Services PLC, Series MTN, 5.30%, 8/9/07 (c) | | | 2,000,000 | | | 2,000,000 |
HBOS Treasury Services PLC, 5.46%, 9/20/07 (c) | | | 500,000 | | | 500,280 |
HBOS Treasury Services PLC, 5.46%, 10/1/07 (c) | | | 8,000,000 | | | 8,000,000 |
Indian Hills Country Club, 5.40%, 10/4/06, (LCD AmSouth Bank NA, Birmingham) | | | 3,785,000 | | | 3,785,000 |
Kent Capital LLC, Series 1999, 5.47%, 10/4/06, (LCD Huntington Bank) | | | 5,285,000 | | | 5,285,000 |
Maryland Economic Development Corp., 5.43%, 10/3/06, (LCD Manufacturers & Traders Trust Co.) | | | 7,000,000 | | | 7,000,000 |
Monet Trust, Series 2001, Class A-2A, 5.43%, 12/28/06, (LCD Dresden Bank AG) (c) (e) | | | 30,000,000 | | | 30,000,000 |
New Keibler Thompson Co., 5.42%, 12/1/08, (LCD Manufacturers & Traders Trust Co.) | | | 4,940,000 | | | 4,940,000 |
Quality Synthetic Rubber Co., 5.32%, 10/4/06, (LCD U.S. Bank N.A.) | | | 288,000 | | | 288,000 |
Spira Millennium LLC, 5.35%, 10/4/06, (LCD Bank of America) | | | 3,655,000 | | | 3,655,000 |
Stone Creek LLC, 5.33%, 10/4/06, (LCD Columbus Bank and Trust Co.) | | | 14,485,000 | | | 14,485,000 |
TOG Properties, Inc., 5.40%, 10/4/06, (LCD AmSouth Bank N.A.) | | | 7,142,000 | | | 7,142,000 |
Vestavia Hills Baptist, 5.40%, 10/4/06, (LCD Amsouth Bank NA) | | | 2,900,000 | | | 2,900,000 |
Wells Fargo & Co., 5.38%, 8/3/07 | | | 2,000,000 | | | 2,000,000 |
World Wildlife Fund, Inc., 5.37%, 10/4/06, (LCD AMBAC Financial Group, Inc.) | | | 4,725,000 | | | 4,725,000 |
| | | | | | |
| | | | | | 173,380,005 |
| | | | | | |
Brokers & Dealers (4.6%) | | | | | | |
Goldman Sachs Group, Inc., 5.38%, 8/15/07 (c) | | | 5,000,000 | | | 5,000,244 |
Greenwich Capital Holdings, 5.29%, 11/9/06 | | | 2,000,000 | | | 2,000,000 |
Merrill Lynch & Co., Inc., Series 1, 5.365%, 5/29/07 | | | 12,000,000 | | | 12,000,000 |
Merrill Lynch & Company, Inc., 5.58%, 7/11/07 (c) | | | 12,000,000 | | | 12,000,000 |
Merrill Lynch & Company, Inc., 5.39%, 8/3/07 | | | 10,000,000 | | | 10,000,000 |
Morgan Stanley, Series EXLS, 5.35%, 8/3/07 | | | 10,000,000 | | | 10,000,000 |
Morgan Stanley, 5.39%, 8/3/07 | | | 5,000,000 | | | 5,000,000 |
Continued
77
Prime Money Market Fund
Schedule of Portfolio Investments, continued | September 30, 2006 |
| | | | | | |
| | | Principal
Amount | | Amortized
Cost |
Variable Rate Notes*, continued | | | | | | |
Brokers & Dealers, continued | | | | | | |
Morgan Stanley, 5.40%, 8/27/07 | | $ | 7,000,000 | | $ | 7,000,000 |
| | | | | | |
| | | | | | 63,000,244 |
| | | | | | |
Financial Services (8.8%) | | | | | | |
Bank of Ireland, 5.31%, 8/14/07 (c) | | | 25,000,000 | | | 25,000,000 |
BNP Paribas SA, 5.36%, 5/18/07 (c) | | | 14,000,000 | | | 14,000,000 |
Compass Securitization LLC, 5.285%, 1/12/07 (c) | | | 8,000,000 | | | 7,999,411 |
Compass Securitization LLC, 5.285%, 3/6/07 (c) | | | 15,000,000 | | | 14,999,030 |
Compass Securitization LLC, 5.285%, 9/3/07 (c) | | | 8,000,000 | | | 7,999,440 |
General Electric Capital Corp., 5.455%, 7/9/07 (c) | | | 7,000,000 | | | 7,000,000 |
General Electric Capital Corp., 5.43%, 8/17/07 (c) | | | 7,000,000 | | | 7,000,000 |
Paradigm Funding LLC, 5.29%, 4(2) 3/1/07 (c) | | | 10,000,000 | | | 9,999,583 |
SLM Corp., 5.33%, 8/10/07 | | | 15,000,000 | | | 15,000,000 |
Westpac Banking Corp., 5.30%, 7/16/07 (c) | | | 12,000,000 | | | 12,000,000 |
| | | | | | |
| | | | | | 120,997,464 |
| | | | | | |
Financial, Speciality (1.0%) | | | | | | |
K2 (USA) LLC, 5.445%, 4/25/07 (c) | | | 4,000,000 | | | 3,999,091 |
K2 (USA) LLC, 5.31%, 7/10/07 (c) | | | 3,000,000 | | | 3,000,085 |
K2 (USA) LLC, 5.32%, 10/9/07 (c) | | | 2,000,000 | | | 1,999,800 |
SLM Corp., 5.685%, 7/25/07 (c) | | | 5,000,000 | | | 5,009,232 |
| | | | | | |
| | | | | | 14,008,208 |
| | | | | | |
Insurance (1.5%) | | | | | | |
Genworth Life Insurance Co., 5.53%, 11/9/06 (e) | | | 5,000,000 | | | 5,000,000 |
Metropolitan Life Insurance Co., 5.61%, 11/1/06 (e) | | | 5,000,000 | | | 5,000,000 |
Metropolitan Life Insurance Co. of Connecticut, 5.28%, 11/21/06 (e) | | | 5,000,000 | | | 5,000,000 |
New York Life Insurance Co., 5.48%, 11/25/06 (e) | | | 5,000,000 | | | 5,000,000 |
| | | | | | |
| | | | | | 20,000,000 |
| | | | | | |
Total Variable Rate Notes
(Cost $391,385,921) | | | | | | 391,385,921 |
| | | | | | |
| | | | | | |
| | | Principal
Amount | | Amortized
Cost |
Repurchase Agreement (5.9%) | | | | | | |
ING Financial Markets, 5.40%, dated 9/29/06, maturing 10/2/06, with a maturity value of $80,114,035 (Collateralized fully by various U.S. Government Agencies) | | $ | 80,078,000 | | $ | 80,078,000 |
| | | | | | |
Total Repurchase Agreement (80,078,000) | | | | | | 80,078,000 |
| | | | | | |
Collateralized Loan Agreements (15.0%) | | | | | | |
Bear Stearns & Co., 5.50%, dated 9/29/06, maturing 10/2/06, with a maturity value of $25,011,448 | | | 25,000,000 | | | 25,000,000 |
First Boston, 5.48%, dated 9/29/06, maturing 10/2/06, with a maturity value of $26,011,863 | | | 26,000,000 | | | 26,000,000 |
Goldman Sachs Group, Inc., 5.48%, dated 9/29/06, maturing 10/2/06, with a maturity value of $18,008,213 | | | 18,000,000 | | | 18,000,000 |
Greenwich Capital Markets, Inc., 5.50%, dated 9/29/06, maturing 10/2/06, with a maturity value of $22,010,083 | | | 22,000,000 | | | 22,000,000 |
J.P. Morgan Securities, Inc., 5.48%, dated 9/29/06, maturing 10/2/06, with a maturity value of $25,011,406 | | | 25,000,000 | | | 25,000,000 |
Merrill Lynch & Co., 5.51%, dated 9/29/06, maturing 10/2/06, with a maturity value of $20,009,175 | | | 20,000,000 | | | 20,000,000 |
Morgan Stanley, 5.48%, dated 9/29/06, maturing 10/2/06, with a maturity value of $45,020,531 | | | 45,000,000 | | | 45,000,000 |
Washington Mutual, 5.45%, dated 9/29/06, maturing 10/2/06, with a maturity value of $25,011,344 | | | 25,000,000 | | | 25,000,000 |
| | | | | | |
Total Collateralized Loan Agreements (Cost $206,000,000) | | | | | | 206,000,000 |
| | | | | | |
Total Investments
(Cost $1,370,562,242) — 100.0% | | | | | | 1,370,562,242 |
Net other assets (liabilities) — 0.0% | | | | | | 29,786 |
| | | | | | |
Net Assets — 100.0% | | | | | $ | 1,370,592,028 |
| | | | | | |
See page 86 for footnote legend to the Schedules of Portfolio Investments.
See accompanying notes to the financial statements.
78
U.S. Treasury Money Market Fund
Schedule of Portfolio Investments | September 30, 2006 |
| | | | | | |
| | | Principal
Amount | | Amortized
Cost |
U.S. Treasury Bills** (12.2%) | | | | | | |
4.65%, 10/12/06 | | $ | 20,000,000 | | $ | 19,970,917 |
4.815%, 12/21/06 | | | 30,000,000 | | | 29,660,476 |
4.94%, 1/18/07 | | | 30,000,000 | | | 29,550,012 |
| | | | | | |
Total U.S. Treasury Bills
(Cost $79,181,405) | | | | | | 79,181,405 |
| | | | | | |
U.S. Treasury Notes (19.9%) | | | | | | |
2.50%, 10/31/06 | | | 30,000,000 | | | 29,938,325 |
3.50%, 11/15/06 | | | 30,000,000 | | | 29,940,801 |
2.88%, 11/30/06 | | | 30,000,000 | | | 29,884,086 |
3.13%, 1/31/07 | | | 30,000,000 | | | 29,810,147 |
2.25%, 2/15/07 | | | 10,000,000 | | | 9,899,421 |
| | | | | | |
Total U.S. Treasury Notes
(Cost $129,472,780) | | | | | | 129,472,780 |
| | | | | | |
Repurchase Agreements (67.9%) | | | | | | |
Bank of America Corp., 4.75%, dated 9/29/06, maturing 10/2/06, with a maturity value of $110,043,542 (Collateralized fully by U.S. Treasury Notes) | | | 110,000,000 | | | 110,000,000 |
First Boston, 4.95%, dated, 9/29/06, maturing 10/2/06, with a maturity value of $131,526,743 (Collateralized fully by U.S. Treasury Notes) | | | 131,472,510 | | | 131,472,510 |
| | | | | | | |
| | | Principal
Amount | | Amortized
Cost | |
Repurchase Agreements, continued | | | | | | | |
Goldman Sachs Group, Inc., 4.90%, dated 9/29/06, maturing 10/2/06, with a maturity value of $75,030,625 (Collateralized fully by U.S. Treasury Notes) | | $ | 75,000,000 | | $ | 75,000,000 | |
Lehman Brothers Holdings, Inc., 5.00%, dated 9/29/06, maturing 10/2/06, with a maturity value of $70,029,167 (Collateralized fully by U.S. Treasury Notes) | | | 70,000,000 | | | 70,000,000 | |
Merrill Lynch & Co., 4.85%, dated 9/29/06, maturing 10/2/06, with a maturity value of $55,022,229 (Collateralized fully by U.S. Treasury Notes) | | | 55,000,000 | | | 55,000,000 | |
| | | | | | | |
Total Repurchase Agreements
(Cost $441,472,510) | | | | | | 441,472,510 | |
| | | | | | | |
Total Investments
(Cost $650,126,695) — 100.0% | | | | | | 650,126,695 | |
Net other assets (liabilities) — 0.0% | | | | | | (307,105 | ) |
| | | | | | | |
Net Assets — 100.0% | | | | | $ | 649,819,590 | |
| | | | | | | |
See page 86 for footnote legend to the Schedules of Portfolio Investments.
See accompanying notes to the financial statements.
79
National Tax-Free Money Market Fund
Schedule of Portfolio Investments | September 30, 2006 |
| | | | | | |
| | | Principal
Amount | | Amortized
Cost |
Municipal Bonds (97.8%) | | | | | | |
Alabama (4.3%) | | | | | | |
Jefferson County, AL, Sewer Refunding Revenue, SubSeries B-7, 3.76%, 10/5/06, XLCA* | | $ | 2,300,000 | | $ | 2,300,000 |
Port City, AL, Medical Clinic Board Revenue, 3.73%, 10/5/06, AMBAC* | | | 1,780,000 | | | 1,780,000 |
| | | | | | |
| | | | | | 4,080,000 |
| | | | | | |
Alaska (1.8%) | | | | | | |
Valdez, AK, Marine Terminal Refunding Revenue, BP Pipelines, Inc. Project, 3.85%, 10/2/06* | | | 1,700,000 | | | 1,700,000 |
| | | | | | |
Arizona (3.8%) | | | | | | |
Arizona Health Facilities Authority Revenue, 3.79%, 10/5/06, Citibank* | | | 3,500,000 | | | 3,500,000 |
Tucson, AZ, Industrial Development Authority Revenue, Lincoln Garden Project, 3.74%, 10/3/06, FHLMC* | | | 100,000 | | | 100,000 |
| | | | | | |
| | | | | | 3,600,000 |
| | | | | | |
Colorado (1.7%) | | | | | | |
Thorton, CO, Industrial Development Refunding Revenue, 3.84%, 8/1/11, U.S. Bank* | | | 1,600,000 | | | 1,600,000 |
| | | | | | |
Florida (8.1%) | | | | | | |
Jacksonville, FL, Economic Development, Commission Health Care Facilities Revenue, Series A, 3.78%, 10/5/06, Fortis Banque Belgium, JP Morgan Chase Bank* | | | 1,225,000 | | | 1,225,000 |
Miami, FL, Health Facilities Authority Refunding Revenue, Mercy Hospital Project, 3.75%, 10/4/06, NationsBank N.A.* | | | 3,020,000 | | | 3,020,000 |
Pasco County, FL, School Board, Certificates of Participation, 3.74%, 10/5/06, AMBAC* | | | 1,250,000 | | | 1,250,000 |
Tallahassee, FL, Capital Bonds Revenue, Series 607, 3.78%, 10/5/06, FSA (c)* | | | 2,290,000 | | | 2,290,000 |
| | | | | | |
| | | | | | 7,785,000 |
| | | | | | |
Illinois (15.2%) | | | | | | |
Chicago, IL, Metropolitan Water Reclamation District, G.O., Series 59, 3.78%, 10/5/06, Goldman Sachs (c)* | | | 2,000,000 | | | 2,000,000 |
Cook County, IL, Public Improvements, G.O., Series B, 3.75%, 10/4/06, Landesbank Hessen* | | | 4,750,000 | | | 4,750,000 |
Illinois Development Finance Authority Revenue, St. Ignatius College Preparatory, 3.76%, 10/4/06, Northern Trust Co.* | | | 4,000,000 | | | 4,000,000 |
Illinois Health Facilities Authority Refunding Revenue, Series B, 3.75%, 10/4/06, J.P. Morgan Chase Bank* | | | 3,800,000 | | | 3,800,000 |
| | | | | | |
| | | | | | 14,550,000 |
| | | | | | |
Indiana (2.1%) | | | | | | |
Indiana Health Facilities Financing Authority Revenue, Riverview Hospital Project, 3.75%, 10/5/06, National City Bank of Indiana* | | | 2,000,000 | | | 2,000,000 |
| | | | | | |
Kentucky (3.1%) | | | | | | |
Jefferson County, KY, Student Housing Industrial Building Revenue, Series A, 3.75%, 10/5/06, Regions Bank* | | | 3,000,000 | | | 3,000,000 |
| | | | | | |
| | | | | | |
| | | Principal
Amount | | Amortized
Cost |
Municipal Bonds, continued | | | | | | |
Louisiana (2.2%) | | | | | | |
New Orleans, LA, Refunding, G.O., Series A20, 3.83%, 10/4/06, FGIC (c)* | | $ | 2,095,000 | | $ | 2,095,000 |
| | | | | | |
Maryland (1.5%) | | | | | | |
Maryland State Health & Higher Educational Facilities Authority Revenue, Series A, 3.75%, 10/4/06, Bank One* | | | 1,400,000 | | | 1,400,000 |
| | | | | | |
Massachusetts (3.9%) | | | | | | |
Clipper Tax Exempt Trust, Certificates of Participation, 3.75%, 2/1/07, State Street Bank & Trust (c)* | | | 3,699,000 | | | 3,699,000 |
| | | | | | |
Michigan (2.1%) | | | | | | |
Kent, MI, Hospital Finance Authority Refunding Revenue, Series B, 3.74%, 10/4/06, MBIA* | | | 2,025,000 | | | 2,025,000 |
| | | | | | |
Minnesota (8.5%) | | | | | | |
Minneapolis, MN, Health Care System Revenue, Series A, 3.74%, 10/4/06, AMBAC* | | | 4,000,000 | | | 4,000,000 |
University of Minnesota, Various Purposes Revenue, Series C, 3.72%, 10/4/06, JP Morgan Chase Bank* | | | 4,150,000 | | | 4,150,000 |
| | | | | | |
| | | | | | 8,150,000 |
| | | | | | |
Missouri (3.1%) | | | | | | |
Kansas City, MO, Industrial Development Authority Revenue, Downtown Arena Project, Series C,, 3.77%, 10/4/06, AMBAC* | | | 3,000,000 | | | 3,000,000 |
| | | | | | |
Nevada (2.6%) | | | | | | |
Truckee, NV, Meadows Water Authority Revenue, Series 2006B, 3.60%, 2/6/07 | | | 2,500,000 | | | 2,500,000 |
| | | | | | |
New Jersey (4.0%) | | | | | | |
Fanwood, NJ, Tax Anticipation Notes, G.O., 4.13%, 12/1/06 | | | 1,400,000 | | | 1,400,746 |
Park Ridge, NJ, Board of Education, G.O., 4.50%, 8/7/07 | | | 1,340,000 | | | 1,345,466 |
West Orange Township, NJ, G.O., 4.50%, 6/20/07 | | | 1,082,545 | | | 1,087,770 |
| | | | | | |
| | | | | | 3,833,982 |
| | | | | | |
New York (6.1%) | | | | | | |
New York State Housing Finance Agency Service Refunding Revenue, Series G, 3.75%, 10/4/06, WestLB* | | | 2,000,000 | | | 2,000,000 |
New York, NY, Public Improvements, G.O., SubSeries H6, 3.74%, 10/4/06, Fleet National Bank* | | | 3,850,000 | | | 3,850,000 |
| | | | | | |
| | | | | | 5,850,000 |
| | | | | | |
Ohio (0.9%) | | | | | | |
Cleveland Heights, OH,, 4.50%, 8/9/07 | | | 850,000 | | | 855,246 |
| | | | | | |
Pennsylvania (3.1%) | | | | | | |
Pennsylvania State Higher Educational Facilities Revenue, Drexel University, Series B, 3.76%, 10/5/06, Landesbank Hessen* | | | 3,000,000 | | | 3,000,000 |
| | | | | | |
Texas (5.0%) | | | | | | |
Harris County, TX, Health Facilities Development Revenue, Texas Medical Center Project, 3.89%, 10/2/06, MBIA* | | | 1,300,000 | | | 1,300,000 |
Continued
80
National Tax-Free Money Market Fund
Schedule of Portfolio Investments, continued | September 30, 2006 |
| | | | | | |
| | |
| | | Principal
Amount | | Amortized
Cost |
Municipal Bonds, continued | | | | | | |
Texas, continued | | | | | | |
North Texas Tollway Authority Revenue, Series C, 3.77%, 10/4/06, FGIC* | | $ | 3,500,000 | | $ | 3,500,000 |
| | | | | | |
| | | | | | 4,800,000 |
| | | | | | |
Virginia (5.7%) | | | | | | |
Virginia Beach, VA, Development Authority Revenue, LifeNet Project, 3.75%, 10/4/06, SunTrust Bank* | | | 3,550,000 | | | 3,550,000 |
Virginia Small Business Finance Authority Refunding Revenue, Virginia Historical Society, 3.75%, 10/4/06, SunTrust Bank* | | | 1,900,000 | | | 1,900,000 |
| | | | | | |
| | | | | | 5,450,000 |
| | | | | | |
Wisconsin (9.0%) | | | | | | |
Wisconsin State Health & Educational Facilities Authority Revenue, Grace Lutheran Foundation Project, 3.74%, 10/4/06, Firstar Bank N.A.* | | | 2,340,000 | | | 2,340,000 |
Wisconsin State Health & Educational Facilities Authority Revenue, Series B, 3.75%, 10/5/06, Marshall & Ilsley* | | | 4,500,000 | | | 4,500,000 |
Wisconsin State Health & Educational Facilities Revenue, 3.74%, 10/5/06, Citibank N.A.* | | | 1,800,000 | | | 1,800,000 |
| | | | | | |
| | | | | | 8,640,000 |
| | | | | | |
Total Municipal Bonds
(Cost $93,613,228) | | | | | | 93,613,228 |
| | | | | | |
| | | | | | |
| | | Shares or
Principal
Amount | | Amortized
Cost |
Commercial Paper (2.1%) | | | | | | |
Connecticut (2.1%) | | | | | | |
Connecticut Development Authority, New England Power Co., Series 1999, 3.70%, 10/30/06 | | $ | 2,000,000 | | $ | 2,000,000 |
| | | | | | |
Total Commercial Paper
(Cost $2,000,000) | | | | | | 2,000,000 |
| | | | | | |
Investment Company (0.0%) | | | | | | |
Investment Company (0.0%) | | | | | | |
SEI Tax-Exempt Trust — Institutional Class | | | 27,717 | | | 27,717 |
| | | | | | |
Total Investment Company
(Cost $27,717) | | | | | | 27,717 |
| | | | | | |
Total Investments
(Cost $95,640,945) — 99.9% | | | | | | 95,640,945 |
Net other assets (liabilities) — 0.1% | | | | | | 119,560 |
| | | | | | |
Net Assets — 100.0% | | | | | $ | 95,760,505 |
| | | | | | |
See page 86 for footnote legend to the Schedules of Portfolio Investments.
See accompanying notes to the financial statements.
81
Capital Manager Conservative Growth Fund
Schedule of Portfolio Investments | September 30, 2006 |
| | | | | | |
| | | Shares | | Fair
Value | |
Affiliated Investment Companies (100.1%) | | | | | | |
BB&T International Equity Fund, Institutional Class | | 330,464 | | $ | 3,711,110 | |
BB&T Large Cap Fund, Institutional Class | | 483,602 | | | 9,855,815 | |
BB&T Large Cap Growth Fund, Institutional Class | | 717,207 | | | 6,512,240 | |
BB&T Mid Cap Growth Fund, Institutional Class | | 89,715 | | | 1,174,370 | |
BB&T Mid Cap Value Fund, Institutional Class | | 130,423 | | | 1,765,931 | |
BB&T Small Cap Fund, Institutional Class | | 124,157 | | | 1,885,952 | |
BB&T Total Return Bond Fund, Institutional Class | | 3,434,900 | | | 34,795,534 | |
BB&T U.S. Treasury Money Market Fund, Institutional Class | | 1,841,589 | | | 1,841,589 | |
| | | | | | |
Total Affiliated Investment Companies
(Cost $55,801,810) | | | | | 61,542,541 | |
| | | | | | |
Total Investments
(Cost $55,801,810) — 100.1% | | | | | 61,542,541 | |
Net other assets (liabilities) — (0.1)% | | | | | (37,067 | ) |
| | | | | | |
Net Assets — 100.0% | | | | $ | 61,505,474 | |
| | | | | | |
See page 86 for footnote legend to the Schedules of Portfolio Investments.
See accompanying notes to the financial statements.
82
Capital Manager Moderate Growth Fund
Schedule of Portfolio Investments | September 30, 2006 |
| | | | | |
| | | Shares | | Fair
Value |
Affiliated Investment Companies (99.9%) | | | | | |
BB&T International Equity Fund, Institutional Class | | 701,834 | | $ | 7,881,594 |
BB&T Large Cap Fund, Institutional Class | | 1,036,179 | | | 21,117,323 |
BB&T Large Cap Growth Fund, Institutional Class | | 1,503,652 | | | 13,653,160 |
BB&T Mid Cap Growth Fund, Institutional Class | | 190,360 | | | 2,491,816 |
BB&T Mid Cap Value Fund, Institutional Class | | 277,122 | | | 3,752,229 |
BB&T Small Cap Fund, Institutional Class | | 263,669 | | | 4,005,138 |
BB&T Total Return Bond Fund, Institutional Class | | 2,520,474 | | | 25,532,403 |
BB&T U.S. Treasury Money Market Fund, Institutional Class | | 2,373,313 | | | 2,373,313 |
| | | | | |
Total Affiliated Investment Companies
(Cost $71,161,734) | | | | | 80,806,976 |
| | | | | |
Total Investments
(Cost $71,161,734) — 99.9% | | | | | 80,806,976 |
Net other assets (liabilities) — 0.1% | | | | | 113,941 |
| | | | | |
Net Assets — 100.0% | | | | $ | 80,920,917 |
| | | | | |
See page 86 for footnote legend to the Schedules of Portfolio Investments.
See accompanying notes to the financial statements.
83
Capital Manager Growth Fund
Schedule of Portfolio Investments | September 30, 2006 |
| | | | | |
| | | Shares | | Fair
Value |
Affiliated Investment Companies (99.8%) | | | | | |
BB&T International Equity Fund, Institutional Class | | 660,358 | | $ | 7,415,820 |
BB&T Large Cap Fund, Institutional Class | | 980,715 | | | 19,986,966 |
BB&T Large Cap Growth Fund, Institutional Class | | 1,401,000 | | | 12,721,080 |
BB&T Mid Cap Growth Fund, Institutional Class | | 179,022 | | | 2,343,394 |
BB&T Mid Cap Value Fund, Institutional Class | | 260,742 | | | 3,530,446 |
BB&T Small Cap Fund, Institutional Class | | 248,004 | | | 3,767,178 |
BB&T Total Return Bond Fund, Institutional Class | | 1,023,264 | | | 10,365,663 |
BB&T U.S. Treasury Money Market Fund, Institutional Class | | 2,218,042 | | | 2,218,042 |
| | | | | |
Total Affiliated Investment Companies
(Cost $54,449,108) | | | | | 62,348,589 |
| | | | | |
Total Investments
(Cost $54,449,108) — 99.8% | | | | | 62,348,589 |
Net other assets (liabilities) — 0.2% | | | | | 123,119 |
| | | | | |
Net Assets — 100.0% | | | | $ | 62,471,708 |
| | | | | |
See page 86 for footnote legend to the Schedules of Portfolio Investments.
See accompanying notes to the financial statements.
84
Capital Manager Equity Fund
Schedule of Portfolio Investments | September 30, 2006 |
| | | | | | |
| | | Shares | | Fair
Value | |
Affiliated Investment Companies (100.0%) | | | | | | |
BB&T International Equity Fund, Institutional Class | | 388,056 | | $ | 4,357,869 | |
BB&T Large Cap Fund, Institutional Class | | 579,827 | | | 11,816,874 | |
BB&T Large Cap Growth Fund, Institutional Class | | 816,241 | | | 7,411,468 | |
BB&T Mid Cap Growth Fund, Institutional Class | | 105,355 | | | 1,379,097 | |
BB&T Mid Cap Value Fund, Institutional Class | | 153,575 | | | 2,079,400 | |
BB&T Small Cap Fund, Institutional Class | | 145,810 | | | 2,214,854 | |
BB&T U.S. Treasury Money Market Fund, Institutional Class | | 1,375,891 | | | 1,375,891 | |
| | | | | | |
Total Affiliated Investment Companies
(Cost $25,518,100) | | | | | 30,635,453 | |
| | | | | | |
Total Investments
(Cost $25,518,100) — 100.0% | | | | | 30,635,453 | |
Net other assets (liabilities) — 0.0% | | | | | (3,475 | ) |
| | | | | | |
Net Assets — 100.0% | | | | $ | 30,631,978 | |
| | | | | | |
See page 86 for footnote legend to the Schedules of Portfolio Investments.
See accompanying notes to the financial statements.
85
BB&T Funds
Footnote Legend to the Schedules of Portfolio Investments
| (a) | Represents non-income producing security. |
| (b) | Represents that all or a portion of the security was on loan as of September 30, 2006. |
| (c) | Rule 144A, Section 4(2) or other security which is restricted as to resale to institutional investors. The Investment Advisor, using board approved procedures, has deemed these securities or a portion of these securities to be liquid. |
| (d) | Represents that all or a portion of the security was pledged as collateral for securities purchased on a when-issued basis. |
| (e) | Rule 144A, Section 4(2) or other security which is restricted as to resale to institutional investors. The Investment Advisor, using board approved procedures, has deemed these securities to be illiquid. As of September 30, 2006, these securities represent 3.7% and 3.6% of net assets in the North Carolina Intermediate Tax-Free Fund and the Prime Money Market Fund, respectively. |
| (f) | Represents a security purchased on a when-issued basis. At September 30, 2006, total cost of investments purchased on a when-issued basis for the Total Return Bond and the North Carolina Intermediate Tax-Free Fund was $39,663,098 and $2,016,215, respectively. |
| * | The interest rate for this variable rate note, which will change periodically, is based either on the prime rate or an index of market rates. The reflected rate is in effect as of September 30, 2006. For bond funds, the maturity date reflected is the final maturity date. For money market funds, the maturity date reflected is the next reset date. |
| ** | Discount Note or zero coupon bond. Rate disclosed represents the effective yield at September 30, 2006. |
| *** | Interest bearing commercial paper |
ADR — American Depositary Receipt.
AMBAC — Insured by AMBAC Indemnity Corp.
AMBAC-TCRS — Secondarily Insured by AMBAC Indemnity Corp.
ETM — Escrowed to Maturity.
FGIC — Insured by the Financial Guaranty Insurance Corp.
FHA — Insured by the Federal Housing Administration.
FSA — Insured by Financial Security Assurance.
G.O. — General Obligation
LCD — Letter of Credit.
LLC — Limited Liability Company.
MBIA — Insured by the Municipal Bond Insurance Association.
NA — North America.
OID — Original Issue Discount.
REIT — Real Estate Investment Trust.
SCSDE — South Carolina School District Enhancement.
XLCA — Insured by XL Capital Assurance.
See accompanying notes to the financial statements.
86
[THIS PAGE IS INTENTIONALLY LEFT BLANK]
87
BB&T Funds
Statements of Assets and Liabilities | September 30, 2006 |
| | | | | | | | |
| | | Large Cap
Fund | | | Large Cap
Growth Fund | |
Assets: | | | | | | | | |
Investments, at cost | | $ | 652,055,288 | | | $ | 284,716,018 | |
Unrealized appreciation (depreciation) | | | 160,666,207 | | | | 32,683,200 | |
| | | | | | | | |
Investments, at fair value* | | | 812,721,495 | | | | 317,399,218 | |
Repurchase agreements, at cost | | | 38,405,481 | | | | 6,880,178 | |
Cash | | | — | | | | — | |
Foreign currency, at value** | | | — | | | | — | |
Interest and dividends receivable | | | 964,315 | | | | 281,220 | |
Receivable for capital shares issued | | | 190,567 | | | | 1,117 | |
Receivable for investments sold | | | — | | | | 7,864,285 | |
Receivable for forward foreign currency contracts | | | — | | | | — | |
Receivable from fund accounting | | | — | | | | — | |
Reclaims receivable | | | — | | | | — | |
Receivable from Advisor | | | — | | | | — | |
Prepaid and other expenses | | | 11,107 | | | | 5,619 | |
| | | | | | | | |
Total Assets | | | 852,292,965 | | | | 332,431,637 | |
| | | | | | | | |
Liabilities: | | | | | | | | |
Call options written (premiums received $—; $—; $—; $—; $—; $—; $910,575; $170,749) | | | — | | | | — | |
Cash overdraft | | | — | | | | 3,710 | |
Dividends payable | | | 270,220 | | | | 131,054 | |
Payable for forward foreign currency contracts | | | — | | | | — | |
Payable for investments purchased | | | — | | | | 4,929,053 | |
Payable for capital shares redeemed | | | 550,374 | | | | 242,032 | |
Payable for collateral received on loaned securities | | | 126,591,112 | | | | 101,006,062 | |
Accrued expenses and other payables: | | | | | | | | |
Investment advisory fees | | | 409,740 | | | | 194,151 | |
Administration fees | | | 66,111 | | | | 31,296 | |
Fund accounting fees | | | 6,014 | | | | 2,950 | |
Transfer agency fees | | | 19,828 | | | | 9,636 | |
Distribution fees | | | 22,181 | | | | 9,325 | |
Compliance service fees | | | 979 | | | | 481 | |
Trustee fees | | | 317 | | | | 156 | |
Other | | | 64,429 | | | | 35,419 | |
| | | | | | | | |
Total Liabilities | | | 128,001,305 | | | | 106,595,325 | |
| | | | | | | | |
Net Assets: | | | | | | | | |
Capital | | | 488,293,326 | | | | 200,780,840 | |
Accumulated (distributions in excess of) net investment income | | | (104,143 | ) | | | 230,874 | |
Accumulated realized gains/(losses) from investment and foreign currency transactions | | | 75,436,270 | | | | (7,858,602 | ) |
Net unrealized appreciation/depreciation on investments and translation of assets and liabilities in foreign currency | | | 160,666,207 | | | | 32,683,200 | |
| | | | | | | | |
Net Assets | | $ | 724,291,660 | | | $ | 225,836,312 | |
| | | | | | | | |
Net Assets | | | | | | | | |
Class A Shares | | $ | 48,656,168 | | | $ | 9,445,810 | |
Class B Shares | | | 14,807,596 | | | | 8,970,050 | |
Class C Shares | | | 161,325 | | | | 36,886 | |
Institutional Shares | | | 660,666,571 | | | | 207,383,566 | |
| | | | | | | | |
Total | | $ | 724,291,660 | | | $ | 225,836,312 | |
| | | | | | | | |
Shares of Beneficial Interest Outstanding (Unlimited number of shares authorized, no par value): | | | | | | | | |
Class A Shares | | | 2,393,513 | | | | 1,058,076 | |
Class B Shares | | | 734,971 | | | | 1,071,062 | |
Class C Shares | | | 8,023 | | | | 4,403 | |
Institutional Shares | | | 32,417,350 | | | | 22,850,209 | |
| | | | | | | | |
Total | | | 35,553,857 | | | | 24,983,750 | |
| | | | | | | | |
Net Asset Value | | | | | | | | |
Class A Shares — redemption price per share | | $ | 20.33 | | | $ | 8.93 | |
| | | | | | | | |
Class B Shares — offering price per share*** | | $ | 20.15 | | | $ | 8.37 | |
| | | | | | | | |
Class C Shares — offering price per share*** | | $ | 20.11 | | | $ | 8.38 | |
| | | | | | | | |
Institutional Shares — offering and redemption price per share | | $ | 20.38 | | | $ | 9.08 | |
| | | | | | | | |
Maximum Sales Charge — Class A Shares | | | 5.75 | % | | | 5.75 | % |
| | | | | | | | |
Maximum Offering Price (100%/(100% — Maximum Sales Charge)) of net asset value adjusted to the nearest cent per share — Class A Shares | | $ | 21.57 | | | $ | 9.47 | |
| | | | | | | | |
| * | The Large Cap Fund, Large Cap Growth Fund, Mid Cap Value Fund, Mid Cap Growth Fund, Small Cap Fund, Special Opportunities Equity Fund and Equity Income Fund include securities on loan of $122,511,470; $97,859,740; $59,151,395; $53,993,107; $27,427,088; $59,886,231 and $29,578,851; respectively. |
| ** | The International Equity Fund includes foreign currency at cost of $2,396,286. |
| *** | Redemption price per share varies by length of time shares are held. |
See accompanying notes to the financial statements.
88
| | | | | | | | | | | | | | | | | | | | | | |
Mid Cap
Value Fund | | | Mid Cap
Growth Fund | | | Small Cap
Fund | | | International
Equity Fund | | | Special
Opportunities
Equity Fund | | | Equity
Income Fund | |
| | | | | | | | | | | | | | | | | | | | | | |
| $ | 260,756,665 | | | $ | 175,466,051 | | | $ | 130,405,898 | | | $ | 188,454,299 | | | $ | 216,523,608 | | | $ | 127,089,920 | |
| | 18,463,003 | | | | 20,958,353 | | | | 13,538,787 | | | | 64,728,915 | | | | 37,739,592 | | | | 15,635,492 | |
| | | | | | | | | | | | | | | | | | | | | | | |
| | 279,219,668 | | | | 196,424,404 | | | | 143,944,685 | | | | 253,183,214 | | | | 254,263,200 | | | | 142,725,412 | |
| | 13,180,103 | | | | 1,778,287 | | | | 8,937,960 | | | | — | | | | 13,495,020 | | | | 6,673,560 | |
| | — | | | | — | | | | — | | | | 3,664,822 | | | | — | | | | — | |
| | — | | | | — | | | | — | | | | 2,393,987 | | | | — | | | | — | |
| | 224,522 | | | | 62,961 | | | | 90,913 | | | | 711,025 | | | | 46,796 | | | | 300,306 | |
| | 254,935 | | | | 99,210 | | | | 161,685 | | | | 2,620 | | | | 417,831 | | | | 377,033 | |
| | — | | | | 5,977,269 | | | | — | | | | 23,077 | | | | 1,014,695 | | | | 110,268 | |
| | — | | | | — | | | | — | | | | 163,117 | | | | — | | | | — | |
| | — | | | | — | | | | — | | | | 321 | | | | — | | | | — | |
| | — | | | | — | | | | — | | | | 575,213 | | | | — | | | | — | |
| | — | | | | — | | | | 48,529 | | | | — | | | | — | | | | — | |
| | 4,311 | | | | 4,848 | | | | 10,228 | | | | 3,433 | | | | 9,092 | | | | 7,729 | |
| | | | | | | | | | | | | | | | | | | | | | | |
| | 292,883,539 | | | | 204,346,979 | | | | 153,194,000 | | | | 260,720,829 | | | | 269,246,634 | | | | 150,194,308 | |
| | | | | | | | | | | | | | | | | | | | | | | |
| | | | | | | | | | | | | | | | | | | | | | |
| | — | | | | — | | | | — | | | | — | | | | 360,500 | | | | 40,425 | |
| | — | | | | — | | | | — | | | | — | | | | — | | | | — | |
| | 39,603 | | | | — | | | | 14,873 | | | | 424,126 | | | | — | | | | 88,674 | |
| | — | | | | — | | | | — | | | | 16,408 | | | | | | | | | |
| | 1,145,254 | | | | 2,671,531 | | | | — | | | | — | | | | 135,675 | | | | — | |
| | 140,891 | | | | 307,823 | | | | 100,945 | | | | 100,875 | | | | 277,011 | | | | 85,543 | |
| | 62,152,094 | | | | 55,773,608 | | | | 28,786,261 | | | | — | | | | 61,799,055 | | | | 30,739,802 | |
| | | | | | | | | | | | | | | | | | | | | | |
| | 129,780 | | | | 84,134 | | | | 82,022 | | | | 190,297 | | | | 133,745 | | | | 67,327 | |
| | 20,974 | | | | 13,517 | | | | 11,044 | | | | 23,829 | | | | 18,847 | | | | 10,819 | |
| | 2,034 | | | | 1,382 | | | | 1,225 | | | | 4,261 | | | | 1,852 | | | | 1,127 | |
| | 6,979 | | | | 5,253 | | | | 6,167 | | | | 5,093 | | | | 14,441 | | | | 7,957 | |
| | 7,754 | | | | 4,272 | | | | 5,370 | | | | 2,513 | | | | 62,910 | | | | 31,055 | |
| | 303 | | | | 204 | | | | 171 | | | | 354 | | | | 278 | | | | 158 | |
| | 98 | | | | 66 | | | | 55 | | | | 115 | | | | 90 | | | | 51 | |
| | 26,745 | | | | 17,344 | | | | — | | | | 53,877 | | | | 8,231 | | | | 4,691 | |
| | | | | | | | | | | | | | | | | | | | | | | |
| | 63,672,509 | | | | 58,879,134 | | | | 29,008,133 | | | | 821,748 | | | | 62,812,635 | | | | 31,077,629 | |
| | | | | | | | | | | | | | | | | | | | | | | |
| | | | | | | | | | | | | | | | | | | | | | |
| | 203,165,703 | | | | 108,397,658 | | | | 116,494,950 | | | | 198,079,465 | | | | 159,131,371 | | | | 100,654,011 | |
| | (66,896 | ) | | | — | | | | (27,923 | ) | | | (820,134 | ) | | | — | | | | (345,575 | ) |
| | 7,649,220 | | | | 16,111,834 | | | | (5,819,947 | ) | | | (2,240,412 | ) | | | 9,012,961 | | | | 3,042,427 | |
| | 18,463,003 | | | | 20,958,353 | | | | 13,538,787 | | | | 64,880,162 | | | | 38,289,667 | | | | 15,765,816 | |
| | | | | | | | | | | | | | | | | | | | | | | |
| $ | 229,211,030 | | | $ | 145,467,845 | | | $ | 124,185,867 | | | $ | 259,899,081 | | | $ | 206,433,999 | | | $ | 119,116,679 | |
| | | | | | | | | | | | | | | | | | | | | | | |
| | | | | | | | | | | | | | | | | | | | | | |
| $ | 13,392,650 | | | $ | 10,381,460 | | | $ | 9,352,901 | | | $ | 4,201,595 | | | $ | 81,882,593 | | | $ | 60,059,329 | |
| | 5,391,165 | | | | 2,376,548 | | | | 4,091,524 | | | | 1,819,323 | | | | 22,901,428 | | | | 9,591,774 | |
| | 742,624 | | | | 32,659 | | | | 19,725 | | | | 187,815 | | | | 34,417,955 | | | | 14,260,898 | |
| | 209,684,591 | | | | 132,677,178 | | | | 110,721,717 | | | | 253,690,348 | | | | 67,232,023 | | | | 35,204,678 | |
| | | | | | | | | | | | | | | | | | | | | | | |
| $ | 229,211,030 | | | $ | 145,467,845 | | | $ | 124,185,867 | | | $ | 259,899,081 | | | $ | 206,433,999 | | | $ | 119,116,679 | |
| | | | | | | | | | | | | | | | | | | | | | | |
| | | | | | | | | | | | | | | | | | | | | | |
| | 992,600 | | | | 833,648 | | | | 619,130 | | | | 380,026 | | | | 4,983,133 | | | | 4,495,930 | |
| | 407,505 | | | | 198,829 | | | | 277,855 | | | | 173,970 | | | | 1,431,176 | | | | 719,445 | |
| | 56,150 | | | | 2,731 | | | | 1,341 | | | | 17,995 | | | | 2,149,667 | | | | 1,070,368 | |
| | 15,489,898 | | | | 10,138,727 | | | | 7,290,067 | | | | 22,592,171 | | | | 4,058,002 | | | | 2,632,591 | |
| | | | | | | | | | | | | | | | | | | | | | | |
| | 16,946,153 | | | | 11,173,935 | | | | 8,188,393 | | | | 23,164,162 | | | | 12,621,978 | | | | 8,918,334 | |
| | | | | | | | | | | | | | | | | | | | | | | |
| | | | | | | | | | | | | | | | | | | | | | |
| $ | 13.49 | | | $ | 12.45 | | | $ | 15.11 | | | $ | 11.06 | | | $ | 16.43 | | | $ | 13.36 | |
| | | | | | | | | | | | | | | | | | | | | | | |
| $ | 13.23 | | | $ | 11.95 | | | $ | 14.73 | | | $ | 10.46 | | | $ | 16.00 | | | $ | 13.33 | |
| | | | | | | | | | | | | | | | | | | | | | | |
| $ | 13.23 | | | $ | 11.96 | | | $ | 14.71 | | | $ | 10.44 | | | $ | 16.01 | | | $ | 13.32 | |
| | | | | | | | | | | | | | | | | | | | | | | |
| $ | 13.54 | | | $ | 13.09 | | | $ | 15.19 | | | $ | 11.23 | | | $ | 16.57 | | | $ | 13.37 | |
| | | | | | | | | | | | | | | | | | | | | | | |
| | 5.75 | % | | | 5.75 | % | | | 5.75 | % | | | 5.75 | % | | | 5.75 | % | | | 5.75 | % |
| | | | | | | | | | | | | | | | | | | | | | | |
| $ | 14.32 | | | $ | 13.21 | | | $ | 16.03 | | | $ | 11.73 | | | $ | 17.43 | | | $ | 14.17 | |
| | | | | | | | | | | | | | | | | | | | | | | |
See accompanying notes to the financial statements.
89
BB&T Funds
Statements of Assets and Liabilities | September 30, 2006 |
| | | | | | | | |
| | | Short U.S.
Government Fund | | | Intermediate U.S.
Government Fund | |
Assets: | | | | | | | | |
Investments, at cost | | $ | 104,658,921 | | | $ | 302,303,232 | |
Unrealized appreciation (depreciation) | | | (627,883 | ) | | | (2,767,457 | ) |
| | | | | | | | |
Investments, at fair value | | | 104,031,038 | | | | 299,535,775 | |
Repurchase agreements, at cost | | | 2,302,725 | | | | 2,046,488 | |
Cash | | | — | | | | — | |
Interest and dividends receivable | | | 771,831 | | | | 1,974,356 | |
Receivable for capital shares issued | | | 333,780 | | | | 5,181 | |
Receivable for investments sold | | | — | | | | — | |
Receivable from fund accounting | | | — | | | | — | |
Prepaid expenses | | | 1,647 | | | | 4,202 | |
| | | | | | | | |
Total Assets | | | 107,441,021 | | | | 303,566,002 | |
| | | | | | | | |
Liabilities: | | | | | | | | |
Dividends payable | | | 142,090 | | | | 546,991 | |
Payable for investments purchased | | | — | | | | — | |
Payable for capital shares redeemed | | | 15,053 | | | | 435,356 | |
Payable for collateral received on loaned securities | | | 34,618,745 | | | | 35,975,000 | |
Accrued expenses and other payables: | | | | | | | | |
Investment advisory fees | | | 36,788 | | | | 140,774 | |
Administration fees | | | 10,396 | | | | 33,254 | |
Fund accounting fees | | | 1,472 | | | | 3,937 | |
Transfer agency fees | | | 1,764 | | | | 7,773 | |
Distribution fees | | | 1,283 | | | | 5,480 | |
Compliance service fees | | | 161 | | | | 558 | |
Trustee fees | | | 52 | | | | 181 | |
Other | | | 8,988 | | | | 40,156 | |
| | | | | | | | |
Total Liabilities | | | 34,836,792 | | | | 37,189,460 | |
| | | | | | | | |
Net Assets: | | | | | | | | |
Capital | | | 81,028,297 | | | | 282,551,331 | |
Accumulated (distributions in excess of) net investment income | | | 578,326 | | | | 3,334,973 | |
Accumulated realized gains/(losses) from investment transactions | | | (8,374,511 | ) | | | (16,742,305 | ) |
Net unrealized appreciation/depreciation on investments | | | (627,883 | ) | | | (2,767,457 | ) |
| | | | | | | | |
Net Assets | | $ | 72,604,229 | | | $ | 266,376,542 | |
| | | | | | | | |
Net Assets | | | | | | | | |
Class A Shares | | $ | 6,232,886 | | | $ | 9,747,743 | |
Class B Shares | | | — | | | | 4,019,686 | |
Class C Shares | | | — | | | | 206,699 | |
Institutional Shares | | | 66,371,343 | | | | 252,402,414 | |
| | | | | | | | |
Total | | $ | 72,604,229 | | | $ | 266,376,542 | |
| | | | | | | | |
Shares of Beneficial Interest Outstanding (Unlimited number of shares authorized, no par value): | | | | | | | | |
Class A Shares | | | 657,361 | | | | 985,733 | |
Class B Shares | | | — | | | | 407,878 | |
Class C Shares | | | — | | | | 20,958 | |
Institutional Shares | | | 6,993,897 | | | | 25,490,546 | |
| | | | | | | | |
Total | | | 7,651,258 | | | | 26,905,115 | |
| | | | | | | | |
Net Asset Value | | | | | | | | |
Class A Shares — redemption price per share | | $ | 9.48 | | | $ | 9.89 | |
| | | | | | | | |
Class B Shares — offering price per share** | | $ | — | | | $ | 9.86 | |
| | | | | | | | |
Class C Shares — offering price per share** | | $ | — | | | $ | 9.86 | |
| | | | | | | | |
Institutional Shares — offering and redemption price per share | | $ | 9.49 | | | $ | 9.90 | |
| | | | | | | | |
Maximum Sales Charge — Class A Shares | | | 3.00 | % | | | 5.75 | % |
| | | | | | | | |
Maximum Offering Price (100%(100% — Maximum Sales Charge)) of net asset value adjusted to the nearest cent per share — Class A Shares | | $ | 9.77 | | | $ | 10.49 | |
| | | | | | | | |
| * | The Short U.S. Government Fund, Intermediate U.S. Government Fund, and Total Return Bond Fund include securities on loan of $33,937,870; $35,279,800 and $95,486,370; respectively. |
| ** | Redemption price per share varies by length of time shares are held. |
See accompanying notes to the financial statements.
90
| | | | | | | | | | | | | | | | | | | | | | |
Total Return
Bond Fund | | | Kentucky
Intermediate
Tax-Free Fund | | | Maryland
Intermediate
Tax-Free Fund | | | North Carolina
Intermediate
Tax-Free Fund | | | South Carolina
Intermediate
Tax-Free Fund | | | Virginia
Intermediate
Tax-Free Fund | |
| | | | | | | | | | | | | | | | | | | | | | |
| $ | 521,962,766 | | | $ | 14,050,626 | | | $ | 9,761,175 | | | $ | 104,550,325 | | | $ | 18,845,221 | | | $ | 74,792,579 | |
| | 1,279,442 | | | | 302,446 | | | | 142,989 | | | | 3,114,610 | | | | 525,292 | | | | 2,461,103 | |
| | | | | | | | | | | | | | | | | | | | | | | |
| | 523,242,208 | | | | 14,353,072 | | | | 9,904,164 | | | | 107,664,935 | | | | 19,370,513 | | | | 77,253,682 | |
| | 12,549,531 | | | | — | | | | — | | | | — | | | | — | | | | — | |
| | 152,901 | | | | — | | | | — | | | | — | | | | — | | | | — | |
| | 2,966,698 | | | | 201,034 | | | | 93,462 | | | | 1,473,943 | | | | 205,444 | | | | 931,497 | |
| | 615,418 | | | | — | | | | — | | | | 212,974 | | | | — | | | | 118,562 | |
| | 24,525,568 | | | | — | | | | — | | | | 27,404 | | | | — | | | | 747,632 | |
| | 513 | | | | — | | | | — | | | | — | | | | — | | | | — | |
| | 3,564 | | | | 92 | | | | 61 | | | | 438 | | | | 325 | | | | 1,522 | |
| | | | | | | | | | | | | | | | | | | | | | | |
| | 564,056,401 | | | | 14,554,198 | | | | 9,997,687 | | | | 109,379,694 | | | | 19,576,282 | | | | 79,052,895 | |
| | | | | | | | | | | | | | | | | | | | | | | |
| | | | | | | | | | | | | | | | | | | | | | |
| | 1,168,869 | | | | 32,851 | | | | 22,596 | | | | 275,217 | | | | 46,587 | | | | 208,574 | |
| | 85,900,687 | | | | 569,415 | | | | — | | | | 2,016,215 | | | | — | | | | 1,280,000 | |
| | 308,678 | | | | 37,202 | | | | — | | | | — | | | | 88,972 | | | | — | |
| | 97,576,279 | | | | — | | | | — | | | | — | | | | — | | | | — | |
| | | | | | | | | | | | | | | | | | | | | | |
| | 213,298 | | | | 4,710 | | | | 2,454 | | | | 39,780 | | | | 6,893 | | | | 28,453 | |
| | 49,943 | | | | 1,322 | | | | 924 | | | | 9,992 | | | | 1,812 | | | | 7,201 | |
| | 5,244 | | | | 943 | | | | 882 | | | | 2,004 | | | | 810 | | | | 1,432 | |
| | 7,682 | | | | 247 | | | | 167 | | | | 1,733 | | | | 333 | | | | 1,091 | |
| | 5,451 | | | | 558 | | | | 402 | | | | 3,925 | | | | 814 | | | | 2,411 | |
| | 782 | | | | 21 | | | | 14 | | | | 150 | | | | 27 | | | | 110 | |
| | 253 | | | | 7 | | | | 4 | | | | 48 | | | | 9 | | | | 35 | |
| | 70,861 | | | | 2,372 | | | | 1,166 | | | | 13,586 | | | | 2,354 | | | | 6,003 | |
| | | | | | | | | | | | | | | | | | | | | | | |
| | 185,308,027 | | | | 649,648 | | | | 28,609 | | | | 2,362,650 | | | | 148,611 | | | | 1,535,310 | |
| | | | | | | | | | | | | | | | | | | | | | | |
| | | | | | | | | | | | | | | | | | | | | | |
| | 387,447,641 | | | | 13,677,210 | | | | 9,970,476 | | | | 103,792,285 | | | $ | 18,875,471 | | | | 74,947,771 | |
| | 2,191,115 | | | | 5,134 | | | | (479 | ) | | | 52,797 | | | | 15,758 | | | | 31,874 | |
| | (12,169,824 | ) | | | (80,240 | ) | | | (143,908 | ) | | | 57,352 | | | | 11,150 | | | | 76,837 | |
| | 1,279,442 | | | | 302,446 | | | | 142,989 | | | | 3,114,610 | | | | 525,292 | | | | 2,461,103 | |
| | | | | | | | | | | | | | | | | | | | | | | |
| $ | 378,748,374 | | | $ | 13,904,550 | | | $ | 9,969,078 | | | $ | 107,017,044 | | | $ | 19,427,671 | | | $ | 77,517,585 | |
| | | | | | | | | | | | | | | | | | | | | | | |
| | | | | | | | | | | | | | | | | | | | | | |
| $ | 6,407,334 | | | $ | 2,729,100 | | | $ | 1,966,267 | | | $ | 19,162,931 | | | $ | 4,001,389 | | | $ | 11,875,099 | |
| | 4,871,996 | | | | — | | | | — | | | | — | | | | — | | | | — | |
| | 115,829 | | | | — | | | | — | | | | — | | | | — | | | | — | |
| | 367,353,215 | | | | 11,175,450 | | | | 8,002,811 | | | | 87,854,113 | | | | 15,426,282 | | | | 65,642,486 | |
| | | | | | | | | | | | | | | | | | | | | | | |
| $ | 378,748,374 | | | $ | 13,904,550 | | | $ | 9,969,078 | | | $ | 107,017,044 | | | $ | 19,427,671 | | | $ | 77,517,585 | |
| | | | | | | | | | | | | | | | | | | | | | | |
| | | | | | | | | | | | | | | | | | | | | | |
| | 632,937 | | | | 269,551 | | | | 194,311 | | | | 1,845,353 | | | | 386,439 | | | | 1,042,326 | |
| | 480,870 | | | | — | | | | — | | | | — | | | | — | | | | — | |
| | 11,433 | | | | — | | | | — | | | | — | | | | — | | | | — | |
| | 36,269,429 | | | | 1,105,064 | | | | 789,653 | | | | 8,461,343 | | | | 1,499,483 | | | | 5,763,016 | |
| | | | | | | | | | | | | | | | | | | | | | | |
| | 37,394,669 | | | | 1,374,615 | | | | 983,964 | | | | 10,306,696 | | | | 1,885,922 | | | | 6,805,342 | |
| | | | | | | | | | | | | | | | | | | | | | | |
| | | | | | | | | | | | | | | | | | | | | | |
| $ | 10.12 | | | $ | 10.12 | | | $ | 10.12 | | | $ | 10.38 | | | $ | 10.35 | | | $ | 11.39 | |
| | | | | | | | | | | | | | | | | | | | | | | |
| $ | 10.13 | | | $ | — | | | $ | — | | | $ | — | | | $ | — | | | $ | — | |
| | | | | | | | | | | | | | | | | | | | | | | |
| $ | 10.13 | | | $ | — | | | $ | — | | | $ | — | | | $ | — | | | $ | — | |
| | | | | | | | | | | | | | | | | | | | | | | |
| $ | 10.13 | | | $ | 10.11 | | | $ | 10.13 | | | $ | 10.38 | | | $ | 10.29 | | | $ | 11.39 | |
| | | | | | | | | | | | | | | | | | | | | | | |
| | 5.75 | % | | | 3.00 | % | | | 3.00 | % | | | 3.00 | % | | | 3.00 | % | | | 3.00 | % |
| | | | | | | | | | | | | | | | | | | | | | | |
| $ | 10.74 | | | $ | 10.44 | | | $ | 10.43 | | | $ | 10.71 | | | $ | 10.67 | | | $ | 11.75 | |
| | | | | | | | | | | | | | | | | | | | | | | |
See accompanying notes to the financial statements.
91
BB&T Funds
Statements of Assets and Liabilities | September 30, 2006 |
| | | | | | | |
| | | West Virginia
Intermediate
Tax-Free Fund | | | Prime Money
Market Fund |
Assets: | | | | | | | |
Investments: | | | | | | | |
Unaffiliated investments, at cost | | $ | 64,062,482 | | | $ | 1,084,484,242 |
Investment in affiliates, at cost | | | — | | | | — |
| | | | | | | |
Total investments, at cost | | | 64,062,482 | | | | 1,084,484,242 |
Unrealized appreciation (depreciation) | | | 1,722,241 | | | | — |
| | | | | | | |
Investments, at value | | | 65,784,723 | | | | 1,084,484,242 |
Repurchase agreements, at cost | | | — | | | | 80,078,000 |
Collateralized loan agreements, at cost | | | — | | | | 206,000,000 |
Cash | | | — | | | | 3,766 |
Interest and dividends receivable | | | 1,113,656 | | | | 5,416,224 |
Receivable for capital shares issued | | | 19,403 | | | | — |
Prepaid expenses | | | 691 | | | | 10,873 |
| | | | | | | |
Total Assets | | | 66,918,473 | | | | 1,375,993,105 |
| | | | | | | |
Liabilities: | | | | | | | |
Dividends payable | | | 182,474 | | | | 2,542,032 |
Payable for investments purchased | | | — | | | | 1,999,800 |
Payable for capital shares redeemed | | | 1,500 | | | | — |
Accrued expenses and other payables: | | | | | | | |
Investment advisory fees | | | 24,569 | | | | 316,129 |
Administration fees | | | 6,193 | | | | 118,817 |
Fund accounting fees | | | 1,371 | | | | 17,869 |
Transfer agency fees | | | 1,068 | | | | 11,296 |
Distribution fees | | | 3,217 | | | | 254,675 |
Compliance service fees | | | 92 | | | | 1,786 |
Trustee fees | | | 30 | | | | 578 |
Other | | | 8,876 | | | | 138,095 |
| | | | | | | |
Total Liabilities | | | 229,390 | | | | 5,401,077 |
| | | | | | | |
Net Assets: | | | | | | | |
Capital | | | 64,803,466 | | | | 1,370,586,340 |
Accumulated (distribution in excess of) net investment income | | | (55,375 | ) | | | 1,184 |
Accumulated realized gains/(losses) from investment transactions | | | 218,751 | | | | 4,504 |
Net unrealized appreciation/depreciation on investments | | | 1,722,241 | | | | — |
| | | | | | | |
Net Assets | | $ | 66,689,083 | | | $ | 1,370,592,028 |
| | | | | | | |
Net Assets | | | | | | | |
Class A Shares | | $ | 15,772,694 | | | $ | 636,326,997 |
Class B Shares | | | — | | | | 2,255,590 |
Class C Shares | | | — | | | | 393,090 |
Institutional Shares | | | 50,916,389 | | | | 731,616,351 |
| | | | | | | |
Total | | $ | 66,689,083 | | | $ | 1,370,592,028 |
| | | | | | | |
Shares of Beneficial Interest Outstanding (Unlimited number of shares authorized, no par value): | | | | | | | |
Class A Shares | | | 1,610,777 | | | | 636,323,798 |
Class B Shares | | | — | | | | 2,255,944 |
Class C Shares | | | — | | | | 393,086 |
Institutional Shares | | | 5,194,569 | | | | 731,628,946 |
| | | | | | | |
Total | | | 6,805,346 | | | | 1,370,601,774 |
| | | | | | | |
Net Asset Value | | | | | | | |
Class A Shares — redemption price per share | | $ | 9.79 | | | $ | 1.00 |
| | | | | | | |
Class B Shares — offering price per share* | | $ | — | | | $ | 1.00 |
| | | | | | | |
Class C Shares — offering price per share* | | $ | — | | | $ | 1.00 |
| | | | | | | |
Institutional Shares — offering and redemption price per share | | $ | 9.80 | | | $ | 1.00 |
| | | | | | | |
Maximum Sales Charge — Class A Shares | | | 3.00 | % | | | NA |
| | | | | | | |
Maximum Offering Price (100%/100% — Maximum Sales Charge) of net asset value adjusted to the nearest cent per share — Class A Shares | | $ | 10.09 | | | $ | 1.00 |
| | | | | �� | | |
| * | Redemption price per share varies by length of time shares are held. |
See accompanying notes to the financial statements.
92
| | | | | | | | | | | | | | | | | | | | |
U.S. Treasury
Money Market
Fund | | National
Tax-Free Money
Market Fund | | Capital Manager
Conservative
Growth Fund | | | Capital Manager
Moderate
Growth Fund | | | Capital Manager
Growth Fund | | | Capital Manager
Equity Fund | |
| | | | | | | | | | | | | | | | | | | | |
| | | | | | | | | | | | | | | | | | | | |
| $ | 208,654,185 | | $ | 95,640,945 | | $ | — | | | $ | — | | | $ | — | | | $ | — | |
| | — | | | — | | | 55,801,810 | | | | 71,161,734 | | | | 54,449,108 | | | | 25,518,100 | |
| | | | | | | | | | | | | | | | | | | | | |
| | 208,654,185 | | | 95,640,945 | | | 55,801,810 | | | | 71,161,734 | | | | 54,449,108 | | | | 25,518,100 | |
| | — | | | — | | | 5,740,731 | | | | 9,645,242 | | | | 7,899,481 | | | | 5,117,353 | |
| | | | | | | | | | | | | | | | | | | | | |
| | 208,654,185 | | | 95,640,945 | | | 61,542,541 | | | | 80,806,976 | | | | 62,348,589 | | | | 30,635,453 | |
| | 441,472,510 | | | — | | | — | | | | — | | | | — | | | | — | |
| | — | | | — | | | — | | | | — | | | | — | | | | — | |
| | — | | | — | | | — | | | | — | | | | — | | | | — | |
| | 1,314,215 | | | 406,626 | | | 187,185 | | | | 198,179 | | | | 131,007 | | | | 52,465 | |
| | — | | | — | | | 1 | | | | 1,331 | | | | 41,493 | | | | 6,760 | |
| | 7,138 | | | 4,197 | | | 978 | | | | 1,627 | | | | 1,361 | | | | 2,172 | |
| | | | | | | | | | | | | | | | | | | | | |
| | 651,448,048 | | | 96,051,768 | | | 61,730,705 | | | | 81,008,113 | | | | 62,522,450 | | | | 30,696,850 | |
| | | | | | | | | | | | | | | | | | | | | |
| | | | | | | | | | | | | | | | | | | | |
| | 1,285,741 | | | 258,161 | | | 7,120 | | | | 8,996 | | | | 4,116 | | | | 4,468 | |
| | — | | | — | | | — | | | | — | | | | — | | | | — | |
| | — | | | — | | | 200,675 | | | | 33,007 | | | | 9,771 | | | | 46,336 | |
| | | | | | | | | | | | | | | | | | | | |
| | 140,167 | | | 16,379 | | | — | | | | — | | | | — | | | | — | |
| | 55,053 | | | 9,490 | | | — | | | | — | | | | — | | | | — | |
| | 10,889 | | | 1,234 | | | 505 | | | | 660 | | | | 506 | | | | 245 | |
| | 5,559 | | | 1,049 | | | 2,007 | | | | 5,797 | | | | 4,901 | | | | 2,192 | |
| | 68,546 | | | 2 | | | 6,118 | | | | 24,610 | | | | 20,394 | | | | 8,152 | |
| | 921 | | | 141 | | | 109 | | | | 141 | | | | 113 | | | | 62 | |
| | 298 | | | 46 | | | 35 | | | | 46 | | | | 37 | | | | 20 | |
| | 61,284 | | | 4,761 | | | 8,662 | | | | 13,939 | | | | 10,904 | | | | 3,397 | |
| | | | | | | | | | | | | | | | | | | | | |
| | 1,628,458 | | | 291,263 | | | 225,231 | | | | 87,196 | | | | 50,742 | | | | 64,872 | |
| | | | | | | | | | | | | | | | | | | | | |
| | | | | | | | | | | | | | | | | | | | |
| | 649,819,344 | | | 95,757,477 | | | 57,364,419 | | | | 71,699,547 | | | | 54,842,631 | | | | 24,030,124 | |
| | 246 | | | 3,028 | | | 54,876 | | | | 94,881 | | | | 83,846 | | | | 47,480 | |
| | — | | | — | | | (1,654,552 | ) | | | (518,753 | ) | | | (354,250 | ) | | | 1,437,021 | |
| | — | | | — | | | 5,740,731 | | | | 9,645,242 | | | | 7,899,481 | | | | 5,117,353 | |
| | | | | | | | | | | | | | | | | | | | | |
| $ | 649,819,590 | | $ | 95,760,505 | | $ | 61,505,474 | | | $ | 80,920,917 | | | $ | 62,471,708 | | | $ | 30,631,978 | |
| | | | | | | | | | | | | | | | | | | | | |
| | | | | | | | | | | | | | | | | | | | |
| $ | 167,899,725 | | $ | 1,005 | | $ | 9,364,676 | | | $ | 33,472,098 | | | $ | 22,801,442 | | | $ | 7,761,893 | |
| | 380,554 | | | 1,004 | | | 4,968,402 | | | | 21,610,252 | | | | 19,365,660 | | | | 8,022,794 | |
| | 55,009 | | | 1,004 | | | 126,760 | | | | 139,183 | | | | 61,330 | | | | 10,212 | |
| | 481,484,302 | | | 95,757,492 | | | 47,045,636 | | | | 25,699,384 | | | | 20,243,276 | | | | 14,837,079 | |
| | | | | | | | | | | | | | | | | | | | | |
| $ | 649,819,590 | | $ | 95,760,505 | | $ | 61,505,474 | | | $ | 80,920,917 | | | $ | 62,471,708 | | | $ | 30,631,978 | |
| | | | | | | | | | | | | | | | | | | | | |
| | | | | | | | | | | | | | | | | | | | |
| | 167,899,969 | | | 1,005 | | | 940,155 | | | | 3,276,340 | | | | 2,229,554 | | | | 670,773 | |
| | 380,552 | | | 1,004 | | | 498,621 | | | | 2,151,129 | | | | 1,927,365 | | | | 712,550 | |
| | 55,009 | | | 1,004 | | | 12,760 | | | | 13,779 | | | | 6,105 | | | | 910 | |
| | 481,484,089 | | | 95,757,492 | | | 4,687,278 | | | | 2,506,213 | | | | 1,977,545 | | | | 1,273,975 | |
| | | | | | | | | | | | | | | | | | | | | |
| | 649,819,619 | | | 95,760,505 | | | 6,138,814 | | | | 7,947,461 | | | | 6,140,569 | | | | 2,658,208 | |
| | | | | | | | | | | | | | | | | | | | | |
| | | | | | | | | | | | | | | | | | | | |
| $ | 1.00 | | $ | 1.00 | | $ | 9.96 | | | $ | 10.22 | | | $ | 10.23 | | | $ | 11.57 | |
| | | | | | | | | | | | | | | | | | | | | |
| $ | 1.00 | | $ | 1.00 | | $ | 9.96 | | | $ | 10.05 | | | $ | 10.05 | | | $ | 11.26 | |
| | | | | | | | | | | | | | | | | | | | | |
| $ | 1.00 | | $ | 1.00 | | $ | 9.93 | | | $ | 10.10 | | | $ | 10.05 | | | $ | 11.22 | |
| | | | | | | | | | | | | | | | | | | | | |
| $ | 1.00 | | $ | 1.00 | | $ | 10.04 | | | $ | 10.25 | | | $ | 10.24 | | | $ | 11.65 | |
| | | | | | | | | | | | | | | | | | | | | |
| | NA | | | NA | | | 5.75 | % | | | 5.75 | % | | | 5.75 | % | | | 5.75 | % |
| | | | | | | | | | | | | | | | | | | | | |
| $ | 1.00 | | $ | 1.00 | | | 10.57 | | | $ | 10.84 | | | $ | 10.85 | | | $ | 12.28 | |
| | | | | | | | | | | | | | | | | | | | | |
See accompanying notes to the financial statements.
93
BB&T Funds
Statements of Operations | For the Year Ended September 30, 2006 |
| | | | | | | | |
| | | Large Cap
Fund | | | Large Cap
Growth Fund | |
Investment Income: | | | | | | | | |
Interest income | | $ | 1,230,665 | | | $ | 459,645 | |
Dividend income | | | 17,070,769 | | | | 4,089,284 | |
Foreign tax withholding | | | — | | | | — | |
Income from securities lending | | | 125,434 | | | | 71,297 | |
| | | | | | | | |
Total Investment Income | | | 18,426,868 | | | | 4,620,226 | |
| | | | | | | | |
Expenses: | | | | | | | | |
Investment advisory fees | | | 5,075,497 | | | | 2,669,370 | |
Administration fees | | | 775,253 | | | | 407,694 | |
Fund accounting fees | | | 86,724 | | | | 46,905 | |
Transfer agency fees | | | 145,019 | | | | 76,221 | |
Distribution fees — Class A Shares | | | 218,866 | | | | 45,932 | |
Distribution fees — Class B Shares | | | 189,381 | | | | 111,680 | |
Distribution fees — Class C Shares | | | 1,607 | | | | 277 | |
Compliance service fees | | | 11,970 | | | | 6,757 | |
Custodian fees | | | 69,727 | | | | 35,486 | |
Legal fees | | | 57,871 | | | | 28,434 | |
Printing fees | | | 65,274 | | | | 32,068 | |
Trustee fees | | | 25,552 | | | | 13,917 | |
Other | | | 97,955 | | | | 43,306 | |
| | | | | | | | |
Total expenses before waivers | | | 6,820,696 | | | | 3,518,047 | |
Less expenses waived by the Investment Advisor | | | (340,766 | ) | | | (180,419 | ) |
Less expenses waived by the Distributor | | | (109,433 | ) | | | (22,966 | ) |
| | | | | | | | |
Net Expenses | | | 6,370,497 | | | | 3,314,662 | |
| | | | | | | | |
Net Investment Income (Loss) | | | 12,056,371 | | | | 1,305,564 | |
| | | | | | | | |
Realized/Unrealized Gains (Losses) on Investments and Foreign Currency Transactions: | | | | | | | | |
Net realized gains (losses) on option contracts | | | — | | | | — | |
Net realized gains (losses) from investment and foreign currency transactions | | | 88,409,170 | | | | 16,243,812 | |
Change in unrealized appreciation/depreciation of investment securities and foreign currency transactions | | | (7,600,664 | ) | | | (18,517,591 | ) |
| | | | | | | | |
Net realized/unrealized gains (losses) on investments and foreign currency transactions | | | 80,808,506 | | | | (2,273,779 | ) |
| | | | | | | | |
Change in net assets from operations | | $ | 92,864,877 | | | $ | (968,215 | ) |
| | | | | | | | |
See accompanying notes to the financial statements.
94
| | | | | | | | | | | | | | | | | | | | | | |
Mid Cap
Value Fund | | | Mid Cap
Growth Fund | | | Small Cap
Fund | | | International
Equity Fund | | | Special
Opportunities
Equity Fund | | | Equity
Income Fund | |
| | | | | | | | | | | | | | | | | | | | | | |
| $ | 311,188 | | | $ | 254,962 | | | $ | 345,825 | | | $ | 3,080 | | | $ | 682,860 | | | $ | 369,196 | |
| | 2,484,748 | | | | 1,222,735 | | | | 814,095 | | | | 7,570,653 | | | | 1,266,956 | | | | 3,157,724 | |
| | — | | | | — | | | | — | | | | (608,813 | ) | | | — | | | | — | |
| | 48,616 | | | | 100,871 | | | | 79,433 | | | | — | | | | 10,083 | | | | 4,360 | |
| | | | | | | | | | | | | | | | | | | | | | | |
| | 2,844,552 | | | | 1,578,568 | | | | 1,239,353 | | | | 6,964,920 | | | | 1,959,899 | | | | 3,531,280 | |
| | | | | | | | | | | | | | | | | | | | | | | |
| | | | | | | | | | | | | | | | | | | | | | |
| | 1,546,717 | | | | 1,103,333 | | | | 944,834 | | | | 2,469,434 | | | | 1,539,712 | | | | 710,045 | |
| | 236,247 | | | | 168,512 | | | | 106,628 | | | | 279,088 | | | | 217,566 | | | | 114,676 | |
| | 27,556 | | | | 19,899 | | | | 13,498 | | | | 58,089 | | | | 25,905 | | | | 14,643 | |
| | 45,403 | | | | 35,418 | | | | 32,803 | | | | 38,714 | | | | 104,026 | | | | 48,885 | |
| | 32,329 | | | | 27,531 | | | | 27,934 | | | | 18,594 | | | | 388,869 | | | | 250,662 | |
| | 50,808 | | | | 26,566 | | | | 25,143 | | | | 19,715 | | | | 221,008 | | | | 75,256 | |
| | 6,293 | | | | 635 | | | | 128 | | | | 1,341 | | | | 316,763 | | | | 113,543 | |
| | 3,478 | | | | 2,544 | | | | 1,298 | | | | 4,282 | | | | 3,450 | | | | 1,625 | |
| | 22,040 | | | | 13,460 | | | | 9,593 | | | | 146,233 | | | | 20,223 | | | | 10,927 | |
| | 16,026 | | | | 10,760 | | | | 12,994 | | | | 19,523 | | | | 11,995 | | | | 9,443 | |
| | 17,320 | | | | 12,362 | | | | 58,896 | | | | 20,421 | | | | 17,360 | | | | 8,983 | |
| | 6,852 | | | | 5,509 | | | | 3,342 | | | | 8,940 | | | | 7,240 | | | | 3,817 | |
| | 31,462 | | | | 22,843 | | | | 19,963 | | | | 32,225 | | | | 40,346 | | | | 36,102 | |
| | | | | | | | | | | | | | | | | | | | | | | |
| | 2,042,531 | | | | 1,449,372 | | | | 1,257,054 | | | | 3,116,599 | | | | 2,914,463 | | | | 1,398,607 | |
| | (102,798 | ) | | | (73,899 | ) | | | (237,497 | ) | | | (246,941 | ) | | | — | | | | — | |
| | — | | | | — | | | | (13,967 | ) | | | (9,297 | ) | | | (194,434 | ) | | | (125,331 | ) |
| | | | | | | | | | | | | | | | | | | | | | | |
| | 1,939,733 | | | | 1,375,473 | | | | 1,005,590 | | | | 2,860,361 | | | | 2,720,029 | | | | 1,273,276 | |
| | | | | | | | | | | | | | | | | | | | | | | |
| | 904,819 | | | | 203,095 | | | | 233,763 | | | | 4,104,559 | | | | (760,130 | ) | | | 2,258,004 | |
| | | | | | | | | | | | | | | | | | | | | | | |
| | | | | | | | | | | | | | | | | | | | | | |
| | — | | | | — | | | | — | | | | — | | | | (196,621 | ) | | | 238,474 | |
| | 8,877,102 | | | | 20,794,688 | | | | 7,772,158 | | | | 19,044,559 | | | | 12,563,370 | | | | 3,091,876 | |
|
16,291,051 |
| | | (22,292,477 | ) | | | (5,276,497 | ) | | | 15,908,410 | | | | 9,047,945 | | | | 9,391,746 | |
| | | | | | | | | | | | | | | | | | | | | | | |
| | 25,168,153 | | | | (1,497,789 | ) | | | 2,495,661 | | | | 34,952,969 | | | | 21,414,694 | | | | 12,722,096 | |
| | | | | | | | | | | | | | | | | | | | | | | |
| $ | 26,072,972 | | | $ | (1,294,694 | ) | | $ | 2,729,424 | | | $ | 39,057,528 | | | $ | 20,654,564 | | | $ | 14,980,100 | |
| | | | | | | | | | | | | | | | | | | | | | | |
See accompanying notes to the financial statements.
95
BB&T Funds
Statements of Operations | For the Year Ended September 30, 2006 |
| | | | | | | | |
| | |
Short U.S.
Government Fund | | |
Intermediate U.S.
Government Fund | |
Investment Income: | | | | | | | | |
Interest income | | $ | 5,172,929 | | | $ | 23,574,944 | |
Dividend income | | | — | | | | — | |
Income from securities lending | | | 62,800 | | | | 178,602 | |
| | | | | | | | |
Total Investment Income | | | 5,235,729 | | | | 23,753,546 | |
| | | | | | | | |
Expenses: | | | | | | | | |
Investment advisory fees | | | 814,222 | | | | 2,780,380 | |
Administration fees | | | 153,384 | | | | 523,806 | |
Fund accounting fees | | | 23,289 | | | | 67,481 | |
Transfer agency fees | | | 18,677 | | | | 69,876 | |
Distribution fees — Class A Shares | | | 35,027 | | | | 55,003 | |
Distribution fees — Class B Shares | | | — | | | | 48,441 | |
Distribution fees — Class C Shares | | | — | | | | 2,534 | |
Compliance service fees | | | 3,019 | | | | 10,680 | |
Custodian fees | | | 11,854 | | | | 43,894 | |
Legal fees | | | 8,712 | | | | 33,072 | |
Printing fees | | | 16,011 | | | | 39,035 | |
Trustee fees | | | 7,790 | | | | 15,460 | |
Other | | | 17,722 | | | | 57,151 | |
| | | | | | | | |
Total expenses before waivers | | | 1,109,707 | | | | 3,746,813 | |
Less expenses waived by the Investment Advisor | | | (203,556 | ) | | | (519,609 | ) |
Less expenses waived by the Distributor | | | (17,514 | ) | | | (27,502 | ) |
| | | | | | | | |
Net Expenses | | | 888,637 | | | | 3,199,702 | |
| | | | | | | | |
Net Investment Income (Loss) | | | 4,347,092 | | | | 20,553,844 | |
| | | | | | | | |
Realized/Unrealized Gains (Losses) on Investments: | | | | | | | | |
Net realized gains (losses) from investment transactions | | | (1,978,418 | ) | | | (9,966,118 | ) |
Change in unrealized appreciation/depreciation of investments | | | 1,712,330 | | | | 1,445,810 | |
| | | | | | | | |
Net realized/unrealized gains (losses) on investments | | | (266,088 | ) | | | (8,520,308 | ) |
| | | | | | | | |
Change in net assets from operations | | $ | 4,081,004 | | | $ | 12,033,536 | |
| | | | | | | | |
See accompanying notes to the financial statements.
96
| | | | | | | | | | | | | | | | | | | | | | |
Total Return
Bond Fund | | | Kentucky
Intermediate
Tax-Free Fund | | | Maryland
Intermediate
Tax-Free Fund | | | North Carolina
Intermediate
Tax-Free Fund | | | South Carolina
Intermediate
Tax-Free Fund | | | Virginia
Intermediate
Tax-Free Fund | |
| | | | | | | | | | | | | | | | | | | | | | |
| $ | 25,975,173 | | | $ | 616,005 | | | $ | 382,570 | | | $ | 4,767,324 | | | $ | 831,116 | | | $ | 3,445,273 | |
| | — | | | | 17,753 | | | | 11,844 | | | | 70,313 | | | | 19,379 | | | | 54,470 | |
| | 191,260 | | | | — | | | | — | | | | — | | | | — | | | | — | |
| | | | | | | | | | | | | | | | | | | | | | | |
| | 26,166,433 | | | | 633,758 | | | | 394,414 | | | | 4,837,637 | | | | 850,495 | | | | 3,499,743 | |
| | | | | | | | | | | | | | | | | | | | | | | |
| | | | | | | | | | | | | | | | | | | | | | |
| | 3,082,584 | | | | 96,941 | | | | 63,448 | | | | 668,147 | | | | 119,847 | | | | 471,653 | |
| | 580,699 | | | | 18,264 | | | | 11,953 | | | | 125,873 | | | | 22,578 | | | | 88,854 | |
| | 71,798 | | | | 11,443 | | | | 10,633 | | | | 23,856 | | | | 11,786 | | | | 19,447 | |
| | 69,511 | | | | 2,378 | | | | 1,520 | | | | 14,771 | | | | 3,040 | | | | 10,473 | |
| | 32,905 | | | | 13,401 | | | | 8,613 | | | | 103,110 | | | | 20,085 | | | | 61,764 | |
| | 55,769 | | | | — | | | | — | | | | — | | | | — | | | | — | |
| | 1,667 | | | | — | | | | — | | | | — | | | | — | | | | — | |
| | 9,213 | | | | 334 | | | | 207 | | | | 1,941 | | | | 380 | | | | 1,508 | |
| | 54,027 | | | | 1,524 | | | | 965 | | | | 10,146 | | | | 2,119 | | | | 7,955 | |
| | 44,539 | | | | 5,590 | | | | 2,721 | | | | 11,992 | | | | 4,308 | | | | 7,881 | |
| | 45,964 | | | | 1,470 | | | | 921 | | | | 11,071 | | | | 1,936 | | | | 7,416 | |
| | 19,604 | | | | 604 | | | | 381 | | | | 3,937 | | | | 756 | | | | 2,982 | |
| | 64,117 | | | | 2,639 | | | | 2,947 | | | | 14,801 | | | | 4,727 | | | | 11,020 | |
| | | | | | | | | | | | | | | | | | | | | | | |
| | 4,132,397 | | | | 154,588 | | | | 104,309 | | | | 989,645 | | | | 191,562 | | | | 690,953 | |
| | (584,078 | ) | | | (34,028 | ) | | | (31,993 | ) | | | (167,037 | ) | | | (34,377 | ) | | | (117,913 | ) |
| | (16,453 | ) | | | (6,701 | ) | | | (4,306 | ) | | | (51,555 | ) | | | (10,042 | ) | | | (30,882 | ) |
| | | | | | | | | | | | | | | | | | | | | | | |
| | 3,531,866 | | | | 113,859 | | | | 68,010 | | | | 771,053 | | | | 147,143 | | | | 542,158 | |
| | | | | | | | | | | | | | | | | | | | | | | |
| | 22,634,567 | | | | 519,899 | | | | 326,404 | | | | 4,066,584 | | | | 703,352 | | | | 2,957,585 | |
| | | | | | | | | | | | | | | | | | | | | | | |
| | | | | | | | | | | | | | | | | | | | | | |
| | (8,825,146 | ) | | | (72,900 | ) | | | 7,432 | | | | (13,423 | ) | | | 9,779 | | | | 24,954 | |
| | 4,715,034 | | | | 157,761 | | | | 69,432 | | | | 48,434 | | | | (29,884 | ) | | | (334,335 | ) |
| | | | | | | | | | | | | | | | | | | | | | | |
| | (4,110,112 | ) | | | 84,861 | | | | 76,864 | | | | 35,011 | | | | (20,105 | ) | | | (309,381 | ) |
| | | | | | | | | | | | | | | | | | | | | | | |
| $ | 18,524,455 | | | $ | 604,760 | | | $ | 403,268 | | | $ | 4,101,595 | | | $ | 683,247 | | | $ | 2,648,204 | |
| | | | | | | | | | | | | | | | | | | | | | | |
See accompanying notes to the financial statements.
97
BB&T Funds
Statements of Operations | For the Year Ended September 30, 2006 |
| | | | | | | | |
| | | West Virginia
Intermediate
Tax-Free Fund | | | Prime Money
Market Fund | |
Investment Income: | | | | | | | | |
Interest income | | $ | 3,117,315 | | | $ | 56,308,099 | |
Dividend income | | | 41,841 | | | | — | |
Dividend income from affiliates | | | — | | | | — | |
Income from securities lending | | | — | | | | — | |
| | | | | | | | |
Total Investment Income | | | 3,159,156 | | | | 56,308,099 | |
| | | | | | | | |
Expenses: | | | | | | | | |
Investment advisory fees | | | 303,144 | | | | 4,676,394 | |
Administration fees | | | 76,147 | | | | 1,321,457 | |
Fund accounting fees | | | 20,837 | | | | 150,406 | |
Transfer agency fees | | | 9,381 | | | | 148,815 | |
Distribution fees — Class A Shares | | | 37,058 | | | | 2,769,589 | |
Distribution fees — Class B Shares | | | — | | | | 16,436 | |
Distribution fees — Class C Shares | | | — | | | | 4,206 | |
Compliance services fees | | | 1,299 | | | | 19,085 | |
Custodian fees | | | 5,549 | | | | 140,746 | |
Legal fees | | | 4,330 | | | | 93,069 | |
Printing fees | | | 5,647 | | | | 136,296 | |
Trustee fees | | | 2,447 | | | | 43,235 | |
Organizational fees | | | — | | | | — | |
Other | | | 11,743 | | | | 143,061 | |
| | | | | | | | |
Total expenses before waivers | | | 477,582 | | | | 9,662,795 | |
Less expenses waived by the Investment Advisor | | | — | | | | (1,286,009 | ) |
Less expenses waived by the Administrator | | | — | | | | — | |
Less expenses waived by the Distributor | | | — | | | | — | |
| | | | | | | | |
Net Expenses | | | 477,582 | | | | 8,376,786 | |
| | | | | | | | |
Net Investment Income (Loss) | | | 2,681,574 | | | | 47,931,313 | |
| | | | | | | | |
Realized/Unrealized Gains (Losses) on Investments: | | | | | | | | |
Net realized gains (losses) from investment securities | | | 136,323 | | | | 5,292 | |
Net realized gain distributions from underlying funds | | | — | | | | — | |
Change in unrealized appreciation/depreciation on investments | | | (192,498 | ) | | | — | |
| | | | | | | | |
Net realized/unrealized gains (losses) on investments | | | (56,175 | ) | | | 5,292 | |
| | | | | | | | |
Change in net assets from operations | | $ | 2,625,399 | | | $ | 47,936,605 | |
| | | | | | | | |
See accompanying notes to the financial statements.
98
| | | | | | | | | | | | | | | | | | | | | | |
U.S. Treasury
Money Market
Fund | | | National
Tax-Free Money
Market Fund | | | Capital Manager
Conservative
Growth Fund | | | Capital Manager
Moderate
Growth Fund | | | Capital Manager
Growth Fund | | | Capital Manager
Equity Fund | |
| | | | | | | | | | | | | | | | | | | | | | |
| $ | 30,197,514 | | | $ | 590,491 | | | $ | — | | | $ | — | | | $ | — | | | $ | — | |
| | — | | | | 2,916 | | | | — | | | | — | | | | — | | | | — | |
| | — | | | | — | | | | 2,877,159 | | | | 2,734,840 | | | | 1,830,591 | | | | 787,037 | |
| | 149,908 | | | | — | | | | — | | | | — | | | | — | | | | — | |
| | | | | | | | | | | | | | | | | | | | | | | |
| | 30,347,422 | | | | 593,407 | | | | 2,877,159 | | | | 2,734,840 | | | | 1,830,591 | | | | 787,037 | |
| | | | | | | | | | | | | | | | | | | | | | | |
| | | | | | | | | | | | | | | | | | | | | | |
| | 2,689,591 | | | | 41,826 | | | | 209,164 | | | | 246,015 | | | | 193,672 | | | | 105,179 | |
| | 760,194 | | | | 19,069 | | | | 94,547 | | | | 111,212 | | | | 87,546 | | | | 47,541 | |
| | 85,113 | | | | 2,313 | | | | 10,581 | | | | 12,364 | | | | 9,733 | | | | 5,303 | |
| | 90,675 | | | | 2,179 | | | | 16,830 | | | | 38,904 | | | | 35,708 | | | | 16,515 | |
| | 631,628 | | | | 1 | | | | 47,438 | | | | 159,328 | | | | 101,598 | | | | 35,091 | |
| | 5,641 | | | | 2 | | | | 50,872 | | | | 219,184 | | | | 184,198 | | | | 78,272 | |
| | 279 | | | | 2 | | | | 1,315 | | | | 1,284 | | | | 543 | | | | 153 | |
| | 13,264 | | | | 267 | | | | 1,669 | | | | 1,802 | | | | 1,367 | | | | 751 | |
| | 70,631 | | | | 1,419 | | | | 8,764 | | | | 10,063 | | | | 8,092 | | | | 4,695 | |
| | 53,209 | | | | 2,310 | | | | 7,088 | | | | 8,226 | | | | 6,662 | | | | 3,663 | |
| | 78,740 | | | | 4,115 | | | | 7,576 | | | | 8,059 | | | | 6,221 | | | | 3,433 | |
| | 25,248 | | | | — | | | | 3,373 | | | | 3,856 | | | | 3,050 | | | | 1,690 | |
| | — | | | | 56,637 | | | | — | | | | — | | | | — | | | | — | |
| | 112,897 | | | | 2,452 | | | | 14,085 | | | | 18,820 | | | | 16,271 | | | | 10,285 | |
| | | | | | | | | | | | | | | | | | | | | | | |
| | 4,617,110 | | | | 132,592 | | | | 473,302 | | | | 839,117 | | | | 654,661 | | | | 312,571 | |
| | (893,817 | ) | | | (65,002 | ) | | | (209,164 | ) | | | (246,015 | ) | | | (193,672 | ) | | | (105,179 | ) |
| | — | | | | — | | | | (94,547 | ) | | | (111,212 | ) | | | (87,546 | ) | | | (47,541 | ) |
| | — | | | | — | | | | (23,719 | ) | | | (79,664 | ) | | | (50,799 | ) | | | (17,545 | ) |
| | | | | | | | | | | | | | | | | | | | | | | |
| | 3,723,293 | | | | 67,590 | | | | 145,872 | | | | 402,226 | | | | 322,644 | | | | 142,306 | |
| | | | | | | | | | | | | | | | | | | | | | | |
| | 26,624,129 | | | | 525,817 | | | | 2,731,287 | | | | 2,332,614 | | | | 1,507,947 | | | | 644,731 | |
| | | | | | | | | | | | | | | | | | | | | | | |
| | | | | | | | | | | | | | | | | | | | | | |
| | — | | | | — | | | | 1,095,376 | | | | (272,821 | ) | | | (1,042,314 | ) | | | 404,368 | |
| | — | | | | — | | | | 1,582,059 | | | | 2,448,754 | | | | 2,275,079 | | | | 1,553,175 | |
| | — | | | | — | | | | (1,047,526 | ) | | | 1,819,387 | | | | 2,791,650 | | | | 724,038 | |
| | | | | | | | | | | | | | | | | | | | | | | |
| | — | | | | — | | | | 1,629,909 | | | | 3,995,320 | | | | 4,024,415 | | | | 2,681,581 | |
| | | | | | | | | | | | | | | | | | | | | | | |
| $ | 26,624,129 | | | $ | 525,817 | | | $ | 4,361,196 | | | $ | 6,327,934 | | | $ | 5,532,362 | | | $ | 3,326,312 | |
| | | | | | | | | | | | | | | | | | | | | | | |
See accompanying notes to the financial statements.
99
BB&T Funds
Statements of Changes in Net Assets | |
| | | | | | | | |
| | | Large Cap
Fund | |
| | | For the
Year Ended
September 30, 2006 | | | For the
Year Ended
September 30, 2005 | |
From Investment Activities Operations: | | | | | | | | |
Net investment income (loss) | | $ | 12,056,371 | | | $ | 12,192,576 | |
Net realized gains (losses) from investment securities | | | 88,409,170 | | | | 47,605,821 | |
Change in unrealized appreciation/depreciation of investments | | | (7,600,664 | ) | | | 35,932,841 | |
| | | | | | | | |
Change in net assets from operations | | | 92,864,877 | | | | 95,731,238 | |
| | | | | | | | |
Dividends to Class A Shareholders: | | | | | | | | |
Net investment income | | | (677,051 | ) | | | (576,782 | ) |
Net realized gains from investment transactions | | | (3,036,244 | ) | | | — | |
Dividends to Class B Shareholders: | | | | | | | | |
Net investment income | | | (156,092 | ) | | | (209,031 | ) |
Net realized gains from investment transactions | | | (1,539,960 | ) | | | — | |
Dividends to Class C Shareholders: | | | | | | | | |
Net investment income | | | (1,303 | ) | | | (1,373 | ) |
Net realized gains from investment transactions | | | (13,216 | ) | | | — | |
Dividends to Institutional Class Shareholders: | | | | | | | | |
Net investment income | | | (11,183,646 | ) | | | (11,420,295 | ) |
Net realized gains from investment transactions | | | (43,740,178 | ) | | | — | |
| | | | | | | | |
Change in net assets from shareholder dividends | | | (60,347,690 | ) | | | (12,207,481 | ) |
| | | | | | | | |
Capital Transactions: | | | | | | | | |
Change in net assets from capital transactions | | | 24,201,504 | | | | (94,385,766 | ) |
| | | | | | | | |
Change in net assets | | | 56,718,691 | | | | (10,862,009 | ) |
Net Assets: | | | | | | | | |
Beginning of period | | | 667,572,969 | | | | 678,434,978 | |
| | | | | | | | |
End of period | | $ | 724,291,660 | | | $ | 667,572,969 | |
| | | | | | | | |
Accumulated (distributions in excess of) net investment income | | $ | (104,143 | ) | | $ | (142,422 | ) |
| | | | | | | | |
See accompanying notes to the financial statements.
100
| | | | | | | | | | | | | | | | | | | | | | |
Large Cap
Growth Fund | | | Mid Cap
Value Fund | | | Mid Cap
Growth Fund | |
For the
Year Ended
September 30, 2006 | | | For the
Year Ended
September 30, 2005 | | | For the
Year Ended
September 30, 2006 | | | For the
Year Ended
September 30, 2005 | | | For the
Year Ended
September 30, 2006 | | | For the
Year Ended
September 30, 2005 | |
| | | | | | | | | | | | | | | | | | | | | | |
| $ | 1,305,564 | | | $ | 2,215,410 | | | $ | 904,819 | | | $ | 2,086,164 | | | $ | 203,095 | | | $ | (650,843 | ) |
| | 16,243,812 | | | | 24,836,740 | | | | 8,877,102 | | | | 78,019,273 | | | | 20,794,688 | | | | 14,423,194 | |
| | (18,517,591 | ) | | | 8,590,549 | | | | 16,291,051 | | | | (40,170,825 | ) | | | (22,292,477 | ) | | | 19,508,277 | |
| | | | | | | | | | | | | | | | | | | | | | | |
| | (968,215 | ) | | | 35,642,699 | | | | 26,072,972 | | | | 39,934,612 | | | | (1,294,694 | ) | | | 33,280,628 | |
| | | | | | | | | | | | | | | | | | | | | | | |
| | | | | | | | | | | | | | | | | | | | | | |
| | (12,977 | ) | | | (41,621 | ) | | | (41,421 | ) | | | (87,140 | ) | | | (18,135 | ) | | | — | |
| | — | | | | — | | | | (1,333,885 | ) | | | (3,524,287 | ) | | | (1,059,712 | ) | | | (107,640 | ) |
| | | | | | | | | | | | | | | | | | | | | | |
| | — | | | | (34,833 | ) | | | (901 | ) | | | (16,556 | ) | | | — | | | | — | |
| | — | | | | — | | | | (513,508 | ) | | | (1,270,093 | ) | | | (249,959 | ) | | | (26,807 | ) |
| | | | | | | | | | | | | | | | | | | | | | |
| | — | | | | (110 | ) | | | (122 | ) | | | (1,758 | ) | | | — | | | | — | |
| | — | | | | — | | | | (45,330 | ) | | | (114,396 | ) | | | (8,280 | ) | | | (2,371 | ) |
| | | | | | | | | | | | | | | | | | | | | | |
| | (1,054,388 | ) | | | (2,146,171 | ) | | | (974,981 | ) | | | (1,899,246 | ) | | | (373,020 | ) | | | — | |
| | — | | | | — | | | | (18,584,706 | ) | | | (54,097,901 | ) | | | (12,750,698 | ) | | | (1,390,450 | ) |
| | | | | | | | | | | | | | | | | | | | | | | |
| | (1,067,365 | ) | | | (2,222,735 | ) | | | (21,494,854 | ) | | | (61,011,377 | ) | | | (14,459,804 | ) | | | (1,527,268 | ) |
| | | | | | | | | | | | | | | | | | | | | | | |
| | | | | | | | | | | | | | | | | | | | | | |
| | (129,985,831 | ) | | | (44,276,953 | ) | | | 35,091,592 | | | | 14,299,002 | | | | 21,521,015 | | | | (20,323,437 | ) |
| | | | | | | | | | | | | | | | | | | | | | | |
| | (132,021,411 | ) | | | (10,856,989 | ) | | | 39,669,710 | | | | (6,777,763 | ) | | | 5,766,517 | | | | 11,429,923 | |
| | | | | | | | | | | | | | | | | | | | | | |
| | 357,857,723 | | | | 368,714,712 | | | | 189,541,320 | | | | 196,319,083 | | | | 139,701,328 | | | | 128,271,405 | |
| | | | | | | | | | | | | | | | | | | | | | | |
| $ | 225,836,312 | | | $ | 357,857,723 | | | $ | 229,211,030 | | | $ | 189,541,320 | | | $ | 145,467,845 | | | $ | 139,701,328 | |
| | | | | | | | | | | | | | | | | | | | | | | |
| $ | 230,874 | | | $ | (7,325 | ) | | $ | (66,896 | ) | | $ | 45,710 | | | $ | — | | | $ | — | |
| | | | | | | | | | | | | | | | | | | | | | | |
See accompanying notes to the financial statements.
101
BB&T Funds
Statements of Changes in Net Assets, continued | |
| | | | | | | | |
| | | Small Cap
Fund | |
| | | For the
Year Ended
September 30, 2006 | | | For the
Year Ended
September 30, 2005 | |
From Investment Activities Operations: | | | | | | | | |
Net investment income (loss) | | $ | 233,763 | | | $ | 693,285 | |
Net realized gains (losses) from option contracts, investment and foreign currency transactions | | | 7,772,158 | | | | 7,666,906 | |
Change in unrealized appreciation/depreciation of investment securities and foreign currency transactions | | | (5,276,497 | ) | | | 3,616,868 | |
| | | | | | | | |
Change in net assets from operations | | | 2,729,424 | | | | 11,977,059 | |
| | | | | | | | |
Dividends to Class A Shareholders: | | | | | | | | |
Net investment income | | | (10,336 | ) | | | (5,318 | ) |
Net realized gains from investment transactions | | | (191,408 | ) | | | (20,187 | ) |
Dividends to Class B Shareholders: | | | | | | | | |
Net investment income | | | (2,860 | ) | | | (1,258 | ) |
Net realized gains from investment transactions | | | (45,459 | ) | | | (4,329 | ) |
Dividends to Class C Shareholders: | | | | | | | | |
Net investment income | | | (9 | ) | | | (29 | ) |
Net realized gains from investment transactions | | | (613 | ) | | | (43 | ) |
Dividends to Institutional Class Shareholders: | | | | | | | | |
Net investment income | | | (292,050 | ) | | | (644,153 | ) |
Net realized gains from investment transactions | | | (8,036,789 | ) | | | (1,923,687 | ) |
| | | | | | | | |
Change in net assets from shareholder dividends | | | (8,579,524 | ) | | | (2,599,004 | ) |
| | | | | | | | |
Capital Transactions: | | | | | | | | |
Change in net assets from capital transactions | | | 67,122,321 | | | | (13,757,275 | ) |
| | | | | | | | |
Change in net assets | | | 61,272,221 | | | | (4,379,220 | ) |
Net Assets: | | | | | | | | |
Beginning of period | | | 62,913,646 | | | | 67,292,866 | |
| | | | | | | | |
End of period | | $ | 124,185,867 | | | $ | 62,913,646 | |
| | | | | | | | |
Accumulated (distributions in excess of) net investment income | | $ | (27,923 | ) | | $ | 18,791 | |
| | | | | | | | |
See accompanying notes to the financial statements.
102
| | | | | | | | | | | | | | | | | | | | | | |
International Equity
Fund | | | Special Opportunities Equity
Fund | | | Equity Income
Fund | |
For the
Year Ended
September 30, 2006 | | | For the
Year Ended
September 30, 2005 | | | For the
Year Ended
September 30, 2006 | | | For the
Year Ended
September 30, 2005 | | | For the
Year Ended
September 30, 2006 | | | For the
Year Ended
September 30, 2005 | |
| | | | | | | | | | | | | | | | | | | | | | |
| $ | 4,104,559 | | | $ | 3,189,210 | | | $ | (760,130 | ) | | $ | (835,017 | ) | | $ | 2,258,004 | | | $ | 1,410,198 | |
| | | | | |
| | 19,044,559 | | | | 23,396,171 | | | | 12,366,749 | | | | 8,511,250 | | | | 3,330,350 | | | | 2,050,561 | |
| | 15,908,410 | | | | 16,828,222 | | | | 9,047,945 | | | | 16,152,156 | | | | 9,391,746 | | | | 5,384,664 | |
| | | | | | | | | | | | | | | | | | | | | | | |
| | 39,057,528 | | | | 43,413,603 | | | | 20,654,564 | | | | 23,828,389 | | | | 14,980,100 | | | | 8,845,423 | |
| | | | | | | | | | | | | | | | | | | | | | | |
| | | | | | | | | | | | | | | | | | | | | | |
| | (55,882 | ) | | | (29,608 | ) | | | — | | | | — | | | | (1,319,564 | ) | | | (602,645 | ) |
| | — | | | | — | | | | (3,922,525 | ) | | | (323,812 | ) | | | (981,811 | ) | | | (18,755 | ) |
| | | | | | | | | | | | | | | | | | | | | | |
| | (19,949 | ) | | | (15,662 | ) | | | — | | | | — | | | | (147,380 | ) | | | (61,733 | ) |
| | — | | | | — | | | | (1,153,429 | ) | | | (136,241 | ) | | | (137,614 | ) | | | (4,173 | ) |
| | | | | | | | | | | | | | | | | | | | | | |
| | (1,335 | ) | | | (234 | ) | | | — | | | | ��� | | | | (221,294 | ) | | | (97,631 | ) |
| | — | | | | — | | | | (1,585,769 | ) | | | (174,173 | ) | | | (213,187 | ) | | | (5,788 | ) |
| | | | | | | | | | | | | | | | | | | | | | |
| | (3,894,301 | ) | | | (3,151,658 | ) | | | — | | | | — | | | | (908,127 | ) | | | (658,424 | ) |
| | — | | | | — | | | | (3,033,471 | ) | | | (381,013 | ) | | | (674,732 | ) | | | (44,436 | ) |
| | | | | | | | | | | | | | | | | | | | | | | |
| | (3,971,467 | ) | | | (3,197,162 | ) | | | (9,695,194 | ) | | | (1,015,239 | ) | | | (4,603,709 | ) | | | (1,493,585 | ) |
| | | | | | | | | | | | | | | | | | | | | | | |
| | | | | | | | | | | | | | | | | | | | | | |
| | (10,378,503 | ) | | | (42,128,491 | ) | | | 6,813,948 | | | | 68,303,302 | | | | 23,032,998 | | | | 47,396,767 | |
| | | | | | | | | | | | | | | | | | | | | | | |
| | 24,707,558 | | | | (1,912,050 | ) | | | 17,773,318 | | | | 91,116,452 | | | | 33,409,389 | | | | 54,748,605 | |
| | | | | | | | | | | | | | | | | | | | | | |
| | 235,191,523 | | | | 237,103,573 | | | | 188,660,681 | | | | 97,544,229 | | | | 85,707,290 | | | | 30,958,685 | |
| | | | | | | | | | | | | | | | | | | | | | | |
| $ | 259,899,081 | | | $ | 235,191,523 | | | $ | 206,433,999 | | | $ | 188,660,681 | | | $ | 119,116,679 | | | $ | 85,707,290 | |
| | | | | | | | | | | | | | | | | | | | | | | |
| $ | (820,134 | ) | | $ | (897,254 | ) | | $ | — | | | $ | — | | | $ | (345,575 | ) | | $ | (7,214 | ) |
| | | | | | | | | | | | | | | | | | | | | | | |
See accompanying notes to the financial statements.
103
BB&T Funds
Statements of Changes in Net Assets, continued
| | | | | | | | |
| | | Short U.S.
Government Fund | |
| | | For the
Year Ended
September 30, 2006 | | | For the
Year Ended
September 30, 2005 | |
From Investment Activities | | | | | | | | |
Operations: | | | | | | | | |
Net investment income (loss) | | $ | 4,347,092 | | | $ | 5,003,172 | |
Net realized gains (losses) from investment securities | | | (1,978,418 | ) | | | (379,543 | ) |
Change in unrealized appreciation/depreciation of investments | | | 1,712,330 | | | | (2,478,333 | ) |
| | | | | | | | |
Change in net assets from operations | | | 4,081,004 | | | | 2,145,296 | |
| | | | | | | | |
Dividends to Class A Shareholders: | | | | | | | | |
Net investment income | | | (230,094 | ) | | | (243,972 | ) |
Net realized gains from investment transactions | | | — | | | | — | |
Dividends to Class B Shareholders: | | | | | | | | |
Net investment income | | | — | | | | — | |
Net realized gains from investment transactions | | | — | | | | — | |
Dividends to Class C Shareholders: | | | | | | | | |
Net investment income | | | — | | | | — | |
Net realized gains from investment transactions | | | — | | | | — | |
Dividends to Institutional Class Shareholders: | | | | | | | | |
Net investment income | | | (4,533,855 | ) | | | (5,957,741 | ) |
Net realized gains from investment transactions | | | — | | | | — | |
| | | | | | | | |
Change in net assets from shareholder dividends | | | (4,763,949 | ) | | | (6,201,713 | ) |
| | | | | | | | |
Capital Transactions: | | | | | | | | |
Change in net assets from capital transactions | | | (90,478,365 | ) | | | (36,554,057 | ) |
| | | | | | | | |
Change in net assets | | | (91,161,310 | ) | | | (40,610,474 | ) |
Net Assets: | | | | | | | | |
Beginning of period | | | 163,765,539 | | | | 204,376,013 | |
| | | | | | | | |
End of period | | $ | 72,604,229 | | | $ | 163,765,539 | |
| | | | | | | | |
Accumulated (distributions in excess of) net investment income | | $ | 578,326 | | | $ | 208,500 | |
| | | | | | | | |
See accompanying notes to the financial statements.
104
| | | | | | | | | | | | | | | | | | | | | | |
Intermediate U.S.
Government Fund | | | Total Return
Bond Fund | | | Kentucky Intermediate
Tax-Free Fund | |
For the
Year Ended
September 30, 2006 | | | For the
Year Ended
September 30, 2005 | | | For the
Year Ended
September 30, 2006 | | | For the
Year Ended
September 30, 2005 | | | For the
Year Ended
September 30, 2006 | | | For the
Year Ended
September 30, 2005 | |
| | | | | | | | | | | | | | | | | | | | | | |
| | | | | | | | | | | | | | | | | | | | | | |
| $ | 20,553,844 | | | $ | 21,870,460 | | | $ | 22,634,567 | | | $ | 13,383,359 | | | $ | 519,899 | | | $ | 495,844 | |
| | (9,966,118 | ) | | | (273,986 | ) | | | (8,825,146 | ) | | | 5,949,823 | | | | (72,900 | ) | | | 51,649 | |
| | 1,445,810 | | | | (7,911,749 | ) | | | 4,715,034 | | | | (12,459,542 | ) | | | 157,761 | | | | (322,868 | ) |
| | | | | | | | | | | | | | | | | | | | | | | |
| | 12,033,536 | | | | 13,684,725 | | | | 18,524,455 | | | | 6,873,640 | | | | 604,760 | | | | 224,625 | |
| | | | | | | | | | | | | | | | | | | | | | | |
| | | | | | | | | | | | | | | | | | | | | | |
| | (465,227 | ) | | | (477,803 | ) | | | (284,767 | ) | | | (243,169 | ) | | | (80,960 | ) | | | (69,816 | ) |
| | — | | | | (56,160 | ) | | | (31,092 | ) | | | (15,675 | ) | | | — | | | | — | |
| | | | | | | | | | | | | | | | | | | | | | |
| | (169,209 | ) | | | (190,379 | ) | | | (197,744 | ) | | | (224,351 | ) | | | — | | | | — | |
| | — | | | | (29,669 | ) | | | (26,599 | ) | | | (20,100 | ) | | | — | | | | — | |
| | | | | | | | | | | | | | | | | | | | | | |
| | (8,786 | ) | | | (14,318 | ) | | | (5,884 | ) | | | (8,225 | ) | | | — | | | | — | |
| | — | | | | (2,287 | ) | | | (927 | ) | | | (747 | ) | | | — | | | | — | |
| | | | | | | | | | | | | | | | | | | | | | |
| | (19,963,279 | ) | | | (23,429,629 | ) | | | (22,969,331 | ) | | | (15,035,177 | ) | | | (439,339 | ) | | | (423,702 | ) |
| | — | | | | (2,449,142 | ) | | | (2,117,462 | ) | | | (858,176 | ) | | | — | | | | — | |
| | | | | | | | | | | | | | | | | | | | | | | |
| | (20,606,501 | ) | | | (26,649,387 | ) | | | (25,633,806 | ) | | | (16,405,620 | ) | | | (520,299 | ) | | | (493,518 | ) |
| | | | | | | | | | | | | | | | | | | | | | | |
| | | | | | | | | | | | | | | | | | | | | | |
| | (283,831,378 | ) | | | 17,614,479 | | | | (89,525,200 | ) | | | 200,521,516 | | | | (4,315,092 | ) | | | 2,217,737 | |
| | | | | | | | | | | | | | | | | | | | | | | |
| | (292,404,343 | ) | | | 4,649,817 | | | | (96,634,551 | ) | | | 190,989,536 | | | | (4,230,631 | ) | | | 1,948,844 | |
| | | | | | | | | | | | | | | | | | | | | | |
| | 558,780,885 | | | | 554,131,068 | | | | 475,382,925 | | | | 284,393,389 | | | | 18,135,181 | | | | 16,186,337 | |
| | | | | | | | | | | | | | | | | | | | | | | |
| $ | 266,376,542 | | | $ | 558,780,885 | | | $ | 378,748,374 | | | $ | 475,382,925 | | | $ | 13,904,550 | | | $ | 18,135,181 | |
| | | | | | | | | | | | | | | | | | | | | | | |
| $ | 3,334,973 | | | $ | 291,829 | | | $ | 2,191,115 | | | $ | 484,864 | | | $ | 5,134 | | | $ | 1,688 | |
| | | | | | | | | | | | | | | | | | | | | | | |
See accompanying notes to the financial statements.
105
BB&T Funds
Statements of Changes in Net Assets, continued | |
| | | | | | | | |
| | | Maryland Intermediate
Tax-Free Fund | |
| | | For the
Year Ended
September 30, 2006 | | | For the
Year Ended
September 30, 2005 | |
From Investment Activities | | | | | | | | |
Operations: | | | | | | | | |
Net investment income (loss) | | $ | 326,404 | | | $ | 303,626 | |
Net realized gains (losses) from investment securities | | | 7,432 | | | | (20,169 | ) |
Change in unrealized appreciation/depreciation of investments | | | 69,432 | | | | (113,820 | ) |
| | | | | | | | |
Change in net assets from operations | | | 403,268 | | | | 169,637 | |
| | | | | | | | |
Dividends to Class A Shareholders: | | | | | | | | |
Net investment income | | | (49,779 | ) | | | (26,781 | ) |
Net realized gains from investment transactions | | | — | | | | — | |
Dividends to Institutional Class Shareholders: | | | | | | | | |
Net investment income | | | (276,916 | ) | | | (277,284 | ) |
Net realized gains from investment transactions | | | — | | | | — | |
| | | | | | | | |
Change in net assets from shareholder dividends | | | (326,695 | ) | | | (304,065 | ) |
| | | | | | | | |
Capital Transactions: | | | | | | | | |
Change in net assets from capital transactions | | | (1,799,980 | ) | | | 2,052,613 | |
| | | | | | | | |
Change in net assets | | | (1,723,407 | ) | | | 1,918,185 | |
Net Assets: | | | | | | | | |
Beginning of period | | | 11,692,485 | | | | 9,774,300 | |
| | | | | | | | |
End of period | | $ | 9,969,078 | | | $ | 11,692,485 | |
| | | | | | | | |
Accumulated (distributions in excess of) net investment income | | $ | (479 | ) | | $ | (139 | ) |
| | | | | | | | |
See accompanying notes to the financial statements.
106
| | | | | | | | | | | | | | | | | | | | | | |
North Carolina Intermediate
Tax-Free Fund | | | South Carolina Intermediate
Tax-Free Fund | | | Virginia Intermediate
Tax-Free Fund | |
For the
Year Ended
September 30, 2006 | | | For the
Year Ended
September 30, 2005 | | | For the
Year Ended
September 30, 2006 | | | For the
Year Ended
September 30, 2005 | | | For the
Year Ended
September 30, 2006 | | | For the
Year Ended
September 30, 2005 | |
| | | | | | | | | | | | | | | | | | | | | | |
| | | | | | | | | | | | | | | | | | | | | | |
| $ | 4,066,584 | | | $ | 3,955,629 | | | $ | 703,352 | | | $ | 699,510 | | | $ | 2,957,585 | | | $ | 2,871,165 | |
| | (13,423 | ) | | | 984,109 | | | | 9,779 | | | | 347,851 | | | | 24,954 | | | | 451,579 | |
| | 48,434 | | | | (3,088,206 | ) | | | (29,884 | ) | | | (719,387 | ) | | | (334,335 | ) | | | (1,964,246 | ) |
| | | | | | | | | | | | | | | | | | | | | | | |
| | 4,101,595 | | | | 1,851,532 | | | | 683,247 | | | | 327,974 | | | | 2,648,204 | | | | 1,358,498 | |
| | | | | | | | | | | | | | | | | | | | | | | |
| | | | | | | | | | | | | | | | | | | | | | |
| | (702,597 | ) | | | (733,411 | ) | | | (132,635 | ) | | | (120,824 | ) | | | (430,643 | ) | | | (439,836 | ) |
| | (188,609 | ) | | | (38,438 | ) | | | (70,839 | ) | | | (26,156 | ) | | | (73,017 | ) | | | (26,900 | ) |
| | | | | | | | | | | | | | | | | | | | | | |
| | (3,317,274 | ) | | | (3,212,382 | ) | | | (570,487 | ) | | | (578,238 | ) | | | (2,478,318 | ) | | | (2,431,188 | ) |
| | (813,080 | ) | | | (159,613 | ) | | | (276,367 | ) | | | (119,968 | ) | | | (374,838 | ) | | | (133,111 | ) |
| | | | | | | | | | | | | | | | | | | | | | | |
| | (5,021,560 | ) | | | (4,143,844 | ) | | | (1,050,328 | ) | | | (845,186 | ) | | | (3,356,816 | ) | | | (3,031,035 | ) |
| | | | | | | | | | | | | | | | | | | | | | | |
| | | | | | | | | | | | | | | | | | | | | | |
| | (7,080,678 | ) | | | (2,116,768 | ) | | | (745,427 | ) | | | (579,207 | ) | | | (2,498,062 | ) | | | 606,500 | |
| | | | | | | | | | | | | | | | | | | | | | | |
| | (8,000,643 | ) | | | (4,409,080 | ) | | | (1,112,508 | ) | | | (1,096,419 | ) | | | (3,206,674 | ) | | | (1,066,037 | ) |
| | | | | | | | | | | | | | | | | | | | | | |
| | 115,017,687 | | | | 119,426,767 | | | | 20,540,179 | | | | 21,636,598 | | | | 80,724,259 | | | | 81,790,296 | |
| | | | | | | | | | | | | | | | | | | | | | | |
| $ | 107,017,044 | | | $ | 115,017,687 | | | $ | 19,427,671 | | | $ | 20,540,179 | | | $ | 77,517,585 | | | $ | 80,724,259 | |
| | | | | | | | | | | | | | | | | | | | | | | |
| $ | 52,797 | | | $ | 44,132 | | | $ | 15,758 | | | $ | 15,982 | | | $ | 31,874 | | | $ | 33,064 | |
| | | | | | | | | | | | | | | | | | | | | | | |
See accompanying notes to the financial statements.
107
BB&T Funds
Statements of Changes in Net Assets, continued | |
| | | | | | | | |
| | | West Virginia Intermediate
Tax-Free Fund | |
| | |
For the
Year Ended
September 30, 2006 | | | For the
Year Ended
September 30, 2005 | |
From Investment Activities | | | | | | | | |
Operations: | | | | | | | | |
Net investment income (loss) | | $ | 2,681,574 | | | $ | 2,658,263 | |
Net realized gains (losses) on securities | | | 136,323 | | | | 424,070 | |
Change in unrealized appreciation/depreciation from investments | | | (192,498 | ) | | | (1,514,595 | ) |
| | | | | | | | |
Change in net assets from operations | | | 2,625,399 | | | | 1,567,738 | |
| | | | | | | | |
Dividends to Class A Shareholders: | | | | | | | | |
Net investment income | | | (558,845 | ) | | | (410,722 | ) |
Net realized gains from investment transactions | | | (87,942 | ) | | | (83,550 | ) |
Dividends to Class B Shareholders: | | | | | | | | |
Net investment income | | | — | | | | — | |
Dividends to Class C Shareholders: | | | | | | | | |
Net investment income | | | — | | | | — | |
Dividends to Institutional Class Shareholders: | | | | | | | | |
Net investment income | | | (2,105,580 | ) | | | (2,242,970 | ) |
Net realized gains from investment transactions | | | (336,138 | ) | | | (472,029 | ) |
| | | | | | | | |
Change in net assets from shareholder dividends | | | (3,088,505 | ) | | | (3,209,271 | ) |
| | | | | | | | |
Capital Transactions: | | | | | | | | |
Change in net assets from capital transactions | | | (2,420,101 | ) | | | (3,118,848 | ) |
| | | | | | | | |
Change in net assets | | | (2,883,207 | ) | | | (4,760,381 | ) |
Net Assets: | | | | | | | | |
Beginning of period | | | 69,572,290 | | | | 74,332,671 | |
| | | | | | | | |
End of period | | $ | 66,689,083 | | | $ | 69,572,290 | |
| | | | | | | | |
Accumulated (distributions in excess of) net investment income | | $ | (55,375 | ) | | $ | (9,154 | ) |
| | | | | | | | |
| (a) | Period from commencement of operations. |
See accompanying notes to the financial statements.
108
| | | | | | | | | | | | | | | | | | |
Prime Money
Market Fund | | | U.S. Treasury Money
Market Fund | | | National Tax-Free Money
Market Fund | |
For the
Year Ended
September 30, 2006 | | | For the
Year Ended
September 30, 2005 | | | For the
Year Ended
September 30, 2006 | | | For the
Year Ended
September 30, 2005 | | | For the Period
August 1, 2006
through
September 30, 2006 (a) | |
| | | | | | | | | | | | | | | | | | |
| | | | | | | | | | | | | | | | | | |
| $ | 47,931,313 | | | $ | 20,982,349 | | | $ | 26,624,129 | | | $ | 17,879,508 | | | $ | 525,817 | |
| | 5,292 | | | | 296 | | | | — | | | | — | | | | — | |
| | — | | | | — | | | | — | | | | — | | | | — | |
| | | | | | �� | | | | | | | | | | | | | |
| | 47,936,605 | | | | 20,982,645 | | | | 26,624,129 | | | | 17,879,508 | | | | 525,817 | |
| | | | | | | | | | | | | | | | | | | |
| | | | | | | | | | | | | | | | | | |
| | (21,234,567 | ) | | | (9,358,223 | ) | | | (4,584,379 | ) | | | (2,034,759 | ) | | | (5 | ) |
| | — | | | | — | | | | — | | | | — | | | | — | |
| | | | | | | | | | | | | | | | | | |
| | (55,231 | ) | | | (26,256 | ) | | | (16,774 | ) | | | (8,071 | ) | | | (4 | ) |
| | | | | | | | | | | | | | | | | | |
| | (14,081 | ) | | | (4,720 | ) | | | (922 | ) | | | (109 | ) | | | (4 | ) |
| | | | | | | | | | | | | | | | | | |
| | (26,636,706 | ) | | | (11,593,150 | ) | | | (22,022,054 | ) | | | (15,836,569 | ) | | | (525,804 | ) |
| | — | | | | — | | | | — | | | | — | | | | — | |
| | | | | | | | | | | | | | | | | | | |
| | (47,940,585 | ) | | | (20,982,349 | ) | | | (26,624,129 | ) | | | (17,879,508 | ) | | | (525,817 | ) |
| | | | | | | | | | | | | | | | | | | |
| | | | | | | | | | | | | | | | | | |
| | 364,257,195 | | | | 47,539,283 | | | | (58,021,270 | ) | | | (341,713,777 | ) | | | 95,760,505 | |
| | | | | | | | | | | | | | | | | | | |
| | 364,253,215 | | | | 47,539,579 | | | | (58,021,270 | ) | | | (341,713,777 | ) | | | 95,760,505 | |
| | | | | | | | | | | | | | | | | | |
| | 1,006,338,813 | | | | 958,799,234 | | | | 707,840,860 | | | | 1,049,554,637 | | | | — | |
| | | | | | | | | | | | | | | | | | | |
| $ | 1,370,592,028 | | | $ | 1,006,338,813 | | | $ | 649,819,590 | | | $ | 707,840,860 | | | $ | 95,760,505 | |
| | | | | | | | | | | | | | | | | | | |
| $ | 1,184 | | | $ | 9,668 | | | $ | 246 | | | $ | 246 | | | $ | 3,028 | |
| | | | | | | | | | | | | | | | | | | |
See accompanying notes to the financial statements.
109
BB&T Funds
Statements of Changes in Net Assets, continued | |
| | | | | | | | |
| | | Capital Manager Conservative
Growth Fund | |
| | | For the
Year Ended
September 30, 2006 | | | For the
Year Ended
September 30, 2005 | |
From Investment Activities | | | | | | | | |
Operations: | | | | | | | | |
Net investment income (loss) | | $ | 2,731,287 | | | $ | 2,105,959 | |
Net realized gains (losses) from investment securities and distributions from underlying funds | | | 2,677,435 | | | | (462,685 | ) |
Change in unrealized appreciation/depreciation on investments | | | (1,047,526 | ) | | | 4,281,075 | |
| | | | | | | | |
Change in net assets from operations | | | 4,361,196 | | | | 5,924,349 | |
| | | | | | | | |
Dividends to Class A Shareholders: | | | | | | | | |
Net investment income | | | (316,793 | ) | | | (168,581 | ) |
Net realized gains from investment transactions | | | — | | | | — | |
Dividends to Class B Shareholders: | | | | | | | | |
Net investment income | | | (132,184 | ) | | | (77,014 | ) |
Net realized gains from investment transactions | | | — | | | | — | |
Dividends to Class C Shareholders: | | | | | | | | |
Net investment income | | | (3,332 | ) | | | (2,499 | ) |
Net realized gains from investment transactions | | | — | | | | — | |
Dividends to Institutional Class Shareholders: | | | | | | | | |
Net investment income | | | (2,306,502 | ) | | | (1,775,465 | ) |
Net realized gains from investment transactions | | | — | | | | — | |
| | | | | | | | |
Change in net assets from shareholder dividends | | | (2,758,811 | ) | | | (2,023,559 | ) |
| | | | | | | | |
Capital Transactions: | | | | | | | | |
Change in net assets from capital transactions | | | (25,686,559 | ) | | | 3,484,227 | |
| | | | | | | | |
Change in net assets | | | (24,084,174 | ) | | | 7,385,017 | |
Net Assets: | | | | | | | | |
Beginning of period | | | 85,589,648 | | | | 78,204,631 | |
| | | | | | | | |
End of period | | $ | 61,505,474 | | | $ | 85,589,648 | |
| | | | | | | | |
Accumulated (distributions in excess of) net investment income | | $ | 54,876 | | | $ | 82,400 | |
| | | | | | | | |
| (a) | Period from commencement of operations. |
See accompanying notes to the financial statements.
110
| | | | | | | | | | | | | | | | | | | | | | |
Capital Manager Moderate
Growth Fund | | | Capital Manager
Growth Fund | | | Capital Manager
Equity Fund | |
For the
Year Ended
September 30, 2006 | | | For the
Year Ended
September 30, 2005 | | | For the
Year Ended
September 30, 2006 | | | For the
Year Ended
September 30, 2005 | | | For the
Year Ended
September 30, 2006 | | | For the
Year Ended
September 30, 2005 | |
| | | | | | | | | | | | | | | | | | | | | | |
| | | | | | | | | | | | | | | | | | | | | | |
| $ | 2,332,614 | | | $ | 1,437,620 | | | $ | 1,507,947 | | | $ | 830,676 | | | $ | 644,731 | | | $ | 313,973 | |
| | | | | | | | | | | | | | | | | | | | | | |
| | 2,175,933 | | | | (1,028,947 | ) | | | 1,232,765 | | | | (477,103 | ) | | | 1,957,543 | | | | 779,359 | |
| | 1,819,387 | | | | 7,702,572 | | | | 2,791,650 | | | | 6,904,538 | | | | 724,038 | | | | 3,696,738 | |
| | | | | | | | | | | | | | | | | | | | | | | |
| | 6,327,934 | | | | 8,111,245 | | | | 5,532,362 | | | | 7,258,111 | | | | 3,326,312 | | | | 4,790,070 | |
| | | | | | | | | | | | | | | | | | | | | | | |
| | | | | | | | | | | | | | | | | | | | | | |
| | (821,797 | ) | | | (404,055 | ) | | | (438,399 | ) | | | (169,918 | ) | | | (120,990 | ) | | | (28,662 | ) |
| | — | | | | — | | | | — | | | | — | | | | (112,648 | ) | | | — | |
| | | | | | | | | | | | | | | | | | | | | | |
| | (405,497 | ) | | | (176,756 | ) | | | (266,484 | ) | | | (66,171 | ) | | | (78,167 | ) | | | (6,994 | ) |
| | — | | | | — | | | | — | | | | — | | | | (134,397 | ) | | | — | |
| | | | | | | | | | | | | | | | | | | | | | |
| | (2,447 | ) | | | (1,384 | ) | | | (879 | ) | | | (138 | ) | | | (173 | ) | | | (1 | ) |
| | — | | | | — | | | | — | | | | — | | | | (336 | ) | | | — | |
| | | | | | | | | | | | | | | | | | | | | | |
| | (1,138,350 | ) | | | (725,067 | ) | | | (840,595 | ) | | | (472,193 | ) | | | (484,161 | ) | | | (192,382 | ) |
| | — | | | | — | | | | — | | | | — | | | | (458,864 | ) | | | — | |
| | | | | | | | | | | | | | | | | | | | | | | |
| | (2,368,091 | ) | | | (1,307,262 | ) | | | (1,546,357 | ) | | | (708,420 | ) | | | (1,389,736 | ) | | | (228,039 | ) |
| | | | | | | | | | | | | | | | | | | | | | | |
| | | | | | | | | | | | | | | | | | | | | | |
| | (17,335,086 | ) | | | 13,866,681 | | | | (13,457,141 | ) | | | 10,933,539 | | | | (10,823,403 | ) | | | 4,544,281 | |
| | | | | | | | | | | | | | | | | | | | | | | |
| | (13,375,243 | ) | | | 20,670,664 | | | | (9,471,136 | ) | | | 17,483,230 | | | | (8,886,827 | ) | | | 9,106,312 | |
| | | | | | | | | | | | | | | | | | | | | | |
| | 94,296,160 | | | | 73,625,496 | | | | 71,942,844 | | | | 54,459,614 | | | | 39,518,805 | | | | 30,412,493 | |
| | | | | | | | | | | | | | | | | | | | | | | |
| $ | 80,920,917 | | | $ | 94,296,160 | | | $ | 62,471,708 | | | $ | 71,942,844 | | | $ | 30,631,978 | | | $ | 39,518,805 | |
| | | | | | | | | | | | | | | | | | | | | | | |
| $ | 94,881 | | | $ | 130,358 | | | $ | 83,846 | | | $ | 122,256 | | | $ | 47,480 | | | $ | 85,934 | |
| | | | | | | | | | | | | | | | | | | | | | | |
See accompanying notes to the financial statements.
111
BB&T Funds
Statements of Changes in Net Assets, continued | |
| | | | | | | | |
| | | Large Cap
Fund | |
| | | For the
Year Ended
September 30, 2006 | | | For the
Year Ended
September 30, 2005 | |
Capital Transactions: | | | | | | | | |
Class A Shares: | | | | | | | | |
Proceeds from shares issued | | $ | 11,455,809 | | | $ | 9,661,619 | |
Dividends reinvested | | | 3,356,212 | | | | 546,626 | |
Value of shares redeemed | | | (8,183,336 | ) | | | (6,489,397 | ) |
| | | | | | | | |
Change in net assets from Class A Share transactions | | | 6,628,685 | | | | 3,718,848 | |
Class B Shares: | | | | | | | | |
Proceeds from shares issued | | | 1,081,268 | | | | 1,142,035 | |
Dividends reinvested | | | 1,681,643 | | | | 210,190 | |
Value of shares redeemed | | | (10,671,968 | ) | | | (8,551,951 | ) |
| | | | | | | | |
Change in net assets from Class B Share transactions | | | (7,909,057 | ) | | | (7,199,726 | ) |
Class C Shares: | | | | | | | | |
Proceeds from shares issued | | | 33,770 | | | | 52,119 | |
Dividends reinvested | | | 14,517 | | | | 1,389 | |
Value of shares redeemed | | | (69,676 | ) | | | (52,297 | ) |
| | | | | | | | |
Change in net assets from Class C Share transactions | | | (21,389 | ) | | | 1,211 | |
Institutional Shares: | | | | | | | | |
Proceeds from shares issued | | | 120,655,536 | | | | 68,736,038 | |
Dividends reinvested | | | 36,292,487 | | | | 6,375,592 | |
Value of shares redeemed | | | (131,444,758 | ) | | | (166,017,729 | ) |
Redemption In-Kind | | | — | | | | — | |
| | | | | | | | |
Change in net assets from Institutional Share transactions | | | 25,503,265 | | | | (90,906,099 | ) |
| | | | | | | | |
Change in net assets from capital transactions | | $ | 24,201,504 | | | $ | (94,385,766 | ) |
| | | | | | | | |
Share Transactions: | | | | | | | | |
Class A Shares: | | | | | | | | |
Issued | | | 594,942 | | | | 517,981 | |
Reinvested | | | 179,580 | | | | 29,386 | |
Redeemed | | | (422,997 | ) | | | (347,071 | ) |
| | | | | | | | |
Change in Class A Shares | | | 351,525 | | | | 200,296 | |
Class B Shares: | | | | | | | | |
Issued | | | 56,846 | | | | 62,625 | |
Reinvested | | | 91,167 | | | | 11,398 | |
Redeemed | | | (560,116 | ) | | | (463,800 | ) |
| | | | | | | | |
Change in Class B Shares | | | (412,103 | ) | | | (389,777 | ) |
Class C Shares: | | | | | | | | |
Issued | | | 1,766 | | | | 2,803 | |
Reinvested | | | 789 | | | | 75 | |
Redeemed | | | (3,652 | ) | | | (2,943 | ) |
| | | | | | | | |
Change in Class C Shares | | | (1,097 | ) | | | (65 | ) |
Institutional Shares: | | | | | | | | |
Issued | | | 6,218,257 | | | | 3,763,766 | |
Reinvested | | | 1,936,824 | | | | 342,725 | |
Redeemed | | | (6,769,780 | ) | | | (8,934,669 | ) |
Redemption In-Kind | | | — | | | | — | |
| | | | | | | | |
Change in Institutional Shares | | | 1,385,301 | | | | (4,828,178 | ) |
| | | | | | | | |
Change in Shares | | | 1,323,626 | | | | (5,017,724 | ) |
| | | | | | | | |
See accompanying notes to the financial statements.
112
| | | | | | | | | | | | | | | | | | | | | | |
Large Cap
Growth Fund | | | Mid Cap
Value Fund | | | Mid Cap
Growth Fund | |
For the
Year Ended
September 30, 2006 | | | For the
Year Ended
September 30, 2005 | | | For the
Year Ended
September 30, 2006 | | | For the
Year Ended
September 30, 2005 | | | For the
Year Ended
September 30, 2006 | | | For the
Year Ended
September 30, 2005 | |
| | | | | | | | | | | | | | | | | | | | | | |
| | | | | | | | | | | | | | | | | | | | | | |
| $ | 2,852,916 | | | $ | 1,781,452 | | | $ | 3,543,605 | | | $ | 4,485,560 | | | $ | 2,584,357 | | | $ | 2,518,857 | |
| | 11,461 | | | | 34,217 | | | | 1,321,057 | | | | 3,485,585 | | | | 1,036,602 | | | | 106,199 | |
| | (2,494,029 | ) | | | (2,280,442 | ) | | | (4,085,956 | ) | | | (3,419,250 | ) | | | (2,501,025 | ) | | | (2,430,159 | ) |
| | | | | | | | | | | | | | | | | | | | | | | |
| | 370,348 | | | | (464,773 | ) | | | 778,706 | | | | 4,551,895 | | | | 1,119,934 | | | | 194,897 | |
| | | | | | | | | | | | | | | | | | | | | | |
| | 432,338 | | | | 602,206 | | | | 1,037,911 | | | | 945,833 | | | | 765,099 | | | | 228,265 | |
| | — | | | | 34,776 | | | | 512,918 | | | | 1,284,643 | | | | 246,230 | | | | 26,526 | |
| | (3,961,543 | ) | | | (2,993,414 | ) | | | (768,298 | ) | | | (730,819 | ) | | | (706,264 | ) | | | (342,348 | ) |
| | | | | | | | | | | | | | | | | | | | | | | |
| | (3,529,205 | ) | | | (2,356,432 | ) | | | 782,531 | | | | 1,499,657 | | | | 305,065 | | | | (87,557 | ) |
| | | | | | | | | | | | | | | | | | | | | | |
| | 23,255 | | | | 11,034 | | | | 433,480 | | | | 86,720 | | | | 26,775 | | | | 59,422 | |
| | — | | | | 110 | | | | 38,170 | | | | 90,479 | | | | 8,279 | | | | 2,371 | |
| | (3,112 | ) | | | (20,255 | ) | | | (104,036 | ) | | | (314,401 | ) | | | (74,621 | ) | | | (241,417 | ) |
| | | | | | | | | | | | | | | | | | | | | | | |
| | 20,143 | | | | (9,111 | ) | | | 367,614 | | | | (137,202 | ) | | | (39,567 | ) | | | (179,624 | ) |
| | | | | | | | | | | | | | | | | | | | | | |
| | 72,052,259 | | | | 38,224,930 | | | | 65,662,801 | | | | 41,973,265 | | | | 50,476,104 | | | | 24,514,270 | |
| | 588,523 | | | | 1,162,910 | | | | 13,345,528 | | | | 34,205,347 | | | | 6,303,907 | | | | 587,204 | |
| | (199,487,899 | ) | | | (80,834,477 | ) | | | (45,845,588 | ) | | | (67,793,960 | ) | | | (31,644,428 | ) | | | (45,352,627 | ) |
| | — | | | | — | | | | — | | | | — | | | | (5,000,000 | ) | | | — | |
| | | | | | | | | | | | | | | | | | | | | | | |
| | (126,847,117 | ) | | | (41,446,637 | ) | | | 33,162,741 | | | | 8,384,652 | | | | 20,135,583 | | | | (20,251,153 | ) |
| | | | | | | | | | | | | | | | | | | | | | | |
| $ | (129,985,831 | ) | | $ | (44,276,953 | ) | | $ | 35,091,592 | | | $ | 14,299,002 | | | $ | 21,521,015 | | | $ | (20,323,437 | ) |
| | | | | | | | | | | | | | | | | | | | | | | |
| | | | | | | | | | | | | | | | | | | | | | |
| | | | | | | | | | | | | | | | | | | | | | |
| | 317,364 | | | | 203,723 | | | | 273,562 | | | | 271,180 | | | | 191,168 | | | | 200,123 | |
| | 1,257 | | | | 3,819 | | | | 105,779 | | | | 259,391 | | | | 79,757 | | | | 8,835 | |
| | (276,880 | ) | | | (260,302 | ) | | | (312,940 | ) | | | (216,209 | ) | | | (188,884 | ) | | | (195,031 | ) |
| | | | | | | | | | | | | | | | | | | | | | | |
| | 41,741 | | | | (52,760 | ) | | | 66,401 | | | | 314,362 | | | | 82,041 | | | | 13,927 | |
| | | | | | | | | | | | | | | | | | | | | | |
| | 50,542 | | | | 73,333 | | | | 80,934 | | | | 57,215 | | | | 58,023 | | | | 19,563 | |
| | — | | | | 4,106 | | | | 41,799 | | | | 97,143 | | | | 19,667 | | | | 2,263 | |
| | (470,181 | ) | | | (361,793 | ) | | | (59,657 | ) | | | (43,973 | ) | | | (56,695 | ) | | | (28,374 | ) |
| | | | | | | | | | | | | | | | | | | | | | | |
| | (419,639 | ) | | | (284,354 | ) | | | 63,076 | | | | 110,385 | | | | 20,995 | | | | (6,548 | ) |
| | | | | | | | | | | | | | | | | | | | | | |
| | 2,671 | | | | 1,334 | | | | 34,345 | | | | 5,360 | | | | 2,021 | | | | 4,938 | |
| | — | | | | 13 | | | | 3,110 | | | | 6,824 | | | | 661 | | | | 202 | |
| | (377 | ) | | | (2,390 | ) | | | (7,989 | ) | | | (19,649 | ) | | | (5,700 | ) | | | (18,787 | ) |
| | | | | | | | | | | | | | | | | | | | | | | |
| | 2,294 | | | | (1,043 | ) | | | 29,466 | | | | (7,465 | ) | | | (3,018 | ) | | | (13,647 | ) |
| | | | | | | | | | | | | | | | | | | | | | |
| | 7,893,018 | | | | 4,363,516 | | | | 5,063,390 | | | | 2,538,005 | | | | 3,586,780 | | | | 1,903,007 | |
| | 63,148 | | | | 128,373 | | | | 1,064,393 | | | | 2,536,735 | | | | 461,521 | | | | 46,864 | |
| | (21,972,602 | ) | | | (9,093,856 | ) | | | (3,519,435 | ) | | | (4,052,925 | ) | | | (2,306,318 | ) | | | (3,563,229 | ) |
| | — | | | | — | | | | — | | | | — | | | | (338,524 | ) | | | — | |
| | | | | | | | | | | | | | | | | | | | | | | |
| | (14,016,436 | ) | | | (4,601,967 | ) | | | 2,608,348 | | | | 1,021,815 | | | | 1,403,459 | | | | (1,613,358 | ) |
| | | | | | | | | | | | | | | | | | | | | | | |
| | (14,392,040 | ) | | | (4,940,124 | ) | | | 2,767,291 | | | | 1,439,097 | | | | 1,503,477 | | | | (1,619,626 | ) |
| | | | | | | | | | | | | | | | | | | | | | | |
See accompanying notes to the financial statements.
113
BB&T Funds
Statements of Changes in Net Assets, continued | |
| | | | | | | | |
| | | Small Cap
Fund | |
| | | For the
Year Ended
September 30, 2006 | | | For the
Year Ended
September 30, 2005 | |
Capital Transactions: | | | | | | | | |
Class A Shares: | | | | | | | | |
Proceeds from shares issued | | $ | 1,563,815 | | | $ | 1,710,491 | |
Proceeds from shares issued in conversion | | | 8,076,416 | | | | — | |
Dividends reinvested | | | 170,057 | | | | 24,657 | |
Value of shares redeemed | | | (1,718,429 | ) | | | (578,781 | ) |
| | | | | | | | |
Change in net assets from Class A Share transactions | | | 8,091,859 | | | | 1,156,367 | |
Class B Shares: | | | | | | | | |
Proceeds from shares issued | | | 315,041 | | | | 127,135 | |
Proceeds from shares issued in conversion | | | 4,879,881 | | | | — | |
Dividends reinvested | | | 48,317 | | | | 5,587 | |
Value of shares redeemed | | | (1,226,132 | ) | | | (35,184 | ) |
| | | | | | | | |
Change in net assets from Class B Share transactions | | | 4,017,107 | | | | 97,538 | |
Class C Shares: | | | | | | | | |
Proceeds from shares issued | | | 2,569 | | | | 4,000 | |
Proceeds from shares issued in conversion | | | 19,229 | | | | — | |
Dividends reinvested | | | 622 | | | | 72 | |
Value of shares redeemed | | | (6,076 | ) | | | (1,606 | ) |
| | | | | | | | |
Change in net assets from Class C Share transactions | | | 16,344 | | | | 2,466 | |
Institutional Shares: | | | | | | | | |
Proceeds from shares issued | | | 32,824,936 | | | | 12,467,749 | |
Proceeds from shares issued in conversion | | | 40,922,638 | | | | — | |
Dividends reinvested | | | 3,865,352 | | | | 1,559,698 | |
Value of shares redeemed | | | (18,615,915 | ) | | | (29,041,093 | ) |
Redemption In-Kind | | | (4,000,000 | ) | | | — | |
| | | | | | | | |
Change in net assets from Institutional Share transactions | | | 54,997,011 | | | | (15,013,646 | ) |
| | | | | | | | |
Change in net assets from capital transactions | | $ | 67,122,321 | | | $ | (13,757,275 | ) |
| | | | | | | | |
Share Transactions: | | | | | | | | |
Class A Shares: | | | | | | | | |
Issued | | | 102,573 | | | | 108,999 | |
Issued in conversion | | | 519,217 | | | | — | |
Reinvested | | | 11,590 | | | | 1,663 | |
Redeemed | | | (112,183 | ) | | | (37,585 | ) |
| | | | | | | | |
Change in Class A Shares | | | 521,197 | | | | 73,077 | |
Class B Shares: | | | | | | | | |
Issued | | | 20,791 | | | | 8,300 | |
Issued in conversion | | | 320,692 | | | | — | |
Reinvested | | | 3,358 | | | | 382 | |
Redeemed | | | (83,084 | ) | | | (2,282 | ) |
| | | | | | | | |
Change in Class B Shares | | | 261,757 | | | | 6,400 | |
Class C Shares: | | | | | | | | |
Issued | | | 176 | | | | 265 | |
Issued in conversion | | | 1,265 | | | | — | |
Reinvested | | | 43 | | | | 5 | |
Redeemed | | | (409 | ) | | | (105 | ) |
| | | | | | | | |
Change in Class C Shares | | | 1,075 | | | | 165 | |
Institutional Shares: | | | | | | | | |
Issued | | | 2,167,101 | | | | 802,471 | |
Issued in conversion | | | 2,617,536 | | | | — | |
Reinvested | | | 262,650 | | | | 105,249 | |
Redeemed | | | (1,227,142 | ) | | | (1,887,106 | ) |
Redemption In-Kind | | | (243,605 | ) | | | — | |
| | | | | | | | |
Change in Institutional Shares | | | 3,576,540 | | | | (979,386 | ) |
| | | | | | | | |
Change in Shares | | | 4,360,569 | | | | (899,744 | ) |
| | | | | | | | |
See accompanying notes to the financial statements.
114
| | | | | | | | | | | | | | | | | | | | | | |
International Equity
Fund | | | Special Opportunities Equity
Fund | | | Equity Income
Fund | |
For the
Year Ended
September 30, 2006 | | | For the
Year Ended
September 30, 2005 | | | For the
Year Ended
September 30, 2006 | | | For the
Year Ended
September 30, 2005 | | | For the
Year Ended
September 30, 2006 | | | For the
Year Ended
September 30, 2005 | |
| | | | | | | | | | | | | | | | | | | | | | |
| | | | | | | | | | | | | | | | | | | | | | |
| $ | 1,793,701 | | | $ | 2,478,283 | | | $ | 15,547,406 | | | $ | 50,533,764 | | | $ | 21,290,688 | | | $ | 33,326,261 | |
| | — | | | | — | | | | — | | | | — | | | | — | | | | - | |
| | 47,633 | | | | 28,796 | | | | 3,800,006 | | | | 314,726 | | | | 2,115,087 | | | | 589,988 | |
| | (1,828,946 | ) | | | (837,193 | ) | | | (17,598,570 | ) | | | (12,154,765 | ) | | | (9,336,457 | ) | | | (1,849,819 | ) |
| | | | | | | | | | | | | | | | | | | | | | | |
| | 12,388 | | | | 1,669,886 | | | | 1,748,842 | | | | 38,693,725 | | | | 14,069,318 | | | | 32,066,430 | |
| | | | | | | | | | | | | | | | | | | | | | |
| | 372,771 | | | | 142,997 | | | | 2,567,933 | | | | 7,432,082 | | | | 3,887,798 | | | | 3,572,969 | |
| | — | | | | — | | | | — | | | | — | | | | — | | | | - | |
| | 19,183 | | | | 16,175 | | | | 1,097,183 | | | | 132,617 | | | | 265,635 | | | | 62,723 | |
| | (850,793 | ) | | | (640,348 | ) | | | (3,722,250 | ) | | | (1,625,829 | ) | | | (955,321 | ) | | | (119,544 | ) |
| | | | | | | | | | | | | | | | | | | | | | | |
| | (458,839 | ) | | | (481,176 | ) | | | (57,134 | ) | | | 5,938,870 | | | | 3,198,112 | | | | 3,516,148 | |
| | | | | | | | | | | | | | | | | | | | | | |
| | 170,185 | | | | 88,381 | | | | 5,924,611 | | | | 14,020,481 | | | | 5,773,799 | | | | 6,467,982 | |
| | — | | | | — | | | | — | | | | — | | | | — | | | | - | |
| | 1,343 | | | | 235 | | | | 1,572,304 | | | | 171,895 | | | | 415,183 | | | | 100,048 | |
| | (90,384 | ) | | | (852 | ) | | | (5,037,947 | ) | | | (3,171,753 | ) | | | (1,775,128 | ) | | | (304,640 | ) |
| | | | | | | | | | | | | | | | | | | | | | | |
| | 81,144 | | | | 87,764 | | | | 2,458,968 | | | | 11,020,623 | | | | 4,413,854 | | | | 6,263,390 | |
| | | | | | | | | | | | | | | | | | | | | | |
| | 55,147,602 | | | | 24,998,978 | | | | 9,101,491 | | | | 15,525,894 | | | | 3,565,186 | | | | 5,868,423 | |
| | — | | | | — | | | | — | | | | — | | | | — | | | | - | |
| | 2,544,478 | | | | 2,083,059 | | | | 2,382,335 | | | | 339,818 | | | | 1,338,621 | | | | 688,209 | |
| | (67,705,276 | ) | | | (70,487,002 | ) | | | (8,820,554 | ) | | | (3,215,628 | ) | | | (3,552,093 | ) | | | (1,005,833 | ) |
| | — | | | | — | | | | — | | | | — | | | | — | | | | - | |
| | | | | | | | | | | | | | | | | | | | | | | |
| | (10,013,196 | ) | | | (43,404,965 | ) | | | 2,663,272 | | | | 12,650,084 | | | | 1,351,714 | | | | 5,550,799 | |
| | | | | | | | | | | | | | | | | | | | | | | |
| $ | (10,378,503 | ) | | $ | (42,128,491 | ) | | $ | 6,813,948 | | | $ | 68,303,302 | | | $ | 23,032,998 | | | $ | 47,396,767 | |
| | | | | | | | | | | | | | | | | | | | | | | |
| | | | | | | | | | | | | | | | | | | | | | |
| | | | | | | | | | | | | | | | | | | | | | |
| | 172,056 | | | | 267,274 | | | | 1,018,572 | | | | 3,430,628 | | | | 1,686,364 | | | | 2,869,638 | |
| | — | | | | — | | | | — | | | | — | | | | — | | | | - | |
| | 4,418 | | | | 3,230 | | | | 257,977 | | | | 21,932 | | | | 169,418 | | | | 50,231 | |
| | (181,464 | ) | | | (93,010 | ) | | | (1,151,094 | ) | | | (804,158 | ) | | | (736,138 | ) | | | (156,448 | ) |
| | | | | | | | | | | | | | | | | | | | | | | |
| | (4,990 | ) | | | 177,494 | | | | 125,455 | | | | 2,648,402 | | | | 1,119,644 | | | | 2,763,421 | |
| | | | | | | | | | | | | | | | | | | | | | |
| | 37,241 | | | | 16,667 | | | | 172,046 | | | | 512,930 | | | | 309,059 | | | | 307,803 | |
| | — | | | | — | | | | — | | | | — | | | | — | | | | - | |
| | 1,888 | | | | 1,917 | | | | 76,035 | | | | 9,352 | | | | 21,327 | | | | 5,368 | |
| | (85,845 | ) | | | (74,499 | ) | | | (249,906 | ) | | | (109,982 | ) | | | (75,605 | ) | | | (10,194 | ) |
| | | | | | | | | | | | | | | | | | | | | | | |
| | (46,716 | ) | | | (55,915 | ) | | | (1,825 | ) | | | 412,300 | | | | 254,781 | | | | 302,977 | |
| | | | | | | | | | | | | | | | | | | | | | |
| | 16,883 | | | | 9,933 | | | | 397,055 | | | | 975,534 | | | | 458,843 | | | | 561,000 | |
| | — | | | | — | | | | — | | | | — | | | | — | | | | - | |
| | 131 | | | | 27 | | | | 108,885 | | | | 12,122 | | | | 33,388 | | | | 8,567 | |
| | (9,159 | ) | | | (101 | ) | | | (336,921 | ) | | | (212,218 | ) | | | (141,240 | ) | | | (25,759 | ) |
| | | | | | | | | | | | | | | | | | | | | | | |
| | 7,855 | | | | 9,859 | | | | 169,019 | | | | 775,438 | | | | 350,991 | | | | 543,808 | |
| | | | | | | | | | | | | | | | | | | | | | |
| | 5,126,219 | | | | 2,743,691 | | | | 588,662 | | | | 1,037,730 | | | | 278,895 | | | | 509,983 | |
| | — | | | | — | | | | — | | | | — | | | | — | | | | - | |
| | 232,202 | | | | 231,260 | | | | 160,751 | | | | 23,598 | | | | 107,088 | | | | 59,891 | |
| | (6,367,133 | ) | | | (7,688,123 | ) | | | (577,140 | ) | | | (210,210 | ) | | | (280,919 | ) | | | (83,473 | ) |
| | — | | | | — | | | | — | | | | — | | | | — | | | | - | |
| | | | | | | | | | | | | | | | | | | | | | | |
| | (1,008,712 | ) | | | (4,713,172 | ) | | | 172,273 | | | | 851,118 | | | | 105,064 | | | | 486,401 | |
| | | | | | | | | | | | | | | | | | | | | | | |
| | (1,052,563 | ) | | | (4,581,734 | ) | | | 464,922 | | | | 4,687,258 | | | | 1,830,480 | | | | 4,096,607 | |
| | | | | | | | | | | | | | | | | | | | | | | |
See accompanying notes to the financial statements.
115
BB&T Funds
Statements of Changes in Net Assets, continued
| | | | | | | | |
| | | Short U.S.
Government Fund | |
| | | For the
Year Ended
September 30, 2006 | | | For the Year Ended
September 30, 2005 | |
Capital Transactions: | | | | | | | | |
Class A Shares: | | | | | | | | |
Proceeds from shares issued | | $ | 1,127,528 | | | $ | 1,521,231 | |
Dividends reinvested | | | 166,865 | | | | 200,254 | |
Value of shares redeemed | | | (3,017,691 | ) | | | (2,023,644 | ) |
| | | | | | | | |
Change in net assets from Class A Share transactions | | | (1,723,298 | ) | | | (302,159 | ) |
Class B Shares: | | | | | | | | |
Proceeds from shares issued | | | — | | | | — | |
Dividends reinvested | | | — | | | | — | |
Value of shares redeemed | | | — | | | | — | |
| | | | | | | | |
Change in net assets from Class B share transactions | | | — | | | | — | |
Class C Shares: | | | | | | | | |
Proceeds from shares issued | | | — | | | | — | |
Dividends reinvested | | | — | | | | — | |
Value of shares redeemed | | | — | | | | — | |
| | | | | | | | |
Change in net assets from Class C share transactions | | | — | | | | — | |
Institutional Shares: | | | | | | | | |
Proceeds from shares issued | | | 11,753,484 | | | | 45,135,970 | |
Dividends reinvested | | | 2,059,779 | | | | 2,187,510 | |
Value of shares redeemed | | | (102,568,330 | ) | | | (83,575,378 | ) |
Redemption In-Kind | | | — | | | | — | |
| | | | | | | | |
Change in net assets from Institutional Share transactions | | | (88,755,067 | ) | | | (36,251,898 | ) |
| | | | | | | | |
Change in net assets from capital transactions | | $ | (90,478,365 | ) | | $ | (36,554,057 | ) |
| | | | | | | | |
Share Transactions: | | | | | | | | |
Class A Shares: | | | | | | | | |
Issued | | | 119,357 | | | | 158,795 | |
Reinvested | | | 17,694 | | | | 20,875 | |
Redeemed | | | (319,852 | ) | | | (211,022 | ) |
| | | | | | | | |
Change in Class A Shares | | | (182,801 | ) | | | (31,352 | ) |
Class B Shares: | | | | | | | | |
Issued | | | — | | | | — | |
Reinvested | | | — | | | | — | |
Redeemed | | | — | | | | — | |
| | | | | | | | |
Change in Class B Shares | | | — | | | | — | |
Class C Shares: | | | | | | | | |
Issued | | | — | | | | | |
Reinvested | | | — | | | | — | |
Redeemed | | | — | | | | — | |
| | | | | | | | |
Change in Class C Shares | | | — | | | | — | |
Institutional Shares: | | | | | | | | |
Issued | | | 1,244,012 | | | | 4,698,111 | |
Reinvested | | | 218,187 | | | | 227,789 | |
Redeemed | | | (10,850,633 | ) | | | (8,711,294 | ) |
Redemption In-Kind | | | — | | | | — | |
| | | | | | | | |
Change in Institutional Shares | | | (9,388,434 | ) | | | (3,785,394 | ) |
| | | | | | | | |
Change in Shares | | | (9,571,235 | ) | | | (3,816,746 | ) |
| | | | | | | | |
See accompanying notes to the financial statements.
116
| | | | | | | | | | | | | | | | | | | | | | |
Intermediate U.S.
Government Fund | | | Total Return
Bond Fund | | | Kentucky Intermediate
Tax-Free Fund | |
For the
Year Ended
September 30, 2006 | | | For the
Year Ended
September 30, 2005 | | | For the
Year Ended
September 30, 2006 | | | For the
Year Ended
September 30, 2005 | | | For the
Year Ended
September 30, 2006 | | | For the
Year Ended
September 30, 2005 | |
| | | | | | | | | | | | | | | | | | | | | | |
| | | | | | | | | | | | | | | | | | | | | | |
| $ | 3,393,825 | | | $ | 7,912,637 | | | $ | 1,566,777 | | | $ | 3,553,124 | | | $ | 470,225 | | | $ | 880,498 | |
| | 412,369 | | | | 511,872 | | | | 281,750 | | | | 236,789 | | | | 68,849 | | | | 68,804 | |
| | (7,612,519 | ) | | | (6,364,645 | ) | | | (2,569,535 | ) | | | (1,171,666 | ) | | | (398,856 | ) | | | (1,085,960 | ) |
| | | | | | | | | | | | | | | | | | | | | | | |
| | (3,806,325 | ) | | | 2,059,864 | | | | (721,008 | ) | | | 2,618,247 | | | | 140,218 | | | | (136,658 | ) |
| | | | | | | | | | | | | | | | | | | | | | |
| | 403,411 | | | | 309,161 | | | | 516,135 | | | | 590,741 | | | | — | | | | — | |
| | 151,333 | | | | 204,831 | | | | 200,161 | | | | 232,014 | | | | — | | | | — | |
| | (2,171,972 | ) | | | (1,534,282 | ) | | | (1,878,269 | ) | | | (1,092,541 | ) | | | — | | | | — | |
| | | | | | | | | | | | | | | | | | | | | | | |
| | (1,617,228 | ) | | | (1,020,290 | ) | | | (1,161,973 | ) | | | (269,786 | ) | | | — | | | | — | |
| | | | | | | | | | | | | | | | | | | | | | |
| | 20,199 | | | | 92,895 | | | | 30,094 | | | | 16,713 | | | | — | | | | — | |
| | 5,918 | | | | 13,100 | | | | 6,267 | | | | 8,371 | | | | — | | | | — | |
| | (87,702 | ) | | | (428,764 | ) | | | (133,111 | ) | | | (57,214 | ) | | | — | | | | — | |
| | | | | | | | | | | | | | | | | | | | | | | |
| | (61,585 | ) | | | (322,769 | ) | | | (96,750 | ) | | | (32,130 | ) | | | — | | | | — | |
| | | | | | | | | | | | | | | | | | | | | | |
| | 33,817,098 | | | | 161,477,331 | | | | 212,135,973 | | | | 239,507,286 | | | | 1,710,390 | | | | 7,483,716 | |
| | 11,550,412 | | | | 13,752,797 | | | | 10,881,639 | | | | 7,254,855 | | | | 694 | | | | 1,275 | |
| | (323,713,750 | ) | | | (158,332,454 | ) | | | (117,974,744 | ) | | | (48,556,956 | ) | | | (6,166,394 | ) | | | (5,130,596 | ) |
| | — | | | | — | | | | (192,588,337 | ) | | | — | | | | — | | | | — | |
| | | | | | | | | | | | | | | | | | | | | | | |
| | (278,346,240 | ) | | | 16,897,674 | | | | (87,545,469 | ) | | | 198,205,185 | | | | (4,455,310 | ) | | | 2,354,395 | |
| | | | | | | | | | | | | | | | | | | | | | | |
| $ | (283,831,378 | ) | | $ | 17,614,479 | | | $ | (89,525,200 | ) | | $ | 200,521,516 | | | $ | (4,315,092 | ) | | $ | 2,217,737 | |
| | | | | | | | | | | | | | | | | | | | | | | |
| | | | | | | | | | | | | | | | | | | | | | |
| | | | | | | | | | | | | | | | | | | | | | |
| | 344,880 | | | | 783,801 | | | | 155,247 | | | | 341,242 | | | | 47,360 | | | | 86,656 | |
| | 42,011 | | | | 50,474 | | | | 27,949 | | | | 22,635 | | | | 6,892 | | | | 6,786 | |
| | (773,802 | ) | | | (629,447 | ) | | | (253,889 | ) | | | (112,317 | ) | | | (39,896 | ) | | | (106,990 | ) |
| | | | | | | | | | | | | | | | | | | | | | | |
| | (386,911 | ) | | | 204,828 | | | | (70,693 | ) | | | 251,560 | | | | 14,356 | | | | (13,548 | ) |
| | | | | | | | | | | | | | | | | | | | | | |
| | 41,199 | | | | 30,638 | | | | 51,008 | | | | 56,591 | | | | — | | | | — | |
| | 15,461 | | | | 20,267 | | | | 19,832 | | | | 22,148 | | | | — | | | | — | |
| | (222,404 | ) | | | (151,847 | ) | | | (187,185 | ) | | | (104,808 | ) | | | — | | | | — | |
| | | | | | | | | | | | | | | | | | | | | | | |
| | (165,744 | ) | | | (100,942 | ) | | | (116,345 | ) | | | (26,069 | ) | | | — | | | | — | |
| | | | | | | | | | | | | | | | | | | | | | |
| | 1,788 | | | | 9,176 | | | | 2,989 | | | | 1,598 | | | | — | | | | — | |
| | 604 | | | | 1,296 | | | | 620 | | | | 800 | | | | — | | | | — | |
| | (8,890 | ) | | | (42,455 | ) | | | (13,311 | ) | | | (5,488 | ) | | | — | | | | — | |
| | | | | | | | | | | | | �� | | | | | | | | | | |
| | (6,498 | ) | | | (31,983 | ) | | | (9,702 | ) | | | (3,090 | ) | | | — | | | | — | |
| | | | | | | | | | | | | | | | | | | | | | |
| | 3,429,697 | | | | 15,900,619 | | | | 21,073,955 | | | | 22,968,831 | | | | 172,234 | | | | 739,641 | |
| | 1,174,507 | | | | 1,355,399 | | | | 1,079,488 | | | | 693,599 | | | | 70 | | | | 126 | |
| | (32,878,165 | ) | | | (15,658,921 | ) | | | (11,710,373 | ) | | | (4,652,378 | ) | | | (617,147 | ) | | | (506,921 | ) |
| | — | | | | — | | | | (18,936,906 | ) | | | — | | | | — | | | | — | |
| | | | | | | | | | | | | | | | | | | | | | | |
| | (28,273,961 | ) | | | 1,597,097 | | | | (8,493,836 | ) | | | 19,010,052 | | | | (444,843 | ) | | | 232,846 | |
| | | | | | | | | | | | | | | | | | | | | | | |
| | (28,833,114 | ) | | | 1,669,000 | | | | (8,690,576 | ) | | | 19,232,453 | | | | (430,487 | ) | | | 219,298 | |
| | | | | | | | | | | | | | | | | | | | | | | |
See accompanying notes to the financial statements.
117
BB&T Funds
Statements of Changes in Net Assets, continued | |
| | | | | | | | |
| | | Maryland Intermediate
Tax-Free Fund | |
| | | For the
Year Ended
September 30, 2006 | | | For the
Year Ended
September 30, 2005 | |
Capital Transactions: | | | | | | | | |
Class A Shares: | | | | | | | | |
Proceeds from shares issued | | $ | 521,102 | | | $ | 1,131,881 | |
Dividends reinvested | | | 36,314 | | | | 19,961 | |
Value of shares redeemed | | | (221,862 | ) | | | (196,969 | ) |
| | | | | | | | |
Change in net assets from Class A Share transactions | | | 335,554 | | | | 954,873 | |
Institutional Shares: | | | | | | | | |
Proceeds from shares issued | | | 2,217,996 | | | | 3,481,070 | |
Dividends reinvested | | | — | | | | 28 | |
Value of shares redeemed | | | (4,353,530 | ) | | | (2,383,358 | ) |
| | | | | | | | |
Change in net assets from Institutional Share transactions | | | (2,135,534 | ) | | | 1,097,740 | |
| | | | | | | | |
Change in net assets from capital transactions | | $ | (1,799,980 | ) | | $ | 2,052,613 | |
| | | | | | | | |
Share Transactions: | | | | | | | | |
Class A Shares: | | | | | | | | |
Issued | | | 52,437 | | | | 112,251 | |
Reinvested | | | 3,642 | | | | 1,978 | |
Redeemed | | | (22,268 | ) | | | (19,446 | ) |
| | | | | | | | |
Change in Class A Shares | | | 33,811 | | | | 94,783 | |
Institutional Shares: | | | | | | | | |
Issued | | | 222,409 | | | | 344,202 | |
Reinvested | | | — | | | | 3 | |
Redeemed | | | (437,179 | ) | | | (235,979 | ) |
| | | | | | | | |
Change in Institutional Shares | | | (214,770 | ) | | | 108,226 | |
| | | | | | | | |
Change in Shares | | | (180,959 | ) | | | 203,009 | |
| | | | | | | | |
See accompanying notes to the financial statements.
118
| | | | | | | | | | | | | | | | | | | | | | |
North Carolina Intermediate
Tax-Free Fund | | | South Carolina Intermediate
Tax-Free Fund | | | Virginia Intermediate
Tax-Free Fund | |
For the
Year Ended
September 30, 2006 | | | For the
Year Ended
September 30, 2005 | | | For the
Year Ended
September 30, 2006 | | | For the
Year Ended
September 30, 2005 | | | For the
Year Ended
September 30, 2006 | | | For the
Year Ended
September 30, 2005 | |
| | | | | | | | | | | | | | | | | | | | | | |
| | | | | | | | | | | | | | | | | | | | | | |
| $ | 4,652,606 | | | $ | 7,701,435 | | | $ | 328,384 | | | $ | 567,315 | | | $ | 1,838,786 | | | $ | 3,405,742 | |
| | 705,765 | | | | 639,663 | | | | 183,085 | | | | 139,596 | | | | 250,054 | | | | 217,712 | |
| | (7,591,504 | ) | | | (8,948,526 | ) | | | (505,780 | ) | | | (690,630 | ) | | | (3,235,407 | ) | | | (3,208,442 | ) |
| | | | | | | | | | | | | | | | | | | | | | | |
| | (2,233,133 | ) | | | (607,428 | ) | | | 5,689 | | | | 16,281 | | | | (1,146,567 | ) | | | 415,012 | |
| | | | | | | | | | | | | | | | | | | | | | |
| | 22,919,184 | | | | 31,065,370 | | | | 3,332,757 | | | | 2,267,601 | | | | 14,726,302 | | | | 16,254,714 | |
| | 49,122 | | | | 27,118 | | | | 1,063 | | | | — | | | | 80,896 | | | | 59,445 | |
| | (27,815,851 | ) | | | (32,601,828 | ) | | | (4,084,936 | ) | | | (2,863,089 | ) | | | (16,158,693 | ) | | | (16,122,671 | ) |
| | | | | | | | | | | | | | | | | | | | | | | |
| | (4,847,545 | ) | | | (1,509,340 | ) | | | (751,116 | ) | | | (595,488 | ) | | | (1,351,495 | ) | | | 191,488 | |
| | | | | | | | | | | | | | | | | | | | | | | |
| $ | (7,080,678 | ) | | $ | (2,116,768 | ) | | $ | (745,427 | ) | | $ | (579,207 | ) | | $ | (2,498,062 | ) | | $ | 606,500 | |
| | | | | | | | | | | | | | | | | | | | | | | |
| | | | | | | | | | | | | | | | | | | | | | |
| | | | | | | | | | | | | | | | | | | | | | |
| | 452,100 | | | | 729,383 | | | | 31,839 | | | | 53,567 | | | | 161,944 | | | | 292,826 | |
| | 68,638 | | | | 60,575 | | | | 17,805 | | | | 13,084 | | | | 22,108 | | | | 18,732 | |
| | (740,681 | ) | | | (851,796 | ) | | | (49,587 | ) | | | (64,210 | ) | | | (285,422 | ) | | | (275,812 | ) |
| | | | | | | | | | | | | | | | | | | | | | | |
| | (219,943 | ) | | | (61,838 | ) | | | 57 | | | | 2,441 | | | | (101,370 | ) | | | 35,746 | |
| | | | | | | | | | | | | | | | | | | | | | |
| | 2,225,950 | | | | 2,948,573 | | | | 325,968 | | | | 214,639 | | | | 1,306,843 | | | | 1,400,680 | |
| | 4,779 | | | | 2,576 | | | | 105 | | | | — | | | | 7,154 | | | | 5,117 | |
| | (2,703,831 | ) | | | (3,087,873 | ) | | | (399,095 | ) | | | (270,854 | ) | | | (1,432,134 | ) | | | (1,386,069 | ) |
| | | | | | | | | | | | | | | | | | | | | | | |
| | (473,102 | ) | | | (136,724 | ) | | | (73,022 | ) | | | (56,215 | ) | | | (118,137 | ) | | | 19,728 | |
| | | | | | | | | | | | | | | | | | | | | | | |
| | (693,045 | ) | | | (198,562 | ) | | | (72,965 | ) | | | (53,774 | ) | | | (219,507 | ) | | | 55,474 | |
| | | | | | | | | | | | | | | | | | | | | | | |
See accompanying notes to the financial statements.
119
BB&T Funds
Statements of Changes in Net Assets, continued | |
| | | | | | | | |
| | | West Virginia Intermediate
Tax-Free Fund | |
| | | For the
Year Ended
September 30, 2006 | | | For the
Year Ended
September 30, 2005 | |
Capital Transactions: | | | | | | | | |
Class A Shares: | | | | | | | | |
Proceeds from shares issued | | $ | 3,071,322 | | | $ | 4,029,274 | |
Dividends reinvested | | | 461,980 | | | | 382,174 | |
Value of shares redeemed | | | (1,595,339 | ) | | | (1,048,404 | ) |
| | | | | | | | |
Change in net assets from Class A Share transactions | | | 1,937,963 | | | | 3,363,044 | |
Class B Shares: | | | | | | | | |
Proceeds from shares issued | | | — | | | | — | |
Dividends reinvested | | | — | | | | — | |
Value of shares redeemed | | | — | | | | — | |
| | | | | | | | |
Change in net assets from Class B Share transactions | | | — | | | | — | |
Class C Shares: | | | | | | | | |
Proceeds from shares issued | | | — | | | | — | |
Dividends reinvested | | | — | | | | — | |
Value of shares redeemed | | | — | | | | — | |
| | | | | | | | |
Change in net assets from Class C Share transactions | | | — | | | | — | |
Institutional Shares: | | | | | | | | |
Proceeds from shares issued | | | 9,179,142 | | | | 7,786,086 | |
Dividends reinvested | | | 6,188 | | | | 1,049 | |
Value of shares redeemed | | | (13,543,394 | ) | | | (14,269,027 | ) |
| | | | | | | | |
Change in net assets from Institutional Share transactions | | | (4,358,064 | ) | | | (6,481,892 | ) |
| | | | | | | | |
Change in net assets from capital transactions | | $ | (2,420,101 | ) | | $ | (3,118,848 | ) |
| | | | | | | | |
Share Transactions: | | | | | | | | |
Class A Shares: | | | | | | | | |
Issued | | | 315,965 | | | | 405,774 | |
Reinvested | | | 47,574 | | | | 38,436 | |
Redeemed | | | (164,690 | ) | | | (105,279 | ) |
| | | | | | | | |
Change in Class A Shares | | | 198,849 | | | | 338,931 | |
Class B Shares: | | | | | | | | |
Issued | | | — | | | | — | |
Reinvested | | | — | | | | — | |
Redeemed | | | — | | | | — | |
| | | | | | | | |
Change in Class B Shares | | | — | | | | — | |
Class C Shares: | | | | | | | | |
Issued | | | — | | | | — | |
Reinvested | | | — | | | | — | |
Redeemed | | | — | | | | — | |
| | | | | | | | |
Change in Class C Shares | | | — | | | | — | |
Institutional Shares: | | | | | | | | |
Issued | | | 944,140 | | | | 783,915 | |
Reinvested | | | 637 | | | | 105 | |
Redeemed | | | (1,394,252 | ) | | | (1,436,248 | ) |
| | | | | | | | |
Change in Institutional Shares | | | (449,475 | ) | | | (652,228 | ) |
| | | | | | | | |
Change in Shares | | | (250,626 | ) | | | (313,297 | ) |
| | | | | | | | |
| (a) | Period from commencement of operations. |
See accompanying notes to the financial statements.
120
| | | | | | | | | | | | | | | | | | |
Prime Money
Market Fund | | | U.S. Treasury Money
Market Fund | | | National Tax-Free Money
Market Fund | |
For the
Year Ended
September 30, 2006 | | | For the
Year Ended
September 30, 2005 | | | For the
Year Ended
September 30, 2006 | | | For the
Year Ended
September 30, 2005 | | | For the Period
August 1, 2006
Through
September 30, 2006 (a) | |
| | | | | | | | | | | | | | | | | | |
| | | | | | | | | | | | | | | | | | |
| $ | 877,547,136 | | | $ | 653,088,826 | | | $ | 209,931,673 | | | $ | 122,382,575 | | | $ | 1,000 | |
| | 21,227,737 | | | | 9,671,407 | | | | 4,583,261 | | | | 2,116,647 | | | | 5 | |
| | (755,729,498 | ) | | | (595,695,608 | ) | | | (160,875,549 | ) | | | (132,739,325 | ) | | | — | |
| | | | | | | | | | | | | | | | | | | |
| | 143,045,375 | | | | 67,064,625 | | | | 53,639,385 | | | | (8,240,103 | ) | | | 1,005 | |
| | | | | | | | | | | | | | | | | | |
| | 1,712,243 | | | | 461,617 | | | | 200,191 | | | | 313,580 | | | | 1,000 | |
| | 54,133 | | | | 26,539 | | | | 15,977 | | | | 7,886 | | | | 4 | |
| | (1,300,846 | ) | | | (977,892 | ) | | | (642,930 | ) | | | (401,098 | ) | | | — | |
| | | | | | | | | | | | | | | | | | | |
| | 465,530 | | | | (489,736 | ) | | | (426,762 | ) | | | (79,632 | ) | | | 1,004 | |
| | | | | | | | | | | | | | | | | | |
| | 598,347 | | | | 93,694 | | | | 49,093 | | | | 32,427 | | | | 1,000 | |
| | 14,032 | | | | 4,767 | | | | 923 | | | | 111 | | | | 4 | |
| | (545,083 | ) | | | (225,799 | ) | | | (32,524 | ) | | | — | | | | — | |
| | | | | | | | | | | | | | | | | | | |
| | 67,296 | | | | (127,338 | ) | | | 17,492 | | | | 32,538 | | | | 1,004 | |
| | | | | | | | | | | | | | | | | | |
| | 1,603,996,022 | | | | 1,062,641,967 | | | | 992,710,421 | | | | 850,340,038 | | | | 126,414,787 | |
| | 3,220,388 | | | | 1,490,626 | | | | 6,433,545 | | | | 3,639,835 | | | | 5 | |
| | (1,386,537,416 | ) | | | (1,083,040,861 | ) | | | (1,110,395,351 | ) | | | (1,187,406,453 | ) | | | (30,657,300 | ) |
| | | | | | | | | | | | | | | | | | | |
| | 220,678,994 | | | | (18,908,268 | ) | | | (111,251,385 | ) | | | (333,426,580 | ) | | | 95,757,492 | |
| | | | | | | | | | | | | | | | | | | |
| $ | 364,257,195 | | | $ | 47,539,283 | | | $ | (58,021,270 | ) | | $ | (341,713,777 | ) | | $ | 95,760,505 | |
| | | | | | | | | | | | | | | | | | | |
| | | | | | | | | | | | | | | | | | |
| | | | | | | | | | | | | | | | | | |
| | 877,547,136 | | | | 653,088,826 | | | | 209,931,673 | | | | 122,382,575 | | | | 1,000 | |
| | 21,227,737 | | | | 9,671,407 | | | | 4,583,261 | | | | 2,116,647 | | | | 5 | |
| | (755,729,498 | ) | | | (595,695,608 | ) | | | (160,875,549 | ) | | | (132,739,325 | ) | | | — | |
| | | | | | | | | | | | | | | | | | | |
| | 143,045,375 | | | | 67,064,625 | | | | 53,639,385 | | | | (8,240,103 | ) | | | 1,005 | |
| | | | | | | | | | | | | | | | | | |
| | 1,712,243 | | | | 461,617 | | | | 200,191 | | | | 313,580 | | | | 1,000 | |
| | 54,133 | | | | 26,539 | | | | 15,977 | | | | 7,886 | | | | 4 | |
| | (1,300,846 | ) | | | (977,892 | ) | | | (642,930 | ) | | | (401,098 | ) | | | — | |
| | | | | | | | | | | | | | | | | | | |
| | 465,530 | | | | (489,736 | ) | | | (426,762 | ) | | | (79,632 | ) | | | 1,004 | |
| | | | | | | | | | | | | | | | | | |
| | 598,347 | | | | 93,694 | | | | 49,093 | | | | 32,427 | | | | 1,000 | |
| | 14,032 | | | | 4,767 | | | | 923 | | | | 111 | | | | 4 | |
| | (545,083 | ) | | | (225,799 | ) | | | (32,524 | ) | | | — | | | | — | |
| | | | | | | | | | | | | | | | | | | |
| | 67,296 | | | | (127,338 | ) | | | 17,492 | | | | 32,538 | | | | 1,004 | |
| | | | | | | | | | | | | | | | | | |
| | 1,603,996,022 | | | | 1,062,641,967 | | | | 992,710,421 | | | | 850,340,038 | | | | 126,414,787 | |
| | 3,220,388 | | | | 1,490,626 | | | | 6,433,545 | | | | 3,639,835 | | | | 5 | |
| | (1,386,537,416 | ) | | | (1,083,040,861 | ) | | | (1,110,395,351 | ) | | | (1,187,406,453 | ) | | | (30,657,300 | ) |
| | | | | | | | | | | | | | | | | | | |
| | 220,678,994 | | | | (18,908,268 | ) | | | (111,251,385 | ) | | | (333,426,580 | ) | | | 95,757,492 | |
| | | | | | | | | | | | | | | | | | | |
| | 364,257,195 | | | | 47,539,283 | | | | (58,021,270 | ) | | | (341,713,777 | ) | | | 95,760,505 | |
| | | | | | | | | | | | | | | | | | | |
See accompanying notes to the financial statements.
121
BB&T Funds
Statements of Changes in Net Assets, continued | |
| | | | | | | | |
| | | Capital Manager Conservative Growth Fund | |
| | | For the
Year Ended
September 30, 2006 | | | For the
Year Ended
September 30, 2005 | |
Capital Transactions: | | | | | | | | |
Class A Shares: | | | | | | | | |
Proceeds from shares issued | | $ | 2,894,718 | | | $ | 4,545,111 | |
Dividends reinvested | | | 299,243 | | | | 174,477 | |
Value of shares redeemed | | | (2,683,350 | ) | | | (1,604,470 | ) |
| | | | | | | | |
Change in net assets from Class A Share transactions | | | 510,611 | | | | 3,115,118 | |
Class B Shares: | | | | | | | | |
Proceeds from shares issued | | | 889,140 | | | | 837,278 | |
Dividends reinvested | | | 127,595 | | | | 83,612 | |
Value of shares redeemed | | | (1,145,079 | ) | | | (1,025,899 | ) |
| | | | | | | | |
Change in net assets from Class B Share transactions | | | (128,344 | ) | | | (105,009 | ) |
Class C Shares: | | | | | | | | |
Proceeds from shares issued | | | 1,495 | | | | 4,097 | |
Dividends reinvested | | | 3,332 | | | | 2,873 | |
Value of shares redeemed | | | (36,001 | ) | | | (40,020 | ) |
| | | | | | | | |
Change in net assets from Class C Share transactions | | | (31,174 | ) | | | (33,050 | ) |
Institutional Shares: | | | | | | | | |
Proceeds from shares issued | | | 5,104,480 | | | | 7,174,505 | |
Dividends reinvested | | | 2,277,160 | | | | 2,031,356 | |
Value of shares redeemed | | | (8,511,559 | ) | | | (8,698,693 | ) |
Redemption-In-Kind | | | (24,907,733 | ) | | | — | |
| | | | | | | | |
Change in net assets from Institutional Share transactions | | | (26,037,652 | ) | | | 507,168 | |
| | | | | | | | |
Change in net assets from capital transactions | | $ | (25,686,559 | ) | | $ | 3,484,227 | |
| | | | | | | | |
Share Transactions: | | | | | | | | |
Class A Shares: | | | | | | | | |
Issued | | | 296,643 | | | | 471,031 | |
Reinvested | | | 30,431 | | | | 18,128 | |
Redeemed | | | (273,031 | ) | | | (166,711 | ) |
| | | | | | | | |
Change in Class A Shares | | | 54,043 | | | | 322,448 | |
Class B Shares: | | | | | | | | |
Issued | | | 90,828 | | | | 87,018 | |
Reinvested | | | 12,972 | | | | 8,692 | |
Redeemed | | | (116,632 | ) | | | (106,529 | ) |
| | | | | | | | |
Change in Class B Shares | | | (12,832 | ) | | | (10,819 | ) |
Class C Shares: | | | | | | | | |
Issued | | | 152 | | | | 425 | |
Reinvested | | | 340 | | | | 300 | |
Redeemed | | | (3,693 | ) | | | (4,189 | ) |
| | | | | | | | |
Change in Class C Shares | | | (3,201 | ) | | | (3,464 | ) |
Institutional Shares: | | | | | | | | |
Issued | | | 513,254 | | | | 738,450 | |
Reinvested | | | 230,153 | | | | 209,918 | |
Redeemed | | | (861,524 | ) | | | (898,329 | ) |
Redemption-In-Kind | | | (2,498,268 | ) | | | — | |
| | | | | | | | |
Change in Institutional Shares | | | (2,616,385 | ) | | | 50,039 | |
| | | | | | | | |
Change in Shares | | | (2,578,375 | ) | | | 358,204 | |
| | | | | | | | |
| (a) | Period from commencement of operations. |
See accompanying notes to the financial statements.
122
| | | | | | | | | | | | | | | | | | | | | | |
Capital Manager Moderate Growth Fund | | | Capital Manager Growth Fund | | | Capital Manager Equity Fund | |
For the
Year Ended
September 30, 2006 | | | For the
Year Ended
September 30, 2005 | | | For the
Year Ended
September 30, 2006 | | | For the
Year Ended
September 30, 2005 | | | For the
Year Ended
September 30, 2006 | | | For the
Year Ended
September 30, 2005 | |
| | | | | | | | | | | | | | | | | | | | | | |
| | | | | | | | | | | | | | | | | | | | | | |
| $ | 8,370,745 | | | $ | 10,050,273 | | | $ | 7,362,741 | | | $ | 6,209,050 | | | $ | 2,384,353 | | | $ | 2,993,886 | |
| | 799,802 | | | | 432,713 | | | | 429,052 | | | | 174,631 | | | | 210,775 | | | | 29,192 | |
| | (5,935,951 | ) | | | (3,962,369 | ) | | | (3,318,572 | ) | | | (2,661,745 | ) | | | (1,401,220 | ) | | | (1,002,205 | ) |
| | | | | | | | | | | | | | | | | | | | | | | |
| | 3,234,596 | | | | 6,520,617 | | | | 4,473,221 | | | | 3,721,936 | | | | 1,193,908 | | | | 2,020,873 | |
| | | | | | | | | | | | | | | | | | | | | | |
| | 3,181,245 | | | | 4,133,083 | | | | 3,406,232 | | | | 4,047,594 | | | | 1,133,885 | | | | 1,701,167 | |
| | 401,790 | | | | 179,010 | | | | 264,038 | | | | 65,614 | | | | 211,435 | | | | 6,959 | |
| | (4,769,211 | ) | | | (3,138,147 | ) | | | (2,440,432 | ) | | | (2,300,772 | ) | | | (1,260,549 | ) | | | (773,587 | ) |
| | | | | | | | | | | | | | | | | | | | | | | |
| | (1,186,176 | ) | | | 1,173,946 | | | | 1,229,838 | | | | 1,812,436 | | | | 84,771 | | | | 934,539 | |
| | | | | | | | | | | | | | | | | | | | | | |
| | 24,138 | | | | 46,923 | | | | 22,379 | | | | 4,603 | | | | 5,438 | | | | 301 | |
| | 2,447 | | | | 1,384 | | | | 879 | | | | 137 | | | | 509 | | | | 1 | |
| | (14,889 | ) | | | (118,189 | ) | | | (1,305 | ) | | | (36,901 | ) | | | (15,439 | ) | | | (74,313 | ) |
| | | | | | | | | | | | | | | | | | | | | | | |
| | 11,696 | | | | (69,882 | ) | | | 21,953 | | | | (32,161 | ) | | | (9,492 | ) | | | (74,011 | ) |
| | | | | | | | | | | | | | | | | | | | | | |
| | 7,818,183 | | | | 8,257,339 | | | | 7,034,663 | | | | 7,167,157 | | | | 6,871,867 | | | | 4,088,655 | |
| | 1,126,897 | | | | 799,904 | | | | 830,721 | | | | 505,600 | | | | 925,609 | | | | 198,724 | |
| | (3,589,079 | ) | | | (2,815,243 | ) | | | (2,757,951 | ) | | | (2,241,429 | ) | | | (1,950,722 | ) | | | (2,624,499 | ) |
| | (24,751,203 | ) | | | — | | | | (24,289,586 | ) | | | — | | | | (17,939,344 | ) | | | — | |
| | | | | | | | | | | | | | | | | | | | | | | |
| | (19,395,202 | ) | | | 6,242,000 | | | | (19,182,153 | ) | | | 5,431,328 | | | | (12,092,590 | ) | | | 1,662,880 | |
| | | | | | | | | | | | | | | | | | | | | | | |
| $ | (17,335,086 | ) | | $ | 13,866,681 | | | $ | (13,457,141 | ) | | $ | 10,933,539 | | | $ | (10,823,403 | ) | | $ | 4,544,281 | |
| | | | | | | | | | | | | | | | | | | | | | | |
| | | | | | | | | | | | | | | | | | | | | | |
| | | | | | | | | | | | | | | | | | | | | | |
| | 839,102 | | | | 1,053,979 | | | | 739,695 | | | | 666,388 | | | | 211,575 | | | | 286,202 | |
| | 79,930 | | | | 45,275 | | | | 43,090 | | | | 18,603 | | | | 18,983 | | | | 2,805 | |
| | (594,781 | ) | | | (415,364 | ) | | | (332,216 | ) | | | (286,259 | ) | | | (124,422 | ) | | | (95,524 | ) |
| | | | | | | | | | | | | | | | | | | | | | | |
| | 324,251 | | | | 683,890 | | | | 450,569 | | | | 398,732 | | | | 106,136 | | | | 193,483 | |
| | | | | | | | | | | | | | | | | | | | | | |
| | 324,054 | | | | 441,141 | | | | 347,785 | | | | 442,110 | | | | 103,854 | | | | 169,091 | |
| | 40,900 | | | | 18,957 | | | | 27,107 | | | | 7,100 | | | | 19,679 | | | | 680 | |
| | (487,690 | ) | | | (335,050 | ) | | | (249,120 | ) | | | (252,552 | ) | | | (115,637 | ) | | | (76,268 | ) |
| | | | | | | | | | | | | | | | | | | | | | | |
| | (122,736 | ) | | | 125,048 | | | | 125,772 | | | | 196,658 | | | | 7,896 | | | | 93,503 | |
| | | | | | | | | | | | | | | | | | | | | | |
| | 2,457 | | | | 4,988 | | | | 2,312 | | | | 499 | | | | 504 | | | | 30 | |
| | 248 | | | | 146 | | | | 90 | | | | 14 | | | | 48 | | | | — | |
| | (1,507 | ) | | | (12,517 | ) | | | (134 | ) | | | (4,068 | ) | | | (1,388 | ) | | | (7,356 | ) |
| | | | | | | | | | | | | | | | | | | | | | | |
| | 1,198 | | | | (7,383 | ) | | | 2,268 | | | | (3,555 | ) | | | (836 | ) | | | (7,326 | ) |
| | | | | | | | | | | | | | | | | | | | | | |
| | 775,206 | | | | 862,088 | | | | 703,458 | | | | 768,886 | | | | 603,581 | | | | 389,867 | |
| | 112,593 | | | | 83,518 | | | | 83,724 | | | | 53,932 | | | | 82,964 | | | | 18,948 | |
| | (357,251 | ) | | | (293,469 | ) | | | (278,118 | ) | | | (239,476 | ) | | | (175,325 | ) | | | (250,678 | ) |
| | (2,436,142 | ) | | | — | | | | (2,407,293 | ) | | | — | | | | (1,579,166 | ) | | | — | |
| | | | | | | | | | | | | | | | | | | | | | | |
| | (1,905,594 | ) | | | 652,137 | | | | (1,898,229 | ) | | | 583,342 | | | | (1,067,946 | ) | | | 158,137 | |
| | | | | | | | | | | | | | | | | | | | | | | |
| | (1,702,881 | ) | | | 1,453,692 | | | | (1,319,620 | ) | | | 1,175,177 | | | | (954,750 | ) | | | 437,797 | |
| | | | | | | | | | | | | | | | | | | | | | | |
See accompanying notes to the financial statements.
123
BB&T Funds
Financial Highlights, Class A Shares
Selected data for a share of beneficial interest outstanding throughout the periods indicated.
| | | | | | | | | | | | | | | | | | | | | |
| | | | | Investment Activities | | | Dividends | |
| | | Net Asset
Value,
Beginning
of Period | | Net
investment
income
(loss) | | | Net realized/
unrealized
gains (losses)
on investments
and foreign
currency
transactions | | | Total from
Investment
Activities | | | Net
investment
income | | | Net realized
gains on
investments
and foreign
currency
transactions | | | Total
Dividends | |
Large Cap Fund | | | | | | | | | | | | | | | | | | | | | |
Year Ended September 30, 2006 | | $ | 19.47 | | 0.30 | (b) | | 2.30 | | | 2.60 | | | (0.30 | ) | | (1.44 | ) | | (1.74 | ) |
Year Ended September 30, 2005 | | $ | 17.26 | | 0.28 | | | 2.22 | | | 2.50 | | | (0.29 | ) | | — | | | (0.29 | ) |
Year Ended September 30, 2004 | | $ | 14.87 | | 0.23 | | | 2.38 | | | 2.61 | | | (0.22 | ) | | — | | | (0.22 | ) |
Year Ended September 30, 2003 | | $ | 12.84 | | 0.23 | | | 2.03 | | | 2.26 | | | (0.23 | ) | | — | | | (0.23 | ) |
Year Ended September 30, 2002 | | $ | 16.79 | | 0.18 | | | (3.47 | ) | | (3.29 | ) | | (0.18 | ) | | (0.48 | ) | | (0.66 | ) |
Large Cap Growth Fund | | | | | | | | | | | | | | | | | | | | | |
Year Ended September 30, 2006 | | $ | 8.97 | | 0.02 | (b) | | (0.05 | ) | | (0.03 | ) | | (0.01 | ) | | — | | | (0.01 | ) |
Year Ended September 30, 2005 | | $ | 8.22 | | 0.02 | (b) | | 0.77 | | | 0.79 | | | (0.04 | ) | | — | | | (0.04 | ) |
Year Ended September 30, 2004 | | $ | 7.69 | | (0.01 | ) | | 0.54 | | | 0.53 | | | — | | | — | | | — | |
Year Ended September 30, 2003 | | $ | 6.60 | | (0.02 | ) | | 1.11 | | | 1.09 | | | — | | | — | | | — | |
Year Ended September 30, 2002 | | $ | 8.16 | | (0.06 | ) | | (1.50 | ) | | (1.56 | ) | | — | | | — | | | — | |
Mid Cap Value Fund | | | | | | | | | | | | | | | | | | | | | |
Year Ended September 30, 2006 | | $ | 13.35 | | 0.03 | (b) | | 1.60 | | | 1.63 | | | (0.04 | ) | | (1.45 | ) | | (1.49 | ) |
Year Ended September 30, 2005 | | $ | 15.40 | | 0.13 | (b) | | 3.04 | | | 3.17 | | | (0.13 | ) | | (5.09 | ) | | (5.22 | ) |
Year Ended September 30, 2004 | | $ | 12.98 | | 0.18 | (b) | | 2.42 | | | 2.60 | | | (0.18 | ) | | — | | | (0.18 | ) |
Year Ended September 30, 2003 | | $ | 10.93 | | 0.16 | (b) | | 2.04 | | | 2.20 | | | (0.15 | ) | | — | | | (0.15 | ) |
Year Ended September 30, 2002 | | $ | 13.12 | | 0.17 | (b) | | (1.04 | ) | | (0.87 | ) | | (0.17 | ) | | (1.15 | ) | | (1.32 | ) |
Mid Cap Growth Fund | | | | | | | | | | | | | | | | | | | | | |
Year Ended September 30, 2006 | | $ | 13.90 | | (0.01 | )(b) | | — | (c) | | (0.01 | ) | | (0.02 | ) | | (1.42 | ) | | (1.44 | ) |
Year Ended September 30, 2005 | | $ | 10.95 | | (0.09 | )(b) | | 3.18 | | | 3.09 | | | — | | | (0.14 | ) | | (0.14 | ) |
Year Ended September 30, 2004 | | $ | 9.84 | | (0.08 | ) | | 1.19 | | | 1.11 | | | — | | | — | | | — | |
Year Ended September 30, 2003 | | $ | 8.07 | | (0.09 | ) | | 1.86 | | | 1.77 | | | — | | | — | | | — | |
Year Ended September 30, 2002 | | $ | 9.80 | | (0.08 | ) | | (1.02 | ) | | (1.10 | ) | | — | | | (0.63 | ) | | (0.63 | ) |
Small Cap Fund | | | | | | | | | | | | | | | | | | | | | |
Year Ended September 30, 2006 | | $ | 16.38 | | — | (b)(c) | | 1.06 | | | 1.06 | | | (0.03 | ) | | (2.30 | ) | | (2.33 | ) |
Year Ended September 30, 2005 | | $ | 14.21 | | 0.11 | (b) | | 2.62 | | | 2.73 | | | (0.14 | ) | | (0.42 | ) | | (0.56 | ) |
Year Ended September 30, 2004 | | $ | 11.44 | | — | (b)(c) | | 2.90 | | | 2.90 | | | (0.01 | ) | | (0.12 | ) | | (0.13 | ) |
May 19, 2003 to September 30, 2003 (a) | | $ | 10.00 | | 0.01 | (b) | | 1.43 | | | 1.44 | | | — | (c) | | — | | | — | (c) |
International Equity Fund | | | | | | | | | | | | | | | | | | | | | |
Year Ended September 30, 2006 | | $ | 9.58 | | 0.14 | (b) | | 1.49 | | | 1.63 | | | (0.15 | ) | | — | | | (0.15 | ) |
Year Ended September 30, 2005 | | $ | 8.12 | | 0.10 | (b) | | 1.47 | | | 1.57 | | | (0.11 | ) | | — | | | (0.11 | ) |
Year Ended September 30, 2004 | | $ | 6.88 | | 0.07 | (b) | | 1.25 | | | 1.32 | | | (0.08 | ) | | — | | | (0.08 | ) |
Year Ended September 30, 2003 | | $ | 6.31 | | 0.06 | (b) | | 0.54 | | | 0.60 | | | (0.03 | ) | | — | | | (0.03 | ) |
Year Ended September 30, 2002 | | $ | 7.43 | | (0.02 | )(b) | | (1.10 | ) | | (1.12 | ) | | — | | | — | | | — | |
Special Opportunities Equity Fund | | | | | | | | | | | | | | | | | | | | | |
Year Ended September 30, 2006 | | $ | 15.57 | | (0.04 | ) | | 1.69 | | | 1.65 | | | — | | | (0.79 | ) | | (0.79 | ) |
Year Ended September 30, 2005 | | $ | 13.08 | | (0.07 | ) | | 2.68 | | | 2.61 | | | — | | | (0.12 | ) | | (0.12 | ) |
Year Ended September 30, 2004 | | $ | 10.53 | | (0.06 | ) | | 2.69 | | | 2.63 | | | — | | | (0.08 | ) | | (0.08 | ) |
June 2, 2003 to September 30, 2003 (a) | | $ | 10.00 | | (0.01 | ) | | 0.54 | | | 0.53 | | | — | | | — | | | — | |
Equity Income Fund | | | | | | | | | | | | | | | | | | | | | |
Year Ended September 30, 2006 | | $ | 12.09 | | 0.28 | | | 1.58 | | | 1.86 | | | (0.32 | ) | | (0.27 | ) | | (0.59 | ) |
Year Ended September 30, 2005 | | $ | 10.35 | | 0.24 | | | 1.77 | | | 2.01 | | | (0.25 | ) | | (0.02 | ) | | (0.27 | ) |
June 30, 2004 to September 30, 2004 (a) | | $ | 10.00 | | 0.05 | (b) | | 0.34 | | | 0.39 | | | (0.04 | ) | | — | | | (0.04 | ) |
| * | During the period certain fees were reduced. If such reductions had not occurred, the ratios would have been as indicated. |
| ** | Portfolio turnover rate is calculated on the basis of the Fund as a whole without distinguishing between classes of shares issued. |
| (a) | Period from commencement of operations. |
| (b) | Per share net investment income (loss) has been calculated using the average daily shares method. |
| (c) | Amount is less than $0.005. |
| (d) | Not annualized for periods less than one year. |
| (e) | Annualized for periods less than one year. |
See accompanying notes to the financial statements.
124
| | | | | | | | | | | | | | | | | | | |
| | | | | | Ratios/Supplementary Data | |
Net Asset
Value,
End of
Period | | Total
Return
(excludes
sales charge) (d) | | | Net Assets,
End of
Period
(000) | | Ratio of
net expenses
to average
net assets (e) | | | Ratio of net
investment
income
(loss) to
average net
assets (e) | | | Ratio of
expenses to
average
net assets* (e) | | | Portfolio
turnover rate** | |
| | | | | | | | | | | | | | | | | | | |
| $ | 20.33 | | 14.29 | % | | $ | 48,656 | | 1.14 | % | | 1.53 | % | | 1.43 | % | | 34.83 | % |
| $ | 19.47 | | 14.60 | % | | $ | 39,756 | | 1.14 | % | | 1.56 | % | | 1.48 | % | | 19.50 | % |
| $ | 17.26 | | 17.61 | % | | $ | 31,783 | | 1.20 | % | | 1.32 | % | | 1.56 | % | | 16.40 | % |
| $ | 14.87 | | 17.73 | % | | $ | 25,397 | | 1.17 | % | | 1.67 | % | | 1.55 | % | | 18.89 | % |
| $ | 12.84 | | (20.57 | )% | | $ | 22,222 | | 1.23 | % | | 1.11 | % | | 1.62 | % | | 23.02 | % |
| | | | | | | | | | | | | | | | | | | |
| $ | 8.93 | | (0.31 | )% | | $ | 9,446 | | 1.13 | % | | 0.19 | % | | 1.43 | % | | 186.19 | % |
| $ | 8.97 | | 9.62 | % | | $ | 9,116 | | 1.14 | % | | 0.38 | % | | 1.49 | % | | 62.78 | % |
| $ | 8.22 | | 6.89 | % | | $ | 8,784 | | 1.22 | % | | (0.33 | )% | | 1.58 | % | | 127.47 | % |
| $ | 7.69 | | 16.52 | % | | $ | 7,042 | | 1.18 | % | | (0.35 | )% | | 1.57 | % | | 91.73 | % |
| $ | 6.60 | | (19.12 | )% | | $ | 6,240 | | 1.28 | % | | (0.57 | )% | | 1.67 | % | | 100.46 | % |
| | | | | | | | | | | | | | | | | | | |
| $ | 13.49 | | 13.18 | % | | $ | 13,393 | | 1.13 | % | | 0.23 | % | | 1.18 | % | | 53.92 | % |
| $ | 13.35 | | 20.82 | % | | $ | 12,361 | | 1.15 | % | | 0.76 | % | | 1.25 | % | | 126.99 | % |
| $ | 15.40 | | 20.10 | % | | $ | 9,423 | | 1.23 | % | | 1.22 | % | | 1.35 | % | | 19.17 | % |
| $ | 12.98 | | 20.31 | % | | $ | 6,841 | | 1.20 | % | | 1.33 | % | | 1.35 | % | | 18.28 | % |
| $ | 10.93 | | (8.24 | )% | | $ | 5,070 | | 1.15 | % | | 1.29 | % | | 1.38 | % | | 18.20 | % |
| | | | | | | | | | | | | | | | | | | |
| $ | 12.45 | | (0.49 | )% | | $ | 10,381 | | 1.14 | % | | (0.07 | )% | | 1.19 | % | | 140.90 | % |
| $ | 13.90 | | 28.45 | % | | $ | 10,444 | | 1.14 | % | | (0.71 | )% | | 1.26 | % | | 92.74 | % |
| $ | 10.95 | | 11.28 | % | | $ | 8,079 | | 1.25 | % | | (0.90 | )% | | 1.36 | % | | 138.61 | % |
| $ | 9.84 | | 21.93 | % | | $ | 6,486 | | 1.19 | % | | (0.96 | )% | | 1.36 | % | | 125.97 | % |
| $ | 8.07 | | (12.54 | )% | | $ | 5,533 | | 1.17 | % | | (0.88 | )% | | 1.44 | % | | 117.06 | % |
| | | | | | | | | | | | | | | | | | | |
| $ | 15.11 | | 6.96 | % | | $ | 9,353 | | 1.28 | % | | (0.03 | )% | | 1.77 | % | | 43.25 | % |
| $ | 16.38 | | 19.64 | % | | $ | 1,604 | | 1.29 | % | | 0.69 | % | | 1.77 | % | | 8.39 | % |
| $ | 14.21 | | 25.53 | % | | $ | 353 | | 1.48 | % | | (0.03 | )% | | 1.91 | % | | 11.25 | % |
| $ | 11.44 | | 14.43 | % | | $ | 112 | | 2.04 | % | | 0.35 | % | | 2.29 | % | | 48.84 | % |
| | | | | | | | | | | | | | | | | | | |
| $ | 11.06 | | 17.04 | % | | $ | 4,202 | | 1.40 | % | | 1.37 | % | | 1.75 | % | | 36.22 | % |
| $ | 9.58 | | 19.46 | % | | $ | 3,687 | | 1.46 | % | | 1.15 | % | | 1.83 | % | | 44.96 | % |
| $ | 8.12 | | 19.25 | % | | $ | 1,686 | | 1.58 | % | | 0.91 | % | | 1.92 | % | | 50.68 | % |
| $ | 6.88 | | 9.58 | % | | $ | 2,162 | | 1.63 | % | | 0.95 | % | | 1.90 | % | | 199.78 | % |
| $ | 6.31 | | (15.07 | )% | | $ | 1,412 | | 1.68 | % | | (0.24 | )% | | 1.93 | % | | 95.86 | % |
| | | | | | | | | | | | | | | | | | | |
| $ | 16.43 | | 11.16 | % | | $ | 81,883 | | 1.28 | % | | (0.26 | )% | | 1.53 | % | | 58.01 | % |
| $ | 15.57 | | 20.05 | % | | $ | 75,627 | | 1.30 | % | | (0.41 | )% | | 1.57 | % | | 30.38 | % |
| $ | 13.08 | | 25.06 | % | | $ | 28,903 | | 1.42 | % | | (0.77 | )% | | 1.80 | % | | 32.06 | % |
| $ | 10.53 | | 5.30 | % | | $ | 5,460 | | 1.06 | % | | (0.42 | )% | | 2.02 | % | | 13.24 | % |
| | | | | | | | | | | | | | | | | | | |
| $ | 13.36 | | 15.79 | % | | $ | 60,059 | | 1.20 | % | | 2.28 | % | | 1.45 | % | | 45.38 | % |
| $ | 12.09 | | 19.55 | % | | $ | 40,825 | | 1.10 | % | | 2.57 | % | | 1.57 | % | | 39.65 | % |
| $ | 10.35 | | 3.89 | % | | $ | 6,342 | | 1.54 | % | | 1.79 | % | | 2.14 | % | | 1.65 | % |
See accompanying notes to the financial statements.
125
BB&T Funds
Financial Highlights, Class A Shares
Selected data for a share of beneficial interest outstanding throughout the periods indicated.
| | | | | | | | | | | | | | | | | | | | |
| | | | | Investment Activities | | Dividends | |
| | | Net Asset
Value,
Beginning
of Period | | Net
investment
income
(loss) | | | Net realized/
unrealized
gains (losses)
on investments | | | Total from
Investment
Activities | | Net
investment
income | | | Net realized
gains on
investments | | | Total
Dividends | |
Short U.S. Government Fund | | | | | | | | | | | | | | | | | | | | |
Year Ended September 30, 2006 | | $ | 9.50 | | 0.28 | (b) | | 0.01 | (i) | | 0.29 | | (0.31 | ) | | — | | | (0.31 | ) |
Year Ended September 30, 2005 | | $ | 9.70 | | 0.23 | | | (0.14 | ) | | 0.09 | | (0.29 | ) | | — | | | (0.29 | ) |
Year Ended September 30, 2004 | | $ | 9.89 | | 0.17 | | | (0.10 | ) | | 0.07 | | (0.26 | ) | | — | | | (0.26 | ) |
Year Ended September 30, 2003 | | $ | 10.08 | | 0.27 | | | (0.11 | ) | | 0.16 | | (0.35 | ) | | — | | | (0.35 | ) |
Year Ended September 30, 2002 | | $ | 10.04 | | 0.43 | (c) | | 0.06 | (c) | | 0.49 | | (0.45 | ) | | — | | | (0.45 | ) |
Intermediate U.S. Government Fund | | | | | | | | | | | | | | | | | | | | |
Year Ended September 30, 2006 | | $ | 10.01 | | 0.41 | (b) | | (0.11 | ) | | 0.30 | | (0.42 | ) | | — | | | (0.42 | ) |
Year Ended September 30, 2005 | | $ | 10.24 | | 0.35 | (b) | | (0.15 | ) | | 0.20 | | (0.38 | ) | | (0.05 | ) | | (0.43 | ) |
Year Ended September 30, 2004 | | $ | 10.57 | | 0.32 | | | (0.19 | ) | | 0.13 | | (0.33 | ) | | (0.13 | ) | | (0.46 | ) |
Year Ended September 30, 2003 | | $ | 10.77 | | 0.35 | | | (0.07 | ) | | 0.28 | | (0.39 | ) | | (0.09 | ) | | (0.48 | ) |
Year Ended September 30, 2002 | | $ | 10.38 | | 0.47 | (d) | | 0.42 | (d) | | 0.89 | | (0.50 | ) | | — | | | (0.50 | ) |
Total Return Bond Fund | | | | | | | | | | | | | | | | | | | | |
Year Ended September 30, 2006 | | $ | 10.31 | | 0.42 | (b) | | (0.12 | ) | | 0.30 | | (0.44 | ) | | (0.05 | ) | | (0.49 | ) |
Year Ended September 30, 2005 | | $ | 10.59 | | 0.38 | (b) | | (0.19 | ) | | 0.19 | | (0.44 | ) | | (0.03 | ) | | (0.47 | ) |
Year Ended September 30, 2004 | | $ | 10.72 | | 0.41 | | | (0.08 | ) | | 0.33 | | (0.46 | ) | | — | | | (0.46 | ) |
Year Ended September 30, 2003 | | $ | 10.33 | | 0.47 | | | 0.41 | | | 0.88 | | (0.49 | ) | | — | | | (0.49 | ) |
Year Ended September 30, 2002 | | $ | 10.56 | | 0.53 | (e) | | (0.04 | )(e) | | 0.49 | | (0.55 | ) | | (0.17 | ) | | (0.72 | ) |
Kentucky Intermediate Tax-Free Fund | | | | | | | | | | | | | | | | | | | | |
Year Ended September 30, 2006 | | $ | 10.06 | | 0.30 | | | 0.06 | | | 0.36 | | (0.30 | ) | | — | | | (0.30 | ) |
Year Ended September 30, 2005 | | $ | 10.22 | | 0.27 | (b) | | (0.16 | ) | | 0.11 | | (0.27 | ) | | — | | | (0.27 | ) |
Year Ended September 30, 2004 | | $ | 10.23 | | 0.27 | (b) | | (0.01 | ) | | 0.26 | | (0.27 | ) | | — | | | (0.27 | ) |
February 24, 2003 to September 30, 2003 (a) | | $ | 10.00 | | 0.15 | (b) | | 0.35 | | | 0.50 | | (0.27 | ) | | — | | | (0.27 | ) |
Maryland Intermediate Tax-Free Fund | | | | | | | | | | | | | | | | | | | | |
Year Ended September 30, 2006 | | $ | 10.02 | | 0.29 | | | 0.10 | | | 0.39 | | (0.29 | ) | | — | | | (0.29 | ) |
Year Ended September 30, 2005 | | $ | 10.15 | | 0.26 | (b) | | (0.13 | ) | | 0.13 | | (0.26 | ) | | — | | | (0.26 | ) |
Year Ended September 30, 2004 | | $ | 10.15 | | 0.24 | | | — | (f) | | 0.24 | | (0.24 | ) | | — | | | (0.24 | ) |
February 24, 2003 to September 30, 2003 (a) | | $ | 10.00 | | 0.18 | | | 0.15 | | | 0.33 | | (0.18 | ) | | — | | | (0.18 | ) |
North Carolina Intermediate Tax-Free Fund | | | | | | | | | | | | | | | | | | | | |
Year Ended September 30, 2006 | | $ | 10.46 | | 0.36 | | | — | (f) | | 0.36 | | (0.35 | ) | | (0.09 | ) | | (0.44 | ) |
Year Ended September 30, 2005 | | $ | 10.67 | | 0.35 | | | (0.19 | ) | | 0.16 | | (0.35 | ) | | (0.02 | ) | | (0.37 | ) |
Year Ended September 30, 2004 | | $ | 10.81 | | 0.32 | | | (0.10 | ) | | 0.22 | | (0.32 | ) | | (0.04 | ) | | (0.36 | ) |
Year Ended September 30, 2003 | | $ | 10.86 | | 0.33 | | | (0.01 | ) | | 0.32 | | (0.33 | ) | | (0.04 | ) | | (0.37 | ) |
Year Ended September 30, 2002 | | $ | 10.54 | | 0.36 | | | 0.40 | | | 0.76 | | (0.36 | ) | | (0.08 | ) | | (0.44 | ) |
South Carolina Intermediate Tax-Free Fund | | | | | | | | | | | | | | | | | | | | |
Year Ended September 30, 2006 | | $ | 10.54 | | 0.34 | | | (0.01 | ) | | 0.33 | | (0.34 | ) | | (0.18 | ) | | (0.52 | ) |
Year Ended September 30, 2005 | | $ | 10.81 | | 0.34 | | | (0.19 | ) | | 0.15 | | (0.34 | ) | | (0.08 | ) | | (0.42 | ) |
Year Ended September 30, 2004 | | $ | 10.88 | | 0.34 | | | (0.07 | ) | | 0.27 | | (0.33 | ) | | (0.01 | ) | | (0.34 | ) |
Year Ended September 30, 2003 | | $ | 10.87 | | 0.34 | | | 0.01 | | | 0.35 | | (0.34 | ) | | — | | | (0.34 | ) |
Year Ended September 30, 2002 | | $ | 10.46 | | 0.37 | | | 0.41 | | | 0.78 | | (0.37 | ) | | — | | | (0.37 | ) |
Virginia Intermediate Tax-Free Fund | | | | | | | | | | | | | | | | | | | | |
Year Ended September 30, 2006 | | $ | 11.49 | | 0.40 | | | (0.05 | ) | | 0.35 | | (0.39 | ) | | (0.06 | ) | | (0.45 | ) |
Year Ended September 30, 2005 | | $ | 11.74 | | 0.39 | | | (0.22 | ) | | 0.17 | | (0.40 | ) | | (0.02 | ) | | (0.42 | ) |
Year Ended September 30, 2004 | | $ | 11.96 | | 0.38 | | | (0.14 | ) | | 0.24 | | (0.38 | ) | | (0.08 | ) | | (0.46 | ) |
Year Ended September 30, 2003 | | $ | 11.99 | | 0.37 | | | 0.01 | | | 0.38 | | (0.37 | ) | | (0.04 | ) | | (0.41 | ) |
Year Ended September 30, 2002 | | $ | 11.57 | | 0.41 | | | 0.42 | | | 0.83 | | (0.41 | ) | | — | | | (0.41 | ) |
| * | During the period certain fees were reduced. If such reductions had not occurred, the ratios would have been as indicated. |
| ** | Portfolio turnover rate is calculated on the basis of the fund as a whole without distinguishing between classes of shares issued. |
| (a) | Period from commencement of operations. |
| (b) | Per share net investment income (loss) has been calculated using the average daily shares method. |
| (c) | Without the adoption of the change in amortization method as required by the November 2000 revised version of the AICPA Audit and Accounting Guide for Investment Companies, the amounts for net investment income, net realized/unrealized gains (losses), and the net investment income ratio would have been: $0.47, $0.02, and 4.38%, respectively. |
| (d) | Without the adoption of the change in amortization method as required by the November 2000 revised version of the AICPA Audit and Accounting Guide for Investment Companies, the amounts for net investment income, net realized/unrealized gains (losses), and the net investment income ratio would have been: $0.49, $0.40, and 4.74%, respectively. |
| (e) | Without the adoption of the change in amortization method as required by the November 2000 revised version of the AICPA Audit and Accounting Guide for Investment Companies, the amounts for net investment income, net realized/unrealized gains (losses), and the net investment income ratio would have been: $0.54, $(0.05), and 5.23%, respectively. |
| (f) | Amount is less than $0.005. |
| (g) | Not annualized for periods less than one year. |
| (h) | Annualized for periods less than one year. |
| (i) | The amount shown for a share outstanding throughout the period does not accord with the change in aggregate gains and losses in the portfolio of securities during the period because of the timing of sales and purchases of Fund shares in relation to fluctuating market values during the period. |
See accompanying notes to the financial statements.
126
| | | | | | | | | | | | | | | | | | | |
| | | | | | Ratios/Supplementary Data | |
Net Asset
Value,
End of
Period | | Total Return
(excludes
sales charge) (g) | | | Net Assets,
End of
Period
(000) | | Ratio of
net expenses
to average
net assets (h) | | | Ratio of net
investment
income
(loss) to
average net
assets (h) | | | Ratio of
expenses to
average
net assets* (h) | | | Portfolio
turnover rate** | |
| | | | | | | | | | | | | | | | | | | |
| $ | 9.48 | | 3.12 | % | | $ | 6,233 | | 0.89 | % | | 2.99 | % | | 1.29 | % | | 98.08 | % |
| $ | 9.50 | | 0.96 | % | | $ | 7,980 | | 0.91 | % | | 2.40 | % | | 1.34 | % | | 33.67 | % |
| $ | 9.70 | | 0.71 | % | | $ | 8,456 | | 0.99 | % | | 1.85 | % | | 1.41 | % | | 62.59 | % |
| $ | 9.89 | | 1.56 | % | | $ | 9,619 | | 1.00 | % | | 2.48 | % | | 1.40 | % | | 93.86 | % |
| $ | 10.08 | | 5.03 | % | | $ | 5,286 | | 1.03 | % | | 4.03 | %(c) | | 1.43 | % | | 73.93 | % |
| | | | | | | | | | | | | | | | | | | |
| $ | 9.89 | | 3.08 | % | | $ | 9,748 | | 0.92 | % | | 4.21 | % | | 1.29 | % | | 127.13 | % |
| $ | 10.01 | | 1.98 | % | | $ | 13,744 | | 0.96 | % | | 3.41 | % | | 1.33 | % | | 107.04 | % |
| $ | 10.24 | | 1.30 | % | | $ | 11,959 | | 1.05 | % | | 2.90 | % | | 1.42 | % | | 98.35 | % |
| $ | 10.57 | | 2.62 | % | | $ | 9,646 | | 1.07 | % | | 3.13 | % | | 1.42 | % | | 209.07 | % |
| $ | 10.77 | | 8.85 | % | | $ | 6,453 | | 1.10 | % | | 4.56 | %(d) | | 1.45 | % | | 79.36 | % |
| | | | | | | | | | | | | | | | | | | |
| $ | 10.12 | | 2.96 | % | | $ | 6,407 | | 0.93 | % | | 4.16 | % | | 1.29 | % | | 226.36 | % |
| $ | 10.31 | | 1.88 | % | | $ | 7,254 | | 0.96 | % | | 3.62 | % | | 1.33 | % | | 173.74 | % |
| $ | 10.59 | | 3.22 | % | | $ | 4,786 | | 1.07 | % | | 3.84 | % | | 1.44 | % | | 31.95 | % |
| $ | 10.72 | | 8.69 | % | | $ | 4,308 | | 1.08 | % | | 4.34 | % | | 1.44 | % | | 43.98 | % |
| $ | 10.33 | | 4.98 | % | | $ | 2,042 | | 1.11 | % | | 5.11 | %(e) | | 1.50 | % | | 69.15 | % |
| | | | | | | | | | | | | | | | | | | |
| $ | 10.12 | | 3.67 | % | | $ | 2,729 | | 0.91 | % | | 3.02 | % | | 1.37 | % | | 64.55 | % |
| $ | 10.06 | | 1.06 | % | | $ | 2,566 | | 0.89 | % | | 2.65 | % | | 1.47 | % | | 37.50 | % |
| $ | 10.22 | | 2.55 | % | | $ | 2,746 | | 0.78 | % | | 2.63 | % | | 1.57 | % | | 24.78 | % |
| $ | 10.23 | | 5.09 | % | | $ | 1,877 | | 0.62 | % | | 2.50 | % | | 1.65 | % | | 42.87 | % |
| | | | | | | | | | | | | | | | | | | |
| $ | 10.12 | | 3.95 | % | | $ | 1,966 | | 0.85 | % | | 2.89 | % | | 1.41 | % | | 219.80 | % |
| $ | 10.02 | | 1.28 | % | | $ | 1,609 | | 0.81 | % | | 2.57 | % | | 1.52 | % | | 44.67 | % |
| $ | 10.15 | | 2.37 | % | | $ | 667 | | 0.75 | % | | 2.32 | % | | 1.73 | % | | 55.18 | % |
| $ | 10.15 | | 3.32 | % | | $ | 482 | | 0.72 | % | | 2.22 | % | | 2.24 | % | | 40.16 | % |
| | | | | | | | | | | | | | | | | | | |
| $ | 10.38 | | 3.58 | % | | $ | 19,163 | | 0.90 | % | | 3.45 | % | | 1.30 | % | | 94.95 | % |
| $ | 10.46 | | 1.49 | % | | $ | 21,600 | | 0.90 | % | | 3.29 | % | | 1.36 | % | | 60.84 | % |
| $ | 10.67 | | 2.10 | % | | $ | 22,689 | | 0.90 | % | | 3.03 | % | | 1.42 | % | | 67.80 | % |
| $ | 10.81 | | 3.04 | % | | $ | 25,323 | | 0.92 | % | | 3.11 | % | | 1.42 | % | | 44.56 | % |
| $ | 10.86 | | 7.46 | % | | $ | 23,828 | | 0.93 | % | | 3.41 | % | | 1.43 | % | | 20.39 | % |
| | | | | | | | | | | | | | | | | | | |
| $ | 10.35 | | 3.27 | % | | $ | 4,001 | | 0.93 | % | | 3.30 | % | | 1.35 | % | | 80.24 | % |
| $ | 10.54 | | 1.39 | % | | $ | 4,072 | | 0.92 | % | | 3.20 | % | | 1.40 | % | | 56.03 | % |
| $ | 10.81 | | 2.60 | % | | $ | 4,149 | | 0.90 | % | | 3.11 | % | | 1.44 | % | | 32.63 | % |
| $ | 10.88 | | 3.29 | % | | $ | 4,680 | | 0.86 | % | | 3.14 | % | | 1.43 | % | | 32.04 | % |
| $ | 10.87 | | 7.67 | % | | $ | 4,128 | | 0.83 | % | | 3.52 | % | | 1.48 | % | | 21.81 | % |
| | | | | | | | | | | | | | | | | | | |
| $ | 11.39 | | 3.23 | % | | $ | 11,877 | | 0.90 | % | | 3.55 | % | | 1.30 | % | | 76.53 | % |
| $ | 11.49 | | 1.44 | % | | $ | 13,145 | | 0.89 | % | | 3.39 | % | | 1.36 | % | | 48.04 | % |
| $ | 11.74 | | 2.05 | % | | $ | 13,005 | | 0.91 | % | | 3.22 | % | | 1.43 | % | | 45.07 | % |
| $ | 11.96 | | 3.24 | % | | $ | 7,447 | | 0.92 | % | | 3.14 | % | | 1.42 | % | | 34.17 | % |
| $ | 11.99 | | 7.36 | % | | $ | 3,041 | | 0.96 | % | | 3.45 | % | | 1.46 | % | | 13.12 | % |
See accompanying notes to the financial statements.
127
BB&T Funds
Financial Highlights, Class A Shares
Selected data for a share of beneficial interest outstanding throughout the periods indicated.
| | | | | | | | | | | | | | | | | | | | | |
| | | Net Asset
Value,
Beginning
of Period | | Investment Activities | | | Dividends | |
| | | | Net
investment
income
(loss) | | |
Net realized/
unrealized
gains (losses)
on investments | | | Total from
Investment
Activities | | | Net
investment
income | | | Net realized
gains on
investments | | | Total
Dividends | |
West Virginia Intermediate Tax-Free Fund | | | | | | | | | | | | | | | | | | | | | |
Year Ended September 30, 2006 | | $ | 9.85 | | 0.39 | | | (0.02 | ) | | 0.37 | | | (0.37 | ) | | (0.06 | ) | | (0.43 | ) |
Year Ended September 30, 2005 | | $ | 10.08 | | 0.35 | (b) | | (0.15 | ) | | 0.20 | | | (0.35 | ) | | (0.08 | ) | | (0.43 | ) |
Year Ended September 30, 2004 | | $ | 10.20 | | 0.32 | | | (0.07 | ) | | 0.25 | | | (0.33 | ) | | (0.04 | ) | | (0.37 | ) |
Year Ended September 30, 2003 | | $ | 10.35 | | 0.33 | (b) | | 0.01 | | | 0.34 | | | (0.33 | ) | | (0.16 | ) | | (0.49 | ) |
Year Ended September 30, 2002 | | $ | 10.01 | | 0.43 | | | 0.31 | | | 0.74 | | | (0.38 | ) | | (0.02 | ) | | (0.40 | ) |
Prime Money Market Fund | | | | | | | | | | | | | | | | | | | | | |
Year Ended September 30, 2006 | | $ | 1.00 | | 0.04 | | | — | (c) | | 0.04 | | | (0.04 | ) | | — | | | (0.04 | ) |
Year Ended September 30, 2005 | | $ | 1.00 | | 0.02 | | | — | (c) | | 0.02 | | | (0.02 | ) | | — | | | (0.02 | ) |
Year Ended September 30, 2004 | | $ | 1.00 | | — | (c) | | — | (c) | | — | (c) | | — | (c) | | — | | | — | (c) |
Year Ended September 30, 2003 | | $ | 1.00 | | — | (c) | | — | | | — | (c) | | — | (c) | | — | | | — | (c) |
Year Ended September 30, 2002 | | $ | 1.00 | | 0.01 | | | — | | | 0.01 | | | (0.01 | ) | | — | | | (0.01 | ) |
U.S. Treasury Money Market Fund | | | | | | | | | | | | | | | | | | | | | |
Year Ended September 30, 2006 | | $ | 1.00 | | 0.04 | | | — | | | 0.04 | | | (0.04 | ) | | — | | | (0.04 | ) |
Year Ended September 30, 2005 | | $ | 1.00 | | 0.02 | | | — | | | 0.02 | | | (0.02 | ) | | — | | | (0.02 | ) |
Year Ended September 30, 2004 | | $ | 1.00 | | — | (c) | | — | | | — | (c) | | — | (c) | | — | | | — | (c) |
Year Ended September 30, 2003 | | $ | 1.00 | | — | (c) | | — | | | — | (c) | | — | (c) | | — | | | — | (c) |
Year Ended September 30, 2002 | | $ | 1.00 | | 0.01 | | | — | (c) | | 0.01 | | | (0.01 | ) | | — | | | (0.01 | ) |
National Tax-Free Money Market Fund | | | | | | | | | | | | | | | | | | | | | |
August 1, 2006 to September 30, 2006 (a) | | $ | 1.00 | | — | (c) | | — | | | — | (c) | | — | (c) | | — | | | — | (c) |
Capital Manager Conservative Growth Fund*** | | | | | | | | | | | | | | | | | | | | | |
Year Ended September 30, 2006 | | $ | 9.76 | | 0.31 | (b) | | 0.22 | | | 0.53 | | | (0.33 | ) | | — | | | (0.33 | ) |
Year Ended September 30, 2005 | | $ | 9.30 | | 0.23 | | | 0.45 | | | 0.68 | | | (0.22 | ) | | — | | | (0.22 | ) |
Year Ended September 30, 2004 | | $ | 8.84 | | 0.16 | (b) | | 0.46 | | | 0.62 | | | (0.16 | ) | | — | | | (0.16 | ) |
Year Ended September 30, 2003 | | $ | 8.29 | | 0.18 | | | 0.57 | | | 0.75 | | | (0.16 | ) | | (0.04 | ) | | (0.20 | ) |
Year Ended September 30, 2002 | | $ | 9.12 | | 0.23 | | | (0.68 | ) | | (0.45 | ) | | (0.20 | ) | | (0.18 | ) | | (0.38 | ) |
Capital Manager Moderate Growth Fund*** | | | | | | | | | | | | | | | | | | | | | |
Year Ended September 30, 2006 | | $ | 9.79 | | 0.24 | (b) | | 0.45 | | | 0.69 | | | (0.26 | ) | | — | | | (0.26 | ) |
Year Ended September 30, 2005 | | $ | 9.01 | | 0.17 | (b) | | 0.76 | | | 0.93 | | | (0.15 | ) | | — | | | (0.15 | ) |
Year Ended September 30, 2004 | | $ | 8.28 | | 0.08 | (b) | | 0.73 | | | 0.81 | | | (0.08 | ) | | — | | | (0.08 | ) |
Year Ended September 30, 2003 | | $ | 7.47 | | 0.08 | | | 0.82 | | | 0.90 | | | (0.08 | ) | | (0.01 | ) | | (0.09 | ) |
Year Ended September 30, 2002 | | $ | 8.82 | | 0.12 | | | (0.99 | ) | | (0.87 | ) | | (0.11 | ) | | (0.37 | ) | | (0.48 | ) |
Capital Manager Growth Fund*** | | | | | | | | | | | | | | | | | | | | | |
Year Ended September 30, 2006 | | $ | 9.68 | | 0.20 | (b) | | 0.56 | | | 0.76 | | | (0.21 | ) | | — | | | (0.21 | ) |
Year Ended September 30, 2005 | | $ | 8.70 | | 0.13 | | | 0.96 | | | 1.09 | | | (0.11 | ) | | — | | | (0.11 | ) |
Year Ended September 30, 2004 | | $ | 7.81 | | 0.05 | (b) | | 0.88 | | | 0.93 | | | (0.04 | ) | | — | | | (0.04 | ) |
Year Ended September 30, 2003 | | $ | 6.87 | | 0.04 | | | 0.94 | | | 0.98 | | | (0.04 | ) | | — | | | (0.04 | ) |
Year Ended September 30, 2002 | | $ | 8.46 | | 0.03 | | | (1.20 | ) | | (1.17 | ) | | (0.02 | ) | | (0.40 | ) | | (0.42 | ) |
Capital Manager Equity Fund*** | | | | | | | | | | | | | | | | | | | | | |
Year Ended September 30, 2006 | | $ | 10.95 | | 0.17 | (b) | | 0.83 | | | 1.00 | | | (0.19 | ) | | (0.19 | ) | | (0.38 | ) |
Year Ended September 30, 2005 | | $ | 9.58 | | 0.09 | (b) | | 1.34 | | | 1.43 | | | (0.06 | ) | | — | | | (0.06 | ) |
Year Ended September 30, 2004 | | $ | 8.45 | | 0.02 | (b) | | 1.12 | | | 1.14 | | | (0.01 | ) | | — | | | (0.01 | ) |
Year Ended September 30, 2003 | | $ | 7.36 | | — | (b)(c) | | 1.15 | | | 1.15 | | | (0.01 | ) | | (0.05 | ) | | (0.06 | ) |
Year Ended September 30, 2002 | | $ | 8.96 | | (0.02 | ) | | (1.58 | ) | | (1.60 | ) | | — | | | — | | | — | |
| * | During the period certain fees were reduced. If such reductions had not occurred, the ratios would have been as indicated. |
| ** | Portfolio turnover rate is calculated on the basis of the Fund as a whole without distinguishing between classes of shares issued. |
| *** | The expense ratios exclude the impact of fees/expenses paid by each underlying fund. |
| (a) | Period from commencement of operations. |
| (b) | Per share net investment income (loss) has been calculated using the average daily shares method. |
| (c) | Amount is less than $0.005. |
| (d) | Not annualized for periods less than one year. |
| (e) | Annualized for periods less than one year. |
See accompanying notes to the financial statements.
128
| | | | | | | | | | | | | | | | | | | |
| | | Total Return
(excludes
sales charge) (d) | | | Ratios/Supplementary Data | |
Net Asset
Value,
End of
Period | | | Net Assets,
End of
Period
(000) | | Ratio of net
expenses to
average
net assets (e) | | | Ratio of net
investment
income
(loss) to
average net
assets (e) | | | Ratio of
expenses to
average
net assets* (e) | | | Portfolio
turnover rate** | |
| | | | | | | | | | | | | | | | | | | |
| $ | 9.79 | | 3.85 | % | | $ | 15,773 | | 0.90 | % | | 3.80 | % | | 0.90 | % | | 50.14 | % |
| $ | 9.85 | | 1.97 | % | | $ | 13,911 | | 0.93 | % | | 3.50 | % | | 0.96 | % | | 32.10 | % |
| $ | 10.08 | | 2.51 | % | | $ | 10,815 | | 1.01 | % | | 3.24 | % | | 1.03 | % | | 16.24 | % |
| $ | 10.20 | | 3.41 | % | | $ | 11,541 | | 0.98 | % | | 3.23 | % | | 1.01 | % | | 25.59 | % |
| $ | 10.35 | | 7.61 | % | | $ | 10,029 | | 0.97 | % | | 3.78 | % | | 1.13 | % | | 61.44 | % |
| | | | | | | | | | | | | | | | | | | |
| $ | 1.00 | | 3.86 | % | | $ | 636,327 | | 0.98 | % | | 3.83 | % | | 1.09 | % | | — | |
| $ | 1.00 | | 1.92 | % | | $ | 493,282 | | 0.91 | % | | 1.91 | % | | 1.13 | % | | — | |
| $ | 1.00 | | 0.41 | % | | $ | 426,217 | | 0.86 | % | | 0.40 | % | | 1.20 | % | | — | |
| $ | 1.00 | | 0.48 | % | | $ | 459,375 | | 0.98 | % | | 0.47 | % | | 1.19 | % | | — | |
| $ | 1.00 | | 1.21 | % | | $ | 416,782 | | 1.05 | % | | 1.20 | % | | 1.23 | % | | — | |
| | | | | | | | | | | | | | | | | | | |
| $ | 1.00 | | 3.64 | % | | $ | 167,900 | | 0.96 | % | | 3.63 | % | | 1.09 | % | | — | |
| $ | 1.00 | | 1.69 | % | | $ | 114,260 | | 0.89 | % | | 1.66 | % | | 1.14 | % | | — | |
| $ | 1.00 | | 0.31 | % | | $ | 122,500 | | 0.79 | % | | 0.31 | % | | 1.21 | % | | — | |
| $ | 1.00 | | 0.30 | % | | $ | 135,059 | | 0.99 | % | | 0.32 | % | | 1.20 | % | | — | |
| $ | 1.00 | | 1.01 | % | | $ | 197,830 | | 1.05 | % | | 1.01 | % | | 1.24 | % | | — | |
| | | | | | | | | | | | | | | | | | | |
| $ | 1.00 | | 0.51 | % | | $ | 1 | | 0.62 | % | | 2.96 | % | | 1.26 | % | | — | |
| | | | | | | | | | | | | | | | | | | |
| $ | 9.96 | | 5.54 | % | | $ | 9,365 | | 0.33 | % | | 3.12 | % | | 0.95 | % | | 5.69 | % |
| $ | 9.76 | | 7.39 | % | | $ | 8,646 | | 0.43 | % | | 2.45 | % | | 1.01 | % | | 52.50 | % |
| $ | 9.30 | | 6.97 | % | | $ | 5,242 | | 0.69 | % | | 1.68 | % | | 1.14 | % | | 2.47 | % |
| $ | 8.84 | | 9.09 | % | | $ | 2,579 | | 0.78 | % | | 1.86 | % | | 1.23 | % | | 33.03 | % |
| $ | 8.29 | | (5.18 | )% | | $ | 1,198 | | 0.79 | % | | 2.25 | % | | 1.24 | % | | 6.29 | % |
| | | | | | | | | | | | | | | | | | | |
| $ | 10.22 | | 7.10 | % | | $ | 33,472 | | 0.35 | % | | 2.44 | % | | 0.97 | % | | 7.33 | % |
| $ | 9.79 | | 10.35 | % | | $ | 28,912 | | 0.48 | % | | 1.77 | % | | 1.05 | % | | 37.83 | % |
| $ | 9.01 | | 9.77 | % | | $ | 20,428 | | 0.74 | % | | 0.92 | % | | 1.19 | % | | 0.17 | % |
| $ | 8.28 | | 12.13 | % | | $ | 8,054 | | 0.75 | % | | 1.11 | % | | 1.20 | % | | 21.46 | % |
| $ | 7.47 | | (10.76 | )% | | $ | 3,194 | | 0.81 | % | | 1.26 | % | | 1.26 | % | | 14.56 | % |
| | | | | | | | | | | | | | | | | | | |
| $ | 10.23 | | 7.97 | % | | $ | 22,801 | | 0.36 | % | | 2.01 | % | | 0.98 | % | | 6.26 | % |
| $ | 9.68 | | 12.51 | % | | $ | 17,219 | | 0.48 | % | | 1.37 | % | | 1.07 | % | | 26.22 | % |
| $ | 8.70 | | 11.85 | % | | $ | 12,007 | | 0.75 | % | | 0.52 | % | | 1.23 | % | | 0.19 | % |
| $ | 7.81 | | 14.22 | % | | $ | 4,660 | | 0.80 | % | | 0.59 | % | | 1.25 | % | | 17.80 | % |
| $ | 6.87 | | (14.82 | )% | | $ | 2,700 | | 0.87 | % | | 0.39 | % | | 1.32 | % | | 8.38 | % |
| | | | | | | | | | | | | | | | | | | |
| $ | 11.57 | | 9.39 | % | | $ | 7,762 | | 0.36 | % | | 1.53 | % | | 0.97 | % | | 1.48 | % |
| $ | 10.95 | | 14.95 | % | | $ | 6,183 | | 0.45 | % | | 0.91 | % | | 1.09 | % | | 2.14 | % |
| $ | 9.58 | | 13.53 | % | | $ | 3,557 | | 0.77 | % | | 0.22 | % | | 1.31 | % | | 3.10 | % |
| $ | 8.45 | | 15.61 | % | | $ | 1,225 | | 0.95 | % | | 0.05 | % | | 1.40 | % | | 8.30 | % |
| $ | 7.36 | | (17.86 | )% | | $ | 645 | | 0.90 | % | | (0.15 | )% | | 1.35 | % | | 5.75 | % |
See accompanying notes to the financial statements.
129
BB&T Funds
Financial Highlights, Class B Shares
Selected data for a share of beneficial interest outstanding throughout the periods indicated.
| | | | | | | | | | | | | | | | | | | | | |
| | | | | Investment Activities | | | Dividends | |
| | | Net Asset
Value,
Beginning
of Period | | Net
investment
income
(loss) | | | Net realized/
unrealized
gains (losses)
on investments
and foreign
currency
transactions | | | Total from
Investment
Activities | | | Net
investment
income | | | Net realized
gains on
investments
and foreign
currency
transactions | | | Total
Dividends | |
Large Cap Fund | | | | | | | | | | | | | | | | | | | | | |
Year Ended September 30, 2006 | | $ | 19.31 | | 0.16 | (b) | | 2.27 | | | 2.43 | | | (0.15 | ) | | (1.44 | ) | | (1.59 | ) |
Year Ended September 30, 2005 | | $ | 17.12 | | 0.13 | | | 2.22 | | | 2.35 | | | (0.16 | ) | | — | | | (0.16 | ) |
Year Ended September 30, 2004 | | $ | 14.75 | | 0.09 | | | 2.38 | | | 2.47 | | | (0.10 | ) | | — | | | (0.10 | ) |
Year Ended September 30, 2003 | | $ | 12.75 | | 0.12 | | | 2.01 | | | 2.13 | | | (0.13 | ) | | — | | | (0.13 | ) |
Year Ended September 30, 2002 | | $ | 16.68 | | 0.06 | | | (3.44 | ) | | (3.38 | ) | | (0.07 | ) | | (0.48 | ) | | (0.55 | ) |
Large Cap Growth Fund | | | | | | | | | | | | | | | | | | | | | |
Year Ended September 30, 2006 | | $ | 8.47 | | (0.05 | )(b) | | (0.05 | ) | | (0.10 | ) | | — | | | — | | | — | |
Year Ended September 30, 2005 | | $ | 7.80 | | (0.03 | )(b) | | 0.72 | | | 0.69 | | | (0.02 | ) | | — | | | (0.02 | ) |
Year Ended September 30, 2004 | | $ | 7.36 | | (0.13 | ) | | 0.57 | | | 0.44 | | | — | | | — | | | — | |
Year Ended September 30, 2003 | | $ | 6.36 | | (0.08 | )(b) | | 1.08 | | | 1.00 | | | — | | | — | | | — | |
Year Ended September 30, 2002 | | $ | 7.93 | | (0.12 | ) | | (1.45 | ) | | (1.57 | ) | | — | | | — | | | — | |
Mid Cap Value Fund | | | | | | | | | | | | | | | | | | | | | |
Year Ended September 30, 2006 | | $ | 13.16 | | (0.07 | )(b) | | 1.59 | | | 1.52 | | | — | (c) | | (1.45 | ) | | (1.45 | ) |
Year Ended September 30, 2005 | | $ | 15.30 | | — | (b)(c) | | 3.02 | | | 3.02 | | | (0.07 | ) | | (5.09 | ) | | (5.16 | ) |
Year Ended September 30, 2004 | | $ | 12.91 | | 0.07 | (b) | | 2.42 | | | 2.49 | | | (0.10 | ) | | — | | | (0.10 | ) |
Year Ended September 30, 2003 | | $ | 10.90 | | 0.07 | | | 2.03 | | | 2.10 | | | (0.09 | ) | | — | | | (0.09 | ) |
Year Ended September 30, 2002 | | $ | 13.10 | | 0.08 | | | (1.03 | ) | | (0.95 | ) | | (0.10 | ) | | (1.15 | ) | | (1.25 | ) |
Mid Cap Growth Fund | | | | | | | | | | | | | | | | | | | | | |
Year Ended September 30, 2006 | | $ | 13.47 | | (0.11 | )(b) | | 0.01 | (g) | | (0.10 | ) | | — | | | (1.42 | ) | | (1.42 | ) |
Year Ended September 30, 2005 | | $ | 10.70 | | (0.17 | )(b) | | 3.08 | | | 2.91 | | | — | | | (0.14 | ) | | (0.14 | ) |
Year Ended September 30, 2004 | | $ | 9.68 | | (0.16 | ) | | 1.18 | | | 1.02 | | | — | | | — | | | — | |
Year Ended September 30, 2003 | | $ | 8.00 | | (0.13 | ) | | 1.81 | | | 1.68 | | | — | | | — | | | — | |
Year Ended September 30, 2002 | | $ | 9.79 | | (0.14 | )(b) | | (1.02 | ) | | (1.16 | ) | | — | | | (0.63 | ) | | (0.63 | ) |
Small Cap Fund | | | | | | | | | | | | | | | | | | | | | |
Year Ended September 30, 2006 | | $ | 16.11 | | (0.12 | )(b) | | 1.05 | | | 0.93 | | | (0.01 | ) | | (2.30 | ) | | (2.31 | ) |
Year Ended September 30, 2005 | | $ | 14.06 | | — | (b)(c) | | 2.58 | | | 2.58 | | | (0.11 | ) | | (0.42 | ) | | (0.53 | ) |
Year Ended September 30, 2004 | | $ | 11.40 | | (0.10 | )(b) | | 2.88 | | | 2.78 | | | — | | | (0.12 | ) | | (0.12 | ) |
May 19, 2003 to September 30, 2003 (a) | | $ | 10.00 | | (0.04 | )(b) | | 1.44 | | | 1.40 | | | — | | | — | | | — | |
International Equity Fund | | | | | | | | | | | | | | | | | | | | | |
Year Ended September 30, 2006 | | $ | 9.09 | | 0.06 | (b) | | 1.42 | | | 1.48 | | | (0.11 | ) | | — | | | (0.11 | ) |
Year Ended September 30, 2005 | | $ | 7.74 | | 0.03 | (b) | | 1.38 | | | 1.41 | | | (0.06 | ) | | — | | | (0.06 | ) |
Year Ended September 30, 2004 | | $ | 6.57 | | 0.02 | (b) | | 1.19 | | | 1.21 | | | (0.04 | ) | | — | | | (0.04 | ) |
Year Ended September 30, 2003 | | $ | 6.07 | | (0.02 | )(b) | | 0.54 | | | 0.52 | | | (0.02 | ) | | — | | | (0.02 | ) |
Year Ended September 30, 2002 | | $ | 7.19 | | (0.07 | )(b) | | (1.05 | ) | | (1.12 | ) | | — | | | — | | | — | |
Special Opportunities Equity Fund | | | | | | | | | | | | | | | | | | | | | |
Year Ended September 30, 2006 | | $ | 15.29 | | (0.16 | ) | | 1.66 | | | 1.50 | | | — | | | (0.79 | ) | | (0.79 | ) |
Year Ended September 30, 2005 | | $ | 12.95 | | (0.13 | ) | | 2.59 | | | 2.46 | | | — | | | (0.12 | ) | | (0.12 | ) |
Year Ended September 30, 2004 | | $ | 10.50 | | (0.12 | ) | | 2.65 | | | 2.53 | | | — | | | (0.08 | ) | | (0.08 | ) |
June 2, 2003 to September 30, 2003 (a) | | $ | 10.00 | | (0.02 | ) | | 0.52 | | | 0.50 | | | — | | | — | | | — | |
Equity Income Fund | | | | | | | | | | | | | | | | | | | | | |
Year Ended September 30, 2006 | | $ | 12.08 | | 0.19 | | | 1.56 | | | 1.75 | | | (0.23 | ) | | (0.27 | ) | | (0.50 | ) |
Year Ended September 30, 2005 | | $ | 10.34 | | 0.16 | | | 1.77 | | | 1.93 | | | (0.17 | ) | | (0.02 | ) | | (0.19 | ) |
June 30, 2004 to September 30, 2004 (a) | | $ | 10.00 | | 0.03 | (b) | | 0.34 | | | 0.37 | | | (0.03 | ) | | — | | | (0.03 | ) |
Intermediate U.S. Government Fund | | | | | | | | | | | | | | | | | | | | | |
Year Ended September 30, 2006 | | $ | 9.98 | | 0.34 | (b) | | (0.12 | ) | | 0.22 | | | (0.34 | ) | | — | | | (0.34 | ) |
Year Ended September 30, 2005 | | $ | 10.20 | | 0.27 | (b) | | (0.13 | ) | | 0.14 | | | (0.31 | ) | | (0.05 | ) | | (0.36 | ) |
Year Ended September 30, 2004 | | $ | 10.53 | | 0.21 | | | (0.16 | ) | | 0.05 | | | (0.25 | ) | | (0.13 | ) | | (0.38 | ) |
Year Ended September 30, 2003 | | $ | 10.73 | | 0.27 | | | (0.07 | ) | | 0.20 | | | (0.31 | ) | | (0.09 | ) | | (0.40 | ) |
Year Ended September 30, 2002 | | $ | 10.35 | | 0.39 | (d) | | 0.41 | (d) | | 0.80 | | | (0.42 | ) | | — | | | (0.42 | ) |
| * | During the period certain fees were reduced. If such reductions had not occurred, the ratios would have been as indicated. |
| ** | Portfolio turnover rate is calculated on the basis of the Fund as a whole without distinguishing between classes of shares issued. |
| (a) | Period from commencement of operations. |
| (b) | Per share net investment income (loss) has been calculated using the average daily shares method. |
| (c) | Amount is less than $0.005. |
| (d) | Without the adoption of the change in amortization method as required by the November 2000 revised version of the AICPA Audit and Accounting Guide for Investment Companies, the amounts for net investment income, net realized/unrealized gains (losses), and the net investment income ratio would have been: $0.41, $0.39 and 3.99% respectively. |
| (e) | Not annualized for periods less than one year. |
| (f) | Annualized for periods less than one year. |
| (g) | The amount shown for a share outstanding throughout the period does not accord with the change in aggregate gains and losses in the portfolio of securities during the period because of the timing of sales and purchases of Fund shares in relation to fluctuating market values during the period. |
See accompanying notes to the financial statements.
130
| | | | | | | | | | | | | | | | | | | |
| | | | | | Ratios/Supplementary Data | |
Net Asset
Value,
End of
Period | | Total Return
(excludes
sales charge) (e) | | | Net Assets,
End of
Period
(000) | | Ratio of net
expenses to
average
net assets (f) | | |
Ratio of net
investment
income
(loss) to
average net
assets (f) | | | Ratio of
expenses to
average
net assets* (f) | | | Portfolio
turnover rate** | |
| | | | | | | | | | | | | | | | | | | |
| $ | 20.15 | | 13.45 | % | | $ | 14,808 | | 1.88 | % | | 0.85 | % | | 1.93 | % | | 34.83 | % |
| $ | 19.31 | | 13.75 | % | | $ | 22,148 | | 1.89 | % | | 0.82 | % | | 1.99 | % | | 19.50 | % |
| $ | 17.12 | | 16.75 | % | | $ | 26,309 | | 1.95 | % | | 0.58 | % | | 2.06 | % | | 16.40 | % |
| $ | 14.75 | | 16.74 | % | | $ | 26,215 | | 1.91 | % | | 0.92 | % | | 2.05 | % | | 18.89 | % |
| $ | 12.75 | | (21.14 | )% | | $ | 24,849 | | 1.98 | % | | 0.36 | % | | 2.12 | % | | 23.02 | % |
| | | | | | | | | | | | | | | | | | | |
| $ | 8.37 | | (1.18 | )% | | $ | 8,970 | | 1.88 | % | | (0.58 | )% | | 1.93 | % | | 186.19 | % |
| $ | 8.47 | | 8.89 | % | | $ | 12,621 | | 1.89 | % | | (0.36 | )% | | 1.99 | % | | 62.78 | % |
| $ | 7.80 | | 5.98 | % | | $ | 13,845 | | 1.96 | % | | (1.08 | )% | | 2.08 | % | | 127.47 | % |
| $ | 7.36 | | 15.72 | % | | $ | 14,217 | | 1.93 | % | | (1.10 | )% | | 2.07 | % | | 91.73 | % |
| $ | 6.36 | | (19.80 | )% | | $ | 13,040 | | 2.03 | % | | (1.32 | )% | | 2.17 | % | | 100.46 | % |
| | | | | | | | | | | | | | | | | | | |
| $ | 13.23 | | 12.38 | % | | $ | 5,391 | | 1.89 | % | | (0.53 | )% | | 1.93 | % | | 53.92 | % |
| $ | 13.16 | | 19.94 | % | | $ | 4,534 | | 1.89 | % | | 0.02 | % | | 1.99 | % | | 126.99 | % |
| $ | 15.30 | | 19.31 | % | | $ | 3,582 | | 1.98 | % | | 0.47 | % | | 2.10 | % | | 19.17 | % |
| $ | 12.91 | | 19.31 | % | | $ | 2,071 | | 1.95 | % | | 0.58 | % | | 2.10 | % | | 18.28 | % |
| $ | 10.90 | | (8.80 | )% | | $ | 1,158 | | 1.91 | % | | 0.63 | % | | 2.12 | % | | 18.20 | % |
| | | | | | | | | | | | | | | | | | | |
| $ | 11.95 | | (1.23 | )% | | $ | 2,377 | | 1.89 | % | | (0.83 | )% | | 1.94 | % | | 140.90 | % |
| $ | 13.47 | | 27.42 | % | | $ | 2,395 | | 1.91 | % | | (1.46 | )% | | 2.01 | % | | 92.74 | % |
| $ | 10.70 | | 10.54 | % | | $ | 1,973 | | 2.00 | % | | (1.65 | )% | | 2.11 | % | | 138.61 | % |
| $ | 9.68 | | 21.00 | % | | $ | 1,030 | | 1.95 | % | | (1.73 | )% | | 2.11 | % | | 125.97 | % |
| $ | 8.00 | | (13.20 | )% | | $ | 507 | | 1.76 | % | | (1.52 | )% | | 2.07 | % | | 117.06 | % |
| | | | | | | | | | | | | | | | | | | |
| $ | 14.73 | | 6.19 | % | | $ | 4,092 | | 2.04 | % | | (0.79 | )% | | 2.28 | % | | 43.25 | % |
| $ | 16.11 | | 18.79 | % | | $ | 259 | | 2.05 | % | | 0.00 | % | | 2.27 | % | | 8.39 | % |
| $ | 14.06 | | 24.56 | % | | $ | 136 | | 2.22 | % | | (0.75 | )% | | 2.41 | % | | 11.25 | % |
| $ | 11.40 | | 14.00 | % | | $ | 29 | | 2.69 | % | | (0.93 | )% | | 2.69 | % | | 48.84 | % |
| | | | | | | | | | | | | | | | | | | |
| $ | 10.46 | | 16.27 | % | | $ | 1,819 | | 2.15 | % | | 0.64 | % | | 2.25 | % | | 36.22 | % |
| $ | 9.09 | | 18.34 | % | | $ | 2,007 | | 2.20 | % | | 0.36 | % | | 2.33 | % | | 44.96 | % |
| $ | 7.74 | | 18.47 | % | | $ | 2,140 | | 2.33 | % | | 0.24 | % | | 2.42 | % | | 50.68 | % |
| $ | 6.57 | | 8.63 | % | | $ | 2,012 | | 2.40 | % | | (0.37 | )% | | 2.41 | % | | 199.78 | % |
| $ | 6.07 | | (15.58 | )% | | $ | 2,056 | | 2.43 | % | | (1.01 | )% | | 2.43 | % | | 95.86 | % |
| | | | | | | | | | | | | | | | | | | |
| $ | 16.00 | | 10.35 | % | | $ | 22,901 | | 2.03 | % | | (1.01 | )% | | 2.03 | % | | 58.01 | % |
| $ | 15.29 | | 19.09 | % | | $ | 21,911 | | 2.06 | % | | (1.18 | )% | | 2.08 | % | | 30.38 | % |
| $ | 12.95 | | 24.17 | % | | $ | 13,215 | | 2.15 | % | | (1.51 | )% | | 2.30 | % | | 32.06 | % |
| $ | 10.50 | | 5.00 | % | | $ | 4,360 | | 1.80 | % | | (1.16 | )% | | 2.50 | % | | 13.24 | % |
| | | | | | | | | | | | | | | | | | | |
| $ | 13.33 | | 14.84 | % | | $ | 9,592 | | 1.95 | % | | 1.52 | % | | 1.95 | % | | 45.38 | % |
| $ | 12.08 | | 18.79 | % | | $ | 5,611 | | 1.87 | % | | 1.74 | % | | 2.09 | % | | 39.65 | % |
| $ | 10.34 | | 3.66 | % | | $ | 1,672 | | 2.29 | % | | 1.07 | % | | 2.65 | % | | 1.65 | % |
| | | | | | | | | | | | | | | | | | | |
| $ | 9.86 | | 2.32 | % | | $ | 4,020 | | 1.68 | % | | 3.48 | % | | 1.79 | % | | 127.13 | % |
| $ | 9.98 | | 1.33 | % | | $ | 5,725 | | 1.71 | % | | 2.67 | % | | 1.84 | % | | 107.04 | % |
| $ | 10.20 | | 0.55 | % | | $ | 6,883 | | 1.80 | % | | 2.15 | % | | 1.92 | % | | 98.35 | % |
| $ | 10.53 | | 1.86 | % | | $ | 7,869 | | 1.82 | % | | 2.42 | % | | 1.92 | % | | 209.97 | % |
| $ | 10.73 | | 7.96 | % | | $ | 5,981 | | 1.85 | % | | 3.81 | %(d) | | 1.95 | % | | 79.36 | % |
See accompanying notes to the financial statements.
131
BB&T Funds
Financial Highlights, Class B Shares
Selected data for a share of beneficial interest outstanding throughout the periods indicated.
| | | | | | | | | | | | | | | | | | | | | |
| | | Net Asset
Value,
Beginning
of Period | | Investment Activities | | | Dividends | |
| | | |
Net
investment
income
(loss) | | | Net realized/
unrealized
gains (losses)
on investments | | | Total from
Investment
Activities | | | Net
investment
income | | | Net realized
gains on
investments | | | Total
Dividends | |
Total Return Bond Fund | | | | | | | | | | | | | | | | | | | | | |
Year Ended September 30, 2006 | | $ | 10.32 | | 0.34 | (b) | | (0.12 | ) | | 0.22 | | | (0.36 | ) | | (0.05 | ) | | (0.41 | ) |
Year Ended September 30, 2005 | | $ | 10.59 | | 0.30 | (b) | | (0.18 | ) | | 0.12 | | | (0.36 | ) | | (0.03 | ) | | (0.39 | ) |
Year Ended September 30, 2004 | | $ | 10.72 | | 0.32 | | | (0.07 | ) | | 0.25 | | | (0.38 | ) | | — | | | (0.38 | ) |
Year Ended September 30, 2003 | | $ | 10.34 | | 0.39 | | | 0.40 | | | 0.79 | | | (0.41 | ) | | — | | | (0.41 | ) |
Year Ended September 30, 2002 | | $ | 10.57 | | 0.45 | (d) | | (0.04 | )(d) | | 0.41 | | | (0.47 | ) | | (0.17 | ) | | (0.64 | ) |
Prime Money Market Fund | | | | | | | | | | | | | | | | | | | | | |
Year Ended September 30, 2006 | | $ | 1.00 | | 0.03 | | | — | (c) | | 0.03 | | | (0.03 | ) | | — | | | (0.03 | ) |
Year Ended September 30, 2005 | | $ | 1.00 | | 0.01 | | | — | (c) | | 0.01 | | | (0.01 | ) | | — | | | (0.01 | ) |
Year Ended September 30, 2004 | | $ | 1.00 | | — | (c) | | — | (c) | | — | (c) | | — | (c) | | — | | | — | (c) |
Year Ended September 30, 2003 | | $ | 1.00 | | — | (c) | | — | | | — | (c) | | — | (c) | | — | | | — | (c) |
Year Ended September 30, 2002 | | $ | 1.00 | | 0.01 | | | — | | | 0.01 | | | (0.01 | ) | | — | | | (0.01 | ) |
U.S. Treasury Money Market Fund | | | | | | | | | | | | | | | | | | | | | |
Year Ended September 30, 2006 | | $ | 1.00 | | 0.03 | | | — | | | 0.03 | | | (0.03 | ) | | — | | | (0.03 | ) |
Year Ended September 30, 2005 | | $ | 1.00 | | 0.01 | | | — | | | 0.01 | | | (0.01 | ) | | — | | | (0.01 | ) |
Year Ended September 30, 2004 | | $ | 1.00 | | — | (c) | | — | | | — | (c) | | — | (c) | | — | | | — | (c) |
Year Ended September 30, 2003 | | $ | 1.00 | | — | (c) | | — | | | — | (c) | | — | (c) | | — | | | — | (c) |
Year Ended September 30, 2002 | | $ | 1.00 | | 0.01 | | | — | | | 0.01 | | | (0.01 | ) | | — | | | (0.01 | ) |
National Tax-Free Money Market Fund | | | | | | | | | | | | | | | | | | | | | |
August 1, 2006 to September 30, 2006 (a) | | $ | 1.00 | | — | (c) | | — | | | — | (c) | | — | (c) | | — | | | — | (c) |
Capital Manager Conservative Growth Fund*** | | | | | | | | | | | | | | | | | | | | | |
Year Ended September 30, 2006 | | $ | 9.76 | | 0.23 | (b) | | 0.23 | | | 0.46 | | | (0.26 | ) | | — | | | (0.26 | ) |
Year Ended September 30, 2005 | | $ | 9.30 | | 0.16 | | | 0.45 | | | 0.61 | | | (0.15 | ) | | — | | | (0.15 | ) |
Year Ended September 30, 2004 | | $ | 8.85 | | 0.09 | (b) | | 0.45 | | | 0.54 | | | (0.09 | ) | | — | | | (0.09 | ) |
Year Ended September 30, 2003 | | $ | 8.29 | | 0.11 | | | 0.59 | | | 0.70 | | | (0.10 | ) | | (0.04 | ) | | (0.14 | ) |
Year Ended September 30, 2002 | | $ | 9.13 | | 0.15 | | | (0.67 | ) | | (0.52 | ) | | (0.14 | ) | | (0.18 | ) | | (0.32 | ) |
Capital Manager Moderate Growth Fund*** | | | | | | | | | | | | | | | | | | | | | |
Year Ended September 30, 2006 | | $ | 9.64 | | 0.17 | (b) | | 0.42 | | | 0.59 | | | (0.18 | ) | | — | | | (0.18 | ) |
Year Ended September 30, 2005 | | $ | 8.86 | | 0.09 | (b) | | 0.77 | | | 0.86 | | | (0.08 | ) | | — | | | (0.08 | ) |
Year Ended September 30, 2004 | | $ | 8.15 | | 0.02 | (b) | | 0.71 | | | 0.73 | | | (0.02 | ) | | — | | | (0.02 | ) |
Year Ended September 30, 2003 | | $ | 7.41 | | 0.04 | | | 0.80 | | | 0.84 | | | (0.09 | ) | | (0.01 | ) | | (0.10 | ) |
Year Ended September 30, 2002 | | $ | 8.75 | | 0.05 | | | (0.97 | ) | | (0.92 | ) | | (0.05 | ) | | (0.37 | ) | | (0.42 | ) |
Capital Manager Growth Fund*** | | | | | | | | | | | | | | | | | | | | | |
Year Ended September 30, 2006 | | $ | 9.51 | | 0.12 | (b) | | 0.56 | | | 0.68 | | | (0.14 | ) | | — | | | (0.14 | ) |
Year Ended September 30, 2005 | | $ | 8.55 | | 0.05 | (b) | | 0.95 | | | 1.00 | | | (0.04 | ) | | — | | | (0.04 | ) |
Year Ended September 30, 2004 | | $ | 7.70 | | (0.02 | )(b) | | 0.87 | | | 0.85 | | | — | | | — | | | — | |
Year Ended September 30, 2003 | | $ | 6.80 | | (0.01 | ) | | 0.91 | | | 0.90 | | | — | (c) | | — | | | — | (c) |
Year Ended September 30, 2002 | | $ | 8.42 | | (0.01 | ) | | (1.21 | ) | | (1.22 | ) | | — | | | (0.40 | ) | | (0.40 | ) |
Capital Manager Equity Fund*** | | | | | | | | | | | | | | | | | | | | | |
Year Ended September 30, 2006 | | $ | 10.67 | | 0.09 | (b) | | 0.80 | | | 0.89 | | | (0.11 | ) | | (0.19 | ) | | (0.30 | ) |
Year Ended September 30, 2005 | | $ | 9.36 | | 0.01 | (b) | | 1.31 | | | 1.32 | | | (0.01 | ) | | — | | | (0.01 | ) |
Year Ended September 30, 2004 | | $ | 8.30 | | (0.05 | )(b) | | 1.11 | | | 1.06 | | | — | | | — | | | — | |
Year Ended September 30, 2003 | | $ | 7.28 | | (0.05 | )(b) | | 1.12 | | | 1.07 | | | — | | | (0.05 | ) | | (0.05 | ) |
Year Ended September 30, 2002 | | $ | 8.93 | | (0.04 | ) | | (1.61 | ) | | (1.65 | ) | | — | | | — | | | — | |
| * | During the period certain fees were reduced. If such reductions had not occurred, the ratios would have been as indicated. |
| ** | Portfolio turnover rate is calculated on the basis of the Fund as a whole without distinguishing between classes of shares issued. |
| *** | The expense ratios exclude the impact of fees/expenses paid by each underlying fund. |
| (a) | Period from commencement of operations. |
| (b) | Per share net investment income (loss) has been calculated using the average daily shares method. |
| (c) | Amount is less than $0.005. |
| (d) | Without the adoption of the change in amortization method as required by the November 2000 revised version of the AICPA Audit and Accounting Guide for Investment Companies, the amounts for net investment income, net realized/unrealized gains (losses) and the net investment income ratio would have been: $0.46, $(0.05) and 4.51%, respectively. |
| (e) | Not annualized for periods less than one year. |
| (f) | Annualized for periods less than one year. |
See accompanying notes to the financial statements.
132
| | | | | | | | | | | | | | | | | | | |
| | | Total
Return
(excludes
sales charge) (e) | | | Ratios/Supplementary Data | |
Net Asset
Value,
End of
Period | | | Net Assets,
End of
Period
(000) | | Ratio of net
expenses to
average
net assets (f) | | | Ratio of net
investment
income
(loss) to
average net
assets (f) | | | Ratio of
expenses to
average
net assets* (f) | | | Portfolio
turnover rate** | |
| | | | | | | | | | | | | | | | | | | |
| $ | 10.13 | | 2.27 | % | | $ | 4,872 | | 1.68 | % | | 3.39 | % | | 1.79 | % | | 226.36 | % |
| $ | 10.32 | | 1.21 | % | | $ | 6,161 | | 1.71 | % | | 2.87 | % | | 1.84 | % | | 173.14 | % |
| $ | 10.59 | | 2.45 | % | | $ | 6,602 | | 1.82 | % | | 3.09 | % | | 1.94 | % | | 31.95 | % |
| $ | 10.72 | | 7.77 | % | | $ | 6,358 | | 1.83 | % | | 3.61 | % | | 1.94 | % | | 43.98 | % |
| $ | 10.34 | | 4.18 | % | | $ | 4,465 | | 1.84 | % | | 4.39 | %(d) | | 1.99 | % | | 69.15 | % |
| | | | | | | | | | | | | | | | | | | |
| $ | 1.00 | | 3.37 | % | | $ | 2,256 | | 1.48 | % | | 3.34 | % | | 1.59 | % | | — | |
| $ | 1.00 | | 1.32 | % | | $ | 1,790 | | 1.49 | % | | 1.28 | % | | 1.63 | % | | — | |
| $ | 1.00 | | 0.06 | % | | $ | 2,280 | | 1.20 | % | | 0.06 | % | | 1.70 | % | | — | |
| $ | 1.00 | | 0.15 | % | | $ | 2,543 | | 1.32 | % | | 0.16 | % | | 1.69 | % | | — | |
| $ | 1.00 | | 0.60 | % | | $ | 2,730 | | 1.67 | % | | 0.70 | % | | 1.77 | % | | — | |
| | | | | | | | | | | | | | | | | | | |
| $ | 1.00 | | 3.12 | % | | $ | 381 | | 1.46 | % | | 2.97 | % | | 1.59 | % | | — | |
| $ | 1.00 | | 1.09 | % | | $ | 807 | | 1.48 | % | | 1.05 | % | | 1.64 | % | | — | |
| $ | 1.00 | | 0.05 | % | | $ | 887 | | 1.05 | % | | 0.05 | % | | 1.71 | % | | — | |
| $ | 1.00 | | 0.16 | % | | $ | 1,126 | | 1.12 | % | | 0.15 | % | | 1.70 | % | | — | |
| $ | 1.00 | | 0.39 | % | | $ | 1,121 | | 1.69 | % | | 0.48 | % | | 1.77 | % | | — | |
| | | | | | | | | | | | | | | | | | | |
| $ | 1.00 | | 0.36 | % | | $ | 1 | | 1.39 | % | | 2.19 | % | | 1.78 | % | | — | |
| | | | | | | | | | | | | | | | | | | |
| $ | 9.96 | | 4.75 | % | | $ | 4,968 | | 1.08 | % | | 2.37 | % | | 1.45 | % | | 5.69 | % |
| $ | 9.76 | | 6.58 | % | | $ | 4,992 | | 1.20 | % | | 1.64 | % | | 1.51 | % | | 52.50 | % |
| $ | 9.30 | | 6.10 | % | | $ | 4,857 | | 1.44 | % | | 0.93 | % | | 1.64 | % | | 2.47 | % |
| $ | 8.85 | | 8.45 | % | | $ | 3,150 | | 1.53 | % | | 1.07 | % | | 1.73 | % | | 33.03 | % |
| $ | 8.29 | | (5.94 | )% | | $ | 1,682 | | 1.53 | % | | 1.49 | % | | 1.73 | % | | 6.29 | % |
| | | | | | | | | | | | | | | | | | | |
| $ | 10.05 | | 6.21 | % | | $ | 21,610 | | 1.10 | % | | 1.70 | % | | 1.47 | % | | 7.33 | % |
| $ | 9.64 | | 9.72 | % | | $ | 21,909 | | 1.24 | % | | 0.99 | % | | 1.55 | % | | 37.83 | % |
| $ | 8.86 | | 8.94 | % | | $ | 19,049 | | 1.49 | % | | 0.17 | % | | 1.69 | % | | 0.17 | % |
| $ | 8.15 | | 11.29 | % | | $ | 8,929 | | 1.50 | % | | 0.35 | % | | 1.70 | % | | 21.46 | % |
| $ | 7.41 | | (11.35 | )% | | $ | 4,384 | | 1.56 | % | | 0.52 | % | | 1.76 | % | | 14.56 | % |
| | | | | | | | | | | | | | | | | | | |
| $ | 10.05 | | 7.22 | % | | $ | 19,366 | | 1.11 | % | | 1.27 | % | | 1.48 | % | | 6.26 | % |
| $ | 9.51 | | 11.68 | % | | $ | 17,141 | | 1.23 | % | | 0.59 | % | | 1.57 | % | | 26.22 | % |
| $ | 8.55 | | 11.04 | % | | $ | 13,730 | | 1.50 | % | | (0.23 | )% | | 1.73 | % | | 0.19 | % |
| $ | 7.70 | | 13.31 | % | | $ | 9,142 | | 1.55 | % | | (0.16 | )% | | 1.75 | % | | 17.80 | % |
| $ | 6.80 | | (15.53 | )% | | $ | 5,712 | | 1.62 | % | | (0.35 | )% | | 1.82 | % | | 8.38 | % |
| | | | | | | | | | | | | | | | | | | |
| $ | 11.26 | | 8.51 | % | | $ | 8,023 | | 1.11 | % | | 0.80 | % | | 1.47 | % | | 1.48 | % |
| $ | 10.67 | | 14.11 | % | | $ | 7,515 | | 1.21 | % | | 0.11 | % | | 1.58 | % | | 2.14 | % |
| $ | 9.36 | | 12.77 | % | | $ | 5,720 | | 1.52 | % | | (0.54 | )% | | 1.81 | % | | 3.10 | % |
| $ | 8.30 | | 14.74 | % | | $ | 2,475 | | 1.70 | % | | (0.69 | )% | | 1.90 | % | | 8.30 | % |
| $ | 7.28 | | (18.48 | )% | | $ | 1,302 | | 1.67 | % | | (0.94 | )% | | 1.87 | % | | 5.75 | % |
See accompanying notes to the financial statements.
133
BB&T Funds
Financial Highlights, Class C Shares
Selected data for a share of beneficial interest outstanding throughout the periods indicated.
| | | | | | | | | | | | | | | | | | | | | |
| | | Net Asset
Value,
Beginning
of Period | | Investment Activities | | | Dividends | |
| | | | Net
investment
income
(loss) | | | Net realized/
unrealized
gains (losses)
on investments
and foreign
currency
transactions | | | Total from
Investment
Activities | | | Net
investment
income | | | Net realized
gains on
investments
and foreign
currency
transactions | | | Total
Dividends | |
Large Cap Fund | | | | | | | | | | | | | | | | | | | | | |
Year Ended September 30, 2006 | | $ | 19.28 | | 0.16 | (b) | | 2.26 | | | 2.42 | | | (0.15 | ) | | (1.44 | ) | | (1.59 | ) |
Year Ended September 30, 2005 | | $ | 17.09 | | 0.14 | | | 2.19 | | | 2.33 | | | (0.14 | ) | | — | | | (0.14 | ) |
Year Ended September 30, 2004 | | $ | 14.73 | | 0.09 | | | 2.37 | | | 2.46 | | | (0.10 | ) | | — | | | (0.10 | ) |
Year Ended September 30, 2003 | | $ | 12.74 | | 0.13 | | | 1.99 | | | 2.12 | | | (0.13 | ) | | — | | | (0.13 | ) |
Year Ended September 30, 2002 | | $ | 16.67 | | 0.08 | | | (3.45 | ) | | (3.37 | ) | | (0.08 | ) | | (0.48 | ) | | (0.56 | ) |
Large Cap Growth Fund | | | | | | | | | | | | | | | | | | | | | |
Year Ended September 30, 2006 | | $ | 8.47 | | (0.05 | )(b) | | (0.04 | ) | | (0.09 | ) | | — | | | — | | | — | |
Year Ended September 30, 2005 | | $ | 7.81 | | (0.04 | )(b) | | 0.73 | | | 0.69 | | | (0.03 | ) | | — | | | (0.03 | ) |
Year Ended September 30, 2004 | | $ | 7.37 | | (0.12 | ) | | 0.56 | | | 0.44 | | | — | | | — | | | — | |
Year Ended September 30, 2003 | | $ | 6.37 | | (0.08 | )(b) | | 1.08 | | | 1.00 | | | — | | | — | | | — | |
Year Ended September 30, 2002 | | $ | 7.94 | | (0.10 | )(b) | | (1.47 | ) | | (1.57 | ) | | — | | | — | | | — | |
Mid Cap Value Fund | | | | | | | | | | | | | | | | | | | | | |
Year Ended September 30, 2006 | | $ | 13.16 | | (0.07 | )(b) | | 1.59 | | | 1.52 | | | — | (c) | | (1.45 | ) | | (1.45 | ) |
Year Ended September 30, 2005 | | $ | 15.30 | | — | (b)(c) | | 3.02 | | | 3.02 | | | (0.07 | ) | | (5.09 | ) | | (5.16 | ) |
Year Ended September 30, 2004 | | $ | 12.92 | | 0.07 | (b) | | 2.41 | | | 2.48 | | | (0.10 | ) | | — | | | (0.10 | ) |
Year Ended September 30, 2003 | | $ | 10.90 | | 0.07 | (b) | | 2.04 | | | 2.11 | | | (0.09 | ) | | — | | | (0.09 | ) |
Year Ended September 30, 2002 | | $ | 13.11 | | 0.08 | | | (1.04 | ) | | (0.96 | ) | | (0.10 | ) | | (1.15 | ) | | (1.25 | ) |
Mid Cap Growth Fund | | | | | | | | | | | | | | | | | | | | | |
Year Ended September 30, 2006 | | $ | 13.47 | | (0.09 | )(b) | | — | (c) | | (0.09 | ) | | — | | | (1.42 | ) | | (1.42 | ) |
Year Ended September 30, 2005 | | $ | 10.70 | | (0.17 | )(b) | | 3.08 | | | 2.91 | | | — | | | (0.14 | ) | | (0.14 | ) |
Year Ended September 30, 2004 | | $ | 9.69 | | (0.16 | ) | | 1.17 | �� | | 1.01 | | | — | | | — | | | — | |
Year Ended September 30, 2003 | | $ | 8.00 | | (0.15 | ) | | 1.84 | | | 1.69 | | | — | | | — | | | — | |
Year Ended September 30, 2002 | | $ | 9.79 | | (0.15 | )(b) | | (1.01 | ) | | (1.16 | ) | | — | | | (0.63 | ) | | (0.63 | ) |
Small Cap Fund | | | | | | | | | | | | | | | | | | | | | |
Year Ended September 30, 2006 | | $ | 16.10 | | (0.11 | )(b) | | 1.03 | | | 0.92 | | | (0.01 | ) | | (2.30 | ) | | (2.31 | ) |
Year Ended September 30, 2005 | | $ | 14.06 | | (0.02 | )(b) | | 2.60 | | | 2.58 | | | (0.12 | ) | | (0.42 | ) | | (0.54 | ) |
Year Ended September 30, 2004 | | $ | 11.40 | | (0.12 | )(b) | | 2.90 | | | 2.78 | | | — | | | (0.12 | ) | | (0.12 | ) |
May 19, 2003 to September 30, 2003 (a) | | $ | 10.00 | | (0.05 | )(b) | | 1.45 | | | 1.40 | | | — | | | — | | | — | |
International Equity Fund | | | | | | | | | | | | | | | | | | | | | |
Year Ended September 30, 2006 | | $ | 9.07 | | 0.05 | (b) | | 1.42 | | | 1.47 | | | (0.10 | ) | | — | | | (0.10 | ) |
Year Ended September 30, 2005 | | $ | 7.74 | | 0.06 | (b) | | 1.36 | | | 1.42 | | | (0.09 | ) | | — | | | (0.09 | ) |
Year Ended September 30, 2004 | | $ | 6.58 | | — | (b) | | 1.20 | | | 1.20 | | | (0.04 | ) | | — | | | (0.04 | ) |
Year Ended September 30, 2003 | | $ | 6.07 | | (0.07 | )(b) | | 0.60 | | | 0.53 | | | (0.02 | ) | | — | | | (0.02 | ) |
Year Ended September 30, 2002 | | $ | 7.20 | | (0.07 | ) | | (1.06 | ) | | (1.13 | ) | | — | | | — | | | — | |
Special Opportunities Equity Fund | | | | | | | | | | | | | | | | | | | | | |
Year Ended September 30, 2006 | | $ | 15.30 | | (0.14 | ) | | 1.64 | | | 1.50 | | | — | | | (0.79 | ) | | (0.79 | ) |
Year Ended September 30, 2005 | | $ | 12.95 | | (0.13 | ) | | 2.60 | | | 2.47 | | | — | | | (0.12 | ) | | (0.12 | ) |
Year Ended September 30, 2004 | | $ | 10.50 | | (0.11 | ) | | 2.64 | | | 2.53 | | | — | | | (0.08 | ) | | (0.08 | ) |
June 2, 2003 to September 30, 2003 (a) | | $ | 10.00 | | (0.02 | ) | | 0.52 | | | 0.50 | | | — | | | — | | | — | |
Equity Income Fund | | | | | | | | | | | | | | | | | | | | | |
Year Ended September 30, 2006 | | $ | 12.07 | | 0.19 | | | 1.56 | | | 1.75 | | | (0.23 | ) | | (0.27 | ) | | (0.50 | ) |
Year Ended September 30, 2005 | | $ | 10.34 | | 0.17 | | | 1.76 | | | 1.93 | | | (0.18 | ) | | (0.02 | ) | | (0.20 | ) |
June 30, 2004 to September 30, 2004 (a) | | $ | 10.00 | | 0.03 | (b) | | 0.34 | | | 0.37 | | | (0.03 | ) | | — | | | (0.03 | ) |
Intermediate U.S. Government Fund | | | | | | | | | | | | | | | | | | | | | |
Year Ended September 30, 2006 | | $ | 9.98 | | 0.34 | (b) | | (0.12 | ) | | 0.22 | | | (0.34 | ) | | — | | | (0.34 | ) |
Year Ended September 30, 2005 | | $ | 10.20 | | 0.27 | (b) | | (0.13 | ) | | 0.14 | | | (0.31 | ) | | (0.05 | ) | | (0.36 | ) |
Year Ended September 30, 2004 | | $ | 10.53 | | 0.17 | | | (0.12 | ) | | 0.05 | | | (0.25 | ) | | (0.13 | ) | | (0.38 | ) |
Year Ended September 30, 2003 | | $ | 10.74 | | 0.26 | | | (0.07 | ) | | 0.19 | | | (0.31 | ) | | (0.09 | ) | | (0.40 | ) |
Year Ended September 30, 2002 | | $ | 10.35 | | 0.38 | (d) | | 0.43 | (d) | | 0.81 | | | (0.42 | ) | | — | | | (0.42 | ) |
| * | During the period certain fees were reduced. If such reductions had not occurred, the ratios would have been as indicated. |
| ** | Portfolio turnover rate is calculated on the basis of the Fund as a whole without distinguishing between classes of shares issued. |
| (a) | Period from commencement of operations. |
| (b) | Per share net investment income (loss) has been calculated using the average daily shares method. |
| (c) | Amount is less than $0.005. |
| (d) | Without the adoption of the change in amortization method as required by the November 2000 revised version of the AICPA Audit and Accounting Guide for Investment Companies, the amounts for net investment income, net realized/unrealized gains (losses), and the net investment income ratio would have been: $0.40, $0.41 and 3.99%, respectively. |
| (e) | Not annualized for periods less than one year. |
| (f) | Annualized for periods less than one year. |
See accompanying notes to the financial statements.
134
| | | | | | | | | | | | | | | | | | | |
Net Asset
Value,
End of
Period | | Total
Return
(excludes
sales charge) (e) | | | Ratios/Supplementary Data | |
| | | Net Assets,
End of
Period
(000) | | Ratio of net
expenses to
average
net assets (f) | | |
Ratio of net
investment
income
(loss) to
average net
assets (f) | | | Ratio of
expenses to
average
net assets* (f) | | | Portfolio
turnover rate** | |
| | | | | | | | | | | | | | | | | | | |
| $ | 20.11 | | 13.42 | % | | $ | 161 | | 1.88 | % | | 0.82 | % | | 1.94 | % | | 34.83 | % |
| $ | 19.28 | | 13.77 | % | | $ | 176 | | 1.88 | % | | 0.80 | % | | 1.98 | % | | 19.50 | % |
| $ | 17.09 | | 16.72 | % | | $ | 157 | | 1.95 | % | | 0.57 | % | | 2.07 | % | | 16.40 | % |
| $ | 14.73 | | 16.72 | % | | $ | 122 | | 1.92 | % | | 0.90 | % | | 2.06 | % | | 18.89 | % |
| $ | 12.74 | | (21.10 | )% | | $ | 52 | | 1.94 | % | | 0.41 | % | | 2.08 | % | | 23.02 | % |
| | | | | | | | | | | | | | | | | | | |
| $ | 8.38 | | (1.18 | )% | | $ | 37 | | 1.89 | % | | (0.56 | )% | | 1.93 | % | | 186.19 | % |
| $ | 8.47 | | 8.90 | % | | $ | 18 | | 1.89 | % | | (0.43 | )% | | 1.98 | % | | 62.78 | % |
| $ | 7.81 | | 5.97 | % | | $ | 25 | | 1.96 | % | | (1.08 | )% | | 2.08 | % | | 127.47 | % |
| $ | 7.37 | | 15.70 | % | | $ | 31 | | 1.93 | % | | (1.10 | )% | | 2.06 | % | | 91.73 | % |
| $ | 6.37 | | (19.77 | )% | | $ | 37 | | 1.98 | % | | (1.23 | )% | | 2.12 | % | | 100.46 | % |
| | | | | | | | | | | | | | | | | | | |
| $ | 13.23 | | 12.38 | % | | $ | 743 | | 1.89 | % | | (0.53 | )% | | 1.93 | % | | 53.92 | % |
| $ | 13.16 | | 19.97 | % | | $ | 351 | | 1.90 | % | | 0.01 | % | | 2.00 | % | | 126.99 | % |
| $ | 15.30 | | 19.20 | % | | $ | 523 | | 1.98 | % | | 0.45 | % | | 2.10 | % | | 19.17 | % |
| $ | 12.92 | | 19.40 | % | | $ | 484 | | 1.95 | % | | 0.61 | % | | 2.10 | % | | 18.28 | % |
| $ | 10.90 | | (8.86 | )% | | $ | 300 | | 1.91 | % | | 0.65 | % | | 2.12 | % | | 18.20 | % |
| | | | | | | | | | | | | | | | | | | |
| $ | 11.96 | | (1.15 | )% | | $ | 33 | | 1.88 | % | | (0.70 | )% | | 1.93 | % | | 140.90 | % |
| $ | 13.47 | | 27.42 | % | | $ | 77 | | 1.91 | % | | (1.46 | )% | | 2.00 | % | | 92.74 | % |
| $ | 10.70 | | 10.42 | % | | $ | 208 | | 2.00 | % | | (1.65 | )% | | 2.11 | % | | 138.61 | % |
| $ | 9.69 | | 21.13 | % | | $ | 164 | | 1.95 | % | | (1.71 | )% | | 2.11 | % | | 125.97 | % |
| $ | 8.00 | | (13.20 | )% | | $ | 143 | | 1.81 | % | | (1.58 | )% | | 2.13 | % | | 117.06 | % |
| | | | | | | | | | | | | | | | | | | |
| $ | 14.71 | | 6.17 | % | | $ | 20 | | 2.03 | % | | (0.76 | )% | | 2.27 | % | | 43.25 | % |
| $ | 16.10 | | 18.71 | % | | $ | 4 | | 2.04 | % | | (0.12 | )% | | 2.25 | % | | 8.39 | % |
| $ | 14.06 | | 24.56 | % | | $ | 1 | | 2.25 | % | | (0.89 | )% | | 2.44 | % | | 11.25 | % |
| $ | 11.40 | | 14.00 | % | | $ | 1 | | 2.64 | % | | (1.15 | )% | | 2.64 | % | | 48.84 | % |
| | | | | | | | | | | | | | | | | | | |
| $ | 10.44 | | 16.26 | % | | $ | 188 | | 2.15 | % | | 0.47 | % | | 2.25 | % | | 36.22 | % |
| $ | 9.07 | | 18.38 | % | | $ | 92 | | 2.23 | % | | 0.70 | % | | 2.34 | % | | 44.96 | % |
| $ | 7.74 | | 18.30 | % | | $ | 2 | | 2.32 | % | | (0.04 | )% | | 2.42 | % | | 50.68 | % |
| $ | 6.58 | | 8.80 | % | | $ | 2 | | 2.40 | % | | (1.06 | )% | | 2.40 | % | | 199.78 | % |
| $ | 6.07 | | (15.69 | )% | | $ | 7 | | 2.43 | % | | (0.98 | )% | | 2.43 | % | | 95.86 | % |
| | | | | | | | | | | | | | | | | | | |
| $ | 16.01 | | 10.34 | % | | $ | 34,418 | | 2.03 | % | | (1.02 | )% | | 2.03 | % | | 58.01 | % |
| $ | 15.30 | | 19.16 | % | | $ | 30,299 | | 2.06 | % | | (1.17 | )% | | 2.08 | % | | 30.38 | % |
| $ | 12.95 | | 24.17 | % | | $ | 15,611 | | 2.15 | % | | (1.51 | )% | | 2.30 | % | | 32.06 | % |
| $ | 10.50 | | 5.00 | % | | $ | 4,052 | | 1.80 | % | | (1.17 | )% | | 2.52 | % | | 13.24 | % |
| | | | | | | | | | | | | | | | | | | |
| $ | 13.32 | | 14.85 | % | | $ | 14,261 | | 1.95 | % | | 1.52 | % | | 1.95 | % | | 45.38 | % |
| $ | 12.07 | | 18.74 | % | | $ | 8,683 | | 1.87 | % | | 1.77 | % | | 2.08 | % | | 39.65 | % |
| $ | 10.34 | | 3.66 | % | | $ | 1,816 | | 2.29 | % | | 1.14 | % | | 2.65 | % | | 1.65 | % |
| | | | | | | | | | | | | | | | | | | |
| $ | 9.86 | | 2.31 | % | | $ | 207 | | 1.68 | % | | 3.47 | % | | 1.79 | % | | 127.13 | % |
| $ | 9.98 | | 1.33 | % | | $ | 274 | | 1.71 | % | | 2.66 | % | | 1.84 | % | | 107.04 | % |
| $ | 10.20 | | 0.55 | % | | $ | 607 | | 1.80 | % | | 2.15 | % | | 1.92 | % | | 98.35 | % |
| $ | 10.53 | | 1.77 | % | | $ | 836 | | 1.82 | % | | 2.57 | % | | 1.92 | % | | 209.07 | % |
| $ | 10.74 | | 8.05 | % | | $ | 1,313 | | 1.79 | % | | 3.81 | %(d) | | 1.89 | % | | 79.36 | % |
See accompanying notes to the financial statements.
135
BB&T Funds
Financial Highlights, Class C Shares
Selected data for a share of beneficial interest outstanding throughout the periods indicated.
| | | | | | | | | | | | | | | | | | | | | |
| | | | | Investment Activities | | | Dividends | |
| | | Net Asset
Value,
Beginning
of Period | | Net
investment
income
(loss) | | |
Net realized/
unrealized
gains (losses)
on investments | | | Total from
Investment
Activities | | | Net
investment
income | | | Net realized
gains on
investments | | | Total
Dividends | |
Total Return Bond Fund | | | | | | | | | | | | | | | | | | | | | |
Year Ended September 30, 2006 | | $ | 10.32 | | 0.34 | (b) | | (0.12 | ) | | 0.22 | | | (0.36 | ) | | (0.05 | ) | | (0.41 | ) |
Year Ended September 30, 2005 | | $ | 10.59 | | 0.30 | (b) | | (0.18 | ) | | 0.12 | | | (0.36 | ) | | (0.03 | ) | | (0.39 | ) |
Year Ended September 30, 2004 | | $ | 10.72 | | 0.33 | | | (0.08 | ) | | 0.25 | | | (0.38 | ) | | — | | | (0.38 | ) |
Year Ended September 30, 2003 | | $ | 10.33 | | 0.39 | | | 0.41 | | | 0.80 | | | (0.41 | ) | | — | | | (0.41 | ) |
Year Ended September 30, 2002 | | $ | 10.56 | | 0.43 | (b)(d) | | — | (d) | | 0.43 | | | (0.49 | ) | | (0.17 | ) | | (0.66 | ) |
Prime Money Market Fund | | | | | | | | | | | | | | | | | | | | | |
Year Ended September 30, 2006 | | $ | 1.00 | | 0.03 | | | — | (c) | | 0.03 | | | (0.03 | ) | | — | | | (0.03 | ) |
Year Ended September 30, 2005 | | $ | 1.00 | | 0.01 | | | — | (c) | | 0.01 | | | (0.01 | ) | | — | | | (0.01 | ) |
Year Ended September 30, 2004 | | $ | 1.00 | | — | (c) | | — | (c) | | — | (c) | | — | (c) | | — | | | — | (c) |
Year Ended September 30, 2003 | | $ | 1.00 | | — | (c) | | — | | | — | (c) | | — | (c) | | — | | | — | (c) |
January 30, 2002 to September 30, 2002 (a) | | $ | 1.00 | | 0.01 | | | — | | | 0.01 | | | (0.01 | ) | | — | | | (0.01 | ) |
U.S. Treasury Money Market Fund | | | | | | | | | | | | | | | | | | | | | |
Year Ended September 30, 2006 | | $ | 1.00 | | 0.03 | | | — | | | 0.03 | | | (0.03 | ) | | — | | | (0.03 | ) |
Year Ended September 30, 2005 | | $ | 1.00 | | 0.01 | | | — | | | 0.01 | | | (0.01 | ) | | — | | | (0.01 | ) |
Year Ended September 30, 2004 | | $ | 1.00 | | — | (c) | | — | | | — | (c) | | — | (c) | | — | | | — | (c) |
Year Ended September 30, 2003 | | $ | 1.00 | | — | (c) | | — | | | — | (c) | | — | (c) | | — | | | — | (c) |
January 30, 2002 to September 30, 2002 (a) | | $ | 1.00 | | — | (c) | | — | | | — | (c) | | — | (c) | | — | | | — | (c) |
National Tax-Free Money Market Fund | | | | | | | | | | | | | | | | | | | | | |
August 1, 2006 to September 30, 2006 (a) | | $ | 1.00 | | — | (c) | | — | | | — | (c) | | — | (c) | | — | | | — | (c) |
Capital Manager Conservative Growth Fund*** | | | | | | | | | | | | | | | | | | | | | |
Year Ended September 30, 2006 | | $ | 9.73 | | 0.23 | (b) | | 0.23 | | | 0.46 | | | (0.26 | ) | | — | | | (0.26 | ) |
Year Ended September 30, 2005 | | $ | 9.27 | | 0.16 | | | 0.45 | | | 0.61 | | | (0.15 | ) | | — | | | (0.15 | ) |
Year Ended September 30, 2004 | | $ | 8.82 | | 0.09 | (b) | | 0.44 | | | 0.53 | | | (0.08 | ) | | — | | | (0.08 | ) |
Year Ended September 30, 2003 | | $ | 8.26 | | 0.09 | | | 0.61 | | | 0.70 | | | (0.10 | ) | | (0.04 | ) | | (0.14 | ) |
Year Ended September 30, 2002 | | $ | 9.10 | | 0.17 | | | (0.69 | ) | | (0.52 | ) | | (0.14 | ) | | (0.18 | ) | | (0.32 | ) |
Capital Manager Moderate Growth Fund*** | | | | | | | | | | | | | | | | | | | | | |
Year Ended September 30, 2006 | | $ | 9.69 | | 0.17 | (b) | | 0.42 | | | 0.59 | | | (0.18 | ) | | — | | | (0.18 | ) |
Year Ended September 30, 2005 | | $ | 8.91 | | 0.09 | (b) | | 0.77 | | | 0.86 | | | (0.08 | ) | | — | | | (0.08 | ) |
Year Ended September 30, 2004 | | $ | 8.18 | | 0.01 | (b) | | 0.73 | | | 0.74 | | | (0.01 | ) | | — | | | (0.01 | ) |
Year Ended September 30, 2003 | | $ | 7.42 | | 0.03 | | | 0.82 | | | 0.85 | | | (0.08 | ) | | (0.01 | ) | | (0.09 | ) |
Year Ended September 30, 2002 | | $ | 8.77 | | 0.04 | | | (0.97 | ) | | (0.93 | ) | | (0.05 | ) | | (0.37 | ) | | (0.42 | ) |
Capital Manager Growth Fund*** | | | | | | | | | | | | | | | | | | | | | |
Year Ended September 30, 2006 | | $ | 9.52 | | 0.11 | (b) | | 0.57 | | | 0.68 | | | (0.15 | ) | | — | | | (0.15 | ) |
Year Ended September 30, 2005 | | $ | 8.56 | | 0.04 | (b) | | 0.95 | | | 0.99 | | | (0.03 | ) | | — | | | (0.03 | ) |
Year Ended September 30, 2004 | | $ | 7.71 | | (0.02 | )(b) | | 0.87 | | | 0.85 | | | — | | | — | | | — | |
Year Ended September 30, 2003 | | $ | 6.80 | | (0.01 | )(b) | | 0.93 | | | 0.92 | | | (0.01 | ) | | — | | | (0.01 | ) |
Year Ended September 30, 2002 | | $ | 8.41 | | (0.02 | ) | | (1.19 | ) | | (1.21 | ) | | — | | | (0.40 | ) | | (0.40 | ) |
Capital Manager Equity Fund*** | | | | | | | | | | | | | | | | | | | | | |
Year Ended September 30, 2006 | | $ | 10.64 | | 0.10 | (b) | | 0.78 | | | 0.88 | | | (0.11 | ) | | (0.19 | ) | | (0.30 | ) |
Year Ended September 30, 2005 | | $ | 9.33 | | (0.01 | )(b) | | 1.32 | | | 1.31 | | | — | (c) | | — | | | — | (c) |
Year Ended September 30, 2004 | | $ | 8.28 | | (0.05 | )(b) | | 1.10 | | | 1.05 | | | — | | | — | | | — | |
Year Ended September 30, 2003 | | $ | 7.26 | | (0.05 | )(b) | | 1.12 | | | 1.07 | | | — | (c) | | (0.05 | ) | | (0.05 | ) |
Year Ended September 30, 2002 | | $ | 8.92 | | (0.12 | ) | | (1.54 | ) | | (1.66 | ) | | — | | | — | | | — | |
| * | During the period certain fees were reduced. If such reductions had not occurred, the ratios would have been as indicated. |
| ** | Portfolio turnover rate is calculated on the basis of the Fund as a whole without distinguishing between classes of shares issued. |
| *** | The expense ratios exclude the impact of fees/expenses paid by each underlying fund. |
| (a) | Period from commencement of operations. |
| (b) | Per share net investment income (loss) has been calculated using the average daily shares method. |
| (c) | Amount is less than $0.005. |
| (d) | Without the adoption of the change in amortization method as required by the November 2000 revised version of the AICPA Audit and Accounting Guide for Investment Companies, the amounts for net investment income, net realized/unrealized gains (losses) and the net investment income ratio would have been: $0.44, $(0.01) and 4.40%, respectively. |
| (e) | Not annualized for periods less than one year. |
| (f) | Annualized for periods less than one year. |
See accompanying notes to the financial statements.
136
| | | | | | | | | | | | | | | | | | | |
| | | | | | Ratios/Supplementary Data | |
Net Asset
Value,
End of
Period | | Total
Return
(excludes
sales charge) (e) | | | Net Assets,
End of
Period
(000) | | Ratio of net
expenses to
average
net assets (f) | | | Ratio of net
investment
income
(loss) to
average net
assets (f) | | | Ratio of
expenses to
average
net assets* (f) | | | Portfolio
turnover rate** | |
| | | | | | | | | | | | | | | | | | | |
| $ | 10.13 | | 2.18 | % | | $ | 116 | | 1.68 | % | | 3.35 | % | | 1.79 | % | | 226.36 | % |
| $ | 10.32 | | 1.21 | % | | $ | 218 | | 1.71 | % | | 2.88 | % | | 1.84 | % | | 173.74 | % |
| $ | 10.59 | | 2.44 | % | | $ | 257 | | 1.82 | % | | 3.09 | % | | 1.94 | % | | 31.95 | % |
| $ | 10.72 | | 7.86 | % | | $ | 282 | | 1.83 | % | | 3.61 | % | | 1.94 | % | | 43.98 | % |
| $ | 10.33 | | 4.37 | % | | $ | 318 | | 1.89 | % | | 4.28 | %(d) | | 2.03 | % | | 69.15 | % |
| | | | | | | | | | | | | | | | | | | |
| $ | 1.00 | | 3.35 | % | | $ | 393 | | 1.48 | % | | 3.35 | % | | 1.59 | % | | — | |
| $ | 1.00 | | 1.32 | % | | $ | 326 | | 1.49 | % | | 1.29 | % | | 1.64 | % | | — | |
| $ | 1.00 | | 0.06 | % | | $ | 453 | | 1.20 | % | | 0.06 | % | | 1.70 | % | | — | |
| $ | 1.00 | | 0.15 | % | | $ | 555 | | 1.30 | % | | 0.14 | % | | 1.69 | % | | — | |
| $ | 1.00 | | 0.28 | % | | $ | 314 | | 1.60 | % | | 0.40 | % | | 1.65 | % | | — | |
| | | | | | | | | | | | | | | | | | | |
| $ | 1.00 | | 3.13 | % | | $ | 55 | | 1.45 | % | | 3.30 | % | | 1.59 | % | | — | |
| $ | 1.00 | | 1.07 | % | | $ | 38 | | 1.50 | % | | 1.40 | % | | 1.66 | % | | — | |
| $ | 1.00 | | 0.05 | % | | $ | 5 | | 1.02 | % | | 0.05 | % | | 1.71 | % | | — | |
| $ | 1.00 | | 0.16 | % | | $ | 8 | | 1.12 | % | | 0.17 | % | | 1.70 | % | | — | |
| $ | 1.00 | | 0.18 | % | | $ | 10 | | 1.60 | % | | 0.27 | % | | 1.64 | % | | — | |
| | | | | | | | | | | | | | | | | | | |
| $ | 1.00 | | 0.36 | % | | $ | 1 | | 1.39 | % | | 2.19 | % | | 1.78 | % | | — | |
| | | | | | | | | | | | | | | | | | | |
| $ | 9.93 | | 4.75 | % | | $ | 127 | | 1.08 | % | | 2.35 | % | | 1.45 | % | | 5.69 | % |
| $ | 9.73 | | 6.58 | % | | $ | 155 | | 1.20 | % | | 1.63 | % | | 1.52 | % | | 52.50 | % |
| $ | 9.27 | | 6.06 | % | | $ | 180 | | 1.44 | % | | 0.93 | % | | 1.64 | % | | 2.47 | % |
| $ | 8.82 | | 8.50 | % | | $ | 148 | | 1.53 | % | | 1.05 | % | | 1.73 | % | | 33.03 | % |
| $ | 8.26 | | (5.98 | )% | | $ | 62 | | 1.52 | % | | 1.45 | % | | 1.72 | % | | 6.29 | % |
| | | | | | | | | | | | | | | | | | | |
| $ | 10.10 | | 6.19 | % | | $ | 139 | | 1.10 | % | | 1.71 | % | | 1.47 | % | | 7.33 | % |
| $ | 9.69 | | 9.62 | % | | $ | 122 | | 1.25 | % | | 0.95 | % | | 1.56 | % | | 37.83 | % |
| $ | 8.91 | | 9.08 | % | | $ | 178 | | 1.49 | % | | 0.17 | % | | 1.69 | % | | 0.17 | % |
| $ | 8.18 | | 11.39 | % | | $ | 182 | | 1.51 | % | | 0.40 | % | | 1.71 | % | | 21.46 | % |
| $ | 7.42 | | (11.40 | )% | | $ | 307 | | 1.58 | % | | 0.53 | % | | 1.78 | % | | 14.56 | % |
| | | | | | | | | | | | | | | | | | | |
| $ | 10.05 | | 7.19 | % | | $ | 61 | | 1.11 | % | | 1.17 | % | | 1.46 | % | | 6.26 | % |
| $ | 9.52 | | 11.61 | % | | $ | 37 | | 1.26 | % | | 0.43 | % | | 1.59 | % | | 26.22 | % |
| $ | 8.56 | | 11.02 | % | | $ | 63 | | 1.50 | % | | (0.23 | )% | | 1.73 | % | | 0.19 | % |
| $ | 7.71 | | 13.48 | % | | $ | 52 | | 1.54 | % | | (0.14 | )% | | 1.74 | % | | 17.80 | % |
| $ | 6.80 | | (15.43 | )% | | $ | 12 | | 1.61 | % | | (0.34 | )% | | 1.81 | % | | 8.38 | % |
| | | | | | | | | | | | | | | | | | | |
| $ | 11.22 | | 8.44 | % | | $ | 10 | | 1.11 | % | | 0.90 | % | | 1.48 | % | | 1.48 | % |
| $ | 10.64 | | 14.15 | % | | $ | 19 | | 1.27 | % | | (0.09 | )% | | 1.63 | % | | 2.14 | % |
| $ | 9.33 | | 12.68 | % | | $ | 85 | | 1.52 | % | | (0.54 | )% | | 1.81 | % | | 3.10 | % |
| $ | 8.28 | | 14.78 | % | | $ | 28 | | 1.73 | % | | (0.66 | )% | | 1.92 | % | | 8.30 | % |
| $ | 7.26 | | (18.61 | )% | | $ | 1 | | 1.94 | % | | (1.31 | )% | | 1.94 | % | | 5.75 | % |
See accompanying notes to the financial statements.
137
BB&T Funds
Financial Highlights, Institutional Shares
Selected data for a share of beneficial interest outstanding throughout the periods indicated.
| | | | | | | | | | | | | | | | | | | | | |
| | | | | Investment Activities | | | Dividends | |
| | | Net Asset
Value,
Beginning
of Period | | Net
investment
income
(loss) | | | Net realized/
unrealized
gains (losses)
on investments
and foreign
currency
transactions | | | Total from
Investment
Activities | | | Net
investment
income | | | Net realized
gains on
investments
and foreign
currency
transactions | | | Total
Dividends | |
Large Cap Fund | | | | | | | | | | | | | | | | | | | | | |
Year Ended September 30, 2006 | | $ | 19.51 | | 0.35 | (b) | | 2.31 | | | 2.66 | | | (0.35 | ) | | (1.44 | ) | | (1.79 | ) |
Year Ended September 30, 2005 | | $ | 17.29 | | 0.34 | | | 2.22 | | | 2.56 | | | (0.34 | ) | | — | | | (0.34 | ) |
Year Ended September 30, 2004 | | $ | 14.90 | | 0.26 | | | 2.39 | | | 2.65 | | | (0.26 | ) | | — | | | (0.26 | ) |
Year Ended September 30, 2003 | | $ | 12.87 | | 0.27 | | | 2.03 | | | 2.30 | | | (0.27 | ) | | — | | | (0.27 | ) |
Year Ended September 30, 2002 | | $ | 16.82 | | 0.22 | | | (3.47 | ) | | (3.25 | ) | | (0.22 | ) | | (0.48 | ) | | (0.70 | ) |
Large Cap Growth Fund | | | | | | | | | | | | | | | | | | | | | |
Year Ended September 30, 2006 | | $ | 9.12 | | 0.04 | (b) | | (0.05 | ) | | (0.01 | ) | | (0.03 | ) | | — | | | (0.03 | ) |
Year Ended September 30, 2005 | | $ | 8.35 | | 0.06 | (b) | | 0.77 | | | 0.83 | | | (0.06 | ) | | — | | | (0.06 | ) |
Year Ended September 30, 2004 | | $ | 7.79 | | (0.01 | ) | | 0.57 | | | 0.56 | | | — | | | — | | | — | |
Year Ended September 30, 2003 | | $ | 6.67 | | (0.01 | )(b) | | 1.13 | | | 1.12 | | | — | | | — | | | — | |
Year Ended September 30, 2002 | | $ | 8.23 | | (0.03 | ) | | (1.53 | ) | | (1.56 | ) | | — | | | — | | | — | |
Mid Cap Value Fund | | | | | | | | | | | | | | | | | | | | | |
Year Ended September 30, 2006 | | $ | 13.38 | | 0.06 | (b) | | 1.62 | | | 1.68 | | | (0.07 | ) | | (1.45 | ) | | (1.52 | ) |
Year Ended September 30, 2005 | | $ | 15.41 | | 0.17 | (b) | | 3.05 | | | 3.22 | | | (0.16 | ) | | (5.09 | ) | | (5.25 | ) |
Year Ended September 30, 2004 | | $ | 12.98 | | 0.22 | (b) | | 2.42 | | | 2.64 | | | (0.21 | ) | | — | | | (0.21 | ) |
Year Ended September 30, 2003 | | $ | 10.93 | | 0.19 | (b) | | 2.04 | | | 2.23 | | | (0.18 | ) | | — | | | (0.18 | ) |
Year Ended September 30, 2002 | | $ | 13.12 | | 0.20 | | | (1.04 | ) | | (0.84 | ) | | (0.20 | ) | | (1.15 | ) | | (1.35 | ) |
Mid Cap Growth Fund | | | | | | | | | | | | | | | | | | | | | |
Year Ended September 30, 2006 | | $ | 14.51 | | 0.02 | (b) | | 0.02 | (f) | | 0.04 | | | (0.04 | ) | | (1.42 | ) | | (1.46 | ) |
Year Ended September 30, 2005 | | $ | 11.40 | | (0.06 | )(b) | | 3.31 | | | 3.25 | | | — | | | (0.14 | ) | | (0.14 | ) |
Year Ended September 30, 2004 | | $ | 10.22 | | (0.08 | ) | | 1.26 | | | 1.18 | | | — | | | — | | | — | |
Year Ended September 30, 2003 | | $ | 8.36 | | (0.06 | ) | | 1.92 | | | 1.86 | | | — | | | — | | | — | |
Year Ended September 30, 2002 | | $ | 10.10 | | (0.06 | ) | | (1.05 | ) | | (1.11 | ) | | — | | | (0.63 | ) | | (0.63 | ) |
Small Cap Fund | | | | | | | | | | | | | | | | | | | | | |
Year Ended September 30, 2006 | | $ | 16.44 | | 0.05 | (b) | | 1.05 | | | 1.10 | | | (0.05 | ) | | (2.30 | ) | | (2.35 | ) |
Year Ended September 30, 2005 | | $ | 14.23 | | 0.16 | (b) | | 2.62 | | | 2.78 | | | (0.15 | ) | | (0.42 | ) | | (0.57 | ) |
Year Ended September 30, 2004 | | $ | 11.44 | | 0.02 | (b) | | 2.91 | | | 2.93 | | | (0.02 | ) | | (0.12 | ) | | (0.14 | ) |
May 19, 2003 to September 30, 2003 (a) | | $ | 10.00 | | (0.01 | )(b) | | 1.45 | | | 1.44 | | | — | (c) | | — | | | — | (c) |
International Equity Fund | | | | | | | | | | | | | | | | | | | | | |
Year Ended September 30, 2006 | | $ | 9.72 | | 0.18 | (b) | | 1.50 | | | 1.68 | | | (0.17 | ) | | — | | | (0.17 | ) |
Year Ended September 30, 2005 | | $ | 8.24 | | 0.12 | (b) | | 1.49 | | | 1.61 | | | (0.13 | ) | | — | | | (0.13 | ) |
Year Ended September 30, 2004 | | $ | 6.98 | | 0.10 | (b) | | 1.26 | | | 1.36 | | | (0.10 | ) | | — | | | (0.10 | ) |
Year Ended September 30, 2003 | | $ | 6.41 | | 0.05 | (b) | | 0.57 | | | 0.62 | | | (0.05 | ) | | — | | | (0.05 | ) |
Year Ended September 30, 2002 | | $ | 7.53 | | — | | | (1.12 | ) | | (1.12 | ) | | — | (c) | | — | | | — | (c) |
Special Opportunities Equity Fund | | | | | | | | | | | | | | | | | | | | | |
Year Ended September 30, 2006 | | $ | 15.65 | | — | (c) | | 1.71 | | | 1.71 | | | — | | | (0.79 | ) | | (0.79 | ) |
Year Ended September 30, 2005 | | $ | 13.12 | | (0.03 | ) | | 2.68 | | | 2.65 | | | — | | | (0.12 | ) | | (0.12 | ) |
Year Ended September 30, 2004 | | $ | 10.53 | | (0.05 | ) | | 2.72 | | | 2.67 | | | — | | | (0.08 | ) | | (0.08 | ) |
June 2, 2003 to September 30, 2003 (a) | | $ | 10.00 | | — | (c) | | 0.53 | | | 0.53 | | | — | (c) | | — | | | — | (c) |
Equity Income Fund | | | | | | | | | | | | | | | | | | | | | |
Year Ended September 30, 2006 | | $ | 12.10 | | 0.32 | | | 1.57 | | | 1.89 | | | (0.35 | ) | | (0.27 | ) | | (0.62 | ) |
Year Ended September 30, 2005 | | $ | 10.35 | | 0.28 | | | 1.76 | | | 2.04 | | | (0.27 | ) | | (0.02 | ) | | (0.29 | ) |
June 30, 2004 to September 30, 2004 (a) | | $ | 10.00 | | 0.05 | (b) | | 0.34 | | | 0.39 | | | (0.04 | ) | | — | | | (0.04 | ) |
| * | During the period certain fees were reduced. If such reductions had not occurred, the ratios would have been as indicated. |
| ** | Portfolio turnover rate is calculated on the basis of the Fund as a whole without distinguishing between classes of shares issued. |
| (a) | Period from commencement of operations. |
| (b) | Per share net investment income (loss) has been calculated using the average daily shares method. |
| (c) | Amount is less than $0.005. |
| (d) | Not annualized for periods less than one year. |
| (e) | Annualized for periods less than one year. |
| (f) | The amount shown for a share outstanding throughout the period does not accord with the change in aggregate gains and losses in the portfolio of securities during the period because of the timing of sales and purchases of Fund shares in relation to fluctuating market values during the period. |
See accompanying notes to the financial statements.
138
| | | | | | | | | | | | | | | | | | | |
| | | | | | Ratios/Supplementary Data | |
Net Asset
Value,
End of
Period | | Total
Return (d) | | | Net Assets,
End of
Period
(000) | | Ratio of net
expenses to
average
net assets (e) | | | Ratio of net
investment
income
(loss) to
average net
assets (e) | | | Ratio of
expenses to
average
net assets* (e) | | | Portfolio
turnover rate** | |
| | | | | | | | | | | | | | | | | | | |
| $ | 20.38 | | 14.59 | % | | $ | 660,667 | | 0.89 | % | | 1.80 | % | | 0.93 | % | | 34.83 | % |
| $ | 19.51 | | 14.92 | % | | $ | 605,493 | | 0.89 | % | | 1.82 | % | | 0.99 | % | | 19.50 | % |
| $ | 17.29 | | 17.86 | % | | $ | 620,186 | | 0.95 | % | | 1.58 | % | | 1.06 | % | | 16.40 | % |
| $ | 14.90 | | 17.98 | % | | $ | 475,289 | | 0.92 | % | | 1.90 | % | | 1.06 | % | | 18.89 | % |
| $ | 12.87 | | (20.33 | )% | | $ | 319,971 | | 0.98 | % | | 1.37 | % | | 1.12 | % | | 23.02 | % |
| | | | | | | | | | | | | | | | | | | |
| $ | 9.08 | | (0.10 | )% | | $ | 207,384 | | 0.88 | % | | 0.40 | % | | 0.93 | % | | 186.19 | % |
| $ | 9.12 | | 9.92 | % | | $ | 336,103 | | 0.89 | % | | 0.63 | % | | 0.99 | % | | 62.78 | % |
| $ | 8.35 | | 7.19 | % | | $ | 346,061 | | 0.97 | % | | (0.08 | )% | | 1.08 | % | | 127.47 | % |
| $ | 7.79 | | 16.79 | % | | $ | 272,961 | | 0.93 | % | | (0.11 | )% | | 1.07 | % | | 91.73 | % |
| $ | 6.67 | | (18.96 | )% | | $ | 160,933 | | 1.02 | % | | (0.30 | )% | | 1.16 | % | | 100.46 | % |
| | | | | | | | | | | | | | | | | | | |
| $ | 13.54 | | 13.52 | % | | $ | 209,685 | | 0.89 | % | | 0.48 | % | | 0.93 | % | | 53.92 | % |
| $ | 13.38 | | 21.14 | % | | $ | 172,295 | | 0.89 | % | | 1.02 | % | | 0.99 | % | | 126.99 | % |
| $ | 15.41 | | 20.44 | % | | $ | 182,791 | | 0.98 | % | | 1.47 | % | | 1.10 | % | | 19.17 | % |
| $ | 12.98 | | 20.60 | % | | $ | 142,280 | | 0.95 | % | | 1.57 | % | | 1.10 | % | | 18.28 | % |
| $ | 10.93 | | (8.01 | )% | | $ | 85,013 | | 0.90 | % | | 1.54 | % | | 1.13 | % | | 18.20 | % |
| | | | | | | | | | | | | | | | | | | |
| $ | 13.09 | | (0.15 | )% | | $ | 132,677 | | 0.89 | % | | 0.17 | % | | 0.94 | % | | 140.90 | % |
| $ | 14.51 | | 28.73 | % | | $ | 126,785 | | 0.91 | % | | (0.46 | )% | | 1.01 | % | | 92.74 | % |
| $ | 11.40 | | 11.55 | % | | $ | 118,012 | | 1.00 | % | | (0.65 | )% | | 1.11 | % | | 138.61 | % |
| $ | 10.22 | | 22.25 | % | | $ | 100,226 | | 0.95 | % | | (0.72 | )% | | 1.12 | % | | 125.97 | % |
| $ | 8.36 | | (12.26 | )% | | $ | 69,975 | | 0.89 | % | | (0.62 | )% | | 1.17 | % | | 117.06 | % |
| | | | | | | | | | | | | | | | | | | |
| $ | 15.19 | | 7.23 | % | | $ | 110,722 | | 1.02 | % | | 0.30 | % | | 1.26 | % | | 43.25 | % |
| $ | 16.44 | | 19.99 | % | | $ | 61,046 | | 1.05 | % | | 1.07 | % | | 1.28 | % | | 8.39 | % |
| $ | 14.23 | | 25.78 | % | | $ | 66,802 | | 1.26 | % | | 0.15 | % | | 1.42 | % | | 11.25 | % |
| $ | 11.44 | | 14.43 | % | | $ | 43,462 | | 1.69 | % | | (0.17 | )% | | 1.69 | % | | 48.84 | % |
| | | | | | | | | | | | | | | | | | | |
| $ | 11.23 | | 17.38 | % | | $ | 253,690 | | 1.15 | % | | 1.68 | % | | 1.25 | % | | 36.22 | % |
| $ | 9.72 | | 19.61 | % | | $ | 229,406 | | 1.20 | % | | 1.34 | % | | 1.33 | % | | 44.96 | % |
| $ | 8.24 | | 19.48 | % | | $ | 233,275 | | 1.32 | % | | 1.30 | % | | 1.42 | % | | 50.68 | % |
| $ | 6.98 | | 9.72 | % | | $ | 187,315 | | 1.40 | % | | 0.78 | % | | 1.41 | % | | 199.78 | % |
| $ | 6.41 | | (14.85 | )% | | $ | 123,330 | | 1.43 | % | | 0.03 | % | | 1.43 | % | | 95.86 | % |
| | | | | | | | | | | | | | | | | | | |
| $ | 16.57 | | 11.50 | % | | $ | 67,232 | | 1.03 | % | | (0.02 | )% | | 1.03 | % | | 58.01 | % |
| $ | 15.65 | | 20.29 | % | | $ | 60,823 | | 1.06 | % | | (0.18 | )% | | 1.08 | % | | 30.38 | % |
| $ | 13.12 | | 25.44 | % | | $ | 39,816 | | 1.12 | % | | (0.49 | )% | | 1.32 | % | | 32.06 | % |
| $ | 10.53 | | 5.31 | % | | $ | 26,360 | | 0.82 | % | | (0.11 | )% | | 1.64 | % | | 13.24 | % |
| | | | | | | | | | | | | | | | | | | |
| $ | 13.37 | | 16.04 | % | | $ | 35,205 | | 0.95 | % | | 2.55 | % | | 0.95 | % | | 45.38 | % |
| $ | 12.10 | | 19.88 | % | | $ | 30,588 | | 0.90 | % | | 2.62 | % | | 1.12 | % | | 39.65 | % |
| $ | 10.35 | | 3.94 | % | | $ | 21,128 | | 1.29 | % | | 1.91 | % | | 1.63 | % | | 1.65 | % |
See accompanying notes to the financial statements.
139
BB&T Funds
Financial Highlights, Institutional Shares
Selected data for a share of beneficial interest outstanding throughout the periods indicated.
| | | | | | | | | | | | | | | | | | | | |
| | | Net Asset
Value,
Beginning
of Period | | Investment Activities | | Dividends | |
| | | |
Net
investment
income
(loss) | | | Net realized/
unrealized
gains (losses)
on investments | | | Total from
Investment
Activities | | Net
investment
income | | | Net realized
gains on
investments | | | Total
Dividends | |
Short U.S. Government Fund | | | | | | | | | | | | | | | | | | | | |
Year Ended September 30, 2006 | | $ | 9.51 | | 0.30 | (b) | | 0.01 | (i) | | 0.31 | | (0.33 | ) | | — | | | (0.33 | ) |
Year Ended September 30, 2005 | | $ | 9.71 | | 0.25 | | | (0.13 | ) | | 0.12 | | (0.32 | ) | | — | | | (0.32 | ) |
Year Ended September 30, 2004 | | $ | 9.90 | | 0.20 | | | (0.11 | ) | | 0.09 | | (0.28 | ) | | — | | | (0.28 | ) |
Year Ended September 30, 2003 | | $ | 10.09 | | 0.29 | | | (0.11 | ) | | 0.18 | | (0.37 | ) | | — | | | (0.37 | ) |
Year Ended September 30, 2002 | | $ | 10.05 | | 0.45 | (c) | | 0.06 | (c) | | 0.51 | | (0.47 | ) | | — | | | (0.47 | ) |
Intermediate U.S. Government Fund | | | | | | | | | | | | | | | | | | | | |
Year Ended September 30, 2006 | | $ | 10.03 | | 0.44 | (b) | | (0.13 | ) | | 0.31 | | (0.44 | ) | | — | | | (0.44 | ) |
Year Ended September 30, 2005 | | $ | 10.25 | | 0.37 | (b) | | (0.13 | ) | | 0.24 | | (0.41 | ) | | (0.05 | ) | | (0.46 | ) |
Year Ended September 30, 2004 | | $ | 10.58 | | 0.34 | | | (0.18 | ) | | 0.16 | | (0.36 | ) | | (0.13 | ) | | (0.49 | ) |
Year Ended September 30, 2003 | | $ | 10.78 | | 0.37 | | | (0.07 | ) | | 0.30 | | (0.41 | ) | | (0.09 | ) | | (0.50 | ) |
Year Ended September 30, 2002 | | $ | 10.39 | | 0.49 | (d) | | 0.42 | (d) | | 0.91 | | (0.52 | ) | | — | | | (0.52 | ) |
Total Return Bond Fund | | | | | | | | | | | | | | | | | | | | |
Year Ended September 30, 2006 | | $ | 10.32 | | 0.45 | (b) | | (0.13 | ) | | 0.32 | | (0.46 | ) | | (0.05 | ) | | (0.51 | ) |
Year Ended September 30, 2005 | | $ | 10.59 | | 0.39 | (b) | | (0.16 | ) | | 0.23 | | (0.47 | ) | | (0.03 | ) | | (0.50 | ) |
Year Ended September 30, 2004 | | $ | 10.72 | | 0.44 | | | (0.08 | ) | | 0.36 | | (0.49 | ) | | — | | | (0.49 | ) |
Year Ended September 30, 2003 | | $ | 10.33 | | 0.49 | | | 0.41 | | | 0.90 | | (0.51 | ) | | — | | | (0.51 | ) |
Year Ended September 30, 2002 | | $ | 10.56 | | 0.55 | (e) | | (0.04 | )(e) | | 0.51 | | (0.57 | ) | | (0.17 | ) | | (0.74 | ) |
Kentucky Intermediate Tax-Free Fund | | | | | | | | | | | | | | | | | | | | |
Year Ended September 30, 2006 | | $ | 10.04 | | 0.33 | | | 0.07 | | | 0.40 | | (0.33 | ) | | — | | | (0.33 | ) |
Year Ended September 30, 2005 | | $ | 10.20 | | 0.29 | (b) | | (0.16 | ) | | 0.13 | | (0.29 | ) | | — | | | (0.29 | ) |
Year Ended September 30, 2004 | | $ | 10.22 | | 0.28 | (b) | | (0.02 | ) | | 0.26 | | (0.28 | ) | | — | | | (0.28 | ) |
February 24, 2003 to September 30, 2003 (a) | | $ | 10.00 | | 0.16 | (b) | | 0.20 | | | 0.36 | | (0.14 | ) | | — | | | (0.14 | ) |
Maryland Intermediate Tax-Free Fund | | | | | | | | | | | | | | | | | | | | |
Year Ended September 30, 2006 | | $ | 10.04 | | 0.31 | | | 0.09 | | | 0.40 | | (0.31 | ) | | — | | | (0.31 | ) |
Year Ended September 30, 2005 | | $ | 10.16 | | 0.28 | (b) | | (0.12 | ) | | 0.16 | | (0.28 | ) | | — | | | (0.28 | ) |
Year Ended September 30, 2004 | | $ | 10.16 | | 0.25 | | | — | (f) | | 0.25 | | (0.25 | ) | | — | | | (0.25 | ) |
February 24, 2003 to September 30, 2003 (a) | | $ | 10.00 | | 0.13 | | | 0.16 | | | 0.29 | | (0.13 | ) | | — | | | (0.13 | ) |
North Carolina Intermediate Tax-Free Fund | | | | | | | | | | | | | | | | | | | | |
Year Ended September 30, 2006 | | $ | 10.46 | | 0.39 | | | — | (f) | | 0.39 | | (0.38 | ) | | (0.09 | ) | | (0.47 | ) |
Year Ended September 30, 2005 | | $ | 10.66 | | 0.38 | | | (0.19 | ) | | 0.19 | | (0.37 | ) | | (0.02 | ) | | (0.39 | ) |
Year Ended September 30, 2004 | | $ | 10.81 | | 0.35 | | | (0.12 | ) | | 0.23 | | (0.34 | ) | | (0.04 | ) | | (0.38 | ) |
Year Ended September 30, 2003 | | $ | 10.86 | | 0.35 | | | (0.01 | ) | | 0.34 | | (0.35 | ) | | (0.04 | ) | | (0.39 | ) |
Year Ended September 30, 2002 | | $ | 10.54 | | 0.38 | | | 0.39 | | | 0.77 | | (0.37 | ) | | (0.08 | ) | | (0.45 | ) |
South Carolina Intermediate Tax-Free Fund | | | | | | | | | | | | | | | | | | | | |
Year Ended September 30, 2006 | | $ | 10.47 | | 0.37 | | | — | (f) | | 0.37 | | (0.37 | ) | | (0.18 | ) | | (0.55 | ) |
Year Ended September 30, 2005 | | $ | 10.74 | | 0.36 | | | (0.19 | ) | | 0.17 | | (0.36 | ) | | (0.08 | ) | | (0.44 | ) |
Year Ended September 30, 2004 | | $ | 10.81 | | 0.35 | | | (0.06 | ) | | 0.29 | | (0.35 | ) | | (0.01 | ) | | (0.36 | ) |
Year Ended September 30, 2003 | | $ | 10.81 | | 0.35 | | | — | (f) | | 0.35 | | (0.35 | ) | | — | | | (0.35 | ) |
Year Ended September 30, 2002 | | $ | 10.39 | | 0.39 | | | 0.41 | | | 0.80 | | (0.38 | ) | | — | | | (0.38 | ) |
Virginia Intermediate Tax-Free Fund | | | | | | | | | | | | | | | | | | | | |
Year Ended September 30, 2006 | | $ | 11.49 | | 0.42 | | | (0.04 | ) | | 0.38 | | (0.42 | ) | | (0.06 | ) | | (0.48 | ) |
Year Ended September 30, 2005 | | $ | 11.74 | | 0.42 | | | (0.23 | ) | | 0.19 | | (0.42 | ) | | (0.02 | ) | | (0.44 | ) |
Year Ended September 30, 2004 | | $ | 11.95 | | 0.40 | | | (0.13 | ) | | 0.27 | | (0.40 | ) | | (0.08 | ) | | (0.48 | ) |
Year Ended September 30, 2003 | | $ | 11.99 | | 0.39 | | | — | (f) | | 0.39 | | (0.39 | ) | | (0.04 | ) | | (0.43 | ) |
Year Ended September 30, 2002 | | $ | 11.57 | | 0.43 | | | 0.41 | | | 0.84 | | (0.42 | ) | | — | | | (0.42 | ) |
| * | During the period certain fees were reduced. If such reductions had not occurred, the ratios would have been as indicated. |
| ** | Portfolio turnover rate is calculated on the basis of the fund as a whole without distinguishing between classes of shares issued. |
| (a) | Period from commencement of operations. |
| (b) | Per share net investment income (loss) has been calculated using the average daily shares method. |
| (c) | Without the adoption of the change in amortization method as required by the November 2000 revised version of the AICPA Audit and Accounting Guide for Investment Companies, the amounts for net investment income, net realized/unrealized gains (losses), and the net investment income ratio would have been: $0.49, $0.02, and 4.65%, respectively. |
| (d) | Without the adoption of the change in amortization method as required by the November 2000 revised version of the AICPA Audit and Accounting Guide for Investment Companies, the amounts for net investment income, net realized/unrealized gains (losses), and the net investment income ratio would have been: $0.51, $0.40, and 4.99%, respectively. |
| (e) | Without the adoption of the change in amortization method as required by the November 2000 revised version of the AICPA Audit and Accounting Guide for Investment Companies, the amounts for net investment income, net realized/unrealized gains (losses), and the net investment income ratio would have been: $0.56, $(0.05), and 5.54%, respectively. |
| (f) | Amount is less than $0.005. |
| (g) | Not annualized for periods less than one year. |
| (h) | Annualized for periods less than one year. |
| (i) | The amount shown for a share outstanding throughtout the period does not accord with the change in aggregate gains and losses in the portfolio of securities during the period because of the timing of sales and purchases of Fund shares in relation to fluctuating market values during the period. |
See accompanying notes to the financial statements.
140
| | | | | | | | | | | | | | | | | | | |
| | | Total
Return (g) | | | Ratios/Supplementary Data | |
Net Asset
Value,
End of
Period | | | Net Assets,
End of
Period
(000) | | Ratio of net
expenses to
average
net assets (h) | | | Ratio of net
investment
income
(loss) to
average net
assets (h) | | | Ratio of
expenses to
average
net assets* (h) | | | Portfolio
turnover rate** | |
| | | | | | | | | | | | | | | | | | | |
| $ | 9.49 | | 3.37 | % | | $ | 66,371 | | 0.64 | % | | 3.21 | % | | 0.79 | % | | 98.08 | % |
| $ | 9.51 | | 1.21 | % | | $ | 155,786 | | 0.66 | % | | 2.64 | % | | 0.84 | % | | 33.67 | % |
| $ | 9.71 | | 0.96 | % | | $ | 195,920 | | 0.74 | % | | 2.10 | % | | 0.91 | % | | 62.59 | % |
| $ | 9.90 | | 1.78 | % | | $ | 199,980 | | 0.76 | % | | 2.81 | % | | 0.91 | % | | 93.86 | % |
| $ | 10.09 | | 5.27 | % | | $ | 181,797 | | 0.78 | % | | 4.30 | %(c) | | 0.93 | % | | 73.93 | % |
| | | | | | | | | | | | | | | | | | | |
| $ | 9.90 | | 3.23 | % | | $ | 252,402 | | 0.67 | % | | 4.45 | % | | 0.79 | % | | 127.13 | % |
| $ | 10.03 | | 2.34 | % | | $ | 539,038 | | 0.70 | % | | 3.67 | % | | 0.83 | % | | 107.04 | % |
| $ | 10.25 | | 1.56 | % | | $ | 534,682 | | 0.80 | % | | 3.15 | % | | 0.92 | % | | 98.35 | % |
| $ | 10.58 | | 2.88 | % | | $ | 447,665 | | 0.82 | % | | 3.43 | % | | 0.92 | % | | 209.07 | % |
| $ | 10.78 | | 9.11 | % | | $ | 340,231 | | 0.85 | % | | 4.81 | %(d) | | 0.95 | % | | 79.36 | % |
| | | | | | | | | | | | | | | | | | | |
| $ | 10.13 | | 3.30 | % | | $ | 367,353 | | 0.67 | % | | 4.42 | % | | 0.79 | % | | 226.36 | % |
| $ | 10.32 | | 2.23 | % | | $ | 461,749 | | 0.71 | % | | 3.87 | % | | 0.83 | % | | 173.74 | % |
| $ | 10.59 | | 3.47 | % | | $ | 272,749 | | 0.82 | % | | 4.09 | % | | 0.94 | % | | 31.95 | % |
| $ | 10.72 | | 8.95 | % | | $ | 215,000 | | 0.83 | % | | 4.61 | % | | 0.94 | % | | 43.98 | % |
| $ | 10.33 | | 5.19 | % | | $ | 142,509 | | 0.83 | % | | 5.42 | %(e) | | 0.98 | % | | 69.15 | % |
| | | | | | | | | | | | | | | | | | | |
| $ | 10.11 | | 4.04 | % | | $ | 11,175 | | 0.66 | % | | 3.26 | % | | 0.87 | % | | 64.55 | % |
| $ | 10.04 | | 1.28 | % | | $ | 15,569 | | 0.68 | % | | 2.87 | % | | 0.97 | % | | 37.50 | % |
| $ | 10.20 | | 2.61 | % | | $ | 13,441 | | 0.63 | % | | 2.78 | % | | 1.07 | % | | 24.78 | % |
| $ | 10.22 | | 3.63 | % | | $ | 14,759 | | 0.53 | % | | 2.56 | % | | 1.23 | % | | 42.87 | % |
| | | | | | | | | | | | | | | | | | | |
| $ | 10.13 | | 4.10 | % | | $ | 8,003 | | 0.60 | % | | 3.13 | % | | 0.90 | % | | 219.80 | % |
| $ | 10.04 | | 1.60 | % | | $ | 10,084 | | 0.58 | % | | 2.78 | % | | 1.03 | % | | 44.67 | % |
| $ | 10.16 | | 2.52 | % | | $ | 9,108 | | 0.60 | % | | 2.47 | % | | 1.23 | % | | 55.18 | % |
| $ | 10.16 | | 2.93 | % | | $ | 4,897 | | 0.61 | % | | 2.27 | % | | 1.65 | % | | 40.16 | % |
| | | | | | | | | | | | | | | | | | | |
| $ | 10.38 | | 3.84 | % | | $ | 87,854 | | 0.65 | % | | 3.70 | % | | 0.80 | % | | 94.95 | % |
| $ | 10.46 | | 1.80 | % | | $ | 93,418 | | 0.68 | % | | 3.51 | % | | 0.86 | % | | 60.84 | % |
| $ | 10.66 | | 2.15 | % | | $ | 96,738 | | 0.75 | % | | 3.18 | % | | 0.92 | % | | 67.80 | % |
| $ | 10.81 | | 3.19 | % | | $ | 95,613 | | 0.77 | % | | 3.26 | % | | 0.92 | % | | 44.56 | % |
| $ | 10.86 | | 7.62 | % | | $ | 93,856 | | 0.78 | % | | 3.57 | % | | 0.93 | % | | 20.39 | % |
| | | | | | | | | | | | | | | | | | | |
| $ | 10.29 | | 3.66 | % | | $ | 15,426 | | 0.69 | % | | 3.58 | % | | 0.86 | % | | 80.24 | % |
| $ | 10.47 | | 1.62 | % | | $ | 16,468 | | 0.71 | % | | 3.44 | % | | 0.93 | % | | 56.03 | % |
| $ | 10.74 | | 2.77 | % | | $ | 17,488 | | 0.75 | % | | 3.26 | % | | 0.94 | % | | 32.63 | % |
| $ | 10.81 | | 3.35 | % | | $ | 18,297 | | 0.72 | % | | 3.31 | % | | 0.93 | % | | 32.04 | % |
| $ | 10.81 | | 7.94 | % | | $ | 17,960 | | 0.67 | % | | 3.70 | % | | 0.97 | % | | 21.81 | % |
| | | | | | | | | | | | | | | | | | | |
| $ | 11.39 | | 3.49 | % | | $ | 65,652 | | 0.65 | % | | 3.80 | % | | 0.80 | % | | 76.53 | % |
| $ | 11.49 | | 1.66 | % | | $ | 67,579 | | 0.68 | % | | 3.60 | % | | 0.86 | % | | 48.04 | % |
| $ | 11.74 | | 2.29 | % | | $ | 68,786 | | 0.76 | % | | 3.37 | % | | 0.93 | % | | 45.07 | % |
| $ | 11.95 | | 3.31 | % | | $ | 77,577 | | 0.78 | % | | 3.28 | % | | 0.92 | % | | 34.17 | % |
| $ | 11.99 | | 7.48 | % | | $ | 81,683 | | 0.78 | % | | 3.66 | % | | 0.93 | % | | 13.12 | % |
See accompanying notes to the financial statements.
141
BB&T Funds
Financial Highlights, Institutional Shares
Selected data for a share of beneficial interest outstanding throughout the periods indicated.
| | | | | | | | | | | | | | | | | | | | | |
| | | | | Investment Activities | | | Dividends | |
| | | Net Asset
Value,
Beginning
of Period | | Net
investment
income
(loss) | | | Net realized/
unrealized
gains (losses)
on investments | | | Total from
Investment
Activities | | | Net
investment
income | | | Net realized
gains on
investments | | | Total
Dividends | |
West Virginia Intermediate Tax-Free Fund | | | | | | | | | | | | | | | | | | | | | |
Year Ended September 30, 2006 | | $ | 9.86 | | 0.40 | | | (0.01 | ) | | 0.39 | | | (0.39 | ) | | (0.06 | ) | | (0.45 | ) |
Year Ended September 30, 2005 | | $ | 10.09 | | 0.37 | (b) | | (0.15 | ) | | 0.22 | | | (0.37 | ) | | (0.08 | ) | | (0.45 | ) |
Year Ended September 30, 2004 | | $ | 10.21 | | 0.36 | | | (0.09 | ) | | 0.27 | | | (0.35 | ) | | (0.04 | ) | | (0.39 | ) |
Year Ended September 30, 2003 | | $ | 10.35 | | 0.35 | | | 0.02 | | | 0.37 | | | (0.35 | ) | | (0.16 | ) | | (0.51 | ) |
Year Ended September 30, 2002 | | $ | 10.02 | | 0.41 | | | 0.34 | | | 0.75 | | | (0.40 | ) | | (0.02 | ) | | (0.42 | ) |
Prime Money Market Fund | | | | | | | | | | | | | | | | | | | | | |
Year Ended September 30, 2006 | | $ | 1.00 | | 0.04 | | | — | (c) | | 0.04 | | | (0.04 | ) | | — | | | (0.04 | ) |
Year Ended September 30, 2005 | | $ | 1.00 | | 0.02 | | | — | (c) | | 0.02 | | | (0.02 | ) | | — | | | (0.02 | ) |
Year Ended September 30, 2004 | | $ | 1.00 | | 0.01 | | | — | | | 0.01 | | | (0.01 | ) | | — | | | (0.01 | ) |
Year Ended September 30, 2003 | | $ | 1.00 | | 0.01 | | | — | | | 0.01 | | | (0.01 | ) | | — | | | (0.01 | ) |
Year Ended September 30, 2002 | | $ | 1.00 | | 0.02 | | | — | (c) | | 0.02 | | | (0.02 | ) | | — | | | (0.02 | ) |
U.S. Treasury Money Market Fund | | | | | | | | | | | | | | | | | | | | | |
Year Ended September 30, 2006 | | $ | 1.00 | | 0.04 | | | — | | | 0.04 | | | (0.04 | ) | | — | | | (0.04 | ) |
Year Ended September 30, 2005 | | $ | 1.00 | | 0.02 | | | — | | | 0.02 | | | (0.02 | ) | | — | | | (0.02 | ) |
Year Ended September 30, 2004 | | $ | 1.00 | | 0.01 | | | — | | | 0.01 | | | (0.01 | ) | | — | | | (0.01 | ) |
Year Ended September 30, 2003 | | $ | 1.00 | | 0.01 | | | — | | | 0.01 | | | (0.01 | ) | | — | | | (0.01 | ) |
Year Ended September 30, 2002 | | $ | 1.00 | | 0.02 | | | — | | | 0.02 | | | (0.02 | ) | | — | | | (0.02 | ) |
National Tax-Free Money Market Fund | | | | | | | | | | | | | | | | | | | | | |
August 1, 2006 to September 30, 2006 (a) | | $ | 1.00 | | 0.01 | | | — | | | 0.01 | | | (0.01 | ) | | — | | | (0.01 | ) |
Capital Manager Conservative Growth Fund*** | | | | | | | | | | | | | | | | | | | | | |
Year Ended September 30, 2006 | | $ | 9.83 | | 0.33 | (b) | | 0.24 | | | 0.57 | | | (0.36 | ) | | — | | | (0.36 | ) |
Year Ended September 30, 2005 | | $ | 9.36 | | 0.26 | | | 0.46 | | | 0.72 | | | (0.25 | ) | | — | | | (0.25 | ) |
Year Ended September 30, 2004 | | $ | 8.90 | | 0.18 | (b) | | 0.46 | | | 0.64 | | | (0.18 | ) | | — | | | (0.18 | ) |
Year Ended September 30, 2003 | | $ | 8.33 | | 0.18 | | | 0.61 | | | 0.79 | | | (0.18 | ) | | (0.04 | ) | | (0.22 | ) |
Year Ended September 30, 2002 | | $ | 9.17 | | 0.22 | | | (0.66 | ) | | (0.44 | ) | | (0.22 | ) | | (0.18 | ) | | (0.40 | ) |
Capital Manager Moderate Growth Fund*** | | | | | | | | | | | | | | | | | | | | | |
Year Ended September 30, 2006 | | $ | 9.83 | | 0.27 | (b) | | 0.43 | | | 0.70 | | | (0.28 | ) | | — | | | (0.28 | ) |
Year Ended September 30, 2005 | | $ | 9.04 | | 0.19 | (b) | | 0.77 | | | 0.96 | | | (0.17 | ) | | — | | | (0.17 | ) |
Year Ended September 30, 2004 | | $ | 8.30 | | 0.10 | (b) | | 0.74 | | | 0.84 | | | (0.10 | ) | | — | | | (0.10 | ) |
Year Ended September 30, 2003 | | $ | 7.47 | | 0.10 | | | 0.82 | | | 0.92 | | | (0.08 | ) | | (0.01 | ) | | (0.09 | ) |
Year Ended September 30, 2002 | | $ | 8.82 | | 0.14 | | | (0.99 | ) | | (0.85 | ) | | (0.13 | ) | | (0.37 | ) | | (0.50 | ) |
Capital Manager Growth Fund*** | | | | | | | | | | | | | | | | | | | | | |
Year Ended September 30, 2006 | | $ | 9.69 | | 0.22 | (b) | | 0.57 | | | 0.79 | | | (0.24 | ) | | — | | | (0.24 | ) |
Year Ended September 30, 2005 | | $ | 8.70 | | 0.15 | (b) | | 0.97 | | | 1.12 | | | (0.13 | ) | | — | | | (0.13 | ) |
Year Ended September 30, 2004 | | $ | 7.81 | | 0.07 | (b) | | 0.88 | | | 0.95 | | | (0.06 | ) | | — | | | (0.06 | ) |
Year Ended September 30, 2003 | | $ | 6.87 | | 0.06 | (b) | | 0.93 | | | 0.99 | | | (0.05 | ) | | — | | | (0.05 | ) |
Year Ended September 30, 2002 | | $ | 8.46 | | 0.05 | | | (1.20 | ) | | (1.15 | ) | | (0.04 | ) | | (0.40 | ) | | (0.44 | ) |
Capital Manager Equity Fund*** | | | | | | | | | | | | | | | | | | | | | |
Year Ended September 30, 2006 | | $ | 11.02 | | 0.20 | (b) | | 0.84 | | | 1.04 | | | (0.22 | ) | | (0.19 | ) | | (0.41 | ) |
Year Ended September 30, 2005 | | $ | 9.64 | | 0.12 | (b) | | 1.34 | | | 1.46 | | | (0.08 | ) | | — | | | (0.08 | ) |
Year Ended September 30, 2004 | | $ | 8.49 | | 0.04 | (b) | | 1.14 | | | 1.18 | | | (0.03 | ) | | — | | | (0.03 | ) |
Year Ended September 30, 2003 | | $ | 7.39 | | 0.02 | (b) | | 1.15 | | | 1.17 | | | (0.02 | ) | | (0.05 | ) | | (0.07 | ) |
Year Ended September 30, 2002 | | $ | 8.97 | | (0.01 | ) | | (1.57 | ) | | (1.58 | ) | | — | (c) | | — | | | — | (c) |
| * | During the period certain fees were reduced. If such reductions had not occurred, the ratios would have been as indicated. |
| ** | Portfolio turnover rate is calculated on the basis of the Fund as a whole without distinguishing between classes of shares issued. |
| *** | The expense ratios exclude the impact of fees/expenses paid by each underlying fund. |
| (a) | Period from commencement of operations. |
| (b) | Per share net investment income (loss) has been calculated using the average daily shares method. |
| (c) | Amount is less than $0.005. |
| (d) | Not annualized for periods less than one year. |
| (e) | Annualized for periods less than one year. |
See accompanying notes to the financial statements.
142
| | | | | | | | | | | | | | | | | | | |
| | | | | | Ratios/Supplementary Data | |
Net Asset
Value,
End of
Period | | Total
Return (d) | | | Net Assets,
End of
Period
(000) | | Ratio of net
expenses to
average
net assets (e) | | | Ratio of net
investment
income
(loss) to
average net
assets (e) | | | Ratio of
expenses to
average
net assets* (e) | | | Portfolio
turnover rate** | |
| | | | | | | | | | | | | | | | | | | |
| $ | 9.80 | | 4.10 | % | | $ | 50,916 | | 0.65 | % | | 4.03 | % | | 0.65 | % | | 50.14 | % |
| $ | 9.86 | | 2.22 | % | | $ | 55,662 | | 0.68 | % | | 3.74 | % | | 0.72 | % | | 32.10 | % |
| $ | 10.09 | | 2.76 | % | | $ | 63,518 | | 0.76 | % | | 3.49 | % | | 0.78 | % | | 16.24 | % |
| $ | 10.21 | | 3.77 | % | | $ | 79,361 | | 0.73 | % | | 3.48 | % | | 0.76 | % | | 25.59 | % |
| $ | 10.35 | | 7.78 | % | | $ | 78,170 | | 0.72 | % | | 4.04 | % | | 0.82 | % | | 61.44 | % |
| | | | | | | | | | | | | | | | | | | |
| $ | 1.00 | | 4.38 | % | | $ | 731,616 | | 0.48 | % | | 4.34 | % | | 0.59 | % | | — | |
| $ | 1.00 | | 2.34 | % | | $ | 510,941 | | 0.49 | % | | 2.31 | % | | 0.63 | % | | — | |
| $ | 1.00 | | 0.70 | % | | $ | 529,849 | | 0.57 | % | | 0.69 | % | | 0.70 | % | | — | |
| $ | 1.00 | | 0.87 | % | | $ | 667,534 | | 0.60 | % | | 0.86 | % | | 0.69 | % | | — | |
| $ | 1.00 | | 1.61 | % | | $ | 532,465 | | 0.64 | % | | 1.54 | % | | 0.71 | % | | — | |
| | | | | | | | | | | | | | | | | | | |
| $ | 1.00 | | 4.15 | % | | $ | 481,484 | | 0.46 | % | | 4.04 | % | | 0.59 | % | | — | |
| $ | 1.00 | | 2.11 | % | | $ | 592,736 | | 0.48 | % | | 2.02 | % | | 0.64 | % | | — | |
| $ | 1.00 | | 0.54 | % | | $ | 926,162 | | 0.57 | % | | 0.53 | % | | 0.71 | % | | — | |
| $ | 1.00 | | 0.67 | % | | $ | 838,022 | | 0.61 | % | | 0.67 | % | | 0.70 | % | | — | |
| $ | 1.00 | | 1.40 | % | | $ | 915,013 | | 0.65 | % | | 1.35 | % | | 0.72 | % | | — | |
| | | | | | | | | | | | | | | | | | | |
| $ | 1.00 | | 0.53 | % | | $ | 95,757 | | 0.40 | % | | 3.14 | % | | 0.79 | % | | — | |
| | | | | | | | | | | | | | | | | | | |
| $ | 10.04 | | 5.87 | % | | $ | 47,046 | | 0.08 | % | | 3.35 | % | | 0.45 | % | | 5.69 | % |
| $ | 9.83 | | 7.70 | % | | $ | 71,796 | | 0.20 | % | | 2.64 | % | | 0.51 | % | | 52.50 | % |
| $ | 9.36 | | 7.16 | % | | $ | 67,925 | | 0.44 | % | | 1.93 | % | | 0.64 | % | | 2.47 | % |
| $ | 8.90 | | 9.55 | % | | $ | 31,748 | | 0.53 | % | | 2.09 | % | | 0.73 | % | | 33.03 | % |
| $ | 8.33 | | (5.05 | )% | | $ | 26,347 | | 0.54 | % | | 2.47 | % | | 0.74 | % | | 6.29 | % |
| | | | | | | | | | | | | | | | | | | |
| $ | 10.25 | | 7.33 | % | | $ | 25,699 | | 0.10 | % | | 2.65 | % | | 0.47 | % | | 7.33 | % |
| $ | 9.83 | | 10.69 | % | | $ | 43,353 | | 0.23 | % | | 2.01 | % | | 0.56 | % | | 37.83 | % |
| $ | 9.04 | | 10.12 | % | | $ | 33,971 | | 0.49 | % | | 1.17 | % | | 0.69 | % | | 0.17 | % |
| $ | 8.30 | | 12.40 | % | | $ | 26,168 | | 0.50 | % | | 1.35 | % | | 0.70 | % | | 21.46 | % |
| $ | 7.47 | | (10.55 | )% | | $ | 20,977 | | 0.58 | % | | 1.48 | % | | 0.78 | % | | 14.56 | % |
| | | | | | | | | | | | | | | | | | | |
| $ | 10.24 | | 8.22 | % | | $ | 20,243 | | 0.11 | % | | 2.24 | % | | 0.48 | % | | 6.26 | % |
| $ | 9.69 | | 12.89 | % | | $ | 37,546 | | 0.23 | % | | 1.60 | % | | 0.57 | % | | 26.22 | % |
| $ | 8.70 | | 12.10 | % | | $ | 28,660 | | 0.50 | % | | 0.77 | % | | 0.73 | % | | 0.19 | % |
| $ | 7.81 | | 14.49 | % | | $ | 21,484 | | 0.56 | % | | 0.82 | % | | 0.76 | % | | 17.80 | % |
| $ | 6.87 | | (14.61 | )% | | $ | 17,981 | | 0.62 | % | | 0.63 | % | | 0.82 | % | | 8.38 | % |
| | | | | | | | | | | | | | | | | | | |
| $ | 11.65 | | 9.66 | % | | $ | 14,837 | | 0.11 | % | | 1.75 | % | | 0.47 | % | | 1.48 | % |
| $ | 11.02 | | 15.23 | % | | $ | 25,802 | | 0.22 | % | | 1.10 | % | | 0.58 | % | | 2.14 | % |
| $ | 9.64 | | 13.87 | % | | $ | 21,051 | | 0.52 | % | | 0.42 | % | | 0.81 | % | | 3.10 | % |
| $ | 8.49 | | 15.82 | % | | $ | 16,077 | | 0.70 | % | | 0.29 | % | | 0.90 | % | | 8.30 | % |
| $ | 7.39 | | (17.61 | )% | | $ | 11,352 | | 0.83 | % | | (0.15 | )% | | 1.03 | % | | 5.75 | % |
See accompanying notes to the financial statements.
143
BB&T Funds
Notes to Financial Statements | September 30, 2006 |
The BB&T Funds commenced operations on October 5, 1992 and are registered under the Investment Company Act of 1940, as amended (“the 1940 Act”), as an open-end investment company established as a Massachusetts business trust.
The BB&T Funds offer shares of the Large Cap Fund (formerly known as the Large Company Value Fund), the Large Cap Growth Fund (formerly known as the Large Company Growth Fund), the Mid Cap Value Fund, the Mid Cap Growth Fund, the Small Cap Fund (formerly known as the Small Company Value Fund), the International Equity Fund, the Special Opportunities Equity Fund, the Equity Income Fund, the Short U.S. Government Fund, the Intermediate U.S. Government Fund, the Total Return Bond Fund, the Kentucky Intermediate Tax-Free Fund, the Maryland Intermediate Tax-Free Fund, the North Carolina Intermediate Tax-Free Fund, the South Carolina Intermediate Tax-Free Fund, the Virginia Intermediate Tax-Free Fund, the West Virginia Intermediate Tax-Free Fund, the Prime Money Market Fund, the U.S. Treasury Money Market Fund, the National Tax-Free Money Market Fund, the Capital Manager Conservative Growth Fund, the Capital Manager Moderate Growth Fund, the Capital Manager Growth Fund and the Capital Manager Equity Fund (referred to individually as a “Fund” and collectively as the “Funds”). The Kentucky Intermediate Tax-Free Fund, the Maryland Intermediate Tax-Free Fund, the North Carolina Intermediate Tax-Free Fund, the South Carolina Intermediate Tax-Free Fund, the Virginia Intermediate Tax-Free Fund and the West Virginia Intermediate Tax-Free Fund are referred to as the “Tax-Free Funds”. The Prime Money Market Fund, the U.S. Treasury Money Market Fund and the National Tax-Free Money Market Fund are referred to as the “Money Market Funds”. The Capital Manager Conservative Growth Fund, the Capital Manager Moderate Growth Fund, the Capital Manager Growth Fund and the Capital Manager Equity Fund are referred to as the “Fund of Funds”. The Funds, excluding the Money Market Funds and the Fund of Funds, are referred to as the “Variable Net Asset Value Funds”. The Fund of Funds invest in underlying mutual funds as opposed to individual securities.
All Funds except the Tax-Free Funds are diversified funds under the 1940 Act. The Tax-Free Funds are non-diversified funds, which means they may concentrate their investments in the securities of a limited number of issuers.
The BB&T Funds are authorized to issue an unlimited amount of shares without par value. The Funds offer up to four classes of shares: Class A Shares, Class B Shares, Class C Shares and Institutional Shares. As of September 30, 2006, Class B Shares and Class C Shares of the Short U.S. Government Fund and the Tax-Free Funds were not yet being offered. Class A Shares of the Variable Net Asset Value Funds and Fund of Funds, excluding the Short U.S. Government Fund, have a maximum sales charge of 5.75% as a percentage of original purchase price. The Class A Shares of the Tax-Free Funds and the Short U.S. Government Fund have a maximum sales charge of 3.00% as a percentage of the original purchase price. Certain purchases of Class A Shares will not be subject to a front-end sales charge, but will be subject to a contingent deferred sales charge (“CDSC”) of 1.00% of the purchase price if redeemed less than one year after purchase. The Class B Shares of the Funds are offered without any front-end sales charge but will be subject to a CDSC ranging from a maximum of 5.00% if redeemed less than one year after purchase to 0.00% if redeemed more than six years after purchase. The Class C Shares of the Funds are offered without any front-end sales charge but will be subject to a maximum CDSC of 1.00% if redeemed less than one year after purchase.
Each class of shares has identical rights and privileges except with respect to the fees paid under the distribution plan, voting rights on matters affecting a single class of shares and the exchange privilege of each class of shares.
During the fiscal year ended September 30, 2006, the Mid Cap Growth Fund, the Small Cap Fund, the Total Return Bond Fund, the Capital Manager Conservative Growth Fund, the Capital Manager Moderate Growth Fund, the Capital Manager Growth Fund and the Capital Manager Equity Fund delivered securities of the Funds in exchange for the redemption of Institutional Shares (redemption-in-kind). Cash and securities were transferred for redemptions at a fair value of $5,000,000; $4,000,000; $192,588,337; $24,907,733; $24,751,203; $24,289,586 and $17,939,344 for the Mid Cap Growth Fund, the Small Cap Fund, the Total Return Bond Fund, the Capital Manager Conservative Growth Fund, the Capital Manager Moderate Growth Fund, the Capital Manager Growth Fund and the Capital Manager Equity Fund, respectively. For financial reporting purposes, the Mid Cap Growth Fund, the Small Cap Fund, the Total Return Bond Fund, the Capital Manager Conservative Growth Fund, the Capital Manager Moderate Growth Fund, the Capital Manager Growth Fund and the Capital Manager Equity Fund recorded net realized gains and losses of $1,074,298; $845,172; $584,613; $842,687, ($72,192); ($905,097) and $406,868, respectively, in connection with the transactions. However, for tax purposes, the transactions received tax-free treatment. These permanent book to tax differences were reclassified within the components of net assets in accordance with the Funds’ accounting policies more fully disclosed in note 2.
Continued
144
BB&T Funds
Notes to Financial Statements, continued | September 30, 2006 |
Under the Funds’ organizational documents, its Officers and Trustees are indemnified against certain liabilities arising out of the performance of their duties to the Funds. In addition, in the normal course of business, the Funds may enter into contracts with their vendors and others that provide for general indemnifications. The Funds’ maximum exposure under these arrangements is unknown as this would involve future claims that may be made against the Funds. However, based on experience, the Funds expect that risk of loss to be remote.
| 2. | Significant Accounting Policies: |
The following is a summary of significant accounting policies followed by the Funds in the preparation of their financial statements. The policies are in conformity with United States generally accepted accounting principles (“GAAP”). The preparation of financial statements requires management to make estimates and assumptions that affect the reported amounts of assets and liabilities and disclosure of contingent assets and liabilities at the date of the financial statements and the reported amounts of income and expenses for the reporting period. Actual results could differ from those estimates.
New Accounting Standards:
In September 2006, the Financial Accounting Standards Board (FASB) issued Statement on Financial Accounting Standards (SFAS) No. 157, “Fair Value Measurements.” This standard establishes a single authoritative definition of fair value, sets out a framework for measuring fair value and requires additional disclosures about fair value measurements. SFAS No. 157 applies to fair value measurements already required or permitted by existing standards. SFAS No. 157 is effective for financial statements issued for fiscal years beginning after November 15, 2007 and interim periods within those fiscal years. The changes to current generally accepted accounting principles from the application of this Statement relate to the definition of fair value, the methods used to measure fair value, and the expanded disclosures about fair value measurements. As of September 30, 2006, the Funds do not believe the adoption of SFAS No. 157 will impact the financial statement amounts, however, additional disclosures may be required about the inputs used to develop the measurements and the effect of certain of the measurements on changes in net assets for the period.
On July 13, 2006, the Financial Accounting Standards Board (FASB) released FASB Interpretation No. 48 “Accounting for Uncertainty in Income Taxes” (FIN 48). FIN 48 provides guidance for how uncertain tax positions should be recognized, measured, presented and disclosed in the financial statements. FIN 48 requires the evaluation of tax positions taken or expected to be taken in the course of preparing the Fund’s tax return to determine whether the tax positions are “more-likely-than-not” of being sustained by the applicable tax authority. Tax positions not deemed to meet the more-likely-than-not threshold would be recorded as a tax benefit or expense in the year of determination. Adoption of FIN 48 is required for fiscal years beginning after December 15, 2006 and is to be applied to all open tax years as of the effective date. Management has not completed their analysis on whether the adoption of FIN 48 will have an impact to the financial statements.
Securities Valuation:
Investments of the Money Market Funds are valued in accordance with Rule 2a-7 of the 1940 Act, at amortized cost, which approximates fair value. Under the amortized cost method, discount or premium is amortized on a constant basis to the maturity of the security.
Investments in common stocks, commercial paper, corporate bonds, municipal securities, U.S. Government securities and U.S. Government agency securities of the Variable Net Asset Value Funds, the principal market for which is a securities exchange or an over-the-counter market, are valued at their latest available sale price (except for those securities that are traded on NASDAQ, which will be valued at the NASDAQ official closing price) or in the absence of such a price, by reference to the latest available bid price in the principal market in which such securities are normally traded. The Variable Net Asset Value Funds may also use an independent pricing service approved by the Board of Trustees to value certain securities. Such prices reflect fair values which may be established through the use of electronic and matrix techniques. Short-term obligations that mature in 60 days or less are valued at either amortized cost or original cost plus interest, which approximates current value. Investments in open-end investment companies, including the Fund of Funds, are valued at their respective net asset values as reported by such companies. Investments in closed-end investment companies are valued at their fair values based upon the latest available bid prices in the principal market in which such securities are normally traded. The differences between cost and fair values of investments are
Continued
145
BB&T Funds
Notes to Financial Statements, continued | September 30, 2006 |
reflected as either unrealized appreciation or depreciation. Securities for which market quotations are not readily available or deemed unreliable (e.g., an approved pricing service does not provide a price, a furnished price is in error, certain stale prices, or an event occurs that materially effects the furnished price) will be valued at fair value using methods determined in good faith by the Pricing Committee under the supervision of the Board of Trustees.
Fair value pricing may be used if events materially affecting the value of foreign securities occur between the time when the exchange on which they are traded closes and the time when the International Equity Fund’s net asset value is calculated, such securities may be valued at fair value in accordance with procedures adopted by the Board of Trustees. Management identifies possible fluctuation in international securities by monitoring the increase or decrease in the value of a designated benchmark index. In the event of an increase or decrease greater than predetermined levels, the International Equity Fund may use a systematic valuation model provided by an independent third party to fair value their international equity securities.
Foreign Currency Translation:
The accounting records of the International Equity Fund are maintained in U.S. dollars. Foreign currency amounts are translated into U.S. dollars at the current rate of exchange to determine the fair value of investments, assets and liabilities. Purchases and sales of securities, income and expenses are translated at the prevailing rate of exchange, on the respective dates of such transactions. The International Equity Fund does not isolate that portion of the results of operations resulting from changes in foreign exchange rates on investments from fluctuations arising from changes in market prices of securities held. Such fluctuations are included with the net realized and unrealized gain or loss from investments and foreign currencies.
Risks Associated with Foreign Securities and Currencies:
Investments in securities of foreign issuers carry certain risks not ordinarily associated with investments in securities of domestic issuers. Such risks include future political and economic developments; and the possible imposition of exchange controls or other foreign governmental laws and restrictions. In addition, with respect to certain countries, there is the possibility of expropriation of assets, confiscatory taxation, political or social instability or diplomatic developments which could adversely affect investments in those countries. Certain foreign investments may also be subject to foreign withholding taxes.
Forward Foreign Currency Exchange Contracts:
The International Equity Fund may enter into forward foreign currency exchange contracts in connection with planned purchases or sales of securities or to hedge the U.S. dollar value of Fund securities denominated in a particular currency. The Fund could be exposed to risks if the counter-parties to the contracts are unable to meet the terms of their contracts and from unanticipated movements in the value of a foreign currency relative to the U.S. dollar. The forward foreign currency exchange contracts are adjusted by the daily exchange rate of the underlying currency and any gains or losses are recorded for financial statement purposes as unrealized gains or losses until the contract settlement date.
Futures Contracts:
The Variable Net Asset Value Funds may invest in financial futures contracts for the purpose of hedging their existing securities or securities it intends to purchase against fluctuations in fair value caused by changes in prevailing markets. Upon entering into a financial futures contract, the Fund is required to pledge to the broker an amount of cash and/or other assets equal to a certain percentage of the contract amount (initial margin deposit). Subsequent payments, known as “variation margin,” are made or received by the Fund each day, depending on the daily fluctuations in the fair value of the underlying security. The Fund recognizes a gain or loss equal to the daily variation margin. Should market conditions move unexpectedly, the Fund may not achieve the anticipated benefits of the financial futures contracts and may realize a loss. The use of futures transactions involves the risk of imperfect correlation in movements in the price of futures contracts and the underlying hedged assets. The Funds held no financial futures contracts as of September 30, 2006.
Securities Transactions and Related Income:
During the period, security transactions are accounted for no later than one business day following the trade date. For financial reporting purposes, however, security transactions are accounted for on trade date of the last business day of the reporting period. Interest income is recognized on the accrual basis and includes, where applicable, the amortization/accretion of premium or discount. Dividend income is recorded on the ex-dividend date. Gains or losses realized from sales of securities are determined by comparing the identified cost of the security lot sold with the net sales proceeds.
Continued
146
BB&T Funds
Notes to Financial Statements, continued | September 30, 2006 |
When-Issued and Forward Commitments:
The Funds, with the exception of the U.S. Treasury Money Market Fund, may purchase securities on a “when-issued” basis. The Large Cap Fund, the Large Cap Growth Fund, the Mid Cap Value Fund, the Mid Cap Growth Fund, the Small Cap Fund, the International Equity Fund, the Special Opportunities Equity Fund, the Equity Income Fund and the Prime Money Market Fund may also purchase or sell securities on a forward commitment basis. The Funds record when-issued securities on the trade date and pledge assets with a value at least equal to the purchase commitment for payment of the securities purchased. The value of the securities underlying when-issued or forward commitments to purchase securities, and any subsequent fluctuation in their value, is taken into account when determining the net asset value of the Funds commencing with the date the Funds agree to purchase the securities. The Funds do not accrue interest or dividends on “when-issued” securities until the underlying securities are received.
Repurchase Agreements and Collateralized Loan Agreements:
The Funds may enter into agreements with member banks of the Federal Deposit Insurance Corporation and with registered broker/dealers that BB&T Asset Management, Inc. (“BB&T”) or a sub-advisor deems creditworthy under guidelines approved by the Board of Trustees, subject to the seller’s agreement to repurchase such securities at a mutually agreed-upon date and price. The repurchase price generally equals the price paid by the Fund plus interest negotiated on the basis of current short-term rates, which may be more or less than the rate on the underlying Fund securities. The seller, under these types of agreements, is required to maintain the value of collateral held pursuant to the agreement at not less than the repurchase price (including accrued interest). Securities subject to repurchase are held by the Funds’ custodian, another qualified custodian, or in the Federal Reserve/Treasury book-entry system. In the event of counterparty default, the Fund has the right to use the collateral to offset losses incurred. There is potential for loss to the Fund in the event the Fund is delayed or prevented from exercising its rights to dispose of the collateral securities, including the risk of a possible decline in the fair value of the underlying securities during the period while the Fund seeks to assert its rights.
Written Options:
The risk associated with purchasing an option is that the Fund pays a premium whether or not the option is exercised. Additionally, the Funds bear the risk of loss of the premium and change in fair value should the counterparty not perform under the contract. Put and call options purchased are accounted for in the same manner as other securities owned. The cost of securities acquired through the exercise of call options is increased by the premiums paid. The proceeds from securities sold through the exercise of put options are decreased by the premiums paid.
In writing an option, the Funds contract with a specified counterparty to purchase (put options written) or sell (call options written) a specified quantity (notional amount) of an underlying asset at a specified price during a specified period upon demand of the counterparty. The risk associated with writing an option is that the Funds bear the market risk of an unfavorable change in the price of an underlying asset and may be required to buy or sell an underlying asset under the contractual terms of the option at a price different from the current fair value.
The Large Cap Fund, the Large Cap Growth Fund, the Mid Cap Value Fund, the Mid Cap Growth Fund, the Small Cap Fund, the International Equity Fund, the Special Opportunities Equity Fund, the Equity Income Fund and the Fund of Funds each may sell call options and the Large Cap Growth Fund and International Equity Fund may purchase put options that are traded on recognized U.S. exchanges and enter into closing transactions with respect to such options. The Special Opportunities Equity Fund and the Equity Income Fund had the following transactions in call options during the year ended September 30, 2006.
| | | | | | | | | | | | | | |
| | | Special Opportunities
Equity Fund | | | Equity Income Fund | |
Covered Call Options | | Number of
Contracts | | | Premiums
Received | | | Number of
Contracts | | | Premiums
Received | |
Balance at beginning of period | | 895 | | | $ | 51,170 | | | — | | | $ | — | |
Options written | | 12,872 | | | | 1,582,477 | | | 2,402 | | | | 416,001 | |
Options closed | | (1,960 | ) | | | (485,894 | ) | | (370 | ) | | | (80,317 | ) |
Options expired | | (3,081 | ) | | | (148,253 | ) | | (712 | ) | | | (164,935 | ) |
Options exercised | | (1,511 | ) | | | (88,925 | ) | | — | | | | — | |
| | | | | | | | | | | | | | |
Balance at end of period | | 7,214 | | | $ | 910,575 | | | 1,320 | | | $ | 170,749 | |
| | | | | | | | | | | | | | |
Continued
147
BB&T Funds
Notes to Financial Statements, continued | September 30, 2006 |
The following is a summary of options outstanding as of September 30, 2006:
| | | | | |
Security | | Number of
Contracts | | Fair Value |
Special Opportunities Equity Fund | | | | | |
ATI Technologies, Inc., $22.50, 11/18/06 | | 2,070 | | $ | 82,800 |
Checkfree Corp., $50.00, 11/18/06 | | 1,135 | | | 45,400 |
Consol Energy, Inc., $47.50, 1/20/07 | | 1,340 | | | 13,400 |
Consol Energy, Inc., $50.00, 1/20/07 | | 860 | | | 4,300 |
KOS Pharmaceuticals, $55.00, 11/18/06 | | 310 | | | 49,600 |
PACCAR, Inc., $60.00, 11/18/06 | | 1,500 | | | 165,000 |
| | | | | |
| | | | $ | 360,500 |
| | | | | |
| | |
Equity Income Fund | | | | | |
KB Home Corp., $60.00, 1/20/07 | | 900 | | $ | 31,500 |
Petroleo Brasileiro S.A., $110.00, 10/21/06 | | 245 | | | 3,675 |
Petroleo Brasileiro S.A., $110.00, 1/20/07 | | 175 | | | 5,250 |
| | | | | |
| | | | $ | 40,425 |
| | | | | |
Security Loans:
To generate additional income, the Funds may lend up to 33 1/3% of their respective total assets pursuant to agreements requiring that the loan be continuously secured by any combination of cash, U.S. Government or U.S. Government agency securities, equal at all times to at least 100% of the fair value.
Pursuant to an exemptive order from the Securities and Exchange Commission, the cash collateral received by the Funds was pooled and at September 30, 2006 was invested in Commercial Paper, Corporate Bonds, Mutual Funds, and Repurchase Agreements (with interest rates ranging from 5.30% to 5.48% and maturity dates ranging from October 2006 through December 2015). These investments are managed by U.S. Bank National Association. The Funds receive payments from borrowers equivalent to the dividends and interest that would have been earned on securities lent while simultaneously seeking to earn income on the investment of collateral. Collateral is marked to market daily to provide a level of collateral at least equal to the fair value of securities lent. There may be risks of delay in recovery of the securities or even loss of rights in the collateral should the borrower of the securities fail financially. However, loans will be made only to borrowers, such as broker-dealers, banks or institutional borrowers of securities, deemed by the Funds to be of good standing and creditworthy under guidelines established by the Board of Trustees and when, in the judgement of the Funds, the consideration which can be earned currently from such securities loans justifies the attendant risks. Loans are subject to termination by the Funds or the borrower at any time and are, therefore, not considered to be illiquid investments. As of September 30, 2006, the following Funds had loans outstanding:
| | | | | | | | | |
| | | Value
of Loaned
Securities | | Value
of Collateral | | Average Value
on Loan
for the period
ended
September 30, 2006 |
Large Cap Fund | | $ | 122,511,470 | | $ | 126,591,112 | | $ | 179,921,206 |
Large Cap Growth Fund | | | 97,859,740 | | | 101,006,062 | | | 113,851,334 |
Mid Cap Value Fund | | | 59,151,395 | | | 62,152,094 | | | 63,296,752 |
Mid Cap Growth Fund | | | 53,993,107 | | | 55,773,608 | | | 65,104,001 |
Small Cap Fund | | | 27,427,088 | | | 28,786,261 | | | 30,361,130 |
Special Opportunities Equity Fund | | | 59,886,231 | | | 61,799,055 | | | 60,606,332 |
Equity Income Fund | | | 29,578,851 | | | 30,739,802 | | | 28,234,016 |
Short U.S. Government Fund | | | 33,937,870 | | | 34,618,745 | | | 70,444,555 |
Intermediate U.S. Government Fund | | | 35,279,800 | | | 35,975,000 | | | 169,457,244 |
Total Return Bond Fund | | | 95,486,370 | | | 97,576,279 | | | 160,209,168 |
U.S. Treasury Money Market Fund | | | — | | | — | | | 183,494,888 |
Continued
148
BB&T Funds
Notes to Financial Statements, continued | September 30, 2006 |
Allocation Methodology:
Expenses directly attributable to a Fund are charged to that Fund. Expenses not directly attributable to a Fund are allocated proportionately among all Funds daily in relation to the net assets of each Fund or on another reasonable basis. Each class of shares bears its pro-rata portion of expenses attributable to its series, except that each class separately bears expenses related specifically to that class, such as distribution fees. Expenses that are attributable to more than one Trust are allocated across the Funds and BB&T Variable Insurance Funds, based upon relative net assets or on another reasonable basis. BB&T serves as the Investment Advisor for each of the Funds and BB&T Variable Insurance Funds. Income and realized and unrealized gains or losses on investments are allocated to each class of shares based on its relative net assets or another appropriate basis.
Dividends to Shareholders:
Dividends from net investment income are declared daily and paid monthly for the Short U.S. Government Fund, the Intermediate U.S. Government Fund, the Total Return Bond Fund, the Tax-Free Funds and the Money Market Funds. Dividends from net investment income are declared and paid monthly for the Large Cap Fund, the Mid Cap Value Fund and the Small Cap Fund. Dividends from net investment income are declared and paid quarterly for the Large Cap Growth Fund, the Mid Cap Growth Fund, the International Equity Fund, the Special Opportunities Equity Fund, the Equity Income Fund and the Fund of Funds. Distributable net realized gains, if any, are declared and distributed at least annually.
The character of income and gains distributed are determined in accordance with federal income tax regulations, which may differ from GAAP. These “book/tax” differences are either considered temporary or permanent in nature. To the extent these differences are permanent in nature (e.g. reclass of market discounts, gain/loss, paydowns and distributions), such amounts are reclassified within the composition of net assets based on their federal tax-basis treatment; temporary differences do not require reclassification. Dividends to shareholders which exceed net investment income and net realized gains for tax purposes are reported as distributions of capital.
Federal Income Taxes:
It is the policy of the Funds to continue to qualify as a regulated investment company by complying with the provisions available to certain investment companies, as defined in applicable sections of the Internal Revenue Code, and to make distributions of net investment income and net realized capital gains sufficient to relieve it from all, or substantially all, federal income taxes. Accordingly, no provision for federal income tax is required.
Redemption Fees:
Effective November 4, 2005, the holding period for shares redeemed or exchanged was reduced from 30 days to 7 days. For shares of the Funds that were redeemed or exchanged in less than 7 days a fee of 2% of the total redemption amount may be assessed subject to certain exceptions or limitations. These exceptions include but are not limited to redemptions or exchanges in the Money Market Funds, automatic non-discretionary rebalancing programs and systematic withdrawal plans. The fee is applied to shares redeemed or exchanged in the order in which they were purchased, and is retained by the Funds for the benefit of remaining shareholders to defray Fund portfolio transaction expenses and facilitate portfolio management. For financial statement purposes, these amounts are included in the Statements of Changes in Net Assets as “Proceeds from Shares Issued”. Effective
Continued
149
BB&T Funds
Notes to Financial Statements, continued | September 30, 2006 |
July 24, 2006, the Funds no longer assess redemption fees. Fees for the Funds during the fiscal years ended September 30, 2005 and September 30, 2006, respectively, were as follows:
| | | | | | |
Fund | | For the
Year Ended
September 30, 2005 | | For the
Year Ended
September 30, 2006 |
Large Cap Fund | | $ | 4,386 | | $ | 745 |
Large Cap Growth Fund | | | 243 | | | 3 |
Mid Cap Value Fund | | | 3,315 | | | 254 |
Mid Cap Growth Fund | | | 2,070 | | | 1,003 |
Small Cap Fund | | | 252 | | | 107 |
International Equity Fund | | | 121 | | | — |
Special Opportunities Equity Fund | | | 3,382 | | | 2,322 |
Equity Income Fund | | | 1,029 | | | 300 |
Short U.S. Government Fund | | | 2,362 | | | 872 |
Intermediate U.S. Government Fund | | | 2,308 | | | 2,240 |
Total Return Bond Fund | | | 6,570 | | | 7,373 |
Kentucky Intermediate Tax-Free Fund | | | — | | | — |
Maryland Intermediate Tax-Free Fund | | | — | | | — |
North Carolina Intermediate Tax-Free Fund | | | 564 | | | 386 |
South Carolina Intermediate Tax-Free Fund | | | — | | | — |
Virginia Intermediate Tax-Free Fund | | | — | | | — |
West Virginia Intermediate Tax-Free Fund | | | 2 | | | 1,646 |
Prime Money Market Fund | | | — | | | — |
U.S. Treasury Money Market Fund | | | — | | | — |
National Tax-Free Money Market Fund | | | — | | | — |
Capital Manager Conservative Growth Fund | | | 1,484 | | | 124 |
Capital Manager Moderate Growth Fund | | | 567 | | | — |
Capital Manager Growth Fund | | | 204 | | | 135 |
Capital Manager Equity Fund | | | 208 | | | 5 |
| 3. | Conversion of the Small Cap Fund and the Small Cap Growth Fund: |
On March 27, 2006, net assets of the Small Cap Growth Fund managed by BB&T were exchanged in a tax-free conversion for shares of the Small Cap Fund and BB&T incurred all merger related expenses. The following is summary of shares issued, net assets converted, net asset value per share issued and unrealized appreciation/depreciation of assets acquired as of the conversion date:
| | | | | | | | | | | | |
| | | Shares
Issued | | Net Assets
Converted | | Net Asset
Value Per
Share Issued | | Unrealized
Appreciation
(Depreciation) | |
Small Cap Fund | | | | | | | | | | | | |
A Shares | | 519,217 | | $ | 8,076,416 | | $ | 15.56 | | $ | 3,875,617 | |
B Shares | | 320,692 | | | 4,879,881 | | | 15.22 | | | (1,836,336 | ) |
C Shares | | 1,265 | | | 19,229 | | | 15.20 | | | (2,775 | ) |
Institutional Shares | | 2,617,536 | | | 40,922,638 | | | 15.63 | | | (940,425 | ) |
Continued
150
BB&T Funds
Notes to Financial Statements, continued | September 30, 2006 |
| 4. | Purchases and Sales of Securities: |
Purchases and sales of securities (excluding securities maturing less than one year from acquisition) for the fiscal year ended September 30, 2006 were as follows:
| | | | | | |
| | | Purchases | | Sales |
Large Cap Fund | | $ | 230,193,817 | | $ | 270,842,971 |
Large Cap Growth Fund | | | 627,234,783 | | | 739,785,130 |
Mid Cap Value Fund | | | 117,910,343 | | | 109,183,117 |
Mid Cap Growth Fund | | | 211,142,474 | | | 195,682,263 |
Small Cap Fund | | | 56,397,924 | | | 35,643,608 |
International Equity Fund | | | 87,987,392 | | | 94,855,773 |
Special Opportunities Equity Fund | | | 103,153,784 | | | 106,548,251 |
Equity Income Fund | | | 65,548,327 | | | 42,508,194 |
Short U.S. Government Fund | | | 70,250,597 | | | 117,762,007 |
Intermediate U.S. Government Fund | | | 304,984,420 | | | 605,572,922 |
Total Return Bond Fund | | | 1,014,234,331 | | | 894,680,102 |
Kentucky Intermediate Tax-Free Fund | | | 10,056,737 | | | 13,635,797 |
Maryland Intermediate Tax-Free Fund | | | 22,271,219 | | | 23,861,141 |
North Carolina Intermediate Tax-Free Fund | | | 103,556,086 | | | 111,659,712 |
South Carolina Intermediate Tax-Free Fund | | | 15,451,560 | | | 16,092,412 |
Virginia Intermediate Tax-Free Fund | | | 58,441,733 | | | 60,554,929 |
West Virginia Intermediate Tax-Free Fund | | | 33,018,011 | | | 35,374,963 |
Capital Manager Conservative Growth Fund | | | 8,308,488 | | | 4,555,000 |
Capital Manager Moderate Growth Fund | | | 18,052,284 | | | 6,870,000 |
Capital Manager Growth Fund | | | 17,844,499 | | | 4,585,000 |
Capital Manager Equity Fund | | | 8,472,477 | | | 585,000 |
Purchases and sales of U.S. Government Securities (excluding securities maturing less than one year from acquisition) for the fiscal year ended September 30, 2006 were as follows:
| | | | | | |
| | | Purchases | | Sales |
Short U.S. Government Fund | | $ | 56,602,786 | | $ | 73,158,155 |
Intermediate U.S. Government Fund | | | 269,840,412 | | | 242,029,270 |
Total Return Bond Fund | | | 306,065,575 | | | 297,012,318 |
Restricted Securities:
A restricted security is a security which has been purchased through a private offering and cannot be resold to the general public without prior registration under the Securities Act of 1933 (The “1933 Act”) or pursuant to the resale limitations provided by Rule 144 under the 1933 Act, or an exemption from the registration requirements of the 1933 Act. Whether a restricted security is illiquid is determined pursuant to guidelines established by the Board of Trustees. Not all restricted securities are considered illiquid. At September 30, 2006, the North Carolina Intermediate Tax-Free Fund and the Prime Money Market Fund held illiquid restricted securities representing 3.7% and 3.6% of net assets, respectively. The illiquid restricted securities held as of September 30, 2006 are identified below:
| | | | | | | | | | | |
Security | | Acquisition Date | | Acquistition Cost | | Principal Amount | | Fair Value |
BB&T North Carolina Intermediate Tax-Free Fund | | | | | | | | | | | |
North Carolina Capital Facilities Finance Agency, 5.25%, 5/1/15, Callable 11/1/06 @ 102 | | 5/15/2003 | | $ | 2,096,517 | | $ | 2,092,897 | | $ | 2,134,755 |
North Carolina Medical Care Commission Hospital Revenue, 4.60%, 8/15/07 | | 3/2/2002 | | | 1,764,467 | | | 1,795,000 | | | 1,798,734 |
Continued
151
BB&T Funds
Notes to Financial Statements, continued | September 30, 2006 |
| | | | | | | | | | | |
Security | | Acquisition Date | | Acquisition Cost | | Principal Amount | | Fair Value |
BB&T Prime Money Market Fund | | | | | | | | | | | |
Genworth Life Insurance Co., 5.53%, 11/9/06 | | 5/9/2006 | | $ | 5,000,000 | | $ | 5,000,000 | | $ | 5,000,000 |
Metlife Insurance Co. of Connecticut, 5.50%, 11/21/06 | | 8/19/2005 | | | 5,000,000 | | | 5,000,000 | | | 5,000,000 |
Metropolitan Life Insurance Co., 5.61%, 11/1/06 | | 2/10/2003 | | | 5,000,000 | | | 5,000,000 | | | 5,000,000 |
Monet Trust, 2000-1, 5.43%, 12/28/06 | | 3/28/2005 | | | 30,000,000 | | | 30,000,000 | | | 30,000,000 |
New York Life Insurance Co., 5.48%, 11/25/06 | | 8/25/2006 | | | 5,000,000 | | | 5,000,000 | | | 5,000,000 |
| 5. | Related Party Transactions: |
Investment advisory services are provided to the Funds by BB&T. Under the terms of the Investment Advisory Agreement, BB&T is entitled to receive fees based on a percentage of the average daily net assets of the Funds. These fees are accrued daily and payable on a monthly basis and are reflected on the Statements of Operations as “Investment advisory fees”. BB&T waived investment advisory fees and certain expenses for the Small Cap Fund and the National Tax-Free Money Market Fund which are not subject to recoupment and are included on the Statements of Operations as “Less expenses waived by the Investment Advisor”.
Information regarding these transactions is as follows for the period ended September 30, 2006:
| | | | | | | | | |
| | | Contractural Fee Rate | | | Fee Rate after
Contractual
Waivers(1) | | | Fee Rate after
Contractual
Waivers(2)* | |
Large Cap Fund | | 0.74 | % | | 0.67 | % | | 0.70 | % |
Large Cap Growth Fund | | 0.74 | % | | 0.67 | % | | 0.70 | % |
Mid Cap Value Fund | | 0.74 | % | | 0.67 | % | | 0.70 | % |
Mid Cap Growth Fund | | 0.74 | % | | 0.67 | % | | 0.70 | % |
Small Cap Fund(3) | | 1.00 | % | | 0.80 | % | | 0.80 | % |
International Equity Fund | | 1.00 | % | | 0.90 | % | | 0.90 | % |
Special Opportunities Equity Fund | | 0.80 | % | | 0.80 | % | | 0.80 | % |
Equity Income Fund | | 0.70 | % | | 0.70 | % | | 0.70 | % |
Short U.S. Government Fund | | 0.60 | % | | 0.45 | % | | 0.45 | % |
Intermediate U.S. Government Fund | | 0.60 | % | | 0.50 | % | | 0.48 | % |
Total Return Bond Fund | | 0.60 | % | | 0.50 | % | | 0.48 | % |
Kentucky Intermediate Tax-Free Fund(3) | | 0.60 | % | | 0.40 | % | | 0.40 | % |
Maryland Intermediate Tax-Free Fund(3) | | 0.60 | % | | 0.30 | % | | 0.30 | % |
North Carolina Intermediate Tax-Free Fund | | 0.60 | % | | 0.45 | % | | 0.45 | % |
South Carolina Intermediate Tax-Free Fund(3) | | 0.60 | % | | 0.45 | % | | 0.45 | % |
Virginia Intermediate Tax-Free Fund | | 0.60 | % | | 0.45 | % | | 0.45 | % |
West Virginia Intermediate Tax-Free Fund | | 0.45 | % | | 0.45 | % | | 0.45 | % |
Prime Money Market Fund | | 0.40 | % | | 0.29 | % | | 0.29 | % |
U.S. Treasury Money Market Fund | | 0.40 | % | | 0.28 | % | | 0.26 | % |
National Tax-Free Money Market Fund | | 0.25 | % | | N/A | | | 0.20 | % |
Capital Manager Conservative Growth Fund | | 0.25 | % | | 0.00 | % | | 0.00 | % |
Capital Manager Moderate Growth Fund | | 0.25 | % | | 0.00 | % | | 0.00 | % |
Capital Manager Growth Fund | | 0.25 | % | | 0.00 | % | | 0.00 | % |
Capital Manager Equity Fund | | 0.25 | % | | 0.00 | % | | 0.00 | % |
| * | Effective February 1, 2006, BB&T contractually agreed to waive a portion of the investment advisory fee as disclosed in the table above. All contractual investment advisory fee waivers are not subject to recoupment in subsequent fiscal periods. |
| (1) | For the period October 1, 2005 through January 31, 2006. |
| (2) | For the period February 1, 2006 through September 30, 2006. |
| (3) | For all or a portion of the fiscal year ended September 30, 2006 BB&T voluntarily waived additional investment advisory fees for the Small Cap Fund, Kentucky Intermediate Tax-Free Fund, Maryland Intermediate Tax-Free Fund, South Carolina Intermediate Tax-Free Fund and National Tax-Free Money Market Fund. All voluntary investment advisory fee waivers are not subject to recoupment in subsequent fiscal periods, and may be discontinued at any time. |
Continued
152
BB&T Funds
Notes to Financial Statements, continued | September 30, 2006 |
Pursuant to a Sub-Advisory agreement with BB&T, UBS Global Asset Management (Americas), Inc. (“UBS”) serves as the Sub-Advisor to the International Equity Fund, subject to the general supervision of the Funds’ Board of Trustees and BB&T. Pursuant to a Sub-Advisory agreement with BB&T, Federated Investment Management Company (“Federated”) serves as the Sub-Advisor to the Prime Money Market Fund and the National Tax-Free Money Market Fund, subject to the general supervision of the Funds’ Board of Trustees and BB&T. Pursuant to a Sub-Advisory agreement with BB&T, Scott & Stringfellow, Inc., a wholly owned subsidiary of BB&T Corporation, serves as the Sub-Advisor to the Special Opportunities Equity Fund and the Equity Income Fund, subject to the general supervision of the Funds’ Board of Trustees and BB&T. Pursuant to a Sub-Advisory agreement with BB&T, Sterling Capital Management LLC, a wholly owned subsidiary of BB&T Corporation, serves as the Sub-Advisor to the Mid Cap Value Fund and the Total Return Bond Fund, subject to the general supervision of the Funds’ Board of Trustees and BB&T. For their services, Sub-Advisors are entitled to a fee, payable by BB&T.
BB&T serves the Funds as administrator. BB&T receives compensation for providing administration services at a rate of 0.12% of the BB&T Funds and BB&T Variable Insurance Funds aggregate average daily net assets up to $5 billion and a rate of 0.08% of the aggregate average daily net assets in excess of $5 billion. This fee is accrued daily and payable on a monthly basis. Expenses incurred are reflected on the Statements of Operations as “Administration fees”. BB&T voluntarily waived administration fees of $94,547, $111,212, $87,546 and $47,541, respectively, of the Capital Manager Conservative Growth Fund, the Capital Manager Moderate Growth Fund, the Capital Manager Growth Fund and the Capital Manager Equity Fund for the fiscal year ended September 30, 2006. Administration fee waivers are included on the Statements of Operations as “Less expenses waived by the Administrator” and these waivers are not subject to recoupment in subsequent fiscal periods. Pursuant to a Sub-Administration Agreement with BB&T, BISYS Fund Services Ohio, Inc. (BISYS Ohio) serves as sub-administrator to the Funds subject to the general supervision of the Funds’ Board of Trustees and BB&T. For these services, BISYS Ohio is entitled to a fee, payable by BB&T. BISYS Ohio is a subsidiary of BISYS Group, Inc.
BISYS Ohio serves the Funds as fund accountant and transfer agent and receives compensation for providing fund accounting and transfer agency services at a rate of 0.02% (0.01% for each service) of the average daily net assets of each Fund, plus certain out of pocket expenses. Expenses incurred are reflected on the Statements of Operations as “Fund accounting fees” and “Transfer agency fees”, respectively.
Under a Compliance Services Agreement between the Trust and BISYS Ohio (the “CCO Agreement”), BISYS Ohio makes an employee available to serve as the Trusts’ Chief Compliance Officer (the “CCO”). Under the CCO Agreement, BISYS Ohio also provides infrastructure and support in implementing the written policies and procedures comprising the Funds’ compliance program, including support services to the CCO. For the services provided under the CCO Agreement, the Funds paid BISYS Ohio $100,000 for the reporting period ended September 30, 2006, plus certain out of pocket expenses. Expenses incurred for the Funds are reflected on the Statements of Operations as “Compliance service fees”. BISYS Ohio pays the salary and other compensation earned by any such individuals as employees of BISYS Ohio.
For the year ended September 30, 2006, the Funds’ paid $395,077 in brokerage fees to Scott & Stringfellow, Inc., a wholly owned subsidiary of BB&T Corporation, on the execution of purchases and sales of the Funds’ portfolio investments.
Effective November 1, 2005, BB&T Funds Distributor, Inc. (“BBTFDI”) serves as distributor to each Fund of the Funds pursuant to a Distribution Agreement (the “Distribution Agreement”). BBTFDI has contractually agreed to waive a portion of the Class A shares distribution fees throughout the year. Effective February 1, 2006 and through January 31, 2007, BBTFDI has contractually agreed to waive 0.25% of the Class A distribution fees of the Funds except for the Mid Cap Value Fund, Mid Cap Growth Fund, West Virginia Intermediate Tax-Free Fund, Prime Money Market Fund and the U.S. Treasury Money Market Fund. BBTFDI waived fees totaling $812,110 of distribution fees for the period ended September 30, 2006. Distribution fee waivers are included in the Statements of Operations as “Less expenses waived by the Distributor” and these waivers are not subject to recoupment in subsequent fiscal periods. Prior to November 1, 2005, BISYS Fund Services LP served as distributor to each Fund of BB&T Funds pursuant to a Distribution Agreement dated October 1, 1993.
The Funds have adopted a Distribution and Shareholder Services Plan (the “Plan”) in accordance with Rule 12b-1 under the 1940 Act. The Plan provides for payments to the distributor of up to 0.50%, 1.00% and 1.00% of the average daily net assets of the Class A Shares, Class B Shares, and Class C Shares, respectively, with exception of the Mid Cap Value Fund, the Mid Cap Growth
Continued
153
BB&T Funds
Notes to Financial Statements, continued | September 30, 2006 |
Fund and the West Virginia Intermediate Tax-Free Fund which receives payments of up to 0.25% of the average daily net assets for Class A. The fees may be used by BBTFDI to pay banks, broker dealers and other institutions, including affiliates of the advisor. As distributor, BBTFDI, is entitled to receive commissions on sales of shares of the Variable Net Asset Value Funds. For the period ended September 30, 2006, BBTFDI received $2,357,878 from commissions earned on sales of shares of the Funds’ Variable Net Asset Value Funds. Commissions paid to affiliated broker-dealers during the fiscal year ended September 30, 2006 were $2,132,253.
The Advisor and/or its affiliates may pay out of their own assets compensation to broker-dealers and other persons for the sale and distribution of the shares and/or for the servicing of the shares. These are additional payments over and above the sales charge (including Rule 12b-1 fees) and service fees paid by the Funds. The payments, which may be different for different financial institutions, will not change the price an investor will pay for shares or the amount that a Fund will receive for the sale of shares.
Certain Officers and Trustees of the Funds are affiliated with the adviser, the administrator, or the sub-administrator. Such Officers and Trustees receive no compensation from the Funds for serving in their respective roles. Each of the five non-interested Trustees who serve on both the Board and the Audit Committee are compensated $6,000 per quarter and $2,400 for each regularly scheduled meeting, plus reimbursement for certain expenses. During the year ended September 30, 2006, actual Trustee compensation was $174,339 in total.
| 6. | Concentration of Credit Risk: |
The Tax-Free Funds invest primarily in debt instruments of municipal issuers in their respective states. The issuers’ abilities to meet their obligations may be affected by economic developments in a specific state or region.
U.S. Bank, N.A. has made available a credit facility to the Funds, pursuant to a Credit Agreement (the “Agreement”). The primary purpose of the Agreement is to allow the Funds to avoid security liquidation that BB&T believes are unfavorable to shareholders. Outstanding principal amounts under the Agreement bear interest at an interest rate equal to the Prime Rate minus 2.00%. The Funds did not utilize this Agreement during the period ended September 30, 2006.
| 8. | Federal Income Tax Information: |
At September 30, 2006, the following Funds have net capital loss carryforwards available to offset future net capital gains, if any, to the extent provided by the Treasury regulations. To the extent that these carryforwards are used to offset future capital gains, it is probable that the gains that are offset will not be distributed to shareholders.
| | | | | |
| | | Amount | | Expires |
Large Cap Growth Fund | | $ | 7,019,454 | | 2011 |
Small Cap Fund* | | | 7,051,245 | | 2009 |
Small Cap Fund* | | | 2,350,415 | | 2010 |
International Equity Fund | | | 636,946 | | 2011 |
Short U.S. Government Fund | | | 349,217 | | 2008 |
Short U.S. Government Fund | | | 498,342 | | 2009 |
Short U.S. Government Fund | | | 118,919 | | 2012 |
Short U.S. Government Fund | | | 2,094,190 | | 2013 |
Short U.S. Government Fund | | | 1,246,269 | | 2014 |
Intermediate U.S. Government Fund | | | 222,709 | | 2013 |
Intermediate U.S. Government Fund | | | 4,243,104 | | 2014 |
Total Return Bond Fund | | | 1,527,254 | | 2014 |
Kentucky Intermediate Tax-Free Fund | | | 7,545 | | 2011 |
Kentucky Intermediate Tax-Free Fund | | | 3,794 | | 2014 |
Maryland Intermediate Tax-Free Fund | | | 14,230 | | 2011 |
Maryland Intermediate Tax-Free Fund | | | 113,581 | | 2013 |
Capital Manager Conservative Growth Fund | | | 1,243,302 | | 2012 |
Capital Manager Conservative Growth Fund | | | 164,216 | | 2013 |
| * | The amount of these losses that may be utilized are limited to $2,350,415 on annual basis as a result of certain ownership changes in 2006. |
Continued
154
BB&T Funds
Notes to Financial Statements, continued | September 30, 2006 |
The tax character of dividends paid to shareholders during the fiscal year ended September 30, 2006, were as follows:
| | | | | | | | | | | | | | | | | | |
| | | Distributions paid from | | | | | | | | |
| | | Ordinary
Income | | Net Long-
Term Gains | | Total Taxable
Distributions | | Tax Exempt
Distributions | | Current Year
Distributions
of Earnings
and Profits | | Total
Distributions
Paid * |
Large Cap Fund | | $ | 16,180,152 | | $ | 43,804,755 | | $ | 59,984,907 | | $ | — | | $ | — | | $ | 59,984,907 |
Large Cap Growth Fund | | | 1,582,511 | | | — | | | 1,582,511 | | | — | | | — | | | 1,582,511 |
Mid Cap Value Fund | | | 11,456,392 | | | 9,945,224 | | | 21,401,616 | | | — | | | — | | | 21,401,616 |
Mid Cap Growth Fund | | | 1,262,723 | | | 13,009,021 | | | 14,271,744 | | | — | | | 188,060 | | | 14,459,804 |
Small Cap Fund | | | 845,622 | | | 7,693,220 | | | 8,538,842 | | | — | | | 24,778 | | | 8,563,620 |
International Equity Fund | | | 2,763,161 | | | — | | | 2,763,161 | | | — | | | — | | | 2,763,161 |
Special Opportunities Equity Fund | | | 3,037,182 | | | 6,658,012 | | | 9,695,194 | | | — | | | — | | | 9,695,194 |
Equity Income Fund | | | 3,534,406 | | | 507,611 | | | 4,042,017 | | | — | | | — | | | 4,042,017 |
Short U.S. Government Fund | | | 4,796,925 | | | — | | | 4,796,925 | | | — | | | — | | | 4,796,925 |
Intermediate U.S. Government Fund | | | 20,142,563 | | | — | | | 20,142,563 | | | — | | | — | | | 20,142,563 |
Total Return Bond Fund | | | 22,226,099 | | | 2,176,080 | | | 24,402,179 | | | — | | | — | | | 24,402,179 |
Kentucky Intermediate Tax-Free Fund | | | — | | | — | | | — | | | 521,519 | | | — | | | 521,519 |
Maryland Intermediate Tax-Free Fund | | | 106 | | | — | | | 106 | | | 326,935 | | | — | | | 327,041 |
North Carolina Intermediate Tax-Free Fund | | | 104,708 | | | 911,150 | | | 1,015,858 | | | 3,962,871 | | | — | | | 4,978,729 |
South Carolina Intermediate Tax-Free Fund | | | — | | | 347,206 | | | 347,206 | | | 694,356 | | | — | | | 1,041,562 |
Virginia Intermediate Tax-Free Fund | | | — | | | 447,855 | | | 447,855 | | | 2,890,792 | | | — | | | 3,338,647 |
West Virginia Intermediate Tax-Free Fund | | | 15,699 | | | 409,576 | | | 425,275 | | | 2,631,959 | | | — | | | 3,057,234 |
Prime Money Market Fund | | | 44,000,932 | | | — | | | 44,000,932 | | | — | | | — | | | 44,000,932 |
U.S. Treasury Money Market Fund | | | 25,302,481 | | | — | | | 25,302,481 | | | — | | | — | | | 25,302,481 |
National Tax-Free Money Market Fund | | | — | | | — | | | — | | | 267,647 | | | — | | | 267,647 |
Capital Manager Conservative Growth Fund | | | 2,156,986 | | | — | | | 2,156,986 | | | — | | | — | | | 2,156,986 |
Capital Manager Moderate Growth Fund | | | 1,857,732 | | | — | | | 1,857,732 | | | — | | | — | | | 1,857,732 |
Capital Manager Growth Fund | | | 1,244,704 | | | — | | | 1,244,704 | | | — | | | — | | | 1,244,704 |
Capital Manager Equity Fund | | | 1,277,116 | | | — | | | 1,277,116 | | | — | | | — | | | 1,277,116 |
The tax character of dividends paid to shareholders during the fiscal year ended September 30, 2005, were as follows:
| | | | | | | | | | | | | | | | | | |
| | | Distributions paid from | | | | | | | | |
| | | Ordinary
Income | | Net Long-
Term Gains | | Total Taxable
Distributions | | Tax Exempt
Distributions | | Current Year
Distributions
of Earnings
and Profits | | Total
Distributions
Paid * |
Large Cap Fund | | $ | 12,372,558 | | $ | — | | $ | 12,372,558 | | $ | — | | $ | — | | $ | 12,372,558 |
Large Cap Growth Fund | | | 1,454,437 | | | — | | | 1,454,437 | | | — | | | — | | | 1,454,437 |
Mid Cap Value Fund | | | 2,320,084 | | | 59,006,677 | | | 61,326,761 | | | — | | | 17,825 | | | 61,344,586 |
Mid Cap Growth Fund | | | — | | | 1,527,268 | | | 1,527,268 | | | — | | | — | | | 1,527,268 |
Small Cap Fund | | | 1,794,045 | | | 839,331 | | | 2,633,376 | | | — | | | 5,259 | | | 2,638,635 |
International Equity Fund | | | 2,762,795 | | | — | | | 2,762,795 | | | — | | | 874,327 | | | 3,637,122 |
Special Opportunities Equity Fund | | | 1,015,239 | | | — | | | 1,015,239 | | | — | | | — | | | 1,015,239 |
Equity Income Fund | | | 1,541,950 | | | — | | | 1,541,950 | | | — | | | — | | | 1,541,950 |
Short U.S. Government Fund | | | 6,397,474 | | | — | | | 6,397,474 | | | — | | | — | | | 6,397,474 |
Intermediate U.S. Government Fund | | | 24,780,721 | | | 2,537,308 | | | 27,318,029 | | | — | | | — | | | 27,318,029 |
Total Return Bond Fund | | | 15,603,344 | | | 894,698 | | | 16,498,042 | | | — | | | — | | | 16,498,042 |
Kentucky Intermediate Tax-Free Fund | | | — | | | — | | | — | | | 489,873 | | | — | | | 489,783 |
Maryland Intermediate Tax-Free Fund | | | — | | | — | | | — | | | 296,788 | | | — | | | 296,788 |
North Carolina Intermediate Tax-Free Fund | | | 5,069 | | | 192,982 | | | 198,051 | | | 3,991,284 | | | — | | | 4,189,335 |
South Carolina Intermediate Tax-Free Fund | | | — | | | 146,124 | | | 146,124 | | | 709,878 | | | — | | | 856,002 |
Virginia Intermediate Tax-Free Fund | | | 1,568 | | | 158,443 | | | 160,011 | | | 2,884,720 | | | — | | | 3,044,731 |
West Virginia Intermediate Tax-Free Fund | | | 3,853 | | | 555,579 | | | 559,432 | | | 2,681,496 | | | — | | | 3,240,928 |
Prime Money Market Fund | | | 20,623,971 | | | 296 | | | 20,624,267 | | | — | | | — | | | 20,624,267 |
U.S. Treasury Money Market Fund | | | 17,575,264 | | | — | | | 17,575,264 | | | — | | | — | | | 17,575,264 |
Capital Manager Conservative Growth Fund | | | 2,347,405 | | | — | | | 2,347,405 | | | — | | | — | | | 2,347,405 |
Capital Manager Moderate Growth Fund | | | 1,436,022 | | | — | | | 1,436,022 | | | — | | | — | | | 1,436,022 |
Capital Manager Growth Fund | | | 756,722 | | | — | | | 756,722 | | | — | | | — | | | 756,722 |
Capital Manager Equity Fund | | | 242,213 | | | — | | | 242,213 | | | — | | | — | | | 242,213 |
| * | Total Distributions paid may differ from the Statements of Changes in Net Assets because distributions are recognized when actually paid for tax purposes. |
Continued
155
BB&T Funds
Notes to Financial Statements, continued | September 30, 2006 |
As of September 30, 2006, the components of accumulated earnings (deficit) on a tax basis was as follows:
| | | | | | | | | | | | | | | | | | | | | | | | | |
| | | Undistributed
Ordinary
Income/Tax
Exempt Income | | Undistributed
Long Term
Capital Gains
(Losses) | | Accumulated
Earnings | | Dividends
Payable* | | | Accumulated
Capital and
Other Losses | | | Unrealized
Appreciation
(Depreciation) | | | Total
Accumulated
Earnings
(Deficit) | |
Large Cap Fund | | $ | 6,041,345 | | $ | 70,414,557 | | $ | 76,455,902 | | $ | (783,804 | ) | | $ | — | | | $ | 160,326,236 | | | $ | 235,998,334 | |
Large Cap Growth Fund | | | 484,026 | | | — | | | 484,026 | | | (253,153 | ) | | | (7,019,454 | ) | | | 31,844,053 | | | | 25,055,472 | |
Mid Cap Value Fund | | | 6,958,982 | | | 1,115,592 | | | 8,074,574 | | | (143,586 | ) | | | — | | | | 18,114,339 | | | | 26,045,327 | |
Mid Cap Growth Fund | | | — | | | 16,286,520 | | | 16,286,520 | | | — | | | | — | | | | 20,783,667 | | | | 37,070,187 | |
Small Cap Fund | | | — | | | 3,598,280 | | | 3,598,280 | | | (27,923 | ) | | | (9,401,660 | ) | | | 13,522,220 | | | | 7,690,917 | |
International Equity Fund | | | 820,876 | | | — | | | 820,876 | | | (1,414,301 | ) | | | (716,946 | ) | | | 63,129,987 | | | | 61,819,616 | |
Special Opportunities Equity Fund | | | 1,779,078 | | | 7,901,155 | | | 9,680,233 | | | — | | | | — | | | | 37,622,395 | | | | 47,302,628 | |
Equity Income Fund | | | 483,827 | | | 2,979,473 | | | 3,463,300 | | | (636,097 | ) | | | — | | | | 15,635,465 | | | | 18,462,668 | |
Short U.S. Government Fund | | | 850,380 | | | — | | | 850,380 | | | (272,055 | ) | | | (8,244,574 | ) | | | (757,819 | ) | | | (8,424,068 | ) |
Intermediate U.S. Government Fund | | | 4,628,534 | | | — | | | 4,628,534 | | | (1,293,561 | ) | | | (14,952,855 | ) | | | (4,556,907 | ) | | | (16,174,789 | ) |
Total Return Bond Fund | | | 4,328,179 | | | — | | | 4,328,179 | | | (2,137,064 | ) | | | (10,356,412 | ) | | | (533,970 | ) | | | (8,699,267 | ) |
Kentucky Intermediate Tax-Free Fund | | | 43,896 | | | — | | | 43,896 | | | (38,763 | ) | | | (80,022 | ) | | | 302,229 | | | | 227,340 | |
Maryland Intermediate Tax-Free Fund | | | 25,627 | | | — | | | 25,627 | | | (26,107 | ) | | | (143,744 | ) | | | 142,826 | | | | (1,398 | ) |
North Carolina Intermediate Tax-Free Fund | | | 370,719 | | | 15,453 | | | 386,172 | | | (317,922 | ) | | | — | | | | 3,156,509 | | | | 3,224,759 | |
South Carolina Intermediate Tax-Free Fund | | | 72,147 | | | 9,845 | | | 81,992 | | | (56,389 | ) | | | — | | | | 526,597 | | | | 552,200 | |
Virginia Intermediate Tax-Free Fund | | | 264,659 | | | 25,902 | | | 290,561 | | | (232,785 | ) | | | — | | | | 2,512,038 | | | | 2,569,814 | |
West Virginia Intermediate Tax-Free Fund | | | 161,128 | | | 188,044 | | | 349,172 | | | (216,502 | ) | | | — | | | | 1,752,947 | | | | 1,885,617 | |
Prime Money Market Fund | | | 5,136,281 | | | 4,504 | | | 5,140,785 | | | (5,135,097 | ) | | | — | | | | — | | | | 5,688 | |
U.S. Treasury Money Market Fund | | | 2,497,403 | | | — | | | 2,497,403 | | | (2,497,157 | ) | | | — | | | | — | | | | 246 | |
National Tax-Free Money Market Fund | | | 261,198 | | | — | | | 261,198 | | | (258,170 | ) | | | — | | | | — | | | | 3,028 | |
Capital Manager Conservative Growth Fund | | | 669,925 | | | — | | | 669,925 | | | (615,051 | ) | | | (1,407,518 | ) | | | 5,493,699 | | | | 4,141,055 | |
Capital Manager Moderate Growth Fund | | | 610,542 | | | 348,321 | | | 958,863 | | | (515,660 | ) | | | — | | | | 8,778,167 | | | | 9,221,370 | |
Capital Manager Growth Fund | | | 388,051 | | | 951,905 | | | 1,339,956 | | | (304,206 | ) | | | — | | | | 6,593,327 | | | | 7,629,077 | |
Capital Manager Equity Fund | | | 160,409 | | | 1,535,846 | | | 1,696,255 | | | (112,928 | ) | | | — | | | | 5,018,527 | | | | 6,601,854 | |
| * | Dividends Payable may differ from the Statements of Assets and Liabilities because distributions are recognized when actually paid for tax purposes. |
Continued
156
BB&T Funds
Notes to Financial Statements, continued | September 30, 2006 |
Under current tax law, capital losses realized after October 31 of a Fund’s fiscal year may be deferred and treated as occurring on the first business day of the following fiscal year for tax purposes. The following Funds had deferred post October capital and currency losses, which will be treated as arising on the first business day of the fiscal year ending September 30, 2007:
| | | |
| | | Post-October Losses |
International Equity Fund | | $ | 80,000 |
Short U.S. Government Fund | | | 3,937,637 |
Intermediate U.S. Government Fund | | | 10,487,042 |
Total Return Bond Fund | | | 8,829,158 |
Kentucky Intermediate Tax-Free Fund | | | 68,683 |
Maryland Intermediate Tax-Free Fund | | | 15,933 |
At September 30, 2006 the cost, gross unrealized appreciation and gross unrealized depreciation on securities for federal income tax purposes, were as follows:
| | | | | | | | | | | | | | |
| | | Tax Cost | | Tax Unrealized Appreciation | | Tax Unrealized Depreciation | | | Net
Unrealized Appreciation (Depreciation) | |
Large Cap Fund | | $ | 690,800,740 | | $ | 164,421,587 | | $ | (4,095,351 | ) | | $ | 160,326,236 | |
Large Cap Growth Fund | | | 292,435,343 | | | 34,462,311 | | | (2,618,258 | ) | | | 31,844,053 | |
Mid Cap Value Fund | | | 274,285,432 | | | 22,592,005 | | | (4,477,666 | ) | | | 18,114,339 | |
Mid Cap Growth Fund | | | 177,419,024 | | | 22,556,307 | | | (1,772,640 | ) | | | 20,783,667 | |
Small Cap Fund | | | 139,360,425 | | | 17,167,389 | | | (3,645,169 | ) | | | 13,522,220 | |
International Equity Fund | | | 190,057,765 | | | 68,116,464 | | | (4,991,015 | ) | | | 63,125,449 | |
Special Opportunities Equity Fund | | | 230,135,825 | | | 38,091,039 | | | (468,644 | ) | | | 37,622,395 | |
Equity Income Fund | | | 133,763,507 | | | 16,620,702 | | | (985,237 | ) | | | 15,635,465 | |
Short U.S. Government Fund | | | 107,091,582 | | | 157,947 | | | (915,766 | ) | | | (757,819 | ) |
Intermediate U.S. Government Fund | | | 306,139,170 | | | 486,538 | | | (5,043,445 | ) | | | (4,556,907 | ) |
Total Return Bond Fund | | | 536,325,709 | | | 3,565,692 | | | (4,099,662 | ) | | | (533,970 | ) |
Kentucky Intermediate Tax-Free Fund | | | 14,050,843 | | | 304,637 | | | (2,408 | ) | | | 302,229 | |
Maryland Intermediate Tax-Free Fund | | | 9,761,338 | | | 145,038 | | | (2,212 | ) | | | 142,826 | |
North Carolina Intermediate Tax-Free Fund | | | 104,508,426 | | | 3,156,509 | | | — | | | | 3,156,509 | |
South Carolina Intermediate Tax-Free Fund | | | 18,843,916 | | | 527,489 | | | (892 | ) | | | 526,597 | |
Virginia Intermediate Tax-Free Fund | | | 74,741,644 | | | 2,513,969 | | | (1,931 | ) | | | 2,512,038 | |
West Virginia Intermediate Tax-Free Fund | | | 64,031,776 | | | 1,753,582 | | | (635 | ) | | | 1,752,947 | |
Prime Money Market Fund | | | 1,370,562,242 | | | — | | | — | | | | — | |
U.S. Treasury Money Market Fund | | | 650,126,695 | | | — | | | — | | | | — | |
National Tax-Free Money Market Fund | | | 95,640,945 | | | — | | | — | | | | — | |
Capital Manager Conservative Growth Fund | | | 56,048,842 | | | 6,305,739 | | | (812,040 | ) | | | 5,493,699 | |
Capital Manager Moderate Growth Fund | | | 72,028,809 | | | 10,048,641 | | | (1,270,474 | ) | | | 8,778,167 | |
Capital Manager Growth Fund | | | 55,755,262 | | | 8,049,005 | | | (1,455,678 | ) | | | 6,593,327 | |
Capital Manager Equity Fund | | | 25,616,926 | | | 5,125,518 | | | (106,991 | ) | | | 5,018,527 | |
At the August 29, 2006 board meeting, the Board of Trustees approved, subject to shareholders’ approval, a fund merger between the Large Cap Fund and the Large Cap Growth Fund, which is scheduled to be completed during the first quarter of 2007.
10. Legal and Regulatory Matters
On September 26, 2006 BISYS Fund Services, Inc. (“BISYS”), an affiliate of BISYS Fund Services Ohio, Inc. which provides various services to the Funds as described in footnote 5, announced a settlement with the Securities and Exchange Commission (“SEC”) regarding the SEC’s investigation related to BISYS’ past payment of certain marketing and other expenses with respect to certain of its mutual fund clients. Although BISYS has reached a settlement with the SEC, the Funds’ management is not aware that any determination has been made as to how the BISYS settlement monies will be distributed. The SEC’s examination of BISYS’ mutual fund clients and their advisers has not been completed. Accordingly, the Funds’ management is currently unable to determine the impact, if any, of such matters on the Funds or the Funds’ financial statements.
157
Report of Independent Registered Public Accounting Firm
| To | the Shareholders and Board of Trustees of BB&T Funds: |
We have audited the accompanying statements of assets and liabilities of BB&T Funds — Large Cap Fund, Large Cap Growth Fund, Mid Cap Value Fund, Mid Cap Growth Fund, Small Cap Fund, International Equity Fund, Special Opportunities Equity Fund, Equity Income Fund, Short U.S. Government Fund, Intermediate U.S. Government Fund, Total Return Bond Fund, Kentucky Intermediate Tax-Free Fund, Maryland Intermediate Tax-Free Fund, North Carolina Intermediate Tax-Free Fund, South Carolina Intermediate Tax-Free Fund, Virginia Intermediate Tax-Free Fund, West Virginia Intermediate Tax-Free Fund, Prime Money Market Fund, U.S. Treasury Money Market Fund, National Tax-Free Money Market Fund, Capital Manager Conservative Growth Fund, Capital Manager Moderate Growth Fund, Capital Manager Growth Fund, and Capital Manager Equity Fund (collectively, the Funds), including the schedules of portfolio investments, as of September 30, 2006, and the related statements of operations for the period then ended, the statements of changes in net assets for each of the periods in the two-year period then ended, and the financial highlights for each of the periods in the five-year period then ended. These financial statements and financial highlights are the responsibility of the Funds’ management. Our responsibility is to express an opinion on these financial statements and financial highlights based on our audits.
We conducted our audits in accordance with the standards of the Public Company Accounting Oversight Board (United States). Those standards require that we plan and perform the audit to obtain reasonable assurance about whether the financial statements and financial highlights are free of material misstatement. An audit includes examining, on a test basis, evidence supporting the amounts and disclosures in the financial statements. Our procedures included confirmation of securities owned as of September 30, 2006, by correspondence with the custodian, transfer agent of the underlying funds, or brokers; where replies were not received from brokers, we performed other auditing procedures. An audit also includes assessing the accounting principles used and significant estimates made by management, as well as evaluating the overall financial statement presentation. We believe that our audits provide a reasonable basis for our opinion.
In our opinion, the financial statements and financial highlights referred to above present fairly, in all material respects, the financial position of the Funds as of September 30, 2006, the results of their operations for the period then ended, the changes in their net assets for each of the periods in the two-year period then ended, and the financial highlights for each of the periods in the five-year period then ended, in conformity with U.S. generally accepted accounting principles.
KPMG LLP
Columbus, Ohio
November 27, 2006
158
BB&T Funds
Other Federal Income Tax Information (Unaudited) | September 30, 2006 |
For the fiscal year ended September 30, 2006, certain dividends paid by the Funds may be subject to a maximum tax rate of 15% as provided for by the Jobs and Growth Tax Reconciliation Act of 2003. The Funds intend to designate the maximum amount allowable as taxed at a maximum rate of 15%. Complete information will be reported in conjunction with your 2006 Form 1099-DIV.
For the period ended September 30, 2006, the following Funds have a qualified dividend income of :
| | | |
| | | Qualified
Dividend
Income |
Large Cap Fund | | $ | 15,068,256 |
Large Cap Growth Fund | | | 1,582,511 |
Mid Cap Value Fund | | | 3,108,892 |
Mid Cap Growth Fund | | | 303,123 |
Small Cap Fund | | | 611,982 |
Special Opportunities Equity Fund | | | 945,171 |
Equity Income Fund | | | 2,713,008 |
Capital Manager Conservative Growth Fund | | | 2,079,158 |
Capital Manager Moderate Growth Fund | | | 59,216 |
Capital Manager Growth Fund | | | 87,689 |
Capital Manager Equity Fund | | | 714,274 |
For corporate shareholders, the following percentage of the total ordinary income dividends paid during the fiscal year ended September 30, 2006, qualify for the corporate dividends received deduction for the following Funds:
| | | |
| | | Dividends
Reduction
Deduction | |
Large Cap Fund | | 93.13 | % |
Large Cap Growth Fund | | 100.00 | % |
Mid Cap Value Fund | | 27.20 | % |
Mid Cap Growth Fund | | 24.59 | % |
Small Cap Fund | | 72.54 | % |
Special Opportunities Equity Fund | | 31.15 | % |
Equity Income Fund | | 77.04 | % |
Capital Manager Conservative Growth Fund | | 96.25 | % |
Capital Manager Moderate Growth Fund | | 2.63 | % |
Capital Manager Growth Fund | | 5.79 | % |
Capital Manager Equity Fund | | 45.18 | % |
During the fiscal year ended September 30, 2006, the following Funds declared tax-exempt income distributions:
| | | |
| | | Amount |
Kentucky Intermediate Tax-Free Fund | | $ | 521,519 |
Maryland Intermediate Tax-Free Fund | | | 326,935 |
North Carolina Intermediate Tax-Free Fund | | | 3,962,871 |
South Carolina Intermediate Tax-Free Fund | | | 694,356 |
Virginia Intermediate Tax-Free Fund | | | 2,890,792 |
West Virginia Intermediate Tax-Free Fund | | | 2,631,959 |
National Tax-Free Money Market Fund | | | 264,647 |
159
BB&T Funds
Special Meeting of Shareholders (Unaudited) | September 30, 2006 |
On November 11, 2005, there was a special meeting of the shareholders of the BB&T Small Cap Fund. The purpose of the meeting was: (1) to approve an amendment to the investment objective of the BB&T Small Cap Fund. A description of the proposal and the number of shares voted is as follows:
| | 1. | Approve an amendment to the investment objective of the Small Cap Fund to seek “long-term capital appreciation” by investing the Fund’s assets primarily in a diversified portfolio of equity and equity-related securities of small capitalization companies. |
| | | | |
AFFIRMATIVE | | AGAINST | | ABSTAIN |
3,070,854 | | 5,170 | | 1,855 |
On March 23, 2006, there was a special meeting of the shareholders of the BB&T Small Company Growth Fund and the BB&T Small Cap Fund. The purpose of the meeting was: (1) to consider and act upon a Plan of Reorganization (“Reorganization Plan”) adopted by BB&T Funds providing for the transfer of all the assets of the BB&T Small Company Growth Fund in exchange the BB&T Small Cap Fund and the assumption by the BB&T Small Cap Fund of all the liabilities of the BB&T Small Company Growth Fund, followed by the dissolution and liquidation of the BB&T Small Company Growth Fund and the distribution of Shares of the BB&T Small Cap Fund to the shareholders of the BB&T Small Company Growth Fund, and (2) to transact such other business as may properly come before the Special Meeting or any adjournment thereof. A description of the proposal and the number of shares voted is as follows:
| | 1. | To consider and act upon a Plan of Reorganization (“Reorganization Plan”) adopted by BB&T Funds providing for the transfer of all the assets of the BB&T Small Company Growth Fund in exchange the BB&T Small Cap Fund and the assumption by the BB&T Small Cap Fund of all the liabilities of the BB&T Small Company Growth Fund, followed by the dissolution and liquidation of the BB&T Small Company Growth Fund and the distribution of Shares of the BB&T Small Cap Fund to the shareholders of the BB&T Small Company Growth Fund. |
| | | | |
AFFIRMATIVE | | AGAINST | | ABSTAIN |
2,496,986 | | 2,431 | | 4,552 |
| | 2. | To transact such other business as may properly come before the Special Meeting or any adjournment thereof. |
| | | | |
AFFIRMATIVE | | AGAINST | | ABSTAIN |
121,024 | | 2,377,025 | | 5,920 |
160
Other Information (Unaudited)
A description of the policies and procedures that the Funds use to determine how to vote proxies relating to portfolio securities is available (i) without charge, upon request, by calling 1-800-228-1872; and (ii) on the Securities and Exchange Commission’s (the “Commission”) website at http://www.sec.gov.
Information regarding how the Funds voted proxies relating to portfolio securities during the most recent 12-month period ended June 30th is available (i) without charge, upon request, by calling 1-800-228-1872 and (ii) on the Commission’s website at http://www.sec.gov.
The Funds file complete Schedules of Portfolio Holdings with the Commission for the first and third quarters of each fiscal year on Form N-Q. The Funds’ Forms N-Q are available without charge on the Commission’s website at http://www.sec.gov, or may be reviewed and copied at the Commission’s Public Reference Roon in Washington, D.C. Information on the operation of the Public Reference Room may be obtained by calling 1-800-SEC-0330.
161
Board Consideration of Advisory and Sub-Advisory Agreements
(Unaudited)
The Board of Trustees, at a meeting held on August 29, 2006, formally considered the Trust’s investment advisory agreement with BB&T Asset Management, Inc. (“BB&TAM” or the “Adviser”) with respect to all funds of the Trust and sub-advisory agreements of BB&TAM with Scott & Stringfellow, Inc. (“Scott & Stringfellow”), with respect to the BB&T Special Opportunities Equity Fund and the Equity Income Fund; UBS Global Asset Management (Americas), Inc., with respect to the International Equity Fund; Federated Investment Management Company, with respect to the National Tax-Free Money Market Fund and the Prime Money Market Fund; and Sterling Capital Management LLC (“Sterling Capital”), with respect to the Mid Cap Value Fund and the Total Return Bond Fund (collectively, the “Advisory Agreements”). Scott & Stringfellow, UBS Global Asset Management (Americas), Inc., Federated Investment Management Company and Sterling Capital are referred to as “Sub-Advisers” and, collectively with the Adviser, the “Advisers.”
The Trustees reviewed extensive material in connection with their review of the Advisory Agreements, including data from an independent provider of mutual fund data (as assembled by the Funds’ sub-administrator) which included comparisons with industry averages for comparable funds for advisory fees and total fund expenses. The data reflected BB&TAM fee waivers in place, as well as BB&TAM’s contractual investment advisory fee levels. The Board was assisted in its review by independent legal counsel, who provided a memorandum detailing the legal standards for review of the Advisory Agreements. The Board received a detailed presentation by BB&TAM, which included a fund-by-fund analysis of performance. Presentations were also provided by each Sub-Adviser. The Board also received fund-by-fund profitability information from the Adviser, Scott & Stringfellow and Sterling Capital. The Board also deliberated outside the presence of management and the Advisers.
In their deliberations, each Trustee attributed different weights to various factors involved in an analysis of whether each Advisory Agreement should be continued, and no factor alone was considered determinative. The Trustees determined that the overall arrangements between the Trust and the Advisers, as provided in the Advisory Agreements, were fair and reasonable and that the continuance of the Advisory Agreements was in the best interests of each Fund and its shareholders.
The matters addressed below were considered and discussed by the Trustees in reaching their conclusions.
Nature, Extent and Quality of Services Provided by the Adviser
The Trustees received and considered information regarding the nature, extent, and quality of the services provided to each Fund under the Advisory Agreements. The Trustees took into account information furnished throughout the year at Trustee meetings, as well as materials furnished specifically in connection with the annual review process. The Trustees considered the background and experience of each Adviser’s senior management and the expertise of investment personnel of each Adviser responsible for the day-to-day management of each Fund. The Trustees considered the overall reputation, and the capabilities and commitment of the Advisers to provide high quality service to the Trust, and the Trustees’ overall confidence in each Adviser’s integrity.
The Trustees received information concerning the investment philosophy and investment processes applied by the Advisers in managing the Funds. The Trustees also considered information regarding regulatory compliance and compliance with the investment policies of the Funds. The Trustees evaluated the trading practices of Scott & Stringfellow, which engages in affiliated brokerage for a majority of the portfolio trades for the Funds it sub-advises. As part of this evaluation, the Trustees received information regarding safeguards employed, such as prohibitions on principal and cross-agency trades. The Trustees also evaluated the procedures of the Advisers designed to fulfill the Advisers’ fiduciary duty to the Funds with respect to possible conflicts of interest, including the Advisers’ codes of ethics (regulating the personal trading of its officers and employees).
Based on their review, the Trustees concluded that, with respect to the quality and nature of services to be provided by the Advisers, the scope of responsibilities was consistent with mutual fund industry norms, and that the quality of the services was wholly acceptable.
Investment Performance
The Trustees considered performance results of each Fund in absolute terms and relative to each Fund’s peer group. It was noted that performance of the equity funds over the last three years had improved considerably over the prior year, although the one-year average percentile had declined. With respect to the fixed income funds, it was noted that the average percentile ranking for one-year performance was generally quite improved over that of the prior year. With respect to the asset allocation funds, it was noted that each asset allocation fund had received a Morningstar rating of at least three stars and was performing in a satisfactory manner.
162
Board Consideration of Advisory and Sub-Advisory Agreements
(Unaudited), continued
In the Trustees’ review of performance, long and short-term performance were considered. In conducting their review, the Trustees particularly focused on Funds where performance compared unfavorably with peers over the most recent one year period. The Trustees noted that the performance of each of the International Equity Fund and the Large Cap Growth Fund was lagging, but that the Adviser was seeking to address the situation, either through monitoring, in the case of the International Equity Fund, or consolidation, in the case of the Large Cap Growth Fund.
After reviewing the performance of each Fund, and taking into consideration the management style, investment strategies, and prevailing market conditions during the prior year and for longer periods, the Trustees concluded that the performance of each of the Funds was generally strong and that in cases where performance issues were encountered, the Adviser was properly addressing the situation.
Cost of Services, Including the Profits Realized by the Advisers and Affiliates
The Trustees considered peer group comparable information with respect to the advisory fees charged by BB&TAM to each of the Funds, taking into consideration both contractual and actual (i.e., after waiver) fee levels. The Trustees concluded that the investment advisory fees fell within an acceptable range as compared to peer groups, particularly in light of the fee waivers that would be continued in the upcoming year.
As part of their review, the Trustees considered benefits to the Adviser aside from investment advisory fees. The Trustees reviewed administration fees received by BB&TAM and considered the fallout benefits to BB&TAM such as the research services available to the Adviser by reason of brokerage commissions generated by the Funds’ turnover. The Trustees also considered benefits to BB&TAM’s affiliates, including brokerage commissions received by Scott & Stringfellow for executing trades on behalf of the Special Opportunities Equity Fund and the Equity Income Fund and sub-advisory fees received by its affiliate, Sterling Capital, for its management of the Mid Cap Value Fund and the Total Return Bond Fund. With respect to Scott & Stringfellow, the Trustees noted that brokerage commissions were paid at a standard commission rate, which was consistent with that used by the Adviser with respect to all equity funds of the Trust and that such brokerage arrangements were considered by the Sub-Adviser to be advantageous.
Consideration of the reasonableness of advisory fees also took into account, where relevant, the profitability of the Advisers. In determining whether all other investment advisory and sub-advisory fees (collectively, the “investment advisory fees”) were reasonable, the Trustees reviewed profitability information provided by the Adviser, Scott & Stringfellow and Sterling Capital with respect to investment advisory services. With respect to such information, the Trustees recognized that such profitability data was generally unaudited and represented an Adviser’s own determination of its and its affiliates’ revenues from the contractual services provided to the Funds, less expenses of providing such services. Expenses include direct and indirect costs and were calculated using an allocation methodology developed by the Adviser. The Trustees also recognized that it is difficult to make comparisons of profitability from fund investment advisory and sub-advisory contracts, because comparative information is not generally publicly available and is affected by numerous factors. Based on their review, the Trustees concluded that the profitability to BB&TAM and its affiliates as a result of their relationships with the Funds was acceptable. With respect to non-affiliated Sub-Adviser profitability, the Trustees noted that while information regarding the profitability of non-affiliated Sub-Advisers was not available, it also was not helpful in assessing the continuance of the Advisory Agreements. The Board also concluded that the fees under the Advisory Agreements were fair and reasonable, in light of the services and benefits provided to each Fund.
Economies of Scale
The Trustees also considered whether fee levels reflect economies of scale and whether economies of scale would be produced by the growth of the Trust’s assets. The Trustees found that the Adviser over the last two years, had generally reduced fund total expense ratios through contract negotiations and fee waivers. The Trustees found that fee waivers entered into by the Adviser allowed investors to enjoy economies of scale appropriately and concluded that contractual breakpoints would not necessarily be required at this time to assure that future economies of scale, when and if achieved, would be shared with shareholders based on the Adviser’s current record of responsible action in this regard.
163
BB&T Funds
Information about Trustees and Officers (Unaudited)
Overall responsibility for the management of the Funds rests with its Board of Trustees’ (“Trustees”), who are elected by the Shareholders of the BB&T Funds (“Funds”). The Trustees’ elect the officers of the Funds to supervise actively its day-to-day operations. The names of the Trustees’, their addresses, birthdate, Term of office and length of time served, principal occupations during the past five years, number of portfolios overseen and directorships held outside of the Funds are set below:
| | | | | | | | |
Name, Address and Birthdate | | Position(s)
Held With
BB&T Funds | | Term of
Office/
Length of
Time Served | | Principal Occupation
During the Past 5 Years | | Number of
Portfolios
in Fund
Complex
by Trustee |
Thomas W. Lambeth
700 Yorkshire Road
Winston-Salem, NC 27106
Birthdate: 1/35 | | Trustee, Chairman of the Board of Trustees | | Indefinite, 8/92 – Present | | From January 2001 to present, Senior Fellow, Z. Smith Reynolds Foundation; From 1978 to January 2001, Executive Director, Z. Smith Reynolds Foundation. | | 31 |
| | | | |
Drew T. Kagan
Montecito Advisors, Inc.
810 N. Jefferson St., Ste 101.
Lewisburg, WV 24901
Birthdate: 2/48 | | Trustee | | Indefinite, 8/00 – Present | | From December 2003 to present, President and Director, Montecito Advisors, Inc; from March 1996 to December 2003, President, Investment Affiliate, Inc. | | 31 |
| | | | |
Laura C. Bingham
Peace College
Office of the President
15 East Peace Street
Raleigh, NC 27604-1194
Birthdate: 11/56 | | Trustee | | Indefinite, 2/01 – Present | | From July 1998 to present, President of Peace College. | | 31 |
| | | | |
Douglas R. Van Scoy
841 Middle St.
Sullivans Island, SC 26481
Birthday: 11/43 | | Trustee | | Indefinite, 5/04 – Present | | Retired; From November 1974 to July 2001, Deputy Director of Private Client Group and Senior Executive Vice President of Smith Barney (investment banking). | | 31 |
| | | | |
James L. Roberts
207 Highland Terrace
Breckenridge, CO 80424
Birthday: 11/42 | | Trustee | | Indefinite, 11/04 – Present | | Retired; From January 1999 to December 2003 President, CEO and Director, Covest Bancshares, Inc. | | 31 |
The following table shows information for trustees who are “interested Persons” of BB&T Funds as defined in the 1940 Act:
| | | | | | | | |
Name, Address and Birthdate | | Position(s)
Held With
BB&T | | Term of
Office/
Length of
Time Served | | Principal Occupation
During the Past 5 Years | | Overseen
Complex |
*Keith F. Karlawish
434 Fayetteville Street, 5th Floor
Raleigh, NC 27601
Birthdate: 8/64 | | Trustee and President | | Indefinite, 6/06 – Present 2/05 – Present | | From May 2002 to present, President, BB&T Asset Management, Inc.; from 1996 to 2002, Senior Vice President and Director of Fixed Income, BB&T Asset Management, Inc. | | 31 |
* Mr. Karlawish is treated by the Funds as an “interested person” (as defined in Section 2(a)(19) of the 1940 Act) of the Funds. Mr. Karlawish is an “interested person” because he owns shares of BB&T Corporation and is the President of BB&T Asset Management, Inc., the Adviser.
164
BB&T Funds
Information about Trustees and Officers (Unaudited), continued
The following table shows information for officers of BB&T Funds:
| | | | | | |
Name and Birthdate | | Position(s)
Held With
BB&T Funds | | Term of
Office/
Length of
Time Served | | Principal Occupation
During the Past 5 Years |
E.G. Purcell, III
Birthdate: 1/55 | | Vice President | | Indefinite, 11/00 – Present | | From 1995 to present, Senior Vice President, BB&T Asset Management, Inc. and its predecessors |
| | | |
James T. Gillespie
Birthdate: 11/66 | | Vice President | | Indefinite, 5/02 – Present | | From February 2005 to present, Vice President of BB&T Asset Management, Inc.; from 1992 to 2005, Director, BISYS Fund Services |
| | | |
Todd M. Miller
Birthdate: 9/71 | | Vice President | | Indefinite, 8/05 – Present | | From June 2005 to Present, Investment Officer and Mutual Fund Administrator, BB&T Asset Management, Inc.; from May 1993 to May 2005, Manager, BISYS Fund Services |
| | | |
Rodney Ruehle
Birthdate: 4/68 | | Anti-Money Laundering Officer and Chief Compliance Officer | | Indefinite, 2/06 – Present | | From August 1995 to present, Fund Compliance Officer, BISYS Fund Services |
| | | |
Troy A. Sheets
Birthdate: 5/71 | | Treasurer | | Indefinite, 5/02 – Present | | From April 2002 to present, Vice President, BISYS Fund Services; from September 1993 to April 2002, Senior Manager, KPMG LLP |
| | | |
Christopher E. Sabato
Birthdate: 12/68 | | Assistant Treasurer | | Indefinite 11/02 – Present | | From February 1993 to present, Vice President, BISYS Fund Services |
The Funds’ Statement of Additional Information includes information about the Funds’ Trustees. To receive your free copy of the Statement of Additional Information, call toll free: 1-800-453-7348.
165

Item 2. Code of Ethics.
(a) The registrant has adopted a code of ethics that applies to the registrant’s principal executive officer, principal financial officer, principal accounting officer or controller, or persons performing similar functions. This code of ethics is included as an Exhibit.
(b) During the period covered by the report, with respect to the registrant’s code of ethics that applies to its principal executive officer, principal financial officer, principal accounting officer or controller, or persons performing similar functions; there have been no amendments to, nor any waivers granted from, a provision that relates to any element of the code of ethics definition enumerated in paragraph (b) of this Item 2.
Item 3. Audit Committee Financial Expert.
3(a)(1) The registrant’s board of directors has determined that the registrant has at least one audit committee financial expert serving on its audit committee.
3(a)(2) The audit committee financial expert is Drew T. Kagan, who is “independent” for purposes of this Item 3 of Form N-CSR.
Item 4. Principal Accountant Fees and Services.
| | | | | | | |
(a) | | Audit Fees | | 2005 | | $ | 176,000 |
| | | | 2006 | | $ | 194,250 |
(b) | | Audit – Related Fees | | 2005 | | $ | 4,400 |
| | | | 2006 | | $ | 14,650 |
| | | |
| | 2005- Fees of 4,400 relate to the consent of the N-1A filing. | | | | | |
| |
| | 2006- Fees of 9,650 relate to the consent of the N-1A filing, the consent on the N-14 filing for the Small Cap and Small Company Growth Funds and consent on the N-14 filing for the Large Cap Fund and Large Cap Growth Fund. |
| | | |
(c) | | Tax Fees | | 2005 | | $ | 66,000 |
| | | | 2006 | | $ | 71,500 |
| |
| | Fees for both 2005 & 2006 relate to the preparation of federal income & excise tax returns and review of the excise tax calculations. Additional fees in 2006 were for a tax return review for a Small Cap merger. |
| | | |
(d) | | All Other Fees | | 2005 | | $ | 0 |
| | | | 2006 | | $ | 0 |
4(e)(1)
Except as permitted by Rule 2-01(c)(7)(i)(C) of Regulation S-X, the Trust’s Audit Committee must pre-approve all audit and non-audit services provided by the independent accountants relating to the operations or financial reporting of the funds. Prior to the commencement of any audit or non-audit services to a fund, the Audit Committee reviews the services to determine whether they are appropriate and permissible under applicable law.
4(e)(2)
None of the services summarized in (b)-(d), above, were approved by the Audit Committee pursuant to Rule 2-01(c)(7)(i)(C) of Regulation S-X.
4(f)
Not applicable.
4(g)
| | | |
2005 | | $ | 512,000 |
2006 | | $ | 520,225 |
In regards to Item 4 (g), the audit committee considered the nonaudit services rendered to the registrant’s investment adviser and any entity controlling, controlled by, or under common control with the investment adviser, and believes the principal accountants independence has not been compromised.
4(h)
Not applicable.
Item 5. Audit Committee of Listed Registrants.
Not applicable.
Item 6. Schedule of Investments.
Not applicable.
Item 7. Disclosure of Proxy Voting Policies and Procedures for Closed-End Management Investment Companies.
Not applicable.
Item 8. Portfolio Managers of Closed-End Management Investment Companies.
Not applicable.
Item 9. Purchases of Equity Securities by Closed-End Management Investment Company and Affiliated Purchasers.
Not applicable.
Item 10. Submission of Matters to a Vote of Security Holders.
Not applicable.
Item 11. Controls and Procedures.
| (a) | The registrant’s principal executive officer and principal financial officer have concluded, based on their evaluation of the registrant’s disclosure controls and procedures as conducted within 90 days of the filing date of this report, that these disclosure controls and procedures are adequately designed and are operating effectively to ensure that information required to be disclosed by the registrant on Form N-CSR is recorded, processed, summarized and reported within the time periods specified in the Securities and Exchange Commission’s rules and forms. |
| (b) | There were no changes in the registrant’s internal control over financial reporting that occurred during the second fiscal quarter of the period covered by this report that have materially affected or are reasonably likely to materially affect, the registrant’s internal control over financial reporting. |
Item 12. Exhibits.
(a)(1) The code of ethics that is the subject of the disclosure required by Item 2 is attached hereto.
(a)(2) Certifications pursuant to Rule 30a-2(a) are attached hereto.
(a)(3) Not applicable.
(b) Certifications pursuant to Rule 30a-2(b) are furnished herewith.
SIGNATURES
Pursuant to the requirements of the Securities Exchange Act of 1934 and the Investment Company Act of 1940, the registrant has duly caused this report to be signed on its behalf by the undersigned, thereunto duly authorized.
| | |
|
| (Registrant) BB&T Funds |
| |
By (Signature and Title)* | | /s/ Troy A. Sheets, Treasurer |
| | Troy A. Sheets, Treasurer |
|
Date December 8, 2006 |
Pursuant to the requirements of the Securities Exchange Act of 1934 and the Investment Company Act of 1940, this report has been signed below by the following persons on behalf of the registrant and in the capacities and on the dates indicated.
| | |
By (Signature and Title)* | | /s/ Keith F. Karlawish, President |
| | Keith F. Karlawish, President |
|
Date December 8, 2006 |
| |
By (Signature and Title)* | | /s/ Troy A. Sheets, Treasurer |
| | Troy A. Sheets, Treasurer |
|
Date December 8, 2006 |
| * | Print the name and title of each signing officer under his or her signature. |