UNITED STATES
SECURITIES AND EXCHANGE COMMISSION
Washington, D.C. 20549
FORM N-CSR
CERTIFIED SHAREHOLDER REPORT OF REGISTERED MANAGEMENT
INVESTMENT COMPANIES
Investment Company Act file number 811-06719
BB&T Funds
(Exact name of registrant as specified in charter)
434 Fayetteville Street Mall, 5th Floor
Raleigh, NC 27601-0575
(Address of principal executive offices) (Zip code)
Keith Karlawish, President
BB&T Funds
434 Fayetteville Street Mall, 5th Floor
Raleigh, NC 27601-0575
(Name and address of agent for service)
registrant’s telephone number, including area code: (800) 228-1872
Date of fiscal year end: September 30
Date of reporting period: September 30, 2007
Form N-CSR is to be used by management investment companies to file reports with the Commission not later than 10 days after the transmission to stockholders of any report that is required to be transmitted to stockholders under Rule 30e-1 under the Investment Company Act of 1940 (17 CFR 270.30e-1). The Commission may use the information provided on Form N-CSR in its regulatory, disclosure review, inspection, and policymaking roles.
A registrant is required to disclose the information specified by Form N-CSR, and the Commission will make this information public. A registrant is not required to respond to the collection of information contained in Form N-CSR unless the Form displays a currently valid Office of Management and Budget (“OMB”) control number. Please direct comments concerning the accuracy of the information collection burden estimate and any suggestions for reducing the burden to Secretary, Securities and Exchange Commission, 100 F Street, NE, Washington, DC 20549. The OMB has reviewed this collection of information under the clearance requirements of 44 U.S.C. § 3507.
| Item 1. | Reports to Stockholders. |
The Report to Shareholders is attached herewith.

BB&T Funds
Table of Contents
Letter from the President and the Investment Advisor
Dear Shareholders:
We are pleased to present this annual report for the 12-month period ended September 30, 2007. Economic growth slowed but remained positive during this fiscal year, while stocks and bonds posted solid returns despite an increase in volatility. The Standard & Poor’s 500® Index (“S&P 500 Index”) gained 16.43% during the period, while the Russell 2000 Index of small-capitalization stocks returned 12.34%, the MSCI EAFE international stock index gained 24.86% and the Lehman Brothers U.S. Aggregate Index gained 5.14%.
Housing woes weigh on the economy
A steep downturn in the housing market dragged down U.S. economic growth during this 12-month period. Powerful global growth, healthy business spending and a positive environment for employment and wages helped the economy continue to expand at a moderate pace.
Increasing numbers of homeowners with weak finances defaulted on mortgages during 2007. The spike in defaults on sub-prime mortgages called into question the credit-worthiness of securities backed by such loans, causing fears of credit and liquidity crises. The Federal Reserve Board acted several times to boost liquidity in the financial markets, most notably by lowering its target Federal Funds rate from 5.25% to 4.75% in September.
Stocks move higher in volatile trading
The U.S. stock market overcame two significant downturns to generate strong gains for the period. Stocks rallied for the first four months of the fiscal year, before concerns about potential economic weakness led to a broad sell-off in late February. The market then rebounded through mid-July as data emerged indicating that the economy was healthier than many investors had feared. Stocks fell substantially during summer, however, as market participants worried about the potential repercussions of the sub-prime mortgage crisis. The Federal Reserve’s larger-than-expected interest-rate cut then led to a powerful surge during the final weeks of the period.
Energy and materials stocks performed well throughout most of the fiscal year, pushed higher by soaring commodity prices. Industrial and technology stocks meanwhile benefited from the strong global economy. Financial stocks suffered some of the market’s weakest returns for the period after tumbling during the summer downturn, while consumer discretionary stocks also lagged the market on fears that the housing slump and rising energy prices would curtail consumer spending.
Foreign stocks outperformed the domestic market, continuing a long-running trend. Strong global economic growth and weakness in the U.S. dollar contributed to foreign stocks’ superior performance.
Bond investors seek quality and liquidity
When the period began, bonds with longer maturities and weaker credit ratings offered little yield advantage over securities with shorter terms and higher quality. That dynamic changed swiftly during the summer, as investors reassessed risk in the face of rising sub-prime mortgage defaults. Higher-quality bonds consequently led the market, as investor demand pushed up their prices and pushed down their yields. Likewise, a surge in demand for short- and intermediate-term bonds caused yields on those securities to fall sharply, while yields on long-term bonds remained relatively stable. The Federal Reserve’s September interest-rate cut further depressed yields on short-term bonds.
Our perspective
We expect modest but positive economic growth during the coming months, as Federal Reserve action helps counteract the recent credit crunch. The U.S. consumer continues to prove resilient despite a number of headwinds, and while domestic business spending slipped in recent months strong global growth should provide support for exports.
We believe the industrial and service economy should continue to drive earnings growth going forward, helping offset sluggish retail sales. Multinational companies are likely to benefit from a falling dollar and the strength of the global economy. Generally, corporations have healthy balance sheets and strong free cash flow, which should allow them to continue taking shareholder-friendly actions such as raising dividends, repurchasing shares and — pending the resolution of the liquidity crunch — make acquisitions.
Equities appear more attractive than bonds given that outlook. In fact, we believe the liquidity crisis may well create a variety of stock-specific investment opportunities for companies with strong liquidity.
Our fixed income funds did particularly well, overall, due to their focus on high quality issuers, as well as accurately predicting a Federal Reserve easing posture. The equity funds generally performed competitively, and in some cases, exceptionally well. The few that did not were mainly due to some contrarian bets on housing and other industries that are out of favor. We believe that these securities were purchased at significant discounts to intrinsic value, and that we will eventually be vindicated.
We would like to remind you that our new Web site, www.bbtfunds.com, offers you access to your fund account(s) online 24 hours a day, 7 days a week. We appreciate your continued support and trust in BB&T Funds. It is our pleasure to serve your ongoing investing needs and we welcome any inquiries you may have by calling us at 800-228-1872.
|

|
| Keith F. Karlawish, CFA |
| President |
| BB&T Funds |
|

|
| Jeffrey J. Schappe, CFA |
| Chief Investment Officer |
| BB&T Asset Management, Inc. |
Past performance does not guarantee future results.
This report is authorized for distribution only when preceded or accompanied by a prospectus. Please read the prospectus carefully before investing or sending money. BB&T Asset Management, Inc., a wholly owned subsidiary of BB&T Corporation, serves as investment adviser to the BB&T Funds and is paid a fee for its services. Shares of the BB&T Funds (each a “Fund” and collectively, the “Funds”) are not deposits or obligations of, or guaranteed or endorsed by, Branch Banking and Trust Company or its affiliates. The Funds are not insured by the FDIC or any other government agency. The Funds currently are distributed by BB&T AM Distributors, Inc. The distributors are not affiliated with Branch Banking and Trust Company or its affiliates.
The foregoing information and opinions are for general information only. BB&T Asset Management, Inc. does not guarantee their accuracy or completeness, nor assume liability for any loss, which may result from the reliance by any person upon any such information or opinions. Such information and opinions are subject to change without notice, are for general information only and are not intended as an offer or solicitation with respect to the purchase or sale of any security or offering individual or personalized investment advice.
1
BB&T Large Cap Fund
Portfolio Manager
Ronald T. Rimkus, CFA
The BB&T Large Cap Fund is managed by Ronald T. Rimkus, a chartered financial analyst and Director of Core Equity at BB&T Asset Management, Inc. Mr. Rimkus has more than 14 years of investment experience, including hands-on management of both growth and value equity portfolios. Most recently, he spent six years overseeing large-company core equity portfolios. Mr. Rimkus holds a BA from Brown University and an MBA from UCLA. He is supported by the BB&T Large Cap Core Equity Portfolio Management Team.
Investment Concerns
Equity securities (stocks) are more volatile and carry more risk than other forms of investments, including investments in high-grade fixed income securities. The net asset value per share of this Fund will fluctuate as the value of the securities in the portfolio changes. Value-based investments are subject to the risk that the broad market may not recognize their intrinsic value.
Q. How did the Fund perform during the 12-month period between October 1, 2006 and September 30, 2007?
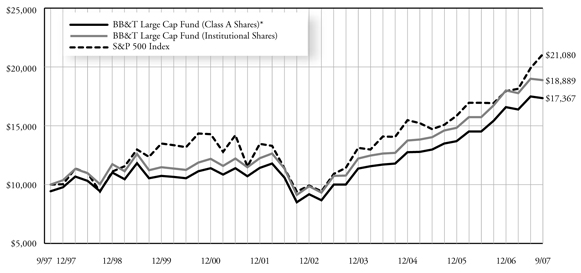
A. The Fund gained 12.89% (Institutional Shares). That compared to a 16.43% return for its benchmark, the S&P 500 Index.
Q. What factors affected the Fund’s performance?
A. The stock market generated strong returns for the 12-month period, helping the Fund produce good absolute performance. Shares of energy, materials, technology and consumer discretionary stocks particularly added to the Fund’s absolute return, while financial stocks reduced the Fund’s gains.1
This Fund seeks to invest in stocks that exhibit a durable competitive advantage and sell at a discount to their intrinsic value. This approach led us to trim or sell some industrial stocks that appeared expensive —leaving a relatively small stake in that sector compared to the benchmark index. Shares of industrial firms continued to perform well during the period, however, as powerful global economic growth boosted demand for industrial companies’ products and services. As a result, the Fund’s underweight position decreased performance relative to the benchmark. Selection among stocks in the sector also reduced relative returns.1
The Fund’s health care allocation also dragged on performance against the index. Losses from shares of a large biotechnology firm especially pulled down returns in that sector as fears mounted over concerns about the safety of one of its leading products.1
Security selection in the consumer discretionary sector provided the largest positive contribution to relative returns. Consumer discretionary stocks in general performed poorly, but the Fund’s holdings in that sector posted strong gains. Our investments in shares of a specialty retailer proved particularly beneficial to relative performance. Furthermore, the Fund’s overweight stake in the consumer discretionary sector magnified the effect of successful stock selection.1
We also over-weighted technology stocks. The technology sector rallied during the 12-month period, so the Fund’s larger-than-benchmark position added to relative returns. Selection in that sector boosted relative returns as well, as the Fund’s investments in a communications equipment maker and a semiconductor manufacturer performed well.1
1 | Portfolio composition is as of September 30, 2007 and is subject to change. |
2
Value of a $10,000 Investment
| * | Reflects 5.75% maximum sales charge. |
| ** | Reflects the applicable contingent deferred sales charge (CDSC), maximum of 5.00%. |
| *** | Reflects the applicable maximum CDSC of 1.00% (applicable only to redemptions within one year of purchase, and as such, are not reflected in the Total Return tables since the periods reflected are for a year or longer). |
Average Annual Total Returns
| | | | | | | | | | | | |
As of September 30, 2007 | | Inception
Date | | | 1 Year | | | 5 Years | | | 10 Years | |
Class A Shares* | | 10/9/92 | | | 6.08 | % | | 13.99 | % | | 5.68 | % |
Class B Shares** | | 1/1/96 | | | 7.92 | % | | 14.34 | % | | 5.65 | % |
Class C Shares*** | | 2/1/01 | 1 | | 11.76 | % | | 14.46 | % | | 5.77 | % |
Institutional Shares | | 10/9/92 | | | 12.89 | % | | 15.63 | % | | 6.57 | % |
S&P 500 Index | | N/A | | | 16.43 | % | | 15.44 | % | | 6.57 | % |
Past performance does not guarantee future results. The performance data quoted represents past performance and current returns may be lower or higher. Total return figures include change in share price, reinvestment of dividends and capital gains, and do not reflect taxes that a shareholder would pay on fund distributions or on the redemption of fund shares. The investment return and principal value will fluctuate so that an investor’s shares, when redeemed, may be worth more or less than the original cost. To obtain performance information current to the most recent month end, please visit www.bbtfunds.com.
The chart above represents a comparison of a hypothetical $10,000 investment in the indicated share class versus a similar investment in the Fund’s benchmark, and represents the reinvestment of dividends and capital gains.
1 | Class C Shares were not in existence prior to 2/1/01. Performance for periods prior to that is based on the historical performance of the Class A Shares, and has been adjusted for the maximum CDSC applicable to Class C Shares, but does not include the Class C Shares 12b-1 fees, which, if reflected, performance would have been lower. |
The S&P 500 Index is generally considered to be representative of the performance of the stock market as a whole. The index is unmanaged and does not reflect the deduction of expenses associated with a mutual fund, such as investment management and fund accounting fees. The Fund’s performance reflects the deduction of fees for these services. Investors cannot invest directly in an index, although they can invest in its underlying securities.
A portion of the Fund’s fees has been waived. If the fees had not been waived, the Fund’s total return for the periods would have been lower.
3
BB&T Mid Cap Value Fund
Portfolio Manager
Timothy P. Beyer, CFA
The BB&T Mid Cap Value Fund is managed by Timothy P. Beyer, CFA, portfolio manager for Sterling Capital Management LLC (“Sterling”), sub-adviser to the Fund. Mr. Beyer, who joined Sterling in 2004, is a graduate of East Carolina University, where he received his BSBA in Finance, and has 16 years of investment management experience. Mr. Beyer is supported by Eduardo Brea, CFA; Robert Bridges, CFA; Lee D. Houser, CFA; Patrick W. Rau, CFA; and Brian Walton, CFA.
Investment Concerns
Mid-capitalization funds typically carry additional risks since smaller companies generally have a higher risk of failure, and historically, their stocks have experienced a greater degree of market volatility than stocks on average.
Equity securities (stocks) are more volatile and carry more risk than other forms of investments, including investments in high-grade fixed income securities. The net asset value per share of this Fund will fluctuate as the value of the securities in the portfolio changes. Value-based investments are subject to the risk that the broad market may not recognize their intrinsic value.
Q. How did the Fund perform during the 12-month period between October 1, 2006 and September 30, 2007?
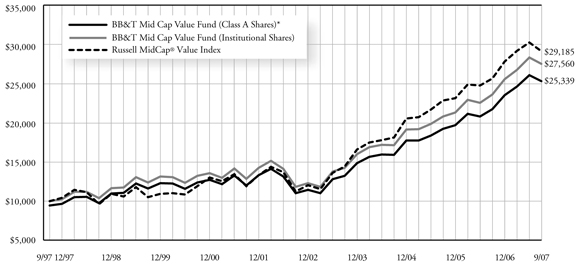
A. The Fund posted a return of 16.75% (Institutional Shares). That compared to a 13.75% return for its benchmark, the Russell Midcap® Value Index.
Q. What factors affected the Fund’s performance?
A. Medium-sized value stocks generated healthy gains, helping the Fund post a solid absolute return for the fiscal year.
The Fund’s holdings in the financial sector increased its returns relative to the benchmark index. For some time we have held very little exposure to shares of banks and real estate investment trusts. That strategy proved highly beneficial to relative returns during this fiscal year, as the housing market’s slump and fears about a credit squeeze caused stocks in those industries to lag the broad mid-cap financial sector. We favored financial stocks with little exposure to real estate and credit concerns, such as shares of data processors and insurance companies. That approach helped the Fund’s allocation to financial stocks outperform the financial shares represented in the index.1
We also held relatively little exposure to energy and commodities-related stocks, because shares in those sectors generally offered little value and inferior long-term secular growth and return characteristics. Energy and commodities stocks performed well during this period, however, so the Fund’s underweight positions weighed somewhat on relative performance.1
Mergers and acquisitions significantly boosted returns relative to the index. Several Fund holdings became the object of buyouts during this period. Indeed, the Fund’s largest position on April 1 announced that it would be acquired at a substantial premium. Investors worried during summer that the credit market’s troubles might scuttle many planned takeovers. We believed those fears were overblown, however, and used declines in stocks that were in the process of being acquired as opportunities to establish new positions and to add to existing positions in such shares.1
1 | Portfolio composition is as of September 30, 2007 and is subject to change. |
4
Value of a $10,000 Investment
| * | Reflects 5.75% maximum sales charge. |
| ** | Reflects the applicable contingent deferred sales charge (CDSC), maximum of 5.00%. |
| *** | Reflects the applicable maximum CDSC of 1.00% (applicable only to redemptions within one year of purchase, and as such, are not reflected in the Total Return tables since the periods reflected are for a year or longer). |
Average Annual Total Returns
| | | | | | | | | | | | |
As of September 30, 2007 | | Inception
Date | | | 1 Year | | | 5 Years | | | 10 Years | |
Class A Shares* | | 8/1/96 | 1 | | 9.81 | % | | 16.75 | % | | 9.74 | % |
Class B Shares** | | 7/25/01 | 1 | | 11.58 | % | | 17.16 | % | | 9.87 | % |
Class C Shares*** | | 7/25/01 | 1 | | 15.60 | % | | 17.27 | % | | 9.86 | % |
Institutional Shares | | 8/1/96 | 1 | | 16.75 | % | | 18.45 | % | | 10.67 | % |
Russell Midcap® Value Index | | N/A | | | 13.75 | % | | 21.02 | % | | 11.31 | % |
Past performance does not guarantee future results. The performance data quoted represents past performance and current returns may be lower or higher. Total return figures include change in share price, reinvestment of dividends and capital gains, and do not reflect taxes that a shareholder would pay on fund distributions or on the redemption of fund shares. The investment return and principal value will fluctuate so that an investor’s shares, when redeemed, may be worth more or less than the original cost. To obtain performance information current to the most recent month end, please visit www.bbtfunds.com.
The chart above represents a comparison of a hypothetical $10,000 investment in the indicated share class versus a similar investment in the Fund’s benchmark, and represents the reinvestment of dividends and capital gains.
1 | Performance shown for Class A and Institutional Shares includes the performance of the OVB Equity Income Portfolio for the periods prior to its consolidation with the BB&T Mid Cap Value Fund on 7/23/01. The performance shown reflects reinvestment of all dividend and capital gains distributions. Class B and C Shares were not in existence prior to 7/25/01. Performance for periods prior to 7/25/01 is based on the historical performance of the Class A Shares, and has been adjusted for the maximum CDSC applicable to Class B and C Shares, respectively, but such performance does not reflect Class B and C Shares’ 12b-1 fees and expenses. With those adjustments, performance would be lower than that shown. |
The Fund is measured against the Russell Midcap® Value Index, an unmanaged index which measures the performance of those securities in the Russell 1000 with lower price-to-book ratios or lower forecasted growth values. The index is unmanaged and does not reflect the deduction of expenses associated with a mutual fund, such as investment management and fund accounting fees. The Fund’s performance reflects the deduction of fees for these services. Investors cannot invest directly in an index, although they can invest in its underlying securities.
A portion of the Fund’s fees has been waived. If fees had not been waived, the Fund’s total return for the periods would have been lower.
5
BB&T Mid Cap Growth Fund
Portfolio Manager
David P. Nolan
The BB&T Mid Cap Growth Fund is managed by David P. Nolan. A graduate of Wake Forest University, where he received a BS in Business, Mr. Nolan managed common and collective trust funds from 1985 to 1993 and has managed the Mid Cap Growth Fund since its inception in 1993.
Investment Concerns
Mid-capitalization funds typically carry additional risks since smaller companies generally have a higher risk of failure, and historically, their stocks have experienced a greater degree of market volatility than stocks on average.
Equity securities (stocks) are more volatile and carry more risk than other forms of investments, including investments in high-grade fixed income securities. The net asset value per share of this Fund will fluctuate as the value of the securities in the portfolio changes.
Q. How did the Fund perform during the 12-month period between October 1, 2006 and September 30, 2007?
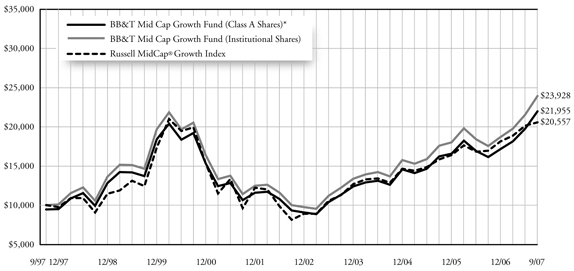
A. The Fund posted a return of 36.43% (Institutional Shares). That compared to a 21.22% return for its benchmark, the Russell Midcap® Growth Index.
Q. What factors affected the Fund’s performance?
A. Medium-sized stocks rallied during the period under review, helping the Fund post strong gains. Powerful performance from certain stocks in the industrial, technology and consumer discretionary sectors particularly contributed to the Fund’s returns.1
Good stock selection helped the Fund outperform its benchmark by a wide margin. Selection among consumer discretionary stocks especially added to the Fund’s relative gains. Shares of a rapidly growing footwear maker surged, accounting for 3.7 percentage points of the Fund’s total return. Likewise, stock of a video-game retailer benefited from strong demand and the potential for higher profit margins; it contributed 2.6 points to the Fund’s total return.1
The Fund’s investment in a manufacturer of solar panels also boosted returns against the benchmark index. Large increases in energy prices led to stronger demand for solar panels, helping the company generate powerful earnings gains. Shares of a maker of airplane parts also performed well; the company benefited from rising global demand from airlines looking to expand and update their fleets.1
The Fund’s sector weightings had a very minor negative impact on relative returns, primarily because we held small positions in cash in order to meet redemptions and seize developing investment opportunities. And while stock selection was overwhelmingly positive, certain individual stocks did weigh on performance against the benchmark. They included shares of a technology firm that suffered from pricing pressure, a cosmetics company that struggled to meet expectations, an apparel firm that was hurt by potential weakness in consumer spending, and an online job recruiter that slid due to concerns about a weakening economy.1
1 | Portfolio composition is as of September 30, 2007 and is subject to change. |
6
Value of a $10,000 Investment
| * | Reflects 5.75% maximum sales charge. |
| ** | Reflects the applicable contingent deferred sales charge (CDSC), maximum of 5.00%. |
| *** | Reflects the applicable maximum CDSC of 1.00% (applicable only to redemptions within one year of purchase, and as such, are not reflected in the Total Return tables since the periods reflected are for a year or longer). |
Average Annual Total Returns
| | | | | | | | | | | | |
As of September 30, 2007 | | Inception
Date | | | 1 Year | | | 5 Years | | | 10 Years | |
Class A Shares* | | 12/30/93 | 1 | | 28.35 | % | | 17.36 | % | | 8.18 | % |
Class B Shares** | | 7/25/01 | 1 | | 31.13 | % | | 17.76 | % | | 8.32 | % |
Class C Shares*** | | 7/25/01 | 1 | | 35.19 | % | | 17.89 | % | | 8.34 | % |
Institutional Shares | | 12/1/93 | 1 | | 36.43 | % | | 19.05 | % | | 9.12 | % |
Russell Midcap® Growth Index | | N/A | | | 21.22 | % | | 20.39 | % | | 7.47 | % |
Past performance does not guarantee future results. The performance data quoted represents past performance and current returns may be lower or higher. Total return figures include change in share price, reinvestment of dividends and capital gains and do not reflect taxes that a shareholder would pay on fund distributions or on the redemption of fund shares. The investment return and principal value will fluctuate so that an investor’s shares, when redeemed may be worth more or less than the original cost. To obtain performance information current to the most recent month end, please visit www.bbtfunds.com.
The chart above represents a comparison of a hypothetical $10,000 investment in the indicated share class versus a similar investment in the Fund’s benchmark, and represents the reinvestment of dividends and capital gains.
1 | Fund performance as shown for Class A and Institutional Shares includes the performance of the OVB Capital Appreciation Portfolio for the periods prior to its consolidation with the BB&T Mid Cap Growth Fund on 7/23/01. The performance shown reflects reinvestment of all dividend and capital gains distributions. The Class B and C Shares were not in existence prior to 7/25/01. Performance for periods prior to 7/25/01 is based on the historical performance of the Class A Shares and has been adjusted for the maximum CDSC applicable to Class B and C Shares, respectively, but such performance does not reflect Class B and C Shares’ 12b-1 fees and expenses. With those adjustments, performance would be lower. |
The Fund is measured against the Russell Midcap® Growth Index, an unmanaged index which measures the performance of those securities in the Russell 1000® Index with higher price-to-book ratios and lower forecasted growth values. The index does not reflect the deduction of expenses associated with a mutual fund, such as investment management and fund accounting fees. The Fund’s performance reflects the deduction of fees for services. Investors cannot invest directly in an index, although they can invest in its underlying securities.
A portion of the Fund’s fees has been waived. If the fees had not been waived, the Fund’s total returns for the periods would have been lower.
7
BB&T Small Cap Fund
Portfolio Manager
John T. Kvantas, CFA
The BB&T Small Cap Fund is managed by John T. Kvantas, CFA. A graduate of the University of Illinois Champaign-Urbana, where he received a BS in Accountancy, Mr. Kvantas also earned an MBA from the Fuqua School of Business at Duke University, and has been managing investors’ money since 1995. He is supported by the BB&T Small Cap Portfolio Management Team, which includes Dan Kane and Brian Baker.
Investment Concerns
Small-capitalization funds typically carry additional risks since smaller companies generally have a higher risk of failure, and historically, their stocks have experienced a greater degree of market volatility than stocks on average.
Equity securities (stocks) are more volatile and carry more risk than other forms of investments, including investments in high-grade fixed income securities. The net asset value per share of this Fund will fluctuate as the value of the securities in the portfolio changes. Value-based investments are subject to the risk that the broad market may not recognize their intrinsic value.
Diversification does not guarantee a profit nor protect against a loss.
Q. How did the Fund perform during the 12-month period between October 1, 2006 and September 30, 2007?
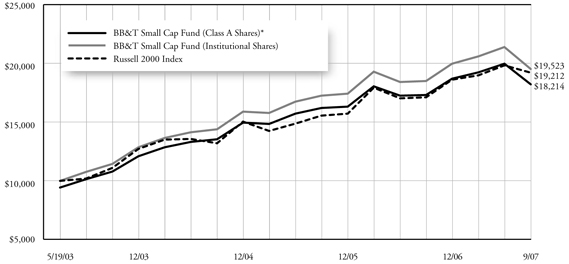
A. The Fund gained 5.43% (Institutional Shares). That compared to a 12.34% return for its benchmark, the Russell 2000® Index of small-cap stocks.
Q. What factors affected the Fund’s performance?
A. Small stocks generally posted solid returns for the period, helping the Fund generate gains. Energy, industrial and financial stocks especially contributed to the Fund’s positive performance, while declines at certain consumer discretionary and technology stocks weighed down returns. Strong merger-and-acquisition activity also lifted the Fund’s gains, as several companies represented in its portfolio were purchased at premiums to their market values.1
Stock selection in the energy sector boosted returns relative to the benchmark index. The energy stocks in the Fund’s portfolio returned an average of 37% for the 12-month period, while the energy stocks in the benchmark gained 22%. Investments in shares of particular oil services and drilling companies benefited from high demand and strong corporate execution.1
The Fund’s holdings in the financial sector also helped its relative performance. The prospect of buyouts buoyed shares of two property/ casualty insurers in the portfolio and contributed to gains against the benchmark. We held a considerably underweight position in real estate investment trusts (REITs), which comprise roughly 7% of the benchmark index. REITs declined significantly during the 12-month period, so the Fund’s light weighting enhanced its performance against the index.1
Our holdings in the consumer discretionary sector weighed on the Fund’s relative returns. Consumer discretionary stocks generally suffered from investor concerns that the housing slump and other factors would depress consumer spending. Shares of a high-end clothing maker in the Fund’s portfolio endured substantial losses, as did the stocks of a radio and television operator and a specialty retailer.1
The Fund’s technology stake did not keep pace with the technology stocks in the benchmark. Shares of a human resources-software firm fell after it took longer than expected to make a transition designed to emphasize the most promising aspect of its business. Likewise, stocks of two electronics manufacturers declined as the companies struggled through business transitions of their own. Those positions weighed on the Fund’s relative performance, but we continue to believe the stocks offer attractive long-term potential.1
Commodities stocks surged during this fiscal year, as supply and demand imbalances led to higher commodity prices. This Fund does not hold commodities stocks, so their strong returns were one reason its performance lagged the benchmark. In a similar fashion, we did not invest in shares of biotechnology firms, which rarely fit the earnings criteria we seek, so strong returns by that industry weighed on the Fund’s relative performance.1
1 | Portfolio composition is as of September 30, 2007 and is subject to change. |
8
Value of a $10,000 Investment
| * | Reflects 5.75% maximum sales charge. |
| ** | Reflects the applicable contingent deferred sales charge (CDSC), maximum of 5.00%. |
| *** | Reflects the applicable maximum CDSC of 1.00% (applicable only to redemptions within one year of purchase, and as such, are not reflected in the Total Return tables since the periods reflected are for a year or longer). |
Average Annual Total Returns
| | | | | | | | |
| | | |
As of September 30, 2007 | | Inception
Date | | 1 Year | | | Since
Inception | |
Class A Shares* | | 5/19/03 | | (0.90 | )% | | 14.72 | % |
Class B Shares** | | 5/19/03 | | 0.45 | % | | 15.12 | % |
Class C Shares*** | | 5/19/03 | | 4.37 | % | | 15.38 | % |
Institutional Shares | | 5/19/03 | | 5.43 | % | | 16.56 | % |
Russell 2000®Index | | 5/31/03 | | 12.34 | % | | 16.26 | % |
Past performance does not guarantee future results. The performance data quoted represents past performance and current returns may be lower or higher. Total return figures include change in share price, reinvestment of dividends and capital gains, and do not reflect taxes that a shareholder would pay on fund distributions or on the redemption of fund shares. The investment return and principal value will fluctuate so that an investor’s shares, when redeemed, may be worth more or less than the original cost. To obtain performance information current to the most recent month end, please visit www.bbtfunds.com.
The chart above represents a comparison of a hypothetical $10,000 investment in the indicated share class versus a similar investment in the Fund’s benchmark, and represents the reinvestment of dividends and capital gains.
The Russell 2000® Index is a widely recognized index of common stocks that measure the performance of small- to mid-sized companies. The index is unmanaged and does not reflect the deduction of expenses associated with a mutual fund, such as investment management and fund accounting fees. The Fund’s performance reflects the deduction of fees for these services. Investors cannot invest directly in an index, although they can invest in its underlying securities.
A portion of the Fund’s fees has been waived. If the fees had not been waived, the Fund’s total return for the periods would have been lower.
9
BB&T International Equity Fund
Portfolio Manager
Rudolph-Riad Younes, CFA
The BB&T International Equity Fund is managed by Rudolph-Riad Younes, CFA, Senior Vice President and Head of International Equity at Julius Baer Investment Management LLC (“JBIM”) since August 2000, and with Julius Baer Group since September 1993, and Richard Pell, Chief Investment Officer and Senior Vice President with JBIM since August 2000, and with the Julius Baer Group since January 1995.
Investment Concerns
There are risks associated with investing in foreign companies, such as erratic market conditions, economic and political instability and fluctuations in currency and exchange rates.
Equity securities (stocks) are more volatile and carry more risk than other forms of investments, including investments in high-grade fixed income securities. The net asset value per share of this Fund will fluctuate as the value of the securities in the portfolio changes.
Q. How did the Fund perform during the 12-month period between October 1, 2006 and September 30, 2007?
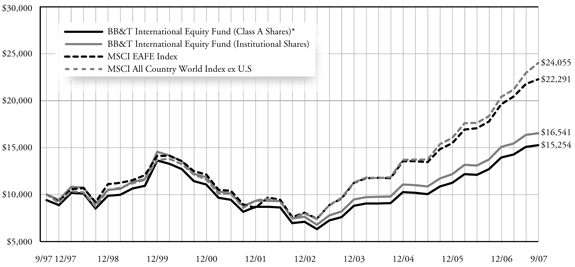
A. The Fund gained 20.39% (Institutional Shares). That compared to a 31.06% return for its benchmark, the MSCI All country World Index ex U.S.
Q. What factors affected the Fund’s performance?
A. Foreign stocks rallied during this 12-month period, helping the Fund post strong absolute returns. Investors bid up international equities in response to powerful global economic growth and healthy corporate profits. Shares of commodities and energy firms performed especially well, as burgeoning demand from China supported higher prices for oil, gold, grain and other commodities. Asian markets posted particularly strong returns, as did commodities-oriented developing markets such as Brazil. The Fund’s returns also benefited significantly from foreign currencies’ strength against the U.S. dollar.1
The Fund underperformed its benchmark during the first three quarters of the fiscal year, weighed down by relatively small positions in materials and energy stocks. Underweight stakes in those rallying sectors more than offset the positive influence of security selection among financial stocks.1
Julius Baer Investment Management assumed management responsibilities for this Fund as of July 2, 2007. The new sub-advisor’s investment strategy employs a combination of top-down research and bottom-up company analysis.1
The Fund continued to lag its benchmark during the final quarter of this period, as an underweight position in commodities-related stocks weighed on relative performance. The Fund’s exposure to developed markets in continental Europe and underweight position in certain emerging markets in Asia and Latin America also hindered relative returns. Nevertheless, its holdings in Indian and the Czech banks helped boost performance against the benchmark.1
The new management team adjusted the Fund’s portfolio late in the period to increase exposure to commodity-driven markets in Canada, Australia and select Asian countries, while reducing the Fund’s assets in western European markets and in highly valued stocks in central and eastern Europe. The Fund’s managers also positioned the portfolio with underweight stakes in Japan and the United Kingdom, where macroeconomic factors created headwinds for equity markets.1
1 | Portfolio composition is as of September 30, 2007 and is subject to change. |
10
Value of a $10,000 Investment
| * | Reflects 5.75% maximum sales charge. |
| ** | Reflects the applicable contingent deferred sales charge (CDSC), maximum of 5.00%. |
| *** | Reflects the applicable maximum CDSC of 1.00% (applicable only to redemptions within one year of purchase, and as such, are not reflected in the Total Return tables since the periods reflected are for a year or longer). |
Average Annual Total Returns
| | | | | | | | | | | | |
As of September 30, 2007 | | Inception
Date | | | 1 Year | | | 5 Years | | | 10 Years | |
Class A Shares* | | 1/2/97 | | | 13.26 | % | | 15.66 | % | | 4.31 | % |
Class B Shares** | | 1/2/97 | | | 16.35 | % | | 16.02 | % | | 4.29 | % |
Class C Shares*** | | 2/1/01 | 1 | | 19.28 | % | | 16.14 | % | | 4.15 | % |
Institutional Shares | | 1/2/97 | | | 20.39 | % | | 17.25 | % | | 5.16 | % |
MSCI All Country World Index ex U.S. | | 12/31/96 | | | 31.06 | % | | 26.32 | % | | 9.17 | % |
MSCI EAFE Index | | 12/31/96 | | | 24.86 | % | | 23.55 | % | | 7.97 | % |
Past performance does not guarantee future results. The performance data quoted represents past performance and current returns may be lower or higher. Total return figures include change in share price, reinvestment of dividends and capital gains, and do not reflect taxes that a shareholder would pay on fund distributions or on the redemption of fund shares. The investment return and principal value will fluctuate so that an investor’s shares, when redeemed, may be worth more or less than the original cost. To obtain performance information current to the most recent month end, please visit www.bbtfunds.com.
The chart above represents a comparison of a hypothetical $10,000 investment in the indicated share class versus a similar investment in the Fund’s benchmark, and represents the reinvestment of dividends and capital gains.
1 | Class C Shares were not in existence prior to 2/1/01. Performance for periods prior to that is based on the historical performance of the Class B Shares, and has been adjusted for the maximum CDSC applicable to Class C Shares. |
The benchmark index for the Fund has changed from the Morgan Stanley Capital International (“MSCI”) Europe, Australasia and Far East (“EAFE”) Index to the MSCI All Country World Index ex U.S. (“MSCI ACWI ex U.S.”). The MSCI ACWI ex U.S. is a unmanaged market capitalization-weighted index that is designed to represent the performance of equity markets in the global developed and emerging markets, excluding the United States. The MSCI EAFE Index is an unmanaged index which is generally representative of the performance of stock markets in that region. The indices do not reflect the deduction of expenses associated with a mutual fund, such as investment management and fund accounting fees. The Fund’s performance reflects the deduction of fees for these services. Investors cannot invest directly in an index, although they can invest in its underlying securities.
A portion of the Fund’s fees has been waived. If the fees had not been waived, the Fund’s total return for the periods would have been lower.
11
BB&T Special Opportunities Equity Fund
Portfolio Manager
George F. Shipp, CFA
The BB&T Special Opportunities Equity Fund is managed by George F. Shipp, CFA, chief investment officer of Scott & Stringfellow, Inc. (“Scott & Stringfellow”), subadvisor to the Fund. Mr. Shipp, who joined Scott & Stringfellow in 1982, holds a BA from the University of Virginia and an MBA from the Darden Graduate School of Business at the University of Virginia. Mr. Shipp is supported by an investment management team from Scott & Stringfellow, which includes Meghann A. Cohen; Joshua L. Haggarty, CFA; R. Griffith Jones, Jr.; and Farley C. Shiner, CPA. The team brings to the Fund more than four decades of combined investment management experience, along with a broad range of investing skills.
Investment Concerns
Equity securities (stocks) are more volatile and carry more risk than other forms of investments, including investments in high-grade fixed income securities. The net asset value per share of this Fund will fluctuate as the value of the securities in the portfolio changes. A concentrated portfolio may add a measure of volatility to performance, as major fluctuations in any one holding will likely affect the fund more than a fund with greater diversification.
Q. How did the Fund perform during the 12-month period between October 1, 2006 and September 30, 2007?
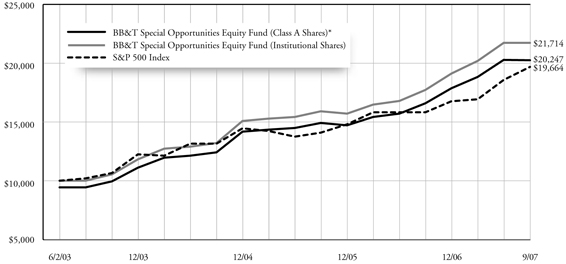
A. The Fund gained 22.55% (Institutional Shares). That compared to a 16.43% return for its benchmark, the S&P 500 Index.
Q. What factors affected the Fund’s performance?
A. Stocks, as measured by the S&P 500, generated positive returns during all four quarters of the fiscal year, boosted by healthy corporate profits and record levels of mergers and acquisitions. Equities’ upward trend helped the Fund produce a strong absolute return for the period.1
The Fund’s relative performance was enhanced by a larger-than-benchmark position in the energy sector, which was the best-performing market sector for the year ended September 30, 2007. Likewise, an overweight position in information technology shares boosted relative returns. The Fund also benefited from being underweight financial stocks, which was the market’s worst-performing sector for the year.1
Stock selection within the consumer discretionary sector helped relative performance as well. The broad consumer discretionary sector lagged the market, primarily because of weak performance among housing, automobile and low-end retail companies, but the Fund’s discretionary holdings had minimal exposure to those markets. As a result, its consumer discretionary allocation outperformed the index. Finally, the Fund benefited from a robust merger-and-acquisition environment, with five of the 29 stocks it owned at the beginning of the fiscal year receiving takeover bids.1
A 30% loss in an online bank and brokerage stock, caused by a rapid and significant deterioration in the credit quality of that firm’s loans and fixed-income investments, detracted from the Fund’s relative performance. The Fund’s cash position reflected strong inflows and provided Fund managers the flexibility to invest in opportunities as they developed, but nevertheless weighed on relative returns in a rising stock-market environment.1
| 1 | Portfolio composition is as of September 30, 2007 and is subject to change. |
12
Value of a $10,000 Investment
| * | Reflects 5.75% maximum sales charge. |
| ** | Reflects the applicable contingent deferred sales charge (CDSC), maximum of 5.00%. |
| *** | Reflects the applicable maximum CDSC of 1.00% (applicable only to redemptions within one year of purchase, and as such, are not reflected in the Total Return tables since the periods reflected are for a year or longer). |
Average Annual Total Returns
| | | | | | | | |
As of September 30, 2007 | | Inception
Date | | 1 Year | | | Since
Inception | |
Class A Shares* | | 6/2/03 | | 15.23 | % | | 17.70 | % |
Class B Shares** | | 6/2/03 | | 17.33 | % | | 18.15 | % |
Class C Shares*** | | 6/2/03 | | 21.32 | % | | 18.43 | % |
Institutional Shares | | 6/2/03 | | 22.55 | % | | 19.62 | % |
S&P 500 Index | | 5/31/03 | | 16.43 | % | | 13.17 | % |
Past performance does not guarantee future results. The performance data quoted represents past performance and current returns may be lower or higher. Total return figures include change in share price, reinvestment of dividends and capital gains, and do not reflect taxes that a shareholder would pay on fund distributions or on the redemption of fund shares. The investment return and principal value will fluctuate so that an investor’s shares, when redeemed, may be worth more or less than the original cost. To obtain performance information current to the most recent month end, please visit www.bbtfunds.com.
The chart above represents a comparison of a hypothetical $10,000 investment in the indicated share class versus a similar investment in the Fund’s benchmark and represents the reinvestment of dividends and capital gains.
The Fund is measured against the S&P 500 Index, an unmanaged index which is generally considered to be representative of the performance of the stock market as a whole. The index does not reflect the deduction of expenses associated with a mutual fund, such as investment management and fund accounting fees. The Fund’s performance reflects the deduction of fees for these services. Investors cannot invest directly in an index, although they can invest in its underlying securities.
A portion of the Fund’s fees has been waived. If the fees had not been waived, the Fund’s total return for the periods would have been lower.
13
BB&T Equity Income Fund
Portfolio Manager
George F. Shipp, CFA
The BB&T Equity Income Fund is managed by George F. Shipp, CFA, Chief Investment Officer of Scott & Stringfellow, Inc. (“Scott & Stringfellow”), subadvisor to the Fund. Mr. Shipp, who joined Scott & Stringfellow in 1982, holds a BA from the University of Virginia and an MBA from the Darden Graduate School of Business at the University of Virginia. Mr. Shipp is supported by an investment management team from Scott & Stringfellow, which includes Meghann A. Cohen; Joshua L. Haggarty, CFA; R. Griffith Jones, Jr.; and Farley C. Shiner, CPA. The team brings to the Fund more than four decades of combined investment management experience, along with a broad range of investing skills.
Investment Concerns
Equity securities (stocks) are more volatile and carry more risk than other forms of investments, including investments in high-grade fixed income securities. The net asset value per share of this Fund will fluctuate as the value of the securities in the portfolio changes. A concentrated portfolio may add a measure of volatility to performance, as major fluctuations in any one holding will likely affect the fund more than a fund with greater diversification.
Q. How did the Fund perform during the 12-month period between October 1, 2006 and September 30, 2007?
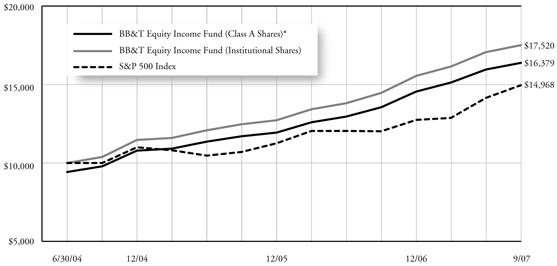
A. The Fund gained 21.16% (Institutional Shares). That compared to a 16.43% return for its benchmark, the S&P 500 Index.
Q. What factors affected the Fund’s performance?
A. Stocks, as measured by the S&P 500, generated positive returns during all four quarters of the fiscal year, boosted by healthy corporate profits and record levels of mergers and acquisitions. Large stocks performed particularly well: The large-capitalization S&P 500 outperformed the small-cap Russell 2000 Index by more than four percentage points for the period. Those trends helped the Fund generate a strong absolute return.1
The Fund’s return relative to its benchmark benefited from consistently solid performance throughout its portfolio. Of the 29 stocks the Fund owned at the beginning of the period, 23 generated positive returns for the 12-month period and the remaining six posted single-digit percentage losses (before accounting for dividends). Relative performance also benefited from an overweight position in the energy sector, which rallied as oil prices reached record highs; indeed, energy was the stock market’s best-performing sector during the Fund’s fiscal year.1
The Fund’s managers navigated a difficult environment within the financial sector by emphasizing shares of real estate owners and reinsurance companies while avoiding banks and mortgage finance companies, which were directly affected by deteriorating credit conditions. The positive effect of the Fund’s stock selection within financials was more than offset by an overweight exposure to the sector, however.1
The Fund invests in stocks that offer above-market dividend yields. That approach, which over history has produced above-average returns, was nevertheless a headwind for the Fund’s relative performance during the past year, as the performance of high-dividend-paying stocks trailed that of stocks with low or no dividends. A relatively large cash stake also reduced relative gains, although that position helped mitigate volatility while providing Fund managers the flexibility to capitalize on investment opportunities as they developed.1
1 | Portfolio composition is as of September 30, 2007 and is subject to change. |
14
Value of a $10,000 Investment
| * | Reflects 5.75% maximum sales charge. |
| ** | Reflects the applicable contingent deferred sales charge (CDSC), maximum of 5.00%. |
| *** | Reflects the applicable maximum CDSC of 1.00% (applicable only to redemptions within one year of purchase, and as such, are not reflected in the Total Return tables since the periods reflected are for a year or longer). |
Average Annual Total Returns
| | | | | | | | |
As of September 30, 2007 | | Inception
Date | | 1 Year | | | Since
Inception | |
Class A Shares* | | 6/30/04 | | 13.85 | % | | 16.38 | % |
Class B Shares** | | 6/30/04 | | 15.97 | % | | 17.00 | % |
Class C Shares*** | | 6/30/04 | | 19.93 | % | | 17.63 | % |
Institutional Shares | | 6/30/04 | | 21.16 | % | | 18.82 | % |
S&P 500 Index | | 6/30/04 | | 16.43 | % | | 11.41 | % |
Past performance does not guarantee future results. The performance data quoted represents past performance and current returns may be lower or higher. Total return figures include change in share price, reinvestment of dividends and capital gains, and do not reflect taxes that a shareholder would pay on fund distributions or on the redemption of fund shares. The investment return and principal value will fluctuate so that an investor’s shares, when redeemed, may be worth more or less than the original cost. To obtain performance information current to the most recent month end, please visit www.bbtfunds.com.
The chart above represents a comparison of a hypothetical $10,000 investment in the indicated share class versus a similar investment in the Fund’s benchmark, and represents the reinvestment of dividends and capital gains.
The Fund is measured against the S&P 500 Index, an unmanaged index which is generally considered to be representative of the performance of the stock market as a whole. The index does not reflect the deduction of expenses associated with a mutual fund, such as investment management and fund accounting fees. The Fund’s performance reflects the deduction of fees for these services. Investors cannot invest directly in an index, although they can invest in its underlying securities.
A portion of the Fund’s fees has been waived. If the fees had not been waived, the Fund’s total return for the periods would have been lower.
15
BB&T Short U.S. Government Fund
Portfolio Manager
Kevin E. McNair, CFA
The BB&T Short U.S. Government Fund is managed by Kevin E. McNair, CFA. Mr. McNair received a BA in Economics from the University of North Carolina-Chapel Hill and a Master’s of Economics from North Carolina State University, and has been managing investors’ money since 1994. Mr. McNair is supported by the BB&T Fixed Income Portfolio Management Team, which includes Carrie R. Breswitz; Brad D. Eppard, CFA; David T. Johnson; Robert F. Millikan, CFA; and Justin B. Nicholson. The team brings to the Fund six decades of combined investment management experience, along with a broad range of specialized skills encompassing a cross-section of fixed-income sectors.
Investment Concerns
Bonds offer a relatively stable level of income, although bond prices will fluctuate providing the potential for principal gain or loss. Intermediate-term, higher-quality bonds generally offer less risk than longer-term bonds and a lower rate of return.
The Fund is subject to the risk that principal value reacts in opposition to the movement of interests rates and that a rising interest rate environment increases the risk of loss of principal.
Q. How did the Fund perform during the 12-month period between October 1, 2006 and September 30, 2007?
A. The Fund gained 4.93% (Institutional Shares). That compared to a 5.95% return for its benchmark, the Merrill Lynch 1-5 Year U.S. Treasuries/Agencies Index.
Q. What factors affected the Fund’s performance?
A. This fiscal year included two distinct environments. Yields on short-term bonds increased gradually during the first three-quarters of the period under review, supported by a stable, 5.25% Federal Funds rate and pushed up by solid economic growth. Investors then flocked to high-quality short-term bonds during the summer, as evidence mounted that rising defaults on sub-prime mortgages might cause a credit squeeze. The Federal Reserve Board reduced the Federal Funds rate in September to 4.75% in order to address the credit market’s problems. Those developments pushed down yields on short-term bonds during the final quarter of the period. Bond prices move in the opposite direction of bond yields, so the environment during the final three months boosted the Fund’s total return.1
Likewise, investors during the early part of this 12-month period favored bonds that offered higher yields, helping mortgage-backed securities and agency issues outperform Treasury notes. But fears of a credit crisis led to a flight to quality during the second half of the period, causing Treasury issues to lead the fixed-income markets.1
We maintained an average duration shorter than that of the Fund’s benchmark. That strategy boosted returns relative to the benchmark during the first three-quarters of the 12-month period, as interest rates generally increased. The Fund’s relatively short duration hampered performance against the benchmark during the final three months of the period, however, as yields on short-term government bonds fell considerably.1
We also maintained larger weightings than the benchmark in mortgage-backed and agency securities — a strategy designed to capture higher yield over the long term. The Fund’s overweight stakes in those sectors helped its relative returns early in the period, but weighed on relative performance when Treasuries assumed market leadership.1
1 | Portfolio composition is as of September 30, 2007 and is subject to change. |
16
Value of a $10,000 Investment

| * | Reflects 3.00% maximum sales charge. |
Average Annual Total Returns
| | | | | | | | | | | |
As of September 30, 2007 | | Inception
Date | | 1 Year | | | 5 Years | | | 10 Years | |
Class A Shares* | | 11/30/92 | | 1.57 | % | | 1.58 | % | | 3.69 | % |
Institutional Shares | | 11/30/92 | | 4.93 | % | | 2.44 | % | | 4.25 | % |
Merrill Lynch 1-5 Year U.S. Treasuries/Agencies Index | | N/A | | 5.95 | % | | 3.00 | % | | 5.04 | % |
Past performance does not guarantee future results. The performance data quoted represents past performance and current returns may be lower or higher. Total return figures include change in share price, reinvestment of dividends and capital gains, and do not reflect taxes that a shareholder would pay on fund distributions or on the redemption of fund shares. The investment return and principal value will fluctuate so that an investor’s shares, when redeemed, may be worth more or less than the original cost. To obtain performance information current to the most recent month end, please visit www.bbtfunds.com.
The chart above represents a comparison of a hypothetical $10,000 investment in the indicated share class versus a similar investment in the Fund’s benchmark, and represents the reinvestment of dividends and capital gains.
The Fund is measured against the Merrill Lynch 1-5 Year U.S. Treasuries/Agencies Index, an unmanaged index which includes U.S. government and agency bonds that have a minimum issue size of $150 million and is a widely-recognized, capitalization weighted (companies with larger market capitalizations have more influence than those with smaller market capitalizations) index of U.S. Treasury securities with maturities of 1 year or greater and no more than 5 years. The index does not reflect the deduction of expenses associated with a mutual fund, such as investment management and fund accounting fees. The Fund’s performance reflects the deduction of fees for these services. Investors cannot invest directly in an index, although they can invest in its underlying securities.
A portion of the Fund’s fees has been waived. If the fees had not been waived, the Fund’s total return for the periods would have been lower.
17
BB&T Intermediate U.S. Government Fund
Portfolio Manager
Brad D. Eppard, CFA
The BB&T Intermediate U.S. Government Fund is managed by Brad D. Eppard, CFA. Mr. Eppard received a BS in Business Administration/ Accounting from Radford University and has been managing investors’ money since 1986. Mr. Eppard is supported by the BB&T Fixed Income Portfolio Management Team, which includes Carrie R. Breswitz; David T. Johnson; Kevin E. McNair, CFA; Robert F. Millikan, CFA; and Justin B. Nicholson. The team brings to the Fund six decades of combined investment management experience, along with a broad range of specialized skills encompassing a cross-section of fixed-income sectors.
Investment Concerns
Bonds offer a relatively stable level of income, although bond prices will fluctuate providing the potential for principal gain or loss. Intermediate-term, higher-quality bonds generally offer less risk than longer-term bonds and a lower rate of return.
The Fund is subject to the risk that principal value reacts in opposition to the movement of interests rates and that a rising interest rate environment increases the risk of loss of principal.
Q. How did the Fund perform during the 12-month period between October 1, 2006 and September 30, 2007?
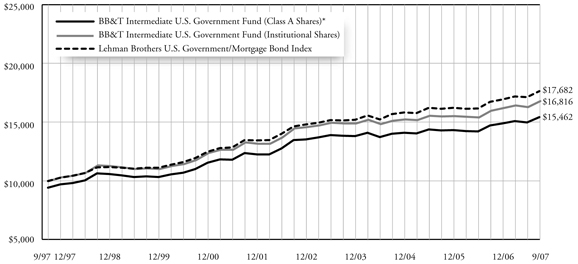
A. The Fund gained 5.04% (Institutional Shares). That compared to a 5.47% return for its benchmark, the Lehman Brothers U.S. Government/Mortgage Bond Index.
Q. What factors affected the Fund’s performance?
A. We focused the Fund’s portfolio on bonds with five-year maturities. Prospects for an interest-rate cut by the Federal Reserve improved throughout the fiscal year, as economic growth slowed and inflationary pressures weakened. Meanwhile, investors concerned about emerging problems in the credit markets flocked to the highest-quality, most liquid securities. Both developments caused yields on intermediate-term government bonds to fall for the period as a whole. Bond prices move in the opposite direction of bond yields, so the decline in five-year bonds’ yields helped this Fund post a solid total return.1
Our duration strategy boosted the Fund’s performance relative to its benchmark index. Duration indicates the likely influence of interest-rate fluctuations on bond prices: The longer a bond’s duration, the more its price is likely to gain if interest rates decline. We maintained a longer average duration than that of the benchmark index, so the decrease in interest rates during this period added to relative gains. The Fund nevertheless held very little exposure to 30-year bonds. Generally avoiding the longest-term government bonds also helped relative performance, as such bonds underperformed bonds with shorter maturities.1
Investors’ flight to quality during the final quarter of the period caused Treasury securities to generate the strongest performance among government-issued bonds. We held an underweight position in Treasuries in order to capture the greater yield available on government agency and mortgage-backed bonds. As a result, Treasury securities’ strong performance dragged somewhat on the Fund’s performance against its benchmark.1
1 | Portfolio composition is as of September 30, 2007 and is subject to change. |
18
Value of a $10,000 Investment
| * | Reflects 5.75% maximum sales charge. |
| ** | Reflects the applicable contingent deferred sales charge (CDSC), maximum of 5.00%. |
| *** | Reflects the applicable maximum CDSC of 1.00% (applicable only to redemptions within one year of purchase, and as such, are not reflected in the Total Return tables since the periods reflected are for a year or longer). |
Average Annual Total Returns
| | | | | | | | | | | | |
As of September 30, 2007 | | Inception
Date | | | 1 Year | | | 5 Years | | | 10 Years | |
Class A Shares* | | 10/9/92 | | | (1.21 | )% | | 1.53 | % | | 4.45 | % |
Class B Shares** | | 1/1/96 | | | 0.01 | % | | 1.84 | % | | 4.46 | % |
Class C Shares*** | | 2/1/01 | 1 | | 4.01 | % | | 1.99 | % | | 4.60 | % |
Institutional Shares | | 10/9/92 | | | 5.04 | % | | 3.00 | % | | 5.33 | % |
Lehman Brothers U.S. Government/Mortgage Bond Index | | N/A | | | 5.47 | % | | 3.81 | % | | 5.87 | % |
Past performance does not guarantee future results. The performance data quoted represents past performance and current returns may be lower or higher. Total return figures include change in share price, reinvestment of dividends and capital gains, and do not reflect taxes that a shareholder would pay on fund distributions or on the redemption of fund shares. The investment return and principal value will fluctuate so that an investor’s shares, when redeemed, may be worth more or less than the original cost. To obtain performance information current to the most recent month end, please visit www.bbtfunds.com.
The chart above represents a comparison of a hypothetical $10,000 investment in the indicated share class versus a similar investment in the Fund’s benchmark and represents the reinvestment of dividends and capital gains.
1 | Class C Shares were not in existence prior to 2/1/01. Performance for periods prior to that is based on the historical performance of the Class A Shares, and has been adjusted for the maximum CDSC applicable to Class C Shares, but does not include the Class C Shares 12b-1 fees, which if reflected, would have lowered performance. |
The Fund is measured by the Lehman Brothers U.S. Government/Mortgage Bond Index, an unmanaged index which is widely used as a broad measure of the performance of U.S. Government bonds with maturities of less than 10 years, and agency mortgage backed securities. The index does not reflect the deduction of expenses associated with a mutual fund, such as investment management and fund accounting fees. The Fund’s performance reflects the deduction of fees for these services. Investors cannot invest directly in an index, although they can invest in its underlying securities.
A portion of the Fund’s fees has been waived. If the fees had not been waived, the Fund’s total return for the periods would have been lower.
19
BB&T Total Return Bond Fund
Portfolio Manager
David M. Ralston
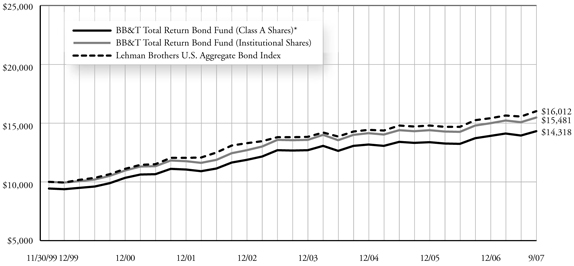
The BB&T Total Return Bond Fund is managed by David M. Ralston, portfolio manager for Sterling Capital Management LLC (“Sterling”), sub-adviser to the Fund. Mr. Ralston co-founded Trinity Capital Advisors in 1989, which merged into Sterling in 1991. He is a graduate of Appalachian State University where he received his BSBA in Finance and has 25 years of investment management experience. Mr. Ralston is supported by Hung Bui, CFA; Howard Buznitsky, CFA; Neil Grant, CFA; Mitchell Kaczmarek; Mark Montgomery, CFA; and Kevin Stoll, CFA.
Investment Concerns
Bonds offer a relatively stable level of income, although bond prices will fluctuate providing the potential for principal gain or loss. Intermediate-term, higher-quality bonds generally offer less risk than longer-term bonds and a lower rate of return.
The Fund is subject to the risk that principal value reacts in opposition to the movement of interests rates and that a rising interest rate environment increases the risk of loss of principal.
Q. How did the Fund perform during the 12-month period between October 1, 2006 and September 30, 2007?
A. The Fund gained 4.77% (Institutional Shares). That compared to a 5.14% return for its benchmark, the Lehman Brothers U.S. Aggregate Index.
Q. What factors affected the Fund’s performance?
A. The yield curve began the fiscal year relatively flat, as short-, intermediate- and long-term bonds offered similar yields. The Federal Reserve’s target short-term interest rate meanwhile stood at 5.25%. The yield curve steepened during the fiscal year, as investors began to price in expectations of future interest-rate reductions by the Federal Reserve. The Federal Reserve cut its target rate in September to 4.75%.
The Fund’s portfolio focused primarily on bonds with maturities of approximately five years, so its absolute returns benefited when falling yields on such bonds pushed their prices higher. Exposure to higher-yielding mortgage-backed securities, collateralized mortgage-backed securities and asset-backed securities also enhanced absolute returns.1
Furthermore, the Fund’s bias toward high-quality bonds boosted returns as the sub-prime mortgage crisis and the resulting credit crunch led to a flight to quality in the fixed-income markets.1
During summer of 2007 an underweight position in corporate bonds helped returns relative to the benchmark index, as government bonds dramatically outperformed corporate issues. The Fund also held an allocation to Treasury Inflation Protected Securities (TIPS), which are not included in the benchmark. TIPS posted the bond markets’ best returns during the period, so that position improved relative gains as well.1
The Fund held a longer duration than that of the benchmark during spring. Yields rose during spring, so the relatively long duration weighed on returns against the index. An overweight position in securities issued by Freddie Mac also hurt performance, as Freddie Mac securities were the worst performing area of the government-sponsored mortgage sector during the 12-month period.1
1 | Portfolio composition is as of September 30, 2007 and is subject to change. |
20
Value of a $10,000 Investment
| * | Reflects 5.75% maximum sales charge. |
| ** | Reflects the applicable contingent deferred sales charge (CDSC), maximum of 5.00%. |
| *** | Reflects the applicable maximum CDSC of 1.00% (applicable only to redemptions within one year of purchase, and as such, are not reflected in the Total Return tables since the periods reflected are for a year or longer). |
Average Annual Total Returns
| | | | | | | | | | | | |
As of September 30, 2007 | | Inception Date | | | 1 Year | | | 5 Years | | | Since Inception | |
Class A Shares* | | 12/2/99 | | | (1.52 | )% | | 3.00 | % | | 4.69 | % |
Class B Shares** | | 12/2/99 | | | (0.27 | )% | | 3.27 | % | | 4.72 | % |
Class C Shares*** | | 2/1/01 | 1 | | 3.83 | % | | 3.48 | % | | 3.96 | % |
Institutional Shares | | 12/2/99 | | | 4.77 | % | | 4.50 | % | | 5.74 | % |
Lehman Brothers U.S. Aggregate Index | | 11/30/99 | | | 5.14 | % | | 4.13 | % | | 6.33 | % |
Past performance does not guarantee future results. The performance data quoted represents past performance and current returns may be lower or higher. Total return figures include change in share price, reinvestment of dividends and capital gains, and do not reflect taxes that a shareholder would pay on fund distributions or on the redemption of fund shares. The investment return and principal value will fluctuate so that an investor’s shares, when redeemed, may be worth more or less than the original cost. To obtain performance information current to the most recent month end, please visit www.bbtfunds.com.
The chart above represents a comparison of a hypothetical $10,000 investment in the indicated share class versus a similar investment in the Fund’s benchmark, and represents the reinvestment of dividends and capital gains.
1 | Class C Shares were not in existence prior to 2/1/01. Performance for periods prior to that is based on the historical performance of the Class B Shares, and has been adjusted for the maximum CDSC applicable to Class C Shares. |
The Fund is measured against the Lehman Brothers U.S. Aggregate Bond Index, an unmanaged index which is a market value-weighted performance benchmark for investment-grade fixed-rate debt issues, including government, corporate, asset-backed, and mortgage-backed securities, with maturities of at least one year. The index is unmanaged and does not reflect the deduction of expenses associated with a mutual fund, such as investment management and fund accounting fees. The Fund’s performance reflects the deduction of fees for these services. Investors cannot invest directly in an index, although they can invest in its underlying securities.
A portion of the Fund’s fees has been waived. If the fees had not been waived, the Fund’s total return for the periods would have been lower.
21
BB&T Kentucky Intermediate Tax-Free Fund
Portfolio Manager
Robert F. Millikan, CFA
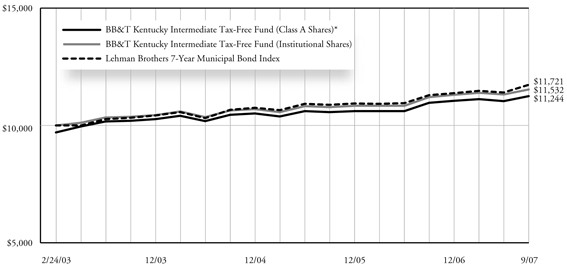
The BB&T Kentucky Intermediate Tax-Free Fund is managed by Robert F. Millikan, CFA, Director of Fixed Income Management for BB&T Asset Management, Inc. Mr. Millikan received a BA in Economics from Wake Forest University, and is a past president of the North Carolina Society of Financial Analysts and chairman of the board of directors of the Carolinas Municipal Advisory Council. Mr. Millikan has been managing investors’ money since 1990. He is supported by the BB&T Fixed Income Portfolio Management Team, which includes Carrie R. Breswitz; Brad D. Eppard, CFA; David T. Johnson; Kevin E. McNair, CFA; and Justin B. Nicholson. The team brings to the Fund six decades of combined investment management experience, along with a broad range of specialized skills encompassing a cross-section of fixed-income sectors.
Investment Concerns
Because the Fund is non-diversified and invests primarily in Kentucky municipal securities, the Fund is particularly susceptible to any economic, political, or regulatory developments affecting a particular issuer of Kentucky municipal securities. Bonds offer a relatively stable level of income, although bond prices will fluctuate providing the potential for principal gain or loss. Intermediate-term, higher-quality bonds generally offer less risk than longer-term bonds and a lower rate of return. The Fund is subject to the risk that principal value reacts in opposition to the movement of interests rates and that a rising interest rate environment increases the risk of loss of principal. The Fund’s income may be subject to certain state and local taxes and, depending on a investors tax status, to the Federal alternative minimum tax.
Q. How did the Fund perform during the 12-month period between October 1, 2006 and September 30, 2007?
A. The Fund gained 2.92% (Institutional Shares). That compared to a 3.81% return for the Lehman Brothers 7-Year Municipal Bond Index.
Q. What factors affected the Fund’s performance?
A. The period began with short-term municipal bonds offering yields only slightly lower than the yields available on longer-term municipal bonds. As the fiscal year progressed investors became increasingly concerned about the possibility that rising defaults on sub-prime mortgages could result in a credit crisis. That development led investors to prize investments that offered liquidity and high credit quality. Yields on short- and intermediate-term municipal bonds fell substantially as a result, while yields on long-term municipal securities remained roughly flat.
Bond prices move in the opposite direction of bond yields, so the environment helped municipal bonds and this Fund post healthy total returns. Furthermore, the Federal Reserve Board in September addressed the troubles in the credit markets by lowering its target Federal Funds rate by 0.5 percentage points. That move also pushed down yields on short- and intermediate-term municipal bonds, boosting the Fund’s returns.1
Kentucky municipal bonds generally offer slightly lower credit quality than other states’ municipal bonds. That factor weighed on returns against the Fund’s benchmark, as higher-quality bonds produced the strongest performance. We maintained the Fund’s average duration slightly longer than that of the benchmark index in order to capture higher yield. That positioning also reduced relative returns, as short-and intermediate-term municipal bonds led the municipal market.1
The Fund held exposure to municipal bonds with maturities of 10 years and longer, which are not represented in the benchmark. That exposure weighed on relative returns, as shorter-term bonds outperformed longer-term securities.1
1 | Portfolio composition is as of September 30, 2007 and is subject to change. |
22
Value of a $10,000 Investment
| * | Reflects 3.00% maximum sales charge. |
Average Annual Total Returns
| | | | | | | | |
As of September 30, 2007 | | Inception
Date | | 1 Year | | | Since
Inception | |
Class A Shares* | | 2/24/03 | | (0.39 | )% | | 2.58 | % |
Institutional Shares | | 2/24/03 | | 2.92 | % | | 3.15 | % |
Lehman Brothers 7-Year Municipal Bond Index | | 2/28/03 | | 3.81 | % | | 3.53 | % |
Past performance does not guarantee future results. The performance data quoted represents past performance and current returns may be lower or higher. Total return figures include change in share price, reinvestment of dividends and capital gains, and do not reflect taxes that a shareholder would pay on fund distributions or on the redemption of fund shares. The investment return and principal value will fluctuate so that an investor’s shares, when redeemed, may be worth more or less than the original cost. To obtain performance information current to the most recent month end, please visit www.bbtfunds.com.
The chart above represents a comparison of a hypothetical $10,000 investment in the indicated share class versus a similar investment in the Fund’s benchmark, and represents the reinvestment of dividends and capital gains.
The Fund is measured against the Lehman Brothers 7-Year Municipal Bond Index, an unmanaged index which is representative of municipal bonds with a minimum credit rating of at least Baa, have a maturity value of at least $5 million and a maturity range of 6-8 years. The index does not reflect the deduction of expenses associated with a mutual fund, such as investment management and fund accounting fees. The Fund performance reflects the deduction of fees for these services. Investors cannot invest directly in an index, although they can invest in its underlying securities.
A portion of the Fund’s fees has been waived. If the fees had not been waived, the Fund’s total return for the periods would have been lower.
23
BB&T Maryland Intermediate Tax-Free Fund
Portfolio Manager
Robert F. Millikan, CFA
The BB&T Maryland Intermediate Tax-Free Fund is managed by Robert F. Millikan, CFA, Director of Fixed Income Management for BB&T Asset Management, Inc. Mr. Millikan received a BA in Economics from Wake Forest University, and is a past president of the North Carolina Society of Financial Analysts and chairman of the board of directors of the Carolinas Municipal Advisory Council. Mr. Millikan has been managing investors’ money since 1990. He is supported by the BB&T Fixed Income Portfolio Management Team, which includes Carrie R. Breswitz; Brad D. Eppard, CFA; David T. Johnson; Kevin E. McNair, CFA; and Justin B. Nicholson. The team brings to the Fund six decades of combined investment management experience, along with a broad range of specialized skills encompassing a cross-section of fixed-income sectors.
Investment Concerns
Because the Fund is non-diversified and invests primarily in Maryland municipal securities, the Fund is particularly susceptible to any economic, political, or regulatory developments affecting a particular issuer of Maryland municipal securities. Bonds offer a relatively stable level of income, although bond prices will fluctuate providing the potential for principal gain or loss. Intermediate-term, higher-quality bonds generally offer less risk than longer-term bonds and a lower rate of return. The Fund is subject to the risk that principal value reacts in opposition to the movement of interests rates and that a rising interest rate environment increases the risk of loss of principal. The Fund’s income may be subject to certain state and local taxes and, depending on a investors tax status, to the Federal alternative minimum tax.
Q. How did the Fund perform during the 12-month period between October 1, 2006 and September 30, 2007?
A. The Fund gained 3.74% (Institutional Shares). That compared to a 3.81% return for the Lehman Brothers 7-Year Municipal Bond Index.
Q. What factors affected the Fund’s performance?
A. When the period began long-term municipal bonds offered yields only slightly higher than short-term municipal bonds. But the difference between yields on short-and long-term munis increased as investors became concerned that rising defaults on sub-prime mortgages could lead to a credit crisis, and prized investments that offered liquidity and high credit quality. Yields on short- and intermediate-term municipal bonds fell considerably as a result, while yields on long-term municipal securities remained fairly stable. The Federal Reserve Board in September addressed the troubles in the credit markets by lowering its target Federal Funds rate by 0.5 percentage points, and that move also pushed down yields on shorter-term municipal bonds. Bond prices move in the opposite direction of bond yields, so the falling-yield environment helped municipal bonds and this Fund post healthy total returns.
The highest-quality bonds generated the strongest returns during this period. Maryland municipal bonds offer very high credit quality, so investors’ risk aversion helped boost this Fund’s return relative to the nationwide benchmark. Relative returns also benefited from an investment near the end of the period in insured floating-rate securities that offered relatively high yields. The Fund’s sizable exposure to shorter-term municipal bonds increased its performance against the benchmark as well, as short- and intermediate-term securities significantly outperformed long-term issues.1
The Fund held exposure to municipal bonds with maturities of 10 years and longer, which are not represented in the benchmark. That exposure weighed on relative returns, as shorter-term bonds outperformed longer-term securities.1
1 | Portfolio composition is as of September 30, 2007 and is subject to change. |
24
Value of a $10,000 Investment
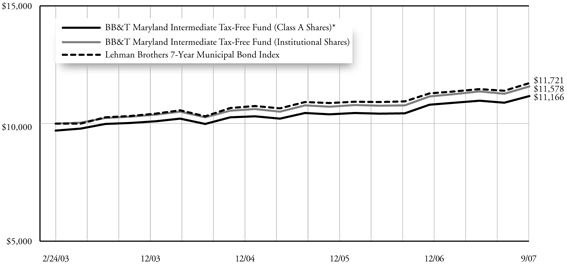
| * | Reflects 3.00% maximum sales charge. |
Average Annual Total Returns
| | | | | | | | |
As of September 30, 2007 | | Inception
Date | | 1 Year | | | Since
Inception | |
Class A Shares* | | 2/24/03 | | 0.31 | % | | 2.43 | % |
Institutional Shares | | 2/24/03 | | 3.74 | % | | 3.24 | % |
Lehman Brothers 7-Year Municipal Bond Index | | 2/28/03 | | 3.81 | % | | 3.53 | % |
Past performance does not guarantee future results. The performance data quoted represents past performance and current returns may be lower or higher. Total return figures include change in share price, reinvestment of dividends and capital gains, and do not reflect taxes that a shareholder would pay on fund distributions or on the redemption of fund shares. The investment return and principal value will fluctuate so that an investor’s shares, when redeemed, may be worth more or less than the original cost. To obtain performance information current to the most recent month end, please visit www.bbtfunds.com.
The chart above represents a comparison of a hypothetical $10,000 investment in the indicated share class versus a similar investment in the Fund’s benchmark, and represents the reinvestment of dividends and capital gains.
The Fund is measured against the Lehman Brothers 7-Year Municipal Bond Index, an unmanaged index which is representative of municipal bonds with a minimum credit rating of at least Baa, have a maturity value of at least $5 million and a maturity range of 6-8 years. The index does not reflect the deduction of expenses associated with a mutual fund, such as investment management and fund accounting fees. The Fund’s performance reflects the deduction of fees for these services. Investors cannot invest directly in an index, although they can invest in its underlying securities.
A portion of the Fund’s fees has been waived. If the fees had not been waived, the Fund’s total return for the periods would have been lower.
25
BB&T North Carolina Intermediate Tax-Free Fund
Portfolio Manager
Robert F. Millikan, CFA
The BB&T North Carolina Intermediate Tax-Free Fund is managed by Robert F. Millikan, CFA, Director of Fixed Income Management for BB&T Asset Management, Inc. Mr. Millikan received a BA in Economics from Wake Forest University, and is a past president of the North Carolina Society of Financial Analysts and chairman of the board of directors of the Carolinas Municipal Advisory Council. Mr. Millikan has been managing investors’ money since 1990. He is supported by the BB&T Fixed Income Portfolio Management Team, which includes Carrie R. Breswitz; Brad D. Eppard, CFA; David T. Johnson; Kevin E. McNair, CFA; and Justin B. Nicholson. The team brings to the Fund six decades of combined investment management experience, along with a broad range of specialized skills encompassing a cross-section of fixed-income sectors.
Investment Concerns
Because the Fund is non-diversified and invests primarily in North Carolina municipal securities, the Fund is particularly susceptible to any economic, political, or regulatory developments affecting a particular issuer of North Carolina municipal securities. Bonds offer a relatively stable level of income, although bond prices will fluctuate providing the potential for principal gain or loss. Intermediate-term, higher-quality bonds generally offer less risk than longer-term bonds and a lower rate of return. The Fund is subject to the risk that principal value reacts in opposition to the movement of interests rates and that a rising interest rate environment increases the risk of loss of principal. The Fund’s income may be subject to certain state and local taxes and, depending on a investors tax status, to the Federal alternative minimum tax.
Q. How did the Fund perform during the 12-month period between October 1, 2006 and September 30, 2007?
A. The Fund gained 3.33% (Institutional Shares). That compared to a 3.81% return for the Lehman Brothers 7-Year Municipal Bond Index.
Q. What factors affected the Fund’s performance?
A. At the beginning of the period long-term municipal bonds offered yields only slightly higher than short-term municipal bonds. The difference between yields on short-and long-term securities increased throughout the period, however, as investors concerned that rising defaults on sub-prime mortgages could cause a credit crisis favored investments that offered greater liquidity. That environment led to declines in the yields of short- and intermediate-term municipal bonds, while yields on long-term municipal securities remained nearly unchanged.
The Federal Reserve Board in September addressed the credit market’s troubles by lowering the target Federal Funds rate by 0.5 percentage points. That move also pushed down yields on short- and intermediate-term municipal bonds. Bond prices rise when bond yields fall, so the environment helped the Fund post strong absolute returns.1
Bonds with the highest credit quality generated the strongest returns during this period. Investors’ preference for quality helped boost this Fund’s return relative to the benchmark index, because North Carolina’s municipal bonds offer very high credit quality. Returns against the benchmark also benefited from a relative trading strategy that helped the Fund capitalize from the steepening of the yield curve.1
The Fund held exposure to municipal bonds with maturities of 10 years and longer, which are not represented in the benchmark. That exposure weighed on relative returns, as shorter-term bonds outperformed longer-term securities.1
1 | Portfolio composition is as of September 30, 2007 and is subject to change. |
26
Value of a $10,000 Investment
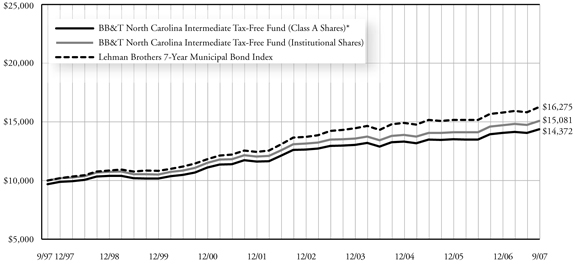
| * | Reflects 3.00% maximum sales charge. |
Average Annual Total Returns
| | | | | | | | | | | |
As of September 30, 2007 | | Inception
Date | | 1 Year | | | 5 Years | | | 10 Years | |
Class A Shares* | | 10/16/92 | | (0.01 | )% | | 2.02 | % | | 3.69 | % |
Institutional Shares | | 10/16/92 | | 3.33 | % | | 2.86 | % | | 4.19 | % |
Lehman Brothers 7-Year Municipal Bond Index | | N/A | | 3.81 | % | | 3.53 | % | | 4.99 | % |
Past performance does not guarantee future results. The performance data quoted represents past performance and current returns may be lower or higher. Total return figures include change in share price, reinvestment of dividends and capital gains, and do not reflect taxes that a shareholder would pay on fund distributions or on the redemption of fund shares. The investment return and principal value will fluctuate so that an investor’s shares, when redeemed, may be worth more or less than the original cost. To obtain performance information current to the most recent month end, please visit www.bbtfunds.com.
The chart above represents a comparison of a hypothetical $10,000 investment in the indicated share class versus a similar investment in the Fund’s benchmark, and represents the reinvestment of dividends and capital gains.
The Fund is measured against the Lehman Brothers 7-Year Municipal Bond Index, an unmanaged index which is representative of municipal bonds with a minimum credit rating of at least Baa, have a maturity value of at least $5 million and a maturity range of 6-8 years. The index does not reflect the deduction of expenses associated with a mutual fund, such as investment management and fund accounting fees. The Fund’s performance reflects the deduction of fees for these services. Investors cannot invest directly in an index, although they can invest in its underlying securities.
A portion of the Fund’s fees has been waived. If the fees had not been waived, the Fund’s total return for the periods would have been lower.
27
BB&T South Carolina Intermediate Tax-Free Fund
Portfolio Manager
Robert F. Millikan, CFA
The BB&T South Carolina Intermediate Tax-Free Fund is managed by Robert F. Millikan, CFA, Director of Fixed Income Management for BB&T Asset Management, Inc. Mr. Millikan received a BA in Economics from Wake Forest University, and is a past president of the North Carolina Society of Financial Analysts and chairman of the board of directors of the Carolinas Municipal Advisory Council. Mr. Millikan has been managing investors’ money since 1990. He is supported by the BB&T Fixed Income Portfolio Management Team, which includes Carrie R. Breswitz; Brad D. Eppard, CFA; David T. Johnson; Kevin E. McNair, CFA; and Justin B. Nicholson. The team brings to the Fund six decades of combined investment management experience, along with a broad range of specialized skills encompassing a cross-section of fixed-income sectors.
Investment Concerns
Because the Fund is non-diversified and invests primarily in South Carolina municipal securities, the Fund is particularly susceptible to any economic, political, or regulatory developments affecting a particular issuer of South Carolina municipal securities. Bonds offer a relatively stable level of income, although bond prices will fluctuate providing the potential for principal gain or loss. Intermediate-term, higher-quality bonds generally offer less risk than longer-term bonds and a lower rate of return. The Fund is subject to the risk that principal value reacts in opposition to the movement of interests rates and that a rising interest rate environment increases the risk of loss of principal. The Fund’s income may be subject to certain state and local taxes and, depending on a investors tax status, to the Federal alternative minimum tax.
Q. How did the Fund perform during the 12-month period between October 1, 2006 and September 30, 2007?
A. The Fund gained 3.08% (Institutional Shares). That compared to a 3.81% return for the Lehman Brothers 7-Year Municipal Bond Index.
Q. What factors affected the Fund’s performance?
A. At the beginning of the period, long-term municipal bonds offered yields only slightly higher than short-term municipal bonds. The difference between short-and long-term bonds’ yields increased throughout the period, as investors prized liquidity due to fears that rising sub-prime mortgage defaults could cause a credit crisis. That environment caused yields to fall on short- and intermediate-term municipal bonds, while yields on long-term municipal securities remained nearly unchanged.
The Federal Reserve Board attempted to ameliorate the credit market’s troubles by lowering its target Federal Funds rate from 5.25% to 4.75% in September. That move also depressed yields on short- and intermediate-term municipal bonds. Bond prices rise when bond yields fall, so the yield declines that occurred during this period helped the Fund post strong absolute returns.1
Bonds with the highest credit quality generated the best returns during this period. South Carolina municipal bonds offer relatively high quality, so investors’ desire for safety generally helped this Fund’s relative performance. Likewise, the Fund’s returns against its benchmark got a boost from our investment near the end of the period in insured floating-rate securities that offered attractive yields. Our relative trading strategy meanwhile helped the Fund profit from a steeper yield curve, improving relative performance.1
The Fund held exposure to municipal bonds with maturities of 10 years and longer, which are not represented in the benchmark. That exposure weighed on relative returns, as shorter-term bonds outperformed longer-term securities.1
1 | Portfolio composition is as of September 30, 2007 and is subject to change. |
28
Value of a $10,000 Investment
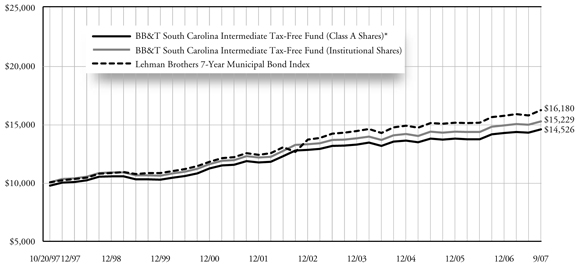
| * | Reflects 3.00% maximum sales charge. |
Average Annual Total Returns
| | | | | | | | | | | |
As of September 30, 2007 | | Inception
Date | | 1 Year | | | 5 Years | | | Since
Inception | |
Class A Shares* | | 10/20/97 | | (0.18 | )% | | 2.06 | % | | 3.83 | % |
Institutional Shares | | 10/20/97 | | 3.08 | % | | 2.89 | % | | 4.32 | % |
Lehman Brothers 7-Year Municipal Bond Index | | 10/31/97 | | 3.81 | % | | 3.53 | % | | 4.97 | % |
Past performance does not guarantee future results. The performance data quoted represents past performance and current returns may be lower or higher. Total return figures include change in share price, reinvestment of dividends and capital gains, and do not reflect taxes that a shareholder would pay on fund distributions or on the redemption of fund shares. The investment return and principal value will fluctuate so that an investor’s shares, when redeemed, may be worth more or less than the original cost. To obtain performance information current to the most recent month end, please visit www.bbtfunds.com.
The chart above represents a comparison of a hypothetical $10,000 investment in the indicated share class versus a similar investment in the Fund’s benchmark, and represents the reinvestment of dividends and capital gains.
The Fund is measured against the Lehman Brothers 7-Year Municipal Bond Index, an unmanaged index which is representative of municipal bonds with a minimum credit rating of at least Baa, have a maturity value of at least $5 million and a maturity range of 6-8 years. The index does not reflect the deduction of expenses associated with a mutual fund, such as investment management and fund accounting fees. The Fund’s performance reflects the deduction of fees for these services. Investors cannot invest directly in an index, although they can invest in its underlying securities.
A portion of the Fund’s fees has been waived. If the fees had not been waived, the Fund’s total return for the periods would have been lower.
29
BB&T Virginia Intermediate Tax-Free Fund
Portfolio Manager
Robert F. Millikan, CFA
The BB&T Virginia Intermediate Tax-Free Fund is managed by Robert F. Millikan, CFA, Director of Fixed Income Management for BB&T Asset Management, Inc. Mr. Millikan received a BA in Economics from Wake Forest University, and is a past president of the North Carolina Society of Financial Analysts and chairman of the board of directors of the Carolinas Municipal Advisory Council. Mr. Millikan has been managing investors’ money since 1990. He is supported by the BB&T Fixed Income Portfolio Management Team, which includes Carrie R. Breswitz; Brad D. Eppard, CFA; David T. Johnson; Kevin E. McNair, CFA; and Justin B. Nicholson. The team brings to the Fund six decades of combined investment management experience, along with a broad range of specialized skills encompassing a cross-section of fixed-income sectors.
Investment Concerns
Because the Fund is non-diversified and invests primarily in Virginia municipal securities, the Fund is particularly susceptible to any economic, political, or regulatory developments affecting a particular issuer of Virginia municipal securities. Bonds offer a relatively stable level of income, although bond prices will fluctuate providing the potential for principal gain or loss. Intermediate-term, higher-quality bonds generally offer less risk than longer-term bonds and a lower rate of return. The Fund is subject to the risk that principal value reacts in opposition to the movement of interest rates and that a rising interest rate environment increases the risk of loss of principal. The Fund’s income may be subject to certain state and local taxes and, depending on a investors tax status, to the Federal alternative minimum tax.
Q. How did the Fund perform during the 12-month period between October 1, 2006 and September 30, 2007?
A. The Fund gained 3.21% (Institutional Shares). That compared to a 3.81% return for the Lehman Brothers 7-Year Municipal Bond Index.
Q. What factors affected the Fund’s performance?
A. The period began with a relatively flat yield curve, in which long-term municipal bonds offered yields only slightly higher than short-term municipal bonds. The yield curve steepened during the second half of the period, as yields on short- and intermediate-term bonds declined and yields on long-term bonds remained stable. That development resulted from investors’ increasing desire for liquidity, as rising sub-prime mortgages defaults led to fears of a credit crisis. The Federal Reserve Board further contributed to declines in short- and intermediate-term bond yields when it lowered its target Federal Funds rate from 5.25% to 4.75% in September — a move intended to address the problems in the credit markets. Bond prices rise when bond yields fall, so the declines in yield we witnessed during this period helped the Fund post healthy absolute returns.1
Bonds with the best credit quality generated the highest returns during this period. Virginia’s bonds earn the highest rating, AAA, so investors’ desire for safety significantly boosted this Fund’s performance against the national benchmark. Our relative trading strategy meanwhile helped the Fund profit from a steeper yield curve, improving relative performance.1
The Fund held exposure to municipal bonds with maturities of 10 years and longer, which are not represented in the benchmark. That exposure weighed on relative returns, as shorter-term bonds outperformed longer-term securities.1
1 | Portfolio composition is as of September 30, 2007 and is subject to change. |
30
Value of a $10,000 Investment
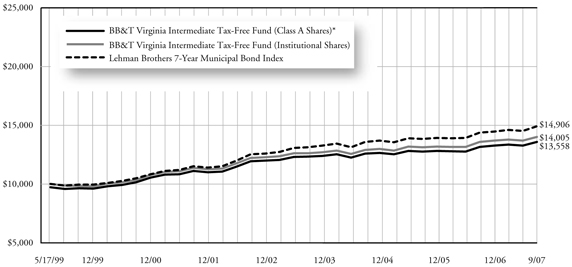
| * | Reflects 3.00% maximum sales charge. |
Average Annual Total Returns
| | | | | | | | | | | |
As of September 30, 2007 | | Inception
Date | | 1 Year | | | 5 Years | | | Since
Inception | |
Class A Shares* | | 5/17/99 | | (0.03 | )% | | 1.98 | % | | 3.70 | % |
Institutional Shares | | 5/17/99 | | 3.21 | % | | 2.79 | % | | 4.10 | % |
Lehman Brothers 7-Year Municipal Bond Index | | 5/31/99 | | 3.81 | % | | 3.53 | % | | 4.91 | % |
Past performance does not guarantee future results. The performance data quoted represents past performance and current returns may be lower or higher. Total return figures include change in share price, reinvestment of dividends and capital gains, and do not reflect taxes that a shareholder would pay on fund distributions or on the redemption of fund shares. The investment return and principal value will fluctuate so that an investor’s shares, when redeemed, may be worth more or less than the original cost. To obtain performance information current to the most recent month end, please visit www.bbtfunds.com.
The chart above represents a comparison of a hypothetical $10,000 investment in the indicated share class versus a similar investment in the Fund’s benchmark, and represents the reinvestment of dividends and capital gains.
The Fund is measured against the Lehman Brothers 7-Year Municipal Bond Index, an unmanaged index which is representative of municipal bonds with a minimum credit rating of at least Baa, have a maturity value of at least $5 million and a maturity range of 6-8 years. The index does not reflect the deduction of expenses associated with a mutual fund, such as investment management and fund accounting fees. The Fund’s performance reflects the deduction of fees for these services. Investors cannot invest directly in an index, although they can invest in its underlying securities.
A portion of the Fund’s fees has been waived. If the fees had not been waived, the Fund’s total return for the periods would have been lower.
31
BB&T West Virginia Intermediate Tax-Free Fund
Portfolio Manager
Robert F. Millikan, CFA
The BB&T West Virginia Intermediate Tax-Free Fund is managed by Robert F. Millikan, CFA, Director of Fixed Income Management for BB&T Asset Management, Inc. Mr. Millikan received a BA in Economics from Wake Forest University, and is a past president of the North Carolina Society of Financial Analysts and chairman of the board of directors of the Carolinas Municipal Advisory Council. Mr. Millikan has been managing investors’ money since 1990. He is supported by the BB&T Fixed Income Portfolio Management Team, which includes Carrie R. Breswitz; Brad D. Eppard, CFA; David T. Johnson; Kevin E. McNair, CFA; and Justin B. Nicholson. The team brings to the Fund six decades of combined investment management experience, along with a broad range of specialized skills encompassing a cross-section of fixed-income sectors.
Investment Concerns
Because the Fund is non-diversified and invests primarily in West Virginia municipal securities, the Fund is particularly susceptible to any economic, political, or regulatory developments affecting a particular issuer of West Virginia municipal securities. Bonds offer a relatively stable level of income, although bond prices will fluctuate providing the potential for principal gain or loss. Intermediate-term, higher-quality bonds generally offer less risk than longer-term bonds and a lower rate of return. The Fund is subject to the risk that principal value reacts in opposition to the movement of interest rates and that a rising interest rate environment increases the risk of loss of principal. The Fund’s income may be subject to certain state and local taxes and, depending on a investors tax status, to the Federal alternative minimum tax.
Q. How did the Fund perform during the 12-month period between October 1, 2006 and September 30, 2007?
A. The Fund gained 3.37% (Institutional Shares). That compared to a 3.81% return for the Lehman Brothers 7-Year Municipal Bond Index.
Q. What factors affected the Fund’s performance?
A. The period began with a nearly flat yield curve, with long-term municipal bonds offering yields only slightly higher than the yields available on short-term municipal bonds. But investors during 2007 became increasingly concerned about the possibility that rising defaults on sub-prime mortgages could result in a credit crisis, so they prized the liquidity offered by short- and intermediate-term bonds. The increased demand for shorter-term municipal bonds caused prices to rise on those securities. Moreover, the Federal Reserve Board in September lowered its target Federal Funds rate by 0.5 percentage points in an attempt to address the credit market’s troubles. That move also buoyed prices of short- and intermediate-term municipal bonds, boosting the Fund’s returns.1
Municipal bonds with the highest credit qualities generally produced the strongest performance during this period. West Virginia municipal bonds offer somewhat lower credit quality than other states’ municipal bonds, and the Fund also held a slightly larger stake in BBB-rated or non-rated bonds than did the index. As a result, investors’ preference for quality weighed on returns against the Fund’s benchmark. The Fund’s positions in bonds with relatively short duration helped boost returns against the index, however.1
The Fund held exposure to municipal bonds with maturities of 10 years and longer, which are not represented in the benchmark. That exposure weighed on relative returns, as shorter-term bonds outperformed longer-term securities.1
1 | Portfolio composition is as of September 30, 2007 and is subject to change. |
32
Value of a $10,000 Investment
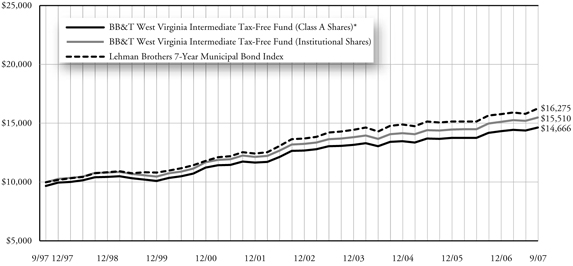
| * | Reflects 3.00% maximum sales charge. |
Average Annual Total Returns
| | | | | | | | | | | | |
As of September 30, 2007 | | Inception
Date | | | 1 Year | | | 5 Years | | | 10 Years | |
Class A Shares* | | 12/17/93 | 1 | | 0.05 | % | | 2.34 | % | | 3.90 | % |
Institutional Shares | | 12/1/93 | 1 | | 3.37 | % | | 3.24 | % | | 4.77 | % |
Lehman Brothers 7-Year Municipal Bond Index | | N/A | | | 3.81 | % | | 3.53 | % | | 4.99 | % |
Past performance does not guarantee future results. The performance data quoted represents past performance and current returns may be lower or higher. Total return figures include change in share price, reinvestment of dividends and capital gains, and do not reflect taxes that a shareholder would pay on fund distributions or on the redemption of fund shares. The investment return and principal value will fluctuate so that an investor’s shares, when redeemed, may be worth more or less than the original cost. To obtain performance information current to the most recent month end, please visit www.bbtfunds.com.
The chart above represents a comparison of a hypothetical $10,000 investment in the indicated share class versus a similar investment in the Fund’s benchmark, and represents the reinvestment of dividends and capital gains.
1 | Fund performance as shown for Class A and Institutional Shares includes the performance of the OVB West Virginia Tax-Exempt Income Portfolio for the periods prior to its consolidation with the BB&T West Virginia Intermediate Tax-Free Fund on 7/23/01. |
The Fund is measured against the Lehman Brothers 7-Year Municipal Bond Index, an unmanaged index which is representative of municipal bonds with a minimum credit rating of at least Baa, have a maturity value of at least $5 million and a maturity range of 6-8 years. The index does not reflect the deduction of expenses associated with a mutual fund, such as investment management and fund accounting fees. The Fund’s performance reflects the deduction of fees for these services. Investors cannot invest directly in an index, although they can invest in its underlying securities.
A portion of the Fund’s fees has been waived. If the fees had not been waived, the Fund’s total return for the periods would have been lower.
33
BB&T National Tax-Free Money Market Fund
Portfolio Managers
Michael Sirianni
The BB&T National Tax-Free Money Market Fund is managed by Michael Sirianni, portfolio manager for Federated Investment Management Company (“Federated IMC”), subadviser to the Fund. Mr. Sirianni is primarily responsible for the day-today management of the portfolio. He is supported by an investment management team from Federated IMC which includes Nancy J. Beltz, CFA, Hanan Callas, CFA, Kyle D. Stewart, CFA, and a group of five money market traders. On average, team members bring more than a decade of investment management experience to the Fund, with specialization in money market portfolio management and credit analysis.
Investment Concerns
Investments in the BB&T National Tax Free Money Market Fund are neither insured nor guaranteed by the Federal Deposit Insurance Corporation or any government agency. Although the Fund seeks to preserve the value of your investments at a $1.00 per share, it is possible to lose money by investing in the Fund.
Q. What factors affected the Fund’s yield during the 12-month period between October 1, 2006 and September 30, 2007?
A. The majority of this Fund is composed of variable rate demand notes (VRDNs), which have yields that fluctuate on a weekly basis. Changes in these securities’ rates are affected by the general interest rate environment (which in turn is heavily influenced by Federal Reserve policy), as well as seasonal factors and supply and demand.1
The overall interest rate environment was stable during most of the period. The Federal Reserve cut the Federal Funds target rate from 5.25% to 4.75% near the end of the period, causing interest rates to decline during the fiscal year’s final weeks.1
Seasonal dips and spikes in interest rates are not uncommon in the tax-exempt money markets, and this year was no exception. The period was punctuated by episodes of higher yields: in December due to lower demand at year-end and in April due to issues related to tax filing.
Yields rose again in August due to troubles in the commercial paper sector, which were related to the sub-prime mortgage crisis. Higher yields in August were not driven directly by supply-demand issues or credit problems among tax-free money market securities — rather, yields increased because of a rise in London Interbank Offer rates, which are represented in the commonly used LIBOR benchmark.
The average ratio of the BMA Index (which tracks seven-day VRDNS) to the LIBOR rose slightly for this fiscal year, and remains in line with historical averages. The ratio is affected by the absolute level of interest rates, the volume of short-term supply, especially of state and local notes, and the demand for those instruments. The modest increase in the BMA-to-LIBOR ratio reflected relatively stable demand throughout much of the year.1
1 | Portfolio composition is as of September 30, 2007 and is subject to change. |
Past performance does not guarantee future results. The performance data quoted represents past performance and current returns may be lower or higher. Total return figures include change in share price, reinvestment of dividends and capital gains, and do not reflect taxes that a shareholder would pay on fund distributions or on the redemption of fund shares. The investment return and principal value will fluctuate so that an investor’s shares, when redeemed, may be worth more or less than the original cost. To obtain performance information current to the most recent month end, please visit www.bbtfunds.com.
A portion of the Fund’s fees has been waived. If the fees had not been waived, the Fund’s total return for the periods would have been lower.
34
BB&T Prime Money Market Fund
Portfolio Managers
Deborah A. Cunningham and Paige Wilhelm
The BB&T Prime Money Market Fund is managed by Deborah A. Cunningham and Paige Wilhelm, portfolio managers for Federated Investment Management Company (“Federated IMC”), subadviser to the Fund. Mrs. Cunningham and Mrs. Wilhelm are primarily responsible for the day-to-day management of the portfolio. They are supported by an investment management team from Federated IMC which includes William Jamison, Natalie F. Metz, Mary Ellen Tesla, Mark F. Weiss, CFA, and a group of eight money market traders. On average, team members bring more than a decade of investment management experience to the Fund, with specialization in money market portfolio management and credit analysis.
Investment Concerns
Investments in the BB&T Prime Money Market Fund are neither insured nor guaranteed by the Federal Deposit Insurance Corporation or any government agency. Although the Fund seeks to preserve the value of your investments at a $1.00 per share, it is possible to lose money by investing in the Fund.
Q. What factors affected the Fund’s yield during the 12-month period between October 1, 2006 and September 30, 2007?
A. The Federal Funds rate stood at 5.25% to begin the period. The Fund’s manager initially targeted an average maturity of between 40 and 50 days — a neutral strategy based on the expectation that the Federal Reserve Board was likely to leave interest rates unchanged during the coming months. The manager in April extended the Fund’s average maturity to a target range of between 45 and 55 days, as signs of slowing economic growth and weakening inflation increased the likelihood that the Fed would reduce the Federal Funds rate later in 2007. Extending the Fund’s average maturity locked in higher yield for shareholders.1
Borrowers with weak credit increasingly defaulted on home loans as 2007 progressed. That development roiled the money markets in August, as investors became concerned about the credit-worthiness of securities backed by such sub-prime mortgages. Investors’ fears caused them to curtail purchases of commercial paper, restricting liquidity and dramatically increasing yields on corporate securities.1
Due to the high-quality securities held by this Fund, the Fund did not suffer directly from sub-prime mortgage defaults. Nevertheless, the manager increased the Fund’s stake in overnight securities in order to ensure sufficient liquidity. That strategy reduced the Fund’s average maturity from the high end to the middle of the 45 to 55 day range, modestly reducing the Fund’s yield.1
The Federal Reserve reduced the Federal Funds rate to 4.75% on September 18. The rate cut boosted liquidity and led to a broad decline in money market yields, particularly on commercial paper. The Fund’s managers sought opportunities in somewhat longer-term securities in order to lock in attractive yield in anticipation of another reduction in interest rates.1
As of September 30, 2007, the Fund held approximately 42% of its assets in commercial paper and corporate notes, 40% in variable-rate securities, 4% in repurchase agreements and 14% in bank instruments. The Fund’s average maturity was 51 days.1
1 | Portfolio composition is as of September 30, 2007 and is subject to change. |
Past performance does not guarantee future results. The performance data quoted represents past performance and current returns may be lower or higher. Total return figures include change in share price, reinvestment of dividends and capital gains, and do not reflect taxes that a shareholder would pay on fund distributions or on the redemption of fund shares. The investment return and principal value will fluctuate so that an investor’s shares, when redeemed, may be worth more or less than the original cost. To obtain performance information current to the most recent month end, please visit www.bbtfunds.com.
A portion of the Fund’s fees has been waived. If the fees had not been waived, the Fund’s total return for the periods would have been lower.
35
BB&T U.S. Treasury Money Market Fund
Portfolio Manager
Kevin E. McNair, CFA
The BB&T U.S. Treasury Money Market Fund is managed by Kevin E. McNair, CFA. Mr. McNair received a BA in Economics from the University of North Carolina at Chapel Hill and a Master’s of Economics from North Carolina State University, and has been managing investors’ money since 1994. Mr. McNair is supported by the BB&T Fixed Income Portfolio Management Team, which includes Brad D. Eppard, CFA; David T. Johnson; and Robert F. Millikan, CFA. The team brings to the Fund six decades of combined investment management experience, along with a broad range of specialized skills encompassing a cross-section of fixed-income sectors.
Investment Concerns
Investments in the BB&T U.S. Treasury Money Market Fund are neither insured nor guaranteed by the Federal Deposit Insurance Corporation or any government agency. Although the Fund seeks to preserve the value of your investments at a $1.00 per share, it is possible to lose money by investing in the Fund.
Q. What factors affected the Fund’s yield during the 12-month period between October 1, 2006 and September 30, 2007?
A. The Federal Funds rate began the period at 5.25%, supporting the yield offered by this Fund and money market securities in general. We anticipated a reduction in that rate during much of the period, as economic growth slowed, inflation appeared to ease and the sub-prime mortgage crisis caused concerns about liquidity. Our expectation for an interest-rate cut led us to extend the Fund’s average maturity, allowing us to lock in higher yields. We particularly emphasized securities with maturities of six months, which paid higher interest than securities with either shorter or longer maturities.1
During summer, fears of a credit and liquidity crisis caused investors to favor the most-liquid and highest-quality securities — the types of securities in which this Fund invests. That trend pushed down yields on Treasury money market issues. We maintained liquidity throughout the period by holding securities with staggered maturities, which provided the Fund with regular infusions of principal as the securities matured. The Federal Reserve Board addressed the market’s liquidity problems in September by cutting the Federal Funds rate to 4.75%. The reduction in that key interest rate caused money market yields to decline. The Fund’s relatively long average maturity, including our emphasis on six-month securities, helped support its yield payments as money market yields declined near the end of the period.1
As of September 30, 2006, the Fund held 65.7% of its assets in repurchase agreements, 18.7% in Treasury bills and 12.1% in Treasury notes. The Fund’s average maturity was 31 days, and its credit quality as rated by Standard & Poor’s was AAA.1
1 | Portfolio composition is as of September 30, 2007 and is subject to change. |
Past performance does not guarantee future results. The performance data quoted represents past performance and current returns may be lower or higher. Total return figures include change in share price, reinvestment of dividends and capital gains, and do not reflect taxes that a shareholder would pay on fund distributions or on the redemption of fund shares. The investment return and principal value will fluctuate so that an investor’s shares, when redeemed, may be worth more or less than the original cost. To obtain performance information current to the most recent month end, please visit www.bbtfunds.com.
A portion of the Fund’s fees has been waived. If the fees had not been waived, the Fund’s total return for the periods would have been lower.
36
BB&T Capital Manager Funds
Portfolio Managers
BB&T Balanced Portfolio Management Team
The BB&T Capital Manager Funds are managed by the BB&T Balanced Portfolio Management Team, which includes Jeffrey J. Schappe, CFA; Will Gholston, CFA; Robert F. Millikan, CFA; and Ronald T. Rimkus, CFA. The team brings to the Fund over eight decades of combined investment management experience, along with a broad range of specialized skills encompassing value stocks, growth stocks and fixed-income securities.
Investment Concerns
Equity securities (stocks) are more volatile and carry more risk than other forms of investments, including investments in high-grade fixed income securities. The net asset value per share of this Fund will fluctuate as the value of the securities in the portfolio changes.
Bonds offer a relatively stable level of income, although bond prices will fluctuate providing the potential for principal gain or loss. Intermediate-term, higher-quality bonds generally offer less risk than longer-term bonds and a lower rate of return.
Capital Manager Conservative Growth Fund
Capital Manager Moderate Growth Fund
Capital Manager Growth Fund
Capital Manager Equity Fund
Q. How did the Funds perform during the 12-month period between October 1, 2006 and September 30, 2007?
A. The Capital Manager Funds and their benchmarks generated the following returns:
The Capital Manager Conservative Growth Fund: 9.16%
The Capital Manager Moderate Growth Fund: 11.80%
The Capital Manager Growth Fund: 13.45%
The Capital Manager Equity Fund: 14.98%
The S&P 500 Index: 16.43%
The Lehman Brothers Intermediate Government Bond Index: 5.43%
Q. What factors affected the Funds’ performance?
A. During the period, the Capital Manager Funds invested in a combination of the BB&T Large Cap Fund, the BB&T Mid Cap Value Fund, the BB&T Mid Cap Growth Fund, the BB&T International Equity Fund, the BB&T Small Cap Fund and the BB&T U.S. Treasury Money Market Fund. The three Capital Manager Funds with fixed-income allocations also held exposure to the BB&T Total Return Bond Fund.1
Stocks significantly outperformed bonds for the period, but both the equity and fixed-income markets generated solid returns. That environment helped all of the Capital Manager Funds post strong absolute performance, with greater returns from the Funds with larger equity allocations. The Funds’ allocations to international equities boosted returns relative to their respective benchmarks. We gradually increased the Funds’ stake in foreign stocks from 15% of equity assets at the beginning of the period to 25% of equity assets as of September 30. Foreign stocks outperformed domestic shares by a wide margin, so the Funds’ substantial international exposure improved relative performance. Overweight positions in mid-cap stocks relative to the S&P 500 Index also lifted returns against the Funds’ composite benchmarks, as medium-sized stocks led the domestic equity market during the period. 1
Meanwhile, the Capital Manager Growth and Moderate Growth Funds benefited from larger-than-neutral positions in stocks. We held the equity allocations of the Growth Fund and the Moderate Growth Fund at 80% and 65% of assets, respectively — both of which represented equity positions five percentage points larger than neutral. That approach helped the Funds’ relative returns benefit from superior stock performance during the period.1
While diversification into international and mid-cap stocks boosted the Funds’ relative performance, allocations to small-cap stocks had the opposite effect: Small caps trailed larger stocks, causing the Funds’ small-cap exposure to weigh on relative returns. Likewise, the Funds’ strategic bias in favor of value stocks, which historically have generated better risk-adjusted returns than growth stocks, crimped performance against the benchmarks.1
1 | Portfolio composition is as of September 30, 2007 and is subject to change. |
37
BB&T Capital Manager Conservative Growth Fund
Value of a $10,000 Investment
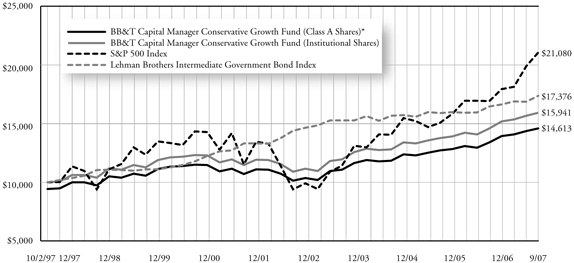
| * | Reflects 5.75% maximum sales charge. |
| ** | Reflects the applicable contingent deferred sales charge (CDSC), maximum of 5.00%. |
| *** | Reflects the applicable maximum CDSC of 1.00% (applicable only to redemptions within one year of purchase, and as such, are not reflected in the Total Return tables since the periods reflected are for a year or longer). |
Average Annual Total Returns
| | | | | | | | | | | | |
As of September 30, 2007 | | Inception
Date | | | 1 Year | | | 5 Years | | | Since
Inception | |
A Shares* | | 1/29/98 | 1 | | 2.58 | % | | 6.29 | % | | 3.81 | % |
B Shares** | | 1/29/99 | 2 | | 4.17 | % | | 6.65 | % | | 3.28 | % |
C Shares*** | | 2/1/01 | 3 | | 8.11 | % | | 6.79 | % | | 2.71 | % |
Institutional Shares | | 10/2/97 | | | 9.16 | % | | 7.88 | % | | 4.78 | % |
S&P 500 Index | | 9/30/97 | | | 16.43 | % | | 15.44 | % | | 6.37 | % |
Lehman Brothers Int. Government Bond Index | | 9/30/97 | | | 5.43 | % | | 3.82 | % | | 5.51 | % |
Past performance does not guarantee future results. The performance data quoted represents past performance and current returns may be lower or higher. Total return figures include change in share price, reinvestment of dividends and capital gains, and do not reflect taxes that a shareholder would pay on fund distributions or on the redemption of fund shares. The investment return and principal value will fluctuate so that an investor’s shares, when redeemed, may be worth more or less than the original cost. To obtain performance information current to the most recent month end, please visit www.bbtfunds.com.
The chart above represents a comparison of a hypothetical $10,000 investment in the indicated share class versus a similar investment in the Fund’s benchmarks, and represents the reinvestment of dividends and capital gains.
1 | Class A Shares were not in existence prior to 1/29/98. Performance for periods prior to that is based on the historical performance of the Institutional Shares, and has been adjusted for the maximum sales charge applicable to the Class A Shares, but does not include the Class A Shares 12b-1 fees, which, if reflected, performance would have been lower. |
2 | Class B Shares were not in existence prior to 1/29/99. Performance for periods prior to that is based on the historical performance of the Class A Shares, and has been adjusted for the maximum CDSC applicable to the Class B Shares, but does not include the Class B Shares 12b-1 fees, which, if reflected, performance would have been lower. |
3 | Class C Shares were not in existence prior to 2/1/01. Performance for periods prior to that is based on the historical performance of the Class A Shares, and has been adjusted for the maximum CDSC applicable to the Class C Shares, but does not include the Class C Shares 12b-1 fees, which if reflected, performance would have been lower. |
The Fund is measured against the S&P 500 Index, which is generally considered to be representative of the performance of the stock market as a whole, and against the Lehman Brothers Intermediate Government Bond Index, which is widely used as a broad measure of the performance of U.S. Government Bonds with maturities of less than 10 years. The indices are unmanaged and do not reflect the deduction of expenses associated with a mutual fund, such as investment management and, fund accounting fees. The Fund’s performance reflects the deduction of fees for these services. Investors cannot invest directly in an index, although they can invest in its underlying securities.
A portion of the Fund’s fees have been waived. If the fees had not been waived, the Fund’s total return for the periods would have been lower.
38
BB&T Capital Manager Moderate Growth Fund
Value of a $10,000 Investment
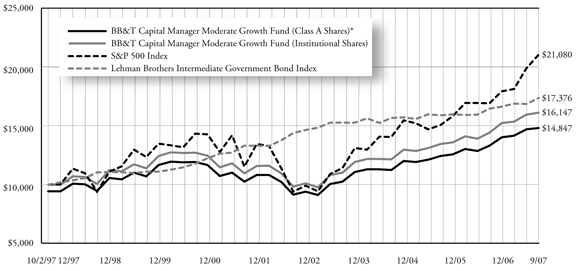
| * | Reflects 5.75% maximum sales charge. |
| ** | Reflects the applicable contingent deferred sales charge (CDSC), maximum of 5.00%. |
| *** | Reflects the applicable maximum CDSC of 1.00% (applicable only to redemptions within one year of purchase, and as such, are not reflected in the Total Return tables since the periods reflected are for a year or longer). |
Average Annual Total Returns
| | | | | | | | | | | | |
As of September 30, 2007 | | Inception
Date | | | 1 Year | | | 5 Years | | | Since
Inception | |
A Shares* | | 1/29/98 | 1 | | 5.10 | % | | 8.84 | % | | 4.11 | % |
B Shares** | | 1/29/99 | 2 | | 6.67 | % | | 9.21 | % | | 3.32 | % |
C Shares*** | | 2/1/01 | 3 | | 10.72 | % | | 9.39 | % | | 2.78 | % |
Institutional Shares | | 10/2/97 | | | 11.80 | % | | 10.45 | % | | 4.91 | % |
S&P 500 Index | | 9/30/97 | | | 16.43 | % | | 15.44 | % | | 6.37 | % |
Lehman Brothers Int. Government Bond Index | | 9/30/97 | | | 5.43 | % | | 3.82 | % | | 5.51 | % |
Past performance does not guarantee future results. The performance data quoted represents past performance and current returns may be lower or higher. Total return figures include change in share price, reinvestment of dividends and capital gains, and do not reflect taxes that a shareholder would pay on fund distributions or on the redemption of fund shares. The investment return and principal value will fluctuate so that an investor’s shares, when redeemed, may be worth more or less than the original cost. To obtain performance information current to the most recent month end, please visit www.bbtfunds.com.
The chart above represents a comparison of a hypothetical $10,000 investment in the indicated share class versus a similar investment in the Fund’s benchmarks, and represents the reinvestment of dividends and capital gains.
1 | Class A Shares were not in existence prior to 1/29/98. Performance for periods prior to that is based on the historical performance of the Institutional Shares, and has been adjusted for the maximum sales charge applicable to the Class A Shares, but does not include the Class A Shares 12b-1 fees, which, if reflected, performance would have been lower. |
2 | Class B Shares were not in existence prior to 1/29/99. Performance for periods prior to that is based on the historical performance of the Class A Shares, and has been adjusted for the maximum CDSC applicable to the Class B Shares, but does not include the Class B Shares 12b-1 fees, which, if reflected, performance would have been lower. |
3 | Class C Shares were not in existence prior to 2/1/01. Performance for periods prior to that is based on the historical performance of the Class A Shares, and has been adjusted for the maximum CDSC applicable to the Class C Shares, but does not include the Class C Shares 12b-1 fees, which if reflected, performance would have been lower. |
The Fund is measured against the S&P 500 Index, which is generally considered to be representative of the performance of the stock market as a whole, and against the Lehman Brothers Intermediate Government Bond Index, which is widely used as a broad measure of the performance of U.S. Government Bonds with maturities of less than 10 years. The indices are unmanaged and do not reflect the deduction of expenses associated with a mutual fund, such as investment management and, fund accounting fees. The Fund’s performance reflects the deduction of fees for these services. Investors cannot invest directly in an index, although they can invest in its underlying securities.
A portion of the Fund’s fees have been waived. If the fees had not been waived, the Fund’s total return for the periods would have been lower.
39
BB&T Capital Manager Growth Fund
Value of a $10,000 Investment
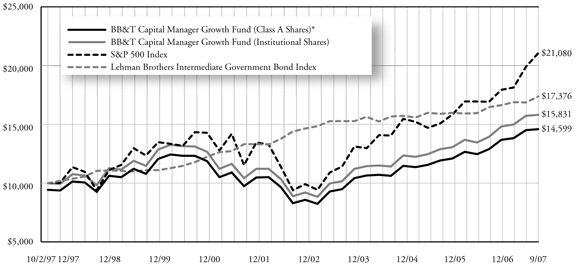
| * | Reflects 5.75% maximum sales charge. |
| ** | Reflects the applicable contingent deferred sales charge (CDSC), maximum of 5.00%. |
| *** | Reflects the applicable maximum CDSC of 1.00% (applicable only to redemptions within one year of purchase, and as such, are not reflected in the Total Return tables since the periods reflected are for a year or longer). |
Average Annual Total Returns
| | | | | | | | | | | | |
As of September 30, 2007 | | Inception
Date | | | 1 Year | | | 5 Years | | | Since
Inception | |
A Shares* | | 1/29/98 | 1 | | 6.72 | % | | 10.61 | % | | 4.00 | % |
B Shares** | | 1/29/99 | 2 | | 8.31 | % | | 10.96 | % | | 3.09 | % |
C Shares*** | | 2/1/01 | 3 | | 12.33 | % | | 11.11 | % | | 2.22 | % |
Institutional Shares | | 10/2/97 | | | 13.45 | % | | 12.21 | % | | 4.70 | % |
S&P 500 Index | | 9/30/97 | | | 16.43 | % | | 15.44 | % | | 6.37 | % |
Lehman Brothers Int. Government Bond Index | | 9/30/97 | | | 5.43 | % | | 3.82 | % | | 5.51 | % |
Past performance does not guarantee future results. The performance data quoted represents past performance and current returns may be lower or higher. Total return figures include change in share price, reinvestment of dividends and capital gains, and do not reflect taxes that a shareholder would pay on fund distributions or on the redemption of fund shares. The investment return and principal value will fluctuate so that an investor’s shares, when redeemed, may be worth more or less than the original cost. To obtain performance information current to the most recent month end, please visit www.bbtfunds.com.
The chart above represents a comparison of a hypothetical $10,000 investment in the indicated share class versus a similar investment in the Fund’s benchmarks, and represents the reinvestment of dividends and capital gains.
1 | Class A Shares were not in existence prior to 1/29/98. Performance for periods prior to that is based on the historical performance of the Institutional Shares, and has been adjusted for the maximum sales charge applicable to the Class A Shares, but does not include the Class A Shares 12b-1 fees, which, if reflected, performance would have been lower. |
2 | Class B Shares were not in existence prior to 1/29/99. Performance for periods prior to that is based on the historical performance of the Class A Shares, and has been adjusted for the maximum CDSC applicable to the Class B Shares, but does not include the Class B Shares 12b-1 fees, which, if reflected, performance would have been lower. |
3 | Class C Shares were not in existence prior to 2/1/01. Performance for periods prior to that is based on the historical performance of the Class A Shares, and has been adjusted for the maximum CDSC applicable to the Class C Shares, but does not include the Class C Shares 12b-1 fees, which if reflected, performance would have been lower. |
The Fund is measured against the S&P 500 Index, which is generally considered to be representative of the performance of the stock market as a whole, and against the Lehman Brothers Intermediate Government Bond Index, which is widely used as a broad measure of the performance of U.S. Government Bonds with maturities of less than 10 years. The indices are unmanaged and do not reflect the deduction of expenses associated with a mutual fund, such as investment management and, fund accounting fees. The Fund’s performance reflects the deduction of fees for these services. Investors cannot invest directly in an index, although they can invest in its underlying securities.
A portion of the Fund’s fees have been waived. If the fees had not been waived, the Fund’s total return for the periods would have been lower.
40
BB&T Capital Manager Equity Fund
Value of a $10,000 Investment
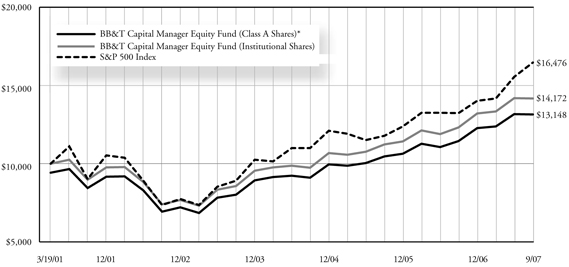
| * | Reflects 5.75% maximum sales charge. |
| ** | Reflects the applicable contingent deferred sales charge (CDSC), maximum of 5.00% |
| *** | Reflects the applicable maximum CDSC of 1.00% (applicable only to redemptions within one year of purchase, and as such, are not reflected in the Total Return tables since the periods reflected are for a year or longer). |
Average Annual Total Returns
| | | | | | | | | | | |
As of September 30, 2007 | | Inception
Date | | 1 Year | | | 5 Years | | | Since
Inception | |
A Shares* | | 3/19/01 | | 8.16 | % | | 12.29 | % | | 4.28 | % |
B Shares** | | 3/19/01 | | 9.88 | % | | 12.65 | % | | 4.44 | % |
C Shares*** | | 3/19/01 | | 14.13 | % | | 12.81 | % | | 4.42 | % |
Institutional Shares | | 3/19/01 | | 14.98 | % | | 13.89 | % | | 5.48 | % |
S&P 500 Index | | 3/31/01 | | 16.43 | % | | 15.44 | % | | 6.14 | % |
Past performance does not guarantee future results. The performance data quoted represents past performance and current returns may be lower or higher. Total return figures include change in share price, reinvestment of dividends and capital gains, and do not reflect taxes that a shareholder would pay on fund distributions or on the redemption of fund shares. The investment return and principal value will fluctuate so that an investor’s shares, when redeemed, may be worth more or less than the original cost. To obtain performance information current to the most recent month end, please visit www.bbtfunds.com.
The chart above represents a comparison of a hypothetical $10,000 investment in the indicated share class versus a similar investment in the Fund’s benchmark, and represents the reinvestment of dividends and capital gains.
The Fund is measured against the S&P 500 Index, an unmanaged index generally considered to be representative of the performance of the stock market as a whole. The index does not reflect the deduction of expenses associated with a mutual fund, such as investment management and fund accounting fees. The Fund’s performance reflects the deduction of fees for these services. Investors cannot invest directly in an index, although they can invest in its underlying securities.
A portion of the Fund’s fees have been waived. If the fees had not been waived, the Fund’s total return for the periods would have been lower.
41
BB&T Funds
Summary of Portfolio Holdings, (Unaudited)
The BB&T Funds invested, as a percentage of net assets, in the following industry sectors, countries, states, funds or security types, as of September 30, 2007.
| | | |
Large Cap Fund | | Percentage
of net assets | |
Consumer Discretionary | | 19.1 | % |
Consumer Staples | | 7.3 | % |
Energy | | 7.6 | % |
Financials | | 18.5 | % |
Health Care | | 19.1 | % |
Industrials | | 5.5 | % |
Information Technology | | 19.5 | % |
Materials | | 1.2 | % |
Investment Company | | 0.5 | % |
| | | |
| | 98.3 | % |
| | | |
| |
Mid Cap Value Fund | | Percentage
of net assets | |
Consumer Discretionary | | 20.7 | % |
Energy | | 1.8 | % |
Financials | | 33.0 | % |
Health Care | | 7.9 | % |
Industrials | | 0.9 | % |
Information Technology | | 27.9 | % |
Materials | | 2.9 | % |
Investment Company | | 5.3 | % |
| | | |
| | 100.4 | % |
| | | |
| |
Mid Cap Growth Fund | | Percentage
of net assets | |
Consumer Discretionary | | 14.3 | % |
Consumer Staples | | 2.5 | % |
Energy | | 10.9 | % |
Financials | | 6.0 | % |
Health Care | | 9.4 | % |
Industrials | | 16.7 | % |
Information Technology | | 27.4 | % |
Materials | | 3.5 | % |
Telecommunication Services | | 3.6 | % |
Utilities | | 1.3 | % |
Exchange Traded Funds | | 2.0 | % |
Investment Company | | 1.2 | % |
| | | |
| | 98.8 | % |
| | | |
| |
Small Cap Fund | | Percentage
of net assets | |
Consumer Discretionary | | 11.6 | % |
Consumer Staples | | 2.3 | % |
Corporate Bonds | | 0.1 | % |
Energy | | 8.6 | % |
Financials | | 14.0 | % |
Health Care | | 6.2 | % |
Industrials | | 24.6 | % |
Information Technology | | 18.8 | % |
Materials | | 0.7 | % |
Utilities | | 2.0 | % |
Exchange Traded Funds | | 3.1 | % |
Investment Company | | 6.6 | % |
| | | |
| | 98.6 | % |
| | | |
| |
International Equity Fund | | Percentage
of net assets | |
Australia | | 4.7 | % |
Austria | | 3.5 | % |
Belgium | | 1.1 | % |
Bermuda | | 0.1 | % |
Brazil | | 0.7 | % |
Canada | | 1.3 | % |
Chile | | 0.1 | % |
China | | 0.8 | % |
Cyprus | | 0.8 | % |
Czech Republic | | 2.2 | % |
Denmark | | 0.7 | % |
Finland | | 3.2 | % |
France | | 8.6 | % |
Germany | | 7.7 | % |
Greece | | 0.9 | % |
Hong Kong | | 4.1 | % |
Hungary | | 3.6 | % |
India | | 3.1 | % |
Indonesia | | 0.0 | % |
Italy | | 2.7 | % |
Japan | | 5.6 | % |
Korea (South) | | 0.5 | % |
Luxembourg | | 0.3 | % |
Mexico | | 0.9 | % |
Netherlands | | 1.8 | % |
New Zealand | | 0.1 | % |
Norway | | 1.2 | % |
Poland | | 3.5 | % |
Portugal | | 0.5 | % |
Romania | | 0.3 | % |
Russia | | 4.9 | % |
Singapore | | 0.5 | % |
South Africa | | 0.2 | % |
Spain | | 0.8 | % |
Sweden | | 2.5 | % |
Switzerland | | 7.4 | % |
Taiwan | | 0.0 | % |
Turkey | | 1.0 | % |
Ukraine | | 0.6 | % |
United Kingdom | | 9.7 | % |
United States | | 6.3 | % |
| | | |
| | 98.5 | % |
| | | |
| |
Special Opportunities Equity Fund | | Percentage
of net assets | |
Consumer Discretionary | | 10.0 | % |
Consumer Staples | | 3.3 | % |
Energy | | 16.0 | % |
Financials | | 6.2 | % |
Health Care | | 16.9 | % |
Industrials | | 8.1 | % |
Information Technology | | 22.4 | % |
Materials | | 5.8 | % |
Investment Company | | 12.4 | % |
| | | |
| | 101.1 | % |
| | | |
42
BB&T Funds
Summary of Portfolio Holdings, (Unaudited)
| | | |
Equity Income Fund | | Percentage
of net assets | |
Consumer Discretionary | | 5.4 | % |
Consumer Staples | | 10.2 | % |
Energy | | 18.0 | % |
Financials | | 25.8 | % |
Health Care | | 10.6 | % |
Industrials | | 7.2 | % |
Information Technology | | 9.5 | % |
Materials | | 2.6 | % |
Telecommunication Services | | 3.2 | % |
Investment Company | | 8.9 | % |
| | | |
| | 101.4 | % |
| | | |
| |
Short U.S. Government Fund | | Percentage
of net assets | |
Federal Home Loan Mortgage Corp. — Collateralized Mortgage Obligations | | 2.7 | % |
Federal National Mortgage Association — Collateralized Mortgage Obligations | | 1.1 | % |
Federal Home Loan Mortgage Corp. — Mortgage-Backed Securities | | 5.8 | % |
Federal National Mortgage Association — Mortgage-Backed Securities | | 18.9 | % |
Federal Farm Credit Bank | | 13.4 | % |
Federal Home Loan Bank | | 14.5 | % |
Federal Home Loan Mortgage Corp. — U.S. Government Agencies | | 13.2 | % |
Federal National Mortgage Association — U.S. Government Agencies | | 14.5 | % |
U.S. Treasury Bills | | 2.2 | % |
U.S. Treasury Notes | | 11.7 | % |
Investment Company | | 1.4 | % |
| | | |
| | 99.4 | % |
| | | |
| |
Intermediate U.S. Government Fund | | Percentage
of net assets | |
Federal Home Loan Mortgage Corp. — Collateralized Mortgage Obligations | | 12.5 | % |
Federal Home Loan Mortgage Corp. — Mortgage-Backed Securities | | 8.5 | % |
Federal National Mortgage Association — Mortgage-Backed Securities | | 49.6 | % |
Federal Home Loan Mortgage Corp. — U.S. Government Agencies | | 9.3 | % |
Private Export Funding Corp. | | 9.8 | % |
U.S. Treasury Notes | | 8.8 | % |
Investment Company | | 1.2 | % |
| | | |
| | 99.7 | % |
| | | |
| |
Total Return Bond Fund | | Percentage
of net assets | |
Asset Backed Securities | | 4.2 | % |
Commercial Mortgage-Backed Securities | | 5.6 | % |
Corporate Bonds | | 19.9 | % |
Federal Home Loan Mortgage Corp. — Collateralized Mortgage Obligations | | 1.4 | % |
Federal National Mortgage Association — Collateralized Mortgage Obligations | | 2.0 | % |
Investment Company | | 1.0 | % |
Federal Home Loan Mortgage Corp. — Mortgage-Backed Securities | | 17.7 | % |
Federal National Mortgage Association — Mortgage-Backed Securities | | 15.8 | % |
Government National Mortgage Association | | 1.5 | % |
Federal Home Loan Bank — Mortgage-Backed Securities | | 3.2 | % |
Federal Home Loan Mortgage Corp. — U.S. Government Agencies | | 3.1 | % |
Federal National Mortgage Association — U.S. Government Agencies | | 4.2 | % |
Municipal Bonds | | 3.8 | % |
U.S. Treasury Notes | | 18.2 | % |
| | | |
| | 101.6 | % |
| | | |
| |
Kentucky Intermediate Tax-Free Fund | | Percentage
of net assets | |
Kentucky Municipal Bonds | | 94.8 | % |
Investment Company | | 3.8 | % |
| | | |
| | 98.6 | % |
| | | |
| |
Maryland Intermediate Tax-Free Fund | | Percentage
of net assets | |
District of Columbia Municipal Bonds | | 8.1 | % |
Maryland Municipal Bonds | | 86.3 | % |
Investment Company | | 2.8 | % |
| | | |
| | 97.2 | % |
| | | |
| |
North Carolina Intermediate Tax-Free Fund | | Percentage
of net assets | |
North Carolina Municipal Bonds | | 97.3 | % |
Investment Company | | 2.2 | % |
| | | |
| | 99.5 | % |
| | | |
| |
South Carolina Intermediate Tax-Free Fund | | Percentage
of net assets | |
South Carolina Municipal Bonds | | 95.3 | % |
Investment Company | | 2.9 | % |
| | | |
| | 98.2 | % |
| | | |
| |
Virginia Intermediate Tax-Free Fund | | Percentage
of net assets | |
District of Columbia Municipal Bonds | | 2.2 | % |
Virginia Municipal Bonds | | 95.4 | % |
Investment Company | | 3.3 | % |
| | | |
| | 100.9 | % |
| | | |
| |
West Virginia Intermediate Tax-Free Fund | | Percentage
of net assets | |
West Virginia Municipal Bonds | | 94.2 | % |
Investment Company | | 5.6 | % |
| | | |
| | 99.8 | % |
| | | |
43
BB&T Funds
Summary of Portfolio Holdings, (Unaudited)
| | | |
National Tax-Free Money Market Fund | | Percentage
of net assets | |
Arizona | | 9.3 | % |
California | | 1.7 | % |
Colorado | | 1.4 | % |
District of Columbia | | 2.2 | % |
Florida | | 7.0 | % |
Georgia | | 5.8 | % |
Illinois | | 3.5 | % |
Kentucky | | 2.1 | % |
Louisiana | | 1.9 | % |
Maine | | 8.0 | % |
Massachusetts | | 3.3 | % |
Minnesota | | 4.4 | % |
Ohio | | 13.8 | % |
Other | | 0.5 | % |
Texas | | 7.7 | % |
Utah | | 10.7 | % |
Virginia | | 4.8 | % |
Washington | | 4.8 | % |
Wisconsin | | 4.7 | % |
Commercial Paper | | 1.9 | % |
Investment Company | | 0.0 | % |
| | | |
| | 99.5 | % |
| | | |
| |
Prime Money Market Fund | | Percentage
of net assets | |
Asset Backed Securities | | 4.3 | % |
Certificates of Deposit | | 7.4 | % |
Commercial Paper | | 37.1 | % |
Corporate Bonds | | 5.2 | % |
Master Note | | 2.0 | % |
Repurchase Agreement | | 3.5 | % |
Variable Rate Notes | | 40.3 | % |
| | | |
| | 99.8 | % |
| | | |
| |
U.S. Treasury Money Market Fund | | Percentage
of net assets | |
Repurchase Agreements | | 65.7 | % |
U.S. Treasury Bills | | 18.7 | % |
U.S. Treasury Notes | | 12.1 | % |
| | | |
| | 96.5 | % |
| | | |
| |
Capital Manager Conservative Growth Fund | | Percentage
of net assets | |
BB&T International Equity Fund | | 9.3 | % |
BB&T Large Cap Fund | | 18.2 | % |
BB&T Mid Cap Growth Fund | | 4.3 | % |
BB&T Mid Cap Value Fund | | 5.9 | % |
BB&T Small Cap Fund | | 3.0 | % |
BB&T Total Return Bond Fund | | 56.1 | % |
BB&T U.S. Treasury Money Market Fund | | 2.8 | % |
| | | |
| | 99.6 | % |
| | | |
| |
Capital Manager Moderate Growth Fund | | Percentage
of net assets | |
BB&T International Equity Fund | | 14.9 | % |
BB&T Large Cap Fund | | 29.2 | % |
BB&T Mid Cap Growth Fund | | 6.9 | % |
BB&T Mid Cap Value Fund | | 9.6 | % |
BB&T Small Cap Fund | | 4.8 | % |
BB&T Total Return Bond Fund | | 31.1 | % |
BB&T U.S. Treasury Money Market Fund | | 3.1 | % |
| | | |
| | 99.6 | % |
| | | |
| |
Capital Manager Growth Fund | | Percentage
of net assets | |
BB&T International Equity Fund | | 18.3 | % |
BB&T Large Cap Fund | | 35.9 | % |
BB&T Mid Cap Growth Fund | | 8.5 | % |
BB&T Mid Cap Value Fund | | 11.7 | % |
BB&T Small Cap Fund | | 5.9 | % |
BB&T Total Return Bond Fund | | 16.5 | % |
BB&T U.S. Treasury Money Market Fund | | 2.9 | % |
| | | |
| | 99.7 | % |
| | | |
| |
Capital Manager Equity Fund | | Percentage
of net assets | |
BB&T International Equity Fund | | 22.2 | % |
BB&T Large Cap Fund | | 43.5 | % |
BB&T Mid Cap Growth Fund | | 10.3 | % |
BB&T Mid Cap Value Fund | | 14.3 | % |
BB&T Small Cap Fund | | 7.2 | % |
BB&T U.S. Treasury Money Market Fund | | 1.8 | % |
| | | |
| | 99.3 | % |
| | | |
44
BB&T Funds
Expense Example (Unaudited)
As a shareholder of the BB&T Funds (each a “Fund” and collectively, the “Funds”), you incur two types of costs: (1) transaction costs, including sales charges (loads) on purchases and (2) ongoing costs, including management fees; distribution fees; and other Fund expenses.
These examples are intended to help you understand your ongoing costs (in dollars) of investing in the Funds’ and to compare these costs with the ongoing costs of investing in other mutual funds. These examples are based on an investment of $1,000 invested at the beginning of the period and held for the entire period from April 1, 2007 through September 30, 2007.
Actual Example
The table below provides information about actual account values and actual expenses. You may use the information below, together with the amount you invested, to estimate the expenses that you paid over the period. Simply divide your account value by $1,000 (for example, an $8,600 account value divided by $1,000 = 8.6), then multiply the result by the number in the table under the heading entitled “Expenses Paid During Period” to estimate the expenses you paid on your account during this period.
| | | | | | | | | | | | |
| | | Beginning
Account Value
4/1/07 | | Ending
Account Value
9/30/07 | | Expenses Paid
During Period*
4/1/07 - 9/30/07 | | Annualized
Expense Ratio
During Period
4/1/07 - 9/30/07 | |
Large Cap Fund | | | | | | | | | | | | |
Class A Shares | | $ | 1,000.00 | | $ | 999.10 | | $ | 5.81 | | 1.16 | % |
Class B Shares | | | 1,000.00 | | | 1,055.80 | | | 9.79 | | 1.90 | % |
Class C Shares | | | 1,000.00 | | | 1,056.60 | | | 9.85 | | 1.91 | % |
Institutional Shares | | | 1,000.00 | | | 1,061.70 | | | 4.70 | | 0.91 | % |
Mid Cap Value Fund | | | | | | | | | | | | |
Class A Shares | | | 1,000.00 | | | 968.90 | | | 5.77 | | 1.17 | % |
Class B Shares | | | 1,000.00 | | | 1,023.90 | | | 9.74 | | 1.92 | % |
Class C Shares | | | 1,000.00 | | | 1,024.70 | | | 9.80 | | 1.93 | % |
Institutional Shares | | | 1,000.00 | | | 1,029.10 | | | 4.73 | | 0.93 | % |
Mid Cap Growth Fund | | | | | | | | | | | | |
Class A Shares | | | 1,000.00 | | | 1,140.70 | | | 6.33 | | 1.18 | % |
Class B Shares | | | 1,000.00 | | | 1,205.80 | | | 10.67 | | 1.93 | % |
Class C Shares | | | 1,000.00 | | | 1,206.50 | | | 10.62 | | 1.92 | % |
Institutional Shares | | | 1,000.00 | | | 1,211.90 | | | 5.10 | | 0.92 | % |
Small Cap Fund | | | | | | | | | | | | |
Class A Shares | | | 1,000.00 | | | 892.30 | | | 6.31 | | 1.33 | % |
Class B Shares | | | 1,000.00 | | | 943.10 | | | 10.13 | | 2.08 | % |
Class C Shares | | | 1,000.00 | | | 943.10 | | | 10.13 | | 2.08 | % |
Institutional Shares | | | 1,000.00 | | | 947.30 | | | 5.27 | | 1.08 | % |
International Equity Fund | | | | | | | | | | | | |
Class A Shares | | | 1,000.00 | | | 1,008.30 | | | 6.90 | | 1.37 | % |
Class B Shares | | | 1,000.00 | | | 1,065.40 | | | 10.92 | | 2.11 | % |
Class C Shares | | | 1,000.00 | | | 1,065.60 | | | 10.98 | | 2.12 | % |
Institutional Shares | | | 1,000.00 | | | 1,070.60 | | | 5.81 | | 1.12 | % |
Special Opportunities Equity Fund | | | | | | | | | | | | |
Class A Shares | | | 1,000.00 | | | 1,013.30 | | | 6.36 | | 1.26 | % |
Class B Shares | | | 1,000.00 | | | 1,071.10 | | | 10.44 | | 2.01 | % |
Class C Shares | | | 1,000.00 | | | 1,071.00 | | | 10.44 | | 2.01 | % |
Institutional Shares | | | 1,000.00 | | | 1,076.20 | | | 5.31 | | 1.02 | % |
Equity Income Fund | | | | | | | | | | | | |
Class A Shares | | | 1,000.00 | | | 1,020.60 | | | 6.03 | | 1.19 | % |
Class B Shares | | | 1,000.00 | | | 1,078.80 | | | 10.11 | | 1.94 | % |
Class C Shares | | | 1,000.00 | | | 1,078.30 | | | 10.11 | | 1.94 | % |
Institutional Shares | | | 1,000.00 | | | 1,084.30 | | | 4.91 | | 0.94 | % |
Short U.S. Government Fund | | | | | | | | | | | | |
Class A Shares | | | 1,000.00 | | | 993.40 | | | 4.59 | | 0.92 | % |
Institutional Shares | | | 1,000.00 | | | 1,026.00 | | | 3.40 | | 0.67 | % |
Intermediate U.S. Government Fund | | | | | | | | | | | | |
Class A Shares | | | 1,000.00 | | | 962.80 | | | 4.58 | | 0.93 | % |
Class B Shares | | | 1,000.00 | | | 1,018.10 | | | 8.50 | | 1.68 | % |
Class C Shares | | | 1,000.00 | | | 1,017.10 | | | 8.50 | | 1.68 | % |
Institutional Shares | | | 1,000.00 | | | 1,022.10 | | | 3.45 | | 0.68 | % |
Total Return Bond Fund | | | | | | | | | | | | |
Class A Shares | | | 1,000.00 | | | 957.60 | | | 4.58 | | 0.93 | % |
Class B Shares | | | 1,000.00 | | | 1,012.10 | | | 8.49 | | 1.68 | % |
Class C Shares | | | 1,000.00 | | | 1,013.10 | | | 8.49 | | 1.68 | % |
Institutional Shares | | | 1,000.00 | | | 1,017.20 | | | 3.45 | | 0.68 | % |
Kentucky Intermediate Tax-Free Fund | | | | | | | | | | | | |
Class A Shares | | | 1,000.00 | | | 981.10 | | | 4.39 | | 0.88 | % |
Institutional Shares | | | 1,000.00 | | | 1,013.50 | | | 3.21 | | 0.64 | % |
45
BB&T Funds
Expense Example (Unaudited)
| | | | | | | | | | | | |
| | | Beginning
Account Value
4/1/07 | | Ending
Account Value
9/30/07 | | Expenses Paid
During Period*
4/1/07 - 9/30/07 | | Annualized
Expense Ratio
During Period
4/1/07 - 9/30/07 | |
Maryland Intermediate Tax-Free Fund | | | | | | | | | | | | |
Class A Shares | | $ | 1,000.00 | | $ | 987.40 | | $ | 4.03 | | 0.81 | % |
Institutional Shares | | | 1,000.00 | | | 1,018.90 | | | 2.82 | | 0.56 | % |
North Carolina Intermediate Tax-Free Fund | | | | | | | | | | | | |
Class A Shares | | | 1,000.00 | | | 984.70 | | | 4.52 | | 0.91 | % |
Institutional Shares | | | 1,000.00 | | | 1,016.40 | | | 3.33 | | 0.66 | % |
South Carolina Intermediate Tax-Free Fund | | | | | | | | | | | | |
Class A Shares | | | 1,000.00 | | | 984.50 | | | 4.66 | | 0.94 | % |
Institutional Shares | | | 1,000.00 | | | 1,016.30 | | | 3.47 | | 0.69 | % |
Virginia Intermediate Tax-Free Fund | | | | | | | | | | | | |
Class A Shares | | | 1,000.00 | | | 984.80 | | | 4.60 | | 0.92 | % |
Institutional Shares | | | 1,000.00 | | | 1,016.50 | | | 3.41 | | 0.67 | % |
West Virginia Intermediate Tax-Free Fund | | | | | | | | | | | | |
Class A Shares | | | 1,000.00 | | | 983.40 | | | 4.58 | | 0.92 | % |
Institutional Shares | | | 1,000.00 | | | 1,015.00 | | | 3.39 | | 0.67 | % |
National Tax-Free Money Market Fund | | | | | | | | | | | | |
Class A Shares | | | 1,000.00 | | | 1,015.60 | | | 3.39 | | 0.67 | % |
Class B Shares | | | 1,000.00 | | | 1,012.40 | | | 6.56 | | 1.30 | % |
Class C Shares | | | 1,000.00 | | | 1,011.50 | | | 7.32 | | 1.45 | % |
Institutional Shares | | | 1,000.00 | | | 1,016.90 | | | 2.12 | | 0.42 | % |
Prime Money Market Fund | | | | | | | | | | | | |
Class A Shares | | | 1,000.00 | | | 1,022.40 | | | 5.02 | | 0.99 | % |
Class B Shares | | | 1,000.00 | | | 1,019.80 | | | 7.55 | | 1.49 | % |
Class C Shares | | | 1,000.00 | | | 1,019.80 | | | 7.49 | | 1.48 | % |
Institutional Shares | | | 1,000.00 | | | 1,024.90 | | | 2.49 | | 0.49 | % |
U.S. Treasury Money Market Fund | | | | | | | | | | | | |
Class A Shares | | | 1,000.00 | | | 1,020.20 | | | 4.96 | | 0.98 | % |
Class B Shares | | | 1,000.00 | | | 1,017.60 | | | 7.46 | | 1.47 | % |
Class C Shares | | | 1,000.00 | | | 1,017.60 | | | 7.48 | | 1.48 | % |
Institutional Shares | | | 1,000.00 | | | 1,022.70 | | | 2.40 | | 0.47 | % |
Capital Manager Conservative Growth Fund | | | | | | | | | | | | |
Class A Shares | | | 1,000.00 | | | 976.10 | | | 1.83 | | 0.37 | % |
Class B Shares | | | 1,000.00 | | | 1,032.90 | | | 5.71 | | 1.12 | % |
Class C Shares | | | 1,000.00 | | | 1,032.50 | | | 5.66 | | 1.11 | % |
Institutional Shares | | | 1,000.00 | | | 1,037.70 | | | 0.61 | | 0.12 | % |
Capital Manager Moderate Growth Fund | | | | | | | | | | | | |
Class A Shares | | | 1,000.00 | | | 987.50 | | | 1.79 | | 0.36 | % |
Class B Shares | | | 1,000.00 | | | 1,043.60 | | | 5.69 | | 1.11 | % |
Class C Shares | | | 1,000.00 | | | 1,043.40 | | | 5.69 | | 1.11 | % |
Institutional Shares | | | 1,000.00 | | | 1,049.50 | | | 0.57 | | 0.11 | % |
Capital Manager Growth Fund | | | | | | | | | | | | |
Class A Shares | | | 1,000.00 | | | 994.90 | | | 1.80 | | 0.36 | % |
Class B Shares | | | 1,000.00 | | | 1,051.10 | | | 5.71 | | 1.11 | % |
Class C Shares | | | 1,000.00 | | | 1,051.20 | | | 5.71 | | 1.11 | % |
Institutional Shares | | | 1,000.00 | | | 1,056.00 | | | 0.57 | | 0.11 | % |
Capital Manager Equity Fund | | | | | | | | | | | | |
Class A Shares | | | 1,000.00 | | | 1,000.10 | | | 1.86 | | 0.37 | % |
Class B Shares | | | 1,000.00 | | | 1,056.90 | | | 5.78 | | 1.12 | % |
Class C Shares | | | 1,000.00 | | | 1,057.00 | | | 5.00 | | 0.97 | % |
Institutional Shares | | | 1,000.00 | | | 1,062.10 | | | 0.57 | | 0.11 | % |
| * | Expenses are equal to the average account value over the period multiplied by the Fund’s annualized expense ratio, multiplied by the number of days in the most recent fiscal half-year divided by the number of days in the fiscal year (to reflect the one-half year period). |
46
BB&T Funds
Expense Example (Unaudited)
Hypothetical Example for Comparison Purposes
The table below provides information about hypothetical account values and hypothetical expenses based on the Funds’ actual expense ratio and an assumed rate of return of 5% per year before expenses, which is not the Fund’s actual return. The hypothetical account values and expenses may not be used to estimate the actual ending account balance or expenses you paid for the period. You may use this information to compare this 5% hypothetical example with the 5% hypothetical examples that appear in the shareholder reports of other funds.
Please note that the expenses shown in the table are meant to highlight your ongoing costs only and do not reflect any transactional costs, such as sales charges (loads), redemption fees, or exchange fees. Therefore, the table is useful in comparing ongoing costs only, and will not help you determine the relative total costs of owning different funds. In addition, if these transactional costs were included, your costs would have been higher.
| | | | | | | | | | | | |
| | | Beginning
Account Value
4/1/07 | | Ending
Account Value
9/30/07 | | Expenses Paid
During Period*
4/1/07 - 9/30/07 | | Annualized
Expense Ratio
During Period
4/1/07 - 9/30/07 | |
Large Cap Fund | | | | | | | | | | | | |
Class A Shares | | $ | 1,000.00 | | $ | 1,019.25 | | $ | 5.87 | | 1.16 | % |
Class B Shares | | | 1,000.00 | | | 1,015.54 | | | 9.60 | | 1.90 | % |
Class C Shares | | | 1,000.00 | | | 1,015.49 | | | 9.65 | | 1.91 | % |
Institutional Shares | | | 1,000.00 | | | 1,020.51 | | | 4.61 | | 0.91 | % |
Mid Cap Value Fund | | | | | | | | | | | | |
Class A Shares | | | 1,000.00 | | | 1,019.20 | | | 5.92 | | 1.17 | % |
Class B Shares | | | 1,000.00 | | | 1,015.44 | | | 9.70 | | 1.92 | % |
Class C Shares | | | 1,000.00 | | | 1,015.39 | | | 9.75 | | 1.93 | % |
Institutional Shares | | | 1,000.00 | | | 1,020.41 | | | 4.71 | | 0.93 | % |
Mid Cap Growth Fund | | | | | | | | | | | | |
Class A Shares | | | 1,000.00 | | | 1,019.15 | | | 5.97 | | 1.18 | % |
Class B Shares | | | 1,000.00 | | | 1,015.39 | | | 9.75 | | 1.93 | % |
Class C Shares | | | 1,000.00 | | | 1,015.44 | | | 9.70 | | 1.92 | % |
Institutional Shares | | | 1,000.00 | | | 1,020.46 | | | 4.66 | | 0.92 | % |
Small Cap Fund | | | | | | | | | | | | |
Class A Shares | | | 1,000.00 | | | 1,018.40 | | | 6.73 | | 1.33 | % |
Class B Shares | | | 1,000.00 | | | 1,014.64 | | | 10.50 | | 2.08 | % |
Class C Shares | | | 1,000.00 | | | 1,014.64 | | | 10.50 | | 2.08 | % |
Institutional Shares | | | 1,000.00 | | | 1,019.65 | | | 5.47 | | 1.08 | % |
International Equity Fund | | | | | | | | | | | | |
Class A Shares | | | 1,000.00 | | | 1,018.20 | | | 6.93 | | 1.37 | % |
Class B Shares | | | 1,000.00 | | | 1,014.49 | | | 10.66 | | 2.11 | % |
Class C Shares | | | 1,000.00 | | | 1,014.44 | | | 10.71 | | 2.12 | % |
Institutional Shares | | | 1,000.00 | | | 1,019.45 | | | 5.67 | | 1.12 | % |
Special Opportunities Equity Fund | | | | | | | | | | | | |
Class A Shares | | | 1,000.00 | | | 1,018.75 | | | 6.38 | | 1.26 | % |
Class B Shares | | | 1,000.00 | | | 1,014.99 | | | 10.15 | | 2.01 | % |
Class C Shares | | | 1,000.00 | | | 1,014.99 | | | 10.15 | | 2.01 | % |
Institutional Shares | | | 1,000.00 | | | 1,019.95 | | | 5.16 | | 1.02 | % |
Equity Income Fund | | | | | | | | | | | | |
Class A Shares | | | 1,000.00 | | | 1,019.10 | | | 6.02 | | 1.19 | % |
Class B Shares | | | 1,000.00 | | | 1,015.34 | | | 9.80 | | 1.94 | % |
Class C Shares | | | 1,000.00 | | | 1,015.34 | | | 9.80 | | 1.94 | % |
Institutional Shares | | | 1,000.00 | | | 1,020.36 | | | 4.76 | | 0.94 | % |
Short U.S. Government Fund | | | | | | | | | | | | |
Class A Shares | | | 1,000.00 | | | 1,020.46 | | | 4.65 | | 0.92 | % |
Institutional Shares | | | 1,000.00 | | | 1,021.71 | | | 3.39 | | 0.67 | % |
Intermediate U.S. Government Fund | | | | | | | | | | | | |
Class A Shares | | | 1,000.00 | | | 1,020.40 | | | 4.71 | | 0.93 | % |
Class B Shares | | | 1,000.00 | | | 1,016.65 | | | 8.49 | | 1.68 | % |
Class C Shares | | | 1,000.00 | | | 1,016.64 | | | 8.50 | | 1.68 | % |
Institutional Shares | | | 1,000.00 | | | 1,021.66 | | | 3.45 | | 0.68 | % |
Total Return Bond Fund | | | | | | | | | | | | |
Class A Shares | | | 1,000.00 | | | 1,020.39 | | | 4.73 | | 0.93 | % |
Class B Shares | | | 1,000.00 | | | 1,016.63 | | | 8.51 | | 1.68 | % |
Class C Shares | | | 1,000.00 | | | 1,016.63 | | | 8.51 | | 1.68 | % |
Institutional Shares | | | 1,000.00 | | | 1,021.65 | | | 3.46 | | 0.68 | % |
Kentucky Intermediate Tax-Free Fund | | | | | | | | | | | | |
Class A Shares | | | 1,000.00 | | | 1,020.64 | | | 4.47 | | 0.88 | % |
Institutional Shares | | | 1,000.00 | | | 1,021.88 | | | 3.23 | | 0.64 | % |
47
BB&T Funds
Expense Example (Unaudited)
| | | | | | | | | | | | |
| | | Beginning
Account Value
4/1/07 | | Ending
Account Value
9/30/07 | | Expenses Paid
During Period*
4/1/07 - 9/30/07 | | Annualized
Expense Ratio
During Period
4/1/07 - 9/30/07 | |
Maryland Intermediate Tax-Free Fund | | | | | | | | | | | | |
Class A Shares | | $ | 1,000.00 | | $ | 1,021.01 | | $ | 4.10 | | 0.81 | % |
Institutional Shares | | | 1,000.00 | | | 1,022.28 | | | 2.82 | | 0.56 | % |
North Carolina Intermediate Tax-Free Fund | | | | | | | | | | | | |
Class A Shares | | | 1,000.00 | | | 1,020.51 | | | 4.60 | | 0.91 | % |
Institutional Shares | | | 1,000.00 | | | 1,021.77 | | | 3.34 | | 0.66 | % |
South Carolina Intermediate Tax-Free Fund | | | | | | | | | | | | |
Class A Shares | | | 1,000.00 | | | 1,020.37 | | | 4.75 | | 0.94 | % |
Institutional Shares | | | 1,000.00 | | | 1,021.62 | | | 3.48 | | 0.69 | % |
Virginia Intermediate Tax-Free Fund | | | | | | | | | | | | |
Class A Shares | | | 1,000.00 | | | 1,020.44 | | | 4.68 | | 0.92 | % |
Institutional Shares | | | 1,000.00 | | | 1,021.69 | | | 3.42 | | 0.67 | % |
West Virginia Intermediate Tax-Free Fund | | | | | | | | | | | | |
Class A Shares | | | 1,000.00 | | | 1,020.45 | | | 4.67 | | 0.92 | % |
Institutional Shares | | | 1,000.00 | | | 1,021.70 | | | 3.40 | | 0.67 | % |
National Tax-Free Money Market Fund | | | | | | | | | | | | |
Class A Shares | | | 1,000.00 | | | 1,021.71 | | | 3.40 | | 0.67 | % |
Class B Shares | | | 1,000.00 | | | 1,018.55 | | | 6.58 | | 1.30 | % |
Class C Shares | | | 1,000.00 | | | 1,017.79 | | | 7.34 | | 1.45 | % |
Institutional Shares | | | 1,000.00 | | | 1,022.96 | | | 2.13 | | 0.42 | % |
Prime Money Market Fund | | | | | | | | | | | | |
Class A Shares | | | 1,000.00 | | | 1,020.11 | | | 5.01 | | 0.99 | % |
Class B Shares | | | 1,000.00 | | | 1,017.60 | | | 7.54 | | 1.49 | % |
Class C Shares | | | 1,000.00 | | | 1,017.65 | | | 7.49 | | 1.48 | % |
Institutional Shares | | | 1,000.00 | | | 1,022.61 | | | 2.48 | | 0.49 | % |
U.S. Treasury Money Market Fund | | | | | | | | | | | | |
Class A Shares | | | 1,000.00 | | | 1,020.16 | | | 4.96 | | 0.98 | % |
Class B Shares | | | 1,000.00 | | | 1,017.68 | | | 7.46 | | 1.47 | % |
Class C Shares | | | 1,000.00 | | | 1,017.65 | | | 7.48 | | 1.48 | % |
Institutional Shares | | | 1,000.00 | | | 1,022.69 | | | 2.40 | | 0.47 | % |
Capital Manager Conservative Growth Fund | | | | | | | | | | | | |
Class A Shares | | | 1,000.00 | | | 1,023.21 | | | 1.88 | | 0.37 | % |
Class B Shares | | | 1,000.00 | | | 1,019.45 | | | 5.67 | | 1.12 | % |
Class C Shares | | | 1,000.00 | | | 1,019.50 | | | 5.62 | | 1.11 | % |
Institutional Shares | | | 1,000.00 | | | 1,024.47 | | | 0.61 | | 0.12 | % |
Capital Manager Moderate Growth Fund | | | | | | | | | | | | |
Class A Shares | | | 1,000.00 | | | 1,023.26 | | | 1.83 | | 0.36 | % |
Class B Shares | | | 1,000.00 | | | 1,019.50 | | | 5.62 | | 1.11 | % |
Class C Shares | | | 1,000.00 | | | 1,019.50 | | | 5.62 | | 1.11 | % |
Institutional Shares | | | 1,000.00 | | | 1,024.52 | | | 0.56 | | 0.11 | % |
Capital Manager Growth Fund | | | | | | | | | | | | |
Class A Shares | | | 1,000.00 | | | 1,023.26 | | | 1.83 | | 0.36 | % |
Class B Shares | | | 1,000.00 | | | 1,019.50 | | | 5.62 | | 1.11 | % |
Class C Shares | | | 1,000.00 | | | 1,019.50 | | | 5.62 | | 1.11 | % |
Institutional Shares | | | 1,000.00 | | | 1,024.52 | | | 0.56 | | 0.11 | % |
Capital Manager Equity Fund | | | | | | | | | | | | |
Class A Shares | | | 1,000.00 | | | 1,023.21 | | | 1.88 | | 0.37 | % |
Class B Shares | | | 1,000.00 | | | 1,019.45 | | | 5.67 | | 1.12 | % |
Class C Shares | | | 1,000.00 | | | 1,020.21 | | | 4.91 | | 0.97 | % |
Institutional Shares | | | 1,000.00 | | | 1,024.52 | | | 0.56 | | 0.11 | % |
| * | Expenses are equal to the average account value over the period multiplied by the Fund’s annualized expense ratio, multiplied by the number of days in the most recent fiscal half-year divided by the number of days in the fiscal year (to reflect the one-half year period). |
48
BB&T Large Cap Fund
Schedule of Portfolio Investments
September 30, 2007
| | | | | |
| Shares | | | | Fair Value |
| COMMON STOCKS (97.8%) | | | |
| | Consumer Discretionary (19.1%) | | | |
| 1,165,016 | | Comcast Corp., Class A(a) | | $ | 28,170,087 |
| 483,265 | | Home Depot, Inc. (The) | | | 15,677,117 |
| 1,088,154 | | KB Home | | | 27,269,139 |
| 306,201 | | Target Corp. | | | 19,465,197 |
| 388,900 | | Tiffany & Co. | | | 20,358,915 |
| 538,754 | | Walt Disney Co. (The) | | | 18,527,750 |
| | | | | |
| | | | | 129,468,205 |
| | | | | |
| | Consumer Staples (7.3%) | | | |
| 661,189 | | Kraft Foods, Inc., Class A | | | 22,817,632 |
| 384,125 | | Procter & Gamble Co. | | | 27,019,353 |
| | | | | |
| | | | | 49,836,985 |
| | | | | |
| | Energy (7.6%) | | | |
| 181,603 | | Anadarko Petroleum Corp. | | | 9,761,161 |
| 219,941 | | ConocoPhillips | | | 19,304,222 |
| 240,287 | | Exxon Mobil Corp. | | | 22,240,965 |
| | | | | |
| | | | | 51,306,348 |
| | | | | |
| | Financials (18.5%) | | | |
| 340,366 | | American International Group, Inc. | | | 23,025,760 |
| 195,435 | | Bank of New York Mellon Corp. (The) | | | 8,626,501 |
| 386,656 | | Citigroup, Inc. | | | 18,045,235 |
| 1,740,507 | | Countrywide Financial Corp. | | | 33,087,038 |
| 420,713 | | JPMorgan Chase & Co. | | | 19,277,070 |
| 879,198 | | Progressive Corp. (The) | | | 17,065,233 |
| 180,426 | | Wells Fargo & Co. | | | 6,426,774 |
| | | | | |
| | | | | 125,553,611 |
| | | | | |
| | Health Care (19.1%) | | | |
| 302,671 | | Amgen, Inc.(a) | | | 17,122,099 |
| 301,157 | | Eli Lilly & Co. | | | 17,144,868 |
| 494,139 | | Johnson & Johnson | | | 32,464,932 |
| 378,676 | | Medtronic, Inc. | | | 21,361,113 |
| 420,881 | | Merck & Co., Inc. | | | 21,755,339 |
| 803,128 | | Pfizer, Inc. | | | 19,620,417 |
| | | | | |
| | | | | 129,468,768 |
| | | | | |
| | Industrials (5.5%) | | | |
| 527,992 | | General Electric Co. | | | 21,858,869 |
| 415,253 | | USG Corp.(a) | | | 15,592,750 |
| | | | | |
| | | | | 37,451,619 |
| | | | | |
| | Information Technology (19.5%) | | | |
| 660,037 | | Cisco Systems, Inc.(a) | | | 21,853,825 |
| 699,841 | | Dell, Inc.(a) | | | 19,315,612 |
| 589,686 | | eBay, Inc.(a) | | | 23,009,548 |
| 912,933 | | Intel Corp. | | | 23,608,447 |
| 201,444 | | Microsoft Corp. | | | 5,934,540 |
| 476,104 | | QUALCOMM, Inc. | | | 20,120,155 |
| 696,142 | | Yahoo!, Inc.(a) | | | 18,684,451 |
| | | | | |
| | | | | 132,526,578 |
| | | | | |
| | Materials (1.2%) | | | |
| 208,843 | | Alcoa, Inc. | | | 8,169,938 |
| | | | | |
| | Total Common Stocks | | | |
| | (Cost $573,138,241) | | | 663,782,052 |
| | | | | |
| INVESTMENT COMPANY (0.5%) | | | |
| 3,466,576 | | Federated Treasury Obligations Fund, Institutional Shares | | | 3,466,576 |
| | | | | |
| | Total Investment Company | | | |
| | (Cost $3,466,576) | | | 3,466,576 |
| | | | | |
| Total Investments — 98.3% | | | |
| (Cost $576,604,817) | | | 667,248,628 |
| Net Other Assets (Liabilities) — 1.7% | | | 11,658,607 |
| | | | | |
| NET ASSETS — 100.0% | | $ | 678,907,235 |
| | | | | |
See footnote legend to Schedules of Portfolio Investments.
See accompanying notes to the financial statements.
49
BB&T Mid Cap Value Fund
Schedule of Portfolio Investments
September 30, 2007
| | | | | | |
| Shares | | | | Fair Value | |
| COMMON STOCKS (95.1%) | | | | |
| | Consumer Discretionary (20.7%) | | | | |
| 127,150 | | Advance Auto Parts, Inc. | | $ | 4,267,154 | |
| 246,050 | | Clear Channel Communications, Inc. | | | 9,212,112 | |
| 89,750 | | Gannett Co., Inc. | | | 3,922,075 | |
| 67,900 | | Guitar Center, Inc.(a) | | | 4,026,470 | |
| 100,650 | | International Speedway Corp., Class A | | | 4,615,809 | |
| 677,000 | | Interpublic Group of Cos., Inc.(a) | | | 7,027,260 | |
| 133,500 | | Kohl’s Corp.(a) | | | 7,653,555 | |
| 157,225 | | Leggett & Platt, Inc. | | | 3,012,431 | |
| 105,450 | | R.H. Donnelley Corp.(a) | | | 5,907,309 | |
| 316,830 | | Select Comfort Corp.(a) | | | 4,419,779 | |
| 74,750 | | Universal Technical Institute, Inc.(a) | | | 1,345,500 | |
| | | | | | |
| | | | | 55,409,454 | |
| | | | | | |
| | Energy (1.8%) | | | | |
| 113,650 | | Forest Oil Corp.(a) | | | 4,891,496 | |
| | | | | | |
| | Financials (33.0%) | | | | |
| 326,700 | | Annaly Capital Management, Inc., REIT | | | 5,204,331 | |
| 177,450 | | Aon Corp. | | | 7,951,535 | |
| 37,500 | | Bear Stearns Cos., Inc. (The) | | | 4,605,375 | |
| 118,400 | | Commerce Bancorp, Inc. | | | 4,591,552 | |
| 182,095 | | Endurance Specialty Holdings, Ltd. | | | 7,566,047 | |
| 200,797 | | Fidelity National Financial, Inc., Class A | | | 3,509,932 | |
| 291,050 | | Hudson City Bancorp, Inc. | | | 4,476,349 | |
| 155,500 | | Marshall & Ilsley Corp. | | | 6,806,235 | |
| 183,000 | | MBIA, Inc. | | | 11,172,150 | |
| 187,100 | | Mercury General Corp. | | | 10,090,303 | |
| 89,260 | | Nuveen Investments, Inc., Class A | | | 5,528,764 | |
| 260,000 | | Popular, Inc. | | | 3,192,800 | |
| 93,650 | | StanCorp Financial Group, Inc. | | | 4,636,612 | |
| 331,350 | | Waddell & Reed Financial, Inc., Class A | | | 8,956,390 | |
| | | | | | |
| | | | | 88,288,375 | |
| | | | | | |
| | Health Care (7.9%) | | | | |
| 139,550 | | Genzyme Corp.(a) | | | 8,646,518 | |
| 225,650 | | King Pharmaceuticals, Inc.(a) | | | 2,644,618 | |
| 141,700 | | Watson Pharmaceuticals, Inc.(a) | | | 4,591,080 | |
| 65,400 | | Zimmer Holdings, Inc.(a) | | | 5,296,746 | |
| | | | | | |
| | | | | 21,178,962 | |
| | | | | | |
| | Industrials (0.9%) | | | | |
| 61,630 | | ChoicePoint, Inc.(a) | | | 2,337,009 | |
| | | | | | |
| | Information Technology (27.9%) | | | | |
| 120,750 | | Affiliated Computer Services, Inc., Class A(a) | | | 6,066,480 | |
| 43,000 | | Alliance Data Systems Corp.(a) | | | 3,329,920 | |
| 210,500 | | Axcelis Technologies, Inc.(a) | | | 1,075,655 | |
| 106,650 | | BMC Software, Inc.(a) | | | 3,330,680 | |
| 464,350 | | CA, Inc. | | | 11,943,082 | |
| 19,275 | | CDW Corp.(a) | | | 1,680,780 | |
| 77,200 | | Ceridian Corp.(a) | | | 2,681,928 | |
| 124,650 | | Computer Sciences Corp.(a) | | | 6,967,935 | |
| 133,100 | | CSG Systems International, Inc.(a) | | | 2,828,375 | |
| 574,600 | | EarthLink, Inc.(a) | | | 4,550,832 | |
| 141,600 | | Fair Isaac Corp. | | | 5,113,176 | |
| 91,955 | | Fidelity National Information Services, Inc. | | | 4,080,043 | |
| 105,100 | | Lexmark International, Inc., Class A(a) | | | 4,364,803 | |
| 220,400 | | MoneyGram International, Inc. | | | 4,978,836 | |
| 145,200 | | Progress Software Corp.(a) | | | 4,399,560 | |
| 265,250 | | Synopsys, Inc.(a) | | | 7,182,970 | |
| | | | | | |
| | | | | 74,575,055 | |
| | | | | | |
| | Materials (2.9%) | | | | |
| 279,975 | | Valspar Corp. | | | 7,618,119 | |
| | | | | | |
| | Total Common Stocks | | | | |
| | (Cost $236,739,303) | | | 254,298,470 | |
| | | | | | |
| INVESTMENT COMPANY (5.3%) | | | | |
| 14,144,622 | | Federated Treasury Obligations Fund, Institutional Shares | | | 14,144,622 | |
| | | | | | |
| | Total Investment Company | | | | |
| | (Cost $14,144,622) | | | 14,144,622 | |
| | | | | | |
| Total Investments — 100.4% | | | | |
| (Cost $250,883,925) | | | 268,443,092 | |
| Net Other Assets (Liabilities) — (0.4)% | | | (957,281 | ) |
| | | | | | |
| NET ASSETS — 100.0% | | $ | 267,485,811 | |
| | | | | | |
50
BB&T Mid Cap Growth Fund
Schedule of Portfolio Investments
September 30, 2007
| | | | | |
| Shares | | | | Fair Value |
| COMMON STOCKS (956%) | | | |
| | Consumer Discretionary (143%) | | | |
| 74,000 | | Crocs, Inc.(a) | | $ | 4,976,500 |
| 81,500 | | Focus Media Holding, Ltd., ADR(a) | | | 4,728,630 |
| 98,000 | | GameStop Corp., Class A(a) | | | 5,522,300 |
| 93,894 | | Guess?, Inc. | | | 4,603,623 |
| 61,540 | | J Crew Group, Inc.(a) | | | 2,553,910 |
| 41,935 | | JC Penney Co, Inc. | | | 2,657,421 |
| 55,550 | | Phillips-Van Heusen Corp. | | | 2,915,264 |
| 39,755 | | Under Armour, Inc., Class A(a) | | | 2,378,144 |
| | | | | |
| | | | | 30,335,792 |
| | | | | |
| | Consumer Staples (25%) | | | |
| 70,720 | | Bare Escentuals, Inc.(a) | | | 1,758,806 |
| 62,085 | | Hansen Natural Corp.(a) | | | 3,518,978 |
| | | | | |
| | | | | 5,277,784 |
| | | | | |
| | Energy (109%) | | | |
| 48,470 | | Cameron International Corp.(a) | | | 4,473,296 |
| 43,350 | | Core Laboratories NV(a) | | | 5,522,356 |
| 39,210 | | Diamond Offshore Drilling, Inc. | | | 4,442,101 |
| 37,580 | | National Oilwell Varco, Inc.(a) | | | 5,430,310 |
| 29,410 | | Transocean, Inc.(a) | | | 3,324,801 |
| | | | | |
| | | | | 23,192,864 |
| | | | | |
| | Financials (60%) | | | |
| 22,000 | | Affiliated Managers Group, Inc.(a) | | | 2,805,220 |
| 30,500 | | AllianceBernstein Holding LP | | | 2,686,135 |
| 6,315 | | CME Group, Inc. | | | 3,709,115 |
| 132,885 | | Invecso PLC, ADR | | | 3,627,761 |
| | | | | |
| | | | | 12,828,231 |
| | | | | |
| | Health Care (94%) | | | |
| 51,330 | | Celgene Corp.(a) | | | 3,660,342 |
| 51,330 | | Cerner Corp.(a) | | | 3,070,047 |
| 79,515 | | Hologic, Inc.(a) | | | 4,850,415 |
| 35,945 | | Medco Health Solutions, Inc.(a) | | | 3,249,069 |
| 87,140 | | Thermo Fisher Scientific, Inc.(a) | | | 5,029,721 |
| | | | | |
| | | | | 19,859,594 |
| | | | | |
| | Industrials (167%) | | | |
| 140,290 | | ABB, Ltd., ADR | | | 3,679,807 |
| 136,150 | | BE Aerospace, Inc.(a) | | | 5,654,309 |
| 112,190 | | Chicago Bridge & Iron Co NV | | | 4,830,901 |
| 119,815 | | Corrections Corp. of America(a) | | | 3,135,559 |
| 81,690 | | Manitowoc Co, Inc. (The) | | | 3,617,233 |
| 65,025 | | Monster Worldwide, Inc.(a) | | | 2,214,751 |
| 22,000 | | Precision Castparts Corp. | | | 3,255,560 |
| 52,285 | | Stericycle, Inc.(a) | | | 2,988,611 |
| 73,000 | | SunPower Corp., Class A(a) | | | 6,045,860 |
| | | | | |
| | | | | 35,422,591 |
| | | | | |
| | Information Technology (274%) | | | |
| 186,255 | | Activision, Inc.(a) | | | 4,021,245 |
| 63,875 | | Akamai Technologies, Inc.(a) | | | 1,835,129 |
| 88,960 | | Amphenol Corp., Class A | | | 3,537,050 |
| 28,320 | | Apple, Inc.(a) | | | 4,348,253 |
| 7,570 | | Baiducom, Inc., ADR(a) | | | 2,192,651 |
| 138,330 | | Ciena Corp.(a) | | | 5,267,606 |
| 34,855 | | Equinix, Inc.(a) | | | 3,091,290 |
| 6,045 | | Google, Inc., Class A(a) | | | 3,429,147 |
| 110,555 | | Juniper Networks, Inc.(a) | | | 4,047,419 |
| 22,330 | | Mastercard, Inc., Class A | | | 3,304,170 |
| 46,600 | | MEMC Electronic Materials, Inc.(a) | | | 2,742,876 |
| 63,720 | | MICROS Systems, Inc.(a) | | | 4,146,260 |
| 171,005 | | Semtech Corp.(a) | | | 3,502,182 |
| 78,425 | | Sina Corp.(a) | | | 3,752,636 |
| 85,560 | | Varian Semiconductor Equipment Associates, Inc.(a) | | | 4,579,171 |
| 99,120 | | VeriFone Holdings, Inc.(a) | | | 4,393,990 |
| | | | | |
| | | | | 58,191,075 |
| | | | | |
| | Materials (35%) | | | |
| 127,440 | | Companhia Vale do Rio Doce, ADR | | | 4,324,039 |
| 92,585 | | Titanium Metals Corp.(a) | | | 3,107,153 |
| | | | | |
| | | | | 7,431,192 |
| | | | | |
| | Telecommunication Services (36%) | | | |
| 73,005 | | American Tower Corp., Class A(a) | | | 3,178,638 |
| 54,460 | | NII Holdings, Inc.(a) | | | 4,473,889 |
| | | | | |
| | | | | 7,652,527 |
| | | | | |
| | Utilities (13%) | | | |
| 54,000 | | Allegheny Energy, Inc.(a) | | | 2,822,040 |
| | | | | |
| | Total Common Stocks (Cost $147,815,450) | | | 203,013,690 |
| | | | | |
| EXCHANGE TRADED FUNDS (20%) | | | |
| 36,000 | | iShares Russell MidCap Growth Index Fund | | | 4,179,600 |
| | | | | |
| | Total Exchange Traded Funds (Cost $3,831,048) | | | 4,179,600 |
| | | | | |
| INVESTMENT COMPANY (12%) | | | |
| 2,604,567 | | Federated Treasury Obligations Fund, Institutional Shares | | | 2,604,567 |
| | | | | |
| | Total Investment Company (Cost $2,604,567) | | | 2,604,567 |
| | | | | |
Total Investments — 988%
(Cost $ 154,251,065) | | | 209,797,857 |
| Net Other Assets (Liabilities) — 12% | | | 2,455,443 |
| | | | | |
| NET ASSETS — 100.0% | | $ | 212,253,300 |
| | | | | |
See footnote legend to Schedules of Portfolio Investments.
See accompanying notes to the financial statements.
51
BB&T Small Cap Fund
Schedule of Portfolio Investments
September 30, 2007
| | | | | |
| Shares | | | | Fair Value |
| COMMON STOCKS (888%) | | | |
| | Consumer Discretionary (116%) | | | |
| 32,487 | | CEC Entertainment, Inc.(a) | | $ | 872,926 |
| 111,000 | | Charlotte Russe Holding, Inc.(a) | | | 1,625,040 |
| 39,547 | | DEB Shops, Inc. | | | 1,063,419 |
| 223,041 | | Hartmarx Corp.(a) | | | 1,092,901 |
| 16,010 | | MDC Holdings, Inc. | | | 655,449 |
| 63,700 | | PF Chang’s China Bistro, Inc.(a) | | | 1,885,520 |
| 29,916 | | Polaris Industries, Inc. | | | 1,304,936 |
| 44,373 | | Stanley Furniture Co., Inc. | | | 721,061 |
| 101,970 | | Steak n Shake Co. (The)(a) | | | 1,530,570 |
| 11,796 | | Zale Corp.(a) | | | 272,959 |
| | | | | |
| | | | | 11,024,781 |
| | | | | |
| | Consumer Staples (23%) | | | |
| 26,600 | | Inter Parfums, Inc. | | | 629,622 |
| 36,600 | | Sanderson Farms, Inc. | | | 1,525,122 |
| | | | | |
| | | | | 2,154,744 |
| | | | | |
| | Energy (86%) | | | |
| 48,636 | | Berry Petroleum Co., Class A | | | 1,925,499 |
| 27,406 | | Forest Oil Corp.(a) | | | 1,179,554 |
| 10,624 | | Oceaneering International, Inc.(a) | | | 805,299 |
| 28,719 | | Oil States International, Inc.(a) | | | 1,387,128 |
| 232,035 | | Pioneer Drilling Co.(a) | | | 2,826,187 |
| | | | | |
| | | | | 8,123,667 |
| | | | | |
| | Financials (140%) | | | |
| 43,160 | | Colonial BancGroup, Inc. (The) | | | 933,119 |
| 68,032 | | Dime Community Bancshares | | | 1,018,439 |
| 73,024 | | First State Bancorp | | | 1,434,191 |
| 16,442 | | Hilb, Rogal & Hobbs Co. | | | 712,432 |
| 46,610 | | Investment Technology Group, Inc.(a) | | | 2,003,298 |
| 27,110 | | Midland Co. (The) | | | 1,489,966 |
| 98,306 | | NewAlliance Bancshares, Inc. | | | 1,443,132 |
| 17,334 | | Peoples Bancorp, Inc. | | | 453,804 |
| 53,680 | | Phoenix Cos, Inc. (The) | | | 757,425 |
| 39,389 | | Stewart Information Services Corp. | | | 1,349,861 |
| 39,595 | | Wintrust Financial Corp. | | | 1,690,310 |
| | | | | |
| | | | | 13,285,977 |
| | | | | |
| | Health Care (62%) | | | |
| 112,200 | | American Medical Systems Holdings, Inc.(a) | | | 1,901,790 |
| 75,000 | | Healthspring, Inc.(a) | | | 1,462,500 |
| 82,200 | | SonoSite, Inc.(a) | | | 2,508,744 |
| | | | | |
| | | | | 5,873,034 |
| | | | | |
| | Industrials (246%) | | | |
| 32,380 | | Curtiss-Wright Corp. | | | 1,538,050 |
| 26,900 | | Esterline Technologies Corp.(a) | | | 1,534,645 |
| 94,863 | | Gibraltar Industries, Inc. | | | 1,754,966 |
| 7,160 | | Granite Construction, Inc. | | | 379,623 |
| 42,028 | | HNI Corp. | | | 1,513,008 |
| 28,955 | | Kaydon Corp. | | | 1,505,370 |
| 126,819 | | LaBarge, Inc.(a) | | | 1,521,828 |
| 104,329 | | Miller Industries, Inc.(a) | | | 1,786,113 |
| 41,830 | | Moog, Inc., Class A(a) | | | 1,838,010 |
| 51,546 | | Mueller Industries, Inc. | | | 1,862,872 |
| 124,324 | | Navigant Consulting, Inc.(a) | | | 1,573,942 |
| 30,340 | | Oshkosh Truck Corp. | | | 1,880,170 |
| 26,000 | | RBC Bearings, Inc.(a) | | | 997,100 |
| 56,644 | | Regal-Beloit Corp. | | | 2,712,681 |
| 28,984 | | Universal Forest Products, Inc. | | | 866,622 |
| | | | | |
| | | | | 23,265,000 |
| | | | | |
| | Information Technology (188%) | | | |
| 96,500 | | Avocent Corp.(a) | | | 2,810,080 |
| 123,743 | | Cognex Corp. | | | 2,197,676 |
| 21,473 | | Comtech Telecommunications Corp.(a) | | | 1,148,591 |
| 151,959 | | Exar Corp.(a) | | | 1,984,584 |
| 104,200 | | Gevity HR, Inc. | | | 1,068,050 |
| 355,063 | | Ixia(a) | | | 3,096,149 |
| 85,800 | | Perot Systems Corp., Class A(a) | | | 1,450,878 |
| 149,053 | | Richardson Electronics, Ltd. | | | 1,021,013 |
| 147,588 | | Rudolph Technologies, Inc.(a) | | | 2,041,142 |
| 24,000 | | Silicon Laboratories, Inc.(a) | | | 1,002 ,240 |
| | | | | |
| | | | | 17,820,403 |
| | | | | |
| | Materials (07%) | | | |
| 43,645 | | Glatfelter 647,692 | | | 647,692 |
| | | | | |
| | Utilities (20%) | | | |
| 13,810 | | AGL Resources, Inc. | | | 547,152 |
| 20,860 | | Empire District Electric Co. (The) | | | 471,228 |
| 10,068 | | Laclede Group, Inc. (The) | | | 324,995 |
| 17,376 | | UIL Holdings Corp. | | | 547,344 |
| | | | | |
| | | | | 1,890,719 |
| | | | | |
| | Total Common Stocks (Cost $78,469,252) | | | 84,086,017 |
| | | | | |
| | |
Principal Amount | | | | |
| CORPORATE BONDS (01%) | | | |
| | Industrials (01%) | | | |
| 125,000 | | Mueller Industries, Inc., 6000%, 11/1/14, Callable 10/26/07 @ $ 103 | | | 115,625 |
| | | | | |
| | Total Corporate Bonds (Cost $ 125,000) | | | 115,625 |
| | | | | |
| | |
| Shares | | | | |
| EXCHANGE TRADED FUNDS (31%) | | | |
| 7,400 | | iShares Russell 2000 Growth Index Fund | | | 634,032 |
| 14,700 | | iShares Russell 2000 Index Fund | | | 1,178,205 |
| 8,100 | | iShares S&P SmallCap 600 Index Fund | | | 564,813 |
| 4,100 | | iShares S&P SmallCap 600/BARRA Growth Index Fund | | | 586,997 |
| | | | | |
| | Total Exchange Traded Funds (Cost $2,367,465) | | | 2,964,047 |
| | | | | |
| INVESTMENT COMPANY (66%) | | | |
| 6,188,360 | | Federated Treasury Obligations Fund, Institutional Shares | | | 6,188,360 |
| | | | | |
| | Total Investment Company (Cost $6,188,360) | | | 6,188,360 |
| | | | | |
Total Investments — 986%
(Cost $ 87,150,077) | | | 93,354,049 |
| Net Other Assets (Liabilities) — 14% | | | 1,292,903 |
| | | | | |
| NET ASSETS — 100.0% | | $ | 94,646,952 |
| | | | | |
See footnote legend to Schedules of Portfolio Investments
See accompanying notes to the financial statements
52
BB&T International Equity Fund
Schedule of Portfolio Investments
September 30, 2007
| | | | | |
| Shares | | | | Fair Value |
| COMMON STOCKS (887%) | | | |
| | Australia (47%) | | | |
| 74,229 | | BHP Billiton, Ltd. | | $ | 2,934,383 |
| 2,826 | | BHP Billiton, Ltd., ADR | | | 222,123 |
| 20,582 | | Brambles, Ltd. | | | 269,569 |
| 23,902 | | Fairfax Media, Ltd. | | | 100,109 |
| 394,748 | | Macquarie Airports | | | 1,523,718 |
| 38,420 | | Newcrest Mining, Ltd. | | | 954,577 |
| 30,773 | | News Corp., Class B | | | 729,082 |
| 6,049 | | Publishing & Broadcasting, Ltd. | | | 105,741 |
| 12,645 | | Rio Tinto, Ltd. | | | 1,214,288 |
| | | | | |
| | | | | 8,053,590 |
| | | | | |
| | Austria (35%) | | | |
| 10,368 | | Erste Bank der Oesterreichischen Sparkassen AG | | | 790,215 |
| 42,390 | | Immoeast AG(a) | | | 461,805 |
| 29,419 | | OMV AG | | | 1,964,511 |
| 10,580 | | Raiffeisen International Bank Holding AG | | | 1,546,365 |
| 17,888 | | Telekom Austria AG | | | 468,059 |
| 2,430 | | Verbund - Oesterreichische Elektrizita-etswirtschafts AG, Class A | | | 140,057 |
| 5,000 | | Wiener Staedtische Versicherung AG | | | 349,356 |
| 6,181 | | Wienerberger AG | | | 386,571 |
| | | | | |
| | | | | 6,106,939 |
| | | | | |
| | Belgium (11%) | | | |
| 599 | | Fortis | | | 17,638 |
| 1,006 | | Groupe Bruxelles Lambert SA | | | 122,019 |
| 6,554 | | KBC Ancora | | | 734,006 |
| 7,297 | | KBC Groep NV | | | 1,003,885 |
| | | | | |
| | | | | 1,877,548 |
| | | | | |
| | Bermuda (01%) | | | |
| 1,622 | | Central European Media Enterprises Ltd., Class A(a) | | | 148,754 |
| | | | | |
| | Brazil (07%) | | | |
| 38,164 | | Cia Vale do Rio Doce, ADR | | | 1,085,766 |
| 5,005 | | Uniao de Bancos Brasileiros SA | | | 68,863 |
| | | | | |
| | | | | 1,154,629 |
| | | | | |
| | Canada (13%) | | | |
| 6,840 | | Cameco Corp. | | | 315,507 |
| 65,159 | | Ivanhoe Mines, Ltd.(a) | | | 846,382 |
| 9,275 | | Potash Corp of Saskatchewan | | | 979,580 |
| 8,485 | | Talisman Energy, Inc. | | | 166,603 |
| | | | | |
| | | | | 2,308,072 |
| | | | | |
| | Chile (01%) | | | |
| 898 | | Sociedad Quimica y Minera de Chile SA, ADR | | | 155,740 |
| | | | | |
| | China (08%) | | | |
| 635,169 | | Beijing Capital International Airport Co., Ltd., Class H | | | 1,322,001 |
| 35,000 | | Weiqiao Textile Co., Ltd., Class H | | | 65,733 |
| | | | | |
| | | | | 1,387,734 |
| | | | | |
| | Cyprus (08%) | | | |
| 74,832 | | Bank of Cyprus Public Co., Ltd. | | | 1,321,023 |
| | | | | |
| | Czech Republic (22%) | | | |
| 16,015 | | Komercni Banka AS | | | 3,727,127 |
| | | | | |
| | Denmark (07%) | | | |
| 692 | | Carlsberg AS, Class B | | | 94,510 |
| 1,117 | | FLSmidth & Co. AS | | | 118,796 |
| 5,729 | | Novo Nordisk AS, Class B | | | 691,482 |
| 442 | | Rockwool International AS, Class B | | | 143,729 |
| 1,681 | | Vestas Wind Systems AS(a) | | | 132,797 |
| | | | | |
| | | | | 1,181,314 |
| | | | | |
| | Finland (32%) | | | |
| 2,601 | | Elisa OYJ | | | 80,854 |
| 24,640 | | Fortum OYJ | | | 904,381 |
| 7,552 | | Kemira OYJ | | | 176,392 |
| 1,535 | | Kesko OYJ, Class B | | | 101,977 |
| 1,170 | | Metso OYJ | | | 80,582 |
| 50,530 | | Nokia OYJ | | | 1,920,931 |
| 1,537 | | Nokian Renkaat OYJ | | | 60,183 |
| 4,455 | | OKO Bank PLC, Class A | | | 92,112 |
| 6,245 | | Orion OYJ, Class B | | | 158,688 |
| 3,597 | | Outotec OYJ | | | 253,891 |
| 22,288 | | Ramirent OYJ | | | 482,760 |
| 9,482 | | Sanoma-WSOY OYJ | | | 294,889 |
| 2,930 | | Stockmann OYJ Abp, Class B | | | 141,342 |
| 2,372 | | Uponor OYJ | | | 73,634 |
| 21,917 | | YIT OYJ | | | 651,300 |
| | | | | |
| | | | | 5,473,916 |
| | | | | |
| | France (86%) | | | |
| 988 | | Accor SA | | | 87,714 |
| 7,856 | | Aeroports de Paris | | | 905,139 |
| 5,994 | | Air Liquide | | | 802,231 |
| 1,528 | | Alstom | | | 310,637 |
| 8,570 | | Bouygues | | | 739,208 |
| 46 | | Carrefour SA | | | 3,223 |
| 3,843 | | Cie de Saint-Gobain | | | 401,074 |
| 524 | | EDF Energies Nouvelles SA | | | 41,649 |
| 10,113 | | Electricite de France | | | 1,069,285 |
| 1,542 | | Eurazeo | | | 227,246 |
| 24,938 | | France Telecom SA | | | 835,309 |
| 771 | | Hermes International | | | 86,765 |
| 4,701 | | JC Decaux SA | | | 165,104 |
| 8,260 | | Lafarge SA | | | 1,279,712 |
| 1,384 | | Lagardere SCA | | | 117,799 |
| 15,296 | | LVMH Moet Hennessy Louis Vuitton SA | | | 1,833,670 |
| 2,213 | | Neuf Cegetel | | | 96,846 |
| 917 | | Nexity | | | 56,527 |
| 2,805 | | Pernod-Ricard SA | | | 612,085 |
| 3,960 | | PPR | | | 745,030 |
| 1,078 | | Remy Cointreau SA | | | 78,088 |
| 1,641 | | Renault SA | | | 237,788 |
| 1,405 | | Sanofi-Aventis | | | 118,965 |
| 1,031 | | Sodexho Alliance SA | | | 71,302 |
| 15,989 | | Suez SA | | | 941,616 |
| 923 | | Technip SA | | | 82,522 |
| 22,190 | | Total SA | | | 1,804,209 |
| 3,532 | | Veolia Environnement | | | 304,150 |
| 5,094 | | Vinci SA | | | 397,981 |
| 4,413 | | Vivendi | | | 186,264 |
| 457 | | Wendel | | | 77,743 |
| | | | | |
| | | | | 14,716,881 |
| | | | | |
| | Germany (77%) | | | |
| 806 | | Adidas AG | | | 52,868 |
Continued
53
BB&T International Equity Fund
Schedule of Portfolio Investments — (continued)
September 30, 2007
| | | | | |
| Shares | | | | Fair Value |
| COMMON STOCKS — (continued) | | | |
| | Germany — (continued) | | | |
| 5,794 | | Arcandor AG(a) | | $ | 193,990 |
| 1,309 | | BASF AG | | | 181,056 |
| 3,058 | | Bayer AG | | | 243,405 |
| 2,482 | | Bilfinger Berger AG | | | 193,983 |
| 29,536 | | Commerzbank AG | | | 1,195,692 |
| 797 | | Continental AG | | | 110,216 |
| 11,362 | | DaimlerChrysler AG | | | 1,144,479 |
| 2,559 | | Deutsche Boerse AG | | | 348,479 |
| 29,644 | | Deutsche Post AG | | | 862,322 |
| 5,826 | | Deutsche Postbank AG | | | 427,756 |
| 7,791 | | E.ON AG | | | 1,440,461 |
| 20,768 | | Fraport AG Frankfurt Airport Services Worldwide | | | 1,435,983 |
| 13,652 | | Fresenius Medical Care AG & Co. KGaA | | | 725,534 |
| 9,213 | | Fresenius SE | | | 695,222 |
| 5,741 | | Henkel KGaA | | | 271,868 |
| 2,834 | | Henkel KGaA - VORZUG | | | 145,844 |
| 5,886 | | Hypo Real Estate Holding AG | | | 334,717 |
| 5,418 | | IKB Deutsche Industriebank AG(a) | | | 108,083 |
| 2,354 | | IVG Immobilien AG | | | 87,743 |
| 1,220 | | Merck KGaA | | | 147,175 |
| 4,218 | | Praktiker Bau-und Heimwerkermaerkte Holding AG, Class A | | | 157,884 |
| 7,851 | | ProSiebenSat.1 Media AG, Preference Shares | | | 246,740 |
| 106 | | Puma AG Rudolf Dassler Sport | | | 45,551 |
| 1,580 | | Rheinmetall AG | | | 125,514 |
| 14,330 | | Rhoen Klinikum AG | | | 458,738 |
| 2,838 | | RWE AG | | | 356,930 |
| 9,684 | | Siemens AG | | | 1,331,448 |
| 2,288 | | Tognum AG(a) | | | 71,776 |
| | | | | 13,141,457 |
| | Greece (0.9%) | | | |
| 93,027 | | Alapis Holding Industrial & Commercial SA(a) | | | 291,833 |
| 17,461 | | Hellenic Telecommunications Organization SA | | | 647,358 |
| 63,744 | | Marfin Investment Group SA | | | 608,999 |
| | | | | |
| | | | | 1,548,190 |
| | | | | |
| | Hong Kong (2.3%) | | | |
| 189,168 | | China Merchants Holdings International Co., Ltd. | | | 1,176,544 |
| 22,061 | | China Mobile, Ltd. | | | 361,258 |
| 478,000 | | Galaxy Entertainment Group, Ltd.(a) | | | 529,413 |
| 311,157 | | GOME Electrical Appliances Holdings, Ltd. | | | 610,798 |
| 34,000 | | Hutchison Telecommunications International, Ltd. | | | 47,235 |
| 11,640 | | Melco PBL Entertainment Macau, Ltd., ADR(a) | | | 192,060 |
| 610,029 | | Shun Tak Holdings, Ltd. | | | 982,469 |
| | | | | |
| | | | | 3,899,777 |
| | | | | |
| | Hungary (3.6%) | | | |
| 161,177 | | Magyar Telekom Telecommunications PLC | | | 897,417 |
| 732 | | MOL Hungarian Oil and Gas Nyrt | | | 118,528 |
| 89,138 | | OTP Bank Nyrt | | | 4,839,034 |
| 1,142 | | Richter Gedeon Nyrt | | | 243,993 |
| | | | | |
| | | | | 6,098,972 |
| | | | | |
| | India (2.2%) | | | |
| 34,600 | | State Bank of India, Ltd., GDR | | | 3,875,200 |
| | | | | |
| | Indonesia (0.0%) | | | |
| 172,430 | | Semen Gresik Persero Tbk PT | | | 99,932 |
| | | | | |
| | Italy (2.7%) | | | |
| 60,802 | | Banca CR Firenze | | | 572,222 |
| 22,752 | | Banca Popolare di Milano Scarl | | | 336,110 |
| 3,199 | | Banca Popolare di Sondrio Scarl | | | 54,739 |
| 11,576 | | Banco Popolare Scarl(a) | | | 259,321 |
| 10,058 | | Bulgari SpA | | | 158,337 |
| 15,731 | | Buzzi Unicem SpA | | | 409,151 |
| 24,838 | | Capitalia SpA . | | | 237,298 |
| 12,875 | | Credito Emiliano SpA | | | 176,614 |
| 9,211 | | ENI SpA | | | 341,362 |
| 5,161 | | Finmeccanica SpA | | | 150,350 |
| 11,052 | | Geox SpA | | | 237,496 |
| 60,672 | | Intesa Sanpaolo SpA | | | 444,254 |
| 3,201 | | Luxottica Group SpA | | | 108,953 |
| 43,495 | | Telecom Italia SpA | | | 132,261 |
| 84,948 | | UniCredito Italiano SpA | | | 726,786 |
| 7,627 | | Unione di Banche Italiane SCPA | | | 205,006 |
| | | | | |
| | | | | 4,550,260 |
| | | | | |
| | Japan (5.6%) | | | |
| 1,690 | | Acom Co., Ltd. | | | 37,665 |
| 1,874 | | Aiful Corp | | | 29,367 |
| 1,800 | | Aisin Seiki Co., Ltd. | | | 71,928 |
| 4,000 | | Bank of Kyoto, Ltd. (The) | | | 48,509 |
| 19,922 | | Bank of Yokohama, Ltd. (The) | | | 137,537 |
| 8,523 | | Canon, Inc. | | | 465,235 |
| 8,000 | | Chiba Bank, Ltd. (The) | | | 61,846 |
| 1,600 | | Credit Saison Co., Ltd. | | | 41,231 |
| 7,000 | | Daihatsu Motor Co., Ltd. | | | 72,703 |
| 3,800 | | Daikin Industries, Ltd. | | | 182,945 |
| 4,000 | | Daiwa Securities Group, Inc. | | | 38,097 |
| 5,600 | | Denso Corp. | | | 211,100 |
| 37 | | Dentsu, Inc. | | | 105,010 |
| 25 | | East Japan Railway Co. | | | 197,188 |
| 1,700 | | Eisai Co., Ltd. | | | 80,364 |
| 1,625 | | Fanuc, Ltd. | | | 165,662 |
| 26 | | Fuji Television Network, Inc. | | | 52,287 |
| 8,000 | | Gunma Bank, Ltd. (The) | | | 53,350 |
| 6,606 | | Honda Motor Co., Ltd. | | | 221,992 |
| 4,820 | | Hoya Corp. | | | 164,492 |
| 2,100 | | Ibiden Co., Ltd. | | | 176,790 |
| 8,000 | | Itochu Corp. | | | 97,157 |
| 58 | | Japan Tobacco, Inc. | | | 318,617 |
| 1,180 | | JFE Holdings, Inc. | | | 83,622 |
| 2,700 | | JS Group Corp. | | | 46,965 |
| 1,800 | | JSR Corp. | | | 44,113 |
| 15 | | KDDI Corp. | | | 111,261 |
| 4,200 | | Komatsu, Ltd. | | | 141,140 |
| 4,202 | | Kubota Corp. | | | 34,607 |
| 1,300 | | Kyocera Corp. | | | 121,891 |
| 2,500 | | Makita Corp. | | | 109,694 |
| 19,000 | | Matsushita Electric Industrial Co., Ltd. | | | 356,462 |
| 2,600 | | Mitsubishi Corp. | | | 82,392 |
| 7,000 | | Mitsubishi Electric Corp. | | | 87,755 |
| 35 | | Mitsubishi UFJ Financial Group, Inc. | | | 307,753 |
| 5,000 | | Mitsubishi UFJ Securities Co. | | | 43,790 |
| 3,000 | | Mitsui & Co., Ltd. | | | 72,868 |
| 2,223 | | Mitsui Fudosan Co., Ltd. | | | 61,736 |
| 37 | | Mizuho Financial Group, Inc. | | | 210,987 |
Continued
54
BB&T International Equity Fund
Schedule of Portfolio Investments — (continued)
September 30, 2007
| | | | | |
| Shares | | | | Fair Value |
| COMMON STOCKS — (continued) | | | |
| | Japan — (continued) | | | |
| 6,000 | | Nikon Corp. | | $ | 206,329 |
| 519 | | Nintendo Co., Ltd. | | | 270,197 |
| 10,111 | | Nippon Electric Glass Co., Ltd. | | | 162,846 |
| 32 | | Nippon Telegraph & Telephone Corp. | | | 149,602 |
| 3,200 | | Nissan Motor Co., Ltd. | | | 32,065 |
| 3,749 | | Nitto Denko Corp. | | | 174,289 |
| 3,213 | | Nomura Holdings, Inc. | | | 53,874 |
| 8,000 | | NSK, Ltd. | | | 70,204 |
| 73 | | NTT DoCoMo, Inc. | | | 104,227 |
| 1,800 | | Promise Co., Ltd. | | | 43,878 |
| 7,000 | | Ricoh Co., Ltd. | | | 148,087 |
| 4 | | Sapporo Hokuyo Holdings, Inc. | | | 39,699 |
| 2,400 | | Seven & I Holdings Co., Ltd. | | | 61,742 |
| 2,000 | | Sharp Corp. | | | 36,303 |
| 5,000 | | Shizuoka Bank, Ltd. (The) | | | 48,579 |
| 5,766 | | Sony Corp. | | | 279,603 |
| 5,700 | | Stanley Electric Co., Ltd. | | | 137,457 |
| 13,000 | | Sumitomo Chemical Co., Ltd. | | | 111,479 |
| 5,000 | | Sumitomo Corp. | | | 96,635 |
| 4,500 | | Sumitomo Electric Industries, Ltd. | | | 71,693 |
| 9,998 | | Sumitomo Heavy Industries, Ltd. | | | 128,734 |
| 19,000 | | Sumitomo Metal Industries, Ltd. | | | 110,826 |
| 29 | | Sumitomo Mitsui Financial Group, Inc. | | | 225,961 |
| 6,248 | | Sumitomo Trust & Banking Co., Ltd. (The) | | | 47,269 |
| 3,000 | | Suruga Bank, Ltd. | | | 36,643 |
| 8,000 | | Suzuki Motor Corp. | | | 236,800 |
| 1,500 | | Takata Corp. | | | 58,503 |
| 2,500 | | Takeda Pharmaceutical Co., Ltd. | | | 175,859 |
| 1,794 | | Takefuji Corp. | | | 35,610 |
| 8,000 | | Toray Industries, Inc. | | | 63,518 |
| 10,210 | | Toyota Motor Corp. | | | 602,653 |
| 4,409 | | Yamada Denki Co., Ltd. | | | 436,428 |
| 2,300 | | Yamaha Motor Co., Ltd. | | | 58,669 |
| 1,000 | | Yamato Holdings Co., Ltd. | | | 15,000 |
| 4,600 | | Yokogawa Electric Corp. | | | 55,986 |
| | | | | |
| | | | | 9,535,355 |
| | | | | |
| | Korea (South) (0.5%) | | | |
| 1,425 | | Hyundai Motor Co. | | | 115,065 |
| 364 | | NHN Corp.(a) | | | 84,239 |
| 1,106 | | Samsung Electronics Co., Ltd. | | | 694,875 |
| | | | | |
| | | | | 894,179 |
| | | | | |
| | Luxembourg (0.3%) | | | |
| 5,834 | | Millicom International Cellular SA(a) | | | 489,473 |
| | | | | |
| | Mexico (0.9%) | | | |
| 1,702 | | America Movil SAB de CV, ADR, Series L | | | 108,928 |
| 40,877 | | America Movil SAB de CV, Series L | | | 130,808 |
| 23,768 | | Controladora Comercial Mexicana SAB de CV | | | 63,041 |
| 67,192 | | Corporacion Moctezuma, SAB de CV | | | 199,535 |
| 1,241 | | Desarrolladora Homex SAB de CV, ADR(a) | | | 68,876 |
| 5,885 | | Fomento Economico Mexicano SAB de CV, ADR | | | 220,099 |
| 106,376 | | Grupo Financiero Banorte SAB de CV, Class O | | | 421,131 |
| 2,936 | | Grupo Televisa SA, ADR | | | 70,963 |
| 62,062 | | Urbi Desarrollos Urbanos SA de CV(a) | | | 223,000 |
| | | | | |
| | | | | 1,506,381 |
| | | | | |
| | Netherlands (1.8%) | | | |
| 2,921 | | Heineken NV | | | 191,682 |
| 7,310 | | ING Groep NV | | | 324,488 |
| 10,292 | | Koninklijke Ahold NV(a) | | | 155,563 |
| 5,074 | | Koninklijke Philips Electronics NV | | | 228,995 |
| 2,104 | | Koninklijke Vopak NV | | | 120,007 |
| 24,181 | | Royal KPN NV | | | 419,631 |
| 18,509 | | TNT NV | | | 775,948 |
| 31,688 | | Unilever NV CVA | | | 978,262 |
| | | | | |
| | | | | 3,194,576 |
| | | | | |
| | New Zealand (0.1%) | | | |
| 115,327 | | Auckland International Airport, Ltd. | | | 273,546 |
| | | | | |
| | Norway (1.2%) | | | |
| 3,666 | | Aker Kvaerner ASA | | | 116,788 |
| 5,139 | | DnB NOR ASA | | | 78,831 |
| 147,578 | | Marine Harvest(a) | | | 187,783 |
| 25,974 | | Norsk Hydro ASA | | | 1,129,776 |
| 4,833 | | Orkla ASA | | | 86,328 |
| 18,693 | | Telenor ASA(a) | | | 374,467 |
| 5,706 | | Yara International ASA | | | 180,454 |
| | | | | |
| | | | | 2,154,427 |
| | | | | |
| | Poland (3.5%) | | | |
| 1,659 | | Bank BPH SA | | | 571,257 |
| 14,818 | | Bank Handlowy w Warszawie SA | | | 635,838 |
| 7,629 | | Bank Millennium SA | | | 34,064 |
| 12,580 | | Bank Pekao SA | | | 1,168,627 |
| 8,527 | | Bank Zachodni WBK SA | | | 816,321 |
| 1,182 | | BRE Bank SA(a) | | | 228,551 |
| 400 | | ING Bank Slaski SA | | | 137,735 |
| 181,999 | | Polskie Gornictwo Naftowe I Gazownictwo SA | | | 346,403 |
| 66,078 | | Powszechna Kasa Oszczednosci Bank Polski SA | | | 1,380,193 |
| 91,957 | | Telekomunikacja Polska SA | | | 728,975 |
| | | | | |
| | | | | 6,047,964 |
| | | | | |
| | Portugal (0.5%) | | | |
| 13,305 | | Energias de Portugal SA | | | 77,786 |
| 123,103 | | Jeronimo Martins SGPS SA | | | 756,568 |
| | | | | |
| | | | | 834,354 |
| | | | | |
| | Russia (4.9%) | | | |
| 8,170 | | CTC Media, Inc.(a) | | | 179,413 |
| 4 | | Evrocement Group OJSC(a) | | | 74,000 |
| 31,017 | | Gazprom OAO, ADR | | | 1,360,095 |
| 2,759 | | LUKOIL, ADR | | | 229,825 |
| 3,630 | | MMC Norilsk Nickel, ADR | | | 929,280 |
| 61,917 | | NovaTek OAO | | | 310,514 |
| 330 | | Open Investments(a) (g) | | | 97,680 |
| 18,471 | | Pharmstandard, GDR(a) (d) | | | 356,490 |
| 6,293 | | Polyus Gold Co., ADR | | | 273,746 |
| 97,658 | | Rosneft Oil Co. OAO, GDR(a) | | | 830,093 |
| 299,125 | | Sberbank | | | 1,247,351 |
| 231 | | Silvinit, Pfd.(g) | | | 69,531 |
| 10,784 | | Sistema-Hals, GDR(a) (d) | | | 104,605 |
| 32,193 | | TNK-BP Holding(a) | | | 65,996 |
| 8,115 | | Unified Energy System, GDR(a) | | | 985,972 |
| 17,688 | | Uralkali | | | 61,024 |
| 92,723 | | URSA Bank, Preference Shares(g) | | | 179,419 |
| 8,430 | | Vimpel-Communications, ADR | | | 227,947 |
| 33,947 | | VTB Bank OJSC, GDR(a) (d) | | | 312,312 |
Continued
55
BB&T International Equity Fund
Schedule of Portfolio Investments — (continued)
September 30, 2007
| | | | | |
| Shares | | | | Fair Value |
| COMMON STOCKS — (continued) | | | |
| | Russia — (continued) | | | |
| 2,507 | | Wimm-Bill-Dann Foods OJSC | | $ | 201,814 |
| 2,408 | | Wimm-Bill-Dann Foods OJSC, ADR | | | 263,291 |
| 3,742 | | X5 Retail Group NV, GDR(a) | | | 127,415 |
| | | | | |
| | | | | 8,487,813 |
| | | | | |
| | South Africa (0.2%) | | | |
| 4,168 | | Impala Platinum Holdings, Ltd. | | | 145,199 |
| 5,709 | | MTN Group, Ltd. | | | 85,196 |
| 2,496 | | Standard Bank Group, Ltd. | | | 35,886 |
| | | | | |
| | | | | 266,281 |
| | | | | |
| | Spain (0.8%) | | | |
| 3,107 | | Gamesa Corp. Tecnologica SA | | | 126,931 |
| 5,479 | | Inditex SA | | | 369,230 |
| 46,330 | | Mapfre SA | | | 209,423 |
| 23,407 | | Telefonica SA | | | 655,192 |
| | | | | |
| | | | | 1,360,776 |
| | | | | |
| | Sweden (2.5%) | | | |
| 6,718 | | Getinge AB, Class B | | | 162,630 |
| 5,080 | | Hennes & Mauritz AB, Class B | | | 322,028 |
| 6,416 | | Modern Times Group AB, Class B | | | 414,186 |
| 51,741 | | Nordea Bank AB | | | 901,680 |
| 5,294 | | OMX AB | | | 229,617 |
| 18,060 | | Skandinaviska Enskilda Banken AB, Class A | | | 587,137 |
| 6,900 | | Skanska AB, Class B | | | 136,788 |
| 2,535 | | Svenska Cellulosa AB, Class B | | | 47,304 |
| 31,988 | | Swedbank AB, Class A | | | 1,069,725 |
| 46,410 | | Telefonaktiebolaget LM Ericsson, B Shares | | | 185,810 |
| 17,399 | | TeliaSonera AB | | | 157,274 |
| | | | | |
| | | | | 4,214,179 |
| | | | | |
| | Switzerland (7.4%) | | | |
| 12,143 | | ABB, Ltd. | | | 319,781 |
| 1,398 | | BKW FMB Energie AG | | | 153,699 |
| 20,953 | | Compagnie Financiere Richemont SA | | | 1,388,468 |
| 2,081 | | Credit Suisse Group | | | 138,167 |
| 890 | | Flughafen Zuerich AG | | | 343,807 |
| 13,779 | | Holcim, Ltd. | | | 1,521,992 |
| 10,028 | | Nestle SA | | | 4,504,740 |
| 19,809 | | Novartis AG | | | 1,093,174 |
| 6,197 | | Roche Holding AG | | | 1,123,631 |
| 209 | | SGS SA. | | | 238,755 |
| 3,410 | | Swatch Group AG (The) | | | 1,118,849 |
| 774 | | Syngenta AG | | | 166,866 |
| 2,563 | | UBS AG | | | 137,809 |
| 7,779 | | Xstrata PLC | | | 516,308 |
| | | | | |
| | | | | 12,766,046 |
| | | | | |
| | Taiwan (0.0%) | | | |
| 4,902 | | Taiwan Semiconductor Manufacturing Co., Ltd., ADR | | | 49,608 |
| | | | | |
| | Turkey (1.0%) | | | |
| 195,030 | | Dogan Sirketler Grubu Holdings(a) | | | 426,578 |
| 30,593 | | Haci Omer Sabanci Holding AS | | | 196,434 |
| 66,799 | | Turkiye Garanti Bankasi AS | | | 511,923 |
| 86,977 | | Turkiye Is Bankasi, Class C | | | 526,041 |
| | | | | |
| | | | | 1,660,976 |
| | | | | |
| | Ukraine (0.6%) | | | |
| 171,687 | | Raiffeisen Bank Aval | | | 37,412 |
| 4,158 | | Ukrnafta Oil Co.(a) | | | 293,750 |
| 66,369 | | UkrTelecom, GDR(a) | | | 642,595 |
| | | | | |
| | | | | 973,757 |
| | | | | |
| | United Kingdom (9.7%) | | | |
| 7,350 | | Aegis Group PLC | | | 18,798 |
| 13,768 | | Amec PLC | | | 208,734 |
| 15,071 | | Anglo American PLC | | | 1,014,169 |
| 10,257 | | BAE Systems PLC | | | 103,565 |
| 70,790 | | BHP Billiton PLC | | | 2,534,628 |
| 12,633 | | BP PLC | | | 146,682 |
| 30,479 | | Burberry Group PLC | | | 409,704 |
| 96,721 | | Compass Group PLC | | | 597,630 |
| 72,422 | | Diageo PLC | | | 1,591,399 |
| 27,906 | | GlaxoSmithKline PLC | | | 740,529 |
| 1,787 | | Go-Ahead Group PLC | | | 87,310 |
| 12,959 | | Intertek Group PLC | | | 251,088 |
| 8,143 | | Kingfisher PLC | | | 29,789 |
| 38,100 | | QinetiQ PLC | | | 136,611 |
| 13,957 | | Reckitt Benckiser PLC | | | 820,127 |
| 16,702 | | Rio Tinto PLC | | | 1,444,800 |
| 40,037 | | Rolls-Royce Group PLC(a) | | | 428,008 |
| 5,442 | | SABMiller PLC | | | 154,989 |
| 16,141 | | Scottish & Newcastle PLC | | | 201,944 |
| 41,437 | | Sibir Energy PLC | | | 439,160 |
| 90,122 | | Smith & Nephew PLC | | | 1,101,725 |
| 93,048 | | Tesco PLC | | | 836,225 |
| 769,597 | | Vodafone Group PLC | | | 2,779,153 |
| 21,790 | | William Hill PLC | | | 286,886 |
| 24,254 | | WPP Group PLC | | | 328,508 |
| | | | | |
| | | | | 16,692,161 |
| | | | | |
| | Total Common Stocks (Cost $136,168,093) | | | 152,228,907 |
| | | | | |
| EXCHANGE TRADED FUNDS (4.2%) | | | |
| | Hong Kong (1.8%) | | | |
| 72,625 | | Hang Seng Investment Index Funds Series - H-Share Index | | | 1,609,664 |
| 24,200 | | Hang Seng Investment Index Funds Series II - Hang Seng Index | | | 854,830 |
| 192,496 | | Tracker Fund of Hong Kong | | | 684,669 |
| | | | | |
| | | | | 3,149,163 |
| | | | | |
| | Singapore (0.5%) | | | |
| 108,098 | | iShares MSCI India(a) | | | 848,569 |
| | | | | |
| | United States (1.9%) | | | |
| 26,683 | | iShares MSCI Australia Index Fund | | | 847,719 |
| 5,609 | | iShares MSCI Brazil Index Fund | | | 412,542 |
| 59,656 | | iShares MSCI Canada Index Fund | | | 1,955,524 |
| | | | | |
| | | | | 3,215,785 |
| | | | | |
| | Total Exchange Traded Funds (Cost $6,868,297) | | | 7,213,517 |
| | | | | |
Continued
56
BB&T International Equity Fund
Schedule of Portfolio Investments — (continued)
September 30, 2007
| | | | | | |
| Shares | | | | Fair Value | |
| RIGHTS/WARRANTS (1.2%) | | | | |
| | Austria (0.0%) | | | | |
| 10,580 | | Raiffeisen International Bank Rights, expire 10/03/07 | | $ | — | |
| 6,181 | | Wienerberger AG Rights, expire 10/08/07(a) | | | — | |
| | | | | | |
| | | | | — | |
| | | | | | |
| | India (0.9%) | | | | |
| 16,114 | | Banking Index Benchmark Exchange Traded Scheme Warrants, Expire 1/20/10(a) (d) | | | 326,889 | |
| 21,020 | | Bharti Airtel, Ltd. Warrants, expire 05/31/10(a) (d) | | | 502,499 | |
| 34,008 | | Canara Bank, Warrants, Expire 01/19/09(a) | | | 237,682 | |
| 6,850 | | ICICI Bank, Ltd. Warrants, expire 01/19/09(a) | | | 182,244 | |
| 6,956 | | ICICI Bank, Ltd. Warrants, expire 05/10/10(a) | | | 184,275 | |
| 2,038 | | Suzlon Energy, Ltd. Warrants, expire 09/16/10 | | | 74,157 | |
| | | | | | |
| | | | | 1,507,746 | |
| | | | | | |
| | Italy (0.0%) | | | | |
| 59,151 | | Capitalia SpA Rights, expire 10/03/07 | | | — | |
| | | | | | |
| | Romania (0.3%) | | | | |
| 49,162 | | BRD-Group Societe Generale, Warrants, Expire 06/30/17(a) | | | 550,958 | |
| | | | | | |
| | Total Rights/Warrants (Cost $1,926,081) | | | 2,058,704 | |
| | | | | | |
| INVESTMENT COMPANY (4.4%) | | | | |
| | United States (4.4%) | | | | |
| 7,516,173 | | Federated Treasury Obligations Fund, Institutional Shares | | | 7,516,173 | |
| | | | | | |
| | Total Investment Company (Cost $7,516,173) | | | 7,516,173 | |
| | | | | | |
Total Investments — 98.5%
(Cost $ 152,478,644) | | | 169,017,301 | |
| Net Other Assets (Liabilities) — 1.5% | | | 2,618,237 | |
| | | | | | |
| NET ASSETS — 100.0% | | $ | 171,635,538 | |
| | | | | | |
| |
| Sector | | Percentage of net assets | |
| Consumer Discretionary | | | 10.8 | % |
| Consumer Staples | | | 7.7 | % |
| Energy | | | 5.9 | % |
| Exchange Traded Fund | | | 2.4 | % |
| Financials | | | 26.1 | % |
| Health Care | | | 4.7 | % |
| Industrials | | | 10.8 | % |
| Information Technology | | | 2.6 | % |
| Investment Company | | | 4.4 | % |
| Materials | | | 12.4 | % |
| Telecommunication Services | | | 7.0 | % |
| Utilities | | | 3.7 | % |
| | | | | | |
| | | 98.5 | % |
| | | | | | |
| | | | | | | | | | | | | | |
Currency | | Delivery
Date | | Contract
Amount in Local
Currency | | Contract
Amount in U.S. Dollar | | Fair Value | | Unrealized
Appreciation
(Depreciation) | |
Short | | | | | | | | | | | | | | |
Czech Koruna vs. U.S. Dollar | | 12/27/2007 | | 14,208,630 | | $ | 728,909 | | $ | 738,966 | | $ | (10,057 | ) |
Hungary Forint vs. U.S. Dollar | | 11/19/2007 | | 318,714,197 | | | 1,643,912 | | | 1,804,959 | | | (161,047 | ) |
Mexican Peso vs. U.S. Dollar | | 11/20/2007 | | 8,600,195 | | | 758,274 | | | 783,515 | | | (25,241 | ) |
Polish Zloty vs. U.S. Dollar | | 11/19/2007 | | 4,151,023 | | | 1,458,110 | | | 1,571,643 | | | (113,533 | ) |
Turkish Lira vs. U.S. Dollar | | 11/19/2007 | | 1,667,414 | | | 1,153,967 | | | 1,356,978 | | | (203,011 | ) |
Turkish Lira vs. U.S. Dollar | | 12/24/2007 | | 523,500 | | | 410,910 | | | 421,397 | | | (10,487 | ) |
| | | | | | | | | | | | | | |
Total Short Contracts | | | | | | $ | 6,154,082 | | $ | 6,677,458 | | $ | (523,376 | ) |
| | | | | | | | | | | | | | |
Long | | | | | | | | | | | | | | |
Australian Dollar vs. U.S. Dollar | | 12/12/2007 | | 993,760 | | $ | 857,847 | | $ | 878,973 | | $ | 21,126 | |
British Pound vs. U.S. Dollar | | 12/24/2007 | | 491,800 | | | 986,108 | | | 1,004,232 | | | 18,124 | |
Canadian Dollar vs. U.S. Dollar | | 12/27/2007 | | 807,861 | | | 807,256 | | | 813,098 | | | 5,842 | |
Japanese Yen vs. U.S. Dollar | | 11/8/2007 | | 812,359,395 | | | 6,967,062 | | | 7,108,509 | | | 141,447 | |
Japanese Yen vs. U.S. Dollar | | 11/20/2007 | | 615,211,449 | | | 5,514,206 | | | 5,391,193 | | | (123,013 | ) |
| | | | | | | | | | | | | | |
Total Long Contracts | | | | | | $ | 15,132,479 | | $ | 15,196,005 | | $ | 63,526 | |
| | | | | | | | | | | | | | |
See footnote legend to the Schedule of Portfolio Investments.
See accompanying notes to the financial statements.
57
BB&T Special Oppotunities Equity Fund
Schedule of Portfolio Investments
September 30, 2007
| | | | | | |
| Shares | | | | Fair Value | |
| COMMON STOCKS (88.7%) | | | | |
| | Consumer Discretionary (10.0%) | | | | |
| 536,000 | | Comcast Corp., Class A(a) | | $ | 12,960,480 | |
| 522,000 | | News Corp., Class A | | | 11,478,780 | |
| 256,100 | | Yum! Brands, Inc | | | 8,663,863 | |
| | | | | | |
| | | | | 33,103,123 | |
| | | | | | |
| | Consumer Staples (3.3%) | | | | |
| 348,500 | | Smithfield Foods, Inc.(a) (h) | | | 10,977,750 | |
| | | | | | |
| | Energy (16.0%) | | | | |
| 155,500 | | Apache Corp | | | 14,004,330 | |
| 287,100 | | CONSOL Energy, Inc.(h) | | | 13,378,860 | |
| 249,000 | | Noble Corp.(h) . | | | 12,213,450 | |
| 200,000 | | Weatherford International, Ltd.(a) (h) | | | 13,436,000 | |
| | | | | | |
| | | | | 53,032,640 | |
| | | | | | |
| | Financials (6.2%) | | | | |
| 144,300 | | Apartment Investment & Management Co., | | | | |
| | Class A, REIT | | | 6,512,259 | |
| 10,900 | | Markel Corp.(a) | | | 5,275,600 | |
| 245,400 | | Wells Fargo & Co | | | 8,741,148 | |
| | | | | | |
| | | | | 20,529,007 | |
| | | | | | |
| | Health Care (16.9%) | | | | |
| 94,500 | | Coventry Health Care, Inc.(a) | | | 5,878,845 | |
| 217,000 | | McKesson Corp. | | | 12,757,430 | |
| 49,500 | | MedCath Corp.(a) | | | 1,359,270 | |
| 252,000 | | Teva Pharmaceutical Industries, Ltd., ADR | | | 11,206,440 | |
| 247,000 | | UnitedHealth Group, Inc. | | | 11,962,210 | |
| 311,500 | | Varian Medical Systems, Inc.(a) | | | 13,048,735 | |
| | | | | | |
| | | | | 56,212,930 | |
| | | | | | |
| | Industrials (8.1%) | | | | |
| 221,000 | | J.B. Hunt Transport Services, Inc. | | | 5,812,300 | |
| 96,500 | | L-3 Communications Holdings, Inc. | | | 9,856,510 | |
| 750,500 | | Southwest Airlines Co. | | | 11,107,400 | |
| | | | | | |
| | | | | 26,776,210 | |
| | | | | | |
| | Information Technology (22.4%) | | | | |
| 333,340 | | ACI Worldwide, Inc.(a) | | | 7,450,149 | |
| 229,900 | | Activision, Inc.(a) (h) | | | 4,963,541 | |
| 409,500 | | Akamai Technologies, Inc.(a) | | | 11,764,935 | |
| 14,000 | | Corning, Inc.(h) | | | 345,100 | |
| 248,000 | | Digital River, Inc.(a) | | | 11,098,000 | |
| 149,000 | | Fair Isaac Corp. | | | 5,380,390 | |
| 219,000 | | Harris Corp. | | | 12,656,010 | |
| 426,500 | | Symantec Corp.(a) | | | 8,265,570 | |
| 465,000 | | Yahoo!, Inc.(a) | | | 12,480,600 | |
| | | | | | |
| | | | | 74,404,295 | |
| | | | | | |
| | Materials (5.8%) | | | | |
| 414,100 | | Nalco Holding Co. | | | 12,278,065 | |
| 270,400 | | Sealed Air Corp. | | | 6,911,424 | |
| | | | | | |
| | | | | 19,189,489 | |
| | | | | | |
| | Total Common Stocks (Cost $239,994,004) | | | 294,225,444 | |
| | | | | | |
| INVESTMENT COMPANIES (12.4%) | | | | |
| 41,007,766 | | Federated Treasury Obligations Fund, Institutional Shares | | | 41,007,766 | |
| 16,900 | | Morgan Stanley Quality Municipal Income Trust | | | 227,305 | |
| | | | | | |
| | Total Investment Companies (Cost $41,228,400) | | | 41,235,071 | |
| | | | | | |
Total Investments — 101.1%
(Cost $ 281,222,404) | | | 335,460,515 | |
| Net Other Assets (Liabilities) — (1.1)% | | | (3,606,263 | ) |
| | | | | | |
| NET ASSETS — 100.0% | | $ | 331,854,252 | |
| | | | | | |
See footnote legend to Schedules of Portfolio Investments.
See accompanying notes to the financial statements.
58
BB&T Equity Income Fund
Schedule of Portfolio Investments
September 30, 2007
| | | | | | |
| Shares | | | | Fair Value | |
| COMMON STOCKS (925%) | | | | |
| | Consumer Discretionary (54%) | | | | |
| 291,000 | | Pearson PLC, ADR | | $ | 4,498,860 | |
| 246,000 | | Regal Entertainment Group, Class A | | | 5,399,700 | |
| | | | | | |
| | | | | 9,898,560 | |
| | | | | | |
| | Consumer Staples (102%) | | | | |
| 93,000 | | Altria Group, Inc. | | | 6,466,290 | |
| 84,500 | | General Mills, Inc. | | | 4,901,845 | |
| 101,000 | | PepsiCo, Inc. | | | 7,399,260 | |
| | | | | | |
| | | | | 18,767,395 | |
| | | | | | |
| | Energy (180%) | | | | |
| 102,500 | | BP PLC, ADR | | | 7,108,375 | |
| 63,800 | | Chevron Corp | | | 5,970,404 | |
| 79,000 | | ConocoPhillips | | | 6,933,830 | |
| 161,800 | | Kinder Morgan Management LLC(a) | | | 7,564,149 | |
| 172,300 | | Natural Resource Partners, LP | | | 5,372,314 | |
| 7,866 | | Natural Resource Partners, LP, SUB UNIT | | | 242,115 | |
| | | | | | |
| | | | | 33,191,187 | |
| | | | | | |
| | Financials (258%) | | | | |
| 146,000 | | Citigroup, Inc. | | | 6,813,820 | |
| 63,625 | | Endurance Specialty Holdings, Ltd | | | 2,643,619 | |
| 125,000 | | Federated Investors, Inc., Class B(h) | | | 4,962,500 | |
| 197,500 | | First Industrial Realty Trust, Inc., REIT | | | 7,676,825 | |
| 280,000 | | Realty Income Corp, REIT | | | 7,826,000 | |
| 183,100 | | US Bancorp | | | 5,956,243 | |
| 168,400 | | Washington Real Estate Investment Trust, REIT | | | 5,587,512 | |
| 149,400 | | Weingarten Realty Investors, REIT | | | 6,194,124 | |
| | | | | | |
| | | | | 47,660,643 | |
| | | | | | |
| | Health Care (106%) | | | | |
| 102,500 | | Abbott Laboratories | | | 5,496,050 | |
| 134,000 | | GlaxoSmithKline PLC, ADR | | | 7,128,800 | |
| 285,000 | | Pfizer, Inc. | | | 6,962,550 | |
| | | | | | |
| | | | | 19,587,400 | |
| | | | | | |
| | Industrials (72%) | | | | |
| 170,000 | | General Electric Co | | | 7,038,000 | |
| 82,000 | | United Parcel Service, Inc., Class B | | | 6,158,200 | |
| | | | | | |
| | | | | 13,196,200 | |
| | | | | | |
| | Information Technology (95%) | | | | |
| 152,000 | | Microchip Technology, Inc. | | | 5,520,640 | |
| 199,000 | | Nokia Corp, ADR(h) | | | 7,548,070 | |
| 442,003 | | Taiwan Semiconductor Manufacturing Co, Ltd, ADR | | | 4,473,070 | |
| | | | | | |
| | | | | 17,541,780 | |
| | | | | | |
| | Materials (26%) | | | | |
| 98,500 | | EI DuPont de Nemours & Co | | | 4,881,660 | |
| | | | | | |
| | Telecommunication Services (32%) | | | | |
| 132,000 | | Verizon Communications, Inc. | | | 5,844,960 | |
| | | | | | |
| | Total Common Stocks (Cost $145,901,034) | | | 170,569,785 | |
| | | | | | |
| | INVESTMENT COMPANY (89%) | | | | |
| 16,369,289 | | Federated Treasury Obligations Fund, Institutional Shares | | | 16,369,289 | |
| | | | | | |
| | Total Investment Company (Cost $16,369,289) | | | 16,369,289 | |
| | | | | | |
Total Investments — 1014%
(Cost $ 162,270,323) | | | 186,939,074 | |
| Net Other Assets (Liabilities) — (14)% | | | (2,554,971 | ) |
| | | | | | |
| NET ASSETS — 100.0% | | $ | 184,384,103 | |
| | | | | | |
See footnote legend to Schedules of Portfolio Investments.
See accompanying notes to the financial statements.
59
BB&T Short U.S. Government Fund
Schedule of Portfolio Investments
September 30, 2007
| | | | | | |
Principal Amount | | | | Fair Value |
| | COLLATERALIZED MORTGAGE OBLIGATIONS (38%) | | | |
| | | Federal Home Loan Mortgage Corp (27%) | | | |
| $ | 449,840 | | 4.500%, 1/15/11, Series 2782, Class MC | | $ | 449,314 |
| | 759,337 | | 5.000%, 6/15/24, Series 2915, Class KA | | | 759,543 |
| | | | | | |
| | | | | | 1,208,857 |
| | | | | | |
| | | Federal National Mortgage Association (11%) | | | |
| | 506,037 | | 6.000%, 4/25/18, Series 2002-27, Class VB | | | 505,469 |
| | | | | | |
| | | Total Collateralized Mortgage Obligations (Cost $ 1,720,303) | | | 1,714,326 |
| | | | | | |
| | MORTGAGE-BACKED SECURITIES (247%) | | | |
| | | Federal Home Loan Mortgage Corp (58%) | | | |
| | 421,180 | | 5.000%, 12/1/08, Pool #M80714 | | | 419,292 |
| | 1,409,796 | | 4.500%, 1/1/10, Pool #M80792 | | | 1,392,988 |
| | 185,105 | | 6.500%, 5/1/13, Pool #E00548 | | | 190,048 |
| | 570,005 | | 6.000%, 9/1/16, Pool #E01049 | | | 578,583 |
| | | | | | |
| | | | | | 2,580,911 |
| | | | | | |
| | | Federal National Mortgage Association (189%) | | | |
| | 1,122,867 | | 4.500%, 1/1/10, Pool #254626 | | | 1,110,755 |
| | 415,590 | | 6.500%, 8/1/13, Pool #251901 | | | 426,983 |
| | 329,771 | | 6.000%, 3/1/16, Pool #253702 | | | 334,927 |
| | 348,233 | | 6.000%, 4/1/16, Pool #535846 | | | 353,678 |
| | 617,670 | | 6.500%, 4/1/16, Pool #253706 | | | 633,815 |
| | 255,172 | | 6.000%, 8/1/16, Pool #545125 | | | 259,148 |
| | 1,490,975 | | 5.000%, 11/1/17, Pool #254510 | | | 1,466,949 |
| | 1,615,035 | | 5.000%, 12/1/17, Pool #254545 | | | 1,589,010 |
| | 2,363,466 | | 4.500%, 3/1/18, Pool #555292 | | | 2,281,737 |
| | | | | | |
| | | | | | 8,457,002 |
| | | | | | |
| | | Total Mortgage-Backed Securities (Cost $ 11,244,180) | | | 11,037,913 |
| | | | | | |
| | US GOVERNMENT AGENCIES (556%) | | | |
| | | Federal Farm Credit Bank (134%) | | | |
| | 5,000,000 | | 4.125%, 4/15/09 | | | 4,976,415 |
| | 1,000,000 | | 5.375%, 7/18/11 | | | 1,028,871 |
| | | | | | |
| | | | | | 6,005,286 |
| | | | | | |
| | | Federal Home Loan Bank (145%) | | | |
| | 1,500,000 | | 4.750%, 4/24/09 | | | 1,506,873 |
| | 4,000,000 | | 3.750%, 8/18/09 | | | 3,954,600 |
| | 1,000,000 | | 4.625%, 2/18/11, Series 616 | | | 1,004,901 |
| | | | | | |
| | | | | | 6,466,374 |
| | | | | | |
| | | Federal Home Loan Mortgage Corp (132%) | | | |
| | 4,500,000 | | 2.750%, 3/15/08 | | | 4,456,701 |
| | 1,500,000 | | 3.375%, 4/15/09 | | | 1,476,373 |
| | | | | | |
| | | | | | 5,933,074 |
| | | | | | |
| | | Federal National Mortgage Association (145%) | | | |
| | 2,500,000 | | 4.670%, 10/10/07** | | | 2,497,128 |
| | 1,500,000 | | 4.625%, 1/15/08 | | | 1,498,535 |
| | 2,500,000 | | 3.875%, 2/15/10 | | | 2,471,150 |
| | | | | | |
| | | | | | 6,466,813 |
| | | | | | |
| | | Total US Government Agencies (Cost $ 24,699,040) | | | 24,871,547 |
| | | | | | |
| | US TREASURY NOTES (117%) | | | |
| | 4,000,000 | | 4.625%, 3/31/08 | | | 4,009,376 |
| | 500,000 | | 4.250%, 10/15/10 | | | 503,164 |
| | 750,000 | | 4.125%, 8/31/12 | | | 746,954 |
| | | | | | |
| | | Total US Treasury Notes (Cost $ 5,236,562) | | | 5,259,494 |
| | | | | | |
| | US TREASURY BILLS (22%) | | | |
| | 1,000,000 | | 4.867%, 2/7/08** | | | 986,197 |
| | | | | | |
| | | Total US Treasury Bills (Cost $ 983,194) | | | 986,197 |
| | | | | | |
| | |
| Shares | | | | |
| | INVESTMENT COMPANY (14%) | | | |
| | 607,935 | | Federated Treasury Obligations Fund, Institutional Shares | | | 607,935 |
| | | | | | |
| | | Total Investment Company (Cost $ 607,935) | | | 607,935 |
| | | | | | |
| Total Investments — 994%
(Cost $ 44,491,214) | | | 44,477,412 |
| | Net Other Assets (Liabilities) — 06% | | | 256,333 |
| | | | | | |
| | NET ASSETS — 100.0% | | $ | 44,733,745 |
| | | | | | |
See footnote legend to Schedules of Portfolio Investments.
See accompanying notes to the financial statements.
60
BB&T Intermediate U.S. Government Fund
Schedule of Portfolio Investments
September 30, 2007
| | | | | | |
Principal
Amount | | | | Fair Value |
| | COLLATERALIZED MORTGAGE OBLIGATIONS (12.5%) | | | |
| | | Federal Home Loan Mortgage Corp. (12.5%) | | | |
| $ | 18,184,523 | | 5.125%, 10/15/15, Series R003, Class AG | | $ | 18,125,487 |
| | | | | | |
| | | Total Collateralized Mortgage Obligations (Cost $17,921,678) | | | 18,125,487 |
| | | | | | |
| | MORTGAGE-BACKED SECURITIES (58.1%) | | | |
| | | Federal Home Loan Mortgage Corp. (8.5%) | | | |
| | 6,464,924 | | 4.500%, 2/1/18, Pool #E94445 | | | 6,239,292 |
| | 6,186,919 | | 5.500%, 2/1/29, Pool #A18613 | | | 6,088,462 |
| | | | | | |
| | | | | | 12,327,754 |
| | | | | | |
| | | Federal National Mortgage Association (49.6%) | | | |
| | 5,526,230 | | 5.000%, 1/1/18, Pool #650205 | | | 5,432,163 |
| | 4,726,932 | | 4.500%, 3/1/18, Pool #555292 | | | 4,563,475 |
| | 1,819,448 | | 5.500%, 1/1/33, Pool #678321 | | | 1,787,826 |
| | 3,528,289 | | 5.000%, 7/1/33, Pool #724965 | | | 3,379,706 |
| | 1,260,372 | | 5.000%, 8/1/33, Pool #738751 | | | 1,207,606 |
| | 781,273 | | 5.000%, 8/1/33, Pool #724365 | | | 749,882 |
| | 987,632 | | 5.000%, 10/1/33, Pool #753298 | | | 946,570 |
| | 3,091,115 | | 6.500%, 11/1/34, Pool #783476 | | | 3,147,681 |
| | 21,815,681 | | 4.500%, 2/1/35, Pool #815426 | | | 20,249,801 |
| | 13,278,355 | | 5.500%, 5/1/35, Pool #825530 | | | 13,021,732 |
| | 9,413,987 | | 5.500%, 9/1/35, Pool #835787 | | | 9,232,049 |
| | 8,224,806 | | 5.500%, 8/1/37, Pool #946238 | | | 7,994,493 |
| | | | | | |
| | | | | | 71,712,984 |
| | | | | | |
| | | Total Mortgage-Backed Securities (Cost $85,606,592) | | | 84,040,738 |
| | | | | | |
| | U.S. GOVERNMENT AGENCIES (19.1%) | | | |
| | | Federal Home Loan Mortgage Corp. (9.3%) | | | |
| | 13,425,000 | | 5.250%, 11/5/12, Callable 11/5/07 @ 100 | | | 13,432,854 |
| | | | | | |
| | | Private Export Funding Corp. (9.8%) | | | |
| | 4,350,000 | | 4.974%, 8/15/13 | | | 4,411,796 |
| | 10,000,000 | | 4.550%, 5/15/15 | | | 9,806,180 |
| | | | | | |
| | | | | | 14,217,976 |
| | | | | | |
| | | Total U.S. Government Agencies (Cost $27,972,816) | | | 27,650,830 |
| | | | | | |
| | U.S. TREASURY NOTES (8.8%) | | | |
| | 10,000,000 | | 4.625%, 7/31/12 | | | 10,174,220 |
| | 2,500,000 | | 4.750%, 8/15/17 | | | 2,533,595 |
| | | | | | |
| | | Total U.S. Treasury Notes (Cost $12,703,248) | | | 12,707,815 |
| | | | | | |
| | |
| Shares | | | | |
| | INVESTMENT COMPANY (1.2%) | | | |
| | 1,735,587 | | Federated Treasury Obligations Fund, Institutional Shares | | | 1,735,587 |
| | | | | | |
| | | Total Investment Company (Cost $1,735,587) | | | 1,735,587 |
| | | | | | |
| Total Investments — 99.7%
(Cost $145,939,921) | | | 144,260,457 |
| | Net Other Assets (Liabilities) — 0.3% | | | 399,763 |
| | | | | | |
| | NET ASSETS — 100.0% | | $ | 144,660,220 |
| | | | | | |
See footnote legend to Schedules of Portfolio Investments.
See accompanying notes to the financial statements.
61
BB&T Total Return Bond Fund
Schedule of Portfolio Investments
September 30, 2007
| | | | | | |
Principal Amount | | | | Fair Value |
| | ASSET BACKED SECURITIES (4.2%) | | | |
| $ | 2,600,000 | | American Express Credit Account Master Trust, Series 2003-2, Class A, 5.863%, 10/15/10*(b) | | $ | 2,601,167 |
| | 5,095,000 | | Chase Funding Mortgage Loan Asset-Backed Certificates, Series 2003-4, Class 1A5 STEP, 5.416%, 5/25/33 | | | 4,945,668 |
| | 667,000 | | Citibank Credit Card Issuance Trust, Series 2003-A1, Class A1, 5.460%, 1/15/10*(b) | | | 667,130 |
| | 4,000,000 | | Credit-Based Asset Servicing and Securitization LLC, Series 2005-CB5, Class AF2, STEP, 4.831%, 8/25/35 | | | 3,908,683 |
| | 1,057,000 | | Discover Card Master Trust I, Series 2004-2, Class A1, 5.773%, 5/15/10*(b) | | | 1,057,272 |
| | 2,150,000 | | MBNA Credit Card Master Note Trust, Series 2003-A3, Class A3, 5.873%, 8/16/10*(b) | | | 2,150,965 |
| | 3,428,213 | | Residential Asset Mortgage Products, Inc., Series 2003-RS4, Class AI6, 4.018%, 3/25/33* | | | 3,223,809 |
| | | | | | |
| | | Total Asset Backed Securities (Cost $19,045,151) | | | 18,554,694 |
| | | | | | |
| | COLLATERALIZED MORTGAGE OBLIGATIONS (3.4%) | | | |
| | | Federal Home Loan Mortgage Corp. (1.4%) | | | |
| | 3,162,516 | | 5.000%, 8/15/31, Series 3025, Class AB | | | 3,136,580 |
| | 3,199,911 | | 5.500%, 7/15/16, Series 3061, Class VU | | | 3,227,552 |
| | | | | | |
| | | | | | 6,364,132 |
| | | | | | |
| | | Federal National Mortgage Association (2.0%) | | | |
| | 2,818,683 | | 4.000%, 1/25/18, Series 2003-35, Class NA | | | 2,726,422 |
| | 3,466,778 | | 5.000%, 5/25/22, Series 2003-79, Class NX | | | 3,431,879 |
| | 2,715,403 | | 5.500%, 10/25/24, Series 2006-18, Class CA | | | 2,738,925 |
| | | | | | |
| | | | | | 8,897,226 |
| | | | | | |
| | | Total Collateralized Mortgage Obligations (Cost $15,103,320) | | | 15,261,358 |
| | | | | | |
| | COMMERCIAL MORTGAGE-BACKED SECURITIES (5.6%) | | | |
| | 1,793,000 | | Banc of America Commercial Mortgage, Inc., Series 2004-6, Class A5, 4.811%, 12/10/42 | | | 1,724,126 |
| | 7,138,000 | | Citigroup/Deutsche Bank Commercial Mortgage Trust, Series 2006-CD3, Class A3, 5.607%, 10/15/48 | | | 7,173,786 |
| | 7,100,000 | | CS First Boston Mortgage Securities Corp., Series 2005-C5, Class A3, 5.100%, 8/15/38* | | | 7,009,437 |
| | 2,600,000 | | Merrill Lynch/Countrywide Commercial Mortgage Trust, Series 2006-3, Class A3, 5.389%, 7/12/46* | | | 2,586,489 |
| | 6,700,000 | | Morgan Stanley Capital I, Series 2007-IQ13, Class A3, 5.330%, 3/15/44 | | | 6,585,521 |
| | | | | | |
| | | Total Commercial Mortgage-Backed Securities (Cost $25,143,771) | | | 25,079,359 |
| | | | | | |
| | CORPORATE BONDS (19.9%) | | | |
| | | Consumer Discretionary (1.7%) | | | |
| | 2,140,000 | | Comcast Corp., 5.500%, 3/15/11 | | | 2,144,119 |
| | 2,200,000 | | Historic TW, Inc., 9.125%, 1/15/13 | | | 2,522,117 |
| | 2,864,000 | | Time Warner, Inc., 5.875%, 11/15/16 | | | 2,801,823 |
| | | | | | |
| | | | | | 7,468,059 |
| | | | | | |
| | | Consumer Staples (1.3%) | | | |
| | 1,450,000 | | CVS Caremark Corp., 5.750%, 8/15/11 | | | 1,468,830 |
| | 4,460,000 | | CVS Caremark Corp., 4.875%, 9/15/14 | | | 4,239,707 |
| | | | | | |
| | | | | | 5,708,537 |
| | | | | | |
| | | Energy (0.5%) | | | |
| | 2,276,000 | | Peabody Energy Corp., Series B, 6.875%, 3/15/13 | | | 2,298,760 |
| | | | | | |
| | | Financials (7.3%) | | | |
| | 838,000 | | Bank of America Corp., 6.250%, 4/15/12 | | | 868,245 |
| | 2,600,000 | | Bank of America Corp., 5.125%, 11/15/14 | | | 2,543,167 |
| | 2,115,000 | | Capital One Financial Corp., 5.500%, 6/1/15 | | | 2,015,115 |
| | 2,355,000 | | ERP Operating LP, 5.125%, 3/15/16 | | | 2,182,567 |
| | 3,459,000 | | GATX Financial Corp., 5.125%, 4/15/10 | | | 3,485,665 |
| | 1,927,000 | | General Electric Capital Corp., MTN, 5.000%, 1/8/16 | | | 1,867,288 |
| | 6,900,000 | | General Electric Capital Corp., MTN, Series A, 6.000%, 6/15/12 | | | 7,114,900 |
| | 1,289,000 | | Goldman Sachs Group, Inc. (The), 5.125%, 1/15/15 | | | 1,237,651 |
| | 2,830,000 | | Lehman Brothers Holdings, Inc., MTN, 6.200%, 9/26/14 | | | 2,841,210 |
| | 1,827,000 | | Lehman Brothers Holdings, Inc., MTN, Series G, 4.800%, 3/13/14 | | | 1,699,472 |
| | 6,985,000 | | Prudential Financial, Inc., MTN, Series B, 5.100%, 9/20/14 | | | 6,733,547 |
| | | | | | |
| | | | | | 32,588,827 |
| | | | | | |
| | | Health Care (0.4%) | | | |
| | 2,167,000 | | Cardinal Health, Inc., 4.000%, 6/15/15 | | | 1,910,102 |
| | | | | | |
| | | Industrials (1.3%) | | | |
| | 2,275,000 | | General Dynamics Corp., 4.250%, 5/15/13 | | | 2,145,209 |
| | 3,350,000 | | Goodrich (BF) Corp., 6.290%, 7/1/16 | | | 3,465,619 |
| | | | | | |
| | | | | | 5,610,828 |
| | | | | | |
| | | Information Technology (3.8%) | | | |
| | 2,270,000 | | Cisco Systems, Inc., 5.250%, 2/22/11 | | | 2,291,115 |
| | 3,499,000 | | Cisco Systems, Inc., 5.500%, 2/22/16 | | | 3,475,606 |
| | 2,340,000 | | Hewlett-Packard Co., 6.500%, 7/1/12 | | | 2,464,205 |
| | 540,000 | | Hewlett-Packard Co., 5.400%, 3/1/17 | | | 524,853 |
| | 2,185,000 | | International Business Machines Corp., 5.700%, 9/14/17 | | | 2,196,447 |
| | 3,986,000 | | Oracle Corp. and Ozark Holding, Inc., 5.000%, 1/15/11 | | | 3,977,139 |
| | 2,128,000 | | Oracle Corp. and Ozark Holding, Inc., 5.250%, 1/15/16 | | | 2,072,117 |
| | | | | | |
| | | | | | 17,001,482 |
| | | | | | |
| | | Telecommunication Services (1.0%) | | | |
| | 4,080,000 | | New Cingular Wireless Services, Inc., 8.125%, 5/1/12(b) | | | 4,524,137 |
| | | | | | |
| | | Utilities (2.6%) | | | |
| | 4,402,000 | | Duke Energy Carolinas LLC, 6.250%, 1/15/12 | | | 4,557,052 |
| | 2,316,000 | | FirstEnergy Corp., Series B, 6.450%, 11/15/11 | | | 2,394,431 |
| | 1,909,000 | | Ohio Power Co., Series K, 6.000%, 6/1/16 | | | 1,917,896 |
| | 2,730,000 | | TECO Energy, Inc., 7.500%, 6/15/10 | | | 2,856,519 |
| | | | | | |
| | | | | | 11,725,898 |
| | | | | | |
| | | Total Corporate Bonds (Cost $89,086,358) | | | 88,836,630 |
| | | | | | |
Continued
62
BB&T Total Return Bond Fund
Schedule of Portfolio Investments — (continued)
September 30, 2007
| | | | | | |
Principal Amount | | | | Fair Value |
| | MORTGAGE-BACKED SECURITIES (35.0%) | | | |
| | | Federal Home Loan Mortgage Corp. (17.7%) | | | |
| $ | 1,607,143 | | 6.000%, 10/1/19, Pool #G11679 | | $ | 1,630,122 |
| | 2,746,622 | | 5.000%, 5/1/20, Pool #B19275 | | | 2,693,030 |
| | 486,918 | | 5.500%, 3/1/21, Pool #J01432 | | | 485,668 |
| | 4,243,573 | | 5.000%, 9/1/21, Pool #G12381 | | | 4,160,773 |
| | 3,314,776 | | 5.500%, 10/1/21, Pool #G12425 | | | 3,305,505 |
| | 3,859,237 | | 5.500%, 11/1/21, Pool #G12454 | | | 3,848,443 |
| | 1,343,548 | | 5.000%, 12/1/21, Pool #J04025 | | | 1,317,305 |
| | 2,441,697 | | 5.000%, 7/1/25, Pool #C90908 | | | 2,360,171 |
| | 2,026,337 | | 4.500%, 6/1/35, Pool #G01842 | | | 1,882,754 |
| | 4,691,069 | | 5.500%, 6/1/35, Pool #A35148 | | | 4,599,079 |
| | 2,973,778 | | 5.500%, 7/1/35, Pool #A36540 | | | 2,915,463 |
| | 1,155,413 | | 6.000%, 7/1/35, Pool #A36304 | | | 1,157,718 |
| | 1,113,456 | | 5.500%, 8/1/35, Pool #A36652 | | | 1,091,622 |
| | 1,703,437 | | 5.000%, 9/1/35, Pool #A37961 | | | 1,627,579 |
| | 891,503 | | 5.500%, 9/1/35, Pool #G08080 | | | 874,021 |
| | 4,184,603 | | 5.120%, 12/1/35, Pool #847603* | | | 4,067,498 |
| | 1,353,681 | | 5.500%, 12/1/35, Pool #A40359 | | | 1,327,136 |
| | 1,742,065 | | 5.000%, 3/1/36, Pool #G08115 | | | 1,664,486 |
| | 3,722,412 | | 5.500%, 4/1/36, Pool #A44445 | | | 3,645,418 |
| | 1,785,492 | | 6.500%, 5/1/36, Pool #A48509 | | | 1,817,855 |
| | 618,530 | | 5.000%, 7/1/36, Pool #G02291 | | | 590,173 |
| | 5,195,106 | | 5.917%, 12/1/36, Pool #1J1390* | | | 5,212,377 |
| | 3,536,467 | | 5.976%, 1/1/37, Pool #1Q0192* | | | 3,543,127 |
| | 3,987,964 | | 6.000%, 4/1/37, Pool #A58853 | | | 3,992,682 |
| | 14,041,431 | | 5.000%, 7/1/37, Pool #G03050 | | | 13,393,739 |
| | 5,863,635 | | 6.000%, 8/1/37, Pool #A64067 | | | 5,870,572 |
| | | | | | |
| | | | | | 79,074,316 |
| | | | | | |
| | | Federal National Mortgage Association (15.8%) | | | |
| | 110,411 | | 6.000%, 10/1/13, Pool #252061 | | | 112,057 |
| | 187,288 | | 5.500%, 4/1/18, Pool #685496 | | | 187,265 |
| | 2,619,422 | | 4.500%, 6/1/19, Pool #780349 | | | 2,524,573 |
| | 272,238 | | 5.000%, 8/1/20, Pool #832058 | | | 266,923 |
| | 479,641 | | 5.000%, 8/1/20, Pool #838787 | | | 470,276 |
| | 1,139,273 | | 5.500%, 11/1/20, Pool #843972 | | | 1,137,054 |
| | 1,306,446 | | 5.500%, 12/1/20, Pool #831138 | | | 1,303,902 |
| | 1,021,679 | | 5.500%, 5/1/21, Pool #895628 | | | 1,019,689 |
| | 653,259 | | 5.500%, 6/1/21, Pool #831526 | | | 651,842 |
| | 146,229 | | 5.000%, 5/1/22, Pool #256716 | | | 143,331 |
| | 2,318,347 | | 6.000%, 7/1/22, Pool #944967 | | | 2,349,604 |
| | 2,524,662 | | 6.000%, 9/1/22, Pool #907006 | | | 2,558,700 |
| | 1,489,743 | | 5.000%, 9/1/25, Pool #255892 | | | 1,438,370 |
| | 4,111,109 | | 5.500%, 2/1/27, Pool #256600 | | | 4,057,121 |
| | 722,675 | | 6.500%, 1/1/35, Pool #809198 | | | 738,113 |
| | 5,148,966 | | 5.500%, 3/1/35, Pool #787561 | | | 5,049,455 |
| | 4,364,144 | | 5.500%, 4/1/35, Pool #822982 | | | 4,283,379 |
| | 401,772 | | 6.000%, 4/1/35, Pool #735503 | | | 403,802 |
| | 1,007,617 | | 7.000%, 6/1/35, Pool #830686 | | | 1,039,608 |
| | 714,471 | | 7.000%, 6/1/35, Pool #255820 | | | 737,154 |
| | 2,386,962 | | 5.500%, 10/1/35, Pool #817568 | | | 2,340,831 |
| | 1,140,234 | | 5.500%, 2/1/36, Pool #831295 | | | 1,118,197 |
| | 1,922,703 | | 5.500%, 2/1/36, Pool #256101 | | | 1,885,544 |
| | 1,808,410 | | 6.500%, 3/1/36, Pool #866062 | | | 1,841,594 |
| | 2,805,684 | | 5.621%, 5/1/36, Pool #871259* | | | 2,794,600 |
| | 2,753,913 | | 5.446%, 6/1/36, Pool #905183* | | | 2,749,488 |
| | 1,531,983 | | 6.500%, 7/1/36, Pool #885493 | | | 1,560,095 |
| | 628,965 | | 5.500%, 12/1/36, Pool #922224 | | | 616,178 |
| | 4,389,386 | | 6.000%, 12/1/36, Pool #888029 | | | 4,396,694 |
| | 9,720,947 | | 5.500%, 1/1/37, Pool #256552 | | | 9,523,318 |
| | 4,033,185 | | 6.000%, 4/1/37, Pool #256674 | | | 4,039,217 |
| | 2,950,632 | | 6.000%, 4/1/37, Pool #914725 | | | 2,955,044 |
| | 4,336,844 | | 6.000%, 7/1/37, Pool #256800 | | | 4,343,330 |
| | | | | | |
| | | | | | 70,636,348 |
| | | | | | |
| | | Government National Mortgage Association (1.5%) |
| | 6,796,744 | | 5.000%, 10/15/37(c) | | | 6,573,729 |
| | | | | | |
| | | Total Mortgage-Backed Securities (Cost $156,977,610) | | | 156,284,393 |
| | | | | | |
| | MUNICIPAL BONDS (3.8%) | | | |
| | | California (1.1%) | | | |
| | 5,255,000 | | Fresno, CA, County Pension Obligation Revenue Bonds, Series A (FGIC), 4.198%, 8/15/13 | | | 4,972,281 |
| | | | | | |
| | | Florida (1.1%) | | | |
| | 1,185,000 | | Gainesville, FL, Post Employment Benefits Pension Revenue Bonds, Retiree Health Care Plan (MBIA), 4.680%, 10/1/13 | | | 1,154,616 |
| | 2,480,000 | | Gainesville, FL, Post Employment Benefits Pension Revenue Bonds, Retiree Health Care Plan (MBIA), 4.710%, 10/1/14 | | | 2,394,837 |
| | 665,000 | | Palm Beach County, FL, Refunding Land Acquisition G.O., 5.735%, 6/1/12 | | | 682,649 |
| | 945,000 | | Palm Beach County, FL, Refunding Land Acquisition G.O., 5.784%, 6/1/13 | | | 971,139 |
| | | | | | |
| | | | | | 5,203,241 |
| | | | | | |
| | | Illinois (0.5%) | | | |
| | 2,100,000 | | Chicago, IL, Public Improvements G.O., Series B, OID (XLCA), 5.250%, 1/1/12 | | | 2,113,335 |
| | | | | | |
| | | Michigan (0.8%) | | | |
| | 3,570,000 | | Michigan Municipal Bond Authority, MI, Refunding School Loan Revenue Bonds (FGIC), 5.222%, 6/1/14 | | | 3,548,509 |
| | | | | | |
| | | Wisconsin (0.3%) | | | |
| | 1,325,000 | | Wisconsin State General Pension Funding Revenue Bonds, Series A, OID (FSA), 4.800%, 5/1/13 | | | 1,295,744 |
| | | | | | |
| | | Total Municipal Bonds (Cost $17,009,023) | | | 17,133,110 |
| | | | | | |
| | U.S. GOVERNMENT AGENCIES (10.5%) | | | |
| | | Federal Home Loan Bank (3.2%) | | | |
| | 9,960,000 | | 5.000%, 9/14/12 | | | 10,129,480 |
| | 4,185,000 | | 5.250%, 9/13/13 | | | 4,293,454 |
| | | | | | |
| | | | | | 14,422,934 |
| | | | | | |
| | | Federal Home Loan Mortgage Corp. (3.1%) | | | |
| | 2,884,000 | | 5.125%, 7/15/12 | | | 2,947,748 |
| | 10,695,000 | | 4.875%, 11/15/13 | | | 10,759,490 |
| | | | | | |
| | | | | | 13,707,238 |
| | | | | | |
| | | Federal National Mortgage Association (4.2%) | | | |
| | 11,210,000 | | 6.125%, 3/15/12 | | | 11,892,386 |
| | 6,950,000 | | 4.625%, 10/15/14 | | | 6,868,039 |
| | | | | | |
| | | | | | 18,760,425 |
| | | | | | |
| | | Total U.S. Government Agencies (Cost $45,961,131) | | | 46,890,597 |
| | | | | | |
Continued
63
BB&T Total Return Bond Fund
Schedule of Portfolio Investments — (continued)
September 30, 2007
| | | | | | | |
Principal Amount | | | | Fair Value | |
| | U.S. TREASURY NOTES (18.2%) | | | | |
| $ | 11,560,000 | | 4.875%, 6/30/12 | | $ | 11,883,322 | |
| | 13,226,000 | | 4.625%, 7/31/12 | | | 13,456,423 | |
| | 4,265,000 | | 1.875%, 7/15/13(f) | | | 4,760,013 | |
| | 29,067,000 | | 4.000%, 2/15/14 | | | 28,526,528 | |
| | 22,882,000 | | 4.250%, 8/15/14 | | | 22,721,117 | |
| | | | | | | |
| | | Total U.S. Treasury Notes (Cost $80,007,926) | | | 81,347,403 | |
| | | | | | | |
| | |
| Shares | | | | Fair Value | |
| | INVESTMENT COMPANY (1.0%) | | | | |
| | 4,784,425 | | Federated Treasury Obligations Fund, Institutional Shares | | $ | 4,784,426 | |
| | | | | | | |
| | | Total Investment Company (Cost $4,784,425) | | | 4,784,426 | |
| | | | | | | |
| Total Investments — 101.6%
(Cost $453,118,715) | | | 454,171,970 | |
| | Net Other Assets (Liabilities) — (1.6)% | | | (7,279,238 | ) |
| | | | | | | |
| | NET ASSETS — 100.0% | | $ | 446,892,732 | |
| | | | | | | |
See footnote legend to Schedules of Portfolio Investments.
See accompanying notes to the financial statements.
64
BB&T Kentucky Intermediate Tax-Free Fund
Schedule of Portfolio Investments
September 30, 2007
| | | | | | |
Principal
Amount | | | | Fair Value |
| | MUNICIPAL BONDS (94.8%) | | | |
| | | Kentucky (94.8%) | | | |
| $ | 160,000 | | Bell County, KY, Public Properties Corp., First Mortgage-Judicial Center Project Revenue, Prerefunded 3/1/11 @ 102, 5.400%, 3/1/13 | | $ | 172,138 |
| | 310,000 | | Grayson County, KY, Public Properties Corp., Judicial Center Project Public Improvement Revenue (FGIC), 4.375%, 9/1/17 | | | 320,903 |
| | 140,000 | | Jefferson County, KY, School District Finance Corp., Jefferson County School Building Refunding Revenue, Series C, Callable 9/1/14 @ 100 (FSA), 4.000%, 9/1/15 | | | 142,174 |
| | 225,000 | | Kenton County, KY, Public Properties Corp., First Mortgage Court Facilities Project Refunding Revenue (AMBAC), 4.125%, 3/1/16 | | | 229,036 |
| | 405,000 | | Kentucky Area Development Districts Financing, Certificates of Participation, Series L, Callable 5/1/16 @ 100, 5.150%, 5/1/36 | | | 410,702 |
| | 250,000 | | Kentucky Area Development Districts Financing, Certificates of Participation, Series M, Callable 11/13/07 @ 100, 4.300%, 8/1/09 | | | 250,075 |
| | 205,000 | | Kentucky Area Development Districts Financing, City of Ewing, Series E, Callable 6/1/10 @ 102 (Wachovia Bank N.A.), 5.400%, 6/1/14 | | | 215,139 |
| | 500,000 | | Kentucky Asset/Liability Commission, Project Notes-Federal Highway Transit, First Series (MBIA), 4.500%, 9/1/17 | | | 523,935 |
| | 500,000 | | Kentucky Asset/Liability Commission, Project Notes-First Series Revenue (MBIA), 5.000%, 5/1/13 | | | 534,630 |
| | 455,000 | | Kentucky Asset/Liability Commission, University of Kentucky Project Notes Revenue (FGIC), 5.000%, 10/1/15 | | | 494,194 |
| | 500,000 | | Kentucky Economic Development Finance Authority, Catholic Health Initiatives Revenue, Series A, Prerefunded 6/1/10 @ 101, OID, 5.750%, 12/1/15 | | | 532,225 |
| | 1,000,000 | | Kentucky State Property & Buildings Commission, Project No. 66 Revenue, Series A, Prerefunded 5/1/10 @ 100 (MBIA), OID, 5.500%, 5/1/15 | | | 1,048,090 |
| | 500,000 | | Kentucky State Property & Buildings Commission, Project No. 67 Refunding Revenue, Prerefunded 9/1/10 @ 100, 5.500%, 9/1/12 | | | 526,990 |
| | 225,000 | | Kentucky State Property & Buildings Commission, Project No. 69 Refunding Revenue, Series A (FSA), 5.250%, 8/1/10 | | | 235,366 |
| | 540,000 | | Kentucky State Property & Buildings Commission, Project No. 69 Refunding Revenue, Series A (FSA), 5.500%, 8/1/11 | | | 577,276 |
| | 400,000 | | Kentucky State Property & Buildings Commission, Project No. 71 Public Improvements Revenue, Escrowed To Maturity, 5.500%, 8/1/11 | | | 427,612 |
| | 250,000 | | Kentucky State Property & Buildings Commission, Project No. 72 Revenue, Prerefunded 10/1/11 @ 100 (MBIA), 5.375%, 10/1/14 | | | 266,810 |
| | 500,000 | | Kentucky State Property & Buildings Commission, Project No. 72 Revenue, Prerefunded 10/1/11 @ 100 (MBIA), 5.375%, 10/1/15 | | | 533,620 |
| | 400,000 | | Kentucky State Property & Buildings Commission, Project No. 73 Road Funding Revenue, 5.250%, 11/1/11 | | | 424,264 |
| | 500,000 | | Kentucky State Property & Buildings Commission, Project No. 74 Revenue, Prerefunded 2/1/12 @ 100 (FSA), 5.375%, 2/1/14 | | | 535,770 |
| | 495,000 | | Kentucky State Property & Buildings Commission, Project No. 76 Refunding Revenue (AMBAC), 5.500%, 8/1/21 | | | 561,439 |
| | 500,000 | | Kentucky State Property & Buildings Commission, Project No. 79 Revenue, Prerefunded 10/1/13 @ 100 (MBIA), 5.125%, 10/1/16 | | | 540,305 |
| | 365,000 | | Kentucky State Property & Buildings Commission, Project No. 79 Revenue, Prerefunded 10/1/13 @ 100 (MBIA), 5.000%, 10/1/22 | | | 391,981 |
| | 500,000 | | Kentucky State Property & Buildings Commission, Project No. 81 Revenue, Callable 11/1/13 @ 100 (AMBAC), 5.000%, 11/1/16 | | | 534,020 |
| | 365,000 | | Kentucky State Property & Buildings Commission, Project No. 85 Revenue, Prerefunded 8/1/15 @ 100 (FSA), 5.000%, 8/1/21 | | | 396,197 |
| | 300,000 | | Kentucky Turnpike Authority Revenue, Series B (AMBAC), 5.000%, 7/1/15 | | | 324,816 |
| | 400,000 | | Kentucky Turnpike Authority, Revitalization Project Refunding Revenue, Series A (AMBAC), 5.500%, 7/1/12 | | | 433,484 |
| | 170,000 | | Kentucky Turnpike Authority, Revitalization Project Refunding Revenue, Series A (AMBAC), 5.500%, 7/1/15 | | | 189,735 |
| | 95,000 | | Larue County, KY, School District Finance Corp., Larue County School Building Revenue (MBIA), 4.250%, 7/1/15 | | | 98,103 |
| | 175,000 | | Louisville & Jefferson County, KY, Metropolitan Government G.O., Series A, 4.000%, 11/1/13 | | | 178,726 |
| | 400,000 | | Louisville & Jefferson County, KY, Metropolitan Government, Norton Healthcare, Inc. Refunding Revenue, Callable 10/1/16 @ 100, 5.000%, 10/1/30 | | | 393,552 |
| | 980,000 | | Louisville & Jefferson County, KY, Metropolitan Sewer District, Sewer & Drainage Systems Revenue, Series A, Callable 11/15/11 @ 101 (MBIA), OID, 5.000%, 5/15/36 | | | 1,001,521 |
| | 350,000 | | Louisville, KY, Parking Authority Revenue, Callable 7/1/07 @ 100, 7.500%, 7/1/09 | | | 373,768 |
| | 250,000 | | University of Kentucky, Construction of Educational Buildings Revenue, Series Q, 5.000%, 5/1/10 | | | 258,830 |
Continued
65
BB&T Kentucky Intermediate Tax-Free Fund
Schedule of Portfolio Investments — (continued)
September 30, 2007
| | | | | | |
Principal Amount | | | | Fair Value |
| | MUNICIPAL BONDS — (continued) | | | |
| | | Kentucky — (continued) | | | |
| $ | 375,000 | | Warren County, KY, Community Hospital Corp. Project Refunding Revenue, Series A, 5.000%, 8/1/14 | | $ | 385,871 |
| | | | | | |
| | | Total Municipal Bonds (Cost $14,283,104) | | | 14,463,297 |
| | | | | | |
| | |
| Shares | | | | Fair Value |
| | INVESTMENT COMPANY (3.8%) |
| | 584,354 | | Federated Tax-Free Obligations Fund, Institutional Service Class | | $ | 584,354 |
| | | | | | |
| | | Total Investment Company (Cost $584,354) | | | 584,354 |
| | | | | | |
| Total Investments — 98.6%
(Cost $14,867,458) | | | 15,047,651 |
| | Net Other Assets (Liabilities) — 1.4% | | | 207,109 |
| | | | | | |
| | NET ASSETS — 100.0% | | $ | 15,254,760 |
| | | | | | |
See footnote legend to Schedules of Portfolio Investments.
See accompanying notes to the financial statements.
66
BB&T Maryland Intermediate Tax-Free Fund
Schedule of Portfolio Investments
September 30, 2007
| | | | | | |
Principal
Amount | | | | Fair Value |
| | MUNICIPAL BONDS (94.4%) | | | |
| | | District of Columbia (8.1%) | | | |
| $ | 500,000 | | Washington, D.C., Metropolitan Area Transit Authority, Refunding Revenue (MBIA), 5.000%, 7/1/12 | | $ | 530,560 |
| | 320,000 | | Washington, D.C., Metropolitan Area Transit Authority, Refunding Revenue (MBIA), 5.000%, 1/1/14 | | | 343,219 |
| | | | | | |
| | | | | | 873,779 |
| | | | | | |
| | | Maryland (86.3%) | | | |
| | 115,000 | | Anne Arundel County, MD, Construction Water & Sewer Refunding G.O., 5.000%, 3/1/13 | | | 123,335 |
| | 400,000 | | Anne Arundel County, MD, G.O., Prerefunded 3/1/12 @ 100, 5.375%, 3/1/13 | | | 429,468 |
| | 280,000 | | Anne Arundel County, MD, G.O., Prerefunded 3/1/12 @ 100, 5.375%, 3/1/15 | | | 300,628 |
| | 70,000 | | Baltimore County, MD, Water Utility Improvements, Metropolitan District, 70th Issue G.O., 5.000%, 9/1/16 | | | 76,677 |
| | 305,000 | | Baltimore, MD, Water Project, Unrefunded Revenue, Series A (FGIC), OID, 5.000%, 7/1/24 | | | 328,775 |
| | 375,000 | | Carroll County, MD, Public Improvements Refunding G.O., 5.000%, 11/1/15 | | | 409,714 |
| | 250,000 | | Frederick County, MD, Public Facilities Improvements G.O., 5.000%, 12/1/15 | | | 272,587 |
| | 380,000 | | Frederick County, MD, Public Facilities Refunding G.O., 5.000%, 8/1/14 | | | 411,464 |
| | 120,000 | | Maryland Health & Higher Educational Facilities Authority, Anne Arundel Medical Center Revenue, Callable 7/1/08 @ 101 (FSA), OID, 5.125%, 7/1/33 | | | 122,224 |
| | 50,000 | | Maryland Health & Higher Educational Facilities Authority, Doctors Community Hospital Revenue, Series A, Callable 7/1/17 @ 100, 5.000%, 7/1/20 | | | 50,885 |
| | 250,000 | | Maryland Health & Higher Educational Facilities Authority, Helix Health Issue Refunding Revenue, Callable 7/1/12 @ 100 (AMBAC), OID, 5.125%, 7/1/12 | | | 266,972 |
| | 385,000 | | Maryland Health & Higher Educational Facilities Authority, Helix Health Issue Refunding Revenue, Callable 7/1/27 @ 100 (AMBAC), OID, 5.000%, 7/1/27 | | | 411,507 |
| | 40,000 | | Maryland Health & Higher Educational Facilities Authority, Howard County General Hospital Refunding Revenue, Callable 11/13/07 @ 100, OID, 5.500%, 7/1/13 | | | 40,985 |
| | 385,000 | | Maryland Health & Higher Educational Facilities Authority, MD Institutional College of Art Revenue, OID, 4.375%, 6/1/13 | | | 387,537 |
| | 110,000 | | Maryland Health & Higher Educational Facilities Authority, Medstar Health, Inc. Refunding Revenue, 5.000%, 8/15/12 | | | 114,275 |
| | 25,000 | | Maryland Health & Higher Educational Facilities Authority, Mercy Ridge Refunding Revenue, 4.500%, 7/1/14 | | | 25,129 |
| | 500,000 | | Maryland Health & Higher Educational Facilities Authority, Shore Health System Refunding Revenue (Radian), 5.750%, 7/1/29* | | | 500,000 |
| | 200,000 | | Maryland State Department of Transportation, County Transportation Transit Improvements Revenue, 5.250%, 12/15/17 | | | 223,646 |
| | 185,000 | | Maryland State Department of Transportation, Transit Improvements Revenue, Second Issue, 5.000%, 6/1/15 | | | 200,958 |
| | 500,000 | | Maryland State Economic Development Corp. Student Housing Revenue, University of Maryland College Park Project, Prerefunded 6/1/13 @100, 6.000%, 6/1/21 | | | 561,070 |
| | 300,000 | | Maryland State Economic Development Corp., Lutheran World Relief Refugee Refunding Revenue, Callable 4/1/17 @ 100, 5.250%, 4/1/19 | | | 314,175 |
| | 305,000 | | Maryland State Transportation Authority Grant & Revenue Anticipate, MD Transit Improvements Revenue, 5.000%, 3/1/16 | | | 330,870 |
| | 380,000 | | Maryland State, State & Local Facilities Loan Cash Flow Management G.O., Second Series, 5.000%, 8/1/11 | | | 400,585 |
| | 500,000 | | Maryland State, State & Local Facilities Loan Public Improvements G.O., First Series, 5.500%, 3/1/12 | | | 540,435 |
| | 130,000 | | Montgomery County, MD, Construction & Public Improvements G.O., Series A, Prerefunded 2/1/12 @ 101, 5.000%, 2/1/22 | | | 138,687 |
| | 300,000 | | Montgomery County, MD, Construction & Public Improvements Refunding G.O., Series A, 5.000%, 7/1/17 | | | 329,106 |
| | 500,000 | | Prince Georges County, MD, Construction & Public Improvements G.O., 5.000%, 10/1/14 | | | 542,210 |
| | 30,000 | | Prince Georges County, MD, Construction & Public Improvements G.O., Series B, 5.000%, 10/1/12 | | | 32,037 |
| | 590,000 | | University System of Maryland, Auxiliary Facilities and Tuition Refunding Revenue, Series A, 5.000%, 4/1/15 | | | 639,277 |
| | 80,000 | | University System of Maryland, Auxiliary Facilities Refunding Revenue, Series A, 5.000%, 4/1/13 | | | 85,716 |
| | 200,000 | | University System of Maryland, Auxiliary Refunding Revenue, Series A, 5.000%, 4/1/13 | | | 214,290 |
| | 100,000 | | Washington County, MD, Public Improvements, G.O. (FGIC), Callable 11/13/07 @ 100, 4.800%, 1/1/08 | | | 100,097 |
| | 275,000 | | Washington Suburban Sanitation District, MD, Sewer Disposal Refunding G.O., 5.000%, 6/1/12 | | | 292,512 |
| | 100,000 | | Washington Suburban Sanitation District, MD, Water Supply Refunding G.O., Prerefunded 6/1/11 @ 100, OID, 4.700%, 6/1/18 | | | 103,960 |
| | | | | | |
| | | | | | 9,321,793 |
| | | | | | |
| | | Total Municipal Bonds (Cost $10,046,206) | | | 10,195,572 |
| | | | | | |
Continued
67
BB&T Maryland Intermediate Tax-Free Fund
Schedule of Portfolio Investments — (continued)
September 30, 2007
| | | | | |
| Shares | | | | Fair Value |
| INVESTMENT COMPANY (2.8%) | | | |
| 299,808 | | Federated Maryland Municipal Cash Trust | | $ | 299,808 |
| | | | | |
| | Total Investment Company (Cost $299,808) | | | 299,808 |
| | | | | |
Total Investments — 97.2%
(Cost $10,346,014) | | | 10,495,380 |
| Net Other Assets (Liabilities) — 2.8% | | | 307,826 |
| | | | | |
| NET ASSETS — 100.0% | | $ | 10,803,206 |
| | | | | |
See footnote legend to Schedules of Portfolio Investments.
See accompanying notes to the financial statements.
68
BB&T North Carolina Intermediate Tax-Free Fund
Schedule of Portfolio Investments
September 30, 2007
| | | | | | |
Principal
Amount | | | | Fair Value |
| | MUNICIPAL BONDS (97.3%) | | | |
| | | North Carolina (97.3%) | | | |
| $ | 1,000,000 | | Alamance County, NC, School Improvements G.O., Callable 2/1/16 @ 100, 5.000%, 2/1/19 | | $ | 1,073,880 |
| | 395,000 | | Albemarle, NC, Healthcare Facilities Refunding Revenue, OID, 4.500%, 10/1/11 | | | 397,445 |
| | 265,000 | | Albemarle, NC, Hospital Authority Revenue, OID, 4.500%, 10/1/12 | | | 266,002 |
| | 1,000,000 | | Appalachian State University, NC, Refunding Revenue, Callable 7/15/15 @ 100 (MBIA), 5.250%, 7/15/20 | | | 1,081,410 |
| | 1,150,000 | | Bladen County, NC, School Improvements G.O., Prerefunded 5/1/10 @ 101.50 (FSA), 5.600%, 5/1/13 | | | 1,224,175 |
| | 1,455,000 | | Broad River Water Authority, NC, Water System Refunding Revenue, Callable 6/1/15 @ 100 (XLCA), 5.000%, 6/1/18 | | | 1,544,934 |
| | 1,050,000 | | Broad River Water Authority, NC, Water System Refunding Revenue, Callable 6/1/15 @ 100 (XLCA), 5.000%, 6/1/19 | | | 1,109,220 |
| | 1,000,000 | | Brunswick County, NC, Enterprise Systems Revenue, Series A, Callable 4/1/14 @ 100 (FSA), 5.250%, 4/1/17 | | | 1,082,190 |
| | 1,460,000 | | Charlotte, NC, Public Improvements G.O., 5.500%, 6/1/09 | | | 1,508,706 |
| | 2,385,000 | | Charlotte, NC, Refunding G.O., Series B, 5.000%, 6/1/15 | | | 2,595,715 |
| | 1,000,000 | | Charlotte, NC, Storm Water Fee Public Improvements, Callable 6/1/16 @ 100, 5.000%, 6/1/23 | | | 1,054,630 |
| | 1,550,000 | | Charlotte-Mecklenburg Hospital Authority, NC, Carolinas Health Care System Revenue, Series A, Prerefunded 1/15/15 @ 100, OID, 5.000%, 1/15/45 | | | 1,671,474 |
| | 1,600,000 | | Charlotte-Mecklenburg Hospital Authority, NC, Carolinas Healthcare System Refunding Revenue, Series A, Prerefunded 11/13/07 @ 102, OID, 5.000%, 1/15/13 | | | 1,635,056 |
| | 590,000 | | Chatham County, NC, School Improvements Certificates of Participation, Callable 6/1/16 @ 100 (AMBAC), 5.000%, 6/1/24 | | | 617,429 |
| | 75,000 | | Cumberland County Finance Corp. , NC, Installment Payment, Detention Center and Mental Health Refunding Revenue, Callable 6/1/09 @ 101 (AMBAC), 5.625%, 6/1/18 | | | 78,062 |
| | 3,615,000 | | Cumberland County, NC, Refunding G.O. (MBIA), 5.000%, 5/1/13 | | | 3,872,930 |
| | 2,565,000 | | Cumberland County, NC, Refunding G.O. (MBIA), 5.000%, 5/1/14 | | | 2,768,199 |
| | 1,055,000 | | Cumberland County, NC, School Improvements G.O., 5.500%, 3/1/09 | | | 1,084,646 |
| | 1,280,000 | | Durham, NC, Refunding G.O., 5.000%, 2/1/13 | | | 1,369,523 |
| | 1,000,000 | | Durham, NC, Refunding G.O., 5.000%, 4/1/15 | | | 1,086,930 |
| | 1,000,000 | | Durham, NC, Water & Sewer Utilities System Revenue, Callable 6/1/11 @ 101, 5.000%, 6/1/12 | | | 1,057,930 |
| | 215,000 | | Forsyth County, NC, School Improvements G.O., 4.500%, 7/1/17 | | | 226,447 |
| | 1,780,000 | | Forsyth County, NC, School Improvements G.O., Callable 7/1/17 @ 100, 5.000%, 7/1/25 | | | 1,887,085 |
| | 1,000,000 | | Gastonia, NC, Combined Utilities System Refunding Revenue (MBIA), 5.000%, 5/1/10 | | | 1,037,080 |
| | 210,000 | | Gastonia, NC, Combined Utilities System Revenue, Callable 5/1/15 @ 100 (AMBAC), 5.000%, 5/1/16 | | | 226,090 |
| | 1,455,000 | | Greenville, NC, Greenville Enterprise Systems Refunding Revenue (FSA), 5.500%, 9/1/10 | | | 1,535,607 |
| | 2,000,000 | | Guilford County, NC, Public Improvements G.O., Series B, 5.000%, 10/1/09 | | | 2,062,000 |
| | 2,030,000 | | Guilford County, NC, Public Improvements G.O., Series B, Prerefunded 10/1/10 @ 102, OID, 5.250%, 10/1/15 | | | 2,166,578 |
| | 1,845,000 | | Harnett County, NC, Custody Receipts Refunding G.O., Callable 6/1/14 @ 100 (AMBAC), 5.000%, 6/1/20 | | | 1,957,102 |
| | 2,245,000 | | Harnett County, NC, School Improvements Certificates of Participation, Series A, Callable 12/1/17 @ 100 (FSA), 5.000%, 12/1/21 | | | 2,377,073 |
| | 185,000 | | High Point, NC, Combined Enterprise System Revenue, Callable 11/1/16 @ 100 (FSA), OID, 4.200%, 11/1/18 | | | 188,328 |
| | 1,180,000 | | Iredell County Public Facilities Corp., NC, School Projects Revenue, Prerefunded 6/1/10 @ 101 (AMBAC), 6.000%, 6/1/14 | | | 1,264,453 |
| | 1,070,000 | | Johnston County Finance Corp., NC, School & Museum Projects Revenue, Prerefunded 8/1/09 @ 101 (FSA), 5.500%, 8/1/10 | | | 1,118,610 |
| | 1,000,000 | | Johnston County, NC, Public Improvements Callable 2/1/17 @ 100 (FGIC), 5.000%, 2/1/24 | | | 1,062,830 |
| | 2,010,000 | | Johnston County, NC, Public Improvements G.O., Callable 2/1/17 @ 100 (FGIC), 5.000%, 2/1/20 | | | 2,162,036 |
| | 1,000,000 | | Johnston County, NC, School Improvements G.O., Prerefunded 3/1/10 @ 101 (FGIC), 5.500%, 3/1/10 | | | 1,054,560 |
| | 125,000 | | Lenoir County, NC, Public Improvements G.O., Callable 2/1/17 @ 100 (FSA), 5.000%, 2/1/21 | | | 133,251 |
| | 125,000 | | Lincoln County, NC, Middle School Project Certificates of Participation (FSA), 5.000%, 6/1/16 | | | 134,764 |
| | 1,000,000 | | New Hanover County, NC, New Hanover Regional Medical Center Project Revenue, Callable 10/1/09 @ 101 (MBIA), 5.250%, 10/1/12 | | | 1,038,430 |
| | 1,500,000 | | New Hanover County, NC, Public Improvements G.O., 5.300%, 11/1/08 | | | 1,529,430 |
| | 1,850,000 | | New Hanover County, NC, Refunding G.O., Callable 11/1/13 @ 100, 5.000%, 11/1/14 | | | 1,985,568 |
| | 3,500,000 | | North Carolina Capital Facilities Finance Agency, A&T University Foundation Project B Revenue, (Radian), 6.000%, 6/1/35* | | | 3,500,000 |
| | 585,000 | | North Carolina Capital Facilities Finance Agency, Brevard College Corp. Refunding Revenue, 4.250%, 10/1/15 | | | 566,081 |
| | 425,000 | | North Carolina Capital Facilities Finance Agency, Brevard College Corp. Refunding Revenue, OID, 4.000%, 10/1/12 | | | 413,521 |
| | 290,000 | | North Carolina Capital Facilities Finance Agency, Brevard College Corp. Refunding Revenue, OID, 4.125%, 10/1/13 | | | 281,874 |
Continued
69
BB&T North Carolina Intermediate Tax-Free Fund
Schedule of Portfolio Investments — (continued)
September 30, 2007
| | | | | | |
Principal
Amount | | | | Fair Value |
| | MUNICIPAL BONDS — (continued) | | | |
| | | North Carolina — (continued) | | | |
| $ | 585,000 | | North Carolina Capital Facilities Finance Agency, Brevard College Corp. Refunding Revenue, OID, 4.125%, 10/1/14 | | $ | 563,589 |
| | 2,015,000 | | North Carolina Eastern Municipal Power Agency, NC, Power System Refunding Revenue, Series A, Callable 1/1/16 @ 100 (AMBAC), 5.250%, 1/1/20 | | | 2,162,679 |
| | 715,000 | | North Carolina Eastern Municipal Power Agency, Power System Refunding Revenue, Series A, Prerefunded 1/1/17 @ 100, OID, 5.000%, 1/1/17 | | | 767,338 |
| | 2,860,000 | | North Carolina Eastern Municipal Power Agency, Power System Refunding Revenue, Series A, Prerefunded 1/1/22 @ 100, OID, 4.500%, 1/1/24 | | | 2,929,956 |
| | 2,235,000 | | North Carolina Eastern Municipal Power Agency, Power System Revenue, Series A, Callable 1/1/21 @ 100, OID, 6.400%, 1/1/21 | | | 2,653,928 |
| | 335,000 | | North Carolina Medical Care Commission, Arbor Acres Unlimited Refunding Revenue, 4.500%, 1/1/17 | | | 330,243 |
| | 1,325,000 | | North Carolina Medical Care Commission, Carolina Medicorp Project Revenue, Callable 11/13/07 @ 100, OID, 5.250%, 5/1/09 | | | 1,326,564 |
| | 530,000 | | North Carolina Medical Care Commission, Gaston Memorial Hospital Project Refunding Revenue, Callable 11/13/07 @ 101, OID, 5.400%, 2/15/11 | | | 540,748 |
| | 2,130,000 | | North Carolina Medical Care Commission, Gaston Memorial Hospital Project Refunding Revenue, Callable 11/13/07 @ 101, OID, 5.500%, 2/15/15 | | | 2,184,379 |
| | 1,180,000 | | North Carolina Medical Care Commission, Health Care & Housing Projects Revenue, Series A (HUD Section 8), 4.650%, 10/1/14 | | | 1,187,717 |
| | 1,000,000 | | North Carolina Medical Care Commission, NC, Health Care Facilities Revenue, Stanly Memorial Hospital Project, Callable 10/1/09 @ 101 OID, 6.250%, 10/1/19 | | | 1,039,850 |
| | 1,000,000 | | North Carolina Medical Care Commission, NC, Health Care Housing ARC Projects Revenue, Series A, Callable 10/1/14 @ 101 (HUD Section 8), 5.500%, 10/1/24 | | | 1,020,750 |
| | 335,000 | | North Carolina Medical Care Commission, Pitt County Hospital Refunding Revenue, Series A, Prerefunded 12/1/08 @ 101, 5.250%, 12/1/13 | | | 344,970 |
| | 750,000 | | North Carolina Medical Care Commission, Stanly Memorial Hospital Project Refunding Revenue, Callable 11/13/07 @ 101 (AMBAC), OID, 5.450%, 10/1/08 | | | 758,513 |
| | 1,115,000 | | North Carolina Medical Care Commission, Wilson Medical Center Refunding Revenue, 5.000%, 11/1/17 | | | 1,165,576 |
| | 255,000 | | North Carolina Municipal Power Agency No. 1, Catawba Electric Power Refunding Revenue, Callable 1/1/13 @ 100 (AMBAC-TCRS), OID, 5.500%, 1/1/13 | | | 273,360 |
| | 90,000 | | North Carolina Municipal Power Agency No. 1, Catawba Electric Power Revenue, Callable 1/1/20 @ 100, OID, 5.000%, 1/1/20 | | | 96,887 |
| | 1,000,000 | | North Carolina State University at Raleigh, NC, Refunding Revenue, Series A, Callable 10/1/15 @ 100 (AMBAC), 5.000%, 10/1/24 | | | 1,048,380 |
| | 1,000,000 | | North Carolina State, Clean Water G.O., Series A, Callable 3/1/16 @ 100, 5.000%, 3/1/17 | | | 1,085,570 |
| | 2,765,000 | | North Carolina State, Refunding G.O., Series A, 5.000%, 9/1/16 | | | 3,026,569 |
| | 1,000,000 | | North Carolina State, Vehicle Grant Revenue, Highway Improvements (MBIA), 5.000%, 3/1/17 | | | 1,085,790 |
| | 1,000,000 | | North Carolina State, Vehicle Grant Revenue, Highway Improvements, Callable 3/1/17 @ 100 (MBIA), 5.000%, 3/1/18 | | | 1,079,320 |
| | 1,410,000 | | Onslow County, NC, School Improvements G.O., Callable 6/1/16 @ 100 (MBIA), OID, 4.500%, 6/1/24 | | | 1,430,163 |
| | 1,040,000 | | Pasquotank County, NC, Refunding Certificates of Participation (MBIA), 5.250%, 6/1/18 | | | 1,142,502 |
| | 1,385,000 | | Piedmont Triad Airport Authority, NC, Refunding Revenue, Series A, Prerefunded 7/1/09 @ 101 (FSA), 6.375%, 7/1/16 | | | 1,466,244 |
| | 2,440,000 | | Pitt County, NC, Pitt County Memorial Hospital Project Refunding Revenue, Callable 11/13/07 @ 101, OID, 5.500%, 12/1/15 | | | 2,634,883 |
| | 745,000 | | Pitt County, NC, School Facilities Project Refunding Certificates of Participation, Series B (AMBAC), 5.000%, 4/1/13 | | | 793,246 |
| | 1,750,000 | | Randolph County, NC, Public Improvements Certificates of Participation, Prerefunded 6/1/09 @ 101 (FSA), OID, 5.300%, 6/1/13 | | | 1,818,478 |
| | 745,000 | | Randolph County, NC, School Improvements Certificates of Participation (AMBAC), 4.250%, 2/1/17 | | | 759,252 |
| | 85,000 | | Randolph County, NC, School Improvements Certificates of Participation (AMBAC), 4.000%, 2/1/11 | | | 85,978 |
| | 405,000 | | Randolph County, NC, School Improvements Certificates of Participation (AMBAC), 4.000%, 2/1/15 | | | 409,042 |
| | 935,000 | | Rutherford County, NC, Refunding Certificates of Participation, Callable 9/1/12 @ 101 (AMBAC), 5.000%, 9/1/18 | | | 985,378 |
| | 1,315,000 | | Union County, NC, School Improvements G.O., Series D (MBIA), 5.000%, 3/1/14 | | | 1,419,490 |
| | 1,255,000 | | University of North Carolina at Charlotte, Series B, Callable 4/1/17 @ 100 (FSA), 5.000%, 4/1/32 | | | 1,299,176 |
| | 880,000 | | University of North Carolina, System Pool Revenue, Series A (AMBAC), 5.000%, 4/1/14 | | | 947,478 |
| | 3,375,000 | | Wake County, NC, Public Improvements G.O., 5.000%, 3/1/12 | | | 3,577,939 |
| | 1,900,000 | | Wake County, NC, School Improvements G.O., Callable 5/1/15 @ 100, 5.000%, 5/1/21 | | | 2,009,630 |
| | 1,000,000 | | Wake County, NC, School Improvements G.O., Prerefunded 2/1/10 @ 100.50, 5.300%, 2/1/11 | | | 1,044,000 |
| | 2,175,000 | | Wake County, NC, Wake County Hospital Revenue, Callable 10/1/13 @ 100 (MBIA), OID, 5.125%, 10/1/13 | | | 2,351,545 |
Continued
70
BB&T North Carolina Intermediate Tax-Free Fund
Schedule of Portfolio Investments — (continued)
September 30, 2007
| | | | | | |
Principal
Amount | | | | Fair Value |
| | MUNICIPAL BONDS — (continued) | | | |
| | | North Carolina — (continued) | | | |
| $ | 60,000 | | Wilmington, NC, Refunding Water Revenue, Certificates of Participation, Series A, Callable 6/1/16 @ 100, 5.000%, 6/1/22 | | $ | 62,878 |
| | 500,000 | | Winston-Salem, NC, Water & Sewer System Refunding Revenue, Series A, 4.000%, 6/1/17 | | | 503,255 |
| | 2,080,000 | | Winston-Salem, NC, Water & Sewer System Refunding Revenue, Series A, Callable 6/1/17 @ 100, 5.000%, 6/1/19 | | | 2,239,515 |
| | 1,065,000 | | Winston-Salem, NC, Water & Sewer Systems Refunding Revenue, Callable 6/1/15 @ 100, 5.000%, 6/1/20 | | | 1,129,709 |
| | | | | | |
| | | Total Municipal Bonds (Cost $110,665,537) | | | 112,871,741 |
| | | | | | |
| | |
| Shares | | | | Fair Value |
| | INVESTMENT COMPANY (2.2%) | | | |
| | 2,452,650 | | BlackRock North Carolina Municipal Money Market Portfolio, Institutional Class | | $ | 2,452,650 |
| | | | | | |
| | | Total Investment Company (Cost $2,452,650) | | | 2,452,650 |
| | | | | | |
| Total Investments — 99.5%
(Cost $113,118,187) | | | 115,324,391 |
| | Net Other Assets (Liabilities) — 0.5% | | | 625,429 |
| | | | | | |
| | NET ASSETS — 100.0% | | $ | 115,949,820 |
| | | | | | |
See footnote legend to Schedules of Portfolio Investments.
See accompanying notes to the financial statements.
71
BB&T South Carolina Intermediate Tax-Free Fund
Schedule of Portfolio Investments
September 30, 2007
| | | | | | |
Principal
Amount | | | | Fair Value |
| | MUNICIPAL BONDS (95.3%) | | | |
| | | South Carolina (95.3%) | | | |
| $ | 500,000 | | Anderson County School District No. 2, SC, G.O., Series B, Prerefunded 3/1/10 @ 101 (SCSDE), 6.000%, 3/1/12 | | $ | 532,920 |
| | 255,000 | | Anderson County School District No. 4, SC, G.O., Callable 3/1/16 @ 100 (FSA, SCSDE), 4.500%, 3/1/23 | | | 256,951 |
| | 125,000 | | Beaufort County School District, SC, Refunding G.O., Series A (SCSDE), 5.000%, 3/1/13 | | | 133,679 |
| | 465,000 | | Beaufort County School District, SC, Refunding G.O., Series A, Callable 3/1/15 @ 100 (SCSDE), 5.000%, 3/1/19 | | | 491,849 |
| | 300,000 | | Beaufort County, SC, Refunding G.O., Series B, Callable 3/1/16 @ 100 (MBIA, State Aid Withholding), 5.000%, 3/1/21 | | | 317,745 |
| | 345,000 | | Berkeley County, SC, Water & Sewer Systems Improvements Revenue, Series A, Callable 6/1/15 @ 100 (FSA), 5.000%, 6/1/21 | | | 362,699 |
| | 300,000 | | Berkeley County, SC, Water & Sewer Systems Improvements Revenue, Series A, Callable 6/1/15 @ 100 (FSA), 5.000%, 6/1/24 | | | 313,386 |
| | 165,000 | | Charleston County School District Development Corp., SC, Refunding G.O., Series B, Callable 2/1/12 @ 100 (SCSDE), 5.000%, 2/1/19 | | | 172,176 |
| | 70,000 | | Charleston County, SC, Transition Sales Tax G.O., Callable 11/1/15 @ 100 (State Aid Withholding), 4.625%, 11/1/27 | | | 71,060 |
| | 335,000 | | Charleston, SC, Refunding and Capital Improvements Revenue, 5.125%, 1/1/12 | | | 355,663 |
| | 570,000 | | Charleston, SC, Waterworks & Sewer Systems Refunding Revenue, Callable 1/1/11 @ 101, 5.250%, 1/1/14 | | | 602,273 |
| | 175,000 | | College of Charleston, SC, Higher Education Facility Revenue, Series C, Callable 4/1/17 @ 100 (XLCA), 5.000%, 4/1/22 | | | 184,618 |
| | 115,000 | | Educational Facilities Authority, SC, Wofford College Revenue, Series A, 4.250%, 4/1/16 | | | 114,310 |
| | 190,000 | | Educational Facilities Authority, SC, Wofford College Revenue, Series A, 4.250%, 4/1/17 | | | 187,659 |
| | 500,000 | | Florence County, SC, McLeod Regional Medical Center Project Refunding Revenue, Series A, Callable 11/1/08 @ 102 (MBIA), 5.250%, 11/1/11 | | | 518,300 |
| | 100,000 | | Florence, SC, New Public Housing Authority Revenue, Callable 2/1/08 @ 100 (U.S. Government Guaranteed), 5.750%, 8/1/10 | | | 105,145 |
| | 375,000 | | Georgetown County School District, SC, School Improvements G.O., Prerefunded 3/1/11 @ 100 (SCSDE), 5.750%, 3/1/13 | | | 401,250 |
| | 380,000 | | Greenville, SC, Waterworks Revenue, Callable 2/1/13 @ 100, 5.250%, 2/1/19 | | | 407,341 |
| | 550,000 | | Horry County School District, SC, School Improvements G.O., Series A (SCSDE), 5.000%, 3/1/11 | | | 576,394 |
| | 250,000 | | Horry County School District, SC, School Improvements G.O., Series A, Callable 3/1/12 @ 100 (SCSDE), 5.375%, 3/1/15 | | | 267,045 |
| | 500,000 | | Kershaw County School District, SC, School Improvements G.O., Prerefunded 2/1/10 @ 100 (SCSDE), 6.125%, 2/1/16 | | | 528,775 |
| | 500,000 | | Lancaster County, SC, Edenmoor Improvements District, Special Assessment, Series A, Callable 12/1/16 @ 101, 5.750%, 12/1/37 | | | 485,330 |
| | 195,000 | | Laurens County School District No. 55, SC, Refunding Revenue, Callable 12/1/15 @ 100, 5.250%, 12/1/24 | | | 199,803 |
| | 60,000 | | Laurens County School District No. 56, SC, School Improvements G.O. (MBIA, SCSDE), 4.125%, 3/1/15 | | | 61,433 |
| | 275,000 | | Lexington County, SC, Health Services District Income Hospital Refunding Revenue, 5.000%, 11/1/15 | | | 287,512 |
| | 485,000 | | Lexington County, SC, Health Services District Income Hospital Revenue, Prerefunded 11/1/13 @ 100, OID, 5.500%, 11/1/32 | | | 531,652 |
| | 500,000 | | Medical University Hospital Authority, SC, Refunding Revenue, Series A, 6.000%, 8/15/12 | | | 552,540 |
| | 300,000 | | Medical University of South Carolina, Hospital Facilities Revenue, Prerefunded 7/1/09 @ 101, OID, 5.700%, 7/1/12 | | | 313,701 |
| | 15,000 | | Newberry County, SC, School Project Revenue, Callable 12/1/15 @ 100 (Assured Guaranty), 5.250%, 12/1/21 | | | 16,169 |
| | 55,000 | | Orangeburg Joint Governmental Action Authority, Orangeburg County, SC, Public Improvements Revenue (MBIA), 5.000%, 4/1/10 | | | 56,898 |
| | 400,000 | | Orangeburg Joint Governmental Action Authority, Orangeburg County, SC, Public Improvements Revenue (MBIA), 5.000%, 10/1/12 | | | 425,264 |
| | 400,000 | | Richland County, SC, Environmental Improvements Refunding Revenue, Series A, 4.600%, 9/1/12 | | | 403,672 |
| | 65,000 | | Richland County, SC, School District No. 1, Refunding G.O., Callable 3/1/15 @ 100 (FSA, SCSDE), 5.000%, 3/1/19 | | | 68,753 |
| | 500,000 | | Richland County, SC, School District No. 2, School Improvements G.O., Series B, Callable 5/1/17 @ 100 (MBIA, SCSDE), 5.000%, 5/1/20 | | | 535,375 |
| | 400,000 | | Scago Educational Facilities Corporation for Colleton School District, SC, Pickens County Project Revenue (FSA), 5.000%, 12/1/14 | | | 430,188 |
| | 500,000 | | South Carolina Jobs-Economic Development Authority, Anderson Area Medical Center Revenue, Callable 2/1/09 @ 101 (FSA), 5.500%, 2/1/11 | | | 516,940 |
| | 700,000 | | South Carolina Jobs-Economic Development Authority, Hospital Facilities Oconee Memorial Hospital Project A Refunding Revenue, Callable 10/12/07 @ 100 (Radian), 6.000%, 10/1/35* | | | 700,000 |
| | 200,000 | | South Carolina Jobs-Economic Development Authority, Refunding & Improvement- Palmetto Health Facilities Revenue, Series C, 6.000%, 8/1/12 | | | 214,236 |
Continued
72
BB&T South Carolina Intermediate Tax-Free Fund
Schedule of Portfolio Investments — (continued)
September 30, 2007
| | | | | | |
Principal
Amount | | | | Fair Value |
| | MUNICIPAL BONDS — (continued) | | | |
| | | South Carolina — (continued) | | | |
| $ | 600,000 | | South Carolina State Public Service Authority, Public Improvements Revenue, Series A, Callable 1/1/14 @ 100 (AMBAC), 5.000%, 1/1/20 | | $ | 631,458 |
| | 125,000 | | South Carolina State Public Service Authority, Public Improvements Revenue, Series A, Callable 1/1/14 @ 100 (FSA), 5.000%, 1/1/17 | | | 133,494 |
| | 500,000 | | South Carolina Transportation Infrastructure Bank, Refunding Revenue, Series B (AMBAC), 5.250%, 10/1/15 | | | 550,925 |
| | 300,000 | | South Carolina, State Highway Refunding G.O., Series A, Callable 8/1/15 @ 100, 4.250%, 8/1/17 | | | 308,208 |
| | 270,000 | | South Carolina, State University Improvements G.O., Series D, Callable 10/1/16 @ 100, OID (State Aid Withholding), 4.000%, 10/1/18 | | | 270,872 |
| | 525,000 | | Spartanburg County School District No. 5, SC, School Improvements G.O. (SCSDE), 5.250%, 5/1/10 | | | 547,953 |
| | 295,000 | | Spartanburg, SC, Waterworks Refunding Junior Lien Revenue (FSA), 5.250%, 6/1/11 | | | 312,225 |
| | 300,000 | | Sumter, SC, Waterworks & Sewer System Improvements Revenue Bonds, Callable 12/1/17 @ 100 (XLCA), 5.000%, 12/1/19 | | | 321,771 |
| | | | | | |
| | | Total Municipal Bonds (Cost $15,516,184) | | | 15,777,610 |
| | | | | | |
| | |
| Shares | | | | |
| | INVESTMENT COMPANY (2.9%) | | | |
| | 481,931 | | Federated Tax-Free Obligations Fund, Institutional Service Class | | | 481,931 |
| | | | | | |
| | | Total Investment Company (Cost $481,931) | | | 481,931 |
| | | | | | |
| Total Investments — 98.2%
(Cost $15,998,115) | | | 16,259,541 |
| | Net Other Assets (Liabilities) — 1.8% | | | 298,903 |
| | | | | | |
| | NET ASSETS — 100.0% | | $ | 16,558,444 |
| | | | | | |
See footnote legend to Schedules of Portfolio Investments.
See accompanying notes to the financial statements.
73
BB&T Virginia Intermediate Tax-Free Fund
Schedule of Portfolio Investments
September 30, 2007
| | | | | | |
Principal
Amount | | | | Fair Value |
| | MUNICIPAL BONDS (97.6%) | | | |
| | | District of Columbia (2.2%) | | | |
| $ | 1,615,000 | | Washington Metropolitan Area Transit Authority, Refunding Revenue (FGIC), 6.000%, 7/1/09 | | $ | 1,683,735 |
| | | Virginia (95.4%) | | | |
| | 1,000,000 | | Alexandria, VA, Construction & Public Improvements G.O., 5.000%, 1/1/13 | | | 1,069,440 |
| | 1,000,000 | | Alexandria, VA, Public Improvements G.O., Series A, 5.000%, 6/15/16 | | | 1,092,990 |
| | 1,000,000 | | Alexandria, VA, Refunding G.O. (State Aid Withholding), 5.000%, 6/15/21 | | | 1,096,940 |
| | 1,000,000 | | Arlington County, VA, Industrial Development Authority, VA Hospital Center Arlington Health System Revenue, 5.500%, 7/1/10 | | | 1,041,390 |
| | 1,000,000 | | Arlington County, VA, Public Improvements G.O., Prerefunded 6/1/09 @ 100 (State Aid Withholding), 5.125%, 6/1/11 | | | 1,027,200 |
| | 1,095,000 | | Arlington County, VA, Refunding & Improvements G.O., Callable 5/15/14 @ 100, 5.000%, 5/15/15 | | | 1,180,180 |
| | 570,000 | | Chesapeake, VA, Refunding G.O., 5.000%, 6/1/13 | | | 611,205 |
| | 805,000 | | Chesapeake, VA, Refunding Public Improvements G.O., 5.000%, 5/1/11 | | | 844,839 |
| | 2,500,000 | | Chesterfield County, VA, Industrial Development Authority, Electric & Power Co. Revenue, Callable 11/8/07 @ 100.50, 5.500%, 10/1/09 | | | 2,527,875 |
| | 3,440,000 | | Chesterfield County, VA, Refunding Public Improvements G.O., 5.000%, 1/1/14 | | | 3,709,524 |
| | 1,000,000 | | Fairfax County, VA, Economic Development Authority, Parking Facility Improvements, Vienna II Metrorail Revenue, 1st Series, Prerefunded 9/1/09 @ 102, OID, 5.250%, 9/1/10 | | | 1,051,750 |
| | 1,000,000 | | Henrico County, VA, Water & Sewer Refunding Revenue, Callable 5/1/09 @ 102, 5.250%, 5/1/11 | | | 1,044,480 |
| | 675,000 | | Leesburg, VA, Public Utilities G.O., Callable 7/1/16 @ 100 (MBIA), 4.750%, 7/1/23 | | | 698,929 |
| | 1,000,000 | | Loudoun County, VA, Public Improvements G.O., Series B, 5.000%, 12/1/14 | | | 1,087,260 |
| | 2,000,000 | | Loudoun County, VA, Public Improvements G.O., Series B (State Aid Withholding), 5.000%, 12/1/16 | | | 2,192,780 |
| | 1,000,000 | | Loudoun County, VA, Public Improvements, Series B, 5.000%, 12/1/15 | | | 1,092,560 |
| | 1,000,000 | | Loudoun County, VA, Sanitation Authority, Water Utility Improvements Revenue (FSA), 5.750%, 1/1/11 | | | 1,068,660 |
| | 1,265,000 | | Newport News, VA, Refunding G.O., Series B, (State Aid Withholding), 5.000%, 2/1/15 | | | 1,367,124 |
| | 1,000,000 | | Newport News, VA, Refunding Public Improvements-Water G.O., Series B, 5.250%, 7/1/21 | | | 1,113,250 |
| | 1,845,000 | | Newport News, VA, School Improvements G.O., Series A, Prerefunded 5/1/10 @ 102, OID, 5.500%, 5/1/13 | | | 1,968,375 |
| | 1,030,000 | | Norfolk, VA, Water Utility Improvements Refunding Revenue, Callable 11/1/08 @ 101 (FSA), 5.125%, 11/1/11 | | | 1,057,099 |
| | 1,065,000 | | Pittsylvania County, VA, School Improvements G.O., Series B, Callable 3/1/11 @ 102 (MBIA, State Aid Withholding), 5.625%, 3/1/15 | | | 1,151,286 |
| | 1,000,000 | | Portsmouth, VA, Public Utility Refunding G.O., Series B, Callable 4/1/15 @ 100 (MBIA), 5.000%, 4/1/21 | | | 1,056,430 |
| | 885,000 | | Portsmouth, VA, Public Utility Refunding G.O., Series B, Callable 4/1/15 @ 100 (MBIA), 5.000%, 4/1/22 | | | 933,702 |
| | 950,000 | | Prince William County, VA, Service Authority, Water & Sewer Systems Refunding Revenue, Callable 7/1/13 @ 102, 5.000%, 7/1/14 | | | 1,025,554 |
| | 1,185,000 | | Richmond, VA, Public Utility Refunding Revenue, Callable 1/15/17 @ 100 (FSA), 4.500%, 1/15/22 | | | 1,203,842 |
| | 1,395,000 | | Spotsylvania County, VA, Public Improvements G.O., Callable 1/15/16 @ 100 (FSA), 5.000%, 1/15/17 | | | 1,509,892 |
| | 2,925,000 | | Spotsylvania County, VA, Refunding G.O. (FSA), 5.500%, 7/15/12 | | | 3,179,768 |
| | 1,500,000 | | Suffolk, VA, Refunding Public Improvements Refunding G.O., Series A (MBIA), 5.000%, 2/1/16 | | | 1,627,350 |
| | 2,600,000 | | Suffolk, VA, Refunding Public Improvements Refunding G.O., Series A (MBIA), 5.000%, 2/1/17 | | | 2,827,942 |
| | 105,000 | | University of Virginia, General University Revenue, Series B, Callable 6/1/13 @ 100, 5.000%, 6/1/22 | | | 110,115 |
| | 1,000,000 | | Upper Occoquan, VA, Sewer Authority, Refunding Revenue, Callable 7/1/15 @ 100 (FSA), 5.000%, 7/1/25 | | | 1,045,030 |
| | 2,500,000 | | Virginia Beach, VA, Public Improvements G.O., Prerefunded 3/1/10 @ 101 (State Aid Withholding), OID, 5.250%, 3/1/11 | | | 2,622,600 |
| | 935,000 | | Virginia College Building Authority, 21st Century College & Equipment Program Revenue, 5.000%, 2/1/10 | | | 966,229 |
| | 1,610,000 | | Virginia College Building Authority, 21st Century College & Equipment Program Revenue, Series B, Callable 2/1/17 @ 100, 5.000%, 2/1/18 | | | 1,739,476 |
| | 2,000,000 | | Virginia College Building Authority, 21st Century College Program Refunding Revenue, Series B, 5.250%, 2/1/13 | | | 2,160,980 |
| | 1,000,000 | | Virginia College Building Authority, Hampton University Project Revenue, 5.500%, 4/1/10 | | | 1,047,870 |
| | 825,000 | | Virginia College Building Authority, Public Higher Education Financing Program Revenue, Series A, Callable 9/1/11 @ 100, 5.000%, 9/1/19 | | | 858,619 |
| | 1,000,000 | | Virginia College Building Authority, Public Higher Education Financing Program Revenue, Series A, Callable 9/1/15 @ 100, 5.000%, 9/1/22 | | | 1,049,980 |
| | 1,035,000 | | Virginia Commonwealth Transportation Board, U.S. Route 58 Corridor Development Program Revenue, Series B, 5.750%, 5/15/09 | | | 1,072,550 |
Continued
74
BB&T Virginia Intermediate Tax-Free Fund
Schedule of Portfolio Investments — (continued)
September 30, 2007
| | | | | | | |
Principal Amount | | | | | |
| | | | Fair Value | |
| | MUNICIPAL BONDS — (continued) | | | | |
| | | Virginia — (continued) | | | | |
| $ | 1,185,000 | | Virginia Commonwealth Transportation Board, U.S. Route 58 Corridor Development Program Revenue, Series B, Prerefunded 5/15/09 @ 101, OID, 5.500%, 5/15/15 | | $ | 1,234,260 | |
| | 1,360,000 | | Virginia Public Building Authority, Public Improvements Revenue, Series A, 5.000%, 8/1/12 | | | 1,446,958 | |
| | 2,240,000 | | Virginia Public Building Authority, VA, Public Facilities Refunding Revenue, Series A, 5.000%, 8/1/11 | | | 2,357,219 | |
| | 1,500,000 | | Virginia Public Building Authority, VA, Virginia Public Facilities Building Revenue, Series A, Callable 8/1/17 @ 100 (MBIA), 5.000%, 8/1/18 | | | 1,627,830 | |
| | 490,000 | | Virginia Public School Authority, Refunding School Financing 1997 Revenue, Series D (State Aid Withholding), 5.250%, 2/1/12 | | | 523,222 | |
| | 80,000 | | Virginia Public School Authority, School Financing 1997 Resolution Revenue, Series A, 5.250%, 8/1/17 | | | 88,642 | |
| | 3,000,000 | | Virginia Public School Authority, School Financing G.O., Series B, Callable 8/1/11 @ 101 (State Aid Withholding), OID, 3.000%, 8/1/20 | | | 2,596,560 | |
| | 615,000 | | Virginia Public School Authority, School Financing G.O., Series B, Prerefunded 8/1/09 @ 101 (State Aid Withholding), OID, 5.250%, 8/1/10 | | | 639,772 | |
| | 1,895,000 | | Virginia Public School Authority, Unrefunded Balance Refunding School Financing Revenue, Series I, 5.250%, 8/1/10 | | | 1,983,876 | |
| | 1,000,000 | | Virginia Resources Authority, State Revolving Fund Refunding Revenue, 5.500%, 10/1/17 | | | 1,133,570 | |
| | 1,040,000 | | Virginia Resources Authority, State Revolving Fund Revenue, 5.250%, 10/1/15 | | | 1,148,950 | |
| | 2,105,000 | | Virginia State, Refunding G.O., Series B, 5.000%, 6/1/14 | | | 2,278,641 | |
| | 1,840,000 | | Winchester, VA, Public Improvements G.O., Callable 11/1/15 @ 100 (FGIC), 5.000%, 11/1/22 | | | 1,944,052 | |
| | | | | | | |
| | | | | | 74,136,617 | |
| | | | | | | |
| | | Total Municipal Bonds (Cost $74,139,032) | | | 75,820,352 | |
| | | | | | | |
| | |
| Shares | | | | | |
| | INVESTMENT COMPANY (3.3%) | | | | |
| | 2,564,249 | | BlackRock Virginia Municipal Money Market Portfolio, Institutional Class | | | 2,564,249 | |
| | | | | | | |
| | | Total Investment Company (Cost $2,564,249) | | | 2,564,249 | |
| | | | | | | |
| Total Investments — 100.9%
(Cost $76,703,281) | | | 78,384,601 | |
| | Net Other Assets (Liabilities) — (0.9)% | | | (671,051 | ) |
| | | | | | | |
| | NET ASSETS — 100.0% | | $ | 77,713,550 | |
| | | | | | | |
See footnote legend to Schedules of Portfolio Investments.
See accompanying notes to the financial statements.
75
BB&T West Virginia Intermediate Tax-Free Fund
Schedule of Portfolio Investments
September 30, 2007
| | | | | | |
Principal Amount | | | | Fair Value |
| | MUNICIPAL BONDS (94.2%) | | | |
| | | West Virginia (94.2%) | | | |
| $ | 1,250,000 | | Berkeley County Board of Education, WV, School Improvements G.O., Callable 5/1/12 @ 101 (FGIC), 5.000%, 5/1/16 | | $ | 1,328,563 |
| | 470,000 | | Berkeley County, WV, Public Service Sewer District Refunding Revenue, Series A, Callable 4/1/12 @ 100, 4.650%, 10/1/25 | | | 470,602 |
| | 690,000 | | Berkeley County, WV, Public Service Sewer District Revenue, Series A, Callable 10/1/13 @ 100, OID, 4.600%, 10/1/15 | | | 684,528 |
| | 720,000 | | Berkeley County, WV, Public Service Sewer District Revenue, Series A, Callable 10/1/13 @ 100, OID, 4.700%, 10/1/16 | | | 716,342 |
| | 500,000 | | Brooke, Pleasants, Tyler & Wetzel Counties, WV, Housing Revenue, 7.400%, 8/15/10 | | | 551,665 |
| | 1,900,000 | | Cabell County, WV, Board of Education School Improvements G.O. (MBIA), 5.000%, 5/1/16 | | | 2,060,360 |
| | 615,000 | | Cabell, Putnam & Wayne Counties, WV, State Housing Revenue, Callable 4/1/11 @ 100 (FGIC), 7.375%, 4/1/11 | | | 685,510 |
| | 1,080,000 | | Charleston, WV, Urban Renewal Authority, Public Improvements Lease Revenue, Callable 12/15/09 @ 103 (FSA), 5.250%, 12/15/18 | | | 1,144,130 |
| | 1,860,000 | | Clarksburg, WV, Water Refunding Revenue, Callable 9/1/12 @ 101 (FGIC), 5.250%, 9/1/19 | | | 1,991,167 |
| | 915,000 | | Fairmont State College, WV, University & College Improvements Revenue, Series B, Callable 6/1/13 @ 100 (FGIC), 5.000%, 6/1/32 | | | 937,225 |
| | 680,000 | | Fairmont, WV, Waterworks Refunding Revenue, Callable 11/13/07 @ 102 (MBIA), OID, 5.375%, 7/1/13 | | | 694,504 |
| | 1,000,000 | | Harrison County, WV, Building Commission, Health Care-Maplewood Retirement Revenue, Prerefunded 4/1/08 @ 102 (AMBAC), OID, 5.150%, 4/1/18 | | | 1,027,890 |
| | 320,000 | | Huntington, WV, Sewer Refunding Revenue, Series A, Callable 11/1/11 @ 100, 4.600%, 11/1/12 | | | 324,634 |
| | 335,000 | | Huntington, WV, Sewer Refunding Revenue, Series A, Callable 11/1/11 @ 100, 4.600%, 11/1/13 | | | 339,476 |
| | 350,000 | | Huntington, WV, Sewer Refunding Revenue, Series A, Callable 11/1/11 @ 100, 4.700%, 11/1/14 | | | 355,215 |
| | 690,000 | | Logan County, WV, 1st Mortgage-Logan County Health Revenue, 8.000%, 12/1/16 | | | 884,352 |
| | 630,000 | | Marshall County, WV, Board of Education, Public School Improvements G.O. (MBIA), 4.500%, 5/1/12 | | | 654,595 |
| | 325,000 | | Marshall County, WV, Board of Education, Public School Improvements G.O. (MBIA), 4.500%, 5/1/13 | | | 339,687 |
| | 1,420,000 | | Monongalia County, WV, Building Commission, Monongalia General Hospital Revenue, Series A, Callable 7/1/15 @ 100, 5.000%, 7/1/30 | | | 1,371,223 |
| | 1,395,000 | | Ohio County, WV, County Commission Sewage System, Fort Henry Centre Funding Revenue, District A, 5.350%, 6/1/17 | | | 1,401,166 |
| | 800,000 | | Ohio County, WV, Board of Education, Refunding G.O., Callable 6/1/08 @ 102 (MBIA-IBC), OID, 5.000%, 6/1/13 | | | 822,928 |
| | 1,190,000 | | Parkersburg, WV, Combined Waterworks & Sewer Systems Refunding Revenue, Series C (FGIC), 5.000%, 9/1/14 | | | 1,284,998 |
| | 1,330,000 | | Parkersburg, WV, Combined Waterworks & Sewer Systems Refunding Revenue, Series C (FGIC), 5.000%, 9/1/15 | | | 1,441,800 |
| | 235,000 | | Parkersburg, WV, Combined Waterworks & Sewer Systems Revenue, Series A, Callable 8/1/15 @ 100 (FGIC), 4.500%, 8/1/22 | | | 236,687 |
| | 1,100,000 | | Pleasants County, WV, Industrial Development, Monongahela Power Co. Refunding Revenue, Series C, Callable 11/13/07 @ 100 (AMBAC), 6.150%, 5/1/15 | | | 1,133,286 |
| | 1,000,000 | | Pleasants County, WV, Industrial Development, West Penn Power-Pleasants Station Refunding Revenue, Series C, Callable 11/13/07 @ 100 (AMBAC, MBIA), 6.150%, 5/1/15 | | | 1,022,540 |
| | 600,000 | | West Virginia Economic Development Authority, Berkeley Co. Development Authority Refunding Revenue, OID, 4.700%, 2/1/17 | | | 597,990 |
| | 2,000,000 | | West Virginia Economic Development Authority, Correctional Juvenile & Public Lease Revenue, Series A (MBIA), 5.500%, 6/1/12 | | | 2,162,960 |
| | 1,000,000 | | West Virginia Economic Development Authority, Correctional Juvenile & Public Lease Revenue, Series A, Callable 6/1/12 @ 101 (MBIA), 5.500%, 6/1/15 | | | 1,085,440 |
| | 1,000,000 | | West Virginia Economic Development Authority, Correctional Juvenile & Public Lease Revenue, Series A, Callable 6/1/12 @ 101 (MBIA), 5.500%, 6/1/18 | | | 1,080,960 |
| | 535,000 | | West Virginia Economic Development Authority, Department of Environmental Protection Lease Revenue, 4.750%, 11/1/11 | | | 557,368 |
| | 440,000 | | West Virginia Economic Development Authority, State Energy Savings Project Lease Revenue, 4.250%, 6/1/12 | | | 450,701 |
| | 985,000 | | West Virginia Economic Development Authority, State Energy Savings Project Lease Revenue, Callable 6/1/15 @ 100, 4.750%, 6/1/21 | | | 1,000,130 |
| | 1,250,000 | | West Virginia Economic Development Authority, State Office Building Lease Revenue, Series A, Callable 10/1/11 @ 101, 5.000%, 10/1/15 | | | 1,316,025 |
| | 820,000 | | West Virginia Higher Education Policy Commission, Higher Education Facilities Refunding Revenue, Series B (FGIC), 5.000%, 4/1/14 | | | 881,894 |
| | 3,135,000 | | West Virginia Higher Education Policy Commission, Higher Education Facilities Refunding Revenue, Series B, Callable 4/1/14 @ 100 (FGIC), 5.000%, 4/1/23 | | | 3,280,025 |
| | 970,000 | | West Virginia Hospital Finance Authority, Veterans Nursing Home Revenue, Callable 3/1/14 @ 100, 5.500%, 3/1/22 | | | 980,932 |
Continued
76
BB&T West Virginia Intermediate Tax-Free Fund
Schedule of Portfolio Investments — (continued)
September 30, 2007
| | | | | | |
Principal Amount | | | | Fair Value |
| | MUNICIPAL BONDS — (continued) | | | |
| | | West Virginia — (continued) | | | |
| $ | 400,000 | | West Virginia Housing Development Fund, Marion Unity Apartments Project Refunding Revenue, Series A, Callable 7/1/11 @ 100, 5.400%, 1/1/16 | | $ | 400,772 |
| | 515,000 | | West Virginia Housing Development Fund, Marion Unity Apartments Project Refunding Revenue, Series A, Callable 7/1/11 @ 100, OID, 5.750%, 1/1/29 | | | 506,883 |
| | 1,500,000 | | West Virginia School Building Authority, Capital Improvements Refunding Revenue, Series A (FGIC), 5.000%, 7/1/15 | | | 1,624,080 |
| | 2,000,000 | | West Virginia School Building Authority, Capital Improvements Refunding Revenue, Series A (FGIC), 5.000%, 7/1/16 | | | 2,171,060 |
| | 2,050,000 | | West Virginia School Building Authority, Capital Improvements Refunding Revenue, Series A, Callable 7/1/17 @ 100 (FGIC), 5.000%, 7/1/18 | | | 2,215,025 |
| | 550,000 | | West Virginia School Building Authority, Capital Improvements Revenue (MBIA), 5.250%, 1/1/14 | | | 598,169 |
| | 520,000 | | West Virginia School Building Authority, Capital Improvements Revenue (MBIA), 5.250%, 7/1/14 | | | 568,428 |
| | 1,525,000 | | West Virginia State Building Commission, Regional Jail Refunding Revenue, Series A (AMBAC), 5.250%, 7/1/10 | | | 1,590,011 |
| | 750,000 | | West Virginia State Hospital Finance Authority, Camden Clark Memorial Hospital Revenue, Series A, Callable 2/15/14 @ 100 (FSA), 5.250%, 2/15/18 | | | 794,505 |
| | 630,000 | | West Virginia State Hospital Finance Authority, Charleston Area Medical Center, Inc. Revenue, Series A, Callable 9/1/16 @ 100, OID, 6.500%, 9/1/16 | | | 739,488 |
| | 450,000 | | West Virginia State Hospital Finance Authority, Charleston Medical Center Revenue, Prerefunded 9/1/10 @ 101, OID, 6.750%, 9/1/30 | | | 493,587 |
| | 800,000 | | West Virginia State Hospital Finance Authority, Department of Health & Human Resource Refunding Revenue, Callable 11/13/07 @ 100 (FSA), 5.000%, 8/1/09 | | | 800,776 |
| | 1,300,000 | | West Virginia State Hospital Finance Authority, Linked Bears & Bulls Refunding Revenue, Callable 11/13/07 @ 100 (MBIA), 6.100%, 1/1/18 | | | 1,357,837 |
| | 1,000,000 | | West Virginia State Parkways Economic Development & Tourism Authority, Refunding Revenue (FGIC), 5.000%, 5/15/10 | | | 1,036,830 |
| | 1,000,000 | | West Virginia State Parkways Economic Development & Tourism Authority, Refunding Revenue (FGIC), 5.250%, 5/15/12 | | | 1,071,080 |
| | 700,000 | | West Virginia State Parkways Economic Development & Tourism Authority, Refunding Revenue (FGIC), 5.250%, 5/15/17 | | | 773,815 |
| | 1,485,000 | | West Virginia University, Projects Revenue, Series A (MBIA), 5.500%, 4/1/11 | | | 1,580,233 |
| | 1,075,000 | | West Virginia Water Development Authority, Infrastructure Jobs Refunding Revenue, Series A, Callable 10/1/16 @ 100 (FSA), 5.000%, 10/1/26 | | | 1,122,536 |
| | 1,000,000 | | West Virginia Water Development Authority, Loan Program II Revenue, Series A, Prerefunded 11/1/09 @ 102 (AMBAC), 5.500%, 11/1/18 | | | 1,058,980 |
| | 1,515,000 | | West Virginia Water Development Authority, Revenue, Series A, Callable 10/1/13 @ 101 (AMBAC), OID, 5.000%, 10/1/28 | | | 1,563,768 |
| | 500,000 | | West Virginia, State Infrastructure Refunding G.O. (FGIC), 5.000%, 11/1/10 | | | 521,440 |
| | 170,000 | | West Virginia, State Infrastructure Refunding G.O., Callable 11/1/16 @ 100 (FGIC), 5.000%, 11/1/17 | | | 184,234 |
| | 1,040,000 | | West Virginia, State Road Highway Improvements G.O. (FSA), 5.500%, 6/1/10 | | | 1,092,073 |
| | 3,950,000 | | West Virginia, State Road Highway Improvements G.O. (FSA), 5.500%, 6/1/11 | | | 4,214,373 |
| | | | | | |
| | | Total Municipal Bonds (Cost $64,163,781) | | | 65,379,481 |
| | | | | | |
| | |
| Shares | | | | |
| | INVESTMENT COMPANY (5.6%) | | | |
| | 3,914,515 | | Federated Tax-Free Obligations Fund, Institutional Service Class | | | 3,914,515 |
| | | | | | |
| | | Total Investment Company (Cost $3,914,515) | | | 3,914,515 |
| | | | | | |
| Total Investments — 99.8%
(Cost $68,078,296) | | | 69,293,996 |
| | Net Other Assets (Liabilities) — 0.2% | | | 120,844 |
| | | | | | |
| | NET ASSETS — 100.0% | | $ | 69,414,840 |
| | | | | | |
See footnote legend to Schedules of Portfolio Investments.
See accompanying notes to the financial statements.
77
BB&T National Tax-Free Money Market Fund
Schedule of Portfolio Investments
September 30, 2007
| | | | | | |
Principal Amount | | | | Amortized Cost |
| | MUNICIPAL BONDS (97.6%) | | | |
| | | Arizona (9.3%) | | | |
| $ | 1,500,000 | | Maricopa County Industrial Development Authority, AZ, Multifamily Housing Revenue, Grand Victoria Housing Project, Series A (Fannie Mae), 3.880%, 10/4/07* | | $ | 1,500,000 |
| | 1,275,000 | | Maricopa County, AZ, Hospital Refunding Revenue, Sun Health Corp. (LaSalle National Bank N.A.), 3.880%, 10/4/07* | | | 1,275,000 |
| | 1,500,000 | | Phoenix Industrial Development Authority, AZ, Multi-Family Housing Refunding Revenue, Copper Palms Apartments Project (FHLMC), 3.880%, 10/3/07* | | | 1,500,000 |
| | 2,720,000 | | RBC Municipal Products, Inc. Trust, Pima County, AZ Refunding Revenue, Series I-8 (FNMA), 3.910%, 10/4/07*(d) | | | 2,720,000 |
| | 2,500,000 | | Salt River Project Agricultural Improvements & Power District Electric System, AZ, Puttable Revenue, Series 2045, 3.920%, 10/4/07*(d) | | | 2,500,000 |
| | 750,000 | | Yavapai County, AZ, Industrial Development Authority Hospital Facilities Revenue, Yavapai Regional Medical Center, Series B (FSA), 3.860%, 10/4/07* | | | 750,000 |
| | | | | | |
| | | | | | 10,245,000 |
| | | | | | |
| | | California (1.7%) | | | |
| | 1,840,000 | | Puttable Floating Option Tax-Exempt Receipts Revenue, Series MT-400, 3.700%, 10/4/07*(d) | | | 1,840,000 |
| | | | | | |
| | | Colorado (1.4%) | | | |
| | 1,600,000 | | Thornton, CO, Kroger Co. Industrial Development Refunding Revenue (U.S. Bank N.A.), 3.940%, 10/4/07* | | | 1,600,000 |
| | | | | | |
| | | District of Columbia (2.2%) | | | |
| | 2,430,000 | | District of Columbia, Association of American Veterinary Medical Colleges Revenue (AMBAC), 3.920%, 10/4/07* | | | 2,430,000 |
| | | | | | |
| | | Florida (7.0%) | | | |
| | 2,400,000 | | Puttable Floating Option Tax Exempt Receipts Revenue, Series EC-1081 (MBIA-IBC), 3.970%, 10/4/07*(d) | | | 2,400,000 |
| | 3,000,000 | | Puttable Floating Option Tax-Exempts Receipts Revenue, Alachua County, FL, Series PT-3956, 3.960%, 10/4/07*(d) | | | 3,000,000 |
| | 2,280,000 | | Tallahassee, FL, Puttable Capital Buildings Revenue, Series 607 (FSA), 3.920%, 10/4/07*(d) | | | 2,280,000 |
| | | | | | |
| | | | | | 7,680,000 |
| | | | | | |
| | | Georgia (5.8%) | | | |
| | 2,000,000 | | De Kalb County, GA, Water & Sewer Refunding Revenue, Series 1906 (FSA), 3.910%, 10/4/07*(d) | | | 2,000,000 |
| | 1,300,000 | | Enhanced Return Puttable Floating Option, GA, Tax-Exempt Receipts Improvement G.O., Series EC 1019, 3.970%, 10/4/07*(d) | | | 1,300,000 |
| | 100,000 | | Gwinnett County Hospital Authority, GA, Refunding Revenue, Gwinnett Hospital System Project, Series A (FSA), 3.860%, 10/3/07* | | | 100,000 |
| | 3,000,000 | | Puttable Floating Option Tax-Exempt Receipts, G.O., Series EC-1127, 3.970%, 10/4/07*(d) | | | 3,000,000 |
| | | | | | |
| | | | | | 6,400,000 |
| | | | | | |
| | | Illinois (3.5%) | | | |
| | 1,076,275 | | ABN AMRO Chicago Corp. Leasetops Master Trust 1, Revenue, Series 1997-1 (LaSalle National Bank), 4.060%, 10/4/07*(d) | | | 1,076,275 |
| | 2,500,000 | | Illinois State, Refunding G.O., Series B, 5.000%, 1/1/08 | | | 2,507,357 |
| | 246,000 | | Western Springs, IL, Timber Trails Project Special Assessment (LaSalle National Bank N.A.), 3.850%, 10/3/07* | | | 246,000 |
| | | | | | |
| | | | | | 3,829,632 |
| | | | | | |
| | | Kentucky (2.1%) | | | |
| | 725,000 | | Henderson County, KY, Hospital Facilities Revenue, Community United Methodist, Series B (Fifth Third Bank), 3.880%, 10/5/07* | | | 725,000 |
| | 1,615,000 | | Jefferson County, KY, University of Louisville Student Housing Industrial Building Revenue, Series A (Regions Bank), 3.860%, 10/4/07* | | | 1,615,000 |
| | | | | | |
| | | | | | 2,340,000 |
| | | | | | |
| | | Louisiana (1.9%) | | | |
| | 2,090,000 | | New Orleans, LA, Refunding G.O., Series A20 (FGIC), 3.970%, 10/3/07*(d) | | | 2,090,000 |
| | | | | | |
| | | Maine (8.0%) | | | |
| | 5,000,000 | | Finance Authority of Maine, Revenue, Mt. Desert (Citizens Bank NH), 3.900%, 10/4/07* | | | 5,000,000 |
| | 3,800,000 | | Lewiston, ME, G.O. Bond Anticipation Notes, 4.000%, 11/15/07 | | | 3,800,913 |
| | | | | | |
| | | | | | 8,800,913 |
| | | | | | |
| | | Massachusetts (3.3%) | | | |
| | 3,670,000 | | Clipper Tax-Exempt Trust, Certificates of Participation, Series 2000-2, 3.730%, 1/1/08*(d) | | | 3,670,000 |
| | | | | | |
| | | Minnesota (4.4%) | | | |
| | 4,810,000 | | Becker, MN, Pollution Control Revenue, Series FP 13, 3.950%, 10/4/07*(d) | | | 4,810,000 |
| | | | | | |
| | | Ohio (13.8%) | | | |
| | 665,000 | | Avon, OH, Bond Anticipation Notes, Cash Flow Management Variable Purposes, 4.100%, 3/3/08 | | | 666,095 |
| | 1,324,000 | | Defiance, OH, G.O. Bond Anticipation Notes, Sanitary Sewer Improvements Cash Flow Management, 4.250%, 4/25/08 | | | 1,327,301 |
| | 3,600,000 | | Elyria, OH, G.O. Bond Anticipation Notes, Energy Conservation Improvements, 4.000%, 10/17/07 | | | 3,600,539 |
| | 1,430,000 | | Elyria, OH, G.O. Bond Anticipation Notes, Street Improvements, 4.000%, 10/17/07 | | | 1,430,211 |
| | 1,525,000 | | Montgomery County, OH, Industrial Development Refunding Revenue (U.S. Bank NA), 3.940%, 10/4/07* | | | 1,525,000 |
Continued
78
BB&T National Tax-Free Money Market Fund
Schedule of Portfolio Investments — (continued)
September 30, 2007
| | | | | | |
Principal Amount | | | | Amortized Cost |
| | MUNICIPAL BONDS — (continued) | | | |
| | | Ohio — (continued) | | |
| $ | 1,405,000 | | Parma Heights, OH, Bond Anticipation Notes Street Improvements Cash Flow Management, Callable 3/11/08 @ 100, 3.750%, 9/12/08 | | $ | 1,405,000 |
| | 2,410,000 | | Puttable Floating Optional Tax-Exempt Receipts, G.O., Highway Improvements Series 1152, 3.950%, 10/4/07*(d) | | | 2,410,000 |
| | 825,500 | | Sidney, OH, G.O. Refunding Bond Anticipation Notes, Various Purposes, 4.250%, 8/14/08 | | | 828,955 |
| | 2,000,000 | | Stark County, OH, G.O. Bond Anticipation Notes, Sewer Improvements, 4.150%, 11/15/07 | | | 2,001,043 |
| | | | | | |
| | | | | | 15,194,144 |
| | | | | | |
| | | Other (0.5%) | | | |
| | 590,000 | | Puttable Floating Option Tax-Exempt Receipts Revenue, Series EC-001, 4.020%, 10/4/07*(d) | | | 590,000 |
| | | | | | |
| | | Texas (7.7%) | | | |
| | 1,000,000 | | Coppell Independent School District, TX, Refunding G.O., (PSF-GTD) OID, 4.730%, 8/15/08** | | | 968,162 |
| | 1,350,000 | | Crawford Education Facilities Corp., TX, Refunding Revenue, University Parking System Project, Series A (BNP Paribas), 3.930%, 10/4/07* | | | 1,350,000 |
| | 1,400,000 | | Denton Independent School District, TX, School Improvements G.O., Series B (PSF-GTD), 3.750%, 8/15/08* | | | 1,400,000 |
| | 3,750,000 | | Puttable Floating Option Tax-Exempt Receipts Revenue, Series PA 1476, 4.010%, 10/4/07*(d) | | | 3,750,000 |
| | 1,000,000 | | Texas Municipal Gas Acquisition & Supply Corp. II, Natural Gas Utility Improvements Revenue, ROCS-10014, 3.990%, 10/4/07*(d) | | | 1,000,000 |
| | | | | | |
| | | | | | 8,468,162 |
| | | | | | |
| | | Utah (10.7%) | | | |
| | 2,500,000 | | Riverton, UT, Hospital Revenue, Series 1762, 3.920%, 10/4/07*(d) | | | 2,500,000 |
| | 4,250,000 | | Utah Transit Authority, Refunding Revenue, Series 63Z (MBIA), 3.910%, 10/4/07*(d) | | | 4,250,000 |
| | 5,000,000 | | Utah Water Finance Agency, Revenue, Series A-20 (AMBAC), 3.900%, 10/3/07* | | | 5,000,000 |
| | | | | | |
| | | | | | 11,750,000 |
| | | | | | |
| | | Virginia (4.8%) | | |
| | 4,255,000 | | Puttable Floating Option Tax-Exempt Receipts Revenue, Series EC-1125 (State Aid Withholding), 3.950%, 10/4/07*(d) | | | 4,255,000 |
| | 1,000,000 | | Tobacco Settlement Financing Corp., VA, Revenue Series 1341, Callable 6/1/15 @ 100, 3.900%, 10/4/07*(d) | | | 1,000,000 |
| | | | | | |
| | | | | | 5,255,000 |
| | | | | | |
| | | Washington (4.8%) | | | |
| | 5,295,000 | | Clark County Public Utility District No. 1, WA, Electricity Power Improvements Revenue, Series A116 (FSA), 3.700%, 2/20/08*(d) | | | 5,295,000 |
| | | | | | |
| | | Wisconsin (4.7%) | | | |
| | 4,210,000 | | Lehman Municipal Trust Receipts, Public Improvements Revenue, Series F7, Callable 8/1/17 @ 100, 3.950%, 10/3/07*(d) | | | 4,210,000 |
| | 1,000,000 | | Rock County, WI, Promissory Notes, Cash Flow Management G.O., 4.250%, 7/10/08 | | | 1,003,348 |
| | | | | | |
| | | | | | 5,213,348 |
| | | | | | |
| | | Total Municipal Bonds (Cost $107,501,199) | | | 107,501,199 |
| | | | | | |
| | | COMMERCIAL PAPER (1.9%) | | | |
| | 2,000,000 | | Connecticut State Development Authority Pollution Control, Series 1999, 3.850%, 10/9/07 | | | 2,000,000 |
| | | | | | |
| | | Total Commercial Paper (Cost $2,000,000) | | | 2,000,000 |
| | | | | | |
| | |
| Shares | | | | |
| | INVESTMENT COMPANY (0.0%) | | | |
| | 12,747 | | SEI Institutional Tax Free Fund | | | 12,747 |
| | | | | | |
| Total Investment Company
(Cost $12,747) | | | 12,747 |
| | | | | | |
| Total Investments — 99.5%
(Cost $109,513,946) | | | 109,513,946 |
| | Net Other Assets (Liabilities) — 0.5% | | | 600,115 |
| | | | | | |
| | NET ASSETS — 100.0% | | $ | 110,114,061 |
| | | | | | |
See footnote legend to Schedules of Portfolio Investments.
See accompanying notes to the financial statements.
79
BB&T Prime Money Market Fund
Schedule of Portfolio Investments
September 30, 2007
| | | | | | |
Principal Amount | | | | Amortized Cost |
| | ASSET BACKED SECURITIES (4.3%) | | | |
| $ | 25,000,000 | | Arkle Master Issue PLC, Series 2007-1A, Class 1A, 5.733%, 5/17/08(d) | | $ | 25,000,000 |
| | 2,230,069 | | Cal Securitization Trust, Series 2007-1, Class A1, 5.424%, 7/15/08(e) | | | 2,230,069 |
| | 2,145,363 | | Capital Auto Receivables Asset Trust, Series 2007-SN1, Class A1A, 5.366%, 6/16/08(d) | | | 2,145,363 |
| | 8,000,000 | | Holmes Master Issuer PLC, Series 2006-1A, Class 1A, 5.733%, 1/15/16(d) | | | 8,000,000 |
| | 11,300,000 | | Holmes Master Issuer PLC, Series 2007-1, Class 1A1, 5.733%, 3/15/08 | | | 11,300,000 |
| | 17,511,959 | | Westpac Securitization Trust, Series 2007-1G, Class A1, 5.470%, 5/21/38(d) | | | 17,511,959 |
| | | | | | |
| | | Total Asset Backed Securities (Cost $66,187,391) | | | 66,187,391 |
| | | | | | |
| | CERTIFICATES OF DEPOSIT (7.4%) | | | |
| | | Banks (6.0%) | | | |
| | 8,000,000 | | Barclays Bank PLC, 5.300%, 1/16/08 | | | 8,000,000 |
| | 5,000,000 | | Barclays Bank PLC, 5.370%, 1/25/08 | | | 5,000,000 |
| | 5,000,000 | | Barclays Bank PLC, 5.380%, 2/15/08 | | | 5,000,000 |
| | 5,300,000 | | Barclays Bank PLC, 5.312%, 5/22/08 | | | 5,300,000 |
| | 5,000,000 | | Credit Suisse, 5.290%, 4/11/08 | | | 5,000,000 |
| | 8,000,000 | | Credit Suisse, New York, 5.420%, 12/4/07 | | | 8,000,000 |
| | 10,000,000 | | Credit Suisse, New York, 5.300%, 1/14/08 | | | 10,000,000 |
| | 5,000,000 | | Credit Suisse, New York, 5.365%, 1/18/08 | | | 5,000,000 |
| | 4,000,000 | | Credit Suisse, New York, 5.300%, 4/17/08 | | | 4,000,000 |
| | 10,000,000 | | Credit Suisse, New York, 5.290%, 5/21/08 | | | 10,000,000 |
| | 5,000,000 | | Credit Suisse, New York, 5.320%, 5/22/08 | | | 5,000,000 |
| | 5,000,000 | | Credit Suisse, New York, 5.380%, 6/2/08 | | | 5,000,000 |
| | 3,000,000 | | Huntington National Bank, 5.350%, 10/5/07 | | | 3,000,000 |
| | 5,000,000 | | Huntington National Bank, 5.360%, 10/19/07 | | | 5,000,000 |
| | 8,000,000 | | Toronto Dominion Bank, 5.420%, 12/12/07 | | | 8,000,000 |
| | | | | | |
| | | | | | 91,300,000 |
| | | | | | |
| | | Financial Services (1.4%) | | | |
| | 5,000,000 | | Deutsche Bank AG, 5.350%, 4/14/08 | | | 5,000,000 |
| | 7,000,000 | | Societe Generale, Paris, 5.360%, 4/2/08 | | | 7,000,000 |
| | 10,000,000 | | Wilmington Trust Co., 5.325%, 10/17/07 | | | 9,999,871 |
| | | | | | |
| | | | | | 21,999,871 |
| | | | | | |
| | | Total Certificates of Deposit (Cost $113,299,871) | | | 113,299,871 |
| | | | | | |
| | COMMERCIAL PAPER** (37.1%) | | | |
| | | Banking (0.3%) | | | |
| | 5,000,000 | | Depfa Bank, PLC, 5.270%, 2/14/08(d) | | | 4,900,408 |
| | | | | | |
| | | Brokers & Dealers (2.3%) | | | |
| | 35,000,000 | | Morgan Stanley, 5.350%, 10/1/07 | | | 35,000,000 |
| | | | | | |
| | | Financial Services (33.7%) | | | |
| | 15,000,000 | | Beta Finance, Inc., 5.280%, 11/5/07(d) | | | 14,923,000 |
| | 25,000,000 | | Compass Securitization, 6.400%, 10/4/07(d) | | | 24,986,667 |
| | 10,000,000 | | Compass Securitization, 6.150%, 10/17/07(d) | | | 9,972,667 |
| | 10,000,000 | | Countrywide Financial Corp., 5.270%, 10/5/07 | | | 9,994,144 |
| | 20,000,000 | | Countrywide Financial Corp., 5.290%, 10/11/07 | | | 19,970,611 |
| | 3,000,000 | | Countrywide Financial Corp., 5.280%, 10/19/07 | | | 2,992,080 |
| | 20,000,000 | | Fairway Finance Corp., 5.230%, 10/29/07(d) | | | 19,918,644 |
| | 10,000,000 | | Fairway Finance Corp., 6.150%, 12/7/07(d) | | | 9,885,542 |
| | 10,000,000 | | Fcar Auto Loan Trust, 5.200%, 10/26/07 | | | 9,963,889 |
| | 10,000,000 | | Fcar Owner Trust I, 5.800%, 3/5/08 | | | 9,748,667 |
| | 10,000,000 | | Ford Credit Auto Receivables I, 5.210%, 1/16/08 | | | 9,845,147 |
| | 10,000,000 | | Ford Credit Auto Receivables II, 5.220%, 1/16/08 | | | 9,844,850 |
| | 7,000,000 | | Ford Credit Auto Receivables Owner Trust I, 5.260%, 10/23/07 | | | 6,977,499 |
| | 15,000,000 | | Ford Credit Auto Receivables Owner Trust I, 5.280%, 11/15/07 | | | 14,901,000 |
| | 5,000,000 | | Ford Credit Auto Receivables Owner Trust I, 5.210%, 1/14/08 | | | 4,924,021 |
| | 5,000,000 | | Ford Credit Auto Receivables Trust I, 5.250%, 10/25/07 | | | 4,982,500 |
| | 5,000,000 | | Ford Credit Auto Receivables Trust II, 5.220%, 1/15/08 | | | 4,923,150 |
| | 5,000,000 | | Fountain Square Commercial Funding Corp., 5.250%, 10/9/07(d) | | | 4,994,167 |
| | 25,000,000 | | Grampian Funding LLC, 5.100%, 12/21/07(d) | | | 24,706,656 |
| | 4,000,000 | | Long Lane Master Trust 4, 5.344%, 3/11/08(d) | | | 3,901,630 |
| | 18,000,000 | | Long Lane Master Trust 4, Series A, 6.300%, 10/10/07(d) | | | 17,971,650 |
| | 20,000,000 | | Long Lane Master Trust IV, 5.950%, 11/20/07(d) | | | 19,834,722 |
| | 5,000,000 | | Paradigm Funding LLC, 5.600%, 11/8/07(d) | | | 4,970,444 |
| | 6,500,000 | | Picaros Funding LLC, 5.756%, 10/5/07(d) | | | 6,496,299 |
| | 20,000,000 | | Picaros Funding LLC, 5.536%, 12/14/07(d) | | | 19,769,778 |
| | 20,000,000 | | Scaldis Capital LLC, 5.290%, 11/8/07 | | | 19,888,322 |
| | 25,000,000 | | Sheffield Receivables, 5.300%, 10/1/07(d) | | | 25,000,000 |
| | 10,000,000 | | Sheffield Receivables, 5.300%, 10/9/07(d) | | | 9,988,222 |
| | 10,000,000 | | Sheffield Receivables, 6.079%, 12/7/07(d) | | | 9,885,542 |
| | 30,000,000 | | Sheffield Receivables, 6.150%, 12/7/07(d) | | | 29,656,625 |
| | 5,000,000 | | Sigma Finance, Inc., 5.185%, 5/22/08(d) | | | 4,831,487 |
| | 25,000,000 | | Three Rivers Funding Corp., 5.265%, 10/25/07(d) | | | 24,912,250 |
| | 22,000,000 | | Tulip Funding Corp., 6.000%, 12/3/07 | | | 21,769,000 |
| | 25,000,000 | | Versailles, CDS, LLC, 5.280%, 11/2/07(d) | | | 24,882,667 |
| | 30,000,000 | | Versailles, CDS, LLC, 5.350%, 11/7/07(d) | | | 29,835,042 |
| | 25,000,000 | | Versailles, CDS, LLC, 5.300%, 11/14/07(d) | | | 24,838,055 |
| | | | | | |
| | | | | | 516,886,636 |
| | | | | | |
| | | Retail (0.8%) | | | |
| | 3,000,000 | | Fortune Brands, Inc., 5.360%, 10/5/07(d) | | | 2,998,213 |
| | 5,000,000 | | Safeway, Inc., 6.150%, 10/11/07(d) | | | 4,991,459 |
| | 5,000,000 | | Safeway, Inc., 6.200%, 10/18/07(d) | | | 4,985,361 |
| | | | | | |
| | | | | | 12,975,033 |
| | | | | | |
| | | Total Commercial Paper (Cost $569,762,077) | | | 569,762,077 |
| | | | | | |
| | CORPORATE BONDS (5.2%) | | | |
| | | Banks (0.5%) | | | |
| | 5,000,000 | | Barclays Bank PLC, 5.350%, 4/23/08 | | | 5,000,000 |
| | 3,000,000 | | Barclays Bank PLC, 5.350%, 5/9/08 | | | 3,000,000 |
| | | | | | |
| | | | | | 8,000,000 |
| | | | | | |
| | | Financial Services (4.0%) | | | |
| | 10,000,000 | | Paradigm Funding LLC, 5.106%, 1/23/08(d) | | | 9,999,690 |
| | 5,000,000 | | Sigma Finance, Inc., Series MTN, 5.315%, 10/12/07(d) | | | 4,999,993 |
| | 7,000,000 | | Sigma Finance, Inc., Series MTN, 5.375%, 2/4/08(d) | | | 7,000,000 |
Continued
80
BB&T Prime Money Market Fund
Schedule of Portfolio Investments — (continued)
September 30, 2007
| | | | | | |
Principal Amount | | | | Amortized Cost |
| | CORPORATE BONDS — (continued) | | | |
| | | Financial Services — (continued) | | | |
| $ | 5,000,000 | | Sigma Finance, Inc., Series MTN, 5.400%, 4/21/08(d) | | $ | 5,000,000 |
| | 5,000,000 | | Sigma Finance, Inc., Series MTN, 5.350%, 5/22/08(d) | | | 5,000,000 |
| | 5,000,000 | | Sigma Finance, Inc., Series MTN, 5.415%, 8/5/08(d) | | | 5,000,000 |
| | 10,000,000 | | SLM Corp., 5.800%, 4/14/08(d) | | | 10,000,000 |
| | 15,000,000 | | SLM Corp., 5.806%, 5/12/08(d) | | | 15,000,000 |
| | | | | | |
| | | | | | 61,999,683 |
| | | | | | |
| | | Retail (0.7%) | | | |
| | 10,000,000 | | Wal-Mart Stores, Inc., 5.933%, 6/1/08 | | | 10,038,473 |
| | | | | | |
| | | Total Corporate Bonds (Cost $80,038,156) | | | 80,038,156 |
| | | | | | |
| | VARIABLE RATE NOTES* (40.3%) | | | |
| | | Banking (23.9%) | | | |
| | 1,755,000 | | Anchor Holdings LLC, Series 2000, 5.220%, 10/4/07 | | | 1,755,000 |
| | 36,000,000 | | Bank of America N.A., Series BKNT, 5.300%, 10/1/07 | | | 36,000,000 |
| | 25,000,000 | | Bank of Ireland, Series XMTN, 5.493%, 10/19/07(d) | | | 25,000,000 |
| | 25,000,000 | | Bank of Montreal, Chicago, Series YCD, 5.470%, 11/21/07 | | | 25,000,000 |
| | 8,500,000 | | Bank of Scotland PLC, Series MTN, 5.580%, 11/20/07(d) | | | 8,500,029 |
| | 10,000,000 | | Bank of Scotland PLC, Series MTN, 5.280%, 12/24/07(d) | | | 10,000,000 |
| | 2,000,000 | | Bank of Scotland PLC, Series MTN, 5.810%, 10/9/07(d) | | | 2,000,000 |
| | 23,300,000 | | Bank of Scotland PLC, Series MTN2, 5.198%, 11/1/07(d) | | | 23,300,000 |
| | 20,000,000 | | BNP Paribas, 5.071%, 10/29/07 | | | 19,975,080 |
| | 14,000,000 | | BNP Paribas, 5.500%, 11/19/07(d) | | | 14,000,000 |
| | 3,170,000 | | Christian Life Assembly of the Assemblies of God, 5.280%, 10/4/07 | | | 3,170,000 |
| | 2,760,000 | | Damascus, Ltd., 5.040%, 10/4/07 | | | 2,760,000 |
| | 15,000,000 | | Depfa Bank PLC, Series EXL, 5.754%, 12/17/07(d) | | | 15,000,000 |
| | 1,505,000 | | Guilford Capital LLC, Series 02-A, 5.230%, 10/4/07 | | | 1,505,000 |
| | 4,805,000 | | HC Equities LP, Series 2001, 5.130%, 10/4/07 | | | 4,805,000 |
| | 3,590,000 | | Indian Hills Country Club, Series 2000, 5.180%, 10/4/07 | | | 3,590,000 |
| | 5,015,000 | | Kent Capital LLC, 5.298%, 10/4/07 | | | 5,015,000 |
| | 35,000,000 | | M&I Marshall & Ilsley Bank, 5.101%, 10/25/07 | | | 35,000,000 |
| | 30,000,000 | | Monet Trust, 5.268%, 12/28/07(e) | | | 30,000,000 |
| | 25,000,000 | | National City Bank, Series BKNT, 5.470%, 10/1/07 | | | 25,000,000 |
| | 20,000,000 | | National City Bank, Series BKNT, 5.490%, 10/1/07 | | | 20,000,000 |
| | 3,535,000 | | Spira Millennium LLC, Series 2001, 5.200%, 10/4/07 | | | 3,535,000 |
| | 14,225,000 | | Stone Creek LLC (Columbus Bank and Trust Co.), 5.190%, 10/4/07 | | | 14,225,000 |
| | 10,000,000 | | Svenska Handelsbanken AB, 5.773%, 10/15/07(d) | | | 10,000,000 |
| | 6,796,000 | | TOG Properties LLC, 5.180%, 10/4/07 | | | 6,796,000 |
| | 2,785,000 | | Vestavia Hills Baptist Church, Series 2000, 5.200%, 10/4/07 | | | 2,785,000 |
| | 2,000,000 | | Wells Fargo & Co., Series MTNC, 5.725%, 10/2/07 | | | 2,000,000 |
| | 12,000,000 | | Westpac Banking Corp., 5.743%, 10/16/07(d) | | | 12,000,000 |
| | 4,630,000 | | World Wildlife Fund, Inc., 5.200%, 10/4/07 | | | 4,630,000 |
| | | | | | |
| | | | | | 367,346,109 |
| | | | | | |
| | | Brokers & Dealers (7.5%) | | | |
| | 25,000,000 | | Goldman Sachs Group LP, 5.340%, 10/1/07(d) | | | 25,000,000 |
| | 35,000,000 | | Goldman Sachs Group, Inc., 5.370%, 10/1/07(e) | | | 35,000,000 |
| | 5,000,000 | | Goldman Sachs Group, Inc., Series MTN, 5.823%, 10/15/07(d) | | | 5,000,067 |
| | 6,500,000 | | Merrill Lynch & Co., Inc., 5.754%, 10/18/07(d) | | | 6,500,000 |
| | 8,000,000 | | Merrill Lynch & Co., Inc., Series MTN, 5.276%, 10/24/07 | | | 8,000,000 |
| | 10,000,000 | | Merrill Lynch & Co., Inc., Series MTN1, 5.800%, 10/4/07(d) | | | 10,000,000 |
| | 4,000,000 | | Morgan Stanley, 5.320%, 5/2/07 | | | 4,000,000 |
| | 5,000,000 | | Morgan Stanley, Series EXL, 5.800%, 10/4/07 | | | 5,000,000 |
| | 7,000,000 | | Morgan Stanley, Series EXL, 5.219%, 10/29/07 | | | 7,000,000 |
| | 10,000,000 | | Morgan Stanley, Series EXLS, 5.845%, 10/3/07 | | | 10,000,000 |
| | | | | | |
| | | | | | 115,500,067 |
| | | | | | |
| | | Financial Services (6.6%) | | | |
| | 7,000,000 | | General Electric Capital Corp., Series MTN, 5.878%, 10/17/07(d) | | | 7,000,000 |
| | 2,000,000 | | K2 (USA) LLC, Series MTN, 4.820%, 10/9/07(d) | | | 1,999,996 |
| | 8,000,000 | | K2 (USA) LLC, Series MTN, 5.315%, 10/19/07(d) | | | 7,999,338 |
| | 5,000,000 | | K2 (USA) LLC, Series MTN, 5.470%, 11/19/07(d) | | | 4,999,685 |
| | 5,000,000 | | K2 (USA) LLC, Series MTN, 5.320%, 10/22/07(d) | | | 4,999,600 |
| | 5,000,000 | | K2 (USA) LLC, Series MTN, 4.840%, 11/15/07(d) | | | 4,998,693 |
| | 10,000,000 | | K2 (USA) LLC, Series MTN, 5.538%, 11/15/07(d) | | | 9,998,257 |
| | 25,000,000 | | K2 (USA) LLC, Series MTN, 4.950%, 11/20/07(d) | | | 24,988,934 |
| | 5,000,000 | | PYXIS Master Trust, Series 2007-6, 5.718%, 12/6/07(e) | | | 5,000,000 |
| | 10,000,000 | | Sigma Finance, Inc., Series MTN, 4.825%, 12/13/07(d) | | | 9,999,900 |
| | 7,000,000 | | Sigma Finance, Inc., Series MTN1, 4.820%, 10/15/07(d) | | | 6,999,796 |
| | 12,000,000 | | Union Hamilton Special Funding LLC, Series MTN, 5.498%, 12/28/07(d) | | | 12,000,000 |
| | | | | | |
| | | | | | 100,984,199 |
| | | | | | |
| | | Insurance (1.3%) | | | |
| | 5,000,000 | | Genworth Life Insurance Co., 5.450%, 11/9/07(e) | | | 5,000,000 |
| | 5,000,000 | | Metropolitan Life Insurance Co., 5.476%, 11/1/07(e) | | | 5,000,000 |
| | 5,000,000 | | New York Life Insurance Co., 5.579%, 11/1/07(e) | | | 5,000,000 |
| | 5,000,000 | | Travelers Insurance Co., 5.453%, 11/19/07(e) | | | 5,000,000 |
| | | | | | |
| | | | | | 20,000,000 |
| | | | | | |
Continued
81
BB&T Prime Money Market Fund
Schedule of Portfolio Investments — (continued)
September 30, 2007
| | | | | | |
Principal Amount | | | | Amortized Cost |
| | VARIABLE RATE NOTES* — (continued) | | | |
| | | Municipal Bonds (1.0%) | | |
| $ | 4,395,000 | | Franklin County, OH, Edison Welding Institute Inc. Project Refunding Revenue Bonds, 5.040%, 10/4/07 | | $ | 4,395,000 |
| | 4,000,000 | | Kansas City, MO, Industrial Development Authority Revenue Bonds, West Edge Project, (M&I Marshall & Ilsley), 5.130%, 10/3/07 | | | 4,000,000 |
| | 7,000,000 | | Maryland State, Economic Development Corp. Revenue Bonds, Human Genome Project Series A, (Manufacturers & Traders), 5.250%, 10/2/07 | | | 7,000,000 |
| | | | | | |
| | | | | | 15,395,000 |
| | | | | | |
| | | Total Variable Rate Notes (Cost $619,225,375) | | | 619,225,375 |
| | | | | | |
| | MASTER NOTE (2.0%) | | | |
| | 30,000,000 | | Bear Stearns & Co., Inc., 5.500%, 10/1/07 | | | 30,000,000 |
| | | | | | |
| | | Total Master Note (Cost $30,000,000) | | | 30,000,000 |
| | | | | | |
| | REPURCHASE AGREEMENT (3.5%) | | | |
| | 53,964,000 | | Bank of America Corp., 5.10%, dated 09/28/07, due 10/01/07, proceeds at maturity, $53,986,935 (Collateralized fully by Mortgage-Backed Security) | | | 53,964,000 |
| | | | | | |
| | | Total Repurchase Agreement (Cost $53,964,000) | | | 53,964,000 |
| | | | | | |
| Total Investments — 99.8%
(Cost $1,532,476,870) | | | 1,532,476,870 |
| | Net Other Assets (Liabilities) — 0.2% | | | 3,139,741 |
| | | | | | |
| | NET ASSETS — 100.0% | | $ | 1,535,616,611 |
| | | | | | |
See footnote legend to Schedules of Portfolio Investments.
See accompanying notes to the financial statements.
82
BB&T U.S. Treasury Money Market Fund
Schedule of Portfolio Investments
September 30, 2007
| | | | | | |
Principal Amount | | | | Amortized Cost |
| U.S. TREASURY NOTES (12.1%) | | |
| $ | 30,000,000 | | 4.250%, 10/31/07 | | $ | 29,985,065 |
| | 75,000,000 | | 3.000%, 11/15/07 | | | 74,940,205 |
| | | | | | |
| | | Total U.S. Treasury Notes (Cost $104,925,270) | | | 104,925,270 |
| | | | | | |
| | U.S. TREASURY BILLS** (18.7%) | | | |
| | 5,000,000 | | 4.812%, 11/15/07 | | | 4,970,922 |
| | 15,000,000 | | 4.808%, 12/13/07 | | | 14,853,087 |
| | 15,000,000 | | 4.808%, 12/13/07 | | | 14,855,520 |
| | 15,000,000 | | 4.989%, 1/17/08 | | | 14,784,900 |
| | 15,000,000 | | 4.989%, 1/17/08 | | | 14,782,202 |
| | 25,000,000 | | 4.279%, 2/14/08 | | | 24,611,361 |
| | 25,000,000 | | 4.279%, 2/14/08 | | | 24,608,056 |
| | 20,000,000 | | 4.016%, 2/28/08 | | | 19,675,417 |
| | 30,000,000 | | 3.995%, 3/13/08 | | | 29,471,100 |
| | | | | | |
| | | Total U.S. Treasury Bills (Cost $162,612,565) | | | 162,612,565 |
| | | | | | |
| | REPURCHASE AGREEMENTS (65.7%) | | | |
| | 150,000,000 | | Bank of America Corp., 5.10%, dated 09/28/07, due 10/01/07, proceeds at maturity, $53,986,935 (Collateralized fully by Mortgage-Backed Security) | | | 150,000,000 |
| | 150,000,000 | | Bear Stearns & Co. Inc., 3.78% dated 09/28/07, due 10/01/07, proceeds at maturity, $150,047,250 (Collateralized fully by U.S. Treasury Securities) | | | 150,000,000 |
| | 125,104,304 | | Credit Suisse First Boston, 3.90%, dated 09/28/07, due 10/01/07, proceeds at maturity, $125,144,963 (Collateralized fully by U.S. Treasury Securities) | | | 125,104,305 |
| | 145,000,000 | | Lehman Brothers, 3.70%, dated 09/28/07, due 10/01/07, proceeds at maturity, $145,044,708 (Collateralized fully by U.S. Treasury Securities) | | | 145,000,000 |
| | | | | | |
| | | Total Repurchase Agreements (Cost $570,104,305) | | | 570,104,305 |
| | | | | | |
| Total Investments — 96.5%
(Cost $837,642,140) | | | 837,642,140 |
| | Net Other Assets (Liabilities) — 3.5% | | | 30,396,050 |
| | | | | | |
| | NET ASSETS — 100.0% | | $ | 868,038,190 |
| | | | | | |
See footnote legend to Schedules of Portfolio Investments.
See accompanying notes to the financial statements.
83
BB&T Capital Manager Conservative Growth Fund
Schedule of Portfolio Investments
September 30, 2007
| | | | | |
| Shares | | | | Fair Value |
| AFFILIATED INVESTMENT COMPANIES (99.6%) | | | |
| 666,437 | | BB&T International Equity Fund, Institutional Class | | $ | 5,758,018 |
| 588,335 | | BB&T Large Cap Fund, Institutional Class | | | 11,296,040 |
| 170,573 | | BB&T Mid Cap Growth Fund, Institutional Class | | | 2,683,114 |
| 246,420 | | BB&T Mid Cap Value Fund, Institutional Class | | | 3,696,303 |
| 123,648 | | BB&T Small Cap Fund, Institutional Class | | | 1,858,425 |
| 3,440,638 | | BB&T Total Return Bond Fund, Institutional Class | | | 34,853,666 |
| 1,747,870 | | BB&T U.S. Treasury Money Market Fund, Institutional Class | | | 1,747,870 |
| | | | | |
| | Total Affiliated Investment Companies (Cost $58,423,004) | | | 61,893,436 |
| | | | | |
Total Investments — 99.6%
(Cost $58,423,004) | | | 61,893,436 |
| Net Other Assets (Liabilities) — 0.4% | | | 263,046 |
| | | | | |
| NET ASSETS — 100.0% | | $ | 62,156,482 |
| | | | | |
See footnote legend to Schedules of Portfolio Investments.
See accompanying notes to the financial statements.
84
BB&T Capital Manager Moderate Growth Fund
Schedule of Portfolio Investments
September 30, 2007
| | | | | |
| Shares | | | | Fair Value |
| AFFILIATED INVESTMENT COMPANIES (99.6%) | | | |
| 1,533,928 | | BB&T International Equity Fund, Institutional Class | | $ | 13,253,140 |
| 1,354,640 | | BB&T Large Cap Fund, Institutional Class | | | 26,009,090 |
| 392,264 | | BB&T Mid Cap Growth Fund, Institutional Class | | | 6,170,311 |
| 567,193 | | BB&T Mid Cap Value Fund, Institutional Class | | | 8,507,891 |
| 284,946 | | BB&T Small Cap Fund, Institutional Class | | | 4,282,736 |
| 2,736,107 | | BB&T Total Return Bond Fund, Institutional Class | | | 27,716,763 |
| 2,717,089 | | BB&T U.S. Treasury Money Market Fund, Institutional Class | | | 2,717,089 |
| | | | | |
| | Total Affiliated Investment Companies (Cost $82,684,105) | | | 88,657,020 |
| | | | | |
Total Investments — 99.6%
(Cost $82,684,105) | | | 88,657,020 |
| Net Other Assets (Liabilities) — 0.4% | | | 332,355 |
| | | | | |
| NET ASSETS — 100.0% | | $ | 88,989,375 |
| | | | | |
See footnote legend to Schedules of Portfolio Investments.
See accompanying notes to the financial statements.
85
BB&T Capital Manager Growth Fund
Schedule of Portfolio Investments
September 30, 2007
| | | | | |
| Shares | | | | Fair Value |
| AFFILIATED INVESTMENT COMPANIES (99.7%) | | | |
| 1,497,883 | | BB&T International Equity Fund, Institutional Class | | $ | 12,941,713 |
| 1,322,280 | | BB&T Large Cap Fund, Institutional Class | | | 25,387,779 |
| 382,964 | | BB&T Mid Cap Growth Fund, Institutional Class | | | 6,024,023 |
| 553,997 | | BB&T Mid Cap Value Fund, Institutional Class | | | 8,309,960 |
| 278,162 | | BB&T Small Cap Fund, Institutional Class | | | 4,180,778 |
| 1,152,925 | | BB&T Total Return Bond Fund, Institutional Class | | | 11,679,134 |
| 2,056,907 | | BB&T U.S. Treasury Money Market Fund, Institutional Class | | | 2,056,907 |
| | | | | |
| | Total Affiliated Investment Companies (Cost $65,731,373) | | | 70,580,294 |
| | | | | |
Total Investments — 99.7%
(Cost $65,731,373) | | | 70,580,294 |
| Net Other Assets (Liabilities) — 0.3% | | | 231,144 |
| | | | | |
| NET ASSETS — 100.0% | | $ | 70,811,438 |
| | | | | |
See footnote legend to Schedules of Portfolio Investments.
See accompanying notes to the financial statements.
86
BB&T Capital Manager Equity Fund
Schedule of Portfolio Investments
September 30, 2007
| | | | | |
| Shares | | | | Fair Value |
| AFFILIATED INVESTMENT COMPANIES (99.3%) | | | |
| 994,767 | | BB&T International Equity Fund, Institutional Class | | $ | 8,594,784 |
| 878,785 | | BB&T Large Cap Fund, Institutional Class | | | 16,872,673 |
| 254,631 | | BB&T Mid Cap Growth Fund, Institutional Class | | | 4,005,344 |
| 368,053 | | BB&T Mid Cap Value Fund, Institutional Class | | | 5,520,800 |
| 184,837 | | BB&T Small Cap Fund, Institutional Class | | | 2,778,107 |
| 707,883 | | BB&T U.S. Treasury Money Market Fund, Institutional Class | | | 707,883 |
| | | | | |
| | Total Affiliated Investment Companies (Cost $35,497,540) | | | 38,479,591 |
| | | | | |
Total Investments — 99.3%
(Cost $35,497,540) | | | 38,479,591 |
| Net Other Assets (Liabilities) — 0.7% | | | 272,664 |
| | | | | |
| NET ASSETS — 100.0% | | $ | 38,752,255 |
| | | | | |
See footnote legend to Schedules of Portfolio Investments.
See accompanying notes to the financial statements.
87
BB&T Funds
Footnote Legend to the Schedules of Portfolio Investments
| (a) | Represents non-income producing security. |
| (b) | Represents that all or a portion of the security was pledged as collateral for securities purchased on a when-issued basis. |
| (c) | Represents a security purchased on a when-issued basis. At September 30, 2007, total cost of investments purchased on a when-issued basis for the Total Return Bond was $6,641,693. |
| (d) | Rule 144A, Section 4(2) or other security which is restricted as to resale to institutional investors. The Investment Advisor, using board approved procedures, has deemed these securities or a portion of these securities to be liquid. |
| (e) | Rule 144A, Section 4(2) or other security which is restricted as to resale to institutional investors. The Investment Advisor, using board approved procedures, has deemed these securities to be illiquid. As of September 30, 2007, these securities represent 6.02% of net assets in the Prime Money Market Fund. (f) Inflation protection security. Principal amount periodically adjusted for inflation. |
| (h) | Security held as collateral for written call option. |
| * | The interest rate for this variable rate note, which will change periodically, is based either on the prime rate or an index of market rates. The reflected rate is in effect as of September 30, 2007. For bond funds, the maturity date reflected is the final maturity date. For money market funds, the maturity date reflected is the next reset date. |
| ** | Discount Note or zero coupon bond. Rate disclosed represents the annualized yield from date of purchase. |
| *** | Interest bearing commercial paper. ADR — American Depository Receipt. |
AMBAC — American Municipal Bond Insurance.
AMBAC-TCRS — Secondarily Insured by AMBAC Indemnity Corp. FGIC — Financial Guaranty Insurance Corp.
FSA — Financial Security Assurance. G.O. — General Obligation.
GDR — Global Depository Receipt. IBC — Insured Bond Certificates. LLC — Limited Liability Company.
MBIA — Municipal Bond Insurance Association MTN — Medium Term Note NA — North America.
OID — Original Issue Discount.
PSF-GTD — Permanent School Fund Guaranteed. REIT — Real Estate Investment Trust.
SCSDE — South Carolina School District Enhancement. STEP — Step Coupon Bond.
XLCA — XL Capital Assurance.
See accompanying notes to the financial statements.
88
(This page has been left blank intentionally.)
BB&T Funds
Statements of Assets and Liabilities
September 30, 2007
| | | | | | | | | | | | | | | | | | | | | | | | | | | | | | | | |
| | | Large Cap
Fund | | | Mid Cap Value Fund | | | Mid Cap
Growth
Fund | | | Small Cap
Fund | | | International
Equity Fund | | | Special
Opportunities
Equity Fund | | | Equity Income
Fund | | | Short U.S.
Government Fund | |
Assets: | | | | | | | | | | | | | | | | | | | | | | | | | | | | | | | | |
Investments, at cost | | $ | 576,604,817 | | | $ | 250,883,925 | | | $ | 154,251,065 | | | $ | 87,150,077 | | | $ | 152,478,644 | | | $ | 281,222,404 | | | $ | 162,270,323 | | | $ | 44,491,214 | |
Unrealized appreciation (depreciation) | | | 90,643,811 | | | | 17,559,167 | | | | 55,546,792 | | | | 6,203,972 | | | | 16,538,657 | | | | 54,238,111 | | | | 24,668,751 | | | | (13,802 | ) |
| | | | | | | | | | | | | | | | | | | | | | | | | | | | | | | | |
Investments, at fair value | | | 667,248,628 | | | | 268,443,092 | | | | 209,797,857 | | | | 93,354,049 | | | | 169,017,301 | | | | 335,460,515 | | | | 186,939,074 | | | | 44,477,412 | |
Cash | | | — | | | | 4 | | | | — | | | | — | | | | 361,811 | | | | — | | | | 13,597 | | | | 625 | |
Foreign currency, at value* | | | — | | | | — | | | | — | | | | — | | | | 7,597,547 | | | | — | | | | — | | | | — | |
Interest and dividends receivable | | | 638,525 | | | | 386,273 | | | | 67,675 | | | | 73,175 | | | | 636,336 | | | | 194,086 | | | | 507,572 | | | | 385,338 | |
Receivable for investments sold | | | 12,830,264 | | | | 1,457,443 | | | | 15,178,092 | | | | 1,208,123 | | | | 3,513,579 | | | | 239,720 | | | | 881,271 | | | | — | |
Receivable for capital shares issued | | | 1,391,425 | | | | 1,155,175 | | | | 1,197,889 | | | | 264,272 | | | | 544,925 | | | | 2,012,671 | | | | 1,638,913 | | | | 101,501 | |
Unrealized appreciation on forward foreign currency contracts | | | — | | | | — | | | | — | | | | — | | | | 186,539 | | | | — | | | | — | | | | — | |
Prepaid and other expenses | | | 15,472 | | | | 8,008 | | | | 7,151 | | | | 9,457 | | | | 6,740 | | | | 14,281 | | | | 14,351 | | | | 2,809 | |
| | | | | | | | | | | | | | | | | | | | | | | | | | | | | | | | |
Total Assets | | | 682,124,314 | | | | 271,449,995 | | | | 226,248,664 | | | | 94,909,076 | | | | 181,864,778 | | | | 337,921,273 | | | | 189,994,778 | | | | 44,967,685 | |
| | | | | | | | | | | | | | | | | | | | | | | | | | | | | | | | |
Liabilities: | | | | | | | | | | | | | | | | | | | | | | | | | | | | | | | | |
Call options written
(premiums received $ — , $ — , $ — , $ — , $ — , $999,154, $148,681 and $ — , respectively) | | | — | | | | — | | | | — | | | | — | | | | — | | | | 997,630 | | | | 386,850 | | | | — | |
Cash overdraft | | | — | | | | — | | | | — | | | | 13 | | | | — | | | | — | | | | — | | | | — | |
Distributions payable | | | 1,397,664 | | | | 127,846 | | | | — | | | | — | | | | — | | | | — | | | | 141,142 | | | | 125,354 | |
Unrealized depreciation on forward foreign currency contracts | | | — | | | | — | | | | — | | | | — | | | | 646,389 | | | | — | | | | — | | | | — | |
Payable for investments purchased | | | — | | | | 3,568,618 | | | | 13,758,003 | | | | — | | | | 9,019,604 | | | | 1,554,662 | | | | 4,707,243 | | | | — | |
Payable for capital shares redeemed | | | 1,254,980 | | | | 29,375 | | | | 63,089 | | | | 171,775 | | | | 418,475 | | | | 3,125,647 | | | | 171,858 | | | | 79,584 | |
Accrued expenses and other payables: | | | | | | | | | | | | | | | | | | | | | | | | | | | | | | | | |
Investment advisory fees | | | 422,999 | | | | 164,883 | | | | 123,213 | | | | 67,957 | | | | 116,466 | | | | 228,446 | | | | 110,592 | | | | 17,957 | |
Administration fees | | | 52,955 | | | | 20,037 | | | | 15,049 | | | | 6,743 | | | | 11,660 | | | | 24,603 | | | | 13,473 | | | | 4,435 | |
Compliance service fees | | | 1,212 | | | | 48 | | | | 24 | | | | — | | | | — | | | | — | | | | 126 | | | | — | |
Distribution (12b-1) fees | | | 26,806 | | | | 9,342 | | | | 4,453 | | | | 4,734 | | | | 2,699 | | | | 90,573 | | | | 52,348 | | | | 824 | |
Trustee fees | | | 14 | | | | 1,003 | | | | 1,026 | | | | 195 | | | | 1,061 | | | | 1,888 | | | | 722 | | | | 119 | |
Transfer agent fees | | | 28,629 | | | | 9,612 | | | | 7,007 | | | | 2,335 | | | | 5,887 | | | | — | | | | — | | | | 45 | |
Other | | | 31,820 | | | | 33,420 | | | | 23,500 | | | | 8,372 | | | | 6,999 | | | | 43,572 | | | | 26,321 | | | | 5,622 | |
| | | | | | | | | | | | | | | | | | | | | | | | | | | | | | | | |
Total Liabilities | | | 3,217,079 | | | | 3,964,184 | | | | 13,995,364 | | | | 262,124 | | | | 10,229,240 | | | | 6,067,021 | | | | 5,610,675 | | | | 233,940 | |
| | | | | | | | | | | | | | | | | | | | | | | | | | | | | | | | |
Net Assets: | | | | | | | | | | | | | | | | | | | | | | | | | | | | | | | | |
Capital | | | 497,435,435 | | | | 223,100,037 | | | | 144,323,097 | | | | 88,025,950 | | | | 144,252,412 | | | | 264,774,775 | | | | 152,702,080 | | | | 52,942,389 | |
Accumulated undistributed (distributions in excess of) net investment income | | | (1,339,038 | ) | | | 8,271 | | | | 197,590 | | | | — | | | | (1,519,068 | ) | | | — | | | | 125,735 | | | | 229,312 | |
Accumulated realized gains from investment, written option and foreign currency transactions | | | 92,167,027 | | | | 26,818,336 | | | | 12,185,821 | | | | 417,030 | | | | 12,551,769 | | | | 12,839,842 | | | | 7,125,706 | | | | (8,424,154 | ) |
Net unrealized appreciation/(depreciation) on investments, written options and translation of assets and liabilities in foreign currency | | | 90,643,811 | | | | 17,559,167 | | | | 55,546,792 | | | | 6,203,972 | | | | 16,350,425 | | | | 54,239,635 | | | | 24,430,582 | | | | (13,802 | ) |
| | | | | | | | | | | | | | | | | | | | | | | | | | | | | | | | |
Net Assets | | $ | 678,907,235 | | | $ | 267,485,811 | | | $ | 212,253,300 | | | $ | 94,646,952 | | | $ | 171,635,538 | | | $ | 331,854,252 | | | $ | 184,384,103 | | | $ | 44,733,745 | |
| | | | | | | | | | | | | | | | | | | | | | | | | | | | | | | | |
Net Assets | | | | | | | | | | | | | | | | | | | | | | | | | | | | | | | | |
Class A Shares | | $ | 58,771,309 | | | $ | 16,810,502 | | | $ | 11,773,992 | | | $ | 8,838,771 | | | $ | 5,203,842 | | | $ | 124,136,488 | | | $ | 97,490,554 | | | $ | 3,978,013 | |
Class B Shares | | | 17,796,140 | | | | 6,112,136 | | | | 2,697,128 | | | | 3,393,269 | | | | 2,041,476 | | | | 29,930,572 | | | | 14,795,864 | | | | — | |
Class C Shares | | | 238,618 | | | | 1,126,025 | | | | 46,107 | | | | 25,638 | | | | 243,643 | | | | 50,577,245 | | | | 26,044,432 | | | | — | |
Institutional Shares | | | 602,101,168 | | | | 243,437,148 | | | | 197,736,073 | | | | 82,389,274 | | | | 164,146,577 | | | | 127,209,947 | | | | 46,053,253 | | | | 40,755,732 | |
| | | | | | | | | | | | | | | | | | | | | | | | | | | | | | | | |
Total | | $ | 678,907,235 | | | $ | 267,485,811 | | | $ | 212,253,300 | | | $ | 94,646,952 | | | $ | 171,635,538 | | | $ | 331,854,252 | | | $ | 184,384,103 | | | $ | 44,733,745 | |
| | | | | | | | | | | | | | | | | | | | | | | | | | | | | | | | |
Shares of Beneficial Interest Outstanding (Unlimited number of shares authorized, no par value) | | | | | | | | | | | | | | | | | | | | | | | | | | | | | | | | |
Class A Shares | | | 3,071,689 | | | | 1,125,910 | | | | 793,538 | | | | 592,309 | | | | 618,404 | | | | 6,786,183 | | | | 6,486,267 | | | | 417,818 | |
Class B Shares | | | 941,371 | | | | 419,943 | | | | 191,805 | | | | 235,187 | | | | 266,925 | | | | 1,697,387 | | | | 987,040 | | | | — | |
Class C Shares | | | 12,646 | | | | 77,404 | | | | 3,275 | | | | 1,779 | | | | 31,984 | | | | 2,866,658 | | | | 1,738,721 | | | | — | |
Institutional Shares | | | 31,364,903 | | | | 16,229,298 | | | | 12,570,569 | | | | 5,480,742 | | | | 18,993,135 | | | | 6,871,875 | | | | 3,059,471 | | | | 4,276,981 | |
| | | | | | | | | | | | | | | | | | | | | | | | | | | | | | | | |
Total | | | 35,390,609 | | | | 17,852,555 | | | | 13,559,187 | | | | 6,310,017 | | | | 19,910,448 | | | | 18,222,103 | | | | 12,271,499 | | | | 4,694,799 | |
| | | | | | | | | | | | | | | | | | | | | | | | | | | | | | | | |
Net Asset Value | | | | | | | | | | | | | | | | | | | | | | | | | | | | | | | | |
Class A Shares - redemption price per share | | $ | 19.13 | | | $ | 14.93 | | | $ | 14.84 | | | $ | 14.92 | | | $ | 8.41 | | | $ | 18.29 | | | $ | 15.03 | | | $ | 9.52 | |
| | | | | | | | | | | | | | | | | | | | | | | | | | | | | | | | |
Class B Shares - offering price per share** | | $ | 18.90 | | | $ | 14.55 | | | $ | 14.06 | | | $ | 14.43 | | | $ | 7.65 | | | $ | 17.63 | | | $ | 14.99 | | | $ | — | |
| | | | | | | | | | | | | | | | | | | | | | | | | | | | | | | | |
Class C Shares - offering price per share** | | $ | 18.87 | | | $ | 14.55 | | | $ | 14.08 | | | $ | 14.41 | | | $ | 7.62 | | | $ | 17.64 | | | $ | 14.98 | | | $ | — | |
| | | | | | | | | | | | | | | | | | | | | | | | | | | | | | | | |
Institutional Shares | | $ | 19.20 | | | $ | 15.00 | | | $ | 15.73 | | | $ | 15.03 | | | $ | 8.64 | | | $ | 18.51 | | | $ | 15.05 | | | $ | 9.53 | |
| | | | | | | | | | | | | | | | | | | | | | | | | | | | | | | | |
Maximum Sales Charge - Class A Shares | | | 5.75 | % | | | 5.75 | % | | | 5.75 | % | | | 5.75 | % | | | 5.75 | % | | | 5.75 | % | | | 5.75 | % | | | 3.00 | % |
| | | | | | | | | | | | | | | | | | | | | | | | | | | | | | | | |
Maximum Offering Price (100%/(100% - Maximum Sales Charge)) of net asset value adjusted to the nearest cent per share - Class A Shares | | $ | 20.30 | | | $ | 15.84 | | | $ | 15.75 | | | $ | 15.83 | | | $ | 8.93 | | | $ | 19.41 | | | $ | 15.95 | | | $ | 9.81 | |
| | | | | | | | | | | | | | | | | | | | | | | | | | | | | | | | |
| * | The International Equity Fund includes foreign currency at cost of $7,375,689. |
| ** | Redemption price per share varies by length of time shares are held. |
See accompanying notes to the financial statements.
90
BB&T Funds
Statements of Assets and Liabilities
September 30, 2007
| | | | | | | | | | | | | | | | | | | | | | | | | | | | | | | | |
| | | Intermediate U.S.
Government Fund | | | Total Return
Bond Fund | | | Kentucky
Intermediate
Tax-Free Fund | | | Maryland
Intermediate
Tax-Free Fund | | | North Carolina
Intermediate
Tax-Free Fund | | | South Carolina
Intermediate
Tax-Free Fund | | | Virginia
Intermediate
Tax-Free Fund | | | West Virginia
Intermediate
Tax-Free Fund | |
Assets: | | | | | | | | | | | | | | | | | | | | | | | | | | | | | | | | |
Investments, at cost | | $ | 145,939,921 | | | $ | 453,118,715 | | | $ | 14,867,458 | | | $ | 10,346,014 | | | $ | 113,118,187 | | | $ | 15,998,115 | | | $ | 76,703,281 | | | $ | 68,078,296 | |
Unrealized appreciation (depreciation) | | | (1,679,464 | ) | | | 1,053,255 | | | | 180,193 | | | | 149,366 | | | | 2,206,204 | | | | 261,426 | | | | 1,681,320 | | | | 1,215,700 | |
| | | | | | | | | | | | | | | | | | | | | | | | | | | | | | | | |
Investments, at fair value | | | 144,260,457 | | | | 454,171,970 | | | | 15,047,651 | | | | 10,495,380 | | | | 115,324,391 | | | | 16,259,541 | | | | 78,384,601 | | | | 69,293,996 | |
Cash | | | 1,903 | | | | 3,127 | | | | 49 | | | | 29 | | | | 651 | | | | 411 | | | | 76 | | | | 40 | |
Interest and dividends receivable | | | 1,043,543 | | | | 3,473,914 | | | | 220,026 | | | | 124,396 | | | | 1,664,005 | | | | 191,570 | | | | 936,765 | | | | 1,056,088 | |
Maturities receivable | | | — | | | | 178,158 | | | | — | | | | — | | | | — | | | | — | | | | — | | | | — | |
Receivable for investments sold | | | — | | | | — | | | | 27,033 | | | | — | | | | 3,660,022 | | | | 154,894 | | | | 330,315 | | | | 65,554 | |
Receivable for capital shares issued | | | 12,408 | | | | 1,560,820 | | | | — | | | | 214,052 | | | | 94,484 | | | | — | | | | 192,997 | | | | 5,000 | |
Prepaid and other expenses | | | 6,576 | | | | 7,301 | | | | 140 | | | | — | | | | 1,056 | | | | 1,417 | | | | 2,062 | | | | 985 | |
| | | | | | | | | | | | | | | | | | | | | | | | | | | | | | | | |
Total Assets | | | 145,324,887 | | | | 459,395,290 | | | | 15,294,899 | | | | 10,833,857 | | | | 120,744,609 | | | | 16,607,833 | | | | 79,846,816 | | | | 70,421,663 | |
| | | | | | | | | | | | | | | | | | | | | | | | | | | | | | | | |
Liabilities: | | | | | | | | | | | | | | | | | | | | | | | | | | | | | | | | |
Distributions payable | | | 326,578 | | | | 1,127,800 | | | | 30,101 | | | | 24,396 | | | | 292,238 | | | | 38,870 | | | | 198,675 | | | | 167,764 | |
Payable for investments purchased | | | — | | | | 10,687,572 | | | | — | | | | — | | | | 4,425,934 | | | | — | | | | 1,618,095 | | | | 796,904 | |
Payable for capital shares redeemed | | | 241,601 | | | | 394,123 | | | | — | | | | — | | | | — | | | | — | | | | 262,689 | | | | — | |
Accrued expenses and other payables: | | | | | | | | | | | | | | | | | | | | | | | | | | | | | | | | |
Investment advisory fees | | | 64,404 | | | | 195,378 | | | | 5,664 | | | | 3,180 | | | | 47,860 | | | | 6,938 | | | | 32,339 | | | | 28,632 | |
Administration fees | | | 11,093 | | | | 33,281 | | | | 1,130 | | | | 783 | | | | 8,675 | | | | 1,264 | | | | 5,912 | | | | 5,190 | |
Compliance service fees | | | — | | | | — | | | | — | | | | 2 | | | | 55 | | | | 9 | | | | 35 | | | | 9 | |
Distribution (12b-1) fees | | | 4,511 | | | | 5,868 | | | | 943 | | | | 481 | | | | 4,043 | | | | 771 | | | | 1,801 | | | | 3,458 | |
Trustee fees | | | 46 | | | | 1,074 | | | | 64 | | | | 40 | | | | 406 | | | | 111 | | | | 319 | | | | 218 | |
Other | | | 16,434 | | | | 57,462 | | | | 2,237 | | | | 1,769 | | | | 15,578 | | | | 1,426 | | | | 13,401 | | | | 4,648 | |
| | | | | | | | | | | | | | | | | | | | | | | | | | | | | | | | |
Total Liabilities | | | 664,667 | | | | 12,502,558 | | | | 40,139 | | | | 30,651 | | | | 4,794,789 | | | | 49,389 | | | | 2,133,266 | | | | 1,006,823 | |
| | | | | | | | | | | | | | | | | | | | | | | | | | | | | | | | |
Net Assets: | | | | | | | | | | | | | | | | | | | | | | | | | | | | | | | | |
Capital | | | 160,231,764 | | | | 455,539,284 | | | | 15,091,006 | | | | 10,780,620 | | | | 113,243,929 | | | | 16,154,993 | | | | 75,641,973 | | | | 68,093,760 | |
Accumulated undistributed (distributions in excess of) net investment income | | | 1,590,109 | | | | 545,387 | | | | 1,082 | | | | (483 | ) | | | 62,775 | | | | 1,168 | | | | 38,240 | | | | (59,173 | ) |
Accumulated realized gains (losses) from investments | | | (15,482,189 | ) | | | (10,245,194 | ) | | | (17,521 | ) | | | (126,297 | ) | | | 436,912 | | | | 140,857 | | | | 352,017 | | | | 164,553 | |
Net unrealized appreciation/depreciation on investments | | | (1,679,464 | ) | | | 1,053,255 | | | | 180,193 | | | | 149,366 | | | | 2,206,204 | | | | 261,426 | | | | 1,681,320 | | | | 1,215,700 | |
| | | | | | | | | | | | | | | | | | | | | | | | | | | | | | | | |
Net Assets | | $ | 144,660,220 | | | $ | 446,892,732 | | | $ | 15,254,760 | | | $ | 10,803,206 | | | $ | 115,949,820 | | | $ | 16,558,444 | | | $ | 77,713,550 | | | $ | 69,414,840 | |
| | | | | | | | | | | | | | | | | | | | | | | | | | | | | | | | |
Net Assets | | | | | | | | | | | | | | | | | | | | | | | | | | | | | | | | |
Class A Shares | | $ | 9,049,704 | | | $ | 8,403,442 | | | $ | 4,629,955 | | | $ | 2,429,418 | | | $ | 19,667,656 | | | $ | 3,769,325 | | | $ | 8,802,154 | | | $ | 16,896,921 | |
Class B Shares | | | 3,006,455 | | | | 4,991,854 | | | | — | | | | — | | | | — | | | | — | | | | — | | | | — | |
Class C Shares | | | 201,449 | | | | 115,444 | | | | — | | | | — | | | | — | | | | — | | | | — | | | | — | |
Institutional Shares | | | 132,402,612 | | | | 433,381,992 | | | | 10,624,805 | | | | 8,373,788 | | | | 96,282,164 | | | | 12,789,119 | | | | 68,911,396 | | | | 52,517,919 | |
| | | | | | | | | | | | | | | | | | | | | | | | | | | | | | | | |
Total | | $ | 144,660,220 | | | $ | 446,892,732 | | | $ | 15,254,760 | | | $ | 10,803,206 | | | $ | 115,949,820 | | | $ | 16,558,444 | | | $ | 77,713,550 | | | $ | 69,414,840 | |
| | | | | | | | | | | | | | | | | | | | | | | | | | | | | | | | |
Outstanding Units of Beneficial Interest (Shares) | | | | | | | | | | | | | | | | | | | | | | | | | | | | | | | | |
Class A Shares | | | 911,339 | | | | 830,110 | | | | 460,093 | | | | 239,334 | | | | 1,903,235 | | | | 366,618 | | | | 777,857 | | | | 1,739,790 | |
Class B Shares | | | 303,811 | | | | 492,690 | | | | — | | | | — | | | | — | | | | — | | | | — | | | | — | |
Class C Shares | | | 20,341 | | | | 11,389 | | | | — | | | | — | | | | — | | | | — | | | | — | | | | — | |
Institutional Shares | | | 13,315,681 | | | | 42,786,361 | | | | 1,057,039 | | | | 823,740 | | | | 9,318,664 | | | | 1,252,029 | | | | 6,090,798 | | | | 5,401,776 | |
| | | | | | | | | | | | | | | | | | | | | | | | | | | | | | | | |
Total | | | 14,551,172 | | | | 44,120,550 | | | | 1,517,132 | | | | 1,063,074 | | | | 11,221,899 | | | | 1,618,647 | | | | 6,868,655 | | | | 7,141,566 | |
| | | | | | | | | | | | | | | | | | | | | | | | | | | | | | | | |
Net Asset Value | | | | | | | | | | | | | | | | | | | | | | | | | | | | | | | | |
Class A Shares - redemption price per share | | $ | 9.93 | | | $ | 10.12 | | | $ | 10.06 | | | $ | 10.15 | | | $ | 10.33 | | | $ | 10.28 | | | $ | 11.32 | | | $ | 9.71 | |
| | | | | | | | | | | | | | | | | | | | | | | | | | | | | | | | |
Class B Shares - offering price per share* | | $ | 9.90 | | | $ | 10.13 | | | $ | — | | | $ | — | | | $ | — | | | $ | — | | | $ | — | | | $ | — | |
| | | | | | | | | | | | | | | | | | | | | | | | | | | | | | | | |
Class C Shares - offering price per share* | | $ | 9.90 | | | $ | 10.14 | | | $ | — | | | $ | — | | | $ | — | | | $ | — | | | $ | — | | | $ | — | |
| | | | | | | | | | | | | | | | | | | | | | | | | | | | | | | | |
Institutional Shares | | $ | 9.94 | | | $ | 10.13 | | | $ | 10.05 | | | $ | 10.17 | | | $ | 10.33 | | | $ | 10.21 | | | $ | 11.31 | | | $ | 9.72 | |
| | | | | | | | | | | | | | | | | | | | | | | | | | | | | | | | |
Maximum Sales Charge - Class A Shares | | | 5.75 | % | | | 5.75 | % | | | 3.00 | % | | | 3.00 | % | | | 3.00 | % | | | 3.00 | % | | | 3.00 | % | | | 3.00 | % |
| | | | | | | | | | | | | | | | | | | | | | | | | | | | | | | | |
Maximum Offering Price (100%/(100% - Maximum Sales Charge)) of net asset value adjusted to the nearest cent per share - Class A Shares | | $ | 10.54 | | | $ | 10.74 | | | $ | 10.37 | | | $ | 10.46 | | | $ | 10.65 | | | $ | 10.60 | | | $ | 11.67 | | | $ | 10.01 | |
| | | | | | | | | | | | | | | | | | | | | | | | | | | | | | | | |
| * | Redemption price per share varies by length of time shares are held. |
See accompanying notes to the financial statements.
91
BB&T Funds
Statements of Assets and Liabilities
September 30, 2007
| | | | | | | | | | | | | | | | | | | | | | | | | | |
| | | National
Tax-Free Money
Market Fund | | | Prime Money Market
Fund | | U.S. Treasury
Money Market
Fund | | Capital Manager
Conservative
Growth Fund | | | Capital Manager
Moderate
Growth Fund | | | Capital Manager
Growth Fund | | | Capital Manager
Equity Fund | |
Assets: | | | | | | | | | | | | | | | | | | | | | | | | | | |
Investments: | | | | | | | | | | | | | | | | | | | | | | | | | | |
Unaffiliated investments, at cost | | $ | 109,513,946 | | | $ | 1,478,512,870 | | $ | 267,537,835 | | $ | — | | | $ | — | | | $ | — | | | $ | — | |
Investment in affiliates, at cost | | | — | | | | — | | | — | | | 58,423,004 | | | | 82,684,105 | | | | 65,731,373 | | | | 35,497,540 | |
| | | | | | | | | | | | | | | | | | | | | | | | | | |
Total investments, at cost | | | 109,513,946 | | | | 1,478,512,870 | | | 267,537,835 | | | 58,423,004 | | | | 82,684,105 | | | | 65,731,373 | | | | 35,497,540 | |
Unrealized appreciation (depreciation) | | | — | | | | — | | | — | | | 3,470,432 | | | | 5,972,915 | | | | 4,848,921 | | | | 2,982,051 | |
| | | | | | | | | | | | | | | | | | | | | | | | | | |
Investments, at value | | | 109,513,946 | | | | 1,478,512,870 | | | 267,537,835 | | | 61,893,436 | | | | 88,657,020 | | | | 70,580,294 | | | | 38,479,591 | |
Repurchase agreements, at cost | | | — | | | | 53,964,000 | | | 570,104,305 | | | — | | | | — | | | | — | | | | — | |
Cash | | | 11 | | | | 1,225 | | | 142 | | | — | | | | — | | | | — | | | | — | |
Interest and dividends receivable | | | 956,233 | | | | 7,250,727 | | | 2,170,352 | | | 204,412 | | | | 260,026 | | | | 195,947 | | | | 101,291 | |
Maturities receivable | | | — | | | | — | | | 30,000,000 | | | — | | | | — | | | | — | | | | — | |
Receivable for capital shares issued | | | — | | | | — | | | 14 | | | 165,565 | | | | 277,333 | | | | 123,721 | | | | 205,517 | |
Prepaid and other expenses | | | 9,369 | | | | 22,361 | | | 14,912 | | | 2,545 | | | | 4,250 | | | | 3,241 | | | | 3,409 | |
| | | | | | | | | | | | | | | | | | | | | | | | | | |
Total Assets | | | 110,479,559 | | | | 1,539,751,183 | | | 869,827,560 | | | 62,265,958 | | | | 89,198,629 | | | | 70,903,203 | | | | 38,789,808 | |
| | | | | | | | | | | | | | | | | | | | | | | | | | |
Liabilities: | | | | | | | | | | | | | | | | | | | | | | | | | | |
Distributions payable | | | 316,493 | | | | 3,049,858 | | | 1,263,308 | | | 5,356 | | | | 7,003 | | | | 2,602 | | | | 3,270 | |
Payable for capital shares redeemed | | | — | | | | 3,502 | | | — | | | 87,053 | | | | 160,136 | | | | 55,712 | | | | 20,989 | |
Accrued expenses and other payables: | | | | | | | | | | | | | | | | | | | | | | | | | | |
Investment advisory fees | | | 24,420 | | | | 445,958 | | | 214,421 | | | 2,894 | | | | 4,186 | | | | 3,227 | | | | 1,739 | |
Administration fees | | | 8,699 | | | | 115,479 | | | 58,464 | | | — | | | | — | | | | — | | | | — | |
Compliance service fees | | | 103 | | | | 2,914 | | | 1,419 | | | — | | | | — | | | | 3 | | | | 15 | |
Distribution (12b-1) fees | | | 109 | | | | 306,057 | | | 128,235 | | | 5,956 | | | | 25,605 | | | | 21,774 | | | | 8,758 | |
Trustee fees | | | 520 | | | | — | | | — | | | 196 | | | | 245 | | | | 204 | | | | 500 | |
Other | | | 15,154 | | | | 210,804 | | | 123,523 | | | 8,021 | | | | 12,079 | | | | 8,243 | | | | 2,282 | |
| | | | | | | | | | | | | | | | | | | | | | | | | | |
Total Liabilities | | | 365,498 | | | | 4,134,572 | | | 1,789,370 | | | 109,476 | | | | 209,254 | | | | 91,765 | | | | 37,553 | |
| | | | | | | | | | | | | | | | | | | | | | | | | | |
Net Assets: | | | | | | | | | | | | | | | | | | | | | | | | | | |
Capital | | | 110,115,995 | | | | 1,535,611,664 | | | 868,037,944 | | | 54,507,191 | | | | 73,852,145 | | | | 57,606,912 | | | | 30,155,513 | |
Accumulated undistributed (distributions in excess of) net investment income | | | — | | | | 4,947 | | | 246 | | | 345,940 | | | | 693,757 | | | | 666,082 | | | | 392,521 | |
Accumulated realized gains (losses) from investments | | | (1,934 | ) | | | — | | | — | | | 3,832,919 | | | | 8,470,558 | | | | 7,689,523 | | | | 5,222,170 | |
Net unrealized appreciation/(depreciation) on investments | | | — | | | | — | | | — | | | 3,470,432 | | | | 5,972,915 | | | | 4,848,921 | | | | 2,982,051 | |
| | | | | | | | | | | | | | | | | | | | | | | | | | |
Net Assets | | $ | 110,114,061 | | | $ | 1,535,616,611 | | $ | 868,038,190 | | $ | 62,156,482 | | | $ | 88,989,375 | | | $ | 70,811,438 | | | $ | 38,752,255 | |
| | | | | | | | | | | | | | | | | | | | | | | | | | |
Net Assets | | | | | | | | | | | | | | | | | | | | | | | | | | |
Class A Shares | | $ | 526,351 | | | $ | 745,381,317 | | $ | 310,412,405 | | $ | 9,780,754 | | | $ | 38,081,125 | | | $ | 26,188,784 | | | $ | 9,383,929 | |
Class B Shares | | | 1,152 | | | | 1,628,663 | | | 301,163 | | | 4,779,405 | | | | 21,790,777 | | | | 20,286,427 | | | | 8,535,220 | |
Class C Shares | | | 1,026 | | | | 460,312 | | | 42,257 | | | 76,690 | | | | 156,467 | | | | 77,634 | | | | 1,144 | |
Institutional Shares | | | 109,585,532 | | | | 788,146,319 | | | 557,282,365 | | | 47,519,633 | | | | 28,961,006 | | | | 24,258,593 | | | | 20,831,962 | |
| | | | | | | | | | | | | | | | | | | | | | | | | | |
Total | | $ | 110,114,061 | | | $ | 1,535,616,611 | | $ | 868,038,190 | | $ | 62,156,482 | | | $ | 88,989,375 | | | $ | 70,811,438 | | | $ | 38,752,255 | |
| | | | | | | | | | | | | | | | | | | | | | | | | | |
Outstanding Units of Beneficial Interest (Shares) | | | | | | | | | | | | | | | | | | | | | | | | | | |
Class A Shares | | | 526,368 | | | | 745,377,452 | | | 310,412,514 | | | 928,480 | | | | 3,479,787 | | | | 2,353,465 | | | | 765,533 | |
Class B Shares | | | 1,152 | | | | 1,629,447 | | | 301,263 | | | 453,609 | | | | 2,026,890 | | | | 1,857,301 | | | | 719,481 | |
Class C Shares | | | 1,026 | | | | 460,305 | | | 42,258 | | | 7,297 | | | | 14,472 | | | | 7,109 | | | | 96 | |
Institutional Shares | | | 109,590,477 | | | | 788,160,238 | | | 557,282,300 | | | 4,475,230 | | | | 2,635,850 | | | | 2,177,303 | | | | 1,686,305 | |
| | | | | | | | | | | | | | | | | | | | | | | | | | |
Total | | | 110,119,023 | | | | 1,535,627,442 | | | 868,038,335 | | | 5,864,616 | | | | 8,156,999 | | | | 6,395,178 | | | | 3,171,415 | |
| | | | | | | | | | | | | | | | | | | | | | | | | | |
Net Asset Value | | | | | | | | | | | | | | | | | | | | | | | | | | |
Class A Shares - redemption price per share | | $ | 1.00 | | | $ | 1.00 | | $ | 1.00 | | $ | 10.53 | | | $ | 10.94 | | | $ | 11.13 | | | $ | 12.26 | |
| | | | | | | | | | | | | | | | | | | | | | | | | | |
Class B Shares - offering price per share* | | $ | 1.00 | | | $ | 1.00 | | $ | 1.00 | | $ | 10.54 | | | $ | 10.75 | | | $ | 10.92 | | | $ | 11.86 | |
| | | | | | | | | | | | | | | | | | | | | | | | | | |
Class C Shares - offering price per share* | | $ | 1.00 | | | $ | 1.00 | | $ | 1.00 | | $ | 10.51 | | | $ | 10.81 | | | $ | 10.92 | | | $ | 11.87 | |
| | | | | | | | | | | | | | | | | | | | | | | | | | |
Institutional Shares | | $ | 1.00 | | | $ | 1.00 | | $ | 1.00 | | $ | 10.62 | | | $ | 10.99 | | | $ | 11.14 | | | $ | 12.35 | |
| | | | | | | | | | | | | | | | | | | | | | | | | | |
Maximum Sales Charge - Class A Shares | | | N/A | | | | N/A | | | N/A | | | 5.75 | % | | | 5.75 | % | | | 5.75 | % | | | 5.75 | % |
| | | | | | | | | | | | | | | | | | | | | | | | | | |
Maximum Offering Price (100%/(100% - Maximum Sales Charge)) of net asset value adjusted to the nearest cent per share - Class A Shares | | $ | 1.00 | | | $ | 1.00 | | $ | 1.00 | | $ | 11.17 | | | $ | 11.61 | | | $ | 11.81 | | | $ | 13.01 | |
| | | | | | | | | | | | | | | | | | | | | | | | | | |
| * | Redemption price per share varies by length of time shares are held. |
See accompanying notes to the financial statements.
92
BB&T Funds
Statements of Operations
For the Year Ended September 30, 2007
| | | | | | | | | | | | | | | | | | | | | | | | | | | | | | | | |
| | | Large Cap
Fund | | | Mid Cap
Value Fund | | | Mid Cap
Growth Fund | | | Small Cap
Fund | | | International
Equity Fund | | | Special
Opportunities
Equity Fund | | | Equity
Income Fund | | | Short U.S.
Government Fund | |
Investment Income: | | | | | | | | | | | | | | | | | | | | | | | | | | | | | | | | |
Interest income | | $ | 1,035,849 | | | $ | 491,683 | | | $ | 245,639 | | | $ | 444,062 | | | $ | 70,753 | | | $ | 1,661,569 | | | $ | 703,137 | | | $ | 2,348,526 | |
Dividend income | | | 15,676,826 | | | | 2,874,778 | | | | 462,781 | | | | 1,137,567 | | | | 4,375,779 | | | | 1,394,723 | | | | 4,586,586 | | | | 10,562 | |
Foreign tax withholding | | | — | | | | (3,314 | ) | | | (5,440 | ) | | | — | | | | (272,084 | ) | | | (7,735 | ) | | | (50,902 | ) | | | — | |
Income from securities lending | | | 148,553 | | | | 62,546 | | | | 356,400 | | | | 76,956 | | | | — | | | | 52,678 | | | | 30,972 | | | | 15,815 | |
| | | | | | | | | | | | | | | | | | | | | | | | | | | | | | | | |
Total investment income | | | 16,861,228 | | | | 3,425,693 | | | | 1,059,380 | | | | 1,658,585 | | | | 4,174,448 | | | | 3,101,235 | | | | 5,269,793 | | | | 2,374,903 | |
| | | | | | | | | | | | | | | | | | | | | | | | | | | | | | | | |
Expenses: | | | | | | | | | | | | | | | | | | | | | | | | | | | | | | | | |
Investment advisory fees (See Note 4) | | | 5,195,172 | | | | 1,752,241 | | | | 1,182,836 | | | | 981,765 | | | | 1,843,603 | | | | 2,020,845 | | | | 989,246 | | | | 305,103 | |
Administration fees (See Note 4) | | | 739,279 | | | | 246,115 | | | | 165,793 | | | | 102,958 | | | | 195,716 | | | | 260,696 | | | | 146,175 | | | | 54,200 | |
Distribution fees - Class A Shares | | | 284,270 | | | | 40,095 | | | | 26,999 | | | | 48,066 | | | | 24,402 | | | | 527,376 | | | | 392,809 | | | | 24,132 | |
Distribution fees - Class B Shares | | | 185,043 | | | | 60,044 | | | | 24,840 | | | | 40,061 | | | | 19,475 | | | | 270,236 | | | | 124,606 | | | | — | |
Distribution fees - Class C Shares | | | 2,202 | | | | 10,058 | | | | 392 | | | | 238 | | | | 1,827 | | | | 436,083 | | | | 204,845 | | | | — | |
Compliance service fees (See Note 4) | | | 10,233 | | | | 3,134 | | | | 2,053 | | | | 1,353 | | | | 2,445 | | | | 2,681 | | | | 1,922 | | | | 728 | |
Trustee fees | | | 37,099 | | | | 11,421 | | | | 7,883 | | | | 4,863 | | | | 10,364 | | | | 12,352 | | | | 6,633 | | | | 2,902 | |
Audit fees | | | 67,959 | | | | 18,865 | | | | 12,524 | | | | 7,323 | | | | 13,078 | | | | 23,387 | | | | 13,243 | | | | 3,701 | |
Custodian fees | | | 43,272 | | | | 10,877 | | | | 4,413 | | | | 4,306 | | | | 90,603 | | | | 13,413 | | | | 8,889 | | | | 2,127 | |
Fund accounting fees (See Note 4) | | | 87,843 | | | | 24,202 | | | | 16,313 | | | | 10,040 | | | | 18,790 | | | | 25,807 | | | | 14,442 | | | | 5,086 | |
Legal fees | | | 145,000 | | | | 45,000 | | | | 30,000 | | | | 18,850 | | | | 34,650 | | | | 35,000 | | | | 27,000 | | | | 9,120 | |
Printing fees | | | 112,000 | | | | 17,000 | | | | 10,333 | | | | 8,000 | | | | 23,000 | | | | 18,178 | | | | 10,838 | | | | 3,930 | |
Transfer agent fees (See Note 4) | | | 218,434 | | | | 72,239 | | | | 50,781 | | | | 39,118 | | | | 46,556 | | | | 91,116 | | | | 48,498 | | | | 10,481 | |
Other | | | 109,861 | | | | 58,017 | | | | 49,760 | | | | 59,070 | | | | 42,340 | | | | 86,554 | | | | 62,664 | | | | 15,647 | |
| | | | | | | | | | | | | | | | | | | | | | | | | | | | | | | | |
Total expenses before waivers | | | 7,237,667 | | | | 2,369,308 | | | | 1,584,920 | | | | 1,326,011 | | | | 2,366,849 | | | | 3,823,724 | | | | 2,051,810 | | | | 437,157 | |
Less expenses reimbursed or waived by the Investment Advisor | | | (402,568 | ) | | | (94,716 | ) | | | (63,937 | ) | | | (196,354 | ) | | | (238,508 | ) | | | — | | | | — | | | | (76,276 | ) |
Less expenses reimbursed or waived by the Distributor | | | (142,135 | ) | | | — | | | | — | | | | (24,033 | ) | | | (12,201 | ) | | | (263,688 | ) | | | (196,405 | ) | | | (12,066 | ) |
| | | | | | | | | | | | | | | | | | | | | | | | | | | | | | | | |
Net expenses | | | 6,692,964 | | | | 2,274,592 | | | | 1,520,983 | | | | 1,105,624 | | | | 2,116,140 | | | | 3,560,036 | | | | 1,855,405 | | | | 348,815 | |
| | | | | | | | | | | | | | | | | | | | | | | | | | | | | | | | |
Net investment income (loss) | | | 10,168,264 | | | | 1,151,101 | | | | (461,603 | ) | | | 552,961 | | | | 2,058,308 | | | | (458,801 | ) | | | 3,414,388 | | | | 2,026,088 | |
| | | | | | | | | | | | | | | | | | | | | | | | | | | | | | | | |
Realized/Unrealized Gains (Losses) on Investments, Written Options and Foreign Currency Transactions: | | | | | | | | | | | | | | | | | | | | | | | | | | | | | | | | |
Net realized gains (losses) from: | | | | | | | | | | | | | | | | | | | | | | | | | | | | | | | | |
Investments | | | 147,788,254 | | | | 32,051,690 | | | | 17,485,970 | | | | 11,045,537 | | | | 87,451,821 | | | | 28,777,319 | | | | 12,595,322 | | | | (260,514 | ) |
Written Options | | | — | | | | — | | | | — | | | | — | | | | — | | | | 1,235,199 | | | | 241,142 | | | | — | |
Foreign currency transactions | | | — | | | | — | | | | — | | | | — | | | | (1,300,855 | ) | | | — | | | | — | | | | — | |
Change in unrealized appreciation/depreciation on: | | | | | | | | | | | | | | | | | | | | | | | | | | | | | | | | |
Investments | | | (70,022,396 | ) | | | (903,836 | ) | | | 34,588,439 | | | | (7,334,815 | ) | | | (48,190,258 | ) | | | 16,498,519 | | | | 9,033,259 | | | | 614,081 | |
Written Options | | | — | | | | — | | | | — | | | | — | | | | — | | | | (548,551 | ) | | | (368,493 | ) | | | — | |
Foreign currency transactions | | | — | | | | — | | | | — | | | | — | | | | (339,479 | ) | | | — | | | | — | | | | — | |
| | | | | | | | | | | | | | | | | | | | | | | | | | | | | | | | |
Net realized/unrealized gains on investments, written options and foreign currency transactions | | | 77,765,858 | | | | 31,147,854 | | | | 52,074,409 | | | | 3,710,722 | | | | 37,621,229 | | | | 45,962,486 | | | | 21,501,230 | | | | 353,567 | |
| | | | | | | | | | | | | | | | | | | | | | | | | | | | | | | | |
Change in net assets from operations | | $ | 87,934,122 | | | $ | 32,298,955 | | | $ | 51,612,806 | | | $ | 4,263,683 | | | $ | 39,679,537 | | | $ | 45,503,685 | | | $ | 24,915,618 | | | $ | 2,379,655 | |
| | | | | | | | | | | | | | | | | | | | | | | | | | | | | | | | |
See accompanying notes to the financial statements.
93
BB&T Funds
Statements of Operations
For the Year Ended September 30, 2007
| | | | | | | | | | | | | | | | | | | | | | | | | | | | | | | | |
| | | Intermediate U.S.
Government Fund | | | Total Return
Bond Fund | | | Kentucky
Intermediate
Tax-Free Fund | | | Maryland
Intermediate
Tax-Free Fund | | | North Carolina
Intermediate
Tax-Free Fund | | | South Carolina
Intermediate
Tax-Free Fund | | | Virginia
Intermediate
Tax-Free Fund | | | West Virginia
Intermediate
Tax-Free Fund | |
Investment Income: | | | | | | | | | | | | | | | | | | | | | | | | | | | | | | | | |
Interest income | | $ | 8,927,182 | | | $ | 22,812,166 | | | $ | 560,022 | | | $ | 398,077 | | | $ | 4,676,065 | | | $ | 755,477 | | | $ | 3,269,229 | | | $ | 3,025,624 | |
Dividend income | | | 23,354 | | | | 35,460 | | | | 21,606 | | | | 18,696 | | | | 109,838 | | | | 22,659 | | | | 67,943 | | | | 70,249 | |
Income from securities lending | | | 38,480 | | | | 119,677 | | | | — | | | | — | | | | — | | | | — | | | | — | | | | — | |
| | | | | | | | | | | | | | | | | | | | | | | | | | | | | | | | |
Total investment income | | | 8,989,016 | | | | 22,967,303 | | | | 581,628 | | | | 416,773 | | | | 4,785,903 | | | | 778,136 | | | | 3,337,172 | | | | 3,095,873 | |
| | | | | | | | | | | | | | | | | | | | | | | | | | | | | | | | |
Expenses: | | | | | | | | | | | | | | | | | | | | | | | | | | | | | | | | |
Investment advisory fees (See Note 4) | | | 1,042,222 | | | | 2,604,037 | | | | 85,122 | | | | 64,388 | | | | 667,077 | | | | 109,118 | | | | 464,763 | | | | 308,700 | |
Administration fees (See Note 4) | | | 184,643 | | | | 455,847 | | | | 14,867 | | | | 11,231 | | | | 116,677 | | | | 19,214 | | | | 81,460 | | | | 72,083 | |
Distribution fees - Class A Shares | | | 47,427 | | | | 38,389 | | | | 17,446 | | | | 10,747 | | | | 96,816 | | | | 19,438 | | | | 46,249 | | | | 41,176 | |
Distribution fees - Class B Shares | | | 34,779 | | | | 48,667 | | | | — | | | | — | | | | — | | | | — | | | | — | | | | — | |
Distribution fees - Class C Shares | | | 2,078 | | | | 1,027 | | | | — | | | | — | | | | — | | | | — | | | | — | | | | — | |
Compliance service fees (See Note 4) | | | 2,455 | | | | 5,824 | | | | 188 | | | | 146 | | | | 1,543 | | | | 239 | | | | 1,080 | | | | 933 | |
Trustee fees | | | 9,702 | | | | 21,474 | | | | 695 | | | | 516 | | | | 5,344 | | | | 812 | | | | 3,790 | | | | 3,281 | |
Audit fees | | | 11,100 | | | | 29,824 | | | | 1,045 | | | | 876 | | | | 9,513 | | | | 1,384 | | | | 6,670 | | | | 5,127 | |
Custodian fees | | | 7,415 | | | | 21,478 | | | | 738 | | | | 511 | | | | 4,968 | | | | 836 | | | | 3,390 | | | | 3,094 | |
Fund accounting fees (See Note 4) | | | 17,372 | | | | 43,403 | | | | 1,419 | | | | 1,073 | | | | 11,118 | | | | 1,819 | | | | 7,746 | | | | 6,860 | |
Interest expense | | | — | | | | — | | | | 33 | | | | 450 | | | | 34 | | | | 37 | | | | — | | | | 251 | |
Legal fees | | | 30,700 | | | | 83,909 | | | | 3,950 | | | | 3,253 | | | | 24,654 | | | | 4,531 | | | | 16,601 | | | | 12,245 | |
Printing fees | | | 12,673 | | | | 38,374 | | | | 1,188 | | | | 786 | | | | 8,376 | | | | 1,538 | | | | 6,101 | | | | 5,006 | |
Transfer agent fees (See Note 4) | | | 36,395 | | | | 85,817 | | | | 2,888 | | | | 2,133 | | | | 21,836 | | | | 3,619 | | | | 15,260 | | | | 13,507 | |
Other | | | 31,542 | | | | 61,258 | | | | 8,850 | | | | 10,232 | | | | 23,938 | | | | 10,833 | | | | 23,797 | | | | 20,932 | |
| | | | | | | | | | | | | | | | | | | | | | | | | | | | | | | | |
Total expenses before waivers | | | 1,470,503 | | | | 3,539,328 | | | | 138,429 | | | | 106,342 | | | | 991,894 | | | | 173,418 | | | | 676,907 | | | | 493,195 | |
Less expenses reimbursed or waived by the Investment Advisor | | | (208,445 | ) | | | (520,809 | ) | | | (28,374 | ) | | | (32,194 | ) | | | (166,769 | ) | | | (29,850 | ) | | | (116,191 | ) | | | — | |
Less expenses reimbursed or waived by the Distributor | | | (23,714 | ) | | | (19,194 | ) | | | (8,723 | ) | | | (5,374 | ) | | | (48,408 | ) | | | (9,719 | ) | | | (23,124 | ) | | | — | |
| | | | | | | | | | | | | | | | | | | | | | | | | | | | | | | | |
Net expenses | | | 1,238,344 | | | | 2,999,325 | | | | 101,332 | | | | 68,774 | | | | 776,717 | | | | 133,849 | | | | 537,592 | | | | 493,195 | |
| | | | | | | | | | | | | | | | | | | | | | | | | | | | | | | | |
Net investment income | | | 7,750,672 | | | | 19,967,978 | | | | 480,296 | | | | 347,999 | | | | 4,009,186 | | | | 644,287 | | | | 2,799,580 | | | | 2,602,678 | |
| | | | | | | | | | | | | | | | | | | | | | | | | | | | | | | | |
Realized/Unrealized Gains (Losses) on Investments: | | | | | | | | | | | | | | | | | | | | | | | | | | | | | | | | |
Net realized gains (losses) from: | | | | | | | | | | | | | | | | | | | | | | | | | | | | | | | | |
Investments | | | (462,878 | ) | | | 509,275 | | | | 62,735 | | | | 17,542 | | | | 513,471 | | | | 156,690 | | | | 456,932 | | | | 137,978 | |
Change in unrealized appreciation/depreciation on: | | | | | | | | | | | | | | | | | | | | | | | | | | | | | | | | |
Investments | | | 1,087,993 | | | | (226,187 | ) | | | (122,253 | ) | | | 6,377 | | | | (908,406 | ) | | | (263,866 | ) | | | (779,783 | ) | | | (506,541 | ) |
| | | | | | | | | | | | | | | | | | | | | | | | | | | | | | | | |
Net realized/unrealized gains (losses) on investments | | | 625,115 | | | | 283,088 | | | | (59,518 | ) | | | 23,919 | | | | (394,935 | ) | | | (107,176 | ) | | | (322,851 | ) | | | (368,563 | ) |
| | | | | | | | | | | | | | | | | | | | | | | | | | | | | | | | |
Change in net assets from operations | | $ | 8,375,787 | | | $ | 20,251,066 | | | $ | 420,778 | | | $ | 371,918 | | | $ | 3,614,251 | | | $ | 537,111 | | | $ | 2,476,729 | | | $ | 2,234,115 | |
| | | | | | | | | | | | | | | | | | | | | | | | | | | | | | | | |
See accompanying notes to the financial statements.
94
BB&T Funds
Statements of Operations
For the Year Ended September 30, 2007
| | | | | | | | | | | | | | | | | | | | | | | | | | | | |
| | | National
Tax-Free Money
Market Fund | | | Prime Money
Market Fund | | | U.S. Treasury
Money Market
Fund | | | Capital Manager
Conservative
Growth Fund | | | Capital Manager
Moderate
Growth Fund | | | Capital Manager
Growth Fund | | | Capital Manager
Equity Fund | |
Investment Income: | | | | | | | | | | | | | | | | | | | | | | | | | | | | |
Interest income | | $ | 4,161,748 | | | $ | 87,732,993 | | | $ | 35,957,659 | | | $ | — | | | $ | — | | | $ | — | | | $ | — | |
Dividend income | | | 6,572 | | | | — | | | | — | | | | — | | | | — | | | | — | | | | — | |
Dividend income from affiliates | | | — | | | | — | | | | — | | | | 2,318,338 | | | | 2,672,522 | | | | 1,832,585 | | | | 785,209 | |
Income from securities lending | | | — | | | | — | | | | 134,905 | | | | — | | | | — | | | | — | | | | — | |
| | | | | | | | | | | | | | | | | | | | | | | | | | | | |
Total investment income: | | | 4,168,320 | | | | 87,732,993 | | | | 36,092,564 | | | | 2,318,338 | | | | 2,672,522 | | | | 1,832,585 | | | | 785,209 | |
| | | | | | | | | | | | | | | | | | | | | | | | | | | | |
Expenses: | | | | | | | | | | | | | | | | | | | | | | | | | | | | |
Investment advisory fees (See Note 4) | | | 282,191 | | | | 6,497,542 | | | | 2,848,763 | | | | 156,404 | | | | 217,374 | | | | 169,598 | | | | 89,115 | |
Administration fees (See Note 4) | | | 117,660 | | | | 1,702,589 | | | | 745,719 | | | | 40,328 | | | | 54,904 | | | | 42,758 | | | | 21,673 | |
Distribution fees - Class A Shares | | | 1,432 | | | | 3,990,514 | | | | 965,317 | | | | 48,082 | | | | 182,473 | | | | 125,502 | | | | 44,262 | |
Distribution fees - Class B Shares | | | 11 | | | | 19,363 | | | | 3,352 | | | | 49,770 | | | | 221,414 | | | | 201,182 | | | | 85,921 | |
Distribution fees - Class C Shares | | | 11 | | | | 4,586 | | | | 398 | | | | 963 | | | | 1,504 | | | | 746 | | | | 12 | |
Compliance service fees (See Note 4) | | | 1,577 | | | | 24,530 | | | | 10,777 | | | | 844 | | | | 1,168 | | | | 907 | | | | 484 | |
Trustee fees | | | 5,267 | | | | 67,546 | | | | 30,126 | | | | 3,007 | | | | 4,131 | | | | 3,197 | | | | 1,269 | |
Audit fees | | | 9,972 | | | | 133,191 | | | | 58,377 | | | | 4,852 | | | | 6,575 | | | | 5,223 | | | | 3,038 | |
Custodian fees | | | 4,765 | | | | 89,636 | | | | 32,470 | | | | 2,873 | | | | 3,879 | | | | 3,006 | | | | 1,582 | |
Fund accounting fees (See Note 4) | | | 11,288 | | | | 162,446 | | | | 71,223 | | | | 6,392 | | | | 8,886 | | | | 6,932 | | | | 3,645 | |
Legal fees | | | 23,064 | | | | 314,605 | | | | 147,251 | | | | 11,950 | | | | 16,650 | | | | 12,940 | | | | 6,760 | |
Printing fees | | | 10,120 | | | | 145,000 | | | | 70,000 | | | | 4,546 | | | | 6,164 | | | | 4,854 | | | | 2,686 | |
Transfer agent fees (See Note 4) | | | 17,647 | | | | 309,657 | | | | 144,209 | | | | 14,020 | | | | 27,349 | | | | 24,142 | | | | 10,011 | |
Other | | | 39,021 | | | | 282,458 | | | | 151,858 | | | | 14,363 | | | | 19,528 | | | | 14,905 | | | | 13,868 | |
| | | | | | | | | | | | | | | | | | | | | | | | | | | | |
Total expenses before waivers | | | 524,026 | | | | 13,743,663 | | | | 5,279,840 | | | | 358,394 | | | | 771,999 | | | | 615,892 | | | | 284,326 | |
Less expenses reimbursed or waived by the Investment Advisor | | | (56,439 | ) | | | (1,897,559 | ) | | | (997,065 | ) | | | (156,404 | ) | | | (217,374 | ) | | | (169,598 | ) | | | (89,115 | ) |
Less expenses waived by the Administrator | | | — | | | | — | | | | — | | | | (40,328 | ) | | | (54,904 | ) | | | (42,758 | ) | | | (21,673 | ) |
Less expenses reimbursed or waived by the Distributor | | | (716 | ) | | | — | | | | — | | | | (24,041 | ) | | | (91,237 | ) | | | (62,751 | ) | | | (22,131 | ) |
| | | | | | | | | | | | | | | | | | | | | | | | | | | | |
Net expenses | | | 466,871 | | | | 11,846,104 | | | | 4,282,775 | | | | 137,621 | | | | 408,484 | | | | 340,785 | | | | 151,407 | |
| | | | | | | | | | | | | | | | | | | | | | | | | | | | |
Net investment income | | | 3,701,449 | | | | 75,886,889 | | | | 31,809,789 | | | | 2,180,717 | | | | 2,264,038 | | | | 1,491,800 | | | | 633,802 | |
| | | | | | | | | | | | | | | | | | | | | | | | | | | | |
Realized/Unrealized Gains (Losses) on Investments: | | | | | | | | | | | | | | | | | | | | | | | | | | | | |
Net realized gains (losses) from: | | | | | | | | | | | | | | | | | | | | | | | | | | | | |
Investments | | | (1,934 | ) | | | 443 | | | | — | | | | 1,004,105 | | | | 632,914 | | | | (63,607 | ) | | | (90,856 | ) |
Distributions from affiliated funds | | | — | | | | — | | | | — | | | | 4,483,366 | | | | 10,102,111 | | | | 9,769,707 | | | | 6,195,846 | |
Change in unrealized appreciation/depreciation on: | | | | | | | | | | | | | | | | | | | | | | | | | | | | |
Investments | | | — | | | | — | | | | — | | | | (2,270,299 | ) | | | (3,672,327 | ) | | | (3,050,560 | ) | | | (2,135,302 | ) |
| | | | | | | | | | | | | | | | | | | | | | | | | | | | |
Net realized/unrealized gains (losses) on investments | | | (1,934 | ) | | | 443 | | | | — | | | | 3,217,172 | | | | 7,062,698 | | | | 6,655,540 | | | | 3,969,688 | |
| | | | | | | | | | | | | | | | | | | | | | | | | | | | |
Change in net assets from operations | | $ | 3,699,515 | | | $ | 75,887,332 | | | $ | 31,809,789 | | | $ | 5,397,889 | | | $ | 9,326,736 | | | $ | 8,147,340 | | | $ | 4,603,490 | |
| | | | | | | | | | | | | | | | | | | | | | | | | | | | |
See accompanying notes to the financial statements.
95
BB&T Funds
Statements of Changes in Net Assets
| | | | | | | | | | | | | | | | | | | | | | | | | | | | | | | | |
| | | Large Cap Fund | | | Mid Cap Value Fund | | | Mid Cap Growth Fund | | | Small Cap Fund | |
| | | For the Year Ended
September 30,
2007 | | | For the Year Ended
September 30,
2006 | | | For the Year Ended
September 30,
2007 | | | For the Year Ended
September 30,
2006 | | | For the Year Ended
September 30,
2007 | | | For the Year Ended
September 30,
2006 | | | For the Year Ended
September 30,
2007 | | | For the Year Ended
September 30,
2006 | |
From Investment Activities: | | | | | | | | | | | | | | | | | | | | | | | | | | | | | | | | |
| | | | | | | | |
Operations: | | | | | | | | | | | | | | | | | | | | | | | | | | | | | | | | |
Net investment income (loss) | | $ | 10,168,264 | | | $ | 12,056,371 | | | $ | 1,151,101 | | | $ | 904,819 | | | $ | (461,603 | ) | | $ | 203,095 | | | $ | 552,961 | | | $ | 233,763 | |
Net realized gains on investments | | | 147,788,254 | | | | 88,409,170 | | | | 32,051,690 | | | | 8,877,102 | | | | 17,485,970 | | | | 20,794,688 | | | | 11,045,537 | | | | 7,772,158 | |
Change in unrealized appreciation/depreciation of investments | | | (70,022,396 | ) | | | (7,600,664 | ) | | | (903,836 | ) | | | 16,291,051 | | | | 34,588,439 | | | | (22,292,477 | ) | | | (7,334,815 | ) | | | (5,276,497 | ) |
| | | | | | | | | | | | | | | | | | | | | | | | | | | | | | | | |
Change in net assets from operations | | | 87,934,122 | | | | 92,864,877 | | | | 32,298,955 | | | | 26,072,972 | | | | 51,612,806 | | | | (1,294,694 | ) | | | 4,263,683 | | | | 2,729,424 | |
| | | | | | | | | | | | | | | | | | | | | | | | | | | | | | | | |
Distributions to Class A Shareholders: | | | | | | | | | | | | | | | | | | | | | | | | | | | | | | | | |
Net investment income | | | (686,203 | ) | | | (677,051 | ) | | | (42,266 | ) | | | (41,421 | ) | | | (11,053 | ) | | | (18,135 | ) | | | (46,916 | ) | | | (10,336 | ) |
Net realized gains from investment transactions | | | (7,872,487 | ) | | | (3,036,244 | ) | | | (693,630 | ) | | | (1,333,885 | ) | | | (1,325,555 | ) | | | (1,059,712 | ) | | | (553,525 | ) | | | (191,408 | ) |
Distributions to Class B Shareholders: | | | | | | | | | | | | | | | | | | | | | | | | | | | | | | | | |
Net investment income | | | (101,336 | ) | | | (156,092 | ) | | | (653 | ) | | | (901 | ) | | | — | | | | — | | | | (15,999 | ) | | | (2,860 | ) |
Net realized gains from investment transactions | | | (2,322,633 | ) | | | (1,539,960 | ) | | | (279,401 | ) | | | (513,508 | ) | | | (325,988 | ) | | | (249,959 | ) | | | (242,839 | ) | | | (45,459 | ) |
Distributions to Class C Shareholders: | | | | | | | | | | | | | | | | | | | | | | | | | | | | | | | | |
Net investment income | | | (1,272 | ) | | | (1,303 | ) | | | (311 | ) | | | (122 | ) | | | — | | | | — | | | | (80 | ) | | | (9 | ) |
Net realized gains from investment transactions | | | (28,087 | ) | | | (13,216 | ) | | | (37,242 | ) | | | (45,330 | ) | | | (3,932 | ) | | | (8,280 | ) | | | (1,227 | ) | | | (613 | ) |
Distributions to Institutional Class Shareholders: | | | | | | | | | | | | | | | | | | | | | | | | | | | | | | | | |
Net investment income | | | (8,772,452 | ) | | | (11,183,646 | ) | | | (908,039 | ) | | | (974,981 | ) | | | (192,033 | ) | | | (373,020 | ) | | | (476,954 | ) | | | (292,050 | ) |
Net realized gains from investment transactions | | | (92,332,617 | ) | | | (43,740,178 | ) | | | (8,780,169 | ) | | | (18,584,706 | ) | | | (15,466,884 | ) | | | (12,750,698 | ) | | | (4,595,341 | ) | | | (8,036,789 | ) |
| | | | | | | | | | | | | | | | | | | | | | | | | | | | | | | | |
Change in net assets from shareholder distributions | | | (112,117,087 | ) | | | (60,347,690 | ) | | | (10,741,711 | ) | | | (21,494,854 | ) | | | (17,325,445 | ) | | | (14,459,804 | ) | | | (5,932,881 | ) | | | (8,579,524 | ) |
| | | | | | | | | | | | | | | | | | | | | | | | | | | | | | | | |
Capital Transactions: | | | | | | | | | | | | | | | | | | | | | | | | | | | | | | | | |
Change in net assets from capital transactions | | | (21,201,460 | ) | | | 24,201,504 | | | | 16,717,537 | | | | 35,091,592 | | | | 32,498,094 | | | | 21,521,015 | | | | (27,869,717 | ) | | | 67,122,321 | |
| | | | | | | | | | | | | | | | | | | | | | | | | | | | | | | | |
Change in net assets | | | (45,384,425 | ) | | | 56,718,691 | | | | 38,274,781 | | | | 39,669,710 | | | | 66,785,455 | | | | 5,766,517 | | | | (29,538,915 | ) | | | 61,272,221 | |
| | | | | | | | |
Net Assets: | | | | | | | | | | | | | | | | | | | | | | | | | | | | | | | | |
Beginning of year | | | 724,291,660 | | | | 667,572,969 | | | | 229,211,030 | | | | 189,541,320 | | | | 145,467,845 | | | | 139,701,328 | | | | 124,185,867 | | | | 62,913,646 | |
| | | | | | | | | | | | | | | | | | | | | | | | | | | | | | | | |
End of year | | $ | 678,907,235 | | | $ | 724,291,660 | | | $ | 267,485,811 | | | $ | 229,211,030 | | | $ | 212,253,300 | | | $ | 145,467,845 | | | $ | 94,646,952 | | | $ | 124,185,867 | |
| | | | | | | | | | | | | | | | | | | | | | | | | | | | | | | | |
Accumulated undistributed (distributions in excess of) net investment income | | $ | (1,339,038 | ) | | $ | (104,143 | ) | | $ | 8,271 | | | $ | (66,896 | ) | | $ | 197,590 | | | $ | — | | | $ | — | | | $ | (27,923 | ) |
| | | | | | | | | | | | | | | | | | | | | | | | | | | | | | | | |
See accompanying notes to the financial statements.
96
BB&T Funds
Statements of Changes in Net Assets, continued
| | | | | | | | | | | | | | | | | | | | | | | | | | | | | | | | |
| | | International Equity Fund | | | Special Opportunities Equity Fund | | | Equity Income Fund | | | Short U.S. Government Fund | |
| | | For the Year Ended
September 30,
2007 | | | For the Year Ended
September 30,
2006 | | | For the Year Ended
September 30,
2007 | | | For the Year Ended
September 30,
2006 | | | For the Year Ended
September 30,
2007 | | | For the Year Ended
September 30,
2006 | | | For the Year Ended
September 30,
2007 | | | For the Year Ended
September 30,
2006 | |
From Investment Activities: | | | | | | | | | | | | | | | | | | | | | | | | | | | | | | | | |
| | | | | | | | |
Operations: | | | | | | | | | | | | | | | | | | | | | | | | | | | | | | | | |
Net investment income (loss) | | $ | 2,058,308 | | | $ | 4,104,559 | | | $ | (458,801 | ) | | $ | (760,130 | ) | | $ | 3,414,388 | | | $ | 2,258,004 | | | $ | 2,026,088 | | | $ | 4,347,092 | |
Net realized gains (losses) on investments, written options and foreign currency transactions | | | 86,150,966 | | | | 19,044,559 | | | | 30,012,518 | | | | 12,366,749 | | | | 12,836,464 | | | | 3,330,350 | | | | (260,514 | ) | | | (1,978,418 | ) |
Change in unrealized appreciation/depreciation of investments, written options and foreign currency transactions | | | (48,529,737 | ) | | | 15,908,410 | | | | 15,949,968 | | | | 9,047,945 | | | | 8,664,766 | | | | 9,391,746 | | | | 614,081 | | | | 1,712,330 | |
| | | | | | | | | | | | | | | | | | | | | | | | | | | | | | | | |
Change in net assets from operations | | | 39,679,537 | | | | 39,057,528 | | | | 45,503,685 | | | | 20,654,564 | | | | 24,915,618 | | | | 14,980,100 | | | | 2,379,655 | | | | 4,081,004 | |
| | | | | | | | | | | | | | | | | | | | | | | | | | | | | | | | |
Distributions to Class A Shareholders: | | | | | | | | | | | | | | | | | | | | | | | | | | | | | | | | |
Net investment income | | | (27,834 | ) | | | (55,882 | ) | | | — | | | | — | | | | (1,869,728 | ) | | | (1,319,564 | ) | | | (195,272 | ) | | | (230,094 | ) |
Net realized gains from investment transactions | | | (1,856,253 | ) | | | — | | | | (8,162,298 | ) | | | (3,922,525 | ) | | | (3,240,578 | ) | | | (981,811 | ) | | | — | | | | — | |
Distributions to Class B Shareholders: | | | | | | | | | | | | | | | | | | | | | | | | | | | | | | | | |
Net investment income | | | (6,694 | ) | | | (19,949 | ) | | | — | | | | — | | | | (204,604 | ) | | | (147,380 | ) | | | — | | | | — | |
Net realized gains from investment transactions | | | (752,554 | ) | | | — | | | | (2,323,517 | ) | | | (1,153,429 | ) | | | (530,234 | ) | | | (137,614 | ) | | | — | | | | — | |
Distributions to Class C Shareholders: | | | | | | | | | | | | | | | | | | | | | | | | | | | | | | | | |
Net investment income | | | (779 | ) | | | (1,335 | ) | | | — | | | | — | | | | (347,483 | ) | | | (221,294 | ) | | | — | | | | — | |
Net realized gains from investment transactions | | | (86,588 | ) | | | — | | | | (3,531,389 | ) | | | (1,585,769 | ) | | | (815,203 | ) | | | (213,187 | ) | | | — | | | | — | |
Distributions to Institutional Class Shareholders: | | | | | | | | | | | | | | | | | | | | | | | | | | | | | | | | |
Net investment income | | | (1,028,961 | ) | | | (3,894,301 | ) | | | — | | | | — | | | | (834,338 | ) | | | (908,127 | ) | | | (1,968,959 | ) | | | (4,533,855 | ) |
Net realized gains from investment transactions | | | (59,687,732 | ) | | | — | | | | (3,593,835 | ) | | | (3,033,471 | ) | | | (905,002 | ) | | | (674,732 | ) | | | — | | | | — | |
| | | | | | | | | | | | | | | | | | | | | | | | | | | | | | | | |
Change in net assets from shareholder distributions | | | (63,447,395 | ) | | | (3,971,467 | ) | | | (17,611,039 | ) | | | (9,695,194 | ) | | | (8,747,170 | ) | | | (4,603,709 | ) | | | (2,164,231 | ) | | | (4,763,949 | ) |
| | | | | | | | | | | | | | | | | | | | | | | | | | | | | | | | |
Capital Transactions: | | | | | | | | | | | | | | | | | | | | | | | | | | | | | | | | |
Change in net assets from capital transactions | | | (64,495,685 | ) | | | (10,378,503 | ) | | | 97,527,607 | | | | 6,813,948 | | | | 49,098,976 | | | | 23,032,998 | | | | (28,085,908 | ) | | | (90,478,365 | ) |
| | | | | | | | | | | | | | | | | | | | | | | | | | | | | | | | |
Change in net assets | | | (88,263,543 | ) | | | 24,707,558 | | | | 125,420,253 | | | | 17,773,318 | | | | 65,267,424 | | | | 33,409,389 | | | | (27,870,484 | ) | | | (91,161,310 | ) |
| | | | | | | | |
Net Assets: | | | | | | | | | | | | | | | | | | | | | | | | | | | | | | | | |
Beginning of year | | | 259,899,081 | | | | 235,191,523 | | | | 206,433,999 | | | | 188,660,681 | | | | 119,116,679 | | | | 85,707,290 | | | | 72,604,229 | | | | 163,765,539 | |
| | | | | | | | | | | | | | | | | | | | | | | | | | | | | | | | |
End of year | | $ | 171,635,538 | | | $ | 259,899,081 | | | $ | 331,854,252 | | | $ | 206,433,999 | | | $ | 184,384,103 | | | $ | 119,116,679 | | | $ | 44,733,745 | | | $ | 72,604,229 | |
| | | | | | | | | | | | | | | | | | | | | | | | | | | | | | | | |
Accumulated undistributed (distributions in excess of) net investment income | | $ | (1,519,068 | ) | | $ | (820,134 | ) | | $ | — | | | $ | — | | | $ | 125,735 | | | $ | (345,575 | ) | | $ | 229,312 | | | $ | 578,326 | |
| | | | | | | | | | | | | | | | | | | | | | | | | | | | | | | | |
See accompanying notes to the financial statements.
97
BB&T Funds
Statements of Changes in Net Assets, continued
| | | | | | | | | | | | | | | | | | | | | | | | | | | | | | | | |
| | | Intermediate U.S. Government Fund | | | Total Return Bond Fund | | | Kentucky Intermediate Tax-Free Fund | | | Maryland Intermediate Tax-Free Fund | |
| | | For the Year Ended
September 30,
2007 | | | For the Year Ended
September 30,
2006 | | | For the Year Ended
September 30,
2007 | | | For the Year Ended
September 30,
2006 | | | For the Year Ended
September 30,
2007 | | | For the Year Ended
September 30,
2006 | | | For the Year Ended
September 30,
2007 | | | For the Year Ended
September 30,
2006 | |
From Investment Activities: | | | | | | | | | | | | | | | | | | | | | | | | | | | | | | | | |
| | | | | | | | |
Operations: | | | | | | | | | | | | | | | | | | | | | | | | | | | | | | | | |
Net investment income | | $ | 7,750,672 | | | $ | 20,553,844 | | | $ | 19,967,978 | | | $ | 22,634,567 | | | $ | 480,296 | | | $ | 519,899 | | | $ | 347,999 | | | $ | 326,404 | |
Net realized gains (losses) on investments | | | (462,878 | ) | | | (9,966,118 | ) | | | 509,275 | | | | (8,825,146 | ) | | | 62,735 | | | | (72,900 | ) | | | 17,542 | | | | 7,432 | |
Change in unrealized appreciation/depreciation of investments | | | 1,087,993 | | | | 1,445,810 | | | | (226,187 | ) | | | 4,715,034 | | | | (122,253 | ) | | | 157,761 | | | | 6,377 | | | | 69,432 | |
| | | | | | | | | | | | | | | | | | | | | | | | | | | | | | | | |
Change in net assets from operations | | | 8,375,787 | | | | 12,033,536 | | | | 20,251,066 | | | | 18,524,455 | | | | 420,778 | | | | 604,760 | | | | 371,918 | | | | 403,268 | |
| | | | | | | | | | | | | | | | | | | | | | | | | | | | | | | | |
Distributions to Class A Shareholders: | | | | | | | | | | | | | | | | | | | | | | | | | | | | | | | | |
Net investment income | | | (405,661 | ) | | | (465,227 | ) | | | (339,118 | ) | | | (284,767 | ) | | | (112,279 | ) | | | (80,960 | ) | | | (65,464 | ) | | | (49,779 | ) |
Net realized gains from investment transactions | | | — | | | | — | | | | — | | | | (31,092 | ) | | | — | | | | — | | | | — | | | | — | |
Distributions to Class B Shareholders: | | | | | | | | | | | | | | | | | | | | | | | | | | | | | | | | |
Net investment income | | | (122,767 | ) | | | (169,209 | ) | | | (178,658 | ) | | | (197,744 | ) | | | — | | | | — | | | | — | | | | — | |
Net realized gains from investment transactions | | | — | | | | — | | | | — | | | | (26,599 | ) | | | — | | | | — | | | | — | | | | — | |
Distributions to Class C Shareholders: | | | | | | | | | | | | | | | | | | | | | | | | | | | | | | | | |
Net investment income | | | (7,341 | ) | | | (8,786 | ) | | | (3,775 | ) | | | (5,884 | ) | | | — | | | | — | | | | — | | | | — | |
Net realized gains from investment transactions | | | — | | | | — | | | | — | | | | (927 | ) | | | — | | | | — | | | | — | | | | — | |
Distributions to Institutional Class Shareholders: | | | | | | | | | | | | | | | | | | | | | | | | | | | | | | | | |
Net investment income | | | (7,236,773 | ) | | | (19,963,279 | ) | | | (19,672,399 | ) | | | (22,969,331 | ) | | | (372,085 | ) | | | (439,339 | ) | | | (282,470 | ) | | | (276,916 | ) |
Net realized gains from investment transactions | | | — | | | | — | | | | — | | | | (2,117,462 | ) | | | — | | | | — | | | | — | | | | — | |
| | | | | | | | | | | | | | | | | | | | | | | | | | | | | | | | |
Change in net assets from shareholder distributions | | | (7,772,542 | ) | | | (20,606,501 | ) | | | (20,193,950 | ) | | | (25,633,806 | ) | | | (484,364 | ) | | | (520,299 | ) | | | (347,934 | ) | | | (326,695 | ) |
| | | | | | | | | | | | | | | | | | | | | | | | | | | | | | | | |
Capital Transactions: | | | | | | | | | | | | | | | | | | | | | | | | | | | | | | | | |
Change in net assets from capital transactions | | | (122,319,567 | ) | | | (283,831,378 | ) | | | 68,087,242 | | | | (89,525,200 | ) | | | 1,413,796 | | | | (4,315,092 | ) | | | 810,144 | | | | (1,799,980 | ) |
| | | | | | | | | | | | | | | | | | | | | | | | | | | | | | | | |
Change in net assets | | | (121,716,322 | ) | | | (292,404,343 | ) | | | 68,144,358 | | | | (96,634,551 | ) | | | 1,350,210 | | | | (4,230,631 | ) | | | 834,128 | | | | (1,723,407 | ) |
| | | | | | | | |
Net Assets: | | | | | | | | | | | | | | | | | | | | | | | | | | | | | | | | |
Beginning of year | | | 266,376,542 | | | | 558,780,885 | | | | 378,748,374 | | | | 475,382,925 | | | | 13,904,550 | | | | 18,135,181 | | | | 9,969,078 | | | | 11,692,485 | |
| | | | | | | | | | | | | | | | | | | | | | | | | | | | | | | | |
End of year | | $ | 144,660,220 | | | $ | 266,376,542 | | | $ | 446,892,732 | | | $ | 378,748,374 | | | $ | 15,254,760 | | | $ | 13,904,550 | | | $ | 10,803,206 | | | $ | 9,969,078 | |
| | | | | | | | | | | | | | | | | | | | | | | | | | | | | | | | |
Accumulated undistributed (distributions in excess of) net investment income | | $ | 1,590,109 | | | $ | 3,334,973 | | | $ | 545,387 | | | $ | 2,191,115 | | | $ | 1,082 | | | $ | 5,134 | | | $ | (483 | ) | | $ | (479 | ) |
| | | | | | | | | | | | | | | | | | | | | | | | | | | | | | | | |
See accompanying notes to the financial statements.
98
BB&T Funds
Statements of Changes in Net Assets, continued
| | | | | | | | | | | | | | | | | | | | | | | | | | | | | | | | |
| | | North Carolina Intermediate Tax-Free Fund | | | South Carolina Intermediate Tax-Free Fund | | | Virginia Intermediate Tax-Free Fund | | | West Virginia Intermediate Tax-Free Fund | |
| | | For the Year Ended
September 30,
2007 | | | For the Year Ended
September 30,
2006 | | | For the Year Ended
September 30,
2007 | | | For the Year Ended
September 30,
2006 | | | For the Year Ended
September 30,
2007 | | | For the Year Ended
September 30,
2006 | | | For the Year Ended
September 30,
2007 | | | For the Year Ended
September 30,
2006 | |
From Investment Activities: | | | | | | | | | | | | | | | | | | | | | | | | | | | | | | | | |
| | | | | | | | |
Operations: | | | | | | | | | | | | | | | | | | | | | | | | | | | | | | | | |
Net investment income | | $ | 4,009,186 | | | $ | 4,066,584 | | | $ | 644,287 | | | $ | 703,352 | | | $ | 2,799,580 | | | $ | 2,957,585 | | | $ | 2,602,678 | | | $ | 2,681,574 | |
Net realized gains (losses) on investments | | | 513,471 | | | | (13,423 | ) | | | 156,690 | | | | 9,779 | | | | 456,932 | | | | 24,954 | | | | 137,978 | | | | 136,323 | |
Change in unrealized appreciation/depreciation of investments | | | (908,406 | ) | | | 48,434 | | | | (263,866 | ) | | | (29,884 | ) | | | (779,783 | ) | | | (334,335 | ) | | | (506,541 | ) | | | (192,498 | ) |
| | | | | | | | | | | | | | | | | | | | | | | | | | | | | | | | |
Change in net assets from operations | | | 3,614,251 | | | | 4,101,595 | | | | 537,111 | | | | 683,247 | | | | 2,476,729 | | | | 2,648,204 | | | | 2,234,115 | | | | 2,625,399 | |
| | | | | | | | | | | | | | | | | | | | | | | | | | | | | | | | |
Distributions to Class A Shareholders: | | | | | | | | | | | | | | | | | | | | | | | | | | | | | | | | |
Net investment income | | | (663,692 | ) | | | (702,597 | ) | | | (132,684 | ) | | | (132,635 | ) | | | (316,773 | ) | | | (430,643 | ) | | | (590,541 | ) | | | (558,845 | ) |
Net realized gains from investment transactions | | | (16,410 | ) | | | (188,609 | ) | | | (5,564 | ) | | | (70,839 | ) | | | (17,262 | ) | | | (73,017 | ) | | | (51,255 | ) | | | (87,942 | ) |
Distributions to Institutional Class Shareholders: | | | | | | | | | | | | | | | | | | | | | | | | | | | | | | | | |
Net investment income | | | (3,376,300 | ) | | | (3,317,274 | ) | | | (525,941 | ) | | | (570,487 | ) | | | (2,508,248 | ) | | | (2,478,318 | ) | | | (1,998,515 | ) | | | (2,105,580 | ) |
Net realized gains from investment transactions | | | (76,717 | ) | | | (813,080 | ) | | | (21,671 | ) | | | (276,367 | ) | | | (132,683 | ) | | | (374,838 | ) | | | (158,341 | ) | | | (336,138 | ) |
| | | | | | | | | | | | | | | | | | | | | | | | | | | | | | | | |
Change in net assets from shareholder distributions | | | (4,133,119 | ) | | | (5,021,560 | ) | | | (685,860 | ) | | | (1,050,328 | ) | | | (2,974,966 | ) | | | (3,356,816 | ) | | | (2,798,652 | ) | | | (3,088,505 | ) |
| | | | | | | | | | | | | | | | | | | | | | | | | | | | | | | | |
Capital Transactions: | | | | | | | | | | | | | | | | | | | | | | | | | | | | | | | | |
Change in net assets from capital transactions | | | 9,451,644 | | | | (7,080,678 | ) | | | (2,720,478 | ) | | | (745,427 | ) | | | 694,202 | | | | (2,498,062 | ) | | | 3,290,294 | | | | (2,420,101 | ) |
| | | | | | | | | | | | | | | | | | | | | | | | | | | | | | | | |
Change in net assets | | | 8,932,776 | | | | (8,000,643 | ) | | | (2,869,227 | ) | | | (1,112,508 | ) | | | 195,965 | | | | (3,206,674 | ) | | | 2,725,757 | | | | (2,883,207 | ) |
| | | | | | | | |
Net Assets: | | | | | | | | | | | | | | | | | | | | | | | | | | | | | | | | |
Beginning of year | | | 107,017,044 | | | | 115,017,687 | | | | 19,427,671 | | | | 20,540,179 | | | | 77,517,585 | | | | 80,724,259 | | | | 66,689,083 | | | | 69,572,290 | |
| | | | | | | | | | | | | | | | | | | | | | | | | | | | | | | | |
End of year | | $ | 115,949,820 | | | $ | 107,017,044 | | | $ | 16,558,444 | | | $ | 19,427,671 | | | $ | 77,713,550 | | | $ | 77,517,585 | | | $ | 69,414,840 | | | $ | 66,689,083 | |
| | | | | | | | | | | | | | | | | | | | | | | | | | | | | | | | |
Accumulated undistributed (distributions in excess of) net investment income | | $ | 62,775 | | | $ | 52,797 | | | $ | 1,168 | | | $ | 15,758 | | | $ | 38,240 | | | $ | 31,874 | | | $ | (59,173 | ) | | $ | (55,375 | ) |
| | | | | | | | | | | | | | | | | | | | | | | | | | | | | | | | |
See accompanying notes to the financial statements.
99
BB&T Funds
Statements of Changes in Net Assets, continued
| | | | | | | | | | | | | | | | | | | | | | | | | | | | | | | | |
| | | National Tax-Free Money Market Fund | | | Prime Money Market Fund | | | US Treasury Money Market Fund | | | Captial Manager Conservative Growth Fund | |
| | | For the Year Ended
September 30,
2007 | | | August 1, 2006
through
September 30,
2006(a) | | | For the Year Ended
September 30,
2007 | | | For the Year Ended
September 30,
2006 | | | For the Year Ended
September 30,
2007 | | | For the Year Ended
September 30,
2006 | | | For the Year Ended
September 30,
2007 | | | For the Year Ended
September 30,
2006 | |
From Investment Activities: | | | | | | | | | | | | | | | | | | | | | | | | | | | | | | | | |
| | | | | | | | |
Operations: | | | | | | | | | | | | | | | | | | | | | | | | | | | | | | | | |
Net investment income | | $ | 3,701,449 | | | $ | 525,817 | | | $ | 75,886,889 | | | $ | 47,931,313 | | | $ | 31,809,789 | | | $ | 26,624,129 | | | $ | 2,180,717 | | | $ | 2,731,287 | |
Net realized gains (losses) on investments | | | (1,934 | ) | | | — | | | | 443 | | | | 5,292 | | | | — | | | | — | | | | 5,487,471 | | | | | |
Net realized gain (loss) from investment securities and distributions from underlying funds | | | — | | | | — | | | | — | | | | — | | | | — | | | | — | | | | — | | | | 2,677,435 | |
Change in unrealized appreciation/depreciation of investments | | | — | | | | — | | | | — | | | | — | | | | — | | | | — | | | | (2,270,299 | ) | | | (1,047,526 | ) |
| | | | | | | | | | | | | | | | | | | | | | | | | | | | | | | | |
Change in net assets from operations | | | 3,699,515 | | | | 525,817 | | | | 75,887,332 | | | | 47,936,605 | | | | 31,809,789 | | | | 26,624,129 | | | | 5,397,889 | | | | 4,361,196 | |
| | | | | | | | | | | | | | | | | | | | | | | | | | | | | | | | |
Distributions to Class A Shareholders: | | | | | | | | | | | | | | | | | | | | | | | | | | | | | | | | |
Net investment income | | | (8,765 | ) | | | (5 | ) | | | (35,268,612 | ) | | | (21,234,567 | ) | | | (7,849,031 | ) | | | (4,584,379 | ) | | | (282,187 | ) | | | (316,793 | ) |
Distributions to Class B Shareholders: | | | | | | | | | | | | | | | | | | | | | | | | | | | | | | | | |
Net investment income | | | (26 | ) | | | (4 | ) | | | (76,320 | ) | | | (55,231 | ) | | | (12,300 | ) | | | (16,774 | ) | | | (108,391 | ) | | | (132,184 | ) |
Distributions to Class C Shareholders: | | | | | | | | | | | | | | | | | | | | | | | | | | | | | | | | |
Net investment income | | | (23 | ) | | | (4 | ) | | | (17,958 | ) | | | (14,081 | ) | | | (1,442 | ) | | | (922 | ) | | | (1,897 | ) | | | (3,332 | ) |
Distributions to Institutional Class Shareholders: | | | | | | | | | | | | | | | | | | | | | | | | | | | | | | | | |
Net investment income | | | (3,695,663 | ) | | | (525,804 | ) | | | (40,525,183 | ) | | | (26,636,706 | ) | | | (23,947,016 | ) | | | (22,022,054 | ) | | | (1,497,178 | ) | | | (2,306,502 | ) |
| | | | | | | | | | | | | | | | | | | | | | | | | | | | | | | | |
Change in net assets from shareholder distributions | | | (3,704,477 | ) | | | (525,817 | ) | | | (75,888,073 | ) | | | (47,940,585 | ) | | | (31,809,789 | ) | | | (26,624,129 | ) | | | (1,889,653 | ) | | | (2,758,811 | ) |
| | | | | | | | | | | | | | | | | | | | | | | | | | | | | | | | |
Capital Transactions: | | | | | | | | | | | | | | | | | | | | | | | | | | | | | | | | |
Change in net assets from capital transactions | | | 14,358,518 | | | | 95,760,505 | | | | 165,025,324 | | | | 364,257,195 | | | | 218,218,600 | | | | (58,021,270 | ) | | | (2,857,228 | ) | | | (25,686,559 | ) |
| | | | | | | | | | | | | | | | | | | | | | | | | | | | | | | | |
Change in net assets | | | 14,353,556 | | | | 95,760,505 | | | | 165,024,583 | | | | 364,253,215 | | | | 218,218,600 | | | | (58,021,270 | ) | | | 651,008 | | | | (24,084,174 | ) |
| | | | | | | | |
Net Assets: | | | | | | | | | | | | | | | | | | | | | | | | | | | | | | | | |
Beginning of year | | | 95,760,505 | | | | — | | | | 1,370,592,028 | | | | 1,006,338,813 | | | | 649,819,590 | | | | 707,840,860 | | | | 61,505,474 | | | | 85,589,648 | |
| | | | | | | | | | | | | | | | | | | | | | | | | | | | | | | | |
End of year | | $ | 110,114,061 | | | $ | 95,760,505 | | | $ | 1,535,616,611 | | | $ | 1,370,592,028 | | | $ | 868,038,190 | | | $ | 649,819,590 | | | $ | 62,156,482 | | | $ | 61,505,474 | |
| | | | | | | | | | | | | | | | | | | | | | | | | | | | | | | | |
Accumulated undistributed (distributions in excess of) net investment income | | $ | — | | | $ | 3,028 | | | $ | 4,947 | | | $ | 1,184 | | | $ | 246 | | | $ | 246 | | | $ | 345,940 | | | $ | 54,876 | |
| | | | | | | | | | | | | | | | | | | | | | | | | | | | | | | | |
| (a) | Period from commencement of operations. |
See accompanying notes to the financial statements.
100
BB&T Funds
Statements of Changes in Net Assets, continued
| | | | | | | | | | | | | | | | | | | | | | | | |
| | | Capital Manager Moderate Growth Fund | | | Capital Manager Growth Fund | | | Capital Manager Equity Fund | |
| | | For the Year Ended
September 30,
2007 | | | For the Year Ended
September 30,
2006 | | | For the Year Ended
September 30,
2007 | | | For the Year Ended
September 30,
2006 | | | For the Year Ended
September 30,
2007 | | | For the Year Ended
September 30,
2006 | |
From Investment Activities: | | | | | | | | | | | | | | | | | | | | | | | | |
| | | | | | |
Operations: | | | | | | | | | | | | | | | | | | | | | | | | |
Net investment income | | $ | 2,264,038 | | | $ | 2,332,614 | | | $ | 1,491,800 | | | $ | 1,507,947 | | | $ | 633,802 | | | $ | 644,731 | |
Net realized gain on investments and distributions from underlying funds | | | 10,735,025 | | | | 2,175,933 | | | | 9,706,100 | | | | 1,232,765 | | | | 6,104,990 | | | | 1,957,543 | |
Change in unrealized appreciation/depreciation of investments | | | (3,672,327 | ) | | | 1,819,387 | | | | (3,050,560 | ) | | | 2,791,650 | | | | (2,135,302 | ) | | | 724,038 | |
| | | | | | | | | | | | | | | | | | | | | | | | |
Change in net assets from operations | | | 9,326,736 | | | | 6,327,934 | | | | 8,147,340 | | | | 5,532,362 | | | | 4,603,490 | | | | 3,326,312 | |
| | | | | | | | | | | | | | | | | | | | | | | | |
Distributions to Class A Shareholders: | | | | | | | | | | | | | | | | | | | | | | | | |
Net investment income | | | (737,996 | ) | | | (821,797 | ) | | | (368,492 | ) | | | (438,399 | ) | | | (73,217 | ) | | | (120,990 | ) |
Net realized gains from investment transactions | | | (718,101 | ) | | | — | | | | (597,093 | ) | | | — | | | | (582,657 | ) | | | (112,648 | ) |
Distributions to Class B Shareholders: | | | | | | | | | | | | | | | | | | | | | | | | |
Net investment income | | | (290,527 | ) | | | (405,497 | ) | | | (152,408 | ) | | | (266,484 | ) | | | (34,917 | ) | | | (78,167 | ) |
Net realized gains from investment transactions | | | (461,691 | ) | | | — | | | | (513,654 | ) | | | — | | | | (610,150 | ) | | | (134,397 | ) |
Distributions to Class C Shareholders: | | | | | | | | | | | | | | | | | | | | | | | | |
Net investment income | | | (1,983 | ) | | | (2,447 | ) | | | (568 | ) | | | (879 | ) | | | (3 | ) | | | (173 | ) |
Net realized gains from investment transactions | | | (3,019 | ) | | | — | | | | (1,846 | ) | | | — | | | | (76 | ) | | | (336 | ) |
Distributions to Institutional Class Shareholders: | | | | | | | | | | | | | | | | | | | | | | | | |
Net investment income | | | (635,461 | ) | | | (1,138,350 | ) | | | (388,096 | ) | | | (840,595 | ) | | | (180,624 | ) | | | (484,161 | ) |
Net realized gains from investment transactions | | | (562,098 | ) | | | — | | | | (549,734 | ) | | | — | | | | (1,126,958 | ) | | | (458,864 | ) |
| | | | | | | | | | | | | | | | | | | | | | | | |
Change in net assets from shareholder distributions | | | (3,410,876 | ) | | | (2,368,091 | ) | | | (2,571,891 | ) | | | (1,546,357 | ) | | | (2,608,602 | ) | | | (1,389,736 | ) |
| | | | | | | | | | | | | | | | | | | | | | | | |
Capital Transactions: | | | | | | | | | | | | | | | | | | | | | | | | |
Change in net assets from capital transactions | | | 2,152,598 | | | | (17,335,086 | ) | | | 2,764,281 | | | | (13,457,141 | ) | | | 6,125,389 | | | | (10,823,403 | ) |
| | | | | | | | | | | | | | | | | | | | | | | | |
Change in net assets | | | 8,068,458 | | | | (13,375,243 | ) | | | 8,339,730 | | | | (9,471,136 | ) | | | 8,120,277 | | | | (8,886,827 | ) |
| | | | | | |
Net Assets: | | | | | | | | | | | | | | | | | | | | | | | | |
Beginning of year | | | 80,920,917 | | | | 94,296,160 | | | | 62,471,708 | | | | 71,942,844 | | | | 30,631,978 | | | | 39,518,805 | |
| | | | | | | | | | | | | | | | | | | | | | | | |
End of year | | $ | 88,989,375 | | | $ | 80,920,917 | | | $ | 70,811,438 | | | $ | 62,471,708 | | | $ | 38,752,255 | | | $ | 30,631,978 | |
| | | | | | | | | | | | | | | | | | | | | | | | |
Accumulated undistributed net investment income | | $ | 693,757 | | | $ | 94,881 | | | $ | 666,082 | | | $ | 83,846 | | | $ | 392,521 | | | $ | 47,480 | |
| | | | | | | | | | | | | | | | | | | | | | | | |
See accompanying notes to the financial statements.
101
BB&T Funds
Statements of Changes in Net Assets, continued
| | | | | | | | | | | | | | | | | | | | | | | | | | | | | | | | |
| | | Large Cap Fund | | | Mid Cap Value Fund | | | Mid Cap Growth Fund | | | Small Cap Fund | |
| | | For the Year Ended
September 30,
2007 | | | For the Year Ended
September 30,
2006 | | | For the Year Ended
September 30,
2007 | | | For the Year Ended
September 30,
2006 | | | For the Year Ended
September 30,
2007 | | | For the Year Ended
September 30,
2006 | | | For the Year Ended
September 30,
2007 | | | For the Year Ended
September 30,
2006 | |
Capital Transactions: | | | | | | | | | | | | | | | | | | | | | | | | | | | | | | | | |
Class A Shares: | | | | | | | | | | | | | | | | | | | | | | | | | | | | | | | | |
Proceeds from shares issued | | $ | 14,187,235 | | | $ | 11,455,809 | | | $ | 4,953,978 | | | $ | 3,543,605 | | | $ | 968,207 | | | $ | 2,584,357 | | | $ | 1,130,020 | | | $ | 1,563,815 | |
Proceeds from shares issued in conversion | | | 9,225,927 | | | | — | | | | — | | | | — | | | | — | | | | — | | | | — | | | | 8,076,416 | |
Distributions reinvested | | | 8,113,607 | | | | 3,356,212 | | | | 717,960 | | | | 1,321,057 | | | | 1,314,016 | | | | 1,036,602 | | | | 583,726 | | | | 170,057 | |
Value of shares redeemed | | | (13,877,936 | ) | | | (8,183,336 | ) | | | (3,752,987 | ) | | | (4,085,956 | ) | | | (2,907,306 | ) | | | (2,501,025 | ) | | | (2,141,754 | ) | | | (1,718,429 | ) |
| | | | | | | | | | | | | | | | | | | | | | | | | | | | | | | | |
Change in net assets from Class A Share transactions | | | 17,648,833 | | | | 6,628,685 | | | | 1,918,951 | | | | 778,706 | | | | (625,083 | ) | | | 1,119,934 | | | | (428,008 | ) | | | 8,091,859 | |
Class B Shares: | | | | | | | | | | | | | | | | | | | | | | | | | | | | | | | | |
Proceeds from shares issued | | | 11,618,943 | | | | 1,081,268 | | | | 834,235 | | | | 1,037,911 | | | | 137,186 | | | | 765,099 | | | | 268,340 | | | | 315,041 | |
Proceeds from shares issued in conversion | | | 8,152,840 | | | | — | | | | — | | | | — | | | | — | | | | — | | | | — | | | | 4,879,881 | |
Distributions reinvested | | | 2,404,114 | | | | 1,681,643 | | | | 279,223 | | | | 512,918 | | | | 319,503 | | | | 246,230 | | | | 258,615 | | | | 48,317 | |
Value of shares redeemed | | | (8,075,693 | ) | | | (10,671,968 | ) | | | (951,182 | ) | | | (768,298 | ) | | | (559,369 | ) | | | (706,264 | ) | | | (1,180,317 | ) | | | (1,226,132 | ) |
| | | | | | | | | | | | | | | | | | | | | | | | | | | | | | | | |
Change in net assets from Class B Share transactions | | | 14,100,204 | | | | (7,909,057 | ) | | | 162,276 | | | | 782,531 | | | | (102,680 | ) | | | 305,065 | | | | (653,362 | ) | | | 4,017,107 | |
Class C Shares: | | | | | | | | | | | | | | | | | | | | | | | | | | | | | | | | |
Proceeds from shares issued | | | 54,527 | | | | 33,770 | | | | 420,064 | | | | 433,480 | | | | 38,080 | | | | 26,775 | | | | 7,800 | | | | 2,569 | |
Proceeds from shares issued in conversion | | | 40,108 | | | | — | | | | — | | | | — | | | | — | | | | — | | | | — | | | | 19,229 | |
Distributions reinvested | | | 29,314 | | | | 14,517 | | | | 32,091 | | | | 38,170 | | | | 3,932 | | | | 8,279 | | | | 1,306 | | | | 622 | |
Value of shares redeemed | | | (32,949 | ) | | | (69,676 | ) | | | (155,437 | ) | | | (104,036 | ) | | | (34,839 | ) | | | (74,621 | ) | | | (2,405 | ) | | | (6,076 | ) |
| | | | | | | | | | | | | | | | | | | | | | | | | | | | | | | | |
Change in net assets from Class C Share transactions | | | 91,000 | | | | (21,389 | ) | | | 296,718 | | | | 367,614 | | | | 7,173 | | | | (39,567 | ) | | | 6,701 | | | | 16,344 | |
Institutional Shares: | | | | | | | | | | | | | | | | | | | | | | | | | | | | | | | | |
Proceeds from shares issued | | | 103,348,503 | | | | 120,655,536 | | | | 88,153,774 | | | | 65,662,801 | | | | 72,025,727 | | | | 50,476,104 | | | | 27,399,451 | | | | 32,824,936 | |
Proceeds from shares issued in conversion | | | 132,004,067 | | | | — | | | | — | | | | — | | | | — | | | | — | | | | — | | | | 40,922,638 | |
Distributions reinvested | | | 69,131,228 | | | | 36,292,487 | | | | 6,994,315 | | | | 13,345,528 | | | | 8,248,047 | | | | 6,303,907 | | | | 1,897,002 | | | | 3,865,352 | |
Value of shares redeemed | | | (197,727,473 | ) | | | (131,444,758 | ) | | | (35,880,335 | ) | | | (45,845,588 | ) | | | (42,686,040 | ) | | | (31,644,428 | ) | | | (19,176,001 | ) | | | (18,615,915 | ) |
Redemption In-Kind | | | (159,797,822 | ) | | | — | | | | (44,928,162 | ) | | | — | | | | (4,369,050 | ) | | | (5,000,000 | ) | | | (36,915,500 | ) | | | (4,000,000 | ) |
| | | | | | | | | | | | | | | | | | | | | | | | | | | | | | | | |
Change in net assets from Institutional Share transactions | | | (53,041,497 | ) | | | 25,503,265 | | | | 14,339,592 | | | | 33,162,741 | | | | 33,218,684 | | | | 20,135,583 | | | | (26,795,048 | ) | | | 54,997,011 | |
| | | | | | | | | | | | | | | | | | | | | | | | | | | | | | | | |
Change in net assets from capital transactions | | $ | (21,201,460 | ) | | $ | 24,201,504 | | | $ | 16,717,537 | | | $ | 35,091,592 | | | $ | 32,498,094 | | | $ | 21,521,015 | | | $ | (27,869,717 | ) | | $ | 67,122,321 | |
| | | | | | | | | | | | | | | | | | | | | | | | | | | | | | | | |
Share Transactions: | | | | | | | | | | | | | | | | | | | | | | | | | | | | | | | | |
Class A Shares: | | | | | | | | | | | | | | | | | | | | | | | | | | | | | | | | |
Issued | | | 460,785 | | | | 594,942 | | | | 336,068 | | | | 273,562 | | | | 76,131 | | | | 191,168 | | | | 71,913 | | | | 102,573 | |
Issued in conversion | | | 499,435 | | | | — | | | | — | | | | — | | | | — | | | | — | | | | — | | | | 519,217 | |
Reinvested | | | 439,377 | | | | 179,580 | | | | 51,779 | | | | 105,779 | | | | 112,508 | | | | 79,757 | | | | 37,880 | | | | 11,590 | |
Redeemed | | | (721,421 | ) | | | (422,997 | ) | | | (254,537 | ) | | | (312,940 | ) | | | (228,749 | ) | | | (188,884 | ) | | | (136,614 | ) | | | (112,183 | ) |
| | | | | | | | | | | | | | | | | | | | | | | | | | | | | | | | |
Change in Class A Shares | | | 678,176 | | | | 351,525 | | | | 133,310 | | | | 66,401 | | | | (40,110 | ) | | | 82,041 | | | | (26,821 | ) | | | 521,197 | |
Class B Shares: | | | | | | | | | | | | | | | | | | | | | | | | | | | | | | | | |
Issued | | | 55,728 | | | | 56,846 | | | | 58,173 | | | | 80,934 | | | | 11,266 | | | | 58,023 | | | | 17,586 | | | | 20,791 | |
Issued in conversion | | | 446,371 | | | | — | | | | — | | | | — | | | | — | | | | — | | | | — | | | | 320,692 | |
Reinvested | | | 131,859 | | | | 91,167 | | | | 20,652 | | | | 41,799 | | | | 28,732 | | | | 19,667 | | | | 17,270 | | | | 3,358 | |
Redeemed | | | (427,558 | ) | | | (560,116 | ) | | | (66,387 | ) | | | (59,657 | ) | | | (47,022 | ) | | | (56,695 | ) | | | (77,524 | ) | | | (83,084 | ) |
| | | | | | | | | | | | | | | | | | | | | | | | | | | | | | | | |
Change in Class B Shares | | | 206,400 | | | | (412,103 | ) | | | 12,438 | | | | 63,076 | | | | (7,024 | ) | | | 20,995 | | | | (42,668 | ) | | | 261,757 | |
Class C Shares: | | | | | | | | | | | | | | | | | | | | | | | | | | | | | | | | |
Issued | | | 2,585 | | | | 1,766 | | | | 30,009 | | | | 34,345 | | | | 3,086 | | | | 2,021 | | | | 513 | | | | 176 | |
Issued in conversion | | | 2,201 | | | | — | | | | — | | | | — | | | | — | | | | — | | | | — | | | | 1,265 | |
Reinvested | | | 1,611 | | | | 789 | | | | 2,373 | | | | 3,110 | | | | 353 | | | | 661 | | | | 87 | | | | 43 | |
Redeemed | | | (1,774 | ) | | | (3,652 | ) | | | (11,128 | ) | | | (7,989 | ) | | | (2,895 | ) | | | (5,700 | ) | | | (162 | ) | | | (409 | ) |
| | | | | | | | | | | | | | | | | | | | | | | | | | | | | | | | |
Change in Class C Shares | | | 4,623 | | | | (1,097 | ) | | | 21,254 | | | | 29,466 | | | | 544 | | | | (3,018 | ) | | | 438 | | | | 1,075 | |
Institutional Shares: | | | | | | | | | | | | | | | | | | | | | | | | | | | | | | | | |
Issued | | | 6,062,779 | | | | 6,218,257 | | | | 5,946,732 | | | | 5,063,390 | | | | 5,255,391 | | | | 3,586,780 | | | | 1,732,916 | | | | 2,167,101 | |
Issued in conversion | | | 7,122,489 | | | | — | | | | — | | | | — | | | | — | | | | — | | | | — | | | | 2,617,536 | |
Reinvested | | | 3,733,676 | | | | 1,936,824 | | | | 501,319 | | | | 1,064,393 | | | | 667,395 | | | | 461,521 | | | | 122,519 | | | | 262,650 | |
Redeemed | | | (10,321,274 | ) | | | (6,769,780 | ) | | | (2,438,770 | ) | | | (3,519,435 | ) | | | (3,166,590 | ) | | | (2,306,318 | ) | | | (1,210,272 | ) | | | (1,227,142 | ) |
Redemption In-Kind | | | (7,650,117 | ) | | | — | | | | (3,269,881 | ) | | | — | | | | (324,354 | ) | | | (338,524 | ) | | | (2,454,488 | ) | | | (243,605 | ) |
| | | | | | | | | | | | | | | | | | | | | | | | | | | | | | | | |
Change in Institutional Shares | | | (1,052,447 | ) | | | 1,385,301 | | | | 739,400 | | | | 2,608,348 | | | | 2,431,842 | | | | 1,403,459 | | | | (1,809,325 | ) | | | 3,576,540 | |
| | | | | | | | | | | | | | | | | | | | | | | | | | | | | | | | |
Change in Shares | | | (163,248 | ) | | | 1,323,626 | | | | 906,402 | | | | 2,767,291 | | | | 2,385,252 | | | | 1,503,477 | | | | (1,878,376 | ) | | | 4,360,569 | |
| | | | | | | | | | | | | | | | | | | | | | | | | | | | | | | | |
See accompanying notes to the financial statements.
102
BB&T Funds
Statements of Changes in Net Assets, continued
| | | | | | | | | | | | | | | | | | | | | | | | | | | | | | | | |
| | | International Equity Fund | | | Special Opportunities Equity Fund | | | Equity Income Fund | | | Short U.S. Government Fund | |
| | | For the Year Ended
September 30,
2007 | | | For the Year Ended
September 30,
2006 | | | For the Year Ended
September 30,
2007 | | | For the Year Ended
September 30,
2006 | | | For the Year Ended
September 30,
2007 | | | For the Year Ended
September 30,
2006 | | | For the Year Ended
September 30,
2007 | | | For the Year Ended
September 30,
2006 | |
Capital Transactions: | | | | | | | | | | | | | | | | | | | | | | | | | | | | | | | | |
Class A Shares: | | | | | | | | | | | | | | | | | | | | | | | | | | | | | | | | |
Proceeds from shares issued | | $ | 1,998,611 | | | $ | 1,793,701 | | | $ | 39,074,075 | | | $ | 15,547,406 | | | $ | 33,173,623 | | | $ | 21,290,688 | | | $ | 229,726 | | | $ | 1,127,528 | |
Distributions reinvested | | | 1,730,260 | | | | 47,633 | | | | 8,015,337 | | | | 3,800,006 | | | | 4,536,352 | | | | 2,115,087 | | | | 169,142 | | | | 166,865 | |
Value of shares redeemed | | | (1,692,331 | ) | | | (1,828,946 | ) | | | (16,340,289 | ) | | | (17,598,570 | ) | | | (9,389,669 | ) | | | (9,336,457 | ) | | | (2,673,820 | ) | | | (3,017,691 | ) |
| | | | | | | | | | | | | | | | | | | | | | | | | | | | | | | | |
Change in net assets from Class A Share transactions | | | 2,036,540 | | | | 12,388 | | | | 30,749,123 | | | | 1,748,842 | | | | 28,320,306 | | | | 14,069,318 | | | | (2,274,952 | ) | | | (1,723,298 | ) |
Class B Shares: | | | | | | | | | | | | | | | | | | | | | | | | | | | | | | | | |
Proceeds from shares issued | | | 389,829 | | | | 372,771 | | | | 4,872,905 | | | | 2,567,933 | | | | 4,309,373 | | | | 3,887,798 | | | | — | | | | — | |
Distributions reinvested | | | 727,505 | | | | 19,183 | | | | 2,216,989 | | | | 1,097,183 | | | | 702,659 | | | | 265,635 | | | | — | | | | — | |
Value of shares redeemed | | | (476,416 | ) | | | (850,793 | ) | | | (2,735,045 | ) | | | (3,722,250 | ) | | | (1,250,201 | ) | | | (955,321 | ) | | | — | | | | — | |
| | | | | | | | | | | | | | | | | | | | | | | | | | | | | | | | |
Change in net assets from Class B Share transactions | | | 640,918 | | | | (458,839 | ) | | | 4,354,849 | | | | (57,134 | ) | | | 3,761,831 | | | | 3,198,112 | | | | — | | | | — | |
Class C Shares: | | | | | | | | | | | | | | | | | | | | | | | | | | | | | | | | |
Proceeds from shares issued | | | 312,057 | | | | 170,185 | | | | 12,824,966 | | | | 5,924,611 | | | | 11,070,676 | | | | 5,773,799 | | | | — | | | | — | |
Distributions reinvested | | | 83,382 | | | | 1,343 | | | | 3,487,658 | | | | 1,572,304 | | | | 1,128,345 | | | | 415,183 | | | | — | | | | — | |
Value of shares redeemed | | | (274,154 | ) | | | (90,384 | ) | | | (4,530,200 | ) | | | (5,037,947 | ) | | | (2,774,081 | ) | | | (1,775,128 | ) | | | — | | | | — | |
| | | | | | | | | | | | | | | | | | | | | | | | | | | | | | | | |
Change in net assets from Class C Share transactions | | | 121,285 | | | | 81,144 | | | | 11,782,424 | | | | 2,458,968 | | | | 9,424,940 | | | | 4,413,854 | | | | — | | | | — | |
Institutional Shares: | | | | | | | | | | | | | | | | | | | | | | | | | | | | | | | | |
Proceeds from shares issued | | | 47,026,787 | | | | 55,147,602 | | | | 109,366,904 | | | | 9,101,491 | | | | 38,208,367 | | | | 3,565,186 | | | | 10,658,575 | | | | 11,753,484 | |
Distributions reinvested | | | 44,384,210 | | | | 2,544,478 | | | | 1,876,403 | | | | 2,382,335 | | | | 1,230,480 | | | | 1,338,621 | | | | 743,822 | | | | 2,059,779 | |
Value of shares redeemed | | | (158,705,425 | ) | | | (67,705,276 | ) | | | (13,032,359 | ) | | | (8,820,554 | ) | | | (2,818,120 | ) | | | (3,552,093 | ) | | | (37,213,353 | ) | | | (102,568,330 | ) |
Redemption In-Kind | | | — | | | | — | | | | (47,569,737 | ) | | | — | | | | (29,028,828 | ) | | | — | | | | — | | | | — | |
| | | | | | | | | | | | | | | | | | | | | | | | | | | | | | | | |
Change in net assets from Institutional Share transactions | | | (67,294,428 | ) | | | (10,013,196 | ) | | | 50,641,211 | | | | 2,663,272 | | | | 7,591,899 | | | | 1,351,714 | | | | (25,810,956 | ) | | | (88,755,067 | ) |
| | | | | | | | | | | | | | | | | | | | | | | | | | | | | | | | |
Change in net assets from capital transactions | | $ | (64,495,685 | ) | | $ | (10,378,503 | ) | | $ | 97,527,607 | | | $ | 6,813,948 | | | $ | 49,098,976 | | | $ | 23,032,998 | | | $ | (28,085,908 | ) | | $ | (90,478,365 | ) |
| | | | | | | | | | | | | | | | | | | | | | | | | | | | | | | | |
Share Transactions: | | | | | | | | | | | | | | | | | | | | | | | | | | | | | | | | |
Class A Shares: | | | | | | | | | | | | | | | | | | | | | | | | | | | | | | | | |
Issued | | | 175,382 | | | | 172,056 | | | | 2,242,033 | | | | 1,018,572 | | | | 2,321,711 | | | | 1,686,364 | | | | 24,191 | | | | 119,357 | |
Reinvested | | | 216,235 | | | | 4,418 | | | | 490,235 | | | | 257,977 | | | | 328,353 | | | | 169,418 | | | | 17,801 | | | | 17,694 | |
Redeemed | | | (153,239 | ) | | | (181,464 | ) | | | (929,218 | ) | | | (1,151,094 | ) | | | (659,727 | ) | | | (736,138 | ) | | | (281,535 | ) | | | (319,852 | ) |
| | | | | | | | | | | | | | | | | | | | | | | | | | | | | | | | |
Change in Class A Shares | | | 238,378 | | | | (4,990 | ) | | | 1,803,050 | | | | 125,455 | | | | 1,990,337 | | | | 1,119,644 | | | | (239,543 | ) | | | (182,801 | ) |
Class B Shares: | | | | | | | | | | | | | | | | | | | | | | | | | | | | | | | | |
Issued | | | 35,045 | | | | 37,241 | | | | 289,148 | | | | 172,046 | | | | 304,174 | | | | 309,059 | | | | — | | | | — | |
Reinvested | | | 100,131 | | | | 1,888 | | | | 139,785 | | | | 76,035 | | | | 51,282 | | | | 21,327 | | | | — | | | | — | |
Redeemed | | | (42,221 | ) | | | (85,845 | ) | | | (162,722 | ) | | | (249,906 | ) | | | (87,861 | ) | | | (75,605 | ) | | | — | | | | — | |
| | | | | | | | | | | | | | | | | | | | | | | | | | | | | | | | |
Change in Class B Shares | | | 92,955 | | | | (46,716 | ) | | | 266,211 | | | | (1,825 | ) | | | 267,595 | | | | 254,781 | | | | — | | | | — | |
Class C Shares: | | | | | | | | | | | | | | | | | | | | | | | | | | | | | | | | |
Issued | | | 26,712 | | | | 16,883 | | | | 765,670 | | | | 397,055 | | | | 781,282 | | | | 458,843 | | | | — | | | | — | |
Reinvested | | | 11,522 | | | | 131 | | | | 219,764 | | | | 108,885 | | | | 82,322 | | | | 33,388 | | | | — | | | | — | |
Redeemed | | | (24,245 | ) | | | (9,159 | ) | | | (268,443 | ) | | | (336,921 | ) | | | (195,251 | ) | | | (141,240 | ) | | | — | | | | — | |
| | | | | | | | | | | | | | | | | | | | | | | | | | | | | | | | |
Change in Class C Shares | | | 13,989 | | | | 7,855 | | | | 716,991 | | | | 169,019 | | | | 668,353 | | | | 350,991 | | | | — | | | | — | |
Institutional Shares: | | | | | | | | | | | | | | | | | | | | | | | | | | | | | | | | |
Issued | | | 3,956,411 | | | | 5,126,219 | | | | 6,193,705 | | | | 588,662 | | | | 2,698,449 | | | | 278,895 | | | | 1,120,091 | | | | 1,244,012 | |
Reinvested | | | 5,403,382 | | | | 232,202 | | | | 113,584 | | | | 160,751 | | | | 87,705 | | | | 107,088 | | | | 78,186 | | | | 218,187 | |
Redeemed | | | (12,958,829 | ) | | | (6,367,133 | ) | | | (727,734 | ) | | | (577,140 | ) | | | (196,172 | ) | | | (280,919 | ) | | | (3,915,193 | ) | | | (10,850,633 | ) |
Redemption In-Kind | | | — | | | | — | | | | (2,765,682 | ) | | | — | | | | (2,163,102 | ) | | | — | | | | — | | | | — | |
| | | | | | | | | | | | | | | | | | | | | | | | | | | | | | | | |
Change in Institutional Shares | | | (3,599,036 | ) | | | (1,008,712 | ) | | | 2,813,873 | | | | 172,273 | | | | 426,880 | | | | 105,064 | | | | (2,716,916 | ) | | | (9,388,434 | ) |
| | | | | | | | | | | | | | | | | | | | | | | | | | | | | | | | |
Change in Shares | | | (3,253,714 | ) | | | (1,052,563 | ) | | | 5,600,125 | | | | 464,922 | | | | 3,353,165 | | | | 1,830,480 | | | | (2,956,459 | ) | | | (9,571,235 | ) |
| | | | | | | | | | | | | | | | | | | | | | | | | | | | | | | | |
See accompanying notes to the financial statements.
103
BB&T Funds
Statements of Changes in Net Assets, continued
| | | | | | | | | | | | | | | | | | | | | | | | | | | | | | | | |
| | | Intermediate U.S. Government Fund | | | Total Return Bond Fund | | | Kentucky Intermediate Tax-Free Fund | | | Maryland Intermediate Tax-Free Fund | |
| | | For the Year Ended
September 30,
2007 | | | For the Year Ended
September 30,
2006 | | | For the Year Ended
September 30,
2007 | | | For the Year Ended
September 30,
2006 | | | For the Year Ended
September 30,
2007 | | | For the Year Ended
September 30,
2006 | | | For the Year Ended
September 30,
2007 | | | For the Year Ended
September 30,
2006 | |
Capital Transactions: | | | | | | | | | | | | | | | | | | | | | | | | | | | | | | | | |
Class A Shares: | | | | | | | | | | | | | | | | | | | | | | | | | | | | | | | | |
Proceeds from shares issued | | $ | 2,916,001 | | | $ | 3,393,825 | | | $ | 3,468,840 | | | $ | 1,566,777 | | | $ | 1,866,791 | | | $ | 470,225 | | | $ | 495,112 | | | $ | 521,102 | |
Distributions reinvested | | | 361,664 | | | | 412,369 | | | | 311,187 | | | | 281,750 | | | | 99,051 | | | | 68,849 | | | | 49,164 | | | | 36,314 | |
Value of shares redeemed | | | (4,005,349 | ) | | | (7,612,519 | ) | | | (1,779,311 | ) | | | (2,569,535 | ) | | | (61,529 | ) | | | (398,856 | ) | | | (88,708 | ) | | | (221,862 | ) |
| | | | | | | | | | | | | | | | | | | | | | | | | | | | | | | | |
Change in net assets from Class A Share transactions | | | (727,684 | ) | | | (3,806,325 | ) | | | 2,000,716 | | | | (721,008 | ) | | | 1,904,313 | | | | 140,218 | | | | 455,568 | | | | 335,554 | |
Class B Shares: | | | | | | | | | | | | | | | | | | | | | | | | | | | | | | | | |
Proceeds from shares issued | | | 154,089 | | | | 403,411 | | | | 851,683 | | | | 516,135 | | | | — | | | | — | | | | — | | | | — | |
Distributions reinvested | | | 113,023 | | | | 151,333 | | | | 161,640 | | | | 200,161 | | | | — | | | | — | | | | — | | | | — | |
Value of shares redeemed | | | (1,292,830 | ) | | | (2,171,972 | ) | | | (896,952 | ) | | | (1,878,269 | ) | | | — | | | | — | | | | — | | | | — | |
| | | | | | | | | | | | | | | | | | | | | | | | | | | | | | | | |
Change in net assets from Class B Share transactions | | | (1,025,718 | ) | | | (1,617,228 | ) | | | 116,371 | | | | (1,161,973 | ) | | | — | | | | — | | | | — | | | | — | |
Class C Shares: | | | | | | | | | | | | | | | | | | | | | | | | | | | | | | | | |
Proceeds from shares issued | | | 51,812 | | | | 20,199 | | | | 40,253 | | | | 30,094 | | | | — | | | | — | | | | — | | | | — | |
Distributions reinvested | | | 5,544 | | | | 5,918 | | | | 3,765 | | | | 6,267 | | | | — | | | | — | | | | — | | | | — | |
Value of shares redeemed | | | (63,903 | ) | | | (87,702 | ) | | | (44,757 | ) | | | (133,111 | ) | | | — | | | | — | | | | — | | | | — | |
| | | | | | | | | | | | | | | | | | | | | | | | | | | | | | | | |
Change in net assets from Class C Share transactions | | | (6,547 | ) | | | (61,585 | ) | | | (739 | ) | | | (96,750 | ) | | | — | | | | — | | | | — | | | | — | |
Institutional Shares: | | | | | | | | | | | | | | | | | | | | | | | | | | | | | | | | |
Proceeds from shares issued | | | 21,463,527 | | | | 33,817,098 | | | | 177,806,545 | | | | 212,135,973 | | | | 2,083,975 | | | | 1,710,390 | | | | 3,509,534 | | | | 2,217,996 | |
Distributions reinvested | | | 2,376,484 | | | | 11,550,412 | | | | 6,152,154 | | | | 10,881,639 | | | | 24,784 | | | | 694 | | | | 18,505 | | | | — | |
Value of shares redeemed | | | (144,399,629 | ) | | | (323,713,750 | ) | | | (100,790,343 | ) | | | (117,974,744 | ) | | | (2,599,276 | ) | | | (6,166,394 | ) | | | (3,173,463 | ) | | | (4,353,530 | ) |
Redemption In-Kind | | | — | | | | — | | | | (17,197,462 | ) | | | (192,588,337 | ) | | | — | | | | — | | | | — | | | | — | |
| | | | | | | | | | | | | | | | | | | | | | | | | | | | | | | | |
Change in net assets from Institutional Share transactions | | | (120,559,618 | ) | | | (278,346,240 | ) | | | 65,970,894 | | | | (87,545,469 | ) | | | (490,517 | ) | | | (4,455,310 | ) | | | 354,576 | | | | (2,135,534 | ) |
| | | | | | | | | | | | | | | | | | | | | | | | | | | | | | | | |
Change in net assets from capital transactions | | $ | (122,319,567 | ) | | $ | (283,831,378 | ) | | $ | 68,087,242 | | | $ | (89,525,200 | ) | | $ | 1,413,796 | | | $ | (4,315,092 | ) | | $ | 810,144 | | | $ | (1,799,980 | ) |
| | | | | | | | | | | | | | | | | | | | | | | | | | | | | | | | |
Share Transactions: | | | | | | | | | | | | | | | | | | | | | | | | | | | | | | | | |
Class A Shares: | | | | | | | | | | | | | | | | | | | | | | | | | | | | | | | | |
Issued | | | 295,035 | | | | 344,880 | | | | 342,963 | | | | 155,247 | | | | 186,791 | | | | 47,360 | | | | 48,939 | | | | 52,437 | |
Reinvested | | | 36,583 | | | | 42,011 | | | | 30,762 | | | | 27,949 | | | | 9,843 | | | | 6,892 | | | | 4,869 | | | | 3,642 | |
Redeemed | | | (406,012 | ) | | | (773,802 | ) | | | (176,552 | ) | | | (253,889 | ) | | | (6,092 | ) | | | (39,896 | ) | | | (8,785 | ) | | | (22,268 | ) |
| | | | | | | | | | | | | | | | | | | | | | | | | | | | | | | | |
Change in Class A Shares | | | (74,394 | ) | | | (386,911 | ) | | | 197,173 | | | | (70,693 | ) | | | 190,542 | | | | 14,356 | | | | 45,023 | | | | 33,811 | |
Class B Shares: | | | | | | | | | | | | | | | | | | | | | | | | | | | | | | | | |
Issued | | | 15,589 | | | | 41,199 | | | | 84,527 | | | | 51,008 | | | | — | | | | — | | | | — | | | | — | |
Reinvested | | | 11,470 | | | | 15,461 | | | | 15,961 | | | | 19,832 | | | | — | | | | — | | | | — | | | | — | |
Redeemed | | | (131,126 | ) | | | (222,404 | ) | | | (88,668 | ) | | | (187,185 | ) | | | — | | | | — | | | | — | | | | — | |
| | | | | | | | | | | | | | | | | | | | | | | | | | | | | | | | |
Change in Class B Shares | | | (104,067 | ) | | | (165,744 | ) | | | 11,820 | | | | (116,345 | ) | | | — | | | | — | | | | — | | | | — | |
Class C Shares: | | | | | | | | | | | | | | | | | | | | | | | | | | | | | | | | |
Issued | | | 5,257 | | | | 1,788 | | | | 3,976 | | | | 2,989 | | | | — | | | | — | | | | — | | | | — | |
Reinvested | | | 562 | | | | 604 | | | | 372 | | | | 620 | | | | — | | | | — | | | | — | | | | — | |
Redeemed | | | (6,436 | ) | | | (8,890 | ) | | | (4,392 | ) | | | (13,311 | ) | | | — | | | | — | | | | — | | | | — | |
| | | | | | | | | | | | | | | | | | | | | | | | | | | | | | | | |
Change in Class C Shares | | | (617 | ) | | | (6,498 | ) | | | (44 | ) | | | (9,702 | ) | | | — | | | | — | | | | — | | | | — | |
Institutional Shares: | | | | | | | | | | | | | | | | | | | | | | | | | | | | | | | | |
Issued | | | 2,166,829 | | | | 3,429,697 | | | | 17,565,627 | | | | 21,073,955 | | | | 207,430 | | | | 172,234 | | | | 347,698 | | | | 222,409 | |
Reinvested | | | 239,674 | | | | 1,174,507 | | | | 606,933 | | | | 1,079,488 | | | | 2,449 | | | | 70 | | | | 1,820 | | | | — | |
Redeemed | | | (14,581,368 | ) | | | (32,878,165 | ) | | | (9,966,290 | ) | | | (11,710,373 | ) | | | (257,904 | ) | | | (617,147 | ) | | | (315,431 | ) | | | (437,179 | ) |
Redemption In-Kind | | | — | | | | — | | | | (1,689,338 | ) | | | (18,936,906 | ) | | | — | | | | — | | | | — | | | | — | |
| | | | | | | | | | | | | | | | | | | | | | | | | | | | | | | | |
Change in Institutional Shares | | | (12,174,865 | ) | | | (28,273,961 | ) | | | 6,516,932 | | | | (8,493,836 | ) | | | (48,025 | ) | | | (444,843 | ) | | | 34,087 | | | | (214,770 | ) |
| | | | | | | | | | | | | | | | | | | | | | | | | | | | | | | | |
Change in Shares | | | (12,353,943 | ) | | | (28,833,114 | ) | | | 6,725,881 | | | | (8,690,576 | ) | | | 142,517 | | | | (430,487 | ) | | | 79,110 | | | | (180,959 | ) |
| | | | | | | | | | | | | | | | | | | | | | | | | | | | | | | | |
See accompanying notes to the financial statements.
104
BB&T Funds
Statements of Changes in Net Assets, continued
| | | | | | | | | | | | | | | | | | | | | | | | | | | | | | | | |
| | | North Carolina Intermediate Tax-Free Fund | | | South Carolina Intermediate Tax-Free Fund | | | Virginia Intermediate Tax-Free Fund | | | West Virginia Intermediate Tax-Free Fund | |
| | | For the Year Ended
September 30,
2007 | | | For the Year Ended
September 30,
2006 | | | For the Year Ended
September 30,
2007 | | | For the Year Ended
September 30,
2006 | | | For the Year Ended
September 30,
2007 | | | For the Year Ended
September 30,
2006 | | | For the Year Ended
September 30,
2007 | | | For the Year Ended
September 30,
2006 | |
Capital Transactions: | | | | | | | | | | | | | | | | | | | | | | | | | | | | | | | | |
Class A Shares: | | | | | | | | | | | | | | | | | | | | | | | | | | | | | | | | |
Proceeds from shares issued | | $ | 2,939,881 | | | $ | 4,652,606 | | | $ | 314,862 | | | $ | 328,384 | | | $ | 706,378 | | | $ | 1,838,786 | | | $ | 2,503,718 | | | $ | 3,071,322 | |
Distributions reinvested | | | 507,750 | | | | 705,765 | | | | 123,800 | | | | 183,085 | | | | 222,489 | | | | 250,054 | | | | 441,243 | | | | 461,980 | |
Value of shares redeemed | | | (2,851,510 | ) | | | (7,591,504 | ) | | | (641,564 | ) | | | (505,780 | ) | | | (3,948,246 | ) | | | (3,235,407 | ) | | | (1,680,758 | ) | | | (1,595,339 | ) |
| | | | | | | | | | | | | | | | | | | | | | | | | | | | | | | | |
Change in net assets from Class A Share transactions | | | 596,121 | | | | (2,233,133 | ) | | | (202,902 | ) | | | 5,689 | | | | (3,019,379 | ) | | | (1,146,567 | ) | | | 1,264,203 | | | | 1,937,963 | |
Institutional Shares: | | | | | | | | | | | | | | | | | | | | | | | | | | | | | | | | |
Proceeds from shares issued | | | 25,728,476 | | | | 22,919,184 | | | | 1,696,157 | | | | 3,332,757 | | | | 16,081,394 | | | | 14,726,302 | | | | 12,202,042 | | | | 9,179,142 | |
Distributions reinvested | | | 280,682 | | | | 49,122 | | | | 36,815 | | | | 1,063 | | | | 236,144 | | | | 80,896 | | | | 146,109 | | | | 6,188 | |
Value of shares redeemed | | | (17,153,635 | ) | | | (27,815,851 | ) | | | (4,250,548 | ) | | | (4,084,936 | ) | | | (12,603,957 | ) | | | (16,158,693 | ) | | | (10,322,060 | ) | | | (13,543,394 | ) |
| | | | | | | | | | | | | | | | | | | | | | | | | | | | | | | | |
Change in net assets from Institutional Share transactions | | | 8,855,523 | | | | (4,847,545 | ) | | | (2,517,576 | ) | | | (751,116 | ) | | | 3,713,581 | | | | (1,351,495 | ) | | | 2,026,091 | | | | (4,358,064 | ) |
| | | | | | | | | | | | | | | | | | | | | | | | | | | | | | | | |
Change in net assets from capital transactions | | $ | 9,451,644 | | | $ | (7,080,678 | ) | | $ | (2,720,478 | ) | | $ | (745,427 | ) | | $ | 694,202 | | | $ | 2,498,062 | | | $ | 3,290,294 | | | $ | (2,420,101 | ) |
| | | | | | | | | | | | | | | | | | | | | | | | | | | | | | | | |
Share Transactions: | | | | | | | | | | | | | | | | | | | | | | | | | | | | | | | | |
Class A Shares: | | | | | | | | | | | | | | | | | | | | | | | | | | | | | | | | |
Issued | | | 286,001 | | | | 452,100 | | | | 30,656 | | | | 31,839 | | | | 62,321 | | | | 161,944 | | | | 256,907 | | | | 315,965 | |
Reinvested | | | 49,151 | | | | 68,638 | | | | 12,039 | | | | 17,805 | | | | 19,657 | | | | 22,108 | | | | 45,342 | | | | 47,574 | |
Redeemed | | | (277,270 | ) | | | (740,681 | ) | | | (62,516 | ) | | | (49,587 | ) | | | (346,447 | ) | | | (285,422 | ) | | | (173,236 | ) | | | (164,690 | ) |
| | | | | | | | | | | | | | | | | | | | | | | | | | | | | | | | |
Change in Class A Shares | | | 57,882 | | | | (219,943 | ) | | | (19,821 | ) | | | 57 | | | | (264,469 | ) | | | (101,370 | ) | | | 129,013 | | | | 198,849 | |
Institutional Shares: | | | | | | | | | | | | | | | | | | | | | | | | | | | | | | | | |
Issued | | | 2,490,891 | | | | 2,225,950 | | | | 166,035 | | | | 325,968 | | | | 1,425,022 | | | | 1,306,843 | | | | 1,257,159 | | | | 944,140 | |
Reinvested | | | 27,072 | | | | 4,779 | | | | 3,589 | | | | 105 | | | | 20,797 | | | | 7,154 | | | | 14,952 | | | | 637 | |
Redeemed | | | (1,660,642 | ) | | | (2,703,831 | ) | | | (417,078 | ) | | | (399,095 | ) | | | (1,118,037 | ) | | | (1,432,134 | ) | | | (1,064,904 | ) | | | (1,394,252 | ) |
| | | | | | | | | | | | | | | | | | | | | | | | | | | | | | | | |
Change in Institutional Shares | | | 857,321 | | | | (473,102 | ) | | | (247,454 | ) | | | (73,022 | ) | | | 327,782 | | | | (118,137 | ) | | | 207,207 | | | | (449,475 | ) |
| | | | | | | | | | | | | | | | | | | | | | | | | | | | | | | | |
Change in Shares | | | 915,203 | | | | (693,045 | ) | | | (267,275 | ) | | | (72,965 | ) | | | 63,313 | | | | (219,507 | ) | | | 336,220 | | | | (250,626 | ) |
| | | | | | | | | | | | | | | | | | | | | | | | | | | | | | | | |
See accompanying notes to the financial statements.
105
BB&T Funds
Statements of Changes in Net Assets, continued
| | | | | | | | | | | | | | | | | | | | | | | | | | | | | | | | |
| | | National Tax-Free Money Market
Fund | | | Prime Money Market Fund | | | U.S. Treasury Money Market Fund | | | Capital Manager Conservative
Growth Fund | |
| | | For the Year
Ended
September 30,
2007 | | | August 1, 2006
through
September 30,
2006(a) | | | For the Year
Ended
September 30,
2007 | | | For the Year
Ended
September 30,
2006 | | | For the Year
Ended
September 30,
2007 | | | For the Year
Ended
September 30,
2006 | | | For the Year
Ended
September 30,
2007 | | | For the Year
Ended
September 30,
2006 | |
Capital Transactions: | | | | | | | | | | | | | | | | | | | | | | | | | | | | | | | | |
Class A Shares: | | | | | | | | | | | | | | | | | | | | | | | | | | | | | | | | |
Proceeds from shares issued | | $ | 531,598 | | | $ | 1,000 | | | $ | 948,772,570 | | | $ | 877,547,136 | | | $ | 326,268,815 | | | $ | 209,931,673 | | | $ | 2,220,068 | | | $ | 2,894,718 | |
Distributions reinvested | | | 8,765 | | | | 5 | | | | 35,261,332 | | | | 21,227,737 | | | | 7,848,573 | | | | 4,583,261 | | | | 269,207 | | | | 299,243 | |
Value of shares redeemed | | | (15,000 | ) | | | — | | | | (874,980,414 | ) | | | (755,729,498 | ) | | | (191,604,870 | ) | | | (160,875,549 | ) | | | (2,602,438 | ) | | | (2,683,350 | ) |
| | | | | | | | | | | | | | | | | | | | | | | | | | | | | | | | |
Change in net assets from Class A Share transactions | | | 525,363 | | | | 1,005 | | | | 109,053,488 | | | | 143,045,375 | | | | 142,512,518 | | | | 53,639,385 | | | | (113,163 | ) | | | 510,611 | |
Class B Shares: | | | | | | | | | | | | | | | | | | | | | | | | | | | | | | | | |
Proceeds from shares issued | | | 122 | | | | 1,000 | | | | 523,824 | | | | 1,712,243 | | | | 155,333 | | | | 200,191 | | | | 778,104 | | | | 889,140 | |
Distributions reinvested | | | 26 | | | | 4 | | | | 71,703 | | | | 54,133 | | | | 11,578 | | | | 15,977 | | | | 105,342 | | | | 127,595 | |
Value of shares redeemed | | | — | | | | — | | | | (1,222,026 | ) | | | (1,300,846 | ) | | | (246,200 | ) | | | (642,930 | ) | | | (1,347,548 | ) | | | (1,145,079 | ) |
| | | | | | | | | | | | | | | | | | | | | | | | | | | | | | | | |
Change in net assets from Class B Share transactions | | | 148 | | | | 1,004 | | | | (626,499 | ) | | | 465,530 | | | | (79,289 | ) | | | (426,762 | ) | | | (464,102 | ) | | | (128,344 | ) |
Class C Shares: | | | | | | | | | | | | | | | | | | | | | | | | | | | | | | | | |
Proceeds from shares issued | | | — | | | | 1,000 | | | | 1,141,860 | | | | 598,347 | | | | 10,635 | | | | 49,093 | | | | 617 | | | | 1,495 | |
Distributions reinvested | | | 22 | | | | 4 | | | | 14,231 | | | | 14,032 | | | | 1,426 | | | | 923 | | | | 1,896 | | | | 3,332 | |
Value of shares redeemed | | | — | | | | — | | | | (1,088,873 | ) | | | (545,083 | ) | | | (24,813 | ) | | | (32,524 | ) | | | (58,914 | ) | | | (36,001 | ) |
| | | | | | | | | | | | | | | | | | | | | | | | | | | | | | | | |
Change in net assets from Class C Share transactions | | | 22 | | | | 1,004 | | | | 67,218 | | | | 67,296 | | | | (12,752 | ) | | | 17,492 | | | | (56,401 | ) | | | (31,174 | ) |
Institutional Shares: | | | | | | | | | | | | | | | | | | | | | | | | | | | | | | | | |
Proceeds from shares issued | | | 211,070,119 | | | | 126,414,787 | | | | 2,835,503,117 | | | | 1,603,996,022 | | | | 985,293,326 | | | | 992,710,421 | | | | 4,200,697 | | | | 5,104,480 | |
Distributions reinvested | | | 34 | | | | 5 | | | | 4,423,119 | | | | 3,220,388 | | | | 7,579,436 | | | | 6,433,545 | | | | 1,492,115 | | | | 2,277,160 | |
Value of shares redeemed | | | (197,237,168 | ) | | | (30,657,300 | ) | | | (2,783,395,119 | ) | | | (1,386,537,416 | ) | | | (917,074,639 | ) | | | (1,110,395,351 | ) | | | (7,916,374 | ) | | | (8,511,559 | ) |
Redemption In-Kind | | | — | | | | — | | | | — | | | | — | | | | — | | | | — | | | | — | | | | (24,907,733 | ) |
| | | | | | | | | | | | | | | | | | | | | | | | | | | | | | | | |
Change in net assets from Institutional Share transactions | | | 13,832,985 | | | | 95,757,492 | | | | 56,531,117 | | | | 220,678,994 | | | | 75,798,123 | | | | (111,251,385 | ) | | | (2,223,562 | ) | | | (26,037,652 | ) |
| | | | | | | | | | | | | | | | | | | | | | | | | | | | | | | | |
Change in net assets from capital transactions | | $ | 14,358,518 | | | $ | 95,760,505 | | | $ | 165,025,324 | | | $ | 364,257,195 | | | $ | 218,218,600 | | | $ | (58,021,270 | ) | | $ | (2,857,228 | ) | | $ | (25,686,559 | ) |
| | | | | | | | | | | | | | | | | | | | | | | | | | | | | | | | |
Share Transactions: | | | | | | | | | | | | | | | | | | | | | | | | | | | | | | | | |
Class A Shares: | | | | | | | | | | | | | | | | | | | | | | | | | | | | | | | | |
Issued | | | 531,598 | | | | 1,000 | | | | 948,772,736 | | | | 877,547,136 | | | | 326,268,815 | | | | 209,931,673 | | | | 213,560 | | | | 296,643 | |
Reinvested | | | 8,765 | | | | 5 | | | | 35,261,333 | | | | 21,227,737 | | | | 7,848,572 | | | | 4,583,261 | | | | 25,954 | | | | 30,431 | |
Redeemed | | | (15,000 | ) | | | — | | | | (874,980,414 | ) | | | (755,729,498 | ) | | | (191,604,842 | ) | | | (160,875,549 | ) | | | (251,189 | ) | | | (273,031 | ) |
| | | | | | | | | | | | | | | | | | | | | | | | | | | | | | | | |
Change in Class A Shares | | | 525,363 | | | | 1,005 | | | | 109,053,655 | | | | 143,045,375 | | | | 142,512,545 | | | | 53,639,385 | | | | (11,675 | ) | | | 54,043 | |
Class B Shares: | | | | | | | | | | | | | | | | | | | | | | | | | | | | | | | | |
Issued | | | 122 | | | | 1,000 | | | | 523,825 | | | | 1,712,243 | | | | 155,333 | | | | 200,191 | | | | 74,835 | | | | 90,828 | |
Reinvested | | | 26 | | | | 4 | | | | 71,703 | | | | 54,133 | | | | 11,578 | | | | 15,977 | | | | 10,152 | | | | 12,972 | |
Redeemed | | | — | | | | — | | | | (1,222,026 | ) | | | (1,300,846 | ) | | | (246,200 | ) | | | (642,930 | ) | | | (129,999 | ) | | | (116,632 | ) |
| | | | | | | | | | | | | | | | | | | | | | | | | | | | | | | | |
Change in Class B Shares | | | 148 | | | | 1,004 | | | | (626,498 | ) | | | 465,530 | | | | (79,289 | ) | | | (426,762 | ) | | | (45,012 | ) | | | (12,832 | ) |
Class C Shares: | | | | | | | | | | | | | | | | | | | | | | | | | | | | | | | | |
Issued | | | — | | | | 1,000 | | | | 1,141,861 | | | | 598,347 | | | | 10,635 | | | | 49,093 | | | | 60 | | | | 152 | |
Reinvested | | | 22 | | | | 4 | | | | 14,231 | | | | 14,032 | | | | 1,426 | | | | 923 | | | | 184 | | | | 340 | |
Redeemed | | | — | | | | — | | | | (1,088,873 | ) | | | (545,083 | ) | | | (24,813 | ) | | | (32,524 | ) | | | (5,707 | ) | | | (3,693 | ) |
| | | | | | | | | | | | | | | | | | | | | | | | | | | | | | | | |
Change in Class C Shares | | | 22 | | | | 1,004 | | | | 67,219 | | | | 67,296 | | | | (12,752 | ) | | | 17,492 | | | | (5,463 | ) | | | (3,201 | ) |
Institutional Shares: | | | | | | | | | | | | | | | | | | | | | | | | | | | | | | | | |
Issued | | | 211,070,119 | | | | 126,414,787 | | | | 2,835,503,292 | | | | 1,603,996,022 | | | | 985,293,326 | | | | 992,710,421 | | | | 402,394 | | | | 513,254 | |
Reinvested | | | 34 | | | | 5 | | | | 4,423,119 | | | | 3,220,388 | | | | 7,579,436 | | | | 6,433,545 | | | | 142,689 | | | | 230,153 | |
Redeemed | | | (197,237,168 | ) | | | (30,657,300 | ) | | | (2,783,395,119 | ) | | | (1,386,537,416 | ) | | | (917,074,551 | ) | | | (1,110,395,351 | ) | | | (757,131 | ) | | | (861,524 | ) |
Redemption In-Kind | | | — | | | | — | | | | — | | | | — | | | | — | | | | — | | | | — | | | | (2,498,268 | ) |
| | | | | | | | | | | | | | | | | | | | | | | | | | | | | | | | |
Change in Institutional Shares | | | 13,832,985 | | | | 95,757,492 | | | | 56,531,292 | | | | 220,678,994 | | | | 75,798,211 | | | | (111,251,385 | ) | | | (212,048 | ) | | | (2,616,385 | ) |
| | | | | | | | | | | | | | | | | | | | | | | | | | | | | | | | |
Change in Shares | | | 14,358,518 | | | | 95,760,505 | | | | 165,025,668 | | | | 364,257,195 | | | | 218,218,715 | | | | (58,021,270 | ) | | | (274,198 | ) | | | (2,578,375 | ) |
| | | | | | | | | | | | | | | | | | | | | | | | | | | | | | | | |
| (a) | Period from commencement of operations. |
See accompanying notes to the financial statements.
106
BB&T Funds
Statements of Changes in Net Assets, continued
| | | | | | | | | | | | | | | | | | | | | | | | |
| | | Capital Manager Moderate
Growth Fund | | | Capital Manager Growth Fund | | | Capital Manager Equity Fund | |
| | | For the Year Ended September 30, 2007 | | | For the Year Ended September 30, 2006 | | | For the Year Ended September 30, 2007 | | | For the Year
Ended
September 30,
2006 | | | For the Year
Ended
September 30,
2007 | | | For the Year
Ended
September 30,
2006 | |
Capital Transactions: | | | | | | | | | | | | | | | | | | | | | | | | |
Class A Shares: | | | | | | | | | | | | | | | | | | | | | | | | |
Proceeds from shares issued | | $ | 6,992,258 | | | $ | 8,370,745 | | | $ | 5,576,223 | | | $ | 7,362,741 | | | $ | 1,726,422 | | | $ | 2,384,353 | |
Distributions reinvested | | | 1,421,952 | | | | 799,802 | | | | 947,443 | | | | 429,052 | | | | 604,103 | | | | 210,775 | |
Value of shares redeemed | | | (6,274,449 | ) | | | (5,935,951 | ) | | | (5,187,348 | ) | | | (3,318,572 | ) | | | (1,239,442 | ) | | | (1,401,220 | ) |
| | | | | | | | | | | | | | | | | | | | | | | | |
Change in net assets from Class A Share transactions | | | 2,139,761 | | | | 3,234,596 | | | | 1,336,318 | | | | 4,473,221 | | | | 1,091,083 | | | | 1,193,908 | |
Class B Shares: | | | | | | | | | | | | | | | | | | | | | | | | |
Proceeds from shares issued | | | 2,183,340 | | | | 3,181,245 | | | | 2,309,756 | | | | 3,406,232 | | | | 884,577 | | | | 1,133,885 | |
Distributions reinvested | | | 746,011 | | | | 401,790 | | | | 661,054 | | | | 264,038 | | | | 643,086 | | | | 211,435 | |
Value of shares redeemed | | | (4,246,433 | ) | | | (4,769,211 | ) | | | (3,720,005 | ) | | | (2,440,432 | ) | | | (1,473,690 | ) | | | (1,260,549 | ) |
| | | | | | | | | | | | | | | | | | | | | | | | |
Change in net assets from Class B Share transactions | | | (1,317,082 | ) | | | (1,186,176 | ) | | | (749,195 | ) | | | 1,229,838 | | | | 53,973 | | | | 84,771 | |
Class C Shares: | | | | | | | | | | | | | | | | | | | | | | | | |
Proceeds from shares issued | | | 67,841 | | | | 24,138 | | | | 15,162 | | | | 22,379 | | | | 1,013 | | | | 5,438 | |
Distributions reinvested | | | 5,003 | | | | 2,447 | | | | 2,414 | | | | 879 | | | | 79 | | | | 509 | |
Value of shares redeemed | | | (64,466 | ) | | | (14,889 | ) | | | (7,327 | ) | | | (1,305 | ) | | | (10,196 | ) | | | (15,439 | ) |
| | | | | | | | | | | | | | | | | | | | | | | | |
Change in net assets from Class C Share transactions | | | 8,378 | | | | 11,696 | | | | 10,249 | | | | 21,953 | | | | (9,104 | ) | | | (9,492 | ) |
Institutional Shares: | | | | | | | | | | | | | | | | | | | | | | | | |
Proceeds from shares issued | | | 7,255,795 | | | | 7,818,183 | | | | 5,818,219 | | | | 7,034,663 | | | | 8,080,999 | | | | 6,871,867 | |
Distributions reinvested | | | 1,183,357 | | | | 1,126,897 | | | | 932,155 | | | | 830,721 | | | | 1,281,235 | | | | 925,609 | |
Value of shares redeemed | | | (7,117,611 | ) | | | (3,589,079 | ) | | | (4,583,465 | ) | | | (2,757,951 | ) | | | (4,372,797 | ) | | | (1,950,722 | ) |
Redemption In-Kind | | | — | | | | (24,751,203 | ) | | | — | | | | (24,289,586 | ) | | | — | | | | (17,939,344 | ) |
| | | | | | | | | | | | | | | | | | | | | | | | |
Change in net assets from Institutional Share transactions | | | 1,321,541 | | | | (19,395,202 | ) | | | 2,166,909 | | | | (19,182,153 | ) | | | 4,989,437 | | | | (12,092,590 | ) |
| | | | | | | | | | | | | | | | | | | | | | | | |
Change in net assets from capital transactions | | $ | 2,152,598 | | | $ | (17,335,086 | ) | | $ | 2,764,281 | | | $ | (13,457,141 | ) | | $ | 6,125,389 | | | $ | (10,823,403 | ) |
| | | | | | | | | | | | | | | | | | | | | | | | |
Share Transactions: | | | | | | | | | | | | | | | | | | | | | | | | |
Class A Shares: | | | | | | | | | | | | | | | | | | | | | | | | |
Issued | | | 654,475 | | | | 839,102 | | | | 515,684 | | | | 739,695 | | | | 146,259 | | | | 211,575 | |
Reinvested | | | 133,980 | | | | 79,930 | | | | 88,868 | | | | 43,090 | | | | 52,420 | | | | 18,983 | |
Redeemed | | | (585,008 | ) | | | (594,781 | ) | | | (480,641 | ) | | | (332,216 | ) | | | (103,919 | ) | | | (124,422 | ) |
| | | | | | | | | | | | | | | | | | | | | | | | |
Change in Class A Shares | | | 203,447 | | | | 324,251 | | | | 123,911 | | | | 450,569 | | | | 94,760 | | | | 106,136 | |
Class B Shares: | | | | | | | | | | | | | | | | | | | | | | | | |
Issued | | | 208,734 | | | | 324,054 | | | | 217,498 | | | | 347,785 | | | | 76,493 | | | | 103,854 | |
Reinvested | | | 71,749 | | | | 40,900 | | | | 63,518 | | | | 27,107 | | | | 57,689 | | | | 19,679 | |
Redeemed | | | (404,722 | ) | | | (487,690 | ) | | | (351,080 | ) | | | (249,120 | ) | | | (127,251 | ) | | | (115,637 | ) |
| | | | | | | | | | | | | | | | | | | | | | | | |
Change in Class B Shares | | | (124,239 | ) | | | (122,736 | ) | | | (70,064 | ) | | | 125,772 | | | | 6,931 | | | | 7,896 | |
Class C Shares: | | | | | | | | | | | | | | | | | | | | | | | | |
Issued | | | 6,425 | | | | 2,457 | | | | 1,126 | | | | 2,312 | | | | 89 | | | | 504 | |
Reinvested | | | 478 | | | | 248 | | | | 21 | | | | 90 | | | | 7 | | | | 48 | |
Redeemed | | | (6,210 | ) | | | (1,507 | ) | | | (143 | ) | | | (134 | ) | | | (910 | ) | | | (1,388 | ) |
| | | | | | | | | | | | | | | | | | | | | | | | |
Change in Class C Shares | | | 693 | | | | 1,198 | | | | 1,004 | | | | 2,268 | | | | (814 | ) | | | (836 | ) |
Institutional Shares: | | | | | | | | | | | | | | | | | | | | | | | | |
Issued | | | 676,580 | | | | 775,206 | | | | 537,595 | | | | 703,458 | | | | 664,857 | | | | 603,581 | |
Reinvested | | | 110,942 | | | | 112,593 | | | | 87,213 | | | | 83,724 | | | | 110,170 | | | | 82,964 | |
Redeemed | | | (657,885 | ) | | | (357,251 | ) | | | (425,050 | ) | | | (278,118 | ) | | | (362,697 | ) | | | (175,325 | ) |
Redemption In-Kind | | | — | | | | (2,436,142 | ) | | | — | | | | (2,407,293 | ) | | | — | | | | (1,579,166 | ) |
| | | | | | | | | | | | | | | | | | | | | | | | |
Change in Institutional Shares | | | 129,637 | | | | (1,905,594 | ) | | | 199,758 | | | | (1,898,229 | ) | | | 412,330 | | | | (1,067,946 | ) |
| | | | | | | | | | | | | | | | | | | | | | | | |
Change in Shares | | | 209,538 | | | | (1,702,881 | ) | | | 254,609 | | | | (1,319,620 | ) | | | 513,207 | | | | (954,750 | ) |
| | | | | | | | | | | | | | | | | | | | | | | | |
See accompanying notes to the financial statements.
107
BB&T Funds
Financial Highlights, Class A Shares
Selected data for a share of beneficial interest outstanding throughout the periods indicated.
| | | | | | | | | | | | | | | | | | | | | | | | | | | | | | | | | | | | | | | | | | |
| | | | | Investment Activities | | | Distributions | | | | | | | | Ratios/Supplementary Data | |
| | | Net Asset
Value,
Beginning
of Period | | Net
investment
income
(loss) | | | Net realized/
unrealized
gains (losses) on investments
and foreign
currency
transactions | | | Total from
Investment
Activities | | | Net
investment
income | | | Net realized
gains on
investments
and foreign
currency
transactions | | | Total
Distributions | | | Net Asset
Value,
End of Period | | Total Return
(excludes
sales charge) (a) | | | Net
Assets,
End of
Period
(000) | | Ratio of net expenses to
average net
assets (b) | | | Ratio of net
investment
income
(loss) to average
net assets (b) | | | Ratio of
expenses to
average
net assets* (b) | | | Portfolio
turnover rate** | |
Large Cap Fund | | | | | | | | | | | | | | | | | | | | | | | | | | | | | | | | | | | | | | | | | | |
Year Ended September 30, 2007 | | $ | 20.33 | | 0.24 | (c) | | 2.14 | | | 2.38 | | | (0.23 | ) | | (3.35 | ) | | (3.58 | ) | | $ | 19.13 | | 12.55 | % | | $ | 58,771 | | 1.16 | % | | 1.25 | % | | 1.47 | % | | 68.60 | % |
Year Ended September 30, 2006 | | $ | 19.47 | | 0.30 | (c) | | 2.30 | | | 2.60 | | | (0.30 | ) | | (1.44 | ) | | (1.74 | ) | | $ | 20.33 | | 14.29 | % | | $ | 48,656 | | 1.14 | % | | 1.53 | % | | 1.43 | % | | 34.83 | % |
Year Ended September 30, 2005 | | $ | 17.26 | | 0.28 | | | 2.22 | | | 2.50 | | | (0.29 | ) | | — | | | (0.29 | ) | | $ | 19.47 | | 14.60 | % | | $ | 39,756 | | 1.14 | % | | 1.56 | % | | 1.48 | % | | 19.50 | % |
Year Ended September 30, 2004 | | $ | 14.87 | | 0.23 | | | 2.38 | | | 2.61 | | | (0.22 | ) | | — | | | (0.22 | ) | | $ | 17.26 | | 17.61 | % | | $ | 31,783 | | 1.20 | % | | 1.32 | % | | 1.56 | % | | 16.40 | % |
Year Ended September 30, 2003 | | $ | 12.84 | | 0.23 | | | 2.03 | | | 2.26 | | | (0.23 | ) | | — | | | (0.23 | ) | | $ | 14.87 | | 17.73 | % | | $ | 25,397 | | 1.17 | % | | 1.67 | % | | 1.55 | % | | 18.89 | % |
Mid Cap Value Fund | | | | | | | | | | | | | | | | | | | | | | | | | | | | | | | | | | | | | | | | | | |
Year Ended September 30, 2007 | | $ | 13.49 | | 0.04 | (c) | | 2.13 | | | 2.17 | | | (0.04 | ) | | (0.69 | ) | | (0.73 | ) | | $ | 14.93 | | 16.48 | % | | $ | 16,811 | | 1.16 | % | | 0.27 | % | | 1.20 | % | | 58.59 | % |
Year Ended September 30, 2006 | | $ | 13.35 | | 0.03 | (c) | | 1.60 | | | 1.63 | | | (0.04 | ) | | (1.45 | ) | | (1.49 | ) | | $ | 13.49 | | 13.18 | % | | $ | 13,393 | | 1.13 | % | | 0.23 | % | | 1.18 | % | | 53.92 | % |
Year Ended September 30, 2005 | | $ | 15.40 | | 0.13 | (c) | | 3.04 | | | 3.17 | | | (0.13 | ) | | (5.09 | ) | | (5.22 | ) | | $ | 13.35 | | 20.82 | % | | $ | 12,361 | | 1.15 | % | | 0.76 | % | | 1.25 | % | | 126.99 | % |
Year Ended September 30, 2004 | | $ | 12.98 | | 0.18 | (c) | | 2.42 | | | 2.60 | | | (0.18 | ) | | — | | | (0.18 | ) | | $ | 15.40 | | 20.10 | % | | $ | 9,423 | | 1.23 | % | | 1.22 | % | | 1.35 | % | | 19.17 | % |
Year Ended September 30, 2003 | | $ | 10.93 | | 0.16 | (c) | | 2.04 | | | 2.20 | | | (0.15 | ) | | — | | | (0.15 | ) | | $ | 12.98 | | 20.31 | % | | $ | 6,841 | | 1.20 | % | | 1.33 | % | | 1.35 | % | | 18.28 | % |
Mid Cap Growth Fund | | | | | | | | | | | | | | | | | | | | | | | | | | | | | | | | | | | | | | | | | | |
Year Ended September 30, 2007 | | $ | 12.45 | | (0.06 | )(c) | | 4.11 | | | 4.05 | | | (0.01 | ) | | (1.65 | ) | | (1.66 | ) | | $ | 14.84 | | 36.19 | % | | $ | 11,774 | | 1.17 | % | | (0.49 | )% | | 1.21 | % | | 134.95 | % |
Year Ended September 30, 2006 | | $ | 13.90 | | (0.01 | )(c) | | — | (d) | | (0.01 | ) | | (0.02 | ) | | (1.42 | ) | | (1.44 | ) | | $ | 12.45 | | (0.49 | )% | | $ | 10,381 | | 1.14 | % | | (0.07 | )% | | 1.19 | % | | 140.90 | % |
Year Ended September 30, 2005 | | $ | 10.95 | | (0.09 | )(c) | | 3.18 | | | 3.09 | | | — | | | (0.14 | ) | | (0.14 | ) | | $ | 13.90 | | 28.45 | % | | $ | 10,444 | | 1.14 | % | | (0.71 | )% | | 1.26 | % | | 92.74 | % |
Year Ended September 30, 2004 | | $ | 9.84 | | (0.08 | ) | | 1.19 | | | 1.11 | | | — | | | — | | | — | | | $ | 10.95 | | 11.28 | % | | $ | 8,079 | | 1.25 | % | | (0.90 | )% | | 1.36 | % | | 138.61 | % |
Year Ended September 30, 2003 | | $ | 8.07 | | (0.09 | ) | | 1.86 | | | 1.77 | | | — | | | — | | | — | | | $ | 9.84 | | 21.93 | % | | $ | 6,486 | | 1.19 | % | | (0.96 | )% | | 1.36 | % | | 125.97 | % |
Small Cap Fund | | | | | | | | | | | | | | | | | | | | | | | | | | | | | | | | | | | | | | | | | | |
Year Ended September 30, 2007 | | $ | 15.11 | | 0.07 | (c) | | 0.73 | | | 0.80 | | | (0.08 | ) | | (0.91 | ) | | (0.99 | ) | | $ | 14.92 | | 5.13 | % | | $ | 8,839 | | 1.31 | % | | 0.42 | % | | 1.76 | % | | 46.54 | % |
Year Ended September 30, 2006 | | $ | 16.38 | | — | (c)(d) | | 1.06 | | | 1.06 | | | (0.03 | ) | | (2.30 | ) | | (2.33 | ) | | $ | 15.11 | | 6.96 | % | | $ | 9,353 | | 1.28 | % | | (0.03 | )% | | 1.77 | % | | 43.25 | % |
Year Ended September 30, 2005 | | $ | 14.21 | | 0.11 | (c) | | 2.62 | | | 2.73 | | | (0.14 | ) | | (0.42 | ) | | (0.56 | ) | | $ | 16.38 | | 19.64 | % | | $ | 1,604 | | 1.29 | % | | 0.69 | % | | 1.77 | % | | 8.39 | % |
Year Ended September 30, 2004 | | $ | 11.44 | | — | (c)(d) | | 2.90 | | | 2.90 | | | (0.01 | ) | | (0.12 | ) | | (0.13 | ) | | $ | 14.21 | | 25.53 | % | | $ | 353 | | 1.48 | % | | (0.03 | )% | | 1.91 | % | | 11.25 | % |
May 19, 2003 to September 30, 2003 (e) | | $ | 10.00 | | 0.01 | (c) | | 1.43 | | | 1.44 | | | — | (d) | | — | | | — | (d) | | $ | 11.44 | | 14.43 | % | | $ | 112 | | 2.04 | % | | 0.35 | % | | 2.29 | % | | 48.84 | % |
International Equity Fund | | | | | | | | | | | | | | | | | | | | | | | | | | | | | | | | | | | | | | | | | | |
Year Ended September 30, 2007 | | $ | 11.06 | | 0.12 | (c) | | 1.82 | | | 1.94 | | | (0.07 | ) | | (4.52 | ) | | (4.59 | ) | | $ | 8.41 | | 20.13 | % | | $ | 5,204 | | 1.38 | % | | 1.02 | % | | 1.75 | % | | 129.8 | % |
Year Ended September 30, 2006 | | $ | 9.58 | | 0.14 | (c) | | 1.49 | | | 1.63 | | | (0.15 | ) | | — | | | (0.15 | ) | | $ | 11.06 | | 17.04 | % | | $ | 4,202 | | 1.40 | % | | 1.37 | % | | 1.75 | % | | 36.22 | % |
Year Ended September 30, 2005 | | $ | 8.12 | | 0.10 | (c) | | 1.47 | | | 1.57 | | | (0.11 | ) | | — | | | (0.11 | ) | | $ | 9.58 | | 19.46 | % | | $ | 3,687 | | 1.46 | % | | 1.15 | % | | 1.83 | % | | 44.96 | % |
Year Ended September 30, 2004 | | $ | 6.88 | | 0.07 | (c) | | 1.25 | | | 1.32 | | | (0.08 | ) | | — | | | (0.08 | ) | | $ | 8.12 | | 19.25 | % | | $ | 1,686 | | 1.58 | % | | 0.91 | % | | 1.92 | % | | 50.68 | % |
Year Ended September 30, 2003 | | $ | 6.31 | | 0.06 | (c) | | 0.54 | | | 0.60 | | | (0.03 | ) | | — | | | (0.03 | ) | | $ | 6.88 | | 9.58 | % | | $ | 2,162 | | 1.63 | % | | 0.95 | % | | 1.90 | % | | 199.78 | % |
Special Opportunities Equity Fund | | | | | | | | | | | | | | | | | | | | | | | | | | | | | | | | | | | | | | | | | | |
Year Ended September 30, 2007 | | $ | 16.43 | | (0.01 | )(c) | | 3.47 | | | 3.46 | | | — | | | (1.60 | ) | | (1.60 | ) | | $ | 18.29 | | 22.24 | % | | $ | 124,136 | | 1.28 | % | | (0.04 | )% | | 1.53 | % | | 49.43 | % |
Year Ended September 30, 2006 | | $ | 15.57 | | (0.04 | ) | | 1.69 | | | 1.65 | | | — | | | (0.79 | ) | | (0.79 | ) | | $ | 16.43 | | 11.16 | % | | $ | 81,883 | | 1.28 | % | | (0.26 | )% | | 1.53 | % | | 58.01 | % |
Year Ended September 30, 2005 | | $ | 13.08 | | (0.07 | ) | | 2.68 | | | 2.61 | | | — | | | (0.12 | ) | | (0.12 | ) | | $ | 15.57 | | 20.05 | % | | $ | 75,627 | | 1.30 | % | | (0.41 | )% | | 1.57 | % | | 30.38 | % |
Year Ended September 30, 2004 | | $ | 10.53 | | (0.06 | ) | | 2.69 | | | 2.63 | | | — | | | (0.08 | ) | | (0.08 | ) | | $ | 13.08 | | 25.06 | % | | $ | 28,903 | | 1.42 | % | | (0.77 | )% | | 1.80 | % | | 32.06 | % |
June 2, 2003 to September 30, 2003 (e) | | $ | 10.00 | | (0.01 | ) | | 0.54 | | | 0.53 | | | — | | | — | | | — | | | $ | 10.53 | | 5.30 | % | | $ | 5,460 | | 1.06 | % | | (0.42 | )% | | 2.02 | % | | 13.24 | % |
Equity Income Fund | | | | | | | | | | | | | | | | | | | | | | | | | | | | | | | | | | | | | | | | | | |
Year Ended September 30, 2007 | | $ | 13.36 | | 0.36 | (c) | | 2.31 | | | 2.67 | | | (0.32 | ) | | (0.68 | ) | | (1.00 | ) | | $ | 15.03 | | 20.83 | % | | $ | 97,491 | | 1.19 | % | | 2.53 | % | | 1.44 | % | | 37.85 | % |
Year Ended September 30, 2006 | | $ | 12.09 | | 0.28 | | | 1.58 | | | 1.86 | | | (0.32 | ) | | (0.27 | ) | | (0.59 | ) | | $ | 13.36 | | 15.79 | % | | $ | 60,059 | | 1.20 | % | | 2.28 | % | | 1.45 | % | | 45.38 | % |
Year Ended September 30, 2005 | | $ | 10.35 | | 0.24 | | | 1.77 | | | 2.01 | | | (0.25 | ) | | (0.02 | ) | | (0.27 | ) | | $ | 12.09 | | 19.55 | % | | $ | 40,825 | | 1.10 | % | | 2.57 | % | | 1.57 | % | | 39.65 | % |
June 30, 2004 to September 30, 2004 (e) | | $ | 10.00 | | 0.05 | (c) | | 0.34 | | | 0.39 | | | (0.04 | ) | | — | | | (0.04 | ) | | $ | 10.35 | | 3.89 | % | | $ | 6,342 | | 1.54 | % | | 1.79 | % | | 2.14 | % | | 1.65 | % |
Short U.S. Government Fund | | | | | | | | | | | | | | | | | | | | | | | | | | | | | | | | | | | | | | | | | | |
Year Ended September 30, 2007 | | $ | 9.48 | | 0.36 | (c) | | 0.07 | | | 0.43 | | | (0.39 | ) | | — | | | (0.39 | ) | | $ | 9.52 | | 4.67 | % | | $ | 3,978 | | 0.91 | % | | 3.77 | % | | 1.31 | % | | 44.10 | % |
Year Ended September 30, 2006 | | $ | 9.50 | | 0.28 | (c) | | 0.01 | (f) | | 0.29 | | | (0.31 | ) | | — | | | (0.31 | ) | | $ | 9.48 | | 3.12 | % | | $ | 6,233 | | 0.89 | % | | 2.99 | % | | 1.29 | % | | 98.08 | % |
Year Ended September 30, 2005 | | $ | 9.70 | | 0.23 | | | (0.14 | ) | | 0.09 | | | (0.29 | ) | | — | | | (0.29 | ) | | $ | 9.50 | | 0.96 | % | | $ | 7,980 | | 0.91 | % | | 2.40 | % | | 1.34 | % | | 33.67 | % |
Year Ended September 30, 2004 | | $ | 9.89 | | 0.17 | | | (0.10 | ) | | 0.07 | | | (0.26 | ) | | — | | | (0.26 | ) | | $ | 9.70 | | 0.71 | % | | $ | 8,456 | | 0.99 | % | | 1.85 | % | | 1.41 | % | | 62.59 | % |
Year Ended September 30, 2003 | | $ | 10.08 | | 0.27 | | | (0.11 | ) | | 0.16 | | | (0.35 | ) | | — | | | (0.35 | ) | | $ | 9.89 | | 1.56 | % | | $ | 9,619 | | 1.00 | % | | 2.48 | % | | 1.40 | % | | 93.86 | % |
| * | During the period certain fees were reduced. If such reductions had not occurred, the ratios would have been as indicated. |
| ** | Portfolio turnover rate is calculated on the basis of the Fund as a whole without distinguishing between classes of shares issued. |
| (a) | Not annualized for periods less than one year. |
| (b) | Annualized for periods less than one year. |
| (c) | Per share net investment income (loss) has been calculated using the average daily shares method. |
| (d) | Amount is less than $0.005. |
| (e) | Period from commencement of operations. |
| (f) | The amount shown for a share outstanding throughout the period does not accord with the change in aggregate gains and losses in the portfolio of securities during the period because of the timing of sales and purchases of Fund shares in relation to fluctuating market values during the period. |
See accompanying notes to the financial statements.
108
BB&T Funds
Financial Highlights, Class A Shares
Selected data for a share of beneficial interest outstanding throughout the periods indicated.
| | | | | | | | | | | | | | | | | | | | | | | | | | | | | | | | | | | | | | | | | |
| | | | | Investment Activities | | Distributions | | | | | | | | Ratios/Supplementary Data | |
| | | Net Asset
Value,
Beginning
of Period | | Net
investment
income
(loss) | | | Net
realized/
unrealized
gains
(losses) on
investments | | | Total from
Investment
Activities | | Net
investment
income | | | Net
realized
gains on
investments | | | Total
Distributions | | | Net
Asset
Value,
End
of
Period | | Total
Return
(excludes
sales
charge)
(a) | | | Net
Assets,
End of
Period
(000) | | Ratio of
net
expenses
to
average
net
assets
(b) | | | Ratio of
net
investment
income
(loss) to
average
net assets
(b) | | | Ratio of
expenses
to
average
net
assets*(b) | | | Portfolio
turnover
rate** | |
Intermediate U.S. Government Fund | | | | | | | | | | | | | | | | | | | | | | | | | | | | | | | | | | | | | | | | | |
Year Ended September 30, 2007 | | $ | 9.89 | | 0.42 | (c) | | 0.04 | | | 0.46 | | (0.42 | ) | | — | | | (0.42 | ) | | $ | 9.93 | | 4.78 | % | | $ | 9,050 | | 0.93 | % | | 4.27 | % | | 1.30 | % | | 85.83 | % |
Year Ended September 30, 2006 | | $ | 10.01 | | 0.41 | (c) | | (0.11 | ) | | 0.30 | | (0.42 | ) | | — | | | (0.42 | ) | | $ | 9.89 | | 3.08 | % | | $ | 9,748 | | 0.92 | % | | 4.21 | % | | 1.29 | % | | 127.13 | % |
Year Ended September 30, 2005 | | $ | 10.24 | | 0.35 | (c) | | (0.15 | ) | | 0.20 | | (0.38 | ) | | (0.05 | ) | | (0.43 | ) | | $ | 10.01 | | 1.98 | % | | $ | 13,744 | | 0.96 | % | | 3.41 | % | | 1.33 | % | | 107.04 | % |
Year Ended September 30, 2004 | | $ | 10.57 | | 0.32 | | | (0.19 | ) | | 0.13 | | (0.33 | ) | | (0.13 | ) | | (0.46 | ) | | $ | 10.24 | | 1.30 | % | | $ | 11,959 | | 1.05 | % | | 2.90 | % | | 1.42 | % | | 98.35 | % |
Year Ended September 30, 2003 | | $ | 10.77 | | 0.35 | | | (0.07 | ) | | 0.28 | | (0.39 | ) | | (0.09 | ) | | (0.48 | ) | | $ | 10.57 | | 2.62 | % | | $ | 9,646 | | 1.07 | % | | 3.13 | % | | 1.42 | % | | 209.07 | % |
Total Return Bond Fund | | | | | | | | | | | | | | | | | | | | | | | | | | | | | | | | | | | | | | | | | |
Year Ended September 30, 2007 | | $ | 10.12 | | 0.44 | (c) | | 0.01 | | | 0.45 | | (0.45 | ) | | — | | | (0.45 | ) | | $ | 10.12 | | 4.51 | % | | $ | 8,403 | | 0.93 | % | | 4.37 | % | | 1.30 | % | | 222.24 | % |
Year Ended September 30, 2006 | | $ | 10.31 | | 0.42 | (c) | | (0.12 | ) | | 0.30 | | (0.44 | ) | | (0.05 | ) | | (0.49 | ) | | $ | 10.12 | | 2.96 | % | | $ | 6,407 | | 0.93 | % | | 4.16 | % | | 1.29 | % | | 226.36 | % |
Year Ended September 30, 2005 | | $ | 10.59 | | 0.38 | (c) | | (0.19 | ) | | 0.19 | | (0.44 | ) | | (0.03 | ) | | (0.47 | ) | | $ | 10.31 | | 1.88 | % | | $ | 7,254 | | 0.96 | % | | 3.62 | % | | 1.33 | % | | 173.74 | % |
Year Ended September 30, 2004 | | $ | 10.72 | | 0.41 | | | (0.08 | ) | | 0.33 | | (0.46 | ) | | — | | | (0.46 | ) | | $ | 10.59 | | 3.22 | % | | $ | 4,786 | | 1.07 | % | | 3.84 | % | | 1.44 | % | | 31.95 | % |
Year Ended September 30, 2003 | | $ | 10.33 | | 0.47 | | | 0.41 | | | 0.88 | | (0.49 | ) | | — | | | (0.49 | ) | | $ | 10.72 | | 8.69 | % | | $ | 4,308 | | 1.08 | % | | 4.34 | % | | 1.44 | % | | 43.98 | % |
Kentucky Intermediate Tax-Free Fund | | | | | | | | | | | | | | | | | | | | | | | | | | | | | | | | | | | | | | | | | |
Year Ended September 30, 2007 | | $ | 10.12 | | 0.32 | (c) | | (0.06 | ) | | 0.26 | | (0.32 | ) | | — | | | (0.32 | ) | | $ | 10.06 | | 2.66 | % | | $ | 4,630 | | 0.90 | % | | 3.19 | % | | 1.35 | % | | 69.73 | % |
Year Ended September 30, 2006 | | $ | 10.06 | | 0.30 | | | 0.06 | | | 0.36 | | (0.30 | ) | | — | | | (0.30 | ) | | $ | 10.12 | | 3.67 | % | | $ | 2,729 | | 0.91 | % | | 3.02 | % | | 1.37 | % | | 64.55 | % |
Year Ended September 30, 2005 | | $ | 10.22 | | 0.27 | (c) | | (0.16 | ) | | 0.11 | | (0.27 | ) | | — | | | (0.27 | ) | | $ | 10.06 | | 1.06 | % | | $ | 2,566 | | 0.89 | % | | 2.65 | % | | 1.47 | % | | 37.50 | % |
Year Ended September 30, 2004 | | $ | 10.23 | | 0.27 | (c) | | (0.01 | ) | | 0.26 | | (0.27 | ) | | — | | | (0.27 | ) | | $ | 10.22 | | 2.55 | % | | $ | 2,746 | | 0.78 | % | | 2.63 | % | | 1.57 | % | | 24.78 | % |
February 24, 2003 to September 30, 2003 (d) | | $ | 10.00 | | 0.15 | (c) | | 0.35 | | | 0.50 | | (0.27 | ) | | — | | | (0.27 | ) | | $ | 10.23 | | 5.09 | % | | $ | 1,877 | | 0.62 | % | | 2.50 | % | | 1.65 | % | | 42.87 | % |
Maryland Intermediate Tax-Free Fund | | | | | | | | | | | | | | | | | | | | | | | | | | | | | | | | | | | | | | | | | |
Year Ended September 30, 2007 | | $ | 10.12 | | 0.31 | (c) | | 0.03 | | | 0.34 | | (0.31 | ) | | — | | | (0.31 | ) | | $ | 10.15 | | 3.38 | % | | $ | 2,429 | | 0.84 | % | | 3.05 | % | | 1.39 | % | | 136.09 | % |
Year Ended September 30, 2006 | | $ | 10.02 | | 0.29 | | | 0.10 | | | 0.39 | | (0.29 | ) | | — | | | (0.29 | ) | | $ | 10.12 | | 3.95 | % | | $ | 1,966 | | 0.85 | % | | 2.89 | % | | 1.41 | % | | 219.80 | % |
Year Ended September 30, 2005 | | $ | 10.15 | | 0.26 | (c) | | (0.13 | ) | | 0.13 | | (0.26 | ) | | — | | | (0.26 | ) | | $ | 10.02 | | 1.28 | % | | $ | 1,609 | | 0.81 | % | | 2.57 | % | | 1.52 | % | | 44.67 | % |
Year Ended September 30, 2004 | | $ | 10.15 | | 0.24 | | | — | (e) | | 0.24 | | (0.24 | ) | | — | | | (0.24 | ) | | $ | 10.15 | | 2.37 | % | | $ | 667 | | 0.75 | % | | 2.32 | % | | 1.73 | % | | 55.18 | % |
February 24, 2003 to September 30, 2003 (d) | | $ | 10.00 | | 0.18 | | | 0.15 | | | 0.33 | | (0.18 | ) | | — | | | (0.18 | ) | | $ | 10.15 | | 3.32 | % | | $ | 482 | | 0.72 | % | | 2.22 | % | | 2.24 | % | | 40.16 | % |
North Carolina Intermediate Tax-Free Fund | | | | | | | | | | | | | | | | | | | | | | | | | | | | | | | | | | | | | | | | | |
Year Ended September 30, 2007 | | $ | 10.38 | | 0.35 | (c) | | (0.04 | )(c) | | 0.31 | | (0.35 | ) | | (0.01 | ) | | (0.36 | ) | | $ | 10.33 | | 3.07 | % | | $ | 19,668 | | 0.91 | % | | 3.40 | % | | 1.31 | % | | 106.16 | % |
Year Ended September 30, 2006 | | $ | 10.46 | | 0.36 | | | — | (e) | | 0.36 | | (0.35 | ) | | (0.09 | ) | | (0.44 | ) | | $ | 10.38 | | 3.58 | % | | $ | 19,163 | | 0.90 | % | | 3.45 | % | | 1.30 | % | | 94.95 | % |
Year Ended September 30, 2005 | | $ | 10.67 | | 0.35 | | | (0.19 | ) | | 0.16 | | (0.35 | ) | | (0.02 | ) | | (0.37 | ) | | $ | 10.46 | | 1.49 | % | | $ | 21,600 | | 0.90 | % | | 3.29 | % | | 1.36 | % | | 60.84 | % |
Year Ended September 30, 2004 | | $ | 10.81 | | 0.32 | | | (0.10 | ) | | 0.22 | | (0.32 | ) | | (0.04 | ) | | (0.36 | ) | | $ | 10.67 | | 2.10 | % | | $ | 22,689 | | 0.90 | % | | 3.03 | % | | 1.42 | % | | 67.80 | % |
Year Ended September 30, 2003 | | $ | 10.86 | | 0.33 | | | (0.01 | ) | | 0.32 | | (0.33 | ) | | (0.04 | ) | | (0.37 | ) | | $ | 10.81 | | 3.04 | % | | $ | 25,323 | | 0.92 | % | | 3.11 | % | | 1.42 | % | | 44.56 | % |
South Carolina Intermediate Tax-Free Fund | | | | | | | | | | | | | | | | | | | | | | | | | | | | | | | | | | | | | | | | | |
Year Ended September 30, 2007 | | $ | 10.35 | | 0.34 | (c) | | (0.05 | ) | | 0.29 | | (0.35 | ) | | (0.01 | ) | | (0.36 | ) | | $ | 10.28 | | 2.91 | % | | $ | 3,769 | | 0.93 | % | | 3.34 | % | | 1.35 | % | | 68.69 | % |
Year Ended September 30, 2006 | | $ | 10.54 | | 0.34 | | | (0.01 | ) | | 0.33 | | (0.34 | ) | | (0.18 | ) | | (0.52 | ) | | $ | 10.35 | | 3.27 | % | | $ | 4,001 | | 0.93 | % | | 3.30 | % | | 1.35 | % | | 80.24 | % |
Year Ended September 30, 2005 | | $ | 10.81 | | 0.34 | | | (0.19 | ) | | 0.15 | | (0.34 | ) | | (0.08 | ) | | (0.42 | ) | | $ | 10.54 | | 1.39 | % | | $ | 4,072 | | 0.92 | % | | 3.20 | % | | 1.40 | % | | 56.03 | % |
Year Ended September 30, 2004 | | $ | 10.88 | | 0.34 | | | (0.07 | ) | | 0.27 | | (0.33 | ) | | (0.01 | ) | | (0.34 | ) | | $ | 10.81 | | 2.60 | % | | $ | 4,149 | | 0.90 | % | | 3.11 | % | | 1.44 | % | | 32.63 | % |
Year Ended September 30, 2003 | | $ | 10.87 | | 0.34 | | | 0.01 | | | 0.35 | | (0.34 | ) | | — | | | (0.34 | ) | | $ | 10.88 | | 3.29 | % | | $ | 4,680 | | 0.86 | % | | 3.14 | % | | 1.43 | % | | 32.04 | % |
Virginia Intermediate Tax-Free Fund | | | | | | | | | | | | | | | | | | | | | | | | | | | | | | | | | | | | | | | | | |
Year Ended September 30, 2007 | | $ | 11.39 | | 0.38 | (c) | | (0.04 | ) | | 0.34 | | (0.39 | ) | | (0.02 | ) | | (0.41 | ) | | $ | 11.32 | | 3.05 | % | | $ | 8,802 | | 0.91 | % | | 3.39 | % | | 1.31 | % | | 85.36 | % |
Year Ended September 30, 2006 | | $ | 11.49 | | 0.40 | | | (0.05 | ) | | 0.35 | | (0.39 | ) | | (0.06 | ) | | (0.45 | ) | | $ | 11.39 | | 3.23 | % | | $ | 11,877 | | 0.90 | % | | 3.55 | % | | 1.30 | % | | 76.53 | % |
Year Ended September 30, 2005 | | $ | 11.74 | | 0.39 | | | (0.22 | ) | | 0.17 | | (0.40 | ) | | (0.02 | ) | | (0.42 | ) | | $ | 11.49 | | 1.44 | % | | $ | 13,145 | | 0.89 | % | | 3.39 | % | | 1.36 | % | | 48.04 | % |
Year Ended September 30, 2004 | | $ | 11.96 | | 0.38 | | | (0.14 | ) | | 0.24 | | (0.38 | ) | | (0.08 | ) | | (0.46 | ) | | $ | 11.74 | | 2.05 | % | | $ | 13,005 | | 0.91 | % | | 3.22 | % | | 1.43 | % | | 45.07 | % |
Year Ended September 30, 2003 | | $ | 11.99 | | 0.37 | | | 0.01 | | | 0.38 | | (0.37 | ) | | (0.04 | ) | | (0.41 | ) | | $ | 11.96 | | 3.24 | % | | $ | 7,447 | | 0.92 | % | | 3.14 | % | | 1.42 | % | | 34.17 | % |
West Virginia Intermediate Tax-Free Fund | | | | | | | | | | | | | | | | | | | | | | | | | | | | | | | | | | | | | | | | | |
Year Ended September 30, 2007 | | $ | 9.79 | | 0.35 | (c) | | (0.05 | ) | | 0.30 | | (0.35 | ) | | (0.03 | ) | | (0.38 | ) | | $ | 9.71 | | 3.12 | % | | $ | 16,897 | | 0.91 | % | | 3.61 | % | | 0.91 | % | | 49.60 | % |
Year Ended September 30, 2006 | | $ | 9.85 | | 0.39 | | | (0.02 | ) | | 0.37 | | (0.37 | ) | | (0.06 | ) | | (0.43 | ) | | $ | 9.79 | | 3.85 | % | | $ | 15,773 | | 0.90 | % | | 3.80 | % | | 0.90 | % | | 50.14 | % |
Year Ended September 30, 2005 | | $ | 10.08 | | 0.35 | | | (0.15 | ) | | 0.20 | | (0.35 | ) | | (0.08 | ) | | (0.43 | ) | | $ | 9.85 | | 1.97 | % | | $ | 13,911 | | 0.93 | % | | 3.50 | % | | 0.96 | % | | 32.10 | % |
Year Ended September 30, 2004 | | $ | 10.20 | | 0.32 | | | (0.07 | ) | | 0.25 | | (0.33 | ) | | (0.04 | ) | | (0.37 | ) | | $ | 10.08 | | 2.51 | % | | $ | 10,815 | | 1.01 | % | | 3.24 | % | | 1.03 | % | | 16.24 | % |
Year Ended September 30, 2003 | | $ | 10.35 | | 0.33 | | | 0.01 | | | 0.34 | | (0.33 | ) | | (0.16 | ) | | (0.49 | ) | | $ | 10.20 | | 3.41 | % | | $ | 11,541 | | 0.98 | % | | 3.23 | % | | 1.01 | % | | 25.59 | % |
| * | During the period certain fees were reduced. If such reductions had not occurred, the ratios would have been as indicated. |
| ** | Portfolio turnover rate is calculated on the basis of the Fund as a whole without distinguishing between classes of shares issued. |
| (a) | Not annualized for periods less than one year. |
| (b) | Annualized for periods less than one year. |
| (c) | Per share net investment income (loss) has been calculated using the average daily shares method. |
| (d) | Period from commencement of operations. |
| (e) | Amount is less than $0.005. |
See accompanying notes to the financial statements.
109
BB&T Funds
Financial Highlights, Class A Shares
Selected data for a share of beneficial interest outstanding throughout the periods indicated.
| | | | | | | | | | | | | | | | | | | | | | | | | | | | | | | | | | | | | | | | | | |
| | | | | Investment Activities | | | Distributions | | | | | | | | Ratios/Supplementary Data | |
| | | Net Asset
Value,
Beginning
of Period | | Net
investment
income
(loss) | | | Net
realized/
unrealized
gains
(losses) on
investments | | | Total from
Investment
Activities | | | Net
investment
income | | | Net
realized
gains on
investments | | | Total
Distributions | | | Net
Asset
Value,
End
of
Period | | Total
Return
(excludes
sales
charge)
(a) | | | Net
Assets,
End of
Period
(000) | | Ratio of
net
expenses
to
average
net
assets
(b) | | | Ratio of
net
investment
income
(loss) to
average
net assets
(b) | | | Ratio of
expenses
to
average
net
assets*(b) | | | Portfolio
turnover
rate** | |
National Tax-Free Money
Market Fund | | | | | | | | | | | | | | | | | | | | | | | | | | | | | | | | | | | | | | | | | | |
Year Ended September 30, 2007 | | $ | 1.00 | | 0.03 | (c) | | — | | | 0.03 | | | (0.03 | ) | | — | | | (0.03 | ) | | $ | 1.00 | | 3.08 | % | | $ | 526 | | 0.66 | % | | 3.06 | % | | 0.97 | % | | — | |
August 1, 2006 to September 30, 2006 (d) | | $ | 1.00 | | — | (e) | | — | | | — | (e) | | — | (e) | | — | | | — | (e) | | $ | 1.00 | | 0.51 | % | | $ | 1 | | 0.62 | % | | 2.96 | % | | 1.26 | % | | — | |
Prime Money Market Fund | | | | | | | | | | | | | | | | | | | | | | | | | | | | | | | | | | | | | | | | | | |
Year Ended September 30, 2007 | | $ | 1.00 | | 0.04 | (c) | | — | | | 0.04 | | | (0.04 | ) | | — | | | (0.04 | ) | | $ | 1.00 | | 4.51 | % | | $ | 745,381 | | 0.98 | % | | 4.42 | % | | 1.10 | % | | — | |
Year Ended September 30, 2006 | | $ | 1.00 | | 0.04 | | | — | (e) | | 0.04 | | | (0.04 | ) | | — | | | (0.04 | ) | | $ | 1.00 | | 3.86 | % | | $ | 636,327 | | 0.98 | % | | 3.83 | % | | 1.09 | % | | — | |
Year Ended September 30, 2005 | | $ | 1.00 | | 0.02 | | | — | (e) | | 0.02 | | | (0.02 | ) | | — | | | (0.02 | ) | | $ | 1.00 | | 1.92 | % | | $ | 493,282 | | 0.91 | % | | 1.91 | % | | 1.13 | % | | — | |
Year Ended September 30, 2004 | | $ | 1.00 | | — | (e) | | — | (e) | | — | (e) | | — | (e) | | — | | | — | (e) | | $ | 1.00 | | 0.41 | % | | $ | 426,217 | | 0.86 | % | | 0.40 | % | | 1.20 | % | | — | |
Year Ended September 30, 2003 | | $ | 1.00 | | — | (e) | | — | | | — | (e) | | — | (e) | | — | | | — | (e) | | $ | 1.00 | | 0.48 | % | | $ | 459,375 | | 0.98 | % | | 0.47 | % | | 1.19 | % | | — | |
U.S. Treasury Money Market Fund | | | | | | | | | | | | | | | | | | | | | | | | | | | | | | | | | | | | | | | | | | |
Year Ended September 30, 2007 | | $ | 1.00 | | 0.04 | (c) | | — | | | 0.04 | | | (0.04 | ) | | — | | | (0.04 | ) | | $ | 1.00 | | 4.20 | % | | $ | 310,413 | | 0.97 | % | | 4.07 | % | | 1.11 | % | | — | |
Year Ended September 30, 2006 | | $ | 1.00 | | 0.04 | | | — | | | 0.04 | | | (0.04 | ) | | — | | | (0.04 | ) | | $ | 1.00 | | 3.64 | % | | $ | 167,900 | | 0.96 | % | | 3.63 | % | | 1.09 | % | | — | |
Year Ended September 30, 2005 | | $ | 1.00 | | 0.02 | | | — | | | 0.02 | | | (0.02 | ) | | — | | | (0.02 | ) | | $ | 1.00 | | 1.69 | % | | $ | 114,260 | | 0.89 | % | | 1.66 | % | | 1.14 | % | | — | |
Year Ended September 30, 2004 | | $ | 1.00 | | — | (e) | | — | | | — | (e) | | — | (e) | | — | | | — | (e) | | $ | 1.00 | | 0.31 | % | | $ | 122,500 | | 0.79 | % | | 0.31 | % | | 1.21 | % | | — | |
Year Ended September 30, 2003 | | $ | 1.00 | | — | (e) | | — | | | — | (e) | | — | (e) | | — | | | — | (e) | | $ | 1.00 | | 0.30 | % | | $ | 135,059 | | 0.99 | % | | 0.32 | % | | 1.20 | % | | — | |
Capital Manager Conservative Growth Fund*** | | | | | | | | | | | | | | | | | | | | | | | | | | | | | | | | | | | | | | | | | | |
Year Ended September 30, 2007 | | $ | 9.96 | | 0.34 | (c) | | 0.53 | | | 0.87 | | | (0.30 | ) | | — | | | (0.30 | ) | | $ | 10.53 | | 8.86 | % | | $ | 9,781 | | 0.35 | % | | 3.28 | % | | 0.91 | % | | 29.58 | % |
Year Ended September 30, 2006 | | $ | 9.76 | | 0.31 | (c) | | 0.22 | | | 0.53 | | | (0.33 | ) | | — | | | (0.33 | ) | | $ | 9.96 | | 5.54 | % | | $ | 9,365 | | 0.33 | % | | 3.12 | % | | 0.95 | % | | 5.69 | % |
Year Ended September 30, 2005 | | $ | 9.30 | | 0.23 | | | 0.45 | | | 0.68 | | | (0.22 | ) | | — | | | (0.22 | ) | | $ | 9.76 | | 7.39 | % | | $ | 8,646 | | 0.43 | % | | 2.45 | % | | 1.01 | % | | 52.50 | % |
Year Ended September 30, 2004 | | $ | 8.84 | | 0.16 | (c) | | 0.46 | | | 0.62 | | | (0.16 | ) | | — | | | (0.16 | ) | | $ | 9.30 | | 6.97 | % | | $ | 5,242 | | 0.69 | % | | 1.68 | % | | 1.14 | % | | 2.47 | % |
Year Ended September 30, 2003 | | $ | 8.29 | | 0.18 | | | 0.57 | | | 0.75 | | | (0.16 | ) | | (0.04 | ) | | (0.20 | ) | | $ | 8.84 | | 9.09 | % | | $ | 2,579 | | 0.78 | % | | 1.86 | % | | 1.23 | % | | 33.03 | % |
Capital Manager Moderate Growth Fund*** | | | | | | | | | | | | | | | | | | | | | | | | | | | | | | | | | | | | | | | | | | |
Year Ended September 30, 2007 | | $ | 10.22 | | 0.29 | (c) | | 0.87 | | | 1.16 | | | (0.22 | ) | | (0.22 | ) | | (0.44 | ) | | $ | 10.94 | | 11.48 | % | | $ | 38,081 | | 0.36 | % | | 2.68 | % | | 0.92 | % | | 40.05 | % |
Year Ended September 30, 2006 | | $ | 9.79 | | 0.24 | (c) | | 0.45 | | | 0.69 | | | (0.26 | ) | | — | | | (0.26 | ) | | $ | 10.22 | | 7.10 | % | | $ | 33,472 | | 0.35 | % | | 2.44 | % | | 0.97 | % | | 7.33 | % |
Year Ended September 30, 2005 | | $ | 9.01 | | 0.17 | (c) | | 0.76 | | | 0.93 | | | (0.15 | ) | | — | | | (0.15 | ) | | $ | 9.79 | | 10.35 | % | | $ | 28,912 | | 0.48 | % | | 1.77 | % | | 1.05 | % | | 37.83 | % |
Year Ended September 30, 2004 | | $ | 8.28 | | 0.08 | (c) | | 0.73 | | | 0.81 | | | (0.08 | ) | | — | | | (0.08 | ) | | $ | 9.01 | | 9.77 | % | | $ | 20,428 | | 0.74 | % | | 0.92 | % | | 1.19 | % | | 0.17 | % |
Year Ended September 30, 2003 | | $ | 7.47 | | 0.08 | | | 0.82 | | | 0.90 | | | (0.08 | ) | | (0.01 | ) | | (0.09 | ) | | $ | 8.28 | | 12.13 | % | | $ | 8,054 | | 0.75 | % | | 1.11 | % | | 1.20 | % | | 21.46 | % |
Capital Manager Growth Fund*** | | | | | | | | | | | | | | | | | | | | | | | | | | | | | | | | | | | | | | | | | | |
Year Ended September 30, 2007 | | $ | 10.23 | | 0.25 | (c) | | 1.08 | | | 1.33 | | | (0.16 | ) | | (0.27 | ) | | (0.43 | ) | | $ | 11.13 | | 13.19 | % | | $ | 26,189 | | 0.36 | % | | 2.33 | % | | 0.93 | % | | 44.48 | % |
Year Ended September 30, 2006 | | $ | 9.68 | | 0.20 | (c) | | 0.56 | | | 0.76 | | | (0.21 | ) | | — | | | (0.21 | ) | | $ | 10.23 | | 7.97 | % | | $ | 22,801 | | 0.36 | % | | 2.01 | % | | 0.98 | % | | 6.26 | % |
Year Ended September 30, 2005 | | $ | 8.70 | | 0.13 | | | 0.96 | | | 1.09 | | | (0.11 | ) | | — | | | (0.11 | ) | | $ | 9.68 | | 12.51 | % | | $ | 17,219 | | 0.48 | % | | 1.37 | % | | 1.07 | % | | 26.22 | % |
Year Ended September 30, 2004 | | $ | 7.81 | | 0.05 | (c) | | 0.88 | | | 0.93 | | | (0.04 | ) | | — | | | (0.04 | ) | | $ | 8.70 | | 11.85 | % | | $ | 12,007 | | 0.75 | % | | 0.52 | % | | 1.23 | % | | 0.19 | % |
Year Ended September 30, 2003 | | $ | 6.87 | | 0.04 | | | 0.94 | | | 0.98 | | | (0.04 | ) | | — | | | (0.04 | ) | | $ | 7.81 | | 14.22 | % | | $ | 4,660 | | 0.80 | % | | 0.59 | % | | 1.25 | % | | 17.80 | % |
Capital Manager Equity Fund*** | | | | | | | | | | | | | | | | | | | | | | | | | | | | | | | | | | | | | | | | | | |
Year Ended September 30, 2007 | | $ | 11.57 | | 0.21 | (c) | | 1.43 | | | 1.64 | | | (0.10 | ) | | (0.85 | ) | | (0.95 | ) | | $ | 12.26 | | 14.79 | % | | $ | 9,384 | | 0.37 | % | | 1.77 | % | | 0.93 | % | | 48.80 | % |
Year Ended September 30, 2006 | | $ | 10.95 | | 0.17 | (c) | | 0.83 | | | 1.00 | | | (0.19 | ) | | (0.19 | ) | | (0.38 | ) | | $ | 11.57 | | 9.39 | % | | $ | 7,762 | | 0.36 | % | | 1.53 | % | | 0.97 | % | | 1.48 | % |
Year Ended September 30, 2005 | | $ | 9.58 | | 0.09 | (c) | | 1.34 | | | 1.43 | | | (0.06 | ) | | — | | | (0.06 | ) | | $ | 10.95 | | 14.95 | % | | $ | 6,183 | | 0.45 | % | | 0.91 | % | | 1.09 | % | | 2.14 | % |
Year Ended September 30, 2004 | | $ | 8.45 | | 0.02 | (c) | | 1.12 | | | 1.14 | | | (0.01 | ) | | — | | | (0.01 | ) | | $ | 9.58 | | 13.53 | % | | $ | 3,557 | | 0.77 | % | | 0.22 | % | | 1.31 | % | | 3.10 | % |
Year Ended September 30, 2003 | | $ | 7.36 | | — | (c)(e) | | 1.15 | | | 1.15 | | | (0.01 | ) | | (0.05 | ) | | (0.06 | ) | | $ | 8.45 | | 15.61 | % | | $ | 1,225 | | 0.95 | % | | 0.05 | % | | 1.40 | % | | 8.30 | % |
| * | During the period certain fees were reduced. If such reductions had not occurred, the ratios would have been as indicated. |
| ** | Portfolio turnover rate is calculated on the basis of the Fund as a whole without distinguishing between classes of shares issued. |
| *** | The expense ratios exclude the impact of fees/expenses paid by each underlying fund. (a) Not annualized for periods less than one year. |
| (b) | Annualized for periods less than one year. |
| (c) | Per share net investment income (loss) has been calculated using the average daily shares method. |
| (d) | Period from commencement of operations. |
| (e) | Amount is less than $0.005. |
See accompanying notes to the financial statements.
110
BB&T Funds
Financial Highlights, Class B Shares
Selected data for a share of beneficial interest outstanding throughout the periods indicated.
| | | | | | | | | | | | | | | | | | | | | | | | | | | | | | | | | | | | | | | | | | |
| | | | | Investment Activities | | | Distributions | | | | | | | | Ratios/Supplementary Data | |
| | | Net Asset
Value,
Beginning
of Period | | Net
investment
income
(loss) | | | Net
realized/
unrealized
gains
(losses) on
investments
and foreign
currency
transactions | | | Total from
Investment
Activities | | | Net
investment
income | | | Net realized
gains on
investments
and foreign
currency
transactions | | | Total
Distributions | | | Net
Asset
Value,
End
of
Period | | Total
Return
(excludes
sales
charge)
(a) | | | Net
Assets,
End of
Period
(000) | | Ratio of
net
expenses
to
average
net
assets
(b) | | | Ratio of
net
investment
income
(loss) to
average
net assets
(b) | | | Ratio of
expenses
to
average
net
assets*(b) | | | Portfolio
turnover
rate** | |
Large Cap Fund | | | | | | | | | | | | | | | | | | | | | | | | | | | | | | | | | | | | | | | | | | |
Year Ended September 30, 2007 | | $ | 20.15 | | 0.09 | (c) | | 2.12 | | | 2.21 | | | (0.11 | ) | | (3.35 | ) | | (3.46 | ) | | $ | 18.90 | | 11.67 | % | | $ | 17,796 | | 1.91 | % | | 0.50 | % | | 1.97 | % | | 68.60 | % |
Year Ended September 30, 2006 | | $ | 19.31 | | 0.16 | (c) | | 2.27 | | | 2.43 | | | (0.15 | ) | | (1.44 | ) | | (1.59 | ) | | $ | 20.15 | | 13.45 | % | | $ | 14,808 | | 1.88 | % | | 0.85 | % | | 1.93 | % | | 34.83 | % |
Year Ended September 30, 2005 | | $ | 17.12 | | 0.13 | | | 2.22 | | | 2.35 | | | (0.16 | ) | | — | | | (0.16 | ) | | $ | 19.31 | | 13.75 | % | | $ | 22,148 | | 1.89 | % | | 0.82 | % | | 1.99 | % | | 19.50 | % |
Year Ended September 30, 2004 | | $ | 14.75 | | 0.09 | | | 2.38 | | | 2.47 | | | (0.10 | ) | | — | | | (0.10 | ) | | $ | 17.12 | | 16.75 | % | | $ | 26,309 | | 1.95 | % | | 0.58 | % | | 2.06 | % | | 16.40 | % |
Year Ended September 30, 2003 | | $ | 12.75 | | 0.12 | | | 2.01 | | | 2.13 | | | (0.13 | ) | | — | | | (0.13 | ) | | $ | 14.75 | | 16.74 | % | | $ | 26,215 | | 1.91 | % | | 0.92 | % | | 2.05 | % | | 18.89 | % |
Mid Cap Value Fund | | | | | | | | | | | | | | | | | | | | | | | | | | | | | | | | | | | | | | | | | | |
Year Ended September 30, 2007 | | $ | 13.23 | | (0.07 | )(c) | | 2.08 | | | 2.01 | | | — | (d) | | (0.69 | ) | | (0.69 | ) | | $ | 14.55 | | 15.58 | % | | $ | 6,112 | | 1.91 | % | | (0.48 | )% | | 1.95 | % | | 58.59 | % |
Year Ended September 30, 2006 | | $ | 13.16 | | (0.07 | )(c) | | 1.59 | | | 1.52 | | | — | (d) | | (1.45 | ) | | (1.45 | ) | | $ | 13.23 | | 12.38 | % | | $ | 5,391 | | 1.89 | % | | (0.53 | )% | | 1.93 | % | | 53.92 | % |
Year Ended September 30, 2005 | | $ | 15.30 | | — | (c)(d) | | 3.02 | | | 3.02 | | | (0.07 | ) | | (5.09 | ) | | (5.16 | ) | | $ | 13.16 | | 19.94 | % | | $ | 4,534 | | 1.89 | % | | 0.02 | % | | 1.99 | % | | 126.99 | % |
Year Ended September 30, 2004 | | $ | 12.91 | | 0.07 | (c) | | 2.42 | | | 2.49 | | | (0.10 | ) | | — | | | (0.10 | ) | | $ | 15.30 | | 19.31 | % | | $ | 3,582 | | 1.98 | % | | 0.47 | % | | 2.10 | % | | 19.17 | % |
Year Ended September 30, 2003 | | $ | 10.90 | | 0.07 | | | 2.03 | | | 2.10 | | | (0.09 | ) | | — | | | (0.09 | ) | | $ | 12.91 | | 19.31 | % | | $ | 2,071 | | 1.95 | % | | 0.58 | % | | 2.10 | % | | 18.28 | % |
Mid Cap Growth Fund | | | | | | | | | | | | | | | | | | | | | | | | | | | | | | | | | | | | | | | | | | |
Year Ended September 30, 2007 | | $ | 11.95 | | (0.15 | )(c) | | 3.91 | | | 3.76 | | | — | | | (1.65 | ) | | (1.65 | ) | | $ | 14.06 | | 35.13 | % | | $ | 2,697 | | 1.92 | % | | (1.24 | )% | | 1.96 | % | | 134.95 | % |
Year Ended September 30, 2006 | | $ | 13.47 | | (0.11 | )(c) | | 0.01 | (e) | | (0.10 | ) | | — | | | (1.42 | ) | | (1.42 | ) | | $ | 11.95 | | (1.23 | )% | | $ | 2,377 | | 1.89 | % | | (0.83 | )% | | 1.94 | % | | 140.90 | % |
Year Ended September 30, 2005 | | $ | 10.70 | | (0.17 | )(c) | | 3.08 | | | 2.91 | | | — | | | (0.14 | ) | | (0.14 | ) | | $ | 13.47 | | 27.42 | % | | $ | 2,395 | | 1.91 | % | | (1.46 | )% | | 2.01 | % | | 92.74 | % |
Year Ended September 30, 2004 | | $ | 9.68 | | (0.16 | ) | | 1.18 | | | 1.02 | | | — | | | — | | | — | | | $ | 10.70 | | 10.54 | % | | $ | 1,973 | | 2.00 | % | | (1.65 | )% | | 2.11 | % | | 138.61 | % |
Year Ended September 30, 2003 | | $ | 8.00 | | (0.13 | ) | | 1.81 | | | 1.68 | | | — | | | — | | | — | | | $ | 9.68 | | 21.00 | % | | $ | 1,030 | | 1.95 | % | | (1.73 | )% | | 2.11 | % | | 125.97 | % |
Small Cap Fund | | | | | | | | | | | | | | | | | | | | | | | | | | | | | | | | | | | | | | | | | | |
Year Ended September 30, 2007 | | $ | 14.73 | | (0.05 | )(c) | | 0.72 | | | 0.67 | | | (0.06 | ) | | (0.91 | ) | | (0.97 | ) | | $ | 14.43 | | 4.37 | % | | $ | 3,393 | | 2.06 | % | | (0.31 | )% | | 2.26 | % | | 46.54 | % |
Year Ended September 30, 2006 | | $ | 16.11 | | (0.12 | )(c) | | 1.05 | | | 0.93 | | | (0.01 | ) | | (2.30 | ) | | (2.31 | ) | | $ | 14.73 | | 6.19 | % | | $ | 4,092 | | 2.04 | % | | (0.79 | )% | | 2.28 | % | | 43.25 | % |
Year Ended September 30, 2005 | | $ | 14.06 | | — | (c)(d) | | 2.58 | | | 2.58 | | | (0.11 | ) | | (0.42 | ) | | (0.53 | ) | | $ | 16.11 | | 18.79 | % | | $ | 259 | | 2.05 | % | | 0.00 | % | | 2.27 | % | | 8.39 | % |
Year Ended September 30, 2004 | | $ | 11.40 | | (0.10 | )(c) | | 2.88 | | | 2.78 | | | — | | | (0.12 | ) | | (0.12 | ) | | $ | 14.06 | | 24.56 | % | | $ | 136 | | 2.22 | % | | (0.75 | )% | | 2.41 | % | | 11.25 | % |
May 19, 2003 to September 30, 2003 (f) | | $ | 10.00 | | (0.04 | )(c) | | 1.44 | | | 1.40 | | | — | | | — | | | — | | | $ | 11.40 | | 14.00 | % | | $ | 29 | | 2.69 | % | | (0.93 | )% | | 2.69 | % | | 48.84 | % |
International Equity Fund | | | | | | | | | | | | | | | | | | | | | | | | | | | | | | | | | | | | | | | | | | |
Year Ended September 30, 2007 | | $ | 10.46 | | 0.03 | (c) | | 1.72 | | | 1.75 | | | (0.04 | ) | | (4.52 | ) | | (4.56 | ) | | $ | 7.65 | | 19.28 | % | | $ | 2,041 | | 2.12 | % | | 0.26 | % | | 2.25 | % | | 129.8 | % |
Year Ended September 30, 2006 | | $ | 9.09 | | 0.06 | (c) | | 1.42 | | | 1.48 | | | (0.11 | ) | | — | | | (0.11 | ) | | $ | 10.46 | | 16.27 | % | | $ | 1,819 | | 2.15 | % | | 0.64 | % | | 2.25 | % | | 36.22 | % |
Year Ended September 30, 2005 | | $ | 7.74 | | 0.03 | (c) | | 1.38 | | | 1.41 | | | (0.06 | ) | | — | | | (0.06 | ) | | $ | 9.09 | | 18.34 | % | | $ | 2,007 | | 2.20 | % | | 0.36 | % | | 2.33 | % | | 44.96 | % |
Year Ended September 30, 2004 | | $ | 6.57 | | 0.02 | (c) | | 1.19 | | | 1.21 | | | (0.04 | ) | | — | | | (0.04 | ) | | $ | 7.74 | | 18.47 | % | | $ | 2,140 | | 2.33 | % | | 0.24 | % | | 2.42 | % | | 50.68 | % |
Year Ended September 30, 2003 | | $ | 6.07 | | (0.02 | )(c) | | 0.54 | | | 0.52 | | | (0.02 | ) | | — | | | (0.02 | ) | | $ | 6.57 | | 8.63 | % | | $ | 2,012 | | 2.40 | % | | (0.37 | )% | | 2.41 | % | | 199.78 | % |
Special Opportunities Equity Fund | | | | | | | | | | | | | | | | | | | | | | | | | | | | | | | | | | | | | | | | | | |
Year Ended September 30, 2007 | | $ | 16.00 | | (0.13 | )(c) | | 3.36 | | | 3.23 | | | — | | | (1.60 | ) | | (1.60 | ) | | $ | 17.63 | | 21.33 | % | | $ | 29,931 | | 2.03 | % | | (0.79 | )% | | 2.03 | % | | 49.43 | % |
Year Ended September 30, 2006 | | $ | 15.29 | | (0.16 | ) | | 1.66 | | | 1.50 | | | — | | | (0.79 | ) | | (0.79 | ) | | $ | 16.00 | | 10.35 | % | | $ | 22,901 | | 2.03 | % | | (1.01 | )% | | 2.03 | % | | 58.01 | % |
Year Ended September 30, 2005 | | $ | 12.95 | | (0.13 | ) | | 2.59 | | | 2.46 | | | — | | | (0.12 | ) | | (0.12 | ) | | $ | 15.29 | | 19.09 | % | | $ | 21,911 | | 2.06 | % | | (1.18 | )% | | 2.08 | % | | 30.38 | % |
Year Ended September 30, 2004 | | $ | 10.50 | | (0.12 | ) | | 2.65 | | | 2.53 | | | — | | | (0.08 | ) | | (0.08 | ) | | $ | 12.95 | | 24.17 | % | | $ | 13,215 | | 2.15 | % | | (1.51 | )% | | 2.30 | % | | 32.06 | % |
June 2, 2003 to September 30, 2003 (f) | | $ | 10.00 | | (0.02 | ) | | 0.52 | | | 0.50 | | | — | | | — | | | — | | | $ | 10.50 | | 5.00 | % | | $ | 4,360 | | 1.80 | % | | (1.16 | )% | | 2.50 | % | | 13.24 | % |
Equity Income Fund | | | | | | | | | | | | | | | | | | | | | | | | | | | | | | | | | | | | | | | | | | |
Year Ended September 30, 2007 | | $ | 13.33 | | 0.25 | (c) | | 2.31 | | | 2.56 | | | (0.22 | ) | | (0.68 | ) | | (0.90 | ) | | $ | 14.99 | | 19.97 | % | | $ | 14,796 | | 1.94 | % | | 1.78 | % | | 1.94 | % | | 37.85 | % |
Year Ended September 30, 2006 | | $ | 12.08 | | 0.19 | | | 1.56 | | | 1.75 | | | (0.23 | ) | | (0.27 | ) | | (0.50 | ) | | $ | 13.33 | | 14.84 | % | | $ | 9,592 | | 1.95 | % | | 1.52 | % | | 1.95 | % | | 45.38 | % |
Year Ended September 30, 2005 | | $ | 10.34 | | 0.16 | | | 1.77 | | | 1.93 | | | (0.17 | ) | | (0.02 | ) | | (0.19 | ) | | $ | 12.08 | | 18.79 | % | | $ | 5,611 | | 1.87 | % | | 1.74 | % | | 2.09 | % | | 39.65 | % |
June 30, 2004 to September 30, 2004 (f) | | $ | 10.00 | | 0.03 | (c) | | 0.34 | | | 0.37 | | | (0.03 | ) | | — | | | (0.03 | ) | | $ | 10.34 | | 3.66 | % | | $ | 1,672 | | 2.29 | % | | 1.07 | % | | 2.65 | % | | 1.65 | % |
Intermediate U.S. Government Fund | | | | | | | | | | | | | | | | | | | | | | | | | | | | | | | | | | | | | | | | | | |
Year Ended September 30, 2007 | | $ | 9.86 | | 0.35 | (c) | | 0.04 | | | 0.39 | | | (0.35 | ) | | — | | | (0.35 | ) | | $ | 9.90 | | 4.01 | % | | $ | 3,006 | | 1.68 | % | | 3.52 | % | | 1.80 | % | | 85.83 | % |
Year Ended September 30, 2006 | | $ | 9.98 | | 0.34 | (c) | | (0.12 | ) | | 0.22 | | | (0.34 | ) | | — | | | (0.34 | ) | | $ | 9.86 | | 2.32 | % | | $ | 4,020 | | 1.68 | % | | 3.48 | % | | 1.79 | % | | 127.13 | % |
Year Ended September 30, 2005 | | $ | 10.20 | | 0.27 | (c) | | (0.13 | ) | | 0.14 | | | (0.31 | ) | | (0.05 | ) | | (0.36 | ) | | $ | 9.98 | | 1.33 | % | | $ | 5,725 | | 1.71 | % | | 2.67 | % | | 1.84 | % | | 107.04 | % |
Year Ended September 30, 2004 | | $ | 10.53 | | 0.21 | | | (0.16 | ) | | 0.05 | | | (0.25 | ) | | (0.13 | ) | | (0.38 | ) | | $ | 10.20 | | 0.55 | % | | $ | 6,883 | | 1.80 | % | | 2.15 | % | | 1.92 | % | | 98.35 | % |
Year Ended September 30, 2003 | | $ | 10.73 | | 0.27 | | | (0.07 | ) | | 0.20 | | | (0.31 | ) | | (0.09 | ) | | (0.40 | ) | | $ | 10.53 | | 1.86 | % | | $ | 7,869 | | 1.82 | % | | 2.42 | % | | 1.92 | % | | 209.97 | % |
| * | During the period certain fees were reduced. If such reductions had not occurred, the ratios would have been as indicated. |
| ** | Portfolio turnover rate is calculated on the basis of the Fund as a whole without distinguishing between classes of shares issued. |
| (a) | Not annualized for periods less than one year. |
| (b) | Annualized for periods less than one year. |
| (c) | Per share net investment income (loss) has been calculated using the average daily shares method. |
| (d) | Amount is less than $0.005. |
| (e) | The amount shown for a share outstanding throughout the period does not accord with the change in aggregate gains and losses in the portfolio of securities during the period because of the timing of sales and purchases of Fund shares in relation to fluctuating market values during the period. |
| (f) | Period from commencement of operations. |
See accompanying notes to the financial statements.
111
BB&T Funds
Financial Highlights, Class B Shares
Selected data for a share of beneficial interest outstanding throughout the periods indicated.
| | | | | | | | | | | | | | | | | | | | | | | | | | | | | | | | | | | | | | | | | | |
| | | | | Investment Activities | | | Distributions | | | | | | | | Ratios/Supplementary Data | |
| | | Net Asset
Value,
Beginning
of Period | | Net
investment
income
(loss) | | | Net
realized/
unrealized
gains
(losses) on
investments | | | Total from
Investment
Activities | | | Net
investment
income | | | Net
realized
gains on
investments | | | Total
Dividends | | | Net
Asset
Value,
End of
Period | | Total
Return
(excludes
sales
charge) (a) | | | Net
Assets,
End of
Period
(000) | | Ratio of net
expenses
to
average
net
assets (b) | | | Ratio of net
investment
income
(loss) to average
net assets (b) | | | Ratio of
expenses
to
average
net
assets*(b) | | | Portfolio
turnover
rate** | |
Total Return Bond
Fund | | | | | | | | | | | | | | | | | | | | | | | | | | | | | | | | | | | | | | | | | | |
Year Ended September 30, 2007 | | $ | 10.13 | | 0.37 | (c) | | — | | | 0.37 | | | (0.37 | ) | | — | | | (0.37 | ) | | $ | 10.13 | | 3.73 | % | | $ | 4,992 | | 1.68 | % | | 3.62 | % | | 1.80 | % | | 222.24 | % |
Year Ended September 30, 2006 | | $ | 10.32 | | 0.34 | (c) | | (0.12 | ) | | 0.22 | | | (0.36 | ) | | (0.05 | ) | | (0.41 | ) | | $ | 10.13 | | 2.27 | % | | $ | 4,872 | | 1.68 | % | | 3.39 | % | | 1.79 | % | | 226.36 | % |
Year Ended September 30, 2005 | | $ | 10.59 | | 0.30 | (c) | | (0.18 | ) | | 0.12 | | | (0.36 | ) | | (0.03 | ) | | (0.39 | ) | | $ | 10.32 | | 1.21 | % | | $ | 6,161 | | 1.71 | % | | 2.87 | % | | 1.84 | % | | 173.14 | % |
Year Ended September 30, 2004 | | $ | 10.72 | | 0.32 | | | (0.07 | ) | | 0.25 | | | (0.38 | ) | | — | | | (0.38 | ) | | $ | 10.59 | | 2.45 | % | | $ | 6,602 | | 1.82 | % | | 3.09 | % | | 1.94 | % | | 31.95 | % |
Year Ended September 30, 2003 | | $ | 10.34 | | 0.39 | | | 0.40 | | | 0.79 | | | (0.41 | ) | | — | | | (0.41 | ) | | $ | 10.72 | | 7.77 | % | | $ | 6,358 | | 1.83 | % | | 3.61 | % | | 1.94 | % | | 43.98 | % |
National Tax-Free Money
Market Fund | | | | | | | | | | | | | | | | | | | | | | | | | | | | | | | | | | | | | | | | | | |
Year Ended September 30, 2007 | | $ | 1.00 | | 0.02 | (c) | | — | | | 0.02 | | | (0.02 | ) | | — | | | (0.02 | ) | | $ | 1.00 | | 2.38 | % | | $ | 1 | | 1.33 | % | | 2.36 | % | | 1.38 | % | | — | |
August 1, 2006 to September 30, 2006 | | $ | 1.00 | | — | (d) | | — | | | — | (d) | | — | (d) | | — | | | — | (d) | | $ | 1.00 | | 0.36 | % | | $ | 1 | | 1.39 | % | | 2.19 | % | | 1.78 | % | | — | |
Prime Money Market Fund | | | | | | | | | | | | | | | | | | | | | | | | | | | | | | | | | | | | | | | | | | |
Year Ended September 30, 2007 | | $ | 1.00 | | 0.04 | (c) | | — | | | 0.04 | | | (0.04 | ) | | — | | | (0.04 | ) | | $ | 1.00 | | 4.01 | % | | $ | 1,629 | | 1.48 | % | | 3.92 | % | | 1.60 | % | | — | |
Year Ended September 30, 2006 | | $ | 1.00 | | 0.03 | | | — | (d) | | 0.03 | | | (0.03 | ) | | — | | | (0.03 | ) | | $ | 1.00 | | 3.37 | % | | $ | 2,256 | | 1.48 | % | | 3.34 | % | | 1.59 | % | | — | |
Year Ended September 30, 2005 | | $ | 1.00 | | 0.01 | | | — | (d) | | 0.01 | | | (0.01 | ) | | — | | | (0.01 | ) | | $ | 1.00 | | 1.32 | % | | $ | 1,790 | | 1.49 | % | | 1.28 | % | | 1.63 | % | | — | |
Year Ended September 30, 2004 | | $ | 1.00 | | — | (d) | | — | (d) | | — | (d) | | — | (d) | | — | | | — | (d) | | $ | 1.00 | | 0.06 | % | | $ | 2,280 | | 1.20 | % | | 0.06 | % | | 1.70 | % | | — | |
Year Ended September 30, 2003 | | $ | 1.00 | | — | (d) | | — | | | — | (d) | | — | (d) | | — | | | — | (d) | | $ | 1.00 | | 0.15 | % | | $ | 2,543 | | 1.32 | % | | 0.16 | % | | 1.69 | % | | — | |
U.S. Treasury Money Market
Fund | | | | | | | | | | | | | | | | | | | | | | | | | | | | | | | | | | | | | | | | | | |
Year Ended September 30, 2007 | | $ | 1.00 | | 0.04 | (c) | | — | | | 0.04 | | | (0.04 | ) | | — | | | (0.04 | ) | | $ | 1.00 | | 3.72 | % | | $ | 301 | | 1.46 | % | | 3.64 | % | | 1.60 | % | | — | |
Year Ended September 30, 2006 | | $ | 1.00 | | 0.03 | | | — | | | 0.03 | | | (0.03 | ) | | — | | | (0.03 | ) | | $ | 1.00 | | 3.12 | % | | $ | 381 | | 1.46 | % | | 2.97 | % | | 1.59 | % | | — | |
Year Ended September 30, 2005 | | $ | 1.00 | | 0.01 | | | — | | | 0.01 | | | (0.01 | ) | | — | | | (0.01 | ) | | $ | 1.00 | | 1.09 | % | | $ | 807 | | 1.48 | % | | 1.05 | % | | 1.64 | % | | — | |
Year Ended September 30, 2004 | | $ | 1.00 | | — | (d) | | — | | | — | (d) | | — | (d) | | — | | | — | (d) | | $ | 1.00 | | 0.05 | % | | $ | 887 | | 1.05 | % | | 0.05 | % | | 1.71 | % | | — | |
Year Ended September 30, 2003 | | $ | 1.00 | | — | (d) | | — | | | — | (d) | | — | (d) | | — | | | — | (d) | | $ | 1.00 | | 0.16 | % | | $ | 1,126 | | 1.12 | % | | 0.15 | % | | 1.70 | % | | — | |
Capital Manager Conservative
Growth Fund*** | | | | | | | | | | | | | | | | | | | | | | | | | | | | | | | | | | | | | | | | | | |
Year Ended September 30, 2007 | | $ | 9.96 | | 0.27 | (c) | | 0.54 | | | 0.81 | | | (0.23 | ) | | — | | | (0.23 | ) | | $ | 10.54 | | 8.17 | % | | $ | 4,779 | | 1.10 | % | | 2.60 | % | | 1.41 | % | | 29.58 | % |
Year Ended September 30, 2006 | | $ | 9.76 | | 0.23 | (c) | | 0.23 | | | 0.46 | | | (0.26 | ) | | — | | | (0.26 | ) | | $ | 9.96 | | 4.75 | % | | $ | 4,968 | | 1.08 | % | | 2.37 | % | | 1.45 | % | | 5.69 | % |
Year Ended September 30, 2005 | | $ | 9.30 | | 0.16 | | | 0.45 | | | 0.61 | | | (0.15 | ) | | — | | | (0.15 | ) | | $ | 9.76 | | 6.58 | % | | $ | 4,992 | | 1.20 | % | | 1.64 | % | | 1.51 | % | | 52.50 | % |
Year Ended September 30, 2004 | | $ | 8.85 | | 0.09 | (c) | | 0.45 | | | 0.54 | | | (0.09 | ) | | — | | | (0.09 | ) | | $ | 9.30 | | 6.10 | % | | $ | 4,857 | | 1.44 | % | | 0.93 | % | | 1.64 | % | | 2.47 | % |
Year Ended September 30, 2003 | | $ | 8.29 | | 0.11 | | | 0.59 | | | 0.70 | | | (0.10 | ) | | (0.04 | ) | | (0.14 | ) | | $ | 8.85 | | 8.45 | % | | $ | 3,150 | | 1.53 | % | | 1.07 | % | | 1.73 | % | | 33.03 | % |
Capital Manager Moderate
Growth Fund*** | | | | | | | | | | | | | | | | | | | | | | | | | | | | | | | | | | | | | | | | | | |
Year Ended September 30, 2007 | | $ | 10.05 | | 0.21 | (c) | | 0.85 | | | 1.06 | | | (0.14 | ) | | (0.22 | ) | | (0.36 | ) | | $ | 10.75 | | 10.67 | % | | $ | 21,791 | | 1.11 | % | | 1.96 | % | | 1.42 | % | | 40.05 | % |
Year Ended September 30, 2006 | | $ | 9.64 | | 0.17 | (c) | | 0.42 | | | 0.59 | | | (0.18 | ) | | — | | | (0.18 | ) | | $ | 10.05 | | 6.21 | % | | $ | 21,610 | | 1.10 | % | | 1.70 | % | | 1.47 | % | | 7.33 | % |
Year Ended September 30, 2005 | | $ | 8.86 | | 0.09 | (c) | | 0.77 | | | 0.86 | | | (0.08 | ) | | — | | | (0.08 | ) | | $ | 9.64 | | 9.72 | % | | $ | 21,909 | | 1.24 | % | | 0.99 | % | | 1.55 | % | | 37.83 | % |
Year Ended September 30, 2004 | | $ | 8.15 | | 0.02 | (c) | | 0.71 | | | 0.73 | | | (0.02 | ) | | — | | | (0.02 | ) | | $ | 8.86 | | 8.94 | % | | $ | 19,049 | | 1.49 | % | | 0.17 | % | | 1.69 | % | | 0.17 | % |
Year Ended September 30, 2003 | | $ | 7.41 | | 0.04 | | | 0.80 | | | 0.84 | | | (0.09 | ) | | (0.01 | ) | | (0.10 | ) | | $ | 8.15 | | 11.29 | % | | $ | 8,929 | | 1.50 | % | | 0.35 | % | | 1.70 | % | | 21.46 | % |
Capital Manager Growth Fund | | | | | | | | | | | | | | | | | | | | | | | | | | | | | | | | | | | | | | | | | | |
Year Ended September 30, 2007 | | $ | 10.05 | | 0.18 | (c) | | 1.04 | | | 1.22 | | | (0.08 | ) | | (0.27 | ) | | (0.35 | ) | | $ | 10.92 | | 12.31 | % | | $ | 20,286 | | 1.11 | % | | 1.71 | % | | 1.43 | % | | 44.48 | % |
Year Ended September 30, 2006 | | $ | 9.51 | | 0.12 | (c) | | 0.56 | | | 0.68 | | | (0.14 | ) | | — | | | (0.14 | ) | | $ | 10.05 | | 7.22 | % | | $ | 19,366 | | 1.11 | % | | 1.27 | % | | 1.48 | % | | 6.26 | % |
Year Ended September 30, 2005 | | $ | 8.55 | | 0.05 | (c) | | 0.95 | | | 1.00 | | | (0.04 | ) | | — | | | (0.04 | ) | | $ | 9.51 | | 11.68 | % | | $ | 17,141 | | 1.23 | % | | 0.59 | % | | 1.57 | % | | 26.22 | % |
Year Ended September 30, 2004 | | $ | 7.70 | | (0.02 | )(c) | | 0.87 | | | 0.85 | | | — | | | — | | | — | | | $ | 8.55 | | 11.04 | % | | $ | 13,730 | | 1.50 | % | | (0.23 | )% | | 1.73 | % | | 0.19 | % |
Year Ended September 30, 2003 | | $ | 6.80 | | (0.01 | ) | | 0.91 | | | 0.90 | | | — | (d) | | — | | | — | (d) | | $ | 7.70 | | 13.31 | % | | $ | 9,142 | | 1.55 | % | | (0.16 | )% | | 1.75 | % | | 17.80 | % |
Capital Manager Equity Fund*** | | | | | | | | | | | | | | | | | | | | | | | | | | | | | | | | | | | | | | | | | | |
Year Ended September 30, 2007 | | $ | 11.26 | | 0.12 | (c) | | 1.38 | | | 1.50 | | | (0.05 | ) | | (0.85 | ) | | (0.90 | ) | | $ | 11.86 | | 13.88 | % | | $ | 8,535 | | 1.12 | % | | 1.07 | % | | 1.43 | % | | 48.80 | % |
Year Ended September 30, 2006 | | $ | 10.67 | | 0.09 | (c) | | 0.80 | | | 0.89 | | | (0.11 | ) | | (0.19 | ) | | (0.30 | ) | | $ | 11.26 | | 8.51 | % | | $ | 8,023 | | 1.11 | % | | 0.80 | % | | 1.47 | % | | 1.48 | % |
Year Ended September 30, 2005 | | $ | 9.36 | | 0.01 | (c) | | 1.31 | | | 1.32 | | | (0.01 | ) | | — | | | (0.01 | ) | | $ | 10.67 | | 14.11 | % | | $ | 7,515 | | 1.21 | % | | 0.11 | % | | 1.58 | % | | 2.14 | % |
Year Ended September 30, 2004 | | $ | 8.30 | | (0.05 | )(c) | | 1.11 | | | 1.06 | | | — | | | — | | | — | | | $ | 9.36 | | 12.77 | % | | $ | 5,720 | | 1.52 | % | | (0.54 | )% | | 1.81 | % | | 3.10 | % |
Year Ended September 30, 2003 | | $ | 7.28 | | (0.05 | )(c) | | 1.12 | | | 1.07 | | | — | | | (0.05 | ) | | (0.05 | ) | | $ | 8.30 | | 14.74 | % | | $ | 2,475 | | 1.70 | % | | (0.69 | )% | | 1.90 | % | | 8.30 | % |
| * | During the period certain fees were reduced. If such reductions had not occurred, the ratios would have been as indicated. |
| ** | Portfolio turnover rate is calculated on the basis of the Fund as a whole without distinguishing between classes of shares issued. |
| *** | The expense ratios exclude the impact of fees/expenses paid by each underlying fund. |
| (a) | Not annualized for periods less than one year. |
| (b) | Annualized for periods less than one year. |
| (c) | Per share net investment income (loss) has been calculated using the average daily shares method. |
| (d) | Amount is less than $0.005. |
See accompanying notes to the financial statements.
112
BB&T Funds
Financial Highlights, Class C Shares
Selected data for a share of beneficial interest outstanding throughout the periods indicated.
| | | | | | | | | | | | | | | | | | | | | | | | | | | | | | | | | | | | | | | | | | |
| | | | | Investment Activities | | | Distributions | | | | | | | | Ratios/Supplementary Data | |
| | | Net Asset Value, Beginning of Period | | Net investment income (loss) | | | Net realized/ unrealized gains (losses) on investments and foreign currency transactions | | | Total from Investment Activities | | | Net investment income | | | Net realized gains on investments and foreign currency transactions | | | Total Distributions | | | Net Asset Value, End
of Period | | Total Return (excludes sales charge) (a) | | | Net Assets, End of Period (000) | | Ratio of net expenses to
average
net assets (b) | | | Ratio of net
investment
income
(loss) to
average
net assets (b) | | | Ratio of
expenses to
average
net assets*(b) | | | Portfolio
turnover rate** | |
Large Cap Fund | | | | | | | | | | | | | | | | | | | | | | | | | | | | | | | | | | | | | | | | | | |
Year Ended September 30, 2007 | | $ | 20.11 | | 0.09 | (c) | | 2.13 | | | 2.22 | | | (0.11 | ) | | (3.35 | ) | | (3.46 | ) | | $ | 18.87 | | 11.76 | % | | $ | 239 | | 1.91 | % | | 0.50 | % | | 1.97 | % | | 68.60 | % |
Year Ended September 30, 2006 | | $ | 19.28 | | 0.16 | (c) | | 2.26 | | | 2.42 | | | (0.15 | ) | | (1.44 | ) | | (1.59 | ) | | $ | 20.11 | | 13.42 | % | | $ | 161 | | 1.88 | % | | 0.82 | % | | 1.94 | % | | 34.83 | % |
Year Ended September 30, 2005 | | $ | 17.09 | | 0.14 | | | 2.19 | | | 2.33 | | | (0.14 | ) | | — | | | (0.14 | ) | | $ | 19.28 | | 13.77 | % | | $ | 176 | | 1.88 | % | | 0.80 | % | | 1.98 | % | | 19.50 | % |
Year Ended September 30, 2004 | | $ | 14.73 | | 0.09 | | | 2.37 | | | 2.46 | | | (0.10 | ) | | — | | | (0.10 | ) | | $ | 17.09 | | 16.72 | % | | $ | 157 | | 1.95 | % | | 0.57 | % | | 2.07 | % | | 16.40 | % |
Year Ended September 30, 2003 | | $ | 12.74 | | 0.13 | | | 1.99 | | | 2.12 | | | (0.13 | ) | | — | | | (0.13 | ) | | $ | 14.73 | | 16.72 | % | | $ | 122 | | 1.92 | % | | 0.90 | % | | 2.06 | % | | 18.89 | % |
Mid Cap Value Fund | | | | | | | | | | | | | | | | | | | | | | | | | | | | | | | | | | | | | | | | | | |
Year Ended September 30, 2007 | | $ | 13.23 | | (0.07 | )(c) | | 2.08 | | | 2.01 | | | — | (d) | | (0.69 | ) | | (0.69 | ) | | $ | 14.55 | | 15.60 | % | | $ | 1,126 | | 1.91 | % | | (0.49 | )% | | 1.95 | % | | 58.59 | % |
Year Ended September 30, 2006 | | $ | 13.16 | | (0.07 | )(c) | | 1.59 | | | 1.52 | | | — | (d) | | (1.45 | ) | | (1.45 | ) | | $ | 13.23 | | 12.38 | % | | $ | 743 | | 1.89 | % | | (0.53 | )% | | 1.93 | % | | 53.92 | % |
Year Ended September 30, 2005 | | $ | 15.30 | | — | (c)(d) | | 3.02 | | | 3.02 | | | (0.07 | ) | | (5.09 | ) | | (5.16 | ) | | $ | 13.16 | | 19.97 | % | | $ | 351 | | 1.90 | % | | 0.01 | % | | 2.00 | % | | 126.99 | % |
Year Ended September 30, 2004 | | $ | 12.92 | | 0.07 | (c) | | 2.41 | | | 2.48 | | | (0.10 | ) | | — | | | (0.10 | ) | | $ | 15.30 | | 19.20 | % | | $ | 523 | | 1.98 | % | | 0.45 | % | | 2.10 | % | | 19.17 | % |
Year Ended September 30, 2003 | | $ | 10.90 | | 0.07 | (c) | | 2.04 | | | 2.11 | | | (0.09 | ) | | — | | | (0.09 | ) | | $ | 12.92 | | 19.40 | % | | $ | 484 | | 1.95 | % | | 0.61 | % | | 2.10 | % | | 18.28 | % |
Mid Cap Growth Fund | | | | | | | | | | | | | | | | | | | | | | | | | | | | | | | | | | | | | | | | | | |
Year Ended September 30, 2007 | | $ | 11.96 | | (0.15 | )(c) | | 3.92 | | | 3.77 | | | — | | | (1.65 | ) | | (1.65 | ) | | $ | 14.08 | | 35.19 | % | | $ | 46 | | 1.92 | % | | (1.23 | )% | | 1.96 | % | | 134.95 | % |
Year Ended September 30, 2006 | | $ | 13.47 | | (0.09 | )(c) | | — | (d) | | (0.09 | ) | | — | | | (1.42 | ) | | (1.42 | ) | | $ | 11.96 | | (1.15 | )% | | $ | 33 | | 1.88 | % | | (0.70 | )% | | 1.93 | % | | 140.90 | % |
Year Ended September 30, 2005 | | $ | 10.70 | | (0.17 | )(c) | | 3.08 | | | 2.91 | | | — | | | (0.14 | ) | | (0.14 | ) | | $ | 13.47 | | 27.42 | % | | $ | 77 | | 1.91 | % | | (1.46 | )% | | 2.00 | % | | 92.74 | % |
Year Ended September 30, 2004 | | $ | 9.69 | | (0.16 | ) | | 1.17 | | | 1.01 | | | — | | | — | | | — | | | $ | 10.70 | | 10.42 | % | | $ | 208 | | 2.00 | % | | (1.65 | )% | | 2.11 | % | | 138.61 | % |
Year Ended September 30, 2003 | | $ | 8.00 | | (0.15 | ) | | 1.84 | | | 1.69 | | | — | | | — | | | — | | | $ | 9.69 | | 21.13 | % | | $ | 164 | | 1.95 | % | | (1.71 | )% | | 2.11 | % | | 125.97 | % |
Small Cap Fund | | | | | | | | | | | | | | | | | | | | | | | | | | | | | | | | | | | | | | | | | | |
Year Ended September 30, 2007 | | $ | 14.71 | | (0.06 | )(c) | | 0.73 | | | 0.67 | | | (0.06 | ) | | (0.91 | ) | | (0.97 | ) | | $ | 14.41 | | 4.37 | % | | $ | 26 | | 2.06 | % | | (0.41 | )% | | 2.26 | % | | 46.54 | % |
Year Ended September 30, 2006 | | $ | 16.10 | | (0.11 | )(c) | | 1.03 | | | 0.92 | | | (0.01 | ) | | (2.30 | ) | | (2.31 | ) | | $ | 14.71 | | 6.17 | % | | $ | 20 | | 2.03 | % | | (0.76 | )% | | 2.27 | % | | 43.25 | % |
Year Ended September 30, 2005 | | $ | 14.06 | | (0.02 | )(c) | | 2.60 | | | 2.58 | | | (0.12 | ) | | (0.42 | ) | | (0.54 | ) | | $ | 16.10 | | 18.71 | % | | $ | 4 | | 2.04 | % | | (0.12 | )% | | 2.25 | % | | 8.39 | % |
Year Ended September 30, 2004 | | $ | 11.40 | | (0.12 | )(c) | | 2.90 | | | 2.78 | | | — | | | (0.12 | ) | | (0.12 | ) | | $ | 14.06 | | 24.56 | % | | $ | 1 | | 2.25 | % | | (0.89 | )% | | 2.44 | % | | 11.25 | % |
May 19, 2003 to September 30, 2003 (e) | | $ | 10.00 | | (0.05 | )(c) | | 1.45 | | | 1.40 | | | — | | | — | | | — | | | $ | 11.40 | | 14.00 | % | | $ | 1 | | 2.64 | % | | (1.15 | )% | | 2.64 | % | | 48.84 | % |
International Equity Fund | | | | | | | | | | | | | | | | | | | | | | | | | | | | | | | | | | | | | | | | | | |
Year Ended September 30, 2007 | | $ | 10.44 | | 0.01 | (c) | | 1.73 | | | 1.74 | | | (0.04 | ) | | (4.52 | ) | | (4.56 | ) | | $ | 7.62 | | 19.28 | % | | $ | 244 | | 2.13 | % | | 0.12 | % | | 2.26 | % | | 129.8 | % |
Year Ended September 30, 2006 | | $ | 9.07 | | 0.05 | (c) | | 1.42 | | | 1.47 | | | (0.10 | ) | | — | | | (0.10 | ) | | $ | 10.44 | | 16.26 | % | | $ | 188 | | 2.15 | % | | 0.47 | % | | 2.25 | % | | 36.22 | % |
Year Ended September 30, 2005 | | $ | 7.74 | | 0.06 | (c) | | 1.36 | | | 1.42 | | | (0.09 | ) | | — | | | (0.09 | ) | | $ | 9.07 | | 18.38 | % | | $ | 92 | | 2.23 | % | | 0.70 | % | | 2.34 | % | | 44.96 | % |
Year Ended September 30, 2004 | | $ | 6.58 | | — | (c) | | 1.20 | | | 1.20 | | | (0.04 | ) | | — | | | (0.04 | ) | | $ | 7.74 | | 18.30 | % | | $ | 2 | | 2.32 | % | | (0.04 | )% | | 2.42 | % | | 50.68 | % |
Year Ended September 30, 2003 | | $ | 6.07 | | (0.07 | )(c) | | 0.60 | | | 0.53 | | | (0.02 | ) | | — | | | (0.02 | ) | | $ | 6.58 | | 8.80 | % | | $ | 2 | | 2.40 | % | | (1.06 | )% | | 2.40 | % | | 199.78 | % |
Special Opportunities Equity Fund | | | | | | | | | | | | | | | | | | | | | | | | | | | | | | | | | | | | | | | | | | |
Year Ended September 30, 2007 | | $ | 16.01 | | (0.13 | )(c) | | 3.36 | | | 3.23 | | | — | | | (1.60 | ) | | (1.60 | ) | | $ | 17.64 | | 21.32 | % | | $ | 50,577 | | 2.03 | % | | (0.79 | )% | | 2.03 | % | | 49.43 | % |
Year Ended September 30, 2006 | | $ | 15.30 | | (0.14 | ) | | 1.64 | | | 1.50 | | | — | | | (0.79 | ) | | (0.79 | ) | | $ | 16.01 | | 10.34 | % | | $ | 34,418 | | 2.03 | % | | (1.02 | )% | | 2.03 | % | | 58.01 | % |
Year Ended September 30, 2005 | | $ | 12.95 | | (0.13 | ) | | 2.60 | | | 2.47 | | | — | | | (0.12 | ) | | (0.12 | ) | | $ | 15.30 | | 19.16 | % | | $ | 30,299 | | 2.06 | % | | (1.17 | )% | | 2.08 | % | | 30.38 | % |
Year Ended September 30, 2004 | | $ | 10.50 | | (0.11 | ) | | 2.64 | | | 2.53 | | | — | | | (0.08 | ) | | (0.08 | ) | | $ | 12.95 | | 24.17 | % | | $ | 15,611 | | 2.15 | % | | (1.51 | )% | | 2.30 | % | | 32.06 | % |
June 2, 2003 to September 30, 2003 (e) | | $ | 10.00 | | (0.02 | ) | | 0.52 | | | 0.50 | | | — | | | — | | | — | | | $ | 10.50 | | 5.00 | % | | $ | 4,052 | | 1.80 | % | | (1.17 | )% | | 2.52 | % | | 13.24 | % |
Equity Income Fund | | | | | | | | | | | | | | | | | | | | | | | | | | | | | | | | | | | | | | | | | | |
Year Ended September 30, 2007 | | $ | 13.32 | | 0.26 | (c) | | 2.30 | | | 2.56 | | | (0.22 | ) | | (0.68 | ) | | (0.90 | ) | | $ | 14.98 | | 19.93 | % | | $ | 26,044 | | 1.94 | % | | 1.79 | % | | 1.94 | % | | 37.85 | % |
Year Ended September 30, 2006 | | $ | 12.07 | | 0.19 | | | 1.56 | | | 1.75 | | | (0.23 | ) | | (0.27 | ) | | (0.50 | ) | | $ | 13.32 | | 14.85 | % | | $ | 14,261 | | 1.95 | % | | 1.52 | % | | 1.95 | % | | 45.38 | % |
Year Ended September 30, 2005 | | $ | 10.34 | | 0.17 | | | 1.76 | | | 1.93 | | | (0.18 | ) | | (0.02 | ) | | (0.20 | ) | | $ | 12.07 | | 18.74 | % | | $ | 8,683 | | 1.87 | % | | 1.77 | % | | 2.08 | % | | 39.65 | % |
June 30, 2004 to September 30, 2004 (e) | | $ | 10.00 | | 0.03 | (c) | | 0.34 | | | 0.37 | | | (0.03 | ) | | — | | | (0.03 | ) | | $ | 10.34 | | 3.66 | % | | $ | 1,816 | | 2.29 | % | | 1.14 | % | | 2.65 | % | | 1.65 | % |
Intermediate U.S. Government Fund | | | | | | | | | | | | | | | | | | | | | | | | | | | | | | | | | | | | | | | | | | |
Year Ended September 30, 2007 | | $ | 9.86 | | 0.35 | (c) | | 0.04 | | | 0.39 | | | (0.35 | ) | | — | | | (0.35 | ) | | $ | 9.90 | | 4.01 | % | | $ | 201 | | 1.68 | % | | 3.52 | % | | 1.80 | % | | 85.83 | % |
Year Ended September 30, 2006 | | $ | 9.98 | | 0.34 | (c) | | (0.12 | ) | | 0.22 | | | (0.34 | ) | | — | | | (0.34 | ) | | $ | 9.86 | | 2.31 | % | | $ | 207 | | 1.68 | % | | 3.47 | % | | 1.79 | % | | 127.13 | % |
Year Ended September 30, 2005 | | $ | 10.20 | | 0.27 | (c) | | (0.13 | ) | | 0.14 | | | (0.31 | ) | | (0.05 | ) | | (0.36 | ) | | $ | 9.98 | | 1.33 | % | | $ | 274 | | 1.71 | % | | 2.66 | % | | 1.84 | % | | 107.04 | % |
Year Ended September 30, 2004 | | $ | 10.53 | | 0.17 | | | (0.12 | ) | | 0.05 | | | (0.25 | ) | | (0.13 | ) | | (0.38 | ) | | $ | 10.20 | | 0.55 | % | | $ | 607 | | 1.80 | % | | 2.15 | % | | 1.92 | % | | 98.35 | % |
Year Ended September 30, 2003 | | $ | 10.74 | | 0.26 | | | (0.07 | ) | | 0.19 | | | (0.31 | ) | | (0.09 | ) | | (0.40 | ) | | $ | 10.53 | | 1.77 | % | | $ | 836 | | 1.82 | % | | 2.57 | % | | 1.92 | % | | 209.07 | % |
| * | During the period certain fees were reduced. If such reductions had not occurred, the ratios would have been as indicated. |
| ** | Portfolio turnover rate is calculated on the basis of the Fund as a whole without distinguishing between classes of shares issued. |
| (a) | Not annualized for periods less than one year. |
| (b) | Annualized for periods less than one year. |
| (c) | Per share net investment income (loss) has been calculated using the average daily shares method. |
| (d) | Amount is less than $0.005. |
| (e) | Period from commencement of operations. |
See accompanying notes to the financial statements.
113
BB&T Funds
Financial Highlights, Class C Shares
Selected data for a share of beneficial interest outstanding throughout the periods indicated.
| | | | | | | | | | | | | | | | | | | | | | | | | | | | | | | | | | | | | | | | | | |
| | | | | Investment Activities | | | Distributions | | | | | | | | Ratios/Supplementary Data | |
| | | Net Asset
Value,
Beginning
of Period | | Net
investment
income
(loss) | | | Net realized/ unrealized gains (losses) on investments (a) | | | Total from
Investment
Activities | | | Net
investment
income | | | Net realized
gains on
investments | | | Total
Distributions | | | Net Asset
Value,
End of
Period | | Total Return
(excludes
sales
charge) (b) | | | Net
Assets,
End of
Period
(000) | | Ratio of
net
expenses
to
average
net
assets (c) | | | Ratio of
net
investment
income
(loss) to
average
net assets
(c) | | | Ratio of
expenses to
average
net assets*(c) | | | Portfolio
turnover
rate** | |
Total Return Bond Fund | | | | | | | | | | | | | | | | | | | | | | | | | | | | | | | | | | | | | | | | | | |
Year Ended September 30, 2007 | | $ | 10.13 | | 0.37 | (a) | | 0.01 | | | 0.38 | | | (0.37 | ) | | — | | | (0.37 | ) | | $ | 10.14 | | 3.83 | % | | $ | 115 | | 1.68 | % | | 3.61 | % | | 1.80 | % | | 222.24 | % |
Year Ended September 30, 2006 | | $ | 10.32 | | 0.34 | (a) | | (0.12 | ) | | 0.22 | | | (0.36 | ) | | (0.05 | ) | | (0.41 | ) | | $ | 10.13 | | 2.18 | % | | $ | 116 | | 1.68 | % | | 3.35 | % | | 1.79 | % | | 226.36 | % |
Year Ended September 30, 2005 | | $ | 10.59 | | 0.30 | (a) | | (0.18 | ) | | 0.12 | | | (0.36 | ) | | (0.03 | ) | | (0.39 | ) | | $ | 10.32 | | 1.21 | % | | $ | 218 | | 1.71 | % | | 2.88 | % | | 1.84 | % | | 173.74 | % |
Year Ended September 30, 2004 | | $ | 10.72 | | 0.33 | | | (0.08 | ) | | 0.25 | | | (0.38 | ) | | — | | | (0.38 | ) | | $ | 10.59 | | 2.44 | % | | $ | 257 | | 1.82 | % | | 3.09 | % | | 1.94 | % | | 31.95 | % |
Year Ended September 30, 2003 | | $ | 10.33 | | 0.39 | | | 0.41 | | | 0.80 | | | (0.41 | ) | | — | | | (0.41 | ) | | $ | 10.72 | | 7.86 | % | | $ | 282 | | 1.83 | % | | 3.61 | % | | 1.94 | % | | 43.98 | % |
National Tax-Free Money Market Fund | | | | | | | | | | | | | | | | | | | | | | | | | | | | | | | | | | | | | | | | | | |
Year Ended September 30, 2007 | | $ | 1.00 | | 0.02 | (a) | | — | | | 0.02 | | | (0.02 | ) | | — | | | (0.02 | ) | | $ | 1.00 | | 2.26 | % | | $ | 1 | | 1.45 | % | | 2.24 | % | | 1.50 | % | | — | |
August 1, 2006 to September 30, 2006 | | $ | 1.00 | | — | (d) | | — | | | — | (d) | | — | (d) | | — | | | — | (d) | | $ | 1.00 | | 0.36 | % | | $ | 1 | | 1.39 | % | | 2.19 | % | | 1.78 | % | | — | |
Prime Money Market Fund | | | | | | | | | | | | | | | | | | | | | | | | | | | | | | | | | | | | | | | | | | |
Year Ended September 30, 2007 | | $ | 1.00 | | 0.04 | (a) | | — | | | 0.04 | | | (0.04 | ) | | — | | | (0.04 | ) | | $ | 1.00 | | 3.99 | % | | $ | 460 | | 1.48 | % | | 3.91 | % | | 1.59 | % | | — | |
Year Ended September 30, 2006 | | $ | 1.00 | | 0.03 | | | — | (d) | | 0.03 | | | (0.03 | ) | | — | | | (0.03 | ) | | $ | 1.00 | | 3.35 | % | | $ | 393 | | 1.48 | % | | 3.35 | % | | 1.59 | % | | — | |
Year Ended September 30, 2005 | | $ | 1.00 | | 0.01 | | | — | (d) | | 0.01 | | | (0.01 | ) | | — | | | (0.01 | ) | | $ | 1.00 | | 1.32 | % | | $ | 326 | | 1.49 | % | | 1.29 | % | | 1.64 | % | | — | |
Year Ended September 30, 2004 | | $ | 1.00 | | — | (d) | | — | (d) | | — | (d) | | — | (d) | | — | | | — | (d) | | $ | 1.00 | | 0.06 | % | | $ | 453 | | 1.20 | % | | 0.06 | % | | 1.70 | % | | — | |
Year Ended September 30, 2003 | | $ | 1.00 | | — | (d) | | — | | | — | (d) | | — | (d) | | — | | | — | (d) | | $ | 1.00 | | 0.15 | % | | $ | 555 | | 1.30 | % | | 0.14 | % | | 1.69 | % | | — | |
U.S. Treasury Money Market Fund | | | | | | | | | | | | | | | | | | | | | | | | | | | | | | | | | | | | | | | | | | |
Year Ended September 30, 2007 | | $ | 1.00 | | 0.04 | (a) | | — | | | 0.04 | | | (0.04 | ) | | — | | | (0.04 | ) | | $ | 1.00 | | 3.68 | % | | $ | 42 | | 1.47 | % | | 3.63 | % | | 1.61 | % | | — | |
Year Ended September 30, 2006 | | $ | 1.00 | | 0.03 | | | — | | | 0.03 | | | (0.03 | ) | | — | | | (0.03 | ) | | $ | 1.00 | | 3.13 | % | | $ | 55 | | 1.45 | % | | 3.30 | % | | 1.59 | % | | — | |
Year Ended September 30, 2005 | | $ | 1.00 | | 0.01 | | | — | | | 0.01 | | | (0.01 | ) | | — | | | (0.01 | ) | | $ | 1.00 | | 1.07 | % | | $ | 38 | | 1.50 | % | | 1.40 | % | | 1.66 | % | | — | |
Year Ended September 30, 2004 | | $ | 1.00 | | — | (d) | | — | | | — | (d) | | — | (d) | | — | | | — | (d) | | $ | 1.00 | | 0.05 | % | | $ | 5 | | 1.02 | % | | 0.05 | % | | 1.71 | % | | — | |
Year Ended September 30, 2003 | | $ | 1.00 | | — | (d) | | — | | | — | (d) | | — | (d) | | — | | | — | (d) | | $ | 1.00 | | 0.16 | % | | $ | 8 | | 1.12 | % | | 0.17 | % | | 1.70 | % | | — | |
Capital Manager Conservative Growth Fund*** | | | | | | | | | | | | | | | | | | | | | | | | | | | | | | | | | | | | | | | | | | |
Year Ended September 30, 2007 | | $ | 9.93 | | 0.27 | (a) | | 0.53 | | | 0.80 | | | (0.22 | ) | | — | | | (0.22 | ) | | $ | 10.51 | | 8.11 | % | | $ | 77 | | 1.10 | % | | 2.58 | % | | 1.41 | % | | 29.58 | % |
Year Ended September 30, 2006 | | $ | 9.73 | | 0.23 | (a) | | 0.23 | | | 0.46 | | | (0.26 | ) | | — | | | (0.26 | ) | | $ | 9.93 | | 4.75 | % | | $ | 127 | | 1.08 | % | | 2.35 | % | | 1.45 | % | | 5.69 | % |
Year Ended September 30, 2005 | | $ | 9.27 | | 0.16 | | | 0.45 | | | 0.61 | | | (0.15 | ) | | — | | | (0.15 | ) | | $ | 9.73 | | 6.58 | % | | $ | 155 | | 1.20 | % | | 1.63 | % | | 1.52 | % | | 52.50 | % |
Year Ended September 30, 2004 | | $ | 8.82 | | 0.09 | (a) | | 0.44 | | | 0.53 | | | (0.08 | ) | | — | | | (0.08 | ) | | $ | 9.27 | | 6.06 | % | | $ | 180 | | 1.44 | % | | 0.93 | % | | 1.64 | % | | 2.47 | % |
Year Ended September 30, 2003 | | $ | 8.26 | | 0.09 | | | 0.61 | | | 0.70 | | | (0.10 | ) | | (0.04 | ) | | (0.14 | ) | | $ | 8.82 | | 8.50 | % | | $ | 148 | | 1.53 | % | | 1.05 | % | | 1.73 | % | | 33.03 | % |
Capital Manager Moderate Growth Fund*** | | | | | | | | | | | | | | | | | | | | | | | | | | | | | | | | | | | | | | | | | | |
Year Ended September 30, 2007 | | $ | 10.10 | | 0.21 | (a) | | 0.86 | | | 1.07 | | | (0.14 | ) | | (0.22 | ) | | (0.36 | ) | | $ | 10.81 | | 10.72 | % | | $ | 156 | | 1.11 | % | | 1.98 | % | | 1.42 | % | | 40.05 | % |
Year Ended September 30, 2006 | | $ | 9.69 | | 0.17 | (a) | | 0.42 | | | 0.59 | | | (0.18 | ) | | — | | | (0.18 | ) | | $ | 10.10 | | 6.19 | % | | $ | 139 | | 1.10 | % | | 1.71 | % | | 1.47 | % | | 7.33 | % |
Year Ended September 30, 2005 | | $ | 8.91 | | 0.09 | (a) | | 0.77 | | | 0.86 | | | (0.08 | ) | | — | | | (0.08 | ) | | $ | 9.69 | | 9.62 | % | | $ | 122 | | 1.25 | % | | 0.95 | % | | 1.56 | % | | 37.83 | % |
Year Ended September 30, 2004 | | $ | 8.18 | | 0.01 | (a) | | 0.73 | | | 0.74 | | | (0.01 | ) | | — | | | (0.01 | ) | | $ | 8.91 | | 9.08 | % | | $ | 178 | | 1.49 | % | | 0.17 | % | | 1.69 | % | | 0.17 | % |
Year Ended September 30, 2003 | | $ | 7.42 | | 0.03 | | | 0.82 | | | 0.85 | | | (0.08 | ) | | (0.01 | ) | | (0.09 | ) | | $ | 8.18 | | 11.39 | % | | $ | 182 | | 1.51 | % | | 0.40 | % | | 1.71 | % | | 21.46 | % |
Capital Manager Growth Fund*** | | | | | | | | | | | | | | | | | | | | | | | | | | | | | | | | | | | | | | | | | | |
Year Ended September 30, 2007 | | $ | 10.05 | | 0.18 | (a) | | 1.04 | | | 1.22 | | | (0.08 | ) | | (0.27 | ) | | (0.35 | ) | | $ | 10.92 | | 12.33 | % | | $ | 78 | | 1.11 | % | | 1.74 | % | | 1.43 | % | | 44.48 | % |
Year Ended September 30, 2006 | | $ | 9.52 | | 0.11 | (a) | | 0.57 | | | 0.68 | | | (0.15 | ) | | — | | | (0.15 | ) | | $ | 10.05 | | 7.19 | % | | $ | 61 | | 1.11 | % | | 1.17 | % | | 1.46 | % | | 6.26 | % |
Year Ended September 30, 2005 | | $ | 8.56 | | 0.04 | (a) | | 0.95 | | | 0.99 | | | (0.03 | ) | | — | | | (0.03 | ) | | $ | 9.52 | | 11.61 | % | | $ | 37 | | 1.26 | % | | 0.43 | % | | 1.59 | % | | 26.22 | % |
Year Ended September 30, 2004 | | $ | 7.71 | | (0.02 | )(a) | | 0.87 | | | 0.85 | | | — | | | — | | | — | | | $ | 8.56 | | 11.02 | % | | $ | 63 | | 1.50 | % | | (0.23 | )% | | 1.73 | % | | 0.19 | % |
Year Ended September 30, 2003 | | $ | 6.80 | | (0.01 | )(a) | | 0.93 | | | 0.92 | | | (0.01 | ) | | — | | | (0.01 | ) | | $ | 7.71 | | 13.48 | % | | $ | 52 | | 1.54 | % | | (0.14 | )% | | 1.74 | % | | 17.80 | % |
Capital Manager Equity Fund*** | | | | | | | | | | | | | | | | | | | | | | | | | | | | | | | | | | | | | | | | | | |
Year Ended September 30, 2007 | | $ | 11.22 | | 0.12 | (a) | | 1.41 | | | 1.53 | | | (0.03 | ) | | (0.85 | ) | | (0.88 | ) | | $ | 11.87 | | 14.13 | % | | $ | 1 | | 1.00 | % | | 1.02 | % | | 1.25 | % | | 48.80 | % |
Year Ended September 30, 2006 | | $ | 10.64 | | 0.10 | (a) | | 0.78 | | | 0.88 | | | (0.11 | ) | | (0.19 | ) | | (0.30 | ) | | $ | 11.22 | | 8.44 | % | | $ | 10 | | 1.11 | % | | 0.90 | % | | 1.48 | % | | 1.48 | % |
Year Ended September 30, 2005 | | $ | 9.33 | | (0.01 | )(a) | | 1.32 | | | 1.31 | | | — | (d) | | — | | | — | (d) | | $ | 10.64 | | 14.15 | % | | $ | 19 | | 1.27 | % | | (0.09 | )% | | 1.63 | % | | 2.14 | % |
Year Ended September 30, 2004 | | $ | 8.28 | | (0.05 | )(a) | | 1.10 | | | 1.05 | | | — | | | — | | | — | | | $ | 9.33 | | 12.68 | % | | $ | 85 | | 1.52 | % | | (0.54 | )% | | 1.81 | % | | 3.10 | % |
Year Ended September 30, 2003 | | $ | 7.26 | | (0.05 | )(a) | | 1.12 | | | 1.07 | | | — | (d) | | (0.05 | ) | | (0.05 | ) | | $ | 8.28 | | 14.78 | % | | $ | 28 | | 1.73 | % | | (0.66 | )% | | 1.92 | % | | 8.30 | % |
| * | During the period certain fees were reduced. If such reductions had not occurred, the ratios would have been as indicated. |
| ** | Portfolio turnover rate is calculated on the basis of the Fund as a whole without distinguishing between classes of shares issued. |
| *** | The expense ratios exclude the impact of fees/expenses paid by each underlying fund. |
| (a) | Per share net investment income (loss) has been calculated using the average daily shares method. |
| (b) | Not annualized for periods less than one year. |
| (c) | Annualized for periods less than one year. |
| (d) | Amount is less than $0.005. |
See accompanying notes to the financial statements.
114
BB&T Funds
Financial Highlights, Institutional Shares
Selected data for a share of beneficial interest outstanding throughout the periods indicated.
| | | | | | | | | | | | | | | | | | | | | | | | | | | | | | | | | | | | | | | | | |
| | | | | Investment Activities | | Distributions | | | | | | | | Ratios/Supplementary Data | |
| | | Net Asset
Value,
Beginning
of Period | | Net
investment
income
(loss) | | | Net realized/
unrealized
gains (losses)
on
investments and foreign currency
transactions | | | Total from
Investment
Activities | | Net
investment
income | | | Net realized
gains on
investments
and foreign
currency
transactions | | | Total
Distributions | | | Net Asset
Value,
End
of
Period | | Total
Return (a) | | | Net
Assets,
End of
Period
(000) | | Ratio of net
expenses to
average
net assets (b) | | | Ratio
of net
investment
income
(loss) to
average
net assets
(b) | | | Ratio of
expenses to
average
net
assets*(b) | | | Portfolio
turnover rate** | |
Large Cap Fund | | | | | | | | | | | | | | | | | | | | | | | | | | | | | | | | | | | | | | | | | |
Year Ended September 30, 2007 | | $ | 20.38 | | 0.29 | (c) | | 2.16 | | | 2.45 | | (0.28 | ) | | (3.35 | ) | | (3.63 | ) | | $ | 19.20 | | 12.89 | % | | $ | 602,101 | | 0.91 | % | | 1.50 | % | | 0.96 | % | | 68.60 | % |
Year Ended September 30, 2006 | | $ | 19.51 | | 0.35 | (c) | | 2.31 | | | 2.66 | | (0.35 | ) | | (1.44 | ) | | (1.79 | ) | | $ | 20.38 | | 14.59 | % | | $ | 660,667 | | 0.89 | % | | 1.80 | % | | 0.93 | % | | 34.83 | % |
Year Ended September 30, 2005 | | $ | 17.29 | | 0.34 | | | 2.22 | | | 2.56 | | (0.34 | ) | | — | | | (0.34 | ) | | $ | 19.51 | | 14.92 | % | | $ | 605,493 | | 0.89 | % | | 1.82 | % | | 0.99 | % | | 19.50 | % |
Year Ended September 30, 2004 | | $ | 14.90 | | 0.26 | | | 2.39 | | | 2.65 | | (0.26 | ) | | — | | | (0.26 | ) | | $ | 17.29 | | 17.86 | % | | $ | 620,186 | | 0.95 | % | | 1.58 | % | | 1.06 | % | | 16.40 | % |
Year Ended September 30, 2003 | | $ | 12.87 | | 0.27 | | | 2.03 | | | 2.30 | | (0.27 | ) | | — | | | (0.27 | ) | | $ | 14.90 | | 17.98 | % | | $ | 475,289 | | 0.92 | % | | 1.90 | % | | 1.06 | % | | 18.89 | % |
Mid Cap Value Fund | | | | | | | | | | | | | | | | | | | | | | | | | | | | | | | | | | | | | | | | | |
Year Ended September 30, 2007 | | $ | 13.54 | | 0.08 | (c) | | 2.13 | | | 2.21 | | (0.06 | ) | | (0.69 | ) | | (0.75 | ) | | $ | 15.00 | | 16.75 | % | | $ | 243,437 | | 0.91 | % | | 0.53 | % | | 0.95 | % | | 58.59 | % |
Year Ended September 30, 2006 | | $ | 13.38 | | 0.06 | (c) | | 1.62 | | | 1.68 | | (0.07 | ) | | (1.45 | ) | | (1.52 | ) | | $ | 13.54 | | 13.52 | % | | $ | 209,685 | | 0.89 | % | | 0.48 | % | | 0.93 | % | | 53.92 | % |
Year Ended September 30, 2005 | | $ | 15.41 | | 0.17 | (c) | | 3.05 | | | 3.22 | | (0.16 | ) | | (5.09 | ) | | (5.25 | ) | | $ | 13.38 | | 21.14 | % | | $ | 172,295 | | 0.89 | % | | 1.02 | % | | 0.99 | % | | 126.99 | % |
Year Ended September 30, 2004 | | $ | 12.98 | | 0.22 | (c) | | 2.42 | | | 2.64 | | (0.21 | ) | | — | | | (0.21 | ) | | $ | 15.41 | | 20.44 | % | | $ | 182,791 | | 0.98 | % | | 1.47 | % | | 1.10 | % | | 19.17 | % |
Year Ended September 30, 2003 | | $ | 10.93 | | 0.19 | (c) | | 2.04 | | | 2.23 | | (0.18 | ) | | — | | | (0.18 | ) | | $ | 12.98 | | 20.60 | % | | $ | 142,280 | | 0.95 | % | | 1.57 | % | | 1.10 | % | | 18.28 | % |
Mid Cap Growth Fund | | | | | | | | | | | | | | | | | | | | | | | | | | | | | | | | | | | | | | | | | |
Year Ended September 30, 2007 | | $ | 13.09 | | (0.04 | )(c) | | 4.35 | | | 4.31 | | (0.02 | ) | | (1.65 | ) | | (1.67 | ) | | $ | 15.73 | | 36.43 | % | | $ | 197,736 | | 0.90 | % | | (0.25 | )% | | 0.94 | % | | 134.95 | % |
Year Ended September 30, 2006 | | $ | 14.51 | | 0.02 | (c) | | 0.02 | (d) | | 0.04 | | (0.04 | ) | | (1.42 | ) | | (1.46 | ) | | $ | 13.09 | | (0.15 | )% | | $ | 132,677 | | 0.89 | % | | 0.17 | % | | 0.94 | % | | 140.90 | % |
Year Ended September 30, 2005 | | $ | 11.40 | | (0.06 | )(c) | | 3.31 | | | 3.25 | | — | | | (0.14 | ) | | (0.14 | ) | | $ | 14.51 | | 28.73 | % | | $ | 126,785 | | 0.91 | % | | (0.46 | )% | | 1.01 | % | | 92.74 | % |
Year Ended September 30, 2004 | | $ | 10.22 | | (0.08 | ) | | 1.26 | | | 1.18 | | — | | | — | | | — | | | $ | 11.40 | | 11.55 | % | | $ | 118,012 | | 1.00 | % | | (0.65 | )% | | 1.11 | % | | 138.61 | % |
Year Ended September 30, 2003 | | $ | 8.36 | | (0.06 | ) | | 1.92 | | | 1.86 | | — | | | — | | | — | | | $ | 10.22 | | 22.25 | % | | $ | 100,226 | | 0.95 | % | | (0.72 | )% | | 1.12 | % | | 125.97 | % |
Small Cap Fund | | | | | | | | | | | | | | | | | | | | | | | | | | | | | | | | | | | | | | | | | |
Year Ended September 30, 2007 | | $ | 15.19 | | 0.10 | (c) | | 0.75 | | | 0.85 | | (0.10 | ) | | (0.91 | ) | | (1.01 | ) | | $ | 15.03 | | 5.43 | % | | $ | 82,389 | | 1.06 | % | | 0.62 | % | | 1.26 | % | | 46.54 | % |
Year Ended September 30, 2006 | | $ | 16.44 | | 0.05 | (c) | | 1.05 | | | 1.10 | | (0.05 | ) | | (2.30 | ) | | (2.35 | ) | | $ | 15.19 | | 7.23 | % | | $ | 110,722 | | 1.02 | % | | 0.30 | % | | 1.26 | % | | 43.25 | % |
Year Ended September 30, 2005 | | $ | 14.23 | | 0.16 | (c) | | 2.62 | | | 2.78 | | (0.15 | ) | | (0.42 | ) | | (0.57 | ) | | $ | 16.44 | | 19.99 | % | | $ | 61,046 | | 1.05 | % | | 1.07 | % | | 1.28 | % | | 8.39 | % |
Year Ended September 30, 2004 | | $ | 11.44 | | 0.02 | (c) | | 2.91 | | | 2.93 | | (0.02 | ) | | (0.12 | ) | | (0.14 | ) | | $ | 14.23 | | 25.78 | % | | $ | 66,802 | | 1.26 | % | | 0.15 | % | | 1.42 | % | | 11.25 | % |
May 19, 2003 to September 30, 2003 (e) | | $ | 10.00 | | (0.01 | )(c) | | 1.45 | | | 1.44 | | — | (f) | | — | | | — | (f) | | $ | 11.44 | | 14.43 | % | | $ | 43,462 | | 1.69 | % | | (0.17 | )% | | 1.69 | % | | 48.84 | % |
International Equity Fund | | | | | | | | | | | | | | | | | | | | | | | | | | | | | | | | | | | | | | | | | |
Year Ended September 30, 2007 | | $ | 11.23 | | 0.14 | (c) | | 1.88 | | | 2.02 | | (0.09 | ) | | (4.52 | ) | | (4.61 | ) | | $ | 8.64 | | 20.39 | % | | $ | 164,147 | | 1.13 | % | | 1.13 | % | | 1.26 | % | | 129.8 | % |
Year Ended September 30, 2006 | | $ | 9.72 | | 0.18 | (c) | | 1.50 | | | 1.68 | | (0.17 | ) | | — | | | (0.17 | ) | | $ | 11.23 | | 17.38 | % | | $ | 253,690 | | 1.15 | % | | 1.68 | % | | 1.25 | % | | 36.22 | % |
Year Ended September 30, 2005 | | $ | 8.24 | | 0.12 | (c) | | 1.49 | | | 1.61 | | (0.13 | ) | | — | | | (0.13 | ) | | $ | 9.72 | | 19.61 | % | | $ | 229,406 | | 1.20 | % | | 1.34 | % | | 1.33 | % | | 44.96 | % |
Year Ended September 30, 2004 | | $ | 6.98 | | 0.10 | (c) | | 1.26 | | | 1.36 | | (0.10 | ) | | — | | | (0.10 | ) | | $ | 8.24 | | 19.48 | % | | $ | 233,275 | | 1.32 | % | | 1.30 | % | | 1.42 | % | | 50.68 | % |
Year Ended September 30, 2003 | | $ | 6.41 | | 0.05 | (c) | | 0.57 | | | 0.62 | | (0.05 | ) | | — | | | (0.05 | ) | | $ | 6.98 | | 9.72 | % | | $ | 187,315 | | 1.40 | % | | 0.78 | % | | 1.41 | % | | 199.78 | % |
Special Opportunities Equity Fund | | | | | | | | | | | | | | | | | | | | | | | | | | | | | | | | | | | | | | | | | |
Year Ended September 30, 2007 | | $ | 16.57 | | 0.03 | (c) | | 3.51 | | | 3.54 | | — | | | (1.60 | ) | | (1.60 | ) | | $ | 18.51 | | 22.55 | % | | $ | 127,210 | | 1.03 | % | | 0.18 | % | | 1.03 | % | | 49.43 | % |
Year Ended September 30, 2006 | | $ | 15.65 | | — | (f) | | 1.71 | | | 1.71 | | — | | | (0.79 | ) | | (0.79 | ) | | $ | 16.57 | | 11.50 | % | | $ | 67,232 | | 1.03 | % | | (0.02 | )% | | 1.03 | % | | 58.01 | % |
Year Ended September 30, 2005 | | $ | 13.12 | | (0.03 | ) | | 2.68 | | | 2.65 | | — | | | (0.12 | ) | | (0.12 | ) | | $ | 15.65 | | 20.29 | % | | $ | 60,823 | | 1.06 | % | | (0.18 | )% | | 1.08 | % | | 30.38 | % |
Year Ended September 30, 2004 | | $ | 10.53 | | (0.05 | ) | | 2.72 | | | 2.67 | | — | | | (0.08 | ) | | (0.08 | ) | | $ | 13.12 | | 25.44 | % | | $ | 39,816 | | 1.12 | % | | (0.49 | )% | | 1.32 | % | | 32.06 | % |
June 2, 2003 to September 30, 2003 (e) | | $ | 10.00 | | — | (f) | | 0.53 | | | 0.53 | | — | (f) | | — | | | — | (f) | | $ | 10.53 | | 5.31 | % | | $ | 26,360 | | 0.82 | % | | (0.11 | )% | | 1.64 | % | | 13.24 | % |
Equity Income Fund | | | | | | | | | | | | | | | | | | | | | | | | | | | | | | | | | | | | | | | | | |
Year Ended September 30, 2007 | | $ | 13.37 | | 0.40 | (c) | | 2.31 | | | 2.71 | | (0.35 | ) | | (0.68 | ) | | (1.03 | ) | | $ | 15.05 | | 21.16 | % | | $ | 46,053 | | 0.94 | % | | 2.81 | % | | 0.94 | % | | 37.85 | % |
Year Ended September 30, 2006 | | $ | 12.10 | | 0.32 | | | 1.57 | | | 1.89 | | (0.35 | ) | | (0.27 | ) | | (0.62 | ) | | $ | 13.37 | | 16.04 | % | | $ | 35,205 | | 0.95 | % | | 2.55 | % | | 0.95 | % | | 45.38 | % |
Year Ended September 30, 2005 | | $ | 10.35 | | 0.28 | | | 1.76 | | | 2.04 | | (0.27 | ) | | (0.02 | ) | | (0.29 | ) | | $ | 12.10 | | 19.88 | % | | $ | 30,588 | | 0.90 | % | | 2.62 | % | | 1.12 | % | | 39.65 | % |
June 30, 2004 to September 30, 2004 (e) | | $ | 10.00 | | 0.05 | (c) | | 0.34 | | | 0.39 | | (0.04 | ) | | — | | | (0.04 | ) | | $ | 10.35 | | 3.94 | % | | $ | 21,128 | | 1.29 | % | | 1.91 | % | | 1.63 | % | | 1.65 | % |
Short U.S. Government Fund | | | | | | | | | | | | | | | | | | | | | | | | | | | | | | | | | | | | | | | | | |
Year Ended September 30, 2007 | | $ | 9.49 | | 0.38 | (c) | | 0.08 | | | 0.46 | | (0.42 | ) | | — | | | (0.42 | ) | | $ | 9.53 | | 4.93 | % | | $ | 40,756 | | 0.66 | % | | 4.01 | % | | 0.81 | % | | 44.10 | % |
Year Ended September 30, 2006 | | $ | 9.51 | | 0.30 | (c) | | 0.01 | (d) | | 0.31 | | (0.33 | ) | | — | | | (0.33 | ) | | $ | 9.49 | | 3.37 | % | | $ | 66,371 | | 0.64 | % | | 3.21 | % | | 0.79 | % | | 98.08 | % |
Year Ended September 30, 2005 | | $ | 9.71 | | 0.25 | | | (0.13 | ) | | 0.12 | | (0.32 | ) | | — | | | (0.32 | ) | | $ | 9.51 | | 1.21 | % | | $ | 155,786 | | 0.66 | % | | 2.64 | % | | 0.84 | % | | 33.67 | % |
Year Ended September 30, 2004 | | $ | 9.90 | | 0.20 | | | (0.11 | ) | | 0.09 | | (0.28 | ) | | — | | | (0.28 | ) | | $ | 9.71 | | 0.96 | % | | $ | 195,920 | | 0.74 | % | | 2.10 | % | | 0.91 | % | | 62.59 | % |
Year Ended September 30, 2003 | | $ | 10.09 | | 0.29 | | | (0.11 | ) | | 0.18 | | (0.37 | ) | | — | | | (0.37 | ) | | $ | 9.90 | | 1.78 | % | | $ | 199,980 | | 0.76 | % | | 2.81 | % | | 0.91 | % | | 93.86 | % |
| * | During the period certain fees were reduced. If such reductions had not occurred, the ratios would have been as indicated. |
| ** | Portfolio turnover rate is calculated on the basis of the Fund as a whole without distinguishing between classes of shares issued. |
| (a) | Not annualized for periods less than one year. |
| (b) | Annualized for periods less than one year. |
| (c) | Per share net investment income (loss) has been calculated using the average daily shares method. |
| (d) | The amount shown for a share outstanding throughout the period does not accord with the change in aggregate gains and losses in the portfolio of securities during the period because of the timing of sales and purchases of Fund shares in relation to fluctuating market values during the period. |
| (e) | Period from commencement of operations. |
| (f) | Amount is less than $0.005. |
See accompanying notes to the financial statements.
115
BB&T Funds
Financial Highlights, Institutional Shares
Selected data for a share of beneficial interest outstanding throughout the periods indicated.
| | | | | | | | | | | | | | | | | | | | | | | | | | | | | | | | | | | | | | | | | |
| | | | | Investment Activities | | Distributions | | | | | | | | Ratios/Supplementary Data | |
| | | Net Asset
Value,
Beginning
of Period | | Net
investment
income
(loss) | | | Net realized/
unrealized
gains (losses)
on investments | | | Total from
Investment
Activities | | Net
investment
income | | | Net
realized
gains on
investments | | | Total
Distributions | | | Net Asset
Value,
End of
Period | | Total
Return (a) | | | Net
Assets,
End of
Period
(000) | | Ratio of
net
expenses
to
average
net
assets (b) | | | Ratio of
net
investment
income (loss) to
average
net assets
(b) | | | Ratio of
expenses to
average
net assets*(b) | | | Portfolio
turnover
rate** | |
Intermediate U.S. Government Fund | | | | | | | | | | | | | | | | | | | | | | | | | | | | | | | | | | | | | | | | | |
Year Ended September 30, 2007 | | $ | 9.90 | | 0.45 | (c) | | 0.04 | | | 0.49 | | (0.45 | ) | | — | | | (0.45 | ) | | $ | 9.94 | | 5.04 | % | | $ | 132,403 | | 0.68 | % | | 4.49 | % | | 0.80 | % | | 85.83 | % |
Year Ended September 30, 2006 | | $ | 10.03 | | 0.44 | (c) | | (0.13 | ) | | 0.31 | | (0.44 | ) | | — | | | (0.44 | ) | | $ | 9.90 | | 3.23 | % | | $ | 252,402 | | 0.67 | % | | 4.45 | % | | 0.79 | % | | 127.13 | % |
Year Ended September 30, 2005 | | $ | 10.25 | | 0.37 | (c) | | (0.13 | ) | | 0.24 | | (0.41 | ) | | (0.05 | ) | | (0.46 | ) | | $ | 10.03 | | 2.34 | % | | $ | 539,038 | | 0.70 | % | | 3.67 | % | | 0.83 | % | | 107.04 | % |
Year Ended September 30, 2004 | | $ | 10.58 | | 0.34 | | | (0.18 | ) | | 0.16 | | (0.36 | ) | | (0.13 | ) | | (0.49 | ) | | $ | 10.25 | | 1.56 | % | | $ | 534,682 | | 0.80 | % | | 3.15 | % | | 0.92 | % | | 98.35 | % |
Year Ended September 30, 2003 | | $ | 10.78 | | 0.37 | | | (0.07 | ) | | 0.30 | | (0.41 | ) | | (0.09 | ) | | (0.50 | ) | | $ | 10.58 | | 2.88 | % | | $ | 447,665 | | 0.82 | % | | 3.43 | % | | 0.92 | % | | 209.07 | % |
Total Return Bond Fund | | | | | | | | | | | | | | | | | | | | | | | | | | | | | | | | | | | | | | | | | |
Year Ended September 30, 2007 | | $ | 10.13 | | 0.47 | (c) | | — | | | 0.47 | | (0.47 | ) | | — | | | (0.47 | ) | | $ | 10.13 | | 4.77 | % | | $ | 433,382 | | 0.68 | % | | 4.62 | % | | 0.80 | % | | 222.24 | % |
Year Ended September 30, 2006 | | $ | 10.32 | | 0.45 | (c) | | (0.13 | ) | | 0.32 | | (0.46 | ) | | (0.05 | ) | | (0.51 | ) | | $ | 10.13 | | 3.30 | % | | $ | 367,353 | | 0.67 | % | | 4.42 | % | | 0.79 | % | | 226.36 | % |
Year Ended September 30, 2005 | | $ | 10.59 | | 0.39 | (c) | | (0.16 | ) | | 0.23 | | (0.47 | ) | | (0.03 | ) | | (0.50 | ) | | $ | 10.32 | | 2.23 | % | | $ | 461,749 | | 0.71 | % | | 3.87 | % | | 0.83 | % | | 173.74 | % |
Year Ended September 30, 2004 | | $ | 10.72 | | 0.44 | | | (0.08 | ) | | 0.36 | | (0.49 | ) | | — | | | (0.49 | ) | | $ | 10.59 | | 3.47 | % | | $ | 272,749 | | 0.82 | % | | 4.09 | % | | 0.94 | % | | 31.95 | % |
Year Ended September 30, 2003 | | $ | 10.33 | | 0.49 | | | 0.41 | | | 0.90 | | (0.51 | ) | | — | | | (0.51 | ) | | $ | 10.72 | | 8.95 | % | | $ | 215,000 | | 0.83 | % | | 4.61 | % | | 0.94 | % | | 43.98 | % |
Kentucky Intermediate Tax-Free Fund | | | | | | | | | | | | | | | | | | | | | | | | | | | | | | | | | | | | | | | | | |
Year Ended September 30, 2007 | | $ | 10.11 | | 0.35 | (c) | | (0.06 | ) | | 0.29 | | (0.35 | ) | | — | | | (0.35 | ) | | $ | 10.05 | | 2.92 | % | | $ | 10,625 | | 0.65 | % | | 3.45 | % | | 0.85 | % | | 69.73 | % |
Year Ended September 30, 2006 | | $ | 10.04 | | 0.33 | | | 0.07 | | | 0.40 | | (0.33 | ) | | — | | | (0.33 | ) | | $ | 10.11 | | 4.04 | % | | $ | 11,175 | | 0.66 | % | | 3.26 | % | | 0.87 | % | | 64.55 | % |
Year Ended September 30, 2005 | | $ | 10.20 | | 0.29 | (c) | | (0.16 | ) | | 0.13 | | (0.29 | ) | | — | | | (0.29 | ) | | $ | 10.04 | | 1.28 | % | | $ | 15,569 | | 0.68 | % | | 2.87 | % | | 0.97 | % | | 37.50 | % |
Year Ended September 30, 2004 | | $ | 10.22 | | 0.28 | (c) | | (0.02 | ) | | 0.26 | | (0.28 | ) | | — | | | (0.28 | ) | | $ | 10.20 | | 2.61 | % | | $ | 13,441 | | 0.63 | % | | 2.78 | % | | 1.07 | % | | 24.78 | % |
February 24, 2003 to September 30, 2003 (d) | | $ | 10.00 | | 0.16 | (c) | | 0.20 | | | 0.36 | | (0.14 | ) | | — | | | (0.14 | ) | | $ | 10.22 | | 3.63 | % | | $ | 14,759 | | 0.53 | % | | 2.56 | % | | 1.23 | % | | 42.87 | % |
Maryland Intermediate Tax-Free Fund | | | | | | | | | | | | | | | | | | | | | | | | | | | | | | | | | | | | | | | | | |
Year Ended September 30, 2007 | | $ | 10.13 | | 0.33 | (c) | | 0.04 | | | 0.37 | | (0.33 | ) | | — | | | (0.33 | ) | | $ | 10.17 | | 3.74 | % | | $ | 8,374 | | 0.59 | % | | 3.29 | % | | 0.89 | % | | 136.09 | % |
Year Ended September 30, 2006 | | $ | 10.04 | | 0.31 | | | 0.09 | | | 0.40 | | (0.31 | ) | | — | | | (0.31 | ) | | $ | 10.13 | | 4.10 | % | | $ | 8,003 | | 0.60 | % | | 3.13 | % | | 0.90 | % | | 219.80 | % |
Year Ended September 30, 2005 | | $ | 10.16 | | 0.28 | (c) | | (0.12 | ) | | 0.16 | | (0.28 | ) | | — | | | (0.28 | ) | | $ | 10.04 | | 1.60 | % | | $ | 10,084 | | 0.58 | % | | 2.78 | % | | 1.03 | % | | 44.67 | % |
Year Ended September 30, 2004 | | $ | 10.16 | | 0.25 | | | — | (e) | | 0.25 | | (0.25 | ) | | — | | | (0.25 | ) | | $ | 10.16 | | 2.52 | % | | $ | 9,108 | | 0.60 | % | | 2.47 | % | | 1.23 | % | | 55.18 | % |
February 24, 2003 to September 30, 2003 (d) | | $ | 10.00 | | 0.13 | | | 0.16 | | | 0.29 | | (0.13 | ) | | — | | | (0.13 | ) | | $ | 10.16 | | 2.93 | % | | $ | 4,897 | | 0.61 | % | | 2.27 | % | | 1.65 | % | | 40.16 | % |
North Carolina Intermediate Tax-Free Fund | | | | | | | | | | | | | | | | | | | | | | | | | | | | | | | | | | | | | | | | | |
Year Ended September 30, 2007 | | $ | 10.38 | | 0.38 | (c) | | (0.04 | ) | | 0.34 | | (0.38 | ) | | (0.01 | ) | | (0.39 | ) | | $ | 10.33 | | 3.33 | % | | $ | 96,282 | | 0.66 | % | | 3.65 | % | | 0.81 | % | | 106.16 | % |
Year Ended September 30, 2006 | | $ | 10.46 | | 0.39 | | | — | (e) | | 0.39 | | (0.38 | ) | | (0.09 | ) | | (0.47 | ) | | $ | 10.38 | | 3.84 | % | | $ | 87,854 | | 0.65 | % | | 3.70 | % | | 0.80 | % | | 94.95 | % |
Year Ended September 30, 2005 | | $ | 10.66 | | 0.38 | | | (0.19 | ) | | 0.19 | | (0.37 | ) | | (0.02 | ) | | (0.39 | ) | | $ | 10.46 | | 1.80 | % | | $ | 93,418 | | 0.68 | % | | 3.51 | % | | 0.86 | % | | 60.84 | % |
Year Ended September 30, 2004 | | $ | 10.81 | | 0.35 | | | (0.12 | ) | | 0.23 | | (0.34 | ) | | (0.04 | ) | | (0.38 | ) | | $ | 10.66 | | 2.15 | % | | $ | 96,738 | | 0.75 | % | | 3.18 | % | | 0.92 | % | | 67.80 | % |
Year Ended September 30, 2003 | | $ | 10.86 | | 0.35 | | | (0.01 | ) | | 0.34 | | (0.35 | ) | | (0.04 | ) | | (0.39 | ) | | $ | 10.81 | | 3.19 | % | | $ | 95,613 | | 0.77 | % | | 3.26 | % | | 0.92 | % | | 44.56 | % |
South Carolina Intermediate Tax-Free Fund | | | | | | | | | | | | | | | | | | | | | | | | | | | | | | | | | | | | | | | | | |
Year Ended September 30, 2007 | | $ | 10.29 | | 0.37 | (c) | | (0.06 | ) | | 0.31 | | (0.38 | ) | | (0.01 | ) | | (0.39 | ) | | $ | 10.21 | | 3.08 | % | | $ | 12,789 | | 0.68 | % | | 3.60 | % | | 0.85 | % | | 68.69 | % |
Year Ended September 30, 2006 | | $ | 10.47 | | 0.37 | | | — | (e) | | 0.37 | | (0.37 | ) | | (0.18 | ) | | (0.55 | ) | | $ | 10.29 | | 3.66 | % | | $ | 15,426 | | 0.69 | % | | 3.58 | % | | 0.86 | % | | 80.24 | % |
Year Ended September 30, 2005 | | $ | 10.74 | | 0.36 | | | (0.19 | ) | | 0.17 | | (0.36 | ) | | (0.08 | ) | | (0.44 | ) | | $ | 10.47 | | 1.62 | % | | $ | 16,468 | | 0.71 | % | | 3.44 | % | | 0.93 | % | | 56.03 | % |
Year Ended September 30, 2004 | | $ | 10.81 | | 0.35 | | | (0.06 | ) | | 0.29 | | (0.35 | ) | | (0.01 | ) | | (0.36 | ) | | $ | 10.74 | | 2.77 | % | | $ | 17,488 | | 0.75 | % | | 3.26 | % | | 0.94 | % | | 32.63 | % |
Year Ended September 30, 2003 | | $ | 10.81 | | 0.35 | | | — | (e) | | 0.35 | | (0.35 | ) | | — | | | (0.35 | ) | | $ | 10.81 | | 3.35 | % | | $ | 18,297 | | 0.72 | % | | 3.31 | % | | 0.93 | % | | 32.04 | % |
Virginia Intermediate Tax-Free Fund | | | | | | | | | | | | | | | | | | | | | | | | | | | | | | | | | | | | | | | | | |
Year Ended September 30, 2007 | | $ | 11.39 | | 0.41 | (c) | | (0.05 | ) | | 0.36 | | (0.42 | ) | | (0.02 | ) | | (0.44 | ) | | $ | 11.31 | | 3.21 | % | | $ | 68,911 | | 0.66 | % | | 3.64 | % | | 0.81 | % | | 85.36 | % |
Year Ended September 30, 2006 | | $ | 11.49 | | 0.42 | | | (0.04 | ) | | 0.38 | | (0.42 | ) | | (0.06 | ) | | (0.48 | ) | | $ | 11.39 | | 3.49 | % | | $ | 65,652 | | 0.65 | % | | 3.80 | % | | 0.80 | % | | 76.53 | % |
Year Ended September 30, 2005 | | $ | 11.74 | | 0.42 | | | (0.23 | ) | | 0.19 | | (0.42 | ) | | (0.02 | ) | | (0.44 | ) | | $ | 11.49 | | 1.66 | % | | $ | 67,579 | | 0.68 | % | | 3.60 | % | | 0.86 | % | | 48.04 | % |
Year Ended September 30, 2004 | | $ | 11.95 | | 0.40 | | | (0.13 | ) | | 0.27 | | (0.40 | ) | | (0.08 | ) | | (0.48 | ) | | $ | 11.74 | | 2.29 | % | | $ | 68,786 | | 0.76 | % | | 3.37 | % | | 0.93 | % | | 45.07 | % |
Year Ended September 30, 2003 | | $ | 11.99 | | 0.39 | | | — | (e) | | 0.39 | | (0.39 | ) | | (0.04 | ) | | (0.43 | ) | | $ | 11.95 | | 3.31 | % | | $ | 77,577 | | 0.78 | % | | 3.28 | % | | 0.92 | % | | 34.17 | % |
West Virginia Intermediate Tax-Free Fund | | | | | | | | | | | | | | | | | | | | | | | | | | | | | | | | | | | | | | | | | |
Year Ended September 30, 2007 | | $ | 9.80 | | 0.37 | (c) | | (0.05 | ) | | 0.32 | | (0.37 | ) | | (0.03 | ) | | (0.40 | ) | | $ | 9.72 | | 3.37 | % | | $ | 52,518 | | 0.66 | % | | 3.85 | % | | 0.66 | % | | 49.60 | % |
Year Ended September 30, 2006 | | $ | 9.86 | | 0.40 | | | (0.01 | ) | | 0.39 | | (0.39 | ) | | (0.06 | ) | | (0.45 | ) | | $ | 9.80 | | 4.10 | % | | $ | 50,916 | | 0.65 | % | | 4.03 | % | | 0.65 | % | | 50.14 | % |
Year Ended September 30, 2005 | | $ | 10.09 | | 0.37 | (c) | | (0.15 | ) | | 0.22 | | (0.37 | ) | | (0.08 | ) | | (0.45 | ) | | $ | 9.86 | | 2.22 | % | | $ | 55,662 | | 0.68 | % | | 3.74 | % | | 0.72 | % | | 32.10 | % |
Year Ended September 30, 2004 | | $ | 10.21 | | 0.36 | | | (0.09 | ) | | 0.27 | | (0.35 | ) | | (0.04 | ) | | (0.39 | ) | | $ | 10.09 | | 2.76 | % | | $ | 63,518 | | 0.76 | % | | 3.49 | % | | 0.78 | % | | 16.24 | % |
Year Ended September 30, 2003 | | $ | 10.35 | | 0.35 | | | 0.02 | | | 0.37 | | (0.35 | ) | | (0.16 | ) | | (0.51 | ) | | $ | 10.21 | | 3.77 | % | | $ | 79,361 | | 0.73 | % | | 3.48 | % | | 0.76 | % | | 25.59 | % |
| * | During the period certain fees were reduced. If such reductions had not occurred, the ratios would have been as indicated. |
| ** | Portfolio turnover rate is calculated on the basis of the Fund as a whole without distinguishing between classes of shares issued. |
| (a) | Not annualized for periods less than one year. |
| (b) | Annualized for periods less than one year. |
| (c) | Per share net investment income (loss) has been calculated using the average daily shares method. |
| (d) | Period from commencement of operations. |
| (e) | Amount is less than $0.005. |
See accompanying notes to the financial statements.
116
BB&T Funds
Financial Highlights, Institutional Shares
Selected data for a share of beneficial interest outstanding throughout the periods indicated.
| | | | | | | | | | | | | | | | | | | | | | | | | | | | | | | | | | | | | | | | | |
| | | | | Investment Activities | | Distributions | | | | | | | | Ratios/Supplementary Data | |
| | | Net Asset
Value,
Beginning
of Period | | Net
investment
income
(loss) | | | Net
realized/
unrealized
gains
(losses) on
investments | | | Total from
Investment
Activities | | Net
investment
income | | | Net
realized
gains on
investments | | | Total
Distributions | | | Net
Asset
Value,
End
of
Period | | Total
Return (a) | | | Net
Assets,
End of
Period
(000) | | Ratio of
net
expenses
to
average
net
assets
(b) | | | Ratio of
net
investment
income
(loss) to
average
net assets
(b) | | | Ratio of
expenses
to
average
net
assets*(b) | | | Portfolio
turnover
rate** | |
National Tax-Free Money Market Fund | | | | | | | | | | | | | | | | | | | | | | | | | | | | | | | | | | | | | | | | | |
Year Ended September 30, 2007 | | $ | 1.00 | | 0.03 | (c) | | — | | | 0.03 | | (0.03 | ) | | — | | | (0.03 | ) | | $ | 1.00 | | 3.33 | % | | $ | 109,590 | | 0.41 | % | | 3.28 | % | | 0.46 | % | | — | |
August 1, 2006 to September 30, 2006 | | $ | 1.00 | | 0.01 | | | — | | | 0.01 | | (0.01 | ) | | — | | | (0.01 | ) | | $ | 1.00 | | 0.53 | % | | $ | 95,757 | | 0.40 | % | | 3.14 | % | | 0.79 | % | | — | |
Prime Money Market Fund | | | | | | | | | | | | | | | | | | | | | | | | | | | | | | | | | | | | | | | | | |
Year Ended September 30, 2007 | | $ | 1.00 | | 0.05 | (c) | | — | | | 0.05 | | (0.05 | ) | | — | | | (0.05 | ) | | $ | 1.00 | | 5.03 | % | | $ | 788,160 | | 0.48 | % | | 4.92 | % | | 0.60 | % | | — | |
Year Ended September 30, 2006 | | $ | 1.00 | | 0.04 | | | — | (d) | | 0.04 | | (0.04 | ) | | — | | | (0.04 | ) | | $ | 1.00 | | 4.38 | % | | $ | 731,616 | | 0.48 | % | | 4.34 | % | | 0.59 | % | | — | |
Year Ended September 30, 2005 | | $ | 1.00 | | 0.02 | | | — | (d) | | 0.02 | | (0.02 | ) | | — | | | (0.02 | ) | | $ | 1.00 | | 2.34 | % | | $ | 510,941 | | 0.49 | % | | 2.31 | % | | 0.63 | % | | — | |
Year Ended September 30, 2004 | | $ | 1.00 | | 0.01 | | | — | | | 0.01 | | (0.01 | ) | | — | | | (0.01 | ) | | $ | 1.00 | | 0.70 | % | | $ | 529,849 | | 0.57 | % | | 0.69 | % | | 0.70 | % | | — | |
Year Ended September 30, 2003 | | $ | 1.00 | | 0.01 | | | — | | | 0.01 | | (0.01 | ) | | — | | | (0.01 | ) | | $ | 1.00 | | 0.87 | % | | $ | 667,534 | | 0.60 | % | | 0.86 | % | | 0.69 | % | | — | |
U.S. Treasury Money Market Fund | | | | | | | | | | | | | | | | | | | | | | | | | | | | | | | | | | | | | | | | | |
Year Ended September 30, 2007 | | $ | 1.00 | | 0.05 | (c) | | — | | | 0.05 | | (0.05 | ) | | — | | | (0.05 | ) | | $ | 1.00 | | 4.72 | % | | $ | 557,282 | | 0.46 | % | | 4.62 | % | | 0.60 | % | | — | |
Year Ended September 30, 2006 | | $ | 1.00 | | 0.04 | | | — | | | 0.04 | | (0.04 | ) | | — | | | (0.04 | ) | | $ | 1.00 | | 4.15 | % | | $ | 481,484 | | 0.46 | % | | 4.04 | % | | 0.59 | % | | — | |
Year Ended September 30, 2005 | | $ | 1.00 | | 0.02 | | | — | | | 0.02 | | (0.02 | ) | | — | | | (0.02 | ) | | $ | 1.00 | | 2.11 | % | | $ | 592,736 | | 0.48 | % | | 2.02 | % | | 0.64 | % | | — | |
Year Ended September 30, 2004 | | $ | 1.00 | | 0.01 | | | — | | | 0.01 | | (0.01 | ) | | — | | | (0.01 | ) | | $ | 1.00 | | 0.54 | % | | $ | 926,162 | | 0.57 | % | | 0.53 | % | | 0.71 | % | | — | |
Year Ended September 30, 2003 | | $ | 1.00 | | 0.01 | | | — | | | 0.01 | | (0.01 | ) | | — | | | (0.01 | ) | | $ | 1.00 | | 0.67 | % | | $ | 838,022 | | 0.61 | % | | 0.67 | % | | 0.70 | % | | — | |
Capital Manager Conservative Growth Fund*** | | | | | | | | | | | | | | | | | | | | | | | | | | | | | | | | | | | | | | | | | |
Year Ended September 30, 2007 | | $ | 10.04 | | 0.38 | (c) | | 0.53 | | | 0.91 | | (0.33 | ) | | — | | | (0.33 | ) | | $ | 10.62 | | 9.16 | % | | $ | 47,520 | | 0.10 | % | | 3.62 | % | | 0.41 | % | | 29.58 | % |
Year Ended September 30, 2006 | | $ | 9.83 | | 0.33 | (c) | | 0.24 | | | 0.57 | | (0.36 | ) | | — | | | (0.36 | ) | | $ | 10.04 | | 5.87 | % | | $ | 47,046 | | 0.08 | % | | 3.35 | % | | 0.45 | % | | 5.69 | % |
Year Ended September 30, 2005 | | $ | 9.36 | | 0.26 | | | 0.46 | | | 0.72 | | (0.25 | ) | | — | | | (0.25 | ) | | $ | 9.83 | | 7.70 | % | | $ | 71,796 | | 0.20 | % | | 2.64 | % | | 0.51 | % | | 52.50 | % |
Year Ended September 30, 2004 | | $ | 8.90 | | 0.18 | (c) | | 0.46 | | | 0.64 | | (0.18 | ) | | — | | | (0.18 | ) | | $ | 9.36 | | 7.16 | % | | $ | 67,925 | | 0.44 | % | | 1.93 | % | | 0.64 | % | | 2.47 | % |
Year Ended September 30, 2003 | | $ | 8.33 | | 0.18 | | | 0.61 | | | 0.79 | | (0.18 | ) | | (0.04 | ) | | (0.22 | ) | | $ | 8.90 | | 9.55 | % | | $ | 31,748 | | 0.53 | % | | 2.09 | % | | 0.73 | % | | 33.03 | % |
Capital Manager Moderate Growth Fund*** | | | | | | | | | | | | | | | | | | | | | | | | | | | | | | | | | | | | | | | | | |
Year Ended September 30, 2007 | | $ | 10.25 | | 0.32 | (c) | | 0.88 | | | 1.20 | | (0.24 | ) | | (0.22 | ) | | (0.46 | ) | | $ | 10.99 | | 11.80 | % | | $ | 28,961 | | 0.11 | % | | 3.02 | % | | 0.42 | % | | 40.05 | % |
Year Ended September 30, 2006 | | $ | 9.83 | | 0.27 | (c) | | 0.43 | | | 0.70 | | (0.28 | ) | | — | | | (0.28 | ) | | $ | 10.25 | | 7.33 | % | | $ | 25,699 | | 0.10 | % | | 2.65 | % | | 0.47 | % | | 7.33 | % |
Year Ended September 30, 2005 | | $ | 9.04 | | 0.19 | (c) | | 0.77 | | | 0.96 | | (0.17 | ) | | — | | | (0.17 | ) | | $ | 9.83 | | 10.69 | % | | $ | 43,353 | | 0.23 | % | | 2.01 | % | | 0.56 | % | | 37.83 | % |
Year Ended September 30, 2004 | | $ | 8.30 | | 0.10 | (c) | | 0.74 | | | 0.84 | | (0.10 | ) | | — | | | (0.10 | ) | | $ | 9.04 | | 10.12 | % | | $ | 33,971 | | 0.49 | % | | 1.17 | % | | 0.69 | % | | 0.17 | % |
Year Ended September 30, 2003 | | $ | 7.47 | | 0.10 | | | 0.82 | | | 0.92 | | (0.08 | ) | | (0.01 | ) | | (0.09 | ) | | $ | 8.30 | | 12.40 | % | | $ | 26,168 | | 0.50 | % | | 1.35 | % | | 0.70 | % | | 21.46 | % |
Capital Manager Growth Fund*** | | | | | | | | | | | | | | | | | | | | | | | | | | | | | | | | | | | | | | | | | |
Year Ended September 30, 2007 | | $ | 10.24 | | 0.27 | (c) | | 1.08 | | | 1.35 | | (0.18 | ) | | (0.27 | ) | | (0.45 | ) | | $ | 11.14 | | 13.45 | % | | $ | 24,259 | | 0.11 | % | | 2.50 | % | | 0.43 | % | | 44.48 | % |
Year Ended September 30, 2006 | | $ | 9.69 | | 0.22 | (c) | | 0.57 | | | 0.79 | | (0.24 | ) | | — | | | (0.24 | ) | | $ | 10.24 | | 8.22 | % | | $ | 20,243 | | 0.11 | % | | 2.24 | % | | 0.48 | % | | 6.26 | % |
Year Ended September 30, 2005 | | $ | 8.70 | | 0.15 | (c) | | 0.97 | | | 1.12 | | (0.13 | ) | | — | | | (0.13 | ) | | $ | 9.69 | | 12.89 | % | | $ | 37,546 | | 0.23 | % | | 1.60 | % | | 0.57 | % | | 26.22 | % |
Year Ended September 30, 2004 | | $ | 7.81 | | 0.07 | (c) | | 0.88 | | | 0.95 | | (0.06 | ) | | — | | | (0.06 | ) | | $ | 8.70 | | 12.10 | % | | $ | 28,660 | | 0.50 | % | | 0.77 | % | | 0.73 | % | | 0.19 | % |
Year Ended September 30, 2003 | | $ | 6.87 | | 0.06 | (c) | | 0.93 | | | 0.99 | | (0.05 | ) | | — | | | (0.05 | ) | | $ | 7.81 | | 14.49 | % | | $ | 21,484 | | 0.56 | % | | 0.82 | % | | 0.76 | % | | 17.80 | % |
Capital Manager Equity Fund*** | | | | | | | | | | | | | | | | | | | | | | | | | | | | | | | | | | | | | | | | | |
Year Ended September 30, 2007 | | $ | 11.65 | | 0.25 | (c) | | 1.42 | | | 1.67 | | (0.12 | ) | | (0.85 | ) | | (0.97 | ) | | $ | 12.35 | | 14.98 | % | | $ | 20,832 | | 0.12 | % | | 2.12 | % | | 0.43 | % | | 48.80 | % |
Year Ended September 30, 2006 | | $ | 11.02 | | 0.20 | (c) | | 0.84 | | | 1.04 | | (0.22 | ) | | (0.19 | ) | | (0.41 | ) | | $ | 11.65 | | 9.66 | % | | $ | 14,837 | | 0.11 | % | | 1.75 | % | | 0.47 | % | | 1.48 | % |
Year Ended September 30, 2005 | | $ | 9.64 | | 0.12 | (c) | | 1.34 | | | 1.46 | | (0.08 | ) | | — | | | (0.08 | ) | | $ | 11.02 | | 15.23 | % | | $ | 25,802 | | 0.22 | % | | 1.10 | % | | 0.58 | % | | 2.14 | % |
Year Ended September 30, 2004 | | $ | 8.49 | | 0.04 | (c) | | 1.14 | | | 1.18 | | (0.03 | ) | | — | | | (0.03 | ) | | $ | 9.64 | | 13.87 | % | | $ | 21,051 | | 0.52 | % | | 0.42 | % | | 0.81 | % | | 3.10 | % |
Year Ended September 30, 2003 | | $ | 7.39 | | 0.02 | (c) | | 1.15 | | | 1.17 | | (0.02 | ) | | (0.05 | ) | | (0.07 | ) | | $ | 8.49 | | 15.82 | % | | $ | 16,077 | | 0.70 | % | | 0.29 | % | | 0.90 | % | | 8.30 | % |
| * | During the period certain fees were reduced. If such reductions had not occurred, the ratios would have been as indicated. |
| ** | Portfolio turnover rate is calculated on the basis of the Fund as a whole without distinguishing between classes of shares issued. |
| *** | The expense ratios exclude the impact of fees/expenses paid by each underlying fund. |
| (a) | Not annualized for periods less than one year. |
| (b) | Annualized for periods less than one year. |
| (c) | Per share net investment income (loss) has been calculated using the average daily shares method. |
| (d) | Amount is less than $0.005. |
See accompanying notes to the financial statements.
117
BB&T Funds
Notes to Financial Statements
September 30, 2007
The BB&T Funds (the “Trust”) commenced operations on October 5, 1992 and is registered under the Investment Company Act of 1940, as amended (“the 1940 Act”), as an open-end investment company established as a Massachusetts business trust.
As of the date of these financial statements, the Trust offers shares of the Large Cap Fund, the Mid Cap Value Fund, the Mid Cap Growth Fund, the Small Cap Fund, the International Equity Fund, the Special Opportunities Equity Fund, the Equity Income Fund, the Short U.S. Government Fund, the Intermediate U.S. Government Fund, the Total Return Bond Fund, the Kentucky Intermediate Tax-Free Fund, the Maryland Intermediate Tax-Free Fund, the North Carolina Intermediate Tax-Free Fund, the South Carolina Intermediate Tax-Free Fund, the Virginia Intermediate Tax-Free Fund, the West Virginia Intermediate Tax-Free Fund, the Equity Index Fund, the Sterling Capital Small Cap Value Fund, the National Tax-Free Money Market Fund, the Prime Money Market Fund, the U.S. Treasury Money Market Fund, the Capital Manager Conservative Growth Fund, the Capital Manager Moderate Growth Fund, the Capital Manager Growth Fund and the Capital Manager Equity Fund (referred to individually as a “Fund” and collectively, the “Funds”). The Large Cap Growth Fund merged into the Large Cap Fund on January 29, 2007. The Equity Index Fund and the Sterling Capital Small Cap Value Fund are not included in these financial statements. The Kentucky IntermediateTax-Free Fund, the Maryland IntermediateTax-Free Fund, the North Carolina Intermediate Tax-Free Fund, the South Carolina Intermediate Tax-Free Fund, the Virginia Intermediate Tax-Free Fund and the West Virginia Intermediate Tax-Free Fund are referred to as the “Tax-Free Funds”. The National Tax-Free Money Market Fund, the Prime Money Market Fund and the U.S. Treasury Money Market Fund are referred to as the “Money Market Funds”. The Capital Manager Conservative Growth Fund, the Capital Manager Moderate Growth Fund, the Capital Manager Growth Fund and the Capital Manager Equity Fund are referred to as the “Funds of Funds”. The Funds, excluding the Money Market Funds and the Fund of Funds, are referred to as the “Variable Net Asset Value Funds”. The Funds of Funds invest in underlying mutual funds as opposed to individual securities.
All Funds except the Tax-Free Funds are diversified funds under the 1940 Act. The Tax-Free Funds are non-diversified funds, which means they may concentrate their investments in the securities of a limited number of issuers.
The Funds are authorized to issue an unlimited amount of shares without par value. The Funds offer up to four classes of shares: Class A Shares, Class B Shares, Class C Shares and Institutional Shares. As of September 30, 2007, Class B Shares and Class C Shares of the Short U.S. Government Fund and the Tax-Free Funds were not yet being offered. Class A Shares of the Variable Net Asset Value Funds and Fund of Funds, excluding the Short U.S. Government Fund, have a maximum sales charge of 5.75% as a percentage of original purchase price. The Class A Shares of the Tax-Free Funds and the Short U.S. Government Fund have a maximum sales charge of 3.00% as a percentage of the original purchase price. Prior to February 1, 2007 certain purchases of Class A Shares of $1 million or more were not subject to a front-end sales charge, but were subject to a contingent deferred sales charge (“CDSC”) of 1.00% of the purchase price if redeemed less than one year after purchase. Beginning February 1, 2007, purchases of Class A Shares of $1 million or more are not subject to a front-end sales charge but will be subject to a CDSC of 1.00% of the purchase price if redeemed within two years after purchase. In addition, effective September 25, 2007, a CDSC of up to 1.00% of the purchase price of ClassA Shares will be charged to the following shareholders who received a sales charge waiver and then redeem their shares within two years after purchase: (i) employees of BB&T Funds, BB&T Corporation and its affiliates, and (ii) shareholders who purchased shares with proceeds from redemptions from another mutual fund complex within 60 days of redemption if a sales charge was paid on such shares. The Class B Shares of the Funds are offered without any front-end sales charge but will be subject to a CDSC ranging from a maximum of 5.00% if redeemed less than one year after purchase to 0.00% if redeemed more than six years after purchase. The Class C Shares of the Funds are offered without any front-end sales charge but will be subject to a maximum CDSC of 1.00% if redeemed less than one year after purchase.
Each class of shares has identical rights and privileges except with respect to the fees paid under the distribution plan, voting rights on matters affecting a single class of shares and the exchange privilege of each class of shares.
During the fiscal year ended September 30, 2007, the Large Cap Fund, the Mid Cap Value Fund, the Mid Cap Growth Fund, the Small Cap Fund, the Special Opportunities Equity Fund, the Equity Income Fund and the Total Return Bond Fund delivered securities of the Funds in exchange for the redemption of Institutional Shares (redemption-in-kind). Cash and securities were transferred for redemptions at a fair value of $159,797,822; $44,928,162; $4,369,050; $36,915,500; $47,569,737; $29,028,828 and $17,197,462 for the Large Cap Fund, the Mid Cap Value Fund, the Mid Cap Growth Fund, the Small Cap Fund, the Special Opportunities Equity Fund, the Equity Income Fund and the Total Return Bond Fund, respectively. For financial reporting
118
BB&T Funds
Notes to Financial Statements — (continued)
September 30, 2007
purposes, the Large Cap Fund, the Mid CapValue Fund, the Mid Cap Growth Fund, the Small Cap Fund, the Special Opportunities Equity Fund, the Equity Income Fund and the Total Return Bond Fund recorded net realized gains and losses of $20,139,921; $1,220,176; $1,671,807; $(599,283), $6,293,003; $2,474,383 and $4,401, respectively, in connection with the transactions. However, for tax purposes, the transactions received tax-free treatment.These permanent book to tax differences were reclassified within the components of net assets in accordance with the Funds’ accounting policies more fully disclosed in Note 2.
Under the Trust’s organizational documents, its Officers and Trustees are indemnified against certain liabilities arising out of the performance of their duties to the Trust. In addition, in the normal course of business, the Funds may enter into contracts with their vendors and others that provide for general indemnifications.The Funds’maximum exposure under these arrangements is unknown as this would involve future claims that may be made against the Funds. However, based on experience, the Funds expect that risk of loss to be remote.
| 2. | Significant Accounting Policies: |
The following is a summary of significant accounting policies followed by the Funds in the preparation of their financial statements.The policies are in conformity with United States generally accepted accounting principles (“GAAP”).The preparation of financial statements requires management to make estimates and assumptions that affect the reported amounts of assets and liabilities and disclosure of contingent assets and liabilities at the date of the financial statements and the reported amounts of income and expenses for the reporting period. Actual results could differ from those estimates.
Recent accounting standards — In September 2006, the Financial Accounting Standards Board (“FASB”) issued Statement on Financial Accounting Standards No. 157, “Fair Value Measurements” (“SFAS No. 157”). This standard establishes a single authoritative definition of fair value, sets out a framework for measuring fair value and requires additional disclosures about fair value measurements. SFAS No. 157 applies to fair value measurements already required or permitted by existing standards. SFAS No. 157 is effective for financial statements issued for fiscal years beginning after November 15, 2007 and interim periods within those fiscal years. The changes to current GAAP from the application of SFAS No. 157 relate to the definition of fair value, the methods used to measure fair value, and the expanded disclosures about fair value measurements. As of September 30, 2007, the Funds do not believe the adoption of SFAS No. 157 will impact the financial statement amounts, however, additional disclosures may be required about the inputs used to develop the measurements and the effect of certain of the measurements on changes in net assets for the period.
In July 2006, the FASB released FASB Interpretation No. 48 “Accounting for Uncertainty in Income Taxes” (“FIN 48”). FIN 48 provides guidance for how uncertain tax positions should be recognized, measured, presented and disclosed in the financial statements. FIN 48 requires the evaluation of tax positions taken or expected to be taken in the course of preparing the Funds’ tax returns to determine whether the tax positions are “more-likely-than-not” of being sustained by the applicable tax authority. Tax positions not deemed to meet the more-likely-than-not threshold would be recorded as a tax benefit or expense in the year of determination. Adoption of FIN 48 is required no later than the last business day of the first financial statement reporting period for fiscal years beginning after December 15, 2006 and is to be applied to all open tax years as of the effective date. Management has not completed their analysis on whether the adoption of FIN 48 will have an impact to the financial statements once adopted.
Securities Valuation — Investments of the Money Market Funds are valued in accordance with Rule 2a-7 of the 1940 Act, at amortized cost, which approximates fair value. Under the amortized cost method, discount or premium is amortized on a constant basis to the maturity of the security.
Investments in common stocks, commercial paper, corporate bonds, municipal securities, U.S. Government securities and U.S. Government agency securities of the Variable Net Asset Value Funds, the principal market for which is a securities exchange or an over-the-counter market, are valued at their latest available sale price (except for those securities that are traded on NASDAQ, which will be valued at the NASDAQ official closing price) or in the absence of such a price, by reference to the latest available bid price in the principal market in which such securities are normally traded. The Variable Net Asset Value Funds may also use an independent pricing service approved by the Board ofTrustees of theTrust (“Board ofTrustees”) to value certain securities. Such prices reflect fair values which may be established through the use of electronic and matrix techniques. Short-term obligations that mature in 60 days or less are valued at either amortized cost or original cost plus interest, which approximates current value. Investments in open-end investment companies, including underlying Funds invested in by the Funds of Funds, are valued at their respective net asset values as reported by such companies. Investments in closed-end investment companies
119
BB&T Funds
Notes to Financial Statements — (continued)
September 30, 2007
are valued at their fair values based upon the latest available bid prices in the principal market in which such securities are normally traded. The differences between cost and fair values of investments are reflected as either unrealized appreciation or depreciation. Securities for which market quotations are not readily available or deemed unreliable (e.g., an approved pricing service does not provide a price, a furnished price is in error, certain stale prices, or an event occurs that materially effects the furnished price) will be valued at fair value using methods determined in good faith by the Pricing Committee under the supervision of the Board of Trustees.
Fair value pricing may be used if events materially affecting the value of foreign securities occur between the time when the exchange on which they are traded closes and the time when the International Equity Fund’s net asset value is calculated; such securities may be valued at fair value in accordance with procedures adopted by the Board of Trustees. Management identifies possible fluctuation in international securities by monitoring the increase or decrease in the value of a designated benchmark index. In the event of an increase or decrease greater than predetermined levels, the International Equity Fund may use a systematic valuation model provided by an independent third party to fair value their international equity securities.
Foreign Currency Translation — The accounting records of the International Equity Fund are maintained in U.S. dollars. Foreign currency amounts are translated into U.S. dollars at the current rate of exchange to determine the fair value of investments, assets and liabilities. Purchases and sales of securities, income and expenses are translated at the prevailing rate of exchange, on the respective dates of such transactions. The International Equity Fund does not isolate that portion of the results of operations resulting from changes in foreign exchange rates on investments from fluctuations arising from changes in market prices of securities held. Such fluctuations are included with the net realized and unrealized gain or loss from investments and foreign currencies.
Risks Associated with Foreign Securities and Currencies — Investments in securities of foreign issuers carry certain risks not ordinarily associated with investments in securities of domestic issuers. Such risks include future political and economic developments; and the possible imposition of exchange controls or other foreign governmental laws and restrictions. In addition, with respect to certain countries, there is the possibility of expropriation of assets, confiscatory taxation, political or social instability or diplomatic developments which could adversely affect investments in those countries. Certain foreign investments may also be subject to foreign withholding taxes.
Forward Foreign Currency Exchange Contracts — The International Equity Fund may enter into forward foreign currency exchange contracts in connection with planned purchases or sales of securities or to hedge the U.S. dollar value of Fund securities denominated in a particular currency. The Fund could be exposed to risks if the counter-parties to the contracts are unable to meet the terms of their contracts and from unanticipated movements in the value of a foreign currency relative to the U.S. dollar. The forward foreign currency exchange contracts are adjusted by the daily exchange rate of the underlying currency and any gains or losses are recorded for financial statement purposes as unrealized gains or losses until the contract settlement date.
Futures Contracts — The Variable Net Asset Value Funds may invest in financial futures contracts for the purpose of hedging their existing securities or securities that the respective Funds intend to purchase against fluctuations in fair value caused by changes in prevailing markets. Upon entering into a financial futures contract, the Fund is required to pledge to the broker an amount of cash and/or other assets equal to a certain percentage of the contract amount (initial margin deposit). Subsequent payments, known as “variation margin,” are made or received by the Fund each day, depending on the daily fluctuations in the fair value of the underlying security. The Fund recognizes a gain or loss equal to the daily variation margin. Should market conditions move unexpectedly, the Fund may not achieve the anticipated benefits of the financial futures contracts and may realize a loss. The use of futures transactions involves the risk of imperfect correlation in movements in the price of futures contracts and the underlying hedged assets. The Funds held no financial futures contracts as of September 30, 2007.
Securities Transactions and Related Income — During the period, security transactions are accounted for no later than one business day following the trade date. For financial reporting purposes, however, security transactions are accounted for on trade date of the last business day of the reporting period. Interest income is recognized on the accrual basis and includes, where applicable, the amortization/accretion of premium or discount. Dividend income is recorded on the ex-dividend date. Gains or losses realized from sales of securities are determined by comparing the identified cost of the security lot sold with the net sales proceeds.
120
BB&T Funds
Notes to Financial Statements — (continued)
September 30, 2007
When-Issued and Forward Commitments — The Funds, with the exception of the U.S. Treasury Money Market Fund, may purchase securities on a “when-issued” basis. The Large Cap Fund, the Mid Cap Value Fund, the Mid Cap Growth Fund, the Small Cap Fund, the International Equity Fund, the Special Opportunities Equity Fund, the Equity Income Fund and the Prime Money Market Fund may also purchase or sell securities on a forward commitment basis. The Funds record when-issued securities on the trade date and pledge assets with a value at least equal to the purchase commitment for payment of the securities purchased. The value of the securities underlying when-issued or forward commitments to purchase securities, and any subsequent fluctuation in their value, is taken into account when determining the net asset value of the Funds commencing with the date the Funds agree to purchase the securities. The Funds do not accrue interest or dividends on “when-issued” securities until the underlying securities are received.
Repurchase Agreements and Collateralized Loan Agreements — The Funds may enter into agreements with member banks of the Federal Deposit Insurance Corporation and with registered broker/dealers that BB&T Asset Management, Inc. (“BB&T AM”) or a sub-advisor deemed creditworthy under guidelines approved by the Board of Trustees, subject to the seller’s agreement to repurchase such securities at a mutually agreed-upon date and price. The repurchase price generally equals the price paid by the Fund plus interest negotiated on the basis of current short-term rates, which may be more or less than the rate on the underlying Fund securities. The seller, under these types of agreements, is required to maintain the value of collateral held pursuant to the agreement at not less than the repurchase price (including accrued interest). Securities subject to repurchase are held by the Funds’ custodian, another qualified custodian, or in the Federal Reserve/Treasury book-entry system. In the event of counterparty default, the Fund has the right to use the collateral to offset losses incurred. There is potential for loss to the Fund in the event the Fund is delayed or prevented from exercising its rights to dispose of the collateral securities, including the risk of a possible decline in the fair value of the underlying securities during the period while the Fund seeks to assert its rights.
Written Options — The risk associated with purchasing an option is that the Fund pays a premium whether or not the option is exercised. Additionally, the Funds bear the risk of loss of the premium and change in fair value should the counterparty not perform under the contract. Put and call options purchased are accounted for in the same manner as other securities owned. The cost of securities acquired through the exercise of call options is increased by the premiums paid. The proceeds from securities sold through the exercise of put options are decreased by the premiums paid.
In writing an option, the Funds contract with a specified counterparty to purchase (put options written) or sell (call options written) a specified quantity (notional amount) of an underlying asset at a specified price during a specified period upon demand of the counterparty. The risk associated with writing an option is that the Funds bear the market risk of an unfavorable change in the price of an underlying asset and may be required to buy or sell an underlying asset under the contractual terms of the option at a price different from the current fair value.
The Large Cap Fund, the Mid Cap Value Fund, the Mid Cap Growth Fund, the Small Cap Fund, the International Equity Fund, the Special Opportunities Equity Fund, the Equity Income Fund and the Funds of Funds each may sell call options and the Large Cap Fund, Mid CapValue Fund, Mid Cap Growth Fund, Small Cap Fund, International Equity Fund, Special Opportunities Equity Fund, Equity Income Fund, Short U.S. Government Fund, Intermediate U.S. Government Fund and Total Return Bond Fund may purchase put options, purchase call options and write secured put options that are traded on recognized U.S. exchanges and enter into closing transactions with respect to such options. The Special Opportunities Equity Fund and the Equity Income Fund had the following transactions in call options during the year ended September 30, 2007:
| | | | | | | | | | | | | | |
| | | Special Opportunities Equity Fund | | | Equity Income Fund | |
Covered Call Options | | Number of Contracts | | | Premiums Received | | | Number of Contracts | | | Premiums Received | |
Balance at beginning of period | | 7,215 | | | $ | 910,575 | | | 1,320 | | | $ | 170,749 | |
Options written | | 25,677 | | | | 1,975,312 | | | 3,717 | | | | 293,664 | |
Options closed | | (5,587 | ) | | | (455,321 | ) | | (1,025 | ) | | | (123,372 | ) |
Options expired | | (11,988 | ) | | | (1,204,644 | ) | | (995 | ) | | | (129,344 | ) |
Options exercised | | (3,293 | ) | | | (226,768 | ) | | (840 | ) | | | (63,016 | ) |
| | | | | | | | | | | | | | |
Balance at end of period | | 12,024 | | | $ | 999,154 | | | 2,177 | | | $ | 148,681 | |
| | | | | | | | | | | | | | |
121
BB&T Funds
Notes to Financial Statements — (continued)
September 30, 2007
The following is a summary of options outstanding as of September 30, 2007:
| | | | | |
| | | Number of Contracts | | Fair Value |
Security | | | | | |
Special Opportunities Equity Fund | | | | | |
ActiVision, Inc., $22.50, 11/17/07 | | 2,299 | | $ | 229,900 |
CONSOL Energy, Inc., $60.00, 10/20/07 | | 2,358 | | | 11,790 |
Corning, Inc., $30.00, 11/17/07 | | 140 | | | 1,400 |
Noble Corp., $ 62.50, 12/22/07 | | 2,000 | | | 90,000 |
Smithfield Foods, Inc., $40.00, 1/19/08 | | 3,227 | | | 64,540 |
Weatherford International, Ltd., $70.00, 11/17/07 | | 2,000 | | | 600,000 |
| | | | | |
| | | | $ | 997,630 |
| | | | | |
Equity Income Fund | | | | | |
Federated Investors, Inc., Class B, $45.00, 1/19/08 | | 187 | | $ | 18,700 |
Nokia Corp., ADR, $40.00, 1/19/08 | | 1,990 | | | 368,150 |
| | | | | |
| | | | $ | 386,850 |
| | | | | |
Security Loans — To generate additional income, the Funds may lend up to 33 1/3% of their respective total assets pursuant to agreements requiring that the loan be continuously secured by any combination of cash, U.S. Government or U.S. Government agency securities, equal at all times to at least 100% of the fair value.
The Funds receive payments from borrowers equivalent to the dividends and interest that would have been earned on securities loaned while simultaneously seeking to earn income on the investment of collateral. Collateral is marked to market daily to provide a level of collateral at least equal to the fair value of securities lent. There may be risks of delay in recovery of the securities or even loss of rights in the collateral should the borrower of the securities fail financially. However, loans will be made only to borrowers, such as broker-dealers, banks or institutional borrowers of securities, deemed by the Funds to be of good standing and creditworthy under guidelines established by the Board of Trustees and when, in the judgment of the Funds, the consideration which can be earned currently from such securities loans justifies the attendant risks. Loans are subject to termination by the Funds or the borrower at any time and are, therefore, not considered to be illiquid investments. There were no securities on loan as of September 30, 2007.
| | | |
| | | Average Value on Loan for the period ended September 30, 2007 |
Large Cap Fund | | $ | 127,086,567 |
Mid Cap Value Fund | | | 77,065,396 |
Mid Cap Growth Fund | | | 70,228,359 |
Small Cap Fund | | | 36,076,100 |
Special Opportunities Equity Fund | | | 64,838,255 |
Equity Income Fund | | | 28,231,286 |
Short U.S. Government Fund | | | 21,642,303 |
Intermediate U.S. Government Fund | | | 70,127,869 |
Total Return Bond Fund | | | 145,233,099 |
U.S. Treasury Money Market Fund | | | 187,388,658 |
Allocation Methodology — Expenses directly attributable to a Fund are charged to that Fund. Expenses not directly attributable to a Fund are allocated proportionately among all Funds daily in relation to the net assets of each Fund or on another reasonable basis. Each class of shares bears its pro-rata portion of expenses attributable to its series, except that each class separately bears expenses related specifically to that class, such as distribution fees. Expenses that are attributable to both the Trust and the BB&T Variable Insurance Funds are allocated across the Funds and BB&T Variable Insurance Funds, based upon relative net assets or on another reasonable basis. Income and realized and unrealized gains or losses on investments are allocated to each class of shares based on its relative net assets or another appropriate basis.
122
BB&T Funds
Notes to Financial Statements — (continued)
September 30, 2007
Distributions to Shareholders — Dividends from net investment income are declared daily and paid monthly for the Short U.S. Government Fund, the Intermediate U.S. Government Fund, the Total Return Bond Fund, the Tax-Free Funds and the Money Market Funds. Dividends from net investment income are declared and paid quarterly for the Large Cap Fund, the Mid Cap Value Fund, the Mid Cap Growth Fund, the Small Cap Fund, the International Equity Fund, the Special Opportunities Equity Fund, the Equity Income Fund and the Fund of Funds. Distributable net realized gains, if any, are declared and distributed at least annually. Distributions to shareholders which exceed net investment income and net realized gains for tax purposes are reported as distributions of capital.
The character of income and gains distributed are determined in accordance with federal income tax regulations, which may differ from GAAP. These “book/tax” differences are either considered temporary or permanent in nature. To the extent these differences are permanent in nature (e.g. reclass of redemptions-in-kind, market discounts, gain/loss, paydowns and distributions), such amounts are reclassified within the composition of net assets based on their federal tax-basis treatment; temporary differences do not require reclassification. These reclassifications have no effect on net assets or net asset values per share.
As of September 30, 2007, these reclassifications were as follows:
| | | | | | | | | | | | |
| | | Increase/
Decrease
Paid-in-Capital | | | Increase/
Decrease
Net Investment
Income(Loss) | | | Increase/
Decrease
Realized
Gain(Loss) | |
Large Cap Fund | | $ | 30,343,569 | | | $ | (1,841,896 | ) | | $ | (28,501,673 | ) |
Mid Cap Value Fund | | | 3,216,797 | | | | (124,665 | ) | | | (3,092,132 | ) |
Mid Cap Growth Fund | | | 3,427,345 | | | | 862,279 | | | | (4,289,624 | ) |
Small Cap Fund | | | (599,283 | ) | | | 14,911 | | | | 584,372 | |
International Equity Fund | | | 10,668,632 | | | | (1,692,974 | ) | | | (8,975,658 | ) |
Special Opportunities Equity Fund | | | 8,115,797 | | | | 458,801 | | | | (8,574,598 | ) |
Equity Income Fund | | | 2,949,093 | | | | 313,075 | | | | (3,262,168 | ) |
Short U.S. Government Fund | | | — | | | | (210,871 | ) | | | 210,871 | |
Intermediate U.S. Government Fund | | | — | | | | (1,722,994 | ) | | | 1,722,994 | |
Total Return Bond Fund | | | 4,401 | | | | (1,419,756 | ) | | | 1,415,355 | |
Kentucky Intermediate Tax-Free Fund | | | — | | | | 16 | | | | (16 | ) |
Maryland Intermediate Tax-Free Fund | | | — | | | | (69 | ) | | | 69 | |
North Carolina Intermediate Tax-Free Fund | | | — | | | | 40,784 | | | | (40,784 | ) |
South Carolina Intermediate Tax-Free Fund(3) | | | — | | | | (253 | ) | | | 253 | |
Virginia Intermediate Tax-Free Fund | | | — | | | | 31,807 | | | | (31,807 | ) |
West Virginia Intermediate Tax-Free Fund | | | — | | | | (17,420 | ) | | | 17,420 | |
Prime Money Market Fund | | | — | | | | 4,947 | | | | (4,947 | ) |
Capital Manager Moderate Growth Fund | | | — | | | | 805 | | | | (805 | ) |
Federal Income Taxes — It is the policy of the Funds to continue to qualify as a regulated investment company by complying with the provisions available to certain investment companies, as defined in applicable sections of the Internal Revenue Code, and to make distributions of net investment income and net realized capital gains sufficient to relieve it from all, or substantially all, federal income taxes. Accordingly, no provision for federal income tax is required.
Redemption Fees — Effective July 24, 2006, the Funds no longer assess redemption fees. Prior to July 24, 2006, the fee was applied to shares redeemed or exchanged in the order in which they were purchased, and is retained by the Funds for the benefit of remaining shareholders to defray Fund portfolio transaction expenses and facilitate portfolio management. For financial statement purposes, these amounts are included in the Statements of Changes in Net Assets as “Proceeds from Shares Issued”. Fees for the Funds during the fiscal year ended September 30, 2006, were as follows:
| | | |
Fund | | For the Year Ended
September 30, 2006 |
Large Cap Fund | | $ | 745 |
Mid Cap Value Fund | | | 254 |
Mid Cap Growth Fund | | | 1,003 |
Small Cap Fund | | | 107 |
Special Opportunities Equity Fund | | | 2,322 |
123
BB&T Funds
Notes to Financial Statements — (continued)
September 30, 2007
| | | |
Fund | | For the Year Ended
September 30, 2006 |
Equity Income Fund | | $ | 300 |
Short U.S. Government Fund | | | 872 |
Intermediate U.S. Government Fund | | | 2,240 |
Total Return Bond Fund | | | 7,373 |
North Carolina Intermediate Tax-Free Fund | | | 386 |
West Virginia Intermediate Tax-Free Fund | | | 1,646 |
Capital Manager Conservative Growth Fund | | | 124 |
Capital Manager Growth Fund | | | 135 |
Capital Manager Equity Fund | | | 5 |
| 3 | Conversion of the Large Cap Fund and the Large Cap Growth Fund: |
On January 29, 2007, net assets of the Large Cap Growth Fund managed by BB&T AM were exchanged in a tax-free conversion for shares of the Large Cap Fund. All fees and expenses incurred by the Large Cap Growth Fund, Large Cap Fund and BB&T AM directly in connection with the consummation of the transaction were borne by BB&T AM. The following is summary of shares issued, net assets converted, net asset value per share issued and unrealized appreciation/depreciation of assets acquired as of the conversion date:
| | | | | | | | | | | | |
| | | Shares
Issued | | Net Assets
Converted | | Net Asset
Value Per
Share Issued | | Unrealized
Appreciation
(Depreciation) | |
Large Cap Fund | | | | | | | | | | | | |
A Shares | | 499,435 | | $ | 9,225,927 | | $ | 18.47 | | $ | (3,731,846 | ) |
B Shares | | 446,271 | | | 8,152,840 | | | 18.26 | | | (4,681,784 | ) |
C Shares | | 2,201 | | | 40,108 | | | 18.22 | | | (5,710 | ) |
Institutional Shares | | 7,122,489 | | | 132,004,067 | | | 18.53 | | | 11,140,426 | |
| 4 | Purchases and Sales of Securities: |
Purchases and sales of securities (excluding in-kind transactions and securities maturing less than one year from acquisition) for the fiscal year ended September 30, 2007 were as follows:
| | | | | | |
| | | Purchases | | Sales |
Large Cap Fund | | $ | 465,755,898 | | $ | 563,785,742 |
Mid Cap Value Fund | | | 182,492,860 | | | 133,373,538 |
Mid Cap Growth Fund | | | 232,398,011 | | | 207,090,892 |
Small Cap Fund | | | 48,889,345 | | | 41,148,363 |
International Equity Fund | | | 233,152,959 | | | 364,188,657 |
Special Opportunities Equity Fund | | | 207,396,218 | | | 107,849,726 |
Equity Income Fund | | | 113,058,749 | | | 48,848,963 |
Short U.S. Government Fund | | | — | | | — |
Intermediate U.S. Government Fund | | | — | | | — |
Total Return Bond Fund | | | — | | | — |
Kentucky Intermediate Tax-Free Fund | | | 10,098,696 | | | 9,534,792 |
Maryland Intermediate Tax-Free Fund | | | 14,592,647 | | | 13,847,230 |
North Carolina Intermediate Tax-Free Fund | | | 123,638,765 | | | 114,908,183 |
South Carolina Intermediate Tax-Free Fund | | | 12,027,187 | | | 15,028,876 |
Virginia Intermediate Tax-Free Fund | | | 65,232,806 | | | 64,122,699 |
West Virginia Intermediate Tax-Free Fund | | | 33,863,509 | | | 32,906,111 |
Capital Manager Conservative Growth Fund | | | 19,611,055 | | | 17,900,246 |
Capital Manager Moderate Growth Fund | | | 44,224,832 | | | 33,646,509 |
Capital Manager Growth Fund | | | 40,490,375 | | | 28,978,515 |
Capital Manager Equity Fund | | | 27,369,946 | | | 16,631,642 |
124
BB&T Funds
Notes to Financial Statements — (continued)
September 30, 2007
Purchases and sales of U.S. Government Securities (excluding in-kind transactions and securities maturing less than one year from acquisition) for the fiscal year ended September 30, 2007 were as follows:
| | | | | | |
| | | Purchases | | Sales |
Short U.S. Government Fund | | $ | 22,104,956 | | $ | 48,902,406 |
Intermediate U.S. Government Fund | | | 149,625,515 | | | 258,822,284 |
Total Return Bond Fund | | | 1,009,953,943 | | | 977,202,152 |
Restricted Securities — A restricted security is a security which has been purchased through a private offering and cannot be resold to the general public without prior registration under the Securities Act of 1933 (The “1933 Act”) or pursuant to the resale limitations provided by Rule 144 under the 1933 Act, or an exemption from the registration requirements of the 1933 Act. Whether a restricted security is illiquid is determined pursuant to guidelines established by the Board of Trustees. Not all restricted securities are considered illiquid. At September 30, 2007, the Prime Money Market Fund held illiquid restricted securities representing 6.02% of net assets. The illiquid restricted securities held as of September 30, 2007 are identified below:
| | | | | | | | | | | | | | |
Security | | Acquisition Date | | Acquisition Cost | | Principal Amount | | Carrying Value
Per Unit (% of Par) | | Fair Value |
Prime Money Market Fund | | | | | | | | | | | | | | |
Cal Securitization Trust, Series 2007-1, Class A1, 5.424%, 7/15/08 | | 6/19/2007 | | $ | 2,230,069 | | $ | 2,230,069 | | $ | 100.00 | | $ | 2,239,069 |
Genworth Life Insurance Co., 5.450%, 11/9/07 | | 5/9/2007 | | | 5,000,000 | | | 5,000,000 | | | 100.00 | | | 5,000,000 |
Goldman Sachs Group, Inc., 5.370%, 10/1/07 | | 12/15/2006 | | | 35,000,000 | | | 35,000,000 | | | 100.00 | | | 35,000,000 |
Metropolitan Life Insurance Co., 5.476%, 11/1/07 | | 8/1/2007 | | | 5,000,000 | | | 5,000,000 | | | 100.00 | | | 5,000,000 |
Monet Trust, 5.268%, 12/28/07 | | 3/28/2005 | | | 30,000,000 | | | 30,000,000 | | | 100.00 | | | 30,000,000 |
New York Life Insurance Co., 5.579%, 11/1/07 | | 8/24/2007 | | | 5,000,000 | | | 5,000,000 | | | 100.00 | | | 5,000,000 |
PYXIS Master Trust, Series 2007-6, 5.718%, 12/6/07 | | 3/6/2007 | | | 5,000,000 | | | 5,000,000 | | | 100.00 | | | 5,000,000 |
Travelers Insurance Co., 5.453%, 11/19/07 | | 8/19/2005 | | | 5,000,000 | | | 5,000,000 | | | 100.00 | | | 5,000,000 |
| 5. | Related Party Transactions: |
Investment advisory services are provided to the Funds by BB&T AM. Under the terms of the investment advisory agreement, BB&T AM is entitled to receive fees based on a percentage of the average daily net assets of the Funds. These fees are accrued daily and payable on a monthly basis and are reflected on the Statements of Operations as “Investment advisory fees”. BB&T AM waived investment advisory fees and certain expenses for the Funds referenced below which are not subject to recoupment and are included on the Statements of Operations as “Less expenses waived by the Investment Advisor”.
Information regarding these transactions is as follows for the period ended September 30, 2007:
| | | | | | | | | |
| | | Contractual
Fee Rate | | | Fee Rate after
Contractual
Waivers(1) | | | Fee Rate after
Contractual
Waivers(2)* | |
Large Cap Fund | | 0.74 | % | | 0.70 | % | | 0.70 | % |
Mid Cap Value Fund | | 0.74 | % | | 0.70 | % | | 0.70 | % |
Mid Cap Growth Fund | | 0.74 | % | | 0.70 | % | | 0.70 | % |
Small Cap Fund(3) | | 1.00 | % | | 0.80 | % | | 0.80 | % |
International Equity Fund | | 1.00 | % | | 0.90 | % | | 0.85 | % |
Special Opportunities Equity Fund | | 0.80 | % | | 0.80 | % | | 0.80 | % |
Equity Income Fund | | 0.70 | % | | 0.70 | % | | 0.70 | % |
Short U.S. Government Fund | | 0.60 | % | | 0.45 | % | | 0.45 | % |
Intermediate U.S. Government Fund | | 0.60 | % | | 0.48 | % | | 0.48 | % |
Total Return Bond Fund | | 0.60 | % | | 0.48 | % | | 0.48 | % |
Kentucky Intermediate Tax-Free Fund | | 0.60 | % | | 0.40 | % | | 0.40 | % |
Maryland Intermediate Tax-Free Fund | | 0.60 | % | | 0.30 | % | | 0.30 | % |
North Carolina Intermediate Tax-Free Fund | | 0.60 | % | | 0.45 | % | | 0.45 | % |
South Carolina Intermediate Tax-Free Fund(3) | | 0.60 | % | | 0.45 | % | | 0.45 | % |
Virginia Intermediate Tax-Free Fund | | 0.60 | % | | 0.45 | % | | 0.45 | % |
West Virginia Intermediate Tax-Free Fund | | 0.45 | % | | 0.45 | % | | 0.45 | % |
125
BB&T Funds
Notes to Financial Statements — (continued)
September 30, 2007
| | | | | | | | | |
| | | Contractual
Fee Rate | | | Fee Rate after
Contractual
Waivers(1) | | | Fee Rate after
Contractual
Waivers(2)* | |
National Tax-Free Money Market Fund | | 0.25 | % | | 0.20 | % | | 0.20 | % |
Prime Money Market Fund | | 0.40 | % | | 0.29 | % | | 0.28 | % |
U.S. Treasury Money Market Fund | | 0.40 | % | | 0.26 | % | | 0.26 | % |
Capital Manager Conservative Growth Fund | | 0.25 | % | | 0.00 | % | | 0.00 | % |
Capital Manager Moderate Growth Fund | | 0.25 | % | | 0.00 | % | | 0.00 | % |
Capital Manager Growth Fund | | 0.25 | % | | 0.00 | % | | 0.00 | % |
Capital Manager Equity Fund | | 0.25 | % | | 0.00 | % | | 0.00 | % |
| * | Effective February 1, 2007, BB&T AM contractually agreed to waive a portion of the investment advisory fee as disclosed in the table above. All contractual investment advisory fee waivers are not subject to recoupment in subsequent fiscal periods. |
(1) | For the period October 1, 2006 through January 31, 2007. |
(2) | For the period February 1, 2007 through January 31, 2008. |
(3) | For all or a portion of the fiscal year ended September 30, 2007 BB&T AM voluntarily waived additional investment advisory fees for the Small Cap Fund and South Carolina Intermediate Tax-Free Fund. All voluntary investment advisory fee waivers are not subject to recoupment in subsequent fiscal periods, and may be discontinued at any time. |
Pursuant to a sub-advisory agreement with BB&T AM, Julius Baer Investment Management LLC (“JBIM”) serves as the sub-advisor to the International Equity Fund, subject to the general supervision of the Funds’ Board of Trustees and BB&T AM. Pursuant to a sub-advisory agreement with BB&T AM, Federated Investment Management Company (“Federated ICM”) serves as the sub-advisor to the Prime Money Market Fund and the National Tax-Free Money Market Fund, subject to the general supervision of the Funds’ Board of Trustees and BB&T AM. Pursuant to a sub-advisory agreement with BB&T AM, Scott & Stringfellow, Inc., a wholly owned subsidiary of BB&T Corporation, serves as the sub-advisor to the Special Opportunities Equity Fund and the Equity Income Fund, subject to the general supervision of the Funds’ Board of Trustees and BB&T AM. Pursuant to a sub-advisory agreement with BB&T AM, Sterling Capital Management LLC, a wholly owned subsidiary of BB&T Corporation, serves as the sub-advisor to the Mid Cap Value Fund and the Total Return Bond Fund, subject to the general supervision of the Funds’ Board of Trustees and BB&T AM. For their services, sub-advisors are entitled to a fee, payable by BB&T AM.
BB&T AM serves as the administrator to the Funds pursuant to the administration agreement. The Funds pay their portion of a fee to BB&T AM for providing administration services based on the aggregate assets of the Funds and the BB&T Variable Insurance Funds at a rate of 0.11% on the first $3.5 billion of average net assets; 0.075% on the next $1 billion of average net assets; 0.06% on the next $1.5 billion of average net assets; and 0.04% of average net assets over $6 billion. This fee is accrued daily and payable on a monthly basis. Expenses incurred are reflected on the Statements of Operations as “Administration fees”. During the fiscal year ended September 30, 2007, BB&TAM voluntarily waived administration fees of $40,328, $54,904, $42,758 and $21,673, respectively, of the Capital Manager Conservative Growth Fund, the Capital Manager Moderate Growth Fund, the Capital Manager Growth Fund and the Capital Manager Equity Fund. Administration fee waivers are included on the Statements of Operations as “Less expenses waived by the Administrator” and these waivers are not subject to recoupment in subsequent fiscal periods. Effective April 23, 2007, pursuant to a sub-administration agreement with BB&T AM, PFPC Inc. (“PFPC”) serves as the sub-administrator to the Funds subject to the general supervision of the Board and BB&T AM. For these services, PFPC is entitled to a fee, payable by BB&T AM. Prior to April 23, 2007, Citi Fund Services (“Citi”), formerly known as BISYS Fund Services Ohio, Inc. served as sub-administrator to the Funds.
Effective April 23, 2007. PFPC serves as the Funds’ fund accountant and transfer agent and receives compensation by the Funds for these services. Expenses incurred are reflected on the Statements of Operations as “Fund accounting fees” and “Transfer agent fees”. Prior to April 23, 2007, Citi served as the Funds’ fund accountant and transfer agent.
On April 23, 2007, BB&T AM’s Chief Compliance Officer (“CCO”) also began to serve as the Funds’ CCO. Since April 23, 2007, the CCO’s compensation is reviewed and approved by the Funds’ Board and paid by BB&T AM. However, the Funds reimburse BB&T AM for their allocable portion of the CCO’s salary. Prior to April 23, 2007, under a Compliance Services Agreement between the Funds and Citi (the “CCO Agreement”), Citi made an employee available to serve as the Funds CCO. For these services under the CCO Agreement, the Funds paid Citi $57,175 for the reporting fiscal year ended September 30, 2007, plus certain out of pocket expenses. Expenses incurred for the Funds are reflected on the Statements of Operations as “Compliance service fees”.
126
BB&T Funds
Notes to Financial Statements — (continued)
September 30, 2007
For the year ended September 30, 2007, the Funds’ paid $343,993 in brokerage fees to Scott & Stringfellow, Inc., a wholly owned subsidiary of BB&T Corporation, on the execution of purchases and sales of the Funds’ portfolio investments.
EffectiveApril 23, 2007, BB&TAM Distributors, Inc. (“BBTAMD”) serves as distributor to each Fund pursuant to a Underwriting Agreement (the “Underwriting Agreement”). BBTAMD has contractually agreed to waive a portion of the Class A shares distribution fees throughout the year. BBTAMD has contractually agreed to waive 0.25% of the Class A distribution fees of the Funds except for the Mid Cap Value Fund, Mid Cap Growth Fund, West Virginia Intermediate Tax-Free Fund, Prime Money Market Fund and the U.S. Treasury Money Market Fund. Distribution fees totaling $989,660 were waived for the period ended September 30, 2007. Distribution fee waivers are included in the Statements of Operations as “Less expenses waived by the Distributor” and these waivers are not subject to recoupment in subsequent fiscal periods. Prior to April 23, 2007, BB&T Funds Distributor, Inc. served as distributor to each Fund pursuant to a Underwriting Agreement dated November 1, 2005.
The Funds have adopted a Distribution and Shareholder Services Plan (the “Plan”) in accordance with Rule 12b-1 under the 1940 Act. The Plan provides for payments to the distributor of up to 0.50%, 1.00% and 1.00% of the average daily net assets of the Class A Shares, Class B Shares, and Class C Shares, respectively, with exception of the Mid Cap Value Fund, the Mid Cap Growth Fund and the West Virginia Intermediate Tax-Free Fund which receives payments of up to 0.25% of the average daily net assets for Class A. The fees may be used by BBTAMD to pay banks, broker dealers and other institutions, including affiliates of the advisor. As distributor, BBTAMD, is entitled to receive commissions on sales of shares of the Variable Net Asset Value Funds. For the period ended September 30, 2007, BBTAMD received $1,186,537 from commissions earned on sales of shares of the Funds’Variable Net Asset Value Funds. Commissions paid to affiliated broker-dealers during the fiscal year ended September 30, 2007 were $2,827,211.
The Adviser and/or its affiliates may pay out of their own assets compensation to broker-dealers and other persons for the sale and distribution of the shares and/or for the servicing of the shares. These are additional payments over and above the sales charge (including Rule 12b-1 fees) and service fees paid by the Funds. The payments, which may be different for different financial institutions, will not change the price an investor will pay for shares or the amount that a Fund will receive for the sale of shares.
Certain Officers and Trustees of the Funds are affiliated with the adviser, the administrator, or the sub-administrator. Such Officers andTrustees receive no compensation from the Funds for serving in their respective roles. Each of the five non-interested Trustees who serve on both the Board and the Audit Committee are compensated $6,000 per quarter and $2,400 for each regularly scheduled meeting, plus reimbursement for certain expenses. During the year ended September 30, 2007, actual Trustee compensation was $247,952 in total.
| 6. | Concentration of Credit Risk: |
The Tax-Free Funds invest primarily in debt instruments of municipal issuers in their respective states. The issuers’ abilities to meet their obligations may be affected by economic developments in a specific state or region.
U.S. Bank, N.A. has made available a credit facility to the Funds, pursuant to a Credit Agreement (the “Agreement”). The primary purpose of the Agreement is to allow the Funds to avoid security liquidation that BB&T AM believes are unfavorable to shareholders. Outstanding principal amounts under the Agreement bear interest at an interest rate equal to the Prime Rate minus 2.00%. There were no open lines of credit at September 30, 2007. During the period ended September 30, 2007 the following Funds utilized lines of credit:
| | | | | | | | | | | | | | |
Fund | | Average
Interest Rate | | | Average
Loan Balance | | Number of
Days Outstanding | | Interest Expense
Incurred | | Maximum Amount
Borrowed During the Period |
Kentucky Intermediate Tax-Free Fund | | 6.25 | % | | $ | 38,800 | | 5 | | $ | 34 | | $ | 69,000 |
Maryland Intermediate Tax-Free Fund | | 6.25 | % | | | 649,500 | | 4 | | | 450 | | | 654,000 |
North Carolina Intermediate Tax-Free Fund | | 6.25 | % | | | 194,000 | | 1 | | | 34 | | | 194,000 |
South Carolina Intermediate Tax-Free Fund | | 6.25 | % | | | 53,250 | | 4 | | | 37 | | | 76,000 |
West Virginia Intermediate Tax-Free Fund | | 6.25 | % | | | 241,500 | | 6 | | | 251 | | | 398,000 |
127
BB&T Funds
Notes to Financial Statements — (continued)
September 30, 2007
| 8. | Federal Income Tax Information: |
At September 30, 2007, the following Funds have net capital loss carryforwards available to offset future net capital gains, if any, to the extent provided by the Treasury regulations. To the extent that these carryforwards are used to offset future capital gains, it is probable that the gains that are offset will not be distributed to shareholders.
| | | | | |
| | | Amount | | Expires |
Small Cap Fund* | | $ | 4,700,830 | | 2009 |
Small Cap Fund* | | | 2,350,415 | | 2010 |
Short U.S. Government Fund | | | 349,217 | | 2008 |
Short U.S. Government Fund | | | 498,342 | | 2009 |
Short U.S. Government Fund | | | 118,919 | | 2012 |
Short U.S. Government Fund | | | 2,094,190 | | 2013 |
Short U.S. Government Fund | | | 1,246,269 | | 2014 |
Short U.S. Government Fund | | | 3,940,976 | | 2015 |
Intermediate U.S. Government Fund | | | 222,709 | | 2013 |
Intermediate U.S. Government Fund | | | 4,243,104 | | 2014 |
Intermediate U.S. Government Fund | | | 9,481,272 | | 2015 |
Total Return Bond Fund | | | 1,527,254 | | 2014 |
Total Return Bond Fund | | | 8,765,688 | | 2015 |
Kentucky Intermediate Tax-Free Fund | | | 7,545 | | 2011 |
Kentucky Intermediate Tax-Free Fund | | | 3,794 | | 2014 |
Kentucky Intermediate Tax-Free Fund | | | 5,948 | | 2015 |
Maryland Intermediate Tax-Free Fund | | | 11,780 | | 2011 |
Maryland Intermediate Tax-Free Fund | | | 113,581 | | 2013 |
| * | The amount of these losses that may be utilized are limited to $2,350,415 on annual basis as a result of certain ownership changes in 2006. |
Capital loss carryforwards utilized in the current year were $2,350,415, $636,946, $2,450 and $1,407,518 for Small Cap Fund, International Equity Fund, Maryland Intermediate Tax-Free Fund and Capital Manager Conservative Growth Fund, respectively.
The tax character of distributions paid to shareholders during the fiscal year ended September 30, 2007, were as follows:
| | | | | | | | | | | | | | | |
| | | Distributions paid from | | | | | | |
| | | Ordinary
Income | | Net Long-Term
Gains | | Total Taxable
Distributions | | Tax Exempt
Distributions | | Total
Distributions
Paid* |
Large Cap Fund | | $ | 19,031,037 | | $ | 92,472,188 | | $ | 111,503,225 | | $ | — | | $ | 111,503,225 |
Mid Cap Value Fund | | | 9,036,233 | | | 1,721,217 | | | 10,757,450 | | | — | | | 10,757,450 |
Mid Cap Growth Fund | | | 203,086 | | | 17,122,359 | | | 17,325,445 | | | — | | | 17,325,445 |
Small Cap Fund | | | 567,872 | | | 5,392,932 | | | 5,960,804 | | | — | | | 5,960,804 |
International Equity Fund | | | 2,478,568 | | | 62,383,127 | | | 64,861,695 | | | — | | | 64,861,695 |
Special Opportunities Equity Fund | | | 5,241,732 | | | 12,369,307 | | | 17,611,039 | | | — | | | 17,611,039 |
Equity Income Fund | | | 4,383,383 | | | 4,858,741 | | | 9,242,124 | | | — | | | 9,242,124 |
Short U.S. Government Fund | | | 2,310,932 | | | — | | | 2,310,932 | | | — | | | 2,310,932 |
Intermediate U.S. Government Fund | | | 8,739,525 | | | — | | | 8,739,525 | | | — | | | 8,739,525 |
Total Return Bond Fund | | | 21,203,214 | | | — | | | 21,203,214 | | | — | | | 21,203,214 |
Kentucky Intermediate Tax-Free Fund | | | 152 | | | — | | | 152 | | | 492,872 | | | 493,024 |
Maryland Intermediate Tax-Free Fund | | | 26 | | | — | | | 26 | | | 349,618 | | | 349,644 |
North Carolina Intermediate Tax-Free Fund | | | 41,099 | | | 93,127 | | | 134,226 | | | 4,024,577 | | | 4,158,803 |
South Carolina Intermediate Tax-Free Fund | | | 217 | | | 27,235 | | | 27,452 | | | 675,927 | | | 703,379 |
Virginia Intermediate Tax-Free Fund | | | 30,930 | | | 149,945 | | | 180,875 | | | 2,828,201 | | | 3,009,076 |
West Virginia Intermediate Tax-Free Fund | | | 5,787 | | | 209,596 | | | 215,383 | | | 2,632,009 | | | 2,847,392 |
National Tax Free Money Market Fund | | | — | | | — | | | — | | | 3,646,154 | | | 3,646,154 |
Prime Money Market Fund | | | 77,968,808 | | | 4,504 | | | 77,973,312 | | | — | | | 77,973,312 |
U.S. Treasury Money Market Fund | | | 33,043,638 | | | — | | | 33,043,638 | | | — | | | 33,043,638 |
Capital Manager Conservative Growth Fund | | | 1,889,653 | | | — | | | 1,889,653 | | | — | | | 1,889,653 |
Capital Manager Moderate Growth Fund | | | 1,665,967 | | | 1,744,909 | | | 3,410,876 | | | — | | | 3,410,876 |
Capital Manager Growth Fund | | | 909,564 | | | 1,662,327 | | | 2,571,891 | | | — | | | 2,571,891 |
Capital Manager Equity Fund | | | 288,761 | | | 2,319,841 | | | 2,608,602 | | | — | | | 2,608,602 |
128
BB&T Funds
Notes to Financial Statements — (continued)
September 30, 2007
The tax character of distributions paid to shareholders during the fiscal year ended September 30, 2006, were as follows:
| | | | | | | | | | | | | | | | | | |
| | | Distributions paid from | | | | | | | | |
| | | Ordinary
Income | | Net Long-Term
Gains | | Total Taxable
Distributions | | Tax Exempt
Distributions | | Current
Year
Distributions
of Earnings
and Profits | | Total
Distributions
Paid* |
Large Cap Fund | | $ | 16,180,152 | | $ | 43,804,755 | | $ | 59,984,907 | | $ | — | | $ | — | | $ | 59,984,907 |
Mid Cap Value Fund | | | 11,456,392 | | | 9,945,224 | | | 21,401,616 | | | — | | | — | | | 21,401,616 |
Mid Cap Growth Fund | | | 1,262,723 | | | 13,009,021 | | | 14,271,744 | | | — | | | 188,060 | | | 14,459,804 |
Small Cap Fund | | | 845,622 | | | 7,693,220 | | | 8,538,842 | | | — | | | 24,778 | | | 8,563,620 |
International Equity Fund | | | 2,763,161 | | | — | | | 2,763,161 | | | — | | | — | | | 2,763,161 |
Special Opportunities Equity Fund | | | 3,037,182 | | | 6,658,012 | | | 9,695,194 | | | — | | | — | | | 9,695,194 |
Equity Income Fund | | | 3,534,406 | | | 507,611 | | | 4,042,017 | | | — | | | — | | | 4,042,017 |
Short U.S. Government Fund | | | 4,796,925 | | | — | | | 4,796,925 | | | — | | | — | | | 4,796,925 |
Intermediate U.S. Government Fund | | | 20,142,563 | | | — | | | 20,142,563 | | | — | | | — | | | 20,142,563 |
Total Return Bond Fund | | | 22,226,099 | | | 2,176,080 | | | 24,402,179 | | | — | | | — | | | 24,402,179 |
Kentucky Intermediate Tax-Free Fund | | | — | | | — | | | — | | | 521,519 | | | — | | | 521,519 |
Maryland Intermediate Tax-Free Fund | | | 106 | | | — | | | 106 | | | 326,935 | | | — | | | 327,041 |
North Carolina Intermediate Tax-Free Fund | | | 104,708 | | | 911,150 | | | 1,015,858 | | | 3,962,871 | | | — | | | 4,978,729 |
South Carolina Intermediate Tax-Free Fund | | | — | | | 347,206 | | | 347,206 | | | 694,356 | | | — | | | 1,041,562 |
Virginia Intermediate Tax-Free Fund | | | — | | | 447,855 | | | 447,855 | | | 2,890,792 | | | — | | | 3,338,647 |
West Virginia Intermediate Tax-Free Fund | | | 15,699 | | | 409,576 | | | 425,275 | | | 2,631,959 | | | — | | | 3,057,234 |
National Tax-Free Money Market Fund | | | — | | | — | | | — | | | 267,647 | | | — | | | 267,647 |
Prime Money Market Fund | | | 44,000,932 | | | — | | | 44,000,932 | | | — | | | — | | | 44,000,932 |
U.S. Treasury Money Market Fund | | | 25,302,481 | | | — | | | 25,302,481 | | | — | | | — | | | 25,302,481 |
Capital Manager Conservative Growth Fund | | | 2,156,986 | | | — | | | 2,156,986 | | | — | | | — | | | 2,156,986 |
Capital Manager Moderate Growth Fund | | | 1,857,732 | | | — | | | 1,857,732 | | | — | | | — | | | 1,857,732 |
Capital Manager Growth Fund | | | 1,244,704 | | | — | | | 1,244,704 | | | — | | | — | | | 1,244,704 |
Capital Manager Equity Fund | | | 1,277,116 | | | — | | | 1,277,116 | | | — | | | — | | | 1,277,116 |
| * | Total Distributions paid may differ from the Statements of Changes in Net Assets because distributions are recognized when actually paid for tax purposes. |
As of September 30, 2007, the components of accumulated earnings (deficit) on a tax basis was as follows:
| | | | | | | | | | | | | | | | | | | | | | | | | |
| | | Undistributed
Ordinary
Income/Tax
Exempt Income | | Undistributed
Long Term
Capital Gains
(Losses) | | Accumulated
Earnings | | Distributions
Payable* | | | Accumulated
Capital and
Other Losses | | | Unrealized
Appreciation
(Depreciation)* | | | Total
Accumulated
Earnings
(Deficit) | |
Large Cap Fund | | $ | 7,440,075 | | $ | 85,278,690 | | $ | 92,718,765 | | $ | (1,397,664 | ) | | $ | — | | | $ | 90,150,699 | | | $ | 181,471,800 | |
Mid Cap Value Fund | | | 11,440,195 | | | 15,851,309 | | | 27,291,504 | | | (127,846 | ) | | | — | | | | 17,222,116 | | | | 44,385,774 | |
Mid Cap Growth Fund | | | 4,632,608 | | | 7,781,944 | | | 12,414,552 | | | — | | | | — | | | | 55,515,651 | | | | 67,930,203 | |
Small Cap Fund | | | 571,017 | | | 6,961,030 | | | 7,532,047 | | | — | | | | (7,051,245 | ) | | | 6,140,200 | | | | 6,621,002 | |
International Equity Fund | | | 3,094,012 | | | 10,334,759 | | | 13,428,771 | | | — | | | | (1,415,672 | ) | | | 15,370,027 | | | | 27,383,126 | |
Special Opportunities Equity Fund | | | 7,926,978 | | | 26,545,795 | | | 34,472,773 | | | — | | | | — | | | | 32,606,704 | | | | 67,079,477 | |
Equity Income Fund | | | 1,237,654 | | | 9,877,150 | | | 11,114,804 | | | (141,142 | ) | | | — | | | | 20,708,361 | | | | 31,682,023 | |
Short U.S. Government Fund | | | 354,665 | | | — | | | 354,665 | | | (125,354 | ) | | | (8,516,320 | ) | | | 78,365 | | | | (8,208,644 | ) |
Intermediate U.S. Government Fund | | | 1,916,687 | | | — | | | 1,916,687 | | | (326,578 | ) | | | (15,385,956 | ) | | | (1,775,697 | ) | | | (15,571,544 | ) |
Total Return Bond Fund | | | 1,673,187 | | | — | | | 1,673,187 | | | (1,127,800 | ) | | | (10,292,942 | ) | | | 1,101,003 | | | | (8,646,552 | ) |
Kentucky Intermediate Tax- Free Fund | | | 31,184 | | | — | | | 31,184 | | | (30,101 | ) | | | (17,287 | ) | | | 179,958 | | | | 163,754 | |
Maryland Intermediate Tax- Free Fund | | | 23,913 | | | — | | | 23,913 | | | (24,396 | ) | | | (125,361 | ) | | | 148,430 | | | | 22,586 | |
North Carolina Intermediate Tax-Free Fund | | | 430,498 | | | 365,041 | | | 795,539 | | | (292,238 | ) | | | — | | | | 2,202,590 | | | | 2,705,891 | |
South Carolina Intermediate Tax-Free Fund | | | 99,635 | | | 79,702 | | | 179,337 | | | (38,870 | ) | | | — | | | | 262,984 | | | | 403,451 | |
Virginia Intermediate Tax- Free Fund | | | 248,834 | | | 347,094 | | | 595,928 | | | (198,675 | ) | | | — | | | | 1,674,324 | | | | 2,071,577 | |
129
BB&T Funds
Notes to Financial Statements — (continued)
September 30, 2007
| | | | | | | | | | | | | | | | | | | | | | | | |
| | | Undistributed
Ordinary
Income/Tax
Exempt Income | | Undistributed
Long Term
Capital Gains
(Losses) | | Accumulated
Earnings | | Distributions
Payable* | | | Accumulated
Capital and
Other Losses | | | Unrealized
Appreciation
(Depreciation)* | | Total
Accumulated
Earnings
(Deficit) | |
West Virginia Intermediate Tax-Free Fund | | $ | 108,590 | | $ | 120,853 | | $ | 229,443 | | $ | (167,764 | ) | | $ | — | | | $ | 1,259,401 | | $ | 1,321,080 | |
National Tax-Free Money Market Fund | | | 316,493 | | | — | | | 316,493 | | | (316,493 | ) | | | (1,934 | ) | | | — | | | (1,934 | ) |
Prime Money Market Fund | | | 3,054,804 | | | — | | | 3,054,804 | | | (3,049,857 | ) | | | — | | | | — | | | 4,947 | |
U.S. Treasury Money Market Fund | | | 1,263,554 | | | — | | | 1,263,554 | | | (1,263,308 | ) | | | — | | | | — | | | 246 | |
Capital Manager Conservative Growth Fund | | | 351,297 | | | 4,095,911 | | | 4,447,208 | | | (5,357 | ) | | | — | | | | 3,207,440 | | | 7,649,291 | |
Capital Manager Moderate Growth Fund | | | 748,215 | | | 8,858,612 | | | 9,606,827 | | | (7,003 | ) | | | — | | | | 5,537,406 | | | 15,137,230 | |
Capital Manager Growth Fund | | | 777,765 | | | 8,405,300 | | | 9,183,065 | | | (2,602 | ) | | | — | | | | 4,024,063 | | | 13,204,526 | |
Capital Manager Equity Fund | | | 464,506 | | | 5,318,048 | | | 5,782,554 | | | (3,270 | ) | | | — | | | | 2,817,458 | | | 8,596,742 | |
| * | Distributions Payable may differ from the Statements of Assets and Liabilities because distributions are recognized when actually paid for tax purposes. The primary differences between book basis and tax basis unrealized appreciation/(depreciation) were due to the deferral of losses on wash sales, mark-to-market adjustments on passive foreign investment companies and constructive sales on hedged positions, basis adjustments on partnership interests and the deferral of market discount and premium until point of sale. |
Under current tax law, capital losses realized after October 31 of a Fund’s fiscal year may be deferred and treated as occurring on the first business day of the following fiscal year for tax purposes. The following Funds had deferred post October capital and currency losses, which will be treated as arising on the first business day of the fiscal year ending September 30, 2007:
| | | |
| | | Post-
October
Losses |
International Equity Fund | | $ | 1,415,672 |
Short U.S. Government Fund | | | 268,407 |
Intermediate U.S. Government Fund | | | 1,438,871 |
National Tax-Free Money Market Fund | | | 1,935 |
At September 30, 2007 the cost, gross unrealized appreciation and gross unrealized depreciation on securities for federal income tax purposes, were as follows:
| | | | | | | | | | | | | | |
| | | Tax Cost | | Tax Unrealized
Appreciation | | Tax Unrealized
Depreciation | | | Net
Unrealized
Appreciation
(Depreciation) | |
Large Cap Fund | | $ | 577,097,929 | | $ | 118,403,739 | | $ | (28,253,040 | ) | | $ | 90,150,699 | |
Mid Cap Value Fund | | | 251,220,976 | | | 24,532,038 | | | (7,309,922 | ) | | | 17,222,116 | |
Mid Cap Growth Fund | | | 154,282,206 | | | 59,434,002 | | | (3,918,351 | ) | | | 55,515,651 | |
Small Cap Fund | | | 87,213,849 | | | 13,329,226 | | | (7,189,026 | ) | | | 6,140,200 | |
International Equity Fund | | | 153,705,394 | | | 20,279,865 | | | (4,967,958 | ) | | | 15,311,907 | |
Special Opportunities Equity Fund | | | 302,855,335 | | | 60,064,248 | | | (27,459,068 | ) | | | 32,605,180 | |
Equity Income Fund | | | 165,992,544 | | | 24,844,153 | | | (3,897,623 | ) | | | 20,946,530 | |
Short U.S. Government Fund | | | 44,399,047 | | | 415,024 | | | (336,659 | ) | | | 78,365 | |
Intermediate U.S. Government Fund | | | 146,036,154 | | | 485,025 | | | (2,260,722 | ) | | | (1,775,697 | ) |
Total Return Bond Fund | | | 453,070,967 | | | 4,043,770 | | | (2,942,767 | ) | | | 1,101,003 | |
Kentucky Intermediate Tax-Free Fund | | | 14,867,693 | | | 195,556 | | | (15,598 | ) | | | 179,958 | |
Maryland Intermediate Tax-Free Fund | | | 10,346,950 | | | 155,153 | | | (6,723 | ) | | | 148,430 | |
North Carolina Intermediate Tax-Free Fund | | | 113,121,801 | | | 2,277,707 | | | (75,117 | ) | | | 2,202,590 | |
South Carolina Intermediate Tax-Free Fund | | | 15,996,557 | | | 295,535 | | | (32,551 | ) | | | 262,984 | |
Virginia Intermediate Tax-Free Fund | | | 76,710,277 | | | 1,746,641 | | | (72,317 | ) | | | 1,674,324 | |
West Virginia Intermediate Tax-Free Fund | | | 68,034,595 | | | 1,306,468 | | | (47,067 | ) | | | 1,259,401 | |
National Tax-Free Money Market Fund | | | 109,513,946 | | | — | | | — | | | | — | |
130
BB&T Funds
Notes to Financial Statements — (continued)
September 30, 2007
| | | | | | | | | | | | | |
| | | Tax Cost | | Tax
Unrealized
Appreciation | | Tax
Unrealized
Depreciation | | | Net
Unrealized
Appreciation
(Depreciation) |
Prime Money Market Fund | | $ | 1,532,476,870 | | $ | — | | $ | — | | | $ | — |
U.S. Treasury Money Market Fund | | | 837,642,140 | | | — | | | — | | | | — |
Capital Manager Conservative Growth Fund | | | 58,685,996 | | | 3,965,864 | | | (758,424 | ) | | | 3,207,440 |
Capital Manager Moderate Growth Fund | | | 83,119,614 | | | 6,700,175 | | | (1,162,769 | ) | | | 5,537,406 |
Capital Manager Growth Fund | | | 66,556,231 | | | 5,523,182 | | | (1,499,119 | ) | | | 4,024,063 |
Capital Manager Equity Fund | | | 35,662,133 | | | 3,494,892 | | | (677,434 | ) | | | 2,817,458 |
131
Report of Independent Registered Public Accounting Firm
To the Shareholders and Board of Trustees of
BB&T Funds:
We have audited the accompanying statements of assets and liabilities of BB&T Funds — Large Cap Fund, Mid Cap Value Fund, Mid Cap Growth Fund, Small Cap Fund, International Equity Fund, Special Opportunities Equity Fund, Equity Income Fund, Short U.S. Government Fund, Intermediate U.S. Government Fund, Total Return Bond Fund, Kentucky Intermediate Tax-Free Fund, Maryland Intermediate Tax-Free Fund, North Carolina Intermediate Tax-Free Fund, South Carolina Intermediate Tax-Free Fund, Virginia Intermediate Tax-Free Fund, West Virginia Intermediate Tax-Free Fund, National Tax-Free Money Market Fund, Prime Money Market Fund, U.S. Treasury Money Market Fund, Capital Manager Conservative Growth Fund, Capital Manager Moderate Growth Fund, Capital Manager Growth Fund, and Capital Manager Equity Fund (collectively, the Funds), including the schedules of portfolio investments, as of September 30, 2007, and the related statements of operations for the period then ended, the statements of changes in net assets for each of the periods in the two-year period then ended, and the financial highlights for each of the periods in the five-year period then ended. These financial statements and financial highlights are the responsibility of the Funds’ management. Our responsibility is to express an opinion on these financial statements and financial highlights based on our audits.
We conducted our audits in accordance with the standards of the Public Company Accounting Oversight Board (United States). Those standards require that we plan and perform the audit to obtain reasonable assurance about whether the financial statements and financial highlights are free of material misstatement. An audit includes examining, on a test basis, evidence supporting the amounts and disclosures in the financial statements. Our procedures included confirmation of securities owned as of September 30, 2007, by correspondence with the custodian, transfer agent of the underlying funds, or brokers; where replies were not received from brokers, we performed other auditing procedures. An audit also includes assessing the accounting principles used and significant estimates made by management, as well as evaluating the overall financial statement presentation. We believe that our audits provide a reasonable basis for our opinion.
In our opinion, the financial statements and financial highlights referred to above present fairly, in all material respects, the financial position of the Funds as of September 30, 2007, the results of their operations for the period then ended, the changes in their net assets for each of the periods in the two-year period then ended, and the financial highlights for each of the periods in the five-year period then ended, in conformity with U.S. generally accepted accounting principles.

New York, NY
November 21, 2007
132
BB&T Funds
September 30, 2007
Other Federal Income Tax Information (Unaudited)
For shareholders that do not have a September 30, 2007 tax year end, this notice is for informational purposes only. For shareholders with a September 30, 2007 tax year end, please consult your tax advisor as to the pertinence of this notice. For the fiscal year ended September 30, 2007, each Fund is designating the following items with regard to distributions paid during the year. The information reported herein may differ from the information and distributions taxable to the shareholders for the calendar year ending December 31, 2007. Complete information will be reported in conjunction with your 2007 Form 1099-DIV.
For the fiscal year ended September 30, 2007, certain dividends paid by the Funds may be subject to a maximum tax rate of 15% as provided for by the Jobs and Growth Tax Reconciliation Act of 2003. The Funds intend to designate the maximum amount allowable as taxed at a maximum rate of 15%.
For the period ended September 30, 2007, the following Funds have a qualified dividend income of :
| | | |
| | | Qualified
Dividend
Income | |
Large Cap Fund | | 75.05 | % |
Mid Cap Value Fund | | 26.56 | % |
Mid Cap Growth Fund | | 6.97 | % |
Small Cap Fund | | 19.36 | % |
International Equity Fund | | 91.77 | % |
Special Opportunities Equity Fund | | 14.36 | % |
Equity Income Fund | | 69.04 | % |
Capital Manager Conservative Growth Fund | | 40.66 | % |
Capital Manager Moderate Growth Fund | | 10.89 | % |
Capital Manager Growth Fund | | 34.54 | % |
Capital Manager Equity Fund | | 61.91 | % |
The percentage represents “Qualified Interest Income” as created by the American Jobs Creation Act of 2004 and is reflected as a percentage of income distributions that is exempt from U.S. withholding tax when paid to foreign investors.
For the period ended September 30, 2007, the following Funds have a Qualified Interest Income of :
| | | |
| | | Qualified
Interest
Income | |
Large Cap Fund | | 8.50 | % |
Mid Cap Value Fund | | 45.48 | % |
Small Cap Fund | | 67.44 | % |
International Equity Fund | | 4.88 | % |
Equity Income Fund | | 18.08 | % |
Short U.S. Government Fund | | 100.00 | % |
Intermediate U.S. Government Fund | | 100.00 | % |
Total Return Bond Fund | | 100.00 | % |
Kentucky Intermediate Tax-Free Fund | | 100.00 | % |
Maryland Intermediate Tax-Free Fund | | 100.00 | % |
North Carolina Intermediate Tax-Free Fund | | 100.00 | % |
South Carolina Intermediate Tax-Free Fund | | 100.00 | % |
Virginia Intermediate Tax-Free Fund | | 100.00 | % |
West Virginia Intermediate Tax-Free Fund | | 100.00 | % |
National Tax-Free Money Market Fund | | 100.00 | % |
Prime Money Market Fund | | 100.00 | % |
U.S. Treasury Money Market Fund | | 100.00 | % |
Capital Manager Conservative Growth Fund | | 90.64 | % |
Capital Manager Moderate Growth Fund | | 75.89 | % |
Capital Manager Growth Fund | | 60.44 | % |
Capital Manager Equity Fund | | 24.84 | % |
133
BB&T Funds
September 30, 2007
The percentage represents “Qualified Short-Tem Capital Gain” as created by the American Jobs Creation Act of 2004 and is reflected as a percentage of short-term capital gain distributions that is exempt from U.S. withholding tax when paid to foreign investors.
For the period ended September 30, 2007, the following Funds have a Qualified Short-Term Capital Gain of :
| | | |
| | | Qualified
Short-Term
Gain | |
Large Cap Fund | | 100.00 | % |
Mid Cap Value Fund | | 100.00 | % |
Mid Cap Growth Fund | | 100.00 | % |
Small Cap Fund | | 100.00 | % |
International Equity Fund | | 100.00 | % |
Special Opportunities Equity Fund | | 100.00 | % |
Equity Income Fund | | 100.00 | % |
Prime Money Market Fund | | 100.00 | % |
Capital Manager Moderate Growth Fund | | 100.00 | % |
For corporate shareholders, the following percentage of the total ordinary income dividends paid during the fiscal year ended September 30, 2007, qualify for the corporate dividends received deduction for the following Funds:
| | | |
| | | Dividends
Reduction
Deduction | |
Large Cap Fund | | 76.05 | % |
Mid Cap Value Fund | | 26.85 | % |
Mid Cap Growth Fund | | 5.53 | % |
Small Cap Fund | | 18.17 | % |
Special Opportunities Equity Fund | | 14.28 | % |
Equity Income Fund | | 55.43 | % |
Capital Manager Conservative Growth Fund | | 40.81 | % |
Capital Manager Moderate Growth Fund | | 13.67 | % |
Capital Manager Growth Fund | | 39.64 | % |
Capital Manager Equity Fund | | 67.88 | % |
During the fiscal year ended September 30, 2007, the following Funds declared tax-exempt income distributions:
| | | |
| | | Amount |
Kentucky Intermediate Tax-Free Fund | | $ | 492,872 |
Maryland Intermediate Tax-Free Fund | | | 349,618 |
North Carolina Intermediate Tax-Free Fund | | | 4,024,577 |
South Carolina Intermediate Tax-Free Fund | | | 675,927 |
Virginia Intermediate Tax-Free Fund | | | 2,828,201 |
West Virginia Intermediate Tax-Free Fund | | | 2,632,009 |
National Tax-Free Money Market Fund | | | 3,646,154 |
During the fiscal year ended September 30, 2007, the following Funds designate long-term capital gain distributions pursuant to Section 852(b)(3) of the Internal Revenue Code:
| | | |
| | | Amount |
Large Cap Fund | | $ | 100,405,864 |
Mid Cap Value Fund | | | 2,215,901 |
Mid Cap Growth Fund | | | 18,340,599 |
Small Cap Fund | | | 5,392,932 |
International Equity Fund | | | 72,422,789 |
Special Opportunities Equity Fund | | | 12,889,032 |
Equity Income Fund | | | 5,188,748 |
North Carolina Intermediate Tax-Free Fund | | | 93,127 |
South Carolina Intermediate Tax-Free Fund | | | 27,235 |
Virginia Intermediate Tax-Free Fund | | | 149,945 |
134
BB&T Funds
September 30, 2007
| | | |
| | | Amount |
West Virginia Intermediate Tax-Free Fund | | $ | 209,596 |
Prime Money Market Fund | | | 4,504 |
Capital Manager Moderate Growth Fund | | | 1,744,909 |
Capital Manager Growth Fund | | | 1,662,327 |
Capital Manager Equity Fund | | | 2,319,841 |
The percentages of ordinary income distributions paid by the Funds during the fiscal year ended September 30, 2007 which was derived from U.S. Treasury securities were as follows:
| | | |
| | | U.S.
Government
Income | |
Short U.S. Government Fund | | 12.96 | % |
Intermediate U.S. Government Fund | | 8.01 | % |
Total Return Bond Fund | | 14.87 | % |
U.S. Treasury Money Market Fund | | 100.00 | % |
The Fund has elected to pass through to their shareholders the foreign taxes paid for the fiscal year ended September 30, 2007 as follows:
| | | | | | |
| | | Foreign
Dividend
Income | | Foreign
Taxes
Paid |
International Equity Fund | | $ | 4,362,860 | | $ | 272,084 |
135
BB&T Funds
September 30, 2007
Special Meeting of Shareholders (Unaudited)
At a Special Meeting of Shareholders of the BB&T International Equity Fund (the “International Equity Fund”), a series of BB&T Funds, held on July 25, 2007, shareholders of the International Equity Fund voted to approve an Investment Sub-Advisory Agreement between BB&TAsset Management, Inc. and Julius Baer Investment Management LLC with respect to the International Equity Fund. The results of the voting are as follows:
| | | | | | |
| | | Affirmative | | Against | | Abstain |
| | 12,205,803 | | 21,797 | | 21,507 |
Other Information (Unaudited)
A description of the policies and procedures that the Funds use to determine how to vote proxies relating to portfolio securities is available (i) without charge, upon request, by calling 1-800-228-1872; and (ii) on the Securities and Exchange Commission’s (the “Commission”) website at http://www.sec.gov.
Information regarding how the Funds voted proxies relating to portfolio securities during the most recent 12-month period ended June 30th is available (i) without charge, upon request, by calling 1-800-228-1872 and (ii) on the Commission’s website at http://www.sec.gov.
The Funds file complete Schedules of Portfolio Holdings with the Commission for the first and third quarters of each fiscal year on Form N-Q. The Funds’ Forms N-Q are available without charge on the Commission’s website at http://www.sec.gov, or may be reviewed and copied at the Commission’s Public Reference Room in Washington, D.C. Information on the operation of the Public Reference Room may be obtained by calling 1-800-SEC-0330.
136
BOARD CONSIDERATION OF ADVISORY AND SUB-ADVISORY AGREEMENTS (UNAUDITED)
The Board of Trustees, at a meeting held on August 28, 2007, formally considered the continuance of the Trust’s investment advisory agreement with BB&T Asset Management, Inc. (“BB&T AM” or the “Adviser”) with respect to all funds of the Trust (except the Sterling Capital Small Cap Value Fund, which is advised by Sterling Capital Management LLC (“Sterling Capital”)), and sub-advisory agreements of BB&T AM with Scott & Stringfellow, Inc. (“Scott & Stringfellow”) with respect to the Special Opportunities Equity Fund and the Equity Income Fund; Federated Investment Management Company (“Federated”) with respect to the National Tax-Free Money Market Fund and the Prime Money Market Fund; and Sterling Capital with respect to the Mid Cap Value Fund and the Total Return Bond Fund. In addition, at a meeting held June 1, 2007, the Board of Trustees formally considered the initial approval of a sub-advisory agreement between BB&T AM and Julius Baer Investment Management LLC – Asset Management Americas (“JBIM”) with respect to the International Equity Fund (together, respectively, the “Approvals” and the “Advisory Agreements”). Scott & Stringfellow, Federated, Sterling Capital and JBIM are referred to as “Sub-Advisers” and, collectively with the Adviser, the “Advisers.”
The Trustees reviewed extensive material in connection with their consideration of the Approvals, including data from an independent provider of mutual fund data (as assembled by the Funds’ administrator), which included comparisons with industry averages for comparable funds for advisory fees, Rule 12b-1 fees, and total fund expenses. The data reflected BB&T AM fee waivers in place, as well as BB&T AM’s contractual investment advisory fee levels. The Board was assisted in its review by independent legal counsel, who provided a memorandum detailing the legal standards for review of the Advisory Agreements. The Board received a detailed presentation by BB&T AM, which included a fund-by-fund analysis of performance and investment process. Presentations were also provided by each Sub-Adviser. With respect to JBIM, the Board received a detailed presentation regarding the organizational structure of the firm and the qualifications of its investment personnel. The Board also received fund-by-fund profitability information from the Adviser, Scott & Stringfellow and Sterling Capital as well as a pro forma profitability analysis from JBIM and firm-wide profitability information from Federated. The Board also deliberated outside the presence of management and the Advisers.
In their deliberations, each Trustee attributed different weights to various factors involved in an analysis of the Advisory Agreement Approvals, and no factor alone was considered determinative. The Trustees determined that the overall arrangements between the Trust and the Advisers, as provided in the Advisory Agreements, were fair and reasonable and that the Approval of the Advisory Agreements was in the best interests of each Fund and its shareholders.
The matters addressed below were considered and discussed by the Trustees in reaching their conclusions.
Nature, Extent and Quality of Services Provided by the Adviser
The Trustees received and considered information regarding the nature, extent, and quality of the services provided to each Fund under the Advisory Agreements. The Trustees took into account information furnished throughout the year at Trustee meetings, as well as materials furnished specifically in connection with the annual review process. The Trustees considered the background and experience of each Adviser’s senior management and the expertise of investment personnel of each Adviser responsible for the day-to-day management of each Fund. The Trustees considered the overall reputation, and the capabilities and commitment of the Advisers to provide high quality service to the Trust, and the Trustees’ overall confidence in each Adviser’s integrity.
The Trustees received information concerning the investment philosophy and investment processes applied by the Advisers in managing the Funds as well as each Adviser’s Form ADV. The Trustees also considered information regarding regulatory compliance and compliance with the investment policies of the Funds. The Trustees evaluated the trading practices of Scott & Stringfellow, which engages in affiliated brokerage for a majority of the portfolio trades for the Funds it sub-advises. As part of this evaluation, the Trustees received information regarding safeguards employed, such as prohibitions on principal and cross-agency trades. The Trustees also received information demonstrating a decreased use by Scott & Stringfellow of affiliated broker transactions over the past year. The Trustees evaluated the procedures of the Advisers designed to fulfill the Advisers’ fiduciary duty to the Funds with respect to possible conflicts of interest, including the Advisers’ codes of ethics (regulating the personal trading of its officers and employees).
Based on their review, the Trustees concluded that, with respect to the quality and nature of services to be provided by the Advisers, the scope of responsibilities was consistent with mutual fund industry norms, and that the quality of the services was very satisfactory.
Investment Performance
The Trustees considered performance results of each Fund in absolute terms and relative to each Fund’s benchmark and peer group. With respect to the Trustees’ review of the performance results of JBIM, the Trustees considered the long-term performance history of composite international equity portfolios advised by JBIM. It was noted that performance of the equity Funds had considerably improved with respect to three-year average percentile rankings in the relevant peer groups. It was also noted that the Special Opportunities Equity Fund and the Equity Income Fund each had received a five-star Morningstar rating. With respect to the fixed income Funds, it was noted that the average percentile ranking for one-year and three-year performance had been strong. With respect to the asset allocation Funds, it was noted that each Fund had been ranked above the average peer group percentile ranking.
In the Trustees’ review of performance, long and short-term performance were considered. In conducting their review, the Trustees particularly focused on Funds where performance compared unfavorably with peers over the most recent one year period. The Trustees noted that the performance of the International Equity Fund continued to lag its peer group, but that the replacement of the Fund’s former sub-adviser with JBIM was intended to improve performance.
137
After reviewing the performance of each Fund, and taking into consideration the management style, investment strategies, and prevailing market conditions during the prior year and for longer periods, the Trustees concluded that the performance of each of the Funds was generally strong and that in cases where performance issues were encountered, the Adviser was properly addressing the situation.
Cost of Services, Including the Profits Realized by the Advisers and Affiliates
The Trustees considered peer group comparable information with respect to the advisory fees charged by BB&T AM to each of the Funds, taking into consideration both contractual and actual (i.e., after waiver) fee levels. The Trustees concluded that the investment advisory fees fell within an acceptable range as compared to peer groups, particularly in light of the fee waivers that would be continued in the upcoming year.
As part of their review, the Trustees considered benefits to the Adviser aside from investment advisory fees. The Trustees reviewed administration fees received by BB&T AM and considered the fallout benefits to BB&T AM such as the research services available to the Adviser by reason of brokerage commissions generated by the Funds’ turnover. The Trustees also considered benefits to BB&T AM’s affiliates, including brokerage commissions received by Scott & Stringfellow for executing trades on behalf of the Special Opportunities Equity Fund and the Equity Income Fund and sub-advisory fees received by its affiliate, Sterling Capital, for its management of the Mid Cap Value Fund and the Total Return Bond Fund. With respect to Scott & Stringfellow, the Trustees noted that brokerage commissions were paid at a standard commission rate, which was consistent with that used by the Adviser with respect to all equity funds of the Trust and that such brokerage arrangements were considered by the Sub-Adviser to be advantageous.
Consideration of the reasonableness of advisory fees also took into account, where relevant, the profitability of the Advisers. In determining whether all other investment advisory and sub-advisory fees (collectively, the “investment advisory fees”) were reasonable, the Trustees reviewed profitability information provided by the Adviser, Strong & Stringfellow, Sterling Capital and JBIM with respect to investment advisory services as well as firm-wide profitability information provided by Federated. With respect to such information, the Trustees recognized that such profitability data was generally unaudited and represented an Adviser’s own determination of its and its affiliates’ revenues from the contractual services provided to the Funds, less expenses of providing such services. Expenses include direct and indirect costs and were calculated using an allocation methodology developed by the Adviser. The Trustees also recognized that it is difficult to make comparisons of profitability from fund investment advisory and sub-advisory contracts, because comparative information is not generally publicly available and is affected by numerous factors. Based on their review, the Trustees concluded that the profitability to BB&T AM, Scott & Stringfellow, and Sterling Capital, as a result of their relationships with the Funds, was acceptable. With respect to the profitability of JBIM and Federated, the Trustees noted that while actual fund-specific information regarding the profitability of each firm was not available, it also was not helpful in assessing the Approval of the Advisory Agreements. The Board also concluded that the fees under the Advisory Agreements were fair and reasonable, in light of the services and benefits provided to each Fund.
Economies of Scale
The Trustees also considered whether fee levels reflect economies of scale and whether economies of scale would be produced by the growth of the Trust’s assets. The Trustees found that the Adviser had generally reduced fund total expense ratios through contract negotiations and fee waivers. The Trustees found that the asset levels of the Trust were not currently so large as to warrant formal contractual breakpoints, and that the fee waivers were a reasonable way to provide the benefits of economies of scale to shareholders at this time.
138
BB&T Funds
Information about Trustees and Officers (Unaudited)
Overall responsibility for the management of the Funds rests with its Board of Trustees’ (“Trustees”), who are elected by the Shareholders of the Funds. The Trustees’elect the officers of the Funds to supervise actively its day-to-day operations. The names of the Trustees’, their addresses, birthdate, term of office and length of time served, principal occupations during the past five years, number of portfolios overseen and directorships held outside of the Funds are listed in the two tables immediately following. The business address of the persons listed below is 434 Fayetteville Street Mall, Raleigh, North Carolina 27601.
| | | | | | | | | | |
Name and Birthdate | | Position(s) Held With BB&T Funds | | Term of Office/ Length of Time Served | | Principal Occupation During the Last 5 Years | | Number of
Portfolios
in Fund
Complex
by Trustee | | Other
Directorships
Held by Trustee |
Thomas W. Lambeth Birthdate: 1/35 | | Trustee, Chairman of the Board of Trustees | | Indefinite, 8/92 — Present | | From January 2001 to present, Senior Fellow, Z. Smith Reynolds Foundation; From 1978 to January 2001, Executive Director, Z. Smith Reynolds Foundation. | | 30 | | None |
| | | | | |
Drew T. Kagan Birthdate: 2/48 | | Trustee | | Indefinite, 8/00 — Present | | From December 2003 to present, President and Director, Montecito Advisors, Inc; from March 1996 to December 2003, President, Investment Affiliate, Inc. | | 30 | | None |
| | | | | |
Laura C. Bingham Birthdate: 11/56 | | Trustee | | Indefinite, 2/01 — Present | | From July 1998 to present, President of Peace College. | | 30 | | None |
| | | | | |
Douglas R. Van Scoy Birthdate: 11/43 | | Trustee | | Indefinite, 5/04 — Present | | Retired; from November 1974 to July 2001, employee of Smith Barney (investment banking), most recently as Director of Private Client Group and Senior Executive Vice President | | 30 | | None |
| | | | | |
James L. Roberts Birthdate: 11/42 | | Trustee | | Indefinite, 11/04 — Present | | Retired; from November 2006 to present, Director, Grand Mountain Bancshares, Inc.; from January 1999 to December 2003, President, CEO and Director, Covest Bancshares, Inc. | | 30 | | None |
139
BB&T Funds
The following table shows information for the trustee who is an “interested persons” of Funds as defined in the 1940 Act:
| | | | | | | | |
Name and Birthdate | | Position(s) Held With BB&T | | Term of Office/ Length of Time Served | | Principal Occupation During the Past 5 Years | | Overseen Complex |
*Keith F. Karlawish Birthdate: 8/64 | | Trustee | | Indefinite, 6/06 — Present 2/05 — Present | | From May 2002 to present, President, BB&T Asset Management, Inc.; from 1996 to 2002, Senior Vice President and Director of Fixed Income, BB&T Asset Management, Inc. | | 30 |
| | | | | | | | |
| * | Mr. Karlawish is treated by the Funds as an “interested person” (as defined in Section 2(a)(19) of the 1940 Act) of the Funds. Mr. Karlawish is an “interested person” because he owns shares of BB&T Corporation and is the President of BB&T Asset Management, Inc., the Adviser. |
The following table shows information for officers of Funds:
| | | | | | | | |
Name and Birthdate | | Position(s) Held With BB&T Funds | | Term of Office/ Length of Time Served | | Principal Occupation During the Last 5 Years | | |
Keith F. Karlawish Birthdate: 8/64 | | President | | Indefinite, 2/05 — Present | | From May 2002 to present, President, BB&T Asset Management, Inc.; from 1996 to 2002, Senior Vice President and Director of Fixed Income, BB&T Asset Management, Inc. | | |
| | | | |
James T. Gillespie Birthdate: 11/66 | | Vice President, Secretary | | Indefinite, 5/02 — Present | | From February 2005 to present, Vice President and Manager of Mutual Fund Administration, BB&T Asset Management, Inc.; from February 1992 to 2005, employee of BISYS Fund Services | | |
| | | | |
E.G. Purcell, III Birthdate: 1/55 | | Vice President | | Indefinite, 11/00 — Present | | From 1995 to present, Senior Vice President, BB&T Asset Management, Inc. and its predecessors | | |
| | | | |
Todd M. Miller Birthdate: 9/71 | | Vice President | | Indefinite, 8/05 — Present | | From June 2005 to Present, Mutual Fund Administrator, BB&T Asset Management, Inc.; from May 2001 to May 2005, Manager, BISYS Fund Services | | |
140
BB&T Funds
| | | | | | | | |
Name and Birthdate | | Position(s) Held With BB&T Funds | | Term of Office/ Length of Time Served | | Principal Occupation During the Last 5 Years | | |
Diana Hanlin Birthdate: 5/67 | | Vice President | | Indefinite, 8/07 — Present | | From April 2007 to present, Compliance Officer, BB&T Asset Management, Inc.; from May 2004 to March 2007, Director of Compliance, BISYS Fund Services, from October 2000 to May 2004, Senior Compliance Analyst, BISYS Fund Services | | |
| | | | |
Clinton L. Ward Birthdate: 11/69 | | Chief Compliance and Anti-Money Laundering Officer | | Indefinite, 4/07 — Present | | From July 2004 to present, Chief Compliance Officer and Secretary, BB&T Asset Management, Inc.; from January 2002 to July 2004, Compliance Analyst, Wachovia Bank, N.A.; from November 1999 to January 2002, Compliance Manager - Mutual Fund Compliance, Banc of America Capital Management, LLC | | |
| | | | |
Andrew J. McNally Birthdate: 12/70 | | Treasurer | | Indefinite, 4/07 — Present | | From December 2000 to present, Vice President and Senior Director, Fund Accounting and Administration Department, PFPC Inc. | | |
| | | | |
Avery Maher Birthdate: 2/45 | | Assistant Secretary | | Indefinite, 4/07 — Present | | From March 2006 to present, Vice President and Counsel, Regulatory Administration Department, PFPC Inc.; from October 2004 to August 2005, Vice President and Assistant General Counsel, JPMorgan Asset Management; from 1992 to 2004, Second Vice President and Assistant Secretary John Hancock Advisers, LLC | | |
The Funds’ Statement of Additional Information includes information about the Funds’ Trustees. To receive your free copy of the Statement of Additional Information, call toll free: 1-800-453-7348.
141

Sterling Capital Small Cap Value Fund
| | |
| Annual Report | | September 30, 2007 |

CAPITAL SMALL
CAP VALUE FUND
STERLING CAPITAL
SMALL CAP VALUE FUND
TABLE OF CONTENTS
The Fund files its complete schedule of investments of fund holdings with the Securities and Exchange Commission (the “SEC”) for the first and third quarters of each fiscal year on Form N-Q within 60 days after period end. The Fund’s Form N-Q is available on the SEC’s website at http://www.sec.gov, and may be reviewed and copied at the SEC’s Public Reference Room in Washington D.C. Information on the operation of the Public Reference Room may be obtained by calling 1-800-SEC-0330.
A description of the policies and procedures that the Fund uses to determine how to vote proxies relating to portfolio securities, as well as information relating to how the Fund voted proxies relating to portfolio securities during the most recent 12-month period ended June 30, is available (i) without charge, upon request, by calling 1-866-450-3722; and (ii) on the SEC’s website at http://www.sec.gov.
STERLING CAPITAL
SMALL CAP VALUE FUND
|
OVERVIEW OF ECONOMIC AND MARKET CONDITIONS |
To Our Fellow Shareholders:
For the year ended September 2007, the Sterling Capital Small Cap Value Fund (the “Fund”) produced a total return of 6.93% versus the Russell 2000 Value Index return of 6.09%. Over the past couple of months we have been reviewing existing holdings and selectively buying other companies tied to the U.S. housing industry including BankUnited Financial, Standard Pacific, Hovnanian Enterprises, Furniture Brands, Trex, Louisiana Pacific, Champion Enterprises, and Select Comfort.1 These companies are all impacted by the fortunes of the domestic housing market. Each of these stocks claims a unique appeal and we believe each can generate long term gains even if there is only a muted improvement in their end markets. Nevertheless, the housing exposure limited our returns for the fiscal year.
Housing — Opportunity or Slow Motion Train Wreck?
The U.S. residential housing market is now in a deep cyclical recession after an unprecedented run in both housing starts and price increases which reached speculative bubble status over the past half-decade. The foundations for the latest boom and current bust have been exhaustively detailed in all the major business publications, and tragically, through word of mouth from newer homeowners and investors that have lost significant value in their homes and (or) are facing foreclosure. New housing starts are expected to slow dramatically as excess inventory — now at a 10-month supply — will need to be worked down.
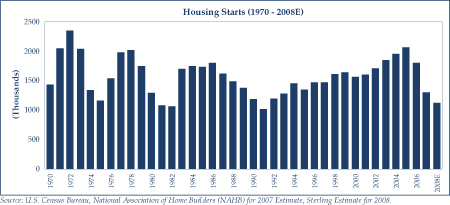
Home prices will undoubtedly need to correct further to reset the market. This may prove more severe than in past cycles due to the dramatic increase in home prices, permissive underwriting standards, and the high level of investor owned units. Since 1987 and 2000, median home prices have advanced at a 6.4% and 10.7%
1 Portfolio composition is as of September 30, 2007 and is subject to change.
1
STERLING CAPITAL
SMALL CAP VALUE FUND
annualized rate, respectively, according to the S&P Case/Shiller home price index. With home inventory levels at such high levels, most pundits are predicting a 10%-20% decline in housing prices to allow the market to reach equilibrium. The distribution of these price declines will be felt in varying degrees based on how feverish the speculation ran in each market.
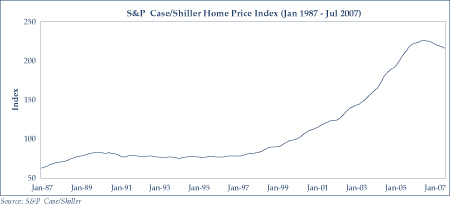
With all of this pessimistic news, we still largely believe the old adage “if it’s in the press, it’s in the price”. The right investment questions are as follows: “Do the current stock market quotes overly discount the long term cash flows of housing- related businesses?” when we consider that many of the companies involved are down 50%-80% from their peaks. “Are there compelling values available or are we being tempted by value traps that will take another leg down as the slow motion train wreck of an unwinding housing market exacts its toll on more businesses and possibly the economy as a whole?”
Despite the current depressed state of the industry, the long term demand for housing remains intact due to population growth and net immigration into the U.S. According to the Joint Center for Housing Studies of Harvard University (JCH), long-term demand (2005-2015) for housing ranges from 1.85-1.95 million units annually. While these numbers may seem a far cry from current estimates for 2007-08, they appear reasonable when reviewing the historical housing start data shown in the enclosed charts. The final question is “Are we involved with businesses that have the staying power to remain solvent through the downturn”? We believe the answer to this question is “Yes” given our attention to liquidity and balance sheet strength and the more developed nature of the capital markets.
2
STERLING CAPITAL
SMALL CAP VALUE FUND
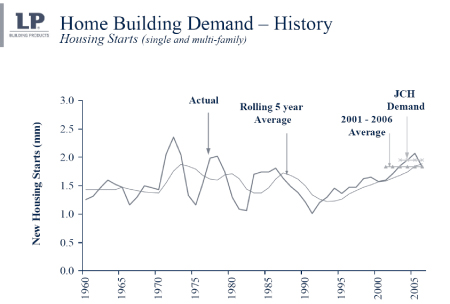
Sources: US Department of Commerce; RISI February 2007 5 year forecast; and the State of the Nation’s Housing – 2004. Joint Center for Housing Studies of Harvard University (JCH)
We have increased our positions in a number of businesses that are primarily serving the residential housing industry to 14% of the portfolio.1 It is our belief that if we are able to weather the current downturn, both in fundamental and psychological terms, we expect investors to be amply rewarded from current levels.
| | | | |
| |
| Housing Related Exposure of Small Cap Portfolio1 |
| | | |
Homebuilders | | Weight | | Comment |
Avatar Holdings | | 1.6% | | Well-financed, low cost land position |
Standard Pacific | | 0.6% | | Stable liquidity |
Hovnanian | | 0.6% | | Stable liquidity |
Champion | | 2.5% | | Manufactured housing builder |
| | | |
Building Products | | | | |
Louisiana-Pacific | | 2.3% | | #1 Market Share |
Trex | | 0.6% | | #1 Market Share |
| | | |
Financing | | | | |
BankUnited Financial | | 2.5% | | Large Option-Arm lender, prime borrowers |
Provident Financial | | 1.5% | | Traditional, high quality mortgage bank |
Washington Federal | | 1.6% | | Traditional high quality mortgage bank |
| | | |
Total | | 13.8% | | |
1 Portfolio composition is as of September 30, 2007 and is subject to change.
3
STERLING CAPITAL
SMALL CAP VALUE FUND
In conclusion, while results over the past year have been muted relative to our long term returns, we are very excited about the investment opportunities the recent market volatility has created. We believe we added a few solid companies to the portfolio during the period at very attractive prices, and are currently working on several others.
Thank you for your continued confidence in Sterling Capital Management.
Sincerely,
STERLING CAPITAL MANAGEMENT LLC
Eduardo A. Brea, CFA
Managing Director
4
STERLING CAPITAL
SMALL CAP VALUE FUND
SEPTEMBER 30, 2007
Comparison of Change in the Value of a $10,000 Investment in the Sterling Capital Small Cap Value Fund and the Russell 2000 Value Index(1)(2)(3)
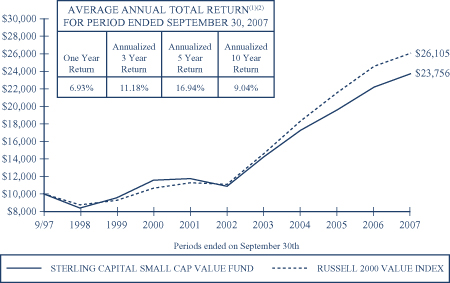
(1) | | These figures represent past performance. Past performance is no guarantee of future performance and should not be considered as a representation of future results of the Fund. If the adviser had not limited certain expenses, the Fund's total return would have been lower. The Fund’s performance assumes the reinvestment of distributions and does not reflect the deduction of taxes that a shareholder would pay on Fund distributions or the redemption of Fund shares. The investment return and principal value of an investment will fluctuate, so an investor's shares, when redeemed, may be worth more or less than its original cost. |
(2) | | The performance for the Sterling Shares is based on the performance of the Institutional Shares of the Fund’s predecessor, Sterling Capital Small Cap Value Fund, a series of the Advisor’s Inner Circle Fund (the “Acquired Fund”), which transferred all of its assets and liabilities to the Fund pursuant to a reorganization on 12/18/06. Information prior to 3/16/01 relates to the UAM Fund Inc.’s Sterling Partners’ Small Cap Value Portfolio, the assets of which were acquired by the Acquired Fund. The Acquired Fund’s investment program was substantially similar to that of the Fund. The performance of the Sterling Shares would have been different because Sterling Shares have different expenses than the predecessor’s Institutional Shares. |
(3) | | The Russell 2000 Value Index is an unmanaged index comprised of Russell 2000 securities (2000 stocks of U.S. companies with small market capitalizations) which have lower price-to-book ratios and lower forecasted growth values. The index is unmanaged and does not reflect transaction costs. A direct investment in an unmanaged index is not possible. |
5
STERLING CAPITAL
SMALL CAP VALUE FUND
SEPTEMBER 30, 2007
|
SECTOR WEIGHTINGS (Unaudited)† |

| † | Percentages based on market value of total investments. |
SCHEDULE OF PORTFOLIO INVESTMENTS
COMMON STOCKS* — 99.6%
| | | | | |
| | | Shares | | Market
Value |
| | | | | |
| | |
CONSUMER DISCRETIONARY — 32.9% | | | | | |
America’s Car-Mart, Inc. (a) | | 19,750 | | $ | 223,372 |
Avatar Holdings, Inc. (a) | | 14,235 | | | 710,754 |
Callaway Golf Co. | | 37,500 | | | 600,375 |
Career Education Corp. (a) | | 22,050 | | | 617,179 |
Champion Enterprises, Inc. (a) | | 103,375 | | | 1,135,057 |
Exide Technologies (a) | | 215,446 | | | 1,400,399 |
Fleetwood Enterprises, Inc. (a) | | 87,950 | | | 751,973 |
Furniture Brands International, Inc. | | 81,000 | | | 821,340 |
Group 1 Automotive, Inc. | | 33,150 | | | 1,112,845 |
Hovnanian Enterprises, Inc., Class A (a) | | 27,900 | | | 309,411 |
K-Swiss, Inc., Class A | | 29,000 | | | 664,390 |
Lithia Motors, Inc., Class A | | 39,471 | | | 673,375 |
Marine Products Corp. | | 16,625 | | | 140,980 |
O’Charleys, Inc. | | 26,750 | | | 405,530 |
Regis Corp. | | 52,467 | | | 1,674,222 |
Select Comfort Corp. (a) | | 64,790 | | | 903,821 |
Standard Pacific Corp. | | 46,050 | | | 252,815 |
Universal Technical Institute, Inc. (a) | | 15,750 | | | 283,500 |
Voyager Learning Co. (a) | | 89,050 | | | 732,882 |
Zale Corp. (a) | | 66,750 | | | 1,544,595 |
| | | | | |
| | | | | 14,958,815 |
| | | | | |
| | |
ENERGY — 2.7% | | | | | |
Forest Oil Corp. (a) | | 28,896 | | | 1,243,684 |
| | | | | |
| | | | | 1,243,684 |
| | | | | |
The accompanying notes are an integral part of the financial statements.
6
STERLING CAPITAL
SMALL CAP VALUE FUND
SEPTEMBER 30, 2007
|
COMMON STOCKS* — continued |
| | | | | |
| | | Shares | | Market
Value |
| | | | | |
| | |
FINANCIALS — 26.6% | | | | | |
Annaly Capital Management, Inc. REIT | | 106,600 | | $ | 1,698,138 |
BankUnited Financial Corp., Class A | | 68,550 | | | 1,065,267 |
Endurance Specialty Holdings, Ltd. | | 27,300 | | | 1,134,315 |
First Citizens BancShares, Inc., Class A | | 10,260 | | | 1,789,344 |
Horace Mann Educators Corp. | | 35,250 | | | 694,777 |
Infinity Property & Casualty Corp. | | 12,300 | | | 494,706 |
Nelnet, Inc., Class A | | 73,753 | | | 1,345,255 |
Phoenix Cos., Inc. (The) | | 77,150 | | | 1,088,587 |
Provident Financial Services, Inc. | | 39,100 | | | 640,067 |
Waddell & Reed Financial, Inc., Class A | | 51,340 | | | 1,387,720 |
Washington Federal, Inc. | | 28,000 | | | 735,280 |
| | | | | |
| | | | | 12,073,456 |
| | | | | |
| | |
HEALTH CARE — 4.0% | | | | | |
CONMED Corp. (a) | | 27,540 | | | 770,845 |
Merit Medical Systems, Inc. (a) | | 35,400 | | | 459,492 |
Odyssey Healthcare, Inc. (a) | | 62,425 | | | 599,904 |
| | | | | |
| | | | | 1,830,241 |
| | | | | |
| | |
INDUSTRIALS — 10.4% | | | | | |
Brink’s Co. (The) | | 15,650 | | | 874,522 |
Covanta Holding Corp. (a) | | 48,810 | | | 1,196,333 |
Crane Co. | | 11,000 | | | 527,670 |
ICT Group, Inc. (a) | | 34,650 | | | 464,656 |
Smith (A.O.) Corp. | | 31,375 | | | 1,376,735 |
Trex Co., Inc. (a) | | 24,625 | | | 273,830 |
| | | | | |
| | | | | 4,713,746 |
| | | | | |
| | |
INFORMATION TECHNOLOGY — 17.0% | | | | | |
Axcelis Technologies, Inc. (a) | | 186,515 | | | 953,092 |
Black Box Corp. | | 40,969 | | | 1,751,834 |
Cabot Microelectronics Corp. (a) | | 22,650 | | | 968,288 |
CSG Systems International, Inc. (a) | | 55,976 | | | 1,189,490 |
EarthLink, Inc. (a) | | 269,625 | | | 2,135,430 |
Orbotech, Ltd. (a) | | 35,650 | | | 749,719 |
| | | | | |
| | | | | 7,747,853 |
| | | | | |
The accompanying notes are an integral part of the financial statements.
7
STERLING CAPITAL
SMALL CAP VALUE FUND
SEPTEMBER 30, 2007
|
COMMON STOCKS* — continued |
| | | | | | |
| | | Shares | | Market
Value | |
| | | | | | |
| | |
MATERIALS — 3.5% | | | | | | |
Louisiana-Pacific Corp. | | 63,100 | | $ | 1,070,807 | |
OMNOVA Solutions, Inc. (a) | | 89,300 | | | 516,154 | |
| | | | | | |
| | | | | 1,586,961 | |
| | | | | | |
| | |
UTILITIES — 2.5% | | | | | | |
Allete, Inc. | | 25,000 | | | 1,119,000 | |
| | | | | | |
| | |
TOTAL COMMON STOCKS
(Cost $42,009,377) | | | | | 45,273,756 | |
| | | | | | |
| | | | | | |
INVESTMENT COMPANIES* — 1.3% | | | | | | |
Federated Treasury Obligations Fund, Institutional Shares
(Cost $584,186) | | 584,186 | | | 584,186 | |
| | | | | | |
| | |
TOTAL INVESTMENTS
(Cost $42,593,563) — 100.9% | | | | | 45,857,942 | |
| | |
NET OTHER ASSETS (LIABILITIES) — (0.9)% | | | | | (405,220 | ) |
| | | | | | |
| | |
NET ASSETS — 100.0% | | | | $ | 45,452,722 | |
| | | | | | |
| * | | Narrow industries are utilized for compliance purposes, whereas broad sectors are utilized for reporting. |
| (a) | | Represents non-income producing security. |
REIT — Real Estate Investment Trust
The accompanying notes are an integral part of the financial statements.
8
STERLING CAPITAL
SMALL CAP VALUE FUND
SEPTEMBER 30, 2007
|
STATEMENT OF ASSETS AND LIABILITIES |
| | | |
Assets: | | | |
Investments at value (Cost $42,593,563) | | $ | 45,857,942 |
Receivable for capital shares sold | | | 36,545 |
Interest and dividends receivable | | | 37,631 |
Prepaid expenses | | | 3,372 |
| | | |
Total Assets | | | 45,935,490 |
| | | |
| |
Liabilities: | | | |
Payable for investment securities purchased | | | 269,611 |
Payable for capital shares redeemed | | | 152,198 |
Accrued expenses and other payables: | | | |
Investment advisory fees | | | 31,054 |
Administration fees | | | 4,797 |
Compliance service fees | | | 809 |
Other | | | 24,299 |
| | | |
Total Liabilities | | | 482,768 |
| | | |
Net Assets | | $ | 45,452,722 |
| | | |
| | | |
NET ASSETS CONSIST OF: | | | |
Paid-in capital | | | 36,360,118 |
Accumulated net realized gain on investments | | | 5,828,225 |
Net unrealized appreciation on investments | | | 3,264,379 |
| | | |
Net Assets | | $ | 45,452,722 |
| | | |
| |
Sterling Shares: | | | |
Shares Issued and Outstanding
(unlimited authorization — no par value) | | | 3,097,142 |
| | | |
Net Asset Value, Offering and Redemption Price Per Share | | | $14.68 |
| | | |
The accompanying notes are an integral part of the financial statements.
9
STERLING CAPITAL
SMALL CAP VALUE FUND
| | | | | | | | |
| | | For the Period Ended
September 30, 2007* | | | For the Year Ended
October 31, 2006 | |
Investment Income: | | | | | | | | |
Dividends | | $ | 532,093 | | | $ | 680,310 | |
Interest | | | 66,886 | | | | 65,748 | |
| | | | | | | | |
Total Investment Income | | | 598,979 | | | | 746,058 | |
| | | | | | | | |
Expenses: | | | | | | | | |
Investment advisory fees | | | 496,203 | | | | 754,603 | |
Administration fees | | | 64,740 | | | | 125,000 | |
Accounting fees | | | 4,683 | | | | — | |
Chief Compliance Officer fees | | | 730 | | | | 6,053 | |
Custodian fees | | | 609 | | | | 17,283 | |
Printing fees | | | 28,999 | | | | 44,868 | |
Professional fees | | | 13,000 | | | | 73,649 | |
Registration and filing fees | | | 24,514 | | | | 21,870 | |
Transfer agent fees | | | 112,482 | | | | 172,250 | |
Trustees’ fees | | | 1,825 | | | | 8,509 | |
Other expenses | | | 16,787 | | | | 9,044 | |
| | | | | | | | |
Total Expenses | | | 764,572 | | | | 1,233,129 | |
Less: | | | | | | | | |
Waiver of investment advisory fees (Note 4) | | | (125,722 | ) | | | (287,980 | ) |
Fees paid indirectly (Note 4) | | | (1,628 | ) | | | (3,406 | ) |
| | | | | | | | |
Net Expenses | | | 637,222 | | | | 941,743 | |
| | | | | | | | |
Net Investment Loss | | | (38,243 | ) | | | (195,685 | ) |
| | | | | | | | |
Realized/Unrealized Gain (Loss) on Investments: | | | | | | | | |
Net realized gain on investments | | | 8,370,740 | | | | 22,691,205 | |
Net change in unrealized appreciation/depreciation on investments | | | (4,992,657 | ) | | | (8,446,370 | ) |
| | | | | | | | |
Net Realized/Unrealized Gain on Investments | | | 3,378,083 | | | | 14,244,835 | |
| | | | | | | | |
| | |
Net Increase in Net Assets Resulting From Operations | | $ | 3,339,840 | | | $ | 14,049,150 | |
| | | | | | | | |
| * | | The Fund’s fiscal year-end changed from October 31 to September 30, effective September 30, 2007. |
The accompanying notes are an integral part of the financial statements.
10
STERLING CAPITAL
SMALL CAP VALUE FUND
|
STATEMENTS OF CHANGES IN NET ASSETS |
| | | | | | | | | | | | |
| | | Period Ended
September 30,
2007* | | | Year Ended
October 31,
2006 | | | Year Ended
October 31,
2005 | |
Operations: | | | | | | | | | | | | |
Net Investment Income (Loss) | | $ | (38,243 | ) | | $ | (195,685 | ) | | $ | 90,811 | |
Net Realized Gain on Investments | | | 8,370,740 | | | | 22,691,205 | | | | 32,120,183 | |
Net Change in Unrealized Appreciation/Depreciation on Investments | | | (4,992,657 | ) | | | (8,446,370 | ) | | | (16,849,941 | ) |
| | | | | | | | | | | | |
Net Increase in Net Assets Resulting From Operations | | | 3,339,840 | | | | 14,049,150 | | | | 15,361,053 | |
| | | | | | | | | | | | |
Distributions: | | | | | | | | | | | | |
Net Investment Income | | | — | | | | (101,502 | ) | | | — | |
Realized Capital Gains | | | (14,260,312 | ) | | | (15,618,613 | ) | | | (23,526,506 | ) |
| | | | | | | | | | | | |
Total Distributions | | | (14,260,312 | ) | | | (15,720,115 | ) | | | (23,526,506 | ) |
| | | | | | | | | | | | |
Capital Share Transactions: | | | | | | | | | | | | |
Issued | | | 28,128,630 | | | | 17,809,586 | | | | 33,586,170 | |
Reinvestment of Distributions | | | 12,238,373 | | | | 14,844,748 | | | | 20,508,982 | |
Redeemed | | | (44,731,125 | ) | | | (69,446,759 | ) | | | (194,683,210 | ) |
| | | | | | | | | | | | |
Net Decrease in Net Assets from Capital Share Transactions | | | (4,364,122 | ) | | | (36,792,425 | ) | | | (140,588,058 | ) |
| | | | | | | | | | | | |
Total Decrease in Net Assets | | | (15,284,594 | ) | | | (38,463,390 | ) | | | (148,753,511 | ) |
| | | | | | | | | | | | |
Net Assets: | | | | | | | | | | | | |
Beginning of period | | | 60,737,316 | | | | 99,200,706 | | | | 247,954,217 | |
| | | | | | | | | | | | |
End of period (Includes Undistributed Net Investment Income of $0, $0, and $0, respectively) | | $ | 45,452,722 | | | $ | 60,737,316 | | | $ | 99,200,706 | |
| | | | | | | | | | | | |
Share Transactions: | | | | | | | | | | | | |
Issued | | | 1,827,911 | | | | 1,020,420 | | | | 1,891,644 | |
Reinvestment of Distributions | | | 834,814 | | | | 938,217 | | | | 1,173,283 | |
Redeemed | | | (2,873,703 | ) | | | (4,095,586 | ) | | | (11,148,492 | ) |
| | | | | | | | | | | | |
Net Decrease in Shares Outstanding | | | (210,978 | ) | | | (2,136,949 | ) | | | (8,083,565 | ) |
| | | | | | | | | | | | |
| * | | The Fund’s fiscal year-end changed from October 31 to September 30, effective September 30, 2007. |
The accompanying notes are an integral part of the financial statements.
11
STERLING CAPITAL
SMALL CAP VALUE FUND
Selected data for a share of beneficial interest outstanding throughout the periods indicated
| | | | | | | | | | | | | | | | | | | | | | | | |
| | | Period Ended
September 30,
2007* | | | Years Ended October 31, | |
| | | | 2006 | | | 2005 | | | 2004 | | | 2003 | | | 2002 | |
Net Asset Value,
Beginning of Period | | $ | 18.36 | | | $ | 18.22 | | | $ | 18.33 | | | $ | 16.17 | | | $ | 11.75 | | | $ | 14.00 | |
| | | | | | | | | | | | | | | | | | | | | | | | |
Income/(Loss) from Investment Operations: | | | | | | | | | | | | | | | | | | | | | | | | |
Net Investment Income (Loss) | | | (0.01 | )(1) | | | (0.04 | )(1) | | | 0.01 | (1) | | | 0.07 | | | | (0.01 | ) | | | (0.01 | ) |
Net Realized and
Unrealized Gain (Loss) | | | 0.68 | (1) | | | 3.09 | (1) | | | 1.61 | (1) | | | 2.61 | | | | 4.54 | | | | (1.30 | ) |
| | | | | | | | | | | | | | | | | | | | | | | | |
Total from Investment Operations | | | 0.67 | | | | 3.05 | | | | 1.62 | | | | 2.68 | | | | 4.53 | | | | (1.31 | ) |
| | | | | | | | | | | | | | | | | | | | | | | | |
Distributions: | | | | | | | | | | | | | | | | | | | | | | | | |
Net Investment Income | | | — | | | | (0.02 | ) | | | — | | | | (0.07 | ) | | | — | | | | — | |
Net Realized Capital Gains | | | (4.35 | ) | | | (2.89 | ) | | | (1.73 | ) | | | (0.45 | ) | | | (0.11 | ) | | | (0.94 | ) |
| | | | | | | | | | | | | | | | | | | | | | | | |
Total Distributions | | | (4.35 | ) | | | (2.91 | ) | | | (1.73 | ) | | | (0.52 | ) | | | (0.11 | ) | | | (0.94 | ) |
| | | | | | | | | | | | | | | | | | | | | | | | |
Net Asset Value,
End of Period | | $ | 14.68 | | | $ | 18.36 | | | $ | 18.22 | | | $ | 18.33 | | | $ | 16.17 | | | $ | 11.75 | |
| | | | | | | | | | | | | | | | | | | | | | | | |
Total Return† | | | 3.67 | %(2) | | | 19.31 | % | | | 9.24 | % | | | 17.03 | % | | | 38.88 | % | | | (10.34 | )% |
| | | | | | | | | | | | | | | | | | | | | | | | |
Ratios and Supplemental Data | | | | | | | | | | | | | | | | | | | | | | | | |
Net Assets, End of Period (000) | | $ | 45,453 | | | $ | 60,737 | | | $ | 99,201 | | | $ | 247,954 | | | $ | 227,702 | | | $ | 167,698 | |
Ratio of Expenses to Average
Net Assets | | | 1.18 | %(3) | | | 1.25 | %(4) | | | 1.25 | %(4) | | | 1.25 | % | | | 1.25 | % | | | 1.25 | % |
Ratio of Expenses to Average
Net Assets (without waivers and fees paid indirectly) | | | 1.41 | %(3) | | | 1.63 | % | | | 1.47 | % | | | 1.36 | % | | | 1.35 | % | | | 1.31 | % |
Ratio of Net Investment Income (Loss) to Average Net Assets | | | (0.07 | )%(3) | | | (0.26 | )% | | | 0.06 | % | | | 0.33 | % | | | (0.10 | )% | | | (0.07 | )% |
Portfolio Turnover Rate | | | 82 | %(2) | | | 56 | % | | | 45 | % | | | 41 | % | | | 46 | % | | | 24 | % |
| | * | | The Fund’s fiscal year-end changed from October 31 to September 30, effective September 30, 2007. |
| | † | | Total return is for the period indicated and has not been annualized. Total returns shown do not reflect the deduction of taxes that a shareholder would pay on fund distributions or the redemption of fund shares. Total return would have been lower if the Adviser did not waive a portion of its fee. Total return for a period of less than one year is not annualized. The performance is based on the performance of the Institutional Shares of the Acquired Fund. |
| | (1) | | Per share calculations based on the Average Shares method. |
| | (4) | | The ratio of expenses to average net assets excludes the effects of fees paid indirectly. If these expense offsets were included, the ratio would not significantly differ. |
The accompanying notes are an integral part of the financial statements.
12
STERLING CAPITAL
SMALL CAP VALUE FUND
SEPTEMBER 30, 2007
|
NOTES TO FINANCIAL STATEMENTS |
1. Organization:
BB&T Funds (the “Trust”) (previously The BB&T Mutual Funds Group) was organized as a Massachusetts business trust by the amended Agreement and Declaration of Trust dated October 1, 1987. The Trust consists of twenty-five series of units of beneficial interest (“Shares”) offered to the public, each representing interests in one of twenty-five separate investment portfolios. These financial statements pertain to the Sterling Capital Small Cap Value Fund (the “Fund”) only. The financial statements of the remaining series are presented in a separate document. The Fund’s prospectus provides a description of the Fund’s investment objectives, policies and strategies.
The Fund may offer to the public four classes of Shares: Class A Shares, Class B Shares, Class C Shares and Sterling Shares. Currently, the Fund only offers Sterling Shares to the public. The Fund is an “open-end” “diversified” management company, as defined in the Investment Company Act of 1940, as amended (the “1940 Act”).
On December, 18, 2006 the Sterling Capital Small Cap Value Fund, a series of The Advisor’s Inner Circle Fund (the “Acquired Fund”), merged with and into the Fund pursuant to an Agreement and Plan of Reorganization (See Note 7).
Effective September 30, 2007, the Fund’s fiscal year end changed from October 31 to September 30.
2. Significant Accounting Policies:
The following is a summary of the significant accounting policies followed by the Fund in the preparation of financial statements. The policies are in conformity with United States generally accepted accounting principles. The preparation of financial statements requires management to make estimates and assumptions that affect the reported amounts of assets and liabilities and disclosure of contingent assets and liabilities at the date of the financial statements and the reported amounts of income and expenses for the reporting period. Actual results could differ from those estimates.
New Accounting Standards — In September 2006, the Financial Accounting Standards Board (“FASB”) issued Statement on Financial Accounting Standards No. 157, “Fair Value Measurements” (“SFAS No. 157”). This standard establishes a single authoritative definition of fair value, sets out a framework for measuring fair value and requires additional disclosures about fair value measurements. SFAS No. 157 applies to fair value measurements already required or permitted by existing standards. SFAS No. 157 is effective for financial statements issued for fiscal years beginning after November 15, 2007 and interim periods within those fiscal years. The changes to current generally accepted accounting principles from the application of SFAS No. 157 relate to the definition of fair value, the methods used to measure fair value, and the expanded disclosures about fair value measurements. As of
13
STERLING CAPITAL
SMALL CAP VALUE FUND
SEPTEMBER 30, 2007
September 30, 2007, the Fund does not believe the adoption of SFAS No. 157 will impact the financial statement amounts; however, additional disclosures may be required about the inputs used to develop the measurements and the effect of certain of the measurements reported on the statement of changes in net assets for the period.
In July, 2006, the FASB released FASB Interpretation No. 48 “Accounting for Uncertainty in Income Taxes” (“FIN 48”). FIN 48 provides guidance for how uncertain tax positions should be recognized, measured, presented and disclosed in the financial statements. FIN 48 requires the evaluation of tax positions taken or expected to be taken in the course of preparing the Fund’s tax returns to determine whether the tax positions are “more-likely-than-not” of being sustained by the applicable tax authority. Tax positions not deemed to meet the more-likely-than-not threshold would be recorded as a tax benefit or expense in year of determination. Adoption of FIN 48 is required no later than the last business day of the first financial statement reporting period for fiscal years beginning after December 15, 2006 and is to be applied to all open tax years as of the effective date. Management has not completed their analysis on whether the adoption of FIN 48 will have an impact on the financial statements once adopted.
Securities Valuation — Investments of the Fund in securities the principal market for which is a securities exchange or an over-the counter market are valued at their latest available sales price (except for those securities traded on NASDAQ, which will be valued at the NASDAQ Official Closing Price), or, absent such a price, by reference to the latest available bid price in the principal market in which such securities are normally traded. Securities the principal market for which is not a securities exchange are valued at their latest bid quotation in such principal market. Short-term securities are valued either at amortized cost or original cost plus interest, which approximates market value. Repurchase Agreements are valued at original cost.
Securities for which market prices are not readily available are valued as determined by the BB&T Funds’ Pricing Committee in their best judgment pursuant to procedures established by and under the general supervision of the Board of Trustees (the “Board”). Some of the more common reasons that may necessitate that a security be valued by the Pricing Committee include: the security’s trading has been halted or suspended; the security has been de-listed from a national exchange; the security’s primary trading market is temporarily closed at a time when under normal conditions it would be open; the security has not been traded for an extended period of time; the security’s primary pricing source is not able or willing to provide a price; or trading of the security is subject to local government-imposed restrictions. As of September 30, 2007 there were no fair valued securities.
Securities Transactions and Related Income — Security transactions are accounted for no later than one business day following the trade date. For
14
STERLING CAPITAL
SMALL CAP VALUE FUND
SEPTEMBER 30, 2007
financial reporting purposes, however, security transactions are accounted for on a trade date of the last business day of the reporting period. Interest income is recognized on the accrual basis and includes, where applicable, the amortization/accretion of premium or discount. Dividend income is recorded on the ex-dividend date. Gains or losses from sales of securities are determined by comparing the identified cost of the security lot sold with the net sale proceeds.
Repurchase Agreements — The Fund may enter into agreements with member banks of the Federal Deposit Insurance Corporation and with registered broker/dealers that Sterling Capital Management LLC (“Sterling Capital” or the “Adviser”) deemed creditworthy under guidelines approved at the Board, subject to a seller’s agreement to repurchase such securities at a mutually agreed-upon date and price. The repurchase price generally equals the price paid by the Fund plus interest negotiated on the basis of current short-term rates, which may be more or less than the rate on the underlying Fund securities. The seller, under these types of agreements, is required to maintain the value of collateral held pursuant to the agreement at not less than the repurchase price (including accrued interest) in a segregated account. Securities subject to repurchase are held by the Fund’s custodian, another qualified custodian, or in the Federal Reserve/Treasury book-entry system. In the event of counterparty default, the Fund has the right to use the collateral to offset losses incurred. There is potential for loss to the Fund in the event the Fund is delayed or prevented from exercising its rights to dispose of the collateral securities, including the risk of a possible decline in the fair value of the underlying securities during the period while the Fund seeks to assert its rights.
Expenses — Expenses that are directly related to the Fund are charged to the Fund. Expenses not directly attributable to the Fund are allocated proportionately in relation to the net assets of each fund in the Trust or another reasonable basis. Expenses that are attributable to both the Trust and the BB&T Variable Insurance Funds are allocated across the Trust and BB&T Variable Insurance Funds, based upon relative net assets or on another reasonable basis.
Distributions to Shareholders — Dividends from net investment income, if any, are declared and paid to shareholders quarterly. Any net realized capital gains are distributed to shareholders at least annually.
Federal Income Taxes — It is the policy of the Fund to continue to qualify as a regulated investment company by complying with the provisions available to certain investment companies, as defined in applicable sections of the Internal Revenue Code, and to make distributions of net investment income and net realized capital gains sufficient to relieve it from all, or substantially all, federal income taxes. Accordingly, no provision for federal income tax is required.
3. Purchases and Sales of Securities:
Purchases and sales of securities (excluding securities maturing less than one year from acquisition and long-term U.S. Government Securities) for the period ended
15
STERLING CAPITAL
SMALL CAP VALUE FUND
SEPTEMBER 30, 2007
September 30, 2007, were $46,799,573 and $62,778,678, respectively. There were no purchases or sales of long-term U.S. Government securities.
4. Related Party Transactions:
Investment advisory and management services are provided to the Fund by Sterling Capital pursuant to an investment advisory agreement (the “Advisory Agreement”) dated July 1, 2006. The Adviser is a successor to Sterling Capital Management Company, which was a wholly-owned subsidiary of United Asset Management. On April 1, 2005, BB&T Corporation acquired a 70% ownership interest in the Adviser. The Adviser now operates as an independently managed subsidiary of BB&T Corporation.
Under the Advisory Agreement, the Adviser receives an annual fee equal to (a) 0.90% of the Fund’s average daily net assets; or (b) such fee as may from time to time be agreed upon in writing by the Trust and the Adviser. A fee agreed to in writing from time to time by the Trust and the Adviser may be significantly lower than the fee calculated at the annual rate and the effect of such lower fee would be to lower the Fund’s expenses and increase net income of the Fund during the period when such lower fee is in effect. The Adviser has contractually agreed to limit its advisory fee paid by the Fund to 0.80% for the period from December 18, 2006 through January 31, 2008. Any reductions in advisory fees are reflected as “Waiver of investment advisory fees” in the Statement of Operations.
Prior to December 18, 2006, the Adviser received a fee equal to 1.00% of the Acquired Fund’s average daily net assets. The Adviser had voluntarily agreed to waive a portion of its advisory fee and to assume expenses, if necessary, in order to limit the Acquired Fund’s total operating expenses to a maximum of 1.25% of average daily net assets.
Since December 18, 2006, BB&T Asset Management, Inc. (“BB&T AM” or the “Administrator”) serves as the Administrator to the Fund as well as other funds in the Trust and the BB&T Variable Insurance Funds pursuant to the Administration Agreement. The Fund pays the Administrator its portion of a fee based on the aggregate assets of the Trust and the BB&T Variable Insurance Funds at an annual rate of 0.11% on the first $3.5 billion of average net assets; 0.075% on the next $1 billion of the average net assets; 0.06% on the next $1.5 billion of the average net assets; and 0.04% on the average net assets over $6 billion. This fee is accrued daily and paid monthly.
Prior to December 18, 2006, SEI Investment Global Funds Services served as the administrator to the Acquired Fund and was paid fees of 0.150% on the first $250 million of the Acquired Fund’s average daily net assets; 0.125% on the next $250 million of the Acquired Fund’s average daily net assets; 0.100% on all Acquired Funds average daily net assets over $500 million; subject to a minimum annual administration fee of $250,000 and $20,000 per each additional class.
16
STERLING CAPITAL
SMALL CAP VALUE FUND
SEPTEMBER 30, 2007
Since December 18, 2006, PFPC Inc. serves as the Fund’s sub-administrator and transfer agent. PFPC Distributors, Inc. (“the Distributor”) serves as the Fund’s principal underwriter pursuant to an Underwriting Agreement dated December 18, 2006.
Prior to December 18, 2006, DST Systems, Inc. and SEI Investments Distribution Co. served as the Acquired Fund’s transfer agent and distributor, respectively.
U.S. Bank National Association acts as custodian (the “Custodian”) for the Fund. The Custodian plays no role in determining the investment policies of the Fund or which securities are to be purchased and sold by the Fund.
Certain brokers, dealers, banks, trust companies and other financial representatives received compensation from the Acquired Fund for providing a variety of services, including record keeping and transaction processing. Such fees were based on the assets of the Acquired Fund that were serviced by the financial representative. Such fees were paid by the Acquired Fund to the extent that the number of accounts serviced by the financial representative multiplied by the account fee charged by the Acquired Fund’s transfer agent would not exceed the amount that would have been charged had the accounts serviced by the financial representative been registered directly through the transfer agent. All fees in excess of this calculated amount were paid by the Adviser. During the period ended September 30, 2007 and for the year ended October 31, 2006, the Acquired Fund paid $10,037 and $86,212, respectively, to third parties for such services. These fees are included under “Transfer agent fees” in the Statements of Operations.
During the period from November 1, 2006 through December 15, 2006, and for the year ended October 31, 2006, the Acquired Fund earned cash management credits, which were used to offset transfer agent fees. This amount is labeled as “Fees paid indirectly” on the Statements of Operations.
Certain Officers and Trustees of the Fund are affiliated with the Adviser, the Administrator or the sub-administrator. Such Officers and Trustees receive no compensation from the Trust for serving in their respective roles. Each of the five Trustees who are not interested persons (as defined on the 1940 Act) of the Trust who serve on both the Board and Audit Committee are compensated $6,000 per quarter and $2,400 for each regularly scheduled meeting, plus reimbursement for certain expenses. Additionally, the Chairman of the Board and Audit Committee Chairman receive an annual retainer of $6,000 and $10,000, respectively.
Since December 18, 2006, BB&T AM’s Chief Compliance Officer (“CCO”) also began to serve as the Fund’s CCO. Since December 18, 2006, the CCO’s compensation is reviewed and approved by the Fund’s Board and paid by the Administrator. However, the Fund reimburses the Administrator for its allocable portion of the CCO’s salary. As a result, the CCO fee paid by the Fund is only part of the total compensation received by the CCO. Expenses incurred for the fund are reflected on the Statement of Operations as “Chief compliance Officer fees”.
17
STERLING CAPITAL
SMALL CAP VALUE FUND
SEPTEMBER 30, 2007
Prior to December 18, 2006, services provided by the former CCO and his staff were paid for by the Acquired Fund as incurred. The services included regulatory oversight of the Advisor and service providers as required by SEC regulations. The CCO’s services had been approved by and are reviewed by the Acquired Fund’s Board.
5. Federal Income Tax Information:
The amount and character of income and capital gain distributions to be paid, if any, are determined in accordance with Federal income tax regulations, which may differ from U.S. generally accepted accounting principles. These differences are primarily due to differing book and tax treatments for wash sales and distribution reclass. Permanent book and tax differences relating to shareholder distributions and redemptions utilized as distributions for Federal income tax purposes resulted in reclassifications to undistributed net investment income (loss), accumulated net realized gain (loss) and paid in capital. Permanent book-tax differences relating to distributions received from REITs, if any, are not included in ending undistributed net investment income (loss) for the purposes of calculating net investment income (loss) per share in the financial highlights. These reclassifications had no impact on the net assets or net asset value of the Fund. Accordingly, the following permanent differences have been reclassified to/from the following accounts as of September 30, 2007:
| | | | |
Undistributed Net Investment Income | | Accumulated Realized Gain | | Paid-in Capital |
$38,243 | | $(2,291,600) | | $2,253,357 |
The tax character of distributions paid during the period ended September 30, 2007 and fiscal years ended October 31, 2006 and October 31, 2005, were as follows:
| | | | | | | | | |
| | | Ordinary
Income | | Long-Term
Capital Gain | | Total |
2007 | | $ | 2,289,539 | | $ | 11,970,773 | | $ | 14,260,312 |
2006 | | | 810,653 | | | 14,909,462 | | | 15,720,115 |
2005 | | | 3,794,861 | | | 19,731,645 | | | 23,526,506 |
As of September 30, 2007, the components of Distributable Earnings on a tax basis were as follows:
| | | |
Undistributed Ordinary Income | | $ | 2,257,857 |
Undistributed Long-Term Capital Gains | | | 4,366,976 |
Unrealized Appreciation | | | 2,467,771 |
| | | |
Total Distributable Earnings | | $ | 9,092,604 |
| | | |
18
STERLING CAPITAL
SMALL CAP VALUE FUND
SEPTEMBER 30, 2007
The Federal tax cost and aggregate gross unrealized appreciation and depreciation on investments held by the Fund at September 30, 2007, were as follows:
| | | | | | |
Federal
Tax Cost | | Aggregate Gross
Unrealized
Appreciation | | Aggregate Gross
Unrealized
Depreciation | | Net Unrealized
Appreciation |
| $43,390,171 | | $7,393,157 | | $ (4,925,386) | | $2,467,771 |
6. Other:
At September 30, 2007, 51% of total shares outstanding were held by two record shareholders of the Fund each owning 10% or greater of the aggregate total shares outstanding.
In the normal course of business, the Fund enters into contracts that provide general indemnifications. The Fund’s maximum exposure under these arrangements is dependent on future claims that may be made against the Fund and, therefore, cannot be established; however, based on experience, the risk of loss from such claim is considered remote.
7. Reorganization:
On December 18, 2006, the Fund acquired all of the assets and assumed all of the liabilities of Sterling Capital Small Cap Value Fund, a series of The Advisor’s Inner Circle Fund, in exchange for shares of the Fund, pursuant to an Agreement and Plan of Reorganization approved by the Acquired Fund’s shareholders on November 8, 2006 and by the Fund’s Board on February 28, 2006. The Fund is the surviving fund for the purposes of maintaining the post-reorganization financial statements and performance history.
The Fund had no assets prior to the reorganization. Accordingly, the reorganization, which was a tax-free reorganization, had no effect on the Fund’s operations. As a result of the reorganization, shareholders of the Acquired Fund became shareholders of the Fund.
19
STERLING CAPITAL
SMALL CAP VALUE FUND
|
REPORT OF INDEPENDENT REGISTERED PUBLIC ACCOUNTING FIRM |
To the Shareholders and Board of Trustees of
Sterling Capital Small Cap Value Fund:
We have audited the accompanying statement of assets and liabilities of the Sterling Capital Small Cap Value Fund, (the “Fund”), including the schedule of portfolio investments, as of September 30, 2007, and the related statements of operations for the period then ended and for the year ended October 31, 2006, the statements of changes in net assets for the period ended September 30, 2007 and for each of the periods in the two-year period ended October 31, 2006, and the financial highlights for the period ended September 30, 2007 and for each of the periods in the five-year period ended October 31, 2006. These financial statements and financial highlights are the responsibility of the Funds’ management. Our responsibility is to express an opinion on these financial statements and financial highlights based on our audits.
We conducted our audit in accordance with the standards of the Public Company Accounting Oversight Board (United States). Those standards require that we plan and perform the audit to obtain reasonable assurance about whether the financial statements and financial highlights are free of material misstatement. An audit includes examining, on a test basis, evidence supporting the amounts and disclosures in the financial statements. Our procedures included confirmation of securities owned as of September 30, 2007, by correspondence with the custodian and brokers; where replies were not received from brokers we performed other auditing procedures. An audit also includes assessing the accounting principles used and significant estimates made by management, as well as evaluating the overall financial statement presentation. We believe that our audit provides a reasonable basis for our opinion.
In our opinion, the financial statements and financial highlights referred to above present fairly, in all material respects, the financial position of Sterling Capital Small Cap Value Fund as of September 30, 2007, the results of its operations for the period ended September 30, 2007 and for the year ended October 31, 2006, the changes in its net assets for the period ended September 30, 2007 and for each of the years in the two-year period ended October 31, 2006, and the financial highlights for the period ended September 30, 2007 and for each of the periods in the five-year period ended October 31, 2006, in conformity with U.S. generally accepted accounting principles.

New York, NY
November 21, 2007
20
STERLING CAPITAL
SMALL CAP VALUE FUND
|
DISCLOSURE OF FUND EXPENSES (unaudited) |
As a shareholder of the BB&T Funds, you incur two types of costs: (1) transaction costs and (2) ongoing costs, including management fees; and other Fund expenses.
These examples are intended to help you understand your ongoing costs (in dollars) of investing in the Fund and to compare these costs with the ongoing costs of investing in other mutual funds.
These examples are based on an investment of $1,000 invested at the beginning of the period and held for the entire period from April 1, 2007 through September 30, 2007.
• Actual Example. The table below provides information about actual account values and actual expenses. You may use the information below, together with the amount you invested, to estimate the expenses you paid over the period. Simply divide your account value by $1,000 (for example, an $8,600 account value divided by $1,000 = 8.6), then multiply the result by the number in the table under the heading entitled “Expenses Paid During Period” to estimate the expenses you paid on your account during this period.
• Hypothetical Example for Comparison Purposes. The table below provides information about hypothetical account values and hypothetical expenses based on the Fund’s actual expense ratio and an assumed rate of return of 5% per year before expenses, which is not the Fund’s actual return. The hypothetical account values and expenses may not be used to estimate the actual ending account balances or expenses you paid for the period. You may use this information to compare this 5% hypothetical example with the 5% hypothetical examples that appear in the shareholder reports of other funds.
Please note that the expenses shown in the table are meant to highlight your ongoing costs only and do not reflect any transactional costs, such as sales charges (loads), redemption fees, or exchange fees. Therefore, the table is useful in comparing ongoing costs only and will not help you determine the relative costs of owning different funds. In addition, if these transactional costs were included, your costs would have been higher.
| | | | | | | | | |
| | | Beginning
Account
Value
04/01/07 | | Ending
Account
Value
09/30/07 | | Expenses
Paid During
Period*
04/01/07 –
09/30/07 | | Annualized
Expense Ratio
During Period
04/1/07 –
09/30/07 |
Sterling Capital Small Cap Value Fund — Sterling Shares | | | | |
Actual Fund Return | | $1,000.00 | | | $954.50 | | $5.60 | | 1.15% |
Hypothetical 5% Return | | $1,000.00 | | $ | 1,019.20 | | $5.79 | | 1.15% |
| *Expenses | are equal to the average account value over the period multiplied by the Fund's annualized expense ratio, multiplied by the number of days in the most recent period ended divided by the number of days in the fiscal year (to reflect the one-half year period). |
21
STERLING CAPITAL
SMALL CAP VALUE FUND
|
BOARD CONSIDERATION OF ADVISORY AGREEMENTS (unaudited) |
The Board of Trustees of BB&T Funds (the “Trust”), at a meeting held on August 28, 2007, formally considered the continuance of the investment advisory agreement between Sterling Capital Management LLC (the “Adviser”) and the Trust (the “Advisory Agreement”) with respect to the Sterling Capital Small Cap Value Fund (the “Fund”).
The Trustees reviewed extensive material in connection with their consideration of the Advisory Agreement, including data from an independent provider of mutual fund data (as assembled by the Fund’s administrator), which included comparisons with industry averages for comparable funds for advisory fees, Rule 12b-1 fees and total fund expenses. The data reflected the Adviser’s fee waivers in place, as well as the Adviser’s contractual investment advisory fee levels. The Board was assisted in its review by independent legal counsel, who provided a memorandum detailing the legal standards for review of the Advisory Agreement. The Board received a detailed presentation by the Adviser, which included an analysis of the Fund’s performance (including the performance of the Adviser’s predecessor fund, the Sterling Capital Small Cap Value Fund, a series of The Adviser’s Inner Circle Fund (the “Predecessor Fund”)) and investment process. The Board also received profitability information from the Adviser and deliberated outside the presence of management and the Adviser.
In their deliberations, each Trustee attributed different weights to various factors involved in an analysis of the Advisory Agreement, and no factor alone was considered determinative. The Trustees determined that the overall arrangements between the Trust and the Adviser, as provided in the Advisory Agreement, were fair and reasonable and that the approval of the Advisory Agreement was in the best interests of the Fund and its shareholders.
The matters addressed below were considered and discussed by the Trustees in reaching their conclusions.
Nature, Extent and Quality of Services Provided by the Adviser
The Trustees received and considered information regarding the nature, extent, and quality of the services provided to the Fund under the Advisory Agreement. The Trustees took into account information furnished at Trustee meetings since December 18, 2006, when the Predecessor Fund merged into the Fund, as well as materials furnished specifically in connection with the annual review process. The Trustees considered the background and experience of the Adviser’s senior management and the expertise of investment personnel of the Adviser responsible for the day-to-day management of the Fund. The Trustees considered the overall reputation, and the capabilities and commitment of the Adviser to provide high quality service to the Fund, and the Trustees’ overall confidence in the Adviser’s integrity.
22
STERLING CAPITAL
SMALL CAP VALUE FUND
The Trustees received information concerning the Adviser’s expertise in value investing and the investment philosophy and investment processes applied by the Adviser in managing the Fund. The Trustees reviewed the Adviser’s Form ADV as well. The Trustees also considered information regarding regulatory compliance and compliance with the investment policies of the Fund. The Trustees evaluated the procedures of the Adviser designed to fulfill the Adviser’s fiduciary duty to the Fund with respect to possible conflicts of interest, including the Adviser’s codes of ethics (regulating the personal trading of its officers and employees).
Based on their review, the Trustees concluded that, with respect to the quality and nature of services to be provided by the Adviser, the scope of responsibilities was consistent with mutual fund industry norms, and that the quality of the services was very satisfactory.
Investment Performance
The Trustees considered performance results of the Fund and the Predecessor Fund in absolute terms and relative to benchmark and peer group performance. It was noted that performance was strong both year-to-date and over the one-year period relative to the benchmark.
After reviewing the performance of the Fund, and taking into consideration the management style, investment strategies, and prevailing market conditions during the prior year and for longer periods, the Trustees concluded that the performance of the Fund was generally strong and that in instances where performance issues were encountered, the Adviser had properly addressed the situation.
Cost of Services, Including the Profits Realized by the Adviser and Affiliates
The Trustees considered peer group comparable information with respect to the advisory fees charged by the Adviser to the Fund, taking into consideration both contractual and actual (i.e., after waiver) fee levels. The Trustees concluded that the investment advisory fees fell within an acceptable range as compared to peer groups, particularly in light of the fee waivers that would be continued in the upcoming year.
As part of their review, the Trustees considered benefits to the Adviser aside from investment advisory fees. The Trustees also considered benefits to the Adviser’s affiliates, including administration fees received by BB&T Asset Management, Inc.
Consideration of the reasonableness of advisory fees also took into account, where relevant, the profitability of the Adviser. In determining whether the investment advisory fees were reasonable, the Trustees reviewed profitability information provided by the Adviser with respect to investment advisory services. With respect to such information, the Trustees recognized that such profitability data was generally unaudited and represented the Adviser’s own determination of its and its affiliates’ revenues from the contractual services provided to the Fund, less expenses of providing such services. Expenses include direct and indirect costs and were calculated
23
STERLING CAPITAL
SMALL CAP VALUE FUND
using an allocation methodology developed by the Adviser. The Trustees also recognized that it is difficult to make comparisons of profitability from fund investment advisory contracts, because comparative information is not generally publicly available and is affected by numerous factors. Based on their review, the Trustees concluded that the profitability to the Adviser, as a result of its relationships with the Fund, was acceptable. The Board also concluded that the fees under the Advisory Agreement were fair and reasonable, in light of the services and benefits provided to the Fund.
Economies of Scale
The Trustees also considered whether fee levels reflect economies of scale and whether economies of scale would be produced by the growth of the Fund’s assets. The Trustees found that the Adviser had generally reduced fund total expense ratios through contract negotiations and fee waivers. The Trustees found that the asset levels of the Fund were not currently so large as to warrant formal contractual breakpoints, and that the fee waivers were a reasonable way to provide the benefits of economies of scale to shareholders at this time.
24
STERLING CAPITAL
SMALL CAP VALUE FUND
|
TRUSTEES AND OFFICERS (Unaudited) |
The Fund is managed under the direction of the Board of Trustees. Subject to the provisions of the Declaration of Trust, By-laws and Massachusetts law, the Trustees have all powers necessary and convenient to carry out this responsibility, including the election and removal of Trust officers.
The Trustees and officers of the Fund, their ages, the position they hold with the BB&T Funds, their term of office and length of time served, a description of their principal occupations during the past five years, the number of portfolios in the fund complex that the Trustee oversees and any other directorships held by the Trustee are listed in the two tables immediately following. The business address of the persons listed below is 434 Fayetteville Street Mall, Raleigh, North Carolina 27601.
| | | | | | | | | | |
| INDEPENDENT TRUSTEES |
Name And Birthdate | | Position(s) Held With The Funds | | Term Of Office
And Length Of Time
Served | | Principal Occupation During The Last 5 Years | | Number Of Portfolios In Fund Complex Overseen By Trustee | | Other Directorships Held By
Trustee |
Thomas W. Lambeth Birthdate: 01/35 | | Trustee Chairman of the Board of Trustees | | Indefinite, 8/92 – Present | | From January 2001 to present, Senior Fellow, Z. Smith Reynolds Foundation; from 1978 to January 2001, Executive Director, Z. Smith Reynolds Foundation. | | 30 | | None |
Drew T. Kagan Birthdate: 02/48 | | Trustee | | Indefinite, 8/00 – Present | | From December 2003 to present, President and Director, Montecito Advisors, Inc.; from March 1996 to December 2003, President, Investment Affiliate, Inc. | | 30 | | None |
Laura C. Bingham Birthdate: 11/56 | | Trustee | | Indefinite, 2/01 – Present | | From July 1998 to present, President of Peace College. | | 30 | | None |
Douglas R. Van Scoy Birthdate: 11/43 | | Trustee | | Indefinite 5/04 – present | | Retired; from November 1974 to July 2001, employee of Smith Barney (investment banking), most recently as the Director of Private Client Group and Senior Executive Vice President | | 30 | | None |
James L. Roberts Birthdate: 11/42 | | Trustee | | Indefinite 11/04 – present | | Retired; from November 2006 to present, Director, Grand Mountain Bancshares, Inc.; from January 1999 to December 2003, President, CEO and Director, Covest Bancshares, Inc. | | 30 | | None |
25
STERLING CAPITAL
SMALL CAP VALUE FUND
| | | | | | | | | | |
|
| INTERESTED TRUSTEE |
Name And Birthdate | | Position(s) Held With The Funds | | Term Of Office
And Length Of Time
Served | | Principal Occupation During The Last 5 Years | | Number Of Portfolios In Fund Complex Overseen By Trustee | | Other Directorships Held By
Trustee |
*Keith F. Karlawish Birthdate: 08/64 | | Trustee | | Indefinite, 6/06 – Present | | From May 2002 to present, President, BB&T Asset Management, Inc.; from 1996 to 2002, Senior Vice President and Director of Fixed Income, BB&T Asset Management, Inc. | | 30 | | N/A |
| * | | Mr. Karlawish is treated by the Fund as an “interested person” (as defined in Section 2(a)(19) of the 1940 Act) of the Fund. Mr. Karlawish is an “interested person” because he owns shares of BB&T Corporation and is the President of BB&T Asset Management, Inc., an affiliate of the Adviser. |
26
STERLING CAPITAL
SMALL CAP VALUE FUND
| | | | | | |
| OFFICERS |
Name And Birthdate | | Position(s) Held With The Funds | | Term Of Office And Length Of Time Served | | Principal Occupation During The Last 5 Years |
Keith F. Karlawish Birthdate: 08/64 | | President | | Indefinite, 2/05 – Present | | From May 2002 to present, President, BB&T Asset Management, Inc.; from 1996 to 2002, Senior Vice President and Director of Fixed Income, BB&T Asset Management, Inc. |
James T. Gillespie Birthdate: 11/66 | | Vice President, Secretary | | Indefinite, 5/02 – Present, 8/06 – Present | | From February 2005 to present, Vice President and Manager of Mutual Fund Administration, BB&T Asset Management, Inc.; from February 1992 to 2005, employee of BISYS Fund Services |
E.G. Purcell, III Birthdate: 01/55 | | Vice President | | Indefinite, 11/00 – Present | | From 1995 to present, Senior Vice President, BB&T Asset Management, Inc. and its predecessors |
Todd M. Miller Birthdate: 9/71 | | Vice President | | Indefinite, 8/05 – Present | | From June 2005 to present, Mutual Fund Administrator, BB&T Asset Management, Inc.; from May 2001 to May 2005, Manager, BISYS Fund Services |
Diana Hanlin Birthdate: 5/67 | | Vice President | | Indefinite, 8/07 – Present | | From April 2007 to present, Compliance Officer, BB&T Asset Management, Inc.; from May 2004 to March 2007, Director of Compliance, BISYS Fund Services; from October 2000 to May 2004, Senior Compliance Analyst, BISYS Fund Services |
Clinton L. Ward Birthdate: 11/69 | | Chief Compliance and Anti-Money Laundering Officer | | Indefinite, 12/06 – Present | | From July 2004 to present, Chief Compliance Officer and Secretary, BB&T Asset Management, Inc.; from January 2002 to July 2004, Compliance Analyst, Wachovia Bank, N.A.; from November 1999 to January 2002, Compliance Manager — Mutual Fund Compliance, Banc of America Capital Management, LLC |
Andrew J. McNally Birthdate: 12/70 | | Treasurer | | Indefinite, 12/06 – Present | | From December 2000 to present, Vice President and Senior Director, Fund Accounting and Administration Department, PFPC Inc. |
Avery Maher Birthdate: 02/45 | | Assistant Secretary | | Indefinite 12/06 – Present | | From March 2006 to present, Vice President and Counsel, Regulatory Administration Department, PFPC Inc.; from October 2004 to August 2005, Vice President and Assistant General Counsel, JPMorgan Asset Management; from 1992 to 2004, Second Vice President and Assistant Secretary, John Hancock Advisers, LLC |
27
STERLING CAPITAL
SMALL CAP VALUE FUND
|
NOTICE TO SHAREHOLDERS (Unaudited) |
For shareholders that do not have an September 30, 2007, tax year end, this notice is for informational purposes only. For shareholders with an September 30, 2007, tax year end, please consult your tax advisor as to the pertinence of this notice. For the fiscal period ended September 30, 2007, the Fund is designating the following items with regard to distributions paid during the year.
| | | | | | | | | | |
Long Long
(15% Rate)
Capital Gain
Distributions | | Ordinary
Income
Distributions | | Total
Distributions | | Qualifying
Dividends(1) | | Qualifying
Dividend
Income(2) | | Qualifying
Short-Term
Capital Gain(3) |
| 84.62% | | 15.38% | | 100.00% | | 47.11% | | 47.37% | | 100.00% |
| (1) | | Qualifying dividends represent dividends which qualify for the corporate dividends received deduction and are reflected as a percentage of “Ordinary Income Distributions”. |
| (2) | | The percentage in this column represents the amount of “Qualifying Dividend Income” as created by the Jobs and Growth Tax Relief Reconciliation Act of 2003 and is reflected as a percentage of “Ordinary Income Distributions”. It is the intention of the Fund to designate the maximum amount permitted by the law. |
| (3) | | The percentage in this column represents the amount of “Qualifying Short-Term Capital Gain” as created by the American Jobs Creation Act of 2004 and is reflected as a percentage of short-term capital gain distributions that is exempt from U.S. withholding tax when paid to foreign investors. |
| | | The information reported herein may differ from the information and distributions taxable to the shareholders for the calendar year ending December 31, 2007. Complete information will be computed and reported in conjunction with your Form 1099-DIV. |
28
Sterling Capital Small Cap Value Fund
P.O. Box 9652
Providence, RI 02940-9652
1-866-450-3722
Adviser:
Sterling Capital Management, LLC
Two Morrocroft Centre
4064 Colony Road, Suite 300
Charlotte, NC 28211
Distributor:
PFPC Distributors, Inc.
760 Moore Road
King of Prussia, PA 19406
Administrator:
BB&T Asset Management, Inc.
434 Fayetteville Street Mall
5th Floor
Raleigh, NC 27601
Legal Counsel:
Ropes and Gray LLP
One Metro Center
700 12th Street, N.W.
Suite 900
Washington D.C. 20005
Transfer Agent:
PFPC Inc.
760 Moore Road
King of Prussia, PA 19406
Auditors
KPMG LLP
345 Park Avenue
New York, NY 10154
This information must be preceded or accompanied by a current prospectus for the Fund described.
A25-AR-0907
| | (a) | The registrant, as of the end of the period covered by this report, has adopted a code of ethics that applies to the registrant’s principal executive officer, principal financial officer, principal accounting officer or controller, or persons performing similar functions, regardless of whether these individuals are employed by the registrant or a third party. |
| | (c) | There have been no material amendments, during the period covered by this report, to a provision of the code of ethics that applies to the registrant’s principal executive officer, principal financial officer, principal accounting officer or controller, or persons performing similar functions, regardless of whether these individuals are employed by the registrant or a third party, and that relates to any element of the code of ethics description. |
| | (d) | The registrant has not granted any waivers, including an implicit waiver, from a provision of the code of ethics that applies to the registrant’s principal executive officer, principal financial officer, principal accounting officer or controller, or persons performing similar functions, regardless of whether these individuals are employed by the registrant or a third party, that relates to one or more of the items set forth in paragraph (b) of this item’s instructions. |
| Item 3. | Audit Committee Financial Expert. |
As of the end of the period covered by the report, the registrant’s board of trustees has determined that Drew Kagan is qualified to serve as an audit committee financial expert serving on its audit committee and that he is “independent,” as defined by Item 3 of Form N-CSR.
| Item 4. | Principal Accountant Fees and Services. |
Audit Fees
| | (a) | The aggregate fees billed for each of the last two fiscal years for professional services rendered by the principal accountant for the audit of the registrant’s annual financial statements or services that are normally provided by the accountant in connection with statutory and regulatory filings or engagements for those fiscal years are $360,000 for 2007 and $194,250 for 2006. |
Audit-Related Fees
| | (b) | The aggregate fees billed in each of the last two fiscal years for assurance and related services by the principal accountant that are reasonably related to the performance of the audit of the registrant’s financial statements and are not reported under paragraph (a) of this Item are $0 for 2007 and $14,650 for 2006. |
2006 - Fees of $9,650 relate to the consent of the N-1A filing, the consent of the N-14 filing for the Small Cap and Small Company Growth Funds and consent on the N-14 filing for the Large Cap and Large Cap Growth Fund.
Tax Fees
| | (c) | The aggregate fees billed in each of the last two fiscal years for professional services rendered by the principal accountant for tax compliance, tax advice, and tax planning are $90,000 for 2007 and $71,500 for 2006. |
Fees for both 2007 and 2006 relate to the preparation of federal income and excise tax returns and review of the excise tax calculations. Additional fees in 2006 were for a tax return review for a Small Cap merger.
All Other Fees
| | (d) | The aggregate fees billed in each of the last two fiscal years for products and services provided by the principal accountant, other than the services reported in paragraphs (a) through (c) of this Item are $0 for 2007 and $0 for 2006. |
| | (e)(1) | Disclose the audit committee’s pre-approval policies and procedures described in paragraph (c)(7) of Rule 2-01 of Regulation S-X. |
Except as permitted by Rule 2-01(c)(7)(i)(C) of Regulation S-X, the Trust’s Audit Committee must pre-approve all audit and non-audit services provided by the independent accountants relating to the operations or financial reporting of the funds. Prior to the commencement of any audit or non-audit services to a fund, the Audit Committee reviews the services to determine whether they are appropriate and permissible under applicable law.
| | (e)(2) | The percentage of services described in each of paragraphs (b) through (d) of this Item that were approved by the audit committee pursuant to paragraph (c)(7)(i)(C) of Rule 2-01 of Regulation S-X are as follows: |
| | (f) | The percentage of hours expended on the principal accountant’s engagement to audit the registrant’s financial statements for the most recent fiscal year that were attributed to work performed by persons other than the principal accountant’s full-time, permanent employees was 0%. |
| | (g) | The aggregate non-audit fees billed by the registrant’s accountant for services rendered to the registrant, and rendered to the registrant’s investment adviser (not including any sub-adviser whose role is primarily portfolio management and is subcontracted with or overseen by another investment adviser), and any entity controlling, controlled by, or under common control with the adviser that provides ongoing services to the registrant for each of the last two fiscal years of the registrant was $465,500 for 2007 and $520,225 for 2006. |
| | (h) | The registrant’s audit committee of the board of directors has considered whether the provision of non-audit services that were rendered to the registrant’s investment adviser (not including any sub-adviser whose role is primarily portfolio management and is subcontracted with or overseen by another investment adviser), and any entity controlling, controlled by, or under common control with the investment adviser that provides ongoing services to the registrant that were not pre-approved pursuant to paragraph (c)(7)(ii) of Rule 2-01 of Regulation S-X is compatible with maintaining the principal accountant’s independence. |
| Item 5. | Audit Committee of Listed registrants. |
Not applicable.
| Item 6. | Schedule of Investments. |
Schedule of Investments in securities of unaffiliated issuers as of the close of the reporting period is included as part of the report to shareholders filed under Item 1 of this form.
| Item 7. | Disclosure of Proxy Voting Policies and Procedures for Closed-End Management Investment Companies. |
Not applicable.
| Item 8. | Portfolio Managers of Closed-End Management Investment Companies. |
Not applicable.
| Item 9. | Purchases of Equity Securities by Closed-End Management Investment Company and Affiliated Purchasers. |
Not applicable.
| Item 10. | Submission of Matters to a Vote of Security Holders. |
Not applicable.
| Item 11. | Controls and Procedures. |
| | (a) | The registrant’s principal executive and principal financial officers, or persons performing similar functions, have concluded that the registrant’s disclosure controls and procedures (as defined in Rule 30a-3(c) under the Investment Company Act of 1940, as amended (the “1940 Act”) (17 CFR 270.30a-3(c))) are effective, as of a date within 90 days of the filing date of the report that includes the disclosure required by this paragraph, based on their evaluation of these controls and procedures required by Rule 30a-3(b) under the 1940 Act (17 CFR 270.30a-3(b)) and Rules 13a-15(b) or 15d-15(b) under the Securities Exchange Act of 1934, as amended (17 CFR 240.13a-15(b) or 240.15d-15(b)). |
| | (b) | There were no changes in the registrant’s internal control over financial reporting (as defined in Rule 30a-3(d) under the 1940 Act (17 CFR 270.30a-3(d)) that occurred during the registrant’s second fiscal quarter of the period covered by this report that has materially affected, or is reasonably likely to materially affect, the registrant’s internal control over financial reporting. |
| | |
| (a)(1) | | Code of ethics, or any amendment thereto, that is the subject of disclosure required by Item 2 is attached hereto. |
| |
| (a)(2) | | Certifications pursuant to Rule 30a-2(a) under the 1940 Act and Section 302 of the Sarbanes-Oxley Act of 2002 are attached hereto. |
| |
| (a)(3) | | Not applicable. |
| (b) | Certifications pursuant to Rule 30a-2(b) under the 1940 Act and Section 906 of the Sarbanes-Oxley Act of 2002 are attached hereto. |
SIGNATURES
Pursuant to the requirements of the Securities Exchange Act of 1934 and the Investment Company Act of 1940, the registrant has duly caused this report to be signed on its behalf by the undersigned, thereunto duly authorized.
| | |
| (registrant) BB&T Funds |
| |
| By (Signature and Title)* | | /s/ Keith F. Karlawish |
| | Keith F. Karlawish, President |
| | (principal executive officer) |
Date 11/28/2007
Pursuant to the requirements of the Securities Exchange Act of 1934 and the Investment Company Act of 1940, this report has been signed below by the following persons on behalf of the registrant and in the capacities and on the dates indicated.
| | |
| By (Signature and Title)* | | /s/ Keith F. Karlawish |
| | Keith F. Karlawish, President |
| | (principal executive officer) |
Date 11/28/2007
| | |
| By (Signature and Title)* | | /s/ Andrew J. McNally |
| | Andrew J. McNally, Treasurer |
| | (principal financial officer) |
Date 11/28/2007
| * | Print the name and title of each signing officer under his or her signature. |