UNITED STATES
SECURITIES AND EXCHANGE COMMISSION
Washington, D.C. 20549
FORM N-CSR
CERTIFIED SHAREHOLDER REPORT OF REGISTERED
MANAGEMENT INVESTMENT COMPANIES
Investment Company Act file number 811-06719
BB&T Funds
(Exact name of registrant as specified in charter)
434 Fayetteville Street, 5th Floor, Raleigh, NC 27626-0575
(Address of principal executive offices) (Zip code)
BISYS Fund Services Ohio, Inc., 3435 Stelzer Road, Columbus, OH 43219
(Name and address of agent for service)
Registrant’s telephone number, including area code: (800) 228-1872
Date of fiscal year end: December 31
Date of reporting period: December 31, 2006
| Item 1. | Reports to Stockholders. |

ANNUAL REPORT
EQUITY INDEX FUND
| | | | |
| CLASS | | A | | SHARES |
| CLASS | | B | | SHARES |
| CLASS | | C | | SHARES |
DECEMBER 31, 2006
LETTER FROMTHE PRESIDENTANDTHE INVESTMENTADVISOR
Dear Shareholders:
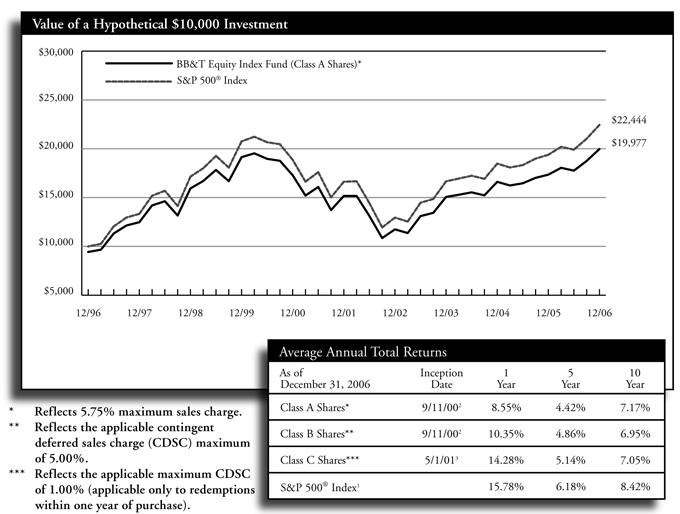
We are pleased to present this annual report for the BB&T Equity Index Fund, covering the 12-month period ended December 31, 2006. Stocks generated strong gains during the year, powering the S&P 500® Index1 to a 15.78% return.
Stocks rallied early in the year, but declined in the spring as investors worried that economic growth might slow considerably. The market then rallied during the second half of 2006. Investors were heartened by the Federal Reserve Board’s decision to leave its target short-term interest rate unchanged following a two-year tightening cycle as inflation pressures began to subside. They also cheered a decline in oil prices from historic highs, as well as powerful corporate earnings growth.
All economic sectors represented in the S&P 500® posted positive returns in that environment. Telecommunications service stocks led the markets with a 36.84% average gain, as investors, encouraged by strong earnings and consolidation in the sector, bid up telecommunications shares. The energy, utilities, financials, materials and consumer discretionary sectors also outperformed the broad-market average. Health care stocks, which produced a return of 7.53%, and information technology shares (8.52%) were the market’s weakest performers, while the industrials and consumer staples sectors also trailed the total return of the index.
Thank you for selecting the BB&T Equity Index Fund. We look forward to serving your investment needs during the months and years ahead.
|
| Sincerely, |
|
| /s/ Keith F. Karlawish |
| Keith F. Karlawish, CFA |
| President |
| BB&T Mutual Funds Group |
|
| /s/ Jeffrey J. Schappe |
| Jeffrey J. Schappe, CFA |
| Chief Investment Officer |
| BB&T Asset Management, Inc. |
1 | “S&P 500®” is a registered service mark of Standard & Poor’s Corporation, which does not sponsor and is in no way affiliated with the Fund or Master Portfolio. The S&P 500® Index is generally considered to be representative of the performance of the stock market as a whole. The index does not reflect the deduction of expenses associated with a mutual fund, such as investment management and fund accounting fees. The Fund’s performance reflects the deduction of fees for these services. Investors cannot invest directly in an index, although they can invest in its underlying securities. |
This report is authorized for distribution only when preceded or accompanied by a prospectus. Please read the prospectus carefully before investing or sending money. BB&T Asset Management, Inc., a wholly owned subsidiary of BB&T Corporation, serves as investment adviser to the BB&T Funds and is paid a fee for its services. Shares of the BB&T Funds are not deposits or obligations of, or guaranteed or endorsed by, Branch Banking and Trust Company or its affiliates. The Funds are not insured by the FDIC or any other government agency. The Funds are distributed by BB&T Funds Distributor, Inc. The distributor is not affiliated with Branch Banking and Trust Company or its affiliates.
The foregoing information and opinions are for general information only. BB&T Asset Management, Inc. does not guarantee their accuracy or completeness, nor assume liability for any loss, which may result from the reliance by any person upon any such information or opinions. Such information and opinions are subject to change without notice, are for general information only and are not intended as an offer or solicitation with respect to the purchase or sale of any security or offering individual or personalized investment advice.
1
BB&T EQUITY INDEX FUND
MASTER PORTFOLIO MANAGER
Barclays Global Fund Advisors, a subsidiary of Barclays Global Investors,
N.A. (S&P 500® Index Master Portfolio)
BB&T Asset Management, Inc. (BB&T Equity Index Fund)
Unlike many traditional, actively managed investment funds, there is no single portfolio manager who makes investment decisions for the BB&T Equity Index Fund. Instead, the Fund invests substantially all of its assets in the S&P 500® Index Master Portfolio which is managed by a team of investment professionals from Barclays, who use a specially designed software program to maintain a close match to the characteristics of the S&P 500® Index.
INVESTMENT CONCERNS
Equity securities (stocks) are more volatile and carry more risk than other forms of investments, including investments in high-grade fixed income securities. The net asset value per share of this Fund will fluctuate as the value of the securities in the portfolio changes. Common stocks, and funds investing in common stocks, generally provide greater return potential when compared with other types of investments.
The performance of the Fund is expected to be lower than that of the S&P 500® Index because of Fund fees and expenses.
PORTFOLIO MANAGERS’ PERSPECTIVE
“Investing in an index fund such as ours is based on the belief that it’s very difficult to ‘beat the market’ on a consistent basis. Our approach, then, is to take advantage of the stock market’s long-term growth potential, while managing costs, to help shareholders potentially build wealth over time. We believe the Fund is an excellent diversification tool for novice and experienced investors alike, and can serve as the foundation of most equity investors’ asset allocation strategies.”
The BB&T Equity Index Fund (the “Fund”) seeks to provide investment results that correspond as closely as practicable, before fees and expenses, to the total return of the broad range of stocks represented in the S&P 500® Index (the “Index”). The Fund employs a two-tier structure, commonly referred to as “master-feeder.” The Fund invests all of its investable assets in the S&P 500® Index Master portfolio (“the Master Portfolio”). For simplicity’s sake, all discussion of the Fund’s investment objective, strategies, risks and holdings refer also to the Master Portfolio’s objectives, strategies, risks, and holdings unless otherwise indicated.
For the 12 months ended December 31, 2006, the Fund returned 15.15% (Class A Shares without sales charge)2 and the Index returned 15.78%. As the Fund seeks to duplicate the returns of the S&P 500® Index, slight underperformance is expected, due primarily to Fund management fees.
The Federal Reserve Board left its target short-term interest rate unchanged during the second half of 2006. That pause followed a two-year campaign of rate increases that pushed the Federal Funds rate from 1.00% to 5.25%. Oil prices rose during the first six months of the year, continuing a multi-year trend, but sank sharply during the final six months of the year. In all, oil prices ended 2006 approximately where they began it.
Meanwhile, corporations produced another year of strong profit growth. The average earnings of the companies that comprise the Index rose roughly 70% between 2000 and 2006. The financials sector made the largest contribution of any economic sector to the Fund’s returns, followed by the energy, consumer discretionary, industrials and consumer staples sectors. Materials stocks were the weakest-performing group on the year.
Among the Fund’s ten largest holdings as of December 31, 2006, performance was mixed for the reporting period. The strongest performer for the reporting period was Altria Group Inc. Exxon Mobil Corp. also performed well, due largely to the rise in oil prices during the reporting period. Procter & Gamble Co. and insurer American International Group Inc. delivered modest gains. The share prices of pharmaceutical giant Pfizer Inc. and healthcare company Johnson & Johnson both declined for the reporting period. General Electric Co., the Fund’s largest holding as of year-end, also declined for the reporting period.†
† | The composition of the Master Portfolio is subject to change. |
2 | Please refer to page 3 for additional performance information. |
Past performance does not guarantee future results. The performance data quoted represents past performance and current returns may be lower or higher. Total return figures include change in share price, reinvestment of dividends and capital gains and do not reflect taxes that a shareholder would pay on Fund distributions or on the redemption of Fund shares. The investment return and principal value will fluctuate so that an investor’s shares, when redeemed, may be worth more or less than the original cost. To obtain performance information current to the most recent month’s end, please visit www.bbtfunds.com.
2
BB&T EQUITY INDEX FUND
Past performance does not guarantee future results. The performance data quoted represents past performance and current returns may be lower or higher. Total return figures include change in share price, reinvestment of dividends and capital gains and do not reflect taxes that a shareholder would pay on Fund distributions or on the redemption of Fund shares. The investment return and principal value will fluctuate so that an investor’s shares, when redeemed may be worth more or less than the original cost. To obtain performance information current to the most recent month end, please visit www.bbtfunds.com.
1 | The Fund is measured against the S&P 500® Index, an unmanaged index which is generally considered to be representative of the performance of the stock market as a whole. Performance data for the S&P 500® Index does not reflect the deduction of expenses associated with a mutual fund, such as investment management and fund accounting fees. The Fund’s performance reflects the deduction of fees for these services. Investors cannot invest directly in an index, although they can invest in its underlying securities. |
2 | The performance of the BB&T Equity Index Fund prior to its commencement date on 9/11/00 is based on the historical performance of the “master portfolio,” which commenced operations on 7/2/93. The performance shown reflects the reinvestment of all dividend and capital gains distributions but does not reflect the deduction of taxes that a shareholder would have paid on Fund distributions or redemptions. The performance has been adjusted to reflect the deduction of fees for services associated with the Fund, such as investment management and fund accounting fees. |
3 | Performance for Class C Shares prior to their inception date on 5/1/01 is based on the historical performance of Class B Shares and has been adjusted for the maximum CDSC applicable to Class C Shares. |
A portion of the Fund’s fees have been reduced. If the fees had not been reduced, the Fund’s total return would have been lower.
3
Portfolio Holdings Summary
(Unaudited)
| | | |
Investment Type | | % of
Investment | |
S&P 500 Index Master Portfolio | | 100.00 | % |
| | | |
Total | | 100.00 | % |
| | | |
For a summary of the S&P 500 Index Master Portfolio holdings, please see the accompanying financial statements of the Master Portfolio.
Expense Examples (Unaudited)
As a shareholder of the BB&T Equity Index Fund (the “Fund”), you incur two types of costs: (1) transaction costs, including sales charges (loads) on purchases and sales and (2) ongoing costs, including management fees and other Fund expenses.
These examples are intended to help you understand your ongoing costs (in dollars) of investing in the Fund and to compare these costs with the ongoing costs of investing in other mutual funds.
These examples are based on an investment of $1,000 invested at the beginning of the period and held for the entire period from July 1, 2006 through December 31, 2006.
Actual Example
The table below provides information about actual account values and actual expenses. You may use the information below, together with the amount you invested, to estimate the expenses that you paid over the period. Simply divide your account value by $1,000 (for example, an $8,600 account value divided by $1,000 = 8.6), then multiply the result by the number in the table under the heading entitled “Expenses Paid During Period” to estimate the expenses you paid on your account during this period.
| | | | | | | | | | | | | | |
| | | | | Beginning
Account Value
7/1/06 | | Ending Account
Value
12/31/06 | | Expenses Paid
During Period*
7/1/06 - 12/31/06 | | Annualized
Expense Ratio
During Period
7/1/06 - 12/31/06 | |
BB&T Equity Index Fund | | Class A | | $ | 1,000.00 | | $ | 1,124.90 | | $ | 3.16 | | 0.59 | % |
| | Class B | | | 1,000.00 | | | 1,120.80 | | | 7.16 | | 1.34 | % |
| | Class C | | | 1,000.00 | | | 1,118.90 | | | 7.16 | | 1.34 | % |
| * | Expenses are equal to the average account value times the Fund’s annualized ratio multiplied by the number of days in the most recent fiscal half-year divided by the number of days in the fiscal year (to reflect the one-half year period). |
Hypothetical Example for Comparison Purposes
The table below provides information about hypothetical account values and hypothetical expenses based the Fund’s actual expense ratio and an assumed rate of return of 5% per year before expenses, which is not the Fund’s actual return. The hypothetical account values and expenses may not be used to estimate the actual ending account balance or expenses you paid for the period. You may use this information to compare this 5% hypothetical example with the 5% hypothetical examples that appear in the shareholder reports of other funds.
Please note that the expenses shown in the table are meant to highlight your ongoing costs only and do not reflect any transactional costs, such as sales charges (loads) on purchases. Therefore, the table is useful in comparing ongoing costs only, and will not help you determine the relative total costs of owning different funds. In addition, if these transactional costs were included, your costs would have been higher.
| | | | | | | | | | | | | | |
| | | | | Beginning
Account Value
7/1/06 | | Ending Account
Value
12/31/06 | | Expenses Paid
During Period*
7/1/06 - 12/31/06 | | Annualized
Expense Ratio
During Period
7/1/06 - 12/31/06 | |
BB&T Equity Index Fund | | Class A | | $ | 1,000.00 | | $ | 1,022.23 | | $ | 3.01 | | 0.59 | % |
| | Class B | | | 1,000.00 | | | 1,018.45 | | | 6.82 | | 1.34 | % |
| | Class C | | | 1,000.00 | | | 1,018.45 | | | 6.82 | | 1.34 | % |
| * | Expenses are equal to the average account value times the Fund’s annualized ratio multiplied by the number of days in the most recent fiscal half-year divided by the number of days in the fiscal year (to reflect the one-half year period). |
4
BB&T FUNDS
Equity Index Fund
| | | | |
| Statement of Assets and Liabilities | |
| December 31, 2006 | |
Assets: | | | | |
Investment in S&P 500 Index Master Portfolio, at value ( See Note 1) | | $ | 122,418,854 | |
Receivable for capital shares issued | | | 427,623 | |
Prepaid expenses | | | 6,341 | |
| | | | |
Total Assets | | | 122,852,818 | |
| | | | |
Liabilities: | | | | |
Dividends payable | | | 431,199 | |
Payable for capital shares redeemed | | | 460,942 | |
Accrued expenses and other payables: | | | | |
Distribution fees | | | 35,948 | |
Transfer agency fees | | | 2,933 | |
Compliance service fees | | | 185 | |
Other | | | 42,314 | |
| | | | |
Total Liabilities | | | 973,521 | |
| | | | |
Net Assets: | | | | |
Capital | | $ | 100,416,608 | |
Accumulated net investment income (loss) | | | (9,444 | ) |
Accumulated realized gains/(losses) from investment transactions | | | (9,771,825 | ) |
Net unrealized appreciation/depreciation on investments | | | 31,243,958 | |
| | | | |
Net Assets | | $ | 121,879,297 | |
| | | | |
Net Assets | | | | |
Class A Shares | | $ | 106,832,680 | |
Class B Shares | | | 14,765,229 | |
Class C Shares | | | 281,388 | |
| | | | |
Total | | $ | 121,879,297 | |
| | | | |
Shares of Beneficial Interest Outstanding (Unlimited number of shares authorized, no par value): | | | | |
Class A Shares | | | 11,225,860 | |
Class B Shares | | | 1,577,903 | |
Class C Shares | | | 29,802 | |
| | | | |
Total | | | 12,833,565 | |
| | | | |
Net Asset Value | | | | |
Class A Shares — redemption price per share | | $ | 9.52 | |
Class B Shares — offering price per share* | | | 9.36 | |
Class C Shares — offering price per share* | | | 9.44 | |
| | | | |
Maximum Sales Charge — Class A Shares | | | 5.75 | % |
| | | | |
Maximum Offering Price (100%/(100% – Maximum Sales Charge)) of net asset value adjusted to the nearest cent per share — Class A Shares | | $ | 10.10 | |
| | | | |
| * | Redemption price per share varies by length of time shares are held. |
| | | | |
| Statement of Operations | |
| For the Year Ended December 31, 2006 | |
Net Investment Income Allocated from Master Portfolio: | | | | |
Dividend income | | $ | 2,036,680 | (a) |
Interest income | | | 855,400 | (a) |
Expenses(b) | | | (73,195 | )(a) |
| | | | |
Net Investment Income Allocated from Master Portfolio | | | 2,818,885 | |
| | | | |
Expenses: | | | | |
Administration fees | | | 165,318 | |
Transfer agency fees | | | 38,088 | |
Distribution fees — Class A Shares | | | 657,832 | |
Distribution fees — Class B Shares | | | 142,895 | |
Distribution fees — Class C Shares | | | 6,754 | |
Fund accounting fees | | | 35,757 | |
Printing fees | | | 41,462 | |
Professional fees | | | 86,174 | |
Compliance service fees | | | 2,552 | |
Custodian fees | | | 7,292 | |
Trustee fees | | | 5,072 | |
Other | | | 37,154 | |
| | | | |
Gross expenses | | | 1,226,350 | |
Less expenses waived by the Administrator | | | (12,164 | ) |
Less expenses waived by the Distributor | | | (328,916 | ) |
| | | | |
Net Expenses | | | 885,270 | |
| | | | |
Net Investment Income | | | 1,933,615 | |
| | | | |
Realized/Unrealized Gains (Losses) Allocated from Master Portfolio: | | | | |
Net realized gains/(losses) from investment transactions | | | (884,119 | )(a) |
Change in unrealized appreciation/depreciation from investments | | | 18,862,116 | (a) |
| | | | |
Net realized/unrealized gains/(losses) allocated from Master Portfolio | | | 17,977,997 | |
| | | | |
Change in net assets from operations | | $ | 19,911,612 | |
| | | | |
| (a) | Allocated from the S&P Index Master Portfolio. |
| (b) | Expenses allocated from the S&P 500 Index Master Portfolio are shown net of any fee reductions. |
See accompanying notes to the financial statements.
5
BB&T FUNDS
Equity Index Fund
| | | | | | | | |
| Statements of Changes in Net Assets | |
| | | For the
Year Ended
December 31,
2006 | | | For the
Year Ended
December 31,
2005 | |
From Investment Activities: | | | | | | | | |
Operations: | | | | | | | | |
Net investment income | | $ | 1,933,615 | | | $ | 1,862,474 | |
Net realized gains (losses) from investment transactions | | | (884,119 | ) | | | 497,069 | |
Change in unrealized appreciation/depreciation from investments | | | 18,862,116 | | | | 3,861,980 | |
| | | | | | | | |
Change in net assets from operations | | | 19,911,612 | | | | 6,221,523 | |
| | | | | | | | |
Dividends to Class A Shareholders: | | | | | | | | |
Net investment income | | | (1,806,481 | ) | | | (1,753,340 | ) |
Dividends to Class B Shareholders: | | | | | | | | |
Net investment income | | | (112,413 | ) | | | (85,645 | ) |
Dividends to Class C Shareholders: | | | | | | | | |
Net investment income | | | (4,997 | ) | | | (3,008 | ) |
| | | | | | | | |
Change in net assets from shareholder dividends | | | (1,923,891 | ) | | | (1,841,993 | ) |
| | | | | | | | |
Capital Transactions: | | | | | | | | |
Proceeds from shares issued | | | | | | | | |
Class A Shares | | | 15,573,301 | | | | 17,160,939 | |
Class B Shares | | | 656,553 | | | | 1,200,160 | |
Class C Shares | | | 21,883 | | | | 659,873 | |
Dividends reinvested | | | | | | | | |
Class A Shares | | | 1,341,143 | | | | 1,663,724 | |
Class B Shares | | | 82,235 | | | | 85,367 | |
Class C Shares | | | 3,368 | | | | 2,999 | |
Value of shares redeemed | | | | | | | | |
Class A Shares | | | (61,367,381 | ) | | | (27,428,219 | ) |
Class B Shares | | | (2,140,942 | ) | | | (2,538,773 | ) |
Class C Shares | | | (626,141 | ) | | | (685,585 | ) |
| | | | | | | | |
Change in net assets from capital transactions | | | (46,455,981 | ) | | | (9,879,515 | ) |
| | | | | | | | |
Change in net assets | | | (28,468,260 | ) | | | (5,499,985 | ) |
Net Assets: | | | | | | | | |
Beginning of year | | | 150,347,557 | | | | 155,847,542 | |
| | | | | | | | |
End of year | | $ | 121,879,297 | | | $ | 150,347,557 | |
| | | | | | | | |
Accumulated undistributed net investment income (loss) | | $ | (9,444 | ) | | $ | 12,924 | |
| | | | | | | | |
Share Transactions: | | | | | | | | |
Issued | | | | | | | | |
Class A Shares | | | 1,771,968 | | | | 2,124,934 | |
Class B Shares | | | 76,484 | | | | 150,998 | |
Class C Shares | | | 2,497 | | | | 82,528 | |
Reinvested | | | | | | | | |
Class A Shares | | | 153,694 | | | | 204,538 | |
Class B Shares | | | 9,538 | | | | 10,666 | |
Class C Shares | | | 386 | | | | 369 | |
Redeemed | | | | | | | | |
Class A Shares | | | (6,817,677 | ) | | | (3,381,042 | ) |
Class B Shares | | | (249,242 | ) | | | (317,526 | ) |
Class C Shares | | | (69,918 | ) | | | (86,024 | ) |
| | | | | | | | |
Change in shares | | | (5,122,270 | ) | | | (1,210,559 | ) |
| | | | | | | | |
See accompanying notes to the financial statements.
6
BB&T FUNDS
Equity Index Fund
| | | | | | | | | | | | | | | | | | | | |
| Financial Highlights, Class A Shares | |
Selected data for a share of beneficial interest outstanding throughout the periods indicated. | |
| | | For the
Year Ended
December 31,
2006 | | | For the
Year Ended
December 31,
2005 | | | For the
Year Ended
December 31,
2004 | | | For the
Year Ended
December 31,
2003 | | | For the
Year Ended
December 31,
2002 | |
Net Asset Value, Beginning of Period | | $ | 8.39 | | | $ | 8.14 | | | $ | 7.48 | | | $ | 5.90 | | | $ | 7.70 | |
| | | | | | | | | | | | | | | | | | | | |
Investment Activities | | | | | | | | | | | | | | | | | | | | |
Net investment income(a) | | | 0.12 | (c) | | | 0.11 | | | | 0.11 | | | | 0.08 | | | | 0.06 | |
Net realized and unrealized gains (losses) from investments(a) | | | 1.14 | | | | 0.25 | | | | 0.66 | | | | 1.58 | | | | (1.80 | ) |
| | | | | | | | | | | | | | | | | | | | |
Total from Investment Activities | | | 1.26 | | | | 0.36 | | | | 0.77 | | | | 1.66 | | | | (1.74 | ) |
| | | | | | | | | | | | | | | | | | | | |
Dividends: | | | | | | | | | | | | | | | | | | | | |
Net investment income | | | (0.13 | ) | | | (0.11 | ) | | | (0.11 | ) | | | (0.08 | ) | | | (0.06 | ) |
| | | | | | | | | | | | | | | | | | | | |
Total Dividends | | | (0.13 | ) | | | (0.11 | ) | | | (0.11 | ) | | | (0.08 | ) | | | (0.06 | ) |
| | | | | | | | | | | | | | | | | | | | |
Net Asset Value — End of Period | | $ | 9.52 | | | $ | 8.39 | | | $ | 8.14 | | | $ | 7.48 | | | $ | 5.90 | |
| | | | | | | | | | | | | | | | | | | | |
Total Return (excludes sales charge) | | | 15.15 | % | | | 4.43 | % | | | 10.23 | % | | | 28.28 | % | | | (22.56 | )% |
| | | | | |
Ratios/Supplementary Data: | | | | | | | | | | | | | | | | | | | | |
Net Assets, End of Period (000’s) | | $ | 106,833 | | | $ | 135,175 | | | $ | 139,833 | | | $ | 109,282 | | | $ | 56,661 | |
Ratio of net expenses to average net assets(a) | | | 0.58 | % | | | 0.57 | % | | | 0.49 | % | | | 0.48 | % | | | 0.55 | % |
Ratio of net investment income to average net assets(a) | | | 1.40 | % | | | 1.32 | % | | | 1.57 | % | | | 1.31 | % | | | 1.08 | % |
Ratio of expenses to average net assets*(a) | | | 0.84 | % | | | 0.84 | % | | | 0.96 | % | | | 0.95 | % | | | 1.05 | % |
Portfolio turnover rate(b) | | | 14 | % | | | 10 | % | | | 14 | % | | | 8 | % | | | 12 | % |
| * | During the period certain fees were reduced. If such fee reductions had not occurred, the ratios would have been as indicated. |
| (a) | The per share amounts and percentages reflect income and expenses assuming inclusion of the Fund’s proportionate share of the income and expenses of the S&P 500 Index Master Portfolio. |
| (b) | This rate represents the portfolio turnover rate of the S&P 500 Index Master Portfolio. |
| (c) | Per share net investment income has been calculated using the daily average shares method. |
See accompanying notes to the financial statements.
7
BB&T FUNDS
Equity Index Fund
| | | | | | | | | | | | | | | | | | | | |
| Financial Highlights, Class B Shares | |
Selected data for a share of beneficial interest outstanding throughout the periods indicated. | |
| | | For the
Year Ended
December 31,
2006 | | | For the
Year Ended
December 31,
2005 | | | For the
Year Ended
December 31,
2004 | | | For the
Year Ended
December 31,
2003 | | | For the
Year Ended
December 31,
2002 | |
Net Asset Value, Beginning of Period | | $ | 8.25 | | | $ | 8.02 | | | $ | 7.37 | | | $ | 5.83 | | | $ | 7.60 | |
| | | | | | | | | | | | | | | | | | | | |
Investment Activities | | | | | | | | | | | | | | | | | | | | |
Net investment income(a) | | | 0.06 | (c) | | | 0.05 | | | | 0.06 | | | | 0.03 | | | | 0.02 | |
Net realized and unrealized gains (losses) from investments(a) | | | 1.12 | | | | 0.23 | | | | 0.65 | | | | 1.54 | | | | (1.77 | ) |
| | | | | | | | | | | | | | | | | | | | |
Total from Investment Activities | | | 1.18 | | | | 0.28 | | | | 0.71 | | | | 1.57 | | | | (1.75 | ) |
| | | | | | | | | | | | | | | | | | | | |
Dividends | | | | | | | | | | | | | | | | | | | | |
Net investment income | | | (0.07 | ) | | | (0.05 | ) | | | (0.06 | ) | | | (0.03 | ) | | | (0.02 | ) |
| | | | | | | | | | | | | | | | | | | | |
Total Dividends | | | (0.07 | ) | | | (0.05 | ) | | | (0.06 | ) | | | (0.03 | ) | | | (0.02 | ) |
| | | | | | | | | | | | | | | | | | | | |
Net Asset Value — End of Period | | $ | 9.36 | | | $ | 8.25 | | | $ | 8.02 | | | $ | 7.37 | | | $ | 5.83 | |
| | | | | | | | | | | | | | | | | | | | |
Total Return | | | 14.35 | % | | | 3.48 | % | | | 9.48 | % | | | 27.18 | % | | | (23.05 | )% |
| | | | | |
Ratios/Supplementary Data: | | | | | | | | | | | | | | | | | | | | |
Net Assets, End of Period (000’s) | | $ | 14,765 | | | $ | 14,367 | | | $ | 15,207 | | | $ | 13,055 | | | $ | 8,678 | |
Ratio of net expenses to average net assets(a) | | | 1.33 | % | | | 1.32 | % | | | 1.23 | % | | | 1.23 | % | | | 1.30 | % |
Ratio of net investment income to average net assets(a) | | | 0.65 | % | | | 0.57 | % | | | 0.81 | % | | | 0.54 | % | | | 0.34 | % |
Ratio of expenses to average net assets*(a) | | | 1.34 | % | | | 1.34 | % | | | 1.45 | % | | | 1.45 | % | | | 1.56 | % |
Portfolio turnover rate(b) | | | 14 | % | | | 10 | % | | | 14 | % | | | 8 | % | | | 12 | % |
| * | During the period certain fees were reduced. If such fee reductions had not occurred, the ratios would have been as indicated. |
| (a) | The per share amounts and percentages reflect income and expenses assuming inclusion of the Fund’s proportionate share of the income and expenses of the S&P 500 Index Master Portfolio. |
| (b) | This rate represents the portfolio turnover rate of the S&P 500 Index Master Portfolio. |
| (c) | Per share net investment income has been calculated using the daily average shares method. |
See accompanying notes to the financial statements.
8
BB&T FUNDS
Equity Index Fund
| | | | | | | | | | | | | | | | | | | | |
| Financial Highlights, Class C Shares | |
Selected data for a share of beneficial interest outstanding throughout the periods indicated. | |
| | | For the
Year Ended
December 31,
2006 | | | For the
Year Ended
December 31,
2005 | | | For the
Year Ended
December 31,
2004 | | | For the
Year Ended
December 31,
2003 | | | For the
Year Ended
December 31,
2002 | |
Net Asset Value, Beginning of Period | | $ | 8.32 | | | $ | 8.08 | | | $ | 7.42 | | | $ | 5.86 | | | $ | 7.56 | |
| | | | | | | | | | | | | | | | | | | | |
Investment Activities | | | | | | | | | | | | | | | | | | | | |
Net investment income(a) | | | 0.06 | (c) | | | 0.03 | | | | 0.07 | | | | 0.04 | | | | 0.03 | (c) |
Net realized and unrealized gains (losses) from investments(a) | | | 1.12 | | | | 0.25 | | | | 0.64 | | | | 1.56 | | | | (1.70 | ) |
| | | | | | | | | | | | | | | | | | | | |
Total from Investment Activities | | | 1.18 | | | | 0.28 | | | | 0.71 | | | | 1.60 | | | | (1.67 | ) |
| | | | | | | | | | | | | | | | | | | | |
Dividends | | | | | | | | | | | | | | | | | | | | |
Net investment income | | | (0.06 | ) | | | (0.04 | ) | | | (0.05 | ) | | | (0.04 | ) | | | (0.03 | ) |
| | | | | | | | | | | | | | | | | | | | |
Total Dividends | | | (0.06 | ) | | | (0.04 | ) | | | (0.05 | ) | | | (0.04 | ) | | | (0.03 | ) |
| | | | | | | | | | | | | | | | | | | | |
Net Asset Value — End of Period | | $ | 9.44 | | | $ | 8.32 | | | $ | 8.08 | | | $ | 7.42 | | | $ | 5.86 | |
| | | | | | | | | | | | | | | | | | | | |
Total Return(b) | | | 14.28 | % | | | 3.50 | % | | | 9.46 | % | | | 27.35 | % | | | (22.08 | )% |
| | | | | |
Ratios/Supplementary Data: | | | | | | | | | | | | | | | | | | | | |
Net Assets, End of Period (000’s) | | $ | 281 | | | $ | 806 | | | $ | 808 | | | $ | 813 | | | $ | 776 | |
Ratio of net expenses to average net assets(a) | | | 1.32 | % | | | 1.32 | % | | | 1.23 | % | | | 1.23 | % | | | 1.30 | % |
Ratio of net investment income to average net assets(a) | | | 0.64 | % | | | 0.59 | % | | | 0.76 | % | | | 0.52 | % | | | 0.41 | % |
Ratio of expenses to average net assets*(a) | | | 1.33 | % | | | 1.34 | % | | | 1.45 | % | | | 1.45 | % | | | 1.56 | % |
Portfolio turnover rate(b) | | | 14 | % | | | 10 | % | | | 14 | % | | | 8 | % | | | 12 | % |
| * | During the period certain fees were reduced. If such fee reductions had not occurred, the ratios would have been as indicated. |
| (a) | The per share amounts and percentages reflect income and expenses assuming inclusion of the Fund’s proportionate share of the income and expenses of the S&P 500 Index Master Portfolio. |
| (b) | This rate represents the portfolio turnover rate of the S&P 500 Index Master Portfolio. |
| (c) | Per share net investment income has been calculated using the daily average shares method. |
See accompanying notes to the financial statements.
9
BB&T FUNDS
Equity Index Fund
Notes to the Financial Statements
December 31, 2006
The BB&T Equity Index Fund (the “Fund”) commenced operations on September 11, 2000 and is registered under the Investment Company Act of 1940, as amended (the “1940 Act”), as a diversified open-end investment company. The Fund is a separate series of the BB&T Funds (“Trust”), a Massachusetts business trust organized in 1992. The Fund invests substantially all of its investable assets in the S&P 500 Index Master Portfolio (the “Master Portfolio”) of the Master Investment Portfolio (“MIP”), a diversified open-end management investment company registered under the of 1940 Act, rather than in a portfolio of securities. The Master Portfolio has substantially the same investment objective as the Fund. Barclays Global Fund Advisors serves as investment advisor for the Master Portfolio. The financial statements of the Master Portfolio, including the schedule of investments in securities, are contained elsewhere in this report and should be read in conjunction with the Fund’s financial statements. The value of the Fund’s investment in the Master Portfolio reflects the Fund’s interest of 4.49% in the net assets of the Master Portfolio at December 31, 2006.
The Fund is authorized to issue an unlimited number of shares without par value. The Fund offers three classes of shares: Class A Shares, Class B Shares and Class C Shares. Class A Shares of the Fund has a maximum sales charge of 5.75% as a percentage of original purchase price. Certain purchases of Class A Shares will not be subject to a front-end sales charge, but will be subject to a contingent deferred sales charge (“CDSC”) of 1.00% of the purchase price if redeemed less than one year after purchase. The Class B Shares of the Funds are offered without any front-end sales charge but will be subject to a CDSC ranging from a maximum of 5.00% if redeemed less than one year after purchase to 0.00% if redeemed more than six years after purchase. The Class C Shares of the Funds are offered without any front-end sales charge but will be subject to a maximum CDSC of 1.00% if redeemed less than one year after purchase.
Each class of shares has identical rights and privileges except with respect to the fees paid under the distribution plan, voting rights on matters affecting a single class of shares and the exchange privilege of each class of shares.
Under the Fund’s organizational documents, its Officers and Trustees are indemnified against certain liabilities arising out of the performance of their duties to the Fund. In addition, in the normal course of business, the Fund may enter into contracts with their vendors and others that provide for general indemnifications. The Fund’s maximum exposure under these arrangements is unknown as this would involve future claims that may be made against the Fund. However, based on experience, the Fund expects that risk of loss to be remote.
| 2. | Significant Accounting Policies: |
The following is a summary of significant accounting policies followed by the Fund in the preparation of its financial statements. The policies are in conformity with U.S. generally accepted accounting principles (GAAP). The preparation of financial statements requires management to make estimates and assumptions that affect the reported amounts of assets and liabilities and disclosure of contingent assets and liabilities at the date of the financial statements and the reported amounts of income and expenses for the period. Actual results could differ from those estimates.
| | (A) | New Accounting Standards—In September 2006, the Financial Accounting Standards Board (FASB) issued Statement on Financial Accounting Standards (SFAS) No. 157, “Fair Value Measurements.” This standard establishes a single authoritative definition of fair value, sets out a framework for measuring fair value and requires additional disclosures about fair value measurements. SFAS No. 157 applies to fair value measurements already required or permitted by existing standards. SFAS No. 157 is effective for financial statements issued for fiscal years beginning after November 15, 2007 and interim periods within those fiscal years. The changes to current generally accepted accounting principles from the application of this Statement relate to the definition of fair value, the methods used to measure fair value, and the expanded disclosures about fair value measurements. As of December 31, 2006, the Fund does not believe the adoption of SFAS No. 157 will impact the financial statement amounts, however, additional disclosures may be required about the inputs used to develop the measurements and the effect of certain of the measurements on changes in net assets for the period. |
Continued
10
BB&T FUNDS
Equity Index Fund
Notes to the Financial Statements, Continued
December 31, 2006
In July 2006, the Financial Accounting Standards Board (FASB) released FASB Interpretation No. 48 “Accounting for Uncertainty in Income Taxes” (FIN 48). FIN 48 provides guidance for how uncertain tax positions should be recognized, measured, presented and disclosed in the financial statements. FIN 48 requires the evaluation of tax positions taken or expected to be taken in the course of preparing the Fund’s tax return to determine whether the tax positions are “more-likely-than-not” of being sustained by the applicable tax authority. Tax positions not deemed to meet the more-likely-than-not threshold would be recorded as a tax benefit or expense in the current year. Adoption of FIN 48 is required no later than the last business day of the first financial statement reporting period for fiscal years beginning after December 15, 2006 and is to be applied to all open tax years as of the effective date. Management has not completed their analysis on whether the adoption of FIN 48 will have an impact to the financial statements upon adoption.
| | (B) | Security Valuation—The Fund records its investments in the Master Portfolio at fair value. Valuation of securities held by the Master Portfolio is discussed in Note 1 of the Master Portfolio’s Notes to Financial Statements, which are included elsewhere in this report. |
| | (C) | Distributions to Shareholders—Dividends from net investment income are declared and paid quarterly by the Fund. Distributable net realized capital gains, if any, are declared and distributed at least annually. The amount of dividends from net investment income and distributions from net realized gains are determined in accordance with federal income tax regulations, which may differ from GAAP. These “book/tax” differences are either considered temporary or permanent in nature. To the extent these differences are permanent in nature (e.g. reclass of market discounts, net operating loss, gain/loss, paydowns, and distributions), such amounts are reclassified within the composition of net assets based on their federal tax-basis treatment; temporary differences (e.g., wash sales) do not require reclassification. Dividends to shareholders which exceed net investment income and net realized gains for tax purposes are reported as distributions of capital. |
| | (D) | Allocation Methodology—The investment income, expenses (other than class specific expenses) and realized and unrealized gains and losses on investments are allocated to each class of shares based on their relative net assets on the date the income is earned, expenses are accrued, or realized and unrealized gains and losses are incurred. |
| | (E) | Expenses—Expenses directly attributable to a class of shares are charged directly to that class. Expenses directly attributable to the Fund are charged to that Fund. Expenses not directly attributable to the Fund are allocated proportionately among all BB&T Funds in relation to the net assets of each Fund or on another reasonable basis. Expenses which are attributable to both the BB&T Funds and BB&T Variable Insurance Fund Trusts are allocated across the BB&T Funds and BB&T Variable Insurance Fund Trusts, based upon relative net assets or on another reasonable basis. BB&T Asset Management, Inc. (“BB&T”) serves as the Investment Advisor for the BB&T Variable Insurance Funds and BB&T Funds Trusts. |
| | (F) | Securities Transactions and Income Recognition—The Fund records daily, its proportionate interest in the net investment income and realized/unrealized capital gains and losses of the Master Portfolio. The performance of the Fund is directly affected by the performance of the Master Portfolio. |
| | (G) | Redemption Fees—Prior to July 24, 2006, for shares of the Fund that are redeemed or exchanged in less than 7 days, a fee of 2% of the total redemption amounts may be assessed subject to certain exceptions or limitations. These exceptions include, but are not limited to, automatic non-discretionary rebalancing programs and systematic withdrawal plans. The fee is applied to shares redeemed or exchanged in the order in which they were purchased, and is retained by the Fund for the benefit of remaining shareholders to defray Fund portfolio transaction expenses and facilitate portfolio management. For financial statement purposes, these amounts are included in the Statements of Changes in Net Assets as “Proceeds from Shares Issued”. Redemption fees during the period January 1, 2006 through December 31, 2006 were $5. Effective July 24, 2006 redemption fees are no longer applicable to share transactions. |
| | (H) | Federal Income Taxes—It is the policy of the Fund to continue to qualify as a regulated investment company by complying with the provisions available to certain investment companies, as defined in applicable sections of the Internal |
Continued
11
BB&T FUNDS
Equity Index Fund
Notes to the Financial Statements, Continued
December 31, 2006
| | Revenue Code, and to make distributions of net investment income and net realized capital gains sufficient to relieve it from all, or substantially all, federal income taxes. Accordingly, no provision for federal income tax is required. |
| 3. | Related Party Transactions: |
Under its Investment Advisory Agreement with respect to the Fund, BB&T Asset Management, Inc. (“BB&T” or “Adviser”) exercises general oversight over the investment performance of the Fund. BB&T will advise the Board of Trustees if investment of all of the Fund’s assets in shares of the Master Portfolio is no longer an appropriate means of achieving the Fund’s investment objective. For periods in which all the Fund’s assets are not invested in the Master Portfolio, BB&T may receive an investment advisory fee from the Fund. For the year ended December 31, 2006, all of the Fund’s investable assets were invested in the Master Portfolio and BB&T received no fees.
BB&T serves the Fund as administrator. BB&T receives compensation for providing administration services at a rate of 0.12% of the BB&T Funds and BB&T Variable Insurance Funds aggregate average daily net assets up to $5 billion and a rate of 0.08% of the aggregate average daily net assets in excess of $5 billion. This fee is accrued daily and payable on a monthly basis. Expenses incurred are reflected on the Statement of Operations as “Administration fees”. BB&T voluntarily waived administration fees of $12,164 for the year ended December 31, 2006. Administration fee waivers are included on the Statement of Operations as “Less expenses waived for the Administrator,” and these waivers are not subject to recoupment in subsequent fiscal periods. Pursuant to a Sub-Administration Agreement with BB&T, BISYS Fund Services Ohio, Inc. (“BISYS Ohio”) serves as sub-administrator to the Trust subject to the general supervision of the Trusts’ Board of Trustees and BB&T. For these services, BISYS Ohio is entitled to a fee, payable by BB&T. BISYS Ohio is a subsidiary of The BISYS Group, Inc.
BISYS Ohio serves the Fund as transfer agent and receives compensation for providing transfer agency services at a rate of 0.01% of the average daily net assets of the Fund. Expenses incurred are reflected on the Statement of Operations as “Transfer agency fees”.
Under a Compliance Services Agreement between the Trust and BISYS Ohio (the “CCO Agreement”), BISYS Ohio makes an employee available to serve as the Trust’s Chief Compliance Officer (the “CCO”). Under the CCO Agreement, BISYS Ohio also provides infrastructure and support in implementing the written policies and procedures comprising the Fund’s compliance program, including support services to the CCO. For the services provided under the CCO Agreement, the Trust paid BISYS Ohio $100,000 for the year ended December 31, 2006, plus certain out of pocket expenses. Expenses incurred for the Fund are reflected on the Statement of Operations as “Compliance service fees”. BISYS Ohio pays the salary and other compensation earned by any such individuals as employees of BISYS Ohio.
BB&T Funds Distributor, Inc. (“BBTFDI”) serves as distributor to the Fund pursuant to a Distribution Agreement (the “Distribution Agreement”). BBTFDI has contractually agreed to waive a portion of the Class A shares distribution fees throughout the year. Effective May 1, 2006 and through April 30, 2007, BBTFDI has contractually agreed to waive 0.25% of the Class A Shares distribution fees of the Fund. BBTFDI waived fees totaling $328,916 of distribution fees for the year ended December 31, 2006. Distribution fee waivers are included in the Statement of Operations as “Less expenses waived by the Distributor”, and these waivers are not subject to recoupment in subsequent fiscal periods.
The Fund has adopted a Distribution and Shareholder Services Plan (the “Plan”) in accordance with Rule 12b-1 under the 1940 Act. The Plan provides for payments to the distributor of up to 0.50%, 1.00% and 1.00% of the average daily net assets of the Fund for Class A Shares, Class B Shares and Class C Shares, respectively. The fees may be used by BBTFDI to pay banks, broker dealers and other institutions, including affiliates of the advisor. As distributor, BBTFDI, is entitled to receive commissions on sales of shares of the Fund. For the year ended December 31, 2006, BBTFDI received $18,459 from commissions earned on sold shares of the fund. Commissions paid to affiliated broker-dealers during the year ended December 31, 2006 were $13,602.
The Adviser and/or its affiliates may pay out of their own assets compensation to broker-dealers and other persons for the sale and distribution of the shares and/or for the servicing of the shares. These are additional payments over and above the sales charge (including Rule 12b-1 fees) and service fees paid by the Fund. The payments, which may be different for different financial institutions, will not change the price an investor will pay for shares or the amount that a Fund will receive for the sale of the shares.
Continued
12
BB&T FUNDS
Equity Index Fund
Notes to the Financial Statements, Continued
December 31, 2006
Certain Officers and Trustees of the Trust are affiliated with the Adviser, the administrator, or the sub-administrator. Such Officers and Trustees receive no compensation from the Trust for serving in their respective roles. Each of the five non-interested Trustees who serve on both the Board and the Audit Committee are compensated $6,000 per quarter and $2,400 for each regularly scheduled meeting, plus reimbursement for certain expenses. During the period ended December 31, 2006, actual Trustee compensation was $191,123 in total from the Trust, of which $5,072 was allocated to the Fund.
At December 31, 2006, the Fund has net capital loss carryforwards available to offset future net capital gains, if any, to the extent provided by the Treasury regulations. To the extent that these carryforwards are used to offset future capital gains, it is probable that the gains that are offset will not be distributed to shareholders.
| | | |
| Amount | | Expires |
| $ | 10,695 | | 2008 |
| | 740,335 | | 2009 |
| | 3,648,463 | | 2010 |
| | 715,833 | | 2011 |
| | 175,416 | | 2012 |
| | 519,736 | | 2013 |
| | 612,669 | | 2014 |
Under current tax law, capital losses realized after October 31 of a Fund’s fiscal year may be deferred and treated as occurring on the first business day of the following fiscal year tax purposes. The Fund had $264,610 of deferred post October capital losses, which will be treated as arising on the first business day of the fiscal year ending December 31, 2007.
The tax character of dividends paid to shareholders during the fiscal year ended December 31, 2006, were as follows:
| | | | | | | | | |
| | | Distributions paid from | | |
| | | Ordinary
Income | | Total Taxable
Distributions | | Total Distributions
Paid* |
BB&T Equity Index Fund | | $ | 1,903,635 | | $ | 1,903,635 | | $ | 1,903,635 |
The tax character of dividends paid to shareholder during the fiscal year ended December 31, 2005, were as follows:
| | | | | | | | | |
| | | Distributions paid from | | |
| | | Ordinary
Income | | Total Taxable
Distributions | | Total Distributions
Paid* |
BB&T Equity Index Fund | | $ | 1,850,387 | | $ | 1,850,387 | | $ | 1,850,387 |
*Total Distributions paid may differ from the Statements of Changes in Net Assets due to differences in the tax rules governing the timing of recognition.
As of December 31, 2006, the components of accumulated earnings (deficit) on a tax basis were as follows:
| | | | | | | | | | | | | | |
| | | Dividends
Payable | | | Accumulated
Capital and
Other Losses | | | Unrealized
Appreciation
(Depreciation) | | Total
Accumulated
Earnings
(Deficit) |
BB&T Equity Index Fund | | $ | (20,256 | ) | | $ | (6,687,757 | ) | | $ | 28,170,702 | | $ | 21,462,689 |
Continued
13
BB&T FUNDS
Equity Index Fund
Notes to the Financial Statements, Continued
December 31, 2006
| 5. | Legal and Regulatory Matters: |
On September 26, 2006 BISYS Fund Services, Inc. (“BISYS”), an affiliate of BISYS Fund Services Ohio, Inc. which provides various services to the Fund as described in footnote 3, announced a settlement with the Securities and Exchange Commission (“SEC”) regarding the SEC’s investigation related to BISYS’ past payment of certain marketing and other expenses with respect to certain of its mutual fund clients. Although BISYS has reached a settlement with the SEC, the Fund’s management is not aware that any determination has been made as to how the BISYS settlement monies will be distributed. The SEC’s examination of BISYS’ mutual fund clients and their advisers has not been completed. Accordingly, the Fund’s management is currently unable to determine the impact, if any, of such matters on the Fund or the Fund’s financial statements.
14
Report of Independent Registered Public Accounting Firm
The Shareholders and Board of Trustees of
BB&T Funds:
We have audited the accompanying statement of assets and liabilities of the BB&T Equity Index Fund (the “Fund”), a series of BB&T Funds, as of December 31, 2006, and the related statement of operations for the year then ended, the statements of changes in net assets for each year in the two-year period then ended and the financial highlights for each year in the five-year period then ended. These financial statements and financial highlights are the responsibility of the Fund’s management. Our responsibility is to express an opinion on these financial statements and financial highlights based on our audits.
We conducted our audits in accordance with the standards of the Public Company Accounting Oversight Board (United States). Those standards require that we plan and perform the audit to obtain reasonable assurance about whether the financial statements and financial highlights are free of material misstatement. An audit includes examining, on a test basis, evidence supporting the amounts and disclosures in the financial statements. Our procedures included confirmation of the Fund’s investment at December 31, 2006 by correspondence with the master portfolio’s fund accounting agent. An audit also includes assessing the accounting principles used and significant estimates made by management, as well as evaluating the overall financial statement presentation. We believe that our audits provide a reasonable basis for our opinion.
In our opinion, the financial statements and financial highlights referred to above present fairly, in all material respects, the financial position the Fund as of December 31, 2006, the results of its operations for the year then ended, the changes in its net assets for each year in the two-year period then ended, and the financial highlights for each year in the five-year period then ended, in conformity with U.S. generally accepted accounting principles.
KPMG LLP
Columbus, Ohio
February 26, 2007
15
BB&T FUNDS
Equity Index Fund
Other Information
December 31, 2006
| Other | Federal Income Tax Information (Unaudited): |
For the period ended December 31, 2006, certain dividends paid by the Fund may be subject to a maximum tax rate of 15% as provided for by the Jobs and Growth Tax Reconciliation Act of 2003. The Fund intends to designate the maximum amount allowable as taxed at a maximum rate of 15%. Complete information will be reported in conjunction with your 2006 Form 1099-DIV. For the fiscal year ended December 31, 2006, 100% of the dividends paid by the Fund was considered qualified dividend income.
For corporate shareholders, 100% of the total ordinary income dividends paid during the fiscal year ended December 31, 2006 qualify for the corporate dividends received deduction.
| Other | Information (Unaudited): |
A description of the policies and procedures that the Fund uses to determine how to vote proxies relating to portfolio securities is available (i) without charge, upon request, by calling 1-800-228-1872 and (ii) on the Securities and Exchange Commission’s (the “Commission”) website at http://www.sec.gov.
Information regarding how the Fund voted proxies relating to portfolio securities during the most recent 12-month period ended June 30th is available (i) without charge, upon request, by calling 1-800-228-1872 and (ii) on the Commission’s website at http://www.sec.gov.
The Fund files complete Schedules of Portfolio Holdings with the Commission for the first and third quarters of each fiscal year on Form N-Q. The Fund’s Forms N-Q are available without charge on the Commission’s website at http://www.sec.gov, or may be reviewed and copied at the Commission’s Public Reference Room in Washington, D.C. Information on the operation of the Public Reference Room may be obtained by calling 1-800-SEC-0330.
16
Board Consideration of Advisory and Sub-Advisory Agreements
(Unaudited)
The Board of Trustees, at a meeting held on August 29, 2006, formally considered the Trust’s investment advisory agreement (the “Advisory Agreement”) with BB&T Asset Management, Inc. (“BB&TAM” or the “Adviser”) with respect to the Equity Index Fund of the Trust (the “Fund”).
The Trustees reviewed extensive material in connection with their review of the Advisory Agreement, including data from an independent provider of mutual fund data (as assembled by the Fund’s sub-administrator) which included comparisons with industry averages for comparable funds for advisory fees and total fund expenses. The data reflected BB&TAM fee waivers in place, as well as BB&TAM’s contractual investment advisory fee levels. The Board was assisted in its review by independent legal counsel, who provided a memorandum detailing the legal standards for review of the Advisory Agreement. The Board received a detailed presentation by BB&TAM, which included a performance analysis. The Board also received profitability information from the Adviser. The Board also deliberated outside the presence of management and the Advisers.
In their deliberations, each Trustee attributed different weights to various factors involved in an analysis of whether the Advisory Agreement should be continued, and no factor alone was considered determinative. The Trustees determined that the overall arrangements between the Trust and the Adviser, as provided in the Advisory Agreement, were fair and reasonable and that the continuance of the Advisory Agreement was in the best interests of the Fund and its shareholders.
The matters addressed below were considered and discussed by the Trustees in reaching their conclusions.
Nature, Extent and Quality of Services Provided by the Adviser
The Trustees received and considered information regarding the nature, extent, and quality of the services provided to the Fund under the Advisory Agreement. The Trustees took into account information furnished throughout the year at Trustee meetings, as well as materials furnished specifically in connection with the annual review process. The Trustees considered the background and experience of the Adviser’s senior management and the expertise of investment personnel responsible for the day-to-day oversight of the Fund. The Trustees considered the overall reputation, and the capabilities and commitment of the Adviser to provide high-quality service to the Trust, and the Trustees’ overall confidence in the Adviser’s integrity.
The Trustees received information concerning the investment philosophy and investment processes applied by the Adviser in managing the Fund. The Trustees also considered information regarding regulatory compliance and compliance with the investment policies of the Fund. The Trustees also evaluated the procedures of the Adviser designed to fulfill the Adviser’s fiduciary duty to the Fund with respect to possible conflicts of interest, including the Adviser’s code of ethics (regulating the personal trading of its officers and employees).
Based on their review, the Trustees concluded that, with respect to the quality and nature of services to be provided by the Adviser, the scope of responsibilities was consistent with mutual fund industry norms, and that the quality of the services was wholly acceptable.
Investment Performance
The Trustees considered performance results of the Fund relative to both its benchmark index and its peer group. It was noted that the Fund had achieved its investment goal of closely tracking the performance of the S&P 500 Index.
After reviewing the Fund’s performance, and taking into consideration the management style, investment strategies, and prevailing market conditions during the prior year and for longer periods, the Trustees concluded that the performance of the Fund was generally strong.
Cost of Services, Including the Profits Realized by the Advisers and Affiliates
The Trustees considered peer group comparable information with respect to the advisory fees charged by BB&TAM, taking into consideration both contractual and actual (i.e., after waiver) fee levels. The Trustees particularly noted that the Adviser was not currently charging an advisory fee since Fund assets were invested entirely in an underlying portfolio. The Trustees concluded that the investment advisory fee was acceptable as compared to peer groups.
As part of their review, the Trustees considered benefits to the Adviser aside from investment advisory fees. The Trustees reviewed administration fees received by BB&TAM and considered the fallout benefits to BB&TAM.
Continued
17
Board Consideration of Advisory and Sub-Advisory Agreements, Continued
(Unaudited)
Consideration of the reasonableness of advisory fees also took into account, where relevant, the profitability of the Adviser. The Trustees reviewed profitability information provided by the Adviser with respect to investment advisory services. With respect to such information, the Trustees recognized that such profitability data was generally unaudited and represented an Adviser’s own determination of its and its affiliates’ revenues from the contractual services provided to the Fund, less expenses of providing such services. Expenses include direct and indirect costs and were calculated using an allocation methodology developed by the Adviser. The Trustees also recognized that it is difficult to make comparisons of profitability from fund investment advisory and sub-advisory contracts, because comparative information is not generally publicly available and is affected by numerous factors. Based on their review, the Trustees concluded that the profitability to BB&TAM and its affiliates as a result of their relationships with the Fund was acceptable. The Board also concluded that the fees under the Advisory Agreement were fair and reasonable, in light of the services and benefits provided to the Fund.
Economies of Scale
The Trustees also considered whether fee levels reflect economies of scale and whether economies of scale would be produced by the growth of the Fund’s assets. Given that no investment advisory fee was currently being charged by BB&TAM, the Trustees determined that the growth of the Fund would not result in greater economies of scale.
18
Information about Trustees and Officers (Unaudited)
Overall responsibility for the management of the Fund rests with its Board of Trustees (“Trustees”), who are elected by the Shareholders of the BB&T Funds (“Funds”). The Trustees elect the officers of the Funds to supervise actively its day-to-day operations. The names of the Trustees, their addresses, birthdate, term of office and length of time served, principal occupations during the past five years, number of portfolios overseen and directorships held outside of the Funds are set below:
| | | | | | | | | | |
Name, Address and Birthdate | | Position(s)
Held With
BB&T Funds | | Term of
Office/
Length of
Time Served | | Principal Occupation
During the Past 5 Years | | Number of
Portfolios in Fund
Complex Overseen
by Trustee | | Outside
Directorships
Held |
Thomas W. Lambeth 700 Yorkshire Road
Winston-Salem, NC 27106 Birthdate: 1/35 | | Trustee, Chairman of the Board of Trustees | | Indefinite, 8/92 — Present | | From January 2001 to present, Senior Fellow, Z. Smith Reynolds Foundation; From 1978 to January 2001, Executive Director, Z. Smith Reynolds Foundation. | | 32 | | None |
| | | | | |
Drew T. Kagan Montecito Advisors, Inc.
810 N. Jefferson St., Ste 101. Lewisburg, WV 24901
Birthdate: 2/48 | | Trustee | | Indefinite, 8/00 — Present | | From December 2003 to present, President and Director, Montecito Advisors, Inc; from March 1996 to December 2003, President, Investment Affiliate, Inc. | | 32 | | None |
| | | | | |
Laura C. Bingham Peace College
Office of the President
15 East Peace Street
Raleigh, NC 27604-1194
Birthdate: 11/56 | | Trustee | | Indefinite, 2/01 — Present | | From July 1998 to present, President of Peace College. | | 32 | | None |
| | | | | |
Douglas R. Van Scoy 841 Middle St.
Sullivans Island, SC 26481
Birthday: 11/43 | | Trustee | | Indefinite, 5/04 — Present | | Retired; From November 1974 to July 2001, Deputy Director of Private Client Group and Senior Executive Vice President of Smith Barney (investment banking). | | 32 | | None |
| | | | | |
James L. Roberts 207 Highland Terrace
Breckenridge, CO 80424
Birthday: 11/42 | | Trustee | | Indefinite, 11/04 — Present | | Retired; From January 1999 to December 2003 President, CEO and Director, Covest Bancshares, Inc. | | 32 | | None |
The following table shows information for trustees who are “interested Persons” of the BB&T Funds as defined in the 1940 Act:
| | | | | | | | | | |
Name, Address and Birthdate | | Position(s)
Held With
BB&T Funds | | Term of
Office/
Length of
Time Served | | Principal Occupation
During the Past 5 Years | | Number of
Portfolios in Fund
Complex Overseen
by Trustee | | Outside
Directorships
Held |
*Keith F. Karlawish 434 Fayetteville Street, 5th Floor
Raleigh, NC 27601
Birthdate: 8/64 | | Trustee and President | | Indefinite, 6/06 — Present 2/05 — Present | | From May 2002 to present, President, BB&T Asset Management, Inc.; from 1996 to 2002, Senior Vice President and Director of Fixed Income, BB&T Asset Management, Inc. | | 32 | | None |
Mr. Karlawish is treated by the Funds as an “interested person” (as defined in Section 2(a)(19) of the 1940 Act) of the Funds.
Mr. Karlawish is an “interested person” because he owns shares of BB&T Corporation and is the President of BB&T Asset Management, Inc., the Adviser.
Continued
19
Information about Trustees and Officers (Unaudited), Continued
The following table shows information for officers of BB&T Funds:
| | | | | | |
Name and Birthdate | | Position(s)
Held With
BB&T Funds | | Term of
Office/
Length of
Time Served | | Principal Occupation
During the Past 5 Years |
E.G. Purcell, III Birthdate: 1/55 | | Vice President | | Indefinite, 11/00 — Present | | From 1995 to present, Senior Vice President, BB&T Asset Management, Inc. and its predecessors |
| | | |
James T. Gillespie Birthdate: 11/66 | | Vice President and Secretary | | Indefinite, 5/02 — Present 8/06 — Present | | From February 2005 to present, Vice President of BB&T Asset Management; from 1992 to 2005, Director, BISYS Fund Services |
| | | |
Todd M. Miller Birthdate: 9/71 | | Vice President | | Indefinite, 8/05 — Present | | From June 2005 to Present, Investment Officer and Mutual Fund Administrator, BB&T Asset Management; from May 1993 to May 2005, Manager, BISYS Fund Services |
| | | |
Rodney Ruehle Birthdate: 4/68 | | Vice President, Chief Compliance Officer and AML Compliance Officer | | Indefinite, 2/06 — Present | | From August 1995 to present, Fund Compliance Officer, BISYS Fund Services. |
| | | |
Troy A. Sheets Birthdate: 5/71 | | Treasurer | | Indefinite, 5/02 — Present | | From April 2002 to present, Vice President, BISYS Fund Services; from September 1993 to April 2002, Senior Manager, KPMG LLP |
| | | |
Christopher E. Sabato Birthdate: 12/68 | | Assistant Treasurer | | Indefinite 11/02 — Present | | From February 1993 to present, Vice President, BISYS Fund Services |
The Fund’s Statement of Additional Information includes additional information about the Fund’s Trustees. To receive your free copy of the Statement of Additional Information, call toll free: 1-800-453-7348.
20
| | |
| S&P 500 Index Master Portfolio | | Schedule of Investments December 31, 2006 |
| | | | | |
| Common Stocks (98.70%): | | | | |
Security | | Shares | | Value |
Advertising (0.18%): | | | | | |
Interpublic Group of Companies Inc.(a)(b) | | 92,689 | | $ | 1,134,513 |
Omnicom Group Inc.(b) | | 36,164 | | | 3,780,585 |
| | | | | |
| | | | | 4,915,098 |
| | | | | |
Aerospace & Defense (2.09%): | | | | | |
Boeing Co. (The) | | 167,387 | | | 14,870,661 |
General Dynamics Corp. | | 84,934 | | | 6,314,843 |
Goodrich Corp.(b) | | 26,227 | | | 1,194,640 |
L-3 Communications Holdings Inc.(b) | | 25,890 | | | 2,117,284 |
Lockheed Martin Corp. | | 74,965 | | | 6,902,028 |
Northrop Grumman Corp. | | 72,529 | | | 4,910,213 |
Raytheon Co. | | 94,466 | | | 4,987,805 |
Rockwell Collins Inc. | | 36,070 | | | 2,282,870 |
United Technologies Corp. | | 212,977 | | | 13,315,322 |
| | | | | |
| | | | | 56,895,666 |
| | | | | |
Agriculture (1.93%): | | | | | |
Altria Group Inc. | | 442,791 | | | 38,000,324 |
Archer-Daniels-Midland Co. | | 138,044 | | | 4,411,886 |
Monsanto Co. | | 114,277 | | | 6,002,971 |
Reynolds American Inc.(b) | | 36,073 | | | 2,361,699 |
UST Inc.(b) | | 33,839 | | | 1,969,430 |
| | | | | |
| | | | | 52,746,310 |
| | | | | |
Airlines (0.09%): | | | | | |
Southwest Airlines Co.(b) | | 165,435 | | | 2,534,464 |
| | | | | |
| | | | | 2,534,464 |
| | | | | |
Apparel (0.39%): | | | | | |
Coach Inc.(a) | | 77,010 | | | 3,308,350 |
Jones Apparel Group Inc. | | 23,719 | | | 792,926 |
Liz Claiborne Inc. | | 21,916 | | | 952,469 |
Nike Inc. Class B | | 40,323 | | | 3,993,187 |
VF Corp.(b) | | 18,719 | | | 1,536,456 |
| | | | | |
| | | | | 10,583,388 |
| | | | | |
Auto Manufacturers (0.37%): | | | | | |
Ford Motor Co. | | 395,922 | | | 2,973,374 |
General Motors Corp. | | 119,058 | | | 3,657,462 |
PACCAR Inc.(b) | | 52,478 | | | 3,405,822 |
| | | | | |
| | | | | 10,036,658 |
| | | | | |
Auto Parts & Equipment (0.16%): | | | | | |
Goodyear Tire & Rubber Co. (The)(a) | | 37,341 | | | 783,788 |
Johnson Controls Inc. | | 41,165 | | | 3,536,897 |
| | | | | |
| | | | | 4,320,685 |
| | | | | |
Banks (6.61%): | | | | | |
Bank of America Corp. | | 952,439 | | | 50,850,718 |
Bank of New York Co. Inc. (The) | | 160,665 | | | 6,325,381 |
BB&T Corp. | | 113,630 | | | 4,991,766 |
Comerica Inc. | | 34,132 | | | 2,002,866 |
Commerce Bancorp Inc.(b) | | 39,381 | | | 1,388,968 |
Compass Bancshares Inc.(b) | | 27,220 | | | 1,623,673 |
Fifth Third Bancorp | | 117,447 | | | 4,807,106 |
First Horizon National Corp.(b) | | 26,138 | | | 1,092,046 |
Huntington Bancshares Inc.(b) | | 50,128 | | | 1,190,540 |
KeyCorp | | 84,887 | | | 3,228,253 |
M&T Bank Corp.(b) | | 16,351 | | | 1,997,438 |
Marshall & Ilsley Corp.(b) | | 53,517 | | | 2,574,703 |
Mellon Financial Corp. | | 86,606 | | | 3,650,443 |
| | | | | |
| Common Stocks, continued | | | | |
Security | | Shares | | Value |
Banks, continued | | | | | |
National City Corp.(b) | | 132,322 | | $ | 4,837,692 |
Northern Trust Corp.(b) | | 39,437 | | | 2,393,432 |
PNC Financial Services Group | | 61,988 | | | 4,589,592 |
Regions Financial Corp.(b) | | 153,209 | | | 5,730,017 |
State Street Corp.(b) | | 69,711 | | | 4,701,310 |
SunTrust Banks Inc.(b) | | 76,502 | | | 6,460,594 |
Synovus Financial Corp.(b) | | 68,183 | | | 2,102,082 |
U.S. Bancorp | | 374,220 | | | 13,543,022 |
Wachovia Corp. | | 403,121 | | | 22,957,741 |
Wells Fargo & Co. | | 712,800 | | | 25,347,168 |
Zions Bancorporation | | 22,444 | | | 1,850,283 |
| | | | | |
| | | | | 180,236,834 |
| | | | | |
Beverages (2.04%): | | | | | |
Anheuser-Busch Companies Inc. | | 161,854 | | | 7,963,217 |
Brown-Forman Corp. Class B(b) | | 16,513 | | | 1,093,821 |
Coca-Cola Co. (The) | | 430,377 | | | 20,765,690 |
Coca-Cola Enterprises Inc. | | 58,186 | | | 1,188,158 |
Constellation Brands Inc. Class A(a)(b) | | 44,534 | | | 1,292,377 |
Molson Coors Brewing Co. Class B | | 9,439 | | | 721,517 |
Pepsi Bottling Group Inc. | | 28,850 | | | 891,753 |
PepsiCo Inc. | | 347,180 | | | 21,716,109 |
| | | | | |
| | | | | 55,632,642 |
| | | | | |
Biotechnology (1.12%): | | | | | |
Amgen Inc.(a) | | 246,495 | | | 16,838,073 |
Biogen Idec Inc.(a) | | 72,327 | | | 3,557,765 |
Celgene Corp.(a) | | 78,048 | | | 4,490,101 |
Genzyme Corp.(a) | | 55,018 | | | 3,388,008 |
MedImmune Inc.(a)(b) | | 50,371 | | | 1,630,509 |
Millipore Corp.(a) | | 11,039 | | | 735,197 |
| | | | | |
| | | | | 30,639,653 |
| | | | | |
Building Materials (0.15%): | | | | | |
American Standard Companies Inc. | | 36,709 | | | 1,683,108 |
Masco Corp.(b) | | 83,780 | | | 2,502,509 |
| | | | | |
| | | | | 4,185,617 |
| | | | | |
Chemicals (1.32%): | | | | | |
Air Products & Chemicals Inc.(b) | | 46,379 | | | 3,259,516 |
Ashland Inc. | | 13,437 | | | 929,572 |
Dow Chemical Co. (The) | | 201,991 | | | 8,067,521 |
Du Pont (E.I.) de Nemours and Co.(b) | | 194,090 | | | 9,454,124 |
Eastman Chemical Co. | | 17,295 | | | 1,025,766 |
Ecolab Inc.(b) | | 37,586 | | | 1,698,887 |
Hercules Inc.(a) (b) | | 23,512 | | | 454,017 |
International Flavors & Fragrances Inc.(b) | | 16,716 | | | 821,759 |
PPG Industries Inc.(b) | | 34,759 | | | 2,231,875 |
Praxair Inc. | | 67,861 | | | 4,026,193 |
Rohm & Haas Co.(b) | | 30,199 | | | 1,543,773 |
Sherwin-Williams Co. (The)(b) | | 23,704 | | | 1,507,100 |
Sigma-Aldrich Corp. | | 14,034 | | | 1,090,722 |
| | | | | |
| | | | | 36,110,825 |
| | | | | |
Coal (0.13%): | | | | | |
CONSOL Energy Inc.(b) | | 38,858 | | | 1,248,508 |
Peabody Energy Corp. | | 55,633 | | | 2,248,130 |
| | | | | |
| | | | | 3,496,638 |
| | | | | |
21
| | |
| S&P 500 Index Master Portfolio | | Schedule of Investments December 31, 2006 |
| | | | | |
| Common Stocks, continued | | | | |
Security | | Shares | | Value |
Commercial Services (0.70%): | | | | | |
Apollo Group Inc. Class A(a)(b) | | 29,694 | | $ | 1,157,175 |
Block (H & R) Inc. | | 67,674 | | | 1,559,209 |
Convergys Corp.(a) | | 29,501 | | | 701,534 |
Donnelley (R.R.) & Sons Co. | | 45,504 | | | 1,617,212 |
Equifax Inc. | | 26,835 | | | 1,089,501 |
McKesson Corp. | | 63,004 | | | 3,194,303 |
Monster Worldwide Inc.(a) | | 26,753 | | | 1,247,760 |
Moody’s Corp. | | 49,844 | | | 3,442,227 |
Robert Half International Inc. | | 36,312 | | | 1,347,901 |
Western Union Co. | | 161,067 | | | 3,611,122 |
| | | | | |
| | | | | 18,967,944 |
| | | | | |
Computers (4.02%): | | | | | |
Affiliated Computer Services Inc. Class A(a)(b) | | 24,988 | | | 1,220,414 |
Apple Computer Inc.(a) | | 179,385 | | | 15,219,023 |
Cognizant Technology Solutions Corp.(a) | | 29,653 | | | 2,288,025 |
Computer Sciences Corp.(a) | | 36,132 | | | 1,928,365 |
Dell Inc.(a) | | 478,333 | | | 12,001,375 |
Electronic Data Systems Corp.(b) | | 108,945 | | | 3,001,435 |
EMC Corp.(a)(b) | | 476,070 | | | 6,284,124 |
Hewlett-Packard Co. | | 578,197 | | | 23,815,934 |
International Business Machines Corp. | | 320,052 | | | 31,093,052 |
Lexmark International Inc. Class A(a)(b) | | 21,098 | | | 1,544,374 |
NCR Corp.(a) | | 37,910 | | | 1,621,032 |
Network Appliance Inc.(a) | | 78,385 | | | 3,078,963 |
SanDisk Corp.(a) | | 47,354 | | | 2,037,643 |
Sun Microsystems Inc.(a) | | 738,722 | | | 4,003,873 |
Unisys Corp.(a)(b) | | 71,803 | | | 562,936 |
| | | | | |
| | | | | 109,700,568 |
| | | | | |
Cosmetics & Personal Care (1.99%): | | | |
Avon Products Inc.(b) | | 94,227 | | | 3,113,260 |
Colgate-Palmolive Co. | | 108,730 | | | 7,093,545 |
Estee Lauder Companies Inc. (The) Class A | | 27,299 | | | 1,114,345 |
Procter & Gamble Co. | | 669,551 | | | 43,032,043 |
| | | | | |
| | | | | 54,353,193 |
| | | | | |
Distribution & Wholesale (0.10%): | | | | | |
Genuine Parts Co.(b) | | 36,041 | | | 1,709,425 |
Grainger (W.W.) Inc.(b) | | 15,911 | | | 1,112,815 |
| | | | | |
| | | | | 2,822,240 |
| | | | | |
Diversified Financial Services (8.78%): | | | |
American Express Co. | | 255,817 | | | 15,520,417 |
Ameriprise Financial Inc. | | 51,304 | | | 2,796,068 |
Bear Stearns Companies Inc. (The) | | 25,341 | | | 4,125,008 |
Capital One Financial Corp. | | 86,188 | | | 6,620,962 |
Chicago Mercantile Exchange Holdings Inc. | | 7,488 | | | 3,817,008 |
CIT Group Inc. | | 41,841 | | | 2,333,473 |
Citigroup Inc. | | 1,041,146 | | | 57,991,832 |
Countrywide Financial Corp. | | 130,225 | | | 5,528,051 |
E*TRADE Financial Corp.(a) | | 89,891 | | | 2,015,356 |
Federal Home Loan Mortgage Corp. | | 145,917 | | | 9,907,764 |
| | | | | |
| Common Stocks, continued | | | | |
Security | | Shares | | Value |
Diversified Financial Services, continued | | | |
Federal National Mortgage Association | | 205,479 | | $ | 12,203,398 |
Federated Investors Inc. Class B(b) | | 19,309 | | | 652,258 |
Franklin Resources Inc. | | 35,091 | | | 3,865,975 |
Goldman Sachs Group Inc. (The) | | 90,752 | | | 18,091,411 |
Janus Capital Group Inc.(b) | | 43,966 | | | 949,226 |
JPMorgan Chase & Co. | | 732,809 | | | 35,394,675 |
Legg Mason Inc. | | 27,602 | | | 2,623,570 |
Lehman Brothers Holdings Inc. | | 113,112 | | | 8,836,309 |
Merrill Lynch & Co. Inc. | | 186,670 | | | 17,378,977 |
Morgan Stanley | | 222,218 | | | 18,095,212 |
Rowe (T.) Price Group Inc. | | 55,070 | | | 2,410,414 |
Schwab (Charles) Corp. (The) | | 217,689 | | | 4,210,105 |
SLM Corp.(b) | | 86,316 | | | 4,209,631 |
| | | | | |
| | | | | 239,577,100 |
| | | | | |
Electric (3.19%): | | | | | |
AES Corp. (The)(a) | | 139,222 | | | 3,068,453 |
Allegheny Energy Inc.(a) | | 34,625 | | | 1,589,634 |
Ameren Corp. | | 43,324 | | | 2,327,799 |
American Electric Power Co. Inc. | | 82,930 | | | 3,531,159 |
CenterPoint Energy Inc.(b) | | 65,629 | | | 1,088,129 |
CMS Energy Corp.(a)(b) | | 46,605 | | | 778,303 |
Consolidated Edison Inc. | | 53,362 | | | 2,565,111 |
Constellation Energy Group Inc. | | 37,812 | | | 2,604,112 |
Dominion Resources Inc. | | 74,288 | | | 6,228,306 |
DTE Energy Co. | | 37,400 | | | 1,810,534 |
Duke Energy Corp.(b) | | 264,566 | | | 8,786,237 |
Dynegy Inc. Class A(a) | | 83,003 | | | 600,942 |
Edison International | | 68,578 | | | 3,118,927 |
Entergy Corp.(b) | | 43,861 | | | 4,049,248 |
Exelon Corp. | | 141,368 | | | 8,749,266 |
FirstEnergy Corp. | | 69,435 | | | 4,186,930 |
FPL Group Inc. | | 85,138 | | | 4,633,210 |
PG&E Corp.(b) | | 73,266 | | | 3,467,680 |
Pinnacle West Capital Corp.(b) | | 20,916 | | | 1,060,232 |
PPL Corp. | | 80,188 | | | 2,873,938 |
Progress Energy Inc. | | 53,319 | | | 2,616,897 |
Public Service Enterprise Group Inc. | | 52,987 | | | 3,517,277 |
Southern Co. (The) | | 156,276 | | | 5,760,333 |
TECO Energy Inc.(b) | | 44,015 | | | 758,378 |
TXU Corp. | | 97,135 | | | 5,265,688 |
Xcel Energy Inc. | | 85,558 | | | 1,972,967 |
| | | | | |
| | | | | 87,009,690 |
| | | | | |
Electrical Components & Equipment (0.35%): | | | |
American Power Conversion Corp. | | 35,740 | | | 1,093,287 |
Emerson Electric Co. | | 171,680 | | | 7,569,371 |
Molex Inc.(b) | | 29,773 | | | 941,720 |
| | | | | |
| | | | | 9,604,378 |
| | | | | |
Electronics (0.48%): | | | | | |
Agilent Technologies Inc.(a) | | 86,013 | | | 2,997,553 |
Applera Corp.-Applied Biosystems Group | | 38,352 | | | 1,407,135 |
Jabil Circuit Inc. | | 39,014 | | | 957,794 |
PerkinElmer Inc. | | 26,427 | | | 587,472 |
Sanmina-SCI Corp.(a) | | 110,847 | | | 382,422 |
Solectron Corp.(a) | | 192,031 | | | 618,340 |
Symbol Technologies Inc. | | 53,117 | | | 793,568 |
Continued
22
| | |
| S&P 500 Index Master Portfolio | | Schedule of Investments December 31, 2006 |
| | | | | |
| Common Stocks, continued | | | | |
Security | | Shares | | Value |
Electronics, continued | | | | | |
Tektronix Inc. | | 17,481 | | $ | 509,921 |
Thermo Fisher Scientific Inc.(a)(b) | | 85,554 | | | 3,874,741 |
Waters Corp.(a) | | 21,685 | | | 1,061,914 |
| | | | | |
| | | | | 13,190,860 |
| | | | | |
Engineering & Construction (0.06%): | | | | | |
Fluor Corp. | | 18,509 | | | 1,511,260 |
| | | | | |
| | | | | 1,511,260 |
| | | | | |
Entertainment (0.12%): | | | | | |
International Game Technology Inc. | | 71,439 | | | 3,300,482 |
| | | | | |
| | | | | 3,300,482 |
| | | | | |
Environmental Control (0.18%): | | | | | |
Allied Waste Industries Inc.(a) | | 53,277 | | | 654,774 |
Waste Management Inc. | | 113,780 | | | 4,183,691 |
| | | | | |
| | | | | 4,838,465 |
| | | | | |
Food (1.45%): | | | | | |
Campbell Soup Co.(b) | | 48,581 | | | 1,889,315 |
ConAgra Foods Inc. | | 107,515 | | | 2,902,905 |
Dean Foods Co.(a) | | 28,175 | | | 1,191,239 |
General Mills Inc. | | 74,271 | | | 4,278,010 |
Heinz (H.J.) Co.(b) | | 69,770 | | | 3,140,348 |
Hershey Co. (The)(b) | | 36,953 | | | 1,840,259 |
Kellogg Co. | | 52,600 | | | 2,633,156 |
Kroger Co. | | 152,080 | | | 3,508,486 |
McCormick & Co. Inc. NVS(b) | | 27,721 | | | 1,068,922 |
Safeway Inc.(b) | | 93,576 | | | 3,233,987 |
Sara Lee Corp. | | 159,979 | | | 2,724,442 |
SUPERVALU Inc. | | 44,600 | | | 1,594,450 |
Sysco Corp. (b) | | 130,213 | | | 4,786,630 |
Tyson Foods Inc. Class A(b) | | 53,338 | | | 877,410 |
Whole Foods Market Inc.(b) | | 29,697 | | | 1,393,680 |
Wrigley (William Jr.) Co.(b) | | 46,141 | | | 2,386,413 |
| | | | | |
| | | | | 39,449,652 |
| | | | | |
Forest Products & Paper (0.39%): | | | | | |
International Paper Co. | | 95,687 | | | 3,262,927 |
MeadWestvaco Corp.(b) | | 38,097 | | | 1,145,196 |
Plum Creek Timber Co. Inc. | | 37,719 | | | 1,503,102 |
Temple-Inland Inc.(b) | | 23,119 | | | 1,064,168 |
Weyerhaeuser Co. | | 51,834 | | | 3,662,072 |
| | | | | |
| | | | | 10,637,465 |
| | | | | |
Gas (0.25%): | | | | | |
KeySpan Corp. | | 36,818 | | | 1,516,165 |
Nicor Inc.(b) | | 9,283 | | | 434,444 |
NiSource Inc. | | 57,846 | | | 1,394,089 |
Peoples Energy Corp.(b) | | 7,975 | | | 355,446 |
Sempra Energy | | 54,981 | | | 3,081,135 |
| | | | | |
| | | | | 6,781,279 |
| | | | | |
Hand & Machine Tools (0.10%): | | | | | |
Black & Decker Corp.(b) | | 15,293 | | | 1,222,981 |
Snap-On Inc. | | 12,210 | | | 581,684 |
Stanley Works (The)(b) | | 17,150 | | | 862,474 |
| | | | | |
| | | | | 2,667,139 |
| | | | | |
Health Care-Products (3.07%): | | | | | |
Bard (C.R.) Inc.(b) | | 21,779 | | | 1,807,004 |
Bausch & Lomb Inc. | | 11,453 | | | 596,243 |
| | | | | |
| Common Stocks, continued | | | | |
Security | | Shares | | Value |
Health Care-Products, continued | | | | | |
Baxter International Inc. | | 137,354 | | $ | 6,371,852 |
Becton, Dickinson & Co. | | 51,508 | | | 3,613,286 |
Biomet Inc.(b) | | 51,628 | | | 2,130,688 |
Boston Scientific Corp.(a) | | 247,965 | | | 4,260,039 |
Johnson & Johnson | | 615,347 | | | 40,625,209 |
Medtronic Inc. | | 242,639 | | | 12,983,613 |
Patterson Companies Inc.(a)(b) | | 29,322 | | | 1,041,224 |
St. Jude Medical Inc.(a) | | 74,220 | | | 2,713,483 |
Stryker Corp.(b) | | 62,471 | | | 3,442,777 |
Zimmer Holdings Inc.(a) | | 51,098 | | | 4,005,061 |
| | | | | |
| | | | | 83,590,479 |
| | | | | |
Health Care-Services (1.48%): | | | | | |
Aetna Inc. | | 113,559 | | | 4,903,478 |
Coventry Health Care Inc.(a) | | 33,429 | | | 1,673,121 |
Health Management Associates Inc. Class A | | 50,540 | | | 1,066,899 |
Humana Inc.(a) | | 34,739 | | | 1,921,414 |
Laboratory Corp. of America Holdings(a)(b) | | 26,343 | | | 1,935,420 |
Manor Care Inc.(b) | | 15,366 | | | 720,973 |
Quest Diagnostics Inc.(b) | | 34,011 | | | 1,802,583 |
Tenet Healthcare Corp.(a)(b) | | 100,137 | | | 697,955 |
UnitedHealth Group Inc. | | 284,142 | | | 15,266,950 |
WellPoint Inc.(a)(b) | | 130,505 | | | 10,269,438 |
| | | | | |
| | | | | 40,258,231 |
| | | | | |
Home Builders (0.25%): | | | | | |
Centex Corp.(b) | | 24,946 | | | 1,403,711 |
Horton (D.R.) Inc. | | 57,305 | | | 1,518,009 |
KB Home(b) | | 16,587 | | | 850,581 |
Lennar Corp. Class A | | 29,116 | | | 1,527,425 |
Pulte Homes Inc.(b) | | 44,528 | | | 1,474,767 |
| | | | | |
| | | | | 6,774,493 |
| | | | | |
Home Furnishings (0.10%): | | | | | |
Harman International Industries Inc. | | 13,711 | | | 1,369,866 |
Whirlpool Corp. | | 16,454 | | | 1,366,011 |
| | | | | |
| | | | | 2,735,877 |
| | | | | |
Household Products & Wares (0.46%): | | | |
Avery Dennison Corp.(b) | | 19,887 | | | 1,350,924 |
Clorox Co. (The) | | 31,806 | | | 2,040,355 |
Fortune Brands Inc.(b) | | 31,744 | | | 2,710,620 |
Kimberly-Clark Corp. | | 96,471 | | | 6,555,204 |
| | | | | |
| | | | | 12,657,103 |
| | | | | |
Housewares (0.06%): | | | | | |
Newell Rubbermaid Inc. | | 58,255 | | | 1,686,482 |
| | | | | |
| | | | | 1,686,482 |
| | | | | |
Insurance (4.94%): | | | | | |
ACE Ltd. | | 68,453 | | | 4,146,198 |
AFLAC Inc. | | 104,479 | | | 4,806,034 |
Allstate Corp. (The) | | 132,545 | | | 8,630,005 |
Ambac Financial Group Inc.(b) | | 22,286 | | | 1,985,014 |
American International Group Inc. | | 549,264 | | | 39,360,258 |
Aon Corp.(b) | | 66,179 | | | 2,338,766 |
Chubb Corp. | | 86,483 | | | 4,575,816 |
CIGNA Corp.(b) | | 20,652 | | | 2,717,184 |
Cincinnati Financial Corp.(b) | | 36,590 | | | 1,657,893 |
Continued
23
| | |
| S&P 500 Index Master Portfolio | | Schedule of Investments December 31, 2006 |
| | | | | |
| Common Stocks, continued | | | | |
Security | | Shares | | Value |
Insurance, continued | | | | | |
Genworth Financial Inc. Class A | | 95,769 | | $ | 3,276,257 |
Hartford Financial Services Group Inc. (The) | | 66,524 | | | 6,207,354 |
Lincoln National Corp. | | 60,442 | | | 4,013,349 |
Loews Corp. | | 96,220 | | | 3,990,243 |
Marsh & McLennan Companies Inc.(b) | | 115,856 | | | 3,552,145 |
MBIA Inc.(b) | | 28,356 | | | 2,071,689 |
MetLife Inc. | | 159,897 | | | 9,435,522 |
MGIC Investment Corp.(b) | | 17,892 | | | 1,118,966 |
Principal Financial Group Inc. | | 56,682 | | | 3,327,233 |
Progressive Corp. (The) | | 162,554 | | | 3,937,058 |
Prudential Financial Inc. | | 102,119 | | | 8,767,937 |
SAFECO Corp.(b) | | 24,028 | | | 1,502,951 |
St. Paul Travelers Companies Inc. | | 145,474 | | | 7,810,499 |
Torchmark Corp.(b) | | 20,810 | | | 1,326,846 |
UnumProvident Corp. | | 72,049 | | | 1,497,178 |
XL Capital Ltd. Class A(b) | | 37,945 | | | 2,732,799 |
| | | | | |
| | | | | 134,785,194 |
| | | | | |
Internet (1.64%): | | | | | |
Amazon.com Inc.(a)(b) | | 66,128 | | | 2,609,411 |
eBay Inc.(a) | | 247,351 | | | 7,437,845 |
Google Inc. Class A(a) | | 45,236 | | | 20,830,273 |
IAC/InterActiveCorp(a)(b) | | 46,919 | | | 1,743,510 |
Symantec Corp.(a) | | 204,903 | | | 4,272,228 |
VeriSign Inc.(a) | | 51,558 | | | 1,239,970 |
Yahoo! Inc.(a)(b) | | 261,720 | | | 6,684,329 |
| | | | | |
| | | | | 44,817,566 |
| | | | | |
Iron & Steel (0.27%): | | | | | |
Allegheny Technologies Inc. | | 21,166 | | | 1,919,333 |
Nucor Corp. | | 64,902 | | | 3,547,543 |
United States Steel Corp. | | 25,896 | | | 1,894,033 |
| | | | | |
| | | | | 7,360,909 |
| | | | | |
Leisure Time (0.37%): | | | | | |
Brunswick Corp. | | 19,071 | | | 608,365 |
Carnival Corp. | | 93,677 | | | 4,594,857 |
Harley-Davidson Inc.(b) | | 55,200 | | | 3,889,944 |
Sabre Holdings Corp. | | 27,788 | | | 886,159 |
| | | | | |
| | | | | 9,979,325 |
| | | | | |
Lodging (0.50%): | | | | | |
Harrah’s Entertainment Inc. | | 39,112 | | | 3,235,345 |
Hilton Hotels Corp.(b) | | 81,194 | | | 2,833,671 |
Marriott International Inc. Class A(b) | | 72,324 | | | 3,451,301 |
Starwood Hotels & Resorts Worldwide Inc. | | 45,844 | | | 2,865,250 |
Wyndham Worldwide Corp.(a) | | 42,525 | | | 1,361,651 |
| | | | | |
| | | | | 13,747,218 |
| | | | | |
Machinery (0.66%): | | | | | |
Caterpillar Inc. | | 138,071 | | | 8,467,894 |
Cummins Inc. | | 10,959 | | | 1,295,135 |
Deere & Co.(b) | | 48,672 | | | 4,627,247 |
Rockwell Automation Inc. | | 37,026 | | | 2,261,548 |
Terex Corp.(a)(b) | | 21,506 | | | 1,388,857 |
| | | | | |
| | | | | 18,040,681 |
| | | | | |
| | | | | |
| Common Stocks, continued | | | | |
Security | | Shares | | Value |
Manufacturing (5.16%): | | | | | |
Cooper Industries Ltd. | | 19,259 | | $ | 1,741,591 |
Danaher Corp.(b) | | 49,808 | | | 3,608,092 |
Dover Corp. | | 42,827 | | | 2,099,380 |
Eastman Kodak Co.(b) | | 60,428 | | | 1,559,042 |
Eaton Corp. | | 31,568 | | | 2,372,020 |
General Electric Co. | | 2,179,157 | | | 81,086,432 |
Honeywell International Inc. | | 172,427 | | | 7,800,597 |
Illinois Tool Works Inc.(b) | | 88,465 | | | 4,086,198 |
Ingersoll-Rand Co. Class A | | 67,714 | | | 2,649,649 |
ITT Industries Inc. | | 38,860 | | | 2,208,025 |
Leggett & Platt Inc.(b) | | 37,825 | | | 904,018 |
Pall Corp. | | 26,387 | | | 911,671 |
Parker Hannifin Corp. | | 25,297 | | | 1,944,833 |
Textron Inc. | | 26,573 | | | 2,491,750 |
3M Co. | | 157,455 | | | 12,270,468 |
Tyco International Ltd.(b) | | 424,237 | | | 12,896,805 |
| | | | | |
| | | | | 140,630,571 |
| | | | | |
Media (3.51%): | | | | | |
CBS Corp. Class B | | 164,342 | | | 5,124,184 |
Clear Channel Communications Inc. | | 104,471 | | | 3,712,899 |
Comcast Corp. Class A(a) | | 440,695 | | | 18,654,619 |
DIRECTV Group Inc. (The)(a) | | 162,265 | | | 4,046,889 |
Dow Jones & Co. Inc. | | 13,868 | | | 526,984 |
Gannett Co. Inc. | | 49,752 | | | 3,008,006 |
McGraw-Hill Companies Inc. (The)(b) | | 74,084 | | | 5,039,194 |
Meredith Corp. | | 8,055 | | | 453,899 |
New York Times Co. Class A(b) | | 30,804 | | | 750,385 |
News Corp. Class A | | 493,191 | | | 10,593,743 |
Scripps (E.W.) Co. Class A | | 17,620 | | | 879,943 |
Time Warner Inc.(b) | | 850,776 | | | 18,529,901 |
Tribune Co. | | 40,191 | | | 1,237,079 |
Univision Communications Inc. Class A(a) | | 52,856 | | | 1,872,160 |
Viacom Inc. Class B(a) | | 149,365 | | | 6,128,446 |
Walt Disney Co. (The)(b) | | 440,127 | | | 15,083,152 |
| | | | | |
| | | | | 95,641,483 |
| | | | | |
Mining (0.70%): | | | | | |
Alcoa Inc. | | 182,509 | | | 5,477,095 |
Freeport-McMoRan Copper & Gold Inc. | | 41,346 | | | 2,304,213 |
Newmont Mining Corp.(b) | | 94,664 | | | 4,274,080 |
Phelps Dodge Corp. | | 42,944 | | | 5,141,256 |
Vulcan Materials Co.(b) | | 20,302 | | | 1,824,541 |
| | | | | |
| | | | | 19,021,185 |
| | | | | |
Office & Business Equipment (0.21%): | | | |
Pitney Bowes Inc.(b) | | 46,617 | | | 2,153,239 |
Xerox Corp.(a)(b) | | 205,905 | | | 3,490,090 |
| | | | | |
| | | | | 5,643,329 |
| | | | | |
Oil & Gas (7.95%): | | | | | |
Anadarko Petroleum Corp. | | 96,728 | | | 4,209,603 |
Apache Corp.(b) | | 69,313 | | | 4,610,008 |
Chesapeake Energy Corp.(b) | | 86,485 | | | 2,512,389 |
Chevron Corp. | | 462,867 | | | 34,034,611 |
ConocoPhillips | | 347,474 | | | 25,000,754 |
Devon Energy Corp. | | 92,862 | | | 6,229,183 |
Continued
24
| | |
| S&P 500 Index Master Portfolio | | Schedule of Investments December 31, 2006 |
| | | | | |
| Common Stocks, continued | | | | |
Security | | Shares | | Value |
Oil & Gas, continued | | | | | |
EOG Resources Inc.(b) | | 51,069 | | $ | 3,189,259 |
Exxon Mobil Corp. | | 1,235,477 | | | 94,674,602 |
Hess Corp. | | 56,357 | | | 2,793,616 |
Marathon Oil Corp. | | 75,411 | | | 6,975,518 |
Murphy Oil Corp.(b) | | 39,317 | | | 1,999,269 |
Nabors Industries Ltd.(a)(b) | | 66,507 | | | 1,980,578 |
Noble Corp.(b) | | 28,863 | | | 2,197,917 |
Occidental Petroleum Corp. | | 181,403 | | | 8,857,908 |
Rowan Companies Inc. | | 23,207 | | | 770,472 |
Sunoco Inc. | | 26,937 | | | 1,679,791 |
Transocean Inc.(a) | | 61,557 | | | 4,979,346 |
Valero Energy Corp. | | 129,037 | | | 6,601,533 |
XTO Energy Inc.(b) | | 76,988 | | | 3,622,285 |
| | | | | |
| | | | | 216,918,642 |
| | | | | |
Oil & Gas Services (1.33%): | | | | | |
Baker Hughes Inc.(b) | | 69,254 | | | 5,170,504 |
BJ Services Co. | | 62,951 | | | 1,845,723 |
Halliburton Co.(b) | | 208,597 | | | 6,476,937 |
National Oilwell Varco Inc.(a) | | 36,909 | | | 2,258,093 |
Schlumberger Ltd. (b) | | 249,330 | | | 15,747,683 |
Smith International Inc. | | 42,178 | | | 1,732,250 |
Weatherford International Ltd.(a) | | 72,830 | | | 3,043,566 |
| | | | | |
| | | | | 36,274,756 |
| | | | | |
Packaging & Containers (0.14%): | | | | | |
Ball Corp. | | 21,915 | | | 955,494 |
Bemis Co. Inc. | | 21,747 | | | 738,963 |
Pactiv Corp.(a) | | 29,008 | | | 1,035,296 |
Sealed Air Corp.(b) | | 17,045 | | | 1,106,561 |
| | | | | |
| | | | | 3,836,314 |
| | | | | |
Pharmaceuticals (5.68%): | | | | | |
Abbott Laboratories | | 323,699 | | | 15,767,378 |
Allergan Inc.(b) | | 32,137 | | | 3,848,084 |
AmerisourceBergen Corp. | | 42,412 | | | 1,906,844 |
Barr Pharmaceuticals Inc.(a) | | 22,352 | | | 1,120,282 |
Bristol-Myers Squibb Co.(b) | | 414,079 | | | 10,898,559 |
Cardinal Health Inc. | | 85,374 | | | 5,500,647 |
Caremark Rx Inc. | | 89,870 | | | 5,132,476 |
Express Scripts Inc.(a) | | 28,985 | | | 2,075,326 |
Forest Laboratories Inc.(a) | | 66,928 | | | 3,386,557 |
Gilead Sciences Inc.(a) | | 96,574 | | | 6,270,550 |
Hospira Inc.(a) | | 33,140 | | | 1,112,841 |
King Pharmaceuticals Inc.(a) | | 51,335 | | | 817,253 |
Lilly (Eli) & Co. | | 207,545 | | | 10,813,095 |
Medco Health Solutions Inc.(a) | | 61,868 | | | 3,306,226 |
Merck & Co. Inc. | | 458,249 | | | 19,979,656 |
Mylan Laboratories Inc. | | 44,405 | | | 886,324 |
Pfizer Inc. | | 1,530,503 | | | 39,640,028 |
Schering-Plough Corp.(b) | | 311,884 | | | 7,372,938 |
Watson Pharmaceuticals Inc.(a) | | 21,309 | | | 554,673 |
Wyeth | | 283,949 | | | 14,458,683 |
| | | | | |
| | | | | 154,848,420 |
| | | | | |
Pipelines (0.34%): | | | | | |
El Paso Corp.(b) | | 146,448 | | | 2,237,725 |
Kinder Morgan Inc.(b) | | 22,547 | | | 2,384,345 |
Questar Corp.(b) | | 18,030 | | | 1,497,392 |
Williams Companies Inc. | | 125,413 | | | 3,275,788 |
| | | | | |
| | | | | 9,395,250 |
| | | | | |
| | | | | |
| Common Stocks, continued | | | | |
Security | | Shares | | Value |
Real Estate (0.10%): | | | | | |
CB Richard Ellis Group Inc. Class A(a) | | 38,616 | | $ | 1,282,051 |
Realogy Corp.(a) | | 45,329 | | | 1,374,375 |
| | | | | |
| | | | | 2,656,426 |
| | | | | |
Real Estate Investment Trusts (1.06%): | | | |
Apartment Investment & Management Co. Class A(b) | | 20,298 | | | 1,137,094 |
Archstone-Smith Trust(b) | | 45,515 | | | 2,649,428 |
Boston Properties Inc.(b) | | 24,308 | | | 2,719,579 |
Equity Office Properties Trust | | 73,700 | | | 3,550,129 |
Equity Residential(b) | | 61,243 | | | 3,108,082 |
Kimco Realty Corp.(b) | | 46,792 | | | 2,103,300 |
ProLogis(b) | | 51,594 | | | 3,135,367 |
Public Storage Inc. | | 25,519 | | | 2,488,103 |
Simon Property Group Inc.(b) | | 46,562 | | | 4,716,265 |
Vornado Realty Trust(b) | | 26,938 | | | 3,272,967 |
| | | | | |
| | | | | 28,880,314 |
| | | | | |
Retail (5.51%): | | | | | |
AutoNation Inc.(a) | | 32,376 | | | 690,256 |
AutoZone Inc.(a) | | 11,094 | | | 1,282,023 |
Bed Bath & Beyond Inc.(a)(b) | | 59,392 | | | 2,262,835 |
Best Buy Co. Inc. | | 85,592 | | | 4,210,271 |
Big Lots Inc.(a)(b) | | 22,516 | | | 516,067 |
Circuit City Stores Inc.(b) | | 29,625 | | | 562,283 |
Costco Wholesale Corp. | | 98,521 | | | 5,208,805 |
CVS Corp.(b) | | 172,930 | | | 5,345,266 |
Darden Restaurants Inc. | | 30,854 | | | 1,239,405 |
Dillard’s Inc. Class A(b) | | 12,705 | | | 444,294 |
Dollar General Corp.(b) | | 64,929 | | | 1,042,760 |
Family Dollar Stores Inc. | | 32,239 | | | 945,570 |
Federated Department Stores Inc. | | 114,427 | | | 4,363,102 |
Gap Inc. (The) | | 113,321 | | | 2,209,760 |
Home Depot Inc. | | 434,638 | | | 17,455,062 |
Kohl’s Corp.(a) | | 68,925 | | | 4,716,538 |
Limited Brands Inc. | | 71,477 | | | 2,068,544 |
Lowe’s Companies Inc.(b) | | 321,722 | | | 10,021,640 |
McDonald’s Corp. | | 260,541 | | | 11,549,783 |
Nordstrom Inc.(b) | | 48,063 | | | 2,371,428 |
Office Depot Inc.(a) | | 59,611 | | | 2,275,352 |
OfficeMax Inc. | | 15,589 | | | 773,994 |
Penney (J.C.) Co. Inc. | | 47,195 | | | 3,651,005 |
RadioShack Corp. | | 28,512 | | | 478,431 |
Sears Holdings Corp.(a)(b) | | 17,508 | | | 2,940,118 |
Staples Inc. | | 152,931 | | | 4,083,258 |
Starbucks Corp.(a) | | 159,177 | | | 5,638,049 |
Target Corp.(b) | | 180,809 | | | 10,315,153 |
Tiffany & Co. | | 29,209 | | | 1,146,161 |
TJX Companies Inc.(b) | | 94,600 | | | 2,697,992 |
Walgreen Co. | | 212,241 | | | 9,739,739 |
Wal-Mart Stores Inc. | | 519,166 | | | 23,975,086 |
Wendy’s International Inc. | | 24,111 | | | 797,833 |
Yum! Brands Inc. | | 56,987 | | | 3,350,836 |
| | | | | |
| | | | | 150,368,699 |
| | | | | |
Savings & Loans (0.41%): | | | | | |
Sovereign Bancorp Inc. (b) | | 75,457 | | | 1,915,853 |
Washington Mutual Inc. | | 202,869 | | | 9,228,511 |
| | | | | |
| | | | | 11,144,364 |
| | | | | |
Continued
25
| | |
| S&P 500 Index Master Portfolio | | Schedule of Investments December 31, 2006 |
| | | | | |
| Common Stocks, continued | | | | |
Security | | Shares | | Value |
Semiconductors (2.42%): | | | | | |
Advanced Micro Devices Inc.(a) | | 114,147 | | $ | 2,322,891 |
Altera Corp.(a) | | 75,579 | | | 1,487,395 |
Analog Devices Inc. | | 74,257 | | | 2,440,828 |
Applied Materials Inc. | | 292,405 | | | 5,394,872 |
Broadcom Corp. Class A(a)(b) | | 98,709 | | | 3,189,288 |
Intel Corp. | | 1,217,430 | | | 24,652,958 |
KLA-Tencor Corp. | | 41,894 | | | 2,084,227 |
Linear Technology Corp.(b) | | 63,387 | | | 1,921,894 |
LSI Logic Corp.(a) | | 83,006 | | | 747,054 |
Maxim Integrated Products Inc.(b) | | 67,482 | | | 2,066,299 |
Micron Technology Inc.(a) | | 156,181 | | | 2,180,287 |
National Semiconductor Corp. | | 62,619 | | | 1,421,451 |
Novellus Systems Inc.(a)(b) | | 25,831 | | | 889,103 |
NVIDIA Corp.(a) | | 74,190 | | | 2,745,772 |
PMC-Sierra Inc.(a)(b) | | 43,249 | | | 290,201 |
QLogic Corp.(a) | | 32,946 | | | 722,176 |
Teradyne Inc.(a) | | 41,559 | | | 621,723 |
Texas Instruments Inc. | | 318,441 | | | 9,171,101 |
Xilinx Inc.(b) | | 71,512 | | | 1,702,701 |
| | | | | |
| | | | | 66,052,221 |
| | | | | |
Software (3.82%): | | | | | |
Adobe Systems Inc.(a)(b) | | 121,930 | | | 5,013,762 |
Autodesk Inc.(a) | | 48,754 | | | 1,972,587 |
Automatic Data Processing Inc. | | 116,966 | | | 5,760,576 |
BMC Software Inc.(a)(b) | | 43,144 | | | 1,389,237 |
CA Inc. | | 86,404 | | | 1,957,051 |
Citrix Systems Inc.(a) | | 38,324 | | | 1,036,664 |
Compuware Corp.(a) | | 78,503 | | | 653,930 |
Electronic Arts Inc.(a) | | 64,552 | | | 3,250,839 |
Fidelity National Information Services Inc.(b) | | 34,221 | | | 1,371,920 |
First Data Corp. | | 161,072 | | | 4,110,557 |
Fiserv Inc.(a) | | 36,659 | | | 1,921,665 |
IMS Health Inc. | | 42,749 | | | 1,174,743 |
Intuit Inc.(a) | | 71,905 | | | 2,193,822 |
Microsoft Corp. | | 1,828,326 | | | 54,593,814 |
Novell Inc.(a) | | 70,772 | | | 438,786 |
Oracle Corp.(a) | | 849,356 | | | 14,557,962 |
Paychex Inc. | | 71,243 | | | 2,816,948 |
| | | | | |
| | | | | 104,214,863 |
| | | | | |
Telecommunications (6.11%): | | | | | |
ADC Telecommunications Inc.(a) | | 24,625 | | | 357,801 |
Alltel Corp. | | 76,729 | | | 4,640,570 |
AT&T Inc. | | 816,659 | | | 29,195,559 |
Avaya Inc.(a)(b) | | 96,375 | | | 1,347,323 |
BellSouth Corp. | | 384,844 | | | 18,130,001 |
CenturyTel Inc.(b) | | 24,476 | | | 1,068,622 |
Ciena Corp.(a) | | 18,153 | | | 503,020 |
Cisco Systems Inc.(a) | | 1,285,553 | | | 35,134,163 |
Citizens Communications Co.(b) | | 68,103 | | | 978,640 |
Comverse Technology Inc.(a)(b) | | 43,007 | | | 907,878 |
Corning Inc.(a) | | 328,403 | | | 6,144,420 |
Embarq Corp. | | 31,371 | | | 1,648,860 |
JDS Uniphase Corp.(a) | | 43,696 | | | 727,975 |
Juniper Networks Inc.(a)(b) | | 119,063 | | | 2,255,053 |
Motorola Inc. | | 515,893 | | | 10,606,760 |
QUALCOMM Inc. | | 348,489 | | | 13,169,399 |
| | | | | | |
| Common Stocks, continued | | | | |
Security | | Shares | | Value |
Telecommunications, continued | | | | | | |
Qwest Communications International Inc.(a)(b) | | | 336,815 | | $ | 2,819,142 |
Sprint Nextel Corp.(b) | | | 619,217 | | | 11,697,009 |
Tellabs Inc.(a) | | | 93,477 | | | 959,074 |
Verizon Communications Inc. | | | 616,266 | | | 22,949,746 |
Windstream Corp. | | | 100,169 | | | 1,424,403 |
| | | | | | |
| | | | | | 166,665,418 |
| | | | | | |
Textiles (0.04%): | | | | | | |
Cintas Corp. | | | 28,500 | | | 1,131,735 |
| | | | | | |
| | | | | | 1,131,735 |
| | | | | | |
Toys, Games & Hobbies (0.10%): | | | | | | |
Hasbro Inc. | | | 34,766 | | | 947,374 |
Mattel Inc. | | | 79,528 | | | 1,802,104 |
| | | | | | |
| | | | | | 2,749,478 |
| | | | | | |
Transportation (1.57%): | | | | | | |
Burlington Northern Santa Fe Corp. | | | 76,206 | | | 5,624,765 |
CSX Corp. | | | 93,359 | | | 3,214,350 |
FedEx Corp. | | | 64,514 | | | 7,007,511 |
Norfolk Southern Corp. | | | 81,263 | | | 4,086,716 |
Ryder System Inc. | | | 13,132 | | | 670,520 |
Union Pacific Corp. | | | 56,706 | | | 5,218,086 |
United Parcel Service Inc. Class B | | | 227,638 | | | 17,068,297 |
| | | | | | |
| | | | | | 42,890,245 |
| | | | | | |
Total Common Stocks
(Cost: $2,275,598,239) | | | | | | 2,692,143,464 |
| | | | | | |
| Short-Term Investments (11.21%): | | | | |
Security | | Shares or
Principal | | Value |
Certificates of Deposit(c) (0.24%): | | | | | | |
Credit Suisse First Boston NY | | | | | | |
5.28% - 5.43%, 04/23/07 - 08/21/07 | | $ | 1,426,559 | | | 1,426,559 |
Washington Mutual Bank | | | | | | |
5.33%, 03/19/07 | | | 5,094,856 | | | 5,094,856 |
| | | | | | |
| | | | | | 6,521,415 |
| | | | | | |
Commercial Paper(c) (2.13%): | | | | | | |
Amstel Funding Corp. | | | | | | |
5.22% - 5.25%, 02/13/07 - 04/17/07(d) | | | 2,142,102 | | | 2,111,447 |
Aspen Funding Corp. | | | | | | |
5.26%, 02/21/07(d) | | | 1,324,663 | | | 1,314,985 |
Beta Finance Inc. | | | | | | |
5.27%, 01/25/07(d) | | | 407,588 | | | 406,217 |
BNP Paribas Finance Inc. | | | | | | |
5.12%, 06/06/07 | | | 713,280 | | | 697,571 |
CAFCO LLC | | | | | | |
5.26%, 01/30/07(d) | | | 1,018,971 | | | 1,014,802 |
Cantabric Finance LLC | | | | | | |
5.25% - 5.26%, 01/25/07 - 03/06/07(d) | | | 2,445,531 | | | 2,427,812 |
Cheyne Finance LLC | | | | | | |
5.24% - 5.26%, 02/15/07 - 04/23/07(d) | | | 2,404,772 | | | 2,375,259 |
Continued
26
| | |
| S&P 500 Index Master Portfolio | | Schedule of Investments December 31, 2006 |
| | | | | | |
| Short-Term Investments, continued | | | | |
Security | | Shares or
Principal | | Value |
Commercial Paper, continued | | | | | | |
Concord Minutemen Capital Co. LLC | | | | | | |
5.27%, 01/11/07(d) | | $ | 203,794 | | $ | 203,526 |
Curzon Funding LLC | | | | | | |
5.24%, 02/27/07(d) | | | 1,117,811 | | | 1,108,700 |
Edison Asset Securitization LLC | | | | | | |
5.21%, 04/11/07(d) | | | 844,584 | | | 832,484 |
Eureka Securitization | | | | | | |
5.26%, 02/09/07(d) | | | 2,547,428 | | | 2,533,284 |
Five Finance Inc. | | | | | | |
5.22%, 04/20/07(d) | | | 937,453 | | | 922,773 |
General Electric Capital Corp. | | | | | | |
5.12%, 06/04/07(d) | | | 1,528,457 | | | 1,495,230 |
Giro Funding Corp. | | | | | | |
5.25%, 03/05/07 - 03/12/07(d) | | | 3,342,225 | | | 3,309,926 |
Grampian Funding LLC | | | | | | |
5.14% - 5.23%, 04/23/07 - 06/06/07(d) | | | 3,973,988 | | | 3,891,613 |
Harrier Finance Funding LLC | | | | | | |
5.12%, 06/06/07(d) | | | 2,037,942 | | | 1,993,061 |
KKR Atlantic Funding Trust | | | | | | |
5.32%, 01/03/07(d) | | | 1,528,457 | | | 1,528,231 |
Lexington Parker Capital Co. LLC | | | | | | |
5.18% - 5.32%, 01/10/07 - 05/17/07(d) | | | 6,706,787 | | | 6,666,565 |
Lockhart Funding LLC | | | | | | |
5.28%, 02/09/07(d) | | | 2,037,942 | | | 2,026,584 |
Nationwide Building Society | | | | | | |
5.21%, 04/13/07(d) | | | 1,936,045 | | | 1,907,746 |
Nestle Capital Corp. | | | | | | |
5.19%, 08/09/07(d) | | | 1,222,765 | | | 1,184,160 |
Norddeutsche Landesbank | | | | | | |
5.27%, 02/15/07 | | | 1,936,045 | | | 1,923,587 |
Polonius Inc. | | | | | | |
5.26%, 02/20/07(d) | | | 576,330 | | | 572,204 |
Regency Markets No. 1 LLC | | | | | | |
5.32%, 01/22/07(d) | | | 677,269 | | | 675,268 |
Sedna Finance Inc. | | | | | | |
5.22%, 04/17/07(d) | | | 1,161,627 | | | 1,143,941 |
Societe Generale | | | | | | |
5.18%, 05/16/07 | | | 5,094,856 | | | 4,996,621 |
Thames Asset Global Securitization No. 1 Inc. | | | | | | |
5.25%, 03/07/07 - 03/12/07(d) | | | 5,171,238 | | | 5,121,434 |
Thornburg Mortgage Capital Resources | | | | | | |
5.28%, 01/17/07 - 03/12/07(d) | | | 2,510,745 | | | 2,493,406 |
Three Pillars Funding Corp. | | | | | | |
5.26%, 02/14/07(d) | | | 1,190,953 | | | 1,183,471 |
| | | | | | |
| | | | | | 58,061,908 |
| | | | | | |
Medium-Term Notes(c) (0.22%): | | | | | | |
Bank of America N.A. | | | | | | |
5.28%, 04/20/07 | | | 509,486 | | | 509,486 |
Cullinan Finance Corp. | | | | | | |
5.71%, 06/28/07(d) | | | 1,528,457 | | | 1,528,457 |
K2 USA LLC | | | | | | |
5.39%, 06/04/07(d) | | | 1,528,457 | | | 1,528,457 |
| | | | | | |
| Short-Term Investments, continued | | | | |
Security | | Shares or
Principal | | Value |
Medium-Term Notes, continued | | | | | | |
Sigma Finance Inc. | | | | | | |
5.13% - 5.51%, 03/30/07 - 06/18/07(d) | | $ | 2,384,393 | | $ | 2,384,393 |
| | | | | | |
| | | | | | 5,950,793 |
| | | | | | |
Money Market Funds (1.09%): | | | | | | |
Barclays Global Investors Funds Institutional Money Market Fund, Institutional Shares | | | | | | |
5.30%(e)(f) | | | 29,683,696 | | | 29,683,696 |
| | | | | | |
| | | | | | 29,683,696 |
| | | | | | |
Repurchase Agreements(c) (2.03%): | | | |
Banc of America Securities LLC, 5.36%, due 1/2/07, maturity value $4,078,312 (collateralized by non-U.S. Government debt securities, value $4,202,958,
4.25% to 8.00%, 3/1/08 to 7/15/17). | | $ | 4,075,885 | | | 4,075,885 |
Bear Stearns Companies Inc. (The), 5.37%, due 1/2/07, maturity
value $3,058,737 (collateralized by U.S. Government obligations,
value $3,119,927, 0.00% to 11.00%, 1/1/08 to 1/1/37). | | | 3,056,913 | | | 3,056,913 |
Bear Stearns Companies Inc. (The), 5.37%, due 1/2/07, maturity
value $7,137,054 (collateralized by non-U.S. Government debt securities, value $7,850,764, 1.00% to 8.84%, 8/3/14 to 12/25/46). | | | 7,132,798 | | | 7,132,798 |
BNP Securities Corp.,
5.36%, due 1/2/07, maturity value $203,915 (collateralized by non-U.S. Government debt securities, value $214,228, 5.46%, 3/15/08). | | | 203,794 | | | 203,794 |
Citigroup Global Markets Holdings Inc., 5.36%, due 1/2/07, maturity
value $7,137,046 (collateralized by non-U.S. Government debt securities, value $7,497,996, 3.78% to 7.41%, 11/25/19 to 10/25/45). | | | 7,132,798 | | | 7,132,798 |
Citigroup Global Markets Holdings Inc., 5.42%, due 1/2/07, maturity
value $2,243,087 (collateralized by non-U.S. Government debt securities, value $2,500,515, 0.00% to 10.00%, 6/1/28 to 11/16/36). | | | 2,241,737 | | | 2,241,737 |
Citigroup Global Markets Holdings Inc., 5.46%, due 1/2/07, maturity
value $1,223,507 (collateralized by non-U.S. Government debt securities, value $1,363,923, 0.00% to 10.00%, 6/1/28 to 11/16/36). | | | 1,222,765 | | | 1,222,765 |
Continued
27
| | |
| S&P 500 Index Master Portfolio | | Schedule of Investments December 31, 2006 |
| | | | | | |
| Short-Term Investments, continued | | | | |
Security | | Shares or
Principal | | Value |
Repurchase Agreements, continued | | | |
Goldman Sachs & Co. Inc.,
5.35%, due 1/2/07, maturity value $4,078,308 (collateralized by non-U.S. Government debt securities, value $4,241,043, 0.00% to 10.00%, 1/23/07 to 5/15/44). | | $ | 4,075,885 | | $ | 4,075,885 |
Goldman Sachs Group Inc.,
5.36%, due 1/2/07, maturity value $756,669 (collateralized by non-U.S. Government debt securities, value $786,619, 0.00% to 10.00%, 1/23/07 to 5/15/44). | | | 756,219 | | | 756,219 |
Goldman Sachs Group Inc.,
5.46%, due 1/2/07, maturity value $1,223,507 (collateralized by non-U.S. Government debt securities, value $1,272,329, 0.00% to 10.00%, 1/23/07 to 5/15/44). | | | 1,222,765 | | | 1,222,765 |
Greenwich Capital Markets Inc., 5.46%, due 1/2/07, maturity value $1,019,589 (collateralized by non-U.S. Government debt securities, value $1,127,586, 5.58%, 1/8/36). | | | 1,018,971 | | | 1,018,971 |
HSBC Securities Inc.,
5.36%, due 1/2/07, maturity value $1,019,578 (collateralized by non-U.S. Government debt securities, value $1,071,244, 3.16% to 5.32%, 5/15/34 to 6/1/46). | | | 1,018,971 | | | 1,018,971 |
JP Morgan Securities Inc.,
5.41%, due 1/2/07, maturity value $509,792 (collateralized by non-U.S. Government debt securities, value $535,622, 5.75% to 8.75%, 10/1/08 to 9/15/25). | | | 509,486 | | | 509,486 |
Lehman Brothers Holdings Inc., 5.36%, due 1/2/07, maturity value $4,078,312 (collateralized by non-U.S. Government debt securities, value $4,203,009, 3.34% to 8.75%, 6/15/07 to 12/1/66). | | | 4,075,885 | | | 4,075,885 |
Lehman Brothers Holdings Inc., 5.44%, due 1/2/07, maturity value $1,529,381 (collateralized by non-U.S. Government debt securities, value $1,575,270, 5.50% to 8.88%, 4/15/11 to 12/1/66). | | | 1,528,457 | | | 1,528,457 |
Merrill Lynch & Co. Inc.,
5.36%, due 1/2/07, maturity value $4,078,312 (collateralized by non-U.S. Government debt securities, value $4,211,173, 0.00% to 10.13%, 6/15/07 to 9/1/26). | | | 4,075,885 | | | 4,075,885 |
| | | | | | |
| Short-Term Investments, continued | | | | |
Security | | Shares or
Principal | | Value |
Repurchase Agreements, continued | | | |
Merrill Lynch & Co. Inc.,
5.44%, due 1/2/07, maturity value $2,039,174 (collateralized by non-U.S. Government debt securities, value $2,100,355, 4.37% to 7.75%, 3/3/08 to 12/1/25). | | $ | 2,037,942 | | $ | 2,037,942 |
Morgan Stanley, 5.36%, due 1/2/07, maturity value $2,039,156 (collateralized by non-U.S. Government debt securities, value $2,122,965, 0.00% to 10.00%, 1/1/07 to 12/31/37). | | | 2,037,942 | | | 2,037,942 |
Morgan Stanley, 5.51%, due 6/4/07, maturity value $1,460,403 (collateralized by non-U.S. Government debt securities, value $1,498,483, 0.00% to 10.00%, 1/1/07 to 12/31/37).(g) | | | 1,426,560 | | | 1,426,560 |
Wachovia Capital,
5.38%, due 1/2/07, maturity value $6,525,313 (collateralized by non-U.S. Government debt securities, value $6,855,310, 3.86% to 8.17%, 8/15/13 to 10/17/44). | | | 6,521,415 | | | 6,521,415 |
| | | | | | |
| | | | | | 55,373,073 |
| | | | | | |
Time Deposits(c) (0.00%): | | | | | | |
Bank of America N.A.
5.13%, 01/02/07 | | | 97,536 | | | 97,536 |
| | | | | | |
| | | | | | 97,536 |
| | | | | | |
U.S. Treasury Obligations (0.06%): | | | |
U.S. Treasury Bill
4.71%, 03/22/07(h)(i) | | | 1,600,000 | | | 1,583,116 |
| | | | | | |
| | | | | | 1,583,116 |
| | | | | | |
Variable & Floating Rate Notes(c) (5.44%): | | | |
Allstate Life Global Funding II | | | | | | |
5.33% - 5.43%, 11/02/07 - 01/25/08(d) | | | 5,217,132 | | | 5,217,688 |
American Express Bank | | | | | | |
5.32%, 02/28/07 | | | 2,037,942 | | | 2,037,940 |
American Express Centurion Bank | | | | | | |
5.44%, 07/19/07 | | | 2,241,737 | | | 2,243,155 |
American Express Credit Corp. | | | | | | |
5.45%, 07/05/07 | | | 611,383 | | | 611,589 |
AmeriCredit Automobile Receivables Trust | | | | | | |
5.35%, 02/06/07 | | | 254,984 | | | 254,984 |
Arkle Master Issuer PLC Series 2006-1A Class 1A | | | | | | |
5.33%, 11/19/07(d) | | | 1,528,457 | | | 1,528,457 |
ASIF Global Financing | | | | | | |
5.41%, 05/03/07(d) | | | 203,794 | | | 203,831 |
Australia & New Zealand Banking Group Ltd. | | | | | | |
5.35%, 01/23/08(d) | | | 1,324,663 | | | 1,324,663 |
Continued
28
| | |
| S&P 500 Index Master Portfolio | | Schedule of Investments December 31, 2006 |
| | | | | | |
| Short-Term Investments, continued | | | | |
Security | | Shares or
Principal | | Value |
Variable & Floating Rate Notes, continued | | | |
Bank of Ireland | | | | | | |
5.33% - 5.35%, 08/14/07 - 12/20/07(d) | | $ | 2,955,016 | | $ | 2,955,096 |
Beta Finance Inc. | | | | | | |
5.32% - 5.41%, 04/25/07 - 07/25/07(d) | | | 5,196,753 | | | 5,196,904 |
BMW US Capital LLC | | | | | | |
5.35%, 01/15/08(d) | | | 2,037,942 | | | 2,037,942 |
BNP Paribas | | | | | | |
5.35%, 11/19/07(d) | | | 3,770,193 | | | 3,770,193 |
Carlyle Loan Investment Ltd. | | | | | | |
5.40%, 04/13/07 - 07/15/07(d) | | | 1,487,698 | | | 1,487,697 |
CC USA Inc. | | | | | | |
5.37%, 07/30/07(d) | | | 1,018,971 | | | 1,019,052 |
Commodore CDO Ltd. | | | | | | |
5.44%, 12/12/07(d) | | | 509,486 | | | 509,486 |
Credit Agricole SA | | | | | | |
5.34%, 11/23/07 | | | 2,037,942 | | | 2,037,942 |
Credit Suisse First Boston NY | | | | | | |
5.38%, 04/24/07 | | | 1,018,971 | | | 1,018,988 |
Cullinan Finance Corp. | | | | | | |
5.36%, 04/25/07(d) | | | 509,486 | | | 509,486 |
DaimlerChrysler Auto Trust Series 2006-C Class A1 | | | | | | |
5.33%, 10/08/07(d) | | | 294,404 | | | 294,404 |
DEPFA Bank PLC | | | | | | |
5.40%, 09/14/07 | | | 2,037,942 | | | 2,037,942 |
Dorada Finance Inc. | | | | | | |
5.34% - 5.41%, 06/27/07 - 07/17/07(d) | | | 2,343,634 | | | 2,343,710 |
Eli Lilly Services Inc. | | | | | | |
5.34%, 12/31/07(d) | | | 1,360,327 | | | 1,360,326 |
Fifth Third Bancorp | | | | | | |
5.33%, 12/21/07(d) | | | 4,075,885 | | | 4,075,885 |
Five Finance Inc. | | | | | | |
5.31% - 5.37%, 06/29/07 - 07/13/07(d) | | | 1,324,663 | | | 1,324,564 |
General Electric Capital Corp. | | | | | | |
5.31% - 5.48%, 07/09/07 - 01/24/08(d) | | | 2,139,839 | | | 2,140,145 |
Granite Master Issuer PLC | | | | | | |
5.32%, 08/20/07(d) | | | 7,132,798 | | | 7,132,798 |
Harrier Finance Funding LLC | | | | | | |
5.32% - 5.37%, 07/25/07 - 08/15/07(d) | | | 2,649,325 | | | 2,649,352 |
Hartford Life Global Funding Trust | | | | | | |
5.37% - 5.41%, 07/13/07 - 01/15/08 | | | 3,056,913 | | | 3,057,202 |
HBOS Treasury Services PLC | | | | | | |
5.46%, 10/24/07(d) | | | 2,037,942 | | | 2,037,942 |
Holmes Financing PLC | | | | | | |
5.32%, 07/16/07(d) | | | 3,566,399 | | | 3,566,399 |
JP Morgan Chase & Co. | | | | | | |
5.32% - 5.45%, 07/27/07 - 08/02/07(g) | | | 5,604,341 | | | 5,604,342 |
K2 USA LLC | | | | | | |
5.20% - 5.33%, 04/02/07 - 06/28/07(d) | | | 1,528,457 | | | 1,528,417 |
| | | | | | |
| Short-Term Investments, continued | | | | |
Security | | Shares or
Principal | | Value |
Variable & Floating Rate Notes, continued | | | |
Kestrel Funding LLC | | | | | | |
5.33%, 07/11/07(d) | | $ | 815,177 | | $ | 815,132 |
Kommunalkredit Austria AG | | | | | | |
5.35%, 01/09/08(d) | | | 1,222,765 | | | 1,222,765 |
Leafs LLC | | | | | | |
5.35%, 01/22/07 - 02/20/07(d) | | | 2,122,779 | | | 2,122,778 |
Links Finance LLC | | | | | | |
5.31% - 5.35%, 05/10/07 - 05/16/07(d) | | | 2,241,737 | | | 2,241,655 |
Lothian Mortgages Master Issuer PLC | | | | | | |
5.32%, 04/24/07(d) | | | 807,034 | | | 807,034 |
Marshall & Ilsley Bank | | | | | | |
5.35%, 01/15/08 | | | 1,120,868 | | | 1,120,868 |
Master Funding LLC | | | | | | |
5.38%, 04/25/07 - 05/25/07(d) | | | 3,688,125 | | | 3,688,125 |
Merrill Lynch & Co. Inc. | | | | | | |
5.46%, 05/30/07(g) | | | 2,241,737 | | | 2,241,737 |
Metropolitan Life Global Funding I | | | | | | |
5.36%, 02/08/07(d) | | | 3,056,913 | | | 3,056,913 |
Metropolitan Life Insurance Funding Agreement | | | | | | |
5.45%, 08/01/07(d)(g) | | | 203,794 | | | 203,794 |
Mound Financing PLC | | | | | | |
5.32%, 05/08/07(d) | | | 1,915,666 | | | 1,915,666 |
Natexis Banques Populaires | | | | | | |
5.35% - 5.37%, 02/05/07 - 01/15/08(d) | | | 7,336,592 | | | 7,336,536 |
National City Bank of Indiana | | | | | | |
5.35%, 05/21/07 | | | 1,018,971 | | | 1,019,004 |
Nationwide Building Society | | | | | | |
5.38% - 5.49%, 02/08/07 - 10/26/07(d) | | | 6,725,210 | | | 6,726,220 |
Newcastle Ltd. | | | | | | |
5.37%, 04/24/07(d) | | | 718,375 | | | 718,309 |
Northern Rock PLC | | | | | | |
5.39%, 08/03/07(d) | | | 2,445,531 | | | 2,445,568 |
Northlake CDO I | | | | | | |
5.42%, 09/06/07(d) | | | 611,383 | | | 611,383 |
Pricoa Global Funding I | | | | | | |
5.34%, 11/27/07 | | | 2,751,222 | | | 2,751,222 |
Principal Life Global Funding I | | | | | | |
5.80%, 02/08/07 | | | 917,074 | | | 917,507 |
Sedna Finance Inc. | | | | | | |
5.33% - 5.36%, 05/25/07 - 08/21/07(d) | | | 2,955,016 | | | 2,954,980 |
Skandinaviska Enskilda Bank NY | | | | | | |
5.35%, 01/18/08(d) | | | 2,037,942 | | | 2,037,942 |
Strips III LLC | | | | | | |
5.40%, 07/24/07(d) | | | 441,139 | | | 441,139 |
SunTrust Bank | | | | | | |
5.32%, 05/01/07 | | | 2,037,942 | | | 2,037,982 |
Tango Finance Corp. | | | | | | |
5.30% - 5.35%, 04/25/07 - 07/16/07(d) | | | 4,972,579 | | | 4,972,325 |
Union Hamilton Special Funding LLC | | | | | | |
5.36% - 5.37%, 03/28/07 - 06/21/07(d) | | | 3,362,605 | | | 3,362,605 |
Continued
29
| | |
| S&P 500 Index Master Portfolio | | Schedule of Investments December 31, 2006 |
| | | | | | | |
| Short-Term Investments, continued | | | | | |
Security | | Shares or
Principal | | Value | |
Variable & Floating Rate Notes, continued | | | | |
Wachovia Asset Securitization Inc. | | | | | | | |
5.34%, 01/25/07(d) | | $ | 2,490,077 | | $ | 2,490,077 | |
Wachovia Bank N.A. | | | | | | | |
5.36%, 05/22/07 | | | 4,075,885 | | | 4,075,885 | |
Wal-Mart Stores Inc. | | | | | | | |
5.50%, 07/16/07(d) | | | 1,528,457 | | | 1,529,007 | |
Wells Fargo & Co. | | | | | | | |
5.36%, 11/15/07(d) | | | 1,018,971 | | | 1,019,021 | |
WhistleJacket Capital Ltd. | | | | | | | |
5.31% - 5.35%, 04/18/07 - 06/13/07(d) | | | 1,528,457 | | | 1,528,459 | |
White Pine Finance LLC | | | | | | | |
5.31% - 5.32%, 05/22/07 - 08/20/07(d) | | | 6,113,827 | | | 6,113,053 | |
Wind Master Trust | | | | | | | |
5.34%, 07/25/07(d) | | | 815,177 | | | 815,177 | |
| | | | | | | |
| | | | | | 148,458,389 | |
| | | | | | | |
Total Short-Term Investments
(Cost: $305,729,192) | | | | | | 305,729,926 | |
| | | | | | | |
Total Investments in
Securities (109.91)%
(Cost: $2,581,327,431) | | | | | | 2,997,873,390 | |
| | | | | | | |
Other Assets, Less
Liabilities (-9.91%) | | | | | | (270,424,060 | ) |
| | | | | | | |
Net Assets (100.00%) | | | | | $ | 2,727,449,330 | |
| | | | | | | |
NVS Non-Voting Shares
(a) | Non-income earning security. |
(b) | All or a portion of this security represents a security on loan. See Note 4. |
(c) | All or a portion of this security (these securities) represent(s) an investment of securities lending collateral. See Note 4. |
(d) | This security or a portion of these securities may be resold to qualified institutional buyers under Rule 144A or pursuant to Section 4(2) of the Securities Act of 1933. |
(e) | Affiliated issuer. See Note 2. |
(f) | The rate quoted is the annualized seven-day yield of the fund at period end. |
(g) | The investment adviser has determined that this security or a portion of these securities is “illiquid,” in that it cannot be sold within seven (7) days for approximately the value at which it is carried in the Master Portfolio. |
(h) | The rate quoted is the yield to maturity. |
(i) | This U.S. Treasury Bill is held in a segregated account in connection with the Master Portfolio’s holdings of futures contracts. See Note 1. |
As of December 31, 2006, the open futures contracts held by the Master Portfolio were as follows:
| | | | | | | | | |
Futures Contracts
(Expiration Date) | | Number of
Contracts | | Notional
Contract
Value | | Net
Unrealized
Depreciation | |
S&P 500 Index (03/16/07) | | 484 | | $ | 34,567,280 | | $ | (37,778 | ) |
| | | | | | | | | |
| | | | | | | $ | (37,778 | ) |
| | | | | | | | | |
The accompanying notes are an integral part of these financial statements.
30
| | |
| S&P 500 Index Master Portfolio | | Portfolio Allocations December 31, 2006 (Unaudited) |
| | | | | | | |
Sector/Investment Type | | Value | | | % of
Net Assets | |
Financial | | $ | 597,280,232 | | | 21.90 | % |
Consumer Non-Cyclical | | | 543,143,627 | | | 19.92 | |
Communications | | | 312,039,565 | | | 11.44 | |
Industrial | | | 298,291,196 | | | 10.94 | |
Technology | | | 285,610,981 | | | 10.47 | |
Energy | | | 266,085,286 | | | 9.75 | |
Consumer Cyclical | | | 222,771,224 | | | 8.16 | |
Utilities | | | 93,790,969 | | | 3.44 | |
Basic Materials | | | 73,130,384 | | | 2.68 | |
Futures Contracts | | | (37,778 | ) | | (0.00 | ) |
Short-Term and Other Net Assets | | | 35,343,644 | | | 1.30 | |
| | | | | | | |
TOTAL | | $ | 2,727,449,330 | | | 100.00 | % |
| | | | | | | |
This table is not part of the financial statements.
31
S&P 500 Index Master Portfolio
| | | |
| Statement of Assets and Liabilities | | |
| December 31, 2006 |
Assets: | | | |
Investments in securities, at value (including securities on loan(a)) (Note 1): | | | |
Unaffiliated issuers (Cost: $2,551,643,735) | | $ | 2,968,189,694 |
Affiliated issuers (Cost: $29,683,696) (Note 2) | | | 29,683,696 |
Receivables: | | | |
Investment securities sold | | | 412,304 |
Dividends and interest | | | 3,900,392 |
| | | |
Total Assets | | | 3,002,186,086 |
| | | |
Liabilities: | | | |
Payables: | | | |
Due to broker — variation margin | | | 134,208 |
Collateral for securities on loan (Note 4) | | | 274,463,114 |
Investment advisory fees (Note 2) | | | 108,068 |
Accrued expenses (Note 2): | | | |
Professional fees | | | 31,298 |
Independent trustees’ fees | | | 68 |
| | | |
Total Liabilities | | | 274,736,756 |
| | | |
Net Assets | | $ | 2,727,449,330 |
| | | |
(a) | Securities on loan with market value of $266,630,828. See Note 4. |
| | | | |
| Statement of Operations | | | |
| For the Year Ended December 31, 2006 | |
Net Investment Income: | | | | |
Dividends from unaffiliated issuers | | $ | 47,597,830 | |
Interest from unaffiliated issuers | | | 103,843 | |
Interest from affiliated issuers (Note 2) | | | 1,396,726 | |
Securities lending income | | | 282,685 | |
| | | | |
Total investment income | | | 49,381,084 | |
| | | | |
Expenses (Note 2): | | | | |
Investment advisory fees | | | 1,247,308 | |
Professional fees | | | 37,568 | |
Independent trustees’ fees | | | 10,506 | |
| | | | |
Total expenses | | | 1,295,382 | |
Less expense reductions (Note 2) | | | (48,074 | ) |
| | | | |
Net expenses | | | 1,247,308 | |
| | | | |
Net investment income | | | 48,133,776 | |
| | | | |
Realized and Unrealized Gain (loss): | | | | |
Net realized loss from sale of investments in unaffiliated issuers(a) | | | (48,740,145 | ) |
Net realized gain on futures contracts | | | 2,584,556 | |
Net change in unrealized appreciation (depreciation) of investments | | | 364,364,199 | |
Net change in unrealized appreciation (depreciation) of futures contracts | | | 339,499 | |
| | | | |
Net realized and unrealized gain | | | 318,548,109 | |
| | | | |
Net Increase in Net Assets Resulting From Operations | | $ | 366,681,885 | |
| | | | |
(a) | Includes a net realized gain of $89,939 resulting from a partial litigation settlement relating to WorldCom Inc. |
The accompanying notes are an integral part of these financial statements.
32
S&P 500 Index Master Portfolio
| | | | | | | | |
| Statements of Changes in Net Assets | | | | | | |
| | | For the
Year Ended
December 31,
2006 | | | For the
Year Ended
December 31,
2005 | |
Increase (decrease) In Net Assets | | | | | | | | |
Operations: | | | | | | | | |
Net investment income | | $ | 48,133,776 | | | $ | 43,812,074 | |
Net realized gain (loss) | | | (46,155,589 | ) | | | 7,404,269 | |
Net change in unrealized appreciation (depreciation) | | | 364,703,698 | | | | 61,163,102 | |
| | | | | | | | |
Net increase in net assets resulting from operations | | | 366,681,885 | | | | 112,379,445 | |
| | | | | | | | |
Interestholder transactions: | | | | | | | | |
Contributions | | | 725,880,991 | | | | 749,027,738 | |
Withdrawals | | | (773,639,196 | ) | | | (859,684,082 | ) |
| | | | | | | | |
Net decrease in net assets resulting from interestholder transactions | | | (47,758,205 | ) | | | (110,656,344 | ) |
| | | | | | | | |
Increase in net assets | | | 318,923,680 | | | | 1,723,101 | |
Net Assets: | | | | | | | | |
Beginning of year | | | 2,408,525,650 | | | | 2,406,802,549 | |
| | | | | | | | |
End of year | | $ | 2,727,449,330 | | | $ | 2,408,525,650 | |
| | | | | | | | |
The accompanying notes are an integral part of these financial statements.
33
S&P 500 Index Master Portfolio
Notes to the Financial Statements
December 31, 2006
Master Investment Portfolio (“MIP”) is registered under the Investment Company Act of 1940, as amended (the “1940 Act”), as an open-end series management investment company organized as a Delaware statutory trust. As of December 31, 2006, MIP offered the following separate portfolios: Active Stock, Bond Index, CoreAlpha Bond, Government Money Market, LifePath Retirement, LifePath 2010, LifePath 2020, LifePath 2030, LifePath 2040, Money Market, Prime Money Market, S&P 500 Index and Treasury Money Market Master Portfolios.
These financial statements relate only to the S&P 500 Index Master Portfolio (the “Master Portfolio”).
Under MIP’s organizational documents, the Master Portfolio’s officers and trustees are indemnified against certain liabilities that may arise out of the performance of their duties to the Master Portfolio. Additionally, in the normal course of business, the Master Portfolio enters into contracts with service providers that contain general indemnification clauses. The Master Portfolio’s maximum exposure under these arrangements is unknown as this would involve future claims that may be made against the Master Portfolio that have not yet occurred.
| 1. | Significant Accounting Policies |
The following significant accounting policies are consistently followed by MIP in the preparation of its financial statements in conformity with accounting principles generally accepted in the United States of America (“U.S. GAAP”) for investment companies. The preparation of financial statements in conformity with U.S. GAAP requires management to make certain estimates and assumptions that affect the reported amounts of assets and liabilities and disclosures of contingent assets and liabilities at the date of the financial statements and the reported amounts of revenue and expenses during the reporting period. Actual results could differ from those estimates.
Security Valuation
The securities and other assets of the Master Portfolio are generally valued using market valuations. A market valuation generally means a valuation (i) obtained from an exchange, a pricing service or a major market maker (or dealer), (ii) based on a price quotation or other equivalent indication of value supplied by an exchange, a pricing service or a major market maker (or dealer) or (iii) based on amortized cost. In the case of shares of funds that are not traded on an exchange, a market valuation means such fund’s published net asset value per share. The investment adviser may use various pricing services or discontinue the use of any pricing service. A price obtained from a pricing service based on such pricing service’s valuation matrix may be considered a market valuation. In the event that current market valuations are not readily available or such valuations do not reflect current market values, the affected investments will be valued using fair value pricing pursuant to the pricing policy and procedures approved by the Board of Trustees of MIP (the “Board”).
Security Transactions and Income Recognition
Security transactions are accounted for on trade date. Dividend income is recognized on the ex-dividend date, net of any foreign tax withheld at source, and interest income is accrued daily. Distributions received by the Master Portfolio may include a return of capital that is estimated by management. Such amounts are recorded as a reduction of the cost of investments or reclassified to capital gains. Realized gains and losses on investment transactions are determined using the specific identification method. The Master Portfolio amortizes premiums and accretes discounts on debt securities purchased, using a constant yield to maturity method.
Federal Income Taxes
In general, MIP believes that the Master Portfolio has and will continue to be operated in a manner so as to qualify it as a non-publicly traded partnership for federal income tax purposes. Provided that the Master Portfolio so qualifies, it will not be subject to any federal income tax on its income and gains (if any). However, each interestholder in the Master Portfolio will be taxed on its distributive share of the Master Portfolio’s taxable income in determining its federal income tax liability. As a non-publicly traded partnership for federal income tax purposes, the Master Portfolio will be deemed to have “passed through” to its interestholders any interest, dividends, gains or losses of the Master Portfolio for such purposes. The determination of such share will be made in accordance with the Internal Revenue Code of 1986, as amended (the “Code”), and regulations promulgated thereunder.
Continued
34
S&P 500 Index Master Portfolio
Notes to the Financial Statements, Continued
December 31, 2006
It is intended that the Master Portfolio’s assets, income and distributions will be managed in such a way that an entity electing and qualifying as a “regulated investment company” under the Code can continue to so qualify by investing substantially all of its assets through the Master Portfolio, provided that the regulated investment company meets other requirements for such qualifications not within the control of the Master Portfolio (e.g., distributing at least 90% of the regulated investment company’s “investment company taxable income” annually).
As of December 31, 2006, the cost of investments for federal income tax purposes for the Master Portfolio was $2,634,080,316. Net unrealized appreciation aggregated $363,732,721, of which $642,092,425 represented gross unrealized appreciation on securities and $278,359,704 represented gross unrealized depreciation on securities.
Futures Contracts
The Master Portfolio may purchase futures contracts to gain exposure to market changes, as this may be more efficient or cost effective than actually buying the securities. A futures contract is an agreement between two parties to buy and sell a security at a set price on a future date and is exchange-traded. Upon entering into a futures contract, the Master Portfolio is required to pledge to the broker and hold in a segregated account, an amount of cash, U.S. Government securities or other high-quality debt and equity securities equal to the minimum “initial margin” requirements of the exchange. Pursuant to the contract, the Master Portfolio agrees to receive from or pay to the broker an amount of cash equal to the daily fluctuation in the value of the contract. Such receipts or payments are known as “variation margin” and are recorded by the Master Portfolio as receivables or payables in the accompanying Statement of Assets and Liabilities. When the contract is closed, the Master Portfolio records a “realized gain (loss) on futures contracts” in its Statement of Operations, equal to the difference between the value of the contract at the time it was opened and the value at the time it was closed. Risks of entering into futures contracts include the possibility that there may be an illiquid market and that a change in the value of the contracts may not correlate with changes in the value of the underlying securities. The amount at risk for futures contracts may exceed the amount reflected in the financial statements.
As of December 31, 2006, the Master Portfolio has pledged to brokers a U.S. Treasury Bill with a face amount of $1,600,000 for initial margin requirements on outstanding futures contracts.
Repurchase Agreements
The Master Portfolio may enter into repurchase agreements with banks and securities dealers. These transactions involve the purchase of securities with a simultaneous commitment to resell the securities to the bank or the dealer at an agreed-upon date and price. A repurchase agreement is accounted for as an investment by the Master Portfolio, collateralized by securities, which are delivered to the Master Portfolio’s custodian or to an agent bank under a tri-party agreement. The securities are marked-to-market daily and additional securities are acquired as needed, to ensure that their value equals or exceeds the repurchase price plus accrued interest.
| 2. | Agreements and other Transactions with Affiliates |
Pursuant to an Investment Advisory Contract with the Master Portfolio, Barclays Global Fund Advisors (“BGFA”) provides investment advisory services to the Master Portfolio. BGFA is a California corporation indirectly owned by Barclays Bank PLC. BGFA is entitled to receive an annual investment advisory fee of 0.05% of the average daily net assets of the Master Portfolio as compensation for investment advisory services. From time to time, BGFA may waive a portion of its advisory fees. Any such waivers will reduce the expenses of the Master Portfolio and, accordingly, have a favorable impact on its performance.
The fees and expenses of the Master Portfolio’s trustees who are not “interested persons” of MIP, as defined in the 1940 Act (“Independent Trustees”), counsel to the Independent Trustees and MIP’s independent registered public accounting firm (the “independent expenses”) are paid directly by the Master Portfolio. BGFA has voluntarily agreed to cap the expenses of the Master Portfolio at the rate at which the Master Portfolio pays an advisory fee to BGFA by providing an offsetting credit against the investment advisory fees paid by the Master Portfolio in an amount equal to the independent expenses.
Continued
35
S&P 500 Index Master Portfolio
Notes to the Financial Statements, Continued
December 31, 2006
For the year ended December 31, 2006, BGFA credited investment advisory fees for the Master Portfolio in the amount of $48,074.
Investors Bank & Trust Company (“IBT”) serves as the custodian and sub-administrator of the Master Portfolio. IBT will not be entitled to receive fees for its custodial services, so long as it is entitled to receive a separate fee from Barclays Global Investors, N.A. (“BGI”) for its services as sub-administrator of the Master Portfolio.
SEI Investments Distribution Company (“SEI”) is the sponsor and placement agent for the Master Portfolio. SEI does not receive any fee from the Master Portfolio for acting as placement agent.
Pursuant to an exemptive order issued by the U.S. Securities and Exchange Commission (“SEC”) , BGI serves as securities lending agent for MIP. BGI is an affiliate of BGFA, the Master Portfolio’s investment adviser. As securities lending agent, BGI receives, as fees, a share of the income earned on investment of the cash collateral received for the loan of securities. For the year ended December 31, 2006, BGI earned $282,685 in securities lending agent fees for its services to the Master Portfolio.
MIP has entered into an administration services arrangement with BGI, which has agreed to provide general administration services, such as managing and coordinating third-party service relationships (e.g., the Master Portfolio’s custodian, financial printer, legal counsel and independent registered public accounting firm), to the Master Portfolio. BGI is not entitled to compensation for providing administration services to the Master Portfolio, for so long as BGI is entitled to compensation for providing administration services to corresponding feeder funds that invest substantially all of their assets in the Master Portfolio, or BGI (or an affiliate) receives investment advisory fees from the Master Portfolio. BGI may delegate certain of its administration duties to sub-administrators.
Cross trades for the year ended December 31, 2006, if any, were executed by the Master Portfolio pursuant to Rule 17a-7 under the 1940 Act. Cross trading is the buying or selling of portfolio securities between funds to which BGFA (or an affiliate) serves as investment adviser. At its regularly scheduled quarterly meetings, the Board reviews such transactions as of the most recent calendar quarter, for compliance with the requirements and restrictions set forth by Rule 17a-7.
The Master Portfolio may invest in certain money market funds managed by BGFA, the Master Portfolio’s investment adviser, including the Government Money Market Fund (“GMMF”), Institutional Money Market Fund (“IMMF”), Prime Money Market Fund (“PMMF”) and Treasury Money Market Fund (“TMMF”) of Barclays Global Investors Funds. The GMMF, IMMF, PMMF and TMMF are feeder funds in a master/feeder fund structure that invest substantially all of their assets in the Government Money Market Master Portfolio, Money Market Master Portfolio, Prime Money Market Master Portfolio and Treasury Money Market Master Portfolio (collectively, the “Money Market Master Portfolios”), respectively, which are also managed by BGFA. While the GMMF, IMMF, PMMF and TMMF do not directly charge an investment advisory fee, the Money Market Master Portfolios in which they invest do charge an investment advisory fee. Income distributions from the GMMF, IMMF, PMMF and TMMF are declared daily and paid monthly from net investment income. Income distributions earned by the Master Portfolio from temporary cash investments are recorded as interest from affiliated issuers in the accompanying Statement of Operations. Income distributions earned by the Master Portfolio from the investment of securities lending collateral are included in securities lending income in the accompanying Statement of Operations.
The following table provides information about the direct investment by the Master Portfolio (exclusive of investments of securities lending collateral) in issuers of which BGFA is an affiliate, for the year ended December 31, 2006.
| | | | | | | | | | | | | | |
Name of Affiliated Issuer | | Number of
Shares Held
Beginning of
Year (in 000s) | | Gross
Additions
(in 000s) | | Gross
Reductions
(in 000s) | | Number of
Shares Held
End of Year
(in 000s) | | Value at End
of Year | | Interest
Income |
IMMF | | 19,125 | | 7,100,132 | | 7,089,573 | | 29,684 | | $ | 29,683,696 | | $ | 1,396,726 |
Certain officers and trustees of MIP are also officers of BGI and/or BGFA. As of December 31, 2006, these officers of BGI and/or BGFA collectively owned less than 1% of MIP’s outstanding beneficial interests.
Continued
36
S&P 500 Index Master Portfolio
Notes to the Financial Statements, Continued
December 31, 2006
| 3. | Investment Portfolio Transactions |
Purchases and sales of investment securities (excluding short-term securities and U.S. government obligations) for the Master Portfolio were $343,775,190 and $354,079,273 respectively for the year ended December 31, 2006.
| 4. | Portfolio Securities Loaned |
The Master Portfolio may lend its investment securities to approved borrowers, such as brokers, dealers and other financial institutions. The borrower pledges and maintains with the Master Portfolio collateral consisting of cash, an irrevocable letter of credit issued by a bank, or securities issued or guaranteed by the U.S. Government. The initial collateral received by the Master Portfolio is required to have a value of at least 102% of the market value of the loaned securities for securities traded on U.S. exchanges and a value of at least 105% for all other securities. The collateral is maintained thereafter, at a value equal to at least 100% of the current market value of the securities on loan. The risks to the Master Portfolio of securities lending are that the borrower may not provide additional collateral when required or may not return the securities when due.
As of December 31, 2006, the Master Portfolio had loaned securities which were collateralized by cash. Pursuant to an exemptive order issued by the SEC, the cash collateral received was invested in a joint account with other investment funds managed by BGFA. The joint account invests in securities with remaining maturities of 397 days or less, repurchase agreements and money market mutual funds, including money market funds managed by BGFA. Repurchase agreements held in the joint account are fully collateralized by U.S. Government securities or non-U.S. Government debt securities. Income from the joint account is allocated daily to the Master Portfolio, based on the Master Portfolio’s portion of the total cash collateral received. The market value of the securities on loan as of December 31, 2006 and the value of the related collateral are disclosed in the Master Portfolio’s Statement of Assets and Liabilities. Securities lending income, which is disclosed in the Master Portfolio’s Statement of Operations, is presented net of rebates paid to, or fees paid by, borrowers.
| 5. | Recently Issued Accounting Pronouncements |
In June 2006, the Financial Accounting Standards Board (“FASB”) issued FASB Interpretation No. 48 (“FIN 48”), “Accounting for Uncertainty in Income Taxes—an interpretation of FASB Statement No. 109.” FIN 48 clarifies the accounting for uncertainty in income taxes recognized in accordance with FASB Statement No. 109, “Accounting for Income Taxes.” This interpretation prescribes a recognition threshold and measurement attribute for the financial statement recognition and measurement of a tax position taken or expected to be taken in a tax return. It also provides guidance on de-recognition, classification, interest and penalties, accounting in interim periods, disclosure and transition. FIN 48 is effective for fiscal years beginning after December 15, 2006. The SEC staff has stated that it would not object if a fund does not implement FIN 48 in its NAV calculation until the date of the fund’s last NAV calculation in the first required financial statement reporting period for its fiscal year beginning after December 15, 2006. MIP is currently evaluating the impact of applying the various provisions of FIN 48.
In September 2006, FASB issued Statement of Financial Accounting Standards No. 157 (“FAS 157”), “Fair Value Measurements.” FAS 157 defines fair value, establishes a framework for measuring fair value in accordance with generally accepted accounting principles and expands disclosure about fair value measurements. FAS 157 is effective for fiscal years beginning after November 15, 2007. MIP is currently evaluating the impact the adoption of FAS 157 will have on the Master Portfolio’s financial statement disclosures.
Financial highlights for the Master Portfolio were as follows:
| | | | | | | | | | | | | | | |
| | | Year Ended
December 31,
2006 | | | Year Ended
December 31,
2005 | | | Year Ended
December 31,
2004 | | | Year Ended
December 31,
2003 | | | Year Ended
December 31,
2002 | |
Ratio of expenses to average net assets | | 0.05 | % | | 0.05 | % | | 0.05 | % | | 0.05 | % | | 0.05 | % |
Ratio of expenses to average net assets prior to expense reductions | | 0.05 | % | | n/a | | | n/a | | | n/a | | | n/a | |
Ratio of net investment income to average net assets | | 1.93 | % | | 1.84 | % | | 1.91 | % | | 1.74 | % | | 1.57 | % |
Portfolio turnover rate(a) | | 14 | % | | 10 | % | | 14 | % | | 8 | % | | 12 | % |
Total return | | 15.75 | % | | 4.87 | % | | 10.82 | % | | 28.52 | % | | (22.05 | )% |
(a) | Portfolio turnover rates include in-kind transactions, if any. |
37
Report of Independent Registered Public Accounting Firm
To the Interestholders and Board of Trustees of
Master Investment Portfolio:
In our opinion, the accompanying statement of assets and liabilities, including the schedule of investments, and the related statements of operations and of changes in net assets and the financial highlights present fairly, in all material respects, the financial position of the S&P 500 Index Master Portfolio, a portfolio of Master Investment Portfolio (the “Master Portfolio”), at December 31, 2006, the results of its operations for the year then ended, the changes in its net assets for each of the two years in the period then ended and its financial highlights for each of the five years in the period then ended, in conformity with accounting principles generally accepted in the United States of America. These financial statements and financial highlights (hereafter referred to as “financial statements”) are the responsibility of the Master Portfolio’s management. Our responsibility is to express an opinion on these financial statements based on our audits. We conducted our audits in accordance with the standards of the Public Company Accounting Oversight Board (United States). Those standards require that we plan and perform the audits to obtain reasonable assurance about whether the financial statements are free of material misstatement. An audit includes examining, on a test basis, evidence supporting the amounts and disclosures in the financial statements, assessing the accounting principles used and significant estimates made by management, and evaluating the overall financial statement presentation. We believe that our audits, which included confirmation of securities at December 31, 2006 by correspondence with the custodian and brokers, provide a reasonable basis for our opinion.
PricewaterhouseCoopers LLP
San Francisco, California
February 22, 2007
38
S&P 500 Index Master Portfolio
Trustee and Officer Information — Unaudited
The Board of Trustees has responsibility for the overall management and operations of the Master Portfolio. Each Trustee serves until he or she resigns, is removed, dies, retires or becomes incapacitated. Each Officer serves until he or she resigns, is removed, dies, retires or becomes disqualified.
Master Investment Portfolio (“MIP”), Barclays Global Investors Funds (“BGIF”), iShares Trust and iShares, Inc. are considered to be members of the same fund complex, as defined in Form N-1A under the 1940 Act. Lee T. Kranefuss, an interested Trustee of MIP, also serves as a Trustee for BGIF and iShares Trust and as a Director of iShares, Inc., and oversees 149 portfolios within the fund complex. Each other Trustee of MIP also serves as a Trustee of BGIF and oversees 24 portfolios within the fund complex. The address for each Trustee and Officer, unless otherwise noted in the tables below, is c/o Barclays Global Investors, N.A., 45 Fremont Street, San Francisco, California 94105.
MIP’s Independent Trustees have designated Leo Soong as its Lead Independent Trustee. Additional information about the Master Portfolio’s Trustees and Officers may be found in Part B of the Master Portfolio’s Registration Statement, which is available without charge, upon request, by calling toll-free 1-877-244-1544.
Interested Trustees and Officers
| | | | | | |
Name, Year of Birth | | Position(s),
Length of
Service | | Principal Occupation(s) During Past Five Years | | Other
Directorships Held |
*Lee T. Kranefuss, 1961 | | Trustee (since 2001), President and Chief Executive Officer (since 2002). | | Chief Executive Officer (since 2005) of Global Index and Markets Group of BGI; Chief Executive Officer (since 2003) of the Intermediary Investor and Exchange Traded Products Business of BGI; Director (since 2005) of Barclays Global Fund Advisors; Director, President and Chief Executive Officer (since 2005) of Barclays Global Investors International, Inc.; Director, Chairman and Chief Executive Officer (since 2005) of Barclays Global Investors Services; Chief Executive Officer (1999-2003) of the Individual Investor Business of BGI. | | Director (since 2003) of BGI Cayman Prime Money Market Fund, Ltd.; Trustee (since 2001) of BGIF; Trustee (since 2003) of iShares Trust; Director (since 2003) of iShares, Inc. |
| | | |
Michael A. Latham, 1965 | | Secretary, Treasurer and Chief Financial Officer (since 2003). | | Chief Operating Officer (since 2003) of the Intermediary Investor and Exchange Traded Products Business of BGI; Director and Chief Financial Officer (since 2005) of Barclays Global Investors International, Inc.; Director (2000-2003) of Mutual Fund Delivery in the U.S. Individual Investor Business of BGI. | | None. |
| * | Lee T. Kranefuss is deemed to be an “interested person” (as defined in the 1940 Act) of MIP due to his affiliations with BGFA, the investment adviser of the Master Portfolio, BGI, the parent company of BGFA and the administrator of the Master Portfolio, and Barclays Global Investors Services, an affiliate of BGFA and BGI. |
Continued
39
S&P 500 Index Master Portfolio
Trustee and Officer Information — Unaudited (Continued)
Independent Trustees
| | | | | | |
Name, Year of Birth | | Position(s),
Length of
Service | | Principal Occupation(s) During Past Five Years | | Other
Directorships Held |
Mary G. F. Bitterman, 1944 | | Trustee (since 2001). | | President (since 2004) and Director (since 2002) of the Bernard Osher Foundation; Director (2003-2004) of Osher Lifelong Learning Institutes; President and Chief Executive Officer (2002-2003) of The James Irvine Foundation; President and Chief Executive Officer (1993-2002) of KQED, Inc. | | Trustee (since 2001) of BGIF; Director (since 1984) and Lead Independent Director (since 2000) of Bank of Hawaii; Director (since 2002) and Chairman of the Board (since 2005) of PBS (Public Broadcasting Service); Advisory Committee Member (since 1999) of Stanford Institute for Economic Policy Research; Director (since 1998) of Commonwealth Club of California; Advisory Committee Member (since 1992) of Pacific Forum/CSIS. |
| | | |
A. John Gambs, 1945 | | Trustee (since 2006). | | Retired. | | Trustee (since 2006) of BGIF; Governor (since 2001) and Vice President (since 2002) of San Francisco Symphony; Trustee (1995-2005), of Marin Country Day School; Trustee (2000-2004), of Marin Academy and President; Director (since 1997) of the Gambs Family Foundation. |
| | | |
Wendy Paskin-Jordan, 1956 | | Trustee (since 2006). | | Managing Partner (since 1999) of Paskin & Kahr Capital Management; Registered Representative (since 2005) ThinkEquity Partners (broker-dealer); Registered Representative (1999-2005) ePlanning Securities, Inc. (broker-dealer). | | Trustee (since 2006) of BGIF; Director (since 2001) of California State Automobile Association; Director (since 2001) of Maier Siebel Baber; Trustee (since 2005) of World Affairs Council of Northern California. |
| | | |
Leo Soong, 1946 | | Trustee (since 2000) and Lead Trustee (since 2006). | | President (since 2002) of Trinity Products LLC; Managing Director (since 1989) of CG Roxane LLC (water company); Co-Founder (President through 1999) of Crystal Geyser Water Co. | | Trustee (since 2000) of BGIF; Vice Chairman (since 2005) of the California Pacific Medical Center; Director (since 1990) of the California State Automobile Association; Director (since 2002) of the American Automobile Association; Director (since 2001) of Flash Electronics. |
40
03/07
(a) The registrant has adopted a code of ethics that applies to the registrant’s principal executive officer, principal financial officer, principal accounting officer or controller, or persons performing similar functions. This code of ethics is included as an Exhibit.
(b) During the period covered by the report, with respect to the registrant’s code of ethics that applies to its principal executive officer, principal financial officer, principal accounting officer or controller, or persons performing similar functions; there have been no amendments to, nor any waivers granted from, a provision that relates to any element of the code of ethics definition enumerated in paragraph (b) of this Item 2.
| Item 3. | Audit Committee Financial Expert. |
3(a)(1) The registrant’s board of directors has determined that the registrant has at least one audit committee financial expert serving on its audit committee.
3(a)(2) The audit committee financial expert is Drew Kagan, who is “independent” for purposes of this Item 3 of Form N-CSR.
| Item 4. | Principal Accountant Fees and Services. |
| | | | | |
(a) Audit Fees | | 2005 | | $ | 12,000 |
| | 2006 | | $ | 13,500 |
(b) Audit-Related Fees | | 2005 | | $ | 4,400 |
| | 2006 | | $ | 4,650 |
|
Fees for both 2005 & 2006 relate to the review and consent of the N-1A filing. |
| | |
(c) Tax Fees | | 2005 | | $ | 2,750 |
| | 2006 | | $ | 2,500 |
|
| Fees for 2005 relate to the preparation of federal income & excise tax returns and review of the excise tax calculations. |
|
| Fees for 2006 relate to the preparation of federal income and excise tax returns. |
| | |
(d) All Other Fees | | 2005 | | $ | 0 |
| | 2006 | | $ | 0 |
(e)(1) Except as permitted by Rule 2-01(c)(7)(i)(C) of Regulation S-X, the Trust’s Audit Committee must pre-approve all audit and non-audit services provided by the independent accountants relating to the operations or financial reporting of the funds. Prior to the commencement of any audit or non-audit services to a fund, the Audit Committee reviews the services to determine whether they are appropriate and permissible under applicable law.
(e)(2) None of the services summarized in (b)-(d), above, were approved by the Audit Committee pursuant to Rule 2-01(c)(7)(i)(C) of Regulation S-X.
(f) Not applicable.
| | | |
| |
(g) 2005 | | $ | 512,000 |
2006 | | $ | 704,484 |
(h) In regards to Item 4 (g), the audit committee considered the non-audit services rendered to the registrant’s investment adviser and any entity controlling, controlled by, or under common control with the investment adviser, and believes the principal accountants independence has not been compromised.
| Item 5. | Audit Committee of Listed Registrants. |
Not applicable.
| Item 6. | Schedule of Investments. |
Not applicable.
| Item 7. | Disclosure of Proxy Voting Policies and Procedures for Closed-End Management Investment Companies. |
Not applicable.
| Item 8. | Portfolio Managers of Closed-End Management Investment Companies. |
Not applicable.
| Item 9. | Purchases of Equity Securities by Closed-End Management Investment Company and Affiliated Purchasers. |
Not applicable.
| Item 10. | Submission of Matters to a Vote of Security Holders. |
Not applicable.
| Item 11. | Controls and Procedures. |
(a) The registrant’s principal executive officer and principal financial officer have concluded, based on their evaluation of the registrant’s disclosure controls and procedures as conducted within 90 days of the filing date of this report, that these disclosure controls and procedures are adequately designed and are operating effectively to ensure that information required to be disclosed by the registrant on Form N-CSR is recorded, processed, summarized and reported within the time periods specified in the Securities and Exchange Commission’s rules and forms.
(b) There were no changes in the registrant’s internal control over financial reporting (as defined in Rule 30a-3(d) under the Act (17 CFR 270.30a-3(d)) that occurred during the second fiscal quarter of the period covered by this report that have materially affected or are reasonably likely to materially affect, the registrant’s internal control over financial reporting.
(a)(1) The code of ethics that is the subject of the disclosure required by Item 2 is attached hereto.
(a)(2) Certifications pursuant to Rule 30a-2(a) are attached hereto.
(a)(3) Not applicable.
(b) Certifications pursuant to Rule 30a-2(b) are furnished herewith.
SIGNATURES
Pursuant to the requirements of the Securities Exchange Act of 1934 and the Investment Company Act of 1940, the registrant has duly caused this report to be signed on its behalf by the undersigned, thereunto duly authorized.
| | |
| (Registrant) | | BB&T Equity Index Fund |
| |
| By (Signature and Title)* | | /s/ Troy A. Sheets |
| | Troy A. Sheets, Treasurer |
|
| Date March 12, 2007 |
Pursuant to the requirements of the Securities Exchange Act of 1934 and the Investment Company Act of 1940, this report has been signed below by the following persons on behalf of the registrant and in the capacities and on the dates indicated.
| | |
| By (Signature and Title)* | | /s/ Keith F. Karlawish |
| | Keith F. Karlawish, President |
|
| Date March 12, 2007 |
| | |
| By (Signature and Title)* | | /s/ Troy A. Sheets |
| | Troy A. Sheets, Treasurer |
|
| Date March 12, 2007 |
| * | Print the name and title of each signing officer under his or her signature. |