UNITED STATES
SECURITIES AND EXCHANGE COMMISSION
Washington, D.C. 20549
FORM N-CSR
CERTIFIED SHAREHOLDER REPORT OF REGISTERED
MANAGEMENT INVESTMENT COMPANIES
Investment Company Act file number 811-06719
BB&T Funds
(Exact name of registrant as specified in charter)
434 Fayetteville Street Mall, 5th Floor
Raleigh, NC 27601-0575
(Address of principal executive offices) (Zip code)
E.G. Purcell, III, President
BB&T Funds
434 Fayetteville Street Mall, 5th Floor
Raleigh, NC 27601-0575
(Name and address of agent for service)
Registrant’s telephone number, including area code: (800) 228-1872
Date of fiscal year end: September 30
Date of reporting period: September 30, 2009
Form N-CSR is to be used by management investment companies to file reports with the Commission not later than 10 days after the transmission to stockholders of any report that is required to be transmitted to stockholders under Rule 30e-1 under the Investment Company Act of 1940 (17 CFR 270.30e-1). The Commission may use the information provided on Form N-CSR in its regulatory, disclosure review, inspection, and policymaking roles.
A registrant is required to disclose the information specified by Form N-CSR, and the Commission will make this information public. A registrant is not required to respond to the collection of information contained in Form N-CSR unless the Form displays a currently valid Office of Management and Budget (“OMB”) control number. Please direct comments concerning the accuracy of the information collection burden estimate and any suggestions for reducing the burden to Secretary, Securities and Exchange Commission, 100 F Street, NE, Washington, DC 20549. The OMB has reviewed this collection of information under the clearance requirements of 44 U.S.C. § 3507.
| Item 1. | Reports to Stockholders. |
The Report to Shareholders is attached herewith.
BB&T Funds
Notice of Privacy Policy & Practices
BB&T Funds recognizes and respects the privacy expectations of our customers.1 We provide this notice to you so that you will know what kinds of information we collect about our customers and the circumstances in which that information may be disclosed to third parties who are not affiliated with the BB&T Funds.
Collection of Customer Information
We collect nonpublic personal information about our customers from the following sources:
| • | | Account Applications and other forms, which may include a customer’s name, address, social security number, and information about a customer’s investment goals and risk tolerance; |
| • | | Account History, including information about the transactions and balances in a customer’s accounts; and |
| • | | Correspondence, written, telephonic or electronic between a customer and the BB&T Funds or service providers to the BB&T Funds. |
Disclosure of Customer Information
We many disclose all of the consumer information outlined above to third parties who are not affiliated with the BB&T Funds:
| • | | as permitted by law — for example with service providers who maintain or service shareholder accounts for the BB&T Funds or to a shareholder’s broker or agent; and |
| • | | to perform marketing services on our behalf or pursuant to a joint marketing agreement with another financial institutional. |
Security of Customer Information
We require service providers to the BB&T Funds:
| • | | to maintain policies and procedures designed to assure only appropriate access to, and use of information about customers of the BB&T Funds; and |
| • | | to maintain physical, electronic and procedural safeguards that comply with applicable legal standards to guard nonpublic personal information of customers of the BB&T Funds. |
We will adhere to the policies and practices described in this notice regardless of whether you are a current or former customer of the BB&T Funds.
1 For purposes of this notice, the terms “customer” or “customers” includes both individual shareholders of the BB&T Funds and individuals who provide nonpublic personal information to the BB&T Funds, but do not invest in BB&T Funds shares.
Table of Contents
Letter from the President and the Investment Advisor
Dear Shareholders:
We are pleased to present this annual report for the 12-month period ended September 30, 2009. The economy suffered through a severe recession during this fiscal year, but during the second half of the period a number of leading economic indicators improved, suggesting that the economy may have begun to mend. In fact, just-released for third quarter of 2009, GDP was 3.5%. Financial markets exhibited tremendous volatility. Stocks generated losses for the period, while bonds posted strong gains. During the 12-month period ended September 30, 2009, the S&P 500 returned -6.91%; the Russell 2000 Index returned -9.55%; the MSCI All CountryWorld Index Ex-U.S. returned 2.75%; and the Barclays Capital U.S. Aggregate Bond Index returned 10.56%.
A challenging economic environment
The U.S. economy faced a number of challenges during the period, from a steady rise in unemployment to weak business and consumer spending and a steep wave of home foreclosures. These issues were compounded by continued fallout from the financial crisis and the high-profile bailouts of large portions of the auto and banking industries. In hopes of boosting liquidity and jumpstarting the economy, the Federal Reserve early in the period lowered its target federal funds rate from 2.00% to a range between 0% and 0.25%.
The economy began to stabilize mid-way through the period. Consumer spending started to rise from very low levels, aided by affordable gas prices, large tax refunds and lower payroll taxes. Nevertheless, the strength and sustainability of the recovery remained uncertain as the period ended.
Stocks fall, then rebound
Equities posted large losses in the first several months of the period, as investors displayed extreme aversion to risk. The market then rallied off its March 9th low point, as credit markets improved and the economy proved more resilient than many investors expected. Information technology stocks led the market for the fiscal year, while the worst-performing sector was financial services.
Foreign stocks fell farther than U.S. stocks early in the period as investors fled assets perceived to be risky, but then recovered more quickly and posted only a slight loss for the period as a whole.
Investors flee to bonds
The financial crisis early in the period drove investors to the relative safety of Treasury securities and other bonds backed by the U.S. government. As investors sought out Treasuries, they virtually ignored higher-risk fixed-income securities such as corporate bonds. That trend, started in the first quarter of 2009, reversed itself as the financial system recovered during the second half of the period. The shift led to strong performance among riskier securities, such as high-yield bonds, and relatively weak performance from Treasury securities. Ultimately, higher-risk holdings generated stronger returns for the period as a whole.
Our perspective
We expect the U.S. economy to grow in the coming months, although long-term growth likely will be
below historical averages due to the combined effects of deleveraging, higher taxes, increased regulation and the continued aftermath of the housing crisis. We believe that consumer spending is likely to remain weak, making higher export levels, as well as government and business spending, imperative to the recovery. We believe that foreign economies are likely to recover more quickly than the United States.
In our view, subdued inflation and the Fed’s extremely accommodative monetary policy remain encouraging for stocks. We expect equities to outperform fixed income as the economy improves in the coming months.
Thank you for your confidence in the BB&T Funds. We encourage you to call us at 1-800-228-1872 with any questions.
|
| Sincerely, |
|
 |
| E.G. Purcell, III |
| President |
| BB&T Funds |
|
 |
| Jeffrey J. Schappe, CFA |
| Chief Investment Officer |
| BB&T Asset Management, Inc. |
Past performance does not guarantee future results.
This report is authorized for distribution only when preceded or accompanied by a prospectus. Please read the prospectus carefully before investing or sending money. BB&T Asset Management, Inc., a wholly owned subsidiary of BB&T Corporation, serves as investment adviser to the BB&T Funds and is paid a fee for its services. Shares of the BB&T Funds (each a “Fund” and collectively, the “Funds”) are not deposits or obligations of, or guaranteed or endorsed by, Branch Banking and Trust Company or its affiliates. The Funds are not insured by the FDIC or any other government agency. The Funds currently are distributed by BB&T AM Distributors, Inc. (the “Distributor”). The Distributor is not affiliated with Branch Banking and Trust Company or its affiliates.
The foregoing information and opinions are for general information only. BB&T Asset Management, Inc. does not guarantee their accuracy or completeness, nor assume liability for any loss, which may result from the reliance by any person upon any such information or opinions. Such information and opinions are subject to change without notice, are for general information only and are not intended as an offer or solicitation with respect to the purchase or sale of any security or offering individual or personalized investment advice.
BB&T Large Cap Fund
Portfolio Manager
Ronald T. Rimkus, CFA
The BB&T Large Cap Fund is managed by Ronald T. Rimkus, a chartered financial analyst and Director of Core Equity at BB&T Asset Management, Inc. Mr. Rimkus has more than 16 years of investment experience, including hands-on management of both growth and value equity portfolios. Most recently, he spent seven years overseeing large-company core equity portfolios. Mr. Rimkus holds a BA from Brown University and an MBA from UCLA. He is supported by the BB&T Large Cap Core Equity Portfolio Management Team.
Investment Concerns
Equity securities (stocks) are more volatile and carry more risk than other forms of investments, including investments in high-grade fixed income securities. The net asset value per share of this Fund will fluctuate as the value of the securities in the portfolio changes. Value-based investments are subject to the risk that the broad market may not recognize their intrinsic value.
Q. How did the Fund perform during the 12-month period between October 1, 2008 and September 30, 2009?
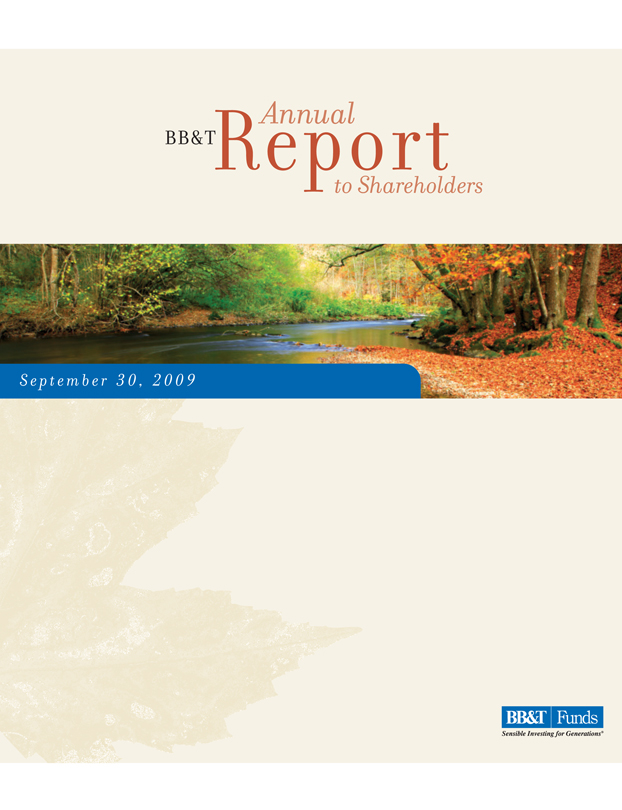
A. The Fund returned -9.40% (Institutional Shares). That compared to a -6.91% return for its benchmark, the S&P 500 Index.
Q. What factors affected the Fund’s performance?
A. The 12-month period ended September 30, 2009 was an historic period in the markets, punctuated by two distinct sub-periods. In the first half of the fiscal year, investors largely shunned perceived investment risk, which led to widespread losses in the equity markets. Certain areas such as shares of financial firms were especially hard hit during the financial crisis in late 2008 and early 2009. However, as the financial markets began to improve in the early months of 2009, investors moved back into the equity markets, fueling a sharp rally among equities in the last half of the period.1
The rally benefited low-quality stocks, including a wide variety of companies that were on the brink of bankruptcy in March. These stocks benefited from improvements in the credit markets, and rallied much more strongly than higher-quality issues in the latter half of the period.1
Sector selection was a main contributor to the Fund’s performance relative to its benchmark. At the start of the fiscal year, the Fund held an overweight in the consumer staples sector and an underweight in energy
and industrials. That positioning helped buoy performance during the worst of the financial crisis. But the Fund’s relative performance suffered when commodities, including energy, performed well in early 2009 prior to the improvement in the credit markets. Once we believed that the recovery in the financial markets was sustainable, we began increasing the Fund’s industrial, commodity and non-dollar exposure. That strategy, however, dragged on the Fund’s returns between March and June. By July, the Fund’s positioning and performance were much more in line with the economic rebound, and our positioning reflects this today.1
Moreover, the Fund during the second half of the period held overweight positions in financial, energy, industrial and material stocks. We believe that a global economic rebound will benefit such holdings, but those overweight positions detracted slightly from relative performance during recent months.1
The Fund generally benefited from its stock selections, which focused on undervalued shares of companies with sustainable competitive advantages, good management and strong returns on invested capital. That said, certain names in the financial sector contributed negatively to overall performance as that sector performed poorly in the wake of the troubles in the financial markets.1
| 1 | Portfolio composition is as of September 30, 2009 and is subject to change. |
| * | Reflects 5.75% maximum sales charge. |
| ** | Reflects the applicable contingent deferred sales charge (CDSC), maximum of 5.00%. |
| *** | Reflects the applicable maximum CDSC of 1.00% (applicable only to redemptions within one year of purchase, and as such, are not reflected in the Average Annual Total Returns table since the periods reflected are for a year or longer). |
| | | | | | | | |
Average Annual Total Returns |
As of September 30, 2009 | | Inception
Date | | 1 Year | | 5 Years | | 10 Years |
Class A Shares* | | 10/9/92 | | -14.86% | | -2.40% | | -0.10% |
Class B Shares** | | 1/1/96 | | -13.87% | | -2.10% | | -0.11% |
Class C Shares*** | | 2/1/011 | | -10.43% | | -1.99% | | -0.17% |
Institutional Shares | | 10/9/92 | | -9.40% | | -0.98% | | 0.75% |
S&P 500 Index | | N/A | | -6.91% | | 1.02% | | -0.15% |
Past performance does not guarantee future results. The performance data quoted represents past performance and current returns may be lower or higher. Total return figures include change in share price, reinvestment of dividends and capital gains, and do not reflect taxes that a shareholder would pay on fund distributions or on the redemption of fund shares. The investment return and principal value will fluctuate so that an investor’s shares, when redeemed, may be worth more or less than the original cost. To obtain performance information current to the most recent month end, please visit www.bbtfunds.com.
The chart above represents a comparison of a hypothetical $10,000 investment in the indicated share class versus a similar investment in the Fund’s benchmark, and represents the reinvestment of dividends and capital gains.
| 1 | Class C Shares were not in existence prior to 2/1/01. Performance for periods prior to that is based on the historical performance of the Class A Shares, and has been adjusted for the maximum CDSC applicable to Class C Shares, but does not include the Class C Shares 12b-1 fees, which, if reflected, would have caused performance to be lower. |
The S&P 500 Index is generally considered to be representative of the performance of the stock market as a whole. The index is unmanaged and does not reflect the deduction of expenses associated with a mutual fund, such as investment management and fund accounting fees. The Fund’s performance reflects the deduction of fees for these services. Investors cannot invest directly in an index, although they can invest in its underlying securities.
A portion of the Fund’s fees has been waived. If the fees had not been waived, the Fund’s total return for the periods would have been lower.
BB&T Mid Cap Value Fund
Portfolio Manager
Timothy P. Beyer, CFA
The BB&T Mid Cap Value Fund is managed by Timothy P. Beyer, CFA, portfolio manager for Sterling Capital Management LLC (“Sterling”), sub-adviser to the Fund. Mr. Beyer, who joined Sterling in 2004, is a graduate of East Carolina University, where he received his BSBA in Finance, and has 20 years of investment management experience. Mr. Beyer is supported by Eduardo Brea, CFA; Robert Bridges, CFA; Lee D. Houser, CFA; Patrick W. Rau, CFA; and Brian Walton, CFA.
Investment Concerns
Mid-capitalization funds typically carry additional risks since smaller companies generally have a higher risk of failure, and historically, their stocks have experienced a greater degree of market volatility than stocks on average.
Equity securities (stocks) are more volatile and carry more risk than other forms of investments, including investments in high-grade fixed income securities. The net asset value per share of this Fund will fluctuate as the value of the securities in the portfolio changes. Value-based investments are subject to the risk that the broad market may not recognize their intrinsic value.
Q. How did the Fund perform during the 12-month period between October 1, 2008 and September 30, 2009?
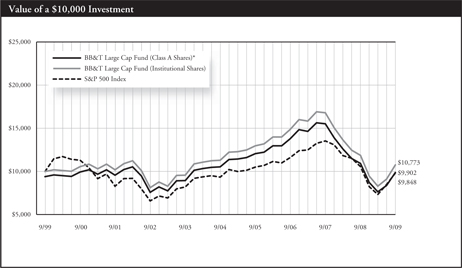
A. The Fund posted a return of 3.21% (Institutional Shares). That compared to a -7.12% return for its benchmark, the Russell Midcap® Value Index.
Q. What factors affected the Fund’s performance?
A. Financial markets experienced a drop of historic proportions in the first half of the fiscal year. While the general market decline affected the Fund’s performance, we were able to produce a positive return for our fiscal year. In particular, our technology and consumer cyclical stocks produced notable gains as the economic environment improved in the second half of the year.1
While we didn’t completely avoid problems in the financial services sector, we had relatively low exposure to the banking industry. At fiscal year end, we owned only two bank stocks, and had very little exposure to real estate investment trusts. The outperformance of our financial stocks significantly boosted the Fund’s performance relative to the benchmark index, which was weighed down by the credit crisis and declining property values.1
The Fund’s health care holdings reduced returns relative to the benchmark, as concerns about potential health care reform weighed on these shares’ performance. However, we continued to believe that the stocks’ valuations are attractive, even under bearish reform scenarios.1
| 1 | Portfolio composition is as of September 30, 2009 and is subject to change. |
| * | Reflects 5.75% maximum sales charge. |
| ** | Reflects the applicable contingent deferred sales charge (CDSC), maximum of 5.00%. |
| *** | Reflects the applicable maximum CDSC of 1.00% (applicable only to redemptions within one year of purchase, and as such, are not reflected in the Average Annual Total Returns table since the periods reflected are for a year or longer). |
| | | | | | | | |
Average Annual Total Returns |
As of September 30, 2009 | | Inception
Date | | 1 Year | | 5 Years | | 10 Years |
Class A Shares* | | 8/1/961 | | -2.69% | | 3.87% | | 5.18% |
Class B Shares** | | 7/25/011 | | -1.83% | | 4.15% | | 5.13% |
Class C Shares*** | | 7/25/011 | | 2.08% | | 4.25% | | 5.09% |
Institutional Shares | | 8/1/961 | | 3.21% | | 5.30% | | 6.04% |
Russell Midcap® Value Index | | N/A | | -7.12% | | 3.53% | | 7.43% |
Past performance does not guarantee future results. The performance data quoted represents past performance and current returns may be lower or higher. Total return figures include change in share price, reinvestment of dividends and capital gains, and do not reflect taxes that a shareholder would pay on fund distributions or on the redemption of fund shares. The investment return and principal value will fluctuate so that an investor’s shares, when redeemed, may be worth more or less than the original cost. To obtain performance information current to the most recent month end, please visit www.bbtfunds.com.
The chart above represents a comparison of a hypothetical $10,000 investment in the indicated share class versus a similar investment in the Fund’s benchmark, and represents the reinvestment of dividends and capital gains.
| 1 | Performance shown for Class A and Institutional Shares includes the performance of the OVB Equity Income Portfolio for the periods prior to its consolidation with the BB&T Mid Cap Value Fund on 7/23/01. The performance shown reflects reinvestment of all dividend and capital gains distributions. Class B and C Shares were not in existence prior to 7/25/01. Performance for periods prior to 7/25/01 is based on the historical performance of the Class A Shares, and has been adjusted for the maximum CDSC applicable to Class B and C Shares, respectively, but such performance does not reflect Class B and C Shares’ 12b-1 fees and expenses. Those adjustments would have caused the Funds’s total return to be lower. |
The Fund is measured against the Russell Midcap® Value Index, an unmanaged index which measures the performance of those securities in the Russell 1000 with lower price-to-book ratios or lower forecasted growth values. The index is unmanaged and does not reflect the deduction of expenses associated with a mutual fund, such as investment management and fund accounting fees. The Fund’s performance reflects the deduction of fees for these services. Investors cannot invest directly in an index, although they can invest in its underlying securities.
A portion of the Fund’s fees has been waived. If fees had not been waived, the Fund’s total return for the periods would have been lower.
BB&T Mid Cap Growth Fund
Portfolio Manager
David P. Nolan
The BB&T Mid Cap Growth Fund is managed by David P. Nolan. A graduate of Wake Forest University, where he received a BS in Business, Mr. Nolan managed common and collective trust funds from 1985 to 1993 and has managed the Mid Cap Growth Fund since its inception in 1993.
Investment Concerns
Mid-capitalization funds typically carry additional risks since smaller companies generally have a higher risk of failure, and historically, their stocks have experienced a greater degree of market volatility than stocks on average.
Equity securities (stocks) are more volatile and carry more risk than other forms of investments, including investments in high-grade fixed income securities. The net asset value per share of this Fund will fluctuate as the value of the securities in the portfolio changes.
Q. How did the Fund perform during the 12-month period between October 1, 2008 and September 30, 2009?
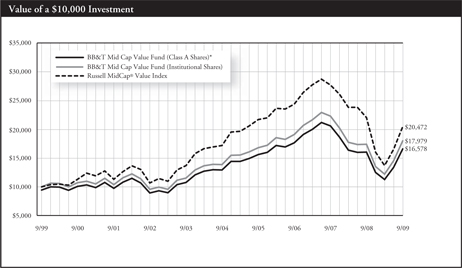
A. The Fund returned -15.04% (Institutional Shares). That compared to a -0.40% return for its benchmark, the Russell Midcap® Growth Index.
Q. What factors affected the Fund’s performance?
A. Medium-sized growth stocks were extremely volatile during the period under review, contributing to the Fund’s negative returns. Poor returns from the high-growth, high price-to-earnings multiple firms in which the Fund invested contributed to much of the Fund’s underperformance.1
The Fund generally holds stocks of firms that the portfolio manager determines have higher projected growth rates than the benchmark index average. As the financial crisis deepened, investors lost confidence in the potential growth of such firms. In addition, the market recovery
that began March 10, 2009, was led by low-growth firms, which the Fund tends to avoid. As a result, the Fund did not fully participate in the market’s rally.1
Stock selection in industrials, health care and technology also dragged on returns during the period under review. Detractors to performance included a global semiconductor firm, a provider of detention and corrections services operating in the United States and a global provider of mining equipment.1
Top contributors to performance included a Canadian coal mining and copper producing company, a global copper and gold producer, and a digital entertainment technology firm. Stock selection in consumer staples and energy also contributed to the Fund’s performance relative to its benchmark index. The Fund’s overweight position in health care also boosted its performance relative to the benchmark.1
| 1 | Portfolio composition is as of September 30, 2009 and is subject to change. |
| * | Reflects 5.75% maximum sales charge. |
| ** | Reflects the applicable contingent deferred sales charge (CDSC), maximum of 5.00%. |
| *** | Reflects the applicable maximum CDSC of 1.00% (applicable only to redemptions within one year of purchase, and as such, are not reflected in the Average Annual Total Returns table since the periods reflected are for a year or longer). |
| | | | | | | | | |
Average Annual Total Returns |
As of September 30, 2009 | | Inception
Date | | | 1 Year | | 5 Years | | 10 Years |
Class A Shares* | | 12/30/93 | 1 | | -20.06% | | -0.05% | | -0.85% |
Class B Shares** | | 7/25/01 | 1 | | -19.03% | | 0.24% | | -0.85% |
Class C Shares*** | | 7/25/01 | 1 | | -15.85% | | 0.40% | | -0.86% |
Institutional Shares | | 12/1/93 | 1 | | -15.04% | | 1.38% | | -0.02% |
Russell Midcap® Growth Index | | N/A | | | -0.40% | | 3.75% | | 2.18% |
Past performance does not guarantee future results. The performance data quoted represents past performance and current returns may be lower or higher. Total return figures include change in share price, reinvestment of dividends and capital gains and do not reflect taxes that a shareholder would pay on fund distributions or on the redemption of fund shares. The investment return and principal value will fluctuate so that an investor’s shares, when redeemed may be worth more or less than the original cost. To obtain performance information current to the most recent month end, please visit www.bbtfunds.com.
The chart above represents a comparison of a hypothetical $10,000 investment in the indicated share class versus a similar investment in the Fund’s benchmark, and represents the reinvestment of dividends and capital gains.
| 1 | Fund performance as shown for Class A and Institutional Shares includes the performance of the OVB Capital Appreciation Portfolio for the periods prior to its consolidation with the BB&T Mid Cap Growth Fund on 7/23/01. The performance shown reflects reinvestment of all dividend and capital gains distributions. The Class B and C Shares were not in existence prior to 7/25/01. Performance for periods prior to 7/25/01 is based on the historical performance of the Class A Shares and has been adjusted for the maximum CDSC applicable to Class B and C Shares, respectively, but such performance does not reflect Class B and C Shares’ 12b-1 fees and expenses. Those adjustments would have caused the Fund’s total return to be lower. |
The Fund is measured against the Russell Midcap® Growth Index, an unmanaged index which measures the performance of those securities in the Russell 1000® Index with higher price-to-book ratios and lower forecasted growth values. The index does not reflect the deduction of expenses associated with a mutual fund, such as investment management and fund accounting fees. The Fund’s performance reflects the deduction of fees for services. Investors cannot invest directly in an index, although they can invest in its underlying securities.
A portion of the Fund’s fees has been waived. If the fees had not been waived, the Fund’s total returns for the periods would have been lower.
BB&T Small Cap Fund
Portfolio Manager
David P. Nolan
The BB&T Small Cap Fund is managed by David P. Nolan. A graduate of Wake Forest University, where he received a BS in Business, Mr. Nolan managed common and collective trust funds from 1985 to 1993. He is supported by the BB&T Small Cap Portfolio Management Team, which includes Brian Baker.
Investment Concerns
Small-capitalization funds typically carry additional risks since smaller companies generally have a higher risk of failure, and historically, their stocks have experienced a greater degree of market volatility than stocks on average.
Equity securities (stocks) are more volatile and carry more risk than other forms of investments, including investments in high-grade fixed income securities. The net asset value per share of this Fund will fluctuate as the value of the securities in the portfolio changes. Value-based investments are subject to the risk that the broad market may not recognize their intrinsic value.
Diversification does not guarantee a profit nor protect against a loss.
Q. How did the Fund perform during the 12-month period between October 1, 2008 and September 30, 2009?
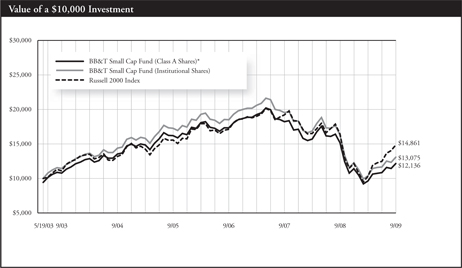
A. The Fund returned -19.70% (Institutional Shares). That compared to a -9.55% return for its benchmark, the Russell 2000® Index of small-cap stocks.
Q. What factors affected the Fund’s performance?
A. The generally poor environment for small-cap stocks contributed to the Fund’s negative returns during the period. In addition, the Fund’s long-term commitment to shares of high-quality companies in the small cap sector played a key role in determining its relative returns.1
The Fund typically invests in shares of companies the portfolio manager believes are financially stable with strong fundamentals and solid defensive characteristics. Such stocks helped the portfolio to outperform the benchmark index by almost two percentage points for the first six months of the fiscal year, when the market declined sharply. But shares
of companies the portfolio manager believes are less financially stable led the market rally that occurred during the second half of the fiscal year. As a result, the Fund trailed the benchmark by a wide margin.1
Some individual stock selections suffered significant declines due to industry-wide or company-specific problems. They included stocks of a global semiconductor firm, a small oil firm and a health care services firm.1
Some stock selections boosted the Fund’s relative performance. They included shares of a digital entertainment technology firm, a marine infrastructure services company and a provider of information technology services. Stock selection in consumer staples also contributed to the Fund’s performance relative to its benchmark. And the Fund’s overweight positions in health care and technology helped bolster its performance, as did its underweight position in financials.1
| 1 | Portfolio composition is as of September 30, 2009 and is subject to change. |
| * | Reflects 5.75% maximum sales charge. |
| ** | Reflects the applicable contingent deferred sales charge (CDSC), maximum of 5.00%. |
| *** | Reflects the applicable maximum CDSC of 1.00% (applicable only to redemptions within one year of purchase, and as such, are not reflected in the Average Annual Total Returns table since the periods reflected are for a year or longer). |
| | | | | | | | |
Average Annual Total Returns |
As of September 30, 2009 | | Inception
Date | | 1 Year | | 5 Year | | Since
Inception |
Class A Shares* | | 5/19/03 | | -24.50% | | -3.32% | | 3.09% |
Class B Shares** | | 5/19/03 | | -23.71% | | -3.02% | | 3.26% |
Class C Shares*** | | 5/19/03 | | -20.57% | | -2.91% | | 3.24% |
Institutional Shares | | 5/19/03 | | -19.70% | | -1.90% | | 4.30% |
Russell 2000® Index | | 5/31/03 | | -9.55% | | 2.41% | | 6.45% |
Past performance does not guarantee future results. The performance data quoted represents past performance and current returns may be lower or higher. Total return figures include change in share price, reinvestment of dividends and capital gains, and do not reflect taxes that a shareholder would pay on fund distributions or on the redemption of fund shares. The investment return and principal value will fluctuate so that an investor’s shares, when redeemed, may be worth more or less than the original cost. To obtain performance information current to the most recent month end, please visit www.bbtfunds.com.
The chart above represents a comparison of a hypothetical $10,000 investment in the indicated share class versus a similar investment in the Fund’s benchmark, and represents the reinvestment of dividends and capital gains.
The Russell 2000® Index is a widely recognized index of common stocks that measures the performance of small- to mid-sized companies. The index is unmanaged and does not reflect the deduction of expenses associated with a mutual fund, such as investment management and fund accounting fees. The Fund’s performance reflects the deduction of fees for these services. Investors cannot invest directly in an index, although they can invest in its underlying securities.
A portion of the Fund’s fees has been waived. If the fees had not been waived, the Fund’s total return for the periods would have been lower.
BB&T International Equity Fund
Portfolio Managers
Rudolph-Riad Younes, CFA
Richard Pell
The BB&T International Equity Fund is managed by Rudolph-Riad Younes, CFA, Director and Head of International Equity at Artio Global Management LLC (“Artio Global”) (previously known as Julius Baer Investment Management LLC ), subadvisor to the Fund, since August 2000, and with the predecessor organization Julius Baer Group since September 1993, and Richard Pell, Chairman, Chief Executive Officer and Chief Investment Officer with Artio Global since August 2000, and with the predecessor organization Julius Baer Group since January 1995.
Investment Concerns
There are risks associated with investing in foreign companies, such as erratic market conditions, economic and political instability and fluctuations in currency and exchange rates.
Equity securities (stocks) are more volatile and carry more risk than other forms of investments, including investments in high-grade fixed income securities. The net asset value per share of this Fund will fluctuate as the value of the securities in the portfolio changes.
Q. How did the Fund perform during the 12-month period between October 1, 2008 and September 30, 2009?
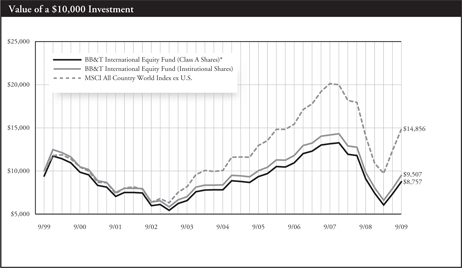
A. The Fund returned -3.42% (Institutional Shares). That compared to a 2.75% return for its benchmark, the MSCI All Country World Index Ex-U.S(net).
Q. What factors affected the Fund’s performance?
A. The portfolio’s absolute return was negatively affected by the decline in the global equity markets, a seizure of the credit markets, and the general negative economic outlook during the period of October 1, 2008 through March 9, 2009. The portfolio and equity markets recovered in a rally that began in the U.S. financial sector at the beginning of March 2009 and has continued through the end of September. This rally quickly expanded to other sectors as investors’ appetite for risk, which had been constrained, increased substantially. Parts of the market that had been areas for concern, such as financial companies and emerging markets, performed well as risk aversion retreated.1
Prior to the market rally in March, the portfolio benefited from a defensive sector posture in sectors such as consumer staples, healthcare, telecommunications and utilities. Underweight allocations to higher-risk areas such as consumer discretionary stocks and emerging markets boosted relative performance during this time. Additionally, higher-than average cash levels over this time frame mitigated some of the downward influence of the global stock markets. Defensive hedges, particularly hedges into the yen, also added to relative performance, as did an underweight position in the Japanese equity market. Following the market reversal, an overweight stake in the materials sector and stock selection within the sector boosted relative performance.1
Three primary factors drove the portfolio’s relative underperformance for the fiscal year as a whole: an underweight to emerging markets, an underweight to global financials, and a bias toward higher-quality companies. The majority of the relative underperformance occurred within an eight-week timeframe following the market reversal in March — prior to that point, relative performance benefited from these positions.1
| 1 | Portfolio composition is as of September 30, 2009 and is subject to change. |
| * | Reflects 5.75% maximum sales charge. |
| ** | Reflects the applicable contingent deferred sales charge (CDSC), maximum of 5.00%. |
| *** | Reflects the applicable maximum CDSC of 1.00% (applicable only to redemptions within one year of purchase, and as such, are not reflected in the Average Annual Total Returns table since the periods reflected are for a year or longer). |
| | | | | | | | |
| Average Annual Total Returns |
As of September 30, 2009 | | Inception
Date | | 1 Year | | 5 Years | | 10 Years |
Class A Shares* | | 1/2/97 | | -9.25% | | 1.04% | | -1.32% |
Class B Shares** | | 1/2/97 | | -8.14% | | 1.39% | | -1.34% |
Class C Shares*** | | 2/1/011 | | -4.66% | | 1.46% | | -1.49% |
Institutional Shares | | 1/2/97 | | -3.42% | | 2.51% | | -0.50% |
MSCI All Country World Index Ex-U.S.(net) | | 12/31/96 | | 2.75% | | 5.42% | | 1.81% |
Past performance does not guarantee future results. The performance data quoted represents past performance and current returns may be lower or higher. Total return figures include change in share price, reinvestment of dividends and capital gains, and do not reflect taxes that a shareholder would pay on fund distributions or on the redemption of fund shares. The investment return and principal value will fluctuate so that an investor’s shares, when redeemed, may be worth more or less than the original cost. To obtain performance information current to the most recent month end, please visit www.bbtfunds.com.
The chart above represents a comparison of a hypothetical $10,000 investment in the indicated share class versus a similar investment in the Fund’s benchmark, and represents the reinvestment of dividends and capital gains.
| 1 | Class C Shares were not in existence prior to 2/1/01. Performance for periods prior to that is based on the historical performance of the Class B Shares, and has been adjusted for the maximum CDSC applicable to Class C Shares. |
The MSCI All Country World Index Ex-U.S. Index(net) is a unmanaged market capitalization-weighted index that is designed to represent the performance of equity markets in the global developed and emerging markets, excluding the United States. The index does not reflect the deduction of expenses associated with a mutual fund, such as investment management and fund accounting fees. The Fund’s performance reflects the deduction of fees for these services. Investors cannot invest directly in an index, although they can invest in its underlying securities.
A portion of the Fund’s fees has been waived. If the fees had not been waived, the Fund’s total return for the periods would have been lower.
BB&T Special Opportunities Equity Fund
Portfolio Manager
George F. Shipp, CFA
The BB&T Special Opportunities Equity Fund is managed by George F. Shipp, CFA, chief investment officer of Scott & Stringfellow, LLC (���Scott & Stringfellow”), subadvisor to the Fund. Mr. Shipp, who joined Scott & Stringfellow in 1982, holds a BA from the University of Virginia and an MBA from the Darden Graduate School of Business at the University of Virginia. Mr. Shipp is supported by an investment management team from Scott & Stringfellow, which includes Meghann A. Cohen; Joshua L. Haggarty, CFA; R. Griffith Jones, Jr.; and Farley C. Shiner, CPA. The team brings to the Fund more than four decades of combined investment management experience, along with a broad range of investing skills.
Investment Concerns
Equity securities (stocks) are more volatile and carry more risk than other forms of investments, including investments in high-grade fixed income securities. The net asset value per share of this Fund will fluctuate as the value of the securities in the portfolio changes. A concentrated portfolio may add a measure of volatility to performance, as major fluctuations in any one holding will likely affect the fund more than a fund with greater diversification.
Q. How did the Fund perform during the 12-month period between October 1, 2008 and September 30, 2009?
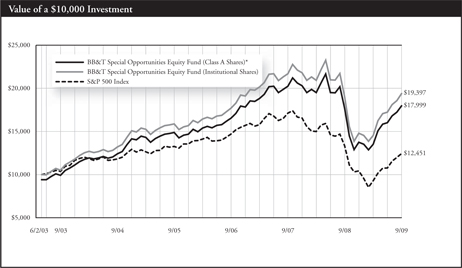
A. The Fund returned 1.91% (Institutional Shares). That compared to a -6.91.% return for its benchmark, the S&P 500 Index.
Q. What factors affected the Fund’s performance?
A. Stocks as measured by the S&P 500 generated losses for the fiscal year due to investors’ concerns about the global economic slowdown, as well as the collapse of credit markets and the ensuing financial panic. While the Fund was not immune to these factors, it produced a modest positive return for the period under review.1
The Fund’s return relative to its benchmark index benefited from sector selection. Information technology and healthcare firms were both among the benchmark index’s three best-performing sectors. The Fund’s overweight positions in these sectors improved performance relative to the index. The Fund’s underweight position in financials also boosted relative performance.1
Meanwhile, a leading provider of cable TV and Internet services, a defense contractor, and a global oil and gas exploration company weighed on returns relative to the benchmark index. Certain characteristics of these firms — underlying earnings and/or long-term asset values — grew during the period, leading us to increase our positions when prices were low.1
| 1 | Portfolio composition is as of September 30, 2009 and is subject to change. |
| * | Reflects 5.75% maximum sales charge. |
| ** | Reflects the applicable contingent deferred sales charge (CDSC), maximum of 5.00%. |
| *** | Reflects the applicable maximum CDSC of 1.00% (applicable only to redemptions within one year of purchase, and as such, are not reflected in the Average Annual Total Returns table since the periods reflected are for a year or longer). |
| | | | | | | | |
Average Annual Total Returns |
As of September 30, 2009 | | Inception
Date | | 1 Year | | 5 Year | | Since
Inception |
Class A Shares* | | 6/2/03 | | -4.14% | | 6.45% | | 9.73% |
Class B Shares** | | 6/2/03 | | -2.75% | | 6.76% | | 9.94% |
Class C Shares*** | | 6/2/03 | | 0.97% | | 6.91% | | 9.94% |
Institutional Shares | | 6/2/03 | | 1.91% | | 7.99% | | 11.04% |
S&P 500 Index | | 5/31/03 | | -6.91% | | 1.02% | | 3.52% |
Past performance does not guarantee future results. The performance data quoted represents past performance and current returns may be lower or higher. Total return figures include change in share price, reinvestment of dividends and capital gains, and do not reflect taxes that a shareholder would pay on fund distributions or on the redemption of fund shares. The investment return and principal value will fluctuate so that an investor’s shares, when redeemed, may be worth more or less than the original cost. To obtain performance information current to the most recent month end, please visit www.bbtfunds.com.
The chart above represents a comparison of a hypothetical $10,000 investment in the indicated share class versus a similar investment in the Fund’s benchmark and represents the reinvestment of dividends and capital gains.
The Fund is measured against the S&P 500 Index, an unmanaged index which is generally considered to be representative of the performance of the stock market as a whole. The index does not reflect the deduction of expenses associated with a mutual fund, such as investment management and fund accounting fees. The Fund’s performance reflects the deduction of fees for these services. Investors cannot invest directly in an index, although they can invest in its underlying securities.
A portion of the Fund’s fees has been waived. If the fees had not been waived, the Fund’s total return for the periods would have been lower.
BB&T Equity Income Fund
Portfolio Manager
George F. Shipp, CFA
The BB&T Equity Income Fund is managed by George F. Shipp, CFA, Chief Investment Officer of Scott & Stringfellow, LLC (“Scott & Stringfellow”), subadvisor to the Fund. Mr. Shipp, who joined Scott & Stringfellow in 1982, holds a BA from the University of Virginia and an MBA from the Darden Graduate School of Business at the University of Virginia. Mr. Shipp is supported by an investment management team from Scott & Stringfellow, which includes Meghann A. Cohen; Joshua L. Haggarty, CFA; R. Griffith Jones, Jr.; and Farley C. Shiner, CPA. The team brings to the Fund more than four decades of combined investment management experience, along with a broad range of investing skills.
Investment Concerns
Equity securities (stocks) are more volatile and carry more risk than other forms of investments, including investments in high-grade fixed income securities. The net asset value per share of this Fund will fluctuate as the value of the securities in the portfolio changes. A concentrated portfolio may add a measure of volatility to performance, as major fluctuations in any one holding will likely affect the fund more than a fund with greater diversification.
Q. How did the Fund perform during the 12-month period between October 1, 2008 and September 30, 2009?
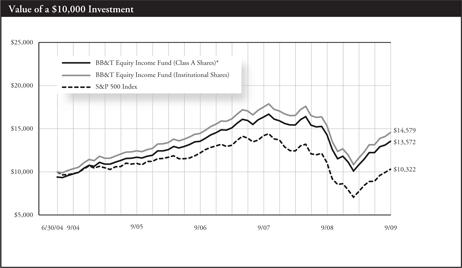
A. The Fund returned -5.18% (Institutional Shares). That compared to a -6.91% return for its benchmark, the S&P 500 Index.
Q. What factors affected the Fund’s performance?
A. Stocks as measured by the S&P 500 generated losses for the fiscal year due to investors’ concerns about the global economic slowdown, as well as the collapse of credit markets and the ensuing financial panic. We believe that these factors caused the Fund to generate a negative return for the period under review.1
The Fund’s return relative to its benchmark index benefited from sector selection. The Fund held an underweight position in financials, the worst-performing sector in the S&P 500 for the fiscal year. The Fund’s underweight position boosted relative performance. The Fund also began the period holding more cash than many of its peers, which allowed managers to take advantage of the price weaknesses that emerged.1
This Fund invests in stocks that offer above average and growing dividends. Although stocks exhibiting those criteria historically have tended to out-perform more speculative no-yield companies, following the stock market’s bottom on March 9, 2009, dividend-payers have dramatically lagged. In the nine months ended September 30, dividend-paying stocks in the S&P 500 gained 17.5% on average, while non-dividend paying stocks have surged 56.7%. These factors were largely responsible for the Fund’s performance relative to its benchmark index. The Fund’s overweight position in energy also dragged on relative performance, as energy shares were the market’s second-worst performer for the fiscal year.1
During a period when record numbers of companies slashed dividends, the Fund saw dividends maintained or increased at the vast majority of its holdings, which we believe is a testament to the high-quality holdings within our portfolio.1
| 1 | Portfolio composition is as of September 30, 2009 and is subject to change. |
| * | Reflects 5.75% maximum sales charge. |
| ** | Reflects the applicable contingent deferred sales charge (CDSC), maximum of 5.00%. |
| *** | Reflects the applicable maximum CDSC of 1.00% (applicable only to redemptions within one year of purchase, and as such, are not reflected in the Average Annual Total Returns table since the periods reflected are for a year or longer). |
| | | | | | | | |
Average Annual Total Returns |
As of September 30, 2009 | | Inception
Date | | 1 Year | | 5 Years | | Since
Inception |
Class A Shares* | | 6/30/04 | | -10.75% | | 5.49% | | 5.99% |
Class B Shares** | | 6/30/04 | | -9.76% | | 5.80% | | 6.24% |
Class C Shares*** | | 6/30/04 | | -6.10% | | 5.95% | | 6.38% |
Institutional Shares | | 6/30/04 | | -5.18% | | 7.00% | | 7.44% |
S&P 500 Index | | 6/30/04 | | -6.91% | | 1.02% | | 0.61% |
Past performance does not guarantee future results. The performance data quoted represents past performance and current returns may be lower or higher. Total return figures include change in share price, reinvestment of dividends and capital gains, and do not reflect taxes that a shareholder would pay on fund distributions or on the redemption of fund shares. The investment return and principal value will fluctuate so that an investor’s shares, when redeemed, may be worth more or less than the original cost. To obtain performance information current to the most recent month end, please visit www.bbtfunds.com.
The chart above represents a comparison of a hypothetical $10,000 investment in the indicated share class versus a similar investment in the Fund’s benchmark, and represents the reinvestment of dividends and capital gains.
The Fund is measured against the S&P 500 Index, an unmanaged index which is generally considered to be representative of the performance of the stock market as a whole. The index does not reflect the deduction of expenses associated with a mutual fund, such as investment management and fund accounting fees. The Fund’s performance reflects the deduction of fees for these services. Investors cannot invest directly in an index, although they can invest in its underlying securities.
A portion of the Fund’s fees has been waived. If the fees had not been waived, the Fund’s total return for the periods would have been lower.
BB&T Short U.S. Government Fund
Portfolio Manager
Kevin E. McNair, CFA
The BB&T Short U.S. Government Fund is managed by Kevin E. McNair, CFA. Mr. McNair received a BA in Economics from the University of North Carolina-Chapel Hill and a Master’s of Economics from North Carolina State University, and has been managing investors’ money since 1994. Mr. McNair is supported by the BB&T Fixed Income Portfolio Management Team, which includes Carrie R. Breswitz; Brad D. Eppard, CFA; David T. Johnson; Robert F. Millikan, CFA; and Justin B. Nicholson. The team brings to the Fund six decades of combined investment management experience, along with a broad range of specialized skills encompassing a cross-section of fixed-income sectors.
Investment Concerns
Bonds offer a relatively stable level of income, although bond prices will fluctuate providing the potential for principal gain or loss. Intermediate-term, higher-quality bonds generally offer less risk than longer-term bonds and a lower rate of return.
The Fund is subject to the risk that principal value reacts in opposition to the movement of interests rates and that a rising interest rate environment increases the risk of loss of principal.
Q. How did the Fund perform during the 12-month period between October 1, 2008 and September 30, 2009?
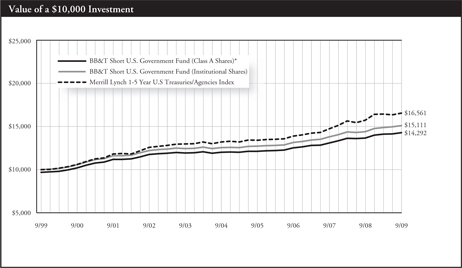
A. The Fund gained 4.94% (Institutional Shares). That compared to a 5.27% return for its benchmark, the Merrill Lynch 1-5 Year U.S. Treasuries/Agencies Index.
Q. What factors affected the Fund’s performance?
A. The financial markets experienced two distinct environments during the 12-month period ended September 30, 2009. The first half of the period was marked by a worsening of the recent financial crisis, which fueled a widespread flight to quality among investors. Treasury securities were the main beneficiaries during that period because of their relative safety. But as the financial markets improved, investors’ appetite for risk increased and securities such as corporate bonds and agency issues performed well.1
Yields fell on short-term bonds early in the period as investor demand grew for short-term securities. Since bond prices rise when yields fall, that demand contributed to the fund’s absolute performance during the period. In relative terms, however, the Fund lagged its benchmark early
in the period due to an underweight position in Treasury securities, which performed very well during the first few months of the period.1
That performance reversed as the period continued thanks to the Fund’s overweight positions relative to its benchmark in corporate bonds and agency securities. We believed that though these securities carried more risk than Treasury securities, they offered more return potential. Indeed, rising investor demand for these securities midway through the period resulted in strong gains, which benefited the Fund. Those overweight positions were largely responsible for the Fund’s outperformance of its benchmark during the period.1
We anticipated that interest rates would rise during the period as the financial markets recovered. That led us to position the Fund with an average duration shorter than that of its benchmark. A shorter duration makes a portfolio less sensitive to interest rate movements. Interest rates, however, continued to fall during the period. That shorter average duration had a slight negative impact on the Fund’s performance relative to the benchmark.1
| 1 | Portfolio composition is as of September 30, 2009 and is subject to change. |
| * | Reflects 3.00% maximum sales charge. |
| | | | | | | | |
Average Annual Total Returns |
As of September 30, 2009 | | Inception
Date | | 1 Year | | 5 Years | | 10 Years |
Class A Shares* | | 11/30/92 | | 1.38% | | 2.87% | | 3.64% |
Institutional Shares | | 11/30/92 | | 4.94% | | 3.76% | | 4.21% |
Merrill Lynch 1-5 Year U.S. Treasuries/Agencies Index | | N/A | | 5.27% | | 5.42% | | 5.12% |
Past performance does not guarantee future results. The performance data quoted represents past performance and current returns may be lower or higher. Total return figures include change in share price, reinvestment of dividends and capital gains, and do not reflect taxes that a shareholder would pay on fund distributions or on the redemption of fund shares. The investment return and principal value will fluctuate so that an investor’s shares, when redeemed, may be worth more or less than the original cost. To obtain performance information current to the most recent month end, please visit www.bbtfunds.com.
The chart above represents a comparison of a hypothetical $10,000 investment in the indicated share class versus a similar investment in the Fund’s benchmark, and represents the reinvestment of dividends and capital gains.
The Fund is measured against the Merrill Lynch 1-5 Year U.S. Treasuries/Agencies Index, an unmanaged index which includes U.S. government and agency bonds that have a minimum issue size of $150 million and is a widely-recognized, capitalization weighted (companies with larger market capitalizations have more influence than those with smaller market capitalizations) index of U.S. Treasury securities with maturities of 1 year or greater and no more than 5 years. The index does not reflect the deduction of expenses associated with a mutual fund, such as investment management and fund accounting fees. The Fund’s performance reflects the deduction of fees for these services. Investors cannot invest directly in an index, although they can invest in its underlying securities.
A portion of the Fund’s fees has been waived. If the fees had not been waived, the Fund’s total return for the periods would have been lower.
BB&T Intermediate U.S. Government Fund
Portfolio Manager
Brad D. Eppard, CFA
The BB&T Intermediate U.S. Government Fund is managed by Brad D. Eppard, CFA. Mr. Eppard received a BS in Business Administration/ Accounting from Radford University and has been managing investors’ money since 1986. Mr. Eppard is supported by the BB&T Fixed Income Portfolio Management Team, which includes Carrie R. Breswitz; David T. Johnson; Kevin E. McNair, CFA; Robert F. Millikan, CFA; and Justin B. Nicholson. The team brings to the Fund six decades of combined investment management experience, along with a broad range of specialized skills encompassing a cross-section of fixed-income sectors.
Investment Concerns
Bonds offer a relatively stable level of income, although bond prices will fluctuate providing the potential for principal gain or loss. Intermediate-term, higher-quality bonds generally offer less risk than longer-term bonds and a lower rate of return.
The Fund is subject to the risk that principal value reacts in opposition to the movement of interests rates and that a rising interest rate environment increases the risk of loss of principal.
Q. How did the Fund perform during the 12-month period between October 1, 2008 and September 30, 2009?
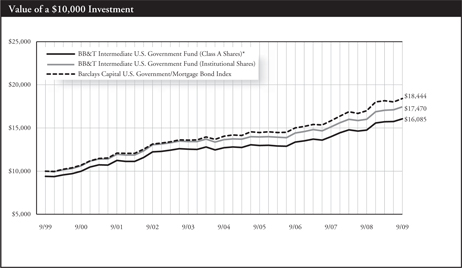
A. The Fund gained 9.06% (Institutional Shares). That compared to a 8.31% return for its benchmark, the Barclays Capital U.S. Government/Mortgage Bond Index.
Q. What factors affected the Fund’s performance?
A. Bonds posted strong returns throughout the period. A deepening financial crisis led investors to seek the relative safety of fixed-income securities — especially Treasuries — early in the period. Falling interest rates also helped push bond prices higher. Bonds continued to perform well during the second half of the period, but Treasuries lost ground relative to other issues as investors grew more optimistic about a market recovery and shifted money into corporate and agency-backed securities.1
The Fund maintained an underweight position in Treasuries relative to
its benchmark, and held a significant overweight in agency debt. That strategy initially dragged on relative returns as Treasuries performed well early in the period. But intervention by the federal government to shore up the finances of agencies including Fannie Mae and Freddie Mac led to a rally in such securities during the second half of the period.1
We also found opportunities in the corporate bond sector around the mid-point of the fiscal year; investors had largely shunned such securities early in the period. A 10% exposure to high-quality corporate bonds helped boost relative performance through the period.1
The Fund’s duration began the period slightly longer than that of its benchmark index. That helped performance early in the period as interest rates fell. However, we anticipated that interest rates would begin to climb as the period wore on, and adopted a relatively short duration. That strategy hurt relative performance as interest rates continued to fall through the period. 1
| 1 | Portfolio composition is as of September 30, 2009 and is subject to change. |
| * | Reflects 5.75% maximum sales charge. |
| ** | Reflects the applicable contingent deferred sales charge (CDSC), maximum of 5.00%. |
| *** | Reflects the applicable maximum CDSC of 1.00% (applicable only to redemptions within one year of purchase, and as such, are not reflected in the Average Annual Total Returns table since the periods reflected are for a year or longer). |
| | | | | | | | |
Average Annual Total Returns |
As of September 30, 2009 | | Inception
Date | | 1 Year | | 5 Years | | 10 Years |
Class A Shares* | | 10/9/92 | | 2.66% | | 3.56% | | 4.87% |
Class B Shares** | | 1/1/96 | | 4.01% | | 3.84% | | 4.86% |
Class C Shares*** | | 2/1/011 | | 8.00% | | 4.03% | | 4.86% |
Institutional Shares | | 10/9/92 | | 9.06% | | 5.04% | | 5.74% |
Barclays Capital U.S. Government/Mortgage Bond Index | | N/A | | 8.31% | | 5.54% | | 6.31% |
Past performance does not guarantee future results. The performance data quoted represents past performance and current returns may be lower or higher. Total return figures include change in share price, reinvestment of dividends and capital gains, and do not reflect taxes that a shareholder would pay on fund distributions or on the redemption of fund shares. The investment return and principal value will fluctuate so that an investor’s shares, when redeemed, may be worth more or less than the original cost. To obtain performance information current to the most recent month end, please visit www.bbtfunds.com.
The chart above represents a comparison of a hypothetical $10,000 investment in the indicated share class versus a similar investment in the Fund’s benchmark and represents the reinvestment of dividends and capital gains.
| 1 | Class C Shares were not in existence prior to 2/1/01. Performance for periods prior to that is based on the historical performance of the Class A Shares, and has been adjusted for the maximum CDSC applicable to Class C Shares, but does not include the Class C Shares 12b-1 fees, which, if reflected, would have caused performance to be lower. |
The Fund is measured by the Barclays Capital U.S. Government/Mortgage Bond Index, an unmanaged index which is widely used as a broad measure of the performance of U.S. Government bonds with maturities of less than 10 years, and agency mortgage backed securities. The index does not reflect the deduction of expenses associated with a mutual fund, such as investment management and fund accounting fees. The Fund’s performance reflects the deduction of fees for these services. Investors cannot invest directly in an index, although they can invest in its underlying securities.
A portion of the Fund’s fees has been waived. If the fees had not been waived, the Fund’s total return for the periods would have been lower.
BB&T Total Return Bond Fund
Portfolio Manager
Mark Montgomery, CFA
The BB&T Total Return Bond Fund is managed by Mark Montgomery, CFA, Managing director, Fixed Income Portfolio Manager and head of Sterling Capital Management’s fixed income team. Mr. Montgomery is supported by Richard LaCoff; Howard Buznitsky, CFA; Neil Grant, CFA; Peter Brown, CFA and Michael Mc Vicker.
Investment Concerns
Bonds offer a relatively stable level of income, although bond prices will fluctuate providing the potential for principal gain or loss. Intermediate-term, higher-quality bonds generally offer less risk than longer-term bonds and a lower rate of return.
The Fund is subject to the risk that principal value reacts in opposition to the movement of interests rates and that a rising interest rate environment increases the risk of loss of principal.
Q. How did the Fund perform during the 12-month period between October 1, 2008 and September 30, 2009?
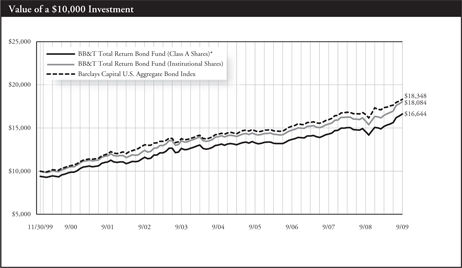
A. The Fund gained 14.16% (Institutional Shares). That compared to a 10.56% return for its benchmark, the Barclays Capital U.S. Aggregate Bond Index.
Q. What factors affected the Fund’s performance?
A. The financial crisis early in the period drove investors to the relative safety of Treasury securities, which are backed by the U.S. government. As investors sought out Treasuries, they virtually ignored higher-risk fixed-income securities such as corporate bonds. However, that trend reversed itself as the financial markets began to recover midway through the period. The shift led to strong performance among more risky securities, and relatively weak performance from Treasury securities. Ultimately, higher-risk holdings generated stronger returns for the period as a whole.1
The Fund performed well relative to its benchmark, in large part due to its exposure to corporate bonds and commercial mortgage-backed
securities. The Fund held an overweight position relative to its benchmark in those securities, which contributed to outperformance during the period.1
The Fund was underweighted in Treasuries relative to its benchmark. We correctly anticipated that the strong demand for these securities early in the period would wane as investors saw improvements in the financial markets. We also anticipated an influx in supply of Treasury bonds due to the government’s fiscal and monetary efforts to stimulate the sagging economy. While our strategy hurt performance slightly early in the period, it added considerably to performance as the period wore on.1
Interest rates were volatile during the period, but ultimately ended the fiscal year lower than at the beginning of the period. We did not choose to take a strong position on the direction of interest rates in this environment, and the Fund’s duration was neutral relative to its benchmark. That neutral position did not significantly affect its relative performance.1
| 1 | Portfolio composition is as of September 30, 2009 and is subject to change. |
| * | Reflects 5.75% maximum sales charge. |
| ** | Reflects the applicable contingent deferred sales charge (CDSC), maximum of 5.00%. |
| *** | Reflects the applicable maximum CDSC of 1.00% (applicable only to redemptions within one year of purchase, and as such, are not reflected in the Average Annual Total Returns table since the periods reflected are for a year or longer). |
| | | | | | | | |
Average Annual Total Returns |
As of September 30, 2009 | | Inception Date | | 1 Year | | 5 Years | | Since Inception |
Class A Shares* | | 12/2/99 | | 7.37% | | 3.72% | | 5.32% |
Class B Shares** | | 12/2/99 | | 9.03% | | 4.03% | | 5.32% |
Class C Shares*** | | 2/1/011 | | 13.14% | | 4.22% | | 5.20% |
Institutional Shares | | 12/2/99 | | 14.16% | | 5.24% | | 6.21% |
Barclays Capital U.S. Aggregate Bond Index | | 11/30/99 | | 10.56% | | 5.13% | | 6.37% |
Past performance does not guarantee future results. The performance data quoted represents past performance and current returns may be lower or higher. Total return figures include change in share price, reinvestment of dividends and capital gains, and do not reflect taxes that a shareholder would pay on fund distributions or on the redemption of fund shares. The investment return and principal value will fluctuate so that an investor’s shares, when redeemed, may be worth more or less than the original cost. To obtain performance information current to the most recent month end, please visit www.bbtfunds.com.
The chart above represents a comparison of a hypothetical $10,000 investment in the indicated share class versus a similar investment in the Fund’s benchmark, and represents the reinvestment of dividends and capital gains.
| 1 | Class C Shares were not in existence prior to 2/1/01. Performance for periods prior to that is based on the historical performance of the Class B Shares, and has been adjusted for the maximum CDSC applicable to Class C Shares, but does not include the Class C Shares 12b-1 fees, which if reflected, would have caused performance to be lower. |
The Fund is measured against the Barclays Capital U.S. Aggregate Bond Index, an unmanaged index which is a market value-weighted performance benchmark for investment-grade fixed-rate debt issues, including government, corporate, asset-backed, and mortgage-backed securities, with maturities of at least one year. The index is unmanaged and does not reflect the deduction of expenses associated with a mutual fund, such as investment management and fund accounting fees. The Fund’s performance reflects the deduction of fees for these services. Investors cannot invest directly in an index, although they can invest in its underlying securities.
A portion of the Fund’s fees has been waived. If the fees had not been waived, the Fund’s total return for the periods would have been lower.
BB&T Kentucky Intermediate Tax-Free Fund
Portfolio Manager
Robert F. Millikan, CFA
The BB&T Kentucky Intermediate Tax-Free Fund is managed by Robert F. Millikan, CFA, Director of Fixed Income Management for BB&T Asset Management, Inc. Mr. Millikan received a BA in Economics from Wake Forest University, and is a past president of the North Carolina Society of Financial Analysts and chairman of the board of directors of the Carolinas Municipal Advisory Council. Mr. Millikan has been managing investors’ money since 1990. He is supported by the BB&T Fixed Income Portfolio Management Team, which includes Carrie R. Breswitz; Brad D. Eppard, CFA; David T. Johnson; Kevin E. McNair, CFA; and Justin B. Nicholson. The team brings to the Fund six decades of combined investment management experience, along with a broad range of specialized skills encompassing a cross-section of fixed-income sectors.
Investment Concerns
Because the Fund is non-diversified and invests primarily in Kentucky municipal securities, the Fund is particularly susceptible to any economic, political, or regulatory developments affecting a particular issuer of Kentucky municipal securities. Bonds offer a relatively stable level of income, although bond prices will fluctuate providing the potential for principal gain or loss. Intermediate-term, higher-quality bonds generally offer less risk than longer-term bonds and a lower rate of return. The Fund is subject to the risk that principal value reacts in opposition to the movement of interests rates and that a rising interest rate environment increases the risk of loss of principal. The Fund’s income may be subject to certain state and local taxes and, depending on a investors tax status, to the Federal alternative minimum tax.
Q. How did the Fund perform during the 12-month period between October 1, 2008 and September 30, 2009?
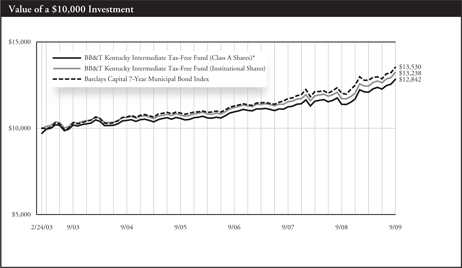
A. The Fund gained 13.00% (Institutional Shares). That compared to a 12.52% return for the Barclays Capital 7-Year Municipal Bond Index.
Q. What factors affected the Fund’s performance?
A. The municipal bond market produced very volatile returns during this period. The financial crisis led to a number of developments that hurt municipal securities in the period’s first several months, including forced selling by institutional investors and the failure of bond insurers. Those conditions led to much higher yields and considerably lower prices on municipal securities. The municipal markets then rallied powerfully between March and September, helping the Fund post strong gains for the fiscal year as a whole.1
We believe that the high quality of the Fund’s portfolio boosted returns relative to the benchmark. We invested opportunistically early in the period to take advantage of the extremely high yields available, and also extended the Fund’s duration in order to capture greater yield. In particular, we purchased some bonds with 20-year maturities, which offered premium yields. Such bonds produced some of the municipal market’s best returns during the summer rally, helping the Fund outperform its index. 1
We allowed the Fund’s duration to shorten as the market surged during the second half of the period. That strategy, which we employed to manage risk, reduced the Fund’s relative performance as longer-term bonds continued to post strong gains.1
| 1 | Portfolio composition is as of September 30, 2009 and is subject to change. |
| * | Reflects 3.00% maximum sales charge. |
| | | | | | | | |
Average Annual Total Returns |
As of September 30, 2009 | | Inception Date | | 1 Year | | 5 Year | | Since Inception |
Class A Shares* | | 2/24/03 | | 9.28% | | 3.56% | | 3.86% |
Institutional Shares | | 2/24/03 | | 13.00% | | 4.48% | | 4.34% |
Barclays Capital 7-Year Municipal Bond Index | | 2/28/03 | | 12.52% | | 4.88% | | 4.70% |
Past performance does not guarantee future results. The performance data quoted represents past performance and current returns may be lower or higher. Total return figures include change in share price, reinvestment of dividends and capital gains, and do not reflect taxes that a shareholder would pay on fund distributions or on the redemption of fund shares. The investment return and principal value will fluctuate so that an investor’s shares, when redeemed, may be worth more or less than the original cost. To obtain performance information current to the most recent month end, please visit www.bbtfunds.com.
The chart above represents a comparison of a hypothetical $10,000 investment in the indicated share class versus a similar investment in the Fund’s benchmark, and represents the reinvestment of dividends and capital gains.
The Fund is measured against the Barclays Capital 7-Year Municipal Bond Index, an unmanaged index which is representative of municipal bonds with a minimum credit rating of at least Baa, have a maturity value of at least $5 million and a maturity range of 6-8 years. The index does not reflect the deduction of expenses associated with a mutual fund, such as investment management and fund accounting fees. The Fund performance reflects the deduction of fees for these services. Investors cannot invest directly in an index, although they can invest in its underlying securities.
A portion of the Fund’s fees has been waived. If the fees had not been waived, the Fund’s total return for the periods would have been lower.
BB&T Maryland Intermediate Tax-Free Fund
Portfolio Manager
Robert F. Millikan, CFA
The BB&T Maryland Intermediate Tax-Free Fund is managed by Robert F. Millikan, CFA, Director of Fixed Income Management for BB&T Asset Management, Inc. Mr. Millikan received a BA in Economics from Wake Forest University, and is a past president of the North Carolina Society of Financial Analysts and chairman of the board of directors of the Carolinas Municipal Advisory Council. Mr. Millikan has been managing investors’ money since 1990. He is supported by the BB&T Fixed Income Portfolio Management Team, which includes Carrie R. Breswitz; Brad D. Eppard, CFA; David T. Johnson; Kevin E. McNair, CFA; and Justin B. Nicholson. The team brings to the Fund six decades of combined investment management experience, along with a broad range of specialized skills encompassing a cross-section of fixed-income sectors.
Investment Concerns
Because the Fund is non-diversified and invests primarily in Maryland municipal securities, the Fund is particularly susceptible to any economic, political, or regulatory developments affecting a particular issuer of Maryland municipal securities. Bonds offer a relatively stable level of income, although bond prices will fluctuate providing the potential for principal gain or loss. Intermediate-term, higher-quality bonds generally offer less risk than longer-term bonds and a lower rate of return. The Fund is subject to the risk that principal value reacts in opposition to the movement of interests rates and that a rising interest rate environment increases the risk of loss of principal. The Fund’s income may be subject to certain state and local taxes and, depending on a investors tax status, to the Federal alternative minimum tax.
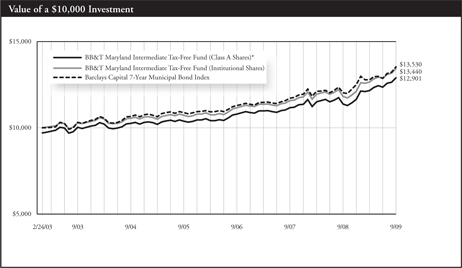
Q. How did the Fund perform during the 12-month period between October 1, 2008 and September 30, 2009?
A. The Fund gained 13.70% (Institutional Shares). That compared to a 12.52% return for the Barclays Capital 7-Year Municipal Bond Index.
Q. What factors affected the Fund’s performance?
A. The municipal bond market produced very volatile returns during this period. The financial crisis led to a number of developments that hurt municipal securities in the period’s first several months, including forced selling by institutional investors and the failure of bond insurers. Those conditions led to much higher yields and considerably lower prices on municipal securities. The municipal markets then rallied powerfully between March and September, helping the Fund post strong gains for the fiscal year as a whole.1
We believe that the high quality of the Fund’s portfolio boosted returns relative to the benchmark. Maryland’s state credit ratings are some of the highest in the nation, so quality-conscious investors prized the state’s municipal bonds. We invested opportunistically early in the period to take advantage of the extremely high yields available, and also extended the Fund’s duration in order to capture greater yield. In particular, we purchased some bonds with 20-year maturities, which offered premium yields. Such bonds produced some of the municipal market’s best returns during the summer rally, helping the Fund outperform its index.1
We allowed the Fund’s duration to shorten as the market surged during the second half of the period. That strategy, which we employed to manage risk, reduced the Fund’s relative performance as longer-term bonds continued to post strong gains.1
| 1 | Portfolio composition is as of September 30, 2009 and is subject to change. |
| * | Reflects 3.00% maximum sales charge. |
| | | | | | | | |
Average Annual Total Returns |
As of September 30, 2009 | | Inception Date | | 1 Year | | 5 Year | | Since Inception |
Class A Shares* | | 2/24/03 | | 10.04% | | 4.06% | | 3.94% |
Institutional Shares | | 2/24/03 | | 13.70% | | 4.96% | | 4.58% |
Barclays Capital 7-Year Municipal Bond Index | | 2/28/03 | | 12.52% | | 4.88% | | 4.70% |
Past performance does not guarantee future results. The performance data quoted represents past performance and current returns may be lower or higher. Total return figures include change in share price, reinvestment of dividends and capital gains, and do not reflect taxes that a shareholder would pay on fund distributions or on the redemption of fund shares. The investment return and principal value will fluctuate so that an investor’s shares, when redeemed, may be worth more or less than the original cost. To obtain performance information current to the most recent month end, please visit www.bbtfunds.com.
The chart above represents a comparison of a hypothetical $10,000 investment in the indicated share class versus a similar investment in the Fund’s benchmark, and represents the reinvestment of dividends and capital gains.
The Fund is measured against the Barclays Capital 7-Year Municipal Bond Index, an unmanaged index which is representative of municipal bonds with a minimum credit rating of at least Baa, have a maturity value of at least $5 million and a maturity range of 6-8 years. The index does not reflect the deduction of expenses associated with a mutual fund, such as investment management and fund accounting fees. The Fund’s performance reflects the deduction of fees for these services. Investors cannot invest directly in an index, although they can invest in its underlying securities.
A portion of the Fund’s fees has been waived. If the fees had not been waived, the Fund’s total return for the periods would have been lower.
BB&T North Carolina Intermediate Tax-Free Fund
Portfolio Manager
Robert F. Millikan, CFA
The BB&T North Carolina Intermediate Tax-Free Fund is managed by Robert F. Millikan, CFA, Director of Fixed Income Management for BB&T Asset Management, Inc. Mr. Millikan received a BA in Economics from Wake Forest University, and is a past president of the North Carolina Society of Financial Analysts and chairman of the board of directors of the Carolinas Municipal Advisory Council. Mr. Millikan has been managing investors’ money since 1990. He is supported by the BB&T Fixed Income Portfolio Management Team, which includes Carrie R. Breswitz; Brad D. Eppard, CFA; David T. Johnson; Kevin E. McNair, CFA; and Justin B. Nicholson. The team brings to the Fund six decades of combined investment management experience, along with a broad range of specialized skills encompassing a cross-section of fixed-income sectors.
Investment Concerns
Because the Fund is non-diversified and invests primarily in North Carolina municipal securities, the Fund is particularly susceptible to any economic, political, or regulatory developments affecting a particular issuer of North Carolina municipal securities. Bonds offer a relatively stable level of income, although bond prices will fluctuate providing the potential for principal gain or loss. Intermediate-term, higher-quality bonds generally offer less risk than longer-term bonds and a lower rate of return. The Fund is subject to the risk that principal value reacts in opposition to the movement of interests rates and that a rising interest rate environment increases the risk of loss of principal. The Fund’s income may be subject to certain state and local taxes and, depending on a investors tax status, to the Federal alternative minimum tax.
Q. How did the Fund perform during the 12-month period between October 1, 2008 and September 30, 2009?
A. The Fund gained 12.63% (Institutional Shares). That compared to a 12.52% return for the Barclays Capital 7-Year Municipal Bond Index.
Q. What factors affected the Fund’s performance?
A. The municipal bond market produced very volatile returns during this period. The financial crisis led to a number of developments that hurt municipal securities in the period’s first several months, including forced selling by institutional investors and the failure of bond insurers. Those conditions led to much higher yields and considerably lower prices on municipal securities. The municipal markets then rallied powerfully between March and September, helping the Fund post strong gains for the fiscal year as a whole.1
We believe that the high quality of the Fund’s portfolio boosted returns relative to the benchmark. We invested opportunistically early in the period to take advantage of the extremely high yields available, and also extended the Fund’s duration in order to capture greater yield. In particular, we purchased some bonds with 20-year maturities, which offered premium yields. Such bonds produced some of the municipal market’s best returns during the summer rally, helping the Fund outperform its index. 1
We allowed the Fund’s duration to shorten as the market surged during the second half of the period. That strategy, which we employed to manage risk, reduced the Fund’s relative performance as longer-term bonds continued to post strong gains.1
| 1 | Portfolio composition is as of September 30, 2009 and is subject to change. |
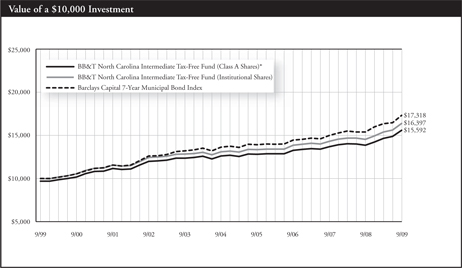
| * | Reflects 3.00% maximum sales charge. |
| | | | | | | | |
Average Annual Total Returns |
As of September 30, 2009 | | Inception Date | | 1 Year | | 5 Years | | 10 Years |
Class A Shares* | | 10/16/92 | | 9.00% | | 3.67% | | 4.54% |
Institutional Shares | | 10/16/92 | | 12.63% | | 4.58% | | 5.07% |
Barclays Capital 7-Year Municipal Bond Index | | N/A | | 12.52% | | 4.88% | | 5.64% |
Past performance does not guarantee future results. The performance data quoted represents past performance and current returns may be lower or higher. Total return figures include change in share price, reinvestment of dividends and capital gains, and do not reflect taxes that a shareholder would pay on fund distributions or on the redemption of fund shares. The investment return and principal value will fluctuate so that an investor’s shares, when redeemed, may be worth more or less than the original cost. To obtain performance information current to the most recent month end, please visit www.bbtfunds.com.
The chart above represents a comparison of a hypothetical $10,000 investment in the indicated share class versus a similar investment in the Fund’s benchmark, and represents the reinvestment of dividends and capital gains.
The Fund is measured against the Barclays Capital 7-Year Municipal Bond Index, an unmanaged index which is representative of municipal bonds with a minimum credit rating of at least Baa, have a maturity value of at least $5 million and a maturity range of 6-8 years. The index does not reflect the deduction of expenses associated with a mutual fund, such as investment management and fund accounting fees. The Fund’s performance reflects the deduction of fees for these services. Investors cannot invest directly in an index, although they can invest in its underlying securities.
A portion of the Fund’s fees has been waived. If the fees had not been waived, the Fund’s total return for the periods would have been lower.
BB&T South Carolina Intermediate Tax-Free Fund
Portfolio Manager
Robert F. Millikan, CFA
The BB&T South Carolina Intermediate Tax-Free Fund is managed by Robert F. Millikan, CFA, Director of Fixed Income Management for BB&T Asset Management, Inc. Mr. Millikan received a BA in Economics from Wake Forest University, and is a past president of the North Carolina Society of Financial Analysts and chairman of the board of directors of the Carolinas Municipal Advisory Council. Mr. Millikan has been managing investors’ money since 1990. He is supported by the BB&T Fixed Income Portfolio Management Team, which includes Carrie R. Breswitz; Brad D. Eppard, CFA; David T. Johnson; Kevin E. McNair, CFA; and Justin B. Nicholson. The team brings to the Fund six decades of combined investment management experience, along with a broad range of specialized skills encompassing a cross-section of fixed-income sectors.
Investment Concerns
Because the Fund is non-diversified and invests primarily in South Carolina municipal securities, the Fund is particularly susceptible to any economic, political, or regulatory developments affecting a particular issuer of South Carolina municipal securities. Bonds offer a relatively stable level of income, although bond prices will fluctuate providing the potential for principal gain or loss. Intermediate-term, higher-quality bonds generally offer less risk than longer-term bonds and a lower rate of return. The Fund is subject to the risk that principal value reacts in opposition to the movement of interests rates and that a rising interest rate environment increases the risk of loss of principal. The Fund’s income may be subject to certain state and local taxes and, depending on a investors tax status, to the Federal alternative minimum tax.
Q. How did the Fund perform during the 12-month period between October 1, 2008 and September 30, 2009?
A. The Fund gained 13.01% (Institutional Shares). That compared to a 12.52% return for the Barclays Capital 7-Year Municipal Bond Index.
Q. What factors affected the Fund’s performance?
A. The municipal bond market produced very volatile returns during this period. The financial crisis led to a number of developments that hurt municipal securities in the period’s first several months, including forced selling by institutional investors and the failure of bond insurers. Those conditions led to much higher yields and considerably lower prices on municipal securities. The municipal markets then rallied powerfully between March and September, helping the Fund post strong gains for the fiscal year as a whole.1
We believe that the high quality of the Fund’s portfolio boosted returns relative to the benchmark. We invested opportunistically early in the period to take advantage of the extremely high yields available, and also extended the Fund’s duration in order to capture greater yield. In particular, we purchased some bonds with 20-year maturities, which offered premium yields. Such bonds produced some of the municipal market’s best returns during the summer rally, helping the Fund outperform its index. 1
We allowed the Fund’s duration to shorten as the market surged during the second half of the period. That strategy, which we employed to manage risk, reduced the Fund’s relative performance as longer-term bonds continued to post strong gains.1
| 1 | Portfolio composition is as of September 30, 2009 and is subject to change. |
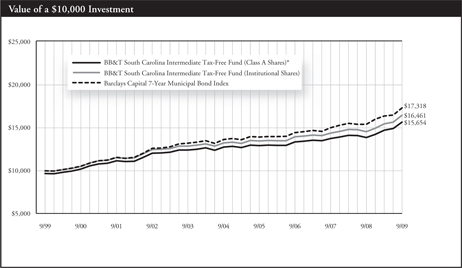
| * | Reflects 3.00% maximum sales charge. |
| | | | | | | | |
Average Annual Total Returns |
As of September 30, 2009 | | Inception Date | | 1 Year | | 5 Years | | 10 Years |
Class A Shares* | | 10/20/97 | | 9.37% | | 3.55% | | 4.58% |
Institutional Shares | | 10/20/97 | | 13.01% | | 4.44% | | 5.11% |
Barclays Capital 7-Year Municipal Bond Index | | 10/31/97 | | 12.52% | | 4.88% | | 5.64% |
Past performance does not guarantee future results. The performance data quoted represents past performance and current returns may be lower or higher. Total return figures include change in share price, reinvestment of dividends and capital gains, and do not reflect taxes that a shareholder would pay on fund distributions or on the redemption of fund shares. The investment return and principal value will fluctuate so that an investor’s shares, when redeemed, may be worth more or less than the original cost. To obtain performance information current to the most recent month end, please visit www.bbtfunds.com.
The chart above represents a comparison of a hypothetical $10,000 investment in the indicated share class versus a similar investment in the Fund’s benchmark, and represents the reinvestment of dividends and capital gains.
The Fund is measured against the Barclays Capital 7-Year Municipal Bond Index, an unmanaged index which is representative of municipal bonds with a minimum credit rating of at least Baa, have a maturity value of at least $5 million and a maturity range of 6-8 years. The index does not reflect the deduction of expenses associated with a mutual fund, such as investment management and fund accounting fees. The Fund’s performance reflects the deduction of fees for these services. Investors cannot invest directly in an index, although they can invest in its underlying securities.
A portion of the Fund’s fees has been waived. If the fees had not been waived, the Fund’s total return for the periods would have been lower.
BB&T Virginia Intermediate Tax-Free Fund
Portfolio Manager
Robert F. Millikan, CFA
The BB&T Virginia Intermediate Tax-Free Fund is managed by Robert F. Millikan, CFA, Director of Fixed Income Management for BB&T Asset Management, Inc. Mr. Millikan received a BA in Economics from Wake Forest University, and is a past president of the North Carolina Society of Financial Analysts and chairman of the board of directors of the Carolinas Municipal Advisory Council. Mr. Millikan has been managing investors’ money since 1990. He is supported by the BB&T Fixed Income Portfolio Management Team, which includes Carrie R. Breswitz; Brad D. Eppard, CFA; David T. Johnson; Kevin E. McNair, CFA; and Justin B. Nicholson. The team brings to the Fund six decades of combined investment management experience, along with a broad range of specialized skills encompassing a cross-section of fixed-income sectors.
Investment Concerns
Because the Fund is non-diversified and invests primarily in Virginia municipal securities, the Fund is particularly susceptible to any economic, political, or regulatory developments affecting a particular issuer of Virginia municipal securities. Bonds offer a relatively stable level of income, although bond prices will fluctuate providing the potential for principal gain or loss. Intermediate-term, higher-quality bonds generally offer less risk than longer-term bonds and a lower rate of return. The Fund is subject to the risk that principal value reacts in opposition to the movement of interest rates and that a rising interest rate environment increases the risk of loss of principal. The Fund’s income may be subject to certain state and local taxes and, depending on a investors tax status, to the Federal alternative minimum tax.
Q. How did the Fund perform during the 12-month period between October 1, 2008 and September 30, 2009?
A. The Fund gained 13.39% (Institutional Shares). That compared to a 12.52% return for the Barclays Capital 7-Year Municipal Bond Index.
Q. What factors affected the Fund’s performance?
A. The municipal bond market produced very volatile returns during this period. The financial crisis led to a number of developments that hurt municipal securities in the period’s first several months, including forced selling by institutional investors and the failure of bond insurers. Those conditions led to much higher yields and considerably lower prices on municipal securities. The municipal markets then rallied powerfully between March and September, helping the Fund post strong gains for the fiscal year as a whole.1
We believe that the high quality of the Fund’s portfolio boosted returns relative to the benchmark. Quality-conscious investors prized Virginia’s municipal bonds, because the state’s credit quality is one of the highest in the nation. We invested opportunistically early in the period to take advantage of the extremely high yields available, and also extended the Fund’s duration in order to capture greater yield. In particular, we purchased some bonds with 20-year maturities, which offered premium yields. Such bonds produced some of the municipal market’s best returns during the summer rally, helping the Fund outperform its index.1
We allowed the Fund’s duration to shorten as the market surged during the second half of the period. That strategy, which we employed to manage risk, reduced the Fund’s relative performance as longer-term bonds continued to post strong gains.1
| 1 | Portfolio composition is as of September 30, 2009 and is subject to change. |
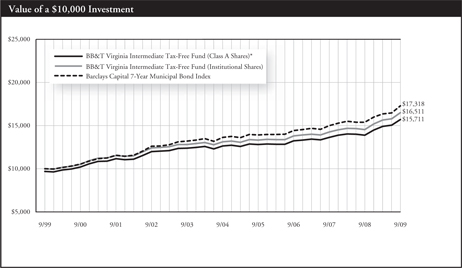
| * | Reflects 3.00% maximum sales charge. |
| | | | | | | | |
Average Annual Total Returns |
As of September 30, 2009 | | Inception Date | | 1 Year | | 5 Years | | 10 Years |
Class A Shares* | | 5/17/99 | | 9.75% | | 3.81% | | 4.62% |
Institutional Shares | | 5/17/99 | | 13.39% | | 4.69% | | 5.14% |
Barclays Capital 7-Year Municipal Bond Index | | 5/31/99 | | 12.52% | | 4.88% | | 5.64% |
Past performance does not guarantee future results. The performance data quoted represents past performance and current returns may be lower or higher. Total return figures include change in share price, reinvestment of dividends and capital gains, and do not reflect taxes that a shareholder would pay on fund distributions or on the redemption of fund shares. The investment return and principal value will fluctuate so that an investor’s shares, when redeemed, may be worth more or less than the original cost. To obtain performance information current to the most recent month end, please visit www.bbtfunds.com.
The chart above represents a comparison of a hypothetical $10,000 investment in the indicated share class versus a similar investment in the Fund’s benchmark, and represents the reinvestment of dividends and capital gains.
The Fund is measured against the Barclays Capital 7-Year Municipal Bond Index, an unmanaged index which is representative of municipal bonds with a minimum credit rating of at least Baa, have a maturity value of at least $5 million and a maturity range of 6-8 years. The index does not reflect the deduction of expenses associated with a mutual fund, such as investment management and fund accounting fees. The Fund’s performance reflects the deduction of fees for these services. Investors cannot invest directly in an index, although they can invest in its underlying securities.
A portion of the Fund’s fees has been waived. If the fees had not been waived, the Fund’s total return for the periods would have been lower.
BB&T West Virginia Intermediate Tax-Free Fund
Portfolio Manager
Robert F. Millikan, CFA
The BB&T West Virginia Intermediate Tax-Free Fund is managed by Robert F. Millikan, CFA, Director of Fixed Income Management for BB&T Asset Management, Inc. Mr. Millikan received a BA in Economics from Wake Forest University, and is a past president of the North Carolina Society of Financial Analysts and chairman of the board of directors of the Carolinas Municipal Advisory Council. Mr. Millikan has been managing investors’ money since 1990. He is supported by the BB&T Fixed Income Portfolio Management Team, which includes Carrie R. Breswitz; Brad D. Eppard, CFA; David T. Johnson; Kevin E. McNair, CFA; and Justin B. Nicholson. The team brings to the Fund six decades of combined investment management experience, along with a broad range of specialized skills encompassing a cross-section of fixed-income sectors.
Investment Concerns
Because the Fund is non-diversified and invests primarily in West Virginia municipal securities, the Fund is particularly susceptible to any economic, political, or regulatory developments affecting a particular issuer of West Virginia municipal securities. Bonds offer a relatively stable level of income, although bond prices will fluctuate providing the potential for principal gain or loss. Intermediate-term, higher-quality bonds generally offer less risk than longer-term bonds and a lower rate of return. The Fund is subject to the risk that principal value reacts in opposition to the movement of interest rates and that a rising interest rate environment increases the risk of loss of principal. The Fund’s income may be subject to certain state and local taxes and, depending on a investors tax status, to the Federal alternative minimum tax.
Q. How did the Fund perform during the 12-month period between October 1, 2008 and September 30, 2009?
A. The Fund gained 11.41% (Institutional Shares). That compared to a 12.52% return for the Barclays Capital 7-Year Municipal Bond Index.
Q. What factors affected the Fund’s performance?
A. The municipal bond market produced very volatile returns during this period. The financial crisis led to a number of developments that hurt municipal securities in the period��s first several months, including forced selling by institutional investors and the failure of bond insurers. Those conditions led to much higher yields and considerably lower prices on municipal securities. The municipal markets then rallied powerfully between March and September, helping the Fund post strong gains for the fiscal year as a whole.1
The collapse of bond insurers weighed on this Fund’s returns relative to its benchmark. West Virginia relied more heavily than other states on
insurance to boost the credit rating of many of its bonds. When the insurers failed the bonds were downgraded, leading to price declines. While we do not count on insurance, the Fund’s returns were affected by bond downgrades.1
We invested opportunistically early in the period to take advantage of the extremely high yields available, and also extended the Fund’s duration in order to capture greater yield. In particular, we purchased some bonds with 20-year maturities, which offered premium yields. Such bonds produced some of the municipal market’s best returns during the summer rally, boosting the Fund’s performance relative to its index.1
We allowed the Fund’s duration to shorten as the market surged during the second half of the period. That strategy, which we employed to manage risk, reduced the Fund’s relative performance as longer-term bonds continued to post strong gains.1
| 1 | Portfolio composition is as of September 30, 2009 and is subject to change. |
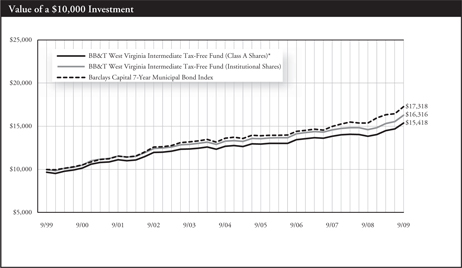
| * | Reflects 3.00% maximum sales charge. |
| | | | | | | | |
Average Annual Total Returns |
As of September 30, 2009 | | Inception
Date | | 1 Year | | 5 Years | | 10 Years |
Class A Shares* | | 12/17/931 | | 7.80% | | 3.30% | | 4.42% |
Institutional Shares | | 12/1/931 | | 11.41% | | 4.19% | | 5.02% |
Barclays Capital 7-Year Municipal Bond Index | | N/A | | 12.52% | | 4.88% | | 5.64% |
Past performance does not guarantee future results. The performance data quoted represents past performance and current returns may be lower or higher. Total return figures include change in share price, reinvestment of dividends and capital gains, and do not reflect taxes that a shareholder would pay on fund distributions or on the redemption of fund shares. The investment return and principal value will fluctuate so that an investor’s shares, when redeemed, may be worth more or less than the original cost. To obtain performance information current to the most recent month end, please visit www.bbtfunds.com.
The chart above represents a comparison of a hypothetical $10,000 investment in the indicated share class versus a similar investment in the Fund’s benchmark, and represents the reinvestment of dividends and capital gains.
| 1 | Fund performance as shown for Class A and Institutional Shares includes the performance of the OVB West Virginia Tax-Exempt Income Portfolio for the periods prior to its consolidation with the BB&T West Virginia Intermediate Tax-Free Fund on 7/23/01. |
The Fund is measured against the Barclays Capital 7-Year Municipal Bond Index, an unmanaged index which is representative of municipal bonds with a minimum credit rating of at least Baa, have a maturity value of at least $5 million and a maturity range of 6-8 years. The index does not reflect the deduction of expenses associated with a mutual fund, such as investment management and fund accounting fees. The Fund’s performance reflects the deduction of fees for these services. Investors cannot invest directly in an index, although they can invest in its underlying securities.
A portion of the Fund’s fees has been waived. If the fees had not been waived, the Fund’s total return for the periods would have been lower.
BB&T National Tax-Free Money Market Fund
Portfolio Managers
Michael Sirianni
The BB&T National Tax-Free Money Market Fund is managed by Michael Sirianni, portfolio manager for Federated Investment Management Company (“Federated IMC”), subadvisor to the Fund. Mr. Sirianni is primarily responsible for the day-today management of the portfolio. He is supported by an investment management team from Federated IMC which includes Nancy J. Beltz, CFA, Hanan Callas, CFA, Kyle D. Stewart, CFA, and a group of five money market traders. On average, team members bring more than a decade of investment management experience to the Fund, with specialization in money market portfolio management and credit analysis.
Investment Concerns
Investments in the BB&T National Tax Free Money Market Fund are neither insured nor guaranteed by the Federal Deposit Insurance Corporation or any government agency. Although the Fund seeks to preserve the value of your investments at a $1.00 per share, it is possible to lose money by investing in the Fund.
Q. What factors affected the Fund’s yield during the 12-month period between October 1, 2008 and September 30, 2009?
A. The Fund began the period with a seven-day yield of 6.33% (Institutional Shares) and ended the period with a seven-day yield of 0.31%.
The financial crisis that occurred during this period had significant impacts on this Fund’s yield. The credit and liquidity crunch that occurred in fall of 2008 led to a spike on yields on municipal money market issues, pushing them well above yields on taxable money market securities.1
We employed a number of strategies to attempt to maintain shareholder liquidity during this period, including maintaining high credit quality and holding between 82% and 85% of assets in highly liquid seven-day demand notes. We also wound down positions in insured paper just prior to this period, which proved beneficial when several bond insurers were downgraded.1
The Federal Reserve Board lowered its target short-term interest rate during this fiscal year, from 2.00% to a range between 0% and 0.25%. The government also responded to the financial crisis by establishing facilities to affirm the market’s liquidity. These factors gradually pushed down yields on the types of securities in which the Fund invests.1
| 1 | Portfolio composition is as of September 30, 2009 and is subject to change. |
Past performance does not guarantee future results. The performance data quoted represents past performance and current returns may be lower or higher. Total return figures include change in share price, reinvestment of dividends and capital gains, and do not reflect taxes that a shareholder would pay on fund distributions or on the redemption of fund shares. The investment return and principal value will fluctuate so that an investor’s shares, when redeemed, may be worth more or less than the original cost. To obtain performance information current to the most recent month end, please visit www.bbtfunds.com.
A portion of the Fund’s fees has been waived. If the fees had not been waived, the Fund’s total return for the periods would have been lower.
BB&T Prime Money Market Fund
Portfolio Managers
Deborah A. Cunningham and Paige Wilhelm
The BB&T Prime Money Market Fund is managed by Deborah A. Cunningham and Paige Wilhelm, portfolio managers for Federated Investment Management Company (“Federated IMC”), subadvisor to the Fund. Mrs. Cunningham and Mrs. Wilhelm are primarily responsible for the day-to-day management of the portfolio. They are supported by an investment management team from Federated IMC which includes William Jamison, Natalie F. Metz, Mary Ellen Tesla, Mark F. Weiss, CFA, and a group of eight money market traders. On average, team members bring more than a decade of investment management experience to the Fund, with specialization in money market portfolio management and credit analysis.
Investment Concerns
Investments in the BB&T Prime Money Market Fund are neither insured nor guaranteed by the Federal Deposit Insurance Corporation or any government agency. Although the Fund seeks to preserve the value of your investments at a $1.00 per share, it is possible to lose money by investing in the Fund.
Q. What factors affected the Fund’s yield during the 12-month period between October 1, 2008 and September 30, 2009?
A. The financial crisis last fall led to a liquidity crunch in the money markets. Investors fled to Treasury bills and away from commercial paper and other non-government instruments, causing yields on money market securities to rise.
Yields gradually declined in 2009, as the government took a number of steps to support the market’s liquidity, including lowering the federal funds rate from 2.00% to a range between 0% and 0.25%.1
The BB&T Prime Money Market Fund invests in commercial paper, asset-backed commercial paper, variable-rate notes, bank instruments
and repurchase agreements. We held the bulk of the Fund’s investments during the period in securities issued by the bank and finance industry, which in our estimation provided the best value to investors. Our stringent credit analysis process enabled the Fund to capture the additional yield offered by such securities while steering clear of credit problems.1
The Fund began the period with a relatively short average maturity of 46 days, in part because of a sizable position in overnight securities — a position designed to ensure liquidity for shareholders during the crisis. The Fund ended the period with an average maturity of 57 days.1
| 1 | Portfolio composition is as of September 30, 2009 and is subject to change. |
Past performance does not guarantee future results. The performance data quoted represents past performance and current returns may be lower or higher. Total return figures include change in share price, reinvestment of dividends and capital gains, and do not reflect taxes that a shareholder would pay on fund distributions or on the redemption of fund shares. The investment return and principal value will fluctuate so that an investor’s shares, when redeemed, may be worth more or less than the original cost. To obtain performance information current to the most recent month end, please visit www.bbtfunds.com.
A portion of the Fund’s fees has been waived. If the fees had not been waived, the Fund’s total return for the periods would have been lower.
BB&T U.S. Treasury Money Market Fund
Portfolio Manager
Kevin E. McNair, CFA
The BB&T U.S. Treasury Money Market Fund is managed by Kevin E. McNair, CFA. Mr. McNair received a BA in Economics from the University of North Carolina at Chapel Hill and a Master’s of Economics from North Carolina State University, and has been managing investors’ money since 1994. Mr. McNair is supported by the BB&T Fixed Income Portfolio Management Team, which includes Brad D. Eppard, CFA; David T. Johnson; and Robert F. Millikan, CFA. The team brings to the Fund six decades of combined investment management experience, along with a broad range of specialized skills encompassing a cross-section of fixed-income sectors.
Investment Concerns
Investments in the BB&T U.S. Treasury Money Market Fund are neither insured nor guaranteed by the Federal Deposit Insurance Corporation or any government agency. Although the Fund seeks to preserve the value of your investments at a $1.00 per share, it is possible to lose money by investing in the Fund.
Q. What factors affected the Fund’s yield during the 12-month period between October 1, 2008 and September 30, 2009?
A. The Federal Funds Rate began the period at 2.00%. In the first month of the period, the Federal Reserve Board (“the Fed”) cut that rate twice by 50 basis points for a combined drop of 100 basis points. In December, the Fed reduced rates again, lowering its target rate to a range of 0.00% to 0.25%.1
Interest rates in general have continued to fall throughout the period, resulting in significantly lower yields among money market securities. The Fund’s (Institutional Shares) seven-day yield was 0.50% at the beginning of the period; by the end of the 12-month period, that seven-day yield stood at just 0.01%.1
The Fund invests primarily in Treasury securities and repurchase agreements that are backed by Treasury securities. That has resulted in a lower yield than some funds that invest in higher-risk fixed-income securities, because Treasury yields have fallen precipitously as the Fed has lowered its target short-term interest rate. What’s more, we expect Treasury yields to remain very low in the near term. We expect that yields will begin to rise when the market anticipates a rise in interest rates, and the Fed has commented that it doesn’t expect to raise interest rates in the near future.1
As of September 30, 2009, the Fund held 48.3% of its assets in repurchase agreements, 34.9% in Treasury bills and 16.7% in Treasury notes. The Fund’s average maturity was 50 days, and its credit quality as rated by Standard & Poor’s was AAA.1
| 1 | Portfolio composition is as of September 30, 2009 and is subject to change. |
Past performance does not guarantee future results. The performance data quoted represents past performance and current returns may be lower or higher. Total return figures include change in share price, reinvestment of dividends and capital gains, and do not reflect taxes that a shareholder would pay on fund distributions or on the redemption of fund shares. The investment return and principal value will fluctuate so that an investor’s shares, when redeemed, may be worth more or less than the original cost. To obtain performance information current to the most recent month end, please visit www.bbtfunds.com.
A portion of the Fund’s fees has been waived. If the fees had not been waived, the Fund’s total return for the periods would have been lower.
BB&T Capital Manager Funds
Portfolio Managers
BB&T Balanced Portfolio Management Team
The BB&T Capital Manager Funds are managed by the BB&T Balanced Portfolio Management Team, which includes Jeffrey J. Schappe, CFA; Will Gholston, CFA; Robert F. Millikan, CFA; and Ronald T. Rimkus, CFA. The team brings to the Fund over eight decades of combined investment management experience, along with a broad range of specialized skills encompassing value stocks, growth stocks and fixed-income securities.
Investment Concerns
Equity securities (stocks) are more volatile and carry more risk than other forms of investments, including investments in high-grade fixed income securities. The net asset value per share of these Funds will fluctuate as the value of the securities in the portfolio changes. Bonds offer a relatively stable level of income, although bond prices will fluctuate providing the potential for principal gain or loss. Intermediate-term, higher-quality bonds generally offer less risk than longer-term bonds and a lower rate of return.
Investments in the BB&T U.S. Treasury Money Market Fund are neither insured nor guaranteed by the Federal Deposit Insurance Corporation or any government agency. Although the Fund seeks to preserve the value of your investments at a $1.00 per share, it is possible to lose money by investing in the Fund.
| | |
Capital Manager Equity Fund Capital Manager Growth Fund Capital Manager Moderate Growth Fund Capital Manager Conservative Growth Fund (Collectively, the “Capital Manager Funds”) Q. How did the Funds (Institutional Shares) perform during the 12-month period between October 1, 2008 and September 30, 2009? A. The Capital Manager Funds and their benchmarks generated the following returns: The Capital Manager Equity Fund: -7.33%. The S&P 500 Index:-6.91%. The Capital Manager Growth Fund: -0.87%. Composite index with a 75% weighting in the S&P 500 and a 25% weighting in the Barclays Capital Intermediate Government Bond Index: -2.68% The Capital Manager Moderate Growth Fund: 2.91%. Composite index with a 60% weighting in the S&P 500 and a 40% weighting in the Barclays Capital Intermediate Government Bond Index : -0.14% The Capital Manager Conservative Growth Fund: 6.28%. Composite index with a 40% weighting in the S&P 500 and a 60% weighting in the Barclays Capital Intermediate Government Bond Index: 3.24% Q. What factors affected the Funds’ performance? A. The Capital Manager Funds invest in a combination of the BB&T Large Cap Fund, the BB&T Mid Cap Value Fund, the BB&T Mid Cap Growth Fund, BB&T Equity Income Fund, BB&T Special Opportunities Equity Fund, the BB&T International Equity Fund, the BB&T U.S. Treasury Money Market Fund, the iShares S&P 500 Index Fund, the iShares Russell 2000 Index Fund, and the Credit Suisse Commodity Return Strategy Fund. The three Capital Manager Funds with fixed-income allocations also hold exposure to the BB&T Total Return Bond Fund.1 | | The equity markets performed poorly during the 12 months through September 2009. The majority of those losses, however, occurred in the early part of the period as the global financial crisis worsened. Midway through the period, the financial markets began to rebound, and domestic and international equities posted strong gains for the duration of the period. The S&P 500 returned - -6.91% during the full 12-month period, while the MSCI All Country World Index Ex-U.S. returned 2.75%. The Funds with allocations to fixed-income securities benefited from relatively strong bond performance, as the Barclays Capital Intermediate Government Bond Index returned 10.01% for the fiscal year.1 Each Capital Manager Fund held 25% of its equity allocation in international equities. The Funds benefited from their exposure to international stocks, which significantly outperformed domestic equities during the latter half of the period.1 The Funds were hurt by their exposure to small-cap equities. The S&P 500 index tracks large-company stocks, which performed better than smaller companies during the recent financial crisis. The freezing of the credit markets strongly impacted small companies, as such companies tend to rely more on credit than their larger peers. The Capital Manager Funds each held 10% of their domestic equity allocations in small-cap equities.1 An overweight exposure in value stocks also dragged on relative performance, as value indices included shares of many of the financial firms that were hardest hit during the recent financial crisis. Value outperformed growth during the latter half of the period, but the poor performance of financial stocks in the early part of the period had a negative impact on the Funds.1 In May, we also added an overweight position in commodities relative to the Funds’ benchmarks. Historically, commodities perform well coming out of a recessionary period. The Dow Jones-UBS Commodity Index slightly outperformed the Barclays Capital Intermediate Government Bond Index during the final three months of the period. As a result, the Funds’ exposure to commodities had a small positive impact on relative performance.1 |
| 1 | Portfolio composition is as of September 30, 2009 and is subject to change. |
BB&T Capital Manager Conservative Growth Fund
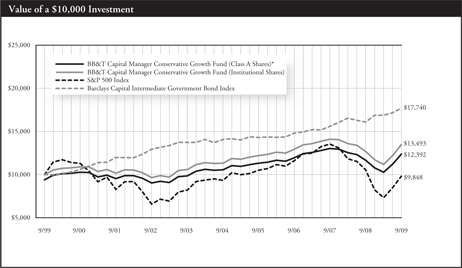
| * | Reflects 5.75% maximum sales charge. |
| ** | Reflects the applicable contingent deferred sales charge (CDSC), maximum of 5.00%. |
| *** | Reflects the applicable maximum CDSC of 1.00% (applicable only to redemptions within one year of purchase, and as such, are not reflected in the Annual Average Total Returns table since the periods reflected are for a year or longer). |
| | | | | | | | |
Average Annual Total Returns |
As of September 30, 2009 | | Inception
Date | | 1 Year | | 5 Years | | 10 Years |
A Shares* | | 1/29/981 | | -0.09% | | 2.01% | | 2.17% |
B Shares** | | 1/29/992 | | 1.15% | | 2.29% | | 2.21% |
C Shares*** | | 2/1/013 | | 5.09% | | 2.45% | | 2.10% |
Institutional Shares | | 10/2/97 | | 6.28% | | 3.50% | | 3.04% |
S&P 500 Index | | 9/30/97 | | -6.91% | | 1.02% | | -0.15% |
Barclays Capital Int. Government Bond Index | | 9/30/97 | | 10.01% | | 4.68% | | 5.90% |
Past performance does not guarantee future results. The performance data quoted represents past performance and current returns may be lower or higher. Total return figures include change in share price, reinvestment of dividends and capital gains, and do not reflect taxes that a shareholder would pay on fund distributions or on the redemption of fund shares. The investment return and principal value will fluctuate so that an investor’s shares, when redeemed, may be worth more or less than the original cost. To obtain performance information current to the most recent month end, please visit www.bbtfunds.com.
The chart above represents a comparison of a hypothetical $10,000 investment in the indicated share class versus a similar investment in the Fund’s benchmarks, and represents the reinvestment of dividends and capital gains.
| 1 | Class A Shares were not in existence prior to 1/29/98. Performance for periods prior to that is based on the historical performance of the Institutional Shares, and has been adjusted for the maximum sales charge applicable to the Class A Shares, but does not include the Class A Shares 12b-1 fees, which, if reflected, performance would have been lower. |
| 2 | Class B Shares were not in existence prior to 1/29/99. Performance for periods prior to that is based on the historical performance of the Class A Shares, and has been adjusted for the maximum CDSC applicable to the Class B Shares, but does not include the Class B Shares 12b-1 fees, which, if reflected, performance would have been lower. |
| 3 | Class C Shares were not in existence prior to 2/1/01. Performance for periods prior to that is based on the historical performance of the Class A Shares, and has been adjusted for the maximum CDSC applicable to the Class C Shares, but does not include the Class C Shares 12b-1 fees, which if reflected, performance would have been lower. |
The Fund is measured against the S&P 500 Index, which is generally considered to be representative of the performance of the stock market as a whole, and against the Barclays Capital Intermediate Government Bond Index, which is widely used as a broad measure of the performance of U.S. Government Bonds with maturities of less than 10 years. The indices are unmanaged and do not reflect the deduction of expenses associated with a mutual fund, such as investment management and, fund accounting fees. The Fund’s performance reflects the deduction of fees for these services. Investors cannot invest directly in an index, although they can invest in its underlying securities.
A portion of the Fund’s fees have been waived. If the fees had not been waived, the Fund’s total return for the periods would have been lower.
BB&T Capital Manager Moderate Growth Fund
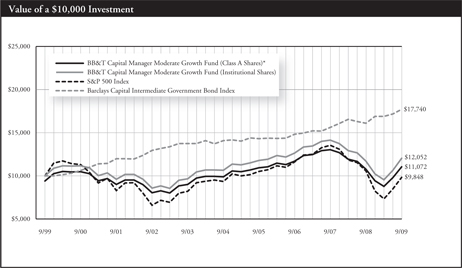
| * | Reflects 5.75% maximum sales charge. |
| ** | Reflects the applicable contingent deferred sales charge (CDSC), maximum of 5.00%. |
| *** | Reflects the applicable maximum CDSC of 1.00% (applicable only to redemptions within one year of purchase, and as such, are not reflected in the Annual Average Total Returns table since the periods reflected are for a year or longer). |
| | | | | | | | |
Average Annual Total Returns |
As of September 30, 2009 | | Inception
Date | | 1 Year | | 5 Years | | 10 years |
A Shares* | | 1/29/981 | | -3.19% | | 1.03%
| | 1.02% |
B Shares** | | 1/29/992 | | -2.19% | | 1.33% | | 1.01% |
C Shares*** | | 2/1/013 | | 1.85% | | 1.48% | | 1.00% |
Institutional Shares | | 10/2/97 | | 2.91% | | 2.50% | | 1.88% |
S&P 500 Index | | 9/30/97 | | -6.91% | | 1.02% | | -0.15% |
Barclays Capital Int. Government Bond Index | | 9/30/97 | | 10.01% | | 4.68% | | 5.90% |
Past performance does not guarantee future results. The performance data quoted represents past performance and current returns may be lower or higher. Total return figures include change in share price, reinvestment of dividends and capital gains, and do not reflect taxes that a shareholder would pay on fund distributions or on the redemption of fund shares. The investment return and principal value will fluctuate so that an investor’s shares, when redeemed, may be worth more or less than the original cost. To obtain performance information current to the most recent month end, please visit www.bbtfunds.com.
The chart above represents a comparison of a hypothetical $10,000 investment in the indicated share class versus a similar investment in the Fund’s benchmarks, and represents the reinvestment of dividends and capital gains.
| 1 | Class A Shares were not in existence prior to 1/29/98. Performance for periods prior to that is based on the historical performance of the Institutional Shares, and has been adjusted for the maximum sales charge applicable to the Class A Shares, but does not include the Class A Shares 12b-1 fees, which, if reflected, performance would have been lower. |
| 2 | Class B Shares were not in existence prior to 1/29/99. Performance for periods prior to that is based on the historical performance of the Class A Shares, and has been adjusted for the maximum CDSC applicable to the Class B Shares, but does not include the Class B Shares 12b-1 fees, which, if reflected, performance would have been lower. |
| 3 | Class C Shares were not in existence prior to 2/1/01. Performance for periods prior to that is based on the historical performance of the Class A Shares, and has been adjusted for the maximum CDSC applicable to the Class C Shares, but does not include the Class C Shares 12b-1 fees, which if reflected, performance would have been lower. |
The Fund is measured against the S&P 500 Index, which is generally considered to be representative of the performance of the stock market as a whole, and against the Barclays Capital Intermediate Government Bond Index, which is widely used as a broad measure of the performance of U.S. Government Bonds with maturities of less than 10 years. The indices are unmanaged and do not reflect the deduction of expenses associated with a mutual fund, such as investment management and, fund accounting fees. The Fund’s performance reflects the deduction of fees for these services. Investors cannot invest directly in an index, although they can invest in its underlying securities.
A portion of the Fund’s fees have been waived. If the fees had not been waived, the Fund’s total return for the periods would have been lower.
BB&T Capital Manager Growth Fund
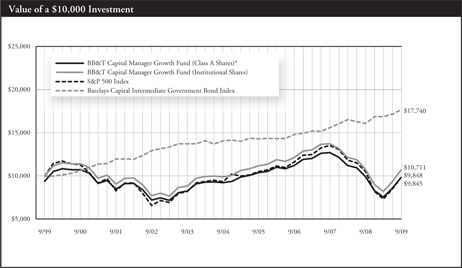
| * | Reflects 5.75% maximum sales charge. |
| ** | Reflects the applicable contingent deferred sales charge (CDSC), maximum of 5.00%. |
| *** | Reflects the applicable maximum CDSC of 1.00% (applicable only to redemptions within one year of purchase, and as such, are not reflected in the Annual Average Total Returns table since the periods reflected are for a year or longer). |
| | | | | | | | |
Average Annual Total Returns |
As of September 30, 2009 | | Inception
Date | | 1 Year | | 5 Years | | 10 Years |
A Shares* | | 1/29/981 | | -6.95%
| | 0.05% | | -0.16% |
B Shares** | | 1/29/992 | | -5.77% | | 0.34% | | -0.16% |
C Shares*** | | 2/1/013 | | -1.90% | | 0.48% | | -0.21% |
Institutional Shares | | 10/2/97 | | -0.87% | | 1.51% | | 0.69% |
S&P 500 Index | | 9/30/97 | | -6.91% | | 1.02% | | -0.15% |
Barclays Capital Int. Government Bond Index | | 9/30/97 | | 10.01% | | 4.68% | | 5.90% |
Past performance does not guarantee future results. The performance data quoted represents past performance and current returns may be lower or higher. Total return figures include change in share price, reinvestment of dividends and capital gains, and do not reflect taxes that a shareholder would pay on fund distributions or on the redemption of fund shares. The investment return and principal value will fluctuate so that an investor’s shares, when redeemed, may be worth more or less than the original cost. To obtain performance information current to the most recent month end, please visit www.bbtfunds.com.
The chart above represents a comparison of a hypothetical $10,000 investment in the indicated share class versus a similar investment in the Fund’s benchmarks, and represents the reinvestment of dividends and capital gains.
| 1 | Class A Shares were not in existence prior to 1/29/98. Performance for periods prior to that is based on the historical performance of the Institutional Shares, and has been adjusted for the maximum sales charge applicable to the Class A Shares, but does not include the Class A Shares 12b-1 fees, which, if reflected, performance would have been lower. |
| 2 | Class B Shares were not in existence prior to 1/29/99. Performance for periods prior to that is based on the historical performance of the Class A Shares, and has been adjusted for the maximum CDSC applicable to the Class B Shares, but does not include the Class B Shares 12b-1 fees, which, if reflected, performance would have been lower. |
| 3 | Class C Shares were not in existence prior to 2/1/01. Performance for periods prior to that is based on the historical performance of the Class A Shares, and has been adjusted for the maximum CDSC applicable to the Class C Shares, but does not include the Class C Shares 12b-1 fees, which if reflected, performance would have been lower. |
The Fund is measured against the S&P 500 Index, which is generally considered to be representative of the performance of the stock market as a whole, and against the Barclays Capital Intermediate Government Bond Index, which is widely used as a broad measure of the performance of U.S. Government Bonds with maturities of less than 10 years. The indices are unmanaged and do not reflect the deduction of expenses associated with a mutual fund, such as investment management and, fund accounting fees. The Fund’s performance reflects the deduction of fees for these services. Investors cannot invest directly in an index, although they can invest in its underlying securities.
A portion of the Fund’s fees have been waived. If the fees had not been waived, the Fund’s total return for the periods would have been lower.
BB&T Capital Manager Equity Fund
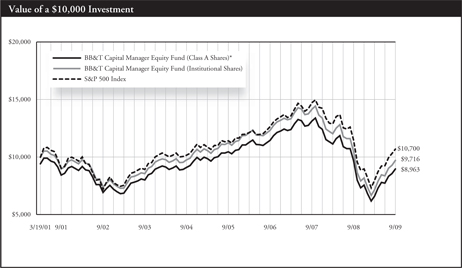
| * | Reflects 5.75% maximum sales charge. |
| ** | Reflects the applicable contingent deferred sales charge (CDSC), maximum of 5.00% |
| *** | Reflects the applicable maximum CDSC of 1.00% (applicable only to redemptions within one year of purchase, and as such, are not reflected in the Annual Average Total Returns table since the periods reflected are for a year or longer). |
| | | | | | | | |
Average Annual Total Returns |
As of September 30, 2009 | | Inception
Date | | 1 Year | | 5 Years | | Since
Inception |
A Shares* | | 3/19/01
| | -12.89% | | -1.49% | | -1.28%
|
B Shares** | | 3/19/01 | | -12.01% | | -1.22% | | -1.29% |
C Shares*** | | 3/19/01 | | -8.11% | | -1.01% | | -1.32% |
Institutional Shares | | 3/19/01 | | -7.33% | | -0.08% | | -0.34% |
S&P 500 Index | | 3/19/01 | | -6.91% | | 1.02% | | -0.80% |
Past performance does not guarantee future results. The performance data quoted represents past performance and current returns may be lower or higher. Total return figures include change in share price, reinvestment of dividends and capital gains, and do not reflect taxes that a shareholder would pay on fund distributions or on the redemption of fund shares. The investment return and principal value will fluctuate so that an investor’s shares, when redeemed, may be worth more or less than the original cost. To obtain performance information current to the most recent month end, please visit www.bbtfunds.com.
The chart above represents a comparison of a hypothetical $10,000 investment in the indicated share class versus a similar investment in the Fund’s benchmark, and represents the reinvestment of dividends and capital gains.
The Fund is measured against the S&P 500 Index, an unmanaged index generally considered to be representative of the performance of the stock market as a whole. The index does not reflect the deduction of expenses associated with a mutual fund, such as investment management and fund accounting fees. The Fund’s performance reflects the deduction of fees for these services. Investors cannot invest directly in an index, although they can invest in its underlying securities.
A portion of the Fund’s fees have been waived. If the fees had not been waived, the Fund’s total return for the periods would have been lower.
Summary of Portfolio Holdings (Unaudited)
The BB&T Funds invested, as a percentage of net assets, in the following industry sectors, countries, states, funds or security types, as of September 30, 2009.
| | |
| Large Cap Fund | | Percentage
of net assets |
Consumer Discretionary | | 6.9% |
Consumer Staples | | 2.7% |
Energy | | 15.1% |
Financials | | 21.4% |
Health Care | | 12.2% |
Industrials | | 13.7% |
Information Technology | | 16.5% |
Materials | | 6.5% |
Utilities | | 2.6% |
Cash Equivalents | | 2.2% |
| | |
| | 99.8% |
| | |
| |
| Mid Cap Value Fund | | Percentage
of net assets |
Consumer Discretionary | | 20.4% |
Energy | | 3.6% |
Financial Services | | 31.9% |
Health Care | | 14.8% |
Materials & Processing | | 3.5% |
Producer Durables | | 5.4% |
Technology | | 16.5% |
Utilities | | 1.7% |
Cash Equivalents | | 6.0% |
| | |
| | 103.8% |
| | |
| |
| Mid Cap Growth Fund | | Percentage
of net assets |
Consumer Discretionary | | 11.8% |
Consumer Staples | | 1.7% |
Energy | | 9.5% |
Financials | | 5.5% |
Health Care | | 7.9% |
Industrials | | 12.7% |
Information Technology | | 28.3% |
Materials | | 9.0% |
Exchange Traded Funds | | 3.5% |
Cash Equivalents | | 16.7% |
| | |
| | 106.6% |
| | |
| |
| Small Cap Fund | | Percentage
of net assets |
Consumer Discretionary | | 15.4% |
Consumer Staples | | 5.2% |
Energy | | 5.2% |
Financials | | 9.2% |
Health Care | | 8.6% |
Industrials | | 20.6% |
Information Technology | | 29.5% |
Materials | | 1.7% |
Utilities | | 0.9% |
Exchange Traded Funds | | 2.4% |
Cash Equivalents | | 13.8% |
| | |
| | 112.5% |
| | |
| | |
| International Equity Fund | | Percentage
of net assets |
Australia | | 6.9% |
Austria | | 0.8% |
Belgium | | 0.7% |
Brazil | | 2.6% |
Canada | | 4.3% |
China | | 2.4% |
Czech Republic | | 1.2% |
Denmark | | 0.6% |
Finland | | 0.5% |
France | | 10.4% |
Germany | | 7.3% |
Greece | | 0.3% |
Hong Kong | | 2.7% |
Hungary | | 0.6% |
India | | 1.1% |
Indonesia | | 0.1% |
Ireland | | 0.6% |
Italy | | 2.6% |
Japan | | 9.8% |
Korea (South) | | 2.8% |
Mexico | | 0.9% |
Netherlands | | 3.7% |
Norway | | 1.0% |
Poland | | 0.3% |
Portugal | | 0.1% |
Russia | | 2.2% |
Singapore | | 0.7% |
South Africa | | 0.8% |
Spain | | 4.0% |
Sweden | | 1.3% |
Switzerland | | 5.9% |
Taiwan | | 0.7% |
Ukraine | | 0.2% |
United Kingdom | | 13.3% |
United States | | 0.1% |
Exchange Traded Funds | | 5.0% |
Cash Equivalents | | 2.4% |
| | |
| | 100.9% |
| | |
| |
| Special Opportunities Equity Fund | | Percentage
of net assets |
Consumer Discretionary | | 6.0% |
Consumer Staples | | 2.0% |
Energy | | 11.3% |
Financials | | 1.7% |
Health Care | | 26.7%
|
Industrials | | 6.3% |
Information Technology | | 27.1% |
Materials | | 3.3% |
Cash Equivalents | | 16.9% |
| | |
| | 101.3% |
| | |
| |
| Equity Income Fund | | Percentage
of net assets |
Consumer Discretionary | | 7.9% |
Consumer Staples | | 18.3% |
Energy | | 20.0% |
Financials | | 5.9% |
Health Care | | 11.5% |
Industrials | | 7.7% |
Information Technology | | 13.8% |
Telecommunication Services | | 3.4% |
Utilities | | 3.8% |
Cash Equivalents | | 16.2% |
| | |
| | 108.5% |
| | |
42
Summary of Portfolio Holdings (Unaudited)
| | |
| Short U.S. Government Fund | | Percentage of net assets |
Corporate Bonds | | 4.9% |
Fannie Mae | | 22.6% |
FDIC Guaranteed Securities | | 7.2% |
Federal Farm Credit Bank | | 12.8% |
Federal Home Loan Bank | | 11.4% |
Freddie Mac | | 22.9% |
Ginnie Mae | | 2.1% |
Municipal Bonds | | 5.8% |
U.S. Treasury Notes | | 5.9% |
Cash Equivalents | | 8.5% |
| | |
| | 104.1% |
| | |
| |
| Intermediate U.S. Government Fund | | Percentage of net assets |
Collateralized Mortgage Obligations | | 0.5% |
Corporate Bonds | | 4.1% |
Fannie Mae | | 40.1% |
FDIC Guaranteed Securities | | 2.7% |
Federal Farm Credit Bank | | 5.4% |
Federal Home Loan Bank | | 10.6% |
Freddie Mac | | 12.8% |
Private Export Funding Corp. | | 5.3% |
U.S. Treasury Bills | | 5.2% |
U.S. Treasury Notes | | 8.3% |
Cash Equivalents | | 6.2% |
| | |
| | 101.2% |
| | |
| |
| Total Return Bond Fund | | Percentage of net assets |
Asset Backed Securities | | 9.2% |
Collateralized Mortgage Obligations | | 5.8% |
Commercial Mortgage-Backed Securities | | 8.1% |
Corporate Bonds | | 33.8% |
Fannie Mae | | 17.8% |
Freddie Mac | | 19.3% |
Ginnie Mae | | 2.0% |
Municipal Bonds | | 6.3% |
U.S. Treasury Notes | | 0.2% |
Cash Equivalents | | 0.3% |
| | |
| | 102.8% |
| | |
| |
| Kentucky Intermediate Tax-Free Fund | | Percentage of net assets |
Kentucky Municipal Bonds | | 94.4% |
Cash Equivalents | | 4.6% |
| | |
| | 99.0% |
| | |
| |
| Maryland Intermediate Tax-Free Fund | | Percentage of net assets |
District of Columbia Municipal Bonds | | 3.7% |
Maryland Municipal Bonds | | 89.5% |
Cash Equivalents | | 5.9% |
| | |
| | 99.1% |
| | |
| |
| North Carolina Intermediate Tax-Free Fund | | Percentage
of net assets |
North Carolina Municipal Bonds | | 95.0% |
Cash Equivalents | | 8.0% |
| | |
| | 103.0% |
| | |
| | |
| South Carolina Intermediate Tax-Free Fund | | Percentage of net assets |
South Carolina Municipal Bonds | | 96.3% |
Cash Equivalents | | 3.5% |
| | |
| | 99.8% |
| | |
| |
| Virginia Intermediate Tax-Free Fund | | Percentage of net assets |
Virginia Municipal Bonds | | 97.4% |
Cash Equivalents | | 1.6% |
| | |
| | 99.0% |
| | |
| |
| West Virginia Intermediate Tax-Free Fund | | Percentage
of net assets |
West Virginia Municipal Bonds | | 97.9% |
Cash Equivalents | | 1.2% |
| | |
| | 99.1% |
| | |
| |
| National Tax-Free Money Market Fund | | Percentage of net assets |
Arizona | | 6.8% |
Colorado | | 2.5% |
Connecticut | | 1.8% |
Florida | | 6.1% |
Georgia | | 13.6% |
Illinois | | 6.5% |
Indiana | | 2.0% |
Maine | | 1.9% |
Massachusetts | | 0.8% |
Mississippi | | 1.3% |
Missouri | | 5.1% |
New Jersey | | 1.4% |
New York | | 0.5% |
North Carolina | | 2.4% |
Ohio | | 15.0% |
Pennsylvania | | 4.3% |
Tennessee | | 0.8% |
Texas | | 2.9% |
Utah | | 3.5% |
Virginia | | 13.1% |
Washington | | 4.5% |
Wisconsin | | 3.1% |
Cash Equivalents | | 0.0% |
| | |
| | 99.9% |
| | |
| |
| Prime Money Market Fund | | Percentage of net assets |
Asset Backed Securities | | 3.3% |
Certificates of Deposit | | 34.7% |
Commercial Paper | | 39.5% |
Corporate Bonds | | 0.8% |
Federal Home Loan Bank | | 6.9% |
Repurchase Agreement | | 8.8% |
Variable Rate Notes | | 6.0% |
| | |
| | 100.0% |
| | |
| |
| U.S. Treasury Money Market Fund | | Percentage of net assets |
Repurchase Agreements | | 48.3% |
U.S. Treasury Bills | | 34.9% |
U.S. Treasury Notes | | 16.7% |
Cash Equivalents | | 3.4% |
| | |
| | 103.3% |
| | |
43
Summary of Portfolio Holdings (Unaudited)
| | |
| Capital Manager Conservative Growth Fund | | |
BB&T Equity Income Fund | | 4.0% |
BB&T International Equity Fund | | 9.5% |
BB&T Large Cap Fund | | 3.6% |
BB&T Mid Cap Growth Fund | | 3.6% |
BB&T Mid Cap Value Fund | | 5.4% |
BB&T Special Opportunities Equity Fund | | 2.0% |
BB&T Total Return Bond Fund | | 55.0% |
BB&T U.S. Treasury Money Market Fund | | 2.7% |
Exchange Traded Funds | | 11.7% |
Cash Equivalents | | 2.1% |
| | |
| | 99.6% |
| | |
| |
| Capital Manager Moderate Growth Fund | | Percentage of Net Assets |
BB&T Equity Income Fund | | 6.5% |
BB&T International Equity Fund | | 15.5% |
BB&T Large Cap Fund | | 5.9% |
BB&T Mid Cap Growth Fund | | 5.9% |
BB&T Mid Cap Value Fund | | 8.8% |
BB&T Special Opportunities Equity Fund | | 3.2% |
BB&T Total Return Bond Fund | | 29.0% |
BB&T U.S. Treasury Money Market Fund | | 2.6% |
Exchange Traded Funds | | 19.1% |
Cash Equivalents | | 3.1% |
| | |
| | 99.6% |
| | |
| | |
| Capital Manager Growth Fund | | |
BB&T Equity Income Fund | | 7.9% |
BB&T International Equity Fund | | 19.1% |
BB&T Large Cap Fund | | 7.2% |
BB&T Mid Cap Growth Fund | | 7.3% |
BB&T Mid Cap Value Fund | | 10.9% |
BB&T Special Opportunities Equity Fund | | 4.0% |
BB&T Total Return Bond Fund | | 13.3% |
BB&T U.S. Treasury Money Market Fund | | 2.4% |
Exchange Traded Funds | | 23.4% |
Cash Equivalents | | 3.9% |
| | |
| | 99.4% |
| | |
| |
| Capital Manager Equity Fund | | |
BB&T Equity Income Fund | | 9.2% |
BB&T International Equity Fund | | 22.0% |
BB&T Large Cap Fund | | 8.3% |
BB&T Mid Cap Growth Fund | | 8.4% |
BB&T Mid Cap Value Fund | | 12.5% |
BB&T Special Opportunities Equity Fund | | 4.6% |
BB&T U.S. Treasury Money Market Fund | | 0.4% |
Exchange Traded Funds | | 27.0% |
Cash Equivalents | | 5.0% |
| | |
| | 97.4% |
| | |
44
Expense Example (Unaudited)
As a shareholder of the BB&T Funds (each a “Fund” and collectively, the “Funds”), you incur two types of costs: (1) transaction costs, including sales charges (loads) on purchases and (2) ongoing costs, including management fees; distribution and/or service (12b-1) fees; and other Fund expenses.
These examples are intended to help you understand your ongoing costs (in dollars) of investing in the Funds’ and to compare these costs with the ongoing costs of investing in other mutual funds. These examples are based on an investment of $1,000 invested at the beginning of the period and held for the entire period from April 1, 2009 through September 30, 2009.
Actual Example
The table below provides information about actual account values and actual expenses. You may use the information below, together with the amount you invested, to estimate the expenses that you paid over the period. Simply divide your account value by $1,000 (for example, an $8,600 account value divided by $1,000 = 8.6), then multiply the result by the number in the table under the heading entitled “Expenses Paid During Period” to estimate the expenses you paid on your account during this period.
| | | | | | | | |
| | | Beginning
Account Value
4/1/09 | | Ending
Account Value
9/30/09 | | Expenses Paid
During Period*
4/1/09 - 9/30/09 | | Annualized
Expense Ratio
During Period
4/1/09 - 9/30/09 |
Large Cap Fund | | | | | | | | |
Class A Shares | | $1,000.00 | | $1,293.00 | | $ 5.86 | | 1.02% |
Class B Shares | | 1,000.00 | | 1,289.20 | | 10.16 | | 1.77% |
Class C Shares | | 1,000.00 | | 1,288.00 | | 10.16 | | 1.77% |
Institutional Shares | | 1,000.00 | | 1,295.90 | | 4.43 | | 0.77% |
Mid Cap Value Fund | | | | | | | | |
Class A Shares | | 1,000.00 | | 1,470.70 | | 7.43 | | 1.20% |
Class B Shares | | 1,000.00 | | 1,463.90 | | 12.04 | | 1.95% |
Class C Shares | | 1,000.00 | | 1,466.70 | | 12.06 | | 1.95% |
Institutional Shares | | 1,000.00 | | 1,473.50 | | 5.89 | | 0.95% |
Mid Cap Growth Fund | | | | | | | | |
Class A Shares | | 1,000.00 | | 1,320.60 | | 7.21 | | 1.24% |
Class B Shares | | 1,000.00 | | 1,316.60 | | 11.56 | | 1.99% |
Class C Shares | | 1,000.00 | | 1,316.10 | | 11.44 | | 1.97% |
Institutional Shares | | 1,000.00 | | 1,322.50 | | 5.76 | | 0.99% |
Small Cap Fund | | | | | | | | |
Class A Shares | | 1,000.00 | | 1,259.00 | | 7.93 | | 1.40% |
Class B Shares | | 1,000.00 | | 1,254.40 | | 12.15 | | 2.15% |
Class C Shares | | 1,000.00 | | 1,255.10 | | 12.04 | | 2.13% |
Institutional Shares | | 1,000.00 | | 1,261.60 | | 6.52 | | 1.15% |
International Equity Fund | | | | | | | | |
Class A Shares | | 1,000.00 | | 1,440.60 | | 10.34 | | 1.69% |
Class B Shares | | 1,000.00 | | 1,436.50 | | 14.90 | | 2.44% |
Class C Shares | | 1,000.00 | | 1,431.40 | | 14.87 | | 2.44% |
Institutional Shares | | 1,000.00 | | 1,439.80 | | 8.81 | | 1.44% |
Special Opportunities Equity Fund | | | | | | | | |
Class A Shares | | 1,000.00 | | 1,330.30 | | 7.48 | | 1.28% |
Class B Shares | | 1,000.00 | | 1,326.70 | | 11.84 | | 2.03% |
Class C Shares | | 1,000.00 | | 1,325.40 | | 11.84 | | 2.03% |
Institutional Shares | | 1,000.00 | | 1,332.00 | | 6.02 | | 1.03% |
Equity Income Fund | | | | | | | | |
Class A Shares | | 1,000.00 | | 1,255.10 | | 6.67 | | 1.18% |
Class B Shares | | 1,000.00 | | 1,250.30 | | 10.89 | | 1.93% |
Class C Shares | | 1,000.00 | | 1,249.90 | | 10.89 | | 1.93% |
Institutional Shares | | 1,000.00 | | 1,256.30 | | 5.26 | | 0.93% |
Short U.S. Government Fund | | | | | | | | |
Class A Shares | | 1,000.00 | | 1,012.80 | | 4.79 | | 0.95% |
Institutional Shares | | 1,000.00 | | 1,015.10 | | 3.54 | | 0.70% |
Intermediate U.S. Government Fund | | | | | | | | |
Class A Shares | | 1,000.00 | | 1,022.30 | | 4.87 | | 0.96% |
Class B Shares | | 1,000.00 | | 1,017.50 | | 8.65 | | 1.71% |
Class C Shares | | 1,000.00 | | 1,017.50 | | 8.65 | | 1.71% |
Institutional Shares | | 1,000.00 | | 1,023.60 | | 3.60 | | 0.71% |
Total Return Bond Fund | | | | | | | | |
Class A Shares | | 1,000.00 | | 1,095.10 | | 5.09 | | 0.97% |
Class B Shares | | 1,000.00 | | 1,092.00 | | 9.02 | | 1.72% |
Class C Shares | | 1,000.00 | | 1,091.90 | | 9.02 | | 1.72% |
Institutional Shares | | 1,000.00 | | 1,097.40 | | 3.79 | | 0.72% |
Kentucky Intermediate Tax-Free Fund | | | | | | | | |
Class A Shares | | 1,000.00 | | 1,062.10 | | 4.86 | | 0.94% |
Institutional Shares | | 1,000.00 | | 1,063.40 | | 3.57 | | 0.69% |
45
Expense Example (Unaudited)
| | | | | | | | | | | | | | | | | | | | | | |
| | | | | Beginning
Account Value
4/1/09 | | | | | | Ending
Account Value
9/30/09 | | | | | | Expenses Paid
During Period*
4/1/09 - 9/30/09 | | | | | | Annualized
Expense Ratio
During Period
4/1/09 - 9/30/09 |
Maryland Intermediate Tax-Free Fund | | | | | | | | | | | | | | | | | | | | | | |
Class A Shares | | | | $1,000.00 | | | | | | $1,060.90 | | | | | | $4.91 | | | | | | 0.95% |
Institutional Shares | | | | 1,000.00 | | | | | | 1,062.20 | | | | | | 3.62 | | | | | | 0.70% |
North Carolina Intermediate Tax-Free Fund | | | | | | | | | | | | | | | | | | | | | | |
Class A Shares | | | | 1,000.00 | | | | | | 1,064.40 | | | | | | 4.81 | | | | | | 0.93% |
Institutional Shares | | | | 1,000.00 | | | | | | 1,065.80 | | | | | | 3.52 | | | | | | 0.68% |
South Carolina Intermediate Tax-Free Fund | | | | | | | | | | | | | | | | | | | | | | |
Class A Shares | | | | 1,000.00 | | | | | | 1,063.00 | | | | | | 5.17 | | | | | | 1.00% |
Institutional Shares | | | | 1,000.00 | | | | | | 1,064.70 | | | | | | 3.88 | | | | | | 0.75% |
Virginia Intermediate Tax-Free Fund | | | | | | | | | | | | | | | | | | | | | | |
Class A Shares | | | | 1,000.00 | | | | | | 1,053.30 | | | | | | 4.79 | | | | | | 0.93% |
Institutional Shares | | | | 1,000.00 | | | | | | 1,054.60 | | | | | | 3.55 | | | | | | 0.69% |
West Virginia Intermediate Tax-Free Fund | | | | | | | | | | | | | | | | | | | | | | |
Class A Shares | | | | 1,000.00 | | | | | | 1,062.20 | | | | | | 4.91 | | | | | | 0.95% |
Institutional Shares | | | | 1,000.00 | | | | | | 1,063.50 | | | | | | 3.62 | | | | | | 0.70% |
National Tax-Free Money Market Fund | | | | | | | | | | | | | | | | | | | | | | |
Class A Shares | | | | 1,000.00 | | | | | | 1,002.40 | | | | | | 3.56 | | | | | | 0.71% |
Institutional Shares | | | | 1,000.00 | | | | | | 1,003.70 | | | | | | 2.31 | | | | | | 0.46% |
Prime Money Market Fund | | | | | | | | | | | | | | | | | | | | | | |
Class A Shares | | | | 1,000.00 | | | | | | 1,000.20 | | | | | | 4.21 | | | | | | 0.84% |
Class B Shares | | | | 1,000.00 | | | | | | 1,000.10 | | | | | | 4.26 | | | | | | 0.85% |
Class C Shares | | | | 1,000.00 | | | | | | 1,000.10 | | | | | | 4.41 | | | | | | 0.88% |
Institutional Shares | | | | 1,000.00 | | | | | | 1,001.60 | | | | | | 2.71 | | | | | | 0.54% |
U.S. Treasury Money Market Fund | | | | | | | | | | | | | | | | | | | | | | |
Class A Shares | | | | 1,000.00 | | | | | | 1,000.10 | | | | | | 1.15 | | | | | | 0.23% |
Class B Shares | | | | 1,000.00 | | | | | | 1,000.10 | | | | | | 1.10 | | | | | | 0.22% |
Class C Shares | | | | 1,000.00 | | | | | | 1,000.10 | | | | | | 1.10 | | | | | | 0.22% |
Institutional Shares | | | | 1,000.00 | | | | | | 1,000.10 | | | | | | 1.10 | | | | | | 0.22% |
Capital Manager Conservative Growth Fund | | | | | | | | | | | | | | | | | | | | | | |
Class A Shares | | | | 1,000.00 | | | | | | 1,202.10 | | | | | | 1.99 | | | | | | 0.36% |
Class B Shares | | | | 1,000.00 | | | | | | 1,195.90 | | | | | | 6.17 | | | | | | 1.12% |
Class C Shares | | | | 1,000.00 | | | | | | 1,197.00 | | | | | | 6.11 | | | | | | 1.11% |
Institutional Shares | | | | 1,000.00 | | | | | | 1,202.90 | | | | | | 0.66 | | | | | | 0.12% |
Capital Manager Moderate Growth Fund | | | | | | | | | | | | | | | | | | | | | | |
Class A Shares | | | | 1,000.00 | | | | | | 1,260.60 | | | | | | 2.04 | | | | | | 0.36% |
Class B Shares | | | | 1,000.00 | | | | | | 1,256.50 | | | | | | 6.28 | | | | | | 1.11% |
Class C Shares | | | | 1,000.00 | | | | | | 1,256.80 | | | | | | 6.28 | | | | | | 1.11% |
Institutional Shares | | | | 1,000.00 | | | | | | 1,262.50 | | | | | | 0.62 | | | | | | 0.11% |
Capital Manager Growth Fund | | | | | | | | | | | | | | | | | | | | | | |
Class A Shares | | | | 1,000.00 | | | | | | 1,301.90 | | | | | | 2.14 | | | | | | 0.37% |
Class B Shares | | | | 1,000.00 | | | | | | 1,296.30 | | | | | | 6.45 | | | | | | 1.12% |
Class C Shares | | | | 1,000.00 | | | | | | 1,295.80 | | | | | | 6.39 | | | | | | 1.11% |
Institutional Shares | | | | 1,000.00 | | | | | | 1,302.90 | | | | | | 0.69 | | | | | | 0.12% |
Capital Manager Equity Fund | | | | | | | | | | | | | | | | | | | | | | |
Class A Shares | | | | 1,000.00 | | | | | | 1,354.00 | | | | | | 2.54 | | | | | | 0.43% |
Class B Shares | | | | 1,000.00 | | | | | | 1,349.40 | | | | | | 6.95 | | | | | | 1.18% |
Class C Shares | | | | 1,000.00 | | | | | | 1,350.70 | | | | | | 6.66 | | | | | | 1.13% |
Institutional Shares | | | | 1,000.00 | | | | | | 1,356.40 | | | | | | 1.06 | | | | | | 0.18% |
| * | Expenses are equal to the average account value over the period multiplied by the Fund’s annualized expense ratio, multiplied by the number of days in the most recent fiscal half-year divided by the number of days in the fiscal year (to reflect the one-half year period). |
46
Expense Example (Unaudited)
Hypothetical Example for Comparison Purposes
The table below provides information about hypothetical account values and hypothetical expenses based on the Funds’actual expense ratio and an assumed rate of return of 5% per year before expenses, which is not the Fund’s actual return. The hypothetical account values and expenses may not be used to estimate the actual ending account balance or expenses you paid for the period. You may use this information to compare the ongoing costs of investing in a Fund and other funds. To do so, compare this 5% hypothetical example with the 5% hypothetical examples that appear in the shareholder reports of other funds.
Please note that the expenses shown in the table are meant to highlight your ongoing costs only and do not reflect any transactional costs, such as sales charges (loads), redemption fees, or exchange fees. Therefore, the table is useful in comparing ongoing costs only, and will not help you determine the relative total costs of owning different funds. In addition, if these transactional costs were included, your costs would have been higher.
| | | | | | | | | | | | | | | | | | | | | | |
| | | | | Beginning
Account Value
4/1/09 | | | | | | Ending
Account Value
9/30/09 | | | | | | Expenses Paid
During Period*
4/1/09 - 9/30/09 | | | | | | Annualized
Expense Ratio
During Period
4/1/09 - 9/30/09 |
Large Cap Fund | | | | | | | | | | | | | | | | | | | | | | |
Class A Shares | | | | $1,000.00 | | | | | | $1,019.95 | | | | | | $ 5.16 | | | | | | 1.02% |
Class B Shares | | | | 1,000.00 | | | | | | 1,016.19 | | | | | | 8.95 | | | | | | 1.77% |
Class C Shares | | | | 1,000.00 | | | | | | 1,016.19 | | | | | | 8.95 | | | | | | 1.77% |
Institutional Shares | | | | 1,000.00 | | | | | | 1,021.21 | | | | | | 3.90 | | | | | | 0.77% |
Mid Cap Value Fund | | | | | | | | | | | | | | | | | | | | | | |
Class A Shares | | | | 1,000.00 | | | | | | 1,019.05 | | | | | | 6.07 | | | | | | 1.20% |
Class B Shares | | | | 1,000.00 | | | | | | 1,015.29 | | | | | | 9.85 | | | | | | 1.95% |
Class C Shares | | | | 1,000.00 | | | | | | 1,015.29 | | | | | | 9.85 | | | | | | 1.95% |
Institutional Shares | | | | 1,000.00 | | | | | | 1,020.31 | | | | | | 4.81 | | | | | | 0.95% |
Mid Cap Growth Fund | | | | | | | | | | | | | | | | | | | | | | |
Class A Shares | | | | 1,000.00 | | | | | | 1,018.85 | | | | | | 6.28 | | | | | | 1.24% |
Class B Shares | | | | 1,000.00 | | | | | | 1,015.09 | | | | | | 10.05 | | | | | | 1.99% |
Class C Shares | | | | 1,000.00 | | | | | | 1,015.19 | | | | | | 9.95 | | | | | | 1.97% |
Institutional Shares | | | | 1,000.00 | | | | | | 1,020.10 | | | | | | 5.01 | | | | | | 0.99% |
Small Cap Fund | | | | | | | | | | | | | | | | | | | | | | |
Class A Shares | | | | 1,000.00 | | | | | | 1,018.05 | | | | | | 7.08 | | | | | | 1.40% |
Class B Shares | | | | 1,000.00 | | | | | | 1,014.29 | | | | | | 10.86 | | | | | | 2.15% |
Class C Shares | | | | 1,000.00 | | | | | | 1,014.39 | | | | | | 10.76 | | | | | | 2.13% |
Institutional Shares | | | | 1,000.00 | | | | | | 1,019.30 | | | | | | 5.82 | | | | | | 1.15% |
International Equity Fund | | | | | | | | | | | | | | | | | | | | | | |
Class A Shares | | | | 1,000.00 | | | | | | 1,016.60 | | | | | | 8.54 | | | | | | 1.69% |
Class B Shares | | | | 1,000.00 | | | | | | 1,012.84 | | | | | | 12.31 | | | | | | 2.44% |
Class C Shares | | | | 1,000.00 | | | | | | 1,012.84 | | | | | | 12.31 | | | | | | 2.44% |
Institutional Shares | | | | 1,000.00 | | | | | | 1,017.85 | | | | | | 7.28 | | | | | | 1.44% |
Special Opportunities Equity Fund | | | | | | | | | | | | | | | | | | | | | | |
Class A Shares | | | | 1,000.00 | | | | | | 1,018.65 | | | | | | 6.48 | | | | | | 1.28% |
Class B Shares | | | | 1,000.00 | | | | | | 1,014.89 | | | | | | 10.25 | | | | | | 2.03% |
Class C Shares | | | | 1,000.00 | | | | | | 1,014.89 | | | | | | 10.25 | | | | | | 2.03% |
Institutional Shares | | | | 1,000.00 | | | | | | 1,019.90 | | | | | | 5.22 | | | | | | 1.03% |
Equity Income Fund | | | | | | | | | | | | | | | | | | | | | | |
Class A Shares | | | | 1,000.00 | | | | | | 1,019.15 | | | | | | 5.97 | | | | | | 1.18% |
Class B Shares | | | | 1,000.00 | | | | | | 1,015.39 | | | | | | 9.75 | | | | | | 1.93% |
Class C Shares | | | | 1,000.00 | | | | | | 1,015.39 | | | | | | 9.75 | | | | | | 1.93% |
Institutional Shares | | | | 1,000.00 | | | | | | 1,020.41 | | | | | | 4.71 | | | | | | 0.93% |
Short U.S. Government Fund | | | | | | | | | | | | | | | | | | | | | | |
Class A Shares | | | | 1,000.00 | | | | | | 1,020.31 | | | | | | 4.81 | | | | | | 0.95% |
Institutional Shares | | | | 1,000.00 | | | | | | 1,021.56 | | | | | | 3.55 | | | | | | 0.70% |
Intermediate U.S. Government Fund | | | | | | | | | | | | | | | | | | | | | | |
Class A Shares | | | | 1,000.00 | | | | | | 1,020.26 | | | | | | 4.86 | | | | | | 0.96% |
Class B Shares | | | | 1,000.00 | | | | | | 1,016.50 | | | | | | 8.64 | | | | | | 1.71% |
Class C Shares | | | | 1,000.00 | | | | | | 1,016.50 | | | | | | 8.64 | | | | | | 1.71% |
Institutional Shares | | | | 1,000.00 | | | | | | 1,021.51 | | | | | | 3.60 | | | | | | 0.71% |
Total Return Bond Fund | | | | | | | | | | | | | | | | | | | | | | |
Class A Shares | | | | 1,000.00 | | | | | | 1,020.21 | | | | | | 4.91 | | | | | | 0.97% |
Class B Shares | | | | 1,000.00 | | | | | | 1,016.44 | | | | | | 8.69 | | | | | | 1.72% |
Class C Shares | | | | 1,000.00 | | | | | | 1,016.44 | | | | | | 8.69 | | | | | | 1.72% |
Institutional Shares | | | | 1,000.00 | | | | | | 1,021.46 | | | | | | 3.65 | | | | | | 0.72% |
Kentucky Intermediate Tax-Free Fund | | | | | | | | | | | | | | | | | | | | | | |
Class A Shares | | | | 1,000.00 | | | | | | 1,020.36 | | | | | | 4.76 | | | | | | 0.94% |
Institutional Shares | | | | 1,000.00 | | | | | | 1,021.61 | | | | | | 3.50 | | | | | | 0.69% |
47
Expense Example (Unaudited)
| | | | | | | | | | | | | | | | | | | | | | |
| | | | | Beginning
Account Value
4/1/09 | | | | | | Ending
Account Value
9/30/09 | | | | | | Expenses Paid
During Period*
4/1/09 - 9/30/09 | | | | | | Annualized
Expense Ratio
During Period
4/1/09 - 9/30/09 |
Maryland Intermediate Tax-Free Fund | | | | | | | | | | | | | | | | | | | | | | |
Class A Shares | | | | $1,000.00 | | | | | | $1,020.31 | | | | | | $4.81 | | | | | | 0.95% |
Institutional Shares | | | | 1,000.00 | | | | | | 1,021.56 | | | | | | 3.55 | | | | | | 0.70% |
North Carolina Intermediate Tax-Free Fund | | | | | | | | | | | | | | | | | | | | | | |
Class A Shares | | | | 1,000.00 | | | | | | 1,020.41 | | | | | | 4.71 | | | | | | 0.93% |
Institutional Shares | | | | 1,000.00 | | | | | | 1,021.66 | | | | | | 3.45 | | | | | | 0.68% |
South Carolina Intermediate Tax-Free Fund | | | | | | | | | | | | | | | | | | | | | | |
Class A Shares | | | | 1,000.00 | | | | | | 1,020.05 | | | | | | 5.06 | | | | | | 1.00% |
Institutional Shares | | | | 1,000.00 | | | | | | 1,021.31 | | | | | | 3.80 | | | | | | 0.75% |
Virginia Intermediate Tax-Free Fund | | | | | | | | | | | | | | | | | | | | | | |
Class A Shares | | | | 1,000.00 | | | | | | 1,020.41 | | | | | | 4.71 | | | | | | 0.93% |
Institutional Shares | | | | 1,000.00 | | | | | | 1,021.61 | | | | | | 3.50 | | | | | | 0.69% |
West Virginia Intermediate Tax-Free Fund | | | | | | | | | | | | | | | | | | | | | | |
Class A Shares | | | | 1,000.00 | | | | | | 1,020.31 | | | | | | 4.81 | | | | | | 0.95% |
Institutional Shares | | | | 1,000.00 | | | | | | 1,021.56 | | | | | | 3.55 | | | | | | 0.70% |
National Tax-Free Money Market Fund | | | | | | | | | | | | | | | | | | | | | | |
Class A Shares | | | | 1,000.00 | | | | | | 1,021.51 | | | | | | 3.60 | | | | | | 0.71% |
Institutional Shares | | | | 1,000.00 | | | | | | 1,022.76 | | | | | | 2.33 | | | | | | 0.46% |
Prime Money Market Fund | | | | | | | | | | | | | | | | | | | | | | |
Class A Shares | | | | 1,000.00 | | | | | | 1,020.86 | | | | | | 4.26 | | | | | | 0.84% |
Class B Shares | | | | 1,000.00 | | | | | | 1,020.81 | | | | | | 4.31 | | | | | | 0.85% |
Class C Shares | | | | 1,000.00 | | | | | | 1,020.66 | | | | | | 4.46 | | | | | | 0.88% |
Institutional Shares | | | | 1,000.00 | | | | | | 1,022.36 | | | | | | 2.74 | | | | | | 0.54% |
U.S. Treasury Money Market Fund | | | | | | | | | | | | | | | | | | | | | | |
Class A Shares | | | | 1,000.00 | | | | | | 1,023.92 | | | | | | 1.17 | | | | | | 0.23% |
Class B Shares | | | | 1,000.00 | | | | | | 1,023.97 | | | | | | 1.12 | | | | | | 0.22% |
Class C Shares | | | | 1,000.00 | | | | | | 1,023.97 | | | | | | 1.12 | | | | | | 0.22% |
Institutional Shares | | | | 1,000.00 | | | | | | 1,023.97 | | | | | | 1.12 | | | | | | 0.22% |
Capital Manager Conservative Growth Fund | | | | | | | | | | | | | | | | | | | | | | |
Class A Shares | | | | 1,000.00 | | | | | | 1,023.26 | | | | | | 1.83 | | | | | | 0.36% |
Class B Shares | | | | 1,000.00 | | | | | | 1,019.45 | | | | | | 5.67 | | | | | | 1.12% |
Class C Shares | | | | 1,000.00 | | | | | | 1,019.50 | | | | | | 5.62 | | | | | | 1.11% |
Institutional Shares | | | | 1,000.00 | | | | | | 1,024.47 | | | | | | 0.61 | | | | | | 0.12% |
Capital Manager Moderate Growth Fund | | | | | | | | | | | | | | | | | | | | | | |
Class A Shares | | | | 1,000.00 | | | | | | 1,023.26 | | | | | | 1.83 | | | | | | 0.36% |
Class B Shares | | | | 1,000.00 | | | | | | 1,019.50 | | | | | | 5.62 | | | | | | 1.11% |
Class C Shares | | | | 1,000.00 | | | | | | 1,019.50 | | | | | | 5.62 | | | | | | 1.11% |
Institutional Shares | | | | 1,000.00 | | | | | | 1,024.52 | | | | | | 0.56 | | | | | | 0.11% |
Capital Manager Growth Fund | | | | | | | | | | | | | | | | | | | | | | |
Class A Shares | | | | 1,000.00 | | | | | | 1,023.21 | | | | | | 1.88 | | | | | | 0.37% |
Class B Shares | | | | 1,000.00 | | | | | | 1,019.45 | | | | | | 5.67 | | | | | | 1.12% |
Class C Shares | | | | 1,000.00 | | | | | | 1,019.50 | | | | | | 5.62 | | | | | | 1.11% |
Institutional Shares | | | | 1,000.00 | | | | | | 1,024.47 | | | | | | 0.61 | | | | | | 0.12% |
Capital Manager Equity Fund | | | | | | | | | | | | | | | | | | | | | | |
Class A Shares | | | | 1,000.00 | | | | | | 1,022.91 | | | | | | 2.18 | | | | | | 0.43% |
Class B Shares | | | | 1,000.00 | | | | | | 1,019.15 | | | | | | 5.97 | | | | | | 1.18% |
Class C Shares | | | | 1,000.00 | | | | | | 1,019.40 | | | | | | 5.72 | | | | | | 1.13% |
Institutional Shares | | | | 1,000.00 | | | | | | 1,024.17 | | | | | | 0.91 | | | | | | 0.18% |
| * | Expenses are equal to the average account value over the period multiplied by the Fund’s annualized expense ratio, multiplied by the number of days in the most recent fiscal half-year divided by the number of days in the fiscal year (to reflect the one-half year period). |
48
Schedule of Portfolio Investments
September 30, 2009
| | | | | | | | | |
Shares | | | | Fair Value |
COMMON STOCKS (97.6%) | | | | | |
| | | | Consumer Discretionary (6.9%) | | | | | |
| 440,510 | | | | Comcast Corp., Class A | | | | $ | 7,440,214 |
| 82,750 | | | | Johnson Controls, Inc.(a) | | | | | 2,115,090 |
| 107,260 | | | | Target Corp. | | | | | 5,006,897 |
| | | | | | | | | |
| | | | | | | | | 14,562,201 |
| | | | | | | | | |
| | | | Consumer Staples (2.7%) | | | | | |
| 44,046 | | | | Philip Morris International, Inc. | | | | | 2,146,802 |
| 73,382 | | | | Wal-Mart Stores, Inc. | | | | | 3,602,322 |
| | | | | | | | | |
| | | | | | | | | 5,749,124 |
| | | | | | | | | |
| | | | Energy (15.1%) | | | | | |
| 91,262 | | | | ConocoPhillips | | | | | 4,121,392 |
| 31,015 | | | | Devon Energy Corp. | | | | | 2,088,240 |
| 51,183 | | | | EOG Resources, Inc. | | | | | 4,274,292 |
| 88,282 | | | | Exxon Mobil Corp. | | | | | 6,057,028 |
| 92,523 | | | | Occidental Petroleum Corp. | | | | | 7,253,803 |
| 100,254 | | | | Schlumberger, Ltd. | | | | | 5,975,138 |
| 26,735 | | | | Transocean, Ltd.(b) | | | | | 2,286,645 |
| | | | | | | | | |
| | | | | | | | | 32,056,538 |
| | | | | | | | | |
| | | | Financials (21.4%) | | | | | |
| 159,436 | | | | Aflac, Inc. | | | | | 6,814,295 |
| 1,923 | | | | Berkshire Hathaway, Inc. Class B(b) | | | | | 6,390,129 |
| 330,116 | | | | Genworth Financial, Inc., Class A | | | | | 3,944,886 |
| 132,927 | | | | JPMorgan Chase & Co. | | | | | 5,824,861 |
| 138,682 | | | | Loews Corp. | | | | | 4,749,858 |
| 54,616 | | | | MetLife, Inc. | | | | | 2,079,231 |
| 238,584 | | | | Progressive Corp. (The)(b) | | | | | 3,955,723 |
| 68,365 | | | | T. Rowe Price Group, Inc. | | | | | 3,124,281 |
| 184,038 | | | | U.S. Bancorp | | | | | 4,023,071 |
| 159,124 | | | | Wells Fargo & Co. | | | | | 4,484,114 |
| | | | | | | | | |
| | | | | | | | | 45,390,449 |
| | | | | | | | | |
| | | | Health Care (12.2%) | | | | | |
| 55,787 | | | | Baxter International, Inc. | | | | | 3,180,417 |
| 68,447 | | | | Johnson & Johnson | | | | | 4,167,738 |
| 62,099 | | | | Medco Health Solutions, Inc.(b) | | | | | 3,434,696 |
| 82,562 | | | | Medtronic, Inc. | | | | | 3,038,282 |
| 145,093 | | | | Merck & Co., Inc. | | | | | 4,589,291 |
| 257,563 | | | | Pfizer, Inc. | | | | | 4,262,667 |
| 60,945 | | | | Teva Pharmaceutical Industries, Ltd., ADR | | | | | 3,081,379 |
| | | | | | | | | |
| | | | | | | | | 25,754,470 |
| | | | | | | | | |
| | | | Industrials (13.7%) | | | | | |
| 219,409 | | | | ABB, Ltd., ADR(b) | | | | | 4,396,956 |
| 326,510 | | | | General Electric Co. | | | | | 5,361,294 |
| 53,515 | | | | Illinois Tool Works, Inc. | | | | | 2,285,626 |
| 85,846 | | | | Ingersoll-Rand Co. PLC | | | | | 2,632,897 |
| 187,562 | | | | Kennametal, Inc. | | | | | 4,615,901 |
| 71,345 | | | | SPX Corp. | | | | | 4,371,308 |
| 258,489 | | | | Terex Corp.(b) | | | | | 5,358,477 |
| | | | | | | | | |
| | | | | | | | | 29,022,459 |
| | | | | | | | | |
| | | | | | | | | |
Shares | | | | Fair Value |
COMMON STOCKS — (continued) | | | | | |
| | | | Information Technology (16.5%) | | | |
| 64,187 | | | | Adobe Systems, Inc.(b) | | | | $ | 2,120,738 |
| 251,527 | | | | Cisco Systems, Inc.(b) | | | | | 5,920,946 |
| 208,373 | | | | eBay, Inc.(b) | | | | | 4,919,687 |
| 11,597 | | | | Google, Inc., Class A(b) | | | | | 5,750,372 |
| 324,873 | | | | Intel Corp. | | | | | 6,357,765 |
| 95,798 | | | | Microsoft Corp. | | | | | 2,480,210 |
| 112,666 | | | | QUALCOMM, Inc. | | | | | 5,067,717 |
| 93,419 | | | | Texas Instruments, Inc. | | | | | 2,213,096 |
| | | | | | | | | |
| | | | | | | | | 34,830,531 |
| | | | | | | | | |
| | | | Materials (6.5%) | | | | | |
| 189,923 | | | | Barrick Gold Corp. | | | | | 7,198,082 |
| 95,820 | | | | Freeport-McMoRan Copper & Gold, Inc. | | | | | 6,574,210 |
| | | | | | | | | |
| | | | | | | | | 13,772,292 |
| | | | | | | | | |
| | | | Utilities (2.6%) | | | | | |
| 367,270 | | | | AES Corp. (The)(b) | | | | | 5,442,941 |
| | | | | | | | | |
| | | | Total Common Stocks
(Cost $174,607,982) | | | | | 206,581,005 |
| | | | | | | | | |
INVESTMENT COMPANY (2.2%) | | | | | |
| 4,643,676 | | | | Federated Treasury Obligations Fund, Institutional Shares | | | | | 4,643,676 |
| | | | | | | | | |
| | | | Total Investment Company
(Cost $4,643,676) | | | | | 4,643,676 |
| | | | | | | | | |
| | | | |
Principal
Amount | | | | | | | | |
SHORT TERM INVESTMENTS (0.0%) | | | | | |
| $396,608 | | | | BNY Institutional Cash Reserve, Series B | | | | | 66,432 |
| | | | | | | | | |
| | | | Total Short Term Investments
(Cost $396,608) | | | | | 66,432 |
| | | | | | | | | |
Total Investments — 99.8%
(Cost $179,648,266) | | | | | 211,291,113 |
Net Other Assets (Liabilities) — 0.2% | | | | | 317,477 |
| | | | | | | | | |
NET ASSETS — 100.0% | | | | $ | 211,608,590 |
| | | | | | | | | |
| (a) | Represents that all or a portion of the security was on loan as of September 30, 2009. |
| (b) | Represents non-income producing security. |
ADR — American Depository Receipt
See accompanying notes to the financial statements.
49
Schedule of Portfolio Investments
September 30, 2009
| | | | | | | | | |
| Shares | | | | Fair Value |
COMMON STOCKS (97.8%) | | | | | |
| | | | Consumer Discretionary (20.4%) | | | | | |
| 233,450 | | | | Chico’s FAS, Inc.(a) | | | | $ | 3,034,850 |
| 392,950 | | | | eBay, Inc.(a) | | | | | 9,277,550 |
| 86,650 | | | | Gannett Co., Inc. | | | | | 1,083,992 |
| 123,850 | | | | International Speedway Corp., Class A | | | | | 3,414,544 |
| 1,059,800 | | | | Interpublic Group of Cos., Inc.(a) | | | | | 7,969,696 |
| 50,400 | | | | Kohl’s Corp.(a) | | | | | 2,875,320 |
| 87,700 | | | | Omnicom Group, Inc. | | | | | 3,239,638 |
| 298,030 | | | | Select Comfort Corp.(a) | | | | | 1,415,642 |
| 187,650 | | | | Universal Technical Institute, Inc.(a) | | | | | 3,696,705 |
| 279,700 | | | | Viacom, Inc., Class B(a) | | | | | 7,842,788 |
| | | | | | | | | |
| | | | | | | | | 43,850,725 |
| | | | | | | | | |
| | | | Energy (3.6%) | | | | | |
| 215,600 | | | | EXCO Resources, Inc.(a) | | | | | 4,029,564 |
| 189,500 | | | | Forest Oil Corp.(a) | | | | | 3,708,515 |
| | | | | | | | | |
| | | | | | | | | 7,738,079 |
| | | | | | | | | |
| | | | Financial Services (31.9%) | | | | | |
| 87,400 | | | | Alliance Data Systems Corp.(a)(b) | | | | | 5,338,392 |
| 231,800 | | | | Annaly Capital Management, Inc., REIT | | | | | 4,204,852 |
| 158,700 | | | | Aspen Insurance Holdings, Ltd. | | | | | 4,200,789 |
| 110,900 | | | | Assurant, Inc. | | | | | 3,555,454 |
| 143,300 | | | | Assured Guaranty, Ltd.(b) | | | | | 2,782,886 |
| 203,602 | | | | Endurance Specialty Holdings, Ltd.(b) | | | | | 7,425,365 |
| 250,650 | | | | Fair Isaac Corp. | | | | | 5,386,468 |
| 299,205 | | | | Fidelity National Information Services, Inc. | | | | | 7,632,720 |
| 268,500 | | | | Leucadia National Corp.(a) | | | | | 6,637,320 |
| 221,450 | | | | Marshall & Ilsley Corp. | | | | | 1,787,101 |
| 62,743 | | | | Mercury General Corp. | | | | | 2,270,042 |
| 38,900 | | | | MI Developments, Inc., Class A | | | | | 524,761 |
| 121,390 | | | | StanCorp Financial Group, Inc. | | | | | 4,900,514 |
| 425,850 | | | | Synovus Financial Corp. | | | | | 1,596,938 |
| 130,700 | | | | Waddell & Reed Financial, Inc., Class A | | | | | 3,718,415 |
| 226,600 | | | | Willis Group Holdings, Ltd. | | | | | 6,394,652 |
| | | | | | | | | |
| | | | | | | | | 68,356,669 |
| | | | | | | | | |
| | | | Health Care (14.8%) | | | | | |
| 109,700 | | | | Coventry Health Care, Inc.(a) | | | | | 2,189,612 |
| 176,254 | | | | Covidien PLC | | | | | 7,624,748 |
| 109,210 | | | | Genzyme Corp.(a) | | | | | 6,195,483 |
| 300,842 | | | | IMS Health, Inc. | | | | | 4,617,925 |
| 450,350 | | | | King Pharmaceuticals, Inc.(a) | | | | | 4,850,269 |
| 62,400 | | | | Wellpoint, Inc.(a) | | | | | 2,955,264 |
| 63,150 | | | | Zimmer Holdings, Inc.(a) | | | | | 3,375,368 |
| | | | | | | | | |
| | | | | | | | | 31,808,669 |
| | | | | | | | | |
| | | | Materials & Processing (3.5%) | | | | | |
| 270,425 | | | | Valspar Corp. | | | | | 7,439,392 |
| | | | | | | | | |
| | | | Producer Durables (5.4%) | | | | | |
| 125,250 | | | | General Dynamics Corp. | | | | | 8,091,150 |
| | | | | | | | | | |
| Shares | | | | Fair Value | |
COMMON STOCKS — (continued) | | | | | | |
| | | | Producer Durables — (continued) | | | | |
| 165,800 | | | | Lexmark International, Inc., Class A(a) | | | | $ | 3,571,332 | |
| | | | | | | | | | |
| | | | | | | | | 11,662,482 | |
| | | | | | | | | | |
| | | | Technology (16.5%) | | | | | | |
| 157,500 | | | | Affiliated Computer Services, Inc., Class A(a) | | | | | 8,531,775 | |
| 397,660 | | | | CA, Inc. | | | | | 8,744,543 | |
| 90,900 | | | | Computer Sciences Corp.(a) | | | | | 4,791,339 | |
| 433,950 | | | | EarthLink, Inc. | | | | | 3,649,520 | |
| 11,000 | | | | MicroStrategy, Inc., Class A(a) | | | | | 786,940 | |
| 138,600 | | | | Progress Software Corp.(a) | | | | | 3,139,290 | |
| 257,700 | | | | Synopsys, Inc.(a) | | | | | 5,777,634 | |
| | | | | | | | | | |
| | | | | | | | | 35,421,041 | |
| | | | | | | | | | |
| | | | Utilities (1.7%) | | | | | | |
| 137,100 | | | | Allegheny Energy, Inc. | | | | | 3,635,892 | |
| | | | | | | | | | |
| | | | Total Common Stocks
(Cost $202,868,354) | | | | | 209,912,949 | |
| | | | | | | | | | |
INVESTMENT COMPANY (2.3%) | | | | | | |
| 5,086,924 | | | | Federated Treasury Obligations Fund, Institutional Shares | | | | | 5,086,924 | |
| | | | | | | | | | |
| | | | Total Investment Company
(Cost $5,086,924) | | | | | 5,086,924 | |
| | | | | | | | | | |
| | | | |
Principal
Amount | | | | | | | | | |
SECURITIES HELD AS COLLATERAL FOR SECURITIES ON LOAN (3.7%) | | | | | | |
| $8,539,905 | | | | Pool of Various Securities | | | | | 7,917,784 | |
| | | | | | | | | | |
| | | | Total Securities Held as Collateral for Securities on Loan (Cost $8,539,905) | | | | | 7,917,784 | |
| | | | | | | | | | |
Total Investments — 103.8%
(Cost $216,495,183) | | | | | 222,917,657 | |
Net Other Assets (Liabilities) — (3.8)% | | | | | (8,240,337 | ) |
| | | | | | | | | | |
NET ASSETS — 100.0% | | | | $ | 214,677,320 | |
| | | | | | | | | | |
| (a) | Represents non-income producing security. |
| (b) | Represents that all or a portion of the security was on loan as of September 30, 2009. |
REIT — Real Estate Investment Trust
See accompanying notes to the financial statements.
50
Schedule of Portfolio Investments
September 30, 2009
| | | | | | | | | |
| Shares | | | | Fair Value |
COMMON STOCKS (86.4%) | | | |
| | | | Consumer Discretionary (11.8%) |
| 14,850 | | | | Amazon.com, Inc.(a) | | | | $ | 1,386,396 |
| 56,775 | | | | Cheesecake Factory (The)(a) | | | | | 1,051,473 |
| 41,400 | | | | Darden Restaurants, Inc. | | | | | 1,412,982 |
| 54,700 | | | | Guess?, Inc. | | | | | 2,026,088 |
| 39,850 | | | | JOS A Bank Clothiers, Inc.(a) | | | | | 1,784,084 |
| 31,800 | | | | P.F. Chang’s China Bistro, Inc.(a)(b) | | | | | 1,080,246 |
| 21,225 | | | | Polo Ralph Lauren Corp. | | | | | 1,626,260 |
| | | | | | | | | |
| | | | | | | | | 10,367,529 |
| | | | | | | | | |
| | | | Consumer Staples (1.7%) |
| 48,500 | | | | Whole Foods Market, Inc.(a)(b) | | | | | 1,478,765 |
| | | | | | | | | |
| | | | Energy (9.5%) |
| 40,925 | | | | Alpha Natural Resources, Inc.(a) | | | | | 1,436,467 |
| 21,450 | | | | Anadarko Petroleum Corp. | | | | | 1,345,558 |
| 71,150 | | | | EXCO Resources, Inc.(a) | | | | | 1,329,794 |
| 30,550 | | | | National Oilwell Varco, Inc.(a) | | | | | 1,317,621 |
| 31,025 | | | | Petroleo Brasileiro SA, ADR | | | | | 1,424,048 |
| 35,200 | | | | Southwestern Energy Co.(a) | | | | | 1,502,336 |
| | | | | | | | | |
| | | | | | | | | 8,355,824 |
| | | | | | | | | |
| | | | Financials (5.5%) |
| 4,425 | | | | CME Group, Inc. | | | | | 1,363,741 |
| 80,350 | | | | Knight Capital Group, Inc., Class A(a) | | | | | 1,747,612 |
| 36,000 | | | | Piper Jaffray Cos.(a) | | | | | 1,717,920 |
| | | | | | | | | |
| | | | | | | | | 4,829,273 |
| | | | | | | | | |
| | | | Health Care (7.9%) |
| 46,000 | | | | Alexion Pharmaceuticals, Inc.(a) | | | | | 2,048,840 |
| 16,300 | | | | Amedisys, Inc.(a)(b) | | | | | 711,169 |
| 24,425 | | | | Celgene Corp.(a) | | | | | 1,365,358 |
| 74,300 | | | | Mylan, Inc.(a)(b) | | | | | 1,189,543 |
| 44,550 | | | | Watson Pharmaceuticals, Inc.(a) | | | | | 1,632,312 |
| | | | | | | | | |
| | | | | | | | | 6,947,222 |
| | | | | | | | | |
| | | | Industrials (12.7%) |
| 49,350 | | | | Aecom Technology Corp.(a) | | | | | 1,339,359 |
| 57,250 | | | | Duoyuan Global Water, Inc., ADR(a)(b) | | | | | 1,906,425 |
| 37,200 | | | | Fluor Corp. | | | | | 1,891,620 |
| 103,800 | | | | McDermott International, Inc.(a) | | | | | 2,623,026 |
| 81,050 | | | | Orion Marine Group, Inc.(a) | | | | | 1,664,767 |
| 79,225 | | | | Quanta Services, Inc.(a) | | | | | 1,753,249 |
| | | | | | | | | |
| | | | | | | | | 11,178,446 |
| | | | | | | | | |
| | | | Information Technology (28.3%) |
| 100,000 | | | | Activision Blizzard, Inc.(a) | | | | | 1,239,000 |
| 79,100 | | | | Altera Corp. | | | | | 1,622,341 |
| 3,975 | | | | Baidu, Inc., ADR(a) | | | | | 1,554,424 |
| 26,000 | | | | Equinix, Inc.(a)(b) | | | | | 2,392,000 |
| 61,000 | | | | InterDigital, Inc.(a) | | | | | 1,412,760 |
| 111,300 | | | | Marvell Technology Group, Ltd.(a) | | | | | 1,801,947 |
| 150,500 | | | | Nuance Communications, Inc.(a) | | | | | 2,251,481 |
| 180,900 | | | | PMC - Sierra, Inc.(a) | | | | | 1,729,404 |
| 62,400 | | | | Red Hat, Inc.(a) | | | | | 1,724,736 |
| 79,700 | | | | Rovi Corp.(a) | | | | | 2,677,920 |
| | | | | | | | | | |
| Shares | | | | Fair Value | |
COMMON STOCKS — (continued) | | | | | | |
| | | | Information Technology — (continued) | |
| 45,200 | | | | Sina China Corp.(a)(b) | | | | $ | 1,715,792 | |
| 51,725 | | | | Synaptics, Inc.(a)(b) | | | | | 1,303,470 | |
| 55,700 | | | | Varian Semiconductor Equipment Associates, Inc.(a) | | | | | 1,829,188 | |
| 71,000 | | | | Xilinx, Inc. | | | | | 1,662,820 | |
| | | | | | | | | | |
| | | | | | | | | 24,917,283 | |
| | | | | | | | | | |
| | | | Materials (9.0%) | |
| 17,075 | | | | Air Products & Chemicals, Inc. | | | | | 1,324,679 | |
| 18,825 | | | | Freeport-McMoRan Copper & Gold, Inc. | | | | | 1,291,583 | |
| 31,725 | | | | Nucor Corp. | | | | | 1,491,392 | |
| 48,700 | | | | Scotts Miracle-Gro Co. (The), Class A | | | | | 2,091,665 | |
| 63,000 | | | | Teck Resources, Ltd., Class B(a) | | | | | 1,736,910 | |
| | | | | | | | | | |
| | | | | | | | | 7,936,229 | |
| | | | | | | | | | |
| | | | Total Common Stocks
(Cost $58,367,861) | | | | | 76,010,571 | |
| | | | | | | | | | |
EXCHANGE TRADED FUNDS (3.5%) | | | | |
| 41,600 | | | | iShares Russell MidCap Growth Index Fund | | | | | 1,769,248 | |
| 13,625 | | | | SPDR Gold Trust(a) | | | | | 1,346,831 | |
| | | | | | | | | | |
| | | | Total Exchange Traded Funds (Cost $2,710,829) | | | | | 3,116,079 | |
| | | | | | | | | | |
INVESTMENT COMPANY (4.7%) | | | | |
| 4,132,134 | | | | Federated Treasury Obligations Fund, Institutional Shares | | | | | 4,132,134 | |
| | | | | | | | | | |
| | | | Total Investment Company (Cost $4,132,134) | | | | | 4,132,134 | |
| | | | | | | | | | |
| | | |
Principal
Amount | | | | | | | |
SECURITIES HELD AS COLLATERAL FOR SECURITIES ON LOAN (12.0%) | | | | | | |
| $10,929,704 | | | | Pool of Various Securities | | | | | 10,517,471 | |
| | | | | | | | | | |
| | | | Total Securities Held as Collateral for Securities on Loan (Cost $10,929,704) | | | | | 10,517,471 | |
| | | | | | | | | | |
Total Investments — 106.6%
(Cost $76,140,528) | | | | | 93,776,255 | |
Net Other Assets (Liabilities) — (6.6)% | | | | | (5,776,951 | ) |
| | | | | | | | | | |
NET ASSETS — 100.0% | | | | $ | 87,999,304 | |
| | | | | | | | | | |
| (a) | Represents non-income producing security. |
| (b) | Represents that all or a portion of the security was on loan as of September 30, 2009. |
ADR — American Depository Receipt
See accompanying notes to the financial statements.
51
Schedule of Portfolio Investments
September 30, 2009
| | | | | | | | | |
| Shares | | | | | | Fair Value |
COMMON STOCKS (96.3%) | | | |
| | Consumer Discretionary (15.4%) | | | | | |
| 21,150 | | | | Buffalo Wild Wings, Inc.(a)(b) | | | | $ | 880,052 |
| 16,100 | | | | CEC Entertainment, Inc.(b) | | | | | 416,346 |
| 18,825 | | | | Cheesecake Factory (The)(b) | | | | | 348,639 |
| 45,500 | | | | Hot Topic, Inc.(b) | | | | | 340,795 |
| 12,175 | | | | JOS A Bank Clothiers, Inc.(b) | | | | | 545,075 |
| 34,000 | | | | La-Z-Boy, Inc. | | | | | 294,100 |
| 22,150 | | | | Monro Muffler, Inc. | | | | | 704,148 |
| 10,550 | | | | P.F. Chang’s China Bistro, Inc.(a)(b) | | | | | 358,383 |
| 17,000 | | | | Polaris Industries, Inc. | | | | | 693,260 |
| | | | | | | | | |
| | | | | | | | | 4,580,798 |
| | | | | | | | | |
| | | | Consumer Staples (5.2%) |
| 15,000 | | | | Diamond Foods, Inc. | | | | | 475,800 |
| 16,200 | | | | Sanderson Farms, Inc. | | | | | 609,768 |
| 15,400 | | | | Whole Foods Market, Inc.(a)(b) | | | | | 469,546 |
| | | | | | | | | |
| | | | | | | | | 1,555,114 |
| | | | | | | | | |
| | | | Energy (5.2%) |
| 13,575 | | | | Alpha Natural Resources, Inc.(b) | | | | | 476,483 |
| 15,000 | | | | Arena Resources, Inc.(b) | | | | | 532,500 |
| 36,500 | | | | Rosetta Resources, Inc.(b) | | | | | 536,185 |
| | | | | | | | | |
| | | | | | | | | 1,545,168 |
| | | | | | | | | |
| | | | Financials (9.2%) |
| 51,000 | | | | Dime Community Bancshares | | | | | 582,930 |
| 113,000 | | | | Fortress Investment Group, LLC, Class A(b) | | | | | 587,600 |
| 27,275 | | | | Knight Capital Group, Inc., Class A(b) | | | | | 593,231 |
| 37,300 | | | | NewAlliance Bancshares, Inc. | | | | | 399,110 |
| 12,225 | | | | Piper Jaffray Cos.(b) | | | | | 583,377 |
| | | | | | | | | |
| | | | | | | | | 2,746,248 |
| | | | | | | | | |
| | | | Health Care (8.6%) |
| 11,300 | | | | Alexion Pharmaceuticals, Inc.(b) | | | | | 503,302 |
| 5,400 | | | | Amedisys, Inc.(a)(b) | | | | | 235,602 |
| 29,950 | | | | American Medical Systems Holdings, Inc.(b) | | | | | 506,754 |
| 63,500 | | | | Geron Corp.(a)(b) | | | | | 416,560 |
| 8,300 | | | | Haemonetics Corp.(b) | | | | | 465,796 |
| 11,575 | | | | Watson Pharmaceuticals, Inc.(b) | | | | | 424,108 |
| | | | | | | | | |
| | | | | | | | | 2,552,122 |
| | | | | | | | | |
| | | | Industrials (20.6%) |
| 19,395 | | | | Curtiss-Wright Corp. | | | | | 661,951 |
| 18,900 | | | | Duoyuan Global Water, Inc., ADR(a)(b) | | | | | 629,370 |
| 46,650 | | | | GrafTech International, Ltd.(b) | | | | | 685,755 |
| 59,600 | | | | LaBarge, Inc.(b) | | | | | 670,500 |
| 20,000 | | | | Marten Transport, Ltd.(b) | | | | | 341,200 |
| 12,000 | | | | Moog, Inc., Class A(b) | | | | | 354,000 |
| 20,000 | | | | MYR Group Inc.(b) | | | | | 421,800 |
| 36,875 | | | | Orion Marine Group, Inc.(b) | | | | | 757,413 |
| 18,700 | | | | Quanta Services, Inc.(b) | | | | | 413,831 |
| 22,530 | | | | RBC Bearings, Inc.(b) | | | | | 525,625 |
| 14,500 | | | | Regal-Beloit Corp. | | | | | 662,795 |
| | | | | | | | | |
| | | | | | | | | 6,124,240 |
| | | | | | | | | |
| | | | Information Technology (29.5%) |
| 49,000 | | | | Aruba Networks, Inc.(b) | | | | | 433,160 |
| 8,650 | | | | Equinix, Inc.(b) | | | | | 795,800 |
| 45,000 | | | | Harris Stratex Networks, Inc., Class A(b) | | | | | 315,000 |
| 20,000 | | | | InterDigital, Inc.(b) | | | | | 463,200 |
| 23,200 | | | | Longtop Financial Technologies, Ltd., ADR(b) | | | | | 660,272 |
| 46,600 | | | | Nuance Communications, Inc.(b) | | | | | 697,136 |
| | | | | | | | | | |
| Shares | | | | | | Fair Value | |
COMMON STOCKS — (continued) | | | | | | |
| | | | Information Technology — (continued) | |
| 61,350 | | | | PMC - Sierra, Inc.(b) | | | | $ | 586,506 | |
| 23,650 | | | | Rovi Corp.(b) | | | | | 794,640 | |
| 17,525 | | | | Silicon Laboratories, Inc.(b) | | | | | 812,459 | |
| 14,850 | | | | STEC, Inc.(a)(b) | | | | | 436,441 | |
| 15,750 | | | | Synaptics, Inc.(a)(b) | | | | | 396,900 | |
| 16,450 | | | | TNS, Inc.(b) | | | | | 450,730 | |
| 66,000 | | | | TriQuint Semiconductor, Inc.(b) | | | | | 509,520 | |
| 18,600 | | | | Varian Semiconductor Equipment Associates, Inc.(b) | | | | | 610,824 | |
| 16,400 | | | | VistaPrint NV(a)(b) | | | | | 832,300 | |
| | | | | | | | | | |
| | | | | | | | | 8,794,888 | |
| | | | | | | | | | |
| | | | Materials (1.7%) | |
| 12,000 | | | | Scotts Miracle-Gro Co. (The), Class A | | | | | 515,400 | |
| | | | | | | | | | |
| | | | Utilities (0.9%) | |
| 8,723 | | | | Laclede Group, Inc. (The) | | | | | 280,532 | |
| 1 | | | | UIL Holdings Corp. | | | | | 26 | |
| | | | | | | | | | |
| | | | | | | | | 280,558 | |
| | | | | | | | | | |
| | | | Total Common Stocks
(Cost $24,378,559) | | | | | 28,694,536 | |
| | | | | | | | | | |
EXCHANGE TRADED FUNDS (2.4%) | | | | |
| 33,675 | | | | iShares Dow Jones US Regional Banks Index Fund | | | | | 705,828 | |
| | | | | | | | | | |
| | | | Total Exchange Traded Funds
(Cost $670,715) | | | | | 705,828 | |
| | | | | | | | | | |
INVESTMENT COMPANY (3.0%) | | | | |
| 887,966 | | | | Federated Treasury Obligations Fund, Institutional Shares | | | | | 887,966 | |
| | | | | | | | | | |
| | | | Total Investment Company
(Cost $887,966) | | | | | 887,966 | |
| | | | | | | | | | |
| | | |
Principal
Amount | | | | | | | |
SECURITIES HELD AS COLLATERAL FOR SECURITIES ON LOAN (10.8%) | | | | |
| $3,412,791 | | Pool of Various Securities | | | | | 3,227,501 | |
| | | | | | | | | | |
| | | | Total Securities Held as Collateral for Securities on Loan
(Cost $3,412,791) | | | | | 3,227,501 | |
| | | | | | | | | | |
Total Investments — 112.5%
(Cost $29,350,031) | | | | | 33,515,831 | |
Net Other Assets (Liabilities) — (12.5)% | | | | | (3,735,869 | ) |
| | | | | | | | | | |
NET ASSETS — 100.0% | | | | $ | 29,779,962 | |
| | | | | | | | | | |
| (a) | Represents that all or a portion of the security was on loan as of September 30, 2009. |
| (b) | Represents non-income producing security. |
ADR — American Depository Receipt
See accompanying notes to the financial statements.
52
|
BB&T International Equity Fund |
Schedule of Portfolio Investments
September 30, 2009
| | | | | | | | | |
| Shares | | | | Fair Value |
COMMON STOCKS (93.5%) |
| | | | Australia (6.9%) | | | | | |
| 16,369 | | | | Alumina, Ltd.(a) | | | | $ | 26,426 |
| 7,028 | | | | AMP, Ltd. | | | | | 40,425 |
| 17,274 | | | | Asciano Group(a) | | | | | 25,221 |
| 16,528 | | | | Australia & New Zealand Banking Group, Ltd. | | | | | 355,631 |
| 25,377 | | | | BHP Billiton, Ltd. | | | | | 844,684 |
| 12,723 | | | | BlueScope Steel, Ltd. | | | | | 32,887 |
| 3,386 | | | | Boral, Ltd. | | | | | 18,192 |
| 6,192 | | | | Brambles, Ltd. | | | | | 44,138 |
| 9,316 | | | | Commonwealth Bank of Australia | | | | | 425,311 |
| 3,829 | | | | CSL, Ltd. | | | | | 113,026 |
| 7,258 | | | | Fortescue Metals Group, Ltd.(a) | | | | | 24,459 |
| 13,838 | | | | Foster’s Group, Ltd. | | | | | 67,754 |
| 13,915 | | | | Insurance Australia Group, Ltd. | | | | | 46,402 |
| 1,560 | | | | Leighton Holdings, Ltd. | | | | | 49,778 |
| 69,281 | | | | Macquarie Airports | | | | | 173,580 |
| 2,099 | | | | Macquarie Group, Ltd. | | | | | 108,864 |
| 12,820 | | | | National Australia Bank, Ltd. | | | | | 347,889 |
| 4,927 | | | | QBE Insurance Group, Ltd. | | | | | 104,579 |
| 26,923 | | | | Rio Tinto, Ltd. | | | | | 1,407,062 |
| 6,977 | | | | Suncorp-Metway, Ltd. | | | | | 54,657 |
| 63,764 | | | | Telstra Corp, Ltd. | | | | | 183,946 |
| 6,780 | | | | Wesfarmers, Ltd. | | | | | 158,445 |
| 15,143 | | | | Westfield Group | | | | | 185,692 |
| 18,159 | | | | Westpac Banking Corp. | | | | | 420,522 |
| 8,520 | | | | Woodside Petroleum, Ltd. | | | | | 391,827 |
| 9,481 | | | | Woolworths, Ltd. | | | | | 244,651 |
| | | | | | | | | |
| | | | | | | | | 5,896,048 |
| | | | | | | | | |
| | | | Austria (0.8%) | | | | | |
| 89 | | | | Andritz AG | | | | | 4,439 |
| 937 | | | | Erste Group Bank AG | | | | | 41,875 |
| 3,035 | | | | Flughafen Wien AG | | | | | 157,666 |
| 9,895 | | | | OMV AG | | | | | 399,211 |
| 303 | | | | Raiffeisen International Bank Holding AG | | | | | 19,758 |
| 2,624 | | | | Telekom Austria AG | | | | | 47,307 |
| 1,209 | | | | Voestalpine AG | | | | | 43,151 |
| | | | | | | | | |
| | | | | | | | | 713,407 |
| | | | | | | | | |
| | | | Belgium (0.7%) | | | | | |
| 4,892 | | | | Anheuser-Busch InBev NV | | | | | 223,389 |
| 504 | | | | Belgacom SA | | | | | 19,633 |
| 37,709 | | | | Fortis(a) | | | | | 176,637 |
| 3,532 | | | | KBC Groep NV(a) | | | | | 177,411 |
| 61 | | | | Solvay SA | | | | | 6,333 |
| | | | | | | | | |
| | | | | | | | | 603,403 |
| | | | | | | | | |
| | | | Brazil (2.6%) | | | | | |
| 15,214 | | | | Banco Bradesco SA, Pref | | | | | 303,576 |
| 1,817 | | | | BRF - Brasil Foods SA(a) | | | | | 48,204 |
| 2,315 | | | | Centrais Eletricas Brasileiras SA, Pref, Class B | | | | | 32,472 |
| 1,831 | | | | Cia Brasileira de Distribuicao Grupo Pao de Acucar, Pref, Class A | | | | | 51,645 |
| 950 | | | | Cia de Bebidas das Americas, Pref | | | | | 78,291 |
| 2,223 | | | | Cia Energetica de Minas Gerais, Pref | | | | | 33,629 |
| 1,702 | | | | Cia Siderurgica Nacional SA | | | | | 52,119 |
| 6,346 | | | | Gerdau SA, Pref | | | | | 85,432 |
| 19,500 | | | | Itau Unibanco Holding SA | | | | | 394,051 |
| 23,622 | | | | Petroleo Brasileiro SA, Pref | | | | | 465,213 |
| 2,913 | | | | Usinas Siderurgicas de Minas Gerais SA, Pref, Class A | | | | | 77,051 |
| | | | | | | | | |
| Shares | | | | Fair Value |
COMMON STOCKS — (continued) | | | | | |
| | | | Brazil — (continued) | | | |
| 24,851 | | | | Vale SA, ADR | | | | $ | 574,804 |
| 1,879 | | | | Vivo Participacoes SA, Pref | | | | | 47,155 |
| | | | | | | | | |
| | | | | | | | | 2,243,642 |
| | | | | | | | | |
| | | | Canada (4.3%) | | | | | |
| 884 | | | | Agrium, Inc. | | | | | 44,190 |
| 5,113 | | | | Bank of Montreal | | | | | 258,694 |
| 6,816 | | | | Bank of Nova Scotia | | | | | 311,117 |
| 9,523 | | | | Bombardier, Inc., Class B | | | | | 44,206 |
| 2,671 | | | | Canadian Imperial Bank of Commerce | | | | | 162,882 |
| 2,889 | | | | Canadian Pacific Railway, Ltd. | | | | | 135,188 |
| 4,783 | | | | EnCana Corp. | | | | | 276,978 |
| 3,313 | | | | Manulife Financial Corp. | | | | | 69,624 |
| 823 | | | | National Bank of Canada | | | | | 45,768 |
| 1,884 | | | | Potash Corp. of Saskatchewan, Inc. | | | | | 170,900 |
| 3,372 | | | | Research In Motion, Ltd.(a) | | | | | 227,779 |
| 1,429 | | | | Rogers Communications, Inc., Class B | | | | | 40,348 |
| 8,887 | | | | Royal Bank of Canada | | | | | 477,697 |
| 983 | | | | Shoppers Drug Mart Corp. | | | | | 40,343 |
| 1,370 | | | | Sun Life Financial, Inc. | | | | | 42,930 |
| 13,457 | | | | Suncor Energy, Inc. | | | | | 470,097 |
| 16,868 | | | | Talisman Energy, Inc. | | | | | 293,514 |
| 8,004 | | | | Teck Resources, Ltd., Class B(a) | | | | | 220,537 |
| 1,265 | | | | Thomson Reuters Corp. | | | | | 42,417 |
| 5,375 | | | | Toronto-Dominion Bank (The) | | | | | 347,657 |
| | | | | | | | | |
| | | | | | | | | 3,722,866 |
| | | | | | | | | |
| | | | China (2.4%) | | | | | |
| 322,205 | | | | Bank of China, Ltd., H Shares | | | | | 169,624 |
| 58,854 | | | | Beijing Capital International Airport Co., Ltd., H Shares(a)(b) | | | | | 36,603 |
| 61,000 | | | | China Citic Bank, H Shares | | | | | 40,220 |
| 258,636 | | | | China Construction Bank Corp., H Shares | | | | | 206,574 |
| 48,190 | | | | China Life Insurance Co., Ltd., H Shares | | | | | 209,858 |
| 426,440 | | | | China Petroleum & Chemical Corp., H Shares | | | | | 362,609 |
| 23,000 | | | | China Shenhua Energy Co., Ltd., H Shares | | | | | 100,458 |
| 218,000 | | | | China Telecom Corp., Ltd., H Shares | | | | | 102,952 |
| 111,000 | | | | CNOOC, Ltd. | | | | | 149,240 |
| 20,000 | | | | Huaneng Power International, Inc., H Shares | | | | | 13,239 |
| 241,658 | | | | Industrial & Commercial Bank of China, Ltd., H Shares | | | | | 182,100 |
| 355,210 | | | | PetroChina, Co., Ltd., H Shares | | | | | 401,499 |
| 9,500 | | | | Ping An Insurance Group Co. of China, Ltd., H Shares | | | | | 75,387 |
| | | | | | | | | |
| | | | | | | | | 2,050,363 |
| | | | | | | | | |
| | | | Czech Republic (1.2%) | | | | | |
| 5,231 | | | | Komercni Banka AS | | | | | 1,043,180 |
| | | | | | | | | |
| | | | Denmark (0.6%) | | | | | |
| 15 | | | | A. P. Moller - Maersk A/S, Class B | | | | | 103,203 |
| 3,666 | | | | Danske Bank A/S(a) | | | | | 96,027 |
| 463 | | | | FLSmidth & Co. A/S | | | | | 25,211 |
| 3,910 | | | | Novo Nordisk A/S, Class B | | | | | 244,805 |
| 575 | | | | Vestas Wind Systems A/S(a) | | | | | 41,568 |
| | | | | | | | | |
| | | | | | | | | 510,814 |
| | | | | | | | | |
| | | | Finland (0.5%) | | | | | |
| 652 | | | | Fortum OYJ | | | | | 16,716 |
| 599 | | | | Kesko OYJ, Class B | | | | | 20,073 |
| 1,495 | | | | Kone OYJ, Class B | | | | | 54,956 |
| 1,220 | | | | Metso OYJ | | | | | 34,331 |
Continued
53
|
BB&T International Equity Fund |
Schedule of Portfolio Investments — (continued)
September 30, 2009
| | | | | | | | | |
| Shares | | | | Fair Value |
COMMON STOCKS — (continued) | | | | | |
| | | | Finland — (continued) | | | | | |
| 2,817 | | | | Neste Oil OYJ | | | | $ | 52,023 |
| 5,006 | | | | Nokia OYJ(b) | | | | | 73,622 |
| 714 | | | | Nokian Renkaat OYJ | | | | | 16,644 |
| 1,316 | | | | Outokumpu OYJ | | | | | 24,766 |
| 1,908 | | | | Sampo OYJ, Class A | | | | | 48,052 |
| 8,391 | | | | Stora Enso OYJ, Class R(a) | | | | | 58,448 |
| | | | | | | | | |
| | | | | | | | | 399,631 |
| | | | | | | | | |
| | | | France (10.4%) | | | | | |
| 1,656 | | | | Accor SA | | | | | 92,183 |
| 3,066 | | | | Aeroports de Paris | | | | | 275,884 |
| 911 | | | | Air France-KLM(a) | | | | | 16,557 |
| 1,552 | | | | Air Liquide SA | | | | | 176,580 |
| 23,528 | | | | Alcatel-Lucent(a) | | | | | 105,252 |
| 1,286 | | | | Alstom SA | | | | | 93,849 |
| 10,730 | | | | ArcelorMittal | | | | | 401,182 |
| 14,152 | | | | AXA SA | | | | | 383,125 |
| 7,757 | | | | BNP Paribas | | | | | 619,779 |
| 1,666 | | | | Bouygues SA(b) | | | | | 84,719 |
| 4,628 | | | | Carrefour SA | | | | | 209,945 |
| 1,085 | | | | Casino Guichard Perrachon SA | | | | | 86,056 |
| 3,380 | | | | Cie de Saint-Gobain | | | | | 175,341 |
| 739 | | | | Cie Generale de Geophysique-Veritas(a) | | | | | 17,243 |
| 1,154 | | | | Compagnie Generale des Etablissements Michelin, Class B | | | | | 90,532 |
| 19,045 | | | | Credit Agricole SA | | | | | 397,978 |
| 8,347 | | | | Danone SA | | | | | 502,999 |
| 2,310 | | | | EDF SA | | | | | 137,040 |
| 38 | | | | Eramet | | | | | 13,187 |
| 20,071 | | | | France Telecom SA | | | | | 534,700 |
| 9,426 | | | | GDF Suez | | | | | 418,567 |
| 3,140 | | | | Lafarge SA | | | | | 280,981 |
| 1,333 | | | | L’Oreal SA | | | | | 132,547 |
| 1,445 | | | | LVMH Moet Hennessy Louis Vuitton SA | | | | | 145,333 |
| 10,491 | | | | Natixis(a) | | | | | 63,251 |
| 1,082 | | | | Pernod-Ricard SA | | | | | 85,929 |
| 2,694 | | | | Peugeot SA(a) | | | | | 82,138 |
| 1,007 | | | | PPR | | | | | 129,073 |
| 2,541 | | | | Publicis Groupe | | | | | 101,921 |
| 3,676 | | | | Renault SA(a) | | | | | 171,411 |
| 8,085 | | | | Sanofi-Aventis SA | | | | | 593,337 |
| 1,534 | | | | Schneider Electric SA | | | | | 155,474 |
| 5,931 | | | | Societe Generale | | | | | 477,355 |
| 16,034 | | | | Total SA | | | | | 952,734 |
| 450 | | | | Vallourec SA | | | | | 76,256 |
| 2,574 | | | | Veolia Environnement(b) | | | | | 98,649 |
| 7,564 | | | | Vinci SA | | | | | 427,921 |
| 4,330 | | | | Vivendi | | | | | 133,982 |
| | | | | | | | | |
| | | | | | | | | 8,940,990 |
| | | | | | | | | |
| | | | Germany (7.3%) | | | | | |
| 2,023 | | | | Adidas AG | | | | | 107,077 |
| 2,882 | | | | Allianz SE | | | | | 360,039 |
| 7,915 | | | | BASF SE | | | | | 419,401 |
| 4,860 | | | | Bayer AG | | | | | 336,749 |
| 1,719 | | | | Bayerische Motoren Werke AG | | | | | 82,886 |
| 321 | | | | Beiersdorf AG | | | | | 18,851 |
| 936 | | | | Celesio AG | | | | | 25,805 |
| 4,848 | | | | Commerzbank AG(a) | | | | | 61,473 |
| 6,165 | | | | Daimler AG | | | | | 310,388 |
| 4,626 | | | | Deutsche Bank AG | | | | | 355,026 |
| | | | | | | | | |
| Shares | | | | Fair Value |
COMMON STOCKS — (continued) | | | | | |
| | | | Germany — (continued) | | | |
| 614 | | | | Deutsche Boerse AG | | | | $ | 50,181 |
| 5,588 | | | | Deutsche Post AG | | | | | 104,669 |
| 17,482 | | | | Deutsche Telekom AG | | | | | 238,684 |
| 13,252 | | | | E.ON AG | | | | | 561,992 |
| 19,313 | | | | Fraport AG Frankfurt Airport Services Worldwide | | | | | 1,027,317 |
| 1,748 | | | | Fresenius SE | | | | | 85,973 |
| 197 | | | | Hamburger Hafen und Logistik AG | | | | | 8,876 |
| 1,718 | | | | HeidelbergCement AG | | | | | 111,221 |
| 633 | | | | K+S AG | | | | | 34,542 |
| 2,114 | | | | MAN AG | | | | | 174,475 |
| 2,265 | | | | Metro AG | | | | | 128,106 |
| 1,487 | | | | Muenchener Rueckversicherungs AG | | | | | 237,251 |
| 367 | | | | Porsche Automobil Holding SE, Pref | | | | | 28,867 |
| 3,431 | | | | RWE AG | | | | | 318,669 |
| 4,273 | | | | SAP AG | | | | | 208,097 |
| 6,830 | | | | Siemens AG | | | | | 632,467 |
| 2,431 | | | | ThyssenKrupp AG | | | | | 83,706 |
| 879 | | | | Volkswagen AG, Pref | | | | | 102,376 |
| 178 | | | | Wacker Chemie AG | | | | | 27,764 |
| | | | | | | | | |
| | | | | | | | | 6,242,928 |
| | | | | | | | | |
| | | | Greece (0.3%) | | | | | |
| 3,525 | | | | Alpha Bank AE(a) | | | | | 64,995 |
| 1,005 | | | | Coca-Cola Hellenic Bottling Co. SA | | | | | 26,751 |
| 5,095 | | | | Hellenic Telecommunications Organization SA | | | | | 84,251 |
| 3,235 | | | | National Bank of Greece SA(a) | | | | | 115,982 |
| | | | | | | | | |
| | | | | | | | | 291,979 |
| | | | | | | | | |
| | | | Hong Kong (2.7%) | | | | | |
| 8,000 | | | | Cheung Kong Holdings, Ltd. | | | | | 101,522 |
| 25,564 | | | | China Merchants Holdings International Co., Ltd. | | | | | 84,773 |
| 41,427 | | | | China Mobile, Ltd. | | | | | 404,111 |
| 32,000 | | | | China Overseas Land & Investment, Ltd.(b) | | | | | 69,202 |
| 34,000 | | | | China Resources Land, Ltd. | | | | | 74,493 |
| 58,000 | | | | China Unicom Hong Kong, Ltd. | | | | | 82,172 |
| 5,500 | | | | CLP Holdings, Ltd. | | | | | 37,329 |
| 78,000 | | | | Denway Motors, Ltd. | | | | | 34,722 |
| 7,900 | | | | Esprit Holdings, Ltd. | | | | | 53,006 |
| 122,886 | | | | GOME Electrical Appliances Holdings, Ltd.(a) | | | | | 32,822 |
| 23,000 | | | | Hang Lung Properties, Ltd. | | | | | 84,729 |
| 13,000 | | | | Henderson Land Development Co., Ltd. | | | | | 85,548 |
| 6,200 | | | | Hong Kong Exchanges & Clearing, Ltd. | | | | | 112,399 |
| 29,600 | | | | HSBC Holdings PLC | | | | | 343,358 |
| 35,000 | | | | Hutchison Whampoa, Ltd. | | | | | 252,676 |
| 14,000 | | | | Li & Fung, Ltd. | | | | | 56,451 |
| 12,000 | | | | MTR Corp., Ltd. | | | | | 41,651 |
| 20,000 | | | | New World Development, Ltd. | | | | | 43,045 |
| 8,000 | | | | Sun Hung Kai Properties, Ltd. | | | | | 117,883 |
| 6,500 | | | | Swire Pacific, Ltd., Class A | | | | | 76,406 |
| 19,000 | | | | Wharf Holdings, Ltd. (The) | | | | | 100,883 |
| 10,000 | | | | Yue Yuen Industrial Holdings, Ltd. | | | | | 27,742 |
| | | | | | | | | |
| | | | | | | | | 2,316,923 |
| | | | | | | | | |
| | | | Hungary (0.6%) | | | | | |
| 19,014 | | | | OTP Bank PLC(a) | | | | | 542,537 |
| | | | | | | | | |
| | | | India (1.1%) | | | | | |
| 868 | | | | Bharat Heavy Electricals, Ltd. | | | | | 42,021 |
| 10,166 | | | | Bharti Airtel, Ltd. | | | | | 88,494 |
Continued
54
|
BB&T International Equity Fund |
Schedule of Portfolio Investments — (continued)
September 30, 2009
| | | | | | | | | |
| Shares | | | | Fair Value |
COMMON STOCKS — (continued) | | | | | |
| | | | India — (continued) | | | | | |
| 386 | | | | HDFC Bank, Ltd., ADR | | | | $ | 45,691 |
| 5,328 | | | | ICICI Bank, Ltd. | | | | | 100,524 |
| 2,369 | | | | ICICI Bank, Ltd., ADR | | | | | 91,349 |
| 1,937 | | | | Infosys Technologies, Ltd., ADR | | | | | 93,925 |
| 9,197 | | | | ITC, Ltd. | | | | | 44,556 |
| 2,494 | | | | Larsen & Toubro, Ltd. | | | | | 87,265 |
| 14,986 | | | | Reliance Communications, Ltd. | | | | | 95,950 |
| 955 | | | | Reliance Industries, Ltd.(a) | | | | | 43,708 |
| 3,840 | | | | State Bank of India, Ltd. | | | | | 175,213 |
| 3,292 | | | | Sterlite Industries, Ltd., ADR | | | | | 52,573 |
| | | | | | | | | |
| | | | | | | | | 961,269 |
| | | | | | | | | |
| | | | Indonesia (0.1%) | | | | | |
| 48,801 | | | | Telekomunikasi Indonesia Tbk PT | | | | | 43,676 |
| | | | | | | | | |
| | | | Ireland (0.6%) | | | | | |
| 7,518 | | | | Allied Irish Banks PLC(a) | | | | | 35,947 |
| 9,505 | | | | CRH PLC | | | | | 263,997 |
| 36,528 | | | | Governor & Co. of the Bank of Ireland (The)(a) | | | | | 182,811 |
| | | | | | | | | |
| | | | | | | | | 482,755 |
| | | | | | | | | |
| | | | Italy (2.6%) | | | | | |
| 8,243 | | | | Assicurazioni Generali SpA | | | | | 225,930 |
| 3,044 | | | | Atlantia SpA | | | | | 73,810 |
| 12,477 | | | | Banca Monte dei Paschi di Siena SpA | | | | | 26,694 |
| 4,699 | | | | Banco Popolare SC(a) | | | | | 45,074 |
| 29,597 | | | | Enel SpA | | | | | 187,862 |
| 27,603 | | | | ENI SpA | | | | | 689,914 |
| 34,729 | | | | Intesa Sanpaolo SpA(a) | | | | | 153,606 |
| 4,162 | | | | Mediaset SpA | | | | | 29,113 |
| 3,447 | | | | Mediobanca SpA | | | | | 47,115 |
| 12,914 | | | | Parmalat SpA | | | | | 35,698 |
| 951 | | | | Saipem SpA | | | | | 28,640 |
| 74,609 | | | | Telecom Italia SpA | | | | | 130,906 |
| 131,842 | | | | UniCredit SpA(a) | | | | | 515,128 |
| | | | | | | | | |
| | | | | | | | | 2,189,490 |
| | | | | | | | | |
| | | | Japan (9.8%) | | | | | |
| 1,200 | | | | Aeon Mall Co., Ltd. | | | | | 24,985 |
| 3,000 | | | | Aisin Seiki Co., Ltd. | | | | | 73,191 |
| 4,300 | | | | Asahi Breweries, Ltd. | | | | | 78,656 |
| 5,000 | | | | Asahi Glass Co., Ltd. | | | | | 40,383 |
| 12,400 | | | | Bank of Yokohama, Ltd. (The) | | | | | 60,781 |
| 800 | | | | Benesse Corp. | | | | | 39,213 |
| 5,100 | | | | Bridgestone Corp. | | | | | 91,529 |
| 7,086 | | | | Canon, Inc. | | | | | 286,550 |
| 10 | | | | Central Japan Railway Co. | | | | | 71,854 |
| 7,900 | | | | Chiba Bank, Ltd. (The) | | | | | 48,932 |
| 900 | | | | Daikin Industries, Ltd. | | | | | 32,385 |
| 14,700 | | | | Daiwa Securities Group, Inc. | | | | | 75,821 |
| 5,731 | | | | Denso Corp. | | | | | 168,549 |
| 2,100 | | | | East Japan Railway Co. | | | | | 151,128 |
| 1,200 | | | | Eisai Co., Ltd. | | | | | 45,185 |
| 500 | | | | FamilyMart Co., Ltd. | | | | | 16,098 |
| 2,925 | | | | Fanuc, Ltd. | | | | | 262,310 |
| 13,000 | | | | Fujitsu, Ltd. | | | | | 85,011 |
| 8,000 | | | | Fukuoka Financial Group, Inc. | | | | | 33,242 |
| 876 | | | | Hitachi Construction Machinery Co., Ltd. | | | | | 18,805 |
| 14,406 | | | | Honda Motor Co., Ltd. | | | | | 443,743 |
| 3,700 | | | | Hoya Corp. | | | | | 87,384 |
| 30,000 | | | | Itochu Corp. | | | | | 198,853 |
| | | | | | | | | |
| Shares | | | | Fair Value |
COMMON STOCKS — (continued) | | | | | |
| | | | Japan — (continued) | | | |
| 1,185 | | | | Japan Steel Works, Ltd. (The) | | | | $ | 13,624 |
| 1,800 | | | | JFE Holdings, Inc. | | | | | 61,761 |
| 9,000 | | | | Kawasaki Heavy Industries, Ltd. | | | | | 22,860 |
| 12 | | | | KDDI Corp. | | | | | 67,643 |
| 8,800 | | | | Kirin Holdings Co., Ltd. | | | | | 134,894 |
| 9,200 | | | | Komatsu, Ltd. | | | | | 172,388 |
| 2,000 | | | | Konica Minolta Holdings, Inc. | | | | | 18,961 |
| 7,202 | | | | Kubota Corp. | | | | | 59,933 |
| 478 | | | | Kurita Water Industries, Ltd. | | | | | 17,147 |
| 500 | | | | Kyocera Corp. | | | | | 46,399 |
| 400 | | | | Lawson, Inc. | | | | | 18,582 |
| 900 | | | | Makita Corp.(b) | | | | | 28,575 |
| 20,200 | | | | Mitsubishi Corp. | | | | | 408,658 |
| 9,000 | | | | Mitsubishi Electric Corp.(a) | | | | | 68,178 |
| 7,000 | | | | Mitsubishi Estate Co., Ltd. | | | | | 110,110 |
| 9,000 | | | | Mitsubishi Heavy Industries, Ltd. | | | | | 34,089 |
| 82,700 | | | | Mitsubishi UFJ Financial Group, Inc. | | | | | 444,064 |
| 510 | | | | Mitsubishi UFJ Lease & Finance Co., Ltd. | | | | | 15,397 |
| 30,700 | | | | Mitsui & Co., Ltd. | | | | | 401,513 |
| 6,500 | | | | Mitsui Fudosan Co., Ltd. | | | | | 109,993 |
| 5,000 | | | | NGK Insulators, Ltd. | | | | | 115,858 |
| 2,800 | | | | Nidec Corp. | | | | | 227,394 |
| 1,000 | | | | Nikon Corp. | | | | | 18,292 |
| 266 | | | | Nintendo Co., Ltd. | | | | | 68,156 |
| 3 | | | | Nippon Building Fund, Inc. | | | | | 26,770 |
| 10,000 | | | | Nippon Steel Corp. | | | | | 36,540 |
| 1,600 | | | | Nippon Telegraph & Telephone Corp. | | | | | 74,149 |
| 15,900 | | | | Nissan Motor Co., Ltd.(a) | | | | | 107,517 |
| 18,500 | | | | Nomura Holdings, Inc.(b) | | | | | 113,970 |
| 77 | | | | NTT DoCoMo, Inc. | | | | | 123,008 |
| 1,500 | | | | Olympus Corp. | | | | | 39,770 |
| 680 | | | | ORIX Corp. | | | | | 41,513 |
| 20,708 | | | | Panasonic Corp. | | | | | 305,204 |
| 2,800 | | | | Resona Holdings, Inc. | | | | | 36,027 |
| 5,000 | | | | Ricoh Co., Ltd. | | | | | 72,857 |
| 900 | | | | Seven & I Holdings Co., Ltd. | | | | | 21,556 |
| 1,000 | | | | Shin-Etsu Chemical Co., Ltd. | | | | | 61,494 |
| 2,000 | | | | Shiseido Co., Ltd. | | | | | 34,869 |
| 6,000 | | | | Shizuoka Bank, Ltd. (The) | | | | | 63,365 |
| 200 | | | | SMC Corp. | | | | | 24,598 |
| 3,366 | | | | Sony Corp. | | | | | 99,557 |
| 800 | | | | Stanley Electric Co., Ltd. | | | | | 16,220 |
| 14,000 | | | | Sumitomo Metal Industries, Ltd. | | | | | 34,468 |
| 10,500 | | | | Sumitomo Mitsui Financial Group, Inc. | | | | | 366,123 |
| 5,500 | | | | Sumitomo Realty & Development Co., Ltd.(b) | | | | | 100,668 |
| 16,500 | | | | Sumitomo Trust & Banking Co., Ltd. (The) | | | | | 87,679 |
| 2,000 | | | | Suruga Bank, Ltd. | | | | | 18,916 |
| 9,100 | | | | Suzuki Motor Corp. | | | | | 212,382 |
| 1,300 | | | | Takeda Pharmaceutical Co., Ltd. | | | | | 54,164 |
| 1,900 | | | | Tokio Marine Holdings, Inc. | | | | | 55,033 |
| 1,500 | | | | Tokyo Electric Power Co., Inc. (The) | | | | | 39,353 |
| 30,000 | | | | Toshiba Corp.(a) | | | | | 157,411 |
| 19,154 | | | | Toyota Motor Corp. | | | | | 761,764 |
| 1,120 | | | | Unicharm Corp. | | | | | 106,304 |
| 122 | | | | Yahoo! Japan Corp. | | | | | 41,453 |
| | | | | | | | | |
| | | | | | | | | 8,453,759 |
| | | | | | | | | |
| | | | Korea (South) (2.8%) | | | | | |
| 113 | | | | Doosan Heavy Industries & Construction Co., Ltd. | | | | | 6,464 |
| 1,490 | | | | Hana Financial Group, Inc. | | | | | 51,342 |
Continued
55
|
BB&T International Equity Fund |
Schedule of Portfolio Investments — (continued)
September 30, 2009
| | | | | | | | | |
| Shares | | | | Fair Value |
COMMON STOCKS — (continued) | | | | | |
| | | | Korea (South) — (continued) | | | | | |
| 1,044 | | | | Hyundai Heavy Industries Co., Ltd. | | | | $ | 159,491 |
| 3,115 | | | | Hyundai Motor Co. | | | | | 294,778 |
| 3,026 | | | | KB Financial Group, Inc.(a) | | | | | 155,377 |
| 2,400 | | | | Kia Motors Corp.(a) | | | | | 37,887 |
| 1,472 | | | | KT&G Corp. | | | | | 89,201 |
| 2,860 | | | | LG Display Co., Ltd. | | | | | 82,286 |
| 732 | | | | LG Electronics, Inc. | | | | | 77,968 |
| 260 | | | | NHN Corp.(a) | | | | | 38,286 |
| 1,070 | | | | POSCO | | | | | 442,258 |
| 810 | | | | POSCO, ADR | | | | | 84,191 |
| 661 | | | | Samsung Electronics Co., Ltd. | | | | | 457,216 |
| 375 | | | | Samsung SDI Co., Ltd. | | | | | 47,422 |
| 3,790 | | | | Shinhan Financial Group Co., Ltd.(a) | | | | | 151,182 |
| 1,265 | | | | SK Telecom Co., Ltd. | | | | | 195,937 |
| | | | | | | | | |
| | | | | | | | | 2,371,286 |
| | | | | | | | | |
| | | | Mexico (0.9%) | | | | | |
| 8,858 | | | | America Movil SAB de CV, ADR, Class L | | | | | 388,246 |
| 10,786 | | | | Cemex SAB de CV, ADR(a) | | | | | 139,355 |
| 79,370 | | | | Cemex SAB de CV, Series CPO(a) | | | | | 102,440 |
| 6,949 | | | | Grupo Televisa SA, ADR | | | | | 129,182 |
| 11,415 | | | | Grupo Televisa SA, Series CPO | | | | | 42,236 |
| | | | | | | | | |
| | | | | | | | | 801,459 |
| | | | | | | | | |
| | | | Netherlands (3.7%) | | | | | |
| 17,781 | | | | Aegon NV(a) | | | | | 150,942 |
| 2,932 | | | | European Aeronautic Defence & Space Co. NV(b) | | | | | 65,839 |
| 301 | | | | Fugro NV, CVA | | | | | 17,383 |
| 8,665 | | | | Heineken NV | | | | | 399,483 |
| 24,075 | | | | ING Groep NV, CVA(a) | | | | | 429,810 |
| 22,852 | | | | Koninklijke KPN NV | | | | | 379,050 |
| 7,982 | | | | Koninklijke Philips Electronics NV | | | | | 194,364 |
| 998 | | | | Randstad Holding NV(a) | | | | | 43,104 |
| 12,614 | | | | Reed Elsevier NV | | | | | 142,317 |
| 29,899 | | | | Royal Dutch Shell PLC, Class A | | | | | 855,370 |
| 812 | | | | SBM Offshore NV | | | | | 17,265 |
| 1,980 | | | | TNT NV | | | | | 53,139 |
| 15,048 | | | | Unilever NV, CVA | | | | | 433,696 |
| | | | | | | | | |
| | | | | | | | | 3,181,762 |
| | | | | | | | | |
| | | | Norway (1.0%) | | | | | |
| 7,285 | | | | DnB NOR ASA(a) | | | | | 84,377 |
| 18,359 | | | | Norsk Hydro ASA(a) | | | | | 122,179 |
| 9,493 | | | | Orkla ASA | | | | | 89,488 |
| 2,802 | | | | Seadrill, Ltd.(a) | | | | | 58,503 |
| 19,079 | | | | StatoilHydro ASA | | | | | 429,072 |
| 3,078 | | | | Telenor ASA(a) | | | | | 35,650 |
| 2,487 | | | | Yara International ASA | | | | | 78,277 |
| | | | | | | | | |
| | | | | | | | | 897,546 |
| | | | | | | | | |
| | | | Poland (0.3%) | | | | | |
| 2,408 | | | | Bank Pekao SA(a) | | | | | 127,528 |
| 12,353 | | | | Powszechna Kasa Oszczednosci Bank Polski SA | | | | | 144,400 |
| | | | | | | | | |
| | | | | | | | | 271,928 |
| | | | | | | | | |
| | | | Portugal (0.1%) | | | | | |
| 12,032 | | | | Banco Comercial Portugues SA, Class R | | | | | 17,801 |
| 10,780 | | | | EDP - Energias de Portugal SA | | | | | 49,376 |
| 4,143 | | | | EDP Renovaveis SA(a) | | | | | 45,561 |
| | | | | | | | | |
| Shares | | | | Fair Value |
COMMON STOCKS — (continued) | | | | | |
| | | | Portugal — (continued) | | | |
| 459 | | | | Galp Energia SGPS SA - Class B | | | | $ | 7,939 |
| | | | | | | | | |
| | | | | | | | | 120,677 |
| | | | | | | | | |
| | | | Russia (2.2%) | | | | | |
| 950 | | | | Evraz Group SA, GDR(a) | | | | | 24,748 |
| 24,588 | | | | Gazprom OAO, ADR | | | | | 581,260 |
| 7,389 | | | | LUKOIL, ADR | | | | | 405,287 |
| 2,027 | | | | Mechel, ADR | | | | | 36,446 |
| 22,916 | | | | MMC Norilsk Nickel, OJSC, ADR(a) | | | | | 286,450 |
| 1,395 | | | | Mobile Telesystems OJSC, ADR | | | | | 67,337 |
| 1,600 | | | | NovaTek OAO, GDR | | | | | 78,880 |
| 30,250 | | | | Rosneft Oil Co., GDR(a) | | | | | 229,900 |
| 3,185 | | | | Severstal, GDR | | | | | 25,296 |
| 5,862 | | | | Sistema-Hals, GDR(a)(c) | | | | | 5,715 |
| 6,722 | | | | Vimpel-Communications, ADR(a) | | | | | 125,701 |
| 11,300 | | | | VTB Bank OJSC, GDR | | | | | 42,262 |
| | | | | | | | | |
| | | | | | | | | 1,909,282 |
| | | | | | | | | |
| | | | Singapore (0.7%) | | | | | |
| 6,000 | | | | City Developments, Ltd. | | | | | 43,957 |
| 12,000 | | | | DBS Group Holdings, Ltd. | | | | | 113,130 |
| 8,000 | | | | Keppel Corp., Ltd. | | | | | 46,001 |
| 16,000 | | | | Oversea-Chinese Banking Corp., Ltd. | | | | | 89,163 |
| 61,000 | | | | Singapore Telecommunications, Ltd. | | | | | 140,737 |
| 7,000 | | | | United Overseas Bank, Ltd. | | | | | 83,385 |
| 17,000 | | | | Wilmar International, Ltd. | | | | | 76,272 |
| | | | | | | | | |
| | | | | | | | | 592,645 |
| | | | | | | | | |
| | | | South Africa (0.8%) | | | | | |
| 567 | | | | Anglo Platinum, Ltd.(a) | | | | | 50,345 |
| 1,782 | | | | Bidvest Group, Ltd. | | | | | 28,122 |
| 20,831 | | | | FirstRand, Ltd. | | | | | 45,783 |
| 4,194 | | | | Impala Platinum Holdings, Ltd. | | | | | 97,704 |
| 9,857 | | | | MTN Group, Ltd. | | | | | 160,281 |
| 2,638 | | | | Naspers, Ltd., Class N | | | | | 90,135 |
| 3,965 | | | | Sasol, Ltd. | | | | | 149,057 |
| 6,666 | | | | Standard Bank Group, Ltd. | | | | | 86,209 |
| | | | | | | | | |
| | | | | | | | | 707,636 |
| | | | | | | | | |
| | | | Spain (4.0%) | | | | | |
| 47,914 | | | | Banco Bilbao Vizcaya Argentaria SA | | | | | 850,499 |
| 3,266 | | | | Banco Popular Espanol SA(b) | | | | | 32,741 |
| 74,834 | | | | Banco Santander Central Hispano SA(b) | | | | | 1,204,598 |
| 753 | | | | Grupo Ferrovial SA(b) | | | | | 36,021 |
| 11,216 | | | | Iberdrola Renovables SA | | | | | 55,148 |
| 24,449 | | | | Iberdrola SA | | | | | 239,889 |
| 3,355 | | | | Inditex SA(b) | | | | | 192,504 |
| 3,139 | | | | Repsol YPF, SA(b) | | | | | 85,393 |
| 26,707 | | | | Telefonica SA | | | | | 736,889 |
| | | | | | | | | |
| | | | | | | | | 3,433,682 |
| | | | | | | | | |
| | | | Sweden (1.3%) | | | | | |
| 5,834 | | | | Atlas Copco AB, Class A | | | | | 75,149 |
| 490 | | | | Autoliv, Inc. | | | | | 16,483 |
| 4,186 | | | | Getinge AB, Class B | | | | | 70,254 |
| 3,216 | | | | Hennes & Mauritz AB, Class B(b) | | | | | 180,606 |
| 17,122 | | | | Sandvik AB | | | | | 189,116 |
| 2,413 | | | | Skandinaviska Enskilda Banken AB, Class A(a) | | | | | 16,268 |
| 12,100 | | | | SKF AB, Class B | | | | | 190,056 |
| 1,574 | | | | SSAB AB, Class A | | | | | 24,384 |
| 11,355 | | | | Svenska Cellulosa AB, Class B | | | | | 153,923 |
Continued
56
|
BB&T International Equity Fund |
Schedule of Portfolio Investments — (continued)
September 30, 2009
| | | | | | | | | |
| Shares | | | | Fair Value |
COMMON STOCKS — (continued) | | | | | |
| | | | Sweden — (continued) | | | | | |
| 4,571 | | | | Swedbank AB, Class A(a) | | | | $ | 43,603 |
| 1,792 | | | | Swedish Match AB | | | | | 35,987 |
| 6,944 | | | | TeliaSonera AB | | | | | 45,620 |
| 11,705 | | | | Volvo AB, Class B | | | | | 108,296 |
| | | | | | | | | |
| | | | | | | | | 1,149,745 |
| | | | | | | | | |
| | | | Switzerland (5.9%) | | | | | |
| 18,179 | | | | ABB, Ltd.(a) | | | | | 364,878 |
| 8,205 | | | | Credit Suisse Group AG | | | | | 455,262 |
| 476 | | | | Flughafen Zuerich AG | | | | | 138,717 |
| 74 | | | | Givaudan SA | | | | | 55,484 |
| 2,012 | | | | Holcim, Ltd.(a) | | | | | 138,042 |
| 23,411 | | | | Nestle SA | | | | | 997,616 |
| 1,118 | | | | Nobel Biocare Holding AG | | | | | 37,004 |
| 21,588 | | | | Novartis AG | | | | | 1,080,129 |
| 4,459 | | | | Roche Holding AG | | | | | 720,720 |
| 243 | | | | Swatch Group AG (The) | | | | | 57,239 |
| 3,510 | | | | Swiss Reinsurance | | | | | 158,446 |
| 276 | | | | Swisscom AG | | | | | 98,743 |
| 561 | | | | Syngenta AG | | | | | 128,895 |
| 24,913 | | | | UBS AG(a) | | | | | 456,045 |
| 839 | | | | Zurich Financial Services AG | | | | | 199,569 |
| | | | | | | | | |
| | | | | | | | | 5,086,789 |
| | | | | | | | | |
| | | | Taiwan (0.7%) | | | | | |
| 4,931 | | | | AU Optronics Corp., ADR | | | | | 47,732 |
| 3,439 | | | | Chunghwa Telecom Co., Ltd., ADR | | | | | 62,040 |
| 39,462 | | | | Taiwan Semiconductor Manufacturing Co., Ltd., ADR | | | | | 432,498 |
| 11,528 | | | | United Microelectronics Corp., ADR(a) | | | | | 43,806 |
| | | | | | | | | |
| | | | | | | | | 586,076 |
| | | | | | | | | |
| | | | Ukraine (0.2%) | | | | | |
| 933,947 | | | | Raiffeisen Bank Aval(a) | | | | | 33,351 |
| 2,656 | | | | Ukrnafta Oil Co.(a) | | | | | 50,001 |
| 1,101,903 | | | | Ukrsotsbank JSCB(a) | | | | | 50,423 |
| 33,222 | | | | UkrTelecom, GDR(a) | | | | | 70,493 |
| | | | | | | | | |
| | | | | | | | | 204,268 |
| | | | | | | | | |
| | | | United Kingdom (13.3%) | | | | | |
| 18,489 | | | | Anglo American PLC(a) | | | | | 588,899 |
| 5,960 | | | | AstraZeneca PLC | | | | | 267,082 |
| 1,918 | | | | Aviva PLC | | | | | 13,736 |
| 69,270 | | | | Barclays PLC(a) | | | | | 409,607 |
| 6,378 | | | | BG Group PLC | | | | | 110,799 |
| 28,323 | | | | BHP Billiton PLC | | | | | 773,120 |
| 109,092 | | | | BP PLC | | | | | 964,135 |
| 4,642 | | | | British Airways PLC(a) | | | | | 16,358 |
| 8,621 | | | | British American Tobacco PLC | | | | | 270,457 |
| 26,871 | | | | BT Group PLC | | | | | 55,827 |
| 15,946 | | | | Cadbury PLC | | | | | 204,638 |
| 21,112 | | | | Diageo PLC | | | | | 323,907 |
| 3,103 | | | | Friends Provident Group PLC | | | | | 4,126 |
| 14,040 | | | | GKN PLC(a) | | | | | 25,512 |
| 45,777 | | | | GlaxoSmithKline PLC | | | | | 899,489 |
| 97,765 | | | | HSBC Holdings PLC | | | | | 1,118,707 |
| 7,110 | | | | Imperial Tobacco Group PLC | | | | | 205,441 |
| 1,223 | | | | Johnson Matthey PLC | | | | | 27,129 |
| 6,468 | | | | Kingfisher PLC | | | | | 22,007 |
| 14,523 | | | | Legal & General Group PLC | | | | | 20,378 |
| 257,832 | | | | Lloyds Banking Group PLC(a) | | | | | 427,303 |
| | | | | | | | | |
| Shares | | | | Fair Value |
COMMON STOCKS — (continued) | | | | | |
| | | | United Kingdom — (continued) | | | |
| 2,987 | | | | Lonmin PLC(a) | | | | $ | 79,912 |
| 14,400 | | | | Marks & Spencer Group PLC | | | | | 83,332 |
| 39,586 | | | | Old Mutual PLC | | | | | 63,265 |
| 16,358 | | | | Prudential PLC | | | | | 157,248 |
| 23,687 | | | | Rio Tinto PLC | | | | | 1,010,183 |
| 6,656 | | | | Rolls-Royce Group PLC(a) | | | | | 50,081 |
| 228,450 | | | | Royal Bank of Scotland Group PLC(a) | | | | | 193,320 |
| 5,567 | | | | Royal Dutch Shell PLC, Class A | | | | | 158,677 |
| 10,696 | | | | Standard Chartered PLC | | | | | 263,588 |
| 49,353 | | | | Tesco PLC | | | | | 315,180 |
| 533,263 | | | | Vodafone Group PLC | | | | | 1,194,839 |
| 332 | | | | WM Morrison Supermarkets PLC | | | | | 1,471 |
| 1,633 | | | | Wolseley PLC(a) | | | | | 39,330 |
| 36,250 | | | | WPP PLC | | | | | 311,102 |
| 50,709 | | | | Xstrata PLC(a) | | | | | 747,604 |
| | | | | | | | | |
| | | | | | | | | 11,417,789 |
| | | | | | | | | |
| | | | United States (0.1%) | | | | | |
| 1,775 | | | | Southern Copper Corp. | | | | | 54,475 |
| | | | | | | | | |
| | | | Total Common Stocks
(Cost $64,575,639) | | | | | 80,436,705 |
| | | | | | | | | |
EXCHANGE TRADED FUNDS (5.0%) | | | | | |
| | | | India (0.1%) | | | | | |
| 22,800 | | | | iShares MSCI India(a) | | | | | 147,288 |
| | | | | | | | | |
| | | | Japan (2.8%) | | | | | |
| 14,314 | | | | Nomura - Nikkei 225 | | | | | 1,624,906 |
| 77,760 | | | | Nomura TOPIX | | | | | 797,827 |
| | | | | | | | | |
| | | | | | | | | 2,422,733 |
| | | | | | | | | |
| | | | Taiwan (2.1%) | | | | | |
| 145,192 | | | | iShares MSCI Taiwan Index Fund | | | | | 1,785,861 |
| | | | | | | | | |
| | | | |
| | | | Total Exchange Traded Funds
(Cost $3,868,618) | | | | | 4,355,882 |
| | | | | | | | | |
RIGHTS/WARRANTS (0.0%) | | | | | |
| | | | France (0.0%) | | | | | |
| 7,854 | | | | BNP Paribas, Rights, Expire 10/13/09(a) | | | | | 17,010 |
| | | | | | | | | |
| | | | Germany (0.0%) | | | | | |
| 611 | | | | HeidelbergCement AG, Rights, Expire, 10/07/09(a) | | | | | 3,264 |
| | | | | | | | | |
| | | | Italy (0.0%) | | | | | |
| 3,283 | | | | Mediobanca SpA, Warrants, Expire 03/18/11(a)(d)(e) | | | | | 233 |
| | | | | | | | | |
| | | | |
| | | | Total Rights/Warrants
(Cost $0) | | | | | 20,507 |
| | | | | | | | | |
INVESTMENT COMPANY (0.6%) | | | | | |
| | | | United States (0.6%) | | | | | |
| 502,117 | | | | Federated Treasury Obligations Fund, Institutional Shares | | | | | 502,117 |
| | | | | | | | | |
| | | | |
| | | | Total Investment Company
(Cost $502,117) | | | | | 502,117 |
| | | | | | | | | |
Continued
57
|
BB&T International Equity Fund |
Schedule of Portfolio Investments — (continued)
September 30, 2009
| | | | | | | | |
Principal Amount | | | | Fair Value | |
SECURITIES HELD AS COLLATERAL FOR SECURITIES ON LOAN (1.8%) | |
$ 1,535,370 | | Pool of Various Securities | | | | $ | 1,518,938 | |
| | | | | | | | |
| | Total Securities Held as Collateral for Securities on Loan (Cost $1,535,370) | | | | | 1,518,938 | |
| | | | | | | | |
Total Investments — 100.9% (Cost $70,481,744) | | | | | 86,834,149 | |
Net Other Assets (Liabilities) — (0.9)% | | | | | (807,061 | ) |
| | | | | | | | |
NET ASSETS — 100.0% | | | | $ | 86,027,088 | |
| | | | | | | | |
| (a) | Represents non-income producing security. |
| (b) | Represents that all or a portion of the security was on loan as of September 30, 2009. |
| (c) | Rule 144A, Section 4(2) or other security which is restricted as to resale to institutional investors. The Investment Advisor, using board approved procedures, has deemed these securities or a portion of these securities to be liquid. |
| (d) | Rule 144A, Section 4(2) or other security which is restricted as to resale to institutional investors. The Investment Advisor, using board approved procedures, has deemed these securities to be illiquid. As of September 30, 2009, these securities represent 0.0003% of net assets. |
| (e) | Security was fair valued under the methods approved by the Board of Trustees. |
ADR — American Depository Receipt
CPO — Certificate of Participation Ordinary
CVA — Share Certificate
GDR — Global Depository Receipt
JSCB — Joint Stock Commercial Bank
Pref — Preference Shares
| | | | | | | |
Sector (unaudited) | | Percentage
of net assets |
Consumer Discretionary | | | | 6.9 | % | | |
Consumer Staples | | | | 6.9 | % | | |
Energy | | | | 10.8 | % | | |
Exchange Traded Funds | | | | 5.0 | % | | |
Financials | | | | 27.2 | % | | |
Health Care | | | | 5.4 | % | | |
Industrials | | | | 10.2 | % | | |
Information Technology | | | | 3.4 | % | | |
Materials | | | | 12.8 | % | | |
Telecommunication Services | | | | 7.2 | % | | |
Utilities | | | | 2.7 | % | | |
Cash Equivalents | | | | 2.4 | % | | |
| | | | | | | |
| | | | 100.9 | % | | |
| | | | | | | |
| | | | | | | | | | | | | | | | | | | | | |
Foreign Currency Exchange Contracts | | Delivery
Date | | Contract
Amount
in Local
Currency | | | Contract
Amount
in U.S. Dollars | | Fair
Value | | | Unrealized
Appreciation/
(Depreciation) | |
Short | | | | | | | | | | | | | | | | | | | | | |
Czech Koruna vs. U.S. Dollar | | 10/27/2009 | | (14,556,674 | ) | | | | $ | (745,492 | ) | | | | $ | (843,235 | ) | | $ | (97,744 | ) |
| | | | | | | | | | | | | | | | | | | | | |
| | | | | | | |
Total Short Contracts | | | | | | | | | $ | (745,492 | ) | | | | $ | (843,235 | ) | | $ | (97,744 | ) |
| | | | | | | | | | | | | | | | | | | | | |
| | | | | | | |
Long | | | | | | | | | | | | | | | | | | | | | |
Canadian Dollar vs. U.S. Dollar | | 12/16/2009 | | 1,223,816 | | | | | | 1,137,096 | | | | | | 1,143,199 | | | $ | 6,103 | |
Japanese Yen vs. U.S. Dollar | | 12/16/2009 | | 143,408,704 | | | | | | 1,584,845 | | | | | | 1,598,450 | | | | 13,605 | |
| | | | | | | | | | | | | | | | | | | | | |
| | | | | | | |
Total Long Contracts | | | | | | | | | $ | 2,721,941 | | | | | $ | 2,741,649 | | | $ | 19,708 | |
| | | | | | | | | | | | | | | | | | | | | |
See accompanying notes to the financial statements.
58
|
BB&T Special Opportunities Equity Fund |
Schedule of Portfolio Investments
September 30, 2009
| | | | | | | |
| Shares | | | | Fair Value |
COMMON STOCKS (84.4%) | | | | | |
| | Consumer Discretionary (6.0%) | | | | | |
| 1,087,000 | | Comcast Corp., Class A | | | | $ | 18,359,430 |
| 317,000 | | Yum! Brands, Inc. | | | | | 10,701,920 |
| | | | | | | |
| | | | | | | 29,061,350 |
| | | | | | | |
| | Consumer Staples (2.0%) | | | | | |
| 144,000 | | Energizer Holdings, Inc.(a)(b) | | | | | 9,552,960 |
| | | | | | | |
| | Energy (11.3%) | | | | | |
| 204,000 | | Apache Corp.(b) | | | | | 18,733,320 |
| 411,000 | | Halliburton Co. | | | | | 11,146,320 |
| 395,000 | | Petroleo Brasileiro SA, ADR(b) | | | | | 15,527,450 |
| 460,900 | | Weatherford International, Ltd.(a)(b) | | | | | 9,554,457 |
| | | | | | | |
| | | | | | | 54,961,547 |
| | | | | | | |
| | Financials (1.7%) | | | | | |
| 24,700 | | Markel Corp.(a) | | | | | 8,146,554 |
| | | | | | | |
| | Health Care (26.7%) | | | | | |
| 412,300 | | Allscripts-Misys Healthcare Solutions, Inc.(b) | | | | | 8,357,321 |
| 324,000 | | Baxter International, Inc. | | | | | 18,471,240 |
| 249,000 | | Becton Dickinson & Co. | | | | | 17,367,750 |
| 803,000 | | Bristol-Myers Squibb Co. | | | | | 18,083,560 |
| 317,000 | | Gilead Sciences, Inc.(a) | | | | | 14,765,860 |
| 284,000 | | McKesson Corp.(b) | | | | | 16,912,200 |
| 311,220 | | Medcath Corp.(a) | | | | | 2,729,399 |
| 334,000 | | Teva Pharmaceutical Industries, Ltd., ADR(c) | | | | | 16,887,040 |
| 647,000 | | UnitedHealth Group, Inc. | | | | | 16,200,880 |
| | | | | | | |
| | | | | | | 129,775,250 |
| | | | | | | |
| | Industrials (6.3%) | | | | | |
| 185,000 | | L-3 Communications Holdings, Inc. | | | | | 14,859,200 |
| 260,000 | | SPX Corp.(b) | | | | | 15,930,200 |
| | | | | | | |
| | | | | | | 30,789,400 |
| | | | | | | |
| | Information Technology (27.1%) | | | | | |
| 1,097,000 | | Activision Blizzard, Inc.(a) | | | | | 13,591,830 |
| 871,000 | | Akamai Technologies, Inc.(a) | | | | | 17,141,280 |
| 834,000 | | Cisco Systems, Inc.(a)(b) | | | | | 19,632,360 |
| 1,212,000 | | Dell, Inc.(a)(b) | | | | | 18,495,120 |
| 709,000 | | eBay, Inc.(a) | | | | | 16,739,490 |
| 470,000 | | Harris Corp. | | | | | 17,672,000 |
| 30,600 | | Harris Stratex Networks, Inc., Class A(a) | | | | | 214,200 |
| | | | | | | | |
Shares | | | | Fair Value | |
COMMON STOCKS — (continued) | | | | | | |
| | Information Technology — (continued) | |
| 509,000 | | Intuit, Inc.(a) | | | | $ | 14,506,500 | |
| 848,000 | | Symantec Corp.(a) | | | | | 13,966,560 | |
| | | | | | | | |
| | | | | | | 131,959,340 | |
| | | | | | | | |
| | Materials (3.3%) | | | | | | |
| 789,900 | | Nalco Holding Co.(b) | | | | | 16,185,051 | |
| | | | | | | | |
| | Total Common Stocks (Cost $364,136,414) | | | | | 410,431,452 | |
| | | | | | | | |
| | |
INVESTMENT COMPANY (16.6%) | | | | | | |
| 80,505,120 | | Federated Treasury Obligations Fund, Institutional Shares | | | | | 80,505,120 | |
| | | | | | | | |
| | Total Investment Company (Cost $80,505,120) | | | | | 80,505,120 | |
| | | | | | | | |
| | | |
Principal Amount | | | | | | | |
SECURITIES HELD AS COLLATERAL FOR
SECURITIES ON LOAN (0.3%) | |
$2,333,863 | | Pool of Various Securities | | | | | 1,688,389 | |
| | | | | | | | |
| | Total Securities Held as Collateral for Securities on Loan (Cost $2,333,863) | | | | | 1,688,389 | |
| | | | | | | | |
Total Investments — 101.3% (Cost $446,975,397) | | | | | 492,624,961 | |
Net Other Assets (Liabilities) — (1.3)% | | | | | (6,337,765 | ) |
| | | | | | | | |
NET ASSETS — 100.0% | | | | $ | 486,287,196 | |
| | | | | | | | |
| (a) | Represents non-income producing security. |
| (b) | Security held as collateral for written call option. |
| (c) | Represents that all or a portion of the security was on loan as of September 30, 2009. |
ADR — American Depository Receipt
See accompanying notes to the financial statements.
59
Schedule of Portfolio Investments
September 30, 2009
| | | | | | | |
| Shares | | | | Fair Value |
COMMON STOCKS (92.3%) | | | | | |
| | Consumer Discretionary (7.9%) | | | | | |
| 258,000 | | McDonald’s Corp. | | | | $ | 14,724,060 |
| 918,000 | | Pearson PLC, ADR(a) | | | | | 11,410,740 |
| | | | | | | |
| | | | | | | 26,134,800 |
| | | | | | | |
| | Consumer Staples (18.3%) | | | | | |
| 185,000 | | Diageo PLC, ADR | | | | | 11,375,650 |
| 221,000 | | Kimberly-Clark Corp. | | | | | 13,034,580 |
| 306,000 | | Kraft Foods, Inc., Class A | | | | | 8,038,620 |
| 229,000 | | PepsiCo, Inc. | | | | | 13,433,140 |
| 299,000 | | Philip Morris International, Inc. | | | | | 14,573,260 |
| | | | | | | |
| | | | | | | 60,455,250 |
| | | | | | | |
| | Energy (20.0%) | | | | | |
| 166,000 | | BP PLC, ADR(a) | | | | | 8,836,180 |
| 158,000 | | Chevron Corp. | | | | | 11,127,940 |
| 320,000 | | Kinder Morgan Management LLC(b) | | | | | 15,152,000 |
| 594,100 | | Natural Resource Partners LP(a) | | | | | 12,398,867 |
| 305,000 | | Teekay Corp.(c) | | | | | 6,670,350 |
| 475,000 | | Teekay LNG Partners LP | | | | | 11,789,500 |
| | | | | | | |
| | | | | | | 65,974,837 |
| | | | | | | |
| | Financials (5.9%) | | | | | |
| 378,000 | | Allstate Corp. (The) | | | | | 11,574,360 |
| 292,000 | | Federated Investors, Inc., Class B(a)(c) | | | | | 7,700,040 |
| | | | | | | |
| | | | | | | 19,274,400 |
| | | | | | | |
| | Health Care (11.5%) | | | | | |
| 256,000 | | Abbott Laboratories | | | | | 12,664,320 |
| 283,000 | | Novartis AG, ADR(c) | | | | | 14,257,540 |
| 669,000 | | Pfizer, Inc. | | | | | 11,071,950 |
| | | | | | | |
| | | | | | | 37,993,810 |
| | | | | | | |
| | Industrials (7.7%) | | | | | |
| 175,000 | | Lockheed Martin Corp. | | | | | 13,664,000 |
| 390,000 | | Waste Management, Inc.(a) | | | | | 11,629,800 |
| | | | | | | |
| | | | | | | 25,293,800 |
| | | | | | | |
| | Information Technology (13.8%) | | | | | |
| 625,500 | | Intel Corp.(c) | | | | | 12,241,035 |
| 870,000 | | Nokia Corp., ADR(a) | | | | | 12,719,400 |
| 418,000 | | Paychex, Inc. | | | | | 12,142,900 |
| 749,944 | | Taiwan Semiconductor Manufacturing Co., Ltd., ADR(c) | | | | | 8,219,386 |
| | | | | | | |
| | | | | | | 45,322,721 |
| | | | | | | |
| | | | | | | | |
Shares | | | | Fair Value | |
COMMON STOCKS — (continued) | | | | | | |
| | Telecommunication Services (3.4%) | |
| 375,000 | | Verizon Communications, Inc. | | | | $ | 11,351,250 | |
| | | | | | | | |
| | Utilities (3.8%) | | | | | | |
| 358,000 | | Dominion Resources, Inc. | | | | | 12,351,000 | |
| | | | | | | | |
| | Total Common Stocks (Cost $298,280,018) | | | | | 304,151,868 | |
| | | | | | | | |
| | |
INVESTMENT COMPANY (7.8%) | | | | | | |
| 25,804,641 | | Federated Treasury Obligations Fund, Institutional Shares | | | | | 25,804,641 | |
| | | | | | | | |
| | Total Investment Company (Cost $25,804,641) | | | | | 25,804,641 | |
| | | | | | | | |
| | | |
Principal Amount | | | | | | | |
SECURITIES HELD AS COLLATERAL FOR SECURITIES ON LOAN (8.4%) | |
$27,939,020 | | Pool of Various Securities | | | | | 27,520,474 | |
| | | | | | | | |
| | Total Securities Held as Collateral for Securities on Loan (Cost $27,939,020) | | | | | 27,520,474 | |
| | | | | | | | |
Total Investments — 108.5% (Cost $352,023,679) | | | | | 357,476,983 | |
Net Other Assets (Liabilities) — (8.5)% | | | | | (27,984,326 | ) |
| | | | | | | | |
NET ASSETS — 100.0% | | | | $ | 329,492,657 | |
| | | | | | | | |
| (a) | Represents that all or a portion of the security was on loan as of September 30, 2009. |
| (b) | Represents non-income producing security. |
| (c) | Security held as collateral for written call option. |
ADR — American Depository Receipt
See accompanying notes to the financial statements.
60
|
BB&T Short U.S. Government Fund |
Schedule of Portfolio Investments
September 30, 2009
| | | | | | | |
Principal Amount | | | | Fair Value |
COLLATERALIZED MORTGAGE OBLIGATIONS (16.4%) |
| | Fannie Mae(a) (5.6%) | | | | | |
| $ 149,259 | | 5.000%, 10/25/15, Series 2003-16, Class PC | | | | $ | 151,246 |
| 1,500,000 | | 4.500%, 9/25/16, Series 2003-81, Class NY | | | | | 1,561,797 |
| 578,977 | | 5.000%, 2/25/18, Series 2004-101, Class B | | | | | 594,461 |
| 280,433 | | 4.500%, 8/25/26, Series 2005-65, Class WG | | | | | 283,350 |
| 1,000,000 | | 5.500%, 3/25/28, Series 2003-8, Class OD | | | | | 1,023,851 |
| | | | | | | |
| | | | | | | 3,614,705 |
| | | | | | | |
| | Freddie Mac(a) (8.7%) | | | | | |
| 998,590 | | 4.500%, 5/15/10, Series 2617, Class BC | | | | | 1,003,113 |
| 294,142 | | 5.000%, 9/15/18, Series 2701, Class OD | | | | | 299,810 |
| 113,584 | | 5.000%, 6/15/24, Series 2915, Class KA | | | | | 114,465 |
| 230,671 | | 5.000%, 2/15/25, Series 2941, Class XA | | | | | 234,590 |
| 273,086 | | 5.000%, 7/15/25, Series 2931, Class JA | | | | | 277,986 |
| 260,608 | | 4.000%, 5/15/26, Series 2750, Class KP | | | | | 264,999 |
| 607,356 | | 4.000%, 8/15/26, Series 2595, Class WJ | | | | | 609,976 |
| 255,927 | | 5.000%, 9/15/26, Series 3018, Class UM | | | | | 259,754 |
| 720,880 | | 4.500%, 5/15/27, Series 2682, Class XJ | | | | | 744,071 |
| 556,575 | | 5.500%, 6/15/27, Series 3255, Class QA | | | | | 569,871 |
| 1,175,493 | | 4.500%, 4/15/29, Series 2614, Class QE | | | | | 1,195,237 |
| | | | | | | |
| | | | | | | 5,573,872 |
| | | | | | | |
| | Ginnie Mae (2.1%) | | | | | |
| 1,294,823 | | 4.500%, 4/16/28, Series 2003-97, Class NC | | | | | 1,323,474 |
| | | | | | | |
| | Total Collateralized Mortgage Obligations (Cost $10,477,384) | | | | | 10,512,051 |
| | | | | | | |
CORPORATE BONDS (4.9%) | | | | | |
| | Financials (4.9%) | | | | | |
| 1,000,000 | | Goldman Sachs Group, Inc. (The), 5.250%, 10/15/13 | | | | | 1,061,615 |
| 1,000,000 | | JPMorgan Chase & Co., 5.125%, 9/15/14 | | | | | 1,041,813 |
| 1,000,000 | | Morgan Stanley, 5.300%, 3/1/13 | | | | | 1,047,832 |
| | | | | | | |
| | Total Corporate Bonds (Cost $3,170,431) | | | | | 3,151,260 |
| | | | | | | |
FDIC GUARANTEED SECURITIES (7.2%) |
| | Financials (7.2%) | | | | | |
| 1,000,000 | | American Express Bank FSB, 3.150%, �� 12/9/11(b) | | | | | 1,038,167 |
| 1,000,000 | | General Electric Capital Corp., 2.200%, 6/8/12 | | | | | 1,015,458 |
| 1,000,000 | | JPMorgan Chase & Co., 2.200%, 6/15/12 | | | | | 1,017,110 |
| 1,500,000 | | Regions Bank, 3.250%, 12/9/11 | | | | | 1,560,459 |
| | | | | | | |
| | Total FDIC Guaranteed Securities (Cost $4,574,884) | | | | | 4,631,194 |
| | | | | | | |
MORTGAGE-BACKED SECURITIES (4.1%) |
| | Fannie Mae(a) (2.5%) | | | | | |
| 425,228 | | 4.500%, 1/1/10, Pool #254626 | | | | | 428,524 |
| 188,383 | | 6.500%, 8/1/13, Pool #251901 | | | | | 201,659 |
| 210,142 | | 6.000%, 3/1/16, Pool #253702 | | | | | 225,426 |
| 196,596 | | 6.000%, 4/1/16, Pool #535846 | | | | | 210,896 |
| 359,841 | | 6.500%, 4/1/16, Pool #253706 | | | | | 388,445 |
| 153,627 | | 6.000%, 8/1/16, Pool #545125 | | | | | 165,040 |
| | | | | | | |
| | | | | | | 1,619,990 |
| | | | | | | |
| | Freddie Mac(a) (1.6%) | | | | | |
| 547,668 | | 4.500%, 1/1/10, Pool #M80792 | | | | | 555,170 |
| | | | | | | |
Principal Amount | | | | Fair Value |
MORTGAGE-BACKED SECURITIES — (continued) |
| | Freddie Mac(a) — (continued) | | | | | |
| $ 85,224 | | 6.500%, 5/1/13, Pool #E00548 | | | | $ | 89,757 |
| 327,138 | | 6.000%, 9/1/16, Pool #E01049 | | | | | 349,779 |
| | | | | | | |
| | | | | | | 994,706 |
| | | | | | | |
| | Total Mortgage-Backed Securities (Cost $2,497,504) | | | | | 2,614,696 |
| | | | | | | |
MUNICIPAL BONDS (5.8%) | | | | | |
| | California (1.7%) | | | | | |
| 1,000,000 | | Northern California Transmission Agency, California-Oregon Transmission Project Refunding Revenue, Series B, 5.370%, 5/1/15 | | | | | 1,083,440 |
| | | | | | | |
| | Texas (1.6%) | | | | | |
| 1,000,000 | | Texas State, College Student Loan G.O., 5.000%, 8/1/11 | | | | | 1,053,700 |
| | | | | | | |
| | Virginia (1.6%) | | | | | |
| 310,000 | | Danville, VA, Refunding G.O., Series B, Taxable (Assured Guaranty State Aid Withholding), 4.000%, 3/1/13 | | | | | 329,660 |
| 215,000 | | Danville, VA, Refunding G.O., Series B, Taxable (Assured Guaranty State Aid Withholding), 4.200%, 3/1/14 | | | | | 229,781 |
| 430,000 | | Danville, VA, Refunding G.O., Series B, Taxable (Assured Guaranty State Aid Withholding), 4.550%, 3/1/15 | | | | | 463,368 |
| | | | | | | |
| | | | | | | 1,022,809 |
| | | | | | | |
| | West Virginia (0.9%) | | | | | |
| 500,000 | | West Virginia School Building Authority, WV, Capital Improvements Refunding Revenue, Series A (NATL-RE FGIC), 5.000%, 7/1/12 | | | | | 543,755 |
| | | | | | | |
| | Total Municipal Bonds
(Cost $3,565,004) | | | | | 3,703,704 |
| | | | | | | |
U.S. GOVERNMENT AGENCIES (51.3%) | | | | | |
| | Fannie Mae(a) (14.5%) | | | | | |
| 2,500,000 | | 3.875%, 2/15/10 | | | | | 2,533,218 |
| 1,000,000 | | 6.250%, 2/1/11 | | | | | 1,059,034 |
| 1,750,000 | | 4.375%, 3/15/13(b) | | | | | 1,898,228 |
| 1,000,000 | | 3.375%, 3/10/14 | | | | | 1,008,352 |
| 2,750,000 | | 3.300%, 7/30/14 | | | | | 2,776,012 |
| | | | | | | |
| | | | | | | 9,274,844 |
| | | | | | | |
| | Federal Farm Credit Bank (12.8%) | | | | | |
| 3,000,000 | | 5.375%, 7/18/11 | | | | | 3,228,831 |
| 1,000,000 | | 3.950%, 3/4/13 | | | | | 1,015,103 |
| 2,750,000 | | 4.250%, 7/8/13 | | | | | 2,947,585 |
| 1,000,000 | | 2.750%, 5/6/14 | | | | | 998,773 |
| | | | | | | |
| | | | | | | 8,190,292 |
| | | | | | | |
| | Federal Home Loan Bank (11.4%) | | | | | |
| 3,000,000 | | 4.625%, 2/18/11, Series 616 | | | | | 3,161,529 |
| 1,500,000 | | 4.340%, 11/28/12 | | | | | 1,538,198 |
| 2,500,000 | | 5.785%, 6/25/14 | | | | | 2,596,730 |
| | | | | | | |
| | | | | | | 7,296,457 |
| | | | | | | |
| | Freddie Mac(a) (12.6%) | | | | | |
| 2,000,000 | | 2.125%, 4/2/12 | | | | | 2,014,962 |
| 2,000,000 | | 2.250%, 8/24/12 | | | | | 2,015,256 |
Continued
61
|
BB&T Short U.S. Government Fund |
Schedule of Portfolio Investments — (continued)
September 30, 2009
| | | | | | | |
Principal
Amount | | | | Fair Value |
U.S. GOVERNMENT AGENCIES — (continued) |
| | Freddie Mac(a) — (continued) | | | | | |
| $2,000,000 | | 3.250%, 3/3/14 | | | | $ | 2,012,990 |
| 2,000,000 | | 3.250%, 3/18/14 | | | | | 2,020,848 |
| | | | | | | |
| | | | | | | 8,064,056 |
| | | | | | | |
| | Total U.S. Government Agencies (Cost $32,314,242) | | | | | 32,825,649 |
| | | | | | | |
| | |
U.S. TREASURY NOTES (5.9%) | | | | | |
| 500,000 | | 4.250%, 10/15/10 | | | | | 519,805 |
| 2,000,000 | | 1.375%, 5/15/12 | | | | | 2,006,718 |
| 1,150,000 | | 4.125%, 8/31/12 | | | | | 1,240,293 |
| | | | | | | |
| | Total U.S. Treasury Notes (Cost $3,664,930) | | | | | 3,766,816 |
| | | | | | | |
| Shares | | | | |
INVESTMENT COMPANY (4.0%) | | | | | |
| 2,548,339 | | Federated Treasury Obligations Fund, Institutional Shares | | | | | 2,548,339 |
| | | | | | | |
| | Total Investment Company (Cost $2,548,339) | | | | | 2,548,339 |
| | | | | | | |
Principal
Amount | | | | |
SECURITIES HELD AS COLLATERAL FOR
SECURITIES ON LOAN (4.5%) |
| $3,005,938 | | Pool of Various Securities | | | | | 2,920,516 |
| | | | | | | |
| | Total Securities Held as Collateral for Securities on Loan (Cost $3,005,938) | | | | | 2,920,516 |
| | | | | | | |
| | | | | | |
| | | Fair Value | |
Total Investments — 104.1% (Cost $65,818,656) | | | | $ | 66,674,225 | |
Net Other Assets (Liabilities) — (4.1)% | | | | | (2,642,173 | ) |
| | | | | | |
NET ASSETS — 100.0% | | | | $ | 64,032,052 | |
| | | | | | |
| (a) | On September 7, 2008, the Federal Housing Finance Agency (FHFA) placed Fannie Mae and Freddie Mac into conservatorship with FHFA as the conservator. The conservatorship is a statutory process designed to stabilize a troubled institution with the objective of returning the entities to normal business operations. |
| (b) | Represents that all or a portion of the security was on loan as of September 30, 2009. |
FDIC — Federal Deposit Insurance Corp.
FGIC — Financial Guaranty Insurance Corp.
G.O. — General Obligation
NATL — National
RE — Reinsurance
See accompanying notes to the financial statements.
62
|
BB&T Intermediate U.S. Government Fund |
Schedule of Portfolio Investments
September 30, 2009
| | | | | | | |
Principal Amount | | | | Fair Value |
COLLATERALIZED MORTGAGE
OBLIGATIONS (0.5%) |
| $ 571,447 | | Chase Mortgage Finance Corp., Series 2005-S3, Class A6, 5.500%, 11/25/35 | | $ | 523,410 |
| 548,334 | | Countrywide Alternative Loan Trust, Series 2004-2CB, Class 1A1, 4.250%, 3/25/34 | | | 518,402 |
| | | | | | | |
| | Total Collateralized Mortgage Obligations (Cost $887,184) | | | | | 1,041,812 |
| | | | | | | |
| |
CORPORATE BONDS (4.1%) | | | |
| | Financials (4.1%) | | | | | |
| 2,000,000 | | Goldman Sachs Group, Inc. (The), 5.125%, 1/15/15 | | | 2,090,056 |
| 2,000,000 | | MBNA Corp., 5.000%, 6/15/15 | | | | | 1,976,198 |
| 2,000,000 | | Morgan Stanley, 4.000%, 1/15/10 | | | | | 2,015,576 |
| 1,780,000 | | Wachovia Corp., 5.300%, 10/15/11 | | | | | 1,885,898 |
| | | | | | | |
| | | |
| | Total Corporate Bonds (Cost $7,867,964) | | | | | 7,967,728 |
| | | | | | | |
|
FDIC GUARANTEED SECURITIES (2.7%) |
| | Financials (2.7%) | | | | | |
| 5,000,000 | | American Express Bank FSB, 3.150%, 12/9/11 | | | | | 5,190,835 |
| | | | | | | |
| | Total FDIC Guaranteed Securities (Cost $4,997,083) | | | | | 5,190,835 |
| | | | | | | |
|
MORTGAGE-BACKED SECURITIES (21.3%) |
| | Fannie Mae(a) (16.4%) | | | | | |
| 3,525,360 | | 5.000%, 1/1/18, Pool #650205 | | | | | 3,745,420 |
| 3,185,516 | | 4.500%, 3/1/18, Pool #555292 | | | | | 3,365,043 |
| 1,254,158 | | 5.500%, 1/1/33, Pool #678321 | | | | | 1,319,871 |
| 2,340,117 | | 5.000%, 7/1/33, Pool #724965 | | | | | 2,430,220 |
| 739,867 | | 5.000%, 8/1/33, Pool #724365 | | | | | 773,102 |
| 915,766 | | 5.000%, 8/1/33, Pool #738751 | | | | | 951,488 |
| 764,208 | | 5.000%, 10/1/33, Pool #753298 | | | | | 793,615 |
| 2,282,896 | | 6.500%, 11/1/34, Pool #783476 | | | | | 2,439,762 |
| 8,210,315 | | 5.500%, 9/1/35, Pool #835787 | | | | | 8,622,541 |
| 7,065,995 | | 5.500%, 8/1/37, Pool #946238 | | | | | 7,350,843 |
| | | | | | | |
| | | | | | | 31,791,905 |
| | | | | | | |
| | Freddie Mac(a) (4.9%) | | | | | |
| 3,979,349 | | 4.500%, 2/1/18, Pool #E94445 | | | | | 4,203,614 |
| 5,013,632 | | 5.500%, 2/1/29, Pool #A18613 | | | | | 5,280,830 |
| | | | | | | |
| | | | | | | 9,484,444 |
| | | | | | | |
| | Total Mortgage-Backed Securities (Cost $39,123,932) | | | | | 41,276,349 |
| | | | | | | |
| | | | | | | | |
Principal
Amount | | | | Fair Value |
| U.S. GOVERNMENT AGENCIES (52.9%) |
| | | Fannie Mae(a) (23.7%) | | | | | |
| $ | 3,000,000 | | 4.050%, 2/22/13 | | | | $ | 3,201,348 |
| | 6,970,000 | | 5.125%, 1/2/14 | | | | | 7,395,170 |
| | 5,775,000 | | 5.400%, 12/14/22 | | | | | 5,825,121 |
| | 13,950,000 | | 5.210%, 1/25/23 | | | | | 14,113,313 |
| | 6,000,000 | | 5.210%, 3/3/23 | | | | | 6,092,514 |
| | 9,000,000 | | 5.800%, 2/9/26 | | | | | 9,319,374 |
| | | | | | | | |
| | | | | | | | 45,946,840 |
| | | | | | | | |
| | | Federal Farm Credit Bank (5.4%) |
| | 10,000,000 | | 4.670%, 2/27/18 | | | | | 10,526,070 |
| | | | | | | | |
| | | Federal Home Loan Bank (10.6%) |
| | 5,000,000 | | 0.500%, 5/13/10, STEP | | | | | 5,001,305 |
| | 10,000,000 | | 0.500%, 7/27/11, STEP | | | | | 10,007,920 |
| | 5,000,000 | | 5.000%, 11/17/17 | | | | | 5,462,135 |
| | | | | | | | |
| | | | | | | | 20,471,360 |
| | | | | | | | |
| | | Freddie Mac(a) (7.9%) | | | | | |
| | 3,000,000 | | 5.875%, 3/21/11(b) | | | | | 3,178,197 |
| | 10,000,000 | | 3.000%, 2/4/14 | | | | | 10,042,090 |
| | 2,000,000 | | 4.875%, 6/13/18 | | | | | 2,180,316 |
| | | | | | | | |
| | | | | | | | 15,400,603 |
| | | | | | | | |
| | | Private Export Funding Corp. (5.3%) |
| | 4,350,000 | | 4.974%, 8/15/13 | | | | | 4,778,131 |
| | 5,000,000 | | 4.550%, 5/15/15 | | | | | 5,407,885 |
| | | | | | | | |
| | | | | | | | 10,186,016 |
| | | | | | | | |
| | | Total U.S. Government Agencies (Cost $100,835,800) | | | | | 102,530,889 |
| | | | | | | | |
|
| U.S. TREASURY NOTES (8.3%) |
| | 10,000,000 | | 1.875%, 4/30/14(b) | | | | | 9,881,250 |
| | 5,000,000 | | 6.250%, 8/15/23 | | | | | 6,267,190 |
| | | | | | | | |
| | | Total U.S. Treasury Notes (Cost $15,983,685) | | | | | 16,148,440 |
| | | | | | | | |
|
| U.S. TREASURY BILLS* (5.2%) |
| | 10,000,000 | | 0.452%, 4/8/10 | | | | | 9,990,970 |
| | | | | | | | |
| | | Total U.S. Treasury Bills (Cost $9,976,375) | | | | | 9,990,970 |
| | | | | | | | |
| | | |
| Shares | | | | | | |
| INVESTMENT COMPANY (4.7%) |
| | 9,114,733 | | Federated Treasury Obligations Fund, Institutional Shares | | | 9,114,733 |
| | | | | | | | |
| | | Total Investment Company (Cost $9,114,733) | | | | | 9,114,733 |
| | | | | | | | |
Continued
63
|
BB&T Intermediate U.S. Government Fund |
Schedule of Portfolio Investments — (continued)
September 30, 2009
| | | | | | | | |
Principal Amount | | | | Fair Value | |
SECURITIES HELD AS COLLATERAL FOR
SECURITIES ON LOAN (1.5%) | |
| $ 2,889,393 | | Pool of Various Securities | | | | $ | 2,798,781 | |
| | | | | | | | |
| | Total Securities Held as Collateral for Securities on Loan (Cost $2,889,393) | | | 2,798,781 | |
| | | | | | | | |
Total Investments — 101.2% (Cost $191,676,149) | | | | | 196,060,537 | |
Net Other Assets (Liabilities) — (1.2)% | | | | | (2,371,785 | ) |
| | | | | | | | |
NET ASSETS — 100.0% | | | | $ | 193,688,752 | |
| | | | | | | | |
| * | Discount note or zero coupon bond. Rate disclosed represents the annualized yield from date of purchase. |
| (a) | On September 7, 2008, the Federal Housing Finance Agency (FHFA) placed Fannie Mae and Freddie Mac into conservatorship with FHFA as the conservator. The conservatorship is a statutory process designed to stabilize a troubled institution with the objective of returning the entities to normal business operations. |
| (b) | Represents that all or a portion of the security was on loan as of September 30, 2009. |
FDIC — Federal Deposit Insurance Corp.
STEP — Step Coupon Bond
See accompanying notes to the financial statements.
64
|
BB&T Total Return Bond Fund |
Schedule of Portfolio Investments
September 30, 2009
| | | | | | | |
Principal Amount | | | | Fair Value |
ASSET BACKED SECURITIES (9.2%) |
$1,205,000 | | American Express Credit Account Master Trust, Series 2007-8, Class B, 0.943%, 5/15/15* | | | | $ | 1,149,598 |
| 1,614,000 | | Carmax Auto Owner Trust, Series 2009-1, Class A3, 4.120%, 3/15/13 | | | | | 1,678,384 |
| 5,095,000 | | Chase Funding Mortgage Loan Asset-Backed Certificates, Series 2003-4, Class 1A5, STEP, 5.416%, 5/25/33(a) | | | | | 4,000,711 |
| 1,250,000 | | Chase Issuance Trust, Series 2005-A13, Class A13, 0.283%, 2/15/13* | | | | | 1,244,064 |
| 2,154,000 | | Chase Issuance Trust, Series 2007-A13, Class A13, 0.283%, 7/15/14*(b) | | | | | 2,115,534 |
| 1,760,000 | | Chase Issuance Trust, Series 2009-A7, Class A7, 0.694%, 9/17/12* | | | | | 1,761,305 |
| 2,762,456 | | Credit-Based Asset Servicing and Securitization LLC, Series 2005-CB5, Class AF2, STEP, 4.831%, 8/25/35(a) | | | | | 2,579,189 |
| 1,970,000 | | Harley-Davidson Motorcycle Trust, Series 2009-1, Class A3, 3.190%, 11/15/13 | | | | | 2,011,399 |
| 1,337,000 | | Honda Auto Receivables Owner Trust, Series 2009-2, Class A4, 4.430%, 7/15/15 | | | | | 1,390,624 |
| 2,935,000 | | Hyundai Auto Receivables Trust, Series 2008-A, Class A4, 5.480%, 11/17/14 | | | | | 3,118,400 |
| 1,640,000 | | MBNA Credit Card Master Note Trust, Series 2005-A4, Class A4, 0.283%, 11/15/12* | | | | | 1,633,537 |
| 2,000,000 | | Nissan Auto Lease Trust, Series 2009-A, Class A3, 2.920%, 12/15/11 | | | | | 2,035,763 |
| 1,290,000 | | Nissan Auto Receivables Owner Trust, Series 2009-A, Class A4, 4.740%, 8/17/15 | | | | | 1,367,404 |
| 2,370,000 | | USAA Auto Owner Trust, Series 2008-1, Class A4, 4.500%, 10/15/13 | | | | | 2,483,795 |
| 2,935,000 | | USAA Auto Owner Trust, Series 2009-1, A4, 4.770%, 9/15/14 | | | | | 3,104,802 |
| 1,384,000 | | World Omni Auto Receivables Trust, Series 2009-A, Class A4, 5.120%, 5/15/14 | | | | | 1,468,337 |
| | | | | | | |
| | Total Asset Backed Securities
(Cost $33,530,616) | | | | | 33,142,846 |
| | | | | | | |
COLLATERALIZED MORTGAGE
OBLIGATIONS (5.8%) |
| 2,991,803 | | Chase Mortgage Finance Corp., Series 2003-S7, Class A1, 0.646%, 8/25/18* | | | | | 2,758,448 |
| 2,427,533 | | Countrywide Home Loan Mortgage Pass Through Trust, Series 2004-7, Class 3A1, 4.049%, 5/25/34* | | | | | 2,199,831 |
| 1,457,055 | | Freddie Mac, Series 2906, Class VC, 5.000%, 12/15/15 | | | | | 1,547,370 |
| 2,784,575 | | MASTR Alternative Loans Trust, Series 2005-4, Class 4A1, 5.500%, 6/25/20 | | | | | 2,666,231 |
| 1,314,456 | | MASTR Asset Securitization Trust, Series 2004-1, Class 1A1, 5.000%, 2/25/34 | | | | | 1,310,985 |
| 3,323,300 | | RAAC, Series 2004-SP3, Class AI5, 4.890%, 12/25/32* | | | | | 3,199,715 |
| 2,577,575 | | RBSSP Resecuritization Trust, Series 2009-6, Class 2A1, 5.330%, 1/26/36*(c) | | | | | 2,433,667 |
| 3,560,990 | | Structured Adjustable Rate Mortgage Loan Trust, Series 2004-6, Class 4A1, 4.842%, 6/25/34* | | | |
| 3,224,318
|
| | | | | | | |
Principal Amount | | | | Fair Value |
COLLATERALIZED MORTGAGE
OBLIGATIONS — (continued) |
| $2,026,622 | | Wells Fargo Mortgage Backed Securities Trust, Series 2005-AR16, Class 6A3, 5.000%, 10/25/35* | | | | $ | 1,845,252 |
| | | | | | | |
| | Total Collateralized Mortgage Obligations
(Cost $20,608,465) | | | | | 21,185,817 |
| | | | | | | |
COMMERCIAL MORTGAGE-BACKED SECURITIES (8.1%) |
| 2,100,000 | | Bear Stearns Commercial Mortgage Securities, Series 2005-PWR8, Class A4, 4.674%, 6/11/41 | | | | | 2,023,147 |
| 2,400,000 | | Credit Suisse Mortgage Capital Certificates, Series 2009-RR1, Class A3A, 5.383%, 2/15/40(c) | | | | | 2,071,949 |
| 3,700,000 | | CS First Boston Mortgage Securities Corp., Series 2005-C1, Class A3, 4.813%, 2/15/38 | | | | | 3,722,096 |
| 1,375,653 | | Greenwich Capital Commercial Funding Corp., Series 2005-GG3, Class A2, 4.305%, 8/10/42. | | | | | 1,367,606 |
| 2,800,000 | | JP Morgan Chase Commercial Mortgage Securities Corp., Series 2003-CB7, Class A4, 4.879%, 1/12/38* | | | | | 2,875,274 |
| 3,073,000 | | JP Morgan Chase Commercial Mortgage Securities Corp., Series 2005-CB11, Class A4, 5.335%, 8/12/37* | | | | | 3,055,956 |
| 2,774,000 | | JP Morgan Chase Commercial Mortgage Securities Corp., Series 2005-LDP1, Class A3, 4.865%, 3/15/46 | | | | | 2,735,653 |
| 3,400,000 | | JP Morgan Chase Commercial Mortgage Securities Corp., Series 2006-CB15, Class A4, 5.814%, 6/12/43* | | | | | 3,206,582 |
| 2,600,000 | | Merrill Lynch/Countrywide Commercial Mortgage Trust, Series 2006-3, Class A3, 5.389%, 7/12/46* | | | | | 2,488,607 |
| 3,700,000 | | Morgan Stanley Capital I, Series 2005-HQ6, Class A4A, 4.989%, 8/13/42 | | | | | 3,600,455 |
| 2,115,000 | | Wachovia Bank Commercial Mortgage Trust, Series 2007-C33, Class A3, 6.100%, 2/15/51* | | | | | 1,999,386 |
| | | | | | | |
| | Total Commercial Mortgage-Backed Securities
(Cost $27,132,682) | | | | | 29,146,711 |
| | | | | | | |
CORPORATE BONDS (33.8%) |
| | Consumer Discretionary (3.2%) | | | | | |
| 2,904,000 | | Comcast Corp., 6.950%, 8/15/37 | | | | | 3,241,334 |
| 2,110,000 | | Historic TW, Inc., 9.125%, 1/15/13 | | | | | 2,450,166 |
| 3,405,000 | | Time Warner Cable, Inc., 6.750%, 6/15/39 | | | | | 3,682,290 |
| 2,085,000 | | Viacom, Inc., 5.625%, 9/15/19 | | | | | 2,119,213 |
| | | | | | | |
| | | | | | | 11,493,003 |
| | | �� | | | | |
| | Consumer Staples (1.4%) | | | | | |
| 1,530,000 | | Altria Group, Inc., 9.950%, 11/10/38 | | | | | 2,080,182 |
| 940,000 | | Brown University, 4.570%, 9/1/19 | | | | | 975,635 |
| 1,800,000 | | CVS Caremark Corp., 6.125%, 9/15/39 | | | | | 1,831,002 |
| | | | | | | |
| | | | | | | 4,886,819 |
| | | | | | | |
| | Energy (2.9%) | | | | | |
| 2,125,000 | | Boardwalk Pipelines LP, 5.750%, 9/15/19 | | | | | 2,121,530 |
| 1,750,000 | | Magellan Midstream Partners LP, 6.550%, 7/15/19 | | | | | 1,944,635 |
Continued
65
|
BB&T Total Return Bond Fund |
Schedule of Portfolio Investments — (continued)
September 30, 2009
| | | | | | | |
Principal Amount | | | | Fair Value |
CORPORATE BONDS — (continued) |
| | Energy — (continued) | | | | | |
| $2,276,000 | | Peabody Energy Corp., Series B, 6.875%, 3/15/13(b) | | | | $ | 2,298,760 |
| 1,725,000 | | Plains All American Pipeline LP, 8.750%, 5/1/19 | | | | | 2,070,695 |
| 1,650,000 | | Smith International, Inc., 9.750%, 3/15/19 | | | | | 2,035,841 |
| | | | | | | |
| | | | | | | 10,471,461 |
| | | | | | | |
| | Financials (14.8%) | | | | | |
| 3,150,000 | | Aflac, Inc., 8.500%, 5/15/19 | | | | | 3,755,021 |
| 3,201,000 | | American Express Co., 8.125%, 5/20/19 | | | | | 3,785,794 |
| 2,600,000 | | Bank of America Corp., 5.125%, 11/15/14(b) | | | | | 2,656,802 |
| 2,042,000 | | Bank of America Corp., 5.750%, 12/1/17 | | | | | 2,038,277 |
| 940,000 | | Bank of America Corp., 7.625%, 6/1/19 | | | | | 1,059,184 |
| 3,160,000 | | Bear Stearns Cos., Inc. (The), 7.250%, 2/1/18(b) | | | | | 3,608,853 |
| 850,000 | | Caterpillar Financial Services Corp., MTN, 7.150%, 2/15/19 | | | | | 985,627 |
| 470,000 | | Credit Suisse, New York, 5.500%, 5/1/14 | | | | | 505,052 |
| 1,315,000 | | Credit Suisse, New York, 5.300%, 8/13/19 | | | | | 1,348,331 |
| 2,355,000 | | ERP Operating LP REIT, 5.125%, 3/15/16(b) | | | | | 2,297,945 |
| 1,769,000 | | GATX Financial Corp., 5.125%, 4/15/10(b) | | | | | 1,784,337 |
| 5,500,000 | | General Electric Capital Corp., MTN, 6.875%, 1/10/39 | | | | | 5,760,315 |
| 1,355,000 | | Goldman Sachs Group, Inc. (The), 7.500%, 2/15/19 | | | | | 1,549,601 |
| 2,380,000 | | Goldman Sachs Group, Inc. (The), 6.125%, 2/15/33 | | | | | 2,544,751 |
| 1,525,000 | | Goldman Sachs Group, Inc. (The), 6.750%, 10/1/37 | | | | | 1,573,847 |
| 2,100,000 | | Merrill Lynch & Co., Inc., 6.875%, 4/25/18 | | | | | 2,208,564 |
| 1,550,000 | | MetLife, Inc., 6.750%, 6/1/16 | | | | | 1,729,812 |
| 1,000,000 | | Morgan Stanley, 4.250%, 5/15/10 | | | | | 1,016,589 |
| 3,888,000 | | Morgan Stanley, MTN, Series F, 6.625%, 4/1/18(b) | | | | | 4,111,261 |
| 2,585,000 | | Prudential Financial, Inc., MTN, Series B, 5.100%, 9/20/14(b) | | | | | 2,612,176 |
| 1,530,000 | | Simon Property Group LP REIT, 6.750%, 5/15/14 | | | | | 1,640,896 |
| 3,525,000 | | Wachovia Bank, N.A., 5.850%, 2/1/37 | | | | | 3,409,606 |
| 1,455,000 | | Wachovia Corp., 5.625%, 10/15/16 | | | | | 1,519,069 |
| | | | | | | |
| | | | | | | 53,501,710 |
| | | | | | | |
| | Health Care (0.8%) |
| 2,940,000 | | Laboratory Corp. of America Holdings, 5.625%, 12/15/15(b) | | | | | 3,039,731 |
| | | | | | | |
| | Industrials (3.9%) |
| 3,593,000 | | Allied Waste North America, Inc., 6.875%, 6/1/17(b) | | | | | 3,794,844 |
| 3,893,000 | | Corrections Corp. of America, 6.250%, 3/15/13(b) | | | | | 3,834,605 |
| 2,380,000 | | Goodrich (BF) Corp., 6.290%, 7/1/16(b) | | | | | 2,586,827 |
| 2,100,000 | | L-3 Communications Corp., 5.875%, 1/15/15 | | | | | 2,089,500 |
| 1,840,000 | | Roper Industries, Inc., 6.250%, 9/1/19 | | | | | 1,910,037 |
| | | | | | | |
| | | | | | | 14,215,813 |
| | | | | | | |
| | Information Technology (1.9%) |
| 755,000 | | Agilent Technologies, Inc., 5.500%, 9/14/15 | | | | | 776,620 |
| 1,750,000 | | Fiserv, Inc., 6.125%, 11/20/12 | | | | | 1,896,715 |
| 3,890,000 | | Xerox Corp., 6.350%, 5/15/18 | | | | | 4,044,067 |
| | | | | | | |
| | | | | | | 6,717,402 |
| | | | | | | |
| | | | | | | |
Principal Amount | | | | Fair Value |
CORPORATE BONDS — (continued) |
| | Materials (1.3%) | | | | | |
| $3,400,000 | | ArcelorMittal, 9.850%, 6/1/19 | | | | $ | 4,021,534 |
| 590,000 | | Valspar Corp., 7.250%, 6/15/19 | | | | | 640,838 |
| | | | | | | |
| | | | | | | 4,662,372 |
| | | | | | | |
| | Telecommunication Services (3.0%) |
| 1,598,000 | | America Movil SAB de CV, 6.375%, 3/1/35 | | | | | 1,665,057 |
| 900,000 | | AT&T, Inc., 5.800%, 2/15/19 | | | | | 963,032 |
| 3,930,000 | | AT&T, Inc., 6.400%, 5/15/38(b) | | | | | 4,171,939 |
| 590,000 | | Telecom Italia Capital SA, 7.175%, 6/18/19 | | | | | 658,347 |
| 655,000 | | Verizon Communications, Inc., 6.350%, 4/1/19 | | | | | 723,295 |
| 2,342,000 | | Verizon Communications, Inc., 7.350%, 4/1/39 | | | | | 2,777,106 |
| | | | | | | |
| | | | | | | 10,958,776 |
| | | | | | | |
| | Utilities (0.6%) | | | | | |
| 1,909,000 | | Ohio Power Co., Series K, 6.000%, 6/1/16 | | | | | 2,053,918 |
| | | | | | | |
| | Total Corporate Bonds
(Cost $112,810,134) | | | | | 122,001,005 |
| | | | | | | |
|
| MORTGAGE-BACKED SECURITIES (39.1%) |
| | Fannie Mae(d) (17.8%) |
| 50,077 | | 6.000%, 10/1/13, Pool #252061 | | | | | 53,672 |
| 124,781 | | 5.500%, 4/1/18, Pool #685496 | | | | | 133,545 |
| 149,744 | | 5.000%, 8/1/20, Pool #832058 | | | | | 158,342 |
| 376,295 | | 5.000%, 8/1/20, Pool #838787 | | | | | 397,902 |
| 820,006 | | 5.500%, 11/1/20, Pool #843972 | | | | | 872,217 |
| 351,405 | | 5.500%, 6/1/21, Pool #831526 | | | | | 372,791 |
| 90,264 | | 5.000%, 5/1/22, Pool #256716 | | | | | 94,841 |
| 1,378,884 | | 6.000%, 7/1/22, Pool #944967 | | | | | 1,470,774 |
| 2,574,712 | | 5.000%, 12/1/22, Pool #967350 | | | | | 2,705,258 |
| 8,519,886 | | 5.000%, 5/1/23, Pool #976197 | | | | | 8,946,067 |
| 1,071,585 | | 5.000%, 9/1/25, Pool #255892 | | | | | 1,121,443 |
| 2,647,580 | | 5.500%, 2/1/27, Pool #256600 | | | | | 2,800,464 |
| 581,430 | | 6.500%, 1/1/35, Pool #809198 | | | | | 625,061 |
| 2,525,825 | | 5.500%, 3/1/35, Pool #787561 | | | | | 2,652,643 |
| 3,370,065 | | 5.500%, 4/1/35, Pool #822982 | | | | | 3,541,377 |
| 282,812 | | 6.000%, 4/1/35, Pool #735503 | | | | | 300,947 |
| 369,279 | | 7.000%, 6/1/35, Pool #255820 | | | | | 404,515 |
| 679,119 | | 7.000%, 6/1/35, Pool #830686 | | | | | 743,920 |
| 1,718,373 | | 5.500%, 10/1/35, Pool #817568 | | | | | 1,804,649 |
| 1,280,313 | | 5.500%, 2/1/36, Pool #256101 | | | | | 1,344,595 |
| 878,984 | | 5.500%, 2/1/36, Pool #831295 | | | | | 923,116 |
| 1,252,844 | | 6.500%, 3/1/36, Pool #866062 | | | | | 1,341,966 |
| 1,213,367 | | 6.000%, 6/1/36, Pool #886959 | | | | | 1,283,970 |
| 1,129,801 | | 6.500%, 7/1/36, Pool #885493 | | | | | 1,210,170 |
| 452,273 | | 5.500%, 12/1/36, Pool #922224 | | | | | 474,345 |
| 5,255,031 | | 5.500%, 1/1/37, Pool #256552 | | | | | 5,511,487 |
| 2,836,100 | | 6.000%, 4/1/37, Pool #256674 | | | | | 2,998,467 |
| 975,382 | | 6.000%, 9/1/37, Pool #955005 | | | | | 1,031,223 |
| 3,585,842 | | 6.000%, 12/1/37, Pool #965613 | | | | | 3,791,131 |
| 5,550,192 | | 4.805%, 7/1/38, Pool #981430* | | | | | 5,801,124 |
| 851,557 | | 5.000%, 11/1/38, Pool #995074 | | | | | 880,950 |
| 1,556,943 | | 4.500%, 1/1/39, Pool #AA0841 | | | | | 1,579,318 |
| 940,882 | | 4.500%, 2/1/39, Pool #930492 | | | | | 954,403 |
| 1,700,000 | | 6.000%, 5/1/39, Pool #935238 | | | | | 1,795,731 |
| 4,000,000 | | 6.000%, 9/1/39, Pool #AD0132 | | | | | 4,229,000 |
| | | | | | | |
| | | | | | | 64,351,424 |
| | | | | | | |
| | Freddie Mac(d) (19.3%) |
| 1,070,142 | | 5.000%, 5/1/20, Pool #B19275 | | | | | 1,132,595 |
| 287,326 | | 5.500%, 3/1/21, Pool #J01432 | | | | | 305,172 |
| 1,701,493 | | 5.500%, 10/1/21, Pool #G12425 | | | | | 1,804,513 |
Continued
66
|
BB&T Total Return Bond Fund |
Schedule of Portfolio Investments — (continued)
September 30, 2009
| | | | | | | |
Principal Amount | | | | Fair Value |
MORTGAGE-BACKED SECURITIES — (continued) |
| | Freddie Mac(d) — (continued) |
| $ 907,691 | | 5.000%, 12/1/21, Pool #J04025 | | | | $ | 956,976 |
| 1,700,000 | | 5.500%, 12/1/22, Pool #G13665 | | | | | 1,802,930 |
| 1,718,359 | | 5.000%, 7/1/25, Pool #C90908 | | | | | 1,795,211 |
| 1,659,680 | | 4.500%, 6/1/35, Pool #G01842 | | | | | 1,685,958 |
| 3,486,539 | | 5.500%, 6/1/35, Pool #A35148 | | | | | 3,662,682 |
| 2,336,378 | | 5.500%, 7/1/35, Pool #A36540 | | | | | 2,454,414 |
| 792,762 | | 6.000%, 7/1/35, Pool #A36304 | | | | | 840,377 |
| 869,214 | | 5.500%, 8/1/35, Pool #A36652 | | | | | 913,128 |
| 1,348,998 | | 5.000%, 9/1/35, Pool #A37961 | | | | | 1,398,799 |
| 643,165 | | 5.500%, 9/1/35, Pool #G08080 | | | | | 675,658 |
| 3,271,498 | | 5.077%, 12/1/35, Pool #847603* | | | | | 3,405,407 |
| 983,532 | | 5.500%, 12/1/35, Pool #A40359 | | | | | 1,033,221 |
| 1,361,487 | | 5.000%, 3/1/36, Pool #G08115 | | | | | 1,411,749 |
| 2,047,090 | | 5.500%, 4/1/36, Pool #A44445 | | | | | 2,147,312 |
| 1,177,212 | | 6.500%, 5/1/36, Pool #A48509 | | | | | 1,256,722 |
| 455,797 | | 5.000%, 7/1/36, Pool #G02291 | | | | | 471,983 |
| 3,182,797 | | 6.000%, 9/1/36, Pool #A52325 | | | | | 3,368,991 |
| 1,341,961 | | 5.500%, 12/1/36, Pool #A80368 | | | | | 1,407,661 |
| 4,343,773 | | 5.881%, 12/1/36, Pool #1J1390* | | | | | 4,587,296 |
| 3,468,157 | | 5.000%, 4/1/37, Pool #G08191 | | | | | 3,589,145 |
| 2,880,864 | | 6.000%, 4/1/37, Pool #A58853 | | | | | 3,047,594 |
| 3,001,233 | | 5.000%, 7/1/37, Pool #G03050 | | | | | 3,105,932 |
| 994,102 | | 6.000%, 8/1/37, Pool #A64067 | | | | | 1,051,636 |
| 1,366,587 | | 5.500%, 9/1/37, Pool #G03202 | | | | | 1,432,425 |
| 1,748,963 | | 5.500%, 1/1/38, Pool #A71523 | | | | | 1,833,223 |
| 2,350,037 | | 5.500%, 1/1/38, Pool #G04507 | | | | | 2,463,255 |
| 2,398,085 | | 5.224%, 4/1/38, Pool #783255* | | | | | 2,519,073 |
| 2,359,452 | | 5.500%, 7/1/38, Pool #A79017 | | | | | 2,472,990 |
| 1,384,090 | | 5.500%, 7/1/38, Pool #G04388 | | | | | 1,450,693 |
| 1,446,651 | | 4.500%, 9/1/38, Pool #G04953 | | | | | 1,465,633 |
| 1,701,226 | | 6.000%, 9/1/38, Pool #A81453 | | | | | 1,797,728 |
| 794,708 | | 4.500%, 1/1/39, Pool #A84147 | | | | | 805,135 |
| 2,361,869 | | 5.000%, 5/1/39, Pool #G08345 | | | | | 2,443,894 |
| 1,762,000 | | 4.500%, 10/15/39(e) | | | | | 1,782,372 |
| | | | | | | |
| | | | | | | 69,779,483 |
| | | | | | | |
| | Ginnie Mae (2.0%) |
| 6,796,744 | | 5.000%, 10/15/39(e) | | | | | 7,032,510 |
| | | | | | | |
| | Total Mortgage-Backed Securities (Cost $136,025,427) | | | | | 141,163,417 |
| | | | | | | |
|
MUNICIPAL BONDS (6.3%) |
| | California (2.3%) | | | | | |
| 3,220,000 | | California State, Water Utility Improvements G.O., Taxable, 5.450%, 4/1/15 | | | | | 3,401,189 |
| 780,000 | | Los Angeles Harbor Department, Crossover Refunding Revenue, Series A, Callable 8/1/12 @ 100 (AMBAC), 5.500%, 8/1/14 | | | | | 831,332 |
| 3,700,000 | | Metropolitan Water District of Southern California, Water Utility Improvements Revenue, Callable 7/1/19 @ 100, 6.538%, 7/1/39 | | | | | 4,006,841 |
| | | | | | | |
| | | | | | | 8,239,362 |
| | | | | | | |
| | District of Columbia (0.4%) |
| 1,310,000 | | Metropolitan Washington Airports Authority, Refunding Revenue Bonds, Series D (NATL-RE), 5.000%, 10/1/11 | | | | | 1,394,364 |
| | | | | | | |
| | | | | | | | |
Principal Amount | | | | Fair Value | |
MUNICIPAL BONDS — (continued) | |
| | Florida (0.3%) | | | | | | |
| $1,300,000 | | Greater Orlando Aviation Authority, FL, Port, Airport & Marina Improvements Revenue, Series A, Callable 11/2/09 @ 101 (NATL-RE FGIC), 5.250%, 10/1/12 | | | | $ | 1,315,678 | |
| | | | | | | | |
| | Iowa (1.4%) | | | | | | |
| 7,050,000 | | Iowa Student Loan Liquidity Corporation, Student Loan Revenue Bonds, Series E, Taxable, Callable 10/13/09 @ 100 (AMBAC, GTD STD LNS), 0.000%, 12/1/31*(a)(f) | | | | | 5,146,500 | |
| | | | | | | | |
| | New Jersey (1.4%) | | | | | | |
| 7,100,000 | | Higher Education Student Assistance Authority, NJ, Student Loan Revenue, Series A, Callable 10/01/09 @ 100 (NATL-RE, GTD STD LNS), 0.823%, 6/1/36*(a)(f) | | | | | 4,970,000 | |
| | | | | | | | |
| | New York (0.5%) | | | | | | |
| 1,785,000 | | New York & New Jersey Port Authority, Port, Airport & Marina Improvements Revenue, Series 122, Callable 11/2/09 @ 100.5 (General Obligation of Authority), 5.500%, 7/15/15 | | | | | 1,796,978 | |
| | | | | | | | |
| | Total Municipal Bonds
(Cost $26,346,466) | | | | | 22,862,882 | |
| | | | | | | | |
| | |
U.S. TREASURY NOTES (0.2%) | | | | | | |
| 750,000 | | 4.500%, 5/15/38(b) | | | | | 807,071 | |
| | | | | | | | |
| | Total U.S. Treasury Notes
(Cost $758,214) | | | | | 807,071 | |
| | | | | | | | |
| | | |
Shares | | | | | | | |
INVESTMENT COMPANY (0.3%) | | | | | | |
| 1,126,960 | | Federated Treasury Obligations Fund, Institutional Shares | | | | | 1,126,960 | |
| | | | | | | | |
| | Total Investment Company
(Cost $1,126,960) | | | | | 1,126,960 | |
| | | | | | | | |
| | | |
Principal Amount | | | | | | | |
SHORT TERM INVESTMENTS (0.0%) | | | | | | |
$596,576 | | BNY Institutional Cash Reserve, Series B | | | | | 99,926 | |
| | | | | | | | |
| | Total Short Term Investments
(Cost $596,576) | | | | | 99,926 | |
| | | | | | | | |
Total Investments — 102.8%
(Cost $358,935,540) | | | | | 371,536,635 | |
Net Other Assets (Liabilities) — (2.8)% | | | | | (10,285,296 | ) |
| | | | | | | | |
NET ASSETS — 100.0% | | | | $ | 361,251,339 | |
| | | | | | | | |
| * | The interest rate for this variable rate note, which will change periodically, is based either on the prime rate or an index of market rates. The reflected rate is in effect as of September 30, 2009. The maturity date reflected is the final maturity date. |
| (b) | Represents that all or a portion of the security was pledged as collateral for securities purchased on a when-issued basis or for futures contracts. |
| (c) | Rule 144A, Section 4(2) or other security which is restricted as to resale to institutional investors. The Investment Advisor, using board approved procedures, has deemed these securities or a portion of these securities to be liquid. |
Continued
67
|
BB&T Total Return Bond Fund |
Schedule of Portfolio Investments — (continued)
September 30, 2009
| (d) | On September 7, 2008, the Federal Housing Finance Agency (FHFA) placed Fannie Mae and Freddie Mac into conservatorship with FHFA as the conservator. The conservatorship is a statutory process designed to stabilize a troubled institution with the objective of returning the entities to normal business operations. |
| (e) | Represents a security purchased on a when-issued basis. At September 30, 2009, total cost of investments purchased on a when-issued basis for the Total Return Bond Fund was $8,761,387. |
| (f) | Security was fair valued under methods approved by the Board of Trustees. |
AMBAC — American Municipal Bond Insurance Corp.
FGIC — Financial Guaranty Insurance Corp.
G.O. — General Obligation
GTD STD LNS — Guaranteed Student Loans
MTN — Medium Term Note
NATL — National
RE — Reinsurance
REIT — Real Estate Investment Trust
STEP — Step Coupon Bond
| | | | | | | | | |
Futures | | Contracts | | Unrealized
Appreciation |
Short | | | | | | | | | |
U.S. Treasury Ten Year Note, December 2009 | | 204 | | | | $ | 69,958 | | |
| | | | | | | | | |
Total Short Contracts | | | | | | $ | 69,958 | | |
| | | | | | | | | |
See accompanying notes to the financial statements.
68
|
BB&T Kentucky Intermediate Tax-Free Fund |
Schedule of Portfolio Investments
September 30, 2009
| | | | | | |
Principal
Amount | | | | Fair Value |
MUNICIPAL BONDS (94.4%) | | | | |
| | Kentucky (94.4%) | | | | |
| $320,000 | | Boone County, KY, School District Finance Corp. Revenue, Callable 8/1/15 @ 100 (XLCA), OID, 4.000%, 8/1/17 | | | | $338,765 |
| 125,000 | | Bullitt County, KY, School District Finance Corp., Bullitt County School Building Revenue, Callable 3/1/18 @ 100, OID, 4.750%, 3/1/22 | | | | 136,230 |
| 300,000 | | Campbell & Kenton Counties, KY, Santation District No. 1, Sewer Improvements Revenue, Callable 8/1/17 @ 100 (NATL-RE), 5.000%, 8/1/25 | | | | 331,329 |
| 375,000 | | Casey County, KY, Public Properties Corp., First Mortgage Revenue, Judicial Center Project, Callable 8/1/12 @ 100, OID, 4.500%, 8/1/16 | | | | 397,556 |
| 500,000 | | Christian County Public Courthouse Corp., KY, Court Facility Project Refunding Revenue (AMBAC), 4.000%, 8/1/16 | | | | 542,785 |
| 300,000 | | Christian County, KY, Jennie Stuart Medical Center Revenue (Assured Guaranty), 5.250%, 2/1/18 | | | | 328,191 |
| 330,000 | | Christian County, KY, School District Finance Corp., Energy Conservation Revenue, OID, 3.700%, 8/1/14 | | | | 346,602 |
| 325,000 | | Cumberland County, KY, School District Finance Corp., Cumberland County School Building Revenue, Callable 6/1/18 @ 100, OID, 4.000%, 6/1/25 | | | | 337,048 |
| 85,000 | | Grayson County, KY, Public Properties Corp., Judicial Center Project Public Improvement Revenue (CIFG), 4.375%, 9/1/17 | | | | 91,382 |
| 100,000 | | Kenton County, KY, Public Properties Corp., First Mortgage Court Facilities Project Refunding Revenue (AMBAC), 4.125%, 3/1/16 | | | | 110,123 |
| 30,000 | | Kentucky Area Development Districts Financing, City of Ewing Trust Lease Program Revenue, Series E, Callable 6/1/10 @ 102 (Wachovia Bank N.A.), 5.400%, 6/1/14 | | | | 31,097 |
| 800,000 | | Kentucky Area Development Districts, Trust Lease Acquisition Program Certificate of Participation, Series M, Callable 10/23/09 @ 100, 4.000%, 11/1/09 | | | | 802,248 |
| 500,000 | | Kentucky Asset/Liability Commission, Project Notes-Federal Highway Transit Revenue, First Series (NATL-RE), 4.500%, 9/1/17 | | | | 560,745 |
| 500,000 | | Kentucky Asset/Liability Commission, Project Notes-First Series Revenue (NATL-RE), 5.000%, 5/1/13 | | | | 551,850 |
| 300,000 | | Kentucky Asset/Liability Commission, University of Kentucky Project Notes Refunding Revenue, Series A, Callable 10/1/17 @ 100 (AMBAC), 5.000%, 10/1/18 | | | | 342,864 |
| 480,000 | | Kentucky Asset/Liability Commission, University of Kentucky Project Notes Revenue (NATL-RE FGIC), 5.000%, 10/1/15 | | | | 545,645 |
| 510,000 | | Kentucky Asset/Liability Commission, University of Kentucky Project Notes Revenue, Series B, Callable 10/1/17 @ 100, 5.000%, 10/1/21 | | | | 571,225 |
| | | | | | |
Principal
Amount | | | | Fair Value |
MUNICIPAL BONDS — (continued) | | | | |
| | Kentucky — (continued) | | | | |
| $500,000 | | Kentucky Economic Development Finance Authority, Baptist Healthcare System Revenue, Series A, Callable 8/15/18 @ 100, OID, 4.750%, 8/15/19 | | | | $546,510 |
| 510,000 | | Kentucky Economic Development Finance Authority, Catholic Health Initiatives Revenue, Series A, Prerefunded 6/1/10 @ 101, OID, 5.750%, 12/1/15 | | | | 532,669 |
| 285,000 | | Kentucky Housing Corp. Refunding Revenue, Series F, Callable 7/1/13 @ 100, 4.850%, 1/1/24 | | | | 289,868 |
| 165,000 | | Kentucky Municipal Power Agency, Prairie State Project Revenue, Series A (NATL-RE), 5.250%, 9/1/17 | | | | 187,013 |
| 255,000 | | Kentucky Municipal Power Agency, Prairie State Project Revenue, Series A, Callable 9/1/17 @ 100 (NATL-RE), 5.250%, 9/1/20 | | | | 281,303 |
| 200,000 | | Kentucky State Property & Buildings Commission, Project No. 66 Revenue, Series A, Prerefunded 5/1/10 @ 100 (NATL-RE), OID, 5.500%, 5/1/15 | | | | 206,024 |
| 300,000 | | Kentucky State Property & Buildings Commission, Project No. 69 Refunding Revenue, Series A (FSA), 5.500%, 8/1/11 | | | | 324,249 |
| 200,000 | | Kentucky State Property & Buildings Commission, Project No. 73 Road Funding Revenue, 5.250%, 11/1/11 | | | | 215,422 |
| 380,000 | | Kentucky State Property & Buildings Commission, Project No. 76 Refunding Revenue (AMBAC), 5.500%, 8/1/21 | | | | 448,221 |
| 440,000 | | Kentucky State Property & Buildings Commission, Project No. 81 Revenue, Callable 11/1/13 @ 100 (AMBAC), 5.000%, 11/1/16 | | | | 475,671 |
| 475,000 | | Kentucky State Property & Buildings Commission, Project No. 83 Refunding Revenue (AMBAC), 5.000%, 10/1/19 | | | | 541,799 |
| 205,000 | | Kentucky Turnpike Authority Revenue, Series B (AMBAC), 5.000%, 7/1/15 | | | | 236,689 |
| 250,000 | | Kentucky Turnpike Authority, Revitalization Project Refunding Revenue, Series A (AMBAC), 5.500%, 7/1/12 | | | | 278,875 |
| 145,000 | | Kentucky Turnpike Authority, Revitalization Project Refunding Revenue, Series A (AMBAC), 5.500%, 7/1/15 | | | | 171,320 |
| 175,000 | | Kentucky Turnpike Authority, Revitalization Project Refunding Revenue, Series B, Callable 7/1/15 @ 100 (AMBAC), 5.000%, 7/1/19 | | | | 195,449 |
| 260,000 | | Knott County, KY, Recreational Facilities Improvements Youth & Recreation Center Project G.O., 5.000%, 9/1/12 | | | | 274,097 |
| 70,000 | | Larue County, KY, School District Finance Corp., Larue County School Building Revenue (NATL-RE), 4.250%, 7/1/15 | | | | 76,878 |
| 415,000 | | Laurel County, KY, Judicial Center Public Properties Corp. Revenue, Callable 3/1/18 @ 100, OID, 4.500%, 3/1/24 | | | | 441,506 |
Continued
69
|
BB&T Kentucky Intermediate Tax-Free Fund |
Schedule of Portfolio Investments — (continued)
September 30, 2009
| | | | | | | |
Principal
Amount | | | | Fair Value |
MUNICIPAL BONDS — (continued) |
| | Kentucky — (continued) |
| $590,000 | | Louisville & Jefferson County Metropolitan Sewer District, KY, Sewer Improvements Revenue, Series A, Callable 11/15/11 @ 101 (NATL-RE), 5.500%, 5/15/34 | | | | $ | 622,533 |
| 400,000 | | Louisville & Jefferson County, KY, First Mortgage Christian Church Homes Revenue, Callable 10/23/09 @ 100, OID, 6.125%, 11/15/18 | | | | | 400,292 |
| 365,000 | | Louisville & Jefferson County, KY, Metropolitan Government Jewish Hospital St. Mary’s Healthcare Refunding Revenue, Callable 2/1/13 @ 100, 6.000%, 2/1/22 | | | | | 381,991 |
| 530,000 | | Louisville & Jefferson County, KY, Metropolitan Government Norton Healthcare, Inc. Refunding Revenue, Callable 10/1/16 @ 100, 5.250%, 10/1/36 | | | | | 524,716 |
| 275,000 | | Monroe County, KY, School District Finance Corp., Monroe County School Building Revenue, Callable 6/1/11 @ 101, OID, 4.600%, 6/1/15 | | | | | 289,055 |
| 765,000 | | Muhlenberg County, KY, Public Improvements G.O., Callable 2/1/11 @ 100, 4.000%, 8/1/14 | | | | | 770,470 |
| 535,000 | | Owensboro, KY, Water Refunding & Improvements Revenue, Callable 9/15/18 @ 100 (Assured Guaranty), 5.250%, 9/15/21 | | | | | 620,776 |
| 585,000 | | Owensboro-Daviess County, KY, Regional Water Resource Agency Refunding & Improvements Revenue, Series A (XLCA), 4.000%, 1/1/16 | | | | | 624,300 |
| 655,000 | | Pulaski County, KY, Public Properties Corp. First Mortgage Revenue, Administration Office of the Court Judicial Facility, Callable 12/1/18 @ 100, OID, 5.500%, 12/1/24 | | | | | 758,189 |
| 250,000 | | Pulaski County, KY, Public Properties Corp. First Mortgage Revenue, Administration Office of the Court Judicial Facility, Callable 12/1/18 @ 100, OID, 5.625%, 12/1/25 | | | | | 290,305 |
| 395,000 | | Trimble County, KY, School District Finance Corp., Trimble County School Building Revenue, Callable 4/1/12 @ 100, OID, 4.600%, 4/1/16 | | | | | 417,448 |
| 375,000 | | Warren County, KY, Community Hospital Corp. Project Refunding Revenue, Series A, 5.000%, 8/1/14 | | | | | 389,449 |
| 500,000 | | Western Kentucky University, KY, General Receipts Revenue (Assured Guaranty), 3.000%, 9/1/13 | | | | | 522,025 |
| | | | | | | |
| | Total Municipal Bonds
(Cost $17,606,135) | | | | | 18,700,797 |
| | | | | | | |
| | | | | | | |
Shares | | | | Fair Value |
INVESTMENT COMPANY (4.6%) |
| 922,430 | | Federated Tax-Free Obligations Fund, Institutional Service Class | | | | $ | 922,430 |
| | | | | | | |
| | Total Investment Company
(Cost $922,430) | | | | | 922,430 |
| | | | | | | |
Total Investments — 99.0%
(Cost $18,528,565) | | | | | 19,623,227 |
Net Other Assets (Liabilities) — 1.0% | | | | | 189,614 |
| | | | | | | |
NET ASSETS — 100.0% | | | | $ | 19,812,841 |
| | | | | | | |
AMBAC — American Municipal Bond Insurance Corp.
CIFG — CDC IXIS Financial Guarantee
FGIC — Financial Guaranty Insurance Corp.
FSA — Financial Security Assurance
G.O. — General Obligation
N.A. — North America
NATL — National
OID — Original Issue Discount
RE — Reinsurance
XLCA — XL Capital Assurance
See accompanying notes to the financial statements.
70
|
BB&T Maryland Intermediate Tax-Free Fund |
Schedule of Portfolio Investments
September 30, 2009
| | | | | | | |
Principal
Amount | | | | Fair Value |
MUNICIPAL BONDS (93.2%) | | | | | |
| | District of Columbia (3.7%) | | | | | |
| $690,000 | | Washington, D.C., Metropolitan Area Transit Authority, Refunding Revenue (NATL-RE), 5.000%, 7/1/12 | | | | $ | 754,087 |
| 260,000 | | Washington, D.C., Metropolitan Area Transit Authority, Refunding Revenue (NATL-RE), 5.000%, 1/1/13 | | | | | 286,338 |
| 30,000 | | Washington, D.C., Metropolitan Area Transit Authority, Refunding Revenue (NATL-RE), 5.000%, 1/1/14 | | | | | 33,508 |
| | | | | | | |
| | | | | | | 1,073,933 |
| | | | | | | |
| | Maryland (89.5%) | | | | | |
| 375,000 | | Anne Arundel County, MD, G.O., Prerefunded 3/1/12 @ 100, 5.375%, 3/1/13 | | | | | 415,069 |
| 215,000 | | Baltimore County, MD, Shelter Elder Care Revenue, Series A, Prerefunded 11/1/09 @ 102, OID, 7.375%, 11/1/21 | | | | | 220,371 |
| 500,000 | | Cecil County, MD, Construction Public Improvements G.O., 4.000%, 6/1/18 | | | | | 556,305 |
| 105,000 | | Cumberland County, MD, G.O., Public Improvements (Assured Guaranty), 4.000%, 9/1/14 | | | | | 116,907 |
| 125,000 | | Cumberland County, MD, G.O., Public Improvements (Assured Guaranty), 4.125%, 9/1/16 | | | | | 140,844 |
| 500,000 | | Frederick County, MD, Public Facilities Improvements G.O., 5.000%, 6/1/16 | | | | | 592,180 |
| 250,000 | | Frederick, MD, Public Improvements G.O., Series A, 4.000%, 3/1/19 | | | | | 281,607 |
| 200,000 | | Frederick, MD, Public Improvements G.O., Series A, Callable 3/1/19 @ 100, OID, 4.500%, 3/1/24 | | | | | 220,602 |
| 500,000 | | Harford County, MD, G.O., Public Improvements, Callable 7/15/15 @ 100, 5.000%, 7/15/23 | | | | | 551,495 |
| 445,000 | | Howard County, MD, Construction & Public Improvements Refunding G.O., Series A, 4.000%, 4/15/17 | | | | | 499,820 |
| 100,000 | | Maryland Community Development Administration, Residential Housing Refunding Revenue, Series C, 3.850%, 9/1/15 | | | | | 105,315 |
| 375,000 | | Maryland Community Development Administration, Residential Housing Revenue, Series A, 3.300%, 9/1/17 | | | | | 382,076 |
| 290,000 | | Maryland Community Development Administration, Residential Housing Revenue, Series A, 3.550%, 9/1/18 | | | | | 296,841 |
| 270,000 | | Maryland Community Development Administration, Residential Housing Revenue, Series A, Callable 9/1/18 @ 100, 4.400%, 9/1/24 | | | | | 275,991 |
| 600,000 | | Maryland Community Development Administration, Residential Housing Revenue, Series A, Callable 9/1/18 @ 100, 4.750%, 9/1/29 | | | | | 612,666 |
| 100,000 | | Maryland Community Development Administration, Residential Housing Revenue, Series G, Callable 3/1/17 @ 100, 4.300%, 9/1/17 | | | | | 105,366 |
| 250,000 | | Maryland Economic Development Corp., Electricity Lights & Power Improvements Revenue, Callable 3/1/19 @ 100, 6.200%, 9/1/22 | | | | | 283,355 |
| | | | | | |
Principal Amount | | | | Fair Value |
MUNICIPAL BONDS — (continued) |
| | Maryland — (continued) | | | | |
| $250,000 | | Maryland Economic Development Corp., Lutheran World Relief Refugee Refunding Revenue, Callable 4/1/17 @ 100, 5.250%, 4/1/19 | | | | $259,090 |
| 490,000 | | Maryland Economic Development Corp., University of Maryland College Park Projects Refunding Revenue (CIFG), 5.000%, 6/1/13 | | | | 514,221 |
| 150,000 | | Maryland Economic Development Corp., University of Maryland College Park Projects Refunding Revenue (CIFG), 5.000%, 6/1/16 | | | | 155,671 |
| 245,000 | | Maryland Health & Higher Educational Facilities Authority, Board of Child Care Revenue, Callable 7/1/12 @ 100, 5.500%, 7/1/13 | | | | 263,814 |
| 255,000 | | Maryland Health & Higher Educational Facilities Authority, Carroll County General Hospital Revenue, Callable 7/1/12 @ 100, 6.000%, 7/1/16 | | | | 270,063 |
| 250,000 | | Maryland Health & Higher Educational Facilities Authority, Carroll County General Hospital Revenue, Callable 7/1/12 @ 100, 6.000%, 7/1/20 | | | | 261,895 |
| 65,000 | | Maryland Health & Higher Educational Facilities Authority, Helix Health Issue Refunding Revenue (AMBAC), OID, 5.125%, 7/1/12 | | | | 72,393 |
| 770,000 | | Maryland Health & Higher Educational Facilities Authority, Helix Health Issue Refunding Revenue (AMBAC), OID, 5.000%, 7/1/27 | | | | 900,269 |
| 60,000 | | Maryland Health & Higher Educational Facilities Authority, Howard County General Hospital Refunding Revenue, Callable 10/23/09 @ 100, OID, 5.500%, 7/1/13 | | | | 63,717 |
| 700,000 | | Maryland Health & Higher Educational Facilities Authority, Johns Hopkins Health System Revenue, 5.000%, 5/15/46* | | | | 762,069 |
| 750,000 | | Maryland Health & Higher Educational Facilities Authority, Lifebridge Health Refunding Revenue, 5.000%, 7/1/15 | | | | 812,595 |
| 195,000 | | Maryland Health & Higher Educational Facilities Authority, Medlantic / Helix Issue Revenue, Series B, Callable 10/23/09 @ 101 (AMBAC), 5.250%, 8/15/13 | | | | 196,462 |
| 500,000 | | Maryland Health & Higher Educational Facilities Authority, Medstar Health Refunding Revenue, Callable 8/15/14 @ 100, OID, 5.375%, 8/15/24 | | | | 517,165 |
| 310,000 | | Maryland Health & Higher Educational Facilities Authority, Memorial Hospital at Easton Revenue, Callable 10/23/09 @ 100 (NATL-RE), OID, 4.700%, 7/1/19 | | | | 310,208 |
| 135,000 | | Maryland Health & Higher Educational Facilities Authority, Mercy Ridge Refunding Revenue, Callable 7/1/17 @ 100, 4.750%, 7/1/34 | | | | 119,719 |
| 300,000 | | Maryland Health & Higher Educational Facilities Authority, Mercy Ridge Revenue, Series A, Prerefunded 4/1/13 @ 101, 6.000%, 4/1/35 | | | | 350,544 |
Continued
71
|
BB&T Maryland Intermediate Tax-Free Fund |
Schedule of Portfolio Investments — (continued)
September 30, 2009
| | | | | | | |
Principal
Amount | | | | Fair Value |
MUNICIPAL BONDS — (continued) |
| | Maryland — (continued) |
| $100,000 | | Maryland Health & Higher Educational Facilities Authority, North Arundel Hospital Revenue, Prerefunded 7/1/10 @ 101, OID, 6.500%, 7/1/31 | | | | $ | 105,514 |
| 200,000 | | Maryland Health & Higher Educational Facilities Authority, Peninsula Regional Medical Center Revenue, 5.000%, 7/1/15 | | | | | 221,428 |
| 500,000 | | Maryland Health & Higher Educational Facilities Authority, Peninsula Regional Medical Center Revenue, Callable 7/1/16 @ 100, 5.000%, 7/1/20 | | | | | 535,720 |
| 635,000 | | Maryland Health & Higher Educational Facilities Authority, Peninsula Regional Medical Center Revenue, Callable 7/1/16 @ 100, 5.000%, 7/1/26 | | | | | 662,661 |
| 400,000 | | Maryland Health & Higher Educational Facilities Authority, Suburban Hospital Refunding Revenue, Series A, 5.500%, 7/1/13 | | | | | 438,648 |
| 60,000 | | Maryland Health & Higher Educational Facilities Authority, Union Hospital of Cecil County Refunding Revenue, Callable 10/23/09 @ 100, 4.700%, 7/1/10 | | | | | 60,132 |
| 150,000 | | Maryland Health & Higher Educational Facilities Authority, University of Maryland Medical Revenue, Prerefunded 7/1/11 @ 100, OID, 5.250%, 7/1/34 | | | | | 161,593 |
| 80,000 | | Maryland Health & Higher Educational Facilities Authority, University of Maryland Medical System Refunding Revenue, 5.000%, 7/1/12 | | | | | 85,066 |
| 250,000 | | Maryland Health & Higher Educational Facilities Authority, University of Maryland Medical System Refunding Revenue, Prerefunded 7/1/12 @ 100, 5.750%, 7/1/17 | | | | | 281,285 |
| 310,000 | | Maryland Health & Higher Educational Facilities Authority, University of Maryland Medical System Refunding Revenue, Series F, 5.000%, 7/1/15 | | | | | 335,873 |
| 500,000 | | Maryland Health & Higher Educational Facilities Authority, University of Maryland Medical System Refunding Revenue, Series F, Callable 7/1/18 @ 100, 5.250%, 7/1/21 | | | | | 544,585 |
| 315,000 | | Maryland Health & Higher Educational Facilities Authority, Washington County Hospital Revenue, 5.000%, 1/1/17 | | | | | 324,239 |
| 245,000 | | Maryland State Department of Transportation County Transportation, Transit Improvements Revenue, Second Issue, 5.000%, 6/1/18 | | | | | 292,677 |
| 250,000 | | Maryland State Department of Transportation, County Transportation Transit Improvements Revenue, 5.250%, 12/15/17 | | | | | 302,705 |
| 500,000 | | Maryland State Department of Transportation, County Transportation Transit Improvements Revenue, Second Issue, Callable 9/1/18 @ 100, 5.000%, 9/1/23 | | | | | 575,625 |
| 880,000 | | Maryland State Transportation Authority Grant & Revenue Anticipate, MD Transit Improvements Revenue, 5.000%, 3/1/16 | | | | | 1,033,657 |
| | | | | | | |
Principal Amount | | | | Fair Value |
MUNICIPAL BONDS — (continued) |
| | Maryland — (continued) |
| $ 40,000 | | Maryland State Transportation Authority, MD Transportation Facility Projects Revenue, Callable 7/1/14 @ 100 (FSA), 5.000%, 7/1/15 | | | | $ | 45,687 |
| 395,000 | | Maryland State, State & Local Facilities Loan Cash Flow Management G.O., Second Series, 5.000%, 8/1/11 | | | | | 426,331 |
| 500,000 | | Maryland State, State & Local Facilities Loan Public Improvements G.O., First Series, 5.500%, 3/1/12 | | | | | 555,045 |
| 500,000 | | Maryland State, State & Local Facilities Loan Public Improvements G.O., First Series, 5.000%, 3/1/16 | | | | | 590,930 |
| 300,000 | | Maryland State, State & Local Facilities Loan Public Improvements G.O., First Series, 5.000%, 3/15/16 | | | | | 354,789 |
| 275,000 | | Maryland State, State & Local Facilities Loan Public Improvements G.O., First Series, Callable 3/15/17 @ 100, 5.000%, 3/15/22 | | | | | 314,232 |
| 510,000 | | Maryland State, State & Local Facilities Loan Public Improvements G.O., Second Series, Callable 7/15/18 @ 100, 5.000%, 7/15/23 | | | | | 590,595 |
| 250,000 | | Maryland Water Quality Financing Administration, Revolving Loan Fund Sewer Improvements Revenue, 5.000%, 3/1/18 | | | | | 294,710 |
| 250,000 | | Montgomery County Housing Opportunities Commission, Housing Refunding Revenue, Series A, Callable 1/1/16 @ 100 (FHA/VA Mortgages), 3.800%, 7/1/16 | | | | | 259,220 |
| 250,000 | | Montgomery County Housing Opportunities Commission, Local Housing Revenue, Series A, 3.700%, 7/1/14 | | | | | 262,785 |
| 170,000 | | Montgomery County, MD, Construction & Public Improvement G.O., Prerefunded 2/1/11 @ 101, OID, 4.750%, 2/1/16 | | | | | 181,169 |
| 445,000 | | Montgomery County, MD, Construction & Public Improvements Refunding G.O., Series A, 5.000%, 5/1/15 | | | | | 521,901 |
| 700,000 | | Montgomery County, MD, Construction & Public Improvements Refunding G.O., Series A, 5.000%, 7/1/15 | | | | | 823,550 |
| 370,000 | | Montgomery County, MD, Construction & Public Improvements Refunding G.O., Series A, 5.000%, 7/1/17 | | | | | 442,150 |
| 270,000 | | Montgomery County, MD, Construction & Public Improvements Refunding G.O., Series A, Callable 7/1/15 @100, 5.000%, 7/1/18 | | | | | 307,111 |
| 300,000 | | Ocean City, MD, Public Improvements G.O. (NATL-RE FGIC), Callable 3/1/11 @ 101, OID, 4.600%, 3/1/15 | | | | | 315,462 |
| 320,000 | | Ocean City, MD, Public Improvements G.O. (NATL-RE FGIC), Callable 3/1/11 @ 101, OID, 4.750%, 3/1/17 | | | | | 337,491 |
| 250,000 | | Prince Georges County, MD, Construction & Public Improvements G.O., 5.000%, 10/1/14 | | | | | 291,300 |
| 50,000 | | University System of Maryland, Auxiliary Facilities & Tuition Refunding Revenue, Series A, 5.000%, 4/1/15 | | | | | 58,261 |
| 550,000 | | University System of Maryland, Auxiliary Facilities & Tuition Revenue, Series A, Callable 4/1/19 @ 100, 4.000%, 4/1/22 | | | | | 593,059 |
Continued
72
|
BB&T Maryland Intermediate Tax-Free Fund |
Schedule of Portfolio Investments — (continued)
September 30, 2009
| | | | | | | | | |
Principal
Amount | | | | Fair Value |
MUNICIPAL BONDS — (continued) | | | | | |
| | | | Maryland — (continued) | | | | | |
| $275,000 | | | | Washington Suburban Sanitation District, MD, Sewer Disposal Refunding G.O., 5.000%, 6/1/12 | | | | $ | 304,747 |
| 100,000 | | | | Washington Suburban Sanitation District, MD, Water Supply Refunding G.O., Prerefunded 6/1/11 @ 100, OID, 4.700%, 6/1/18 | | | | | 106,800 |
| 475,000 | | | | Westminster, MD, McDaniel College, Inc. Revenue, Callable 11/1/16 @ 100, 5.000%, 11/1/22 | | | | | 490,713 |
| | | | | | | | | |
| | | | | | | | | 25,916,151 |
| | | | | | | | | |
| | | | Total Municipal Bonds
(Cost $25,404,584) | | | | | 26,990,084 |
| | | | | | | | | |
| | | |
| Shares | | | | | | |
INVESTMENT COMPANY (5.9%) | | | | | |
| 1,721,808 | | | | Federated Maryland Municipal Cash Trust | | | | | 1,721,808 |
| | | | | | | | | |
| | | | Total Investment Company
(Cost $1,721,808) | | | | | 1,721,808 |
| | | | | | | | | |
Total Investments — 99.1%
(Cost $27,126,392) | | | | | 28,711,892 |
Net Other Assets (Liabilities) — 0.9% | | | | | 264,711 |
| | | | | | | | | |
NET ASSETS — 100.0% | | | | $ | 28,976,603 |
| | | | | | | | | |
| * | The interest rate for this variable rate note, which will change periodically, is based either on the prime rate or an index of market rates. The reflected rate is in effect as of September 30, 2009. The maturity date reflected is the final maturity date. |
AMBAC — American Municipal Bond Insurance Corp.
CIFG — CDC IXIS Financial Guarantee
FGIC — Financial Guaranty Insurance Corp.
FHA — Federal Housing Authority
FSA — Financial Security Assurance
G.O. — General Obligation
NATL — National
OID — Original Issue Discount
RE — Reinsurance
VA — Veterans Administration
See accompanying notes to the financial statements.
73
|
BB&T North Carolina Intermediate Tax-Free Fund |
Schedule of Portfolio Investments
September 30, 2009
| | | | | | | | | |
Principal
Amount | | | | Fair Value |
MUNICIPAL BONDS (95.0%) | | | | | |
| | | | North Carolina (95.0%) | | | | | |
| $1,000,000 | | | | Alamance County, NC, School Improvements G.O., Callable 2/1/16 @ 100, 5.000%, 2/1/19 | | | | $ | 1,145,050 |
| 260,000 | | | | Albemarle, NC, Healthcare Authority Refunding Revenue, OID, 4.500%, 10/1/11 | | | | | 262,330 |
| 45,000 | | | | Albemarle, NC, Hospital Authority Refunding Revenue, OID, 4.500%, 10/1/12 | | | | | 45,333 |
| 1,150,000 | | | | Bladen County, NC, School Improvements G.O., Prerefunded 5/1/10 @ 101.50 (FSA), 5.600%, 5/1/13 | | | | | 1,203,004 |
| 1,065,000 | | | | Broad River Water Authority, NC, Water System Refunding Revenue, Callable 6/1/15 @ 100 (XLCA), 5.000%, 6/1/18 | | | | | 1,104,267 |
| 775,000 | | | | Broad River Water Authority, NC, Water System Refunding Revenue, Callable 6/1/15 @ 100 (XLCA), 5.000%, 6/1/19 | | | | | 799,986 |
| 2,975,000 | | | | Cabarrus County, NC, Installment Financing Contract Certificate of Participation, 4.000%, 1/1/15 | | | | | 3,214,606 |
| 1,700,000 | | | | Cabarrus County, NC, Installment Financing Contract Certificate of Participation, Callable 1/1/19 @ 100, 5.000%, 1/1/23 | | | | | 1,894,293 |
| 1,000,000 | | | | Cabarrus County, NC, Installment Financing Contract Certificate of Participation, Series C, Callable 6/1/18 @ 100, OID, 5.000%, 6/1/23 | | | | | 1,107,190 |
| 1,000,000 | | | | Cape Fear Public Utility Authority, NC, Water & Sewer System Revenue, Callable 8/1/18 @ 100, 5.000%, 8/1/26 | | | | | 1,120,380 |
| 1,015,000 | | | | Catawba County, NC, Public School & Community College Improvements Projects Certificate of Participation, Callable 6/1/14 @ 100 (NATL-RE), 5.250%, 6/1/23 | | | | | 1,076,925 |
| 1,280,000 | | | | Charlotte, NC, Storm Water Fee Public Improvements Revenue, Callable 6/1/16 @ 100, 5.000%, 6/1/20 | | | | | 1,458,291 |
| 1,000,000 | | | | Charlotte, NC, Storm Water Fee Public Improvements Revenue, Callable 6/1/16 @ 100, 5.000%, 6/1/23 | | | | | 1,119,910 |
| 1,555,000 | | | | Charlotte-Mecklenburg Hospital Authority, NC, Carolinas Health Care System Refunding Revenue, Series A, 5.000%, 1/15/17 | | | | | 1,717,575 |
| 3,135,000 | | | | Charlotte-Mecklenburg Hospital Authority, NC, Carolinas Health Care System Revenue, Series A, Prerefunded 1/15/15 @ 100, OID, 5.000%, 1/15/45 | | | | | 3,637,227 |
| 2,000,000 | | | | Concord, NC, Refunding Revenue, Series B, Callable 12/1/19 @ 100, 5.000%, 12/1/22 | | | | | 2,250,000 |
| 1,180,000 | | | | Cumberland County, NC, County Improvements Projects Certificate of Participation, Series A, Callable 12/1/19 @ 100, OID, 4.875%, 12/1/25 | | | | | 1,300,879 |
| 2,710,000 | | | | Cumberland County, NC, Refunding G.O. (NATL-RE), 5.000%, 5/1/13 | | | | | 3,057,856 |
| 2,205,000 | | | | Cumberland County, NC, Refunding G.O. (NATL-RE), 5.000%, 5/1/14 | | | | | 2,532,046 |
| 860,000 | | | | Dare County, NC, Certificates of Participation (AMBAC), 4.000%, 6/1/15 | | | | | 911,875 |
| 1,795,000 | | | | Davidson County, NC, G.O., Callable 6/1/17 @ 100 (FSA), 5.000%, 6/1/25 | | | | | 2,006,128 |
| | | | | | | | | |
Principal
Amount | | | | Fair Value |
MUNICIPAL BONDS — (continued) | | | | | |
| | | | North Carolina — (continued) | | | | | |
| $2,000,000 | | | | Durham County, NC, Public Improvements Certificate of Participation, Series A, Callable 6/1/19 @ 100, 5.000%, 6/1/24 | | | | $ | 2,255,060 |
| 1,000,000 | | | | Durham, NC, Water & Sewer Utilities System Revenue, Callable 6/1/11 @ 101, 5.000%, 6/1/12 | | | | | 1,075,740 |
| 2,000,000 | | | | Fayetteville, NC, Public Works Commission Refunding Revenue, Series A, 5.000%, 3/1/16 | | | | | 2,311,100 |
| 1,275,000 | | | | Gaston County, NC, Refunding G.O., Series C, 3.500%, 6/1/20 | | | | | 1,354,012 |
| 1,000,000 | | | | Gastonia, NC, Combined Utilities Systems Refunding Revenue (NATL-RE), 5.000%, 5/1/10 | | | | | 1,023,010 |
| 400,000 | | | | Goldsboro, NC, Sewer Improvements G.O., Callable 10/23/09 @ 102, 4.250%, 6/1/13 | | | | | 408,920 |
| 1,455,000 | | | | Greenville, NC, Greenville Enterprise Systems Refunding Revenue (FSA), 5.500%, 9/1/10 | | | | | 1,519,369 |
| 1,000,000 | | | | Guilford County, NC, Public Improvements G.O., Series B, 5.000%, 10/1/09 | | | | | 1,000,130 |
| 2,075,000 | | | | Guilford County, NC, Public Improvements G.O., Series B, Prerefunded 10/1/10 @ 102, OID, 5.250%, 10/1/15 | | | | | 2,220,022 |
| 525,000 | | | | Haywood County, NC, School Improvements G.O., Callable 5/1/16 @ 100 (XLCA), 5.000%, 5/1/17 | | | | | 598,421 |
| 570,000 | | | | High Point, NC, High Point Combined Enterprise Systems Revenue, Callable 11/1/18 @ 100 (FSA), 5.000%, 11/1/26 | | | | | 634,159 |
| 1,180,000 | | | | Iredell County Public Facilities Corp., NC, School Projects Revenue, Prerefunded 6/1/10 @ 101 (AMBAC), 6.000%, 6/1/14 | | | | | 1,236,911 |
| 870,000 | | | | Iredell County, NC, School Projects Certificate of Participation (FSA), 5.250%, 6/1/17 | | | | | 1,021,406 |
| 850,000 | | | | Johnston County, NC, Public Improvements G.O., Callable 2/1/15 @ 100 (NATL-RE FGIC), 5.250%, 2/1/16 | | | | | 984,470 |
| 1,110,000 | | | | Johnston Memorial Hospital Authority Revenue (FSA FHA), 5.000%, 10/1/16 | | | | | 1,232,255 |
| 600,000 | | | | Lumberton, NC, Sewer Improvements G.O., Callable 10/23/09 @ 100.5, 4.750%, 2/1/10 | | | | | 604,668 |
| 590,000 | | | | Mooresville, NC, Telecommunications Improvements Certificate of Participation, 5.000%, 9/1/13 | | | | | 658,051 |
| 1,435,000 | | | | Mooresville, NC, Telecommunications Improvements Certificate of Participation, 5.000%, 9/1/16 | | | | | 1,642,601 |
| 1,000,000 | | | | New Hanover County, NC, New Hanover Regional Medical Center Project Revenue, Callable 10/23/09 @ 101 (NATL-RE), 5.250%, 10/1/12 | | | | | 1,011,560 |
| 1,000,000 | | | | New Hanover County, NC, Regional Medical Center Revenue, Series A, Callable 10/1/19 @ 100 (FSA), 5.000%, 10/1/21 | | | | | 1,086,330 |
| 1,000,000 | | | | New Hanover County, NC, Regional Medical Center Revenue, Series A, Callable 10/1/19 @ 100 (FSA), 5.000%, 10/1/22 | | | | | 1,081,170 |
| 235,000 | | | | North Carolina Capital Facilities Finance Agency, Brevard College Corp. Refunding Revenue, 4.250%, 10/1/15 | | | | | 209,169 |
Continued
74
|
BB&T North Carolina Intermediate Tax-Free Fund |
Schedule of Portfolio Investments — (continued)
September 30, 2009
| | | | | | | | | |
Principal
Amount | | | | Fair Value |
MUNICIPAL BONDS — (continued) | | | | | |
| | | | North Carolina — (continued) | | | | | |
| $ 295,000 | | | | North Carolina Capital Facilities Finance Agency, Brevard College Corp. Refunding Revenue, OID, 4.125%, 10/1/14 | | | | $ | 267,064 |
| 645,000 | | | | North Carolina Capital Facilities Finance Agency, Meredith College Refunding Revenue, 5.000%, 6/1/16 | | | | | 677,772 |
| 1,205,000 | | | | North Carolina Capital Facilities Finance Agency, Meredith College Refunding Revenue, 5.000%, 6/1/17 | | | | | 1,254,742 |
| 1,165,000 | | | | North Carolina Capital Facilities Finance Agency, Meredith College Refunding Revenue, Callable 6/1/18 @ 100, OID, 5.000%, 6/1/19 | | | | | 1,191,247 |
| 545,000 | | | | North Carolina Capital Facilities Finance Agency, Meredith College Refunding Revenue, OID, 4.250%, 6/1/14 | | | | | 558,663 |
| 1,905,000 | | | | North Carolina Eastern Municipal Power Agency, Power System Refunding Revenue, Series A, 5.000%, 1/1/14 | | | | | 2,067,858 |
| 2,980,000 | | | | North Carolina Eastern Municipal Power Agency, Power System Refunding Revenue, Series A, Callable 1/1/16 @ 100 (AMBAC), 5.250%, 1/1/20 | | | | | 3,189,196 |
| 890,000 | | | | North Carolina Eastern Municipal Power Agency, Power System Refunding Revenue, Series A, OID, 5.000%, 1/1/17 | | | | | 1,026,873 |
| 2,000,000 | | | | North Carolina Eastern Municipal Power Agency, Power System Refunding Revenue, Series B, OID, 4.000%, 1/1/18 | | | | | 2,025,180 |
| 2,335,000 | | | | North Carolina Eastern Municipal Power Agency, Power System Revenue, Series A, OID, 6.400%, 1/1/21 | | | | | 2,958,398 |
| 2,000,000 | | | | North Carolina Infrastructure Finance Corporation, Correctional Facilities Projects Revenue, Callable 10/1/13 @ 100, 5.000%, 10/1/19 | | | | | 2,202,160 |
| 1,000,000 | | | | North Carolina Medical Care Commission, First Mortgage Deerfield Revenue, Series A, Callable 11/1/18 @ 100, OID, 6.000%, 11/1/33 | | | | | 997,410 |
| 2,000,000 | | | | North Carolina Medical Care Commission, First Mortgage Givens Estates Revenue, Series A, Prerefunded 7/1/13 @ 101, OID, 6.500%, 7/1/32 | | | | | 2,388,940 |
| 1,995,000 | | | | North Carolina Medical Care Commission, Health Care Housing ARC Projects Revenue, Series A (HUD Section 8), 4.650%, 10/1/14 | | | | | 1,995,000 |
| 1,560,000 | | | | North Carolina Medical Care Commission, Health Care Housing ARC Projects Revenue, Series A, Callable 10/1/14 @ 101 (HUD Section 8), 5.500%, 10/1/24 | | | | | 1,552,122 |
| 1,500,000 | | | | North Carolina Medical Care Commission, Novant Health Obligation Group Refunding Revenue, Group A, 5.000%, 11/1/13 | | | | | 1,654,410 |
| 1,875,000 | | | | North Carolina Medical Care Commission, Novant Health Obligation Group Refunding Revenue, Group A, Callable 11/1/13 @ 100, 5.000%, 11/1/14 | | | | | 2,048,344 |
| 1,000,000 | | | | North Carolina Medical Care Commission, Novant Health Refunding Revenue, Callable 11/1/13 @ 100 (FSA-CR), 5.000%, 11/1/15 | | | | | 1,071,180 |
| | | | | | | | | |
Principal
Amount | | | | Fair Value |
MUNICIPAL BONDS — (continued) | | | | | |
| | | | North Carolina — (continued) | | | | | |
| $1,000,000 | | | | North Carolina Medical Care Commission, Stanly Memorial Hospital Project Revenue, Callable 10/23/09 @ 101, OID, 6.250%, 10/1/19 | | | | $ | 1,010,230 |
| 3,000,000 | | | | North Carolina Medical Care Commission, Universal Health System Refunding Revenue, Series E2, 6.000%, 12/1/36* | | | | | 3,345,810 |
| 1,045,000 | | | | North Carolina Medical Care Commission, Wakemed Revenue, Series A, Callable 10/1/14 @ 100 (Assured Guaranty), 4.000%, 10/1/17 | | | | | 1,077,019 |
| 2,000,000 | | | | North Carolina Medical Care Commission, Wakemed Revenue, Series A, Callable 10/1/14 @ 100 (Assured Guaranty), 5.625%, 10/1/29 | | | | | 2,123,680 |
| 1,115,000 | | | | North Carolina Medical Care Commission, Wilson Medical Center Refunding Revenue, 5.000%, 11/1/17 | | | | | 1,167,015 |
| 1,690,000 | | | | North Carolina Municipal Power Agency No. 1, Catawba Electric Power Refunding Revenue, Series A, 5.250%, 1/1/13 | | | | | 1,863,208 |
| 1,000,000 | | | | North Carolina Municipal Power Agency No. 1, Catawba Electric Power Refunding Revenue, Series A, 5.250%, 1/1/17 | | | | | 1,138,640 |
| 910,000 | | | | North Carolina Municipal Power Agency No. 1, Catawba Electric Power Refunding Revenue, Series A, Callable 1/1/18 @ 100, 5.250%, 1/1/20 | | | | | 1,021,166 |
| 1,000,000 | | | | North Carolina State University at Raleigh Revenue, Series B, 4.000%, 10/1/12 | | | | | 1,085,890 |
| 1,350,000 | | | | North Carolina State University at Raleigh Revenue, Series B, 4.000%, 10/1/14 | | | | | 1,499,337 |
| 500,000 | | | | North Carolina State University at Raleigh Revenue, Series B, 4.000%, 10/1/15 | | | | | 557,500 |
| 1,000,000 | | | | North Carolina State, Clean Water G.O., Series A, Callable 3/1/16 @ 100, 5.000%, 3/1/17 | | | | | 1,167,340 |
| 1,500,000 | | | | North Carolina State, Public Improvements G.O., Series A, Callable 3/1/17 @ 100, 5.000%, 3/1/20 | | | | | 1,738,935 |
| 2,900,000 | | | | North Carolina State, Refunding G.O., Series A, 5.000%, 9/1/16 | | | | | 3,452,508 |
| 2,000,000 | | | | North Carolina State, Refunding G.O., Series B, 5.000%, 4/1/17 | | | | | 2,385,060 |
| 1,030,000 | | | | North Carolina State, Vehicle Grant Revenue, Highway Improvements (NATL-RE), 5.000%, 3/1/16 | | | | | 1,193,543 |
| 1,070,000 | | | | North Carolina State, Vehicle Grant Revenue, Highway Improvements (NATL-RE), 5.000%, 3/1/17 | | | | | 1,246,250 |
| 1,050,000 | | | | North Carolina State, Vehicle Grant Revenue, Highway Improvements, Callable 3/1/17 @ 100 (NATL-RE), 5.000%, 3/1/18 | | | | | 1,208,393 |
| 1,500,000 | | | | Onslow County, NC, G.O., Callable 4/1/18 @ 100, 5.000%, 4/1/26 | | | | | 1,653,795 |
| 165,000 | | | | Onslow County, NC, School Project, Certificate of Participation, Callable 6/1/16 @ 100 (XLCA), 5.000%, 6/1/18 | | | | | 180,525 |
| 65,000 | | | | Onslow Water & Sewer Authority, Combined Enterprise Systems Revenue, Series A (NATL-RE), 5.000%, 6/1/18 | | | | | 73,794 |
Continued
75
|
BB&T North Carolina Intermediate Tax-Free Fund |
Schedule of Portfolio Investments — (continued)
September 30, 2009
| | | | | | | | | |
Principal
Amount | | | | Fair Value |
MUNICIPAL BONDS — (continued) | | | | | |
| | | | North Carolina — (continued) | | | | | |
| $1,720,000 | | | | Onslow Water & Sewer Authority, Combined Enterprise Systems Revenue, Series B, Callable 6/1/14 @ 100 (XLCA), 5.000%, 6/1/21 | | | | $ | 1,821,119 |
| 1,105,000 | | | | Orange County, NC, Public Improvements Project Certificates of Participation, Series A, Callable 4/1/16 @ 100 (AMBAC), 5.000%, 4/1/19 | | | | | 1,231,920 |
| 930,000 | | | | Pasquotank County, NC, Refunding Certificate of Participation (NATL-RE), 5.250%, 6/1/18 | | | | | 1,061,883 |
| 2,440,000 | | | | Pitt County, NC, Pitt County Memorial Hospital Project Refunding Revenue, Callable 10/23/09 @ 100, OID, 5.500%, 12/1/15 | | | | | 2,615,241 |
| 2,200,000 | | | | Raleigh, NC, Combined Enterprise Systems Revenue, Callable 3/1/14@ 100, 5.000%, 3/1/31 | | | | | 2,321,066 |
| 415,000 | | | | Randolph County, NC, Refunding Certificate of Participation (FSA), 5.000%, 6/1/15 | | | | | 475,843 |
| 1,390,000 | | | | Rockingham County, NC, Certificate of Participation (Assured Guaranty), 5.000%, 4/1/17 | | | | | 1,610,927 |
| 110,000 | | | | Surry County, NC, Northern Hospital District Revenue, 4.000%, 10/1/10 | | | | | 110,916 |
| 1,085,000 | | | | Surry County, NC, Northern Hospital District Revenue, Callable 4/1/18 @ 100, OID, 5.500%, 10/1/21 | | | | | 1,109,380 |
| 210,000 | | | | Surry County, NC, Northern Hospital District Revenue, OID, 4.000%, 10/1/11 | | | | | 211,649 |
| 600,000 | | | | Thomasville, NC, Thomasville Enterprise Systems Revenue, Series B, Callable 10/23/09 @ 101 (FSA), OID, 5.100%, 6/1/17 | | | | | 604,506 |
| 1,355,000 | | | | Union County, NC, School Improvements G.O., Series A, Callable 3/1/19 @ 100, 4.000%, 3/1/22 | | | | | 1,453,929 |
| 4,610,000 | | | | Union County, NC, School Improvements G.O., Series D, Callable 3/1/17 @ 100 (NATL-RE), 5.000%, 3/1/19 | | | | | 5,350,089 |
| 1,000,000 | | | | University of North Carolina at Chapel Hill Revenue, Series A, Callable 12/1/15 @ 100, 5.000%, 12/1/34 | | | | | 1,059,750 |
| 1,410,000 | | | | University of North Carolina at Greensboro Revenue, Series A, Callable 4/1/19 @ 100 (Assured Guaranty), OID, 5.000%, 4/1/34 | | | | | 1,505,612 |
| 1,355,000 | | | | University of North Carolina at Wilmington Revenue, Callable 1/1/13 @ 100 (AMBAC), 5.250%, 1/1/21 | | | | | 1,464,484 |
| 1,465,000 | | | | University of North Carolina System College Improvements Revenue, General Trust Indenture, Series C, 4.250%, 10/1/14 | | | | | 1,573,644 |
| 400,000 | | | | University of North Carolina System College Improvements Revenue, Series A (AMBAC), 5.000%, 4/1/14 | | | | | 443,560 |
| 1,020,000 | | | | University of North Carolina System College Improvements Revenue, Series A, Callable 10/1/16 @ 100 (NATL-RE), 5.000%, 10/1/17 | | | | | 1,139,116 |
| | | | | | | | | | |
Principal
Amount | | | | Fair Value | |
MUNICIPAL BONDS — (continued) | | | | | | |
| | | | North Carolina — (continued) | | | | | | |
| $ 500,000 | | | | University of North Carolina System College Improvements Revenue, Series B (AMBAC), 4.000%, 4/1/14 | | | | $ | 529,740 | |
| 3,000,000 | | | | Wake County, NC, Public Improvements G.O., 5.000%, 3/1/12 | | | | | 3,295,980 | |
| 1,075,000 | | | | Wake County, NC, Wake County Hospital Revenue (NATL-RE), OID, 5.125%, 10/1/13 | | | | | 1,194,606 | |
| 1,000,000 | | | | Winston-Salem, NC, Water & Sewer System Refunding Revenue, Series A, Callable 6/1/17 @ 100, 5.000%, 6/1/19 | | | | | 1,169,580 | |
| 1,000,000 | | | | Winston-Salem, NC, Water & Sewer Systems Refunding Revenue, Callable 6/1/15 @ 100, 5.000%, 6/1/20 | | | | | 1,137,330 | |
| | | | | | | | | | |
| | | | Total Municipal Bonds
(Cost $142,899,628) | | | | | 151,941,752 | |
| | | | | | | | | | |
| | | |
| Shares | | | | | | | |
INVESTMENT COMPANY (8.0%) | | | | | | |
| | | | |
| 12,690,467 | | | | Federated North Carolina Municipal Money Market Portfolio, Institutional Class | | | | | 12,690,467 | |
| | | | | | | | | | |
| | | | Total Investment Company
(Cost $12,690,467) | | | | | 12,690,467 | |
| | | | | | | | | | |
Total Investments — 103.0%
(Cost $155,590,095) | | | | | 164,632,219 | |
Net Other Assets (Liabilities) — (3.0)% | | | | | (4,753,570 | ) |
| | | | | | | | | | |
NET ASSETS — 100.0% | | | | $ | 159,878,649 | |
| | | | | | | | | | |
| * | The interest rate for this variable rate note, which will change periodically, is based either on the prime rate or an index of market rates. The reflected rate is in effect as of September 30, 2009. The maturity date reflected is the final maturity date. |
AMBAC — American Municipal Bond Insurance Corp.
CR — Custodial Receipts
FGIC — Financial Guaranty Insurance Corp.
FHA — Federal Housing Authority
FSA — Insured by Financial Security Assurance
G.O. — General Obligation
HUD — Housing & Urban Development
NATL — National
OID — Original Issue Discount
RE — Reinsurance
XLCA — XL Capital Assurance
See accompanying notes to the financial statements.
76
|
BB&T South Carolina Intermediate Tax-Free Fund |
Schedule of Portfolio Investments
September 30, 2009
| | | | | | | | | |
Principal
Amount | | | | Fair Value |
MUNICIPAL BONDS (96.3%) | | | | | |
| | | | South Carolina (96.3%) | | | | | |
| $785,000 | | | | Beaufort-Jasper Water & Sewer Authority, SC, Refunding & Improvements Revenue, Callable 3/1/17 @ 101 (FSA), 4.750%, 3/1/25 | | | | $ | 856,184 |
| 505,000 | | | | Bennettsville, SC, Combined Utility Systems, Refunding & Improvements Revenue, Callable 2/1/14 @ 100 (AMBAC), OID, 3.625%, 2/1/16 | | | | | 525,639 |
| 250,000 | | | | Camden, SC, Public Utilities Improvements Refunding Revenue (NATL-RE FGIC), OID, 3.500%, 3/1/12 | | | | | 260,500 |
| 180,000 | | | | Cayce, SC, Waterworks & Sewer Revenue Refunding & Improvements Revenue, Series A (XLCA), 4.250%, 7/1/13 | | | | | 193,856 |
| 125,000 | | | | Cayce, SC, Waterworks & Sewer Revenue Refunding & Improvements Revenue, Series A (XLCA), 4.500%, 7/1/15 | | | | | 137,259 |
| 300,000 | | | | Cayce, SC, Waterworks & Sewer Systems Refunding & Improvements Revenue, Series A (XLCA), 5.250%, 7/1/16 | | | | | 343,236 |
| 185,000 | | | | Cayce, SC, Waterworks & Sewer Systems Refunding & Improvements Revenue, Series A (XLCA), 5.250%, 7/1/17 | | | | | 212,352 |
| 310,000 | | | | Charleston County, SC, Hospital Facilities Revenue Care Alliance Health Series B1 (FSA), 5.000%, 8/15/16 | | | | | 342,569 |
| 200,000 | | | | Clarendon County, Public Improvements G.O., Callable 3/1/10 @ 101 (NATL-RE FGIC), OID, 4.250%, 3/1/15 | | | | | 203,232 |
| 160,000 | | | | Coastal Carolina University, SC, Refunding Revenue (XLCA), 4.000%, 6/1/17 | | | | | 167,861 |
| 215,000 | | | | College of Charleston, SC, Academic & Administrative Facilities Revenue, Series D (XLCA), 4.250%, 4/1/12 | | | | | 226,780 |
| 485,000 | | | | College of Charleston, SC, Academic & Administrative Facilities Revenue, Series D (XLCA), 4.500%, 4/1/17 | | | | | 525,076 |
| 120,000 | | | | Colleton County, SC, School Improvements G.O., Callable 10/23/09 @ 101 (FSA, State Aid Withholding), OID, 4.200%, 3/1/12 | | | | | 121,480 |
| 155,000 | | | | Darlington County, SC, Correctional Facilities Improvements G.O., Callable 10/23/09 @ 101 (AMBAC), 4.000%, 3/1/11 | | | | | 156,875 |
| 325,000 | | | | Dorchester County, SC, Transition Projects G.O., Series A (XLCA), 5.000%, 5/1/14 | | | | | 363,688 |
| 345,000 | | | | Dorchester County, SC, Transition Projects G.O., Series A (XLCA), 5.000%, 5/1/15 | | | | | 389,508 |
| 275,000 | | | | Dorchester County, SC, Waterworks Revenue (NATL-RE), 5.000%, 10/1/15 | | | | | 307,090 |
| 200,000 | | | | Educational Facilities Authority, SC, Wofford College Revenue, Series A, 4.000%, 4/1/15 | | | | | 209,920 |
| 125,000 | | | | Educational Facilities Authority, SC, Wofford College Revenue, Series A, 4.250%, 4/1/17 | | | | | 131,476 |
| 630,000 | | | | Florence County, SC, McLeod Regional Medical Center Project Refunding Revenue, Series A, Callable 10/23/09 @ 102 (NATL-RE), 5.250%, 11/1/11 | | | | | 644,087 |
| 100,000 | | | | Florence, SC, New Public Housing Authority Revenue, Callable 2/1/10 @ 100 (U.S. Government Guaranteed), 5.750%, 8/1/10 | | | | | 104,193 |
| | | | | | | | | |
Principal
Amount | | | | Fair Value |
MUNICIPAL BONDS — (continued) | | |
| | | | South Carolina — (continued) | | |
| $440,000 | | | | Fort Mill School Facilities Corp., SC, Installment Purchase Revenue, 5.000%, 12/1/12 | | | | $ | 482,464 |
| 335,000 | | | | Fort Mill School Facilities Corp., SC, Installment Purchase Revenue, Callable 12/1/16 @ 100, 5.250%, 12/1/18 | | | | | 370,038 |
| 260,000 | | | | Georgetown County School District, SC, Refunding G.O., Series B, Callable 3/1/12 @ 102 (FSA, SCSDE), 5.000%, 3/1/16 | | | | | 288,699 |
| 175,000 | | | | Georgetown County, SC, Refunding G.O., Series A, Callable 3/1/13 @ 100 (NATL-RE FGIC, State Aid Withholding), OID, 4.375%, 3/1/18 | | | | | 181,209 |
| 100,000 | | | | Greenville, SC, Sewer System Revenue, Callable 4/1/12 @ 100 (NATL-RE), OID, 4.600%, 4/1/15 | | | | | 105,976 |
| 380,000 | | | | Greenville, SC, Waterworks Revenue, Callable 2/1/13 @ 100, 5.250%, 2/1/19 | | | | | 419,653 |
| 445,000 | | | | Greenwood County, SC, Self Regional Healthcare Revenue, Callable 10/1/19 @ 100, OID, 4.875%, 10/1/22 | | | | | 453,295 |
| 530,000 | | | | Greenwood County, SC, Self Regional Healthcare Revenue, Callable 10/1/19 @ 100, OID, 5.000%, 10/1/23 | | | | | 537,923 |
| 250,000 | | | | Horry County School District, SC, School Improvements G.O., Series A, Callable 3/1/12 @ 100 (SCSDE), 5.375%, 3/1/15 | | | | | 274,650 |
| 500,000 | | | | Horry County, SC, Correctional Facilities Improvements G.O., Callable 3/1/18 @ 100, OID, 4.125%, 3/1/22 | | | | | 536,180 |
| 215,000 | | | | Kershaw County, SC, Correctional Facilities Improvements G.O., Series A, Callable 10/23/09 @ 100 (FSA, State Aid Withholding), 4.000%, 4/1/12 | | | | | 215,466 |
| 305,000 | | | | Kershaw County, SC, Correctional Facilities Improvements G.O., Series A, Callable 10/23/09 @ 100 (FSA, State Aid Withholding), 4.000%, 4/1/13 | | | | | 305,586 |
| 500,000 | | | | Kershaw County, SC, Public Schools Foundation Installment Power Refunding Revenue, Kershaw County School District Project (CIFG), 5.000%, 12/1/16 | | | | | 562,650 |
| 415,000 | | | | Laurens County School District No. 55, SC, Refunding Revenue, Callable 12/1/15 @ 100, 5.250%, 12/1/24 | | | | | 416,921 |
| 690,000 | | | | Lexington County, SC, Health Services District Income Hospital Refunding Revenue, 5.000%, 11/1/15 | | | | | 744,938 |
| 500,000 | | | | Lexington County, SC, School District No. 3, Refunding G.O., Callable 3/1/12 @ 102 (FSA), 5.000%, 3/1/16 | | | | | 553,405 |
| 500,000 | | | | Medical University Hospital Authority, SC, Refunding Revenue, Series A, 6.000%, 8/15/12 | | | | | 569,980 |
| 115,000 | | | | Myrtle Beach, SC, Public Improvements G.O., Series A (Assured Guaranty), 5.000%, 3/1/18 | | | | | 137,109 |
| 365,000 | | | | Myrtle Beach, SC, Recreational Facilities Improvements, Special Tax Revenue, 4.000%, 3/1/19 | | | | | 386,049 |
Continued
77
|
BB&T South Carolina Intermediate Tax-Free Fund |
Schedule of Portfolio Investments — (continued)
September 30, 2009
| | | | | | | | | |
Principal
Amount | | | | Fair Value |
MUNICIPAL BONDS — (continued) | | | | | |
| | | | South Carolina — (continued) | | | | | |
| $280,000 | | | | Myrtle Beach, SC, Recreational Facilities Improvements, Special Tax Revenue, OID, 4.000%, 3/1/20 | | | | $ | 293,600 |
| 100,000 | | | | Newberry County, SC, Newberry County Memorial Hospital Refunding Revenue (Radian), OID, 3.500%, 12/1/10 | | | | | 99,976 |
| 565,000 | | | | Newberry Investing in Children’s Education, SC, Newberry County School District Project Revenue, 5.250%, 12/1/14 | | | | | 606,934 |
| 750,000 | | | | Oconee County, SC, Duke Power Co. Project Refunding Revenue, 3.600%, 2/1/17 | | | | | 770,940 |
| 420,000 | | | | Piedmont Municipal Power Agency, SC, Power System Refunding Revenue (NATL-RE), OID, 5.375%, 1/1/25 | | | | | 485,016 |
| 500,000 | | | | Piedmont Municipal Power Agency, SC, Power System Refunding Revenue, Series A3, 5.000%, 1/1/16 | | | | | 546,170 |
| 285,000 | | | | Piedmont Municipal Power Agency, SC, Power System Refunding Revenue, Series A3 (Assured Guaranty), 5.000%, 1/1/18 | | | | | 320,836 |
| 500,000 | | | | Richland County School District No. 2, SC, School Improvements G.O., Series B, Callable 2/1/12 @ 100, (NATL-RE FGIC, SCSDE), 5.000%, 2/1/21 | | | | | 531,010 |
| 425,000 | | | | Scago Educational Facilities Corp. for Colleton School District, SC, Pickens County Project Revenue (FSA), 5.000%, 12/1/14 | | | | | 474,376 |
| 205,000 | | | | Scago Educational Facilities Corp. for Colleton School District, SC, School Improvements Revenue (Assured Guaranty), 5.000%, 12/1/15 | | | | | 231,960 |
| 205,000 | | | | South Carolina Educational Facilities Authority for Private Nonprofit Institutions, Wofford College Project Revenue, 4.000%, 4/1/15 | | | | | 216,554 |
| 190,000 | | | | South Carolina Educational Facilities Authority for Private Nonprofit Institutions, Wofford College Project Revenue, 4.000%, 4/1/16 | | | | | 199,544 |
| 525,000 | | | | South Carolina Jobs-Economic Development Authority, Anderson Area Medical Center Revenue, Callable 10/23/09 @ 101 (FSA), 5.500%, 2/1/11 | | | | | 531,982 |
| 775,000 | | | | South Carolina Jobs-Economic Development Authority, Kershaw County Medical Center Project Revenue, OID, 5.000%, 9/15/18 | | | | | 776,643 |
| 550,000 | | | | South Carolina Jobs-Economic Development Authority, Refunding & Improvement-AnMed Health Revenue, Series B (Assured Guaranty), 5.000%, 2/1/19 | | | | | 598,867 |
| 160,000 | | | | South Carolina Jobs-Economic Development Authority, Refunding & Improvement-Palmetto Health Facilities Revenue, Series C, 6.000%, 8/1/12 | | | | | 170,621 |
| 535,000 | | | | South Carolina Jobs-Economic Development Authority, Tuomey Medical Center Refunding Revenue (CIFG), 5.000%, 11/1/12 | | | | | 553,923 |
| 530,000 | | | | South Carolina State Public Service Authority Refunding Revenue, Series A, Callable 1/1/17 @ 100 (AMBAC), 5.000%, 1/1/23 | | | | | 593,473 |
| 280,000 | | | | South Carolina State Public Service Authority Refunding Revenue, Series A, Callable 1/1/17 @ 100 (AMBAC), 5.000%, 1/1/26 | | | | | 308,568 |
| | | | | | | | | |
Principal
Amount | | | | Fair Value |
MUNICIPAL BONDS — (continued) | | | | | |
| | | | South Carolina — (continued) | | | | | |
| $150,000 | | | | South Carolina State Public Service Authority, Electricity Lights & Power Improvements Revenue, Series A, Callable 1/1/10 @ 101 (NATL-RE), 5.500%, 1/1/11 | | | | $ | 153,174 |
| 150,000 | | | | South Carolina State Public Service Authority, Electricity Lights & Power Refunding & Improvements Revenue, Series A, Callable 1/1/12 @ 101 (FSA), 5.250%, 1/1/17 | | | | | 163,932 |
| 500,000 | | | | South Carolina State Public Service Authority, Refunding Revenue, Series A, Callable 1/1/19 @ 100, 5.000%, 1/1/27 | | | | | 559,235 |
| 390,000 | | | | South Carolina State Public Service Authority, Refunding Revenue, Series B, Callable 1/1/16 @ 100, Series B (NATL-RE), 5.000%, 1/1/22 | | | | | 433,212 |
| 115,000 | | | | South Carolina Transportation Infrastructure Bank, Highway Improvements Revenue, Series A, Callable 10/1/13 @ 100 (AMBAC), 5.000%, 10/1/14 | | | | | 128,208 |
| 330,000 | | | | South Carolina Transportation Infrastructure Bank, Junior Lien Revenue, Series B (AMBAC), 5.250%, 10/1/11 | | | | | 357,327 |
| 470,000 | | | | South Carolina Transportation Infrastructure Bank, Refunding Revenue, Series B (AMBAC), 5.250%, 10/1/15 | | | | | 547,898 |
| 450,000 | | | | South Carolina Transportation Infrastructure Bank, Transit Improvements Revenue, Series A (XLCA), 5.000%, 10/1/15 | | | | | 517,761 |
| 410,000 | | | | South Carolina Transportation Infrastructure Bank, Transit Improvements Revenue, Series A, Callable 10/1/16 @ 100 (XLCA), 5.000%, 10/1/22 | | | | | 451,512 |
| 525,000 | | | | Spartanburg County School District No. 5, SC, School Improvements G.O. (SCSDE), 5.250%, 5/1/10 | | | | | 540,172 |
| 375,000 | | | | Spartanburg County, SC, Regional Health Services District Refunding Revenue, Series A (Assured Guaranty), 4.000%, 4/15/16 | | | | | 391,609 |
| 40,000 | | | | Spartanburg County, SC, Regional Health Services District Refunding Revenue, Series D (Assured Guaranty), 4.250%, 4/15/16 | | | | | 42,478 |
| 280,000 | | | | York County, SC, G.O., Callable 11/1/16 @ 100, OID, 5.100%, 11/1/21 | | | | | 317,050 |
| 510,000 | | | | York County, SC, School District No. 3, G.O., Callable 3/1/17 @ 100 (FSA, SCSDE), 5.000%, 3/1/22 | | | | | 574,857 |
| | | | | | | | | |
| | | | Total Municipal Bonds
(Cost $26,057,990) | | | | | 27,454,470 |
| | | | | | | | | |
Continued
78
|
BB&T South Carolina Intermediate Tax-Free Fund |
Schedule of Portfolio Investments — (continued)
September 30, 2009
| | | | | | | | | |
| Shares | | | | Fair Value |
INVESTMENT COMPANY (3.5%) |
| 1,005,068 | | | | Federated Tax-Free Obligations Fund, Institutional Service Class | | | | $ | 1,005,068 |
| | | | | | | | | |
| | | | Total Investment Company
(Cost $1,005,068) | | | | | 1,005,068 |
| | | | | | | | | |
Total Investments — 99.8%
(Cost $27,063,058) | | | | | 28,459,538 |
Net Other Assets (Liabilities) — 0.2% | | | | | 69,256 |
| | | | | | | | | |
NET ASSETS — 100.0% | | | | $ | 28,528,794 |
| | | | | | | | | |
AMBAC — American Municipal Bond Insurance Corp.
CIFG — CDC IXIS Financial Guarantee
FGIC — Financial Guaranty Insurance Corp.
FSA — Insured by Financial Security Assurance
G.O. — General Obligation
NATL — National
OID — Original Issue Discount
RE — Reinsurance
SCSDE — South Carolina School District Enhancement
XLCA — XL Capital Assurance
See accompanying notes to the financial statements.
79
|
BB&T Virginia Intermediate Tax-Free Fund |
Schedule of Portfolio Investments
September 30, 2009
| | | | | | | | | |
Principal
Amount | | | | Fair Value |
MUNICIPAL BONDS (97.4%) | | | | | |
| | | | Virginia (97.4%) | | | | | |
| $1,000,000 | | | | Alexandria, VA, Public Improvements G.O., Series A, 5.000%, 6/15/16 | | | | $ | 1,188,470 |
| 1,000,000 | | | | Alexandria, VA, Refunding G.O. (State Aid Withholding), 5.000%, 6/15/21 | | | | | 1,223,670 |
| 1,000,000 | | | | Arlington County, VA, Industrial Development Authority, VA Hospital Center Arlington Health System Revenue, 5.500%, 7/1/10 | | | | | 1,025,990 |
| 1,095,000 | | | | Arlington County, VA, Refunding & Improvements G.O., Callable 5/15/14 @ 100, 5.000%, 5/15/15 | | | | | 1,253,260 |
| 1,080,000 | | | | Chesapeake Bay Bridge & Tunnel District, General Resolution Refunding Revenue (BHAC-CR NATL-RE), 5.500%, 7/1/25 | | | | | 1,371,524 |
| 2,100,000 | | | | Chesapeake Economic Development Authority, Pollution Control Refunding Revenue, 3.600%, 2/1/32* | | | | | 2,156,196 |
| 1,100,000 | | | | Chesterfield County, VA, Economic Development Authority, Electric & Power Refunding Revenue, Series A, Callable 5/1/19 @ 100, 5.000%, 5/1/23 | | | | | 1,170,609 |
| 2,325,000 | | | | Chesterfield County, VA, Refunding Public Improvements G.O., 5.000%, 1/1/14 | | | | | 2,664,171 |
| 810,000 | | | | Danville, VA, Refunding G.O., Series A, Callable 3/1/19 @ 100 (Assured Guaranty State Aid Withholding), 5.000%, 3/1/21 | | | | | 934,797 |
| 825,000 | | | | Danville, VA, Refunding G.O., Series A, Callable 3/1/19 @ 100 (Assured Guaranty State Aid Withholding), 5.000%, 3/1/22 | | | | | 945,648 |
| 1,500,000 | | | | Fredericksburg Economic Development Authority, MediCorp Health System Obligation Refunding Revenue, 5.000%, 6/15/16 | | | | | 1,617,960 |
| 1,000,000 | | | | Fredericksburg Economic Development Authority, MediCorp Health System Obligation Refunding Revenue, 5.000%, 6/15/17 | | | | | 1,077,400 |
| 1,390,000 | | | | Henrico County, VA, Economic Development Authority, Virginia United Methodist Refunding Revenue, Series A, Prerefunded 6/1/12 @100, OID, 6.700%, 6/1/27 | | | | | 1,592,843 |
| 1,000,000 | | | | Loudoun County, VA, Public Improvements G.O., Series B (State Aid Withholding), 5.000%, 12/1/14 | | | | | 1,169,700 |
| 1,000,000 | | | | Loudoun County, VA, Public Improvements G.O., Series B (State Aid Withholding), 5.000%, 12/1/15 | | | | | 1,185,460 |
| 1,020,000 | | | | Loudoun County, VA, Public Improvements G.O., Series B (State Aid Withholding), 5.000%, 12/1/16 | | | | | 1,219,726 |
| 1,000,000 | | | | Loudoun County, VA, Sanitation Authority, Water Utility Improvements Revenue (FSA), 5.750%, 1/1/11 | | | | | 1,063,910 |
| 635,000 | | | | Middlesex County, VA, Industrial Development Authority Refunding Revenue, Callable 8/1/14 @ 101 (NATL-RE), 4.000%, 8/1/20 | | | | | 622,059 |
| 1,435,000 | | | | Montgomery County, VA, Industrial Development Authority Revenue, 5.000%, 2/1/18 | | | | | 1,615,136 |
| | | | | | | | | |
Principal
Amount | | | | Fair Value |
MUNICIPAL BONDS — (continued) | | |
| | | | Virginia — (continued) | | |
| $2,500,000 | | | | New River Valley Regional Jail Authority, Grant Anticipation Notes Correctional Facility Improvements Revenue, Callable 4/1/10 @ 100, 4.000%, 4/1/11 | | | | $ | 2,522,875 |
| 1,205,000 | | | | Newport News Economic Development Authority, Public Improvements Revenue, Series A, Callable 1/15/16 @ 100, 5.250%, 1/15/25 | | | | | 1,338,900 |
| 1,105,000 | | | | Newport News, VA, Refunding G.O., Series B, (State Aid Withholding), 5.000%, 2/1/15 | | | | | 1,281,060 |
| 1,000,000 | | | | Newport News, VA, Refunding Public Improvements-Water G.O., Series B, 5.250%, 7/1/21 | | | | | 1,234,830 |
| 1,000,000 | | | | Norfolk, VA, Parking Systems Refunding Revenue, Series B (AMBAC), 5.000%, 2/1/13 | | | | | 1,087,780 |
| 1,030,000 | | | | Norfolk, VA, Water Utility Improvements Refunding Revenue, Callable 10/23/09 @ 101 (FSA), 5.125%, 11/1/11 | | | | | 1,044,090 |
| 1,000,000 | | | | Norfolk, VA, Water Utility Improvements Revenue, Callable 11/1/18 @ 100, 5.000%, 11/1/23 | | | | | 1,150,710 |
| 400,000 | | | | Northern Virginia Transportation District Commission, VA, Commuter Rail Refunding Revenue, Virginia Railway Express Project, Callable 10/23/09 @ 101 (FSA), 5.375%, 7/1/14 | | | | | 405,372 |
| 1,000,000 | | | | Pittsylvania County, VA, School Improvements G.O., Series B, 5.000%, 2/1/19 | | | | | 1,147,810 |
| 1,320,000 | | | | Pittsylvania County, VA, School Improvements G.O., Series B, Callable 2/1/19 @ 100, OID, 5.200%, 2/1/20 | | | | | 1,516,957 |
| 1,775,000 | | | | Pittsylvania County, VA, School Improvements G.O., Series B, Callable 2/1/19 @ 100, OID, 5.375%, 2/1/21 | | | | | 2,044,747 |
| 1,065,000 | | | | Pittsylvania County, VA, School Improvements G.O., Series B, Callable 3/1/11 @ 102 (NATL-RE, School Board Resolution Federal), 5.625%, 3/1/15 | | | | | 1,154,748 |
| 1,440,000 | | | | Portsmouth, VA, Refunding G.O., Series B, Callable 7/15/19 @ 100, 5.250%, 7/15/23 | | | | | 1,676,390 |
| 950,000 | | | | Prince William County, VA, Industrial Development Authority Potomac Hospital Corporation Revenue, Callable 10/1/13 @ 102, 5.500%, 10/1/18 | | | | | 971,898 |
| 825,000 | | | | Prince William County, VA, Service Authority, Water & Sewer Systems Refunding Revenue, Callable 7/1/13 @ 102, 5.000%, 7/1/14 | | | | | 944,584 |
| 955,000 | | | | Richmond Metropolitan Authority, VA, Expressway Refunding Revenue (NATL-RE FGIC), 5.250%, 7/15/15 | | | | | 1,072,513 |
| 1,490,000 | | | | Richmond Metropolitan Authority, VA, Expressway Refunding Revenue (NATL-RE FGIC), 5.250%, 7/15/16 | | | | | 1,681,942 |
| 1,050,000 | | | | Southampton County, VA, Industrial Development Authority, Public Facilities Lease Revenue, Series A, Callable 4/1/16 @ 100 (CIFG), 5.000%, 4/1/19 | | | | | 1,127,941 |
| 1,000,000 | | | | Spotsylvania County, VA, Public Improvements G.O., Callable 1/15/16 @ 100 (FSA), 5.000%, 1/15/17 | | | | | 1,163,330 |
Continued
80
|
BB&T Virginia Intermediate Tax-Free Fund |
Schedule of Portfolio Investments — (continued)
September 30, 2009
| | | | | | | | | |
Principal
Amount | | | | Fair Value |
MUNICIPAL BONDS — (continued) | | | | | |
| | | | Virginia — (continued) | | | | | |
| $2,925,000 | | | | Spotsylvania County, VA, Refunding G.O. (FSA), 5.500%, 7/15/12 | | | | $ | 3,290,303 |
| 375,000 | | | | Stafford County & Staunton Industrial Development Authority, VA, Virginia Municipal League Association Counties Program B Revenue (CIFG), OID, 4.250%, 8/1/15 | | | | | 385,781 |
| 170,000 | | | | Stafford County & Staunton Industrial Development Authority, VA, Virginia Municipal League Association Counties Program Revenue (XLCA), 4.000%, 8/1/15 | | | | | 181,286 |
| 330,000 | | | | Stafford County & Staunton Industrial Development Authority, VA, Virginia Municipal League Association Counties Program Revenue (XLCA), OID, 4.000%, 8/1/17 | | | | | 348,863 |
| 600,000 | | | | Stafford County & Staunton Industrial Development Authority, VA, Virginia Municipal League Association Counties Program Revenue (XLCA), OID, 4.000%, 8/1/18 | | | | | 631,470 |
| 1,000,000 | | | | Suffolk, VA, Public Improvements Refunding G.O., Callable 12/1/15 @100, 5.000%, 12/1/18 | | | | | 1,138,610 |
| 1,300,000 | | | | Suffolk, VA, Public Improvements Refunding G.O., Series A (NATL-RE), 5.000%, 2/1/16 | | | | | 1,517,490 |
| 2,425,000 | | | | Suffolk, VA, Public Improvements Refunding G.O., Series A (NATL-RE), 5.000%, 2/1/17 | | | | | 2,853,497 |
| 2,175,000 | | | | Tobacco Settlement Financing Corp., VA, Asset-Backed Revenue, Callable 6/1/12 @ 100, OID, 5.500%, 6/1/26 | | | | | 2,452,508 |
| 300,000 | | | | Tobacco Settlement Financing Corp., VA, Asset-Backed Revenue, Prerefunded 6/1/15 @ 100, OID, 5.625%, 6/1/37 | | | | | 355,917 |
| 1,650,000 | | | | Virginia Beach, VA, Public Improvements G.O., Callable 6/1/19 @ 100, 5.000%, 6/1/20 | | | | | 1,970,545 |
| 2,000,000 | | | | Virginia Beach, VA, Public Improvements G.O., Callable 6/1/19 @ 100, 5.000%, 6/1/22 | | | | | 2,347,260 |
| 1,610,000 | | | | Virginia College Building Authority, 21st Century College & Equipment Program Revenue, Series B, Callable 2/1/17 @ 100, 5.000%, 2/1/18 | | | | | 1,878,210 |
| 2,000,000 | | | | Virginia College Building Authority, 21st Century College Program Refunding Revenue, Series B, 5.250%, 2/1/13 | | | | | 2,258,880 |
| 1,000,000 | | | | Virginia College Building Authority, Hampton University Project Revenue, 5.500%, 4/1/10 | | | | | 1,023,590 |
| 1,000,000 | | | | Virginia College Building Authority, Public Higher Education Financing Program Revenue, Series A, Callable 9/1/15 @ 100, 5.000%, 9/1/22 | | | | | 1,133,630 |
| 1,525,000 | | | | Virginia Commonwealth, Public Improvements G.O., Series B, 5.000%, 6/1/17 | | | | | 1,824,312 |
| 1,370,000 | | | | Virginia Commonwealth, Refunding G.O., Series B, 5.000%, 6/1/14 | | | | | 1,585,433 |
| 2,240,000 | | | | Virginia Public Building Authority, Public Facilities Refunding Revenue, Series A, 5.000%, 8/1/11 | | | | | 2,413,936 |
| | | | | | | | | |
Principal
Amount | | | | Fair Value |
MUNICIPAL BONDS — (continued) | | | | | |
| | | | Virginia — (continued) | | | | | |
| $1,000,000 | | | | Virginia Public Building Authority, Virginia Public Facilities Building Revenue, Series A, Callable 8/1/17 @ 100 (NATL-RE), 5.000%, 8/1/18 | | | | $ | 1,172,220 |
| 1,000,000 | | | | Virginia Public School Authority, School Financing 1997 Resolution Revenue, Series B, Callable 8/1/17 @100 (NATL-RE), 5.000%, 8/1/26 | | | | | 1,114,310 |
| 1,000,000 | | | | Virginia Public School Authority, Unrefunded Balance Refunding School Financing Revenue, Series I, 5.250%, 8/1/10 | | | | | 1,040,400 |
| 1,360,000 | | | | Virginia Resources Authority, Clean Water State Revolving Fund Revenue, Callable 10/1/17 @ 100, 4.750%, 10/1/24 | | | | | 1,521,541 |
| 1,000,000 | | | | Virginia Resources Authority, State Revolving Fund Refunding Revenue, 5.500%, 10/1/17 | | | | | 1,234,580 |
| 805,000 | | | | Virginia Resources Authority, State Revolving Fund Revenue, 5.250%, 10/1/15 | | | | | 962,603 |
| 1,000,000 | | | | Western Virginia Regional Jail Authority, Aniticipation Notes Correctional Facility Improvements Revenue, Callable 10/23/09 @ 100, 4.125%, 12/1/09 | | | | | 1,002,790 |
| 2,000,000 | | | | York County, VA, Economic Development Authority, Electric & Power Refunding Revenue, Series A, 4.050%, 5/1/33* | | | | | 2,092,240 |
| | | | | | | | | |
| | | | Total Municipal Bonds
(Cost $82,871,718) | | | | | 89,399,211 |
| | | | | | | | | |
| | | |
| Shares | | | | | | |
INVESTMENT COMPANY (1.6%) | | | | | |
| | | | |
| 1,508,588 | | | | Federated Virginia Municipal Money Market Portfolio, Institutional Class | | | | | 1,508,588 |
| | | | | | | | | |
| | | | Total Investment Company
(Cost $1,508,588) | | | | | 1,508,588 |
| | | | | | | | | |
Total Investments — 99.0%
(Cost $84,380,306) | | | | | 90,907,799 |
Net Other Assets (Liabilities) — 1.0% | | | | | 921,451 |
| | | | | | | | | |
NET ASSETS — 100.0% | | | | $ | 91,829,250 |
| | | | | | | | | |
| * | The interest rate for this variable rate note, which will change periodically, is based either on the prime rate or an index of market rates. The reflected rate is in effect as of September 30, 2009. The maturity date reflected is the final maturity date. |
AMBAC — American Municipal Bond Insurance Corp.
BHAC — Berkshire Hathaway Insurance Corp.
CIFG — CDC IXIS Financial Guarantee
CR — Custodial Receipts
FGIC — Financial Guaranty Insurance Corp.
FSA — Financial Security Assurance
G.O. — General Obligation
NATL — National
OID — Original Issue Discount
RE — Reinsurance
XLCA — XL Capital Assurance
See accompanying notes to the financial statements.
81
|
BB&T West Virginia Intermediate Tax-Free Fund |
Schedule of Portfolio Investments
September 30, 2009
| | | | | | | | | |
Principal
Amount | | | | Fair Value |
MUNICIPAL BONDS (97.9%) | | | | | |
| | | | West Virginia (97.9%) | | | | | |
| $1,250,000 | | | | Berkeley County Board of Education, WV, School Improvements G.O., Callable 5/1/12 @ 101 (NATL-RE FGIC), 5.000%, 5/1/16 | | | | $ | 1,379,550 |
| 975,000 | | | | Berkeley County, WV, Public Service Sewer District Revenue, Series A, Callable 3/1/15 @ 100, 5.000%, 3/1/22 | | | | | 1,009,652 |
| 670,000 | | | | Braxton County, WV, Board of Education Public Schools Improvements G.O., Callable 5/1/18 @ 100 (FSA), 5.000%, 5/1/23 | | | | | 754,541 |
| 1,110,000 | | | | Brooke County, WV, Board of Education School Improvements G.O., Callable 5/1/11 @ 100 (NATL-RE FGIC), 5.000%, 5/1/16 | | | | | 1,176,012 |
| 500,000 | | | | Brooke, Pleasants, Tyler & Wetzel Counties, WV, Housing Revenue, 7.400%, 8/15/10 | | | | | 529,120 |
| 200,000 | | | | Cabell County, WV, Board of Education School Improvements G.O. (NATL-RE), 5.000%, 5/1/11 | | | | | 212,982 |
| 1,375,000 | | | | Cabell County, WV, Board of Education School Improvements G.O. (NATL-RE), 5.000%, 5/1/16 | | | | | 1,593,653 |
| 490,000 | | | | Cabell, Putnam & Wayne Counties, WV, State Housing Revenue (FGIC), 7.375%, 4/1/11 | | | | | 537,020 |
| 1,030,000 | | | | Charleston, WV, Urban Renewal Authority, Public Improvements Lease Revenue, Callable 12/15/09 @ 103 (FSA), 5.250%, 12/15/18 | | | | | 1,068,955 |
| 1,765,000 | | | | Clarksburg, WV, Water Refunding Revenue, Callable 9/1/12 @ 101 (NATL-RE FGIC), 5.250%, 9/1/19 | | | | | 1,909,042 |
| 1,000,000 | | | | Fairmont State College, WV, University & College Improvements Revenue, Series A, Callable 6/1/13 @ 100 (NATL-RE FGIC), 5.250%, 6/1/22 | | | | | 1,045,300 |
| 680,000 | | | | Fairmont, WV, Waterworks Refunding Revenue, Callable 10/23/09 @ 100 (NATL-RE), OID, 5.375%, 7/1/13 | | | | | 682,094 |
| 2,000,000 | | | | Greenbrier County, WV, Board of Education Public Schools Improvements G.O. (FSA), 5.000%, 5/1/18 | | | | | 2,333,700 |
| 1,030,000 | | | | Greenbrier County, WV, Commission Tax Increment Revenue, White Sulphur Springs Project 1-A, Callable 6/1/15 @ 100, 6.000%, 6/1/18 | | | | | 1,034,305 |
| 1,390,000 | | | | Harrison County, WV, County Commission Tax Allocation Refunding Revenue, Charles Pointe Project No. 2, Series A, Callable 6/1/18 @ 100, 6.500%, 6/1/23 | | | | | 1,211,079 |
| 545,000 | | | | Harrison County, WV, County Commission Tax Allocation Refunding Revenue, Charles Pointe Project No. 2, Series B, OID, 5.500%, 6/1/13 | | | | | 526,203 |
| 690,000 | | | | Logan County, WV, 1st Mortgage-Logan County Health Revenue, 8.000%, 12/1/16 | | | | | 860,547 |
| 1,000,000 | | | | Mason County, WV, Appalachian Power Co. Project Refunding Revenue, Series K, Callable 12/1/09 @ 101 (AMBAC), 6.050%, 12/1/24 | | | | | 1,014,610 |
| 1,285,000 | | | | Monongalia County, WV, Building Commission, Monongalia General Hospital Revenue, Series A, Callable 7/1/15 @ 100, 5.250%, 7/1/20 | | | | | 1,350,548 |
| | | | | | | | | |
Principal
Amount | | | | Fair Value |
MUNICIPAL BONDS — (continued) | | | | | |
| | | | West Virginia — (continued) | | | | | |
| $ 600,000 | | | | Morgantown, WV, Custodial Receipts Revenue, OID, 4.375%, 7/15/24 | | | | $ | 600,126 |
| 1,345,000 | | | | Ohio County, WV, County Commission Sewage System, Fort Henry Centre Tax Allocation Revenue, District A, 5.350%, 6/1/17 | | | | | 1,268,093 |
| 555,000 | | | | Ohio County, WV, Board of Education, Refunding G.O., Callable 12/1/09 @ 100.5 (NATL-RE-IBC), OID, 5.000%, 6/1/13 | | | | | 562,365 |
| 250,000 | | | | Ohio County, WV, Board of Education, Refunding G.O., Callable 12/1/09 @ 100.5 (NATL-RE-IBC), OID, 5.125%, 6/1/18 | | | | | 253,338 |
| 1,030,000 | | | | Ohio County, WV, County Commission Sewage System, Fort Henry Centre Tax Allocation Revenue, District A, Callable 6/1/17 @ 100, 5.625%, 6/1/22 | | | | | 968,983 |
| 1,190,000 | | | | Parkersburg, WV, Combined Waterworks & Sewer Systems Refunding Revenue, Series C (NATL-RE FGIC), 5.000%, 9/1/14 | | | | | 1,280,749 |
| 1,330,000 | | | | Parkersburg, WV, Combined Waterworks & Sewer Systems Refunding Revenue, Series C (NATL-RE FGIC), 5.000%, 9/1/15 | | | | | 1,431,146 |
| 2,100,000 | | | | Pleasants County, WV, Industrial Development, Monongahela Power Co. Refunding Revenue, Series C, Callable 10/23/09 @ 100 (AMBAC), 6.150%, 5/1/15 | | | | | 2,102,289 |
| 1,400,000 | | | | Shepherd University Board of Governors, WV, Residence Facilities Projects Revenue, Callable 6/1/15 @100 (NATL-RE), 5.000%, 6/1/25 | | | | | 1,471,036 |
| 1,000,000 | | | | Shepherd University Board of Governors, WV, Shepherd University Wellness Center Project Revenue, Callable 12/1/17 @100 (NATL-RE), 5.000%, 6/1/22 | | | | | 1,088,600 |
| 1,195,000 | | | | West Virginia Commissioner of Highways, Surface Transportation Improvements Revenue, Series A (FSA), 5.000%, 9/1/14 | | | | | 1,368,538 |
| 2,000,000 | | | | West Virginia Economic Development Authority, Correctional Juvenile & Public Lease Revenue, Series A (NATL-RE), 5.500%, 6/1/12 | | | | | 2,179,100 |
| 1,000,000 | | | | West Virginia Economic Development Authority, Correctional Juvenile & Public Lease Revenue, Series A, Callable 6/1/12 @ 101 (NATL-RE), 5.500%, 6/1/15 | | | | | 1,076,350 |
| 1,000,000 | | | | West Virginia Economic Development Authority, Correctional Juvenile & Public Lease Revenue, Series A, Callable 6/1/12 @ 101 (NATL-RE), 5.500%, 6/1/18 | | | | | 1,061,720 |
| 1,040,000 | | | | West Virginia Economic Development Authority, Correctional Juvenile & Public Lease Revenue, Series A, Callable 6/1/12 @ 101 (NATL-RE), 5.500%, 6/1/19 | | | | | 1,101,152 |
| 1,000,000 | | | | West Virginia Economic Development Authority, Correctional Juvenile & Public Lease Revenue, Series A, Callable 6/1/12 @101 (NATL-RE), 5.500%, 6/1/13 | | | | | 1,090,890 |
| 1,515,000 | | | | West Virginia Economic Development Authority, Correctional Juvenile & Public Lease Revenue, Series A, Callable 6/1/12 @101 (NATL-RE), OID, 5.000%, 6/1/26 | | | | | 1,572,797 |
Continued
82
|
BB&T West Virginia Intermediate Tax-Free Fund |
Schedule of Portfolio Investments — (continued)
September 30, 2009
| | | | | | | | | |
Principal
Amount | | | | Fair Value |
MUNICIPAL BONDS — (continued) | | | | | |
| | | | West Virginia — (continued) | | | | | |
| $450,000 | | | | West Virginia Economic Development Authority, Department of Environmental Protection Lease Revenue, 4.750%, 11/1/11 | | | | $ | 484,524 |
| 240,000 | | | | West Virginia Economic Development Authority, State Energy Savings Project Lease Revenue, 4.250%, 6/1/12 | | | | | 253,783 |
| 250,000 | | | | West Virginia Economic Development Authority, State Energy Savings Project Lease Revenue, Callable 6/1/15 @ 100, 4.750%, 6/1/21 | | | | | 261,595 |
| 2,300,000 | | | | West Virginia Economic Development Authority, State Office Building & Parking Lot Lease Revenue, Series A, Callable 8/1/19 @100, OID, 4.750%, 8/1/29 | | | | | 2,397,175 |
| 1,250,000 | | | | West Virginia Economic Development Authority, State Office Building Lease Revenue, Series A, Callable 10/1/11 @ 101, 5.000%, 10/1/15 | | | | | 1,356,362 |
| 820,000 | | | | West Virginia Higher Education Policy Commission, Higher Education Facilities Refunding Revenue, Series B (NATL-RE FGIC), 5.000%, 4/1/14 | | | | | 915,973 |
| 1,000,000 | | | | West Virginia Higher Education Policy Commission, Higher Education Facilities Refunding Revenue, Series B, Callable 4/1/14 @ 100 (NATL-RE FGIC), 5.000%, 4/1/16 | | | | | 1,096,590 |
| 1,795,000 | | | | West Virginia Higher Education Policy Commission, Higher Education Facilities Refunding Revenue, Series B, Callable 4/1/14 @ 100 (NATL-RE FGIC), 5.000%, 4/1/23 | | | | | 1,932,605 |
| 1,070,000 | | | | West Virginia Higher Education Policy Commission, Higher Education Facilities Refunding Revenue, Series B, Callable 4/1/14 @ 100 (NATL-RE FGIC), 5.000%, 4/1/34 | | | | | 1,098,162 |
| 550,000 | | | | West Virginia School Building Authority Excess, Lottery Revenue, 5.000%, 7/1/16 | | | | | 628,133 |
| 1,705,000 | | | | West Virginia School Building Authority Excess, Lottery Revenue, Callable 7/1/18 @ 100, OID, 5.000%, 7/1/27 | | | | | 1,853,386 |
| 1,525,000 | | | | West Virginia School Building Authority, Capital Improvements Refunding Revenue, Series A (NATL-RE FGIC), 5.000%, 7/1/15 | | | | | 1,716,723 |
| 2,100,000 | | | | West Virginia School Building Authority, Capital Improvements Refunding Revenue, Series A (NATL-RE FGIC), 5.000%, 7/1/16 | | | | | 2,374,785 |
| 1,960,000 | | | | West Virginia School Building Authority, Capital Improvements Refunding Revenue, Series A, Callable 7/1/17 @ 100 (NATL-RE FGIC), 5.000%, 7/1/18 | | | | | 2,199,002 |
| 1,465,000 | | | | West Virginia School Building Authority, Capital Improvements Refunding Revenue, Series A, Callable 7/1/17 @ 100 (NATL-RE FGIC), 5.000%, 7/1/19 | | | | | 1,631,951 |
| 200,000 | | | | West Virginia School Building Authority, Capital Improvements Revenue (NATL-RE), 5.250%, 1/1/14 | | | | | 224,456 |
| 1,020,000 | | | | West Virginia School Building Authority, Capital Improvements Revenue (NATL-RE), 5.250%, 7/1/14 | | | | | 1,156,425 |
| 1,300,000 | | | | West Virginia School Building Authority, Excess Lottery Revenue, 5.000%, 7/1/18 | | | | | 1,490,164 |
| | | | | | | | | |
Principal
Amount | | | | Fair Value |
MUNICIPAL BONDS — (continued) | | | | | |
| | | | West Virginia — (continued) | | | | | |
| $1,295,000 | | | | West Virginia State Building Commission, Regional Jail Refunding Revenue, Series A (AMBAC), 5.250%, 7/1/10 | | | | $ | 1,330,172 |
| 35,000 | | | | West Virginia State Hospital Finance Authority, Camden Clark Memorial Hospital Revenue, Series A, Callable 2/15/14 @ 100 (FSA), 5.250%, 2/15/18 | | | | | 37,157 |
| 640,000 | | | | West Virginia State Hospital Finance Authority, Charleston Area Medical Center, Inc. Revenue, Series A, OID, 6.500%, 9/1/16 | | | | | 791,706 |
| 450,000 | | | | West Virginia State Hospital Finance Authority, Charleston Medical Center Revenue, Prerefunded 9/1/10 @ 101, OID, 6.750%, 9/1/30 | | | | | 480,200 |
| 2,000,000 | | | | West Virginia State Hospital Finance Authority, Charleston Refunding & Improvements Revenue, Series A, 5.000%, 9/1/19 | | | | | 2,064,680 |
| 1,405,000 | | | | West Virginia State Hospital Finance Authority, Linked Bears & Bulls Refunding Revenue, Callable 10/23/09 @ 100 (NATL-RE), 6.100%, 1/1/18 | | | | | 1,406,826 |
| 785,000 | | | | West Virginia State Hospital Finance Authority, West Virginia United Health System Refunding Revenue, Series E, Callable 12/1/18 @ 100, OID, 5.375%, 6/1/28 | | | | | 822,861 |
| 1,000,000 | | | | West Virginia State Parkways Economic Development & Tourism Authority, Refunding Revenue (NATL-RE FGIC General Obligation of Authority), 5.250%, 5/15/12 | | | | | 1,092,170 |
| 700,000 | | | | West Virginia State Parkways Economic Development & Tourism Authority, Refunding Revenue (NATL-RE FGIC General Obligation of Authority), 5.250%, 5/15/17 | | | | | 808,983 |
| 360,000 | | | | West Virginia University, Projects Refunding Revenue, Series B, Callable 10/1/14 @ 100 (NATL-RE FGIC), 5.000%, 10/1/21 | | | | | 387,637 |
| 1,440,000 | | | | West Virginia University, Projects Revenue, Series A (NATL-RE), 5.500%, 4/1/11 | | | | | 1,527,221 |
| 955,000 | | | | West Virginia University, Projects Revenue, Series A (NATL-RE), 5.250%, 4/1/28 | | | | | 1,080,458 |
| 500,000 | | | | West Virginia Water Development Authority, Infrastructure Jobs Refunding Revenue, Series A, Callable 10/1/16 @ 100 (FSA), 5.000%, 10/1/26 | | | | | 540,420 |
| 540,000 | | | | West Virginia Water Development Authority, Infrastructure Jobs Revenue, Series A, Callable 10/1/16 @ 100 (FSA), 4.750%, 10/1/23 | | | | | 580,144 |
| 1,110,000 | | | | West Virginia Water Development Authority, Loan Program II Refunding Revenue, Series B, Callable 11/1/13 @ 101 (AMBAC), 5.250%, 11/1/23 | | | | | 1,179,430 |
| 890,000 | | | | West Virginia Water Development Authority, Loan Programs Refunding Revenue, Series A1, Callable 11/1/12 @ 102 (AMBAC), 5.250%, 11/1/23 | | | | | 942,795 |
| 60,000 | | | | West Virginia, State Road Refunding G.O. (NATL-RE FGIC), 5.000%, 6/1/12 | | | | | 66,175 |
Continued
83
|
BB&T West Virginia Intermediate Tax-Free Fund |
Schedule of Portfolio Investments — (continued)
September 30, 2009
| | | | | | | | | |
Principal
Amount | | | | Fair Value |
MUNICIPAL BONDS — (continued) | | | | | |
| | | | West Virginia — (continued) | | | | | |
| $2,090,000 | | | | West Virginia, State Road Refunding G.O. (NATL-RE FGIC), 5.000%, 6/1/15 | | | | $ | 2,425,633 |
| | | | | | | | | |
| | | | Total Municipal Bonds
(Cost $77,551,621) | | | | | 81,342,647 |
| | | | | | | | | |
| | | | | | | | | |
Shares | | | | Fair Value |
INVESTMENT COMPANY (1.2%) | | | | | |
| | | | |
| 1,047,315 | | | | Federated Tax-Free Obligations Fund, Institutional Service Class | | | | $ | 1,047,315 |
| | | | | | | | | |
| | | | Total Investment Company
(Cost $1,047,315) | | | | | 1,047,315 |
| | | | | | | | | |
Total Investments — 99.1%
(Cost $78,598,936) | | | | | 82,389,962 |
Net Other Assets (Liabilities) — 0.9% | | | | | 727,303 |
| | | | | | | | | |
NET ASSETS — 100.0% | | | | $ | 83,117,265 |
| | | | | | | | | |
AMBAC — American Municipal Bond Insurance Corp.
FGIC — Financial Guaranty Insurance Corp.
FSA — Financial Security Assurance
G.O. — General Obligation
IBC — Insured Bond Certificates
NATL — National
OID — Original Issue Discount
RE — Reinsurance
See accompanying notes to the financial statements.
84
|
BB&T National Tax-Free Money Market Fund |
Schedule of Portfolio Investments
September 30, 2009
| | | | | | | | | |
Principal
Amount | | | | Amortized
Cost |
MUNICIPAL BONDS (99.9%) | | | | | |
| | | | Arizona (6.8%) | | | | | |
| $1,700,000 | | | | Arizona State Board of Regents, AZ, Arizona State University System Refunding Revenue, Series A (Lloyds TSB Bank Plc), 0.280%, 10/7/09* | | | | $ | 1,700,000 |
| 1,000,000 | | | | Clipper Tax-Exempt Certificate Trust Revenue, Series 2009-33 (State Street & BB&T Co.), 0.350%, 10/1/09* | | | | | 1,000,000 |
| 5,000,000 | | | | Salt River Project Agricultural Improvement & Power District, Electric System Refunding Revenue, Callable 1/1/16 @ 100, 0.360%, 10/1/09*(a) | | | | | 5,000,000 |
| 750,000 | | | | Scottsdale Industrial Development Authority, AZ, Scottsdale Healthcare Refunding Revenue, Series C (FSA), 0.340%, 10/7/09* | | | | | 750,000 |
| 3,000,000 | | | | Scottsdale Industrial Development Authority, AZ, Scottsdale Healthcare Refunding Revenue, Series D (FSA), 0.340%, 10/7/09* | | | | | 3,000,000 |
| 5,200,000 | | | | Tempe Union High School District No. 213, AZ, Refunding G.O., 3.250%, 7/1/10 | | | | | 5,304,100 |
| 1,000,000 | | | | Yavapai County Industrial Development Authority Northern Arizona Healthcare Refunding Revenue, Series B (Banco Bilbao Vizcaya), 0.350%, 10/1/09* | | | | | 1,000,000 |
| | | | | | | | | |
| | | | | | | | | 17,754,100 |
| | | | | | | | | |
| | | | Colorado (2.5%) | | | | | |
| 4,900,000 | | | | Colorado Educational & Cultural Facilities Authority, Fuller Theological Project Revenue (Keybank N.A.), 2.000%, 10/1/09* | | | | | 4,900,000 |
| 1,600,000 | | | | Thornton, CO, Kroger Co. Industrial Development Refunding Revenue (U.S. Bank N.A.), 0.500%, 10/1/09* | | | | | 1,600,000 |
| | | | | | | | | |
| | | | | | | | | 6,500,000 |
| | | | | | | | | |
| | | | Connecticut (1.8%) | | | | | |
| 4,580,000 | | | | Plymouth, CT, G.O. Bond Anticipation Notes Cash Flow Management, 1.750%, 8/26/10 | | | | | 4,620,941 |
| | | | | | | | | |
| | | | Florida (6.1%) | | | | | |
| 3,885,000 | | | | Miami, FL, Health Facilities Authority Refunding Revenue, Mercy Hospital Project (NationsBank N.A.), 0.290%, 10/7/09* | | | | | 3,885,000 |
| 4,300,000 | | | | Orange County, FL, Industrial Development Authority, Catholic Diocese Project Revenue (Suntrust Bank), 0.900%, 10/7/09* | | | | | 4,300,000 |
| 4,700,000 | | | | Orlando & Orange County, FL, Expressway Authority Refunding Revenue, Series D (FSA), 0.370%, 10/1/09* | | | | | 4,700,000 |
| 3,070,000 | | | | Volusia County, FL, Educational Facility Authority, Bethune Cookman College Project Revenue (Suntrust Bank), 0.850%, 10/7/09* | | | | | 3,070,000 |
| | | | | | | | | |
| | | | | | | | | 15,955,000 |
| | | | | | | | | |
| | | | Georgia (13.6%) | | | | | |
| 920,000 | | | | Clayton County, GA, Housing Authority Refunding Revenue, Summerwind, Series A (Fannie Mae), 0.370%, 10/1/09* | | | | | 920,000 |
| 4,000,000 | | | | De Kalb County, GA, Housing Authority Refunding Revenue, Timber Trace Apartments Project (Freddie Mac), 0.370%, 10/1/09* | | | | | 4,000,000 |
| | | | | | | | | |
Principal
Amount | | | | Amortized
Cost |
MUNICIPAL BONDS — (continued) | | | | | |
| | | | Georgia — (continued) | | | | | |
| $1,700,000 | | | | Fulton County, GA, Development Authority Refunding Revenue, 0.450%, 10/15/09* | | | | $ | 1,700,000 |
| 2,750,000 | | | | Fulton County, GA, Development Authority Revenue, Children Healthcare Atlanta, 0.300%, 10/7/09* | | | | | 2,750,000 |
| 3,000,000 | | | | Fulton County, GA, Development Authority Revenue, Woodward Academy, Inc. Project (FHLB), 0.290%, 10/7/09* | | | | | 3,000,000 |
| 3,000,000 | | | | Fulton County, GA, Residential Care Facilities for the Elderly Authority Refunding Revenue, First Mortgage Lenbrook Project, Series C (Bank of Scotland), 0.300%, 10/7/09* | | | | | 3,000,000 |
| 2,090,000 | | | | Gainesville & Hall County, GA, Hospital Authority, Northeast Georgia Health System Refunding Revenue, Series G (Bayerische Landesbank), 0.450%, 10/7/09* | | | | | 2,090,000 |
| 11,400,000 | | | | Macon-Bibb County, GA, Hospital Authority Revenue, Anticipation Certificates, Central Georgia Senior Health, Inc. (Suntrust Bank), 0.290%, 10/7/09* | | | | | 11,400,000 |
| 4,000,000 | | | | Monroe County, GA, Development Authority Pollution Control Revenue, Scherer Project No. 1, 0.320%, 10/1/09* | | | | | 4,000,000 |
| 2,500,000 | | | | Private Colleges & Universities Authority, Emory University Refunding Revenue, Series C1, 0.250%, 10/1/09* | | | | | 2,500,000 |
| | | | | | | | | |
| | | | | | | | | 35,360,000 |
| | | | | | | | | |
| | | | Illinois (6.5%) | | | | | |
| 6,140,000 | | | | Chicago Board of Education, IL, School Improvements G.O., Series B (FSA), 0.650%, 10/1/09* | | | | | 6,140,000 |
| 1,750,000 | | | | Cook County, IL, Capital Improvements G.O., Series B, 0.360%, 10/7/09* | | | | | 1,750,000 |
| 4,000,000 | | | | Illinois Finance Authority, Swedish Conevant Refunding Revenue, Series A (LaSalle Bank N.A.), 0.290%, 10/1/09* | | | | | 4,000,000 |
| 5,000,000 | | | | Illinois Financial Authority, Bradley University Revenue, Series A (Northern Trust Company), 0.310%, 10/1/09* | | | | | 5,000,000 |
| | | | | | | | | |
| | | | | | | | | 16,890,000 |
| | | | | | | | | |
| | | | Indiana (2.0%) | | | | | |
| 5,155,000 | | | | Indianapolis City, IN, Washington Pointe Project Refunding Revenue, Series A (Fannie Mae), 0.380%, 10/2/09* | | | | | 5,155,000 |
| | | | | | | | | |
| | | | Maine (1.9%) | | | | | |
| 5,000,000 | | | | Finance Authority of Maine Revenue, Mt. Desert (Citizens Bank), 1.500%, 10/1/09* | | | | | 5,000,000 |
| | | | | | | | | |
| | | | Massachusetts (0.8%) | | | | | |
| 2,000,000 | | | | Massachusetts Health & Educational Facilities Authority, Cape Cod Healthcare Revenue, Series D (Assured Guaranty), 0.450%, 10/1/09* | | | | | 2,000,000 |
| | | | | | | | | |
| | | | Mississippi (1.3%) | | | | | |
| 3,500,000 | | | | Mississippi Business Finance Corp., MS, Industrial Improvements Revenue Gulfport Promenade Project (Regions Bank), 1.600%, 10/1/09* | | | | | 3,500,000 |
| | | | | | | | | |
Continued
85
|
BB&T National Tax-Free Money Market Fund |
Schedule of Portfolio Investments — (continued)
September 30, 2009
| | | | | | | | | |
Principal
Amount | | | | Amortized
Cost |
MUNICIPAL BONDS — (continued) | | | | | |
| | | | Missouri (5.1%) | | | | | |
| $8,550,000 | | | | Kansas City Industrial Development Authority, MO, Bethesda Living Center Nursing Homes Revenue, Series A (LaSalle National Bank), 0.380%, 10/1/09* | | | | $ | 8,550,000 |
| 2,900,000 | | | | Missouri State Health & Educational Facilities Authority, MO, Dialsis Clinic, Inc. Project Revenue (Suntrust Bank), 0.900%, 10/7/09* | | | | | 2,900,000 |
| 1,900,000 | | | | Missouri State Health & Educational Facilities Authority, MO, Sisters Mercy Health Revenue, Series D, 0.380%, 10/1/09* | | | | | 1,900,000 |
| | | | | | | | | |
| | | | | | | | | 13,350,000 |
| | | | | | | | | |
| | | | New Jersey (1.4%) | | | | | |
| 1,750,000 | | | | Englewood Cliffs Borough, NJ, G.O. Bond Anticipation Notes Cash Flow Management, 2.500%, 5/7/10 | | | | | 1,766,570 |
| 1,925,000 | | | | Plainsboro Township, NJ, G.O. Anticipation Notes Cash Flow Management, 2.500%, 12/10/09 | | | | | 1,928,084 |
| | | | | | | | | |
| | | | | | | | | 3,694,654 |
| | | | | | | | | |
| | | | New York (0.5%) | | | | | |
| 1,305,000 | | | | Rochester, NY, G.O. Bond Anticipation Notes Cash Flow Management, 2.000%, 8/23/10 | | | | | 1,317,704 |
| | | | | | | | | |
| | | | North Carolina (2.4%) | | | | | |
| 2,300,000 | | | | Charlotte, NC, Water & Sewer Systems Revenue, Series B, 0.340%, 10/1/09* | | | | | 2,300,000 |
| 4,000,000 | | | | Charlotte-Mecklenburg Hospital Authority, NC, Healthcare System Revenue, Series D (FSA), 0.390%, 10/1/09* | | | | | 4,000,000 |
| | | | | | | | | |
| | | | | | | | | 6,300,000 |
| | | | | | | | | |
| | | | Ohio (15.0%) | | | | | |
| 1,500,000 | | | | Butler County, OH, G.O. Bond Anticipation Notes, 1.250%, 8/5/10 | | | | | 1,506,905 |
| 2,480,000 | | | | Cuyahoga County, OH, Magnificat High School Project Revenue (Fifth Third Bank), 1.900%, 10/1/09* | | | | | 2,480,000 |
| 2,200,000 | | | | Dover, OH, G.O. Bond Anticipation Refunding Notes, 2.550%, 4/1/10 | | | | | 2,205,907 |
| 1,000,000 | | | | Hamilton County, OH, Hospital Facilities Revenue, Drake Center, Inc., Series A (U.S. Bank N.A.), 0.400%, 10/1/09* | | | | | 1,000,000 |
| 1,860,000 | | | | Hamilton County, OH, Student Housing Revenue, Block 3 Project (Citizen Bank), 1.000%, 10/1/09* | | | | | 1,860,000 |
| 1,900,000 | | | | Kent State University Revenues, University & College Improvements General Receipts (Keybank N.A.), 1.300%, 10/1/09* | | | | | 1,900,000 |
| 1,500,000 | | | | Maple Heights, OH, City School District, G.O. School Facilities Improvements Notes Cash Flow Management, 3.500%, 11/5/09 | | | | | 1,501,261 |
| 1,425,000 | | | | Montgomery County, OH, Industrial Development Refunding Revenue, Kroger Co. (U.S. Bank N.A.), 0.500%, 10/1/09* | | | | | 1,425,000 |
| 2,100,000 | | | | Mount Vernon, OH, G.O. Bond Anticipation Notes Cash Flow Management, 2.000%, 2/23/10 | | | | | 2,103,279 |
| | | | | | | | | |
Principal
Amount | | | | Amortized
Cost |
MUNICIPAL BONDS — (continued) | | | | | |
| | | | Ohio — (continued) | | | | | |
| $ 750,000 | | | | Ohio State Water Development Authority, Firstenergy Project Refunding Revenue, Series B (Barclays Bank PLC), 0.250%, 10/7/09* | | | | $ | 750,000 |
| 2,000,000 | | | | Oregon City, OH, G.O. Bond Anticipation Notes Cash Flow Management, 1.050%, 9/8/10 | | | | | 2,007,627 |
| 3,000,000 | | | | Perrysburg City, OH, G.O. Bond Anticipation Notes, Cash Flow Management, Various Purposes Improvements, 1.500%, 12/17/09 | | | | | 3,003,124 |
| 2,000,000 | | | | Pike County, OH, Health Care Facilities Refunding Revenue, National Church, Series A (Bank of America N.A.), 0.430%, 10/1/09* | | | | | 2,000,000 |
| 100,000 | | | | Port of Greater Cincinnati Development Authority, OH, National Underground Revenue, Series A (JP Morgan Chase Bank), 0.320%, 10/7/09* | | | | | 100,000 |
| 2,545,000 | | | | South Euclid, OH, G.O. Bond Anticipation Refunding Notes, Series B, 2.500%, 1/25/10 | | | | | 2,557,012 |
| 4,500,000 | | | | Summit County, OH, Western Reserve Academy Project Revenue (Keybank N.A.), 1.300%, 10/1/09* | | | | | 4,500,000 |
| 1,650,000 | | | | Tipp City, OH, G.O. Bond Anticipation Notes Cash Flow Management, Various Purposes Improvements, 2.650%, 4/20/10 | | | | | 1,658,036 |
| 1,500,000 | | | | Vandalia Butler, OH, City School District, G.O. Bond Anticipation Notes, School Improvements, Series B, 1.500%, 3/1/10 | | | | | 1,504,639 |
| 5,000,000 | | | | Williams County, OH, Community Hospitals & Wellness Center Revenue (Fifth Third Bank), 0.900%, 10/2/09* | | | | | 5,000,000 |
| | | | | | | | | |
| | | | | | | | | 39,062,790 |
| | | | | | | | | |
| | | | Pennsylvania (4.3%) | | | | | |
| 1,100,000 | | | | Bethlehem Area School District, PA, G.O. (FSA, State Aid Withholding), 0.850%, 10/1/09* | | | | | 1,100,000 |
| 7,200,000 | | | | Chester County, PA, Industrial Development Authority Revenue, University Student Housing, LLC (Citizens Bank), 0.290%, 10/7/09* | | | | | 7,200,000 |
| 3,000,000 | | | | Hamburg Area School District, PA, G.O. Cash Flow Management (State Aid Withholding), 2.041%, 11/1/09* | | | | | 3,015,665 |
| | | | | | | | | |
| | | | | | | | | 11,315,665 |
| | | | | | | | | |
| | | | Tennessee (0.8%) | | | | | |
| 2,100,000 | | | | Hendersonville, TN, Industrial Development Board, Educational Facilities Revenue, Pope John Paul II High School (Suntrust Bank N.A.), 0.950%, 10/7/09* | | | | | 2,100,000 |
| | | | | | | | | |
| | | | Texas (2.9%) | | | | | |
| 1,350,000 | | | | Crawford, TX, Education Facilities Corp. Refunding Revenue, University Parking System Project, Series A, (BNP Paribas), 1.020%, 10/1/09* | | | | | 1,350,000 |
| 3,445,000 | | | | Houston Higher Education Finance Corp., TX, University & College Improvements Revenue, Tierwester Oaks, Series A (Bank of New York), 1.200%, 10/1/09* | | | | | 3,445,000 |
Continued
86
|
BB&T National Tax-Free Money Market Fund |
Schedule of Portfolio Investments — (continued)
September 30, 2009
| | | | | | | | | |
Principal
Amount | | | | Amortized
Cost |
MUNICIPAL BONDS — (continued) | | | | | |
| | | | Texas — (continued) | | | | | |
| $2,600,000 | | | | Texas State, TX, Tax & Revenue Anticipation Notes Cash Flow Management, 2.500%, 8/31/10 | | | | $ | 2,647,810 |
| | | | | | | | | |
| | | | | | | | | 7,442,810 |
| | | | | | | | | |
| | | | Utah (3.5%) | | | | | |
| 3,500,000 | | | | Murray City, UT, Hospital Revenue, IHC Health Services, Inc., Series C, 0.300%, 10/1/09* | | | | | 3,500,000 |
| 2,500,000 | | | | Riverton, UT, Hospital Puttable Revenue, Series 1762, 0.330%, 10/1/09*(a) | | | | | 2,500,000 |
| 3,125,000 | | | | Utah Housing Corp., UT, Timbergate Local Multifamily Housing Revenue, Series A (Freddie Mac), 0.400%, 10/1/09* | | | | | 3,125,000 |
| | | | | | | | | |
| | | | | | | | | 9,125,000 |
| | | | | | | | | |
| | | | Virginia (13.1%) | | | | | |
| 9,000,000 | | | | Fairfax County, VA, Industrial Development Authority, Inova Health System Project Revenue, Series C-1, 0.850%, 10/6/09* | | | | | 9,000,000 |
| 800,000 | | | | Falls Church, VA, Economic Development Authority, Tax Analysts Project Revenue, Series A (Citibank N.A.), 0.340%, 10/7/09* | | | | | 800,000 |
| 2,900,000 | | | | Hampton, VA, Redevelopment & Housing Authority, Multifamily Housing Refunding Revenue, Township Apartments Project (Fannie Mae), 0.320%, 10/7/09* | | | | | 2,900,000 |
| 2,300,000 | | | | Hanover County, VA, Economic Development Authority Refunding Revenue, Bon Secours Health System, Inc., Series D-2 (U.S. Bank N.A.), 0.240%, 10/7/09* | | | | | 2,300,000 |
| 1,230,000 | | | | James City County, VA, Industrial Development Authority, Refunding Retirement Facilities Revenue, Housing Chambrel Project (Fannie Mae), 0.370%, 10/1/09* | | | | | 1,230,000 |
| 4,900,000 | | | | James City County, VA, Industrial Development Authority, Riverside Health Systems Revenue, 0.500%, 10/7/09* | | | | | 4,900,000 |
| 2,750,000 | | | | Loudoun County, VA, Industrial Development Authority, Howard Hughes Medical Institute Revenue, Series C, 0.210%, 10/7/09* | | | | | 2,750,000 |
| 2,305,000 | | | | Loudoun County, VA, Industrial Development Authority, Howard Hughes Medical Institute Revenue, Series F, 0.240%, 10/7/09* | | | | | 2,305,000 |
| 2,000,000 | | | | Norfolk, VA, Economic Development Authority, Sentara Healthcare Refunding Revenue, Series C, 0.230%, 10/7/09* | | | | | 2,000,000 |
| 3,170,000 | | | | Peninsula Ports Authority, VA, Health Systems Refunding Revenue, Riverside Health Systems Project, 0.500%, 10/7/09* | | | | | 3,170,000 |
| 2,905,000 | | | | Virginia Resources Authority, VA, Water Revenue, Henrico County Project, 0.950%, 10/1/09* | | | | | 2,905,000 |
| | | | | | | | | |
| | | | | | | | | 34,260,000 |
| | | | | | | | | |
| | | | Washington (4.5%) | | | | | |
| 5,680,000 | | | | Washington Economic Development Finance Authority, WA, Northwest Center Project Revenue, Series A (Keybank N.A.), 1.300%, 10/1/09* | | | | | 5,680,000 |
| | | | | | | | | |
Principal
Amount | | | | Amortized
Cost |
MUNICIPAL BONDS — (continued) | | | | | |
| | | | Washington — (continued) | | | | | |
| $6,070,000 | | | | Washington State Housing Finance Commission, WA, Forest Ridge School Nonprofit Revenue, Series A (Keybank N.A.), 1.300%, 10/1/09* | | | | $ | 6,070,000 |
| | | | | | | | | |
| | | | | | | | | 11,750,000 |
| | | | | | | | | |
| | | | Wisconsin (3.1%) | | | | | |
| 3,500,000 | | | | Verona Area School District, WI, Tax & Revenue Anticipation Notes, Cash Flow Management, 1.500%, 2/1/10 | | | | | 3,506,499 |
| 3,000,000 | | | | Wisconsin Health & Educational Facilities Authority, WI, Wausau Hospital Revenue, Series B (AMBAC) (M&I Bank), 2.150%, 10/7/09* | | | | | 3,000,000 |
| 1,600,000 | | | | Wisconsin School Districts Temporary Borrowing Program, WI, Tax & Revenue Anticipation Promissory Notes Cash Flow Management, Certificate of Participation, Series B, 3.000%, 10/30/09 | | | | | 1,601,630 |
| | | | | | | | | |
| | | | | | | | | 8,108,129 |
| | | | | | | | | |
| | | | Total Municipal Bonds
(Cost $260,561,793) | | | | | 260,561,793 |
| | | | | | | | | |
| | |
| Shares | | | | Fair Value |
INVESTMENT COMPANY (0.0%) | | | | | |
| 49,100 | | | | SEI Institutional Tax Free Fund | | | | | 49,100 |
| | | | | | | | | |
| | | | Total Investment Company
(Cost $49,100) | | | | | 49,100 |
| | | | | | | | | |
Total Investments — 99.9%
(Cost $260,610,893) | | | | | 260,610,893 |
Net Other Assets (Liabilities) — 0.1% | | | | | 327,877 |
| | | | | | | | | |
NET ASSETS — 100.0% | | | | $ | 260,938,770 |
| | | | | | | | | |
| * | The interest rate for this variable rate note, which will change periodically, is based either on the prime rate or an index of market rates. The reflected rate is in effect as of September 30, 2009. The maturity date reflected is the next reset date. |
| (a) | Rule 144A, Section 4(2) or other security which is restricted as to resale to institutional investors. The Investment Advisor, using board approved procedures, has deemed these securities or a portion of these securities to be liquid. |
AMBAC — American Municipal Bond Insurance Corp.
FHLB — Federal Home Loan Bank
FSA — Insured by Financial Security Assurance
G.O. — General Obligation
N.A. — North America
See accompanying notes to the financial statements.
87
|
BB&T Prime Money Market Fund |
Schedule of Portfolio Investments
September 30, 2009
| | | | | | | | |
Principal Amount | | | | Amortized
Cost |
| ASSET BACKED SECURITIES (3.3%) | | | |
$ | 538,532 | | Ford Credit Auto Owner Trust, Series 2009-A, Class A1, 1.861%, 4/15/10(a) | | | | $ | 538,532 |
| | 2,675,278 | | Honda Auto Receivables Owner Trust, Series 2009-1, Class A1, 1.978%, 2/16/10 | | | | | 2,675,279 |
| | 18,643,210 | | Honda Auto Receivables Owner Trust, Series 2009-3, Class A1, 0.754%, 7/15/10 | | | | | 18,643,210 |
| | 13,000,000 | | Hyundai Auto Receivables Trust, Series 2009-A, Class A1, 0.357%, 9/15/10 | | | | | 13,000,000 |
| | 2,668,550 | | Nissan Auto Receivables Owner Trust, Series 2009-1, Class A1, 1.999%, 3/15/10 | | | | | 2,668,550 |
| | | | | | | | |
| | | Total Asset Backed Securities
(Cost $37,525,571) | | | 37,525,571 |
| | | | | | | | |
| CERTIFICATES OF DEPOSIT (34.7%) |
| | | Banks (34.7%) | | | | | |
| | 20,000,000 | | Bank of Montreal, 0.230%, 10/19/09 | | | | | 20,000,000 |
| | 15,000,000 | | Bank of Tokyo, 0.280%, 12/18/09 | | | | | 15,000,000 |
| | 15,000,000 | | The Bank of Tokyo-Mitsubishi UFJ, Ltd., 0.320%, 11/19/09 | | | | | 15,000,000 |
| | 20,000,000 | | The Bank of Tokyo-Mitsubishi UFJ, Ltd., 0.280%, 11/27/09 | | | | | 20,000,000 |
| | 25,000,000 | | Barclays Bank PLC, 0.800%, 1/19/10 | | | | | 25,000,000 |
| | 25,000,000 | | BNP Paribas, 0.290%, 12/1/09 | | | | | 25,000,000 |
| | 30,000,000 | | Calyon, Paris, 0.400%, 11/20/09 | | | | | 30,000,000 |
| | 35,000,000 | | Calyon, Paris, 0.450%, 2/22/10 | | | | | 35,000,000 |
| | 25,000,000 | | Canadian Imperial Bank of Commerce, 0.380%, 3/22/10 | | | | | 25,000,000 |
| | 25,000,000 | | Compass Bank, 0.680%, 11/25/09 | | | | | 25,000,190 |
| | 50,000,000 | | Mizuho Corp. Bank, Ltd., 0.370%, 10/20/09 | | | | | 50,000,000 |
| | 15,000,000 | | Mizuho Corp. Bank, Ltd., 0.370%, 10/21/09 | | | | | 15,000,000 |
| | 15,000,000 | | Rabobank, N.A., 0.290%, 1/25/10 | | | | | 15,000,000 |
| | 25,000,000 | | Royal Bank of Scottland, 0.230%, 10/16/09 | | | | | 25,000,000 |
| | 10,000,000 | | Societe Generale, Paris, 0.500%, 2/1/10 | | | | | 10,000,000 |
| | 20,000,000 | | State Street Bank & Trust Co., 0.350%, 10/7/09 | | | | | 20,000,000 |
| | 20,000,000 | | State Street Bank & Trust Co., 1.400%, 10/13/09 | | | | | 20,000,000 |
| | 10,000,000 | | Union Bank, N.A., 0.350%, 11/17/09 | | | | | 10,000,000 |
| | | | | | | | |
| | | Total Certificates of Deposit
(Cost $400,000,190) | | | | | 400,000,190 |
| | | | | | | | |
| COMMERCIAL PAPER* (39.5%) | | | | | |
| | | Asset Backed Securities (20.1%) |
| | 2,000,000 | | Alpine Securitization Corp., 0.280%, 11/9/09(a) | | | | | 1,999,393 |
| | 40,000,000 | | Atlantic Asset Securitization, Corp., 0.350%, 10/5/09(a) | | | | | 39,998,445 |
| | 20,000,000 | | Atlantic Asset Securitization, Corp., 0.380%, 10/6/09(a) | | | | | 19,998,945 |
| | 20,000,000 | | Clipper Receivables Co. LLC, 0.230%, 11/16/09(a) | | | | | 19,994,122 |
| | 20,000,000 | | Enterprise Funding LLC, 0.330%, 10/19/09(a) | | | | | 19,996,700 |
| | 10,011,000 | | Fairway Finance Co. LLC, 0.290%, 11/4/09(a) | | | | | 10,008,258 |
| | 4,707,000 | | Fairway Finance Co. LLC, 0.290%, 11/10/09(a) | | | | | 4,705,483 |
| | 25,000,000 | | FCAR Owner Trust, 1.170%, 10/13/09 | | | | | 24,990,250 |
| | 25,000,000 | | Surrey Funding Corp., 0.210%, 10/19/09(a) | | | | | 24,997,375 |
| | 10,000,000 | | Yorktown Capital LLC, 0.300%, 11/9/09(a) | | | | | 9,996,750 |
| | 55,000,000 | | Yorktown Capital LLC, 0.300%, 11/17/09(a) | | | | | 54,978,458 |
| | | | | | | | |
| | | | | | | | 231,664,179 |
| | | | | | | | |
| | | | | | | |
Principal Amount | | | | Amortized
Cost |
COMMERCIAL PAPER* — (continued) | | | | | |
| | Banking (1.7%) | | | | | |
| $20,000,000 | | Australia & New Zealand Banking, 1.037%, 10/2/09**(a) | | | | $ | 20,000,000 |
| | | | | | | |
| | Financial Services (17.7%) | | | | | |
| 25,000,000 | | Banco Bilbao Vizcaya Argentaria SA, 1.015%, 11/12/09(a) | | | | | 24,970,396 |
| 20,000,000 | | Bank of America Corp., 0.250%, 12/15/09 | | | | | 19,989,583 |
| 25,000,000 | | Bank of America Corp., 0.280%, 12/16/09 | | | | | 24,985,222 |
| 1,000,000 | | BASF AG, 0.520%, 10/13/09 | | | | | 999,827 |
| 40,000,000 | | BASF SE, 0.646%, 12/7/09(a) | | | | | 39,951,611 |
| 5,000,000 | | General Electric Capital Corp., 0.390%, 11/20/09 | | | | | 4,997,292 |
| 30,000,000 | | General Electric Capital Corp., 0.650%, 11/23/09 | | | | | 29,971,292 |
| 3,000,000 | | General Electric Capital Corp., 0.390%, 12/1/09 | | | | | 2,998,017 |
| 15,000,000 | | ING (US) Funding LLC, 0.380%, 3/15/10 | | | | | 14,973,875 |
| 10,000,000 | | Societe Generale North America, Inc., 1.050%, 10/21/09 | | | | | 9,994,167 |
| 30,000,000 | | Societe Generale North America, Inc., 0.290%, 11/25/09 | | | | | 29,986,708 |
| | | | | | | |
| | | | | | | 203,817,990 |
| | | | | | | |
| | Total Commercial Paper
(Cost $455,482,169) | | | | | 455,482,169 |
| | | | | | | |
CORPORATE BONDS (0.8%) | | | | | |
| | Financial Services (0.7%) | | | | | |
| 8,181,000 | | General Electric Capital Corp., MTN, 7.375%, 1/19/10 | | | | | 8,303,502 |
| | | | | | | |
| | Materials (0.1%) | | | | | |
| 1,000,000 | | E.I. Du Pont de Nemours & Co., 6.875%, 10/15/09 | | | | | 1,002,190 |
| | | | | | | |
| | Total Corporate Bonds
(Cost $9,305,692) | | | | | 9,305,692 |
| | | | | | | |
VARIABLE RATE NOTES*** (6.0%) | | | | | |
| | Banking (5.5%) | | | | | |
| 1,670,000 | | Anchor Holdings LLC, Series 2000 (U.S. Bank, N.A.), 1.200%, 10/8/09 | | | | | 1,670,000 |
| 8,000,000 | | Bank of America, N.A., 0.808%, 10/2/09(a) | | | | | 8,000,126 |
| 15,000,000 | | Bank of Montreal, Chicago, 0.774%, 10/5/09(a) | | | | | 15,000,000 |
| 10,000,000 | | BP Capital Markets PLC, 0.366%, 10/9/09 | | | | | 10,000,000 |
| 4,695,000 | | HC Equities LP, Series 2001 (Wachovia Bank N.A.), 0.350%, 10/8/09 | | | | | 4,695,000 |
| 20,000,000 | | National Australia Bank, Ltd., 0.484%, 10/6/09(a) | | | | | 20,000,000 |
| 3,280,000 | | Spira Millennium LLC, Series 2001 (Bank of America N.A.), 3.500%, 10/8/09 | | | | | 3,280,000 |
| 578,000 | | Wachovia Bank, N.A., 0.733%, 11/2/09 | | | | | 578,000 |
| | | | | | | |
| | | | | | | 63,223,126 |
| | | | | | | |
| | Financial Services (0.1%) | | | | | |
| 300,000 | | General Electric Capital Corp., MTN, 0.419%, 12/15/09 | | | | | 299,899 |
| 572,000 | | General Electric Capital Corp., MTN, 0.220%, 10/1/09 | | | | | 571,272 |
| | | | | | | |
| | | | | | | 871,171 |
| | | | | | | |
|
BB&T Prime Money Market Fund |
Schedule of Portfolio Investments — (continued)
September 30, 2009
| | | | | | | |
| | | |
Principal
Amount | | | | | | Amortized
Cost |
VARIABLE RATE NOTES*** — (continued) |
| | Health Care (0.4%) | | | | | |
| $ 5,000,000 | | Roche Holdings, Inc., 1.393%, 11/25/09(a) | | $ | 5,000,000 |
| | | | | | | |
| | Total Variable Rate Notes (Cost $69,094,297) | | | 69,094,297 |
| | | | | | | |
U.S. GOVERNMENT AGENCIES (6.9%) | | | | | |
| | Federal Home Loan Bank (6.9%) |
| 40,000,000 | | 0.660%, 10/1/09*** | | | | | 40,000,000 |
| 20,000,000 | | 0.790%, 10/1/09*** | | | | | 19,998,851 |
| 10,000,000 | | 0.800%, 6/22/10 | | | | | 10,000,000 |
| 10,000,000 | | 0.720%, 6/28/10 | | | | | 10,000,000 |
| | | | | | | |
| | Total U.S. Government Agencies (Cost $79,998,851) | | | | | 79,998,851 |
| | | | | | | |
REPURCHASE AGREEMENT (8.8%) | | | | | |
| 101,821,000 | | Merrill Lynch & Co., Inc., 0.070%, dated 9/30/09, due 10/1/09, proceeds at maturity, $101,821,198 (Collateralized fully by Government Mortgage-Backed Securities) | | | 101,821,000 |
| | | | | | | |
| | Total Repurchase Agreement (Cost $101,821,000) | | | | | 101,821,000 |
| | | | | | | |
| | | | | | | |
| | | |
| | | | | | | Amortized
Cost |
Total Investments — 100.0%
(Cost $1,153,227,770) | | | | $ | 1,153,227,770 |
Net Other Assets (Liabilities) — 0.0% | | | | | 155,279 |
| | | | | | | |
NET ASSETS — 100.0% | | | | $ | 1,153,383,049 |
| | | | | | | |
| * | Discount note or zero coupon bond. Rate disclosed represents the annualized yield from date of purchase. |
| ** | Interest bearing commercial paper. |
| *** | The interest rate for this variable rate note, which will change periodically, is based either on the prime rate or an index of market rates. The reflected rate is in effect as of September 30, 2009. The maturity date reflected is the next reset date. |
| (a) | Rule 144A, Section 4(2) or other security which is restricted as to resale to institutional investors. The Investment Advisor, using board approved procedures, has deemed these securities or a portion of these securities to be liquid. |
MTN — Medium Term Note
N.A. — North America
See accompanying notes to the financial statements.
89
|
BB&T U.S. Treasury Money Market Fund |
Schedule of Portfolio Investments
September 30, 2009
| | | | | | | |
| | | |
Principal
Amount | | | | | | Amortized
Cost |
U.S. TREASURY NOTES (16.7%) | | | | | |
| $20,000,000 | | 3.625%, 10/31/09 | | | | $ | 20,050,687 |
| 40,000,000 | | 3.500%, 11/15/09 | | | | | 40,150,422 |
| 40,000,000 | | 1.750%, 3/31/10 | | | | | 40,301,748 |
| | | | | | | |
| | Total U.S. Treasury Notes (Cost $100,502,857) | | | | | 100,502,857 |
| | | | | | | |
| | |
U.S. TREASURY BILLS* (34.9%) | | | | | |
| 20,000,000 | | 0.442%, 10/22/09 | | | | | 19,994,861 |
| 40,000,000 | | 0.381%, 11/19/09 | | | | | 39,979,338 |
| 30,000,000 | | 0.280%, 12/10/09(a) | | | | | 29,983,667 |
| 30,000,000 | | 0.185%, 1/14/10 | | | | | 29,983,813 |
| 20,000,000 | | 0.250%, 1/28/10(a) | | | | | 19,983,471 |
| 40,000,000 | | 0.160%, 2/18/10 | | | | | 39,975,111 |
| 30,000,000 | | 0.255%, 2/25/10 | | | | | 29,968,762 |
| | | | | | | |
| | Total U.S. Treasury Bills (Cost $209,869,023) | | | | | 209,869,023 |
| | | | | | | |
| | | | | | | | |
| | | |
Principal
Amount | | | | | | Amortized
Cost | |
| | |
REPURCHASE AGREEMENTS (48.3%) | | | | | | |
| $80,000,000 | | Bank of America Corp., 0.010%, dated 9/30/09, due 10/1/09, proceeds at maturity, $80,000,022 (Collateralized fully by U.S. Treasury Securities) | | $ | 80,000,000 | |
| 92,852,555 | | Credit Suisse First Boston, 0.020%, dated 9/30/09, due 10/1/09, proceeds at maturity, $92,852,606 (Collateralized fully by U.S. Treasury Securities) | | | 92,852,555 | |
| 50,000,000 | | Goldman Sachs Group, Inc., 0.010%, dated 9/30/09, due 10/1/09, proceeds at maturity, $50,000,014 (Collateralized fully by U.S. Treasury Securities) | | | 50,000,000 | |
| 68,000,000 | | JPMorgan Chase & Co., 0.030%, dated 9/30/09, due 10/1/09, proceeds at maturity, $68,000,057 (Collateralized fully by U.S. Treasury Securities) | | | 68,000,000 | |
| | | | | | | | |
| | Total Repurchase Agreements
(Cost $290,852,555) | | | | | 290,852,555 | |
| | | | | | | | |
| | | |
| | | | | | | Fair Value | |
SECURITIES HELD AS COLLATERAL FOR
SECURITIES ON LOAN (3.4%) | |
| 20,706,000 | | Pool of Various Securities | | | | | 20,706,000 | |
| | | | | | | | |
| | Total Securities Held as Collateral for Securities on Loan
(Cost $20,706,000) | | | 20,706,000 | |
| | | | | | | | |
Total Investments — 103.3%
(Cost $621,930,435) | | | | | 621,930,435 | |
Net Other Assets (Liabilities) — (3.3)% | | | | | (20,093,678 | ) |
| | | | | | | | |
NET ASSETS — 100.0% | | | | $ | 601,836,757 | |
| | | | | | | | |
| * | Discount note or zero coupon bond. Rate disclosed represents the annualized yield from date of purchase. |
| (a) | Represents that all or a portion of the security was on loan as of September 30, 2009. |
See accompanying notes to the financial statements.
90
|
BB&T Capital Manager Conservative Growth Fund |
Schedule of Portfolio Investments
September 30, 2009
| | | | | | | |
| Shares | | | | Fair Value |
AFFILIATED INVESTMENT COMPANIES (85.8%) |
| | | |
| 50,374 | | BB&T Equity Income Fund, Institutional Class | | | | $ | 576,275 |
| 269,084 | | BB&T International Equity Fund, Institutional Class | | | | | 1,383,092 |
| 51,854 | | BB&T Large Cap Fund, Institutional Class | | | | | 525,281 |
| 61,936 | | BB&T Mid Cap Growth Fund, Institutional Class | | | | | 528,315 |
| 72,666 | | BB&T Mid Cap Value Fund, Institutional Class | | | | | 789,158 |
| 19,451 | | BB&T Special Opportunities Equity Fund, Institutional Class | | | | | 290,203 |
| 740,773 | | BB&T Total Return Bond Fund, Institutional Class | | | | | 7,985,530 |
| 393,051 | | BB&T U.S. Treasury Money Market Fund, Institutional Class | | | | | 393,051 |
| | | | | | | |
| | Total Affiliated Investment Companies
(Cost $11,548,066) | | | | | 12,470,905 |
| | | | | | | |
| | |
EXCHANGE TRADED FUNDS (11.7%) | | | | | |
| | | |
| 6,784 | | iShares Russell 2000 Index Fund | | | | | 408,600 |
| 12,203 | | iShares S&P 500 Index Fund | | | | | 1,292,786 |
| | | | | | | |
| | Total Exchange Traded Funds
(Cost $1,316,673) | | | | | 1,701,386 |
| | | | | | | |
| | |
INVESTMENT COMPANY (2.1%) | | | | | |
| | | |
| 35,692 | | Credit Suisse Commodity Return Strategy Fund | | | | | 298,388 |
| | | | | | | |
| | Total Investment Company
(Cost $291,000) | | | | | 298,388 |
| | | | | | | |
Total Investments — 99.6%
(Cost $13,155,739) | | | | | 14,470,679 |
Net Other Assets (Liabilities) — 0.4% | | | | | 60,053 |
| | | | | | | |
NET ASSETS — 100.0% | | | | $ | 14,530,732 |
| | | | | | | |
See accompanying notes to the financial statements.
91
|
BB&T Capital Manager Moderate Growth Fund |
Schedule of Portfolio Investments
September 30, 2009
| | | | | | | |
| Shares | | | | Fair Value |
AFFILIATED INVESTMENT COMPANIES (77.4%) |
| | | |
| 211,895 | | BB&T Equity Income Fund, Institutional Class | | | | $ | 2,424,073 |
| 1,131,757 | | BB&T International Equity Fund, Institutional Class | | | | | 5,817,231 |
| 218,113 | | BB&T Large Cap Fund, Institutional Class | | | | | 2,209,489 |
| 260,370 | | BB&T Mid Cap Growth Fund, Institutional Class | | | | | 2,220,960 |
| 305,544 | | BB&T Mid Cap Value Fund, Institutional Class | | | | | 3,318,208 |
| 81,722 | | BB&T Special Opportunities Equity Fund, Institutional Class | | | | | 1,219,297 |
| 1,010,741 | | BB&T Total Return Bond Fund, Institutional Class | | | | | 10,895,793 |
| 983,943 | | BB&T U.S. Treasury Money Market Fund, Institutional Class | | | | | 983,943 |
| | | | | | | |
| | Total Affiliated Investment Companies
(Cost $29,871,941) | | | | | 29,088,994 |
| | | | | | | |
| | |
EXCHANGE TRADED FUNDS (19.1%) | | | | | |
| | | |
| 28,544 | | iShares Russell 2000 Index Fund | | | | | 1,719,205 |
| 51,306 | | iShares S&P 500 Index Fund | | | | | 5,435,358 |
| | | | | | | |
| | Total Exchange Traded Funds
(Cost $8,210,970) | | | | | 7,154,563 |
| | | | | | | |
| | |
INVESTMENT COMPANY (3.1%) | | | | | |
| | | |
| 138,682 | | Credit Suisse Commodity Return Strategy Fund | | | | | 1,159,380 |
| | | | | | | |
| | Total Investment Company
(Cost $1,131,000) | | | | | 1,159,380 |
| | | | | | | |
Total Investments — 99.6%
(Cost $39,213,911) | | | | | 37,402,937 |
Net Other Assets (Liabilities) — 0.4% | | | | | 167,726 |
| | | | | | | |
NET ASSETS — 100.0% | | | | $ | 37,570,663 |
| | | | | | | |
See accompanying notes to the financial statements.
92
|
BB&T Capital Manager Growth Fund |
Schedule of Portfolio Investments
September 30, 2009
| | | | | | | |
| Shares | | | | Fair Value |
AFFILIATED INVESTMENT COMPANIES (72.1%) |
| | | |
| 196,783 | | BB&T Equity Income Fund, Institutional Class | | | | $ | 2,251,196 |
| 1,051,011 | | BB&T International Equity Fund, Institutional Class | | | | | 5,402,196 |
| 202,531 | | BB&T Large Cap Fund, Institutional Class | | | | | 2,051,640 |
| 241,841 | | BB&T Mid Cap Growth Fund, Institutional Class | | | | | 2,062,902 |
| 283,774 | | BB&T Mid Cap Value Fund, Institutional Class | | | | | 3,081,790 |
| 75,898 | | BB&T Special Opportunities Equity Fund, Institutional Class | | | | | 1,132,392 |
| 348,429 | | BB&T Total Return Bond Fund, Institutional Class | | | | | 3,756,067 |
| 693,937 | | BB&T U.S. Treasury Money Market Fund, Institutional Class | | | | | 693,937 |
| | | | | | | |
| | Total Affiliated Investment Companies
(Cost $21,883,300) | | | | | 20,432,120 |
| | | | | | | |
| | |
EXCHANGE TRADED FUNDS (23.4%) | | | | | |
| | | |
| 26,506 | | iShares Russell 2000 Index Fund | | | | | 1,596,457 |
| 47,644 | | iShares S&P 500 Index Fund | | | | | 5,047,405 |
| | | | | | | |
| | Total Exchange Traded Funds
(Cost $7,551,076) | | | | | 6,643,862 |
| | | | | | | |
| | |
INVESTMENT COMPANY (3.9%) | | | | | |
| | | |
| 130,701 | | Credit Suisse Commodity Return Strategy Fund | | | | | 1,092,662 |
| | | | | | | |
| | Total Investment Company
(Cost $1,067,000) | | | | | 1,092,662 |
| | | | | | | |
Total Investments — 99.4%
(Cost $30,501,376) | | | | | 28,168,644 |
Net Other Assets (Liabilities) — 0.6% | | | | | 162,606 |
| | | | | | | |
NET ASSETS — 100.0% | | | | $ | 28,331,250 |
| | | | | | | |
See accompanying notes to the financial statements.
93
|
BB&T Capital Manager Equity Fund |
Schedule of Portfolio Investments
September 30, 2009
| | | | | | | |
| Shares | | | | Fair Value |
AFFILIATED INVESTMENT COMPANIES (65.4%) |
| | | |
| 77,824 | | BB&T Equity Income Fund, Institutional Class | | | | $ | 890,306 |
| 415,340 | | BB&T International Equity Fund, Institutional Class | | | | | 2,134,849 |
| 80,044 | | BB&T Large Cap Fund, Institutional Class | | | | | 810,844 |
| 95,524 | | BB&T Mid Cap Growth Fund, Institutional Class | | | | | 814,820 |
| 112,155 | | BB&T Mid Cap Value Fund, Institutional Class | | | | | 1,217,999 |
| 29,954 | | BB&T Special Opportunities Equity Fund, Institutional Class | | | | | 446,915 |
| 41,758 | | BB&T U.S. Treasury Money Market Fund, Institutional Class | | | | | 41,758 |
| | | | | | | |
| | Total Affiliated Investment Companies
(Cost $6,913,062) | | | | | 6,357,491 |
| | | | | | | |
| | |
EXCHANGE TRADED FUNDS (27.0%) | | | | | |
| | | |
| 10,478 | | iShares Russell 2000 Index Fund | | | | | 631,090 |
| 18,836 | | iShares S&P 500 Index Fund | | | | | 1,995,486 |
| | | | | | | |
| | Total Exchange Traded Funds
(Cost $3,003,729) | | | | | 2,626,576 |
| | | | | | | |
| | |
INVESTMENT COMPANY (5.0%) | | | | | |
| | | |
| 58,035 | | Credit Suisse Commodity Return Strategy Fund | | | | | 485,173 |
| | | | | | | |
| | Total Investment Company
(Cost $474,000) | | | | | 485,173 |
| | | | | | | |
Total Investments — 97.4%
(Cost $10,390,791) | | | | | 9,469,240 |
Net Other Assets (Liabilities) — 2.6% | | | | | 253,884 |
| | | | | | | |
NET ASSETS — 100.0% | | | | $ | 9,723,124 |
| | | | | | | |
See accompanying notes to the financial statements.
94
(This page has been left blank intentionally.)
Statements of Assets and Liabilities
September 30, 2009
| | | | | | | | |
| | | Large Cap
Fund | | | Mid Cap
Value Fund | |
Assets: | | | | | | | | |
Investments, at cost* | | $ | 179,648,266 | | | $ | 216,495,183 | |
Unrealized appreciation | | | 31,642,847 | | | | 6,422,474 | |
| | | | | | | | |
Investments, at fair value | | | 211,291,113 | | | | 222,917,657 | |
Cash | | | — | | | | — | |
Foreign currency, at value** | | | — | | | | — | |
Interest and dividends receivable | | | 227,187 | | | | 304,280 | |
Receivable for investments sold | | | — | | | | — | |
Receivable for capital shares issued | | | 835,776 | | | | 874,514 | |
Unrealized appreciation on forward foreign currency contracts | | | — | | | | — | |
Prepaid and other expenses | | | 16,085 | | | | 14,359 | |
| | | | | | | | |
Total Assets | | | 212,370,161 | | | | 224,110,810 | |
| | | | | | | | |
Liabilities: | | | | | | | | |
Call options written
(premiums received $ — , $ — , $ — , $ — , $ — , $3,691,935, $832,684 and $ — , respectively) | | | — | | | | — | |
Deferred tax liability | | | — | | | | — | |
Distributions payable | | | — | | | | — | |
Unrealized depreciation on forward foreign currency contracts | | | — | | | | — | |
Payable for investments purchased | | | — | | | | 31,093 | |
Payable for capital shares redeemed | | | 167,433 | | | | 699,823 | |
Payable for collateral received on loaned securities | | | — | | | | 8,539,905 | |
Payable to securities lending agent | | | 396,608 | | | | — | |
Accrued expenses and other payables: | | | | | | | | |
Investment advisory fees | | | 116,122 | | | | 104,414 | |
Administration fees | | | 17,436 | | | | 16,172 | |
Compliance service fees | | | 188 | | | | 155 | |
Distribution (12b-1) fees | | | 9,779 | | | | 5,076 | |
Other | | | 54,005 | | | | 36,852 | |
| | | | | | | | |
Total Liabilities | | | 761,571 | | | | 9,433,490 | |
| | | | | | | | |
Net Assets | | $ | 211,608,590 | | | $ | 214,677,320 | |
| | | | | | | | |
Net Assets Consist of: | | | | | | | | |
| | |
Capital | | $ | 336,215,241 | | | $ | 257,239,120 | |
Accumulated undistributed (distributions in excess of) net investment income (loss) | | | 187,541 | | | | 343,702 | |
Accumulated realized losses from investment, written option and foreign currency transactions | | | (156,437,039 | ) | | | (49,327,976 | ) |
Net unrealized appreciation on investments, written options and translation of assets and liabilities in foreign currency | | | 31,642,847 | | | | 6,422,474 | |
| | | | | | | | |
Net Assets | | $ | 211,608,590 | | | $ | 214,677,320 | |
| | | | | | | | |
Net Assets | | | | | | | | |
Class A Shares | | $ | 29,290,207 | | | $ | 10,716,954 | |
Class B Shares | | | 4,500,568 | | | | 3,453,948 | |
Class C Shares | | | 92,783 | | | | 175,839 | |
Institutional Shares | | | 177,725,032 | | | | 200,330,579 | |
| | | | | | | | |
Total | | $ | 211,608,590 | | | $ | 214,677,320 | |
| | | | | | | | |
Shares of Beneficial Interest Outstanding (Unlimited number of shares authorized, no par value) | | | | | | | | |
Class A Shares | | | 2,906,695 | | | | 991,547 | |
Class B Shares | | | 454,750 | | | | 333,620 | |
Class C Shares | | | 9,415 | | | | 17,010 | |
Institutional Shares | | | 17,552,157 | | | | 18,445,895 | |
| | | | | | | | |
Total | | | 20,923,017 | | | | 19,788,072 | |
| | | | | | | | |
Net Asset Value | | | | | | | | |
Class A Shares - redemption price per share | | $ | 10.08 | | | $ | 10.81 | |
| | | | | | | | |
Class B Shares - offering price per share*** | | $ | 9.90 | | | $ | 10.35 | |
| | | | | | | | |
Class C Shares - offering price per share*** | | $ | 9.85 | | | $ | 10.34 | |
| | | | | | | | |
Institutional Shares | | $ | 10.13 | | | $ | 10.86 | |
| | | | | | | | |
Maximum Sales Charge - Class A Shares | | | 5.75 | % | | | 5.75 | % |
| | | | | | | | |
Maximum Offering Price (100%/(100% - Maximum Sales Charge)) of net asset value adjusted to the nearest cent per share - Class A Shares | | $ | 10.69 | | | $ | 11.47 | |
| | | | | | | | |
| * | The Large Cap Fund, Mid Cap Value Fund, Mid Cap Growth Fund, Small Cap Fund, International Equity Fund, Special Opportunities Equity Fund, Equity Income Fund, and Short U.S. Government Fund include securities on loan of $38,136, $8,155,066, $10,730,246, $3,335,592, $1,430,216, $2,257,504, $27,110,095, and $2,936,396, respectively. |
| ** | The International Equity Fund includes foreign currency at cost of $168,130. |
| *** | Redemption price per share varies by length of time shares are held. |
96
| | | | | | | | | | | | | | | | | | | | | | |
Mid Cap
Growth Fund | | | Small Cap
Fund | | | International
Equity Fund | | | Special
Opportunities
Equity Fund | | | Equity
Income Fund | | | Short U.S.
Government Fund | |
| | | | | | | | | | | | | | | | | | | | | | |
| $ | 76,140,528 | | | $ | 29,350,031 | | | $ | 70,481,744 | | | $ | 446,975,397 | | | $ | 352,023,679 | | | $ | 65,818,656 | |
| | 17,635,727 | | | | 4,165,800 | | | | 16,352,405 | | | | 45,649,564 | | | | 5,453,304 | | | | 855,569 | |
| | | | | | | | | | | | | | | | | | | | | | | |
| | 93,776,255 | | | | 33,515,831 | | | | 86,834,149 | | | | 492,624,961 | | | | 357,476,983 | | | | 66,674,225 | |
| | — | | | | — | | | | 20 | | | | — | | | | — | | | | — | |
| | — | | | | — | | | | 164,518 | | | | — | | | | — | | | | — | |
| | 45,421 | | | | 9,923 | | | | 324,456 | | | | 642,049 | | | | 742,430 | | | | 411,929 | |
| | 6,768,105 | | | | 65,033 | | | | 2,011,068 | | | | 92,921 | | | | 122,610 | | | | — | |
| | 434,651 | | | | 217,653 | | | | 536,382 | | | | 1,763,343 | | | | 1,315,508 | | | | 130,679 | |
| | — | | | | — | | | | 19,708 | | | | — | | | | — | | | | — | |
| | 13,824 | | | | 12,412 | | | | 5,744 | | | | 23,160 | | | | 21,290 | | | | 2,311 | |
| | | | | | | | | | | | | | | | | | | | | | | |
| | 101,038,256 | | | | 33,820,852 | | | | 89,896,045 | | | | 495,146,434 | | | | 359,678,821 | | | | 67,219,144 | |
| | | | | | | | | | | | | | | | | | | | | | | |
| | | | | | | | | | | | | | | | | | | | | | |
| | | | | | | | | | | | | | | | | | | | | | |
| | — | | | | — | | | | — | | | | 4,796,932 | | | | 782,930 | | | | — | |
| | — | | | | — | | | | 7,249 | | | | — | | | | — | | | | — | |
| | — | | | | — | | | | — | | | | — | | | | 603 | | | | 129,574 | |
| | — | | | | — | | | | 97,744 | | | | — | | | | — | | | | — | |
| | 1,708,628 | | | | 534,405 | | | | 1,742,972 | | | | 406,784 | | | | 254,316 | | | | — | |
| | 315,806 | | | | 64,783 | | | | 378,517 | | | | 794,845 | | | | 903,190 | | | | 11,805 | |
| | 10,929,704 | | | | 3,412,791 | | | | 1,535,370 | | | | 2,333,863 | | | | 27,939,020 | | | | 3,005,938 | |
| | — | | | | — | | | | — | | | | — | | | | — | | | | — | |
| | | | | | | | | | | | | | | | | | | | | | |
| | 48,509 | | | | 16,186 | | | | 59,359 | | | | 301,487 | | | | 158,994 | | | | 23,286 | |
| | 7,217 | | | | 2,469 | | | | 7,000 | | | | 39,649 | | | | 26,523 | | | | 5,095 | |
| | 80 | | | | 26 | | | | 74 | | | | 422 | | | | 279 | | | | 56 | |
| | 2,360 | | | | 1,934 | | | | 1,577 | | | | 101,987 | | | | 62,226 | | | | 1,018 | |
| | 26,648 | | | | 8,296 | | | | 39,095 | | | | 83,269 | | | | 58,083 | | | | 10,320 | |
| | | | | | | | | | | | | | | | | | | | | | | |
| | 13,038,952 | | | | 4,040,890 | | | | 3,868,957 | | | | 8,859,238 | | | | 30,186,164 | | | | 3,187,092 | |
| | | | | | | | | | | | | | | | | | | | | | | |
| $ | 87,999,304 | | | $ | 29,779,962 | | | $ | 86,027,088 | | | $ | 486,287,196 | | | $ | 329,492,657 | | | $ | 64,032,052 | |
| | | | | | | | | | | | | | | | | | | | | | | |
| | | | | | | | | | | | | | | | | | | | | | |
| $ | 136,082,513 | | | $ | 47,178,875 | | | $ | 136,285,706 | | | $ | 471,805,084 | | | $ | 359,006,617 | | | $ | 70,859,921 | |
| | 16,695 | | | | 4,832 | | | | 240,868 | | | | 7,704 | | | | 774,477 | | | | (16,176 | ) |
| | (65,735,631) | | | | (21,569,545 | ) | | | (66,773,818 | ) | | | (30,070,159 | ) | | | (35,791,495 | ) | | | (7,667,262 | ) |
| | 17,635,727 | | | | 4,165,800 | | | | 16,274,332 | | | | 44,544,567 | | | | 5,503,058 | | | | 855,569 | |
| | | | | | | | | | | | | | | | | | | | | | | |
| $ | 87,999,304 | | | $ | 29,779,962 | | | $ | 86,027,088 | | | $ | 486,287,196 | | | $ | 329,492,657 | | | $ | 64,032,052 | |
| | | | | | | | | | | | | | | | | | | | | | | |
| | | | | | | | | | | | | | | | | | | | | | |
| | | | | |
| $ | 6,155,444 | | | $ | 4,891,769 | | | $ | 3,332,826 | | | $ | 175,318,584 | | | $ | 99,479,950 | | | $ | 4,909,222 | |
| | 1,350,792 | | | | 1,126,831 | | | | 953,735 | | | | 24,068,222 | | | | 13,567,260 | | | | — | |
| | 35,919 | | | | 13,935 | | | | 165,985 | | | | 58,479,218 | | | | 39,164,193 | | | | — | |
| | 80,457,149 | | | | 23,747,427 | | | | 81,574,542 | | | | 228,421,172 | | | | 177,281,254 | | | | 59,122,830 | |
| | | | | | | | | | | | | | | | | | | | | | | |
| $ | 87,999,304 | | | $ | 29,779,962 | | | $ | 86,027,088 | | | $ | 486,287,196 | | | $ | 329,492,657 | | | $ | 64,032,052 | |
| | | | | | | | | | | | | | | | | | | | | | | |
| | 774,639 | | | | 538,193 | | | | 670,294 | | | | 11,957,163 | | | | 8,705,679 | | | | 507,947 | |
| | 183,554 | | | | 130,551 | | | | 216,479 | | | | 1,733,362 | | | | 1,191,240 | | | | — | |
| | 4,872 | | | | 1,618 | | | | 37,875 | | | | 4,209,353 | | | | 3,444,370 | | | | — | |
| | 9,428,147 | | | | 2,578,375 | | | | 15,869,917 | | | | 15,308,493 | | | | 15,491,537 | | | | 6,116,032 | |
| | | | | | | | | | | | | | | | | | | | | | | |
| | 10,391,212 | | | | 3,248,737 | | | | 16,794,565 | | | | 33,208,371 | | | | 28,832,826 | | | | 6,623,979 | |
| | | | | | | | | | | | | | | | | | | | | | | |
| | | | | | | | | | | | | | | | | | | | | | |
| $ | 7.95 | | | $ | 9.09 | | | $ | 4.97 | | | $ | 14.66 | | | $ | 11.43 | | | $ | 9.66 | |
| | | | | | | | | | | | | | | | | | | | | | | |
| $ | 7.36 | | | $ | 8.63 | | | $ | 4.41 | | | $ | 13.89 | | | $ | 11.39 | | | $ | — | |
| | | | | | | | | | | | | | | | | | | | | | | |
| $ | 7.37 | | | $ | 8.61 | | | $ | 4.38 | | | $ | 13.89 | | | $ | 11.37 | | | $ | — | |
| | | | | | | | | | | | | | | | | | | | | | | |
| $ | 8.53 | | | $ | 9.21 | | | $ | 5.14 | | | $ | 14.92 | | | $ | 11.44 | | | $ | 9.67 | |
| | | | | | | | | | | | | | | | | | | | | | | |
| | 5.75 | % | | | 5.75 | % | | | 5.75 | % | | | 5.75 | % | | | 5.75 | % | | | 3.00 | % |
| | | | | | | | | | | | | | | | | | | | | | | |
| $ | 8.44 | | | $ | 9.64 | | | $ | 5.27 | | | $ | 15.55 | | | $ | 12.13 | | | $ | 9.96 | |
| | | | | | | | | | | | | | | | | | | | | | | |
97
Statements of Assets and Liabilities
September 30, 2009
| | | | | | | | |
| | | Intermediate U.S.
Government Fund | | | Total Return
Bond Fund | |
Assets: | | | | | | | | |
Investments, at cost* | | $ | 191,676,149 | | | $ | 358,935,540 | |
Unrealized appreciation | | | 4,384,388 | | | | 12,601,095 | |
| | | | | | | | |
Investments, at fair value | | | 196,060,537 | | | | 371,536,635 | |
Cash | | | — | | | | 55,569 | |
Interest and dividends receivable | | | 1,235,565 | | | | 3,159,144 | |
Receivable for investments sold | | | — | | | | 273,551 | |
Receivable for capital shares issued | | | 268,093 | | | | 1,479,060 | |
Prepaid and other expenses | | | 4,084 | | | | 5,722 | |
| | | | | | | | |
Total Assets | | | 197,568,279 | | | | 376,509,681 | |
| | | | | | | | |
Liabilities: | | | | | | | | |
Distributions payable | | | 285,955 | | | | 770,715 | |
Payable for investments purchased | | | — | | | | 13,245,904 | |
Payable for capital shares redeemed | | | 574,504 | | | | 376,507 | |
Payable for collateral received on loaned securities | | | 2,889,393 | | | | — | |
Payable to securities lending agent | | | — | | | | 596,576 | |
Payable for daily variation margin on futures contracts | | | — | | | | 6,375 | |
Accrued expenses and other payables: | | | | | | | | |
Investment advisory fees | | | 75,326 | | | | 142,286 | |
Administration fees | | | 15,680 | | | | 29,633 | |
Compliance service fees | | | 163 | | | | 322 | |
Distribution (12b-1) fees | | | 5,795 | | | | 7,953 | |
Other | | | 32,711 | | | | 82,071 | |
| | | | | | | | |
Total Liabilities | | | 3,879,527 | | | | 15,258,342 | |
| | | | | | | | |
Net Assets | | $ | 193,688,752 | | | $ | 361,251,339 | |
| | | | | | | | |
Net Assets Consist of: | | | | | | | | |
| | |
Capital | | $ | 200,974,406 | | | $ | 350,047,787 | |
Accumulated undistributed (distributions in excess of) net investment income | | | 1,879,324 | | | | 864,466 | |
Accumulated realized gains (losses) from investments | | | (13,549,366 | ) | | | (2,192,051 | ) |
Net unrealized appreciation on investments and futures contracts | | | 4,384,388 | | | | 12,531,137 | |
| | | | | | | | |
Net Assets | | $ | 193,688,752 | | | $ | 361,251,339 | |
| | | | | | | | |
Net Assets | | | | | | | | |
Class A Shares | | $ | 12,865,286 | | | $ | 15,759,633 | |
Class B Shares | | | 3,255,907 | | | | 5,361,991 | |
Class C Shares | | | 426,084 | | | | 399,675 | |
Institutional Shares | | | 177,141,475 | | | | 339,730,040 | |
| | | | | | | | |
Total | | $ | 193,688,752 | | | $ | 361,251,339 | |
| | | | | | | | |
Shares of Beneficial Interest Outstanding (Unlimited number of shares authorized, no par value) | | | | | | | | |
Class A Shares | | | 1,218,836 | | | | 1,462,538 | |
Class B Shares | | | 309,517 | | | | 497,172 | |
Class C Shares | | | 40,452 | | | | 37,041 | |
Institutional Shares | | | 16,760,052 | | | | 31,512,199 | |
| | | | | | | | |
Total | | | 18,328,857 | | | | 33,508,950 | |
| | | | | | | | |
Net Asset Value | | | | | | | | |
Class A Shares - redemption price per share | | $ | 10.56 | | | $ | 10.78 | |
| | | | | | | | |
Class B Shares - offering price per share** | | $ | 10.52 | | | $ | 10.78 | |
| | | | | | | | |
Class C Shares - offering price per share** | | $ | 10.53 | | | $ | 10.79 | |
| | | | | | | | |
Institutional Shares | | $ | 10.57 | | | $ | 10.78 | |
| | | | | | | | |
Maximum Sales Charge - Class A Shares | | | 5.75 | % | | | 5.75 | % |
| | | | | | | | |
Maximum Offering Price (100%/(100% - Maximum Sales Charge)) of net asset value adjusted to the nearest cent per share - Class A Shares | | $ | 11.20 | | | $ | 11.44 | |
| | | | | | | | |
| * | The Intermediate U.S. Government Fund includes securities on loan of $2,816,285. |
| ** | Redemption price per share varies by length of time shares are held. |
See accompanying notes to the financial statements.
98
| | | | | | | | | | | | | | | | | | | | | | |
Kentucky
Intermediate
Tax-Free Fund | | | Maryland
Intermediate
Tax-Free Fund | | | North Carolina
Intermediate
Tax-Free Fund | | | South Carolina
Intermediate
Tax-Free Fund | | | Virginia
Intermediate
Tax-Free Fund | | | West Virginia
Intermediate
Tax-Free Fund | |
| | | | | | | | | | | | | | | | | | | | | | |
| $ | 18,528,565 | | | $ | 27,126,392 | | | $ | 155,590,095 | | | $ | 27,063,058 | | | $ | 84,380,306 | | | $ | 78,598,936 | |
| | 1,094,662 | | | | 1,585,500 | | | | 9,042,124 | | | | 1,396,480 | | | | 6,527,493 | | | | 3,791,026 | |
| | | | | | | | | | | | | | | | | | | | | | | |
| | 19,623,227 | | | | 28,711,892 | | | | 164,632,219 | | | | 28,459,538 | | | | 90,907,799 | | | | 82,389,962 | |
| | — | | | | — | | | | — | | | | — | | | | — | | | | — | |
| | 233,663 | | | | 274,667 | | | | 2,099,155 | | | | 327,238 | | | | 1,065,019 | | | | 1,228,543 | |
| | — | | | | — | | | | 59,300 | | | | — | | | | — | | | | — | |
| | 5,250 | | | | 50,602 | | | | 525,357 | | | | — | | | | 107,019 | | | | 9,070 | |
| | 588 | | | | 1,496 | | | | 1,595 | | | | 1,439 | | | | 2,561 | | | | 2,263 | |
| | | | | | | | | | | | | | | | | | | | | | | |
| | 19,862,728 | | | | 29,038,657 | | | | 167,317,626 | | | | 28,788,215 | | | | 92,082,398 | | | | 83,629,838 | |
| | | | | | | | | | | | | | | | | | | | | | | |
| | | | | | | | | | | | | | | | | | | | | | |
| | 35,918 | | | | 43,307 | | | | 333,546 | | | | 39,627 | | | | 185,842 | | | | 194,464 | |
| | — | | | | — | | | | 6,625,613 | | | | 63,621 | | | | — | | | | 257,538 | |
| | — | | | | 1,020 | | | | 375,507 | | | | 135,837 | | | | 4,112 | | | | 4,000 | |
| | — | | | | — | | | | — | | | | — | | | | — | | | | — | |
| | — | | | | — | | | | — | | | | — | | | | — | | | | — | |
| | — | | | | — | | | | — | | | | — | | | | — | | | | — | |
| | | | | | | | | | | | | | | | | | | | | | |
| | 6,439 | | | | 8,834 | | | | 56,971 | | | | 10,142 | | | | 33,804 | | | | 30,059 | |
| | 1,636 | | | | 2,246 | | | | 12,641 | | | | 2,267 | | | | 7,599 | | | | 6,550 | |
| | 17 | | | | 21 | | | | 132 | | | | 23 | | | | 81 | | | | 70 | |
| | 1,393 | | | | 1,645 | | | | 5,892 | | | | 2,272 | | | | 3,950 | | | | 3,916 | |
| | 4,484 | | | | 4,981 | | | | 28,675 | | | | 5,632 | | | | 17,760 | | | | 15,976 | |
| | | | | | | | | | | | | | | | | | | | | | | |
| | 49,887 | | | | 62,054 | | | | 7,438,977 | | | | 259,421 | | | | 253,148 | | | | 512,573 | |
| | | | | | | | | | | | | | | | | | | | | | | |
| $ | 19,812,841 | | | $ | 28,976,603 | | | $ | 159,878,649 | | | $ | 28,528,794 | | | $ | 91,829,250 | | | $ | 83,117,265 | |
| | | | | | | | | | | | | | | | | | | | | | | |
| | | | | | | | | | | | | | | | | | | | | | |
| $ | 18,635,976 | | | $ | 27,389,700 | | | $ | 149,787,625 | | | $ | 27,154,574 | | | $ | 84,422,865 | | | $ | 79,197,098 | |
| | 1,137 | | | | (500 | ) | | | 67,036 | | | | 1,228 | | | | 41,395 | | | | (41,282 | ) |
| | 81,066 | | | | 1,903 | | | | 981,864 | | | | (23,488 | ) | | | 837,497 | | | | 170,423 | |
| | 1,094,662 | | | | 1,585,500 | | | | 9,042,124 | | | | 1,396,480 | | | | 6,527,493 | | | | 3,791,026 | |
| | | | | | | | | | | | | | | | | | | | | | | |
| $ | 19,812,841 | | | $ | 28,976,603 | | | $ | 159,878,649 | | | $ | 28,528,794 | | | $ | 91,829,250 | | | $ | 83,117,265 | |
| | | | | | | | | | | | | | | | | | | | | | | |
| | | | | | | | | | | | | | | | | | | | | | |
| | | | | |
| $ | 6,999,085 | | | $ | 8,272,815 | | | $ | 29,765,177 | | | $ | 11,254,502 | | | $ | 20,230,328 | | | $ | 19,518,336 | |
| | — | | | | — | | | | — | | | | — | | | | — | | | | — | |
| | — | | | | — | | | | — | | | | — | | | | — | | | | — | |
| | 12,813,756 | | | | 20,703,788 | | | | 130,113,472 | | | | 17,274,292 | | | | 71,598,922 | | | | 63,598,929 | |
| | | | | | | | | | | | | | | | | | | | | | | |
| $ | 19,812,841 | | | $ | 28,976,603 | | | $ | 159,878,649 | | | $ | 28,528,794 | | | $ | 91,829,250 | | | $ | 83,117,265 | |
| | | | | | | | | | | | | | | | | | | | | | | |
| | | | | | | | | | | | | | | | | | | | | | |
| | 655,382 | | | | 753,846 | | | | 2,737,841 | | | | 1,053,416 | | | | 1,676,139 | | | | 1,944,511 | |
| | — | | | | — | | | | — | | | | — | | | | — | | | | — | |
| | — | | | | — | | | | — | | | | — | | | | — | | | | — | |
| | 1,201,374 | | | | 1,883,877 | | | | 11,969,502 | | | | 1,627,610 | | | | 5,933,489 | | | | 6,329,769 | |
| | | | | | | | | | | | | | | | | | | | | | | |
| | 1,856,756 | | | | 2,637,723 | | | | 14,707,343 | | | | 2,681,026 | | | | 7,609,628 | | | | 8,274,280 | |
| | | | | | | | | | | | | | | | | | | | | | | |
| | | | | | | | | | | | | | | | | | | | | | |
| $ | 10.68 | | | $ | 10.97 | | | $ | 10.87 | | | $ | 10.68 | | | $ | 12.07 | | | $ | 10.04 | |
| | | | | | | | | | | | | | | | | | | | | | | |
| $ | — | | | $ | — | | | $ | — | | | $ | — | | | $ | — | | | $ | — | |
| | | | | | | | | | | | | | | | | | | | | | | |
| $ | — | | | $ | — | | | $ | — | | | $ | — | | | $ | — | | | $ | — | |
| | | | | | | | | | | | | | | | | | | | | | | |
| $ | 10.67 | | | $ | 10.99 | | | $ | 10.87 | | | $ | 10.61 | | | $ | 12.07 | | | $ | 10.05 | |
| | | | | | | | | | | | | | | | | | | | | | | |
| | 3.00 | % | | | 3.00 | % | | | 3.00 | % | | | 3.00 | % | | | 3.00 | % | | | 3.00 | % |
| | | | | | | | | | | | | | | | | | | | | | | |
| $ | 11.01 | | | $ | 11.31 | | | $ | 11.21 | | | $ | 11.01 | | | $ | 12.44 | | | $ | 10.35 | |
| | | | | | | | | | | | | | | | | | | | | | | |
99
Statements of Assets and Liabilities
September 30, 2009
| | | | | | |
| | | National
Tax-Free Money
Market Fund | | Prime
Money Market
Fund |
Assets: | | | | | | |
Investments: | | | | | | |
Investments-unaffiliated, at cost | | $ | 260,610,893 | | $ | 1,051,406,770 |
Investments-affiliated, at cost | | | — | | | — |
| | | | | | |
Total investments, at cost* | | | 260,610,893 | | | 1,051,406,770 |
Unrealized appreciation (depreciation) | | | — | | | — |
| | | | | | |
Investments, at value | | | 260,610,893 | | | 1,051,406,770 |
Repurchase agreements, at cost | | | — | | | 101,821,000 |
Cash | | | — | | | 308 |
Interest and dividends receivable | | | 505,602 | | | 767,572 |
Receivable for investments sold | | | — | | | — |
Receivable for capital shares issued | | | — | | | 29,403 |
Prepaid and other expenses | | | 2,543 | | | 15,324 |
| | | | | | |
Total Assets | | | 261,119,038 | | | 1,154,040,377 |
| | | | | | |
Liabilities: | | | | | | |
Distributions payable | | | 72,517 | | | 6,815 |
Payable for investments purchased | | | — | | | — |
Payable for capital shares redeemed | | | — | | | 982 |
Payable for collateral received on loaned securities | | | — | | | — |
Accrued expenses and other payables: | | | | | | |
Investment advisory fees | | | 43,212 | | | 260,287 |
Administration fees | | | 21,545 | | | 102,819 |
Audit fees | | | 20,455 | | | 132,561 |
Compliance service fees | | | 233 | | | 1,171 |
Distribution (12b-1) fees | | | 11 | | | — |
Transfer agent fees | | | 12,224 | | | 72,549 |
Other | | | 10,071 | | | 80,144 |
| | | | | | |
Total Liabilities | | | 180,268 | | | 657,328 |
| | | | | | |
Net Assets | | $ | 260,938,770 | | $ | 1,153,383,049 |
| | | | | | |
Net Assets Consist of: | | | | | | |
| | |
Capital | | $ | 260,937,882 | | $ | 1,153,381,690 |
Accumulated undistributed (distributions in excess of) net investment income | | | 888 | | | 791 |
Accumulated realized gains (losses) from investments | | | — | | | 568 |
Net unrealized appreciation/(depreciation) on investments | | | — | | | — |
| | | | | | |
Net Assets | | $ | 260,938,770 | | $ | 1,153,383,049 |
| | | | | | |
Net Assets | | | | | | |
Class A Shares | | $ | 50,208 | | $ | 270,851,887 |
Class B Shares | | | — | | | 1,900,946 |
Class C Shares | | | — | | | 892,623 |
Institutional Shares | | | 260,888,562 | | | 879,737,593 |
| | | | | | |
Total | | $ | 260,938,770 | | $ | 1,153,383,049 |
| | | | | | |
Shares of Beneficial Interest Outstanding (Unlimited number of shares authorized, no par value) | | | | | | |
Class A Shares | | | 50,199 | | | 270,850,552 |
Class B Shares | | | — | | | 1,901,722 |
Class C Shares | | | — | | | 892,620 |
Institutional Shares | | | 260,890,712 | | | 879,752,573 |
| | | | | | |
Total | | | 260,940,911 | | | 1,153,397,467 |
| | | | | | |
Net Asset Value | | | | | | |
Class A Shares - redemption price per share | | $ | 1.00 | | $ | 1.00 |
| | | | | | |
Class B Shares - offering price per share** | | $ | — | | $ | 1.00 |
| | | | | | |
Class C Shares - offering price per share** | | $ | — | | $ | 1.00 |
| | | | | | |
Institutional Shares | | $ | 1.00 | | $ | 1.00 |
| | | | | | |
Maximum Sales Charge - Class A Shares | | | N/A | | | N/A |
| | | | | | |
Maximum Offering Price (100%/(100% - Maximum Sales Charge)) of net asset value adjusted to the nearest cent per share - Class A Shares | | $ | 1.00 | | $ | 1.00 |
| | | | | | |
| * | The U.S. Treasury Money Market Fund includes securities on loan of $20,294,172. |
| ** | Redemption price per share varies by length of time shares are held. |
See accompanying notes to the financial statements.
100
| | | | | | | | | | | | | | | | | |
U.S. Treasury
Money Market
Fund | | Capital Manager
Conservative
Growth Fund | | | Capital Manager
Moderate
Growth Fund | | | Capital Manager
Growth Fund | | | Capital Manager
Equity Fund | |
| | | | | | | | | | | | | | | | | |
| $ | 331,077,880 | | $ | 1,607,673 | | | $ | 9,341,970 | | | $ | 8,618,076 | | | $ | 3,477,729 | |
| | — | | | 11,548,066 | | | | 29,871,941 | | | | 21,883,300 | | | | 6,913,062 | |
| | | | | | | | | | | | | | | | | | |
| | 331,077,880 | | | 13,155,739 | | | | 39,213,911 | | | | 30,501,376 | | | | 10,390,791 | |
| | — | | | 1,314,940 | | | | (1,810,974 | ) | | | (2,332,732 | ) | | | (921,551 | ) |
| | | | | | | | | | | | | | | | | | |
| | 331,077,880 | | | 14,470,679 | | | | 37,402,937 | | | | 28,168,644 | | | | 9,469,240 | |
| | 290,852,555 | | | — | | | | — | | | | — | | | | — | |
| | — | | | — | | | | — | | | | — | | | | — | |
| | 834,269 | | | 29,502 | | | | 39,715 | | | | 13,609 | | | | 3 | |
| | — | | | 209,529 | | | | 541,266 | | | | 382,456 | | | | 270,344 | |
| | 1,426 | | | 39,274 | | | | 7,664 | | | | 929 | | | | 2,091 | |
| | 14,131 | | | 2,925 | | | | 3,440 | | | | 3,430 | | | | 3,811 | |
| | | | | | | | | | | | | | | | | | |
| | 622,780,261 | | | 14,751,909 | | | | 37,995,022 | | | | 28,569,068 | | | | 9,745,489 | |
| | | | | | | | | | | | | | | | | | |
| | | | | | | | | | | | | | | | | |
| | 3,109 | | | 1,106 | | | | 1,869 | | | | 261 | | | | — | |
| | — | | | 163,000 | | | | 382,000 | | | | 211,000 | | | | 15,000 | |
| | — | | | 48,166 | | | | 17,135 | | | | 8,500 | | | | — | |
| | 20,706,000 | | | — | | | | — | | | | — | | | | — | |
| | 5,192 | | | — | | | | — | | | | — | | | | — | |
| | | | | | | | | | | | | | | | | |
| | 51,087 | | | — | | | | — | | | | — | | | | — | |
| | 87,922 | | | 2,166 | | | | 3,746 | | | | 2,762 | | | | 1,091 | |
| | 565 | | | 13 | | | | 33 | | | | 24 | | | | 9 | |
| | — | | | 3,906 | | | | 14,673 | | | | 11,637 | | | | 4,523 | |
| | 41,828 | | | 916 | | | | 2,098 | | | | 1,410 | | | | 428 | |
| | 47,801 | | | 1,904 | | | | 2,805 | | | | 2,224 | | | | 1,314 | |
| | | | | | | | | | | | | | | | | | |
| | 20,943,504 | | | 221,177 | | | | 424,359 | | | | 237,818 | | | | 22,365 | |
| | | | | | | | | | | | | | | | | | |
| $ | 601,836,757 | | $ | 14,530,732 | | | $ | 37,570,663 | | | $ | 28,331,250 | | | $ | 9,723,124 | |
| | | | | | | | | | | | | | | | | | |
| | | | | | | | | | | | | | | | | |
| | | | |
| $ | 601,834,705 | | $ | 23,217,644 | | | $ | 52,841,380 | | | $ | 44,840,539 | | | $ | 21,078,316 | |
| | 2,052 | | | (1,106 | ) | | | (1,869 | ) | | | (261 | ) | | | — | |
| | — | | | (10,000,746 | ) | | | (13,457,874 | ) | | | (14,176,296 | ) | | | (10,433,641 | ) |
| | — | | | 1,314,940 | | | | (1,810,974 | ) | | | (2,332,732 | ) | | | (921,551 | ) |
| | | | | | | | | | | | | | | | | | |
| $ | 601,836,757 | | $ | 14,530,732 | | | $ | 37,570,663 | | | $ | 28,331,250 | | | $ | 9,723,124 | |
| | | | | | | | | | | | | | | | | | |
| | | | | | | | | | | | | | | | | |
| $ | 168,094,105 | | $ | 5,929,149 | | | $ | 24,425,907 | | | $ | 16,609,202 | | | $ | 4,809,917 | |
| | 935,340 | | | 3,184,191 | | | | 11,733,713 | | | | 9,972,751 | | | | 4,214,590 | |
| | 53,833 | | | 101,386 | | | | 88,962 | | | | 99,322 | | | | 5,696 | |
| | 432,753,479 | | | 5,316,006 | | | | 1,322,081 | | | | 1,649,975 | | | | 692,921 | |
| | | | | | | | | | | | | | | | | | |
| $ | 601,836,757 | | $ | 14,530,732 | | | $ | 37,570,663 | | | $ | 28,331,250 | | | $ | 9,723,124 | |
| | | | | | | | | | | | | | | | | | |
| | | | | | | | | | | | | | | | | |
| | 168,093,952 | | | 697,767 | | | | 3,136,056 | | | | 2,336,163 | | | | 710,577 | |
| | 935,422 | | | 374,667 | | | | 1,538,042 | | | | 1,434,803 | | | | 653,310 | |
| | 53,833 | | | 11,973 | | | | 11,588 | | | | 14,306 | | | | 881 | |
| | 432,752,810 | | | 619,931 | | | | 168,852 | | | | 231,726 | | | | 101,214 | |
| | | | | | | | | | | | | | | | | | |
| | 601,836,017 | | | 1,704,338 | | | | 4,854,538 | | | | 4,016,998 | | | | 1,465,982 | |
| | | | | | | | | | | | | | | | | | |
| | | | | | | | | | | | | | | | | |
| $ | 1.00 | | $ | 8.50 | | | $ | 7.79 | | | $ | 7.11 | | | $ | 6.77 | |
| | | | | | | | | | | | | | | | | | |
| $ | 1.00 | | $ | 8.50 | | | $ | 7.63 | | | $ | 6.95 | | | $ | 6.45 | |
| | | | | | | | | | | | | | | | | | |
| $ | 1.00 | | $ | 8.47 | | | $ | 7.68 | | | $ | 6.94 | | | $ | 6.47 | |
| | | | | | | | | | | | | | | | | | |
| $ | 1.00 | | $ | 8.58 | | | $ | 7.83 | | | $ | 7.12 | | | $ | 6.85 | |
| | | | | | | | | | | | | | | | | | |
| | N/A | | | 5.75 | % | | | 5.75 | % | | | 5.75 | % | | | 5.75 | % |
| | | | | | | | | | | | | | | | | | |
| $ | 1.00 | | $ | 9.02 | | | $ | 8.27 | | | $ | 7.54 | | | $ | 7.18 | |
| | | | | | | | | | | | | | | | | | |
101
Statements of Operations
For the Year Ended September 30, 2009
| | | | | | | | |
| | | Large Cap
Fund | | | Mid Cap
Value Fund | |
| | |
Investment Income: | | | | | | | | |
Interest income | | $ | — | | | $ | — | |
Dividend income | | | 4,772,283 | | | | 2,100,235 | |
Foreign tax withholding | | | (8,435 | ) | | | — | |
Income from securities lending | | | 5,471 | | | | 16,369 | |
| | | | | | | | |
Total investment income | | | 4,769,319 | | | | 2,116,604 | |
| | | | | | | | |
Expenses: | | | | | | | | |
Investment advisory fees (See Note 4) | | | 1,518,526 | | | | 1,116,659 | |
Administration fees (See Note 4) | | | 204,257 | | | | 150,455 | |
Distribution fees - Class A Shares | | | 131,034 | | | | 21,311 | |
Distribution fees - Class B Shares | | | 49,718 | | | | 29,548 | |
Distribution fees - Class C Shares | | | 786 | | | | 1,692 | |
Compliance service fees (See Note 4) | | | 2,036 | | | | 1,580 | |
Trustee fees | | | 13,744 | | | | 9,559 | |
Audit fees | | | 4,944 | | | | 10,635 | |
Custodian fees | | | 11,468 | | | | 14,607 | |
Fund accounting fees (See Note 4) | | | 20,521 | | | | 15,090 | |
Legal fees | | | 37,122 | | | | 83,656 | |
Printing fees | | | 8,994 | | | | 9,289 | |
State registration fees | | | 29,893 | | | | 35,007 | |
Transfer agent fees (See Note 4) | | | 87,198 | | | | 71,054 | |
Other | | | 15,984 | | | | 14,646 | |
| | | | | | | | |
Total expenses excluding excise tax | | | 2,136,225 | | | | 1,584,788 | |
Excise tax | | | — | | | | — | |
| | | | | | | | |
Total expenses before waivers | | | 2,136,225 | | | | 1,584,788 | |
Less expenses waived by the Investment Advisor (See Note 4) | | | (287,289 | ) | | | (79,893 | ) |
Less expenses waived by the Distributor (See Note 4) | | | (65,517 | ) | | | — | |
| | | | | | | | |
Net expenses | | | 1,783,419 | | | | 1,504,895 | |
| | | | | | | | |
Net investment income (loss) | | | 2,985,900 | | | | 611,709 | |
| | | | | | | | |
Realized/Unrealized Gains (Losses) on Investments, Written Options and Foreign Currency Transactions: | | | | | | | | |
Net realized gains (losses) from: | | | | | | | | |
Investments | | | (46,332,109 | ) | | | (32,156,836 | ) |
Written Options | | | — | | | | — | |
Foreign currency transactions | | | — | | | | — | |
Change in unrealized appreciation/depreciation on: | | | | | | | | |
Investments | | | 7,658,623 | | | | 35,343,826 | |
Deferred Tax | | | — | | | | — | |
Written Options | | | — | | | | — | |
Foreign currency transactions | | | — | | | | — | |
| | | | | | | | |
Net realized/unrealized gains (losses) on investments, written options and foreign currency transactions | | | (38,673,486 | ) | | | 3,186,990 | |
| | | | | | | | |
Change in net assets from operations | | $ | (35,687,586 | ) | | $ | 3,798,699 | |
| | | | | | | | |
See accompanying notes to the financial statements.
102
| | | | | | | | | | | | | | | | | | | | | | |
Mid Cap
Growth Fund | | | Small Cap
Fund | | | International
Equity Fund | | | Special
Opportunities
Equity Fund | | | Equity
Income Fund | | | Short U.S.
Government Fund | |
| | | | | |
| | | | | | | | | | | | | | | | | | | | | | |
| $ | — | | | $ | — | | | $ | 22,101 | | | $ | — | | | $ | — | | | $ | 1,554,275 | |
| | 710,831 | | | | 235,542 | | | | 2,535,168 | | | | 4,994,978 | | | | 11,113,049 | | | | 6,053 | |
| | (2,418 | ) | | | — | | | | (240,586 | ) | | | (108,503 | ) | | | (188,634 | ) | | | — | |
| | 140,629 | | | | 39,716 | | | | 61,242 | | | | — | | | | 62,164 | | | | 6,626 | |
| | | | | | | | | | | | | | | | | | | | | | | |
| | 849,042 | | | | 275,258 | | | | 2,377,925 | | | | 4,886,475 | | | | 10,986,579 | | | | 1,566,954 | |
| | | | | | | | | | | | | | | | | | | | | | | |
| | | | | | | | | | | | | | | | | | | | | | |
| | 806,501 | | | | 291,258 | | | | 774,882 | | | | 2,880,855 | | | | 1,867,606 | | | | 285,250 | |
| | 108,713 | | | | 29,013 | | | | 77,247 | | | | 360,181 | | | | 266,427 | | | | 47,377 | |
| | 13,597 | | | | 23,233 | | | | 13,395 | | | | 619,562 | | | | 421,418 | | | | 24,728 | |
| | 12,847 | | | | 12,114 | | | | 8,835 | | | | 206,806 | | | | 123,809 | | | | — | |
| | 203 | | | | 111 | | | | 1,350 | | | | 430,874 | | | | 294,993 | | | | — | |
| | 1,145 | | | | 298 | | | | 786 | | | | 3,919 | | | | 2,956 | | | | 510 | |
| | 7,767 | | | | 1,943 | | | | 5,216 | | | | 21,575 | | | | 16,313 | | | | 2,844 | |
| | 7,677 | | | | 547 | | | | 4,063 | | | | 36,440 | | | | 33,211 | | | | 5,862 | |
| | 16,062 | | | | 7,944 | | | | 250,783 | | | | 23,028 | | | | 22,599 | | | | 3,247 | |
| | 10,899 | | | | 2,913 | | | | 7,749 | | | | 36,011 | | | | 26,680 | | | | 4,754 | |
| | 59,132 | | | | 21,805 | | | | 11,492 | | | | 115,845 | | | | 92,533 | | | | 15,686 | |
| | 7,579 | | | | 1,260 | | | | 3,406 | | | | 21,877 | | | | 17,564 | | | | 2,256 | |
| | 27,975 | | | | 28,842 | | | | 12,099 | | | | 47,086 | | | | 53,433 | | | | 4,731 | |
| | 48,400 | | | | 13,238 | | | | 31,249 | | | | 180,912 | | | | 119,815 | | | | 19,209 | |
| | 13,575 | | | | 6,990 | | | | 89,812 | | | | 26,432 | | | | 24,263 | | | | 10,870 | |
| | | | | | | | | | | | | | | | | | | | | | | |
| | 1,142,072 | | | | 441,509 | | | | 1,292,364 | | | | 5,011,403 | | | | 3,383,620 | | | | 427,324 | |
| | — | | | | — | | | | — | | | | — | | | | — | | | | 1,904 | |
| | | | | | | | | | | | | | | | | | | | | | | |
| | 1,142,072 | | | | 441,509 | | | | 1,292,364 | | | | 5,011,403 | | | | 3,383,620 | | | | 429,228 | |
| | (49,235 | ) | | | (68,648 | ) | | | (116,232 | ) | | | (52,039 | ) | | | (59,867 | ) | | | (71,313 | ) |
| | — | | | | (11,617 | ) | | | (6,698 | ) | | | (309,781 | ) | | | (210,709 | ) | | | (12,364 | ) |
| | | | | | | | | | | | | | | | | | | | | | | |
| | 1,092,837 | | | | 361,244 | | | | 1,169,434 | | | | 4,649,583 | | | | 3,113,044 | | | | 345,551 | |
| | | | | | | | | | | | | | | | | | | | | | | |
| | (243,795 | ) | | | (85,986 | ) | | | 1,208,491 | | | | 236,892 | | | | 7,873,535 | | | | 1,221,403 | |
| | | | | | | | | | | | | | | | | | | | | | | |
| | | | | | | | | | | | | | | | | | | | | | |
| | | | | | | | | | | | | | | | | | | | | | |
| | | | | | | | | | | | | | | | | | | | | | |
| | (64,014,199) | | | | (10,142,718 | ) | | | (47,615,788 | ) | | | (36,047,205 | ) | | | (39,386,563 | ) | | | 244,397 | |
| | — | | | | — | | | | — | | | | 6,347,389 | | | | 1,324,489 | | | | — | |
| | — | | | | — | | | | 1,312,757 | | | | — | | | | — | | | | — | |
| | | | | | | | | | | | | | | | | | | | | | |
| | 31,030,936 | | | | 1,293,576 | | | | 36,550,433 | | | | 59,675,875 | | | | 21,679,515 | | | | 846,904 | |
| | — | | | | — | | | | (7,249 | ) | | | — | | | | — | | | | — | |
| | — | | | | — | | | | — | | | | (2,289,136 | ) | | | 382,625 | | | | — | |
| | — | | | | — | | | | 4,606 | | | | — | | | | — | | | | — | |
| | | | | | | | | | | | | | | | | | | | | | | |
| | | | | | | | | | | | | | | | | | | | | | |
| | (32,983,263 | ) | | | (8,849,142 | ) | | | (9,755,241 | ) | | | 27,686,923 | | | | (15,999,934 | ) | | | 1,091,301 | |
| | | | | | | | | | | | | | | | | | | | | | | |
| $ | (33,227,058 | ) | | $ | (8,935,128 | ) | | $ | (8,546,750 | ) | | $ | 27,923,815 | | | $ | (8,126,399 | ) | | $ | 2,312,704 | |
| | | | | | | | | | | | | | | | | | | | | | | |
103
Statements of Operations
For the Year Ended September 30, 2009
| | | | | | | | |
| | | Intermediate U.S.
Government Fund | | | Total Return
Bond Fund | |
| | |
Investment Income: | | | | | | | | |
Interest income | | $ | 6,105,655 | | | $ | 20,218,591 | |
Dividend income | | | 13,959 | | | | 6,190 | |
Income from securities lending | | | 11,623 | | | | 13,746 | |
| | | | | | | | |
Total investment income | | | 6,131,237 | | | | 20,238,527 | |
| | | | | | | | |
Expenses: | | | | | | | | |
Investment advisory fees (See Note 4) | | | 908,058 | | | | 2,284,717 | |
Administration fees (See Note 4) | | | 151,379 | | | | 379,392 | |
Distribution fees - Class A Shares | | | 58,757 | | | | 52,681 | |
Distribution fees - Class B Shares | | | 34,884 | | | | 51,619 | |
Distribution fees - Class C Shares | | | 2,788 | | | | 2,565 | |
Compliance service fees (See Note 4) | | | 1,639 | | | | 4,107 | |
Trustee fees | | | 9,067 | | | | 24,505 | |
Audit fees | | | 15,764 | | | | 42,202 | |
Custodian fees | | | 8,546 | | | | 19,374 | |
Fund accounting fees (See Note 4) | | | 15,134 | | | | 38,079 | |
Interest expense | | | — | | | | — | |
Legal fees | | | 32,396 | | | | 106,850 | |
Printing fees | | | 8,360 | | | | 24,521 | |
Transfer agent fees (See Note 4) | | | 68,772 | | | | 161,424 | |
Other | | | 23,824 | | | | 57,817 | |
| | | | | | | | |
Total expenses before waivers | | | 1,339,368 | | | | 3,249,853 | |
Less expenses waived by the Investment Advisor (See Note 4) | | | (181,611 | ) | | | (456,943 | ) |
Less expenses waived by the Distributor (See Note 4) | | | (29,379 | ) | | | (26,341 | ) |
| | | | | | | | |
Net expenses | | | 1,128,378 | | | | 2,766,569 | |
| | | | | | | | |
Net investment income | | | 5,002,859 | | | | 17,471,958 | |
| | | | | | | | |
Realized/Unrealized Gains (Losses) on Investments and Futures Contracts: | | | | | | | | |
Net realized gains (losses) from: | | | | | | | | |
Investments | | | 1,189,783 | | | | 5,457,438 | |
Futures contracts | | | — | | | | (796,780 | ) |
Change in unrealized appreciation/depreciation on: | | | | | | | | |
Investments | | | 5,841,592 | | | | 26,847,224 | |
Futures contracts | | | — | | | | (69,958 | ) |
| | | | | | | | |
Net realized/unrealized gains on investments and futures contracts | | | 7,031,375 | | | | 31,437,924 | |
| | | | | | | | |
Change in net assets from operations | | $ | 12,034,234 | | | $ | 48,909,882 | |
| | | | | | | | |
See accompanying notes to the financial statements.
104
| | | | | | | | | | | | | | | | | | | | | |
Kentucky
Intermediate
Tax-Free Fund | | | Maryland
Intermediate
Tax-Free Fund | | | North Carolina
Intermediate
Tax-Free Fund | | | South Carolina
Intermediate
Tax-Free Fund | | | Virginia
Intermediate
Tax-Free Fund | | | West Virginia
Intermediate
Tax-Free Fund |
| | | | | |
| | | | | | | | | | | | | | | | | | | | | |
| $ | 707,881 | | | $ | 735,116 | | | $ | 5,551,341 | | | $ | 922,152 | | | $ | 3,337,494 | | | $ | 3,222,102 |
| | 7,861 | | | | 9,210 | | | | 26,093 | | | | 9,822 | | | | 22,992 | | | | 17,226 |
| | — | | | | — | | | | — | | | | — | | | | — | | | | — |
| | | | | | | | | | | | | | | | | | | | | | |
| | 715,742 | | | | 744,326 | | | | 5,577,434 | | | | 931,974 | | | | 3,360,486 | | | | 3,239,328 |
| | | | | | | | | | | | | | | | | | | | | | |
| | | | | | | | | | | | | | | | | | | | | |
| | 104,684 | | | | 119,262 | | | | 818,516 | | | | 134,188 | | | | 501,303 | | | | 332,069 |
| | 17,427 | | | | 19,873 | | | | 136,304 | | | | 22,337 | | | | 83,415 | | | | 73,644 |
| | 29,089 | | | | 27,564 | | | | 117,595 | | | | 42,675 | | | | 60,650 | | | | 41,344 |
| | — | | | | — | | | | — | | | | — | | | | — | | | | — |
| | — | | | | — | | | | — | | | | — | | | | — | | | | — |
| | 194 | | | | 226 | | | | 1,506 | | | | 248 | | | | 912 | | | | 795 |
| | 1,063 | | | | 1,158 | | | | 8,324 | | | | 1,341 | | | | 5,150 | | | | 4,530 |
| | 1,988 | | | | 2,428 | | | | 15,770 | | | | 2,711 | | | | 9,526 | | | | 8,542 |
| | 973 | | | | 1,104 | | | | 6,868 | | | | 1,221 | | | | 4,256 | | | | 3,766 |
| | 1,745 | | | | 1,988 | | | | 13,642 | | | | 2,236 | | | | 8,355 | | | | 7,379 |
| | — | | | | — | | | | — | | | | — | | | | 14 | | | | — |
| | 2,569 | | | | 2,863 | | | | 20,016 | | | | 3,262 | | | | 12,320 | | | | 10,976 |
| | 1,089 | | | | 1,202 | | | | 8,367 | | | | 1,377 | | | | 5,160 | | | | 4,595 |
| | 7,355 | | | | 8,291 | | | | 57,984 | | | | 9,419 | | | | 35,420 | | | | 31,403 |
| | 12,409 | | | | 15,666 | | | | 29,468 | | | | 17,741 | | | | 21,703 | | | | 24,475 |
| | | | | | | | | | | | | | | | | | | | | | |
| | 180,585 | | | | 201,625 | | | | 1,234,360 | | | | 238,756 | | | | 748,184 | | | | 543,518 |
| | (34,895 | ) | | | (45,382 | ) | | | (204,629 | ) | | | (33,547 | ) | | | (125,326 | ) | | | — |
| | (14,544 | ) | | | (13,782 | ) | | | (58,798 | ) | | | (21,337 | ) | | | (30,325 | ) | | | — |
| | | | | | | | | | | | | | | | | | | | | | |
| | 131,146 | | | | 142,461 | | | | 970,933 | | | | 183,872 | | | | 592,533 | | | | 543,518 |
| | | | | | | | | | | | | | | | | | | | | | |
| | 584,596 | | | | 601,865 | | | | 4,606,501 | | | | 748,102 | | | | 2,767,953 | | | | 2,695,810 |
| | | | | | | | | | | | | | | | | | | | | | |
| | | | | | | | | | | | | | | | | | | | | |
| | | | | | | | | | | | | | | | | | | | | |
| | 76,541 | | | | (2,034 | ) | | | 974,303 | | | | (26,687 | ) | | | 844,628 | | | | 129,036 |
| | — | | | | — | | | | — | | | | — | | | | — | | | | — |
| | | | | | | | | | | | | | | | | | | | | |
| | 1,443,910 | | | | 1,980,869 | | | | 10,689,480 | | | | 2,016,126 | | | | 6,763,743 | | | | 5,203,311 |
| | — | | | | — | | | | — | | | | — | | | | — | | | | — |
| | | | | | | | | | | | | | | | | | | | | | |
| | 1,520,451 | | | | 1,978,835 | | | | 11,663,783 | | | | 1,989,439 | | | | 7,608,371 | | | | 5,332,347 |
| | | | | | | | | | | | | | | | | | | | | | |
| $ | 2,105,047 | | | $ | 2,580,700 | | | $ | 16,270,284 | | | $ | 2,737,541 | | | $ | 10,376,324 | | | $ | 8,028,157 |
| | | | | | | | | | | | | | | | | | | | | | |
105
Statements of Operations
For the Year Ended September 30, 2009
| | | | | | | | |
| | | National
Tax-Free Money
Market Fund | | | Prime Money
Market Fund | |
| | |
Investment Income: | | | | | | | | |
Interest income | | $ | 3,071,900 | | | $ | 20,975,803 | |
Dividend income from unaffiliates | | | 13,116 | | | | — | |
Dividend income from affiliates | | | — | | | | — | |
Income from securities lending | | | — | | | | — | |
| | | | | | | | |
Total investment income | | | 3,085,016 | | | | 20,975,803 | |
| | | | | | | | |
Expenses: | | | | | | | | |
Investment advisory fees (See Note 4) | | | 547,914 | | | | 5,557,012 | |
Administration fees (See Note 4) | | | 219,076 | | | | 1,384,902 | |
Distribution fees - Class A Shares | | | 249 | | | | 2,132,608 | |
Distribution fees - Class B Shares | | | 4 | | | | 21,153 | |
Distribution fees - Class C Shares | | | 4 | | | | 9,486 | |
Compliance service fees (See Note 4) | | | 2,466 | | | | 15,051 | |
Trustee fees | | | 13,537 | | | | 100,021 | |
Audit fees | | | 29,737 | | | | 151,595 | |
Custodian fees | | | 11,273 | | | | 67,638 | |
Fund accounting fees (See Note 4) | | | 21,916 | | | | 138,925 | |
Government insurance fees (See Note 8) | | | 59,107 | | | | 682,276 | |
Legal fees | | | 31,575 | | | | 215,975 | |
Printing fees | | | 15,353 | | | | 103,750 | |
State registration fees | | | 7,933 | | | | 14,164 | |
Transfer agent fees (See Note 4) | | | 94,458 | | | | 606,124 | |
Other | | | 19,983 | | | | 129,007 | |
| | | | | | | | |
Total expenses before waivers | | | 1,074,585 | | | | 11,329,687 | |
Less expenses waived by the Investment Advisor (See Note 4) | | | (109,583 | ) | | | (1,694,018 | ) |
Less expenses waived by the Administrator (See Note 4) | | | — | | | | — | |
Less expenses waived by the Distributor (See Note 4) | | | (125 | ) | | | (331,292 | ) |
| | | | | | | | |
Net expenses | | | 964,877 | | | | 9,304,377 | |
| | | | | | | | |
Net investment income | | | 2,120,139 | | | | 11,671,426 | |
| | | | | | | | |
Realized/Unrealized Gains (Losses) on Investments: | | | | | | | | |
Net realized gains (losses) from: | | | | | | | | |
Unaffiliated Investment transactions | | | 885 | | | | 568 | |
Affiliated Investment transactions | | | — | | | | — | |
Distributions from affiliated funds | | | — | | | | — | |
Change in unrealized appreciation/depreciation on: | | | | | | | | |
Investments | | | — | | | | — | |
| | | | | | | | |
Net realized/unrealized gains (losses) on investments | | | 885 | | | | 568 | |
| | | | | | | | |
Change in net assets from operations | | $ | 2,121,024 | | | $ | 11,671,994 | |
| | | | | | | | |
See accompanying notes to the financial statements.
106
| | | | | | | | | | | | | | | | | | |
U.S. Treasury
Money Market
Fund | | | Capital Manager
Conservative
Growth Fund | | | Capital Manager
Moderate
Growth Fund | | | Capital Manager
Growth Fund | | | Capital Manager
Equity Fund | |
| | | | |
| | | | | | | | | | | | | | | | | | |
| $ | 3,012,477 | | | $ | — | | | $ | — | | | $ | — | | | $ | — | |
| | — | | | | 64,032 | | | | 162,979 | | | | 200,292 | | | | 74,603 | |
| | — | | | | 757,839 | | | | 971,515 | | | | 528,636 | | | | 177,317 | |
| | 61,250 | | | | — | | | | — | | | | — | | | | — | |
| | | | | | | | | | | | | | | | | | | |
| | 3,073,727 | | | | 821,871 | | | | 1,134,494 | | | | 728,928 | | | | 251,920 | |
| | | | | | | | | | | | | | | | | | | |
| | | | | | | | | | | | | | | | | | |
| | 3,593,307 | | | | 55,192 | | | | 98,345 | | | | 72,590 | | | | 28,382 | |
| | 892,356 | | | | — | | | | — | | | | — | | | | — | |
| | 1,265,737 | | | | 28,081 | | | | 108,473 | | | | 71,165 | | | | 20,285 | |
| | 10,690 | | | | 31,791 | | | | 116,221 | | | | 97,978 | | | | 39,863 | |
| | 555 | | | | 879 | | | | 721 | | | | 522 | | | | 16 | |
| | 9,707 | | | | 220 | | | | 407 | | | | 298 | | | | 112 | |
| | 63,875 | | | | 1,791 | | | | 2,760 | | | | 2,066 | | | | 885 | |
| | 137,124 | | | | 1,764 | | | | 2,776 | | | | 1,861 | | | | 445 | |
| | 46,636 | | | | 1,054 | | | | 1,906 | | | | 1,410 | | | | 546 | |
| | 89,833 | | | | 2,208 | | | | 3,934 | | | | 2,904 | | | | 1,135 | |
| | 108,229 | | | | — | | | | — | | | | — | | | | — | |
| | 151,016 | | | | 3,613 | | | | 5,743 | | | | 4,192 | | | | 1,623 | |
| | 65,469 | | | | 1,422 | | | | 2,329 | | | | 1,700 | | | | 639 | |
| | 11,172 | | | | 6,668 | | | | 8,249 | | | | 8,950 | | | | 8,205 | |
| | 395,591 | | | | 9,491 | | | | 17,558 | | | | 12,279 | | | | 4,546 | |
| | 152,149 | | | | 6,125 | | | | 6,591 | | | | 5,973 | | | | 4,829 | |
| | | | | | | | | | | | | | | | | | | |
| | 6,993,446 | | | | 150,299 | | | | 376,013 | | | | 283,888 | | | | 111,511 | |
| | (3,034,708 | ) | | | (55,192 | ) | | | (98,345 | ) | | | (72,590 | ) | | | (28,382 | ) |
| | (257 | ) | | | — | | | | — | | | | — | | | | — | |
| | (1,227,929 | ) | | | (14,041 | ) | | | (54,236 | ) | | | (35,583 | ) | | | (10,142 | ) |
| | | | | | | | | | | | | | | | | | | |
| | 2,730,552 | | | | 81,066 | | | | 223,432 | | | | 175,715 | | | | 72,987 | |
| | | | | | | | | | | | | | | | | | | |
| | 343,175 | | | | 740,805 | | | | 911,062 | | | | 553,213 | | | | 178,933 | |
| | | | | | | | | | | | | | | | | | | |
| | | | | | | | | | | | | | | | | | |
| | | | | | | | | | | | | | | | | | |
| | — | | | | (2,521,249 | ) | | | (2,341,217 | ) | | | (2,335,099 | ) | | | (2,106,974 | ) |
| | — | | | | (6,612,440 | ) | | | (8,241,003 | ) | | | (7,496,111 | ) | | | (6,477,011 | ) |
| | — | | | | 133,242 | | | | 231,936 | | | | 216,574 | | | | 133,035 | |
| | | | | | | | | | | | | | | | | | |
| | — | | | | 6,267,927 | | | | 6,828,013 | | | | 5,483,507 | | | | 4,531,287 | |
| | | | | | | | | | | | | | | | | | | |
| | — | | | | (2,732,520 | ) | | | (3,522,271 | ) | | | (4,131,129 | ) | | | (3,919,663 | ) |
| | | | | | | | | | | | | | | | | | | |
| $ | 343,175 | | | $ | (1,991,715 | ) | | $ | (2,611,209 | ) | | $ | (3,577,916 | ) | | $ | (3,740,730 | ) |
| | | | | | | | | | | | | | | | | | | |
107
Statements of Changes in Net Assets
| | | | | | | | |
| | | Large Cap
Fund | |
| | |
| | | For the
Year Ended
September 30,
2009 | | | For the
Year Ended
September 30,
2008 | |
| | |
From Investment Activities: | | | | | | | | |
| | |
Operations: | | | | | | | | |
Net investment income (loss) | | $ | 2,985,900 | | | $ | 5,872,379 | |
Net realized gains (losses) on investments | | | (46,332,109 | ) | | | (108,155,884 | ) |
Change in unrealized appreciation/depreciation of investments | | | 7,658,623 | | | | (66,659,587 | ) |
| | | | | | | | |
Change in net assets from operations | | | (35,687,586 | ) | | | (168,943,092 | ) |
| | | | | | | | |
Distributions to Class A Shareholders: | | | | | | | | |
Net investment income | | | (345,013 | ) | | | (341,699 | ) |
Net realized gains from investment transactions | | | — | | | | (8,274,317 | ) |
Return of capital | | | — | | | | — | |
Distributions to Class B Shareholders: | | | | | | | | |
Net investment income | | | (32,847 | ) | | | (44,925 | ) |
Net realized gains from investment transactions | | | — | | | | (2,391,787 | ) |
Return of capital | | | — | | | | — | |
Distributions to Class C Shareholders: | | | | | | | | |
Net investment income | | | (687 | ) | | | (897 | ) |
Net realized gains from investment transactions | | | — | | | | (42,713 | ) |
Return of capital | | | — | | | | — | |
Distributions to Institutional Class Shareholders: | | | | | | | | |
Net investment income | | | (2,716,522 | ) | | | (3,849,660 | ) |
Net realized gains from investment transactions | | | — | | | | (83,406,706 | ) |
Return of capital | | | — | | | | — | |
| | | | | | | | |
Change in net assets from shareholder distributions | | | (3,095,069 | ) | | | (98,352,704 | ) |
| | | | | | | | |
Capital Transactions: | | | | | | | | |
Change in net assets from capital transactions | | | (50,719,431 | ) | | | (110,500,763 | ) |
| | | | | | | | |
Change in net assets | | | (89,502,086 | ) | | | (377,796,559 | ) |
Net Assets: | | | | | | | | |
Beginning of year | | | 301,110,676 | | | | 678,907,235 | |
| | | | | | | | |
End of year | | $ | 211,608,590 | | | $ | 301,110,676 | |
| | | | | | | | |
Accumulated undistributed (distributions in excess of) net investment income (loss) | | $ | 187,541 | | | $ | 296,710 | |
| | | | | | | | |
See accompanying notes to the financial statements.
108
| | | | | | | | | | | | | | | | | | | | | | |
Mid Cap
Value Fund | | | Mid Cap
Growth Fund | | | Small Cap
Fund | |
| | | | | |
For the Year Ended
September 30,
2009 | | | For the
Year Ended
September 30,
2008 | | | For the
Year Ended
September 30,
2009 | | | For the
Year Ended
September 30,
2008 | | | For the
Year Ended
September 30,
2009 | | | For the
Year Ended
September 30,
2008 | |
| | | | | |
| | | | | | | | | | | | | | | | | | | | | | |
| | | | | |
| | | | | | | | | | | | | | | | | | | | | | |
| $ | 611,709 | | | $ | 879,150 | | | $ | (243,795 | ) | | $ | (706,211 | ) | | $ | (85,986 | ) | | $ | (47,088 | ) |
| | (32,156,836 | ) | | | (16,834,089 | ) | | | (64,014,199 | ) | | | 5,590,374 | | | | (10,142,718 | ) | | | (9,037,965 | ) |
| | 35,343,826 | | | | (46,480,519 | ) | | | 31,030,936 | | | | (68,942,001 | ) | | | 1,293,576 | | | | (3,331,748 | ) |
| | | | | | | | | | | | | | | | | | | | | | | |
| | 3,798,699 | | | | (62,435,458 | ) | | | (33,227,058 | ) | | | (64,057,838 | ) | | | (8,935,128 | ) | | | (12,416,801 | ) |
| | | | | | | | | | | | | | | | | | | | | | | |
| | | | | | | | | | | | | | | | | | | | | | |
| | (23,972 | ) | | | (54,349 | ) | | | — | | | | — | | | | — | | | | — | |
| | — | | | | (3,751,755 | ) | | | (255,034 | ) | | | (831,721 | ) | | | — | | | | (698,940 | ) |
| | — | | | | — | | | | (38,940 | ) | | | — | | | | — | | | | — | |
| | | | | | | | | | | | | | | | | | | | | | |
| | (2,888 | ) | | | — | | | | — | | | | — | | | | — | | | | — | |
| | — | | | | (562,319 | ) | | | (70,128 | ) | | | (199,021 | ) | | | — | | | | (268,548 | ) |
| | — | | | | — | | | | (10,707 | ) | | | — | | | | — | | | | — | |
| | | | | | | | | | | | | | | | | | | | | | |
| | (258 | ) | | | — | | | | — | | | | — | | | | — | | | | — | |
| | — | | | | (104,132 | ) | | | (900 | ) | | | (3,514 | ) | | | — | | | | (2,260 | ) |
| | — | | | | — | | | | (137 | ) | | | — | | | | — | | | | — | |
| | | | | | | | | | | | | | | | | | | | | | |
| | (500,098 | ) | | | (574,144 | ) | | | — | | | | — | | | | — | | | | — | |
| | — | | | | (22,736,900 | ) | | | (5,052,336 | ) | | | (13,328,532 | ) | | | — | | | | (6,562,322 | ) |
| | — | | | | — | | | | (771,397 | ) | | | — | | | | — | | | | — | |
| | | | | | | | | | | | | | | | | | | | | | | |
| | (527,216 | ) | | | (27,783,599 | ) | | | (6,199,579 | ) | | | (14,362,788 | ) | | | — | | | | (7,532,070 | ) |
| | | | | | | | | | | | | | | | | | | | | | | |
| | | | | | | | | | | | | | | | | | | | | | |
| | 15,033,959 | | | | 19,105,124 | | | | (44,860,626 | ) | | | 38,453,893 | | | | (3,972,192 | ) | | | (32,010,799 | ) |
| | | | | | | | | | | | | | | | | | | | | | | |
| | 18,305,442 | | | | (71,113,933 | ) | | | (84,287,263 | ) | | | (39,966,733 | ) | | | (12,907,320 | ) | | | (51,959,670 | ) |
| | | | | | | | | | | | | | | | | | | | | | |
| | 196,371,878 | | | | 267,485,811 | | | | 172,286,567 | | | | 212,253,300 | | | | 42,687,282 | | | | 94,646,952 | |
| | | | | | | | | | | | | | | | | | | | | | | |
| $ | 214,677,320 | | | $ | 196,371,878 | | | $ | 87,999,304 | | | $ | 172,286,567 | | | $ | 29,779,962 | | | $ | 42,687,282 | |
| | | | | | | | | | | | | | | | | | | | | | | |
| $ | 343,702 | | | $ | 259,209 | | | $ | 16,695 | | | $ | — | | | $ | 4,832 | | | $ | — | |
| | | | | | | | | | | | | | | | | | | | | | | |
109
Statements of Changes in Net Assets, continued
| | | | | | | | |
| | | International
Equity Fund | |
| | |
| | | For the
Year Ended
September 30,
2009 | | | For the
Year Ended
September 30,
2008 | |
| | |
From Investment Activities: | | | | | | | | |
Operations: | | | | | | | | |
Net investment income (loss) | | $ | 1,208,491 | | | $ | 2,088,399 | |
Net realized gains (losses) on investments, written options and foreign currency transactions | | | (46,303,031 | ) | | | (16,393,048 | ) |
Change in unrealized appreciation/depreciation of investments, deferred tax, written
options and foreign currency transactions | | | 36,547,790 | | | | (36,623,883 | ) |
| | | | | | | | |
Change in net assets from operations | | | (8,546,750 | ) | | | (50,928,532 | ) |
| | | | | | | | |
Distributions to Class A Shareholders: | | | | | | | | |
Net investment income | | | (76,648 | ) | | | (11,955 | ) |
Net realized gains from investment transactions | | | — | | | | (478,211 | ) |
Return of capital | | | | | | | | |
Distributions to Class B Shareholders: | | | | | | | | |
Net investment income | | | (27,852 | ) | | | (2,081 | ) |
Net realized gains from investment transactions | | | — | | | | (200,385 | ) |
Return of capital | | | | | | | | |
Distributions to Class C Shareholders: | | | | | | | | |
Net investment income | | | (4,032 | ) | | | (511 | ) |
Net realized gains from investment transactions | | | — | | | | (34,501 | ) |
Return of capital | | | | | | | | |
Distributions to Institutional Class Shareholders: | | | | | | | | |
Net investment income | | | (2,301,592 | ) | | | (540,819 | ) |
Net realized gains from investment transactions | | | — | | | | (14,487,875 | ) |
Return of capital | | | | | | | | |
| | | | | | | | |
Change in net assets from shareholder distributions | | | (2,410,124 | ) | | | (15,756,338 | ) |
| | | | | | | | |
Capital Transactions: | | | | | | | | |
Change in net assets from capital transactions | | | (17,431,292 | ) | | | 9,464,586 | |
| | | | | | | | |
Change in net assets | | | (28,388,166 | ) | | | (57,220,284 | ) |
Net Assets: | | | | | | | | |
Beginning of year | | | 114,415,254 | | | | 171,635,538 | |
| | | | | | | | |
End of year | | $ | 86,027,088 | | | $ | 114,415,254 | |
| | | | | | | | |
Accumulated undistributed (distributions in excess of) net investment income | | $ | 240,868 | | | $ | (661,873 | ) |
| | | | | | | | |
See accompanying notes to the financial statements.
110
| | | | | | | | | | | | | | | | | | | | | | |
Special
Opportunities
Equity Fund | | | Equity
Income Fund | | | Short U.S.
Government Fund | |
| | | | | |
For the
Year Ended
September 30,
2009 | | | For the
Year Ended
September 30,
2008 | | | For the
Year Ended
September 30,
2009 | | | For the
Year Ended
September 30,
2008 | | | For the
Year Ended
September 30,
2009 | | | For the
Year Ended
September 30,
2008 | |
| | | | | |
| | | | | | | | | | | | | | | | | | | | | | |
| | | | | | | | | | | | | | | | | | | | | | |
| $ | 236,892 | | | $ | (2,000,807 | ) | | $ | 7,873,535 | | | $ | 7,032,540 | | | $ | 1,221,403 | | | $ | 1,619,641 | |
| | (29,699,816 | ) | | | 15,766,722 | | | | (38,062,074 | ) | | | 82,198 | | | | 244,397 | | | | 195,216 | |
| | | | | | | | | | | | | | | | | | | | | | |
| | 57,386,739 | | | | (67,081,807 | ) | | | 22,062,140 | | | | (40,989,664 | ) | | | 846,904 | | | | 22,467 | |
| | | | | | | | | | | | | | | | | | | | | | | |
| | 27,923,815 | | | | (53,315,892 | ) | | | (8,126,399 | ) | | | (33,874,926 | ) | | | 2,312,704 | | | | 1,837,324 | |
| | | | | | | | | | | | | | | | | | | | | | | |
| | | | | | | | | | | | | | | | | | | | | | |
| | (40,821 | ) | | | — | | | | (1,725,326 | ) | | | (2,376,144 | ) | | | (159,233 | ) | | | (162,712 | ) |
| | (4,588,187 | ) | | | (5,137,250 | ) | | | (236,183 | ) | | | (3,896,710 | ) | | | — | | | | — | |
| | (868,873 | ) | | | | | | | | | | | | | | | | | | | | |
| | | | | | | | | | | | | | | | | | | | | | |
| | (1,008 | ) | | | — | | | | (155,790 | ) | | | (254,731 | ) | | | — | | | | — | |
| | (984,305 | ) | | | (1,275,392 | ) | | | (35,400 | ) | | | (594,630 | ) | | | — | | | | — | |
| | (164,603 | ) | | | | | | | | | | | | | | | | | | | | |
| | | | | | | | | | | | | | | | | | | | | | |
| | (1,761 | ) | | | — | | | | (402,593 | ) | | | (510,441 | ) | | | — | | | | — | |
| | (1,915,038 | ) | | | (2,183,656 | ) | | | (76,742 | ) | | | (1,055,156 | ) | | | — | | | | — | |
| | (319,017 | ) | | | | | | | | | | | | | | | | | | | | |
| | | | | | | | | | | | | | | | | | | | | | |
| | (82,919 | ) | | | — | | | | (3,286,149 | ) | | | (2,489,416 | ) | | | (1,470,163 | ) | | | (1,678,801 | ) |
| | (6,753,084 | ) | | | (5,422,617 | ) | | | (374,003 | ) | | | (1,897,188 | ) | | | — | | | | — | |
| | (1,312,270 | ) | | | | | | | | | | | | | | | | | | | | |
| | | | | | | | | | | | | | | | | | | | | | | |
| | (17,031,886 | ) | | | (14,018,915 | ) | | | (6,292,186 | ) | | | (13,074,416 | ) | | | (1,629,396 | ) | | | (1,841,513 | ) |
| | | | | | | | | | | | | | | | | | | | | | | |
| | | | | | | | | | | | | | | | | | | | | | |
| | 108,025,531 | | | | 102,850,291 | | | | 57,257,803 | | | | 149,218,678 | | | | 13,757,171 | | | | 4,862,017 | |
| | | | | | | | | | | | | | | | | | | | | | | |
| | 118,917,460 | | | | 35,515,484 | | | | 42,839,218 | | | | 102,269,336 | | | | 14,440,479 | | | | 4,857,828 | |
| | | | | | | | | | | | | | | | | | | | | | |
| | 367,369,736 | | | | 331,854,252 | | | | 286,653,439 | | | | 184,384,103 | | | | 49,591,573 | | | | 44,733,745 | |
| | | | | | | | | | | | | | | | | | | | | | | |
| $ | 486,287,196 | | | $ | 367,369,736 | | | $ | 329,492,657 | | | $ | 286,653,439 | | | $ | 64,032,052 | | | $ | 49,591,573 | |
| | | | | | | | | | | | | | | | | | | | | | | |
| $ | 7,704 | | | $ | — | | | $ | 774,477 | | | $ | 438,623 | | | $ | (16,176 | ) | | $ | 134,181 | |
| | | | | | | | | | | | | | | | | | | | | | | |
111
Statements of Changes in Net Assets, continued
| | | | | | | | |
| | | Intermediate U.S.
Government Fund | |
| | |
| | | For the
Year Ended
September 30,
2009 | | | For the
Year Ended
September 30,
2008 | |
| | |
From Investment Activities: | | | | | | | | |
Operations: | | | | | | | | |
Net investment income | | $ | 5,002,859 | | | $ | 5,915,268 | |
Net realized gains (losses) on investments and futures contracts | | | 1,189,783 | | | | 1,437,688 | |
Change in unrealized appreciation/depreciation of investments and futures contracts | | | 5,841,592 | | | | 222,260 | |
| | | | | | | | |
Change in net assets from operations | | | 12,034,234 | | | | 7,575,216 | |
| | | | | | | | |
Distributions to Class A Shareholders: | | | | | | | | |
Net investment income | | | (392,008 | ) | | | (392,787 | ) |
Net realized gains from investment transactions | | | — | | | | — | |
Distributions to Class B Shareholders: | | | | | | | | |
Net investment income | | | (91,614 | ) | | | (104,647 | ) |
Distributions to Class C Shareholders: | | | | | | | | |
Net investment income | | | (6,890 | ) | | | (6,854 | ) |
Distributions to Institutional Class Shareholders: | | | | | | | | |
Net investment income | | | (4,800,213 | ) | | | (5,528,547 | ) |
Net realized gains from investment transactions | | | — | | | | — | |
| | | | | | | | |
Change in net assets from shareholder distributions | | | (5,290,725 | ) | | | (6,032,835 | ) |
| | | | | | | | |
Capital Transactions: | | | | | | | | |
Change in net assets from capital transactions | | | 63,757,441 | | | | (23,014,799 | ) |
| | | | | | | | |
Change in net assets | | | 70,500,950 | | | | (21,472,418 | ) |
Net Assets: | | | | | | | | |
Beginning of year | | | 123,187,802 | | | | 144,660,220 | |
| | | | | | | | |
End of year | | $ | 193,688,752 | | | $ | 123,187,802 | |
| | | | | | | | |
Accumulated undistributed (distributions in excess of) net investment income | | $ | 1,879,324 | | | $ | 2,087,951 | |
| | | | | | | | |
See accompanying notes to the financial statements.
112
| | | | | | | | | | | | | | | | | | | | | | |
Total Return
Bond Fund | | | Kentucky
Intermediate
Tax-Free Fund | | | Maryland
Intermediate
Tax-Free Fund | |
| | | | | |
For the
Year Ended
September 30,
2009 | | | For the
Year Ended
September 30,
2008 | | | For the
Year Ended
September 30,
2009 | | | For the
Year Ended
September 30,
2008 | | | For the
Year Ended
September 30,
2009 | | | For the
Year Ended
September 30,
2008 | |
| | | | | |
| | | | | | | | | | | | | | | | | | | | | | |
| | | | | | | | | | | | | | | | | | | | | | |
| $ | 17,471,958 | | | $ | 20,586,282 | | | $ | 584,596 | | | $ | 535,952 | | | $ | 601,865 | | | $ | 435,124 | |
| | 4,660,658 | | | | 4,893,431 | | | | 76,541 | | | | 174,779 | | | | (2,034 | ) | | | 258,887 | |
| | 26,777,266 | | | | (15,299,384 | ) | | | 1,443,910 | | | | (529,441 | ) | | | 1,980,869 | | | | (544,735 | ) |
| | | | | | | | | | | | | | | | | | | | | | | |
| | 48,909,882 | | | | 10,180,329 | | | | 2,105,047 | | | | 181,290 | | | | 2,580,700 | | | | 149,276 | |
| | | | | | | | | | | | | | | | | | | | | | | |
| | | | | | | | | | | | | | | | | | | | | | |
| | (463,538 | ) | | | (388,654 | ) | | | (183,794 | ) | | | (163,224 | ) | | | (155,759 | ) | | | (107,055 | ) |
| | — | | | | — | | | | (54,264 | ) | | | — | | | | (35,179 | ) | | | — | |
| | | | | | | | | | | | | | | | | | | | | | |
| | (188,599 | ) | | | (190,134 | ) | | | — | | | | — | | | | — | | | | — | |
| | | | | | | | | | | | | | | | | | | | | | |
| | (9,298 | ) | | | (5,112 | ) | | | — | | | | — | | | | — | | | | — | |
| | | | | | | | | | | | | | | | | | | | | | |
| | (16,996,203 | ) | | | (20,998,569 | ) | | | (397,069 | ) | | | (371,553 | ) | | | (442,167 | ) | | | (327,380 | ) |
| | — | | | | — | | | | (103,322 | ) | | | — | | | | (98,119 | ) | | | — | |
| | | | | | | | | | | | | | | | | | | | | | | |
| | (17,657,638 | ) | | | (21,582,469 | ) | | | (738,449 | ) | | | (534,777 | ) | | | (731,224 | ) | | | (434,435 | ) |
| | | | | | | | | | | | | | | | | | | | | | | |
| | | | | | | | | | | | | | | | | | | | | | |
| | (113,914,589 | ) | | | 8,423,092 | | | | 2,012,242 | | | | 1,532,728 | | | | 11,210,947 | | | | 5,398,133 | |
| | | | | | | | | | | | | | | | | | | | | | | |
| | (82,662,345 | ) | | | (2,979,048 | ) | | | 3,378,840 | | | | 1,179,241 | | | | 13,060,423 | | | | 5,112,974 | |
| | | | | | | | | | | | | | | | | | | | | | |
| | 443,913,684 | | | | 446,892,732 | | | | 16,434,001 | | | | 15,254,760 | | | | 15,916,180 | | | | 10,803,206 | |
| | | | | | | | | | | | | | | | | | | | | | | |
| $ | 361,251,339 | | | $ | 443,913,684 | | | $ | 19,812,841 | | | $ | 16,434,001 | | | $ | 28,976,603 | | | $ | 15,916,180 | |
| | | | | | | | | | | | | | | | | | | | | | | |
| $ | 864,466 | | | $ | 615,479 | | | $ | 1,137 | | | $ | 1,081 | | | $ | (500 | ) | | $ | (481 | ) |
| | | | | | | | | | | | | | | | | | | | | | | |
113
Statements of Changes in Net Assets, continued
| | | | | | | | |
| | | North Carolina
Intermediate
Tax-Free Fund | |
| | |
| | | For the
Year Ended
September 30,
2009 | | | For the
Year Ended
September 30,
2008 | |
| | |
From Investment Activities: | | | | | | | | |
Operations: | | | | | | | | |
Net investment income | | $ | 4,606,501 | | | $ | 4,290,208 | |
Net realized gains (losses) on investments | | | 974,303 | | | | 1,286,524 | |
Change in unrealized appreciation/depreciation of investments | | | 10,689,480 | | | | (3,853,560 | ) |
| | | | | | | | |
Change in net assets from operations | | | 16,270,284 | | | | 1,723,172 | |
| | | | | | | | |
Distributions to Class A Shareholders: | | | | | | | | |
Net investment income | | | (743,381 | ) | | | (688,755 | ) |
Net realized gains from investment transactions | | | (211,075 | ) | | | (80,446 | ) |
Distributions to Institutional Class Shareholders: | | | | | | | | |
Net investment income | | | (3,856,177 | ) | | | (3,598,766 | ) |
Net realized gains from investment transactions | | | (1,036,786 | ) | | | (392,937 | ) |
| | | | | | | | |
Change in net assets from shareholder distributions | | | (5,847,419 | ) | | | (4,760,904 | ) |
| | | | | | | | |
Capital Transactions: | | | | | | | | |
Change in net assets from capital transactions | | | 24,925,395 | | | | 11,618,301 | |
| | | | | | | | |
Change in net assets | | | 35,348,260 | | | | 8,580,569 | |
Net Assets: | | | | | | | | |
Beginning of year | | | 124,530,389 | | | | 115,949,820 | |
| �� | | | | | | | |
End of year | | $ | 159,878,649 | | | $ | 124,530,389 | |
| | | | | | | | |
Accumulated undistributed (distributions in excess of) net investment income | | $ | 67,036 | | | $ | 63,879 | |
| | | | | | | | |
See accompanying notes to the financial statements.
114
| | | | | | | | | | | | | | | | | | | | | | |
South Carolina
Intermediate
Tax-Free Fund | | | Virginia
Intermediate
Tax-Free Fund | | | West Virginia
Intermediate
Tax-Free Fund | |
| | | | | |
For the
Year Ended
September 30,
2009 | | | For the
Year Ended
September 30,
2008 | | | For the
Year Ended
September 30,
2009 | | | For the
Year Ended
September 30,
2008 | | | For the
Year Ended
September 30,
2009 | | | For the
Year Ended
September 30,
2008 | |
| | | | | |
| | | | | | | | | | | | | | | | | | | | | | |
| | | | | | | | | | | | | | | | | | | | | | |
| $ | 748,102 | | | $ | 637,506 | | | $ | 2,767,953 | | | $ | 2,799,936 | | | $ | 2,695,810 | | | $ | 2,574,060 | |
| | (26,687 | ) | | | 367,435 | | | | 844,628 | | | | 674,431 | | | | 129,036 | | | | 80,243 | |
| | 2,016,126 | | | | (881,072 | ) | | | 6,763,743 | | | | (1,917,570 | ) | | | 5,203,311 | | | | (2,627,985 | ) |
| | | | | | | | | | | | | | | | | | | | | | | |
| | 2,737,541 | | | | 123,869 | | | | 10,376,324 | | | | 1,556,797 | | | | 8,028,157 | | | | 26,318 | |
| | | | | | | | | | | | | | | | | | | | | | | |
| | | | | | | | | | | | | | | | | | | | | | |
| | (269,642 | ) | | | (173,638 | ) | | | (369,951 | ) | | | (301,636 | ) | | | (566,422 | ) | | | (545,928 | ) |
| | (118,467 | ) | | | (38,461 | ) | | | (78,927 | ) | | | (41,927 | ) | | | (19,073 | ) | | | (26,658 | ) |
| | | | | | | | | | | | | | | | | | | | | | |
| | (473,675 | ) | | | (462,900 | ) | | | (2,394,907 | ) | | | (2,493,904 | ) | | | (2,110,420 | ) | | | (2,023,069 | ) |
| | (235,059 | ) | | | (118,799 | ) | | | (585,966 | ) | | | (331,095 | ) | | | (69,580 | ) | | | (94,238 | ) |
| | | | | | | | | | | | | | | | | | | | | | | |
| | (1,096,843 | ) | | | (793,798 | ) | | | (3,429,751 | ) | | | (3,168,562 | ) | | | (2,765,495 | ) | | | (2,689,893 | ) |
| | | | | | | | | | | | | | | | | | | | | | | |
| | | | | | | | | | | | | | | | | | | | | | |
| | 6,108,311 | | | | 4,891,270 | | | | 3,568,450 | | | | 5,212,442 | | | | 4,887,895 | | | | 6,215,443 | |
| | | | | | | | | | | | | | | | | | | | | | | |
| | 7,749,009 | | | | 4,221,341 | | | | 10,515,023 | | | | 3,600,677 | | | | 10,150,557 | | | | 3,551,868 | |
| | | | | | | | | | | | | | | | | | | | | | |
| | 20,779,785 | | | | 16,558,444 | | | | 81,314,227 | | | | 77,713,550 | | | | 72,966,708 | | | | 69,414,840 | |
| | | | | | | | | | | | | | | | | | | | | | | |
| $ | 28,528,794 | | | $ | 20,779,785 | | | $ | 91,829,250 | | | $ | 81,314,227 | | | $ | 83,117,265 | | | $ | 72,966,708 | |
| | | | | | | | | | | | | | | | | | | | | | | |
| $ | 1,228 | | | $ | 1,168 | | | $ | 41,395 | | | $ | 41,165 | | | $ | (41,282 | ) | | $ | (41,328 | ) |
| | | | | | | | | | | | | | | | | | | | | | | |
115
Statements of Changes in Net Assets, continued
| | | | | | | | |
| | | National
Tax-Free Money
Market Fund | |
| | |
| | | For the
Year Ended
September 30,
2009 | | | For the
Year Ended
September 30,
2008 | |
| | |
From Investment Activities: | | | | | | | | |
Operations: | | | | | | | | |
Net investment income | | $ | 2,120,139 | | | $ | 2,737,858 | |
Net realized gains (losses) from investments and distributions from underlying funds | | | 885 | | | | 14,077 | |
Change in unrealized appreciation/depreciation of investments | | | — | | | | — | |
| | | | | | | | |
Change in net assets from operations | | | 2,121,024 | | | | 2,751,935 | |
| | | | | | | | |
Distributions to Class A Shareholders: | | | | | | | | |
Net investment income | | | (325 | ) | | | (10,692 | ) |
Net realized gains from investment transactions | | | — | | | | — | |
Distributions to Class B Shareholders: | | | | | | | | |
Net investment income | | | (4 | ) | | | (18 | ) |
Net realized gains from investment transactions | | | — | | | | — | |
Distributions to Class C Shareholders: | | | | | | | | |
Net investment income | | | (3 | ) | | | (14 | ) |
Net realized gains from investment transactions | | | — | | | | — | |
Distributions to Institutional Class Shareholders: | | | | | | | | |
Net investment income | | | (2,131,947 | ) | | | (2,727,134 | ) |
Net realized gains from investment transactions | | | — | | | | — | |
| | | | | | | | |
Change in net assets from shareholder distributions | | | (2,132,279 | ) | | | (2,737,858 | ) |
| | | | | | | | |
Capital Transactions: | | | | | | | | |
Change in net assets from capital transactions | | | 109,505,842 | | | | 41,316,045 | |
| | | | | | | | |
Change in net assets | | | 109,494,587 | | | | 41,330,122 | |
Net Assets: | | | | | | | | |
Beginning of year | | | 151,444,183 | | | | 110,114,061 | |
| | | | | | | | |
End of year | | $ | 260,938,770 | | | $ | 151,444,183 | |
| | | | | | | | |
Accumulated undistributed (distributions in excess of) net investment income | | $ | 888 | | | $ | — | |
| | | | | | | | |
See accompanying notes to the financial statements.
116
| | | | | | | | | | | | | | | | | | | | | | |
Prime Money
Market Fund | | | U.S. Treasury
Money Market
Fund | | | Capital Manager
Conservative
Growth Fund | |
| | | | | |
For the
Year Ended
September 30,
2009 | | | For the
Year Ended
September 30,
2008 | | | For the
Year Ended
September 30,
2009 | | | For the
Year Ended
September 30,
2008 | | | For the
Year Ended
September 30,
2009 | | | For the
Year Ended
September 30,
2008 | |
| | | | | |
| | | | | | | | | | | | | | | | | | | | | | |
| | | | | | | | | | | | | | | | | | | | | | |
| $ | 11,671,426 | | | $ | 54,480,283 | | | $ | 343,175 | | | $ | 18,748,322 | | | $ | 740,805 | | | $ | 1,661,202 | |
| | 568 | | | | 11,598 | | | | — | | | | — | | | | (9,000,447 | ) | | | 669,531 | |
| | — | | | | — | | | | — | | | | — | | | | 6,267,927 | | | | (8,423,419 | ) |
| | | | | | | | | | | | | | | | | | | | | | | |
| | 11,671,994 | | | | 54,491,881 | | | | 343,175 | | | | 18,748,322 | | | | (1,991,715 | ) | | | (6,092,686 | ) |
| | | | | | | | | | | | | | | | | | | | | | | |
| | | | | | | | | | | | | | | | | | | | | | |
| | (3,328,886 | ) | | | (23,091,397 | ) | | | (86,171 | ) | | | (5,415,625 | ) | | | (167,125 | ) | | | (379,799 | ) |
| | — | | | | — | | | | — | | | | — | | | | (111,915 | ) | | | (675,434 | ) |
| | | | | | | | | | | | | | | | | | | | | | |
| | (7,014 | ) | | | (38,723 | ) | | | (223 | ) | | | (4,407 | ) | | | (71,271 | ) | | | (154,488 | ) |
| | — | | | | — | | | | — | | | | — | | | | (62,677 | ) | | | (328,822 | ) |
| | | | | | | | | | | | | | | | | | | | | | |
| | (2,335 | ) | | | (9,286 | ) | | | (18 | ) | | | (536 | ) | | | (2,064 | ) | | | (2,782 | ) |
| | — | | | | — | | | | — | | | | — | | | | (1,617 | ) | | | (5,338 | ) |
| | | | | | | | | | | | | | | | | | | | | | |
| | (8,344,788 | ) | | | (31,345,034 | ) | | | (256,763 | ) | | | (13,327,754 | ) | | | (514,802 | ) | | | (1,911,902 | ) |
| | — | | | | — | | | | — | | | | — | | | | (663,941 | ) | | | (3,205,241 | ) |
| | | | | | | | | | | | | | | | | | | | | | | |
| | (11,683,023 | ) | | | (54,484,440 | ) | | | (343,175 | ) | | | (18,748,322 | ) | | | (1,595,412 | ) | | | (6,663,806 | ) |
| | | | | | | | | | | | | | | | | | | | | | | |
| | | | | | | | | | | | | | | | | | | | | | |
| | (586,801,661 | ) | | | 204,571,687 | | | | (596,524,912 | ) | | | 330,323,479 | | | | (33,566,315 | ) | | | 2,284,184 | |
| | | | | | | | | | | | | | | | | | | | | | | |
| | (586,812,690 | ) | | | 204,579,128 | | | | (596,524,912 | ) | | | 330,323,479 | | | | (37,153,442 | ) | | | (10,472,308 | ) |
| | | | | | | | | | | | | | | | | | | | | | |
| | 1,740,195,739 | | | | 1,535,616,611 | | | | 1,198,361,669 | | | | 868,038,190 | | | | 51,684,174 | | | | 62,156,482 | |
| | | | | | | | | | | | | | | | | | | | | | | |
| $ | 1,153,383,049 | | | $ | 1,740,195,739 | | | $ | 601,836,757 | | | $ | 1,198,361,669 | | | $ | 14,530,732 | | | $ | 51,684,174 | |
| | | | | | | | | | | | | | | | | | | | | | | |
| $ | 791 | | | $ | 790 | | | $ | 2,052 | | | $ | 246 | | | $ | (1,106 | ) | | $ | (21 | ) |
| | | | | | | | | | | | | | | | | | | | | | | |
117
Statements of Changes in Net Assets, continued
| | | | | | | | |
| | | Capital Manager
Moderate
Growth Fund | |
| | | For the
Year Ended
September 30,
2009 | | | For the
Year Ended
September 30,
2008 | |
From Investment Activities: | | | | | | | | |
Operations: | | | | | | | | |
Net investment income | | $ | 911,062 | | | $ | 1,347,806 | |
Net realized losses from investments and distributions from underlying funds | | | (10,350,284 | ) | | | (1,416,539 | ) |
Change in unrealized appreciation/depreciation of investments | | | 6,828,013 | | | | (14,611,902 | ) |
| | | | | | | | |
Change in net assets from operations | | | (2,611,209 | ) | | | (14,680,635 | ) |
| | | | | | | | |
Distributions to Class A Shareholders: | | | | | | | | |
Net investment income | | | (518,431 | ) | | | (1,338,507 | ) |
Net realized gains from investment transactions | | | — | | | | (3,913,868 | ) |
Distributions to Class B Shareholders: | | | | | | | | |
Net investment income | | | (195,965 | ) | | | (637,141 | ) |
Net realized gains from investment transactions | | | — | | | | (2,268,968 | ) |
Distributions to Class C Shareholders: | | | | | | | | |
Net investment income | | | (1,228 | ) | | | (3,995 | ) |
Net realized gains from investment transactions | | | — | | | | (15,622 | ) |
Distributions to Institutional Class Shareholders: | | | | | | | | |
Net investment income | | | (216,943 | ) | | | (1,086,147 | ) |
Net realized gains from investment transactions | | | — | | | | (2,971,557 | ) |
| | | | | | | | |
Change in net assets from shareholder distributions | | | (932,567 | ) | | | (12,235,805 | ) |
| | | | | | | | |
Capital Transactions: | | | | | | | | |
Change in net assets from capital transactions | | | (23,343,292 | ) | | | 2,384,796 | |
| | | | | | | | |
Change in net assets | | | (26,887,068 | ) | | | (24,531,644 | ) |
Net Assets: | | | | | | | | |
Beginning of year | | | 64,457,731 | | | | 88,989,375 | |
| | | | | | | | |
End of year | | $ | 37,570,663 | | | $ | 64,457,731 | |
| | | | | | | | |
Accumulated undistributed (distributions in excess of) net investment income | | $ | (1,869 | ) | | $ | (3,744 | ) |
| | | | | | | | |
See accompanying notes to the financial statements.
118
| | | | | | | | | | | | | | |
Capital Manager
Growth Fund | | | Capital Manager
Equity Fund | |
For the
Year Ended
September 30,
2009 | | | For the
Year Ended
September 30,
2008 | | | For the
Year Ended
September 30,
2009 | | | For the
Year Ended
September 30,
2008 | |
| | | | | | | | | | | | | | |
| | | | | | | | | | | | | | |
| $ | 553,213 | | | $ | 673,888 | | | $ | 178,933 | | | $ | 132,063 | |
| | (9,614,636 | ) | | | (2,615,566 | ) | | | (8,450,950 | ) | | | (1,094,252 | ) |
| | 5,483,507 | | | | (12,665,160 | ) | | | 4,531,287 | | | | (8,434,889 | ) |
| | | | | | | | | | | | | | | |
| | (3,577,916 | ) | | | (14,606,838 | ) | | | (3,740,730 | ) | | | (9,397,078 | ) |
| | | | | | | | | | | | | | | |
| | | | | | | | | | | | | | |
| | (275,030 | ) | | | (886,881 | ) | | | (40,297 | ) | | | (271,820 | ) |
| | — | | | | (3,182,428 | ) | | | — | | | | (1,301,734 | ) |
| | | | | | | | | | | | | | |
| | (121,905 | ) | | | (560,278 | ) | | | (35,300 | ) | | | (228,300 | ) |
| | — | | | | (2,484,154 | ) | | | — | | | | (1,263,915 | ) |
| | | | | | | | | | | | | | |
| | (695 | ) | | | (2,442 | ) | | | (5 | ) | | | (31 | ) |
| | — | | | | (10,693 | ) | | | — | | | | (175 | ) |
| | | | | | | | | | | | | | |
| | (181,769 | ) | | | (878,236 | ) | | | (113,522 | ) | | | (663,376 | ) |
| | — | | | | (2,958,707 | ) | | | — | | | | (2,967,902 | ) |
| | | | | | | | | | | | | | | |
| | (579,399 | ) | | | (10,963,819 | ) | | | (189,124 | ) | | | (6,697,253 | ) |
| | | | | | | | | | | | | | | |
| | | | | | | | | | | | | | |
| | (17,029,420 | ) | | | 4,277,204 | | | | (11,434,883 | ) | | | 2,429,937 | |
| | | | | | | | | | | | | | | |
| | (21,186,735 | ) | | | (21,293,453 | ) | | | (15,364,737 | ) | | | (13,664,394 | ) |
| | | | | | | | | | | | | | |
| | 49,517,985 | | | | 70,811,438 | | | | 25,087,861 | | | | 38,752,255 | |
| | | | | | | | | | | | | | | |
| $ | 28,331,250 | | | $ | 49,517,985 | | | $ | 9,723,124 | | | $ | 25,087,861 | |
| | | | | | | | | | | | | | | |
| $ | (261 | ) | | $ | 2,649 | | | $ | — | | | $ | (1,432 | ) |
| | | | | | | | | | | | | | | |
119
Statements of Changes in Net Assets, continued
| | | | | | | | |
| | | Large Cap
Fund | |
| | |
| | | For the
Year Ended
September 30,
2009 | | | For the
Year Ended
September 30,
2008 | |
Capital Transactions: | | | | | | | | |
Class A Shares: | | | | | | | | |
Proceeds from shares issued | | $ | 1,983,302 | | | $ | 4,094,192 | |
Distributions reinvested | | | 339,192 | | | | 8,375,699 | |
Value of shares redeemed | | | (4,782,648 | ) | | | (9,975,098 | ) |
| | | | | | | | |
Change in net assets from Class A Share transactions | | | (2,460,154 | ) | | | 2,494,793 | |
Class B Shares: | | | | | | | | |
Proceeds from shares issued | | | 204,563 | | | | 528,077 | |
Distributions reinvested | | | 32,712 | | | | 2,406,467 | |
Value of shares redeemed | | | (2,386,581 | ) | | | (5,900,383 | ) |
| | | | | | | | |
Change in net assets from Class B Share transactions | | | (2,149,306 | ) | | | (2,965,839 | ) |
Class C Shares: | | | | | | | | |
Proceeds from shares issued | | | 45,286 | | | | 176,781 | |
Distributions reinvested | | | 651 | | | | 42,073 | |
Value of shares redeemed | | | (82,461 | ) | | | (192,818 | ) |
| | | | | | | | |
Change in net assets from Class C Share transactions | | | (36,524 | ) | | | 26,036 | |
Institutional Shares: | | | | | | | | |
Proceeds from shares issued | | | 19,666,433 | | | | 54,150,546 | |
Distributions reinvested | | | 2,293,574 | | | | 62,183,344 | |
Value of shares redeemed | | | (68,033,454 | ) | | | (226,393,904 | ) |
| | | | | | | | |
Change in net assets from Institutional Share transactions | | | (46,073,447 | ) | | | (110,060,014 | ) |
| | | | | | | | |
Change in net assets from capital transactions | | $ | (50,719,431 | ) | | $ | (110,505,024 | ) |
| | | | | | | | |
| | |
Share Transactions: | | | | | | | | |
Class A Shares: | | | | | | | | |
Issued | | | 227,591 | | | | 292,219 | |
Reinvested | | | 39,583 | | | | 566,965 | |
Redeemed | | | (549,666 | ) | | | (741,687 | ) |
| | | | | | | | |
Change in Class A Shares | | | (282,492 | ) | | | 117,497 | |
Class B Shares: | | | | | | | | |
Issued | | | 24,291 | | | | 38,287 | |
Reinvested | | | 3,930 | | | | 164,797 | |
Redeemed | | | (281,391 | ) | | | (436,535 | ) |
| | | | | | | | |
Change in Class B Shares | | | (253,170 | ) | | | (233,451 | ) |
Class C Shares: | | | | | | | | |
Issued | | | 5,147 | | | | 12,588 | |
Reinvested | | | 78 | | | | 2,890 | |
Redeemed | | | (8,687 | ) | | | (15,247 | ) |
| | | | | | | | |
Change in Class C Shares | | | (3,462 | ) | | | 231 | |
Institutional Shares: | | | | | | | | |
Issued | | | 2,272,328 | | | | 3,815,821 | |
Reinvested | | | 265,040 | | | | 4,188,597 | |
Redeemed | | | (7,603,398 | ) | | | (16,751,134 | ) |
| | | | | | | | |
Change in Institutional Shares | | | (5,066,030 | ) | | | (8,746,716 | ) |
| | | | | | | | |
Change in Shares | | | (5,605,154 | ) | | | (8,862,439 | ) |
| | | | | | | | |
See accompanying notes to the financial statements.
120
| | | | | | | | | | | | | | | | | | | | | | |
Mid Cap
Value Fund | | | Mid Cap
Growth Fund | | | Small Cap
Fund | |
| | | | | |
For the
Year Ended
September 30,
2009 | | | For the
Year Ended
September 30,
2008 | | | For the
Year Ended
September 30,
2009 | | | For the
Year Ended
September 30,
2008 | | | For the
Year Ended
September 30,
2009 | | | For the
Year Ended
September 30,
2008 | |
| | | | | | | | | | | | | | | | | | | | | | |
| | | | | | | | | | | | | | | | | | | | | | |
| $ | 1,513,470 | | | $ | 31,373,575 | | | $ | 506,657 | | | $ | 1,505,577 | | | $ | 496,886 | | | $ | 908,488 | |
| | 23,737 | | | | 3,778,444 | | | | 293,130 | | | | 822,666 | | | | — | | | | 680,951 | |
| | (18,697,334 | ) | | | (10,645,106 | ) | | | (1,087,029 | ) | | | (1,891,497 | ) | | | (1,026,248 | ) | | | (1,458,959 | ) |
| | | | | | | | | | | | | | | | | | | | | | | |
| | (17,160,127 | ) | | | 24,506,913 | | | | (287,242 | ) | | | 436,746 | | | | (529,362 | ) | | | 130,480 | |
| | | | | | | | | | | | | | | | | | | | | | |
| | 193,887 | | | | 306,602 | | | | 81,030 | | | | 619,001 | | | | 88,516 | | | | 132,492 | |
| | 2,885 | | | | 560,831 | | | | 74,999 | | | | 183,244 | | | | — | | | | 266,745 | |
| | (793,203 | ) | | | (945,376 | ) | | | (414,479 | ) | | | (365,179 | ) | | | (468,822 | ) | | | (1,052,630 | ) |
| | | | | | | | | | | | | | | | | | | | | | | |
| | (596,431 | ) | | | (77,943 | ) | | | (258,450 | ) | | | 437,066 | | | | (380,306 | ) | | | (653,393 | ) |
| | | | | | | | | | | | | | | | | | | | | | |
| | 13,579 | | | | 42,358 | | | | 33,464 | | | | 46,372 | | | | 9,001 | | | | 5,985 | |
| | 125 | | | | 93,402 | | | | 1,037 | | | | 3,521 | | | | — | | | | 2,269 | |
| | (120,248 | ) | | | (606,537 | ) | | | (21,513 | ) | | | (48,413 | ) | | | (5,236 | ) | | | (14,770 | ) |
| | | | | | | | | | | | | | | | | | | | | | | |
| | (106,544 | ) | | | (470,777 | ) | | | 12,988 | | | | 1,480 | | | | 3,765 | | | | (6,516 | ) |
| | | | | | | | | | | | | | | | | | | | | | |
| | 84,559,427 | | | | 49,877,344 | | | | 29,052,759 | | | | 74,297,015 | | | | 8,459,184 | | | | 14,297,058 | |
| | 378,820 | | | | 17,813,502 | | | | 2,992,277 | | | | 6,724,412 | | | | — | | | | 2,929,232 | |
| | (52,041,186 | ) | | | (72,545,320 | ) | | | (76,372,958 | ) | | | (43,442,826 | ) | | | (11,525,473 | ) | | | (48,707,178 | ) |
| | | | | | | | | | | | | | | | | | | | | | | |
| | 32,897,061 | | | | (4,854,474 | ) | | | (44,327,922 | ) | | | 37,578,601 | | | | (3,066,289 | ) | | | (31,480,888 | ) |
| | | | | | | | | | | | | | | | | | | | | | | |
| $ | 15,033,959 | | | $ | 19,103,719 | | | $ | (44,860,626 | ) | | $ | 38,453,893 | | | $ | (3,972,192 | ) | | $ | (32,010,317 | ) |
| | | | | | | | | | | | | | | | | | | | | | | |
| | | | | |
| | | | | | | | | | | | | | | | | | | | | | |
| | | | | | | | | | | | | | | | | | | | | | |
| | 169,260 | | | | 2,150,405 | | | | 73,755 | | | | 111,756 | | | | 62,024 | | | | 72,286 | |
| | 2,909 | | | | 299,224 | | | | 46,455 | | | | 56,619 | | | | — | | | | 52,992 | |
| | (1,854,915 | ) | | | (901,246 | ) | | | (160,187 | ) | | | (147,297 | ) | | | (124,379 | ) | | | (117,039 | ) |
| | | | | | | | | | | | | | | | | | | | | | | |
| | (1,682,746 | ) | | | 1,548,383 | | | | (39,977 | ) | | | 21,078 | | | | (62,355 | ) | | | 8,239 | |
| | | | | | | | | | | | | | | | | | | | | | |
| | 25,735 | | | | 26,405 | | | | 13,076 | | | | 50,128 | | | | 11,572 | | | | 10,847 | |
| | 367 | | | | 45,707 | | | | 12,755 | | | | 13,385 | | | | — | | | | 21,564 | |
| | (100,401 | ) | | | (84,136 | ) | | | (67,193 | ) | | | (30,403 | ) | | | (61,568 | ) | | | (87,051 | ) |
| | | | | | | | | | | | | | | | | | | | | | | |
| | (74,299 | ) | | | (12,024 | ) | | | (41,362 | ) | | | 33,110 | | | | (49,996 | ) | | | (54,640 | ) |
| | | | | | | | | | | | | | | | | | | | | | |
| | 1,655 | | | | 3,800 | | | | 4,857 | | | | 3,617 | | | | 1,150 | | | | 503 | |
| | 15 | | | | 7,618 | | | | 176 | | | | 257 | | | | — | | | | 184 | |
| | (16,984 | ) | | | (56,499 | ) | | | (3,176 | ) | | | (4,134 | ) | | | (683 | ) | | | (1,314 | ) |
| | | | | | | | | | | | | | | | | | | | | | | |
| | (15,314 | ) | | | (45,081 | ) | | | 1,857 | | | | (260 | ) | | | 467 | | | | (627 | ) |
| | | | | | | | | | | | | | | | | | | | | | |
| | 9,161,697 | | | | 4,073,328 | | | | 3,999,163 | | | | 5,424,728 | | | | 1,033,718 | | | | 1,121,583 | |
| | 46,311 | | | | 1,403,044 | | | | 441,990 | | | | 434,674 | | | | — | | | | 226,021 | |
| | (6,271,824 | ) | | | (6,195,958 | ) | | | (10,298,457 | ) | | | (3,144,521 | ) | | | (1,411,466 | ) | | | (3,872,224 | ) |
| | | | | | | | | | | | | | | | | | | | | | | |
| | 2,936,184 | | | | (719,586 | ) | | | (5,857,304 | ) | | | 2,714,881 | | | | (377,748 | ) | | | (2,524,620 | ) |
| | | | | | | | | | | | | | | | | | | | | | | |
| | 1,163,825 | | | | 771,692 | | | | (5,936,786 | ) | | | 2,768,809 | | | | (489,632 | ) | | | (2,571,648 | ) |
| | | | | | | | | | | | | | | | | | | | | | | |
121
Statements of Changes in Net Assets, continued
| | | | | | | | |
| | | International
Equity Fund | |
| | |
| | | For the
Year Ended
September 30,
2009 | | | For the
Year Ended
September 30,
2008 | |
Capital Transactions: | | | | | | | | |
Class A Shares: | | | | | | | | |
Proceeds from shares issued | | $ | 611,996 | | | $ | 1,710,821 | |
Distributions reinvested | | | 73,346 | | | | 477,321 | |
Value of shares redeemed | | | (619,562 | ) | | | (1,749,026 | ) |
| | | | | | | | |
Change in net assets from Class A Share transactions | | | 65,780 | | | | 439,116 | |
Class B Shares: | | | | | | | | |
Proceeds from shares issued | | | 117,435 | | | | 496,814 | |
Distributions reinvested | | | 27,848 | | | | 197,185 | |
Value of shares redeemed | | | (322,513 | ) | | | (635,380 | ) |
| | | | | | | | |
Change in net assets from Class B Share transactions | | | (177,230 | ) | | | 58,619 | |
Class C Shares: | | | | | | | | |
Proceeds from shares issued | | | 6,213 | | | | 405,510 | |
Distributions reinvested | | | 3,934 | | | | 34,368 | |
Value of shares redeemed | | | (2,823 | ) | | | (346,251 | ) |
| | | | | | | | |
Change in net assets from Class C Share transactions | | | 7,324 | | | | 93,627 | |
Institutional Shares: | | | | | | | | |
Proceeds from shares issued | | | 18,592,178 | | | | 40,508,166 | |
Distributions reinvested | | | 1,355,129 | | | | 12,174,623 | |
Value of shares redeemed | | | (37,274,473 | ) | | | (43,809,359 | ) |
| | | | | | | | |
Change in net assets from Institutional Share transactions | | | (17,327,166 | ) | | | 8,873,430 | |
| | | | | | | | |
Change in net assets from capital transactions | | $ | (17,431,292 | ) | | $ | 9,464,792 | |
| | | | | | | | |
| | |
Share Transactions: | | | | | | | | |
Class A Shares: | | | | | | | | |
Issued | | | 138,546 | | | | 229,099 | |
Reinvested | | | 17,422 | | | | 60,390 | |
Redeemed | | | (149,273 | ) | | | (244,295 | ) |
| | | | | | | | |
Change in Class A Shares | | | 6,695 | | | | 45,194 | |
Class B Shares: | | | | | | | | |
Issued | | | 30,688 | | | | 75,714 | |
Reinvested | | | 7,426 | | | | 27,694 | |
Redeemed | | | (91,372 | ) | | | (100,597 | ) |
| | | | | | | | |
Change in Class B Shares | | | (53,258 | ) | | | 2,811 | |
Class C Shares: | | | | | | | | |
Issued | | | 1,326 | | | | 57,268 | |
Reinvested | | | 1,055 | | | | 4,857 | |
Redeemed | | | (868 | ) | | | (57,747 | ) |
| | | | | | | | |
Change in Class C Shares | | | 1,513 | | | | 4,378 | |
Institutional Shares: | | | | | | | | |
Issued | | | 4,282,213 | | | | 5,457,885 | |
Reinvested | | | 311,524 | | | | 1,494,589 | |
Redeemed | | | (8,714,073 | ) | | | (5,955,355 | ) |
| | | | | | | | |
Change in Institutional Shares | | | (4,120,336 | ) | | | 997,119 | |
| | | | | | | | |
Change in Shares | | | (4,165,386 | ) | | | 1,049,502 | |
| | | | | | | | |
See accompanying notes to the financial statements.
122
| | | | | | | | | | | | | | | | | | | | | | |
Special
Opportunities
Equity Fund | | | Equity
Income Fund | | | Short U.S.
Government Fund | |
| | | | | |
For the
Year Ended
September 30,
2009 | | | For the
Year Ended
September 30,
2008 | | | For the
Year Ended
September 30,
2009 | | | For the
Year Ended
September 30,
2008 | | | For the
Year Ended
September 30,
2009 | | | For the
Year Ended
September 30,
2008 | |
| | | | | | | | | | | | | | | | | | | | | | |
| | | | | | | | | | | | | | | | | | | | | | |
| $ | 71,191,936 | | | $ | 40,856,686 | | | $ | 30,607,899 | | | $ | 34,710,707 | | | $ | 1,494,189 | | | $ | 1,048,526 | |
| | 5,215,999 | | | | 5,048,436 | | | | 1,743,806 | | | | 5,628,335 | | | | 149,156 | | | | 150,983 | |
| | (29,786,631 | ) | | | (23,153,482 | ) | | | (24,727,229 | ) | | | (19,460,110 | ) | | | (1,476,030 | ) | | | (496,939 | ) |
| | | | | | | | | | | | | | | | | | | | | | | |
| | 46,621,304 | | | | 22,751,640 | | | | 7,624,476 | | | | 20,878,932 | | | | 167,315 | | | | 702,570 | |
| | | | | | | | | | | | | | | | | | | | | | |
| | 2,146,745 | | | | 4,512,724 | | | | 2,091,712 | | | | 4,803,961 | | | | — | | | | — | |
| | 1,122,418 | | | | 1,230,275 | | | | 184,877 | | | | 821,322 | | | | — | | | | — | |
| | (4,131,438 | ) | | | (3,949,418 | ) | | | (2,738,223 | ) | | | (2,168,984 | ) | | | — | | | | — | |
| | | | | | | | | | | | | | | | | | | | | | | |
| | (862,275 | ) | | | 1,793,581 | | | | (461,634 | ) | | | 3,456,299 | | | | — | | | | — | |
| | | | | | | | | | | | | | | | | | | | | | |
| | 16,178,384 | | | | 13,757,104 | | | | 14,110,019 | | | | 13,710,537 | | | | — | | | | — | |
| | 2,167,962 | | | | 2,118,775 | | | | 435,434 | | | | 1,473,697 | | | | — | | | | — | |
| | (8,736,669 | ) | | | (6,354,178 | ) | | | (6,328,259 | ) | | | (2,618,231 | ) | | | — | | | | — | |
| | | | | | | | | | | | | | | | | | | | | | | |
| | 9,609,677 | | | | 9,521,701 | | | | 8,217,194 | | | | 12,566,003 | | | | — | | | | — | |
| | | | | | | | | | | | | | | | | | | | | | |
| | 106,067,836 | | | | 97,927,526 | | | | 81,509,154 | | | | 121,610,130 | | | | 62,733,868 | | | | 16,917,479 | |
| | 5,139,975 | | | | 2,934,080 | | | | 2,352,452 | | | | 3,172,202 | | | | 450,895 | | | | 771,045 | |
| | (58,550,986 | ) | | | (32,078,237 | ) | | | (41,983,839 | ) | | | (12,464,888 | ) | | | (49,594,907 | ) | | | (13,529,077 | ) |
| | | | | | | | | | | | | | | | | | | | | | | |
| | 52,656,825 | | | | 68,783,369 | | | | 41,877,767 | | | | 112,317,444 | | | | 13,589,856 | | | | 4,159,447 | |
| | | | | | | | | | | | | | | | | | | | | | | |
| $ | 108,025,531 | | | $ | 102,850,291 | | | $ | 57,257,803 | | | $ | 149,218,678 | | | $ | 13,757,171 | | | $ | 4,862,017 | |
| | | | | | | | | | | | | | | | | | | | | | | |
| | | | | |
| | | | | | | | | | | | | | | | | | | | | | |
| | | | | | | | | | | | | | | | | | | | | | |
| | 5,868,766 | | | | 2,323,415 | | | | 3,015,882 | | | | 2,521,954 | | | | 154,765 | | | | 108,963 | |
| | 490,046 | | | | 283,620 | | | | 169,595 | | | | 405,008 | | | | 15,462 | | | | 15,762 | |
| | (2,437,192 | ) | | | (1,357,676 | ) | | | (2,462,292 | ) | | | (1,430,735 | ) | | | (153,057 | ) | | | (51,766 | ) |
| | | | | | | | | | | | | | | | | | | | | | | |
| | 3,921,620 | | | | 1,249,359 | | | | 723,185 | | | | 1,496,227 | | | | 17,170 | | | | 72,959 | |
| | | | | | | | | | | | | | | | | | | | | | |
| | 192,268 | | | | 267,355 | | | | 215,807 | | | | 348,224 | | | | — | | | | — | |
| | 111,063 | | | | 71,904 | | | | 18,056 | | | | 58,978 | | | | — | | | | — | |
| | (368,389 | ) | | | (238,226 | ) | | | (275,597 | ) | | | (161,268 | ) | | | — | | | | — | |
| | | | | | | | | | | | | | | | | | | | | | | |
| | (65,058 | ) | | | 101,033 | | | | (41,734 | ) | | | 245,934 | | | | — | | | | — | |
| | | | | | | | | | | | | | | | | | | | | | |
| | 1,352,888 | | | | 814,720 | | | | 1,380,189 | | | | 1,001,325 | | | | — | | | | — | |
| | 214,531 | | | | 123,760 | | | | 42,286 | | | | 106,251 | | | | — | | | | — | |
| | (783,829 | ) | | | (379,374 | ) | | | (631,797 | ) | | | (192,606 | ) | | | — | | | | — | |
| | | | | | | | | | | | | | | | | | | | | | | |
| | 783,590 | | | | 559,106 | | | | 790,678 | | | | 914,970 | | | | — | | | | — | |
| | | | | | | | | | | | | | | | | | | | | | |
| | 8,619,828 | | | | 5,554,590 | | | | 8,044,137 | | | | 8,974,014 | | | | 6,496,098 | | | | 1,760,740 | |
| | 474,889 | | | | 162,733 | | | | 228,246 | | | | 232,928 | | | | 46,794 | | | | 80,416 | |
| | (4,537,247 | ) | | | (1,838,175 | ) | | | (4,117,926 | ) | | | (929,332 | ) | | | (5,133,031 | ) | | | (1,411,966 | ) |
| | | | | | | | | | | | | | | | | | | | | | | |
| | 4,557,470 | | | | 3,879,148 | | | | 4,154,457 | | | | 8,277,610 | | | | 1,409,861 | | | | 429,190 | |
| | | | | | | | | | | | | | | | | | | | | | | |
| | 9,197,622 | | | | 5,788,646 | | | | 5,626,586 | | | | 10,934,741 | | | | 1,427,031 | | | | 502,149 | |
| | | | | | | | | | | | | | | | | | | | | | | |
123
Statements of Changes in Net Assets, continued
| | | | | | | | |
| | | Intermediate U.S.
Government Fund | |
| | | For the
Year Ended
September 30,
2009 | | | For the
Year Ended
September 30,
2008 | |
Capital Transactions: | | | | | | | | |
Class A Shares: | | | | | | | | |
Proceeds from shares issued | | $ | 5,507,545 | | | $ | 4,151,603 | |
Distributions reinvested | | | 356,399 | | | | 353,870 | |
Value of shares redeemed | | | (3,198,228 | ) | | | (3,966,599 | ) |
| | | | | | | | |
Change in net assets from Class A Share transactions | | | 2,665,716 | | | | 538,874 | |
Class B Shares: | | | | | | | | |
Proceeds from shares issued | | | 770,323 | | | | 385,327 | |
Distributions reinvested | | | 86,626 | | | | 97,910 | |
Value of shares redeemed | | | (837,317 | ) | | | (451,241 | ) |
| | | | | | | | |
Change in net assets from Class B Share transactions | | | 19,632 | | | | 31,996 | |
Class C Shares: | | | | | | | | |
Proceeds from shares issued | | | 354,900 | | | | 36,955 | |
Distributions reinvested | | | 4,738 | | | | 5,172 | |
Value of shares redeemed | | | (118,825 | ) | | | (69,095 | ) |
| | | | | | | | |
Change in net assets from Class C Share transactions | | | 240,813 | | | | (26,968 | ) |
Institutional Shares: | | | | | | | | |
Proceeds from shares issued | | | 122,254,012 | | | | 22,634,205 | |
Distributions reinvested | | | 1,957,937 | | | | 2,070,689 | |
Value of shares redeemed | | | (63,380,669 | ) | | | (48,264,831 | ) |
| | | | | | | | |
Change in net assets from Institutional Share transactions | | | 60,831,280 | | | | (23,559,937 | ) |
| | | | | | | | |
Change in net assets from capital transactions | | $ | 63,757,441 | | | $ | (23,016,035 | ) |
| | | | | | | | |
| | |
Share Transactions: | | | | | | | | |
Class A Shares: | | | | | | | | |
Issued | | | 530,446 | | | | 409,227 | |
Reinvested | | | 34,310 | | | | 34,970 | |
Redeemed | | | (308,512 | ) | | | (392,944 | ) |
| | | | | | | | |
Change in Class A Shares | | | 256,244 | | | | 51,253 | |
Class B Shares: | | | | | | | | |
Issued | | | 74,821 | | | | 38,259 | |
Reinvested | | | 8,377 | | | | 9,709 | |
Redeemed | | | (80,647 | ) | | | (44,813 | ) |
| | | | | | | | |
Change in Class B Shares | | | 2,551 | | | | 3,155 | |
Class C Shares: | | | | | | | | |
Issued | | | 33,865 | | | | 3,621 | |
Reinvested | | | 457 | | | | 512 | |
Redeemed | | | (11,434 | ) | | | (6,910 | ) |
| | | | | | | | |
Change in Class C Shares | | | 22,888 | | | | (2,777 | ) |
Institutional Shares: | | | | | | | | |
Issued | | | 11,698,649 | | | | 2,222,644 | |
Reinvested | | | 188,282 | | | | 204,335 | |
Redeemed | | | (6,102,237 | ) | | | (4,767,302 | ) |
| | | | | | | | |
Change in Institutional Shares | | | 5,784,694 | | | | (2,340,323 | ) |
| | | | | | | | |
Change in Shares | | | 6,066,377 | | | | (2,288,692 | ) |
| | | | | | | | |
See accompanying notes to the financial statements.
124
| | | | | | | | | | | | | | | | | | | | | | |
Total Return
Bond Fund | | | Kentucky
Intermediate
Tax-Free Fund | | | Maryland
Intermediate
Tax-Free Fund | |
For the
Year Ended
September 30,
2009 | | | For the
Year Ended
September 30,
2008 | | | For the
Year Ended
September 30,
2009 | | | For the
Year Ended
September 30,
2008 | | | For the
Year Ended
September 30,
2009 | | | For the
Year Ended
September 30,
2008 | |
| | | | | | | | | | | | | | | | | | | | | | |
| | | | | | | | | | | | | | | | | | | | | | |
| $ | 9,088,236 | | | $ | 4,023,188 | | | $ | 1,307,631 | | | $ | 1,625,822 | | | $ | 3,911,381 | | | $ | 2,480,710 | |
| | 438,479 | | | | 361,811 | | | | 188,172 | | | | 145,862 | | | | 139,925 | | | | 77,643 | |
| | (3,473,367 | ) | | | (3,860,681 | ) | | | (477,223 | ) | | | (767,557 | ) | | | (680,310 | ) | | | (511,076 | ) |
| | | | | | | | | | | | | | | | | | | | | | | |
| | 6,053,348 | | | | 524,318 | | | | 1,018,580 | | | | 1,004,127 | | | | 3,370,996 | | | | 2,047,277 | |
| | | | | | | | | | | | | | | | | | | | | | |
| | 1,403,822 | | | | 1,208,252 | | | | — | | | | — | | | | — | | | | — | |
| | 175,040 | | | | 172,345 | | | | — | | | | — | | | | — | | | | — | |
| | (1,628,138 | ) | | | (1,297,198 | ) | | | — | | | | — | | | | — | | | | — | |
| | | | | | | | | | | | | | | | | | | | | | | |
| | (49,276 | ) | | | 83,399 | | | | — | | | | — | | | | — | | | | — | |
| | | | | | | | | | | | | | | | | | | | | | |
| | 188,344 | | | | 71,982 | | | | — | | | | — | | | | — | | | | — | |
| | 8,524 | | | | 5,545 | | | | — | | | | — | | | | — | | | | — | |
| | (7,826 | ) | | | (4,672 | ) | | | — | | | | — | | | | — | | | | — | |
| | | | | | | | | | | | | | | | | | | | | | | |
| | 189,042 | | | | 72,855 | | | | — | | | | — | | | | — | | | | — | |
| | | | | | | | | | | | | | | | | | | | | | |
| | 94,275,883 | | | | 129,656,163 | | | | 4,166,460 | | | | 4,491,038 | | | | 9,576,183 | | | | 5,307,244 | |
| | 5,788,138 | | | | 5,905,278 | | | | 22 | | | | 510 | | | | 34,871 | | | | 502 | |
| | (220,171,724 | ) | | | (127,818,921 | ) | | | (3,172,820 | ) | | | (3,962,947 | ) | | | (1,771,103 | ) | | | (1,956,890 | ) |
| | | | | | | | | | | | | | | | | | | | | | | |
| | (120,107,703 | ) | | | 7,742,520 | | | | 993,662 | | | | 528,601 | | | | 7,839,951 | | | | 3,350,856 | |
| | | | | | | | | | | | | | | | | | | | | | | |
| $ | (113,914,589 | ) | | $ | 8,423,092 | | | $ | 2,012,242 | | | $ | 1,532,728 | | | $ | 11,210,947 | | | $ | 5,398,133 | |
| | | | | | | | | | | | | | | | | | | | | | | |
| | | | | |
| | | | | | | | | | | | | | | | | | | | | | |
| | | | | | | | | | | | | | | | | | | | | | |
| | 880,753 | | | | 391,613 | | | | 127,302 | | | | 158,556 | | | | 367,703 | | | | 240,284 | |
| | 42,944 | | | | 35,338 | | | | 18,641 | | | | 14,398 | | | | 13,488 | | | | 7,564 | |
| | (341,607 | ) | | | (376,613 | ) | | | (48,014 | ) | | | (75,594 | ) | | | (64,532 | ) | | | (49,995 | ) |
| | | | | | | | | | | | | | | | | | | | | | | |
| | 582,090 | | | | 50,338 | | | | 97,929 | | | | 97,360 | | | | 316,659 | | | | 197,853 | |
| | | | | | | | | | | | | | | | | | | | | | |
| | 139,668 | | | | 117,924 | | | | — | | | | — | | | | — | | | | — | |
| | 17,205 | | | | 16,814 | | | | — | | | | — | | | | — | | | | — | |
| | (160,292 | ) | | | (126,837 | ) | | | — | | | | — | | | | — | | | | — | |
| | | | | | | | | | | | | | | | | | | | | | | |
| | (3,419 | ) | | | 7,901 | | | | — | | | | — | | | | — | | | | — | |
| | | | | | | | | | | | | | | | | | | | | | |
| | 18,404 | | | | 7,112 | | | | — | | | | — | | | | — | | | | — | |
| | 832 | | | | 541 | | | | — | | | | — | | | | — | | | | — | |
| | (781 | ) | | | (456 | ) | | | — | | | | — | | | | — | | | | — | |
| | | | | | | | | | | | | | | | | | | | | | | |
| | 18,455 | | | | 7,197 | | | | — | | | | — | | | | — | | | | — | |
| | | | | | | | | | | | | | | | | | | | | | |
| | 9,274,960 | | | | 12,641,438 | | | | 404,656 | | | | 440,545 | | | | 903,818 | | | | 512,268 | |
| | 569,241 | | | | 576,342 | | | | 2 | | | | 50 | | | | 3,330 | | | | 48 | |
| | (21,833,628 | ) | | | (12,502,515 | ) | | | (309,841 | ) | | | (391,077 | ) | | | (169,663 | ) | | | (189,664 | ) |
| | | | | | | | | | | | | | | | | | | | | | | |
| | (11,989,427 | ) | | | 715,265 | | | | 94,817 | | | | 49,518 | | | | 737,485 | | | | 322,652 | |
| | | | | | | | | | | | | | | | | | | | | | | |
| | (11,392,301 | ) | | | 780,701 | | | | 192,746 | | | | 146,878 | | | | 1,054,144 | | | | 520,505 | |
| | | | | | | | | | | | | | | | | | | | | | | |
125
Statements of Changes in Net Assets, continued
| | | | | | | | |
| | | North Carolina
Intermediate
Tax-Free Fund | |
| | |
| | | For the
Year Ended
September 30,
2009 | | | For the
Year Ended
September 30,
2008 | |
Capital Transactions: | | | | | | | | |
Class A Shares: | | | | | | | | |
Proceeds from shares issued | | $ | 8,512,398 | | | $ | 2,944,205 | |
Distributions reinvested | | | 700,409 | | | | 568,199 | |
Value of shares redeemed | | | (2,239,327 | ) | | | (1,700,381 | ) |
| | | | | | | | |
Change in net assets from Class A Share transactions | | | 6,973,480 | | | | 1,812,023 | |
Institutional Shares: | | | | | | | | |
Proceeds from shares issued | | | 53,325,044 | | | | 31,782,264 | |
Distributions reinvested | | | 86,026 | | | | 77,486 | |
Value of shares redeemed | | | (35,459,155 | ) | | | (22,053,472 | ) |
| | | | | | | | |
Change in net assets from Institutional Share transactions | | | 17,951,915 | | | | 9,806,278 | |
| | | | | | | | |
Change in net assets from capital transactions | | $ | 24,925,395 | | | $ | 11,618,301 | |
| | | | | | | | |
| | |
Share Transactions: | | | | | | | | |
Class A Shares: | | | | | | | | |
Issued | | | 808,322 | | | | 283,508 | |
Reinvested | | | 67,986 | | | | 54,918 | |
Redeemed | | | (216,514 | ) | | | (163,614 | ) |
| | | | | | | | |
Change in Class A Shares | | | 659,794 | | | | 174,812 | |
Institutional Shares: | | | | | | | | |
Issued | | | 5,114,666 | | | | 3,060,340 | |
Reinvested | | | 8,269 | | | | 7,487 | |
Redeemed | | | (3,416,981 | ) | | | (2,122,943 | ) |
| | | | | | | | |
Change in Institutional Shares | | | 1,705,954 | | | | 944,884 | |
| | | | | | | | |
Change in Shares | | | 2,365,748 | | | | 1,119,696 | |
| | | | | | | | |
See accompanying notes to the financial statements.
126
| | | | | | | | | | | | | | | | | | | | | | |
South Carolina
Intermediate
Tax-Free Fund | | | Virginia
Intermediate
Tax-Free Fund | | | West Virginia
Intermediate
Tax-Free Fund | |
| | | | | |
For the
Year Ended
September 30,
2009 | | | For the
Year Ended
September 30,
2008 | | | For the
Year Ended
September 30,
2009 | | | For the
Year Ended
September 30,
2008 | | | For the
Year Ended
September 30,
2009 | | | For the
Year Ended
September 30,
2008 | |
| | | | | | | | | | | | | | | | | | | | | | |
| | | | | | | | | | | | | | | | | | | | | | |
| $ | 4,351,829 | | | $ | 3,981,152 | | | $ | 10,846,093 | | | $ | 2,172,054 | | | $ | 3,638,868 | | | $ | 3,207,979 | |
| | 363,052 | | | | 198,480 | | | | 313,225 | | | | 238,707 | | | | 369,696 | | | | 382,916 | |
| | (1,566,583 | ) | | | (211,899 | ) | | | (1,688,822 | ) | | | (1,338,143 | ) | | | (1,807,775 | ) | | | (3,748,942 | ) |
| | | | | | | | | | | | | | | | | | | | | | | |
| | 3,148,298 | | | | 3,967,733 | | | | 9,470,496 | | | | 1,072,618 | | | | 2,200,789 | | | | (158,047 | ) |
| | | | | | | | | | | | | | | | | | | | | | |
| | 6,388,083 | | | | 5,213,821 | | | | 13,709,083 | | | | 15,679,123 | | | | 17,512,513 | | | | 16,692,942 | |
| | 51,922 | | | | 4,568 | | | | 22,190 | | | | 59,853 | | | | 53,700 | | | | 37,186 | |
| | (3,479,992 | ) | | | (4,294,852 | ) | | | (19,633,319 | ) | | | (11,599,152 | ) | | | (14,879,107 | ) | | | (10,356,638 | ) |
| | | | | | | | | | | | | | | | | | | | | | | |
| | 2,960,013 | | | | 923,537 | | | | (5,902,046 | ) | | | 4,139,824 | | | | 2,687,106 | | | | 6,373,490 | |
| | | | | | | | | | | | | | | | | | | | | | | |
| $ | 6,108,311 | | | $ | 4,891,270 | | | $ | 3,568,450 | | | $ | 5,212,442 | | | $ | 4,887,895 | | | $ | 6,215,443 | |
| | | | | | | | | | | | | | | | | | | | | | | |
| | | | | |
| | | | | | | | | | | | | | | | | | | | | | |
| | | | | | | | | | | | | | | | | | | | | | |
| | 422,507 | | | | 386,187 | | | | 924,445 | | | | 190,550 | | | | 374,355 | | | | 331,224 | |
| | 36,060 | | | | 19,397 | | | | 27,104 | | | | 21,015 | | | | 38,419 | | | | 39,668 | |
| | (156,703 | ) | | | (20,650 | ) | | | (147,293 | ) | | | (117,539 | ) | | | (191,986 | ) | | | (386,959 | ) |
| | | | | | | | | | | | | | | | | | | | | | | |
| | 301,864 | | | | 384,934 | | | | 804,256 | | | | 94,026 | | | | 220,788 | | | | (16,067 | ) |
| | | | | | | | | | | | | | | | | | | | | | |
| | 622,738 | | | | 511,702 | | | | 1,172,262 | | | | 1,373,960 | | | | 1,802,282 | | | | 1,725,229 | |
| | 5,167 | | | | 449 | | | | 1,933 | | | | 5,271 | | | | 5,594 | | | | 3,860 | |
| | (344,978 | ) | | | (419,497 | ) | | | (1,691,879 | ) | | | (1,018,856 | ) | | | (1,541,826 | ) | | | (1,067,146 | ) |
| | | | | | | | | | | | | | | | | | | | | | | |
| | 282,927 | | | | 92,654 | | | | (517,684 | ) | | | 360,375 | | | | 266,050 | | | | 661,943 | |
| | | | | | | | | | | | | | | | | | | | | | | |
| | 584,791 | | | | 477,588 | | | | 286,572 | | | | 454,401 | | | | 486,838 | | | | 645,876 | |
| | | | | | | | | | | | | | | | | | | | | | | |
127
Statements of Changes in Net Assets, continued
| | | | | | | | |
| | | National
Tax-Free Money
Market Fund | |
| | |
| | | For the
Year Ended
September 30,
2009 | | | For the
Year Ended
September 30,
2008 | |
Capital Transactions: | | | | | | | | |
Class A Shares: | | | | | | | | |
Proceeds from shares issued | | $ | 77,000 | | | $ | 647,092 | |
Distributions reinvested | | | 322 | | | | 10,685 | |
Value of shares redeemed | | | (31,187 | ) | | | (1,180,165 | ) |
| | | | | | | | |
Change in net assets from Class A Share transactions | | | 46,135 | | | | (522,388 | ) |
Class B Shares: | | | | | | | | |
Proceeds from shares issued | | | — | | | | 50 | |
Distributions reinvested | | | — | | | | 17 | |
Value of shares redeemed | | | (1,097 | )* | | | (122 | ) |
| | | | | | | | |
Change in net assets from Class B Share transactions | | | (1,097 | ) | | | (55 | ) |
Class C Shares: | | | | | | | | |
Proceeds from shares issued | | | — | | | | — | |
Distributions reinvested | | | — | | | | 14 | |
Value of shares redeemed | | | (1,040 | )* | | | — | |
| | | | | | | | |
Change in net assets from Class C Share transactions | | | (1,040 | ) | | | 14 | |
Institutional Shares: | | | | | | | | |
Proceeds from shares issued | | | 344,322,885 | | | | 271,228,429 | |
Distributions reinvested | | | 10,075 | | | | 24 | |
Value of shares redeemed | | | (234,871,116 | ) | | | (229,389,979 | ) |
| | | | | | | | |
Change in net assets from Institutional Share transactions | | | 109,461,844 | | | | 41,838,474 | |
| | | | | | | | |
Change in net assets from capital transactions | | $ | 109,505,842 | | | $ | 41,316,045 | |
| | | | | | | | |
| | |
Share Transactions: | | | | | | | | |
Class A Shares: | | | | | | | | |
Issued | | | 77,000 | | | | 647,092 | |
Reinvested | | | 322 | | | | 10,685 | |
Redeemed | | | (31,187 | ) | | | (1,180,081 | ) |
| | | | | | | | |
Change in Class A Shares | | | 46,135 | | | | (522,304 | ) |
Class B Shares: | | | | | | | | |
Issued | | | — | | | | 50 | |
Reinvested | | | — | | | | 17 | |
Redeemed | | | (1,097 | )* | | | (122 | ) |
| | | | | | | | |
Change in Class B Shares | | | (1,097 | ) | | | (55 | ) |
Class C Shares: | | | | | | | | |
Issued | | | — | | | | — | |
Reinvested | | | — | | | | 14 | |
Redeemed | | | (1,040 | )* | | | — | |
| | | | | | | | |
Change in Class C Shares | | | (1,040 | ) | | | 14 | |
Institutional Shares: | | | | | | | | |
Issued | | | 344,322,885 | | | | 271,228,345 | |
Reinvested | | | 10,075 | | | | 24 | |
Redeemed | | | (234,871,115 | ) | | | (229,389,979 | ) |
| | | | | | | | |
Change in Institutional Shares | | | 109,461,845 | | | | 41,838,390 | |
| | | | | | | | |
Change in Shares | | | 109,505,843 | | | | 41,316,045 | |
| | | | | | | | |
| * | The Class B Shares and Class C Shares liquidated on 1/29/09. |
See accompanying notes to the financial statements.
128
| | | | | | | | | | | | | | | | | | | | | | |
Prime Money
Market Fund | | | U.S. Treasury
Money Market Fund | | | Capital Manager
Conservative
Growth Fund | |
| | | | | |
For the
Year Ended
September 30,
2009 | | | For the
Year Ended
September 30,
2008 | | | For the
Year Ended
September 30,
2009 | | | For the
Year Ended
September 30,
2008 | | | For the
Year Ended
September 30,
2009 | | | For the
Year Ended
September 30,
2008 | |
| | | | | | | | | | | | | | | | | | | | | | |
| | | | | | | | | | | | | | | | | | | | | | |
| $ | 187,765,892 | | | $ | 883,890,942 | | | $ | 141,940,413 | | | $ | 491,757,763 | | | $ | 1,103,857 | | | $ | 1,694,450 | |
| | 3,326,989 | | | | 23,082,837 | | | | 86,122 | | | | 5,415,250 | | | | 273,616 | | | | 1,010,158 | |
| | (683,388,858 | ) | | | (889,204,868 | ) | | | (458,963,771 | ) | | | (322,554,015 | ) | | | (2,868,514 | ) | | | (2,902,409 | ) |
| | | | | | | | | | | | | | | | | | | | | | | |
| | (492,295,977 | ) | | | 17,768,911 | | | | (316,937,236 | ) | | | 174,618,998 | | | | (1,491,041 | ) | | | (197,801 | ) |
| | | | | | | | | | | | | | | | | | | | | | |
| | 1,578,997 | | | | 1,405,424 | | | | 1,394,849 | | | | 734,529 | | | | 431,215 | | | | 853,169 | |
| | 6,554 | | | | 35,735 | | | | 209 | | | | 4,078 | | | | 132,124 | | | | 469,631 | |
| | (1,451,437 | ) | | | (1,302,998 | ) | | | (1,056,675 | ) | | | (442,830 | ) | | | (1,387,571 | ) | | | (1,018,074 | ) |
| | | | | | | | | | | | | | | | | | | | | | | |
| | 134,114 | | | | 138,161 | | | | 338,383 | | | | 295,777 | | | | (824,232 | ) | | | 304,726 | |
| | | | | | | | | | | | | | | | | | | | | | |
| | 1,558,892 | | | | 591,737 | | | | 35,571 | | | | — | | | | 2,541 | | | | 38,452 | |
| | 2,013 | | | | 6,991 | | | | 17 | | | | 536 | | | | 3,680 | | | | 8,067 | |
| | (912,463 | ) | | | (814,854 | ) | | | (18,848 | ) | | | (5,700 | ) | | | (30 | ) | | | (10,295 | ) |
| | | | | | | | | | | | | | | | | | | | | | | |
| | 648,442 | | | | (216,126 | ) | | | 16,740 | | | | (5,164 | ) | | | 6,191 | | | | 36,224 | |
| | | | | | | | | | | | | | | | | | | | | | |
| | 1,886,208,967 | | | | 2,154,640,348 | | | | 1,110,279,019 | | | | 1,477,466,490 | | | | 1,383,961 | | | | 4,321,850 | |
| | 1,006,032 | | | | 3,002,828 | | | | 64,060 | | | | 3,812,095 | | | | 1,172,690 | | | | 5,099,022 | |
| | (1,982,503,239 | ) | | | (1,970,762,435 | ) | | | (1,390,285,878 | ) | | | (1,325,864,717 | ) | | | (33,813,884 | ) | | | (7,279,837 | ) |
| | | | | | | | | | | | | | | | | | | | | | | |
| | (95,288,240 | ) | | | 186,880,741 | | | | (279,942,799 | ) | | | 155,413,868 | | | | (31,257,233 | ) | | | 2,141,035 | |
| | | | | | | | | | | | | | | | | | | | | | | |
| $ | (586,801,661 | ) | | $ | 204,571,687 | | | $ | (596,524,912 | ) | | $ | 330,323,479 | | | $ | (33,566,315 | ) | | $ | 2,284,184 | |
| | | | | | | | | | | | | | | | | | | | | | | |
| | | | | |
| | | | | | | | | | | | | | | | | | | | | | |
| | | | | | | | | | | | | | | | | | | | | | |
| | 187,765,892 | | | | 883,891,108 | | | | 141,940,413 | | | | 491,757,438 | | | | 145,115 | | | | 179,927 | |
| | 3,326,989 | | | | 23,082,837 | | | | 86,123 | | | | 5,415,250 | | | | 36,062 | | | | 105,410 | |
| | (683,388,858 | ) | | | (889,204,868 | ) | | | (458,963,771 | ) | | | (322,554,015 | ) | | | (381,702 | ) | | | (315,524 | ) |
| | | | | | | | | | | | | | | | | | | | | | | |
| | (492,295,977 | ) | | | 17,769,077 | | | | (316,937,235 | ) | | | 174,618,673 | | | | (200,525 | ) | | | (30,187 | ) |
| | | | | | | | | | | | | | | | | | | | | | |
| | 1,578,997 | | | | 1,405,455 | | | | 1,394,849 | | | | 734,529 | | | | 59,003 | | | | 90,995 | |
| | 6,554 | | | | 35,704 | | | | 208 | | | | 4,078 | | | | 17,490 | | | | 48,874 | |
| | (1,451,437 | ) | | | (1,302,998 | ) | | | (1,056,675 | ) | | | (442,830 | ) | | | (185,810 | ) | | | (109,494 | ) |
| | | | | | | | | | | | | | | | | | | | | | | |
| | 134,114 | | | | 138,161 | | | | 338,382 | | | | 295,777 | | | | (109,317 | ) | | | 30,375 | |
| | | | | | | | | | | | | | | | | | | | | | |
| | 1,558,892 | | | | 591,737 | | | | 35,571 | | | | — | | | | 330 | | | | 4,134 | |
| | 2,013 | | | | 6,991 | | | | 17 | | | | 535 | | | | 488 | | | | 845 | |
| | (912,463 | ) | | | (814,855 | ) | | | (18,848 | ) | | | (5,700 | ) | | | (4 | ) | | | (1,117 | ) |
| | | | | | | | | | | | | | | | | | | | | | | |
| | 648,442 | | | | (216,127 | ) | | | 16,740 | | | | (5,165 | ) | | | 814 | | | | 3,862 | |
| | | | | | | | | | | | | | | | | | | | | | |
| | 1,886,208,967 | | | | 2,154,640,182 | | | | 1,110,279,019 | | | | 1,477,465,931 | | | | 180,694 | | | | 460,888 | |
| | 1,006,032 | | | | 3,002,828 | | | | 64,060 | | | | 3,812,095 | | | | 154,895 | | | | 528,361 | |
| | (1,982,503,239 | ) | | | (1,970,762,435 | ) | | | (1,390,285,878 | ) | | | (1,325,864,717 | ) | | | (4,411,452 | ) | | | (768,685 | ) |
| | | | | | | | | | | | | | | | | | | | | | | |
| | (95,288,240 | ) | | | 186,880,575 | | | | (279,942,799 | ) | | | 155,413,309 | | | | (4,075,863 | ) | | | 220,564 | |
| | | | | | | | | | | | | | | | | | | | | | | |
| | (586,801,661 | ) | | | 204,571,686 | | | | (596,524,912 | ) | | | 330,322,594 | | | | (4,384,891 | ) | | | 224,614 | |
| | | | | | | | | | | | | | | | | | | | | | | |
129
Statements of Changes in Net Assets, continued
| | | | | | | | |
| | | Capital Manager
Moderate
Growth Fund | |
| | |
| | | For the
Year Ended
September 30,
2009 | | | For the
Year Ended
September 30,
2008 | |
Capital Transactions: | | | | | | | | |
Class A Shares: | | | | | | | | |
Proceeds from shares issued | | $ | 2,971,395 | | | $ | 4,054,599 | |
Distributions reinvested | | | 511,761 | | | | 5,146,292 | |
Value of shares redeemed | | | (6,232,223 | ) | | | (7,984,960 | ) |
| | | | | | | | |
Change in net assets from Class A Share transactions | | | (2,749,067 | ) | | | 1,215,931 | |
Class B Shares: | | | | | | | | |
Proceeds from shares issued | | | 407,315 | | | | 1,455,799 | |
Distributions reinvested | | | 194,626 | | | | 2,882,142 | |
Value of shares redeemed | | | (3,675,777 | ) | | | (4,267,809 | ) |
| | | | | | | | |
Change in net assets from Class B Share transactions | | | (3,073,836 | ) | | | 70,132 | |
Class C Shares: | | | | | | | | |
Proceeds from shares issued | | | 7,452 | | | | 13,771 | |
Distributions reinvested | | | 1,228 | | | | 19,617 | |
Value of shares redeemed | | | (90 | ) | | | (68,497 | ) |
| | | | | | | | |
Change in net assets from Class C Share transactions | | | 8,590 | | | | (35,109 | ) |
Institutional Shares: | | | | | | | | |
Proceeds from shares issued | | | 723,777 | | | | 4,551,083 | |
Distributions reinvested | | | 214,818 | | | | 4,023,713 | |
Value of shares redeemed | | | (18,467,574 | ) | | | (7,440,954 | ) |
| | | | | | | | |
Change in net assets from Institutional Share transactions | | | (17,528,979 | ) | | | 1,133,842 | |
| | | | | | | | |
Change in net assets from capital transactions | | $ | (23,343,292 | ) | | $ | 2,384,796 | |
| | | | | | | | |
| | |
Share Transactions: | | | | | | | | |
Class A Shares: | | | | | | | | |
Issued | | | 433,920 | | | | 445,339 | |
Reinvested | | | 74,892 | | | | 544,253 | |
Redeemed | | | (946,756 | ) | | | (895,379 | ) |
| | | | | | | | |
Change in Class A Shares | | | (437,944 | ) | | | 94,213 | |
Class B Shares: | | | | | | | | |
Issued | | | 63,505 | | | | 158,755 | |
Reinvested | | | 29,309 | | | | 309,633 | |
Redeemed | | | (564,356 | ) | | | (485,694 | ) |
| | | | | | | | |
Change in Class B Shares | | | (471,542 | ) | | | (17,306 | ) |
Class C Shares: | | | | | | | | |
Issued | | | 1,061 | | | | 1,510 | |
Reinvested | | | 183 | | | | 2,091 | |
Redeemed | | | (13 | ) | | | (7,716 | ) |
| | | | | | | | |
Change in Class C Shares | | | 1,231 | | | | (4,115 | ) |
Institutional Shares: | | | | | | | | |
Issued | | | 109,413 | | | | 497,015 | |
Reinvested | | | 31,749 | | | | 424,216 | |
Redeemed | | | (2,699,565 | ) | | | (829,826 | ) |
| | | | | | | | |
Change in Institutional Shares | | | (2,558,403 | ) | | | 91,405 | |
| | | | | | | | |
Change in Shares | | | (3,466,658 | ) | | | 164,197 | |
| | | | | | | | |
See accompanying notes to the financial statements.
130
| | | | | | | | | | | | | | |
Capital Manager
Growth Fund | | | Capital Manager
Equity Fund | |
| | | |
For the
Year Ended
September 30,
2009 | | | For the
Year Ended
September 30,
2008 | | | For the
Year Ended
September 30,
2009 | | | For the Year Ended September 30, 2008 | |
| | | | | | | | | | | | | | |
| | | | | | | | | | | | | | |
| $ | 1,738,721 | | | $ | 2,941,986 | | | $ | 506,015 | | | $ | 704,541 | |
| | 273,487 | | | | 4,057,489 | | | | 38,360 | | | | 1,550,704 | |
| | (2,943,160 | ) | | | (5,400,646 | ) | | | (885,055 | ) | | | (2,186,528 | ) |
| | | | | | | | | | | | | | | |
| | (930,952 | ) | | | 1,598,829 | | | | (340,680 | ) | | | 68,717 | |
| | | | | | | | | | | | | | |
| | 318,527 | | | | 927,328 | | | | 179,777 | | | | 491,242 | |
| | 120,376 | | | | 3,024,893 | | | | 35,220 | | | | 1,489,187 | |
| | (2,947,687 | ) | | | (3,701,869 | ) | | | (830,315 | ) | | | (1,499,992 | ) |
| | | | | | | | | | | | | | | |
| | (2,508,784 | ) | | | 250,352 | | | | (615,318 | ) | | | 480,437 | |
| | | | | | | | | | | | | | |
| | 43,206 | | | | 11,140 | | | | 4,494 | | | | — | |
| | 695 | | | | 13,134 | | | | 5 | | | | 206 | |
| | (60 | ) | | | (15,905 | ) | | | — | | | | — | |
| | | | | | | | | | | | | | | |
| | 43,841 | | | | 8,369 | | | | 4,499 | | | | 206 | |
| | | | | | | | | | | | | | |
| | 1,193,730 | | | | 5,209,046 | | | | 1,069,147 | | | | 3,663,772 | |
| | 181,769 | | | | 3,836,943 | | | | 109,897 | | | | 3,545,554 | |
| | (15,009,024 | ) | | | (6,626,335 | ) | | | (11,662,428 | ) | | | (5,328,749 | ) |
| | | | | | | | | | | | | | | |
| | (13,633,525 | ) | | | 2,419,654 | | | | (10,483,384 | ) | | | 1,880,577 | |
| | | | | | | | | | | | | | | |
| $ | (17,029,420 | ) | | $ | 4,277,204 | | | $ | (11,434,883 | ) | | $ | 2,429,937 | |
| | | | | | | | | | | | | | | |
| | | |
| | | | | | | | | | | | | | |
| | | | | | | | | | | | | | |
| | 282,599 | | | | 323,287 | | | | 89,077 | | | | 77,290 | |
| | 44,689 | | | | 434,854 | | | | 6,718 | | | | 156,652 | |
| | (489,607 | ) | | | (613,123 | ) | | | (152,292 | ) | | | (232,401 | ) |
| | | | | | | | | | | | | | | |
| | (162,319 | ) | | | 145,018 | | | | (56,497 | ) | | | 1,541 | |
| | | | | | | | | | | | | | |
| | 54,973 | | | | 107,676 | | | | 35,154 | | | | 53,972 | |
| | 20,331 | | | | 329,834 | | | | 6,439 | | | | 156,128 | |
| | (496,028 | ) | | | (439,284 | ) | | | (150,409 | ) | | | (167,455 | ) |
| | | | | | | | | | | | | | | |
| | (420,724 | ) | | | (1,774 | ) | | | (108,816 | ) | | | 42,645 | |
| | | | | | | | | | | | | | |
| | 6,560 | | | | 1,118 | | | | 762 | | | | — | |
| | 115 | | | | 1,432 | | | | 1 | | | | 22 | |
| | (10 | ) | | | (2,018 | ) | | | — | | | | — | |
| | | | | | | | | | | | | | | |
| | 6,665 | | | | 532 | | | | 763 | | | | 22 | |
| | | | | | | | | | | | | | |
| | 200,066 | | | | 591,710 | | | | 185,987 | | | | 404,707 | |
| | 29,851 | | | | 411,309 | | | | 19,046 | | | | 355,533 | |
| | (2,427,109 | ) | | | (751,404 | ) | | | (1,976,166 | ) | | | (574,198 | ) |
| | | | | | | | | | | | | | | |
| | (2,197,192 | ) | | | 251,615 | | | | (1,771,133 | ) | | | 186,042 | |
| | | | | | | | | | | | | | | |
| | (2,773,570 | ) | | | 395,391 | | | | (1,935,683 | ) | | | 230,250 | |
| | | | | | | | | | | | | | | |
131
Financial Highlights, Class A Shares
Selected data for a share of beneficial interest outstanding throughout the periods indicated.
| | | | | | | | | | | | | | | | |
| | | | | Investment Activities | | Distributions |
| | | | | | | | |
| | | | | | | | | | | | | | | | | |
| | | Net Asset
Value,
Beginning
of Year | | Net investment income (loss) | | Net realized/ unrealized
gains (losses)
on investments | | Total from Investment Activities | | Net investment income | | Net realized gains on investments | | Return
of
capital | | Total
Distributions |
Large Cap Fund | | | | | | | | | | | | | | | | |
Year Ended September 30, 2009 | | $11.31 | | 0.11(a) | | (1.22) | | (1.11) | | (0.12) | | — | | — | | (0.12) |
Year Ended September 30, 2008 | | $19.13 | | 0.15(a) | | (5.14) | | (4.99) | | (0.10) | | (2.73) | | — | | (2.83) |
Year Ended September 30, 2007 | | $20.33 | | 0.24(a) | | 2.14 | | 2.38 | | (0.23) | | (3.35) | | — | | (3.58) |
Year Ended September 30, 2006 | | $19.47 | | 0.30(a) | | 2.30 | | 2.60 | | (0.30) | | (1.44) | | — | | (1.74) |
Year Ended September 30, 2005 | | $17.26 | | 0.28 | | 2.22 | | 2.50 | | (0.29) | | — | | — | | (0.29) |
Mid Cap Value Fund | | | | | | | | | | | | | | | | |
Year Ended September 30, 2009 | | $10.50 | | 0.02(a) | | 0.31 | | 0.33 | | (0.02) | | — | | — | | (0.02) |
Year Ended September 30, 2008 | | $14.93 | | 0.02(a) | | (3.07) | | (3.05) | | (0.02) | | (1.36) | | — | | (1.38) |
Year Ended September 30, 2007 | | $13.49 | | 0.04(a) | | 2.13 | | 2.17 | | (0.04) | | (0.69) | | — | | (0.73) |
Year Ended September 30, 2006 | | $13.35 | | 0.03(a) | | 1.60 | | 1.63 | | (0.04) | | (1.45) | | — | | (1.49) |
Year Ended September 30, 2005 | | $15.40 | | 0.13(a) | | 3.04 | | 3.17 | | (0.13) | | (5.09) | | — | | (5.22) |
Mid Cap Growth Fund | | | | | | | | | | | | | | | | |
Year Ended September 30, 2009 | | $ 9.93 | | (0.03)(a) | | (1.57) | | (1.60) | | — | | (0.33) | | (0.05) | | (0.38) |
Year Ended September 30, 2008 | | $14.84 | | (0.08)(a) | | (3.80) | | (3.88) | | — | | (1.03) | | — | | (1.03) |
Year Ended September 30, 2007 | | $12.45 | | (0.06)(a) | | 4.11 | | 4.05 | | (0.01) | | (1.65) | | — | | (1.66) |
Year Ended September 30, 2006 | | $13.90 | | (0.01)(a) | | —(b) | | (0.01) | | (0.02) | | (1.42) | | — | | (1.44) |
Year Ended September 30, 2005 | | $10.95 | | (0.09)(a) | | 3.18 | | 3.09 | | — | | (0.14) | | — | | (0.14) |
Small Cap Fund | | | | | | | | | | | | | | | | |
Year Ended September 30, 2009 | | $11.35 | | (0.04)(a) | | (2.22) | | (2.26) | | — | | — | | — | | — |
Year Ended September 30, 2008 | | $14.92 | | (0.03)(a) | | (2.34) | | (2.37) | | — | | (1.20) | | — | | (1.20) |
Year Ended September 30, 2007 | | $15.11 | | 0.07(a) | | 0.73 | | 0.80 | | (0.08) | | (0.91) | | — | | (0.99) |
Year Ended September 30, 2006 | | $16.38 | | —(a)(b) | | 1.06 | | 1.06 | | (0.03) | | (2.30) | | — | | (2.33) |
Year Ended September 30, 2005 | | $14.21 | | 0.11(a) | | 2.62 | | 2.73 | | (0.14) | | (0.42) | | — | | (0.56) |
International Equity Fund | | | | | | | | | | | | | | | | |
Year Ended September 30, 2009 | | $ 5.31 | | 0.06(a) | | (0.28) | | (0.22) | | (0.12) | | — | | — | | (0.12) |
Year Ended September 30, 2008 | | $ 8.41 | | 0.08(a) | | (2.41) | | (2.33) | | (0.02) | | (0.75) | | — | | (0.77) |
Year Ended September 30, 2007 | | $11.06 | | 0.12(a) | | 1.82 | | 1.94 | | (0.07) | | (4.52) | | — | | (4.59) |
Year Ended September 30, 2006 | | $ 9.58 | | 0.14(a) | | 1.49 | | 1.63 | | (0.15) | | — | | — | | (0.15) |
Year Ended September 30, 2005 | | $ 8.12 | | 0.10(a) | | 1.47 | | 1.57 | | (0.11) | | — | | — | | (0.11) |
Special Opportunities Equity Fund | | | | | | | | | | | | | | | | |
Year Ended September 30, 2009 | | $15.34 | | —(a)(b) | | —(b) | | —(b) | | —(b) | | (0.57) | | (0.11) | | (0.68) |
Year Ended September 30, 2008 | | $18.29 | | (0.08)(a) | | (2.12) | | (2.20) | | — | | (0.75) | | — | | (0.75) |
Year Ended September 30, 2007 | | $16.43 | | (0.01)(a) | | 3.47 | | 3.46 | | — | | (1.60) | | — | | (1.60) |
Year Ended September 30, 2006 | | $15.57 | | (0.04) | | 1.69 | | 1.65 | | — | | (0.79) | | — | | (0.79) |
Year Ended September 30, 2005 | | $13.08 | | (0.07) | | 2.68 | | 2.61 | | — | | (0.12) | | — | | (0.12) |
Equity Income Fund | | | | | | | | | | | | | | | | |
Year Ended September 30, 2009 | | $12.35 | | 0.30(a) | | (0.99) | | (0.69) | | (0.20) | | (0.03) | | — | | (0.23) |
Year Ended September 30, 2008 | | $15.03 | | 0.43(a) | | (2.21) | | (1.78) | | (0.32) | | (0.58) | | — | | (0.90) |
Year Ended September 30, 2007 | | $13.36 | | 0.36(a) | | 2.31 | | 2.67 | | (0.32) | | (0.68) | | — | | (1.00) |
Year Ended September 30, 2006 | | $12.09 | | 0.28 | | 1.58 | | 1.86 | | (0.32) | | (0.27) | | — | | (0.59) |
Year Ended September 30, 2005 | | $10.35 | | 0.24 | | 1.77 | | 2.01 | | (0.25) | | (0.02) | | — | | (0.27) |
Short U.S. Government Fund | | | | | | | | | | | | | | | | |
Year Ended September 30, 2009 | | $ 9.54 | | 0.24(a) | | 0.19 | | 0.43 | | (0.31) | | — | | — | | (0.31) |
Year Ended September 30, 2008 | | $ 9.52 | | 0.33(a) | | 0.07 | | 0.40 | | (0.38) | | — | | — | | (0.38) |
Year Ended September 30, 2007 | | $ 9.48 | | 0.36(a) | | 0.07 | | 0.43 | | (0.39) | | — | | — | | (0.39) |
Year Ended September 30, 2006 | | $ 9.50 | | 0.28(a) | | 0.01(c) | | 0.29 | | (0.31) | | — | | — | | (0.31) |
Year Ended September 30, 2005 | | $ 9.70 | | 0.23 | | (0.14) | | 0.09 | | (0.29) | | — | | — | | (0.29) |
| * | During the period certain fees were reduced. If such reductions had not occurred, the ratios would have been as indicated. |
| ** | Portfolio turnover rate is calculated on the basis of the Fund as a whole without distinguishing between classes of shares issued. |
| (a) | Per share net investment income (loss) has been calculated using the average daily shares method. |
| (b) | Amount is less than $0.005. |
| (c) | The amount shown for a share outstanding throughout the period does not accord with the change in aggregate gains and losses in the portfolio of securities during the period because of the timing of sales and purchases of Fund shares in relation to fluctuating market values during the period. |
See accompanying notes to the financial statements.
132
| | | | | | | | | | | | |
| | | | | Ratios/Supplementary Data |
Net Asset Value, End of Year | | Total
Return
(excludes
sales charge) | | Net Assets,
End of
Year
(000) | | Ratio of
net expenses
to average
net assets | | Ratio of net
investment
income
(loss) to
average net
assets | | Ratio of
expenses to
average
net assets* | | Portfolio
turnover rate** |
| | | | | | | | | | | | |
| $10.08 | | (9.67)% | | $ 29,290 | | 1.06% | | 1.25% | | 1.45% | | 92.97% |
| $11.31 | | (29.46)% | | $ 36,066 | | 1.14% | | 1.05% | | 1.43% | | 38.43% |
| $19.13 | | 12.55% | | $ 58,771 | | 1.16% | | 1.25% | | 1.47% | | 68.60% |
| $20.33 | | 14.29% | | $ 48,656 | | 1.14% | | 1.53% | | 1.43% | | 34.83% |
| $19.47 | | 14.60% | | $ 39,756 | | 1.14% | | 1.56% | | 1.48% | | 19.50% |
| | | | | | | | | | | | |
| $10.81 | | 3.24% | | $ 10,717 | | 1.21% | | 0.19% | | 1.26% | | 46.83% |
| $10.50 | | (22.00)% | | $ 28,068 | | 1.14% | | 0.17% | | 1.18% | | 65.74% |
| $14.93 | | 16.48% | | $ 16,811 | | 1.16% | | 0.27% | | 1.20% | | 58.59% |
| $13.49 | | 13.18% | | $ 13,393 | | 1.13% | | 0.23% | | 1.18% | | 53.92% |
| $13.35 | | 20.82% | | $ 12,361 | | 1.15% | | 0.76% | | 1.25% | | 126.99% |
| | | | | | | | | | | | |
| $ 7.95 | | (15.14)% | | $ 6,155 | | 1.23% | | (0.46)% | | 1.27% | | 173.21% |
| $ 9.93 | | (28.33)% | | $ 8,093 | | 1.15% | | (0.58)% | | 1.19% | | 218.03% |
| $14.84 | | 36.19% | | $ 11,774 | | 1.17% | | (0.49)% | | 1.21% | | 134.95% |
| $12.45 | | (0.49)% | | $ 10,381 | | 1.14% | | (0.07)% | | 1.19% | | 140.90% |
| $13.90 | | 28.45% | | $ 10,444 | | 1.14% | | (0.71)% | | 1.26% | | 92.74% |
| | | | | | | | | | | | |
| $ 9.09 | | (19.91)% | | $ 4,892 | | 1.41% | | (0.47)% | | 1.89% | | 137.20% |
| $11.35 | | (16.80)% | | $ 6,814 | | 1.28% | | (0.23)% | | 1.73% | | 94.93% |
| $14.92 | | 5.13% | | $ 8,839 | | 1.31% | | 0.42% | | 1.76% | | 46.54% |
| $15.11 | | 6.96% | | $ 9,353 | | 1.28% | | (0.03)% | | 1.77% | | 43.25% |
| $16.38 | | 19.64% | | $ 1,604 | | 1.29% | | 0.69% | | 1.77% | | 8.39% |
| | | | | | | | | | | | |
| $ 4.97 | | (3.78)% | | $ 3,333 | | 1.74% | | 1.34% | | 2.13% | | 223.19% |
| $ 5.31 | | (30.82)% | | $ 3,524 | | 1.56% | | 1.11% | | 1.99% | | 112.65% |
| $ 8.41 | | 20.13% | | $ 5,204 | | 1.38% | | 1.02% | | 1.75% | | 129.80% |
| $11.06 | | 17.04% | | $ 4,202 | | 1.40% | | 1.37% | | 1.75% | | 36.22% |
| $ 9.58 | | 19.46% | | $ 3,687 | | 1.46% | | 1.15% | | 1.83% | | 44.96% |
| | | | | | | | | | | | |
| $14.66 | | 1.74% | | $175,319 | | 1.28% | | 0.02% | | 1.54% | | 45.22% |
| $15.34 | | (12.61)% | | $123,249 | | 1.24% | | (0.48)% | | 1.49% | | 25.80% |
| $18.29 | | 22.24% | | $124,136 | | 1.28% | | (0.04)% | | 1.53% | | 49.43% |
| $16.43 | | 11.16% | | $ 81,883 | | 1.28% | | (0.26)% | | 1.53% | | 58.01% |
| $15.57 | | 20.05% | | $ 75,627 | | 1.30% | | (0.41)% | | 1.57% | | 30.38% |
| | | | | | | | | | | | |
| $11.43 | | (5.33)% | | $ 99,480 | | 1.18% | | 2.93% | | 1.45% | | 37.13% |
| $12.35 | | (12.47)% | | $ 98,584 | | 1.14% | | 3.09% | | 1.39% | | 30.01% |
| $15.03 | | 20.83% | | $ 97,491 | | 1.19% | | 2.53% | | 1.44% | | 37.85% |
| $13.36 | | 15.79% | | $ 60,059 | | 1.20% | | 2.28% | | 1.45% | | 45.38% |
| $12.09 | | 19.55% | | $ 40,825 | | 1.10% | | 2.57% | | 1.57% | | 39.65% |
| | | | | | | | | | | | |
| $ 9.66 | | 4.57% | | $ 4,909 | | 0.98% | | 2.44% | | 1.38% | | 89.57% |
| $ 9.54 | | 4.23% | | $ 4,680 | | 0.90% | | 3.42% | | 1.30% | | 48.20% |
| $ 9.52 | | 4.67% | | $ 3,978 | | 0.91% | | 3.77% | | 1.31% | | 44.10% |
| $ 9.48 | | 3.12% | | $ 6,233 | | 0.89% | | 2.99% | | 1.29% | | 98.08% |
| $ 9.50 | | 0.96% | | $ 7,980 | | 0.91% | | 2.40% | | 1.34% | | 33.67% |
133
Financial Highlights, Class A Shares
Selected data for a share of beneficial interest outstanding throughout the periods indicated.
| | | | | | | | | | | | | | |
| | | | | Investment Activities | | Distributions |
| | | | | | | |
| | | | | | | | | | | | | | | |
| | | Net Asset
Value,
Beginning
of Year | | Net
investment
income | | Net realized/
unrealized
gains (losses)
on investments | | Total from
Investment
Activities | | Net
investment
income | | Net realized
gains on
investments | | Total
Distributions |
Intermediate U.S. Government Fund | | | | | | | | | | | | | | |
Year Ended September 30, 2009 | | $10.03 | | 0.33(a) | | 0.55 | | 0.88 | | (0.35) | | — | | (0.35) |
Year Ended September 30, 2008 | | $ 9.93 | | 0.41(a) | | 0.11 | | 0.52 | | (0.42) | | — | | (0.42) |
Year Ended September 30, 2007 | | $ 9.89 | | 0.42(a) | | 0.04 | | 0.46 | | (0.42) | | — | | (0.42) |
Year Ended September 30, 2006 | | $10.01 | | 0.41(a) | | (0.11) | | 0.30 | | (0.42) | | — | | (0.42) |
Year Ended September 30, 2005 | | $10.24 | | 0.35(a) | | (0.15) | | 0.20 | | (0.38) | | (0.05) | | (0.43) |
Total Return Bond Fund | | | | | | | | | | | | | | |
Year Ended September 30, 2009 | | $ 9.88 | | 0.45(a) | | 0.90 | | 1.35 | | (0.45) | | — | | (0.45) |
Year Ended September 30, 2008 | | $10.12 | | 0.43(a) | | (0.21) | | 0.22 | | (0.46) | | — | | (0.46) |
Year Ended September 30, 2007 | | $10.12 | | 0.44(a) | | 0.01 | | 0.45 | | (0.45) | | — | | (0.45) |
Year Ended September 30, 2006 | | $10.31 | | 0.42(a) | | (0.12) | | 0.30 | | (0.44) | | (0.05) | | (0.49) |
Year Ended September 30, 2005 | | $10.59 | | 0.38(a) | | (0.19) | | 0.19 | | (0.44) | | (0.03) | | (0.47) |
Kentucky Intermediate Tax-Free Fund | | | | | | | | | | | | | | |
Year Ended September 30, 2009 | | $ 9.88 | | 0.33(a) | | 0.89 | | 1.22 | | (0.32) | | (0.10) | | (0.42) |
Year Ended September 30, 2008 | | $10.06 | | 0.32(a) | | (0.18) | | 0.14 | | (0.32) | | — | | (0.32) |
Year Ended September 30, 2007 | | $10.12 | | 0.32(a) | | (0.06) | | 0.26 | | (0.32) | | — | | (0.32) |
Year Ended September 30, 2006 | | $10.06 | | 0.30 | | 0.06 | | 0.36 | | (0.30) | | — | | (0.30) |
Year Ended September 30, 2005 | | $10.22 | | 0.27(a) | | (0.16) | | 0.11 | | (0.27) | | — | | (0.27) |
Maryland Intermediate Tax-Free Fund | | | | | | | | | | | | | | |
Year Ended September 30, 2009 | | $10.04 | | 0.30(a) | | 1.01 | | 1.31 | | (0.30) | | (0.08) | | (0.38) |
Year Ended September 30, 2008 | | $10.15 | | 0.31(a) | | (0.11) | | 0.20 | | (0.31) | | — | | (0.31) |
Year Ended September 30, 2007 | | $10.12 | | 0.31(a) | | 0.03 | | 0.34 | | (0.31) | | — | | (0.31) |
Year Ended September 30, 2006 | | $10.02 | | 0.29 | | 0.10 | | 0.39 | | (0.29) | | — | | (0.29) |
Year Ended September 30, 2005 | | $10.15 | | 0.26(a) | | (0.13) | | 0.13 | | (0.26) | | — | | (0.26) |
North Carolina Intermediate Tax-Free Fund | | | | | | | | | | | | | | |
Year Ended September 30, 2009 | | $10.09 | | 0.33(a) | | 0.88 | | 1.21 | | (0.33) | | (0.10) | | (0.43) |
Year Ended September 30, 2008 | | $10.33 | | 0.35(a) | | (0.20) | | 0.15 | | (0.35) | | (0.04) | | (0.39) |
Year Ended September 30, 2007 | | $10.38 | | 0.35(a) | | (0.04)(a) | | 0.31 | | (0.35) | | (0.01) | | (0.36) |
Year Ended September 30, 2006 | | $10.46 | | 0.36 | | —(b) | | 0.36 | | (0.35) | | (0.09) | | (0.44) |
Year Ended September 30, 2005 | | $10.67 | | 0.35 | | (0.19) | | 0.16 | | (0.35) | | (0.02) | | (0.37) |
South Carolina Intermediate Tax-Free Fund | | | | | | | | | | | | | | |
Year Ended September 30, 2009 | | $ 9.95 | | 0.33(a) | | 0.90 | | 1.23 | | (0.33) | | (0.17) | | (0.50) |
Year Ended September 30, 2008 | | $10.28 | | 0.34(a) | | (0.24) | | 0.10 | | (0.34) | | (0.09) | | (0.43) |
Year Ended September 30, 2007 | | $10.35 | | 0.34(a) | | (0.05) | | 0.29 | | (0.35) | | (0.01) | | (0.36) |
Year Ended September 30, 2006 | | $10.54 | | 0.34 | | (0.01) | | 0.33 | | (0.34) | | (0.18) | | (0.52) |
Year Ended September 30, 2005 | | $10.81 | | 0.34 | | (0.19) | | 0.15 | | (0.34) | | (0.08) | | (0.42) |
Virginia Intermediate Tax-Free Fund | | | | | | | | | | | | | | |
Year Ended September 30, 2009 | | $11.11 | | 0.36(a) | | 1.05 | | 1.41 | | (0.36) | | (0.09) | | (0.45) |
Year Ended September 30, 2008 | | $11.32 | | 0.37(a) | | (0.16) | | 0.21 | | (0.37) | | (0.05) | | (0.42) |
Year Ended September 30, 2007 | | $11.39 | | 0.38(a) | | (0.04) | | 0.34 | | (0.39) | | (0.02) | | (0.41) |
Year Ended September 30, 2006 | | $11.49 | | 0.40 | | (0.05) | | 0.35 | | (0.39) | | (0.06) | | (0.45) |
Year Ended September 30, 2005 | | $11.74 | | 0.39 | | (0.22) | | 0.17 | | (0.40) | | (0.02) | | (0.42) |
West Virginia Intermediate Tax-Free Fund | | | | | | | | | | | | | | |
Year Ended September 30, 2009 | | $ 9.36 | | 0.33(a) | | 0.69 | | 1.02 | | (0.33) | | (0.01) | | (0.34) |
Year Ended September 30, 2008 | | $ 9.71 | | 0.33(a) | | (0.33) | | — | | (0.33) | | (0.02) | | (0.35) |
Year Ended September 30, 2007 | | $ 9.79 | | 0.35(a) | | (0.05) | | 0.30 | | (0.35) | | (0.03) | | (0.38) |
Year Ended September 30, 2006 | | $ 9.85 | | 0.39 | | (0.02) | | 0.37 | | (0.37) | | (0.06) | | (0.43) |
Year Ended September 30, 2005 | | $10.08 | | 0.35 | | (0.15) | | 0.20 | | (0.35) | | (0.08) | | (0.43) |
| * | During the period certain fees were reduced. If such reductions had not occurred, the ratios would have been as indicated. |
| ** | Portfolio turnover rate is calculated on the basis of the Fund as a whole without distinguishing between classes of shares issued. |
| (a) | Per share net investment income (loss) has been calculated using the average daily shares method. |
| (b) | Amount is less than $0.005. |
See accompanying notes to the financial statements.
134
| | | | | | | | | | | | |
| | | | | Ratios/Supplementary Data |
| | | | | | |
| | | | | | | | | | | | | |
Net Asset Value, End of Year | | Total
Return
(excludes
sales charge) | | Net Assets,
End of
Year
(000) | | Ratio of
net expenses
to average
net assets | | Ratio of net
investment
income to
average net
assets | | Ratio of
expenses to
average
net assets* | | Portfolio
turnover rate** |
| | | | | | | | | | | | |
| $10.56 | | 8.90% | | $12,865 | | 0.95% | | 3.14% | | 1.32% | | 47.13% |
| $10.03 | | 5.30% | | $ 9,654 | | 0.92% | | 4.08% | | 1.29% | | 116.07% |
| $ 9.93 | | 4.78% | | $ 9,050 | | 0.93% | | 4.27% | | 1.30% | | 85.83% |
| $ 9.89 | | 3.08% | | $ 9,748 | | 0.92% | | 4.21% | | 1.29% | | 127.13% |
| $10.01 | | 1.98% | | $13,744 | | 0.96% | | 3.41% | | 1.33% | | 107.04% |
| | | | | | | | | | | | |
| $10.78 | | 13.89% | | $15,760 | | 0.96% | | 4.38% | | 1.33% | | 122.26% |
| $ 9.88 | | 2.06% | | $ 8,700 | | 0.91% | | 4.24% | | 1.28% | | 190.15% |
| $10.12 | | 4.51% | | $ 8,403 | | 0.93% | | 4.37% | | 1.30% | | 222.24% |
| $10.12 | | 2.96% | | $ 6,407 | | 0.93% | | 4.16% | | 1.29% | | 226.36% |
| $10.31 | | 1.88% | | $ 7,254 | | 0.96% | | 3.62% | | 1.33% | | 173.74% |
| | | | | | | | | | | | |
| $10.68 | | 12.71% | | $ 6,999 | | 0.92% | | 3.18% | | 1.37% | | 33.56% |
| $ 9.88 | | 1.34% | | $ 5,510 | | 0.89% | | 3.13% | | 1.34% | | 54.22% |
| $10.06 | | 2.66% | | $ 4,630 | | 0.90% | | 3.19% | | 1.35% | | 69.73% |
| $10.12 | | 3.67% | | $ 2,729 | | 0.91% | | 3.02% | | 1.37% | | 64.55% |
| $10.06 | | 1.06% | | $ 2,566 | | 0.89% | | 2.65% | | 1.47% | | 37.50% |
| | | | | | | | | | | | |
| $10.97 | | 13.44% | | $ 8,273 | | 0.90% | | 2.84% | | 1.38% | | 37.11% |
| $10.04 | | 1.84% | | $ 4,389 | | 0.79% | | 3.01% | | 1.34% | | 108.13% |
| $10.15 | | 3.38% | | $ 2,429 | | 0.84% | | 3.05% | | 1.39% | | 136.09% |
| $10.12 | | 3.95% | | $ 1,966 | | 0.85% | | 2.89% | | 1.41% | | 219.80% |
| $10.02 | | 1.28% | | $ 1,609 | | 0.81% | | 2.57% | | 1.52% | | 44.67% |
| | | | | | | | | | | | |
| $10.87 | | 12.35% | | $29,765 | | 0.92% | | 3.17% | | 1.32% | | 38.42% |
| $10.09 | | 1.42% | | $20,971 | | 0.89% | | 3.34% | | 1.29% | | 82.02% |
| $10.33 | | 3.07% | | $19,668 | | 0.91% | | 3.40% | | 1.31% | | 106.16% |
| $10.38 | | 3.58% | | $19,163 | | 0.90% | | 3.45% | | 1.30% | | 94.95% |
| $10.46 | | 1.49% | | $21,600 | | 0.90% | | 3.29% | | 1.36% | | 60.84% |
| | | | | | | | | | | | |
| $10.68 | | 12.78% | | $11,255 | | 0.98% | | 3.18% | | 1.38% | | 42.06% |
| $ 9.95 | | 0.94% | | $ 7,481 | | 0.96% | | 3.28% | | 1.36% | | 127.76% |
| $10.28 | | 2.91% | | $ 3,769 | | 0.93% | | 3.34% | | 1.35% | | 68.69% |
| $10.35 | | 3.27% | | $ 4,001 | | 0.93% | | 3.30% | | 1.35% | | 80.24% |
| $10.54 | | 1.39% | | $ 4,072 | | 0.92% | | 3.20% | | 1.40% | | 56.03% |
| | | | | | | | | | | | |
| $12.07 | | 13.11% | | $20,230 | | 0.92% | | 3.05% | | 1.32% | | 35.90% |
| $11.11 | | 1.79% | | $ 9,683 | | 0.89% | | 3.25% | | 1.29% | | 53.28% |
| $11.32 | | 3.05% | | $ 8,802 | | 0.91% | | 3.39% | | 1.31% | | 85.36% |
| $11.39 | | 3.23% | | $11,877 | | 0.90% | | 3.55% | | 1.30% | | 76.53% |
| $11.49 | | 1.44% | | $13,145 | | 0.89% | | 3.39% | | 1.36% | | 48.04% |
| | | | | | | | | | | | |
| $10.04 | | 11.14% | | $19,518 | | 0.93% | | 3.45% | | 0.93% | | 24.19% |
| $ 9.36 | | (0.08)% | | $16,138 | | 0.91% | | 3.41% | | 0.91% | | 39.13% |
| $ 9.71 | | 3.12% | | $16,897 | | 0.91% | | 3.61% | | 0.91% | | 49.60% |
| $ 9.79 | | 3.85% | | $15,773 | | 0.90% | | 3.80% | | 0.90% | | 50.14% |
| $ 9.85 | | 1.97% | | $13,911 | | 0.93% | | 3.50% | | 0.96% | | 32.10% |
135
Financial Highlights, Class A Shares
Selected data for a share of beneficial interest outstanding throughout the periods indicated.
| | | | | | | | | | | | | | |
| | | | | Investment Activities | | Distributions |
| | | | | | | |
| | | | | | | | | | | | | | | |
| | | Net Asset
Value,
Beginning
of Period | | Net
investment
income | | Net realized/
unrealized
gains (losses)
on investments | | Total from
Investment
Activities | | Net
investment
income | | Net realized
gains on
investments | | Total
Distributions |
National Tax-Free Money Market Fund | | | | | | | | | | | | | | |
Year Ended September 30, 2009 | | $ 1.00 | | 0.01(c) | | —(d) | | 0.01 | | (0.01) | | — | | (0.01) |
Year Ended September 30, 2008 | | $ 1.00 | | 0.02(c) | | —(d) | | 0.02 | | (0.02) | | — | | (0.02) |
Year Ended September 30, 2007 | | $ 1.00 | | 0.03(c) | | — | | 0.03 | | (0.03) | | �� | | (0.03) |
August 1, 2006 to September 30, 2006 (e) | | $ 1.00 | | —(d) | | — | | —(d) | | —(d) | | — | | —(d) |
Prime Money Market Fund | | | | | | | | | | | | | | |
Year Ended September 30, 2009 | | $ 1.00 | | 0.01(c) | | —(d) | | 0.01 | | (0.01) | | — | | (0.01) |
Year Ended September 30, 2008 | | $ 1.00 | | 0.03(c) | | —(d) | | 0.03 | | (0.03) | | — | | (0.03) |
Year Ended September 30, 2007 | | $ 1.00 | | 0.04(c) | | — | | 0.04 | | (0.04) | | — | | (0.04) |
Year Ended September 30, 2006 | | $ 1.00 | | 0.04 | | —(d) | | 0.04 | | (0.04) | | — | | (0.04) |
Year Ended September 30, 2005 | | $ 1.00 | | 0.02 | | —(d) | | 0.02 | | (0.02) | | — | | (0.02) |
U.S. Treasury Money Market Fund | | | | | | | | | | | | | | |
Year Ended September 30, 2009 | | $ 1.00 | | —(c)(d) | | — | | —(d) | | —(d) | | — | | —(d) |
Year Ended September 30, 2008 | | $ 1.00 | | 0.02(c) | | —(d) | | 0.02 | | (0.02) | | — | | (0.02) |
Year Ended September 30, 2007 | | $ 1.00 | | 0.04(c) | | — | | 0.04 | | (0.04) | | — | | (0.04) |
Year Ended September 30, 2006 | | $ 1.00 | | 0.04 | | — | | 0.04 | | (0.04) | | — | | (0.04) |
Year Ended September 30, 2005 | | $ 1.00 | | 0.02 | | — | | 0.02 | | (0.02) | | — | | (0.02) |
Capital Manager Conservative Growth Fund*** | | | | | | | | | | | | | | |
Year Ended September 30, 2009 | | $ 8.43 | | 0.23(c) | | 0.21 | | 0.44 | | (0.23) | | (0.14) | | (0.37) |
Year Ended September 30, 2008 | | $10.53 | | 0.26(c) | | (1.24) | | (0.98) | | (0.39) | | (0.73) | | (1.12) |
Year Ended September 30, 2007 | | $ 9.96 | | 0.34(c) | | 0.53 | | 0.87 | | (0.30) | | — | | (0.30) |
Year Ended September 30, 2006 | | $ 9.76 | | 0.31(c) | | 0.22 | | 0.53 | | (0.33) | | — | | (0.33) |
Year Ended September 30, 2005 | | $ 9.30 | | 0.23 | | 0.45 | | 0.68 | | (0.22) | | — | | (0.22) |
Capital Manager Moderate Growth Fund*** | | | | | | | | | | | | | | |
Year Ended September 30, 2009 | | $ 7.77 | | 0.16(c) | | 0.02 | | 0.18 | | (0.16) | | — | | (0.16) |
Year Ended September 30, 2008 | | $10.94 | | 0.17(c) | | (1.86) | | (1.69) | | (0.35) | | (1.13) | | (1.48) |
Year Ended September 30, 2007 | | $10.22 | | 0.29(c) | | 0.87 | | 1.16 | | (0.22) | | (0.22) | | (0.44) |
Year Ended September 30, 2006 | | $ 9.79 | | 0.24(c) | | 0.45 | | 0.69 | | (0.26) | | — | | (0.26) |
Year Ended September 30, 2005 | | $ 9.01 | | 0.17(c) | | 0.76 | | 0.93 | | (0.15) | | — | | (0.15) |
Capital Manager Growth Fund*** | | | | | | | | | | | | | | |
Year Ended September 30, 2009 | | $ 7.33 | | 0.12(c) | | (0.22) | | (0.10) | | (0.12) | | — | | (0.12) |
Year Ended September 30, 2008 | | $11.13 | | 0.11(c) | | (2.21) | | (2.10) | | (0.33) | | (1.37) | | (1.70) |
Year Ended September 30, 2007 | | $10.23 | | 0.25(c) | | 1.08 | | 1.33 | | (0.16) | | (0.27) | | (0.43) |
Year Ended September 30, 2006 | | $ 9.68 | | 0.20(c) | | 0.56 | | 0.76 | | (0.21) | | — | | (0.21) |
Year Ended September 30, 2005 | | $ 8.70 | | 0.13 | | 0.96 | | 1.09 | | (0.11) | | — | | (0.11) |
Capital Manager Equity Fund*** | | | | | | | | | | | | | | |
Year Ended September 30, 2009 | | $ 7.41 | | 0.07(c) | | (0.65) | | (0.58) | | (0.06) | | — | | (0.06) |
Year Ended September 30, 2008 | | $12.26 | | 0.04(c) | | (2.76) | | (2.72) | | (0.32) | | (1.81) | | (2.13) |
Year Ended September 30, 2007 | | $11.57 | | 0.21(c) | | 1.43 | | 1.64 | | (0.10) | | (0.85) | | (0.95) |
Year Ended September 30, 2006 | | $10.95 | | 0.17(c) | | 0.83 | | 1.00 | | (0.19) | | (0.19) | | (0.38) |
Year Ended September 30, 2005 | | $ 9.58 | | 0.09(c) | | 1.34 | | 1.43 | | (0.06) | | — | | (0.06) |
| * | During the period certain fees were reduced. If such reductions had not occurred, the ratios would have been as indicated. |
| ** | Portfolio turnover rate is calculated on the basis of the Fund as a whole without distinguishing between classes of shares issued. |
| *** | The expense ratios exclude the impact of fees/expenses paid by each underlying fund. |
| (a) | Not annualized for periods less than one year. |
| (b) | Annualized for periods less than one year. |
| (c) | Per share net investment income (loss) has been calculated using the average daily shares method. |
| (d) | Amount is less than $0.005. |
| (e) | Period from commencement of operations. |
See accompanying notes to the financial statements.
136
| | | | | | | | | | | | |
| | | | | Ratios/Supplementary Data |
| | | | | | |
| | | | | | | | | | | | | |
Net Asset
Value,
End of
Period | | Total
Return
(excludes
sales charge) (a) | | Net Assets,
End of
Period
(000) | | Ratio of
net expenses
to average
net assets (b) | | Ratio of net
investment
income to
average net
assets (b) | | Ratio of
expenses to
average
net assets*(b) | | Portfolio
turnover rate** |
| | | | | | | | | | | | |
| $ 1.00 | | 0.80% | | $ 50 | | 0.69% | | 0.67% | | 0.99% | | — |
| $ 1.00 | | 2.11% | | $ 4 | | 0.66% | | 2.48% | | 0.96% | | — |
| $ 1.00 | | 3.08% | | $ 526 | | 0.66% | | 3.06% | | 0.97% | | — |
| $ 1.00 | | 0.51% | | $ 1 | | 0.62% | | 2.96% | | 1.26% | | — |
| | | | | | | | | | | | |
| $ 1.00 | | 0.53% | | $270,852 | | 0.96% | | 0.78% | | 1.16% | | — |
| $ 1.00 | | 2.86% | | $763,152 | | 0.96% | | 2.79% | | 1.08% | | — |
| $ 1.00 | | 4.51% | | $745,381 | | 0.98% | | 4.42% | | 1.10% | | — |
| $ 1.00 | | 3.86% | | $636,327 | | 0.98% | | 3.83% | | 1.09% | | — |
| $ 1.00 | | 1.92% | | $493,282 | | 0.91% | | 1.91% | | 1.13% | | — |
| | | | | | | | | | | | |
| $ 1.00 | | 0.03% | | $168,094 | | 0.33% | | 0.03% | | 1.13% | | — |
| $ 1.00 | | 1.75% | | $485,031 | | 0.93% | | 1.72% | | 1.08% | | — |
| $ 1.00 | | 4.20% | | $310,413 | | 0.97% | | 4.07% | | 1.11% | | — |
| $ 1.00 | | 3.64% | | $167,900 | | 0.96% | | 3.63% | | 1.09% | | — |
| $ 1.00 | | 1.69% | | $114,260 | | 0.89% | | 1.66% | | 1.14% | | — |
| | | | | | | | | | | | |
| $ 8.50 | | 5.95% | | $ 5,929 | | 0.43% | | 2.95% | | 0.93% | | 21.56% |
| $ 8.43 | | (10.33)% | | $ 7,573 | | 0.35% | | 2.72% | | 0.85% | | 39.99% |
| $10.53 | | 8.86% | | $ 9,781 | | 0.35% | | 3.28% | | 0.91% | | 29.58% |
| $ 9.96 | | 5.54% | | $ 9,365 | | 0.33% | | 3.12% | | 0.95% | | 5.69% |
| $ 9.76 | | 7.39% | | $ 8,646 | | 0.43% | | 2.45% | | 1.01% | | 52.50% |
| | | | | | | | | | | | |
| $ 7.79 | | 2.67% | | $ 24,426 | | 0.38% | | 2.36% | | 0.88% | | 22.46% |
| $ 7.77 | | (17.44)% | | $ 27,775 | | 0.35% | | 1.82% | | 0.85% | | 63.63% |
| $10.94 | | 11.48% | | $ 38,081 | | 0.36% | | 2.68% | | 0.92% | | 40.05% |
| $10.22 | | 7.10% | | $ 33,472 | | 0.35% | | 2.44% | | 0.97% | | 7.33% |
| $ 9.79 | | 10.35% | | $ 28,912 | | 0.48% | | 1.77% | | 1.05% | | 37.83% |
| | | | | | | | | | | | |
| $ 7.11 | | (1.25)% | | $ 16,609 | | 0.39% | | 1.89% | | 0.89% | | 24.08% |
| $ 7.33 | | (21.65)% | | $ 18,321 | | 0.35% | | 1.23% | | 0.85% | | 77.54% |
| $11.13 | | 13.19% | | $ 26,189 | | 0.36% | | 2.33% | | 0.93% | | 44.48% |
| $10.23 | | 7.97% | | $ 22,801 | | 0.36% | | 2.01% | | 0.98% | | 6.26% |
| $ 9.68 | | 12.51% | | $ 17,219 | | 0.48% | | 1.37% | | 1.07% | | 26.22% |
| | | | | | | | | | | | |
| $ 6.77 | | (7.60)% | | $ 4,810 | | 0.46% | | 1.23% | | 0.97% | | 20.24% |
| $ 7.41 | | (26.23)% | | $ 5,680 | | 0.38% | | 0.44% | | 0.88% | | 67.40% |
| $12.26 | | 14.79% | | $ 9,384 | | 0.37% | | 1.77% | | 0.93% | | 48.80% |
| $11.57 | | 9.39% | | $ 7,762 | | 0.36% | | 1.53% | | 0.97% | | 1.48% |
| $10.95 | | 14.95% | | $ 6,183 | | 0.45% | | 0.91% | | 1.09% | | 2.14% |
137
Financial Highlights, Class B Shares
Selected data for a share of beneficial interest outstanding throughout the periods indicated.
| | | | | | | | | | | | | | | | |
| | | | | Investment Activities | | Distributions |
| | | | | | | | |
| | | | | | | | | | | | | | | | | |
| | | Net Asset
Value,
Beginning
of Year | | Net
investment
income
(loss) | | Net realized/
unrealized
gains (losses)
on investments | | Total from
Investment
Activities | | Net
investment
income | | Net realized
gains on
investments | | Return
of
capital | | Total
Distributions |
Large Cap Fund | | | | | | | | | | | | | | | | |
Year Ended September 30, 2009 | | $11.11 | | 0.05(a) | | (1.21) | | (1.16) | | (0.05) | | — | | — | | (0.05) |
Year Ended September 30, 2008 | | $18.90 | | 0.04(a) | | (5.05) | | (5.01) | | (0.05) | | (2.73) | | — | | (2.78) |
Year Ended September 30, 2007 | | $20.15 | | 0.09(a) | | 2.12 | | 2.21 | | (0.11) | | (3.35) | | — | | (3.46) |
Year Ended September 30, 2006 | | $19.31 | | 0.16(a) | | 2.27 | | 2.43 | | (0.15) | | (1.44) | | — | | (1.59) |
Year Ended September 30, 2005 | | $17.12 | | 0.13 | | 2.22 | | 2.35 | | (0.16) | | — | | — | | (0.16) |
Mid Cap Value Fund | | | | | | | | | | | | | | | | |
Year Ended September 30, 2009 | | $10.14 | | (0.05)(a) | | 0.27 | | 0.22 | | (0.01) | | — | | — | | (0.01) |
Year Ended September 30, 2008 | | $14.55 | | (0.07)(a) | | (2.98) | | (3.05) | | — | | (1.36) | | — | | (1.36) |
Year Ended September 30, 2007 | | $13.23 | | (0.07)(a) | | 2.08 | | 2.01 | | —(b) | | (0.69) | | — | | (0.69) |
Year Ended September 30, 2006 | | $13.16 | | (0.07)(a) | | 1.59 | | 1.52 | | —(b) | | (1.45) | | — | | (1.45) |
Year Ended September 30, 2005 | | $15.30 | | —(a)(b) | | 3.02 | | 3.02 | | (0.07) | | (5.09) | | — | | (5.16) |
Mid Cap Growth Fund | | | | | | | | | | | | | | | | |
Year Ended September 30, 2009 | | $ 9.31 | | (0.08)(a) | | (1.49) | | (1.57) | | — | | (0.33) | | (0.05) | | (0.38) |
Year Ended September 30, 2008 | | $14.06 | | (0.16)(a) | | (3.56) | | (3.72) | | — | | (1.03) | | — | | (1.03) |
Year Ended September 30, 2007 | | $11.95 | | (0.15)(a) | | 3.91 | | 3.76 | | — | | (1.65) | | — | | (1.65) |
Year Ended September 30, 2006 | | $13.47 | | (0.11)(a) | | 0.01(c) | | (0.10) | | — | | (1.42) | | — | | (1.42) |
Year Ended September 30, 2005 | | $10.70 | | (0.17)(a) | | 3.08 | | 2.91 | | — | | (0.14) | | — | | (0.14) |
Small Cap Fund | | | | | | | | | | | | | | | | |
Year Ended September 30, 2009 | | $10.86 | | (0.09)(a) | | (2.14) | | (2.23) | | — | | — | | — | | — |
Year Ended September 30, 2008 | | $14.43 | | (0.12)(a) | | (2.25) | | (2.37) | | — | | (1.20) | | — | | (1.20) |
Year Ended September 30, 2007 | | $14.73 | | (0.05)(a) | | 0.72 | | 0.67 | | (0.06) | | (0.91) | | — | | (0.97) |
Year Ended September 30, 2006 | | $16.11 | | (0.12)(a) | | 1.05 | | 0.93 | | (0.01) | | (2.30) | | — | | (2.31) |
Year Ended September 30, 2005 | | $14.06 | | —(a)(b) | | 2.58 | | 2.58 | | (0.11) | | (0.42) | | — | | (0.53) |
International Equity Fund | | | | | | | | | | | | | | | | |
Year Ended September 30, 2009 | | $ 4.75 | | 0.02(a) | | (0.25) | | (0.23) | | (0.11) | | — | | — | | (0.11) |
Year Ended September 30, 2008 | | $ 7.65 | | 0.02(a) | | (2.16) | | (2.14) | | (0.01) | | (0.75) | | — | | (0.76) |
Year Ended September 30, 2007 | | $10.46 | | 0.03(a) | | 1.72 | | 1.75 | | (0.04) | | (4.52) | | — | | (4.56) |
Year Ended September 30, 2006 | | $ 9.09 | | 0.06(a) | | 1.42 | | 1.48 | | (0.11) | | — | | — | | (0.11) |
Year Ended September 30, 2005 | | $ 7.74 | | 0.03(a) | | 1.38 | | 1.41 | | (0.06) | | — | | — | | (0.06) |
Special Opportunities Equity Fund | | | | | | | | | | | | | | | | |
Year Ended September 30, 2009 | | $14.65 | | (0.05)(a) | | (0.05) | | (0.10) | | —(b) | | (0.57) | | (0.09) | | (0.66) |
Year Ended September 30, 2008 | | $17.63 | | (0.21)(a) | | (2.02) | | (2.23) | | — | | (0.75) | | — | | (0.75) |
Year Ended September 30, 2007 | | $16.00 | | (0.13)(a) | | 3.36 | | 3.23 | | — | | (1.60) | | — | | (1.60) |
Year Ended September 30, 2006 | | $15.29 | | (0.16) | | 1.66 | | 1.50 | | — | | (0.79) | | — | | (0.79) |
Year Ended September 30, 2005 | | $12.95 | | (0.13) | | 2.59 | | 2.46 | | — | | (0.12) | | — | | (0.12) |
Equity Income Fund | | | | | | | | | | | | | | | | |
Year Ended September 30, 2009 | | $12.31 | | 0.22(a) | | (0.98) | | (0.76) | | (0.13) | | (0.03) | | — | | (0.16) |
Year Ended September 30, 2008 | | $14.99 | | 0.32(a) | | (2.20) | | (1.88) | | (0.22) | | (0.58) | | — | | (0.80) |
Year Ended September 30, 2007 | | $13.33 | | 0.25(a) | | 2.31 | | 2.56 | | (0.22) | | (0.68) | | — | | (0.90) |
Year Ended September 30, 2006 | | $12.08 | | 0.19 | | 1.56 | | 1.75 | | (0.23) | | (0.27) | | — | | (0.50) |
Year Ended September 30, 2005 | | $10.34 | | 0.16 | | 1.77 | | 1.93 | | (0.17) | | (0.02) | | — | | (0.19) |
Intermediate U.S. Government Fund | | | | | | | | | | | | | | | | |
Year Ended September 30, 2009 | | $10.00 | | 0.25(a) | | 0.54 | | 0.79 | | (0.27) | | — | | — | | (0.27) |
Year Ended September 30, 2008 | | $ 9.90 | | 0.34(a) | | 0.10 | | 0.44 | | (0.34) | | — | | — | | (0.34) |
Year Ended September 30, 2007 | | $ 9.86 | | 0.35(a) | | 0.04 | | 0.39 | | (0.35) | | — | | — | | (0.35) |
Year Ended September 30, 2006 | | $ 9.98 | | 0.34(a) | | (0.12) | | 0.22 | | (0.34) | | — | | — | | (0.34) |
Year Ended September 30, 2005 | | $10.20 | | 0.27(a) | | (0.13) | | 0.14 | | (0.31) | | (0.05) | | — | | (0.36) |
| * | During the period certain fees were reduced. If such reductions had not occurred, the ratios would have been as indicated. |
| ** | Portfolio turnover rate is calculated on the basis of the Fund as a whole without distinguishing between classes of shares issued. |
| (a) | Per share net investment income (loss) has been calculated using the average daily shares method. |
| (b) | Amount is less than $0.005. |
| (c) | The amount shown for a share outstanding throughout the period does not accord with the change in aggregate gains and losses in the portfolio of securities during the period because of the timing of sales and purchases of Fund shares in relation to fluctuating market values during the period. |
See accompanying notes to the financial statements.
138
| | | | | | | | | | | | |
| | | | | Ratios/Supplementary Data |
Net Asset
Value, End of Year | | Total
Return
(excludes
sales charge) | | Net Assets,
End of
Year
(000) | | Ratio of
net expenses
to average
net assets | | Ratio of net
investment
income
(loss) to
average net
assets | | Ratio of
expenses to
average
net assets* | | Portfolio
turnover rate** |
| | | | | | | | | | | | |
| $ 9.90 | | (10.31)% | | $ 4,501 | | 1.82% | | 0.54% | | 1.96% | | 92.97% |
| $11.11 | | (29.98)% | | $ 7,866 | | 1.89% | | 0.28% | | 1.93% | | 38.43% |
| $18.90 | | 11.67% | | $17,796 | | 1.91% | | 0.50% | | 1.97% | | 68.60% |
| $20.15 | | 13.45% | | $14,808 | | 1.88% | | 0.85% | | 1.93% | | 34.83% |
| $19.31 | | 13.75% | | $22,148 | | 1.89% | | 0.82% | | 1.99% | | 19.50% |
| | | | | | | | | | | | |
| $10.35 | | 2.17% | | $ 3,454 | | 1.96% | | (0.60)% | | 2.01% | | 46.83% |
| $10.14 | | (22.60)% | | $ 4,136 | | 1.89% | | (0.58)% | | 1.93% | | 65.74% |
| $14.55 | | 15.58% | | $ 6,112 | | 1.91% | | (0.48)% | | 1.95% | | 58.59% |
| $13.23 | | 12.38% | | $ 5,391 | | 1.89% | | (0.53)% | | 1.93% | | 53.92% |
| $13.16 | | 19.94% | | $ 4,534 | | 1.89% | | 0.02% | | 1.99% | | 126.99% |
| | | | | | | | | | | | |
| $ 7.36 | | (15.86)% | | $ 1,351 | | 1.98% | | (1.20)% | | 2.02% | | 173.21% |
| $ 9.31 | | (28.79)% | | $ 2,093 | | 1.90% | | (1.32)% | | 1.94% | | 218.03% |
| $14.06 | | 35.13% | | $ 2,697 | | 1.92% | | (1.24)% | | 1.96% | | 134.95% |
| $11.95 | | (1.23)% | | $ 2,377 | | 1.89% | | (0.83)% | | 1.94% | | 140.90% |
| $13.47 | | 27.42% | | $ 2,395 | | 1.91% | | (1.46)% | | 2.01% | | 92.74% |
| | | | | | | | | | | | |
| $ 8.63 | | (20.53)% | | $ 1,127 | | 2.16% | | (1.20)% | | 2.39% | | 137.20% |
| $10.86 | | (17.42)% | | $ 1,960 | | 2.03% | | (1.00)% | | 2.23% | | 94.93% |
| $14.43 | | 4.37% | | $ 3,393 | | 2.06% | | (0.31)% | | 2.26% | | 46.54% |
| $14.73 | | 6.19% | | $ 4,092 | | 2.04% | | (0.79)% | | 2.28% | | 43.25% |
| $16.11 | | 18.79% | | $ 259 | | 2.05% | | 0.00% | | 2.27% | | 8.39% |
| | | | | | | | | | | | |
| $ 4.41 | | (4.43)% | | $ 954 | | 2.49% | | 0.58% | | 2.64% | | 223.19% |
| $ 4.75 | | (31.33)% | | $ 1,281 | | 2.31% | | 0.38% | | 2.49% | | 112.65% |
| $ 7.65 | | 19.28% | | $ 2,041 | | 2.12% | | 0.26% | | 2.25% | | 129.80% |
| $10.46 | | 16.27% | | $ 1,819 | | 2.15% | | 0.64% | | 2.25% | | 36.22% |
| $ 9.09 | | 18.34% | | $ 2,007 | | 2.20% | | 0.36% | | 2.33% | | 44.96% |
| | | | | | | | | | | | |
| $13.89 | | 1.04% | | $24,068 | | 2.03% | | (0.39)% | | 2.04% | | 45.22% |
| $14.65 | | (13.28)% | | $26,347 | | 1.99% | | (1.22)% | | 1.99% | | 25.80% |
| $17.63 | | 21.33% | | $29,931 | | 2.03% | | (0.79)% | | 2.03% | | 49.43% |
| $16.00 | | 10.35% | | $22,901 | | 2.03% | | (1.01)% | | 2.03% | | 58.01% |
| $15.29 | | 19.09% | | $21,911 | | 2.06% | | (1.18)% | | 2.08% | | 30.38% |
| | | | | | | | | | | | |
| $11.39 | | (6.05)% | | $13,567 | | 1.93% | | 2.18% | | 1.95% | | 37.13% |
| $12.31 | | (13.14)% | | $15,176 | | 1.89% | | 2.35% | | 1.89% | | 30.01% |
| $14.99 | | 19.97% | | $14,796 | | 1.94% | | 1.78% | | 1.94% | | 37.85% |
| $13.33 | | 14.84% | | $ 9,592 | | 1.95% | | 1.52% | | 1.95% | | 45.38% |
| $12.08 | | 18.79% | | $ 5,611 | | 1.87% | | 1.74% | | 2.09% | | 39.65% |
| | | | | | | | | | | | |
| $10.52 | | 8.01% | | $ 3,256 | | 1.70% | | 2.42% | | 1.82% | | 47.13% |
| $10.00 | | 4.52% | | $ 3,070 | | 1.67% | | 3.34% | | 1.79% | | 116.07% |
| $ 9.90 | | 4.01% | | $ 3,006 | | 1.68% | | 3.52% | | 1.80% | | 85.83% |
| $ 9.86 | | 2.32% | | $ 4,020 | | 1.68% | | 3.48% | | 1.79% | | 127.13% |
| $ 9.98 | | 1.33% | | $ 5,725 | | 1.71% | | 2.67% | | 1.84% | | 107.04% |
139
Financial Highlights, Class B Shares
Selected data for a share of beneficial interest outstanding throughout the periods indicated.
| | | | | | | | | | | | | | |
| | | | | Investment Activities | | Distributions |
| | | |
| | | | | | | |
| | | Net Asset
Value,
Beginning
of Year | | Net
investment
income
(loss) | | Net realized/
unrealized
gains (losses)
on investments | | Total from
Investment
Activities | | Net
investment
income | | Net realized
gains on
investments | | Total
Distributions |
Total Return Bond Fund | | | | | | | | | | | | | | |
Year Ended September 30, 2009 | | $ 9.89 | | 0.37(a) | | 0.89 | | 1.26 | | (0.37) | | — | | (0.37) |
Year Ended September 30, 2008 | | $10.13 | | 0.36(a) | | (0.22) | | 0.14 | | (0.38) | | — | | (0.38) |
Year Ended September 30, 2007 | | $10.13 | | 0.37(a) | | — | | 0.37 | | (0.37) | | — | | (0.37) |
Year Ended September 30, 2006 | | $10.32 | | 0.34(a) | | (0.12) | | 0.22 | | (0.36) | | (0.05) | | (0.41) |
Year Ended September 30, 2005 | | $10.59 | | 0.30(a) | | (0.18) | | 0.12 | | (0.36) | | (0.03) | | (0.39) |
Prime Money Market Fund | | | | | | | | | | | | | | |
Year Ended September 30, 2009 | | $ 1.00 | | —(a)(b) | | —(b) | | —(b) | | —(b) | | — | | —(b) |
Year Ended September 30, 2008 | | $ 1.00 | | 0.02(a) | | —(b) | | 0.02 | | (0.02) | | — | | (0.02) |
Year Ended September 30, 2007 | | $ 1.00 | | 0.04(a) | | — | | 0.04 | | (0.04) | | — | | (0.04) |
Year Ended September 30, 2006 | | $ 1.00 | | 0.03 | | —(b) | | 0.03 | | (0.03) | | — | | (0.03) |
Year Ended September 30, 2005 | | $ 1.00 | | 0.01 | | —(b) | | 0.01 | | (0.01) | | — | | (0.01) |
U.S. Treasury Money Market Fund | | | | | | | | | | | | | | |
Year Ended September 30, 2009 | | $ 1.00 | | —(a)(b) | | — | | —(b) | | —(b) | | — | | —(b) |
Year Ended September 30, 2008 | | $ 1.00 | | 0.01(a) | | —(b) | | 0.01 | | (0.01) | | — | | (0.01) |
Year Ended September 30, 2007 | | $ 1.00 | | 0.04(a) | | — | | 0.04 | | (0.04) | | — | | (0.04) |
Year Ended September 30, 2006 | | $ 1.00 | | 0.03 | | — | | 0.03 | | (0.03) | | — | | (0.03) |
Year Ended September 30, 2005 | | $ 1.00 | | 0.01 | | — | | 0.01 | | (0.01) | | — | | (0.01) |
Capital Manager Conservative Growth Fund*** | | | | | | | | | | | | | | |
Year Ended September 30, 2009 | | $ 8.43 | | 0.17(a) | | 0.21 | | 0.38 | | (0.17) | | (0.14) | | (0.31) |
Year Ended September 30, 2008 | | $10.54 | | 0.19(a) | | (1.25) | | (1.06) | | (0.32) | | (0.73) | | (1.05) |
Year Ended September 30, 2007 | | $ 9.96 | | 0.27(a) | | 0.54 | | 0.81 | | (0.23) | | — | | (0.23) |
Year Ended September 30, 2006 | | $ 9.76 | | 0.23(a) | | 0.23 | | 0.46 | | (0.26) | | — | | (0.26) |
Year Ended September 30, 2005 | | $ 9.30 | | 0.16 | | 0.45 | | 0.61 | | (0.15) | | — | | (0.15) |
Capital Manager Moderate Growth Fund*** | | | | | | | | | | | | | | |
Year Ended September 30, 2009 | | $ 7.62 | | 0.11(a) | | 0.01 | | 0.12 | | (0.11) | | — | | (0.11) |
Year Ended September 30, 2008 | | $10.75 | | 0.10(a) | | (1.81) | | (1.71) | | (0.29) | | (1.13) | | (1.42) |
Year Ended September 30, 2007 | | $10.05 | | 0.21(a) | | 0.85 | | 1.06 | | (0.14) | | (0.22) | | (0.36) |
Year Ended September 30, 2006 | | $ 9.64 | | 0.17(a) | | 0.42 | | 0.59 | | (0.18) | | — | | (0.18) |
Year Ended September 30, 2005 | | $ 8.86 | | 0.09(a) | | 0.77 | | 0.86 | | (0.08) | | — | | (0.08) |
Capital Manager Growth Fund*** | | | | | | | | | | | | | | |
Year Ended September 30, 2009 | | $ 7.17 | | 0.07(a) | | (0.22) | | (0.15) | | (0.07) | | — | | (0.07) |
Year Ended September 30, 2008 | | $10.92 | | 0.04(a) | | (2.15) | | (2.11) | | (0.27) | | (1.37) | | (1.64) |
Year Ended September 30, 2007 | | $10.05 | | 0.18(a) | | 1.04 | | 1.22 | | (0.08) | | (0.27) | | (0.35) |
Year Ended September 30, 2006 | | $ 9.51 | | 0.12(a) | | 0.56 | | 0.68 | | (0.14) | | — | | (0.14) |
Year Ended September 30, 2005 | | $ 8.55 | | 0.05(a) | | 0.95 | | 1.00 | | (0.04) | | — | | (0.04) |
Capital Manager Equity Fund*** | | | | | | | | | | | | | | |
Year Ended September 30, 2009 | | $ 7.09 | | 0.03(a) | | (0.62) | | (0.59) | | (0.05) | | — | | (0.05) |
Year Ended September 30, 2008 | | $11.86 | | (0.03)(a) | | (2.65) | | (2.68) | | (0.28) | | (1.81) | | (2.09) |
Year Ended September 30, 2007 | | $11.26 | | 0.12(a) | | 1.38 | | 1.50 | | (0.05) | | (0.85) | | (0.90) |
Year Ended September 30, 2006 | | $10.67 | | 0.09(a) | | 0.80 | | 0.89 | | (0.11) | | (0.19) | | (0.30) |
Year Ended September 30, 2005 | | $ 9.36 | | 0.01(a) | | 1.31 | | 1.32 | | (0.01) | | — | | (0.01) |
| * | During the period certain fees were reduced. If such reductions had not occurred, the ratios would have been as indicated. |
| ** | Portfolio turnover rate is calculated on the basis of the Fund as a whole without distinguishing between classes of shares issued. |
| *** | The expense ratios exclude the impact of fees/expenses paid by each underlying fund. |
| (a) | Per share net investment income (loss) has been calculated using the average daily shares method. |
| (b) | Amount is less than $0.005. |
See accompanying notes to the financial statements.
140
| | | | | | | | | | | | |
| | | | | Ratios/Supplementary Data |
Net Asset Value, End of Year | | Total
Return
(excludes
sales charge) | | Net Assets,
End of
Year
(000) | | Ratio of
net expenses
to average
net assets | | Ratio of net
investment
income
(loss) to
average net
assets | | Ratio of
expenses to
average
net assets* | | Portfolio
turnover rate** |
| | | | | | | | | | | | |
| $10.78 | | 13.03% | | $ 5,362 | | 1.71% | | 3.62% | | 1.83% | | 122.26% |
| $ 9.89 | | 1.31% | | $ 4,951 | | 1.66% | | 3.49% | | 1.78% | | 190.15% |
| $10.13 | | 3.73% | | $ 4,992 | | 1.68% | | 3.62% | | 1.80% | | 222.24% |
| $10.13 | | 2.27% | | $ 4,872 | | 1.68% | | 3.39% | | 1.79% | | 226.36% |
| $10.32 | | 1.21% | | $ 6,161 | | 1.71% | | 2.87% | | 1.84% | | 173.14% |
| | | | | | | | | | | | |
| $ 1.00 | | 0.34% | | $ 1,901 | | 1.13% | | 0.33% | | 1.66% | | — |
| $ 1.00 | | 2.35% | | $ 1,767 | | 1.46% | | 2.26% | | 1.58% | | — |
| $ 1.00 | | 4.01% | | $ 1,629 | | 1.48% | | 3.92% | | 1.60% | | — |
| $ 1.00 | | 3.37% | | $ 2,256 | | 1.48% | | 3.34% | | 1.59% | | — |
| $ 1.00 | | 1.32% | | $ 1,790 | | 1.49% | | 1.28% | | 1.63% | | — |
| | | | | | | | | | | | |
| $ 1.00 | | 0.03% | | $ 935 | | 0.28% | | 0.02% | | 1.64% | | — |
| $ 1.00 | | 1.28% | | $ 597 | | 1.38% | | 1.14% | | 1.58% | | — |
| $ 1.00 | | 3.72% | | $ 301 | | 1.46% | | 3.64% | | 1.60% | | — |
| $ 1.00 | | 3.12% | | $ 381 | | 1.46% | | 2.97% | | 1.59% | | — |
| $ 1.00 | | 1.09% | | $ 807 | | 1.48% | | 1.05% | | 1.64% | | — |
| | | | | | | | | | | | |
| $ 8.50 | | 5.15% | | $ 3,184 | | 1.18% | | 2.20% | | 1.43% | | 21.56% |
| $ 8.43 | | (11.09)% | | $ 4,081 | | 1.10% | | 1.98% | | 1.35% | | 39.99% |
| $10.54 | | 8.17% | | $ 4,779 | | 1.10% | | 2.60% | | 1.41% | | 29.58% |
| $ 9.96 | | 4.75% | | $ 4,968 | | 1.08% | | 2.37% | | 1.45% | | 5.69% |
| $ 9.76 | | 6.58% | | $ 4,992 | | 1.20% | | 1.64% | | 1.51% | | 52.50% |
| | | | | | | | | | | | |
| $ 7.63 | | 1.81% | | $11,734 | | 1.13% | | 1.63% | | 1.38% | | 22.46% |
| $ 7.62 | | (17.99)% | | $15,305 | | 1.10% | | 1.07% | | 1.35% | | 63.63% |
| $10.75 | | 10.67% | | $21,791 | | 1.11% | | 1.96% | | 1.42% | | 40.05% |
| $10.05 | | 6.21% | | $21,610 | | 1.10% | | 1.70% | | 1.47% | | 7.33% |
| $ 9.64 | | 9.72% | | $21,909 | | 1.24% | | 0.99% | | 1.55% | | 37.83% |
| | | | | | | | | | | | |
| $ 6.95 | | (1.89)% | | $ 9,973 | | 1.15% | | 1.17% | | 1.40% | | 24.08% |
| $ 7.17 | | (22.32)% | | $13,306 | | 1.10% | | 0.47% | | 1.35% | | 77.54% |
| $10.92 | | 12.31% | | $20,286 | | 1.11% | | 1.71% | | 1.43% | | 44.48% |
| $10.05 | | 7.22% | | $19,366 | | 1.11% | | 1.27% | | 1.48% | | 6.26% |
| $ 9.51 | | 11.68% | | $17,141 | | 1.23% | | 0.59% | | 1.57% | | 26.22% |
| | | | | | | | | | | | |
| $ 6.45 | | (8.38)% | | $ 4,215 | | 1.21% | | 0.50% | | 1.47% | | 20.24% |
| $ 7.09 | | (26.69)% | | $ 5,406 | | 1.13% | | (0.31)% | | 1.38% | | 67.40% |
| $11.86 | | 13.88% | | $ 8,535 | | 1.12% | | 1.07% | | 1.43% | | 48.80% |
| $11.26 | | 8.51% | | $ 8,023 | | 1.11% | | 0.80% | | 1.47% | | 1.48% |
| $10.67 | | 14.11% | | $ 7,515 | | 1.21% | | 0.11% | | 1.58% | | 2.14% |
141
Financial Highlights, Class C Shares
Selected data for a share of beneficial interest outstanding throughout the periods indicated.
| | | | | | | | | | | | | | | | |
| | | | | Investment Activities | | Distributions |
| | | |
| | | | | | | |
| | | Net Asset
Value,
Beginning
of Year | | Net
investment
income
(loss) | | Net realized/
unrealized
gains (losses)
on investments | | Total from
Investment
Activities | | Net
investment
income | | Net realized
gains on
investments | | Return
of
capital | | Total
Distributions |
Large Cap Fund | | | | | | | | | | | | | | | | |
Year Ended September 30, 2009 | | $11.08 | | 0.04(a) | | (1.21) | | (1.17) | | (0.06) | | — | | — | | (0.06) |
Year Ended September 30, 2008 | | $18.87 | | 0.04(a) | | (5.05) | | (5.01) | | (0.05) | | (2.73) | | — | | (2.78) |
Year Ended September 30, 2007 | | $20.11 | | 0.09(a) | | 2.13 | | 2.22 | | (0.11) | | (3.35) | | — | | (3.46) |
Year Ended September 30, 2006 | | $19.28 | | 0.16(a) | | 2.26 | | 2.42 | | (0.15) | | (1.44) | | — | | (1.59) |
Year Ended September 30, 2005 | | $17.09 | | 0.14 | | 2.19 | | 2.33 | | (0.14) | | — | | — | | (0.14) |
Mid Cap Value Fund | | | | | | | | | | | | | | | | |
Year Ended September 30, 2009 | | $10.14 | | (0.05)(a) | | 0.26 | | 0.21 | | (0.01) | | — | | — | | (0.01) |
Year Ended September 30, 2008 | | $14.55 | | (0.07)(a) | | (2.98) | | (3.05) | | — | | (1.36) | | — | | (1.36) |
Year Ended September 30, 2007 | | $13.23 | | (0.07)(a) | | 2.08 | | 2.01 | | —(b) | | (0.69) | | — | | (0.69) |
Year Ended September 30, 2006 | | $13.16 | | (0.07)(a) | | 1.59 | | 1.52 | | —(b) | | (1.45) | | — | | (1.45) |
Year Ended September 30, 2005 | | $15.30 | | —(a)(b) | | 3.02 | | 3.02 | | (0.07) | | (5.09) | | — | | (5.16) |
Mid Cap Growth Fund | | | | | | | | | | | | | | | | |
Year Ended September 30, 2009 | | $ 9.32 | | (0.08)(a) | | (1.49) | | (1.57) | | — | | (0.33) | | (0.05) | | (0.38) |
Year Ended September 30, 2008 | | $14.08 | | (0.16)(a) | | (3.57) | | (3.73) | | — | | (1.03) | | — | | (1.03) |
Year Ended September 30, 2007 | | $11.96 | | (0.15)(a) | | 3.92 | | 3.77 | | — | | (1.65) | | — | | (1.65) |
Year Ended September 30, 2006 | | $13.47 | | (0.09)(a) | | —(b) | | (0.09) | | — | | (1.42) | | — | | (1.42) |
Year Ended September 30, 2005 | | $10.70 | | (0.17)(a) | | 3.08 | | 2.91 | | — | | (0.14) | | — | | (0.14) |
Small Cap Fund | | | | | | | | | | | | | | | | |
Year Ended September 30, 2009 | | $10.84 | | (0.09)(a) | | (2.14) | | (2.23) | | — | | — | | — | | — |
Year Ended September 30, 2008 | | $14.41 | | (0.12)(a) | | (2.25) | | (2.37) | | — | | (1.20) | | — | | (1.20) |
Year Ended September 30, 2007 | | $14.71 | | (0.06)(a) | | 0.73 | | 0.67 | | (0.06) | | (0.91) | | — | | (0.97) |
Year Ended September 30, 2006 | | $16.10 | | (0.11)(a) | | 1.03 | | 0.92 | | (0.01) | | (2.30) | | — | | (2.31) |
Year Ended September 30, 2005 | | $14.06 | | (0.02)(a) | | 2.60 | | 2.58 | | (0.12) | | (0.42) | | — | | (0.54) |
International Equity Fund | | | | | | | | | | | | | | | | |
Year Ended September 30, 2009 | | $ 4.73 | | 0.02(a) | | (0.26) | | (0.24) | | (0.11) | | — | | — | | (0.11) |
Year Ended September 30, 2008 | | $ 7.62 | | 0.03(a) | | (2.16) | | (2.13) | | (0.01) | | (0.75) | | — | | (0.76) |
Year Ended September 30, 2007 | | $10.44 | | 0.01(a) | | 1.73 | | 1.74 | | (0.04) | | (4.52) | | — | | (4.56) |
Year Ended September 30, 2006 | | $ 9.07 | | 0.05(a) | | 1.42 | | 1.47 | | (0.10) | | — | | — | | (0.10) |
Year Ended September 30, 2005 | | $ 7.74 | | 0.06(a) | | 1.36 | | 1.42 | | (0.09) | | — | | — | | (0.09) |
Special Opportunities Equity Fund | | | | | | | | | | | | | | | | |
Year Ended September 30, 2009 | | $14.66 | | (0.06)(a) | | (0.05) | | (0.11) | | —(b) | | (0.57) | | (0.09) | | (0.66) |
Year Ended September 30, 2008 | | $17.64 | | (0.21)(a) | | (2.02) | | (2.23) | | — | | (0.75) | | — | | (0.75) |
Year Ended September 30, 2007 | | $16.01 | | (0.13)(a) | | 3.36 | | 3.23 | | — | | (1.60) | | — | | (1.60) |
Year Ended September 30, 2006 | | $15.30 | | (0.14) | | 1.64 | | 1.50 | | — | | (0.79) | | — | | (0.79) |
Year Ended September 30, 2005 | | $12.95 | | (0.13) | | 2.60 | | 2.47 | | — | | (0.12) | | — | | (0.12) |
Equity Income Fund | | | | | | | | | | | | | | | | |
Year Ended September 30, 2009 | | $12.30 | | 0.22(a) | | (0.99) | | (0.77) | | (0.13) | | (0.03) | | — | | (0.16) |
Year Ended September 30, 2008 | | $14.98 | | 0.33(a) | | (2.21) | | (1.88) | | (0.22) | | (0.58) | | — | | (0.80) |
Year Ended September 30, 2007 | | $13.32 | | 0.26(a) | | 2.30 | | 2.56 | | (0.22) | | (0.68) | | — | | (0.90) |
Year Ended September 30, 2006 | | $12.07 | | 0.19 | | 1.56 | | 1.75 | | (0.23) | | (0.27) | | — | | (0.50) |
Year Ended September 30, 2005 | | $10.34 | | 0.17 | | 1.76 | | 1.93 | | (0.18) | | (0.02) | | — | | (0.20) |
Intermediate U.S. Government Fund | | | | | | | | | | | | | | | | |
Year Ended September 30, 2009 | | $10.01 | | 0.24(a) | | 0.55 | | 0.79 | | (0.27) | | — | | — | | (0.27) |
Year Ended September 30, 2008 | | $ 9.90 | | 0.34(a) | | 0.12 | | 0.46 | | (0.35) | | — | | — | | (0.35) |
Year Ended September 30, 2007 | | $ 9.86 | | 0.35(a) | | 0.04 | | 0.39 | | (0.35) | | — | | — | | (0.35) |
Year Ended September 30, 2006 | | $ 9.98 | | 0.34(a) | | (0.12) | | 0.22 | | (0.34) | | — | | — | | (0.34) |
Year Ended September 30, 2005 | | $10.20 | | 0.27(a) | | (0.13) | | 0.14 | | (0.31) | | (0.05) | | — | | (0.36) |
| * | During the period certain fees were reduced. If such reductions had not occurred, the ratios would have been as indicated. |
| ** | Portfolio turnover rate is calculated on the basis of the Fund as a whole without distinguishing between classes of shares issued. |
| (a) | Per share net investment income (loss) has been calculated using the average daily shares method. |
| (b) | Amount is less than $0.005. |
See accompanying notes to the financial statements.
142
| | | | | | | | | | | | |
| | | | | Ratios/Supplementary Data |
Net Asset Value, End of Year | | Total
Return
(excludes
sales charge) | | Net Assets,
End of
Year
(000) | | Ratio of
net expenses
to average
net assets | | Ratio of net
investment
income
(loss) to
average net
assets | | Ratio of
expenses to
average
net assets* | | Portfolio
turnover rate** |
| | | | | | | | | | | | |
| $ 9.85 | | (10.43)% | | $ 93 | | 1.81% | | 0.49% | | 1.95% | | 92.97% |
| $11.08 | | (30.00)% | | $ 143 | | 1.89% | | 0.28% | | 1.94% | | 38.43% |
| $18.87 | | 11.76% | | $ 239 | | 1.91% | | 0.50% | | 1.97% | | 68.60% |
| $20.11 | | 13.42% | | $ 161 | | 1.88% | | 0.82% | | 1.94% | | 34.83% |
| $19.28 | | 13.77% | | $ 176 | | 1.88% | | 0.80% | | 1.98% | | 19.50% |
| | | | | | | | | | | | |
| $10.34 | | 2.08% | | $ 176 | | 1.96% | | (0.59)% | | 2.01% | | 46.83% |
| $10.14 | | (22.59)% | | $ 328 | | 1.89% | | (0.60)% | | 1.93% | | 65.74% |
| $14.55 | | 15.60% | | $ 1,126 | | 1.91% | | (0.49)% | | 1.95% | | 58.59% |
| $13.23 | | 12.38% | | $ 743 | | 1.89% | | (0.53)% | | 1.93% | | 53.92% |
| $13.16 | | 19.97% | | $ 351 | | 1.90% | | 0.01% | | 2.00% | | 126.99% |
| | | | | | | | | | | | |
| $ 7.37 | | (15.85)% | | $ 36 | | 1.96% | | (1.20)% | | 2.01% | | 173.21% |
| $ 9.32 | | (28.82)% | | $ 28 | | 1.90% | | (1.35)% | | 1.94% | | 218.03% |
| $14.08 | | 35.19% | | $ 46 | | 1.92% | | (1.23)% | | 1.96% | | 134.95% |
| $11.96 | | (1.15)% | | $ 33 | | 1.88% | | (0.70)% | | 1.93% | | 140.90% |
| $13.47 | | 27.42% | | $ 77 | | 1.91% | | (1.46)% | | 2.00% | | 92.74% |
| | | | | | | | | | | | |
| $ 8.61 | | (20.57)% | | $ 14 | | 2.14% | | (1.22)% | | 2.38% | | 137.20% |
| $10.84 | | (17.44)% | | $ 12 | | 2.03% | | (0.98)% | | 2.23% | | 94.93% |
| $14.41 | | 4.37% | | $ 26 | | 2.06% | | (0.41)% | | 2.26% | | 46.54% |
| $14.71 | | 6.17% | | $ 20 | | 2.03% | | (0.76)% | | 2.27% | | 43.25% |
| $16.10 | | 18.71% | | $ 4 | | 2.04% | | (0.12)% | | 2.25% | | 8.39% |
| | | | | | | | | | | | |
| $ 4.38 | | (4.66)% | | $ 166 | | 2.49% | | 0.60% | | 2.63% | | 223.19% |
| $ 4.73 | | (31.30)% | | $ 172 | | 2.31% | | 0.48% | | 2.50% | | 112.65% |
| $ 7.62 | | 19.28% | | $ 244 | | 2.13% | | 0.12% | | 2.26% | | 129.80% |
| $10.44 | | 16.26% | | $ 188 | | 2.15% | | 0.47% | | 2.25% | | 36.22% |
| $ 9.07 | | 18.38% | | $ 92 | | 2.23% | | 0.70% | | 2.34% | | 44.96% |
| | | | | | | | | | | | |
| $13.89 | | 0.97% | | $58,479 | | 2.03% | | (0.51)% | | 2.04% | | 45.22% |
| $14.66 | | (13.27)% | | $50,230 | | 1.99% | | (1.23)% | | 1.99% | | 25.80% |
| $17.64 | | 21.32% | | $50,577 | | 2.03% | | (0.79)% | | 2.03% | | 49.43% |
| $16.01 | | 10.34% | | $34,418 | | 2.03% | | (1.02)% | | 2.03% | | 58.01% |
| $15.30 | | 19.16% | | $30,299 | | 2.06% | | (1.17)% | | 2.08% | | 30.38% |
| | | | | | | | | | | | |
| $11.37 | | (6.10)% | | $39,164 | | 1.93% | | 2.18% | | 1.95% | | 37.13% |
| $12.30 | | (13.07)% | | $32,637 | | 1.89% | | 2.39% | | 1.89% | | 30.01% |
| $14.98 | | 19.93% | | $26,044 | | 1.94% | | 1.79% | | 1.94% | | 37.85% |
| $13.32 | | 14.85% | | $14,261 | | 1.95% | | 1.52% | | 1.95% | | 45.38% |
| $12.07 | | 18.74% | | $ 8,683 | | 1.87% | | 1.77% | | 2.08% | | 39.65% |
| | | | | | | | | | | | |
| $10.53 | | 8.00% | | $ 426 | | 1.70% | | 2.31% | | 1.82% | | 47.13% |
| $10.01 | | 4.62% | | $ 176 | | 1.67% | | 3.33% | | 1.79% | | 116.07% |
| $ 9.90 | | 4.01% | | $ 201 | | 1.68% | | 3.52% | | 1.80% | | 85.83% |
| $ 9.86 | | 2.31% | | $ 207 | | 1.68% | | 3.47% | | 1.79% | | 127.13% |
| $ 9.98 | | 1.33% | | $ 274 | | 1.71% | | 2.66% | | 1.84% | | 107.04% |
143
Financial Highlights, Class C Shares
Selected data for a share of beneficial interest outstanding throughout the periods indicated.
| | | | | | | | | | | | | | |
| | | | | Investment Activities | | Distributions |
| | | |
| | | | | | | |
| | | Net Asset
Value,
Beginning
of Year | | Net
investment
income
(loss) | | Net realized/
unrealized
gains (losses)
on investments | | Total from
Investment
Activities | | Net
investment
income | | Net realized
gains on
investments | | Total
Distributions |
Total Return Bond Fund | | | | | | | | | | | | | | |
Year Ended September 30, 2009 | | $ 9.89 | | 0.37(a) | | 0.90 | | 1.27 | | (0.37) | | — | | (0.37) |
Year Ended September 30, 2008 | | $10.14 | | 0.36(a) | | (0.23) | | 0.13 | | (0.38) | | — | | (0.38) |
Year Ended September 30, 2007 | | $10.13 | | 0.37(a) | | 0.01 | | 0.38 | | (0.37) | | — | | (0.37) |
Year Ended September 30, 2006 | | $10.32 | | 0.34(a) | | (0.12) | | 0.22 | | (0.36) | | (0.05) | | (0.41) |
Year Ended September 30, 2005 | | $10.59 | | 0.30(a) | | (0.18) | | 0.12 | | (0.36) | | (0.03) | | (0.39) |
Prime Money Market Fund | | | | | | | | | | | | | | |
Year Ended September 30, 2009 | | $ 1.00 | | —(a)(b) | | —(b) | | —(b) | | —(b) | | — | | —(b) |
Year Ended September 30, 2008 | | $ 1.00 | | 0.02(a) | | —(b) | | 0.02 | | (0.02) | | — | | (0.02) |
Year Ended September 30, 2007 | | $ 1.00 | | 0.04(a) | | — | | 0.04 | | (0.04) | | — | | (0.04) |
Year Ended September 30, 2006 | | $ 1.00 | | 0.03 | | —(b) | | 0.03 | | (0.03) | | — | | (0.03) |
Year Ended September 30, 2005 | | $ 1.00 | | 0.01 | | —(b) | | 0.01 | | (0.01) | | — | | (0.01) |
U.S. Treasury Money Market Fund | | | | | | | | | | | | | | |
Year Ended September 30, 2009 | | $ 1.00 | | —(a)(b) | | — | | —(b) | | —(b) | | — | | —(b) |
Year Ended September 30, 2008 | | $ 1.00 | | 0.01(a) | | —(b) | | 0.01 | | (0.01) | | — | | (0.01) |
Year Ended September 30, 2007 | | $ 1.00 | | 0.04(a) | | — | | 0.04 | | (0.04) | | — | | (0.04) |
Year Ended September 30, 2006 | | $ 1.00 | | 0.03 | | — | | 0.03 | | (0.03) | | — | | (0.03) |
Year Ended September 30, 2005 | | $ 1.00 | | 0.01 | | — | | 0.01 | | (0.01) | | — | | (0.01) |
Capital Manager Conservative Growth Fund*** | | | | | | | | | | | | | | |
Year Ended September 30, 2009 | | $ 8.41 | | 0.17(a) | | 0.21 | | 0.38 | | (0.18) | | (0.14) | | (0.32) |
Year Ended September 30, 2008 | | $10.51 | | 0.19(a) | | (1.24) | | (1.05) | | (0.32) | | (0.73) | | (1.05) |
Year Ended September 30, 2007 | | $ 9.93 | | 0.27(a) | | 0.53 | | 0.80 | | (0.22) | | — | | (0.22) |
Year Ended September 30, 2006 | | $ 9.73 | | 0.23(a) | | 0.23 | | 0.46 | | (0.26) | | — | | (0.26) |
Year Ended September 30, 2005 | | $ 9.27 | | 0.16 | | 0.45 | | 0.61 | | (0.15) | | — | | (0.15) |
Capital Manager Moderate Growth Fund*** | | | | | | | | | | | | | | |
Year Ended September 30, 2009 | | $ 7.67 | | 0.11(a) | | 0.01 | | 0.12 | | (0.11) | | — | | (0.11) |
Year Ended September 30, 2008 | | $10.81 | | 0.09(a) | | (1.82) | | (1.73) | | (0.28) | | (1.13) | | (1.41) |
Year Ended September 30, 2007 | | $10.10 | | 0.21(a) | | 0.86 | | 1.07 | | (0.14) | | (0.22) | | (0.36) |
Year Ended September 30, 2006 | | $ 9.69 | | 0.17(a) | | 0.42 | | 0.59 | | (0.18) | | — | | (0.18) |
Year Ended September 30, 2005 | | $ 8.91 | | 0.09(a) | | 0.77 | | 0.86 | | (0.08) | | — | | (0.08) |
Capital Manager Growth Fund*** | | | | | | | | | | | | | | |
Year Ended September 30, 2009 | | $ 7.17 | | 0.07(a) | | (0.22) | | (0.15) | | (0.08) | | — | | (0.08) |
Year Ended September 30, 2008 | | $10.92 | | 0.04(a) | | (2.15) | | (2.11) | | (0.27) | | (1.37) | | (1.64) |
Year Ended September 30, 2007 | | $10.05 | | 0.18(a) | | 1.04 | | 1.22 | | (0.08) | | (0.27) | | (0.35) |
Year Ended September 30, 2006 | | $ 9.52 | | 0.11(a) | | 0.57 | | 0.68 | | (0.15) | | — | | (0.15) |
Year Ended September 30, 2005 | | $ 8.56 | | 0.04(a) | | 0.95 | | 0.99 | | (0.03) | | — | | (0.03) |
Capital Manager Equity Fund*** | | | | | | | | | | | | | | |
Year Ended September 30, 2009 | | $ 7.10 | | 0.02(a) | | (0.60) | | (0.58) | | (0.05) | | — | | (0.05) |
Year Ended September 30, 2008 | | $11.87 | | (0.03)(a) | | (2.66) | | (2.69) | | (0.27) | | (1.81) | | (2.08) |
Year Ended September 30, 2007 | | $11.22 | | 0.12(a) | | 1.41 | | 1.53 | | (0.03) | | (0.85) | | (0.88) |
Year Ended September 30, 2006 | | $10.64 | | 0.10(a) | | 0.78 | | 0.88 | | (0.11) | | (0.19) | | (0.30) |
Year Ended September 30, 2005 | | $ 9.33 | | (0.01)(a) | | 1.32 | | 1.31 | | —(b) | | — | | —(b) |
| * | During the period certain fees were reduced. If such reductions had not occurred, the ratios would have been as indicated. |
| ** | Portfolio turnover rate is calculated on the basis of the Fund as a whole without distinguishing between classes of shares issued. |
| *** | The expense ratios exclude the impact of fees/expenses paid by each underlying fund. |
| (a) | Per share net investment income (loss) has been calculated using the average daily shares method. |
| (b) | Amount is less than $0.005. |
See accompanying notes to the financial statements.
144
| | | | | | | | | | | | |
| | | | | Ratios/Supplementary Data |
Net Asset Value, End of Year | | Total
Return
(excludes
sales charge) | | Net Assets,
End of
Year
(000) | | Ratio of
net expenses
to average
net assets | | Ratio of net
investment
income
(loss) to
average net
assets | | Ratio of
expenses to
average
net assets* | | Portfolio
turnover rate** |
| | | | | | | | | | | | |
| $10.79 | | 13.14% | | $400 | | 1.71% | | 3.61% | | 1.83% | | 122.26% |
| $ 9.89 | | 1.21% | | $184 | | 1.66% | | 3.49% | | 1.78% | | 190.15% |
| $10.14 | | 3.83% | | $115 | | 1.68% | | 3.61% | | 1.80% | | 222.24% |
| $10.13 | | 2.18% | | $116 | | 1.68% | | 3.35% | | 1.79% | | 226.36% |
| $10.32 | | 1.21% | | $218 | | 1.71% | | 2.88% | | 1.84% | | 173.74% |
| | | | | | | | | | | | |
| $ 1.00 | | 0.34% | | $893 | | 1.10% | | 0.24% | | 1.66% | | — |
| $ 1.00 | | 2.36% | | $244 | | 1.46% | | 2.46% | | 1.59% | | — |
| $ 1.00 | | 3.99% | | $460 | | 1.48% | | 3.91% | | 1.59% | | — |
| $ 1.00 | | 3.35% | | $393 | | 1.48% | | 3.35% | | 1.59% | | — |
| $ 1.00 | | 1.32% | | $326 | | 1.49% | | 1.29% | | 1.64% | | — |
| | | | | | | | | | | | |
| $ 1.00 | | 0.04% | | $ 54 | | 0.28% | | 0.03% | | 1.64% | | — |
| $ 1.00 | | 1.29% | | $ 37 | | 1.38% | | 1.30% | | 1.58% | | — |
| $ 1.00 | | 3.68% | | $ 42 | | 1.47% | | 3.63% | | 1.61% | | — |
| $ 1.00 | | 3.13% | | $ 55 | | 1.45% | | 3.30% | | 1.59% | | — |
| $ 1.00 | | 1.07% | | $ 38 | | 1.50% | | 1.40% | | 1.66% | | — |
| | | | | | | | | | | | |
| $ 8.47 | | 5.09% | | $101 | | 1.17% | | 2.19% | | 1.43% | | 21.56% |
| $ 8.41 | | (10.99)% | | $ 94 | | 1.10% | | 1.99% | | 1.35% | | 39.99% |
| $10.51 | | 8.11% | | $ 77 | | 1.10% | | 2.58% | | 1.41% | | 29.58% |
| $ 9.93 | | 4.75% | | $127 | | 1.08% | | 2.35% | | 1.45% | | 5.69% |
| $ 9.73 | | 6.58% | | $155 | | 1.20% | | 1.63% | | 1.52% | | 52.50% |
| | | | | | | | | | | | |
| $ 7.68 | | 1.85% | | $ 89 | | 1.13% | | 1.58% | | 1.38% | | 22.46% |
| $ 7.67 | | (18.02)% | | $ 79 | | 1.10% | | 1.04% | | 1.35% | | 63.63% |
| $10.81 | | 10.72% | | $156 | | 1.11% | | 1.98% | | 1.42% | | 40.05% |
| $10.10 | | 6.19% | | $139 | | 1.10% | | 1.71% | | 1.47% | | 7.33% |
| $ 9.69 | | 9.62% | | $122 | | 1.25% | | 0.95% | | 1.56% | | 37.83% |
| | | | | | | | | | | | |
| $ 6.94 | | (1.90)% | | $ 99 | | 1.14% | | 1.13% | | 1.39% | | 24.08% |
| $ 7.17 | | (22.31)% | | $ 55 | | 1.10% | | 0.49% | | 1.35% | | 77.54% |
| $10.92 | | 12.33% | | $ 78 | | 1.11% | | 1.74% | | 1.43% | | 44.48% |
| $10.05 | | 7.19% | | $ 61 | | 1.11% | | 1.17% | | 1.46% | | 6.26% |
| $ 9.52 | | 11.61% | | $ 37 | | 1.26% | | 0.43% | | 1.59% | | 26.22% |
| | | | | | | | | | | | |
| $ 6.47 | | (8.11)% | | $ 6 | | 1.13% | | 0.35% | | 1.36% | | 20.24% |
| $ 7.10 | | (26.77)% | | $ 1 | | 1.13% | | (0.32)% | | 1.43% | | 67.40% |
| $11.87 | | 14.13% | | $ 1 | | 1.00% | | 1.02% | | 1.25% | | 48.80% |
| $11.22 | | 8.44% | | $ 10 | | 1.11% | | 0.90% | | 1.48% | | 1.48% |
| $10.64 | | 14.15% | | $ 19 | | 1.27% | | (0.09)% | | 1.63% | | 2.14% |
145
Financial Highlights, Institutional Shares
Selected data for a share of beneficial interest outstanding throughout the periods indicated.
| | | | | | | | | | | | | | | | |
| | | | | Investment Activities | | Distributions |
| | | |
| | | | | | | |
| | | Net Asset
Value,
Beginning
of Year | | Net
investment
income
(loss) | | Net realized/
unrealized
gains (losses)
on investments | | Total from
Investment
Activities | | Net
investment
income | | Net realized
gains on
investments | | Return
of
capital | | Total
Distributions |
Large Cap Fund | | | | | | | | | | | | | | | | |
Year Ended September 30, 2009 | | $11.36 | | 0.13(a) | | (1.22) | | (1.09) | | (0.14) | | — | | — | | (0.14) |
Year Ended September 30, 2008 | | $19.20 | | 0.18(a) | | (5.16) | | (4.98) | | (0.13) | | (2.73) | | — | | (2.86) |
Year Ended September 30, 2007 | | $20.38 | | 0.29(a) | | 2.16 | | 2.45 | | (0.28) | | (3.35) | | — | | (3.63) |
Year Ended September 30, 2006 | | $19.51 | | 0.35(a) | | 2.31 | | 2.66 | | (0.35) | | (1.44) | | — | | (1.79) |
Year Ended September 30, 2005 | | $17.29 | | 0.34 | | 2.22 | | 2.56 | | (0.34) | | — | | — | | (0.34) |
Mid Cap Value Fund | | | | | | | | | | | | | | | | |
Year Ended September 30, 2009 | | $10.56 | | 0.04(a) | | 0.29 | | 0.33 | | (0.03) | | — | | — | | (0.03) |
Year Ended September 30, 2008 | | $15.00 | | 0.05(a) | | (3.10) | | (3.05) | | (0.03) | | (1.36) | | — | | (1.39) |
Year Ended September 30, 2007 | | $13.54 | | 0.08(a) | | 2.13 | | 2.21 | | (0.06) | | (0.69) | | — | | (0.75) |
Year Ended September 30, 2006 | | $13.38 | | 0.06(a) | | 1.62 | | 1.68 | | (0.07) | | (1.45) | | — | | (1.52) |
Year Ended September 30, 2005 | | $15.41 | | 0.17(a) | | 3.05 | | 3.22 | | (0.16) | | (5.09) | | — | | (5.25) |
Mid Cap Growth Fund | | | | | | | | | | | | | | | | |
Year Ended September 30, 2009 | | $10.60 | | (0.01)(a) | | (1.68) | | (1.69) | | — | | (0.33) | | (0.05) | | (0.38) |
Year Ended September 30, 2008 | | $15.73 | | (0.04)(a) | | (4.06) | | (4.10) | | — | | (1.03) | | — | | (1.03) |
Year Ended September 30, 2007 | | $13.09 | | (0.04)(a) | | 4.35 | | 4.31 | | (0.02) | | (1.65) | | — | | (1.67) |
Year Ended September 30, 2006 | | $14.51 | | 0.02(a) | | 0.02(b) | | 0.04 | | (0.04) | | (1.42) | | — | | (1.46) |
Year Ended September 30, 2005 | | $11.40 | | (0.06)(a) | | 3.31 | | 3.25 | | — | | (0.14) | | — | | (0.14) |
Small Cap Fund | | | | | | | | | | | | | | | | |
Year Ended September 30, 2009 | | $11.47 | | (0.02)(a) | | (2.24) | | (2.26) | | — | | — | | — | | — |
Year Ended September 30, 2008 | | $15.03 | | —(a)(c) | | (2.36) | | (2.36) | | — | | (1.20) | | — | | (1.20) |
Year Ended September 30, 2007 | | $15.19 | | 0.10(a) | | 0.75 | | 0.85 | | (0.10) | | (0.91) | | — | | (1.01) |
Year Ended September 30, 2006 | | $16.44 | | 0.05(a) | | 1.05 | | 1.10 | | (0.05) | | (2.30) | | — | | (2.35) |
Year Ended September 30, 2005 | | $14.23 | | 0.16(a) | | 2.62 | | 2.78 | | (0.15) | | (0.42) | | — | | (0.57) |
International Equity Fund | | | | | | | | | | | | | | | | |
Year Ended September 30, 2009 | | $ 5.47 | | 0.07(a) | | (0.28) | | (0.21) | | (0.12) | | — | | — | | (0.12) |
Year Ended September 30, 2008 | | $ 8.64 | | 0.10(a) | | (2.49) | | (2.39) | | (0.03) | | (0.75) | | — | | (0.78) |
Year Ended September 30, 2007 | | $11.23 | | 0.14(a) | | 1.88 | | 2.02 | | (0.09) | | (4.52) | | — | | (4.61) |
Year Ended September 30, 2006 | | $ 9.72 | | 0.18(a) | | 1.50 | | 1.68 | | (0.17) | | — | | — | | (0.17) |
Year Ended September 30, 2005 | | $ 8.24 | | 0.12(a) | | 1.49 | | 1.61 | | (0.13) | | — | | — | | (0.13) |
Special Opportunities Equity Fund | | | | | | | | | | | | | | | | |
Year Ended September 30, 2009 | | $15.58 | | 0.04(a) | | (0.01) | | 0.03 | | —(c) | | (0.58) | | (0.11) | | (0.69) |
Year Ended September 30, 2008 | | $18.51 | | (0.04)(a) | | (2.14) | | (2.18) | | — | | (0.75) | | — | | (0.75) |
Year Ended September 30, 2007 | | $16.57 | | 0.03(a) | | 3.51 | | 3.54 | | — | | (1.60) | | — | | (1.60) |
Year Ended September 30, 2006 | | $15.65 | | —(c) | | 1.71 | | 1.71 | | — | | (0.79) | | — | | (0.79) |
Year Ended September 30, 2005 | | $13.12 | | (0.03) | | 2.68 | | 2.65 | | — | | (0.12) | | — | | (0.12) |
Equity Income Fund | | | | | | | | | | | | | | | | |
Year Ended September 30, 2009 | | $12.37 | | 0.32(a) | | (0.99) | | (0.67) | | (0.23) | | (0.03) | | — | | (0.26) |
Year Ended September 30, 2008 | | $15.05 | | 0.51(a) | | (2.26) | | (1.75) | | (0.35) | | (0.58) | | — | | (0.93) |
Year Ended September 30, 2007 | | $13.37 | | 0.40(a) | | 2.31 | | 2.71 | | (0.35) | | (0.68) | | — | | (1.03) |
Year Ended September 30, 2006 | | $12.10 | | 0.32 | | 1.57 | | 1.89 | | (0.35) | | (0.27) | | — | | (0.62) |
Year Ended September 30, 2005 | | $10.35 | | 0.28 | | 1.76 | | 2.04 | | (0.27) | | (0.02) | | — | | (0.29) |
Short U.S. Government Fund | | | | | | | | | | | | | | | | |
Year Ended September 30, 2009 | | $ 9.54 | | 0.25(a) | | 0.22 | | 0.47 | | (0.34) | | — | | — | | (0.34) |
Year Ended September 30, 2008 | | $ 9.53 | | 0.35(a) | | 0.06 | | 0.41 | | (0.40) | | — | | — | | (0.40) |
Year Ended September 30, 2007 | | $ 9.49 | | 0.38(a) | | 0.08 | | 0.46 | | (0.42) | | — | | — | | (0.42) |
Year Ended September 30, 2006 | | $ 9.51 | | 0.30(a) | | 0.01(b) | | 0.31 | | (0.33) | | — | | — | | (0.33) |
Year Ended September 30, 2005 | | $ 9.71 | | 0.25 | | (0.13) | | 0.12 | | (0.32) | | — | | — | | (0.32) |
| * | During the period certain fees were reduced. If such reductions had not occurred, the ratios would have been as indicated. |
| ** | Portfolio turnover rate is calculated on the basis of the Fund as a whole without distinguishing between classes of shares issued. |
| (a) | Per share net investment income (loss) has been calculated using the average daily shares method. |
| (b) | The amount shown for a share outstanding throughout the period does not accord with the change in aggregate gains and losses in the portfolio of securities during the period because of the timing of sales and purchases of Fund shares in relation to fluctuating market values during the period. |
| (c) | Amount is less than $0.005. |
See accompanying notes to the financial statements.
146
| | | | | | | | | | | | |
| | | | | Ratios/Supplementary Data |
Net Asset Value, End of Year | | Total
Return | | Net Assets,
End of
Year
(000) | | Ratio of
net expenses
to average
net assets | | Ratio of net
investment
income
(loss) to
average net
assets | | Ratio of
expenses to
average
net assets* | | Portfolio
turnover rate** |
| | | | | | | | | | | | |
| $10.13 | | (9.40)% | | $177,725 | | 0.81% | | 1.51% | | 0.95% | | 92.97% |
| $11.36 | | (29.32)% | | $257,036 | | 0.89% | | 1.28% | | 0.94% | | 38.43% |
| $19.20 | | 12.89% | | $602,101 | | 0.91% | | 1.50% | | 0.96% | | 68.60% |
| $20.38 | | 14.59% | | $660,667 | | 0.89% | | 1.80% | | 0.93% | | 34.83% |
| $19.51 | | 14.92% | | $605,493 | | 0.89% | | 1.82% | | 0.99% | | 19.50% |
| | | | | | | | | | | | |
| $10.86 | | 3.21% | | $200,331 | | 0.96% | | 0.44% | | 1.02% | | 46.83% |
| $10.56 | | (21.87)% | | $163,840 | | 0.89% | | 0.43% | | 0.93% | | 65.74% |
| $15.00 | | 16.75% | | $243,437 | | 0.91% | | 0.53% | | 0.95% | | 58.59% |
| $13.54 | | 13.52% | | $209,685 | | 0.89% | | 0.48% | | 0.93% | | 53.92% |
| $13.38 | | 21.14% | | $172,295 | | 0.89% | | 1.02% | | 0.99% | | 126.99% |
| | | | | | | | | | | | |
| $ 8.53 | | (15.04)% | | $ 80,457 | | 0.98% | | (0.20)% | | 1.02% | | 173.21% |
| $10.60 | | (28.12)% | | $162,072 | | 0.90% | | (0.31)% | | 0.94% | | 218.03% |
| $15.73 | | 36.43% | | $197,736 | | 0.90% | | (0.25)% | | 0.94% | | 134.95% |
| $13.09 | | (0.15)% | | $132,677 | | 0.89% | | 0.17% | | 0.94% | | 140.90% |
| $14.51 | | 28.73% | | $126,785 | | 0.91% | | (0.46)% | | 1.01% | | 92.74% |
| | | | | | | | | | | | |
| $ 9.21 | | (19.70)% | | $ 23,747 | | 1.16% | | (0.21)% | | 1.39% | | 137.20% |
| $11.47 | | (16.60)% | | $ 33,901 | | 1.03% | | (0.01)% | | 1.23% | | 94.93% |
| $15.03 | | 5.43% | | $ 82,389 | | 1.06% | | 0.62% | | 1.26% | | 46.54% |
| $15.19 | | 7.23% | | $110,722 | | 1.02% | | 0.30% | | 1.26% | | 43.25% |
| $16.44 | | 19.99% | | $ 61,046 | | 1.05% | | 1.07% | | 1.28% | | 8.39% |
| | | | | | | | | | | | |
| $ 5.14 | | (3.42)% | | $ 81,575 | | 1.49% | | 1.58% | | 1.64% | | 223.19% |
| $ 5.47 | | (30.65)% | | $109,438 | | 1.31% | | 1.36% | | 1.49% | | 112.65% |
| $ 8.64 | | 20.39% | | $164,147 | | 1.13% | | 1.13% | | 1.26% | | 129.80% |
| $11.23 | | 17.38% | | $253,690 | | 1.15% | | 1.68% | | 1.25% | | 36.22% |
| $ 9.72 | | 19.61% | | $229,406 | | 1.20% | | 1.34% | | 1.33% | | 44.96% |
| | | | | | | | | | | | |
| $14.92 | | 1.91% | | $228,421 | | 1.03% | | 0.30% | | 1.04% | | 45.22% |
| $15.58 | | (12.35)% | | $167,544 | | 0.99% | | (0.24)% | | 0.99% | | 25.80% |
| $18.51 | | 22.55% | | $127,210 | | 1.03% | | 0.18% | | 1.03% | | 49.43% |
| $16.57 | | 11.50% | | $ 67,232 | | 1.03% | | (0.02)% | | 1.03% | | 58.01% |
| $15.65 | | 20.29% | | $ 60,823 | | 1.06% | | (0.18)% | | 1.08% | | 30.38% |
| | | | | | | | | | | | |
| $11.44 | | (5.18)% | | $177,281 | | 0.93% | | 3.19% | | 0.95% | | 37.13% |
| $12.37 | | (12.24)% | | $140,256 | | 0.89% | | 3.72% | | 0.89% | | 30.01% |
| $15.05 | | 21.16% | | $ 46,053 | | 0.94% | | 2.81% | | 0.94% | | 37.85% |
| $13.37 | | 16.04% | | $ 35,205 | | 0.95% | | 2.55% | | 0.95% | | 45.38% |
| $12.10 | | 19.88% | | $ 30,588 | | 0.90% | | 2.62% | | 1.12% | | 39.65% |
| | | | | | | | | | | | |
| $ 9.67 | | 4.94% | | $ 59,123 | | 0.70% | | 2.58% | | 0.85% | | 89.57% |
| $ 9.54 | | 4.38% | | $ 44,912 | | 0.65% | | 3.68% | | 0.80% | | 48.20% |
| $ 9.53 | | 4.93% | | $ 40,756 | | 0.66% | | 4.01% | | 0.81% | | 44.10% |
| $ 9.49 | | 3.37% | | $ 66,371 | | 0.64% | | 3.21% | | 0.79% | | 98.08% |
| $ 9.51 | | 1.21% | | $155,786 | | 0.66% | | 2.64% | | 0.84% | | 33.67% |
147
Financial Highlights, Institutional Shares
Selected data for a share of beneficial interest outstanding throughout the periods indicated.
| | | | | | | | | | | | | | |
| | | | | Investment Activities | | Distributions |
| | | | | | | |
| | | Net Asset
Value,
Beginning
of Year | | Net
investment
income | | Net realized/
unrealized
gains (losses)
on investments | | Total from
Investment
Activities | | Net
investment
income | | Net realized
gains on
investments | | Total
Distributions |
Intermediate U.S. Government Fund | | | | | | | | | | | | | | |
Year Ended September 30, 2009 | | $10.05 | | 0.35(a) | | 0.55 | | 0.90 | | (0.38) | | — | | (0.38) |
Year Ended September 30, 2008 | | $ 9.94 | | 0.44(a) | | 0.12 | | 0.56 | | (0.45) | | — | | (0.45) |
Year Ended September 30, 2007 | | $ 9.90 | | 0.45(a) | | 0.04 | | 0.49 | | (0.45) | | — | | (0.45) |
Year Ended September 30, 2006 | | $10.03 | | 0.44(a) | | (0.13) | | 0.31 | | (0.44) | | — | | (0.44) |
Year Ended September 30, 2005 | | $10.25 | | 0.37(a) | | (0.13) | | 0.24 | | (0.41) | | (0.05) | | (0.46) |
Total Return Bond Fund | | | | | | | | | | | | | | |
Year Ended September 30, 2009 | | $ 9.89 | | 0.47(a) | | 0.89 | | 1.36 | | (0.47) | | — | | (0.47) |
Year Ended September 30, 2008 | | $10.13 | | 0.46(a) | | (0.22) | | 0.24 | | (0.48) | | — | | (0.48) |
Year Ended September 30, 2007 | | $10.13 | | 0.47(a) | | — | | 0.47 | | (0.47) | | — | | (0.47) |
Year Ended September 30, 2006 | | $10.32 | | 0.45(a) | | (0.13) | | 0.32 | | (0.46) | | (0.05) | | (0.51) |
Year Ended September 30, 2005 | | $10.59 | | 0.39(a) | | (0.16) | | 0.23 | | (0.47) | | (0.03) | | (0.50) |
Kentucky Intermediate Tax-Free Fund | | | | | | | | | | | | | | |
Year Ended September 30, 2009 | | $ 9.87 | | 0.35(a) | | 0.90 | | 1.25 | | (0.35) | | (0.10) | | (0.45) |
Year Ended September 30, 2008 | | $10.05 | | 0.34(a) | | (0.18) | | 0.16 | | (0.34) | | — | | (0.34) |
Year Ended September 30, 2007 | | $10.11 | | 0.35(a) | | (0.06) | | 0.29 | | (0.35) | | — | | (0.35) |
Year Ended September 30, 2006 | | $10.04 | | 0.33 | | 0.07 | | 0.40 | | (0.33) | | — | | (0.33) |
Year Ended September 30, 2005 | | $10.20 | | 0.29(a) | | (0.16) | | 0.13 | | (0.29) | | — | | (0.29) |
Maryland Intermediate Tax-Free Fund | | | | | | | | | | | | | | |
Year Ended September 30, 2009 | | $10.06 | | 0.33(a) | | 1.01 | | 1.34 | | (0.33) | | (0.08) | | (0.41) |
Year Ended September 30, 2008 | | $10.17 | | 0.34(a) | | (0.11) | | 0.23 | | (0.34) | | — | | (0.34) |
Year Ended September 30, 2007 | | $10.13 | | 0.33(a) | | 0.04 | | 0.37 | | (0.33) | | — | | (0.33) |
Year Ended September 30, 2006 | | $10.04 | | 0.31 | | 0.09 | | 0.40 | | (0.31) | | — | | (0.31) |
Year Ended September 30, 2005 | | $10.16 | | 0.28(a) | | (0.12) | | 0.16 | | (0.28) | | — | | (0.28) |
North Carolina Intermediate Tax-Free Fund | | | | | | | | | | | | | | |
Year Ended September 30, 2009 | | $10.09 | | 0.36(a) | | 0.88 | | 1.24 | | (0.36) | | (0.10) | | (0.46) |
Year Ended September 30, 2008 | | $10.33 | | 0.37(a) | | (0.20) | | 0.17 | | (0.37) | | (0.04) | | (0.41) |
Year Ended September 30, 2007 | | $10.38 | | 0.38(a) | | (0.04) | | 0.34 | | (0.38) | | (0.01) | | (0.39) |
Year Ended September 30, 2006 | | $10.46 | | 0.39 | | —(b) | | 0.39 | | (0.38) | | (0.09) | | (0.47) |
Year Ended September 30, 2005 | | $10.66 | | 0.38 | | (0.19) | | 0.19 | | (0.37) | | (0.02) | | (0.39) |
South Carolina Intermediate Tax-Free Fund | | | | | | | | | | | | | | |
Year Ended September 30, 2009 | | $ 9.89 | | 0.35(a) | | 0.89 | | 1.24 | | (0.35) | | (0.17) | | (0.52) |
Year Ended September 30, 2008 | | $10.21 | | 0.36(a) | | (0.23) | | 0.13 | | (0.36) | | (0.09) | | (0.45) |
Year Ended September 30, 2007 | | $10.29 | | 0.37(a) | | (0.06) | | 0.31 | | (0.38) | | (0.01) | | (0.39) |
Year Ended September 30, 2006 | | $10.47 | | 0.37 | | —(b) | | 0.37 | | (0.37) | | (0.18) | | (0.55) |
Year Ended September 30, 2005 | | $10.74 | | 0.36 | | (0.19) | | 0.17 | | (0.36) | | (0.08) | | (0.44) |
Virginia Intermediate Tax-Free Fund | | | | | | | | | | | | | | |
Year Ended September 30, 2009 | | $11.10 | | 0.39(a) | | 1.06 | | 1.45 | | (0.39) | | (0.09) | | (0.48) |
Year Ended September 30, 2008 | | $11.31 | | 0.40(a) | | (0.16) | | 0.24 | | (0.40) | | (0.05) | | (0.45) |
Year Ended September 30, 2007 | | $11.39 | | 0.41(a) | | (0.05) | | 0.36 | | (0.42) | | (0.02) | | (0.44) |
Year Ended September 30, 2006 | | $11.49 | | 0.42 | | (0.04) | | 0.38 | | (0.42) | | (0.06) | | (0.48) |
Year Ended September 30, 2005 | | $11.74 | | 0.42 | | (0.23) | | 0.19 | | (0.42) | | (0.02) | | (0.44) |
West Virginia Intermediate Tax-Free Fund | | | | | | | | | | | | | | |
Year Ended September 30, 2009 | | $ 9.37 | | 0.36(a) | | 0.68 | | 1.04 | | (0.35) | | (0.01) | | (0.36) |
Year Ended September 30, 2008 | | $ 9.72 | | 0.36(a) | | (0.34) | | 0.02 | | (0.35) | | (0.02) | | (0.37) |
Year Ended September 30, 2007 | | $ 9.80 | | 0.37(a) | | (0.05) | | 0.32 | | (0.37) | | (0.03) | | (0.40) |
Year Ended September 30, 2006 | | $ 9.86 | | 0.40 | | (0.01) | | 0.39 | | (0.39) | | (0.06) | | (0.45) |
Year Ended September 30, 2005 | | $10.09 | | 0.37(a) | | (0.15) | | 0.22 | | (0.37) | | (0.08) | | (0.45) |
| * | During the period certain fees were reduced. If such reductions had not occurred, the ratios would have been as indicated. |
| ** | Portfolio turnover rate is calculated on the basis of the Fund as a whole without distinguishing between classes of shares issued. |
| (a) | Per share net investment income (loss) has been calculated using the average daily shares method. |
| (b) | Amount is less than $0.005. |
See accompanying notes to the financial statements.
148
| | | | | | | | | | | | |
| | |
| | | | | Ratios/Supplementary Data |
| | | | | | |
Net Asset Value, End of Year | | Total
Return | | Net Assets,
End of
Year
(000) | | Ratio of
net expenses
to average
net assets | | Ratio of net
investment
income to
average net
assets | | Ratio of
expenses to
average
net assets* | | Portfolio
turnover rate ** |
| | | | | | | | | | | | |
| $10.57 | | 9.06% | | $177,141 | | 0.70% | | 3.35% | | 0.82% | | 47.13% |
| $10.05 | | 5.67% | | $110,289 | | 0.67% | | 4.33% | | 0.79% | | 116.07% |
| $ 9.94 | | 5.04% | | $132,403 | | 0.68% | | 4.49% | | 0.80% | | 85.83% |
| $ 9.90 | | 3.23% | | $252,402 | | 0.67% | | 4.45% | | 0.79% | | 127.13% |
| $10.03 | | 2.34% | | $539,038 | | 0.70% | | 3.67% | | 0.83% | | 107.04% |
| | | | | | | | | | | | |
| $10.78 | | 14.16% | | $339,730 | | 0.71% | | 4.61% | | 0.83% | | 122.26% |
| $ 9.89 | | 2.32% | | $430,079 | | 0.66% | | 4.48% | | 0.78% | | 190.15% |
| $10.13 | | 4.77% | | $433,382 | | 0.68% | | 4.62% | | 0.80% | | 222.24% |
| $10.13 | | 3.30% | | $367,353 | | 0.67% | | 4.42% | | 0.79% | | 226.36% |
| $10.32 | | 2.23% | | $461,749 | | 0.71% | | 3.87% | | 0.83% | | 173.74% |
| | | | | | | | | | | | |
| $10.67 | | 13.00% | | $ 12,814 | | 0.67% | | 3.44% | | 0.87% | | 33.56% |
| $ 9.87 | | 1.59% | | $ 10,924 | | 0.64% | | 3.38% | | 0.84% | | 54.22% |
| $10.05 | | 2.92% | | $ 10,625 | | 0.65% | | 3.45% | | 0.85% | | 69.73% |
| $10.11 | | 4.04% | | $ 11,175 | | 0.66% | | 3.26% | | 0.87% | | 64.55% |
| $10.04 | | 1.28% | | $ 15,569 | | 0.68% | | 2.87% | | 0.97% | | 37.50% |
| | | | | | | | | | | | |
| $10.99 | | 13.70% | | $ 20,704 | | 0.65% | | 3.10% | | 0.87% | | 37.11% |
| $10.06 | | 2.10% | | $ 11,527 | | 0.54% | | 3.26% | | 0.84% | | 108.13% |
| $10.17 | | 3.74% | | $ 8,374 | | 0.59% | | 3.29% | | 0.89% | | 136.09% |
| $10.13 | | 4.10% | | $ 8,003 | | 0.60% | | 3.13% | | 0.90% | | 219.80% |
| $10.04 | | 1.60% | | $ 10,084 | | 0.58% | | 2.78% | | 1.03% | | 44.67% |
| | | | | | | | | | | | |
| $10.87 | | 12.63% | | $130,113 | | 0.67% | | 3.42% | | 0.82% | | 38.42% |
| $10.09 | | 1.67% | | $103,560 | | 0.64% | | 3.59% | | 0.79% | | 82.02% |
| $10.33 | | 3.33% | | $ 96,282 | | 0.66% | | 3.65% | | 0.81% | | 106.16% |
| $10.38 | | 3.84% | | $ 87,854 | | 0.65% | | 3.70% | | 0.80% | | 94.95% |
| $10.46 | | 1.80% | | $ 93,418 | | 0.68% | | 3.51% | | 0.86% | | 60.84% |
| | | | | | | | | | | | |
| $10.61 | | 13.01% | | $ 17,274 | | 0.73% | | 3.45% | | 0.88% | | 42.06% |
| $ 9.89 | | 1.27% | | $ 13,298 | | 0.71% | | 3.52% | | 0.86% | | 127.76% |
| $10.21 | | 3.08% | | $ 12,789 | | 0.68% | | 3.60% | | 0.85% | | 68.69% |
| $10.29 | | 3.66% | | $ 15,426 | | 0.69% | | 3.58% | | 0.86% | | 80.24% |
| $10.47 | | 1.62% | | $ 16,468 | | 0.71% | | 3.44% | | 0.93% | | 56.03% |
| | | | | | | | | | | | |
| $12.07 | | 13.39% | | $ 71,599 | | 0.67% | | 3.36% | | 0.82% | | 35.90% |
| $11.10 | | 2.13% | | $ 71,631 | | 0.64% | | 3.50% | | 0.79% | | 53.28% |
| $11.31 | | 3.21% | | $ 68,911 | | 0.66% | | 3.64% | | 0.81% | | 85.36% |
| $11.39 | | 3.49% | | $ 65,652 | | 0.65% | | 3.80% | | 0.80% | | 76.53% |
| $11.49 | | 1.66% | | $ 67,579 | | 0.68% | | 3.60% | | 0.86% | | 48.04% |
| | | | | | | | | | | | |
| $10.05 | | 11.41% | | $ 63,599 | | 0.68% | | 3.71% | | 0.68% | | 24.19% |
| $ 9.37 | | 0.18% | | $ 56,829 | | 0.66% | | 3.66% | | 0.66% | | 39.13% |
| $ 9.72 | | 3.37% | | $ 52,518 | | 0.66% | | 3.85% | | 0.66% | | 49.60% |
| $ 9.80 | | 4.10% | | $ 50,916 | | 0.65% | | 4.03% | | 0.65% | | 50.14% |
| $ 9.86 | | 2.22% | | $ 55,662 | | 0.68% | | 3.74% | | 0.72% | | 32.10% |
149
Financial Highlights, Institutional Shares
Selected data for a share of beneficial interest outstanding throughout the periods indicated.
| | | | | | | | | | | | | | |
| | | | | Investment Activities | | Distributions |
| | | | | | | |
| | | Net Asset
Value,
Beginning
of Period | | Net
investment
income | | Net realized/
unrealized
gains (losses)
on investments | | Total from
Investment
Activities | | Net
investment
income | | Net realized
gains on
investments | | Total
Distributions |
National Tax-Free Money Market Fund | | | | | | | | | | | | | | |
Year Ended September 30, 2009 | | $ 1.00 | | 0.01(c) | | —(d) | | 0.01 | | (0.01) | | — | | (0.01) |
Year Ended September 30, 2008 | | $ 1.00 | | 0.02(c) | | —(d) | | 0.02 | | (0.02) | | — | | (0.02) |
Year Ended September 30, 2007 | | $ 1.00 | | 0.03(c) | | — | | 0.03 | | (0.03) | | — | | (0.03) |
August 1, 2006 to September 30, 2006 (e) | | $ 1.00 | | 0.01 | | — | | 0.01 | | (0.01) | | — | | (0.01) |
Prime Money Market Fund | | | | | | | | | | | | | | |
Year Ended September 30, 2009 | | $ 1.00 | | 0.01(c) | | —(d) | | 0.01 | | (0.01) | | — | | (0.01) |
Year Ended September 30, 2008 | | $ 1.00 | | 0.03(c) | | —(d) | | 0.03 | | (0.03) | | — | | (0.03) |
Year Ended September 30, 2007 | | $ 1.00 | | 0.05(c) | | — | | 0.05 | | (0.05) | | — | | (0.05) |
Year Ended September 30, 2006 | | $ 1.00 | | 0.04 | | —(d) | | 0.04 | | (0.04) | | — | | (0.04) |
Year Ended September 30, 2005 | | $ 1.00 | | 0.02 | | —(d) | | 0.02 | | (0.02) | | — | | (0.02) |
U.S. Treasury Money Market Fund | | | | | | | | | | | | | | |
Year Ended September 30, 2009 | | $ 1.00 | | —(c)(d) | | — | | —(d) | | —(d) | | — | | —(d) |
Year Ended September 30, 2008 | | $ 1.00 | | 0.02(c) | | —(d) | | 0.02 | | (0.02) | | — | | (0.02) |
Year Ended September 30, 2007 | | $ 1.00 | | 0.05(c) | | — | | 0.05 | | (0.05) | | — | | (0.05) |
Year Ended September 30, 2006 | | $ 1.00 | | 0.04 | | — | | 0.04 | | (0.04) | | — | | (0.04) |
Year Ended September 30, 2005 | | $ 1.00 | | 0.02 | | — | | 0.02 | | (0.02) | | — | | (0.02) |
Capital Manager Conservative Growth Fund*** | | | | | | | | | | | | | | |
Year Ended September 30, 2009 | | $ 8.50 | | 0.30(c) | | 0.17 | | 0.47 | | (0.25) | | (0.14) | | (0.39) |
Year Ended September 30, 2008 | | $10.62 | | 0.28(c) | | (1.26) | | (0.98) | | (0.41) | | (0.73) | | (1.14) |
Year Ended September 30, 2007 | | $10.04 | | 0.38(c) | | 0.53 | | 0.91 | | (0.33) | | — | | (0.33) |
Year Ended September 30, 2006 | | $ 9.83 | | 0.33(c) | | 0.24 | | 0.57 | | (0.36) | | — | | (0.36) |
Year Ended September 30, 2005 | | $ 9.36 | | 0.26 | | 0.46 | | 0.72 | | (0.25) | | — | | (0.25) |
Capital Manager Moderate Growth Fund*** | | | | | | | | | | | | | | |
Year Ended September 30, 2009 | | $ 7.81 | | 0.24(c) | | (0.04) | | 0.20 | | (0.18) | | — | | (0.18) |
Year Ended September 30, 2008 | | $10.99 | | 0.19(c) | | (1.86) | | (1.67) | | (0.38) | | (1.13) | | (1.51) |
Year Ended September 30, 2007 | | $10.25 | | 0.32(c) | | 0.88 | | 1.20 | | (0.24) | | (0.22) | | (0.46) |
Year Ended September 30, 2006 | | $ 9.83 | | 0.27(c) | | 0.43 | | 0.70 | | (0.28) | | — | | (0.28) |
Year Ended September 30, 2005 | | $ 9.04 | | 0.19(c) | | 0.77 | | 0.96 | | (0.17) | | — | | (0.17) |
Capital Manager Growth Fund*** | | | | | | | | | | | | | | |
Year Ended September 30, 2009 | | $ 7.34 | | 0.22(c) | | (0.31) | | (0.09) | | (0.13) | | — | | (0.13) |
Year Ended September 30, 2008 | | $11.14 | | 0.13(c) | | (2.20) | | (2.07) | | (0.36) | | (1.37) | | (1.73) |
Year Ended September 30, 2007 | | $10.24 | | 0.27(c) | | 1.08 | | 1.35 | | (0.18) | | (0.27) | | (0.45) |
Year Ended September 30, 2006 | | $ 9.69 | | 0.22(c) | | 0.57 | | 0.79 | | (0.24) | | — | | (0.24) |
Year Ended September 30, 2005 | | $ 8.70 | | 0.15(c) | | 0.97 | | 1.12 | | (0.13) | | — | | (0.13) |
Capital Manager Equity Fund*** | | | | | | | | | | | | | | |
Year Ended September 30, 2009 | | $ 7.48 | | 0.20(c) | | (0.77) | | (0.57) | | (0.06) | | — | | (0.06) |
Year Ended September 30, 2008 | | $12.35 | | 0.07(c) | | (2.78) | | (2.71) | | (0.35) | | (1.81) | | (2.16) |
Year Ended September 30, 2007 | | $11.65 | | 0.25(c) | | 1.42 | | 1.67 | | (0.12) | | (0.85) | | (0.97) |
Year Ended September 30, 2006 | | $11.02 | | 0.20(c) | | 0.84 | | 1.04 | | (0.22) | | (0.19) | | (0.41) |
Year Ended September 30, 2005 | | $ 9.64 | | 0.12(c) | | 1.34 | | 1.46 | | (0.08) | | — | | (0.08) |
| * | During the period certain fees were reduced. If such reductions had not occurred, the ratios would have been as indicated. |
| ** | Portfolio turnover rate is calculated on the basis of the Fund as a whole without distinguishing between classes of shares issued. |
| *** | The expense ratios exclude the impact of fees/expenses paid by each underlying fund. |
| (a) | Not annualized for periods less than one year. |
| (b) | Annualized for periods less than one year. |
| (c) | Per share net investment income (loss) has been calculated using the average daily shares method. |
| (d) | Amount is less than $0.005. |
| (e) | Period from commencement of operations. |
See accompanying notes to the financial statements.
150
| | | | | | | | | | | | |
| | | | | Ratios/Supplementary Data |
| | | | | | |
Net Asset
Value,
End of
Period | | Total
Return (a) | | Net Assets,
End of
Period
(000) | | Ratio of
net expenses
to average
net assets (b) | | Ratio of net
investment
income to
average net
assets (b) | | Ratio of
expenses to
average
net assets*(b) | | Portfolio
turnover rate ** |
| | | | | | | | | | | | |
| $ 1.00 | | 1.05% | | $260,889 | | 0.44% | | 0.97% | | 0.49% | | — |
| $ 1.00 | | 2.37% | | $151,438 | | 0.40% | | 2.34% | | 0.45% | | — |
| $ 1.00 | | 3.33% | | $109,590 | | 0.41% | | 3.28% | | 0.46% | | — |
| $ 1.00 | | 0.53% | | $ 95,757 | | 0.40% | | 3.14% | | 0.79% | | — |
| | | | | | | | | | | | |
| $ 1.00 | | 0.92% | | $879,738 | | 0.54% | | 0.87% | | 0.66% | | — |
| $ 1.00 | | 3.38% | | $975,033 | | 0.46% | | 3.28% | | 0.58% | | — |
| $ 1.00 | | 5.03% | | $788,160 | | 0.48% | | 4.92% | | 0.60% | | — |
| $ 1.00 | | 4.38% | | $731,616 | | 0.48% | | 4.34% | | 0.59% | | — |
| $ 1.00 | | 2.34% | | $510,941 | | 0.49% | | 2.31% | | 0.63% | | — |
| | | | | | | | | | | | |
| $ 1.00 | | 0.04% | | $432,753 | | 0.29% | | 0.04% | | 0.64% | | — |
| $ 1.00 | | 2.24% | | $712,696 | | 0.44% | | 2.18% | | 0.58% | | — |
| $ 1.00 | | 4.72% | | $557,282 | | 0.46% | | 4.62% | | 0.60% | | — |
| $ 1.00 | | 4.15% | | $481,484 | | 0.46% | | 4.04% | | 0.59% | | — |
| $ 1.00 | | 2.11% | | $592,736 | | 0.48% | | 2.02% | | 0.64% | | — |
| | | | | | | | | | | | |
| $ 8.58 | | 6.28% | | $ 5,316 | | 0.14% | | 3.84% | | 0.39% | | 21.56% |
| $ 8.50 | | (10.21)% | | $ 39,937 | | 0.10% | | 2.97% | | 0.35% | | 39.99% |
| $10.62 | | 9.16% | | $ 47,520 | | 0.10% | | 3.62% | | 0.41% | | 29.58% |
| $10.04 | | 5.87% | | $ 47,046 | | 0.08% | | 3.35% | | 0.45% | | 5.69% |
| $ 9.83 | | 7.70% | | $ 71,796 | | 0.20% | | 2.64% | | 0.51% | | 52.50% |
| | | | | | | | | | | | |
| $ 7.83 | | 2.91% | | $ 1,322 | | 0.13% | | 3.61% | | 0.38% | | 22.46% |
| $ 7.81 | | (17.23)% | | $ 21,298 | | 0.10% | | 2.07% | | 0.35% | | 63.63% |
| $10.99 | | 11.80% | | $ 28,961 | | 0.11% | | 3.02% | | 0.42% | | 40.05% |
| $10.25 | | 7.33% | | $ 25,699 | | 0.10% | | 2.65% | | 0.47% | | 7.33% |
| $ 9.83 | | 10.69% | | $ 43,353 | | 0.23% | | 2.01% | | 0.56% | | 37.83% |
| | | | | | | | | | | | |
| $ 7.12 | | (0.87)% | | $ 1,650 | | 0.14% | | 3.54% | | 0.38% | | 24.08% |
| $ 7.34 | | (21.54)% | | $ 17,836 | | 0.10% | | 1.48% | | 0.35% | | 77.54% |
| $11.14 | | 13.45% | | $ 24,259 | | 0.11% | | 2.50% | | 0.43% | | 44.48% |
| $10.24 | | 8.22% | | $ 20,243 | | 0.11% | | 2.24% | | 0.48% | | 6.26% |
| $ 9.69 | | 12.89% | | $ 37,546 | | 0.23% | | 1.60% | | 0.57% | | 26.22% |
| | | | | | | | | | | | |
| $ 6.85 | | (7.33)% | | $ 693 | | 0.17% | | 3.41% | | 0.42% | | 20.24% |
| $ 7.48 | | (26.02)% | | $ 14,000 | | 0.13% | | 0.70% | | 0.38% | | 67.40% |
| $12.35 | | 14.98% | | $ 20,832 | | 0.12% | | 2.12% | | 0.43% | | 48.80% |
| $11.65 | | 9.66% | | $ 14,837 | | 0.11% | | 1.75% | | 0.47% | | 1.48% |
| $11.02 | | 15.23% | | $ 25,802 | | 0.22% | | 1.10% | | 0.58% | | 2.14% |
151
Notes to Financial Statements
September 30, 2009
BB&T Funds (the “Trust”) commenced operations on October 5, 1992 and is registered under the Investment Company Act of 1940, as amended (“the 1940 Act”), as an open-end investment company established as a Massachusetts business trust.
As of the date of these financial statements, the Trust offers shares of the Large Cap Fund, the Mid Cap Value Fund, the Mid Cap Growth Fund, the Small Cap Fund, the International Equity Fund, the Special Opportunities Equity Fund, the Equity Income Fund, the Short U.S. Government Fund, the Intermediate U.S. Government Fund, the Total Return Bond Fund, the Kentucky Intermediate Tax-Free Fund, the Maryland Intermediate Tax-Free Fund, the North Carolina Intermediate Tax-Free Fund, the South Carolina Intermediate Tax-Free Fund, the Virginia Intermediate Tax-Free Fund, the West Virginia Intermediate Tax-Free Fund, the Equity Index Fund, the Sterling Capital Small Cap Value Fund, the National Tax-Free Money Market Fund, the Prime Money Market Fund, the U.S. Treasury Money Market Fund, the Capital Manager Conservative Growth Fund, the Capital Manager Moderate Growth Fund, the Capital Manager Growth Fund and the Capital Manager Equity Fund (referred to individually as a “Fund” and collectively, the “Funds”). The Equity Index Fund and the Sterling Capital Small Cap Value Fund are not included in these financial statements. The Kentucky Intermediate Tax-Free Fund, the Maryland Intermediate Tax-Free Fund, the North Carolina Intermediate Tax-Free Fund, the South Carolina Intermediate Tax-Free Fund, the Virginia Intermediate Tax-Free Fund and the West Virginia Intermediate Tax-Free Fund are referred to as the “Tax-Free Funds”. The National Tax-Free Money Market Fund, the Prime Money Market Fund and the U.S. Treasury Money Market Fund are referred to as the “Money Market Funds”. The Capital Manager Conservative Growth Fund, the Capital Manager Moderate Growth Fund, the Capital Manager Growth Fund and the Capital Manager Equity Fund are referred to as the “Funds of Funds”. The Funds, excluding the Money Market Funds and the Fund of Funds, are referred to as the “Variable Net Asset Value Funds”. The Funds of Funds invest in underlying mutual funds as opposed to individual securities.
All Funds except the Tax-Free Funds are “diversified” funds, as defined in the 1940 Act. The Tax-Free Funds are non-diversified funds, which means they may concentrate their investments in the securities of a limited number of issuers.
The Funds are authorized to issue an unlimited amount of shares. As of September 30, 2009, the Funds discussed herein offered up to four classes of shares: Class A Shares, Class B Shares, Class C Shares and Institutional Shares. As of June 1, 2009, Class B Shares of the Funds were closed to new accounts and additional purchases by existing shareholders. As of September 30, 2009, Class B Shares and Class C Shares of the Short U.S. Government Fund, the National Tax-Free Money Market Fund and the Tax-Free Funds were not being offered. Class A Shares of the Variable Net Asset Value Funds and Fund of Funds, excluding the Short U.S. Government Fund, have a maximum sales charge of 5.75% as a percentage of original purchase price. The Class A Shares of the Tax-Free Funds and the Short U.S. Government Fund have a maximum sales charge of 3.00% as a percentage of the original purchase price. Purchases of $1 million or more of Class A Shares are not subject to a front-end sales charge but will be subject to a Contingent Deferred Sales Charge (“CDSC”) of 1.00% of the purchase price if redeemed within two years after purchase. This charge is based on the lower of the price paid for the shares or their net asset value at the time of redemption. In addition, a CDSC of up to 1.00% of the purchase price of Class A Shares will be charged to the following shareholders who received a sales charge waiver and then redeem their shares within two years after purchase: (i) employees of the Trust, BB&T Corporation and its affiliates, and (ii) shareholders who purchased shares with proceeds from redemptions from another mutual fund complex within 60 days of redemption if a sales charge was paid on such shares. This charge is based on the lower of the price paid for the shares or their net asset value at the time of redemption. The Class B Shares of the Funds are offered without any front-end sales charge but will be subject to a CDSC ranging from a maximum of 5.00% if redeemed less than one year after purchase to 0.00% if redeemed more than six years after purchase. The Class C Shares of the Funds are offered without any front-end sales charge but will be subject to a maximum CDSC of 1.00% if redeemed less than one year after purchase.
Each class of shares has identical rights and privileges except with respect to the fees paid under the distribution plan, voting rights on matters affecting a single class of shares and the exchange privilege of each class of shares.
Under the Trust’s organizational documents, its Officers and Trustees are indemnified against certain liabilities arising out of the performance of their duties to the Trust. In addition, in the normal course of business, the Funds may enter into contracts with their vendors and others that provide for general indemnifications. The Funds’ maximum exposure under these arrangements is unknown, as this would involve future claims that may be made against the Funds. However, based on experience, the Funds expect that risk of loss to be remote.
152
Notes to Financial Statements — (continued)
September 30, 2009
| | 2. | Significant Accounting Policies: |
The following is a summary of significant accounting policies followed by the Funds in the preparation of their financial statements. The policies are in conformity with United States generally accepted accounting principles (“GAAP”). The preparation of financial statements requires management to make estimates and assumptions that affect the reported amounts of assets and liabilities and disclosure of contingent assets and liabilities at the date of the financial statements and the reported amounts of income and expenses for the reporting period. Actual results could differ from those estimates.
Securities Valuation — Investments of the Money Market Funds are valued in accordance with Rule 2a-7 of the 1940 Act at amortized cost, which approximates fair value. Under the amortized cost method, discount or premium is amortized on a constant basis to the maturity of the security.
Investments in common stocks, commercial paper, corporate bonds, municipal securities, U.S. Government securities, U.S. Government agency securities, futures and options held by the Variable Net Asset Value Funds, the principal market for which is a securities exchange or an over-the-counter market, are valued at their latest available sale price (except for those securities that are traded on NASDAQ, which will be valued at the NASDAQ official closing price) or in the absence of such a price, by reference to the latest available bid price in the principal market in which such securities are normally traded. The Variable Net Asset Value Funds may also use an independent pricing service approved by the Board of Trustees of the Trust (“Board”) to value certain securities, including through the use of electronic and matrix techniques. Short-term obligations without significant credit risk that mature in 60 days or less are valued at either amortized cost or original cost plus interest, which approximates current value. Investments in open-end investment companies, including underlying funds invested in by the Funds of Funds, are valued at their respective net asset values as reported by such companies. Investments in closed-end investment companies are valued at their market values based upon the latest available sale price or, absent such a price, by reference to the latest available bid prices in the principal market in which such securities are normally traded. The differences between cost and fair value of investments are reflected as either unrealized appreciation or depreciation. Securities for which market quotations are not readily available or deemed unreliable (e.g., an approved pricing service does not provide a price, a furnished price is in error, certain stale prices, or an event occurs that materially affects the furnished price) will be valued by the Pricing Committee at fair value determined in good faith under procedures established by and under the general supervision of the Board. The following Funds had securities valued by the Pricing Committee as of September 30, 2009:
| | | | | |
| | | Market Value | | Percentage of
Net Assets |
International Equity Fund | | $ | 233 | | 0.0003% |
Equity Income Fund | | | (1,875) | | (0.0004%) |
Total Return Bond Fund | | | 10,116,500 | | 2.80% |
Fair value pricing may be used if events materially affecting the value of foreign securities occur between the time when the exchange on which they are traded closes and the time when the International Equity Fund’s net asset value is calculated; such securities may be valued at fair value in accordance with procedures adopted by the Board. Management identifies possible fluctuation in international securities by monitoring the increase or decrease in the value of a designated benchmark index. In the event of an increase or decrease greater than predetermined levels, the International Equity Fund may use a systematic valuation model provided by an independent third party to fair value their international equity securities.
Fair Value Measurements — The objective of a fair value measurement is to determine the price that would be received to sell an asset or paid to transfer a liability in an orderly transaction between market participants at the measurement date (an exit price). Accordingly, the fair value hierarchy gives the highest priority to quoted prices (unadjusted) in active markets for identical assets or liabilities (Level 1) and the lowest priority to unobservable inputs (Level 3). The three levels of the fair value hierarchy are described below:
• Level 1 – quoted prices in active markets for identical securities
• Level 2 – other significant observable inputs (including quoted prices for similar securities, interest rates, prepayment speeds, credit risk, etc.)
• Level 3 – significant unobservable inputs (including the Fund’s own assumptions in determining the fair value of investments)
153
Notes to Financial Statements — (continued)
September 30, 2009
The inputs or methodology used for valuing securities are not necessarily an indication of the risk associated with investing in those securities.
The summary of inputs used to determine the fair valuation of the Fund’s investments as of September 30, 2009 is as follows:
| | | | | | | | | | | | | | | |
Assets: Investments in Securities | | Level 1–
Quoted Prices | | | | Level 2–
Other Significant
Observable Inputs | | | | Level 3–
Significant
Unobservable Inputs | | Total |
| | | | | | |
| | | | | | |
Large Cap Fund | | $ | 211,224,681 | | (a) | | $ | 66,432 | | (b) | | $— | | $ | 211,291,113 |
Mid Cap Value Fund | | | 214,999,873 | | (a) | | | 7,917,784 | | (b) | | — | | | 222,917,657 |
Mid Cap Growth Fund | | | 83,258,784 | | (a) | | | 10,517,471 | | (b) | | — | | | 93,776,255 |
Small Cap Fund | | | 30,288,330 | | (a) | | | 3,227,501 | | (b) | | — | | | 33,515,831 |
Special Opportunities Equity Fund | | | 490,936,572 | | (a) | | | 1,688,389 | | (b) | | — | | | 492,624,961 |
Equity Income Fund | | | 329,956,509 | | (a) | | | 27,520,474 | | (b) | | — | | | 357,476,983 |
Short U.S. Government Fund | | | 2,548,339 | | (c) | | | 64,125,886 | | (a) | | — | | | 66,674,225 |
Intermediate U.S. Government Fund | | | 9,114,733 | | (c) | | | 186,945,804 | | (a) | | — | | | 196,060,537 |
Kentucky Intermediate Tax-Free Fund | | | 922,430 | | (c) | | | 18,700,797 | | (a) | | — | | | 19,623,227 |
Maryland Intermediate Tax-Free Fund | | | 1,721,808 | | (c) | | | 26,990,084 | | (a) | | — | | | 28,711,892 |
North Carolina Intermediate Tax-Free Fund | | | 12,690,467 | | (c) | | | 151,941,752 | | (a) | | — | | | 164,632,219 |
South Carolina Intermediate Tax-Free Fund | | | 1,005,068 | | (c) | | | 27,454,470 | | (a) | | — | | | 28,459,538 |
Virginia Intermediate Tax-Free Fund | | | 1,508,588 | | (c) | | | 89,399,211 | | (a) | | — | | | 90,907,799 |
West Virginia Intermediate Tax-Free Fund | | | 1,047,315 | | (c) | | | 81,342,647 | | (a) | | — | | | 82,389,962 |
National Tax-Free Money Market Fund | | | 49,100 | | (c) | | | 260,561,793 | | (a) | | — | | | 260,610,893 |
Prime Money Market Fund | | | — | | | | | 1,153,227,770 | | (a) | | — | | | 1,153,227,770 |
U.S. Treasury Money Market Fund | | | — | | | | | 621,930,435 | | (a) | | — | | | 621,930,435 |
Capital Manager Conservative Growth Fund | | | 14,470,679 | | (a) | | | — | | | | — | | | 14,470,679 |
Capital Manager Moderate Growth Fund | | | 37,402,936 | | (a) | | | — | | | | — | | | 37,402,936 |
Capital Manager Growth Fund | | | 28,168,644 | | (a) | | | — | | | | — | | | 28,168,644 |
Capital Manager Equity Fund | | | 9,469,240 | | (a) | | | — | | | | — | | | 9,469,240 |
Liabilities: Other Financial Instruments- Written Options | | | | | | | | | | | | |
| | | | | | |
Special Opportunities Equity Fund | | $ | 4,796,932 | | | | $ | — | | | | $— | | $ | 4,796,932 |
Equity Income Fund | | | 781,055 | | | | | 1,875 | | | | — | | | 782,930 |
|
| | (a) | Industries or security types as disclosed in the Schedules of Portfolio Investments. |
| | (b) | Represents securities held as collateral for securities on loan. |
| | (c) | Represents investment companies. |
BB&T Total Return Bond
| | | | | | | | | | | | |
Assets: Investments in Securities | | Level 1-
Quoted Prices | | Level 2-
Other Significant
Observable Inputs | | Level 3-
Significant
Unobservable Inputs | | Total |
| | | | |
| | | | |
Asset Backed Securities | | $ | — | | $ | 33,142,846 | | $ | — | | $ | 33,142,846 |
Collateralized Mortgages Obligations | | | — | | | 21,185,817 | | | — | | | 21,185,817 |
Commercial Mortgage-Backed Securities | | | — | | | 29,146,711 | | | — | | | 29,146,711 |
Corporate Bonds | | | — | | | 122,001,005 | | | — | | | 122,001,005 |
Mortgage-Backed Securities | | | — | | | 141,163,417 | | | — | | | 141,163,417 |
Municipal Bonds | | | — | | | 12,746,382 | | | 10,116,500 | | | 22,862,882 |
U.S. Treasury Notes | | | — | | | 807,071 | | | — | | | 807,071 |
Investment Company | | | 1,126,960 | | | — | | | — | | | 1,126,960 |
Short Term Investments | | | — | | | 99,926 | | | — | | | 99,926 |
| | | | | | | | | | | | |
Total | | $ | 1,126,960 | | $ | 360,293,175 | | $ | 10,116,500 | | $ | 371,536,635 |
| | | | | | | | | | | | |
Other Financial Instruments- Financial Futures Contracts | | | | | | | | |
| | | | |
Total Return Bond Fund | | $ | 69,958 | | $ | — | | $ | — | | $ | 69,958 |
154
Notes to Financial Statements — (continued)
September 30, 2009
BB&T International Equity Fund
| | | | | | | | | | | |
Assets: Investments in Securities | | Level 1-
Quoted Prices | | Level 2-
Other Significant
Observable Inputs | | Level 3-
Significant
Unobservable Inputs | | Total |
Common Equities: | | | | | | | | | | | |
Australia | | $ | 5,896,048 | | $ | — | | $— | | $ | 5,896,048 |
Austria | | | 713,407 | | | — | | — | | | 713,407 |
Belgium | | | 603,403 | | | — | | — | | | 603,403 |
Brazil | | | 2,243,642 | | | — | | — | | | 2,243,642 |
Canada | | | 3,722,866 | | | — | | — | | | 3,722,866 |
China | | | 2,050,363 | | | — | | — | | | 2,050,363 |
Czech Republic | | | 1,043,180 | | | — | | — | | | 1,043,180 |
Denmark | | | 510,814 | | | — | | — | | | 510,814 |
Finland | | | 399,631 | | | — | | — | | | 399,631 |
France | | | 8,940,990 | | | — | | — | | | 8,940,990 |
Germany | | | 6,242,928 | | | — | | — | | | 6,242,928 |
Greece | | | 291,979 | | | — | | — | | | 291,979 |
Hong Kong | | | 2,316,923 | | | — | | — | | | 2,316,923 |
Hungary | | | 542,537 | | | — | | — | | | 542,537 |
India | | | 961,269 | | | — | | — | | | 961,269 |
Indonesia | | | 43,676 | | | — | | — | | | 43,676 |
Ireland | | | 482,755 | | | — | | — | | | 482,755 |
Italy | | | 2,189,490 | | | — | | — | | | 2,189,490 |
Japan | | | 8,453,759 | | | — | | — | | | 8,453,759 |
Korea (South) | | | 2,371,286 | | | — | | — | | | 2,371,286 |
Mexico | | | 801,459 | | | — | | — | | | 801,459 |
Netherlands | | | 3,181,762 | | | — | | — | | | 3,181,762 |
Norway | | | 897,546 | | | — | | — | | | 897,546 |
Poland | | | 271,928 | | | — | | — | | | 271,928 |
Portugal | | | 120,677 | | | — | | — | | | 120,677 |
Russia | | | 1,909,282 | | | — | | — | | | 1,909,282 |
Singapore | | | 592,645 | | | — | | — | | | 592,645 |
South Africa | | | 707,636 | | | — | | — | | | 707,636 |
Spain | | | 3,433,682 | | | — | | — | | | 3,433,682 |
Sweden | | | 1,149,745 | | | — | | — | | | 1,149,745 |
Switzerland | | | 5,086,789 | | | — | | — | | | 5,086,789 |
Taiwan | | | 586,076 | | | — | | — | | | 586,076 |
Ukraine | | | 70,493 | | | 133,775 | | — | | | 204,268 |
United Kingdom | | | 11,417,789 | | | — | | — | | | 11,417,789 |
United States | | | 54,475 | | | — | | — | | | 54,475 |
Exchange Traded Funds | | | 4,355,882 | | | — | | — | | | 4,355,882 |
Rights and Warrants | | | 20,274 | | | 233 | | — | | | 20,507 |
Investment Company | | | 502,117 | | | — | | — | | | 502,117 |
Securities Held as Collateral for Securities on Loan | | | — | | | 1,518,938 | | — | | | 1,518,938 |
| | | | | | | | | | | |
Total | | $ | 85,181,203 | | $ | 1,652,946 | | $— | | $ | 86,834,149 |
Other Financial Instruments - Foreign Currency Exchange Contracts | | | | | | | | |
International Equity Fund | | $ | — | | $ | 19,708 | | $— | | $ | 19,708 |
Liabilities: | | | | | | | | | | | |
Foreign Currency Exchange | | | | | | | | |
International Equity Fund | | $ | — | | $ | 97,744 | | $— | | $ | 97,744 |
155
Notes to Financial Statements — (continued)
September 30, 2009
The following is a reconciliation of Level 3 investments for which significant unobservable inputs were used to determine fair value:
| | | | |
Municipal Bonds | | Total
Return
Bond Fund | |
| |
Balance as of 10/01/08 (market value) | | $ | 13,584,500 | |
Change in unrealized appreciation/(depreciation)* | | | (3,468,000 | ) |
| | | | |
| |
Balance as of 09/30/09 (market value) | | $ | 10,116,500 | |
| | | | |
| |
| | * | Included in “Change in unrealized appreciation/depreciation on investments” in the Statement of Operations. |
Foreign Currency Translation — The accounting records of the International Equity Fund are maintained in U.S. dollars. Foreign currency amounts are translated into U.S. dollars at the latest foreign exchange bid quotation (from an approved pricing vendor) to determine the fair value of investments, assets and liabilities. Purchases and sales of securities, income and expenses are translated at the prevailing rate of exchange, on the respective dates of such transactions. The International Equity Fund does not isolate that portion of the results of operations resulting from changes in foreign exchange rates on investments from fluctuations arising from changes in market prices of securities held. Such fluctuations are included with the net realized and unrealized gain or loss from investments and foreign currencies.
Risks Associated with Foreign Securities and Currencies — Investments in securities of foreign issuers carry certain risks not ordinarily associated with investments in securities of domestic issuers. Such risks include future political and economic developments and the possible imposition of exchange controls or other foreign governmental laws and restrictions. In addition, with respect to certain countries, there is the possibility of expropriation of assets, confiscatory taxation, political or social instability or diplomatic developments which could adversely affect investments in those countries. Certain foreign investments may also be subject to foreign withholding taxes.
Foreign Currency Exchange Contracts — The International Equity Fund may enter into foreign currency exchange contracts (foreign currency exchange risk) in connection with planned purchases or sales of securities or to hedge the U.S. dollar value of Fund securities denominated in a particular currency. A foreign currency exchange contract is an agreement between two parties to buy and sell a currency at a set exchange rate on a future date. The Fund could be exposed to risks if the counterparties to the contracts are unable to meet the terms of their contracts and from unanticipated movements in the value of a foreign currency relative to the U.S. dollar. In the event of default by the counterparty to the transaction, the Fund’s maximum amount of loss, as either the buyer or seller, is the unrealized gain of the contract. The forward foreign currency exchange contracts are adjusted by the daily exchange rate of the underlying currency and any gains or losses are recorded for financial statement purposes as unrealized gains or losses until the contract settlement date. When the contract is closed, the Fund records a realized gain (loss) equal to the difference between the value at the time it was opened and the value at the time it was closed.
During the year the International Equity Fund utilized forward foreign currency contracts to hedge the Fund’s portfolio against currency risk. The Fund also utilized forward foreign currency contracts to reduce or eliminate an underweighted position in a currency relative to its benchmark when purchasing the underlying equity securities denominated in that currency is not advisable. Additionally, the Fund hedged some of the fund’s currency exposure to emerging market currencies such as the Czech Koruna, Hungarian Forint and Polish Zloty by selling these currencies forward versus the U.S. dollar, using 3-month forward currency contracts. At the same time, although it is preferred to underweight the equity holding in Japan, the United Kingdom and Canada versus the benchmark, the fund moved closer to the benchmark weight assigned to each country through the use of forward currency transactions (buy the foreign currency, sell the U.S. dollar).
For open foreign currency exchange contracts as of September 30, 2009, see the Schedules of Portfolio Investments, which is also indicative of activity for the year ended September 30, 2009.
Financial Futures Contracts — The Variable Net Asset Value Funds may invest in financial futures contracts and options on financial futures contracts to gain exposure to, or economically hedge against, changes in the value of equity securities
156
Notes to Financial Statements — (continued)
September 30, 2009
(equity risk), interest rates (interest rate risk), or foreign currencies (foreign currency exchange rate risk). Upon entering into a financial futures contract, the Fund is required to pledge to the broker an amount of cash and/or other assets equal to a certain percentage of the contract amount (initial margin deposit). Subsequent payments, known as “variation margin,” are made or received by the Fund each day, depending on the daily fluctuations in the fair value of the underlying security. The Fund recognizes a gain or loss equal to the daily variation margin. Should market conditions move unexpectedly, the Fund may not achieve the anticipated benefits of the financial futures contracts and may realize a loss. The use of futures transactions involves the risk of imperfect correlation in movements in the price of futures contracts and the underlying hedged assets. Exchange traded financial futures contracts involve minimal counterparty risk since financial futures contracts are guaranteed against default by the exchange on which they trade. For open financial futures contracts as of September 30, 2009, see the Schedules of Portfolio Investments. The Total Return Bond Fund used futures contracts for economically hedging duration. The Total Return Bond Fund had limited activity in these transactions.
Options Contracts — The Large Cap Fund, the Mid Cap Value Fund, the Mid Cap Growth Fund, the Small Cap Fund, the International Equity Fund, the Special Opportunities Equity Fund, the Equity Income Fund and the Funds of Funds may write (sell) “covered” call options and purchase options to close out options previously written by it. The Tax-Free Funds and the National Tax-Free Money Market Fund may acquire put options with respect to tax-exempt obligations held in their portfolios. The Large Cap Fund, the Mid Cap Value Fund, the Mid Cap Growth Fund, the Small Cap Fund, the International Equity Fund, the Special Opportunities Equity Fund, and the Equity Income Fund may buy put options for the purpose of hedging, or, with respect to the International Equity Fund, cross-hedging. The International Equity Fund may not write or sell unsecured put options, except for transactions in options on securities, securities indices, futures contracts, and options on futures contracts. These transactions may be entered into to hedge against changes in interest rates (interest rate risk), security prices (equity risk), currency fluctuations (foreign currency exchange rate risk), and other market developments, or for the purposes of earning additional income (i.e., speculation).
The risk associated with purchasing an option is that the Fund pays a premium whether or not the option is exercised. Additionally, the Funds bear the risk of loss of the premium and change in value should the counterparty not perform under the contract. Put and call options purchased are accounted for in the same manner as other securities owned. The cost of securities acquired through the exercise of call options is increased by the premiums paid. The proceeds from securities sold through the exercise of put options are decreased by the premiums paid.
In writing an option, the Funds contract with a specified counterparty to purchase (put option written) or sell (call option written) a specified quantity (notional amount) of an underlying asset at a specified price during a specified period upon demand of the counterparty. The risk associated with writing an option is that the Funds bear the market risk of an unfavorable change in the price of an underlying asset and may be required to buy or sell an underlying asset under the contractual terms of the option at a price different from the current value. The Funds may execute transactions in both listed and over-the-counter options. When purchasing over-the-counter options, the Fund bears the risk of economic loss from counterparty default, equal to the market value of the option. Listed options involve minimal counterparty risk since the listed options are guaranteed against default by the exchange on which they trade. Transactions in over-the-counter options may expose the Funds to the risk of default by the counterparty to the transaction. In the event of default by the counterparty to the over-the-counter transaction, the Funds maximum amount of loss is the premium paid (as the purchaser) or the unrealized loss of the contract (as the writer). The Special Opportunities Equity and Equity Income Funds invested in written options to economically hedge the downside exposure by collecting a premium when sold against the equity holding. The options contracts listed below are also indicative of activity for the fiscal year ended September 30, 2009.
| | | | | | | | | | | | | | |
| | | Special Opportunities
Equity Fund | | | Equity Income Fund | |
Covered Call Options | | Number of
Contracts | | | Premiums
Received | | | Number of
Contracts | | | Premiums
Received | |
| | | | |
Balance at beginning of period | | 18,162 | | | $ | 3,435,544 | | | 3,135 | | | $ | 200,954 | |
Options written | | 126,956 | | | | 12,315,477 | | | 64,352 | | | | 4,667,782 | |
Options closed | | (34,160 | ) | | | (3,237,021 | ) | | (18,754 | ) | | | (950,214 | ) |
Options expired | | (71,195 | ) | | | (7,299,091 | ) | | (26,171 | ) | | | (1,272,966 | ) |
Options exercised | | (13,214 | ) | | | (1,522,974 | ) | | (10,390 | ) | | | (1,812,872 | ) |
| | | | | | | | | | | | | | |
| | | | |
Balance at end of period | | 26,549 | | | $ | 3,691,935 | | | 12,172 | | | $ | 832,684 | |
| | | | | | | | | | | | | | |
157
Notes to Financial Statements — (continued)
September 30, 2009
The following is a summary of written call options outstanding as of September 30, 2009:
| | | | | | |
Security | | Number of
Contracts | | Value | |
Special Opportunities Equity Fund | | | | | | |
Allscripts-Misys Healthcare Solutions Inc., $20.00, 12/19/09 | | 1,000 | | $ | (185,000 | ) |
Allscripts-Misys Healthcare Solutions Inc., $20.00, 1/16/10 | | 2,400 | | | (523,200 | ) |
Allscripts-Misys Healthcare Solutions Inc., $22.50, 1/16/10 | | 723 | | | (89,652 | ) |
Apache Corp., $100.00, 1/16/10 | | 1,000 | | | (390,000 | ) |
Cisco Systems, Inc., $24.00, 10/17/09 | | 1,000 | | | (32,000 | ) |
Cisco Systems, Inc., $25.00, 10/17/09 | | 1,000 | | | (10,000 | ) |
Cisco Systems, Inc., $25.00, 1/16/10 | | 1,000 | | | (85,000 | ) |
Dell, Inc., $18.00, 11/21/09 | | 1,500 | | | (22,500 | ) |
Dell, Inc., $20.00, 1/16/10 | | 900 | | | (12,600 | ) |
Energizer Holdings, Inc., $75.00, 11/21/09 | | 1,000 | | | (65,000 | ) |
McKesson Corp., $65.00, 11/21/09 | | 700 | | | (45,500 | ) |
McKesson Corp., $70.00, 1/16/10 | | 1,100 | | | (49,500 | ) |
Nalco Holding Co., $22.50, 11/21/09 | | 1,100 | | | (44,000 | ) |
Nalco Holding Co., $22.50, 1/16/10 | | 3,460 | | | (276,800 | ) |
Petroleo Brasileiro SA, ADR, $35.00, 12/19/09 | | 3,950 | | | (2,093,500 | ) |
SPX Corp., $65.00,12/19/09 | | 1,237 | | | (296,880 | ) |
SPX Corp., $70.00,12/19/09 | | 1,200 | | | (120,000 | ) |
Weatherford International Ltd., $20.00, 11/21/09 | | 2,279 | | | (455,800 | ) |
| | | | | | |
| | |
| | 26,549 | | $ | (4,796,932 | ) |
| | | | | | |
| | |
Equity Income Fund | | | | | |
| | |
Federated Investors, Inc., Class B, $30.00, 10/17/09* | | 375 | | $ | (1,875 | ) |
Federated Investors, Inc., Class B, $30.00, 1/16/10 | | 2,000 | | | (90,000 | ) |
Intel Corp., $19.00, 10/17/09 | | 875 | | | (82,250 | ) |
Intel Corp., $20.00, 10/17/09 | | 1,000 | | | (45,000 | ) |
Intel Corp., $21.00, 10/17/09 | | 1,000 | | | (18,000 | ) |
Novartis AG, ADR, $55.00, 1/16/10 | | 1,065 | | | (101,175 | ) |
Taiwan Semiconductor Manufacturing Co., Ltd., ADR, $10.00, 10/17/09 | | 2,857 | | | (257,130 | ) |
Teekay Corp., $22.50, 10/17/09 | | 1,500 | | | (67,500 | ) |
Teekay Corp., $25.00, 1/16/10 | | 1,500 | | | (120,000 | ) |
| | | | | | |
| | |
| | 12,172 | | $ | (782,930 | ) |
| | | | | | |
| |
| | * | Security was valued under methods approved by the Board of Trustees. |
Securities Transactions and Related Income — During the period, security transactions are accounted for no later than one business day following the trade date. For financial reporting purposes, however, security transactions are accounted for on trade date of the last business day of the reporting period. Interest income is recognized on the accrual basis and includes, where applicable, the amortization/accretion of premium or discount. Dividend income is recorded on the ex-dividend date. Gains or losses realized from sales of securities are determined by comparing the identified cost of the security lot sold with the net sales proceeds.
When-Issued and Forward Commitments — The Funds, with the exception of the U.S. Treasury Money Market Fund, may purchase securities on a “when-issued” basis. The Large Cap Fund, the Mid Cap Value Fund, the Mid Cap Growth Fund, the Small Cap Fund, the International Equity Fund, the Special Opportunities Equity Fund, the Equity Income Fund, the National Tax-Free Money Market Fund, and the Prime Money Market Fund may also purchase or sell securities on a forward commitment basis. The Funds record when-issued securities on the trade date and pledge assets with a value at least equal to the purchase commitment for payment of the securities purchased. The value of the securities underlying when-issued or forward commitments to purchase securities, and any subsequent fluctuation in their value, is taken into account when determining the net asset value of the Funds commencing with the date the Funds agree to purchase the securities. The Funds do not accrue interest or dividends on “when-issued” securities until the underlying securities are received.
158
Notes to Financial Statements — (continued)
September 30, 2009
Repurchase Agreements and Collateralized Loan Agreements — The Funds may enter into agreements with member banks of the Federal Deposit Insurance Corporation and with registered broker/dealers that BB&T Asset Management, Inc. (“BB&T AM”) or a sub-advisor deems creditworthy under guidelines approved by the Board, subject to the seller’s agreement to repurchase such securities at a mutually agreed-upon date and price. The repurchase price generally equals the price paid by the Fund plus interest negotiated on the basis of current short-term rates, which may be more or less than the rate on the underlying Fund securities. The seller, under these types of agreements, is required to maintain the value of collateral held pursuant to the agreement at not less than the repurchase price (including accrued interest). Securities subject to repurchase are held by the Funds’ custodian, or another qualified custodian, or in the Federal Reserve/Treasury book-entry system. In the event of counterparty default, the Fund has the right to use the collateral to offset losses incurred. There is potential for loss to the Fund in the event the Fund is delayed or prevented from exercising its rights to dispose of the collateral securities, including the risk of a possible decline in the fair value of the underlying securities during the period while the Fund seeks to assert its rights.
Mortgage Dollar Rolls — The Variable Net Asset Value Funds and the Tax-Free Money Market Fund may sell mortgage-backed securities for delivery in the current month and simultaneously contract to repurchase substantially similar (same type, coupon and maturity) securities on a specific future date at an agreed-upon price. The market value of the securities that the Fund is required to purchase may decline below the agreed upon repurchase price of those securities. Pools of mortgages collateralizing those securities may have different prepayment histories than those sold. During the period between the sale and repurchase, the Fund will not be entitled to receive interest and principal payments on the securities sold. Proceeds of the sale will be invested in additional instruments for the Fund, and the income from these investments will generate income for the Fund. If such income does not exceed the income, capital appreciation and gain or loss that would have been realized on the securities sold as part of the dollar roll, the use of this technique will diminish the investment performance of the Fund compared with what the performance would have been without the use of dollar rolls. The Funds account for mortgage dollar roll transactions as purchases and sales.
Security Loans — The Funds may loan securities secured by collateral in the form of securities issued or guaranteed by the U.S. Government or its agencies on instrumentalities, irrevocable letters of credit, U.S. dollar cash or other forms of collateral as may be agreed to between the Trust and Mellon Bank, N.A., the lending agent (“Mellon”). A Fund may receive compensation for lending securities in the form of fees payable by the borrower or by retaining a portion of the income and earnings from the investment and reinvestment of cash collateral received and held on behalf of the Fund (after payment of a “broker rebate fee” to the borrower). In extremely low interest rate environments, the broker rebate fee may exceed the interest earned on the cash collateral which would result in a loss to the Fund. A Fund also continues to receive interest or dividends on the securities loaned. Although security loans are secured at all times by collateral, the loans may not be fully supported if, for example, the instruments in which cash collateral is invested decline in value or the borrower fails to provide additional collateral when required in a timely manner or at all. Concurrently with the delivery of the Fund’s securities to a borrower, Mellon is required to obtain from the borrower collateral equal to at least 102% of the market value of the securities loaned plus accrued interest in the case of U.S. securities, and at least 105% of the market value of the securities loaned plus accrued interest in the case of foreign securities. If at the close of trading on any business day the market value of the collateral is less than 100% of the market value of such loaned securities as of such business day, the borrower is required to deliver additional collateral which will cause the total collateral to be equal to not less than 102% of the market value of the securities loaned plus accrued interest in the case of U.S. securities and 105% of the market value of the securities loaned plus accrued interest in the case of foreign securities. A Fund bears all of the gains and losses on such investments. Cash collateral received by a Fund at September 30, 2009 was invested in the BNY Institutional Cash Reserve Fund (“ICRF”) Series A and B, an unregistered investment pool managed by Mellon, which was invested in repurchase agreements and Lehman Brothers.
The net asset value of a Fund will be affected by an increase or decrease in the value of the securities loaned and by an increase or decrease in the value of the ICRF or any other investment vehicle in which cash collateral may be invested. At September 30, 2009, the ICRF held investments in Lehman Brothers (Series B) which was in default. The default resulted in the value of the ICRF being less than the amount of collateral owed back to the borrowing brokers. The difference between the value of the collateral investments in the ICRF and what is owed to the borrowing brokers negatively impacted the NAV’s of certain Funds at September 30, 2009 by the following amounts per share:
| | |
| | | NAV Impact |
| |
Large Cap Fund | | $0.02 |
Mid Cap Value Fund | | 0.03 |
Mid Cap Growth Fund | | 0.04 |
Small Cap Fund | | 0.06 |
Special Opportunities Equity Fund | | 0.02 |
Equity Income Fund | | 0.01 |
Short U.S. Government Fund | | 0.01 |
Total Return Fund | | 0.01 |
159
Notes to Financial Statements — (continued)
September 30, 2009
There may be risks of delay in recovery of the securities or even loss of rights in the collateral should the borrower of the securities fail financially. Another risk from securities lending is that the borrower may not provide additional collateral when required or return the securities when due or when called for by the Fund. The Funds are indemnified from losses resulting from brokers failing to return securities. As the securities lending agent for the Funds, Mellon receives for its services 20% of the revenues earned on the securities lending activities and incurs all expenses. The securities lending agent may make payments to borrowers and placing brokers, who may not be affiliated, directly or indirectly, with the Trust, the advisor or the distributor. In connection with lending securities, a Fund may pay reasonable administrative and custodial fees. The value of the securities on loan and the liability to return the related collateral at September 30, 2009, are shown on the Statements of Assets and Liabilities. As of September 30, 2009, the following Funds had loans outstanding:
| | | | | | | | | | | | | | | |
| | | Value
of Loaned
Securities | | Cost
of Cash
Collateral | | Value
of Cash
Collateral | | Value
of Non Cash
Collateral | | Average Value
on Loan
for the Year
Ended
September 30, 2009 |
| | | | | |
Large Cap Fund | | $ | 38,136 | | $ | — | | $ | — | | $ | 40,284 | | $ | 3,114,832 |
Mid Cap Value Fund | | | 8,155,066 | | | 8,539,905 | | | 7,917,784 | | | — | | | 8,108,523 |
Mid Cap Growth Fund | | | 10,730,246 | | | 10,929,704 | | | 10,517,471 | | | 91,834 | | | 11,875,026 |
Small Cap Fund | | | 3,335,592 | | | 3,412,791 | | | 3,227,501 | | | — | | | 3,726,111 |
International Equity Fund | | | 1,430,216 | | | 1,535,370 | | | 1,518,938 | | | 33,402 | | | 2,222,063 |
Special Opportunities Equity Fund | | | 2,257,504 | | | 2,333,863 | | | 1,688,389 | | | — | | | 7,650,832 |
Equity Income Fund | | | 27,110,095 | | | 27,939,020 | | | 27,520,474 | | | — | | | 14,273,426 |
Short U.S. Government Fund | | | 2,936,396 | | | 3,005,938 | | | 2,920,516 | | | — | | | 3,133,781 |
Intermediate U.S. Government Fund | | | 2,816,285 | | | 2,889,393 | | | 2,798,781 | | | — | | | 5,432,033 |
U.S. Treasury Money Market Fund | | | 20,294,172 | | | 20,706,000 | | | 20,706,000 | | | — | | | 29,095,021 |
Expenses and Allocation Methodology — Expenses directly attributable to a Fund are charged to that Fund. Expenses not directly attributable to a Fund are allocated proportionately among all Funds daily in relation to the net assets of each Fund or on another reasonable basis. Each class of shares bears its pro-rata portion of expenses attributable to its series, except that each class separately bears expenses related specifically to that class, such as distribution fees. Expenses that are attributable to both the Trust and the BB&T Variable Insurance Funds are allocated across the Funds and BB&T Variable Insurance Funds, based upon relative net assets or on another reasonable basis. Income and realized and unrealized gains or losses on investments are allocated to each class of shares based on its relative net assets or another appropriate basis.
Distributions to Shareholders — Dividends from net investment income are declared daily and paid monthly for the Short U.S. Government Fund, the Intermediate U.S. Government Fund, the Total Return Bond Fund, the Tax-Free Funds and the Money Market Funds. Dividends from net investment income are declared and paid quarterly for the Large Cap Fund, the Mid Cap Value Fund, the Mid Cap Growth Fund, the Small Cap Fund, the Special Opportunities Equity Fund, the Equity Income Fund and the Fund of Funds if the annualized yield of the distribution exceeds an amount determined annually by the Board of Trustees. Dividends from net investment income are declared and paid annually for the International Equity Fund. Distributable net realized gains, if any, are declared and distributed at least annually. Distributions to shareholders which exceed net investment income and net realized gains for tax purposes are reported as distributions of capital.
160
Notes to Financial Statements — (continued)
September 30, 2009
The character of income and gains distributed are determined in accordance with federal income tax regulations, which may differ from GAAP. These “book/tax” differences are either considered temporary or permanent in nature. To the extent these differences are permanent in nature (e.g., reclass of market discounts, gain/loss, paydowns and distributions), such amounts are reclassified within the composition of net assets based on their federal tax-basis treatment; temporary differences do not require reclassification. These reclassifications have no effect on net assets or net asset values per share.
As of September 30, 2009, these reclassifications were as follows:
| | | | | | | | | | | | |
| | | Decrease
Paid-in-Capital | | | Increase/
(Decrease)
Net Investment
Income(Loss) | | | Increase/
(Decrease)
Realized
Gain(Loss) | |
| | | |
Mid Cap Growth Fund | | $ | (220,462 | ) | | $ | 260,490 | | | $ | (40,028 | ) |
Small Cap Fund | | | (4,804,949 | ) | | | 90,818 | | | | 4,714,131 | |
International Equity Fund | | | — | | | | 2,104,374 | | | | (2,104,374 | ) |
Special Opportunities Equity Fund | | | — | | | | (102,679 | ) | | | 102,679 | |
Equity Income Fund | | | — | | | | (1,967,823 | ) | | | 1,967,823 | |
Short U.S. Government Fund | | | (352,440 | ) | | | 257,636 | | | | 94,804 | |
Intermediate U.S. Government Fund | | | — | | | | 79,239 | | | | (79,239 | ) |
Total Return Bond Fund | | | — | | | | 434,667 | | | | (434,667 | ) |
Kentucky Intermediate Tax-Free Fund | | | — | | | | (3,677 | ) | | | 3,677 | |
Maryland Intermediate Tax-Free Fund | | | — | | | | (3,958 | ) | | | 3,958 | |
North Carolina Intermediate Tax-Free Fund | | | — | | | | (3,786 | ) | | | 3,786 | |
South Carolina Intermediate Tax-Free Fund | | | — | | | | (4,725 | ) | | | 4,725 | |
Virginia Intermediate Tax-Free Fund | | | — | | | | (2,865 | ) | | | 2,865 | |
West Virginia Intermediate Tax-Free Fund | | | — | | | | (18,922 | ) | | | 18,922 | |
National Tax-Free Money Market Fund | | | — | | | | 13,028 | | | | (13,028 | ) |
Prime Money Market Fund | | | — | | | | 11,598 | | | | (11,598 | ) |
U.S. Treasury Money Market Fund | | | (1,806 | ) | | | 1,806 | | | | — | |
Capital Manager Conservative Growth Fund | | | (7,416 | ) | | | 13,372 | | | | (5,956 | ) |
Capital Manager Moderate Growth Fund | | | (13,614 | ) | | | 23,380 | | | | (9,766 | ) |
Capital Manager Growth Fund | | | (14,157 | ) | | | 23,276 | | | | (9,119 | ) |
Capital Manager Equity Fund | | | (6,020 | ) | | | 11,623 | | | | (5,603 | ) |
Credit Enhancements — Certain obligations held in the Funds have credit enhancement or liquidity features that may, under certain circumstances, provide for repayment of principal and interest on the obligation upon demand date, interest rate reset date or final maturity. These enhancements may include: letters of credit; liquidity guarantees; security purchase agreements; tender option purchase agreements; and third party insurance (i.e., AMBAC).
Federal Income Taxes — It is the policy of the Funds to continue to qualify as a regulated investment company by complying with the provisions available to certain investment companies, as defined in applicable sections of the Internal Revenue Code of 1986, as amended (the “Code”), and to make distributions of net investment income and net realized capital gains sufficient to relieve it from all, or substantially all, federal income taxes. Accordingly, no provision for federal income tax is required.
In addition to the requirements of the Code, the International Equity Fund may be subject to short-term capital gains tax in India on gains realized upon disposition of Indian securities held less than one year. The tax is computed on net realized gains; any realized losses in excess of gains may be carried forward for a period of up to eight years to offset future gains. Any net taxes payable must be remitted to the Indian government prior to repatriation of sales proceeds. The International Equity Funds may accrue a deferred tax liability for net unrealized short-term gains in excess of available carryforwards on Indian securities. This accrual may reduce the International Equity Fund’s net asset value. As of September 30, 2009, Fund has recorded a payable of $7,249 respectively as an estimate for potential future India capital gains taxes.
161
Notes to Financial Statements — (continued)
September 30, 2009
| | 3. | Purchases and Sales of Securities: |
Purchases and sales of securities (excluding U.S. Government securities and securities maturing less than one year from acquisition) for the fiscal year ended September 30, 2009 were as follows:
| | | | | | |
| | | Purchases | | Sales |
| | |
Large Cap Fund | | $ | 186,769,942 | | $ | 222,120,232 |
Mid Cap Value Fund | | | 89,526,247 | | | 71,837,296 |
Mid Cap Growth Fund | | | 185,015,548 | | | 236,964,049 |
Small Cap Fund | | | 39,998,338 | | | 42,006,451 |
International Equity Fund | | | 166,753,361 | | | 175,118,771 |
Special Opportunities Equity Fund | | | 180,147,703 | | | 147,487,118 |
Equity Income Fund | | | 175,391,693 | | | 92,282,089 |
Short U.S. Government Fund | | | 12,370,569 | | | 6,700,426 |
Intermediate U.S. Government Fund | | | 17,903,759 | | | 17,938,609 |
Total Return Bond Fund | | | 206,537,182 | | | 208,618,236 |
Kentucky Intermediate Tax-Free Fund | | | 7,368,791 | | | 5,574,167 |
Maryland Intermediate Tax-Free Fund | | | 17,159,284 | | | 6,985,119 |
North Carolina Intermediate Tax-Free Fund | | | 72,372,244 | | | 50,952,663 |
South Carolina Intermediate Tax-Free Fund | | | 15,328,478 | | | 9,090,663 |
Virginia Intermediate Tax-Free Fund | | | 34,234,743 | | | 29,136,785 |
West Virginia Intermediate Tax-Free Fund | | | 23,139,691 | | | 17,445,009 |
Capital Manager Conservative Growth Fund | | | 4,940,358 | | | 38,106,852 |
Capital Manager Moderate Growth Fund | | | 8,916,539 | | | 31,312,390 |
Capital Manager Growth Fund | | | 7,080,552 | | | 23,379,828 |
Capital Manager Equity Fund | | | 2,368,373 | | | 13,368,348 |
Purchases and sales of U.S. Government Securities (excluding securities maturing less than one year from acquisition) for the fiscal year ended September 30, 2009 were as follows:
| | | | | | |
| | | Purchases | | Sales |
| | |
Short U.S. Government Fund | | $ | 46,780,997 | | $ | 32,842,472 |
Intermediate U.S. Government Fund | | | 103,498,934 | | | 45,471,324 |
Total Return Bond Fund | | | 264,605,331 | | | 332,231,445 |
Restricted Securities — A restricted security is a security which has been purchased through a private offering and cannot be resold to the general public without prior registration under the Securities Act of 1933 (the “1933 Act”) or pursuant to the resale limitations provided by Rule 144 under the 1933 Act or an exemption from the registration requirements of the 1933 Act. Whether a restricted security is illiquid is determined pursuant to guidelines established by the Board of Trustees. Not all restricted securities are considered illiquid. At September 30, 2009, the International Equity Fund held illiquid restricted securities representing 0.0003% of net assets. The illiquid restricted securities held as of September 30, 2009 are identified below:
| | | | | | | | | | | |
Security | | Acquisition Date | | Acquisition Cost | | Share Amount | | Carrying Value
Per
Share | | Value |
| | | | | |
International Equity Fund | | | | | | | | | | | |
Mediobanca SpA Warrants, Expire 3/18/11 | | 09/28/2009 | | $— | | 3,283 | | $— | | $ | 233 |
162
Notes to Financial Statements — (continued)
September 30, 2009
| | 4. | Related Party Transactions: |
Investment advisory services are provided to the Funds by BB&T AM. Under the terms of the investment advisory agreement, BB&T AM is entitled to receive fees based on a percentage of the average daily net assets of the Funds. These fees are accrued daily and payable on a monthly basis and are reflected on the Statements of Operations as “Investment advisory fees”. BB&T AM waived investment advisory fees and certain expenses for the Funds referenced below which are not subject to recoupment, except as noted, and are included on the Statements of Operations as “Less expenses waived by the Investment Advisor”. Information regarding these transactions is as follows for the fiscal year ended September 30, 2009:
| | | | |
| | | Contractual
Fee Rate | | Fee Rate after
Contractual
Waivers |
Large Cap Fund | | 0.74% | | 0.60%(1)(2)(3) |
Mid Cap Value Fund | | 0.74% | | 0.70%(1)(2) |
Mid Cap Growth Fund | | 0.74% | | 0.70%(1)(2) |
Small Cap Fund | | 1.00% | | 0.80%(1)(2) |
International Equity Fund | | 1.00% | | 0.85%(2) |
Special Opportunities Equity Fund | | 0.80% | | 0.80%(1) |
Equity Income Fund | | 0.70% | | 0.70%(1) |
Short U.S. Government Fund | | 0.60% | | 0.45%(2) |
Intermediate U.S. Government Fund | | 0.60% | | 0.48%(2) |
Total Return Bond Fund | | 0.60% | | 0.48%(2) |
Kentucky Intermediate Tax-Free Fund | | 0.60% | | 0.40%(2) |
Maryland Intermediate Tax-Free Fund | | 0.60% | | 0.40%(2)(3) |
North Carolina Intermediate Tax-Free Fund | | 0.60% | | 0.45%(2) |
South Carolina Intermediate Tax-Free Fund | | 0.60% | | 0.45%(2) |
Virginia Intermediate Tax-Free Fund | | 0.60% | | 0.45%(2) |
West Virginia Intermediate Tax-Free Fund | | 0.45% | | 0.45% |
National Tax-Free Money Market Fund | | 0.25% | | 0.20%(2)(4) |
Prime Money Market Fund | | 0.40% | | 0.28%(1)(2)(4) |
U.S. Treasury Money Market Fund | | 0.40% | | 0.26%(1)(2)(4) |
Capital Manager Conservative Growth Fund | | 0.25% | | 0.00%(2) |
Capital Manager Moderate Growth Fund | | 0.25% | | 0.00%(2) |
Capital Manager Growth Fund | | 0.25% | | 0.00%(2) |
Capital Manager Equity Fund | | 0.25% | | 0.00%(2) |
| | (1) | For all or a portion of the fiscal year ended September 30, 2009 BB&T AM voluntarily waived additional advisory fees. Except as reflected below, voluntary investment advisory fee waivers are not subject to recoupment in subsequent fiscal periods, and may be discontinued at any time. |
| | (2) | BB&T AM contractually agreed to limit the advisory fees paid by the Fund from February 1, 2009 through January 31, 2010. |
| | (3) | The fee rate after contractual waiver for the period from October 1, 2008 through January 31, 2009 was 0.70% for Large Cap Fund and 0.30% for Maryland Intermediate Tax-Free Fund. |
| | (4) | BB&T AM has contractually agreed to limit the advisory fees paid by each Money Market Fund to 0.20% with regard to the National Tax-Free Money Market Fund, 0.28% with regard to the Prime Money Market Fund, and 0.26% with regard to the U.S. Treasury Money Market Fund (each, an “Advisory Fee Limit”) for the period from March 1, 2009 through February 28, 2012. From March 1, 2010 through February 28, 2012, BB&T AM may recoup from each Money Market Fund all or a portion of the advisory fees that it voluntarily waives with respect to such Fund beyond the Advisory Fee Limit during the period from March 1, 2009 through February 28, 2010 (the “Recoupment Amount”), subject to certain limitations. BB&T AM may not recoup any amount from a Fund if the Recoupment Amount plus the Advisory Fee Limit would exceed the Contractual Fee Rate noted in the table above. |
Pursuant to a sub-advisory agreement with BB&TAM, Artio Global Management LLC serves as the sub-advisor to the International Equity Fund, subject to the general supervision of the Funds’ Board of Trustees and BB&T AM. Pursuant to a sub-advisory agreement with BB&TAM, Federated Investment Management Company serves as the sub-advisor to the Prime Money Market Fund and the National Tax-Free Money Market Fund, subject to the general supervision of the Funds’ Board of Trustees and BB&T AM. Pursuant to a sub-advisory agreement with BB&T AM, Scott & Stringfellow LLC, a wholly owned subsidiary of BB&T Corporation, serves as the sub-advisor to the Special Opportunities Equity Fund and the Equity Income Fund, subject to the general supervision of the Funds’ Board of Trustees and BB&T AM. Pursuant to a sub-advisory agreement with BB&T AM, Sterling Capital Management LLC, a wholly owned subsidiary of BB&T Corporation, serves as the sub-advisor to the Mid Cap Value Fund and the Total Return Bond Fund, subject to the general supervision of the Funds’ Board of Trustees and BB&T AM. For their services, sub-advisors are entitled to a fee, payable by BB&T AM.
BB&T AM serves as the administrator to the Funds pursuant to the administration agreement effective as of April 23, 2007. The Funds pay their portion of a fee to BB&T AM for providing administration services based on the aggregate assets of the Funds and the BB&T Variable Insurance Funds, excluding the assets of the Funds of Funds, at a rate of 0.11% on the first $3.5 billion of average net assets; 0.075% on the next $1 billion of average net assets; 0.06% on the next $1.5 billion of average net assets; and 0.04% of average net assets over $6 billion. This fee is accrued daily and payable on a monthly basis. Expenses incurred are reflected on the Statements of Operations as “Administration fees”. Pursuant to a sub-administration agreement with BB&TAM, PNC Global Investment Servicing (U.S.) Inc. (“PNC” or the “Sub-Administrator”), serves as the sub-administrator to the Funds subject to the general supervision of the Board of Trustees and BB&T AM. For these services, PNC is entitled to a fee payable by BB&T AM.
163
Notes to Financial Statements — (continued)
September 30, 2009
PNC serves as the Funds’ fund accountant and transfer agent and receives compensation by the Funds for these services. Expenses incurred are reflected on the Statements of Operations as “Fund accounting fees” and “Transfer agent fees”.
BB&TAM’s Chief Compliance Officer (“CCO”) serves as the Funds’ CCO. The CCO’s compensation is reviewed and approved by the Funds’ Board of Trustees and paid by BB&T AM. However, the Funds reimburse BB&T AM for their allocable portion of the CCO’s salary. Expenses incurred for the Funds are reflected on the Statements of Operations as “Compliance service fees”.
For the fiscal year ended September 30, 2009, the Funds’ paid $672,437 in brokerage fees to Scott & Stringfellow LLC, a wholly owned subsidiary of BB&T Corporation, on the execution of purchases and sales of the Funds’ portfolio investments.
The Funds have adopted a Distribution and Shareholder Services Plan (the “Plan”) in accordance with Rule 12b-1 under the 1940 Act. BB&TAM Distributors, Inc. (“BBTAMD”) serves as distributor to each Fund pursuant to an underwriting agreement, effective as of April 23, 2007. The Plan provides for payments to the distributor of up to 0.50%, 1.00% and 1.00% of the average daily net assets of the Class A Shares, Class B Shares, and Class C Shares, respectively, with the exception of the Mid Cap Value Fund, the Mid Cap Growth Fund and the West Virginia Intermediate Tax-Free Fund which make payments of up to 0.25% of the average daily net assets for Class A. BBTAMD has contractually agreed to waive 0.25% of the Class A distribution fees of the Funds except for the Mid Cap Value Fund, Mid Cap Growth Fund, West Virginia Intermediate Tax-Free Fund, Prime Money Market Fund and U.S. Treasury Money Market Fund through January 31, 2010, and may voluntarily waive additional fees at any time. The total contractual and voluntary waiver of distribution fees was $2,484,540 for the fiscal year ended September 30, 2009. Distribution fee waivers are included in the Statements of Operations as “Less expenses waived by the Distributor” and these waivers are not subject to recoupment in subsequent fiscal periods. As distributor, BBTAMD is entitled to receive commissions on sales of shares of the Variable Net Asset Value Funds. For the fiscal year ended September 30, 2009, BBTAMD received $499,548 from commissions earned on sales of shares of the Funds’ Variable Net Asset Value Funds. Commissions paid to affiliated broker-dealers during the fiscal year ended September 30, 2009 were $602,180. The fees may be used by BBTAMD to pay banks, broker dealers and other institutions, including affiliates of BB&T AM.
BB&T AM and/or its affiliates may pay out of their own bona fide profits compensation to broker-dealers and other persons for the sale and distribution of the shares and/or for the servicing of the shares. These are additional payments over and above the sales charge (including Rule 12b-1 fees) and service fees paid by the Funds. The payments, which may be different for different financial institutions, will not change the price an investor will pay for shares or the amount that a Fund will receive for the sale of shares.
Certain officers and Trustees of the Funds are affiliated with BB&T AM, or the Sub-Administrator. Such officers and Trustees receive no compensation from the Funds for serving in their respective roles. Each of the Trustees who are not interested persons (as defined in the 1940 Act) of the Trust who serve on the Board of Trustees are compensated at the annual rate of $30,000 plus $5,000 for each regularly scheduled quarterly meeting attended, $4,000 for each special meeting attended in person and $3,000 for each special meeting attended by telephone, plus reimbursement for certain out of pocket expenses. Each Trustee serving on a Committee of the Board of Trustees receives a fee of $4,000 for each Committee meeting attended in person and $3,000 for each Committee meeting attended by telephone, plus reimbursement for certain out of pocket expenses. Additionally, the Chairman of the Board of Trustees and the Audit Committee Chairman each receive an annual retainer of $10,000, and the Chairman of the Nominations Committee receives $1,000 for each meeting attended. The fees are allocated across the Funds and the BB&T Variable Insurance Funds based upon relative net assets.
| | 5. | Concentration of Credit Risk: |
The Tax-Free Funds invest primarily in debt instruments of municipal issuers in their respective states. The issuers’ abilities to meet their obligations may be affected by economic developments in a specific state or region.
U.S. Bank, N.A. has made available a credit facility to the Funds, pursuant to a Credit Agreement (the “Agreement”). The primary purpose of the Agreement is to allow the Funds to avoid security liquidations that BB&T AM believes are unfavorable to shareholders. Outstanding principal amounts under the Agreement bear interest at a rate per annum equal to the Prime Rate minus two percent (2%), but never a net rate of less than two percent (2%) per annum. During the fiscal year ended September 30, 2009 the following Funds utilized lines of credit:
| | | | | | | | | | |
| | | Average
Interest Rate | | Average
Loan Balance | | Number of
Days Outstanding | | Interest Expense
Incurred | | Maximum Amount
Borrowed
During the Period |
North Carolina Intermediate Tax-Free Fund | | 3.25% | | $3,000 | | 1 | | $— | | $3,000 |
Virginia Intermediate Tax-Free Fund | | 2.00% | | 251,000 | | 1 | | 14 | | 251,000 |
164
Notes to Financial Statements — (continued)
September 30, 2009
| | 7. | Federal Income Tax Information: |
Management evaluates its tax positions to determine if the tax positions taken meet the minimum recognition threshold in connection with accounting for uncertainties in income tax positions taken or expected to be taken for the purposes of measuring and recognizing tax liabilities in the financial statements. Recognition of tax benefits of an uncertain tax position is required only when the position is “more likely than not” to be sustained assuming examination by taxing authorities. The Funds recognize interest and penalties, if any, related to unrecognized tax benefits as income tax expense in the Statements of Operations. During the period, the Funds did not incur any interest or penalties.
Management has analyzed the Funds’ tax positions taken on federal income tax returns for all open tax years (current and prior three tax years), and has concluded that no provision for federal income tax is required in the Funds’ financial statements. The Funds’ federal and state income and federal excise tax returns for tax years for which the applicable statutes of limitations have not expired are subject to examination by the Internal Revenue Service and state departments of revenue.
At September 30, 2009, the following Funds had net capital loss carryforwards available to offset future net capital gains, if any, to the extent provided by the Treasury regulations. To the extent that these carryforwards are used to offset future capital gains, it is probable that the gains that are offset will not be distributed to shareholders.
| | | | |
| | | Amount | | Expires |
Large Cap Fund | | $120,078,510 | | 2017 |
Mid Cap Value Fund | | 233,334 | | 2016 |
Mid Cap Value Fund | | 13,084,749 | | 2017 |
Mid Cap Growth Fund | | 9,011,526 | | 2017 |
Small Cap Fund* | | 2,350,415 | | 2010 |
Small Cap Fund | | 982,080 | | 2016 |
Small Cap Fund | | 10,282,133 | | 2017 |
International Equity Fund | | 34,249,253 | | 2017 |
Special Opportunities Equity Fund | | 24,473 | | 2017 |
Equity Income Fund | | 1,752,496 | | 2017 |
Short U.S. Government Fund | | 118,919 | | 2012 |
Short U.S. Government Fund | | 2,094,190 | | 2013 |
Short U.S. Government Fund | | 1,246,269 | | 2014 |
Short U.S. Government Fund | �� | 3,940,976 | | 2015 |
Short U.S. Government Fund | | 160,380 | | 2016 |
Intermediate U.S. Government Fund | | 3,134,925 | | 2014 |
Intermediate U.S. Government Fund | | 10,119,332 | | 2016 |
Total Return Bond Fund | | 1,589,668 | | 2015 |
Maryland Intermediate Tax-Free Fund | | 865 | | 2017 |
South Carolina Intermediate Tax-Free Fund | | 16,576 | | 2017 |
Capital Manager Conservative Growth Fund | | 122,214 | | 2017 |
Capital Manager Moderate Growth Fund | | 508,094 | | 2017 |
Capital Manager Growth Fund | | 1,235,282 | | 2017 |
Capital Manager Equity Fund | | 958,260 | | 2017 |
| | * | The amount of these losses that may be utilized is limited to $2,350,415 on an annual basis as a result of certain ownership changes in 2006. |
Capital loss carryforwards utilized in the current year were $147,806, $1,216,700 and $5,169,505 for Short U.S. Government Fund, Intermediate U.S. Government Fund and Total Return Bond Fund, respectively. Short U.S. Government Fund had $350,536 and Small Cap Fund had $4,700, 830 in capital loss carryforwards that expired in the current year.
165
Notes to Financial Statements — (continued)
September 30, 2009
The tax character of distributions paid to shareholders during the fiscal year ended September 30, 2009, were as follows:
| | | | | | | | | | | | |
| | | Distributions paid from | | Total Taxable
Distributions | | Return
Of Capital | | Tax Exempt
Distributions | | Total
Distributions
Paid* |
| | | Ordinary
Income | | Net
Long-Term
Gains | | | | |
Large Cap Fund | | $ 3,095,069 | | $ — | | $ 3,095,069 | | $ — | | $ — | | $ 3,095,069 |
Mid Cap Value Fund | | 527,216 | | — | | 527,216 | | — | | — | | 527,216 |
Mid Cap Growth Fund | | — | | 5,378,398 | | 5,378,398 | | 821,181 | | — | | 6,199,579 |
Small Cap Fund | | — | | — | | — | | — | | — | | — |
International Equity Fund | | 2,410,124 | | — | | 2,410,124 | | — | | — | | 2,410,124 |
Special Opportunities Equity Fund | | 2,000,916 | | 12,366,207 | | 14,367,123 | | 2,664,763 | | — | | 17,031,886 |
Equity Income Fund | | 6,195,917 | | 722,290 | | 6,918,207 | | — | | — | | 6,918,207 |
Short U.S. Government Fund | | 1,556,218 | | — | | 1,556,218 | | — | | — | | 1,556,218 |
Intermediate U.S. Government Fund | | 5,245,906 | | — | | 5,245,906 | | — | | — | | 5,245,906 |
Total Return Bond Fund | | 18,081,190 | | — | | 18,081,190 | | — | | — | | 18,081,190 |
Kentucky Intermediate Tax-Free Fund | | 78,614 | | 79,018 | | 157,632 | | — | | 580,083 | | 737,715 |
Maryland Intermediate Tax-Free Fund | | 67,470 | | 65,809 | | 133,279 | | — | | 589,996 | | 723,275 |
North Carolina Intermediate Tax-Free Fund | | 799,514 | | 451,034 | | 1,250,548 | | — | | 4,606,284 | | 5,856,832 |
South Carolina Intermediate Tax-Free Fund | | 213,453 | | 140,118 | | 353,571 | | — | | 742,791 | | 1,096,362 |
Virginia Intermediate Tax-Free Fund | | 224,947 | | 440,130 | | 665,077 | | — | | 2,797,561 | | 3,462,638 |
West Virginia Intermediate Tax-Free Fund | | 87,470 | | 1,228 | | 88,698 | | — | | 2,667,477 | | 2,756,175 |
National Tax Free Money Market Fund | | 11,974 | | 745 | | 12,719 | | — | | 2,457,019 | | 2,469,738 |
Prime Money Market Fund | | 13,466,347 | | — | | 13,466,347 | | — | | — | | 13,466,347 |
U.S. Treasury Money Market Fund | | 740,484 | | — | | 740,484 | | — | | — | | 740,484 |
Capital Manager Conservative Growth Fund | | 757,656 | | 840,501 | | 1,598,157 | | — | | — | | 1,598,157 |
Capital Manager Moderate Growth Fund | | 934,441 | | — | | 934,441 | | — | | — | | 934,441 |
Capital Manager Growth Fund | | 579,698 | | — | | 579,698 | | — | | — | | 579,698 |
Capital Manager Equity Fund | | 190,556 | | — | | 190,556 | | — | | — | | 190,556 |
The tax character of distributions paid to shareholders during the fiscal year ended September 30, 2008, were as follows:
| | | | | | | | | | |
| | | Distributions paid from | | Total Taxable
Distributions | | Tax Exempt
Distributions | | Total
Distributions
Paid* |
| | | Ordinary
Income | | Net
Long-Term
Gains | | | |
Large Cap Fund | | $13,358,739 | | $86,391,629 | | $ 99,750,368 | | $ — | | $99,750,368 |
Mid Cap Value Fund | | 12,060,136 | | 15,851,309 | | 27,911,445 | | — | | 27,911,445 |
Mid Cap Growth Fund | | 4,642,107 | | 9,720,681 | | 14,362,788 | | — | | 14,362,788 |
Small Cap Fund | | 571,040 | | 6,961,030 | | 7,532,070 | | — | | 7,532,070 |
International Equity Fund | | 3,556,351 | | 12,199,987 | | 15,756,338 | | — | | 15,756,338 |
Special Opportunities Equity Fund | | 4,562,577 | | 9,456,338 | | 14,018,915 | | — | | 14,018,915 |
Equity Income Fund | | 5,642,983 | | 6,945,951 | | 12,588,934 | | — | | 12,588,934 |
Short U.S. Government Fund | | 1,910,471 | | — | | 1,910,471 | | — | | 1,910,471 |
Intermediate U.S. Government Fund | | 6,118,277 | | — | | 6,118,277 | | — | | 6,118,277 |
Total Return Bond Fund | | 21,516,002 | | — | | 21,516,002 | | — | | 21,516,002 |
Kentucky Intermediate Tax-Free Fund | | — | | — | | — | | 529,694 | | 529,694 |
Maryland Intermediate Tax-Free Fund | | — | | — | | — | | 423,473 | | 423,473 |
North Carolina Intermediate Tax-Free Fund | | 76,486 | | 397,834 | | 474,320 | | 4,235,863 | | 4,710,183 |
South Carolina Intermediate Tax-Free Fund | | 61,456 | | 95,804 | | 157,260 | | 636,262 | | 793,522 |
Virginia Intermediate Tax-Free Fund | | 17,619 | | 357,893 | | 375,512 | | 2,772,996 | | 3,148,508 |
West Virginia Intermediate Tax-Free Fund | | 15,299 | | 120,896 | | 136,195 | | 2,536,318 | | 2,672,513 |
National Tax Free Money Market Fund | | — | | — | | — | | 2,644,375 | | 2,644,375 |
Prime Money Market Fund | | 55,744,159 | | — | | 55,744,159 | | — | | 55,744,159 |
U.S. Treasury Money Market Fund | | 19,611,212 | | — | | 19,611,212 | | — | | 19,611,212 |
Capital Manager Conservative Growth Fund | | 2,450,477 | | 4,214,835 | | 6,665,312 | | — | | 6,665,312 |
Capital Manager Moderate Growth Fund | | 3,380,453 | | 8,858,612 | | 12,239,065 | | — | | 12,239,065 |
Capital Manager Growth Fund | | 2,560,561 | | 8,405,300 | | 10,965,861 | | — | | 10,965,861 |
Capital Manager Equity Fund | | 1,314,812 | | 5,384,279 | | 6,699,091 | | — | | 6,699,091 |
| | * | Total Distributions paid may differ from the Statements of Changes in Net Assets because distributions are recognized when actually paid for tax purposes. |
166
Notes to Financial Statements — (continued)
September 30, 2009
As of September 30, 2009, the components of accumulated earnings (deficit) on a tax basis was as follows:
| | | | | | | | | | | | | | | | | | |
| | | Undistributed
Ordinary
Income/Tax
Exempt Income | | Undistributed
Long Term
Capital Gains | | Accumulated
Earnings | | Distributions
Payable* | | | Accumulated
Capital and
Other Losses | | | Unrealized
Appreciation
(Depreciation)* | | | Total
Accumulated
Earnings
(Deficit) | |
Large Cap Fund | | $ 184,462 | | $ — | | $ 184,462 | | $ — | | | $(154,252,485 | ) | | $29,461,372 | | | $(124,606,651 | ) |
Mid Cap Value Fund | | 335,948 | | — | | 335,948 | | — | | | (43,510,227 | ) | | 612,479 | | | (42,561,800 | ) |
Mid Cap Growth Fund | | — | | — | | — | | — | | | (64,344,488 | ) | | 16,261,279 | | | (48,083,209 | ) |
Small Cap Fund | | — | | — | | — | | — | | | (21,483,312 | ) | | 4,084,399 | | | (17,398,913 | ) |
International Equity Fund | | 1,789,912 | | — | | 1,789,912 | | — | | | (65,357,466 | ) | | 13,308,936 | | | (50,258,618 | ) |
Special Opportunities Equity Fund | | — | | — | | — | | — | | | (29,289,414 | ) | | 43,771,526 | | | 14,482,112 | |
Equity Income Fund | | 758,137 | | — | | 758,137 | | (603 | ) | | (37,722,671 | ) | | 7,451,177 | | | (29,513,960 | ) |
Short U.S. Government Fund | | 109,972 | | — | | 109,972 | | (129,574 | ) | | (7,560,734 | ) | | 752,467 | | | (6,827,869 | ) |
Intermediate U.S. Government Fund | | 2,158,910 | | — | | 2,158,910 | | (285,955 | ) | | (13,254,257 | ) | | 4,095,648 | | | (7,285,654 | ) |
Total Return Bond Fund | | 1,633,241 | | — | | 1,633,241 | | (770,715 | ) | | (2,329,412 | ) | | 12,670,438 | | | 11,203,552 | |
Kentucky Intermediate Tax-Free Fund | | 37,056 | | 76,482 | | 113,538 | | (35,918 | ) | | — | | | 1,099,245 | | | 1,176,865 | |
Maryland Intermediate Tax-Free Fund | | 42,807 | | — | | 42,807 | | (43,307 | ) | | (865 | ) | | 1,588,268 | | | 1,586,903 | |
North Carolina Intermediate Tax-Free Fund | | 594,981 | | 783,575 | | 1,378,556 | | (333,546 | ) | | — | | | 9,046,014 | | | 10,091,024 | |
South Carolina Intermediate Tax-Free Fund | | 40,855 | | — | | 40,855 | | (39,627 | ) | | (26,377 | ) | | 1,399,369 | | | 1,374,220 | |
Virginia Intermediate Tax- Free Fund | | 741,410 | | 348,797 | | 1,090,207 | | (185,842 | ) | | — | | | 6,502,020 | | | 7,406,385 | |
West Virginia Intermediate Tax-Free Fund | | 157,234 | | 126,213 | | 283,447 | | (194,464 | ) | | — | | | 3,831,184 | | | 3,920,167 | |
National Tax-Free Money Market Fund | | 73,405 | | — | | 73,405 | | (72,517 | ) | | — | | | — | | | 888 | |
Prime Money Market Fund | | 8,174 | | — | | 8,174 | | (6,815 | ) | | — | | | — | | | 1,359 | |
U.S. Treasury Money Market Fund | | — | | — | | — | | (3,109 | ) | | — | | | 5,161 | | | 2,052 | |
Capital Manager Conservative Growth Fund | | — | | — | | — | | (1,106 | ) | | (9,096,754 | ) | | 410,948 | | | (8,686,912 | ) |
Capital Manager Moderate Growth Fund | | — | | — | | — | | (1,869 | ) | | (9,947,401 | ) | | (5,321,447 | ) | | (15,270,717 | ) |
Capital Manager Growth Fund | | — | | — | | — | | (261 | ) | | (10,150,630 | ) | | (6,358,398 | ) | | (16,509,289 | ) |
Capital Manager Equity Fund | | — | | — | | — | | — | | | (9,014,693 | ) | | (2,340,499 | ) | | (11,355,192 | ) |
| | * | Distributions Payable may differ from the Statements of Assets and Liabilities because distributions are recognized when actually paid for tax purposes. The primary differences between book basis and tax basis unrealized appreciation/(depreciation) were due to the deferral of losses on wash sales, mark-to-market adjustments on passive foreign investment companies and constructive sales on hedged positions, basis adjustments on partnership interests and the deferral of market discount and premium until point of sale. |
Under current tax law, capital losses realized after October 31 of a Fund’s fiscal year may be deferred and treated as occurring on the first business day of the following fiscal year for tax purposes. The following Funds had deferred post October capital and currency losses, which will be treated as arising on the first business day of the fiscal year ended September 30, 2010:
| | | | |
| | | Post-October
Capital
Losses | | Post-October
Currency
Losses |
Large Cap Fund | | $34,173,975 | | $— |
Mid Cap Value Fund | | 30,192,144 | | — |
Mid Cap Growth Fund | | 55,332,962 | | — |
Small Cap Fund | | 7,868,684 | | — |
167
Notes to Financial Statements — (continued)
September 30, 2009
| | | | |
| | | Post-
October
Capital
Losses | | Post-
October
Currency
Losses |
International Equity Fund | | $29,653,692 | | $1,454,521 |
Special Opportunities Fund | | 29,264,941 | | — |
Equity Income Fund | | 35,970,175 | | — |
Total Return Bond Fund | | 739,744 | | — |
South Carolina Intermediate Tax-Free Fund | | 9,801 | | — |
Capital Manager Conservative Growth Fund | | 8,974,540 | | — |
Capital Manager Moderate Growth Fund | | 9,439,307 | | — |
Capital Manager Growth Fund | | 8,915,348 | | — |
Capital Manager Equity Fund | | 8,056,433 | | — |
At September 30, 2009, the cost, gross unrealized appreciation and gross unrealized depreciation on securities for federal income tax purposes were as follows:
| | | | | | | | | | |
| | | Tax Cost | | Tax
Unrealized
Appreciation | | Tax
Unrealized
Depreciation | | | Net
Unrealized
Appreciation
(Depreciation) | |
Large Cap Fund | | $ 181,829,741 | | $39,037,760 | | $ (9,576,388 | ) | | $29,461,372 | |
Mid Cap Value Fund | | 222,305,178 | | 28,313,261 | | (27,700,782 | ) | | 612,479 | |
Mid Cap Growth Fund | | 77,514,976 | | 19,511,072 | | (3,249,793 | ) | | 16,261,279 | |
Small Cap Fund | | 29,431,432 | | 5,410,356 | | (1,325,957 | ) | | 4,084,399 | |
International Equity Fund | | 73,525,176 | | 19,399,981 | | (6,091,008 | ) | | 13,308,973 | |
Special Opportunities Equity Fund | | 447,748,438 | | 70,741,016 | | (25,864,493 | ) | | 44,876,523 | |
Equity Income Fund | | 350,075,560 | | 23,722,662 | | (16,321,239 | ) | | 7,401,423 | |
Short U.S. Government Fund | | 65,921,758 | | 1,126,423 | | (373,956 | ) | | 752,467 | |
Intermediate U.S. Government Fund | | 191,964,889 | | 4,655,366 | | (559,718 | ) | | 4,095,648 | |
Total Return Bond Fund | | 358,866,197 | | 19,241,593 | | (6,571,155 | ) | | 12,670,438 | |
Kentucky Intermediate Tax-Free Fund | | 18,523,982 | | 1,099,487 | | (242 | ) | | 1,099,245 | |
Maryland Intermediate Tax-Free Fund | | 27,123,624 | | 1,588,269 | | (1 | ) | | 1,588,268 | |
North Carolina Intermediate Tax-Free Fund | | 155,586,205 | | 9,109,943 | | (63,929 | ) | | 9,046,014 | |
South Carolina Intermediate Tax-Free Fund | | 27,060,169 | | 1,402,377 | | (3,008 | ) | | 1,399,369 | |
Virginia Intermediate Tax-Free Fund | | 84,405,779 | | 6,568,823 | | (66,803 | ) | | 6,502,020 | |
West Virginia Intermediate Tax-Free Fund | | 78,558,778 | | 4,183,739 | | (352,555 | ) | | 3,831,184 | |
National Tax-Free Money Market Fund | | 260,610,893 | | — | | — | | | — | |
Prime Money Market Fund | | 1,153,227,770 | | — | | — | | | — | |
U.S. Treasury Money Market Fund | | 621,925,274 | | 5,161 | | — | | | 5,161 | |
Capital Manager Conservative Growth Fund | | 14,059,731 | | 1,380,292 | | (969,344 | ) | | 410,948 | |
Capital Manager Moderate Growth Fund | | 42,724,384 | | 993,681 | | (6,315,128 | ) | | (5,321,447 | ) |
Capital Manager Growth Fund | | 34,527,042 | | 457,131 | | (6,815,529 | ) | | (6,358,398 | ) |
Capital Manager Equity Fund | | 11,809,739 | | 12,571 | | (2,353,070 | ) | | (2,340,499 | ) |
The Money Market Funds participated in the U.S. Department of the Treasury’s Temporary Guarantee Program for Money Market Funds (the “Program”) during the 12-month period ended September 30, 2009. Subject to certain conditions and limitations, in the event that the per share value of a Money Market Fund fell below $0.995 and the Money Market Fund liquidated its holdings, the Program provided coverage to shareholders in the Money Market Fund for up to $1.00 per share for the lesser of either the number of shares the investor held in the Money Market Fund at the close of business on September 19, 2008 or the number of shares the investor held the date the per share value fell below $0.995.
As a participant in the Program, which expired on September 18, 2009, each of the Money Market Funds paid a fee of 0.01% multiplied by the number of outstanding shares of such Fund as of September 19, 2008 for the period September 19, 2008 through December 18, 2008. BB&T Prime Money Market Fund and BB&T National Tax-Free Money Market Fund continued to participate in the Program for the periods from December 19, 2008 through April 30, 2009, and from May 1, 2009 through September 18, 2009. These Funds each paid a fee of 0.015% multiplied by the number of outstanding shares of such Fund as of September 19, 2008 for the period December 19, 2008 through April 30, 2009 and for the period from May 1, 2009
168
Notes to Financial Statements — (continued)
September 30, 2009
through September 18, 2009. This expense was borne by the Money Market Funds, as described above, without regard to any expense limitation in effect for such Fund. The participation fees for the period September 19, 2008 through September 30, 2009 are included as “Government insurance fees” on the Statements of Operations.
At a meeting of the Board held on November 17, 2009, the Board approved the reorganization of the BB&T Mid Cap Growth Fund with and into the BB&T Mid Cap Value Fund and the reorganization of the BB&T Small Cap Fund with and into the Sterling Capital Small Cap Value Fund. The reorganizations are subject to shareholders’ approval and, if approved, are scheduled to be completed during the first quarter of 2010.
Management has evaluated the impact of all subsequent events on the Funds through November 20, 2009, the date the financial statements were issued, and has noted no additional events that require recognition or disclosure in the financial statements.
169
Report of Independent Registered Public Accounting Firm
To the Shareholders and Board of Trustees of BB&T Funds:
We have audited the accompanying statements of assets and liabilities of the BB&T Large Cap Fund, BB&T Mid Cap Value Fund, BB&T Mid Cap Growth Fund, BB&T Small Cap Fund, BB&T International Equity Fund, BB&T Special Opportunities Equity Fund, BB&T Equity Income Fund, BB&T Short U.S. Government Fund, BB&T Intermediate U.S. Government Fund, BB&T Total Return Bond Fund, BB&T Kentucky Intermediate Tax-Free Fund, BB&T Maryland Intermediate Tax-Free Fund, BB&T North Carolina Intermediate Tax-Free Fund, BB&T South Carolina Intermediate Tax-Free Fund, BB&T Virginia Intermediate Tax-Free Bond Fund, BB&T West Virginia Intermediate Tax-Free Fund, BB&T National Tax-Free Money Market Fund, BB&T Prime Money Market Fund, BB&T U.S. Treasury Money Market Fund, BB&T Capital Manager Conservative Growth Fund, BB&T Capital Manager Moderate Growth Fund, BB&T Capital Manager Growth Fund, and BB&T Capital Manager Equity Fund (collectively, the “Funds”), twenty-three of the funds constituting BB&T Funds, including the schedules of portfolio investments, as of September 30, 2009, and the related statements of operations for the year then ended, the statements of changes in net assets for each of the years in the two-year period then ended, and the financial highlights for each of the years or periods in the five-year period then ended. These financial statements and financial highlights are the responsibility of the Funds’ management. Our responsibility is to express an opinion on these financial statements and financial highlights based on our audits.
We conducted our audits in accordance with the standards of the Public Company Accounting Oversight Board (United States). Those standards require that we plan and perform the audit to obtain reasonable assurance about whether the financial statements and financial highlights are free of material misstatement. An audit includes examining, on a test basis, evidence supporting the amounts and disclosures in the financial statements. Our procedures included confirmation of securities owned as of September 30, 2009, by correspondence with the custodian, transfer agent of the underlying funds and brokers or by other appropriate auditing procedures where replies from brokers were not received. An audit also includes assessing the accounting principles used and significant estimates made by management, as well as evaluating the overall financial statement presentation. We believe that our audits provide a reasonable basis for our opinion.
In our opinion, the financial statements and financial highlights referred to above presents fairly, in all material respects, the financial position of the Funds as of September 30, 2009, the results of their operations for the year then ended, the changes in their net assets for each of the years in the two-year period then ended, and the financial highlights for each of the years or periods in the five-year period then ended, in conformity with U.S. generally accepted accounting principles.

New York, NY
November 20, 2009
170
September 30, 2009
Notice to Shareholders (Unaudited)
For shareholders that do not have a September 30, 2009, tax year end, this notice is for informational purposes only. For shareholders with a September 30, 2009 tax year end, please consult your tax advisor as to the pertinence of this notice.
For the fiscal year ended September 30, 2009, in order to meet certain requirements of the Internal Revenue Code, we are advising you that certain distributions paid during the year from the following Funds are designated as:
| | | | | | | | | | | | | | |
| | | (a)
Long-Term
Capital
Gain | | (b)
Qualified
Dividend
Income % | | (c)
(for corporate
shareholders)
Dividends
Received
Deduction % | | (d)
(for foreign
shareholders)
Qualified
Short-Term
Capital Gain % | | (e)
(for foreign
shareholders)
Qualified
Interest
Income % | | (f)
Exempt-
Interest
Dividend |
Large Cap Fund | | $ | — | | 100.00% | | 100.00% | | — | | 0.70% | | $ | — |
Mid Cap Value Fund | | | — | | 100.00% | | 100.00% | | — | | 1.86% | | | — |
Mid Cap Growth Fund | | | 5,378,398 | | — | | — | | — | | — | | | — |
International Equity Fund | | | — | | 52.21% | | 0.69% | | — | | 0.68% | | | — |
Special Opportunities Equity Fund | | | 12,366,207 | | 85.85% | | 79.69% | | 85.85% | | 1.06% | | | — |
Equity Income Fund | | | 722,290 | | 100.00% | | 97.43% | | — | | 1.06% | | | — |
Short U.S. Government Fund | | | — | | — | | — | | — | | 99.25% | | | — |
Intermediate U.S. Government Fund | | | — | | — | | — | | — | | 99.86% | | | — |
Total Return Bond Fund | | | — | | — | | — | | — | | 100.00% | | | — |
Kentucky Intermediate Tax-Free Fund | | | 79,018 | | — | | — | | 100.00% | | — | | | 580,083 |
Maryland Intermediate Tax-Free Fund | | | 65,809 | | — | | — | | 100.00% | | — | | | 589,996 |
North Carolina Intermediate Tax-Free Fund | | | 451,034 | | — | | — | | 100.00% | | 100.00% | | | 4,606,284 |
South Carolina Intermediate Tax-Free Fund | | | 140,118 | | — | | — | | 99.97% | | — | | | 742,791 |
Virginia Intermediate Tax-Free Fund | | | 440,130 | | — | | — | | 100.00% | | — | | | 2,797,561 |
West Virginia Intermediate Tax-Free Fund | | | 1,228 | | — | | — | | 99.95% | | — | | | 2,667,477 |
National Tax-Free Money Market Fund | | | 745 | | — | | — | | 95.19% | | — | | | 2,457,019 |
Prime Money Market Fund | | | — | | — | | — | | 0.09% | | 100.00% | | | — |
U.S. Treasury Money Market Fund | | | — | | — | | — | | — | | 96.77% | | | — |
Capital Manager Conservative Growth Fund | | | 840,501 | | 23.79% | | 11.58% | | — | | 70.56% | | | — |
Capital Manager Moderate Growth Fund | | | — | | 40.47% | | 21.76% | | — | | 57.49% | | | — |
Capital Manager Growth Fund | | | — | | 62.07% | | 33.32% | | — | | 37.67% | | | — |
Capital Manager Equity Fund | | | — | | 100.00% | | 51.77% | | — | | 0.58% | | | — |
| | (a) | Each Fund designates the maximum amount allowable but not less than the amounts shown above as a capital gain dividend in accordance with Section 852(b)(3)(C) of the Internal Revenue Code. |
| | (b) | Each Fund designates the maximum amount allowable, but not less than the percentages shown above as ordinary income dividends paid during the year as qualified dividend income in accordance with Section 854 of the Internal Revenue Code. |
| | (c) | Each Fund designates the maximum amount allowable but not less than the percentages shown above of ordinary income dividends paid during the year as eligible for the corporate dividends received deduction in accordance with Section 854 of the Internal Revenue Code. |
| | (d) | Each Fund designates the maximum amount allowable but not less than the percentages shown above as a short-term capital gain dividend in accordance with Sections 871(k)(2) and 881(e) of the Internal Revenue Code. |
| | (e) | Each Fund designates the maximum amount allowable but not less than the percentages shown above as interest-related dividends in accordance with Sections 871(k)(1) and 881(e) of the Internal Revenue Code. |
| | (f) | Each Fund designates the maximum amount allowable but not less than the amounts shown above as exempt-interest dividends in accordance with Section 852(b)(5) of the Internal Revenue Code. |
Capital gain dividends distributed during the fiscal year ended September 30, 2009 are generally subject to the maximum tax rate of 15%. In addition, Qualified Dividend Income is generally subject to a maximum rate of 15%.
The information reported herein may differ from the information and distributions paid to the shareholders subject to tax reporting.
171
September 30, 2009
For the fiscal year ended September 30, 2009, the following funds designate the maximum amount allowable but not less than the percentages of the following Funds investment company taxable income were derived from U.S. Treasury securities:
| | | |
| | | U.S.
Government
Income | |
Short U.S. Government Fund | | 7.49 | % |
Intermediate U.S. Government Fund | | 5.81 | % |
Total Return Bond Fund | | 1.09 | % |
Prime Money Market Fund | | 3.42 | % |
U.S. Treasury Money Market Fund | | 69.71 | % |
For the fiscal year ended September 30, 2009, the following fund has made an election to pass-through the maximum amounts paid derived from foreign source income as well as any foreign taxes paid in accordance with Section 853 of the Internal Revenue Code to their shareholders or the following amounts:
| | | | | | |
| | | Foreign
Dividend
Income | | Foreign
Taxes
Paid |
International Equity Fund | | $ | 2,261,962 | | $ | 219,519 |
172
September 30, 2009
Other Information (Unaudited)
A description of the policies and procedures that the Funds use to determine how to vote proxies relating to portfolio securities is available (i) without charge, upon request, by calling 1-800-228-1872; and (ii) on the Securities and Exchange Commission’s (the “Commission”) website at http://www.sec.gov.
Information regarding how the Funds voted proxies relating to portfolio securities during the most recent 12-month period ended June 30th is available (i) without charge, upon request, by calling 1-800-228-1872 and (ii) on the Commission’s website at http://www.sec.gov.
The Funds file complete Schedules of Portfolio Holdings with the Commission for the first and third quarters of each fiscal year on Form N-Q. The Funds’ Forms N-Q are available without charge on the Commission’s website at http://www.sec.gov, or may be reviewed and copied at the Commission’s Public Reference Room in Washington, D.C. Information on the operation of the Public Reference Room may be obtained by calling 1-800-SEC-0330.
173
BOARD CONSIDERATION OF ADVISORY AND SUB-ADVISORY AGREEMENTS (UNAUDITED)
The Board of Trustees, at a meeting held on August 24-25, 2009, formally considered the continuance of the Trust’s investment advisory agreement BB&TAM, which serves as investment adviser to all funds of the Trust (except the Sterling Capital Small Cap Value Fund). At that same meeting, the Board of Trustees considered the continuance of sub-advisory agreements of BB&TAM with Scott & Stringfellow, LLC (“Scott & Stringfellow”) with respect to the Special Opportunities Equity Fund and the Equity Income Fund; Federated Investment Management Company (“Federated”) with respect to the National Tax-Free Money Market Fund and the Prime Money Market Fund; Sterling Capital Management LLC (“Sterling Capital”) with respect to the Mid Cap Value Fund and the Total Return Bond Fund; and Artio Global Management LLC (“Artio”) with respect to the International Equity Fund. All the above referenced agreements are collectively the “Advisory Agreements” and are performed by the “Advisers”; the action considered was the “Continuance” of the Advisory Agreements.
The Trustees reviewed extensive material in connection with their consideration of the Continuance, including data from an independent provider of mutual fund data (as assembled by the Funds’ administrator), which included comparisons with industry averages for comparable funds for advisory fees, 12b-1 fees, and total fund expenses. The data reflected BB&TAM fee waivers in place, as well as BB&TAM’s contractual investment advisory fee levels. The Board was assisted in its review by independent legal counsel, who provided a memorandum detailing the legal standards for review of the Advisory Agreements. The Board received a detailed presentation by BB&TAM, which included a fund-by-fund analysis of performance and investment processes. Presentations were also provided by each entity utilized by BB&TAM as a sub-adviser. The Board also received fund-by-fund profitability information from BB&TAM, Scott & Stringfellow, Sterling Capital and Artio and firm-wide profitability information from Federated. The Independent Trustees also deliberated outside the presence of management and the Advisers.
In their deliberations, each Trustee attributed different weights to various factors involved in an analysis of the Continuance, and no factor alone was considered determinative. The Trustees determined that the overall arrangements between the Trust and the Advisers, as provided in the Advisory Agreements, were fair and reasonable and that the Continuance of the Advisory Agreements was in the best interests of each Fund and its shareholders.
The matters addressed below were considered and discussed by the Trustees in reaching their conclusions.
Nature, Extent and Quality of Services Provided by Adviser and the Sub-Advisers
The Trustees received and considered information regarding the nature, extent, and quality of the services provided to each Fund under the Advisory Agreements. The Trustees took into account information furnished throughout the year at Trustee meetings, as well as materials furnished specifically in connection with the annual review process. The Trustees considered the background and experience of each Adviser’s senior management and the expertise of investment personnel of each Adviser responsible for the day-to-day management of each Fund. The Trustees considered the overall reputation, and the capabilities and commitment of the Advisers to provide high quality service to the Trust, and the Trustees’ overall confidence in each Adviser’s integrity.
The Trustees received information concerning the investment philosophy and investment processes applied by the Advisers in managing the Funds as well as each Adviser’s Form ADV. The Trustees also considered information regarding regulatory compliance and compliance with the investment policies of the Funds. The Trustees evaluated the trading practices of Scott & Stringfellow, which engages in affiliated brokerage for portfolio trades for the Funds it sub-advises. The Trustees received information demonstrating a declining level of affiliated brokerage transactions by Scott & Stringfellow over the past year. The Trustees evaluated the procedures of the Advisers designed to fulfill the Advisers’ fiduciary duty to the Funds with respect to possible conflicts of interest, including the Advisers’ codes of ethics (regulating the personal trading of its officers and employees).
Based on their review, the Trustees concluded that, with respect to the quality and nature of services to be provided by the Advisers, the scope of responsibilities was consistent with mutual fund industry norms, and that the quality of the services was satisfactory.
Investment Performance
The Trustees considered performance results of each Fund in absolute terms and relative to each Fund’s benchmark and peer group. With regard to equity Funds, it was noted that there was a sharp dispersion of performance results ranging from the 4th to the 91st percentile for one-year performance and from the 2nd to the 97th percentile for three-year performance. The Trustees noted BB&TAM’s efforts to enhance the investment results of the equity teams. With respect to the fixed income Funds, it was noted that the average percentile ranking relative to peers for one-year and three-year performance had been strong. With respect to the Capital Manager Funds, it was noted that the Funds had generally outperformed benchmarks, but lagged peers, due to BB&TAM’s conservative approach to portfolio construction.
In the Trustees’ review of performance, long and short-term performance were considered. In conducting their review, the Trustees particularly focused on Funds where performance compared unfavorably with peers over the most recent one year period. The Trustees noted that, although the performance of the Large Cap Fund continued to lag its peer group, BB&TAM’s Chief Investment Officer had increased his oversight of the portfolio management team, investment process, and portfolio composition. It was also noted that the Chief Investment Officer had similarly increased oversight with respect to the Mid Cap Growth Fund and Small Cap Fund. With respect to the International Equity Fund, Large Cap Fund, Mid Cap Growth Fund, and Small Cap Fund, it was the consensus of the
174
Trustees that each of these funds would be the subject of increased focus and review at upcoming meetings of the Board. With regard to International Equity Fund, the Trustees noted that the Fund had been more conservatively positioned than its peers in the first quarter of 2009, which had caused the Fund’s performance to lag during the most recent market rally. The Trustees noted that Artio had moderated its defensive position somewhat and had seen improved performance after the first quarter.
After reviewing the performance of each Fund, and taking into consideration the management style, investment strategies, and prevailing market conditions during the prior year and for longer periods, the Trustees concluded that the performance of each of the Funds was acceptable or better or that in cases where performance issues were encountered, the Adviser was appropriately addressing the situation.
Cost of Services, Including the Profits Realized by the Advisers and Affiliates
The Trustees considered peer group comparable information with respect to the advisory fees charged by BB&TAM to each of the Funds, taking into consideration both contractual and actual (i.e., after waiver) fee levels. The Trustees concluded that the investment advisory fees fell within an acceptable range as compared to peer groups, particularly in light of the fee waivers that are in place.
As part of their review, the Trustees considered benefits to the Adviser aside from investment advisory fees. The Trustees reviewed administration fees received by BB&TAM and considered the fallout benefits to BB&TAM such as the research services available to the Adviser by reason of brokerage commissions generated by the Funds’ turnover. The Trustees also considered benefits to BB&TAM’s affiliates, including brokerage commissions received by Scott & Stringfellow for executing trades on behalf of the Special Opportunities Equity Fund and the Equity Income Fund and sub-advisory fees received by its affiliate, Sterling Capital, for its management of the Mid Cap Value Fund and the Total Return Bond Fund. With respect to Scott & Stringfellow, the Trustees noted that brokerage commissions were paid at a standard commission rate, which was consistent with that used by the Adviser with respect to all equity funds of the Trust and that such brokerage arrangements were considered by the Sub-Adviser to be advantageous.
The Trustees also considered information from BB&TAM regarding fees for separate accounts managed by BB&TAM with investment objectives and strategies similar to those of comparable BB&T Funds. The Trustees noted that the fees for separate accounts were generally lower than those for the Funds. The Trustees noted that a representative of BB&TAM explained that management of the Funds was a much more intensive process than management of separate accounts, including daily fluctuations in the size of the Funds and the need to comply with extensive and complex restrictions set by applicable regulation or established in controlling disclosure documents.
The Trustees also considered the reasonableness of advisory fees, and, where relevant, the profitability of the Advisers. In determining whether all other investment advisory and sub-advisory fees (collectively, the “investment advisory fees”) were reasonable, the Trustees reviewed profitability information provided by BB&TAM, Scott & Stringfellow, Sterling Capital and Artio with respect to investment advisory services as well as firm-wide profitability information provided by Federated. With respect to such information, the Trustees recognized that such profitability data was generally unaudited and represented an Adviser’s own determination of its and its affiliates’ revenues from the contractual services provided to the Funds, less expenses of providing such services. Expenses include direct and indirect costs and were calculated using an allocation methodology developed by the Adviser. The Trustees also recognized that it is difficult to make comparisons of profitability from fund investment advisory and sub-advisory contracts, because comparative information is not generally publicly available and could be affected by numerous factors. Based on their review, the Trustees concluded that the profitability to BB&TAM, Scott & Stringfellow, Sterling Capital, and Artio, as a result of their relationships with the Funds, was acceptable. With respect to the profitability of Federated, the Trustees found that while actual fund-specific information regarding the profitability of the firm was not available, it would not have been as helpful in assessing the Continuance of the Advisory Agreements as otherwise would have been the case since the fees were paid by BB&TAM. The Board concluded that the fees under the Advisory Agreements were fair and reasonable, in light of the services and benefits provided to each Fund.
Economies of Scale
The Trustees also considered whether fee levels reflect economies of scale and whether economies of scale would be produced by the growth of the Trust’s assets. The Trustees found that the Adviser had generally reduced fund total expense ratios through fee waivers. The Trustees noted decreases in asset levels on a complex-wide basis during the past two years. The Trustees found that the asset levels of the Trust were not currently so large as to warrant formal contractual breakpoints, and found that the fee waivers were a reasonable way to provide the benefits of economies of scale to shareholders at this time.
175
Information about Trustees and Officers (Unaudited)
Overall responsibility for the management of the Funds rests with its Board of Trustees (“Trustees”), who are elected by the Shareholders of the Funds. The Trustees elect the officers of the Funds to supervise actively its day-to-day operations. The names of the Trustees, birthdate, term of office and length of time served, principal occupations during the past five years, number of portfolios overseen and directorships held outside of the Funds are listed in the two tables immediately following. The business address of the persons listed below is 434 Fayetteville Street Mall, Raleigh, North Carolina 27601.
INDEPENDENT TRUSTEES
| | | | | | | | | | |
Name and Birthdate | | Position(s) Held With BB&T Funds | | Term of Office/
Length of Time Served | | Principal Occupation
During the Last 5 Years | | Number of
Portfolios
in Fund
Complex
by Trustee* | | Other Directorships Held by Trustee |
| | | | | |
Thomas W. Lambeth Birthdate: 01/35 | | Trustee, Chairman of the Board of Trustees | | Indefinite, 08/92 — Present | | From January 2001 to present, Senior Fellow, Z. Smith Reynolds Foundation; From 1978 to January 2001, Executive Director, Z. Smith Reynolds Foundation | | 30 | | None |
| | | | | |
Drew T. Kagan Birthdate: 02/48 | | Trustee | | Indefinite, 08/00 — Present | | From December 2003 to present, CEO, Montecito Advisors, Inc; from March 1996 to December 2003, President, Investment Affiliate, Inc. | | 30 | | Director, Montecito Advisors, Inc. |
| | | | | |
Laura C. Bingham Birthdate: 11/56 | | Trustee | | Indefinite, 02/01 — Present | | From July 1998 to present, President of Peace College | | 30 | | None |
| | | | | |
Douglas R. Van Scoy Birthdate: 11/43 | | Trustee | | Indefinite, 05/04 — Present | | Retired; from November 1974 to July 2001, employee of Smith Barney (investment banking), most recently as Director of Private Client Group and Senior Executive Vice President | | 30 | | None |
| | | | | |
James L. Roberts Birthdate: 11/42 | | Trustee | | Indefinite, 11/04 — Present | | Retired; from November 2006 to present, Director, Grand Mountain Bancshares, Inc.; from January 1999 to December 2003, President, CEO and Director, Covest Bancshares, Inc. | | 30 | | None |
176
The following table shows information for the trustee who is an “interested person” of the Funds as defined in the 1940 Act:
INTERESTED TRUSTEE
| | | | | | | | | | |
Name and Birthdate | | Position(s) Held With BB&T Funds | | Term of Office/ Length of Time Served | | Principal Occupation
During the Past 5 Years | | Number of
Portfolios
in Fund
Complex
by Trustee* | | Other Directorships Held by Trustee |
| | | | | |
R. Lee Youngblood** Birthdate: 01/47 | | Trustee | | Indefinite, 01/09 — Present | | From April 1971 to present, employee of Branch Banking and Trust Company (currently Executive Vice President) | | 30 | | Director, Sterling Capital Management, LLC; Director, Scott & Stringfellow, LLC; Director, BB&T Investment Services, Inc. |
| | * | The BB&T Fund Complex consists of two open-end investment management companies: the Trust and BB&T Variable Insurance Funds. |
| | ** | Mr. Youngblood is treated by the Fund as an “interested person” (as defined in Section 2(a)(19) of the 1940 Act) of the Funds. Mr. Youngblood is an “interested person” because he owns shares of BB&T Corporation. |
The following table shows information for officers of Funds:
| | | | | | | | |
Name and Birthdate | | Position(s) Held With BB&T Funds | | Term of Office/ Length of Time Served | | Principal Occupation During the Last 5 Years | | |
| | | | |
E.G. Purcell, III Birthdate: 01/55 | | President and Secretary | | Indefinite, President and Secretary, 11/ 08 — Present; Vice President, 11/00-11/08 | | From 1995 to present, Senior Vice President, BB&T Asset Management, Inc. and its predecessors | | |
| | | | |
Todd M. Miller Birthdate: 09/71 | | Vice President | | Indefinite, 08/05 — Present | | From May 2009 to Present, Vice President, BB&T Asset Management, Inc.; from June 2005 to May 2009, Mutual Fund Administrator; from May 2001 to May 2005, Manager, BISYS Fund Services | | |
177
| | | | | | | | |
Name and Birthdate | | Position(s) Held With BB&T Funds | | Term of Office/ Length of Time Served | | Principal Occupation During the Last 5 Years | | |
| | | | |
Clinton L. Ward Birthdate: 11/69 | | Chief Compliance and Anti-Money Laundering Officer | | Indefinite, 04/07 — Present | | From July 2004 to present, Chief Compliance Officer and Secretary, BB&T Asset Management, Inc.; from January 2002 to July 2004, Compliance Analyst, Evergreen Investments; from November 1999 to January 2002, Compliance Manager - Mutual Fund Compliance, Banc of America Capital Management, LLC | | |
| | | | |
Andrew J. McNally Birthdate: 12/70 | | Treasurer | | Indefinite, 04/07 — Present | | From January 2007 to present, Vice President and Senior Director, July 2000 to December 2006, Director, Fund Accounting and Administration Department, PNC Global Investment Servicing | | |
| | | | |
Avery Maher Birthdate: 02/45 | | Assistant Secretary | | Indefinite, 04/07 — Present | | From March 2006 to present, Vice President and Counsel, Regulatory Administration Department, PNC Global Investment Servicing; from October 2004 to August 2005, Vice President and Assistant General Counsel, JPMorgan Asset Management; from 1992 to 2004, Second Vice President and Assistant Secretary, John Hancock Advisers, LLC | | |
The Funds’ Statement of Additional Information includes additional information about the Funds’ Trustees and Officers. To receive your free copy of the Statement of Additional Information, call toll free: 1-800-453-7348.
178
INVESTMENT ADVISER
BB&T Asset Management, Inc.
434 Fayetteville Street
5th Floor
Raleigh, NC 27601
DISTRIBUTOR
BB&T AM Distributors, Inc.
760 Moore Road
King of Prussia, PA 19406
LEGAL COUNSEL
Ropes & Gray LLP
One Metro Center
700 12th Street, N.W.
Suite 900
Washington, D. C. 20005
TRANSFER AGENT
PNC Global Investment Servicing (U.S.) Inc.
760 Moore Road
King of Prussia, PA 19406
INDEPENDENT REGISTERED PUBLIC ACCOUNTING FIRM
KPMG LLP
345 Park Avenue
New York, New York 10154

Sterling Capital Small Cap Value Fund
| | |
| Annual Report | | September 30, 2009 |

CAPITAL SMALL
CAP VALUE FUND
BB&T FUNDS
|
NOTICE OF PRIVACY POLICY & PRACTICES |
BB&T Funds recognizes and respects the privacy expectations of our customers.1 We provide this notice to you so that you will know what kinds of information we collect about our customers and the circumstances in which that information may be disclosed to third parties who are not affiliated with the BB&T Funds.
Collection of Customer Information
We collect nonpublic personal information about our customers from the following sources:
| • | | Account Applications and other forms, which may include a customer’s name, address, social security number, and information about a customer’s investment goals and risk tolerance; |
| • | | Account History, including information about the transactions and balances in a customer’s accounts; and |
| • | | Correspondence, written, telephonic or electronic between a customer and the BB&T Funds or service providers to the BB&T Funds. |
Disclosure of Customer Information
We may disclose all of the consumer information outlined above to third parties who are not affiliated with the BB&T Funds:
| • | | as permitted by law — for example with service providers who maintain or service shareholder accounts for the BB&T Funds or to a shareholder’s broker or agent; and |
| • | | to perform marketing services on our behalf or pursuant to a joint marketing agreement with another financial institution. |
Security of Customer Information
We require service providers to the BB&T Funds:
| • | | to maintain policies and procedures designed to assure only appropriate access to, and use of information about customers of the BB&T Funds; and |
| • | | to maintain physical, electronic and procedural safeguards that comply with applicable legal standards to guard nonpublic personal information of customers of the BB&T Funds. |
We will adhere to the policies and practices described in this notice regardless of whether you are a current or former customer of the BB&T Funds.
| 1 | For purposes of this notice, the terms “customer” or “customers” includes both individual shareholders of the BB&T Funds and individuals who provide nonpublic personal information to the BB&T Funds, but do not invest in BB&T Funds shares. |
STERLING CAPITAL
SMALL CAP VALUE FUND
TABLE OF CONTENTS
The Fund files its complete schedule of portfolio holdings with the Securities and Exchange Commission (the “SEC”) for the first and third quarters of each fiscal year on Form N-Q within 60 days after period end. The Fund’s Form N-Q is available on the SEC’s website at http://www.sec.gov, and may be reviewed and copied at the SEC’s Public Reference Room in Washington D.C. Information on the operation of the Public Reference Room may be obtained by calling 1-800-SEC-0330.
A description of the policies and procedures that the Fund uses to determine how to vote proxies relating to portfolio securities, as well as information on how the Fund voted proxies relating to portfolio securities during the most recent 12-month period ended June 30, is available (i) without charge, upon request, by calling 1-866-450-3722; and (ii) on the SEC’s website at http://www.sec.gov.
STERLING CAPITAL
SMALL CAP VALUE FUND
|
OVERVIEW OF ECONOMIC AND MARKET CONDITIONS |
To Our Fellow Shareholders:
For the year ended September 30, 2009, the Sterling Capital Small Cap Value Fund (the “Fund”) produced a return of 8.68% versus the Russell 2000 Value Index return of -12.61%. Cleary, this year stood in stark contrast to 2008. One year ago, the U.S. capital markets had seized up, reacting to the risk that large financial institutions, made insolvent through leverage and lending in residential real estate, would in turn create the second U.S. depression in 80 years. The U.S. government reacted to these realities through capital support for key financial institutions and a sundry of other loan guarantee programs for various financial assets. The U.S. government went further, however, by offering tax credits for homebuyers, cash for clunkers, and producing an enormous $787 billion stimulus plan with plenty of transfer payments that do little to stimulate economic activity. The government’s aptitude for spending continues undiminished as it entertains a health care overhaul that will cost taxpayers almost a trillion dollars over the coming decade. This is not lost on the world’s view of our fiscal prudence as the value of the U.S. dollar continues to fall.
The performance data quoted represents past performance. Past performance does not guarantee future results. The investment return and principal value of an investment will fluctuate so that an investor’s shares when redeemed, may be worth more or less than their original cost and current performance may be lower or higher than the performance quoted. For performance data current to the most recent month end, please call 1-866-450-3722. Returns assume reinvestment of all dividend and capital gains distributions. In the current prospectus, the total expense ratio for the Fund is 1.76%.

1
STERLING CAPITAL
SMALL CAP VALUE FUND
As of this writing, economic activity had stemmed its free fall although the unemployment rate, as a lagging measure of economic activity, is expected to remain stubbornly high for a while longer. Stocks have rallied as the Government bailout measures and aggressive cost cutting throughout corporate America have produced profits in excess of expectations. Credit markets have improved, allowing some corporations to re-finance upcoming debt maturities.
We believe that there remain, however, significant headwinds to economic stability, including rising federal and state budget deficits and declining commercial real estate values. While not as significant in size as residential real estate, lending institutions will likely need to write down commercial real estate loans for the next couple of years, which may force these institutions into additional capital raising exercises and more conservative lending postures. In your portfolio, we have managed the commercial real estate exposure to be modest and held in what we believe are strongly capitalized institutions relative to the Russell 2000 Value Index.
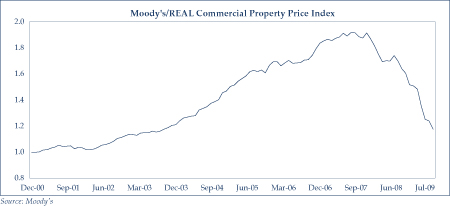
Residential real estate, however, appears to be finding a bottom. While home prices throughout the country continue to demonstrate year-over-year declines in value, there are signs of stabilization as low interest rates, tax incentives, and housing affordability are beginning to spur a rise in existing home sales – at least at the low end of the market. Further, in many of the hardest hit regions of the country, monthly home pricing trends are actually showing month-to-month gains.
2
STERLING CAPITAL
SMALL CAP VALUE FUND
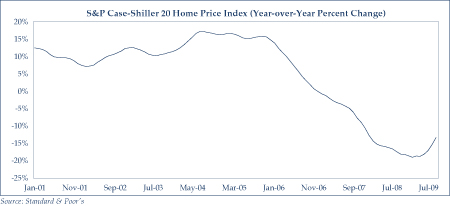
As policymakers in Washington debate the merits of massive healthcare reform, many stocks within this sector have become increasingly volatile. Due to this volatility we believe that attractive investment opportunities are being created in certain insurers and healthcare providers. Insurers with strong balance sheets should allow them to quickly adapt to the altered playing field. Importantly, valuations as measured by both price-to-earnings and free cash flow yield, in our opinion, offer strong investment appeal throughout this sector.
In summary, we believe that investors should recognize that stock prices lead future economic activity rather than lag it. When Warren Buffett wrote his “Buy American, I Am” article, published in the New York Times last year, he said that stock prices discounted tremendous fear and that recessions have normally been infrequent events in our country’s history. We shared Mr. Buffet’s view and positioned the portfolio into more “offensive” ideas and were rewarded throughout the year. We have been active in trimming and selling more fully valued positions into this rally and reinvesting in businesses that we believe demonstrate better risk-adjusted returns.
We will continue to look for businesses that we believe demonstrate strong cash generating profiles at modest valuations. The recent rally in the market has made this more difficult. The markets, however, are dynamic and opportunities are available for disciplined investors willing to focus on the fundamentals.
Sincerely,
STERLING CAPITAL MANAGEMENT
Eduardo A. Brea, CFA
3
STERLING CAPITAL
SMALL CAP VALUE FUND
SEPTEMBER 30, 2009
Comparison of Change in the Value of a $10,000 Investment in the Sterling Capital Small Cap Value Fund and the Russell 2000 Value Index
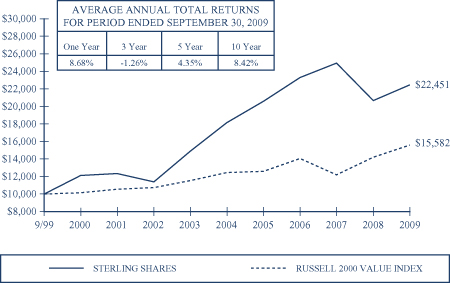
| | | These figures quoted represent past performance. Past performance is no guarantee of future performance and should not be considered as a representation of future results of the Fund. If the Fund’s investment adviser had not limited certain expenses, the Fund’s total return would have been lower. The Fund’s performance assumes the reinvestment of distributions and does not reflect the deduction of taxes that a shareholder would pay on Fund distributions or the redemption of Fund shares. The investment return and principal value of an investment will fluctuate, so an investor’s shares, when redeemed, may be worth more or less than their original cost. Current performance may be higher or lower than the performance quoted. For performance data current to the most recent month-end, please call 1-866-450-3722. |
| | | The performance information for the Sterling Shares prior to 12/18/06 is based on the performance of the Institutional Shares of the Fund’s predecessor, Sterling Capital Small Cap Value Fund, a series of the Advisor’s Inner Circle Fund (the “Acquired Fund”), which transferred all of the assets and liabilities to the Fund pursuant to a reorganization on 12/18/06. Performance information prior to 3/16/01 relates to the UAM Fund Inc.’s Sterling Partners’ Small Cap Value Portfolio, the assets of which were acquired by the Acquired Fund. The Acquired Fund’s investment program was substantially similar to that of the Fund. The performance of the Sterling Shares would have been different because Sterling Shares have different expenses than the predecessor’s Institutional Shares. |
| - | | The Russell 2000 Value Index is an unmanaged index comprised of Russell 2000 securities (2000 stocks of U.S. companies with small market capitalizations) which have lower price-to-book ratios and lower forecasted growth values. The index is unmanaged and does not reflect transaction costs. A direct investment in an unmanaged index is not possible. |
| | | Investing in small capitalization companies involves greater risk such as higher volatility and less liquidity than investing in larger more established companies. |
4
STERLING CAPITAL
SMALL CAP VALUE FUND
SEPTEMBER 30, 2009

| † | Percentages based on market value of total investments. |
| * | Short-Term Investments represents the invested cash collateral received in connection with securities lending (see Note 2) and other cash equivalents. |
SCHEDULE OF PORTFOLIO INVESTMENTS
COMMON STOCKS* — 96.5%
| | | | | |
| | | Shares | | Market
Value |
| | | | | |
| | |
CONSUMER DISCRETIONARY — 15.1% | | | | | |
Exide Technologies (a) | | 117,300 | | $ | 934,881 |
Interpublic Group of Cos., Inc. (The) (a) | | 127,250 | | | 956,920 |
K-Swiss, Inc., Class A | | 18,650 | | | 163,933 |
Meredith Corp. (b) | | 26,750 | | | 800,895 |
Regis Corp. | | 33,517 | | | 519,513 |
Signet Jewelers, Ltd. | | 19,501 | | | 513,461 |
| | | | | |
| | | | | 3,889,603 |
| | | | | |
| | |
CONSUMER STAPLES — 2.4% | | | | | |
Winn-Dixie Stores, Inc. (a) | | 47,984 | | | 629,550 |
| | | | | |
| | |
FINANCIAL SERVICES — 27.7% | | | | | |
AmeriCredit Corp. (a) (b) | | 31,550 | | | 498,175 |
Assured Guaranty, Ltd. | | 9,450 | | | 183,519 |
Avatar Holdings, Inc. (a) | | 13,635 | | | 259,065 |
Brookline Bancorp, Inc. | | 25,950 | | | 252,234 |
Comerica, Inc. | | 9,400 | | | 278,898 |
Endurance Specialty Holdings, Ltd. (b) | | 19,450 | | | 709,342 |
Fair Isaac Corp. | | 30,000 | | | 644,700 |
First Citizens BancShares, Inc., Class A | | 5,214 | | | 829,547 |
First Horizon National Corp. (a) | | 23,580 | | | 311,961 |
Highwoods Properties, Inc. | | 18,200 | | | 572,390 |
Horace Mann Educators Corp. | | 34,000 | | | 474,980 |
Investment Technology Group, Inc. (a) | | 8,800 | | | 245,696 |
The accompanying notes are an integral part of the financial statements.
5
STERLING CAPITAL
SMALL CAP VALUE FUND
SEPTEMBER 30, 2009
|
COMMON STOCKS* — continued |
| | | | | |
| | | Shares | | Market
Value |
| | | | | |
Marshall & Ilsley Corp. | | 52,100 | | $ | 420,447 |
Parkway Properties, Inc. | | 4,709 | | | 92,767 |
StanCorp Financial Group, Inc. | | 16,300 | | | 658,031 |
Synovus Financial Corp. | | 126,600 | | | 474,750 |
Washington Federal, Inc. | | 13,650 | | | 230,139 |
| | | | | |
| | | | | 7,136,641 |
| | | | | |
| | |
HEALTH CARE — 4.5% | | | | | |
Coventry Health Care, Inc. (a) | | 14,200 | | | 283,432 |
Healthspring, Inc. (a) | | 20,769 | | | 254,420 |
IMS Health, Inc. | | 18,900 | | | 290,115 |
Martek Biosciences Corp. (a) | | 10,200 | | | 230,418 |
Palomar Medical Technologies, Inc. (a) | | 5,800 | | | 94,018 |
| | | | | |
| | | | | 1,152,403 |
| | | | | |
| | |
INDUSTRIALS — 0.2% | | | | | |
Colfax Corp. (a) | | 4,400 | | | 46,772 |
| | | | | |
| | |
MATERIALS & PROCESSING — 8.3% | | | | | |
Cabot Microelectronics Corp. (a) | | 14,800 | | | 515,928 |
Louisiana-Pacific Corp. (a) | | 132,300 | | | 882,441 |
Mueller Industries, Inc. | | 15,100 | | | 360,437 |
Sensient Technologies Corp. | | 13,343 | | | 370,535 |
| | | | | |
| | | | | 2,129,341 |
| | | | | |
| | |
ENERGY — 2.7% | | | | | |
Holly Corp. | | 21,250 | | | 544,425 |
Resolute Energy Corp. (a) | | 15,300 | | | 158,355 |
| | | | | |
| | | | | 702,780 |
| | | | | |
| | |
PRODUCER DURABLES — 12.2% | | | | | |
Covanta Holding Corp. (a) | | 34,650 | | | 589,050 |
ICT Group, Inc. (a) | | 34,160 | | | 358,680 |
Knoll, Inc. | | 16,200 | | | 168,966 |
Smith (A.O.) Corp. | | 20,175 | | | 768,668 |
UTi Worldwide, Inc. | | 60,600 | | | 877,488 |
Viad Corp. | | 19,283 | | | 383,925 |
| | | | | |
| | | | | 3,146,777 |
| | | | | |
The accompanying notes are an integral part of the financial statements.
6
STERLING CAPITAL
SMALL CAP VALUE FUND
SEPTEMBER 30, 2009
|
COMMON STOCKS* — continued |
| | | | | | | |
| | | Shares | | Market
Value | |
| | | | | | | |
| | |
TECHNOLOGY — 16.8% | | | | | | | |
Axcelis Technologies, Inc. (a) | | | 113,515 | | $ | 136,218 | |
Black Box Corp. | | | 18,165 | | | 455,760 | |
Compuware Corp. (a) | | | 67,300 | | | 493,309 | |
CSG Systems International, Inc. (a) | | | 14,650 | | | 234,547 | |
EarthLink, Inc. | | | 83,200 | | | 699,712 | |
MicroStrategy, Inc., Class A (a) | | | 10,053 | | | 719,192 | |
National Semiconductor Corp. | | | 49,500 | | | 706,365 | |
Orbotech, Ltd. (a) | | | 64,023 | | | 605,337 | |
Voyager Learning Co. (a) | | | 60,200 | | | 285,950 | |
| | | | | | | |
| | | | | | 4,336,390 | |
| | | | | | | |
| | |
UTILITIES — 6.6% | | | | | | | |
ALLETE, Inc. | | | 14,400 | | | 483,408 | |
Cleco Corp. | | | 27,800 | | | 697,224 | |
NII Holdings, Inc. (a) | | | 17,700 | | | 530,646 | |
| | | | | | | |
| | | | | | 1,711,278 | |
| | | | | | | |
| | |
TOTAL COMMON STOCKS
(Cost $22,907,859) | | | | | | 24,881,535 | |
| | | | | | | |
INVESTMENT COMPANIES — 2.3% | |
Federated Treasury Obligations Fund,
Institutional Shares | | | | | | | |
(Cost $598,114) | | | 598,114 | | | 598,114 | |
| | | | | | | |
| | | | | | | |
SECURITIES HELD AS COLLATERAL FOR SECURITIES ON LOAN — 3.4% | |
| | | Principal
Amount | | | |
Pool of Various Securities
(Cost $910,967) | | $ | 910,967 | | | 879,427 | |
| | | | | | | |
| | |
TOTAL INVESTMENTS
(Cost $24,416,940) — 102.2% | | | | | | 26,359,076 | |
| | |
NET OTHER ASSETS (LIABILITIES) — (2.2)% | | | | | | (569,183 | ) |
| | | | | | | |
| | |
NET ASSETS — 100.0% | | | | | $ | 25,789,893 | |
| | | | | | | |
| * | | Narrow industries are utilized for compliance purposes, whereas broad sectors are utilized for reporting. |
| (a) | | Represents non-income producing security. |
| (b) | | Represents that all or a portion of the security was on loan as of September 30, 2009. |
The accompanying notes are an integral part of the financial statements.
7
STERLING CAPITAL
SMALL CAP VALUE FUND
SEPTEMBER 30, 2009
|
STATEMENT OF ASSETS AND LIABILITIES |
| | | | |
Assets: | | | | |
Investments at value (Cost $24,416,940)* | | $ | 26,359,076 | |
Receivable for investment securities sold | | | 33,669 | |
Receivable for capital shares sold | | | 439,530 | |
Dividends and securities lending income receivable | | | 15,303 | |
Prepaid expenses | | | 9,297 | |
| | | | |
Total Assets | | | 26,856,875 | |
| | | | |
| |
Liabilities: | | | | |
Payable for collateral received on loaned securities | | | 910,967 | |
Payable for investment securities purchased | | | 117,272 | |
Payable for capital shares redeemed | | | 4,460 | |
Accrued expenses and other payables: | | | | |
Investment advisory fees | | | 9,014 | |
Administration fees | | | 2,003 | |
Compliance service fees | | | 385 | |
Other | | | 22,881 | |
| | | | |
Total Liabilities | | | 1,066,982 | |
| | | | |
Net Assets | | $ | 25,789,893 | |
| | | | |
| | | | |
NET ASSETS CONSIST OF: | | | | |
Paid-in capital | | $ | 31,168,600 | |
Undistributed net investment income | | | 36,615 | |
Accumulated net realized loss on investments | | | (7,357,458 | ) |
Net unrealized appreciation on investments | | | 1,942,136 | |
| | | | |
Net Assets | | $ | 25,789,893 | |
| | | | |
| |
Sterling Shares: | | | | |
Shares Issued and Outstanding
(unlimited authorization — no par value) | | | 2,510,892 | |
| | | | |
Net Asset Value, Offering and Redemption Price Per Share | | | $ 10.27 | |
| | | | |
| * | | The market value of securities on loan is $887,707. |
The accompanying notes are an integral part of the financial statements.
8
STERLING CAPITAL
SMALL CAP VALUE FUND
FOR THE YEAR ENDED
SEPTEMBER 30, 2009
| | | | |
Investment Income: | | | | |
Dividends | | $ | 255,052 | |
Income from securities lending | | | 11,921 | |
| | | | |
Total Investment Income | | | 266,973 | |
| | | | |
Expenses: | | | | |
Investment advisory fees | | | 146,349 | |
Administration fees (Note 4) | | | 16,267 | |
Accounting fees (Note 4) | | | 1,626 | |
Custodian fees | | | 5,000 | |
Interest expense | | | 221 | |
Printing fees | | | 17,684 | |
Professional fees | | | 6,655 | |
Registration and filing fees | | | 19,162 | |
Transfer agent fees (Note 4) | | | 70,506 | |
Trustees’ fees | | | 1,017 | |
Other expenses | | | 5,907 | |
| | | | |
Total Expenses | | | 290,394 | |
Less: | | | | |
Waiver of investment advisory fees (Note 4) | | | (60,037 | ) |
| | | | |
Net Expenses | | | 230,357 | |
| | | | |
Net Investment Income | | | 36,616 | |
| | | | |
Realized/Unrealized Gain (Loss) on Investments: | | | | |
Net realized loss on investments | | | (6,586,015 | ) |
Net change in unrealized appreciation/depreciation on investments | | | 7,332,034 | |
| | | | |
Net Realized/Unrealized Gain on Investments | | | 746,019 | |
| | | | |
| |
Net Increase in Net Assets Resulting from Operations | | $ | 782,635 | |
| | | | |
The accompanying notes are an integral part of the financial statements.
9
STERLING CAPITAL
SMALL CAP VALUE FUND
|
STATEMENTS OF CHANGES IN NET ASSETS |
| | | | | | | | |
| | | Year Ended
September 30,
2009 | | | Year Ended
September 30,
2008 | |
Operations: | | | | | | | | |
Net Investment Income | | $ | 36,616 | | | $ | 1,688 | |
Net Realized Gain (Loss) on Investments | | | (6,586,015 | ) | | | 1,507,848 | |
Net Change in Unrealized Appreciation/Depreciation on Investments | | | 7,332,034 | | | | (8,654,277 | ) |
| | | | | | | | |
Net Increase (Decrease) in Net Assets Resulting From Operations | | | 782,635 | | | | (7,144,741 | ) |
| | | | | | | | |
Distributions: | | | | | | | | |
Realized Capital Gains | | | (629,909 | ) | | | (7,479,296 | ) |
| | | | | | | | |
Capital Share Transactions: | | | | | | | | |
Issued | | | 8,470,107 | | | | 3,312,898 | |
Reinvestment of Distributions | | | 606,770 | | | | 7,112,610 | |
Redeemed | | | (6,074,530 | ) | | | (18,619,373 | ) |
| | | | | | | | |
Net Increase (Decrease) in Net Assets from
Capital Share Transactions | | | 3,002,347 | | | | (8,193,865 | ) |
| | | | | | | | |
Total Increase (Decrease) in Net Assets | | | 3,155,073 | | | | (22,817,902 | ) |
Net Assets: | | | | | | | | |
Beginning of year | | | 22,634,820 | | | | 45,452,722 | |
| | | | | | | | |
End of year (Includes Undistributed Net Investment Income of $36,615 and $0, respectively) | | $ | 25,789,893 | | | $ | 22,634,820 | |
| | | | | | | | |
Share Transactions: | | | | | | | | |
Issued | | | 971,707 | | | | 301,948 | |
Reinvestment of Distributions | | | 98,342 | | | | 640,199 | |
Redeemed | | | (846,871 | ) | | | (1,751,575 | ) |
| | | | | | | | |
Net Increase (Decrease) in Shares Outstanding | | | 223,178 | | | | (809,428 | ) |
| | | | | | | | |
The accompanying notes are an integral part of the financial statements.
10
STERLING CAPITAL
SMALL CAP VALUE FUND
Sterling Shares
Selected data for a share of beneficial interest outstanding throughout the periods indicated
| | | | | | | | | | | | | | | | | | | | | | | | |
| | | Year Ended
September 30,
2009 | | | Year Ended
September 30,
2008 | | | Period Ended
September 30,
2007* | | | Years Ended October 31, | |
| | | | | | 2006 | | | 2005 | | | 2004 | |
Net Asset Value,
Beginning of Period | | $ | 9.89 | | | $ | 14.68 | | | $ | 18.36 | | | $ | 18.22 | | | $ | 18.33 | | | $ | 16.17 | |
| | | | | | | | | | | | | | | | | | | | | | | | |
Income (Loss) from Investment Operations: | | | | | | | | | | | | | | | | | | | | | | | | |
Net Investment Income (Loss) | | | 0.02 | (1) | | | — | (1)(2) | | | (0.01 | )(1) | | | (0.04 | )(1) | | | 0.01 | (1) | | | 0.07 | |
Net Realized and Unrealized Gain (Loss) | | | 0.65 | (1) | | | (2.24 | )(1) | | | 0.68 | (1) | | | 3.09 | (1) | | | 1.61 | (1) | | | 2.61 | |
| | | | | | | | | | | | | | | | | | | | | | | | |
Total from Investment Operations | | | 0.67 | | | | (2.24 | ) | | | 0.67 | | | | 3.05 | | | | 1.62 | | | | 2.68 | |
| | | | | | | | | | | | | | | | | | | | | | | | |
Distributions: | | | | | | | | | | | | | | | | | | | | | | | | |
Net Investment Income | | | — | | | | — | | | | — | | | | (0.02 | ) | | | — | | | | (0.07 | ) |
Net Realized Capital Gains | | | (0.29 | ) | | | (2.55 | ) | | | (4.35 | ) | | | (2.89 | ) | | | (1.73 | ) | | | (0.45 | ) |
| | | | | | | | | | | | | | | | | | | | | | | | |
Total Distributions | | | (0.29 | ) | | | (2.55 | ) | | | (4.35 | ) | | | (2.91 | ) | | | (1.73 | ) | | | (0.52 | ) |
| | | | | | | | | | | | | | | | | | | | | | | | |
Net Asset Value,
End of Period | | $ | 10.27 | | | $ | 9.89 | | | $ | 14.68 | | | $ | 18.36 | | | $ | 18.22 | | | $ | 18.33 | |
| | | | | | | | | | | | | | | | | | | | | | | | |
Total Return † | | | 8.68 | % | | | (17.16 | )% | | | 3.67 | %(3) | | | 19.31 | % | | | 9.24 | % | | | 17.03 | % |
| | | | | | | | | | | | | | | | | | | | | | | | |
Ratios and Supplemental Data | | | | | | | | | | | | | | | | | | | | | | | | |
Net Assets, End of Period (000) | | $ | 25,790 | | | $ | 22,635 | | | $ | 45,453 | | | $ | 60,737 | | | $ | 99,201 | | | $ | 247,954 | |
Ratio of Expenses to Average
Net Assets | | | 1.42 | % | | | 1.26 | % | | | 1.18 | %(4) | | | 1.25 | %(5) | | | 1.25 | %(5) | | | 1.25 | % |
Ratio of Expenses to Average Net Assets (without waivers and fees paid indirectly) | | | 1.79 | % | | | 1.40 | % | | | 1.41 | %(4) | | | 1.63 | % | | | 1.47 | % | | | 1.36 | % |
Ratio of Net Investment Income (Loss) to Average Net Assets | | | 0.23 | % | | | 0.01 | % | | | (0.07 | )%(4) | | | (0.26 | )% | | | 0.06 | % | | | 0.33 | % |
Portfolio Turnover Rate | | | 89 | % | | | 64 | % | | | 82 | % (3) | | | 56 | % | | | 45 | % | | | 41 | % |
| * | | The Fund’s fiscal year-end changed from October 31 to September 30, effective September 30, 2007. |
| | † | | Total return is for the period indicated and has not been annualized. Total returns shown do not reflect the deduction of taxes that a shareholder would pay on fund distributions or the redemption of fund shares. Total return would have been lower if the Adviser did not waive a portion of its fee. The performance information for the Sterling Shares prior to 12/18/06 is based on the performances of the Institutional Shares of the Fund’s predecessor, Sterling Capital Small Cap Value Fund, a series of The Advisor’s Inner Circle Fund which transferred all of its assets and liabilities to the Fund pursuant to a reorganization. |
| | (1) | | Per share calculations based on average shares outstanding. |
| | (2) | | Amount is less than $0.005. |
| | (5) | | The ratio of expenses to average net assets excludes the effects of fees paid indirectly. If these expense offsets were included, the ratio would not significantly differ. |
The accompanying notes are an integral part of the financial statements.
11
STERLING CAPITAL
SMALL CAP VALUE FUND
SEPTEMBER 30, 2009
|
NOTES TO FINANCIAL STATEMENTS |
1. Organization:
BB&T Funds (the “Trust”) commenced operations on October 5, 1992 and is registered under the Investment Company Act of 1940, as amended (the “1940 Act”), as an open-end investment company established as a Massachusetts business trust. The Trust consists of twenty-five series of units of beneficial interest (“Shares”) offered to the public, each representing interests in one of twenty-five separate investment portfolios. These financial statements pertain to the Sterling Capital Small Cap Value Fund (the “Fund”) only. The financial statements of the remaining series are presented in separate documents. The Fund’s prospectus provides a description of the Fund’s investment objectives, policies and strategies.
The Fund may offer to the public four classes of Shares: Class A Shares, Class B Shares, Class C Shares and Sterling Shares. Currently, the Fund only offers Sterling Shares to the public. The Fund is an “open-end” “diversified” management company, as defined in the 1940 Act.
Each class of Shares has identical rights and privileges except with respect to the voting rights on matters affecting a single class of shares and the exchange privilege of each class of Shares.
Under the Trust’s organizational documents, its officers and Trustees are indemnified against certain liabilities arising out of the performance of their duties to the Trust. In addition, in the normal course of business, the Fund may enter into contracts with its vendors and others that provide for general indemnifications. The Fund’s maximum exposure under these arrangements is unknown, as this would involve future claims that may be made against the Fund. However, based on experience, the Fund expects that risk of loss to be remote.
2. Significant Accounting Policies:
The following is a summary of the significant accounting policies followed by the Fund in the preparation of financial statements. The policies are in conformity with United States generally accepted accounting principles (“GAAP”). The preparation of financial statements requires management to make estimates and assumptions that affect the reported amounts of assets and liabilities and disclosure of contingent assets and liabilities at the date of the financial statements and the reported amounts of income and expenses for the reporting period. Actual results could differ from those estimates.
Securities Valuation — Investments of the Fund in securities the principal market for which is a securities exchange or an over-the counter market are valued at their latest available sales price (except for those securities traded on NASDAQ, which will be valued at the NASDAQ Official Closing Price), or, absent such a price, by reference to the latest available bid price in the
12
STERLING CAPITAL
SMALL CAP VALUE FUND
SEPTEMBER 30, 2009
principal market in which such securities are normally traded. Securities the principal market for which is not a securities exchange are valued at their latest bid quotation in such principal market. The Fund may also use an independent pricing service approved by the Board of Trustees (the “Board”). Short-term securities are valued either at amortized cost or original cost plus interest, which approximates current value.
Securities for which market prices are not readily available or deemed unreliable are valued as determined by the BB&T Funds’ Pricing Committee (“Pricing Committee”) in their best judgment pursuant to procedures established by and under the general supervision of the Board. Some of the more common reasons that may necessitate that a security be valued by the Pricing Committee include: the security’s trading has been halted or suspended; the security has been de-listed from a national exchange; the security’s primary trading market is temporarily closed at a time when under normal conditions it would be open; the security has not been traded for an extended period of time; the security’s primary pricing source is not able or willing to provide a price; or an event occurs that materially affects the furnished price. There were no securities valued by the Pricing Committee as of September 30, 2009.
Fair Value Measurements — The objective of a fair value measurement is to determine the price that would be received to sell an asset or paid to transfer a liability in an orderly transaction between market participants at the measurement date (an exit price). Accordingly, the fair value hierarchy gives the highest priority to quoted prices (unadjusted) in active markets for identical assets or liabilities (Level 1) and the lowest priority to unobservable inputs (Level 3). The three levels of the fair value hierarchy are described below:
Level 1 — quoted prices in active markets for identical securities
Level 2 — other significant observable inputs (including quoted prices for similar securities, interest rates, prepayment speeds, credit risk, etc.)
Level 3 — significant unobservable inputs (including the Fund’s own assumptions in determining the fair value of investments)
The inputs or methodology used for valuing securities are not necessarily an indication of the risk associated with investing in those securities.
The summary of inputs used to value each Fund’s investments as of September 30, 2009 is as follows:
| | | | | | | | | | | | |
Investments in Securities | | Level 1 —
Quoted
Prices* | | Level 2 —Other
Significant
Observable Inputs | | Level 3 —
Significant
Unobservable
Inputs | | Total
Fair Value |
Common Stocks | | $ | 24,881,535 | | $ | — | | $ | — | | $ | 24,881,535 |
Investment Companies | | | 598,114 | | | — | | | — | | | 598,114 |
Securities Held as Collateral for Securities on Loan | | | — | | | 879,427 | | | — | | | 879,427 |
| | | | | | | | | | | | |
Total | | $ | 25,479,649 | | $ | 879,427 | | $ | — | | $ | 26,359,076 |
| | | | | | | | | | | | |
| | * | | Industry classifications as defined on the Schedule of Portfolio Investments. |
13
STERLING CAPITAL
SMALL CAP VALUE FUND
SEPTEMBER 30, 2009
Securities Transactions and Related Income — During the period, securities transactions are accounted for no later than one business day following the trade date. For financial reporting purposes, however, security transactions are accounted for on trade date of the last business day of the reporting period. Interest income is recognized on the accrual basis and includes, where applicable, the amortization/accretion of premium or discount. Dividend income is recorded on the ex-dividend date. Gains or losses from sales of securities are determined by comparing the identified cost of the security lot sold with the net sales proceeds.
Expenses — Expenses directly attributable to the Fund are charged to the Fund. Expenses not directly attributable to the Fund are allocated proportionately among all Funds daily in relation to the net assets of each Fund in the Trust or another reasonable basis. Expenses which are attributable to both the Trust and the BB&T Variable Insurance Funds are allocated across the Trust and BB&T Variable Insurance Funds, based upon relative net assets or on another reasonable basis.
Distributions to Shareholders — Dividends from net investment income, if any, are declared and paid to shareholders quarterly. Any net realized capital gains are distributed to shareholders at least annually.
Federal Income Taxes — It is the policy of the Fund to continue to qualify as a regulated investment company by complying with the provisions available to certain investment companies, as defined in applicable sections of the Internal Revenue Code, and to make distributions of net investment income and net realized capital gains sufficient to relieve it from all, or substantially all, federal income taxes. Accordingly, no provision for federal income tax is required.
Security Loans — The Fund may loan securities secured by collateral in the form of securities issued or guaranteed by the U.S. Government or its agencies or instrumentalities, irrevocable letters of credit, U.S. dollars, cash or other forms of collateral as may be agreed between the Trust and Mellon Bank, N.A., the lending agent (“Mellon”). A Fund may receive compensation for lending securities in the form of fees payable by the borrower or by retaining a portion of income and earnings from the investment and reinvestment of cash collateral received and held on behalf of the Fund (after payment of a “broker rebate fee” to the borrower). In extremely low interest rate environments, the broker rebate fee may exceed the interest earned on the cash collateral which would result in a loss to the Fund. A Fund also continues to receive interest or dividends on the securities loaned. Although security loans are secured at all times by collateral, the loans may not be fully supported if, for example, the instruments in which cash collateral is invested decline in value or the borrower fails to provide additional collateral when required in a timely manner or at all. Concurrently with the delivery of a Fund’s securities to a borrower,
14
STERLING CAPITAL
SMALL CAP VALUE FUND
SEPTEMBER 30, 2009
Mellon is required to obtain from the borrower collateral equal to at least 102% of the market value of the securities loaned plus accrued interest in the case of U.S. securities, and at least 105% of the market value of the securities loaned plus accrued interest in the case of foreign securities. If at the close of trading on any business day the market value of the collateral is less than 100% of the market value of such loaned securities as of such business day, the borrower is required to deliver additional collateral which will cause the total collateral to be equal to not less than 102% of the market value of the securities loaned plus accrued interest in the case of U.S. securities and 105% of the market value of the securities loaned plus accrued interest in the case of foreign securities. The Fund bears all of the gains and losses on such investments. Cash collateral received by the Fund at September 30, 2009, was invested in the BNY Institutional Cash Reserve Fund (“ICRF”) Series A and B, an unregistered investment pool managed by Mellon, which was invested in repurchase agreements and Lehman Brothers.
The net asset value of a Fund may be affected by an increase or decrease in the value of the securities loaned or by an increase or decrease in the value of the ICRF or any other investment vehicle in which cash collateral may be invested. At September 30, 2009, the ICRF held investments in Lehman Brothers (Series B) which was in default. The default resulted in the value of the ICRF being less than the amount of collateral owed back to the borrowing brokers. The difference between the value of the collateral investments in the ICRF and what is owed to the borrowing brokers negatively affects net asset value of the Fund. The difference between the value of the collateral investments in the ICRF and what is owed to borrowing brokers negatively impacted the NAV of the Fund at September 30, 2009 by $0.01 per share.
There may be risks of delay in recovery of the securities or even loss of rights in the collateral should the borrower of the securities fail financially. Another risk from securities lending is that the borrower may not provide additional collateral when required or return the securities when due or when called for by the Fund. The Fund is indemnified from losses resulting from brokers failing to return securities. As the securities lending agent for the Fund, Mellon receives for its services 20% of the revenues earned on the securities lending activities and incurs all expenses. The securities lending agent may make payments to borrowers and placing brokers, who may not be affiliated, directly or indirectly, with the Trust, the advisor or the distributor. In connection with lending securities, the Fund may pay reasonable administrative and custodial fees. The value of the securities on loan and the liability to return the related collateral at September 30, 2009 are shown on the Statement of Assets and Liabilities. At September 30, 2009, the Fund had the following loan(s) outstanding:
| | | | | | |
Value of Loaned
Securities | | Cost of Cash
Collateral | | Value of Cash
Collateral | | Average Value on Loan for the Year Ended September 30, 2009 |
$887,707 | | $910,967 | | $879,427 | | $875,160 |
15
STERLING CAPITAL
SMALL CAP VALUE FUND
SEPTEMBER 30, 2009
3. Purchases and Sales of Securities:
Purchases and sales of securities (excluding securities maturing less than one year from acquisition) for the fiscal year ended September 30, 2009, were $16,779,090 and $14,787,283 respectively.
4. Related Party Transactions:
Investment advisory and management services are provided to the Fund by Sterling Capital Management, LLC (the “Advisor”) pursuant to an Investment Advisory Agreement (the “Advisory Agreement”) dated July 1, 2006, amended, and restated August 28, 2008. The Advisor is a successor to Sterling Capital Management Company, which was a wholly-owned subsidiary of United Asset Management. On April 1, 2005, BB&T Corporation acquired a 70% ownership interest in the Advisor. The Advisor now operates as an independently managed subsidiary of BB&T Corporation.
Under the Advisory Agreement, the Advisor receives an annual fee equal to (a) 0.90% of the Fund’s average daily net assets; or (b) such fee as may from time to time be agreed upon in writing by the Trust and the Advisor. A fee agreed to in writing from time to time by the Trust and the Advisor may be significantly lower than the fee calculated at the annual rate and the effect of such lower fee would be to lower the Fund’s expenses and increase net income of the Fund during the period when such lower fee is in effect. The Advisor has contractually agreed to limit its advisory fee paid by the Fund to 0.80% through January 31, 2010. In addition, the Advisor voluntarily waived additional advisory fees during the period. Voluntary investment advisory fee waivers are not subject to recoupment in subsequent fiscal periods and may be discontinued at any time. Any reductions in advisory fees are reflected as “Waiver of investment advisory fees” in the Statement of Operations.
BB&T Asset Management, Inc. (“BB&T AM” or the “Administrator”) serves as the administrator to the Fund pursuant to the administration agreement effective as of April 23, 2007. The Fund pays its portion of a fee to BB&T AM for providing administration services based on the aggregate assets of the Trust and the BB&T Variable Insurance Funds at a rate of 0.11% on the first $3.5 billion of average net assets; 0.075% on the next $1 billion of average net assets; 0.06% on the next $1.5 billion of average net assets; and 0.04% of average net assets over $6 billion. This fee is accrued daily and payable on a monthly basis. Expenses incurred are reflected on the Statement of Operations as “Administration fees”. Pursuant to a sub-administration agreement with BB&T AM, PNC Global Investment Servicing (U.S.) Inc. (“PNC”) serves as the sub-administrator to the Fund subject to the general supervision of the Board and BB&T AM. For these services, PNC is entitled to a fee payable by BB&T AM.
PNC serves as the Funds’ fund accountant and transfer agent and receives compensation by the Funds for these services. Expenses incurred are reflected on the Statement of Operations as “Accounting fees” and “Transfer agent fees”.
16
STERLING CAPITAL
SMALL CAP VALUE FUND
SEPTEMBER 30, 2009
U.S. Bank National Association (“U.S. Bank”) acts as custodian (the “Custodian”) for the Fund. The Custodian plays no role in determining the investment policies of the Fund or which securities are to be purchased and sold by the Fund. Mellon serves as the securities lending agent to the Fund.
BB&T AM’s Chief Compliance Officer (“CCO”) serves as the Fund’s CCO. The CCO’s compensation is reviewed and approved by the Fund’s Board and paid by BB&T AM. However, the Fund reimburses BB&T AM for its allocable portion of the CCO’s salary. Expenses incurred for the fund, if any, are reflected on the Statement of Operations as “Chief Compliance Officer fees”.
Certain Officers and Trustees of the Fund are affiliated with the adviser, the administrator, or the sub-administrator. Such Officers and Trustees receive no compensation from the Trust for serving in their respective roles. Each of the Trustees who is not an interested person (as defined in the 1940 Act) of the Trust is compensated at the annual rate of $30,000 plus $5,000 for each regularly scheduled quarterly meeting attended, $4,000 for each special meeting attended in person and $3,000 for each special meeting attended by telephone. Each Trustee serving on a Committee of the Board of Trustees receives a fee of $4,000 for each Committee meeting attended in person and $3,000 for each Committee meeting attended by telephone, plus reimbursement for certain out of pocket expenses. Additionally, the Chairman of the Board and Audit Committee Chairman each receive an annual retainer of $10,000, and the Chairman of the Nominations Committee receives $1,000 for each meeting over which he or she presides as Chairman. The fees are allocated across the Trust and the BB&T Variable Insurance Funds based upon relative net assets.
5. Line of Credit:
U.S. Bank has made available a credit facility to the Fund, pursuant to a Credit Agreement (the “Agreement”). The primary purpose of the Agreement is to allow the Fund to avoid security liquidations that BB&T AM believes are unfavorable to shareholders. Outstanding principal amounts under the Agreement bear interest at a rate per annum equal to the Prime Rate minus two percent (2%), but never a net rate of less than two percent (2%) per annum. During the fiscal year ended September 30, 2009, the Fund utilized the line of credit as follows:
| | | | | | | | | | | | | | |
| | | Average
Interest Rate | | | Average
Loan Balance | | Number of
Days
Outstanding | | Interest
Expense
Incurred | | Maximum
Amount
Borrowed
During the
Period |
Sterling Capital Small Cap Value Fund | | 1.50 | % | | $ | 324,733 | | 15 | | $ | 221 | | $ | 591,000 |
17
STERLING CAPITAL
SMALL CAP VALUE FUND
SEPTEMBER 30, 2009
6. Federal Income Tax Information:
Management evaluates its tax positions to determine if the tax positions taken meet the minimum recognition threshold in connection with accounting for uncertainties in income tax positions taken or expected to be taken for the purposes of measuring and recognizing tax liabilities in the financial statements. Recognition of tax benefits of an uncertain tax position is required only when the position is “more likely than not” to be sustained assuming examination by taxing authorities. The Fund recognizes interest and penalties, if any, related to unrecognized tax benefits as income tax expense in the Statement of Operations. During the period, the Fund did not incur any interest or penalties.
Management has analyzed the Fund’s tax positions taken on federal income tax returns for all open tax years (current and prior three tax years), and has concluded that no provision for federal income tax is required in the Fund’s financial statements. The Fund’s federal and state income and federal excise tax returns for tax years for which the applicable statutes of limitations have not expired are subject to examination by the Internal Revenue Service and state departments of revenue.
At September 30, 2009, the Fund has net capital loss carryforwards available to offset future net capital gains, if any, to the extent provided by the Treasury regulations. To the extent that these carryforwards are used to offset future capital gains, it is probable that the gains that are offset will not be distributed to shareholders.
| | |
Amount | | Expires |
| $1,483,067 | | 2017 |
GAAP requires that certain components of net assets be adjusted to reflect permanent differences between financial reporting and tax reporting. Permanent book and tax differences relating to prior year net operating losses and current year distribution redesignations resulted in reclassifications to undistributed net investment income and accumulated net realized gain (loss). These reclassifications had no impact on the net assets or net asset value of the Fund. Accordingly, the following permanent difference amounts have been reclassified to/from the following accounts as of September 30, 2009:
| | | | |
Undistributed Net
Investment Income | | Accumulated Realized Gain | | Paid-in Capital |
| $(1) | | $1 | | $— |
The tax character of distributions paid during the fiscal year ended September 30, 2009 and fiscal year ended September 30, 2008, were as follows:
| | | | | | | | | |
| | | Ordinary
Income | | Long-Term
Capital Gain | | Total |
2009 | | $ | 26,070 | | $ | 603,839 | | $ | 629,909 |
2008 | | | 2,550,158 | | | 4,929,138 | | | 7,479,296 |
18
STERLING CAPITAL
SMALL CAP VALUE FUND
SEPTEMBER 30, 2009
As of September 30, 2009, the components of accumulated losses on a tax basis were as follows:
| | | | |
Undistributed Ordinary Income | | $ | 35,555 | |
Accumulated Capital and Other Losses | | | (5,782,880 | ) |
Unrealized Appreciation | | | 368,618 | |
| | | | |
Total Accumulated losses | | $ | (5,378,707 | ) |
| | | | |
The differences between the components of Accumulated losses on a tax basis and the amounts reflected in the statement of net assets are due to temporary book-tax differences that will reverse in a subsequent period. These differences are primarily due to differing book and tax treatment for wash sales and post October losses.
Under current tax law, capital losses realized after October 31 of a Fund’s fiscal year may be deferred and treated as occurring on the first business day of the following fiscal year for tax purposes. The Fund had deferred post October capital and currency losses, which will be treated as arising on the first business day of the fiscal year ended September 30, 2010 of $4,299,813.
The federal tax cost and aggregate gross unrealized appreciation and depreciation on investments held by the Fund at September 30, 2009, were as follows:
| | | | | | |
Federal Tax Cost | | Aggregate Gross
Unrealized
Appreciation | | Aggregate Gross
Unrealized
Depreciation | | Net Unrealized Appreciation |
| $25,990,458 | | $3,638,089 | | $(3,269,471) | | $368,618 |
7. Other:
At September 30, 2009, 64% of total shares outstanding were held by three record shareholders of the Fund each owning 10% or greater of the aggregate total shares outstanding.
In the normal course of business, the Fund enters into contracts that provide general indemnifications. The Fund’s maximum exposure under these arrangements is dependent on future claims that may be made against the Fund and, therefore, cannot be established; however, based on experience, the risk of loss from such claim is considered remote.
8. Subsequent Events:
At a meeting of the Board held on November 17, 2009, the Board approved the reorganization of the BB&T Small Cap Fund with and into the Fund. The reorganization is subject to approval by shareholders of BB&T Small Cap Fund and, if approved, is scheduled to be completed during the first quarter of 2010.
Management has evaluated the impact of all subsequent events on the Fund through November 20, 2009, the date the financial statements were issued, and has noted no additional events that require recognition or disclosure in the financial statements.
19
STERLING CAPITAL
SMALL CAP VALUE FUND
|
REPORT OF INDEPENDENT REGISTERED PUBLIC ACCOUNTING FIRM |
To the Shareholders and Board of Trustees of
BB&T Funds:
We have audited the accompanying statement of assets and liabilities of the Sterling Capital Small Cap Value Fund (the “Fund”), one of the funds constituting BB&T Funds, including the schedule of portfolio investments, as of September 30, 2009, and the related statement of operations for the year then ended, the statements of changes in net assets for each of the years in the two-year period then ended, and the financial highlights for each of the years or periods in the six-year period then ended. These financial statements and financial highlights are the responsibility of the Funds’ management. Our responsibility is to express an opinion on these financial statements and financial highlights based on our audit.
We conducted our audit in accordance with the standards of the Public Company Accounting Oversight Board (United States). Those standards require that we plan and perform the audit to obtain reasonable assurance about whether the financial statements and financial highlights are free of material misstatement. An audit includes examining, on a test basis, evidence supporting the amounts and disclosures in the financial statements. Our procedures included confirmation of securities owned as of September 30, 2009, by correspondence with the custodian and brokers or by other appropriate auditing procedures where replies from brokers were not received. An audit also includes assessing the accounting principles used and significant estimates made by management, as well as evaluating the overall financial statement presentation. We believe that our audit provides a reasonable basis for our opinion.
In our opinion, the financial statements and financial highlights referred to above present fairly, in all material respects, the financial position of the Sterling Capital Small Cap Value Fund as of September 30, 2009, the results of its operations for the year then ended, the changes in its net assets for each of the years in the two-year period then ended, and the financial highlights for each of the years or periods in the six-year period then ended, in conformity with U.S. generally accepted accounting principles.

New York, New York
November 20, 2009
20
STERLING CAPITAL
SMALL CAP VALUE FUND
|
DISCLOSURE OF FUND EXPENSES (unaudited) |
As a shareholder of the BB&T Funds, you incur two types of costs: (1) transaction costs and (2) ongoing costs, including management fees; and other Fund expenses.
These examples are intended to help you understand your ongoing costs (in dollars) of investing in the Fund and to compare these costs with the ongoing costs of investing in other mutual funds.
These examples are based on an investment of $1,000 invested at the beginning of the period and held for the entire period from April 1, 2009 through September 30, 2009.
• Actual Example. The table below provides information about actual account values and actual expenses. You may use the information below, together with the amount you invested, to estimate the expenses you paid over the period. Simply divide your account value by $1,000 (for example, an $8,600 account value divided by $1,000 = 8.6), then multiply the result by the number in the table under the heading entitled “Expenses Paid During Period” to estimate the expenses you paid on your account during this period.
• Hypothetical Example for Comparison Purposes. The table below provides information about hypothetical account values and hypothetical expenses based on the Fund’s actual expense ratio and an assumed rate of return of 5% per year before expenses, which is not the Fund’s actual return. The hypothetical account values and expenses may not be used to estimate the actual ending account balances or expenses you paid for the period. You may use this information to compare this 5% hypothetical example with the 5% hypothetical examples that appear in the shareholder reports of other funds.
Please note that the expenses shown in the table are meant to highlight your ongoing costs only and do not reflect any transactional costs, such as sales charges (loads), redemption fees, or exchange fees. Therefore, the table is useful in comparing ongoing costs only and will not help you determine the relative costs of owning different funds. In addition, if these transactional costs were included, your costs would have been higher.
| | | | | | | | | | | | |
| | | Beginning
Account
Value
04/01/09 | | Ending
Account
Value
09/30/09 | | Expenses
Paid During
Period*
04/01/09 –
09/30/09 | | Annualized
Expense Ratio
During Period
04/01/09 –
09/30/09 | |
Sterling Capital Small Cap Value Fund — Sterling Shares | | | | | | |
Actual Fund Return | | $ | 1,000.00 | | $ | 1,656.50 | | $ | 8.72 | | 1.31 | % |
Hypothetical 5% Return | | $ | 1,000.00 | | $ | 1,018.50 | | $ | 6.63 | | 1.31 | % |
| *Expenses | are equal to the average account value over the period multiplied by the Fund’s annualized expense ratio, multiplied by the number of days in the most recent period ended divided by the number of days in the fiscal year (to reflect the one-half year period). |
21
STERLING CAPITAL
SMALL CAP VALUE FUND
|
BOARD CONSIDERATION OF ADVISORY AGREEMENTS |
The Board of Trustees, at a meeting held on August 24-25, 2009, formally considered the continuance of the investment advisory agreement between the Advisor and the Trust with respect to the Fund.
The Trustees reviewed extensive material in connection with their consideration of the Advisory Agreement, including data from an independent provider of mutual fund data (as assembled by the Fund’s administrator), which included comparisons with industry averages for comparable funds for advisory fees, Rule 12b-1 fees, and total fund expenses. The data reflected the Adviser’s fee waivers in place, as well as the Adviser’s contractual investment advisory fee levels. The Board was assisted in its review by independent legal counsel, who provided a memorandum detailing the legal standards for review of the Advisory Agreement. The Board received a detailed presentation by the Adviser, which included an analysis of the Fund’s performance and investment process. The Board also received profitability information from the Adviser. The Independent Trustees deliberated outside the presence of management and the Adviser.
In their deliberations, each Trustee attributed different weights to various factors involved in an analysis of the Advisory Agreement, and no factor alone was considered determinative. The Trustees determined that the overall arrangements between the Trust and the Adviser, as provided in the Advisory Agreement, were fair and reasonable and that the continuance of the Advisory Agreement was in the best interests of the Fund and its shareholders.
The matters addressed below were considered and discussed by the Trustees in reaching their conclusions.
Nature, Extent and Quality of Services Provided by the Adviser
The Trustees received and considered information regarding the nature, extent, and quality of the services provided to the Fund under the Advisory Agreement. The Trustees took into account information furnished throughout the year at Trustee meetings, as well as materials furnished specifically in connection with the annual review process. The Trustees considered the background and experience of the Adviser’s senior management and the expertise of investment personnel of the Adviser responsible for the day-to-day management of the Fund. The Trustees considered the overall reputation, and the capabilities and commitment of the Adviser to provide high quality service to the Fund, and the Trustees’ overall confidence in the Adviser’s integrity.
The Trustees received information concerning the Adviser’s expertise in value investing and the investment philosophy and investment processes applied by the Adviser in managing the Fund. The Trustees reviewed the Adviser’s Form ADV as well. The Trustees also considered information regarding regulatory compliance
22
STERLING CAPITAL
SMALL CAP VALUE FUND
and compliance with the investment policies of the Fund. The Trustees evaluated the procedures of the Adviser designed to fulfill the Adviser’s fiduciary duty to the Fund with respect to possible conflicts of interest, including the Adviser’s codes of ethics (regulating the personal trading of its officers and employees).
Based on their review, the Trustees concluded that, with respect to the quality and nature of services to be provided by the Adviser, the scope of responsibilities was consistent with mutual fund industry norms, and that the quality of the services was satisfactory.
Investment Performance
The Trustees considered performance results of the Fund in absolute terms and relative to benchmark and peer group performance. It was noted that the Fund had outperformed its benchmark and peer group for the year-to-date period and that the Fund had competitive performance over longer measurement periods. Taking into consideration the management style, investment strategies, and prevailing market conditions during the prior year and for longer periods, the Trustees concluded that the Adviser had produced acceptable performance in its management of the Fund.
Cost of Services, Including the Profits Realized by the Adviser and Affiliates
The Trustees considered peer group comparable information with respect to the advisory fees charged by the Adviser to the Fund, taking into consideration both contractual and actual (i.e., after waiver) fee levels. The Trustees concluded that the investment advisory fees fell within an acceptable range as compared to peer groups, particularly in light of the fee waivers that are in place.
As part of their review, the Trustees considered information from the Adviser regarding fees for separate accounts managed by the Adviser with investment objectives and strategies similar to those of the Fund. The Trustees also considered benefits to the Adviser aside from investment advisory fees. The Trustees considered benefits to the Adviser’s affiliates, including administration fees received by BB&T Asset Management, Inc.
Consideration of the reasonableness of advisory fees also took into account information regarding the profitability of the Adviser. With respect to such information, the Trustees recognized that profitability data was unaudited and represented the Adviser’s own determination of revenues from the contractual services provided to the Fund, less expenses of providing such services. Expenses include direct and indirect costs and were calculated using an allocation methodology developed by the Adviser. The Trustees also recognized that it is difficult to make comparisons of profitability from fund investment advisory contracts, because comparative information is not generally publicly available and is affected by numerous factors. Based on their review, the Trustees concluded that the profitability to the Adviser, as a result of its relationships with the Fund, was acceptable. The Board also concluded that the fees under the Advisory Agreement were fair and reasonable, in light of the services and benefits provided to the Fund.
23
STERLING CAPITAL
SMALL CAP VALUE FUND
Economies of Scale
The Trustees also considered whether fee levels reflect economies of scale and whether economies of scale would be produced by the growth of the Fund’s assets. The Trustees found that the asset levels of the Fund were not currently so large as to warrant formal contractual breakpoints, and that the fee waivers were a reasonable way to provide the benefits of economies of scale to shareholders at this time.
24
STERLING CAPITAL
SMALL CAP VALUE FUND
Overall responsibility for the management of the Fund rests with its Board of Trustees (“Trustees”). The Trustees elect the officers of the Fund to supervise actively its day-to-day operations. The names of the Trustees, birth date, term of office and length of time served, principal occupations during the past five years, number of portfolios overseen and directorships held outside of the Fund are listed in the two tables immediately following. The business address of the persons listed below is 434 Fayetteville Street Mall, 5th Floor, Raleigh, North Carolina 27601.
| | | | | | | | | | |
| INDEPENDENT TRUSTEES |
Name and Birthdate | | Position(s) Held With The Fund | | Term of Office/ Length of Time Served | | Principal Occupation During the Last 5 Years | | Number of
Portfolios
in Fund
Complex
by Trustee* | | Other Directorships Held by
Trustee |
Thomas W. Lambeth Birthdate: 1/35 | | Trustee Chairman of the Board of Trustees | | Indefinite, 8/92 – Present | | From January 2001 to present, Senior Fellow, Z. Smith Reynolds Foundation; from 1978 to January 2001, Executive Director, Z. Smith Reynolds Foundation | | 30 | | None |
| | | | | |
Drew T. Kagan Birthdate: 2/48 | | Trustee | | Indefinite, 8/00 –Present | | From December 2003 to present, CEO, Montecito Advisors, Inc.; from March 1996 to December 2003, President, Investment Affiliate, Inc. | | 30 | | Director, Montecito Advisors, Inc. |
| | | | | |
Laura C. Bingham Birthdate: 11/56 | | Trustee | | Indefinite, 2/01 – Present | | From July 1998 to present, President of Peace College | | 30 | | None |
| | | | | |
Douglas R. Van Scoy Birthdate: 11/43 | | Trustee | | Indefinite 5/04 – Present | | Retired; from November 1974 to July 2001, employee of Smith Barney (investment banking), most recently as the Deputy Director of Private Client Group and Senior Executive Vice President | | 30 | | None |
| | | | | |
James L. Roberts Birthdate: 11/42 | | Trustee | | Indefinite 11/04 – Present | | Retired; from November 2006 to present, Director, Grand Mountain Bancshares, Inc.; from January 1999 to December 2003, President, CEO and Director, Covest Bancshares, Inc. | | 30 | | None |
25
STERLING CAPITAL
SMALL CAP VALUE FUND
| | | | | | | | | | |
|
| INTERESTED TRUSTEE |
Name and Birthdate | | Position(s) Held With The Fund | | Term of Office/ Length of Time Served | | Principal Occupation During the Last 5 Years | | Number of
Portfolios
in Fund
Complex
by Trustee* | | Other Directorships Held by
Trustee |
R. Lee Youngblood** Birthdate: 1/47 | | Trustee | | Indefinite, 1/09 – Present | | From April 1971 to present, employee of Branch Banking and Trust Company (currently Executive Vice President) | | 30 | | Director, Sterling Capital Management, LLC; Director, Scott & Stringfellow, LLC; Director, BB&T Investment Services, Inc. |
| * | | The Fund Complex consists of two open-end investment management companies: the Trust and the BB&T Variable Insurance Funds. |
| ** | | Mr. Youngblood is treated by the Fund as an “interested person” (as defined in Section 2(a)(19) of the 1940 Act) of the Fund. Mr. Youngblood is an “interested person” because he owns shares of BB&T Corporation. |
The Fund’s Statement of Additional Information includes additional information about the Fund’s Trustees. To receive your free copy of the Statement of Additional Information, call toll free: 1-800-453-7348.
26
STERLING CAPITAL
SMALL CAP VALUE FUND
The following table shows information for officers of the Fund:
| | | | | | |
| OFFICERS |
Name and Birthdate | | Position(s) Held With The Fund | | Term of Office/ Length of Time Served | | Principal Occupation During the Last 5 Years |
E.G. Purcell, III Birthdate: 1/55 | | President and Secretary | | Indefinite, President and Secretary, 11/08-Present; Vice President, 11/00-11/08 | | From 1995 to present, Senior Vice President, BB&T Asset Management, Inc. and its predecessors |
| | | |
| Todd M. Miller Birthdate: 9/71 | | Vice President | | Indefinite, 8/05-Present | | From May 2009 to Present, Vice President, BB&T Asset Management, Inc.; from June 2005 to May 2009, Mutual Fund Administrator; from May 2001 to May 2005, Manager, BISYS Fund Services |
| | | |
| Clinton L. Ward Birthdate: 11/69 | | Chief Compliance and Anti-Money Laundering Officer | | Indefinite, 4/07-Present | | From July 2004 to present, Chief Compliance Officer and Secretary, BB&T Asset Management, Inc.; from January 2002 to July 2004, Compliance Analyst, Evergreen Investments; from November 1999 to January 2002, Compliance Manager — Mutual Fund Compliance, Banc of America Capital Management, LLC |
| | | |
| Andrew J. McNally Birthdate: 12/70 | | Treasurer | | Indefinite, 4/07-Present | | From January 2007 to present, Vice President and Senior Director, July 2000 to December 2006, Director, Fund Accounting and Administration Department, PNC Global Investment Servicing |
| | | |
| Avery Maher Birthdate: 2/45 | | Assistant Secretary | | Indefinite 4/07-Present | | From March 2006 to present, Vice President and Counsel, Regulatory Administration Department, PNC Global Investment Servicing; from October 2004 to August 2005, Vice President and Assistant General Counsel, JPMorgan Asset Management; from 1992 to 2004, Second Vice President and Assistant Secretary, John Hancock Advisers, LLC |
27
STERLING CAPITAL
SMALL CAP VALUE FUND
|
NOTICE TO SHAREHOLDERS (unaudited) |
For shareholders that do not have a September 30, 2009, tax year end, this notice is for informational purposes only. For shareholders with a September 30, 2009 tax year end, please consult your tax advisor as to the pertinence of this notice.
For the fiscal year ended September 30, 2009, in order to meet certain requirements of the Internal Revenue Code, we are advising you that distributions paid during the year from the Fund are designated as:
| | | | | | |
(a) Long-Term Capital Gain | | (b)
Qualified
Dividend
Income % | | (c)
(for corporate
shareholders)
Dividends
Received
Deduction % | | (d)
(for foreign
shareholders)
Qualified
Interest
Income % |
| 603,839 | | 100% | | 100% | | 0.25% |
| (a) | | The Fund designates the maximum amount allowable but not less than the amount shown above as a capital gain dividend in accordance with Section 852(b)(3)(C) of the Internal Revenue Code. |
| (b) | | The Fund designates the maximum amount allowable, but not less than the percentage shown above as ordinary income dividends paid during the year as qualified dividend income in accordance with Section 854 of the Internal Revenue Code. |
| (c) | | The Fund designates the maximum amount allowable but not less than the percentage shown above of ordinary income dividends paid during the year as eligible for the corporate dividends received deduction in accordance with Section 854 of the Internal Revenue Code. |
| (d) | | The Fund designates the maximum amount allowable but not less than the percentage shown above as interest-related dividends in accordance with Sections 871(k)(1) and 881(e) of the Internal Revenue Code. |
Capital gain dividends distributed during the fiscal year ended September 30, 2009 are generally subject to the maximum tax rate of 15%. In addition, Qualified Dividend Income is generally subject to a maximum rate of 15%.
The information reported herein may differ from the information and distributions paid to the shareholders subject to tax reporting.
28
Sterling Capital Small Cap Value Fund
P.O. Box 9652
Providence, RI 02940-9652
1-866-450-3722
Adviser:
Sterling Capital Management, LLC
Two Morrocroft Centre
4064 Colony Road, Suite 300
Charlotte, NC 28211
Distributor:
BB&T AM Distributors, Inc.
760 Moore Road
King of Prussia, PA 19406
Administrator:
BB&T Asset Management, Inc.
434 Fayetteville Street Mall
5th Floor
Raleigh, NC 27601
Legal Counsel:
Ropes and Gray LLP
One Metro Center
700 12th Street, N.W.
Suite 900
Washington D.C. 20005
Transfer Agent:
PNC Global Investment Servicing (U.S.) Inc.
760 Moore Road
King of Prussia, PA 19406
Independent Registered Public Accounting Firm
KPMG LLP
345 Park Avenue
New York, New York 10154
This information must be preceded or accompanied by a current prospectus for the Fund described.
A25-AR-0909
| | (a) | The registrant, as of the end of the period covered by this report, has adopted a code of ethics that applies to the registrant’s principal executive officer, principal financial officer, principal accounting officer or controller, or persons performing similar functions, regardless of whether these individuals are employed by the registrant or a third party (the “Code of Ethics”). |
| | (c) | There have been no amendments, during the period covered by this report, to a provision of the Code of Ethics that applies to the registrant’s principal executive officer, principal financial officer, principal accounting officer or controller, or persons performing similar functions, regardless of whether these individuals are employed by the registrant or a third party, and that relates to any element of the code of ethics definition enumerated in Item 2(b) of Form N-CSR. |
| | (d) | The registrant has not granted any waivers, including an implicit waiver, from a provision of the code of ethics that applies to the registrant’s principal executive officer, principal financial officer, principal accounting officer or controller, or persons performing similar functions, regardless of whether these individuals are employed by the registrant or a third party, that relates to one or more of the items set forth in paragraph (b) of this item’s instructions. |
| Item 3. | Audit Committee Financial Expert. |
As of the end of the period covered by the report, the registrant’s board of trustees has determined that Drew Kagan is qualified to serve as an audit committee financial expert serving on its audit committee and that he is “independent,” as defined by Item 3 of Form N-CSR.
| Item 4. | Principal Accountant Fees and Services. |
Audit Fees
| | (a) | The aggregate fees billed for each of the last two fiscal years for professional services rendered by the principal accountant for the audit of the registrant’s annual financial statements or services that are normally provided by the accountant in connection with statutory and regulatory filings or engagements for those fiscal years are $444,960 for 2009 and $432,000 for 2008. |
Audit-Related Fees
| | (b) | The aggregate fees billed in each of the last two fiscal years for assurance and related services by the principal accountant that are reasonably related to the performance of the audit of the registrant’s financial statements and are not reported under paragraph (a) of this Item are $0 for 2009 and $0 for 2008. |
Tax Fees
| | (c) | The aggregate fees billed in each of the last two fiscal years for professional services rendered by the principal accountant for tax compliance, tax advice, and tax planning are $95,760 for 2009 and $93,000 for 2008. Fees for both 2009 and 2008 relate to the preparation of federal income and excise tax returns and review of capital gains distribution calculations. |
All Other Fees
| | (d) | The aggregate fees billed in each of the last two fiscal years for products and services provided by the principal accountant, other than the services reported in paragraphs (a) through (c) of this Item are $0 for 2009 and $0 for 2008. |
| | (e)(1) | Except as permitted by Rule 2-01(c)(7)(i)(C) of Regulation S-X, the Trust’s Audit Committee must pre-approve all audit and non-audit services provided by the independent accountants relating to the operations or financial reporting of the funds. Prior to the commencement of any audit or non-audit services to a fund, the Audit Committee reviews the services to determine whether they are appropriate and permissible under applicable law. |
| | (e)(2) | The percentage of services described in each of paragraphs (b) through (d) of this Item that were approved by the audit committee pursuant to paragraph (c)(7)(i)(C) of Rule 2-01 of Regulation S-X are as follows: |
| | (f) | The percentage of hours expended on the principal accountant’s engagement to audit the registrant’s financial statements for the most recent fiscal year that were attributed to work performed by persons other than the principal accountant’s full-time, permanent employees was 0%. |
| | (g) | The aggregate non-audit fees billed by the registrant’s accountant for services rendered to the registrant, and rendered to the registrant’s investment adviser (not including any sub-adviser whose role is primarily portfolio management and is subcontracted with or overseen by another investment adviser), and any entity controlling, controlled by, or under common control with the adviser that provides ongoing services to the registrant for each of the last two fiscal years of the registrant was $18,000 for 2009 and $385,000 for 2008. |
| | (h) | The audit committee of the registrant’s board of trustees has considered whether the provision of non-audit services that were rendered to the registrant’s investment adviser (not including any sub-adviser whose role is primarily portfolio management and is subcontracted with or overseen by another investment adviser), and any entity controlling, controlled by, or under common control with the investment adviser that provides ongoing services to the registrant that were not pre-approved pursuant to paragraph (c)(7)(ii) of Rule 2-01 of Regulation S-X is compatible with maintaining the principal accountant’s independence. |
| Item 5. | Audit Committee of Listed Registrants. |
Not applicable.
| | (a) | Schedule of Investments in securities of unaffiliated issuers as of the close of the reporting period is included as part of the report to shareholders filed under Item 1 of this form. |
| Item 7. | Disclosure of Proxy Voting Policies and Procedures for Closed-End Management Investment Companies. |
Not applicable.
| Item 8. | Portfolio Managers of Closed-End Management Investment Companies. |
Not applicable.
| Item 9. | Purchases of Equity Securities by Closed-End Management Investment Company and Affiliated Purchasers. |
Not applicable.
| Item 10. | Submission of Matters to a Vote of Security Holders. |
There have been no material changes to the procedures by which shareholders may recommend nominees to the registrant’s board of trustees, where those changes were implemented after the registrant last provided disclosure in response to the requirements of Item 407(c)(2)(iv) of Regulation S-K (17 CFR 229.407) (as required by Item 22(b)(15) of Schedule 14A (17 CFR 240.14a-101)), or this Item.
| Item 11. | Controls and Procedures. |
| | (a) | The registrant’s principal executive officer and principal financial officer have concluded, based on their evaluation of the effectiveness of the design and operation of the registrant’s disclosure controls and procedures (as defined in Rule 30a-3(c) under the Investment Company Act of 1940 (17 CFR 270.30a-3(c))) as of a date within 90 days of the filing date of this report, that the design and operation of such procedures are effective to provide reasonable assurance that information required to be disclosed by the registrant on Form N-CSR is recorded, processed, summarized and reported within the time periods specified in the Securities and Exchange Commission’s rules and forms. |
| | (b) | There were no changes in the registrant’s internal control over financial reporting (as defined in Rule 30a-3(d) under the 1940 Act (17 CFR 270.30a-3(d))) that occurred during the second fiscal quarter of the period covered by this report that have materially affected, or are reasonably likely to materially affect, the registrant’s internal control over financial reporting. |
| | |
| (a)(1) | | Code of ethics that is the subject of disclosure required by Item 2 was included as Exhibit (a)(1) of the registrant’s Form N-CSR filed on December 8, 2008 (Accession No. 0001193125-08-249460), and is hereby incorporated by reference. |
| |
| (a)(2) | | Certifications pursuant to Rule 30a-2(a) under the 1940 Act and Section 302 of the Sarbanes-Oxley Act of 2002 are attached hereto. |
| |
| (a)(3) | | Not applicable. |
| |
| (b) | | Certifications pursuant to Rule 30a-2(b) under the 1940 Act and Section 906 of the Sarbanes- Oxley Act of 2002 are attached hereto. |
SIGNATURES
Pursuant to the requirements of the Securities Exchange Act of 1934 and the Investment Company Act of 1940, the registrant has duly caused this report to be signed on its behalf by the undersigned, thereunto duly authorized.
(Registrant) BB&T Funds
| | |
By (Signature and Title)* | | /s/ E.G. PURCELL, III |
| | E.G. Purcell, III, President (principal executive officer) |
Date 11/24/09
Pursuant to the requirements of the Securities Exchange Act of 1934 and the Investment Company Act of 1940, this report has been signed below by the following persons on behalf of the registrant and in the capacities and on the dates indicated.
| | |
By (Signature and Title)* | | /s/ E.G. PURCELL, III |
| | E.G. Purcell, III, President (principal executive officer) |
Date 11/24/09
| | |
By (Signature and Title)* | | /s/ ANDREW J. MCNALLY |
| | Andrew J. McNally, Treasurer (principal financial officer) |
Date 11/24/09
| * | Print the name and title of each signing officer under his or her signature. |