UNITED STATES
SECURITIES AND EXCHANGE COMMISSION
Washington, D.C. 20549
FORM N-CSR
CERTIFIED SHAREHOLDER REPORT OF REGISTERED MANAGEMENT
INVESTMENT COMPANIES
Investment Company Act file number 811-06719
Sterling Capital Funds
(Exact name of registrant as specified in charter)
434 Fayetteville Street Mall, 5th Floor
Raleigh, NC 27601-0575
(Address of principal executive offices) (Zip code)
E.G. Purcell, III, President
Sterling Capital Funds
434 Fayetteville Street Mall, 5th Floor
Raleigh, NC 27601-0575
(Name and address of agent for service)
Registrant’s telephone number, including area code: (800) 228-1872
Date of fiscal year end: September 30
Date of reporting period: September 30, 2011
Form N-CSR is to be used by management investment companies to file reports with the Commission not later than 10 days after the transmission to stockholders of any report that is required to be transmitted to stockholders under Rule 30e-1 under the Investment Company Act of 1940 (17 CFR 270.30e-1). The Commission may use the information provided on Form N-CSR in its regulatory, disclosure review, inspection, and policymaking roles.
A registrant is required to disclose the information specified by Form N-CSR, and the Commission will make this information public. A registrant is not required to respond to the collection of information contained in Form N-CSR unless the Form displays a currently valid Office of Management and Budget (“OMB”) control number. Please direct comments concerning the accuracy of the information collection burden estimate and any suggestions for reducing the burden to Secretary, Securities and Exchange Commission, 100 F Street, NE, Washington, DC 20549. The OMB has reviewed this collection of information under the clearance requirements of 44 U.S.C. § 3507.
Item 1. Reports to Stockholders.
The Report to Shareholders is attached herewith.

Notice of Privacy Policy & Practices
Sterling Capital Funds recognizes and respects the privacy expectations of our customers.1 We provide this notice to you so that you will know what kinds of information we collect about our customers and the circumstances in which that information may be disclosed to third parties who are not affiliated with the Sterling Capital Funds.
Collection of Customer Information
We collect nonpublic personal information about our customers from the following sources:
| | • | | Account Applications and other forms, which may include a customer’s name, address, social security number, and information about a customer’s investment goals and risk tolerance; |
| | • | | Account History, including information about the transactions and balances in a customer’s accounts; and |
| | • | | Correspondence, written, telephonic or electronic between a customer and the Sterling Capital Funds or service providers to the Sterling Capital Funds. |
Disclosure of Customer Information
We many disclose all of the consumer information outlined above to third parties who are not affiliated with the Sterling Capital Funds:
| | • | | as permitted by law — for example with service providers who maintain or service shareholder accounts for the Sterling Capital Funds or to a shareholder’s broker or agent; and |
| | • | | to perform marketing services on our behalf or pursuant to a joint marketing agreement with another financial institution. |
Security of Customer Information
We require service providers to the Sterling Capital Funds:
| | • | | to maintain policies and procedures designed to assure only appropriate access to, and use of information about customers of the Sterling Capital Funds; and |
| | • | | to maintain physical, electronic and procedural safeguards that comply with applicable legal standards to guard nonpublic personal information of customers of the Sterling Capital Funds. |
We will adhere to the policies and practices described in this notice regardless of whether you are a current or former customer of the Sterling Capital Funds.
1 For purposes of this notice, the terms “customer” or “customers” includes both individual shareholders of the Sterling Capital Funds and individuals who provide nonpublic personal information to the Sterling Capital Funds, but do not invest in Sterling Capital Funds shares.
(This page has been left blank intentionally.)
Letter from the President and the Investment Advisor
Dear Shareholders:
We are pleased to present this annual report for the 12-month period ended September 30, 2011. The economy during this time continued its slow recovery from the severe recession of 2008. A number of leading economic indicators pointed to slow growth, though many quickly deteriorated in early 2011. Downward revisions to GDP numbers indicated the economy’s expansion had nearly stalled. The resulting blow to investor confidence sent financial markets into a period of tremendous volatility, which erased much of the gains made during the first three quarters of the fiscal year. Overall, the S&P 500 returned 1.1%; the Russell 2000 Index of small-capitalization stocks returned -3.53%; the MSCI EAFE Index of international stocks returned -12.02%; and the Barclays Capital U.S. Aggregate Bond Index returned 5.26%.
A stalling economy
Entering 2011, a second round of quantitative easing by the Federal Reserve, along with strengthened corporate balance sheets and improved earnings reports, led to general sentiment that the economy was on a path to recovery. But while our projections for the first half of the fiscal year accurately predicted soft patches and a faltering expansion, they over estimated economic growth. Several factors continued to drag on the recovery, including continued weakness in the housing market and stubbornly high unemployment figures. Additionally, supply chain disruptions resulting from the March 2011 tsunami in Japan dealt a setback to manufacturing activity and the deteriorated fiscal positions of Greece, Ireland, Portugal and other peripheral members of the euro zone tempered any optimism.
Those negatives, along with concerns that domestic political bickering would limit opportunities for policies that could support a near-term recovery, boosted concerns about a double-dip recession. A few positives remained by September 2011, in particular robust manufacturing activity and an expanded service sector. Nevertheless, it appeared that the recession was much more severe than initially reported and that the U.S. economic recovery to this point has been much flatter.
A volatile period for stocks
Equity markets ended the period down slightly. Market gains through the first three quarters of the fiscal year gave way to high market volatility and steep losses in the final quarter. The market’s volatility was the result of several factors, including concern over the slowing pace of the U.S. economy, Greek sovereign debt challenges and partisan gridlock in Washington. A second round of quantitative easing by the Federal Reserve and strengthening corporate balance sheets helped the market perform well early in the period. Attractive valuations and dividend yields (which in many cases were higher than yields offered by domestic fixed-income securities) helped drive up investor confidence, fueling increasing demand for equities. Investors who until this point had traded largely based on their appetite for risk began paying more attention to industry and company fundamentals.
Equities stumbled at the end of the second quarter of 2011, as concerns about European sovereign debt, most notably in Greece, raised fears of financial system contagion and a second global recession. Additionally, unrest in the Middle East contributed to worries about the global oil supply, sending prices higher. After steadying briefly in July, the markets gave back their gains for the year in August. High market volatility continued through the remainder of the period as confidence swung wildly and investors returned to trading based on their degree of willingness to assume risk.
Consumer staples, which tends to hold up well in slowing economies, was one of the best-performing sectors during the 12-month period. Financial services and basic materials stocks were among the period’s worst performers. Emerging markets suffered from efforts by China and others to cool mounting inflation, while European stock markets were hurt by concerns about sovereign debt problems in countries such as Greece. Many of our Sterling Capital funds lagged their benchmarks slightly during this fiscal year due to the challenging economic and investing climate.
Strong performance from Treasuries
The fixed-income market performed well during the first half of the period. The Federal Reserve’s policies to provide quantitative easing and to
keep the federal funds rate low provided support for many kinds of bonds. The Treasury yield curve remained steep through the first quarter of 2011: Short-term yields remained anchored by the low federal funds rate, while long-term rates reflected the expectation for higher inflation brought about by strengthening economic growth.
Concerns about European sovereign debt near the end of the third fiscal quarter drove investors to the perceived safety of the U.S. dollar and Treasuries, pushing down yields. Lower GDP numbers further contributed to the flight from risk, causing a downward shift in yields. In an ironic twist, Standard & Poor’s August downgrade of the U.S. long-term credit rating sparked a bond market rally that drove the 10-year Treasury yield close at its all-time low. Investors continued to view Treasuries as safe havens as they cut risk amid uncertainty.
Our perspective
Challenges to the recovery remain, as high unemployment and uncertain fiscal policy produce headwinds. We believe unemployment is unlikely to improve in 2011. Still, we believe that the Federal Reserve’s policies will continue to be accommodative although it is unlikely to be enough without fiscal expansion to boost economic growth and we see a likely chance of recession here and in Europe.
Thank you for your confidence in the Sterling Capital Funds. We encourage you to call us with any questions at 1-800-228-1872.
Sincerely,

E.G. Purcell, III
President
Sterling Capital Funds

Jeffrey J. Schappe, CFA
Managing Director-Chief Investment Officer
Sterling Capital Management LLC
Past performance does not guarantee future results.
This report is authorized for distribution only when preceded or accompanied by a prospectus. Please read the prospectus carefully before investing or sending money. Sterling Capital Management LLC (“Sterling Capital”) serves as investment advisor to the Sterling Capital Funds and is paid a fee for its services. Shares of the Sterling Capital Funds (each a “Fund” and collectively, the “Funds”) are not deposits or obligations of, or guaranteed or endorsed by, Branch Banking and Trust Company or its affiliates. The Funds are not insured by the FDIC or any other government agency. The Funds currently are distributed by Sterling Capital Distributors, Inc. The distributor is not affiliated with Branch Banking and Trust Company or its affiliates.
The foregoing information and opinions are for general information only. Sterling Capital does not guarantee their accuracy or completeness, nor assume liability for any loss, which may result from the reliance by any person upon any such information or opinions. Such information and opinions are subject to change without notice, are for general information only and are not intended as an offer or solicitation with respect to the purchase or sale of any security or as offering individual or personalized investment advice.
Sterling Capital Select Equity Fund
Portfolio Manager
Stephen L. Morgan
Sterling Capital Select Equity Fund (formerly known as BB&T Select Equity Fund) (the “Fund”) is managed by Stephen L. Morgan, portfolio manager for Sterling Capital Management LLC (“Sterling Capital”), advisor to the Fund. Stephen joined Sterling Capital in 1999. He has investment experience since 1980. Stephen is a graduate of American University where he received his BS in Finance and Accounting. He received his MBA from Virginia Tech. The Investment Team supporting the Fund has more than 65 combined years of investment experience and includes:
| • | | Greg Towner, CFA, CMT, Director |
| • | | J. Blake Guyler, CFA, Director |
| • | | James M. Walden, CFA, Director |
Investment Concerns
Value-based investments are subject to the risk that the broad market may not recognize their intrinsic value. Equity securities (stocks) are more volatile and carry more risk. The net asset value per share of this Fund will fluctuate as the value of the securities in the portfolio changes. The Fund may invest in foreign securities which involve certain risks such as currency volatility and political, social and economic instability.
Q. How did the Fund perform during the 12-month period between October 1, 2010 and September 30, 2011?
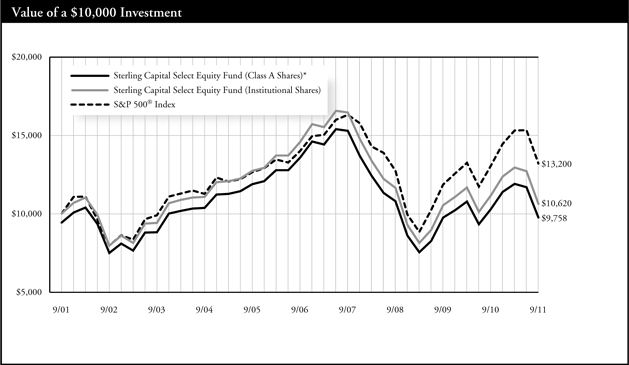
A. The Fund posted a return of -4.74% (Institutional Shares). That compared to a 1.14% return for its benchmark, S&P 500® Index.
Q. What factors affected the Fund’s performance?
A. The Fund’s return relative to its benchmark benefited from its overweight position in the energy and technology sectors, both of which performed relatively well during the period. Investors favored technology stocks, for example, for their perceived attractive valuations
and strong balance sheets. The Fund’s underweight position in financial services stocks also benefited relative performance, as those stocks underperformed other sectors of the market.1
The Fund’s underperformance relative to its benchmark resulted in part from the fact that growth stocks outperformed value stocks during the period, and the Fund was underweight growth stocks. The Fund’s underweight positions in consumer staples and utilities — defensive sectors which performed relatively well during the period — also dampened the Fund’s relative performance.1
| 1 | Portfolio composition is as of September 30, 2011 and is subject to change. |
| * | Reflects 5.75% maximum sales charge. |
| ** | Reflects the applicable contingent deferred sales charge (CDSC), maximum of 5.00%. |
| *** | Reflects the applicable maximum CDSC of 1.00% (applicable only to redemptions within one year of purchase, and as such, are not reflected in the Average Annual Total Returns table since the periods reflected are for a year or longer). |
| | | | | | | | | | | | | | | | |
Average Annual Total Returns | | | | | |
As of September 30, 2011 | |
| Inception
Date |
| | | 1 Year | | | | 5 Years | | | | 10 Years | |
Class A Shares* | | | 10/9/92 | | | | -10.45% | | | | -7.50% | | | | -0.24% | |
Class B Shares** | | | 1/1/96 | | | | -9.44% | | | | -7.22% | | | | -0.26% | |
Class C Shares*** | | | 2/1/01 | | | | -5.72% | | | | -7.10% | | | | -0.41% | |
Institutional Shares | | | 10/9/92 | | | | -4.74% | | | | -6.15% | | | | 0.60% | |
S&P 500® Index | | | N/A | | | | 1.14% | | | | -1.18% | | | | 2.82% | |
Past performance does not guarantee future results. The performance data quoted represents past performance and current returns may be lower or higher. Total return figures include change in share price, reinvestment of dividends and capital gains, and do not reflect taxes that a shareholder would pay on fund distributions or on the redemption of fund shares. The investment return and principal value will fluctuate so that an investor’s shares, when redeemed, may be worth more or less than the original cost. To obtain performance information current to the most recent month end, please visit www.sterlingcapitalfunds.com.
The chart above represents a comparison of a hypothetical $10,000 investment in the indicated share class versus a similar investment in the Fund’s benchmark, and represents the reinvestment of dividends and capital gains.
S&P 500® Index is generally considered to be representative of the performance of the stock market as a whole. The index is unmanaged and does not reflect the deduction of expenses associated with a mutual fund, such as investment management and fund accounting fees. The Fund’s performance reflects the deduction of fees for these services. Investors cannot invest directly in an index, although they can invest in its underlying securities.
A portion of the Fund’s fees has been waived. If the fees had not been waived, the Fund’s total return for the periods would have been lower.
Sterling Capital Mid Value Fund
Portfolio Manager
Timothy P. Beyer, CFA
Sterling Capital Mid Value Fund (formerly known as BB&T Mid Cap Value Fund) (the “Fund”) is managed by Timothy P. Beyer, CFA, portfolio manager for Sterling Capital Management LLC (“Sterling Capital”), advisor to the Fund. Timothy joined Sterling Capital in 2004. He has investment experience since 1989. Timothy is a graduate of East Carolina University where he received his BSBA in Finance. The Investment Team supporting the Fund has more than 97 combined years of investment experience and includes:
| • | | Eduardo A. Brea, CFA, Managing Director |
| • | | Robert W. Bridges, CFA, Director |
| • | | Lee D. Houser, CFA, Director |
| • | | Patrick W. Rau, CFA, Executive Director |
| • | | Brian R. Walton, CFA, Managing Director |
Investment Concerns
The Fund may invest in undervalued securities which may not appreciate in value as anticipated or remain undervalued for longer than anticipated. Investments made in small to mid-capitalization companies are subject to greater risks than large company stocks due to limited resources and inventory and are more sensitive to adverse conditions. The Fund may invest in foreign securities which may be more volatile and less liquid due to currency fluctuation and political, social and economic instability.
Q. How did the Fund perform during the 12-month period between October 1, 2010 and September 30, 2011?
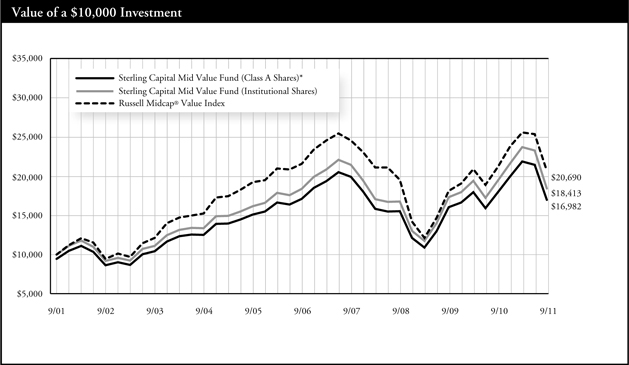
A. The Fund posted a return of -5.29% (Institutional Shares). That compared to a -2.36% return for its benchmark, Russell Midcap® Value Index.
Q. What factors affected the Fund’s performance?
A. In a market environment that continued to exhibit signs of economic stress, cyclical stocks led the market lower. Weakening energy prices hurt energy stocks, and technology stocks performed poorly.
Meanwhile, defensive stocks, such as utilities and consumer staples, performed well. Health care stocks contributed positively to the Fund’s
absolute return due to their attractive valuations and defensive nature in a weakening economy.1
Much of the Fund’s underperformance relative to its benchmark can be attributed to underweight positions in utilities and consumer staples.1
Overweight positions in the health care, financials and consumer discretionary sectors benefited the Fund’s relative performance. Stock selection in health care, including new investments in a biotech-related health care company, also benefited the Fund. Additionally, holdings of a dominant online retailer as well as a specialty mattress firm helped the Fund’s relative performance.1
| 1 | Portfolio composition is as of September 30, 2011 and is subject to change. |
| * | Reflects 5.75% maximum sales charge. |
| ** | Reflects the applicable contingent deferred sales charge (CDSC), maximum of 5.00%. |
| *** | Reflects the applicable maximum CDSC of 1.00% (applicable only to redemptions within one year of purchase, and as such, are not reflected in the Average Annual Total Returns table since the periods reflected are for a year or longer). |
| | | | | | | | | | | | | | | | |
Average Annual Total Returns | | | | | | | | | |
As of September 30, 2011 | | Inception
Date | | | 1 Year | | | 5 Years | | | 10 Years | |
Class A Shares* | | | 8/1/96 | | | | -10.96% | | | | -1.30% | | | | 5.44% | |
Class B Shares** | | | 7/25/01 | | | | -10.00% | | | | -1.11% | | | | 5.41% | |
Class C Shares*** | | | 7/25/01 | | | | -6.26% | | | | -0.96% | | | | 5.24% | |
Institutional Shares | | | 8/1/96 | | | | -5.29% | | | | 0.04% | | | | 6.29% | |
Class R Shares | | | 2/1/101 | | | | -5.71% | | | | -0.06% | | | | 6.24% | |
Russell Midcap® Value Index | | | N/A | | | | -2.36% | | | | -0.84% | | | | 7.54% | |
Past performance does not guarantee future results. The performance data quoted represents past performance and current returns may be lower or higher. Total return figures include change in share price, reinvestment of dividends and capital gains, and do not reflect taxes that a shareholder would pay on fund distributions or on the redemption of fund shares. The investment return and principal value will fluctuate so that an investor’s shares, when redeemed, may be worth more or less than the original cost. To obtain performance information current to the most recent month end, please visit www.sterlingcapitalfunds.com.
The chart above represents a comparison of a hypothetical $10,000 investment in the indicated share class versus a similar investment in the Fund’s benchmark, and represents the reinvestment of dividends and capital gains.
| 1 | Class R Shares were not in existence prior to 2/1/10. Performance for periods prior to 2/1/10 is based on the performance of the Institutional Shares, but such performance does not reflect Class R Shares’ 12b-1 fees, which if reflected, would have caused performance to be lower. |
The Fund is measured against Russell Midcap® Value Index, an unmanaged index which measures the performance of those securities in the Russell 1000 with lower price-to-book ratios or lower forecasted growth values. The index is unmanaged and does not reflect the deduction of expenses associated with a mutual fund, such as investment management and fund accounting fees. The Fund’s performance reflects the deduction of fees for these services. Investors cannot invest directly in an index, although they can invest in its underlying securities.
A portion of the Fund’s fees has been waived. If fees had not been waived, the Fund’s total return for the periods would have been lower.
Sterling Capital Small Value Fund
Portfolio Manager
Eduardo Brea, CFA
Sterling Capital Small Value Fund (formerly known as Sterling Capital Small Cap Value Fund) (the “Fund”) is managed by Eduardo Brea, CFA, Managing Director and Equity Portfolio Manager for Sterling Capital Management LLC (“Sterling Capital”), advisor to the Fund. Eduardo joined Sterling Capital in 1995. He has investment experience since 1989. Mr. Brea is a graduate of the University of Florida where he received his BS in Finance. He received his MBA from University of South Florida. The Investment Team supporting the Fund has more than 97 combined years of investment experience and includes:
| • | | Timothy P. Beyer, CFA, Managing Director |
| • | | Brian R. Walton, CFA, Managing Director |
| • | | Patrick W. Rau, CFA, Executive Director |
| • | | Robert W. Bridges, CFA, Director |
| • | | Lee D. Houser, CFA, Director |
Investment Concerns
The Fund may invest in undervalued securities which may not appreciate in value as anticipated or remain undervalued for longer than anticipated. Investments made in small to mid-capitalization companies are subject to greater risks than large company stocks due to limited resources and inventory and are more sensitive to adverse conditions. The Fund may invest in foreign securities which may be more volatile and less liquid due to currency fluctuation and political, social and economic instability.
Q. How did the Fund perform during the 12-month period between October 1, 2010 and September 30, 2011?
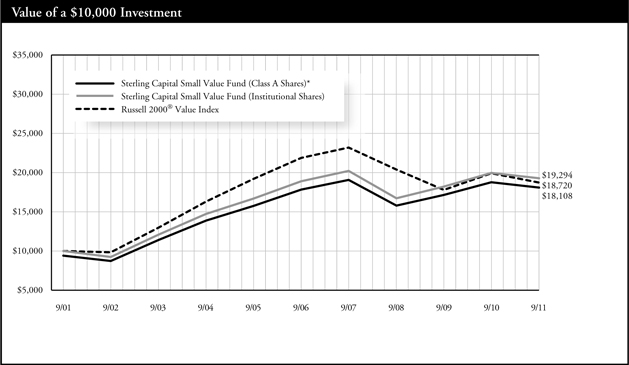
A. The Fund returned -3.31% (Institutional Shares). That compared to a -5.99% return for its benchmark, Russell 2000® Value Index (the “Index”) of small-cap stocks.
Q. What factors affected the Fund’s performance?
A. While the Fund’s performance was slightly negative for fiscal year 2011, we performed better than the Russell 2000® Value Index. The recent decline in the equity markets reflects investor concerns regarding budgetary imbalances and the inexorable growth in debt financed government spending, both in the U.S. and Europe. These concerns were manifest in significant declines in economically sensitive companies in the consumer, financial, technology, and producer durables sectors. Defensive sectors such as utilities and consumer staples outperformed.1
For the Fund, we outperformed the Index in 7 out of 10 sectors, largely through stock selection. The impact of sector selection was marginally negative. As a bottom-up value manager, we expect the vast majority of our value–added attribution to reside in stock selection. In 2011, our portfolio also benefited from the announced acquisition of two portfolio holdings - National Semiconductor (acquired by Texas Instruments) and Graham Packaging (acquired by Reynolds Group) at significant premiums to our purchase price.1
We are using the weak equity markets to establish positions in businesses with significant upside and economic sensitivity. This is where the best risk/reward valuations lead us. While our sector weightings are not dramatically different from the benchmark, we do have overweights in technology, consumer discretionary and producer durables. We have meaningful underweights in utilities and REITs.1
| 1 | Portfolio composition is as of September 30, 2011 and is subject to change. |
| * | Reflects 5.75% maximum sales charge. |
| ** | Reflects the applicable contingent deferred sales charge (CDSC), maximum of 5.00%. |
| *** | Reflects the applicable maximum CDSC of 1.00% (applicable only to redemptions within one year of purchase, and as such, are not reflected in the Average Annual Total Returns table since the periods reflected are for a year or longer). |
| | | | | | | | | | | | | | | | |
Average Annual Total Returns | |
As of September 30, 2011 | |
| Inception
Date |
| | | 1 Year | | | | 5 Years | | | | 10 Years | |
Class A Shares* | | | 2/1/101 | | | | -9.10% | | | | -0.87% | | | | 6.12% | |
Class B Shares** | | | 2/1/101 | | | | -9.08% | | | | -0.18% | | | | 6.62% | |
Class C Shares*** | | | 2/1/101 | | | | -4.30% | | | | 0.08% | | | | 6.62% | |
Institutional Shares | | | 1/2/971 | | | | -3.31% | | | | 0.40% | | | | 6.79% | |
Class R Shares | | | 2/1/101 | | | | -3.49% | | | | 0.34% | | | | 6.76% | |
Russell 2000® Value Index | | | N/A | | | | -5.99% | | | | -3.08% | | | | 6.47% | |
Past performance does not guarantee future results. The performance data quoted represents past performance and current returns may be lower or higher. Total return figures include change in share price, reinvestment of dividends and capital gains, and do not reflect taxes that a shareholder would pay on fund distributions or on the redemption of fund shares. The investment return and principal value will fluctuate so that an investor’s shares, when redeemed, may be worth more or less than the original cost. To obtain performance information current to the most recent month end, please visit www.sterlingcapitalfunds.com.
The chart above represents a comparison of a hypothetical $10,000 investment in the indicated share class versus a similar investment in the Fund’s benchmark, and represents the reinvestment of dividends and capital gains.
| 1 | Class A, B, C and R Shares were not in existence prior to 2/1/10. Performance for periods prior to 2/1/10 is based on the performance of Institutional Shares and has been adjusted for maximum CDSC to the class applicable but does not include 12b-1 fees, which if reflected, would have caused performance of Class A, B C and R Shares to be lower. The performance information for Institutional Shares (formerly known as Sterling Shares) prior to 12/18/06 is based on the performance of the Institutional Shares of the Fund’s Predecessor, Sterling Capital Small Cap Value Fund, a series of The Advisors’ Inner Circle Fund (the “Predecessor Fund”), which transferred all of its assets and liabilities to the Fund pursuant to a reorganization. Information prior to 3/16/01 relates to the UAM Fund Inc.’s Sterling Partners’ Small Cap Value Portfolio, the assets of which were acquired by the Predecessor Fund. The performance of the Fund’s Institutional Shares would have been different because the Fund’s Institutional Shares have different expenses than the Predecessor’s Institutional Shares. |
Russell 2000® Value Index is a widely recognized index of common stocks that measures the performance of small- to mid-sized companies. The Index is unmanaged and does not reflect the deduction of expenses associated with a mutual fund, such as investment management and fund accounting fees. The Fund’s performance reflects the deduction of fees for these services. Investors cannot invest directly in an index, although they can invest in its underlying securities.
A portion of the Fund’s fees has been waived. If the fees had not been waived, the Fund’s total return for the periods would have been lower.
Sterling Capital International Fund
Portfolio Managers
Richard Pell, Chief Investment Officer
Artio Global Management LLC (subadviser)
Sterling Capital International Fund (formerly known as BB&T International Equity Fund) (the “Fund”) is managed by Richard Pell, Chief Investment Officer, at Ario Global Management LLC (“Artio Global”), subadvisor to the Fund. Richard has managed the Fund since 2007. He received his BA from the University of California at Berkeley and an MBA from New York University. Richard has investment experience since 1983.
Investment Concerns
The Fund invests in the securities of foreign and emerging markets which involve certain risks such as currency fluctuation and political, social and economic instability. The Fund may invest in derivatives (futures, options, swaps) and exchange traded funds which may incur additional costs. Derivatives may be more sensitive to changes in market conditions and may amplify risks. The Fund may engage in writing covered call options. By writing covered call options, the Fund limits its opportunity to profit from an increase in the price of the underlying stock above the premium and the strike price, but continues to bear the risk of a decline in the stock price. While the Fund receives premiums for writing covered call options, the price it realizes from the exercise of an option could be substantially below a stock’s current market price.
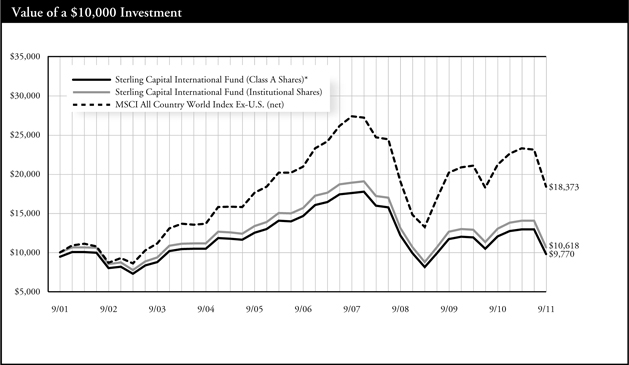
Q. How did the Fund perform during the 12-month period between October 1, 2010 and September 30, 2011?
A. The Fund returned -18.50% (Institutional Shares). That compared to a -13.24% return for its benchmark, MSCI All Country World Index Ex-US. (net).
Q. What factors affected the Fund’s performance?
A. Volatility was the overriding trend of the 12-month period, as investor sentiment rose and fell amid bouts of extreme optimism and pessimism. The global economy worked through a long list of challenges. Meanwhile, governmental policy actions to prop up weaker segments of the market rendered traditional fundamental analysis less effective at determining market direction. Ultimately, investor concerns outweighed optimism and absolute returns were in negative territory for the period.1
The single largest drag on the Fund’s relative performance was its overweight position in emerging markets. An overweight position in China and India and stock selection in those countries and Russia also were notable detractors for the period.1
Stock and sector selection in certain areas of the developed markets, most notably in the financial and consumer staples sectors, also hurt the Fund’s relative performance. While an underweight position in the financials sector helped mitigate some of the poor relative performance, stock selection offset any benefits.1
The Fund’s relative performance benefited from stock selection in the developed markets portion of the portfolio. In particular, the industrials and information technology sectors added value. Stock selection in the emerging markets of Korea and Taiwan also boosted relative performance.1
| 1 | Portfolio composition is as of September 30, 2011 and is subject to change. |
| * | Reflects 5.75% maximum sales charge. |
| ** | Reflects the applicable contingent deferred sales charge (CDSC), maximum of 5.00%. |
| *** | Reflects the applicable maximum CDSC of 1.00% (applicable only to redemptions within one year of purchase, and as such, are not reflected in the Average Annual Total Returns table since the periods reflected are for a year or longer). |
| | | | | | | | | | | | | | |
Average Annual Total Returns | |
As of September 30, 2011 | | Inception
Date | | | 1 Year | | | | 5 Years | | | | 10 Years | |
Class A Shares* | | 1/2/97 | | | -23.64% | | | | -8.84% | | | | -0.23% | |
Class B Shares** | | 1/2/97 | | | -22.42% | | | | -8.50% | | | | -0.23% | |
Class C Shares*** | | 2/1/01 | | | -19.23% | | | | -8.41% | | | | -0.38% | |
Institutional Shares | | 1/2/97 | | | -18.50% | | | | -7.49% | | | | 0.60% | |
MSCI All Country World Index Ex-U.S. (net) | | N/A | | | -13.24% | | | | -4.13% | | | | 4.28% | |
Past performance does not guarantee future results. The performance data quoted represents past performance and current returns may be lower or higher. Total return figures include change in share price, reinvestment of dividends and capital gains, and do not reflect taxes that a shareholder would pay on fund distributions or on the redemption of fund shares. The investment return and principal value will fluctuate so that an investor’s shares, when redeemed, may be worth more or less than the original cost. To obtain performance information current to the most recent month end, please visit www.sterlingcapitalfunds.com.
The chart above represents a comparison of a hypothetical $10,000 investment in the indicated share class versus a similar investment in the Fund’s benchmark, and represents the reinvestment of dividends and capital gains.
MSCI All Country World Index Ex-U.S. (net) is a unmanaged market capitalization-weighted index that is designed to represent the performance of equity markets in the global developed and emerging markets, excluding the United States. The index does not reflect the deduction of expenses associated with a mutual fund, such as investment management and fund accounting fees. The Fund’s performance reflects the deduction of fees for these services. Investors cannot invest directly in an index, although they can invest in its underlying securities.
A portion of the Fund’s fees has been waived. If the fees had not been waived, the Fund’s total return for the periods would have been lower.
Sterling Capital Special Opportunities Fund
Portfolio Manager
George F. Shipp, CFA
Chief Investment Officer
Scott & Stringfellow, LLC (subadviser)
Sterling Capital Special Opportunities Fund (formerly known as BB&T Special Opportunities Fund) (the “Fund”) is managed by George F. Shipp, CFA, Chief Investment Officer of Scott & Stringfellow, LLC (“Scott & Stringfellow”), subadvisor to the Fund. George has been the Fund’s manager since 2003 and also manages the Sterling Capital Equity Income Fund. He has investment experience since 1982. George is a graduate of the University of Virginia and received his MBA at the Darden Graduate School of Business. The Investment Team supporting the Fund has more than 123 combined years of investment experience and includes:
| • | | Joshua L. Haggerty, CFA |
| • | | Michael S. Peasley, CFA |
Investment Concerns
The Fund is subject to investment style risk which depends on the market segment in which the Fund is primarily invested. An investment in growth stocks may be particularly sensitive to market conditions while value stocks may be undervalued for longer than anticipated. The Fund may invest in foreign securities subject to risks such as currency volatility and political and social instability or small capitalization companies subject to greater volatility and less liquidity due to limited resources or product lines. The Fund may engage in writing covered call options. By writing covered call options, the Fund limits its opportunity to profit from an increase in the price of the underlying stock above the premium and the strike price, but continues to bear the risk of a decline in the stock price. While the Fund receives premiums for writing covered call options, the price it realizes from the exercise of an option could be substantially below a stock’s current market price.
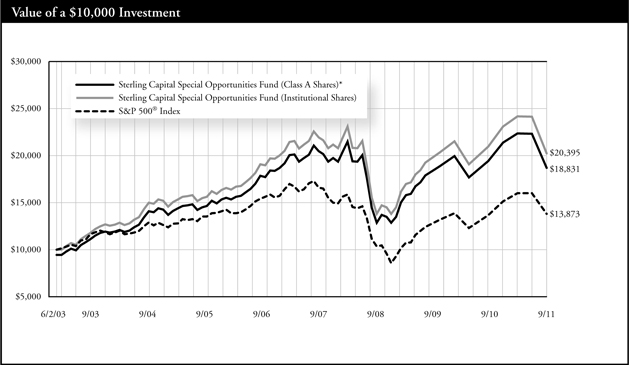
Q. How did the Fund perform during the 12-month period between October 1, 2010 and September 30, 2011?
A. The Fund returned -3.46% (Institutional Shares). That compared to a 1.14% return for its benchmark, S&P 500® Index.
Q. What factors affected the Fund’s performance?
A. Easy monetary policy and strong corporate earnings helped buoy investors’ appetite for stocks early in the 12-month period. Midway through 2011, however, investor optimism gave way to increasing uncertainty as a result of ongoing European sovereign credit concerns and evidence of macroeconomic deceleration. The end of the 12-month period was marked by increasing volatility.1
The Fund’s relative performance suffered from an overweight position in small- and mid-cap stocks, which experienced considerable volatility
during the period. By comparison, the benchmark has a bias toward larger-cap shares, which weathered the volatility better than the smaller cap stocks. Stock selection within the technology and energy sectors also detracted from performance. An underweight position in the market’s top performing sectors, utilities and consumer staples, further contributed to the Fund’s relative underperformance.1
The Fund benefited from overweight positions in the technology and health care sectors, both of which performed well during the period under review. Stock selection in the health care sector also contributed to the Fund’s relative performance. In particular, double-digit percentage gains in a diversified health insurer and a large drug distributor helped relative performance. The Fund’s lone holding in basic materials was also a solid contributor.1
| 1 | Portfolio composition is as of September 30, 2011 and is subject to change. |
| * | Reflects 5.75% maximum sales charge. |
| ** | Reflects the applicable contingent deferred sales charge (CDSC), maximum of 5.00%. |
| *** | Reflects the applicable maximum CDSC of 1.00% (applicable only to redemptions within one year of purchase, and as such, are not reflected in the Average Annual Total Returns table since the periods reflected are for a year or longer). |
| | | | | | | | |
Average Annual Total Returns |
As of September 30, 2011 | | Inception
Date | | 1 Year | | 5 Years | | Since Inception |
Class A Shares* | | 6/2/03 | | -9.25% | | 1.39% | | 7.90% |
Class B Shares** | | 6/2/03 | | -8.23% | | 1.67% | | 7.87% |
Class C Shares*** | | 6/2/03 | | -4.43% | | 1.83% | | 7.86% |
Institutional Shares | | 6/2/03 | | -3.46% | | 2.85% | | 8.93% |
Class R Shares | | 2/1/101 | | -3.95% | | 2.77% | | 8.88% |
S&P 500® Index | | 5/31/03 | | 1.14% | | -1.18% | | 4.01% |
Past performance does not guarantee future results. The performance data quoted represents past performance and current returns may be lower or higher. Total return figures include change in share price, reinvestment of dividends and capital gains, and do not reflect taxes that a shareholder would pay on fund distributions or on the redemption of fund shares. The investment return and principal value will fluctuate so that an investor’s shares, when redeemed, may be worth more or less than the original cost. To obtain performance information current to the most recent month end, please visit www.sterlingcapitalfunds.com.
The chart above represents a comparison of a hypothetical $10,000 investment in the indicated share class versus a similar investment in the Fund’s benchmark and represents the reinvestment of dividends and capital gains.
| 1 | Class R Shares were not in existence prior to 2/1/10. Performance for periods prior to 2/1/10 is based on the performance of Institutional Shares, but such performance does not reflect Class R Shares’ 12b-1 fees, which if reflected, would have caused performance to be lower. |
The Fund is measured against S&P 500® Index, an unmanaged index which is generally considered to be representative of the performance of the stock market as a whole. The index does not reflect the deduction of expenses associated with a mutual fund, such as investment management and fund accounting fees. The Fund’s performance reflects the deduction of fees for these services. Investors cannot invest directly in an index, although they can invest in its underlying securities.
A portion of the Fund’s fees has been waived. If the fees had not been waived, the Fund’s total return for the periods would have been lower.
Sterling Capital Equity Income Fund
Portfolio Manager
George F. Shipp, CFA
Chief Investment Officer
Scott & Stringfellow, LLC (subadviser)
Sterling Capital Equity Income Fund (formerly known as BB&T Equity Income Fund) (the “Fund”) is managed by George F. Shipp, CFA, Chief Investment Officer of Scott & Stringfellow, LLC (“Scott & Stringfellow”), subadvisor to the Fund. George has been the Fund’s manager since 2004 and also manages the Sterling Capital Special Opportunities Fund. He has investment experience since 1982. George is a graduate of the University of Virginia and received his MBA at the Darden Graduate School of Business. The Investment Team supporting the Fund has more than 123 combined years of investment experience and includes:
| • | | Joshua L. Haggerty, CFA |
| • | | Michael S. Peasley, CFA |
Investment Concerns
The Fund invests primarily in dividend-paying securities but also in convertible securities in search of yield. These securities may be undervalued and their value could be negatively affected by a rise in interest rates. The Fund may engage in writing covered call options. By writing covered call options, the Fund limits its opportunity to profit from an increase in the price of the underlying stock above the premium and the strike price, but continues to bear the risk of a decline in the stock price. While the Fund receives premiums for writing covered call options, the price it realizes from the exercise of an option could be substantially below a stock’s current market price.
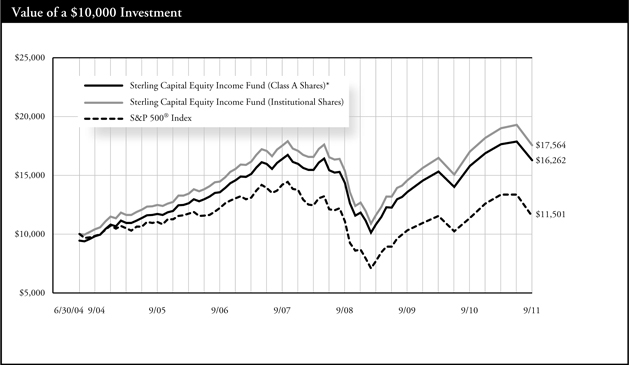
Q. How did the Fund perform during the 12-month period between October 1, 2010 and September 30, 2011?
A. The Fund returned 3.17% (Institutional Shares). That compared to a 1.14% return for its benchmark, S&P 500® Index.
Q. What factors affected the Fund’s performance?
A. Easy monetary policy and strong corporate earnings helped buoy investors’ appetite for stocks in the first half of 2011. But this positive performance gave way to increasing volatility in the final quarter of the fiscal year, as ongoing sovereign credit concerns and evidence of macroeconomic deceleration dominated investor sentiment.1
The Fund’s positioning in large cap, dividend-paying securities served it well during the period of market volatility. The Fund surpassed its benchmark in part due to an overweight position in the consumer
staples sector. Stock selection in this sector also benefited the Fund, with strong performance coming from shares of a global foods company and a global personal care business. The Fund sold both holdings during the year. Underweight positions in the financials and basic materials sectors, the market’s worst performing sectors, also contributed to relative performance.1
The Fund’s relative performance suffered in part due to underperformance from its health care holdings. Weak returns from shares of a European capital goods company and a domestic thrift also contributed negatively to the Fund’s performance relative to the benchmark. The Fund’s cash holdings were an additional drag on performance due to the Federal Reserve’s decision to keep interest rates near zero.1
| 1 | Portfolio composition is as of September 30, 2011 and is subject to change. |
| * | Reflects 5.75% maximum sales charge. |
| ** | Reflects the applicable contingent deferred sales charge (CDSC), maximum of 5.00% |
| *** | Reflects the applicable maximum CDSC of 1.00% (applicable only to redemptions within one year of purchase, and as such, are not reflected in the Average Annual Total Returns table since the periods reflected are for a year or longer). |
| | | | | | | | | | | | | | |
Average Annual Total Returns | |
As of September 30, 2011 | | Inception
Date | | 1 Year | | | 5 Years | | | Since Inception | |
Class A Shares* | | 6/30/04 | | | -3.02% | | | | 2.48% | | | | 6.94% | |
Class B Shares** | | 6/30/04 | | | -1.88% | | | | 2.76% | | | | 7.01% | |
Class C Shares*** | | 6/30/04 | | | 2.13% | | | | 2.94% | | | | 7.01% | |
Institutional Shares | | 6/30/04 | | | 3.17% | | | | 3.97% | | | | 8.08% | |
Class R Shares | | 2/1/101 | | | 2.74% | | | | 3.82% | | | | 7.97% | |
S&P 500® Index | | 6/30/04 | | | 1.14% | | | | -1.18% | | | | 1.95% | |
Past performance does not guarantee future results. The performance data quoted represents past performance and current returns may be lower or higher. Total return figures include change in share price, reinvestment of dividends and capital gains, and do not reflect taxes that a shareholder would pay on fund distributions or on the redemption of fund shares. The investment return and principal value will fluctuate so that an investor’s shares, when redeemed, may be worth more or less than the original cost. To obtain performance information current to the most recent month end, please visit www.sterlingcapitalfunds.com.
The chart above represents a comparison of a hypothetical $10,000 investment in the indicated share class versus a similar investment in the Fund’s benchmark, and represents the reinvestment of dividends and capital gains.
| 1 | Class R Shares were not in existence prior to 2/1/10. Performance for periods prior to 2/1/10 is based on the performance of Institutional Shares, but such performance does not reflect Class R Shares’ 12b-1 fees, which if reflected, would have caused performance to be lower. |
The Fund is measured against S&P 500® Index, an unmanaged index which is generally considered to be representative of the performance of the stock market as a whole. The index does not reflect the deduction of expenses associated with a mutual fund, such as investment management and fund accounting fees. The Fund’s performance reflects the deduction of fees for these services. Investors cannot invest directly in an index, although they can invest in its underlying securities.
A portion of the Fund’s fees has been waived. If the fees had not been waived, the Fund’s total return for the periods would have been lower.
Sterling Capital Short-Term Bond Fund
Portfolio Managers
Sterling Capital Short-Term Bond Fund (formerly known as BB&T Short U.S. Government Fund) (the “Fund”) is managed by Mark Montgomery, CFA and Richard LaCoff, portfolio managers for Sterling Capital Management LLC (“Sterling Capital”), advisor to the Fund.
Mark Montgomery, CFA
Mark joined Sterling Capital in 1997. He has co-managed the Fund since 2008 and also co-manages the Sterling Capital Total Return Bond Fund. He received his BS from West Chester University and an MBA from Drexel University. Mark has investment experience since 1990.
Richard D. LaCoff
Richard joined Sterling Capital in 2007. He has co-managed the Fund since 2010 and also co-manages the Sterling Capital Total Return Bond Fund. He received his BS from Villanova University and an MBA from Drexel University. Richard has investment experience since 1991.
The Investment Team supporting the Fund includes 18 investment professionals with an average of more than 16 years industry experience.
Investment Concerns
The Fund is subject to the same risks as the underlying bonds in the portfolio such as credit, prepayment, call and interest rate risk. As interest rates rise the value of bond prices will decline and an investor may lose money. The Fund may invest in more aggressive investments such as foreign securities which may expose the fund to currency and exchange rate fluctuations; derivatives (futures and swaps); mortgage-backed securities sensitive to interest rates and high yield debt (also known as junk bonds) all of which may cause greater volatility and less liquidity. Derivatives may be more sensitive to changes in market conditions and may amplify risks.
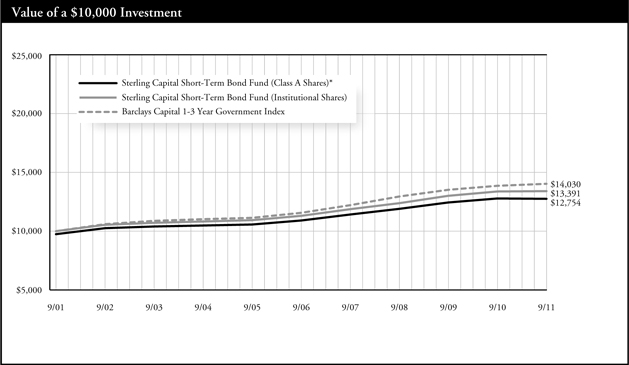
Q. How did the Fund perform during the 12-month period between October 1, 2010 and September 30, 2011?
A. The Fund gained 0.05% (Institutional Shares). That compared to a 1.23% return for its benchmark, Barclays Capital 1-3 Year Government Index.
Q. What factors affected the Fund’s performance?
A. Investors engaged in a flight-to-quality during the period, selecting U.S. Treasuries and municipal bonds in the face of sluggish U.S. economic growth and the uncertainty generated by Europe’s sovereign
debt woes. The Fund benefited from an overweight exposure to taxable municipal bonds. However, the Fund’s allocation to commercial mortgage-backed securities was a drag on absolute performance, as spreads widened due to concerns about a slowdown in the U.S. economy.1
The Fund’s position in long-duration bonds, which rose in value as rates fell, boosted relative performance. Exposure to corporate bonds weighed on relative performance, as investors reacted to a slowing global economy and Greece’s ongoing debt crisis.1
| 1 | Portfolio composition is as of September 30, 2011 and is subject to change. |
| * | Reflects 2.50% maximum sales charge. |
| | | | | | | | | | | | | | |
| Average Annual Total Returns | |
As of September 30, 2011 | | Inception
Date | | 1 Year | | | 5 Years | | | 10 Years | |
Class A Shares* | | 11/30/92 | | | -2.72% | | | | 2.67% | | | | 2.46% | |
Institutional Shares | | 11/30/92 | | | 0.05% | | | | 3.42% | | | | 2.96% | |
Barclays Capital 1-3 Year
Government Index | | 11/30/92 | | | 1.23% | | | | 3.96% | | | | 3.44% | |
Past performance does not guarantee future results. The performance data quoted represents past performance and current returns may be lower or higher. Total return figures include change in share price, reinvestment of dividends and capital gains, and do not reflect taxes that a shareholder would pay on fund distributions or on the redemption of fund shares. The investment return and principal value will fluctuate so that an investor’s shares, when redeemed, may be worth more or less than the original cost. To obtain performance information current to the most recent month end, please visit www.sterlingcapitalfunds.com.
The chart above represents a comparison of a hypothetical $10,000 investment in the indicated share class versus a similar investment in the Fund’s benchmark, and represents the reinvestment of dividends and capital gains.
The Fund is measured against Barclays Capital 1-3 Year Government Index which consists of securities in Barclays Capital U.S. Government Index with a maturity from one up to three years. The index does not reflect the deduction of expenses associated with a mutual fund, such as investment management and fund accounting fees. The Fund’s performance reflects the deduction of fees for these services. Investors cannot invest directly in an index, although they can invest in its underlying securities.
A portion of the Fund’s fees has been waived. If the fees had not been waived, the Fund’s total return for the periods would have been lower.
Sterling Capital Intermediate U.S. Government Fund
Portfolio Manager
Brad D. Eppard, CFA
Sterling Capital Intermediate U.S. Government Fund (formerly known as BB&T Intermediate U.S. Government Fund) (the “Fund”) is managed by Brad D. Eppard, CFA, Director and Portfolio Manager for Sterling Capital Management LLC (“Sterling Capital”), advisor to the Fund. Brad joined Sterling Capital in 2003. He has investment experience since 1985. He has been the portfolio manager for the Fund since 2003. Brad is a graduate of Radford University where he received his BS in Business Administration/Accounting. He is a CFA Charterholder. The Investment Team supporting the Fund includes 18 investment professionals with an average of more than 16 years industry experience.
Investment Concerns
The Fund is subject to the same risks as the underlying bonds in the portfolio such as credit, prepayment, call and interest rate risk. As interest rates rise the value of bond prices will decline and an investor may lose money. The Fund may invest in mortgage-backed securities which tend to be more sensitive to changes in interest rates. The Fund invests in securities issued or guaranteed by the U.S. government or its agencies (such as Fannie Mae or Freddie Mac). Although U.S. government securities issued directly by the U.S. government are guaranteed by the U.S. Treasury, other U.S. government securities issued by an agency or instrumentality of the U.S. government may not be. No assurance can be given that the U.S. government would provide financial support to its agencies and instrumentalities if not required to do so by law.
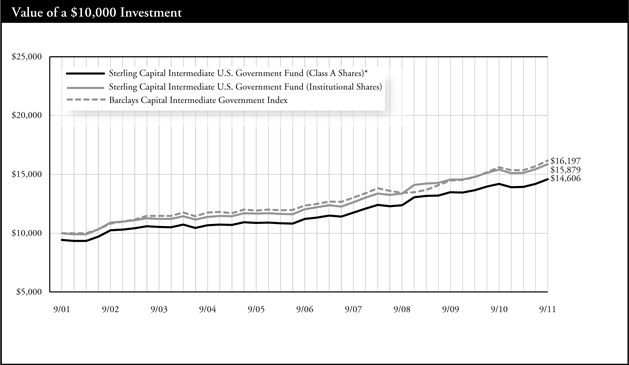
Q. How did the Fund perform during the 12-month period between October 1, 2010 and September 30, 2011?
A. The Fund gained 3.02% (Institutional Shares). That compared to a 3.40% return for its benchmark, Barclays Capital Intermediate Government Index.
Q. What factors affected the Fund’s performance?
A. The Fund’s coupon income remained low during the period as the Federal Reserve’s concerns about the U.S. economy weighed upon interest rates. The yield for the 10-year Treasury, for instance, dropped from 2.51% to 1.92% over the course of the period. At the same time, the Fund’s absolute return was boosted by higher bond prices, as
investors sought shelter from continued fiscal problems in peripheral European countries.1
The Fund’s performance lagged the benchmark in part because of its stake in high-grade paper issued by financial corporations. The industry’s struggles dragged on bond prices during the period under review.1
At the same time, the Fund’s relative performance benefited from maintaining a longer average duration than the benchmark index. The strategy allowed the portfolio to benefit from an overall drop in interest rates.1
| 1 | Portfolio composition is as of September 30, 2011 and is subject to change. |
| * | Reflects 5.75% maximum sales charge. |
| ** | Reflects the applicable contingent deferred sales charge (CDSC), maximum of 5.00%. |
| *** | Reflects the applicable maximum CDSC of 1.00% (applicable only to redemptions within one year of purchase, and as such, are not reflected in the Average Annual Total Returns table since the periods reflected are for a year or longer). |
| | | | | | | | | | | | | | |
Average Annual Total Returns | | | | | |
As of September 30, 2011 | | Inception Date | | 1 Year | | | 5 Years | | | 10 Years | |
Class A Shares* | | 10/9/92 | | | -3.07% | | | | 4.19% | | | | 3.86% | |
Class B Shares** | | 1/1/96 | | | -2.00% | | | | 4.46% | | | | 3.85% | |
Class C Shares*** | | 2/1/01 | | | 1.99% | | | | 4.67% | | | | 3.71% | |
Institutional Shares | | 10/9/92 | | | 3.02% | | | | 5.69% | | | | 4.73% | |
Barclays Capital Intermediate Government Index | | 9/30/92 | | | 3.40% | | | | 5.92% | | | | 5.12% | |
Past performance does not guarantee future results. The performance data quoted represents past performance and current returns may be lower or higher. Total return figures include change in share price, reinvestment of dividends and capital gains, and do not reflect taxes that a shareholder would pay on fund distributions or on the redemption of fund shares. The investment return and principal value will fluctuate so that an investor’s shares, when redeemed, may be worth more or less than the original cost. To obtain performance information current to the most recent month end, please visit www.sterlingcapitalfunds.com.
The chart above represents a comparison of a hypothetical $10,000 investment in the indicated share class versus a similar investment in the Fund’s benchmark and represents the reinvestment of dividends and capital gains.
The Fund is measured by Barclays Capital Intermediate Government Bond Index, an unmanaged index comprised of all publicly issued non-convertible domestic debt of the U.S. government or any agency there of, or corporate debt guaranteed by the U.S. government all with outstanding principal of $1 million and maturity between one and ten years. The index does not reflect the deduction of expenses associated with a mutual fund, such as investment management and fund accounting fees. The Fund’s performance reflects the deduction of fees for these services. Investors cannot invest directly in an index, although they can invest in its underlying securities.
A portion of the Fund’s fees has been waived. If the fees had not been waived, the Fund’s total return for the periods would have been lower.
Sterling Capital Total Return Bond Fund
Portfolio Managers
Sterling Capital Total Return Bond Fund (formerly known as BB&T Total Return Bond Fund) (the “Fund”) is managed by Mark Montgomery, CFA and Richard LaCoff, portfolio managers for Sterling Capital Management LLC (“Sterling Capital”), advisor to the Fund.
Mark Montgomery, CFA
Mark joined Sterling Capital in 1997. He has co-managed the Fund since 2008 and also co-manages the Sterling Capital Short-Term Bond Fund. He received his BS from West Chester University and an MBA from Drexel University. Mark has investment experience since 1990.
Richard D. LaCoff
Richard joined Sterling Capital in 2007. He has co-managed the Fund since 2010 and also co-manages the Sterling Capital Short-Term Bond Fund. He received his BS from Villanova University and an MBA from Drexel University. Richard has investment experience since 1991. The Investment Team supporting the Fund includes 18 investment professionals with an average of more than 16 years industry experience.
Investment Concerns
The Fund is subject to the same risks as the underlying bonds in the portfolio such as credit, prepayment, call and interest rate risk. As interest rates rise the value of bond prices will decline and an investor may lose money. The Fund may invest in more aggressive investments such as foreign securities which may expose the fund to currency and exchange rate fluctuations; derivatives (futures and swaps); mortgage-backed securities sensitive to interest rates and high yield debt (also known as junk bonds) all of which may cause greater volatility and less liquidity. Derivatives may be more sensitive to changes in market conditions and may amplify risks.
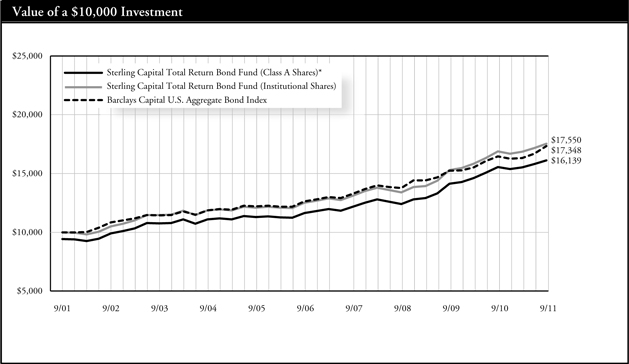
Q. How did the Fund perform during the 12-month period between October 1, 2010 and September 30, 2011?
A. The Fund gained 3.94% (Institutional Shares). That compared to a 5.26% return for its benchmark, Barclays Capital U.S. Aggregate Bond Index.
Q. What factors affected the Fund’s performance?
A. Concerns about sovereign debt risk in Europe — particularly in Greece — and its potential to weigh on the U.S. economy’s growth rate created uncertainty during the period. Nervous investors flocked to U.S. Treasury securities with extremely high levels of liquidity and safety — pushing bond prices higher and yields lower. The Fund’s absolute return benefited in that environment.1
The Fund’s relative return benefited from the Fund’s overweight position in mortgage-backed securities, which offered higher yields than
Treasury securities along with strong credit ratings. Also, the Fund’s duration was longer than that of its benchmark index, which helped relative returns as prices of longer-term securities rose more than prices on shorter-term issues in the declining rate environment.1
The Fund’s relative return was dampened by the Fund’s overweight position in corporate bonds, which lagged Treasuries during the period. Investors feared that the U.S. economy would slow significantly and corporate profits would suffer as a result. Combined, those forces pushed down prices on corporate bonds. In particular, the Fund’s overweight position in corporate bonds from the financials sector was a drag on relative performance. Investors worried about global financial institutions’ exposure to Greece, which was in danger of defaulting on its debt during the period.1
| 1 | Portfolio composition is as of September 30, 2011 and is subject to change. |
| * | Reflects 5.75% maximum sales charge. |
| ** | Reflects the applicable contingent deferred sales charge (CDSC), maximum of 5.00%. |
| *** | Reflects the applicable maximum CDSC of 1.00% (applicable only to redemptions within one year of purchase, and as such, are not reflected in the Average Annual Total Returns table since the periods reflected are for a year or longer). |
| | | | | | | | | | | | | | |
Average Annual Total Returns | | | | | |
As of September 30, 2011 | | Inception
Date | | 1 Year | | | 5 Years | | | 10 Years | |
Class A Shares* | | 12/2/99 | | | -2.28% | | | | 5.48% | | | | 4.90% | |
Class B Shares** | | 12/2/99 | | | -1.00% | | | | 5.78% | | | | 4.89% | |
Class C Shares*** | | 2/1/01 | | | 2.91% | | | | 5.96% | | | | 4.77% | |
Institutional Shares | | 12/2/99 | | | 3.94% | | | | 7.00% | | | | 5.79% | |
Class R Shares | | 2/1/101 | | | 3.24% | | | | 6.77% | | | | 5.67% | |
Barclays Capital U.S. Aggregate Bond Index | | N/A | | | 5.26% | | | | 6.53% | | | | 5.66% | |
Past performance does not guarantee future results. The performance data quoted represents past performance and current returns may be lower or higher. Total return figures include change in share price, reinvestment of dividends and capital gains, and do not reflect taxes that a shareholder would pay on fund distributions or on the redemption of fund shares. The investment return and principal value will fluctuate so that an investor’s shares, when redeemed, may be worth more or less than the original cost. To obtain performance information current to the most recent month end, please visit www.sterlingcapitalfunds.com.
The chart above represents a comparison of a hypothetical $10,000 investment in the indicated share class versus a similar investment in the Fund’s benchmark, and represents the reinvestment of dividends and capital gains.
| 1 | Class R Shares were not in existence prior to 2/1/10. Performance for periods prior to 2/1/10 is based on the performance of Institutional Shares, but such performance does not reflect Class R Shares’ 12b-1 fees, which if reflected, would have caused performance to be lower. |
The Fund is measured against Barclays Capital U.S. Aggregate Bond Index, an unmanaged index which is a market value-weighted performance benchmark for investment-grade fixed-rate debt issues, including government, corporate, asset-backed, and mortgage-backed securities, with maturities of at least one year. The index is unmanaged and does not reflect the deduction of expenses associated with a mutual fund, such as investment management and fund accounting fees. The Fund’s performance reflects the deduction of fees for these services. Investors cannot invest directly in an index, although they can invest in its underlying securities.
A portion of the Fund’s fees has been waived. If the fees had not been waived, the Fund’s total return for the periods would have been lower.
Sterling Capital Kentucky Intermediate Tax-Free Fund
Portfolio Manager
Robert F. Millikan, CFA
Sterling Capital Kentucky Intermediate Tax-Free Fund (formerly known as BB&T Kentucky Intermediate Tax-Free Fund) (the “Fund”) is managed by Robert F. Millikan, CFA, Executive Director and Portfolio Manager for Sterling Capital Management LLC (“Sterling Capital”), advisor to the Fund. Robert joined Sterling Capital in 2000. He manages the state-specific municipal bond fund portfolios and has investment experience since 1990. Bob is a graduate of Wake Forest University where he received his BA in Economics and is a CFA Charterholder. The Investment Team supporting the Fund includes 18 investment professionals with an average of more than 16 years industry experience.
Investment Concerns
The Fund is subject to the same risks as the underlying bonds in the portfolios such as credit, prepayment and interest rate risk. As interest rates rise the value of bond prices will decline and an investor may lose money. The Fund is non-diversified and may invest a greater percentage of its assets in a single issuer than funds that are more diversified. Furthermore, the Fund invests primarily in municipal obligations issued by Kentucky and its political subdivisions and therefore will be affected by economic, political or other events affecting Kentucky.
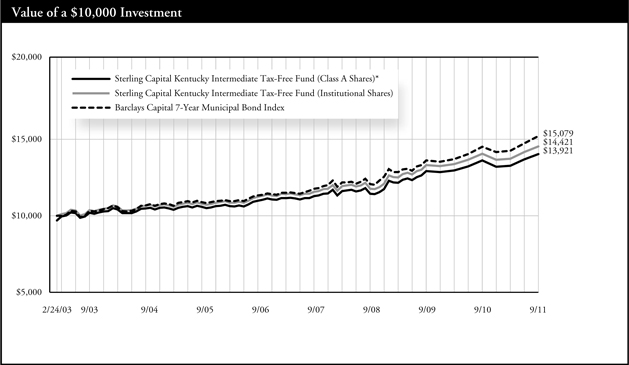
Q. How did the Fund perform during the 12-month period between October 1, 2010 and September 30, 2011?
A. The Fund gained 3.34% (Institutional Shares). That compared to a 4.65% return for Barclays Capital 7-Year Municipal Bond Index.
Q. What factors affected the Fund’s performance?
A. Municipal bond markets generated strong absolute returns during the period. Several factors sparked a rally in Treasuries, which also prompted a muni bond rally. The threat of default by the Greek government and its reverberations through Europe in addition to Japan’s economic woes combined to drive Treasury and muni prices higher. Soft domestic economic growth and the Federal Reserve’s decision to keep short-term rates low buoyed the Fund’s returns as well. Issues with longer maturities — 7 to 10 years — were the bond market’s biggest performers.1
The Fund’s exposure to shorter-term bonds than the benchmark index dragged on relative returns. The Fund’s relative performance benefited from exposure to hospital, education and transportation bonds, which outperformed general obligation issues.1
| 1 | Portfolio composition is as of September 30, 2011 and is subject to change. |
| * | Reflects 3.00% maximum sales charge. |
| | | | | | | | |
Average Annual Total Returns |
As of September 30, 2011 | | Inception
Date | | 1 Year | | 5 Years | | Since Inception |
Class A Shares* | | 2/24/03 | | -0.06% | | 4.28% | | 3.92% |
Institutional Shares | | 2/24/03 | | 3.34% | | 5.18% | | 4.35% |
Barclays Capital 7-Year Municipal Bond Index | | 2/28/03 | | 4.65% | | 5.95% | | 4.90% |
Past performance does not guarantee future results. The performance data quoted represents past performance and current returns may be lower or higher. Total return figures include change in share price, reinvestment of dividends and capital gains, and do not reflect taxes that a shareholder would pay on fund distributions or on the redemption of fund shares. The investment return and principal value will fluctuate so that an investor’s shares, when redeemed, may be worth more or less than the original cost. To obtain performance information current to the most recent month end, please visit www.sterlingcapitalfunds.com.
The chart above represents a comparison of a hypothetical $10,000 investment in the indicated share class versus a similar investment in the Fund’s benchmark, and represents the reinvestment of dividends and capital gains.
The Fund is measured against Barclays Capital 7-Year Municipal Bond Index, an unmanaged index which is representative of municipal bonds with a minimum credit rating of at least Baa, have a maturity value of at least $5 million and a maturity range of six to eight years. The index does not reflect the deduction of expenses associated with a mutual fund, such as investment management and fund accounting fees. The Fund performance reflects the deduction of fees for these services. Investors cannot invest directly in an index, although they can invest in its underlying securities.
A portion of the Fund’s fees has been waived. If the fees had not been waived, the Fund’s total return for the periods would have been lower.
Sterling Capital Maryland Intermediate Tax-Free Fund
Portfolio Manager
Robert F. Millikan, CFA
Sterling Capital Maryland Intermediate Tax-Free Fund (formerly known as BB&T Maryland Intermediate Tax-Free Fund) (the “Fund”) is managed by Robert F. Millikan, CFA, Executive Director and Portfolio Manager for Sterling Capital Management LLC (“Sterling Capital”), advisor to the Fund. Robert joined Sterling Capital in 2000. He manages the state-specific municipal bond fund portfolios and has investment experience since 1990. Bob is a graduate of Wake Forest University where he received his BA in Economics and is a CFA Charterholder. The Investment Team supporting the Fund includes 18 investment professionals with an average of more than 16 years industry experience.
Investment Concerns
The Fund is subject to the same risks as the underlying bonds in the portfolios such as credit, prepayment and interest rate risk. As interest rates rise the value of bond prices will decline and an investor may lose money. The Fund is non-diversified and may invest a greater percentage of its assets in a single issuer than funds that are more diversified. Furthermore, the Fund invests primarily in municipal obligations issued by Maryland and its political subdivisions and therefore will be affected by economic, political or other events affecting Maryland.
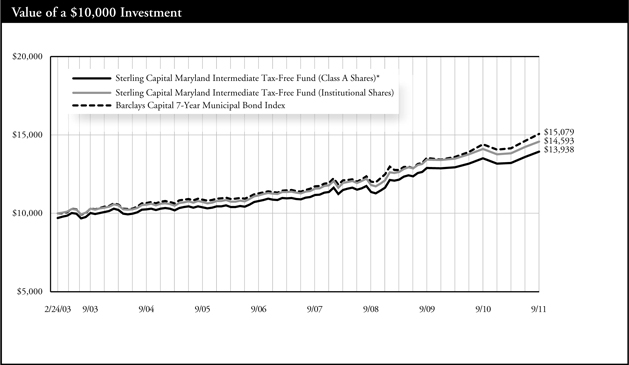
Q. How did the Fund perform during the 12-month period between October 1, 2010 and September 30, 2011?
A. The Fund gained 3.44% (Institutional Shares). That compared to a 4.65% return for Barclays Capital 7-Year Municipal Bond Index.
Q. What factors affected the Fund’s performance?
A. Investors bid up U.S. Treasuries and municipal bonds as market participants sought shelter from a global economy slowdown and the worries triggered by the euro zone’s ongoing debt crisis. Falling interest rates also helped longer-duration municipal bonds generate strong absolute returns.1
The Fund’s exposure to bonds shorter than five years dragged on returns relative to the benchmark. Meanwhile, holdings in high-quality states such as Maryland lagged those of bonds in more economically challenged jurisdictions, such as California, Illinois and New Jersey, which outperformed as spreads narrowed. Exposure to general obligation bonds weighed on relative returns, while the Fund’s positions in health care and education revenue bonds buoyed relative performance.1
| 1 | Portfolio composition is as of September 30, 2011 and is subject to change. |
| * | Reflects 3.00% maximum sales charge. |
| | | | | | | | |
Average Annual Total Returns |
As of September 30, 2011 | | Inception
Date | | 1 Year | | 5 Years | | Since
Inception |
Class A Shares* | | 2/24/03 | | -0.04% | | 4.60% | | 3.94% |
Institutional Shares | | 2/24/03 | | 3.44% | | 5.51% | | 4.49% |
Barclays Capital 7-Year Municipal Bond Index | | 2/28/03 | | 4.65% | | 5.95% | | 4.90% |
Past performance does not guarantee future results. The performance data quoted represents past performance and current returns may be lower or higher. Total return figures include change in share price, reinvestment of dividends and capital gains, and do not reflect taxes that a shareholder would pay on fund distributions or on the redemption of fund shares. The investment return and principal value will fluctuate so that an investor’s shares, when redeemed, may be worth more or less than the original cost. To obtain performance information current to the most recent month end, please visit www.sterlingcapitalfunds.com.
The chart above represents a comparison of a hypothetical $10,000 investment in the indicated share class versus a similar investment in the Fund’s benchmark, and represents the reinvestment of dividends and capital gains.
The Fund is measured against Barclays Capital 7-Year Municipal Bond Index, an unmanaged index which is representative of municipal bonds with a minimum credit rating of at least Baa, have a maturity value of at least $5 million and a maturity range of six to eight years. The index does not reflect the deduction of expenses associated with a mutual fund, such as investment management and fund accounting fees. The Fund’s performance reflects the deduction of fees for these services. Investors cannot invest directly in an index, although they can invest in its underlying securities.
A portion of the Fund’s fees has been waived. If the fees had not been waived, the Fund’s total return for the periods would have been lower.
Sterling Capital North Carolina Intermediate Tax-Free Fund
Portfolio Manager
Robert F. Millikan, CFA
Sterling Capital North Carolina Intermediate Tax-Free Fund (formerly known as BB&T North Carolina Intermediate Tax-Free Fund) (the “Fund”) is managed by Robert F. Millikan, CFA, Executive Director and Portfolio Manager for Sterling Capital Management LLC (“Sterling Capital”), advisor to the Fund. Robert joined Sterling Capital in 2000. He manages the state-specific municipal bond fund portfolios and has investment experience since 1990. Bob is a graduate of Wake Forest University where he received his BA in Economics and is a CFA Charterholder. The Investment Team supporting the Fund includes 18 investment professionals with an average of more than 16 years industry experience.
Investment Concerns
The Fund is subject to the same risks as the underlying bonds in the portfolios such as credit, prepayment and interest rate risk. As interest rates rise the value of bond prices will decline and an investor may lose money. The Fund is non-diversified and may invest a greater percentage of its assets in a single issuer than funds that are more diversified. Furthermore, the Fund invests primarily in municipal obligations issued by North Carolina and its political subdivisions and therefore will be affected by economic, political or other events affecting North Carolina.
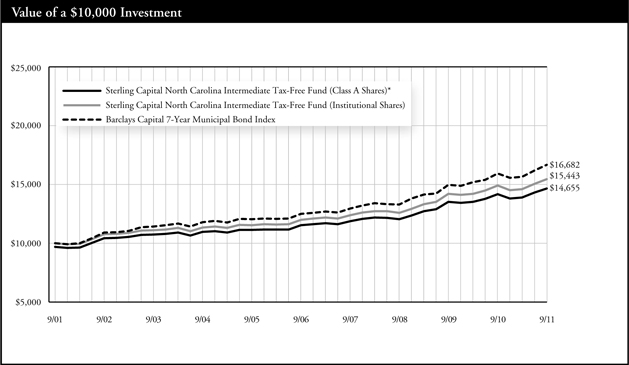
Q. How did the Fund perform during the 12-month period between October 1, 2010 and September 30, 2011?
A. The Fund gained 3.60% (Institutional Shares). That compared to a 4.65% return for Barclays Capital 7-Year Municipal Bond Index.
Q. What factors affected the Fund’s performance?
A. Investors bid up U.S. Treasuries and municipal bonds as market participants sought shelter from a global economy slowdown and the worries triggered by the euro zone’s ongoing debt crisis. Falling interest rates also helped longer-duration municipal bonds generate strong absolute returns.1
The Fund’s exposure to bonds shorter than five years dragged on returns relative to the benchmark. Meanwhile, holdings in high-quality states such as North Carolina lagged those of bonds in more economically challenged jurisdictions, such as California, Illinois and New Jersey, which outperformed as spreads narrowed. Exposure to general obligation bonds weighed on relative returns, while the Fund’s positions in health care and education revenue bonds buoyed relative performance.1
| 1 | Portfolio composition is as of September 30, 2011 and is subject to change. |
| * | Reflects 3.00% maximum sales charge. |
| | | | | | | | | | | | | | | | |
Average Annual Total Returns | |
As of September 30, 2011 | |
| Inception
Date |
| | | 1 Year | | | | 5 Years | | | | 10 Years | |
Class A Shares* | | | 10/16/92 | | | | 0.25% | | | | 4.29% | | | | 3.90% | |
Institutional Shares | | | 10/16/92 | | | | 3.60% | | | | 5.19% | | | | 4.44% | |
Barclays Capital 7-Year Municipal Bond Index | | | N/A | | | | 4.65% | | | | 5.95% | | | | 5.25% | |
Past performance does not guarantee future results. The performance data quoted represents past performance and current returns may be lower or higher. Total return figures include change in share price, reinvestment of dividends and capital gains, and do not reflect taxes that a shareholder would pay on fund distributions or on the redemption of fund shares. The investment return and principal value will fluctuate so that an investor’s shares, when redeemed, may be worth more or less than the original cost. To obtain performance information current to the most recent month end, please visit www.sterlingcapitalfunds.com.
The chart above represents a comparison of a hypothetical $10,000 investment in the indicated share class versus a similar investment in the Fund’s benchmark, and represents the reinvestment of dividends and capital gains.
The Fund is measured against Barclays Capital 7-Year Municipal Bond Index, an unmanaged index which is representative of municipal bonds with a minimum credit rating of at least Baa, have a maturity value of at least $5 million and a maturity range of six to eight years. The index does not reflect the deduction of expenses associated with a mutual fund, such as investment management and fund accounting fees. The Fund’s performance reflects the deduction of fees for these services. Investors cannot invest directly in an index, although they can invest in its underlying securities.
A portion of the Fund’s fees has been waived. If the fees had not been waived, the Fund’s total return for the periods would have been lower.
Sterling Capital South Carolina Intermediate Tax-Free Fund
Portfolio Manager
Robert F. Millikan, CFA
Sterling Capital South Carolina Intermediate Tax-Free Fund (formerly known as BB&T South Carolina Intermediate Tax-Free Fund) (the “Fund”) is managed by Robert F. Millikan, CFA, Executive Director and Portfolio Manager for Sterling Capital Management LLC (“Sterling Capital”), advisor to the Fund. Robert joined Sterling Capital in 2000. He manages the state-specific municipal bond fund portfolios and has investment experience since 1990. Bob is a graduate of Wake Forest University where he received his BA in Economics and is a CFA Charterholder. The Investment Team supporting the Fund includes 18 investment professionals with an average of more than 16 years industry experience.
Investment Concerns
The Fund is subject to the same risks as the underlying bonds in the portfolios such as credit, prepayment and interest rate risk. As interest rates rise the value of bond prices will decline and an investor may lose money. The Fund is non-diversified and may invest a greater percentage of its assets in a single issuer than funds that are more diversified. Furthermore, the Fund invests primarily in municipal obligations issued by South Carolina and its political subdivisions and therefore will be affected by economic, political or other events affecting South Carolina.
Q. How did the Fund perform during the 12-month period between October 1, 2010 and September 30, 2011?
A. The Fund gained 3.37% (Institutional Shares). That compared to a 4.65% return for Barclays Capital 7-Year Municipal Bond Index.
Q. What factors affected the Fund’s performance?
A. Investors bid up U.S. Treasuries and municipal bonds as market participants sought shelter from a global economy slowdown and the worries triggered by the euro zone’s ongoing debt crisis. Falling interest rates also helped longer-duration municipal bonds generate strong absolute returns.1
The Fund’s exposure to bonds shorter than five years dragged on returns relative to the benchmark. Meanwhile, holdings in high-quality states such as South Carolina lagged those of bonds in more economically challenged jurisdictions, such as California, Illinois and New Jersey, which outperformed as spreads narrowed. Exposure to general obligation bonds weighed on relative returns, while the Fund’s positions in health care and education revenue bonds buoyed relative performance.1
| 1 | Portfolio composition is as of September 30, 2011 and is subject to change. |
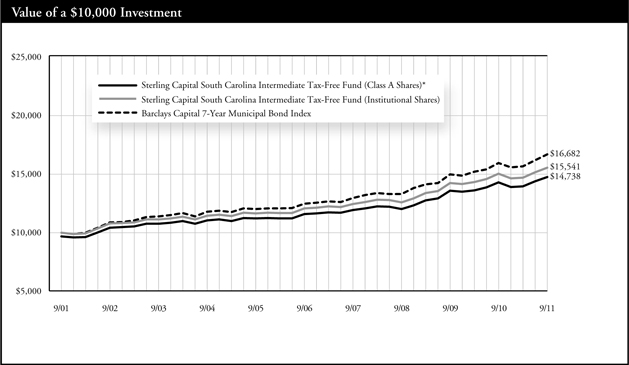
| * | Reflects 3.00% maximum sales charge. |
| | | | | | | | | | | | | | | | |
Average Annual Total Returns | |
As of September 30, 2011 | |
| Inception
Date |
| | | 1 Year | | | | 5 Years | | | | 10 Years | |
Class A Shares* | | | 10/20/97 | | | | 0.00% | | | | 4.28% | | | | 3.95% | |
Institutional Shares | | | 10/20/97 | | | | 3.37% | | | | 5.17% | | | | 4.51% | |
Barclays Capital 7-Year Municipal Bond Index | | | N/A | | | | 4.65% | | | | 5.95% | | | | 5.25% | |
Past performance does not guarantee future results. The performance data quoted represents past performance and current returns may be lower or higher. Total return figures include change in share price, reinvestment of dividends and capital gains, and do not reflect taxes that a shareholder would pay on fund distributions or on the redemption of fund shares. The investment return and principal value will fluctuate so that an investor’s shares, when redeemed, may be worth more or less than the original cost. To obtain performance information current to the most recent month end, please visit www.sterlingcapitalfunds.com.
The chart above represents a comparison of a hypothetical $10,000 investment in the indicated share class versus a similar investment in the Fund’s benchmark, and represents the reinvestment of dividends and capital gains.
The Fund is measured against Barclays Capital 7-Year Municipal Bond Index, an unmanaged index which is representative of municipal bonds with a minimum credit rating of at least Baa, have a maturity value of at least $5 million and a maturity range of six to eight years. The index does not reflect the deduction of expenses associated with a mutual fund, such as investment management and fund accounting fees. The Fund’s performance reflects the deduction of fees for these services. Investors cannot invest directly in an index, although they can invest in its underlying securities.
A portion of the Fund’s fees has been waived. If the fees had not been waived, the Fund’s total return for the periods would have been lower.
Sterling Capital Virginia Intermediate Tax-Free Fund
Portfolio Manager
Robert F. Millikan, CFA
Sterling Capital Virginia Intermediate Tax-Free Fund (formerly known as BB&T Virginia Intermediate Tax-Free Fund) (the “Fund”) is managed by Robert F. Millikan, CFA, Executive Director and Portfolio Manager for Sterling Capital Management LLC (“Sterling Capital”), advisor to the Fund. Robert joined Sterling Capital in 2000. He manages the state-specific municipal bond fund portfolios and has investment experience since 1990. Bob is a graduate of Wake Forest University where he received his BA in Economics and is a CFA Charterholder. The Investment Team supporting the Fund includes 18 investment professionals with an average of more than 16 years industry experience.
Investment Concerns
The Fund is subject to the same risks as the underlying bonds in the portfolios such as credit, prepayment and interest rate risk. As interest rates rise the value of bond prices will decline and an investor may lose money. The Fund is non-diversified and may invest a greater percentage of its assets in a single issuer than funds that are more diversified. Furthermore, the Fund invests primarily in municipal obligations issued by Virginia and its political subdivisions and therefore will be affected by economic, political or other events affecting Virginia.
Q. How did the Fund perform during the 12-month period between October 1, 2010 and September 30, 2011?
A. The Fund gained 3.11% (Institutional Shares). That compared to a 4.65% return for Barclays Capital 7-Year Municipal Bond Index.
Q. What factors affected the Fund’s performance?
A. Investors bid up U.S. Treasuries and municipal bonds as market participants sought shelter from a global economy slowdown and the worries triggered by the euro zone’s ongoing debt crisis. Falling interest rates also helped longer-duration municipal bonds generate strong absolute returns.1
The Fund’s exposure to bonds shorter than five years dragged on returns relative to the benchmark. Meanwhile, holdings in high-quality states such as Virginia lagged those of bonds in more economically challenged jurisdictions, such as California, Illinois and New Jersey, which outperformed as spreads narrowed. Exposure to general obligation bonds weighed on relative returns, while the Fund’s positions in health care and education revenue bonds buoyed relative performance.1
| 1 | Portfolio composition is as of September 30, 2011 and is subject to change. |
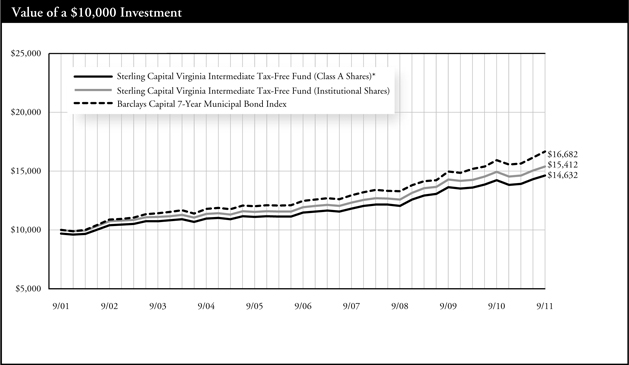
| * | Reflects 3.00% maximum sales charge. |
| | | | | | | | | | | | | | | | |
| Average Annual Total Returns | |
As of September 30, 2011 | | Inception
Date | | | 1 Year | | | 5 Years | | | 10 Years | |
Class A Shares* | | | 5/17/99 | | | | -0.27% | | | | 4.33% | | | | 3.88% | |
Institutional Shares | | | 5/17/99 | | | | 3.11% | | | | 5.22% | | | | 4.42% | |
Barclays Capital 7-Year Municipal Bond Index | | | N/A | | | | 4.65% | | | | 5.95% | | | | 5.25% | |
Past performance does not guarantee future results. The performance data quoted represents past performance and current returns may be lower or higher. Total return figures include change in share price, reinvestment of dividends and capital gains, and do not reflect taxes that a shareholder would pay on fund distributions or on the redemption of fund shares. The investment return and principal value will fluctuate so that an investor’s shares, when redeemed, may be worth more or less than the original cost. To obtain performance information current to the most recent month end, please visit www.sterlingcapitalfunds.com.
The chart above represents a comparison of a hypothetical $10,000 investment in the indicated share class versus a similar investment in the Fund’s benchmark, and represents the reinvestment of dividends and capital gains.
The Fund is measured against Barclays Capital 7-Year Municipal Bond Index, an unmanaged index which is representative of municipal bonds with a minimum credit rating of at least Baa, have a maturity value of at least $5 million and a maturity range of six to eight years. The index does not reflect the deduction of expenses associated with a mutual fund, such as investment management and fund accounting fees. The Fund’s performance reflects the deduction of fees for these services. Investors cannot invest directly in an index, although they can invest in its underlying securities.
A portion of the Fund’s fees has been waived. If the fees had not been waived, the Fund’s total return for the periods would have been lower.
Sterling Capital West Virginia Intermediate Tax-Free Fund
Portfolio Manager
Robert F. Millikan, CFA
Sterling Capital West Virginia Intermediate Tax-Free Fund (formerly known as BB&T West Virginia Intermediate Tax-Free Fund) (the “Fund”) is managed by Robert F. Millikan, CFA, Executive Director and Portfolio Manager for Sterling Capital Management LLC (“Sterling Capital”), advisor to the Fund. Robert joined Sterling Capital in 2000. He manages the state-specific municipal bond fund portfolios and has investment experience since 1990. Bob is a graduate of Wake Forest University where he received his BA in Economics and is a CFA Charterholder. The Investment Team supporting the Fund includes 18 investment professionals with an average of more than 16 years industry experience.
Investment Concerns
The Fund is subject to the same risks as the underlying bonds in the portfolios such as credit, prepayment and interest rate risk. As interest rates rise the value of bond prices will decline and an investor may lose money. The Fund is non-diversified and may invest a greater percentage of its assets in a single issuer than funds that are more diversified. Furthermore, the Fund invests primarily in municipal obligations issued by West Virginia and its political subdivisions and therefore will be affected by economic, political or other events affecting West Virginia.
Q. How did the Fund perform during the 12-month period between October 1, 2010 and September 30, 2011?
A. The Fund gained 3.48% (Institutional Shares). That compared to a 4.65% return for Barclays Capital 7-Year Municipal Bond Index.
Q. What factors affected the Fund’s performance?
A. Municipal bond markets generated strong absolute returns during the period. Several factors sparked a rally in Treasuries, which also prompted a muni bond rally. The threat of default by the Greek government and its reverberations through Europe in addition to
Japan’s economic woes combined to drive Treasury and muni prices higher. Soft domestic economic growth and the Federal Reserve’s decision to keep short-term rates low buoyed the Fund’s returns as well. Issues with longer maturities — seven to 10 years — were the bond market’s biggest performers.1
The Fund’s exposure to shorter-term bonds than the benchmark index dragged on relative returns. The Fund’s relative performance benefited from exposure to hospital, education and transportation bonds, which outperformed general obligation issues.1
| 1 | Portfolio composition is as of September 30, 2011 and is subject to change. |
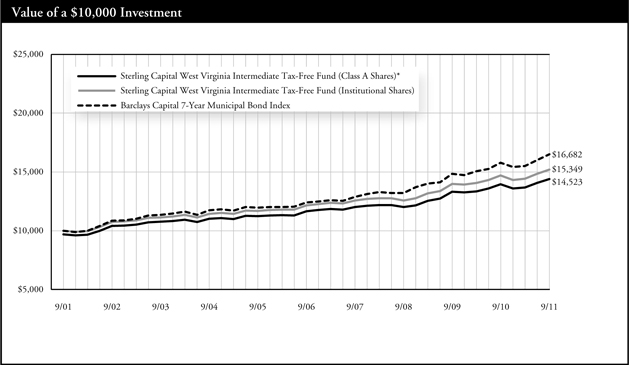
| * | Reflects 3.00% maximum sales charge. |
| | | | | | | | | | | | | | | | |
Average Annual Total Returns | |
As of September 30, 2011 | | Inception
Date | | | 1 Year | | | 5 Years | | | 10 Years | |
Class A Shares* | | | 12/17/93 | | | | 0.17% | | | | 3.76% | | | | 3.80% | |
Institutional Shares | | | 12/1/93 | | | | 3.48% | | | | 4.65% | | | | 4.38% | |
Barclays Capital 7-Year Municipal Bond Index | | | N/A | | | | 4.65% | | | | 5.95% | | | | 5.25% | |
Past performance does not guarantee future results. The performance data quoted represents past performance and current returns may be lower or higher. Total return figures include change in share price, reinvestment of dividends and capital gains, and do not reflect taxes that a shareholder would pay on fund distributions or on the redemption of fund shares. The investment return and principal value will fluctuate so that an investor’s shares, when redeemed, may be worth more or less than the original cost. To obtain performance information current to the most recent month end, please visit www.sterlingcapitalfunds.com.
The chart above represents a comparison of a hypothetical $10,000 investment in the indicated share class versus a similar investment in the Fund’s benchmark, and represents the reinvestment of dividends and capital gains.
The Fund is measured against Barclays Capital 7-Year Municipal Bond Index, an unmanaged index which is representative of municipal bonds with a minimum credit rating of at least Baa, have a maturity value of at least $5 million and a maturity range of six to eight years. The index does not reflect the deduction of expenses associated with a mutual fund, such as investment management and fund accounting fees. The Fund’s performance reflects the deduction of fees for these services. Investors cannot invest directly in an index, although they can invest in its underlying securities.
A portion of the Fund’s fees has been waived. If the fees had not been waived, the Fund’s total return for the periods would have been lower.
Sterling Capital National Tax-Free Money Market Fund
Portfolio Manager
Michael Sirianni, CFA
Federated Investment Management Company (subadviser)
Sterling Capital National Tax-Free Money Market Fund (formerly known as BB&T National Tax-Free Money Market Fund) (the “Fund”) was managed during the 12-month period by Michael Sirianni, portfolio manager for Federated Investment Management Company (“Federated IMC”), subadvisor to the Fund. Michael managed the Fund since 2006. He received his BA from Pennsylvania State University and an MBA from the University of Pittsburgh. Michael has investment experience since 1987. The Investment Team at Federated IMC supporting the Fund has an average of more than 11 years of investment management experience:
Investment Concerns
Distributions of the Fund net interest income from tax-exempt securities generally are not subject to federal income tax, but for some may be subject to the federal alternative minimum tax and to state and local taxes. A portion of the Fund distributions may be taxable as ordinary income or capital gains.
An investment in a money market fund is not insured or guaranteed by the Federal Deposit Insurance Corporation (FDIC) or any other government agency. Although a money market fund seeks to preserve the value of your investment at $1 per share, it is possible to lose money by investing in a money market fund.
Q. What factors affected the Fund’s yield during the 12-month period between October 1, 2010 and September 30, 2011?
A. The Fund began the period with a seven-day yield of 0.02% (Institutional Shares) and ended the period with a seven-day yield of 0.01%.
The Federal Reserve worked to safeguard a U.S. economic recovery by holding short-term lending rates at the historically low range of 0.00%
to 0.25%. That kept the yield generated by the Fund low in turn.1
The Fund’s absolute performance was also affected by the European debt crisis, which caused a backup in seven-day variable rate demand note rates late in the period. Performance also fell during a reconfiguration of the Fund’s portfolio in connection with a change in subadvisor. Overall, rates moved steadily downward during the period due to demand from taxable money funds.1
| 1 | Portfolio composition is as of September 30, 2011 and is subject to change. |
Past performance does not guarantee future results. The performance data quoted represents past performance and current returns may be lower or higher. Total return figures include change in share price, reinvestment of dividends and capital gains, and do not reflect taxes that a shareholder would pay on fund distributions or on the redemption of fund shares. The investment return and principal value will fluctuate so that an investor’s shares, when redeemed, may be worth more or less than the original cost. To obtain performance information current to the most recent month end, please visit www.sterlingcapitalfunds.com.
A portion of the Fund’s fees has been waived. If the fees had not been waived, the Fund’s total return for the periods would have been lower.
Sterling Capital Prime Money Market Fund
Portfolio Manager
Paige Wilhelm, CFA
Federated Investment Management Company (subadviser)
Sterling Capital Prime Money Market Fund (formerly known as BB&T Prime Money Market Fund) (the “Fund”) was managed during the 12-month period by Paige Wilhelm, portfolio manager for Federated Investment Management Company (“Federated IMC”), subadvisor to the Fund. Paige managed the Fund since 2006. She received her BS from Indiana University and an MBA from Duquesne University. Paige has investment experience since 1991. The Investment Team at Federated IMC supporting the Fund has an average of more than 11 years of investment management experience:
Investment Concerns
An investment in a money market fund is not insured or guaranteed by the Federal Deposit Insurance Corporation (FDIC) or any other government agency. Although a money market fund seeks to preserve the value of your investment at $1 per share, it is possible to lose money by investing in a money market fund.
Q. What factors affected the Fund’s yield during the 12-month period between October 1, 2010 and September 30, 2011?
A. Concerns that the U.S. economic recovery was weakening spurred the Federal Reserve to keep short term rates between 0.00% and 0.25%, a factor that limited absolute returns. Meanwhile, the European debt crisis weighed on three-month LIBOR rates, which ended the period under review at 0.37%. These borrowing rates influenced the yields of commercial paper and certificates of deposit securities in the Fund’s portfolio.1
The Fund’s yield fell in the last month of the fiscal year, the result of
portfolio adjustments in connection with the appointment of its new subadvisor.1
The Fund’s seven-day yield was 0.06% (Institutional Shares) at the beginning of the 12-month period, eventually declining to 0.01% by the end of the period.1
The Fund continued its approach of investing in commercial paper, asset-backed commercial paper and bank instruments. Throughout the year, the Fund’s managers targeted an average maturity of 40 to 50 days for the Fund. The majority of the purchases were concentrated in the short end of the money market yield curve, from one to three months.1
| 1 | Portfolio composition is as of September 30, 2011 and is subject to change. |
Past performance does not guarantee future results. The performance data quoted represents past performance and current returns may be lower or higher. Total return figures include change in share price, reinvestment of dividends and capital gains, and do not reflect taxes that a shareholder would pay on fund distributions or on the redemption of fund shares. The investment return and principal value will fluctuate so that an investor’s shares, when redeemed, may be worth more or less than the original cost. To obtain performance information current to the most recent month end, please visit www.sterlingcapitalfunds.com.
A portion of the Fund’s fees has been waived. If the fees had not been waived, the Fund’s total return for the periods would have been lower.
Sterling Capital U.S. Treasury Money Market Fund
Portfolio Manager
Kevin E. McNair, CFA
Sterling Capital U.S. Treasury Money Market Fund (formerly known as BB&T U.S. Treasury Money Market Fund) (the “Fund”) is managed by Kevin E. McNair, CFA, portfolio manager for Sterling Capital Management LLC (“Sterling Capital”), advisor to the Fund. Mr. McNair joined Sterling Capital in 1994. He has investment experience since 1994. Kevin is a graduate of the University of North Carolina at Chapel Hill where he received his BA in Economics. He received his MA in Economics from North Carolina State University. The Investment Team supporting the Fund has more than 65 combined years of investment experience:
| • | | Robert F. Millikan, CFA, Executive Director |
| • | | Brad D. Eppard, CFA, Director |
| • | | David T. Johnson, Associate Director |
Investment Concerns
U.S. government guarantees apply only to the underlying securities of the Fund that are issued by the U.S. government or its agencies or instrumentalities and not the Fund shares.
An investment in a money market fund is not insured or guaranteed by the Federal Deposit Insurance Corporation (FDIC) or any other government agency. Although a money market fund seeks to preserve the value of your investment at $1 per share, it is possible to lose money by investing in a money market fund.
Q. What was the fund’s seven-day yield during the period between October 1, 2010 and September 30, 2011?
A. The Fund’s seven-day yield was 0.01% at the beginning of the period; it remained 0.01% at the end of the 12-months.1
Q. What factors affected the Fund’s yield during the 12-month period between October 1, 2010 and September 30, 2011?
A. Throughout the fiscal year, the Federal Reserve Board maintained its target for the Federal Funds Rate at the historically low range between 0.00% and 0.25%. Additionally, investors fled to U.S. Treasuries as
shelter from the uncertainty stirred by Europe’s unfolding sovereign debt crisis and concerns about a global economic slowdown. Interest rates in general fell throughout the period, resulting in significantly lower yields among money market securities.1
As of September 30, 2011, the Fund held 40% of its assets in repurchase agreements, 26% in Treasury bills and 22% in Treasury notes. The Fund’s average maturity was 59 days, and its credit quality as rated by Standard & Poor’s was AAA.1
| 1 | Portfolio composition is as of September 30, 2011 and is subject to change. |
Past performance does not guarantee future results. The performance data quoted represents past performance and current returns may be lower or higher. Total return figures include change in share price, reinvestment of dividends and capital gains, and do not reflect taxes that a shareholder would pay on fund distributions or on the redemption of fund shares. The investment return and principal value will fluctuate so that an investor’s shares, when redeemed, may be worth more or less than the original cost. To obtain performance information current to the most recent month end, please visit www.sterlingcapitalfunds.com.
A portion of the Fund’s fees has been waived. If the fees had not been waived, the Fund’s total return for the periods would have been lower.
Sterling Capital Strategic Allocation Funds
Portfolio Managers
Team Managed
Sterling Capital Strategic Allocation Funds (formerly known as BB&T Capital Manager Funds) (the “Funds”) are managed by Asset Allocation and ARC Teams of Sterling Capital Management LLC led by Jeffrey J. Schappe, CFA, Managing Director and Chief Investment Officer & James C. Willis, CFA, Managing Director. The Investment Team supporting the Funds includes 10 investment professionals with an average of more than 15 years industry experience.
Investment Concerns
The Funds are primarily concentrated in underlying funds and are therefore subject to the same risks the funds are invested in bear a portion of the expenses of the underlying funds. The underlying funds may be invested in equity securities and are subject to market risk. Investments in bonds are subject to credit risk, call risk and interest rate risk (as interest rates rise the value of bond prices will decline). The underlying funds may invest in more aggressive investments such as foreign securities, which involve certain risks such as currency volatility, political and social instability and reduced market liquidity; small capitalization companies subject to greater volatility and less liquidity due to limited resources or product lines and more sensitive to economic factors; and high-yield (junk) debt securities which involve greater risks than investment grade bonds. The underlying funds may also be money market funds.
An investment in a money market fund is not insured or guaranteed by the Federal Deposit Insurance Corporation (FDIC) or any other government agency. Although a money market fund seeks to preserve the value of your investment at $1 per share, it is possible to lose money by investing in them.
Sterling Capital Strategic Allocation Conservative Fund (formerly known as BB&T Capital Manager Conservative Growth Fund) Sterling Capital Strategic Allocation Balanced Fund (formerly known as BB&T Capital Manager Moderate Growth Fund) Sterling Capital Strategic Allocation Growth Fund (formerly known as BB&T Capital Manager Growth Fund) Sterling Capital Strategic Allocation Equity Fund (formerly known as BB&T Capital Manager Equity Fund) (Collectively, “Sterling Capital Strategic Allocation Funds”)
Q. How did the Funds (Institutional Shares) perform during the 12-month period between October 1, 2010 and September 30, 2011?
A. Sterling Capital Strategic Allocation Funds and their benchmarks generated the following returns:
Sterling Capital Strategic Allocation Conservative Fund: -0.31%. Composite index with a 40% weighting in S&P 500® and a 60% weighting in Barclays Capital Intermediate Government Bond Index: 2.96%.
Sterling Capital Strategic Allocation Balanced Fund: -3.02%. Composite index with a 60% weighting in S&P 500® and a 40% weighting in Barclays Capital Intermediate Government Bond Index: 2.44%.
Sterling Capital Strategic Allocation Growth Fund: -4.86%. Composite index with a 75% weighting in S&P 500® and a 25% weighting in Barclays Capital Intermediate Government Bond Index: 1.99%.
Sterling Capital Strategic Allocation Equity Fund: -6.64%. The S&P 500® Index: 1.14%.
Q. What factors affected the Funds’ performance?
A. The Strategic Allocation Funds invest in a combination of Sterling Capital equity funds, external equity and commodity funds, and exchange traded funds. The three Strategic Allocation Funds with fixed-
income allocations also hold exposure to Sterling Capital Total Return Bond Fund.1
The bond market performed well during the period as government bond yields dropped to very low levels due to a slowdown in global economic growth. Global equity markets were a drag on the Fund’s absolute returns as fears of double-dip recessions in the United States and Europe resulted in sub-par returns over the period.1
The Funds’ relative performance suffered from overweight positions in mid-cap and small cap equity shares within the United States. The Russell Mid Cap and Russell 2000® indices returned -0.88% and -3.53%, respectively, versus 1.14% for S&P 500® over the 1-year period. The overall equity allocation made a negative contribution to relative performance, as did an overweight position in value stocks within developed equity, both domestic and international. The Russell 3000® Value Index underperformed Russell 3000® Growth Index (-2.22% vs. 3.39%), and Russell Developed ex U.S. Large Cap Value Index underperformed its growth counterpart over the period (-7.28% vs. -10.75%).1
In the Balanced and Growth Funds, a 5% overweight position in equity contributed negatively to the Funds’ relative performances, as stocks underperformed bonds during the period. S&P 500® returned 1.14% during the period, versus 3 .40% for Barclays Capital Intermediate Government Bond Index.1
The Funds’ relative performance benefited from an overweight position in non-U.S. small cap equity. The Russell Developed ex-U.S. Small Cap Index returned -4.67%, versus -8.71% for Russell Developed ex-U.S. Index. An overweight position in value stocks within the emerging markets equity allocation also made a positive contribution to relative performance. The Russell Emerging Markets Value Index returned - 13.99% versus -16.70% for Russell Emerging Markets Growth Index. The Funds maintained a 60/40 value -to-growth split within their emerging markets equity allocation.1
| 1 | Portfolio composition is as of September 30, 2011 and is subject to change. |
Sterling Capital Strategic Allocation Conservative Fund
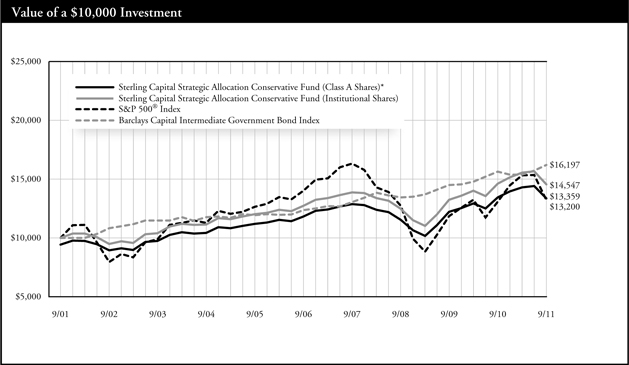
| * | Reflects 5.75% maximum sales charge. |
| ** | Reflects the applicable contingent deferred sales charge (CDSC), maximum of 5.00%. |
| *** | Reflects the applicable maximum CDSC of 1.00% (applicable only to redemptions within one year of purchase, and as such, are not reflected in the Annual Average Total Returns table since the periods reflected are for a year or longer). |
| | | | | | | | | | | | | | | | |
Average Annual Total Returns | | | | | |
As of September 30, 2011 | | Inception
Date | | | 1 Year | | | 5 Years | | | 10 Years | |
A Shares* | | | 1/29/98 | | | | -6.24 | % | | | 1.28 | % | | | 2.94 | % |
B Shares** | | | 1/29/99 | | | | -5.11 | % | | | 1.58 | % | | | 2.94 | % |
C Shares*** | | | 2/1/01 | | | | -1.30 | % | | | 1.73 | % | | | 2.78 | % |
Institutional Shares | | | 10/2/97 | | | | -0.31 | % | | | 2.74 | % | | | 3.82 | % |
S&P 500® Index | | | 9/30/97 | | | | 1.14 | % | | | -1.18 | % | | | 2.82 | % |
Barclays Capital Int. Government Bond Index | | | N/A | | | | 3.40 | % | | | 5.92 | % | | | 5.12 | % |
Past performance does not guarantee future results. The performance data quoted represents past performance and current returns may be lower or higher. Total return figures include change in share price, reinvestment of dividends and capital gains, and do not reflect taxes that a shareholder would pay on fund distributions or on the redemption of fund shares. The investment return and principal value will fluctuate so that an investor’s shares, when redeemed, may be worth more or less than the original cost. To obtain performance information current to the most recent month end, please visit www.sterlingcapitalfunds.com.
The chart above represents a comparison of a hypothetical $10,000 investment in the indicated share class versus a similar investment in the Fund’s benchmarks, and represents the reinvestment of dividends and capital gains.
The Fund is measured against S&P 500® Index, which is generally considered to be representative of the performance of the stock market as a whole, and against Barclays Capital Intermediate Government Bond Index, which is widely used as a broad measure of the performance of U.S. Government Bonds with maturities of less than 10 years. The indices are unmanaged and do not reflect the deduction of expenses associated with a mutual fund, such as investment management and, fund accounting fees. The Fund’s performance reflects the deduction of fees for these services. Investors cannot invest directly in an index, although they can invest in its underlying securities.
A portion of the Fund’s fees have been waived. If the fees had not been waived, the Fund’s total return for the periods would have been lower.
Sterling Capital Strategic Allocation Balanced Fund
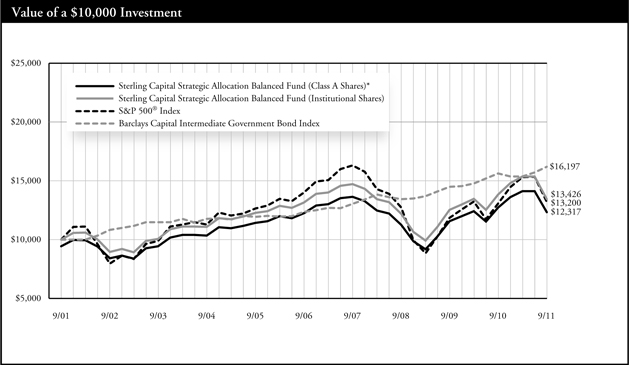
| * | Reflects 5.75% maximum sales charge. |
| ** | Reflects the applicable contingent deferred sales charge (CDSC), maximum of 5.00%. |
| *** | Reflects the applicable maximum CDSC of 1.00% (applicable only to redemptions within one year of purchase, and as such, are not reflected in the Annual Average Total Returns table since the periods reflected are for a year or longer). |
| | | | | | | | | | | | | | | | |
Average Annual Total Returns | | | | | |
As of September 30, 2011 | | Inception Date | | | 1 Year | | | 5 Years | | | 10 years | |
A Shares* | | | 1/29/98 | | | | -8.83 | % | | | -1.04 | % | | | 2.11% | |
B Shares** | | | 1/29/99 | | | | -7.80 | % | | | -0.76 | % | | | 2.12% | |
C Shares*** | | | 2/1/01 | | | | -3.97 | % | | | -0.59 | % | | | 1.98% | |
Institutional Shares | | | 10/2/97 | | | | -3.02 | % | | | 0.41 | % | | | 2.99% | |
S&P 500® Index | | | 9/30/97 | | | | 1.14 | % | | | -1.18 | % | | | 2.82% | |
Barclays Capital Int. Government Bond Index | | | N/A | | | | 3.40 | % | | | 5.92 | % | | | 5.12% | |
Past performance does not guarantee future results. The performance data quoted represents past performance and current returns may be lower or higher. Total return figures include change in share price, reinvestment of dividends and capital gains, and do not reflect taxes that a shareholder would pay on fund distributions or on the redemption of fund shares. The investment return and principal value will fluctuate so that an investor’s shares, when redeemed, may be worth more or less than the original cost. To obtain performance information current to the most recent month end, please visit www.sterlingcapitalfunds.com.
The chart above represents a comparison of a hypothetical $10,000 investment in the indicated share class versus a similar investment in the Fund’s benchmarks, and represents the reinvestment of dividends and capital gains.
The Fund is measured against S&P 500® Index, which is generally considered to be representative of the performance of the stock market as a whole, and against Barclays Capital Intermediate Government Bond Index, which is widely used as a broad measure of the performance of U.S. Government Bonds with maturities of less than 10 years. The indices are unmanaged and do not reflect the deduction of expenses associated with a mutual fund, such as investment management and, fund accounting fees. The Fund’s performance reflects the deduction of fees for these services. Investors cannot invest directly in an index, although they can invest in its underlying securities.
A portion of the Fund’s fees have been waived. If the fees had not been waived, the Fund’s total return for the periods would have been lower.
Sterling Capital Strategic Allocation Growth Fund
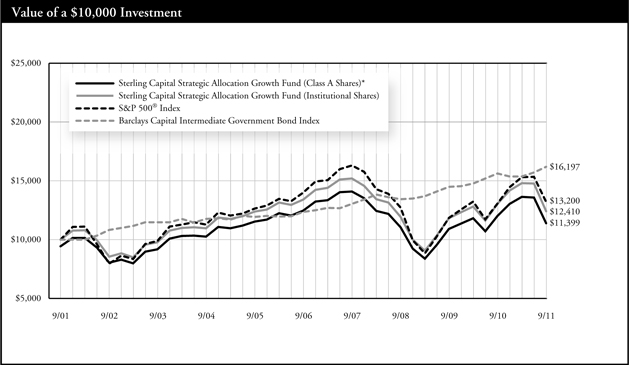
| * | Reflects 5.75% maximum sales charge. |
| ** | Reflects the applicable contingent deferred sales charge (CDSC), maximum of 5.00%. |
| *** | Reflects the applicable maximum CDSC of 1.00% (applicable only to redemptions within one year of purchase, and as such, are not reflected in the Annual Average Total Returns table since the periods reflected are for a year or longer). |
| | | | | | | | | | | | | | | | |
Average Annual Total Returns | | | | | |
As of September 30, 2011 | | Inception
Date | | | 1 Year | | | 5 Years | | | 10 Years | |
A Shares* | | | 1/29/98 | | | | -10.57 | % | | | -2.90 | % | | | 1.32 | % |
B Shares** | | | 1/29/99 | | | | -9.43 | % | | | -2.64 | % | | | 1.31 | % |
C Shares*** | | | 2/1/01 | | | | -5.78 | % | | | -2.48 | % | | | 1.18 | % |
Institutional Shares | | | 10/2/97 | | | | -4.86 | % | | | -1.51 | % | | | 2.18 | % |
S&P 500® Index | | | 9/30/97 | | | | 1.14 | % | | | -1.18 | % | | | 2.82 | % |
Barclays Capital Int. Government Bond Index | | | N/A | | | | 3.40 | % | | | 5.92 | % | | | 5.12 | % |
Past performance does not guarantee future results. The performance data quoted represents past performance and current returns may be lower or higher. Total return figures include change in share price, reinvestment of dividends and capital gains, and do not reflect taxes that a shareholder would pay on fund distributions or on the redemption of fund shares. The investment return and principal value will fluctuate so that an investor’s shares, when redeemed, may be worth more or less than the original cost. To obtain performance information current to the most recent month end, please visit www.sterlingcapitalfunds.com.
The chart above represents a comparison of a hypothetical $10,000 investment in the indicated share class versus a similar investment in the Fund’s benchmarks, and represents the reinvestment of dividends and capital gains.
The Fund is measured against S&P 500® Index, which is generally considered to be representative of the performance of the stock market as a whole, and against Barclays Capital Intermediate Government Bond Index, which is widely used as a broad measure of the performance of U.S. Government Bonds with maturities of less than 10 years. The indices are unmanaged and do not reflect the deduction of expenses associated with a mutual fund, such as investment management and, fund accounting fees. The Fund’s performance reflects the deduction of fees for these services. Investors cannot invest directly in an index, although they can invest in its underlying securities.
A portion of the Fund’s fees have been waived. If the fees had not been waived, the Fund’s total return for the periods would have been lower.
Sterling Capital Strategic Allocation Equity Fund
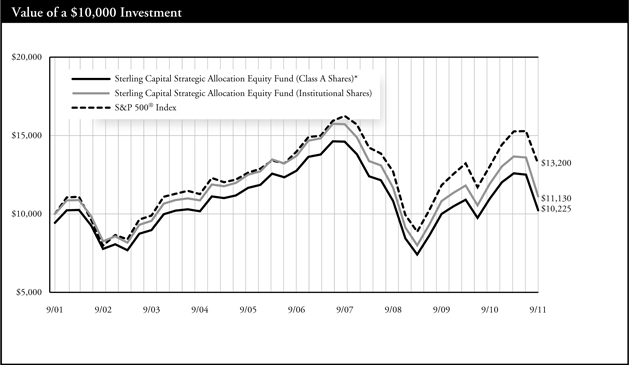
| * | Reflects 5.75% maximum sales charge. |
| ** | Reflects the applicable contingent deferred sales charge (CDSC), maximum of 5.00% |
| *** | Reflects the applicable maximum CDSC of 1.00% (applicable only to redemptions within one year of purchase, and as such, are not reflected in the Annual Average Total Returns table since the periods reflected are for a year or longer). |
| | | | | | | | | | | | | | |
Average Annual Total Returns | | | | | |
As of September 30, 2011 | | Inception
Date | | 1 Year | | | 5 Years | | | 10 Years | |
A Shares* | | 3/19/01 | | | -12.29 | % | | | -5.48 | % | | | 0.22 | % |
B Shares** | | 3/19/01 | | | -11.35 | % | | | -5.21 | % | | | 0.22 | % |
C Shares*** | | 3/19/01 | | | -7.55 | % | | | -4.99 | % | | | 0.09 | % |
Institutional Shares | | 3/19/01 | | | -6.64 | % | | | -4.11 | % | | | 1.08 | % |
S&P 500® Index | | 3/19/01 | | | 1.14 | % | | | -1.18 | % | | | 2.82 | % |
Past performance does not guarantee future results. The performance data quoted represents past performance and current returns may be lower or higher. Total return figures include change in share price, reinvestment of dividends and capital gains, and do not reflect taxes that a shareholder would pay on fund distributions or on the redemption of fund shares. The investment return and principal value will fluctuate so that an investor’s shares, when redeemed, may be worth more or less than the original cost. To obtain performance information current to the most recent month end, please visit www.sterlingcapitalfunds.com.
The chart above represents a comparison of a hypothetical $10,000 investment in the indicated share class versus a similar investment in the Fund’s benchmark, and represents the reinvestment of dividends and capital gains.
The Fund is measured against S&P 500® Index, an unmanaged index generally considered to be representative of the performance of the stock market as a whole. The index does not reflect the deduction of expenses associated with a mutual fund, such as investment management and fund accounting fees. The Fund’s performance reflects the deduction of fees for these services. Investors cannot invest directly in an index, although they can invest in its underlying securities.
A portion of the Fund’s fees have been waived. If the fees had not been waived, the Fund’s total return for the periods would have been lower.
|
| Sterling Capital Funds |
|
Summary of Portfolio Holdings (Unaudited) |
Sterling Capital Funds invested, as a percentage of net assets, in the following industry sectors, countries, states, funds or security types, as of September 30, 2011.
| | | | | |
| Sterling Capital Select Equity Fund | | Percentage
of net assets |
Consumer Discretionary | | | | 10.8 | % |
Consumer Staples | | | | 12.2 | % |
Energy | | | | 11.4 | % |
Financials | | | | 13.2 | % |
Health Care | | | | 12.7 | % |
Industrials | | | | 8.1 | % |
Information Technology | | | | 23.4 | % |
Materials | | | | 2.9 | % |
Telecommunication Services | | | | 2.2 | % |
Exchange Traded Fund | | | | 0.8 | % |
Cash Equivalents | | | | 2.2 | % |
| | | | | |
| | | | 99.9 | % |
| | | | | |
| |
| Sterling Capital Mid Value Fund | | Percentage
of net assets |
Consumer Discretionary | | | | 19.8 | % |
Energy | | | | 4.5 | % |
Financial Services | | | | 35.8 | % |
Health Care | | | | 15.6 | % |
Producer Durables | | | | 9.9 | % |
Technology | | | | 12.6 | % |
Cash Equivalents | | | | 1.8 | % |
| | | | | |
| | | | 100.0 | % |
| | | | | |
| |
| Sterling Capital Small Value Fund | | Percentage
of net assets |
Consumer Discretionary | | | | 15.7 | % |
Energy | | | | 5.1 | % |
Financial Services | | | | 31.2 | % |
Health Care | | | | 7.4 | % |
Materials & Processing | | | | 4.7 | % |
Producer Durables | | | | 19.0 | % |
Technology | | | | 13.7 | % |
Utilities | | | | 2.3 | % |
Cash Equivalents | | | | 1.3 | % |
| | | | | |
| | | | 100.4 | % |
| | | | | |
| | | | | |
| Sterling Capital International Fund | | Percentage
of net assets |
Australia | | | | 2.1 | % |
Austria | | | | 0.4 | % |
Brazil | | | | 0.1 | % |
Canada | | | | 7.0 | % |
China | | | | 10.8 | % |
Czech Republic | | | | 0.7 | % |
Denmark | | | | 1.9 | % |
Finland | | | | 0.2 | % |
France | | | | 9.7 | % |
Germany | | | | 8.3 | % |
Greece | | | | 0.1 | % |
Hong Kong | | | | 3.4 | % |
India | | | | 6.9 | % |
Ireland | | | | 1.4 | % |
Israel | | | | 0.3 | % |
Italy | | | | 1.9 | % |
Japan | | | | 10.5 | % |
Korea (South) | | | | 2.2 | % |
Mexico | | | | 0.2 | % |
Netherlands | | | | 1.4 | % |
Norway | | | | 0.2 | % |
Russia | | | | 2.4 | % |
South Africa | | | | 0.3 | % |
Sweden | | | | 1.1 | % |
Switzerland | | | | 3.7 | % |
United Kingdom | | | | 18.3 | % |
Cash Equivalents | | | | 3.8 | % |
| | | | | |
| | | | 99.3 | % |
| | | | | |
| |
| Sterling Capital Special Opportunities Fund | | Percentage
of net assets |
Consumer Discretionary | | | | 11.4 | % |
Consumer Staples | | | | 5.7 | % |
Energy | | | | 12.0 | % |
Financials | | | | 6.3 | % |
Health Care | | | | 20.6 | % |
Industrials | | | | 4.7 | % |
Information Technology | | | | 31.9 | % |
Materials | | | | 3.2 | % |
Utilities | | | | 1.4 | % |
Cash Equivalents | | | | 5.1 | % |
| | | | | |
| | | | 102.3 | % |
| | | | | |
| |
| Sterling Capital Equity Income Fund | | Percentage
of net assets |
Consumer Discretionary | | | | 12.5 | % |
Consumer Staples | | | | 11.7 | % |
Energy | | | | 17.1 | % |
Financials | | | | 5.7 | % |
Health Care | | | | 10.1 | % |
Industrials | | | | 10.1 | % |
Information Technology | | | | 13.6 | % |
Telecommunication Services | | | | 6.5 | % |
Cash Equivalents | | | | 12.7 | % |
| | | | | |
| | | | 100.0 | % |
| | | | | |
40
|
| Sterling Capital Funds |
|
Summary of Portfolio Holdings (Unaudited) |
| | | | | |
| Sterling Capital Short-Term Bond Fund | | Percentage
of net assets |
Collateralized Mortgage Obligations | | | | 10.3 | % |
Commercial Mortgage-Backed Securities | | | | 15.3 | % |
Corporate Bonds | | | | 56.5 | % |
Mortgage-Backed Securities | | | | 1.2 | % |
Municipal Bonds | | | | 9.5 | % |
Preferred Stocks | | | | 3.5 | % |
U.S. Government Agencies | | | | 0.8 | % |
U.S. Treasury Notes | | | | 1.6 | % |
Cash Equivalents | | | | 0.7 | % |
| | | | | |
| | | | 99.4 | % |
| | | | | |
| |
| Sterling Capital Intermediate U.S. Government Fund | | Percentage
of net assets |
Collateralized Mortgage Obligations | | | | 5.9 | % |
Corporate Bonds | | | | 7.6 | % |
Mortgage-Backed Securities | | | | 24.9 | % |
Municipal Bonds | | | | 2.4 | % |
U.S. Government Agencies | | | | 42.7 | % |
U.S. Treasury Notes | | | | 15.4 | % |
Cash Equivalents | | | | 3.4 | % |
| | | | | |
| | | | 102.3 | % |
| | | | | |
| |
| Sterling Capital Total Return Bond Fund | | Percentage
of net assets |
Asset Backed Securities | | | | 2.9 | % |
Collateralized Mortgage Obligations | | | | 10.3 | % |
Commercial Mortgage-Backed Securities | | | | 10.0 | % |
Corporate Bonds | | | | 35.2 | % |
Mortgage-Backed Securities | | | | 33.1 | % |
Municipal Bonds | | | | 3.8 | % |
Preferred Stocks | | | | 1.1 | % |
U.S. Treasury Notes | | | | 4.2 | % |
Cash Equivalents | | | | 3.3 | % |
| | | | | |
| | | | 103.9 | % |
| | | | | |
| |
| Sterling Capital Kentucky Intermediate Tax-Free Fund | | Percentage
of net assets |
Kentucky Municipal Bonds | | | | 92.2 | % |
Cash Equivalents | | | | 6.9 | % |
| | | | | |
| | | | 99.1 | % |
| | | | | |
| |
| Sterling Capital Maryland Intermediate Tax-Free Fund | | Percentage
of net assets |
Maryland Municipal Bonds | | | | 97.8 | % |
Cash Equivalents | | | | 0.4 | % |
| | | | | |
| | | | 98.2 | % |
| | | | | |
| |
Sterling Capital North Carolina Intermediate Tax-Free
Fund | | Percentage
of net assets |
North Carolina Municipal Bonds | | | | 100.4 | % |
Cash Equivalents | | | | 0.3 | % |
| | | | | |
| | | | 100.7 | % |
| | | | | |
| |
Sterling Capital South Carolina Intermediate Tax-Free
Fund | | Percentage
of net assets |
South Carolina Municipal Bonds | | | | 97.9 | % |
Cash Equivalents | | | | 3.0 | % |
| | | | | |
| | | | 100.9 | % |
| | | | | |
| | | | | |
| Sterling Capital Virginia Intermediate Tax-Free Fund | | Percentage
of net assets |
District of Columbia Municipal Bonds | | | | 1.3 | % |
Virginia Municipal Bonds | | | | 96.6 | % |
Cash Equivalents | | | | 1.2 | % |
| | | | | |
| | | | 99.1 | % |
| | | | | |
| |
| Sterling Capital West Virginia Intermediate Tax-Free Fund | | Percentage
of net assets |
West Virginia Municipal Bonds | | | | 95.0 | % |
Cash Equivalents | | | | 5.7 | % |
| | | | | |
| | | | 100.7 | % |
| | | | | |
| |
| Sterling Capital National Tax-Free Money Market Fund | | Percentage
of net assets |
Alaska | | | | 12.1 | % |
Arizona | | | | 6.6 | % |
California | | | | 9.7 | % |
Florida | | | | 3.9 | % |
Georgia | | | | 6.1 | % |
Illinois | | | | 2.5 | % |
Louisiana | | | | 4.5 | % |
Nevada | | | | 4.1 | % |
New Jersey | | | | 2.4 | % |
New York | | | | 11.8 | % |
Ohio | | | | 20.9 | % |
Pennsylvania | | | | 6.2 | % |
Texas | | | | 2.2 | % |
Utah | | | | 2.0 | % |
Virginia | | | | 2.9 | % |
Wisconsin | | | | 1.0 | % |
Cash Equivalents | | | | 1.0 | % |
| | | | | |
| | | | 99.9 | % |
| | | | | |
| |
| Sterling Capital Prime Money Market Fund | | Percentage
of net assets |
Asset Backed Securities | | | | 0.4 | % |
Certificates of Deposit | | | | 12.5 | % |
Commercial Paper | | | | 45.3 | % |
Corporate Bonds | | | | 2.2 | % |
Repurchase Agreement | | | | 21.9 | % |
U.S. Government Agencies | | | | 12.2 | % |
U.S. Treasury Notes | | | | 1.0 | % |
Variable Rate Notes | | | | 4.5 | % |
| | | | | |
| | | | 100.0 | % |
| | | | | |
| |
| Sterling Capital U.S. Treasury Money Market Fund | | Percentage
of net assets |
Repurchase Agreements | | | | 40.2 | % |
U.S. Treasury Bills | | | | 26.2 | % |
U.S. Treasury Notes | | | | 22.2 | % |
| | | | | |
| | | | 88.6 | % |
| | | | | |
41
|
| Sterling Capital Funds |
Summary of Portfolio Holdings (Unaudited) |
| | | | | |
| Sterling Capital Strategic Allocation Conservative Fund | | Percentage
of net assets |
Sterling Capital Equity Income Fund, Institutional Class | | | | 2.8 | % |
Sterling Capital International Fund, Institutional Class | | | | 3.6 | % |
Sterling Capital Mid Value Fund, Institutional Class | | | | 3.8 | % |
Sterling Capital Select Equity Fund, Institutional Class | | | | 7.7 | % |
Sterling Capital Small Value Fund, Institutional Class | | | | 1.0 | % |
Sterling Capital Special Opportunities Fund, Institutional Class | | | | 1.8 | % |
Sterling Capital Total Return Bond Fund, Institutional Class | | | | 52.9 | % |
Sterling Capital U.S. Treasury Money Market Fund | | | | 5.7 | % |
Non-Affiliated Investment Companies | | | | 7.2 | % |
Exchange Traded Funds | | | | 14.7 | % |
| | | | | |
| | | | 101.2 | % |
| | | | | |
| |
| Sterling Capital Strategic Allocation Balanced Fund | | Percentage
of net assets |
Sterling Capital Equity Income Fund, Institutional Class | | | | 4.4 | % |
Sterling Capital International Fund, Institutional Class | | | | 5.7 | % |
Sterling Capital Mid Value Fund, Institutional Class | | | | 6.0 | % |
Sterling Capital Select Equity Fund, Institutional Class | | | | 12.0 | % |
Sterling Capital Small Value Fund, Institutional Class | | | | 1.5 | % |
Sterling Capital Special Opportunities Fund, Institutional Class | | | | 2.8 | % |
Sterling Capital Total Return Bond Fund, Institutional Class | | | | 27.4 | % |
Sterling Capital U.S. Treasury Money Market Fund | | | | 7.6 | % |
Non-Affiliated Investment Companies | | | | 9.2 | % |
Exchange Traded Funds | | | | 24.8 | % |
| | | | | |
| | | | 101.4 | % |
| | | | | |
| | | | | |
| Sterling Capital Strategic Allocation Growth Fund | | Percentage
of net assets |
Sterling Capital Equity Income Fund, Institutional Class | | | | 5.5 | % |
Sterling Capital International Fund, Institutional Class | | | | 7.1 | % |
Sterling Capital Mid Value Fund, Institutional Class | | | | 7.5 | % |
Sterling Capital Select Equity Fund, Institutional Class | | | | 15.0 | % |
Sterling Capital Small Value Fund, Institutional Class | | | | 1.9 | % |
Sterling Capital Special Opportunities Fund, Institutional Class | | | | 3.5 | % |
Sterling Capital Total Return Bond Fund, Institutional Class | | | | 11.5 | % |
Sterling Capital U.S. Treasury Money Market Fund | | | | 9.8 | % |
Non-Affiliated Investment Companies | | | | 9.1 | % |
Exchange Traded Funds | | | | 30.9 | % |
| | | | | |
| | | | 101.8 | % |
| | | | | |
| |
| Sterling Capital Strategic Allocation Equity Fund | | Percentage
of net assets |
Sterling Capital Equity Income Fund, Institutional Class | | | | 6.4 | % |
Sterling Capital International Fund, Institutional Class | | | | 8.3 | % |
Sterling Capital Mid Value Fund, Institutional Class | | | | 8.8 | % |
Sterling Capital Select Equity Fund, Institutional Class | | | | 17.6 | % |
Sterling Capital Small Value Fund, Institutional Class | | | | 2.2 | % |
Sterling Capital Special Opportunities Fund, Institutional Class | | | | 4.1 | % |
Sterling Capital U.S. Treasury Money Market Fund | | | | 5.7 | % |
Non-Affiliated Investment Companies | | | | 10.2 | % |
Exchange Traded Funds | | | | 39.4 | % |
| | | | | |
| | | | 102.7 | % |
| | | | | |
42
|
| Sterling Capital Funds |
|
Expense Example (Unaudited) |
As a shareholder of the Sterling Capital Funds (each a “Fund” and collectively, the “Funds”), you incur two types of costs: (1) transaction costs, including sales charges (loads) on purchases and (2) ongoing costs, including management fees; distribution and/or service (12b-1) fees; and other Fund expenses.
These examples are intended to help you understand your ongoing costs (in dollars) of investing in the Funds and to compare these costs with the ongoing costs of investing in other mutual funds. These examples are based on an investment of $1,000 invested at the beginning of the period and held for the entire period from April 1, 2011 through September 30, 2011.
Actual Example
The table below provides information about actual account values and actual expenses. You may use the information below, together with the amount you invested, to estimate the expenses that you paid over the period. Simply divide your account value by $1,000 (for example, an $8,600 account value divided by $1,000 = 8.6), then multiply the result by the number in the table under the heading entitled “Expenses Paid During Period” to estimate the expenses you paid on your account during this year.
| | | | | | | | | | | | | | | | | | | | |
| | | Beginning
Account Value
4/1/11 | | Ending
Account Value
9/30/11 | | Expenses Paid
During Period*
4/1/11 - 9/30/11 | | Annualized
Expense Ratio
During Period
4/1/11 - 9/30/11 |
Sterling Capital Select Equity Fund | | | | | | | | | | | | | | | | | | | | |
Class A Shares | | | $ | 1,000.00 | | | | $ | 819.80 | | | | $ | 4.97 | | | | | 1.09 | % |
Class B Shares | | | | 1,000.00 | | | | | 816.50 | | | | | 8.38 | | | | | 1.84 | % |
Class C Shares | | | | 1,000.00 | | | | | 816.70 | | | | | 8.38 | | | | | 1.84 | % |
Institutional Shares | | | | 1,000.00 | | | | | 821.00 | | | | | 3.83 | | | | | 0.84 | % |
Sterling Capital Mid Value Fund | | | | | | | | | | | | | | | | | | | | |
Class A Shares | | | | 1,000.00 | | | | | 776.40 | | | | | 5.30 | | | | | 1.19 | % |
Class B Shares | | | | 1,000.00 | | | | | 773.10 | | | | | 8.62 | | | | | 1.94 | % |
Class C Shares | | | | 1,000.00 | | | | | 773.30 | | | | | 8.62 | | | | | 1.94 | % |
Institutional Shares | | | | 1,000.00 | | | | | 777.30 | | | | | 4.19 | | | | | 0.94 | % |
Class R Shares | | | | 1,000.00 | | | | | 775.90 | | | | | 6.37 | | | | | 1.43 | % |
Sterling Capital Small Value Fund | | | | | | | | | | | | | | | | | | | | |
Class A Shares | | | | 1,000.00 | | | | | 760.40 | | | | | 5.87 | | | | | 1.33 | % |
Class B Shares | | | | 1,000.00 | | | | | 757.60 | | | | | 9.16 | | | | | 2.08 | % |
Class C Shares | | | | 1,000.00 | | | | | 757.60 | | | | | 9.16 | | | | | 2.08 | % |
Institutional Shares | | | | 1,000.00 | | | | | 761.40 | | | | | 4.77 | | | | | 1.08 | % |
Class R Shares | | | | 1,000.00 | | | | | 762.50 | | | | | 6.80 | | | | | 1.54 | % |
Sterling Capital International Fund | | | | | | | | | | | | | | | | | | | | |
Class A Shares | | | | 1,000.00 | | | | | 755.10 | | | | | 6.20 | | | | | 1.41 | % |
Class B Shares | | | | 1,000.00 | | | | | 753.70 | | | | | 9.54 | | | | | 2.17 | % |
Class C Shares | | | | 1,000.00 | | | | | 754.80 | | | | | 9.50 | | | | | 2.16 | % |
Institutional Shares | | | | 1,000.00 | | | | | 756.70 | | | | | 5.11 | | | | | 1.16 | % |
Sterling Capital Special Opportunities Fund | | | | | | | | | | | | | | | | | | | | |
Class A Shares | | | | 1,000.00 | | | | | 835.20 | | | | | 5.93 | | | | | 1.29 | % |
Class B Shares | | | | 1,000.00 | | | | | 832.10 | | | | | 9.37 | | | | | 2.04 | % |
Class C Shares | | | | 1,000.00 | | | | | 832.20 | | | | | 9.37 | | | | | 2.04 | % |
Institutional Shares | | | | 1,000.00 | | | | | 836.50 | | | | | 4.79 | | | | | 1.04 | % |
Class R Shares | | | | 1,000.00 | | | | | 834.10 | | | | | 7.08 | | | | | 1.54 | % |
Sterling Capital Equity Income Fund | | | | | | | | | | | | | | | | | | | | |
Class A Shares | | | | 1,000.00 | | | | | 922.80 | | | | | 5.74 | | | | | 1.19 | % |
Class B Shares | | | | 1,000.00 | | | | | 919.30 | | | | | 9.33 | | | | | 1.94 | % |
Class C Shares | | | | 1,000.00 | | | | | 919.50 | | | | | 9.34 | | | | | 1.94 | % |
Institutional Shares | | | | 1,000.00 | | | | | 924.00 | | | | | 4.53 | | | | | 0.94 | % |
Class R Shares | | | | 1,000.00 | | | | | 921.80 | | | | | 6.89 | | | | | 1.43 | % |
Sterling Capital Short-Term Bond Fund | | | | | | | | | | | | | | | | | | | | |
Class A Shares | | | | 1,000.00 | | | | | 1,002.20 | | | | | 3.97 | | | | | 0.79 | % |
Institutional Shares | | | | 1,000.00 | | | | | 1,002.40 | | | | | 2.71 | | | | | 0.54 | % |
Sterling Capital Intermediate U.S. Government Fund | | | | | | | | | | | | | | | | | | | | |
Class A Shares | | | | 1,000.00 | | | | | 1,047.00 | | | | | 4.87 | | | | | 0.95 | % |
Class B Shares | | | | 1,000.00 | | | | | 1,043.20 | | | | | 8.71 | | | | | 1.70 | % |
Class C Shares | | | | 1,000.00 | | | | | 1,042.20 | | | | | 8.70 | | | | | 1.70 | % |
Institutional Shares | | | | 1,000.00 | | | | | 1,048.30 | | | | | 3.59 | | | | | 0.70 | % |
Sterling Capital Total Return Bond Fund | | | | | | | | | | | | | | | | | | | | |
Class A Shares | | | | 1,000.00 | | | | | 1,038.80 | | | | | 4.86 | | | | | 0.95 | % |
Class B Shares | | | | 1,000.00 | | | | | 1,034.90 | | | | | 8.67 | | | | | 1.70 | % |
Class C Shares | | | | 1,000.00 | | | | | 1,035.80 | | | | | 8.68 | | | | | 1.70 | % |
Institutional Shares | | | | 1,000.00 | | | | | 1,041.00 | | | | | 3.58 | | | | | 0.70 | % |
Class R Shares | | | | 1,000.00 | | | | | 1,037.90 | | | | | 6.13 | | | | | 1.20 | % |
Sterling Capital Kentucky Intermediate Tax-Free Fund | | | | | | | | | | | | | | | | | | | | |
Class A Shares | | | | 1,000.00 | | | | | 1,055.70 | | | | | 4.84 | | | | | 0.94 | % |
Institutional Shares | | | | 1,000.00 | | | | | 1,057.10 | | | | | 3.56 | | | | | 0.69 | % |
43
|
| Sterling Capital Funds |
|
Expense Example (Unaudited) |
| | | | | | | | | | | | | | | | | | | | |
| | | Beginning
Account Value
4/1/11 | | Ending
Account Value
9/30/11 | | Expenses Paid
During Period*
4/1/11 - 9/30/11 | | Annualized
Expense Ratio
During Period
4/1/11 - 9/30/11 |
Sterling Capital Maryland Intermediate Tax-Free Fund | | | | | | | | | | | | | | | | | | | | |
Class A Shares | | | $ | 1,000.00 | | | | $ | 1,053.80 | | | | $ | 4.74 | | | | | 0.92 | % |
Institutional Shares | | | | 1,000.00 | | | | | 1,055.10 | | | | | 3.45 | | | | | 0.67 | % |
Sterling Capital North Carolina Intermediate Tax-Free Fund | | | | | | | | | | | | | | | | | | | | |
Class A Shares | | | | 1,000.00 | | | | | 1,055.40 | | | | | 4.74 | | | | | 0.92 | % |
Institutional Shares | | | | 1,000.00 | | | | | 1,056.70 | | | | | 3.45 | | | | | 0.67 | % |
Sterling Capital South Carolina Intermediate Tax-Free Fund | | | | | | | | | | | | | | | | | | | | |
Class A Shares | | | | 1,000.00 | | | | | 1,055.40 | | | | | 4.95 | | | | | 0.96 | % |
Institutional Shares | | | | 1,000.00 | | | | | 1,057.00 | | | | | 3.66 | | | | | 0.71 | % |
Sterling Capital Virginia Intermediate Tax-Free Fund | | | | | | | | | | | | | | | | | | | | |
Class A Shares | | | | 1,000.00 | | | | | 1,051.30 | | | | | 4.78 | | | | | 0.93 | % |
Institutional Shares | | | | 1,000.00 | | | | | 1,053.60 | | | | | 3.50 | | | | | 0.68 | % |
Sterling Capital West Virginia Intermediate Tax-Free Fund | | | | | | | | | | | | | | | | | | | | |
Class A Shares | | | | 1,000.00 | | | | | 1,052.90 | | | | | 4.84 | | | | | 0.94 | % |
Institutional Shares | | | | 1,000.00 | | | | | 1,054.20 | | | | | 3.55 | | | | | 0.69 | % |
Sterling Capital National Tax-Free Money Market Fund | | | | | | | | | | | | | | | | | | | | |
Class A Shares | | | | 1,000.00 | | | | | 1,000.10 | | | | | 1.40 | | | | | 0.28 | % |
Institutional Shares | | | | 1,000.00 | | | | | 1,000.10 | | | | | 1.40 | | | | | 0.28 | % |
Sterling Capital Prime Money Market Fund | | | | | | | | | | | | | | | | | | | | |
Class A Shares | | | | 1,000.00 | | | | | 1,000.10 | | | | | 1.00 | | | | | 0.20 | % |
Class B Shares | | | | 1,000.00 | | | | | 1,000.10 | | | | | 1.00 | | | | | 0.20 | % |
Class C Shares | | | | 1,000.00 | | | | | 1,000.10 | | | | | 1.00 | | | | | 0.20 | % |
Institutional Shares | | | | 1,000.00 | | | | | 1,000.10 | | | | | 1.00 | | | | | 0.20 | % |
Sterling Capital U.S. Treasury Money Market Fund | | | | | | | | | | | | | | | | | | | | |
Class A Shares | | | | 1,000.00 | | | | | 1,000.10 | | | | | 0.25 | | | | | 0.05 | % |
Class B Shares | | | | 1,000.00 | | | | | 1,000.10 | | | | | 0.25 | | | | | 0.05 | % |
Class C Shares | | | | 1,000.00 | | | | | 1,000.10 | | | | | 0.25 | | | | | 0.05 | % |
Institutional Shares | | | | 1,000.00 | | | | | 1,000.10 | | | | | 0.25 | | | | | 0.05 | % |
Sterling Capital Strategic Allocation Conservative Fund | | | | | | | | | | | | | | | | | | | | |
Class A Shares | | | | 1,000.00 | | | | | 934.40 | | | | | 3.54 | | | | | 0.73 | % |
Class B Shares | | | | 1,000.00 | | | | | 931.50 | | | | | 7.17 | | | | | 1.48 | % |
Class C Shares | | | | 1,000.00 | | | | | 931.40 | | | | | 7.17 | | | | | 1.48 | % |
Institutional Shares | | | | 1,000.00 | | | | | 936.10 | | | | | 2.33 | | | | | 0.48 | % |
Sterling Capital Strategic Allocation Balanced Fund | | | | | | | | | | | | | | | | | | | | |
Class A Shares | | | | 1,000.00 | | | | | 872.10 | | | | | 3.14 | | | | | 0.67 | % |
Class B Shares | | | | 1,000.00 | | | | | 869.10 | | | | | 6.65 | | | | | 1.42 | % |
Class C Shares | | | | 1,000.00 | | | | | 870.10 | | | | | 6.66 | | | | | 1.42 | % |
Institutional Shares | | | | 1,000.00 | | | | | 874.00 | | | | | 1.97 | | | | | 0.42 | % |
Sterling Capital Strategic Allocation Growth Fund | | | | | | | | | | | | | | | | | | | | |
Class A Shares | | | | 1,000.00 | | | | | 837.00 | | | | | 3.18 | | | | | 0.69 | % |
Class B Shares | | | | 1,000.00 | | | | | 834.80 | | | | | 6.62 | | | | | 1.44 | % |
Class C Shares | | | | 1,000.00 | | | | | 834.60 | | | | | 6.62 | | | | | 1.44 | % |
Institutional Shares | | | | 1,000.00 | | | | | 838.30 | | | | | 2.03 | | | | | 0.44 | % |
Sterling Capital Strategic Allocation Equity Fund | | | | | | | | | | | | | | | | | | | | |
Class A Shares | | | | 1,000.00 | | | | | 811.00 | | | | | 3.72 | | | | | 0.82 | % |
Class B Shares | | | | 1,000.00 | | | | | 807.00 | | | | | 7.11 | | | | | 1.57 | % |
Class C Shares | | | | 1,000.00 | | | | | 807.50 | | | | | 7.11 | | | | | 1.57 | % |
Institutional Shares | | | | 1,000.00 | | | | | 812.00 | | | | | 2.59 | | | | | 0.57 | % |
| * | Expenses are equal to the average account value over the period multiplied by the Fund’s annualized expense ratio, multiplied by 183 days divided by 365 (to reflect the six month period). |
44
|
| Sterling Capital Funds |
|
Expense Example (Unaudited) |
Hypothetical Example for Comparison Purposes
The table below provides information about hypothetical account values and hypothetical expenses based on the Fund’s actual expense ratio and an assumed rate of return of 5% per year before expenses, which is not the Funds’ actual return. The hypothetical account values and expenses may not be used to estimate the actual ending account balance or expenses you paid for the year. You may use this information to compare the ongoing costs of investing in a Fund and other funds. To do so, compare this 5% hypothetical example with the 5% hypothetical examples that appear in the shareholder reports of other funds.
Please note that the expenses shown in the table are meant to highlight your ongoing costs only and do not reflect any transactional costs, such as sales charges (loads), redemption fees, or exchange fees. Therefore, the table is useful in comparing ongoing costs only, and will not help you determine the relative total costs of owning different funds. In addition, if these transactional costs were included, your costs would have been higher.
| | | | | | | | | | | | | | | | | | | | |
| | | Beginning
Account Value
4/1/11 | | Ending
Account Value
9/30/11 | | Expenses Paid
During Period*
4/1/11 - 9/30/11 | | Annualized
Expense Ratio
During Period
4/1/11 - 9/30/11 |
Sterling Capital Select Equity Fund | | | | | | | | | | | | | | | | | | | | |
Class A Shares | | | $ | 1,000.00 | | | | $ | 1,019.60 | | | | $ | 5.52 | | | | | 1.09 | % |
Class B Shares | | | | 1,000.00 | | | | | 1,015.84 | | | | | 9.30 | | | | | 1.84 | % |
Class C Shares | | | | 1,000.00 | | | | | 1,015.84 | | | | | 9.30 | | | | | 1.84 | % |
Institutional Shares | | | | 1,000.00 | | | | | 1,020.86 | | | | | 4.26 | | | | | 0.84 | % |
Sterling Capital Mid Value Fund | | | | | | | | | | | | | | | | | | | | |
Class A Shares | | | | 1,000.00 | | | | | 1,019.10 | | | | | 6.02 | | | | | 1.19 | % |
Class B Shares | | | | 1,000.00 | | | | | 1,015.34 | | | | | 9.80 | | | | | 1.94 | % |
Class C Shares | | | | 1,000.00 | | | | | 1,015.34 | | | | | 9.80 | | | | | 1.94 | % |
Institutional Shares | | | | 1,000.00 | | | | | 1,020.36 | | | | | 4.76 | | | | | 0.94 | % |
Class R Shares | | | | 1,000.00 | | | | | 1,017.90 | | | | | 7.23 | | | | | 1.43 | % |
Sterling Capital Small Value Fund | | | | | | | | | | | | | | | | | | | | |
Class A Shares | | | | 1,000.00 | | | | | 1,018.40 | | | | | 6.73 | | | | | 1.33 | % |
Class B Shares | | | | 1,000.00 | | | | | 1,014.64 | | | | | 10.50 | | | | | 2.08 | % |
Class C Shares | | | | 1,000.00 | | | | | 1,014.64 | | | | | 10.50 | | | | | 2.08 | % |
Institutional Shares | | | | 1,000.00 | | | | | 1,019.65 | | | | | 5.47 | | | | | 1.08 | % |
Class R Shares | | | | 1,000.00 | | | | | 1,017.35 | | | | | 7.79 | | | | | 1.54 | % |
Sterling Capital International Fund | | | | | | | | | | | | | | | | | | | | |
Class A Shares | | | | 1,000.00 | | | | | 1,018.00 | | | | | 7.13 | | | | | 1.41 | % |
Class B Shares | | | | 1,000.00 | | | | | 1,014.19 | | | | | 10.96 | | | | | 2.17 | % |
Class C Shares | | | | 1,000.00 | | | | | 1,014.24 | | | | | 10.91 | | | | | 2.16 | % |
Institutional Shares | | | | 1,000.00 | | | | | 1,019.25 | | | | | 5.87 | | | | | 1.16 | % |
Sterling Capital Special Opportunities Fund | | | | | | | | | | | | | | | | | | | | |
Class A Shares | | | | 1,000.00 | | | | | 1,018.60 | | | | | 6.53 | | | | | 1.29 | % |
Class B Shares | | | | 1,000.00 | | | | | 1,014.84 | | | | | 10.30 | | | | | 2.04 | % |
Class C Shares | | | | 1,000.00 | | | | | 1,014.84 | | | | | 10.30 | | | | | 2.04 | % |
Institutional Shares | | | | 1,000.00 | | | | | 1,019.85 | | | | | 5.27 | | | | | 1.04 | % |
Class R Shares | | | | 1,000.00 | | | | | 1,017.35 | | | | | 7.79 | | | | | 1.54 | % |
Sterling Capital Equity Income Fund | | | | | | | | | | | | | | | | | | | | |
Class A Shares | | | | 1,000.00 | | | | | 1,019.10 | | | | | 6.02 | | | | | 1.19 | % |
Class B Shares | | | | 1,000.00 | | | | | 1,015.34 | | | | | 9.80 | | | | | 1.94 | % |
Class C Shares | | | | 1,000.00 | | | | | 1,015.34 | | | | | 9.80 | | | | | 1.94 | % |
Institutional Shares | | | | 1,000.00 | | | | | 1,020.36 | | | | | 4.76 | | | | | 0.94 | % |
Class R Shares | | | | 1,000.00 | | | | | 1,017.90 | | | | | 7.23 | | | | | 1.43 | % |
Sterling Capital Short-Term Bond Fund | | | | | | | | | | | | | | | | | | | | |
Class A Shares | | | | 1,000.00 | | | | | 1,021.11 | | | | | 4.00 | | | | | 0.79 | % |
Institutional Shares | | | | 1,000.00 | | | | | 1,022.36 | | | | | 2.74 | | | | | 0.54 | % |
Sterling Capital Intermediate U.S. Government Fund | | | | | | | | | | | | | | | | | | | | |
Class A Shares | | | | 1,000.00 | | | | | 1,020.31 | | | | | 4.81 | | | | | 0.95 | % |
Class B Shares | | | | 1,000.00 | | | | | 1,016.55 | | | | | 8.59 | | | | | 1.70 | % |
Class C Shares | | | | 1,000.00 | | | | | 1,016.55 | | | | | 8.59 | | | | | 1.70 | % |
Institutional Shares | | | | 1,000.00 | | | | | 1,021.56 | | | | | 3.55 | | | | | 0.70 | % |
Sterling Capital Total Return Bond Fund | | | | | | | | | | | | | | | | | | | | |
Class A Shares | | | | 1,000.00 | | | | | 1,020.31 | | | | | 4.81 | | | | | 0.95 | % |
Class B Shares | | | | 1,000.00 | | | | | 1,016.55 | | | | | 8.59 | | | | | 1.70 | % |
Class C Shares | | | | 1,000.00 | | | | | 1,016.55 | | | | | 8.59 | | | | | 1.70 | % |
Institutional Shares | | | | 1,000.00 | | | | | 1,021.56 | | | | | 3.55 | | | | | 0.70 | % |
Class R Shares | | | | 1,000.00 | | | | | 1,019.05 | | | | | 6.07 | | | | | 1.20 | % |
Sterling Capital Kentucky Intermediate Tax-Free Fund | | | | | | | | | | | | | | | | | | | | |
Class A Shares | | | | 1,000.00 | | | | | 1,020.36 | | | | | 4.76 | | | | | 0.94 | % |
Institutional Shares | | | | 1,000.00 | | | | | 1,021.61 | | | | | 3.50 | | | | | 0.69 | % |
45
|
| Sterling Capital Funds |
|
Expense Example (Unaudited) |
| | | | | | | | | | | | | | | | | | | | |
| | | Beginning
Account Value
4/1/11 | | Ending
Account Value
9/30/11 | | Expenses Paid
During Period*
4/1/11 - 9/30/11 | | Annualized
Expense Ratio
During Period
4/1/11 - 9/30/11 |
Sterling Capital Maryland Intermediate Tax-Free Fund | | | | | | | | | | | | | | | | | | | | |
Class A Shares | | | $ | 1,000.00 | | | | $ | 1,020.46 | | | | $ | 4.66 | | | | | 0.92 | % |
Institutional Shares | | | | 1,000.00 | | | | | 1,021.71 | | | | | 3.40 | | | | | 0.67 | % |
Sterling Capital North Carolina Intermediate Tax-Free Fund | | | | | | | | | | | | | | | | | | | | |
Class A Shares | | | | 1,000.00 | | | | | 1,020.46 | | | | | 4.66 | | | | | 0.92 | % |
Institutional Shares | | | | 1,000.00 | | | | | 1,021.71 | | | | | 3.40 | | | | | 0.67 | % |
Sterling Capital South Carolina Intermediate Tax-Free Fund | | | | | | | | | | | | | | | | | | | | |
Class A Shares | | | | 1,000.00 | | | | | 1,020.26 | | | | | 4.86 | | | | | 0.96 | % |
Institutional Shares | | | | 1,000.00 | | | | | 1,021.51 | | | | | 3.60 | | | | | 0.71 | % |
Sterling Capital Virginia Intermediate Tax-Free Fund | | | | | | | | | | | | | | | | | | | | |
Class A Shares | | | | 1,000.00 | | | | | 1,020.41 | | | | | 4.71 | | | | | 0.93 | % |
Institutional Shares | | | | 1,000.00 | | | | | 1,021.66 | | | | | 3.45 | | | | | 0.68 | % |
Sterling Capital West Virginia Intermediate Tax-Free Fund | | | | | | | | | | | | | | | | | | | | |
Class A Shares | | | | 1,000.00 | | | | | 1,020.36 | | | | | 4.76 | | | | | 0.94 | % |
Institutional Shares | | | | 1,000.00 | | | | | 1,021.61 | | | | | 3.50 | | | | | 0.69 | % |
Sterling Capital National Tax-Free Money Market Fund | | | | | | | | | | | | | | | | | | | | |
Class A Shares | | | | 1,000.00 | | | | | 1,023.66 | | | | | 1.42 | | | | | 0.28 | % |
Institutional Shares | | | | 1,000.00 | | | | | 1,023.66 | | | | | 1.42 | | | | | 0.28 | % |
Sterling Capital Prime Money Market Fund | | | | | | | | | | | | | | | | | | | | |
Class A Shares | | | | 1,000.00 | | | | | 1,024.07 | | | | | 1.01 | | | | | 0.20 | % |
Class B Shares | | | | 1,000.00 | | | | | 1,024.07 | | | | | 1.01 | | | | | 0.20 | % |
Class C Shares | | | | 1,000.00 | | | | | 1,024.07 | | | | | 1.01 | | | | | 0.20 | % |
Institutional Shares | | | | 1,000.00 | | | | | 1,024.07 | | | | | 1.01 | | | | | 0.20 | % |
Sterling Capital U.S. Treasury Money Market Fund | | | | | | | | | | | | | | | | | | | | |
Class A Shares | | | | 1,000.00 | | | | | 1,024.82 | | | | | 0.25 | | | | | 0.05 | % |
Class B Shares | | | | 1,000.00 | | | | | 1,024.82 | | | | | 0.25 | | | | | 0.05 | % |
Class C Shares | | | | 1,000.00 | | | | | 1,024.82 | | | | | 0.25 | | | | | 0.05 | % |
Institutional Shares | | | | 1,000.00 | | | | | 1,024.82 | | | | | 0.25 | | | | | 0.05 | % |
Sterling Capital Strategic Allocation Conservative Fund | | | | | | | | | | | | | | | | | | | | |
Class A Shares | | | | 1,000.00 | | | | | 1,021.41 | | | | | 3.70 | | | | | 0.73 | % |
Class B Shares | | | | 1,000.00 | | | | | 1,017.65 | | | | | 7.49 | | | | | 1.48 | % |
Class C Shares | | | | 1,000.00 | | | | | 1,017.65 | | | | | 7.49 | | | | | 1.48 | % |
Institutional Shares | | | | 1,000.00 | | | | | 1,022.66 | | | | | 2.43 | | | | | 0.48 | % |
Sterling Capital Strategic Allocation Balanced Fund | | | | | | | | | | | | | | | | | | | | |
Class A Shares | | | | 1,000.00 | | | | | 1,021.71 | | | | | 3.40 | | | | | 0.67 | % |
Class B Shares | | | | 1,000.00 | | | | | 1,017.95 | | | | | 7.18 | | | | | 1.42 | % |
Class C Shares | | | | 1,000.00 | | | | | 1,017.95 | | | | | 7.18 | | | | | 1.42 | % |
Institutional Shares | | | | 1,000.00 | | | | | 1,022.96 | | | | | 2.13 | | | | | 0.42 | % |
Sterling Capital Strategic Allocation Growth Fund | | | | | | | | | | | | | | | | | | | | |
Class A Shares | | | | 1,000.00 | | | | | 1,021.61 | | | | | 3.50 | | | | | 0.69 | % |
Class B Shares | | | | 1,000.00 | | | | | 1,017.85 | | | | | 7.28 | | | | | 1.44 | % |
Class C Shares | | | | 1,000.00 | | | | | 1,017.85 | | | | | 7.28 | | | | | 1.44 | % |
Institutional Shares | | | | 1,000.00 | | | | | 1,022.86 | | | | | 2.23 | | | | | 0.44 | % |
Sterling Capital Strategic Allocation Equity Fund | | | | | | | | | | | | | | | | | | | | |
Class A Shares | | | | 1,000.00 | | | | | 1,020.96 | | | | | 4.15 | | | | | 0.82 | % |
Class B Shares | | | | 1,000.00 | | | | | 1,017.20 | | | | | 7.94 | | | | | 1.57 | % |
Class C Shares | | | | 1,000.00 | | | | | 1,017.20 | | | | | 7.94 | | | | | 1.57 | % |
Institutional Shares | | | | 1,000.00 | | | | | 1,022.21 | | | | | 2.89 | | | | | 0.57 | % |
| * | Expenses are equal to the average account value over the period multiplied by the Fund’s annualized expense ratio, multiplied by 183 days divided by 365 (to reflect the six month period). |
46
|
| Sterling Capital Select Equity Fund |
Schedule of Portfolio Investments |
September 30, 2011 |
| | | | | | |
Shares | | | | Fair Value | |
COMMON STOCKS (96.9%) | | | | |
| | Consumer Discretionary (10.8%) | |
207,600 | | Comcast Corp., Class A | | $ | 4,338,840 | |
70,100 | | Kohl’s Corp. | | | 3,441,910 | |
161,000 | | Lowe’s Cos., Inc. | | | 3,113,740 | |
132,571 | | Staples, Inc. | | | 1,763,194 | |
71,000 | | Target Corp. | | | 3,481,840 | |
123,900 | | Walt Disney Co. (The) | | | 3,736,824 | |
| | | | | | |
| | | | | 19,876,348 | |
| | | | | | |
| | Consumer Staples (12.2%) | | | | |
139,500 | | Archer-Daniels-Midland Co. | | | 3,460,995 | |
37,230 | | Coca-Cola Co. (The) | | | 2,515,259 | |
93,500 | | CVS Caremark Corp. | | | 3,139,730 | |
83,400 | | Kraft Foods, Inc., Class A | | | 2,800,572 | |
86,100 | | PepsiCo, Inc. | | | 5,329,590 | |
46,900 | | Procter & Gamble Co. (The) | | | 2,963,142 | |
42,900 | | Wal-Mart Stores, Inc. | | | 2,226,510 | |
| | | | | | |
| | | | | 22,435,798 | |
| | | | | | |
| | Energy (11.4%) | | | | |
40,400 | | Baker Hughes, Inc. | | | 1,864,864 | |
89,000 | | Cenovus Energy, Inc. | | | 2,733,190 | |
29,000 | | Chevron Corp. | | | 2,683,080 | |
27,000 | | ConocoPhillips | | | 1,709,640 | |
55,250 | | Exxon Mobil Corp. | | | 4,012,808 | |
60,000 | | Schlumberger, Ltd. | | | 3,583,800 | |
170,000 | | Suncor Energy, Inc. | | | 4,324,800 | |
| | | | | | |
| | | | | 20,912,182 | |
| | | | | | |
| | Financials (13.2%) | | | | |
19,800 | | American Express Co. | | | 889,020 | |
40,500 | | Aon Corp. | | | 1,700,190 | |
49,550 | | Berkshire Hathaway, Inc., Class B(a) | | | 3,520,032 | |
150,000 | | JPMorgan Chase & Co. | | | 4,518,000 | |
97,100 | | MetLife, Inc. | | | 2,719,771 | |
121,400 | | Morgan Stanley | | | 1,638,900 | |
58,200 | | Travelers Cos., Inc. (The) | | | 2,836,086 | |
155,400 | | Wells Fargo & Co. | | | 3,748,248 | |
171,900 | | Weyerhaeuser Co., REIT | | | 2,673,045 | |
| | | | | | |
| | | | | 24,243,292 | |
| | | | | | |
| | Health Care (12.7%) | | | | |
38,400 | | Abbott Laboratories | | | 1,963,776 | |
66,000 | | Amgen, Inc. | | | 3,626,700 | |
81,600 | | Express Scripts, Inc.(a) | | | 3,024,912 | |
45,600 | | Johnson & Johnson. | | | 2,905,176 | |
89,000 | | Medtronic, Inc. | | | 2,958,360 | |
72,000 | | Merck & Co., Inc. | | | 2,355,120 | |
148,200 | | Pfizer, Inc. | | | 2,620,176 | |
89,000 | | St. Jude Medical, Inc. | | | 3,220,910 | |
13,500 | | Stryker Corp. | | | 636,255 | |
| | | | | | |
| | | | | 23,311,385 | |
| | | | | | |
| | Industrials (8.1%) | | | | |
39,000 | | FedEx Corp. | | | 2,639,520 | |
359,000 | | General Electric Co. | | | 5,471,160 | |
82,500 | | Honeywell International, Inc. | | | 3,622,575 | |
393,000 | | Southwest Airlines Co. | | | 3,159,720 | |
| | | | | | |
| | | | | 14,892,975 | |
| | | | | | |
| | Information Technology (23.4%) | |
18,600 | | Apple, Inc.(a) | | | 7,089,948 | |
| | | | | | |
Shares | | | | Fair Value | |
COMMON STOCKS — (continued) | | | | |
| | Information Technology — (continued) | |
297,000 | | Cisco Systems, Inc. | | $ | 4,600,530 | |
113,190 | | Corning, Inc. | | | 1,399,028 | |
6,720 | | Google, Inc., Class A(a) | | | 3,456,634 | |
105,000 | | Intel Corp. | | | 2,239,650 | |
18,450 | | International Business Machines Corp. | | | 3,229,303 | |
258,000 | | Microsoft Corp. | | | 6,421,620 | |
125,700 | | Oracle Corp. | | | 3,612,618 | |
53,300 | | QUALCOMM, Inc. | | | 2,591,979 | |
162,900 | | TE Connectivity, Ltd. | | | 4,584,006 | |
138,000 | | Texas Instruments, Inc. | | | 3,677,700 | |
| | | | | | |
| | | | | 42,903,016 | |
| | | | | | |
| | Materials (2.9%) | | | | |
278,000 | | Alcoa, Inc.(b) | | | 2,660,460 | |
45,000 | | E.I. du Pont de Nemours & Co. | | | 1,798,650 | |
27,000 | | Freeport-McMoRan Copper & Gold, Inc. | | | 822,150 | |
| | | | | | |
| | | | | 5,281,260 | |
| | | | | | |
| | Telecommunication Services (2.2%) | |
138,950 | | AT&T, Inc | | | 3,962,854 | |
| | | | | | |
| | Total Common Stocks
(Cost $180,120,323) | | | 177,819,110 | |
| | | | | | |
EXCHANGE TRADED FUND (0.8%) | | | | |
44,000 | | Utilities Select Sector Standard and Poors Depositary Receipt Fund | | | 1,480,160 | |
| | | | | | |
| | Total Exchange Traded Fund
(Cost $1,412,784) | | | 1,480,160 | |
| | | | | | |
INVESTMENT COMPANY (1.2%) | | | | |
2,203,142 | | Federated Treasury Obligations Fund, Institutional Shares | | | 2,203,142 | |
| | | | | | |
| | Total Investment Company
(Cost $2,203,142) | | | 2,203,142 | |
| | | | | | |
Principal Amount | | | | | |
SECURITIES HELD AS COLLATERAL FOR
SECURITIES ON LOAN (1.0%) | |
$1,853,159 | | BNY Mellon Overnight Government Fund | | | 1,853,159 | |
| | | | | | |
| | Total Securities Held as Collateral for Securities on Loan
(Cost $1,853,159) | | | 1,853,159 | |
| | | | | | |
Total Investments — 99.9%
(Cost $185,589,408) | | | 183,355,571 | |
Net Other Assets (Liabilities) — 0.1% | | | 176,642 | |
| | | | | | |
NET ASSETS — 100.0% | | $ | 183,532,213 | |
| | | | | | |
| (a) | Represents non-income producing security. |
| (b) | Represents that all or a portion of the security was on loan as of September 30, 2011. |
REIT — Real Estate Investment Trust
See accompanying notes to the financial statements.
47
|
| Sterling Capital Mid Value Fund |
Schedule of Portfolio Investments |
September 30, 2011 |
| | | | | | |
Shares | | | | Fair Value | |
COMMON STOCKS (98.2%) | | | | |
| | Consumer Discretionary (19.8%) | |
| 520,112 | | Chico’s FAS, Inc. | | $ | 5,944,880 | |
| 395,725 | | eBay, Inc.(a) | | | 11,669,930 | |
| 119,757 | | Gannett Co., Inc. | | | 1,141,284 | |
| 179,189 | | International Speedway Corp., Class A | | | 4,092,677 | |
| 1,403,642 | | Interpublic Group of Cos., Inc. (The) | | | 10,106,222 | |
| 300,770 | | Omnicom Group, Inc. | | | 11,080,367 | |
| 146,111 | | Select Comfort Corp.(a) | | | 2,041,171 | |
| 240,826 | | Universal Technical Institute, Inc.(a) | | | 3,272,825 | |
| 358,983 | | Viacom, Inc., Class B | | | 13,907,001 | |
| | | | | | |
| | | | | 63,256,357 | |
| | | | | | |
| | Energy (4.5%) | | | | |
| 553,418 | | EXCO Resources, Inc. | | | 5,932,641 | |
| 261,926 | | Forest Oil Corp.(a) | | | 3,771,734 | |
| 383,275 | | Rex Energy Corp.(a)(b) | | | 4,848,429 | |
| | | | | | |
| | | | | 14,552,804 | |
| | | | | | |
| | Financial Services (35.8%) | | | | |
| 293,697 | | Annaly Capital Management, Inc., REIT | | | 4,884,181 | |
| 500,692 | | Aspen Insurance Holdings, Ltd. | | | 11,535,944 | |
| 153,228 | | Assurant, Inc. | | | 5,485,562 | |
| 363,203 | | Assured Guaranty, Ltd. | | | 3,991,601 | |
| 716,400 | | E*Trade Financial Corp.(a) | | | 6,526,404 | |
| 365,385 | | Endurance Specialty Holdings, Ltd. | | | 12,477,898 | |
| 31,775 | | Enstar Group, Ltd.(a) | | | 3,025,933 | |
| 352,967 | | Fair Isaac Corp. | | | 7,705,270 | |
| 228,552 | | Fidelity National Information Services, Inc. | | | 5,558,385 | |
| 310,300 | | Lender Processing Services, Inc. | | | 4,248,007 | |
| 584,850 | | Leucadia National Corp. | | | 13,264,398 | |
| 354,600 | | Lincoln National Corp. | | | 5,542,398 | |
| 410,820 | | MI Developments, Inc. | | | 10,907,271 | |
| 168,886 | | StanCorp Financial Group, Inc. | | | 4,656,187 | |
| 433,184 | | Willis Group Holdings PLC. | | | 14,888,534 | |
| | | | | | |
| | | | | 114,697,973 | |
| | | | | | |
| | Health Care (15.6%) | | | | |
| 125,500 | | Becton Dickinson & Co. | | | 9,201,660 | |
| 188,613 | | Covidien PLC. | | | 8,317,833 | |
| 181,700 | | Life Technologies Corp.(a) | | | 6,982,731 | |
| 369,000 | | Omnicare, Inc. | | | 9,383,670 | |
| 152,042 | | WellPoint, Inc. | | | 9,925,302 | |
| 116,422 | | Zimmer Holdings, Inc.(a) | | | 6,228,577 | |
| | | | | | |
| | | | | 50,039,773 | |
| | | | | | |
| | Producer Durables (9.9%) | | | | |
| 173,095 | | General Dynamics Corp. | | | 9,847,374 | |
| 349,319 | | Lexmark International, Inc., Class A(a) | | | 9,442,093 | |
| | | | | | |
Shares | | | | Fair Value | |
COMMON STOCKS — (continued) | | | | |
| | Producer Durables — (continued) | |
| 57,296 | | Synopsys, Inc.(a) | | | $ 1,395,731 | |
| 1,557,467 | | Xerox Corp. | | | 10,855,545 | |
| | | | | | |
| | | | | 31,540,743 | |
| | | | | | |
| | Technology (12.6%) | | | | |
| 722,549 | | CA, Inc. | | | 14,024,676 | |
| 125,648 | | Computer Sciences Corp. | | | 3,373,649 | |
| 261,275 | | DST Systems, Inc. | | | 11,451,683 | |
| 711,696 | | EarthLink, Inc. | | | 4,647,375 | |
| 300,000 | | Netscout Systems, Inc.(a) | | | 3,426,000 | |
| 288,400 | | SAIC, Inc.(a) | | | 3,406,004 | |
| | | | | | |
| | | | | 40,329,387 | |
| | | | | | |
| | Total Common Stocks
(Cost $321,228,957) | | | 314,417,037 | |
| | | | | | |
INVESTMENT COMPANY (1.8%) | | | | |
| 5,620,153 | | Federated Treasury Obligations Fund, Institutional Shares | | | 5,620,153 | |
| | | | | | |
| | Total Investment Company
(Cost $5,620,153) | | | 5,620,153 | |
| | | | | | |
Principal
Amount | | | | | |
SECURITIES HELD AS COLLATERAL FOR SECURITIES ON LOAN (0.0%) | | | | |
| $109,928 | | BNY Mellon Overnight Government Fund | | | 109,928 | |
| | | | | | |
| | Total Securities Held as Collateral for Securities on Loan
(Cost $109,928) | | | 109,928 | |
| | | | | | |
Total Investments — 100.0%
(Cost $326,959,038) | | | 320,147,118 | |
Net Other Assets (Liabilities) — 0.0% | | | (96,837) | |
| | | | | | |
NET ASSETS — 100.0% | | $ | 320,050,281 | |
| | | | | | |
| (a) | Represents non-income producing security. |
| (b) | Represents that all or a portion of the security was on loan as of September 30, 2011. |
REIT — Real Estate Investment Trust
See accompanying notes to the financial statements.
48
|
| Sterling Capital Small Value Fund |
Schedule of Portfolio Investments |
September 30, 2011 |
| | | | | | |
Shares | | | | Fair Value | |
COMMON STOCKS (99.1%) | | | | |
| | Consumer Discretionary (15.7%) | |
| 130,958 | | Cambium Learning Group, Inc.(a) | | | $ 391,564 | |
| 83,600 | | Chico’s FAS, Inc. | | | 955,548 | |
| 170,899 | | Entercom Communications Corp., Class A(a) | | | 897,220 | |
| 270,900 | | Exide Technologies(a) | | | 1,083,600 | |
| 108,600 | | hhgregg, Inc.(a)(b) | | | 1,058,850 | |
| 64,196 | | Kirkland’s, Inc.(a) | | | 588,677 | |
| 114,500 | | Meredith Corp.(b) | | | 2,592,280 | |
| 169,500 | | Regis Corp. | | | 2,388,255 | |
| 39,217 | | Signet Jewelers, Ltd.(a) | | | 1,325,534 | |
| | | | | | |
| | | | | 11,281,528 | |
| | | | | | |
| | Energy (5.1%) | | | | |
| 61,600 | | Forest Oil Corp.(a) | | | 887,040 | |
| 118,085 | | Resolute Energy Corp.(a) | | | 1,341,446 | |
| 114,000 | | Rex Energy Corp.(a) | | | 1,442,100 | |
| | | | | | |
| | | | | 3,670,586 | |
| | | | | | |
| | Financial Services (31.2%) | | | | |
| 87,800 | | AMERISAFE, Inc.(a) | | | 1,616,398 | |
| 65,752 | | Aspen Insurance Holdings, Ltd. | | | 1,514,926 | |
| 119,142 | | Assured Guaranty, Ltd. | | | 1,309,371 | |
| 26,155 | | Avatar Holdings, Inc.(a) | | | 213,948 | |
| 254,870 | | Bank Mutual Corp. | | | 665,211 | |
| 72,570 | | Brookline Bancorp, Inc. | | | 559,515 | |
| 76,696 | | Campus Crest Communities, Inc., REIT(b) | | | 834,452 | |
| 54,381 | | Endurance Specialty Holdings, Ltd. | | | 1,857,111 | |
| 2,388 | | Enstar Group, Ltd.(a) | | | 227,409 | |
| 64,200 | | Fair Isaac Corp. | | | 1,401,486 | |
| 193,700 | | First American Financial Corp. | | | 2,479,360 | |
| 10,238 | | First Citizens BancShares, Inc., Class A | | | 1,469,562 | |
| 48,063 | | Horace Mann Educators Corp. | | | 548,399 | |
| 164,700 | | Investment Technology Group, Inc.(a) | | | 1,612,413 | |
| 80,000 | | Lender Processing Services, Inc. | | | 1,095,200 | |
| 72,435 | | Parkway Properties, Inc., REIT | | | 797,509 | |
| 683,800 | | Popular, Inc.(a) | | | 1,025,700 | |
| 46,023 | | StanCorp Financial Group, Inc. | | | 1,268,854 | |
| 112,370 | | Washington Federal, Inc. | | | 1,431,594 | |
| 68,546 | | Westfield Financial, Inc. | | | 451,718 | |
| | | | | | |
| | | | | 22,380,136 | |
| | | | | | |
| | Health Care (7.4%) | | | | |
| 37,019 | | Coventry Health Care, Inc.(a) | | | 1,066,517 | |
| 54,700 | | Lincare Holdings, Inc. | | | 1,230,750 | |
| 37,300 | | Teleflex, Inc. | | | 2,005,621 | |
| 61,400 | | VCA Antech, Inc.(a) | | | 981,172 | |
| | | | | | |
| | | | | 5,284,060 | |
| | | | | | |
| | Materials & Processing (4.7%) | | | | |
| 24,800 | | Cabot Microelectronics Corp.(a) | | | 852,872 | |
| 226,000 | | Ferro Corp.(a) | | | 1,389,900 | |
| 29,557 | | Mueller Industries, Inc. | | | 1,140,605 | |
| | | | | | |
| | | | | 3,383,377 | |
| | | | | | |
| | Producer Durables (19.0%) | | | | |
| 85,736 | | Covanta Holding Corp. | | | 1,302,330 | |
| 268,600 | | EnergySolutions, Inc.(a) | | | 948,158 | |
| 42,500 | | FTI Consulting, Inc.(a) | | | 1,564,425 | |
| 58,200 | | Granite Construction, Inc. | | | 1,092,414 | |
| 84,400 | | Harsco Corp. | | | 1,636,516 | |
| | | | | | |
Shares | | | | Fair Value | |
COMMON STOCKS — (continued) | | | | |
| | Producer Durables — (continued) | |
| 64,800 | | Lexmark International, Inc., Class A(a) | | $ | 1,751,544 | |
| 68,556 | | PHH Corp.(a) | | | 1,102,380 | |
| 118,360 | | SYKES Enterprises, Inc.(a) | | | 1,769,482 | |
| 52,400 | | TeleTech Holdings, Inc.(a) | | | 798,576 | |
| 130,918 | | UTi Worldwide, Inc. | | | 1,707,171 | |
| | | | | | |
| | | | | 13,672,996 | |
| | | | | | |
| | Technology (13.7%) | | | | |
| 51,014 | | Black Box Corp. | | | 1,089,149 | |
| 131,598 | | Compuware Corp.(a) | | | 1,008,041 | |
| 69,917 | | DST Systems, Inc. | | | 3,064,462 | |
| 339,071 | | EarthLink, Inc. | | | 2,214,134 | |
| 272,989 | | Lionbridge Technologies, Inc.(a) | | | 671,553 | |
| 180,863 | | Orbotech, Ltd.(a) | | | 1,750,754 | |
| | | | | | |
| | | | | 9,798,093 | |
| | | | | | |
| | Utilities (2.3%) | | | | |
| 94,767 | | NTELOS Holdings Corp. | | | 1,680,219 | |
| | | | | | |
| | Total Common Stocks
(Cost $82,883,568) | | | 71,150,995 | |
| | | | | | |
RIGHTS (0.0%) | | | | |
| 79,600 | | Voyager Learning Co., Contingent Rights(c) | | | 0 | |
| | | | | | |
| | Total Rights
(Cost $0) | | | 0 | |
| | | | | | |
INVESTMENT COMPANY (0.2%) | | | | |
| 158,745 | | Federated Treasury Obligations Fund, Institutional Shares | | | 158,745 | |
| | | | | | |
| | Total Investment Company
(Cost $158,745) | | | 158,745 | |
| | | | | | |
| | |
Principal
Amount | | | | | |
SECURITIES HELD AS COLLATERAL FOR SECURITIES ON LOAN (1.1%) | | | | |
| $769,385 | | BNY Mellon Overnight Government Fund | | | 769,385 | |
| | | | | | |
| | Total Securities Held as Collateral for Securities on Loan
(Cost $769,385) | | | 769,385 | |
| | | | | | |
Total Investments — 100.4%
(Cost $83,811,698) | | | 72,079,125 | |
Net Other Assets (Liabilities) — (0.4)% | | | (312,980 | ) |
| | | | | | |
NET ASSETS — 100.0% | | $ | 71,766,145 | |
| | | | | | |
| (a) | Represents non-income producing security. |
| (b) | Represents that all or a portion of the security was on loan as of September 30, 2011. |
| (c) | Security was fair valued under methods approved by the Board. |
REIT — Real Estate Investment Trust
See accompanying notes to the financial statements.
49
|
| Sterling Capital International Fund |
Schedule of Portfolio Investments |
September 30, 2011 |
| | | | | | |
Shares | | | | Fair Value | |
COMMON STOCKS (95.5%) | | | | |
| | Australia (2.1%) | | | | |
| 99,821 | | Asciano, Ltd. | | $ | 137,532 | |
| 122,658 | | MAp Group | | | 379,804 | |
| 23,647 | | Newcrest Mining, Ltd. | | | 779,431 | |
| | | | | | |
| | | | | 1,296,767 | |
| | | | | | |
| | Austria (0.4%) | | | | |
| 9,321 | | Erste Group Bank AG | | | 237,722 | |
| | | | | | |
| | Brazil (0.1%) | | | | |
| 4,600 | | Diagnosticos da America SA | | | 38,410 | |
| | | | | | |
| | Canada (7.0%) | | | | |
| 26,081 | | Barrick Gold Corp. | | | 1,222,290 | |
| 10,265 | | Cenovus Energy, Inc.(a) | | | 316,110 | |
| 7,492 | | Goldcorp, Inc. | | | 343,678 | |
| 34,177 | | Ivanhoe Mines, Ltd.(b) | | | 471,283 | |
| 2,767 | | Pan American Silver Corp. | | | 74,542 | |
| 23,779 | | Potash Corp. of Saskatchewan, Inc. | | | 1,032,488 | |
| 35,875 | | Suncor Energy, Inc. | | | 916,132 | |
| | | | | | |
| | | | | 4,376,523 | |
| | | | | | |
| | China (10.8%) | | | | |
| 13,000 | | Anhui Conch Cement Co., Ltd., H Shares | | | 35,310 | |
| 9,294 | | Baidu, Inc., ADR(b) | | | 993,622 | |
| 689,000 | | Belle International Holdings, Ltd. | | | 1,187,831 | |
| 290,600 | | Changsha Zoomlion Heavy Industry Science & Technology Development Co., Ltd., H Shares(a) | | | 324,739 | |
| 177,564 | | China Merchants Holdings International Co., Ltd. | | | 476,087 | |
| 90,000 | | China National Building Material Co., Ltd., H Shares | | | 75,847 | |
| 198,000 | | China Resources Enterprise, Ltd. | | | 658,647 | |
| 25,751 | | Ctrip.Com International, Ltd., ADR(b) | | | 828,152 | |
| 256,000 | | Dongfeng Motor Group Co., Ltd., H Shares | | | 347,057 | |
| 8,448 | | Focus Media Holding, Ltd., ADR(b) | | | 141,842 | |
| 925,000 | | Geely Automobile Holdings, Ltd.(a) | | | 204,701 | |
| 177,000 | | Golden Eagle Retail Group, Ltd.(a) | | | 360,784 | |
| 296,000 | | Intime Department Store Group Co., Ltd. | | | 327,836 | |
| 75,600 | | Lianhua Supermarket Holdings, Ltd., H Shares | | | 107,153 | |
| 110,000 | | Tingyi Cayman Islands Holding Corp. | | | 269,640 | |
| 163,000 | | Wumart Stores, Inc., H Shares | | | 322,139 | |
| 88,000 | | Zhuzhou CSR Times Electric Co., Ltd., H Shares | | | 145,349 | |
| | | | | | |
| | | | | 6,806,736 | |
| | | | | | |
| | Czech Republic (0.7%) | | | | |
| 2,250 | | Komercni Banka AS | | | 417,306 | |
| | | | | | |
| | Denmark (1.9%) | | | | |
| 2,352 | | Carlsberg AS, Class B | | | 139,378 | |
| 10,744 | | Novo Nordisk AS, Class B | | | 1,071,544 | |
| | | | | | |
| | | | | 1,210,922 | |
| | | | | | |
| | Finland (0.2%) | | | | |
| 6,170 | | Fortum OYJ | | | 145,234 | |
| | | | | | |
| | France (9.7%) | | | | |
| 6,448 | | CFAO SA | | | 230,763 | |
| 12,396 | | Cie Generale d’Optique Essilor International SA | | | 891,430 | |
| 11,167 | | Danone | | | 686,470 | |
5,501 | | Eutelsat Communications SA | | | 220,986 | |
| 10,989 | | GDF Suez | | | 326,501 | |
| | | | | | |
Shares | | | | Fair Value | |
COMMON STOCKS — (continued) | | | | |
| | France — (continued) | | | | |
| 2,045 | | IIiad SA | | $ | 228,456 | |
| 139,577 | | L’Occitane International SA(b) | | | 281,135 | |
| 7,236 | | LVMH Moet Hennessy Louis Vuitton SA | | | 955,152 | |
| 2,634 | | PPR | | | 340,473 | |
| 5,188 | | Sanofi | | | 341,249 | |
| 13,682 | | Schneider Electric SA | | | 732,198 | |
| 8,604 | | SES SA | | | 209,381 | |
| 3,784 | | Technip SA | | | 303,162 | |
| 5,460 | | Total SA | | | 240,891 | |
| 2,243 | | Vinci SA | | | 96,206 | |
| | | | | | |
| | | | | 6,084,453 | |
| | | | | | |
| | Germany (8.3%) | | | | |
| 2,646 | | BASF SE | | | 161,314 | |
| 5,649 | | Bayerische Motoren Werke AG | | | 373,179 | |
| 2,500 | | Brenntag AG | | | 216,873 | |
| 2,201 | | Continental AG(b) | | | 127,041 | |
| 7,166 | | Daimler AG | | | 318,703 | |
| 9,972 | | Deutsche Bank AG | | | 345,542 | |
| 15,052 | | E.ON AG | | | 326,568 | |
| 19,589 | | Fraport AG Frankfurt Airport Services Worldwide | | | 1,153,464 | |
| 9,923 | | Fresenius SE & Co. KGaA | | | 882,022 | |
| 456 | | Henkel AG & Co. KGaA | | | 19,985 | |
| 3,079 | | Henkel AG & Co. KGaA, Preference Shares | | | 163,717 | |
| 6,348 | | SAP AG | | | 323,000 | |
| 5,921 | | Volkswagen AG, Preference Shares | | | 781,383 | |
| | | | | | |
| | | | | 5,192,791 | |
| | | | | | |
| | Greece (0.1%) | | | | |
| 4,858 | | Coca-Cola Hellenic Bottling Co. SA(b) | | | 85,620 | |
| | | | | | |
| | Hong Kong (3.4%) | | | | |
| 357,000 | | Hang Lung Properties, Ltd. | | | 1,062,191 | |
| 206,000 | | Li & Fung, Ltd.(a) | | | 343,728 | |
| 163,600 | | Sands China, Ltd.(b) | | | 382,771 | |
| 64,000 | | United Laboratories International Holdings, Ltd. (The)(a) | | | 48,532 | |
| 117,200 | | Wynn Macau, Ltd. | | | 277,156 | |
| | | | | | |
| | | | | 2,114,378 | |
| | | | | | |
| | India (6.9%) | | | | |
| 35,731 | | Adani Enterprises, Ltd. | | | 382,973 | |
| 20,879 | | Axis Bank, Ltd. | | | 431,530 | |
| 50,364 | | HDFC Bank, Ltd. | | | 476,430 | |
| 29,074 | | Housing Development Finance Corp. | | | 378,499 | |
| 145,512 | | ITC, Ltd. | | | 586,171 | |
| 17,822 | | JSW Steel, Ltd. | | | 214,480 | |
| 20,232 | | Larsen & Toubro, Ltd. | | | 557,596 | |
| 31,098 | | Mahindra & Mahindra, Ltd. | | | 507,983 | |
| 114,448 | | Mundra Port & Special Economic Zone, Ltd. | | | 382,422 | |
| 12,760 | | Reliance Capital, Ltd. | | | 81,434 | |
| 8,192 | | State Bank of India, Ltd. | | | 317,734 | |
| | | | | | |
| | | | | 4,317,252 | |
| | | | | | |
| | Ireland (1.4%) | | | | |
| 12,365 | | CRH PLC. | | | 192,293 | |
| 90,415 | | Dragon Oil PLC. | | | 666,888 | |
| | | | | | |
| | | | | 859,181 | |
| | | | | | |
| | Israel (0.3%) | | | | |
| 5,795 | | Teva Pharmaceutical Industries, Ltd., ADR | | | 215,690 | |
| | | | | | |
Continued
50
|
| Sterling Capital International Fund |
Schedule of Portfolio Investments — (continued) |
September 30, 2011 |
| | | | | | |
Shares | | | | Fair Value | |
COMMON STOCKS — (continued) | |
| | Italy (1.9%) | | | | |
| 7,142 | | Buzzi Unicem SpA(b) | | | $ 57,664 | |
| 13,359 | | ENI SpA | | | 235,021 | |
| 43,116 | | Fiat Industrial SpA(b) | | | 322,171 | |
| 16,883 | | Saipem SpA | | | 592,547 | |
| | | | | | |
| | | | | 1,207,403 | |
| | | | | | |
| | Japan (10.5%) | | | | |
| 4,000 | | Aisin Seiki Co., Ltd. | | | 133,182 | |
| 22,000 | | Asahi Glass Co., Ltd. | | | 214,791 | |
| 3,686 | | Canon, Inc. | | | 167,367 | |
| 900 | | Daikin Industries, Ltd. | | | 25,778 | |
| 3,831 | | Denso Corp. | | | 123,156 | |
| 4,125 | | FANUC Corp. | | | 568,202 | |
| 15,706 | | Honda Motor Co., Ltd. | | | 460,105 | |
| 82,000 | | Isuzu Motors, Ltd. | | | 352,284 | |
| 27,000 | | Itochu Corp. | | | 258,007 | |
| 38 | | KDDI Corp. | | | 261,606 | |
| 27,900 | | Komatsu, Ltd. | | | 601,526 | |
| 12,700 | | Mitsubishi Corp. | | | 258,567 | |
| 25,000 | | Mitsubishi Electric Corp. | | | 221,447 | |
| 4,800 | | Mitsui & Co., Ltd. | | | 69,529 | |
| 41,200 | | Nissan Motor Co., Ltd. | | | 364,539 | |
| 1,400 | | Nitto Denko Corp. | | | 55,099 | |
| 2,350 | | SMC Corp. | | | 343,481 | |
| 10,700 | | Softbank Corp. | | | 313,083 | |
| 19,800 | | Suzuki Motor Corp. | | | 436,450 | |
| 15,654 | | Toyota Motor Corp. | | | 536,606 | |
| 17,060 | | Unicharm Corp. | | | 818,258 | |
| | | | | | |
| | | | | 6,583,063 | |
| | | | | | |
| | Korea (South) (2.2%) | | | | |
| 23,591 | | Celltrion, Inc | | | 865,581 | |
| 3,024 | | Hyundai Motor Co. | | | 528,649 | |
| | | | | | |
| | | | | 1,394,230 | |
| | | | | | |
| | Mexico (0.2%) | | | | |
| 34,571 | | Grupo Financiero Banorte SAB de CV, Series O | | | 102,179 | |
| | | | | | |
| | Netherlands (1.4%) | | | | |
| 3,358 | | ASML Holding NV | | | 116,114 | |
| 5,014 | | Heineken NV | | | 225,081 | |
| 72,865 | | ING Groep NV, CVA(b) | | | 513,978 | |
| | | | | | |
| | | | | 855,173 | |
| | | | | | |
| | Norway (0.2%) | | | | |
| 285,066 | | Marine Harvest ASA | | | 124,236 | |
| | | | | | |
| | Russia (2.4%) | | | | |
| 2,172 | | Magnit OJSC, GDR | | | 41,174 | |
| 1,048 | | NovaTek OAO, GDR | | | 120,319 | |
| 8,227 | | O’Key Group SA, GDR(a) | | | 51,941 | |
| 6,900 | | Pharmstandard, OJSC, GDR(b) | | | 130,911 | |
| 282,356 | | Sberbank of Russia | | | 610,861 | |
| 137,668 | | VTB Bank, OJSC, GDR | | | 564,102 | |
| | | | | | |
| | | | | 1,519,308 | |
| | | | | | |
| | South Africa (0.3%) | | | | |
| 15,483 | | Shoprite Holdings, Ltd. | | | 216,807 | |
| | | | | | |
| | Sweden (1.1%) | | | | |
| 13,890 | | Atlas Copco AB, Class A | | | 245,860 | |
| | | | | | |
Shares | | | | Fair Value | |
COMMON STOCKS — (continued) | |
| | Sweden — (continued) | | | | |
| 11,742 | | Elekta AB, Class B(a) | | | $ 441,729 | |
| | | | | | |
| | | | | 687,589 | |
| | | | | | |
| | Switzerland (3.7%) | | | | |
| 5,975 | | Dufry AG(b) | | | 522,353 | |
| 371 | | Flughafen Zuerich AG | | | 139,785 | |
| 15,242 | | Nobel Biocare Holding AG(b) | | | 153,000 | |
| 1,372 | | Swatch Group AG (The) | | | 451,421 | |
| 7,425 | | Swiss Re AG(b) | | | 348,313 | |
| 2,253 | | Syngenta AG(b) | | | 585,483 | |
| 13,944 | | UBS AG(b) | | | 159,500 | |
| | | | | | |
| | | | | 2,359,855 | |
| | | | | | |
| | United Kingdom (18.3%) | | | | |
| 16,370 | | AMEC PLC. | | | 206,556 | |
| 34,325 | | ARM Holdings PLC. | | | 293,536 | |
| 70,247 | | BG Group PLC. | | | 1,344,436 | |
| 57,501 | | BHP Billiton PLC. | | | 1,536,084 | |
| 16,879 | | Burberry Group PLC. | | | 306,512 | |
| 27,062 | | Cairn Energy PLC(b) | | | 117,369 | |
| 40,234 | | Compass Group PLC. | | | 324,593 | |
| 23,117 | | Diageo PLC. | | | 440,765 | |
| 34,194 | | Hikma Pharmaceuticals PLC. | | | 302,089 | |
| 84,398 | | HSBC Holdings PLC. | | | 646,432 | |
| 44,736 | | Premier Oil PLC(b) | | | 240,499 | |
| 8,091 | | Reckitt Benckiser Group PLC. | | | 409,957 | |
| 23,720 | | Rio Tinto PLC. | | | 1,051,942 | |
| 42,021 | | Rolls-Royce Holdings PLC(b) | | | 386,290 | |
| 46,139 | | Royal Dutch Shell PLC, Class A | | | 1,425,562 | |
| 23,288 | | Smith & Nephew PLC. | | | 209,486 | |
| 415,415 | | Vodafone Group PLC. | | | 1,070,645 | |
| 35,414 | | WPP PLC. | | | 328,024 | |
| 68,603 | | Xstrata PLC. | | | 866,301 | |
| | | | | | |
| | | | | 11,507,078 | |
| | | | | | |
| | Total Common Stocks
(Cost $65,404,905) | | | 59,955,906 | |
| | | | | | |
INVESTMENT COMPANY (0.8%) | |
| | United States (0.8%) | | | | |
| 505,528 | | Federated Treasury Obligations Fund, Institutional Shares | | | 505,528 | |
| | | | | | |
| | Total Investment Company
(Cost $505,528) | | | 505,528 | |
| | | | | | |
| | | | | | |
Principal
Amount | | | | | |
SECURITIES HELD AS COLLATERAL FOR | |
SECURITIES ON LOAN (3.0%) | | | | |
| $1,876,684 | | BNY Mellon Overnight Government Fund | | | 1,876,684 | |
| | | | | | |
| | Total Securities Held as Collateral for Securities on Loan
(Cost $1,876,684) | | | 1,876,684 | |
| | | | | | |
Total Investments — 99.3%
(Cost $67,787,117) | | | 62,338,118 | |
Net Other Assets (Liabilities) — 0.7% | | | 448,002 | |
| | | | | | |
NET ASSETS — 100.0% | | | $62,786,120 | |
| | | | | | |
Continued
51
|
| Sterling Capital International Fund |
Schedule of Portfolio Investments — (continued) |
September 30, 2011 |
| (a) | Represents that all or a portion of the security was on loan as of September 30, 2011. |
| (b) | Represents non-income producing security. |
ADR — American Depository Receipt
CVA — Share Certificate
GDR — Global Depository Receipt
OAO — Unlimited Joint-Stock Company
OJSC — Open Joint Stock Company
| | | | |
Sector (unaudited) | | Percentage
of net assets | |
Consumer Discretionary | | | 21.7 | % |
Consumer Staples | | | 8.5 | % |
Energy | | | 10.7 | % |
Financials | | | 10.7 | % |
Health Care | | | 8.9 | % |
Industrials | | | 13.8 | % |
Information Technology | | | 3.0 | % |
Materials | | | 13.9 | % |
Telecommunication Services | | | 3.0 | % |
Utilities | | | 1.3 | % |
Cash Equivalents | | | 3.8 | % |
| | | | |
| | | 99.3 | % |
| | | | |
| | | | | | | | | | | | | | | | | | | | |
Forward Foreign Currency Exchange Contracts | | Counterparty | | Delivery
Date | | Contract
Amount
in Local
Currency | | | Contract
Amount
in U.S. Dollars | | | Fair
Value | | | Unrealized
Appreciation/
(Depreciation) | |
Short | | | | | | | | | | | | | | | | | | | | |
Euro vs. U.S. Dollar | | Credit Suisse First Boston | | 12/21/2011 | | | (865,883 | ) | | | $ (1,200,759 | ) | | | $ (1,155,221 | ) | | | $ 45,538 | |
Euro vs. U.S. Dollar | | Credit Suisse First Boston | | 12/21/2011 | | | (999,640 | ) | | | (1,377,724 | ) | | | (1,338,834 | ) | | | 38,890 | |
Euro vs. U.S. Dollar | | Deutsche Bank | | 12/21/2011 | | | (1,547,902 | ) | | | (2,122,856 | ) | | | (2,081,147 | ) | | | 41,709 | |
Euro vs. U.S. Dollar | | Deutsche Bank | | 12/21/2011 | | | (1,322,803 | ) | | | (1,831,752 | ) | | | (1,771,651 | ) | | | 60,101 | |
Euro vs. U.S. Dollar | | Deutsche Bank | | 12/21/2011 | | | (1,214,402 | ) | | | (1,672,493 | ) | | | (1,626,468 | ) | | | 46,025 | |
Euro vs. U.S. Dollar | | UBS Securities | | 12/21/2011 | | | (2,482,393 | ) | | | (3,334,244 | ) | | | (3,334,244 | ) | | | - | |
Swiss Franc vs. U.S. Dollar | | Goldman Sach | | 12/21/2011 | | | (609,187 | ) | | | (698,898 | ) | | | (673,292 | ) | | | 25,606 | |
Swiss Franc vs. U.S. Dollar | | UBS Securities | | 12/21/2011 | | | (626,844 | ) | | | (711,817 | ) | | | (692,806 | ) | | | 19,011 | |
| | | | | | | | | | | | | | | | | | | | |
Total Short Contracts | | | | | | | | | | | $(12,950,543 | ) | | | $(12,673,663 | ) | | | $276,880 | |
| | | | | | | | | | | | | | | | | | | | |
| | | | | | |
Long | | | | | | | | | | | | | | | | | | | | |
Euro vs. U.S. Dollar | | Credit Suisse First Boston | | 12/21/2011 | | | 940,255 | | | | $ 1,282,504 | | | | $ 1,261,166 | | | | $ (21,338 | ) |
Euro vs. U.S. Dollar | | Deutsche Bank | | 12/21/2011 | | | 864,423 | | | | 1,178,709 | | | | 1,159,416 | | | | (19,293 | ) |
| | | | | | | | | | | | | | | | | | | | |
Total Long Contracts | | | | | | | | | | | $ 2,461,213 | | | | $ 2,420,582 | | | | $ (40,631 | ) |
| | | | | | | | | | | | | | | | | | | | |
See accompanying notes to the financial statements.
52
|
| Sterling Capital Special Opportunities Fund |
Schedule of Portfolio Investments |
September 30, 2011 |
| | | | | | |
Shares | | | | Fair Value | |
COMMON STOCKS (97.2%) | |
| | Consumer Discretionary (11.4%) | |
| 1,283,000 | | Comcast Corp., Class A | | $ | 26,814,700 | |
| 2,368,000 | | Ford Motor Co.(a) | | | 22,898,560 | |
| 422,000 | | Yum! Brands, Inc.(b) | | | 20,842,580 | |
| | | | | | |
| | | | | 70,555,840 | |
| | | | | | |
| |
| | Consumer Staples (5.7%) | |
| 1,530,387 | | Dole Food Co., Inc.(a)(c) | | | 15,303,870 | |
| 298,000 | | Energizer Holdings, Inc.(a)(b) | | | 19,799,120 | |
| | | | | | |
| | | | | 35,102,990 | |
| | | | | | |
| | |
| | Energy (12.0%) | | | | |
| 268,000 | | Apache Corp.(b) | | | 21,504,320 | |
| 185,000 | | EOG Resources, Inc. | | | 13,136,850 | |
| 591,000 | | Halliburton Co.(b) | | | 18,037,320 | |
| 295,000 | | Southwestern Energy Co.(a)(b) | | | 9,832,350 | |
| 923,000 | | Weatherford International, Ltd.(a)(b) | | | 11,269,830 | |
| | | | | | |
| | | | | 73,780,670 | |
| | | | | | |
| | |
| | Financials (6.3%) | | | | |
| 1,238,400 | | Charles Schwab Corp. (The) | | | 13,956,768 | |
| 100,000 | | CME Group, Inc. | | | 24,640,000 | |
| | | | | | |
| | | | | 38,596,768 | |
| | | | | | |
| | |
| | Health Care (20.6%) | | | | |
| 54,000 | | Becton Dickinson & Co. | | | 3,959,280 | |
| 720,000 | | Gilead Sciences, Inc.(a) | | | 27,936,000 | |
| 190,000 | | McKesson Corp. | | | 13,813,000 | |
| 847,000 | | Merck & Co., Inc. | | | 27,705,370 | |
| 679,000 | | Teva Pharmaceutical Industries, Ltd., ADR | | | 25,272,380 | |
| 606,900 | | UnitedHealth Group, Inc.(b) | | | 27,990,228 | |
| | | | | | |
| | | | | 126,676,258 | |
| | | | | | |
| |
| | Industrials (4.7%) | |
| 213,000 | | FedEx Corp. | | | 14,415,840 | |
| 235,000 | | L-3 Communications Holdings, Inc.(b) | | | 14,562,950 | |
| | | | | | |
| | | | | 28,978,790 | |
| | | | | | |
| |
| | Information Technology (31.9%) | |
| 2,268,000 | | Activision Blizzard, Inc. | | | 26,989,200 | |
| 951,000 | | Adobe Systems, Inc.(a) | | | 22,985,670 | |
| 248,000 | | Akamai Technologies, Inc.(a) | | | 4,930,240 | |
| 713,000 | | Broadcom Corp., Class A(a)(b) | | | 23,735,770 | |
| 1,439,000 | | Cisco Systems, Inc. | | | 22,290,110 | |
| 1,440,000 | | Dell, Inc.(a) | | | 20,376,000 | |
| | | | | | |
Shares | | | | Fair Value | |
COMMON STOCKS — (continued) | |
| | Information Technology — (continued) | |
| 841,000 | | eBay, Inc.(a)(b) | | $ | 24,801,090 | |
| 514,000 | | Harris Corp.(c) | | | 17,563,380 | |
| 410,000 | | Intuit, Inc.(a) | | | 19,450,400 | |
| 466,000 | | Itron, Inc.(a) | | | 13,747,000 | |
| | | | | | |
| | | | | 196,868,860 | |
| | | | | | |
| | Materials (3.2%) | | | | |
| 1,427,000 | | Yamana Gold, Inc.(b) | | | 19,492,820 | |
| | | | | | |
| | Utilities (1.4%) | | | | |
| 164,200 | | NextEra Energy, Inc. | | | 8,870,084 | |
| | | | | | |
| | Total Common Stocks
(Cost $589,430,715) | | | 598,923,080 | |
| | | | | | |
INVESTMENT COMPANY (3.4%) | |
| 21,004,244 | | Federated Treasury Obligations Fund, Institutional Shares | | | 21,004,244 | |
| | | | | | |
| | Total Investment Company
(Cost $21,004,244) | | | 21,004,244 | |
| | | | | | |
| | |
Principal
Amount | | | | | |
SECURITIES HELD AS COLLATERAL FOR SECURITIES ON LOAN (1.7%) | |
| $10,443,545 | | BNY Mellon Overnight Government Fund | | | 10,443,545 | |
| | | | | | |
| | Total Securities Held as Collateral for Securities on Loan
(Cost $10,443,545) | | | 10,443,545 | |
| | | | | | |
Total Investments — 102.3%
(Cost $620,878,504) | | | 630,370,869 | |
| Net Other Assets (Liabilities) — (2.3)% | | | (13,885,507 | ) |
| | | | | | |
| NET ASSETS — 100.0% | | $ | 616,485,362 | |
| | | | | | |
| (a) | Represents non-income producing security. |
| (b) | Security held as collateral for written call option. |
| (c) | Represents that all or a portion of the security was on loan as of September 30, 2011. |
ADR — American Depository Receipt
See accompanying notes to the financial statements.
53
|
| Sterling Capital Equity Income Fund |
Schedule of Portfolio Investments |
September 30, 2011 |
| | | | | | |
Shares | | | | Fair Value | |
COMMON STOCKS (87.3%) | |
| | Consumer Discretionary (12.5%) | |
| 320,000 | | McDonald’s Corp.(a) | | $ | 28,102,400 | |
| 453,000 | | Omnicom Group, Inc. | | | 16,688,520 | |
| 941,000 | | Pearson PLC, ADR | | | 16,476,910 | |
| 603,000 | | Target Corp. | | | 29,571,120 | |
| | | | | | |
| | | | | 90,838,950 | |
| | | | | | |
| | |
| | Consumer Staples (11.7%) | | | | |
| 760,000 | | Archer-Daniels-Midland Co. | | | 18,855,600 | |
| 201,000 | | Diageo PLC, ADR | | | 15,261,930 | |
| 497,000 | | PepsiCo, Inc. | | | 30,764,300 | |
| 314,200 | | Philip Morris International, Inc. | | | 19,599,796 | |
| | | | | | |
| | | | | 84,481,626 | |
| | | | | | |
| | |
| | Energy (17.1%) | | | | |
| 268,000 | | Chevron Corp. | | | 24,795,360 | |
| 380,000 | | ConocoPhillips | | | 24,061,600 | |
| 514,000 | | Kinder Morgan Management LLC(b) | | | 30,166,660 | |
| 981,400 | | Natural Resource Partners LP(c) | | | 24,888,304 | |
| 189,500 | | Royal Dutch Shell PLC, ADR | | | 11,758,475 | |
| 275,000 | | Teekay LNG Partners LP | | | 8,558,000 | |
| | | | | | |
| | | | | 124,228,399 | |
| | | | | | |
| | |
| | Financials (5.7%) | | | | |
| 103,000 | | BlackRock, Inc. | | | 15,245,030 | |
| 41,000 | | Hudson City Bancorp, Inc | | | 232,060 | |
| 530,000 | | Travelers Cos., Inc. (The) | | | 25,826,900 | |
| | | | | | |
| | | | | 41,303,990 | |
| | | | | | |
| | |
| | Health Care (10.1%) | | | | |
| 569,000 | | Abbott Laboratories | | | 29,098,660 | |
| 456,000 | | Novartis AG, ADR | | | 25,431,120 | |
| 1,068,000 | | Pfizer, Inc. | | | 18,882,240 | |
| | | | | | |
| | | | | 73,412,020 | |
| | | | | | |
| | |
| | Industrials (10.1%) | | | | |
| 625,000 | | Emerson Electric Co.(a) | | | 25,818,750 | |
| 317,000 | | Illinois Tool Works, Inc | | | 13,187,200 | |
| 230,000 | | Lockheed Martin Corp | | | 16,707,200 | |
| 529,000 | | Waste Management, Inc | | | 17,224,240 | |
| | | | | | |
| | | | | 72,937,390 | |
| | | | | | |
| |
| | Information Technology (13.6%) | |
| 1,039,000 | | Intel Corp. | | | 22,161,870 | |
| 966,000 | | Microsoft Corp. | | | 24,043,740 | |
| | | | | | |
Shares | | | | Fair Value | |
COMMON STOCKS — (continued) | |
| | Information Technology — (continued) | |
| 533,000 | | Paychex, Inc. | | $ | 14,055,210 | |
| 1,694,000 | | Taiwan Semiconductor Manufacturing Co., Ltd., ADR(c) | | | 19,362,420 | |
| 707,000 | | Texas Instruments, Inc. | | | 18,841,550 | |
| | | | | | |
| | | | | 98,464,790 | |
| | | | | | |
| | Telecommunication Services (6.5%) | |
| 795,000 | | Rogers Communications, Inc., Class B | | | 27,196,950 | |
| 535,000 | | Verizon Communications, Inc. | | | 19,688,000 | |
| | | | | | |
| | | | | 46,884,950 | |
| | | | | | |
| | Total Common Stocks
(Cost $589,117,872) | | | 632,552,115 | |
| | | | | | |
INVESTMENT COMPANY (12.7%) | | | | |
| 91,686,701 | | Federated Treasury Obligations Fund, Institutional Shares | | | 91,686,701 | |
| | | | | | |
| | Total Investment Company
(Cost $91,686,701) | | | 91,686,701 | |
| | | | | | |
| | |
Principal
Amount | | | | | |
SECURITIES HELD AS COLLATERAL FOR SECURITIES ON LOAN (0.0%) | |
| $289,900 | | BNY Mellon Overnight Government Fund | | | 289,900 | |
| | | | | | |
| | Total Securities Held as Collateral for Securities on Loan
(Cost $289,900) | | | 289,900 | |
| | | | | | |
Total Investments — 100.0%
(Cost $681,094,473) | | | 724,528,716 | |
| Net Other Assets (Liabilities) — 0.0% | | | (120,961 | ) |
| | | | | | |
| NET ASSETS — 100.0% | | $ | 724,407,755 | |
| | | | | | |
| (a) | Security held as collateral for written call option. |
| (b) | Represents non-income producing security. |
| (c) | Represents that all or a portion of the security was on loan as of September 30, 2011. |
ADR — American Depository Receipt
See accompanying notes to the financial statements.
54
|
| Sterling Capital Short-Term Bond Fund |
Schedule of Portfolio Investments |
September 30, 2011 |
| | | | | | |
Principal
Amount | | | | Fair Value | |
COLLATERALIZED MORTGAGE | |
OBLIGATIONS (10.3%) | |
| $ 546,820 | | Countrywide Home Loans Mortgage Pass Through Trust, Series 2003-J7, Class 1A3, 5.250%, 8/25/33 | | | $ 562,120 | |
| 649,189 | | Freddie Mac, Series 3640, Class JA, 1.500%, 3/15/15(a) | | | 654,862 | |
| 589,783 | | Freddie Mac, Series 2636, Class B, 5.500%, 7/15/17(a) | | | 612,418 | |
| 949,584 | | Freddie Mac, Series 3414, Class A, 4.500%, 7/15/22(a) | | | 991,854 | |
| 558,662 | | Freddie Mac, Series 3591, Class A, 4.000%, 1/15/23(a) | | | 580,936 | |
| 436,488 | | Ginnie Mae, Series 2004-5, Class VB, 6.000%, 5/20/23 | | | 444,978 | |
| 1,479,047 | | Ginnie Mae, Series 2010-34, Class AD, 2.500%, 10/20/32 | | | 1,516,460 | |
| 239,413 | | Ginnie Mae, Series 2005-58, Class NJ, 4.500%, 8/20/35 | | | 242,847 | |
| 485,092 | | Structured Asset Securities Corp., Series 2003-10, Class A, 6.000%, 4/25/33 | | | 507,923 | |
| 395,613 | | Wells Fargo Mortgage Backed Securities Trust, Series 2007-16, Class 1A1, 6.000%, 12/28/37 | | | 409,480 | |
| | | | | | |
| | Total Collateralized Mortgage Obligations (Cost $6,533,673) | | | 6,523,878 | |
| | | | | | |
|
COMMERCIAL MORTGAGE-BACKED | |
SECURITIES (15.3%) | |
| 628,540 | | Banc of America Merrill Lynch Commercial Mortgage, Inc., Series 2004-3, Class A5, 5.730%, 6/10/39(b) | | | 676,707 | |
| 600,000 | | Banc of America Merrill Lynch Commercial Mortgage, Inc., Series 2004-4, Class A6, 4.877%, 7/10/42(b) | | | 628,936 | |
| 300,000 | | Banc of America Merrill Lynch Commercial Mortgage, Inc., Series 2005-1, Class A5, 5.330%, 11/10/42(b) | | | 325,516 | |
| 500,000 | | Banc of America Merrill Lynch Commercial Mortgage, Inc., Series 2005-1, Class AJ, 5.353%, 11/10/42(b) | | | 476,509 | |
| 420,000 | | Bear Stearns Commercial Mortgage Securities, Series 2003-T12, Class A4, 4.680%, 8/13/39(b) | | | 438,698 | |
| 500,000 | | Bear Stearns Commercial Mortgage Securities, Series 2005-PW10, Class A4, 5.405%, 12/11/40(b) | | | 540,763 | |
| 540,000 | | Bear Stearns Commercial Mortgage Securities, Series 2005-PWR8, Class A4, 4.674%, 6/11/41 | | | 573,753 | |
| 155,000 | | Bear Stearns Commercial Mortgage Securities, Series 2004-T16, Class A6, 4.750%, 2/13/46(b) | | | 165,109 | |
| 120,000 | | Credit Suisse First Boston Mortgage Securities Corp., Series 2002-CP5, Class C, 5.230%, 12/15/35 | | | 120,854 | |
| 650,000 | | Credit Suisse First Boston Mortgage Securities Corp., Series 2004-C5, Class A4, 4.829%, 11/15/37 | | | 693,417 | |
| 115,000 | | Credit Suisse First Boston Mortgage Securities Corp., Series 2005-C1, Class A4, 5.014%, 2/15/38(b) | | | 122,937 | |
| | | | | | |
Principal Amount | | | | Fair Value | |
COMMERCIAL MORTGAGE-BACKED | |
SECURITIES — (continued) | |
| $603,000 | | Credit Suisse First Boston Mortgage Securities Corp., Series 2005-C1, Class AJ, 5.075%, 2/15/38(b) | | | $ 575,393 | |
| 600,000 | | JPMorgan Chase Commercial Mortgage Securities Corp., Series 2005-LDP2, Class AM, 4.780%, 7/15/42 | | | 598,475 | |
| 230,100 | | LB-UBS Commercial Mortgage Trust, Series 2004-C7, Class A6, 4.786%, 10/15/29(b) | | | 244,464 | |
| 600,000 | | LB-UBS Commercial Mortgage Trust, Series 2005-C2, Class A5, 5.150%, 4/15/30(b) | | | 648,440 | |
| 414,000 | | LB-UBS Commercial Mortgage Trust, Series 2004-C2, Class A4, 4.367%, 3/15/36 | | | 434,431 | |
| 500,000 | | Merrill Lynch Mortgage Trust, Series 2005-MKB2, Class AJ, 5.263%, 9/12/42(b) | | | 440,983 | |
| 616,000 | | Morgan Stanley Capital I, Series 2005-HQ6, Class A4A, 4.989%, 8/13/42 | | | 663,341 | |
| 650,000 | | Wachovia Bank Commercial Mortgage Trust, Series 2004-C11, Class A5, 5.215%, 1/15/41(b) | | | 691,282 | |
| 600,000 | | Wachovia Bank Commercial Mortgage Trust, Series 2005-C20, Class AMFX, 5.179%, 7/15/42(b) | | | 615,926 | |
| | | | | | |
| | Total Commercial Mortgage-Backed Securities
(Cost $9,847,561) | | | 9,675,934 | |
| | | | | | |
|
CORPORATE BONDS (56.5%) | |
| | Consumer Discretionary (3.1%) | |
| 1,000,000 | | Macy’s Retail Holdings, Inc., 5.750%, 7/15/14 | | | 1,068,086 | |
| 900,000 | | Royal Caribbean Cruises, Ltd., 6.875%, | | | | |
| | 12/1/13 | | | 906,750 | |
| | | | | | |
| | | | | 1,974,836 | |
| | | | | | |
| | Consumer Staples (1.9%) | | | | |
| 875,000 | | Altria Group, Inc., 8.500%, 11/10/13 | | | 997,952 | |
| 245,000 | | Pepsico, Inc., 0.800%, 8/25/14 | | | 243,761 | |
| | | | | | |
| | | | | 1,241,713 | |
| | | | | | |
| | Energy (6.1%) | | | | |
| 360,000 | | Apache Corp., 5.250%, 4/15/13 | | | 383,220 | |
| 1,000,000 | | BP Capital Markets PLC, 5.250%, 11/7/13 | | | 1,076,735 | |
| 1,179,000 | | Energy Transfer Partners LP, 8.500%, 4/15/14 | | | 1,337,737 | |
| 1,000,000 | | Spectra Energy Capital LLC, 5.900%, 9/15/13 | | | 1,070,550 | |
| | | | | | |
| | | | | 3,868,242 | |
| | | | | | |
| | Financials (33.8%) | | | | |
| 665,000 | | Abbey National Treasury Services PLC, 2.875%, 4/25/14 | | | 626,641 | |
| 1,000,000 | | ABN AMRO Bank NV, 3.000%, 1/31/14(c) | | | 984,153 | |
| 1,000,000 | | American Express Bank FSB, BKNT, 5.500%, 4/16/13 | | | 1,055,698 | |
| 640,000 | | American Honda Finance Corp., 1.850%, 9/19/14(c) | | | 640,952 | |
| 1,000,000 | | Bank of America Corp., 5.125%, 11/15/14 | | | 979,639 | |
| 1,000,000 | | Brandywine Operating Partnership LP, REIT, 5.750%, 4/1/12 | | | 1,013,955 | |
| 1,000,000 | | Citigroup, Inc., 5.625%, 8/27/12 | | | 1,018,259 | |
| 1,000,000 | | Citigroup, Inc., 5.000%, 9/15/14 | | | 980,759 | |
| 1,000,000 | | Colonial Realty LP, 6.150%, 4/15/13. | | | 1,031,183 | |
| 650,000 | | Ford Motor Credit Co. LLC, 7.000%, 10/1/13 | | | 682,576 | |
Continued
55
|
| Sterling Capital Short-Term Bond Fund |
Schedule of Portfolio Investments — (continued) |
September 30, 2011 |
| | | | | | |
Principal Amount | | | | Fair Value | |
CORPORATE BONDS — (continued) | |
| | Financials — (continued) | | | | |
| $1,000,000 | | General Electric Capital Corp., 4.800%, 5/1/13 | | $ | 1,050,212 | |
| 1,000,000 | | Goldman Sachs Group, Inc. (The), 5.250%, 10/15/13 | | | 1,039,051 | |
| 1,000,000 | | HCP, Inc., REIT, 2.700%, 2/1/14 | | | 985,172 | |
| 1,000,000 | | HSBC Finance Corp., 4.750%, 7/15/13 | | | 1,033,830 | |
| 1,000,000 | | Jackson National Life Global Funding, 5.375%, 5/8/13(c) | | | 1,056,181 | |
| 1,000,000 | | Jefferies Group, Inc., 5.875%, 6/8/14 | | | 1,049,179 | |
| 1,000,000 | | JPMorgan Chase & Co., 5.125%, 9/15/14 | | | 1,053,146 | |
| 1,000,000 | | Metropolitan Life Global Funding I, 2.000%, 1/10/14(c) | | | 1,004,581 | |
| 1,000,000 | | Metropolitan Life Global Funding I, 5.125%, 6/10/14(c) | | | 1,080,064 | |
| 1,000,000 | | Morgan Stanley, 5.300%, 3/1/13 | | | 1,008,350 | |
| 260,000 | | PNC Funding Corp., 3.000%, 5/19/14 | | | 268,575 | |
| 1,000,000 | | Prudential Financial, Inc., MTN, 2.750%, 1/14/13 | | | 1,008,823 | |
| 500,000 | | UBS AG, BKNT, 2.250%, 8/12/13 | | | 491,035 | |
| 280,000 | | USAA Capital Corp., 1.050%, 9/30/14(c) | | | 279,032 | |
| | | | | | |
| | | | | 21,421,046 | |
| | | | | | |
| | Health Care (1.6%) | | | | |
| 420,000 | | Stryker Corp., 3.000%, 1/15/15 | | | 442,862 | |
| 540,000 | | UnitedHealth Group, Inc., 5.500%, 11/15/12 | | | 566,815 | |
| | | | | | |
| | | | | 1,009,677 | |
| | | | | | |
| | Industrials (4.4%) | | | | |
| 1,000,000 | | Corrections Corp. of America, 6.250%, 3/15/13 | | | 1,000,000 | |
| 1,000,000 | | Roper Industries, Inc., 6.625%, 8/15/13 | | | 1,083,014 | |
| 705,000 | | Sealed Air Corp., 7.875%, 6/15/17 | | | 741,641 | |
| | | | | | |
| | | | | 2,824,655 | |
| | | | | | |
| | Materials (2.8%) | | | | |
| 650,000 | | Alcoa, Inc., 6.000%, 7/15/13 | | | 695,117 | |
| 1,024,000 | | Dow Chemical Co. (The), 4.850%, 8/15/12 | | | 1,054,313 | |
| | | | | | |
| | | | | 1,749,430 | |
| | | | | | |
| | Telecommunication Services (2.8%) | |
| 550,000 | | America Movil SAB de CV, 5.500%, 3/1/14 | | | 594,688 | |
| 180,000 | | Qwest Communications International, Inc., Series B, 7.500%, 2/15/14 | | | 180,000 | |
| 1,000,000 | | Telecom Italia Capital SA, 5.250%, 11/15/13 | | | 977,475 | |
| | | | | | |
| | | | | 1,752,163 | |
| | | | | | |
| | Total Corporate Bonds
(Cost $36,315,894) | | | 35,841,762 | |
| | | | | | |
|
MORTGAGE-BACKED SECURITIES (1.2%) | |
| | Fannie Mae(a) (0.9%) | | | | |
| 55,229 | | 6.500%, 8/1/13, Pool #251901 | | | 57,437 | |
| 100,917 | | 6.000%, 3/1/16, Pool #253702 | | | 109,470 | |
| 97,726 | | 6.000%, 4/1/16, Pool #535846 | | | 106,008 | |
| 177,607 | | 6.500%, 4/1/16, Pool #253706 | | | 195,099 | |
| 77,450 | | 6.000%, 8/1/16, Pool #545125 | | | 84,159 | |
| | | | | | |
| | | | | 552,173 | |
| | | | | | |
| | Freddie Mac(a) (0.3%) | | | | |
| 24,114 | | 6.500%, 5/1/13, Pool #E00548 | | | 25,007 | |
| | | | | | |
Principal Amount | | | | Fair Value | |
MORTGAGE-BACKED SECURITIES — (continued) | |
Freddie Mac(a) — (continued) | |
| $161,923 | | 6.000%, 9/1/16, Pool #E01049 | | $ | 173,090 | |
| | | | | | |
| | | | | 198,097 | |
| | | | | | |
| | Total Mortgage-Backed Securities
(Cost $696,424) | | | 750,270 | |
| | | | | | |
|
MUNICIPAL BONDS (9.5%) | |
| | California (1.7%) | | | | |
| 1,000,000 | | Northern California Transmission Agency, California-Oregon Transmission Project, Refunding Revenue, Series B, 5.370%, 5/1/15 | | | 1,096,860 | |
| | | | | | |
| | Illinois (1.6%) | | | | |
| 1,000,000 | | Illinois State, Build America Bonds, G.O., 4.200%, 7/1/14 | | | 1,041,120 | |
| | | | | | |
| | Nebraska (1.2%) | | | | |
| 690,000 | | Nebraska Public Power District General Revenue, Taxable, Series B, 4.850%, 1/1/14 | | | 744,676 | |
| | | | | | |
| | New York (1.7%) | | | | |
| 1,000,000 | | New York State Urban Development Corporate, Revenue, Taxable, State Personal Income Tax, Series B, 2.626%, 12/15/14 | | | 1,047,390 | |
| | | | | | |
| | North Carolina (1.7%) | | | | |
| 1,000,000 | | Brunswick County, NC, Build America Bonds, Recovery Revenue, Series Z, 3.300%, 4/1/15 | | | 1,063,670 | |
| | | | | | |
| | Virginia (1.6%) | | | | |
| 310,000 | | Danville, VA, Refunding G.O., Series B, Taxable (Assured Guaranty, State Aid Withholding), 4.000%, 3/1/13 | | | 324,297 | |
| 215,000 | | Danville, VA, Refunding G.O., Series B, Taxable (Assured Guaranty, State Aid Withholding), 4.200%, 3/1/14 | | | 230,676 | |
| 430,000 | | Danville, VA, Refunding G.O., Series B, Taxable (Assured Guaranty, State Aid Withholding), 4.550%, 3/1/15 | | | 472,798 | |
| | | | | | |
| | | | | 1,027,771 | |
| | | | | | |
| | Total Municipal Bonds
(Cost $5,769,808) | | | 6,021,487 | |
| | | | | | |
|
U.S. GOVERNMENT AGENCIES (0.8%) | |
| | Freddie Mac(a) (0.8%) | | | | |
| 500,000 | | 1.350%, 5/23/14 | | | 500,655 | |
| | | | | | |
| | Total U.S. Government Agencies
(Cost $501,656) | | | 500,655 | |
| | | | | | |
|
U.S. TREASURY NOTES (1.6%) | |
| 950,000 | | 2.250%, 1/31/15 | | | 1,004,179 | |
| | | | | | |
| | Total U.S. Treasury Notes
(Cost $1,004,893) | | | 1,004,179 | |
| | | | | | |
Continued
56
|
| Sterling Capital Short-Term Bond Fund |
Schedule of Portfolio Investments — (continued) |
September 30, 2011 |
| | | | | | |
Shares | | | | Fair Value | |
PREFERRED STOCKS (3.5%) | |
| | Financials (3.5%) | | | | |
| 18,393 | | Duke Realty Corp., REIT, 8.375% | | | $ 478,218 | |
| 29,500 | | Fifth Third Capital Trust VI, 7.250% | | | 742,810 | |
| 16,156 | | Public Storage, REIT, 7.000%(d) | | | 415,048 | |
| 21,766 | | Vornado Realty LP, REIT, 7.875% | | | 583,329 | |
| | | | | | |
| | Total Preferred Stocks
(Cost $2,242,560) | | | 2,219,405 | |
| | | | | | |
INVESTMENT COMPANY (0.6%) | |
| 408,137 | | Federated Treasury Obligations Fund, Institutional Shares | | | 408,137 | |
| | | | | | |
| | Total Investment Company
(Cost $408,137) | | | 408,137 | |
| | | | | | |
| | | | | | |
Principal
Amount | | | | | |
SECURITIES HELD AS COLLATERAL FOR SECURITIES ON LOAN (0.1%) | |
| $53,000 | | BNY Mellon Overnight Government Fund | | | 53,000 | |
| | | | | | |
| | Total Securities Held as Collateral for Securities on Loan
(Cost $53,000) | | | 53,000 | |
| | | | | | |
Total Investments — 99.4%
(Cost $63,373,606) | | | 62,998,707 | |
| Net Other Assets (Liabilities) — 0.6% | | | 365,615 | |
| | | | | | |
| NET ASSETS — 100.0% | | | $ 63,364,322 | |
| | | | | | |
| (a) | On September 7, 2008, the Federal Housing Finance Agency (FHFA) placed Fannie Mae and Freddie Mac into conservatorship with FHFA as the conservator. The conservatorship is a statutory process designed to stabilize a troubled institution with the objective of returning the entities to normal business operations. |
| (b) | The interest rate for this variable rate note, which will change periodically, is based either on the prime rate or an index of market rates. The reflected rate is in effect as of September 30, 2011. The maturity date reflected is the final maturity date. |
| (c) | Rule 144A, Section 4(2) or other security which is restricted as to resale to qualified institutional investors. The Investment Advisor, using Board approved procedures, has deemed these securities or a portion of these securities to be liquid. |
| (d) | Represents that all or a portion of the security was on loan as of September 30, 2011. |
BKNT — Bank Note
G.O. — General Obligation
MTN — Medium Term Note
REIT — Real Estate Investment Trust
See accompanying notes to the financial statements.
57
|
| Sterling Capital Intermediate U.S. Government Fund |
Schedule of Portfolio Investments |
September 30, 2011 |
| | | | | | |
Principal
Amount | | | | Fair Value | |
COLLATERALIZED MORTGAGE
OBLIGATIONS (5.9%) | |
| $2,757,432 | | Fannie Mae, Series 2010-129, Class NA, 3.500%, 3/25/25(a) | | | $ 2,907,320 | |
| 2,000,000 | | Freddie Mac, Series K701, Class A2, 3.882%, 11/25/17(a)(b) | | | 2,160,957 | |
| 3,865,070 | | Freddie Mac, Series 3644, Class BA, 4.500%, 2/15/29(a) | | | 4,096,596 | |
| 860,744 | | Ginnie Mae, Series 1999-17, Class F, 0.529%, 5/16/29(b) | | | 861,312 | |
| | | | | | |
| | Total Collateralized Mortgage Obligations (Cost $9,770,100) | | | 10,026,185 | |
| | | | | | |
CORPORATE BONDS (7.6%) | | | | |
| | Financials (7.6%) | | | | |
| 1,570,000 | | Aflac, Inc., 8.500%, 5/15/19 | | | 1,911,076 | |
| 3,000,000 | | General Electric Capital Corp., 2.800%, 1/8/13 | | | 3,051,642 | |
| 1,000,000 | | Goldman Sachs Group, Inc. (The), 5.125%, 1/15/15 | | | 1,032,377 | |
| 2,000,000 | | MBNA Corp., 5.000%, 6/15/15 | | | 1,954,560 | |
| 2,000,000 | | Metropolitan Life Global Funding I, 2.000%, 1/10/14(c) | | | 2,009,162 | |
| 3,000,000 | | Morgan Stanley, GMTN, 5.750%, 8/31/12 | | | 3,099,120 | |
| | | | | | |
| | Total Corporate Bonds
(Cost $12,991,398) | | | 13,057,937 | |
| | | | | | |
MORTGAGE-BACKED SECURITIES (24.9%) | |
| | Fannie Mae(a) (15.3%) | | | | |
| 1,792,372 | | 5.000%, 1/1/18, Pool #650205 | | | 1,939,297 | |
| 1,657,163 | | 4.500%, 3/1/18, Pool #555292 | | | 1,775,137 | |
| 1,983,151 | | 3.584%, 9/1/20, Pool #FN0000 | | | 2,088,959 | |
| 4,528,753 | | 4.000%, 8/1/25, Pool #AE2977 | | | 4,782,519 | |
| 857,410 | | 5.500%, 1/1/33, Pool #678321 | | | 936,908 | |
| 1,380,179 | | 5.000%, 7/1/33, Pool #724965 | | | 1,492,677 | |
| 693,981 | | 5.000%, 8/1/33, Pool #724365 | | | 749,944 | |
| 176,774 | | 5.000%, 8/1/33, Pool #738751 | | | 191,017 | |
| 470,677 | | 5.000%, 10/1/33, Pool #753298 | | | 508,886 | |
| 2,016,039 | | 6.500%, 11/1/34, Pool #783476 | | | 2,223,681 | |
| 4,316,110 | | 5.500%, 9/1/35, Pool #835787 | | | 4,712,248 | |
| 1,223,985 | | 6.000%, 7/1/37, Pool #938378 | | | 1,343,400 | |
| 3,206,476 | | 5.500%, 8/1/37, Pool #946238 | | | 3,475,052 | |
| | | | | | |
| | | | | 26,219,725 | |
| | | | | | |
| | Freddie Mac(a) (6.5%) | | | | |
| 2,100,671 | | 4.500%, 2/1/18, Pool #E94445 | | | 2,244,933 | |
| 4,690,243 | | 3.500%, 12/1/25, Pool #G14007 | | | 4,893,925 | |
| 2,884,087 | | 5.500%, 2/1/29, Pool #A18613 | | | 3,141,582 | |
| 833,213 | | 6.000%, 8/1/37, Pool #P51312 | | | 906,744 | |
| | | | | | |
| | | | | 11,187,184 | |
| | | | | | |
| | Ginnie Mae (3.1%) | | | | |
| 654,237 | | 6.500%, 12/20/38, Pool #4311 | | | 723,869 | |
| 756,785 | | 6.500%, 1/20/39, Pool #4338 | | | 837,332 | |
| 1,228,973 | | 5.000%, 11/20/38, Pool #4283 | | | 1,316,432 | |
| 2,291,753 | | 5.500%, 8/20/39, Pool #4514 | | | 2,469,438 | |
| | | | | | |
| | | | | 5,347,071 | |
| | | | | | |
| | Total Mortgage-Backed Securities
(Cost $40,137,031) | | | 42,753,980 | |
| | | | | | |
| | | | | | |
Principal
Amount | | | | Fair Value | |
MUNICIPAL BONDS (2.4%) | | | | |
| | New York (1.2%) | | | | |
| $1,950,000 | | New York State, Build America Bonds, G.O., 4.090%, 3/1/18 | | | $ 2,113,644 | |
| | | | | | |
| | North Carolina (1.2%) | | | | |
| 1,855,000 | | Brunswick County, NC, Enterprise System Water Utility Improvements Revenue, Build America Bonds, Recovery Zone Economic Development Project, Callable 4/1/20 @ 100, 5.050%, 4/1/22 | | | 2,020,726 | |
| | | | | | |
| | Total Municipal Bonds
(Cost $3,899,872) | | | 4,134,370 | |
| | | | | | |
U.S. GOVERNMENT AGENCIES (42.7%) | |
| | Fannie Mae(a) (13.2%) | | | | |
| 2,000,000 | | 0.400%, 2/1/13, Series 1(b) | | | 2,003,418 | |
| 3,000,000 | | 4.050%, 2/22/13 | | | 3,152,835 | |
| 5,000,000 | | 1.000%, 4/12/16, STEP | | | 5,000,970 | |
| 5,000,000 | | 1.000%, 7/27/21, STEP | | | 5,006,950 | |
| 2,450,000 | | 2.000%, 5/23/23, Series 1, STEP | | | 2,453,651 | |
| 5,000,000 | | 3.000%, 7/27/26, Series 1, STEP | | | 5,023,215 | |
| | | | | | |
| | | | | 22,641,039 | |
| | | | | | |
| | Federal Farm Credit Bank (16.6%) | |
| 10,000,000 | | 4.670%, 2/27/18 | | | 11,656,230 | |
| 13,800,000 | | 5.050%, 12/21/21 | | | 16,688,312 | |
| | | | | | |
| | | | | 28,344,542 | |
| | | | | | |
| | Federal Home Loan Bank (1.1%) | |
| 1,895,000 | | 2.250%, 7/13/26, STEP | | | 1,899,707 | |
| | | | | | |
| | Freddie Mac(a) (5.8%) | | | | |
| 2,000,000 | | 4.875%, 6/13/18 | | | 2,391,844 | |
| 3,000,000 | | 0.500%, 9/20/18, STEP | | | 3,002,874 | |
| 4,000,000 | | 3.750%, 3/27/19(d) | | | 4,518,852 | |
| | | | | | |
| | | | | 9,913,570 | |
| | | | | | |
| | Private Export Funding Corp. (6.0%) | |
| 4,350,000 | | 4.974%, 8/15/13 | | | 4,700,288 | |
| 5,000,000 | | 4.550%, 5/15/15 | | | 5,621,005 | |
| | | | | | |
| | | | | 10,321,293 | |
| | | | | | |
| | Total U.S. Government Agencies
(Cost $68,297,148) | | | 73,120,151 | |
| | | | | | |
U.S. TREASURY NOTES (15.4%) | | | | |
| 2,000,000 | | 4.625%, 2/15/17 | | | 2,372,968 | |
| 3,000,000 | | 2.500%, 6/30/17 | | | 3,225,000 | |
| 4,000,000 | | 3.500%, 2/15/18 | | | 4,543,436 | |
| 5,000,000 | | 3.625%, 8/15/19 | | | 5,757,810 | |
| 3,000,000 | | 3.125%, 5/15/21 | | | 3,329,760 | |
| 5,000,000 | | 6.250%, 8/15/23 | | | 7,126,560 | |
| | | | | | |
| | Total U.S. Treasury Notes
(Cost $24,468,933) | | | 26,355,534 | |
| | | | | | |
Continued
58
|
| Sterling Capital Intermediate U.S. Government Fund |
Schedule of Portfolio Investments — (continued) |
September 30, 2011 |
| | | | | | |
Shares | | | | Fair Value | |
INVESTMENT COMPANY (0.7%) | | | | |
| 1,276,702 | | Federated Treasury Obligations Fund, Institutional Shares | | | $ 1,276,702 | |
| | | | | | |
| | Total Investment Company
(Cost $1,276,702) | | | 1,276,702 | |
| | | | | | |
| | |
Principal
Amount | | | | | |
SECURITIES HELD AS COLLATERAL FOR SECURITIES ON LOAN (2.7%) | |
| $4,605,000 | | BNY Mellon Overnight Government Fund | | | 4,605,000 | |
| | | | | | |
| | Total Securities Held as Collateral for Securities on Loan
(Cost $4,605,000) | | | 4,605,000 | |
| | | | | | |
| |
Total Investments — 102.3%
(Cost $165,446,184) | | | 175,329,859 | |
Net Other Assets (Liabilities) — (2.3)% | | | (3,897,454) | |
| | | | | | |
NET ASSETS — 100.0% | | | $ 171,432,405 | |
| | | | | | |
| (a) | On September 7, 2008, the Federal Housing Finance Agency (FHFA) placed Fannie Mae and Freddie Mac into conservatorship with FHFA as the conservator. The conservatorship is a statutory process designed to stabilize a troubled institution with the objective of returning the entities to normal business operations. |
| (b) | The interest rate for this variable rate note, which will change periodically, is based either on the prime rate or an index of market rates. The reflected rate is in effect as of September 30, 2011. The maturity date reflected is the final maturity date. |
| (c) | Rule 144A, Section 4(2) or other security which is restricted as to resale to qualified institutional investors. The Investment Advisor, using Board approved procedures, has deemed these securities or a portion of these securities to be liquid. |
| (d) | Represents that all or a portion of the security was on loan as of September 30, 2011. |
G.O. — General Obligation
GMTN — Global Medium Term Note
STEP — Step Coupon Bond
See accompanying notes to the financial statements.
59
|
| Sterling Capital Total Return Bond Fund |
Schedule of Portfolio Investments |
September 30, 2011 |
| | | | | | |
Principal
Amount | | | | Fair Value | |
ASSET BACKED SECURITIES (2.9%) | | | | |
| $2,300,000 | | Capital One Multi-Asset Execution Trust, Series 2004-A1, Class A1, 0.439%, 12/15/16(a) | | | $ 2,297,774 | |
| 2,154,000 | | Chase Issuance Trust, Series 2007-A13, Class A13, 0.269%, 7/15/14(a)(b) | | | 2,152,593 | |
| 1,345,079 | | Credit-Based Asset Servicing and Securitization LLC, Series 2005-CB5, Class AF2, STEP, 4.831%, 8/25/35 | | | 1,306,399 | |
| 650,000 | | MBNA Credit Card Master Note Trust, Series 2006-A2, Class A2, 0.289%, 6/15/15(a) | | | 649,826 | |
| 4,100,000 | | MBNA Credit Card Master Note Trust, Series 2006-A5, Class A5, 0.289%, 10/15/15(a) | | | 4,097,959 | |
| 2,026,803 | | RAAC, Series 2004-SP1, Class AI3, STEP, 5.618%, 3/25/34 | | | 2,077,815 | |
| | | | | | |
| | Total Asset Backed Securities
(Cost $12,560,047) | | | 12,582,366 | |
| | | | | | |
COLLATERALIZED MORTGAGE
OBLIGATIONS (10.3%) | |
| 1,881,756 | | Adjustable Rate Mortgage Trust, Series 2004-5, Class 4A1, 5.182%, 4/25/35(a) | | | 1,754,068 | |
| 1,263,108 | | Banc of America Alternative Loan Trust, Series 2004-10, Class 1CB1, 6.000%, 11/25/34 | | | 1,281,038 | |
| 2,491,926 | | Banc of America Funding Corp., Series 2006-2, Class 3A1, 6.000%, 3/25/36 | | | 2,480,084 | |
| 1,560,845 | | Countrywide Home Loan Mortgage Pass Through Trust, Series 2002-38, Class A3, 5.000%, 2/25/18 | | | 1,576,647 | |
| 550,854 | | Countrywide Home Loan Mortgage Pass Through Trust, Series 2003-28, Class A3, 4.500%, 8/25/33 | | | 555,723 | |
| 611,223 | | Countrywide Home Loans Mortgage Pass Through Trust, Series 2003-J7, Class 1A3, 5.250%, 8/25/33 | | | 628,325 | |
| 1,594,488 | | Credit Suisse First Boston Mortgage Securities Corp., Series 2005-7, Class 4A3, 5.000%, 8/25/20 | | | 1,616,047 | |
| 4,070,391 | | Fannie Mae, Series 2011-31, Class DA, 3.500%, 11/25/28(c) | | | 4,246,640 | |
| 1,549,210 | | Fannie Mae, Series 2003-33, Class A, 4.000%, 5/25/33(c) | | | 1,668,240 | |
| 1,477,487 | | Fannie Mae, Series 2003-33, Class AQ, 4.000%, 5/25/33(c) | | | 1,571,827 | |
| 2,416,988 | | Fannie Mae, Series 2008-29, Class BG, 4.700%, 12/25/35(c) | | | 2,589,382 | |
| 1,050,110 | | First Horizon Asset Securities, Inc., Series 2003-5, Class 1A19, 5.500%, 7/25/33 | | | 1,088,794 | |
| 1,037,842 | | Freddie Mac, Series 2906, Class VC, 5.000%, 12/15/15(c) | | | 1,095,389 | |
| 1,354,200 | | Freddie Mac, Series 3773, Class AL, 3.250%, 6/15/25(c) | | | 1,417,605 | |
| 3,118,021 | | Ginnie Mae, Series 2008-51, Class PG, 5.000%, 6/20/38 | | | 3,417,434 | |
| 1,364,439 | | MASTR Alternative Loans Trust, Series 2004-13, Class 3A1, 6.500%, 1/25/35 | | | 1,376,117 | |
| 382,908 | | MASTR Asset Securitization Trust, Series 2003-4, Class 5A1, 5.500%, 5/25/33 | | | 405,208 | |
| 2,003,381 | | RAAC, Series 2004-SP3, Class AI5, 4.890%, 12/25/32(a) | | | 2,015,450 | |
| 1,887,526 | | Residential Accredit Loans, Inc., Series 2005-QR1, Class A, 6.000%, 10/25/34 | | | 1,905,975 | |
| 972,562 | | Residential Asset Securitization Trust, Series 2004-IP2, Class 4A, 3.445%, 12/25/34(a) | | | 831,013 | |
| | | | | | |
Principal
Amount | | | | Fair Value | |
COLLATERALIZED MORTGAGE
OBLIGATIONS — (continued) | |
| $2,554,774 | | Structured Adjustable Rate Mortgage Loan Trust, Series 2004-6, Class 4A1, 2.520%, 6/25/34(a) | | | $ 2,327,696 | |
| 2,080,234 | | Structured Asset Securities Corp., Series 2003-10, Class A, 6.000%, 4/25/33 | | | 2,178,145 | |
| 916,175 | | Structured Asset Securities Corp., Series 2005-6, Class 5A1, 5.000%, 5/25/35 | | | 908,870 | |
| 2,139,459 | | Wells Fargo Mortgage Backed Securities Trust, Series 2004-BB, Class A2, 2.738%, 1/25/35(a) | | | 1,880,013 | |
| 2,331,768 | | Wells Fargo Mortgage Backed Securities Trust, Series 2005-AR16, Class 6A3, 2.724%, 10/25/35(a) | | | 2,039,355 | |
| 1,274,666 | | Wells Fargo Mortgage Backed Securities Trust, Series 2007-16, Class 1A1, 6.000%, 12/28/37 | | | 1,319,345 | |
| | | | | | |
| | Total Collateralized Mortgage Obligations (Cost $43,701,293) | | | 44,174,430 | |
| | | | | | |
COMMERCIAL MORTGAGE-BACKED
SECURITIES (10.0%) | |
| 936,000 | | Banc of America Merrill Lynch Commercial Mortgage, Inc., Series 2004-4, Class A6, 4.877%, 7/10/42(a) | | | 981,140 | |
| 1,164,000 | | Banc of America Merrill Lynch Commercial Mortgage, Inc., Series 2005-1, Class AJ, 5.353%, 11/10/42(a) | | | 1,109,313 | |
| 2,100,000 | | Banc of America Merrill Lynch Commercial Mortgage, Inc., Series 2006-3, Class A4, 5.889%, 7/10/44(a) | | | 2,263,313 | |
| 938,139 | | Banc of America Merrill Lynch Commercial Mortgage, Inc., Series 2007-2, Class A2, 5.634%, 4/10/49(a) | | | 950,916 | |
| 3,848,000 | | Citigroup/Deutsche Bank Commercial Mortgage Trust, Series 2005-CD1, Class AM, 5.398%, 7/15/44(a) | | | 3,955,036 | |
| 2,050,000 | | Citigroup/Deutsche Bank Commercial Mortgage Trust, Series 2006-CD3, Class A5, 5.617%, 10/15/48 | | | 2,155,407 | |
| 850,000 | | Credit Suisse First Boston Mortgage Securities Corp., Series 2005-C6, Class A4, 5.230%, 12/15/40(a) | | | 924,096 | |
| 1,620,000 | | Credit Suisse First Boston Mortgage Securities Corp., Series 2002-CP5, Class C, 5.230%, 12/15/35 | | | 1,631,526 | |
| 700,000 | | Credit Suisse First Boston Mortgage Securities Corp., Series 2004-C5, Class A4, 4.829%, 11/15/37 | | | 746,757 | |
| 2,828,000 | | Credit Suisse First Boston Mortgage Securities Corp., Series 2005-C1, Class AJ, 5.075%, 2/15/38(a) | | | 2,698,530 | |
| 2,214,000 | | DBUBS Mortgage Trust, Series 2011-LC2A, Class A4, 4.537%, 7/10/44(d) | | | 2,248,828 | |
| 3,080,000 | | LB-UBS Commercial Mortgage Trust, Series 2004-C7, Class A6, 4.786%, 10/15/29(a) | | | 3,272,263 | |
| 2,500,000 | | LB-UBS Commercial Mortgage Trust, Series 2007-C1, Class A4, 5.424%, 2/15/40 | | | 2,638,520 | |
| 2,600,000 | | Merrill Lynch/Countrywide Commercial Mortgage Trust, Series 2006-3, Class A3, 5.389%, 7/12/46(a) | | | 2,603,596 | |
Continued
60
|
| Sterling Capital Total Return Bond Fund |
Schedule of Portfolio Investments — (continued) |
September 30, 2011 |
| | | | | | |
Principal Amount | | | | Fair Value | |
COMMERCIAL MORTGAGE-BACKED
SECURITIES — (continued) | |
| $3,700,000 | | Morgan Stanley Capital I, Series 2005-HQ6, Class A4A, 4.989%, 8/13/42 | | | $ 3,984,356 | |
| 2,390,000 | | Morgan Stanley Capital I, Series 2006-HQ8, Class AM, 5.647%, 3/12/44(a) | | | 2,364,437 | |
| 1,050,000 | | Wachovia Bank Commercial Mortgage Trust, Series 2004-C11, Class B, 5.306%, 1/15/41(a) | | | 1,038,204 | |
| 3,600,000 | | Wachovia Bank Commercial Mortgage Trust, Series 2005-C20, Class AMFX, 5.179%, 7/15/42(a) | | | 3,695,555 | |
| 2,807,000 | | Wachovia Bank Commercial Mortgage Trust, Series 2007-C30, Class A3, 5.246%, 12/15/43 | | | 2,845,549 | |
| 716,000 | | Wachovia Bank Commercial Mortgage Trust, Series 2005-C22, Class A4, 5.444%, 12/15/44(a) | | | 779,482 | |
| | | | | | |
| | Total Commercial Mortgage-Backed Securities
(Cost $41,925,732) | | | 42,886,824 | |
| | | | | | |
CORPORATE BONDS (35.2%) | | | | |
| | Consumer Discretionary (3.5%) | | | | |
| 1,270,000 | | CBS Corp., 8.875%, 5/15/19 | | | 1,621,993 | |
| 3,100,000 | | Comcast Cable Communications Holdings, Inc., 9.455%, 11/15/22(b) | | | 4,472,841 | |
| 3,790,000 | | Macy’s Retail Holdings, Inc., 5.350%, 3/15/12 | | | 3,848,317 | |
| 2,492,000 | | NBCUniversal Media LLC, 5.950%, 4/1/41 | | | 2,772,305 | |
| 1,013,000 | | Nordstrom, Inc., 6.250%, 1/15/18 | | | 1,200,181 | |
| 1,039,000 | | Walt Disney Co. (The), 1.350%, 8/16/16 | | | 1,024,581 | |
| | | | | | |
| | | | | 14,940,218 | |
| | | | | | |
| | Consumer Staples (3.5%) | | | | |
| 2,125,000 | | Altria Group, Inc., 9.950%, 11/10/38 | | | 3,028,301 | |
| 1,657,000 | | Anheuser-Busch InBev Worldwide, Inc., 6.375%, 1/15/40 | | | 2,199,785 | |
| 1,000,000 | | Coca-Cola Co. (The), 3.150%, 11/15/20 | | | 1,032,188 | |
| 2,015,000 | | CVS Caremark Corp., 6.125%, 9/15/39 | | | 2,364,429 | |
| 2,851,000 | | Lorillard Tobacco Co., 6.875%, 5/1/20(e) | | | 3,161,554 | |
| 1,057,000 | | Procter & Gamble Co. (The), 1.450%, 8/15/16 | | | 1,057,093 | |
| 1,833,000 | | Wal-Mart Stores, Inc., 5.625%, 4/15/41 | | | 2,258,262 | |
| | | | | | |
| | | | | 15,101,612 | |
| | | | | | |
| | Energy (3.1%) | | | | |
| 1,445,000 | | Baker Hughes, Inc., 3.200%, 8/15/21(d) | | | 1,456,184 | |
| 1,655,000 | | BP Capital Markets PLC, 3.200%, 3/11/16 | | | 1,725,382 | |
| 3,575,000 | | Energy Transfer Partners LP, 9.000%, 4/15/19 | | | 4,306,388 | |
| 2,688,000 | | NuStar Logistics LP, 7.650%, 4/15/18(b) | | | 3,206,209 | |
| 757,000 | | Occidental Petroleum Corp., 1.750%, 2/15/17 | | | 751,309 | |
| 1,949,000 | | Schlumberger Investment SA, 3.300%, 9/14/21(d) | | | 1,950,943 | |
| | | | | | |
| | | | | 13,396,415 | |
| | | | | | |
| | Financials (15.3%) | | | | |
| 586,000 | | Aflac, Inc., 8.500%, 5/15/19 | | | 713,306 | |
| 2,134,000 | | American Honda Finance Corp., 1.850%, 9/19/14(d) | | | 2,137,173 | |
| 907,000 | | American International Group, Inc., 4.875%, 9/15/16 | | | 869,539 | |
| 1,318,000 | | Berkshire Hathaway, Inc., 2.200%, 8/15/16 | | | 1,326,601 | |
| 3,016,000 | | Colonial Realty LP, 6.250%, 6/15/14 | | | 3,201,915 | |
| 3,958,000 | | Credit Suisse AG, 5.400%, 1/14/20 | | | 3,802,486 | |
| | | | | | |
Principal Amount | | | | Fair Value | |
CORPORATE BONDS — (continued) | | | | |
| | Financials — (continued) | | | | |
| $1,000,000 | | Ford Motor Credit Co. LLC,
7.000%, 10/1/13(b) | | | $ 1,050,117 | |
| 1,950,000 | | Ford Motor Credit Co. LLC,
7.000%, 4/15/15(b) | | | 2,047,500 | |
| 2,960,000 | | General Electric Capital Corp., 2.950%, 5/9/16 | | | 2,966,530 | |
| 1,835,000 | | General Electric Capital Corp., GMTN, 6.875%, 1/10/39 | | | 2,106,105 | |
| 2,595,000 | | Goldman Sachs Group, Inc. (The), 7.500%, 2/15/19 | | | 2,895,810 | |
| 1,461,000 | | Goldman Sachs Group, Inc. (The), 5.250%, 7/27/21 | | | 1,441,298 | |
| 1,780,000 | | Health Care REIT, Inc., 4.950%, 1/15/21(b) | | | 1,709,701 | |
| 2,100,000 | | ING Bank NV, 4.000%, 3/15/16(b)(d) | | | 2,112,888 | |
| 1,817,000 | | Jefferies Group, Inc., 8.500%, 7/15/19(b) | | | 2,020,833 | |
| 1,014,000 | | John Deere Capital Corp., MTN, 1.850%, 9/15/16 | | | 1,008,850 | |
| 3,496,000 | | JPMorgan Chase & Co., 4.350%, 8/15/21(e) | | | 3,532,725 | |
| 959,000 | | KeyCorp, MTN, 5.100%, 3/24/21(b) | | | 967,732 | |
| 3,376,000 | | Macquarie Bank, Ltd., 6.625%, 4/7/21(b)(d) | | | 3,171,624 | |
| 1,917,000 | | Merrill Lynch & Co., Inc., MTN, 6.875%, 4/25/18 | | | 1,917,688 | |
| 2,250,000 | | MetLife, Inc., 6.750%, 6/1/16 | | | 2,587,781 | |
| 1,992,000 | | Morgan Stanley, 4.750%, 4/1/14 | | | 1,893,035 | |
| 3,499,000 | | Morgan Stanley, MTN, 6.625%, 4/1/18(b) | | | 3,471,225 | |
| 665,000 | | PNC Funding Corp., 2.700%, 9/19/16. | | | 665,057 | |
| 987,000 | | Prudential Financial, Inc.,
8.875%, 6/15/38(a)(b) | | | 1,064,726 | |
| 2,230,000 | | Scottrade Financial Services, Inc., 6.125%, 7/11/21(d) | | | 2,253,738 | |
| 1,882,000 | | Simon Property Group LP, REIT, 10.350%, 4/1/19 | | | 2,517,384 | |
| 2,135,000 | | SL Green Realty Corp., REIT, 5.000%, 8/15/18 . | | | 2,063,467 | |
| 1,272,000 | | U.S. Bank N.A., 3.778%, 4/29/20(a) | | | 1,288,084 | |
| 1,396,000 | | Ventas Realty LP, REIT, 4.750%, 6/1/21(b) | | | 1,340,682 | |
| 1,240,000 | | WEA Finance LLC, 4.625%, 5/10/21(b)(d) | | | 1,184,076 | |
| 467,000 | | XL Group, Ltd., 5.750%, 10/1/21(f) | | | 465,662 | |
| 4,040,000 | | ZFS Finance USA Trust II,
6.450%, 12/15/65(a)(d) | | | 3,555,200 | |
| | | | | | |
| | | | | 65,350,538 | |
| | | | | | |
| | Health Care (1.0%) | | | | |
| 1,190,000 | | DENTSPLY International, Inc., 2.750%, 8/15/16 | | | 1,198,196 | |
| 1,726,000 | | Stryker Corp., 2.000%, 9/30/16 | | | 1,734,323 | |
| 1,390,000 | | Thermo Fisher Scientific, Inc., 2.250%, 8/15/16 | | | 1,409,365 | |
| | | | | | |
| | | | | 4,341,884 | |
| | | | | | |
| | Industrials (2.4%) | | | | |
| 1,101,000 | | Burlington Northern Santa Fe LLC, 4.950%, 9/15/41 | | | 1,168,248 | |
| 4,089,000 | | Corrections Corp. of America, 6.250%, 3/15/13(b) | | | 4,089,000 | |
| 1,210,000 | | Textron, Inc., 4.625%, 9/21/16 | | | 1,224,792 | |
| 2,210,000 | | Verisk Analytics, Inc., 5.800%, 5/1/21(b) | | | 2,481,059 | |
| 1,210,000 | | Waste Management, Inc., 2.600%, 9/1/16 | | | 1,212,868 | |
| | | | | | |
| | | | | 10,175,967 | |
| | | | | | |
| | Information Technology (0.7%) | | | | |
| 1,210,000 | | Applied Materials, Inc., 4.300%, 6/15/21 | | | 1,260,809 | |
| 887,000 | | Intel Corp., 4.800%, 10/1/41 | | | 953,479 | |
Continued
61
|
| Sterling Capital Total Return Bond Fund |
Schedule of Portfolio Investments — (continued) |
September 30, 2011 |
| | | | | | |
Principal
Amount | | | | Fair Value | |
CORPORATE BONDS — (continued) | |
| | Information Technology — (continued) | |
| $855,000 | | Oracle Corp., 5.375%, 7/15/40(d) | | $ | 991,797 | |
| | | | | | |
| | | | | 3,206,085 | |
| | | | | | |
| | Materials (2.1%) | | | | |
| 1,091,000 | | ArcelorMittal, 5.500%, 3/1/21 | | | 977,591 | |
| 399,000 | | Bemis Co., Inc., 4.500%, 10/15/21(f) | | | 403,798 | |
| 4,779,000 | | Sealed Air Corp., 6.875%, 7/15/33(d) | | | 4,154,069 | |
| 1,846,000 | | Vale Overseas, Ltd., 6.875%, 11/21/36 | | | 1,991,094 | |
| 1,459,000 | | Xstrata Finance Canada, Ltd., 5.800%, 11/15/16(d) | | | 1,604,137 | |
| | | | | | |
| | | | | 9,130,689 | |
| | | | | | |
| | Telecommunication Services (2.7%) | |
| 1,299,000 | | AT&T, Inc., 3.875%, 8/15/21 | | | 1,336,228 | |
| 1,965,000 | | Crown Castle International Corp., 9.000%, 1/15/15 | | | 2,082,900 | |
| 1,074,000 | | France Telecom SA, 4.125%, 9/14/21 | | | 1,067,657 | |
| 1,185,000 | | Qwest Communications International, Inc., Series B, 7.500%, 2/15/14 | | | 1,185,000 | |
| 2,144,000 | | Telecom Italia Capital SA, 7.721%, 6/4/38 | | | 2,044,190 | |
| 1,306,000 | | Telefonica Emisiones SAU, 5.134%, 4/27/20(b) | | | 1,216,339 | |
| 2,095,000 | | Verizon Communications, Inc., 6.350%, 4/1/19 | | | 2,519,300 | |
| | | | | | |
| | | | | 11,451,614 | |
| | | | | | |
| | Utilities (0.9%) | | | | |
| 1,619,000 | | Duke Energy Carolinas LLC, 6.100%, 6/1/37 | | | 2,039,618 | |
| 471,000 | | PSEG Power LLC, 2.750%, 9/15/16 | | | 468,882 | |
| 1,389,000 | | Southern Co., 1.950%, 9/1/16 | | | 1,382,662 | |
| | | | | | |
| | | | | 3,891,162 | |
| | | | | | |
| | Total Corporate Bonds
(Cost $150,225,682) | | | 150,986,184 | |
| | | | | | |
MORTGAGE-BACKED SECURITIES (33.1%) | |
| | Fannie Mae(c) (16.2%) | | | | |
| 15,500 | | 6.000%, 10/1/13, Pool #252061 | | | 16,814 | |
| 85,391 | | 5.000%, 8/1/20, Pool #832058 | | | 92,337 | |
| 243,757 | | 5.000%, 8/1/20, Pool #838787 | | | 263,586 | |
| 42,246 | | 5.000%, 5/1/22, Pool #256716 | | | 45,524 | |
| 310,205 | | 6.000%, 7/1/22, Pool #944967 | | | 337,651 | |
| 872,113 | | 5.000%, 5/1/23, Pool #976197 | | | 938,151 | |
| 1,663,215 | | 4.000%, 5/1/24, Pool #AA4622 | | | 1,755,373 | |
| 220,902 | | 5.000%, 10/1/24, Pool #AD0339 | | | 237,629 | |
| 559,341 | | 5.000%, 9/1/25, Pool #255892 | | | 607,747 | |
| 2,466,975 | | 4.000%, 12/1/25, Pool #AH0973 | | | 2,605,211 | |
| 12,386,532 | | 3.500%, 6/1/26, Pool #AB3171 | | | 12,953,269 | |
| 1,187,263 | | 5.500%, 2/1/27, Pool #256600 | | | 1,291,780 | |
| 299,345 | | 6.500%, 1/1/35, Pool #809198 | | | 334,971 | |
| 1,776,040 | | 5.500%, 3/1/35, Pool #787561 | | | 1,939,047 | |
| 166,907 | | 6.000%, 4/1/35, Pool #735503 | | | 185,277 | |
| 166,375 | | 7.000%, 6/1/35, Pool #255820 | | | 190,951 | |
| 253,735 | | 7.000%, 6/1/35, Pool #830686 | | | 291,215 | |
| 1,126,713 | | 5.500%, 10/1/35, Pool #817568 | | | 1,230,124 | |
| 535,383 | | 6.500%, 3/1/36, Pool #866062 | | | 595,753 | |
| 343,706 | | 6.500%, 7/1/36, Pool #885493 | | | 382,463 | |
| 2,575,896 | | 6.000%, 7/1/37, Pool #940807 | | | 2,831,232 | |
| 465,639 | | 6.000%, 9/1/37, Pool #955005 | | | 511,795 | |
| 3,377,762 | | 5.500%, 6/1/38, Pool #257231 | | | 3,670,888 | |
| 1,941,499 | | 4.754%, 7/1/38, Pool #981430(a) | | | 2,078,202 | |
| 5,245,459 | | 4.500%, 1/1/40, Pool #AC8568 | | | 5,571,933 | |
| 5,842,424 | | 4.500%, 6/1/40, Pool #AD6432 | | | 6,206,054 | |
| 3,818,284 | | 5.000%, 6/1/40, Pool #AB1149 | | | 4,114,122 | |
| | | | | | |
Principal
Amount | | | | Fair Value | |
MORTGAGE-BACKED SECURITIES — (continued) | |
| | Fannie Mae(c) — (continued) | | | | |
| $1,833,273 | | 5.000%, 6/1/40, Pool #AD4927 | | | $ 1,975,314 | |
| 1,835,772 | | 5.000%, 6/1/40, Pool #AD8718 | | | 1,978,006 | |
| 1,398,718 | | 5.000%, 6/1/40, Pool #AD8842 | | | 1,506,216 | |
| 3,301,701 | | 4.000%, 3/1/41, Pool #AH8824 | | | 3,464,000 | |
| 4,723,818 | | 4.500%, 5/1/41, Pool #AI1023 | | | 5,017,826 | |
| 4,173,000 | | 4.500%, 10/15/41(f) | | | 4,426,640 | |
| | | | | | |
| | | | | 69,647,101 | |
| | | | | | |
| | Freddie Mac(c) (11.1%) | | | | |
| 589,993 | | 5.000%, 5/1/20, Pool #B19275 | | | 637,619 | |
| 728,525 | | 5.500%, 10/1/21, Pool #G12425 | | | 788,597 | |
| 517,253 | | 5.000%, 12/1/21, Pool #J04025 | | | 558,361 | |
| 863,402 | | 5.000%, 7/1/25, Pool #C90908 | | | 938,958 | |
| 1,429,707 | | 5.500%, 7/1/35, Pool #A36540 | | | 1,557,353 | |
| 421,795 | | 6.000%, 7/1/35, Pool #A36304 | | | 465,385 | |
| 806,841 | | 5.000%, 3/1/36, Pool #G08115 | | | 869,254 | |
| 244,913 | | 6.500%, 5/1/36, Pool #A48509 | | | 273,344 | |
| 258,172 | | 5.000%, 7/1/36, Pool #G02291 | | | 278,021 | |
| 354,631 | | 6.000%, 8/1/37, Pool #A64067 | | | 389,506 | |
| 3,982,783 | | 6.000%, 8/1/37, Pool #A64401 | | | 4,380,999 | |
| 1,144,567 | | 6.000%, 8/1/37, Pool #A64981 | | | 1,257,128 | |
| 939,103 | | 5.500%, 1/1/38, Pool #A71523 | | | 1,019,279 | |
| 853,078 | | 5.500%, 3/1/38, Pool #G04044 | | | 924,443 | |
| 5,626,191 | | 5.500%, 10/1/38, Pool #G04814 | | | 6,106,527 | |
| 977,970 | | 5.000%, 2/1/39, Pool #G05253 | | | 1,050,106 | |
| 8,915,229 | | 5.500%, 1/1/40, Pool #G06021 | | | 9,676,366 | |
| 5,878,314 | | 5.000%, 6/1/40, Pool #C03479 | | | 6,318,330 | |
| 2,268,145 | | 3.776%, 7/1/40, Pool #1B4948(a) | | | 2,391,489 | |
| 4,522,595 | | 5.000%, 7/1/40, Pool #A93070 | | | 4,861,130 | |
| 2,523,268 | | 4.000%, 9/1/40, Pool #A93643 | | | 2,645,226 | |
| | | | | | |
| | | | | 47,387,421 | |
| | | | | | |
| | Ginnie Mae (5.8%) | | | | |
| 1,969,625 | | 5.500%, 1/15/39, Pool #646685 | | | 2,177,731 | |
| 7,060,663 | | 4.500%, 3/15/39, Pool #697957 | | | 7,698,519 | |
| 3,039,515 | | 4.500%, 2/15/40, Pool #737031 | | | 3,307,454 | |
| 1,403,753 | | 5.000%, 2/15/40, Pool #737037 | | | 1,543,129 | |
| 4,633,572 | | 4.500%, 9/20/40, Pool #4801 | | | 5,030,446 | |
| 2,718,000 | | 5.000%, 10/15/41(f) | | | 2,984,704 | |
| 1,762,000 | | 5.500%, 10/15/41(f) | | | 1,946,459 | |
| | | | | | |
| | | | | 24,688,442 | |
| | | | | | |
| | Total Mortgage-Backed Securities
(Cost $137,758,188) | | | 141,722,964 | |
| | | | | | |
MUNICIPAL BONDS (3.8%) | | | | |
| | California (1.6%) | | | | |
| 1,285,000 | | California State, Build America Bonds, School Improvements G.O., Taxable, 7.625%, 3/1/40 . | | | 1,607,496 | |
| 780,000 | | Los Angeles Harbor Department, Crossover Refunding Revenue, Series A, Callable 8/1/12 @ 100 (AMBAC), 5.500%, 8/1/14 | | | 806,325 | |
| 3,700,000 | | Metropolitan Water District of Southern California, Build America Bonds, Water Utility Improvements Revenue, Callable 7/1/19 @ 100, 6.538%, 7/1/39 | | | 4,253,890 | |
| | | | | | |
| | | | | 6,667,711 | |
| | | | | | |
Continued
62
|
| Sterling Capital Total Return Bond Fund |
Schedule of Portfolio Investments — (continued) |
September 30, 2011 |
| | | | | | |
Principal
Amount | | | | Fair Value | |
MUNICIPAL BONDS — (continued) | |
| | Florida (0.6%) | | | | |
| $2,500,000 | | Greater Orlando Aviation Authority, Airport Facilities Refunding Revenue, Taxable, Series D, 3.733%, 10/1/20(f) | | $ | 2,513,900 | |
| | | | | | |
| | New York (1.6%) | | | | |
| 1,785,000 | | New York & New Jersey Port Authority, Port, Airport & Marina Improvements Revenue, Series 122, Callable 10/31/11 @ 100 (G.O. of Authority), 5.500%, 7/15/15 | | | 1,790,641 | |
| 1,735,000 | | New York City Municipal Water Finance Authority, Water Utility Improvements Revenue, Series EE, Build America Bonds Taxable, Callable 6/15/20 @ 100, 6.491%, 6/15/42 | | | 1,969,416 | |
| 2,900,000 | | New York, NY, Build America Bonds, Public Improvements G.O., Series G1, 4.774%, 3/1/20 | | | 3,243,563 | |
| | | | | | |
| | | | | 7,003,620 | |
| | | | | | |
| | Total Municipal Bonds
(Cost $14,811,338) | | | 16,185,231 | |
| | | | | | |
U.S. TREASURY NOTES (4.2%) | | | | |
| 7,415,000 | | 2.125%, 8/15/21 | | | 7,545,949 | |
| 8,015,000 | | 4.500%, 8/15/39 | | | 10,490,882 | |
| | | | | | |
| | Total U.S. Treasury Notes
(Cost $15,526,459) | | | 18,036,831 | |
| | | | | | |
| | |
Shares | | | | | |
PREFERRED STOCKS (1.1%) | | | | |
| | Financials (1.1%) | | | | |
| 75,600 | | Citigroup Capital XIII, 7.875% | | | 1,996,596 | |
| 102,026 | | Fifth Third Capital Trust VI, 7.250% | | | 2,569,015 | |
| | | | | | |
| | Total Preferred Stocks
(Cost $4,524,092) | | | 4,565,611 | |
| | | | | | |
INVESTMENT COMPANY (1.7%) | | | | |
| 7,128,049 | | Federated Treasury Obligations Fund, Institutional Shares | | | 7,128,049 | |
| | | | | | |
| | Total Investment Company
(Cost $7,128,049) | | | 7,128,049 | |
| | | | | | |
| | | | | | |
Principal Amount | | | | Fair Value | |
SECURITIES HELD AS COLLATERAL FOR
SECURITIES ON LOAN (1.6%) | |
| $6,977,960 | | BNY Mellon Overnight Government Fund Total Securities Held as Collateral for Securities on Loan
(Cost $6,977,960) | | $ | 6,977,960 | |
| | | | | | |
| | Total Securities Held as Collateral for Securities on Loan
(Cost $6,977,960) | | | 6,977,960 | |
| | | | | | |
Total Investments — 103.9%
(Cost $435,138,840) | | | 445,246,450 | |
Net Other Assets (Liabilities) — (3.9)% | | | (16,897,318) | |
| | | | | | |
NET ASSETS — 100.0% | | $ | 428,349,132 | |
| | | | | | |
| (a) | The interest rate for this variable rate note, which will change periodically, is based either on the prime rate or an index of market rates. The reflected rate is in effect as of September 30, 2011. The maturity date reflected is the final maturity date. |
| (b) | Represents that all or a portion of the security was pledged as collateral for securities purchased on a when-issued basis. |
| (c) | On September 7, 2008, the Federal Housing Finance Agency (FHFA) placed Fannie Mae and Freddie Mac into conservatorship with FHFA as the conservator. The conservatorship is a statutory process designed to stabilize a troubled institution with the objective of returning the entities to normal business operations. |
| (d) | Rule 144A, Section 4(2) or other security which is restricted as to resale to qualified institutional investors. The Investment Advisor, using Board approved procedures, has deemed these securities or a portion of these securities to be liquid. |
| (e) | Represents that all or a portion of the security was on loan as of September 30, 2011. |
| (f) | Represents securities purchased on a when-issued basis. At September 30, 2011, total cost of investments purchased on a when-issued basis was $12,739,194. |
AMBAC — American Municipal Bond Insurance Corp.
G.O. — General Obligation
GMTN — Global Medium Term Note
MTN — Medium Term Note
N.A. — North America
REIT — Real Estate Investment Trust
STEP — Step Coupon Bond
See accompanying notes to the financial statements.
63
|
| Sterling Capital Kentucky Intermediate Tax-Free Fund |
Schedule of Portfolio Investments |
September 30, 2011 |
| | | | | | |
Principal
Amount | | | | Fair Value | |
MUNICIPAL BONDS (92.2%) | |
| | Kentucky (92.2%) | | | | |
| $ 75,000 | | Bullitt County, KY, School District Finance Corp., Bullitt County School Building Revenue, Callable 3/1/18 @ 100, OID, 4.750%, 3/1/22 | | $ | 83,012 | |
| 185,000 | | Campbell & Kenton Counties, KY, Sanitation District No. 1, Sewer Improvements Revenue, Callable 8/1/17 @ 100 (NATL-RE), 5.000%, 8/1/25 | | | 203,657 | |
| 375,000 | | Casey County, KY, Public Properties Corp., First Mortgage Revenue, Judicial Center Project, Callable 8/1/12 @ 100, OID, 4.500%, 8/1/16 | | | 385,136 | |
| 500,000 | | Christian County Public Courthouse Corp., KY, Court Facility Project Refunding Revenue (AMBAC), 4.000%, 8/1/16 | | | 559,035 | |
| 300,000 | | Christian County, KY, Jennie Stuart Medical Center Revenue (Assured Guaranty), 5.250%, 2/1/18 | | | 325,056 | |
| 105,000 | | Grayson County, KY, Public Properties Corp., Judicial Center Project Public Improvements Revenue (CIFG), 4.375%, 9/1/17 | | | 117,670 | |
| 300,000 | | Jefferson County, KY, School District Finance Corp., Jefferson County School Building Refunding Revenue, Series A (AGM), 5.250%, 1/1/15 | | | 341,322 | |
| 500,000 | | Jefferson County, KY, School District Finance Corp., Jefferson County School Building Refunding Revenue, Series A (AGM), 5.250%, 1/1/19 | | | 600,215 | |
| 100,000 | | Kenton County, KY, Public Properties Corp., First Mortgage Court Facilities Project Refunding Revenue (AMBAC), 4.125%, 3/1/16 | | | 112,126 | |
| 500,000 | | Kentucky Asset/Liability Commission, Project Notes-Federal Highway Transit Revenue, First Series (NATL-RE), 4.500%, 9/1/17 | | | 578,300 | |
| 300,000 | | Kentucky Asset/Liability Commission, University of Kentucky Project Notes Refunding Revenue, Series A, Callable 10/1/17 @ 100 (AMBAC), 5.000%, 10/1/18. | | | 349,287 | |
| 480,000 | | Kentucky Asset/Liability Commission, University of Kentucky Project Notes Revenue (NATL-RE FGIC), 5.000%, 10/1/15. | | | 552,091 | |
| 510,000 | | Kentucky Asset/Liability Commission, University of Kentucky Project Notes Revenue, Series B, Callable 10/1/17 @ 100, 5.000%, 10/1/21 | | | 570,792 | |
| 670,000 | | Kentucky Economic Development Finance Authority, Baptist Healthcare System Revenue, Series A, Callable 8/15/18 @ 100, OID, 4.750%, 8/15/19 | | | 750,728 | |
| 500,000 | | Kentucky Economic Development Finance Authority, Catholic Health Revenue, Series B, 5.000%, 5/1/39(a) | | | 558,970 | |
| 500,000 | | Kentucky Economic Development Finance Authority, Owensboro Medical Health System Revenue, Series A, 5.000%, 6/1/16 | | | 534,760 | |
| 555,000 | | Kentucky Economic Development Finance Authority, Saint Elizabeth Medical Center, Inc. Refunding Revenue, Series A, Callable 5/1/19 @ 100, OID, 5.000%, 5/1/24 | | | 589,121 | |
| | | | | | |
Principal
Amount | | | | Fair Value | |
MUNICIPAL BONDS — (continued) | |
| | Kentucky — (continued) | | | | |
| $250,000 | | Kentucky Housing Corp. Refunding Revenue, Series B, 2.950%, 7/1/15 | | | $261,273 | |
| 500,000 | | Kentucky Municipal Power Agency, Prairie State Project Revenue, Series A (AGM), 5.000%, 9/1/20 | | | 581,390 | |
| 165,000 | | Kentucky Municipal Power Agency, Prairie State Project Revenue, Series A (NATL-RE), 5.250%, 9/1/17 | | | 193,786 | |
| 255,000 | | Kentucky Municipal Power Agency, Prairie State Project Revenue, Series A, Callable 9/1/17 @ 100 (NATL-RE), 5.250%, 9/1/20. | | | 286,577 | |
| 500,000 | | Kentucky Rural Water Finance Corp., Refunding & Improvements Revenue, Flexible Term Program, Series B, Callable 2/1/20 @ 100, 4.000%, 2/1/21 | | | 551,160 | |
| 410,000 | | Kentucky State Property & Buildings Commission, Project No. 76 Refunding Revenue (AMBAC), 5.500%, 8/1/21 | | | 492,935 | |
| 530,000 | | Kentucky State Property & Buildings Commission, Project No. 81 Revenue, Callable 11/1/13 @ 100 (AMBAC), 5.000%, 11/1/16 | | | 570,487 | |
| 385,000 | | Kentucky State Property & Buildings Commission, Project No. 83 Refunding Revenue (AMBAC), 5.000%, 10/1/19 | | | 451,370 | |
| 105,000 | | Kentucky Turnpike Authority Revenue, Series B (AMBAC), 5.000%, 7/1/15 | | | 120,389 | |
| 500,000 | | Kentucky Turnpike Authority, Revitalization Projects Refunding Revenue, Series B, Callable 7/1/15 @ 100 (AMBAC), 5.000%, 7/1/25 | | | 527,500 | |
| 500,000 | | Kentucky Turnpike Authority, Revitalization Projects Revenue, Series A, Callable 7/1/19 @ 100, 5.000%, 7/1/25 | | | 555,895 | |
| 260,000 | | Knott County, KY, Recreational Facilities Improvements Youth & Recreation Center Project G.O., 5.000%, 9/1/12 | | | 266,833 | |
| 265,000 | | Larue County, KY, School District Finance Corp., Larue County School Building Revenue (NATL-RE), 4.250%, 7/1/15 | | | 296,538 | |
| 415,000 | | Laurel County, KY, Judicial Center Public Properties Corp. Revenue, Callable 3/1/18 @ 100, OID, 4.500%, 3/1/24 | | | 442,104 | |
| 400,000 | | Louisville & Jefferson County, KY, Metropolitan Government First Mortgage Christian Church Homes Revenue, Callable 10/31/11 @ 100, OID, 6.125%, 11/15/18 | | | 400,652 | |
| 500,000 | | Louisville & Jefferson County, KY, Metropolitan Sewer District, Sewer Refunding Revenue, Series A, Callable 11/15/21 @ 100, 5.000%, 5/15/30 | | | 542,570 | |
| 605,000 | | Louisville & Jefferson County, KY, Metropolitan Sewer District, Sewer Refunding Revenue, Series A, Callable 5/15/15 @ 100 (AGM), 5.000%, 5/15/19 | | | 675,410 | |
| 730,000 | | Louisville & Jefferson County, KY, Metropolitan Sewer District, Sewer Refunding Revenue, Series A, Callable 5/15/19 @ 100, 5.000%, 5/15/20 | | | 850,946 | |
Continued
64
|
| Sterling Capital Kentucky Intermediate Tax-Free Fund |
Schedule of Portfolio Investments – (continued) |
September 30, 2011 |
| | | | | | |
Principal
Amount | | | | Fair Value | |
MUNICIPAL BONDS — (continued) | |
| | Kentucky — (continued) | | | | |
| $500,000 | | Louisville Kentucky Regional Airport Authority Refunding Revenue, Series B, 3.000%, 7/1/15 | | | $ 525,295 | |
| 240,000 | | Monroe County, KY, School District Finance Corp., Monroe County School Building Revenue, Callable 10/31/11 @ 100, OID, 4.300%, 10/1/18 | | | 240,386 | |
| 535,000 | | Owensboro, KY, Water Refunding & Improvements Revenue, Callable 9/15/18 @ 100 (Assured Guaranty), 5.250%, 9/15/21 | | | 618,658 | |
| 585,000 | | Owensboro-Daviess County, KY, Regional Water Resource Agency Refunding & Improvements Revenue, Series A (XLCA), 4.000%, 1/1/16 | | | 642,739 | |
| 655,000 | | Pulaski County, KY, Public Properties Corp. First Mortgage Revenue, Administration Office of the Court Judicial Facility, Callable 12/1/18 @ 100, OID, 5.500%, 12/1/24 | | | 754,652 | |
| 250,000 | | Pulaski County, KY, Public Properties Corp. First Mortgage Revenue, Administration Office of the Court Judicial Facility, Callable 12/1/18 @ 100, OID, 5.625%, 12/1/25 | | | 288,243 | |
| 300,000 | | Rowan County, KY, School District Finance Corp., Rowan County School Building Revenue, OID, 4.000%, 11/1/17 | | | 343,296 | |
| 490,000 | | Russell, KY, Bon Secours Health System, Inc. Refunding Revenue, Series A, Callable 11/15/12 @ 100, OID, 5.625%, 11/15/30 | | | 491,367 | |
| 225,000 | | Somerset, KY, Water System Revenue, Series B, Callable 10/31/11 @ 100 (AGM), OID, 4.375%, 12/1/18 | | | 225,421 | |
| 375,000 | | Warren County, KY, Community Hospital Corp. Project Refunding Revenue, Series A, 5.000%, 8/1/14 | | | 400,736 | |
| 380,000 | | Warren County, KY, Community Hospital Corp. Project Refunding Revenue, Series A, 5.000%, 8/1/17 | | | 415,245 | |
| 500,000 | | Western Kentucky University, KY, General Receipts Revenue (Assured Guaranty), 3.000%, 9/1/13 | | | 520,420 | |
| | | | | | |
| | Total Municipal Bonds
(Cost $19,391,375) | | | 20,745,551 | |
| | | | | | |
| | | | | | |
Shares | | | | Fair Value | |
INVESTMENT COMPANY (6.9%) | |
| 1,547,054 | | Federated Tax-Free Obligations Fund, Institutional Class | | | $ 1,547,054 | |
| | | | | | |
| | Total Investment Company
(Cost $1,547,054) | | | 1,547,054 | |
| | | | | | |
| |
Total Investments — 99.1%
(Cost $20,938,429) | | | 22,292,605 | |
Net Other Assets (Liabilities) — 0.9% | | | 194,002 | |
| | | | | | |
NET ASSETS — 100.0%. | | | $22,486,607 | |
| | | | | | |
| (a) | The interest rate for this variable rate note, which will change periodically, is based either on the prime rate or an index of market rates. The reflected rate is in effect as of September 30, 2011. The maturity date reflected is the final maturity date. |
AGM — Assured Guaranty Municipal Corp.
AMBAC — American Municipal Bond Insurance Corp.
CIFG — CDC IXIS Financial Guarantee
FGIC — Financial Guaranty Insurance Corp.
G.O. — General Obligation
NATL — National
OID — Original Issue Discount
RE — Reinsurance
XLCA — XL Capital Assurance
See accompanying notes to the financial statements.
65
|
| Sterling Capital Maryland Intermediate Tax-Free Fund |
Schedule of Portfolio Investments |
September 30, 2011 |
| | | | | | |
Principal Amount | | | | Fair Value | |
MUNICIPAL BONDS (97.8%) | |
| | Maryland (97.8%) | | | | |
| $370,000 | | Annapolis, MD, Refunding G.O., Callable 8/1/21 @ 100, 5.000%, 8/1/23 | | | $443,034 | |
| 500,000 | | Anne Arundel County, MD, Construction General Improvements Refunding G.O., 4.000%, 4/1/20 | | | 573,205 | |
| 580,000 | | Baltimore County, MD, Water Utility Improvements, Metropolitan District, 71st Issue G.O., 5.000%, 2/1/17 | | | 692,885 | |
| 600,000 | | Baltimore, MD, Refunding Certificate of Participation, Series A, 5.000%, 10/1/17 | | | 700,602 | |
| 75,000 | | Baltimore, MD, Waste Water Project Revenue, Series D, Callable 7/1/17 @ 100 (AMBAC), 5.000%, 7/1/18 | | | 88,049 | |
| 375,000 | | Baltimore, MD, Waste Water Projects Revenue, Series A, Callable 7/1/21 @ 100, 4.000%, 7/1/22 | | | 415,526 | |
| 250,000 | | Baltimore, MD, Waste Water Projects Revenue, Series C, Callable 7/1/16 @ 100 (AMBAC), 5.000%, 7/1/26 | | | 272,675 | |
| 500,000 | | Cecil County, MD, Construction Public Improvements G.O., 4.000%, 6/1/18 | | | 573,130 | |
| 500,000 | | Frederick County, MD, Consolidated Public Improvements G.O., Series A, 4.000%, 2/1/18 | | | 570,405 | |
| 500,000 | | Frederick County, MD, Public Facilities Improvements G.O., 5.000%, 6/1/16 | | | 590,060 | |
| 225,000 | | Frederick, MD, Public Improvements G.O., Series A, 4.000%, 3/1/19 | | | 258,577 | |
| 500,000 | | Harford County, MD, G.O., Public Improvements, Callable 7/15/15 @ 100, 5.000%, 7/15/23 | | | 557,110 | |
| 125,000 | | Howard County, MD, Certificates of Participation, Series A, 8.050%, 2/15/21 | | | 181,727 | |
| 135,000 | | Howard County, MD, Certificates of Participation, Series B, 8.250%, 2/15/20 | | | 194,018 | |
| 445,000 | | Howard County, MD, Construction & Public Improvements Refunding G.O., Series A, 4.000%, 4/15/17 | | | 509,374 | |
| 100,000 | | Maryland Community Development Administration, Residential Housing Refunding Revenue, Series C, 3.850%, 9/1/15 | | | 106,756 | |
| 250,000 | | Maryland Community Development Administration, Residential Housing Refunding Revenue, Series K, 4.100%, 9/1/16 | | | 271,700 | |
| 805,000 | | Maryland Community Development Administration, Residential Housing Revenue, Series A, Callable 9/1/18 @ 100, 4.400%, 9/1/24 | | | 837,603 | |
| 440,000 | | Maryland Community Development Administration, Residential Housing Revenue, Series A, Callable 9/1/18 @ 100, 4.750%, 9/1/29 | | | 449,244 | |
| 315,000 | | Maryland Community Development Administration, Residential Housing Revenue, Series B, 3.750%, 9/1/14 | | | 331,774 | |
| 680,000 | | Maryland Community Development Administration, Residential Housing Revenue, Series G, Callable 3/1/17 @ 100, 4.300%, 9/1/17 | | | 731,408 | |
| 250,000 | | Maryland Economic Development Corp., Electricity Lights & Power Improvements Refunding Revenue, Callable 3/1/19 @ 100, 6.200%, 9/1/22 | | | 299,177 | |
| | | | | | |
Principal
Amount | | | | Fair Value | |
MUNICIPAL BONDS — (continued) | |
| | Maryland — (continued) | | | | |
| $ 210,000 | | Maryland Economic Development Corp., Lutheran World Relief Refugee Refunding Revenue, Callable 4/1/17 @ 100, 5.250%, 4/1/19 | | | $ 223,705 | |
| 540,000 | | Maryland Economic Development Corp., University of Maryland College Park Projects Refunding Revenue (AGC), 5.000%, 6/1/13 | | | 566,816 | |
| 735,000 | | Maryland Economic Development Corp., University of Maryland College Park Projects Refunding Revenue (AGC), 5.000%, 6/1/16 | | | 811,050 | |
| 555,000 | | Maryland Environmental Service Revenue, Mid Shore II Regional Landfill, 4.000%, 11/1/17 . | | | 622,022 | |
| 95,000 | | Maryland Health & Higher Educational Facilities Authority, Anne Arundel Health System Revenue, OID, 4.000%, 7/1/18 | | | 101,274 | |
| 250,000 | | Maryland Health & Higher Educational Facilities Authority, Anne Arundel Health System Revenue, OID, 4.250%, 7/1/19 | | | 268,065 | |
| 570,000 | | Maryland Health & Higher Educational Facilities Authority, Board of Child Care Revenue, Callable 7/1/12 @ 100, 5.500%, 7/1/13 | | | 586,946 | |
| 250,000 | | Maryland Health & Higher Educational Facilities Authority, Carroll County General Hospital Revenue, Callable 7/1/12 @ 100, 6.000%, 7/1/20 | | | 254,533 | |
| 200,000 | | Maryland Health & Higher Educational Facilities Authority, Charlestown Community Refunding Revenue, OID, 2.650%, 1/1/13 | | | 200,560 | |
| 900,000 | | Maryland Health & Higher Educational Facilities Authority, College of Notre Dame Refunding Revenue, 4.000%, 10/1/19 | | | 974,061 | |
| 1,250,000 | | Maryland Health & Higher Educational Facilities Authority, Helix Health Issue Refunding Revenue (AMBAC), OID, 5.000%, 7/1/27 | | | 1,506,900 | |
| 35,000 | | Maryland Health & Higher Educational Facilities Authority, Howard County General Hospital Refunding Revenue, Callable 10/31/11 @ 100, OID, 5.500%, 7/1/13 | | | 36,299 | |
| 185,000 | | Maryland Health & Higher Educational Facilities Authority, Medlantic/Helix Issue Revenue, Series A, Callable 10/31/11 @ 100 (AGM), OID, 4.750%, 8/15/18 | | | 185,313 | |
| 295,000 | | Maryland Health & Higher Educational Facilities Authority, Medlantic/Helix Issue Revenue, Series B, Callable 10/31/11 @ 100 (AMBAC), 5.250%, 8/15/13 | | | 295,944 | |
| 575,000 | | Maryland Health & Higher Educational Facilities Authority, Medstar Health Refunding Revenue, Callable 8/15/14 @ 100, OID, 5.375%, 8/15/24 | | | 596,637 | |
| 360,000 | | Maryland Health & Higher Educational Facilities Authority, Memorial Hospital at Easton Revenue, Callable 10/31/11 @ 100 (NATL-RE), OID, 4.700%, 7/1/19 | | | 360,515 | |
| 320,000 | | Maryland Health & Higher Educational Facilities Authority, Peninsula Regional Medical Center Revenue, 5.000%, 7/1/15 | | | 352,458 | |
Continued
66
|
| Sterling Capital Maryland Intermediate Tax-Free Fund |
Schedule of Portfolio Investments — (continued) |
September 30, 2011 |
| | | | | | |
Principal Amount | | | | Fair Value | |
MUNICIPAL BONDS — (continued) | |
| | Maryland — (continued) | | | | |
| $ 405,000 | | Maryland Health & Higher Educational Facilities Authority, Peninsula Regional Medical Center Revenue, Callable 7/1/16 @ 100, 5.000%, 7/1/20 | | | $ 433,933 | |
| 585,000 | | Maryland Health & Higher Educational Facilities Authority, Peninsula Regional Medical Center Revenue, Callable 7/1/16 @ 100, 5.000%, 7/1/26 | | | 598,356 | |
| 400,000 | | Maryland Health & Higher Educational Facilities Authority, Suburban Hospital Refunding Revenue, Series A, 5.500%, 7/1/13 | | | 429,592 | |
| 310,000 | | Maryland Health & Higher Educational Facilities Authority, University of Maryland Medical System Refunding Revenue, Series F, Callable 7/1/18 @ 100, 5.250%, 7/1/21 | | | 341,673 | |
| 400,000 | | Maryland Health & Higher Educational Facilities Authority, University of Maryland Medical System Revenue, 5.000%, 7/1/19 | | | 447,612 | |
| 320,000 | | Maryland Health & Higher Educational Facilities Authority, Washington County Hospital Revenue, 5.000%, 1/1/17 | | | 339,520 | |
| 240,000 | | Maryland Health & Higher Educational Facilities Authority, Western Maryland Health System Refunding Revenue, Series A (NATL-RE FHA), 4.000%, 1/1/12 | | | 241,896 | |
| 265,000 | | Maryland State Department of Transportation County Transportation, Transit Improvements Revenue, Second Issue, 5.000%, 6/1/18 | | | 320,581 | |
| 400,000 | | Maryland State Department of Transportation, County Transportation Transit Improvements Revenue, 5.250%, 12/15/17 | | | 489,816 | |
| 500,000 | | Maryland State Department of Transportation, County Transportation Transit Improvements Revenue, Second Issue, Callable 9/1/18 @ 100, 5.000%, 9/1/23 | | | 574,270 | |
| 1,005,000 | | Maryland State Transportation Authority Grant & Revenue Anticipate, MD Transit Improvements Revenue, 5.000%, 3/1/16 | | | 1,174,895 | |
| 1,000,000 | | Maryland State Transportation Authority, Transportation Facility Projects Revenue, Series A, 4.000%, 7/1/18 | | | 1,141,670 | |
| 610,000 | | Maryland State Transportation Authority, Transportation Facility Projects Revenue, Series A, 5.000%, 7/1/19 | | | 738,362 | |
| 500,000 | | Maryland State, State & Local Facilities Loan Public Improvements G.O., First Series, 5.000%, 3/1/16 | | | 587,600 | |
| 330,000 | | Maryland State, State & Local Facilities Loan Public Improvements G.O., First Series, 5.000%, 3/15/16 | | | 388,235 | |
| 590,000 | | Maryland State, State & Local Facilities Loan Public Improvements G.O., Second Series, Callable 7/15/18 @ 100, 5.000%, 7/15/23 | | | 680,913 | |
| 250,000 | | Maryland Water Quality Financing Administration, Revolving Loan Fund Sewer Improvements Revenue, 5.000%, 3/1/18 | | | 298,240 | |
| 250,000 | | Montgomery County Housing Opportunities Commission, Housing Refunding Revenue, Series A, Callable 1/1/16 @ 100 (FHA/VA Mortgages), 3.800%, 7/1/16 | | | 266,463 | |
| | | | | | |
Principal
Amount | | | | Fair Value | |
MUNICIPAL BONDS — (continued) | |
| | Maryland — (continued) | | | | |
| $ 250,000 | | Montgomery County Housing Opportunities Commission, Local Housing Revenue, Series A, 3.700%, 7/1/14 | | | $ 264,425 | |
| 500,000 | | Montgomery County, MD, Construction & Public Improvements G.O., Series A, Callable 6/1/15 @ 100, 5.000%, 6/1/24 | | | 555,315 | |
| 480,000 | | Montgomery County, MD, Construction & Public Improvements Refunding G.O., Series A, 5.000%, 5/1/15 | | | 553,891 | |
| 700,000 | | Montgomery County, MD, Construction & Public Improvements Refunding G.O., Series A, 5.000%, 7/1/15 | | | 812,133 | |
| 510,000 | | Montgomery County, MD, Construction & Public Improvements Refunding G.O., Series A, 5.000%, 7/1/17 | | | 615,045 | |
| 270,000 | | Montgomery County, MD, Construction & Public Improvements Refunding G.O., Series A, Callable 7/1/15 @ 100, 5.000%, 7/1/18 | | | 307,854 | |
| 500,000 | | Montgomery County, MD, Department Liquor Control Revenue, Series A, Callable 4/1/21 @ 100, OID, 4.500%, 4/1/26 | | | 537,610 | |
| 1,000,000 | | Montgomery County, MD, Public Transportation Equipment Certificate of Participation, 4.000%, 5/1/17 | | | 1,110,790 | |
| 250,000 | | Prince Georges County, MD, Construction & Public Improvements G.O., 5.000%, 10/1/14 | | | 283,207 | |
| 500,000 | | Talbot County, MD, Public Improvements G.O., 5.000%, 12/15/16 | | | 598,325 | |
| 500,000 | | University System of Maryland, Auxiliary Facility & Tuition Revenue, Unrefunded Balance, Series A, Callable 4/1/12 @ 100, 5.250%, 4/1/17 | | | 511,575 | |
| 400,000 | | Westminster, MD, McDaniel College, Inc. Revenue, Callable 11/1/16 @ 100, 5.000%, 11/1/22 | | | 421,240 | |
| | | | | | |
| | Total Municipal Bonds
(Cost $31,535,879) | | | 33,656,174 | |
| | | | | | |
| | | | | | |
Shares | | | | | |
INVESTMENT COMPANY (0.4%) | |
| 115,828 | | Federated Maryland Municipal Cash Trust | | | 115,828 | |
| | | | | | |
| | Total Investment Company
(Cost $115,828) | | | 115,828 | |
| | | | | | |
Total Investments — 98.2%
(Cost $31,651,707) | | | 33,772,002 | |
| Net Other Assets (Liabilities) — 1.8% | | | 634,332 | |
| | | | | | |
| NET ASSETS — 100.0% | | | $34,406,334 | |
| | | | | | |
AGC — Assured Guaranty Corp.
AGM — Assured Guaranty Municipal Corp.
AMBAC — American Municipal Bond Insurance Corp.
FHA — Federal Housing Authority
G.O. — General Obligation
NATL — National
OID — Original Issue Discount
RE — Reinsurance
VA — Veterans Administration
See accompanying notes to the financial statements.
67
|
| Sterling Capital North Carolina Intermediate Tax-Free Fund |
Schedule of Portfolio Investments |
September 30, 2011 |
| | | | | | |
Principal
Amount | | | | Fair Value | |
MUNICIPAL BONDS (100.4%) | |
| | North Carolina (100.4%) | | | | |
| $1,000,000 | | Alamance County, NC, School Improvements G.O., Callable 2/1/16 @ 100, 5.000%, 2/1/19 | | | $1,134,670 | |
| 1,760,000 | | Albemarle, NC, Hospital Authority Refunding Revenue, OID, 4.500%, 10/1/11 | | | 1,759,982 | |
| 1,045,000 | | Albemarle, NC, Hospital Authority Refunding Revenue, OID, 4.500%, 10/1/12 | | | 1,042,565 | |
| 2,335,000 | | Appalachian State University Revenue, Callable 10/1/21 @ 100, 5.000%, 10/1/24 | | | 2,712,966 | |
| 2,655,000 | | Appalachian State University Revenue, Callable 10/1/21 @ 100, 4.750%, 10/1/27 | | | 2,907,225 | |
| 1,065,000 | | Broad River Water Authority, NC, Water System Refunding Revenue, Callable 6/1/15 @ 100 (XLCA), 5.000%, 6/1/18 | | | 1,139,976 | |
| 725,000 | | Broad River Water Authority, NC, Water System Refunding Revenue, Callable 6/1/15 @ 100 (XLCA), 5.000%, 6/1/19 | | | 768,007 | |
| 1,000,000 | | Buncombe County, NC, Certificate of Participation, Callable 4/1/16 @ 100 (NATL-RE), 5.000%, 4/1/19 | | | 1,115,230 | |
| 1,935,000 | | Buncombe County, NC, Public Improvements Revenue, Series A, 4.000%, 6/1/17 | | | 2,128,326 | |
| 2,975,000 | | Cabarrus County, NC, Installment Financing Contract Certificate of Participation, 4.000%, 1/1/15 | | | 3,261,909 | |
| 1,960,000 | | Cabarrus County, NC, Installment Financing Contract Certificate of Participation, 5.000%, 1/1/17 | | | 2,286,869 | |
| 1,305,000 | | Cabarrus County, NC, Installment Financing Contract Certificate of Participation, Callable 1/1/19 @ 100, 5.000%, 1/1/20 | | | 1,511,699 | |
| 1,730,000 | | Cabarrus County, NC, Installment Financing Contract Certificate of Participation, Callable 1/1/19 @ 100, 5.000%, 1/1/23 | | | 1,940,766 | |
| 1,000,000 | | Cabarrus County, NC, Installment Financing Contract Certificate of Participation, Series C, Callable 6/1/18 @ 100, OID, 5.000%, 6/1/23 | | | 1,111,160 | |
| 1,135,000 | | Cape Fear Public Utility Authority, NC, Water & Sewer System Revenue, Callable 8/1/18 @ 100, 5.000%, 8/1/26 | | | 1,255,094 | |
| 930,000 | | Cape Fear Public Utility Authority, NC, Water & Sewer System Revenue, Callable 8/1/18 @ 100, 5.000%, 8/1/31 | | | 999,480 | |
| 1,475,000 | | Cape Fear Public Utility Authority, NC, Water & Sewer System Revenue, Callable 8/1/21 @ 100, 5.000%, 8/1/26 | | | 1,684,096 | |
| 1,015,000 | | Catawba County, NC, Public School & Community College Improvements Projects Certificate of Participation, Callable 6/1/14 @ 100 (NATL-RE), 5.250%, 6/1/23 | | | 1,064,258 | |
| 1,000,000 | | Charlotte, NC, Airport Refunding Revenue, Series B, 5.000%, 7/1/15 | | | 1,131,340 | |
| 1,000,000 | | Charlotte, NC, Airport Revenue, Series A, Callable 7/1/20 @ 100, 5.000%, 7/1/27 | | | 1,082,390 | |
| 1,280,000 | | Charlotte, NC, Storm Water Fee Public Improvements Revenue, Callable 6/1/16 @ 100, 5.000%, 6/1/20 | | | 1,445,466 | |
| 1,000,000 | | Charlotte, NC, Storm Water Fee Public Improvements Revenue, Callable 6/1/16 @ 100, 5.000%, 6/1/23 | | | 1,106,760 | |
| | | | | | |
Principal
Amount | | | | Fair Value | |
MUNICIPAL BONDS — (continued) | |
| | North Carolina — (continued) | | | | |
| $1,415,000 | | Charlotte-Mecklenburg Hospital Authority, NC, Carolinas Health Care System Refunding Revenue, Series A, 5.000%, 1/15/17 | | | $1,632,485 | |
| 2,000,000 | | Concord, NC, Refunding Revenue, Series B, Callable 12/1/19 @ 100, 5.000%, 12/1/22 | | | 2,292,040 | |
| 1,180,000 | | Cumberland County, NC, County Improvements Projects Certificate of Participation, Series A, Callable 12/1/19 @ 100, OID, 4.875%, 12/1/25 | | | 1,291,911 | |
| 2,710,000 | | Cumberland County, NC, Refunding G.O. (NATL-RE), 5.000%, 5/1/13 | | | 2,908,237 | |
| 2,205,000 | | Cumberland County, NC, Refunding G.O. (NATL-RE), 5.000%, 5/1/14 | | | 2,458,421 | |
| 990,000 | | Durham County, NC, Industrial Facilities & Pollution Control Financing Authority, Research Triangle Institute Revenue, 5.000%, 2/1/20 | | | 1,164,408 | |
| 2,000,000 | | Durham County, NC, Public Improvements Certificate of Participation, Series A, Callable 6/1/19 @ 100, 5.000%, 6/1/24 | | | 2,235,100 | |
| 365,000 | | Elizabeth City State University Revenue, Series A (AGM), 4.000%, 4/1/13 | | | 376,731 | |
| 380,000 | | Elizabeth City State University Revenue, Series A (AGM), 4.000%, 4/1/14 | | | 397,514 | |
| 470,000 | | Elizabeth City State University Revenue, Series A (AGM), 4.000%, 4/1/15 | | | 497,312 | |
| 565,000 | | Elizabeth City State University Revenue, Series A (AGM), 4.000%, 4/1/16 | | | 599,471 | |
| 2,070,000 | | Fayetteville, NC, Public Works Commission Refunding Revenue, Series A, 5.000%, 3/1/16 | | | 2,416,021 | |
| 305,000 | | Haywood County, NC, School Improvements G.O., Callable 5/1/16 @ 100 (XLCA), 5.000%, 5/1/17 | | | 350,049 | |
| 1,000,000 | | Henderson County, NC, Certificates of Participation, Series A (AMBAC), 5.000%, 6/1/16 | | | 1,150,810 | |
| 1,030,000 | | Henderson County, NC, Limited Obligation Revenue, Series B, 4.000%, 12/1/16 | | | 1,155,475 | |
| 450,000 | | Iredell County, NC, School Projects Certificate of Participation (AGM), 5.250%, 6/1/17 | | | 528,111 | |
| 1,000,000 | | Lee County, NC, Public Facilities Projects Certificate of Participation, Callable 4/1/17 @ 100 (AGM), 5.000%, 4/1/19 | | | 1,133,720 | |
| 1,750,000 | | Lincoln County, NC, Refunding G.O., Series A, 5.000%, 6/1/18 | | | 2,117,045 | |
| 2,535,000 | | Lincoln County, NC, Refunding G.O., Series A, 4.000%, 6/1/19 | | | 2,905,414 | |
| 800,000 | | Lincolnton, NC, Combined Enterprise System Refunding Revenue, Callable 5/1/15 @ 100 (XLCA), 5.000%, 5/1/17 | | | 846,560 | |
| 310,000 | | Lincolnton, NC, Combined Enterprise System Refunding Revenue, Callable 5/1/15 @ 100 (XLCA), OID, 4.125%, 5/1/20 | | | 310,800 | |
| 2,000,000 | | Mecklenburg County, NC, Refunding G.O., 5.000%, 2/1/21 | | | 2,478,240 | |
| 1,280,000 | | Monroe, NC, Combined Enterprise System Refunding Revenue (AGM), 4.000%, 3/1/19 | | | 1,417,587 | |
| 1,000,000 | | Mooresville, NC, Telecommunications Improvements Certificate of Participation, 5.000%, 9/1/15 | | | 1,136,120 | |
Continued
68
|
| Sterling Capital North Carolina Intermediate Tax-Free Fund |
Schedule of Portfolio Investments — (continued) |
September 30, 2011 |
| | | | | | |
Principal
Amount | | | | Fair Value | |
MUNICIPAL BONDS — (continued) | |
| | North Carolina — (continued) | | | | |
| $1,460,000 | | Mooresville, NC, Telecommunications Improvements Certificate of Participation, 5.000%, 9/1/16 | | | $1,684,198 | |
| 1,855,000 | | New Hanover County, NC, New Hanover County Projects Refunding Revenue, 5.000%, 12/1/19 | | | 2,224,646 | |
| 1,015,000 | | New Hanover County, NC, New Hanover County Projects Refunding Revenue, 5.000%, 12/1/20 | | | 1,218,984 | |
| 1,000,000 | | New Hanover County, NC, New Hanover Regional Medical Center Project Revenue, Callable 10/1/11 @ 100 (NATL-RE), 5.250%, 10/1/12 | | | 1,000,140 | |
| 3,000,000 | | New Hanover County, NC, New Hanover Regional Medical Center Project Revenue, Callable 10/1/11 @ 100 (NATL-RE), OID, 5.000%, 10/1/19 | | | 3,000,390 | |
| 2,500,000 | | New Hanover County, NC, New Hanover Regional Medical Refunding Revenue, 4.000%, 10/1/19 | | | 2,647,825 | |
| 1,270,000 | | New Hanover County, NC, New Hanover Regional Medical Refunding Revenue, Callable 10/1/21 @ 100, 5.000%, 10/1/23 | | | 1,378,763 | |
| 1,000,000 | | New Hanover County, NC, Regional Medical Center Revenue, Series A, Callable 10/1/19 @ 100 (AGM), 5.000%, 10/1/21 | | | 1,119,680 | |
| 1,050,000 | | New Hanover County, NC, Regional Medical Center Revenue, Series A, Callable 10/1/19 @ 100 (AGM), 5.000%, 10/1/22 | | | 1,162,193 | |
| 1,905,000 | | North Carolina Eastern Municipal Power Agency, Power System Refunding Revenue, Series A, 5.000%, 1/1/14 | | | 2,073,402 | |
| 2,065,000 | | North Carolina Eastern Municipal Power Agency, Power System Refunding Revenue, Series A, Callable 1/1/16 @ 100 (AMBAC), 5.250%, 1/1/20 | | | 2,317,508 | |
| 2,000,000 | | North Carolina Eastern Municipal Power Agency, Power System Refunding Revenue, Series B, OID, 4.000%, 1/1/18 | | | 2,189,580 | |
| 2,400,000 | | North Carolina Eastern Municipal Power Agency, Power System Revenue, Series A, OID, 6.400%, 1/1/21 | | | 2,996,640 | |
| 2,115,000 | | North Carolina Infrastructure Finance Corp., Correctional Facilities Projects Revenue, Callable 10/1/13 @ 100, 5.000%, 10/1/19 | | | 2,257,910 | |
| 5,000,000 | | North Carolina Infrastructure Finance Corp., Correctional Facilities Projects Revenue, Callable 10/1/13 @ 100, 5.000%, 10/1/20 | | | 5,352,200 | |
| 2,015,000 | | North Carolina Medical Care Commission, Blue Ridge Healthcare Refunding Revenue, Series A, 4.000%, 1/1/16 | | | 2,136,162 | |
| 2,065,000 | | North Carolina Medical Care Commission, Caromont Health Revenue (Assured Guaranty), OID, 3.500%, 2/15/19 | | | 2,147,393 | |
| 990,000 | | North Carolina Medical Care Commission, First Mortgage Deerfield Revenue, Series A, Callable 11/1/18 @ 100, OID, 6.000%, 11/1/33 | | | 1,013,423 | |
| 1,515,000 | | North Carolina Medical Care Commission, Firsthealth Carolina Refunding Revenue, Series C, OID, 4.000%, 10/1/18 | | | 1,667,833 | |
| | | | | | |
Principal
Amount | | | | Fair Value | |
MUNICIPAL BONDS — (continued) | |
| | North Carolina — (continued) | | | | |
| $ 915,000 | | North Carolina Medical Care Commission, Health Care Facilities Refunding Revenue, Appalachian Regional Healthcare System, Series A, 5.000%, 7/1/19 | | | $ 978,565 | |
| 1,180,000 | | North Carolina Medical Care Commission, Health Care Facilities Refunding Revenue, Appalachian Regional Healthcare System, Series A, 5.375%, 7/1/20 | | | 1,292,360 | |
| 2,005,000 | | North Carolina Medical Care Commission, Health Care Housing ARC Projects Revenue, Series A (HUD Section 8), 4.650%, 10/1/14 | | | 2,054,544 | |
| 1,435,000 | | North Carolina Medical Care Commission, Health Care Housing ARC Projects Revenue, Series A, Callable 10/1/14 @ 101 (HUD Section 8), 5.500%, 10/1/24 | | | 1,457,099 | |
| 1,000,000 | | North Carolina Medical Care Commission, Mission Health Combine Group Refunding Revenue, Callable 10/1/17 @ 100 (AGM-CR), 5.000%, 10/1/25 | | | 1,060,290 | |
| 3,000,000 | | North Carolina Medical Care Commission, North Carolina Baptist Hospital Refunding Revenue, 5.000%, 6/1/20 | | | 3,459,870 | |
| 1,580,000 | | North Carolina Medical Care Commission, Novant Health Obligation Group Refunding Revenue, Group A, 5.000%, 11/1/13 | | | 1,679,461 | |
| 1,910,000 | | North Carolina Medical Care Commission, Novant Health Obligation Group Refunding Revenue, Group A, Callable 11/1/13 @ 100, 5.000%, 11/1/14 | | | 2,014,248 | |
| 1,000,000 | | North Carolina Medical Care Commission, Novant Health Refunding Revenue, Callable 11/1/13 @ 100 (AGM-CR), 5.000%, 11/1/15 | | | 1,065,430 | |
| 2,000,000 | | North Carolina Medical Care Commission, Rex Healthcare Refunding Revenue, Series A, 5.000%, 7/1/17 | | | 2,238,980 | |
| 1,000,000 | | North Carolina Medical Care Commission, Stanly Memorial Hospital Project Revenue, Callable 10/31/11 @ 100, OID, 6.250%, 10/1/19 | | | 1,001,540 | |
| 3,485,000 | | North Carolina Medical Care Commission, Universal Health System Refunding Revenue, Series E2, 6.000%, 12/1/36(a) | | | 3,926,968 | |
| 1,045,000 | | North Carolina Medical Care Commission, Wakemed Revenue, Series A, Callable 10/1/14 @ 100 (Assured Guaranty), 4.000%, 10/1/17 | | | 1,101,639 | |
| 2,000,000 | | North Carolina Medical Care Commission, Wakemed Revenue, Series A, Callable 10/1/14 @ 100 (Assured Guaranty), 5.625%, 10/1/29 | | | 2,084,780 | |
| 1,115,000 | | North Carolina Medical Care Commission, Wilson Medical Center Refunding Revenue, 5.000%, 11/1/17 | | | 1,228,596 | |
| 1,000,000 | | North Carolina Municipal Power Agency No. 1, Catawba Electric Power Refunding Revenue, Series A, 5.250%, 1/1/17 | | | 1,172,700 | |
| 925,000 | | North Carolina Municipal Power Agency No. 1, Catawba Electric Power Refunding Revenue, Series A, Callable 1/1/18 @ 100, 5.250%, 1/1/20 | | | 1,060,411 | |
Continued
69
|
| Sterling Capital North Carolina Intermediate Tax-Free Fund |
Schedule of Portfolio Investments — (continued) |
September 30, 2011 |
| | | | | | |
Principal
Amount | | | | Fair Value | |
MUNICIPAL BONDS — (continued) | |
| | North Carolina — (continued) | |
| $1,470,000 | | North Carolina Municipal Power Agency No. 1, Catawba Electric Revenue, Series A, Callable 1/1/13 @ 100 (AGM), 5.250%, 1/1/16 | | | $1,546,425 | |
| 2,135,000 | | North Carolina Municipal Power Agency No. 1, Catawba Electric Revenue, Series A, Callable 1/1/13 @ 100 (NATL-RE), 5.250%, 1/1/19 | | | 2,235,857 | |
| 1,000,000 | | North Carolina State, Clean Water G.O., Series A, Callable 3/1/16 @ 100, 5.000%, 3/1/17 | | | 1,162,090 | |
| 2,000,000 | | North Carolina State, Public Improvements G.O., Series A, Callable 3/1/17 @ 100, 5.000%, 3/1/20 | | | 2,307,800 | |
| 2,925,000 | | North Carolina State, Refunding G.O., Series A, 5.000%, 9/1/16 | | | 3,483,090 | |
| 2,380,000 | | North Carolina State, Refunding G.O., Series B, 5.000%, 4/1/17 | | | 2,855,714 | |
| 1,000,000 | | North Carolina State, Repair & Renovation Project, Certificates of Participation, Series B, Callable 6/1/14 @ 100, 5.000%, 6/1/21 | | | 1,059,430 | |
| 1,080,000 | | North Carolina State, Vehicle Grant Revenue, Highway Improvements (NATL-RE), 5.000%, 3/1/16 | | | 1,255,468 | |
| 1,720,000 | | North Carolina State, Vehicle Grant Revenue, Highway Improvements (NATL-RE), 5.000%, 3/1/17 | | | 2,025,042 | |
| 1,085,000 | | North Carolina State, Vehicle Grant Revenue, Highway Improvements, Callable 3/1/17 @ 100 (NATL-RE), 5.000%, 3/1/18 | | | 1,260,390 | |
| 115,000 | | Onslow Water & Sewer Authority, Combined Enterprise Systems Revenue, Series A (NATL-RE), 5.000%, 6/1/18 | | | 134,760 | |
| 1,520,000 | | Onslow Water & Sewer Authority, Combined Enterprise Systems Revenue, Series B, Callable 6/1/14 @ 100 (XLCA), 5.000%, 6/1/21 | | | 1,644,108 | |
| 1,365,000 | | Orange County, NC, Public Facilities Co. Revenue, Callable 10/1/21 @ 100, 5.000%, 10/1/23 | | | 1,567,225 | |
| 1,105,000 | | Orange County, NC, Public Improvements Project Certificates of Participation, Series A, Callable 4/1/16 @ 100 (AMBAC), 5.000%, 4/1/19 | | | 1,227,323 | |
| 1,105,000 | | Pasquotank County, NC, Refunding Certificate of Participation (NATL-RE), 5.250%, 6/1/18 | | | 1,277,347 | |
| 1,000,000 | | Pasquotank County, NC, Refunding Certificate of Participation (NATL-RE), 5.250%, 6/1/19 | | | 1,155,310 | |
| 2,440,000 | | Pitt County, NC, Pitt County Memorial Hospital Project Refunding Revenue, Callable 10/31/11 @ 100, OID, 5.500%, 12/1/15 | | | 2,648,156 | |
| 2,700,000 | | Raleigh Durham Airport Authority Refunding Revenue, Series B, 3.000%, 11/1/16 | | | 2,883,222 | |
| 2,150,000 | | Raleigh Durham Airport Authority Refunding Revenue, Series B1, Callable 5/1/20 @ 100, 5.000%, 11/1/28 | | | 2,363,882 | |
| 4,445,000 | | Raleigh, NC, Combined Enterprise Systems Revenue, Callable 3/1/14 @ 100, 5.000%, 3/1/31 | | | 4,704,010 | |
| 1,400,000 | | Rockingham County, NC, Certificate of Participation (Assured Guaranty), 5.000%, 4/1/17 | | | 1,629,726 | |
| 1,510,000 | | Rockingham County, NC, Refunding Revenue, 5.000%, 4/1/18 | | | 1,729,222 | |
| | | | | | |
Principal Amount | | | | Fair Value | |
MUNICIPAL BONDS — (continued) | |
| | North Carolina — (continued) | | | | |
| $1,085,000 | | Surry County, NC, Northern Hospital District Revenue, Callable 4/1/18 @ 100, OID, 5.500%, 10/1/21 | | | $ 1,127,423 | |
| 160,000 | | Surry County, NC, Northern Hospital District Revenue, OID, 4.000%, 10/1/11 | | | 160,003 | |
| 2,000,000 | | Union County, NC, Refunding G.O., Series A, 5.000%, 3/1/22 | | | 2,472,040 | |
| 4,610,000 | | Union County, NC, School Improvements G.O., Series D, Callable 3/1/17 @ 100 (NATL-RE), 5.000%, 3/1/19 | | | 5,355,714 | |
| 2,285,000 | | University of North Carolina at Greensboro, Refunding Revenue, Callable 4/1/21 @ 100, 5.000%, 4/1/23 | | | 2,626,402 | |
| 2,000,000 | | University of North Carolina at Greensboro, Refunding Revenue, Callable 4/1/21 @ 100, 5.000%, 4/1/36 | | | 2,125,920 | |
| 1,160,000 | | University of North Carolina System Pool Refunding Revenue, Appalachian State University, Series B1, 4.000%, 10/1/15 | | | 1,298,875 | |
| 3,260,000 | | University of North Carolina System Pool Refunding Revenue, Appalachian State University, Series B1, Callable 4/1/20 @ 100, 5.250%, 10/1/22 | | | 3,882,334 | |
| 3,095,000 | | University of North Carolina System Pool Refunding Revenue, Asheville/Wilmington, Series C, Callable 4/1/20 @ 100 (Assured Guaranty), 5.000%, 10/1/20 | | | 3,707,965 | |
| 1,485,000 | | University of North Carolina System Pool Refunding Revenue, Asheville/Wilmington, Series C, Callable 4/1/20 @ 100 (Assured Guaranty), 5.250%, 10/1/24 | | | 1,729,877 | |
| 1,975,000 | | University of North Carolina System Pool Refunding Revenue, The University of North Carolina at Greensboro, Series B2, 5.000%, 4/1/17 | | | 2,329,078 | |
| 1,565,000 | | University of North Carolina System Pool Revenue, General Trust Indenture, Series C, 4.250%, 10/1/14 | | | 1,693,158 | |
| 1,005,000 | | University of North Carolina System Pool Revenue, Series A, Callable 10/1/16 @ 100 (NATL-RE), 5.000%, 10/1/17 | | | 1,157,680 | |
| 890,000 | | University of North Carolina System Pool Revenue, Series A, Callable 4/1/13 @ 100 (AMBAC), 5.250%, 4/1/21 | | | 934,981 | |
| 500,000 | | University of North Carolina System Pool Revenue, Series B (AMBAC), 4.000%, 4/1/14 | | | 525,105 | |
| 1,000,000 | | Wilkes County, NC, Certificates of Participation (NATL-RE), OID, 4.000%, 6/1/13 | | | 1,050,680 | |
| 1,000,000 | | Wilson, NC, Public Improvements Project Certificates of Participation, Series A (Assured Guaranty), 5.000%, 5/1/16 | | | 1,149,420 | |
| 1,000,000 | | Winston-Salem, NC, Water & Sewer System Refunding Revenue, Series A, Callable 6/1/17 @ 100, 5.000%, 6/1/19 | | | 1,174,660 | |
| | | | | | |
| | Total Municipal Bonds
(Cost $201,392,267) | | | 213,513,079 | |
| | | | | | |
Continued
70
|
| Sterling Capital North Carolina Intermediate Tax-Free Fund |
Schedule of Portfolio Investments — (continued) |
September 30, 2011 |
| | | | | | |
Shares | | | | Fair Value | |
INVESTMENT COMPANY (0.3%) | | | | |
| 697,165 | | Federated North Carolina Municipal Money Market Portfolio, Institutional Class | | | $ 697,165 | |
| | | | | | |
| | Total Investment Company
(Cost $697,165) | | | 697,165 | |
| | | | | | |
Total Investments — 100.7%
(Cost $202,089,432) | | | 214,210,244 | |
| Net Other Assets (Liabilities) — (0.7)% | | | (1,430,472 | ) |
| | | | | | |
| NET ASSETS — 100.0%. | | | $212,779,772 | |
| | | | | | |
| (a) | The interest rate for this variable rate note, which will change periodically, is based either on the prime rate or an index of market rates. The reflected rate is in effect as of September 30, 2011. The maturity date reflected is the final maturity date. |
AGM — Assured Guaranty Municipal Corp.
AMBAC — American Municipal Bond Insurance Corp.
CR — Custodial Receipts
G.O. — General Obligation
HUD — Housing & Urban Development
NATL — National
OID — Original Issue Discount
RE — Reinsurance
XLCA — XL Capital Assurance
See accompanying notes to the financial statements.
71
|
| Sterling Capital South Carolina Intermediate Tax-Free Fund |
Schedule of Portfolio Investments |
September 30, 2011 |
| | | | | | |
Principal
Amount | | | | Fair Value | |
MUNICIPAL BONDS (97.9%) | |
| | South Carolina (97.9%) | | | | |
| $ 335,000 | | Anderson County, School District No. 1, SC, School Improvements G.O. (SCSDE), 4.000%, 3/1/19 | | | $ 380,758 | |
| 1,000,000 | | Anderson Regional Joint Water System Refunding Revenue, Series A, Callable 7/15/21 @ 100, 5.000%, 7/15/25 | | | 1,129,590 | |
| 1,000,000 | | Beaufort County School District, Refunding G.O., SC, Series A, Callable 3/1/17 @ 100 (AGM, SCSDE), 5.000%, 3/1/27 | | | 1,084,220 | |
| 400,000 | | Beaufort County School District, Refunding G.O., SC, Series D, Callable 3/1/19 @ 100 (SCSDE), 5.000%, 3/1/23 | | | 460,572 | |
| 615,000 | | Beaufort County, SC, New River Redevelopment Project Area Tax Increment Revenue, Callable 12/1/12 @ 100 (NATL-RE), 5.500%, 6/1/16 | | | 648,591 | |
| 505,000 | | Bennettsville, SC, Combined Utility Systems, Refunding & Improvements Revenue, Callable 2/1/14 @ 100 (AMBAC), OID, 3.625%, 2/1/16 | | | 513,529 | |
| 250,000 | | Camden, SC, Public Utilities Improvements Refunding Revenue (NATL-RE FGIC), OID, 3.500%, 3/1/12 | | | 253,113 | |
| 290,000 | | Camden, SC, Public Utilities Improvements Refunding Revenue, Callable 3/1/14 @ 100 (NATL-RE FGIC), 5.000%, 3/1/15 | | | 315,392 | |
| 125,000 | | Cayce, SC, Waterworks & Sewer Systems Refunding & Improvements Revenue, Series A (XLCA), 4.500%, 7/1/15 | | | 138,560 | |
| 760,000 | | Cayce, SC, Waterworks & Sewer Systems Refunding & Improvements Revenue, Series A (XLCA), 5.250%, 7/1/16 | | | 877,587 | |
| 310,000 | | Cayce, SC, Waterworks & Sewer Systems Refunding & Improvements Revenue, Series A (XLCA), 5.250%, 7/1/17 | | | 361,184 | |
| 595,000 | | Cayce, SC, Waterworks & Sewer Systems Refunding & Improvements Revenue, Series A (XLCA), 5.250%, 7/1/20 | | | 696,858 | |
| 310,000 | | Charleston County, SC, Hospital Facilities Care Alliance Health Revenue, Series B1 (AGM), 5.000%, 8/15/16 | | | 351,642 | |
| 660,000 | | Chesterfield County School District, SC, Refunding Certificate Participation, Chesterfield School Facilities Inc., Callable 2/1/13 @ 100 (XLCA), OID, 3.500%, 2/1/14 | | | 670,441 | |
| 185,000 | | Coastal Carolina University, SC, Refunding Revenue (XLCA), 4.000%, 6/1/17. | | | 202,963 | |
| 485,000 | | College of Charleston, SC, Academic & Administrative Facilities Revenue, Series D (XLCA), 4.500%, 4/1/17 | | | 543,850 | |
| 120,000 | | Colleton County, SC, School Improvements G.O., Callable 10/31/11 @ 100 (AGM, State Aid Withholding), OID, 4.200%, 3/1/12 | | | 120,358 | |
| 350,000 | | Dorchester County, SC, Transition Projects G.O., Series A (XLCA), 5.000%, 5/1/14 | | | 385,123 | |
| 345,000 | | Dorchester County, SC, Transition Projects G.O., Series A (XLCA), 5.000%, 5/1/15 | | | 390,061 | |
| 225,000 | | Dorchester County, SC, Waterworks Revenue (NATL-RE), 5.000%, 10/1/15 | | | 255,033 | |
| | | | | | |
Principal
Amount | | | | Fair Value | |
MUNICIPAL BONDS — (continued) | |
| | South Carolina — (continued) | | | | |
| $670,000 | | Easley, SC, Combined Utility System Refunding Revenue, Callable 12/1/19 @ 100 (Assured Guaranty), 5.000%, 12/1/24 | | | $ 764,912 | |
| 200,000 | | Educational Facilities Authority, SC, Wofford College Revenue, Series A, 4.000%, 4/1/15 | | | 216,500 | |
| 125,000 | | Educational Facilities Authority, SC, Wofford College Revenue, Series A, 4.250%, 4/1/17 | | | 138,473 | |
| 440,000 | | Fort Mill School Facilities Corp., SC, Installment Purchase Revenue, 5.000%, 12/1/12 | | | 459,716 | |
| 335,000 | | Fort Mill School Facilities Corp., SC, Installment Purchase Revenue, Callable 12/1/16 @ 100, 5.250%, 12/1/18 | | | 373,036 | |
| 260,000 | | Georgetown County School District, SC, Refunding G.O., Series B, Callable 3/1/12 @ 102 (AGM, SCSDE), 5.000%, 3/1/16 | | | 269,916 | |
| 1,030,000 | | Georgetown County, SC, Refunding G.O., 4.000%, 3/1/23 | | | 1,141,456 | |
| 200,000 | | Grand Strand Water & Sewer Authority, SC, Water Works & Sewer System Refunding Revenue, Callable 6/1/12 @ 100 (AGM), 5.375%, 6/1/14 | | | 206,428 | |
| 900,000 | | Greenville County, SC, School District Installment Purchase Refunding Revenue, Callable 12/1/16 @ 100, 5.000%, 12/1/22 | | | 990,864 | |
| 500,000 | | Greenville, SC, Hospital System Board Facilities Refunding Revenue, Series A, Callable 5/1/18 @100, 5.250%, 5/1/22 | | | 552,915 | |
| 260,000 | | Greenville, SC, Hospital System Board Facilities Revenue, Callable 10/31/11 @ 101 (AMBAC), 5.500%, 5/1/26 | | | 260,018 | |
| 100,000 | | Greenville, SC, Sewer System Revenue, Callable 4/1/12 @ 100 (NATL-RE), OID, 4.600%, 4/1/15 | | | 101,655 | |
| 380,000 | | Greenville, SC, Waterworks Revenue, Prerefunded 2/1/13 @ 100, 5.250%, 2/1/19 | | | 404,746 | |
| 395,000 | | Greenwood County, SC, Self Regional Healthcare Revenue, Callable 10/1/19 @ 100, OID, 4.875%, 10/1/22 | | | 419,723 | |
| 530,000 | | Greenwood County, SC, Self Regional Healthcare Revenue, Callable 10/1/19 @ 100, OID, 5.000%, 10/1/23 | | | 560,968 | |
| 1,175,000 | | Greenwood, SC, Combined Public Utility Revenue, Series A, 4.000%, 12/1/18 | | | 1,304,744 | |
| 250,000 | | Horry County School District, SC, School Improvements G.O., Series A, Prerefunded 3/1/12 @ 100 (SCSDE), 5.375%, 3/1/15 | | | 255,425 | |
| 325,000 | | Horry County School District, SC, School Improvements G.O., Series B, Callable 3/1/17 @ 100 (NATL-RE, SCSDE), 5.000%, 3/1/21 | | | 369,021 | |
| 500,000 | | Kershaw County, SC, Public Schools Foundation Installment Power, Refunding Revenue, Kershaw County School District Project (AGC), 5.000%, 12/1/16 | | | 555,170 | |
| 645,000 | | Lancaster Educational Assistance Program, Inc., Lancaster County School District Project Revenue, Callable 12/1/14 @ 100, 5.250%, 12/1/17 | | | 702,405 | |
| 315,000 | | Laurens County School District No. 55, SC, School Improvements Revenue, Callable 12/1/15 @ 100, 5.250%, 12/1/24 | | | 328,980 | |
Continued
72
|
| Sterling Capital South Carolina Intermediate Tax-Free Fund |
Schedule of Portfolio Investments — (continued) |
September 30, 2011 |
| | | | | | |
Principal
Amount | | | | Fair Value | |
MUNICIPAL BONDS — (continued) | |
| | South Carolina — (continued) | | | | |
| $ 825,000 | | Lexington County, SC, Health Services District, Inc., Refunding Revenue, 5.000%, 11/1/15 | | | $ 920,015 | |
| 480,000 | | Lexington County, SC, Health Services District, Inc., Refunding Revenue, 5.000%, 11/1/16 | | | 543,341 | |
| 725,000 | | Lexington County, SC, Health Services District, Inc., Refunding Revenue, Callable 11/1/21 @ 100, 5.000%, 11/1/22 | | | 801,147 | |
| 1,010,000 | | Lexington County, SC, School District No. 1, Refunding G.O., Callable 3/1/17 @ 100 (SCSDE), 5.125%, 3/1/21 | | | 1,153,198 | |
| 500,000 | | Lexington County, SC, School District No. 3, Refunding G.O., Callable 3/1/12 @ 102 (AGM, SCSDE), 5.000%, 3/1/16 | | | 518,965 | |
| 1,000,000 | | Lexington One School Facilities Corp., Lexington County School District No. 1 Revenue, 5.000%, 12/1/16 | | | 1,143,550 | |
| 890,000 | | Lexington, SC, Waterworks & Sewer System Refunding Revenue, Callable 4/1/21 @ 100, 5.000%, 4/1/22 | | | 1,034,474 | |
| 400,000 | | Mount Pleasant, SC, Public Improvements G.O., 4.000%, 12/1/12 | | | 417,592 | |
| 115,000 | | Myrtle Beach, SC, Public Improvements G.O., Series A (Assured Guaranty), 5.000%, 3/1/18 | | | 138,599 | |
| 365,000 | | Myrtle Beach, SC, Recreational Facilities Improvements, Special Tax Revenue, 4.000%, 3/1/19 | | | 406,176 | |
| 735,000 | | Myrtle Beach, SC, Refunding G.O., Series B, Callable 3/1/21 @ 100 (State Aid Withholding), 4.000%, 3/1/23 | | | 802,414 | |
| 840,000 | | Myrtle Beach, SC, Refunding G.O., Series B, Callable 3/1/21 @ 100 (State Aid Withholding), 4.000%, 3/1/24 | | | 902,756 | |
| 310,000 | | Newberry Investing in Children’s Education, SC, Newberry County School District Project Revenue, 5.000%, 12/1/12 | | | 321,817 | |
| 790,000 | | Newberry Investing in Children’s Education, SC, Newberry County School District Project Revenue, 5.250%, 12/1/14 | | | 864,797 | |
| 750,000 | | Oconee County, SC, Duke Power Co. Project Refunding Revenue, 3.600%, 2/1/17 | | | 803,753 | |
| 565,000 | | Orangeburg County, SC, School District No. 5, Refunding G.O. (SCSDE), 5.000%, 3/1/21 | | | 678,938 | |
| 420,000 | | Piedmont Municipal Power Agency, SC, Power System Refunding Revenue (NATL-RE), OID, 5.375%, 1/1/25 | | | 501,056 | |
| 830,000 | | Piedmont Municipal Power Agency, SC, Power System Refunding Revenue, Series A3, 5.000%, 1/1/16 | | | 941,892 | |
| 435,000 | | Piedmont Municipal Power Agency, SC, Power System Refunding Revenue, Series A3 (Assured Guaranty), 5.000%, 1/1/18 | | | 501,929 | |
| 400,000 | | Renewable Water Resources Sewage System, SC, Refunding Revenue, Series A, Callable 1/1/20 @ 100, 5.000%, 1/1/21 | | | 466,028 | |
| 1,000,000 | | Richland County School District No. 1, SC, School Improvements G.O., Callable 3/1/13 @ 101 (AGM, SCSDE), OID, 4.750%, 3/1/24 | | | 1,057,590 | |
| | | | | | |
Principal
Amount | | | | Fair Value | |
MUNICIPAL BONDS — (continued) | |
| | South Carolina — (continued) | | | | |
| $125,000 | | Richland County School District No. 1, SC, School Improvements G.O., Callable 3/1/13 @ 101 (AGM, SCSDE), OID, 4.750%, 3/1/27 | | | $ 130,867 | |
| 365,000 | | Rock Hill, SC, Public Improvements G.O., Callable 4/1/21 @ 100 (State Aid Withholding), 5.000%, 4/1/26 | | | 414,625 | |
| 390,000 | | Rock Hill, SC, Public Improvements G.O., Callable 4/1/21 @ 100 (State Aid Withholding), 5.000%, 4/1/27 | | | 439,635 | |
| 205,000 | | Scago Educational Facilities Corp. for Colleton School District, SC, School Improvements Revenue (Assured Guaranty), 5.000%, 12/1/15 | | | 230,863 | |
| 635,000 | | Scago Educational Facilities Corp. for Pickens School District, SC, Pickens County Project Revenue (AGM), 5.000%, 12/1/14 | | | 707,898 | |
| 520,000 | | Scago Educational Facilities Corp. for Pickens School District, SC, Pickens County Project Revenue, Callable 12/1/16 @ 100 (AGM), 5.000%, 12/1/18 | | | 586,180 | |
| 750,000 | | Scago Educational Facilities Corp. for Pickens School District, SC, Pickens County Project Revenue, Callable 12/1/16 @ 100 (AGM), 5.000%, 12/1/19 | | | 833,445 | |
| 545,000 | | Scago Educational Facilities Corp. for Spartanburg School District No. 5, SC, Spartanburg County Project Revenue, Callable 10/1/15 @ 100 (AGM), 5.000%, 4/1/21 | | | 584,442 | |
| 500,000 | | Scago Public Facilities Corp. for Georgetown County Project, Refunding Revenue, Series A, 5.000%, 12/1/18 | | | 567,890 | |
| 500,000 | | Scago Public Facilities Corp. for Georgetown County Project, Refunding Revenue, Series A, 5.000%, 12/1/19 | | | 565,225 | |
| 250,000 | | South Carolina Educational Facilities Authority for Private Nonprofit Institutions of Higher Learning, SC, Furman University Revenue, 5.000%, 10/1/18 | | | 295,377 | |
| 180,000 | | South Carolina Educational Facilities Authority for Private Nonprofit Institutions, Wofford College Project Revenue, 4.000%, 4/1/15 | | | 194,040 | |
| 240,000 | | South Carolina Educational Facilities Authority for Private Nonprofit Institutions, Wofford College Project Revenue, 4.000%, 4/1/16 | | | 260,388 | |
| 325,000 | | South Carolina Jobs-Economic Development Authority, Coastal Housing Foundation Revenue, Series A, OID, 5.500%, 4/1/20 | | | 343,798 | |
| 775,000 | | South Carolina Jobs-Economic Development Authority, Kershaw County Medical Center Project Revenue, OID, 5.000%, 9/15/18 | | | 809,162 | |
| 500,000 | | South Carolina Jobs-Economic Development Authority, Palmetto Health Refunding Revenue, Series A (AGM), 5.000%, 8/1/19 | | | 553,410 | |
| 250,000 | | South Carolina Jobs-Economic Development Authority, Refunding & Improvement AnMed Health Revenue, 5.000%, 2/1/16 | | | 280,995 | |
Continued
73
|
| Sterling Capital South Carolina Intermediate Tax-Free Fund |
Schedule of Portfolio Investments — (continued) |
September 30, 2011 |
| | | | | | |
Principal
Amount | | | | Fair Value | |
MUNICIPAL BONDS — (continued) | |
| | South Carolina — (continued) | | | | |
| $550,000 | | South Carolina Jobs-Economic Development Authority, Refunding & Improvement AnMed Health Revenue, Series B (Assured Guaranty), 5.000%, 2/1/19 | | | $624,646 | |
| 300,000 | | South Carolina Jobs-Economic Development Authority, Refunding & Improvement- Palmetto Health Facilities Revenue, Series C, Prerefunded 8/1/13 @ 100, 6.875%, 8/1/27 | | | 334,920 | |
| 150,000 | | South Carolina State Public Service Authority, Improvements Revenue, Series A, Prerefunded 1/1/12 @ 101 (AGM), 5.250%, 1/1/17 | | | 153,365 | |
| 540,000 | | South Carolina State Public Service Authority, Refunding Revenue, Series A, Callable 1/1/17 @ 100 (AMBAC), 5.000%, 1/1/23 | | | 597,910 | |
| 65,000 | | South Carolina State Public Service Authority, Refunding Revenue, Series A, Callable 1/1/17 @ 100 (AMBAC), 5.000%, 1/1/26 | | | 70,351 | |
| 580,000 | | South Carolina State Public Service Authority, Refunding Revenue, Series A, Callable 1/1/19 @ 100, 5.000%, 1/1/27 | | | 637,223 | |
| 635,000 | | South Carolina State Public Service Authority, Refunding Revenue, Series A, Callable 1/1/19 @ 100, 5.000%, 1/1/32 | | | 678,307 | |
| 690,000 | | South Carolina State Public Service Authority, Refunding Revenue, Series B, Callable 1/1/16 @ 100 (NATL-RE), 5.000%, 1/1/22 | | | 757,109 | |
| 450,000 | | South Carolina Transportation Infrastructure Bank, Highway Improvements Revenue, Series A, Callable 10/1/12 @ 100 (AMBAC), 5.250%, 10/1/21 | | | 465,907 | |
| 750,000 | | South Carolina Transportation Infrastructure Bank, Highway Improvements Revenue, Series A, Callable 10/1/12 @ 100 (AMBAC), 5.000%, 10/1/25 | | | 775,763 | |
| 305,000 | | South Carolina Transportation Infrastructure Bank, Junior Lien Revenue, Series B (AMBAC), 5.250%, 10/1/11 | | | 305,043 | |
| 500,000 | | South Carolina Transportation Infrastructure Bank, Refunding Revenue, Series B (AMBAC), 5.250%, 10/1/15 | | | 574,510 | |
| 475,000 | | South Carolina Transportation Infrastructure Bank, Transit Improvements Revenue, Series A (XLCA), 5.000%, 10/1/15 | | | 541,182 | |
| 435,000 | | South Carolina Transportation Infrastructure Bank, Transit Improvements Revenue, Series A, Callable 10/1/16 @ 100 (XLCA), 5.000%, 10/1/22 | | | 466,398 | |
| 400,000 | | Spartanburg County School District No. 1, SC, School Improvements G.O., Callable 9/1/16 @ 100 (AGM, SCSDE), 5.000%, 3/1/22 | | | 441,660 | |
| 325,000 | | Spartanburg County, SC, Regional Health Services District, Refunding Revenue, Series A (Assured Guaranty), 4.000%, 4/15/16 | | | 350,152 | |
| 600,000 | | Spartanburg County, SC, Regional Health Services District, Refunding Revenue, Series A, Callable 4/15/18 @ 100 (Assured Guaranty), 5.250%, 4/15/21 | | | 662,532 | |
| | | | | | |
Principal
Amount | | | | Fair Value | |
MUNICIPAL BONDS — (continued) | |
| | South Carolina — (continued) | | | | |
| $1,000,000 | | Sumter County, SC, Public Improvements G.O., 5.000%, 3/1/13 | | | $ 1,064,070 | |
| 250,000 | | Three Rivers Solid Waste Authority, SC, Solid Waste Disposal Facilities Refunding Revenue, 5.000%, 12/15/13 | | | 269,520 | |
| 830,000 | | Three Rivers Solid Waste Authority, SC, Solid Waste Disposal Facilities Refunding Revenue, 4.500%, 12/15/16 | | | 915,988 | |
| 500,000 | | University of South Carolina Refunding Revenue, Series A, Callable 5/1/20 @ 100, 5.000%, 5/1/28 | | | 545,120 | |
| 150,000 | | University of South Carolina Revenue, Series A, Callable 5/1/13 @ 100 (AMBAC), OID, 4.750%, 5/1/27 | | | 152,331 | |
| 280,000 | | York County, SC, G.O., Callable 11/1/16 @ 100, OID, 5.100%, 11/1/21 | | | 315,487 | |
| 370,000 | | York County, SC, School District No. 1, Refunding G.O., Series A, Callable 3/1/19 @ 100 (SCSDE), 5.000%, 3/1/20 | | | 440,837 | |
| | | | | | |
| | Total Municipal Bonds
(Cost $52,466,023) | | | 55,015,094 | |
| | | | | | |
| | |
Shares | | | | | |
INVESTMENT COMPANY (3.0%) | |
| 1,698,948 | | Federated Tax-Free Obligations Fund, Institutional Class | | | 1,698,948 | |
| | | | | | |
| | Total Investment Company
(Cost $1,698,948) | | | 1,698,948 | |
| | | | | | |
Total Investments — 100.9%
(Cost $54,164,971) | | | 56,714,042 | |
Net Other Assets (Liabilities) — (0.9)% | | | (513,271 | ) |
| | | | | | |
NET ASSETS — 100.0% | | | $56,200,771 | |
| | | | | | |
AGC — Assured Guaranty Corp.
AGM — Assured Guaranty Municipal Corp.
AMBAC — American Municipal Bond Insurance Corp.
FGIC — Financial Guaranty Insurance Corp.
G.O. — General Obligation
NATL — National
OID — Original Issue Discount
RE — Reinsurance
SCSDE — South Carolina School District Enhancement
XLCA — XL Capital Assurance
See accompanying notes to the financial statements.
74
|
| Sterling Capital Virginia Intermediate Tax-Free Fund |
Schedule of Portfolio Investments |
September 30, 2011 |
| | | | | | |
Principal
Amount | | | | Fair Value | |
MUNICIPAL BONDS (97.9%) | |
| | District of Columbia (1.3%) | | | | |
| $1,000,000 | | Metropolitan Washington Airports Authority Revenue, Series A, Callable 10/1/20 @ 100, 5.000%, 10/1/23 | | | $1,133,140 | |
| 400,000 | | Metropolitan Washington Airports Authority, Refunding Revenue, Series B, Callable 10/1/19 @ 100, 5.000%, 10/1/21 | | | 458,228 | |
| | | | | | |
| | | | | 1,591,368 | |
| | | | | | |
| | Virginia (96.6%) | | | | |
| 1,000,000 | | Alexandria, VA, Public Improvements G.O., Series A, 5.000%, 6/15/16 | | | 1,184,320 | |
| 1,000,000 | | Alexandria, VA, Refunding G.O. (State Aid Withholding), 5.000%, 6/15/21 | | | 1,244,420 | |
| 1,000,000 | | Arlington County, VA, Industrial Development Authority, VA Hospital Center Arlington Health System Refunding Revenue, 5.000%, 7/1/18 | | | 1,132,820 | |
| 1,100,000 | | Chesapeake Bay Bridge & Tunnel District, General Resolution Refunding Revenue (BHAC-CR NATL-RE), 5.500%, 7/1/25 | | | 1,308,153 | |
| 2,100,000 | | Chesapeake Economic Development Authority, Pollution Control Refunding Revenue, 3.600%, 2/1/32(a) | | | 2,164,533 | |
| 1,805,000 | | Chesapeake Hospital Authority, VA, Chesapeake General Hospital Refunding Revenue, Series A, Callable 7/1/14 @ 101, 5.250%, 7/1/17 | | | 1,952,035 | |
| 875,000 | | Chesapeake, VA, Refunding G.O., Series A (State Aid Withholding), 4.000%, 12/1/21 | | | 991,935 | |
| 925,000 | | Chesapeake, VA, Refunding G.O., Series A (State Aid Withholding), 3.000%, 12/1/22 | | | 941,456 | |
| 1,100,000 | | Chesterfield County, VA, Economic Development Authority, Electric & Power Refunding Revenue, Series A, Callable 5/1/19 @ 100, 5.000%, 5/1/23 | | | 1,223,783 | |
| 2,325,000 | | Chesterfield County, VA, Refunding Public Improvements G.O., 5.000%, 1/1/14 | | | 2,562,941 | |
| 675,000 | | Danville, VA, Refunding G.O., Series A, Callable 3/1/19 @ 100 (Assured Guaranty, State Aid Withholding), 5.000%, 3/1/21 | | | 781,441 | |
| 600,000 | | Danville, VA, Refunding G.O., Series A, Callable 3/1/19 @ 100 (Assured Guaranty, State Aid Withholding), 5.000%, 3/1/22 | | | 686,442 | |
| 1,750,000 | | Dinwiddie County, VA, Industrial Development Authority Refunding Revenue, Series B, Callable 2/15/14 @ 100 (NATL-RE), 5.000%, 2/15/24 | | | 1,798,510 | |
| 1,000,000 | | Fairfax County, VA, Industrial Development Authority, Inova Health System Project Refunding Revenue (AGM-CR), OID, 5.250%, 8/15/19 | | | 1,137,100 | |
| 1,000,000 | | Fairfax County, VA, Industrial Development Authority, Inova Health Systems Project Refunding Revenue, Series C, 4.000%, 5/15/14 | | | 1,081,760 | |
| 795,000 | | Fairfax County, VA, Industrial Development Authority, Inova Health Systems Project Refunding Revenue, Series C, 5.000%, 5/15/18 | | | 934,888 | |
| 915,000 | | Fairfax County, VA, Redevelopment & Housing Authority Refunding Revenue, 3.500%, 10/1/18 | | | 1,002,080 | |
| | | | | | |
Principal
Amount | | | | Fair Value | |
MUNICIPAL BONDS — (continued) | |
| | Virginia — (continued) | | | | |
| $1,500,000 | | Fredericksburg Economic Development Authority, MediCorp Health System Obligation Refunding Revenue, 5.000%, 6/15/16 | | | $1,659,000 | |
| 1,175,000 | | Fredericksburg Economic Development Authority, MediCorp Health System Obligation Refunding Revenue, 5.000%, 6/15/17 | | | 1,307,235 | |
| 1,275,000 | | Fredericksburg Economic Development Authority, MediCorp Health System Obligation Refunding Revenue, 5.250%, 6/15/19 | | | 1,434,809 | |
| 1,000,000 | | Hampton, VA, Public Improvements Refunding G.O., Series A, Callable 1/15/19 @100, 5.000%, 1/15/21 | | | 1,183,730 | |
| 775,000 | | Harrisonburg, VA, Refunding G.O., Series B (State Aid Withholding), 5.000%, 7/15/18 | | | 934,511 | |
| 1,000,000 | | Loudoun County, VA, Public Improvements G.O., Series B (State Aid Withholding), 5.000%, 12/1/14 | | | 1,139,890 | |
| 1,000,000 | | Loudoun County, VA, Public Improvements G.O., Series B (State Aid Withholding), 5.000%, 12/1/15 | | | 1,174,130 | |
| 1,020,000 | | Loudoun County, VA, Public Improvements G.O., Series B (State Aid Withholding), 5.000%, 12/1/16 | | | 1,219,981 | |
| 580,000 | | Middlesex County, VA, Industrial Development Authority Refunding Revenue, Callable 8/1/14 @ 101 (NATL-RE), 4.000%, 8/1/20 | | | 573,887 | |
| 1,465,000 | | Montgomery County, VA, Economic Development Authority, Virginia Tech Foundation Refunding Revenue, Series A, Callable 6/1/20 @ 100, 5.000%, 6/1/27 | | | 1,643,159 | |
| 1,315,000 | | Montgomery County, VA, Industrial Development Authority Revenue, 5.000%, 2/1/18 | | | 1,538,234 | |
| 1,000,000 | | Montgomery County, VA, Industrial Development Authority, Public Projects Revenue, Callable 2/1/18 @ 100, 5.000%, 2/1/24 | | | 1,091,420 | |
| 1,155,000 | | Newport News Economic Development Authority, Public Improvements Revenue, Series A, Callable 1/15/16 @ 100, 5.250%, 1/15/25 | | | 1,258,326 | |
| 1,105,000 | | Newport News, VA, Refunding G.O., Series B (State Aid Withholding), 5.000%, 2/1/15 | | | 1,261,004 | |
| 1,000,000 | | Newport News, VA, Refunding Public Improvements-Water G.O., Series B, 5.250%, 7/1/21 | | | 1,250,910 | |
| 500,000 | | Norfolk, VA, Bond Anticipation Notes Refunding G.O., Series A, Callable 7/1/12 @ 100, 3.000%, 1/1/14 | | | 509,760 | |
| 1,000,000 | | Norfolk, VA, Parking Systems Refunding Revenue, Series B (AMBAC), 5.000%, 2/1/13 | | | 1,041,440 | |
| 1,030,000 | | Norfolk, VA, Water Utility Improvements Refunding Revenue, Callable 10/31/11 @ 100 (AGM), 5.125%, 11/1/11 | | | 1,034,182 | |
| 200,000 | | Norfolk, VA, Water Utility Improvements Refunding Revenue, Callable 10/31/11 @ 100 (AGM), 5.125%, 11/1/23 | | | 200,686 | |
Continued
75
|
| Sterling Capital Virginia Intermediate Tax-Free Fund |
Schedule of Portfolio Investments — (continued) |
September 30, 2011 |
| | | | | | |
Principal
Amount | | | | Fair Value | |
MUNICIPAL BONDS — (continued) | |
| | Virginia — (continued) | | | | |
| $1,000,000 | | Norfolk, VA, Water Utility Improvements Revenue, Callable 11/1/18 @ 100, 5.000%, 11/1/23 | | | $1,145,470 | |
| 400,000 | | Northern Virginia Transportation District Commission, VA, Commuter Rail Refunding Revenue, Virginia Railway Express Project, Callable 10/31/11 @ 100 (AGM), 5.375%, 7/1/14 | | | 401,552 | |
| 900,000 | | Northwestern Regional Jail Authority Revenue, Callable 7/1/15 @ 100 (NATL-RE), 5.000%, 7/1/33 | | | 922,815 | |
| 1,000,000 | | Pittsylvania County, VA, Refunding G.O., Series B, 3.000%, 3/1/16 | | | 1,069,440 | |
| 1,000,000 | | Pittsylvania County, VA, School Improvements G.O., Series B, 5.000%, 2/1/19 | | | 1,183,500 | |
| 1,320,000 | | Pittsylvania County, VA, School Improvements G.O., Series B, Callable 2/1/19 @ 100, OID, 5.200%, 2/1/20 | | | 1,556,610 | |
| 1,775,000 | | Pittsylvania County, VA, School Improvements G.O., Series B, Callable 2/1/19 @ 100, OID, 5.375%, 2/1/21 | | | 2,095,618 | |
| 1,440,000 | | Portsmouth, VA, Refunding G.O., Series B, Callable 7/15/19 @ 100, 5.250%, 7/15/23 | | | 1,711,094 | |
| 1,055,000 | | Portsmouth, VA, Refunding G.O., Series D, Callable 7/15/20 @ 100, 5.000%, 7/15/21 | | | 1,277,911 | |
| 1,500,000 | | Prince William County, VA, Lease Refunding Certificate of Participation, 3.500%, 10/1/18 | | | 1,627,140 | |
| 825,000 | | Prince William County, VA, Service Authority, Water & Sewer Systems Refunding Revenue, Callable 7/1/13 @ 102, 5.000%, 7/1/14 | | | 906,056 | |
| 1,035,000 | | Richmond Metropolitan Authority, VA, Expressway Refunding Revenue (NATL-RE FGIC), 5.250%, 7/15/15 | | | 1,170,564 | |
| 1,490,000 | | Richmond Metropolitan Authority, VA, Expressway Refunding Revenue (NATL-RE FGIC), 5.250%, 7/15/16 | | | 1,710,103 | |
| 880,000 | | Riverside, VA, Regional Jail Authority Refunding Revenue, Callable 7/1/13 @ 101 (NATL-RE), 5.000%, 7/1/17 | | | 942,277 | |
| 2,000,000 | | Roanoke Economic Development Authority, Carilion Health System Revenue, Series A, Callable 7/1/12 @ 100 (NATL-RE), 5.750%, 7/1/14 | | | 2,071,040 | |
| 1,100,000 | | Smyth County, VA, Industrial Development Authority, Mountain States Health Alliance Refunding Revenue, 5.000%, 7/1/15 | | | 1,183,556 | |
| 885,000 | | Smyth County, VA, Industrial Development Authority, Mountain States Health Alliance Refunding Revenue, 5.000%, 7/1/20 | | | 947,738 | |
| 550,000 | | Southampton County, VA, Industrial Development Authority, Public Facilities Lease Revenue, Series A, Callable 4/1/16 @ 100 (AGC), 5.000%, 4/1/19 | | | 592,477 | |
| 1,000,000 | | Spotsylvania County, VA, Public Improvements G.O., Callable 1/15/16 @ 100 (AGM), 5.000%, 1/15/17 | | | 1,152,350 | |
| 1,420,000 | | Spotsylvania County, VA, Water & Sewer System Refunding Revenue, Series A, Callable 6/1/20 @ 100, 5.000%, 6/1/28 | | | 1,596,094 | |
| | | | | | |
Principal
Amount | | | | Fair Value | |
MUNICIPAL BONDS — (continued) | |
| | Virginia — (continued) | | | | |
| $375,000 | | Stafford County & Staunton Industrial Development Authority, VA, Virginia Municipal League Association Counties Program B Revenue (AGC), OID, 4.250%, 8/1/15 | | | $ 402,293 | |
| 170,000 | | Stafford County & Staunton Industrial Development Authority, VA, Virginia Municipal League Association Counties Program Revenue (XLCA), 4.000%, 8/1/15 | | | 184,154 | |
| 355,000 | | Stafford County & Staunton Industrial Development Authority, VA, Virginia Municipal League Association Counties Program Revenue (XLCA), OID, 4.000%, 8/1/17 | | | 387,166 | |
| 600,000 | | Stafford County & Staunton Industrial Development Authority, VA, Virginia Municipal League Association Counties Program Revenue (XLCA), OID, 4.000%, 8/1/18 | | | 652,050 | |
| 765,000 | | Stafford County & Staunton Industrial Development Authority, VA, Virginia Municipal League Association Counties Program, Public Improvements Revenue, Series B (XLCA), 5.000%, 8/1/16 | | | 857,213 | |
| 1,515,000 | | Stafford County & Staunton Industrial Development Authority, VA, Virginia Municipal League Association Revenue, Series I, 4.000%, 2/1/16 | | | 1,659,167 | |
| 960,000 | | Stafford County & Staunton Industrial Development Authority, VA, Virginia Municipal League Association Revenue, Series I, 4.000%, 2/1/17 | | | 1,054,656 | |
| 1,000,000 | | Suffolk, VA, Public Improvements Refunding G.O., Callable 12/1/15 @100, 5.000%, 12/1/18 | | | 1,140,410 | |
| 1,300,000 | | Suffolk, VA, Public Improvements Refunding G.O., Series A (NATL-RE), 5.000%, 2/1/16 | | | 1,515,774 | |
| 2,425,000 | | Suffolk, VA, Public Improvements Refunding G.O., Series A (NATL-RE), 5.000%, 2/1/17 | | | 2,873,407 | |
| 2,175,000 | | Tobacco Settlement Financing Corp., VA, Asset-Backed Revenue, Callable 6/1/15 @ 100, OID, 5.500%, 6/1/26 | | | 2,418,339 | |
| 535,000 | | Tobacco Settlement Financing Corp., VA, Asset-Backed Revenue, Prerefunded 6/1/15 @ 100, OID, 5.625%, 6/1/37 | | | 629,154 | |
| 1,650,000 | | Virginia Beach, VA, Public Improvements G.O., Prerefunded 6/1/19 @ 100, 5.000%, 6/1/20 | | | 2,049,581 | |
| 2,000,000 | | Virginia Beach, VA, Public Improvements G.O., Prerefunded 6/1/19 @ 100, 5.000%, 6/1/22 | | | 2,484,340 | |
| 1,000,000 | | Virginia Biotechnology Research Partnership Authority, Constructions Laboratories Project Refunding Revenue, 5.000%, 9/1/19 | | | 1,203,510 | |
| 2,000,000 | | Virginia College Building Authority, 21st Century College Program Refunding Revenue, Series B, 5.250%, 2/1/13 | | | 2,130,640 | |
| 825,000 | | Virginia College Building Authority, Public Higher Education Financing Program Revenue, 21St Century College & Equipment, Series A, Callable 2/1/18 @ 100, 5.000%, 2/1/21 | | | 954,665 | |
Continued
76
|
| Sterling Capital Virginia Intermediate Tax-Free Fund |
Schedule of Portfolio Investments — (continued) |
September 30, 2011 |
| | | | | | |
Principal
Amount | | | | Fair Value | |
MUNICIPAL BONDS — (continued) | |
| | Virginia — (continued) | | | | |
| $1,040,000 | | Virginia College Building Authority, Public Higher Education Financing Program Revenue, Series A, Callable 9/1/15 @ 100, 5.000%, 9/1/22 | | | $1,162,751 | |
| 1,525,000 | | Virginia Commonwealth, Public Improvements G.O., Series B, 5.000%, 6/1/17 | | | 1,837,595 | |
| 1,370,000 | | Virginia Commonwealth, Refunding G.O., Series B, 5.000%, 6/1/14 | | | 1,534,359 | |
| 1,075,000 | | Virginia Housing Development Authority, Commonwealth Mortgage Single Family Housing-State Refunding Revenue, Series A1, Callable 7/1/19 @ 100 (G.O. of Authority), 4.600%, 7/1/25 | | | 1,119,613 | |
| 1,500,000 | | Virginia Housing Development Authority, Homeownership Mortgage Single Family Housing-State Revenue, Series A, 3.900%, 3/1/19 | | | 1,586,100 | |
| 1,500,000 | | Virginia Port Authority Revenue, Callable 7/1/20 @ 100, 5.000%, 7/1/28 | | | 1,677,885 | |
| 1,000,000 | | Virginia Public Building Authority, Virginia Public Facilities Building Revenue, Series A, Callable 8/1/17 @ 100 (NATL-RE), 5.000%, 8/1/18 | | | 1,184,050 | |
| 1,000,000 | | Virginia Public School Authority, School Financing 1997 Resolution Revenue, Series B, Callable 8/1/17 @100 (NATL-RE), 5.000%, 8/1/26 | | | 1,099,000 | |
| 1,225,000 | | Virginia Resources Authority, Clean Water State Revolving Fund Revenue, Callable 10/1/17 @ 100, 4.750%, 10/1/24 | | | 1,346,557 | |
| 1,100,000 | | Virginia Resources Authority, State Revolving Fund Refunding Revenue, 5.500%, 10/1/17 | | | 1,361,085 | |
| 70,000 | | Virginia Resources Authority, State Revolving Fund Revenue, 5.250%, 10/1/15 | | | 82,870 | |
| 2,160,000 | | Virginia Resources Authority, State Revolving Fund Revenue, Series B, Callable 10/1/21 @ 100, 4.000%, 10/1/30 | | | 2,202,876 | |
| 1,835,000 | | Virginia Small Business Financing Authority, Sentara Healthcare Refunding Revenue, 4.000%, 11/1/16 | | | 2,034,116 | |
| 525,000 | | Virginia Small Business Financing Authority, Sentara Healthcare Refunding Revenue, Callable 5/1/20 @ 100, OID, 4.000%, 11/1/20 | | | 570,685 | |
| 1,255,000 | | Western Regional Jail Authority Revenue, Callable 6/1/17 @ 100 (NATL-RE), 4.750%, 6/1/23 | | | 1,358,525 | |
| | | | | | |
Principal
Amount | | | | Fair Value | |
MUNICIPAL BONDS — (continued) | |
| | Virginia — (continued) | | | | |
| $2,000,000 | | York County, VA, Economic Development Authority, Electric & Power Refunding Revenue, Series A, 4.050%, 5/1/33(a) | | $ | 2,128,720 | |
| | | | | | |
| | | | | 113,731,622 | |
| | | | | | |
| | Total Municipal Bonds
(Cost $107,302,033) | | | 115,322,990 | |
| | | | | | |
| | |
Shares | | | | | |
| | INVESTMENT COMPANY (1.2%) | |
| 1,366,647 | | Federated Virginia Municipal Money Market Portfolio, Institutional Class | | | 1,366,647 | |
| | | | | | |
| | Total Investment Company
(Cost $1,366,647) | | | 1,366,647 | |
| | | | | | |
Total Investments — 99.1%
(Cost $108,668,680) | | | 116,689,637 | |
Net Other Assets (Liabilities) — 0.9% | | | 1,076,415 | |
| | | | | | |
NET ASSETS — 100.0% | | $ | 117,766,052 | |
| | | | | | |
| (a) | The interest rate for this variable rate note, which will change periodically, is based either on the prime rate or an index of market rates. The reflected rate is in effect as of September 30, 2011. The maturity date reflected is the final maturity date. |
AGC — Assured Guaranty Corp.
AGM — Assured Guaranty Municipal Corp.
AMBAC — American Municipal Bond Insurance Corp.
BHAC — Berkshire Hathaway Insurance Corp.
CR — Custodial Receipts
FGIC — Financial Guaranty Insurance Corp.
G.O. — General Obligation
NATL — National
OID — Original Issue Discount
RE — Reinsurance
XLCA — XL Capital Assurance
See accompanying notes to the financial statements.
77
|
| Sterling Capital West Virginia Intermediate Tax-Free Fund |
Schedule of Portfolio Investments |
September 30, 2011 |
| | | | | | |
Principal
Amount | | | | Fair Value | |
MUNICIPAL BONDS (95.0%) | |
| | West Virginia (95.0%) | | | | |
| $1,250,000 | | Berkeley County Board of Education, WV, School Improvements G.O., Callable 5/1/12 @ 101 (NATL-RE FGIC), 5.000%, 5/1/16 | | | $1,294,175 | |
| 975,000 | | Berkeley County, WV, Public Service Sewer District Revenue, Series A, Callable 3/1/15 @ 100, 5.000%, 3/1/22 | | | 1,017,081 | |
| 2,500,000 | | Berkeley, Hardy, & Jefferson Counties, WV, Local Multifamily Housing Revenue, Scattered Site Project, Callable 12/1/20 @ 100 (Freddie Mac), 5.375%, 12/1/44(a) | | | 2,622,475 | |
| 670,000 | | Braxton County, WV, Board of Education Public Schools Improvements G.O., Callable 5/1/18 @ 100 (AGM), 5.000%, 5/1/23 | | | 748,973 | |
| 1,110,000 | | Brooke County, WV, Board of Education School Improvements G.O., Callable 10/31/11 @ 100 (NATL-RE FGIC), 5.000%, 5/1/16 | | | 1,114,096 | |
| 1,450,000 | | Cabell County, WV, Board of Education School Improvements G.O. (NATL-RE), 5.000%, 5/1/16 | | | 1,689,003 | |
| 1,030,000 | | Charleston, WV, Urban Renewal Authority, Public Improvements Lease Revenue, Callable 10/25/11 @ 102 (AGM), 5.250%, 12/15/18 | | | 1,053,741 | |
| 2,425,000 | | Clarksburg, WV, Water Refunding Revenue, Callable 9/1/12 @ 101 (NATL-RE FGIC), 5.250%, 9/1/19 | | | 2,532,306 | |
| 900,000 | | Fairmont State University, WV, University & College Improvements Revenue, Series A, Callable 6/1/13 @ 100 (NATL-RE FGIC), 5.250%, 6/1/22 | | | 928,278 | |
| 680,000 | | Fairmont, WV, Waterworks Refunding Revenue, Callable 10/31/11 @ 100 (NATL-RE), OID, 5.375%, 7/1/13 | | | 682,394 | |
| 2,250,000 | | Greenbrier County, WV, Board of Education Public Schools Improvements G.O. (AGM), 5.000%, 5/1/18 | | | 2,678,917 | |
| 1,030,000 | | Greenbrier County, WV, Commission Tax Increment Revenue, White Sulphur Springs Project 1-A, Callable 6/1/15 @ 100, 6.000%, 6/1/18 | | | 1,071,262 | |
| 2,090,000 | | Hancock County, WV, Board of Education G.O., Callable 5/1/21 @ 100 (West Virginia Board Commission), OID, 4.500%, 5/1/32 | | | 2,147,308 | |
| 1,320,000 | | Harrison County, WV, County Commission Tax Allocation Refunding Revenue, Charles Pointe Project No. 2, Series A, Callable 6/1/18 @ 100, 6.500%, 6/1/23 | | | 1,232,920 | |
| 245,000 | | Huntington Municipal Development Authority Revenue, Huntington Public Facilities Refunding Revenue, Series A, 3.000%, 11/1/13 | | | 247,114 | |
| 875,000 | | Huntington Municipal Development Authority Revenue, Huntington Public Facilities Refunding Revenue, Series A, 4.000%, 11/1/16 | | | 903,026 | |
| 610,000 | | Logan County, WV, 1st Mortgage-Logan County Health Revenue, 8.000%, 12/1/16 | | | 729,121 | |
| 1,000,000 | | Mason County, WV, Appalachian Power Co. Project Refunding Revenue, Series K, Callable 10/31/11 @ 100.5 (AMBAC), 6.050%, 12/1/24 | | | 1,005,310 | |
| | | | | | |
Principal
Amount | | | | Fair Value | |
MUNICIPAL BONDS — (continued) | |
| | West Virginia — (continued) | | | | |
| $3,040,000 | | Monongalia County, WV, Board of Education G.O., Callable 5/1/14 @ 101 (NATL-RE), OID, 5.000%, 5/1/33 | | | $ 3,209,480 | |
| 1,555,000 | | Monongalia County, WV, Building Commission, Monongalia General Hospital Revenue, Series A, Callable 7/1/15 @ 100, 5.250%, 7/1/20 | | | 1,633,077 | |
| 600,000 | | Morgantown, WV, Custodial Receipts Revenue, OID, 4.375%, 7/15/24 | | | 600,258 | |
| 1,060,000 | | Ohio County, WV, County Commission Sewage System, Fort Henry Centre Tax Allocation Revenue, District A, 5.350%, 6/1/17 | | | 1,086,447 | |
| 290,000 | | Ohio County, WV, Board of Education, Refunding G.O., Callable 12/1/11 @ 100 (NATL-RE-IBC), OID, 5.000%, 6/1/13 | | | 291,082 | |
| 250,000 | | Ohio County, WV, Board of Education, Refunding G.O., Callable 12/1/11 @ 100 (NATL-RE-IBC), OID, 5.125%, 6/1/18 | | | 250,827 | |
| 1,030,000 | | Ohio County, WV, County Commission Sewage System, Fort Henry Centre Tax Allocation Revenue, District A, Callable 6/1/17 @ 100, 5.625%, 6/1/22 | | | 1,054,215 | |
| 1,190,000 | | Parkersburg, WV, Combined Waterworks & Sewer Systems Refunding Revenue, Series C (NATL-RE FGIC), 5.000%, 9/1/14 | | | 1,292,959 | |
| 1,330,000 | | Parkersburg, WV, Combined Waterworks & Sewer Systems Refunding Revenue, Series C (NATL-RE FGIC), 5.000%, 9/1/15 | | | 1,471,884 | |
| 420,000 | | Pleasants County, WV, Board of Education G.O., 3.000%, 5/1/17 | | | 448,606 | |
| 220,000 | | Pleasants County, WV, Board of Education G.O., 4.000%, 5/1/18 | | | 247,124 | |
| 960,000 | | Pleasants County, WV, Board of Education G.O., 4.000%, 5/1/21 | | | 1,063,056 | |
| 795,000 | | Pleasants County, WV, Board of Education G.O., Callable 5/1/21 @ 100, 4.000%, 5/1/22 | | | 862,448 | |
| 1,210,000 | | Pleasants County, WV, Board of Education G.O., Callable 5/1/21 @ 100, 4.000%, 5/1/23 | | | 1,288,009 | |
| 1,265,000 | | Pleasants County, WV, Board of Education G.O., Callable 5/1/21 @ 100, 4.000%, 5/1/24 | | | 1,325,252 | |
| 1,000,000 | | Preston County, WV, Board of Education G.O. (West Virginia Board Commission), 3.000%, 5/1/19 | | | 1,044,910 | |
| 1,570,000 | | Preston County, WV, Board of Education G.O. (West Virginia Board Commission), 4.000%, 5/1/21 | | | 1,744,144 | |
| 1,555,000 | | Princeton, WV, Princeton Community Hospital Refunding Revenue, Callable 5/1/15 @ 100, 4.250%, 5/1/18 | | | 1,478,852 | |
| 2,105,000 | | Putnam County, WV, Board of Education G.O., 4.000%, 5/1/19 | | | 2,409,488 | |
| 1,000,000 | | Putnam County, WV, Board of Education G.O., Callable 5/1/20 @ 100, 4.000%, 5/1/22 | | | 1,102,560 | |
| 1,400,000 | | Shepherd University Board of Governors, WV, Residence Facilities Projects Revenue, Callable 6/1/15 @ 100 (NATL-RE), 5.000%, 6/1/25 | | | 1,466,248 | |
| 1,000,000 | | Shepherd University Board of Governors, WV, Shepherd University Wellness Center Project Revenue, Callable 12/1/17 @ 100 (NATL-RE), 5.000%, 6/1/22 | | | 1,104,900 | |
Continued
78
|
| Sterling Capital West Virginia Intermediate Tax-Free Fund |
Schedule of Portfolio Investments — (continued) |
September 30, 2011 |
| | | | | | |
Principal
Amount | | | | Fair Value | |
MUNICIPAL BONDS — (continued) | |
| | West Virginia — (continued) | | | | |
| $1,700,000 | | West Virginia Board of Education, WV, Refunding Revenue, 5.000%, 5/1/19 | | | $1,932,441 | |
| 1,235,000 | | West Virginia Commissioner of Highways, Surface Transportation Improvements Revenue, Series A (AGM), 5.000%, 9/1/14 | | | 1,386,016 | |
| 555,000 | | West Virginia Economic Development Authority, Correctional Juvenile & Public Lease Revenue, Callable 6/1/12 @ 101 (NATL-RE) OID, 5.000%, 6/1/26 | | | 573,304 | |
| 2,000,000 | | West Virginia Economic Development Authority, Correctional Juvenile & Public Lease Revenue, Series A (NATL-RE), 5.500%, 6/1/12 | | | 2,065,060 | |
| 1,000,000 | | West Virginia Economic Development Authority, Department of Environmental Protection Lease Revenue, Callable 11/1/12 @ 102, 5.500%, 11/1/22 | | | 1,063,080 | |
| 1,000,000 | | West Virginia Economic Development Authority, Solid Waste Disposal Facilities Revenue, Ohio Power Co. Amos Project, Series A, 3.125%, 3/1/43(a) | | | 1,030,340 | |
| 155,000 | | West Virginia Economic Development Authority, State Energy Savings Project Lease Revenue, Callable 6/1/15 @ 100, 4.750%, 6/1/21 | | | 163,926 | |
| 1,000,000 | | West Virginia Economic Development Authority, State Office Building & Parking Lot Lease Revenue, Series A, Callable 8/1/19 @ 100, OID, 4.750%, 8/1/29 | | | 1,054,100 | |
| 1,250,000 | | West Virginia Economic Development Authority, State Office Building Lease Revenue, Series A, Callable 10/31/11 @ 101, 5.000%, 10/1/15 | | | 1,266,687 | |
| 360,000 | | West Virginia Higher Education Policy Commission, Community & Technical Capital Improvements Revenue, Series A, Callable 7/1/19 @ 100, 5.000%, 7/1/20 | | | 411,196 | |
| 820,000 | | West Virginia Higher Education Policy Commission, Higher Education Facilities Refunding Revenue, Series B (NATL-RE FGIC), 5.000%, 4/1/14 | | | 901,147 | |
| 1,125,000 | | West Virginia Higher Education Policy Commission, Higher Education Facilities Refunding Revenue, Series B, Callable 4/1/14 @ 100 (NATL-RE FGIC), 5.000%, 4/1/16 | | | 1,216,170 | |
| 1,850,000 | | West Virginia Higher Education Policy Commission, Higher Education Facilities Refunding Revenue, Series B, Callable 4/1/14 @ 100 (NATL-RE FGIC), 5.000%, 4/1/23 | | | 1,991,877 | |
| 2,490,000 | | West Virginia Higher Education Policy Commission, Higher Education Facilities Refunding Revenue, Series B, Callable 4/1/14 @ 100 (NATL-RE FGIC), 5.000%, 4/1/34 | | | 2,531,533 | |
| 550,000 | | West Virginia School Building Authority Excess, Lottery Revenue, 5.000%, 7/1/16 | | | 636,196 | |
| 1,500,000 | | West Virginia School Building Authority, Capital Improvements Refunding Revenue, Series A (NATL-RE FGIC), 5.000%, 7/1/14 | | | 1,652,355 | |
| 1,600,000 | | West Virginia School Building Authority, Capital Improvements Refunding Revenue, Series A (NATL-RE FGIC), 5.000%, 7/1/15 | | | 1,808,896 | |
| | | | | | |
Principal
Amount | | | | Fair Value | |
MUNICIPAL BONDS — (continued) | |
| | West Virginia — (continued) | | | | |
| $2,100,000 | | West Virginia School Building Authority, Capital Improvements Refunding Revenue, Series A (NATL-RE FGIC), 5.000%, 7/1/16 | | | $2,412,480 | |
| 1,960,000 | | West Virginia School Building Authority, Capital Improvements Refunding Revenue, Series A, Callable 7/1/17 @ 100 (NATL-RE FGIC), 5.000%, 7/1/18 | | | 2,256,685 | |
| 1,790,000 | | West Virginia School Building Authority, Capital Improvements Refunding Revenue, Series A, Callable 7/1/17 @ 100 (NATL-RE FGIC), 5.000%, 7/1/19 | | | 2,026,280 | |
| 1,150,000 | | West Virginia School Building Authority, Capital Improvements Revenue (NATL-RE), 5.250%, 7/1/14 | | | 1,279,203 | |
| 1,300,000 | | West Virginia School Building Authority, Excess Lottery Revenue, 5.000%, 7/1/18 | | | 1,533,922 | |
| 1,705,000 | | West Virginia School Building Authority, Excess Lottery Revenue, Callable 7/1/18 @ 100, OID, 5.000%, 7/1/27 | | | 1,859,678 | |
| 1,000,000 | | West Virginia School Building Authority, Excess Lottery Revenue, Series B, Callable 7/1/20 @ 100, 5.000%, 7/1/30 | | | 1,100,320 | |
| 1,690,000 | | West Virginia State Building Commission, Regional Jail Refunding Revenue, Series A (AMBAC), 5.375%, 7/1/21 | | | 1,801,455 | |
| 640,000 | | West Virginia State Hospital Finance Authority, Charleston Area Medical Center, Inc. Revenue, Series A, OID, 6.500%, 9/1/16 | | | 770,336 | |
| 500,000 | | West Virginia State Hospital Finance Authority, United Health System Refunding Revenue, Series C, 5.000%, 6/1/18 | | | 554,215 | |
| 845,000 | | West Virginia State Hospital Finance Authority, Vy Health System Obligation Revenue, Callable 1/1/15 @ 100, OID, 5.000%, 1/1/24 | | | 862,204 | |
| 785,000 | | West Virginia State Hospital Finance Authority, West Virginia United Health System Refunding Revenue, Series E, Callable 12/1/18 @ 100, OID, 5.375%, 6/1/28 | | | 811,093 | |
| 825,000 | | West Virginia State Parkways Economic Development & Tourism Authority, Refunding Revenue (NATL-RE FGIC G.O. of Authority), 5.250%, 5/15/17 | | | 977,377 | |
| 2,000,000 | | West Virginia State Parkways Economic Development & Tourism Authority, Refunding Revenue (NATL-RE FGIC G.O. of Authority), 5.250%, 5/15/19 | | | 2,398,980 | |
| 285,000 | | West Virginia University, Projects Refunding Revenue, Series B, Callable 10/1/14 @ 100 (NATL-RE FGIC), 5.000%, 10/1/21 | | | 311,542 | |
| 955,000 | | West Virginia University, Projects Revenue, Series A (NATL-RE), 5.250%, 4/1/28 | | | 1,109,548 | |
| 500,000 | | West Virginia University, Projects Revenue, Series B, 5.000%, 10/1/19 | | | 587,380 | |
| 465,000 | | West Virginia Water Development Authority, Infrastructure Jobs Refunding Revenue, Series A, Callable 10/1/16 @ 100 (AGM), 5.000%, 10/1/26 | | | 494,779 | |
| 500,000 | | West Virginia Water Development Authority, Infrastructure Jobs Revenue, Series A, Callable 10/1/16 @ 100 (AGM), 4.750%, 10/1/23 | | | 534,065 | |
Continued
79
|
| Sterling Capital West Virginia Intermediate Tax-Free Fund |
Schedule of Portfolio Investments — (continued) |
September 30, 2011 |
| | | | | | |
Principal
Amount | | | | Fair Value | |
MUNICIPAL BONDS — (continued) | |
| | West Virginia — (continued) | | | | |
| $1,110,000 | | West Virginia Water Development Authority, Loan Program II Refunding Revenue, Series B, Callable 11/1/13 @ 101 (AMBAC), 5.250%, 11/1/23 | | | $ 1,163,003 | |
| 890,000 | | West Virginia Water Development Authority, Loan Programs Refunding Revenue, Series A1, Callable 11/1/12 @ 102 (AMBAC), 5.250%, 11/1/23 | | | 925,253 | |
| 2,090,000 | | West Virginia, State Road Refunding G.O. (NATL-RE FGIC), 5.000%, 6/1/15 | | | 2,407,764 | |
| | | | | | |
| | Total Municipal Bonds
(Cost $95,191,999) | | | 100,035,212 | |
| | | | | | |
| | |
Shares | | | | | |
INVESTMENT COMPANY (5.7%) | |
| 5,990,426 | | Federated Tax-Free Obligations Fund, Institutional Class | | | 5,990,426 | |
| | | | | | |
| | Total Investment Company
(Cost $5,990,426) | | | 5,990,426 | |
| | | | | | |
Total Investments — 100.7%
(Cost $101,182,425) | | | 106,025,638 | |
Net Other Assets (Liabilities) — (0.7)% | | | (783,795) | |
| | | | | | |
NET ASSETS — 100.0%. | | | $105,241,843 | |
| | | | | | |
| (a) | The interest rate for this variable rate note, which will change periodically, is based either on the prime rate or an index of market rates. The reflected rate is in effect as of September 30, 2011. The maturity date reflected is the final maturity date. |
AGM — Assured Guaranty Municipal Corp.
AMBAC — American Municipal Bond Insurance Corp.
FGIC — Financial Guaranty Insurance Corp.
G.O. — General Obligation
IBC — Insured Bond Certificates
NATL — National
OID — Original Issue Discount
RE — Reinsurance
See accompanying notes to the financial statements.
80
|
| Sterling Capital National Tax-Free Money Market Fund |
Schedule of Portfolio Investments |
September 30, 2011 |
| | | | | | |
Principal
Amount | | | | Amortized
Cost | |
MUNICIPAL BONDS (98.9%) | |
| | Alaska (12.1%) | | | | |
| $6,590,000 | | Valdez City, AK, Exxon Mobil Project Refunding Revenue (Exxon Mobil Corp.), 0.080%, 10/3/11(a) | | $ | 6,590,000 | |
| 12,000,000 | | Valdez City, AK, Exxon Pipeline Co. Refunding Revenue, Project A, 0.090%, 10/3/11(a) | | | 12,000,000 | |
| | | | | | |
| | | | | 18,590,000 | |
| | | | | | |
| | Arizona (6.6%) | | | | |
| 1,315,000 | | Phoenix Industrial Development Authority, AZ, Southwestern College of Phoenix Revenue (Comerica Bank), 0.250%, 10/7/11(a) | | | 1,315,000 | |
| 5,000,000 | | Salt River Project Agricultural Improvement & Power District, Electric System Refunding Revenue, Callable 1/1/16 @ 100, 0.160%, 10/7/11(a)(b) | | | 5,000,000 | |
| 3,780,000 | | Sun Devil Energy Center LLC, Arizona State University Project Refunding Revenue (Assured Guaranty, Royal Bank of Canada), 0.210%, 10/7/11(a) | | | 3,780,000 | |
| | | | | | |
| | | | | 10,095,000 | |
| | | | | | |
| | California (9.7%) | | | | |
| 6,915,000 | | California Statewide Communities Development Authority Refunding Revenue, Rady Children Hospital, Series B (Wells Fargo Bank N.A.), 0.090%, 10/3/11(a) | | | 6,915,000 | |
| 8,000,000 | | California, G.O. Cash Flow Management, Series C1 (Bank of America N.A.), 0.140%, 10/3/11(a) | | | 8,000,000 | |
| | | | | | |
| | | | | 14,915,000 | |
| | | | | | |
| | Florida (3.9%) | | | | |
| 6,000,000 | | St. Lucie County, FL, Florida Power & Light Co. Project Refunding Revenue, 0.170%, 10/3/11(a) | | | 6,000,000 | |
| | | | | | |
| | Georgia (6.1%) | | | | |
| 4,330,000 | | Bartow County, GA, Development Authority Revenue, VMC Specialty Alloys (Comerica Bank), 0.190%, 10/7/11(a) | | | 4,330,000 | |
| 1,250,000 | | Fayette County, GA, Hospital Authority Refunding Revenue, Fayette Community Hospital (FHLB), 0.140%, 10/7/11(a) | | | 1,250,000 | |
| 2,025,000 | | Main Street Natural Gas, Inc., GA, Gas Project Revenue, Series A (Royal Bank of Canada), 0.160%, 10/7/11(a) | | | 2,025,000 | |
| 1,750,000 | | Roswell Housing Authority, Multifamily Housing Refunding Revenue, Belcourt Ltd. Project, Series A (Northern Trust Company), 0.160%, 10/7/11(a) | | | 1,750,000 | |
| | | | | | |
| | | | | 9,355,000 | |
| | | | | | |
| | Illinois (2.5%) | | | | |
| 3,900,000 | | Illinois Finance Authority, IL, Swedish Conevant Refunding Revenue, Series A (Bank of America N.A.),
0.230%, 10/7/11(a) | | | 3,900,000 | |
| | | | | | |
| | Louisiana (4.5%) | | | | |
| 7,000,000 | | St. James Parish, LA, Nucor Steel LLC Project Revenue, Series B1 (Nucor Corporation), 0.160%, 10/7/11(a) | | | 7,000,000 | |
| | | | | | |
| | | | | | |
Principal
Amount | | | | Amortized
Cost | |
MUNICIPAL BONDS — (continued) | |
| | Nevada (4.1%) | | | | |
| $6,250,000 | | Clark County, NV, Las Vegas-McCarran International Airport, Refunding Revenue (Union Bank N.A.), 0.160%, 10/7/11(a) | | $ | 6,250,000 | |
| | | | | | |
| | New Jersey (2.4%) | | | | |
| 1,000,000 | | Belmar Borough, NJ, G.O. Bond Anticipation Notes Cash Flow Management, 2.000%, 4/27/12 | | | 1,002,811 | |
| 1,750,000 | | Clinton Township, NJ, G.O. Bond Anticipation Notes Cash Flow Management, 1.500%, 2/2/12 | | | 1,754,126 | |
| 1,000,000 | | Stone Harbor Borough, NJ, G.O. Bond Anticipation Notes Cash Flow Management, 1.250%, 11/10/11 | | | 1,000,653 | |
| | | | | | |
| | | | | 3,757,590 | |
| | | | | | |
| | New York (11.8%) | | | | |
| 3,000,000 | | Nassau County, NY, Interim Finance Authority Refunding Revenue, Series C (JP Morgan Chase Bank), 0.150%, 10/7/11(a) | | | 3,000,000 | |
| 1,500,000 | | New York Mortgage Agency, Single Family Housing State Revenue, Series 159 (Bank of America N.A.), 0.160%, 10/7/11(a) | | | 1,500,000 | |
| 8,000,000 | | New York State Housing Finance Agency, Gotham West Housing Revenue, Series A2 (Wells Fargo Bank N.A.), 0.090%, 10/7/11(a) | | | 8,000,000 | |
| 5,700,000 | | Triborough Bridge & Tunnel Authority Refunding Revenue, Series C (JP Morgan Chase Bank), 0.150%, 10/7/11(a) | | | 5,700,000 | |
| | | | | | |
| | | | | 18,200,000 | |
| | | | | | |
| | Ohio (20.9%) | | | | |
| 7,145,000 | | Allen County, OH, Catholic Healthcare Revenue, Series C (Bank of Nova Scotia), 0.090%, 10/3/11(a) | | | 7,145,000 | |
| 3,000,000 | | Avon City, OH, G.O. Bond Anticipation Notes, Series A, 1.000%, 7/3/12 | | | 3,013,058 | |
| 1,000,000 | | Bowling Green City, OH, G.O. Bond Anticipation Notes, 1.000%, 3/16/12 | | | 1,001,355 | |
| 1,500,000 | | Butler County, OH, G.O. Bond Anticipation Notes, 0.500%, 8/2/12 | | | 1,500,000 | |
| 3,915,000 | | Greene County, OH, Medical Health System, Inc. Refunding Revenue, Series A (JPMorgan Chase Bank), 0.230%, 10/7/11(a) | | | 3,915,000 | |
| 3,005,000 | | Hamilton County, OH, Local Multifamily Housing Revenue, Block 3 Project (Citizens Bank, Bank of New York Mellon), 0.160%, 10/7/11(a) | | | 3,005,000 | |
| 1,500,000 | | Kent City, OH, G.O. Bond Anticipation Notes Cash Flow Management, Parking Improvement, 1.500%, 5/17/12 | | | 1,506,983 | |
| 5,000,000 | | Montgomery County, OH, Miami Valley Hospital Revenue, Series B (JP Morgan Chase Bank), 0.160%, 10/3/11(a) | | | 5,000,000 | |
| 2,000,000 | | Niles City, OH, G.O. Bond Anticipation Notes Cash Flow Management, 1.250%, 11/9/11 | | | 2,001,167 | |
| 4,000,000 | | University of Cincinnati, OH, Bond Anticipation Refunding Revenue Notes, Series H, 2.000%, 12/16/11 | | | 4,012,427 | |
| | | | | | |
| | | | | 32,099,990 | |
| | | | | | |
Continued
81
|
| Sterling Capital National Tax-Free Money Market Fund |
Schedule of Portfolio Investments — (continued) |
September 30, 2011 |
| | | | | | |
Principal
Amount | | | | Amortized
Cost | |
MUNICIPAL BONDS — (continued) | |
| | Pennsylvania (6.2%) | | | | |
| $9,540,000 | | Pennsylvania Higher Educational Facilities Authority, La Salle University Revenue, Series B (Citizens Bank), 0.230%, 10/7/11(a) | | $ | 9,540,000 | |
| | | | | | |
| | Texas (2.2%) | | | | |
| 3,345,000 | | Houston Higher Education Finance Corp., TX, University & College Improvements Revenue, Tierwester Oaks, Series A (Bank of New York Mellon), 0.850%, 10/31/11(a) | | | 3,345,000 | |
| | | | | | |
| | Utah (2.0%) | | | | |
| 3,125,000 | | Utah Housing Corp., UT, Timbergate Local Multifamily Housing Revenue, Series A (Freddie Mac), 0.210%, 10/7/11(a) | | | 3,125,000 | |
| | | | | | |
| | Virginia (2.9%) | | | | |
| 4,500,000 | | Hanover County, VA, Economic Development Authority Refunding Revenue, Bon Secours Health System, Inc., Series D2 (U.S. Bank N.A.), 0.120%, 10/7/11(a) | | | 4,500,000 | |
| | | | | | |
| | Wisconsin (1.0%) | | | | |
| 1,500,000 | | Wisconsin Health & Educational Facilities Authority, Capitol Lakes, Inc. Revenue, Series B (U.S. Bank N.A.), 0.170%, 10/7/11(a) | | | 1,500,000 | |
| | | | | | |
| | Total Municipal Bonds
(Cost $152,172,580) | | | 152,172,580 | |
| | | | | | |
| | | | | | |
Shares | | | | Fair Value | |
| | INVESTMENT COMPANY (1.0%) | |
| 1,501,481 | | SEI Institutional Tax Free Fund | | $ | 1,501,481 | |
| | | | | | |
| | Total Investment Company
(Cost $1,501,481) | | | 1,501,481 | |
| | | | | | |
| |
Total Investments — 99.9%
(Cost $153,674,061) | | | 153,674,061 | |
Net Other Assets (Liabilities) — 0.1% | | | 118,522 | |
| | | | | | |
NET ASSETS — 100.0%. | | $ | 153,792,583 | |
| | | | | | |
| (a) | The interest rate for this variable rate note, which will change periodically, is based either on the prime rate or an index of market rates. The reflected rate is in effect as of September 30, 2011. The maturity date reflected is the next reset date. |
| (b) | Rule 144A, Section 4(2) or other security which is restricted as to resale to qualified institutional investors. The Investment Advisor, using Board approved procedures, has deemed these securities or a portion of these securities to be liquid. |
FHLB — Federal Home Loan Bank
G.O. — General Obligation
N.A. — North America
See accompanying notes to the financial statements.
82
|
| Sterling Capital Prime Money Market Fund |
Schedule of Portfolio Investments |
September 30, 2011 |
| | | | | | |
Principal
Amount | | | | Amortized
Cost | |
ASSET BACKED SECURITIES (0.4%) | | | | |
| $ 793,007 | | AmeriCredit Automobile Receivables Trust, Series 2011-2, Class A1, 0.323%, 4/9/12 | | $ | 793,007 | |
| 1,231,624 | | World Omni Automobile Lease Securitization Trust, Series 2011-A, Class A1, 0.301%, 4/16/12 | | | 1,231,624 | |
| | | | | | |
| | Total Asset Backed Securities
(Cost $2,024,631) | | | 2,024,631 | |
| | | | | | |
| |
CERTIFICATES OF DEPOSIT (12.5%) | | | | |
| | Banks (12.5%) | | | | |
| 21,000,000 | | Bank of Montreal, 0.080%, 10/3/11 | | | 21,000,000 | |
| 3,500,000 | | Bank of Montreal, Series YCD, 0.325%, 10/26/11 | | | 3,500,000 | |
| 15,000,000 | | Bank of Tokyo Mitsubishi UFJ, Ltd., 0.320%, 12/8/11 | | | 15,000,000 | |
| 17,000,000 | | Mizuho Corp. Bank, Ltd., 0.300%, 11/15/11 | | | 17,000,000 | |
| 5,000,000 | | Westpac Banking Corp., Series YCD, 0.330%, 10/17/11(a) | | | 5,000,000 | |
| | | | | | |
| | |
| | Total Certificates of Deposit
(Cost $61,500,000) | | | 61,500,000 | |
| | | | | | |
COMMERCIAL PAPER(b) (45.3%) | | | | |
| | Asset Backed Securities (17.7%) | |
| 18,000,000 | | Chariot Funding LLC, 0.150%, 10/24/11(c) | | | 17,998,275 | |
| 24,000,000 | | Falcon Asset Securitization Co. LLC, 0.150%, 10/17/11(c) | | | 23,998,400 | |
| 10,750,000 | | Fcar Auto Loan Trust, 0.210%, 10/3/11 | | | 10,749,875 | |
| 9,000,000 | | Fcar Auto Loan Trust, 0.210%, 11/7/11 | | | 8,998,057 | |
| 1,367,000 | | Gotham Funding Corp., 0.220%, 10/25/11(c) | | | 1,366,799 | |
| 7,000,000 | | Gotham Funding Corp., 0.210%, 10/31/11(c) | | | 6,998,775 | |
| 7,200,000 | | Jupiter Securitization Co. LLC, 0.120%, 10/11/11(c) | | | 7,199,760 | |
| 10,000,000 | | Variable Funding Capital Co., 0.130%, 10/26/11(c) | | | 9,999,097 | |
| | | | | | |
| | | | | 87,309,038 | |
| | | | | | |
| | |
| | Banking (1.4%) | | | | |
| 7,000,000 | | Australia & New Zealand Banking Group, Ltd., 0.314%, 10/7/11(a)(c)(d) | | | 7,000,000 | |
| | | | | | |
| | Financial Services (26.2%) | | | | |
| 24,000,000 | | Bank of Nova Scotia, 0.075%, 10/3/11 | | | 23,999,900 | |
| 24,000,000 | | Citigroup Funding, Inc., 0.200%, 10/3/11 | | | 23,999,733 | |
| 1,000,000 | | Citigroup Funding, Inc., 0.300%, 11/7/11 | | | 999,692 | |
| 3,175,000 | | Conocophillips Qatar Funding, Ltd., 0.150%, 10/7/11(c) | | | 3,174,921 | |
| 21,000,000 | | Conocophillips Qatar Funding, Ltd., 0.220%, 11/7/11(c) | | | 20,995,252 | |
| 5,000,000 | | Du Pont (E.I.) de Nemours Co., 0.090%, 10/12/11(c) | | | 4,999,863 | |
| 8,000,000 | | General Electric Capital Corp., 0.050%, 10/31/11 | | | 7,999,667 | |
| 5,000,000 | | General Electric Capital Corp., 0.300%, 2/15/12 | | | 4,994,292 | |
| 23,000,000 | | Roche Holdings, Inc., 0.030%, 10/3/11(c) | | | 22,999,962 | |
| 15,000,000 | | Toyota Motor Credit Corp., 0.340%, 12/22/11 | | | 14,988,383 | |
| | | | | | |
| | | | | 129,151,665 | |
| | | | | | |
| | Total Commercial Paper
(Cost $223,460,703) | | | 223,460,703 | |
| | | | | | |
| | | | | | |
Principal
Amount | | | | Amortized
Cost | |
CORPORATE BONDS (2.2%) | | | | |
| | Financial Services (2.2%) | | | | |
| $ 3,539,000 | | General Electric Capital Corp., MTN, Series A, 5.875%, 2/15/12 | | $ | 3,611,361 | |
| 7,037,000 | | General Electric Capital Corp., MTN, Series A, 6.000%, 6/15/12 | | | 7,310,039 | |
| | | | | | |
| | Total Corporate Bonds
(Cost $10,921,400) | | | 10,921,400 | |
| | | | | | |
VARIABLE RATE NOTES(a) (4.5%) | | | | |
| | Banking (4.5%) | | | | |
| 1,465,000 | | Anchor Holdings LLC, Series 2000 (U.S. Bank, N.A.), 0.450%, 10/6/11 | | | 1,465,000 | |
| 20,000,000 | | Australia & New Zealand Banking Group, Ltd., 0.311%, 10/20/11(c) | | | 20,000,000 | |
| 400,000 | | JPMorgan Chase Bank N.A., 0.277%, 10/28/11 | | | 399,828 | |
| 45,000 | | Spira Millennium LLC, Series 2001 (Bank of America N.A.), 1.050%, 10/6/11 | | | 45,000 | |
| 500,000 | | Wells Fargo & Co., 0.343%, 10/24/11 | | | 499,981 | |
| | | | | | |
| | |
| | Total Variable Rate Notes
(Cost $22,409,809) | | | 22,409,809 | |
| | | | | | |
U.S. GOVERNMENT AGENCIES (12.2%) | |
| | Federal Financing Bank (5.1%) | |
| 25,000,000 | | Straight-A Funding LLC, 0.200%, 10/25/11(c) | | | 24,996,667 | |
| | | | | | |
| | Federal Home Loan Bank (7.1%) | |
| 20,000,000 | | Federal Home Loan Bank, 0.190%, 3/15/12 | | | 19,996,983 | |
| 10,000,000 | | Federal Home Loan Bank, 0.330%, 9/11/12 | | | 10,000,000 | |
| 5,000,000 | | Federal Home Loan Bank, 0.450%, 9/21/12 | | | 5,000,000 | |
| | | | | | |
| | | | | 34,996,983 | |
| | | | | | |
| | |
| | Total U.S. Government Agencies
(Cost $59,993,650) | | | 59,993,650 | |
| | | | | | |
U.S. TREASURY NOTES (1.0%) | | | | |
| 5,000,000 | | 0.750%, 11/30/11 | | | 5,003,651 | |
| | | | | | |
| | Total U.S. Treasury Notes
(Cost $5,003,651) | | | 5,003,651 | |
| | | | | | |
REPURCHASE AGREEMENT (21.9%) | | | | |
| 108,224,000 | | Merrill Lynch & Co., Inc., 0.090%, dated 9/30/11, due 10/3/11, proceeds at maturity, $108,224,812 (Collateralized fully by Government Mortgage-Backed Securities) | | | 108,224,000 | |
| | | | | | |
| | Total Repurchase Agreement
(Cost $108,224,000) | | | 108,224,000 | |
| | | | | | |
| |
Total Investments — 100.0%
(Cost $493,537,844) | | | 493,537,844 | |
| Net Other Assets (Liabilities) — 0.0% | | | (15,608 | ) |
| | | | | | |
| NET ASSETS — 100.0% | | $ | 493,522,236 | |
| | | | | | |
| (a) | The interest rate for this variable rate note, which will change periodically, is based either on the prime rate or an index of market rates. The reflected rate is in effect as of September 30, 2011. The maturity date reflected is the |
Continued
83
|
| Sterling Capital Prime Money Market Fund |
Schedule of Portfolio Investments – (continued) |
September 30, 2011 |
| (b) | Discount note or zero coupon bond. Rate disclosed represents the annualized yield from date of purchase. |
| (c) | Rule 144A, Section 4(2) or other security which is restricted as to resale to qualified institutional investors.The Investment Advisor, using Board approved procedures, has deemed these securities or a portion of these securities to be liquid. |
| (d) | Interest bearing commercial paper. |
MTN — Medium Term Note
N.A. — North America
YCD — Yankee Certificate of Deposit
See accompanying notes to the financial statements.
84
|
| Sterling Capital U.S. Treasury Money Market Fund |
Schedule of Portfolio Investments |
September 30, 2011 |
| | | | | | |
Principal
Amount | | | | Amortized
Cost | |
U.S. TREASURY NOTES (22.2%) | | | | |
| $ 20,000,000 | | 1.750%, 11/15/11 | | $ | 20,042,649 | |
| 15,000,000 | | 0.750%, 11/30/11 | | | 15,016,972 | |
| 20,000,000 | | 0.875%, 1/31/12 | | | 20,054,820 | |
| | | | | | |
| | Total U.S. Treasury Notes
(Cost $55,114,441) | | | 55,114,441 | |
| | | | | | |
U.S. TREASURY BILLS(a) (26.2%) | | | | |
| 20,000,000 | | 0.020%, 12/8/11 | | | 19,999,244 | |
| 25,000,000 | | 0.045%, 2/16/12 | | | 24,995,678 | |
| 20,000,000 | | 0.031%, 3/29/12 | | | 19,996,895 | |
| | | | | | |
| | Total U.S. Treasury Bills
(Cost $64,991,817) | | | 64,991,817 | |
| | | | | | |
| | | | | | |
Principal
Amount | | | | Amortized
Cost | |
REPURCHASE AGREEMENTS (40.2%) | | | | |
| $ 50,000,000 | | Bank of America Corp., 0.020%, dated 9/30/11, due 10/3/11, proceeds at maturity, $50,000,083 (Collateralized fully by U.S. Treasury Securities) | | $ | 50,000,000 | |
| 50,000,000 | | JPMorgan Chase & Co., 0.010%, dated 9/30/11, due 10/3/11, proceeds at maturity, $50,000,042 (Collateralized fully by U.S. Treasury Securities) | | | 50,000,000 | |
| | | | | | |
| | Total Repurchase Agreements
(Cost $100,000,000) | | | 100,000,000 | |
| | | | | | |
| |
Total Investments — 88.6%
(Cost $220,106,258) | | | 220,106,258 | |
| Net Other Assets (Liabilities) — 11.4% | | | 28,187,260 | |
| | | | | | |
| NET ASSETS — 100.0% | | $ | 248,293,518 | |
| | | | | | |
| (a) | Rate disclosed represents the annualized yield from date of purchase. |
See accompanying notes to the financial statements.
85
|
| Sterling Capital Strategic Allocation Conservative Fund |
Schedule of Portfolio Investments |
September 30, 2011 |
| | | | | | |
Shares | | | | Fair Value | |
AFFILIATED INVESTMENT COMPANIES (79.3%) | |
| 34,998 | | Sterling Capital Equity Income Fund, Institutional Class | | $ | 464,421 | |
| 142,553 | | Sterling Capital International Fund, Institutional Class(a) | | | 603,000 | |
| 55,954 | | Sterling Capital Mid Value Fund, Institutional Class | | | 639,550 | |
| 128,131 | | Sterling Capital Select Equity Fund, Institutional Class | | | 1,274,908 | |
| 14,991 | | Sterling Capital Small Value Fund, Institutional Class(a) | | | 162,202 | |
| 19,096 | | Sterling Capital Special Opportunities Fund, Institutional Class(a) | | | 297,891 | |
| 794,738 | | Sterling Capital Total Return Bond Fund, Institutional Class | | | 8,789,797 | |
| 942,110 | | Sterling Capital U.S. Treasury Money Market Fund, Institutional Class | | | 942,110 | |
| | | | | | |
| | Total Affiliated Investment Companies
(Cost $12,163,718) | | | 13,173,879 | |
| | | | | | |
|
NON-AFFILIATED INVESTMENT COMPANIES (7.2%) | |
| 39,216 | | Credit Suisse Commodity Return Strategy Fund | | | 320,396 | |
| 23,815 | | Harding, Loevner International Equity Portfolio | | | 303,643 | |
| 16,553 | | Lazard Emerging Markets Equity Portfolio | | | 284,222 | |
| 9,922 | | Oppenheimer Developing Markets Fund | | | 282,666 | |
| | | | | | |
| | Total Non-Affiliated Investment Companies
(Cost $1,274,981) | | | 1,190,927 | |
| | | | | | |
|
EXCHANGE TRADED FUNDS (14.7%) | |
| 6,394 | | iShares Dow Jones US Real Estate Index Fund | | | 323,345 | |
| 6,222 | | iShares MSCI EAFE Small Cap Index Fund | | | 217,397 | |
| 7,435 | | iShares MSCI EAFE Value Index Fund | | | 308,478 | |
| 3,949 | | iShares MSCI Emerging Markets Index Fund | | | 138,491 | |
| 3,730 | | iShares Russell 2000 Index Fund | | | 239,653 | |
| 12,679 | | iShares Russell Midcap Growth Index Fund | | | 629,386 | |
| 5,098 | | iShares S&P 500 Index Fund | | | 579,592 | |
| | | | | | |
| | Total Exchange Traded Funds
(Cost $2,214,721) | | | 2,436,342 | |
| | | | | | |
Total Investments — 101.2%
(Cost $15,653,420) | | | 16,801,148 | |
| Net Other Assets (Liabilities) — (1.2)% | | | (194,069 | ) |
| | | | | | |
| NET ASSETS — 100.0% | | | $16,607,079 | |
| | | | | | |
| (a) | Represents non-income producing security. |
See accompanying notes to the financial statements.
86
|
| Sterling Capital Strategic Allocation Balanced Fund |
Schedule of Portfolio Investments |
September 30, 2011 |
| | | | | | |
Shares | | | | Fair Value | |
AFFILIATED INVESTMENT COMPANIES (67.4%) | |
| 107,587 | | Sterling Capital Equity Income Fund, Institutional Class | | $ | 1,427,685 | |
| 437,910 | | Sterling Capital International Fund, Institutional Class(a) | | | 1,852,360 | |
| 171,952 | | Sterling Capital Mid Value Fund, Institutional Class | | | 1,965,410 | |
| 393,575 | | Sterling Capital Select Equity Fund, Institutional Class | | | 3,916,075 | |
| 46,078 | | Sterling Capital Small Value Fund, Institutional Class(a) | | | 498,560 | |
| 58,731 | | Sterling Capital Special Opportunities Fund, Institutional Class(a) | | | 916,197 | |
| 807,670 | | Sterling Capital Total Return Bond Fund, Institutional Class | | | 8,932,827 | |
| 2,485,500 | | Sterling Capital U.S. Treasury Money Market Fund, Institutional Class | | | 2,485,500 | |
| | | | | | |
| | Total Affiliated Investment Companies
(Cost $20,646,121) | | | 21,994,614 | |
| | | | | | |
|
NON-AFFILIATED INVESTMENT
COMPANIES (9.2%) | |
| 118,567 | | Credit Suisse Commodity Return Strategy Fund | | | 968,692 | |
| 73,075 | | Harding, Loevner International Equity Portfolio | | | 931,704 | |
| 31,710 | | Lazard Emerging Markets Equity Portfolio | | | 544,458 | |
| 19,057 | | Oppenheimer Developing Markets Fund | | | 542,943 | |
| | | | | | |
| | Total Non-Affiliated Investment Companies
(Cost $3,141,204) | | | 2,987,797 | |
| | | | | | |
EXCHANGE TRADED FUNDS (24.8%) | |
| 19,312 | | iShares Dow Jones US Real Estate Index Fund | | | 976,608 | |
| 19,121 | | iShares MSCI EAFE Small Cap Index Fund | | | 668,088 | |
| 22,801 | | iShares MSCI EAFE Value Index Fund | | | 946,014 | |
| 30,345 | | iShares MSCI Emerging Markets Index Fund | | | 1,064,199 | |
| 11,455 | | iShares Russell 2000 Index Fund | | | 735,984 | |
| 38,923 | | iShares Russell Midcap Growth Index Fund | | | 1,932,138 | |
| 15,660 | | iShares S&P 500 Index Fund | | | 1,780,385 | |
| | | | | | |
| | Total Exchange Traded Funds
(Cost $7,752,228) | | | 8,103,416 | |
| | | | | | |
Total Investments — 101.4%
(Cost $31,539,553) | | | 33,085,827 | |
| Net Other Assets (Liabilities) — (1.4)% | | | (456,744 | ) |
| | | | | | |
| NET ASSETS — 100.0% | | $ | 32,629,083 | |
| | | | | | |
| (a) | Represents non-income producing security. |
See accompanying notes to the financial statements.
87
|
| Sterling Capital Strategic Allocation Growth Fund |
Schedule of Portfolio Investments |
September 30, 2011 |
| | | | | | |
Shares | | | | Fair Value | |
AFFILIATED INVESTMENT COMPANIES (61.8%) | |
| 95,459 | | Sterling Capital Equity Income Fund, Institutional Class | | | $ 1,266,746 | |
| 388,782 | | Sterling Capital International Fund, Institutional Class(a) | | | 1,644,549 | |
| 152,585 | | Sterling Capital Mid Value Fund, Institutional Class | | | 1,744,043 | |
| 349,341 | | Sterling Capital Select Equity Fund, Institutional Class | | | 3,475,945 | |
| 40,928 | | Sterling Capital Small Value Fund, Institutional Class(a) | | | 442,839 | |
| 52,132 | | Sterling Capital Special Opportunities Fund, Institutional Class(a) | | | 813,262 | |
| 239,725 | | Sterling Capital Total Return Bond Fund, Institutional Class | | | 2,651,356 | |
| 2,258,108 | | Sterling Capital U.S. Treasury Money Market Fund, Institutional Class | | | 2,258,108 | |
| | | | | | |
| | Total Affiliated Investment Companies
(Cost $13,651,557) | | | 14,296,848 | |
| | | | | | |
|
NON-AFFILIATED INVESTMENT COMPANIES (9.1%) | |
| 84,402 | | Credit Suisse Commodity Return Strategy Fund | | | 689,568 | |
| 64,849 | | Harding, Loevner International Equity Portfolio | | | 826,822 | |
| 16,883 | | Lazard Emerging Markets Equity Portfolio | | | 289,877 | |
| 10,167 | | Oppenheimer Developing Markets Fund | | | 289,658 | |
| | | | | | |
| | Total Non-Affiliated Investment Companies
(Cost $2,189,890) | | | 2,095,925 | |
| | | | | | |
|
EXCHANGE TRADED FUNDS (30.9%) | |
| 17,203 | | iShares Dow Jones US Real Estate Index Fund | | | 869,956 | |
| 16,979 | | iShares MSCI EAFE Small Cap Index Fund | | | 593,246 | |
| 10,150 | | iShares MSCI EAFE Value Index Fund | | | 421,123 | |
| 37,704 | | iShares MSCI Emerging Markets Index Fund | | | 1,322,279 | |
| 10,166 | | iShares Russell 2000 Index Fund | | | 653,166 | |
| 34,539 | | iShares Russell Midcap Growth Index Fund | | | 1,714,516 | |
| 13,903 | | iShares S&P 500 Index Fund | | | 1,580,632 | |
| | | | | | |
| | Total Exchange Traded Funds
(Cost $6,866,394) | | | 7,154,918 | |
| | | | | | |
Total Investments — 101.8%
(Cost $22,707,841) | | | 23,547,691 | |
Net Other Assets (Liabilities) — (1.8)% | | | (427,521) | |
| | | | | | |
NET ASSETS — 100.0% | | | $ 23,120,170 | |
| | | | | | |
| (a) | Represents non-income producing security. |
See accompanying notes to the financial statements.
88
|
| Sterling Capital Strategic Allocation Equity Fund |
Schedule of Portfolio Investments |
September 30, 2011 |
| | | | | | |
Shares | | | | Fair Value | |
AFFILIATED INVESTMENT COMPANIES (53.1%) | |
| 36,527 | | Sterling Capital Equity Income Fund, Institutional Class | | | $ 484,720 | |
| 148,467 | | Sterling Capital International Fund, Institutional Class(a) | | | 628,015 | |
| 58,325 | | Sterling Capital Mid Value Fund, Institutional Class | | | 666,660 | |
| 133,506 | | Sterling Capital Select Equity Fund, Institutional Class | | | 1,328,382 | |
| 15,669 | | Sterling Capital Small Value Fund, Institutional Class(a) | | | 169,543 | |
| 19,903 | | Sterling Capital Special Opportunities Fund, Institutional Class(a) | | | 310,489 | |
| 432,478 | | Sterling Capital U.S. Treasury Money Market Fund, Institutional Class | | | 432,478 | |
| | | | | | |
| | Total Affiliated Investment Companies
(Cost $3,937,689) | | | 4,020,287 | |
| | | | | | |
|
NON-AFFILIATED INVESTMENT COMPANIES (10.2%) | |
| 41,544 | | Credit Suisse Commodity Return Strategy Fund | | | 339,411 | |
| 24,818 | | Harding, Loevner International Equity Portfolio | | | 316,429 | |
| 3,451 | | Lazard Emerging Markets Equity Portfolio | | | 59,246 | |
| 2,058 | | Oppenheimer Developing Markets Fund | | | 58,621 | |
| | | | | | |
| | Total Non-Affiliated Investment Companies
(Cost $798,862) | | | 773,707 | |
| | | | | | |
|
EXCHANGE TRADED FUNDS (39.4%) | |
| 6,778 | | iShares Dow Jones US Real Estate Index Fund | | | 342,763 | |
| 6,485 | | iShares MSCI EAFE Small Cap Index Fund | | | 226,586 | |
| 7,023 | | iShares MSCI EAFE Value Index Fund | | | 291,384 | |
| 17,287 | | iShares MSCI Emerging Markets Index Fund | | | 606,255 | |
| 3,886 | | iShares Russell 2000 Index Fund | | | 249,676 | |
| 13,205 | | iShares Russell Midcap Growth Index Fund | | | 655,496 | |
| 5,314 | | iShares S&P 500 Index Fund | | | 604,149 | |
| | | | | | |
| | Total Exchange Traded Funds
(Cost $2,910,879) | | | 2,976,309 | |
| | | | | | |
Total Investments — 102.7%
(Cost $7,647,430) | | | 7,770,303 | |
Net Other Assets (Liabilities) — (2.7)% | | | (201,980) | |
| | | | | | |
NET ASSETS — 100.0% | | | $7,568,323 | |
| | | | | | |
| (a) | Represents non-income producing security. |
See accompanying notes to the financial statements.
89
|
| Sterling Capital Funds |
Statements of Assets and Liabilities |
September 30, 2011 |
| | | | | | | | |
| | | Sterling Capital
Select Equity
Fund | | | Sterling Capital
Mid
Value Fund | |
Assets: | | | | | | | | |
Investments, at cost* | | $ | 185,589,408 | | | $ | 326,959,038 | |
Unrealized appreciation (depreciation) | | | (2,233,837 | ) | | | (6,811,920 | ) |
| | | | | | | | |
Investments, at fair value | | | 183,355,571 | | | | 320,147,118 | |
Cash | | | — | | | | — | |
Foreign currency, at value** | | | — | | | | — | |
Interest and dividends receivable | | | 214,815 | | | | 550,203 | |
Receivable for investments sold | | | 5,559,398 | | | | 273,091 | |
Receivable for capital shares issued | | | 691,247 | | | | 1,026,886 | |
Receivable from security lending agent | | | 317,287 | | | | 993,973 | |
Unrealized appreciation on forward foreign currency exchange contracts | | | — | | | | — | |
Prepaid expenses | | | 16,521 | | | | 18,211 | |
| | | | | | | | |
Total Assets | | | 190,154,839 | | | | 323,009,482 | |
| | | | | | | | |
Liabilities: | | | | | | | | |
Call options written (premiums received $ — , $ — , $ — , $ — , $2,286,751, $231,859 and $ — , respectively) | | | — | | | | — | |
Distributions payable | | | — | | | | 217 | |
Unrealized depreciation on forward foreign currency exchange contracts | | | — | | | | — | |
Payable for investments purchased | | | 4,122,621 | | | | 1,078,371 | |
Payable for capital shares redeemed | | | 88,884 | | | | 217,529 | |
Payable for collateral received on loaned securities | | | 1,853,159 | | | | 109,928 | |
Payable to securities lending agent | | | 396,608 | | | | 1,242,467 | |
Accrued expenses and other payables: | | | | | | | | |
Investment advisory fees | | | 94,737 | | | | 196,204 | |
Administration fees | | | 16,283 | | | | 28,905 | |
Compliance service fees | | | 202 | | | | 359 | |
Distribution (12b-1) fees | | | 7,144 | | | | 6,667 | |
Trustee fees | | | 112 | | | | 199 | |
Other | | | 42,876 | | | | 78,355 | |
| | | | | | | | |
Total Liabilities | | | 6,622,626 | | | | 2,959,201 | |
| | | | | | | | |
Net Assets | | $ | 183,532,213 | | | $ | 320,050,281 | |
| | | | | | | | |
Net Assets Consist of: | | | | | | | | |
Capital | | $ | 308,022,990 | | | $ | 372,790,717 | |
Accumulated undistributed (distributions in excess of) net investment income | | | 59,967 | | | | 362,628 | |
Accumulated realized gain (loss) | | | (122,316,907 | ) | | | (46,291,144 | ) |
Net unrealized appreciation (depreciation) | | | (2,233,837 | ) | | | (6,811,920 | ) |
| | | | | | | | |
Net Assets | | $ | 183,532,213 | | | $ | 320,050,281 | |
| | | | | | | | |
Net Assets | | | | | | | | |
Class A Shares | | $ | 24,602,771 | | | $ | 18,016,568 | |
Class B Shares | | | 1,921,977 | | | | 2,603,943 | |
Class C Shares | | | 175,531 | | | | 397,623 | |
Institutional Shares | | | 156,831,934 | | | | 299,032,044 | |
Class R Shares | | | — | | | | 103 | |
| | | | | | | | |
Total | | $ | 183,532,213 | | | $ | 320,050,281 | |
| | | | | | | | |
Shares of Beneficial Interest Outstanding (Unlimited number of shares authorized, no par value) | | | | | | | | |
Class A Shares | | | 2,486,005 | | | | 1,585,162 | |
Class B Shares | | | 197,611 | | | | 241,052 | |
Class C Shares | | | 18,155 | | | | 36,874 | |
Institutional Shares | | | 15,768,093 | | | | 26,162,305 | |
Class R Shares | | | — | | | | 9 | |
| | | | | | | | |
Total | | | 18,469,864 | | | | 28,025,402 | |
| | | | | | | | |
Net Asset Value | | | | | | | | |
Class A Shares - redemption price per share | | $ | 9.90 | | | $ | 11.37 | |
| | | | | | | | |
Class B Shares - offering price per share*** | | $ | 9.73 | | | $ | 10.80 | |
| | | | | | | | |
Class C Shares - offering price per share*** | | $ | 9.67 | | | $ | 10.78 | |
| | | | | | | | |
Institutional Shares | | $ | 9.95 | | | $ | 11.43 | |
| | | | | | | | |
Class R Shares | | $ | — | | | $ | 11.36 | **** |
| | | | | | | | |
Maximum Sales Charge - Class A Shares | | | 5.75 | % | | | 5.75 | % |
| | | | | | | | |
Maximum Offering Price (100%/(100%- Maximum Sales Charge)) of net asset value adjusted to the nearest cent per share - Class A Shares | | $ | 10.50 | | | $ | 12.06 | |
| | | | | | | | |
| * | The Sterling Capital Select Equity Fund, Sterling Capital Mid Value Fund, Sterling Capital Small Value Fund, Sterling Capital International Fund, Sterling Capital Special Opportunities Fund, Sterling Capital Equity Income Fund, and Sterling Capital Short-Term Bond Fund include securities on loan of $1,612,248, $99,328, $719,376, $1,630,864, $9,833,044, $282,639, and $51,380, respectively. |
| ** | The Sterling Capital International Fund includes foreign currency at cost of $1,373,900. |
| *** | Redemption price per share varies by length of time shares are held. |
| **** | The Sterling Capital Mid Value Fund, and Sterling Capital Small Value Fund net asset value for Class R Shares is calculated using unrounded net assets of $103.11, and $102.77 divided by the unrounded shares of 9.074, and 9.521, respectively. |
See accompanying notes to the financial statements.
90
| | | | | | | | | | | | | | | | | | | | | | | |
Sterling Capital
Small Value
Fund | | Sterling Capital
International Fund | | Sterling Capital
Special
Opportunities Fund | | Sterling Capital
Equity
Income Fund | | Sterling Capital
Short-Term
Bond Fund |
| | | | | | | | | | | | | | | | | | | | | | | | |
| | $ | 83,811,698 | | | | $ | 67,787,117 | | | | $ | 620,878,504 | | | | $ | 681,094,473 | | | | $ | 63,373,606 | |
| | | (11,732,573 | ) | | | | (5,448,999 | ) | | | | 9,492,365 | | | | | 43,434,243 | | | | | (374,899 | ) |
| | | | | | | | | | | | | | | | | | | | | | | | |
| | | 72,079,125 | | | | | 62,338,118 | | | | | 630,370,869 | | | | | 724,528,716 | | | | | 62,998,707 | |
| | | — | | | | | 548,693 | | | | | — | | | | | — | | | | | — | |
| | | — | | | | | 1,327,462 | | | | | — | | | | | — | | | | | — | |
| | | 74,281 | | | | | 213,116 | | | | | 416,874 | | | | | 1,054,378 | | | | | 650,909 | |
| | | 506,735 | | | | | 312,329 | | | | | 227,287 | | | | | 260,696 | | | | | — | |
| | | 281,759 | | | | | 380,742 | | | | | 1,267,718 | | | | | 4,606,400 | | | | | 30,529 | |
| | | 208,366 | | | | | 15,789 | | | | | 620,275 | | | | | 402,207 | | | | | 82,086 | |
| | | — | | | | | 276,880 | | | | | — | | | | | — | | | | | — | |
| | | 14,546 | | | | | 7,132 | | | | | 24,465 | | | | | 29,439 | | | | | 2,419 | |
| | | | | | | | | | | | | | | | | | | | | | | | |
| | | 73,164,812 | | | | | 65,420,261 | | | | | 632,927,488 | | | | | 730,881,836 | | | | | 63,764,650 | |
| | | | | | | | | | | | | | | | | | | | | | | | |
| | | | | | | | | | | | | | | | | | | | | | | | |
| | | — | | | | | — | | | | | 459,946 | | | | | 171,500 | | | | | — | |
| | | — | | | | | — | | | | | — | | | | | 3,439 | | | | | 162,722 | |
| | | — | | | | | 40,631 | | | | | — | | | | | — | | | | | — | |
| | | 120,067 | | | | | 598,180 | | | | | 2,630,946 | | | | | 3,405,911 | | | | | — | |
| | | 170,505 | | | | | 3,894 | | | | | 1,384,155 | | | | | 1,328,060 | | | | | 44,590 | |
| | | 769,385 | | | | | 1,876,684 | | | | | 10,443,545 | | | | | 289,900 | | | | | 53,000 | |
| | | 260,458 | | | | | 19,737 | | | | | 775,344 | | | | | 502,759 | | | | | 102,608 | |
| | | | | | | | | | | | | | | | | | | | | | | | |
| | | 50,545 | | | | | 47,626 | | | | | 431,611 | | | | | 421,709 | | | | | 15,837 | |
| | | 6,515 | | | | | 5,778 | | | | | 55,638 | | | | | 62,131 | | | | | 5,445 | |
| | | 82 | | | | | 74 | | | | | 680 | | | | | 734 | | | | | 67 | |
| | | 1,940 | | | | | 1,150 | | | | | 121,481 | | | | | 141,660 | | | | | 1,596 | |
| | | 47 | | | | | 42 | | | | | 300 | | | | | 263 | | | | | 19 | |
| | | 19,123 | | | | | 40,345 | | | | | 138,480 | | | | | 146,015 | | | | | 14,444 | |
| | | | | | | | | | | | | | | | | | | | | | | | |
| | | 1,398,667 | | | | | 2,634,141 | | | | | 16,442,126 | | | | | 6,474,081 | | | | | 400,328 | |
| | | | | | | | | | | | | | | | | | | | | | | | |
| | $ | 71,766,145 | | | | $ | 62,786,120 | | | | $ | 616,485,362 | | | | $ | 724,407,755 | | | | $ | 63,364,322 | |
| | | | | | | | | | | | | | | | | | | | | | | | |
| | | | | | | | | | | | | | | | | | | | | | | | |
| | $ | 86,445,413 | | | | $ | 126,640,326 | | | | $ | 596,443,605 | | | | $ | 710,098,778 | | | | $ | 72,332,406 | |
| | | 586 | | | | | 368,953 | | | | | 7,193 | | | | | 508,249 | | | | | (69,864 | ) |
| | | (2,947,281 | ) | | | | (58,978,553 | ) | | | | 8,715,394 | | | | | (29,693,874 | ) | | | | (8,523,321 | ) |
| | | (11,732,573 | ) | | | | (5,244,606 | ) | | | | 11,319,170 | | | | | 43,494,602 | | | | | (374,899 | ) |
| | | | | | | | | | | | | | | | | | | | | | | | |
| | $ | 71,766,145 | | | | $ | 62,786,120 | | | | $ | 616,485,362 | | | | $ | 724,407,755 | | | | $ | 63,364,322 | |
| | | | | | | | | | | | | | | | | | | | | | | | |
| | | | | | | | | | | | | | | | | | | | | | | | |
| | $ | 6,152,077 | | | | $ | 2,803,262 | | | | $ | 197,137,626 | | | | $ | 214,621,509 | | | | $ | 7,684,435 | |
| | | 571,116 | | | | | 480,633 | | | | | 16,581,603 | | | | | 12,313,946 | | | | | — | |
| | | 81,043 | | | | | 80,300 | | | | | 71,563,984 | | | | | 104,207,724 | | | | | — | |
| | | 64,961,806 | | | | | 59,421,925 | | | | | 330,913,340 | | | | | 392,660,220 | | | | | 55,679,887 | |
| | | 103 | | | | | — | | | | | 288,809 | | | | | 604,356 | | | | | — | |
| | | | | | | | | | | | | | | | | | | | | | | | |
| | $ | 71,766,145 | | | | $ | 62,786,120 | | | | $ | 616,485,362 | | | | $ | 724,407,755 | | | | $ | 63,364,322 | |
| | | | | | | | | | | | | | | | | | | | | | | | |
| | | | | | | | | | | | | | | | | | | | | | | | |
| | | 569,992 | | | | | 687,840 | | | | | 12,927,419 | | | | | 16,197,840 | | | | | 821,283 | |
| | | 53,415 | | | | | 134,380 | | | | | 1,166,125 | | | | | 931,981 | | | | | — | |
| | | 7,578 | | | | | 22,518 | | | | | 5,029,505 | | | | | 7,911,302 | | | | | — | |
| | | 6,002,160 | | | | | 14,048,865 | | | | | 21,217,452 | | | | | 29,584,149 | | | | | 5,950,371 | |
| | | 10 | | | | | — | | | | | 18,582 | | | | | 45,828 | | | | | — | |
| | | | | | | | | | | | | | | | | | | | | | | | |
| | | 6,633,155 | | | | | 14,893,603 | | | | | 40,359,083 | | | | | 54,671,100 | | | | | 6,771,654 | |
| | | | | | | | | | | | | | | | | | | | | | | | |
| | $ | 10.79 | | | | $ | 4.08 | | | | $ | 15.25 | | | | $ | 13.25 | | | | $ | 9.36 | |
| | | | | | | | | | | | | | | | | | | | | | | | |
| | $ | 10.69 | | | | $ | 3.58 | | | | $ | 14.22 | | | | $ | 13.21 | | | | $ | — | |
| | | | | | | | | | | | | | | | | | | | | | | | |
| | $ | 10.69 | | | | $ | 3.57 | | | | $ | 14.23 | | | | $ | 13.17 | | | | $ | — | |
| | | | | | | | | | | | | | | | | | | | | | | | |
| | $ | 10.82 | | | | $ | 4.23 | | | | $ | 15.60 | | | | $ | 13.27 | | | | $ | 9.36 | |
| | | | | | | | | | | | | | | | | | | | | | | | |
| | $ | 10.79 | **** | | | $ | — | | | | $ | 15.54 | | | | $ | 13.19 | | | | $ | — | |
| | | | | | | | | | | | | | | | | | | | | | | | |
| | | 5.75 | % | | | | 5.75 | % | | | | 5.75 | % | | | | 5.75 | % | | | | 2.50 | % |
| | | | | | | | | | | | | | | | | | | | | | | | |
| | $ | 11.45 | | | | $ | 4.33 | | | | $ | 16.18 | | | | $ | 14.06 | | | | $ | 9.60 | |
| | | | | | | | | | | | | | | | | | | | | | | | |
91
|
| Sterling Capital Funds |
Statements of Assets and Liabilities |
September 30, 2011 |
| | | | | | | | |
| | |
Sterling Capital
Intermediate U.S.
Government Fund | | | Sterling Capital
Total Return
Bond Fund | |
Assets: | | | | | | | | |
Investments, at cost* | | $ | 165,446,184 | | | $ | 435,138,840 | |
Unrealized appreciation (depreciation) | | | 9,883,675 | | | | 10,107,610 | |
| | | | | | | | |
Investments, at fair value | | | 175,329,859 | | | | 445,246,450 | |
Interest and dividends receivable | | | 1,011,669 | | | | 3,460,713 | |
Receivable for investments sold. | | | — | | | | 202,415 | |
Receivable for capital shares issued | | | 563,133 | | | | 1,109,651 | |
Receivable from security lending agent | | | 87,074 | | | | 477,261 | |
Prepaid expenses | | | 4,687 | | | | 9,429 | |
| | | | | | | | |
Total Assets | | | 176,996,422 | | | | 450,505,919 | |
| | | | | | | | |
Liabilities: | | | | | | | | |
Distributions payable | | | 283,899 | | | | 701,950 | |
Payable for investments purchased | | | — | | | | 13,144,977 | |
Payable for capital shares redeemed | | | 440,993 | | | | 428,783 | |
Payable for collateral received on loaned securities | | | 4,605,000 | | | | 6,977,960 | |
Payable to securities lending agent | | | 108,843 | | | | 596,576 | |
Accrued expenses and other payables: | | | | | | | | |
Investment advisory fees | | | 68,622 | | | | 168,916 | |
Administration fees | | | 14,745 | | | | 36,295 | |
Compliance service fees | | | 190 | | | | 441 | |
Distribution (12b-1) fees | | | 4,591 | | | | 14,041 | |
Trustee fees | | | 54 | | | | 104 | |
Other | | | 37,080 | | | | 86,744 | |
| | | | | | | | |
Total Liabilities | | | 5,564,017 | | | | 22,156,787 | |
| | | | | | | | |
Net Assets | | $ | 171,432,405 | | | $ | 428,349,132 | |
| | | | | | | | |
Net Assets Consist of: | | | | | | | | |
Capital | | $ | 174,151,371 | | | $ | 407,315,393 | |
Accumulated undistributed (distributions in excess of) net investment income | | | 1,563,584 | | | | 801,183 | |
Accumulated realized gain (loss) | | | (14,166,225 | ) | | | 10,124,946 | |
Net unrealized appreciation (depreciation) | | | 9,883,675 | | | | 10,107,610 | |
| | | | | | | | |
Net Assets | | $ | 171,432,405 | | | $ | 428,349,132 | |
| | | | | | | | |
Net Assets | | | | | | | | |
Class A Shares | | $ | 13,343,756 | | | $ | 37,274,172 | |
Class B Shares | | | 1,616,709 | | | | 3,776,282 | |
Class C Shares | | | 658,223 | | | | 4,223,641 | |
Institutional Shares | | | 155,813,717 | | | | 383,069,510 | |
Class R Shares | | | — | | | | 5,527 | |
| | | | | | | | |
Total | | $ | 171,432,405 | | | $ | 428,349,132 | |
| | | | | | | | |
Shares of Beneficial Interest Outstanding (Unlimited number of shares authorized, no par value) | | | | | | | | |
Class A Shares | | | 1,236,881 | | | | 3,371,969 | |
Class B Shares | | | 150,372 | | | | 341,287 | |
Class C Shares | | | 61,098 | | | | 381,544 | |
Institutional Shares | | | 14,424,808 | | | | 34,634,584 | |
Class R Shares | | | — | | | | 501 | |
| | | | | | | | |
Total | | | 15,873,159 | | | | 38,729,885 | |
| | | | | | | | |
Net Asset Value | | | | | | | | |
Class A Shares - redemption price per share | | $ | 10.79 | | | $ | 11.05 | |
| | | | | | | | |
Class B Shares - offering price per share** | | $ | 10.75 | | | $ | 11.06 | |
| | | | | | | | |
Class C Shares - offering price per share** | | $ | 10.77 | | | $ | 11.07 | |
| | | | | | | | |
Institutional Shares | | $ | 10.80 | | | $ | 11.06 | |
| | | | | | | | |
Class R Shares | | $ | — | | | $ | 11.02 | *** |
| | | | | | | | |
Maximum Sales Charge - Class A Shares | | | 5.75 | % | | | 5.75 | % |
| | | | | | | | |
Maximum Offering Price (100%/(100% - Maximum Sales Charge)) of net asset value adjusted to the nearest cent per share - Class A Shares | | $ | 11.45 | | | $ | 11.72 | |
| | | | | | | | |
| * | The Sterling Capital Intermediate U.S. Government Fund and Sterling Capital Total Return Bond Fund include securities on loan of $4,518,852 and $6,694,279, respectively. |
| ** | Redemption price per share varies by length of time shares are held. |
| *** | The Sterling Capital Total Return Fund net asset value for Class R Shares is calculated using unrounded net assets of $5,527.41 divided by the unrounded shares of 501.466. |
See accompanying notes to the financial statements.
92
| | | | | | | | | | | | | | | | | | | | | | |
Sterling Capital Kentucky Intermediate Tax-Free Fund | | | Sterling Capital
Maryland Intermediate
Tax-Free Fund | | | Sterling Capital
North Carolina
Intermediate
Tax-Free Fund | | | Sterling Capital
South Carolina
Intermediate
Tax-Free Fund | | | Sterling Capital
Virginia Intermediate
Tax-Free Fund | | | Sterling Capital
West Virginia
Intermediate
Tax-Free Fund | |
| | | | | | | | | | | | | | | | | | | | | | | |
| | $20,938,429 | | | | $31,651,707 | | | | $202,089,432 | | | | $54,164,971 | | | | $108,668,680 | | | | $101,182,425 | |
| | 1,354,176 | | | | 2,120,295 | | | | 12,120,812 | | | | 2,549,071 | | | | 8,020,957 | | | | 4,843,213 | |
| | | | | | | | | | | | | | | | | | | | | | |
| | 22,292,605 | | | | 33,772,002 | | | | 214,210,244 | | | | 56,714,042 | | | | 116,689,637 | | | | 106,025,638 | |
| | 238,780 | | | | 368,287 | | | | 2,918,800 | | | | 668,580 | | | | 1,259,411 | | | | 1,454,408 | |
| | — | | | | 341,196 | | | | 4,259,526 | | | | 55,430 | | | | — | | | | — | |
| | 18,378 | | | | — | | | | 370,240 | | | | 138,852 | | | | 162,408 | | | | 278,234 | |
| | — | | | | — | | | | — | | | | — | | | | — | | | | — | |
| | 703 | | | | 2,126 | | | | 2,294 | | | | 1,716 | | | | 3,109 | | | | 2,831 | |
| | | | | | | | | | | | | | | | | | | | | | |
| | 22,550,466 | | | | 34,483,611 | | | | 221,761,104 | | | | 57,578,620 | | | | 118,114,565 | | | | 107,761,111 | |
| | | | | | | | | | | | | | | | | | | | | | |
| | | | | | | | | | | | | | | | | | | | | | |
| | 39,327 | | | | 50,643 | | | | 366,979 | | | | 79,193 | | | | 192,297 | | | | 209,427 | |
| | — | | | | — | | | | 8,393,324 | | | | 1,216,863 | | | | — | | | | 2,232,591 | |
| | 7,318 | | | | 512 | | | | 70,033 | | | | 39,673 | | | | 69,778 | | | | — | |
| | — | | | | — | | | | — | | | | — | | | | — | | | | — | |
| | — | | | | — | | | | — | | | | — | | | | — | | | | — | |
| | | | | | | | | | | | | | | | | | | | | | |
| | 7,249 | | | | 11,455 | | | | 78,838 | | | | 20,812 | | | | 43,768 | | | | 39,079 | |
| | 1,869 | | | | 2,954 | | | | 18,069 | | | | 4,770 | | | | 10,031 | | | | 8,957 | |
| | 23 | | | | 36 | | | | 220 | | | | 57 | | | | 122 | | | | 109 | |
| | 1,685 | | | | 1,898 | | | | 10,479 | | | | 3,350 | | | | 7,963 | | | | 6,597 | |
| | 5 | | | | 10 | | | | 48 | | | | 11 | | | | 25 | | | | 28 | |
| | 6,383 | | | | 9,769 | | | | 43,342 | | | | 13,120 | | | | 24,529 | | | | 22,480 | |
| | | | | | | | | | | | | | | | | | | | | | |
| | 63,859 | | | | 77,277 | | | | 8,981,332 | | | | 1,377,849 | | | | 348,513 | | | | 2,519,268 | |
| | | | | | | | | | | | | | | | | | | | | | |
| | $22,486,607 | | | | $34,406,334 | | | | $212,779,772 | | | | $56,200,771 | | | | $117,766,052 | | | | $105,241,843 | |
| | | | | | | | | | | | | | | | | | | | | | |
| | | | | | | | | | | | | | | | | | | | | | |
| | $21,073,046 | | | | $32,070,371 | | | | $199,322,126 | | | | $53,387,157 | | | | $109,511,423 | | | $ | 99,946,281 | |
| | 2,445 | | | | 381 | | | | 69,242 | | | | 3,745 | | | | 41,556 | | | | (36,286 | ) |
| | 56,940 | | | | 215,287 | | | | 1,267,592 | | | | 260,798 | | | | 192,116 | | | | 488,635 | |
| | 1,354,176 | | | | 2,120,295 | | | | 12,120,812 | | | | 2,549,071 | | | | 8,020,957 | | | | 4,843,213 | |
| | | | | | | | | | | | | | | | | | | | | | |
| | $22,486,607 | | | | $34,406,334 | | | | $212,779,772 | | | | $56,200,771 | | | | $117,766,052 | | | | $105,241,843 | |
| | | | | | | | | | | | | | | | | | | | | | |
| | | | | | | | | | | | | | | | | | | | | | |
| $ | 8,729,194 | | | $ | 9,232,310 | | | $ | 51,293,814 | | | $ | 16,338,100 | | | $ | 39,231,169 | | | $ | 32,791,208 | |
| | — | | | | — | | | | — | | | | — | | | | — | | | | — | |
| | — | | | | — | | | | — | | | | — | | | | — | | | | — | |
| | 13,757,413 | | | | 25,174,024 | | | | 161,485,958 | | | | 39,862,671 | | | | 78,534,883 | | | | 72,450,635 | |
| | — | | | | — | | | | — | | | | — | | | | — | | | | — | |
| | | | | | | | | | | | | | | | | | | | | | |
| | $22,486,607 | | | | $34,406,334 | | | | $212,779,772 | | | | $56,200,771 | | | | $117,766,052 | | | | $105,241,843 | |
| | | | | | | | | | | | | | | | | | | | | | |
| | | | | | | | | | | | | | | | | | | | | | |
| | 808,266 | | | | 821,915 | | | | 4,655,180 | | | | 1,489,300 | | | | 3,236,501 | | | | 3,227,904 | |
| | — | | | | — | | | | — | | | | — | | | | — | | | | — | |
| | — | | | | — | | | | — | | | | — | | | | — | | | | — | |
| | 1,275,528 | | | | 2,237,747 | | | | 14,657,073 | | | | 3,657,845 | | | | 6,480,605 | | | | 7,124,436 | |
| | — | | | | — | | | | — | | | | — | | | | — | | | | — | |
| | | | | | | | | | | | | | | | | | | | | | |
| | 2,083,794 | | | | 3,059,662 | | | | 19,312,253 | | | | 5,147,145 | | | | 9,717,106 | | | | 10,352,340 | |
| | | | | | | | | | | | | | | | | | | | | | |
| | | | | | | | | | | | | | | | | | | | | | |
| $ | 10.80 | | | $ | 11.23 | | | $ | 11.02 | | | $ | 10.97 | | | $ | 12.12 | | | $ | 10.16 | |
| | | | | | | | | | | | | | | | | | | | | | |
| $ | — | | | $ | — | | | $ | — | | | $ | — | | | $ | — | | | $ | — | |
| | | | | | | | | | | | | | | | | | | | | | |
| $ | — | | | $ | — | | | $ | — | | | $ | — | | | $ | — | | | $ | — | |
| | | | | | | | | | | | | | | | | | | | | | |
| $ | 10.79 | | | $ | 11.25 | | | $ | 11.02 | | | $ | 10.90 | | | $ | 12.12 | | | $ | 10.17 | |
| | | | | | | | | | | | | | | | | | | | | | |
| $ | — | | | $ | — | | | $ | — | | | $ | — | | | $ | — | | | $ | — | |
| | | | | | | | | | | | | | | | | | | | | | |
| | 3.00% | | | | 3.00 | % | | | 3.00 | % | | | 3.00 | % | | | 3.00 | % | | | 3.00 | % |
| | | | | | | | | | | | | | | | | | | | | | |
| | | | | |
| $ | 11.13 | | | $ | 11.58 | | | $ | 11.36 | | | $ | 11.31 | | | $ | 12.49 | | | $ | 10.47 | |
| | | | | | | | | | | | | | | | | | | | | | |
93
|
| Sterling Capital Funds |
Statements of Assets and Liabilities |
September 30, 2011 |
| | | | | | | | |
| | | Sterling Capital
National
Tax- Free Money
Market Fund | | | Sterling Capital
Prime
Money Market
Fund | |
Assets: | | | | | | | | |
Investments: | | | | | | | | |
Investments-unaffiliated, at cost | | $ | 153,674,061 | | | $ | 385,313,844 | |
Investments-affiliated, at cost | | | — | | | | — | |
| | | | | | | | |
Total investments, at cost | | | 153,674,061 | | | | 385,313,844 | |
Net unrealized appreciation (depreciation) | | | — | | | | — | |
| | | | | | | | |
Investments, at value | | | 153,674,061 | | | | 385,313,844 | |
Repurchase agreements, at cost | | | — | | | | 108,224,000 | |
Cash | | | — | | | | 800 | |
Interest and dividends receivable | | | 165,795 | | | | 188,263 | |
Receivable for capital shares issued | | | — | | | | 6,228 | |
Receivable from Investment Advisor | | | — | | | | 19,683 | |
Prepaid expenses | | | 2,716 | | | | 11,085 | |
| | | | | | | | |
Total Assets | | | 153,842,572 | | | | 493,763,903 | |
| | | | | | | | |
Liabilities: | | | | | | | | |
Distributions payable | | | 1,402 | | | | 2,106 | |
Payable for investments purchased | | | — | | | | — | |
Payable for capital shares redeemed | | | — | | | | 79,969 | |
Accrued expenses and other payables: | | | | | | | | |
Investment advisory fees | | | 4,619 | | | | — | |
Administration fees | | | 12,899 | | | | 41,974 | |
Audit fees | | | 6,561 | | | | 25,420 | |
Compliance service fees | | | 152 | | | | 536 | |
Distribution (12b-1) fees | | | — | | | | 1 | |
Trustee fees | | | 11 | | | | 332 | |
Fund accounting fees | | | 2,503 | | | | 8,494 | |
Printing fees | | | 6,131 | | | | 20,819 | |
Transfer agent fees | | | 10,491 | | | | 42,249 | |
Other | | | 5,220 | | | | 19,767 | |
| | | | | | | | |
Total Liabilities | | | 49,989 | | | | 241,667 | |
| | | | | | | | |
Net Assets | | $ | 153,792,583 | | | $ | 493,522,236 | |
| | | | | | | | |
Net Assets Consist of: | | | | | | | | |
Capital | | $ | 153,791,294 | | | $ | 493,539,841 | |
Accumulated undistributed net investment income | | | 1,289 | | | | 2,202 | |
Accumulated realized gain (loss) | | | — | | | | (19,807 | ) |
Net unrealized appreciation (depreciation) | | | — | | | | — | |
| | | | | | | | |
Net Assets | | $ | 153,792,583 | | | $ | 493,522,236 | |
| | | | | | | | |
Net Assets | | | | | | | | |
Class A Shares | | $ | 182,664 | | | $ | 163,384,386 | |
Class B Shares | | | — | | | | 1,154,709 | |
Class C Shares | | | — | | | | 665,274 | |
Institutional Shares | | | 153,609,919 | | | | 328,317,867 | |
| | | | | | | | |
Total | | $ | 153,792,583 | | | $ | 493,522,236 | |
| | | | | | | | |
Shares of Beneficial Interest Outstanding (Unlimited number of shares authorized, no par value) | | | | | | | | |
Class A Shares | | | 182,647 | | | | 163,388,484 | |
Class B Shares | | | — | | | | 1,155,498 | |
Class C Shares | | | — | | | | 665,286 | |
Institutional Shares | | | 153,611,675 | | | | 328,346,349 | |
| | | | | | | | |
Total | | | 153,794,322 | | | | 493,555,617 | |
| | | | | | | | |
Net Asset Value | | | | | | | | |
Class A Shares - redemption price per share | | $ | 1.00 | | | $ | 1.00 | |
| | | | | | | | |
Class B Shares - offering price per share* | | $ | — | | | $ | 1.00 | |
| | | | | | | | |
Class C Shares - offering price per share* | | $ | — | | | $ | 1.00 | |
| | | | | | | | |
Institutional Shares. | | $ | 1.00 | | | $ | 1.00 | |
| | | | | | | | |
Maximum Sales Charge - Class A Shares | | | N/A | | | | N/A | |
| | | | | | | | |
Maximum Offering Price (100%/(100% - Maximum Sales Charge)) of net asset value adjusted to the nearest cent per
share - Class A Shares | | $ | 1.00 | | | $ | 1.00 | |
| | | | | | | | |
| * | Redemption price per share varies by length of time shares are held. |
See accompanying notes to the financial statements.
94
| | | | | | | | | | | | | | | | | | |
Sterling Capital
U.S. Treasury
Money Market
Fund | | | Sterling Capital
Strategic Allocation
Conservative Fund | | | Sterling Capital
Strategic Allocation
Balanced Fund | | | Sterling Capital
Strategic Allocation
Growth Fund | | | Sterling Capital
Strategic Allocation
Equity Fund | |
| | | | | | | | | | | | | | | | | | |
| | | | | | | | | | | | | | | | | | |
| $ | 120,106,258 | | | $ | 3,489,702 | | | $ | 10,893,432 | | | $ | 9,056,284 | | | $ | 3,709,741 | |
| | — | | | | 12,163,718 | | | | 20,646,121 | | | | 13,651,557 | | | | 3,937,689 | |
| | | | | | | | | | | | | | | | | | |
| | 120,106,258 | | | | 15,653,420 | | | | 31,539,553 | | | | 22,707,841 | | | | 7,647,430 | |
| | — | | | | 1,147,728 | | | | 1,546,274 | | | | 839,850 | | | | 122,873 | |
| | | | | | | | | | | | | | | | | | |
| | 120,106,258 | | | | 16,801,148 | | | | 33,085,827 | | | | 23,547,691 | | | | 7,770,303 | |
| | 100,000,000 | | | | — | | | | — | | | | — | | | | — | |
| | 28,028,063 | | | | — | | | | — | | | | — | | | | — | |
| | 199,849 | | | | 29,481 | | | | 32,693 | | | | 9,126 | | | | 1 | |
| | 639 | | | | 10,959 | | | | 71,545 | | | | 10,384 | | | | 14 | |
| | 33,586 | | | | — | | | | — | | | | — | | | | — | |
| | 8,567 | | | | 2,711 | | | | 4,683 | | | | 3,418 | | | | 3,703 | |
| | | | | | | | | | | | | | | | | | |
| | 248,376,962 | | | | 16,844,299 | | | | 33,194,748 | | | | 23,570,619 | | | | 7,774,021 | |
| | | | | | | | | | | | | | | | | | |
| | | | | | | | | | | | | | | | | | |
| | 633 | | | | 2,766 | | | | 811 | | | | 194 | | | | — | |
| | — | | | | 223,281 | | | | 537,565 | | | | 399,913 | | | | 197,933 | |
| | 3,357 | | | | 63 | | | | 839 | | | | 30,608 | | | | 38 | |
| | | | | | | | | | | | | | | | | | |
| | — | | | | 3,397 | | | | 7,024 | | | | 5,024 | | | | 1,658 | |
| | 21,483 | | | | — | | | | — | | | | — | | | | — | |
| | 13,332 | | | | 684 | | | | 1,670 | | | | 1,252 | | | | 417 | |
| | 259 | | | | 16 | | | | 36 | | | | 26 | | | | 9 | |
| | 1 | | | | 3,846 | | | | 11,522 | | | | 8,634 | | | | 3,454 | |
| | 61 | | | | 5 | | | | 15 | | | | 13 | | | | 5 | |
| | 4,212 | | | | 271 | | | | 577 | | | | 416 | | | | 138 | |
| | 10,742 | | | | 501 | | | | 1,222 | | | | 916 | | | | 305 | |
| | 18,692 | | | | 1,238 | | | | 2,654 | | | | 1,976 | | | | 631 | |
| | 10,672 | | | | 1,152 | | | | 1,730 | | | | 1,477 | | | | 1,110 | |
| | | | | | | | | | | | | | | | | | |
| | 83,444 | | | | 237,220 | | | | 565,665 | | | | 450,449 | | | | 205,698 | |
| | | | | | | | | | | | | | | | | | |
| $ | 248,293,518 | | | $ | 16,607,079 | | | $ | 32,629,083 | | | $ | 23,120,170 | | | $ | 7,568,323 | |
| | | | | | | | | | | | | | | | | | |
| | | | | | | | | | | | | | | | | | |
| $ | 248,291,466 | | | $ | 25,019,449 | | | $ | 46,786,222 | | | $ | 38,837,333 | | | $ | 18,766,938 | |
| | 2,052 | | | | 965 | | | | 981 | | | | 270 | | | | — | |
| | — | | | | (9,561,063 | ) | | | (15,704,394 | ) | | | (16,557,283 | ) | | | (11,321,488 | ) |
| | — | | | | 1,147,728 | | | | 1,546,274 | | | | 839,850 | | | | 122,873 | |
| | | | | | | | | | | | | | | | | | |
| $ | 248,293,518 | | | $ | 16,607,079 | | | $ | 32,629,083 | | | $ | 23,120,170 | | | $ | 7,568,323 | |
| | | | | | | | | | | | | | | | | | |
| | | | | | | | | | | | | | | | | | |
| $ | 129,413,414 | | | $ | 10,688,786 | | | $ | 25,226,777 | | | $ | 16,246,317 | | | $ | 4,806,186 | |
| | 632,275 | | | | 1,812,593 | | | | 6,560,057 | | | | 5,521,416 | | | | 2,672,503 | |
| | 76,293 | | | | 152,001 | | | | 367,400 | | | | 225,642 | | | | 25,154 | |
| | 118,171,536 | | | | 3,953,699 | | | | 474,849 | | | | 1,126,795 | | | | 64,480 | |
| | | | | | | | | | | | | | | | | | |
| $ | 248,293,518 | | | $ | 16,607,079 | | | $ | 32,629,083 | | | $ | 23,120,170 | | | $ | 7,568,323 | |
| | | | | | | | | | | | | | | | | | |
| | | | | | | | | | | | | | | | | | |
| | 129,413,248 | | | | 1,222,596 | | | | 3,171,953 | | | | 2,256,155 | | | | 708,757 | |
| | 632,338 | | | | 206,996 | | | | 842,207 | | | | 785,756 | | | | 414,791 | |
| | 76,290 | | | | 17,449 | | | | 46,977 | | | | 32,169 | | | | 3,916 | |
| | 118,170,902 | | | | 447,795 | | | | 59,369 | | | | 156,178 | | | | 9,389 | |
| | | | | | | | | | | | | | | | | | |
| | 248,292,778 | | | | 1,894,836 | | | | 4,120,506 | | | | 3,230,258 | | | | 1,136,853 | |
| | | | | | | | | | | | | | | | | | |
| | | | | | | | | | | | | | | | | | |
| $ | 1.00 | | | $ | 8.74 | | | $ | 7.95 | | | $ | 7.20 | | | $ | 6.78 | |
| | | | | | | | | | | | | | | | | | |
| $ | 1.00 | | | $ | 8.76 | | | $ | 7.79 | | | $ | 7.03 | | | $ | 6.44 | |
| | | | | | | | | | | | | | | | | | |
| $ | 1.00 | | | $ | 8.71 | | | $ | 7.82 | | | $ | 7.01 | | | $ | 6.42 | |
| | | | | | | | | | | | | | | | | | |
| $ | 1.00 | | | $ | 8.83 | | | $ | 8.00 | | | $ | 7.21 | | | $ | 6.87 | |
| | | | | | | | | | | | | | | | | | |
| | N/A | | | | 5.75 | % | | | 5.75 | % | | | 5.75 | % | | | 5.75 | % |
| | | | | | | | | | | | | | | | | | |
| $ | 1.00 | | | $ | 9.27 | | | $ | 8.44 | | | $ | 7.64 | | | $ | 7.19 | |
| | | | | | | | | | | | | | | | | | |
95
|
| Sterling Capital Funds |
Statements of Operations |
For the Year Ended September 30, 2011 |
| | | | | | | | |
| | | Sterling Capital
Select
Equity Fund | | | Sterling Capital
Mid
Value Fund | |
Investment Income: | | | | | | | | |
Interest income | | $ | — | | | $ | — | |
Dividend income | | | 4,555,706 | | | | 5,721,124 | |
Foreign tax withholding | | | (47,297 | ) | | | (24,646 | ) |
Income from securities lending | | | 12,693 | | | | 13,688 | |
| | | | | | | | |
Total investment income | | | 4,521,102 | | | | 5,710,166 | |
| | | | | | | | |
Expenses: | | | | | | | | |
Investment advisory fees (See Note 5) | | | 1,664,871 | | | | 2,797,397 | |
Administration fees (See Note 5) | | | 230,847 | | | | 387,807 | |
Distribution fees - Class A Shares | | | 150,650 | | | | 53,799 | |
Distribution fees - Class B Shares | | | 28,451 | | | | 37,112 | |
Distribution fees - Class C Shares | | | 1,952 | | | | 4,842 | |
Distribution fees - Class R Shares | | | — | | | | — | |
Compliance service fees (See Note 5) | | | 2,750 | | | | 4,628 | |
Trustee fees | | | 17,732 | | | | 29,550 | |
Audit fees | | | 25,525 | | | | 36,356 | |
Custodian fees | | | 12,296 | | | | 21,989 | |
Fund accounting fees (See Note 5) | | | 22,498 | | | | 37,803 | |
Interest expense (See Note 7) | | | — | | | | 1,091 | |
Legal fees | | | 30,737 | | | | 50,733 | |
Printing fees | | | 23,929 | | | | 38,430 | |
Transfer agent fees (See Note 5) | | | 99,418 | | | | 185,387 | |
Other | | | 63,222 | | | | 94,018 | |
| | | | | | | | |
Total expenses before waivers/reimbursements | | | 2,374,878 | | | | 3,780,942 | |
| | | | | | | | |
Less expenses waived/reimbursed by the Investment Advisor (See Note 5) | | | (318,638 | ) | | | (155,637 | ) |
Less expenses waived by the Distributor (See Note 5) | | | (75,325 | ) | | | — | |
| | | | | | | | |
Net expenses | | | 1,980,915 | | | | 3,625,305 | |
| | | | | | | | |
Net investment income (loss) | | | 2,540,187 | | | | 2,084,861 | |
| | | | | | | | |
Realized and Unrealized Gain (Loss): | | | | | | | | |
Net realized gain (loss) from: | | | | | | | | |
Investments | | | 9,711,265 | | | | 17,824,487 | |
Written options | | | — | | | | — | |
Foreign currency transactions | | | — | | | | — | |
Change in unrealized appreciation/depreciation on: | | | | | | | | |
Investments | | | (19,231,933 | ) | | | (38,208,279 | ) |
Written options | | | — | | | | — | |
Foreign currency transactions | | | — | | | | — | |
| | | | | | | | |
Total realized and unrealized loss | | | (9,520,668 | ) | | | (20,383,792 | ) |
| | | | | | | | |
Change in net assets from operations | | $ | (6,980,481 | ) | | $ | (18,298,931 | ) |
| | | | | | | | |
See accompanying notes to the financial statements.
96
| | | | | | | | | | | | | | | | | | | | | | | |
Sterling Capital
Small
Value Fund | | Sterling Capital
International Fund | | Sterling Capital
Special
Opportunities Fund | | Sterling Capital
Equity
Income Fund | | Sterling Capital
Short-Term
Bond Fund |
| | | | | | | | | | | | | | | | | | | | | | | | |
| | $ | — | | | | $ | — | | | | $ | — | | | | $ | — | | | | $ | 1,606,451 | |
| | | 755,409 | | | | | 1,756,019 | | | | | 6,126,694 | | | | | 19,889,200 | | | | | 114,427 | |
| | | (2,102) | | | | | (146,182 | ) | | | | (63,519 | ) | | | | (522,279 | ) | | | | — | |
| | | 22,268 | | | | | 44,595 | | | | | 60,210 | | | | | 158,750 | | | | | 213 | |
| | | | | | | | | | | | | | | | | | | | | | | | |
| | | 775,575 | | | | | 1,654,432 | | | | | 6,123,385 | | | | | 19,525,671 | | | | | 1,721,091 | |
| | | | | | | | | | | | | | | | | | | | | | | | |
| | | | | | | | | | | | | | | | | | | | | | | | |
| | | 737,846 | | | | | 820,137 | | | | | 5,215,292 | | | | | 4,578,463 | | | | | 287,643 | |
| | | 84,056 | | | | | 84,194 | | | | | 668,637 | | | | | 670,217 | | | | | 66,146 | |
| | | 35,652 | | | | | 19,032 | | | | | 1,138,590 | | | | | 988,823 | | | | | 39,690 | |
| | | 9,112 | | | | | 7,457 | | | | | 228,854 | | | | | 141,166 | | | | | — | |
| | | 844 | | | | | 1,441 | | | | | 828,373 | | | | | 919,786 | | | | | — | |
| | | — | | | | | — | | | | | 392 | | | | | 769 | | | | | — | |
| | | 999 | | | | | 1,008 | | | | | 7,950 | | | | | 7,946 | | | | | 785 | |
| | | 6,414 | | | | | 6,535 | | | | | 50,253 | | | | | 48,666 | | | | | 5,077 | |
| | | 7,187 | | | | | 9,385 | | | | | 68,335 | | | | | 65,931 | | | | | 7,019 | |
| | | 7,306 | | | | | 161,997 | | | | | 40,763 | | | | | 44,884 | | | | | 3,561 | |
| | | 8,198 | | | | | 8,201 | | | | | 65,191 | | | | | 65,407 | | | | | 6,443 | |
| | | 83 | | | | | — | | | | | — | | | | | — | | | | | — | |
| | | 10,839 | | | | | 11,265 | | | | | 87,522 | | | | | 86,036 | | | | | 14,406 | |
| | | 12,348 | | | | | 10,171 | | | | | 70,455 | | | | | 68,116 | | | | | 9,841 | |
| | | 44,491 | | | | | 35,728 | | | | | 351,225 | | | | | 339,950 | | | | | 27,386 | |
| | | 53,479 | | | | | 98,172 | | | | | 123,884 | | | | | 117,243 | | | | | 24,080 | |
| | | | | | | | | | | | | | | | | | | | | | | | |
| | | 1,018,854 | | | | | 1,274,723 | | | | | 8,945,716 | | | | | 8,143,403 | | | | | 492,077 | |
| | | | | | | | | | | | | | | | | | | | | | | | |
| | | (84,031) | | | | | (124,399 | ) | | | | (6,613 | ) | | | | (6,417 | ) | | | | (63,061 | ) |
| | | (17,826) | | | | | (9,516 | ) | | | | (569,295 | ) | | | | (494,411 | ) | | | | (19,845 | ) |
| | | | | | | | | | | | | | | | | | | | | | | | |
| | | 916,997 | | | | | 1,140,808 | | | | | 8,369,808 | | | | | 7,642,575 | | | | | 409,171 | |
| | | | | | | | | | | | | | | | | | | | | | | | |
| | | (141,422) | | | | | 513,624 | | | | | (2,246,423 | ) | | | | 11,883,096 | | | | | 1,311,920 | |
| | | | | | | | | | | | | | | | | | | | | | | | |
| | | | | | | | | | | | | | | | | | | | | | | | |
| | | | | | | | | | | | | | | | | | | | | | | | |
| | | 10,713,879 | | | | | 2,505,867 | | | | | 9,968,686 | | | | | 5,772,644 | | | | | 471,941 | |
| | | — | | | | | — | | | | | 3,246,049 | | | | | 892,255 | | | | | — | |
| | | — | | | | | (265,682 | ) | | | | — | | | | | — | | | | | — | |
| | | | | | | | | | | | | | | | | | | | | | | | |
| | | (15,856,005) | | | | | (17,109,780 | ) | | | | (48,704,646 | ) | | | | (15,731,499 | ) | | | | (1,799,676 | ) |
| | | — | | | | | — | | | | | 2,304,725 | | | | | (26,862 | ) | | | | — | |
| | | — | | | | | 337,251 | | | | | — | | | | | — | | | | | — | |
| | | | | | | | | | | | | | | | | | | | | | | | |
| | | (5,142,126) | | | | | (14,532,344 | ) | | | | (33,185,186 | ) | | | | (9,093,462 | ) | | | | (1,327,735 | ) |
| | | | | | | | | | | | | | | | | | | | | | | | |
| | $ | (5,283,548 | ) | | | $ | (14,018,720 | ) | | | $ | (35,431,609 | ) | | | $ | 2,789,634 | | | | $ | (15,815 | ) |
| | | | | | | | | | | | | | | | | | | | | | | | |
97
|
| Sterling Capital Funds |
| Statements of Operations |
| For the Year Ended September 30, 2011 |
| | | | | | | | |
| | | Sterling Capital
Intermediate U.S.
Government Fund | | | Sterling Capital
Total Return
Bond Fund | |
Investment Income: | | | | | | | | |
Interest income | | $ | 6,068,985 | | | $ | 18,474,952 | |
Dividend income | | | 577 | | | | 253,677 | |
Income from securities lending | | | 3,072 | | | | 1,885 | |
| | | | | | | | |
Total investment income | | | 6,072,634 | | | | 18,730,514 | |
| | | | | | | | |
Expenses: | | | | | | | | |
Investment advisory fees (See Note 5) | | | 1,117,130 | | | | 2,536,312 | |
Administration fees (See Note 5) | | | 191,081 | | | | 433,914 | |
Distribution fees - Class A Shares | | | 66,596 | | | | 165,547 | |
Distribution fees - Class B Shares | | | 20,351 | | | | 42,706 | |
Distribution fees - Class C Shares | | | 5,777 | | | | 27,416 | |
Distribution fees - Class R Shares | | | — | | | | 36 | |
Compliance service fees (See Note 5) | | | 2,265 | | | | 5,147 | |
Trustee fees | | | 14,604 | | | | 32,689 | |
Audit fees | | | 20,627 | | | | 47,251 | |
Custodian fees | | | 9,587 | | | | 21,738 | |
Fund accounting fees (See Note 5) | | | 18,619 | | | | 42,272 | |
Interest expense (See Note 7) | | | — | | | | — | |
Legal fees | | | 25,271 | | | | 56,777 | |
Printing fees | | | 18,882 | | | | 40,528 | |
Transfer agent fees (See Note 5) | | | 83,445 | | | | 179,280 | |
Other | | | 40,410 | | | | 83,836 | |
| | | | | | | | |
Total expenses before waivers/reimbursements | | | 1,634,645 | | | | 3,715,449 | |
| | | | | | | | |
Less expenses waived/reimbursed by the Investment Advisor (See Note 5) | | | (225,233 | ) | | | (510,480 | ) |
Less expenses waived by the Distributor (See Note 5) | | | (33,298 | ) | | | (82,773 | ) |
| | | | | | | | |
Net expenses | | | 1,376,114 | | | | 3,122,196 | |
| | | | | | | | |
Net investment income | | | 4,696,520 | | | | 15,608,318 | |
| | | | | | | | |
Realized and Unrealized Gain (Loss): | | | | | | | | |
Net realized gain from investments | | | 364,812 | | | | 14,268,158 | |
Change in unrealized appreciation/depreciation on investments | | | 519,239 | | | | (13,665,787 | ) |
| | | | | | | | |
Total realized and unrealized gain (loss) | | | 884,051 | | | | 602,371 | |
| | | | | | | | |
Change in net assets from operations | | $ | 5,580,571 | | | $ | 16,210,689 | |
| | | | | | | | |
See accompanying notes to the financial statements.
98
| | | | | | | | | | | | | | | | | | | | | | | | | | | | |
Sterling Capital Kentucky Intermediate Tax-Free Fund | | Sterling Capital
Maryland Intermediate
Tax-Free Fund | | Sterling Capital
North Carolina
Intermediate
Tax-Free Fund | | Sterling Capital
South Carolina
Intermediate
Tax-Free Fund | | Sterling Capital
Virginia Intermediate
Tax-Free Fund | | Sterling Capital
West Virginia
Intermediate
Tax-Free Fund |
| | | | | | | | | | | | | | | | | | | | | | | | | | | | | |
| | | $843,255 | | | | $ | 1,242,026 | | | | $ | 7,305,041 | | | | $ | 1,726,034 | | | | $ | 4,061,906 | | | | $ | 4,228,107 | |
| | | 600 | | | | | 1,615 | | | | | 438 | | | | | 1,661 | | | | | 355 | | | | | 2,577 | |
| | | — | | | | | — | | | | | — | | | | | — | | | | | — | | | | | — | |
| | | | | | | | | | | | | | | | | | | | | | | | | | | | | |
| | | 843,855 | | | | | 1,243,641 | | | | | 7,305,479 | | | | | 1,727,695 | | | | | 4,062,261 | | | | | 4,230,684 | |
| | | | | | | | | | | | | | | | | | | | | | | | | | | | | |
| | | | | | | | | | | | | | | | | | | | | | | | | | | | | |
| | | 114,755 | | | | | 181,669 | | | | | 1,014,527 | | | | | 253,286 | | | | | 567,542 | | | | | 461,437 | |
| | | 23,489 | | | | | 37,080 | | | | | 208,741 | | | | | 52,243 | | | | | 116,635 | | | | | 105,219 | |
| | | 41,328 | | | | | 50,659 | | | | | 246,931 | | | | | 77,555 | | | | | 184,292 | | | | | 75,838 | |
| | | — | | | | | — | | | | | — | | | | | — | | | | | — | | | | | — | |
| | | — | | | | | — | | | | | — | | | | | — | | | | | — | | | | | — | |
| | | — | | | | | — | | | | | — | | | | | — | | | | | — | | | | | — | |
| | | 279 | | | | | 441 | | | | | 2,480 | | | | | 620 | | | | | 1,386 | | | | | 1,251 | |
| | | 1,778 | | | | | 2,829 | | | | | 15,642 | | | | | 3,857 | | | | | 8,762 | | | | | 7,921 | |
| | | 2,503 | | | | | 3,797 | | | | | 21,714 | | | | | 5,172 | | | | | 12,289 | | | | | 11,066 | |
| | | 1,361 | | | | | 2,017 | | | | | 10,357 | | | | | 2,765 | | | | | 5,885 | | | | | 5,343 | |
| | | 2,285 | | | | | 3,606 | | | | | 20,339 | | | | | 5,092 | | | | | 11,358 | | | | | 10,254 | |
| | | — | | | | | 7 | | | | | — | | | | | — | | | | | — | | | | | 25 | |
| | | 3,108 | | | | | 4,906 | | | | | 27,197 | | | | | 6,762 | | | | | 15,235 | | | | | 13,745 | |
| | | 4,439 | | | | | 5,569 | | | | | 19,906 | | | | | 6,829 | | | | | 12,179 | | | | | 11,110 | |
| | | 9,678 | | | | | 15,708 | | | | | 87,840 | | | | | 21,598 | | | | | 48,041 | | | | | 43,297 | |
| | | 15,664 | | | | | 23,287 | | | | | 43,623 | | | | | 27,349 | | | | | 32,093 | | | | | 34,794 | |
| | | | | | | | | | | | | | | | | | | | | | | | | | | | | |
| | | 220,667 | | | | | 331,575 | | | | | 1,719,297 | | | | | 463,128 | | | | | 1,015,697 | | | | | 781,300 | |
| | | | | | | | | | | | | | | | | | | | | | | | | | | | | |
| | | (23,553 | ) | | | | (37,684 | ) | | | | (100,501 | ) | | | | (24,521 | ) | | | | (57,194 | ) | | | | (938 | ) |
| | | (20,664 | ) | | | | (25,330 | ) | | | | (123,465 | ) | | | | (38,778 | ) | | | | (92,146 | ) | | | | — | |
| | | | | | | | | | | | | | | | | | | | | | | | | | | | | |
| | | 176,450 | | | | | 268,561 | | | | | 1,495,331 | | | | | 399,829 | | | | | 866,357 | | | | | 780,362 | |
| | | | | | | | | | | | | | | | | | | | | | | | | | | | | |
| | | 667,405 | | | | | 975,080 | | | | | 5,810,148 | | | | | 1,327,866 | | | | | 3,195,904 | | | | | 3,450,322 | |
| | | | | | | | | | | | | | | | | | | | | | | | | | | | | |
| | | | | | | | | | | | | | | | | | | | | | | | | | | | | |
| | | 51,975 | | | | | 211,605 | | | | | 1,254,011 | | | | | 259,552 | | | | | 213,879 | | | | | 415,515 | |
| | | (55,570 | ) | | | | (157,407 | ) | | | | 382,912 | | | | | 239,280 | | | | | 81,055 | | | | | (379,139 | ) |
| | | | | | | | | | | | | | | | | | | | | | | | | | | | | |
| | | (3,595 | ) | | | | 54,198 | | | | | 1,636,923 | | | | | 498,832 | | | | | 294,934 | | | | | 36,376 | |
| | | | | | | | | | | | | | | | | | | | | | | | | | | | | |
| | | $663,810 | | | | $ | 1,029,278 | | | | $ | 7,447,071 | | | | $ | 1,826,698 | | | | $ | 3,490,838 | | | | $ | 3,486,698 | |
| | | | | | | | | | | | | | | | | | | | | | | | | | | | | |
99
|
| Sterling Capital Funds |
Statements of Operations |
For the Year Ended September 30, 2011 |
| | | | | | | | | | |
| | | Sterling Capital
National
Tax-Free Money
Market Fund | | Sterling Capital
Prime Money
Market Fund |
Investment Income: | | | | | | | | | | |
Interest income | | | $ | 544,181 | | | | $ | 1,510,197 | |
Dividend income - unaffiliated | | | | 349 | | | | | — | |
Dividend income - affiliated | | | | — | | | | | — | |
Income from securities lending | | | | — | | | | | — | |
| | | | | | | | | | |
Total investment income | | | | 544,530 | | | | | 1,510,197 | |
| | | | | | | | | | |
Expenses: | | | | | | | | | | |
Investment advisory fees (See Note 5) | | | | 368,926 | | | | | 2,284,729 | |
Administration fees (See Note 5) | | | | 151,498 | | | | | 585,711 | |
Distribution fees - Class A Shares | | | | 650 | | | | | 813,109 | |
Distribution fees - Class B Shares | | | | — | | | | | 12,510 | |
Distribution fees - Class C Shares | | | | — | | | | | 5,198 | |
Compliance service fees (See Note 5) | | | | 1,785 | | | | | 6,979 | |
Trustee fees | | | | 11,749 | | | | | 45,497 | |
Audit fees | | | | 18,220 | | | | | 81,283 | |
Custodian fees | | | | 7,412 | | | | | 27,986 | |
Fund accounting fees (See Note 5) | | | | 14,757 | | | | | 57,118 | |
Legal fees | | | | 19,928 | | | | | 77,306 | |
Printing fees | | | | 19,868 | | | | | 62,539 | |
State registration fees | | | | 3,860 | | | | | 18,207 | |
Transfer agent fees (See Note 5) | | | | 62,120 | | | | | 268,302 | |
Other | | | | 21,067 | | | | | 88,154 | |
| | | | | | | | | | |
Total expenses before waivers/reimbursements | | | | 701,840 | | | | | 4,434,628 | |
| | | | | | | | | | |
Less expenses waived/reimbursed by the Investment Advisor (See Note 5) | | | | (180,660 | ) | | | | (2,153,434 | ) |
Less expenses waived by the Distributor (See Note 5) | | | | (645 | ) | | | | (830,816 | ) |
| | | | | | | | | | |
Net expenses | | | | 520,535 | | | | | 1,450,378 | |
| | | | | | | | | | |
Net investment income | | | | 23,995 | | | | | 59,819 | |
| | | | | | | | | | |
Realized and Unrealized Gain (Loss): | | | | | | | | | | |
Net realized gain (loss) from: | | | | | | | | | | |
Investment transactions - unaffiliated | | | | 166 | | | | | — | |
Investment transactions - affiliated | | | | — | | | | | — | |
Distributions from affiliated funds | | | | — | | | | | — | |
Change in unrealized appreciation/depreciation on investments | | | | — | | | | | — | |
| | | | | | | | | | |
Total realized and unrealized gain (loss) | | | | 166 | | | | | — | |
| | | | | | | | | | |
Change in net assets from operations | | | $ | 24,161 | | | | $ | 59,819 | |
| | | | | | | | | | |
See accompanying notes to the financial statements.
100
| | | | | | | | | | | | | | | | | | | | | | | |
Sterling Capital
U.S. Treasury
Money Market
Fund | | Sterling Capital
Strategic Allocation
Conservative
Fund | | Sterling Capital
Strategic Allocation
Balanced
Fund | | Sterling Capital
Strategic Allocation
Growth Fund | | Sterling Capital
Strategic Allocation
Equity Fund |
| | | | | | | | | | | | | | | | | | | | | | | | |
| | $ | 318,324 | | | | $ | — | | | | $ | — | | | | $ | — | | | | $ | — | |
| | | — | | | | | 79,888 | | | | | 318,797 | | | | | 303,346 | | | | | 114,177 | |
| | | — | | | | | 379,719 | | | | | 532,209 | | | | | 220,189 | | | | | 34,481 | |
| | | 9,856 | | | | | — | | | | | — | | | | | — | | | | | — | |
| | | | | | | | | | | | | | | | | | | | | | | | |
| | | 328,180 | | | | | 459,607 | | | | | 851,006 | | | | | 523,535 | | | | | 148,658 | |
| | | | | | | | | | | | | | | | | | | | | | | | |
| | | | | | | | | | | | | | | | | | | | | | | | |
| | | 1,199,252 | | | | | 38,501 | | | | | 93,823 | | | | | 70,356 | | | | | 23,454 | |
| | | 307,996 | | | | | — | | | | | — | | | | | — | | | | | — | |
| | | 678,542 | | | | | 43,329 | | | | | 137,793 | | | | | 93,988 | | | | | 28,301 | |
| | | 6,449 | | | | | 22,958 | | | | | 89,104 | | | | | 76,963 | | | | | 36,330 | |
| | | 822 | | | | | 1,537 | | | | | 2,994 | | | | | 2,083 | | | | | 240 | |
| | | 3,648 | | | | | 187 | | | | | 459 | | | | | 345 | | | | | 115 | |
| | | 23,908 | | | | | 1,194 | | | | | 2,943 | | | | | 2,223 | | | | | 736 | |
| | | 46,667 | | | | | 1,879 | | | | | 4,343 | | | | | 3,258 | | | | | 1,119 | |
| | | 15,296 | | | | | 1,005 | | | | | 2,131 | | | | | 1,662 | | | | | 707 | |
| | | 29,981 | | | | | 1,540 | | | | | 3,753 | | | | | 2,814 | | | | | 938 | |
| | | 41,678 | | | | | 2,056 | | | | | 5,136 | | | | | 3,873 | | | | | 1,291 | |
| | | 34,246 | | | | | 3,974 | | | | | 6,586 | | | | | 5,751 | | | | | 3,682 | |
| | | 11,950 | | | | | 6,833 | | | | | 8,502 | | | | | 8,827 | | | | | 9,155 | |
| | | 133,658 | | | | | 8,068 | | | | | 17,535 | | | | | 13,083 | | | | | 4,073 | |
| | | 77,627 | | | | | 6,911 | | | | | 9,271 | | | | | 8,390 | | | | | 6,051 | |
| | | | | | | | | | | | | | | | | | | | | | | | |
| | | 2,611,720 | | | | | 139,972 | | | | | 384,373 | | | | | 293,616 | | | | | 116,192 | |
| | | | | | | | | | | | | | | | | | | | | | | | |
| | | (1,627,104 | ) | | | | (12,939 | ) | | | | (32,519 | ) | | | | (25,058 | ) | | | | (8,630 | ) |
| | | (685,813 | ) | | | | (21,665 | ) | | | | (68,896 | ) | | | | (46,994 | ) | | | | (14,151 | ) |
| | | | | | | | | | | | | | | | | | | | | | | | |
| | | 298,803 | | | | | 105,368 | | | | | 282,958 | | | | | 221,564 | | | | | 93,411 | |
| | | | | | | | | | | | | | | | | | | | | | | | |
| | | 29,377 | | | | | 354,239 | | | | | 568,048 | | | | | 301,971 | | | | | 55,247 | |
| | | | | | | | | | | | | | | | | | | | | | | | |
| | | | | | | | | | | | | | | | | | | | | | | | |
| | | | | | | | | | | | | | | | | | | | | | | | |
| | | — | | | | | 67,785 | | | | | 322,055 | | | | | 265,311 | | | | | 65,997 | |
| | | — | | | | | 23,057 | | | | | 62,744 | | | | | (9,144 | ) | | | | 16,454 | |
| | | — | | | | | 147,406 | | | | | 190,999 | | | | | 61,639 | | | | | 2,238 | |
| | | — | | | | | (799,965 | ) | | | | (2,118,015 | ) | | | | (1,653,544 | ) | | | | (656,666 | ) |
| | | | | | | | | | | | | | | | | | | | | | | | |
| | | — | | | | | (561,717 | ) | | | | (1,542,217 | ) | | | | (1,335,738 | ) | | | | (571,977 | ) |
| | | | | | | | | | | | | | | | | | | | | | | | |
| | $ | 29,377 | | | | $ | (207,478 | ) | | | $ | (974,169 | ) | | | $ | (1,033,767 | ) | | | $ | (516,730 | ) |
| | | | | | | | | | | | | | | | | | | | | | | | |
101
Statements of Changes in Net Assets
| | | | | | | | |
| | | Sterling Capital
Select Equity
Fund | |
| | | For the
Year Ended
September 30,
2011 | | | For the
Year Ended
September 30,
2010 | |
From Investment Activities: | | | | | | | | |
Operations: | | | | | | | | |
Net investment income (loss) | | $ | 2,540,187 | | | $ | 2,515,781 | |
Net realized gain | | | 9,711,265 | | | | 24,408,867 | |
Change in unrealized appreciation/depreciation | | | (19,231,933 | ) | | | (14,644,751 | ) |
| | | | | | | | |
Change in net assets from operations | | | (6,980,481 | ) | | | 12,279,897 | |
| | | | | | | | |
Distributions to Class A Shareholders: | | | | | | | | |
Net investment income | | | (278,699 | ) | | | (304,109 | ) |
Distributions to Class B Shareholders: | | | | | | | | |
Net investment income | | | (4,449 | ) | | | (9,130 | ) |
Distributions to Class C Shareholders: | | | | | | | | |
Net investment income | | | (482 | ) | | | (385 | ) |
Distributions to Institutional Class Shareholders: | | | | | | | | |
Net investment income | | | (2,246,205 | ) | | | (2,340,083 | ) |
Distributions to Class R Shareholders: | | | | | | | | |
Net investment income | | | — | | | | — | |
| | | | | | | | |
Change in net assets from shareholder distributions | | | (2,529,835 | ) | | | (2,653,707 | ) |
| | | | | | | | |
Capital Transactions: | | | | | | | | |
Change in net assets from capital transactions | | | (22,827,529 | ) | | | (5,364,722 | ) |
| | | | | | | | |
Change in net assets | | | (32,337,845 | ) | | | 4,261,468 | |
Net Assets: | | | | | | | | |
Beginning of year | | | 215,870,058 | | | | 211,608,590 | |
| | | | | | | | |
End of year | | $ | 183,532,213 | | | $ | 215,870,058 | |
| | | | | | | | |
Accumulated undistributed net investment income | | $ | 59,967 | | | $ | 49,615 | |
| | | | | | | | |
See accompanying notes to the financial statements.
102
| | | | | | | | | | | | | | |
Sterling Capital
Mid Value
Fund | | | Sterling Capital
Small Value
Fund | |
For the
Year Ended
September 30,
2011 | | | For the
Year Ended
September 30,
2010 | | | For the
Year Ended
September 30,
2011 | | | For the
Year Ended
September 30,
2010 | |
| | | | | | | | | | | | | | | |
| | | | | | | | | | | | | | | |
| $ | 2,084,861 | | | $ | 1,548,036 | | | $ | (141,422 | ) | | $ | 289,641 | |
| | 17,824,487 | | | | 10,152,026 | | | | 10,713,879 | | | | 2,995,648 | |
| | (38,208,279 | ) | | | 22,306,272 | | | | (15,856,005 | ) | | | 1,117,930 | |
| | | | | | | | | | | | | | |
| | (18,298,931 | ) | | | 34,006,334 | | | | (5,283,548 | ) | | | 4,403,219 | |
| | | | | | | | | | | | | | |
| | | | | | | | | | | | | | | |
| | (83,097 | ) | | | (41,826 | ) | | | — | | | | (16,230 | ) |
| | | | | | | | | | | | | | | |
| | — | | | | (578 | ) | | | — | | | | — | |
| | | | | | | | | | | | | | | |
| | — | | | | (86 | ) | | | — | | | | (29 | ) |
| | | | | | | | | | | | | | | |
| | (2,065,891 | ) | | | (1,422,492 | ) | | | — | | | | (309,695 | ) |
| | | | | | | | | | | | | | | |
| | (1 | ) | | | — | | | | — | | | | — | |
| | | | | | | | | | | | | | |
| | (2,148,989 | ) | | | (1,464,982 | ) | | | — | | | | (325,954 | ) |
| | | | | | | | | | | | | | |
| | | | | | | | | | | | | | | |
| | (2,074,023 | ) | | | 95,353,552 | | | | 10,598,838 | | | | 36,583,697 | |
| | | | | | | | | | | | | | |
| | (22,521,943 | ) | | | 127,894,904 | | | | 5,315,290 | | | | 40,660,962 | |
| | | | | | | | | | | | | | | |
| | 342,572,224 | | | | 214,677,320 | | | | 66,450,855 | | | | 25,789,893 | |
| | | | | | | | | | | | | | |
| $ | 320,050,281 | | | $ | 342,572,224 | | | $ | 71,766,145 | | | $ | 66,450,855 | |
| | | | | | | | | | | | | | |
| $ | 362,628 | | | $ | 426,756 | | | $ | 586 | | | $ | 474 | |
| | | | | | | | | | | | | | |
103
Statements of Changes in Net Assets, continued
| | | | | | | | |
| | |
Sterling Capital
International Fund | |
| | | For the
Year Ended
September 30,
2011 | | | For the
Year Ended
September 30,
2010 | |
From Investment Activities: | | | | | | | | |
Operations: | | | | | | | | |
Net investment income (loss) | | $ | 513,624 | | | $ | 586,579 | |
Net realized gain (loss) | | | 2,240,185 | | | | 6,020,933 | |
Change in unrealized appreciation/depreciation | | | (16,772,529 | ) | | | (4,746,409 | ) |
| | | | | | | | |
Change in net assets from operations | | | (14,018,720 | ) | | | 1,861,103 | |
| | | | | | | | |
Distributions to Class A Shareholders: | | | | | | | | |
Net investment income | | | — | | | | (71,166 | ) |
Net realized gains from investment transactions | | | — | | | | — | |
Distributions to Class B Shareholders: | | | | | | | | |
Net investment income | | | — | | | | (13,417 | ) |
Net realized gains from investment transactions | | | — | | | | — | |
Distributions to Class C Shareholders: | | | | | | | | |
Net investment income | | | — | | | | (1,289 | ) |
Net realized gains from investment transactions | | | — | | | | — | |
Distributions to Institutional Class Shareholders: | | | | | | | | |
Net investment income | | | — | | | | (1,704,204 | ) |
Net realized gains from investment transactions | | | — | | | | — | |
Distributions to Class R Shareholders: | | | | | | | | |
Net investment income | | | — | | | | — | |
Net realized gains from investment transactions | | | — | | | | — | |
| | | | | | | | |
Change in net assets from shareholder distributions | | | — | | | | (1,790,076 | ) |
| | | | | | | | |
Capital Transactions: | | | | | | | | |
Change in net assets from capital transactions | | | (4,048,662 | ) | | | (5,244,613 | ) |
| | | | | | | | |
Change in net assets | | | (18,067,382 | ) | | | (5,173,586 | ) |
Net Assets: | | | | | | | | |
Beginning of year | | | 80,853,502 | | | | 86,027,088 | |
| | | | | | | | |
End of year | | $ | 62,786,120 | | | $ | 80,853,502 | |
| | | | | | | | |
Accumulated undistributed (distributions in excess of) net investment income | | $ | 368,953 | | | $ | 36,240 | |
| | | | | | | | |
See accompanying notes to the financial statements.
104
| | | | | | | | | | | | | | | | | | | | | | |
Sterling Capital
Special Opportunities
Fund | | | Sterling Capital
Equity Income
Fund | | | Sterling Capital
Short-Term
Bond Fund | |
For the
Year Ended
September 30,
2011 | | | For the
Year Ended
September 30,
2010 | | | For the
Year Ended
September 30,
2011 | | | For the
Year Ended
September 30,
2010 | | | For the
Year Ended
September 30,
2011 | | | For the
Year Ended
September 30,
2010 | |
| | | | | | | | | | | | | | | | | | | | | | | |
| | | | | | | | | | | | | | | | | | | | | | | |
| $ | (2,246,423 | ) | | $ | (2,062,780 | ) | | $ | 11,883,096 | | | $ | 9,692,908 | | | $ | 1,311,920 | | | $ | 1,376,789 | |
| | 13,214,735 | | | | 30,972,685 | | | | 6,664,899 | | | | (4,833,681 | ) | | | 471,941 | | | | 81,049 | |
| | (46,399,921 | ) | | | 13,174,524 | | | | (15,758,361 | ) | | | 53,749,905 | | | | (1,799,676 | ) | | | 569,208 | |
| | | | | | | | | | | | | | | | | | | | | | |
| | (35,431,609 | ) | | | 42,084,429 | | | | 2,789,634 | | | | 58,609,132 | | | | (15,815 | ) | | | 2,027,046 | |
| | | | | | | | | | | | | | | | | | | | | | |
| | | | | | | | | | | | | | | | | | | | | | | |
| | — | | | | — | | | | (2,850,034 | ) | | | (2,432,974 | ) | | | (251,475 | ) | | | (159,210 | ) |
| | (1,245,005 | ) | | | — | | | | — | | | | — | | | | — | | | | — | |
| | | | | | | | | | | | | | | | | | | | | | | |
| | — | | | | — | | | | (78,899 | ) | | | (165,165 | ) | | | — | | | | — | |
| | (143,250 | ) | | | — | | | | — | | | | — | | | | — | | | | — | |
| | | | | | | | | | | | | | | | | | | | | | | |
| | — | | | | — | | | | (645,175 | ) | | | (715,612 | ) | | | — | | | | — | |
| | (482,193 | ) | | | — | | | | — | | | | — | | | | — | | | | — | |
| | | | | | | | | | | | | | | | | | | | | | | |
| | — | | | | — | | | | (5,972,929 | ) | | | (4,712,617 | ) | | | (1,928,036 | ) | | | (1,812,725 | ) |
| | (1,609,782 | ) | | | — | | | | — | | | | — | | | | — | | | | — | |
| | | | | | | | | | | | | | | | | | | | | | | |
| | — | | | | — | | | | (3,869 | ) | | | (2 | ) | | | — | | | | — | |
| | (23 | ) | | | — | | | | — | | | | — | | | | — | | | | — | |
| | | | | | | | | | | | | | | | | | | | | | |
| | (3,480,253 | ) | | | — | | | | (9,550,906 | ) | | | (8,026,370 | ) | | | (2,179,511 | ) | | | (1,971,935 | ) |
| | | | | | | | | | | | | | | | | | | | | | |
| | | | | | | | | | | | | | | | | | | | | | | |
| | 102,072,915 | | | | 24,952,684 | | | | 267,797,359 | | | | 83,296,249 | | | | (2,276,535 | ) | | | 3,749,020 | |
| | | | | | | | | | | | | | | | | | | | | | |
| | 63,161,053 | | | | 67,037,113 | | | | 261,036,087 | | | | 133,879,011 | | | | (4,471,861 | ) | | | 3,804,131 | |
| | | | | | | | | | | | | | | | | | | | | | | |
| | 553,324,309 | | | | 486,287,196 | | | | 463,371,668 | | | | 329,492,657 | | | | 67,836,183 | | | | 64,032,052 | |
| | | | | | | | | | | | | | | | | | | | | | |
| $ | 616,485,362 | | | $ | 553,324,309 | | | $ | 724,407,755 | | | $ | 463,371,668 | | | $ | 63,364,322 | | | $ | 67,836,183 | |
| | | | | | | | | | | | | | | | | | | | | | |
| $ | 7,193 | | | $ | 10,372 | | | $ | 508,249 | | | $ | 117,587 | | | $ | (69,864 | ) | | $ | (61,308 | ) |
| | | | | | | | | | | | | | | | | | | | | | |
105
Statements of Changes in Net Assets, continued
| | | | | | | | |
| | |
Sterling Capital
Intermediate U.S.
Government Fund | |
| | | For the
Year Ended
September 30,
2011 | | | For the
Year Ended
September 30,
2010 | |
From Investment Activities: | | | | | | | | |
Operations: | | | | | | | | |
Net investment income | | $ | 4,696,520 | | | $ | 6,080,730 | |
Net realized gain | | | 364,812 | | | | 358,846 | |
Change in unrealized appreciation/depreciation | | | 519,239 | | | | 4,980,048 | |
| | | | | | | | |
Change in net assets from operations | | | 5,580,571 | | | | 11,419,624 | |
| | | | | | | | |
Distributions to Class A Shareholders: | | | | | | | | |
Net investment income | | | (388,302 | ) | | | (374,693 | ) |
Net realized gains from investment transactions | | | — | | | | — | |
Distributions to Class B Shareholders: | | | | | | | | |
Net investment income | | | (44,359 | ) | | | (68,197 | ) |
Net realized gains from investment transactions | | | — | | | | — | |
Distributions to Class C Shareholders: | | | | | | | | |
Net investment income | | | (12,479 | ) | | | (9,864 | ) |
Net realized gains from investment transactions | | | — | | | | — | |
Distributions to Institutional Class Shareholders: | | | | | | | | |
Net investment income | | | (5,383,635 | ) | | | (6,151,978 | ) |
Net realized gains from investment transactions | | | — | | | | — | |
Distributions to Class R Shareholders: | | | | | | | | |
Net investment income | | | — | | | | — | |
Net realized gains from investment transactions | | | — | | | | — | |
| | | | | | | | |
Change in net assets from shareholder distributions | | | (5,828,775 | ) | | | (6,604,732 | ) |
| | | | | | | | |
Capital Transactions: | | | | | | | | |
Change in net assets from capital transactions | | | (21,876,200 | ) | | | (4,946,835 | ) |
| | | | | | | | |
Change in net assets | | | (22,124,404 | ) | | | (131,943 | ) |
Net Assets: | | | | | | | | |
Beginning of year | | | 193,556,809 | | | | 193,688,752 | |
| | | | | | | | |
End of year | | $ | 171,432,405 | | | $ | 193,556,809 | |
| | | | | | | | |
Accumulated undistributed net investment income | | $ | 1,563,584 | | | $ | 1,781,240 | |
| | | | | | | | |
See accompanying notes to the financial statements.
106
| | | | | | | | | | | | | | | | | | | | | | |
Sterling Capital
Total Return
Bond Fund | | | Sterling Capital
Kentucky
Intermediate
Tax-Free Fund | | | Sterling Capital
Maryland
Intermediate
Tax-Free Fund | |
For the
Year Ended
September 30,
2011 | | | For the
Year Ended
September 30,
2010 | | | For the
Year Ended
September 30,
2011 | | | For the
Year Ended
September 30,
2010 | | | For the
Year Ended
September 30,
2011 | | | For the
Year Ended
September 30,
2010 | |
| | | | | | | | | | | | | | | | | | | | | | | |
| | | | | | | | | | | | | | | | | | | | | | | |
| $ | 15,608,318 | | | $ | 16,142,317 | | | $ | 667,405 | | | $ | 643,601 | | | $ | 975,080 | | | $ | 927,333 | |
| | 14,268,158 | | | | 11,061,276 | | | | 51,975 | | | | 240,755 | | | | 211,605 | | | | 134,739 | |
| | (13,665,787 | ) | | | 11,242,260 | | | | (55,570 | ) | | | 315,084 | | | | (157,407 | ) | | | 692,202 | |
| | | | | | | | | | | | | | | | | | | | | | |
| | 16,210,689 | | | | 38,445,853 | | | | 663,810 | | | | 1,199,440 | | | | 1,029,278 | | | | 1,754,274 | |
| | | | | | | | | | | | | | | | | | | | | | |
| | | | | | | | | | | | | | | | | | | | | | | |
| | (1,348,602 | ) | | | (996,048 | ) | | | (227,910 | ) | | | (214,321 | ) | | | (254,810 | ) | | | (247,523 | ) |
| | (634,430 | ) | | | (13,422 | ) | | | (38,264 | ) | | | (73,964 | ) | | | (39,478 | ) | | | (1,441 | ) |
| | | | | | | | | | | | | | | | | | | | | | | |
| | (142,390 | ) | | | (188,149 | ) | | | — | | | | — | | | | — | | | | — | |
| | (87,766 | ) | | | (3,855 | ) | | | — | | | | — | | | | — | | | | — | |
| | | | | | | | | | | | | | | | | | | | | | | |
| | (90,958 | ) | | | (40,862 | ) | | | — | | | | — | | | | — | | | | — | |
| | (45,094 | ) | | | (356 | ) | | | — | | | | — | | | | — | | | | — | |
| | | | | | | | | | | | | | | | | | | | | | | |
| | (16,555,119 | ) | | | (17,065,752 | ) | | | (437,764 | ) | | | (427,340 | ) | | | (717,536 | ) | | | (676,872 | ) |
| | (7,357,525 | ) | | | (255,197 | ) | | | (72,893 | ) | | | (134,098 | ) | | | (93,115 | ) | | | (3,717 | ) |
| | | | | | | | | | | | | | | | | | | | | | | |
| | (286 | ) | | | (442 | ) | | | — | | | | — | | | | — | | | | — | |
| | (102 | ) | | | — | | | | — | | | | — | | | | — | | | | — | |
| | | | | | | | | | | | | | | | | | | | | | |
| | (26,262,272 | ) | | | (18,564,083 | ) | | | (776,831 | ) | | | (849,723 | ) | | | (1,104,939 | ) | | | (929,553 | ) |
| | | | | | | | | | | | | | | | | | | | | | |
| | | | | | | | | | | | | | | | | | | | | | | |
| | 16,123,293 | | | | 41,144,313 | | | | (1,064,194 | ) | | | 3,501,264 | | | | (3,603,399 | ) | | | 8,284,070 | |
| | | | | | | | | | | | | | | | | | | | | | |
| | 6,071,710 | | | | 61,026,083 | | | | (1,177,215 | ) | | | 3,850,981 | | | | (3,679,060 | ) | | | 9,108,791 | |
| | | | | | | | | | | | | | | | | | | | | | | |
| | 422,277,422 | | | | 361,251,339 | | | | 23,663,822 | | | | 19,812,841 | | | | 38,085,394 | | | | 28,976,603 | |
| | | | | | | | | | | | | | | | | | | | | | |
| $ | 428,349,132 | | | $ | 422,277,422 | | | $ | 22,486,607 | | | $ | 23,663,822 | | | $ | 34,406,334 | | | $ | 38,085,394 | |
| | | | | | | | | | | | | | | | | | | | | | |
| $ | 801,183 | | | $ | 445,395 | | | $ | 2,445 | | | $ | 2,442 | | | $ | 381 | | | $ | 381 | |
| | | | | | | | | | | | | | | | | | | | | | |
107
Statements of Changes in Net Assets, continued
| | | | | | | | |
| | | Sterling Capital
North Carolina
Intermediate
Tax-Free Fund | |
| | | For the Year
Ended
September 30,
2011 | | | For the Year
Ended
September 30,
2010 | |
From Investment Activities: | | | | | | | | |
Operations: | | | | | | | | |
Net investment income | | $ | 5,810,148 | | | $ | 5,266,844 | |
Net realized gain | | | 1,254,011 | | | | 1,068,103 | |
Change in unrealized appreciation/depreciation | | | 382,912 | | | | 2,695,776 | |
| | | | | | | | |
Change in net assets from operations | | | 7,447,071 | | | | 9,030,723 | |
| | | | | | | | |
Distributions to Class A Shareholders: | | | | | | | | |
Net investment income | | | (1,315,194 | ) | | | (1,054,124 | ) |
Net realized gains from investment transactions | | | (262,531 | ) | | | (198,488 | ) |
Distributions to Institutional Class Shareholders: | | | | | | | | |
Net investment income | | | (4,485,011 | ) | | | (4,204,568 | ) |
Net realized gains from investment transactions | | | (794,016 | ) | | | (797,240 | ) |
| | | | | | | | |
Change in net assets from shareholder distributions | | | (6,856,752 | ) | | | (6,254,420 | ) |
| | | | | | | | |
Capital Transactions: | | | | | | | | |
Change in net assets from capital transactions | | | 17,781,903 | | | | 31,752,598 | |
| | | | | | | | |
Change in net assets | | | 18,372,222 | | | | 34,528,901 | |
Net Assets: | | | | | | | | |
Beginning of year | | | 194,407,550 | | | | 159,878,649 | |
| | | | | | | | |
End of year | | $ | 212,779,772 | | | $ | 194,407,550 | |
| | | | | | | | |
Accumulated undistributed (distributions in excess of) net investment income | | $ | 69,242 | | | $ | 69,116 | |
| | | | | | | | |
See accompanying notes to the financial statements.
108
| | | | | | | | | | | | | | | | | | | | | | |
Sterling Capital
South Carolina
Intermediate
Tax-Free Fund | | | Sterling Capital
Virginia
Intermediate
Tax-Free Fund | | | Sterling Capital
West Virginia
Intermediate
Tax-Free Fund | |
For the
Year Ended
September 30,
2011 | | | For the
Year Ended
September 30,
2010 | | | For the
Year Ended
September 30,
2011 | | | For the
Year Ended
September 30,
2010 | | | For the
Year Ended
September 30,
2011 | | | For the
Year Ended
September 30,
2010 | |
| | �� | | | | | | | | | | | | | | | | | | | | | |
| | | | | | | | | | | | | | | | | | | | | | | |
| $ | 1,327,866 | | | $ | 1,064,858 | | | $ | 3,195,904 | | | $ | 2,993,723 | | | $ | 3,450,322 | | | $ | 3,175,509 | |
| | 259,552 | | | | 149,905 | | | | 213,879 | | | | 377,135 | | | | 415,515 | | | | 104,867 | |
| | 239,280 | | | | 913,311 | | | | 81,055 | | | | 1,412,409 | | | | (379,139 | ) | | | 1,431,326 | |
| | | | | | | | | | | | | | | | | | | | | | |
| | 1,826,698 | | | | 2,128,074 | | | | 3,490,838 | | | | 4,783,267 | | | | 3,486,698 | | | | 4,711,702 | |
| | | | | | | | | | | | | | | | | | | | | | |
| | | | | | | | | | | | | | | | | | | | | | | |
| | (376,076) | | | | (346,635 | ) | | | (973,747 | ) | | | (732,727 | ) | | | (961,280 | ) | | | (780,468 | ) |
| | (41,431) | | | | — | | | | (121,044 | ) | | | (209,494 | ) | | | (29,936 | ) | | | (32,736 | ) |
| | | | | | | | | | | | | | | | | | | | | | | |
| | (946,666) | | | | (711,699 | ) | | | (2,220,233 | ) | | | (2,259,089 | ) | | | (2,468,656 | ) | | | (2,375,666 | ) |
| | (92,871) | | | | — | | | | (245,955 | ) | | | (663,572 | ) | | | (70,247 | ) | | | (104,016 | ) |
| | | | | | | | | | | | | | | | | | | | | | |
| | (1,457,044) | | | | (1,058,334 | ) | | | (3,560,979 | ) | | | (3,864,882 | ) | | | (3,530,119 | ) | | | (3,292,886 | ) |
| | | | | | | | | | | | | | | | | | | | | | |
| | | | | | | | | | | | | | | | | | | | | | | |
| | 10,357,591 | | | | 15,874,992 | | | | 5,330,656 | | | | 19,757,902 | | | | 4,666,863 | | | | 16,082,320 | |
| | | | | | | | | | | | | | | | | | | | | | |
| | 10,727,245 | | | | 16,944,732 | | | | 5,260,515 | | | | 20,676,287 | | | | 4,623,442 | | | | 17,501,136 | |
| | | | | | | | | | | | | | | | | | | | | | | |
| | 45,473,526 | | | | 28,528,794 | | | | 112,505,537 | | | | 91,829,250 | | | | 100,618,401 | | | | 83,117,265 | |
| | | | | | | | | | | | | | | | | | | | | | |
| $ | 56,200,771 | | | $ | 45,473,526 | | | $ | 117,766,052 | | | $ | 112,505,537 | | | $ | 105,241,843 | | | $ | 100,618,401 | |
| | | | | | | | | | | | | | | | | | | | | | |
| $ | 3,745 | | | $ | 2,876 | | | $ | 41,556 | | | $ | 41,557 | | | $ | (36,286 | ) | | $ | (38,193 | ) |
| | | | | | | | | | | | | | | | | | | | | | |
109
Statements of Changes in Net Assets, continued
| | | | | | | | |
| | | Sterling Capital
National Tax-Free
Money Market Fund | |
| | | For the
Year Ended
September 30,
2011 | | | For the
Year Ended
September 30,
2010 | |
From Investment Activities: | | | | | | | | |
Operations: | | | | | | | | |
Net investment income | | $ | 23,995 | | | $ | 67,893 | |
Net realized gain (loss) | | | 166 | | | | 235 | |
Change in unrealized appreciation/depreciation | | | — | | | | — | |
| | | | | | | | |
Change in net assets from operations | | | 24,161 | | | | 68,128 | |
| | | | | | | | |
Distributions to Class A Shareholders: | | | | | | | | |
Net investment income | | | (9 | ) | | | (6 | ) |
Distributions to Class B Shareholders: | | | | | | | | |
Net investment income | | | — | | | | — | |
Distributions to Class C Shareholders: | | | | | | | | |
Net investment income | | | — | | | | — | |
Distributions to Institutional Class Shareholders: | | | | | | | | |
Net investment income | | | (23,986 | ) | | | (67,887 | ) |
| | | | | | | | |
Change in net assets from shareholder distributions | | | (23,995 | ) | | | (67,893 | ) |
| | | | | | | | |
Capital Transactions: | | | | | | | | |
Change in net assets from capital transactions | | | (1,696,414 | ) | | | (105,450,174 | ) |
| | | | | | | | |
Change in net assets | | | (1,696,248 | ) | | | (105,449,939 | ) |
Net Assets: | | | | | | | | |
Beginning of year | | | 155,488,831 | | | | 260,938,770 | |
| | | | | | | | |
End of year | | $ | 153,792,583 | | | $ | 155,488,831 | |
| | | | | | | | |
Accumulated undistributed (distributions in excess of) net investment income | | $ | 1,289 | | | $ | 1,123 | |
| | | | | | | | |
See accompanying notes to the financial statements.
110
| | | | | | | | | | | | | | | | | | | | | | |
Sterling Capital
Prime Money
Market Fund | | | Sterling Capital
U.S. Treasury
Money Market Fund | | | Sterling Capital
Strategic Allocation
Conservative Fund | |
For the
Year Ended
September 30,
2011 | | | For the
Year Ended
September 30,
2010 | | | For the
Year Ended
September 30,
2011 | | | For the
Year Ended
September 30,
2010 | | | For the
Year Ended
September 30,
2011 | | | For the
Year Ended
September 30,
2010 | |
| | | | | | | | | | | | | | | | | | | | | | | |
| | | | | | | | | | | | | | | | | | | | | | | |
| $ | 59,819 | | | $ | 329,532 | | | $ | 29,377 | | | $ | 277,603 | | | $ | 354,239 | | | $ | 424,657 | |
| | — | | | | (18,963 | ) | | | — | | | | — | | | | 238,248 | | | | 310,195 | |
| | — | | | | — | | | | — | | | | — | | | | (799,965 | ) | | | 632,753 | |
| | | | | | | | | | | | | | | | | | | | | | |
| | 59,819 | | | | 310,569 | | | | 29,377 | | | | 277,603 | | | | (207,478 | ) | | | 1,367,605 | |
| | | | | | | | | | | | | | | | | | | | | | |
| | | | | | | | | | | | | | | | | | | | | | | |
| | (17,002 | ) | | | (94,245 | ) | | | (13,291 | ) | | | (99,439 | ) | | | (263,358 | ) | | | (208,070 | ) |
| | | | | | | | | | | | | | | | | | | | | | | |
| | (117 | ) | | | (806 | ) | | | (56 | ) | | | (487 | ) | | | (51,279 | ) | | | (57,985 | ) |
| | | | | | | | | | | | | | | | | | | | | | | |
| | (51 | ) | | | (301 | ) | | | (7 | ) | | | (78 | ) | | | (3,330 | ) | | | (2,907 | ) |
| | | | | | | | | | | | | | | | | | | | | | | |
| | (42,650 | ) | | | (234,180 | ) | | | (16,023 | ) | | | (177,599 | ) | | | (138,193 | ) | | | (160,463 | ) |
| | | | | | | | | | | | | | | | | | | | | | |
| | (59,820 | ) | | | (329,532 | ) | | | (29,377 | ) | | | (277,603 | ) | | | (456,160 | ) | | | (429,425 | ) |
| | | | | | | | | | | | | | | | | | | | | | |
| | | | | | | | | | | | | | | | | | | | | | | |
| | (77,250,419 | ) | | | (582,591,430 | ) | | | (97,117,179 | ) | | | (256,426,060 | ) | | | 2,713,470 | | | | (911,665 | ) |
| | | | | | | | | | | | | | | | | | | | | | |
| | (77,250,420 | ) | | | (582,610,393 | ) | | | (97,117,179 | ) | | | (256,426,060 | ) | | | 2,049,832 | | | | 26,515 | |
| | | | | | | | | | | | | | | | | | | | | | | |
| | 570,772,656 | | | | 1,153,383,049 | | | | 345,410,697 | | | | 601,836,757 | | | | 14,557,247 | | | | 14,530,732 | |
| | | | | | | | | | | | | | | | | | | | | | |
| $ | 493,522,236 | | | $ | 570,772,656 | | | $ | 248,293,518 | | | $ | 345,410,697 | | | $ | 16,607,079 | | | $ | 14,557,247 | |
| | | | | | | | | | | | | | | | | | | | | | |
| $ | 2,202 | | | $ | 2,203 | | | $ | 2,052 | | | $ | 2,052 | | | $ | 965 | | | $ | (3 | ) |
| | | | | | | | | | | | | | | | | | | | | | |
111
Statements of Changes in Net Assets, continued
| | | | | | | | |
| | | Sterling Capital
Strategic Allocation
Balanced Fund | |
| | | For the
Year Ended
September 30,
2011 | | | For the
Year Ended
September 30,
2010 | |
From Investment Activities: | | | | | | | | |
Operations: | | | | | | | | |
Net investment income | | $ | 568,048 | | | $ | 763,481 | |
Net realized gain (loss) | | | 575,798 | | | | (2,683,861 | ) |
Change in unrealized appreciation/depreciation | | | (2,118,015 | ) | | | 5,475,263 | |
| | | | | | | | |
Change in net assets from operations | | | (974,169 | ) | | | 3,554,883 | |
| | | | | | | | |
Distributions to Class A Shareholders: | | | | | | | | |
Net investment income | | | (555,638 | ) | | | (573,059 | ) |
Distributions to Class B Shareholders: | | | | | | | | |
Net investment income | | | (117,926 | ) | | | (164,202 | ) |
Distributions to Class C Shareholders: | | | | | | | | |
Net investment income | | | (3,965 | ) | | | (2,023 | ) |
Distributions to Institutional Class Shareholders: | | | | | | | | |
Net investment income | | | (19,747 | ) | | | (30,576 | ) |
| | | | | | | | |
Change in net assets from shareholder distributions | | | (697,276 | ) | | | (769,860 | ) |
| | | | | | | | |
Capital Transactions: | | | | | | | | |
Change in net assets from capital transactions | | | (2,244,133 | ) | | | (3,811,025 | ) |
| | | | | | | | |
Change in net assets | | | (3,915,578 | ) | | | (1,026,002 | ) |
Net Assets: | | | | | | | | |
Beginning of year | | | 36,544,661 | | | | 37,570,663 | |
| | | | | | | | |
End of year | | $ | 32,629,083 | | | $ | 36,544,661 | |
| | | | | | | | |
Accumulated undistributed (distributions in excess of) net investment income | | $ | 981 | | | $ | 1 | |
| | | | | | | | |
See accompanying notes to the financial statements.
112
| | | | | | | | | | | | | | |
Sterling Capital
Strategic Allocation
Growth Fund | | | Sterling Capital
Strategic Allocation
Equity Fund | |
For the
Year Ended
September 30,
2011 | | | For the
Year Ended
September 30,
2010 | | | For the
Year Ended
September 30,
2011 | | | For the
Year Ended
September 30,
2010 | |
| | | | | | | | | | | | | | | |
| | | | | | | | | | | | | | | |
| $ | 301,971 | | | $ | 439,669 | | | $ | 55,247 | | | $ | 94,920 | |
| | 317,806 | | | | (2,656,759 | ) | | | 84,689 | | | | (972,536 | ) |
| | (1,653,544 | ) | | | 4,826,126 | | | | (656,666 | ) | | | 1,701,090 | |
| | | | | | | | | | | | | | |
| | (1,033,767 | ) | | | 2,609,036 | | | | (516,730 | ) | | | 823,474 | |
| | | | | | | | | | | | | | |
| | | | | | | | | | | | | | | |
| | (253,260 | ) | | | (310,591 | ) | | | (36,522 | ) | | | (73,354 | ) |
| | | | | | | | | | | | | | | |
| | (61,068 | ) | | | (96,586 | ) | | | (19,158 | ) | | | (18,738 | ) |
| | | | | | | | | | | | | | | |
| | (1,574 | ) | | | (1,507 | ) | | | (108 | ) | | | (103 | ) |
| | | | | | | | | | | | | | | |
| | (25,014 | ) | | | (33,543 | ) | | | (471 | ) | | | (2,733 | ) |
| | | | | | | | | | | | | | |
| | (340,916 | ) | | | (442,227 | ) | | | (56,259 | ) | | | (94,928 | ) |
| | | | | | | | | | | | | | |
| | | | | | | | | | | | | | | |
| | (3,459,430 | ) | | | (2,543,776 | ) | | | (763,412 | ) | | | (1,546,946 | ) |
| | | | | | | | | | | | | | |
| | (4,834,113 | ) | | | (376,967 | ) | | | (1,336,401 | ) | | | (818,400 | ) |
| | | | | | | | | | | | | | | |
| | 27,954,283 | | | | 28,331,250 | | | | 8,904,724 | | | | 9,723,124 | |
| | | | | | | | | | | | | | |
| $ | 23,120,170 | | | $ | 27,954,283 | | | $ | 7,568,323 | | | $ | 8,904,724 | |
| | | | | | | | | | | | | | |
| $ | 270 | | | $ | 16 | | | $ | — | | | $ | (8 | ) |
| | | | | | | | | | | | | | |
113
Statements of Changes in Net Assets, continued
| | | | | | | | |
| | |
Sterling Capital
Select Equity
Fund | |
| | | For the
Year Ended
September 30,
2011 | | | For the
Year Ended
September 30,
2010 | |
Capital Transactions: | | | | | | | | |
Class A Shares: | | | | | | | | |
Proceeds from shares issued | | $ | 1,306,679 | | | $ | 1,873,968 | |
Proceeds from shares issued in reorganization | | | — | | | | — | |
Distributions reinvested | | | 273,561 | | | | 298,975 | |
Value of shares redeemed. | | | (4,558,635 | ) | | | (3,884,963 | ) |
| | | | | | | | |
Change in net assets from Class A Share transactions | | | (2,978,395 | ) | | | (1,712,020 | ) |
Class B Shares: | | | | | | | | |
Proceeds from shares issued | | | — | | | | 3,397 | |
Proceeds from shares issued in reorganization | | | — | | | | — | |
Distributions reinvested | | | 4,426 | | | | 9,086 | |
Value of shares redeemed. | | | (1,183,282 | ) | | | (1,586,831 | ) |
| | | | | | | | |
Change in net assets from Class B Share transactions | | | (1,178,856 | ) | | | (1,574,348 | ) |
Class C Shares: | | | | | | | | |
Proceeds from shares issued | | | 446,921 | | | | 37,394 | |
Proceeds from shares issued in reorganization | | | — | | | | — | |
Distributions reinvested | | | 468 | | | | 364 | |
Value of shares redeemed. | | | (350,213 | ) | | | (25,101 | ) |
| | | | | | | | |
Change in net assets from Class C Share transactions | | | 97,176 | | | | 12,657 | |
Institutional Shares: | | | | | | | | |
Proceeds from shares issued | | | 13,216,687 | | | | 25,938,993 | |
Proceeds from shares issued in reorganization | | | — | | | | — | |
Distributions reinvested | | | 2,052,268 | | | | 2,142,283 | |
Value of shares redeemed. | | | (34,036,409 | ) | | | (30,172,287 | ) |
| | | | | | | | |
Change in net assets from Institutional Share transactions | | | (18,767,454 | ) | | | (2,091,011 | ) |
Class R Shares: | | | | | | | | |
Proceeds from shares issued | | | — | | | | — | |
Distributions reinvested | | | — | | | | — | |
| | | | | | | | |
Change in net assets from Class R Share transactions | | | — | | | | — | |
| | | | | | | | |
Change in net assets from capital transactions | | $ | (22,827,529 | ) | | $ | (5,364,722 | ) |
| | | | | | | | |
Share Transactions: | | | | | | | | |
Class A Shares: | | | | | | | | |
Issued | | | 113,406 | | | | 178,138 | |
Issued in reorganization | | | — | | | | — | |
Reinvested | | | 23,879 | | | | 28,862 | |
Redeemed. | | | (394,692 | ) | | | (370,283 | ) |
| | | | | | | | |
Change in Class A Shares | | | (257,407 | ) | | | (163,283 | ) |
Class B Shares: | | | | | | | | |
Issued | | | — | | | | 325 | |
Issued in reorganization | | | — | | | | — | |
Reinvested | | | 383 | | | | 910 | |
Redeemed. | | | (104,881 | ) | | | (153,876 | ) |
| | | | | | | | |
Change in Class B Shares | | | (104,498 | ) | | | (152,641 | ) |
Class C Shares: | | | | | | | | |
Issued | | | 37,539 | | | | 3,641 | |
Issued in reorganization | | | — | | | | — | |
Reinvested | | | 40 | | | | 36 | |
Redeemed. | | | (30,092 | ) | | | (2,424 | ) |
| | | | | | | | |
Change in Class C Shares | | | 7,487 | | | | 1,253 | |
Institutional Shares: | | | | | | | | |
Issued | | | 1,143,237 | | | | 2,497,662 | |
Issued in reorganization | | | — | | | | — | |
Reinvested | | | 178,555 | | | | 205,444 | |
Redeemed | | | (2,944,639 | ) | | | (2,864,323 | ) |
| | | | | | | | |
Change in Institutional Shares | | | (1,622,847 | ) | | | (161,217 | ) |
Class R Shares: | | | | | | | | |
Issued | | | — | | | | — | |
Reinvested | | | — | | | | — | |
| | | | | | | | |
Change in Class R Shares | | | — | | | | — | |
| | | | | | | | |
Change in Shares | | | (1,977,265 | ) | | | (475,888 | ) |
| | | | | | | | |
See accompanying notes to the financial statements.
114
| | | | | | | | | | | | | | |
Sterling Capital
Mid Value
Fund | | | Sterling Capital
Small Value
Fund | |
For the
Year Ended
September 30,
2011 | | | For the
Year Ended
September 30,
2010 | | | For the
Year Ended
September 30,
2011 | | | For the
Year Ended
September 30,
2010 | |
| | | | | | | | | | | | | | |
| | | | | | | | | | | | | | |
| $ | 4,129,954 | | | $ | 2,870,738 | | | $ | 2,453,868 | | | $ | 691,577 | |
| | — | | | | 5,898,265 | | | | — | | | | 4,823,599 | |
| | 82,160 | | | | 41,433 | | | | — | | | | 15,377 | |
| | (3,815,899 | ) | | | (2,431,070 | ) | | | (1,230,919 | ) | | | (438,388 | ) |
| | | | | | | | | | | | | | |
| | 396,215 | | | | 6,379,366 | | | | 1,222,949 | | | | 5,092,165 | |
| | | | | | | | | | | | | | |
| | 17,386 | | | | 18,231 | | | | 3,747 | | | | 20,551 | |
| | — | | | | 1,265,846 | | | | — | | | | 1,039,671 | |
| | — | | | | 578 | | | | — | | | | — | |
| | (1,156,345 | ) | | | (1,379,754 | ) | | | (400,005 | ) | | | (188,467 | ) |
| | | | | | | | | | | | | | |
| | (1,138,959 | ) | | | (95,099 | ) | | | (396,258 | ) | | | 871,755 | |
| | | | | | | | | | | | | | |
| | 142,570 | | | | 268,770 | | | | 41,541 | | | | 38,609 | |
| | — | | | | 72,648 | | | | — | | | | 17,265 | |
| | — | | | | 77 | | | | — | | | | 29 | |
| | (158,574 | ) | | | (120,962 | ) | | | (9,583 | ) | | | — | |
| | | | | | | | | | | | | | |
| | (16,004 | ) | | | 220,533 | | | | 31,958 | | | | 55,903 | |
| | | | | | | | | | | | | | |
| | 79,874,150 | | | | 90,925,122 | | | | 31,667,164 | | | | 25,776,748 | |
| | — | | | | 69,504,565 | | | | — | | | | 22,752,363 | |
| | 1,632,364 | | | | 1,113,413 | | | | — | | | | 282,125 | |
| | (82,821,790 | ) | | | (72,694,448 | ) | | | (21,926,975 | ) | | | (18,247,462 | ) |
| | | | | | | | | | | | | | |
| | (1,315,276 | ) | | | 88,848,652 | | | | 9,740,189 | | | | 30,563,774 | |
| | | | | | | | | | | | | | |
| | — | | | | 100 | | | | — | | | | 100 | |
| | 1 | | | | — | | | | — | | | | — | |
| | | | | | | | | | | | | | |
| | 1 | | | | 100 | | | | — | | | | 100 | |
| | | | | | | | | | | | | | |
| $ | (2,074,023 | ) | | $ | 95,353,552 | | | $ | 10,598,838 | | | $ | 36,583,697 | |
| | | | | | | | | | | | | | |
| | | | | | | | | | | | | | |
| | | | | | | | | | | | | | |
| | 299,913 | | | | 247,446 | | | | 184,213 | | | | 62,722 | |
| | — | | | | 533,366 | | | | — | | | | 457,112 | |
| | 6,200 | | | | 3,559 | | | | — | | | | 1,375 | |
| | (284,646 | ) | | | (212,223 | ) | | | (95,928 | ) | | | (39,502 | ) |
| | | | | | | | | | | | | | |
| | 21,467 | | | | 572,148 | | | | 88,285 | | | | 481,707 | |
| | | | | | | | | | | | | | |
| | 1,337 | | | | 1,630 | | | | 294 | | | | 1,770 | |
| | — | | | | 119,580 | | | | — | | | | 98,525 | |
| | — | | | | 54 | | | | — | | | | — | |
| | (89,801 | ) | | | (125,368 | ) | | | (30,375 | ) | | | (16,799 | ) |
| | | | | | | | | | | | | | |
| | (88,464 | ) | | | (4,104 | ) | | | (30,081 | ) | | | 83,496 | |
| | | | | | | | | | | | | | |
| | 10,736 | | | | 25,005 | | | | 3,284 | | | | 3,449 | |
| | — | | | | 6,874 | | | | — | | | | 1,636 | |
| | — | | | | 7 | | | | — | | | | 2 | |
| | (11,760 | ) | | | (10,998 | ) | | | (793 | ) | | | — | |
| | | | | | | | | | | | | | |
| | (1,024 | ) | | | 20,888 | | | | 2,491 | | | | 5,087 | |
| | | | | | | | | | | | | | |
| | 5,827,023 | | | | 7,899,523 | | | | 2,363,110 | | | | 2,348,845 | |
| | — | | | | 6,253,352 | | | | — | | | | 2,156,153 | |
| | 123,183 | | | | 94,163 | | | | — | | | | 25,419 | |
| | (6,098,326 | ) | | | (6,382,508 | ) | | | (1,729,664 | ) | | | (1,672,595 | ) |
| | | | | | | | | | | | | | |
| | (148,120 | ) | | | 7,864,530 | | | | 633,446 | | | | 2,857,822 | |
| | | | | | | | | | | | | | |
| | — | | | | 9 | | | | — | | | | 10 | |
| | — | (a) | | | — | | | | — | | | | — | |
| | | | | | | | | | | | | | |
| | — | | | | 9 | | | | — | | | | 10 | |
| | | | | | | | | | | | | | |
| | (216,141 | ) | | | 8,453,471 | | | | 694,141 | | | | 3,428,122 | |
| | | | | | | | | | | | | | |
115
Statements of Changes in Net Assets, continued
| | | | | | | | |
| | |
Sterling Capital
International Fund | |
| | | For the
Year Ended
September 30,
2011 | | | For the
Year Ended
September 30,
2010 | |
Capital Transactions: | | | | | | | | |
Class A Shares: | | | | | | | | |
Proceeds from shares issued | | $ | 544,336 | | | $ | 774,803 | |
Distributions reinvested | | | — | | | | 67,212 | |
Value of shares redeemed | | | (880,374 | ) | | | (412,591 | ) |
| | | | | | | | |
Change in net assets from Class A Share transactions | | | (336,038 | ) | | | 429,424 | |
Class B Shares: | | | | | | | | |
Proceeds from shares issued | | | 4,009 | | | | 12,418 | |
Distributions reinvested | | | — | | | | 13,416 | |
Value of shares redeemed | | | (227,364 | ) | | | (171,023 | ) |
| | | | | | | | |
Change in net assets from Class B Share transactions | | | (223,355 | ) | | | (145,189 | ) |
Class C Shares: | | | | | | | | |
Proceeds from shares issued | | | 33,240 | | | | 61,384 | |
Distributions reinvested | | | — | | | | 1,243 | |
Value of shares redeemed | | | (100,807 | ) | | | (64,606 | ) |
| | | | | | | | |
Change in net assets from Class C Share transactions | | | (67,567 | ) | | | (1,979 | ) |
Institutional Shares: | | | | | | | | |
Proceeds from shares issued | | | 11,055,206 | | | | 17,518,739 | |
Distributions reinvested | | | — | | | | 1,313,469 | |
Value of shares redeemed | | | (14,476,908 | ) | | | (24,359,077 | ) |
| | | | | | | | |
Change in net assets from Institutional Share transactions | | | (3,421,702 | ) | | | (5,526,869 | ) |
Class R Shares: | | | | | | | | |
Proceeds from shares issued | | | — | | | | — | |
Distributions reinvested | | | — | | | | — | |
Value of shares redeemed | | | — | | | | — | |
| | | | | | | | |
Change in net assets from Class R Share transactions | | | — | | | | — | |
| | | | | | | | |
Change in net assets from capital transactions | | $ | (4,048,662 | ) | | $ | (5,244,613 | ) |
| | | | | | | | |
Share Transactions: | | | | | | | | |
Class A Shares: | | | | | | | | |
Issued | | | 103,692 | | | | 157,914 | |
Reinvested | | | — | | | | 13,469 | |
Redeemed | | | (171,054 | ) | | | (86,475 | ) |
| | | | | | | | |
Change in Class A Shares | | | (67,362 | ) | | | 84,908 | |
Class B Shares: | | | | | | | | |
Issued | | | 854 | | | | 2,853 | |
Reinvested | | | — | | | | 3,029 | |
Redeemed | | | (49,022 | ) | | | (39,813 | ) |
| | | | | | | | |
Change in Class B Shares | | | (48,168 | ) | | | (33,931 | ) |
Class C Shares: | | | | | | | | |
Issued | | | 7,224 | | | | 14,545 | |
Reinvested | | | — | | | | 281 | |
Redeemed | | | (22,842 | ) | | | (14,565 | ) |
| | | | | | | | |
Change in Class C Shares | | | (15,618 | ) | | | 261 | |
Institutional Shares: | | | | | | | | |
Issued | | | 2,080,881 | | | | 3,550,284 | |
Reinvested | | | — | | | | 255,042 | |
Redeemed | | | (2,681,243 | ) | | | (5,026,016 | ) |
| | | | | | | | |
Change in Institutional Shares | | | (600,362 | ) | | | (1,220,690 | ) |
Class R Shares: | | | | | | | | |
Issued | | | — | | | | — | |
Reinvested | | | — | | | | — | |
Redeemed | | | — | | | | — | |
| | | | | | | | |
Change in Class R Shares | | | — | | | | — | |
| | | | | | | | |
Change in Shares | | | (731,510 | ) | | | (1,169,452 | ) |
| | | | | | | | |
See accompanying notes to the financial statements.
116
| | | | | | | | | | | | | | | | | | | | | | |
Sterling Capital
Special Opportunities
Fund | | | Sterling Capital
Equity Income
Fund | | | Sterling Capital
Short-Term
Bond Fund | |
For the
Year Ended
September 30,
2011 | | | For the
Year Ended
September 30,
2010 | | | For the
Year Ended
September 30,
2011 | | | For the
Year Ended
September 30,
2010 | | | For the
Year Ended
September 30,
2011 | | | For the
Year Ended
September 30,
2010 | |
| | | | | | | | | | | | | | | | | | | | | | |
| | | | | | | | | | | | | | | | | | | | | | |
| $ | 42,547,882 | | | $ | 51,993,177 | | | $ | 115,268,295 | | | $ | 56,192,472 | | | $ | 1,086,414 | | | $ | 4,110,791 | |
| | 1,162,491 | | | | — | | | | 2,481,187 | | | | 2,155,411 | | | | 232,528 | | | | 144,544 | |
| | (39,778,101 | ) | | | (39,871,310 | ) | | | (45,007,593 | ) | | | (29,827,673 | ) | | | (1,116,100 | ) | | | (1,432,444 | ) |
| | | | | | | | | | | | | | | | | | | | | | |
| | 3,932,272 | | | | 12,121,867 | | | | 72,741,889 | | | | 28,520,210 | | | | 202,842 | | | | 2,822,891 | |
| | | | | | | | | | | | | | | | | | | | | | |
| | 101,183 | | | | 343,236 | | | | 368,399 | | | | 417,400 | | | | — | | | | — | |
| | 140,106 | | | | — | | | | 76,343 | | | | 159,855 | | | | — | | | | — | |
| | (5,676,023 | ) | | | (3,658,508 | ) | | | (2,436,376 | ) | | | (2,011,466 | ) | | | — | | | | — | |
| | | | | | | | | | | | | | | | | | | | | | |
| | (5,434,734 | ) | | | (3,315,272 | ) | | | (1,991,634 | ) | | | (1,434,211 | ) | | | — | | | | — | |
| | | | | | | | | | | | | | | | | | | | | | |
| | 17,883,379 | | | | 18,967,620 | | | | 46,746,433 | | | | 28,710,451 | | | | — | | | | — | |
| | 454,558 | | | | — | | | | 572,163 | | | | 637,652 | | | | — | | | | — | |
| | (15,855,849 | ) | | | (8,876,442 | ) | | | (11,762,809 | ) | | | (5,905,408 | ) | | | — | | | | — | |
| | | | | | | | | | | | | | | | | | | | | | |
| | 2,482,088 | | | | 10,091,178 | | | | 35,555,787 | | | | 23,442,695 | | | | — | | | | — | |
| | | | | | | | | | | | | | | | | | | | | | |
| | 160,836,610 | | | | 72,577,644 | | | | 212,268,199 | | | | 91,200,777 | | | | 28,008,022 | | | | 44,168,629 | |
| | 1,199,576 | | | | — | | | | 4,494,951 | | | | 3,193,068 | | | | 430,631 | | | | 345,286 | |
| | (61,286,798 | ) | | | (66,522,833 | ) | | | (55,927,133 | ) | | | (61,626,392 | ) | | | (30,918,030 | ) | | | (43,587,786 | ) |
| | | | | | | | | | | | | | | | | | | | | | |
| | 100,749,388 | | | | 6,054,811 | | | | 160,836,017 | | | | 32,767,453 | | | | (2,479,377 | ) | | | 926,129 | |
| | | | | | | | | | | | | | | | | | | | | | |
| | 343,900 | | | | 100 | | | | 663,854 | | | | 102 | | | | — | | | | — | |
| | 1 | | | | — | | | | 1,250 | | | | — | | | | — | | | | — | |
| | — | | | | — | | | | (9,804 | ) | | | — | | | | — | | | | — | |
| | | | | | | | | | | | | | | | | | | | | | |
| | 343,901 | | | | 100 | | | | 655,300 | | | | 102 | | | | — | | | | — | |
| | | | | | | | | | | | | | | | | | | | | | |
| $ | 102,072,915 | | | $ | 24,952,684 | | | $ | 267,797,359 | | | $ | 83,296,249 | | | $ | (2,276,535 | ) | | $ | 3,749,020 | |
| | | | | | | | | | | | | | | | | | | | | | |
| | | | | | | | | | | | | | | | | | | | | | |
| | | | | | | | | | | | | | | | | | | | | | |
| | 2,440,066 | | | | 3,355,853 | | | | 8,227,767 | | | | 4,535,254 | | | | 113,570 | | | | 426,037 | |
| | 67,982 | | | | — | | | | 176,768 | | | | 173,740 | | | | 24,408 | | | | 14,986 | |
| | (2,300,350 | ) | | | (2,593,295 | ) | | | (3,187,795 | ) | | | (2,433,573 | ) | | | (117,223 | ) | | | (148,442 | ) |
| | | | | | | | | | | | | | | | | | | | | | |
| | 207,698 | | | | 762,558 | | | | 5,216,740 | | | | 2,275,421 | | | | 20,755 | | | | 292,581 | |
| | | | | | | | | | | | | | | | | | | | | | |
| | 6,102 | | | | 22,957 | | | | 26,424 | | | | 34,155 | | | | — | | | | — | |
| | 8,735 | | | | — | | | | 5,442 | | | | 12,953 | | | | — | | | | — | |
| | (353,788 | ) | | | (251,243 | ) | | | (173,173 | ) | | | (165,060 | ) | | | — | | | | — | |
| | | | | | | | | | | | | | | | | | | | | | |
| | (338,951 | ) | | | (228,286 | ) | | | (141,307 | ) | | | (117,952 | ) | | | — | | | | — | |
| | | | | | | | | | | | | | | | | | | | | | |
| | 1,085,144 | | | | 1,291,925 | | | | 3,353,006 | | | | 2,348,842 | | | | — | | | | — | |
| | 28,321 | | | | — | | | | 41,054 | | | | 51,694 | | | | — | | | | — | |
| | (974,809 | ) | | | (610,429 | ) | | | (842,642 | ) | | | (485,022 | ) | | | — | | | | — | |
| | | | | | | | | | | | | | | | | | | | | | |
| | 138,656 | | | | 681,496 | | | | 2,551,418 | | | | 1,915,514 | | | | — | | | | — | |
| | | | | | | | | | | | | | | | | | | | | | |
| | 8,923,269 | | | | 4,599,664 | | | | 15,129,888 | | | | 7,384,647 | | | | 2,933,323 | | | | 4,580,436 | |
| | 68,743 | | | | — | | | | 319,591 | | | | 256,959 | | | | 45,186 | | | | 35,804 | |
| | (3,452,570 | ) | | | (4,230,147 | ) | | | (3,967,552 | ) | | | (5,030,921 | ) | | | (3,236,851 | ) | | | (4,523,559 | ) |
| | | | | | | | | | | | | | | | | | | | | | |
| | 5,539,442 | | | | 369,517 | | | | 11,481,927 | | | | 2,610,685 | | | | (258,342 | ) | | | 92,681 | |
| | | | | | | | | | | | | | | | | | | | | | |
| | 18,575 | | | | 7 | | | | 46,439 | | | | 8 | | | | — | | | | — | |
| | — | (a) | | | — | | | | 91 | | | | — | | | | — | | | | — | |
| | — | | | | — | | | | (710 | ) | | | — | | | | — | | | | — | |
| | | | | | | | | | | | | | | | | | | | | | |
| | 18,575 | | | | 7 | | | | 45,820 | | | | 8 | | | | — | | | | — | |
| | | | | | | | | | | | | | | | | | | | | | |
| | 5,565,420 | | | | 1,585,292 | | | | 19,154,598 | | | | 6,683,676 | | | | (237,587 | ) | | | 385,262 | |
| | | | | | | | | | | | | | | | | | | | | | |
117
Statements of Changes in Net Assets, continued
| | | | | | | | |
| | |
Sterling Capital
Intermediate U.S.
Government Fund | |
| | | For the
Year Ended
September 30,
2011 | | | For the
Year Ended
September 30,
2010 | |
Capital Transactions: | | | | | | | | |
Class A Shares: | | | | | | | | |
Proceeds from shares issued | | $ | 2,482,590 | | | $ | 4,505,216 | |
Distributions reinvested | | | 359,049 | | | | 338,424 | |
Value of shares redeemed | | | (3,683,848 | ) | | | (3,763,183 | ) |
| | | | | | | | |
Change in net assets from Class A Share transactions | | | (842,209 | ) | | | 1,080,457 | |
Class B Shares: | | | | | | | | |
Proceeds from shares issued | | | 17,699 | | | | 102,822 | |
Distributions reinvested | | | 42,321 | | | | 65,859 | |
Value of shares redeemed | | | (1,110,225 | ) | | | (801,098 | ) |
| | | | | | | | |
Change in net assets from Class B Share transactions | | | (1,050,205 | ) | | | (632,417 | ) |
Class C Shares: | | | | | | | | |
Proceeds from shares issued | | | 319,702 | | | | 238,283 | |
Distributions reinvested | | | 11,574 | | | | 7,308 | |
Value of shares redeemed | | | (206,958 | ) | | | (145,608 | ) |
| | | | | | | | |
Change in net assets from Class C Share transactions | | | 124,318 | | | | 99,983 | |
Institutional Shares: | | | | | | | | |
Proceeds from shares issued | | | 58,098,418 | | | | 75,251,756 | |
Distributions reinvested | | | 1,578,337 | | | | 1,890,858 | |
Value of shares redeemed | | | (79,784,859 | ) | | | (82,637,472 | ) |
| | | | | | | | |
Change in net assets from Institutional Share transactions | | | (20,108,104 | ) | | | (5,494,858 | ) |
Class R Shares: | | | | | | | | |
Proceeds from shares issued | | | — | | | | — | |
Distributions reinvested | | | — | | | | — | |
Value of shares redeemed | | | — | | | | — | |
| | | | | | | | |
Change in net assets from Class R Share transactions | | | — | | | | — | |
| | | | | | | | |
Change in net assets from capital transactions | | $ | (21,876,200 | ) | | $ | (4,946,835 | ) |
| | | | | | | | |
Share Transactions: | | | | | | | | |
Class A Shares: | | | | | | | | |
Issued | | | 232,957 | | | | 422,099 | |
Reinvested | | | 33,842 | | | | 31,771 | |
Redeemed | | | (347,581 | ) | | | (355,043 | ) |
| | | | | | | | |
Change in Class A Shares | | | (80,782 | ) | | | 98,827 | |
Class B Shares: | | | | | | | | |
Issued | | | 1,689 | | | | 9,743 | |
Reinvested | | | 4,003 | | | | 6,208 | |
Redeemed. | | | (105,154 | ) | | | (75,634 | ) |
| | | | | | | | |
Change in Class B Shares | | | (99,462 | ) | | | (59,683 | ) |
Class C Shares: | | | | | | | | |
Issued | | | 29,809 | | | | 22,353 | |
Reinvested | | | 1,093 | | | | 687 | |
Redeemed | | | (19,501 | ) | | | (13,795 | ) |
| | | | | | | | |
Change in Class C Shares | | | 11,401 | | | | 9,245 | |
Institutional Shares: | | | | | | | | |
Issued | | | 5,481,308 | | | | 7,082,674 | |
Reinvested | | | 148,560 | | | | 177,406 | |
Redeemed | | | (7,485,145 | ) | | | (7,740,047 | ) |
| | | | | | | | |
Change in Institutional Shares | | | (1,855,277 | ) | | | (479,967 | ) |
Class R Shares: | | | | | | | | |
Issued | | | — | | | | — | |
Reinvested | | | — | | | | — | |
Redeemed | | | — | | | | — | |
| | | | | | | | |
Change in Class R Shares | | | — | | | | — | |
| | | | | | | | |
Change in Shares | | | (2,024,120 | ) | | | (431,578 | ) |
| | | | | | | | |
See accompanying notes to the financial statements.
118
| | | | | | | | | | | | | | | | | | | | | | |
Sterling Capital
Total Return
Bond Fund | | | Sterling Capital
Kentucky
Intermediate
Tax-Free Fund | | | Sterling Capital
Maryland
Intermediate
Tax-Free Fund | |
For the Year Ended September 30, 2011 | | | For the
Year Ended
September 30,
2010 | | | For the
Year Ended
September 30,
2011 | | | For the
Year Ended
September 30,
2010 | | | For the
Year Ended
September 30,
2011 | | | For the
Year Ended
September 30,
2010 | |
| | | | | | | | | | | | | | | | | | | | | | |
| | | | | | | | | | | | | | | | | | | | | | |
| $ | 13,937,015 | | | $ | 17,946,667 | | | $ | 1,876,423 | | | $ | 1,652,461 | | | $ | 1,808,094 | | | $ | 3,865,425 | |
| | 1,835,147 | | | | 937,006 | | | | 171,746 | | | | 212,686 | | | | 231,522 | | | | 188,548 | |
| | (9,185,657) | | | | (4,393,142 | ) | | | (1,670,955 | ) | | | (608,591 | ) | | | (4,494,655 | ) | | | (803,200 | ) |
| | | | | | | | | | | | | | | | | | | | | | |
| | 6,586,505 | | | | 14,490,531 | | | | 377,214 | | | | 1,256,556 | | | | (2,455,039 | ) | | | 3,250,773 | |
| | | | | | | | | | | | | | | | | | | | | | |
| | 357,115 | | | | 368,858 | | | | — | | | | — | | | | — | | | | — | |
| | 218,289 | | | | 181,092 | | | | — | | | | — | | | | — | | | | — | |
| | (1,444,031) | | | | (1,392,427 | ) | | | — | | | | — | | | | — | | | | — | |
| | | | | | | | | | | | | | | | | | | | | | |
| | (868,627) | | | | (842,477 | ) | | | — | | | | — | | | | — | | | | — | |
| | | | | | | | | | | | | | | | | | | | | | |
| | 3,835,293 | | | | 1,677,308 | | | | — | | | | — | | | | — | | | | — | |
| | 119,566 | | | | 38,749 | | | | — | | | | — | | | | — | | | | — | |
| | (1,818,325) | | | | (48,269 | ) | | | — | | | | — | | | | — | | | | — | |
| | | | | | | | | | | | | | | | | | | | | | |
| | 2,136,534 | | | | 1,667,788 | | | | — | | | | — | | | | — | | | | — | |
| | | | | | | | | | | | | | | | | | | | | | |
| | 109,416,093 | | | | 124,403,924 | | | | 4,358,758 | | | | 6,222,750 | | | | 7,505,892 | | | | 9,290,636 | |
| | 11,133,580 | | | | 7,433,934 | | | | 6,361 | | | | 4,288 | | | | 120,550 | | | | 70,460 | |
| | (112,244,050) | | | | (106,050,848 | ) | | | (5,806,527 | ) | | | (3,982,330 | ) | | | (8,774,802 | ) | | | (4,327,799 | ) |
| | | | | | | | | | | | | | | | | | | | | | |
| | 8,305,623 | | | | 25,787,010 | | | | (1,441,408 | ) | | | 2,244,708 | | | | (1,148,360 | ) | | | 5,033,297 | |
| | | | | | | | | | | | | | | | | | | | | | |
| | — | | | | 41,019 | | | | — | | | | — | | | | — | | | | — | |
| | 312 | | | | 442 | | | | — | | | | — | | | | — | | | | — | |
| | (37,054) | | | | — | | | | — | | | | — | | | | — | | | | — | |
| | | | | | | | | | | | | | | | | | | | | | |
| | (36,742) | | | | 41,461 | | | | — | | | | — | | | | — | | | | — | |
| | | | | | | | | | | | | | | | | | | | | | |
| $ | 16,123,293 | | | $ | 41,144,313 | | | $ | (1,064,194 | ) | | $ | 3,501,264 | | | $ | (3,603,399 | ) | | $ | 8,284,070 | |
| | | | | | | | | | | | | | | | | | | | | | |
| | | | | | | | | | | | | | | | | | | | | | |
| | | | | | | | | | | | | | | | | | | | | | |
| | 1,263,511 | | | | 1,633,596 | | | | 177,324 | | | | 156,280 | | | | 163,416 | | | | 352,058 | |
| | 167,607 | | | | 85,073 | | | | 16,266 | | | | 20,123 | | | | 21,099 | | | | 17,147 | |
| | (837,917) | | | | (402,439 | ) | | | (159,252 | ) | | | (57,857 | ) | | | (412,346 | ) | | | (73,305 | ) |
| | | | | | | | | | | | | | | | | | | | | | |
| | 593,201 | | | | 1,316,230 | | | | 34,338 | | | | 118,546 | | | | (227,831 | ) | | | 295,900 | |
| | | | | | | | | | | | | | | | | | | | | | |
| | 32,399 | | | | 33,411 | | | | — | | | | — | | | | — | | | | — | |
| | 19,926 | | | | 16,494 | | | | — | | | | — | | | | — | | | | — | |
| | (131,192) | | | | (126,923 | ) | | | — | | | | — | | | | — | | | | — | |
| | | | | | | | | | | | | | | | | | | | | | |
| | (78,867) | | | | (77,018 | ) | | | — | | | | — | | | | — | | | | — | |
| | | | | | | | | | | | | | | | | | | | | | |
| | 348,171 | | | | 152,524 | | | | — | | | | — | | | | — | | | | — | |
| | 10,908 | | | | 3,495 | | | | — | | | | — | | | | — | | | | — | |
| | (166,194) | | | | (4,401 | ) | | | — | | | | — | | | | — | | | | — | |
| | | | | | | | | | | | | | | | | | | | | | |
| | 192,885 | | | | 151,618 | | | | — | | | | — | | | | — | | | | — | |
| | | | | | | | | | | | | | | | | | | | | | |
| | 9,958,709 | | | | 11,308,728 | | | | 412,636 | | | | 589,502 | | | | 684,151 | | | | 848,859 | |
| | 1,016,189 | | | | 676,154 | | | | 606 | | | | 406 | | | | 10,959 | | | | 6,395 | |
| | (10,222,066) | | | | (9,615,329 | ) | | | (551,092 | ) | | | (377,904 | ) | | | (802,833 | ) | | | (393,661 | ) |
| | | | | | | | | | | | | | | | | | | | | | |
| | 752,832 | | | | 2,369,553 | | | | (137,850 | ) | | | 212,004 | | | | (107,723 | ) | | | 461,593 | |
| | | | | | | | | | | | | | | | | | | | | | |
| | — | | | | 3,698 | | | | — | | | | — | | | | — | | | | — | |
| | 29 | | | | 39 | | | | — | | | | — | | | | — | | | | — | |
| | (3,265) | | | | — | | | | — | | | | — | | | | — | | | | — | |
| | | | | | | | | | | | | | | | | | | | | | |
| | (3,236) | | | | 3,737 | | | | — | | | | — | | | | — | | | | — | |
| | | | | | | | | | | | | | | | | | | | | | |
| | 1,456,815 | | | | 3,764,120 | | | | (103,512 | ) | | | 330,550 | | | | (335,554 | ) | | | 757,493 | |
| | | | | | | | | | | | | | | | | | | | | | |
119
Statements of Changes in Net Assets, continued
| | | | | | | | |
| | | Sterling Capital
North Carolina
Intermediate
Tax-Free Fund | |
| | | For the
Year Ended
September 30,
2011 | | | For the
Year Ended
September 30,
2010 | |
Capital Transactions: | | | | | | | | |
Class A Shares: | | | | | | | | |
Proceeds from shares issued | | $ | 12,062,122 | | | $ | 18,279,880 | |
Distributions reinvested | | | 1,188,282 | | | | 937,820 | |
Value of shares redeemed | | | (8,573,729 | ) | | | (3,174,236 | ) |
| | | | | | | | |
Change in net assets from Class A Share transactions | | | 4,676,675 | | | | 16,043,464 | |
Institutional Shares: | | | | | | | | |
Proceeds from shares issued | | | 47,005,341 | | | | 48,039,734 | |
Distributions reinvested | | | 491,929 | | | | 297,178 | |
Value of shares redeemed | | | (34,392,042 | ) | | | (32,627,778 | ) |
| | | | | | | | |
Change in net assets from Institutional Share transactions | | | 13,105,228 | | | | 15,709,134 | |
| | | | | | | | |
Change in net assets from capital transactions | | $ | 17,781,903 | | | $ | 31,752,598 | |
| | | | | | | | |
Share Transactions: | | | | | | | | |
Class A Shares: | | | | | | | | |
Issued | | | 1,116,654 | | | | 1,698,060 | |
Reinvested | | | 110,459 | | | | 86,951 | |
Redeemed | | | (800,395 | ) | | | (294,390 | ) |
| | | | | | | | |
Change in Class A Shares | | | 426,718 | | | | 1,490,621 | |
Institutional Shares: | | | | | | | | |
Issued | | | 4,371,583 | | | | 4,463,190 | |
Reinvested | | | 45,654 | | | | 27,537 | |
Redeemed | | | (3,189,003 | ) | | | (3,031,390 | ) |
| | | | | | | | |
Change in Institutional Shares | | | 1,228,234 | | | | 1,459,337 | |
| | | | | | | | |
Change in Shares | | | 1,654,952 | | | | 2,949,958 | |
| | | | | | | | |
See accompanying notes to the financial statements.
120
| | | | | | | | | | | | | | | | | | | | | | |
Sterling Capital
South Carolina
Intermediate
Tax-Free Fund | | | Sterling Capital
Virginia
Intermediate
Tax-Free Fund | | | Sterling Capital
West Virginia
Intermediate
Tax-Free Fund | |
For the
Year Ended
September 30,
2011 | | | For the
Year Ended
September 30,
2010 | | | For the
Year Ended
September 30,
2011 | | | For the
Year Ended
September 30,
2010 | | | For the
Year Ended
September 30,
2011 | | | For the
Year Ended
September 30,
2010 | |
| | | | | | | | | | | | | | | | | | | | | | | |
| | | | | | | | | | | | | | | | | | | | | | | |
| $ | 2,674,952 | | | $ | 4,684,576 | | | $ | 10,660,614 | | | $ | 16,772,363 | | | $ | 4,499,294 | | | $ | 10,426,589 | |
| | 359,482 | | | | 313,137 | | | | 758,929 | | | | 710,183 | | | | 678,285 | | | | 531,561 | |
| | (2,067,448) | | | | (1,278,839) | | | | (7,412,557) | | | | (2,767,743) | | | | (2,202,987) | | | | (1,052,717) | |
| | | | | | | | | | | | | | | | | | | | | | |
| | 966,986 | | | | 3,718,874 | | | | 4,006,986 | | | | 14,714,803 | | | | 2,974,592 | | | | 9,905,433 | |
| | | | | | | | | | | | | | | | | | | | | | | |
| | 20,486,170 | | | | 17,684,617 | | | | 17,707,604 | | | | 17,058,923 | | | | 15,908,089 | | | | 15,576,892 | |
| | 121,414 | | | | 83,271 | | | | 141,565 | | | | 52,397 | | | | 67,531 | | | | 65,070 | |
| | (11,216,979) | | | | (5,611,770) | | | | (16,525,499) | | | | (12,068,221) | | | | (14,283,349) | | | | (9,465,075) | |
| | | | | | | | | | | | | | | | | | | | | | |
| | 9,390,605 | | | | 12,156,118 | | | | 1,323,670 | | | | 5,043,099 | | | | 1,692,271 | | | | 6,176,887 | |
| | | | | | | | | | | | | | | | | | | | | | |
| $ | 10,357,591 | | | $ | 15,874,992 | | | $ | 5,330,656 | | | $ | 19,757,902 | | | $ | 4,666,863 | | | $ | 16,082,320 | |
| | | | | | | | | | | | | | | | | | | | | | |
| | | | | | | | | | | | | | | | | | | | | | | |
| | | | | | | | | | | | | | | | | | | | | | | |
| | 249,169 | | | | 436,592 | | | | 891,130 | | | | 1,402,257 | | | | 447,037 | | | | 1,042,175 | |
| | 33,574 | | | | 29,356 | | | | 63,950 | | | | 59,606 | | | | 68,136 | | | | 53,130 | |
| | (192,377) | | | | (120,430) | | | | (624,449) | | | | (232,132) | | | | (221,995) | | | | (105,090) | |
| | | | | | | | | | | | | | | | | | | | | | |
| | 90,366 | | | | 345,518 | | | | 330,631 | | | | 1,229,731 | | | | 293,178 | | | | 990,215 | |
| | | | | | | | | | | | | | | | | | | | | | | |
| | 1,927,693 | | | | 1,674,989 | | | | 1,497,093 | | | | 1,432,235 | | | | 1,596,926 | | | | 1,558,216 | |
| | 11,408 | | | | 7,853 | | | | 11,930 | | | | 4,380 | | | | 6,790 | | | | 6,512 | |
| | (1,061,112) | | | | (530,596) | | | | (1,389,740) | | | | (1,008,782) | | | | (1,427,151) | | | | (946,626) | |
| | | | | | | | | | | | | | | | | | | | | | |
| | 877,989 | | | | 1,152,246 | | | | 119,283 | | | | 427,833 | | | | 176,565 | | | | 618,102 | |
| | | | | | | | | | | | | | | | | | | | | | |
| | 968,355 | | | | 1,497,764 | | | | 449,914 | | | | 1,657,564 | | | | 469,743 | | | | 1,608,317 | |
| | | | | | | | | | | | | | | | | | | | | | |
121
Statements of Changes in Net Assets, continued
| | | | | | | | |
| | | Sterling Capital
National Tax-Free
Money Market Fund | |
| | | For the
Year Ended
September 30,
2011 | | | For the
Year Ended
September 30,
2010 | |
Capital Transactions: | | | | | | | | |
Class A Shares: | | | | | | | | |
Proceeds from shares issued | | $ | 275,877 | | | $ | 193,086 | |
Distributions reinvested | | | 9 | | | | 5 | |
Value of shares redeemed | | | (197,213 | ) | | | (139,315 | ) |
| | | | | | | | |
Change in net assets from Class A Share transactions | | | 78,673 | | | | 53,776 | |
Class B Shares: | | | | | | | | |
Proceeds from shares issued | | | — | | | | — | |
Distributions reinvested | | | — | | | | — | |
Value of shares redeemed | | | — | | | | — | |
| | | | | | | | |
Change in net assets from Class B Share transactions | | | — | | | | — | |
Class C Shares: | | | | | | | | |
Proceeds from shares issued | | | — | | | | — | |
Distributions reinvested | | | — | | | | — | |
Value of shares redeemed | | | — | | | | — | |
| | | | | | | | |
Change in net assets from Class C Share transactions | | | — | | | | — | |
Institutional Shares: | | | | | | | | |
Proceeds from shares issued | | | 219,407,698 | | | | 254,452,716 | |
Distributions reinvested | | | 382 | | | | 982 | |
Value of shares redeemed | | | (221,183,167 | ) | | | (359,957,648 | ) |
| | | | | | | | |
Change in net assets from Institutional Share transactions | | | (1,775,087 | ) | | | (105,503,950 | ) |
| | | | | | | | |
Change in net assets from capital transactions | | $ | (1,696,414 | ) | | $ | (105,450,174 | ) |
| | | | | | | | |
Share Transactions: | | | | | | | | |
Class A Shares: | | | | | | | | |
Issued | | | 275,877 | | | | 193,086 | |
Reinvested | | | 9 | | | | 5 | |
Redeemed | | | (197,214 | ) | | | (139,315 | ) |
| | | | | | | | |
Change in Class A Shares | | | 78,672 | | | | 53,776 | |
Class B Shares: | | | | | | | | |
Issued | | | — | | | | — | |
Reinvested | | | — | | | | — | |
Redeemed | | | — | | | | — | |
| | | | | | | | |
Change in Class B Shares | | | — | | | | — | |
Class C Shares: | | | | | | | | |
Issued | | | — | | | | — | |
Reinvested | | | — | | | | — | |
Redeemed | | | — | | | | — | |
| | | | | | | | |
Change in Class C Shares | | | — | | | | — | |
Institutional Shares: | | | | | | | | |
Issued | | | 219,407,698 | | | | 254,452,716 | |
Reinvested | | | 382 | | | | 982 | |
Redeemed | | | (221,183,167 | ) | | | (359,957,648 | ) |
| | | | | | | | |
Change in Institutional Shares | | | (1,775,087 | ) | | | (105,503,950 | ) |
| | | | | | | | |
Change in Shares | | | (1,696,415 | ) | | | (105,450,174 | ) |
| | | | | | | | |
See accompanying notes to the financial statements.
122
| | | | | | | | | | | | | | | | | | | | | | |
Sterling Capital
Prime Money
Market Fund | | | Sterling Capital
U.S. Treasury
Money Market Fund | | | Sterling Capital
Strategic Allocation
Conservative Fund | |
For the
Year Ended
September 30,
2011 | | | For the
Year Ended
September 30,
2010 | | | For the
Year Ended
September 30, 2011 | | | For the
Year Ended
September 30, 2010 | | | For the
Year Ended
September 30, 2011 | | | For the
Year Ended
September 30, 2010 | |
| | | | | | | | | | | | | | | | | | | | | | | |
| | | | | | | | | | | | | | | | | | | | | | | |
| $ | 162,282,865 | | | $ | 132,211,386 | | | $ | 121,360,013 | | | $ | 113,397,348 | | | $ | 5,015,386 | | | $ | 1,595,118 | |
| | 16,754 | | | | 94,134 | | | | 13,021 | | | | 99,288 | | | | 255,171 | | | | 202,858 | |
| | (171,557,820 | ) | | | (230,509,387 | ) | | | (128,165,069 | ) | | | (145,385,305 | ) | | | (1,326,128 | ) | | | (924,550 | ) |
| | | | | | | | | | | | | | | | | | | | | | |
| | (9,258,201 | ) | | | (98,203,867 | ) | | | (6,792,035 | ) | | | (31,888,669 | ) | | | 3,944,429 | | | | 873,426 | |
| | | | | | | | | | | | | | | | | | | | | | | |
| | 392,192 | | | | 345,965 | | | | 607,992 | | | | 222,141 | | | | 116,290 | | | | 48,341 | |
| | 111 | | | | 777 | | | | 54 | | | | 473 | | | | 51,132 | | | | 57,630 | |
| | (731,298 | ) | | | (753,971 | ) | | | (647,253 | ) | | | (486,491 | ) | | | (708,751 | ) | | | (1,059,080 | ) |
| | | | | | | | | | | | | | | | | | | | | | |
| | (338,995 | ) | | | (407,229 | ) | | | (39,207 | ) | | | (263,877 | ) | | | (541,329 | ) | | | (953,109 | ) |
| | | | | | | | | | | | | | | | | | | | | | | |
| | 831,428 | | | | 345,883 | | | | 25,090 | | | | 97,671 | | | | 59,041 | | | | 34,938 | |
| | 49 | | | | 262 | | | | 7 | | | | 78 | | | | 3,330 | | | | 2,907 | |
| | (645,650 | ) | | | (759,306 | ) | | | (43,171 | ) | | | (57,218 | ) | | | (29,965 | ) | | | (20,331 | ) |
| | | | | | | | | | | | | | | | | | | | | | |
| | 185,827 | | | | (413,161 | ) | | | (18,074 | ) | | | 40,531 | | | | 32,406 | | | | 17,514 | |
| | | | | | | | | | | | | | | | | | | | | | | |
| | 1,072,199,722 | | | | 1,137,654,760 | | | | 494,334,835 | | | | 601,947,679 | | | | 546,674 | | | | 674,652 | |
| | 8,746 | | | | 60,616 | | | | 3,677 | | | | 32,221 | | | | 136,657 | | | | 158,491 | |
| | (1,140,047,518 | ) | | | (1,621,282,549 | ) | | | (584,606,375 | ) | | | (826,293,945 | ) | | | (1,405,367 | ) | | | (1,682,639 | ) |
| | | | | | | | | | | | | | | | | | | | | | |
| | (67,839,050 | ) | | | (483,567,173 | ) | | | (90,267,863 | ) | | | (224,314,045 | ) | | | (722,036 | ) | | | (849,496 | ) |
| | | | | | | | | | | | | | | | | | | | | | |
| $ | (77,250,419 | ) | | $ | (582,591,430 | ) | | $ | (97,117,179 | ) | | $ | (256,426,060 | ) | | $ | 2,713,470 | | | $ | (911,665 | ) |
| | | | | | | | | | | | | | | | | | | | | | |
| | | | | | | | | | | | | | | | | | | | | | | |
| | | | | | | | | | | | | | | | | | | | | | | |
| | 162,282,865 | | | | 132,211,386 | | | | 121,360,013 | | | | 113,397,348 | | | | 539,236 | | | | 182,820 | |
| | 16,754 | | | | 94,134 | | | | 13,021 | | | | 99,288 | | | | 27,653 | | | | 23,219 | |
| | (171,557,820 | ) | | | (230,509,387 | ) | | | (128,165,069 | ) | | | (145,385,305 | ) | | | (142,259 | ) | | | (105,840 | ) |
| | | | | | | | | | | | | | | | | | | | | | |
| | (9,258,201 | ) | | | (98,203,867 | ) | | | (6,792,035 | ) | | | (31,888,669 | ) | | | 424,630 | | | | 100,199 | |
| | | | | | | | | | | | | | | | | | | | | | | |
| | 392,192 | | | | 345,965 | | | | 607,992 | | | | 222,141 | | | | 12,441 | | | | 5,548 | |
| | 111 | | | | 777 | | | | 54 | | | | 473 | | | | 5,510 | | | | 6,599 | |
| | (731,298 | ) | | | (753,971 | ) | | | (647,253 | ) | | | (486,491 | ) | | | (75,930 | ) | | | (121,839 | ) |
| | | | | | | | | | | | | | | | | | | | | | |
| | (338,995 | ) | | | (407,229 | ) | | | (39,207 | ) | | | (263,877 | ) | | | (57,979 | ) | | | (109,692 | ) |
| | | | | | | | | | | | | | | | | | | | | | | |
| | 831,428 | | | | 345,883 | | | | 25,090 | | | | 97,671 | | | | 6,319 | | | | 4,012 | |
| | 49 | | | | 262 | | | | 7 | | | | 78 | | | | 361 | | | | 334 | |
| | (645,650 | ) | | | (759,306 | ) | | | (43,171 | ) | | | (57,218 | ) | | | (3,243 | ) | | | (2,307 | ) |
| | | | | | | | | | | | | | | | | | | | | | |
| | 185,827 | | | | (413,161 | ) | | | (18,074 | ) | | | 40,531 | | | | 3,437 | | | | 2,039 | |
| | | | | | | | | | | | | | | | | | | | | | | |
| | 1,072,199,721 | | | | 1,137,654,760 | | | | 494,334,835 | | | | 601,947,679 | | | | 57,633 | | | | 77,032 | |
| | 8,746 | | | | 60,616 | | | | 3,677 | | | | 32,221 | | | | 14,639 | | | | 17,968 | |
| | (1,140,047,518 | ) | | | (1,621,282,549 | ) | | | (584,606,375 | ) | | | (826,293,945 | ) | | | (149,029 | ) | | | (190,379 | ) |
| | | | | | | | | | | | | | | | | | | | | | |
| | (67,839,051 | ) | | | (483,567,173 | ) | | | (90,267,863 | ) | | | (224,314,045 | ) | | | (76,757 | ) | | | (95,379 | ) |
| | | | | | | | | | | | | | | | | | | | | | |
| | (77,250,420 | ) | | | (582,591,430 | ) | | | (97,117,179 | ) | | | (256,426,060 | ) | | | 293,331 | | | | (102,833 | ) |
| | | | | | | | | | | | | | | | | | | | | | |
123
Statements of Changes in Net Assets, continued
| | | | | | | | |
| Capital Transactions: | | Sterling Capital
Strategic Allocation
Balanced Fund | |
| | For the
Year Ended
September 30,
2011 | | | For the
Year Ended
September 30,
2010 | |
Class A Shares: | | | | | | | | |
Proceeds from shares issued | | $ | 5,474,152 | | | $ | 3,214,410 | |
Distributions reinvested | | | 547,144 | | | | 564,372 | |
Value of shares redeemed | | | (4,747,071 | ) | | | (4,682,727 | ) |
| | | | | | | | |
Change in net assets from Class A Share transactions | | | 1,274,225 | | | | (903,945 | ) |
Class B Shares: | | | | | | | | |
Proceeds from shares issued | | | 65,635 | | | | 66,952 | |
Distributions reinvested | | | 117,632 | | | | 163,364 | |
Value of shares redeemed | | | (3,204,333 | ) | | | (2,979,289 | ) |
| | | | | | | | |
Change in net assets from Class B Share transactions | | | (3,021,066 | ) | | | (2,748,973 | ) |
Class C Shares: | | | | | | | | |
Proceeds from shares issued | | | 251,737 | | | | 110,268 | |
Distributions reinvested | | | 3,965 | | | | 2,023 | |
Value of shares redeemed | | | (36,473 | ) | | | (23,710 | ) |
| | | | | | | | |
Change in net assets from Class C Share transactions | | | 219,229 | | | | 88,581 | |
Institutional Shares: | | | | | | | | |
Proceeds from shares issued | | | 60,466 | | | | 57,459 | |
Distributions reinvested | | | 18,878 | | | | 29,000 | |
Value of shares redeemed | | | (795,865 | ) | | | (333,147 | ) |
| | | | | | | | |
Change in net assets from Institutional Share transactions | | | (716,521 | ) | | | (246,688 | ) |
| | | | | | | | |
Change in net assets from capital transactions | | $ | (2,244,133 | ) | | $ | (3,811,025 | ) |
| | | | | | | | |
Share Transactions: | | | | | | | | |
Class A Shares: | | | | | | | | |
Issued | | | 614,538 | | | | 400,068 | |
Reinvested | | | 61,998 | | | | 70,379 | |
Redeemed | | | (533,320 | ) | | | (577,766 | ) |
| | | | | | | | |
Change in Class A Shares | | | 143,216 | | | | (107,319 | ) |
Class B Shares: | | | | | | | | |
Issued | | | 7,494 | | | | 8,675 | |
Reinvested | | | 13,526 | | | | 20,856 | |
Redeemed | | | (368,043 | ) | | | (378,343 | ) |
| | | | | | | | |
Change in Class B Shares | | | (347,023 | ) | | | (348,812 | ) |
Class C Shares: | | | | | | | | |
Issued | | | 28,265 | | | | 13,719 | |
Reinvested | | | 454 | | | | 256 | |
Redeemed | | | (4,221 | ) | | | (3,084 | ) |
| | | | | | | | |
Change in Class C Shares | | | 24,498 | | | | 10,891 | |
Institutional Shares: | | | | | | | | |
Issued | | | 6,819 | | | | 7,053 | |
Reinvested | | | 2,122 | | | | 3,595 | |
Redeemed | | | (88,142 | ) | | | (40,930 | ) |
| | | | | | | | |
Change in Institutional Shares | | | (79,201 | ) | | | (30,282 | ) |
| | | | | | | | |
Change in Shares | | | (258,510 | ) | | | (475,522 | ) |
| | | | | | | | |
See accompanying notes to the financial statements.
124
| | | | | | | | | | | | | | |
Sterling Capital
Strategic Allocation
Growth Fund | | | Sterling Capital
Strategic Allocation
Equity Fund | |
For the
Year Ended
September 30,
2011 | | | For the
Year Ended
September 30,
2010 | | | For the
Year Ended
September 30,
2011 | | | For the
Year Ended
September 30,
2010 | |
| | | | | | | | | | | | | | | |
| $ | 2,696,346 | | | $ | 2,007,029 | | | $ | 820,780 | | | $ | 992,664 | |
| | 251,872 | | | | 309,062 | | | | 35,113 | | | | 70,109 | |
| | (3,428,291 | ) | | | (2,428,605 | ) | | | (805,733 | ) | | | (1,112,685 | ) |
| | | | | | | | | | | | | | |
| | (480,073 | ) | | | (112,514 | ) | | | 50,160 | | | | (49,912 | ) |
| | | | | | | | | | | | | | | |
| | 20,188 | | | | 13,572 | | | | — | | | | 25,269 | |
| | 60,176 | | | | 95,344 | | | | 19,135 | | | | 18,691 | |
| | (2,615,756 | ) | | | (2,492,057 | ) | | | (845,936 | ) | | | (915,440 | ) |
| | | | | | | | | | | | | | |
| | (2,535,392 | ) | | | (2,383,141 | ) | | | (826,801 | ) | | | (871,480 | ) |
| | | | | | | | | | | | | | | |
| | 89,637 | | | | 57,913 | | | | 11,433 | | | | 15,495 | |
| | 1,574 | | | | 1,507 | | | | 108 | | | | 103 | |
| | (1,180 | ) | | | (11,486 | ) | | | — | | | | (5,356 | ) |
| | | | | | | | | | | | | | |
| | 90,031 | | | | 47,934 | | | | 11,541 | | | | 10,242 | |
| | | | | | | | | | | | | | | |
| | 148,178 | | | | 74,782 | | | | 11,472 | | | | 17,994 | |
| | 24,796 | | | | 33,541 | | | | 471 | | | | 2,291 | |
| | (706,970 | ) | | | (204,378 | ) | | | (10,255 | ) | | | (656,081 | ) |
| | | | | | | | | | | | | | |
| | (533,996 | ) | | | (96,055 | ) | | | 1,688 | | | | (635,796 | ) |
| | | | | | | | | | | | | | |
| $ | (3,459,430 | ) | | $ | (2,543,776 | ) | | $ | (763,412 | ) | | $ | (1,546,946 | ) |
| | | | | | | | | | | | | | |
| | | | | | | | | | | | | | | |
| | | | | | | | | | | | | | | |
| | 325,991 | | | | 273,552 | | | | 103,391 | | | | 139,104 | |
| | 30,497 | | | | 42,200 | | | | 4,401 | | | | 10,023 | |
| | (420,945 | ) | | | (331,303 | ) | | | (101,438 | ) | | | (157,301 | ) |
| | | | | | | | | | | | | | |
| | (64,457 | ) | | | (15,551 | ) | | | 6,354 | | | | (8,174 | ) |
| | | | | | | | | | | | | | | |
| | 2,439 | | | | 1,822 | | | | — | | | | 3,744 | |
| | 7,404 | | | | 13,353 | | | | 2,512 | | | | 2,778 | |
| | (325,308 | ) | | | (348,757 | ) | | | (112,033 | ) | | | (135,520 | ) |
| | | | | | | | | | | | | | |
| | (315,465 | ) | | | (333,582 | ) | | | (109,521 | ) | | | (128,998 | ) |
| | | | | | | | | | | | | | | |
| | 11,183 | | | | 8,036 | | | | 1,518 | | | | 2,305 | |
| | 194 | | | | 211 | | | | 14 | | | | 15 | |
| | (151 | ) | | | (1,610 | ) | | | — | | | | (817 | ) |
| | | | | | | | | | | | | | |
| | 11,226 | | | | 6,637 | | | | 1,532 | | | | 1,503 | |
| | | | | | | | | | | | | | | |
| | 18,216 | | | | 10,056 | | | | 1,661 | | | | 2,448 | |
| | 3,003 | | | | 4,570 | | | | 58 | | | | 324 | |
| | (83,810 | ) | | | (27,583 | ) | | | (1,316 | ) | | | (95,000 | ) |
| | | | | | | | | | | | | | |
| | (62,591 | ) | | | (12,957 | ) | | | 403 | | | | (92,228 | ) |
| | | | | | | | | | | | | | |
| | (431,287 | ) | | | (355,453 | ) | | | (101,232 | ) | | | (227,897 | ) |
| | | | | | | | | | | | | | |
125
Financial Highlights, Class A Shares
The financial highlights table is intended to help you understand the Funds’ financial performance for the past 5 years or, if shorter, the period of the Funds’ operations. Certain information reflects financial results for a single Fund share. The total returns in the table represent the rate that an investor would have earned (or lost) on an investment in the Fund (assuming reinvestment of all dividends and distributions).
| | | | | | | | | | | | | | | | | | | | | | | | | | | | | | | | |
| | | | | | Investment Activities | | | Distributions | |
| | | Net Asset
Value,
Beginning
of Period | | | Net
investment
income
(loss)(a) | | |
Net realized/
unrealized
gains (losses)
on investments | | | Total from
Investment
Activities | | | Net
investment
income | | | Net realized
gains on
investments | | | Return
of
capital | | | Total
Distributions | |
Sterling Capital Select Equity Fund | | | | | | | | | | | | | | | | | | | | | | | | | | | | | | | | |
Year Ended September 30, 2011 | | $ | 10.52 | | | | 0.11 | | | | (0.62 | ) | | | (0.51 | ) | | | (0.11 | ) | | | — | | | | — | | | | (0.11 | ) |
Year Ended September 30, 2010 | | $ | 10.08 | | | | 0.10 | | | | 0.45 | | | | 0.55 | | | | (0.11 | ) | | | — | | | | — | | | | (0.11 | ) |
Year Ended September 30, 2009 | | $ | 11.31 | | | | 0.11 | | | | (1.22 | ) | | | (1.11 | ) | | | (0.12 | ) | | | — | | | | — | | | | (0.12 | ) |
Year Ended September 30, 2008 | | $ | 19.13 | | | | 0.15 | | | | (5.14 | ) | | | (4.99 | ) | | | (0.10 | ) | | | (2.73 | ) | | | — | | | | (2.83 | ) |
Year Ended September 30, 2007 | | $ | 20.33 | | | | 0.24 | | | | 2.14 | | | | 2.38 | | | | (0.23 | ) | | | (3.35 | ) | | | — | | | | (3.58 | ) |
Sterling Capital Mid Value Fund | | | | | | | | | | | | | | | | | | | | | | | | | | | | | | | | |
Year Ended September 30, 2011 | | $ | 12.08 | | | | 0.04 | | | | (0.70 | ) | | | (0.66 | ) | | | (0.05 | ) | | | — | | | | — | | | | (0.05 | ) |
Year Ended September 30, 2010 | | $ | 10.81 | | | | 0.04 | | | | 1.27 | | | | 1.31 | | | | (0.04 | ) | | | — | | | | — | | | | (0.04 | ) |
Year Ended September 30, 2009 | | $ | 10.50 | | | | 0.02 | | | | 0.31 | | | | 0.33 | | | | (0.02 | ) | | | — | | | | — | | | | (0.02 | ) |
Year Ended September 30, 2008 | | $ | 14.93 | | | | 0.02 | | | | (3.07 | ) | | | (3.05 | ) | | | (0.02 | ) | | | (1.36 | ) | | | — | | | | (1.38 | ) |
Year Ended September 30, 2007 | | $ | 13.49 | | | | 0.04 | | | | 2.13 | | | | 2.17 | | | | (0.04 | ) | | | (0.69 | ) | | | — | | | | (0.73 | ) |
Sterling Capital Small Value Fund | | | | | | | | | | | | | | | | | | | | | | | | | | | | | | | | |
Year Ended September 30, 2011 | | $ | 11.19 | | | | (0.05 | ) | | | (0.35 | ) | | | (0.40 | ) | | | — | | | | — | | | | — | | | | — | |
February 1, 2010 to September 30, 2010(d) | | $ | 10.55 | | | | 0.04 | | | | 0.63 | | | | 0.67 | | | | (0.03 | ) | | | — | | | | — | | | | (0.03 | ) |
Sterling Capital International Fund | | | | | | | | | | | | | | | | | | | | | | | | | | | | | | | | |
Year Ended September 30, 2011 | | $ | 5.02 | | | | 0.02 | | | | (0.96 | ) | | | (0.94 | ) | | | — | | | | — | | | | — | | | | — | |
Year Ended September 30, 2010 | | $ | 4.97 | | | | 0.02 | | | | 0.13 | | | | 0.15 | | | | (0.10 | ) | | | — | | | | — | | | | (0.10 | ) |
Year Ended September 30, 2009 | | $ | 5.31 | | | | 0.06 | | | | (0.28 | ) | | | (0.22 | ) | | | (0.12 | ) | | | — | | | | — | | | | (0.12 | ) |
Year Ended September 30, 2008 | | $ | 8.41 | | | | 0.08 | | | | (2.41 | ) | | | (2.33 | ) | | | (0.02 | ) | | | (0.75 | ) | | | — | | | | (0.77 | ) |
Year Ended September 30, 2007 | | $ | 11.06 | | | | 0.12 | | | | 1.82 | | | | 1.94 | | | | (0.07 | ) | | | (4.52 | ) | | | — | | | | (4.59 | ) |
Sterling Capital Special Opportunities Fund | | | | | | | | | | | | | | | | | | | | | | | | | | | | | | | | |
Year Ended September 30, 2011 | | $ | 15.93 | | | | (0.06 | ) | | | (0.52 | ) | | | (0.58 | ) | | | — | | | | (0.10 | ) | | | — | | | | (0.10 | ) |
Year Ended September 30, 2010 | | $ | 14.66 | | | | (0.06 | ) | | | 1.33 | | | | 1.27 | | | | — | | | | — | | | | — | | | | — | |
Year Ended September 30, 2009 | | $ | 15.34 | | | | — | (f) | | | — | (f) | | | — | (f) | | | — | (f) | | | (0.57 | ) | | | (0.11 | ) | | | (0.68 | ) |
Year Ended September 30, 2008 | | $ | 18.29 | | | | (0.08 | ) | | | (2.12 | ) | | | (2.20 | ) | | | — | | | | (0.75 | ) | | | — | | | | (0.75 | ) |
Year Ended September 30, 2007 | | $ | 16.43 | | | | (0.01 | ) | | | 3.47 | | | | 3.46 | | | | — | | | | (1.60 | ) | | | — | | | | (1.60 | ) |
Sterling Capital Equity Income Fund | | | | | | | | | | | | | | | | | | | | | | | | | | | | | | | | |
Year Ended September 30, 2011 | | $ | 13.05 | | | | 0.25 | | | | 0.14 | (g) | | | 0.39 | | | | (0.19 | ) | | | — | | | | — | | | | (0.19 | ) |
Year Ended September 30, 2010 | | $ | 11.43 | | | | 0.30 | | | | 1.56 | | | | 1.86 | | | | (0.24 | ) | | | — | | | | — | | | | (0.24 | ) |
Year Ended September 30, 2009 | | $ | 12.35 | | | | 0.30 | | | | (0.99 | ) | | | (0.69 | ) | | | (0.20 | ) | | | (0.03 | ) | | | — | | | | (0.23 | ) |
Year Ended September 30, 2008 | | $ | 15.03 | | | | 0.43 | | | | (2.21 | ) | | | (1.78 | ) | | | (0.32 | ) | | | (0.58 | ) | | | — | | | | (0.90 | ) |
Year Ended September 30, 2007 | | $ | 13.36 | | | | 0.36 | | | | 2.31 | | | | 2.67 | | | | (0.32 | ) | | | (0.68 | ) | | | — | | | | (1.00 | ) |
Sterling Capital Short-Term Bond Fund | | | | | | | | | | | | | | | | | | | | | | | | | | | | | | | | |
Year Ended September 30, 2011 | | $ | 9.68 | | | | 0.17 | | | | (0.19 | ) | | | (0.02 | ) | | | (0.30 | ) | | | — | | | | — | | | | (0.30 | ) |
Year Ended September 30, 2010 | | $ | 9.66 | | | | 0.16 | | | | 0.10 | | | | 0.26 | | | | (0.24 | ) | | | — | | | | — | | | | (0.24 | ) |
Year Ended September 30, 2009 | | $ | 9.54 | | | | 0.24 | | | | 0.19 | | | | 0.43 | | | | (0.31 | ) | | | — | | | | — | | | | (0.31 | ) |
Year Ended September 30, 2008 | | $ | 9.52 | | | | 0.33 | | | | 0.07 | | | | 0.40 | | | | (0.38 | ) | | | — | | | | — | | | | (0.38 | ) |
Year Ended September 30, 2007 | | $ | 9.48 | | | | 0.36 | | | | 0.07 | | | | 0.43 | | | | (0.39 | ) | | | — | | | | — | | | | (0.39 | ) |
| * | During the period certain fees were reduced. If such reductions had not occurred, the ratios would have been as indicated. |
| ** | Portfolio turnover rate is calculated on the basis of the Fund as a whole without distinguishing between classes of shares issued. |
| (a) | Per share net investment income (loss) has been calculated using the average daily shares method. |
| (b) | Not annualized for periods less than one year. |
| (c) | Annualized for periods less than one year. |
| (d) | Period from commencement of operations. |
| (e) | Includes proceeds received from a settlement of litigation, which impacted the Fund’s total return. Not including these proceeds, the Fund’s total return would have been 6.01%. |
| (f) | Amount is less than $0.005. |
| (g) | The amount shown for a share outstanding throughout the period does not accord with the change in aggregate gains and losses in the portfolio of securities during the period because of the timing of sales and purchases of Fund shares in relation to fluctuating market values during the period. |
See accompanying notes to the financial statements.
126
| | | | | | | | | | | | | | | | | | | | | | | | | | |
| | | | | | | Ratios/Supplementary Data | |
Net Asset Value, End of Period | | | Total Return (excludes sales charge) (b) | | | Net Assets, End of Period (000) | | | Ratio of net expenses to average net assets (c) | | | Ratio of net
investment income (loss) to average net assets (c) | | | Ratio of expenses to average net assets*(c) | | | Portfolio turnover rate**(b) | |
| | | | | | | | | | | | | | | | | | | | | | | | | | | |
| $ | 9.90 | | | | (5.01 | )% | | $ | 24,603 | | | | 1.08 | % | | | 0.93 | % | | | 1.47 | % | | | 66.29 | % |
| $ | 10.52 | | | | 5.47 | % | | $ | 28,849 | | | | 1.09 | % | | | 0.98 | % | | | 1.48 | % | | | 119.85 | % |
| $ | 10.08 | | | | (9.67 | )% | | $ | 29,290 | | | | 1.06 | % | | | 1.25 | % | | | 1.45 | % | | | 92.97 | % |
| $ | 11.31 | | | | (29.46 | )% | | $ | 36,066 | | | | 1.14 | % | | | 1.05 | % | | | 1.43 | % | | | 38.43 | % |
| $ | 19.13 | | | | 12.55 | % | | $ | 58,771 | | | | 1.16 | % | | | 1.25 | % | | | 1.47 | % | | | 68.60 | % |
| | | | | | | | | | | | | | | | | | | | | | | | | | | |
| $ | 11.37 | | | | (5.51 | )% | | $ | 18,017 | | | | 1.18 | % | | | 0.32 | % | | | 1.22 | % | | | 38.30 | % |
| $ | 12.08 | | | | 12.09 | % | | $ | 18,890 | | | | 1.20 | % | | | 0.33 | % | | | 1.30 | % | | | 45.02 | % |
| $ | 10.81 | | | | 3.24 | % | | $ | 10,717 | | | | 1.21 | % | | | 0.19 | % | | | 1.26 | % | | | 46.83 | % |
| $ | 10.50 | | | | (22.00 | )% | | $ | 28,068 | | | | 1.14 | % | | | 0.17 | % | | | 1.18 | % | | | 65.74 | % |
| $ | 14.93 | | | | 16.48 | % | | $ | 16,811 | | | | 1.16 | % | | | 0.27 | % | | | 1.20 | % | | | 58.59 | % |
| | | | | | | | | | | | | | | | | | | | | | | | | | | |
| $ | 10.79 | | | | (3.57 | )% | | $ | 6,152 | | | | 1.33 | % | | | (0.39 | )% | | | 1.69 | % | | | 63.02 | % |
| $ | 11.19 | | | | 6.39 | %(e) | | $ | 5,389 | | | | 1.40 | % | | | 0.49 | % | | | 1.91 | % | | | 95.89 | % |
| | | | | | | | | | | | | | | | | | | | | | | | | | | |
| $ | 4.08 | | | | (18.92 | )% | | $ | 2,803 | | | | 1.62 | % | | | 0.40 | % | | | 2.02 | % | | | 75.63 | % |
| $ | 5.02 | | | | 3.01 | % | | $ | 3,788 | | | | 1.79 | % | | | 0.49 | % | | | 2.49 | % | | | 145.31 | % |
| $ | 4.97 | | | | (3.78 | )% | | $ | 3,333 | | | | 1.74 | % | | | 1.34 | % | | | 2.13 | % | | | 223.19 | % |
| $ | 5.31 | | | | (30.82 | )% | | $ | 3,524 | | | | 1.56 | % | | | 1.11 | % | | | 1.99 | % | | | 112.65 | % |
| $ | 8.41 | | | | 20.13 | % | | $ | 5,204 | | | | 1.38 | % | | | 1.02 | % | | | 1.75 | % | | | 129.80 | % |
| | | | | | | | | | | | | | | | | | | | | | | | | | | |
| $ | 15.25 | | | | (3.72 | )% | | $ | 197,138 | | | | 1.28 | % | | | (0.35 | )% | | | 1.53 | % | | | 31.51 | % |
| $ | 15.93 | | | | 8.66 | % | | $ | 202,670 | | | | 1.29 | % | | | (0.38 | )% | | | 1.55 | % | | | 25.65 | % |
| $ | 14.66 | | | | 1.74 | % | | $ | 175,319 | | | | 1.28 | % | | | 0.02 | % | | | 1.54 | % | | | 45.22 | % |
| $ | 15.34 | | | | (12.61 | )% | | $ | 123,249 | | | | 1.24 | % | | | (0.48 | )% | | | 1.49 | % | | | 25.80 | % |
| $ | 18.29 | | | | 22.24 | % | | $ | 124,136 | | | | 1.28 | % | | | (0.04 | )% | | | 1.53 | % | | | 49.43 | % |
| | | | | | | | | | | | | | | | | | | | | | | | | | | |
| $ | 13.25 | | | | 2.93 | % | | $ | 214,622 | | | | 1.18 | % | | | 1.80 | % | | | 1.43 | % | | | 16.64 | % |
| $ | 13.05 | | | | 16.42 | % | | $ | 143,283 | | | | 1.19 | % | | | 2.43 | % | | | 1.45 | % | | | 21.63 | % |
| $ | 11.43 | | | | (5.33 | )% | | $ | 99,480 | | | | 1.18 | % | | | 2.93 | % | | | 1.45 | % | | | 37.13 | % |
| $ | 12.35 | | | | (12.47 | )% | | $ | 98,584 | | | | 1.14 | % | | | 3.09 | % | | | 1.39 | % | | | 30.01 | % |
| $ | 15.03 | | | | 20.83 | % | | $ | 97,491 | | | | 1.19 | % | | | 2.53 | % | | | 1.44 | % | | | 37.85 | % |
| | | | | | | | | | | | | | | | | | | | | | | | | | | |
| $ | 9.36 | | | | (0.20 | )% | | $ | 7,684 | | | | 0.85 | % | | | 1.81 | % | | | 1.20 | % | | | 120.09 | % |
| $ | 9.68 | | | | 2.75 | % | | $ | 7,747 | | | | 0.95 | % | | | 1.66 | % | | | 1.36 | % | | | 55.50 | % |
| $ | 9.66 | | | | 4.57 | % | | $ | 4,909 | | | | 0.98 | % | | | 2.44 | % | | | 1.38 | % | | | 89.57 | % |
| $ | 9.54 | | | | 4.23 | % | | $ | 4,680 | | | | 0.90 | % | | | 3.42 | % | | | 1.30 | % | | | 48.20 | % |
| $ | 9.52 | | | | 4.67 | % | | $ | 3,978 | | | | 0.91 | % | | | 3.77 | % | | | 1.31 | % | | | 44.10 | % |
127
Financial Highlights, Class A Shares
The financial highlights table is intended to help you understand the Funds’ financial performance for the past 5 years or, if shorter, the period of the Funds’ operations. Certain information reflects financial results for a single Fund share. The total returns in the table represent the rate that an investor would have earned (or lost) on an investment in the Fund (assuming reinvestment of all dividends and distributions).
| | | | | | | | | | | | | | | | | | | | | | | | | | | | |
| | | | | | Investment Activities | | | Distributions | |
| | |
Net Asset
Value,
Beginning
of Year | | | Net
investment
income(a) | | | Net realized/
unrealized
gains (losses)
on investments | | | Total from
Investment
Activities | | | Net
investment
income | | | Net realized
gains on
investments | | | Total
Distributions | |
Sterling Capital Intermediate U.S. Government Fund | | | | | | | | | | | | | | | | | | | | | | | | | | | | |
Year Ended September 30, 2011 | | $ | 10.80 | | | | 0.24 | | | | 0.06 | | | | 0.30 | | | | (0.31 | ) | | | — | | | | (0.31 | ) |
Year Ended September 30, 2010 | | $ | 10.56 | | | | 0.29 | | | | 0.27 | | | | 0.56 | | | | (0.32 | ) | | | — | | | | (0.32 | ) |
Year Ended September 30, 2009 | | $ | 10.03 | | | | 0.33 | | | | 0.55 | | | | 0.88 | | | | (0.35 | ) | | | — | | | | (0.35 | ) |
Year Ended September 30, 2008 | | $ | 9.93 | | | | 0.41 | | | | 0.11 | | | | 0.52 | | | | (0.42 | ) | | | — | | | | (0.42 | ) |
Year Ended September 30, 2007 | | $ | 9.89 | | | | 0.42 | | | | 0.04 | | | | 0.46 | | | | (0.42 | ) | | | — | | | | (0.42 | ) |
Sterling Capital Total Return Bond Fund | | | | | | | | | | | | | | | | | | | | | | | | | | | | |
Year Ended September 30, 2011 | | $ | 11.32 | | | | 0.38 | | | | 0.01 | | | | 0.39 | | | | (0.45 | ) | | | (0.21 | ) | | | (0.66 | ) |
Year Ended September 30, 2010 | | $ | 10.78 | | | | 0.43 | | | | 0.61 | | | | 1.04 | | | | (0.49 | ) | | | (0.01 | ) | | | (0.50 | ) |
Year Ended September 30, 2009 | | $ | 9.88 | | | | 0.45 | | | | 0.90 | | | | 1.35 | | | | (0.45 | ) | | | — | | | | (0.45 | ) |
Year Ended September 30, 2008 | | $ | 10.12 | | | | 0.43 | | | | (0.21 | ) | | | 0.22 | | | | (0.46 | ) | | | — | | | | (0.46 | ) |
Year Ended September 30, 2007 | | $ | 10.12 | | | | 0.44 | | | | 0.01 | | | | 0.45 | | | | (0.45 | ) | | | — | | | | (0.45 | ) |
Sterling Capital Kentucky Intermediate Tax-Free Fund | | | | | | | | | | | | | | | | | | | | | | | | | | | | |
Year Ended September 30, 2011 | | $ | 10.83 | | | | 0.29 | | | | 0.02 | (b) | | | 0.31 | | | | (0.29 | ) | | | (0.05 | ) | | | (0.34 | ) |
Year Ended September 30, 2010 | | $ | 10.68 | | | | 0.29 | | | | 0.25 | | | | 0.54 | | | | (0.29 | ) | | | (0.10 | ) | | | (0.39 | ) |
Year Ended September 30, 2009 | | $ | 9.88 | | | | 0.33 | | | | 0.89 | | | | 1.22 | | | | (0.32 | ) | | | (0.10 | ) | | | (0.42 | ) |
Year Ended September 30, 2008 | | $ | 10.06 | | | | 0.32 | | | | (0.18 | ) | | | 0.14 | | | | (0.32 | ) | | | — | | | | (0.32 | ) |
Year Ended September 30, 2007 | | $ | 10.12 | | | | 0.32 | | | | (0.06 | ) | | | 0.26 | | | | (0.32 | ) | | | — | | | | (0.32 | ) |
Sterling Capital Maryland Intermediate Tax-Free Fund | | | | | | | | | | | | | | | | | | | | | | | | | | | | |
Year Ended September 30, 2011 | | $ | 11.21 | | | | 0.28 | | | | 0.06 | | | | 0.34 | | | | (0.28 | ) | | | (0.04 | ) | | | (0.32 | ) |
Year Ended September 30, 2010 | | $ | 10.97 | | | | 0.28 | | | | 0.24 | | | | 0.52 | | | | (0.28 | ) | | | — | (c) | | | (0.28 | ) |
Year Ended September 30, 2009 | | $ | 10.04 | | | | 0.30 | | | | 1.01 | | | | 1.31 | | | | (0.30 | ) | | | (0.08 | ) | | | (0.38 | ) |
Year Ended September 30, 2008 | | $ | 10.15 | | | | 0.31 | | | | (0.11 | ) | | | 0.20 | | | | (0.31 | ) | | | — | | | | (0.31 | ) |
Year Ended September 30, 2007 | | $ | 10.12 | | | | 0.31 | | | | 0.03 | | | | 0.34 | | | | (0.31 | ) | | | — | | | | (0.31 | ) |
Sterling Capital North Carolina Intermediate Tax-Free Fund | | | | | | | | | | | | | | | | | | | | | | | | | | | | |
Year Ended September 30, 2011 | | $ | 11.01 | | | | 0.29 | | | | 0.07 | | | | 0.36 | | | | (0.29 | ) | | | (0.06 | ) | | | (0.35 | ) |
Year Ended September 30, 2010 | | $ | 10.87 | | | | 0.30 | | | | 0.20 | | | | 0.50 | | | | (0.30 | ) | | | (0.06 | ) | | | (0.36 | ) |
Year Ended September 30, 2009 | | $ | 10.09 | | | | 0.33 | | | | 0.88 | | | | 1.21 | | | | (0.33 | ) | | | (0.10 | ) | | | (0.43 | ) |
Year Ended September 30, 2008 | | $ | 10.33 | | | | 0.35 | | | | (0.20 | ) | | | 0.15 | | | | (0.35 | ) | | | (0.04 | ) | | | (0.39 | ) |
Year Ended September 30, 2007 | | $ | 10.38 | | | | 0.35 | | | | (0.04 | ) | | | 0.31 | | | | (0.35 | ) | | | (0.01 | ) | | | (0.36 | ) |
Sterling Capital South Carolina Intermediate Tax-Free Fund | | | | | | | | | | | | | | | | | | | | | | | | | | | | |
Year Ended September 30, 2011 | | $ | 10.93 | | | | 0.26 | | | | 0.07 | | | | 0.33 | | | | (0.26 | ) | | | (0.03 | ) | | | (0.29 | ) |
Year Ended September 30, 2010 | | $ | 10.68 | | | | 0.30 | | | | 0.25 | | | | 0.55 | | | | (0.30 | ) | | | — | | | | (0.30 | ) |
Year Ended September 30, 2009 | | $ | 9.95 | | | | 0.33 | | | | 0.90 | | | | 1.23 | | | | (0.33 | ) | | | (0.17 | ) | | | (0.50 | ) |
Year Ended September 30, 2008 | | $ | 10.28 | | | | 0.34 | | | | (0.24 | ) | | | 0.10 | | | | (0.34 | ) | | | (0.09 | ) | | | (0.43 | ) |
Year Ended September 30, 2007 | | $ | 10.35 | | | | 0.34 | | | | (0.05 | ) | | | 0.29 | | | | (0.35 | ) | | | (0.01 | ) | | | (0.36 | ) |
Sterling Capital Virginia Intermediate Tax-Free Fund | | | | | | | | | | | | | | | | | | | | | | | | | | | | |
Year Ended September 30, 2011 | | $ | 12.14 | | | | 0.31 | | | | 0.02 | | | | 0.33 | | | | (0.31 | ) | | | (0.04 | ) | | | (0.35 | ) |
Year Ended September 30, 2010 | | $ | 12.07 | | | | 0.33 | | | | 0.18 | | | | 0.51 | | | | (0.33 | ) | | | (0.11 | ) | | | (0.44 | ) |
Year Ended September 30, 2009 | | $ | 11.11 | | | | 0.36 | | | | 1.05 | | | | 1.41 | | | | (0.36 | ) | | | (0.09 | ) | | | (0.45 | ) |
Year Ended September 30, 2008 | | $ | 11.32 | | | | 0.37 | | | | (0.16 | ) | | | 0.21 | | | | (0.37 | ) | | | (0.05 | ) | | | (0.42 | ) |
Year Ended September 30, 2007 | | $ | 11.39 | | | | 0.38 | | | | (0.04 | ) | | | 0.34 | | | | (0.39 | ) | | | (0.02 | ) | | | (0.41 | ) |
Sterling Capital West Virginia Intermediate Tax-Free Fund | | | | | | | | | | | | | | | | | | | | | | | | | | | | |
Year Ended September 30, 2011 | | $ | 10.17 | | | | 0.32 | | | | — | | | | 0.32 | | | | (0.32 | ) | | | (0.01 | ) | | | (0.33 | ) |
Year Ended September 30, 2010 | | $ | 10.04 | | | | 0.33 | | | | 0.15 | | | | 0.48 | | | | (0.33 | ) | | | (0.02 | ) | | | (0.35 | ) |
Year Ended September 30, 2009 | | $ | 9.36 | | | | 0.33 | | | | 0.69 | | | | 1.02 | | | | (0.33 | ) | | | (0.01 | ) | | | (0.34 | ) |
Year Ended September 30, 2008 | | $ | 9.71 | | | | 0.33 | | | | (0.33 | ) | | | — | | | | (0.33 | ) | | | (0.02 | ) | | | (0.35 | ) |
Year Ended September 30, 2007 | | $ | 9.79 | | | | 0.35 | | | | (0.05 | ) | | | 0.30 | | | | (0.35 | ) | | | (0.03 | ) | | | (0.38 | ) |
| * | During the period certain fees were reduced. If such reductions had not occurred, the ratios would have been as indicated. |
| ** | Portfolio turnover rate is calculated on the basis of the Fund as a whole without distinguishing between classes of shares issued. |
| (a) | Per share net investment income has been calculated using the average daily shares method. |
| (b) | The amount shown for a share outstanding throughout the period does not accord with the change in aggregate gains and losses in the portfolio of securities during the period because of the timing of sales and purchases of Fund shares in relation to fluctuating market values during the period. |
| (c) | Amount is less than $0.005. |
See accompanying notes to the financial statements.
128
| | | | | | | | | | | | | | | | | | | | | | | | | | |
| | | | | | | Ratios/Supplementary Data | |
Net Asset
Value,
End of
Year | | | Total
Return
(excludes
sales charge) | | | Net Assets,
End of
Year
(000) | | | Ratio of
net expenses
to average
net assets | | |
Ratio of net
investment
income to
average net
assets | | | Ratio of
expenses to
average
net assets* | | | Portfolio
turnover rate** | |
| | | | | | | | | | | | | | | | | | | | | | | | | | | |
| $ | 10.79 | | | | 2.86 | % | | $ | 13,344 | | | | 0.96 | % | | | 2.30 | % | | | 1.33 | % | | | 83.62 | % |
| $ | 10.80 | | | | 5.38 | % | | $ | 14,235 | | | | 0.96 | % | | | 2.76 | % | | | 1.34 | % | | | 83.92 | % |
| $ | 10.56 | | | | 8.90 | % | | $ | 12,865 | | | | 0.95 | % | | | 3.14 | % | | | 1.32 | % | | | 47.13 | % |
| $ | 10.03 | | | | 5.30 | % | | $ | 9,654 | | | | 0.92 | % | | | 4.08 | % | | | 1.29 | % | | | 116.07 | % |
| $ | 9.93 | | | | 4.78 | % | | $ | 9,050 | | | | 0.93 | % | | | 4.27 | % | | | 1.30 | % | | | 85.83 | % |
| | | | | | | | | | | | | | | | | | | | | | | | | | | |
| $ | 11.05 | | | | 3.68 | % | | $ | 37,274 | | | | 0.95 | % | | | 3.47 | % | | | 1.32 | % | | | 131.87 | % |
| $ | 11.32 | | | | 10.00 | % | | $ | 31,465 | | | | 0.96 | % | | | 3.90 | % | | | 1.34 | % | | | 122.94 | % |
| $ | 10.78 | | | | 13.89 | % | | $ | 15,760 | | | | 0.96 | % | | | 4.38 | % | | | 1.33 | % | | | 122.26 | % |
| $ | 9.88 | | | | 2.06 | % | | $ | 8,700 | | | | 0.91 | % | | | 4.24 | % | | | 1.28 | % | | | 190.15 | % |
| $ | 10.12 | | | | 4.51 | % | | $ | 8,403 | | | | 0.93 | % | | | 4.37 | % | | | 1.30 | % | | | 222.24 | % |
| | | | | | | | | | | | | | | | | | | | | | | | | | | |
| $ | 10.80 | | | | 3.00 | % | | $ | 8,729 | | | | 0.93 | % | | | 2.76 | % | | | 1.28 | % | | | 15.73 | % |
| $ | 10.83 | | | | 5.25 | % | | $ | 8,380 | | | | 0.94 | % | | | 2.76 | % | | | 1.40 | % | | | 20.68 | % |
| $ | 10.68 | | | | 12.71 | % | | $ | 6,999 | | | | 0.92 | % | | | 3.18 | % | | | 1.37 | % | | | 33.56 | % |
| $ | 9.88 | | | | 1.34 | % | | $ | 5,510 | | | | 0.89 | % | | | 3.13 | % | | | 1.34 | % | | | 54.22 | % |
| $ | 10.06 | | | | 2.66 | % | | $ | 4,630 | | | | 0.90 | % | | | 3.19 | % | | | 1.35 | % | | | 69.73 | % |
| | | | | | | | | | | | | | | | | | | | | | | | | | | |
| $ | 11.23 | | | | 3.09 | % | | $ | 9,232 | | | | 0.92 | % | | | 2.52 | % | | | 1.28 | % | | | 21.89 | % |
| $ | 11.21 | | | | 4.81 | % | | $ | 11,763 | | | | 0.94 | % | | | 2.52 | % | | | 1.40 | % | | | 12.26 | % |
| $ | 10.97 | | | | 13.44 | % | | $ | 8,273 | | | | 0.90 | % | | | 2.84 | % | | | 1.38 | % | | | 37.11 | % |
| $ | 10.04 | | | | 1.84 | % | | $ | 4,389 | | | | 0.79 | % | | | 3.01 | % | | | 1.34 | % | | | 108.13 | % |
| $ | 10.15 | | | | 3.38 | % | | $ | 2,429 | | | | 0.84 | % | | | 3.05 | % | | | 1.39 | % | | | 136.09 | % |
| | | | | | | | | | | | | | | | | | | | | | | | | | | |
| $ | 11.02 | | | | 3.35 | % | | $ | 51,294 | | | | 0.92 | % | | | 2.67 | % | | | 1.22 | % | | | 15.15 | % |
| $ | 11.01 | | | | 4.79 | % | | $ | 46,560 | | | | 0.93 | % | | | 2.79 | % | | | 1.34 | % | | | 19.19 | % |
| $ | 10.87 | | | | 12.35 | % | | $ | 29,765 | | | | 0.92 | % | | | 3.17 | % | | | 1.32 | % | | | 38.42 | % |
| $ | 10.09 | | | | 1.42 | % | | $ | 20,971 | | | | 0.89 | % | | | 3.34 | % | | | 1.29 | % | | | 82.02 | % |
| $ | 10.33 | | | | 3.07 | % | | $ | 19,668 | | | | 0.91 | % | | | 3.40 | % | | | 1.31 | % | | | 106.16 | % |
| | | | | | | | | | | | | | | | | | | | | | | | | | | |
| $ | 10.97 | | | | 3.11 | % | | $ | 16,338 | | | | 0.96 | % | | | 2.43 | % | | | 1.26 | % | | | 25.83 | % |
| $ | 10.93 | | | | 5.25 | % | | $ | 15,290 | | | | 0.98 | % | | | 2.81 | % | | | 1.39 | % | | | 14.60 | % |
| $ | 10.68 | | | | 12.78 | % | | $ | 11,255 | | | | 0.98 | % | | | 3.18 | % | | | 1.38 | % | | | 42.06 | % |
| $ | 9.95 | | | | 0.94 | % | | $ | 7,481 | | | | 0.96 | % | | | 3.28 | % | | | 1.36 | % | | | 127.76 | % |
| $ | 10.28 | | | | 2.91 | % | | $ | 3,769 | | | | 0.93 | % | | | 3.34 | % | | | 1.35 | % | | | 68.69 | % |
| | | | | | | | | | | | | | | | | | | | | | | | | | | |
| $ | 12.12 | | | | 2.85 | % | | $ | 39,231 | | | | 0.93 | % | | | 2.64 | % | | | 1.23 | % | | | 15.33 | % |
| $ | 12.14 | | | | 4.39 | % | | $ | 35,284 | | | | 0.94 | % | | | 2.79 | % | | | 1.35 | % | | | 9.54 | % |
| $ | 12.07 | | | | 13.11 | % | | $ | 20,230 | | | | 0.92 | % | | | 3.05 | % | | | 1.32 | % | | | 35.90 | % |
| $ | 11.11 | | | | 1.79 | % | | $ | 9,683 | | | | 0.89 | % | | | 3.25 | % | | | 1.29 | % | | | 53.28 | % |
| $ | 11.32 | | | | 3.05 | % | | $ | 8,802 | | | | 0.91 | % | | | 3.39 | % | | | 1.31 | % | | | 85.36 | % |
| | | | | | | | | | | | | | | | | | | | | | | | | | | |
| $ | 10.16 | | | | 3.22 | % | | $ | 32,791 | | | | 0.94 | % | | | 3.19 | % | | | 0.94 | % | | | 23.34 | % |
| $ | 10.17 | | | | 4.87 | % | | $ | 29,858 | | | | 0.94 | % | | | 3.33 | % | | | 0.95 | % | | | 6.60 | % |
| $ | 10.04 | | | | 11.14 | % | | $ | 19,518 | | | | 0.93 | % | | | 3.45 | % | | | 0.93 | % | | | 24.19 | % |
| $ | 9.36 | | | | (0.08 | )% | | $ | 16,138 | | | | 0.91 | % | | | 3.41 | % | | | 0.91 | % | | | 39.13 | % |
| $ | 9.71 | | | | 3.12 | % | | $ | 16,897 | | | | 0.91 | % | | | 3.61 | % | | | 0.91 | % | | | 49.60 | % |
129
Financial Highlights, Class A Shares
The financial highlights table is intended to help you understand the Funds’ financial performance for the past 5 years or, if shorter, the period of the Funds’ operations. Certain information reflects financial results for a single Fund share. The total returns in the table represent the rate that an investor would have earned (or lost) on an investment in the Fund (assuming reinvestment of all dividends and distributions).
| | | | | | | | | | | | | | | | | | | | | | | | | | | | |
| | | | | | Investment Activities | | | Distributions | |
| | |
Net Asset
Value,
Beginning
of Year | | | Net
investment
income(a) | | | Net realized/
unrealized
gains (losses)
on investments | | | Total from
Investment
Activities | | | Net
investment
income | | | Net realized
gains on
investments | | | Total
Distributions | |
Sterling Capital National Tax-Free Money Market Fund | | | | | | | | | | | | | | | | | |
Year Ended September 30, 2011 | | | $1.00 | | | | — | (b) | | | — | (b) | | | — | (b) | | | — | (b) | | | — | | | | — | (b) |
Year Ended September 30, 2010 | | | $1.00 | | | | — | (b) | | | — | (b) | | | — | (b) | | | — | (b) | | | — | | | | — | (b) |
Year Ended September 30, 2009 | | | $1.00 | | | | 0.01 | | | | — | (b) | | | 0.01 | | | | (0.01 | ) | | | — | | | | (0.01 | ) |
Year Ended September 30, 2008 | | | $1.00 | | | | 0.02 | | | | — | (b) | | | 0.02 | | | | (0.02 | ) | | | — | | | | (0.02 | ) |
Year Ended September 30, 2007 | | | $1.00 | | | | 0.03 | | | | — | | | | 0.03 | | | | (0.03 | ) | | | — | | | | (0.03 | ) |
Sterling Capital Prime Money Market Fund | | | | | | | | | | | | | | | | | |
Year Ended September 30, 2011 | | | $1.00 | | | | — | (b) | | | — | (b) | | | — | (b) | | | — | (b) | | | — | | | | — | (b) |
Year Ended September 30, 2010 | | | $1.00 | | | | — | (b) | | | — | (b) | | | — | (b) | | | — | (b) | | | — | | | | — | (b) |
Year Ended September 30, 2009 | | | $1.00 | | | | 0.01 | | | | — | (b) | | | 0.01 | | | | (0.01 | ) | | | — | | | | (0.01 | ) |
Year Ended September 30, 2008 | | | $1.00 | | | | 0.03 | | | | — | (b) | | | 0.03 | | | | (0.03 | ) | | | — | | | | (0.03 | ) |
Year Ended September 30, 2007 | | | $1.00 | | | | 0.04 | | | | — | | | | 0.04 | | | | (0.04 | ) | | | — | | | | (0.04 | ) |
Sterling Capital U.S. Treasury Money Market Fund | | | | | | | | | | | | | | | | | |
Year Ended September 30, 2011 | | | $1.00 | | | | — | (b) | | | — | (b) | | | — | (b) | | | — | (b) | | | — | | | | — | (b) |
Year Ended September 30, 2010 | | | $1.00 | | | | — | (b) | | | — | (b) | | | — | (b) | | | — | (b) | | | — | | | | — | (b) |
Year Ended September 30, 2009 | | | $1.00 | | | | — | (b) | | | — | | | | — | (b) | | | — | (b) | | | — | | | | — | (b) |
Year Ended September 30, 2008 | | | $1.00 | | | | 0.02 | | | | — | (b) | | | 0.02 | | | | (0.02 | ) | | | — | | | | (0.02 | ) |
Year Ended September 30, 2007 | | | $1.00 | | | | 0.04 | | | | — | | | | 0.04 | | | | (0.04 | ) | | | — | | | | (0.04 | ) |
Sterling Capital Strategic Allocation Conservative Fund(c) | | | | | | | | | | | | | | | | | |
Year Ended September 30, 2011 | | | $9.06 | | | | 0.22 | | | | (0.26 | ) | | | (0.04 | ) | | | (0.28 | ) | | | — | | | | (0.28 | ) |
Year Ended September 30, 2010 | | | $8.50 | | | | 0.26 | | | | 0.57 | | | | 0.83 | | | | (0.27 | ) | | | — | | | | (0.27 | ) |
Year Ended September 30, 2009 | | | $8.43 | | | | 0.23 | | | | 0.21 | | | | 0.44 | | | | (0.23 | ) | | | (0.14) | | | | (0.37 | ) |
Year Ended September 30, 2008 | | | $10.53 | | | | 0.26 | | | | (1.24 | ) | | | (0.98 | ) | | | (0.39 | ) | | | (0.73) | | | | (1.12 | ) |
Year Ended September 30, 2007 | | | $9.96 | | | | 0.34 | | | | 0.53 | | | | 0.87 | | | | (0.30 | ) | | | — | | | | (0.30 | ) |
Sterling Capital Strategic Allocation Balanced Fund(c) | | | | | | | | | | | | | | | | | |
Year Ended September 30, 2011 | | | $8.39 | | | | 0.15 | | | | (0.41 | ) | | | (0.26 | ) | | | (0.18 | ) | | | — | | | | (0.18 | ) |
Year Ended September 30, 2010 | | | $7.79 | | | | 0.18 | | | | 0.60 | | | | 0.78 | | | | (0.18 | ) | | | — | | | | (0.18 | ) |
Year Ended September 30, 2009 | | | $7.77 | | | | 0.16 | | | | 0.02 | | | | 0.18 | | | | (0.16 | ) | | | — | | | | (0.16 | ) |
Year Ended September 30, 2008 | | | $10.94 | | | | 0.17 | | | | (1.86 | ) | | | (1.69 | ) | | | (0.35 | ) | | | (1.13) | | | | (1.48 | ) |
Year Ended September 30, 2007 | | | $10.22 | | | | 0.29 | | | | 0.87 | | | | 1.16 | | | | (0.22 | ) | | | (0.22) | | | | (0.44 | ) |
Sterling Capital Strategic Allocation Growth Fund(c) | | | | | | | | | | | | | | | | | |
Year Ended September 30, 2011 | | | $7.69 | | | | 0.10 | | | | (0.48 | ) | | | (0.38 | ) | | | (0.11 | ) | | | — | | | | (0.11 | ) |
Year Ended September 30, 2010 | | | $7.11 | | | | 0.13 | | | | 0.58 | | | | 0.71 | | | | (0.13 | ) | | | — | | | | (0.13 | ) |
Year Ended September 30, 2009 | | | $7.33 | | | | 0.12 | | | | (0.22 | ) | | | (0.10 | ) | | | (0.12 | ) | | | — | | | | (0.12 | ) |
Year Ended September 30, 2008 | | | $11.13 | | | | 0.11 | | | | (2.21 | ) | | | (2.10 | ) | | | (0.33 | ) | | | (1.37) | | | | (1.70 | ) |
Year Ended September 30, 2007 | | | $10.23 | | | | 0.25 | | | | 1.08 | | | | 1.33 | | | | (0.16 | ) | | | (0.27) | | | | (0.43 | ) |
Sterling Capital Strategic Allocation Equity Fund(c) | | | | | | | | | | | | | | | | | |
Year Ended September 30, 2011 | | | $7.33 | | | | 0.07 | | | | (0.57 | ) | | | (0.50 | ) | | | (0.05 | ) | | | — | | | | (0.05 | ) |
Year Ended September 30, 2010 | | | $6.77 | | | | 0.10 | | | | 0.56 | | | | 0.66 | | | | (0.10 | ) | | | — | | | | (0.10 | ) |
Year Ended September 30, 2009 | | | $7.41 | | | | 0.07 | | | | (0.65 | ) | | | (0.58 | ) | | | (0.06 | ) | | | — | | | | (0.06 | ) |
Year Ended September 30, 2008 | | | $12.26 | | | | 0.04 | | | | (2.76 | ) | | | (2.72 | ) | | | (0.32 | ) | | | (1.81) | | | | (2.13 | ) |
Year Ended September 30, 2007 | | | $11.57 | | | | 0.21 | | | | 1.43 | | | | 1.64 | | | | (0.10 | ) | | | (0.85) | | | | (0.95 | ) |
| * | During the period certain fees were reduced. If such reductions had not occurred, the ratios would have been as indicated. |
| ** | Portfolio turnover rate is calculated on the basis of the Fund as a whole without distinguishing between classes of shares issued. |
| (a) | Per share net investment income has been calculated using the average daily shares method. |
| (b) | Amount is less than $0.005. |
| (c) | The expense ratios exclude the impact of fees/expenses paid by each underlying fund. |
See accompanying notes to the financial statements.
130
| | | | | | | | | | | | | | | | | | | | | | | | | | |
| | | | | | | Ratios/Supplementary Data | |
Net Asset
Value,
End of
Year | | | Total
Return
(excludes
sales charge) | | | Net
Assets,
End of
Year
(000) | | | Ratio of
net expenses
to average
net assets | | | Ratio of net
investment
income to
average net
assets | | | Ratio of
expenses to
average
net assets* | | | Portfolio
turnover rate** | |
| | | | | | | | | | | | | | | | | | | | | | | | | | | |
| $ | 1.00 | | | | 0.01 | % | | $ | 183 | | | | 0.33 | % | | | 0.01 | % | | | 0.97 | % | | | — | |
| $ | 1.00 | | | | 0.01 | % | | $ | 104 | | | | 0.42 | % | | | 0.01 | % | | | 0.99 | % | | | — | |
| $ | 1.00 | | | | 0.80 | % | | $ | 50 | | | | 0.69 | % | | | 0.67 | % | | | 0.99 | % | | | — | |
| $ | 1.00 | | | | 2.11 | % | | $ | 4 | | | | 0.66 | % | | | 2.48 | % | | | 0.96 | % | | | — | |
| $ | 1.00 | | | | 3.08 | % | | $ | 526 | | | | 0.66 | % | | | 3.06 | % | | | 0.97 | % | | | — | |
| | | | | | | | | | | | | | | | | | | | | | | | | | | |
| $ | 1.00 | | | | 0.01 | % | | $ | 163,384 | | | | 0.26 | % | | | 0.01 | % | | | 1.13 | % | | | — | |
| $ | 1.00 | | | | 0.05 | % | | $ | 172,643 | | | | 0.34 | % | | | 0.05 | % | | | 1.13 | % | | | — | |
| $ | 1.00 | | | | 0.53 | % | | $ | 270,852 | | | | 0.96 | % | | | 0.78 | % | | | 1.16 | % | | | — | |
| $ | 1.00 | | | | 2.86 | % | | $ | 763,152 | | | | 0.96 | % | | | 2.79 | % | | | 1.08 | % | | | — | |
| $ | 1.00 | | | | 4.51 | % | | $ | 745,381 | | | | 0.98 | % | | | 4.42 | % | | | 1.10 | % | | | — | |
| | | | | | | | | | | | | | | | | | | | | | | | | | | |
| $ | 1.00 | | | | 0.01 | % | | $ | 129,413 | | | | 0.09 | % | | | 0.01 | % | | | 1.14 | % | | | — | |
| $ | 1.00 | | | | 0.07 | % | | $ | 136,205 | | | | 0.15 | % | | | 0.07 | % | | | 1.13 | % | | | — | |
| $ | 1.00 | | | | 0.03 | % | | $ | 168,094 | | | | 0.33 | % | | | 0.03 | % | | | 1.13 | % | | | — | |
| $ | 1.00 | | | | 1.75 | % | | $ | 485,031 | | | | 0.93 | % | | | 1.72 | % | | | 1.08 | % | | | — | |
| $ | 1.00 | | | | 4.20 | % | | $ | 310,413 | | | | 0.97 | % | | | 4.07 | % | | | 1.11 | % | | | — | |
| | | | | | | | | | | | | | | | | | | | | | | | | | | |
| $ | 8.74 | | | | (0.55 | )% | | $ | 10,689 | | | | 0.64 | % | | | 2.34 | % | | | 0.97 | % | | | 8.36 | % |
| $ | 9.06 | | | | 9.93 | % | | $ | 7,230 | | | | 0.46 | % | | | 3.01 | % | | | 0.97 | % | | | 33.33 | % |
| $ | 8.50 | | | | 5.95 | % | | $ | 5,929 | | | | 0.43 | % | | | 2.95 | % | | | 0.93 | % | | | 21.56 | % |
| $ | 8.43 | | | | (10.33 | )% | | $ | 7,573 | | | | 0.35 | % | | | 2.72 | % | | | 0.85 | % | | | 39.99 | % |
| $ | 10.53 | | | | 8.86 | % | | $ | 9,781 | | | | 0.35 | % | | | 3.28 | % | | | 0.91 | % | | | 29.58 | % |
| | | | | | | | | | | | | | | | | | | | | | | | | | | |
| $ | 7.95 | | | | (3.29 | )% | | $ | 25,227 | | | | 0.58 | % | | | 1.68 | % | | | 0.91 | % | | | 9.96 | % |
| $ | 8.39 | | | | 10.18 | % | | $ | 25,419 | | | | 0.41 | % | | | 2.27 | % | | | 0.92 | % | | | 47.76 | % |
| $ | 7.79 | | | | 2.67 | % | | $ | 24,426 | | | | 0.38 | % | | | 2.36 | % | | | 0.88 | % | | | 22.46 | % |
| $ | 7.77 | | | | (17.44 | )% | | $ | 27,775 | | | | 0.35 | % | | | 1.82 | % | | | 0.85 | % | | | 63.63 | % |
| $ | 10.94 | | | | 11.48 | % | | $ | 38,081 | | | | 0.36 | % | | | 2.68 | % | | | 0.92 | % | | | 40.05 | % |
| | | | | | | | | | | | | | | | | | | | | | | | | | | |
| $ | 7.20 | | | | (5.10 | )% | | $ | 16,246 | | | | 0.59 | % | | | 1.26 | % | | | 0.93 | % | | | 9.06 | % |
| $ | 7.69 | | | | 10.13 | % | | $ | 17,838 | | | | 0.42 | % | | | 1.81 | % | | | 0.93 | % | | | 57.35 | % |
| $ | 7.11 | | | | (1.25 | )% | | $ | 16,609 | | | | 0.39 | % | | | 1.89 | % | | | 0.89 | % | | | 24.08 | % |
| $ | 7.33 | | | | (21.65 | )% | | $ | 18,321 | | | | 0.35 | % | | | 1.23 | % | | | 0.85 | % | | | 77.54 | % |
| $ | 11.13 | | | | 13.19 | % | | $ | 26,189 | | | | 0.36 | % | | | 2.33 | % | | | 0.93 | % | | | 44.48 | % |
| | | | | | | | | | | | | | | | | | | | | | | | | | | |
| $ | 6.78 | | | | (6.91 | )% | | $ | 4,806 | | | | 0.71 | % | | | 0.87 | % | | | 1.05 | % | | | 10.72 | % |
| $ | 7.33 | | | | 9.90 | % | | $ | 5,148 | | | | 0.50 | % | | | 1.41 | % | | | 1.06 | % | | | 66.32 | % |
| $ | 6.77 | | | | (7.60 | )% | | $ | 4,810 | | | | 0.46 | % | | | 1.23 | % | | | 0.97 | % | | | 20.24 | % |
| $ | 7.41 | | | | (26.23 | )% | | $ | 5,680 | | | | 0.38 | % | | | 0.44 | % | | | 0.88 | % | | | 67.40 | % |
| $ | 12.26 | | | | 14.79 | % | | $ | 9,384 | | | | 0.37 | % | | | 1.77 | % | | | 0.93 | % | | | 48.80 | % |
131
Financial Highlights, Class B Shares
The financial highlights table is intended to help you understand the Funds’ financial performance for the past 5 years or, if shorter, the period of the Funds’ operations. Certain information reflects financial results for a single Fund share. The total returns in the table represent the rate that an investor would have earned (or lost) on an investment in the Fund (assuming reinvestment of all dividends and distributions).
| | | | | | | | | | | | | | | | | | | | | | | | | | | | | | | | |
| | | | | | Investment Activities | | | Distributions | |
| | |
Net Asset
Value,
Beginning
of Period | | | Net
investment
income
(loss)(a) | | | Net realized/
unrealized
gains (losses)
on investments | | | Total from
Investment
Activities | | | Net
investment
income | | | Net realized
gains on
investments | | | Return
of
capital | | | Total
Distributions | |
Sterling Capital Select Equity Fund | | | | | | | | | | | | | | | | | | | | | | | | | |
Year Ended September 30, 2011 | | $ | 10.33 | | | | 0.02 | | | | (0.60 | ) | | | (0.58 | ) | | | (0.02 | ) | | | — | | | | — | | | | (0.02 | ) |
Year Ended September 30, 2010 | | $ | 9.90 | | | | 0.02 | | | | 0.44 | | | | 0.46 | | | | (0.03 | ) | | | — | | | | — | | | | (0.03 | ) |
Year Ended September 30, 2009 | | $ | 11.11 | | | | 0.05 | | | | (1.21 | ) | | | (1.16 | ) | | | (0.05 | ) | | | — | | | | — | | | | (0.05 | ) |
Year Ended September 30, 2008 | | $ | 18.90 | | | | 0.04 | | | | (5.05 | ) | | | (5.01 | ) | | | (0.05 | ) | | | (2.73 | ) | | | — | | | | (2.78 | ) |
Year Ended September 30, 2007 | | $ | 20.15 | | | | 0.09 | | | | 2.12 | | | | 2.21 | | | | (0.11 | ) | | | (3.35 | ) | | | — | | | | (3.46 | ) |
Sterling Capital Mid Value Fund | | | | | | | | | | | | | | | | | | | | | | | | | |
Year Ended September 30, 2011 | | $ | 11.52 | | | | (0.06 | ) | | | (0.66 | ) | | | (0.72 | ) | | | — | | | | — | | | | — | | | | — | |
Year Ended September 30, 2010 | | $ | 10.35 | | | | (0.05 | ) | | | 1.22 | | | | 1.17 | | | | — | (d) | | | — | | | | — | | | | — | (d) |
Year Ended September 30, 2009 | | $ | 10.14 | | | | (0.05 | ) | | | 0.27 | | | | 0.22 | | | | (0.01 | ) | | | — | | | | — | | | | (0.01 | ) |
Year Ended September 30, 2008 | | $ | 14.55 | | | | (0.07 | ) | | | (2.98 | ) | | | (3.05 | ) | | | — | | | | (1.36 | ) | | | — | | | | (1.36 | ) |
Year Ended September 30, 2007 | | $ | 13.23 | | | | (0.07 | ) | | | 2.08 | | | | 2.01 | | | | — | (d) | | | (0.69 | ) | | | — | | | | (0.69 | ) |
Sterling Capital Small Value Fund | | | | | | | | | | | | | | | | | | | | | | | | | |
Year Ended September 30, 2011 | | $ | 11.17 | | | | (0.15 | ) | | | (0.33 | ) | | | (0.48 | ) | | | — | | | | — | | | | — | | | | — | |
February 1, 2010 to September 30, 2010(e) | | $ | 10.55 | | | | (0.02 | ) | | | 0.64 | | | | 0.62 | | | | — | | | | — | | | | — | | | | — | |
Sterling Capital International Fund | | | | | | | | | | | | | | | | | | | | | | | | | |
Year Ended September 30, 2011 | | $ | 4.44 | | | | (0.02 | ) | | | (0.84 | ) | | | (0.86 | ) | | | — | | | | — | | | | — | | | | — | |
Year Ended September 30, 2010 | | $ | 4.41 | | | | (0.01 | ) | | | 0.11 | | | | 0.10 | | | | (0.07 | ) | | | — | | | | — | | | | (0.07 | ) |
Year Ended September 30, 2009 | | $ | 4.75 | | | | 0.02 | | | | (0.25 | ) | | | (0.23 | ) | | | (0.11 | ) | | | — | | | | — | | | | (0.11 | ) |
Year Ended September 30, 2008 | | $ | 7.65 | | | | 0.02 | | | | (2.16 | ) | | | (2.14 | ) | | | (0.01 | ) | | | (0.75 | ) | | | — | | | | (0.76 | ) |
Year Ended September 30, 2007 | | $ | 10.46 | | | | 0.03 | | | | 1.72 | | | | 1.75 | | | | (0.04 | ) | | | (4.52 | ) | | | — | | | | (4.56 | ) |
Sterling Capital Special Opportunities Fund | | | | | | | | | | | | | | | | | | | | | | | | | |
Year Ended September 30, 2011 | | $ | 14.97 | | | | (0.18 | ) | | | (0.47 | ) | | | (0.65 | ) | | | — | | | | (0.10 | ) | | | — | | | | (0.10 | ) |
Year Ended September 30, 2010 | | $ | 13.89 | | | | (0.16 | ) | | | 1.24 | | | | 1.08 | | | | — | | | | — | | | | — | | | | — | |
Year Ended September 30, 2009 | | $ | 14.65 | | | | (0.05 | ) | | | (0.05 | ) | | | (0.10 | ) | | | — | (d) | | | (0.57 | ) | | | (0.09 | ) | | | (0.66 | ) |
Year Ended September 30, 2008 | | $ | 17.63 | | | | (0.21 | ) | | | (2.02 | ) | | | (2.23 | ) | | | — | | | | (0.75 | ) | | | — | | | | (0.75 | ) |
Year Ended September 30, 2007 | | $ | 16.00 | | | | (0.13 | ) | | | 3.36 | | | | 3.23 | | | | — | | | | (1.60 | ) | | | — | | | | (1.60 | ) |
Sterling Capital Equity Income Fund | | | | | | | | | | | | | | | | | | | | | | | | | |
Year Ended September 30, 2011 | | $ | 13.01 | | | | 0.14 | | | | 0.14 | (g) | | | 0.28 | | | | (0.08 | ) | | | — | | | | — | | | | (0.08 | ) |
Year Ended September 30, 2010 | | $ | 11.39 | | | | 0.20 | | | | 1.57 | | | | 1.77 | | | | (0.15 | ) | | | — | | | | — | | | | (0.15 | ) |
Year Ended September 30, 2009 | | $ | 12.31 | | | | 0.22 | | | | (0.98 | ) | | | (0.76 | ) | | | (0.13 | ) | | | (0.03 | ) | | | — | | | | (0.16 | ) |
Year Ended September 30, 2008 | | $ | 14.99 | | | | 0.32 | | | | (2.20 | ) | | | (1.88 | ) | | | (0.22 | ) | | | (0.58 | ) | | | — | | | | (0.80 | ) |
Year Ended September 30, 2007 | | $ | 13.33 | | | | 0.25 | | | | 2.31 | | | | 2.56 | | | | (0.22 | ) | | | (0.68 | ) | | | — | | | | (0.90 | ) |
Sterling Capital Intermediate U.S. Government Fund | | | | | | | | | | | | | | | | | | | | | | | | | |
Year Ended September 30, 2011 | | $ | 10.77 | | | | 0.17 | | | | 0.04 | | | | 0.21 | | | | (0.23 | ) | | | — | | | | — | | | | (0.23 | ) |
Year Ended September 30, 2010 | | $ | 10.52 | | | | 0.21 | | | | 0.28 | | | | 0.49 | | | | (0.24 | ) | | | — | | | | — | | | | (0.24 | ) |
Year Ended September 30, 2009 | | $ | 10.00 | | | | 0.25 | | | | 0.54 | | | | 0.79 | | | | (0.27 | ) | | | — | | | | — | | | | (0.27 | ) |
Year Ended September 30, 2008 | | $ | 9.90 | | | | 0.34 | | | | 0.10 | | | | 0.44 | | | | (0.34 | ) | | | — | | | | — | | | | (0.34 | ) |
Year Ended September 30, 2007 | | $ | 9.86 | | | | 0.35 | | | | 0.04 | | | | 0.39 | | | | (0.35 | ) | | | — | | | | — | | | | (0.35 | ) |
| * | During the period certain fees were reduced. If such reductions had not occurred, the ratios would have been as indicated. |
| ** | Portfolio turnover rate is calculated on the basis of the Fund as a whole without distinguishing between classes of shares issued. |
| (a) | Per share net investment income (loss) has been calculated using the average daily shares method. |
| (b) | Not annualized for periods less than one year. |
| (c) | Annualized for periods less than one year. |
| (d) | Amount is less than $0.005. |
| (e) | Period from commencement of operations. |
| (f) | Includes proceeds received from a settlement of litigation, which impacted the Fund’s total return. Not including these proceeds, the Fund’s total return would have been 5.50%. |
| (g) | The amount shown for a share outstanding throughout the period does not accord with the change in aggregate gains and losses in the portfolio of securities during the period because of the timing of sales and purchases of Fund shares in relation to fluctuating market values during the period. |
See accompanying notes to the financial statements.
132
| | | | | | | | | | | | | | | | | | | | | | | | | | |
| | | | | | | Ratios/Supplementary Data | |
Net Asset
Value,
End of
Period | | | Total Return
(excludes
sales charge) (b) | | | Net Assets,
End of
Period
(000) | | | Ratio of
net expenses
to average
net assets (c) | | | Ratio of net
investment
income
(loss) to
average net
assets (c) | | | Ratio of
expenses to
average
net assets*(c) | | | Portfolio
turnover rate**(b) | |
| | | | | | | | | | | | | | | | | | | | | | | | | | | |
| $ | 9.73 | | | | (5.67 | )% | | $ | 1,922 | | | | 1.83 | % | | | 0.18 | % | | | 1.97 | % | | | 66.29 | % |
| $ | 10.33 | | | | 4.64 | % | | $ | 3,121 | | | | 1.83 | % | | | 0.17 | % | | | 1.98 | % | | | 119.85 | % |
| $ | 9.90 | | | | (10.31 | )% | | $ | 4,501 | | | | 1.82 | % | | | 0.54 | % | | | 1.96 | % | | | 92.97 | % |
| $ | 11.11 | | | | (29.98 | )% | | $ | 7,866 | | | | 1.89 | % | | | 0.28 | % | | | 1.93 | % | | | 38.43 | % |
| $ | 18.90 | | | | 11.67 | % | | $ | 17,796 | | | | 1.91 | % | | | 0.50 | % | | | 1.97 | % | | | 68.60 | % |
| | | | | | | | | | | | | | | | | | | | | | | | | | | |
| $ | 10.80 | | | | (6.25 | )% | | $ | 2,604 | | | | 1.93 | % | | | (0.45 | )% | | | 1.97 | % | | | 38.30 | % |
| $ | 11.52 | | | | 11.32 | % | | $ | 3,796 | | | | 1.94 | % | | | (0.48 | )% | | | 2.05 | % | | | 45.02 | % |
| $ | 10.35 | | | | 2.17 | % | | $ | 3,454 | | | | 1.96 | % | | | (0.60 | )% | | | 2.01 | % | | | 46.83 | % |
| $ | 10.14 | | | | (22.60 | )% | | $ | 4,136 | | | | 1.89 | % | | | (0.58 | )% | | | 1.93 | % | | | 65.74 | % |
| $ | 14.55 | | | | 15.58 | % | | $ | 6,112 | | | | 1.91 | % | | | (0.48 | )% | | | 1.95 | % | | | 58.59 | % |
| | | | | | | | | | | | | | | | | | | | | | | | | | | |
| $ | 10.69 | | | | (4.30 | )% | | $ | 571 | | | | 2.08 | % | | | (1.15 | )% | | | 2.19 | % | | | 63.02 | % |
| $ | 11.17 | | | | 5.88 | %(f) | | $ | 932 | | | | 2.15 | % | | | (0.28 | )% | | | 2.41 | % | | | 95.89 | % |
| | | | | | | | | | | | | | | | | | | | | | | | | | | |
| $ | 3.58 | | | | (19.19 | )% | | $ | 481 | | | | 2.38 | % | | | (0.40 | )% | | | 2.53 | % | | | 75.63 | % |
| $ | 4.44 | | | | 1.93 | % | | $ | 810 | | | | 2.54 | % | | | (0.31 | )% | | | 2.96 | % | | | 145.31 | % |
| $ | 4.41 | | | | (4.43 | )% | | $ | 954 | | | | 2.49 | % | | | 0.58 | % | | | 2.64 | % | | | 223.19 | % |
| $ | 4.75 | | | | (31.33 | )% | | $ | 1,281 | | | | 2.31 | % | | | 0.38 | % | | | 2.49 | % | | | 112.65 | % |
| $ | 7.65 | | | | 19.28 | % | | $ | 2,041 | | | | 2.12 | % | | | 0.26 | % | | | 2.25 | % | | | 129.80 | % |
| | | | | | | | | | | | | | | | | | | | | | | | | | | |
| $ | 14.22 | | | | (4.43 | )% | | $ | 16,582 | | | | 2.03 | % | | | (1.10 | )% | | | 2.03 | % | | | 31.51 | % |
| $ | 14.97 | | | | 7.78 | % | | $ | 22,538 | | | | 2.04 | % | | | (1.13 | )% | | | 2.05 | % | | | 25.65 | % |
| $ | 13.89 | | | | 1.04 | % | | $ | 24,068 | | | | 2.03 | % | | | (0.39 | )% | | | 2.04 | % | | | 45.22 | % |
| $ | 14.65 | | | | (13.28 | )% | | $ | 26,347 | | | | 1.99 | % | | | (1.22 | )% | | | 1.99 | % | | | 25.80 | % |
| $ | 17.63 | | | | 21.33 | % | | $ | 29,931 | | | | 2.03 | % | | | (0.79 | )% | | | 2.03 | % | | | 49.43 | % |
| | | | | | | | | | | | | | | | | | | | | | | | | | | |
| $ | 13.21 | | | | 2.13 | % | | $ | 12,314 | | | | 1.93 | % | | | 1.02 | % | | | 1.93 | % | | | 16.64 | % |
| $ | 13.01 | | | | 15.59 | % | | $ | 13,959 | | | | 1.94 | % | | | 1.67 | % | | | 1.94 | % | | | 21.63 | % |
| $ | 11.39 | | | | (6.05 | )% | | $ | 13,567 | | | | 1.93 | % | | | 2.18 | % | | | 1.95 | % | | | 37.13 | % |
| $ | 12.31 | | | | (13.14 | )% | | $ | 15,176 | | | | 1.89 | % | | | 2.35 | % | | | 1.89 | % | | | 30.01 | % |
| $ | 14.99 | | | | 19.97 | % | | $ | 14,796 | | | | 1.94 | % | | | 1.78 | % | | | 1.94 | % | | | 37.85 | % |
| | | | | | | | | | | | | | | | | | | | | | | | | | | |
| $ | 10.75 | | | | 1.99 | % | | $ | 1,617 | | | | 1.71 | % | | | 1.58 | % | | | 1.83 | % | | | 83.62 | % |
| $ | 10.77 | | | | 4.71 | % | | $ | 2,690 | | | | 1.71 | % | | | 1.99 | % | | | 1.84 | % | | | 83.92 | % |
| $ | 10.52 | | | | 8.01 | % | | $ | 3,256 | | | | 1.70 | % | | | 2.42 | % | | | 1.82 | % | | | 47.13 | % |
| $ | 10.00 | | | | 4.52 | % | | $ | 3,070 | | | | 1.67 | % | | | 3.34 | % | | | 1.79 | % | | | 116.07 | % |
| $ | 9.90 | | | | 4.01 | % | | $ | 3,006 | | | | 1.68 | % | | | 3.52 | % | | | 1.80 | % | | | 85.83 | % |
133
Financial Highlights, Class B Shares
The financial highlights table is intended to help you understand the Funds’ financial performance for the past 5 years or, if shorter, the period of the Funds’ operations. Certain information reflects financial results for a single Fund share. The total returns in the table represent the rate that an investor would have earned (or lost) on an investment in the Fund (assuming reinvestment of all dividends and distributions).
| | | | | | | | | | | | | | | | | | | | | | | | | | | | |
| | | | | | Investment Activities | | | Distributions | |
| | | Net Asset
Value,
Beginning
of Year | | | Net
investment
income
(loss)(a) | | |
Net realized/
unrealized
gains (losses)
on investments | | | Total from
Investment
Activities | | | Net
investment
income | | | Net realized
gains on
investments | | | Total
Distributions | |
Sterling Capital Total Return Bond Fund | | | | | | | | | | | | | | | | | | | | | |
Year Ended September 30, 2011 | | $ | 11.33 | | | | 0.30 | | | | 0.01 | | | | 0.31 | | | | (0.37 | ) | | | (0.21 | ) | | | (0.58 | ) |
Year Ended September 30, 2010 | | $ | 10.78 | | | | 0.35 | | | | 0.62 | | | | 0.97 | | | | (0.41 | ) | | | (0.01 | ) | | | (0.42 | ) |
Year Ended September 30, 2009 | | $ | 9.89 | | | | 0.37 | | | | 0.89 | | | | 1.26 | | | | (0.37 | ) | | | — | | | | (0.37 | ) |
Year Ended September 30, 2008 | | $ | 10.13 | | | | 0.36 | | | | (0.22 | ) | | | 0.14 | | | | (0.38 | ) | | | — | | | | (0.38 | ) |
Year Ended September 30, 2007 | | $ | 10.13 | | | | 0.37 | | | | — | | | | 0.37 | | | | (0.37 | ) | | | — | | | | (0.37 | ) |
Sterling Capital Prime Money Market Fund | | | | | | | | | | | | | | | | | | | | | |
Year Ended September 30, 2011 | | $ | 1.00 | | | | — | (b) | | | — | (b) | | | — | (b) | | | — | (b) | | | — | | | | — | (b) |
Year Ended September 30, 2010 | | $ | 1.00 | | | | — | (b) | | | — | (b) | | | — | (b) | | | — | (b) | | | — | | | | — | (b) |
Year Ended September 30, 2009 | | $ | 1.00 | | | | — | (b) | | | — | (b) | | | — | (b) | | | — | (b) | | | — | | | | — | (b) |
Year Ended September 30, 2008 | | $ | 1.00 | | | | 0.02 | | | | — | (b) | | | 0.02 | | | | (0.02 | ) | | | — | | | | (0.02 | ) |
Year Ended September 30, 2007 | | $ | 1.00 | | | | 0.04 | | | | — | | | | 0.04 | | | | (0.04 | ) | | | — | | | | (0.04 | ) |
Sterling Capital U.S. Treasury Money Market Fund | | | | | | | | | | | | | | | | | | | | | |
Year Ended September 30, 2011 | | $ | 1.00 | | | | — | (b) | | | — | (b) | | | — | (b) | | | — | (b) | | | — | | | | — | (b) |
Year Ended September 30, 2010 | | $ | 1.00 | | | | — | (b) | | | — | (b) | | | — | (b) | | | — | (b) | | | — | | | | — | (b) |
Year Ended September 30, 2009 | | $ | 1.00 | | | | — | (b) | | | — | | | | — | (b) | | | — | (b) | | | — | | | | — | (b) |
Year Ended September 30, 2008 | | $ | 1.00 | | | | 0.01 | | | | — | (b) | | | 0.01 | | | | (0.01 | ) | | | — | | | | (0.01 | ) |
Year Ended September 30, 2007 | | $ | 1.00 | | | | 0.04 | | | | — | | | | 0.04 | | | | (0.04 | ) | | | — | | | | (0.04 | ) |
Sterling Capital Strategic Allocation Conservative Fund(c) | | | | | | | | | | | | | | | | | | | | | |
Year Ended September 30, 2011 | | $ | 9.07 | | | | 0.15 | | | | (0.25 | ) | | | (0.10 | ) | | | (0.21 | ) | | | — | | | | (0.21 | ) |
Year Ended September 30, 2010 | | $ | 8.50 | | | | 0.20 | | | | 0.57 | | | | 0.77 | | | | (0.20 | ) | | | — | | | | (0.20 | ) |
Year Ended September 30, 2009 | | $ | 8.43 | | | | 0.17 | | | | 0.21 | | | | 0.38 | | | | (0.17 | ) | | | (0.14 | ) | | | (0.31 | ) |
Year Ended September 30, 2008 | | $ | 10.54 | | | | 0.19 | | | | (1.25 | ) | | | (1.06 | ) | | | (0.32 | ) | | | (0.73 | ) | | | (1.05 | ) |
Year Ended September 30, 2007 | | $ | 9.96 | | | | 0.27 | | | | 0.54 | | | | 0.81 | | | | (0.23 | ) | | | — | | | | (0.23 | ) |
Sterling Capital Strategic Allocation Balanced Fund(c) | | | | | | | | | | | | | | | | | | | | | |
Year Ended September 30, 2011 | | $ | 8.22 | | | | 0.08 | | | | (0.40 | ) | | | (0.32 | ) | | | (0.11 | ) | | | — | | | | (0.11 | ) |
Year Ended September 30, 2010 | | $ | 7.63 | | | | 0.12 | | | | 0.59 | | | | 0.71 | | | | (0.12 | ) | | | — | | | | (0.12 | ) |
Year Ended September 30, 2009 | | $ | 7.62 | | | | 0.11 | | | | 0.01 | | | | 0.12 | | | | (0.11 | ) | | | — | | | | (0.11 | ) |
Year Ended September 30, 2008 | | $ | 10.75 | | | | 0.10 | | | | (1.81 | ) | | | (1.71 | ) | | | (0.29 | ) | | | (1.13 | ) | | | (1.42 | ) |
Year Ended September 30, 2007 | | $ | 10.05 | | | | 0.21 | | | | 0.85 | | | | 1.06 | | | | (0.14 | ) | | | (0.22 | ) | | | (0.36 | ) |
Sterling Capital Strategic Allocation Growth Fund(c) | | | | | | | | | | | | | | | | | | | | | |
Year Ended September 30, 2011 | | $ | 7.51 | | | | 0.04 | | | | (0.46 | ) | | | (0.42 | ) | | | (0.06 | ) | | | — | | | | (0.06 | ) |
Year Ended September 30, 2010 | | $ | 6.95 | | | | 0.08 | | | | 0.56 | | | | 0.64 | | | | (0.08 | ) | | | — | | | | (0.08 | ) |
Year Ended September 30, 2009 | | $ | 7.17 | | | | 0.07 | | | | (0.22 | ) | | | (0.15 | ) | | | (0.07 | ) | | | — | | | | (0.07 | ) |
Year Ended September 30, 2008 | | $ | 10.92 | | | | 0.04 | | | | (2.15 | ) | | | (2.11 | ) | | | (0.27 | ) | | | (1.37 | ) | | | (1.64 | ) |
Year Ended September 30, 2007 | | $ | 10.05 | | | | 0.18 | | | | 1.04 | | | | 1.22 | | | | (0.08 | ) | | | (0.27 | ) | | | (0.35 | ) |
Sterling Capital Strategic Allocation Equity Fund(c) | | | | | | | | | | | | | | | | | | | | | |
Year Ended September 30, 2011 | | $ | 7.01 | | | | 0.01 | | | | (0.54 | ) | | | (0.53 | ) | | | (0.04 | ) | | | — | | | | (0.04 | ) |
Year Ended September 30, 2010 | | $ | 6.45 | | | | 0.04 | | | | 0.55 | | | | 0.59 | | | | (0.03 | ) | | | — | | | | (0.03 | ) |
Year Ended September 30, 2009 | | $ | 7.09 | | | | 0.03 | | | | (0.62 | ) | | | (0.59 | ) | | | (0.05 | ) | | | — | | | | (0.05 | ) |
Year Ended September 30, 2008 | | $ | 11.86 | | | | (0.03 | ) | | | (2.65 | ) | | | (2.68 | ) | | | (0.28 | ) | | | (1.81 | ) | | | (2.09 | ) |
Year Ended September 30, 2007 | | $ | 11.26 | | | | 0.12 | | | | 1.38 | | | | 1.50 | | | | (0.05 | ) | | | (0.85 | ) | | | (0.90 | ) |
| * | During the period certain fees were reduced. If such reductions had not occurred, the ratios would have been as indicated. |
| ** | Portfolio turnover rate is calculated on the basis of the Fund as a whole without distinguishing between classes of shares issued. |
| (a) | Per share net investment income (loss) has been calculated using the average daily shares method. |
| (b) | Amount is less than $0.005. |
| (c) | The expense ratios exclude the impact of fees/expenses paid by each underlying fund. |
See accompanying notes to the financial statements.
134
| | | | | | | | | | | | | | | | | | | | |
| | | | | | | Ratios/Supplementary Data |
Net Asset
Value,
End of
Year | | | Total
Return
(excludes
sales charge) | | | Net Assets,
End of
Year
(000) | | | Ratio of
net expenses
to average
net assets | | Ratio of net
investment
income
(loss) to
average net
assets | | | Ratio of
expenses to
average
net assets* | | Portfolio
turnover rate** |
| | | | | | | | | | | | | | | | | | | | | |
| $ | 11.06 | | | | 2.91 | % | | $ | 3,776 | | | 1.70% | | | 2.74 | % | | 1.82% | | 131.87% |
| $ | 11.33 | | | | 9.18 | % | | $ | 4,762 | | | 1.71% | | | 3.21 | % | | 1.83% | | 122.94% |
| $ | 10.78 | | | | 13.03 | % | | $ | 5,362 | | | 1.71% | | | 3.62 | % | | 1.83% | | 122.26% |
| $ | 9.89 | | | | 1.31 | % | | $ | 4,951 | | | 1.66% | | | 3.49 | % | | 1.78% | | 190.15% |
| $ | 10.13 | | | | 3.73 | % | | $ | 4,992 | | | 1.68% | | | 3.62 | % | | 1.80% | | 222.24% |
| | | | | | | | | | | | | | | | | | | | | |
| $ | 1.00 | | | | 0.01 | % | | $ | 1,155 | | | 0.26% | | | 0.01 | % | | 1.63% | | — |
| $ | 1.00 | | | | 0.05 | % | | $ | 1,494 | | | 0.34% | | | 0.05 | % | | 1.63% | | — |
| $ | 1.00 | | | | 0.34 | % | | $ | 1,901 | | | 1.13% | | | 0.33 | % | | 1.66% | | — |
| $ | 1.00 | | | | 2.35 | % | | $ | 1,767 | | | 1.46% | | | 2.26 | % | | 1.58% | | — |
| $ | 1.00 | | | | 4.01 | % | | $ | 1,629 | | | 1.48% | | | 3.92 | % | | 1.60% | | — |
| | | | | | | | | | | | | | | | | | | | | |
| $ | 1.00 | | | | 0.01 | % | | $ | 632 | | | 0.09% | | | 0.01 | % | | 1.64% | | — |
| $ | 1.00 | | | | 0.07 | % | | $ | 671 | | | 0.15% | | | 0.06 | % | | 1.64% | | — |
| $ | 1.00 | | | | 0.03 | % | | $ | 935 | | | 0.28% | | | 0.02 | % | | 1.64% | | — |
| $ | 1.00 | | | | 1.28 | % | | $ | 597 | | | 1.38% | | | 1.14 | % | | 1.58% | | — |
| $ | 1.00 | | | | 3.72 | % | | $ | 301 | | | 1.46% | | | 3.64 | % | | 1.60% | | — |
| | | | | | | | | | | | | | | | | | | | | |
| $ | 8.76 | | | | (1.24 | )% | | $ | 1,813 | | | 1.37% | | | 1.61 | % | | 1.47% | | 8.36% |
| $ | 9.07 | | | | 9.15 | % | | $ | 2,403 | | | 1.21% | | | 2.25 | % | | 1.47% | | 33.33% |
| $ | 8.50 | | | | 5.15 | % | | $ | 3,184 | | | 1.18% | | | 2.20 | % | | 1.43% | | 21.56% |
| $ | 8.43 | | | | (11.09 | )% | | $ | 4,081 | | | 1.10% | | | 1.98 | % | | 1.35% | | 39.99% |
| $ | 10.54 | | | | 8.17 | % | | $ | 4,779 | | | 1.10% | | | 2.60 | % | | 1.41% | | 29.58% |
| | | | | | | | | | | | | | | | | | | | | |
| $ | 7.79 | | | | (4.01 | )% | | $ | 6,560 | | | 1.31% | | | 0.96 | % | | 1.41% | | 9.96% |
| $ | 8.22 | | | | 9.40 | % | | $ | 9,771 | | | 1.16% | | | 1.48 | % | | 1.41% | | 47.76% |
| $ | 7.63 | | | | 1.81 | % | | $ | 11,734 | | | 1.13% | | | 1.63 | % | | 1.38% | | 22.46% |
| $ | 7.62 | | | | (17.99 | )% | | $ | 15,305 | | | 1.10% | | | 1.07 | % | | 1.35% | | 63.63% |
| $ | 10.75 | | | | 10.67 | % | | $ | 21,791 | | | 1.11% | | | 1.96 | % | | 1.42% | | 40.05% |
| | | | | | | | | | | | | | | | | | | | | |
| $ | 7.03 | | | | (5.68 | )% | | $ | 5,521 | | | 1.33% | | | 0.52 | % | | 1.43% | | 9.06% |
| $ | 7.51 | | | | 9.22 | % | | $ | 8,275 | | | 1.17% | | | 1.05 | % | | 1.43% | | 57.35% |
| $ | 6.95 | | | | (1.89 | )% | | $ | 9,973 | | | 1.15% | | | 1.17 | % | | 1.40% | | 24.08% |
| $ | 7.17 | | | | (22.32 | )% | | $ | 13,306 | | | 1.10% | | | 0.47 | % | | 1.35% | | 77.54% |
| $ | 10.92 | | | | 12.31 | % | | $ | 20,286 | | | 1.11% | | | 1.71 | % | | 1.43% | | 44.48% |
| | | | | | | | | | | | | | | | | | | | | |
| $ | 6.44 | | | | (7.68 | )% | | $ | 2,673 | | | 1.45% | | | 0.14 | % | | 1.54% | | 10.72% |
| $ | 7.01 | | | | 9.17 | % | | $ | 3,673 | | | 1.25% | | | 0.63 | % | | 1.55% | | 66.32% |
| $ | 6.45 | | | | (8.38 | )% | | $ | 4,215 | | | 1.21% | | | 0.50 | % | | 1.47% | | 20.24% |
| $ | 7.09 | | | | (26.69 | )% | | $ | 5,406 | | | 1.13% | | | (0.31 | )% | | 1.38% | | 67.40% |
| $ | 11.86 | | | | 13.88 | % | | $ | 8,535 | | | 1.12% | | | 1.07 | % | | 1.43% | | 48.80% |
135
Financial Highlights, Class C Shares
The financial highlights table is intended to help you understand the Funds’ financial performance for the past 5 years or, if shorter, the period of the Funds’ operations. Certain information reflects financial results for a single Fund share. The total returns in the table represent the rate that an investor would have earned (or lost) on an investment in the Fund (assuming reinvestment of all dividends and distributions).
| | | | | | | | | | | | | | | | | | | | | | | | | | | | | | | | |
| | | | | | Investment Activities | | | Distributions | |
| | | Net Asset
Value,
Beginning
of Period | | |
Net
investment
income
(loss)(a) | | | Net realized/
unrealized
gains (losses)
on investments | | | Total from
investment
Activities | | | Net
investment
income | | | Net realized
gains on
investments | | | Return
of
capital | | | Total
Distributions | |
Sterling Capital Select Equity Fund | | | | | | | | | | | | | | | | | | | | | | | | | |
Year Ended September 30, 2011 | | $ | 10.28 | | | | 0.01 | | | | (0.59 | ) | | | (0.58 | ) | | | (0.03 | ) | | | — | | | | — | | | | (0.03 | ) |
Year Ended September 30, 2010 | | $ | 9.85 | | | | 0.02 | | | | 0.45 | | | | 0.47 | | | | (0.04 | ) | | | — | | | | — | | | | (0.04 | ) |
Year Ended September 30, 2009 | | $ | 11.08 | | | | 0.04 | | | | (1.21 | ) | | | (1.17 | ) | | | (0.06 | ) | | | — | | | | — | | | | (0.06 | ) |
Year Ended September 30, 2008 | | $ | 18.87 | | | | 0.04 | | | | (5.05 | ) | | | (5.01 | ) | | | (0.05 | ) | | | (2.73 | ) | | | — | | | | (2.78 | ) |
Year Ended September 30, 2007 | | $ | 20.11 | | | | 0.09 | | | | 2.13 | | | | 2.22 | | | | (0.11 | ) | | | (3.35 | ) | | | — | | | | (3.46 | ) |
Sterling Capital Mid Value Fund | | | | | | | | | | | | | | | | | | | | | | | | | |
Year Ended September 30, 2011 | | $ | 11.50 | | | | (0.05 | ) | | | (0.67 | ) | | | (0.72 | ) | | | — | | | | — | | | | — | | | | — | |
Year Ended September 30, 2010 | | $ | 10.34 | | | | (0.05 | ) | | | 1.21 | | | | 1.16 | | | | — | (d) | | | — | | | | — | | | | — | (d) |
Year Ended September 30, 2009 | | $ | 10.14 | | | | (0.05 | ) | | | 0.26 | | | | 0.21 | | | | (0.01 | ) | | | — | | | | — | | | | (0.01 | ) |
Year Ended September 30, 2008 | | $ | 14.55 | | | | (0.07 | ) | | | (2.98 | ) | | | (3.05 | ) | | | — | | | | (1.36 | ) | | | — | | | | (1.36 | ) |
Year Ended September 30, 2007 | | $ | 13.23 | | | | (0.07 | ) | | | 2.08 | | | | 2.01 | | | | — | (d) | | | (0.69 | ) | | | — | | | | (0.69 | ) |
Sterling Capital Small Value Fund | | | | | | | | | | | | | | | | | | | | | | | | | |
Year Ended September 30, 2011 | | $ | 11.17 | | | | (0.15 | ) | | | (0.33 | ) | | | (0.48 | ) | | | — | | | | — | | | | — | | | | — | |
February 1, 2010 to September 30, 2010(e) | | $ | 10.55 | | | | (0.01 | ) | | | 0.64 | | | | 0.63 | | | | (0.01 | ) | | | — | | | | — | | | | (0.01 | ) |
Sterling Capital International Fund | | | | | | | | | | | | | | | | | | | | | | | | | |
Year Ended September 30, 2011 | | $ | 4.42 | | | | (0.02 | ) | | | (0.83 | ) | | | (0.85 | ) | | | — | | | | — | | | | — | | | | — | |
Year Ended September 30, 2010 | | $ | 4.38 | | | | (0.01 | ) | | | 0.10 | | | | 0.09 | | | | (0.05 | ) | | | — | | | | — | | | | (0.05 | ) |
Year Ended September 30, 2009 | | $ | 4.73 | | | | 0.02 | | | | (0.26 | ) | | | (0.24 | ) | | | (0.11 | ) | | | — | | | | — | | | | (0.11 | ) |
Year Ended September 30, 2008 | | $ | 7.62 | | | | 0.03 | | | | (2.16 | ) | | | (2.13 | ) | | | (0.01 | ) | | | (0.75 | ) | | | — | | | | (0.76 | ) |
Year Ended September 30, 2007 | | $ | 10.44 | | | | 0.01 | | | | 1.73 | | | | 1.74 | | | | (0.04 | ) | | | (4.52 | ) | | | — | | | | (4.56 | ) |
Sterling Capital Special Opportunities Fund | | | | | | | | | | | | | | | | | |
Year Ended September 30, 2011 | | $ | 14.98 | | | | (0.18 | ) | | | (0.47 | ) | | | (0.65 | ) | | | — | | | | (0.10 | ) | | | — | | | | (0.10 | ) |
Year Ended September 30, 2010 | | $ | 13.89 | | | | (0.16 | ) | | | 1.25 | | | | 1.09 | | | | — | | | | — | | | | — | | | | — | |
Year Ended September 30, 2009 | | $ | 14.66 | | | | (0.06 | ) | | | (0.05 | ) | | | (0.11 | ) | | | — | (d) | | | (0.57 | ) | | | (0.09 | ) | | | (0.66 | ) |
Year Ended September 30, 2008 | | $ | 17.64 | | | | (0.21 | ) | | | (2.02 | ) | | | (2.23 | ) | | | — | | | | (0.75 | ) | | | — | | | | (0.75 | ) |
Year Ended September 30, 2007 | | $ | 16.01 | | | | (0.13 | ) | | | 3.36 | | | | 3.23 | | | | — | | | | (1.60 | ) | | | — | | | | (1.60 | ) |
Sterling Capital Equity Income Fund | | | | | | | | | | | | | | | | | | | | | | | | | | | | | | | | |
Year Ended September 30, 2011 | | $ | 12.98 | | | | 0.15 | | | | 0.13 | (g) | | | 0.28 | | | | (0.09 | ) | | | — | | | | — | | | | (0.09 | ) |
Year Ended September 30, 2010 | | $ | 11.37 | | | | 0.21 | | | | 1.56 | | | | 1.77 | | | | (0.16 | ) | | | — | | | | — | | | | (0.16 | ) |
Year Ended September 30, 2009 | | $ | 12.30 | | | | 0.22 | | | | (0.99 | ) | | | (0.77 | ) | | | (0.13 | ) | | | (0.03 | ) | | | — | | | | (0.16 | ) |
Year Ended September 30, 2008 | | $ | 14.98 | | | | 0.33 | | | | (2.21 | ) | | | (1.88 | ) | | | (0.22 | ) | | | (0.58 | ) | | | — | | | | (0.80 | ) |
Year Ended September 30, 2007 | | $ | 13.32 | | | | 0.26 | | | | 2.30 | | | | 2.56 | | | | (0.22 | ) | | | (0.68 | ) | | | — | | | | (0.90 | ) |
Sterling Capital Intermediate U.S. Government Fund | | | | | | | | | | | | | | | | | |
Year Ended September 30, 2011 | | $ | 10.79 | | | | 0.16 | | | | 0.05 | | | | 0.21 | | | | (0.23 | ) | | | — | | | | — | | | | (0.23 | ) |
Year Ended September 30, 2010 | | $ | 10.53 | | | | 0.21 | | | | 0.29 | | | | 0.50 | | | | (0.24 | ) | | | — | | | | — | | | | (0.24 | ) |
Year Ended September 30, 2009 | | $ | 10.01 | | | | 0.24 | | | | 0.55 | | | | 0.79 | | | | (0.27 | ) | | | — | | | | — | | | | (0.27 | ) |
Year Ended September 30, 2008 | | $ | 9.90 | | | | 0.34 | | | | 0.12 | | | | 0.46 | | | | (0.35 | ) | | | — | | | | — | | | | (0.35 | ) |
Year Ended September 30, 2007 | | $ | 9.86 | | | | 0.35 | | | | 0.04 | | | | 0.39 | | | | (0.35 | ) | | | — | | | | — | | | | (0.35 | ) |
| * | During the period certain fees were reduced. If such reductions had not occurred, the ratios would have been as indicated. |
| ** | Portfolio turnover rate is calculated on the basis of the Fund as a whole without distinguishing between classes of shares issued. |
| (a) | Per share net investment income (loss) has been calculated using the average daily shares method. |
| (b) | Not annualized for periods less than one year. |
| (c) | Annualized for periods less than one year. |
| (d) | Amount is less than $0.005. |
| (e) | Period from commencement of operations. |
| (f) | Includes proceeds received from a settlement of litigation, which impacted the Fund’s total return. Not including these proceeds, the Fund’s total return would have been 5.55%. |
| (g) | The amount shown for a share outstanding throughout the period does not accord with the change in aggregate gains and losses in the portfolio of securities during the period because of the timing of sales and purchases of Fund shares in relation to fluctuating market values during the period. |
See accompanying notes to the financial statements.
136
| | | | | | | | | | | | | | | | | | | | | | | | |
| | | | | | | Ratios/Supplementary Data | |
Net Asset
Value,
End of
Period | | | Total
Return
(excludes
sales charge) (b) | | | Net Assets,
End of
Period
(000) | | | Ratio of
net expenses
to average
net assets (c) | | Ratio of net
investment
income
(loss) to
average net
assets (c) | | | Ratio of
expenses to
average
net assets*(c) | | | Portfolio
turnover rate**(b) | |
| | | | | | | | | | | | | | | | | | | | | | | | | |
| $ | 9.67 | | | | (5.72 | )% | | $ | 176 | | | 1.84% | | | 0.13 | % | | | 1.99 | % | | | 66.29 | % |
| $ | 10.28 | | | | 4.75 | % | | $ | 110 | | | 1.84% | | | 0.23 | % | | | 1.99 | % | | | 119.85 | % |
| $ | 9.85 | | | | (10.43 | )% | | $ | 93 | | | 1.81% | | | 0.49 | % | | | 1.95 | % | | | 92.97 | % |
| $ | 11.08 | | | | (30.00 | )% | | $ | 143 | | | 1.89% | | | 0.28 | % | | | 1.94 | % | | | 38.43 | % |
| $ | 18.87 | | | | 11.76 | % | | $ | 239 | | | 1.91% | | | 0.50 | % | | | 1.97 | % | | | 68.60 | % |
| | | | | | | | | | | | | | | | | | | | | | | | | |
| $ | 10.78 | | | | (6.26 | )% | | $ | 398 | | | 1.93% | | | (0.42 | )% | | | 1.97 | % | | | 38.30 | % |
| $ | 11.50 | | | | 11.26 | % | | $ | 436 | | | 1.95% | | | (0.42 | )% | | | 2.06 | % | | | 45.02 | % |
| $ | 10.34 | | | | 2.08 | % | | $ | 176 | | | 1.96% | | | (0.59 | )% | | | 2.01 | % | | | 46.83 | % |
| $ | 10.14 | | | | (22.59 | )% | | $ | 328 | | | 1.89% | | | (0.60 | )% | | | 1.93 | % | | | 65.74 | % |
| $ | 14.55 | | | | 15.60 | % | | $ | 1,126 | | | 1.91% | | | (0.49 | )% | | | 1.95 | % | | | 58.59 | % |
| | | | | | | | | | | | | | | | | | | | | | | | | |
| $ | 10.69 | | | | (4.30 | )% | | $ | 81 | | | 2.09% | | | (1.13 | )% | | | 2.19 | % | | | 63.02 | % |
| $ | 11.17 | | | | 5.93 | %(f) | | $ | 57 | | | 2.16% | | | (0.11 | )% | | | 2.38 | % | | | 95.89 | % |
| | | | | | | | | | | | | | | | | | | | | | | | | |
| $ | 3.57 | | | | (19.23 | )% | | $ | 80 | | | 2.37% | | | (0.41 | )% | | | 2.52 | % | | | 75.63 | % |
| $ | 4.42 | | | | 2.12 | % | | $ | 169 | | | 2.54% | | | (0.25 | )% | | | 2.99 | % | | | 145.31 | % |
| $ | 4.38 | | | | (4.66 | )% | | $ | 166 | | | 2.49% | | | 0.60 | % | | | 2.63 | % | | | 223.19 | % |
| $ | 4.73 | | | | (31.30 | )% | | $ | 172 | | | 2.31% | | | 0.48 | % | | | 2.50 | % | | | 112.65 | % |
| $ | 7.62 | | | | 19.28 | % | | $ | 244 | | | 2.13% | | | 0.12 | % | | | 2.26 | % | | | 129.80 | % |
| | | | | | | | | | | | | | | | | | | | | | | | | |
| $ | 14.23 | | | | (4.43 | )% | | $ | 71,564 | | | 2.03% | | | (1.10 | )% | | | 2.03 | % | | | 31.51 | % |
| $ | 14.98 | | | | 7.85 | % | | $ | 73,282 | | | 2.04% | | | (1.12 | )% | | | 2.05 | % | | | 25.65 | % |
| $ | 13.89 | | | | 0.97 | % | | $ | 58,479 | | | 2.03% | | | (0.51 | )% | | | 2.04 | % | | | 45.22 | % |
| $ | 14.66 | | | | (13.27 | )% | | $ | 50,230 | | | 1.99% | | | (1.23 | )% | | | 1.99 | % | | | 25.80 | % |
| $ | 17.64 | | | | 21.32 | % | | $ | 50,577 | | | 2.03% | | | (0.79 | )% | | | 2.03 | % | | | 49.43 | % |
| | | | | | | | | | | | | | | | | | | | | | | | | |
| $ | 13.17 | | | | 2.13 | % | | $ | 104,208 | | | 1.93% | | | 1.05 | % | | | 1.93 | % | | | 16.64 | % |
| $ | 12.98 | | | | 15.62 | % | | $ | 69,549 | | | 1.94% | | | 1.69 | % | | | 1.95 | % | | | 21.63 | % |
| $ | 11.37 | | | | (6.10 | )% | | $ | 39,164 | | | 1.93% | | | 2.18 | % | | | 1.95 | % | | | 37.13 | % |
| $ | 12.30 | | | | (13.07 | )% | | $ | 32,637 | | | 1.89% | | | 2.39 | % | | | 1.89 | % | | | 30.01 | % |
| $ | 14.98 | | | | 19.93 | % | | $ | 26,044 | | | 1.94% | | | 1.79 | % | | | 1.94 | % | | | 37.85 | % |
| | | | | | | | | | | | | | | | | | | | | | | | | |
| $ | 10.77 | | | | 1.99 | % | | $ | 658 | | | 1.71% | | | 1.54 | % | | | 1.83 | % | | | 83.62 | % |
| $ | 10.79 | | | | 4.80 | % | | $ | 536 | | | 1.71% | | | 2.00 | % | | | 1.84 | % | | | 83.92 | % |
| $ | 10.53 | | | | 8.00 | % | | $ | 426 | | | 1.70% | | | 2.31 | % | | | 1.82 | % | | | 47.13 | % |
| $ | 10.01 | | | | 4.62 | % | | $ | 176 | | | 1.67% | | | 3.33 | % | | | 1.79 | % | | | 116.07 | % |
| $ | 9.90 | | | | 4.01 | % | | $ | 201 | | | 1.68% | | | 3.52 | % | | | 1.80 | % | | | 85.83 | % |
137
Financial Highlights, Class C Shares
The financial highlights table is intended to help you understand the Funds’ financial performance for the past 5 years or, if shorter, the period of the Funds’ operations. Certain information reflects financial results for a single Fund share. The total returns in the table represent the rate that an investor would have earned (or lost) on an investment in the Fund (assuming reinvestment of all dividends and distributions).
| | | | | | | | | | | | | | | | | | | | | | | | | | | | |
| | | | | | Investment Activities | | | Distributions | |
| | |
Net Asset
Value,
Beginning
of Year | | | Net
investment
income
(loss)(a) | | | Net realized/
unrealized
gains (losses)
on investments | | | Total from
Investment
Activities | | | Net
investment
income | | | Net realized
gains on
investments | | | Total
Distributions | |
Sterling Capital Total Return Bond Fund | | | | | | | | | | | | | | | | | |
Year Ended September 30, 2011 | | $ | 11.34 | | | | 0.30 | | | | 0.01 | | | | 0.31 | | | | (0.37 | ) | | | (0.21 | ) | | | (0.58 | ) |
Year Ended September 30, 2010 | | $ | 10.79 | | | | 0.34 | | | | 0.63 | | | | 0.97 | | | | (0.41 | ) | | | (0.01 | ) | | | (0.42 | ) |
Year Ended September 30, 2009 | | $ | 9.89 | | | | 0.37 | | | | 0.90 | | | | 1.27 | | | | (0.37 | ) | | | — | | | | (0.37 | ) |
Year Ended September 30, 2008 | | $ | 10.14 | | | | 0.36 | | | | (0.23 | ) | | | 0.13 | | | | (0.38 | ) | | | — | | | | (0.38 | ) |
Year Ended September 30, 2007 | | $ | 10.13 | | | | 0.37 | | | | 0.01 | | | | 0.38 | | | | (0.37 | ) | | | — | | | | (0.37 | ) |
Sterling Capital Prime Money Market Fund | | | | | | | | | | | | | | | | | |
Year Ended September 30, 2011 | | $ | 1.00 | | | | — | (b) | | | — | (b) | | | — | (b) | | | — | (b) | | | — | | | | — | (b) |
Year Ended September 30, 2010 | | $ | 1.00 | | | | — | (b) | | | — | (b) | | | — | (b) | | | — | (b) | | | — | | | | — | (b) |
Year Ended September 30, 2009 | | $ | 1.00 | | | | — | (b) | | | — | (b) | | | — | (b) | | | — | (b) | | | — | | | | — | (b) |
Year Ended September 30, 2008 | | $ | 1.00 | | | | 0.02 | | | | — | (b) | | | 0.02 | | | | (0.02 | ) | | | — | | | | (0.02 | ) |
Year Ended September 30, 2007 | | $ | 1.00 | | | | 0.04 | | | | — | | | | 0.04 | | | | (0.04 | ) | | | — | | | | (0.04 | ) |
Sterling Capital U.S. Treasury Money Market Fund | | | | | | | | | | | | | | | | | |
Year Ended September 30, 2011 | | $ | 1.00 | | | | — | (b) | | | — | (b) | | | — | (b) | | | — | (b) | | | — | | | | — | (b) |
Year Ended September 30, 2010 | | $ | 1.00 | | | | — | (b) | | | — | (b) | | | — | (b) | | | — | (b) | | | — | | | | — | (b) |
Year Ended September 30, 2009 | | $ | 1.00 | | | | — | (b) | | | — | | | | — | (b) | | | — | (b) | | | — | | | | — | (b) |
Year Ended September 30, 2008 | | $ | 1.00 | | | | 0.01 | | | | — | (b) | | | 0.01 | | | | (0.01 | ) | | | — | | | | (0.01 | ) |
Year Ended September 30, 2007 | | $ | 1.00 | | | | 0.04 | | | | — | | | | 0.04 | | | | (0.04 | ) | | | — | | | | (0.04 | ) |
Sterling Capital Strategic Allocation Conservative Fund(c) | | | | | | | | | | | | | | | | | |
Year Ended September 30, 2011 | | $ | 9.03 | | | | 0.15 | | | | (0.26 | ) | | | (0.11 | ) | | | (0.21 | ) | | | — | | | | (0.21 | ) |
Year Ended September 30, 2010 | | $ | 8.47 | | | | 0.20 | | | | 0.57 | | | | 0.77 | | | | (0.21 | ) | | | — | | | | (0.21 | ) |
Year Ended September 30, 2009 | | $ | 8.41 | | | | 0.17 | | | | 0.21 | | | | 0.38 | | | | (0.18 | ) | | | (0.14 | ) | | | (0.32 | ) |
Year Ended September 30, 2008 | | $ | 10.51 | | | | 0.19 | | | | (1.24 | ) | | | (1.05 | ) | | | (0.32 | ) | | | (0.73 | ) | | | (1.05 | ) |
Year Ended September 30, 2007 | | $ | 9.93 | | | | 0.27 | | | | 0.53 | | | | 0.80 | | | | (0.22 | ) | | | — | | | | (0.22 | ) |
Sterling Capital Strategic Allocation Balanced Fund(c) | | | | | | | | | | | | | | | | | |
Year Ended September 30, 2011 | | $ | 8.26 | | | | 0.08 | | | | (0.40 | ) | | | (0.32 | ) | | | (0.12 | ) | | | — | | | | (0.12 | ) |
Year Ended September 30, 2010 | | $ | 7.68 | | | | 0.12 | | | | 0.59 | | | | 0.71 | | | | (0.13 | ) | | | — | | | | (0.13 | ) |
Year Ended September 30, 2009 | | $ | 7.67 | | | | 0.11 | | | | 0.01 | | | | 0.12 | | | | (0.11 | ) | | | — | | | | (0.11 | ) |
Year Ended September 30, 2008 | | $ | 10.81 | | | | 0.09 | | | | (1.82 | ) | | | (1.73 | ) | | | (0.28 | ) | | | (1.13 | ) | | | (1.41 | ) |
Year Ended September 30, 2007 | | $ | 10.10 | | | | 0.21 | | | | 0.86 | | | | 1.07 | | | | (0.14 | ) | | | (0.22 | ) | | | (0.36 | ) |
Sterling Capital Strategic Allocation Growth Fund(c) | | | | | | | | | | | | | | | | | |
Year Ended September 30, 2011 | | $ | 7.50 | | | | 0.04 | | | | (0.46 | ) | | | (0.42 | ) | | | (0.07 | ) | | | — | | | | (0.07 | ) |
Year Ended September 30, 2010 | | $ | 6.94 | | | | 0.08 | | | | 0.56 | | | | 0.64 | | | | (0.08 | ) | | | — | | | | (0.08 | ) |
Year Ended September 30, 2009 | | $ | 7.17 | | | | 0.07 | | | | (0.22 | ) | | | (0.15 | ) | | | (0.08 | ) | | | — | | | | (0.08 | ) |
Year Ended September 30, 2008 | | $ | 10.92 | | | | 0.04 | | | | (2.15 | ) | | | (2.11 | ) | | | (0.27 | ) | | | (1.37 | ) | | | (1.64 | ) |
Year Ended September 30, 2007 | | $ | 10.05 | | | | 0.18 | | | | 1.04 | | | | 1.22 | | | | (0.08 | ) | | | (0.27 | ) | | | (0.35 | ) |
Sterling Capital Strategic Allocation Equity Fund(c) | | | | | | | | | | | | | | | | | |
Year Ended September 30, 2011 | | $ | 6.98 | | | | 0.01 | | | | (0.53 | ) | | | (0.52 | ) | | | (0.04 | ) | | | — | | | | (0.04 | ) |
Year Ended September 30, 2010 | | $ | 6.47 | | | | 0.04 | | | | 0.54 | | | | 0.58 | | | | (0.07 | ) | | | — | | | | (0.07 | ) |
Year Ended September 30, 2009 | | $ | 7.10 | | | | 0.02 | | | | (0.60 | ) | | | (0.58 | ) | | | (0.05 | ) | | | — | | | | (0.05 | ) |
Year Ended September 30, 2008 | | $ | 11.87 | | | | (0.03 | ) | | | (2.66 | ) | | | (2.69 | ) | | | (0.27 | ) | | | (1.81 | ) | | | (2.08 | ) |
Year Ended September 30, 2007 | | $ | 11.22 | | | | 0.12 | | | | 1.41 | | | | 1.53 | | | | (0.03 | ) | | | (0.85 | ) | | | (0.88 | ) |
| * | During the period certain fees were reduced. If such reductions had not occurred, the ratios would have been as indicated. |
| ** | Portfolio turnover rate is calculated on the basis of the Fund as a whole without distinguishing between classes of shares issued. |
| (a) | Per share net investment income (loss) has been calculated using the average daily shares method. |
| (b) | Amount is less than $0.005. |
| (c) | The expense ratios exclude the impact of fees/expenses paid by each underlying fund. |
See accompanying notes to the financial statements.
138
| | | | | | | | | | | | | | | | | | | | | | | | | | |
| | | | | | | Ratios/Supplementary Data | |
Net Asset
Value,
End of
Year | | | Total
Return
(excludes
sales charge) | | | Net Assets,
End of
Year
(000) | | | Ratio of
net expenses
to average
net assets | | | Ratio of net
investment
income
(loss) to
average net
assets | | | Ratio of
expenses to
average
net assets* | | | Portfolio
turnover rate** | |
| | | | | | | | | | | | | | | | | | | | | | | | | | | |
| $ | 11.07 | | | | 2.91 | % | | $ | 4,224 | | | | 1.70 | % | | | 2.68 | % | | | 1.82 | % | | | 131.87 | % |
| $ | 11.34 | | | | 9.18 | % | | $ | 2,140 | | | | 1.71 | % | | | 3.09 | % | | | 1.85 | % | | | 122.94 | % |
| $ | 10.79 | | | | 13.14 | % | | $ | 400 | | | | 1.71 | % | | | 3.61 | % | | | 1.83 | % | | | 122.26 | % |
| $ | 9.89 | | | | 1.21 | % | | $ | 184 | | | | 1.66 | % | | | 3.49 | % | | | 1.78 | % | | | 190.15 | % |
| $ | 10.14 | | | | 3.83 | % | | $ | 115 | | | | 1.68 | % | | | 3.61 | % | | | 1.80 | % | | | 222.24 | % |
| | | | | | | | | | | | | | | | | | | | | | | | | | | |
| $ | 1.00 | | | | 0.01 | % | | $ | 665 | | | | 0.25 | % | | | 0.01 | % | | | 1.64 | % | | | — | |
| $ | 1.00 | | | | 0.05 | % | | $ | 479 | | | | 0.35 | % | | | 0.04 | % | | | 1.64 | % | | | — | |
| $ | 1.00 | | | | 0.34 | % | | $ | 893 | | | | 1.10 | % | | | 0.24 | % | | | 1.66 | % | | | — | |
| $ | 1.00 | | | | 2.36 | % | | $ | 244 | | | | 1.46 | % | | | 2.46 | % | | | 1.59 | % | | | — | |
| $ | 1.00 | | | | 3.99 | % | | $ | 460 | | | | 1.48 | % | | | 3.91 | % | | | 1.59 | % | | | — | |
| | | | | | | | | | | | | | | | | | | | | | | | | | | |
| $ | 1.00 | | | | 0.01 | % | | $ | 76 | | | | 0.10 | % | | | 0.01 | % | | | 1.64 | % | | | — | |
| $ | 1.00 | | | | 0.07 | % | | $ | 94 | | | | 0.16 | % | | | 0.10 | % | | | 1.63 | % | | | — | |
| $ | 1.00 | | | | 0.04 | % | | $ | 54 | | | | 0.28 | % | | | 0.03 | % | | | 1.64 | % | | | — | |
| $ | 1.00 | | | | 1.29 | % | | $ | 37 | | | | 1.38 | % | | | 1.30 | % | | | 1.58 | % | | | — | |
| $ | 1.00 | | | | 3.68 | % | | $ | 42 | | | | 1.47 | % | | | 3.63 | % | | | 1.61 | % | | | — | |
| | | | | | | | | | | | | | | | | | | | | | | | | | | |
| $ | 8.71 | | | | (1.30 | )% | | $ | 152 | | | | 1.39 | % | | | 1.57 | % | | | 1.47 | % | | | 8.36 | % |
| $ | 9.03 | | | | 9.17 | % | | $ | 127 | | | | 1.21 | % | | | 2.28 | % | | | 1.47 | % | | | 33.33 | % |
| $ | 8.47 | | | | 5.09 | % | | $ | 101 | | | | 1.17 | % | | | 2.19 | % | | | 1.43 | % | | | 21.56 | % |
| $ | 8.41 | | | | (10.99 | )% | | $ | 94 | | | | 1.10 | % | | | 1.99 | % | | | 1.35 | % | | | 39.99 | % |
| $ | 10.51 | | | | 8.11 | % | | $ | 77 | | | | 1.10 | % | | | 2.58 | % | | | 1.41 | % | | | 29.58 | % |
| | | | | | | | | | | | | | | | | | | | | | | | | | | |
| $ | 7.82 | | | | (3.97 | )% | | $ | 367 | | | | 1.35 | % | | | 0.93 | % | | | 1.42 | % | | | 9.96 | % |
| $ | 8.26 | | | | 9.34 | % | | $ | 186 | | | | 1.16 | % | | | 1.49 | % | | | 1.42 | % | | | 47.76 | % |
| $ | 7.68 | | | | 1.85 | % | | $ | 89 | | | | 1.13 | % | | | 1.58 | % | | | 1.38 | % | | | 22.46 | % |
| $ | 7.67 | | | | (18.02 | )% | | $ | 79 | | | | 1.10 | % | | | 1.04 | % | | | 1.35 | % | | | 63.63 | % |
| $ | 10.81 | | | | 10.72 | % | | $ | 156 | | | | 1.11 | % | | | 1.98 | % | | | 1.42 | % | | | 40.05 | % |
| | | | | | | | | | | | | | | | | | | | | | | | | | | |
| $ | 7.01 | | | | (5.78 | )% | | $ | 226 | | | | 1.36 | % | | | 0.50 | % | | | 1.43 | % | | | 9.06 | % |
| $ | 7.50 | | | | 9.33 | % | | $ | 157 | | | | 1.17 | % | | | 1.07 | % | | | 1.43 | % | | | 57.35 | % |
| $ | 6.94 | | | | (1.90 | )% | | $ | 99 | | | | 1.14 | % | | | 1.13 | % | | | 1.39 | % | | | 24.08 | % |
| $ | 7.17 | | | | (22.31 | )% | | $ | 55 | | | | 1.10 | % | | | 0.49 | % | | | 1.35 | % | | | 77.54 | % |
| $ | 10.92 | | | | 12.33 | % | | $ | 78 | | | | 1.11 | % | | | 1.74 | % | | | 1.43 | % | | | 44.48 | % |
| | | | | | | | | | | | | | | | | | | | | | | | | | | |
| $ | 6.42 | | | | (7.55 | )% | | $ | 25 | | | | 1.48 | % | | | 0.10 | % | | | 1.56 | % | | | 10.72 | % |
| $ | 6.98 | | | | 9.02 | % | | $ | 17 | | | | 1.22 | % | | | 0.58 | % | | | 1.54 | % | | | 66.32 | % |
| $ | 6.47 | | | | (8.11 | )% | | $ | 6 | | | | 1.13 | % | | | 0.35 | % | | | 1.36 | % | | | 20.24 | % |
| $ | 7.10 | | | | (26.77 | )% | | $ | 1 | | | | 1.13 | % | | | (0.32 | )% | | | 1.43 | % | | | 67.40 | % |
| $ | 11.87 | | | | 14.13 | % | | $ | 1 | | | | 1.00 | % | | | 1.02 | % | | | 1.25 | % | | | 48.80 | % |
139
Financial Highlights, Institutional Shares
The financial highlights table is intended to help you understand the Funds’ financial performance for the past 5 years or, if shorter, the period of the Funds’ operations. Certain information reflects financial results for a single Fund share. The total returns in the table represent the rate that an investor would have earned (or lost) on an investment in the Fund (assuming reinvestment of all dividends and distributions).
| | | | | | | | | | | | | | | | | | | | | | | | | | | | | | | | |
| | | | | | Investment Activities | | | Distributions | |
| | | Net Asset
Value,
Beginning
of Period | | |
Net
investment
income
(loss)(a) | | | Net realized/
unrealized
gains (losses)
on investments | | | Total from
Investment
Activities | | | Net
investment
income | | | Net realized
gains on
investments | | | Return
of
capital | | | Total
Distributions | |
Sterling Capital Select Equity Fund | | | | | | | | | | | | | | | | | | | | | | | | | | | | | | | | |
Year Ended September 30, 2011 | | $ | 10.57 | | | | 0.14 | | | | (0.62 | ) | | | (0.48 | ) | | | (0.14 | ) | | | — | | | | — | | | | (0.14 | ) |
Year Ended September 30, 2010 | | $ | 10.13 | | | | 0.13 | | | | 0.45 | | | | 0.58 | | | | (0.14 | ) | | | — | | | | — | | | | (0.14 | ) |
Year Ended September 30, 2009 | | $ | 11.36 | | | | 0.13 | | | | (1.22 | ) | | | (1.09 | ) | | | (0.14 | ) | | | — | | | | — | | | | (0.14 | ) |
Year Ended September 30, 2008 | | $ | 19.20 | | | | 0.18 | | | | (5.16 | ) | | | (4.98 | ) | | | (0.13 | ) | | | (2.73 | ) | | | — | | | | (2.86 | ) |
Year Ended September 30, 2007 | | $ | 20.38 | | | | 0.29 | | | | 2.16 | | | | 2.45 | | | | (0.28 | ) | | | (3.35 | ) | | | — | | | | (3.63 | ) |
Sterling Capital Mid Value Fund | | | | | | | | | | | | | | | | | | | | | | | | | | | | | | | | |
Year Ended September 30, 2011 | | $ | 12.14 | | | | 0.08 | | | | (0.71 | ) | | | (0.63 | ) | | | (0.08 | ) | | | — | | | | — | | | | (0.08 | ) |
Year Ended September 30, 2010 | | $ | 10.86 | | | | 0.07 | | | | 1.27 | | | | 1.34 | | | | (0.06 | ) | | | — | | | | — | | | | (0.06 | ) |
Year Ended September 30, 2009 | | $ | 10.56 | | | | 0.04 | | | | 0.29 | | | | 0.33 | | | | (0.03 | ) | | | — | | | | — | | | | (0.03 | ) |
Year Ended September 30, 2008 | | $ | 15.00 | | | | 0.05 | | | | (3.10 | ) | | | (3.05 | ) | | | (0.03 | ) | | | (1.36 | ) | | | — | | | | (1.39 | ) |
Year Ended September 30, 2007 | | $ | 13.54 | | | | 0.08 | | | | 2.13 | | | | 2.21 | | | | (0.06 | ) | | | (0.69 | ) | | | — | | | | (0.75 | ) |
Sterling Capital Small Value Fund | | | | | | | | | | | | | | | | | | | | | | | | | | | | | | | | |
Year Ended September 30, 2011 | | $ | 11.19 | | | | (0.02 | ) | | | (0.35 | ) | | | (0.37 | ) | | | — | | | | — | | | | — | | | | — | |
Year Ended September 30, 2010 | | $ | 10.27 | | | | 0.06 | | | | 0.92 | | | | 0.98 | | | | (0.06 | ) | | | — | | | | — | | | | (0.06 | ) |
Year Ended September 30, 2009 | | $ | 9.89 | | | | 0.02 | | | | 0.65 | | | | 0.67 | | | | — | | | | (0.29 | ) | | | — | | | | (0.29 | ) |
Year Ended September 30, 2008 | | $ | 14.68 | | | | — | (e) | | | (2.24 | ) | | | (2.24 | ) | | | — | | | | (2.55 | ) | | | — | | | | (2.55 | ) |
Period Ended September 30, 2007(f) | | $ | 18.36 | | | | (0.01 | ) | | | 0.68 | | | | 0.67 | | | | — | | | | (4.35 | ) | | | — | | | | (4.35 | ) |
Year Ended October 31, 2006 | | $ | 18.22 | | | | (0.04 | ) | | | 3.09 | | | | 3.05 | | | | (0.02 | ) | | | (2.89 | ) | | | — | | | | (2.91 | ) |
Sterling Capital International Fund | | | | | | | | | | | | | | | | | | | | | | | | | | | | | | | | |
Year Ended September 30, 2011 | | $ | 5.19 | | | | 0.03 | | | | (0.99 | ) | | | (0.96 | ) | | | — | | | | — | | | | — | | | | — | |
Year Ended September 30, 2010 | | $ | 5.14 | | | | 0.04 | | | | 0.12 | | | | 0.16 | | | | (0.11 | ) | | | — | | | | — | | | | (0.11 | ) |
Year Ended September 30, 2009 | | $ | 5.47 | | | | 0.07 | | | | (0.28 | ) | | | (0.21 | ) | | | (0.12 | ) | | | — | | | | — | | | | (0.12 | ) |
Year Ended September 30, 2008 | | $ | 8.64 | | | | 0.10 | | | | (2.49 | ) | | | (2.39 | ) | | | (0.03 | ) | | | (0.75 | ) | | | — | | | | (0.78 | ) |
Year Ended September 30, 2007 | | $ | 11.23 | | | | 0.14 | | | | 1.88 | | | | 2.02 | | | | (0.09 | ) | | | (4.52 | ) | | | — | | | | (4.61 | ) |
Sterling Capital Special Opportunities Fund | | | | | | | | | | | | | | | | | | | | | | | | | | | | | | | | |
Year Ended September 30, 2011 | | $ | 16.25 | | | | (0.02 | ) | | | (0.53 | ) | | | (0.55 | ) | | | — | | | | (0.10 | ) | | | — | | | | (0.10 | ) |
Year Ended September 30, 2010 | | $ | 14.92 | | | | (0.02 | ) | | | 1.35 | | | | 1.33 | | | | — | | | | — | | | | — | | | | — | |
Year Ended September 30, 2009 | | $ | 15.58 | | | | 0.04 | | | | (0.01 | ) | | | 0.03 | | | | — | (e) | | | (0.58 | ) | | | (0.11 | ) | | | (0.69 | ) |
Year Ended September 30, 2008 | | $ | 18.51 | | | | (0.04 | ) | | | (2.14 | ) | | | (2.18 | ) | | | — | | | | (0.75 | ) | | | — | | | | (0.75 | ) |
Year Ended September 30, 2007 | | $ | 16.57 | | | | 0.03 | | | | 3.51 | | | | 3.54 | | | | — | | | | (1.60 | ) | | | — | | | | (1.60 | ) |
Sterling Capital Equity Income Fund | | | | | | | | | | | | | | | | | | | | | | | | | | | | | | | | |
Year Ended September 30, 2011 | | $ | 13.07 | | | | 0.29 | | | | 0.14 | (h) | | | 0.43 | | | | (0.23 | ) | | | — | | | | — | | | | (0.23 | ) |
Year Ended September 30, 2010 | | $ | 11.44 | | | | 0.33 | | | | 1.57 | | | | 1.90 | | | | (0.27 | ) | | | — | | | | — | | | | (0.27 | ) |
Year Ended September 30, 2009 | | $ | 12.37 | | | | 0.32 | | | | (0.99 | ) | | | (0.67 | ) | | | (0.23 | ) | | | (0.03 | ) | | | — | | | | (0.26 | ) |
Year Ended September 30, 2008 | | $ | 15.05 | | | | 0.51 | | | | (2.26 | ) | | | (1.75 | ) | | | (0.35 | ) | | | (0.58 | ) | | | — | | | | (0.93 | ) |
Year Ended September 30, 2007 | | $ | 13.37 | | | | 0.40 | | | | 2.31 | | | | 2.71 | | | | (0.35 | ) | | | (0.68 | ) | | | — | | | | (1.03 | ) |
Sterling Capital Short-Term Bond Fund | | | | | | | | | | | | | | | | | | | | | | | | | | | | | | | | |
Year Ended September 30, 2011 | | $ | 9.68 | | | | 0.20 | | | | (0.19 | ) | | | 0.01 | | | | (0.33 | ) | | | — | | | | — | | | | (0.33 | ) |
Year Ended September 30, 2010 | | $ | 9.67 | | | | 0.19 | | | | 0.09 | | | | 0.28 | | | | (0.27 | ) | | | — | | | | — | | | | (0.27 | ) |
Year Ended September 30, 2009 | | $ | 9.54 | | | | 0.25 | | | | 0.22 | | | | 0.47 | | | | (0.34 | ) | | | — | | | | — | | | | (0.34 | ) |
Year Ended September 30, 2008 | | $ | 9.53 | | | | 0.35 | | | | 0.06 | | | | 0.41 | | | | (0.40 | ) | | | — | | | | — | | | | (0.40 | ) |
Year Ended September 30, 2007 | | $ | 9.49 | | | | 0.38 | | | | 0.08 | | | | 0.46 | | | | (0.42 | ) | | | — | | | | — | | | | (0.42 | ) |
| * | During the period certain fees were reduced. If such reductions had not occurred, the ratios would have been as indicated. |
| ** | Portfolio turnover rate is calculated on the basis of the Fund as a whole without distinguishing between classes of shares issued. |
| (a) | Per share net investment income (loss) has been calculated using the average daily shares method. |
| (b) | Not annualized for periods less than one year. |
| (c) | Annualized for periods less than one year. |
| (d) | Includes proceeds received from a settlement of litigation, which impacted the Fund’s total return. Not including these proceeds, the Fund’s total return would have been 9.10%. |
| (e) | Amount is less than $0.005. |
| (f) | The Fund’s fiscal year-end changed from October 31 to September 30, effective September 30, 2007. |
| (g) | The performance information for the Institutional Shares prior to December 18, 2006 is based on the performances of the Institutional Shares of the Fund’s predecessor, Sterling Capital Small Value Fund, a series of The Advisor’s Inner Circle Fund which transferred all of its assets and liabilities to the Fund pursuant to a reorganization. |
| (h) | The amount shown for a share outstanding throughout the period does not accord with the change in aggregate gains and losses in the portfolio of securities during the period because of the timing of sales and purchases of Fund shares in relation to fluctuating market values during the period. |
See accompanying notes to the financial statements.
140
| | | | | | | | | | | | | | | | | | | | | | | | |
| | | | | | Ratios/Supplementary Data | |
Net Asset
Value,
End of
Period | | Total
Return (b) | | | Net Assets,
End of
Period
(000) | | | Ratio of
net expenses
to average
net assets (c) | | | Ratio of net
investment
income
(loss) to
average net
assets (c) | | | Ratio of
expenses to
average
net assets*(c) | | | Portfolio
turnover rate**(b) | |
| | | | | | | | | | | | | | | | | | | | | | | | | |
| $ 9.95 | | | (4.74 | )% | | $ | 156,832 | | | | 0.83 | % | | | 1.18 | % | | | 0.98 | % | | | 66.29 | % |
| $10.57 | | | 5.71 | % | | $ | 183,791 | | | | 0.84 | % | | | 1.23 | % | | | 0.99 | % | | | 119.85 | % |
| $10.13 | | | (9.40 | )% | | $ | 177,725 | | | | 0.81 | % | | | 1.51 | % | | | 0.95 | % | | | 92.97 | % |
| $11.36 | | | (29.32 | )% | | $ | 257,036 | | | | 0.89 | % | | | 1.28 | % | | | 0.94 | % | | | 38.43 | % |
| $19.20 | | | 12.89 | % | | $ | 602,101 | | | | 0.91 | % | | | 1.50 | % | | | 0.96 | % | | | 68.60 | % |
| | | | | | | | | | | | | | | | | | | | | | | | | |
| $11.43 | | | (5.29 | )% | | $ | 299,032 | | | | 0.93 | % | | | 0.58 | % | | | 0.97 | % | | | 38.30 | % |
| $12.14 | | | 12.39 | % | | $ | 319,451 | | | | 0.94 | % | | | 0.58 | % | | | 1.05 | % | | | 45.02 | % |
| $10.86 | | | 3.21 | % | | $ | 200,331 | | | | 0.96 | % | | | 0.44 | % | | | 1.02 | % | | | 46.83 | % |
| $10.56 | | | (21.87 | )% | | $ | 163,840 | | | | 0.89 | % | | | 0.43 | % | | | 0.93 | % | | | 65.74 | % |
| $15.00 | | | 16.75 | % | | $ | 243,437 | | | | 0.91 | % | | | 0.53 | % | | | 0.95 | % | | | 58.59 | % |
| | | | | | | | | | | | | | | | | | | | | | | | | |
| $10.82 | | | (3.31 | )% | | $ | 64,962 | | | | 1.08 | % | | | (0.14 | )% | | | 1.19 | % | | | 63.02 | % |
| $11.19 | | | 9.59 | %(d) | | $ | 60,073 | | | | 1.20 | % | | | 0.56 | % | | | 1.42 | % | | | 95.89 | % |
| $10.27 | | | 8.68 | % | | $ | 25,790 | | | | 1.42 | % | | | 1.79 | % | | | 0.23 | % | | | 89.00 | % |
| $ 9.89 | | | (17.16 | )% | | $ | 22,635 | | | | 1.26 | % | | | 1.40 | % | | | 0.01 | % | | | 64.00 | % |
| $14.68 | | | 3.67 | % | | $ | 45,453 | | | | 1.18 | % | | | 1.41 | % | | | (0.07 | )% | | | 82.00 | % |
| $18.36 | | | 19.31 | %(g) | | $ | 60,737 | | | | 1.25 | % | | | 1.63 | % | | | (0.26 | )% | | | 56.00 | % |
| | | | | | | | | | | | | | | | | | | | | | | | | |
| $ 4.23 | | | (18.50 | )% | | $ | 59,422 | | | | 1.37 | % | | | 0.65 | % | | | 1.52 | % | | | 75.63 | % |
| $ 5.19 | | | 3.09 | % | | $ | 76,087 | | | | 1.54 | % | | | 0.73 | % | | | 1.96 | % | | | 145.31 | % |
| $ 5.14 | | | (3.42 | )% | | $ | 81,575 | | | | 1.49 | % | | | 1.58 | % | | | 1.64 | % | | | 223.19 | % |
| $ 5.47 | | | (30.65 | )% | | $ | 109,438 | | | | 1.31 | % | | | 1.36 | % | | | 1.49 | % | | | 112.65 | % |
| $ 8.64 | | | 20.39 | % | | $ | 164,147 | | | | 1.13 | % | | | 1.13 | % | | | 1.26 | % | | | 129.80 | % |
| | | | | | | | | | | | | | | | | | | | | | | | | |
| $15.60 | | | (3.46 | )% | | $ | 330,913 | | | | 1.04 | % | | | (0.09 | )% | | | 1.04 | % | | | 31.51 | % |
| $16.25 | | | 8.91 | % | | $ | 254,834 | | | | 1.04 | % | | | (0.13 | )% | | | 1.05 | % | | | 25.65 | % |
| $14.92 | | | 1.91 | % | | $ | 228,421 | | | | 1.03 | % | | | 0.30 | % | | | 1.04 | % | | | 45.22 | % |
| $15.58 | | | (12.35 | )% | | $ | 167,544 | | | | 0.99 | % | | | (0.24 | )% | | | 0.99 | % | | | 25.80 | % |
| $18.51 | | | 22.55 | % | | $ | 127,210 | | | | 1.03 | % | | | 0.18 | % | | | 1.03 | % | | | 49.43 | % |
| | | | | | | | | | | | | | | | | | | | | | | | | |
| $13.27 | | | 3.17 | % | | $ | 392,660 | | | | 0.93 | % | | | 2.06 | % | | | 0.93 | % | | | 16.64 | % |
| $13.07 | | | 16.77 | % | | $ | 236,580 | | | | 0.94 | % | | | 2.68 | % | | | 0.95 | % | | | 21.63 | % |
| $11.44 | | | (5.18 | )% | | $ | 177,281 | | | | 0.93 | % | | | 3.19 | % | | | 0.95 | % | | | 37.13 | % |
| $12.37 | | | (12.24 | )% | | $ | 140,256 | | | | 0.89 | % | | | 3.72 | % | | | 0.89 | % | | | 30.01 | % |
| $15.05 | | | 21.16 | % | | $ | 46,053 | | | | 0.94 | % | | | 2.81 | % | | | 0.94 | % | | | 37.85 | % |
| | | | | | | | | | | | | | | | | | | | | | | | | |
| $ 9.36 | | | 0.05 | % | | $ | 55,680 | | | | 0.60 | % | | | 2.07 | % | | | 0.70 | % | | | 120.09 | % |
| $ 9.68 | | | 2.90 | % | | $ | 60,089 | | | | 0.70 | % | | | 1.93 | % | | | 0.86 | % | | | 55.50 | % |
| $ 9.67 | | | 4.94 | % | | $ | 59,123 | | | | 0.70 | % | | | 2.58 | % | | | 0.85 | % | | | 89.57 | % |
| $ 9.54 | | | 4.38 | % | | $ | 44,912 | | | | 0.65 | % | | | 3.68 | % | | | 0.80 | % | | | 48.20 | % |
| $ 9.53 | | | 4.93 | % | | $ | 40,756 | | | | 0.66 | % | | | 4.01 | % | | | 0.81 | % | | | 44.10 | % |
141
Financial Highlights, Institutional Shares
The financial highlights table is intended to help you understand the Funds’ financial performance for the past 5 years or, if shorter, the period of the Funds’ operations. Certain information reflects financial results for a single Fund share. The total returns in the table represent the rate that an investor would have earned (or lost) on an investment in the Fund (assuming reinvestment of all dividends and distributions).
| | | | | | | | | | | | | | | | | | | | | | | | | | | | |
| | | | | | Investment Activities | | | Distributions | |
| | |
Net Asset
Value,
Beginning
of Year | | | Net
investment
income(a) | | | Net realized/
unrealized
gains (losses)
on investments | | | Total from
Investment
Activities | | | Net
investment
income | | | Net realized
gains on
investments | | | Total
Distributions | |
Sterling Capital Intermediate U.S. Government Fund | | | | | | | | | | | | | | | | | | | | | | | | | |
Year Ended September 30, 2011 | | $ | 10.82 | | | | 0.27 | | | | 0.05 | | | | 0.32 | | | | (0.34 | ) | | | — | | | | (0.34 | ) |
Year Ended September 30, 2010 | | $ | 10.57 | | | | 0.32 | | | | 0.28 | | | | 0.60 | | | | (0.35 | ) | | | — | | | | (0.35 | ) |
Year Ended September 30, 2009 | | $ | 10.05 | | | | 0.35 | | | | 0.55 | | | | 0.90 | | | | (0.38 | ) | | | — | | | | (0.38 | ) |
Year Ended September 30, 2008 | | $ | 9.94 | | | | 0.44 | | | | 0.12 | | | | 0.56 | | | | (0.45 | ) | | | — | | | | (0.45 | ) |
Year Ended September 30, 2007 | | $ | 9.90 | | | | 0.45 | | | | 0.04 | | | | 0.49 | | | | (0.45 | ) | | | — | | | | (0.45 | ) |
Sterling Capital Total Return Bond Fund | | | | | | | | | | | | | | | | | | | | | | | | | |
Year Ended September 30, 2011 | | $ | 11.33 | | | | 0.41 | | | | 0.01 | | | | 0.42 | | | | (0.48 | ) | | | (0.21 | ) | | | (0.69 | ) |
Year Ended September 30, 2010 | | $ | 10.78 | | | | 0.46 | | | | 0.62 | | | | 1.08 | | | | (0.52 | ) | | | (0.01 | ) | | | (0.53 | ) |
Year Ended September 30, 2009 | | $ | 9.89 | | | | 0.47 | | | | 0.89 | | | | 1.36 | | | | (0.47 | ) | | | — | | | | (0.47 | ) |
Year Ended September 30, 2008 | | $ | 10.13 | | | | 0.46 | | | | (0.22 | ) | | | 0.24 | | | | (0.48 | ) | | | — | | | | (0.48 | ) |
Year Ended September 30, 2007 | | $ | 10.13 | | | | 0.47 | | | | — | | | | 0.47 | | | | (0.47 | ) | | | — | | | | (0.47 | ) |
Sterling Capital Kentucky Intermediate Tax-Free Fund | | | | | | | | | | | | | | | | | | | | | | | | | |
Year Ended September 30, 2011 | | $ | 10.81 | | | | 0.32 | | | | 0.03 | (b) | | | 0.35 | | | | (0.32 | ) | | | (0.05 | ) | | | (0.37 | ) |
Year Ended September 30, 2010 | | $ | 10.67 | | | | 0.32 | | | | 0.24 | | | | 0.56 | | | | (0.32 | ) | | | (0.10 | ) | | | (0.42 | ) |
Year Ended September 30, 2009 | | $ | 9.87 | | | | 0.35 | | | | 0.90 | | | | 1.25 | | | | (0.35 | ) | | | (0.10 | ) | | | (0.45 | ) |
Year Ended September 30, 2008 | | $ | 10.05 | | | | 0.34 | | | | (0.18 | ) | | | 0.16 | | | | (0.34 | ) | | | — | | | | (0.34 | ) |
Year Ended September 30, 2007 | | $ | 10.11 | | | | 0.35 | | | | (0.06 | ) | | | 0.29 | | | | (0.35 | ) | | | — | | | | (0.35 | ) |
Sterling Capital Maryland Intermediate Tax-Free Fund | | | | | | | | | | | | | | | | | | | | | | | | | |
Year Ended September 30, 2011 | | $ | 11.22 | | | | 0.31 | | | | 0.06 | | | | 0.37 | | | | (0.30 | ) | | | (0.04 | ) | | | (0.34 | ) |
Year Ended September 30, 2010 | | $ | 10.99 | | | | 0.30 | | | | 0.23 | | | | 0.53 | | | | (0.30 | ) | | | — | (c) | | | (0.30 | ) |
Year Ended September 30, 2009 | | $ | 10.06 | | | | 0.33 | | | | 1.01 | | | | 1.34 | | | | (0.33 | ) | | | (0.08 | ) | | | (0.41 | ) |
Year Ended September 30, 2008 | | $ | 10.17 | | | | 0.34 | | | | (0.11 | ) | | | 0.23 | | | | (0.34 | ) | | | — | | | | (0.34 | ) |
Year Ended September 30, 2007 | | $ | 10.13 | | | | 0.33 | | | | 0.04 | | | | 0.37 | | | | (0.33 | ) | | | — | | | | (0.33 | ) |
Sterling Capital North Carolina Intermediate Tax-Free Fund | | | | | | | | | | | | | | | | | | | | | | | | | |
Year Ended September 30, 2011 | | $ | 11.01 | | | | 0.31 | | | | 0.07 | | | | 0.38 | | | | (0.31 | ) | | | (0.06 | ) | | | (0.37 | ) |
Year Ended September 30, 2010 | | $ | 10.87 | | | | 0.33 | | | | 0.20 | | | | 0.53 | | | | (0.33 | ) | | | (0.06 | ) | | | (0.39 | ) |
Year Ended September 30, 2009 | | $ | 10.09 | | | | 0.36 | | | | 0.88 | | | | 1.24 | | | | (0.36 | ) | | | (0.10 | ) | | | (0.46 | ) |
Year Ended September 30, 2008 | | $ | 10.33 | | | | 0.37 | | | | (0.20 | ) | | | 0.17 | | | | (0.37 | ) | | | (0.04 | ) | | | (0.41 | ) |
Year Ended September 30, 2007 | | $ | 10.38 | | | | 0.38 | | | | (0.04 | ) | | | 0.34 | | | | (0.38 | ) | | | (0.01 | ) | | | (0.39 | ) |
Sterling Capital South Carolina Intermediate Tax-Free Fund | | | | | | | | | | | | | | | | | | | | | | | | | |
Year Ended September 30, 2011 | | $ | 10.86 | | | | 0.29 | | | | 0.06 | | | | 0.35 | | | | (0.28 | ) | | | (0.03 | ) | | | (0.31 | ) |
Year Ended September 30, 2010 | | $ | 10.61 | | | | 0.32 | | | | 0.25 | | | | 0.57 | | | | (0.32 | ) | | | — | | | | (0.32 | ) |
Year Ended September 30, 2009 | | $ | 9.89 | | | | 0.35 | | | | 0.89 | | | | 1.24 | | | | (0.35 | ) | | | (0.17 | ) | | | (0.52 | ) |
Year Ended September 30, 2008 | | $ | 10.21 | | | | 0.36 | | | | (0.23 | ) | | | 0.13 | | | | (0.36 | ) | | | (0.09 | ) | | | (0.45 | ) |
Year Ended September 30, 2007 | | $ | 10.29 | | | | 0.37 | | | | (0.06 | ) | | | 0.31 | | | | (0.38 | ) | | | (0.01 | ) | | | (0.39 | ) |
Sterling Capital Virginia Intermediate Tax-Free Fund | | | | | | | | | | | | | | | | | | | | | | | | | |
Year Ended September 30, 2011 | | $ | 12.14 | | | | 0.34 | | | | 0.02 | | | | 0.36 | | | | (0.34 | ) | | | (0.04 | ) | | | (0.38 | ) |
Year Ended September 30, 2010 | | $ | 12.07 | | | | 0.36 | | | | 0.18 | | | | 0.54 | | | | (0.36 | ) | | | (0.11 | ) | | | (0.47 | ) |
Year Ended September 30, 2009 | | $ | 11.10 | | | | 0.39 | | | | 1.06 | | | | 1.45 | | | | (0.39 | ) | | | (0.09 | ) | | | (0.48 | ) |
Year Ended September 30, 2008 | | $ | 11.31 | | | | 0.40 | | | | (0.16 | ) | | | 0.24 | | | | (0.40 | ) | | | (0.05 | ) | | | (0.45 | ) |
Year Ended September 30, 2007 | | $ | 11.39 | | | | 0.41 | | | | (0.05 | ) | | | 0.36 | | | | (0.42 | ) | | | (0.02 | ) | | | (0.44 | ) |
Sterling Capital West Virginia Intermediate Tax-Free Fund | | | | | | | | | | | | | | | | | | | | | | | | | |
Year Ended September 30, 2011 | | $ | 10.18 | | | | 0.34 | | | | — | | | | 0.34 | | | | (0.34 | ) | | | (0.01 | ) | | | (0.35 | ) |
Year Ended September 30, 2010 | | $ | 10.05 | | | | 0.36 | | | | 0.15 | | | | 0.51 | | | | (0.36 | ) | | | (0.02 | ) | | | (0.38 | ) |
Year Ended September 30, 2009 | | $ | 9.37 | | | | 0.36 | | | | 0.68 | | | | 1.04 | | | | (0.35 | ) | | | (0.01 | ) | | | (0.36 | ) |
Year Ended September 30, 2008 | | $ | 9.72 | | | | 0.36 | | | | (0.34 | ) | | | 0.02 | | | | (0.35 | ) | | | (0.02 | ) | | | (0.37 | ) |
Year Ended September 30, 2007 | | $ | 9.80 | | | | 0.37 | | | | (0.05 | ) | | | 0.32 | | | | (0.37 | ) | | | (0.03 | ) | | | (0.40 | ) |
| * | During the period certain fees were reduced. If such reductions had not occurred, the ratios would have been as indicated. |
| ** | Portfolio turnover rate is calculated on the basis of the Fund as a whole without distinguishing between classes of shares issued. |
| (a) | Per share net investment income (loss) has been calculated using the average daily shares method. |
| (b) | The amount shown for a share outstanding throughout the period does not accord with the change in aggregate gains and losses in the portfolio of securities during the period because of the timing of sales and purchases of Fund shares in relation to fluctuating market values during the period. |
| (c) | Amount is less than $0.005. |
See accompanying notes to the financial statements.
142
| | | | | | | | | | | | | | | | | | | | | | | | | | |
NetAsset Value, End of Year | | | | | | Ratios/Supplementary Data | |
| | Total
Return | | | Net Assets,
End of
Year
(000) | | | Ratio of
net expenses
to average
net assets | | | Ratio of net
investment
income to
average net
assets | | | Ratio of
expenses to
average
net assets* | | | Portfolio
turnover rate** | |
| | | | | | | | | | | | | | |
| | $10.80 | | | | 3.02 | % | | $ | 155,814 | | | | 0.71 | % | | | 2.55 | % | | | 0.83 | % | | | 83.62 | % |
| | $10.82 | | | | 5.74 | % | | $ | 176,096 | | | | 0.71 | % | | | 3.00 | % | | | 0.84 | % | | | 83.92 | % |
| | $10.57 | | | | 9.06 | % | | $ | 177,141 | | | | 0.70 | % | | | 3.35 | % | | | 0.82 | % | | | 47.13 | % |
| | $10.05 | | | | 5.67 | % | | $ | 110,289 | | | | 0.67 | % | | | 4.33 | % | | | 0.79 | % | | | 116.07 | % |
| | $ 9.94 | | | | 5.04 | % | | $ | 132,403 | | | | 0.68 | % | | | 4.49 | % | | | 0.80 | % | | | 85.83 | % |
| | | | | | | | | | | | | | |
| | $11.06 | | | | 3.94 | % | | $ | 383,070 | | | | 0.70 | % | | | 3.73 | % | | | 0.82 | % | | | 131.87 | % |
| | $11.33 | | | | 10.27 | % | | $ | 383,868 | | | | 0.71 | % | | | 4.19 | % | | | 0.84 | % | | | 122.94 | % |
| | $10.78 | | | | 14.16 | % | | $ | 339,730 | | | | 0.71 | % | | | 4.61 | % | | | 0.83 | % | | | 122.26 | % |
| | $9.89 | | | | 2.32 | % | | $ | 430,079 | | | | 0.66 | % | | | 4.48 | % | | | 0.78 | % | | | 190.15 | % |
| | $10.13 | | | | 4.77 | % | | $ | 433,382 | | | | 0.68 | % | | | 4.62 | % | | | 0.80 | % | | | 222.24 | % |
| | | | | | | | | | | | | | |
| | $10.79 | | | | 3.34 | % | | $ | 13,757 | | | | 0.68 | % | | | 3.01 | % | | | 0.79 | % | | | 15.73 | % |
| | $10.81 | | | | 5.42 | % | | $ | 15,284 | | | | 0.69 | % | | | 3.01 | % | | | 0.90 | % | | | 20.68 | % |
| | $10.67 | | | | 13.00 | % | | $ | 12,814 | | | | 0.67 | % | | | 3.44 | % | | | 0.87 | % | | | 33.56 | % |
| | $ 9.87 | | | | 1.59 | % | | $ | 10,924 | | | | 0.64 | % | | | 3.38 | % | | | 0.84 | % | | | 54.22 | % |
| | $10.05 | | | | 2.92 | % | | $ | 10,625 | | | | 0.65 | % | | | 3.45 | % | | | 0.85 | % | | | 69.73 | % |
| | | | | | | | | | | | | | |
| | $11.25 | | | | 3.44 | % | | $ | 25,174 | | | | 0.67 | % | | | 2.77 | % | | | 0.78 | % | | | 21.89 | % |
| | $11.22 | | | | 4.97 | % | | $ | 26,322 | | | | 0.68 | % | | | 2.77 | % | | | 0.89 | % | | | 12.26 | % |
| | $10.99 | | | | 13.70 | % | | $ | 20,704 | | | | 0.65 | % | | | 3.10 | % | | | 0.87 | % | | | 37.11 | % |
| | $10.06 | | | | 2.10 | % | | $ | 11,527 | | | | 0.54 | % | | | 3.26 | % | | | 0.84 | % | | | 108.13 | % |
| | $10.17 | | | | 3.74 | % | | $ | 8,374 | | | | 0.59 | % | | | 3.29 | % | | | 0.89 | % | | | 136.09 | % |
| | | | | | | | | | | | | | |
| | $11.02 | | | | 3.60 | % | | $ | 161,486 | | | | 0.67 | % | | | 2.92 | % | | | 0.72 | % | | | 15.15 | % |
| | $11.01 | | | | 5.05 | % | | $ | 147,848 | | | | 0.68 | % | | | 3.05 | % | | | 0.84 | % | | | 19.19 | % |
| | $10.87 | | | | 12.63 | % | | $ | 130,113 | | | | 0.67 | % | | | 3.42 | % | | | 0.82 | % | | | 38.42 | % |
| | $10.09 | | | | 1.67 | % | | $ | 103,560 | | | | 0.64 | % | | | 3.59 | % | | | 0.79 | % | | | 82.02 | % |
| | $10.33 | | | | 3.33 | % | | $ | 96,282 | | | | 0.66 | % | | | 3.65 | % | | | 0.81 | % | | | 106.16 | % |
| | | | | | | | | | | | | | |
| | $10.90 | | | | 3.37 | % | | $ | 39,863 | | | | 0.71 | % | | | 2.68 | % | | | 0.76 | % | | | 25.83 | % |
| | $10.86 | | | | 5.53 | % | | $ | 30,183 | | | | 0.73 | % | | | 3.05 | % | | | 0.89 | % | | | 14.60 | % |
| | $10.61 | | | | 13.01 | % | | $ | 17,274 | | | | 0.73 | % | | | 3.45 | % | | | 0.88 | % | | | 42.06 | % |
| | $9.89 | | | | 1.27 | % | | $ | 13,298 | | | | 0.71 | % | | | 3.52 | % | | | 0.86 | % | | | 127.76 | % |
| | $10.21 | | | | 3.08 | % | | $ | 12,789 | | | | 0.68 | % | | | 3.60 | % | | | 0.85 | % | | | 68.69 | % |
| | | | | | | | | | | | | | |
| | $12.12 | | | | 3.11 | % | | $ | 78,535 | | | | 0.68 | % | | | 2.90 | % | | | 0.73 | % | | | 15.33 | % |
| | $12.14 | | | | 4.65 | % | | $ | 77,222 | | | | 0.69 | % | | | 3.05 | % | | | 0.85 | % | | | 9.54 | % |
| | $12.07 | | | | 13.39 | % | | $ | 71,599 | | | | 0.67 | % | | | 3.36 | % | | | 0.82 | % | | | 35.90 | % |
| | $11.10 | | | | 2.13 | % | | $ | 71,631 | | | | 0.64 | % | | | 3.50 | % | | | 0.79 | % | | | 53.28 | % |
| | $11.31 | | | | 3.21 | % | | $ | 68,911 | | | | 0.66 | % | | | 3.64 | % | | | 0.81 | % | | | 85.36 | % |
| | | | | | | | | | | | | | |
| | $10.17 | | | | 3.48 | % | | $ | 72,451 | | | | 0.69 | % | | | 3.44 | % | | | 0.69 | % | | | 23.34 | % |
| | $10.18 | | | | 5.13 | % | | $ | 70,760 | | | | 0.69 | % | | | 3.58 | % | | | 0.70 | % | | | 6.60 | % |
| | $10.05 | | | | 11.41 | % | | $ | 63,599 | | | | 0.68 | % | | | 3.71 | % | | | 0.68 | % | | | 24.19 | % |
| | $ 9.37 | | | | 0.18 | % | | $ | 56,829 | | | | 0.66 | % | | | 3.66 | % | | | 0.66 | % | | | 39.13 | % |
| | $ 9.72 | | | | 3.37 | % | | $ | 52,518 | | | | 0.66 | % | | | 3.85 | % | | | 0.66 | % | | | 49.60 | % |
143
Financial Highlights, Institutional Shares
The financial highlights table is intended to help you understand the Funds’ financial performance for the past 5 years or, if shorter, the period of the Funds’ operations. Certain information reflects financial results for a single Fund share. The total returns in the table represent the rate that an investor would have earned (or lost) on an investment in the Fund (assuming reinvestment of all dividends and distributions).
| | | | | | | | | | | | | | | | | | | | | | | | | | | | |
| | | | | | Investment Activities | | | Distributions | |
| | |
Net Asset
Value,
Beginning
of Year | | | Net
investment
income(a) | | | Net realized/
unrealized
gains (losses)
on investments | | | Total from
Investment
Activities | | | Net
investment
income | | | Net realized
gains on
investments | | | Total
Distributions | |
Sterling Capital National Tax-Free Money Market Fund | | | | | | | | | | | | | | | | | |
Year Ended September 30, 2011 | | $ | 1.00 | | | | — | (b) | | | — | (b) | | | — | (b) | | | — | (b) | | | — | | | | — | (b) |
Year Ended September 30, 2010 | | $ | 1.00 | | | | — | (b) | | | — | (b) | | | — | (b) | | | — | (b) | | | — | | | | — | (b) |
Year Ended September 30, 2009 | | $ | 1.00 | | | | 0.01 | | | | — | (b) | | | 0.01 | | | | (0.01 | ) | | | — | | | | (0.01 | ) |
Year Ended September 30, 2008 | | $ | 1.00 | | | | 0.02 | | | | — | (b) | | | 0.02 | | | | (0.02 | ) | | | — | | | | (0.02 | ) |
Year Ended September 30, 2007 | | $ | 1.00 | | | | 0.03 | | | | — | | | | 0.03 | | | | (0.03 | ) | | | — | | | | (0.03 | ) |
Sterling Capital Prime Money Market Fund | | | | | | | | | | | | | | | | | |
Year Ended September 30, 2011 | | $ | 1.00 | | | | — | (b) | | | — | (b) | | | — | (b) | | | — | (b) | | | — | | | | — | (b) |
Year Ended September 30, 2010 | | $ | 1.00 | | | | — | (b) | | | — | (b) | | | — | (b) | | | — | (b) | | | — | | | | — | (b) |
Year Ended September 30, 2009 | | $ | 1.00 | | | | 0.01 | | | | — | (b) | | | 0.01 | | | | (0.01 | ) | | | — | | | | (0.01 | ) |
Year Ended September 30, 2008 | | $ | 1.00 | | | | 0.03 | | | | — | (b) | | | 0.03 | | | | (0.03 | ) | | | — | | | | (0.03 | ) |
Year Ended September 30, 2007 | | $ | 1.00 | | | | 0.05 | | | | — | | | | 0.05 | | | | (0.05 | ) | | | — | | | | (0.05 | ) |
Sterling Capital U.S. Treasury Money Market Fund | | | | | | | | | | | | | | | | | |
Year Ended September 30, 2011 | | $ | 1.00 | | | | — | (b) | | | — | (b) | | | — | (b) | | | — | (b) | | | — | | | | — | (b) |
Year Ended September 30, 2010 | | $ | 1.00 | | | | — | (b) | | | — | (b) | | | — | (b) | | | — | (b) | | | — | | | | — | (b) |
Year Ended September 30, 2009 | | $ | 1.00 | | | | — | (b) | | | — | | | | — | (b) | | | — | (b) | | | — | | | | — | (b) |
Year Ended September 30, 2008 | | $ | 1.00 | | | | 0.02 | | | | — | (b) | | | 0.02 | | | | (0.02 | ) | | | — | | | | (0.02 | ) |
Year Ended September 30, 2007 | | $ | 1.00 | | | | 0.05 | | | | — | | | | 0.05 | | | | (0.05 | ) | | | — | | | | (0.05 | ) |
Sterling Capital Strategic Allocation Conservative Fund(c) | | | | | | | | | | | | | | | | | |
Year Ended September 30, 2011 | | $ | 9.15 | | | | 0.25 | | | | (0.27 | ) | | | (0.02 | ) | | | (0.30 | ) | | | — | | | | (0.30 | ) |
Year Ended September 30, 2010 | | $ | 8.58 | | | | 0.29 | | | | 0.57 | | | | 0.86 | | | | (0.29 | ) | | | — | | | | (0.29 | ) |
Year Ended September 30, 2009 | | $ | 8.50 | | | | 0.30 | | | | 0.17 | | | | 0.47 | | | | (0.25 | ) | | | (0.14 | ) | | | (0.39 | ) |
Year Ended September 30, 2008 | | $ | 10.62 | | | | 0.28 | | | | (1.26 | ) | | | (0.98 | ) | | | (0.41 | ) | | | (0.73 | ) | | | (1.14 | ) |
Year Ended September 30, 2007 | | $ | 10.04 | | | | 0.38 | | | | 0.53 | | | | 0.91 | | | | (0.33 | ) | | | — | | | | (0.33 | ) |
Sterling Capital Strategic Allocation Balanced Fund(c) | | | | | | | | | | | | | | | | | |
Year Ended September 30, 2011 | | $ | 8.44 | | | | 0.19 | | | | (0.43 | ) | | | (0.24 | ) | | | (0.20 | ) | | | — | | | | (0.20 | ) |
Year Ended September 30, 2010 | | $ | 7.83 | | | | 0.20 | | | | 0.61 | | | | 0.81 | | | | (0.20 | ) | | | — | | | | (0.20 | ) |
Year Ended September 30, 2009 | | $ | 7.81 | | | | 0.24 | | | | (0.04 | ) | | | 0.20 | | | | (0.18 | ) | | | — | | | | (0.18 | ) |
Year Ended September 30, 2008 | | $ | 10.99 | | | | 0.19 | | | | (1.86 | ) | | | (1.67 | ) | | | (0.38 | ) | | | (1.13 | ) | | | (1.51 | ) |
Year Ended September 30, 2007 | | $ | 10.25 | | | | 0.32 | | | | 0.88 | | | | 1.20 | | | | (0.24 | ) | | | (0.22 | ) | | | (0.46 | ) |
Sterling Capital Strategic Allocation Growth Fund(c) | | | | | | | | | | | | | | | | | |
Year Ended September 30, 2011 | | $ | 7.70 | | | | 0.13 | | | | (0.49 | ) | | | (0.36 | ) | | | (0.13 | ) | | | — | | | | (0.13 | ) |
Year Ended September 30, 2010 | | $ | 7.12 | | | | 0.15 | | | | 0.58 | | | | 0.73 | | | | (0.15 | ) | | | — | | | | (0.15 | ) |
Year Ended September 30, 2009 | | $ | 7.34 | | | | 0.22 | | | | (0.31 | ) | | | (0.09 | ) | | | (0.13 | ) | | | — | | | | (0.13 | ) |
Year Ended September 30, 2008 | | $ | 11.14 | | | | 0.13 | | | | (2.20 | ) | | | (2.07 | ) | | | (0.36 | ) | | | (1.37 | ) | | | (1.73 | ) |
Year Ended September 30, 2007 | | $ | 10.24 | | | | 0.27 | | | | 1.08 | | | | 1.35 | | | | (0.18 | ) | | | (0.27 | ) | | | (0.45 | ) |
Sterling Capital Strategic Allocation Equity Fund(c) | | | | | | | | | | | | | | | | | |
Year Ended September 30, 2011 | | $ | 7.41 | | | | 0.10 | | | | (0.58 | ) | | | (0.48 | ) | | | (0.06 | ) | | | — | | | | (0.06 | ) |
Year Ended September 30, 2010 | | $ | 6.85 | | | | 0.12 | | | | 0.57 | | | | 0.69 | | | | (0.13 | ) | | | — | | | | (0.13 | ) |
Year Ended September 30, 2009 | | $ | 7.48 | | | | 0.20 | | | | (0.77 | ) | | | (0.57 | ) | | | (0.06 | ) | | | — | | | | (0.06 | ) |
Year Ended September 30, 2008 | | $ | 12.35 | | | | 0.07 | | | | (2.78 | ) | | | (2.71 | ) | | | (0.35 | ) | | | (1.81 | ) | | | (2.16 | ) |
Year Ended September 30, 2007 | | $ | 11.65 | | | | 0.25 | | | | 1.42 | | | | 1.67 | | | | (0.12 | ) | | | (0.85 | ) | | | (0.97 | ) |
| * | During the period certain fees were reduced. If such reductions had not occurred, the ratios would have been as indicated. |
| ** | Portfolio turnover rate is calculated on the basis of the Fund as a whole without distinguishing between classes of shares issued. |
| (a) | Per share net investment income has been calculated using the average daily shares method. |
| (b) | Amount is less than $0.005. |
| (c) | The expense ratios exclude the impact of fees/expenses paid by each underlying fund. |
See accompanying notes to the financial statements.
144
| | | | | | | | | | | | | | | | | | | | | | | | | | |
| | | | | | | Ratios/Supplementary Data | |
Net Asset
Value,
End of
Year | | | Total
Return | | | Net Assets,
End of
Year
(000) | | | Ratio of
net expenses
to average
net assets | | | Ratio of net
investment
income to
average net
assets | | | Ratio of
expenses to
average
net assets* | | | Portfolio
turnover rate** | |
| | | | | | | | | | | | | | | | | | | | | | | | | | | |
| $ | 1.00 | | | | 0.02 | % | | $ | 153,610 | | | | 0.35 | % | | | 0.02 | % | | | 0.48 | % | | | — | |
| $ | 1.00 | | | | 0.03 | % | | $ | 155,385 | | | | 0.40 | % | | | 0.03 | % | | | 0.48 | % | | | — | |
| $ | 1.00 | | | | 1.05 | % | | $ | 260,889 | | | | 0.44 | % | | | 0.97 | % | | | 0.49 | % | | | — | |
| $ | 1.00 | | | | 2.37 | % | | $ | 151,438 | | | | 0.40 | % | | | 2.34 | % | | | 0.45 | % | | | — | |
| $ | 1.00 | | | | 3.33 | % | | $ | 109,590 | | | | 0.41 | % | | | 3.28 | % | | | 0.46 | % | | | — | |
| | | | | | | | | | | | | | | | | | | | | | | | | | | |
| $ | 1.00 | | | | 0.01 | % | | $ | 328,318 | | | | 0.25 | % | | | 0.01 | % | | | 0.63 | % | | | — | |
| $ | 1.00 | | | | 0.05 | % | | $ | 396,157 | | | | 0.35 | % | | | 0.04 | % | | | 0.63 | % | | | — | |
| $ | 1.00 | | | | 0.92 | % | | $ | 879,738 | | | | 0.54 | % | | | 0.87 | % | | | 0.66 | % | | | — | |
| $ | 1.00 | | | | 3.38 | % | | $ | 975,033 | | | | 0.46 | % | | | 3.28 | % | | | 0.58 | % | | | — | |
| $ | 1.00 | | | | 5.03 | % | | $ | 788,160 | | | | 0.48 | % | | | 4.92 | % | | | 0.60 | % | | | — | |
| | | | | | | | | | | | | | | | | | | | | | | | | | | |
| $ | 1.00 | | | | 0.01 | % | | $ | 118,172 | | | | 0.10 | % | | | 0.01 | % | | | 0.64 | % | | | — | |
| $ | 1.00 | | | | 0.07 | % | | $ | 208,439 | | | | 0.15 | % | | | 0.05 | % | | | 0.64 | % | | | — | |
| $ | 1.00 | | | | 0.04 | % | | $ | 432,753 | | | | 0.29 | % | | | 0.04 | % | | | 0.64 | % | | | — | |
| $ | 1.00 | | | | 2.24 | % | | $ | 712,696 | | | | 0.44 | % | | | 2.18 | % | | | 0.58 | % | | | — | |
| $ | 1.00 | | | | 4.72 | % | | $ | 557,282 | | | | 0.46 | % | | | 4.62 | % | | | 0.60 | % | | | — | |
| | | | | | | | | | | | | | | | | | | | | | | | | | | |
| $ | 8.83 | | | | (0.31 | )% | | $ | 3,954 | | | | 0.37 | % | | | 2.61 | % | | | 0.47 | % | | | 8.36 | % |
| $ | 9.15 | | | | 10.22 | % | | $ | 4,798 | | | | 0.21 | % | | | 3.26 | % | | | 0.47 | % | | | 33.33 | % |
| $ | 8.58 | | | | 6.28 | % | | $ | 5,316 | | | | 0.14 | % | | | 3.84 | % | | | 0.39 | % | | | 21.56 | % |
| $ | 8.50 | | | | (10.21 | )% | | $ | 39,937 | | | | 0.10 | % | | | 2.97 | % | | | 0.35 | % | | | 39.99 | % |
| $ | 10.62 | | | | 9.16 | % | | $ | 47,520 | | | | 0.10 | % | | | 3.62 | % | | | 0.41 | % | | | 29.58 | % |
| | | | | | | | | | | | | | | | | | | | | | | | | | | |
| $ | 8.00 | | | | (3.02 | )% | | $ | 475 | | | | 0.29 | % | | | 2.13 | % | | | 0.41 | % | | | 9.96 | % |
| $ | 8.44 | | | | 10.53 | % | | $ | 1,169 | | | | 0.16 | % | | | 2.52 | % | | | 0.41 | % | | | 47.76 | % |
| $ | 7.83 | | | | 2.91 | % | | $ | 1,322 | | | | 0.13 | % | | | 3.61 | % | | | 0.38 | % | | | 22.46 | % |
| $ | 7.81 | | | | (17.23 | )% | | $ | 21,298 | | | | 0.10 | % | | | 2.07 | % | | | 0.35 | % | | | 63.63 | % |
| $ | 10.99 | | | | 11.80 | % | | $ | 28,961 | | | | 0.11 | % | | | 3.02 | % | | | 0.42 | % | | | 40.05 | % |
| | | | | | | | | | | | | | | | | | | | | | | | | | | |
| $ | 7.21 | | | | (4.86 | )% | | $ | 1,127 | | | | 0.32 | % | | | 1.62 | % | | | 0.43 | % | | | 9.06 | % |
| $ | 7.70 | | | | 10.39 | % | | $ | 1,684 | | | | 0.17 | % | | | 2.05 | % | | | 0.43 | % | | | 57.35 | % |
| $ | 7.12 | | | | (0.87 | )% | | $ | 1,650 | | | | 0.14 | % | | | 3.54 | % | | | 0.38 | % | | | 24.08 | % |
| $ | 7.34 | | | | (21.54 | )% | | $ | 17,836 | | | | 0.10 | % | | | 1.48 | % | | | 0.35 | % | | | 77.54 | % |
| $ | 11.14 | | | | 13.45 | % | | $ | 24,259 | | | | 0.11 | % | | | 2.50 | % | | | 0.43 | % | | | 44.48 | % |
| | | | | | | | | | | | | | | | | | | | | | | | | | | |
| $ | 6.87 | | | | (6.64 | )% | | $ | 64 | | | | 0.45 | % | | | 1.18 | % | | | 0.55 | % | | | 10.72 | % |
| $ | 7.41 | | | | 10.15 | % | | $ | 67 | | | | 0.25 | % | | | 1.65 | % | | | 0.52 | % | | | 66.32 | % |
| $ | 6.85 | | | | (7.33 | )% | | $ | 693 | | | | 0.17 | % | | | 3.41 | % | | | 0.42 | % | | | 20.24 | % |
| $ | 7.48 | | | | (26.02 | )% | | $ | 14,000 | | | | 0.13 | % | | | 0.70 | % | | | 0.38 | % | | | 67.40 | % |
| $ | 12.35 | | | | 14.98 | % | | $ | 20,832 | | | | 0.12 | % | | | 2.12 | % | | | 0.43 | % | | | 48.80 | % |
145
Financial Highlights, Class R Shares
The financial highlights table is intended to help you understand the Funds’ financial performance for the past 5 years or, if shorter, the period of the Funds’ operations. Certain information reflects financial results for a single Fund share. The total returns in the table represent the rate that an investor would have earned (or lost) on an investment in the Fund (assuming reinvestment of all dividends and distributions).
| | | | | | | | | | | | | | | | | | | | | | | | | | | | |
| | | | | | Investment Activities | | | Distributions | |
| | |
Net Asset
Value,
Beginning
of Period | | | Net
investment
income (loss)(a) | | | Net realized/
unrealized
gains (loss)
on investments | | | Total from
Investment
Activities | | | Net
investment
income | | | Net realized
gains on
investments | | | Total
Distributions | |
Sterling Capital Mid Value Fund | | | | | | | | | | | | | | | | | | | | | | | | | | | | |
Year Ended September 30, 2011 | | $ | 12.12 | | | | 0.05 | | | | (0.73 | ) | | | (0.68 | ) | | | (0.08 | ) | | | — | | | | (0.08 | ) |
February 1, 2010 to September 30, 2010(e) | | $ | 11.11 | | | | 0.03 | | | | 1.01 | | | | 1.04 | | | | (0.03 | ) | | | — | | | | (0.03 | ) |
Sterling Capital Small Value Fund | | | | | | | | | | | | | | | | | | | | | | | | | | | | |
Year Ended September 30, 2011 | | $ | 11.18 | | | | (0.02 | ) | | | (0.37 | ) | | | (0.39 | ) | | | — | | | | — | | | | — | |
February 1, 2010 to September 30, 2010(e) | | $ | 10.55 | | | | 0.06 | | | | 0.62 | | | | 0.68 | | | | (0.05 | ) | | | — | | | | (0.05 | ) |
Sterling Capital Special Opportunities Fund | | | | | | | | | | | | | | | | | | | | | | | | | | | | |
Year Ended September 30, 2011 | | $ | 16.26 | | | | (0.11 | ) | | | (0.51 | ) | | | (0.62 | ) | | | — | | | | (0.10 | ) | | | (0.10 | ) |
February 1, 2010 to September 30, 2010(e) | | $ | 15.32 | | | | (0.03 | ) | | | 0.97 | | | | 0.94 | | | | — | | | | — | | | | — | |
Sterling Capital Equity Income Fund | | | | | | | | | | | | | | | | | | | | | | | | | | | | |
Year Ended September 30, 2011 | | $ | 13.03 | | | | 0.24 | | | | 0.13 | | | | 0.37 | | | | (0.21 | ) | | | — | | | | (0.21 | ) |
February 1, 2010 to September 30, 2010(e) | | $ | 11.94 | | | | 0.23 | | | | 1.04 | | | | 1.27 | | | | (0.18 | ) | | | — | | | | (0.18 | ) |
Sterling Capital Total Return Bond Fund | | | | | | | | | | | | | | | | | | | | | | | | | | | | |
Year Ended September 30, 2011 | | $ | 11.32 | | | | 0.37 | | | | (0.03 | ) | | | 0.34 | | | | (0.43 | ) | | | (0.21 | ) | | | (0.64 | ) |
February 1, 2010 to September 30, 2010(e) | | $ | 10.87 | | | | 0.25 | | | | 0.50 | | | | 0.75 | | | | (0.30 | ) | | | — | | | | (0.30 | ) |
| * | During the period certain fees were reduced. If such reductions had not occurred, the ratios would have been as indicated. |
| ** | Portfolio turnover rate is calculated on the basis of the Fund as a whole without distinguishing between classes of shares issued. |
| (a) | Per share net investment income (loss) has been calculated using the average daily shares method. |
| (b) | Not annualized for periods less than one year. |
| (c) | Annualized for periods less than one year. |
| (d) | Net Assets are below $1,000. |
| (e) | Period from commencement of operations. |
| (f) | Includes proceeds received from a settlement of litigation, which impacted the Fund’s total return. Not including these proceeds, the Fund’s total return would have been 6.08%. |
See accompanying notes to the financial statements.
146
| | | | | | | | | | | | | | | | | | | | | | | | | | |
| | | | | | | Ratios/Supplementary Data | |
Net Asset
Value,
End of
Period | | | Total Return
(excludes
sales charge)(b) | | | Net Assets, End of
Period (000) | | | Ratio of
net expenses
to average
net assets(c) | | | Ratio of net
investment
income to
average net
assets(c) | | | Ratio of
expenses to average
net assets*(c) | | | Portfolio
turnover rate**(b) | |
| | | | | | | | | | | | | | | | | | | | | | | | | | | |
| $ | 11.36 | | | | (5.71) | % | | $ | — | (d) | | | 1.44 | % | | | 0.36 | % | | | 1.56 | % | | | 38.30 | % |
| $ | 12.12 | | | | 9.47 | % | | $ | — | (d) | | | 1.44 | % | | | 0.42 | % | | | 1.68 | % | | | 45.02 | % |
| | | | | | | | | | | | | | | | | | | | | | | | | | | |
| $ | 10.79 | | | | (3.49) | % | | $ | — | (d) | | | 1.57 | % | | | (0.12) | % | | | 1.58 | % | | | 63.02 | % |
| $ | 11.18 | | | | 6.46 | %(f) | | $ | — | (d) | | | 1.65 | % | | | 0.82 | % | | | 3.44 | % | | | 95.89 | % |
| | | | | | | | | | | | | | | | | | | | | | | | | | | |
| $ | 15.54 | | | | (3.95) | % | | $ | 289 | | | | 1.54 | % | | | (0.62) | % | | | 1.54 | % | | | 31.51 | % |
| $ | 16.26 | | | | 6.20 | % | | $ | — | (d) | | | 1.54 | % | | | (0.29) | % | | | 1.57 | % | | | 25.65 | % |
| | | | | | | | | | | | | | | | | | | | | | | | | | | |
| $ | 13.19 | | | | 2.74 | % | | $ | 604 | | | | 1.43 | % | | | 1.72 | % | | | 1.43 | % | | | 16.64 | % |
| $ | 13.03 | | | | 10.76 | % | | $ | — | (d) | | | 1.45 | % | | | 2.86 | % | | | 1.49 | % | | | 21.63 | % |
| | | | | | | | | | | | | | | | | | | | | | | | | | | |
| $ | 11.02 | | | | 3.24 | % | | $ | 6 | | | | 1.20 | % | | | 3.32 | % | | | 1.33 | % | | | 131.87 | % |
| $ | 11.32 | | | | 7.03 | % | | $ | 42 | | | | 1.21 | % | | | 3.45 | % | | | 1.37 | % | | | 122.94 | % |
147
|
| Sterling Capital Funds |
Notes to Financial Statements |
September 30, 2011 |
Sterling Capital Funds (formerly known as BB&T Funds) (the “Trust”) commenced operations on October 5, 1992 and is registered under the Investment Company Act of 1940, as amended (“the 1940 Act”), as an open-end investment company established as a Massachusetts business trust.
As the date of these financial statements, Trust offers shares of Sterling Capital Select Equity Fund, Sterling Capital Mid Value Fund, Sterling Capital Small Value Fund, Sterling Capital International Fund, Sterling Capital Special Opportunities Fund, Sterling Capital Equity Income Fund, Sterling Capital Short-Term Bond Fund, Sterling Capital Intermediate U.S. Government Fund, Sterling Capital Total Return Bond Fund, Sterling Capital Kentucky Intermediate Tax-Free Fund, Sterling Capital Maryland Intermediate Tax-Free Fund, Sterling Capital North Carolina Intermediate Tax-Free Fund, Sterling Capital South Carolina Intermediate Tax-Free Fund, Sterling Capital Virginia Intermediate Tax-Free Fund, Sterling Capital West Virginia Intermediate Tax-Free Fund, Sterling Capital National Tax-Free Money Market Fund, Sterling Capital Prime Money Market Fund, Sterling Capital U.S. Treasury Money Market Fund, Sterling Capital Strategic Allocation Conservative Fund, Sterling Capital Strategic Allocation Balanced Fund, Sterling Capital Strategic Allocation Growth Fund, Sterling Capital Strategic Allocation Equity Fund, Sterling Capital Corporate Fund, Sterling Capital Securitized Opportunities Fund and Sterling Capital Equity Index Fund (referred to individually as a “Fund” and collectively as the “Funds”). This report includes all Funds in the Trust, except for Sterling Capital Corporate Fund, Sterling Capital Securitized Opportunities Fund and Sterling Capital Equity Index Fund which are shown in separate reports. Sterling Capital Kentucky Intermediate Tax-Free Fund, Sterling Capital Maryland Intermediate Tax-Free Fund, Sterling Capital North Carolina Intermediate Tax-Free Fund, Sterling Capital South Carolina Intermediate Tax-Free Fund, Sterling Capital Virginia Intermediate Tax-Free Fund and Sterling Capital West Virginia Intermediate Tax-Free Fund are referred to as the “Tax-Free Funds.” Sterling Capital National Tax-Free Money Market Fund, Sterling Capital Prime Money Market Fund and Sterling Capital U.S. Treasury Money Market Fund are referred to as the “Money Market Funds.” Sterling Capital Strategic Allocation Conservative Fund, Sterling Capital Strategic Allocation Balanced Fund, Sterling Capital Strategic Allocation Growth Fund and Sterling Capital Strategic Allocation Equity Fund are referred to as the “Funds of Funds.” The Funds, excluding the Money Market Funds and the Funds of Funds, are referred to as the “Variable Net Asset Value Funds.” The Funds of Funds invest in underlying mutual funds and exchange traded funds as opposed to individual securities.
All Funds except the Tax-Free Funds are “diversified” funds, as defined in the 1940 Act. The Tax-Free Funds are non-diversified funds, which means they may invest in the securities of a limited number of issuers.
By owning shares of underlying investment companies (including exchange traded funds), each of the Funds of Funds invests, to varying degrees, in securities of U.S. and non-U.S. companies, including small and medium sized companies, and in fixed-income securities. Funds of Funds with exposure to underlying equity funds may include funds that invest in real estate of other similar securities. In addition, underlying investment companies may invest in derivatives.
The Funds are authorized to issue an unlimited amount of shares. As of September 30, 2011, the Funds discussed herein offered up to five classes of shares: Class A Shares, Class B Shares, Class C Shares, Class R Shares and Institutional Shares. Class B Shares of the Funds are closed to new accounts and additional purchases by existing shareholders. Sterling Capital Mid Value Fund, Sterling Capital Small Value Fund, Sterling Capital Special Opportunities Fund, Sterling Capital Equity Income Fund and Sterling Capital Total Return Bond Fund offer Class R Shares. Class B Shares and Class C Shares of Sterling Capital Short-Term Bond Fund, Sterling Capital National Tax-Free Money Market Fund and the Tax-Free Funds are not being offered. Class B Shares automatically convert to Class A Shares after eight years. Class A Shares of the Variable Net Asset Value Funds and Funds of Funds, excluding Sterling Capital Short-Term Bond Fund, have a maximum sales charge of 5.75% as a percentage of original purchase price. Class A Shares of Sterling Capital Short-Term Bond Fund and the Tax-Free Funds have a maximum sales charge of 2.50% and 3.00%, respectively, as a percentage of the original purchase price. Prior to March 1, 2011 Class A Shares of Sterling Capital Short-Term Bond Fund’s maximum sales charge was 3.00%. Purchases of $1 million or more of Class A Shares are not subject to a front-end sales charge but will be subject to a Contingent Deferred Sales Charge (“CDSC”) of 1.00% of the purchase price if redeemed within two years after purchase, with respect to Short-Term Bond Fund, sales over $500,000 are not subject to a sales load but will be subject to a CDSC of 0.50% of the purchase price if redeemed within 18 months of purchase. This charge is based on the lower of the price paid for the shares or their net asset value at the time of redemption. In addition, a CDSC of up to 1.00% of the purchase price of Class A Shares will be charged to the following shareholders who received a sales charge waiver and then redeem their shares within two years after purchase: (i) employees of the Trust, Sterling Capital Management LLC and its affiliates, and (ii) shareholders who purchased shares online at
148
|
| Sterling Capital Funds |
Notes to Financial Statements — (continued) |
September 30, 2011 |
www.sterlingcapitalfunds.com. This charge is based on the lower of the price paid for the shares or their net asset value at the time of redemption. The Class B Shares of the Funds will be subject to a CDSC ranging from a maximum of 5.00% if redeemed less than one year after purchase to 0.00% if redeemed more than six years after purchase. Class C Shares of the Funds are offered without any front-end sales charge but will be subject to a maximum CDSC of 1.00% if redeemed less than one year after purchase.
Each class of shares has identical rights and privileges except with respect to the fees paid under the distribution plan, voting rights on matters affecting a single class of shares and the exchange privilege of each class of shares.
Under the Trust’s organizational documents, its Officers and Trustees are indemnified against certain liabilities arising out of the performance of their duties to the Trust. In addition, in the normal course of business, the Funds may enter into contracts with their vendors and others that provide for general indemnifications. The Funds’ maximum exposure under these arrangements is unknown, as this would involve future claims that may be made against the Funds. However, based on experience, the Funds expect that risk of loss to be remote.
On November 17, 2009, the Board of Trustees of the Trust (the “Board”) approved an Agreement and Plan of Reorganization which provided for the acquisition of all of the assets and the assumption of the liabilities of BB&T Mid Cap Growth Fund and BB&T Small Cap Fund in exchange for shares of Sterling Capital Mid Value Fund (formerly known as BB&T Mid Cap Value Fund) and Sterling Capital Small Value Fund (formerly known as Sterling Capital Small Cap Value Fund), respectively. The purpose of the transactions were to enhance investment management efficiencies, offer greater market leverage and market presence, economies of scale, and greater opportunities for asset growth. Shareholders approved the plan at a meeting on January 26, 2010 and the reorganization took place on February 1, 2010. The acquisitions were accomplished by tax-free exchanges of shares on February 1, 2010. For financial reporting purposes, assets received and shares issued by Sterling Capital Mid Value Fund and Sterling Capital Small Value Fund were recorded at fair value; however, the cost basis of the investments received from BB&T Mid Cap Growth Fund and BB&T Small Cap Fund was carried forward to align ongoing reporting of Sterling Capital Mid Value Fund and Sterling Capital Small Value Fund’s realized and unrealized gains and losses with amounts distributable to shareholders for tax purposes.
| | | | | | | | | | | | | | | | | | | | | | |
Acquired Fund | | Class | | | Shares
Redeemed | | | Acquiring Fund | | Class | | Shares
Issued | | | Value | | | Conversion
Ratio |
| | | | | | | |
BB&T Mid Cap Growth Fund | | | A | | | | 740,972 | | | Sterling Capital Mid Value Fund | | A | | | 533,366 | | | $ | 5,898,265 | | | 0.7198 |
| | | B | | | | 172,106 | | | | | B | | | 119,580 | | | | 1,265,846 | | | 0.6948 |
| | | C | | | | 9,860 | | | | | C | | | 6,874 | | | | 72,648 | | | 0.6972 |
| | | Institutional | | | | 8,122,185 | | | | | Institutional | | | 6,253,352 | | | | 69,504,565 | | | 0.7699 |
| | | | | | | | | | | | | | | | | | | | | | |
| | | | | | | | | | | | | | | | | | $ | 76,741,324 | | | |
| | | | | | | | | | | | | | | | | | | | | | |
| | | | | | | |
BB&T Small Cap Fund | | | A | | | | 529,861 | | | Sterling Capital Small Value Fund | | A | | | 457,112 | | | $ | 4,823,599 | | | 0.8627 |
| | | B | | | | 120,569 | | | | | B | | | 98,525 | | | | 1,039,671 | | | 0.8172 |
| | | C | | | | 2,006 | | | | | C | | | 1,636 | | | | 17,265 | | | 0.8155 |
| | | Institutional | | | | 2,464,273 | | | | | Institutional | | | 2,156,153 | | | | 22,752,363 | | | 0.8750 |
| | | | | | | | | | | | | | | | | | | | | | |
| | | | | | | | | | | | | | | | | | $ | 28,632,898 | | | |
| | | | | | | | | | | | | | | | | | | | | | |
The net assets and net unrealized appreciation immediately before the acquisitions were as follows:
| | | | | | | | | | | | | | |
Acquired Fund | | Net Assets | | | Unrealized
Appreciation | | | Acquiring
Fund | | Net Assets | |
| | | | |
BB&T Mid Cap Growth Fund | | | $76,741,324 | | | | $2,667,613 | | | Sterling Capital Mid Value Fund | | $ | 223,679,726 | |
| | | | |
BB&T Small Cap Fund | | | $28,632,898 | | | | $1,063,366 | | | Sterling Capital Small Value Fund | | $ | 31,378,798 | |
149
|
| Sterling Capital Funds |
Notes to Financial Statements — (continued) |
September 30, 2011 |
Assuming the acquisition had been completed on October 1, 2009, the beginning of the reporting period for the Funds, Sterling Capital Mid Value Fund and Sterling Capital Small Value Fund pro-forma results of operations for the fiscal year ended September 30, 2010 were as follows:
| | | | |
Sterling Capital Mid Value Fund | | | | |
Net investment income | | $ | 1,473,885 | |
Net realized and unrealized gain on investments | | | 32,986,960 | |
| | | | |
| |
Net increase in net assets from operations | | $ | 34,460,845 | |
| | | | |
| |
Sterling Capital Small Value Fund | | | | |
Net investment income | | $ | 233,700 | |
Net realized and unrealized gain on investments | | | 4,260,865 | |
| | | | |
| |
Net increase in net assets from operations | | $ | 4,494,565 | |
| | | | |
Because the combined investment portfolios have been managed as a single integrated portfolio since the acquisition was completed, it is not practicable to separate the amounts of revenue and earnings of BB&T Mid Cap Growth Fund and BB&T Small Cap Fund that have been included in Sterling Capital Mid Value Fund and Sterling Capital Small Value Fund’s Statements of Changes since February 1, 2010, respectively. Since BB&T Mid Cap Growth Fund, BB&T Small Cap Fund, Sterling Capital Mid Value Fund and Sterling Capital Small Value Fund sold and redeemed shares throughout the period, it is not practicable to provide pro-forma information on a per-share basis.
| 3. | Significant Accounting Policies: |
The following is a summary of significant accounting policies followed by the Funds in the preparation of their financial statements. The policies are in conformity with United States generally accepted accounting principles (“GAAP”). The preparation of financial statements requires management to make estimates and assumptions that affect the reported amounts of assets and liabilities and disclosure of contingent assets and liabilities at the date of the financial statements and the reported amounts of income and expenses for the reporting period. Actual results could differ from those estimates.
Securities Valuation — Investments of the Money Market Funds are valued in accordance with Rule 2a-7 of the 1940 Act at amortized cost, which approximates fair value. Under the amortized cost method, discount or premium is amortized on a constant basis to the maturity of the security.
Investments in securities held by the Variable Net Asset Value Funds, the principal market for which is a securities exchange or an over-the-counter market, are valued at their latest available sale price (except for those securities that are traded on NASDAQ, which will be valued at the NASDAQ official closing price) or in the absence of such a price, by reference to the latest available bid price in the principal market in which such securities are normally traded. The Variable Net Asset Value Funds may also use an independent pricing service approved by the Board to value certain securities, including the use of electronic and matrix techniques. Short-term obligations without significant credit risk that mature in 60 days or less are valued at either amortized cost or original cost plus interest, which approximates fair value. Investments in open-end investment companies, including underlying funds invested in by the Funds of Funds, are valued at their respective net asset values as reported by such companies. Investments in closed-end investment companies and exchange traded funds are valued at their market values based upon the latest available sale price or, absent such a price, by reference to the latest available bid prices in the principal market in which such securities are normally traded. The differences between cost and fair value of investments are reflected as either unrealized appreciation or depreciation. Securities for which market quotations are not readily available or deemed unreliable (e.g., an approved pricing service does not provide a price, a furnished price is in error, certain stale prices, or an event occurs that materially affects the furnished price) will be fair valued in accordance with procedures established in good faith under the general supervision of the Board. The following Funds had securities that were recorded at fair value at September 30, 2011:
| | | | | | | | |
| | | Fair Value | | | Percentage of
Net Assets | |
Sterling Capital Small Value Fund | | $ | — | | | | 0.000% | |
Sterling Capital Special Opportunities Fund | | | 48,000 | | | | 0.008% | |
Sterling Capital Equity Income Fund | | | 3,500 | | | | 0.000% | |
Fair value pricing may be used if events materially affecting the value of foreign securities occur between the time when the exchange on which they are traded closes and the time when Sterling Capital International Fund’s net asset value is calculated;
150
|
| Sterling Capital Funds |
Notes to Financial Statements — (continued) |
September 30, 2011 |
such securities may be valued at fair value in accordance with procedures adopted by the Board. Management identifies possible fluctuation in international securities by monitoring the increase or decrease in the value of a designated benchmark index. In the event of an increase or decrease greater than predetermined levels, Sterling Capital International Fund may use a systematic valuation model provided by an independent third party to fair value their international equity securities. As of September 30, 2011, Sterling Capital International Fund was fair valued using a systematic valuation model.
Fair Value Measurements — The objective of a fair value measurement is to determine the price that would be received to sell an asset or paid to transfer a liability in an orderly transaction between market participants at the measurement date (an exit price). Accordingly, the fair value hierarchy gives the highest priority to quoted prices (unadjusted) in active markets for identical assets or liabilities (Level 1) and the lowest priority to unobservable inputs (Level 3). The three levels of the fair value hierarchy are described below:
• Level 1 – quoted prices in active markets for identical securities
• Level 2 – based on other significant observable inputs (including quoted prices for similar securities, interest rates, prepayment speeds, credit risk, etc.)
• Level 3 – based on significant unobservable inputs (including the Fund’s own assumptions in determining the fair value of investments)
The inputs or methodology used for valuing securities are not necessarily an indication of the risk associated with investing in those securities. During the year ended September 30, 2011 there were no significant changes to the valuation policies and procedures.
The summary of inputs used to determine the fair value of each Fund’s investments as of September 30, 2011 is as follows:
| | | | | | | | | | | | | | | | |
| | | Level 1–
Quoted Prices | | | Level 2–
Other Significant
Observable Inputs | | | Level 3–
Significant
Unobservable Inputs | | | Total | |
Assets: | | | | | | | | | | | | | | | | |
Investments in Securities | | | | | | | | | | | | | | | | |
Sterling Capital Select Equity Fund | | $ | 181,502,412(a) | | | $ | 1,853,159(b) | | | | $— | | | $ | 183,355,571 | |
Sterling Capital Mid Value Fund | | | 320,037,190(a) | | | | 109,928(b) | | | | — | | | | 320,147,118 | |
Sterling Capital Small Value Fund | | | 71,309,740(a) | | | | 769,385(b) | | | | — | | | | 72,079,125 | |
Sterling Capital International Fund | | | 7,550,260(a) | | | | 54,787,858(a)(b) | | | | — | | | | 62,338,118 | |
Sterling Capital Special Opportunities Fund | | | 619,927,324(a) | | | | 10,443,545(b) | | | | — | | | | 630,370,869 | |
Sterling Capital Equity Income Fund | | | 724,238,816(a) | | | | 289,900(b) | | | | — | | | | 724,528,716 | |
Sterling Capital Short-Term Bond Fund | | | 408,137(c) | | | | 62,590,570(a)(b) | | | | — | | | | 62,998,707 | |
Sterling Capital Intermediate U.S. Government Fund | | | 1,276,702(c) | | | | 174,053,157(a)(b) | | | | — | | | | 175,329,859 | |
Sterling Capital Total Return Bond Fund | | | 7,128,049(c) | | | | 438,118,401(a)(b) | | | | — | | | | 445,246,450 | |
Sterling Capital Kentucky Intermediate Tax-Free Fund | | | 1,547,054(c) | | | | 20,745,551(a) | | | | — | | | | 22,292,605 | |
Sterling Capital Maryland Intermediate Tax-Free Fund | | | 115,828(c) | | | | 33,656,174(a) | | | | — | | | | 33,772,002 | |
Sterling Capital North Carolina Intermediate Tax-Free Fund | | | 697,165(c) | | | | 213,513,079(a) | | | | — | | | | 214,210,244 | |
Sterling Capital South Carolina Intermediate Tax-Free Fund | | | 1,698,948(c) | | | | 55,015,094(a) | | | | — | | | | 56,714,042 | |
Sterling Capital Virginia Intermediate Tax-Free Fund | | | 1,366,647(c) | | | | 115,322,990(a) | | | | — | | | | 116,689,637 | |
Sterling Capital West Virginia Intermediate Tax-Free Fund | | | 5,990,426(c) | | | | 100,035,212(a) | | | | — | | | | 106,025,638 | |
Sterling Capital National Tax-Free Money Market Fund | | | 1,501,481(c) | | | | 152,172,580(a) | | | | — | | | | 153,674,061 | |
Sterling Capital Prime Money Market Fund | | | — | | | | 493,537,844(a) | | | | — | | | | 493,537,844 | |
Sterling Capital U.S. Treasury Money Market Fund | | | — | | | | 220,106,258(a) | | | | — | | | | 220,106,258 | |
Sterling Capital Strategic Allocation Conservative Fund | | | 16,801,148(a) | | | | — | | | | — | | | | 16,801,148 | |
Sterling Capital Strategic Allocation Balanced Fund | | | 33,085,827(a) | | | | — | | | | — | | | | 33,085,827 | |
Sterling Capital Strategic Allocation Growth Fund | | | 23,547,691(a) | | | | — | | | | — | | | | 23,547,691 | |
Sterling Capital Strategic Allocation Equity Fund | | | 7,770,303(a) | | | | — | | | | — | | | | 7,770,303 | |
| | | | |
Other Financial Instruments- | | | | | | | | | | | | | | | | |
Forward Foreign Currency Exchange Contracts (Foreign Currency Risk) | | | | | | | | | | | | | | | | |
Sterling Capital International Fund (d) | | $ | — | | | $ | 276,880 | | | | $— | | | $ | 276,880 | |
151
|
| Sterling Capital Funds |
Notes to Financial Statements — (continued) |
September 30, 2011 |
| | | | | | | | | | | | | | | | |
| | | Level 1–
Quoted Prices | | | Level 2–
Other Significant
Observable Inputs | | | Level 3–
Significant
Unobservable Inputs | | | Total | |
Liabilities: | | | | | | | | | | | | | | | | |
Other Financial Instruments- | | | | | | | | | | | | | | | | |
Written Options (Equity Risk) | | | | | | | | | | | | | | | | |
Sterling Capital Special Opportunities Fund (d) | | $ | 449,946 | | | | $10,000 | | | | $— | | | $ | 459,946 | |
Sterling Capital Equity Income Fund (d) | | | 168,000 | | | | 3,500 | | | | — | | | | 171,500 | |
Forward Foreign Currency Exchange Contracts (Foreign Currency Risk) | | | | | | | | | | | | | | | | |
Sterling Capital International Fund (d) | | $ | — | | | | $40,631 | | | | $— | | | $ | 40,631 | |
| | (a) | Industries, countries or security types are disclosed in the Schedules of Portfolio Investments. |
| | (b) | All or part of the balance represents securities held as collateral for securities on loan. |
| | (c) | Represents investment companies. |
| | (d) | Other financial instruments are foreign currency exchange contracts and written options. Foreign currency exchange contracts are valued at the unrealized appreciation depreciation on the instruments and written options are shown at value. |
Except for Sterling Capital International Fund, there were no significant transfers between Level 1 and Level 2 for the fiscal year ended September 30, 2011. Sterling Capital International Fund had common stocks valued at $42,200,107 that transferred from Level 1 to Level 2 of the fair value hierarchy as of September 30, 2011. The common stocks that transferred from Level 1 to Level 2 did so as a result of foreign equities that were valued based on quoted prices at September 30, 2010 however were fair valued at September 30, 2011. The Fund’s policy is to recognize transfers in and transfers out as of beginning of the reporting period.
In May 2011, the Financial Accounting Standards Board (“FASB”) issued Accounting Standards Update (“ASU”) No. 2011-04: Amendments to Achieve Common Fair Value Measurement and Disclosure Requirements in U.S. GAAP and International Financial Reporting Standards (“IFRS”). ASU No. 2011-04 includes common requirements for measurement of and disclosure about fair value between U.S. GAAP and IFRS. In addition, ASU No. 2011-04 will require reporting entities to disclose the following information for fair value measurements categorized within Level 3 of the fair value hierarchy: quantitative information about the unobservable inputs used in the fair value measurement, the valuation processes used by the reporting entity and a narrative description of the sensitivity of the fair value measurement to changes in unobservable inputs and the interrelationships between those unobservable inputs. Finally, ASU No. 2011-04 will require reporting entities to make disclosures about amounts and reasons for all transfers in and out of Level 1 and Level 2 fair value measurements. The new and revised disclosures are effective for interim and annual reporting periods beginning after December 15, 2011. At this time, management is evaluating the implications of ASU No. 2011-04 and its impact on the financial statements.
Foreign Currency Translation — The accounting records of Sterling Capital International Fund are maintained in U.S. dollars. Foreign currency amounts are translated into U.S. dollars at the latest foreign exchange bid quotation (from an approved pricing vendor) to determine the fair value of investments, assets and liabilities. Purchases and sales of securities, income and expenses are translated at the prevailing rate of exchange, on the respective dates of such transactions. Sterling Capital International Fund does not isolate that portion of the results of operations resulting from changes in foreign exchange rates on investments from fluctuations arising from changes in market prices of securities held. Such fluctuations are included with the net realized and unrealized gain or loss from investments.
Risks Associated with Foreign Securities and Currencies — Investments in securities of foreign issuers carry certain risks not ordinarily associated with investments in securities of domestic issuers. Such risks include future political and economic developments and the possible imposition of exchange controls or other foreign governmental laws and restrictions. In addition, with respect to certain countries, there is the possibility of expropriation of assets, confiscatory taxation, political or social instability or diplomatic developments which could adversely affect investments in those countries. Certain foreign investments may also be subject to foreign withholding taxes.
Forward Foreign Currency Exchange Contracts — Sterling Capital International Fund enters into forward foreign currency exchange contracts (foreign currency exchange risk) in connection with planned purchases or sales of securities or to hedge the U.S. dollar value of securities denominated in a particular currency. A foreign currency exchange contract is an agreement between two parties to buy and sell a currency at a set exchange rate on a future date. The Fund could be exposed to risks if the counterparties to the contracts are unable to meet the terms of their contracts and from unanticipated movements
152
|
| Sterling Capital Funds |
Notes to Financial Statements — (continued) |
September 30, 2011 |
in the value of a foreign currency relative to the U.S. dollar. In the event of default by the counterparty to the transaction, the Fund’s maximum amount of loss, as either the buyer or seller, is the unrealized appreciation of the contract. The forward foreign currency exchange contracts are adjusted by the daily exchange rate of the underlying currency and any gains or losses are recorded for financial statement purposes as unrealized appreciation or depreciation until the contract settlement date. When the contract is closed, the Fund records a realized gain or loss equal to the difference between the value at the time it was opened and the value at the time it was closed.
During the fiscal year, Sterling Capital International Fund utilized forward foreign currency exchange contracts to hedge the Fund’s portfolio against currency risks. The Fund also utilized forward foreign currency contracts to reduce or eliminate an underweighted position in a currency relative to its benchmark. Additionally, the Fund hedged some of its currency exposure to the Euro and Swiss Franc by selling these currencies forward versus the U.S. dollar, using 3-month forward currency contracts. At the same time, although the Fund prefers to underweight its equity holdings in Japan versus the benchmark, the Fund has chosen to move closer to the benchmark weight assigned to each country through the use of forward currency transactions (buy the foreign currency, sell the U.S. dollar). For open forward foreign currency exchange contracts as of September 30, 2011, see the Schedule of Portfolio Investments.
Options Contracts — Sterling Capital Special Opportunities Fund and Sterling Capital Equity Income Fund write (sell) “covered” call options and purchase options to close out options previously written by it. These transactions are entered into to hedge against changes in security prices (equity risk) or for the purposes of earning additional income (i.e., speculation).
The risk associated with purchasing an option is that the Fund pays a premium whether or not the option is exercised. Additionally, the Funds bear the risk of loss of the premium and change in value should the counterparty not perform under the contract. Put and call options purchased are accounted for in the same manner as other securities owned. The cost of securities acquired through the exercise of call options is increased by the premiums paid. The proceeds from securities sold through the exercise of put options are decreased by the premiums paid.
In writing an option, the Funds contract with a specified counterparty to purchase (put option written) or sell (call option written) a specified quantity (notional amount) of an underlying asset at a specified price during a specified period upon demand of the counterparty. The risk associated with writing an option is that the Funds bear the market risk of an unfavorable change in the price of an underlying asset and are required to buy or sell an underlying asset under the contractual terms of the option at a price different from the current value. The Funds execute transactions in both listed and over-the-counter options. When purchasing over-the-counter options, the Fund bears the risk of economic loss from counterparty default, equal to the market value of the option. Listed options involve minimal counterparty risk since the listed options are guaranteed against default by the exchange on which they trade. Transactions in over-the-counter options expose the Funds to the risk of default by the counterparty to the transaction. In the event of default by the counterparty to the over-the-counter transaction, the Funds’ maximum amount of loss is the premium paid (as the purchaser) or the unrealized depreciation of the contract (as the writer). The Sterling Capital Special Opportunities and Sterling Capital Equity Income Funds invested in written options to economically hedge the downside exposure by collecting a premium when sold against the equity holding. Details of written option activity for the fiscal year ended September 30, 2011 are as follows:
| | | | | | | | | | | | | | | | |
| | | Sterling Capital
Special
Opportunities
Fund | | | Sterling Capital
Equity
Income Fund | |
Covered Call Options | | Number of
Contracts | | | Premiums
Received | | | Number of
Contracts | | | Premiums
Received | |
Balance at beginning of year | | | 15,263 | | | $ | 1,642,049 | | | | 7,958 | | | $ | 589,691 | |
Options written | | | 58,649 | | | | 6,028,830 | | | | 16,898 | | | | 1,042,071 | |
Options closed | | | (14,860 | ) | | | (1,356,117 | ) | | | (3,698 | ) | | | (200,184 | ) |
Options expired | | | (31,691 | ) | | | (2,959,498 | ) | | | (14,600 | ) | | | (842,106 | ) |
Options exercised | | | (7,969 | ) | | | (1,068,513 | ) | | | (4,358 | ) | | | (357,613 | ) |
| | | | | | | | | | | | | | | | |
Balance at end of year | | | 19,392 | | | $ | 2,286,751 | | | | 2,200 | | | $ | 231,859 | |
| | | | | | | | | | | | | | | | |
153
|
| Sterling Capital Funds |
Notes to Financial Statements — (continued) |
September 30, 2011 |
The following is a summary of written call options outstanding as of September 30, 2011:
| | | | | | | | |
| | | Number of
Contracts | | | Value | |
Sterling Capital Special Opportunities Fund | | | | | | | | |
Broadcom Corp., $44.00, 11/19/11 | | | 1,000 | | | $ | (8,000 | ) |
eBay, Inc., $36.00, 1/21/12 | | | 1,000 | | | | (101,000 | ) |
eBay, Inc., $40.00, 1/21/12 | | | 1,000 | | | | (45,000 | ) |
Energizer Holdings, Inc., $90.00, 11/19/11(a) | | | 1,500 | | | | (7,500 | ) |
Halliburton Co., $52.50, 10/22/11 | | | 1,500 | | | | (6,000 | ) |
Halliburton Co., $55.00, 10/22/11 | | | 500 | | | | (1,500 | ) |
Halliburton Co., $55.00, 1/21/12 | | | 500 | | | | (3,000 | ) |
L-3 Communications Holdings, Inc., $95.00, 10/22/11(a) | | | 500 | | | | (2,500 | ) |
Southwestern Energy Co., $50.00, 12/17/11 | | | 2,950 | | | | (32,450 | ) |
UnitedHealth Group, Inc., $60.00, 1/21/12 | | | 1,300 | | | | (53,300 | ) |
Weatherford International, Ltd., $25.00, 11/19/11 | | | 1,500 | | | | (6,000 | ) |
Weatherford International, Ltd., $27.00, 11/19/11 | | | 1,800 | | | | (5,400 | ) |
Yamana Gold Inc., $19.00, 1/21/12 | | | 2,442 | | | | (92,796 | ) |
Yamana Gold Inc., $20.00, 1/21/12 | | | 1,000 | | | | (28,000 | ) |
Yum! Brands, Inc., $60.00, 1/21/12 | | | 900 | | | | (67,500 | ) |
| | | | | | | | |
| | |
| | | 19,392 | | | $ | (459,946 | ) |
| | | | | | | | |
| | |
Sterling Capital Equity Income Fund | | | | | | | | |
Emerson Electric Co., $65.00, 12/17/11(a) | | | 700 | | | $ | (3,500 | ) |
McDonald’s Corp., $95.00, 12/17/11 | | | 750 | | | | (102,000 | ) |
McDonald’s Corp., $100.00, 1/21/12 | | | 750 | | | | (66,000 | ) |
| | | | | | | | |
| | |
| | | 2,200 | | | $ | (171,500 | ) |
| | | | | | | | |
| | (a) | Security was fair valued under methods approved by the Board. |
Derivative Instruments Categorized by Risk Exposure — The Fund’s derivative contracts held at September 30, 2011, if any, are not accounted for as hedging instruments under GAAP and are disclosed in the Schedule of Investments (or Note 3 Options Contracts) together with the related counterparty. The following is a summary of the location of the derivative instruments held by the Funds on the Statements of Assets and Liabilities and the category of primary risk exposure as of September 30, 2011:
Fair Values of Derivative Instruments
| | | | | | | | | | | | | | |
| | | Statements of Assets
and Liabilities Location | | Sterling Capital
International
Fund | | | Sterling Capital
Special
Opportunities
Fund | | | Sterling Capital
Equity
Income Fund | |
Assets | | | | | | | | | | | | | | |
Foreign currency contracts | | Unrealized appreciation on forward foreign currency exchange contracts | | | $276,880 | | | | — | | | | — | |
| | | | |
Liabilities | | | | | | | | | | | | | | |
Equity contracts | | Call options written | | | — | | | | $459,946 | | | | $171,500 | |
Foreign currency contracts | | Unrealized depreciation on forward foreign currency exchange contracts | | | $ 40,631 | | | | — | | | | — | |
154
|
| Sterling Capital Funds |
Notes to Financial Statements — (continued) |
September 30, 2011 |
The effect of derivative instruments on the Statements of Operations for the fiscal year ended September 30, 2011:
Net Realized Gain (Loss)
| | | | | | | | | | | | |
| | | Sterling Capital
International
Fund | | | Sterling Capital
Special
Opportunities
Fund | | | Sterling Capital
Equity
Income Fund | |
Foreign Currency Contracts | | | | | | | | | | | | |
Forward foreign currency exchange contracts | | | $(228,497) | | | | — | | | | — | |
Equity Contracts | | | | | | | | | | | | |
Written options | | | — | | | | $3,246,049 | | | | $892,255 | |
Net Change in Unrealized Appreciation (Depreciation)
��
| | | | | | | | | | | | |
| | | Sterling Capital
International
Fund | | | Sterling Capital
Special
Opportunities
Fund | | | Sterling Capital
Equity
Income Fund | |
Foreign Currency Contracts | | | | | | | | | | | | |
Forward foreign currency exchange contracts | | | $401,517 | | | | — | | | | — | |
Equity Contracts | | | | | | | | | | | | |
Written options | | | — | | | | $2,304,725 | | | | $(26,862) | |
For the fiscal year ended September 30, 2011, the average quarterly balance of derivative financial instruments was as follows:
The Average Quarterly Balance of Derivative Instruments
| | | | | | | | | | | | |
| | | Sterling Capital
International
Fund | | | Sterling Capital
Special
Opportunities
Fund | | | Sterling Capital
Special
Opportunities
Fund | |
Forward Foreign Currency Exchange Contracts (Foreign Currency Risk) | | | | | | | | | | | | |
Average number of contracts - U.S. dollars purchased | | | 4 | | | | — | | | | — | |
Average U.S. dollar amounts purchased | | | $5,024,700 | | | | — | | | | — | |
Average number of contracts - U.S. dollars sold | | | 1 | | | | — | | | | — | |
Average U.S. dollar amounts sold | | | $1,230,466 | | | | — | | | | — | |
| | | |
Options Written (Equity Risk) | | | | | | | | | | | | |
Average number of contracts | | | — | | | | 12,608 | | | | 4,836 | |
Average premium | | | — | | | | $1,340,965 | | | | $283,585 | |
Securities Transactions and Related Income — During the period, security transactions are accounted for no later than one business day following the trade date. For financial reporting purposes, however, security transactions as of the last business day of the reporting period are accounted for on the trade date. Interest income is recognized on the accrual basis and includes, where applicable, the amortization/accretion of premium or discount. Dividend income is recorded on the ex-dividend date. Gains or losses realized from sales of securities are determined by comparing the identified cost of the security lot sold with the net sales proceeds.
When-Issued and Forward Commitments — The Funds, with the exception of Sterling Capital U.S. Treasury Money Market Fund, may purchase securities on a “when-issued” basis. Sterling Capital Select Equity Fund, Sterling Capital Mid Value Fund, Sterling Capital Small Value Fund, Sterling Capital International Fund, Sterling Capital Special Opportunities Fund, Sterling Capital Equity Income Fund, Sterling Capital National Tax-Free Money Market Fund, and Sterling Capital Prime Money Market Fund may also purchase or sell securities on a forward commitment basis. The Funds record when-issued securities on the trade date and pledge assets with a value at least equal to the purchase commitment for payment of the securities purchased. The value of the securities underlying when-issued or forward commitments to purchase securities, and any subsequent fluctuation in their value, is taken into account when determining the net asset value of the Funds commencing with the date the Funds agree to purchase the securities. The Funds do not accrue interest or dividends on
155
|
| Sterling Capital Funds |
Notes to Financial Statements — (continued) |
September 30, 2011 |
“when-issued” securities until the underlying securities are received.
Repurchase Agreements and Collateralized Loan Agreements — The Funds may enter into agreements with member banks of the Federal Deposit Insurance Corporation and with registered broker/dealers that the advisor or a sub-advisor deems creditworthy under guidelines approved by the Board, subject to the seller’s agreement to repurchase such securities at a mutually agreed-upon date and price. The repurchase price generally equals the price paid by the Fund plus interest negotiated on the basis of current short-term rates, which may be more or less than the rate on the underlying Fund securities. The seller, under these types of agreements, is required to maintain the value of collateral held pursuant to the agreement at not less than the repurchase price (including accrued interest). Securities subject to repurchase are held by the Funds’ custodian, or another qualified custodian, or in the Federal Reserve/Treasury book-entry system. In the event of counterparty default, the Fund has the right to use the collateral to offset losses incurred. There is potential for loss to the Fund in the event the Fund is delayed or prevented from exercising its rights to dispose of the collateral securities, including the risk of a possible decline in the fair value of the underlying securities during the period while the Fund seeks to assert its rights.
Mortgage Dollar Rolls — The Variable Net Asset Value Funds and the Tax-Free Money Market Fund may sell mortgage-backed securities for delivery in the current month and simultaneously contract to repurchase substantially similar (same type, coupon and maturity) securities on a specific future date at an agreed-upon price. The market value of the securities that the Fund is required to purchase may decline below the agreed upon repurchase price of those securities. Pools of mortgages collateralizing those securities may have different prepayment histories than those sold. During the period between the sale and repurchase, the Fund will not be entitled to receive interest and principal payments on the securities sold. Proceeds of the sale will be invested in additional instruments for the Fund, and the income from these investments will generate income for the Fund. If such income does not exceed the income, capital appreciation and gain or loss that would have been realized on the securities sold as part of the dollar roll, the use of this technique will diminish the investment performance of the Fund compared with what the performance would have been without the use of dollar rolls. The Funds account for mortgage dollar roll transactions as purchases and sales.
In April 2011, the FASB issued ASU No. 2011-03: Reconsideration of Effective Control for Repurchase Agreements. ASU No. 2011-03 changes the assessment of effective control for repurchase agreements including dollar roll transactions. The new and revised disclosures are effective for interim and annual reporting periods beginning after December 15, 2011. At this time, management is evaluating the implications of ASU No. 2011-03 and its impact on the financial statements.
Security Loans — The Funds may loan securities secured by collateral in the form of securities issued or guaranteed by the U.S. Government or its agencies on instrumentalities, irrevocable letters of credit, U.S. dollar cash or other forms of collateral as may be agreed to between the Trust and The Bank of New York Mellon, the lending agent (“BNY Mellon Bank”). A Fund may receive compensation for lending securities in the form of fees payable by the borrower or by retaining a portion of the income and earnings from the investment and reinvestment of cash collateral received and held on behalf of the Fund (after payment of a “broker rebate fee” to the borrower). In extremely low interest rate environments, the broker rebate fee may exceed the interest earned on the cash collateral which would result in a loss to the Fund. A Fund also continues to receive interest or dividends on the securities loaned. Although security loans are secured at all times by collateral, the loans may not be fully supported if, for example, the instruments in which cash collateral is invested decline in value or the borrower fails to provide additional collateral when required in a timely manner or at all. Concurrently with the delivery of the Fund’s securities to a borrower, BNY Mellon Bank is required to obtain from the borrower collateral equal to at least 102% of the market value of the securities loaned plus accrued interest in the case of U.S. securities, and at least 105% of the market value of the securities loaned plus accrued interest in the case of foreign securities. If at the close of trading on any business day the market value of the collateral is less than 100% of the market value of such loaned securities as of such business day, the borrower is required to deliver additional collateral which will cause the total collateral to be equal to not less than 102% of the market value of the securities loaned plus accrued interest in the case of U.S. securities and 105% of the market value of the securities loaned plus accrued interest in the case of foreign securities. A Fund bears all of the gains and losses on such investments. During the fiscal year, cash collateral received by a Fund was invested in BNY Mellon Institutional Cash Reserve Fund (“ICRF”), Series A and B, an unregistered investment pool managed by BNY Mellon Bank, which was invested in repurchase agreements and Lehman Brothers floating rate medium term notes. Cash collateral received by a Fund at September 30, 2011 was invested in the BNY Mellon Overnight
156
|
| Sterling Capital Funds |
Notes to Financial Statements — (continued) |
September 30, 2011 |
Government Fund (formerly known as BNY Mellon ICRF Series A).
Effective July 1, 2010, the Trust, on behalf of each applicable Fund, entered into an agreement with BNY Mellon Bank and the Bank of New York Mellon Corporation (“BNYMC”) with respect to each Fund’s position in BNY Mellon ICRF Series B, pursuant to which (i) BNYMC will support the value of certain defaulted securities issued by Lehman Brothers and held by BNY Mellon ICRF Series B, and (ii) if certain conditions are met, each Fund will have the right to sell the defaulted securities to BNYMC at a price equal to 80% of par value. During the year those conditions were met and on September 29, 2011 the Funds recorded the sale of the defaulted securities to BNYMC at a price equal to 80% of par value.
There may be risks of delay in recovery of the securities or even loss of rights in the collateral should the borrower of the securities fail financially. Another risk from securities lending is that the borrower may not provide additional collateral when required or return the securities when due or when called for by the Fund. The Funds are indemnified from losses resulting from brokers failing to return securities. The securities lending agent may make payments to borrowers and placing brokers, who may not be affiliated, directly or indirectly, with the Trust, Sterling Capital Management LLC (“Sterling Capital”) or the Distributor. In connection with lending securities, a Fund may pay reasonable administrative and custodial fees. The value of the securities on loan and the liability to return the related collateral for each Fund at September 30, 2011, are shown on the Statements of Assets and Liabilities.
As of September 30, 2011, the following Funds had loans outstanding:
| | | | | | | | | | | | |
| | | Value
of Loaned
Securities | | | Value
of
Collateral | | | Average Value
on Loan
for the Year
ended
September 30, 2011 | |
Sterling Capital Select Equity Fund | | $ | 1,612,248 | | | $ | 1,853,159 | | | $ | 1,508,319 | |
Sterling Capital Mid Value Fund | | | 99,328 | | | | 109,928 | | | | 6,823,422 | |
Sterling Capital Small Value Fund | | | 719,376 | | | | 769,385 | | | | 922,397 | |
Sterling Capital International Fund | | | 1,630,864 | | | | 1,876,684 | | | | 2,938,556 | |
Sterling Capital Special Opportunities Fund | | | 9,833,044 | | | | 10,443,545 | | | | 9,377,540 | |
Sterling Capital Equity Income Fund | | | 282,639 | | | | 289,900 | | | | 21,227,961 | |
Sterling Capital Short-Term Bond Fund | | | 51,380 | | | | 53,000 | | | | 89,564 | |
Sterling Capital Intermediate U.S. Government Fund | | | 4,518,852 | | | | 4,605,000 | | | | 2,729,124 | |
Sterling Capital Total Return Bond Fund | | | 6,694,279 | | | | 6,977,960 | | | | 1,426,909 | |
Expenses and Allocation Methodology — Expenses directly attributable to a Fund are charged to that Fund. Expenses not directly attributable to a Fund are allocated proportionately among all Funds daily in relation to the net assets of each Fund or on another reasonable basis. Each class of shares bears its pro-rata portion of expenses attributable to its series, except that each class separately bears expenses related specifically to that class, such as distribution fees. Expenses that are attributable to both the Trust and the Sterling Capital Variable Insurance Funds are allocated across the Funds and Sterling Capital Variable Insurance Funds, based upon relative net assets or on another reasonable basis. Income and realized and unrealized gains or losses on investments are allocated to each class of shares based on its relative net assets or another appropriate basis.
Distributions to Shareholders — Dividends from net investment income are declared daily and paid monthly for Sterling Capital Short-Term Bond Fund, Sterling Capital Intermediate U.S. Government Fund, Sterling Capital Total Return Bond Fund, the Tax-Free Funds and the Money Market Funds. Dividends from net investment income are declared and paid quarterly for Sterling Capital Select Equity Fund, Sterling Capital Mid Value Fund, Sterling Capital Small Value Fund, Sterling Capital Special Opportunities Fund, Sterling Capital Equity Income Fund and the Funds of Funds if the annualized yield of the distribution exceeds an amount determined annually by the Board. Dividends from net investment income are declared and paid annually for Sterling Capital International Fund. Distributable net realized gains, if any, are declared and distributed at least annually. Distributions to shareholders which exceed net investment income and net realized gains for tax purposes are reported as distributions of capital.
The character of income and gains distributed are determined in accordance with federal income tax regulations, which may differ from U.S. GAAP. These “book/tax” differences are either considered temporary or permanent in nature. To the extent these differences are permanent in nature (e.g., reclass of net operating losses, disposition of market discount and market
157
|
| Sterling Capital Funds |
Notes to Financial Statements — (continued) |
September 30, 2011 |
premium bonds, paydown gains and losses, treatment of partnership interests and character of distributions) such amounts are reclassified within the composition of net assets based on their federal tax-basis treatment; temporary differences do not require reclassification. These reclassifications have no effect on net assets or net asset values per share.
As of September 30, 2011, these reclassifications were as follows:
| | | | | | | | | | | | |
| | | Increase/
(Decrease)
Paid-in-Capital | | | Increase/
(Decrease)
Net Investment
Income(Loss) | | | Increase/
(Decrease)
Realized
Gain(Loss) | |
Sterling Capital Small Value Fund | | $ | (1 | ) | | $ | 141,534 | | | $ | (141,533 | ) |
Sterling Capital International Fund | | | 2,053 | | | | (180,911 | ) | | | 178,858 | |
Sterling Capital Special Opportunities Fund | | | (2,092,332 | ) | | | 2,243,244 | | | | (150,912 | ) |
Sterling Capital Equity Income Fund | | | — | | | | (1,941,528 | ) | | | 1,941,528 | |
Sterling Capital Short-Term Bond Fund | | | — | | | | 859,035 | | | | (859,035 | ) |
Sterling Capital Intermediate U.S. Government Fund | | | — | | | | 914,599 | | | | (914,599 | ) |
Sterling Capital Total Return Bond Fund | | | — | | | | 2,884,825 | | | | (2,884,825 | ) |
Sterling Capital Kentucky Intermediate Tax-Free Fund | | | — | | | | (1,728 | ) | | | 1,728 | |
Sterling Capital Maryland Intermediate Tax-Free Fund | | | — | | | | (2,734 | ) | | | 2,734 | |
Sterling Capital North Carolina Intermediate Tax-Free Fund | | | — | | | | (9,817 | ) | | | 9,817 | |
Sterling Capital South Carolina Intermediate Tax-Free Fund | | | — | | | | (4,255 | ) | | | 4,255 | |
Sterling Capital Virginia Intermediate Tax-Free Fund | | | — | | | | (1,925 | ) | | | 1,925 | |
Sterling Capital West Virginia Intermediate Tax-Free Fund | | | — | | | | (18,479 | ) | | | 18,479 | |
Sterling Capital National Tax-Free Money Market Fund | | | — | | | | 166 | | | | (166 | ) |
Sterling Capital Strategic Allocation Conservative Fund | | | — | | | | 102,889 | | | | (102,889 | ) |
Sterling Capital Strategic Allocation Balanced Fund | | | — | | | | 130,208 | | | | (130,208 | ) |
Sterling Capital Strategic Allocation Growth Fund | | | — | | | | 39,199 | | | | (39,199 | ) |
Sterling Capital Strategic Allocation Equity Fund | | | (1,020 | ) | | | 1,020 | | | | — | |
Credit Enhancements — Certain obligations held in the Funds have credit enhancement or liquidity features that may, under certain circumstances, provide for repayment of principal and interest on the obligation upon demand date, interest rate reset date or final maturity. These enhancements may include: letters of credit; liquidity guarantees; security purchase agreements; tender option purchase agreements; and third party insurance (i.e., AMBAC).
Federal Income Taxes — It is the policy of the Funds to continue to qualify as a regulated investment company by complying with the provisions available to certain investment companies, as defined in applicable sections of the Internal Revenue Code of 1986, as amended (the “Code”), and to make distributions of net investment income and net realized capital gains sufficient to relieve it from all, or substantially all, federal income taxes. Accordingly, no provision for federal income tax is required.
In addition to the requirements of the Code, Sterling Capital International Fund may be subject to short-term capital gains tax in India on gains realized upon disposition of Indian securities held less than one year. The tax is computed on net realized gains; any realized losses in excess of gains may be carried forward for a period of up to eight years to offset future gains. Any net taxes payable must be remitted to the Indian government prior to repatriation of sales proceeds. Sterling Capital International Fund may accrue a deferred tax liability for net unrealized short-term gains in excess of available carry forwards on Indian securities. This accrual may reduce Sterling Capital International Fund’s net asset value. As of September 30, 2011, Sterling Capital International Fund has no recorded payable as an estimate for potential future India capital gains taxes.
| 4. | Purchases and Sales of Securities: |
Purchases and sales of securities (excluding U.S. Government securities and securities maturing less than one year from acquisition) for the fiscal year ended September 30, 2011 were as follows:
| | | | | | | | |
| | | Purchases | | | Sales | |
Sterling Capital Select Equity Fund | | $ | 146,783,236 | | | $ | 166,463,677 | |
Sterling Capital Mid Value Fund | | | 142,981,679 | | | | 146,190,822 | |
Sterling Capital Small Value Fund | | | 62,038,465 | | | | 50,052,627 | |
Sterling Capital International Fund | | | 60,034,591 | | | | 63,277,785 | |
Sterling Capital Special Opportunities Fund | | | 324,794,861 | | | | 187,389,950 | |
Sterling Capital Equity Income Fund | | | 313,564,439 | | | | 92,598,122 | |
Sterling Capital Short-Term Bond Fund | | | 70,039,396 | | | | 31,888,234 | |
158
|
| Sterling Capital Funds |
Notes to Financial Statements — (continued) |
September 30, 2011 |
| | | | | | | | |
| | | Purchases | | | Sales | |
Sterling Capital Intermediate U.S. Government Fund | | $ | 20,464,669 | | | $ | 22,104,056 | |
Sterling Capital Total Return Bond Fund | | | 243,952,076 | | | | 249,252,538 | |
Sterling Capital Kentucky Intermediate Tax-Free Fund | | | 3,454,773 | | | | 5,227,238 | |
Sterling Capital Maryland Intermediate Tax-Free Fund | | | 7,624,622 | | | | 10,262,996 | |
Sterling Capital North Carolina Intermediate Tax-Free Fund | | | 55,914,859 | | | | 30,050,928 | |
Sterling Capital South Carolina Intermediate Tax-Free Fund | | | 24,833,178 | | | | 12,639,451 | |
Sterling Capital Virginia Intermediate Tax-Free Fund | | | 23,350,131 | | | | 16,831,370 | |
Sterling Capital West Virginia Intermediate Tax-Free Fund | | | 25,839,136 | | | | 23,046,502 | |
Sterling Capital Strategic Allocation Conservative Fund | | | 3,697,249 | | | | 1,253,836 | |
Sterling Capital Strategic Allocation Balanced Fund | | | 3,653,454 | | | | 7,459,492 | |
Sterling Capital Strategic Allocation Growth Fund | | | 2,484,520 | | | | 6,845,121 | |
Sterling Capital Strategic Allocation Equity Fund | | | 976,675 | | | | 1,445,826 | |
Purchases and sales of U.S. Government Securities (excluding securities maturing less than one year from acquisition) for the fiscal year ended September 30, 2011 were as follows:
| | | | | | | | |
| | | Purchases | | | Sales | |
Sterling Capital Short-Term Bond Fund | | $ | 11,479,730 | | | $ | 43,592,195 | |
Sterling Capital Intermediate U.S. Government Fund | | | 129,371,910 | | | | 133,442,000 | |
Sterling Capital Total Return Bond Fund | | | 356,791,727 | | | | 309,444,969 | |
| 5. | Investments in Affiliated Issuers: |
A summary of the Funds’ transactions in the shares of affiliated issuers during the fiscal year ended September 30, 2011 is set forth below:
| | | | | | | | | | | | | | | | | | | | | | | | | | | | |
| | | Shares Held at
September 30,
2010 | | | Shares
Purchased | | | Shares
Sold | | | Shares Held at
September 30,
2011 | | | Value at
September 30,
2011 | | | Dividend
Income
October 1, 2010-
September, 2011 | | | Distributions
and Net Realized
Gain (Loss)
October 1, 2010-
September 30, 2011 | |
Sterling Capital Strategic Allocation Conservative Fund | | | | | | | | | | | | | | | | | | | | | | | | | | | | |
Sterling Capital Equity Income Fund, Institutional Class | | | 32,746 | | | | 5,134 | | | | 2,882 | | | | 34,998 | | | $ | 464,421 | | | $ | 7,271 | | | $ | 643 | |
Sterling Capital International Fund, Institutional Class | | | 110,490 | | | | 42,866 | | | | 10,803 | | | | 142,553 | | | | 603,000 | | | | — | | | | 11,115 | |
Sterling Capital Mid Value Fund, Institutional Class | | | 59,145 | | | | 14,371 | | | | 17,562 | | | | 55,954 | | | | 639,550 | | | | 4,388 | | | | 26,729 | |
Sterling Capital Select Equity Fund, Institutional Class | | | 111,019 | | | | 29,470 | | | | 12,358 | | | | 128,131 | | | | 1,274,908 | | | | 14,687 | | | | (21,043) | |
Sterling Capital Small Value Fund, Institutional Class | | | 16,546 | | | | 4,394 | | | | 5,949 | | | | 14,991 | | | | 162,202 | | | | — | | | | (46) | |
Sterling Capital Special Opportunities Fund, Institutional Class | | | 16,948 | | | | 3,880 | | | | 1,732 | | | | 19,096 | | | | 297,891 | | | | — | | | | 10,234 | |
Sterling Capital Total Return Bond Fund, Institutional Class | | | 675,576 | | | | 130,931 | | | | 11,769 | | | | 794,738 | | | | 8,789,797 | | | | 353,327 | | | | 142,831 | |
Sterling Capital U.S. Treasury Money Market Fund, Institutional Class | | | 418,079 | | | | 117,035,970 | | | | 116,511,939 | | | | 942,110 | | | | 942,110 | | | | 46 | | | | — | |
| | | | | | | | | | | | | | | | | | | | | | | | | | | | |
Total Affiliates | | | 1,440,549 | | | | 117,267,016 | | | | 116,574,994 | | | | 2,132,571 | | | $ | 13,173,879 | | | $ | 379,719 | | | $ | 170,463 | |
| | | | | | | | | | | | | | | | | | | | | | | | | | | | |
Sterling Capital Strategic Allocation Balanced Fund | | | | | | | | | | | | | | | | | | | | | | | | | | | | |
Sterling Capital Equity Income Fund, Institutional Class | | | 134,548 | | | | 2,918 | | | | 29,879 | | | | 107,587 | | | $ | 1,427,685 | | | $ | 27,847 | | | $ | 14,849 | |
Sterling Capital International Fund, Institutional Class | | | 454,296 | | | | 46,603 | | | | 62,989 | | | | 437,910 | | | | 1,852,360 | | | | — | | | | 22,074 | |
Sterling Capital Mid Value Fund, Institutional Class | | | 243,138 | | | | 5,890 | | | | 77,076 | | | | 171,952 | | | | 1,965,410 | | | | 16,530 | | | | 150,661 | |
159
|
| Sterling Capital Funds |
Notes to Financial Statements — (continued) |
September 30, 2011 |
| | | | | | | | | | | | | | | | | | | | | | | | | | | | |
| | | Shares Held at
September 30,
2010 | | | Shares
Purchased | | | Shares
Sold | | | Shares Held at
September 30,
2011 | | | Value at
September 30,
2011 | | | Dividend
Income
October 1, 2010-
September, 2011 | | | Distributions
and Net Realized
Gain (Loss)
October 1, 2010-
September 30,
2011 | |
Sterling Capital Select Equity Fund, Institutional Class | | | 456,585 | | | | 10,261 | | | | 73,271 | | | | 393,575 | | | $ | 3,916,075 | | | $ | 56,433 | | | $ | (167,416) | |
Sterling Capital Small Value Fund, Institutional Class | | | 68,130 | | | | 1,315 | | | | 23,367 | | | | 46,078 | | | | 498,560 | | | | — | | | | 25,403 | |
Sterling Capital Special Opportunities Fund, Institutional Class | | | 69,693 | | | | 973 | | | | 11,935 | | | | 58,731 | | | | 916,197 | | | | — | | | | 12,266 | |
Sterling Capital Total Return Bond Fund, Institutional Class | | | 838,469 | | | | 113,404 | | | | 144,203 | | | | 807,670 | | | | 8,932,827 | | | | 431,324 | | | | 195,906 | |
Sterling Capital U.S. Treasury Money Market Fund, Institutional Class | | | 396,164 | | | | 183,930,991 | | | | 181,841,655 | | | | 2,485,500 | | | | 2,485,500 | | | | 75 | | | | — | |
| | | | | | | | | | | | | | | | | | | | | | | | | | | | |
Total Affiliates | | | 2,661,023 | | | | 184,112,355 | | | | 182,264,375 | | | | 4,509,003 | | | $ | 21,994,614 | | | $ | 532,209 | | | $ | 253,743 | |
| | | | | | | | | | | | | | | | | | | | | | | | | | | | |
Sterling Capital Strategic Allocation Growth Fund | | | | | | | | | | | | | | | | | | | | | | | | | | | | |
Sterling Capital Equity Income Fund, Institutional Class | | | 125,242 | | | | 763 | | | | 30,546 | | | | 95,459 | | | $ | 1,266,746 | | | | $25,388 | | | | $20,483 | |
Sterling Capital International Fund, Institutional Class | | | 422,855 | | | | 11,038 | | | | 45,111 | | | | 388,782 | | | | 1,644,549 | | | | — | | | | (17,645) | |
Sterling Capital Mid Value Fund, Institutional Class | | | 226,397 | | | | 3,364 | | | | 77,176 | | | | 152,585 | | | | 1,744,043 | | | | 15,354 | | | | 145,978 | |
Sterling Capital Select Equity Fund, Institutional Class | | | 425,003 | | | | 6,010 | | | | 81,672 | | | | 349,341 | | | | 3,475,945 | | | | 52,257 | | | | (193,717) | |
Sterling Capital Small Value Fund, Institutional Class | | | 63,423 | | | | 928 | | | | 23,423 | | | | 40,928 | | | | 442,839 | | | | — | | | | 27,476 | |
Sterling Capital Special Opportunities Fund, Institutional Class | | | 64,866 | | | | 1,266 | | | | 14,000 | | | | 52,132 | | | | 813,262 | | | | — | | | | 14,256 | |
Sterling Capital Total Return Bond Fund, Institutional Class | | | 256,099 | | | | 26,247 | | | | 42,621 | | | | 239,725 | | | | 2,651,356 | | | | 127,136 | | | | 55,664 | |
Sterling Capital U.S. Treasury Money Market Fund, Institutional Class | | | 863,643 | | | | 135,043,034 | | | | 133,648,569 | | | | 2,258,108 | | | | 2,258,108 | | | | 54 | | | | — | |
| | | | | | | | | | | | | | | | | | | | | | | | | | | | |
Total Affiliates | | | 2,447,528 | | | | 135,092,650 | | | | 133,963,118 | | | | 3,577,060 | | | $ | 14,296,848 | | | $ | 220,189 | | | $ | 52,495 | |
| | | | | | | | | | | | | | | | | | | | | | | | | | | | |
Sterling Capital Strategic Allocation Equity Fund | | | | | | | | | | | | | | | | | | | | | | | | | | | | |
Sterling Capital Equity Income Fund, Institutional Class | | | 43,332 | | | | 605 | | | | 7,410 | | | | 36,527 | | | $ | 484,720 | | | | $9,393 | | | | $5,060 | |
Sterling Capital International Fund, Institutional Class | | | 146,499 | | | | 11,847 | | | | 9,879 | | | | 148,467 | | | | 628,015 | | | | — | | | | 5,134 | |
Sterling Capital Mid Value Fund, Institutional Class | | | 78,437 | | | | 596 | | | | 20,708 | | | | 58,325 | | | | 666,660 | | | | 5,687 | | | | 33,314 | |
Sterling Capital Select Equity Fund, Institutional Class | | | 147,155 | | | | 1,883 | | | | 15,532 | | | | 133,506 | | | | 1,328,382 | | | | 19,379 | | | | (37,822) | |
Sterling Capital Small Value Fund, Institutional Class | | | 21,995 | | | | 387 | | | | 6,713 | | | | 15,669 | | | | 169,543 | | | | — | | | | 8,170 | |
Sterling Capital Special Opportunities Fund, Institutional Class | | | 22,468 | | | | 557 | | | | 3,122 | | | | 19,903 | | | | 310,489 | | | | — | | | | 4,836 | |
Sterling Capital U.S. Treasury Money Market Fund, Institutional Class | | | 497,104 | | | | 54,296,287 | | | | 54,360,913 | | | | 432,478 | | | | 432,478 | | | | 22 | | | | — | |
| | | | | | | | | | | | | | | | | | | | | | | | | | | | |
Total Affiliates | | | 956,990 | | | | 54,312,162 | | | | 54,424,277 | | | | 844,875 | | | $ | 4,020,287 | | | $ | 34,481 | | | $ | 18,692 | |
| | | | | | | | | | | | | | | | | | | | | | | | | | | | |
160
|
| Sterling Capital Funds |
Notes to Financial Statements — (continued) |
September 30, 2011 |
| 6. | Related Party Transactions: |
Under the terms of the investment advisory agreement Sterling Capital (the “Advisor”) is entitled to receive fees based on a percentage of the average daily net assets of the Funds. These fees are accrued daily and payable on a monthly basis and are reflected on the Statements of Operations as “Investment advisory fees.” Sterling Capital waived investment advisory fees and reimbursed certain expenses for the Funds referenced below which are not subject to recoupment, except as noted, and are included on the Statements of Operations as “Less expenses waived/reimbursed by the Investment Advisor.” Information regarding these transactions is as follows for the fiscal year ended September 30, 2011:
| | | | |
| | | Contractual
Fee Rate | | Fee Rate after
Contractual
Waivers(1) |
Sterling Capital Select Equity Fund | | 0.74% | | 0.60%(2) |
Sterling Capital Mid Value Fund | | 0.74% | | 0.70%(2) |
Sterling Capital Small Value Fund | | 0.90% | | 0.80%(2)(3) |
Sterling Capital International Fund | | 1.00% | | 0.85%(2) |
Sterling Capital Special Opportunities Fund | | 0.80% | | 0.80% |
Sterling Capital Equity Income Fund | | 0.70% | | 0.70% |
Sterling Capital Short-Term Bond Fund | | 0.34%(4) | | 0.30%(4) |
Sterling Capital Intermediate U.S. Government Fund | | 0.60% | | 0.48%(2) |
Sterling Capital Total Return Bond Fund | | 0.60% | | 0.48%(2) |
Sterling Capital Kentucky Intermediate Tax-Free Fund | | 0.45%(5) | | 0.40%(2)(5) |
Sterling Capital Maryland Intermediate Tax-Free Fund | | 0.45%(5) | | 0.40%(2)(5) |
Sterling Capital North Carolina Intermediate Tax-Free Fund | | 0.45%(6) | | 0.45%(2)(6) |
Sterling Capital South Carolina Intermediate Tax-Free Fund | | 0.45%(6) | | 0.45%(2)(6) |
Sterling Capital Virginia Intermediate Tax-Free Fund | | 0.45%(6) | | 0.45%(2)(6) |
Sterling Capital West Virginia Intermediate Tax-Free Fund | | 0.45% | | 0.45% |
Sterling Capital National Tax-Free Money Market Fund | | 0.25% | | 0.20%(7) |
Sterling Capital Prime Money Market Fund | | 0.40% | | 0.28%(7) |
Sterling Capital U.S. Treasury Money Market Fund | | 0.40% | | 0.26%(7) |
Sterling Capital Strategic Allocation Conservative Fund | | 0.25% | | ��0.25%(8) |
Sterling Capital Strategic Allocation Balanced Fund | | 0.25% | | 0.25%(8) |
Sterling Capital Strategic Allocation Growth Fund | | 0.25% | | 0.25%(8) |
Sterling Capital Strategic Allocation Equity Fund | | 0.25% | | 0.25%(8) |
| | | | |
| | (1) | For all or a portion of the fiscal year ended September 30, 2011, Sterling Capital voluntarily reimbursed certain expenses of the Funds. Voluntary reimbursements of expenses are not subject to recoupment in subsequent fiscal periods, and may be discontinued at any time. |
| | (2) | Sterling Capital contractually agreed to limit the advisory fees paid by the Fund through January 31, 2012. |
| | (3) | Sterling Capital and the Fund’s prior investment adviser contractually agreed to limit the advisory fees to 0.80% and total annual fund operating expenses paid by the Fund from February 1, 2010 through January 31, 2011 to 1.40% with respect to Class A Shares, 2.15% with respect to Class B and C Shares, 1.15% with respect to Institutional Shares, and 1.65% with respect to Class R Shares. |
| | (4) | Sterling Capital contractually agreed to limit the advisory fees paid by the Fund from March 1, 2011 through January 31, 2012. The contractual fee rate was 0.60% and the fee rate after contractual waivers was 0.45% from October 1, 2010 through February 28, 2011. |
| | (5) | The contractual fee rate was 0.60% and the fee rate after contractual waivers was 0.40% from October 1, 2010 through January 31, 2011. |
| | (6) | The contractual fees rate for the Fund was 0.60% and the fees rate after the contractual waiver was 0.45% from October 1, 2010 through January 31, 2011. |
| | (7) | Sterling Capital has contractually agreed to limit the advisory fees paid by each Money Market Fund to 0.20% with regard to Sterling Capital National Tax-Free Money Market Fund, 0.28% with regard to Sterling Capital Prime Money Market Fund, and 0.26% with regard to Sterling Capital U.S. Treasury Money Market Fund (each, an “Advisory Fee Limit”) for the period from March 1, 2009 through February 29, 2012. From March 1, 2010 through February 29, 2012, Sterling Capital may recoup from each Money Market Fund all or a portion of the advisory fees that it voluntarily waives with respect to such Fund beyond the Advisory Fee Limit during the period from March 1, 2009 through February 29, 2012 (the “Recoupment Amount”), subject to certain limitations. Sterling Capital may not recoup any amount from a Fund if the Recoupment Amount plus the Advisory Fee Limit would exceed the Contractual Fee Rate noted in the table above. |
| | (8) | Sterling Capital contractually agreed to limit the advisory fees paid by the fund from February 1, 2010 to January 31, 2011. The fee rate after the contractual waiver was 0.00%. |
As of September 30, 2011, the amount of waived fees that are subject to possible recoupment through February 29, 2012 are as follows:
| | | | |
| | | Amount | |
Sterling Capital National Tax-Free Money Market Fund | | $ | 159,242 | |
Sterling Capital Prime Money Market Fund | | | 2,780,138 | |
Sterling Capital U.S. Treasury Money Market Fund | | | 4,090,515 | |
161
|
| Sterling Capital Funds |
Notes to Financial Statements — (continued) |
September 30, 2011 |
Pursuant to a sub-advisory agreement with Sterling Capital, Artio Global Management LLC (Artio) serves as the sub-advisor to Sterling Capital International Fund, subject to the general supervision of the Board and Sterling Capital. Pursuant to a sub-advisory agreement with Sterling Capital, Federated Investment Management Company (Federated) served during the 12-month period as the sub-advisor to Sterling Capital Prime Money Market Fund and Sterling Capital National Tax-Free Money Market Fund, subject to the general supervision of the Board and Sterling Capital (See Note 9). Pursuant to a sub-advisory agreement with Sterling Capital, Scott & String fellow LLC (Scott & String fellow), a wholly owned subsidiary of BB&T Corporation, serves as the sub-advisor to Sterling Capital Special Opportunities Fund and Sterling Capital Equity Income Fund, subject to the general supervision of the Board and Sterling Capital. For their services, sub-advisors are entitled to a fee, payable by Sterling Capital.
Sterling Capital serves as the administrator to the Funds pursuant to an administration agreement. The Funds (except the Funds of Funds, Sterling Capital Corporate Fund and Sterling Capital Securitized Opportunities Fund, the latter two of which are described in a separate report) pay their portion of a fee to Sterling Capital for providing administration services based on the aggregate assets of the Funds and Sterling Capital Variable Insurance Funds (formerly known as BB&T Variable Insurance Funds), excluding the assets of the Funds of Funds, Sterling Capital Corporate Fund, Sterling Capital Securitized Opportunities Fund and Sterling Capital Strategic Allocation Equity VIF, at a rate of 0.11% on the first $3.5 billion of average net assets; 0.075% on the next $1 billion of average net assets; 0.06% on the next $1.5 billion of average net assets; and 0.04% of average net assets over $6 billion. This fee is accrued daily and payable on a monthly basis. Expenses incurred are reflected on the Statements of Operations as “Administration fees.” Pursuant to a sub-administration agreement with Sterling Capital, BNY Mellon Investment Servicing (US) Inc. (“BNY Mellon” or the “Sub-Administrator”), serves as the sub-administrator to the Funds subject to the general supervision of the Board and Sterling Capital. For these services, BNY Mellon is entitled to a fee payable by Sterling Capital.
BNY Mellon serves as the Funds’ fund accountant and transfer agent and receives compensation by the Funds (except Sterling Capital Corporate Fund and Sterling Capital Securitized Opportunities Fund which are described in a separate report) for these services. Expenses incurred are reflected on the Statements of Operations as “Fund accounting fees” and “Transfer agent fees.”
Sterling Capital’s Chief Compliance Officer (“CCO”) serves as the Funds’ CCO. The CCO’s compensation is reviewed and approved by the Funds’ Board and paid by Sterling Capital. However, the Funds reimburse Sterling Capital for their allocable portion of the CCO’s salary. Expenses incurred for the Funds are reflected on the Statements of Operations as “Compliance service fees.”
For the fiscal year ended September 30, 2011, the Funds paid $222,245 in brokerage fees to Scott & String fellow on the execution of purchases and sales of the Funds’ portfolio investments.
The Funds have adopted a Distribution and Shareholder Services Plan (the “Plan”) in accordance with Rule 12b-1 under the 1940 Act. Sterling Capital Distributors, Inc. (“the Distributor”) serves as distributor to the Funds pursuant to an underwriting agreement effective as of April 23, 2007. The Plan provides for payments to the Distributor of up to 0.50%, 1.00%, 1.00% and 0.50% of the average daily net assets of the Class A Shares, Class B Shares, Class C Shares, and Class R Shares, respectively, with the exception of Sterling Capital Mid Value Fund and Sterling Capital West Virginia Intermediate Tax-Free Fund which make payments of up to 0.25% of the average daily net assets for Class A. The Distributor contractually agreed to limit the distribution and service (12b-1) fees for Class A Shares of the Funds to 0.25% except for Sterling Capital Mid Value Fund, Sterling Capital West Virginia Intermediate Tax-Free Fund, Sterling Capital Prime Money Market Fund and Sterling Capital U.S. Treasury Money Market Fund through January 31, 2012, and may voluntarily waive additional fees at any time. The total contractual and voluntary waiver of distribution fees was $3,271,652 for the fiscal year ended September 30, 2011. Distribution fee waivers are included in the Statements of Operations as “Less expenses waived by the Distributor” and these waivers are not subject to recoupment in subsequent fiscal periods. The Distributor is entitled to receive commissions on sales of shares of the Variable Net Asset Value Funds. For the fiscal year ended September 30, 2011, the Distributor received $806,026 from commissions earned on sales of shares of the Variable Net Asset Value Funds. Commissions paid to affiliated broker-dealers during the fiscal year ended September 30, 2011 were $443,840. The fees may be used by the Distributor to pay banks, broker dealers and other institutions, including affiliates of the Advisor.
162
|
| Sterling Capital Funds |
Notes to Financial Statements — (continued) |
September 30, 2011 |
Sterling Capital and/or its affiliates may pay out of their own bona fide profits compensation to broker-dealers and other persons for the sale and distribution of the shares and/or for the servicing of the shares. These are additional payments over and above the sales charge (including Rule 12b-1 fees) and service fees paid by the Funds. The payments, which may be different for different financial institutions, will not change the price an investor will pay for shares or the amount that a Fund will receive for the sale of shares.
Certain Officers and a Trustee of the Funds are affiliated with Sterling Capital or the Sub-Administrator. Such Officers and Trustee receive no compensation from the Funds for serving in their respective roles. Each of the Trustees who are not interested persons (as defined in the 1940 Act) of the Trust who serve on the Board are compensated at the annual rate of $40,000 plus $5,000 for each regularly scheduled quarterly meeting attended, $4,000 for each special meeting attended in person and $3,000 for each special meeting attended by telephone, plus reimbursement for certain out of pocket expenses. Each Trustee serving on a Committee of the Board receives a fee of $4,000 for each Committee meeting attended in person and $3,000 for each Committee meeting attended by telephone, plus reimbursement for certain out of pocket expenses. Additionally, the Chairman of the Board and the Audit Committee Chairman each receive an annual retainer of $15,000, and the Chairman of the Nominations Committee receives additional compensation at the rate of $1,000 for each meeting over which he or she presides as Chairman. The fees are allocated across the Trust and the Sterling Capital Variable Insurance Funds based upon relative net assets.
| 7. | Concentration of Credit Risk: |
The Tax-Free Funds invest primarily in debt instruments of municipal issuers in their respective states. The issuers’ abilities to meet their obligations may be affected by economic developments in a specific state or region.
U.S. Bank, N.A. has made available a credit facility to the Trust, pursuant to an umbrella credit agreement (“the Agreement”). The primary purpose of the Agreement is to allow the Trust to avoid security liquidations that Sterling Capital believes are unfavorable to shareholders. Under the Agreement, an aggregate commitment amount of $50,000,000 has been made available for use by all funds of the Trust. Outstanding principal amounts under the Agreement bear interest at a rate per annum equal to the Prime Rate minus two percent (2%), but never at a rate of less than one percent (1%) per annum. The Agreement expires on March 31, 2012. Prior to April 1, 2011, the credit agreement in place established separate commitment amounts for each Fund. Outstanding principal amounts under the prior credit agreement bore interest at a rate per annum equal to the Prime Rate minus two percent (2%), but never at a rate of less than two percent (2%) per annum on amounts borrowed. During the fiscal year ended September 30, 2011 the following Funds utilized lines of credit:
| | | | | | | | | | | | | | | | |
| | | Average
Interest Rate | | Average
Loan Balance | | | Number of
Days Outstanding | | Interest Expense
Incurred | | | Maximum Amount
Borrowed | |
Sterling Capital Mid Value Fund | | 1.88% | | $ | 1,531,000 | | | 13 | | $ | 1,091 | | | | $9,242,000 | |
Sterling Capital Small Value Fund | | 1.25% | | | 399,500 | | | 6 | | | 83 | | | | 799,000 | |
Sterling Capital Maryland Intermediate Tax- Free Fund | | 2.00% | | | 39,000 | | | 3 | | | 7 | | | | 39,000 | |
Sterling Capital West Virginia Intermediate Tax-Free Fund | | 1.25% | | | 237,000 | | | 3 | | | 25 | | | | 237,000 | |
| 9. | Federal Tax Information: |
Management evaluates its tax positions to determine if the tax positions taken meet the minimum recognition threshold in connection with accounting for uncertainties in income tax positions taken or expected to be taken for the purposes of measuring and recognizing tax liabilities in the financial statements. Recognition of tax benefits of an uncertain tax position is required only when the position is “more likely than not” to be sustained assuming examination by taxing authorities. The Funds recognize interest and penalties, if any, related to unrecognized tax benefits as income tax expense. During the period, the Funds did not incur any interest or penalties.
Management has analyzed the Funds’ tax positions taken on federal income tax returns for all open tax years (current and prior three tax years), and has concluded that no provision for federal income tax is required. The Funds’ federal income and excise tax returns for tax years for which the applicable statutes of limitations have not expired are subject to examination by the Internal Revenue Service and state departments of revenue.
163
|
| Sterling Capital Funds |
Notes to Financial Statements — (continued) |
September 30, 2011 |
At September 30, 2011, the following Funds had net capital loss carryforwards available to offset future net capital gains, if any, to the extent provided by the Treasury regulations. To the extent that these carryforwards are used to offset future capital gains, it is probable that the gains that are offset will not be distributed to shareholders.
| | | | | | |
| | | Amount | | | Expires |
Sterling Capital Select Equity Fund | | $ | 110,011,194 | | | 2017 |
Sterling Capital Select Equity Fund | | | 10,325,708 | | | 2018 |
Sterling Capital Mid Value Fund | | | 22,741,167 | | | 2017 |
Sterling Capital Mid Value Fund | | | 17,450,982 | | | 2018 |
Sterling Capital Small Value Fund | | | 4,456,431 | | | 2016 |
Sterling Capital Small Value Fund | | | 2,655,981 | | | 2017 |
Sterling Capital International Fund | | | 32,299,715 | | | 2017 |
Sterling Capital International Fund | | | 25,579,528 | | | 2018 |
Sterling Capital Equity Income Fund | | | 33,082,724 | | | 2018 |
Sterling Capital Short-Term Bond Fund | | | 48,188 | | | 2012 |
Sterling Capital Short-Term Bond Fund | | | 2,094,190 | | | 2013 |
Sterling Capital Short-Term Bond Fund | | | 1,246,269 | | | 2014 |
Sterling Capital Short-Term Bond Fund | | | 3,940,976 | | | 2015 |
Sterling Capital Short-Term Bond Fund | | | 160,380 | | | 2016 |
Sterling Capital Short-Term Bond Fund | | | 359,956 | | | 2019 |
Sterling Capital Intermediate U.S. Government Fund | | | 2,827,748 | | | 2014 |
Sterling Capital Intermediate U.S. Government Fund | | | 10,119,332 | | | 2016 |
Sterling Capital Intermediate U.S. Government Fund | | | 37,464 | | | 2019 |
Sterling Capital Prime Money Market Fund | | | 19,807 | | | 2019 |
Sterling Capital Strategic Allocation Conservative Fund | | | 14,165 | | | 2017 |
Sterling Capital Strategic Allocation Conservative Fund | | | 8,974,540 | | | 2018 |
Sterling Capital Strategic Allocation Balanced Fund | | | 508,094 | | | 2017 |
Sterling Capital Strategic Allocation Balanced Fund | | | 9,432,218 | | | 2018 |
Sterling Capital Strategic Allocation Balanced Fund | | | 3,964,763 | | | 2019 |
Sterling Capital Strategic Allocation Growth Fund | | | 1,235,282 | | | 2017 |
Sterling Capital Strategic Allocation Growth Fund | | | 8,914,876 | | | 2018 |
Sterling Capital Strategic Allocation Growth Fund | | | 4,640,596 | | | 2019 |
Sterling Capital Strategic Allocation Equity Fund | | | 958,260 | | | 2017 |
Sterling Capital Strategic Allocation Equity Fund | | | 8,277,491 | | | 2018 |
Sterling Capital Strategic Allocation Equity Fund | | | 1,129,373 | | | 2019 |
Capital loss carryforwards utilized in the current year were $10,067,316, $14,940,416, $4,741,183, $1,949,538, $3,852,046 and $108,049 for Sterling Capital Select Equity Fund, Sterling Capital Mid Value Fund, Sterling Capital Small Value Fund, Sterling Capital International Fund, Sterling Capital Equity Income Fund, and Sterling Capital Strategic Allocation Conservative Fund, respectively. For Sterling Capital Small Value and Sterling Capital Mid Value Funds capital losses acquired in the reorganization are subject to limitations under Internal Revenue Code Section 381-384.
The Regulated Investment Company Modernization Act of 2010 (the “Act”) was signed into law on December 22, 2010. The Act makes changes to several tax rules impacting Regulated Investment Companies (“RICs”). The provisions of the Act will generally be effective for Funds’ taxable year ending September 30, 2012. The Act allows for capital losses originating in taxable years beginning after December 22, 2010 (“post-enactment capital losses”) to be carried forward indefinitely. However, the Act requires any future capital gains to be first offset by post-enactment capital losses before using capital losses incurred in taxable years beginning prior to the effective date of the Act. As a result of this ordering rule, capital loss carryforwards incurred in taxable years beginning prior to the effective date of the Act have an increased likelihood to expire unused. Furthermore, post-enactment capital losses will retain their character as either short-term or long-term capital losses rather than being considered all short-term capital losses as under previous law.
164
|
| Sterling Capital Funds |
Notes to Financial Statements — (continued) |
September 30, 2011 |
The tax character of distributions paid to shareholders during the fiscal year ended September 30, 2011 were as follows:
| | | | | | | | | | | | | | | | | | | | |
| | | Distributions paid from | | | | | | | | | | |
| | | Ordinary
Income | | | Net
Long-Term
Gains | | | Total Taxable
Distributions | | | Tax Exempt
Distributions | | | Total
Distributions
Paid* | |
Sterling Capital Select Equity Fund | | $ | 2,529,854 | | | $ | — | | | $ | 2,529,854 | | | $ | — | | | $ | 2,529,854 | |
Sterling Capital Mid Value Fund | | | 2,148,818 | | | | — | | | | 2,148,818 | | | | — | | | | 2,148,818 | |
Sterling Capital Small Value Fund | | | 302 | | | | — | | | | 302 | | | | — | | | | 302 | |
Sterling Capital International Fund | | | — | | | | — | | | | — | | | | — | | | | — | |
Sterling Capital Special Opportunities Fund | | | — | | | | 3,480,253 | | | | 3,480,253 | | | | — | | | | 3,480,253 | |
Sterling Capital Equity Income Fund | | | 9,549,811 | | | | — | | | | 9,549,811 | | | | — | | | | 9,549,811 | |
Sterling Capital Short-Term Bond Fund | | | 2,103,545 | | | | — | | | | 2,103,545 | | | | — | | | | 2,103,545 | |
Sterling Capital Intermediate U.S. Government Fund | | | 5,886,940 | | | | — | | | | 5,886,940 | | | | — | | | | 5,886,940 | |
Sterling Capital Total Return Bond Fund | | | 23,938,737 | | | | 2,394,789 | | | | 26,333,526 | | | | — | | | | 26,333,526 | |
Sterling Capital Kentucky Intermediate Tax-Free Fund | | | 1,812 | | | | 109,347 | | | | 111,159 | | | | 666,600 | | | | 777,759 | |
Sterling Capital Maryland Intermediate Tax-Free Fund | | | 34,364 | | | | 98,229 | | | | 132,593 | | | | 976,969 | | | | 1,109,562 | |
Sterling Capital North Carolina Intermediate Tax-Free Fund | | | 297,482 | | | | 759,154 | | | | 1,056,636 | | | | 5,771,102 | | | | 6,827,738 | |
Sterling Capital South Carolina Intermediate Tax-Free Fund | | | 126,393 | | | | 8,619 | | | | 135,012 | | | | 1,304,839 | | | | 1,439,851 | |
Sterling Capital Virginia Intermediate Tax-Free Fund. | | | 33,720 | | | | 333,279 | | | | 366,999 | | | | 3,199,948 | | | | 3,566,947 | |
Sterling Capital West Virginia Intermediate Tax-Free Fund | | | 2,308 | | | | 99,488 | | | | 101,796 | | | | 3,432,048 | | | | 3,533,844 | |
Sterling Capital National Tax-Free Money Market Fund | | | — | | | | 166 | | | | 166 | | | | 24,613 | | | | 24,779 | |
Sterling Capital Prime Money Market Fund | | | 72,227 | | | | — | | | | 72,227 | | | | — | | | | 72,227 | |
Sterling Capital U.S. Treasury Money Market Fund | | | 30,093 | | | | — | | | | 30,093 | | | | — | | | | 30,093 | |
Sterling Capital Strategic Allocation Conservative Fund | | | 455,323 | | | | — | | | | 455,323 | | | | — | | | | 455,323 | |
Sterling Capital Strategic Allocation Balanced Fund | | | 698,584 | | | | — | | | | 698,584 | | | | — | | | | 698,584 | |
Sterling Capital Strategic Allocation Growth Fund | | | 341,188 | | | | — | | | | 341,188 | | | | — | | | | 341,188 | |
Sterling Capital Strategic Allocation Equity Fund | | | 56,764 | | | | — | | | | 56,764 | | | | — | | | | 56,764 | |
The tax character of distributions paid to shareholders during the fiscal year ended September 30, 2010 were as follows:
| | | | | | | | | | | | | | | | | | | | |
| | | Distributions paid from | | | | | | | | | | |
| | | Ordinary
Income | | | Net
Long-Term
Gains | | | Total Taxable
Distributions | | | Tax Exempt
Distributions | | | Total
Distributions
Paid* | |
Sterling Capital Select Equity Fund | | $ | 2,653,688 | | | $ | — | | | $ | 2,653,688 | | | $ | — | | | $ | 2,653,688 | |
Sterling Capital Mid Value Fund | | | 1,464,936 | | | | — | | | | 1,464,936 | | | | — | | | | 1,464,936 | |
Sterling Capital Small Value Fund | | | 325,652 | | | | — | | | | 325,652 | | | | — | | | | 325,652 | |
Sterling Capital International Fund | | | 1,790,076 | | | | — | | | | 1,790,076 | | | | — | | | | 1,790,076 | |
Sterling Capital Special Opportunities Fund | | | — | | | | — | | | | — | | | | — | | | | — | |
Sterling Capital Equity Income Fund | | | 8,024,629 | | | | — | | | | 8,024,629 | | | | — | | | | 8,024,629 | |
Sterling Capital Short-Term Bond Fund | | | 2,014,753 | | | | — | | | | 2,014,753 | | | | — | | | | 2,014,753 | |
Sterling Capital Intermediate U.S. Government Fund | | | 6,548,623 | | | | — | | | | 6,548,623 | | | | — | | | | 6,548,623 | |
Sterling Capital Total Return Bond Fund | | | 18,561,594 | | | | — | | | | 18,561,594 | | | | — | | | | 18,561,594 | |
Sterling Capital Kentucky Intermediate Tax-Free Fund | | | 129,835 | | | | 80,683 | | | | 210,518 | | | | 634,868 | | | | 845,386 | |
Sterling Capital Maryland Intermediate Tax-Free Fund | | | 4,261 | | | | 2,231 | | | | 6,492 | | | | 911,102 | | | | 917,594 | |
Sterling Capital North Carolina Intermediate Tax-Free Fund | | | 238,236 | | | | 783,605 | | | | 1,021,841 | | | | 5,228,160 | | | | 6,250,001 | |
Sterling Capital South Carolina Intermediate Tax-Free Fund | | | 5,618 | | | | — | | | | 5,618 | | | | 1,030,343 | | | | 1,035,961 | |
Sterling Capital Virginia Intermediate Tax-Free Fund | | | 532,421 | | | | 358,874 | | | | 891,295 | | | | 2,961,164 | | | | 3,852,459 | |
Sterling Capital West Virginia Intermediate Tax-Free Fund | | | 21,240 | | | | 132,670 | | | | 153,910 | | | | 3,120,288 | | | | 3,274,198 | |
Sterling Capital National Tax-Free Money Market Fund | | | 68 | | | | 31 | | | | 99 | | | | 138,125 | | | | 138,224 | |
Sterling Capital Prime Money Market Fund | | | 321,834 | | | | — | | | | 321,834 | | | | — | | | | 321,834 | |
Sterling Capital U.S. Treasury Money Market Fund | | | 279,363 | | | | — | | | | 279,363 | | | | — | | | | 279,363 | |
Sterling Capital Strategic Allocation Conservative Fund | | | 428,602 | | | | — | | | | 428,602 | | | | — | | | | 428,602 | |
Sterling Capital Strategic Allocation Balanced Fund | | | 769,610 | | | | — | | | | 769,610 | | | | — | | | | 769,610 | |
Sterling Capital Strategic Allocation Growth Fund | | | 442,022 | | | | — | | | | 442,022 | | | | — | | | | 442,022 | |
Sterling Capital Strategic Allocation Equity Fund | | | 94,423 | | | | — | | | | 94,423 | | | | — | | | | 94,423 | |
| * | Total Distributions paid may differ from the Statements of Changes in Net Assets because distributions are recognized when actually paid for tax purposes. |
165
|
| Sterling Capital Funds |
Notes to Financial Statements — (continued) |
September 30, 2011 |
As of September 30, 2011, the components of accumulated earnings (deficit) on a tax basis were as follows:
| | | | | | | | | | | | | | | | | | | | | | | | | | | | |
| | | Undistributed
Ordinary
Income/Tax
Exempt Income | | | Undistributed
Long Term
Capital Gains | | | Accumulated
Earnings | | | Distributions
Payable | | | Accumulated
Capital and
Other Losses | | | Unrealized
Appreciation
(Depreciation)* | | | Total
Accumulated
Earnings
(Deficit) | |
Sterling Capital Select Equity Fund | | | $ 58,933 | | | | $ — | | | | $ 58,933 | | | | $ — | | | $ | (120,336,902 | ) | | $ | (4,212,808 | ) | | $ | (124,490,777 | ) |
Sterling Capital Mid Value Fund | | | 357,536 | | | | — | | | | 357,536 | | | | (217 | ) | | | (40,192,149 | ) | | | (12,905,606 | ) | | | (52,740,436 | ) |
Sterling Capital Small Value Fund | | | 213,038 | | | | 5,962,010 | | | | 6,175,048 | | | | — | | | | (7,112,412 | ) | | | (13,741,904 | ) | | | (14,679,268 | ) |
Sterling Capital International Fund | | | 746,107 | | | | — | | | | 746,107 | | | | — | | | | (57,972,477 | ) | | | (6,627,836 | ) | | | (63,854,206 | ) |
Sterling Capital Special Opportunities Fund | | | — | | | | 10,209,805 | | | | 10,209,805 | | | | — | | | | — | | | | 9,831,952 | | | | 20,041,757 | |
Sterling Capital Equity Income Fund | | | 494,674 | | | | — | | | | 494,674 | | | | (3,439 | ) | | | (33,082,724 | ) | | | 46,900,466 | | | | 14,308,977 | |
Sterling Capital Short-Term Bond Fund | | | 86,324 | | | | — | | | | 86,324 | | | | (162,722 | ) | | | (8,022,676 | ) | | | (869,010 | ) | | | (8,968,084 | ) |
Sterling Capital Intermediate U.S. Government Fund | | | 1,846,336 | | | | — | | | | 1,846,336 | | | | (283,899 | ) | | | (13,289,060 | ) | | | 9,007,657 | | | | (2,718,966 | ) |
Sterling Capital Total Return Bond Fund | | | 2,191,040 | | | | 10,538,605 | | | | 12,729,645 | | | | (701,950 | ) | | | — | | | | 9,006,044 | | | | 21,033,739 | |
Sterling Capital Kentucky Intermediate Tax-Free Fund | | | 41,773 | | | | 52,561 | | | | 94,334 | | | | (39,327 | ) | | | — | | | | 1,358,554 | | | | 1,413,561 | |
Sterling Capital Maryland Intermediate Tax-Free Fund | | | 51,024 | | | | 207,698 | | | | 258,722 | | | | (50,643 | ) | | | — | | | | 2,127,884 | | | | 2,335,963 | |
Sterling Capital North Carolina Intermediate Tax- Free Fund | | | 436,221 | | | | 1,251,617 | | | | 1,687,838 | | | | (366,979 | ) | | | — | | | | 12,136,787 | | | | 13,457,646 | |
Sterling Capital South Carolina Intermediate Tax- Free Fund | | | 82,938 | | | | 250,163 | | | | 333,101 | | | | (79,193 | ) | | | — | | | | 2,559,706 | | | | 2,813,614 | |
Sterling Capital Virginia Intermediate Tax-Free Fund | | | 233,853 | | | | 213,801 | | | | 447,654 | | | | (192,297 | ) | | | — | | | | 7,999,272 | | | | 8,254,629 | |
Sterling Capital West Virginia Intermediate Tax-Free Fund | | | 173,140 | | | | 429,573 | | | | 602,713 | | | | (209,427 | ) | | | — | | | | 4,902,276 | | | | 5,295,562 | |
Sterling Capital National Tax- Free Money Market Fund | | | 2,691 | | | | — | | | | 2,691 | | | | (1,402 | ) | | | — | | | | — | | | | 1,289 | |
Sterling Capital Prime Money Market Fund | | | 4,308 | | | | — | | | | 4,308 | | | | (2,106 | ) | | | (19,807 | ) | | | — | | | | (17,605 | ) |
Sterling Capital U.S. Treasury Money Market Fund | | | 3,529 | | | | — | | | | 3,529 | | | | (633 | ) | | | — | | | | (844 | ) | | | 2,052 | |
Sterling Capital Strategic Allocation Conservative Fund | | | 3,731 | | | | — | | | | 3,731 | | | | (2,766 | ) | | | (8,988,705 | ) | | | 575,370 | | | | (8,412,370 | ) |
Sterling Capital Strategic Allocation Balanced Fund | | | 1,792 | | | | — | | | | 1,792 | | | | (811 | ) | | | (13,905,075 | ) | | | (253,045 | ) | | | (14,157,139 | ) |
Sterling Capital Strategic Allocation Growth Fund | | | 464 | | | | — | | | | 464 | | | | (194 | ) | | | (15,036,629 | ) | | | (680,804 | ) | | | (15,717,163 | ) |
Sterling Capital Strategic Allocation Equity Fund | | | — | | | | — | | | | — | | | | — | | | | (10,391,884 | ) | | | (806,731 | ) | | | (11,198,615 | ) |
| * | The primary differences between book basis and tax basis unrealized appreciation (depreciation) were due to the deferral of losses on wash sales and straddles, mark-to-market adjustments on passive foreign investment companies, basis adjustments on partnership interests, hybrid securities and the deferral of market discount and premium until point of sale. |
166
|
| Sterling Capital Funds |
Notes to Financial Statements — (continued) |
September 30, 2011 |
Under current tax law, capital losses realized after October 31 of a Fund’s fiscal year may be deferred and treated as occurring on the first business day of the following fiscal year for tax purposes. The following Funds had deferred post-October capital and currency losses, which will be treated as arising on the first business day of the fiscal year ending September 30, 2012:
| | | | | | | | |
| | | Post-
October
Capital
Losses | | | Post-
October
Currency
Losses | |
Sterling Capital International Fund | | $ | — | | | $ | 93,234 | |
Sterling Capital Short-Term Bond Fund | | | 172,717 | | | | — | |
Sterling Capital Intermediate U.S. Government Fund | | | 304,516 | | | | — | |
Sterling Capital Strategic Allocation Growth Fund | | | 245,875 | | | | — | |
Sterling Capital Strategic Allocation Equity Fund | | | 26,760 | | | | — | |
At September 30, 2011, federal income tax cost, gross unrealized appreciation and gross unrealized depreciation on securities were as follows:
| | | | | | | | | | | | | | | | |
| | | Tax Cost | | | Gross Tax
Unrealized
Appreciation | | | Gross Tax
Unrealized
Depreciation | | | Net Tax
Unrealized
Appreciation
(Depreciation) | |
Sterling Capital Select Equity Fund | | $ | 187,568,379 | | | $ | 14,574,294 | | | $ | (18,787,102 | ) | | $ | (4,212,808 | ) |
Sterling Capital Mid Value Fund | | | 333,052,724 | | | | 32,878,037 | | | | (45,783,643 | ) | | | (12,905,606 | ) |
Sterling Capital Small Value Fund | | | 85,821,029 | | | | 2,259,937 | | | | (16,001,841 | ) | | | (13,741,904 | ) |
Sterling Capital International Fund | | | 68,935,267 | | | | 3,357,759 | | | | (9,954,908 | ) | | | (6,597,149 | ) |
Sterling Capital Special Opportunities Fund | | | 622,365,722 | | | | 59,730,526 | | | | (51,725,379 | ) | | | 8,005,147 | |
Sterling Capital Equity Income Fund | | | 677,688,609 | | | | 68,218,352 | | | | (21,378,245 | ) | | | 46,840,107 | |
Sterling Capital Short-Term Bond Fund | | | 63,867,717 | | | | 441,329 | | | | (1,310,339 | ) | | | (869,010 | ) |
Sterling Capital Intermediate U.S. Government Fund | | | 166,322,202 | | | | 10,021,324 | | | | (1,013,667 | ) | | | 9,007,657 | |
Sterling Capital Total Return Bond Fund | | | 436,240,406 | | | | 14,237,510 | | | | (5,231,466 | ) | | | 9,006,044 | |
Sterling Capital Kentucky Intermediate Tax-Free Fund | | | 20,934,051 | | | | 1,362,655 | | | | (4,101 | ) | | | 1,358,554 | |
Sterling Capital Maryland Intermediate Tax-Free Fund | | | 31,644,118 | | | | 2,127,884 | | | | — | | | | 2,127,884 | |
Sterling Capital North Carolina Intermediate Tax-Free Fund | | | 202,073,457 | | | | 12,180,924 | | | | (44,137 | ) | | | 12,136,787 | |
Sterling Capital South Carolina Intermediate Tax-Free Fund | | | 54,154,336 | | | | 2,580,876 | | | | (21,170 | ) | | | 2,559,706 | |
Sterling Capital Virginia Intermediate Tax-Free Fund | | | 108,690,365 | | | | 8,071,931 | | | | (72,659 | ) | | | 7,999,272 | |
Sterling Capital West Virginia Intermediate Tax-Free Fund | | | 101,123,362 | | | | 5,071,269 | | | | (168,993 | ) | | | 4,902,276 | |
Sterling Capital National Tax-Free Money Market Fund | | | 153,674,061 | | | | — | | | | — | | | | — | |
Sterling Capital Prime Money Market Fund | | | 493,537,844 | | | | — | | | | — | | | | — | |
Sterling Capital U.S. Treasury Money Market Fund | | | 220,107,102 | | | | — | | | | (844 | ) | | | (844 | ) |
Sterling Capital Strategic Allocation Conservative Fund | | | 16,225,778 | | | | 1,359,161 | | | | (783,791 | ) | | | 575,370 | |
Sterling Capital Strategic Allocation Balanced Fund | | | 33,338,872 | | | | 2,301,196 | | | | (2,554,241 | ) | | | (253,045 | ) |
Sterling Capital Strategic Allocation Growth Fund | | | 24,228,495 | | | | 1,559,508 | | | | (2,240,312 | ) | | | (680,804 | ) |
Sterling Capital Strategic Allocation Equity Fund | | | 8,577,034 | | | | 476,416 | | | | (1,283,147 | ) | | | (806,731 | ) |
Management has evaluated the need for the disclosure and/or adjustments resulting from subsequent events through the date the financial statements were issued, and has noted the following items:
On July 26, 2011, the Trust and Sterling Capital obtained exemptive relief from the Securities and Exchange Commission that permits Sterling Capital to appoint and replace unaffiliated sub-advisors, enter into sub-advisory agreements with unaffiliated sub-advisors, and amend and terminate sub-advisory agreements with unaffiliated sub-advisors on behalf of the Funds without shareholder approval. Effective October 1, 2011 BlackRock Advisors, LLC has been approved by the Board (pursuant to the recommendation of Sterling Capital) to serve as sub-advisor to Sterling Capital National Tax-Free Money Market Fund and Sterling Capital Prime Money Market Fund.
On November 18, 2011, the Board approved the liquidation and termination of Sterling Capital International Fund. Accordingly, the assets of the Fund will be liquidated on January 31, 2012. After paying in full all known or reasonably ascertainable liabilities of the Fund, including without limitation all charges, taxes and expenses of the Fund, whether due, accrued or anticipated, that have been incurred or are expected to be incurred by the Fund, the Fund will distribute to its shareholders their pro rata share of the proceeds.
167
|
| Sterling Capital Funds |
Notes to Financial Statements — (continued) |
September 30, 2011 |
On November 18, 2011, the Board approved a change with respect to the time period over which Sterling Capital may recoup all or a portion of the advisory fees that it voluntarily waives with respect to each Money Market Fund (see Note 6). In connection with this change, Sterling Capital has agreed that it will not be able to recoup any portion of the advisory fees that it voluntarily waived with respect to the Money Market Funds during the period from March 1, 2009 through February 28, 2010; however, Sterling Capital will be able to recoup advisory fees waived in subsequent periods through January 31, 2013. The amount of advisory fees waived during the period from March 1, 2009 through February 28, 2010 that Sterling Capital has agreed that it will not be able to recoup is $1,256,251. Other than as noted above, the terms of the Amended and Restated Advisory Fee Limitation and Recoupment Agreement, as described in Note 6, are unchanged.
168
Report of Independent Registered Public Accounting Firm
The Board of Trustees and Shareholders of Sterling Capital Funds:
We have audited the accompanying statements of assets and liabilities of the Sterling Capital Select Equity Fund (formerly BB&T Select Equity Fund), Sterling Capital Mid Value Fund (formerly BB&T Mid Cap Value Fund), Sterling Capital Small Value Fund (formerly Sterling Capital Small Cap Value Fund), Sterling Capital International Fund (formerly BB&T International Equity Fund), Sterling Capital Special Opportunities Fund (formerly BB&T Special Opportunities Equity Fund), Sterling Capital Equity Income Fund (formerly BB&T Equity Income Fund), Sterling Capital Short-Term Bond Fund (formerly BB&T Short U.S. Government Fund), Sterling Capital Intermediate U.S. Government Fund (formerly BB&T Intermediate U.S. Government Fund), Sterling Capital Total Return Bond Fund (formerly BB&T Total Return Bond Fund), Sterling Capital Kentucky Intermediate Tax-Free Fund (formerly BB&T Kentucky Intermediate Tax-Free Fund), Sterling Capital Maryland Intermediate Tax-Free Fund (formerly BB&T Maryland Intermediate Tax-Free Fund), Sterling Capital North Carolina Intermediate Tax-Free Fund (formerly BB&T North Carolina Intermediate Tax-Free Fund), Sterling Capital South Carolina Intermediate Tax-Free Fund (formerly BB&T South Carolina Intermediate Tax-Free Fund), Sterling Capital Virginia Intermediate Tax-Free Fund (formerly BB&T Virginia Intermediate Tax-Free Fund), Sterling Capital West Virginia Intermediate Tax-Free Fund (formerly BB&T West Virginia Intermediate Tax-Free Fund), Sterling Capital National Tax-Free Money Market Fund (formerly BB&T National Tax-Free Money Market Fund), Sterling Capital Prime Money Market Fund (formerly BB&T Prime Money Market Fund), Sterling Capital U.S. Treasury Money Market Fund (formerly BB&T U.S. Treasury Money Market Fund), Sterling Capital Strategic Allocation Conservative Fund (formerly BB&T Capital Manager Conservative Growth Fund), Sterling Capital Strategic Allocation Balanced Fund (formerly BB&T Capital Manager Moderate Growth Fund), Sterling Capital Strategic Allocation Growth Fund (formerly BB&T Capital Manager Growth Fund) and Sterling Capital Strategic Allocation Equity Fund (formerly BB&T Capital Manager Equity Fund) (collectively “the Funds”), twenty-two of the funds constituting Sterling Capital Funds, including the schedules of portfolio investments, as of September 30, 2011, and the related statements of operations for the year then ended, the statements of changes in net assets for each of the years in the two-year period then ended, and the financial highlights for each of the years or periods in the five-year period ended September 30, 2011 (and the year ended October 31, 2006 for Sterling Capital Small Value Fund). These financial statements and financial highlights are the responsibility of the Funds’ management. Our responsibility is to express an opinion on these financial statements and financial highlights based on our audits.
We conducted our audits in accordance with standards of the Public Company Accounting Oversight Board (United States). Those standards require that we plan and perform the audit to obtain reasonable assurance about whether the financial statements and financial highlights are free of material misstatement. An audit includes examining on a test basis, evidence supporting the amounts and disclosures in the financial statements. Our procedures included confirmation of securities owned as of September 30, 2011, by correspondence with the custodian, transfer agent of the underlying funds and brokers or by other appropriate auditing procedures. An audit also includes assessing the accounting principles used and significant estimates made by management, as well as evaluating the overall financial statement presentation. We believe that our audits provide a reasonable basis for our opinion.
In our opinion, the financial statements and the financial highlights referred to above present fairly, in all material respects, the financial position of each of the aforementioned funds of Sterling Capital Funds as of September 30, 2011, the results of their operations for the year then ended, the changes in their net assets for each of the years in the two-year period then ended, and the financial highlights for each of the years or periods in the five-year period ended September 30, 2011 (and the year ended October 31, 2006 for Sterling Capital Small Value Fund), in conformity with U.S. generally accepted accounting principles.
Philadelphia, Pennsylvania
November 28, 2011
169
BOARD CONSIDERATION OF ADVISORY AGREEMENTS (UNAUDITED)
May 2011 Approvals
The Board of Trustees, at a meeting held on May 19, 2011, formally considered the approval of an investment advisory agreement (the “New Advisory Agreement”) between Sterling Capital Funds (the “Trust”) and Sterling Capital Management LLC (“Sterling Capital”), which serves as investment adviser to each series of the Trust, with respect to the Sterling Capital Corporate Fund and the Sterling Capital Securitized Opportunities Fund, two proposed new series of the Trust (the “New Funds”).
At a meeting held on August 25-26, 2011, the Trustees formally considered the continuance of the Trust’s investment advisory agreement with Sterling Capital with respect to each series of the Trust other than the New Funds (the “Current Funds”). The Board of Trustees also considered the continuance of sub-advisory agreements of Sterling Capital with Scott & String fellow, LLC (“Scott & String fellow”), with respect to the Sterling Capital Special Opportunities Fund and the Sterling Capital Equity Income Fund, and with Artio Global Management LLC (“Artio” and, together with Sterling Capital and Scott & String fellow, the “Current Advisers”), with respect to the Sterling Capital International Fund. The above referenced agreements are collectively referred to herein as the “Current Advisory Agreements.” At the same meeting, the Board of Trustees also formally considered the approval of a new investment sub-advisory agreement (the “New Sub-Advisory Agreement” and, together with the New Advisory Agreement and the Current Advisory Agreements, the “Advisory Agreements”) between Sterling Capital and BlackRock Advisors, LLC (“BlackRock” and, together with the Current Advisers, the “Advisers”) with respect to the Sterling Capital National Tax-Free Money Market Fund and the Sterling Capital Prime Money Market Fund (collectively, the “Money Market Funds” and, together with the New Funds and the Current Funds, the “Funds”).
The Trustees reviewed extensive material in connection with their consideration of the Advisory Agreements, including data from an independent provider of mutual fund data (as assembled by the Trust’s administrator), which, where applicable, included comparisons with industry averages for comparable funds for advisory fees, 12b-1 fees, and total fund expenses. The data reflected Sterling Capital fee waivers in place, as well as Sterling Capital’s contractual investment advisory fee levels. The Board was assisted in its review by independent legal counsel, who provided memoranda detailing the legal standards for review of the Advisory Agreements. At each meeting, the Board received a detailed presentation by Sterling Capital, which included a fund-by-fund analysis of investment processes and, where applicable, performance. Presentations were also provided by each entity proposed to be utilized by Sterling Capital as a sub-adviser. The Board also received fund-by-fund profitability information from the Current Advisers. The Independent Trustees also deliberated outside the presence of management and the Advisers.
With respect to the New Funds and the Money Market Funds, the Trustees’ determination to approve the New Advisory Agreement and the New Sub-Advisory Agreement, respectively, was based on a comprehensive evaluation of all of the information provided to them. In the process of considering the New Advisory Agreement, the Trustees considered information regarding, among other things, the proposed portfolio management team and the experience of the members of the team, the team’s anticipated investment strategy, and other information relating to the nature, extent, and quality of services to be provided by Sterling Capital. With respect to the Money Market Funds, the Trustees received a detailed presentation from BlackRock that included information regarding, among other things, BlackRock’s risk management approach, its experience with respect to comparable cash management sub-advisory relationships, and the proposed portfolio management team.
In their deliberations regarding the Advisory Agreements, each Trustee attributed different weights to various factors involved in an analysis of the Advisory Agreements, and in each case no factor alone was considered determinative. The Trustees determined that the overall arrangements between the Trust and the Advisers, as provided in the Advisory Agreements, were fair and reasonable and that the continuance of the Current Advisory Agreements and the approval of the New Advisory Agreement and the New Sub-Advisory Agreement were in the best interests of each applicable Fund and its shareholders.
The matters addressed below were considered and discussed by the Trustees in reaching their conclusions.
Nature, Extent and Quality of Services Provided by the Adviser and Sub-Advisers
The Trustees received and considered information regarding the nature, extent, and quality of the services provided to each Current Fund under the Current Advisory Agreements. The Trustees took into account information furnished throughout the year at Trustee meetings, as well as materials furnished specifically in connection with the annual review process. The Trustees considered the background and experience of each Current Adviser’s senior management and the expertise of investment personnel of each Current Adviser responsible for the day-to-day management of each Current Fund. The Trustees considered the overall reputation, and the capabilities and commitment of the Current Advisers to provide high quality service to the Current Funds.
With respect to the New Funds, the Trustees considered the expertise of each New Fund’s proposed portfolio management team generally and the services provided to the Current Funds by Sterling Capital. The Trustees considered the financial position of Sterling Capital and the commitment that Sterling Capital has made to the Trust generally. The Board also considered Sterling Capital’s specific responsibilities in all aspects of day-to-day management of the New Funds as well as the qualifications, experience and responsibilities of the other key personnel that would be involved in the day-to-day activities of the New Funds. The Trustees concluded that the nature and quality of services that Sterling Capital would provide to the New Funds appeared consistent with both those provided to the Current Funds by Sterling Capital as well as with industry norms.
170
With respect to the Money Market Funds, the Trustees considered the expertise of the Money Market Fund’s proposed portfolio management team generally and the size of similar funds managed by the proposed portfolio managers. The Trustees reviewed information concerning BlackRock’s expertise in managing money market funds and the investment philosophy and investment processes applied by BlackRock in managing such funds. The Trustees considered the background and experience of BlackRock’s senior management and the expertise of investment personnel of BlackRock responsible for the day-to-day management of the Money Market Funds. The Trustees considered the overall reputation, and the capabilities and commitment of BlackRock to provide high-quality service to the Money Market Funds, and the Trustees’ overall confidence in BlackRock’s integrity.
The Trustees received information concerning the investment philosophy and investment processes applied or to be applied by the Advisers in managing the Funds as well as each Current Adviser’s Form ADV. The Trustees also considered information regarding regulatory compliance and, with respect to the Current Funds, compliance with the investment policies of the Funds. The Trustees evaluated the trading practices of Scott & String fellow, which engages in affiliated brokerage for portfolio trades for the Current Funds it sub-advises. The Trustees evaluated the procedures of the Advisers designed to fulfill the Advisers’ fiduciary duty to the Funds with respect to possible conflicts of interest, including the Advisers’ codes of ethics (regulating the personal trading of its officers and employees).
Based on their review, the Trustees concluded that, with respect to the nature, extent and quality of services to be provided by the Advisers, the nature and extent of responsibilities was consistent with mutual fund industry norms, and that the quality of the services provided or to be provided by the Advisers was or was expected to be satisfactory or better.
Investment Performance
The Trustees considered performance results of each Current Fund in absolute terms and relative to each Current Fund’s benchmark and peer group. In the Trustees’ review of performance, long- and short-term performance were considered. In conducting their review, the Trustees particularly focused on Current Funds where performance compared unfavorably with peers. The Trustees noted that the performance of the Select Equity Fund and the International Fund continued to be a source of concern for the Board. Although the Trustees concluded that Sterling Capital had taken appropriate steps to address those Funds’ continued underperformance, the Trustees determined to increase oversight of these Funds during the upcoming year, including enhanced reporting from the Adviser.
After reviewing the performance of each Current Fund and taking into consideration the management style, investment strategies, and prevailing market conditions during the prior year and for longer periods, the Trustees concluded that the performance of each Current Fund was acceptable or better or that, in cases where performance issues were encountered, Sterling Capital was appropriately addressing the situation.
With respect to the New Funds, the Trustees noted that the New Funds had not commenced operations at the time of the May 2011 Board meeting and had no historical investment performance. The Trustees considered that Sterling Capital does not currently offer stand-alone investment products comparable to either of the New Funds, and determined that comparable performance information with respect to other Sterling Capital clients would not provide suitable comparison information for evaluation of the New Advisory Agreement. The Trustees also noted that no performance history was available in a start-up fund context, such as that presented by the New Funds. The Trustees concluded, however, that Sterling Capital possessed the personnel and resources capable of producing attractive and competitive returns for each of the New Funds.
With respect to the Money Market Funds, the Trustees determined that the prospects for the Money Market Funds to have satisfactory or better performance were good.
Cost of Services, Including the Profits Realized by the Advisers and Affiliates
The Trustees considered peer group comparable information with respect to the advisory fees charged by Sterling Capital to each of the Current Funds and the advisory fees proposed to be charged by Sterling Capital to each of the New Funds, taking into consideration both contractual and actual (i.e., after fee waivers) fee levels. The Trustees concluded that the investment advisory fees paid by the Current Funds fell within an acceptable range as compared to peer groups, and were fair and reasonable, particularly in light of the fee waivers that are in place. With respect to the New Funds, the Trustees concluded that the contractual fees were fair and reasonable and noted that fee waivers agreed to by Sterling Capital would produce actual fees well below industry averages. With respect to the Money Market Funds, the Trustees noted that the fees proposed to be paid to BlackRock fell within an acceptable range, were fair and reasonable, and were identical to those paid to the current sub-adviser. The Trustees also noted that these fees were not borne directly by the shareholders of the respective Money Market Funds, but rather by Sterling Capital.
As part of their review, the Trustees considered benefits to Sterling Capital aside from investment advisory fees. The Trustees reviewed administration fees received by Sterling Capital and considered the fallout benefits to Sterling Capital such as the research services available to Sterling Capital by reason of brokerage commissions generated by the Funds’ turnover. The Trustees also considered benefits to Sterling Capital’s affiliates, including brokerage commissions received by Scott & String fellow for executing trades on behalf of the Special Opportunities Fund and the Equity Income Fund. With respect to Scott & String fellow, the Trustees noted that brokerage commissions were paid at a standard commission rate, which was consistent with that used by Sterling Capital with respect to all equity funds of the Trust and that such brokerage arrangements were considered by Scott & String fellow to be advantageous.
The Trustees also considered information from Sterling Capital regarding fees for separate accounts managed by Sterling Capital with investment objectives and strategies similar to those of comparable Funds. The Trustees noted that a representative of Sterling
171
Capital explained that management of the Funds was a much more intensive process than management of separate accounts, including daily fluctuations in the size of the Funds and the need to comply with extensive and complex restrictions set by applicable regulation or established in controlling disclosure documents, and therefore the Trustees concluded that the differences between the services that Sterling Capital provides to the Funds and those it provides to separate accounts substantially limit the probative value of comparisons to those other clients. The Trustees also noted that, with respect to the New Funds, Sterling Capital did not currently offer stand-alone investment products comparable to either Fund and therefore concluded that comparable fee information with respect to other Sterling Capital clients would not provide suitable comparison information for evaluation of the New Advisory Agreement.
The Trustees also considered the reasonableness of current and proposed advisory fees in the context of the profitability of the Advisers. In determining whether all other current and proposed investment advisory and sub-advisory fees (collectively, the “investment advisory fees”) were reasonable, the Trustees reviewed profitability information provided by the Current Advisers with respect to investment advisory services. With respect to such information, the Trustees recognized that such profitability data was generally unaudited and represented an Adviser’s own determination of its and its affiliates’ revenues from the contractual services provided or expected to be provided to the Funds, less expenses of providing such services. Expenses include direct and indirect costs and were calculated using an allocation methodology developed by the Adviser. The Trustees also recognized that it is difficult to make comparisons of profitability from fund investment advisory and sub-advisory contracts, because comparative information is not generally publicly available and could be affected by numerous factors. Based on their review, the Trustees concluded that the profitability of the Current Advisers as a result of their relationships with the Funds was acceptable.
Based on the foregoing, the Trustees concluded that the fees proposed under the Advisory Agreements were fair and reasonable, in light of the services and benefits provided or expected to be provided to each Fund.
Economies of Scale
The Trustees also considered whether fee levels reflect economies of scale and whether economies of scale would be produced by the growth of the Funds’ assets. The Trustees found that Sterling Capital had generally reduced the total expense ratios for the Current Funds through fee waivers and would do so with respect to the New Funds at least during the New Funds’ inception stage. The Trustees also noted that shareholders of the Money Market Funds had received the benefit of very significant fee waivers from Sterling Capital over the past year, and it was likely that fee waivers would continue due to the currently low interest rate conditions. The Trustees found that the asset levels of the Funds were not currently so large as to warrant formal contractual breakpoints, and found that the fee waivers were a reasonable way to provide the benefits of economies of scale to shareholders of the Funds at this time.
172
|
| Sterling Capital Funds |
September 30, 2011 |
Notice to Shareholders (Unaudited)
For shareholders that do not have a September 30, 2011 tax year end, this notice is for informational purposes only. For shareholders with a September 30, 2011 tax year end, please consult your tax advisor as to the pertinence of this notice.
For the fiscal year ended September 30, 2011, in order to meet certain requirements of the Internal Revenue Code, we are advising you that certain distributions paid during the year from the following Funds are designated as:
| | | | | | | | | | | | | | | | | | | | | | | | |
| | | (a)
Long-Term
Capital
Gain | | | (b)
Qualified
Dividend
Income % | | | (c)
(for corporate
shareholders)
Dividends
Received
Deduction % | | | (d)
(for foreign
shareholders)
Qualified
Short-Term
Capital Gain % | | | (e)
(for foreign
shareholders)
Qualified
Interest
Income % | | | (f)
Exempt-
Interest
Dividend | |
Sterling Capital Select Equity Fund | | $ | — | | | | 100.00% | | | | 100.00% | | | | — | | | | 0.01% | | | $ | — | |
Sterling Capital Mid Value Fund | | | — | | | | 100.00% | | | | 100.00% | | | | — | | | | 0.01% | | | | — | |
Sterling Capital Small Value Fund | | | — | | | | 100.00% | | | | 100.00% | | | | 100.00% | | | | — | | | | — | |
Sterling Capital International Fund | | | — | | | | 100.00% | | | | — | | | | — | | | | 0.01% | | | | — | |
Sterling Capital Special Opportunities Fund | | | 3,480,253 | | | | — | | | | — | | | | — | | | | — | | | | — | |
Sterling Capital Equity Income Fund | | | — | | | | 100.00% | | | | 100.00% | | | | — | | | | 0.06% | | | | — | |
Sterling Capital Short-Term Bond Fund | | | — | | | | — | | | | — | | | | — | | | | 99.97% | | | | — | |
Sterling Capital Intermediate U.S. Government Fund | | | — | | | | — | | | | — | | | | — | | | | 99.45% | | | | — | |
Sterling Capital Total Return Bond Fund | | | 2,394,789 | | | | — | | | | — | | | | 100.00% | | | | 96.63% | | | | — | |
Sterling Capital Kentucky Intermediate Tax- Free Fund | | | 109,347 | | | | — | | | | — | | | | 100.00% | | | | — | | | | 666,600 | |
Sterling Capital Maryland Intermediate Tax- Free Fund | | | 98,229 | | | | — | | | | — | | | | 100.00% | | | | — | | | | 976,969 | |
Sterling Capital North Carolina Intermediate Tax-Free Fund | | | 759,154 | | | | — | | | | — | | | | 100.00% | | | | — | | | | 5,771,102 | |
Sterling Capital South Carolina Intermediate Tax-Free Fund | | | 8,619 | | | | — | | | | — | | | | 100.00% | | | | 97.46% | | | | 1,304,839 | |
Sterling Capital Virginia Intermediate Tax- Free Fund | | | 333,279 | | | | — | | | | — | | | | 100.00% | | | | — | | | | 3,199,948 | |
Sterling Capital West Virginia Intermediate Tax-Free Fund | | | 99,488 | | | | — | | | | — | | | | 100.00% | | | | 98.57% | | | | 3,432,048 | |
Sterling Capital National Tax-Free Money Market Fund | | | 166 | | | | — | | | | — | | | | — | | | | — | | | | 24,613 | |
Sterling Capital Prime Money Market Fund | | | — | | | | — | | | | — | | | | — | | | | 98.43% | | | | — | |
Sterling Capital U.S. Treasury Money Market Fund | | | — | | | | — | | | | — | | | | — | | | | 94.59% | | | | — | |
Sterling Capital Strategic Allocation Conservative Fund | | | — | | | | 14.94% | | | | 9.46% | | | | — | | | | 78.35% | | | | — | |
Sterling Capital Strategic Allocation Balanced Fund | | | — | | | | 39.49% | | | | 23.76% | | | | — | | | | 55.29% | | | | — | |
Sterling Capital Strategic Allocation Growth Fund | | | — | | | | 76.36% | | | | 45.01% | | | | — | | | | 28.57% | | | | — | |
Sterling Capital Strategic Allocation Equity Fund | | | — | | | | 100.00% | | | | 99.76% | | | | — | | | | 0.01% | | | | — | |
(a) Each Fund designates the maximum amount allowable but not less than the amounts shown above as a capital gain dividend in accordance with Section 852(b)(3)(c) of the Internal Revenue Code.
(b) Each Fund designates the maximum amount allowable, but not less than the percentages shown above as ordinary income dividends paid during the year as qualified dividend income in accordance with Section 854 of the Internal Revenue Code.
(c) Each Fund designates the maximum amount allowable but not less than the percentages shown above of ordinary income dividends paid during the year as eligible for the corporate dividends received deduction in accordance with Section 854 of the Internal Revenue Code.
(d) Each Fund designates the maximum amount allowable but not less than the percentages shown above as a short-term capital gain dividend in accordance with Sections 871(k)(2) and 881(e) of the Internal Revenue Code.
(e) Each Fund designates the maximum amount allowable but not less than the percentages shown above as interest-related dividends in accordance with Sections 871(k)(1) and 881(e) of the Internal Revenue Code.
173
|
| Sterling Capital Funds |
September 30, 2011 |
(f) Each Fund designates the maximum amount allowable but not less than the amounts shown above as exempt-interest dividends in accordance with Section 852(b)(5) of the Internal Revenue Code.
Capital gain dividends distributed during the fiscal year ended September 30, 2011 are generally subject to the maximum tax rate of 15%. In addition, Qualified Dividend Income is generally subject to a maximum rate of 15%.
The information reported herein may differ from the information and distributions paid to the shareholders subject to tax reporting.
For the fiscal year ended September 30, 2011, the following funds designate the maximum amount allowable but not less than the percentages of the following Funds investment company taxable income were derived from U.S. Treasury securities:
| | | | |
| | | U.S.
Government
Income | |
Sterling Capital Short-Term Bond Fund | | | 5.39% | |
Sterling Capital Intermediate U.S. Government Fund | | | 22.79% | |
Sterling Capital Total Return Bond Fund | | | 2.42% | |
Sterling Capital Prime Money Market Fund | | | 3.99% | |
Sterling Capital U.S. Treasury Money Market Fund | | | 54.04% | |
Sterling Capital Strategic Allocation Conservative Fund | | | 1.97% | |
Sterling Capital Strategic Allocation Balanced Fund | | | 1.39% | |
Sterling Capital Strategic Allocation Growth Fund | | | 0.72% | |
For the fiscal year ended September 30, 2011, the following fund has made an election to pass-through the maximum amounts paid derived from foreign source income as well as any foreign taxes paid in accordance with Section 853 of the Internal Revenue Code to their shareholders or the following amounts:
| | | | | | | | |
| | | Foreign
Dividend
Income | | | Foreign
Taxes
Paid | |
Sterling Capital International Fund | | $ | 1,739,511 | | | $ | 131,760 | |
174
|
| Sterling Capital Funds |
September 30, 2011 |
Other Information (Unaudited)
A description of the policies and procedures that the Funds use to determine how to vote proxies relating to portfolio securities is available (i) without charge, upon request, by calling 1-800-228-1872; and (ii) on the Securities and Exchange Commission’s (the “Commission”) website at http://www.sec.gov.
Information regarding how the Funds voted proxies relating to portfolio securities during the most recent 12-month period ended June 30th is available (i) without charge, upon request, by calling 1-800-228-1872 and (ii) on the Commission’s website at http://www.sec.gov.
The Funds file complete Schedules of Portfolio Holdings with the Commission for the first and third quarters of each fiscal year on Form N-Q. The Funds’ Forms N-Q are available without charge on the Commission’s website at http://www.sec.gov, or may be reviewed and copied at the Commission’s Public Reference Room in Washington, D.C. Information on the operation of the Public Reference Room may be obtained by calling 1-800-SEC-0330.
175
Information about Trustees and Officers (Unaudited)
Overall responsibility for the management of the Funds rests with its Board of Trustees (“Trustees”), who are elected by the Shareholders of the Funds. The Trustees elect the officers of the Funds to supervise actively its day-to-day operations. The names of the Trustees, birthdates, term of office and length of time served, principal occupations during the past five years, number of portfolios overseen and directorships held outside of the Funds are listed in the two tables immediately following. The business address of the persons listed below is 434 Fayetteville Street Mall, Fifth floor, Raleigh, North Carolina 27601.
INDEPENDENT TRUSTEES
| | | | | | | | | | |
Name and Birthdate | | Position(s) Held With the Funds | | Term of Office/ Length of Time Served | | Principal Occupation During the Last 5 Years | | Number of
Portfolios
in Fund
Complex
by Trustee* | | Other
Directorships
Held
by Trustee |
| | | | | |
Thomas W. Lambeth Birthdate: 01/35 | | Trustee, Chairman of the Board of Trustees | | Indefinite, 08/92 — Present | | From January 2001 to present, Senior Fellow, Z. Smith Reynolds Foundation | | 29 | | None |
| | | | | |
Drew T. Kagan | | Trustee | | Indefinite, | | From September 2010 to | | 29 | | None |
Birthdate: 02/48 | | | | 08/00 — Present | | present, Chairman, | | | | |
| | | | | | Montecito Advisors, Inc.; | | | | |
| | | | | | from December 2003 to | | | | |
| | | | | | September 2010, CEO, | | | | |
| | | | | | Montecito Advisors, Inc.; | | | | |
| | | | | | from March 1996 to | | | | |
| | | | | | December 2003, | | | | |
| | | | | | President, Investment | | | | |
| | | | | | Affiliate, Inc. | | | | |
| | | | | |
Laura C. Bingham | | Trustee | | Indefinite, | | From June 2010 to present | | 29 | | None |
Birthdate: 11/56 | | | | 02/01 — Present | | independent consultant; | | | | |
| | | | | | from July 1998 to June | | | | |
| | | | | | 2010, President of Peace | | | | |
| | | | | | College | | | | |
| | | | | |
Douglas R. Van Scoy | | Trustee | | Indefinite, | | Retired; from November | | 29 | | None |
Birthdate: 11/43 | | | | 05/04 — Present | | 1974 to July 2001, | | | | |
| | | | | | employee of Smith Barney | | | | |
| | | | | | (investment banking), | | | | |
| | | | | | most recently as Director | | | | |
| | | | | | of Private Client Group | | | | |
| | | | | | and Senior Executive Vice | | | | |
| | | | | | President | | | | |
| | | | | |
James L. Roberts | | Trustee | | Indefinite, | | Retired; from November | | 29 | | None |
Birthdate: 11/42 | | | | 11/04 — Present | | 2006 to present, Director, | | | | |
| | | | | | Grand Mountain | | | | |
| | | | | | Bancshares, Inc.; from | | | | |
| | | | | | January 1999 to | | | | |
| | | | | | December 2003, | | | | |
| | | | | | President, CEO and | | | | |
| | | | | | Director, Coyest | | | | |
| | | | | | Bancshares, Inc. | | | | |
176
The following table shows information for the trustee who is an “interested person” of the Funds as defined in the 1940 Act:
INTERESTED TRUSTEE
| | | | | | | | | | |
Name and Birthdate | | Position(s) Held
With the Funds | | Term of Office/ Length of Time Served | | Principal Occupation During the Past 5 Years | | Number of
Portfolios
in Fund
Complex
by Trustee* | | Other Directorships Held by Trustee |
| | | | | |
Alexander W. McAlister** Birthdate: 03/60 | | Trustee | | Indefinite, 11/10 — Present | | President, Sterling Capital
Management LLC | | 29 | | Director, Sterling Capital Management LLC |
* The Sterling Capital Fund Complex consists of two open-end investment management companies: Sterling Capital Funds and Sterling Capital Variable Insurance Funds.
**Mr. McAlister is treated by the Fund as an “interested person” (as defined in Section 2(a)(19) of the 1940 Act) of the Funds because he is the president of Sterling Capital Management LLC, the Funds’ advisor.
The following table shows information for officers of Funds:
| | | | | | |
Name and Birthdate | | Position(s) Held With the Funds | | Term of Office/ Length of Time Served | | Principal Occupation During the Last 5 Years |
| | | |
E.G. Purcell, III Birthdate: 01/55 | | President | | Indefinite, President 11/08 — Present; Secretary, 11/08 — 08/10; Vice President, 11/00 — 11/08 | | From 1995 to present, Executive Director, Sterling Capital Management LLC and its predecessors |
| | | |
James T. Gillespie Birthdate: 11/66 | | Treasurer | | Indefinite, 06/10 — Present | | From June 2010 to present, Director, Sterling Capital Management LLC and its predecessors; from August 2008 to June 2010, Vice President Relationship Management, JPMorgan Chase & Co.; from February 2005 to August 2008, Senior Vice President and Manager of Mutual Fund Administration, Sterling Capital Management LLC and its predecessors |
| | | |
Todd M. Miller Birthdate: 09/71 | | Vice President and Secretary | | Indefinite, Vice President, 08/05 — Present; Secretary, 08/10 — Present | | From June 2009 to present, Director, Sterling Capital Management LLC and its predecessors; from June 2005 to May 2009, Mutual Fund Administrator; from May 2001 to May 2005, manager, BISYS Fund Services |
177
| | | | | | |
Name and Birthdate | | Position(s) Held With the Funds | | Term of Office/ Length of Time Served | | Principal Occupation During the Last 5 Years |
| | | |
Clinton L. Ward Birthdate: 11/69 | | Executive Director, Chief Compliance and Anti-Money Laundering Officer | | Indefinite, 04/07 — Present | | From July 2004 to present, Chief Compliance Officer and Executive Director, Sterling Capital Management LLC and its predecessors |
| | | |
Andrew J. McNally Birthdate: 12/70 | | Assistant Treasurer | | Indefinite, Assistant Treasurer, 06/10 — Present; Treasurer, 04/07 — 06/10 | | From January 2007 to present Vice President and Senior Director, and from July 2000 to December 2006, Vice President and Director, Fund Accounting and Administration Department, BNY Mellon Investment Servicing (US) Inc. |
The Funds’ Statement of Additional Information includes additional information about the Funds’ Trustees and Officers. To receive your free copy of the Statement of Additional Information, call toll free: 1-800-228-1872.
178
INVESTMENT ADVISOR
Sterling Capital Management LLC
Two Morrocroft Centre
4064 Colony Road, Suite 300
Charlotte, NC 28211
DISTRIBUTOR
Sterling Capital Distributors, Inc.
760 Moore Road
King of Prussia, PA 19406
LEGAL COUNSEL
Ropes & Gray LLP
One Metro Center
700 12th Street, N.W.
Suite 900
Washington, DC 20005
TRANSFER AGENT
BNY Mellon Investment Servicing (US) Inc.
301 Bellevue Parkway
Wilmington, DE 19809
INDEPENDENT REGISTERED PUBLIC ACCOUNTING FIRM
KPMG LLP
1601 Market Street
Philadelphia, PA 19103


ANNUAL REPORT
Sterling Capital Corporate Fund
Sterling Capital Securitized Opportunities Fund
CLASS S SHARES
SEPTEMBER 30, 2011

Notice of Privacy Policy & Practices
Sterling Capital Funds recognizes and respects the privacy expectations of our customers.1 We provide this notice to you so that you will know what kinds of information we collect about our customers and the circumstances in which that information may be disclosed to third parties who are not affiliated with the Sterling Capital Funds.
Collection of Customer Information
We collect nonpublic personal information about our customers from the following sources:
| | • | | Account Applications and other forms, which may include a customer’s name, address, social security number, and information about a customer’s investment goals and risk tolerance; |
| | • | | Account History, including information about the transactions and balances in a customer’s accounts; and |
| | • | | Correspondence, written, telephonic or electronic between a customer and the Sterling Capital Funds or service providers to the Sterling Capital Funds. |
Disclosure of Customer Information
We many disclose all of the consumer information outlined above to third parties who are not affiliated with the Sterling Capital Funds:
| | • | | as permitted by law — for example with service providers who maintain or service shareholder accounts for the Sterling Capital Funds or to a shareholder’s broker or agent; and |
| | • | | to perform marketing services on our behalf or pursuant to a joint marketing agreement with another financial institution. |
Security of Customer Information
We require service providers to the Sterling Capital Funds:
| | • | | to maintain policies and procedures designed to assure only appropriate access to, and use of information about customers of the Sterling Capital Funds; and |
| | • | | to maintain physical, electronic and procedural safeguards that comply with applicable legal standards to guard nonpublic personal information of customers of the Sterling Capital Funds. |
We will adhere to the policies and practices described in this notice regardless of whether you are a current or former customer of the Sterling Capital Funds.
1 For purposes of this notice, the terms “customer” or “customers” includes both individual shareholders of the Sterling Capital Funds and individuals who provide nonpublic personal information to the Sterling Capital Funds, but do not invest in Sterling Capital Funds shares.
| | | | |
Table of Contents | |
Management Discussion of Performance | | | | |
| |
Letter from the President and the Investment Advisor | | | 1 | |
| |
Summary of Portfolio Holdings | | | 2 | |
| |
Expense Example | | | 3 | |
| |
Schedules of Portfolio Investments | | | | |
| |
Sterling Capital Corporate Fund | | | 4 | |
| |
Sterling Capital Securitized Opportunities Fund | | | 6 | |
| |
Financial Statements | | | 8 | |
| |
Notes to Financial Statements | | | 12 | |
| |
Report of Independent Registered Public Accounting Firm | | | 17 | |
| |
Other Information | | | 19 | |
| |
Board of Trustees | | | 23 | |
(This page has been left blank intentionally.)
| | | | | | | | |
| Letter from the President and the Investment Advisor |
Dear Shareholders: We are pleased to present this annual report for the 12-month period ended September 30, 2011. The economy during this time continued its slow recovery from the severe recession of 2008. A number of leading economic indicators pointed to slow growth, though many quickly deteriorated in early 2011. Downward revisions to GDP numbers indicated the economy’s expansion had nearly stalled. The resulting blow to investor confidence sent financial markets into a period of tremendous volatility, which erased much of the gains made during the first three quarters of the fiscal year. Overall, the S&P500 returned 1.1%; the Russell 2000 Index of small-capitalization stocks returned -3.53%; the MSCI EAFE Index of international stocks returned -12.02%; and the Barclays Capital U.S. Aggregate Bond Index returned 5.26%. A stalling economy Entering 2011, a second round of quantitative easing by the Federal Reserve, along with strengthened corporate balance sheets and improved earnings reports, led to general sentiment that the economy was on a path to recovery. But while our projections for the first half of the fiscal year accurately predicted soft patches and a faltering expansion, they overestimated economic growth. Several factors continued to drag on the recovery, including continued weakness in the housing market and stubbornly high unemployment figures. Additionally, supply chain disruptions resulting from the March 2011 tsunami in Japan dealt a setback to manufacturing activity and the deteriorated fiscal positions of Greece, Ireland, Portugal and other peripheral members of the euro zone tempered any optimism. Those negatives, along with concerns that domestic political bickering would limit opportunities for policies that could support a near-term recovery, boosted concerns about a double-dip recession. A few positives remained by September 2011, in particular robust manufacturing activity and an expanded service sector. Nevertheless, it appeared that the recession was much more severe than initially reported and that the U.S. economic recovery to this point has been much flatter. | | | | A volatile period for stocks Equity markets ended the period down slightly. Market gains through the first three quarters of the fiscal year gave way to high market volatility and steep losses in the final quarter. The market’s volatility was the result of several factors, including concern over the slowing pace of the U.S. economy, Greek sovereign debt challenges and partisan gridlock in Washington. A second round of quantitative easing by the Federal Reserve and strengthening corporate balance sheets helped the market perform well early in the period. Attractive valuations and dividend yields (which in many cases were higher than yields offered by domestic fixed-income securities) helped drive up investor confidence, fueling increasing demand for equities. Investors who until this point had traded largely based on their appetite for risk began paying more attention to industry and company fundamentals. Equities stumbled at the end of the second quarter of 2011, as concerns about European sovereign debt, most notably in Greece, raised fears of financial system contagion and a second global recession. Additionally, unrest in the Middle East contributed to worries about the global oil supply, sending prices higher. After steadying briefly in July, the markets gave back their gains for the year in August. High market volatility continued through the remainder of the period as confidence swung wildly and investors returned to trading based on their degree of willingness to assume risk. Consumer staples, which tends to hold up well in slowing economies, was one of the best-performing sectors during the 12-month period. Financial services and basic materials stocks were among the period’s worst performers. Emerging markets suffered from efforts by China and others to cool mounting inflation, while European stock markets were hurt by concerns about sovereign debt problems in countries such as Greece. Many of our Sterling Capital funds lagged their benchmarks slightly during this fiscal year due to the challenging economic and investing climate. Strong performance from Treasuries The fixed-income market performed well during the first half of the period. The Federal Reserve’s policies to provide quantitative easing and to | | | | keep the federal funds rate low provided support for many kinds of bonds. The Treasury yield curve remained steep through the first quarter of 2011: Short-term yields remained anchored by the low federal funds rate, while long-term rates reflected the expectation for higher inflation brought about by strengthening economic growth. Concerns about European sovereign debt near the end of the third fiscal quarter drove investors to the perceived safety of the U.S. dollar and Treasuries, pushing down yields. Lower GDP numbers further contributed to the flight from risk, causing a downward shift in yields. In an ironic twist, Standard & Poor’s August downgrade of the U.S. long-term credit rating sparked a bond market rally that drove the 10-year Treasury yield close at its all-time low. Investors continued to view Treasuries as safe havens as they cut risk amid uncertainty. Our perspective Challenges to the recovery remain, as high unemployment and uncertain fiscal policy produce headwinds. We believe employment is unlikely to improve in 2011. Still, we believe that the Federal Reserve’s policies will continue to be accommodative although it is unlikely to be enough without fiscal expansion to boost economic growth and we see a likely chance of recession here and in Europe. Thank you for your confidence in the Sterling Capital Funds. We encourage you to call us with any questions at 1-800-228-1872. Sincerely, 
E.G. Purcell, III President Sterling Capital Funds 
Jeffrey J. Schappe, CFA Managing Director-Chief Investment Officer Sterling Capital Management LLC |
|
Past performance does not guarantee future results. This report is authorized for distribution only when preceded or accompanied by a prospectus. Please read the prospectus carefully before investing or sending money. Sterling Capital Management LLC (“Sterling Capital”) serves as investment advisor to the Sterling Capital Funds and is paid a fee for its services. Shares of the Sterling Capital Funds (each a “Fund” and collectively, the “Funds”) are not deposits or obligations of, or guaranteed or endorsed by, Branch Banking and Trust Company or its affiliates. The Funds are not insured by the FDIC or any other government agency. The Funds currently are distributed by Sterling Capital Distributors, Inc. The distributor is not affiliated with Branch Banking and Trust Company or its affiliates. The foregoing information and opinions are for general information only. Sterling Capital does not guarantee their accuracy or completeness, nor assume liability for any loss, which may result from the reliance by any person upon any such information or opinions. Such information and opinions are subject to change without notice, are for general information only and are not intended as an offer or solicitation with respect to the purchase or sale of any security or as offering individual or personalized investment advice. |
|
Sterling Capital Funds |
Summary of Portfolio Holdings (Unaudited) September 30, 2011 |
Each Sterling Capital Fund’s portfolio composition was as follows at September 30, 2011:
| | | | | |
| Sterling Capital Corporate Fund | | Percentage
of net assets |
Corporate Bonds | | | | 95.8 | % |
Preferred Stocks | | | | 2.0 | % |
Cash Equivalents | | | | 4.9 | % |
| | | | | |
| | | | 102.7 | % |
| | | | | |
| |
| Sterling Capital Securitized Opportunities Fund | | Percentage
of net assets |
Asset Backed Securities | | | | 5.3 | % |
Collateralized Mortgage Obligations | | | | 1.2 | % |
Commercial Mortgage-Backed Securities | | | | 14.1 | % |
Mortgage-Backed Securities | | | | 84.8 | % |
Cash Equivalents | | | | 9.1 | % |
| | | | | |
| | | | 114.5 | % |
| | | | | |
2
|
Sterling Capital Funds |
Expense Example (Unaudited) September 30, 2011 |
As a shareholder of the Sterling Capital Funds (each a “Fund” and collectively, the “Funds”), you incur two types of costs: (1) transaction costs, and (2) ongoing costs, including management fees and other Fund expenses.
These examples are intended to help you understand your ongoing costs (in dollars) of investing in the Funds and to compare these costs with the ongoing costs of investing in other mutual funds.
These examples are based on an investment of $1,000 invested at the beginning of the period and held for the entire period from June 30, 2011 (commencement of operations) through September 30, 2011.
Actual Example
The table below provides information about actual account values and actual expenses. You may use the information below, together with the amount you invested, to estimate the expenses that you paid over the period. Simply divide your account value by $1,000 (for example, an $8,600 account value divided by $1,000 = 8.6), then multiply the result by the number in the table under the heading entitled “Expenses Paid During Period” to estimate the expenses you paid on your account during this period.
| | | | | | | | | | | | | | | | | | | | |
| | | Beginning
Account Value
6/30/11 | | Ending
Account Value
9/30/11 | | Expenses Paid
During Period
6/30/11 - 9/30/11* | | Expense Ratio
During Period
6/30/11 - 9/30/11 |
Sterling Capital Corporate Fund | | | $ | 1,000.00 | | | | $ | 1,001.20 | | | | $ | 0.76 | | | | | 0.30 | % |
Sterling Capital Securitized Opportunities Fund | | | | 1,000.00 | | | | | 1,018.40 | | | | | 0.86 | | | | | 0.34 | % |
| * | Expenses are equal to the average account value over the period multiplied by the Fund’s annualized expense ratio, multiplied by 92 days divided by 365 (to reflect the period from commencement of operations). |
Hypothetical Example for Comparison Purposes
The table below provides information about hypothetical account values and hypothetical expenses based on each Sterling Capital Fund’s actual expense ratio and an assumed rate of return of 5% per year before expenses, which is not the Funds’ actual return. The hypothetical account values and expenses may not be used to estimate the actual ending account balance or expenses you paid for the period. You may use this information to compare this 5% hypothetical example with the 5% hypothetical examples that appear in the shareholder reports of other funds.
Please note that the expenses shown in the table are meant to highlight your ongoing costs only and do not reflect any transactional costs. Therefore, the table is useful in comparing ongoing costs only, and will not help you determine the relative total costs of owning different funds. In addition, if these transactional costs were included, your costs would have been higher.
| | | | | | | | | | | | | | | | | | | | |
| | | Beginning
Account Value
6/30/11 | | Ending
Account Value
9/30/11 | | Expenses Paid
During Period
6/30/11 - 9/30/11* | | Expense Ratio
During Period
6/30/11 - 9/30/11 |
Sterling Capital Corporate Fund | | | $ | 1,000.00 | | | | $ | 1,011.85 | | | | $ | 0.76 | | | | | 0.30 | % |
Sterling Capital Securitized Opportunities Fund | | | | 1,000.00 | | | | | 1,011.75 | | | | | 0.86 | | | | | 0.34 | % |
| * | Expenses are equal to the average account value over the period multiplied by the Fund’s annualized expense ratio, multiplied by 92 days divided by 365 (to reflect the period from commencement of operations). |
3
|
Sterling Capital Corporate Fund |
Schedule of Portfolio Investments September 30, 2011 |
| | | | | | |
Principal Amount | | | | Fair Value | |
CORPORATE BONDS (95.8%) | |
| | Consumer Discretionary (9.9%) | |
$190,000 | | CBS Corp., 8.875%, 5/15/19 | | $ | 242,660 | |
425,000 | | Comcast Corp., 6.500%, 1/15/17 | | | 499,170 | |
480,000 | | DIRECTV Holdings LLC, 6.000%, 8/15/40 | | | 512,306 | |
440,000 | | Home Depot, Inc., 5.875%, 12/16/36 | | | 512,244 | |
345,000 | | Macy’s Retail Holdings, Inc., 5.750%, 7/15/14 | | | 368,490 | |
310,000 | | McDonald’s Corp., MTN, 5.350%, 3/1/18 | | | 369,714 | |
455,000 | | NBCUniversal Media LLC, 5.950%, 4/1/41 | | | 506,179 | |
75,000 | | Nordstrom, Inc., 6.250%, 1/15/18 | | | 88,858 | |
515,000 | | Time Warner Cable, Inc., 5.000%, 2/1/20 | | | 547,075 | |
350,000 | | Time Warner, Inc., 6.100%, 7/15/40 | | | 384,453 | |
185,000 | | Walt Disney Co. (The), 1.350%, 8/16/16. | | | 182,433 | |
325,000 | | Walt Disney Co. (The), MTN, Series B, 6.200%, 6/20/14 | | | 367,870 | |
| | | | | | |
| | | | | 4,581,452 | |
| | | | | | |
| | Consumer Staples (9.3%) | | | | |
340,000 | | Altria Group, Inc., 9.950%, 11/10/38 | | | 484,528 | |
275,000 | | Anheuser-Busch InBev Worldwide, Inc., 4.125%, 1/15/15 | | | 298,018 | |
214,000 | | Anheuser-Busch InBev Worldwide, Inc., 6.375%, 1/15/40 | | | 284,100 | |
465,000 | | Cargill, Inc., 4.307%, 5/14/21(a) | | | 504,153 | |
412,000 | | Coca-Cola Co. (The), 3.150%, 11/15/20 | | | 425,261 | |
330,000 | | CVS Caremark Corp., 6.125%, 9/15/39 | | | 387,227 | |
440,000 | | Kraft Foods, Inc., 5.375%, 2/10/20 | | | 497,957 | |
405,000 | | Lorillard Tobacco Co., 6.875%, 5/1/20 | | | 449,116 | |
370,000 | | Procter & Gamble Co. (The), 1.450%, 8/15/16 | | | 370,033 | |
345,000 | | Wal-Mart Stores, Inc., 2.800%, 4/15/16 | | | 363,972 | |
205,000 | | Wal-Mart Stores, Inc., 5.625%, 4/15/41 | | | 252,561 | |
| | | | | | |
| | | | | 4,316,926 | |
| | | | | | |
| | Energy (9.6%) | | | | |
265,000 | | Apache Corp., 3.625%, 2/1/21 | | | 277,978 | |
500,000 | | Baker Hughes, Inc., 3.200%, 8/15/21(a) | | | 503,870 | |
385,000 | | BP Capital Markets PLC, 3.200%, 3/11/16 | | | 401,373 | |
485,000 | | Buckeye Partners LP, 4.875%, 2/1/21 | | | 499,514 | |
405,000 | | Energy Transfer Partners LP, 9.000%, 4/15/19 | | | 487,857 | |
440,000 | | Enterprise Products Operating LLC, 6.450%, 9/1/40 | | | 498,045 | |
185,000 | | Occidental Petroleum Corp., 1.750%, 2/15/17 | | | 183,609 | |
475,000 | | Plains All American Pipeline LP, 5.000%, 2/1/21 | | | 500,736 | |
300,000 | | Schlumberger Investment SA, 3.300%, 9/14/21(a) | | | 300,299 | |
385,000 | | Shell International Finance BV, 6.375%, 12/15/38 | | | 524,615 | |
215,000 | | Statoil ASA, 5.100%, 8/17/40 | | | 251,178 | |
| | | | | | |
| | | | | 4,429,074 | |
| | | | | | |
| | Financials (37.8%) | | | | |
205,000 | | Abbey National Treasury Services PLC, 4.000%, 4/27/16 | | | 189,244 | |
315,000 | | ACE INA Holdings, Inc., 5.900%, 6/15/19 | | | 367,487 | |
395,000 | | Aflac, Inc., 8.500%, 5/15/19 | | | 480,812 | |
420,000 | | American Express Co., 7.250%, 5/20/14 | | | 476,009 | |
150,000 | | American International Group, Inc., 4.875%, 9/15/16 | | | 143,805 | |
360,000 | | ANZ National International, Ltd., 3.125%, 8/10/15(a) | | | 361,641 | |
290,000 | | Bank of America Corp., 4.875%, 1/15/13 | | | 288,990 | |
250,000 | | Bank of Nova Scotia, 4.375%, 1/13/21 | | | 272,810 | |
| | | | | | |
Principal Amount | | | | Fair Value | |
CORPORATE BONDS — (continued) | | | | |
| | Financials — (continued) | |
$390,000 | | Caterpillar Financial Services Corp., MTN, 7.150%, 2/15/19 | | $ | 501,288 | |
405,000 | | Citigroup, Inc., 6.010%, 1/15/15 | | | 430,428 | |
235,000 | | Citigroup, Inc., 6.875%, 3/5/38 | | | 255,145 | |
465,000 | | Colonial Realty LP, 6.250%, 6/15/14 | | | 493,664 | |
395,000 | | Credit Suisse AG, 5.400%, 1/14/20 | | | 379,480 | |
355,000 | | Ford Motor Credit Co. LLC, 7.000%, 4/15/15 | | | 372,750 | |
940,000 | | General Electric Capital Corp., 4.375%, 9/21/15 | | | 999,200 | |
430,000 | | General Electric Capital Corp., GMTN, 6.875%, 1/10/39 | | | 493,529 | |
355,000 | | Goldman Sachs Group, Inc. (The), 5.450%, 11/1/12 | | | 365,951 | |
525,000 | | Goldman Sachs Group, Inc. (The), 6.125%, 2/15/33 | | | 527,132 | |
510,000 | | HSBC Finance Corp., 6.676%, 1/15/21(a) | | | 501,239 | |
625,000 | | ING Bank NV, 2.650%, 1/14/13(a) | | | 620,923 | |
305,000 | | Jefferies Group, Inc., 8.500%, 7/15/19 | | | 339,215 | |
185,000 | | John Deere Capital Corp., MTN, 1.850%, 9/15/16 | | | 184,060 | |
485,000 | | JPMorgan Chase & Co., 3.700%, 1/20/15 | | | 496,959 | |
725,000 | | JPMorgan Chase & Co., 4.350%, 8/15/21 | | | 732,616 | |
490,000 | | KeyCorp, MTN, 3.750%, 8/13/15 | | | 504,777 | |
375,000 | | Macquarie Bank, Ltd., 6.625%, 4/7/21(a) | | | 352,298 | |
100,000 | | Merrill Lynch & Co., Inc., 6.750%, 6/1/28 | | | 94,643 | |
400,000 | | Merrill Lynch & Co., Inc., MTN, 6.875%, 4/25/18 | | | 400,144 | |
315,000 | | MetLife, Inc., 6.750%, 6/1/16 | | | 362,289 | |
830,000 | | Morgan Stanley, MTN, 6.625%, 4/1/18 | | | 823,411 | |
345,000 | | National Rural Utilities Cooperative Finance Corp., 10.375%, 11/1/18 | | | 495,717 | |
350,000 | | PNC Bank N.A., BKNT, 4.875%, 9/21/17 | | | 368,789 | |
195,000 | | Prudential Financial, Inc., 8.875%, 6/15/38(b) | | | 210,356 | |
230,000 | | Prudential Financial, Inc., Series MTN, 5.625%, 5/12/41 | | | 218,107 | |
265,000 | | Raymond James Financial, Inc., 4.250%, 4/15/16 | | | 267,738 | |
200,000 | | Reinsurance Group of America, Inc., 5.000%, 6/1/21 | | | 209,698 | |
200,000 | | SL Green Realty Corp., REIT, 5.000%, 8/15/18 | | | 193,299 | |
750,000 | | U.S. Bank N.A., 3.778%, 4/29/20(b) | | | 759,484 | |
450,000 | | Ventas Realty LP, REIT, 4.750%, 6/1/21 | | | 432,168 | |
505,000 | | Wachovia Corp., 5.500%, 8/1/35 | | | 497,052 | |
495,000 | | WEA Finance LLC, 4.625%, 5/10/21(a) | | | 472,676 | |
480,000 | | Wells Fargo & Co., 3.676%, 6/15/16 | | | 499,501 | |
101,000 | | XL Group, Ltd., 5.750%, 10/1/21 | | | 100,711 | |
| | | | | | |
| | | | | 17,537,235 | |
| | | | | | |
| | Health Care (6.5%) | | | | |
320,000 | | Abbott Laboratories, 5.125%, 4/1/19 | | | 377,331 | |
415,000 | | Amgen, Inc., 5.850%, 6/1/17 | | | 494,443 | |
300,000 | | DENTSPLY International, Inc., 2.750%, 8/15/16 | | | 302,066 | |
158,000 | | Stryker Corp., 2.000%, 9/30/16 | | | 158,762 | |
475,000 | | Teva Pharmaceutical Finance II BV, 3.000%, 6/15/15 | | | 497,919 | |
470,000 | | Thermo Fisher Scientific, Inc., 3.200%, 3/1/16 | | | 493,706 | |
470,000 | | WellPoint, Inc., 4.350%, 8/15/20 | | | 497,328 | |
165,000 | | Wyeth, 5.500%, 2/1/14 | | | 181,646 | |
| | | | | | |
| | | | | 3,003,201 | |
| | | | | | |
Continued
4
|
Sterling Capital Corporate Fund |
Schedule of Portfolio Investments — (continued) September 30, 2011 |
| | | | | | |
Principal Amount | | | | Fair Value | |
CORPORATE BONDS — (continued) | |
| | Industrials (5.6%) | | | | |
| $675,000 | | Burlington Northern Santa Fe LLC, 4.700%, 10/1/19 | | $ | 752,018 | |
| 100,000 | | Corrections Corp. of America, 6.250%, 3/15/13 | | | 100,000 | |
| 350,000 | | Republic Services, Inc., 3.800%, 5/15/18 | | | 363,939 | |
| 245,000 | | Textron, Inc., 4.625%, 9/21/16 | | | 247,995 | |
| 345,000 | | Tyco International Finance SA, 4.125%, 10/15/14 | | | 366,768 | |
| 445,000 | | Verisk Analytics, Inc., 5.800%, 5/1/21 | | | 499,580 | |
| 245,000 | | Waste Management, Inc., 2.600%, 9/1/16 | | | 245,581 | |
| | | | | | |
| | | | | 2,575,881 | |
| | | | | | |
| | Information Technology (3.3%) | | | | |
| 485,000 | | Applied Materials, Inc., 4.300%, 6/15/21 | | | 505,366 | |
| 370,000 | | Hewlett-Packard Co., 1.550%, 5/30/14 | | | 367,631 | |
| 145,000 | | Intel Corp., 4.800%, 10/1/41 | | | 155,867 | |
| 300,000 | | International Business Machines Corp., 1.000%, 8/5/13 | | | 302,162 | |
| 168,000 | | Oracle Corp., 5.375%, 7/15/40(a) | | | 194,880 | |
| | | | | | |
| | | | | 1,525,906 | |
| | | | | | |
| | Materials (4.4%) | | | | |
| 185,000 | | Alcoa, Inc., 5.550%, 2/1/17 | | | 193,396 | |
| 155,000 | | ArcelorMittal, 9.850%, 6/1/19 | | | 175,626 | |
| 130,000 | | Bemis Co., Inc., 4.500%, 10/15/21 | | | 131,563 | |
| 495,000 | | Dow Chemical Co. (The), 4.250%, 11/15/20 | | | 497,659 | |
| 250,000 | | International Paper Co., 7.500%, 8/15/21 | | | 289,130 | |
| 365,000 | | Rio Tinto Finance USA, Ltd., 5.200%, 11/2/40 | | | 392,543 | |
| 215,000 | | Sealed Air Corp., 6.875%, 7/15/33(a) | | | 186,885 | |
| 160,000 | | Vale Overseas, Ltd., 6.875%, 11/21/36 | | | 172,576 | |
| | | | | | |
| | | | | 2,039,378 | |
| | | | | | |
| | Telecommunication Services (5.1%) | |
| 320,000 | | AT&T, Inc., 5.500%, 2/1/18 | | | 369,370 | |
| 200,000 | | AT&T, Inc., 3.875%, 8/15/21 | | | 205,732 | |
| 255,000 | | British Telecommunications PLC, 9.875%, 12/15/30 | | | 368,919 | |
| 90,000 | | Crown Castle International Corp., 9.000%, 1/15/15 | | | 95,400 | |
| 195,000 | | France Telecom SA, 4.125%, 9/14/21 | | | 193,848 | |
| 295,000 | | Telecom Italia Capital SA, 5.250%, 10/1/15 | | | 281,248 | |
| 375,000 | | Telefonica Emisiones SAU, 3.992%, 2/16/16 | | | 356,822 | |
| 410,000 | | Verizon Communications, Inc., 6.350%, 4/1/19 | | | 493,037 | |
| | | | | | |
| | | | | 2,364,376 | |
| | | | | | |
| | Utilities (4.3%) | | | | |
| 285,000 | | Alabama Power Co., Series 07-D, 4.850%, 12/15/12 | | | 298,152 | |
| 270,000 | | Columbus Southern Power Co., Series D, 6.600%, 3/1/33 | | | 345,196 | |
| 410,000 | | Duke Energy Carolinas LLC, 6.100%, 6/1/37 | | | 516,518 | |
| 250,000 | | Georgia Power Co., 1.300%, 9/15/13 | | | 251,662 | |
| 125,000 | | PSEG Power LLC, 2.750%, 9/15/16 | | | 124,438 | |
| | | | | | |
Principal Amount | | | | Fair Value | |
CORPORATE BONDS — (continued) | |
| | Utilities — (continued) | | | | |
| $395,000 | | Virginia Electric and Power Co., 5.400%, 4/30/18 | | $ | 465,094 | |
| | | | | | |
| | | | | 2,001,060 | |
| | | | | | |
| | Total Corporate Bonds
(Cost $44,707,308) | | | 44,374,489 | |
| | | | | | |
| | |
Shares | | | | | |
PREFERRED STOCKS (2.0%) | |
| | Financials (1.5%) | | | | |
| 7,200 | | Citigroup Capital XIII, 7.875% | | | 190,152 | |
| 12,000 | | Fifth Third Capital Trust VI, 7.250% | | | 302,160 | |
| 8,000 | | Public Storage, REIT, 7.000% | | | 205,520 | |
| | | | | | |
| | | | | 697,832 | |
| | | | | | |
| | Telecommunication Services (0.5%) | |
| 8,000 | | Qwest Corp., 7.375% | | | 200,720 | |
| | | | | | |
| | Total Preferred Stocks
(Cost $919,392) | | | 898,552 | |
| | | | | | |
|
INVESTMENT COMPANY (4.9%) | |
| 2,287,857 | | Federated Treasury Obligations Fund, Institutional Shares | | | 2,287,857 | |
| | | | | | |
| | Total Investment Company
(Cost $2,287,857) | | | 2,287,857 | |
| | | | | | |
Total Investments — 102.7%
(Cost $47,914,557) | | | 47,560,898 | |
Net Other Assets (Liabilities) — (2.7)% | | | (1,232,496 | ) |
| | | | | | |
NET ASSETS — 100.0% | | $ | 46,328,402 | |
| | | | | | |
| (a) | Rule 144A, Section 4(2) or other security which is restricted as to resale to qualified institutional investors. The Investment Advisor, using Board approved procedures, has deemed these securities or a portion of these securities to be liquid. |
| (b) | The interest rate for this variable rate note, which will change periodically, is based either on the prime rate or an index of market rates. The reflected rate is in effect as of September 30, 2011. The maturity date reflected is the final maturity date. |
BKNT — Bank Note
GMTN — Global Medium Term Note
MTN — Medium Term Note
REIT — Real Estate Investment Trust
See accompanying notes to the financial statements.
5
|
Sterling Capital Securitized Opportunities Fund |
Schedule of Portfolio Investments September 30, 2011 |
| | | | | | |
Principal Amount | | | | Fair Value | |
ASSET BACKED SECURITIES (5.3%) | | | | |
$325,000 | | American Express Credit Account Master Trust, Series 2009-2, Class A, 1.479%, 3/15/17(a)(b) | | $ | 335,173 | |
| 310,000 | | Bank of America Credit Card Trust, Series 2008-A7, Class A7, 0.929%, 12/15/14(a)(b) | | | 311,545 | |
| 381,000 | | Capital One Multi-Asset Execution Trust, Series 2006-A5, Class A5, 0.289%, 1/15/16(a)(b) | | | 380,068 | |
| 433,000 | | Chase Issuance Trust, Series 2008-A6, Class A6, 1.429%, 5/15/15(a)(b) | | | 440,803 | |
| 330,000 | | MBNA Credit Card Master Note Trust, Series 2006-A2, Class A2, 0.289%, 6/15/15(a)(b) | | | 329,912 | |
| | | | | | |
| | Total Asset Backed Securities
(Cost $1,798,781) | | | 1,797,501 | |
| | | | | | |
COLLATERALIZED MORTGAGE OBLIGATIONS (1.2%) | | | | |
| 273,410 | | Countrywide Home Loans Mortgage Pass Through Trust, Series 2003-J7, Class 1A3, 5.250%, 8/25/33 | | | 281,060 | |
| 140,567 | | Credit Suisse First Boston Mortgage Securities Corp., Series 2005-7, Class 4A3, 5.000%, 8/25/20 | | | 142,467 | |
| | | | | | |
| | Total Collateralized Mortgage Obligations
(Cost $423,417) | | | 423,527 | |
| | | | | | |
COMMERCIAL MORTGAGE-BACKED SECURITIES (14.1%) | | | | |
| 300,000 | | Banc of America Merrill Lynch Commercial Mortgage, Inc., Series 2005-1, Class A5, 5.330%, 11/10/42(a)(b) | | | 325,516 | |
| 355,000 | | Banc of America Merrill Lynch Commercial Mortgage, Inc., Series 2006-3, Class A4, 5.889%, 7/10/44(a)(b) | | | 382,608 | |
| 188,846 | | Banc of America Merrill Lynch Commercial Mortgage, Inc., Series 2007-2, Class A2, 5.634%, 4/10/49(a) | | | 191,418 | |
| 300,000 | | Bear Stearns Commercial Mortgage Securities, Series 2005-PW10, Class A4, 5.405%, 12/11/40(a) | | | 324,458 | |
| 300,000 | | Bear Stearns Commercial Mortgage Securities, Series 2005-PWR8, Class A4, 4.674%, 6/11/41(b) | | | 318,752 | |
| 250,000 | | Bear Stearns Commercial Mortgage Securities, Series 2007-PW18, Class A4, 5.700%, 6/11/50(b) | | | 269,140 | |
| 300,000 | | Citigroup/Deutsche Bank Commercial Mortgage Trust, Series 2006-CD3, Class A5, 5.617%, 10/15/48(b) | | | 315,425 | |
| 180,000 | | Greenwich Capital Commercial Funding Corp., Series 2007-GG9, Class A4, 5.444%, 3/10/39(b) | | | 186,643 | |
| 300,000 | | JPMorgan Chase Commercial Mortgage Securities Corp., Series 2006-CB15, Class A4, 5.814%, 6/12/43(a)(b) | | | 319,763 | |
| 300,000 | | JPMorgan Chase Commercial Mortgage Securities Corp., Series 2006-LDP7, Class A4, 6.072%, 4/15/45(a)(b) | | | 329,756 | |
| 345,000 | | JPMorgan Chase Commercial Mortgage Securities Corp., Series 2007-LDPX, Class A3, 5.420%, 1/15/49(b) | | | 357,706 | |
| | | | | | |
Principal
Amount | | | | Fair Value | |
COMMERCIAL MORTGAGE-BACKED SECURITIES — (continued) | | | | |
$300,000 | | LB-UBS Commercial Mortgage Trust, Series 2005-C2, Class A5, 5.150%, 4/15/30(a)(b) | | $ | 324,220 | |
| 300,000 | | LB-UBS Commercial Mortgage Trust, Series 2007-C1, Class A4, 5.424%, 2/15/40(b) | | | 316,622 | |
| 240,000 | | Morgan Stanley Capital I, Series 2006-HQ10, Class A4, 5.328%, 11/12/41(b) | | | 257,921 | |
| 160,000 | | Morgan Stanley Capital I, Series 2006-HQ8, Class AM, 5.647%, 3/12/44(a)(b) | | | 158,289 | |
| 400,000 | | Wachovia Bank Commercial Mortgage Trust, Series 2005-C20, Class AMFX, 5.179%, 7/15/42(a)(b) | | | 410,617 | |
| | | | | | |
| | Total Commercial Mortgage-Backed Securities (Cost $4,878,693) | | | 4,788,854 | |
| | | | | | |
MORTGAGE-BACKED SECURITIES (84.8%) | |
| | Fannie Mae(c) (37.5%) | | | | |
| 542,907 | | 4.500%, 6/1/24, Pool #931412 | | | 578,163 | |
| 110,151 | | 4.000%, 10/1/25, Pool #MA0535 | | | 116,323 | |
| 528,740 | | 3.500%, 2/1/26, Pool #AH6973 | | | 552,932 | |
| 246,341 | | 4.000%, 2/1/26, Pool #AH4828 | | | 260,145 | |
| 385,737 | | 3.500%, 3/1/26, Pool #AH9032 | | | 403,386 | |
| 469,868 | | 4.000%, 3/1/26, Pool #AH6827 | | | 496,196 | |
| 523,896 | | 3.500%, 4/1/26, Pool #AI1242 | | | 547,867 | |
| 472,079 | | 5.500%, 3/1/37, Pool #256636 | | | 513,637 | |
| 437,693 | | 6.000%, 10/1/37, Pool #943635 | | | 481,080 | |
| 953,350 | | 5.000%, 5/1/38, Pool #933806 | | | 1,026,619 | |
| 467,494 | | 5.500%, 5/1/38, Pool #889452 | | | 508,063 | |
| 758,111 | | 5.500%, 6/1/38, Pool #984277 | | | 824,848 | |
| 430,937 | | 6.000%, 8/1/38, Pool #964874 | | | 473,385 | |
| 398,687 | | 6.000%, 9/1/38, Pool #190391 | | | 437,957 | |
| 273,207 | | 5.500%, 11/1/38, Pool #930175 | | | 296,916 | |
| 478,443 | | 5.000%, 1/1/39, Pool #995245 | | | 515,587 | |
| 542,949 | | 4.500%, 6/1/39, Pool #AA7681 | | | 576,742 | |
| 546,809 | | 4.500%, 9/1/39, Pool #AC1830 | | | 580,843 | |
| 494,108 | | 5.000%, 12/1/39, Pool #AC8518 | | | 532,082 | |
| 543,137 | | 4.500%, 6/1/40, Pool #AD6432 | | | 576,941 | |
| 540,385 | | 4.500%, 7/1/40, Pool #AB1250 | | | 574,018 | |
| 299,694 | | 4.500%, 9/1/40, Pool #AE0411 | | | 319,564 | |
| 387,803 | | 4.000%, 1/1/41, Pool #AH4732 | | | 407,472 | |
| 86,586 | | 4.000%, 2/1/41, Pool #AH6188 | | | 91,140 | |
| 419,324 | | 4.500%, 6/1/41, Pool #AC9298 | | | 445,423 | |
| 532,000 | | 4.500%, 10/15/41(d) | | | 564,336 | |
| | | | | | |
| | | | | 12,701,665 | |
| | | | | | |
| | Freddie Mac(c) (31.0%) | | | | |
| 492,214 | | 3.500%, 1/1/26, Pool #J13878 | | | 513,589 | |
| 512,134 | | 4.000%, 4/1/26, Pool #J15161 | | | 539,622 | |
| 400,399 | | 4.000%, 6/1/26, Pool #G18391 | | | 421,890 | |
| 268,676 | | 3.500%, 7/1/26, Pool #J16057 | | | 280,428 | |
| 181,588 | | 6.000%, 2/1/37, Pool #G02681 | | | 199,844 | |
| 464,038 | | 6.000%, 11/1/37, Pool #G03940 | | | 509,673 | |
| 525,774 | | 5.000%, 10/1/38, Pool #G04832 | | | 565,130 | |
| 406,031 | | 5.500%, 1/1/39, Pool #G05179 | | | 440,696 | |
| 524,887 | | 5.000%, 2/1/39, Pool #G05253 | | | 563,603 | |
| 424,836 | | 5.500%, 10/1/39, Pool #A89387 | | | 460,376 | |
| 512,158 | | 5.000%, 4/1/40, Pool #A91812 | | | 553,296 | |
| 402,337 | | 5.500%, 4/1/40, Pool #C03467 | | | 436,687 | |
| 439,006 | | 5.500%, 6/1/40, Pool #A92764 | | | 475,458 | |
| 551,403 | | 5.000%, 8/1/40, Pool #C03491 | | | 592,677 | |
| 416,637 | | 4.000%, 11/1/40, Pool #A95085 | | | 436,775 | |
Continued
6
|
Sterling Capital Securitized Opportunities Fund |
Schedule of Portfolio Investments — (continued) September 30, 2011 |
| | | | | | |
Principal Amount | | | | Fair Value | |
MORTGAGE-BACKED SECURITIES — (continued) | |
| | Freddie Mac(c) — (continued) | | | | |
| $532,398 | | 4.000%, 12/1/40, Pool #A95447 | | | $ 559,628 | |
| 548,669 | | 4.500%, 2/1/41, Pool #G08435 | | | 580,849 | |
| 560,418 | | 5.000%, 4/1/41, Pool #A97944 | | | 603,856 | |
| 558,732 | | 4.500%, 6/1/41, Pool #Q01443 | | | 591,503 | |
| 555,206 | | 4.500%, 6/1/41, Pool #Q01637 | | | 587,769 | |
| 560,518 | | 5.000%, 6/1/41, Pool #Q01226 | | | 603,263 | |
| | | | | | |
| | | | | 10,516,612 | |
| | | | | | |
| | Ginnie Mae (16.3%) | | | | |
| 51,478 | | 5.500%, 11/15/38, Pool #411080 | | | 56,917 | |
| 483,353 | | 5.000%, 12/15/38, Pool #782483 | | | 531,407 | |
| 530,893 | | 4.500%, 6/15/39, Pool #720075 | | | 579,019 | |
| 271,444 | | 4.500%, 10/15/40, Pool #737536 | | | 296,051 | |
| 56,652 | | 4.000%, 12/20/40, Pool #755678 | | | 60,730 | |
| 528,320 | | 4.500%, 3/15/41, Pool #738121 | | | 576,214 | |
| 448,489 | | 4.500%, 3/20/41, Pool #4978 | | | 486,903 | |
| 486,180 | | 5.000%, 4/20/41, Pool #5018 | | | 534,717 | |
| 507,153 | | 4.500%, 5/15/41, Pool #738310 | | | 553,127 | |
| 531,159 | | 4.500%, 6/20/41, Pool #5082 | | | 576,654 | |
| 662,000 | | 5.000%, 10/15/41(d) | | | 726,959 | |
| 494,000 | | 5.500%, 10/15/41(d) | | | 545,716 | |
| | | | | | |
| | | | | 5,524,414 | |
| | | | | | |
| | Total Mortgage-Backed Securities (Cost $28,351,517) | | | 28,742,691 | |
| | | | | | |
| | |
Shares | | | | | |
INVESTMENT COMPANY (9.1%) | | | | |
| 3,072,825 | | Federated Treasury Obligations Fund,
Institutional Shares | | | 3,072,825 | |
| | | | | | |
| | Total Investment Company
(Cost $3,072,825) | | | 3,072,825 | |
| | | | | | |
Total Investments — 114.5%
(Cost $38,525,233) | | | 38,825,398 | |
Net Other Assets (Liabilities) — (14.5)% | | | (4,920,494 | ) |
| | | | | | |
NET ASSETS — 100.0% | | | $33,904,904 | |
| | | | | | |
| (a) | The interest rate for this variable rate note, which will change periodically, is based either on the prime rate or an index of market rates. The reflected rate is in effect as of September 30, 2011. The maturity date reflected is the final maturity date. |
| (b) | Represents that all or a portion of the security was pledged as collateral for securities purchased on a when-issued basis. |
| (c) | On September 7, 2008, the Federal Housing Finance Agency (FHFA) placed Fannie Mae and Freddie Mac into conservatorship with FHFA as the conservator. The conservatorship is a statutory process designed to stabilize a troubled institution with the objective of returning the entities to normal business operations. |
| (d) | Represents securities purchased on a when-issued basis. At September 30, 2011, total cost of investments purchased on a when-issued basis was $1,843,474. |
See accompanying notes to the financial statements.
7
|
Sterling Capital Funds |
Statements of Assets and Liabilities September 30, 2011 |
| | | | | | | | | | |
| | | Sterling Capital
Corporate Fund | | Sterling Capital
Securitized
Opportunities Fund |
Assets: | | | | | | | | | | |
Investments: | | | | | | | | | | |
Total investments, at cost | | | | $47,914,557 | | | | | $38,525,233 | |
Unrealized appreciation (depreciation) | | | | (353,659 | ) | | | | 300,165 | |
| | | | | | | | | | |
Investments, at fair value | | | | 47,560,898 | | | | | 38,825,398 | |
Interest and dividends receivable | | | | 576,523 | | | | | 116,986 | |
Receivable for capital shares issued | | | | 589,812 | | | | | — | |
| | | | | | | | | | |
Total Assets | | | | 48,727,233 | | | | | 38,942,384 | |
| | | | | | | | | | |
Liabilities: | | | | | | | | | | |
Distributions payable | | | | 23,240 | | | | | — | |
Payable for investments purchased | | | | 2,232,186 | | | | | 4,958,748 | |
Payable for capital shares redeemed | | | | 133,542 | | | | | 68,374 | |
Accrued expenses and other payables: | | | | | | | | | | |
Investment advisory fees | | | | 4,952 | | | | | 4,102 | |
Compliance service fees | | | | 29 | | | | | 33 | |
Other fees | | | | 4,882 | | | | | 6,223 | |
| | | | | | | | | | |
Total Liabilities | | | | 2,398,831 | | | | | 5,037,480 | |
| | | | | | | | | | |
Net Assets: | | | | $46,328,402 | | | | | $33,904,904 | |
| | | | | | | | | | |
Net Assets Consist of: | | | | | | | | | | |
Capital | | | | $46,666,021 | | | | | $33,572,275 | |
Accumulated undistributed net investment income | | | | 3,528 | | | | | 5,892 | |
Accumulated realized gain | | | | 12,512 | | | | | 26,572 | |
Net unrealized appreciation (depreciation) | | | | (353,659 | ) | | | | 300,165 | |
| | | | | | | | | | |
Net Assets | | | | $46,328,402 | | | | | $33,904,904 | |
| | | | | | | | | | |
Shares of Beneficial Interest Outstanding (Unlimited number of shares authorized, no par value) | | | | 4,659,241 | | | | | 3,353,906 | |
| | | | | | | | | | |
Net Asset Value — offering and redemption price per share | | | $ | 9.94 | | | | $ | 10.11 | |
| | | | | | | | | | |
See accompanying notes to the financial statements.
8
|
Sterling Capital Funds |
Statements of Operations For the Period June 30, 2011* to September 30, 2011 |
| | | | | | | | | | |
| | | Sterling Capital
Corporate Fund | | Sterling Capital
Securitized
Opportunities Fund |
Investment Income: | | | | | | | | | | |
Interest income | | | | $ 223,830 | | | | | $214,082 | |
Dividend income | | | | 15,941 | | | | | 102 | |
| | | | | | | | | | |
Total investment income | | | | 239,771 | | | | | 214,184 | |
| | | | | | | | | | |
Expenses: | | | | | | | | | | |
Investment advisory fees (See Note 4) | | | | 26,845 | | | | | 30,141 | |
Administration fees (See Note 4) | | | | 3,372 | | | | | 3,789 | |
Audit fees | | | | 695 | | | | | 2,385 | |
Compliance service fees (See Note 4) | | | | 69 | | | | | 90 | |
Custodian fees | | | | 205 | | | | | 310 | |
Fund accounting fees (See Note 4) | | | | 671 | | | | | 753 | |
Legal fees | | | | 2,302 | | | | | 4,253 | |
Printing fees | | | | 3,000 | | | | | 3,000 | |
Transfer agent fees (See Note 4) | | | | 1,033 | | | | | 2,324 | |
Other fees | | | | 716 | | | | | 1,037 | |
| | | | | | | | | | |
Total expenses before waivers/reimbursements | | | | 38,908 | | | | | 48,082 | |
| | | | | | | | | | |
Less expenses waived/reimbursed by the Investment Advisor (See Note 4) | | | | (18,708 | ) | | | | (22,408 | ) |
| | | | | | | | | | |
Net expenses | | | | 20,200 | | | | | 25,674 | |
| | | | | | | | | | |
Net investment income | | | | 219,571 | | | | | 188,510 | |
| | | | | | | | | | |
Realized and Unrealized Gain (Loss): | | | | | | | | | | |
Net realized gain from investment transactions | | | | 12,512 | | | | | 82,425 | |
Change in unrealized appreciation/depreciation on investments | | | | (353,659 | ) | | | | 300,165 | |
| | | | | | | | | | |
Net realized and unrealized gain (loss) | | | | (341,147 | ) | | | | 382,590 | |
| | | | | | | | | | |
Change in net assets from operations | | | | $(121,576 | ) | | | | $571,100 | |
| | | | | | | | | | |
| * | Commencement of operations. |
See accompanying notes to the financial statements.
9
|
Sterling Capital Funds |
Statements of Changes in Net Assets |
| | | | | | | | | | |
| | | Sterling Capital
Corporate Fund | | Sterling Capital
Securitized
Opportunities Fund |
| | |
| | | For the Period
June 30, 2011* to
September 30, 2011 | | For the Period
June 30, 2011* to
September 30, 2011 |
From Investment Activities: | | | | | | | | | | |
Operations: | | | | | | | | | | |
Net investment income | | | $ | 219,571 | | | | $ | 188,510 | |
Net realized gain | | | | 12,512 | | | | | 82,425 | |
Change in unrealized appreciation/depreciation | | | | (353,659 | ) | | | | 300,165 | |
| | | | | | | | | | |
Change in net assets from operations | | | | (121,576 | ) | | | | 571,100 | |
| | | | | | | | | | |
Distributions to Shareholders: | | | | | | | | | | |
Net investment income | | | | (216,043 | ) | | | | (238,471 | ) |
| | | | | | | | | | |
Change in net assets from shareholders distributions | | | | (216,043 | ) | | | | (238,471 | ) |
| | | | | | | | | | |
Capital Transactions: | | | | | | | | | | |
Proceeds from shares issued | | | | 48,932,269 | | | | | 35,993,815 | |
Distributions reinvested | | | | 162,438 | | | | | 238,471 | |
Value of shares redeemed | | | | (2,428,686 | ) | | | | (2,660,011 | ) |
| | | | | | | | | | |
Change in net assets from capital transactions | | | | 46,666,021 | | | | | 33,572,275 | |
| | | | | | | | | | |
Change in net assets | | | | 46,328,402 | | | | | 33,904,904 | |
Net Assets: | | | | | | | | | | |
Beginning of period | | | | — | | | | | — | |
| | | | | | | | | | |
End of period | | | $ | 46,328,402 | | | | $ | 33,904,904 | |
| | | | | | | | | | |
Accumulated undistributed net investment income | | | $ | 3,528 | | | | $ | 5,892 | |
| | | | | | | | | | |
Share Transactions: | | | | | | | | | | |
Issued | | | | 4,885,779 | | | | | 3,592,923 | |
Reinvested | | | | 16,297 | | | | | 23,581 | |
Redeemed | | | | (242,835 | ) | | | | (262,598 | ) |
| | | | | | | | | | |
Change in Shares | | | | 4,659,241 | | | | | 3,353,906 | |
| | | | | | | | | | |
| * | Commencement of operations. |
See accompanying notes to the financial statements.
10
|
Sterling Capital Funds |
Financial Highlights, Class S Shares |
The financial highlights table is intended to help you understand the Funds’ financial performance for the past 5 years or, if shorter, the period of the Funds’ operations. Certain information reflects financial results for a single Fund share. The total returns in the table represent the rate that an investor would have earned (or lost) on an investment in the Fund (assuming reinvestment of all dividends and distributions).
| | | | | |
Sterling Capital Corporate Fund | | | | | |
| | | For the Period
June 30, 2011* to
September 30, 2011 |
Net Asset Value, Beginning of Period | | | $ | 10.00 | |
| | | | | |
Investment Activities: | | | | | |
Net investment income(a) | | | | 0.08 | |
Net realized and unrealized losses from investments | | | | (0.07 | ) |
| | | | | |
Total from Investment Activities | | | | 0.01 | |
| | | | | |
Distributions: | | | | | |
Net investment income | | | | (0.07 | ) |
| | | | | |
Net Asset Value, End of Period | | | $ | 9.94 | |
| | | | | |
Total Return(b) | | | | 0.12 | % |
Ratios/Supplementary Data: | | | | | |
Net Assets, End of Period (000’s) | | | $ | 46,328 | |
Ratio of net expenses to average net assets(c) | | | | 0.30 | % |
Ratio of net investment income to average net assets(c) | | | | 3.27 | % |
Ratio of expenses to average net assets(c)(d) | | | | 0.58 | % |
Portfolio turnover rate(b) | | | | 7 | % |
| |
Sterling Capital Securitized Opportunities Fund | | | | | |
| | | For the Period
June 30, 2011* to
September 30, 2011 |
Net Asset Value, Beginning of Period | | | $ | 10.00 | |
| | | | | |
Investment Activities: | | | | | |
Net investment income(a) | | | | 0.06 | |
Net realized and unrealized gains from investments | | | | 0.12 | |
| | | | | |
Total from Investment Activities | | | | 0.18 | |
| | | | | |
Distributions: | | | | | |
Net investment income | | | | (0.07 | ) |
| | | | | |
Net Asset Value, End of Period | | | $ | 10.11 | |
| | | | | |
Total Return(b) | | | | 1.84 | % |
Ratios/Supplementary Data: | | | | | |
Net Assets, End of Period (000’s) | | | $ | 33,905 | |
Ratio of net expenses to average net assets(c) | | | | 0.34 | % |
Ratio of net investment income to average net assets(c) | | | | 2.50 | % |
Ratio of expenses to average net assets(c)(d) | | | | 0.64 | % |
Portfolio turnover rate(b) | | | | 26 | % |
| * | Commencement of operations. |
| (a) | Per share net investment income has been calculated using the average daily shares method. |
| (b) | Not annualized for periods less than one year. |
| (c) | Annualized for periods less than one year. |
| (d) | During the period certain fees were reduced. If such reductions had not occurred, the ratios would have been as indicated. |
See accompanying notes to the financial statements.
11
|
Sterling Capital Funds |
Notes to Financial Statements September 30, 2011 |
Sterling Capital Corporate Fund and Sterling Capital Securitized Opportunities Fund (each a “Fund” and collectively as the “Funds”) commenced operations on June 30, 2011. The Funds are separate series of the Sterling Capital Funds (formerly known as BB&T Funds) (the “Trust”), a Massachusetts business trust organized in 1992 and registered under the Investment Company Act of 1940 (“the 1940 Act”) as an open-end investment company. The Funds are authorized to issue an unlimited amount of shares. The Funds offer one class of Shares, Class S Shares. Class S Shares are available to customers of Sterling Capital Management LLC (“Sterling Capital”) or its affiliates. The funds are “diversified” funds, as defined in the 1940 Act.
Under the Trust’s organizational documents, its Officers and Trustees are indemnified against certain liabilities arising out of the performance of their duties to the Trust. In addition, in the normal course of business, the Funds may enter into contracts with their vendors and others that provide for general indemnifications. The Funds’ maximum exposure under these arrangements is unknown as this would involve future claims that may be made against the Funds. However, based on experience of the Trust, the Funds expect that risk of loss to be remote.
| 2. | Significant Accounting Policies: |
The following is a summary of significant accounting policies followed by the Funds in the preparation of their financial statements. The policies are in conformity with United States generally accepted accounting principles (“U.S. GAAP”). The preparation of the financial statements requires management to make estimates and assumptions that affect the reported amounts of assets and liabilities and disclosure of contingent assets and liabilities at the date of the financial statements and the reported amounts of income and expenses for the reporting period. Actual results could differ from those estimates.
Securities Valuation — Investments in securities held by the Funds, the principal market for which is a securities exchange or an over-the-counter market, are valued at their latest available sale price (except for those securities that are traded on NASDAQ, which will be valued at the NASDAQ official closing price) or in the absence of such a price, by reference to the latest available bid price in the principal market in which such securities are normally traded. The Funds may also use an independent pricing service approved by the Board of Trustees (the “Board”) to value certain securities, including through the use of electronic and matrix techniques. Short-term obligations without significant credit risk that mature in 60 days or less are valued at either amortized cost or original cost plus interest, which approximates fair value. Investments in open-end investment companies, are valued at their respective net asset values as reported by such companies. The differences between cost and fair values of investments are reflected as either unrealized appreciation or depreciation. Securities for which market quotations are not readily available or deemed unreliable (e.g., an approved pricing service does not provide a price, a furnished price is in error, certain stale prices, or an event occurs that materially affects the furnished price) will be fair valued in accordance with procedures established in good faith under the general supervision of the Board. No securities were valued in accordance with these procedures as of September 30, 2011.
Fair Value Measurements — The objective of a fair value measurement is to determine the price that would be received to sell an asset or paid to transfer a liability in an orderly transaction between market participants at the measurement date (an exit price). Accordingly, the fair value hierarchy gives the highest priority to quoted prices (unadjusted) in active markets for identical assets or liabilities (Level 1) and the lowest priority to unobservable inputs (Level 3). The three levels of the fair value hierarchy are described below:
• Level 1 – quoted prices in active markets for identical securities
• Level 2 – based on other significant observable inputs (including quoted prices for similar securities, interest rates, prepayment speeds, credit risk, etc.)
• Level 3 – based on significant unobservable inputs (including the Fund’s own assumptions in determining the fair value of investments)
The inputs or methodology used for valuing securities are not necessarily an indication of the risk associated with investing in those securities. During the period June 30, 2011 (commencement of operations) through September 30, 2011 there were no significant changes to the valuation policies and procedures.
12
|
Sterling Capital Funds |
Notes to Financial Statements — (continued) September 30, 2011 |
The summary of inputs used to determine the fair value of each Fund’s investments as of September 30, 2011 is as follows:
| | | | | | | | | | | | | | | | | | | | |
Investments in Securities | | Level 1–
Quoted Prices(a) | | Level 2–
Other Significant
Observable Inputs(b) | | Level 3–
Significant
Unobservable Inputs | | Total |
Sterling Capital Corporate Fund | | | | $2,287,857 | | | | | $45,273,041 | | | | | $— | | | | | $47,560,898 | |
Sterling Capital Securitized Opportunities Fund | | | | 3,072,825 | | | | | 35,752,573 | | | | | — | | | | | 38,825,398 | |
| | (a) | Represents investment companies. |
| | (b) | Industries or security types are disclosed in the Schedules of Portfolio Investments. |
There were no significant transfers between Level 1 and Level 2 during the three-month period ended September 30, 2011.
In May 2011, the Financial Accounting Standards Board (“FASB”) issued Accounting Standards Update (“ASU”) No. 2011-04: Amendments to Achieve Common Fair Value Measurement and Disclosure Requirements in U.S. GAAP and International Financial Reporting Standards (“IFRS”). ASU No. 2011-04 includes common requirements for measurement of and disclosure about fair value between U.S. GAAP and IFRS. In addition, ASU No. 2011-04 will require reporting entities to disclose the following information for fair value measurements categorized within Level 3 of the fair value hierarchy: quantitative information about the unobservable inputs used in the fair value measurement, the valuation processes used by the reporting entity and a narrative description of the sensitivity of the fair value measurement to changes in unobservable inputs and the interrelationships between those unobservable inputs. Finally, ASU No. 2011-04 will require reporting entities to make disclosures about amounts and reasons for all transfers in and out of Level 1 and Level 2 fair value measurements. The new and revised disclosures are effective for interim and annual reporting periods beginning after December 15, 2011. At this time, management is evaluating the implications of ASU No. 2011-04 and its impact on the financial statements.
Securities Transactions and Related Income — During the period, security transactions are accounted for no later than one business day following the trade date. For financial reporting purposes, however, security transactions as of the last business day of the reporting period are accounted for on the trade date. Interest income is recognized on the accrual basis and includes, where applicable, the amortization/accretion of premium or discount. Dividend income is recorded on the ex-dividend date. Gains or losses realized from sales of securities are determined by comparing the identified cost of the security lot sold with the net sales proceeds.
When-Issued and Forward Commitments — The Funds may purchase securities on a “when-issued” basis. The Funds record when-issued securities on the trade date and pledge assets with a value at least equal to the purchase commitment for payment of the securities purchased. The value of the securities underlying when-issued or forward commitments to purchase securities, and any subsequent fluctuation in their value, is taken into account when determining the net asset value of the Funds commencing with the date the Funds agree to purchase the securities. The Funds do not accrue interest or dividends on “when-issued” securities until the underlying securities are received.
Mortgage Dollar Rolls — The Funds may sell mortgage-backed securities for delivery in the current month and simultaneously contract to repurchase substantially similar (same type, coupon and maturity) securities on a specific future date at an agreed-upon price. The market value of the securities that the Fund is required to purchase may decline below the agreed upon repurchase price of those securities. Pools of mortgages collateralizing those securities may have different prepayment histories than those sold. During the period between the sale and repurchase, the Fund will not be entitled to receive interest and principal payments on the securities sold. Proceeds of the sale will be invested in additional instruments for the Fund, and the income from these investments will generate income for the Fund. If such income does not exceed the income, capital appreciation and gain or loss that would have been realized on the securities sold as part of the dollar roll, the use of this technique will diminish the investment performance of the Fund compared with what the performance would have been without the use of dollar rolls. The Funds account for mortgage dollar roll transactions as purchases and sales.
In April 2011, the FASB issued ASU No. 2011-03: Reconsideration of Effective Control for Repurchase Agreements. ASU No. 2011-03 changes the assessment of effective control for repurchase agreements including dollar roll transactions. The new and revised disclosures are effective for interim and annual reporting periods beginning after December 15, 2011. At this time, management is evaluating the implications of ASU No. 2011-03 and its impact on the financial statements.
13
|
Sterling Capital Funds |
Notes to Financial Statements — (continued) September 30, 2011 |
Expenses and Allocation Methodology — Expenses directly attributable to a Fund are charged to that Fund. Expenses not directly attributable to a Fund are allocated proportionately across the Trust daily in relation to the net assets of each Fund or on another reasonable basis. Expenses which are attributable to both the Trust and the Sterling Capital Variable Insurance Funds are allocated across the Trust and Sterling Capital Variable Insurance Funds, based upon relative net assets or on another reasonable basis.
Distributions to Shareholders — Dividends from net investment income are declared daily and paid monthly. Distributable net realized gains, if any, are declared and distributed at least annually. Distributions to shareholders which exceed net investment income and net realized gains for tax purposes are reported as distributions of capital.
The character of income and gains distributed are determined in accordance with federal income tax regulations, which may differ from U.S. GAAP. These “book/tax” differences are either considered temporary or permanent in nature. To the extent these differences are permanent in nature (e.g., tax treatment of mortgage dollar rolls and paydown gains and losses) such amounts are reclassified within the composition of net assets based on their federal tax-basis treatment; temporary differences do not require reclassification. These reclassifications have no impact on net assets or net asset values per share.
As of September 30, 2011, these reclassifications were as follows:
| | | | | | | | |
| | | Increase
Net Investment
Income | | | Decrease
Realized
Gains | |
Sterling Capital Securitized Opportunities Fund | | | $55,853 | | | | $(55,853 | ) |
Federal Income Taxes — It is the policy of the Funds to continue to qualify as a regulated investment company by complying with the provisions available to certain investment companies, as defined in applicable sections of the Internal Revenue Code of 1986, as amended (the “Internal Revenue Code”), and to make distributions of net investment income and net realized capital gains sufficient to relieve it from all, or substantially all, federal income taxes. Accordingly, no provision for federal income tax is required.
| 3. | Purchases and Sales of Securities: |
Purchases and sales of securities (excluding U.S. Government Securities and securities maturing less than one year from acquisition) for the period June 30, 2011 (commencement of operations) through September 30, 2011 were as follows:
| | | | | | | | | | |
| | | Purchases | | Sales |
Sterling Capital Corporate Fund | | | | $47,959,188 | | | | | $2,284,496 | |
Sterling Capital Securitized Opportunities Fund | | | | 7,166,106 | | | | | 80,927 | |
Purchases and sales of U.S. Government Securities (excluding securities maturing less than one year from acquisition) for the period June 30, 2011 (commencement of operations) through September 30, 2011 for Sterling Capital Securitized Opportunities Fund were $38,006,832 and $8,966,572, respectively.
| 4. | Related Party Transactions: |
Under the terms of the investment advisory agreement Sterling Capital (the “Advisor”) is entitled to receive fees based on a percentage of the average daily net assets of the Funds. These fees are accrued daily and payable on a monthly basis and are reflected on the Statements of Operations as “Investment advisory fees.” Sterling Capital waived investment advisory fees and reimbursed certain expenses for the Funds referenced below which are not subject to recoupment and are included on the Statements of Operations as “Less expenses waived/reimbursed by the Investment Advisor.” Information regarding these transactions is as follows for the period June 30, 2011 (commencement of operations) through September 30, 2011:
| | | | |
| | | Contractual
Fee Rate | | Fee Rate after
Contractual
Waivers(1,2) |
Sterling Capital Corporate Fund | | 0.40% | | 0.15% |
Sterling Capital Securitized Opportunities Fund | | 0.40% | | 0.15% |
| | 1 | For a portion of the period ended September 30, 2011 Sterling Capital voluntarily reimbursed certain expenses of the Funds. Voluntary reimbursements of expenses are not subject to recoupment in subsequent fiscal periods, and may be discontinued at any time. |
| | 2 | Sterling Capital contractually agreed to limit the advisory fees paid by the Fund from June 30, 2011 through January 31, 2013. |
14
|
Sterling Capital Funds |
Notes to Financial Statements — (continued) September 30, 2011 |
Sterling Capital serves as the administrator to the Funds pursuant to an administration agreement. Each Fund pays an annual asset-based fee of 0.05% of the Fund’s average daily net assets to Sterling Capital for providing administration services. This fee is accrued daily and payable on a monthly basis. Expenses incurred are reflected on the Statements of Operations as “Administration fees.” Pursuant to a sub-administration agreement with Sterling Capital, BNY Mellon Investment Servicing (US) Inc. (“BNY Mellon” or the “Sub-Administrator”), serves as the sub-administrator to the Funds subject to the general supervision of the Board and Sterling Capital. For these services, BNY Mellon is entitled to a fee payable by Sterling Capital.
BNY Mellon serves as the Funds’ fund accountant and transfer agent and receives compensation by the Funds for these services. Expenses incurred are reflected on the Statements of Operations as “Fund accounting fees” and “Transfer agent fees.”
Sterling Capital’s Chief Compliance Officer (“CCO”) serves as the Funds’ CCO. The CCO’s compensation is reviewed and approved by the Funds’ Board and paid by Sterling Capital. However, the Funds reimburse Sterling Capital for their allocable portion of the CCO’s salary. Expenses incurred for the Funds are reflected on the Statements of Operations as “Compliance service fees.”
Certain Officers and a Trustee of the Funds are affiliated with Sterling Capital or the Sub-Administrator. Such Officers and Trustee receive no compensation from the Funds for serving in their respective roles. Each of the Trustees who are not interested persons (as defined in the 1940 Act) of the Trust who serve on the Board are compensated at the annual rate of $40,000 plus $5,000 for each regularly scheduled quarterly meeting attended, $4,000 for each special meeting attended in person and $3,000 for each special meeting attended by telephone, plus reimbursement for certain out of pocket expenses. Each Trustee serving on a Committee of the Board receives a fee of $4,000 for each Committee meeting attended in person and $3,000 for each Committee meeting attended by telephone, plus reimbursement for certain out of pocket expenses. Additionally, the Chairman of the Board and the Audit Committee Chairman each receive an annual retainer of $15,000, and the Chairman of the Nominations Committee receives additional compensation at the rate of $1,000 for each meeting over which he or she presides as Chairman. The fees are allocated across the Funds in the Trust and the Sterling Capital Variable Insurance Funds based upon relative net assets.
U.S. Bank, N.A. has made available a credit facility to the Trust, pursuant to an umbrella credit agreement (the “Agreement”). The primary purpose of the Agreement is to allow the Trust to avoid security liquidations that Sterling Capital believes are unfavorable to shareholders. Under the Agreement, an aggregate commitment amount of $50,000,000 has been made available for use by all funds of the Trust. Outstanding principal amounts under the Agreement bear interest at a rate per annum equal to the Prime Rate minus two percent (2%), but never at a rate of less than one percent (1%) per annum. The Agreement expires on March 31, 2012. During the period June 30, 2011 (commencement of operations) through September 30, 2011 the line of credit was not utilized by the Funds.
| 6. | Federal Tax Information: |
Management evaluates its tax positions to determine if the tax positions taken meet the minimum recognition threshold in connection with accounting for uncertainties in income tax positions taken or expected to be taken for the purposes of measuring and recognizing tax liabilities in the financial statements. Recognition of tax benefits of an uncertain tax position is required only when the position is “more likely than not” to be sustained assuming examination by taxing authorities. The Funds recognize interest and penalties, if any, related to unrecognized tax benefits as “Income tax expense” in the Statements of Operations. During the period, the Funds did not incur any interest or penalties.
Management has analyzed the Funds’ tax positions taken on federal income tax returns for all open tax years (current year), and has concluded that no provision for federal income tax is required in the Funds’ financial statements. The Funds’ federal and state income and federal excise tax returns for tax years for which the applicable statutes of limitations have not expired are subject to examination by the Internal Revenue Service and state departments of revenue.
The tax character of distributions paid to shareholders during the period June 30, 2011 (commencement of operations) through September 30, 2011, were as follows:
15
|
Sterling Capital Funds |
Notes to Financial Statements — (continued) September 30, 2011 |
| | | | |
| | | Ordinary
Income* | |
Sterling Capital Corporate Fund | | $ | 192,803 | |
Sterling Capital Securitized Opportunities Fund | | | 238,471 | |
| | * | Distributions paid may differ from the Statements of Changes in Net Assets because distributions are recognized when actually paid for tax purposes. |
As of September 30, 2011, the components of accumulated earnings (deficit) on a tax basis were as follows:
| | | | | | | | | | | | | | | | | | | | |
| | | Undistributed
Ordinary
Income | | Distributions
Payable | | Unrealized
Appreciation
(Depreciation)* | | Total
Accumulated
Earnings(Deficit) |
Sterling Capital Corporate Fund | | | $ | 37,663 | | | | $ | (23,240 | ) | | | $ | (352,042 | ) | | | $ | (337,619 | ) |
Sterling Capital Securitized Opportunities Fund | | | | 32,464 | | | | | — | | | | | 300,165 | | | | | 332,629 | |
| | * | The primary differences between book basis and tax basis unrealized appreciation were due to hybrid securities. |
As of September 30, 2011, federal income tax cost, gross unrealized appreciation and gross unrealized depreciation on securities were as follows:
| | | | | | | | | | | | | | | | | | | | |
| | | Tax Cost | | Tax Gross
Unrealized
Appreciation | | Tax Gross
Unrealized
Depreciation | | Net Tax Gross
Unrealized
Appreciation
(Depreciation) |
Sterling Capital Corporate Fund | | | $ | 47,912,940 | | | | $ | 354,744 | | | | $ | (706,786 | ) | | | $ | (352,042 | ) |
Sterling Capital Securitized Opportunities Fund | | | | 38,525,233 | | | | | 412,640 | | | | | (112,475 | ) | | | | 300,165 | |
The Regulated Investment Company Modernization Act of 2010 (the “Act”) was signed into law on December 22, 2010. The Act makes changes to several tax rules impacting Regulated Investment Companies (“RICs”). The provisions of the Act are generally effective for the Funds taxable year ending September 30, 2011 as these Funds commenced operations subsequent to December 22, 2010. The Act allows for capital losses originating in taxable years beginning after December 22, 2010 (“post-enactment capital losses”) to be carried forward indefinitely. Furthermore, post-enactment capital losses will retain their character as either short-term or long-term capital losses rather than being considered all short-term capital losses as under previous law.
Management has evaluated the need for disclosure and/or adjustments resulting from subsequent events through the date the financial statements were issued, and has noted no events that require recognition or disclosure in the financial statements.
16
Report of Independent Registered Public Accounting Firm
The Board of Trustees and Shareholders of Sterling Capital Funds:
We have audited the accompanying statements of assets and liabilities, including the schedules of portfolio investments, of the Sterling Capital Corporate Fund and the Sterling Capital Securitized Opportunities Fund (collectively “the Funds”), two of the funds constituting Sterling Capital Funds, as of September 30, 2011, and the related statements of operations and changes in net assets, and the financial highlights for the period June 30, 2011 (commencement of operations) through September 30, 2011. These financial statements and financial highlights are the responsibility of the Funds’ management. Our responsibility is to express an opinion on these financial statements and financial highlights based on our audits.
We conducted our audits in accordance with standards of the Public Company Accounting Oversight Board (United States). Those standards require that we plan and perform the audit to obtain reasonable assurance about whether the financial statements and financial highlights are free of material misstatement. An audit includes examining on a test basis, evidence supporting the amounts and disclosures in the financial statements. Our procedures included confirmation of securities owned as of September 30, 2011, by correspondence with the custodian and brokers or by other appropriate auditing procedures. An audit also includes assessing the accounting principles used and significant estimates made by management, as well as evaluating the overall financial statement presentation. We believe that our audits provide a reasonable basis for our opinion.
In our opinion, the financial statements and the financial highlights referred to above present fairly, in all material respects, the financial position of the Sterling Capital Corporate Fund and the Sterling Capital Securitized Opportunities Fund as of September 30, 2011, and the results of their operations, the changes in their net assets, and the financial highlights for the period June 30, 2011 (commencement of operations) through September 30, 2011, in conformity with U.S. generally accepted accounting principles.

Philadelphia, Pennsylvania
November 28, 2011
17
|
Sterling Capital Funds |
September 30, 2011 |
Notice to Shareholders (Unaudited)
All designations are based on financial information available as of the date of this annual report and, accordingly are subject to change. For each item it is the intention of the Funds to designate the maximum amount permitted under the Internal Revenue Code and the regulations thereunder.
For the period June 30, 2011 (commencement of operations) through September 30, 2011, each Fund is designating the following items with regard to distributions paid during the period.
For the period June 30, 2011 (commencement of operations) through September 30, 2011, in order to meet certain requirements of the Internal Revenue Code, we are advising you that certain distributions paid during the period June 30, 2011 (commencement of operations) through September 30, 2011 from the following Funds are designated as:
| | | | | | | | | | |
| | | (a) Long-Term Capital Gain | | (b) Qualified Dividend Income % | | (c) (for corporate shareholders) Dividends Received Deduction % | | (d) (for foreign shareholders) Qualified Short-Term Capital Gain % | | (e) (for foreign shareholders) Qualified Interest Income % |
Sterling Capital Corporate Fund | | N/A | | 1.48% | | 1.48% | | N/A | | 82.85% |
Sterling Capital Securitized Opportunities Fund | | N/A | | — | | — | | N/A | | 96.80% |
(a) Each Fund designates the maximum amount allowable but not less than the amounts shown above as a capital gain dividend in accordance with Section 852(b)(3)(c) of the Internal Revenue Code.
(b) Each Fund designates the maximum amount allowable, but not less than the percentages shown above as ordinary income dividends paid during the period as qualified dividend income in accordance with Section 854 of the Internal Revenue Code.
(c) Each Fund designates the maximum amount allowable but not less than the percentages shown above of ordinary income dividends paid during the period as eligible for the corporate dividends received deduction in accordance with Section 854 of the Internal Revenue Code.
(d) Each Fund designates the maximum amount allowable but not less than the percentages shown above as a short-term capital gain dividend in accordance with Sections 871(k)(2) and 881(e) of the Internal Revenue Code.
(e) Each Fund designates the maximum amount allowable but not less than the percentages shown above as interest-related dividends in accordance with Sections 871(k)(1) and 881(e) of the Internal Revenue Code.
Capital gain dividends distributed during the period are generally subject to the maximum tax rate of 15%. In addition, Qualified Dividend Income is generally subject to a maximum rate of 15%.
The information reported herein may differ from the information and distributions paid to the shareholders subject to tax reporting.
For the period June 30, 2011 (commencement of operations) through September 30, 2011, the following Fund designated the following percentage of investment company taxable income, or if different the maximum allowable by tax law, as being derived from U.S. Treasury securities:
| | |
| | | U.S. Government Income |
Sterling Capital Corporate Fund | | 0.10% |
18
|
Sterling Capital Funds |
Other Information September 30, 2011 |
Other Information (Unaudited)
A description of the policies and procedures that the Funds use to determine how to vote proxies relating to portfolio securities is available (i) without charge, upon request, by calling 1-800-228-1872; and (ii) on the Securities and Exchange Commission’s (the “Commission”) website at http://www.sec.gov.
Information regarding how the Sterling Capital Funds voted proxies relating to portfolio securities during the most recent 12-month period ended June 30th is available (i) without charge, upon request, by calling 1-800-228-1872 and (ii) on the Commission’s website at http://www.sec.gov.
The Funds file complete Schedules of Portfolio Holdings with the Commission for the first and third quarters of each fiscal year on Form N-Q. The Funds’ Forms N-Q are available without charge on the Commission’s website at http://www.sec.gov, or may be reviewed and copied at the Commission’s Public Reference Room in Washington, D.C. Information on the operation of the Public Reference Room may be obtained by calling 1-800-SEC-0330.
19
BOARD CONSIDERATION OF ADVISORY AGREEMENTS (UNAUDITED)
The Board of Trustees, at a meeting held on May 19, 2011, formally considered the approval of an investment advisory agreement (the “New Advisory Agreement”) between Sterling Capital Funds (the “Trust”) and Sterling Capital Management LLC (“Sterling Capital”), which serves as investment adviser to each series of the Trust, with respect to the Sterling Capital Corporate Fund and the Sterling Capital Securitized Opportunities Fund, two proposed new series of the Trust (the “New Funds”).
At a meeting held on August 25-26, 2011, the Trustees formally considered the continuance of the Trust’s investment advisory agreement with Sterling Capital with respect to each series of the Trust other than the New Funds (the “Current Funds”). The Board of Trustees also considered the continuance of sub-advisory agreements of Sterling Capital with Scott & Stringfellow, LLC (“Scott & Stringfellow”), with respect to the Sterling Capital Special Opportunities Fund and the Sterling Capital Equity Income Fund, and with Artio Global Management LLC (“Artio” and, together with Sterling Capital and Scott & Stringfellow, the “Current Advisers”), with respect to the Sterling Capital International Fund. The above referenced agreements are collectively referred to herein as the “Current Advisory Agreements.” At the same meeting, the Board of Trustees also formally considered the approval of a new investment sub-advisory agreement (the “New Sub-Advisory Agreement” and, together with the New Advisory Agreement and the Current Advisory Agreements, the “Advisory Agreements”) between Sterling Capital and BlackRock Advisors, LLC (“BlackRock” and, together with the Current Advisers, the “Advisers”) with respect to the Sterling Capital National Tax-Free Money Market Fund and the Sterling Capital Prime Money Market Fund (collectively, the “Money Market Funds” and, together with the New Funds and the Current Funds, the “Funds”).
The Trustees reviewed extensive material in connection with their consideration of the Advisory Agreements, including data from an independent provider of mutual fund data (as assembled by the Trust’s administrator), which, where applicable, included comparisons with industry averages for comparable funds for advisory fees, 12b-1 fees, and total fund expenses. The data reflected Sterling Capital fee waivers in place, as well as Sterling Capital’s contractual investment advisory fee levels. The Board was assisted in its review by independent legal counsel, who provided memoranda detailing the legal standards for review of the Advisory Agreements. At each meeting, the Board received a detailed presentation by Sterling Capital, which included a fund-by-fund analysis of investment processes and, where applicable, performance. Presentations were also provided by each entity proposed to be utilized by Sterling Capital as a sub-adviser. The Board also received fund-by-fund profitability information from the Current Advisers. The Independent Trustees also deliberated outside the presence of management and the Advisers.
With respect to the New Funds and the Money Market Funds, the Trustees’ determination to approve the New Advisory Agreement and the New Sub-Advisory Agreement, respectively, was based on a comprehensive evaluation of all of the information provided to them. In the process of considering the New Advisory Agreement, the Trustees considered information regarding, among other things, the proposed portfolio management team and the experience of the members of the team, the team’s anticipated investment strategy, and other information relating to the nature, extent, and quality of services to be provided by Sterling Capital. With respect to the Money Market Funds, the Trustees received a detailed presentation from BlackRock that included information regarding, among other things, BlackRock’s risk management approach, its experience with respect to comparable cash management sub-advisory relationships, and the proposed portfolio management team.
In their deliberations regarding the Advisory Agreements, each Trustee attributed different weights to various factors involved in an analysis of the Advisory Agreements, and in each case no factor alone was considered determinative. The Trustees determined that the overall arrangements between the Trust and the Advisers, as provided in the Advisory Agreements, were fair and reasonable and that the continuance of the Current Advisory Agreements and the approval of the New Advisory Agreement and the New Sub-Advisory Agreement were in the best interests of each applicable Fund and its shareholders.
The matters addressed below were considered and discussed by the Trustees in reaching their conclusions.
Nature, Extent and Quality of Services Provided by the Adviser and Sub-Advisers
The Trustees received and considered information regarding the nature, extent, and quality of the services provided to each Current Fund under the Current Advisory Agreements. The Trustees took into account information furnished throughout the year at Trustee meetings, as well as materials furnished specifically in connection with the annual review process. The Trustees considered the background and experience of each Current Adviser’s senior management and the expertise of investment personnel of each Current Adviser responsible for the day-to-day management of each Current Fund. The Trustees considered the overall reputation, and the capabilities and commitment of the Current Advisers to provide high quality service to the Current Funds.
With respect to the New Funds, the Trustees considered the expertise of each New Fund’s proposed portfolio management team generally and the services provided to the Current Funds by Sterling Capital. The Trustees considered the financial position of Sterling Capital and the commitment that Sterling Capital has made to the Trust generally. The Board also considered Sterling Capital’s specific responsibilities in all aspects of day-to-day management of the New Funds as well as the qualifications, experience and responsibilities of the other key personnel that would be involved in the day-to-day activities of the New Funds. The Trustees concluded that the nature and quality of services that Sterling Capital would provide to the New Funds appeared consistent with both those provided to the Current Funds by Sterling Capital as well as with industry norms.
With respect to the Money Market Funds, the Trustees considered the expertise of the Money Market Fund’s proposed portfolio
20
management team generally and the size of similar funds managed by the proposed portfolio managers. The Trustees reviewed information concerning BlackRock’s expertise in managing money market funds and the investment philosophy and investment processes applied by BlackRock in managing such funds. The Trustees considered the background and experience of BlackRock’s senior management and the expertise of investment personnel of BlackRock responsible for the day-to-day management of the Money Market Funds. The Trustees considered the overall reputation, and the capabilities and commitment of BlackRock to provide high-quality service to the Money Market Funds, and the Trustees’ overall confidence in BlackRock’s integrity.
The Trustees received information concerning the investment philosophy and investment processes applied or to be applied by the Advisers in managing the Funds as well as each Current Adviser’s Form ADV. The Trustees also considered information regarding regulatory compliance and, with respect to the Current Funds, compliance with the investment policies of the Funds. The Trustees evaluated the trading practices of Scott & Stringfellow, which engages in affiliated brokerage for portfolio trades for the Current Funds it sub-advises. The Trustees evaluated the procedures of the Advisers designed to fulfill the Advisers’ fiduciary duty to the Funds with respect to possible conflicts of interest, including the Advisers’ codes of ethics (regulating the personal trading of its officers and employees).
Based on their review, the Trustees concluded that, with respect to the nature, extent and quality of services to be provided by the Advisers, the nature and extent of responsibilities was consistent with mutual fund industry norms, and that the quality of the services provided or to be provided by the Advisers was or was expected to be satisfactory or better.
Investment Performance
The Trustees considered performance results of each Current Fund in absolute terms and relative to each Current Fund’s benchmark and peer group. In the Trustees’review of performance, long- and short-term performance were considered. In conducting their review, the Trustees particularly focused on Current Funds where performance compared unfavorably with peers. The Trustees noted that the performance of the Select Equity Fund and the International Fund continued to be a source of concern for the Board. Although the Trustees concluded that Sterling Capital had taken appropriate steps to address those Funds’ continued underperformance, the Trustees determined to increase oversight of these Funds during the upcoming year, including enhanced reporting from the Adviser.
After reviewing the performance of each Current Fund and taking into consideration the management style, investment strategies, and prevailing market conditions during the prior year and for longer periods, the Trustees concluded that the performance of each Current Fund was acceptable or better or that, in cases where performance issues were encountered, Sterling Capital was appropriately addressing the situation.
With respect to the New Funds, the Trustees noted that the New Funds had not commenced operations at the time of the May 2011 Board meeting and had no historical investment performance. The Trustees considered that Sterling Capital does not currently offer stand-alone investment products comparable to either of the New Funds, and determined that comparable performance information with respect to other Sterling Capital clients would not provide suitable comparison information for evaluation of the New Advisory Agreement. The Trustees also noted that no performance history was available in a start-up fund context, such as that presented by the New Funds. The Trustees concluded, however, that Sterling Capital possessed the personnel and resources capable of producing attractive and competitive returns for each of the New Funds.
With respect to the Money Market Funds, the Trustees determined that the prospects for the Money Market Funds to have satisfactory or better performance were good.
Cost of Services, Including the Profits Realized by the Advisers and Affiliates
The Trustees considered peer group comparable information with respect to the advisory fees charged by Sterling Capital to each of the Current Funds and the advisory fees proposed to be charged by Sterling Capital to each of the New Funds, taking into consideration both contractual and actual (i.e., after fee waivers) fee levels. The Trustees concluded that the investment advisory fees paid by the Current Funds fell within an acceptable range as compared to peer groups, and were fair and reasonable, particularly in light of the fee waivers that are in place. With respect to the New Funds, the Trustees concluded that the contractual fees were fair and reasonable and noted that fee waivers agreed to by Sterling Capital would produce actual fees well below industry averages. With respect to the Money Market Funds, the Trustees noted that the fees proposed to be paid to BlackRock fell within an acceptable range, were fair and reasonable, and were identical to those paid to the current sub-adviser. The Trustees also noted that these fees were not borne directly by the shareholders of the respective Money Market Funds, but rather by Sterling Capital.
As part of their review, the Trustees considered benefits to Sterling Capital aside from investment advisory fees. The Trustees reviewed administration fees received by Sterling Capital and considered the fallout benefits to Sterling Capital such as the research services available to Sterling Capital by reason of brokerage commissions generated by the Funds’turnover. The Trustees also considered benefits to Sterling Capital’s affiliates, including brokerage commissions received by Scott & Stringfellow for executing trades on behalf of the Special Opportunities Fund and the Equity Income Fund. With respect to Scott & Stringfellow, the Trustees noted that brokerage commissions were paid at a standard commission rate, which was consistent with that used by Sterling Capital with respect to all equity funds of the Trust and that such brokerage arrangements were considered by Scott & Stringfellow to be advantageous.
The Trustees also considered information from Sterling Capital regarding fees for separate accounts managed by Sterling Capital with investment objectives and strategies similar to those of comparable Funds. The Trustees noted that a representative of Sterling Capital explained that management of the Funds was a much more intensive process than management of separate accounts, including
21
daily fluctuations in the size of the Funds and the need to comply with extensive and complex restrictions set by applicable regulation or established in controlling disclosure documents, and therefore the Trustees concluded that the differences between the services that Sterling Capital provides to the Funds and those it provides to separate accounts substantially limit the probative value of comparisons to those other clients. The Trustees also noted that, with respect to the New Funds, Sterling Capital did not currently offer stand-alone investment products comparable to either Fund and therefore concluded that comparable fee information with respect to other Sterling Capital clients would not provide suitable comparison information for evaluation of the New Advisory Agreement.
The Trustees also considered the reasonableness of current and proposed advisory fees in the context of the profitability of the Advisers. In determining whether all other current and proposed investment advisory and sub-advisory fees (collectively, the “investment advisory fees”) were reasonable, the Trustees reviewed profitability information provided by the Current Advisers with respect to investment advisory services. With respect to such information, the Trustees recognized that such profitability data was generally unaudited and represented an Adviser’s own determination of its and its affiliates’ revenues from the contractual services provided or expected to be provided to the Funds, less expenses of providing such services. Expenses include direct and indirect costs and were calculated using an allocation methodology developed by the Adviser. The Trustees also recognized that it is difficult to make comparisons of profitability from fund investment advisory and sub-advisory contracts, because comparative information is not generally publicly available and could be affected by numerous factors. Based on their review, the Trustees concluded that the profitability of the Current Advisers as a result of their relationships with the Funds was acceptable.
Based on the foregoing, the Trustees concluded that the fees proposed under the Advisory Agreements were fair and reasonable, in light of the services and benefits provided or expected to be provided to each Fund.
Economies of Scale
The Trustees also considered whether fee levels reflect economies of scale and whether economies of scale would be produced by the growth of the Funds’ assets. The Trustees found that Sterling Capital had generally reduced the total expense ratios for the Current Funds through fee waivers and would do so with respect to the New Funds at least during the New Funds’ inception stage. The Trustees also noted that shareholders of the Money Market Funds had received the benefit of very significant fee waivers from Sterling Capital over the past year, and it was likely that fee waivers would continue due to the currently low interest rate conditions. The Trustees found that the asset levels of the Funds were not currently so large as to warrant formal contractual breakpoints, and found that the fee waivers were a reasonable way to provide the benefits of economies of scale to shareholders of the Funds at this time.
22
Information about Trustees and Officers (Unaudited)
Overall responsibility for the management of the Funds rests with its Board of Trustees (“Trustees”), who are elected by the Shareholders of the Funds. The Trustees elect the officers of the Funds to supervise actively its day-to-day operations. The names of the Trustees, birthdates, term of office and length of time served, principal occupations during the past five years, number of portfolios overseen and directorships held outside of the Funds are listed in the two tables immediately following. The business address of the persons listed below is 434 Fayetteville Street Mall, 5th Floor, Raleigh, North Carolina 27601.
INDEPENDENT TRUSTEES
| | | | | | | | | | |
Name and Birthdate | | Position(s) Held With the Funds | | Term of Office/ Length of Time Served | | Principal Occupation During the Last 5 Years | | Number of
Portfolios in Fund
Complex Overseen
by Trustee* | | Other Directorships Held by Trustee |
| | | | | |
Thomas W. Lambeth Birthdate: 01/35 | | Trustee, Chairman of the Board of Trustees | | Indefinite, 08/92 — Present | | From January 2001 to present, Senior Fellow, Z. Smith Reynolds Foundation | | 29 | | None |
| | | | | |
Drew T. Kagan Birthdate: 02/48 | | Trustee | | Indefinite, 08/00 — Present | | From September 2010 to present, Chairman, Montecito Advisors, Inc.; from December 2003 to September 2010, CEO, Montecito Advisors, Inc.; from March 1996 to December 2003, President, Investment Affiliate, Inc. | | 29 | | None |
| | | | | |
Laura C. Bingham Birthdate: 11/56 | | Trustee | | Indefinite, 02/01 — Present | | From June 2010 to present, independent consultant; from July 1998 to June 2010, President of Peace College | | 29 | | None |
| | | | | |
Douglas R. Van Scoy Birthdate: 11/43 | | Trustee | | Indefinite, 05/04 — Present | | Retired; from November 1974 to July 2001, employee of Smith Barney (investment banking), most recently as Director of Private Client Group and Senior Executive Vice President | | 29 | | None |
| | | | | |
James L. Roberts Birthdate: 11/42 | | Trustee | | Indefinite, 11/04 — Present | | Retired; from November 2006 to present, Director, Grand Mountain Bancshares, Inc.; from January 1999 to December 2003, President, CEO and Director, Covest Bancshares, Inc. | | 29 | | None |
23
The following table shows information for the trustee who is an “interested person” of the Funds as defined in the 1940 Act :
INTERESTED TRUSTEE
| | | | | | | | | | |
Name and Birthdate | | Position(s) Held With the Funds | | Term of Office/ Length of Time Served | | Principal Occupation During the Past 5 Years | | Number of
Portfolios in Fund
Complex
by Trustee* | | Other Directorships Held by Trustee |
| | | | | |
Alexander W. McAlister** Birthdate: 03/60 | | Trustee | | Indefinite, 11/10 — Present | | President, Sterling Capital Management LLC | | 29 | | Director, Sterling Capital Management LLC |
| | | | |
| | * | | The Sterling Capital Funds Complex consists of two open-end investment management companies: Sterling Capital Funds and Sterling Capital Variable Insurance Funds. |
| | |
| | ** | | Mr. McAlister is treated by the Funds as an “interested person” (as defined in Section 2(a)(19) of the 1940 Act) of the Funds because he is an officer of the Advisor. |
The following table shows information for officers of Funds:
| | | | | | | | |
Name and Birthdate | | Position(s) Held With the Funds | | Term of Office/ Length of Time Served | | Principal Occupation During the Last 5 Years | | |
| | | | |
E.G. Purcell, III Birthdate: 01/55 | | President | | Indefinite, President 11/08 — Present; Secretary, 11/08 — 08/10; Vice President, 11/00 — 11/08 | | From 1995 to present, Executive Director, Sterling Capital Management LLC and its predecessors | | |
| | | | |
James T. Gillespie Birthdate: 11/66 | | Treasurer | | Indefinite, 06/10 — Present | | From June 2010 to present, Director, Sterling Capital Management LLC and its predecessors; from August 2008 to June 2010, Vice President Relationship Management, JPMorgan Chase & Co.; from February 2005 to August 2008, Director, Sterling Capital Management LLC and its predecessors | | |
24
| | | | | | | | |
Name and Birthdate | | Position(s) Held With the Funds | | Term of Office/ Length of Time Served | | Principal Occupation During the Last 5 Years | | |
| | | | |
Todd M. Miller Birthdate: 09/71 | | Vice President and Secretary | | Indefinite, Vice President, 08/05 — Present; Secretary, 08/10 — Present | | From May 2009 to present, Director, Sterling Capital Management LLC and its predecessors; from June 2005 to May 2009, Mutual Fund Administrator; from May 2001 to May 2005, Manager, BISYS Fund Services | | |
| | | | |
Clinton L. Ward Birthdate: 11/69 | | Executive Director, Chief Compliance and Anti-Money Laundering Officer | | Indefinite, 04/07 — Present | | From July 2004 to present, Chief Compliance Officer and Executive Director, Sterling Capital Management LLC and its predecessors | | |
| | | | |
Andrew J. McNally Birthdate: 12/70 | | Assistant Treasurer | | Indefinite, Assistant Treasurer, 06/10 — Present; Treasurer, 04/07 — 06/10 | | From January 2007 to present, Vice President and Senior Director, and from July 2000 to December 2006, Vice President and Director, Fund Accounting and Administration Department, BNY Mellon Investment Servicing (US) Inc. | | |
The Funds’ Statement of Additional Information includes additional information about the Funds’ Trustees and Officers. To receive your free copy of the Statement of Additional Information, call toll free: 1-800-228-1872.
25
(This page has been left blank intentionally.)
INVESTMENT ADVISOR
Sterling Capital Management LLC
Two Morrocroft Centre
4064 Colony Road, Suite 300
Charlotte, NC 28211
DISTRIBUTOR
Sterling Capital Distributors, Inc.
760 Moore Road
King of Prussia, PA 19406
LEGALCOUNSEL
Ropes & Gray LLP
One Metro Center
700 12th Street, N.W.
Suite 900
Washington, DC 20005
TRANSFER AGENT
BNY Mellon Investment Servicing (US) Inc.
301 Bellevue Parkway
Wilmington, DE 19809
INDEPENDENT REGISTERED PUBLIC ACCOUNTING FIRM
KPMG LLP
1601 Market Street
Philadelphia, PA 19103
Item 2. Code of Ethics.
| | (a) | The registrant, as of the end of the period covered by this report, has adopted a code of ethics that applies to the registrant’s principal executive officer, principal financial officer, principal accounting officer or controller, or persons performing similar functions, regardless of whether these individuals are employed by the registrant or a third party (the “Code of Ethics”). |
| | (c) | There have been no amendments, during the period covered by this report, to a provision of the Code of Ethics that applies to the registrant’s principal executive officer, principal financial officer, principal accounting officer or controller, or persons performing similar functions, regardless of whether these individuals are employed by the registrant or a third party, and that relates to any element of the code of ethics definition enumerated in Item 2(b) of Form N-CSR. |
| | (d) | The registrant has not granted any waivers, including an implicit waiver, from a provision of the code of ethics that applies to the registrant’s principal executive officer, principal financial officer, principal accounting officer or controller, or persons performing similar functions, regardless of whether these individuals are employed by the registrant or a third party, that relates to one or more of the items set forth in Item 2(b) of Form N-CSR. |
Item 3. Audit Committee Financial Expert.
As of the end of the period covered by the report, the registrant’s board of trustees has determined that Drew Kagan is qualified to serve as an audit committee financial expert serving on its audit committee and that he is “independent,” as defined by Item 3 of Form N-CSR.
Item 4. Principal Accountant Fees and Services.
Audit Fees
| | (a) | The aggregate fees billed for each of the last two fiscal years for professional services rendered by the principal accountant for the audit of the registrant’s annual financial statements or services that are normally provided by the accountant in connection with statutory and regulatory filings or engagements for those fiscal years are $409,500 for 2011 and $414,655 for 2010. |
Audit-Related Fees
| | (b) | The aggregate fees billed in each of the last two fiscal years for assurance and related services by the principal accountant that are reasonably related to the performance of the audit of the registrant’s financial statements and are not reported under paragraph (a) of this Item are $0 for 2011 and $0 for 2010. |
Tax Fees
| | (c) | The aggregate fees billed in each of the last two fiscal years for professional services rendered by the principal accountant for tax compliance, tax advice, and tax planning are $87,780 for 2011 and $96,230 for 2010. Fees for both 2011 and 2010 relate to the preparation of federal income and excise tax returns and review of capital gains distribution calculations. |
All Other Fees
| | (d) | The aggregate fees billed in each of the last two fiscal years for products and services provided by the principal accountant, other than the services reported in paragraphs (a) through (c) of this Item are $0 for 2011 and $0 for 2010. |
| | (e)(1) | Except as permitted by Rule 2-01(c)(7)(i)(C) of Regulation S-X, the Trust’s Audit Committee must pre-approve all audit and non-audit services provided by the independent accountants relating to the operations or financial reporting of the funds. Prior to the commencement of any audit or non-audit services to a fund, the Audit Committee reviews the services to determine whether they are appropriate and permissible under applicable law. |
| | (e)(2) | The percentage of services described in each of paragraphs (b) through (d) of this Item that were approved by the audit committee pursuant to paragraph (c)(7)(i)(C) of Rule 2-01 of Regulation S-X are as follows: |
(b) N/A
(c) 100%
(d) N/A
| | (f) | The percentage of hours expended on the principal accountant’s engagement to audit the registrant’s financial statements for the most recent fiscal year that were attributed to work performed by persons other than the principal accountant’s full-time, permanent employees was zero percent. |
| | (g) | The aggregate non-audit fees billed by the registrant’s accountant for services rendered to the registrant, and rendered to the registrant’s investment adviser (not including any sub-adviser whose role is primarily portfolio management and is subcontracted with or overseen by another investment adviser), and any entity controlling, controlled by, or under common control with the adviser that provides ongoing services to the registrant for each of the last two fiscal years of the registrant was $94,600 for 2011 and $67,000 for 2010. |
| | (h) | The audit committee of the registrant’s board of trustees has considered whether the provision of non-audit services that were rendered to the registrant’s investment adviser (not including any sub-adviser whose role is primarily portfolio management and is subcontracted with or overseen by another investment adviser), and any entity controlling, controlled by, or under common control with the investment adviser that provides ongoing services to the registrant that were not pre-approved pursuant to paragraph (c)(7)(ii) of Rule 2-01 of Regulation S-X is compatible with maintaining the principal accountant’s independence. |
Item 5. Audit Committee of Listed Registrants.
Not applicable.
Item 6. Investments.
| (a) | Schedule of Investments in securities of unaffiliated issuers as of the close of the reporting period is included as part of the report to shareholders filed under Item 1 of this form. |
Item 7. Disclosure of Proxy Voting Policies and Procedures for Closed-End Management Investment Companies.
Not applicable.
Item 8. Portfolio Managers of Closed-End Management Investment Companies.
Not applicable.
Item 9. Purchases of Equity Securities by Closed-End Management Investment Company and Affiliated Purchasers.
Not applicable.
Item 10. Submission of Matters to a Vote of Security Holders.
There have been no material changes to the procedures by which shareholders may recommend nominees to the registrant’s board of trustees, where those changes were implemented after the registrant last provided disclosure in response to the requirements of Item 407(c)(2)(iv) of Regulation S-K (17 CFR 229.407) (as required by Item 22(b)(15) of Schedule 14A (17 CFR 240.14a-101)), or this Item.
Item 11. Controls and Procedures.
| | (a) | The registrant’s principal executive officer and principal financial officer have concluded, based on their evaluation of the effectiveness of the design and operation of the registrant’s disclosure controls and procedures (as defined in Rule 30a-3(c) under the Investment Company Act of 1940 (17 CFR 270.30a-3(c))) as of a date within 90 days of the filing date of this report, that the design and operation of such procedures are effective to provide reasonable assurance that |
| | information required to be disclosed by the registrant on Form N-CSR is recorded, processed, summarized and reported within the time periods specified in the Securities and Exchange Commission’s rules and forms, and that information required to be disclosed by the registrant in the reports that it files or submits on Form N-CSR is accumulated and communicated to the registrant’s management, including its principal executive and principal financial officers, as appropriate to allow timely decisions regarding required disclosure. |
| | (b) | There were no changes in the registrant’s internal control over financial reporting (as defined in Rule 30a-3(d) under the 1940 Act (17 CFR 270.30a-3(d))) that occurred during the second fiscal quarter of the period covered by this report that have materially affected, or are reasonably likely to materially affect, the registrant’s internal control over financial reporting. |
Item 12. Exhibits.
| | |
| |
| (a)(1) | | The registrant’s Code of Ethics is attached hereto. |
| |
| (a)(2) | | Certifications pursuant to Rule 30a-2(a) under the 1940 Act and Section 302 of the Sarbanes-Oxley Act of 2002 are attached hereto. |
| |
| (a)(3) | | Not applicable. |
| |
| (b) | | Certifications pursuant to Rule 30a-2(b) under the 1940 Act and Section 906 of the Sarbanes-Oxley Act of 2002 are attached hereto. |
SIGNATURES
Pursuant to the requirements of the Securities Exchange Act of 1934 and the Investment Company Act of 1940, the registrant has duly caused this report to be signed on its behalf by the undersigned, thereunto duly authorized.
(Registrant) Sterling Capital Funds
By (Signature and Title) /s/ E.G. Purcell, III
E.G. Purcell, III, President
(principal executive officer)
Date 11/22/11
Pursuant to the requirements of the Securities Exchange Act of 1934 and the Investment Company Act of 1940, this report has been signed below by the following persons on behalf of the registrant and in the capacities and on the dates indicated.
By (Signature and Title) /s/ E.G. Purcell, III
E.G. Purcell, III, President
(principal executive officer)
Date 11/22/11
By (Signature and Title) /s/ James T. Gillespie
James T. Gillespie, Treasurer
(principal financial officer)
Date 11/22/11