UNITED STATES
SECURITIES AND EXCHANGE COMMISSION
Washington, D.C. 20549
FORM N-CSR
CERTIFIED SHAREHOLDER REPORT OF REGISTERED MANAGEMENT
INVESTMENT COMPANIES
Investment Company Act file number 811-06719
| | | | |
| | Sterling Capital Funds | | |
| | (Exact name of registrant as specified in charter) | | |
434 Fayetteville Street, 5th Floor
| | | | |
| | Raleigh, NC 27601-0575 | | |
| | (Address of principal executive offices) (Zip code) | | |
James T. Gillespie, President
Sterling Capital Funds
434 Fayetteville Street, 5th Floor
| | | | |
| | Raleigh, NC 27601-0575 | | |
| | (Name and address of agent for service) | | |
Registrant’s telephone number, including area code: (800) 228-1872
Date of fiscal year end: December 31
Date of reporting period: December 31, 2012
Form N-CSR is to be used by management investment companies to file reports with the Commission not later than 10 days after the transmission to stockholders of any report that is required to be transmitted to stockholders under Rule 30e-1 under the Investment Company Act of 1940 (17 CFR 270.30e-1). The Commission may use the information provided on Form N-CSR in its regulatory, disclosure review, inspection, and policymaking roles.
A registrant is required to disclose the information specified by Form N-CSR, and the Commission will make this information public. A registrant is not required to respond to the collection of information contained in Form N-CSR unless the Form displays a currently valid Office of Management and Budget (“OMB”) control number. Please direct comments concerning the accuracy of the information collection burden estimate and any suggestions for reducing the burden to Secretary, Securities and Exchange Commission, 100 F Street, NE, Washington, DC 20549. The OMB has reviewed this collection of information under the clearance requirements of 44 U.S.C. § 3507.
Item 1. Reports to Stockholders.
The Report to Shareholders is attached herewith.

ANNUAL REPORT
STERLING CAPITAL EQUITY INDEX FUND
Class A Shares
Class B Shares
Class C Shares
Institutional Shares
DECEMBER 31, 2012

Notice of Privacy Policy & Practices
Sterling Capital Funds recognizes and respects the privacy expectations of our customers.1 We provide this notice to you so that you will know what kinds of information we collect about our customers and the circumstances in which that information may be disclosed to third parties who are not affiliated with the Sterling Capital Funds.
Collection of Customer Information
We collect nonpublic personal information about our customers from the following sources:
| | • | | Account Applications and other forms, which may include a customer’s name, address, social security number and information about a customer’s investment goals and risk tolerance; |
| | • | | Account History, including information about the transactions and balances in a customer’s accounts; and |
| | • | | Correspondence, written, telephonic or electronic between a customer and the Sterling Capital Funds or service providers to the Sterling Capital Funds. |
Disclosure of Customer Information
We may disclose all of the consumer information outlined above to third parties who are not affiliated with the Sterling Capital Funds:
| | • | | as permitted by law — for example, with service providers who maintain or service shareholder accounts for the Sterling Capital Funds or to a shareholder’s broker or agent; and |
| | • | | to perform marketing services on our behalf or pursuant to a joint marketing agreement with another financial institution. |
Security of Customer Information
We require service providers to the Sterling Capital Funds:
| | • | | to maintain policies and procedures designed to assure only appropriate access to, and use of information about customers of the Sterling Capital Funds; and |
| | • | | to maintain physical, electronic and procedural safeguards that comply with applicable legal standards to guard nonpublic personal information of customers of the Sterling Capital Funds. |
We will adhere to the policies and practices described in this notice regardless of whether you are a current or former customer of the Sterling Capital Funds.
1 For purposes of this notice, the terms “customer” or “customers” includes both individual shareholders of the Sterling Capital Funds and individuals who provide nonpublic personal information to the Sterling Capital Funds, but do not invest in Sterling Capital Funds shares.
Letter from the Investment Advisor
Dear Shareholders,
We are pleased to present this annual report for the Sterling Capital Equity Index Fund covering the 12-month period through December 31, 2012.
U.S. equities made strong gains this year despite significant economic headwinds in the U.S. and abroad. Concerns about the ongoing eurozone debt crisis, an economic slowdown in China and the political face-off over the “fiscal cliff ” in the U.S. weighed on investors throughout the period. However, the U.S. economy continued its gradual recovery, supported by accommodative monetary policy and a recovering housing market. The S&P 500® Index1 (S&P) returned 16.00% for the year.
Early in the year, a nearly two-month stock rally was sustained by positive economic indicators and improving conditions in Europe due to the European Central Bank’s (ECB) long-term refinancing operations. Much of the gains made during that rally were lost by Summer, however. Disappointing job growth in the U.S. and a slowdown in China cast a pall over markets. Conditions in Europe deteriorated in the Spring as political instability in Greece deepened and Spain struggled to cope with a severe deficit.
Stocks made strong gains throughout the Summer as European leaders made significant progress toward fiscal integration in the euro currency bloc and the ECB president announced a commitment to doing “whatever it takes” to hold the eurozone together. In September, the ECB took significant measures to reduce peripheral countries’ interest costs while the U.S. Federal Reserve announced additional quantitative easing measures intended to improve employment and boost core inflation expectations.
Signs of vulnerability in the global economy dragged stocks down in the Fall. Slowing economic growth in China, and a rare leadership change in that country, threatened to undermine one of the world’s major drivers of growth. Disappointing economic data in the U.S. showed that another recession remained possible due to ongoing weakness, including declining exports and weak consumer income and savings.
Stocks picked up pace during the final months of the year as investors responded to a low interest rate environment by taking on more risk to achieve greater returns. Meanwhile, political leaders in the U.S. struggled to confront the looming fiscal cliff, which was scheduled to bring about automatic tax increases and spending cuts. Uncertainty regarding the fiscal cliff negotiations fueled high volatility in markets during the final days of 2012, and stocks pulled back slightly as the year ended without a last-minute deal.
For the year, international markets slightly outperformed U.S. stocks, with the MSCI EAFE Index showing a return of (+17.32%) during the period. In domestic markets, financials (+28.82%) and consumer discretionary (+23.89%) led among sectors in the S&P for 2012. Telecommunication services (+18.31%) and health care stocks (+17.70%) performed well after valuations in these sectors were pushed down by regulatory uncertainty. Every sector of the S&P moved higher in 2012, but energy stocks (+4.58%) lagged behind due to declining oil prices in the second half of the year, while utilities (+1.31%) lost favor with investors seeking higher risk investments.
Thank you for selecting the Sterling Capital Equity Index Fund. We look forward to serving your investment needs during the months and years ahead.
Sincerely,

Jeffrey J. Schappe, CFA
Managing Director-Chief Market Strategist
Sterling Capital Management LLC
| | 1 | “S&P 500®” is a registered service mark of Standard & Poor’s Corporation, which does not sponsor and is in no way affiliated with the Fund or Master Portfolio. The S&P 500® Index is generally considered to be representative of the performance of the stock market as a whole. The index does not reflect the deduction of expenses associated with a mutual fund, such as investment management and fund accounting fees. The Fund’s performance reflects the deduction of fees for these services. Investors cannot invest directly in an index, although they can invest in its underlying securities. |
Past performance does not guarantee future results. Mutual fund investing involves risk including the possible loss of principal.
This report is authorized for distribution only when preceded or accompanied by a prospectus. Please read the prospectus carefully before investing or sending money. Sterling Capital Management LLC (“Sterling Capital”) serves as investment advisor to the Sterling Capital Funds (each a “Fund” and collectively, the “Funds”) and is paid a fee for its services. Shares of the Funds are not deposits or obligations of, or guaranteed or endorsed by, Branch Banking and Trust Company or its affiliates. The Funds are not insured by the FDIC or any other government agency. The Funds currently are distributed by Sterling Capital Distributors, LLC. The distributor is not affiliated with Branch Banking and Trust Company or its affiliates.
The foregoing information and opinions are for general information only. Sterling Capital does not guarantee their accuracy or completeness, nor assume liability for any loss, which may result from the reliance by any person upon any such information or opinions. Such information and opinions are subject to change without notice, are for general information only and are not intended as an offer or solicitation with respect to the purchase or sale of any security or as offering individual or personalized investment advice.
Sterling Capital Equity Index Fund
Investment Advisors
BlackRock Fund Advisors, a subsidiary of BlackRock, Inc. (S&P 500® Stock Master Portfolio), Sterling Capital Management LLC (Sterling Capital Equity Index Fund).
Unlike many traditional, actively managed investment funds, there is no single portfolio manager who makes investment decisions for the Sterling Capital Equity Index Fund (the “Fund”). Instead, the Fund invests substantially all of its assets in the S&P 500® Stock Master Portfolio (the “Master Portfolio”), which is managed by a team of investment professionals from BlackRock Fund Advisors, who use a specially designed software program to maintain a close match to the characteristics of the S&P 500® Index.
Investment Concerns
Equity securities (stocks) are more volatile. The net asset value per share of this Fund will fluctuate as the value of the securities held by the Master Portfolio changes. Common stocks, and funds investing in common stocks, generally provide greater return potential when compared with other types of investments.
The performance of the Fund is expected to be lower than that of the S&P 500® Index because of Fund fees and expenses.
Portfolio Manager’s Perspective
“Investing in an index fund such as ours is based on the belief that it’s very difficult to ‘beat the market’ on a consistent basis. Our approach, then, is to take advantage of the stock market’s long-term growth potential, while managing costs, to help shareholders potentially build wealth over time. We believe the Fund is an excellent tool for novice and experienced investors alike, and can serve as the foundation of most equity investors’ asset allocation strategies.”
Q. How did the Fund perform during the 12-month period between January 1, 2012 and December 31, 2012?
A. The Fund’s Class A Shares underperformed its benchmark, the S&P 500® Index.
Q. What factors affected the Fund’s performance?
A. The Fund seeks to approximate, as closely as possible, the performance of the capitalization-weighted S&P 500® Index.
Stocks began the year with a strong rally amid low volatility. The debt situation in Europe stabilized and global liquidity conditions improved as the European Central Bank (ECB) implemented its long-term refinancing operations. Positive economic indicators in the U.S. brightened the outlook for the world economy and equities moved boldly higher through the first two months of 2012.
A flare-up in the European debt crisis halted the rally in the Spring. Political instability in Greece caused anxiety about whether the country would continue its membership in the eurozone. Spain faced severe deficit issues, policymaking issues and a liquidity crisis in the nation’s banks. Many European countries fell into recession. Alongside the drama in Europe, investors became discouraged by gloomy economic reports from various parts of the world. A slowdown in China, a key powerhouse for global growth, was of particular concern. In the U.S., disappointing jobs reports signaled that the recovery was losing steam. U.S. equities lost half of their year-to-date gains by the end of May.
As the global economic picture dimmed, investors grew increasingly optimistic that the world’s central banks would intervene to stimulate growth. European leaders took meaningful steps toward fiscal integration in the euro currency bloc, helping to fuel a powerful equity rebound in June. A month later, ECB president Mario Draghi boosted
investor confidence by stating that his organization would do “whatever it takes” to hold the eurozone together. This assurance, along with growing hopes for additional central bank stimulus, overshadowed concerns about the dreary economic landscape. U.S. stocks continued their advance through the third quarter. In September, the ECB announced its decision to backstop eurozone governments with unlimited purchases of short-term sovereign debt. Days later, the U.S. Federal Reserve announced an aggressive stimulus program involving purchases of agency mortgage-backed securities.
Concerns about the world economy resurfaced in the Fall amid political uncertainty in key nations. Global trade slowed as Europe’s recession deepened, U.S. growth remained lackluster and growth continued to decelerate in China, where leadership change compounded uncertainty. In the U.S., the “fiscal cliff” threatened to push the nation into recession unless politicians could agree upon alternate measures to reduce the deficit before the end of 2012. Worries that political gridlock would preclude a budget deal prior to the deadline drove high levels of volatility in equity markets around the world in the months leading up to the last day of the year.
Despite a downtrodden economic environment and a suspenseful lead-up to the fiscal cliff deadline, U.S. stock prices moved higher through the final months of 2012 as investors took on more risk to achieve meaningful returns in the low interest rate environment.
The consumer discretionary and financials sectors saw the largest gains in 2012 among the S&P 500® Index sectors. Global central bank stimulus helped drive financials up 28.82%. Telecommunications services and health care stocks also performed well. All of the sectors moved higher during 2012, but energy stocks gained only 4.58% due to declining oil prices in the latter part of the year and utilities gained just 1.31% as investors sought riskier investments.
| | * | Reflects 5.75% maximum sales charge. |
| | ** | Reflects the applicable contingent deferred sales charge (CDSC), maximum of 5.00%. |
| | *** | Reflects the applicable maximum CDSC of 1.00% (applicable only to redemptions within one year of purchase, and as such, are not reflected in the Average Annual Total Returns table since the periods reflected are for a year or longer). |
| | | | | | | | | | | | | | |
| Average Annual Total Returns | | | | | | |
As of December 31, 2012 | | Inception
Date | | | 1 Year | | | 5 Years | | | 10 Years |
Class A Shares* | | | 9/11/00 | | | | 8.28 | % | | | -0.39% | | | 5.75% |
Class B Shares** | | | 9/11/00 | | | | 9.99 | % | | | -0.15% | | | 5.57% |
Class C Shares*** | | | 5/11/01 | | | | 13.90 | % | | | 0.04% | | | 5.58% |
Institutional Shares | | | 5/1/071 | | | | 15.01 | % | | | 1.10% | | | 6.52% |
S&P 500® Index | | | N/A | | | | 16.00 | % | | | 1.66% | | | 7.10% |
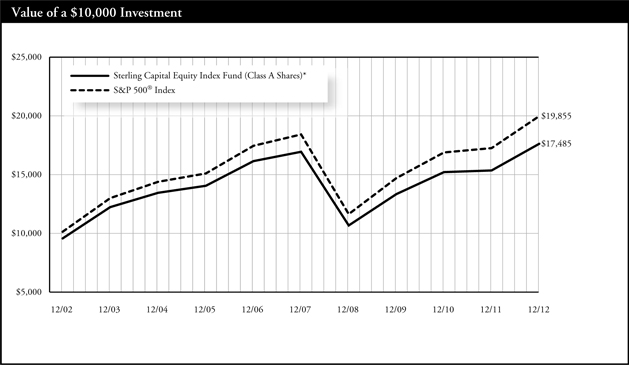
Past performance does not guarantee future results. The performance data quoted represents past performance and current returns may be lower or higher. Total return figures include change in share price, reinvestment of dividends and capital gains, and do not reflect taxes that a shareholder would pay on fund distributions or on the redemption of fund shares. The investment return and principal value will fluctuate so that an investor’s shares, when redeemed, may be worth more or less than the original cost. To obtain performance information current to the most recent month end, please visit www.sterlingcapitalfunds.com.
The chart above represents a comparison of a hypothetical $10,000 investment in the indicated share class versus a similar investment in the Fund’s benchmark, and represents the reinvestment of dividends and capital gains.
| 1 | Performance for Institutional Shares were not in existence prior to 5/1/07. Performance for periods prior to 5/1/07 is based on the performance of Class A Shares. Such performance would differ only to the extent that the Classes have different expenses. |
The Fund is measured against the S&P 500® Index, an unmanaged index which is generally considered to be representative of the performance of the stock market as a whole. Performance data for the S&P 500® Index does not reflect the deduction of expenses associated with a mutual fund, such as investment management and fund accounting fees. The Fund’s performance reflects the deduction of fees for these services. Investors cannot invest directly in an index, although they can invest in its underlying securities.
A portion of the Fund’s fees had been contractually waived prior to 5/1/12. Fund performance for certain time periods would have been lower without fee waivers in effect. There are currently no agreements in effect.
Portfolio Holdings Summary
(Unaudited)
| | |
Investment Types | | % of Investments |
| |
S&P 500 Stock Master Portfolio | | 100.00% |
For a summary of the S&P 500 Stock Master Portfolio’s holdings, please see the accompanying financial statements of the S&P 500 Stock Master Portfolio.
Expense Example (Unaudited)
As a shareholder of the Sterling Capital Equity Index Fund (the “Fund”), you incur two types of costs: (1) transaction costs, including sales charges (loads) on purchases and (2) ongoing costs, including management fees; distribution and/or service (12b-1) fees; and other Fund expenses.
These examples are intended to help you understand your ongoing costs (in dollars) of investing in the Fund and to compare these costs with the ongoing costs of investing in other mutual funds. These examples are based on an investment of $1,000 invested at the beginning of the period and held for the entire period from July 1, 2012 through December 31, 2012.
Actual Example
The table below provides information about actual account values and actual expenses. You may use the information below, together with the amount you invested, to estimate the expenses that you paid over the period. Simply divide your account value by $1,000 (for example, an $8,600 account value divided by $1,000 = 8.6), then multiply the result by the number in the table under the heading entitled “Expenses Paid During Period” to estimate the expenses you paid on your account during this period.
| | | | | | | | |
| | | Beginning
Account Value
7/1/12 | | Ending
Account Value
12/31/12 | | Expenses Paid
During Period*
7/1/12 - 12/31/12 | | Annualized
Expense Ratio**
During Period
7/1/12 - 12/31/12 |
Sterling Capital Equity Index Fund | | | | | | | | |
Class A Shares | | $1,000.00 | | $1,054.30 | | $5.58 | | 1.08% |
Class B Shares | | 1,000.00 | | 1,050.80 | | 9.43 | | 1.83% |
Class C Shares | | 1,000.00 | | 1,049.90 | | 9.43 | | 1.83% |
Institutional Shares | | 1,000.00 | | 1,055.80 | | 4.29 | | 0.83% |
| | * | Expenses are equal to the average account value over the period multiplied by the Fund’s annualized expense ratio, multiplied by 184 days divided by 366 (to reflect the six month period). |
| | ** | The annual expense ratio includes expenses allocated from the S&P 500 Stock Master Portfolio. |
Hypothetical Example for Comparison Purposes
The table below provides information about hypothetical account values and hypothetical expenses based on the Fund’s actual expense ratio and an assumed rate of return of 5% per year before expenses, which is not the Fund’s actual return. The hypothetical account values and expenses may not be used to estimate the actual ending account balance or expenses you paid for the period. You may use this information to compare the ongoing costs of investing in a Fund and other funds. To do so, compare this 5% hypothetical example with the 5% hypothetical examples that appear in the shareholder reports of other funds.
Please note that the expenses shown in the table are meant to highlight your ongoing costs only and do not reflect any transactional costs, such as sales charges (loads), redemption fees or exchange fees. Therefore, the table is useful in comparing ongoing costs only, and will not help you determine the relative total costs of owning different funds. In addition, if these transactional costs were included, your costs would have been higher.
| | | | | | | | |
| | | Beginning
Account Value
7/1/12 | | Ending
Account Value
12/31/12 | | Expenses Paid
During Period*
7/1/12 - 12/31/12 | | Annualized
Expense Ratio**
During Period
7/1/12 - 12/31/12 |
Sterling Capital Equity Index Fund | | | | | | | | |
Class A Shares | | $1,000.00 | | $1,019.71 | | $5.48 | | 1.08% |
Class B Shares | | 1,000.00 | | 1,015.94 | | 9.27 | | 1.83% |
Class C Shares | | 1,000.00 | | 1,015.94 | | 9.27 | | 1.83% |
Institutional Shares | | 1,000.00 | | 1,020.96 | | 4.22 | | 0.83% |
| | * | Expenses are equal to the average account value over the period multiplied by the Fund’s annualized expense ratio, multiplied by 184 days divided by 366 (to reflect the six month period). |
| | ** | The annual expense ratio includes expenses allocated from the S&P 500 Stock Master Portfolio. |
4
|
Sterling Capital Equity Index Fund |
Statement of Assets and Liabilities
December 31, 2012
| | | | |
Assets: | | | | |
Investment in S&P 500 Stock Master Portfolio, at value (See Note 1) | | $ | 20,474,148 | |
Receivable for capital shares issued | | | 11,276 | |
Prepaid expenses | | | 4,306 | |
| | | | |
Total Assets | | | 20,489,730 | |
| | | | |
Liabilities: | | | | |
Distributions payable | | | 85 | |
Payable for capital shares redeemed | | | 11,275 | |
Accrued expenses and other payables: | | | | |
Administration fees | | | 1,697 | |
Compliance service fees | | | 36 | |
Distribution fees | | | 4,328 | |
Trustee fees | | | 18 | |
Fund accounting fees | | | 8,531 | |
Printing fees | | | 10,730 | |
Professional fees | | | 18,510 | |
Other | | | 816 | |
| | | | |
Total Liabilities | | | 56,026 | |
| | | | |
Net Assets | | $ | 20,433,704 | |
| | | | |
Net Assets Consist of: | | | | |
Capital | | $ | 28,793,579 | |
Accumulated undistributed net investment income | | | 10,796 | |
Accumulated realized loss | | | (16,519,911 | ) |
Net unrealized appreciation (depreciation) | | | 8,149,240 | |
| | | | |
Net Assets | | $ | 20,433,704 | |
| | | | |
Net Assets | | | | |
Class A Shares | | $ | 13,898,676 | |
Class B Shares | | | 1,280,153 | |
Class C Shares | | | 338,136 | |
Institutional Shares | | | 4,916,739 | |
| | | | |
Total | | $ | 20,433,704 | |
| | | | |
| |
Shares of Beneficial Interest Outstanding (Unlimited number of shares authorized, no par value): | | | | |
Class A Shares | | | 1,452,798 | |
Class B Shares | | | 135,934 | |
Class C Shares | | | 35,672 | |
Institutional Shares | | | 514,797 | |
| | | | |
Total | | | 2,139,201 | |
| | | | |
Net Asset Value | | | | |
Class A Shares - redemption price per share | | $ | 9.57 | |
| | | | |
Class B Shares - offering price per share* | | $ | 9.42 | |
| | | | |
Class C Shares - offering price per share* | | $ | 9.48 | |
| | | | |
Institutional Shares - offering and redemption price per share | | $ | 9.55 | |
| | | | |
Maximum Sales Charge - Class A Shares | | | 5.75 | % |
| | | | |
Maximum Offering Price (100%/(100% - Maximum Sales Charge)) of net asset value adjusted to the nearest cent per share - Class A Shares | | $ | 10.15 | |
| | | | |
| * | Redemption price per share varies by length of time shares are held. |
See accompanying notes to the financial statements.
5
|
Sterling Capital Equity Index Fund |
Statement of Operations
For the Year Ended December 31, 2012
| | | | |
Net Investment Income Allocated from Master Portfolio: | | | | |
Dividend income | | $ | 465,477 | |
Foreign tax withholding | | | (255 | ) |
Interest Income | | | 875 | |
Securities lending income | | | 5,013 | |
Expenses(a) | | | (10,142 | ) |
| | | | |
Net Investment Income Allocated from Master Portfolio | | | 460,968 | |
| | | | |
Expenses: | | | | |
Distribution fees - Class A Shares | | | 45,247 | |
Distribution fees - Class B Shares | | | 16,335 | |
Distribution fees - Class C Shares | | | 2,769 | |
Administration fees (See Note 3) | | | 20,176 | |
Fund accounting fees | | | 45,337 | |
Compliance service fees (See Note 3) | | | 213 | |
Custodian fees | | | 957 | |
Printing fees | | | 32,801 | |
Professional fees | | | 29,178 | |
Registration fees | | | 13,864 | |
Transfer agent fees (See Note 3) | | | 11,991 | |
Trustees fees | | | 1,810 | |
Other | | | 8,076 | |
| | | | |
Gross expenses | | | 228,754 | |
Less expenses waived by the Distributor (See Note 3) | | | (11,379 | ) |
| | | | |
Net Expenses | | | 217,375 | |
| | | | |
Net Investment Income | | | 243,593 | |
| | | | |
Realized and Unrealized Gain (Loss) Allocated from Master Portfolio: | | | | |
Net realized gain from: | | | | |
Investments | | | 6,282,242 | |
Futures contracts | | | 31,648 | |
Change in unrealized appreciation/depreciation on: | | | | |
Investments | | | (3,719,312 | ) |
Futures contracts | | | 9,403 | |
| | | | |
Net realized/unrealized gains allocated from Master Portfolio | | | 2,603,981 | |
| | | | |
Change in net assets from operations | | $ | 2,847,574 | |
| | | | |
| (a) | Expenses allocated from the S&P 500 Stock Master Portfolio are shown net of any fee reductions. |
See accompanying notes to the financial statements.
6
|
Sterling Capital Equity Index Fund |
Statements of Changes in Net Assets
| | | | | | | | |
| | | For the
Year Ended
December 31,
2012 | | | For the
Year Ended
December 31,
2011 | |
From Investment Activities: | | | | | | | | |
Operations: | | | | | | | | |
Net investment income | | $ | 243,593 | | | $ | 226,747 | |
Net realized gain (loss) | | | 6,313,890 | | | | (1,517,723 | ) |
Change in unrealized appreciation/depreciation | | | (3,709,909 | ) | | | 1,636,552 | |
| | | | | | | | |
Change in net assets from operations | | | 2,847,574 | | | | 345,576 | |
| | | | | | | | |
Distributions to Class A Shareholders: | | | | | | | | |
Net investment income | | | (154,294 | ) | | | (152,667 | ) |
Return of Capital | | | — | | | | (4,792 | ) |
Distributions to Class B Shareholders: | | | | | | | | |
Net investment income | | | (4,354 | ) | | | (5,564 | ) |
Return of Capital | | | — | | | | (175 | ) |
Distributions to Class C Shareholders: | | | | | | | | |
Net investment income | | | (1,369 | ) | | | (578 | ) |
Return of Capital | | | — | | | | (18 | ) |
Distributions to Institutional Shareholders: | | | | | | | | |
Net investment income | | | (66,914 | ) | | | (60,392 | ) |
Return of Capital | | | — | | | | (1,895 | ) |
| | | | | | | | |
Change in net assets from shareholder distributions | | | (226,931 | ) | | | (226,081 | ) |
| | | | | | | | |
Capital Transactions: | | | | | | | | |
Class A Shares: | | | | | | | | |
Proceeds from shares issued | | | 2,496,732 | | | | 2,350,164 | |
Distributions reinvested | | | 152,830 | | | | 156,426 | |
Value of shares redeemed | | | (4,418,884 | ) | | | (7,695,209 | ) |
| | | | | | | | |
Change in net assets from Class A Share transactions | | | (1,769,322 | ) | | | (5,188,619 | ) |
Class B Shares: | | | | | | | | |
Proceeds from shares issued | | | 14,035 | | | | — | |
Distributions reinvested | | | 4,138 | | | | 5,588 | |
Value of shares redeemed | | | (984,289 | ) | | | (1,599,125 | ) |
| | | | | | | | |
Change in net assets from Class B Share transactions | | | (966,116 | ) | | | (1,593,537 | ) |
Class C Shares: | | | | | | | | |
Proceeds from shares issued | | | 115,956 | | | | 163,007 | |
Distributions reinvested | | | 1,369 | | | | 596 | |
Value of shares redeemed | | | (33,577 | ) | | | (105,847 | ) |
| | | | | | | | |
Change in net assets from Class C Share transactions | | | 83,748 | | | | 57,756 | |
Institutional Shares: | | | | | | | | |
Distributions reinvested | | | 60,723 | | | | 61,282 | |
Value of shares redeemed | | | (46,246 | ) | | | (965,485 | ) |
| | | | | | | | |
Change in net assets from Institutional Share transactions | | | 14,477 | | | | (904,203 | ) |
| | | | | | | | |
Change in net assets from capital transactions | | | (2,637,213 | ) | | | (7,628,603 | ) |
| | | | | | | | |
Change in Net Assets | | | (16,570 | ) | | | (7,509,108 | ) |
Net Assets: | | | | | | | | |
Beginning of year | | | 20,450,274 | | | | 27,959,382 | |
| | | | | | | | |
End of year | | $ | 20,433,704 | | | $ | 20,450,274 | |
| | | | | | | | |
Accumulated undistributed net investment income | | $ | 10,796 | | | $ | — | |
| | | | | | | | |
Share Transactions: | | | | | | | | |
Class A Shares: | | | | | | | | |
Issued | | | 270,316 | | | | 274,089 | |
Reinvested | | | 16,292 | | | | 18,445 | |
Redeemed | | | (482,400 | ) | | | (895,791 | ) |
| | | | | | | | |
Change in Class A Shares | | | (195,792 | ) | | | (603,257 | ) |
Class B Shares: | | | | | | | | |
Issued | | | 1,512 | | | | — | |
Reinvested | | | 444 | | | | 665 | |
Redeemed | | | (108,943 | ) | | | (190,362 | ) |
| | | | | | | | |
Change in Class B Shares | | | (106,987 | ) | | | (189,697 | ) |
Class C Shares: | | | | | | | | |
Issued | | | 12,822 | | | | 18,806 | |
Reinvested | | | 147 | | | | 71 | |
Redeemed | | | (3,608 | ) | | | (13,914 | ) |
| | | | | | | | |
Change in Class C Shares | | | 9,361 | | | | 4,963 | |
Institutional Shares: | | | | | | | | |
Reinvested | | | 6,487 | | | | 7,224 | |
Redeemed | | | (5,130 | ) | | | (109,587 | ) |
| | | | | | | | |
Change in Institutional Shares | | | 1,357 | | | | (102,363 | ) |
| | | | | | | | |
Change in Shares | | | (292,061 | ) | | | (890,354 | ) |
| | | | | | | | |
See accompanying notes to the financial statements.
7
|
Sterling Capital Equity Index Fund |
Financial Highlights, Class A Shares
The financial highlights table is intended to help you understand the Fund’s financial performance for the past 5 years. Certain information reflects financial results for a single Fund share. The total returns in the table represent the rate that an investor would have earned (or lost) on an investment in the Fund (assuming reinvestment of all dividends and distributions).
| | | | | | | | | | | | | | | | | | | | | | | | | | | | | | | | | | | | | | | | |
| | | For the Year Ended
December 31, 2012 | | For the Year Ended
December 31, 2011 | | For the Year Ended
December 31, 2010 | | For the Year Ended
December 31, 2009 | | For the
Year Ended
December 31, 2008 |
Net Asset Value, Beginning of Year | | | | $ | 8.43 | | | | | | | $ | 8.44 | | | | | | | $ | 7.49 | | | | | | | $ | 6.05 | | | | | | | $ | 9.85 | | | |
| | | | | | | | | | | | | | | | | | | | | | | | | | | | | | | | | | | | | | | | |
Investment Activities: | | | | | | | | | | | | | | | | | | | | | | | | | | | | | | | | | | | | | | | | |
Net investment income(a)(b) | | | | | 0.11 | | | | | | | | 0.09 | | | | | | | | 0.09 | | | | | | | | 0.08 | | | | | | | | 0.15 | | | |
Net realized and unrealized gain (loss) from investments(b) | | | | | 1.14 | | | | | | | | (0.01 | )(c) | | | | | | | 0.96 | | | | | | | | 1.45 | | | | | | | | (3.80 | ) | | |
| | | | | | | | | | | | | | | | | | | | | | | | | | | | | | | | | | | | | | | | |
Total from Investment Activities | | | | | 1.25 | | | | | | | | 0.08 | | | | | | | | 1.05 | | | | | | | | 1.53 | | | | | | | | (3.65 | ) | | |
| | | | | | | | | | | | | | | | | | | | | | | | | | | | | | | | | | | | | | | | |
Distributions: | | | | | | | | | | | | | | | | | | | | | | | | | | | | | | | | | | | | | | | | |
Net investment income | | | | | (0.11 | ) | | | | | | | (0.09 | ) | | | | | | | (0.10 | ) | | | | | | | (0.08 | ) | | | | | | | (0.15 | ) | | |
Return of capital | | | | | — | | | | | | | | (0.00 | )(d) | | | | | | | — | | | | | | | | (0.01 | ) | | | | | | | (0.00 | )(d) | | |
| | | | | | | | | | | | | | | | | | | | | | | | | | | | | | | | | | | | | | | | |
Total Distributions | | | | | (0.11 | ) | | | | | | | (0.09 | ) | | | | | | | (0.10 | ) | | | | | | | (0.09 | ) | | | | | | | (0.15 | ) | | |
| | | | | | | | | | | | | | | | | | | | | | | | | | | | | | | | | | | | | | | | |
Net Asset Value — End of Year | | | | $ | 9.57 | | | | | | | $ | 8.43 | | | | | | | $ | 8.44 | | | | | | | $ | 7.49 | | | | | | | $ | 6.05 | | | |
| | | | | | | | | | | | | | | | | | | | | | | | | | | | | | | | | | | | | | | | |
Total Return (excludes sales charge) | | | | | 14.83 | % | | | | | | | 0.94 | % | | | | | | | 14.09 | % | | | | | | | 25.60 | % | | | | | | | (37.35 | )% | | |
| | | | | | | | | | | | | | | |
Ratios/Supplementary Data: | | | | | | | | | | | | | | | | | | | | | | | | | | | | | | | | | | | | | | | | |
Net Assets, End of Year (000’s) | | | | $ | 13,899 | | | | | | | $ | 13,896 | | | | | | | $ | 19,004 | | | | | | | $ | 19,191 | | | | | | | $ | 15,795 | | | |
Ratio of net expenses to average net assets(b) | | | | | 1.12 | % | | | | | | | 1.10 | % | | | | | | | 0.93 | % | | | | | | | 1.00 | % | | | | | | | 0.54 | % | | |
Ratio of net investment income to average net assets(b) | | | | | 1.22 | % | | | | | | | 1.02 | % | | | | | | | 1.20 | % | | | | | | | 1.27 | % | | | | | | | 1.79 | % | | |
Ratio of expenses to average net assets*(b) | | | | | 1.20 | % | | | | | | | 1.36 | % | | | | | | | 1.18 | % | | | | | | | 1.25 | % | | | | | | | 0.79 | % | | |
Portfolio turnover rate(e) | | | | | 10 | % | | | | | | | 5 | % | | | | | | | 9 | % | | | | | | | 5 | % | | | | | | | 8 | % | | |
| * | During the periods, certain fees were contractually waived (See Note 3 in the Notes to the Financial Statements). If such reductions had not occurred, the ratios would have been as indicated. |
| (a) | Per share net investment income has been calculated using the average daily shares method. |
| (b) | The per share amounts and percentages reflect income and expenses assuming inclusion of the Fund’s proportionate share of the income and expenses of the S&P 500 Stock Master Portfolio. |
| (c) | The amount shown for a share outstanding throughout the period does not accord with the change in aggregate gains and losses in the portfolio of securities during the period because of the timing of sales and purchases of Fund shares in relation to fluctuating market values during the period. |
| (d) | Less than (0.01) per share. |
| (e) | This rate represents the portfolio turnover rate of the S&P 500 Stock Master Portfolio. |
See accompanying notes to the financial statements.
8
|
Sterling Capital Equity Index Fund |
Financial Highlights, Class B Shares
The financial highlights table is intended to help you understand the Fund’s financial performance for the past 5 years. Certain information reflects financial results for a single Fund share. The total returns in the table represent the rate that an investor would have earned (or lost) on an investment in the Fund (assuming reinvestment of all dividends and distributions).
| | | | | | | | | | | | | | | | | | | | | | | | | | | | | | | | | | | | | | | | |
| | | For the
Year Ended
December 31, 2012 | | For the
Year Ended
December 31, 2011 | | For the
Year Ended
December 31, 2010 | | For the
Year Ended
December 31, 2009 | | For the
Year Ended
December 31, 2008 |
Net Asset Value, Beginning of Year | | | | $ | 8.29 | | | | | | | $ | 8.29 | | | | | | | $ | 7.35 | | | | | | | $ | 5.94 | | | | | | | $ | 9.67 | | | |
| | | | | | | | | | | | | | | | | | | | | | | | | | | | | | | | | | | | | | | | |
Investment Activities: | | | | | | | | | | | | | | | | | | | | | | | | | | | | | | | | | | | | | | | | |
Net investment income(a)(b) | | | | | 0.04 | | | | | | | | 0.02 | | | | | | | | 0.03 | | | | | | | | 0.03 | | | | | | | | 0.09 | | | |
Net realized and unrealized gain (loss) from investments(b) | | | | | 1.12 | | | | | | | | — | | | | | | | | 0.94 | | | | | | | | 1.42 | | | | | | | | (3.73 | ) | | |
| | | | | | | | | | | | | | | | | | | | | | | | | | | | | | | | | | | | | | | | |
Total from Investment Activities | | | | | 1.16 | | | | | | | | 0.02 | | | | | | | | 0.97 | | | | | | | | 1.45 | | | | | | | | (3.64 | ) | | |
| | | | | | | | | | | | | | | | | | | | | | | | | | | | | | | | | | | | | | | | |
Distributions: | | | | | | | | | | | | | | | | | | | | | | | | | | | | | | | | | | | | | | | | |
Net investment income | | | | | (0.03 | ) | | | | | | | (0.02 | ) | | | | | | | (0.03 | ) | | | | | | | (0.04 | ) | | | | | | | (0.09 | ) | | |
Return of capital | | | | | — | | | | | | | | (0.00 | )(c) | | | | | | | — | | | | | | | | (0.00 | )(c) | | | | | | | (0.00 | )(c) | | |
| | | | | | | | | | | | | | | | | | | | | | | | | | | | | | | | | | | | | | | | |
Total Distributions | | | | | (0.03 | ) | | | | | | | (0.02 | ) | | | | | | | (0.03 | ) | | | | | | | (0.04 | ) | | | | | | | (0.09 | ) | | |
| | | | | | | | | | | | | | | | | | | | | | | | | | | | | | | | | | | | | | | | |
Net Asset Value — End of Year | | | | $ | 9.42 | | | | | | | $ | 8.29 | | | | | | | $ | 8.29 | | | | | | | $ | 7.35 | | | | | | | $ | 5.94 | | | |
| | | | | | | | | | | | | | | | | | | | | | | | | | | | | | | | | | | | | | | | |
Total Return (excludes sales charge) | | | | | 13.99 | % | | | | | | | 0.23 | % | | | | | | | 13.30 | % | | | | | | | 24.58 | % | | | | | | | (37.83 | )% | | |
| | | | | | | | | | | | | | | |
Ratios/Supplementary Data: | | | | | | | | | | | | | | | | | | | | | | | | | | | | | | | | | | | | | | | | |
Net Assets, End of Year (000’s) | | | | $ | 1,280 | | | | | | | $ | 2,014 | | | | | | | $ | 3,588 | | | | | | | $ | 5,298 | | | | | | | $ | 6,432 | | | |
Ratio of net expenses to average net assets(b) | | | | | 1.87 | % | | | | | | | 1.84 | % | | | | | | | 1.67 | % | | | | | | | 1.76 | % | | | | | | | 1.30 | % | | |
Ratio of net investment income to average net assets(b) | | | | | 0.41 | % | | | | | | | 0.26 | % | | | | | | | 0.42 | % | | | | | | | 0.55 | % | | | | | | | 1.05 | % | | |
Ratio of expenses to average net assets*(b) | | | | | 1.87 | % | | | | | | | 1.85 | % | | | | | | | 1.68 | % | | | | | | | 1.76 | % | | | | | | | 1.30 | % | | |
Portfolio turnover rate(d) | | | | | 10 | % | | | | | | | 5 | % | | | | | | | 9 | % | | | | | | | 5 | % | | | | | | | 8 | % | | |
| * | During the periods, certain fees were contractually waived (See Note 3 in the Notes to the Financial Statements). If such reductions had not occurred, the ratios would have been as indicated. |
| (a) | Per share net investment income has been calculated using the average daily shares method. |
| (b) | The per share amounts and percentages reflect income and expenses assuming inclusion of the Fund’s proportionate share of the income and expenses of the S&P 500 Stock Master Portfolio. |
| (c) | Less than (0.01) per share. |
| (d) | This rate represents the portfolio turnover rate of the S&P 500 Stock Master Portfolio. |
See accompanying notes to the financial statements.
9
|
Sterling Capital Equity Index Fund |
Financial Highlights, Class C Shares
The financial highlights table is intended to help you understand the Fund’s financial performance for the past 5 years. Certain information reflects financial results for a single Fund share. The total returns in the table represent the rate that an investor would have earned (or lost) on an investment in the Fund (assuming reinvestment of all dividends and distributions).
| | | | | | | | | | | | | | | | | | | | | | | | | | | | | | | | | | | | | | | | |
| | | For the
Year Ended
December 31, 2012 | | For the
Year Ended
December 31, 2011 | | For the
Year Ended
December 31, 2010 | | For the
Year Ended
December 31, 2009 | | For the
Year Ended
December 31, 2008 |
Net Asset Value, Beginning of Year | | | | $ | 8.36 | | | | | | | $ | 8.36 | | | | | | | $ | 7.42 | | | | | | | $ | 6.00 | | | | | | | $ | 9.76 | | | |
| | | | | | | | | | | | | | | | | | | | | | | | | | | | | | | | | | | | | | | | |
Investment Activities: | | | | | | | | | | | | | | | | | | | | | | | | | | | | | | | | | | | | | | | | |
Net investment income(a)(b) | | | | | 0.05 | | | | | | | | 0.02 | | | | | | | | 0.04 | | | | | | | | 0.03 | | | | | | | | 0.08 | | | |
Net realized and unrealized gain (loss) from investments(b) | | | | | 1.11 | | | | | | | | — | | | | | | | | 0.94 | | | | | | | | 1.44 | | | | | | | | (3.76 | ) | | |
| | | | | | | | | | | | | | | | | | | | | | | | | | | | | | | | | | | | | | | | |
Total from Investment Activities | | | | | 1.16 | | | | | | | | 0.02 | | | | | | | | 0.98 | | | | | | | | 1.47 | | | | | | | | (3.68 | ) | | |
| | | | | | | | | | | | | | | | | | | | | | | | | | | | | | | | | | | | | | | | |
Distributions: | | | | | | | | | | | | | | | | | | | | | | | | | | | | | | | | | | | | | | | | |
Net investment income | | | | | (0.04 | ) | | | | | | | (0.02 | ) | | | | | | | (0.04 | ) | | | | | | | (0.04 | ) | | | | | | | (0.08 | ) | | |
Return of capital | | | | | — | | | | | | | | (0.00 | )(c) | | | | | | | — | | | | | | | | (0.01 | ) | | | | | | | (0.00 | )(c) | | |
| | | | | | | | | | | | | | | | | | | | | | | | | | | | | | | | | | | | | | | | |
Total Distributions | | | | | (0.04 | ) | | | | | | | (0.02 | ) | | | | | | | (0.04 | ) | | | | | | | (0.05 | ) | | | | | | | (0.08 | ) | | |
| | | | | | | | | | | | | | | | | | | | | | | | | | | | | | | | | | | | | | | | |
Net Asset Value — End of Year | | | | $ | 9.48 | | | | | | | $ | 8.36 | | | | | | | $ | 8.36 | | | | | | | $ | 7.42 | | | | | | | $ | 6.00 | | | |
| | | | | | | | | | | | | | | | | | | | | | | | | | | | | | | | | | | | | | | | |
Total Return (excludes sales charge) | | | | | 13.90 | % | | | | | | | 0.29 | % | | | | | | | 13.28 | % | | | | | | | 24.60 | % | | | | | | | (37.84 | )% | | |
| | | | | | | | | | | | | | | |
Ratios/Supplementary Data: | | | | | | | | | | | | | | | | | | | | | | | | | | | | | | | | | | | | | | | | |
Net Assets, End of Year (000’s) | | | | $ | 338 | | | | | | | $ | 220 | | | | | | | $ | 179 | | | | | | | $ | 123 | | | | | | | $ | 89 | | | |
Ratio of net expenses to average net assets(b) | | | | | 1.86 | % | | | | | | | 1.87 | % | | | | | | | 1.68 | % | | | | | | | 1.74 | % | | | | | | | 1.30 | % | | |
Ratio of net investment income to average net assets(b) | | | | | 0.51 | % | | | | | | | 0.26 | % | | | | | | | 0.46 | % | | | | | | | 0.52 | % | | | | | | | 0.95 | % | | |
Ratio of expenses to average net assets*(b) | | | | | 1.86 | % | | | | | | | 1.87 | % | | | | | | | 1.69 | % | | | | | | | 1.74 | % | | | | | | | 1.30 | % | | |
Portfolio turnover rate(d) | | | | | 10 | % | | | | | | | 5 | % | | | | | | | 9 | % | | | | | | | 5 | % | | | | | | | 8 | % | | |
| * | During the periods, certain fees were contractually waived (See Note 3 in the Notes to the Financial Statements). If such reductions had not occurred, the ratios would have been as indicated. |
| (a) | Per share net investment income has been calculated using the average daily shares method. |
| (b) | The per share amounts and percentages reflect income and expenses assuming inclusion of the Fund’s proportionate share of the income and expenses of the S&P 500 Stock Master Portfolio. |
| (c) | Less than (0.01) per share. |
| (d) | This rate represents the portfolio turnover rate of the S&P 500 Stock Master Portfolio. |
See accompanying notes to the financial statements.
10
|
Sterling Capital Equity Index Fund |
Financial Highlights, Institutional Shares
The financial highlights table is intended to help you understand the Fund’s financial performance for the past 5 years. Certain information reflects financial results for a single Fund share. The total returns in the table represent the rate that an investor would have earned (or lost) on an investment in the Fund (assuming reinvestment of all dividends and distributions).
| | | | | | | | | | | | | | | | | | | | | | | | | | | | | | | | | | | | | | | | |
| | | For the
Year Ended
December 31, 2012 | | For the
Year Ended
December 31, 2011 | | For the
Year Ended
December 31, 2010 | | For the
Year Ended
December 31, 2009 | | For the
Year Ended
December 31, 2008 |
Net Asset Value, Beginning of Year | | | | $ | 8.42 | | | | | | | $ | 8.43 | | | | | | | $ | 7.48 | | | | | | | $ | 6.02 | | | | | | | $ | 9.81 | | | |
| | | | | | | | | | | | | | | | | | | | | | | | | | | | | | | | | | | | | | | | |
Investment Activities: | | | | | | | | | | | | | | | | | | | | | | | | | | | | | | | | | | | | | | | | |
Net investment income(a)(b) | | | | | 0.14 | | | | | | | | 0.11 | | | | | | | | 0.11 | | | | | | | | 0.10 | | | | | | | | 0.17 | | | |
Net realized and unrealized gain (loss) from investments(b) | | | | | 1.12 | | | | | | | | (0.01 | )(c) | | | | | | | 0.96 | | | | | | | | 1.47 | | | | | | | | (3.79 | ) | | |
| | | | | | | | | | | | | | | | | | | | | | | | | | | | | | | | | | | | | | | | |
Total from Investment Activities | | | | | 1.26 | | | | | | | | 0.10 | | | | | | | | 1.07 | | | | | | | | 1.57 | | | | | | | | (3.62 | ) | | |
| | | | | | | | | | | | | | | | | | | | | | | | | | | | | | | | | | | | | | | | |
Distributions: | | | | | | | | | | | | | | | | | | | | | | | | | | | | | | | | | | | | | | | | |
Net investment income | | | | | (0.13 | ) | | | | | | | (0.11 | ) | | | | | | | (0.12 | ) | | | | | | | (0.10 | ) | | | | | | | (0.17 | ) | | |
Return of capital | | | | | — | | | | | | | | (0.00 | )(d) | | | | | | | — | | | | | | | | (0.01 | ) | | | | | | | (0.00 | )(d) | | |
| | | | | | | | | | | | | | | | | | | | | | | | | | | | | | | | | | | | | | | | |
Total Distributions | | | | | (0.13 | ) | | | | | | | (0.11 | ) | | | | | | | (0.12 | ) | | | | | | | (0.11 | ) | | | | | | | (0.17 | ) | | |
| | | | | | | | | | | | | | | | | | | | | | | | | | | | | | | | | | | | | | | | |
Net Asset Value — End of Year | | | | $ | 9.55 | | | | | | | $ | 8.42 | | | | | | | $ | 8.43 | | | | | | | $ | 7.48 | | | | | | | $ | 6.02 | | | |
| | | | | | | | | | | | | | | | | | | | | | | | | | | | | | | | | | | | | | | | |
Total Return (excludes sales charge) | | | | | 15.01 | % | | | | | | | 1.21 | % | | | | | | | 14.41 | % | | | | | | | 26.36 | % | | | | | | | (37.24 | )% | | |
| | | | | | | | | | | | | | | |
Ratios/Supplementary Data: | | | | | | | | | | | | | | | | | | | | | | | | | | | | | | | | | | | | | | | | |
Net Assets, End of Year (000’s) | | | | $ | 4,917 | | | | | | | $ | 4,321 | | | | | | | $ | 5,189 | | | | | | | $ | 3,343 | | | | | | | $ | 47,259 | | | |
Ratio of net expenses to average net assets(b) | | | | | 0.87 | % | | | | | | | 0.85 | % | | | | | | | 0.68 | % | | | | | | | 0.72 | % | | | | | | | 0.30 | % | | |
Ratio of net investment income to average net assets(b) | | | | | 1.47 | % | | | | | | | 1.27 | % | | | | | | | 1.46 | % | | | | | | | 1.66 | % | | | | | | | 2.08 | % | | |
Ratio of expenses to average net assets*(b) | | | | | 0.87 | % | | | | | | | 0.86 | % | | | | | | | 0.69 | % | | | | | | | 0.72 | % | | | | | | | 0.30 | % | | |
Portfolio turnover rate(e) | | | | | 10 | % | | | | | | | 5 | % | | | | | | | 9 | % | | | | | | | 5 | % | | | | | | | 8 | % | | |
| * | During the periods, certain fees were contractually waived (See Note 3 in the Notes to the Financial Statements). If such reductions had not occurred, the ratios would have been as indicated. |
| (a) | Per share net investment income has been calculated using the average daily shares method. |
| (b) | The per share amounts and percentages reflect income and expenses assuming inclusion of the Fund’s proportionate share of the income and expenses of the S&P 500 Stock Master Portfolio. |
| (c) | The amount shown for a share outstanding throughout the period does not accord with the change in aggregate gains and losses in the portfolio of securities during the period because of the timing of sales and purchases of Fund shares in relation to fluctuating market values during the period. |
| (d) | Less than (0.01) per share. |
| (e) | This rate represents the portfolio turnover rate of the S&P 500 Stock Master Portfolio. |
See accompanying notes to the financial statements.
11
|
Sterling Capital Equity Index Fund |
Notes to the Financial Statements
December 31, 2012
The Sterling Capital Equity Index Fund (the “Fund”) commenced operations on September 11, 2000 and is registered under the Investment Company Act of 1940, as amended (the “1940 Act”), as a diversified open-end investment company. The Fund is a separate series of the Sterling Capital Funds (the “Trust”), a Massachusetts business trust organized in 1992. The Fund invests all of its investable assets in the S&P 500 Stock Master Portfolio (the “Master Portfolio”) of the Master Investment Portfolio (“MIP”), a diversified open-end management investment company registered under the 1940 Act, rather than in a portfolio of securities. The Master Portfolio has substantially the same investment objective as the Fund. BlackRock Fund Advisors serves as investment advisor for the Master Portfolio. The financial statements of the Master Portfolio, including the schedule of investments in securities, are contained elsewhere in this report and should be read in conjunction with the Fund’s financial statements. The value of the Fund’s investment in the Master Portfolio reflects the Fund’s interest of 1.19% in the net assets of the Master Portfolio at December 31, 2012.
The Fund is authorized to issue an unlimited number of shares. The Fund offers four classes of shares: Class A Shares, Class B Shares, Class C Shares and Institutional Shares. Class B Shares of the Fund are closed to new accounts and additional purchases by existing shareholders. Class B Shares automatically convert to Class A Shares after eight years. Class A Shares of the Fund have a maximum sales charge of 5.75% as a percentage of the original purchase price. Purchases of $1 million or more of Class A Shares are not subject to a front-end sales charge, but will be subject to a contingent deferred sales charge (“CDSC”) of up to 1.00% of the purchase price as described below. A CDSC of up to 1.00% of the purchase price of Class A Shares will be charged to the following shareholders who received a sales charge waiver, and then redeem their shares within two years after purchase: (i) shareholders who purchased $1 million or more and (ii) employees of the Trust, BB&T Corporation and its affiliates for shares purchased prior 2/17/2012. The CDSC is based on the lower of the cost for the shares or their net asset value at the time of redemption. Class B Shares of the Fund are offered without any front-end sales charge but will be subject to a CDSC ranging from a maximum of 5.00% if redeemed less than one year after purchase to 0.00% if redeemed more than six years after purchase. Class C Shares of the Fund are offered without any front-end sales charge but will be subject to a maximum CDSC of 1.00% if redeemed less than one year after purchase. Institutional Shares of the Fund are offered without any front-end sales charge and without any CDSC.
Each class of shares has identical rights and privileges except with respect to the fees paid under the distribution plan, voting rights on matters affecting a single class of shares and the exchange privilege of each class of shares.
Under the Trust’s organizational documents, its Officers and Trustees are indemnified against certain liabilities arising out of the performance of their duties to the Trust. In addition, in the normal course of business, the Fund may enter into contracts with their vendors and others that provide for general indemnifications.The Fund’s maximum exposure under these arrangements is unknown, as this would involve future claims that may be made against the Fund. However, based on experience, the Fund expects that risk of loss to be remote.
| | 2. | Significant Accounting Policies: |
The following is a summary of significant accounting policies followed by the Fund in the preparation of its financial statements.The policies are in conformity with United States generally accepted accounting principles (“U.S. GAAP”). The preparation of financial statements requires management to make estimates and assumptions that affect the reported amounts of assets and liabilities and disclosure of contingent assets and liabilities at the date of the financial statements and the reported amounts of income and expenses for the reporting period. Actual results could differ from those estimates.
Securities Valuation — The Fund records its investment in the Master Portfolio at fair value. Valuation of securities held by the Master Portfolio is discussed in Note 1 of the Master Portfolio’s Notes to Financial Statements, which are included elsewhere in this report.
Fair Value Measurements — The objective of a fair value measurement is to determine the price that would be received to sell an asset or paid to transfer a liability in an orderly transaction between market participants at the measurement date (an exit price). Accordingly, the fair value hierarchy gives the highest priority to quoted prices (unadjusted) in active markets for identical assets or liabilities (Level 1) and the lowest priority to unobservable inputs (Level 3). The three levels of the fair value hierarchy are described below:
• Level 1 – quoted prices in active markets for identical securities
12
|
Sterling Capital Equity Index Fund |
Notes to the Financial Statements — (continued)
December 31, 2012
• Level 2 – based on other significant observable inputs (including quoted prices for similar securities, interest rates, prepayment speeds, credit risk, etc.)
• Level 3 – based on significant unobservable inputs (including the Fund’s own assumptions in determining the fair value of investments)
The inputs or methodology used for valuing securities are not necessarily an indication of the risk associated with investing in those securities. During the fiscal year ended December 31, 2012, there were no significant changes to the valuation policies and procedures.
The summary of inputs used to determine the fair value of the Fund’s investment as of December 31, 2012 is as follows:
| | | | | | | | |
| | | Level 1–
Quoted Inputs | | Level 2–
Other Significant
Observable Inputs | | Level 3–
Other
Significant
Unobservable Inputs | | Total Fair Value |
| | | | |
Investment in Master Portfolio | | $20,474,148 | | $— | | $— | | $20,474,148 |
There were no transfers between Level 1 and Level 2 for the fiscal year ended December 31, 2012. The Fund’s policy is to recognize transfers in and transfers out as of the beginning of the reporting period.
Distributions to Shareholders — Distributions from net investment income are declared and paid quarterly by the Fund. Distributable net realized gains, if any, are declared and distributed at least annually. The character of income and gains distributed are determined in accordance with federal income tax regulations, which may differ from U.S. GAAP. These “book/tax” differences are either considered temporary or permanent in nature. To the extent these differences are permanent in nature (e.g., redemptions in-kind, wash sales, expiration of capital loss carryforwards, investments in real estate investment trusts (REITs), gains and losses from contributed securities, and return of capital distribution received from securities held), such amounts are reclassified within the composition of net assets based on their federal tax-basis treatment; temporary differences do not require reclassification. These reclassifications have no effect on net assets or net asset values per share. Distributions to shareholders which exceed net investment income and net realized gains for tax purposes are reported as distributions of capital.
As of December 31, 2012, these reclassifications were as follows:
| | | | | | |
| | | Undistributed Net
Investment Income | | Accumulated
Realized Gains | | Paid-in-Capital |
| | $(5,866) | | $(7,845,122) | | $7,850,988 |
Expenses and Allocation Methodology — Expenses directly attributable to a class of shares are charged to that class. Expenses directly attributable to the Fund are charged to the Fund. Expenses not directly attributable to the Fund are allocated proportionately among the Trust daily in relation to the net assets of each series of the Trust or on another reasonable basis. Each class of shares bears its pro-rata portion of expenses attributable to its series, except that each class separately bears expenses related specifically to that class, such as distribution fees. Expenses that are attributable to both the Trust and Sterling Capital Variable Insurance Funds are allocated across the Trust and Sterling Capital Variable Insurance Funds, based upon relative net assets or on another reasonable basis. Income and realized and unrealized gains or losses on investments are allocated to each class of shares based on its relative net assets.
Securities Transactions and Income Recognition — The Fund records daily its proportionate interest in the net investment income and realized/unrealized capital gains and losses of the Master Portfolio. The performance of the Fund is directly affected by the performance of the Master Portfolio.
Federal Income Taxes — It is the policy of the Fund to continue to qualify as a regulated investment company by complying with the provisions available to certain investment companies, as defined in applicable sections of the Internal Revenue Code of 1986, as amended, and to make distributions of net investment income and net realized capital gains sufficient to relieve it from all, or substantially all, federal income taxes. Accordingly, no provision for federal income tax is required.
13
|
Sterling Capital Equity Index Fund |
Notes to the Financial Statements — (continued)
December 31, 2012
| | 3. | Related Party Transactions: |
Under its Investment Advisory Agreement with respect to the Fund, Sterling Capital Management LLC (“Sterling Capital” or the “Advisor”) exercises general oversight over the investment performance of the Fund. Sterling Capital will advise the Board of Trustees (the “Board”) if investment of all of the Fund’s assets in the Master Portfolio is no longer an appropriate means of achieving the Fund’s investment objective. For periods in which all of the Fund’s assets are not invested in the Master Portfolio, Sterling Capital may receive an investment advisory fee from the Fund. For the fiscal year ended December 31, 2012, all of the Fund’s investable assets were invested in the Master Portfolio and Sterling Capital received no advisory fees.
Sterling Capital serves as the administrator to the Fund pursuant to an administration agreement. The Fund pays its portion of a fee to Sterling Capital for providing administration services based on the aggregate assets of the Trust (except Sterling Capital Strategic Allocation Conservative Fund, Sterling Capital Strategic Allocation Balanced Fund, Sterling Capital Strategic Allocation Growth Fund and Sterling Capital Strategic Allocation Equity Fund) and the Sterling Capital Variable Insurance Funds (except Sterling Capital Strategic Allocation Equity VIF) at a rate of 0.1075% on the first $3.5 billion of average net assets; 0.075% on the next $1 billion of average net assets; 0.06% on the next $1.5 billion of average net assets; and 0.04% of average net assets over $6 billion. Prior to July 1, 2012, the administration fee with respect to the first $3.5 billion of average net assets was 0.11%. This fee is accrued daily and payable on a monthly basis. Expenses incurred are reflected on the Statement of Operations as “Administration fees.” Pursuant to a Sub-Administration Agreement with Sterling Capital, BNY Mellon Investment Servicing (US) Inc. (“BNY Mellon” or the “Sub-Administrator”), serves as sub-administrator to the Fund subject to the general supervision of the Board and Sterling Capital. For these services, BNY Mellon is entitled to a fee payable by Sterling Capital.
BNY Mellon serves as the Fund’s transfer agent and receives compensation by the Fund for these services. Expenses incurred are reflected on the Statement of Operations as “Transfer agent fees.”
Sterling Capital’s Chief Compliance Officer (“CCO”) serves as the Fund’s CCO. The CCO’s compensation is reviewed and approved by the Fund’s Board and paid by Sterling Capital. However, the Fund reimburses Sterling Capital for its allocable portion of the CCO’s salary. Expenses incurred for the Fund are reflected on the Statement of Operations as “Compliance service fees.”
The Fund has adopted a Distribution and Shareholder Services Plan (the “Plan”) in accordance with Rule 12b-1 under the 1940 Act. Sterling Capital Distributors, LLC (formerly known as Sterling Capital Distributors, Inc.) (the “Distributor”) serves as distributor to the Fund pursuant to an Underwriting Agreement. As of May 1, 2012, the Plan provides for payments to the Distributor of up to 0.25%, 1.00% and 1.00% of the average daily net assets of the Class A Shares, Class B Shares and Class C Shares, respectively. Prior to May 1, 2012, the Plan provided for payments to the distributor of up to 0.50%, 1.00% and 1.00% of the average daily net assets of the Class A Shares, Class B Shares and Class C Shares, respectively. The Distributor had contractually agreed to limit the distribution and service (12b-1) fees for Class A Shares of the Fund to 0.25% through April 30, 2012. Distribution fees totaling $11,379 were waived for the fiscal year ended December 31, 2012. Distribution fee waivers are included in the Statement of Operations as “Less expenses waived by the Distributor” and these waivers are not subject to recoupment in subsequent fiscal periods. The Distributor is entitled to receive commissions on sales of shares of the Fund. For the fiscal year ended December 31, 2012, the Distributor received $1,263 from commissions earned on sales of shares of the Fund. Commissions paid to affiliated broker-dealers during the fiscal year ended December 31, 2012 were $548. The fees may be used by the Distributor to pay banks, broker-dealers and other institutions, including affiliates of the Advisor.
Sterling Capital and/or its affiliates may pay out of their own bona fide profits compensation to broker-dealers and other persons for the sale and distribution of the shares and/or for the servicing of the shares. These are additional payments over and above the sales charge (including Rule 12b-1 fees) and service fees paid by the Fund. The payments, which may be different for different financial institutions, will not change the price an investor will pay for shares or the amount that a Fund will receive for the sale of the shares.
Certain Officers and a Trustee of the Trust are affiliated with Sterling Capital or the Sub-Administrator. Such Officers and Trustee receive no compensation from the Trust for serving in their respective roles. Each of the Trustees who are not interested persons (as defined in the 1940 Act) of the Trust who serve on the Board are compensated at the annual rate of $40,000 plus $5,000 for each regularly scheduled quarterly meeting attended, $4,000 for each special meeting attended in person and $3,000
14
|
Sterling Capital Equity Index Fund |
Notes to the Financial Statements — (continued)
December 31, 2012
for each special meeting attended by telephone, plus reimbursement for certain out of pocket expenses. The Trustee who is an interested person as defined in the 1940 Act of the Trust, but not affiliated with Sterling Capital is compensated at the annual rate of $40,000 plus $4,000 for each regularly scheduled quarterly meeting attended, $3,200 for each special meeting attended in person and $2,400 for each special meeting attended by telephone, plus reimbursement for certain out of pocket expenses. Each Trustee serving on a Committee of the Board receives a fee of $4,000 for each Committee meeting attended in person and $3,000 for each Committee meeting attended by telephone, plus reimbursement for certain out of pocket expenses. Committee meeting fees are only paid when such Committee meetings are not held in conjunction with a regular board meeting. Additionally, the Chairman of the Board and the Audit Committee Chairman each receive an annual retainer of $15,000, and the Chairman of the Nominations Committee receives additional compensation at the rate of $1,000 for each meeting over which he or she presides as Chairman. The fees are allocated across the Trust and the Sterling Capital Variable Insurance Funds based upon relative net assets. During the year ended December 31, 2012, actual Trustee compensation was $394,400 in total from the Trust, of which $1,638 was allocated to the Fund.
| | 4. | Federal Tax Information: |
Management evaluates its tax positions to determine if the tax positions taken meet the minimum recognition threshold in connection with accounting for uncertainties in income tax positions taken or expected to be taken for the purposes of measuring and recognizing tax liabilities in the financial statements. Recognition of tax benefits of an uncertain tax position is required only when the position is “more likely than not” to be sustained assuming examination by taxing authorities. The Fund recognizes interest and penalties, if any, related to unrecognized tax benefits as income tax expense in the Statements of Operations. During the year ended December 31, 2012, the Fund did not incur any interest or penalties.
Management has analyzed the Fund’s tax positions taken on federal income tax returns for all open tax years (current and prior three tax years), and has concluded that no provision for federal income tax is required in the Fund’s financial statements. The Fund’s federal and state income and federal excise tax returns for tax years for which the applicable statutes of limitations have not expired are subject to examination by the Internal Revenue Service and state departments of revenue.
Under the Regulated Investment Company Modernization Act of 2010, capital losses originating in taxable years beginning after December 22, 2010 (“post-enactment capital losses”) are carried forward indefinitely. Furthermore, post-enactment capital losses will retain their character as either short-term or long-term capital losses rather than being considered all short-term capital losses as under previous law.
At December 31, 2012, the Fund had net capital loss carryforwards available to offset future net capital gains, if any, to the extent provided by the Treasury regulations.
| | | | |
Amount | | | Expires |
| $ | 519,736 | | | 2013 |
| | 612,669 | | | 2014 |
| | 3,549,980 | | | 2016 |
| | 1,338,848 | | | 2017 |
| | 2,743,646 | | | 2018 |
| | 206 | | | Short-term Losses* |
| | 942,969 | | | Long-term Losses* |
| | | | |
| $ | 9,708,054 | | | |
| | | | |
| | * | Post-Enactment Losses: Must be utilized prior to losses subject to expiration. |
Capital loss carryforwards that expired in the current fiscal year was $175,416.
Under current tax law, capital losses realized after October 31 and ordinary losses realized after December 31 of a Fund’s fiscal year may be deferred and treated as occurring on the first business day of the following fiscal year for tax purposes. The Fund had $1,479,810 of deferred qualified late-year losses, which will be treated as arising on the first business day of the fiscal year ending December 31, 2013.
15
|
Sterling Capital Equity Index Fund |
Notes to the Financial Statements — (continued)
December 31, 2012
The tax character of distributions paid to shareholders of the Fund during the fiscal year ended December 31, 2012 , were as follows:
| | | | | | | | | | |
| | | Distributions paid from | | | | | | |
| | | Ordinary
Income | | Total
Taxable
Distributions | | Total
Distributions
Paid* | | | | |
| | $226,931 | | $226,931 | | $226,931 | | | |
The tax character of distributions paid to shareholders of the Fund during the fiscal year ended December 31, 2011, were as follows: |
| | | Distributions paid from | | | | | | |
| | | Ordinary
Income | | Return
of
Capital | | Total
Distributions
Paid* | | | | |
| | $219,201 | | $6,880 | | $226,081 | | | |
| | * | Total Distributions Paid may differ from the Statement of Changes in Net Assets due to differences in the tax rules governing the timing of recognition. |
At December 31, 2012, the components of accumulated deficit on a tax basis were as follows:
| | | | | | | | | | | | | | | | |
| | | Undistributed Ordinary Income | | | | Accumulated
Capital and
Other Losses | | | | Unrealized
Appreciation | | | | Total
Accumulated
Deficit | | |
| | $10,796 | | | | $(11,187,864) | | | | $2,817,193 | | | | $(8,359,875) | |
Management has evaluated the need for the disclosure and/or adjustments resulting from subsequent events through the date the financial statements were issued, and has noted no events that require recognition or disclosure in the financial statements.
16
Report of Independent Registered Public Accounting Firm
The Board of Trustees and Shareholders of
Sterling Capital Funds:
We have audited the accompanying statement of assets and liabilities of the Sterling Capital Equity Index Fund (the “Fund”), one of the funds constituting Sterling Capital Funds, as of December 31, 2012, and the related statement of operations for the year then ended, the statement of changes in net assets for each of the years in the two-period then ended, and the financial highlights for each of the years in the five-year period then ended. These financial statements and financial highlights are the responsibility of the Fund’s management. Our responsibility is to express an opinion on these financial statements and financial highlights based on our audits.
We conducted our audits in accordance with the standards of the Public Company Accounting Oversight Board (United States). Those standards require that we plan and perform the audit to obtain reasonable assurance about whether the financial statements and financial highlights are free of material misstatement. An audit includes examining, on a test basis, evidence supporting the amounts and disclosures in the financial statements. Our procedures included confirmation of the Fund’s investment at December 31, 2012, by correspondence with the master portfolio’s fund accounting agent. An audit also includes assessing the accounting principles used and significant estimates made by management, as well as evaluating the overall financial statement presentation. We believe that our audits provide a reasonable basis for our opinion.
In our opinion, the financial statements and the financial highlights referred to above present fairly, in all material respects, the financial position of the Sterling Capital Equity Index Fund as of December 31, 2012, the results of its operations for the year then ended, the changes in its net assets for each of the years in the two-year period then ended, and the financial highlights for each of the years in the five-year period then ended, in conformity with U.S. generally accepted accounting principles.

Philadelphia, Pennsylvania
February 26, 2013
17
BOARD CONSIDERATION OF ADVISORY AGREEMENT (UNAUDITED)
The Board of Trustees, at a meeting held on August 15-16, 2012, approved the continuance of the investment advisory agreement (the “Advisory Agreement”) between Sterling Capital Funds (the “Trust”) and Sterling Capital Management LLC (“Sterling Capital”), which serves as investment adviser to the Sterling Capital Equity Index Fund (the “Fund”) of the Trust for a new term running through January 31, 2013. At a meeting held on November 14, 2012, the Board of Trustees approved the further continuance of the Advisory Agreement between the Trust and Sterling Capital for a new term running through January 31, 2014. The Board approved the continuation of the Advisory Agreement two times in 2012 in order to adjust the Board’s contract review schedule for future years. As a result of this schedule change, the Board will have additional time for its review and deliberations in future years.
The Trustees reviewed extensive material in connection with their consideration of the Advisory Agreement, including data from an independent provider of mutual fund data (as assembled by the Trust’s administrator), which included comparisons with industry averages for comparable funds for advisory fees, 12b-1 fees, and total fund expenses. The data reflected Sterling Capital fee waivers in place, as well as Sterling Capital’s contractual investment advisory fee levels. The Board was assisted in its review by independent legal counsel, who provided memoranda detailing the legal standards for review of the Advisory Agreement. To facilitate its review, the Board received a detailed presentation by Sterling Capital, which included an analysis of investment processes and performance. The Board also received and considered fund-specific profitability information from the Adviser. The Independent Trustees met outside the presence of management and the Adviser with their independent legal counsel as part of their deliberations.
In their deliberations regarding the Advisory Agreement, each Trustee attributed different weights to various factors involved in an analysis of the Advisory Agreement, and in each case no factor alone was considered determinative. The Trustees determined that the overall arrangements between the Trust and Sterling Capital, as provided in the Advisory Agreement, were fair and reasonable and that the continuance of the Advisory Agreement was in the best interests of the Fund and its shareholders.
The matters addressed below were considered by the Trustees in reaching their conclusions.
Nature, Extent and Quality of Services Provided by the Adviser — The Trustees received and considered information regarding the nature, extent, and quality of the services provided to the Fund under the Advisory Agreement. The Trustees took into account information furnished throughout the year at Trustee meetings, as well as materials furnished specifically in connection with the annual review process. The Trustees considered the background and experience of the Adviser’s senior management and the expertise of investment personnel of the Adviser responsible for oversight of the Fund. The Trustees considered the overall reputation and the capabilities and commitment of the Adviser to provide high quality service to the Fund.
The Trustees received information concerning the investment philosophy and investment processes applied or to be applied by the Adviser in managing the Fund as well as the Adviser’s Form ADV. The Trustees also considered information regarding regulatory compliance and compliance with the investment policies of the Fund. The Trustees also considered the Adviser’s trading practices and the procedures of the Adviser designed to fulfill the Adviser’s fiduciary duty to the Fund with respect to possible conflicts of interest, including the Adviser’s code of ethics (regulating the personal trading of its officers and employees).
Based on their review, the Trustees concluded that, with respect to the quality and nature of services to be provided by the Adviser, the scope of responsibilities was consistent with mutual fund industry norms, and that the quality of the services provided by the Adviser was satisfactory or better.
Investment Performance — The Trustees considered performance results of the Fund in absolute terms and relative to the Fund’s benchmark and peer group. In the Trustees’ review of performance, long- and short-term performance were considered.
After reviewing the performance of the Fund and taking into consideration the management style, investment strategies, and prevailing market conditions during the prior year and for longer periods, the Trustees concluded that the performance of the Fund was acceptable or better. It was noted that, during the previous year, the Fund had generally achieved its investment goal of closely tracking the performance of the S&P 500® Index.
Cost of Services, Including the Profits Realized by the Advisers and Affiliates — The Trustees noted that the Adviser was not currently charging an advisory fee and will not do so for so long as Fund assets are invested entirely in an underlying portfolio. Notably, that underlying portfolio is sponsored and managed by an entity unaffiliated with the Adviser.
It was in the context described above that the Trustees considered issues related to the profitability of the Adviser. The Trustees reviewed profitability information provided by the Adviser with respect to its services as adviser and administrator. With respect to such information, the Trustees recognized that such profitability data was generally unaudited and represented the Adviser’s own determination of its and its affiliates’ revenues from the contractual services provided to the Fund, less expenses of providing such services. Expenses include direct and indirect costs and were calculated using an allocation methodology developed by the Adviser. The Trustees also recognized that it is difficult to make comparisons of profitability from Fund investment advisory and administration contracts, because comparative information is not generally publicly available and could be affected by numerous factors. Based on their review, the Trustees concluded that the profitability of the Adviser as a result of its relationship with the Fund was acceptable.
18
Economies of Scale — The Trustees also considered whether fee levels reflect economies of scale and whether economies of scale would be produced by the growth of the Fund’s assets. Given that no investment advisory fee is currently being charged by Sterling Capital, the Trustees determined that the growth of the Fund would not result in greater economies of scale on the advisory fee level. Because no investment advisory fee is currently being charged by Sterling Capital and the investment advisory fee charged by the underlying portfolio is sufficiently low (0.05% of the average daily net assets of the underlying portfolio), the Fund is effectively benefiting from economies of scale.
19
|
Sterling Capital Equity Index Fund |
December 31, 2012
Notice to Shareholders (Unaudited)
All percentages below are based on financial information available as of the date of this annual report and, accordingly are subject to change. For each item it is the intention of the Fund to report the maximum amount permitted under the Internal Revenue Code and the regulations thereunder.
For the fiscal year ended December 31, 2012, the Fund is reporting the following items with regard to distributions paid during the year.
| | | | |
Qualified Dividend Income % | | | | (for corporate shareholders) Dividends Received Deduction % |
100.00% | | | | 100.00% |
20
|
Sterling Capital Equity Index Fund |
Other Information
December 31, 2012 (Unaudited)
A description of the policies and procedures that the Fund uses to determine how to vote proxies relating to portfolio securities is available (i) without charge, upon request, by calling 1-800-228-1872; and (ii) on the Securities and Exchange Commission’s (the “Commission”) website at http://www.sec.gov.
Information regarding how the Fund voted proxies relating to portfolio securities during the most recent 12-month period ended June 30th is available (i) without charge, upon request, by calling 1-800-228-1872; and (ii) on the Commission’s website at http://www.sec.gov.
The Fund files complete Schedules of Portfolio Holdings with the Commission for the first and third quarters of each fiscal year on Form N-Q. The Fund’s Form N-Q is filed with the Commission within 60 days of the end of the quarter to which it relates, and is available without charge on the Commission’s website at http://www.sec.gov, or may be reviewed and copied at the Commission’s Public Reference Room in Washington, D.C. Information on the operation of the Public Reference Room may be obtained by calling 1-800-SEC-0330.
21
|
Sterling Capital Equity Index Fund |
Information about Trustees and Officers (Unaudited)
Overall responsibility for the management of the Fund rests with its Board of Trustees (“Trustees”), who are elected by the Shareholders of the Fund. The Trustees elect the officers of the Fund to supervise actively its day-to-day operations. The names of the Trustees, birthdates, term of office and length of time served, principal occupations during the past five years, number of portfolios overseen and directorships held outside of the Fund are listed in the two tables immediately following. The business address of the persons listed below is 434 Fayetteville Street, 5th Floor, Raleigh, North Carolina 27601.
INDEPENDENT TRUSTEES
| | | | | | | | | | |
Name and Birthdate | | Position(s) Held
With the Funds | | Term of Office/ Length of Time Served | | Principal Occupation During the Last 5 Years | | Number of
Portfolios
in Fund
Complex
Overseen
by Trustee* | | Other
Directorships
Held
by Trustee |
| | | | | |
Thomas W. Lambeth Birthdate: 1/35 | | Trustee, Chairman of the Board of Trustees | | Indefinite, 8/92 — Present | | From January 2001 to present, Senior Fellow, Z. Smith Reynolds Foundation | | 26 | | None |
| | | | | |
Drew T. Kagan Birthdate: 2/48 | | Trustee | | Indefinite, 8/00 — Present | | From September 2010 to present, Chairman, Montecito Advisors, Inc.; from December 2003 to September 2010, CEO, Montecito Advisors, Inc.; from March 1996 to December 2003, President, Investment Affiliate, Inc. | | 26 | | None |
| | | | | |
Laura C. Bingham Birthdate: 11/56 | | Trustee | | Indefinite, 2/01 — Present | | From June 2010 to present, independent consultant; from July 1998 to June 2010, President of Peace College | | 26 | | None |
| | | | | |
Douglas R. Van Scoy Birthdate: 11/43 | | Trustee | | Indefinite, 5/04 — Present | | Retired; from November 1974 to July 2001, employee of Smith Barney (investment banking), most recently as Director of Private Client Group and Senior Executive Vice President | | 26 | | None |
| | | | | |
James L. Roberts Birthdate: 11/42 | | Trustee | | Indefinite, 11/04 — Present | | Retired; from November 2006 to present, Director, Grand Mountain Bancshares, Inc.; from January 1999 to December 2003, President, CEO and Director, Covest Bancshares, Inc. | | 26 | | None |
22
|
Sterling Capital Equity Index Fund |
The following table shows information for trustees who are, each, an “interested person” of the Fund as defined in the 1940 Act:
INTERESTED TRUSTEES
| | | | | | | | | | |
Name and Birthdate | | Position(s) Held With the Funds | | Term of Office/ Length of Time Served | | Principal Occupation During the Past 5 Years | | Number of Portfolios in Fund Complex by Trustee* | | Other Directorships Held by Trustee |
| | | | | |
| Alexander W. McAlister** Birthdate: 3/60 | | Trustee | | Indefinite,
11/10 — Present | | President, Sterling Capital Management LLC | | 26 | | Director,
Sterling Capital Management LLC |
| | | | | |
Alan G. Priest***
Birthdate: 5/52 | | Trustee | | Indefinite,
7/12 — Present | | Retired; from April 1987 to April 2012, Partner, Ropes & Gray LLP | | 26 | | None |
| | * | The Sterling Capital Funds Complex consists of two open-end investment management companies: Sterling Capital Funds |
and Sterling Capital Variable Insurance Funds.
| | ** | Mr. McAlister is treated by the Funds as an “interested person” (as defined in Section 2(a)(19) of the 1940 Act) of the Funds |
because he is an officer of the Advisor.
| | *** | Mr. Priest is treated by the Fund as an “interested person” (as defined in Section 2(a)(19) of the 1940 Act) of the Funds because he was a partner of a law firm that acted as counsel to the Funds during the past two fiscal years. |
The following table shows information for officers of the Fund:
| | | | | | |
Name and Birthdate | | Position(s) Held With the Funds | | Term of Office/ Length of Time Served | | Principal Occupation During the Last 5 Years |
| | | |
James T. Gillespie Birthdate: 11/66 | | President | | Indefinite, President 12/12 — Present | | From March 2012 to present, Executive Director, Sterling Capital Management LLC; From June 2010 to March 2012, Director, Sterling Capital Management LLC and its predecessors; from August 2008 to June 2010, Vice President Relationship Management, JP Morgan Chase & Co.; from February 2005 to August 2008, Senior Vice President and Manager of Mutual Fund Administration, Sterling Capital Management LLC and its predecessors |
| | | |
Kenneth R. Cotner Birthdate: 2/59 | | Treasurer | | Indefinite, 12/12 — Present | | From 2001 to present, Chief Operating Officer; Sterling Capital Management LLC and its predecessors |
23
|
Sterling Capital Equity Index Fund |
| | | | | | |
Name and Birthdate | | Position(s) Held With the Funds | | Term of Office/ Length of Time Served | | Principal Occupation During the Last 5 Years |
| | | |
Todd M. Miller Birthdate: 9/71 | | Vice President and Secretary | | Indefinite, Vice President, 8/05 — Present; Secretary, 8/10 — Present | | From June 2009 to present, Director, Sterling Capital Management LLC and its predecessors; from June 2005 to May 2009, Mutual Fund Administrator; from May 2001 to May 2005, Manager, BISYS Fund Services |
| | | |
Clinton L. Ward Birthdate: 11/69 | | Executive Director, Chief Compliance and Anti-Money Laundering Officer | | Indefinite, 4/07 — Present | | From July 2004 to present, Chief Compliance Officer and Executive Director, Sterling Capital Management LLC and its predecessors |
| | | |
Andrew J. McNally Birthdate: 12/70 | | Assistant Treasurer | | Indefinite, Assistant Treasurer, 6/10 — Present; Treasurer, 4/07 — 6/10 | | From January 2007 to present, Vice President and Senior Director, and from July 2000 to December 2006, Vice President and Director, Fund Accounting and Administration Department, BNY Mellon Investment Servicing (US) Inc. |
| | | |
Julie M. Powers Birthdate: 10/69 | | Assistant Secretary | | Indefinite, 11/11 — Present | | From November 2011 to present, Vice President; from March 2009 to October 2011, Senior Manager and Vice President; from August 2005 to February 2009, Manager and Assistant Vice President, Regulatory Administration Department, BNY Mellon Investment Servicing (US) Inc. |
The Fund’s Statement of Additional Information includes additional information about the Fund’s Trustees and Officers. To receive your free copy of the Statement of Additional Information, call toll free: 1-800-228-1872.
24
| | |
Master Portfolio Information | | S&P 500 Stock Master Portfolio |
As of December 31, 2012 |
| | |
| Ten Largest Holdings | | Percent of Long-Term Investments |
Apple, Inc. | | 4% |
Exxon Mobil Corp. | | 3 |
General Electric Co. | | 2 |
Chevron Corp. | | 2 |
International Business Machines Corp. | | 2 |
Microsoft Corp. | | 2 |
Johnson & Johnson | | 2 |
AT&T, Inc. | | 2 |
Google, Inc., Class A | | 1 |
The Procter & Gamble Co. | | 1 |
| | |
| Sector Allocation | | Percent of Long-Term Investments |
Information Technology | | 19% |
Financials | | 16 |
Health Care | | 12 |
Consumer Discretionary | | 11 |
Energy | | 11 |
Consumer Staples | | 11 |
Industrials | | 10 |
Materials | | 4 |
Utilities | | 3 |
Telecommunication Services | | 3 |
For Master Portfolio compliance purposes, the Master Portfolio’s sector classifications refer to any one or more of the sector sub-classifications used by one or more widely recognized market indexes or ratings group indexes, and/or as defined by Master Portfolio management. These definitions may not apply for purposes of this report, which may combine sector sub-classifications for reporting ease.
| | | | | | |
| | | | | | | |
| | BLACKROCK S&P 500 STOCK FUND | | DECEMBER 31, 2012 | | 25 |
| | |
| Schedule of Investments December 31, 2012 | | S&P 500 Stock Master Portfolio |
| | (Percentages shown are based on Net Assets) |
| | | | | | | | |
Common Stocks | | Shares | | | Value | |
Aerospace & Defense – 2.3% | | | | | | | | |
The Boeing Co. | | | 88,987 | | | $ | 6,706,060 | |
General Dynamics Corp. | | | 43,507 | | | | 3,013,730 | |
Honeywell International, Inc. | | | 102,715 | | | | 6,519,321 | |
L-3 Communications Holdings, Inc. | | | 12,365 | | | | 947,406 | |
Lockheed Martin Corp. (a) | | | 35,229 | | | | 3,251,284 | |
Northrop Grumman Corp. | | | 32,222 | | | | 2,177,563 | |
Precision Castparts Corp. | | | 19,080 | | | | 3,614,134 | |
Raytheon Co. | | | 43,299 | | | | 2,492,290 | |
Rockwell Collins, Inc. (a) | | | 18,427 | | | | 1,071,899 | |
Textron, Inc. | | | 36,947 | | | | 915,916 | |
United Technologies Corp. | | | 110,568 | | | | 9,067,682 | |
| | | | | | | | |
| | | | | | | 39,777,285 | |
| |
Air Freight & Logistics – 0.7% | | | | | | | | |
C.H. Robinson Worldwide, Inc. | | | 21,098 | | | | 1,333,816 | |
Expeditors International of Washington, Inc. | | | 27,431 | | | | 1,084,896 | |
FedEx Corp. | | | 38,294 | | | | 3,512,326 | |
United Parcel Service, Inc., Class B (a) | | | 93,865 | | | | 6,920,666 | |
| | | | | | | | |
| | | | | | | 12,851,704 | |
| |
Airlines – 0.1% | | | | | | | | |
Southwest Airlines Co. | | | 96,660 | | | | 989,798 | |
| |
Auto Components – 0.3% | | | | | | | | |
BorgWarner, Inc. (b) | | | 15,330 | | | | 1,097,935 | |
Delphi Automotive Plc (b) | | | 38,694 | | | | 1,480,045 | |
The Goodyear Tire & Rubber Co. (b) | | | 32,127 | | | | 443,674 | |
Johnson Controls, Inc. | | | 89,658 | | | | 2,752,500 | |
| | | | | | | | |
| | | | | | | 5,774,154 | |
| |
Automobiles – 0.5% | | | | | | | | |
Ford Motor Co. | | | 499,900 | | | | 6,473,705 | |
Harley-Davidson, Inc. | | | 29,719 | | | | 1,451,476 | |
| | | | | | | | |
| | | | | | | 7,925,181 | |
| |
Beverages – 2.3% | | | | | | | | |
Beam, Inc. | | | 20,846 | | | | 1,273,482 | |
Brown-Forman Corp., Class B | | | 19,828 | | | | 1,254,121 | |
The Coca-Cola Co. | | | 505,917 | | | | 18,339,491 | |
Coca-Cola Enterprises, Inc. | | | 35,458 | | | | 1,125,082 | |
Constellation Brands, Inc., Class A (b) | | | 19,825 | | | | 701,607 | |
Dr. Pepper Snapple Group, Inc. (a) | | | 27,344 | | | | 1,208,058 | |
Molson Coors Brewing Co., Class B | | | 20,392 | | | | 872,574 | |
Monster Beverage Corp. (b) | | | 19,595 | | | | 1,036,184 | |
PepsiCo, Inc. | | | 202,894 | | | | 13,884,036 | |
| | | | | | | | |
| | | | | | | 39,694,635 | |
| |
Biotechnology – 1.6% | | | | | | | | |
Alexion Pharmaceuticals, Inc. (b) | | | 25,466 | | | | 2,388,966 | |
Amgen, Inc. | | | 100,660 | | | | 8,688,971 | |
Biogen Idec, Inc. (b) | | | 31,020 | | | | 4,549,703 | |
Celgene Corp. (b) | | | 55,501 | | | | 4,369,039 | |
Gilead Sciences, Inc. (b) | | | 99,344 | | | | 7,296,817 | |
| | | | | | | | |
| | | | | | | 27,293,496 | |
| |
Building Products – 0.0% | | | | | | | | |
Masco Corp. (a) | | | 46,647 | | | | 777,139 | |
| |
Capital Markets – 1.9% | | | | | | | | |
Ameriprise Financial, Inc. | | | 27,028 | | | | 1,692,764 | |
The Bank of New York Mellon Corp. | | | 153,344 | | | | 3,940,941 | |
BlackRock, Inc. (a)(c) | | | 16,465 | | | | 3,403,480 | |
The Charles Schwab Corp. | | | 143,722 | | | | 2,063,848 | |
| | | | | | | | |
Common Stocks | | Shares | | | Value | |
Capital Markets (concluded) | | | | | | | | |
E*Trade Financial Corp. (b) | | | 33,617 | | | $ | 300,872 | |
Franklin Resources, Inc. | | | 18,082 | | | | 2,272,907 | |
The Goldman Sachs Group, Inc. | | | 57,951 | | | | 7,392,229 | |
Invesco Ltd. | | | 58,350 | | | | 1,522,351 | |
Legg Mason, Inc. (a) | | | 15,460 | | | | 397,631 | |
Morgan Stanley | | | 181,190 | | | | 3,464,353 | |
Northern Trust Corp. | | | 28,648 | | | | 1,436,984 | |
State Street Corp. | | | 61,006 | | | | 2,867,892 | |
T. Rowe Price Group, Inc. | | | 33,405 | | | | 2,175,668 | |
| | | | | | | | |
| | | | | | | 32,931,920 | |
| |
Chemicals – 2.5% | | | | | | | | |
Air Products & Chemicals, Inc. | | | 27,899 | | | | 2,344,074 | |
Airgas, Inc. | | | 9,204 | | | | 840,233 | |
CF Industries Holdings, Inc. | | | 8,239 | | | | 1,673,835 | |
The Dow Chemical Co. | | | 157,233 | | | | 5,081,771 | |
E.I. du Pont de Nemours & Co. | | | 122,260 | | | | 5,498,032 | |
Eastman Chemical Co. (a) | | | 20,094 | | | | 1,367,397 | |
Ecolab, Inc. | | | 34,554 | | | | 2,484,433 | |
FMC Corp. (a) | | | 17,960 | | | | 1,051,019 | |
International Flavors & Fragrances, Inc. (a) | | | 10,697 | | | | 711,778 | |
LyondellBasell Industries NV, Class A | | | 49,762 | | | | 2,840,913 | |
Monsanto Co. | | | 70,096 | | | | 6,634,586 | |
The Mosaic Co. | | | 36,282 | | | | 2,054,650 | |
PPG Industries, Inc. | | | 20,102 | | | | 2,720,806 | |
Praxair, Inc. (a) | | | 39,008 | | | | 4,269,426 | |
The Sherwin-Williams Co. | | | 11,215 | | | | 1,725,091 | |
Sigma-Aldrich Corp. (a) | | | 15,804 | | | | 1,162,858 | |
| | | | | | | | |
| | | | | | | 42,460,902 | |
| |
Commercial Banks – 2.7% | | | | | | | | |
BB&T Corp. | | | 91,711 | | | | 2,669,707 | |
Comerica, Inc. | | | 25,038 | | | | 759,653 | |
Fifth Third Bancorp (a) | | | 117,850 | | | | 1,790,141 | |
First Horizon National Corp. (a) | | | 32,505 | | | | 322,124 | |
Huntington Bancshares, Inc. (a) | | | 112,187 | | | | 716,875 | |
KeyCorp | | | 122,711 | | | | 1,033,227 | |
M&T Bank Corp. (a) | | | 15,936 | | | | 1,569,218 | |
The PNC Financial Services Group, Inc. (c) | | | 69,347 | | | | 4,043,624 | |
Regions Financial Corp. | | | 185,116 | | | | 1,318,026 | |
SunTrust Banks, Inc. | | | 70,619 | | | | 2,002,049 | |
US Bancorp | | | 246,671 | | | | 7,878,672 | |
Wells Fargo & Co. | | | 642,119 | | | | 21,947,627 | |
Zions Bancorporation (a) | | | 24,132 | | | | 516,425 | |
| | | | | | | | |
| | | | | | | 46,567,368 | |
| |
Commercial Services & Supplies – 0.5% | |
The ADT Corp. | | | 30,458 | | | | 1,415,992 | |
Avery Dennison Corp. | | | 13,127 | | | | 458,395 | |
Cintas Corp. (a) | | | 13,975 | | | | 571,577 | |
Iron Mountain, Inc. (a) | | | 21,835 | | | | 677,977 | |
Pitney Bowes, Inc. (a) | | | 25,978 | | | | 276,406 | |
Republic Services, Inc. | | | 39,214 | | | | 1,150,147 | |
Stericycle, Inc. (b) | | | 11,259 | | | | 1,050,127 | |
Tyco International Ltd. | | | 61,032 | | | | 1,785,186 | |
Waste Management, Inc. | | | 57,173 | | | | 1,929,017 | |
| | | | | | | | |
| | | | | | | 9,314,824 | |
| |
Communications Equipment – 1.9% | | | | | | | | |
Cisco Systems, Inc. | | | 696,215 | | | | 13,680,625 | |
F5 Networks, Inc. (b) | | | 10,347 | | | | 1,005,211 | |
See Notes to Financial Statements.
| | | | | | |
| | | | | | | |
26 | | BLACKROCK S&P 500 STOCK FUND | | DECEMBER 31, 2012 | | |
| | |
| Schedule of Investments (continued) | | S&P 500 Stock Master Portfolio (Percentages shown are based on Net Assets) |
| | | | | | | | |
Common Stocks | | Shares | | | Value | |
Communications Equipment (concluded) | |
Harris Corp. | | | 14,867 | | | $ | 727,888 | |
JDS Uniphase Corp. (b) | | | 30,584 | | | | 414,107 | |
Juniper Networks, Inc. (b) | | | 67,728 | | | | 1,332,210 | |
Motorola Solutions, Inc. | | | 36,828 | | | | 2,050,583 | |
QUALCOMM, Inc. | | | 223,453 | | | | 13,858,555 | |
| | | | | | | | |
| | | | | | | 33,069,179 | |
| |
Computers & Peripherals – 4.9% | | | | | | | | |
Apple, Inc. | | | 123,365 | | | | 65,757,246 | |
Dell, Inc. | | | 191,258 | | | | 1,937,444 | |
EMC Corp. (b) | | | 276,227 | | | | 6,988,543 | |
Hewlett-Packard Co. | | | 257,762 | | | | 3,673,108 | |
NetApp, Inc. (b) | | | 47,053 | | | | 1,578,628 | |
SanDisk Corp. (b) | | | 31,728 | | | | 1,382,072 | |
Seagate Technology Plc | | | 44,136 | | | | 1,345,265 | |
Western Digital Corp. | | | 28,808 | | | | 1,224,052 | |
| | | | | | | | |
| | | | | | | 83,886,358 | |
| |
Construction & Engineering – 0.2% | | | | | | | | |
Fluor Corp. | | | 21,846 | | | | 1,283,234 | |
Jacobs Engineering Group, Inc. (b) | | | 17,049 | | | | 725,776 | |
Quanta Services, Inc. (b) | | | 27,838 | | | | 759,699 | |
| | | | | | | | |
| | | | | | | 2,768,709 | |
| |
Construction Materials – 0.1% | | | | | | | | |
Vulcan Materials Co. (a) | | | 16,993 | | | | 884,486 | |
| |
Consumer Finance – 0.9% | | | | | | | | |
American Express Co. | | | 127,720 | | | | 7,341,346 | |
Capital One Financial Corp. | | | 76,263 | | | | 4,417,915 | |
Discover Financial Services | | | 66,256 | | | | 2,554,169 | |
SLM Corp. | | | 60,744 | | | | 1,040,545 | |
| | | | | | | | |
| | | | | | | 15,353,975 | |
| |
Containers & Packaging – 0.1% | | | | | | | | |
Ball Corp. | | | 20,217 | | | | 904,711 | |
Bemis Co. | | | 13,527 | | | | 452,613 | |
Owens-Illinois, Inc. (b) | | | 21,399 | | | | 455,157 | |
Sealed Air Corp. | | | 25,435 | | | | 445,367 | |
| | | | | | | | |
| | | | | | | 2,257,848 | |
| |
Distributors – 0.1% | | | | | | | | |
Genuine Parts Co. (a) | | | 20,309 | | | | 1,291,246 | |
| |
Diversified Consumer Services – 0.1% | | | | | |
Apollo Group, Inc., Class (a)(b) | | | 13,092 | | | | 273,884 | |
H&R Block, Inc. | | | 35,603 | | | | 661,148 | |
| | | | | | | | |
| | | | | | | 935,032 | |
| |
Diversified Financial Services – 3.5% | |
Bank of America Corp. | | | 1,413,370 | | | | 16,395,092 | |
Citigroup, Inc. | | | 384,551 | | | | 15,212,838 | |
CME Group, Inc. (a) | | | 40,200 | | | | 2,038,542 | |
IntercontinentalExchange, Inc. (b) | | | 9,528 | | | | 1,179,662 | |
JPMorgan Chase & Co. | | | 498,503 | | | | 21,919,177 | |
Leucadia National Corp. (a) | | | 25,914 | | | | 616,494 | |
Moody’s Corp. | | | 25,416 | | | | 1,278,933 | |
The NASDAQ OMX Group, Inc. (a) | | | 15,543 | | | | 388,730 | |
NYSE Euronext | | | 31,963 | | | | 1,008,113 | |
| | | | | | | | |
| | | | | | | 60,037,581 | |
| |
| | | | | | | | |
Common Stocks | | Shares | | | Value | |
Diversified Telecommunication Services – 2.7% | |
AT&T, Inc. | | | 744,967 | | | $ | 25,112,838 | |
CenturyLink, Inc. | | | 81,836 | | | | 3,201,424 | |
Frontier Communications Corp. (a) | | | 130,617 | | | | 559,041 | |
Verizon Communications, Inc. | | | 374,246 | | | | 16,193,624 | |
Windstream Corp. (a) | | | 76,806 | | | | 635,954 | |
| | | | | | | | |
| | | | | | | 45,702,881 | |
| |
Electric Utilities – 1.9% | | | | | | | | |
American Electric Power Co., Inc. | | | 63,608 | | | | 2,714,790 | |
Duke Energy Corp. | | | 92,338 | | | | 5,891,164 | |
Edison International | | | 42,714 | | | | 1,930,246 | |
Entergy Corp. (a) | | | 23,313 | | | | 1,486,204 | |
Exelon Corp. | | | 111,992 | | | | 3,330,642 | |
FirstEnergy Corp. (a) | | | 54,845 | | | | 2,290,327 | |
NextEra Energy, Inc. (a) | | | 55,483 | | | | 3,838,869 | |
Northeast Utilities, Inc. | | | 41,112 | | | | 1,606,657 | |
Pepco Holdings, Inc. (a) | | | 30,140 | | | | 591,045 | |
Pinnacle West Capital Corp. | | | 14,397 | | | | 733,959 | |
PPL Corp. | | | 76,243 | | | | 2,182,837 | |
The Southern Co. (a) | | | 114,605 | | | | 4,906,240 | |
Xcel Energy, Inc. | | | 63,902 | | | | 1,706,822 | |
| | | | | | | | |
| | | | | | | 33,209,802 | |
| |
Electrical Equipment – 0.7% | | | | | | | | |
Eaton Corp. Plc | | | 60,535 | | | | 3,280,997 | |
Emerson Electric Co. (a) | | | 95,010 | | | | 5,031,730 | |
Rockwell Automation, Inc. | | | 18,297 | | | | 1,536,765 | |
Roper Industries, Inc. | | | 12,892 | | | | 1,437,200 | |
| | | | | | | | |
| | | | | | | 11,286,692 | |
| |
Electronic Equipment, Instruments & Components – 0.4% | |
Amphenol Corp., Class A | | | 21,023 | | | | 1,360,188 | |
Corning, Inc. | | | 193,989 | | | | 2,448,141 | |
Flir Systems, Inc. | | | 19,754 | | | | 440,712 | |
Jabil Circuit, Inc. | | | 24,337 | | | | 469,461 | |
Molex, Inc. | | | 18,072 | | | | 493,908 | |
TE Connectivity Ltd. | | | 55,479 | | | | 2,059,380 | |
| | | | | | | | |
| | | | | | | 7,271,790 | |
| |
Energy Equipment & Services – 1.8% | |
Baker Hughes, Inc. | | | 57,637 | | | | 2,353,895 | |
Cameron International Corp. (b) | | | 32,332 | | | | 1,825,465 | |
Diamond Offshore Drilling, Inc. (a) | | | 9,094 | | | | 618,028 | |
Ensco Plc, Class A (a) | | | 30,441 | | | | 1,804,542 | |
FMC Technologies, Inc. (b) | | | 31,231 | | | | 1,337,624 | |
Halliburton Co. | | | 121,663 | | | | 4,220,489 | |
Helmerich & Payne, Inc. | | | 13,840 | | | | 775,178 | |
Nabors Industries Ltd. (b) | | | 38,006 | | | | 549,187 | |
National Oilwell Varco, Inc. | | | 55,968 | | | | 3,825,413 | |
Noble Corp. | | | 33,069 | | | | 1,151,463 | |
Rowan Cos. Plc, Class A (b) | | | 16,267 | | | | 508,669 | |
Schlumberger Ltd. | | | 174,085 | | | | 12,062,350 | |
| | | | | | | | |
| | | | | | | 31,032,303 | |
| |
Food & Staples Retailing – 2.3% | |
Costco Wholesale Corp. | | | 56,697 | | | | 5,599,963 | |
CVS Caremark Corp. | | | 163,543 | | | | 7,907,304 | |
The Kroger Co. | | | 67,468 | | | | 1,755,518 | |
Safeway, Inc. (a) | | | 31,467 | | | | 569,238 | |
Sysco Corp. (a) | | | 77,047 | | | | 2,439,308 | |
Wal-Mart Stores, Inc. | | | 219,388 | | | | 14,968,843 | |
See Notes to Financial Statements.
| | | | | | |
| | | | | | | |
| | BLACKROCK S&P 500 STOCK FUND | | DECEMBER 31, 2012 | | 27 |
| | |
| Schedule of Investments (continued) | | S&P 500 Stock Master Portfolio (Percentages shown are based on Net Assets) |
| | | | | | | | |
Common Stocks | | Shares | | | Value | |
Food & Staples Retailing (concluded) | | | | | | | | |
Walgreen Co. | | | 112,630 | | | $ | 4,168,436 | |
Whole Foods Market, Inc. | | | 22,613 | | | | 2,065,245 | |
| | | | | | | | |
| | | | | | | 39,473,855 | |
| |
Food Products – 1.7% | | | | | | | | |
Archer-Daniels-Midland Co. | | | 86,362 | | | | 2,365,455 | |
Campbell Soup Co. (a) | | | 23,526 | | | | 820,822 | |
ConAgra Foods, Inc. | | | 53,403 | | | | 1,575,389 | |
Dean Foods Co. (b) | | | 24,242 | | | | 400,235 | |
General Mills, Inc. | | | 84,673 | | | | 3,421,636 | |
H.J. Heinz Co. (a) | | | 42,031 | | | | 2,424,348 | |
The Hershey Co. (a) | | | 19,643 | | | | 1,418,618 | |
Hormel Foods Corp. (a) | | | 17,568 | | | | 548,297 | |
The J.M. Smucker Co. (a) | | | 14,251 | | | | 1,229,006 | |
Kellogg Co. | | | 32,438 | | | | 1,811,662 | |
Kraft Foods Group, Inc. | | | 77,663 | | | | 3,531,337 | |
McCormick & Co., Inc. (a) | | | 17,353 | | | | 1,102,436 | |
Mead Johnson Nutrition Co. | | | 26,646 | | | | 1,755,705 | |
Mondelez International, Inc., Class A (a) | | | 233,006 | | | | 5,934,663 | |
Tyson Foods, Inc., Class A | | | 37,769 | | | | 732,719 | |
| | | | | | | | |
| | | | | | | 29,072,328 | |
| |
Gas Utilities – 0.1% | | | | | | | | |
AGL Resources, Inc. | | | 15,467 | | | | 618,216 | |
ONEOK, Inc. (a) | | | 26,842 | | | | 1,147,495 | |
| | | | | | | | |
| | | | | | | 1,765,711 | |
| |
Health Care Equipment & Supplies – 1.7% | |
Baxter International, Inc. | | | 72,029 | | | | 4,801,453 | |
Becton Dickinson & Co. | | | 25,859 | | | | 2,021,915 | |
Boston Scientific Corp. (b) | | | 180,455 | | | | 1,034,007 | |
C.R. Bard, Inc. | | | 10,062 | | | | 983,460 | |
CareFusion Corp. (b) | | | 28,985 | | | | 828,391 | |
Covidien Plc | | | 62,122 | | | | 3,586,924 | |
DENTSPLY International, Inc. (a) | | | 18,526 | | | | 733,815 | |
Edwards Lifesciences Corp. (b) | | | 15,162 | | | | 1,367,158 | |
Intuitive Surgical, Inc. (b) | | | 5,215 | | | | 2,557,280 | |
Medtronic, Inc. (a) | | | 132,688 | | | | 5,442,862 | |
St. Jude Medical, Inc. | | | 40,479 | | | | 1,462,911 | |
Stryker Corp. | | | 37,836 | | | | 2,074,170 | |
Varian Medical Systems, Inc. (b) | | | 14,380 | | | | 1,010,051 | |
Zimmer Holdings, Inc. | | | 22,779 | | | | 1,518,448 | |
| | | | | | | | |
| | | | | | | 29,422,845 | |
| |
Health Care Providers & Services – 1.9% | |
Aetna, Inc. (a) | | | 43,852 | | | | 2,030,348 | |
AmerisourceBergen Corp. (a) | | | 30,933 | | | | 1,335,687 | |
Cardinal Health, Inc. | | | 44,637 | | | | 1,838,152 | |
Cigna Corp. (a) | | | 37,535 | | | | 2,006,621 | |
Coventry Health Care, Inc. | | | 17,644 | | | | 790,980 | |
DaVita, Inc. (b) | | | 10,982 | | | | 1,213,840 | |
Express Scripts Holding Co. (b) | | | 107,043 | | | | 5,780,322 | |
Humana, Inc. | | | 20,784 | | | | 1,426,406 | |
Laboratory Corp. of America Holdings (b) | | | 12,432 | | | | 1,076,860 | |
McKesson Corp. | | | 30,942 | | | | 3,000,136 | |
Patterson Cos., Inc. (a) | | | 10,994 | | | | 376,325 | |
Quest Diagnostics, Inc. (a) | | | 20,785 | | | | 1,211,142 | |
Tenet Healthcare Corp. (b) | | | 13,925 | | | | 452,145 | |
UnitedHealth Group, Inc. | | | 134,005 | | | | 7,268,431 | |
WellPoint, Inc. | | | 39,802 | | | | 2,424,738 | |
| | | | | | | | |
| | | | | | | 32,232,133 | |
| |
| | | | | | | | |
Common Stocks | | Shares | | | Value | |
Health Care Technology – 0.1% | | | | | | | | |
Cerner Corp. (b) | | | 19,109 | | | $ | 1,483,623 | |
| |
Hotels, Restaurants & Leisure – 1.8% | | | | | | | | |
Carnival Corp. | | | 58,513 | | | | 2,151,523 | |
Chipotle Mexican Grill, Inc. (b) | | | 4,132 | | | | 1,229,105 | |
Darden Restaurants, Inc. (a) | | | 16,890 | | | | 761,232 | |
International Game Technology | | | 35,015 | | | | 496,163 | |
Marriott International, Inc., Class A | | | 32,338 | | | | 1,205,237 | |
McDonald’s Corp. | | | 131,691 | | | | 11,616,463 | |
Starbucks Corp. | | | 97,561 | | | | 5,231,221 | |
Starwood Hotels & Resorts Worldwide, Inc. (a) | | | 25,740 | | | | 1,476,446 | |
Wyndham Worldwide Corp. | | | 18,439 | | | | 981,139 | |
Wynn Resorts Ltd. | | | 10,395 | | | | 1,169,334 | |
Yum! Brands, Inc. (a) | | | 59,286 | | | | 3,936,590 | |
| | | | | | | | |
| | | | | | | 30,254,453 | |
| |
Household Durables – 0.3% | | | | | | | | |
D.R. Horton, Inc. (a) | | | 36,601 | | | | 723,968 | |
Garmin Ltd. (a) | | | 14,270 | | | | 582,501 | |
Harman International Industries, Inc. | | | 8,812 | | | | 393,368 | |
Leggett & Platt, Inc. (a) | | | 18,481 | | | | 503,053 | |
Lennar Corp., Class A (a) | | | 21,496 | | | | 831,250 | |
Newell Rubbermaid, Inc. | | | 37,613 | | | | 837,642 | |
PulteGroup, Inc. (b) | | | 44,514 | | | | 808,374 | |
Whirlpool Corp. | | | 10,198 | | | | 1,037,646 | |
| | | | | | | | |
| | | | | | | 5,717,802 | |
| |
Household Products – 2.1% | | | | | | | | |
The Clorox Co. (a) | | | 17,093 | | | | 1,251,549 | |
Colgate-Palmolive Co. | | | 58,258 | | | | 6,090,291 | |
Kimberly-Clark Corp. (a) | | | 51,342 | | | | 4,334,805 | |
The Procter & Gamble Co. | | | 358,612 | | | | 24,346,169 | |
| | | | | | | | |
| | | | | | | 36,022,814 | |
| |
Independent Power Producers & Energy Traders – 0.1% | |
The AES Corp. | | | 81,305 | | | | 869,964 | |
NRG Energy, Inc. | | | 42,366 | | | | 973,994 | |
| | | | | | | | |
| | | | | | | 1,843,958 | |
| |
Industrial Conglomerates – 2.4% | | | | | | | | |
3M Co. (a) | | | 83,470 | | | | 7,750,189 | |
Danaher Corp. | | | 76,325 | | | | 4,266,568 | |
General Electric Co. | | | 1,375,329 | | | | 28,868,156 | |
| | | | | | | | |
| | | | | | | 40,884,913 | |
| |
Insurance – 3.9% | | | | | | | | |
ACE Ltd. | | | 44,548 | | | | 3,554,930 | |
Aflac, Inc. | | | 61,471 | | | | 3,265,340 | |
The Allstate Corp. | | | 63,238 | | | | 2,540,270 | |
American International Group, Inc. (b) | | | 193,572 | | | | 6,833,092 | |
Aon Plc (a) | | | 41,832 | | | | 2,325,859 | |
Assurant, Inc. | | | 10,347 | | | | 359,041 | |
Berkshire Hathaway, Inc., Class B (b) | | | 239,240 | | | | 21,459,828 | |
The Chubb Corp. | | | 34,383 | | | | 2,589,728 | |
Cincinnati Financial Corp. | | | 19,157 | | | | 750,188 | |
Genworth Financial, Inc., Class A (b) | | | 64,457 | | | | 484,072 | |
Hartford Financial Services Group, Inc. (a) | | | 57,183 | | | | 1,283,187 | |
Lincoln National Corp. (a) | | | 36,154 | | | | 936,389 | |
Loews Corp. | | | 40,834 | | | | 1,663,985 | |
Marsh & McLennan Cos., Inc. | | | 71,356 | | | | 2,459,641 | |
MetLife, Inc. | | | 143,046 | | | | 4,711,935 | |
Principal Financial Group, Inc. (a) | | | 36,322 | | | | 1,035,903 | |
See Notes to Financial Statements.
| | | | | | |
| | | | | | | |
28 | | BLACKROCK S&P 500 STOCK FUND | | DECEMBER 31, 2012 | | |
| | |
| Schedule of Investments (continued) | | S&P 500 Stock Master Portfolio (Percentages shown are based on Net Assets) |
| | | | | | |
Common Stocks | | Shares | | | Value |
|
Insurance (concluded) | | | | | | |
The Progressive Corp. (a) | | | 73,071 | | | $ 1,541,798 |
Prudential Financial, Inc. | | | 60,876 | | | 3,246,517 |
Torchmark Corp. | | | 12,498 | | | 645,772 |
The Travelers Cos., Inc. | | | 50,056 | | | 3,595,022 |
Unum Group | | | 36,189 | | | 753,455 |
XL Group Plc | | | 39,514 | | | 990,221 |
| | | | | | |
| | | | | | 67,026,173 |
|
Internet & Catalog Retail – 1.0% | | | | | | |
Amazon.com, Inc. (b) | | | 47,518 | | | 11,933,670 |
Expedia, Inc. | | | 12,217 | | | 750,735 |
Netflix, Inc. (a)(b) | | | 7,271 | | | 674,603 |
Priceline.com, Inc. (b) | | | 6,538 | | | 4,061,406 |
TripAdvisor, Inc. (b) | | | 14,368 | | | 602,881 |
| | | | | | |
| | | | | | 18,023,295 |
|
Internet Software & Services – 2.1% | | | | | | |
Akamai Technologies, Inc. (b) | | | 23,249 | | | 951,117 |
eBay, Inc. (b) | | | 152,704 | | | 7,790,958 |
Google, Inc., Class A (b) | | | 34,904 | | | 24,759,850 |
VeriSign, Inc. (b) | | | 20,367 | | | 790,647 |
Yahoo! Inc. (b) | | | 136,402 | | | 2,714,400 |
| | | | | | |
| | | | | | 37,006,972 |
|
IT Services – 3.7% | | | | | | |
Accenture Plc, Class A | | | 83,721 | | | 5,567,447 |
Automatic Data Processing, Inc. | | | 63,645 | | | 3,628,401 |
Cognizant Technology Solutions Corp., Class A (b) | | | 39,351 | | | 2,913,942 |
Computer Sciences Corp. | | | 20,287 | | | 812,494 |
Fidelity National Information Services, Inc. | | | 32,756 | | | 1,140,236 |
Fiserv, Inc. (b) | | | 17,533 | | | 1,385,633 |
International Business Machines Corp. | | | 139,305 | | | 26,683,873 |
MasterCard, Inc., Class A | | | 14,020 | | | 6,887,746 |
Paychex, Inc. (a) | | | 42,443 | | | 1,321,675 |
SAIC, Inc. (a) | | | 37,300 | | | 422,236 |
Teradata Corp. (b) | | | 22,177 | | | 1,372,535 |
Total System Services, Inc. | | | 21,060 | | | 451,105 |
Visa, Inc., Class A (a) | | | 68,368 | | | 10,363,221 |
The Western Union Co. | | | 78,404 | | | 1,067,078 |
| | | | | | |
| | | | | | 64,017,622 |
|
Leisure Equipment & Products – 0.1% | | | | | | |
Hasbro, Inc. (a) | | | 15,142 | | | 543,598 |
Mattel, Inc. (a) | | | 44,966 | | | 1,646,655 |
| | | | | | |
| | | | | | 2,190,253 |
|
Life Sciences Tools & Services – 0.4% | | | | | | |
Agilent Technologies, Inc. | | | 45,668 | | | 1,869,648 |
Life Technologies Corp. (b) | | | 22,609 | | | 1,109,650 |
PerkinElmer, Inc. | | | 15,012 | | | 476,481 |
Thermo Fisher Scientific, Inc. | | | 47,275 | | | 3,015,199 |
Waters Corp. (b) | | | 11,413 | | | 994,301 |
| | | | | | |
| | | | | | 7,465,279 |
|
Machinery – 1.9% | | | | | | |
Caterpillar, Inc. | | | 85,746 | | | 7,681,127 |
Cummins, Inc. | | | 23,171 | | | 2,510,578 |
Deere & Co. | | | 51,350 | | | 4,437,667 |
Dover Corp. | | | 23,511 | | | 1,544,908 |
| | | | | | |
Common Stocks | | Shares | | | Value |
|
Machinery (concluded) | | | | | | |
Flowserve Corp. | | | 6,571 | | | $ 964,623 |
Illinois Tool Works, Inc. (a) | | | 55,953 | | | 3,402,502 |
Ingersoll-Rand Plc | | | 36,758 | | | 1,762,914 |
Joy Global, Inc. | | | 13,833 | | | 882,269 |
PACCAR, Inc. | | | 46,260 | | | 2,091,414 |
Pall Corp. (a) | | | 14,606 | | | 880,157 |
Parker Hannifin Corp. | | | 19,536 | | | 1,661,732 |
Pentair Ltd., Registered Shares (a) | | | 27,552 | | | 1,354,181 |
Snap-On, Inc. | | | 7,620 | | | 601,904 |
Stanley Black & Decker, Inc. | | | 22,118 | | | 1,636,068 |
Xylem, Inc. | | | 24,252 | | | 657,229 |
| | | | | | |
| | | | | | 32,069,273 |
|
Media – 3.5% | | | | | | |
Cablevision Systems Corp., New York Group, Class A (a) | | | 28,088 | | | 419,635 |
CBS Corp., Class B | | | 77,557 | | | 2,951,044 |
Comcast Corp., Class A | | | 348,545 | | | 13,028,612 |
DIRECTV (b) | | | 79,273 | | | 3,976,334 |
Discovery Communications, Inc., Class A (b) | | | 31,361 | | | 1,990,796 |
Gannett Co., Inc. | | | 30,197 | | | 543,848 |
The Interpublic Group of Cos., Inc. | | | 56,777 | | | 625,682 |
The McGraw-Hill Cos., Inc. | | | 36,460 | | | 1,993,268 |
News Corp., Class A | | | 264,516 | | | 6,755,739 |
Omnicom Group, Inc. (a) | | | 34,664 | | | 1,731,813 |
Scripps Networks Interactive, Class A (a) | | | 11,405 | | | 660,578 |
Time Warner Cable, Inc. | | | 39,600 | | | 3,848,724 |
Time Warner, Inc. (a) | | | 124,134 | | | 5,937,329 |
Viacom, Inc., Class B | | | 60,632 | | | 3,197,732 |
The Walt Disney Co. (a) | | | 232,449 | | | 11,573,636 |
The Washington Post Co., Class B (a) | | | 597 | | | 218,030 |
| | | | | | |
| | | | | | 59,452,800 |
|
Metals & Mining – 0.7% | | | | | | |
Alcoa, Inc. | | | 139,700 | | | 1,212,596 |
Allegheny Technologies, Inc. (a) | | | 14,066 | | | 427,044 |
Cliffs Natural Resources, Inc. (a) | | | 18,607 | | | 717,486 |
Freeport-McMoRan Copper & Gold, Inc. | | | 124,460 | | | 4,256,532 |
Newmont Mining Corp. | | | 65,075 | | | 3,022,083 |
Nucor Corp. (a) | | | 41,602 | | | 1,796,374 |
United States Steel Corp. (a) | | | 18,890 | | | 450,904 |
| | | | | | |
| | | | | | 11,883,019 |
|
Multi-Utilities – 1.2% | | | | | | |
Ameren Corp. | | | 31,734 | | | 974,868 |
CenterPoint Energy, Inc. | | | 55,930 | | | 1,076,652 |
CMS Energy Corp. | | | 34,603 | | | 843,621 |
Consolidated Edison, Inc. | | | 38,416 | | | 2,133,625 |
Dominion Resources, Inc. (a) | | | 75,332 | | | 3,902,198 |
DTE Energy Co. | | | 22,572 | | | 1,355,449 |
Integrys Energy Group, Inc. | | | 10,203 | | | 532,801 |
NiSource, Inc. (a) | | | 40,571 | | | 1,009,812 |
PG&E Corp. | | | 56,359 | | | 2,264,505 |
Public Service Enterprise Group, Inc. (a) | | | 66,344 | | | 2,030,126 |
SCANA Corp. (a) | | | 17,258 | | | 787,655 |
Sempra Energy | | | 29,485 | | | 2,091,666 |
TECO Energy, Inc. (a) | | | 26,624 | | | 446,218 |
Wisconsin Energy Corp. | | | 30,151 | | | 1,111,064 |
| | | | | | |
| | | | | | 20,560,260 |
|
See Notes to Financial Statements.
| | | | | | |
| | | | | | | |
| | BLACKROCK S&P 500 STOCK FUND | | DECEMBER 31, 2012 | | 29 |
| | |
| Schedule of Investments (continued) | | S&P 500 Stock Master Portfolio (Percentages shown are based on Net Assets) |
| | | | | | |
Common Stocks | | Shares | | | Value |
|
Multiline Retail – 0.8% | | | | | | |
Big Lots, Inc. (b) | | | 7,652 | | | $ 217,776 |
Dollar General Corp. (b) | | | 34,490 | | | 1,520,664 |
Dollar Tree, Inc. (b) | | | 29,854 | | | 1,210,878 |
Family Dollar Stores, Inc. (a) | | | 12,597 | | | 798,776 |
J.C. Penney Co., Inc. (a) | | | 18,688 | | | 368,341 |
Kohl’s Corp. | | | 27,802 | | | 1,194,930 |
Macy’s, Inc. | | | 51,897 | | | 2,025,021 |
Nordstrom, Inc. (a) | | | 19,998 | | | 1,069,893 |
Target Corp. | | | 85,385 | | | 5,052,230 |
| | | | | | |
| | | | | | 13,458,509 |
|
Office Electronics – 0.1% | | | | | | |
Xerox Corp. | | | 166,042 | | | 1,132,406 |
|
Oil, Gas & Consumable Fuels – 8.9% | | | | | | |
Anadarko Petroleum Corp. | | | 65,523 | | | 4,869,014 |
Apache Corp. | | | 51,299 | | | 4,026,972 |
Cabot Oil & Gas Corp. | | | 27,487 | | | 1,367,203 |
Chesapeake Energy Corp. (a) | | | 67,942 | | | 1,129,196 |
Chevron Corp. | | | 256,640 | | | 27,753,050 |
ConocoPhillips | | | 159,174 | | | 9,230,500 |
CONSOL Energy, Inc. | | | 29,903 | | | 959,886 |
Denbury Resources, Inc. (b) | | | 50,799 | | | 822,944 |
Devon Energy Corp. | | | 49,372 | | | 2,569,319 |
EOG Resources, Inc. | | | 35,515 | | | 4,289,857 |
EQT Corp. | | | 19,573 | | | 1,154,416 |
Exxon Mobil Corp. | | | 597,959 | | | 51,753,351 |
Hess Corp. | | | 38,945 | | | 2,062,527 |
Kinder Morgan, Inc. | | | 82,924 | | | 2,929,705 |
Marathon Oil Corp. | | | 92,602 | | | 2,839,177 |
Marathon Petroleum Corp. | | | 44,461 | | | 2,801,043 |
Murphy Oil Corp. | | | 24,155 | | | 1,438,430 |
Newfield Exploration Co. (b) | | | 17,641 | | | 472,426 |
Noble Energy, Inc. | | | 23,319 | | | 2,372,475 |
Occidental Petroleum Corp. | | | 106,235 | | | 8,138,663 |
Peabody Energy Corp. | | | 35,137 | | | 934,996 |
Phillips 66 | | | 82,018 | | | 4,355,156 |
Pioneer Natural Resources Co. (a) | | | 16,150 | | | 1,721,429 |
QEP Resources, Inc. (a) | | | 23,317 | | | 705,806 |
Range Resources Corp. (a) | | | 21,285 | | | 1,337,337 |
Southwestern Energy Co. (b) | | | 45,788 | | | 1,529,777 |
Spectra Energy Corp. | | | 87,272 | | | 2,389,507 |
Tesoro Corp. | | | 18,388 | | | 809,991 |
Valero Energy Corp. | | | 72,556 | | | 2,475,611 |
The Williams Cos., Inc. | | | 88,329 | | | 2,891,891 |
WPX Energy, Inc. (b) | | | 26,106 | | | 388,457 |
| | | | | | |
| | | | | | 152,520,112 |
|
Paper & Forest Products – 0.2% | | | | | | |
International Paper Co. | | | 57,558 | | | 2,293,111 |
MeadWestvaco Corp. | | | 22,883 | | | 729,281 |
| | | | | | |
| | | | | | 3,022,392 |
|
Personal Products – 0.2% | | | | | | |
Avon Products, Inc. | | | 56,467 | | | 810,866 |
The Estée Lauder Cos., Inc., Class A (a) | | | 31,472 | | | 1,883,914 |
| | | | | | |
| | | | | | 2,694,780 |
|
Pharmaceuticals – 6.0% | | | | | | |
Abbott Laboratories | | | 207,276 | | | 13,576,578 |
Allergan, Inc. | | | 40,318 | | | 3,698,370 |
Bristol-Myers Squibb Co. | | | 216,548 | | | 7,057,299 |
Eli Lilly & Co. | | | 133,898 | | | 6,603,849 |
Forest Laboratories, Inc. (b) | | | 30,613 | | | 1,081,251 |
Hospira, Inc. (b) | | | 21,569 | | | 673,816 |
| | | | | | |
Common Stocks | | Shares | | | Value |
|
Pharmaceuticals (concluded) | | | | | | |
Johnson & Johnson | | | 363,417 | | | $ 25,475,532 |
Merck & Co., Inc. | | | 398,659 | | | 16,321,099 |
Mylan, Inc. (b) | | | 53,399 | | | 1,467,405 |
Perrigo Co. (a) | | | 11,561 | | | 1,202,691 |
Pfizer, Inc. | | | 965,650 | | | 24,218,502 |
Watson Pharmaceuticals, Inc. (b) | | | 16,718 | | | 1,437,748 |
| | | | | | |
| | | | | | 102,814,140 |
|
Professional Services – 0.1% | | | | | | |
The Dun & Bradstreet Corp. (a) | | | 5,884 | | | 462,777 |
Equifax, Inc. | | | 15,619 | | | 845,300 |
Robert Half International, Inc. (a) | | | 18,551 | | | 590,293 |
| | | | | | |
| | | | | | 1,898,370 |
|
Real Estate Investment Trusts (REITs) – 2.1% |
American Tower Corp. | | | 51,831 | | | 4,004,981 |
Apartment Investment & Management Co., Class A | | | 19,126 | | | 517,549 |
AvalonBay Communities, Inc. | | | 14,991 | | | 2,032,630 |
Boston Properties, Inc. | | | 19,773 | | | 2,092,181 |
Equity Residential (a) | | | 42,171 | | | 2,389,830 |
HCP, Inc. (a) | | | 59,257 | | | 2,677,231 |
Health Care REIT, Inc. | | | 34,034 | | | 2,085,944 |
Host Hotels & Resorts, Inc. (a) | | | 95,008 | �� | | 1,488,775 |
Kimco Realty Corp. (a) | | | 53,505 | | | 1,033,717 |
Plum Creek Timber Co., Inc. (a) | | | 21,113 | | | 936,784 |
ProLogis, Inc. (a) | | | 60,410 | | | 2,204,361 |
Public Storage | | | 18,901 | | | 2,739,889 |
Simon Property Group, Inc. | | | 40,562 | | | 6,412,447 |
Ventas, Inc. (a) | | | 38,740 | | | 2,507,253 |
Vornado Realty Trust | | | 22,198 | | | 1,777,616 |
Weyerhaeuser Co. | | | 70,973 | | | 1,974,469 |
| | | | | | |
| | | | | | 36,875,657 |
|
Real Estate Management & Development – 0.0% |
CBRE Group, Inc., Class A (b) | | | 39,553 | | | 787,105 |
|
Road & Rail – 0.8% | | | | | | |
CSX Corp. | | | 135,373 | | | 2,670,909 |
Norfolk Southern Corp. | | | 41,484 | | | 2,565,371 |
Ryder System, Inc. (a) | | | 6,643 | | | 331,685 |
Union Pacific Corp. | | | 61,709 | | | 7,758,055 |
| | | | | | |
| | | | | | 13,326,020 |
|
Semiconductors & Semiconductor Equipment – 1.9% |
Advanced Micro Devices, Inc. (b) | | | 79,792 | | | 191,501 |
Altera Corp. | | | 42,004 | | | 1,446,618 |
Analog Devices, Inc. | | | 39,491 | | | 1,660,991 |
Applied Materials, Inc. | | | 157,267 | | | 1,799,134 |
Broadcom Corp., Class A (b) | | | 68,010 | | | 2,258,612 |
First Solar, Inc. (a)(b) | | | 7,836 | | | 241,976 |
Intel Corp. | | | 652,682 | | | 13,464,830 |
KLA-Tencor Corp. | | | 21,814 | | | 1,041,837 |
Lam Research Corp. (b) | | | 22,533 | | | 814,117 |
Linear Technology Corp. | | | 30,308 | | | 1,039,564 |
LSI Corp. (b) | | | 73,071 | | | 517,343 |
Microchip Technology, Inc. (a) | | | 25,482 | | | 830,458 |
Micron Technology, Inc. (b) | | | 132,963 | | | 844,315 |
NVIDIA Corp. | | | 81,844 | | | 1,005,863 |
Teradyne, Inc. (a)(b) | | | 24,559 | | | 414,802 |
Texas Instruments, Inc. | | | 147,060 | | | 4,550,036 |
Xilinx, Inc. | | | 34,244 | | | 1,229,360 |
| | | | | | |
| | | | | | 33,351,357 |
|
See Notes to Financial Statements.
| | | | | | |
| | | | | | | |
30 | | BLACKROCK S&P 500 STOCK FUND | | DECEMBER 31, 2012 | | |
| | |
| Schedule of Investments (continued) | | S&P 500 Stock Master Portfolio (Percentages shown are based on Net Assets) |
| | | | | | | | |
Common Stocks | | Shares | | | Value | |
Software – 3.4% | | | | | | | | |
Adobe Systems, Inc. (b) | | | 64,890 | | | $ | 2,445,055 | |
Autodesk, Inc. (b) | | | 29,516 | | | | 1,043,391 | |
BMC Software, Inc. (b) | | | 18,748 | | | | 743,546 | |
CA, Inc. | | | 44,071 | | | | 968,680 | |
Citrix Systems, Inc. (b) | | | 24,434 | | | | 1,606,535 | |
Electronic Arts, Inc. (b) | | | 40,175 | | | | 583,743 | |
Intuit, Inc. (a) | | | 36,476 | | | | 2,170,322 | |
Microsoft Corp. | | | 993,348 | | | | 26,552,192 | |
Oracle Corp. | | | 493,021 | | | | 16,427,460 | |
Red Hat, Inc. (b) | | | 25,285 | | | | 1,339,094 | |
Salesforce.com, Inc. (b) | | | 17,126 | | | | 2,878,881 | |
Symantec Corp. (b) | | | 91,124 | | | | 1,714,042 | |
| | | | | | | | 58,472,941 | |
Specialty Retail – 2.1% | | | | | | | | |
Abercrombie & Fitch Co., Class A | | | 10,482 | | | | 502,822 | |
AutoNation, Inc. (b) | | | 5,077 | | | | 201,557 | |
AutoZone, Inc. (b) | | | 4,850 | | | | 1,718,986 | |
Bed Bath & Beyond, Inc. (b) | | | 30,096 | | | | 1,682,667 | |
Best Buy Co., Inc. | | | 34,919 | | | | 413,790 | |
CarMax, Inc. (b) | | | 29,997 | | | | 1,126,087 | |
GameStop Corp., Class A (a) | | | 15,975 | | | | 400,813 | |
The Gap, Inc. | | | 39,030 | | | | 1,211,491 | |
The Home Depot, Inc. | | | 196,121 | | | | 12,130,084 | |
Limited Brands, Inc. (a) | | | 31,363 | | | | 1,475,943 | |
Lowe’s Cos., Inc. | | | 147,560 | | | | 5,241,331 | |
O’Reilly Automotive, Inc. (b) | | | 15,057 | | | | 1,346,397 | |
PetSmart, Inc. | | | 14,144 | | | | 966,601 | |
Ross Stores, Inc. | | | 29,176 | | | | 1,579,880 | |
Staples, Inc. (a) | | | 88,564 | | | | 1,009,630 | |
Tiffany & Co. | | | 15,586 | | | | 893,701 | |
TJX Cos., Inc. | | | 95,690 | | | | 4,062,041 | |
Urban Outfitters, Inc. (b) | | | 14,304 | | | | 563,005 | |
| | | | | | | | 36,526,826 | |
Textiles, Apparel & Luxury Goods – 0.6% | | | | | | | | |
Coach, Inc. | | | 37,232 | | | | 2,066,748 | |
Fossil, Inc. (b) | | | 7,086 | | | | 659,707 | |
NIKE, Inc., Class B | | | 95,768 | | | | 4,941,629 | |
Ralph Lauren Corp. | | | 8,031 | | | | 1,204,007 | |
VF Corp. (a) | | | 11,549 | | | | 1,743,553 | |
| | | | | | | | 10,615,644 | |
Thrifts & Mortgage Finance – 0.1% | | | | | | | | |
Hudson City Bancorp, Inc. | | | 62,298 | | | | 506,483 | |
People’s United Financial, Inc. | | | 45,773 | | | | 553,395 | |
| | | | | | | | 1,059,878 | |
| | | | | | |
Common Stocks | | Shares | | | Value |
Tobacco – 1.8% | | | | | | |
Altria Group, Inc. | | | 265,652 | | | $ 8,346,786 |
Lorillard, Inc. | | | 16,996 | | | 1,982,923 |
Philip Morris International, Inc. | | | 219,111 | | | 18,326,444 |
Reynolds American, Inc. | | | 42,570 | | | 1,763,675 |
| | | | | | |
| | | | | | | 30,419,828 |
Trading Companies & Distributors – 0.2% | | | |
Fastenal Co. (a) | | | 35,386 | | | 1,652,172 |
W.W. Grainger, Inc. | | | 7,845 | | | 1,587,593 |
| | | | | | |
| | | | | | | 3,239,765 |
Wireless Telecommunication Services – 0.3% | | | |
Crown Castle International Corp. (b) | | | 38,428 | | | 2,772,964 |
MetroPCS Communications, Inc. (b) | | | 41,588 | | | 413,385 |
Sprint Nextel Corp. (b) | | | 393,803 | | | 2,232,863 |
| | | | | | |
| | | | | | | 5,419,212 |
Total Long-Term Investments (Cost – $1,293,534,778) – 97.3% | | | 1,670,850,611 |
| | | | | | |
| | | | | | | | |
| | |
Short-Term Securities | | | | | | | | |
Money Market Funds – 9.0% | | | | | | | | |
BlackRock Cash Funds: Institutional, SL Agency Shares, 0.25% (c)(d)(e) | | | 132,083,169 | | | | 132,083,169 | |
BlackRock Cash Funds: Prime, SL Agency Shares, 0.22% (c)(d)(e) | | | 22,497,136 | | | | 22,497,136 | |
| | | | | | | | |
| | | | | | | | 154,580,305 | |
| | |
| | |
| Par
(000) |
| | | | |
US Treasury Obligations – 0.1% | |
US Treasury Bill, 0.06%, 3/21/13 (f)(g) | | $ | 2,605 | | | | 2,604,802 | |
Total Short-Term Securities (Cost – $157,185,104) – 9.1% | | | | 157,185,107 | |
Total Investments (Cost – $1,450,719,882*) – 106.4% | | | | 1,828,035,718 | |
Liabilities in Excess of Other Assets – (6.4)% | | | | (110,103,497) | |
| | | | | | | | |
Net Assets – 100.0% | | | | | | $ | 1,717,932,221 | |
| | | | | | | | |
Notes to Schedule of Investments
* As of December 31, 2012, gross unrealized appreciation and gross unrealized depreciation based on cost for federal income tax purposes were as follows:
| | | | |
Tax cost | | $ | 1,504,245,385 | |
| | | | |
Gross unrealized appreciation | | $ | 479,746,147 | |
Gross unrealized depreciation | | | (155,955,814) | |
| | | | |
Net unrealized appreciation | | $ | 323,790,333 | |
| | | | |
(a) Security, or a portion of security, is on loan.
(b) Non-income producing security.
See Notes to Financial Statements.
| | | | | | |
| | | | | | | |
| | BLACKROCK S&P 500 STOCK FUND | | DECEMBER 31, 2012 | | 31 |
| | |
| Schedule of Investments (concluded) | | S&P 500 Stock Master Portfolio |
| | |
| (c) | Investments in issuers considered to be an affiliate of the Master Portfolio during the year ended December 31, 2012, for purposes of Section 2(a)(3) of the Investment Company Act of 1940, as amended, were as follows: |
| | | | | | | | | | | | | | | | | | | | | | | | | | | | |
| Affiliate | | Shares Held at December 31, 2011 | | | Shares Purchased | | | Shares Sold | | | Shares Held at December 31, 2012 | | | Value at December 31,
2012 | | | Income | | | Realized Gain/Loss | |
BlackRock, Inc. | | | 18,408 | | | | 5,209 | | | | (7,152 | ) | | | 16,465 | | | $ | 3,403,480 | | | $ | 104,691 | | | $ | (124,340) | |
BlackRock Cash Funds: Institutional, SL Agency Shares | | | 170,771,686 | | | | – | | | | (38,688,517 | )1 | | | 132,083,169 | | | $ | 132,083,169 | | | $ | 451,965 | | | | – | |
BlackRock Cash Funds: Prime, SL Agency Shares | | | 53,764,558 | | | | – | | | | (31,267,422 | )1 | | | 22,497,136 | | | $ | 22,497,136 | | | $ | 100,879 | | | | – | |
The PNC Financial Services Group, Inc. | | | 96,666 | | | | 7,399 | | | | (34,718 | ) | | | 69,347 | | | $ | 4,043,624 | | | $ | 129,398 | | | $ | 309,903 | |
| | 1 | Represents net shares sold. |
| (d) | Represents the current yield as of report date. |
| (e) | All or a portion of security was purchased with the cash collateral from loaned securities. |
| (f) | All or a portion of security has been pledged as collateral in connection with open financial futures contracts. |
| (g) | Rates shown are discount rates or a range of discount rates paid at the time of purchase. |
| — | Financial futures contracts as of December 31, 2012 were as follows: |
| | | | | | | | | | |
Contracts Purchased | | Issue | | Exchange | | Expiration | | Notional Value | | Unrealized Appreciation |
785 | | S&P 500 E-Mini | | Chicago Mercantile | | March 2013 | | $55,738,925 | | $391,638 |
| — | Fair Value Measurements — Various inputs are used in determining the fair value of investments and derivative financial instruments. These inputs to valuation techniques are categorized into a disclosure hierarchy consisting of three broad levels for financial statement purposes as follows: |
| | — | Level 1 — unadjusted price quotations in active markets/exchanges for identical assets and liabilities that the Master Portfolio has the ability to access |
| | — | Level 2 — other observable inputs (including, but not limited to, quoted prices for similar assets or liabilities in markets that are active, quoted prices for identical or similar assets or liabilities in markets that are not active, inputs other than quoted prices that are observable for the assets or liabilities (such as interest rates, yield curves, volatilities, prepayment speeds, loss severities, credit risks and default rates) or other market-corroborated inputs) |
| | — | Level 3 — unobservable inputs based on the best information available in the circumstances, to the extent observable inputs are not available (including the Master Portfolio’s own assumptions used in determining the fair value of investments and derivative financial instruments) |
The hierarchy gives the highest priority to unadjusted quoted prices in active markets for identical assets or liabilities (Level 1 measurements) and the lowest priority to unobservable inputs (Level 3 measurements). Accordingly, the degree of judgment exercised in determining fair value is greatest for instruments categorized in Level 3. The inputs used to measure fair value may fall into different levels of the fair value hierarchy. In such cases, for disclosure purposes, the level in the fair value hierarchy within which the fair value measurement falls in its entirety is determined based on the lowest level input that is significant to the fair value measurement in its entirety.
Changes in valuation techniques may result in transfers into or out of an assigned level within the disclosure hierarchy. In accordance with the Master Portfolio’s policy, transfers between different levels of the fair value disclosure hierarchy are deemed to have occurred as of the beginning of the reporting period. The categorization of a value determined for investments and derivative financial instruments is based on the pricing transparency of the investment and derivative financial instrument and is not necessarily an indication of the risks associated with investing in the securities. For information about the Master Portfolio’s policy regarding valuation of investments and derivative financial instruments and other significant accounting policies, please refer to Note 1 of the Notes to Financial Statements.
The following tables summarize the Master Portfolio’s investments and derivative financial instruments categorized in the disclosure hierarchy as of December 31, 2012:
| | | | | | | | | | | | | | | | |
| | | Level 1 | | | Level 2 | | | Level 3 | | | Total | |
Assets: | | | | | | | | | | | | | | | | |
Investments: | | | | | | | | | | | | | | | | |
Long-Term Investments: | | | | | | | | | | | | | | | | |
Common Stocks2 | | | $1,670,850,611 | | | | – | | | | – | | | | $1,670,850,611 | |
Short-Term Investments: | | | | | | | | | | | | | | | | |
Money Market Funds | | | 154,580,305 | | | | – | | | | – | | | | 154,580,305 | |
US Treasury Obligations | | | – | | | | $2,604,802 | | | | – | | | | 2,604,802 | |
Total | | | $1,825,430,916 | | | | $2,604,802 | | | | – | | | | $1,828,035,718 | |
2 See above Schedule of Investments for values in each industry. | | | | | | | | | | | | | | | | |
| | | Level 1 | | | Level 2 | | | Level 3 | | | Total | |
Derivative Financial Instruments3 | | | | | | | | | | | | | | | | |
Assets: | | | | | | | | | | | | | | | | |
Equity contracts | | | $391,638 | | | | — | | | | — | | | | $391,638 | |
3 Derivative financial instruments are financial futures contracts, which are valued at the unrealized appreciation/depreciation on the instrument.
Certain of the Master Portfolio’s liabilities are held at carrying amount, which approximates fair value for financial statement purposes. As of December 31, 2012, collateral on securities loaned at value of $104,564,691 are categorized as Level 2 within the disclosure hierarchy.
There were no transfers between levels during the year ended December 31, 2012.
See Notes to Financial Statements.
| | | | | | |
| | | | | | | |
32 | | BLACKROCK S&P 500 STOCK FUND | | DECEMBER 31, 2012 | | |
| | |
| Statement of Assets and Liabilities | | S&P 500 Stock Master Portfolio |
December 31, 2012
| | | | |
Assets | | | | |
Investments at value – unaffiliated (including securities loaned of $103,692,867) (cost – $1,289,042,959) | | $ | 1,666,008,309 | |
Investments at value – affiliated (cost – $161,676,923) | | | 162,027,409 | |
Dividends receivable | | | 1,842,013 | |
Variation margin receivable | | | 1,349,744 | |
Investments sold receivable | | | 248,287 | |
Securities lending income receivable – affiliated | | | 30,921 | |
Interest receivable | | | 4,796 | |
Total assets | | | 1,831,511,479 | |
| | | | |
Liabilities | | | | |
Collateral on securities loaned at value | | | 104,564,691 | |
Withdrawals payable to investors | | | 8,902,792 | |
Investment advisory fees payable | | | 60,306 | |
Professional fees payable | | | 38,415 | |
Trustees’ fees payable | | | 13,054 | |
Total liabilities | | | 113,579,258 | |
Net Assets | | $ | 1,717,932,221 | |
| | | | |
Net Assets Consist of | | | | |
Investors’ capital | | $ | 1,340,224,747 | |
Net unrealized appreciation/depreciation | | | 377,707,474 | |
Net Assets | | $ | 1,717,932,221 | |
See Notes to Financial Statements.
| | | | | | |
| | | | | | | |
| | BLACKROCK S&P 500 STOCK FUND | | DECEMBER 31, 2012 | | 33 |
| | | | |
Statement of Operations | | | S&P 500 Stock Master Portfolio | |
| | | | | |
| Year Ended December 31, 2012 |
| |
| | | | | | |
| |
Investment Income | | | | | |
| |
Dividends – unaffiliated | | | $ | 42,797,690 | |
Securities lending – affiliated – net | | | | 468,876 | |
Dividends – affiliated | | | | 234,089 | |
Income – affiliated | | | | 83,968 | |
Interest | | | | 1,770 | |
Foreign taxes withheld | | | | (21,026) | |
| |
Total income | | | | 43,565,367 | |
| | | | | |
| | | | | | |
| |
Expenses | | | | | |
| |
Investment advisory | | | | 958,487 | |
Reorganization costs | | | | 169,342 | |
Trustees | | | | 54,213 | |
Professional | | | | 40,156 | |
| | | | | |
| |
Total expenses | | | | 1,222,198 | |
Less reorganization costs reimbursed | | | | (169,342) | |
Less fees waived by Manager | | | | (94,369) | |
| | | | | |
| |
Total expenses after fees waived | | | | 958,487 | |
| | | | | |
| |
Net investment income | | | | 42,606,880 | |
| | | | | |
| | | | | | |
| |
Realized and Unrealized Gain (Loss) | | | | | |
| |
Net realized gain (loss) from: | | | | | |
Investments – unaffiliated | | | | (21,226,635) | |
Investments – affiliated | | | | 185,563 | |
Redemptions-in-kind | | | | 231,258,145 | |
Financial futures contracts | | | | 3,105,397 | |
| | | | | |
| | | | 213,322,470 | |
| | | | | |
Net change in unrealized appreciation/depreciation on: | | | | | |
Investments | | | | 26,943,872 | |
Financial futures contracts | | | | 332,601 | |
| | | | | |
| | | | 27,276,473 | |
| | | | | |
Total realized and unrealized gain | | | | 240,598,943 | |
| | | | | |
Net Increase in Net Assets Resulting from Operations | | | | $283,205,823 | |
| | | | | |
| | | | | | |
See Notes to Financial Statements. | | | | | | |
| | | | | | | |
34 | | BLACKROCK S&P 500 STOCK FUND | | DECEMBER 31, 2012 | | |
| | |
Statements of Changes in Net Assets | | S&P 500 Stock Master Portfolio |
| | | | | | | | |
| | | Year Ended December 31, | |
| Increase (Decrease) in Net Assets: | | 2012 | | | 2011 | |
| | |
| | | | | | | | | |
Operations | | | | | | | | |
Net investment income | | $ | 42,606,880 | | | $ | 45,199,220 | |
Net realized gain (loss) | | | 213,322,470 | | | | (26,094,326) | |
Net change in unrealized appreciation/depreciation | | | 27,276,473 | | | | 26,305,661 | |
| | | | |
Net increase in net assets resulting from operations: | | | 283,205,823 | | | | 45,410,555 | |
| | | | |
| | | | | | | | |
Capital Transactions | | | | | | | | |
Proceeds from contributions | | | 392,443,684 | | | | 195,530,480 | |
Value of withdrawals | | | (1,066,033,494) | | | | (291,341,608) | |
| | | | |
Net decrease in net assets derived from capital transactions | | | (673,589,810) | | | | (95,811,128) | |
| | | | |
| | | | | | | | |
Net Assets | | | | | | | | |
Total decrease in net assets | | | (390,383,987) | | | | (50,400,573) | |
Beginning of year | | | 2,108,316,208 | | | | 2,158,716,781 | |
| | | | |
End of year | | $ | 1,717,932,221 | | | $ | 2,108,316,208 | |
| | | | |
| | | | | | |
| See Notes to Financial Statements. | | | | | | |
| | | | | | | |
| | BLACKROCK S&P 500 STOCK FUND | | DECEMBER 31, 2012 | | 35 |
| | |
| Financial Highlights | | S&P 500 Stock Master Portfolio |
| | | | | | | | | | | | | | | | | | | | |
| | | Year Ended December 31, | |
| | | 2012 | | | 2011 | | | 2010 | | | 2009 | | | 2008 | |
Total Investment Return | | | | | | | | | | | | | | | | | | | | |
Total Investment Return | | | 15.98% | | | | 2.13% | | | | 15.06% | | | | 26.63% | | | | (36.86)% | |
| | | | | | | | | | | | | | | | | | | | |
Ratios to Average Net Assets | | | | | | | | | | | | | | | | | | | | |
Total expenses | | | 0.06% | | | | 0.06% | | | | 0.05% | | | | 0.05% | | | | 0.05% | |
Total expenses after fees waived | | | 0.05% | | | | 0.05% | | | | 0.05% | | | | 0.05% | | | | 0.05% | |
Net investment income | | | 2.22% | | | | 2.08% | | | | 2.01% | | | | 2.35% | | | | 2.32% | |
| | | | | | | | | | | | | | | | | | | | |
Supplemental Data | | | | | | | | | | | | | | | | | | | | |
Net assets, end of year (000) | | $ | 1,717,932 | | | $ | 2,108,316 | | | $ | 2,158,717 | | | $ | 2,049,062 | | | $ | 1,690,980 | |
Portfolio turnover | | | 10% | | | | 5% | | | | 9% | | | | 5% | | | | 8% | |
See Notes to Financial Statements.
| | | | | | |
| | | | | | | |
36 | | BLACKROCK S&P 500 STOCK FUND | | DECEMBER 31, 2012 | | |
| | |
| Notes to Financial Statements | | S&P 500 Stock Master Portfolio |
1. Organization and Significant Accounting Policies:
S&P 500 Stock Master Portfolio (the “Master Portfolio”), a series of Master Investment Portfolio (“MIP”), is registered under the Investment Company Act of 1940, as amended (the “1940 Act”), as a diversified, open-end management investment company. MIP is organized as a Delaware statutory trust. The Master Portfolio’s financial statements are prepared in conformity with accounting principles generally accepted in the United States of America (“US GAAP”), which may require management to make estimates and assumptions that affect the reported amounts of assets and liabilities in the financial statements and the reported amounts of increases and decreases in net assets from operations during the reporting period. Actual results may differ from those estimates.
Reorganization: On May 16, 2012, the Board approved a plan of reorganization whereby the Master Portfolio will acquire substantially all of the assets and assume certain stated liabilities of Master S&P 500 Index Series, a series of Quantitative Master Series LLC (the “Target Master Portfolio”) in exchange for beneficial interests of the Master Portfolio (the “Master Reorganization”). The Master Reorganization is subject to shareholder approval by the feeder funds that invest their assets in the Target Master Portfolio and certain other conditions. On December 12, 2012, the Master Reorganization was approved by the shareholders of each feeder fund of the Target Master Portfolio. However, the Master Reorganization is not expected to close until the reorganization of BlackRock S&P 500 Index Fund (“S&P 500 Index Fund”), a series of BlackRock Index Funds, Inc., with BlackRock S&P 500 Stock Fund, a series of BlackRock Funds III (the “S&P 500 Fund Reorganization”) is approved by S&P 500 Index Fund’s shareholders. If the S&P 500 Fund Reorganization is not approved, the Board of Directors of the Target Master Portfolio will consider other options, including whether to proceed with the Master Reorganization or other alternatives.
Valuation: US GAAP defines fair value as the price the Master Portfolio would receive to sell an asset or pay to transfer a liability in an orderly transaction between market participants at the measurement date. The Master Portfolio determines the fair values of its financial instruments at market value using independent dealers or pricing services under policies approved by the Board of Trustees of MIP (the “Board”). The Black-Rock Global Valuation Methodologies Committee (the “Global Valuation Committee”) is the committee formed by management to develop global pricing policies and procedures and to provide oversight of the pricing function for the Master Portfolio for all financial instruments.
Equity investments traded on a recognized securities exchange or the NASDAQ Global Market System (“NASDAQ”) are valued at the last reported sale price that day or the NASDAQ official closing price, if applicable. For equity investments traded on more than one exchange, the last reported sale price on the exchange where the stock is primarily traded is used. Equity investments traded on a recognized exchange for
which there were no sales on that day are valued at the last available bid (long positions) or ask (short positions) price. If no bid or ask price is available, the prior day’s price will be used, unless it is determined that such prior day’s price no longer reflects the fair value of the security. Financial futures contracts traded on exchanges are valued at their last sale price. Investments in open-end registered investment companies are valued at NAV each business day. Short-term securities with remaining maturities of 60 days or less may be valued at amortized cost, which approximates fair value.
In the event that application of these methods of valuation results in a price for an investment that is deemed not to be representative of the market value of such investment or if a price is not available, the investment will be valued by the Global Valuation Committee, or its delegate, in accordance with a policy approved by the Board as reflecting fair value (“Fair Value Assets”). When determining the price for Fair Value Assets, the Global Valuation Committee, or its delegate, seeks to determine the price that the Master Portfolio might reasonably expect to receive from the current sale of that asset in an arm’s-length transaction. Fair value determinations shall be based upon all available factors that the investment advisor and/or sub-advisor deem relevant consistent with the principles of fair value measurements which include the market approach, income approach and/or in the case of recent investments, the cost approach, as appropriate. A market approach generally consists of using comparable market transactions. The income approach generally is used to discount future cash flows to present value and adjusted for liquidity as appropriate. These factors include but are not limited to: (i) attributes specific to the investment or asset; (ii) the principal market for the investment or asset; (iii) the customary participants in the principal market for the investment or asset; (iv) data assumptions by market participants for the investment or asset, if reasonably available; (v) quoted prices for similar investments or assets in active markets; and (vi) other factors, such as future cash flows, interest rates, yield curves, volatilities, prepayment speeds, loss severities, credit risks, recovery rates, liquidation amounts and/or default rates. Due to the inherent uncertainty of valuations of such investments, the fair values may differ from the values that would have been used had an active market existed. The Global Valuation Committee, or its delegate, employs various methods for calibrating valuation approaches for investments where an active market does not exist, including regular due diligence of the Master Portfolio’s pricing vendors, a regular review of key inputs and assumptions, transactional back-testing or disposition analysis to compare unrealized gains and losses to realized gains and losses, reviews of missing or stale prices and large movements in market values and reviews of any market related activity. The pricing of all Fair Value Assets is subsequently reported to the Board or a committee thereof on a quarterly basis.
Preferred Stock: The Master Portfolio may invest in preferred stock. Preferred stock has a preference over common stock in liquidation (and
| | | | | | |
| | | | | | | |
| | BLACKROCK S&P 500 STOCK FUND | | DECEMBER 31, 2012 | | 37 |
| | |
| Notes to Financial Statements (continued) | | S&P 500 Stock Master Portfolio |
generally in receiving dividends as well) but is subordinated to the liabilities of the issuer in all respects. As a general rule, the market value of preferred stock with a fixed dividend rate and no conversion element varies inversely with interest rates and perceived credit risk, while the market price of convertible preferred stock generally also reflects some element of conversion value. Because preferred stock is junior to debt securities and other obligations of the issuer, deterioration in the credit quality of the issuer will cause greater changes in the value of a preferred stock than in a more senior debt security with similar stated yield characteristics. Unlike interest payments on debt securities, preferred stock dividends are payable only if declared by the issuer’s board of directors. Preferred stock also may be subject to optional or mandatory redemption provisions.
Segregation and Collateralization: In cases in which the 1940 Act and the interpretive positions of the Securities and Exchange Commission (“SEC”) require that the Master Portfolio either deliver collateral or segregate assets in connection with certain investments (e.g., financial futures contracts), the Master Portfolio will, consistent with SEC rules and/or certain interpretive letters issued by the SEC, segregate collateral or designate on its books and records cash or liquid securities having a market value at least equal to the amount that would otherwise be required to be physically segregated. Furthermore, based on requirements and agreements with certain exchanges and third party broker-dealers, the Master Portfolio engaging in such transactions may have requirements to deliver/deposit securities to/with an exchange or broker-dealer as collateral for certain investments.
Investment Transactions and Investment Income: For financial reporting purposes, investment transactions are recorded on the dates the transactions are entered into (the trade dates). Realized gains and losses on investment transactions are determined on the identified cost basis. Dividend income is recorded on the ex-dividend dates. Dividends from foreign securities where the ex-dividend date may have passed are subsequently recorded when the Master Portfolio is informed of the ex-dividend date. Under the applicable foreign tax laws, a withholding tax at various rates may be imposed on capital gains, dividends and interest. Upon notification from issuers, some of the dividend income received from a real estate investment trust may be redesignated as a reduction of cost of the related investment and/or realized gain. Interest income, including amortization and accretion of premiums and discounts on debt securities, is recognized on the accrual basis.
Securities Lending: The Master Portfolio may lend securities to approved borrowers, such as banks, brokers and other financial institutions. The borrower pledges cash, securities issued or guaranteed by the US government or irrevocable letters of credit issued by a bank as collateral. The initial collateral received by the Master Portfolio is required to have a value of at least 102% of the current value of the loaned securities for securities traded on US exchanges and a value of at least 105% for all other securities. The collateral is maintained there-
after in an amount equal to at least 100% of the current market value of the loaned securities. The market value of the loaned securities is determined at the close of business of the Master Portfolio and any additional required collateral is delivered to the Master Portfolio on the next business day. Securities lending income, as disclosed in the Statement of Operations, represents the income earned from the investment of the cash collateral, net of rebates paid to, or fees paid by, borrowers and less the fees paid to the securities lending agent. During the term of the loan, the Master Portfolio earns dividend or interest income on the securities loaned but does not receive interest income on the securities received as collateral. Loans of securities are terminable at any time and the borrower, after notice, is required to return borrowed securities within the standard time period for settlement of securities transactions. The risks of securities lending include the risk that the borrower may not provide additional collateral when required or may not return the securities when due. To mitigate this risk the Master Portfolio benefits from a borrower default indemnity provided by BlackRock, Inc. (“BlackRock”). BlackRock’s indemnity allows for full replacement of securities lent. The Master Portfolio also could suffer a loss if the value of an investment purchased with cash collateral falls below the market value of loaned securities or if the value of an investment purchased with cash collateral falls below the value of the original cash collateral received. During the year ended December 31, 2012, any securities on loan were collateralized by cash.
Income Taxes: The Master Portfolio is classified as a partnership for federal income tax purposes. As such, each investor in the Master Portfolio is treated as the owner of its proportionate share of net assets, income, expenses and realized and unrealized gains and losses of the Master Portfolio. Therefore, no federal income tax provision is required. It is intended that the Master Portfolio’s assets will be managed so an investor in the Master Portfolio can satisfy the requirements of Sub-chapter M of the Internal Revenue Code of 1986, as amended.
The Master Portfolio files US federal and various state and local tax returns. No income tax returns are currently under examination. The statute of limitations on the Master Portfolio’s US federal tax returns remains open for each of the four years ended December 31, 2012. The statutes of limitations on the Master Portfolio’s state and local tax returns may remain open for an additional year depending upon the jurisdiction. Management does not believe there are any uncertain tax positions that require recognition of a tax liability.
Recent Accounting Standards: In December 2011, the Financial Accounting Standards Board (the “FASB”) issued guidance that will expand current disclosure requirements on the offsetting of certain assets and liabilities. The new disclosures will be required for investments and derivative financial instruments subject to master netting or similar agreements which are eligible for offset in the Statement of Assets and Liabilities and will require an entity to disclose both gross and net information about such investments and transactions in the
| | | | | | |
| | | | | | | |
38 | | BLACKROCK S&P 500 STOCK FUND | | DECEMBER 31, 2012 | | |
| | |
| Notes to Financial Statements (continued) | | S&P 500 Stock Master Portfolio |
financial statements. In January 2013, the FASB issued guidance that clarifies which investments and transactions are subject to the offsetting disclosure requirements. The scope of the disclosure requirements for offsetting will be limited to derivative instruments, repurchase agreements and reverse repurchase agreements, and securities borrowing and securities lending transactions. The guidance is effective for financial statements with fiscal years beginning on or after January 1, 2013, and interim periods within those fiscal years. Management is evaluating the impact of this guidance on the Master Portfolio’s financial statement disclosures.
Other: Expenses directly related to the Master Portfolio are charged to the Master Portfolio. Other operating expenses shared by several funds are pro rated among those funds on the basis of relative net assets or other appropriate methods.
2. Derivative Financial Instruments:
The Master Portfolio engages in various portfolio investment strategies using derivative contracts both to increase the return of the Master Portfolio and/or to economically hedge, or protect, its exposure to certain risks such as equity risks. These contracts may be transacted on an exchange.
Losses may arise if the value of the contract decreases due to an unfavorable change in the market rates or values of the underlying instrument or if the counterparty does not perform under the contract. Counterparty risk related to exchange-traded financial futures contracts is deemed to be minimal due to the protection against defaults provided by the exchange on which these contracts trade.
Financial Futures Contracts: The Master Portfolio purchases or sells financial futures contracts and options on financial futures contracts to gain exposure to, or economically hedge against, changes in the value of equity securities (equity risk). Financial futures contracts are agreements between the Master Portfolio and counterparty to buy or sell a specific quantity of an underlying instrument at a specified price and at a specified date. Depending on the terms of the particular contract, financial futures contracts are settled either through physical delivery of the underlying instrument on the settlement date or by payment of a cash settlement amount on the settlement date. Pursuant to the contract, the Master Portfolio agrees to receive from or pay to the broker an amount of cash equal to the daily fluctuation in value of the contract. Such receipts or payments are known as variation margin and are recorded by the Master Portfolio as unrealized appreciation or depreciation. When the contract is closed, the Master Portfolio records a realized gain or loss equal to the difference between the value of the contract at the time it was opened and the value at the time it was closed. The use of financial futures contracts involves the risk of an imperfect correlation in the movements in the price of financial futures contracts, interest rates and the underlying assets.
| | | | | | |
| Derivative Financial Instruments Categorized by Risk Exposure: | |
Fair Values of Derivative Financial Instruments as of December 31, 2012 | |
| | | Asset Derivatives | |
| | | Statement of
Assets and
Liabilities
Location | | Value | |
Equity contracts | | Net unrealized
appreciation1 | | $ | 391,638 | |
| | 1 | Includes cumulative appreciation/depreciation on financial futures contracts as reported in the Schedule of Investments. Only current day’s variation margin is reported within the Statement of Assets and Liabilities. |
| | |
|
The Effect of Derivative Financial Instruments in the Statement of Operations |
Year Ended December 31, 2012 |
|
| | | Net Realized Gain (Loss) From |
| | |
Equity contracts: | | |
Financial futures contracts | | $3,105,397 |
|
| | | Net Change in Unrealized
Appreciation/Depreciation on |
| | |
Equity contracts: | | |
Financial futures contracts | | $ 332,601 |
|
| | |
For the year ended December 31, 2012, the average quarterly balances of outstanding derivative financial instruments were as follows: |
|
Financial futures contracts: | | |
Average number of contracts purchased | | 668 |
Average notional value of contracts purchased | | $46,618,662 |
|
3. Investment Advisory Agreement and Other Transactions with Affiliates:
The PNC Financial Services Group, Inc. (“PNC”) is the largest stockholder and an affiliate, for 1940 Act purposes, of BlackRock.
MIP, on behalf of the Master Portfolio, entered into an Investment Advisory Agreement (the “Investment Advisory Agreement”) with Black-Rock Fund Advisors (“BFA”), the Master Portfolio’s investment advisor, an indirect, wholly owned subsidiary of BlackRock, to provide investment advisory services. BFA is responsible for the management of the Master Portfolio’s investments and provides the necessary personnel, facilities, equipment and certain other services necessary to the operations of the Master Portfolio. For such services, the Master Portfolio pays BFA a monthly fee based on a percentage of the Master Portfolio’s average daily net assets at an annual rate of 0.05%.
MIP entered into an Administration Agreement with BlackRock Institutional Trust Company, N.A. (“BTC”), which has agreed to provide general administration services (other than investment advice and related portfolio activities). BTC may delegate certain of its administration duties to sub-administrators. BTC, in consideration thereof, has agreed to bear all of the Master Portfolio’s and MIP’s ordinary operating expenses excluding, generally, investment advisory fees, distribution
| | | | | | |
| | | | | | | |
| | BLACKROCK S&P 500 STOCK FUND | | DECEMBER 31, 2012 | | 39 |
| | |
| Notes to Financial Statements (continued) | | S&P 500 Stock Master Portfolio |
fees, brokerage and other expenses related to the execution of portfolio transactions, extraordinary expenses and certain other expenses which are borne by the Master Portfolio. Effective July 1, 2012, BlackRock Advisors, LLC (“BAL”) replaced BTC as administrator and entered into an Administration Agreement with the Trust, on behalf of the Fund, on similar terms.
BAL, and previously, BTC is not entitled to compensation for providing administration services to the Master Portfolio, for so long as BAL, and previously, BTC is entitled to compensation for providing administration services to corresponding feeder funds that invest substantially all of their assets in the Master Portfolio, or BAL, and previously, BTC (or an affiliate) receives investment advisory fees from the Master Portfolio.
The fees and expenses of MIP’s trustees who are not “interested persons” of MIP, as defined in the 1940 Act (“Independent Trustees”), counsel to the Independent Trustees and MIP’s independent registered public accounting firm (together, the “independent expenses”) are paid directly by the Master Portfolio. BFA has contractually agreed to cap the expenses of the Master Portfolio at the rate at which the Master Portfolio pays an advisory fee to BFA by providing an offsetting credit against the investment advisory fees paid by the Master Portfolio in an amount equal to the independent expenses. This contractual waiver is effective through April 30, 2013. The amount of the waiver, if any, is shown as fees waived by manager in the Statement of Operations.
MIP, on behalf of the Master Portfolio, received an exemptive order from the SEC permitting it, among other things, to pay an affiliated securities lending agent a fee based on a share of the income derived from the securities lending activities and has retained BlackRock Institutional Trust Company, N.A. (“BTC”), an affiliate of BFA, as the securities lending agent. BTC may, on behalf of the Master Portfolio, invest cash collateral received by the Master Portfolio for such loans, among other things, in a private investment company managed by BTC or in registered money market funds advised by BTC or its affiliates. The market value of securities on loan and the value of the related collateral, if applicable, are shown in the Statement of Assets and Liabilities as securities loaned at value and collateral on securities loaned at value, respectively. The cash collateral invested by BTC is disclosed in the Schedule of Investments, if any. Securities lending income is equal to the total of income earned from the reinvestment of cash collateral, net of rebates paid to, or fees paid by, borrowers of securities. The Master Portfolio retains 65% of securities lending income and pays a fee to BTC equal to 35% of such income. The Master Portfolio benefits from a borrower default indemnity provided by BlackRock. As securities lending agent, BTC bears all operational costs directly related to securities lending as well as the cost of borrower default indemnification. BTC does not receive any fees for managing the cash collateral. The share of income earned by the Master Portfolio is shown as securities lending-affiliated-net in the Statement of Operations. For the year ended
December 31, 2012, BTC received $237,905 in securities lending agent fees related to securities lending activities for the Master Portfolio.
Certain officers and/or trustees of MIP are officers and/or directors of BlackRock or its affiliates.
4. Investments:
Purchases and sales of investments, excluding short-term securities, for the year ended December 31, 2012, were $192,971,320 and $271,905,331, respectively.
5. Borrowings:
The Master Portfolio, along with certain other funds managed by BFA and its affiliates, is a party to a $500 million credit agreement with a group of lenders. The Master Portfolio may borrow under the credit agreement to fund shareholder redemptions. Effective November 2011 to November 2012, the credit agreement has the following terms: a commitment fee of 0.065% per annum based on the Master Portfolio’s pro rata share of the unused portion of the credit agreement and interest at a rate equal to the higher of (a) the one-month London Interbank Offered Rate (“LIBOR”) plus 0.80% per annum or (b) the Fed Funds rate plus 0.80% per annum on amounts borrowed. In addition, the Master Portfolio paid administration and arrangement fees which were allocated to the Master Portfolio based on its net assets as of October 31, 2011. The credit agreement, which expired in November 2012, was renewed with the same terms until November 2013. Effective November 2012 to November 2013, the credit agreement has the following terms: a commitment fee of 0.065% per annum based on the Master Portfolio’s pro rata share of the unused portion of the credit agreement and interest at a rate equal to the higher of (a) the one-month LIBOR plus 0.80% per annum or (b) the Fed Funds rate plus 0.80% per annum on amounts borrowed. In addition, the Master Portfolio paid administration and arrangement fees which were allocated to the Master Portfolio based on its net assets as of October 31, 2012. The Master Portfolio did not borrow under the credit agreement during the year ended December 31, 2012.
6. Market and Credit Risk:
In the normal course of business, the Master Portfolio invests in securities and enters into transactions where risks exist due to fluctuations in the market (market risk) or failure of the issuer of a security to meet all its obligations (issuer credit risk). The value of securities held by the Master Portfolio may decline in response to certain events, including those directly involving the issuers whose securities are owned by the Master Portfolio; conditions affecting the general economy; overall market changes; local, regional or global political, social or economic instability; and currency and interest rate and price fluctuations. Similar to issuer credit risk, the Master Portfolio may be exposed to counter-party credit risk, or the risk that an entity with which the Master Portfolio has unsettled or open transactions may fail to or be unable to perform on its commitments. The Master Portfolio manages counterparty credit
| | | | | | |
| | | | | | | |
40 | | BLACKROCK S&P 500 STOCK FUND | | DECEMBER 31, 2012 | | |
| | |
| Notes to Financial Statements (concluded) | | S&P 500 Stock Master Portfolio |
risk by entering into transactions only with counterparties that it believes have the financial resources to honor their obligations and by monitoring the financial stability of those counterparties. Financial assets, which potentially expose the Master Portfolio to market, issuer and counter-party credit risks, consist principally of financial instruments and receivables due from counterparties. The extent of the Master Portfolio’s exposure to market, issuer and counterparty credit risks with respect to these financial assets is generally approximated by their value recorded in the Statement of Assets and Liabilities, less any collateral held by the Master Portfolio.
7. Subsequent Events:
Management has evaluated the impact of all subsequent events on the Master Portfolio through the date the financial statements were issued and has determined that there were no subsequent events requiring adjustment or additional disclosure in the financial statements.
| | | | | | |
| | | | | | | |
| | BLACKROCK S&P 500 STOCK FUND | | DECEMBER 31, 2012 | | 41 |
| | |
Report of Independent Registered Public Accounting Firm | | S&P 500 Stock Master Portfolio |
To the Interestholders and Board of Trustees of Master Investment Portfolio:
In our opinion, the accompanying statement of assets and liabilities, including the schedule of investments, and the related statements of operations and of changes in net assets and the financial highlights present fairly, in all material respects, the financial position of the S&P 500 Stock Master Portfolio, a portfolio of Master Investment Portfolio (the “Master Portfolio”), at December 31, 2012, the results of its operations for the year then ended, the changes in its net assets for each of the two years in the period then ended and the financial highlights for each of the five years in the period then ended, in conformity with accounting principles generally accepted in the United States of America. These financial statements and financial highlights (hereafter referred to as “financial statements”) are the responsibility of the Master Portfolio’s management. Our responsibility is to express an opinion on these financial statements based on our audits. We conducted our audits of these financial statements in accordance with
standards of the Public Company Accounting Oversight Board (United States). Those standards require that we plan and perform the audit to obtain reasonable assurance about whether the financial statements are free of material misstatement. An audit includes examining, on a test basis, evidence supporting the amounts and disclosures in the financial statements, assessing the accounting principles used and significant estimates made by management, and evaluating the overall financial statement presentation. We believe that our audits, which included confirmation of securities at December 31, 2012 by correspondence with the custodian, transfer agent, and brokers, provide a reasonable basis for our opinion.
PricewaterhouseCoopers LLP
New York, New York
February 22, 2013
| | | | | | |
| | | | | | | |
42 | | BLACKROCK S&P 500 STOCK FUND | | DECEMBER 31, 2012 | | |
| | | | | | | | | | |
Name, Address and Year of Birth | | Position(s)
Held with
Trust/MIP | | Length
of Time
Served as
a Trustee2 | | Principal Occupation(s) During Past
Five Years | | Number of BlackRock-
Advised Registered
Investment Companies
(“RICs”) Consisting of
Investment Portfolios
(“Portfolios”) Overseen | | Public Directorships |
Independent Trustees1 | | | | | | | | | | |
Ronald W. Forbes 55 East 52nd Street New York, NY 10055 1940 | | Co-Chairman of the Board
and Trustee | | Since 2009 | | Professor Emeritus of Finance, School of Business, State University of New York at Albany since 2000. | | 33 RICs consisting of
106 Portfolios | | None |
Rodney D. Johnson 55 East 52nd Street New York, NY 10055 1941 | | Co-Chairman of the Board
and Trustee | | Since 2009 | | President, Fairmount Capital Advisors, Inc. since 1987; Member of the Archdiocesan Investment Committee of the Archdiocese of Philadelphia since 2004; Director, The Committee of Seventy (civic) since 2006; Director, Fox Chase Cancer Center from 2004 to 2011. | | 33 RICs consisting of
106 Portfolios | | None |
David O. Beim 55 East 52nd Street New York, NY 10055 1940 | | Trustee | | Since 2009 | | Professor of Professional Practice at the Columbia University Graduate School of Business since 1991; Trustee, Phillips Exeter Academy since 2002; Chairman, Wave Hill, Inc. (public garden and cultural center) from 1990 to 2006. | | 33 RICs consisting of
106 Portfolios | | None |
Dr. Matina S. Horner 55 East 52nd Street New York, NY 10055 1939 | | Trustee | | Since 2009 | | Executive Vice President of Teachers Insurance and Annuity Association and College Retirement Equities Fund from 1989 to 2003. | | 33 RICs consisting of 106 Portfolios | | NSTAR (electric and
gas utility) |
Herbert I. London 55 East 52nd Street New York, NY 10055 1939 | | Trustee | | Since 2009 | | Professor Emeritus, New York University since 2005; John M. Olin Professor of Humanities, New York University from 1993 to 2005 and Professor thereof from 1980 to 2005; President Emeritus, Hudson Institute (policy research organization) since 2011, President thereof from 1997 to 2011 and Trustee since 1980; Chairman of the Board of Trustees for Grantham University since 2006; Director, InnoCentive, Inc. (strategic solutions company) since 2005; Director, Cerego, LLC (software development and design) since 2005; Director, Cybersettle (dispute resolution technology) since 2009. | | 33 RICs consisting of
106 Portfolios | | AIMS Worldwide,
Inc. (marketing) |
Ian A. MacKinnon 55 East 52nd Street New York, NY 10055 1948 | | Trustee | | Since 2012 | | Director, Kennett Capital, Inc. (investments) since 2006; Director, Free Library of Philadelphia from
1999 to 2008. | | 33 RICs consisting of 106 Portfolios | | None |
Cynthia A. Montgomery 55 East 52nd Street New York, NY 10055 1952 | | Trustee | | Since 2009 | | Professor, Harvard Business School since 1989; Director, McLean Hospital since 2005; Director, Harvard Business School Publishing from 2005 to 2010. | | 33 RICs consisting of 106 Portfolios | | Newell Rubbermaid,
Inc. (manufacturing) |
Joseph P. Platt 55 East 52nd Street New York, NY 10055 1947 | | Trustee | | Since 2009 | | Director, The West Penn Allegheny Health System (a not-for-profit health system) since 2008; Director, Jones and Brown (Canadian insurance broker) since 1998; General Partner, Thorn Partners, LP (private investments) since 1998; Director, WQED Multi-Media (public broadcasting not-for-profit) since 2001; Partner, Amarna Corporation, LLC (private investment company) from 2002 to 2008. | | 33 RICs consisting of 106 Portfolios | | Greenlight Capital
Re, Ltd.
(reinsurance
company) |
Robert C. Robb, Jr. 55 East 52nd Street New York, NY 10055 1945 | | Trustee | | Since 2009 | | Partner, Lewis, Eckert, Robb and Company (management and financial consulting firm) since 1981. | | 33 RICs consisting of 106 Portfolios | | None |
| | | | | | |
| | | | | | | |
| | BLACKROCK S&P 500 STOCK FUND | | DECEMBER 31, 2012 | | 43 |
| | |
| Officers and Trustees (continued) | | |
| | | | | | | | | | |
Name, Address and Year of Birth | | Position(s) Held with Trust/MIP | | Length of Time Served as a Trustee2 | | Principal Occupation(s) During Past Five Years | | Number of BlackRock-
Advised Registered
Investment Companies
(“RICs”) Consisting of
Investment Portfolios
(“Portfolios”) Overseen | | Public
Directorships |
Independent Trustees1 (concluded) | | | | |
Toby Rosenblatt 55 East 52nd Street New York, NY 10055 1938 | | Trustee | | Since 2009 | | President, Founders Investments Ltd. (private investments) since 1999; Director, Forward Management, LLC since 2007; Director, College Access Foundation of California (philanthropic foundation) since 2009; Director, A.P. Pharma, Inc. (specialty pharmaceuticals) from 1983 to 2011; Director, The James Irvine Foundation (philanthropic foundation) from 1998 to 2008. | | 33 RICs consisting of 106 Portfolios | | None |
Kenneth L. Urish 55 East 52nd Street New York, NY 10055 1951 | | Trustee | | Since 2009 | | Managing Partner, Urish Popeck & Co., LLC (certified public accountants and consultants) since 1976; Chairman Elect of the Professional Ethics Committee of the Pennsylvania Institute of Certified Public Accountants and Committee Member thereof since 2007; Member of External Advisory Board, The Pennsylvania State University Accounting Department since 2001; Trustee, The Holy Family Institute from 2001 to 2010; President and Trustee, Pittsburgh Catholic Publishing Associates from 2003 to 2008; Director, Inter-Tel from 2006 to 2007. | | 33 RICs consisting of 106 Portfolios | | None |
Frederick W. Winter 55 East 52nd Street New York, NY 10055 1945 | | Trustee | | Since 2009 | | Professor and Dean Emeritus of the Joseph M. Katz School of Business, University of Pittsburgh since 2005 and Dean thereof from 1997 to 2005; Director, Alkon Corporation (pneumatics) since 1992; Director, Tippman Sports (recreation) since 2005; Director, Indotronix International (IT services) from 2004 to 2008. | | 33 RICs consisting of 106 Portfolios | | None |
| | 1 Trustees serve until their resignation, removal or death, or until December 31 of the year in which they turn 72. The Board has approved one-year extensions in terms of Trustees who turn 72 prior to December 31, 2013. |
. | | 2 Date shown is the earliest date a person has served for the Trust/MIP covered by this annual report. In connection with the acquisition of Barclays Global Investors by BlackRock, Inc. (“BlackRock”) in December 2009, the Trustees were elected to the Trust’s/MIP’s Board. As a result, although the chart shows certain Trustees as joining the Trust’s/MIP’s board in 2009, each Trustee first became a member of the boards of other funds advised by BlackRock Advisors, LLC or its affiliates as follows: David O. Beim, 1998; Ronald W. Forbes, 1977; Dr. Matina S. Horner, 2004; Rodney D. Johnson, 1995; Herbert I. London, 1987; Cynthia A. Montgomery, 1994; Joseph P. Platt, 1999; Robert C. Robb, Jr., 1998; Toby Rosenblatt, 2005; Kenneth L. Urish, 1999; and Frederick W. Winter, 1999. |
| Interested Trustees3 | | | | |
Paul L. Audet 55 East 52nd Street New York, NY 10055 1953 | | Trustee | | Since 2011 | | Senior Managing Director of BlackRock, and Head of U.S. Mutual Funds since 2011; Chair of the U.S. Mutual Funds Committee reporting to the Global Executive Committee since 2011; Head of BlackRock’s Real Estate business from 2008 to 2011; Member of BlackRock’s Global Operating and Corporate Risk Management Committees and of the BlackRock Alternative Investors Executive Committee and Investment Committee for the Private Equity Fund of Funds business since 2008; Head of BlackRock’s Global Cash Management business from 2005 to 2010; Acting Chief Financial Officer of BlackRock from 2007 to 2008; Chief Financial Officer of BlackRock from 1998 to 2005. | | 155 RICs consisting of 278 Portfolios | | None |
Henry Gabbay 55 East 52nd Street New York, NY 10055 1947 | | Trustee | | Since 2007 | | Consultant, BlackRock from 2007 to 2008; Managing Director, BlackRock from 1989 to 2007; Chief Administrative Officer, BlackRock Advisors, LLC from 1998 to 2007; President of BlackRock Funds and BlackRock Bond Allocation Target Shares from 2005 to 2007 and Treasurer of certain closed-end funds in the BlackRock fund complex from 1989 to 2006. | | 155 RICs consisting of 278 Portfolios | | None |
| | 3 Mr. Audet is an “interested person,” as defined in the 1940 Act, of the Trust/MIP based on his position with BlackRock and its affiliates. Mr. Gabbay is an “interested person” of the Trust/MIP based on his former positions with BlackRock and its affiliates as well as his ownership of BlackRock and The PNC Financial Services Group, Inc. securities. Mr. Audet and Mr. Gabbay are also Trustees of the BlackRock registered closed-end funds and Trustees of other BlackRock registered open-end funds. Trustees serve until their resignation, removal or death, or until December 31 of the year in which they turn 72. |
| | | | | | |
| | | | | | | |
44 | | BLACKROCK S&P 500 STOCK FUND | | DECEMBER 31, 2012 | | |
| | |
| Officers and Trustees (concluded) | | |
| | | | | | |
Name, Address and Year of Birth | | Position(s)
Held with the
Trust/MIP | | Length of Time
Served | | Principal Occupation(s) During Past Five Years |
| Trust/MIP Officers1 | | | | | | |
John M. Perlowski 55 East 52nd Street New York, NY 10055 1964 | | President and Chief Executive Officer | | Since 2010 | | Managing Director of BlackRock since 2009; Global Head of BlackRock Fund Administration since 2009; Managing Director and Chief Operating Officer of the Global Product Group at Goldman Sachs Asset Management, L.P. from 2003 to 2009; Treasurer of Goldman Sachs Mutual Funds from 2003 to 2009 and Senior Vice President thereof from 2007 to 2009; Director of Goldman Sachs Offshore Funds from 2002 to 2009; Director of Family Resource Network (charitable foundation) since 2009. |
Richard Hoerner, CFA 55 East 52nd Street New York, NY 10055 1958 | | Vice President | | Since 2009 | | Managing Director of BlackRock since 2000; Co-head of BlackRock’s Cash Management Portfolio Management Group since 2002; Member of the Cash Management Group Executive Committee since 2005. |
Brendan Kyne 55 East 52nd Street New York, NY 10055 1977 | | Vice President | | Since 2009 | | Managing Director of BlackRock since 2010; Director of BlackRock from 2008 to 2009; Head of Product Development and Management for BlackRock’s U.S. Retail Group since 2009 and Co-head thereof from 2007 to 2009; Vice President of BlackRock from 2005 to 2008. |
Simon Mendelson 55 East 52nd Street New York, NY 10055 1964 | | Vice President | | Since 2009 | | Managing Director of BlackRock since 2005; Co-head of the Global Cash and Securities Lending Group since 2010; Chief Operating Officer and Head of the Global Client Group for BlackRock’s Global Cash Management Business from 2007 to 2010; Head of BlackRock’s Strategy and Development Group from 2005 to 2007; Partner of McKinsey & Co. from 1997 to 2005. |
Christopher Stavrakos, CFA 55 East 52nd Street New York, NY 10055 1959 | | Vice President | | Since 2009 | | Managing Director of BlackRock since 2006; Co-head of BlackRock’s Cash Management Portfolio Management Group since 2006; Senior Vice President, CIO, and Director of Liability Management for the Securities Lending Group at Mellon Bank from 1999 to 2006. |
Neal Andrews 55 East 52nd Street New York, NY 10055 1966 | | Chief Financial Officer | | Since 2007 | | Managing Director of BlackRock since 2006; Senior Vice President and Line of Business Head of Fund Accounting and Administration at PNC Global Investment Servicing (U.S.) Inc. from 1992 to 2006. |
Jay Fife 55 East 52nd Street New York, NY 10055 1970 | | Treasurer | | Since 2007 | | Managing Director of BlackRock since 2007; Director of BlackRock in 2006; Assistant Treasurer of the MLIM and Fund Asset Management, L.P. advised funds from 2005 to 2006; Director of MLIM Fund Services Group from 2001 to 2006. |
Brian Kindelan 55 East 52nd Street New York, NY 10055 1959 | | Chief Compliance Officer and Anti- Money Laundering Officer | | Since 2007 | | Chief Compliance Officer of the BlackRock-advised funds since 2007; Managing Director and Senior Counsel of BlackRock since 2005. |
Benjamin Archibald 55 East 52nd Street New York, NY 10055 1975 | | Secretary | | Since 2012 | | Director of BlackRock since 2010; Assistant Secretary to the funds from 2010 to 2012; General Counsel and Chief Operating Officer of Uhuru Capital Management from 2009 to 2010; Executive Director and Counsel of Goldman Sachs Asset Management from 2005 to 2009. |
| |
| | 1 Officers of the Trust/MIP serve at the pleasure of the Board of Trustees. |
| | | | | | |
Investment Advisor BlackRock Fund Advisors San Francisco, CA 94105 | | Custodian and Accounting Agent State Street Bank and Trust Company Boston, MA 02110 | | Independent Registered Public Accounting Firm PricewaterhouseCoopers LLP New York, NY 10017 | | Legal Counsel Sidley Austin LLP New York, NY 10019 |
| | | |
Administrator | | Transfer Agent | | Distributor | | Address of the Trust/MIP |
BlackRock Advisors, LLC | | BNY Mellon Investment | | BlackRock Investments, LLC | | 400 Howard Street |
Wilmington, DE 19809 | | Servicing (US) Inc. | | New York, NY 10022 | | San Francisco, CA 94105 |
| | Wilmington, DE 19809 | | | | |
| | | | | | |
| | | | | | | |
| | BLACKROCK S&P 500 STOCK FUND | | DECEMBER 31, 2012 | | 45 |
EQX-AR-1212
Item 2. Code of Ethics.
| | (a) | The registrant, as of the end of the period covered by this report, has adopted a code of ethics that applies to the registrant’s principal executive officer, principal financial officer, principal accounting officer or controller, or persons performing similar functions, regardless of whether these individuals are employed by the registrant or a third party (the “Code of Ethics”). |
| | (c) | There have been no amendments, during the period covered by this report, to a provision of the Code of Ethics that applies to the registrant’s principal executive officer, principal financial officer, principal accounting officer or controller, or persons performing similar functions, regardless of whether these individuals are employed by the registrant or a third party, and that relates to any element of the code of ethics definition enumerated in Item 2(b) of Form N-CSR. |
| | (d) | The registrant has not granted any waivers, including an implicit waiver, from a provision of the code of ethics that applies to the registrant’s principal executive officer, principal financial officer, principal accounting officer or controller, or persons performing similar functions, regardless of whether these individuals are employed by the registrant or a third party, that relates to one or more of the items set forth in Item 2(b) of Form N-CSR. |
Item 3. Audit Committee Financial Expert.
As of the end of the period covered by the report, the registrant’s board of trustees has determined that Drew Kagan is qualified to serve as an audit committee financial expert serving on its audit committee and that he is “independent,” as defined by Item 3 of Form N-CSR.
Item 4. Principal Accountant Fees and Services.
Audit Fees
| | (a) | The aggregate fees billed for each of the last two fiscal years for professional services rendered by the principal accountant for the audit of the registrant’s annual financial statements or services that are normally provided by the accountant in connection with statutory and regulatory filings or engagements for those fiscal years are $17,325 for 2012 and $17,000 for 2011. |
Audit-Related Fees
| | (b) | The aggregate fees billed in each of the last two fiscal years for assurance and related services by the principal accountant that are reasonably related to the performance of the audit of the registrant’s financial statements and are not reported under paragraph (a) of this Item are $0 for 2012 and $0 for 2011. |
Tax Fees
| | (c) | The aggregate fees billed in each of the last two fiscal years for professional services rendered by the principal accountant for tax compliance, tax advice, and tax planning are $3,400 for 2012 and $3,990 for 2011. Fees for both 2012 and 2011 relate to the preparation of federal income and excise tax returns and review of capital gains distribution calculations. |
All Other Fees
| | (d) | The aggregate fees billed in each of the last two fiscal years for products and services provided by the principal accountant, other than the services reported in paragraphs (a) through (c) of this Item are $0 for 2012 and $0 for 2011. |
| | |
| (e)(1) | | Except as permitted by Rule 2-01(c)(7)(i)(C) of Regulation S-X, the Trust’s Audit Committee must pre-approve all audit and non-audit services provided by the independent accountants relating to the operations or financial reporting of the funds. Prior to the commencement of any audit or non-audit services to a fund, the Audit Committee reviews the services to determine whether they are appropriate and permissible under applicable law. |
| |
| (e)(2) | | The percentage of services described in each of paragraphs (b) through (d) of this Item that were approved by the audit committee pursuant to paragraph (c)(7)(i)(C) of Rule 2-01 of Regulation S-X are as follows: |
(b) N/A
(c) 100%
(d) N/A
| | (f) | The percentage of hours expended on the principal accountant’s engagement to audit the registrant’s financial statements for the most recent fiscal year that were attributed to work performed by persons other than the principal accountant’s full-time, permanent employees was zero percent. |
| | (g) | The aggregate non-audit fees billed by the registrant’s accountant for services rendered to the registrant, and rendered to the registrant’s investment adviser (not including any sub-adviser whose role is primarily portfolio management and is subcontracted with or overseen by another investment adviser), and any entity controlling, controlled by, or under common control with the adviser that provides ongoing services to the registrant for each of the last two fiscal years of the registrant was $199,900 for 2012 and $94,590 for 2011. |
| | (h) | The audit committee of the registrant’s board of trustees has considered whether the provision of non-audit services that were rendered to the registrant’s investment adviser (not including any sub-adviser whose role is primarily portfolio management and is subcontracted with or overseen by another investment adviser), and any entity controlling, controlled by, or under common control with the investment adviser that provides ongoing services to the registrant that were not pre-approved pursuant to paragraph (c)(7)(ii) of Rule 2-01 of Regulation S-X is compatible with maintaining the principal accountant’s independence. |
Item 5. Audit Committee of Listed Registrants.
Not applicable.
Item 6. Investments.
| (a) | Schedule of Investments in securities of unaffiliated issuers as of the close of the reporting period is included as part of the report to shareholders filed under Item 1 of this form. |
| Item 7. | Disclosure of Proxy Voting Policies and Procedures for Closed-End Management Investment Companies. |
Not applicable.
Item 8. Portfolio Managers of Closed-End Management Investment Companies.
Not applicable.
| Item 9. | Purchases of Equity Securities by Closed-End Management Investment Company and Affiliated Purchasers. |
Not applicable.
Item 10. Submission of Matters to a Vote of Security Holders.
There have been no material changes to the procedures by which shareholders may recommend nominees to the registrant’s board of trustees, where those changes were implemented after the registrant last provided disclosure in response to the requirements of Item 407(c)(2)(iv) of Regulation S-K (17 CFR 229.407) (as required by Item 22(b)(15) of Schedule 14A (17 CFR 240.14a-101)), or this Item.
Item 11. Controls and Procedures.
| | (a) | The registrant’s principal executive officer and principal financial officer have concluded, based on their evaluation of the effectiveness of the design and operation of the registrant’s disclosure controls and procedures (as defined in Rule 30a-3(c) under the Investment Company Act of 1940 (17 CFR 270.30a-3(c))) as of a date within 90 days of the filing date of this report, that the |
| | design and operation of such procedures are effective to provide reasonable assurance that information required to be disclosed by the registrant on Form N-CSR is recorded, processed, summarized and reported within the time periods specified in the Securities and Exchange Commission’s rules and forms, and that information required to be disclosed by the registrant in the reports that it files or submits on Form N-CSR is accumulated and communicated to the registrant’s management, including its principal executive and principal financial officers, as appropriate to allow timely decisions regarding required disclosure. |
| | (b) | There were no changes in the registrant’s internal control over financial reporting (as defined in Rule 30a-3(d) under the 1940 Act (17 CFR 270.30a-3(d))) that occurred during the second fiscal quarter of the period covered by this report that have materially affected, or are reasonably likely to materially affect, the registrant’s internal control over financial reporting. |
Item 12. Exhibits.
| | |
| (a)(1) | | The registrant’s Code of Ethics is attached hereto. |
| |
| (a)(2) | | Certifications pursuant to Rule 30a-2(a) under the 1940 Act and Section 302 of the Sarbanes-Oxley Act of 2002 are attached hereto. |
| |
| (a)(3) | | Not applicable. |
| |
| (b) | | Certifications pursuant to Rule 30a-2(b) under the 1940 Act and Section 906 of the Sarbanes-Oxley Act of 2002 are attached hereto. |
SIGNATURES
Pursuant to the requirements of the Securities Exchange Act of 1934 and the Investment Company Act of 1940, the registrant has duly caused this report to be signed on its behalf by the undersigned, thereunto duly authorized.
| | |
| (Registrant) | | Sterling Capital Funds |
| | |
By (Signature and Title) | | /s/ James T. Gillespie |
| | James T. Gillespie, President |
| | (principal executive officer) |
Pursuant to the requirements of the Securities Exchange Act of 1934 and the Investment Company Act of 1940, this report has been signed below by the following persons on behalf of the registrant and in the capacities and on the dates indicated.
| | |
By (Signature and Title) | | /s/ James T. Gillespie |
| | James T. Gillespie, President |
| | (principal executive officer) |
| | |
By (Signature and Title) | | /s/ Kenneth R. Cotner |
| | Kenneth R. Cotner, Treasurer |
| | (principal financial officer) |