UNITED STATES
SECURITIES AND EXCHANGE COMMISSION
Washington, D.C. 20549
FORM N-CSR
CERTIFIED SHAREHOLDER REPORT OF REGISTERED MANAGEMENT
INVESTMENT COMPANIES
Investment Company Act file number 811-06719
Sterling Capital Funds
(Exact name of registrant as specified in charter)
3605 Glenwood Avenue, Suite 100
Raleigh, NC 27612
(Address of principal executive offices) (Zip code)
James T. Gillespie, President
Sterling Capital Funds
3605 Glenwood Avenue, Suite 100
Raleigh, NC 27612
(Name and address of agent for service)
Registrant’s telephone number, including area code: (800) 228-1872
Date of fiscal year end: September 30
Date of reporting period: September 30, 2016
Form N-CSR is to be used by management investment companies to file reports with the Commission not later than 10 days after the transmission to stockholders of any report that is required to be transmitted to stockholders under Rule 30e-1 under the Investment Company Act of 1940 (17 CFR 270.30e-1). The Commission may use the information provided on Form N-CSR in its regulatory, disclosure review, inspection, and policymaking roles.
A registrant is required to disclose the information specified by Form N-CSR, and the Commission will make this information public. A registrant is not required to respond to the collection of information contained in Form N-CSR unless the Form displays a currently valid Office of Management and Budget (“OMB”) control number. Please direct comments concerning the accuracy of the information collection burden estimate and any suggestions for reducing the burden to Secretary, Securities and Exchange Commission, 450 Fifth Street, NW, Washington, DC 20549-0609. The OMB has reviewed this collection of information under the clearance requirements of 44 U.S.C. § 3507.
Item 1. Reports to Stockholders.
The Report to Shareholders is attached herewith.

STERLING CAPITAL FUNDS
ANNUAL REPORT | SEPTEMBER 30, 2016
May lose value • Not FDIC insured • Not insured by any government agency • Not guaranteed by the bank • Not a deposit
Notice of Privacy Policy & Practices
Sterling Capital Funds provide this notice to you so that you will know what kinds of information we collect about shareholders1, prospective investors, and individuals (such as beneficiaries), and the circumstances in which that information may be disclosed to third parties who are not affiliated with Sterling Capital Funds.
Collection of Personal Information
We collect nonpublic personal information about you from the following sources:
• | Account Applications and other forms, which may include your name, address, social security number, and information about your investment goals and risk tolerance; | |
• | Account History, including information about the transactions and balances in your account(s); | |
• | Correspondence, written, telephonic or electronic between you and Sterling Capital Funds or service providers working on behalf of Sterling Capital Funds; | |
• | Online, your name and e-mail address if you provide them; and | |
• | Third Parties, such as your financial intermediary in connection with your transactions, or third-party data services used to verify or update personal information that you provide. | |
To comply with federal regulations, information we receive from you or a third party will be used to verify your identity.
Disclosure of Personal Information
We may disclose your personal information as permitted by law to third parties who are not affiliated with the Sterling Capital Funds, including:
• | in connection with legal proceedings, such as responding to a subpoena; | |
• | to service providers who maintain or service shareholder accounts for Sterling Capital Funds or to a shareholder’s broker or agent; or to companies that mail account-related materials, such as shareholder reports; and | |
• | to perform marketing services on our behalf, or pursuant to a joint marketing agreement with another financial institution. | |
Safeguarding of Personal Information
Sterling Capital Funds employs policies, practices and procedures for safeguarding your personal information that we believe comply with applicable law, however no security measures are perfect or impenetrable.
We request that all service providers to Sterling Capital Funds:
• | maintain policies and procedures designed to assure only appropriate access to, and use of your personal information; and | |
• | maintain physical, electronic and procedural safeguards that comply with applicable legal standards to guard your nonpublic personal information. | |
When information is shared with third parties, they are not permitted to use the information for any purpose other than to assist our servicing of your account(s), including helping us improve the services we offer.
1 For purposes of this notice, the terms “shareholder” or “shareholders” includes both individual shareholders (both current and former) of the Sterling Capital Funds and individuals (such as beneficiaries, for example) whose nonpublic personal information is provided to the Sterling Capital Funds, even though they do not invest in Sterling Capital Funds shares.
Sterling Capital Funds
|
| 1 | ||||
Fund Summary | ||||
| 2 | ||||
| 4 | ||||
| 6 | ||||
| 8 | ||||
| 10 | ||||
| 12 | ||||
| 14 | ||||
| 16 | ||||
| 18 | ||||
| 20 | ||||
| 22 | ||||
| 24 | ||||
| 26 | ||||
| 28 | ||||
| 30 | ||||
| 32 | ||||
| 34 | ||||
| 36 | ||||
| 38 | ||||
| 40 | ||||
| 42 | ||||
| 44 | ||||
| 46 | ||||
| 48 | ||||
| 52 | ||||
| 56 | ||||
Schedules of Portfolio Investments | ||||
| 60 | ||||
| 62 | ||||
| 63 | ||||
| 66 | ||||
| 67 | ||||
| 68 | ||||
| 72 | ||||
| 74 | ||||
| 75 | ||||
| 76 | ||||
| 77 | ||||
| 81 | ||||
| 85 | ||||
| 87 | ||||
| 94 | ||||
| 96 | ||||
| 99 | ||||
| 100 | ||||
| 102 | ||||
| 106 | ||||
| 109 | ||||
| 112 | ||||
| 115 | ||||
| 116 | ||||
| 117 | ||||
| 118 | ||||
| 190 | ||||
| 207 | ||||
| 209 | ||||
| 210 |
(This page has been left blank intentionally.)
Letter from the President and the Investment Advisor
Dear Shareholders:
We are pleased to present this Sterling Capital Funds annual report covering the 12 months between October 1, 2015, and September 30, 2016.
U.S. equities delivered very strong returns during the period under review. Ongoing concerns about the possibility of a global economic slowdown receded enough during the second half of the period to allow broad-based gains to all sectors. The United Kingdom’s June 23 referendum vote to exit the European Union triggered market turmoil in the U.S. and internationally, but global equities quickly recovered, climbing sharply during the third quarter of 2016. The U.S. Federal Reserve raised interest rates in December but declined any further increases during the rest of the 12-month period. Fixed-income securities posted strong gains.
Slow and Steady Economic Growth Continues
The U.S. economy expanded at a slower rate during the period under review than in the previous period. Gross domestic product (GDP) grew at an annualized rate of 0.9% during the fourth quarter of 2015. That growth rate fell to 0.8% in the first quarter of 2016 amid concerns about falling oil prices and the prospect of slowing growth abroad. GDP growth picked up slightly in the second quarter of 2016, however, expanding at a rate of 1.4% as oil prices rose, personal spending picked up and exports increased.
Economic indicators in the U.S. were mixed during the period. The unemployment rate remained basically flat, beginning the period at 5%, then moving slightly lower before moving back to 5%. Consumer-related data was generally positive. Personal income, wages and consumer confidence all rose significantly. An increase in consumer spending was more modest, although it climbed quite high during the spring. The housing market continued its long recovery with rising prices and sales, but some weak spots remained, signaled by a decline in the number of building permits issued.
Corporate profits were relatively weak throughout much of the period while industrial production and manufacturing activity declined. Low energy and commodity prices dragged on oil and gas production as well as mining production, though prices did rise significantly late in the period. Merger-and-acquisition activity was quite steady throughout the period.
U.S. exports increased markedly during the period after falling during the previous period. U.S. goods became more appealing to foreign markets in part due to many foreign currencies appreciating against the dollar. A pickup in some major overseas economies late in the period also boosted U.S. exports and supported demand for some commodities. Inflation remained low by historical standards.
Uncertainty Abroad Roils Market
The global economy was jolted in June by the Brexit vote in the U.K., but a rally in most markets diminished the losses suffered in the immediate aftermath of the vote. Even British stocks rose as investors were reassured by the election of a new U.K. prime minister and interest rate cuts by the Bank of England. Commitments to accommodative monetary
policy from the European Central Bank, the Bank of Japan and the U.S. Federal Reserve also buoyed investor sentiment. The Bank of Japan took a new approach at jumpstarting economic growth by swapping out its multi-year program of quantitative easing for a new plan to maintain a long-term interest rate target
The ongoing economic slowdown in China continued to have a profound impact on economies throughout the world, especially emerging markets that are heavily dependent on Chinese demand for commodities and other goods. A pickup in Chinese manufacturing activity and industrial output late in the period helped to alleviate this weakness in the global economy, boosting commodity prices. However, excess debt and industrial overcapacity in China continued to pose significant long-term challenges as it continued to make the difficult transition to a consumer-driven economy.
Geopolitical turmoil in many areas had economic implications during the period. The ouster of Brazilian President Dilma Rousseff through impeachment threw that nation into political chaos, but a market-friendly approach to reform by current President Michel Temer appeared to be one factor supporting a skyrocketing rally of Brazilian equities. An attempted coup in Turkey, the ongoing conflict in Syria and a particularly heated race for U.S. president were other forces casting a backdrop of uncertainty on global markets.
The Federal Reserve’s long-anticipated interest rate increase in December 2015 was the first in a decade. The Brexit vote served to push interest rates lower during the last few months of the period.
Strong Gains for Stocks and Bonds
U.S. equities began the period with a nearly month-long rally before pulling back gradually for two months and then plummeting in January. The sharp downturn in early 2016, diminished any gains from earlier in the period, was driven by concerns about slowing economic growth and falling oil prices. Halfway through the period, however, markets were rallying again and that upward trajectory continued – with a few brief interruptions – through September. The Brexit referendum vote triggered a sell-off in markets throughout the globe, but the period ended on a positive note. The third quarter of 2016 was one of the least volatile quarters in several years and brought broad-based gains for equities that made up for the post-Brexit declines. All sectors of the S&P 500® Index1 (S&P 500) gained more than 7% during the period and three sectors – information technology, telecommunications and materials – all rose well over 20%.
Investors favored a risk-off approach during the first half of the period, preferring investments perceived as safe havens, including consumer staples, utilities stocks and yield-oriented investments such as REITs. Later in the period this dynamic shifted as investors began to favor more economically sensitive sectors over defensive sectors.
The S&P 500 climbed 15.4% during the 12 months under review. Small-cap stocks slightly outperformed larger company shares, with the Russell 2000 Index of small-cap stocks gaining 15.5% compared to the Russell 1000 Index’s 14.9% return. International stocks, as measured by the MSCI EAFE Net Index, returned 6.5% for the period. Emerging markets easily outpaced developed markets during the period, with the MSCI Emerging Markets Index climbing 16.8%.
The yield curve flattened during the 12 months under review as short-term rates drifted marginally higher and long-term rates declined. The Brexit referendum vote helped drag down rates during the second half of the period, pushing bond prices higher. The Bloomberg Barclay’s U.S. Aggregate Bond Index returned 5.2% during the period.
Our Perspective
U.S. economic growth was even more sluggish this year than in previous years, but most economic indicators suggested relative stability rather than signaling new and urgent challenges. We believe that the fallout from Brexit may continue to show uncertainty for months or years to come, and the contentious political environment in the U.S. may also threaten economic stability. More broadly, the potential for slowing economic growth abroad could significantly undermine U.S. economic growth, in our opinion. We believe these hurdles offer good reason for investors to be cautious and to expect volatility in the months ahead. Nonetheless, we do not see a high probability of recession in the U.S. in the near-term. We are optimistic that the gradual recovery of the U.S. will continue, driven in part by improvements in housing, employment and business spending. Our expectations for global economic growth are modest.
Given the current economic environment, we continue to recommend investors maintain a well-diversified portfolio with downside protection. Stocks with strong financials and attractive valuations are likely to outperform, in our estimation. Overall, we believe the stock market can be expected to present better relative value than the fixed-income market, which continues to offer low yields. We will continue to monitor the evolving economic and market climate, and will manage the Sterling Capital Funds accordingly.
Thank you for your confidence in Sterling Capital Management. We look forward to serving your investment needs during the months and years ahead, and we encourage you to call us at 1-800-228-1872 with any questions.
Sincerely,

James T. Gillespie
President
Sterling Capital Funds

Jeffrey J. Schappe, CFA
Managing Director-Chief Market Strategist Sterling Capital Management LLC
| 1 | “S&P 500®” is a registered service mark of Standard & Poor’s Corporation, which does not sponsor and is in no way affiliated with the Sterling Capital Funds. The S&P 500® Index is generally considered to be representative of the performance of the stock market as a whole. The index does not reflect the deduction of expenses associated with a mutual fund, such as investment management and fund accounting fees. A Fund’s performance reflects the deduction of fees for these services. Investors cannot invest directly in an index, although they can invest in its underlying securities. |
Past performance does not guarantee future results. Mutual fund investing involves risk including the possible loss of principal.
This report is authorized for distribution only when preceded or accompanied by a prospectus. Please read the prospectus carefully before investing or sending money. Sterling Capital Management LLC (“Sterling Capital”) serves as investment advisor to the Sterling Capital Funds (each a “Fund” and collectively, the “Funds”) and is paid a fee for its services. Shares of the Funds are not deposits or obligations of, or guaranteed or endorsed by, Branch Banking and Trust Company or its affiliates. The Funds are not insured by the FDIC or any other government agency. The Funds currently are distributed by Sterling Capital Distributors, LLC. The distributor is not affiliated with Branch Banking and Trust Company or its affiliates.
The foregoing information and opinions are for general information only. Sterling Capital does not guarantee their accuracy or completeness, nor assume liability for any loss, which may result from the reliance by any person upon any such information or opinions. Such information and opinions are subject to change without notice, are for general information only and are not intended as an offer or solicitation with respect to the purchase or sale of any security or as offering individual or personalized investment advice.
| 1 | ||||
Sterling Capital Behavioral Large Cap Value Equity Fund
Portfolio Managers
Sterling Capital Behavioral Large Cap Value Equity Fund (the “Fund”) is managed by Robert W. Bridges, CFA, and Robert O. Weller, CFA, Executive Directors and portfolio managers for Sterling Capital Management LLC (“Sterling Capital”), advisor to the Fund.
Robert W. Bridges, CFA
Mr. Bridges, CFA, Executive Director joined Sterling Capital in 1996 and has been a co-portfolio manager of the Fund since 2013. He has investment experience since 1991. He is a graduate of Wake Forest University where he received his BS in Business.
Robert O. Weller, CFA
Mr. Weller, CFA, Executive Director joined Sterling Capital in 2012 and has been a co-portfolio manager of the Fund since 2013. He has investment experience since 1996. He is a graduate of Loyola University Maryland where he received his BBA in Finance.
Investment Considerations
The Fund may invest in undervalued securities which may not appreciate in value as anticipated or remain undervalued for longer than anticipated. Investments made in large- to mid-capitalization companies are subject to greater risks than large company stocks due to limited resources and inventory as well as more sensitivity to adverse conditions. The Fund may invest in foreign securities which may be more volatile and less liquid due to currency fluctuations, political instability, social and economic risks.
Q. How did the Fund perform during the 12-month period between October 1, 2015 and September 30, 2016?
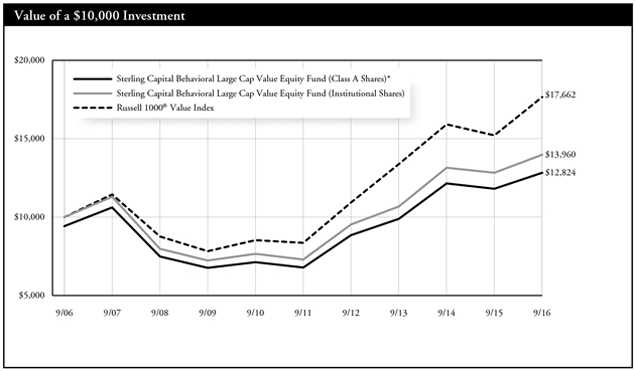
A. The Fund’s Institutional Shares underperformed its current benchmark, the Russell 1000® Value Index.
Q. What factors affected the Fund’s performance?
A. U.S. stocks delivered steady returns throughout most of the period and ended the period with substantial gains. This generally positive trajectory, supported by modest economic growth and low interest rates, was interrupted by a sharp sell-off early in the year triggered by tepid global economic growth and concerns about the health of the Chinese economy. The United Kingdom’s late-June referendum vote to leave the European Union also dealt a blow to markets, but U.S. stocks recovered quickly.
The Fund’s performance relative to its benchmark is largely a reflection of its strategy to employ an investment process rooted in principles of behavioral finance. This process is specifically designed to capitalize upon known investor biases and heuristics (mental shortcuts) by taking into account the impact on markets of behavioral factors such as greed,
fear and ego.
Several factors detracted from the Fund’s performance relative to its benchmark. The largest detractor was the Fund’s exposure to the value and momentum-based behavioral strategies. These strategies were not able to capitalize upon behavioral anomalies in the market and instead hurt the Fund’s relative performance. The momentum strategy took an especially negative turn during the early months of 2016 as the market favored dividend yielding and low volatility stocks.
Moreover, the Fund’s defensive positioning within the energy sector detracted from returns in 2016 as the price of oil stabilized and then increased as the year progressed. Stock selection in the healthcare equipment and services industry group also detracted from returns.
The Fund’s positioning in telecommunications was a net contributor to performance. Stock selection in the financial services sector contributed positively to the Fund’s performance relative to its benchmark. A slight bias in the Fund’s portfolio away from the largest companies in the benchmark also contributed to relative returns.
Portfolio composition is as of September 30, 2016 and is subject to change and risk.
| 2 | ||||
| * | Reflects 5.75% maximum sales charge. |
| ** | Reflects the applicable contingent deferred sales charge (CDSC), maximum of 5.00%. |
| *** | Reflects the applicable maximum CDSC of 1.00% (applicable only to redemptions within one year of purchase, and as such, are not reflected in the Average Annual Total Returns table since the periods reflected are for a year or longer). |
Average Annual Total Returns
| ||||||||||
As of September 30, 2016 | Inception Date | 1 Year | 5 Years | 10 Years | ||||||
Class A Shares* | 10/9/92 | 2.40% | 12.29% | 2.52% | ||||||
Class B Shares** | 1/1/96 | 3.82% | 12.64% | 2.51% | ||||||
Class C Shares*** | 2/1/01 | 7.87% | 12.78% | 2.36% | ||||||
Institutional Shares | 10/9/92 | 8.94% | 13.91% | 3.39% | ||||||
Russell 1000® Value Index | N/A | 16.20% | 16.15% | 5.85% | ||||||
Past performance does not guarantee future results. The performance data quoted represents past performance and current returns may be lower or higher. Total return figures include change in share price, reinvestment of dividends and capital gains, and do not reflect taxes that a shareholder would pay on fund distributions or on the redemption of fund shares. The investment return and principal value will fluctuate so that an investor’s shares, when redeemed, may be worth more or less than the original cost. To obtain performance information current to the most recent month end, please visit www.sterlingcapitalfunds.com.
The chart above represents a comparison of a hypothetical $10,000 investment in the indicated share class versus a similar investment in the Fund’s benchmark, and represents the reinvestment of dividends and capital gains.
The Russell 1000® Value Index is a widely recognized index of common stocks that measures the performance of the large-cap value sector of the U.S. equity market. The index is unmanaged and does not reflect the deduction of expenses associated with a mutual fund, such as investment management and fund accounting fees. The Fund’s performance reflects the deduction of fees for these services. Investors cannot invest directly in an index, although they can invest in its underlying securities.
A portion of the Fund’s fees has been waived. If the fees had not been waived, the Fund’s total return for the periods would have been lower.
| 3 | ||||
Sterling Capital Mid Value Fund
Portfolio Manager
Timothy P. Beyer, CFA
Sterling Capital Mid Value Fund (the “Fund”)is managed by Timothy P. Beyer, CFA, Managing Director and portfolio manager for Sterling Capital Management LLC (“Sterling Capital”), advisor to the Fund. Mr. Beyer joined Sterling Capital in 2004 and has been the lead portfolio manager of the Fund since 2005. He has investment experience since 1989. Mr. Beyer is a graduate of East Carolina University where he received his BSBA in Finance.
Investment Considerations
The Fund may invest in undervalued securities that may not appreciate in value as anticipated or remain undervalued for longer than anticipated. Investments made in small to mid-capitalization companies are subject to greater risks than large company stocks due to limited resources and inventory and are more sensitive to adverse conditions. The Fund may invest in foreign securities, which may be more volatile and less liquid due to currency fluctuation, political instability, social and economic risks.
Q. How did the Fund perform during the 12-month period between October 1, 2015 and September 30, 2016?
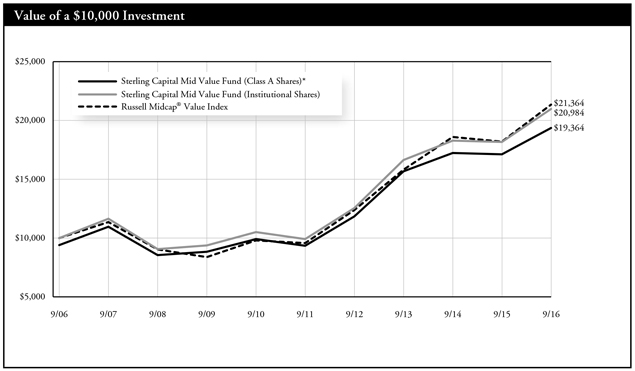
A. The Fund’s Institutional Shares underperformed its current benchmark, the Russell Midcap® Value Index.
Q. What factors affected the Fund’s performance?
A. While a general backdrop of low interest rates and modest economic growth helped boost absolute returns throughout the fiscal year, the Fund’s substantially underweight positions in high valuation sectors of the market was a major contributor to its relative underperformance. Low beta, high dividend-yielding sectors such as utilities, REITs, and consumer staples performed well in the continued low rate environment. Our underweight to these groups detracted from our relative performance.
The Fund’s overweight position in consumer discretionary shares also detracted from performance during a year when investors turned to more defensive sectors. Specifically, holdings in two clothing retailers dragged on returns, as consumer spending shifted away from apparel and toward housing, automobiles and technology.
Holdings in healthcare, particularly a leading medical device manufacturer and a leading diagnostics company, contributed to the Fund’s relative performance. On the heels of strong fundamental progress in the economy, the Fund’s holdings in producer durables also saw strong gains. The Fund’s purchase of an online auction company late in the year benefitted from strong gains in response to signs that the company’s strategy to accelerate growth was gaining traction.
Portfolio composition is as of September 30, 2016 and is subject to change and risk.
| 4 | ||||
| * | Reflects 5.75% maximum sales charge. |
| ** | Reflects the applicable contingent deferred sales charge (CDSC), maximum of 5.00%. |
| *** | Reflects the applicable maximum CDSC of 1.00% (applicable only to redemptions within one year of purchase, and as such, are not reflected in the Average Annual Total Returns table since the periods reflected are for a year or longer). |
Average Annual Total Returns
| ||||||||||
| As of September 30, 2016 | Inception Date | 1 Year | 5 Years | 10 Years | ||||||
Class A Shares* | 8/1/96 | 6.54% | 14.28% | 6.83% | ||||||
Class B Shares** | 7/25/01 | 8.60% | 14.66% | 6.79% | ||||||
Class C Shares*** | 7/25/01 | 12.22% | 14.79% | 6.62% | ||||||
Institutional Shares | 8/1/96 | 13.32% | 15.93% | 7.69% | ||||||
Class R Shares | 2/1/101 | 12.82% | 15.11% | 7.26% | ||||||
Russell Midcap® Value Index | N/A | 17.26% | 17.38% | 7.89% | ||||||
Past performance does not guarantee future results. The performance data quoted represents past performance and current returns may be lower or higher. Total return figures include change in share price, reinvestment of dividends and capital gains, and do not reflect taxes that a shareholder would pay on fund distributions or on the redemption of fund shares. The investment return and principal value will fluctuate so that an investor’s shares, when redeemed, may be worth more or less than the original cost. To obtain performance information current to the most recent month end, please visit www.sterlingcapitalfunds.com.
The chart above represents a comparison of a hypothetical $10,000 investment in the indicated share class versus a similar investment in the Fund’s benchmark, and represents the reinvestment of dividends and capital gains.
| 1 | Class R Shares were not in existence prior to 2/1/10. Performance for periods prior to 2/1/10 is based on the performance of the Institutional Shares, but such performance does not reflect Class R Shares’ 12b-1 fees, which if reflected, would have caused performance to be lower. |
The Fund is measured against the Russell Midcap® Value Index, an unmanaged index, which measures the performance of the mid-cap value segment of the U.S. equity universe. It includes those Russell Midcap® Index companies with lower price-to-book ratios and lower forecasted growth values. The index is unmanaged and does not reflect the deduction of expenses associated with a mutual fund, such as investment management and fund accounting fees. The Fund’s performance reflects the deduction of fees for these services. Investors cannot invest directly in an index, although they can invest in its underlying securities.
| 5 | ||||
Sterling Capital Behavioral Small Cap Value Equity Fund
Portfolio Managers
Sterling Capital Behavioral Small Cap Value Equity Fund (the “Fund”) is managed by Robert W. Bridges, CFA, and Robert O. Weller, CFA, Executive Directors and portfolio managers for Sterling Capital Management LLC (“Sterling Capital”), advisor to the Fund.
Robert W. Bridges, CFA
Mr. Bridges, CFA, Executive Director joined Sterling Capital in 1996 and has been a co-portfolio manager of the Fund since 2013. He has investment experience since 1991. He is a graduate of Wake Forest University where he received his BS in Business.
Robert O. Weller, CFA
Mr. Weller, CFA, Executive Director joined Sterling Capital in 2012 and has been a co-portfolio manager of the Fund since 2013. He has investment experience since 1996. He is a graduate of Loyola University Maryland where he received his BBA in Finance.
Investment Considerations
The Fund may invest in undervalued securities, which may not appreciate in value as anticipated or remain undervalued for longer than anticipated. Investments made in small to mid-capitalization companies are subject to greater risks than large company stocks due to limited resources and inventory and are more sensitive to adverse conditions. The Fund may invest in foreign securities, which may be more volatile and less liquid due to currency fluctuations and political, social and economic instability.
Q. How did the Fund perform during the 12-month period between October 1, 2015 and September 30, 2016?
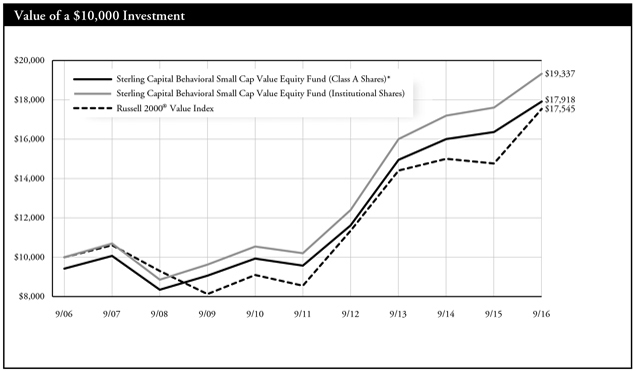
A. The Fund’s Institutional Shares underperformed its current benchmark, the Russell 2000® Value Index.
Q. What factors affected the Fund’s performance?
A. U.S. stocks delivered steady returns throughout most of the period and ended the period with substantial gains. This generally positive trajectory, supported by modest economic growth and low interest rates, was interrupted by a sharp sell-off early in the year triggered by tepid global economic growth and concerns about the health of the Chinese economy. The United Kingdom’s late-June referendum vote to leave the European Union also dealt a blow to markets, but U.S. stocks recovered fairly quickly.
The Fund’s performance relative to its benchmark is largely a reflection of its strategy to employ an investment process rooted in principles of behavioral finance. This process is specifically designed to capitalize upon known investor biases and heuristics (mental shortcuts) by taking into account the impact on markets of behavioral factors such as greed,
fear, and ego.
A multitude of factors detracted from the Fund’s relative performance over the past year, but the value and momentum factors used to capitalize upon behavioral anomalies in the market were primary sources of underperformance. The U.S. equity market did not reward the Fund’s behavioral value exposure during the period. Momentum, one of the key behavioral anomalies the fund seeks to capitalize upon, took an especially negative turn in 2016 as the market shifted its focus to dividend-yielding and low volatility stocks at the beginning of the year.
Moreover, the Fund’s defensive positioning within the energy sector detracted from returns in 2016 as oil prices stabilized at the beginning of the period and then increased as the year progressed. Stock selection in the healthcare equipment and services industry group also detracted from the Fund’s returns relative to its Benchmark.
Stock selection in both the banking and construction sectors contributed positively to the Fund’s relative performance during the period. Financial services was also a net contributor.
Portfolio composition is as of September 30, 2016 and is subject to change and risk.
| 6 | ||||
| * | Reflects 5.75% maximum sales charge. |
| ** | Reflects the applicable contingent deferred sales charge (CDSC), maximum of 5.00%. |
| *** | Reflects the applicable maximum CDSC of 1.00% (applicable only to redemptions within one year of purchase, and as such, are not reflected in the Average Annual Total Returns table since the periods reflected are for a year or longer). |
Average Annual Total Returns
| ||||||||
As of September 30, 2016 | Inception Date | 1 Year | 5 Years | 10 Years | ||||
Class A Shares* | 2/1/101 | 3.20% | 12.02% | 6.01% | ||||
Class B Shares** | 2/1/101 | 3.72% | 12.25% | 6.10% | ||||
Class C Shares*** | 2/1/101 | 8.68% | 12.50% | 6.10% | ||||
Institutional Shares | 1/2/97 | 9.80% | 13.64% | 6.82% | ||||
Class R Shares | 2/1/101 | 9.22% | 13.19% | 6.57% | ||||
Russell 2000® Value Index | N/A | 18.81% | 15.45% | 5.78% | ||||
Past performance does not guarantee future results. The performance data quoted represents past performance and current returns may be lower or higher. Total return figures include change in share price, reinvestment of dividends and capital gains, and do not reflect taxes that a shareholder would pay on fund distributions or on the redemption of fund shares. The investment return and principal value will fluctuate so that an investor’s shares, when redeemed, may be worth more or less than the original cost. To obtain performance information current to the most recent month end, please visit www.sterlingcapitalfunds.com.
The chart above represents a comparison of a hypothetical $10,000 investment in the indicated share class versus a similar investment in the Fund’s benchmark, and represents the reinvestment of dividends and capital gains.
| 1 | Class A, B, C and R Shares were not in existence prior to 2/1/10. Performance for periods prior to 2/1/10 is based on the performance of Institutional Shares and have been adjusted for maximum CDSC to the applicable class but does not include 12b-1 fees, which if reflected, would have caused performance of Class A, B C and R Shares to be lower. The performance information for Institutional Shares (formerly known as Sterling Shares) prior to 12/18/06 is based on the performance of the Institutional Shares of the Fund’s predecessor, Sterling Capital Small Cap Value Fund, a series of The Advisors’ Inner Circle Fund (the “Predecessor Fund”), which transferred all of its assets and liabilities to the Fund pursuant to a reorganization. The performance of the Fund’s Institutional Shares would have been different because the Fund’s Institutional Shares have different expenses than the Predecessor’s Institutional Shares. |
The Russell 2000® Value Index is a widely recognized index of common stocks that measures the performance of the small-cap value sector of the U.S. equity market. The index is unmanaged and does not reflect the deduction of expenses associated with a mutual fund, such as investment management and fund accounting fees. The Fund’s performance reflects the deduction of fees for these services. Investors cannot invest directly in an index, although they can invest in its underlying securities.
| 7 | ||||
Sterling Capital Special Opportunities Fund
Portfolio Manager
George F. Shipp, CFA
Sterling Capital Special Opportunities Fund (the “Fund”) is managed by George F. Shipp, CFA, Senior Managing Director and portfolio manager for Sterling Capital Management LLC (“Sterling Capital”), advisor to the Fund. Mr. Shipp joined the CHOICE Asset Management Team of Scott & Stringfellow in 2000 and Sterling Capital as part of a business realignment in 2013. He has been the Fund’s lead portfolio manager since inception and also manages the Sterling Capital Equity Income Fund. He has investment experience since 1982. Mr. Shipp is a graduate of the University of Virginia and received his MBA at the Darden Graduate School of Business.
Investment Considerations
The Fund is subject to investment style risk, which depends on the market segment in which the Fund is primarily invested. An investment in growth stocks may be particularly sensitive to market conditions while value stocks may be undervalued for longer than anticipated. The Fund may invest in foreign securities subject to risks such as currency volatility and political and social instability or small capitalization companies subject to greater volatility and less liquidity due to limited resources or product lines. The Fund may engage in writing covered call options on securities. By writing covered call options, the Fund limits its opportunity to profit from an increase in the price of the underlying stock above the premium and the strike price, but continues to bear the risk of a decline in the stock price. While the Fund receives premiums for writing covered call options, the price it realizes from the exercise of an option could be substantially below a stock’s current market price.
Q. How did the Fund perform during the 12-month period between October 1, 2015 and September 30, 2016?
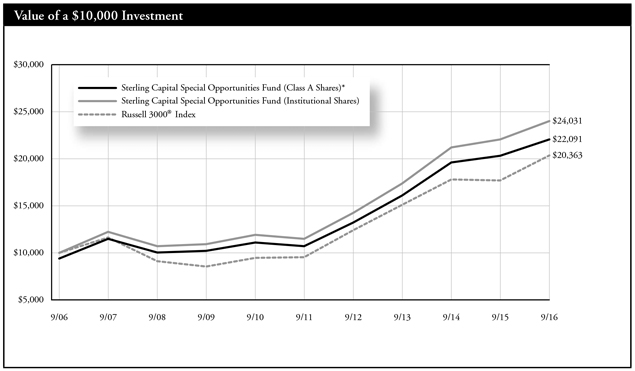
A. The Fund’s Institutional Shares underperformed its current benchmark, the Russell 3000® Index.
Q. What factors affected the Fund’s performance?
A. The Russell 3000® Index posted a 14.96% gain during the 12-month period despite experiencing high levels of volatility. In December 2015 the Federal Reserve voted unanimously to raise the target for its federal funds interest rate by a quarter point — the first such increase since June 2006. Concurrently, corporate earnings faltered, oil prices plunged further, high yield credit markets became dysfunctional, and emerging market economies were in turmoil. U.S. stocks responded by declining more than 10%, reaching a low in early February. The Russell 3000® Index rallied strongly in subsequent months as most of those negatives reversed. The Fund benefited from this volatile environment during the first half of the period, but underperformed in the second half as a “risk on” environment favoring lower-quality stocks prevailed, and a relatively tumultuous earnings season in the final quarter of the period weighed on results.
The biggest detractor from performance was an overweight position in the healthcare sector, which underperformed due to uncertainty around the U.S. Presidential election cycle. Stock selection in the healthcare sector also weighed on relative results, including holdings of a leading provider of store brand over-the-counter consumer products. The abrupt departure of the company’s CEO and a series of lower-than-expected guidance on earnings and revenues dragged on the stock’s
price. The Fund’s investments in a provider of diagnostic tests also faced a setback as competition heated up in its core product line.
Weakness in the healthcare sector was partially offset by strength in the nation’s leading provider of healthcare insurance and outperformance by a leading provider of orthopedic devices. Additionally, the Fund benefitted from an underweight exposure to the financial sector, as that was the worst performing sector during the period. Financial stocks struggled as investors sought out more defensive investments in a volatile environment. An overweight position and stock selection in the technology sector also added to results. In particular, holdings of a leading publisher of video games contributed to results after the better-than-expected launch of its new franchise. Investments in an online search provider, a networking equipment company and a provider of consumer tax and small business accounting software also added to results. Stocks that hurt performance included a genetic diagnostic maker which encountered unanticipated pricing pressures, a generic drug manufacturer that reported disappointing sales in Europe and the subsequent resignation of its CEO, and a leading internet infrastructure provider which witnessed slowing (but still growing) revenue.
Among consumer discretionary holdings, investments in a large media company benefited from advertising increases from coverage for both the Olympics and the U.S. Presidential election. Stock selection in consumer staples also added to relative performance, in particular holdings of the leading domestic producer of chicken and beef, as well as the worldwide leader in chocolate, cookies, crackers and candy.
Portfolio composition is as of September 30, 2016 and is subject to change and risk.
| 8 | ||||
| * | Reflects 5.75% maximum sales charge. |
| ** | Reflects the applicable contingent deferred sales charge (CDSC), maximum of 5.00%. |
| *** | Reflects the applicable maximum CDSC of 1.00% (applicable only to redemptions within one year of purchase, and as such, are not reflected in the Average Annual Total Returns table since the periods reflected are for a year or longer). |
Average Annual Total Returns
| ||||||||
| As of September 30, 2016 | Inception Date | 1 Year | 5 Years | 10 Years | ||||
Class A Shares* | 6/2/03 | 2.33% | 14.21% | 8.25% | ||||
Class B Shares** | 6/2/03 | 4.11% | 14.59% | 8.24% | ||||
Class C Shares*** | 6/2/03 | 7.76% | 14.70% | 8.08% | ||||
Institutional Shares | 6/2/03 | 8.86% | 15.86% | 9.16% | ||||
Class R Shares | 2/1/101 | 8.34% | 15.29% | 8.85% | ||||
Russell 3000® Index | N/A | 14.96% | 16.36% | 7.37% | ||||
Past performance does not guarantee future results. The performance data quoted represents past performance and current returns may be lower or higher. Total return figures include change in share price, reinvestment of dividends and capital gains, and do not reflect taxes that a shareholder would pay on fund distributions or on the redemption of fund shares. The investment return and principal value will fluctuate so that an investor’s shares, when redeemed, may be worth more or less than the original cost. To obtain performance information current to the most recent month end, please visit www.sterlingcapitalfunds.com.
The chart above represents a comparison of a hypothetical $10,000 investment in the indicated share class versus a similar investment in the Fund’s benchmarks and represents the reinvestment of dividends and capital gains.
| 1 | Class R Shares were not in existence prior to 2/1/10. Performance for periods prior to 2/1/10 is based on the performance of Institutional Shares, but such performance does not reflect Class R Shares’ 12b-1 fees, which if reflected, would have caused performance to be lower. |
The Fund is measured against the Russell 3000® Index, an unmanaged index that is generally considered to be representative of the performance of the stock market as a whole. The index does not reflect the deduction of expenses associated with a mutual fund, such as investment management and fund accounting fees. The Fund’s performance reflects the deduction of fees for these services. Investors cannot invest directly in an index, although they can invest in its underlying securities.
A portion of the Fund’s fees has been waived. If the fees had not been waived, the Fund’s total return for the periods would have been lower.
| 9 | ||||
Sterling Capital Equity Income Fund
Portfolio Manager
George F. Shipp, CFA
Sterling Capital Equity Income Fund (the “Fund”) is managed by George F. Shipp, CFA, Senior Managing Director and portfolio manager for Sterling Capital Management LLC (“Sterling Capital”), advisor to the Fund. Mr. Shipp joined the CHOICE Asset Management Team of Scott & Stringfellow in 2000 and Sterling Capital as part of a business realignment in 2013. He has been the Fund’s lead portfolio manager since inception and also manages the Sterling Capital Special Opportunities Fund. He has investment experience since 1982. Mr. Shipp is a graduate of the University of Virginia and received his MBA at the Darden Graduate School of Business.
Investment Considerations
The Fund invests primarily in dividend-paying securities. These securities may be undervalued and their value could be negatively affected by a rise in interest rates. The Fund may engage in writing covered call options on securities. By writing covered call options, the Fund limits its opportunity to profit from an increase in the price of the underlying stock above the premium and the strike price, but continues to bear the risk of a decline in the stock price. While the Fund receives premiums for writing covered call options, the price it realizes from the exercise of an option could be substantially below a stock’s current market price.
Q. How did the Fund perform during the 12-month period between October 1, 2015 and September 30, 2016?
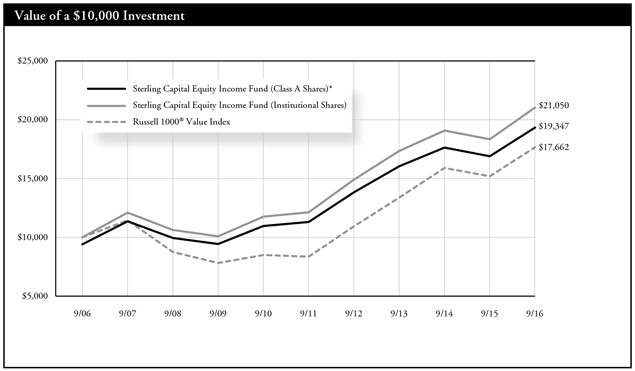
A. The Fund’s Institutional Shares underperformed its current benchmark, the Russell 1000® Value Index.
Q. What factors affected the Fund’s performance?
A. The first half of 2016 was marked by volatility, as the market anticipated and then reacted to the U.S. Federal Reserve raising the federal funds rate for the first time in nearly a decade. As investors sought safety, companies that were perceived to produce steady cash flows performed well, and dividend-paying stocks benefited. This backdrop benefited the Fund, which owns only dividend-paying companies.
A sharp rebound in oil prices in the last eight months of the fiscal year benefited the energy sector, and the Fund’s underweight allocation in this sector detracted from relative performance. During a 12-month period that saw strong market gains, the Fund’s cash holdings also dragged on performance compared to the fully invested index. The Fund was also underweight real estate and utilities, two of the best-performing sectors this fiscal year.
Yields on 10-year Treasuries declined from 2.06% at the start of the fiscal year to just 1.61% by its end. Given the substantial decline in
Treasury yields, investors began looking elsewhere for investments perceived to be safe, but that might offer a higher return. In this environment, the Fund benefited from dividend-paying stocks that were perceived to be relatively safe, including a leading domestic wireless telecommunications company whose shares delivered a 25% total return; a diversified healthcare conglomerate that posted 30% gains; and the world’s largest software company, which rose 34% in the period.
Individual stocks which hurt performance in the fiscal year included a second oil & gas pipeline, whose finances became strained by lower commodity prices, and a large nationwide bank, which unexpectedly came under consumer and congressional attack for aggressive business practices.
Strong stock selection, specifically in the consumer discretionary, energy, and basic materials sectors, also boosted performance. Consumer stocks that generated total returns over 20% included a media conglomerate, a leading advertising agency, a large homebuilder, and the world’s largest fast food restaurant franchisor. In addition, shares of a leading pipeline company posted 70% gains, while a leading gardening company’s shares rose 40%.
Portfolio composition is as of September 30, 2016 and is subject to change and risk.
| 10 | ||||
| * | Reflects 5.75% maximum sales charge. |
| ** | Reflects the applicable contingent deferred sales charge (CDSC), maximum of 5.00%. |
| *** | Reflects the applicable maximum CDSC of 1.00% (applicable only to redemptions within one year of purchase, and as such, are not reflected in the Average Annual Total Returns table since the periods reflected are for a year or longer). |
Average Annual Total Returns | ||||||||
As of September 30, 2016 | Inception Date | 1 Year | 5 Years | 10 Years | ||||
Class A Shares* | 6/30/04 | 7.90% | 10.03% | 6.82% | ||||
Class B Shares** | 6/30/04 | 9.67% | 10.38% | 6.82% | ||||
Class C Shares*** | 6/30/04 | 13.66% | 10.52% | 6.66% | ||||
Institutional Shares | 6/30/04 | 14.75% | 11.62% | 7.73% | ||||
Class R Shares | 2/1/101 | 14.18% | 11.06% | 7.38% | ||||
Russell 1000® Value Index | N/A | 16.20% | 16.15% | 5.85% | ||||
Past performance does not guarantee future results. The performance data quoted represents past performance and current returns may be lower or higher. Total return figures include change in share price, reinvestment of dividends and capital gains, and do not reflect taxes that a shareholder would pay on fund distributions or on the redemption of fund shares. The investment return and principal value will fluctuate so that an investor’s shares, when redeemed, may be worth more or less than the original cost. To obtain performance information current to the most recent month end, please visit www.sterlingcapitalfunds.com.
The chart above represents a comparison of a hypothetical $10,000 investment in the indicated share class versus a similar investment in the Fund’s benchmarks, and represents the reinvestment of dividends and capital gains.
| 1 | Class R Shares were not in existence prior to 2/1/10. Performance for periods prior to 2/1/10 is based on the performance of Institutional Shares, but such performance does not reflect Class R Shares’ 12b-1 fees, which if reflected, would have caused performance to be lower. |
The Fund is measured against the Russell 1000® Value Index, an unmanaged index that is generally considered to be representative of the performance of the stock market as a whole. The index does not reflect the deduction of expenses associated with a mutual fund, such as investment management and fund accounting fees. The Fund’s performance reflects the deduction of fees for these services. Investors cannot invest directly in an index, although they can invest in its underlying securities.
| 11 | ||||
Sterling Capital Long/Short Equity Fund
Portfolio Managers
Sterling Capital Long/Short Equity Fund (the “Fund”) is managed by L. Joshua Wein, CAIA and Executive Director and James C. Willis, CFA and Managing Director, portfolio managers for Sterling Capital Management LLC (“Sterling Capital”), advisor to the Fund.
L. Joshua Wein, CAIA
Mr. Wein, Executive Director, joined BB&T Asset Management in 2008 and Sterling Capital through merger in 2010 and has been a co-portfolio manager of the Fund since its inception. He has investment experience since 1995. He is a graduate of Emory University and received his MBA from Vanderbilt University.
James C. Willis, CFA
Mr. Willis, Managing Director, joined BB&T Asset Management in 2003 and Sterling Capital through merger in 2010 and has been a co-portfolio manager of the Fund since its inception. He has investment experience since 1996. He is a graduate of Rice University and received his MBA from Georgetown University.
The Sub-Advisers and Sub-Adviser Portfolio Managers of the Fund for the fiscal year ended September 30, 2016 are the following:
| ● | Lucas Capital Management (Red Bank, NJ); Portfolio Manager: Ashton Lee |
| ● | Emancipation Capital, LLC (New York, NY); Portfolio Manager: Charles Frumberg |
| ● | Highland Capital Healthcare Advisors, L.P. (Dallas, Texas); Portfolio Manager: Michael Gregory |
| ● | Gator Capital Management (Tampa, FL); Portfolio Manager: Derek Pilecki, CFA |
| ● | Caerus Investors, LLC (New York, NY); Portfolio Managers: Ward Davis, Brian Agnew |
Investment Considerations
All investments carry a certain amount of risk and the Fund cannot guarantee that it will achieve its investment objective. The portfolio managers’ judgments about the capabilities of each Sub Adviser and the impact of each Sub Adviser’s investment techniques on the Fund’s overall investment exposures may prove incorrect, and the Fund may fail to produce the intended results. Unlike most traditional long only equity funds, the Fund will engage in short selling and derivative trading activities as a way of mitigating risk and/or enhancing return. Short sales by a fund theoretically involve unlimited loss potential since the market price of securities sold short may continuously increase. These strategies may involve significant transaction costs and may amplify risk.
Q. How did the Fund perform during the 12-month period between October 1, 2015 and September 30, 2016?
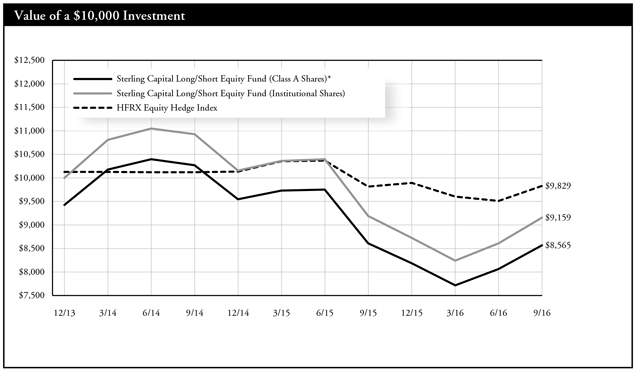
A. The Fund’s Institutional Shares underperformed its current benchmark, the HFRX Equity Hedge Index.
Q. What factors affected the Fund’s performance?
A. Equity markets posted strong returns during the 12-month period. Stocks faltered early in the period amid concerns over global economic growth and a continued decline in commodity prices. However, modestly improving economic conditions in the U.S. and abroad, stabilizing commodity prices and accommodative policies by central banks around the world helped push stocks higher for much of the period. Investors cheered the Federal Reserve’s cautious approach to raising interest rates, but also worried about the near-term impact of the U.K.’s June decision to leave the European Union.
In that environment, defensive sectors performed well as investors sought out relatively safe areas of the equity market. The real estate and utility sectors also benefited as investors were attracted to the dividend yields offered by many companies in these sectors. In absolute terms, the Fund’s health care holdings dragged on performance. Pharmaceutical firms in particular were hard hit by lawmakers’ considerable focus on drug-pricing practices. The Fund’s financial
holdings also hurt returns as financial firms were negatively impacted by continued low interest rates.
The Fund’s technology and telecommunications services holdings were the largest drivers of absolute returns, as these industries saw an uptick in mergers-and-acquisitions activity, particularly among smaller companies. The Fund’s energy holdings also benefited from rising oil prices.
The Fund underperformed its benchmark, which is an index of long/ short equity funds, for the 12-month period. Making comparisons to an index of hedge funds can be challenging, however, so the Fund’s holdings will be discussed relative to its peer group, as represented by the Morningstar Long/Short Equity category. The Fund’s performance relative to its benchmark benefited from overweight positions in the energy and technology sectors. Meanwhile, the Fund’s exposure to the health care sector and its bias toward smaller cap stocks dragged on relative results.
Throughout the 12-month period, the Fund’s net exposure — the difference between its long and short exposures — stayed in a relatively tight band of between 54% and 46%. Net exposure was a modest contributor to relative returns.
Portfolio composition is as of September 30, 2016 and is subject to change and risk.
| 12 | ||||
| * | Reflects 5.75% maximum sales charge. |
| ** | Reflects the applicable maximum CDSC of 1.00% (applicable only to redemptions within one year of purchase, and as such, are not reflected in the Average Annual Total Returns table since the periods reflected are for a year or longer). |
Average Annual Total Returns | ||||||
As of September 30, 2016 | Inception Date | 1 Year | Since Inception | |||
Class A Shares* | 12/13/13 | -6.27% | -5.39% | |||
Class C Shares** | 12/13/13 | -1.27% | -4.03% | |||
Institutional Shares | 12/13/13 | -0.33% | -3.09% | |||
HFRX Equity Hedge Index | 11/30/13 | 0.13% | -0.14% | |||
Past performance does not guarantee future results. The performance data quoted represents past performance and current returns may be lower or higher. Total return figures include change in share price, reinvestment of dividends and capital gains, and do not reflect taxes that a shareholder would pay on fund distributions or on the redemption of fund shares. The investment return and principal value will fluctuate so that an investor’s shares, when redeemed, may be worth more or less than the original cost. To obtain performance information current to the most recent month end, please visit www.sterlingcapitalfunds.com.
The chart above represents a comparison of a hypothetical $10,000 investment in the indicated share class versus a similar investment in the Fund’s benchmark, and represents the reinvestment of dividends and capital gains.
The Fund is measured against the HFRX Equity Hedge Index, an unmanaged index that is generally considered to be representative of the performance of the stock market as a whole. The index does not reflect the deduction of expenses associated with a mutual fund, such as investment management and fund accounting fees. The Fund’s performance reflects the deduction of fees for these services. Investors cannot invest directly in an index, although they can invest in its underlying securities.
A portion of the Fund’s fees has been waived. If the fees had not been waived, the Fund’s total return for the periods would have been lower.
| 13 | ||||
Sterling Capital Behavioral International Equity Fund
Portfolio Managers
Sterling Capital Behavioral International Equity Fund (the “Fund”) is managed by Robert W. Bridges, CFA and Robert O. Weller, CFA Executive Directors and portfolio managers for Sterling Capital Management LLC (“Sterling Capital”), advisor to the Fund.
Robert W. Bridges, CFA
Mr. Bridges, CFA, Executive Director joined Sterling Capital in 1996 and has been a co-portfolio manager of the Fund since inception. He has investment experience since 1991. He is a graduate of Wake Forest University where he received his BS in Business.
Robert O. Weller, CFA
Mr. Weller, CFA, Executive Director joined Sterling Capital in 2012 and has been a co-portfolio manager of the Fund since inception. He has investment experience since 1996. He is a graduate of Loyola University Maryland where he received his BBA in Finance.
Investment Considerations
The overall results of the Fund will be dependent on the process and ability of the Adviser to apply “behavioral finance” principles to recognize a company’s value, earnings revisions and market momentum. The Fund will invest in foreign securities which may be more volatile and less liquid due to currency fluctuation, political instability, and social and economic risks. The Fund may invest in REITs (Real Estate Investment Trusts), the value of which will be affected by conditions of the real estate industry, and exchange-traded funds (ETFs). Investing in ETFs may cause shareholders to bear additional costs, and an ETF may not exactly replicate the performance it seeks to track.
Q. How did the Fund perform during the 12-month period between October 1, 2015 and September 30, 2016?
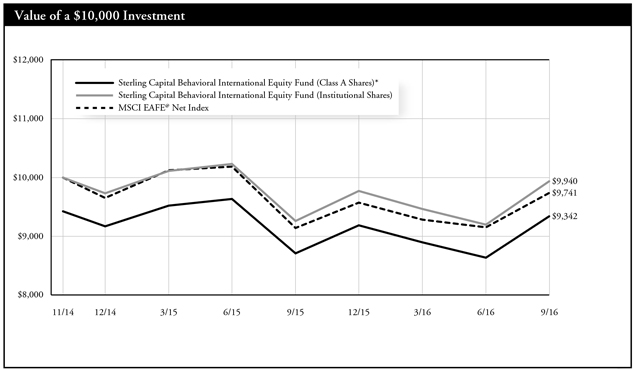
A. The Fund’s Institutional Shares outperformed its current benchmark, the MSCI EAFE® Net Index.
Q. What factors affected the Fund’s performance?
A. International equities generated positive returns during the fiscal year ending September 30, 2016. While slow global economic growth and geopolitical turmoil dragged down stocks during the first half of the period, stocks reversed course during the second half, boosted by accommodative monetary policy, rising commodity prices and positive economic data in China. The United Kingdom’s late-June referendum vote to leave the European Union sent U.S. and international stocks plummeting, but most markets recovered quickly. Emerging markets far outpaced developed markets during the period.
The Fund’s performance relative to its benchmark is largely a reflection of its strategy to employ an investment process rooted in principles of
behavioral finance. This process is specifically designed to capitalize upon known investor biases and heuristics (mental shortcuts) by taking into account the impact on markets of behavioral factors such as greed, fear and ego.
International markets rewarded the Fund’s behavioral value exposure during the period under review, contributing positively to its performance relative to its benchmark. Stock selection in the life insurance and asset management sectors also boosted the Fund’s relative performance, as did a slight bias away from the benchmark’s largest companies.
Momentum, the other key behavioral anomaly the Fund seeks to capitalize upon, hurt the Fund’s performance relative to its benchmark. This behavioral strategy turned negative in early 2016 as investors favored dividend yielding and low volatility stocks. Stock selection in the computer hardware sector also hurt relative returns.
Portfolio composition is as of September 30, 2016 and is subject to change and risk.
| 14 | ||||
| * | Reflects 5.75% maximum sales charge. |
| ** | Reflects the applicable maximum CDSC of 1.00% (applicable only to redemptions within one year of purchase, and as such, are not reflected in the Average Annual Total Returns table since the periods reflected are for a year or longer). |
Average Annual Total Returns | ||||||||
As of September 30, 2016 | Inception Date | 1 Year | Since Inception | |||||
Class A Shares* | 11/28/14 | 1.10% | -3.63% | |||||
Class C Shares** | 11/28/14 | 6.38% | -1.18% | |||||
Institutional Shares | 11/28/14 | 7.30% | -0.33% | |||||
MSCI EAFE® Net Index | 11/30/14 | 6.52% | -1.43% | |||||
Past performance does not guarantee future results. The performance data quoted represents past performance and current returns may be lower or higher. Total return figures include change in share price, reinvestment of dividends and capital gains, and do not reflect taxes that a shareholder would pay on fund distributions or on the redemption of fund shares. The investment return and principal value will fluctuate so that an investor’s shares, when redeemed, may be worth more or less than the original cost. To obtain performance information current to the most recent month end, please visit www.sterlingcapitalfunds.com.
The chart above represents a comparison of a hypothetical $10,000 investment in the indicated share class versus a similar investment in the Fund’s benchmark, and represents the reinvestment of dividends and capital gains.
Fund is measured against the MSCI EAFE® Net Index, an unmanaged Index which is generally representative of large- and mid-cap equity across developed markets countries around the world, excluding the U.S. and Canada. The index does not reflect the deduction of expenses associated with a mutual fund, such as investment management and fund accounting fees. The Fund’s performance reflects the deduction of fees for these services. Investors cannot invest directly in an index, although they can invest in its underlying securities.
A portion of the Fund’s fees has been waived. If the fees had not been waived, the Fund’s total return for the periods would have been lower.
| 15 | ||||
Sterling Capital Stratton Mid Cap Value Fund
Portfolio Manager
Shawn M. Gallagher, CFA
Sterling Capital Stratton Mid Cap Value Fund (the “Fund”) is managed by Shawn M. Gallagher, CFA Director and portfolio manager for Sterling Capital Management LLC (“Sterling Capital”), advisor to the Fund. Mr. Gallagher joined the Stratton Funds Team of Stratton Management Company in 2005 and Sterling Capital Management as part of a business acquisition in 2015. He has been the lead portfolio manager to the Fund since 2015 and the Predecessor Fund since 2012. Mr. Gallagher has investment experience since 2003. He is a graduate of Pennsylvania State University where he received his BS in Finance.
Investment Considerations
Mid-capitalization companies are generally riskier than large company stocks due to greater volatility and less liquidity. Value stocks can perform differently than other types of stocks and can continue to be undervalued by the market for long periods of time.
Q. How did the Fund perform during the 12-month period between October 1, 2015 and September 30, 2016?
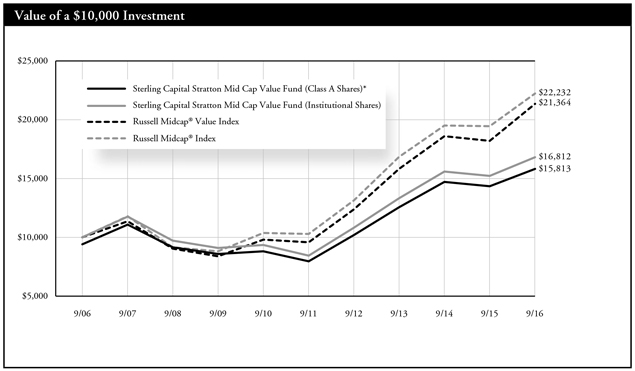
A. The Fund’s Institutional Shares underperformed its current benchmark, the Russell Midcap® Value Index.
Q. What factors affected the Fund’s performance?
A. U.S. mid-cap stocks posted strong growth for the period despite a dramatic -13% decline during the first six weeks of 2016. In January and early February, weak international economic data, continued commodity price declines and signs of a general deterioration in financial conditions drove investors to adopt a risk-averse attitude that weighed on stocks. That decline was relatively short-lived, however, and mid-cap stocks rebounded; they posted gains of nearly 25% during the balance of the year, driven mostly by improved economic data and a cautious tone from the Federal Reserve in its approach to raising interest rates.
The Fund’s absolute returns benefited from holdings in the energy, health care, utilities, consumer staples, producer durables and technology sectors. These sectors posted strong double-digit gains, on average. The Fund’s materials and consumer discretionary investments dragged on absolute performance. These more cyclical holdings underperformed as investors gravitated to stocks perceived to be safe in a period marked by heightened uncertainty over global growth, the prospect of a recession and the impacts of the U.K.’s vote to leave the European Union.
The Fund underperformed its benchmark for the period, with most of
that underperformance occurring in the volatile first and second quarters of 2016. The Fund’s significant underweight positions in the utilities and real estate sectors dragged on relative performance. These sectors rallied as investors were attracted to stocks offering relatively high dividend yields in the low interest rate environment. A modest overweight position in the banking industry also weighed on relative results as these holdings underperformed as interest rates remained low. Stock selection in the materials sector also weighed on results, particularly in the chemicals subsector. In particular, holdings of a domestic nitrogen fertilizer producer performed poorly as the company’s low-cost production advantage was outweighed by weakening fundamentals in the industry, including excess supply. Lack of exposure to the metals and mining industry also hurt results, as that subsector benefitted from sharply higher gold and industrial metals prices beginning in early 2016.
Stock selection in the health care sector added to relative returns. The Fund benefited from exposure to several medical equipment manufacturers, which performed well due in part to strong earnings results driven by organic growth and acquisition activity. Stock selection in the energy sector also added to results, as did an underweight position in this sector early in the period which helped avoid some of the losses incurred by the benchmark in early 2016 when the price of oil dropped. The Fund added to its energy sector holdings as oil prices began to recover, which helped boost results as that sector rebounded in the latter half of the period.
Portfolio composition is as of September 30, 2016 and is subject to change and risk. |
| 16 | ||||
| * | Reflects 5.75% maximum sales charge. |
| ** | Reflects the applicable maximum CDSC of 1.00% (applicable only to redemptions within one year of purchase, and as such, are not reflected in the Average Annual Total Returns table since the periods reflected are for a year or longer). |
Average Annual Total Returns | ||||||||
As of September 30, 2016 | Inception Date | 1 Year | 5 Years | 10 Years | ||||
Class A Shares* | 11/13/15 | 3.81% | 13.34% | 4.69% | ||||
Class C Shares** | 11/13/15 | 9.43% | 14.55% | 5.24% | ||||
Institutional Shares | 09/30/72 | 10.37% | 14.75% | 5.33% | ||||
Russell Midcap® Value Index | N/A | 17.26% | 17.38% | 7.89% | ||||
Russell Midcap® Index | N/A | 14.25% | 16.67% | 8.32% | ||||
Past performance does not guarantee future results. The performance data quoted represents past performance and current returns may be lower or higher. Total return figures include change in share price, reinvestment of dividends and capital gains, and do not reflect taxes that a shareholder would pay on fund distributions or on the redemption of fund shares. The investment return and principal value will fluctuate so that an investor’s shares, when redeemed, may be worth more or less than the original cost. The performance shown here (for periods prior to the date of commencement of operations on November 16, 2015) is that of Stratton Mid Cap Value Fund (the “Predecessor Fund”), whose shares were reorganized into Institutional Shares of the Fund at the close of business on November 13, 2015. Because the Fund had no investment operations prior to the closing of the reorganization, and based on the similarity of the Fund to the Predecessor Fund, the Predecessor Fund is treated as the survivor of the reorganization for accounting and performance reporting purposes. Accordingly, all performance and other information shown for the Fund for periods prior to November 16, 2015 is that of the Predecessor Fund. Performance for Class A Shares and Class C Shares, prior to the date of commencement of operations on November 16, 2015, is based on the performance of the shares of the Predecessor Fund. To obtain performance information current to the most recent month end, please visit www.sterlingcapitalfunds.com.
The Board of Trustees of the Fund approved a change of the fiscal year of the Fund from December 31st to September 30th.
The chart above represents a comparison of a hypothetical $10,000 investment in the indicated share class versus a similar investment in the Fund’s benchmarks, and represents the reinvestment of dividends and capital gains.
The Fund is measured against the Russell Midcap® Value Index and the Russell Midcap® Index, unmanaged indices that are generally considered to be representative of the performance of the stock market as a whole. The indices do not reflect the deduction of expenses associated with a mutual fund, such as investment management and fund accounting fees. The Fund’s performance reflects the deduction of fees for these services. Investors cannot invest directly in an index, although they can invest in its underlying securities.
A portion of the Fund’s fees has been waived. If the fees had not been waived, the Fund’s total return for the periods would have been lower.
| 17 | ||||
Sterling Capital Stratton Real Estate Fund
Portfolio Manager
Andrew T. DiZio, CFA
Sterling Capital Stratton Real Estate Fund (the “Fund”) is managed by Andrew T. DiZio, CFA, Director and portfolio manager for Sterling Capital Management LLC (“Sterling Capital”), advisor to the Fund. Mr. DiZio joined the Stratton Funds Team of Stratton Management Company in 2012 and Sterling Capital Management as part of a business acquisition in 2015. He has been the lead portfolio manager of the Fund since 2015 and the Predecessor Fund since 2012. Mr. DiZio has investment experience since 2003. He is a graduate of Pennsylvania State University where he received his BS in Finance.
Investment Considerations
Real Estate Funds may be subject to a higher degree of market risk because of concentration in a specific industry or geographic sector. Risks include declines in value of real estate, general and economic conditions, changes in the value of the underlying property and defaults by borrowers.
Q. How did the Fund perform during the 12-month period between October 1, 2015 and September 30, 2016?
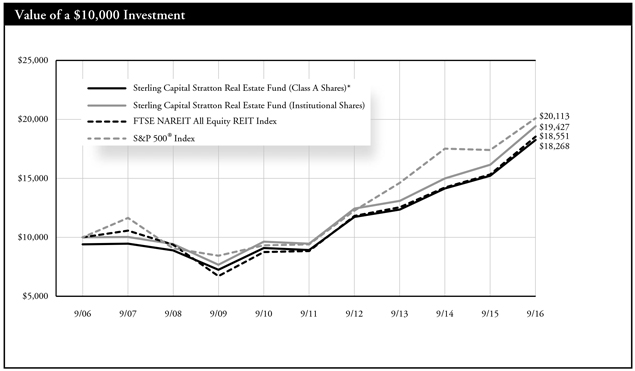
A. The Fund’s Institutional Shares underperformed its current benchmark, the FTSE NAREIT All Equity REITs Index.
Q. What factors affected the Fund’s performance?
A. The real estate sector delivered strong returns over the 12-month period. That positive performance was driven primarily by strong underlying fundamentals, namely favorable supply and demand trends that drove occupancy and rental rates higher for most property types. Global macroeconomic factors, including declining global interest rates and rising economic and political uncertainty, also helped drive positive absolute returns as investors favored equities that offered steady cash flows, including REITs. Investments in data center, infrastructure and health care subsectors made strong contributions to the Fund’s absolute returns.
The Fund’s underperformance of its benchmark was driven in large part by stock selection in the retail subsector. In particular, the timing of the sale of a shopping center REIT dragged on the Fund’s relative performance. After the Board of Directors of the shopping center REIT announced accounting irregularities and fired its management team, the Fund sold the holding. The stock then rebounded when no further
issues came to light and a new CEO took over. The Fund’s overweight exposure to the economically sensitive lodging subsector also weighed on results. Stalled corporate profitability reduced demand for hotel rooms from business travelers, while the rise of Airbnb options reduced demand from leisure travelers. The Fund’s choice of individual REITs within the lodging subsector helped offset some but not all of the relative underperformance from its overweight position.
Stock selection within the residential and infrastructure subsectors was the largest contributor to relative performance. The Fund’s above-benchmark exposure to residential REITs with properties in the Southeast added to results, as rising apartment supply primarily hurt higher-end rental properties in major West Coast and Northeast markets. The Fund’s investments in REITs tied to student housing were also a relative outperformer in the residential subsector, including a holding that was purchased by a private equity firm at a healthy premium. Within the infrastructure subsector, the Fund benefitted from owning a unique REIT with significant underground fiber assets. The REIT’s stock nearly doubled as investors factored those distinctive assets into its share price. Stock selection within the specialty, health care, office and data center subsectors also boosted returns.
Portfolio composition is as of September 30, 2016 and is subject to change and risk.
| 18 | ||||
| * | Reflects 5.75% maximum sales charge. |
| ** | Reflects the applicable maximum CDSC of 1.00% (applicable only to redemptions within one year of purchase, and as such, are not reflected in the Average Annual Total Returns table since the periods reflected are for a year or longer). |
Average Annual Total Returns | ||||||||
As of September 30, 2016 | Inception Date | 1 Year | 5 Years | 10 Years | ||||
Class A Shares* | 11/13/15 | 12.98% | 14.03% | 6.21% | ||||
Class C Shares** | 11/13/15 | 19.11% | 15.25% | 6.77% | ||||
Institutional Shares | 05/31/80 | 20.13% | 15.44% | 6.87% | ||||
FTSE NAREIT All Equity REIT Index | N/A | 20.94% | 15.97% | 6.37% | ||||
S&P 500® Index | N/A | 7.82% | 16.36% | 7.23% | ||||
Past performance does not guarantee future results. The performance data quoted represents past performance and current returns may be lower or higher. Total return figures include change in share price, reinvestment of dividends and capital gains, and do not reflect taxes that a shareholder would pay on fund distributions or on the redemption of fund shares. The investment return and principal value will fluctuate so that an investor’s shares, when redeemed, may be worth more or less than the original cost. The performance shown here (for periods prior to the date of commencement of operations on November 16, 2015) is that of Stratton Real Estate Fund (the “Predecessor Fund”), whose shares were reorganized into Institutional Shares of the Fund at the close of business on November 13, 2015. Because the Fund had no investment operations prior to the closing of the reorganization, and based on the similarity of the Fund to the Predecessor Fund, the Predecessor Fund is treated as the survivor of the reorganization for accounting and performance reporting purposes. Accordingly, all performance and other information shown for the Fund for periods prior to November 16, 2015 is that of the Predecessor Fund. Performance for Class A Shares and Class C Shares, prior to the date of commencement of operations on November 16, 2015, is based on the performance of the shares of the Predecessor Fund. To obtain performance information current to the most recent month end, please visit www.sterlingcapitalfunds.com.
The Board of Trustees of the Fund approved a change of the fiscal year of the Fund from December 31st to September 30th.
The chart above represents a comparison of a hypothetical $10,000 investment in the indicated share class versus a similar investment in the Fund’s benchmarks, and represents the reinvestment of dividends and capital gains.
The Fund is measured against the Index, an unmanaged index, which is generally considered to be representative of the performance of the stock market as a whole. The index does not reflect the deduction of expenses associated with a mutual fund, such as investment management and fund accounting fees. The Fund’s performance reflects the deduction of fees for these services. Investors cannot invest directly in an index, although they can invest in its underlying securities.
A portion of the Fund’s fees has been waived. If the fees had not been waived, the Fund’s total return for the periods would have been lower.
| 19 | ||||
Sterling Capital Stratton Small Cap Value Fund
Portfolio Manager
Gerald M. Van Horn, CFA
Sterling Capital Stratton Small Cap Value Fund (the “Fund”) is managed by Gerald M. Van Horn, CFA, Executive Director and portfolio manager for Sterling Capital Management LLC (“Sterling Capital”), advisor to the Fund. Mr. Van Horn, joined the Stratton Funds Team of Stratton Management Company in 1998 and Sterling Capital Management as part of a business acquisition in 2015. He has been the lead portfolio manager to the Fund since 2015 and the Predecessor Fund since 2000. Mr. Van Horn has investment experience since 1996. He is a graduate of the College of New Jersey where he received his BA in Economics.
Investment Considerations
Small cap company stocks are generally riskier than large company stocks due to greater volatility and less liquidity. Value stocks can perform differently than other types of stocks and can continue to be undervalued by the market for long periods of time.
Q. How did the Fund perform during the 12-month period between October 1, 2015 and September 30, 2016?
A. The Fund’s Institutional Shares underperformed its current benchmark, the Russell 2000® Value Index.
Q. What factors affected the Fund’s performance?
A. Small-cap equity markets posted strong absolute returns for the 12-month period despite a weak start in late 2015 and early 2016. Shifting macroeconomic data in mid-February, including a rebound in oil prices and a weaker U.S. dollar, helped spark a rally in equities. The gains continued through the remainder of the period, despite some periods of increased volatility. The Fund’s absolute return particularly benefited from strong performance among energy holdings, which rebounded in mid-February along with oil prices. The Fund’s holdings in the technology, health care and utility sectors also added to absolute performance.
The Fund’s underperformance relative to its benchmark was in large part due to negative stock selection within the materials and processing sector. In particular, lack of exposure to the benchmark’s holdings related to the metals and mining sector dragged on relative returns given
that the sector rallied sharply from the February lows. The Fund’s holdings of an American ready-mixed concrete producer also weighed on returns as weak second quarter earnings hurt the company’s share price. Stock selection in the financial services sector also weighed on relative results. A below-benchmark exposure to the strongly performing REIT industry dragged on results as investors sought out those stocks’ higher yields amid the low-interest-rate environment.
Stock selection in the consumer discretionary, energy and health care sectors added to the Fund’s relative results. Among the Fund’s consumer discretionary holdings, a hunting and fishing supplies retailer outperformed near the end of the period amid investor speculation that it was being targeted for a takeover. Shares of a consumer products company were the subject of a takeover during the period, which added to results. Among the Fund’s energy holdings, the Fund benefited from investments in two oil and gas companies, which outperformed during the period. The Fund also benefited from a below-benchmark exposure to the broader energy sector, which generally underperformed. Stock selection within the health care sector also added to relative results.
Portfolio composition is as of September 30, 2016 and is subject to change and risk.
| 20 | ||||
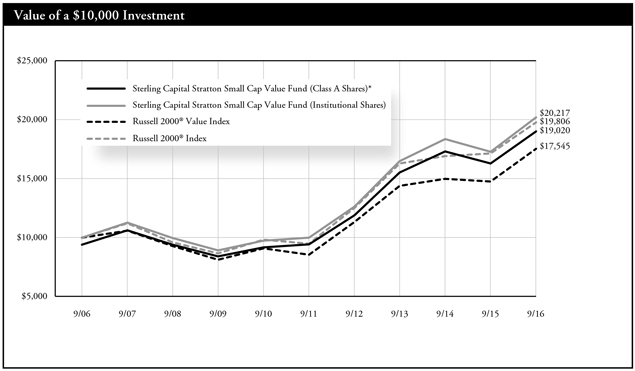
| * | Reflects 5.75% maximum sales charge. |
| ** | Reflects the applicable maximum CDSC of 1.00% (applicable only to redemptions within one year of purchase, and as such, are not reflected in the Average Annual Total Returns table since the periods reflected are for a year or longer). |
Average Annual Total Returns | ||||||||
As of September 30, 2016 | Inception Date | 1 Year | 5 Years | 10 Years | ||||
Class A Shares* | 11/16/15 | 9.97% | 13.70% | 6.64% | ||||
Class C Shares** | 11/16/15 | 15.92% | 14.90% | 7.20% | ||||
Institutional Shares | 4/12/93 | 16.90% | 15.09% | 7.29% | ||||
Russell 2000® Value Index | N/A | 18.81% | 15.45% | 5.78% | ||||
Russell 2000® Index | N/A | 15.47% | 15.82% | 7.07% | ||||
Past performance does not guarantee future results. The performance data quoted represents past performance and current returns may be lower or higher. Total return figures include change in share price, reinvestment of dividends and capital gains, and do not reflect taxes that a shareholder would pay on fund distributions or on the redemption of fund shares. The investment return and principal value will fluctuate so that an investor’s shares, when redeemed, may be worth more or less than the original cost. The performance shown here (for periods prior to the date of commencement of operations on November 16, 2015) is that of Stratton Small Cap Value Fund (the “Predecessor Fund”), whose shares were reorganized into Institutional Shares of the Fund at the close of business on November 13, 2015. Because the Fund had no investment operations prior to the closing of the reorganization, and based on the similarity of the Fund to the Predecessor Fund, the Predecessor Fund is treated as the survivor of the reorganization for accounting and performance reporting purposes. Accordingly, all performance and other information shown for the Fund for periods prior to November 16, 2015 is that of the Predecessor Fund. Performance for Class A Shares and Class C Shares, prior to the date of commencement of operations on November 16, 2015, is based on the performance of the shares of the Predecessor Fund. To obtain performance information current to the most recent month end, please visit www.sterlingcapitalfunds.com.
The Board of Trustees of the Fund approved a change of the fiscal year of the Fund from December 31st to September 30th.
The chart above represents a comparison of a hypothetical $10,000 investment in the indicated share class versus a similar investment in the Fund’s benchmarks, and represents the reinvestment of dividends and capital gains.
The Fund is measured against the Russell 2000® Value Index and the Russell 2000® Index, unmanaged indices that are generally considered to be representative of the performance of the stock market as a whole. The indices do not reflect the deduction of expenses associated with a mutual fund, such as investment management and fund accounting fees. The Fund’s performance reflects the deduction of fees for these services. Investors cannot invest directly in an index, although they can invest in its underlying securities.
| 21 | ||||
Sterling Capital Ultra Short Bond Fund
Portfolio Managers
Sterling Capital Ultra Short Bond Fund (the “Fund”) is managed by Mark Montgomery, CFA and Richard LaCoff, Senior Managing Directors and portfolio managers for Sterling Capital Management LLC (“Sterling Capital”), advisor to the Fund.
Mark Montgomery, CFA
Mr. Montgomery, Senior Managing Director joined Sterling Capital in 1997 and has been a co-portfolio manager of the Fund since inception. He is co-head of Sterling Capital’s Fixed Income Portfolio Management. He has investment experience since 1990. He is a graduate of West Chester University and received his MBA from Drexel University.
Richard T. LaCoff
Mr. LaCoff, Senior Managing Director joined Sterling Capital in 2007 and has been a co-portfolio manager of the Fund since inception. He is co-head of Sterling Capital’s Fixed Income Portfolio Management. He has investment experience since 1991. He is a graduate of Villanova University and received his MS in Finance from Drexel University.
Investment Considerations
The Fund is subject to the same risks as the underlying bonds in the portfolio such as credit, prepayment, call and interest rate risk. As interest rates rise, the value of bond prices will decline and an investor may lose money. The Fund may invest in more aggressive investments, such as foreign securities, which may expose the Fund to currency and exchange rate fluctuations; mortgage-backed securities sensitive to interest rates; and high yield debt (also known as junk bonds), all of which may cause greater volatility and less liquidity.
Q. How did the Fund perform during the 12-month period between October 1, 2015 and September 30, 2016?
A. The Fund’s Institutional Shares outperformed its current benchmark, the Citigroup 6-Month U.S. Treasury Bill Index.
Q. What factors affected the Fund’s performance?
A. The Fund’s absolute return benefited during the period from declines in both interest rates and credit risk premiums, due to monetary easing policies and slow global economic growth. Falling yields and increased demand for risk assets helped drive prices higher on the securities held in the portfolio. The Fund’s return is driven primarily by income generated by the securities it holds, although the price performance of those securities is also a contributing factor. Income was a positive contributor to the Fund’s total return, as is the case with traditional fixed income investments.
The Fund outperformed its benchmark as interest rates declined for the period and the yield curve flattened. The Fund was able to take advantage of the flattening curve through its duration and yield curve
position by purchasing longer maturities on the short end of the curve, which added to relative performance. The Fund’s overweight allocation to corporate bonds contributed positively to the Fund’s relative return, as corporate bonds provided significant excess return relative to duration-matched Treasuries held by the benchmark. The Fund also benefited from an overweight allocation to risk assets, which outperformed due to declining credit risk premiums. Lower-quality credit outperformed higher-quality credit during the period, and the Fund’s overweight exposure to triple-B rated bonds and high-yield securities contributed positively to relative performance.
The Fund’s allocation to the securitized sector also added to relative returns. An overweight allocation to asset-backed securities and commercial mortgage-backed securities contributed positively to the Fund’s relative performance as investors sought higher yields in higher-quality assets. Finally, the Fund’s overweight allocation to risk assets provided an income advantage relative to the benchmark, which contributed positively to the Fund’s relative return.
Portfolio composition is as of September 30, 2016 and is subject to change and risk.
| 22 | ||||
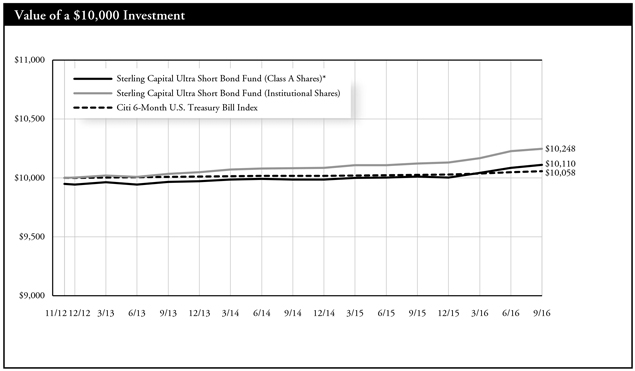
| * | Reflects 0.50% maximum sales charge. |
Average Annual Total Returns |
| |||||||||||
As of September 30, 2016 | Inception Date | 1 Year | Since Inception | |||||||||
Class A Shares* | 11/30/12 | 0.48% | 0.29% | |||||||||
Institutional Shares | 11/30/12 | 1.24% | 0.64% | |||||||||
Citi 6-Month U.S. Treasury Bill Index |
| 11/30/12
|
|
| 0.33%
|
|
| 0.15%
|
| |||
Past performance does not guarantee future results. The performance data quoted represents past performance and current returns may be lower or higher. Total return figures include change in share price, reinvestment of dividends and capital gains, and do not reflect taxes that a shareholder would pay on fund distributions or on the redemption of fund shares. The investment return and principal value will fluctuate so that an investor’s shares, when redeemed, may be worth more or less than the original cost. To obtain performance information current to the most recent month end, please visit www.sterlingcapitalfunds.com.
The chart above represents a comparison of a hypothetical $10,000 investment in the indicated share class versus a similar investment in the Fund’s benchmark, and represents the reinvestment of dividends and capital gains.
The Fund is measured against the Citi 6-Month U.S. Treasury Bill Index, which measures the performance of Treasury bills with a maturity of six months or less. The index does not reflect the deduction of expenses associated with a mutual fund, such as investment management and fund accounting fees. The Fund’s performance reflects the deduction of fees for these services. Investors cannot invest directly in an index, although they can invest in its underlying securities.
A portion of the Fund’s fees has been waived. If the fees had not been waived, the Fund’s total return for the periods would have been lower.
| 23 | ||||
Sterling Capital Short Duration Bond Fund
Portfolio Managers
Sterling Capital Short Duration Bond Fund (the “Fund”) is managed by Mark Montgomery, CFA and Richard LaCoff, Senior Managing Directors and portfolio managers for Sterling Capital Management LLC (“Sterling Capital”), advisor to the Fund.
Mark Montgomery, CFA
Mr. Montgomery, Senior Managing Director joined Sterling Capital in 1997 and has been a co-portfolio manager of the Fund since 2011. He is co-head of Sterling Capital’s Fixed Income Portfolio Management. He has investment experience since 1990. He is a graduate of West Chester University and received his MBA from Drexel University.
Richard T. LaCoff
Mr. LaCoff, Senior Managing Director joined Sterling Capital in 2007 and has been a co-portfolio manager of the Fund since 2011. He is co-head of Sterling Capital’s Fixed Income Portfolio Management. He has investment experience since 1991. He is a graduate of Villanova University and received his MS in Finance from Drexel University.
Investment Considerations
The Fund is subject to the same risks as the underlying bonds in the portfolio such as credit, prepayment, call and interest rate risk. As interest rates rise, the value of bond prices will decline and an investor may lose money. The Fund may invest in more aggressive investments, such as foreign securities, which may expose the Fund to currency and exchange rate fluctuations; mortgage-backed securities sensitive to interest rates; and high yield debt (also known as junk bonds), all of which may cause greater volatility and less liquidity.
Q. How did the Fund perform during the 12-month period between October 1, 2015 and September 30, 2016?
A. The Fund’s Institutional Shares outperformed its current benchmark, the BofA Merrill Lynch 1–3 Year U.S. Corporate Government Index.
Q. What factors affected the Fund’s performance?
A. The Fund’s absolute return benefited from a decline in interest rates and a decline in credit risk premiums, due to monetary easing policies and slow global economic growth. Investors grew more comfortable with risk as market volatility eased during the period. Their efforts to seek out higher yield among riskier assets drove up demand, which led to higher prices and helped risk assets outperform for the period. These trends led to price appreciation on the securities held by the portfolio and contributed positively to the Fund’s absolute performance. The Fund’s return is driven primarily by the income generated by the securities it holds, and the price performance of those securities.
The Fund outperformed compared to its benchmark, in part due to its bias toward slightly longer durations on the short end of the yield curve. The Fund was positioned to take advantage of a yield curve that
flattened as investors remained confident in the Federal Reserve’s interest rate policy and as investors bought longer maturities, taking on greater interest rate risk. The Fund also benefited from its overweight exposure to risk assets, which outperformed during the period as credit risk premiums declined on higher investor demand. Lower-quality credit outperformed higher-quality credit and the Fund was overweight to triple-B rated bonds and high yield securities, which contributed positively to relative results.
The Fund’s allocation to corporate bonds also contributed positively to relative results — it maintained an overweight position to corporate bonds throughout the year, while maintaining an underweight allocation to Treasury securities. The corporate sector outperformed across a number of sectors, including financials, industrials and utilities, which contributed to relative results. The Fund’s allocation to the securitized sector also contributed to relative returns, particularly the Fund’s overweight allocation to asset-backed securities and commercial mortgage-backed securities.
Portfolio composition is as of September 30, 2016 and is subject to change and risk.
| 24 | ||||
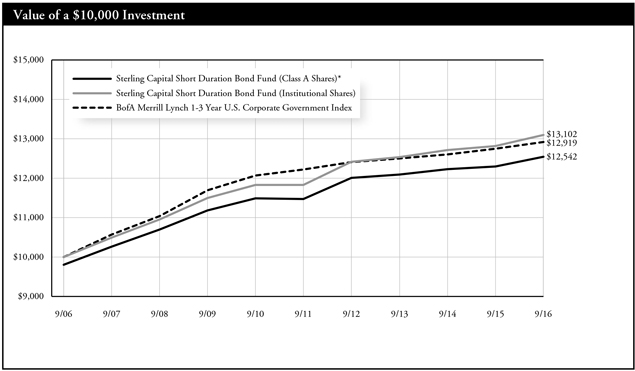
| * | Reflects 2.00% maximum sales charge. |
| ** | Reflects the applicable maximum CDSC of 1.00% (applicable only to redemptions within one year of purchase, and as such, are not reflected in the Average Annual Total Returns table since the periods reflected are for a year or longer). |
Average Annual Total Returns | ||||||||
As of September 30, 2016 | Inception Date | 1 Year | 5 Years | 10 Years | ||||
Class A Shares* | 11/30/92 | -0.05% | 1.40% | 2.29% | ||||
Class C Shares** | 2/1/121 | 1.22% | 1.08% | 2.13% | ||||
Institutional Shares | 11/30/92 | 2.24% | 2.06% | 2.74% | ||||
BofA Merrill Lynch | N/A | 1.32% | 1.11% | 2.59% | ||||
Past performance does not guarantee future results. The performance data quoted represents past performance and current returns may be lower or higher. Total return figures include change in share price, reinvestment of dividends and capital gains, and do not reflect taxes that a shareholder would pay on fund distributions or on the redemption of fund shares. The investment return and principal value will fluctuate so that an investor’s shares, when redeemed, may be worth more or less than the original cost. To obtain performance information current to the most recent month end, please visit www.sterlingcapitalfunds.com.
The chart above represents a comparison of a hypothetical $10,000 investment in the indicated share class versus a similar investment in the Fund’s benchmark, and represents the reinvestment of dividends and capital gains.
| 1 | Class C Shares were not in existence prior to 2/1/12. Performance for periods prior to 2/1/12 is based on the performance of Class A Shares. Such performance could differ only to the extent that the Classes have different expenses. |
The Fund is measured against the BofA Merrill Lynch 1-3 Year U.S. Corporate Government Index, which consists of securities with a maturity from one to three years. The index does not reflect the deduction of expenses associated with a mutual fund, such as investment management and fund accounting fees. The Fund’s performance reflects the deduction of fees for these services. Investors cannot invest directly in an index, although they can invest in its underlying securities.
A portion of the Fund’s fees has been waived. If the fees had not been waived, the Fund’s total return for the periods would have been lower.
| 25 | ||||
Sterling Capital Intermediate U.S. Government Fund
Portfolio Manager
Brad D. Eppard, CFA
Sterling Capital Intermediate U.S. Government Fund (the “Fund”) is managed by Brad D. Eppard, CFA, Director and portfolio manager for Sterling Capital Management LLC (“Sterling Capital”), advisor to the Fund. Mr. Eppard joined BB&T Asset Management in 2003 and Sterling Capital through merger in 2010 and has been lead portfolio manager to the Fund since 2003. He has investment experience since 1985. Mr. Eppard is a graduate of Radford University where he received his BS in Business Administration/Accounting.
Investment Considerations
The Fund is subject to the same risks as the underlying bonds in the portfolio such as credit, prepayment, call and interest rate risk. As interest rates rise, the value of bond prices will decline and an investor may lose money. The Fund may invest in mortgage-backed securities, which tend to be more sensitive to changes in interest rates. The Fund invests in securities issued or guaranteed by the U.S. government or its agencies (such as Fannie Mae or Freddie Mac). Although U.S. government securities issued directly by the U.S. government are guaranteed by the U.S. Treasury, other U.S. government securities issued by an agency or instrumentality of the U.S. government may not be. No assurance can be given that the U.S. government would provide financial support to its agencies and instrumentalities if not required to do so by law.
Q. How did the Fund perform during the 12-month period between October 1, 2015 and September 30, 2016?
A. The Fund’s Institutional Shares outperformed its current benchmark, the Bloomberg Barclays U.S. Government Intermediate Index.
Q. What factors affected the Fund’s performance?
A. The Fund invests primarily in government securities and maintains an average portfolio duration of between two and a half years and seven years. Falling intermediate and long–term interest rates during the period pushed bond prices higher during the period. Low inflation dragged on income early in the period, but this dynamic changed as inflation picked up in mid-2016.
During the period the Fund maintained a duration longer than its benchmark. This proved beneficial as yields on longer-term securities fell, driving prices higher. The Fund also maintained a modest barbell
strategy focusing on exposure to bonds with short and long maturities. The Fund benefited from that strategy as the yield curve flattened during the period.
An allocation to higher-quality corporate bonds contributed positively to the Fund’s performance relative to its benchmark, offering both income and rising prices as spreads relative to Treasuries compressed.
The Fund’s exposure to Treasury inflation-protected securities (TIPS) early in the period detracted somewhat from relative performance. By the end of the period, however, the Fund’s overall investments in TIPS contributed modestly to positive returns.
Falling interest rates increased reinvestment risk associated with the Fund’s exposure to callable and step-up agency securities. The Fund’s performance relative to its benchmark was hurt modestly as many of these securities were called away.
Portfolio composition is as of September 30, 2016 and is subject to change and risk.
| 26 | ||||
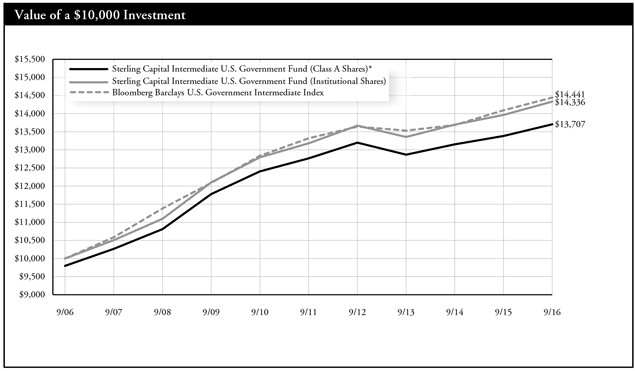
| * | Reflects 2.00% maximum sales charge. |
| ** | Reflects the applicable contingent deferred sales charge (CDSC), maximum of 5.00%. |
| *** | Reflects the applicable maximum CDSC of 1.00% (applicable only to redemptions within one year of purchase, and as such, are not reflected in the Average Annual Total Returns table since the periods reflected are for a year or longer). |
Average Annual Total Returns |
| |||||||||||||||
As of September 30, 2016 | Inception Date | 1 Year | 5 Years | 10 Years | ||||||||||||
Class A Shares* | 10/9/92 | 0.30% | 1.02% | 3.20% | ||||||||||||
Class B Shares** | 1/1/96 | -2.50% | 0.49% | 2.79% | ||||||||||||
Class C Shares*** | 2/1/01 | 1.51% | 0.68% | 2.65% | ||||||||||||
Institutional Shares | 10/9/92 | 2.63% | 1.69% | 3.67% | ||||||||||||
Bloomberg Barclays U.S. Government Intermediate Index | N/A | 2.44% | 1.62% | 3.74% | ||||||||||||
Past performance does not guarantee future results. The performance data quoted represents past performance and current returns may be lower or higher. Total return figures include change in share price, reinvestment of dividends and capital gains, and do not reflect taxes that a shareholder would pay on fund distributions or on the redemption of fund shares. The investment return and principal value will fluctuate so that an investor’s shares, when redeemed, may be worth more or less than the original cost. To obtain performance information current to the most recent month end, please visit www.sterlingcapitalfunds.com.
The chart above represents a comparison of a hypothetical $10,000 investment in the indicated share class versus a similar investment in the Fund’s benchmark and represents the reinvestment of dividends and capital gains.
The Fund is measured against the Bloomberg Barclays U.S. Government Intermediate Index, an unmanaged index comprised of all publicly issued non-convertible domestic debt of the U.S. government or any agency there of, or corporate debt guaranteed by the U.S. government all with outstanding principal of $1 million and maturity between one and ten years. The index does not reflect the deduction of expenses associated with a mutual fund, such as investment management and fund accounting fees. The Fund’s performance reflects the deduction of fees for these services. Investors cannot invest directly in an index, although they can invest in its underlying securities.
A portion of the Fund’s fees has been waived. If the fees had not been waived, the Fund’s total return for the periods would have been lower.
| 27 | ||||
Sterling Capital Total Return Bond Fund
Portfolio Managers
Sterling Capital Total Return Bond Fund (the “Fund”) is managed by Mark Montgomery, CFA and Richard LaCoff, Senior Managing Directors and portfolio managers for Sterling Capital Management LLC (“Sterling Capital”), advisor to the Fund.
Mark Montgomery, CFA
Mr. Montgomery, Senior Managing Director joined Sterling Capital in 1997 and has been a co-portfolio manager of the Fund since 2008. He is co-head of Sterling Capital’s Fixed Income Portfolio Management. He has investment experience since 1990. He is a graduate of West Chester University and received his MBA from Drexel University.
Richard T. LaCoff
Mr. LaCoff, Senior Managing Director joined Sterling Capital in 2007 and has been a co-portfolio manager of the Fund since 2011. He is co-head of Sterling Capital’s Fixed Income Portfolio Management. He has investment experience since 1991. He is a graduate of Villanova University and received his MS in Finance from Drexel University.
Investment Considerations
The Fund is subject to the same risks as the underlying bonds in the portfolio such as credit, prepayment, call and interest rate risk. As interest rates rise, the value of bond prices will decline and an investor may lose money. The Fund may invest in foreign securities, which may expose the fund to currency and exchange rate fluctuations; and mortgage-backed securities sensitive to interest rates; and high yield debt (also known as junk bonds), all of which may cause greater volatility and less liquidity. Derivatives may be more sensitive to changes in market conditions and may amplify risks.
Q. How did the Fund perform during the 12-month period between October 1, 2015 and September 30, 2016?
A. The Fund’s Institutional Shares outperformed its current benchmark, the Bloomberg Barclays U.S. Aggregate Bond Index.
Q. What factors affected the Fund’s performance?
A. Long-term interest rates declined during the period, which helped drive up prices on existing bonds. A decline in credit risk premiums also helped drive up prices, as volatility eased later in the period and investors grew less risk averse. Risk assets outperformed during the year as a result, and investors sought out higher yields and were willing to take on more risk. These trends helped drive up prices on the securities held by the Fund. The Fund’s absolute return was driven primarily by income derived from the securities it held, and income was a positive contributor to the Fund’s total return. Falling commodity prices generally weighed on absolute results, particularly oil prices, which caused an increase in credit risk premiums and ratings downgrades in the energy sector.
The Fund outperformed its benchmark for the period, particularly due to an overweight allocation to risk assets, as credit risk premiums
declined. Lower-quality credit outperformed higher-quality credit for the 12-month period, and the Fund’s overweight to triple-B rated bonds contributed positively to relative performance. The Fund’s allocation to corporate bonds in particular contributed positively to relative return, providing the highest excess return relative to duration-matched Treasuries in the benchmark. The Fund’s relative performance was also helped by its allocation to taxable municipal securities and the securitized sector — particularly asset-backed securities, commercial mortgage-backed securities and residential mortgage-backed securities — as did its income advantage relative to the benchmark.
The Fund’s average duration was shorter than the benchmark during a period when interest rates declined, and this bias weighed on relative results. Additionally, the Fund’s allocation to energy bonds detracted from performance as oil prices fell early in 2016. Some securities in this sector were sold during the period to reduce the Fund’s risk exposure. Additionally, the Fund’s overweight allocation to financials, which underperformed relative to industrials and utilities, dragged on relative results, as did its underweight allocation to agency pass-through securities, which outperformed during the year.
Portfolio composition is as of September 30, 2016 and is subject to change and risk.
| 28 | ||||
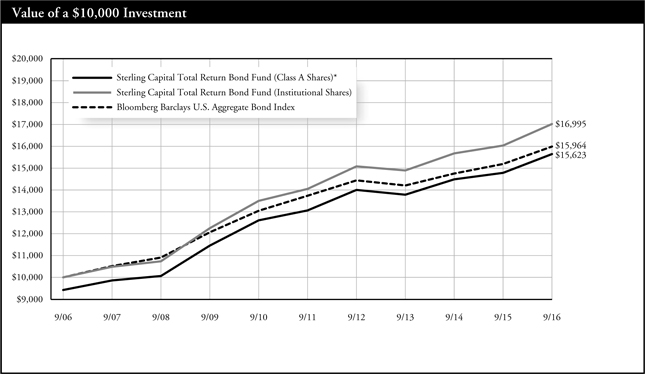
| * | Reflects 5.75% maximum sales charge. |
| ** | Reflects the applicable contingent deferred sales charge (CDSC), maximum of 5.00%. |
| *** | Reflects the applicable maximum CDSC of 1.00% (applicable only to redemptions within one year of purchase, and as such, are not reflected in the Average Annual Total Returns table since the periods reflected are for a year or longer). |
Average Annual Total Returns | ||||||||
As of September 30, 2016 | Inception Date | 1 Year | 5 Years | 10 Years | ||||
Class A Shares* | 12/2/99 | -0.23% | 2.44% | 4.56% | ||||
Class B Shares** | 12/2/99 | 1.05% | 2.70% | 4.56% | ||||
Class C Shares*** | 2/1/01 | 5.05% | 2.88% | 4.41% | ||||
Institutional Shares | 12/2/99 | 6.10% | 3.91% | 5.45% | ||||
Class R Shares | 2/1/101 | 5.59% | 3.38% | 5.06% | ||||
Bloomberg Barclays U.S. Aggregate Bond Index | N/A | 5.19% | 3.08% | 4.79% | ||||
Past performance does not guarantee future results. The performance data quoted represents past performance and current returns may be lower or higher. Total return figures include change in share price, reinvestment of dividends and capital gains, and do not reflect taxes that a shareholder would pay on fund distributions or on the redemption of fund shares. The investment return and principal value will fluctuate so that an investor’s shares, when redeemed, may be worth more or less than the original cost. To obtain performance information current to the most recent month end, please visit www.sterlingcapitalfunds.com.
The chart above represents a comparison of a hypothetical $10,000 investment in the indicated share class versus a similar investment in the Fund’s benchmark, and represents the reinvestment of dividends and capital gains.
| 1 | Class R Shares were not in existence prior to 2/1/10. Performance for periods prior to 2/1/10 is based on the performance of Institutional Shares, but such performance does not reflect Class R Shares’ 12b-1 fees, which if reflected, would have caused performance to be lower. |
The Fund is measured against the Bloomberg Barclays U.S. Aggregate Bond Index, an unmanaged index, which is a market value-weighted performance benchmark for investment-grade fixed-rate debt issues, including government, corporate, asset-backed, and mortgage-backed securities, with maturities of at least one year. The index is unmanaged and does not reflect the deduction of expenses associated with a mutual fund, such as investment management and fund accounting fees. The Fund’s performance reflects the deduction of fees for these services. Investors cannot invest directly in an index, although they can invest in its underlying securities.
A portion of the Fund’s fees has been waived. If the fees had not been waived, the Fund’s total return for the periods would have been lower.
| 29 | ||||
Sterling Capital Corporate Fund
Portfolio Managers
Sterling Capital Corporate Fund (the “Fund”) is managed by Mark Montgomery, CFA and Richard LaCoff, Senior Managing Directors and portfolio managers for Sterling Capital Management LLC (“Sterling Capital”), advisor to the Fund.
Mark Montgomery, CFA
Mr. Montgomery, Senior Managing Director joined Sterling Capital in 1997 and has been a co-portfolio manager of the Fund since inception. He is co-head of Sterling Capital’s Fixed Income Portfolio Management. He has investment experience since 1990. He is a graduate of West Chester University and received his MBA from Drexel University.
Richard T. LaCoff
Mr. LaCoff, Senior Managing Director joined Sterling Capital in 2007 and has been a co-portfolio manager of the Fund since inception. He is co-head of Sterling Capital’s Fixed Income Portfolio Management. He has investment experience since 1991. He is a graduate of Villanova University and received his MS in Finance from Drexel University.
Investment Considerations
The Fund is subject to the same risks as the underlying bonds in the portfolio such as credit, prepayment, call and interest rate risk. As interest rates rise, the value of bond prices will decline and an investor may lose money. The Fund may invest in more aggressive investments, such as foreign securities, which may expose the fund to currency and exchange rate fluctuations; mortgage-backed securities sensitive to interest rates; and high yield debt (also known as junk bonds), all of which may cause greater volatility and less liquidity. Derivatives may be more sensitive to changes in market conditions and may amplify risks.
Q. How did the Fund perform during the 12-month period between October 1, 2015 and September 30, 2016?
A. The Fund’s Institutional Shares outperformed its current benchmark, the Bloomberg Barclays Corporate Intermediate Bond Index.
Q. What factors affected the Fund’s performance?
A. Aggressive monetary policies, which pushed interest rates down, eased globally during the period. That trend, along with strong demand for fixed income investments, helped bonds post positive total returns for the period. The prevalence of low and often negative interest rates in other major developed fixed income markets drove yield-seeking foreign investors to USD-denominated assets, which helped drive the Fund’s absolute performance. Corporate bonds performed particularly well after commodity prices bottomed in February and as credit spreads — the difference between yields on corporate bonds and less riskier U.S. Treasuries — tightened dramatically over the next several months.
The Fund outperformed its benchmark, in large part due to its allocation to lower-quality, higher-yielding bonds, including subordinated and preferred securities. Investors seeking yield continued to move lower down the risk and quality spectrums which drove up
demand for these lower-quality bonds. As a result, higher-risk assets, particularly the Fund’s holdings of below-investment-grade securities, outperformed the broader benchmark. The Fund’s allocation decisions within the financial sector also contributed to relative results. The Fund held an overweight allocation to insurance company- and REIT-related debt. Banks underperformed the broader market through much of the year and the Fund’s underweight allocation to bank debt enhanced relative performance. Finally, the period saw a flattening yield curve as investors sought bonds with longer maturities and amid the continued possibility that the Federal Reserve would raise interest rates. The Fund benefitted by including an overweight allocation to the short and long ends of the curve and an underweight allocation to the intermediate area of the curve.
The Fund’s overweight allocation to the financial sector and its underweight exposure to the industrials sector dragged on relative results as commodity-related sub-sectors outperformed during the period. A slight bias toward holdings with short durations also detracted from relative performance.
Portfolio composition is as of September 30, 2016 and is subject to change and risk.
| 30 | ||||
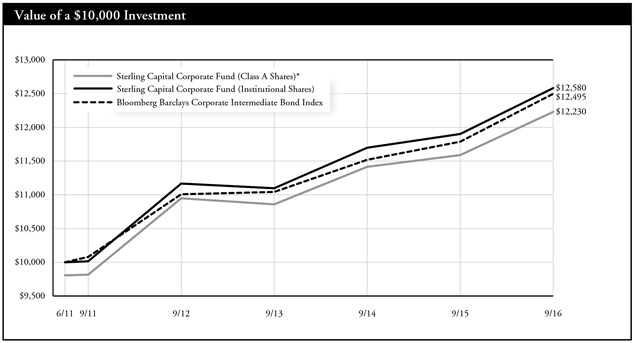
| * | Reflects 2.00% maximum sales charge. |
| ** | Reflects the applicable maximum contingent deferred sales charge (CDSC) of 1.00% (applicable only to redemptions within one year of purchase, and as such, are not reflected in the Annual Total Returns table since the periods reflected are for a year or longer). |
Average Annual Total Returns | ||||||||
As of September 30, 2016 | Inception Date | 1 Year | 5 Year | Since Inception | ||||
Class A Shares* | 2/1/131 | 3.40% | 4.08% | 3.91% | ||||
Class C Shares** | 2/1/131 | 4.69% | 3.89% | 3.72% | ||||
Institutional Shares | 6/30/112 | 5.70% | 4.67% | 4.47% | ||||
Bloomberg Barclays Corporate Intermediate Bond Index | 6/30/11 | 5.55% | 4.31% | 4.25% | ||||
Past performance does not guarantee future results. The performance data quoted represents past performance and current returns may be lower or higher. Total return figures include change in share price, reinvestment of dividends and capital gains, and do not reflect taxes that a shareholder would pay on fund distributions or on the redemption of fund shares. The investment return and principal value will fluctuate so that an investor’s shares, when redeemed, may be worth more or less than the original cost. To obtain performance information current to the most recent month end, please call 1-888-228-1872.
The chart above represents a comparison of a hypothetical $10,000 investment in the indicated share class versus a similar investment in the Fund’s benchmark, and represents the reinvestment of dividends and capital gains.
| 1 | Class A and C Shares were not in existence prior to 2/1/13. Performance for periods prior to 2/1/13 is based on the performance of Institutional Shares and has been adjusted for maximum CDSC to the class applicable but does not include 12b-1 fees, which if reflected, would have caused performance of Class A and C Shares to be lower. |
| 2 | The Fund converted Class S Shares into Institutional Shares effective 2/1/13. |
The Fund is measured against the Bloomberg Barclays Corporate Intermediate Bond Index, an unmanaged index consisting of dollar-denominated debt from U.S. industrial, utility and financial institutions issuers with a duration of 1 to 10 years. The index does not reflect the deduction of expenses associated with a mutual fund, such as investment management and fund accounting fees. The Fund’s performance reflects the deduction of fees for these services. Investors cannot invest directly in an index, although they can invest in its underlying securities.
| 31 | ||||
Sterling Capital Securitized Opportunities Fund
Portfolio Managers
Sterling Capital Securitized Opportunities Fund (the “Fund”) is managed by Executive Director Michael Sun, CFA, Jeffrey Ormsby, CFA and Byron Mims, CFA, Directors and portfolio managers for Sterling Capital Management LLC (“Sterling Capital”), advisor to the Fund.
Michael Z. Sun, CFA
Mr. Sun, Executive Director, joined Sterling Capital in 2009 and has been a co-portfolio manager to the Fund since 2014. Mr. Sun has investment experience since 1998 and is a graduate of Nanjing University and received his MS from Beijing University and his MA from Bowling Green State University.
Byron G. Mims, CFA
Mr. Mims, Director, joined Sterling Capital in 2012 and has been a co-portfolio manager to the Fund since 2016. Mr. Mims has investment experience since 2006. He is a graduate of North Carolina State University where he received his BS in Economics. He was a summa cum laude graduate and was recognized as valedictorian.
Jeffrey D. Ormsby, CFA
Mr. Ormsby, Director, joined Sterling Capital in 2011 and has been a co-portfolio manager to the Fund since 2016. Mr. Ormsby has investment experience since 2006. He is a graduate of North Carolina State University where he received his BS in Economics. He was a summa cum laude graduate and was recognized as Valedictorian. Mr. Ormsby received his MBA from the University of North Carolina at Chapel Hill’s Kenan-Flagler Business School, where he was the Norman Block Valedictorian Award recipient.
Investment Considerations
The Fund is subject to the same risks as the underlying bonds in the portfolio such as credit, prepayment, call and interest rate risk. As interest rates rise, the value of bond prices will decline and an investor may lose money. The Fund may invest in more aggressive investments, such as foreign securities, which may expose the Fund to currency and exchange rate fluctuations; mortgage-backed securities sensitive to interest rates; and high yield debt (also known as junk bonds), all of which may cause greater volatility and less liquidity.
Q. How did the Fund perform during the 12-month period between October 1, 2015 and September 30, 2016?
A. The Fund’s Institutional Shares outperformed its current benchmark, the Bloomberg Barclays U.S. Mortgage Backed Securities Index.
Q. What factors affected the Fund’s performance?
A. All sectors within the Fund had positive absolute returns for the period. As long-term interest rates fell, prices on long duration assets rose, which contributed to the Fund’s absolute performance. And while short-term interest rates rose, which negatively impacted prices on shorter duration securities, the higher yields on those holdings was more than enough to offset the negative impacts.
The Fund outperformed its benchmark, due primarily to its overweight allocation to risk assets. As investors sought yield, they turned to risk assets such as commercial mortgage-backed securities, asset-backed securities and residential mortgage-backed securities. The Fund held an overweight allocation to each of these sectors, and each outperformed the benchmark return, boosting the Fund’s relative results.
The Fund’s positioning in agency mortgage-backed securities detracted from relative returns, however. The Fund was positioned defensively in this sector in order to guard against higher interest rates and higher interest rate volatility, which could have weighed on mortgage-backed returns. However, as interest rates and interest rate volatility remained low for the period, this defensive positioning weighed on the Fund’s performance relative to its benchmark.
Portfolio composition is as of September 30, 2016 and is subject to change and risk.
| 32 | ||||
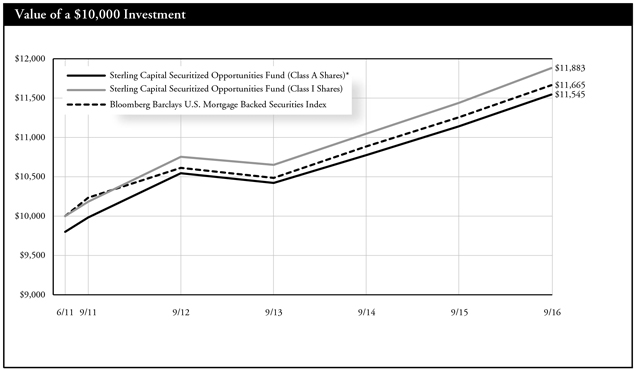
| * | Reflects 2.00% maximum sales charge. |
| ** | Reflects the applicable maximum contingent deferred sales charge (CDSC) of 1.00% (applicable only to redemptions within one year of purchase, and as such, are not reflected in the Annual Total Returns table since the periods reflected are for a year or longer). |
Average Annual Total Returns |
| |||||||||||||||
As of September 30, 2016 | Inception Date | 1 Year | 5 Year | Since Inception | ||||||||||||
Class A Shares* | 2/1/131 | 1.57% | 2.53% | 2.77% | ||||||||||||
Class C Shares** | 2/1/131 | 2.83% | 2.41% | 2.65% | ||||||||||||
Institutional Shares | 6/30/112 | 3.86% | 3.13% | 3.34% | ||||||||||||
Bloomberg Barclays U.S. Mortgage Backed Securities Index | 6/30/11 | 3.72% | 2.65% | 2.98% | ||||||||||||
Past performance does not guarantee future results. The performance data quoted represents past performance and current returns may be lower or higher. Total return figures include change in share price, reinvestment of dividends and capital gains, and do not reflect taxes that a shareholder would pay on fund distributions or on the redemption of fund shares. The investment return and principal value will fluctuate so that an investor’s shares, when redeemed, may be worth more or less than the original cost. To obtain performance information current to the most recent month end, please call 1-888-228-1872.
The chart above represents a comparison of a hypothetical $10,000 investment in the indicated share class versus a similar investment in the Fund’s benchmark, and represents the reinvestment of dividends and capital gains.
| 1 | Class A and C Shares were not in existence prior to 2/1/13. Performance for periods prior to 2/1/13 is based on the performance of Institutional Shares and has been adjusted for maximum CDSC to the class applicable but does not include 12b-1 fees, which if reflected, would have caused performance of Class A and C Shares to be lower. |
| 2 | The Fund converted Class S Shares into Institutional Shares effective 2/1/13. |
The Fund is measured against the Bloomberg Barclays U.S. Mortgage Backed Securities Index. The index measures the performance of investment grade fixed-rate mortgage-backed pass-through securities of Ginnie Mae, Fannie Mae, and Freddie Mac. The index is unmanaged and does not reflect the deduction of expenses associated with a mutual fund, such as investment management and fund accounting fees. The Fund’s performance reflects the deduction of fees for these services. Investors cannot invest directly in an index, although they can invest in its underlying securities.
A portion of the Fund’s fees has been waived. If the fees had not been waived, the Fund’s total return for the periods would have been lower.
| 33 | ||||
Sterling Capital Kentucky Intermediate Tax-Free Fund
Portfolio Manager
Robert F. Millikan, CFA
Sterling Capital Kentucky Intermediate Tax-Free Fund (the “Fund”) is managed by Robert F. Millikan, CFA, Executive Director and portfolio manager for Sterling Capital Management LLC (“Sterling Capital”), advisor to the Fund. Mr. Millikan joined BB&T Asset Management in 2000 and Sterling Capital through merger in 2010. He is lead portfolio manager of the Fund and has managed or been a member of the team that manages the state-specific municipal bond fund portfolios since 2000 and has investment experience since 1990. Mr. Millikan is a graduate of Wake Forest University where he received his BA in Economics.
Investment Considerations
The Fund is subject to the same risks as the underlying bonds in the portfolios such as credit, prepayment and interest rate risk. As interest rates rise, the value of bond prices will decline and an investor may lose money. The Fund is non-diversified and may invest a greater percentage of its assets in a single issuer than funds that are more diversified. Furthermore, the Fund invests primarily in municipal obligations issued by Kentucky and its political subdivisions and therefore will be affected by economic, political or other events affecting Kentucky.
Q. How did the Fund perform during the 12-month period between October 1, 2015 and September 30, 2016?
A. The Fund’s Institutional Shares underperformed its current benchmark, the BofA Merrill Lynch 2-17 Year Municipal Bond Index.
Q. What factors affected the Fund’s performance?
A. Municipal bond markets delivered positive returns during the 12-month period. Concerns about lagging global growth and low yields on government bonds elsewhere boosted demand for municipal bonds.
The surge in demand for municipal bonds resulted in higher prices and pushed down yields, which tumbled to near-record lows. Yields were further suppressed by a reduction in supply due to several factors, including weak refunding levels and reluctance among some states and municipalities to take on new debt. That said, those issues were more muted later in the period and municipal bond supply rebounded strongly. Issuance hit record levels in August and a strong issue calendar continued into September. Investors during the period had concerns about Puerto Rico’s default and about the fiscal health of some localities, but sentiment remained positive given municipal bonds’
stability relative to other asset classes.
The Fund’s relatively short duration position dragged on performance relative to the benchmark as interest rates fell during the period. An underweight position in the benchmark’s longest maturities also hurt results as those issues rallied during the 12-month period.
The Fund’s relative performance also suffered from a bias toward higher-quality bonds. We believed that lower-rated issuers did not adequately compensate investors for the additional risk they carry. However, lower-rated municipal issues outperformed their higher-rated peers. For instance, AAA-rated municipal bonds returned 3.83% during the period compared to a 6.59% return for BBB-rated issues. In Kentucky, a relatively weak local economy and large underfunded pension liabilities continued to weigh on the state’s credit.
The Fund benefited from an overweight position in revenue bonds, especially among healthcare and hospital bonds. An underweight position in general obligation bonds also benefited relative performance, as these bonds lagged during the period.
Portfolio composition is as of September 30, 2016 and is subject to change and risk.
| 34 | ||||
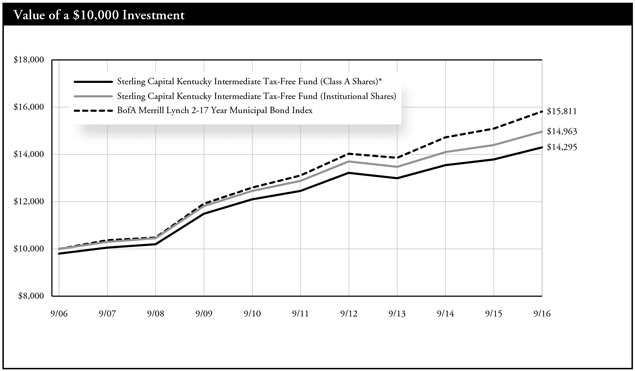
| * | Reflects 2.00% maximum sales charge. |
| ** | Reflects the applicable maximum contingent deferred sales charge of 1.00% (applicable only to redemptions within one year of purchase, and as such, are not reflected in the Average Annual Total Returns table since the periods reflected are for a year or longer). |
Average Annual Total Returns | ||||||||
As of September 30, 2016 | Inception Date | 1 Year | 5 Years | 10 Years | ||||
Class A Shares* | 2/24/03 | 1.58% | 2.39% | 3.64% | ||||
Class C Shares** | 2/1/121 | 2.93% | 2.11% | 3.50% | ||||
Institutional Shares | 2/24/03 | 3.95% | 3.06% | 4.11% | ||||
BofA Merrill Lynch 2-17 Year Municipal Bond Index | N/A | 4.77% | 3.82% | 4.69% | ||||
Past performance does not guarantee future results. The performance data quoted represents past performance and current returns may be lower or higher. Total return figures include change in share price, reinvestment of dividends and capital gains, and do not reflect taxes that a shareholder would pay on fund distributions or on the redemption of fund shares. The investment return and principal value will fluctuate so that an investor’s shares, when redeemed, may be worth more or less than the original cost. To obtain performance information current to the most recent month end, please visit www.sterlingcapitalfunds.com.
The chart above represents a comparison of a hypothetical $10,000 investment in the indicated share class versus a similar investment in the Fund’s benchmark, and represents the reinvestment of dividends and capital gains.
| 1 | Class C Shares were not in existence prior to 2/1/12. Performance for periods prior to 2/1/12 is based on the performance of Class A Shares. Such performance would differ only to the extent that the Classes have different expenses. |
The Fund is measured against the BofA Merrill Lynch 2-17 Year Municipal Bond Index, an unmanaged index that is representative of municipal bonds. The index does not reflect the deduction of expenses associated with a mutual fund, such as investment management and fund accounting fees. The Fund’s performance reflects the deduction of fees for these services. Investors cannot invest directly in an index, although they can invest in its underlying securities.
A portion of the Fund’s fees has been waived. If the fees had not been waived, the Fund’s total return for the periods would have been lower.
| 35 | ||||
Sterling Capital Maryland Intermediate Tax-Free Fund
Portfolio Manager
Robert F. Millikan, CFA
Sterling Capital Maryland Intermediate Tax-Free Fund (the “Fund”) is managed by Robert F. Millikan, CFA, Executive Director and portfolio manager for Sterling Capital Management LLC (“Sterling Capital”), advisor to the Fund. Mr. Millikan joined BB&T Asset Management in 2000 and Sterling Capital through merger in 2010. He is lead portfolio manager of the Fund and has managed or been a member of the team that manages the state-specific municipal bond fund portfolios since 2000 and has investment experience since 1990. Mr. Millikan is a graduate of Wake Forest University where he received his BA in Economics.
Investment Considerations
The Fund is subject to the same risks as the underlying bonds in the portfolios such as credit, prepayment and interest rate risk. As interest rates rise, the value of bond prices will decline and an investor may lose money. The Fund is non-diversified and may invest a greater percentage of its assets in a single issuer than funds that are more diversified. Furthermore, the Fund invests primarily in municipal obligations issued by Maryland and its political subdivisions and therefore will be affected by economic, political or other events affecting Maryland.
Q. How did the Fund perform during the 12-month period between October 1, 2015 and September 30, 2016?
A. The Fund’s Institutional Shares underperformed its current benchmark, the BofA Merrill Lynch 2-17 Year Municipal Bond Index.
Q. What factors affected the Fund’s performance?
A. Municipal bond markets delivered positive returns during the 12-month period. Concerns about lagging global growth and low yields on government bonds elsewhere boosted demand for municipal bonds.
The surge in demand for municipal bonds resulted in higher prices and pushed down yields, which tumbled to near-record lows. Yields were further suppressed by a reduction in supply due to several factors, including weak refunding levels and reluctance among some states and municipalities to take on new debt. That said, those issues were more muted later in the period and municipal bond supply rebounded strongly. Issuance hit record levels in August and a strong issue calendar continued into September. Investors during the period had concerns about Puerto Rico’s default and about the fiscal health of some
localities, but sentiment remained positive given municipal bonds’ stability relative to other asset classes.
The Fund’s relatively short duration position dragged on performance relative to the benchmark as interest rates fell during the period. An underweight position in the benchmark’s longest maturities also hurt results as those issues rallied during the 12-month period.
The Fund’s relative performance also suffered from a bias toward higher-quality bonds. We believed that lower-rated issuers did not adequately compensate investors for the additional risk they carry. However, lower-rated municipal issues outperformed their higher-rated peers. For instance, AAA-rated municipal bonds returned 3.83% during the period compared to a 6.59% return for BBB-rated issues.
The Fund benefited from an overweight position in revenue bonds, especially among healthcare and hospital bonds. An underweight position in general obligation bonds also benefited relative performance, as these bonds lagged during the period.
Portfolio composition is as of September 30, 2016 and is subject to change and risk.
| 36 | ||||
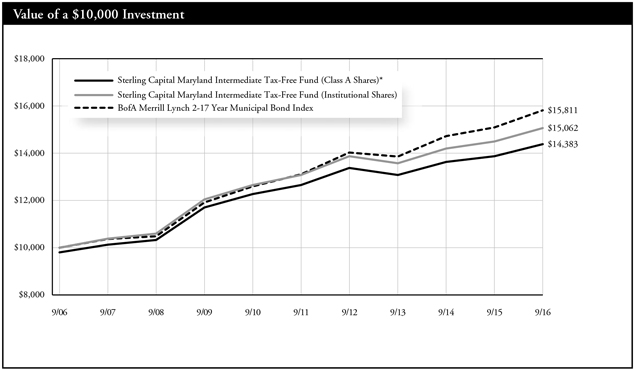
| * | Reflects 2.00% maximum sales charge. |
| ** | Reflects the applicable maximum contingent deferred sales charge of 1.00% (applicable only to redemptions within one year of purchase, and as such, are not reflected in the Average Annual Total Returns table since the periods reflected are for a year or longer). |
Average Annual Total Returns | ||||||||
As of September 30, 2016 | Inception Date | 1 Year | 5 Years | 10 Years | ||||
Class A Shares* | 2/24/03 | 1.63% | 2.20% | 3.70% | ||||
Class C Shares** | 2/1/121 | 2.85% | 1.90% | 3.55% | ||||
Institutional Shares | 2/24/03 | 3.97% | 2.87% | 4.18% | ||||
BofA Merrill Lynch 2-17 Year Municipal Bond Index | N/A | 4.77% | 3.82% | 4.69% | ||||
Past performance does not guarantee future results. The performance data quoted represents past performance and current returns may be lower or higher. Total return figures include change in share price, reinvestment of dividends and capital gains, and do not reflect taxes that a shareholder would pay on fund distributions or on the redemption of fund shares. The investment return and principal value will fluctuate so that an investor’s shares, when redeemed, may be worth more or less than the original cost. To obtain performance information current to the most recent month end, please visit www.sterlingcapitalfunds.com.
The chart above represents a comparison of a hypothetical $10,000 investment in the indicated share class versus a similar investment in the Fund’s benchmark, and represents the reinvestment of dividends and capital gains.
| 1 | Class C Shares were not in existence prior to 2/1/12. Performance for periods prior to 2/1/12 is based on the performance of Class A Shares. Such performance would differ only to the extent that the Classes have different expenses. |
The Fund is measured against the BofA Merrill Lynch 2-17 Year Municipal Bond Index, an unmanaged index, which is representative of municipal bonds. The index does not reflect the deduction of expenses associated with a mutual fund, such as investment management and fund accounting fees. The Fund’s performance reflects the deduction of fees for these services. Investors cannot invest directly in an index, although they can invest in its underlying securities.
A portion of the Fund’s fees has been waived. If the fees had not been waived, the Fund’s total return for the periods would have been lower.
| 37 | ||||
Sterling Capital North Carolina Intermediate Tax-Free Fund
Portfolio Manager
Robert F. Millikan, CFA
Sterling Capital North Carolina Intermediate Tax-Free Fund (the “Fund”) is managed by Robert F. Millikan, CFA, Executive Director and portfolio manager for Sterling Capital Management LLC (“Sterling Capital”), advisor to the Fund. Mr. Millikan joined BB&T Asset Management in 2000 and Sterling Capital through merger in 2010. He is lead portfolio manager of the Fund and has managed or been a member of the team that manages the state-specific municipal bond fund portfolios since 2000 and has investment experience since 1990. Mr. Millikan is a graduate of Wake Forest University where he received his BA in Economics.
Investment Considerations
The Fund is subject to the same risks as the underlying bonds in the portfolios such as credit, prepayment and interest rate risk. As interest rates rise, the value of bond prices will decline and an investor may lose money. The Fund is non-diversified and may invest a greater percentage of its assets in a single issuer than funds that are more diversified. Furthermore, the Fund invests primarily in municipal obligations issued by North Carolina and its political subdivisions and therefore will be affected by economic, political or other events affecting North Carolina.
Q. How did the Fund perform during the 12-month period between October 1, 2015 and September 30, 2016?
A. The Fund’s Institutional Shares underperformed its current benchmark, the BofA Merrill Lynch 2-17 Year Municipal Bond Index.
Q. What factors affected the Fund’s performance?
A. Municipal bond markets delivered positive returns during the 12-month period. Concerns about lagging global growth and low yields on government bonds elsewhere boosted demand for municipal bonds.
The surge in demand for municipal bonds resulted in higher prices and pushed down yields, which tumbled to near-record lows. Yields were further suppressed by a reduction in supply due to several factors, including weak refunding levels and reluctance among some states and municipalities to take on new debt. That said, those issues were more muted later in the period and municipal bond supply rebounded strongly. Issuance hit record levels in August and a strong issue calendar continued into September. Investors during the period had concerns about Puerto Rico’s default and about the fiscal health of some
localities, but sentiment remained positive given municipal bonds’ stability relative to other asset classes.
The Fund’s relatively short duration position dragged on performance relative to the benchmark as interest rates fell during the period. An underweight position in the benchmark’s longest maturities also hurt results as those issues rallied during the 12-month period.
The Fund’s relative performance also suffered from a bias toward higher-quality bonds. We believed that lower-rated issuers did not adequately compensate investors for the additional risk they carry. However, lower-rated municipal issues outperformed their higher-rated peers. For instance, AAA-rated municipal bonds returned 3.83% during the period compared to a 6.59% return for BBB-rated issues.
The Fund benefited from an overweight position in revenue bonds, especially among healthcare and hospital bonds. An underweight position in general obligation bonds also benefited relative performance, as these bonds lagged during the period.
Portfolio composition is as of September 30, 2016 and is subject to change and risk.
| 38 | ||||
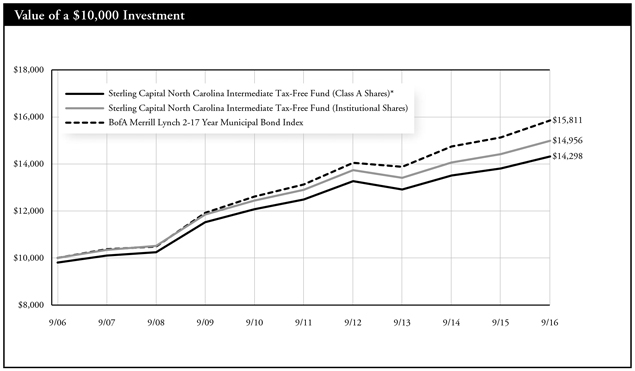
| * | Reflects 2.00% maximum sales charge. |
| ** | Reflects the applicable maximum contingent deferred sales charge of 1.00% (applicable only to redemptions within one year of purchase, and as such, are not reflected in the Average Annual Total Returns table since the periods reflected are for a year or longer). |
Average Annual Total Returns | ||||||||
As of September 30, 2016 | Inception Date | 1 Year | 5 Years | 10 Years | ||||
Class A Shares* | 10/16/92 | 1.65% | 2.37% | 3.64% | ||||
Class C Shares** | 2/1/121 | 2.91% | 2.05% | 3.47% | ||||
Institutional Shares | 10/16/92 | 3.94% | 3.04% | 4.11% | ||||
BofA Merrill Lynch 2-17 Year Municipal Bond Index | N/A | 4.77% | 3.82% | 4.69% | ||||
Past performance does not guarantee future results. The performance data quoted represents past performance and current returns may be lower or higher. Total return figures include change in share price, reinvestment of dividends and capital gains, and do not reflect taxes that a shareholder would pay on fund distributions or on the redemption of fund shares. The investment return and principal value will fluctuate so that an investor’s shares, when redeemed, may be worth more or less than the original cost. To obtain performance information current to the most recent month end, please visit www.sterlingcapitalfunds.com.
The chart above represents a comparison of a hypothetical $10,000 investment in the indicated share class versus a similar investment in the Fund’s benchmark, and represents the reinvestment of dividends and capital gains.
| 1 | Class C Shares were not in existence prior to 2/1/12. Performance for periods prior to 2/1/12 is based on the performance of Class A Shares. Such performance would differ only to the extent that the Classes have different expenses. |
The Fund is measured against the BofA Merrill Lynch 2-17 Year Municipal Bond Index, an unmanaged index, which is representative of municipal bonds. The index does not reflect the deduction of expenses associated with a mutual fund, such as investment management and fund accounting fees. The Fund’s performance reflects the deduction of fees for these services. Investors cannot invest directly in an index, although they can invest in its underlying securities.
A portion of the Fund’s fees had been waived. If the fees had not been waived, the Fund’s total return for the periods would have been lower.
| 39 | ||||
Sterling Capital South Carolina Intermediate Tax-Free Fund
Portfolio Manager
Robert F. Millikan, CFA
Sterling Capital South Carolina Intermediate Tax-Free Fund (the “Fund”) is managed by Robert F. Millikan, CFA, Executive Director and portfolio manager for Sterling Capital Management LLC (“Sterling Capital”), advisor to the Fund. Mr. Millikan joined BB&T Asset Management in 2000 and Sterling Capital through merger in 2010. He is lead portfolio manager of the Fund and has managed or been a member of the team that manages the state-specific municipal bond fund portfolios since 2000 and has investment experience since 1990. Mr. Millikan is a graduate of Wake Forest University where he received his BA in Economics.
Investment Considerations
The Fund is subject to the same risks as the underlying bonds in the portfolios such as credit, prepayment and interest rate risk. As interest rates rise, the value of bond prices will decline and an investor may lose money. The Fund is non-diversified and may invest a greater percentage of its assets in a single issuer than funds that are more diversified. Furthermore, the Fund invests primarily in municipal obligations issued by South Carolina and its political subdivisions and therefore will be affected by economic, political or other events affecting South Carolina.
Q. How did the Fund perform during the 12-month period between October 1, 2015 and September 30, 2016?
A. The Fund’s Institutional Shares underperformed its current benchmark, the BofA Merrill Lynch 2-17 Year Municipal Bond Index.
Q. What factors affected the Fund’s performance?
A. Municipal bond markets delivered positive returns during the 12-month period. Concerns about lagging global growth and low yields on government bonds elsewhere boosted demand for municipal bonds.
The surge in demand for municipal bonds resulted in higher prices and pushed down yields, which tumbled to near-record lows. Yields were further suppressed by a reduction in supply due to several factors, including weak refunding levels and reluctance among some states and municipalities to take on new debt. That said, those issues were more muted later in the period and municipal bond supply rebounded strongly. Issuance hit record levels in August and a strong issue calendar continued into September. Investors during the period had concerns about Puerto Rico’s default and about the fiscal health of some
localities, but sentiment remained positive given municipal bonds’ stability relative to other asset classes.
The Fund’s relatively short duration position dragged on performance relative to the benchmark as interest rates fell during the period. An underweight position in the benchmark’s longest maturities also hurt results as those issues rallied during the 12-month period.
The Fund’s relative performance also suffered from a bias toward higher-quality bonds. We believed that lower-rated issuers did not adequately compensate investors for the additional risk they carry. However, lower-rated municipal issues outperformed their higher-rated peers. For instance, AAA-rated municipal bonds returned 3.83% during the period compared to a 6.59% return for BBB-rated issues.
The Fund benefited from an overweight position in revenue bonds, especially among healthcare and hospital bonds. An underweight position in general obligation bonds also benefited relative performance, as these bonds lagged during the period.
Portfolio composition is as of September 30, 2016 and is subject to change and risk.
| 40 | ||||
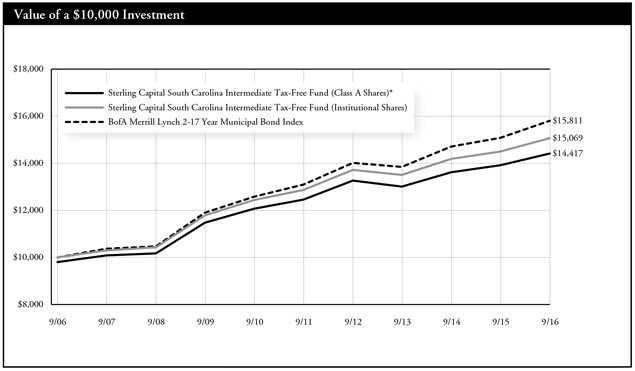
| * | Reflects 2.00% maximum sales charge. |
| ** | Reflects the applicable maximum contingent deferred sales charge of 1.00% (applicable only to redemptions within one year of purchase, and as such, are not reflected in the Average Annual Total Returns table since the periods reflected are for a year or longer). |
Average Annual Total Returns | ||||||||
As of September 30, 2016 | Inception Date | 1 Year | 5 Years | 10 Years | ||||
Class A Shares* | 10/20/97 | 1.50% | 2.56% | 3.73% | ||||
Class C Shares** | 2/1/121 | 2.82% | 2.24% | 3.57% | ||||
Institutional Shares | 10/20/97 | 3.87% | 3.21% | 4.19% | ||||
BofA Merrill Lynch 2-17 Year Municipal Bond Index | N/A | 4.77% | 3.82% | 4.69% | ||||
Past performance does not guarantee future results. The performance data quoted represents past performance and current returns may be lower or higher. Total return figures include change in share price, reinvestment of dividends and capital gains, and do not reflect taxes that a shareholder would pay on fund distributions or on the redemption of fund shares. The investment return and principal value will fluctuate so that an investor’s shares, when redeemed, may be worth more or less than the original cost. To obtain performance information current to the most recent month end, please visit www.sterlingcapitalfunds.com.
The chart above represents a comparison of a hypothetical $10,000 investment in the indicated share class versus a similar investment in the Fund’s benchmark, and represents the reinvestment of dividends and capital gains.
| 1 | Class C Shares were not in existence prior to 2/1/12. Performance for periods prior to 2/1/12 is based on the performance of Class A Shares. Such performance would differ only to the extent that the Classes have different expenses. |
The Fund is measured against the BofA Merrill Lynch 2-17 Year Municipal Bond Index, an unmanaged index, which is representative of municipal bonds. The index does not reflect the deduction of expenses associated with a mutual fund, such as investment management and fund accounting fees. The Fund’s performance reflects the deduction of fees for these services. Investors cannot invest directly in an index, although they can invest in its underlying securities.
A portion of the Fund’s fees has been waived. If the fees had not been waived, the Fund’s total return for the periods would have been lower.
| 41 | ||||
Sterling Capital Virginia Intermediate Tax-Free Fund
Portfolio Manager
Robert F. Millikan, CFA
Sterling Capital Virginia Intermediate Tax-Free Fund (the “Fund”) is managed by Robert F. Millikan, CFA, Executive Director and portfolio manager for Sterling Capital Management LLC (“Sterling Capital”), advisor to the Fund. Mr. Millikan joined BB&T Asset Management in 2000 and Sterling Capital through merger in 2010. He is lead portfolio manager of the Fund and has managed or been a member of the team that manages the state-specific municipal bond fund portfolios since 2000 and has investment experience since 1990. Mr. Millikan is a graduate of Wake Forest University where he received his BA in Economics.
Investment Considerations
The Fund is subject to the same risks as the underlying bonds in the portfolios such as credit, prepayment and interest rate risk. As interest rates rise, the value of bond prices will decline and an investor may lose money. The Fund is non-diversified and may invest a greater percentage of its assets in a single issuer than funds that are more diversified. Furthermore, the Fund invests primarily in municipal obligations issued by Virginia and its political subdivisions and therefore will be affected by economic, political or other events affecting Virginia.
Q. How did the Fund perform during the 12-month period between October 1, 2015 and September 30, 2016?
A. The Fund’s Institutional Shares underperformed its current benchmark, the BofA Merrill Lynch 2-17 Year Municipal Bond Index.
Q. What factors affected the Fund’s performance?
A. Municipal bond markets delivered positive returns during the 12-month period. Concerns about lagging global growth and low yields on government bonds elsewhere boosted demand for municipal bonds.
The surge in demand for municipal bonds resulted in higher prices and pushed down yields, which tumbled to near-record lows. Yields were further suppressed by a reduction in supply due to several factors, including weak refunding levels and reluctance among some states and municipalities to take on new debt. That said, those issues were more muted later in the period and municipal bond supply rebounded strongly. Issuance hit record levels in August and a strong issue calendar continued into September. Investors during the period had concerns about Puerto Rico’s default and about the fiscal health of some
localities, but sentiment remained positive given municipal bonds’ stability relative to other asset classes.
The Fund’s relatively short duration position dragged on performance relative to the benchmark as interest rates fell during the period. An underweight position in the benchmark’s longest maturities also hurt results as those issues rallied during the 12-month period.
The Fund’s relative performance also suffered from a bias toward higher-quality bonds. We believed that lower-rated issuers did not adequately compensate investors for the additional risk they carry. However, lower-rated municipal issues outperformed their higher-rated peers. For instance, AAA-rated municipal bonds returned 3.83% during the period compared to a 6.59% return for BBB-rated issues.
The Fund benefited from an overweight position in revenue bonds, especially among healthcare and hospital bonds. An underweight position in general obligation bonds also benefited relative performance, as these bonds lagged during the period.
Portfolio composition is as of September 30, 2016 and is subject to change and risk.
| 42 | ||||
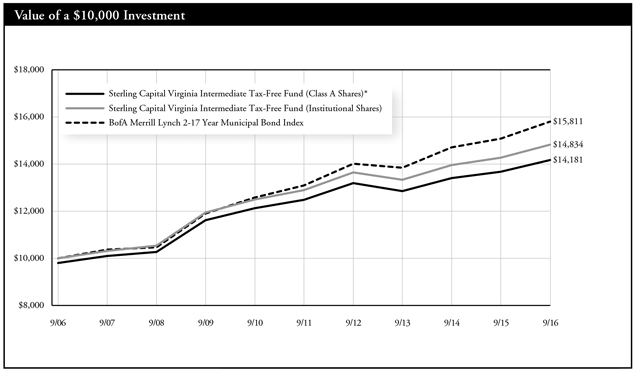
| * | Reflects 2.00% maximum sales charge. |
| ** | Reflects the applicable maximum contingent deferred sales charge of 1.00% (applicable only to redemptions within one year of purchase, and as such, are not reflected in the Average Annual Total Returns table since the periods reflected are for a year or longer). |
Average Annual Total Returns | ||||||||
As of September 30, 2016 | Inception Date | 1 Year | 5 Years | 10 Years | ||||
Class A Shares* | 5/17/99 | 1.62% | 2.16% | 3.55% | ||||
Class C Shares** | 2/1/121 | 2.88% | 1.86% | 3.40% | ||||
Institutional Shares | 5/17/99 | 3.91% | 2.84% | 4.02% | ||||
BofA Merrill Lynch 2-17 Year Municipal Bond Index | N/A | 4.77% | 3.82% | 4.69% | ||||
Past performance does not guarantee future results. The performance data quoted represents past performance and current returns may be lower or higher. Total return figures include change in share price, reinvestment of dividends and capital gains, and do not reflect taxes that a shareholder would pay on fund distributions or on the redemption of fund shares. The investment return and principal value will fluctuate so that an investor’s shares, when redeemed, may be worth more or less than the original cost. To obtain performance information current to the most recent month end, please visit www.sterlingcapitalfunds.com.
The chart above represents a comparison of a hypothetical $10,000 investment in the indicated share class versus a similar investment in the Fund’s benchmark, and represents the reinvestment of dividends and capital gains.
| 1 | Class C Shares were not in existence prior to 2/1/12. Performance for periods prior to 2/1/12 is based on the performance of Class A Shares. Such performance would differ only to the extent that the Classes have different expenses. |
The Fund is measured against the BofA Merrill Lynch 2-17 Year Municipal Bond Index, an unmanaged index, which is representative of municipal bonds. The index does not reflect the deduction of expenses associated with a mutual fund, such as investment management and fund accounting fees. The Fund’s performance reflects the deduction of fees for these services. Investors cannot invest directly in an index, although they can invest in its underlying securities.
A portion of the Fund’s fees has been waived. If the fees had not been waived, the Fund’s total return for the periods would have been lower.
| 43 | ||||
Sterling Capital West Virginia Intermediate Tax-Free Fund
Portfolio Manager
Robert F. Millikan, CFA
Sterling Capital West Virginia Intermediate Tax-Free Fund (the “Fund”) is managed by Robert F. Millikan, CFA, Executive Director and portfolio manager for Sterling Capital Management LLC (“Sterling Capital”), advisor to the Fund. Mr. Millikan joined BB&T Asset Management in 2000 and Sterling Capital through merger in 2010. He is lead portfolio manager of the Fund and has managed or been a member of the team that manages the state-specific municipal bond fund portfolios since 2000 and has investment experience since 1990. Mr. Millikan is a graduate of Wake Forest University where he received his BA in Economics.
Investment Considerations
The Fund is subject to the same risks as the underlying bonds in the portfolios such as credit, prepayment and interest rate risk. As interest rates rise, the value of bond prices will decline and an investor may lose money. The Fund is non-diversified and may invest a greater percentage of its assets in a single issuer than funds that are more diversified. Furthermore, the Fund invests primarily in municipal obligations issued by West Virginia and its political subdivisions and therefore will be affected by economic, political or other events affecting West Virginia.
Q. How did the Fund perform during the 12-month period between October 1, 2015 and September 30, 2016?
A. The Fund’s Institutional Shares underperformed its current benchmark, the BofA Merrill Lynch 2-17 Year Municipal Bond Index.
Q. What factors affected the Fund’s performance?
A. Municipal bond markets delivered positive returns during the 12-month period. Concerns about lagging global growth and low yields on government bonds elsewhere boosted demand for municipal bonds.
The surge in demand for municipal bonds resulted in higher prices and pushed down yields, which tumbled to near-record lows. Yields were further suppressed by a reduction in supply due to several factors, including weak refunding levels and reluctance among some states and municipalities to take on new debt. That said, those issues were more muted later in the period and municipal bond supply rebounded strongly. Issuance hit record levels in August and a strong issue calendar continued into September. Investors during the period had concerns about Puerto Rico’s default and about the fiscal health of some localities, but sentiment remained positive given municipal bonds’ stability relative to other asset classes.
The Fund’s relatively short duration position dragged on performance
relative to the benchmark as interest rates fell during the period. An underweight position in the benchmark’s longest maturities also hurt results as those issues rallied during the 12-month period.
The Fund’s relative performance also suffered from a bias toward higher-quality bonds. We believed that lower-rated issuers did not adequately compensate investors for the additional risk they carry. However, lower-rated municipal issues outperformed their higher-rated peers. For instance, AAA-rated municipal bonds returned 3.83% during the period compared to a 6.59% return for BBB-rated issues.
West Virginia’s debt rating was downgraded by credit rating agencies Standard & Poor’s and Fitch, which noted that the state’s reduced financial flexibility poses a near-term challenge for the state. Despite the state’s lower credit rating, bonds issued by West Virginia outperformed higher-rated municipal bonds as investors sought out higher-yielding issues.
The Fund benefited from an overweight position in revenue bonds, especially among healthcare and hospital bonds. An underweight position in general obligation bonds also benefited relative performance, as these bonds lagged during the period.
Portfolio composition is as of September 30, 2016 and is subject to change and risk.
| 44 | ||||
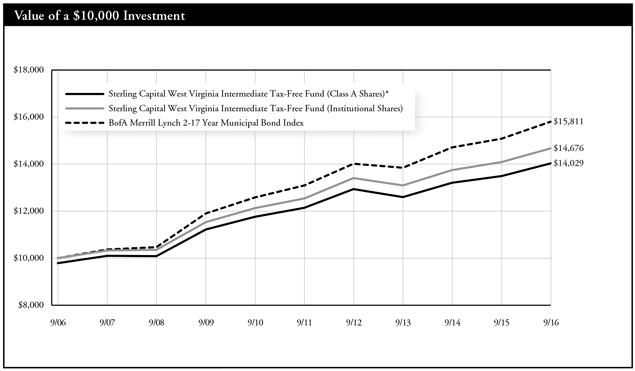
| * | Reflects 2.00% maximum sales charge. |
| ** | Reflects the applicable maximum contingent deferred sales charge of 1.00% (applicable only to redemptions within one year of purchase, and as such, are not reflected in the Average Annual Total Returns table since the periods reflected are for a year or longer). |
Average Annual Total Returns | ||||||||
As of September 30, 2016 | Inception Date | 1 Year | 5 Years | 10 Years | ||||
Class A Shares* | 12/17/93 | 1.81% | 2.50% | 3.44% | ||||
Class C Shares** | 01/31/12 | 3.14% | 2.20% | 3.29% | ||||
Institutional Shares | 12/01/93 | 4.18% | 3.18% | 3.91% | ||||
BofA Merrill Lynch 2-17 Year Municipal Bond Index | N/A | 4.77% | 3.82% | 4.69% | ||||
Past performance does not guarantee future results. The performance data quoted represents past performance and current returns may be lower or higher. Total return figures include change in share price, reinvestment of dividends and capital gains, and do not reflect taxes that a shareholder would pay on fund distributions or on the redemption of fund shares. The investment return and principal value will fluctuate so that an investor’s shares, when redeemed, may be worth more or less than the original cost. To obtain performance information current to the most recent month end, please visit www.sterlingcapitalfunds.com.
The chart above represents a comparison of a hypothetical $10,000 investment in the indicated share class versus a similar investment in the Fund’s benchmark, and represents the reinvestment of dividends and capital gains.
| 1 | Class C Shares were not in existence prior to 2/1/12. Performance for periods prior to 2/1/12 is based on the performance of Class A Shares. Such performance would differ only to the extent that the Classes have different expenses. |
The Fund is measured against the BofA Merrill Lynch 2-17 Year Municipal Bond Index, an unmanaged index, which is representative of municipal bonds. The index does not reflect the deduction of expenses associated with a mutual fund, such as investment management and fund accounting fees. The Fund’s performance reflects the deduction of fees for these services. Investors cannot invest directly in an index, although they can invest in its underlying securities.
A portion of the Fund’s fees had been waived. If the fees had not been waived, the Fund’s total return for the periods would have been lower.
| 45 | ||||
Sterling Capital Diversified Income Fund
Portfolio Managers
Sterling Capital Diversified Income Fund (the “Fund”) is managed by Shane A. Burke, and Brandon W. Carl, CFA, Directors and portfolio managers for Sterling Capital Management LLC (“Sterling Capital”), advisor to the fund, and members of the Sterling Capital Advisory Solutions Team.
Shane A. Burke
Mr. Burke, Director, joined Sterling Capital in 2013 and has been a co-portfolio manager of the Fund since 2015. He has investment experience since 2002. He is a graduate of the University of North Carolina at Wilmington where he received his BS in Finance. He received his MBA from San Francisco-Golden Gate University.
Brandon W. Carl, CFA
Mr. Carl, Director, joined BB&T Asset Management in 2001 and Sterling Capital through merger in 2010. Mr. Carl has been a co-portfolio manager to the Fund since 2016. Mr. Carl has investment experience since 2001. He is a graduate of the University of South Carolina where he received his BS in Finance and Management.
Investment Considerations
The Fund is primarily concentrated in underlying funds and is therefore subject to the same risks as the underlying funds it is invested in and may entail higher expenses. The underlying funds may invest in undervalued securities, which may not appreciate in value as anticipated or may remain undervalued for longer than anticipated. The underlying funds may invest in equity securities including more aggressive investments that engage in long/short equity strategies and in options writing strategies and that invest in derivatives, preferred stocks, exchange-traded funds (ETFs), Master Limited Partnerships (MLPs, the value of which will be affected by the natural resources sector of the economy and regulation) and real estate investment trusts (REITs, the value of which will be affected by conditions of the real estate industry). The Fund’s volatility may be amplified by its use of short sales and derivatives. The Fund is subject to the same risks as the debt securities held by the underlying funds such as credit, prepayment, call and interest rate risk. As interest rates rise, the value of debt securities will decline and an investor may lose money. Investing in high yield debt (also known as junk bonds) involves greater risks and less liquidity than investment grade bonds.
Q. How did the Fund perform during the 12-month period between October 1, 2015 and September 30, 2016?
A. The Fund’s Institutional Shares outperformed its current benchmark, 40% MSCI World Index/60% Bloomberg Barclays U.S. Aggregate Bond Index.
Q. What factors affected the Fund’s performance?
A. All of the Fund’s sub-sectors posted positive absolute returns. For example, the Fund benefited from its investment in “fallen angels”–investment-grade bonds that have been downgraded to high-yield bonds. Increases in oil prices in the latter half of the period and the resulting strengthening of the energy sector benefitted fallen angels’ performance. Investments in REITs and high dividend yielding global equities continued to provide steady dividends and were bolstered by falling interest rates in the first half of 2016. Falling interest rates also increased prices for long-term Treasury bonds. The Fund strategically
holds these investments as a downside hedge, and they made a significant contribution to its absolute performance.
The Fund outperformed its benchmark for the fiscal year. The Fund’s allocation to emerging market debt was the single largest contributor to its relative performance, as the benchmark does not hold those types of investments. The Fund’s overweight position in long-term Treasury bonds relative to the benchmark also contributed to the Fund’s outperformance over the period.
The Fund’s more conservative approach to equities, which incorporates covered calls to minimize risk, detracted from relative performance. While a covered call strategy limits downside risk, it also caps potential returns. In addition, the Fund’s allocation to agency mortgage-backed securities pulled down relative returns. Low interest rates facilitated refinancing and early prepayment of mortgages during the reporting period, contributing to the securities’ underperformance.
Portfolio composition is as of September 30, 2016 and is subject to change and risk.
| 46 | ||||
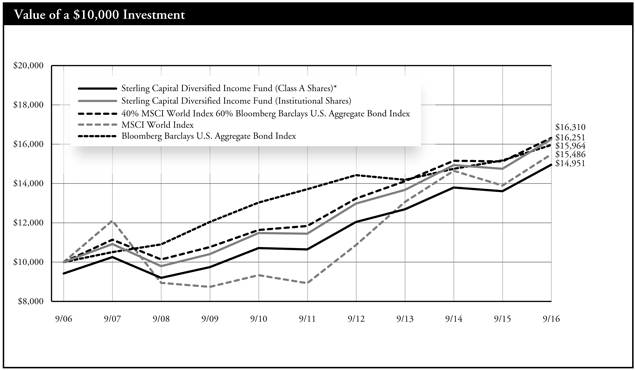
| * | Reflects 5.75% maximum sales charge. |
| ** | Reflects the applicable contingent deferred sales charge (CDSC), maximum of 5.00%. |
| *** | Reflects the applicable maximum CDSC of 1.00% (applicable only to redemptions within one year of purchase, and as such, are not reflected in the Average Annual Total Returns table since the periods reflected are for a year or longer). |
Average Annual Total Returns | ||||||||
As of September 30, 2016 | Inception Date | 1 Year | 5 Years | 10 Years | ||||
Class A Shares* | 1/29/98 | 3.58% | 5.76% | 4.10% | ||||
Class B Shares** | 1/29/99 | 4.98% | 6.03% | 4.11% | ||||
Class C Shares*** | 2/1/01 | 9.07% | 6.21% | 3.94% | ||||
Institutional Shares | 10/2/97 | 10.13% | 7.26% | 4.98% | ||||
40% MSCI World Index 60% Bloomberg Barclays U.S. Aggregate Bond Index | N/A | 7.84% | 6.62% | 5.01% | ||||
MSCI World Index | N/A | 11.36% | 11.63% | 4.47% | ||||
Bloomberg Barclays U.S. Aggregate Bond Index | N/A | 5.19% | 3.08% | 4.79% | ||||
Past performance does not guarantee future results. The performance data quoted represents past performance and current returns may be lower or higher. Total return figures include change in share price, reinvestment of dividends and capital gains, and do not reflect taxes that a shareholder would pay on fund distributions or on the redemption of fund shares. The investment return and principal value will fluctuate so that an investor’s shares, when redeemed, may be worth more or less than the original cost. To obtain performance information current to the most recent month end, please visit www.sterlingcapitalfunds.com.
The chart above represents a comparison of a hypothetical $10,000 investment in the indicated share class versus a similar investment in the Fund’s benchmarks, and represents the reinvestment of dividends and capital gains.
The Fund is measured against the 40% MSCI World Index and 60% Bloomberg Barclays U.S. Aggregate Bond Index. The indices are unmanaged and do not reflect the deduction of expenses associated with a mutual fund, such as investment management and, fund accounting fees. The Fund’s performance reflects the deduction of fees for these services. Investors cannot invest directly in an index, although they can invest in its underlying securities.
A portion of the Fund’s fees had been waived. If the fees had not been waived, the Fund’s total return for the periods would have been lower.
| 47 | ||||
Sterling Capital Strategic Allocation Funds
Portfolio Managers
Team Managed
Sterling Capital Strategic Allocation Funds (the “Funds”) are managed by the Sterling Capital Advisory Solutions Team, which is led by James C. Willis, CFA, Managing Director & Director of Advisory Solutions, Jeffrey J. Schappe, CFA, Managing Director and Kevin J. Stoll, CFA, Executive Director. Mr. Willis, Mr. Schappe and Mr. Stoll have managed the Funds since 2010, 2005 and 2016, respectively.
James C. Willis, CFA
Mr. Willis, Managing Director, joined BB&T Asset Management in 2003 and Sterling Capital Management LLC (“Sterling Capital”) through merger in October 2010 and has been a co-portfolio manager of the Fund since 2010. He has investment experience since 1996. He is a graduate of Rice University where he received a BA in Economics and Political Science and a MBA from Georgetown University.
Jeffrey J. Schappe, CFA
Mr. Schappe, Managing Director, joined BB&T Asset Management in 2004 and Sterling Capital through merger in October 2010 and has been a co-portfolio manager of the Fund since 2005. He has investment experience since 1991. He is a graduate of University of Wisconsin- Madison where he received a BA in Journalism and a MBA in Finance.
Kevin J. Stoll, CFA
Mr. Stoll, Executive Director, joined Sterling Capital in 2013 and has been a co-portfolio manager to the Funds since 2016. He has investment experience since 1998. He is a graduate of Northwestern University where he received his BA in Economics and Mathematical Methods in the Social Sciences and his MBA from Duke University’s Fuqua School of Business.
Investment Considerations
The Funds are primarily concentrated in underlying funds and are therefore subject to the same risks as the underlying funds and bear a portion of the expenses of the underlying funds. The underlying funds may be invested in equity securities and are subject to market risk. Investments in bonds are subject to credit risk, call risk and interest rate risk (as interest rates rise the value of bond prices will decline). The underlying funds may invest in foreign securities, which involve certain risks such as currency volatility, political and social instability and reduced market liquidity; small capitalization companies which are subject to greater volatility and less liquidity due to limited resources or product lines and are more sensitive to economic factors; and high-yield debt securities (also known as junk bonds), which involve greater risks than investment grade bonds. The underlying funds may also be money market funds.
Sterling Capital Strategic Allocation Balanced Fund (the “Balanced Fund”)
Sterling Capital Strategic Allocation Growth Fund (the “Growth Fund”)
(Collectively, “Sterling Capital Strategic Allocation Funds”)
Q. How did the Funds perform during the 12-month period between October 1, 2015 and September 30, 2016?
A. The Growth Fund’s Institutional Shares underperformed its current benchmark, 75% MSCI World Index/25% Bloomberg Barclays U.S. Aggregate Bond Index.
The Balanced Fund’s Institutional Shares underperformed its current benchmark, 60% MSCI World Index / 40% Bloomberg Barclays U.S. Aggregate Bond Index.
Q. What factors affected the Funds’ performance?
A. The Sterling Capital Strategic Allocation Funds held five underlying Funds: The Sterling Capital Special Opportunities Fund, the Sterling Capital Equity Income Fund, the Sterling Capital Total Return Bond Fund, the Sterling Capital Long/Short Equity Fund and the Sterling Capital Behavioral International Equity Fund.
The broad equity and fixed income markets performed well over the fiscal year, spurred by the continuation of relatively low interest rates on the domestic side, subsiding fears of economic fallout in China and the recovery of the energy market in the second half of the reporting period. As a result, four of the five underlying funds’ Institutional Shares posted positive absolute returns. The Sterling Capital Long/Short Equity Fund was the only detractor, with its negative returns due largely to an overexposure to the energy sector. The structural nature of the product, which includes short positions, also proved a drag on absolute returns.
Both of the Sterling Capital Strategic Allocation Funds trailed their
benchmarks over the reporting period. The Funds’ holding of a money market fund position detracted from relative performance, as its diminutive returns paled in comparison to the positive absolute returns of the broader equity and fixed income markets. In addition, three of the Funds’ underlying funds’ Institutional Shares underperformed relative to their benchmarks.
For example, the Sterling Capital Long/Short Equity Fund underperformed its benchmark, due to its exposure to the health care sector and its bias toward smaller cap stocks. The Sterling Capital Special Opportunities Fund faced challenges due to an overweight position in healthcare, which suffered due to uncertainty related to the U.S. presidential election. The Sterling Capital Equity Income Fund also dragged on relative returns, underperforming its benchmark largely because of an underweight position in the energy sector, which rebounded when oil prices increased.
The Funds’ overweight equity position relative to its benchmarks contributed to relative performance, as equity markets maintained strength over the period. The Funds’ underweight fixed income position also offered a relative advantage. Two of the underlying funds’ Institutional Shares outperformed their respective benchmarks over the period, boosting relative returns.
The Sterling Capital Total Return Bond Fund’s relative performance benefited from an overweight allocation to risk assets as credit risk premiums declined. Lower quality credit outperformed higher quality credit, and the Fund’s overweight to BBB-rated bonds benefitted its relative returns. The Sterling Capital Behavioral International Equity Fund also beat its benchmark, thanks to its strategy of employing an investment process rooted in principles of behavioral finance. This process is specifically designed to capitalize upon known investor biases and heuristics (mental shortcuts) by taking into account the impact on markets of behavioral factors such as greed, fear and ego. International markets rewarded the Fund’s behavioral value exposure during the period under review.
Portfolio composition is as of September 30, 2016 and is subject to change and risk. |
| 48 | ||||
Sterling Capital Strategic Allocation Balanced Fund
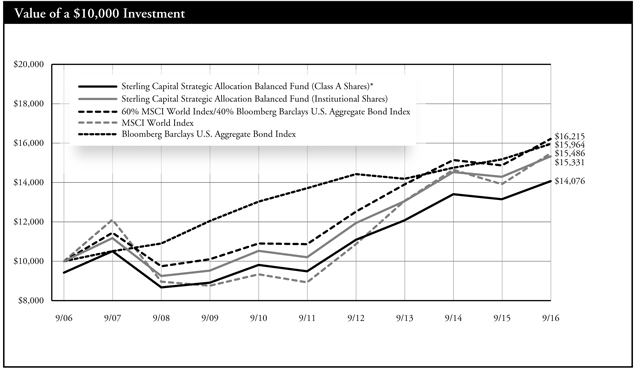
| * | Reflects 5.75% maximum sales charge. |
| ** | Reflects the applicable contingent deferred sales charge (CDSC), maximum of 5.00%. |
| *** | Reflects the applicable maximum CDSC of 1.00% (applicable only to redemptions within one year of purchase, and as such, are not reflected in the Annual Average Total Returns table since the periods reflected are for a year or longer). |
Average Annual Total Returns | ||||||||||||||
As of September 30, 2016 | Inception Date | 1 Year | 5 Years | 10 Years | ||||||||||
Class A Shares* | 1/29/98 | 0.86% | 6.91% | 3.48% | ||||||||||
Class B Shares** | 1/29/99 | 2.23% | 7.22% | 3.47% | ||||||||||
Class C Shares*** | 2/1/01 | 6.18% | 7.39% | 3.32% | ||||||||||
Institutional Shares | 10/2/97 | 7.24% | 8.48% | 4.37% | ||||||||||
60% MSCI World Index/ 40% Bloomberg Barclays U.S. Aggregate Bond Index | N/A | 9.08% | 8.33% | 4.95% | ||||||||||
MSCI World Index | N/A | 11.36% | 11.63% | 4.47% | ||||||||||
Bloomberg Barclays U.S. Aggregate Bond Index | N/A | 5.19% | 3.08% | 4.79% | ||||||||||
Past performance does not guarantee future results. The performance data quoted represents past performance and current returns may be lower or higher. Total return figures include change in share price, reinvestment of dividends and capital gains, and do not reflect taxes that a shareholder would pay on fund distributions or on the redemption of fund shares. The investment return and principal value will fluctuate so that an investor’s shares, when redeemed, may be worth more or less than the original cost. To obtain performance information current to the most recent month end, please visit www.sterlingcapitalfunds.com.
The chart above represents a comparison of a hypothetical $10,000 investment in the indicated share class versus a similar investment in the Fund’s benchmarks, and represents the reinvestment of dividends and capital gains.
The Fund is measured against the 60% MSCI World Index/40% Bloomberg Barclays U.S. Aggregate Bond Index. The index is unmanaged and do not reflect the deduction of expenses associated with a mutual fund, such as investment management and, fund accounting fees. The Fund’s performance reflects the deduction of fees for these services. Investors cannot invest directly in an index, although they can invest in its underlying securities.
A portion of the Fund’s fees had been waived. If the fees had not been waived, the Fund’s total return for the periods would have been lower. Currently all management fees are being waived.
| 49 | ||||
Sterling Capital Strategic Allocation Growth Fund
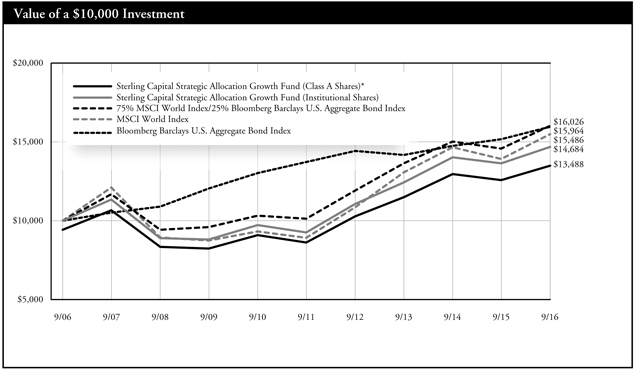
| * | Reflects 5.75% maximum sales charge. |
| ** | Reflects the applicable contingent deferred sales charge (CDSC), maximum of 5.00%. |
| *** | Reflects the applicable maximum CDSC of 1.00% (applicable only to redemptions within one year of purchase, and as such, are not reflected in the Annual Average Total Returns table since the periods reflected are for a year or longer). |
Average Annual Total Returns | ||||||||||||||
As of September 30, 2016 | Inception Date | 1 Year | 5 Years | 10 Years | ||||||||||
Class A Shares* | 1/29/98 | 1.05% | 8.05% | 3.04% | ||||||||||
Class B Shares** | 1/29/99 | 2.43% | 8.38% | 3.02% | ||||||||||
Class C Shares*** | 2/1/01 | 6.46% | 8.54% | 2.88% | ||||||||||
Institutional Shares | 10/2/97 | 7.58% | 9.64% | 3.92% | ||||||||||
75% MSCI World Index/ 25% Bloomberg Barclays U.S. Aggregate Bond Index | N/A | 9.96% | 9.59% | 4.83% | ||||||||||
MSCI World Index | N/A | 11.36% | 11.63% | 4.47% | ||||||||||
Bloomberg Barclays U.S. Aggregate Bond Index | N/A | 5.19% | 3.08% | 4.79% | ||||||||||
Past performance does not guarantee future results. The performance data quoted represents past performance and current returns may be lower or higher. Total return figures include change in share price, reinvestment of dividends and capital gains, and do not reflect taxes that a shareholder would pay on fund distributions or on the redemption of fund shares. The investment return and principal value will fluctuate so that an investor’s shares, when redeemed, may be worth more or less than the original cost. To obtain performance information current to the most recent month end, please visit www.sterlingcapitalfunds.com.
The chart above represents a comparison of a hypothetical $10,000 investment in the indicated share class versus a similar investment in the Fund’s benchmarks, and represents the reinvestment of dividends and capital gains.
The Fund is measured against the 75% MSCI World Index/25% Bloomberg Barclays U.S. Aggregate Bond Index. The index is unmanaged and do not reflect the deduction of expenses associated with a mutual fund, such as investment management and, fund accounting fees. The Fund’s performance reflects the deduction of fees for these services. Investors cannot invest directly in an index, although they can invest in its underlying securities.
A portion of the Fund’s fees had been waived. If the fees had not been waived, the Fund’s total return for the periods would have been lower. Currently all management fees are being waived.
| 50 | ||||
(This page has been left blank intentionally.)
Sterling Capital Funds
|
|
Sterling Capital Funds invested, as a percentage of net assets, in the following industries, countries, states, funds or security types, as of September 30, 2016:
| Sterling Capital Behavioral Large Cap Value Equity Fund | Percentage of net assets | ||||
Automobiles & Components | 2.4 | % | |||
Banks | 9.4 | % | |||
Capital Goods | 6.8 | % | |||
Consumer Durables & Apparel | 0.4 | % | |||
Consumer Services | 0.6 | % | |||
Diversified Financials | 7.3 | % | |||
Energy | 12.6 | % | |||
Food & Staples Retailing | 2.6 | % | |||
Food, Beverage & Tobacco | 3.2 | % | |||
Health Care Equipment & Services | 4.6 | % | |||
Household & Personal Products | 2.1 | % | |||
Insurance | 4.0 | % | |||
Materials | 3.8 | % | |||
Media | 1.9 | % | |||
Pharmaceuticals, Biotechnology & Life Sciences | 8.4 | % | |||
Real Estate | 4.2 | % | |||
Retailing | 0.3 | % | |||
Semiconductors & Semiconductor Equipment | 4.2 | % | |||
Software & Services | 3.7 | % | |||
Technology Hardware & Equipment | 3.5 | % | |||
Telecommunication Services | 5.0 | % | |||
Transportation | 1.0 | % | |||
Utilities | 6.5 | % | |||
Money Market Fund | 1.6 | % | |||
| 100.1 | % | ||||
| Sterling Capital Mid Value Fund | Percentage of net assets | ||||
Automobiles & Components | 3.3 | % | |||
Capital Goods | 7.0 | % | |||
Commercial & Professional Services | 3.2 | % | |||
Diversified Financials | 16.7 | % | |||
Energy | 0.6 | % | |||
Health Care Equipment & Services | 8.7 | % | |||
Insurance | 13.4 | % | |||
Materials | 3.6 | % | |||
Media | 9.9 | % | |||
Real Estate | 5.3 | % | |||
Retailing | 3.1 | % | |||
Software & Services | 13.1 | % | |||
Technology Hardware & Equipment | 7.9 | % | |||
Transportation | 1.3 | % | |||
Money Market Fund | 2.4 | % | |||
| 99.5 | % | ||||
| Sterling Capital Behavioral Small Cap Value Equity Fund | Percentage of net assets | ||||
Automobiles & Components | 4.0 | % | |||
Banks | 20.0 | % | |||
Capital Goods | 9.9 | % | |||
Commercial & Professional Services | 3.2 | % | |||
Consumer Durables & Apparel | 1.4 | % | |||
Consumer Services | 1.7 | % | |||
Diversified Financials | 9.3 | % | |||
Energy | 4.6 | % | |||
Food & Staples Retailing | 0.4 | % | |||
Food, Beverage & Tobacco | 2.2 | % | |||
Health Care Equipment & Services | 3.5 | % | |||
Household & Personal Products | 0.8 | % | |||
Insurance | 11.4 | % | |||
Materials | 3.2 | % | |||
Pharmaceuticals, Biotechnology & Life Sciences | 1.0 | % | |||
Real Estate | 1.2 | % | |||
Retailing | 2.5 | % | |||
Semiconductors & Semiconductor Equipment | 1.1 | % | |||
Software & Services | 1.6 | % | |||
Technology Hardware & Equipment | 6.3 | % | |||
Telecommunication Services | 0.4 | % | |||
Transportation | 1.8 | % | |||
Utilities | 6.4 | % | |||
Exchange Traded Fund | 1.3 | % | |||
Money Market Fund | 0.8 | % | |||
| 100.0 | % | ||||
| Sterling Capital Special Opportunities Fund | Percentage of net assets | ||||
Automobiles & Components | 5.9 | % | |||
Commercial & Professional Services | 7.8 | % | |||
Consumer Durables & Apparel | 4.3 | % | |||
Consumer Services | 3.6 | % | |||
Diversified Financials | 3.6 | % | |||
Food, Beverage & Tobacco | 1.3 | % | |||
Health Care Equipment & Services | 17.0 | % | |||
Media | 13.7 | % | |||
Pharmaceuticals, Biotechnology & Life Sciences | 8.3 | % | |||
Real Estate | 4.9 | % | |||
Software & Services | 21.5 | % | |||
Technology Hardware & Equipment | 4.1 | % | |||
Transportation | 1.6 | % | |||
Money Market Fund | 2.2 | % | |||
| 99.8 | % | ||||
52
Sterling Capital Funds
|
Summary of Portfolio Holdings (Unaudited) |
| Sterling Capital Equity Income Fund | Percentage of net assets | ||||||
Automobiles & Components | 2.7 | % | |||||
Banks | 3.5 | % | |||||
Capital Goods | 2.1 | % | |||||
Commercial & Professional Services | 2.1 | % | |||||
Consumer Durables & Apparel | 1.9 | % | |||||
Consumer Services | 5.4 | % | |||||
Diversified Financials | 6.3 | % | |||||
Energy | 4.9 | % | |||||
Food, Beverage & Tobacco | 3.9 | % | |||||
Health Care Equipment & Services | 7.3 | % | |||||
Household & Personal Products | 4.2 | % | |||||
Materials | 3.3 | % | |||||
Media | 5.8 | % | |||||
Pharmaceuticals, Biotechnology & Life Sciences | 15.0 | % | |||||
Real Estate | 2.0 | % | |||||
Semiconductors & Semiconductor Equipment | 8.3 | % | |||||
Software & Services | 8.0 | % | |||||
Telecommunication Services | 4.5 | % | |||||
Transportation | 3.7 | % | |||||
Money Market Fund | 5.3 | % | |||||
| 100.2 | % | ||||||
| Sterling Capital Long/Short Equity Fund | Long-Term Investment Percentage of net assets | ||||
Banks | 4.6 | % | |||
Consumer Durables & Apparel | 3.3 | % | |||
Consumer Services | 4.4 | % | |||
Diversified Financials | 12.6 | % | |||
Energy | 14.6 | % | |||
Exchange Traded Funds | 0.3 | % | |||
Food, Beverage & Tobacco | 3.9 | % | |||
Health Care Equipment & Services | 6.5 | % | |||
Household & Personal Products | 0.0 | % | |||
Insurance | 1.9 | % | |||
Media | 1.6 | % | |||
Pharmaceuticals, Biotechnology & Life Sciences | 8.7 | % | |||
Real Estate | 1.3 | % | |||
Retailing | 1.5 | % | |||
Software & Services | 13.9 | % | |||
Technology Hardware & Equipment | 3.8 | % | |||
Telecommunication Services | 2.8 | % | |||
Money Market Fund | 10.9 | % | |||
| 96.6 | % | ||||
| Sterling Capital Long/Short Equity Fund | Investments Sold Short Percentage of net assets | ||||
Automobiles & Components | (1.0 | )% | |||
Banks | (1.0 | )% | |||
Consumer Durables & Apparel | (2.9 | )% | |||
Consumer Services | (2.8 | )% | |||
Diversified Financials | (0.9 | )% | |||
Energy | (4.3 | )% | |||
Exchange Traded Funds | (8.4 | )% | |||
Food & Staples Retailing | (0.6 | )% | |||
Food, Beverage & Tobacco | (0.5 | )% | |||
Health Care Equipment & Services | (3.4 | )% | |||
Pharmaceuticals, Biotechnology & Life Sciences | (4.4 | )% | |||
Real Estate | (0.9 | )% | |||
Retailing | (2.2 | )% | |||
Semiconductors & Semiconductor Equipment | (0.3 | )% | |||
Software & Services | (3.4 | )% | |||
Technology Hardware & Equipment | (1.4 | )% | |||
Transportation | (0.6 | )% | |||
| (39.0 | )% | ||||
| Sterling Capital Behavioral International Equity Fund | Percentage of net assets | ||||
Australia | 9.3 | % | |||
Austria | 0.9 | % | |||
Denmark | 2.0 | % | |||
Finland | 1.5 | % | |||
France | 7.6 | % | |||
Germany | 6.9 | % | |||
Hong Kong | 4.9 | % | |||
Ireland | 0.2 | % | |||
Israel | 2.4 | % | |||
Italy | 2.1 | % | |||
Japan | 26.0 | % | |||
Netherlands | 1.3 | % | |||
Norway | 1.3 | % | |||
Portugal | 1.0 | % | |||
Singapore | 2.9 | % | |||
Spain | 2.2 | % | |||
Sweden | 2.2 | % | |||
Switzerland | 8.4 | % | |||
United Kingdom | 15.1 | % | |||
Money Market Fund | 1.2 | % | |||
| 99.4 | % | ||||
| Sterling Capital Stratton Mid Cap Value Fund | Percentage of net assets | ||||
Automobiles & Components | 4.5 | % | |||
Banks | 6.8 | % | |||
Capital Goods | 5.3 | % | |||
Consumer Durables & Apparel | 5.8 | % | |||
Consumer Services | 1.8 | % | |||
Diversified Financials | 3.5 | % | |||
Energy | 7.6 | % | |||
Food & Staples Retailing | 3.1 | % | |||
Food, Beverage & Tobacco | 2.3 | % | |||
Health Care Equipment & Services | 4.8 | % | |||
Household & Personal Products | 1.7 | % | |||
Insurance | 5.1 | % | |||
Materials | 7.3 | % | |||
Pharmaceuticals, Biotechnology & Life Sciences | 5.7 | % | |||
Real Estate | 11.9 | % | |||
Semiconductors & Semiconductor Equipment | 3.7 | % | |||
Software & Services | 8.0 | % | |||
Technology Hardware & Equipment | 5.5 | % | |||
Utilities | 2.9 | % | |||
Money Market Fund | 2.9 | % | |||
| 100.2 | % | ||||
| Sterling Capital Stratton Real Estate Fund | Percentage of net assets | ||||
Diversified | 5.8 | % | |||
Health Care | 9.8 | % | |||
Hotel & Resort | 4.7 | % | |||
Industrial | 4.2 | % | |||
Office | 14.1 | % | |||
Residential | 14.9 | % | |||
Retail | 24.8 | % | |||
Specialized | 19.6 | % | |||
Money Market Fund | 1.8 | % | |||
| 99.7 | % | ||||
53
Sterling Capital Funds
|
Summary of Portfolio Holdings (Unaudited) |
| Sterling Capital Stratton Small Cap Value Fund | Percentage of net assets | ||||
Automobiles & Components | 3.7 | % | |||
Banks | 19.1 | % | |||
Capital Goods | 10.7 | % | |||
Consumer Services | 1.7 | % | |||
Diversified Financials | 1.4 | % | |||
Energy | 4.0 | % | |||
Food & Staples Retailing | 2.8 | % | |||
Health Care Equipment & Services | 2.7 | % | |||
Insurance | 3.2 | % | |||
Materials | 4.8 | % | |||
Media | 1.5 | % | |||
Pharmaceuticals, Biotechnology & Life Sciences | 2.8 | % | |||
Real Estate | 9.2 | % | |||
Retailing | 1.4 | % | |||
Semiconductors & Semiconductor Equipment | 3.3 | % | |||
Software & Services | 7.7 | % | |||
Technology Hardware & Equipment | 5.3 | % | |||
Transportation | 1.7 | % | |||
Utilities | 6.8 | % | |||
Money Market Fund | 6.2 | % | |||
| 100.0 | % | ||||
| Sterling Capital Ultra Short Bond Fund | Percentage of net assets | ||||
Asset Backed Securities | 16.4 | % | |||
Collateralized Mortgage Obligations | 0.1 | % | |||
Commercial Mortgage-Backed Securities | 13.3 | % | |||
Commercial Paper | 2.0 | % | |||
Corporate Bonds | 52.4 | % | |||
Municipal Bonds | 6.6 | % | |||
Money Market Fund | 2.2 | % | |||
| 93.0 | % | ||||
| Sterling Capital Short Duration Bond Fund | Percentage of net assets | ||||
Asset Backed Securities | 14.8 | % | |||
Collateralized Mortgage Obligations | 1.2 | % | |||
Commercial Mortgage-Backed Securities | 12.8 | % | |||
Corporate Bonds | 61.9 | % | |||
Foreign Government Bond | 0.5 | % | |||
Municipal Bonds | 2.0 | % | |||
U.S. Government Agencies | 1.5 | % | |||
U.S. Treasury Note | 4.1 | % | |||
Money Market Fund | 1.4 | % | |||
| 100.2 | % | ||||
| Sterling Capital Intermediate U.S. Government Fund | Percentage of net assets | ||||
Asset Backed Securities | 1.3 | % | |||
Collateralized Mortgage Obligations | 3.7 | % | |||
Commercial Mortgage-Backed Securities | 0.6 | % | |||
Corporate Bonds | 5.2 | % | |||
Mortgage-Backed Securities | 8.1 | % | |||
Municipal Bonds | 0.8 | % | |||
U.S. Government Agencies | 25.5 | % | |||
U.S. Treasury Notes | 52.5 | % | |||
Money Market Fund | 2.2 | % | |||
| 99.9 | % | ||||
| Sterling Capital Total Return Bond Fund | Percentage of net assets | ||||
Asset Backed Securities | 14.8 | % | |||
Collateralized Mortgage Obligations | 5.6 | % | |||
Commercial Mortgage-Backed Securities | 14.0 | % | |||
Corporate Bonds | 37.2 | % | |||
Mortgage-Backed Securities | 10.4 | % | |||
Municipal Bonds | 6.5 | % | |||
Preferred Stocks | 0.2 | % | |||
U.S. Treasury Bonds | 4.7 | % | |||
U.S. Treasury Notes | 5.4 | % | |||
Money Market Fund | 2.3 | % | |||
| 101.1 | % | ||||
| Sterling Capital Corporate Fund | Percentage of net assets | ||||
Corporate Bonds | 98.8 | % | |||
Money Market Fund | 0.5 | % | |||
| 99.3 | % | ||||
| Sterling Capital Securitized Opportunities Fund | Percentage of net assets | ||||
Asset Backed Securities | 24.5 | % | |||
Collateralized Mortgage Obligations | 16.8 | % | |||
Commercial Mortgage-Backed Securities | 20.5 | % | |||
Mortgage-Backed Securities | 35.9 | % | |||
U.S. Treasury Notes | 0.9 | % | |||
Money Market Fund | 1.3 | % | |||
| 99.9 | % | ||||
| Sterling Capital Kentucky Intermediate Tax-Free Fund | Percentage of net assets | ||||
Kentucky Municipal Bonds | 92.5 | % | |||
Money Market Fund | 6.5 | % | |||
| 99.0 | % | ||||
| Sterling Capital Maryland Intermediate Tax-Free Fund | Percentage of net assets | ||||
Maryland Municipal Bonds | 97.1 | % | |||
Money Market Fund | 2.1 | % | |||
| 99.2 | % | ||||
| Sterling Capital North Carolina Intermediate Tax-Free Fund | Percentage of net assets | ||||
North Carolina Municipal Bonds | 97.7 | % | |||
Money Market Fund | 2.3 | % | |||
| 100.0 | % | ||||
| Sterling Capital South Carolina Intermediate Tax-Free Fund | Percentage of net assets | ||||
South Carolina Municipal Bonds | 97.0 | % | |||
Money Market Fund | 1.9 | % | |||
| 98.9 | % | ||||
| Sterling Capital Virginia Intermediate Tax-Free Fund | Percentage of net assets | ||||
District of Columbia Municipal Bonds | 1.7 | % | |||
Virginia Municipal Bonds | 95.4 | % | |||
Money Market Fund | 1.9 | % | |||
| 99.0 | % | ||||
54
Sterling Capital Funds
|
Summary of Portfolio Holdings (Unaudited) |
| Sterling Capital West Virginia Intermediate Tax-Free Fund | Percentage of net assets | ||||
West Virginia Municipal Bonds | 96.7 | % | |||
Money Market Fund | 2.2 | % | |||
| 98.9 | % | ||||
| Sterling Capital Diversified Income Fund | Percentage of net assets | ||||
Equity Funds | 47.3 | % | |||
Fixed Income Fund | 51.6 | % | |||
Money Market Fund | 1.3 | % | |||
| 100.2 | % | ||||
| Sterling Capital Strategic Allocation Balanced Fund | Percentage of net assets | ||||
Equity Funds | 66.5 | % | |||
Fixed Income Fund | 32.9 | % | |||
Money Market Fund | 0.6 | % | |||
| 100.0 | % | ||||
| Sterling Capital Strategic Allocation Growth Fund | Percentage of net assets | ||||
Equity Funds | 82.5 | % | |||
Fixed Income Fund | 16.9 | % | |||
Money Market Fund | 0.6 | % | |||
| 100.0 | % | ||||
55
Sterling Capital Funds
|
|
As a shareholder of the Sterling Capital Funds (each, a “Fund” and collectively, the “Funds”), you incur two types of costs: (1) transaction costs, including sales charges (loads) on purchases and (2) ongoing costs, including management fees; distribution and/or service (12b-1) fees; and other Fund expenses.
These examples are intended to help you understand your ongoing costs (in dollars) of investing in the Funds and to compare these costs with the ongoing costs of investing in other mutual funds. These examples are based on an investment of $1,000 invested at the beginning of the period and held for the entire period from April 1, 2016 through September 30, 2016.
Actual Example
The table below provides information about actual account values and actual expenses. You may use the information below, together with the amount you invested, to estimate the expenses that you paid over the period. Simply divide your account value by $1,000 (for example, an $8,600 account value divided by $1,000 = 8.6), then multiply the result by the number in the table under the heading entitled “Expenses Paid During Period” to estimate the expenses you paid on your account during this period.
| Beginning Account Value 4/1/16 | Ending Account Value 9/30/16 | Expenses Paid During Period* 4/1/16 - 9/30/16 | Annualized Expense Ratio During Period 4/1/16 - 9/30/16 | |||||||||||||||||
Sterling Capital Behavioral Large Cap Value Equity Fund | ||||||||||||||||||||
Class A Shares | $ | 1,000.00 | $ | 1,040.95 | $ | 5.05 | 0.99 | % | ||||||||||||
Class B Shares | 1,000.00 | 1,036.99 | 8.86 | 1.74 | % | |||||||||||||||
Class C Shares | 1,000.00 | 1,037.19 | 8.86 | 1.74 | % | |||||||||||||||
Institutional Shares | 1,000.00 | 1,042.71 | 3.78 | 0.74 | % | |||||||||||||||
Sterling Capital Mid Value Fund | ||||||||||||||||||||
Class A Shares | 1,000.00 | 1,058.26 | 5.97 | 1.16 | % | |||||||||||||||
Class B Shares | 1,000.00 | 1,054.05 | 9.81 | 1.91 | % | |||||||||||||||
Class C Shares | 1,000.00 | 1,054.39 | 9.81 | 1.91 | % | |||||||||||||||
Institutional Shares | 1,000.00 | 1,059.48 | 4.69 | 0.91 | % | |||||||||||||||
Class R Shares | 1,000.00 | 1,056.58 | 7.30 | 1.42 | % | |||||||||||||||
Sterling Capital Behavioral Small Cap Value Equity Fund | ||||||||||||||||||||
Class A Shares | 1,000.00 | 1,066.31 | 5.42 | 1.05 | % | |||||||||||||||
Class B Shares | 1,000.00 | 1,061.49 | 9.28 | 1.80 | % | |||||||||||||||
Class C Shares | 1,000.00 | 1,062.93 | 9.39 | 1.82 | % | |||||||||||||||
Institutional Shares | 1,000.00 | 1,067.80 | 4.24 | 0.82 | % | |||||||||||||||
Class R Shares | 1,000.00 | 1,064.66 | 6.86 | 1.33 | % | |||||||||||||||
Sterling Capital Special Opportunities Fund | ||||||||||||||||||||
Class A Shares | 1,000.00 | 1,001.40 | 5.75 | 1.15 | % | |||||||||||||||
Class B Shares | 1,000.00 | 997.30 | 9.44 | 1.89 | % | |||||||||||||||
Class C Shares | 1,000.00 | 997.84 | 9.49 | 1.90 | % | |||||||||||||||
Institutional Shares | 1,000.00 | 1,003.13 | 4.51 | 0.90 | % | |||||||||||||||
Class R Shares | 1,000.00 | 1,000.47 | 7.00 | 1.40 | % | |||||||||||||||
Sterling Capital Equity Income Fund | ||||||||||||||||||||
Class A Shares | 1,000.00 | 1,075.80 | 6.23 | 1.20 | % | |||||||||||||||
Class B Shares | 1,000.00 | 1,072.20 | 10.10 | 1.95 | % | |||||||||||||||
Class C Shares | 1,000.00 | 1,071.58 | 10.10 | 1.95 | % | |||||||||||||||
Institutional Shares | 1,000.00 | 1,077.03 | 4.93 | 0.95 | % | |||||||||||||||
Class R Shares | 1,000.00 | 1,074.24 | 7.52 | 1.45 | % | |||||||||||||||
Sterling Capital Long/Short Equity Fund | ||||||||||||||||||||
Class A Shares | 1,000.00 | 1,109.54 | 20.78 | 3.94 | % | |||||||||||||||
Class C Shares | 1,000.00 | 1,106.16 | 24.75 | 4.70 | % | |||||||||||||||
Institutional Shares | 1,000.00 | 1,111.40 | 19.58 | 3.71 | % | |||||||||||||||
Sterling Capital Behavioral International Equity Fund | ||||||||||||||||||||
Class A Shares | 1,000.00 | 1,049.89 | 3.48 | 0.68 | % | |||||||||||||||
Class C Shares | 1,000.00 | 1,046.79 | 7.88 | 1.54 | % | |||||||||||||||
Institutional Shares | 1,000.00 | 1,049.83 | 3.54 | 0.69 | % | |||||||||||||||
Sterling Capital Stratton Mid Cap Value Fund | ||||||||||||||||||||
Class A Shares | 1,000.00 | 1,075.67 | 6.23 | 1.20 | % | |||||||||||||||
Class C Shares | 1,000.00 | 1,071.56 | 10.15 | 1.96 | % | |||||||||||||||
Institutional Shares | 1,000.00 | 1,076.97 | 4.93 | 0.95 | % | |||||||||||||||
Sterling Capital Stratton Real Estate Fund | ||||||||||||||||||||
Class A Shares | 1,000.00 | 1,053.32 | 5.54 | 1.08 | % | |||||||||||||||
Class C Shares | 1,000.00 | 1,049.16 | 9.43 | 1.84 | % | |||||||||||||||
Institutional Shares | 1,000.00 | 1,054.58 | 4.26 | 0.83 | % | |||||||||||||||
Sterling Capital Stratton Small Cap Value Fund | ||||||||||||||||||||
Class A Shares | 1,000.00 | 1,119.64 | 7.05 | 1.33 | % | |||||||||||||||
Class C Shares | 1,000.00 | 1,115.24 | 11.00 | 2.08 | % | |||||||||||||||
Institutional Shares | 1,000.00 | 1,120.88 | 5.73 | 1.08 | % | |||||||||||||||
Sterling Capital Ultra Short Bond Fund | ||||||||||||||||||||
Class A Shares | 1,000.00 | 1,006.65 | 3.36 | 0.67 | % | |||||||||||||||
Institutional Shares | 1,000.00 | 1,007.92 | 2.16 | 0.43 | % | |||||||||||||||
56
Sterling Capital Funds
|
Expense Example (Unaudited) |
| Beginning Account Value 4/1/16 | Ending Account Value 9/30/16 | Expenses Paid During Period* 4/1/16 - 9/30/16 | Annualized Expense Ratio During Period 4/1/16 - 9/30/16 | |||||||||||||||||
Sterling Capital Short Duration Bond Fund | ||||||||||||||||||||
Class A Shares | $ | 1,000.00 | $ | 1,013.25 | $ | 3.52 | 0.70 | % | ||||||||||||
Class C Shares | 1,000.00 | 1,008.33 | 7.28 | 1.45 | % | |||||||||||||||
Institutional Shares | 1,000.00 | 1,014.51 | 2.27 | 0.45 | % | |||||||||||||||
Sterling Capital Intermediate U.S. Government Fund | ||||||||||||||||||||
Class A Shares | 1,000.00 | 1,009.90 | 4.22 | 0.84 | % | |||||||||||||||
Class B Shares | 1,000.00 | 1,006.11 | 7.97 | 1.59 | % | |||||||||||||||
Class C Shares | 1,000.00 | 1,006.12 | 7.97 | 1.59 | % | |||||||||||||||
Institutional Shares | 1,000.00 | 1,011.17 | 2.97 | 0.59 | % | |||||||||||||||
Sterling Capital Total Return Bond Fund | ||||||||||||||||||||
Class A Shares | 1,000.00 | 1,034.66 | 3.81 | 0.75 | % | |||||||||||||||
Class B Shares | 1,000.00 | 1,030.78 | 7.56 | 1.49 | % | |||||||||||||||
Class C Shares | 1,000.00 | 1,031.74 | 7.57 | 1.49 | % | |||||||||||||||
Institutional Shares | 1,000.00 | 1,036.92 | 2.50 | 0.49 | % | |||||||||||||||
Class R Shares | 1,000.00 | 1,034.42 | 5.09 | 1.00 | % | |||||||||||||||
Sterling Capital Corporate Fund | ||||||||||||||||||||
Class A Shares | 1,000.00 | 1,037.75 | 4.48 | 0.88 | % | |||||||||||||||
Class C Shares | 1,000.00 | 1,033.94 | 8.29 | 1.63 | % | |||||||||||||||
Institutional Shares | 1,000.00 | 1,037.96 | 3.31 | 0.65 | % | |||||||||||||||
Sterling Capital Securitized Opportunities Fund | ||||||||||||||||||||
Class A Shares | 1,000.00 | 1,023.04 | 4.45 | 0.88 | % | |||||||||||||||
Class C Shares | 1,000.00 | 1,019.20 | 8.18 | 1.62 | % | |||||||||||||||
Institutional Shares | 1,000.00 | 1,023.30 | 3.14 | 0.62 | % | |||||||||||||||
Sterling Capital Kentucky Intermediate Tax-Free Fund | ||||||||||||||||||||
Class A Shares | 1,000.00 | 1,016.63 | 4.49 | 0.89 | % | |||||||||||||||
Class C Shares | 1,000.00 | 1,012.89 | 8.20 | 1.63 | % | |||||||||||||||
Institutional Shares | 1,000.00 | 1,017.91 | 3.23 | 0.64 | % | |||||||||||||||
Sterling Capital Maryland Intermediate Tax-Free Fund | ||||||||||||||||||||
Class A Shares | 1,000.00 | 1,013.23 | 4.28 | 0.85 | % | |||||||||||||||
Class C Shares | 1,000.00 | 1,009.42 | 8.04 | 1.60 | % | |||||||||||||||
Institutional Shares | 1,000.00 | 1,014.45 | 3.02 | 0.60 | % | |||||||||||||||
Sterling Capital North Carolina Intermediate Tax-Free Fund | ||||||||||||||||||||
Class A Shares | 1,000.00 | 1,012.81 | 3.98 | 0.79 | % | |||||||||||||||
Class C Shares | 1,000.00 | 1,008.11 | 7.78 | 1.55 | % | |||||||||||||||
Institutional Shares | 1,000.00 | 1,014.10 | 2.77 | 0.55 | % | |||||||||||||||
Sterling Capital South Carolina Intermediate Tax-Free Fund | ||||||||||||||||||||
Class A Shares | 1,000.00 | 1,011.33 | 4.07 | 0.81 | % | |||||||||||||||
Class C Shares | 1,000.00 | 1,008.46 | 7.83 | 1.56 | % | |||||||||||||||
Institutional Shares | 1,000.00 | 1,012.58 | 2.82 | 0.56 | % | |||||||||||||||
Sterling Capital Virginia Intermediate Tax-Free Fund | ||||||||||||||||||||
Class A Shares | 1,000.00 | 1,013.00 | 4.03 | 0.80 | % | |||||||||||||||
Class C Shares | 1,000.00 | 1,009.23 | 7.79 | 1.55 | % | |||||||||||||||
Institutional Shares | 1,000.00 | 1,014.29 | 2.77 | 0.55 | % | |||||||||||||||
Sterling Capital West Virginia Intermediate Tax-Free Fund | ||||||||||||||||||||
Class A Shares | 1,000.00 | 1,015.06 | 4.13 | 0.82 | % | |||||||||||||||
Class C Shares | 1,000.00 | 1,011.23 | 7.89 | 1.57 | % | |||||||||||||||
Institutional Shares | 1,000.00 | 1,016.31 | 2.87 | 0.57 | % | |||||||||||||||
Sterling Capital Diversified Income Fund | ||||||||||||||||||||
Class A Shares | 1,000.00 | 1,068.94 | 3.88 | 0.75 | % | |||||||||||||||
Class B Shares | 1,000.00 | 1,064.70 | 7.95 | 1.54 | % | |||||||||||||||
Class C Shares | 1,000.00 | 1,064.63 | 7.64 | 1.48 | % | |||||||||||||||
Institutional Shares | 1,000.00 | 1,069.46 | 2.59 | 0.50 | % | |||||||||||||||
Sterling Capital Strategic Allocation Balanced Fund | ||||||||||||||||||||
Class A Shares | 1,000.00 | 1,046.72 | 2.00 | 0.39 | % | |||||||||||||||
Class B Shares | 1,000.00 | 1,043.22 | 5.82 | 1.14 | % | |||||||||||||||
Class C Shares | 1,000.00 | 1,042.71 | 5.82 | 1.14 | % | |||||||||||||||
Institutional Shares | 1,000.00 | 1,048.68 | 0.72 | 0.14 | % | |||||||||||||||
Sterling Capital Strategic Allocation Growth Fund | ||||||||||||||||||||
Class A Shares | 1,000.00 | 1,048.84 | 2.10 | 0.41 | % | |||||||||||||||
Class B Shares | 1,000.00 | 1,046.01 | 5.98 | 1.17 | % | |||||||||||||||
Class C Shares | 1,000.00 | 1,045.17 | 5.93 | 1.16 | % | |||||||||||||||
Institutional Shares | 1,000.00 | 1,051.06 | 0.82 | 0.16 | % | |||||||||||||||
| * | Expenses are equal to the average account value over the period multiplied by the Fund’s annualized expense ratio, multiplied by 183 days divided by 366 (to reflect the six month period). |
57
Sterling Capital Funds
|
Expense Example (Unaudited) |
Hypothetical Example for Comparison Purposes
The table below provides information about hypothetical account values and hypothetical expenses based on the Fund’s actual expense ratio and an assumed rate of return of 5% per year before expenses, which is not the Funds’ actual return. The hypothetical account values and expenses may not be used to estimate the actual ending account balance or expenses you paid for the year. You may use this information to compare the ongoing costs of investing in a Fund and other funds. To do so, compare this 5% hypothetical example with the 5% hypothetical examples that appear in the shareholder reports of other funds.
Please note that the expenses shown in the table are meant to highlight your ongoing costs only and do not reflect any transactional costs, such as sales charges (loads), redemption fees, or exchange fees. Therefore, the table is useful in comparing ongoing costs only, and will not help you determine the relative total costs of owning different funds. In addition, if these transactional costs were included, your costs would have been higher.
| Beginning Account Value 4/1/16 | Ending Account Value 9/30/16 | Expenses Paid During Period* 4/1/16 - 9/30/16 | Annualized Expense Ratio During Period 4/1/16 - 9/30/16 | |||||||||||||||||
Sterling Capital Behavioral Large Cap Value Equity Fund | ||||||||||||||||||||
Class A Shares | $ | 1,000.00 | $ | 1,020.05 | $ | 5.00 | 0.99 | % | ||||||||||||
Class B Shares | 1,000.00 | 1,016.30 | 8.77 | 1.74 | % | |||||||||||||||
Class C Shares | 1,000.00 | 1,016.30 | 8.77 | 1.74 | % | |||||||||||||||
Institutional Shares | 1,000.00 | 1,021.30 | 3.74 | 0.74 | % | |||||||||||||||
Sterling Capital Mid Value Fund | ||||||||||||||||||||
Class A Shares | 1,000.00 | 1,019.20 | 5.86 | 1.16 | % | |||||||||||||||
Class B Shares | 1,000.00 | 1,015.45 | 9.62 | 1.91 | % | |||||||||||||||
Class C Shares | 1,000.00 | 1,015.45 | 9.62 | 1.91 | % | |||||||||||||||
Institutional Shares | 1,000.00 | 1,020.45 | 4.60 | 0.91 | % | |||||||||||||||
Class R Shares | 1,000.00 | 1,017.90 | 7.16 | 1.42 | % | |||||||||||||||
Sterling Capital Behavioral Small Cap Value Equity Fund | ||||||||||||||||||||
Class A Shares | 1,000.00 | 1,019.75 | 5.30 | 1.05 | % | |||||||||||||||
Class B Shares | 1,000.00 | 1,016.00 | 9.07 | 1.80 | % | |||||||||||||||
Class C Shares | 1,000.00 | 1,015.90 | 9.17 | 1.82 | % | |||||||||||||||
Institutional Shares | 1,000.00 | 1,020.90 | 4.14 | 0.82 | % | |||||||||||||||
Class R Shares | 1,000.00 | 1,018.35 | 6.71 | 1.33 | % | |||||||||||||||
Sterling Capital Special Opportunities Fund | ||||||||||||||||||||
Class A Shares | 1,000.00 | 1,019.25 | 5.81 | 1.15 | % | |||||||||||||||
Class B Shares | 1,000.00 | 1,015.55 | 9.52 | 1.89 | % | |||||||||||||||
Class C Shares | 1,000.00 | 1,015.50 | 9.57 | 1.90 | % | |||||||||||||||
Institutional Shares | 1,000.00 | 1,020.50 | 4.55 | 0.90 | % | |||||||||||||||
Class R Shares | 1,000.00 | 1,018.00 | 7.06 | 1.40 | % | |||||||||||||||
Sterling Capital Equity Income Fund | ||||||||||||||||||||
Class A Shares | 1,000.00 | 1,019.00 | 6.06 | 1.20 | % | |||||||||||||||
Class B Shares | 1,000.00 | 1,015.25 | 9.82 | 1.95 | % | |||||||||||||||
Class C Shares | 1,000.00 | 1,015.25 | 9.82 | 1.95 | % | |||||||||||||||
Institutional Shares | 1,000.00 | 1,020.25 | 4.80 | 0.95 | % | |||||||||||||||
Class R Shares | 1,000.00 | 1,017.75 | 7.31 | 1.45 | % | |||||||||||||||
Sterling Capital Long/Short Equity Fund | ||||||||||||||||||||
Class A Shares | 1,000.00 | 1,005.30 | 19.75 | 3.94 | % | |||||||||||||||
Class C Shares | 1,000.00 | 1,001.50 | 23.52 | 4.70 | % | |||||||||||||||
Institutional Shares | 1,000.00 | 1,006.45 | 18.61 | 3.71 | % | |||||||||||||||
Sterling Capital Behavioral International Equity Fund | ||||||||||||||||||||
Class A Shares | 1,000.00 | 1,021.60 | 3.44 | 0.68 | % | |||||||||||||||
Class C Shares | 1,000.00 | 1,017.30 | 7.77 | 1.54 | % | |||||||||||||||
Institutional Shares | 1,000.00 | 1,021.55 | 3.49 | 0.69 | % | |||||||||||||||
Sterling Capital Stratton Mid Cap Value Fund | ||||||||||||||||||||
Class A Shares | 1,000.00 | 1,019.00 | 6.06 | 1.20 | % | |||||||||||||||
Class C Shares | 1,000.00 | 1,015.20 | 9.87 | 1.96 | % | |||||||||||||||
Institutional Shares | 1,000.00 | 1,020.25 | 4.80 | 0.95 | % | |||||||||||||||
Sterling Capital Stratton Real Estate Fund | ||||||||||||||||||||
Class A Shares | 1,000.00 | 1,019.60 | 5.45 | 1.08 | % | |||||||||||||||
Class C Shares | 1,000.00 | 1,015.80 | 9.27 | 1.84 | % | |||||||||||||||
Institutional Shares | 1,000.00 | 1,020.85 | 4.19 | 0.83 | % | |||||||||||||||
Sterling Capital Stratton Small Cap Value Fund | ||||||||||||||||||||
Class A Shares | 1,000.00 | 1,018.35 | 6.71 | 1.33 | % | |||||||||||||||
Class C Shares | 1,000.00 | 1,014.60 | 10.48 | 2.08 | % | |||||||||||||||
Institutional Shares | 1,000.00 | 1,019.60 | 5.45 | 1.08 | % | |||||||||||||||
Sterling Capital Ultra Short Bond Fund | ||||||||||||||||||||
Class A Shares | 1,000.00 | 1,021.65 | 3.39 | 0.67 | % | |||||||||||||||
Institutional Shares | 1,000.00 | 1,022.85 | 2.17 | 0.43 | % | |||||||||||||||
58
Sterling Capital Funds
|
Expense Example (Unaudited) |
| Beginning Account Value 4/1/16 | Ending Account Value 9/30/16 | Expenses Paid During Period* 4/1/16 - 9/30/16 | Annualized Expense Ratio During Period 4/1/16 - 9/30/16 | |||||||||||||||||
Sterling Capital Short Duration Bond Fund | ||||||||||||||||||||
Class A Shares | $ | 1,000.00 | $ | 1,021.50 | $ | 3.54 | 0.70 | % | ||||||||||||
Class C Shares | 1,000.00 | 1,017.75 | 7.31 | 1.45 | % | |||||||||||||||
Institutional Shares | 1,000.00 | 1,022.75 | 2.28 | 0.45 | % | |||||||||||||||
Sterling Capital Intermediate U.S. Government Fund | ||||||||||||||||||||
Class A Shares | 1,000.00 | 1,020.80 | 4.24 | 0.84 | % | |||||||||||||||
Class B Shares | 1,000.00 | 1,017.05 | 8.02 | 1.59 | % | |||||||||||||||
Class C Shares | 1,000.00 | 1,017.05 | 8.02 | 1.59 | % | |||||||||||||||
Institutional Shares | 1,000.00 | 1,022.05 | 2.98 | 0.59 | % | |||||||||||||||
Sterling Capital Total Return Bond Fund | ||||||||||||||||||||
Class A Shares | 1,000.00 | 1,021.25 | 3.79 | 0.75 | % | |||||||||||||||
Class B Shares | 1,000.00 | 1,017.55 | 7.52 | 1.49 | % | |||||||||||||||
Class C Shares | 1,000.00 | 1,017.55 | 7.52 | 1.49 | % | |||||||||||||||
Institutional Shares | 1,000.00 | 1,022.55 | 2.48 | 0.49 | % | |||||||||||||||
Class R Shares | 1,000.00 | 1,020.00 | 5.05 | 1.00 | % | |||||||||||||||
Sterling Capital Corporate Fund | ||||||||||||||||||||
Class A Shares | 1,000.00 | 1,020.60 | 4.45 | 0.88 | % | |||||||||||||||
Class C Shares | 1,000.00 | 1,016.85 | 8.22 | 1.63 | % | |||||||||||||||
Institutional Shares | 1,000.00 | 1,021.75 | 3.29 | 0.65 | % | |||||||||||||||
Sterling Capital Securitized Opportunities Fund | ||||||||||||||||||||
Class A Shares | 1,000.00 | 1,020.60 | 4.45 | 0.88 | % | |||||||||||||||
Class C Shares | 1,000.00 | 1,016.90 | 8.17 | 1.62 | % | |||||||||||||||
Institutional Shares | 1,000.00 | 1,021.90 | 3.13 | 0.62 | % | |||||||||||||||
Sterling Capital Kentucky Intermediate Tax-Free Fund | ||||||||||||||||||||
Class A Shares | 1,000.00 | 1,020.55 | 4.50 | 0.89 | % | |||||||||||||||
Class C Shares | 1,000.00 | 1,016.85 | 8.22 | 1.63 | % | |||||||||||||||
Institutional Shares | 1,000.00 | 1,021.80 | 3.23 | 0.64 | % | |||||||||||||||
Sterling Capital Maryland Intermediate Tax-Free Fund | ||||||||||||||||||||
Class A Shares | 1,000.00 | 1,020.75 | 4.29 | 0.85 | % | |||||||||||||||
Class C Shares | 1,000.00 | 1,017.00 | 8.07 | 1.60 | % | |||||||||||||||
Institutional Shares | 1,000.00 | 1,022.00 | 3.03 | 0.60 | % | |||||||||||||||
Sterling Capital North Carolina Intermediate Tax-Free Fund | ||||||||||||||||||||
Class A Shares | 1,000.00 | 1,021.05 | 3.99 | 0.79 | % | |||||||||||||||
Class C Shares | 1,000.00 | 1,017.25 | 7.82 | 1.55 | % | |||||||||||||||
Institutional Shares | 1,000.00 | 1,022.25 | 2.78 | 0.55 | % | |||||||||||||||
Sterling Capital South Carolina Intermediate Tax-Free Fund | ||||||||||||||||||||
Class A Shares | 1,000.00 | 1,020.95 | 4.09 | 0.81 | % | |||||||||||||||
Class C Shares | 1,000.00 | 1,017.20 | 7.87 | 1.56 | % | |||||||||||||||
Institutional Shares | 1,000.00 | 1,022.20 | 2.83 | 0.56 | % | |||||||||||||||
Sterling Capital Virginia Intermediate Tax-Free Fund | ||||||||||||||||||||
Class A Shares | 1,000.00 | 1,021.00 | 4.04 | 0.80 | % | |||||||||||||||
Class C Shares | 1,000.00 | 1,017.25 | 7.82 | 1.55 | % | |||||||||||||||
Institutional Shares | 1,000.00 | 1,022.25 | 2.78 | 0.55 | % | |||||||||||||||
Sterling Capital West Virginia Intermediate Tax-Free Fund | ||||||||||||||||||||
Class A Shares | 1,000.00 | 1,020.90 | 4.14 | 0.82 | % | |||||||||||||||
Class C Shares | 1,000.00 | 1,017.15 | 7.92 | 1.57 | % | |||||||||||||||
Institutional Shares | 1,000.00 | 1,022.15 | 2.88 | 0.57 | % | |||||||||||||||
Sterling Capital Diversified Income Fund | ||||||||||||||||||||
Class A Shares | 1,000.00 | 1,021.25 | 3.79 | 0.75 | % | |||||||||||||||
Class B Shares | 1,000.00 | 1,017.30 | 7.77 | 1.54 | % | |||||||||||||||
Class C Shares | 1,000.00 | 1,017.60 | 7.47 | 1.48 | % | |||||||||||||||
Institutional Shares | 1,000.00 | 1,022.50 | 2.53 | 0.50 | % | |||||||||||||||
Sterling Capital Strategic Allocation Balanced Fund | ||||||||||||||||||||
Class A Shares | 1,000.00 | 1,023.05 | 1.97 | 0.39 | % | |||||||||||||||
Class B Shares | 1,000.00 | 1,019.30 | 5.76 | 1.14 | % | |||||||||||||||
Class C Shares | 1,000.00 | 1,019.30 | 5.76 | 1.14 | % | |||||||||||||||
Institutional Shares | 1,000.00 | 1,024.30 | 0.71 | 0.14 | % | |||||||||||||||
Sterling Capital Strategic Allocation Growth Fund | ||||||||||||||||||||
Class A Shares | 1,000.00 | 1,022.95 | 2.07 | 0.41 | % | |||||||||||||||
Class B Shares | 1,000.00 | 1,019.15 | 5.91 | 1.17 | % | |||||||||||||||
Class C Shares | 1,000.00 | 1,019.20 | 5.86 | 1.16 | % | |||||||||||||||
Institutional Shares | 1,000.00 | 1,024.20 | 0.81 | 0.16 | % | |||||||||||||||
| * | Expenses are equal to the average account value over the period multiplied by the Fund’s annualized expense ratio, multiplied by 183 days divided by 366 (to reflect the six month period). |
59
Sterling Capital Behavioral Large Cap Value Equity Fund
|
Schedule of Portfolio Investments |
September 30, 2016
|
Shares | Fair Value | |||||
COMMON STOCKS — 98.5% | ||||||
Automobiles & Components — 2.4% |
| |||||
| 110,450 | Johnson Controls International PLC | $ | 5,139,239 | |||
| 10,829 | Lear Corp. | 1,312,691 | ||||
|
| |||||
| 6,451,930 | ||||||
|
| |||||
Banks — 9.4% | ||||||
| 11,250 | Cullen/Frost Bankers, Inc. | 809,325 | ||||
| 163,100 | JPMorgan Chase & Co. | 10,860,829 | ||||
| 30,550 | PacWest Bancorp | 1,310,901 | ||||
| 33,500 | Popular, Inc. | 1,280,370 | ||||
| 134,550 | Regions Financial Corp. | 1,328,009 | ||||
| 111,650 | SunTrust Banks, Inc. | 4,890,270 | ||||
| 116,499 | Wells Fargo & Co. | 5,158,576 | ||||
|
| |||||
| 25,638,280 | ||||||
|
| |||||
Capital Goods — 6.8% | ||||||
| 36,800 | Cummins, Inc. | 4,715,920 | ||||
| 78,500 | Eaton Corp. PLC | 5,158,235 | ||||
| 36,250 | Honeywell International, Inc. | 4,226,387 | ||||
| 9,000 | Huntington Ingalls Industries, Inc. | 1,380,780 | ||||
| 4,150 | Illinois Tool Works, Inc. | 497,336 | ||||
| 9,600 | L-3 Communications Holdings, Inc. | 1,447,008 | ||||
| 50,100 | Vectrus, Inc.(a) | 763,023 | ||||
| 7,150 | WESCO International, Inc.(a) | 439,654 | ||||
|
| |||||
| 18,628,343 | ||||||
|
| |||||
Consumer Durables & Apparel — 0.4% |
| |||||
| 24,300 | Michael Kors Holdings, Ltd.(a) | 1,136,997 | ||||
|
| |||||
Consumer Services — 0.6% | ||||||
| 64,850 | International Game Technology PLC | 1,581,043 | ||||
|
| |||||
Diversified Financials — 7.3% | ||||||
| 8,500 | BlackRock, Inc. | 3,080,910 | ||||
| 83,100 | Discover Financial Services | 4,699,305 | ||||
| 34,750 | Eaton Vance Corp. | 1,356,987 | ||||
| 40,800 | Federated Investors, Inc., Class B | 1,208,904 | ||||
| 47,300 | Morgan Stanley | 1,516,438 | ||||
| 99,250 | Navient Corp. | 1,436,147 | ||||
| 98,050 | NorthStar Asset Management Group, Inc. | 1,267,787 | ||||
| 74,300 | State Street Corp. | 5,173,509 | ||||
|
| |||||
| 19,739,987 | ||||||
|
| |||||
Energy — 12.6% | ||||||
| 64,500 | Apache Corp. | 4,119,615 | ||||
| 95,100 | Baker Hughes, Inc. | 4,799,697 | ||||
| 178,250 | Chesapeake Energy Corp.(a) | 1,117,627 | ||||
| 374,900 | Denbury Resources, Inc.(a) | 1,210,927 | ||||
| 111,600 | Devon Energy Corp. | 4,922,676 | ||||
| 295,500 | EP Energy Corp., Class A(a) | 1,294,290 | ||||
| 125,800 | Nabors Industries, Ltd. | 1,529,728 | ||||
| 32,450 | ONEOK, Inc. | 1,667,605 | ||||
| 61,900 | Patterson-UTI Energy, Inc. | 1,384,703 | ||||
| 29,400 | Pioneer Natural Resources Co. | 5,458,110 | ||||
| 313,250 | Seadrill, Ltd.(a) | 742,403 | ||||
| 87,225 | Valero Energy Corp. | 4,622,925 | ||||
| 29,750 | World Fuel Services Corp. | 1,376,235 | ||||
|
| |||||
| 34,246,541 | ||||||
|
| |||||
Food & Staples Retailing — 2.6% |
| |||||
| 98,450 | Wal-Mart Stores, Inc. | 7,100,214 | ||||
|
| |||||
Food, Beverage & Tobacco — 3.2% |
| |||||
| 33,450 | Archer-Daniels-Midland Co. | 1,410,587 | ||||
Shares | Fair Value | |||||
COMMON STOCKS — (continued) | ||||||
Food, Beverage & Tobacco — (continued) |
| |||||
| 11,800 | Ingredion, Inc. | $ | 1,570,108 | |||
| 8,450 | JM Smucker Co. (The) | 1,145,313 | ||||
| 62,950 | Tyson Foods, Inc., Class A | 4,700,477 | ||||
|
| |||||
| 8,826,485 | ||||||
|
| |||||
Health Care Equipment & Services — 4.6% |
| |||||
| 55,150 | Express Scripts Holding Co.(a) | 3,889,729 | ||||
| 58,950 | HCA Holdings, Inc.(a) | 4,458,389 | ||||
| 29,300 | UnitedHealth Group, Inc. | 4,102,000 | ||||
|
| |||||
| 12,450,118 | ||||||
|
| |||||
Household & Personal Products — 2.1% |
| |||||
| 30,350 | Energizer Holdings, Inc. | 1,516,286 | ||||
| 24,000 | Herbalife, Ltd.(a) | 1,487,760 | ||||
| 25,950 | Nu Skin Enterprises, Inc., Class A | 1,681,041 | ||||
| 7,200 | Spectrum Brands Holdings, Inc. | 991,368 | ||||
|
| |||||
| 5,676,455 | ||||||
|
| |||||
Insurance — 4.0% |
| |||||
| 71,600 | Aflac, Inc. | 5,145,892 | ||||
| 57,200 | American International Group, Inc. | 3,394,248 | ||||
| 29,650 | First American Financial Corp. | 1,164,652 | ||||
| 24,850 | Principal Financial Group, Inc. | 1,280,023 | ||||
|
| |||||
| 10,984,815 | ||||||
|
| |||||
Materials — 3.8% |
| |||||
| 31,200 | Berry Plastics Group, Inc.(a) | 1,368,120 | ||||
| 26,150 | Cabot Corp. | 1,370,521 | ||||
| 84,350 | International Paper Co. | 4,047,113 | ||||
| 22,250 | Nucor Corp. | 1,100,263 | ||||
| 15,150 | Reliance Steel & Aluminum Co. | 1,091,255 | ||||
| 52,450 | Steel Dynamics, Inc. | 1,310,725 | ||||
|
| |||||
| 10,287,997 | ||||||
|
| |||||
Media — 1.9% |
| |||||
| 21,300 | CBS Corp., Class B | 1,165,962 | ||||
| 46,250 | Omnicom Group, Inc. | 3,931,250 | ||||
|
| |||||
| 5,097,212 | ||||||
|
| |||||
Pharmaceuticals, Biotechnology & Life |
| |||||
| 14,600 | Amgen, Inc. | 2,435,426 | ||||
| 95,850 | Johnson & Johnson | 11,322,761 | ||||
| 270,850 | Pfizer, Inc. | 9,173,689 | ||||
|
| |||||
| 22,931,876 | ||||||
|
| |||||
Real Estate — 4.2% |
| |||||
| 14,650 | Digital Realty Trust, Inc., REIT | 1,422,808 | ||||
| 36,800 | Gaming and Leisure Properties, Inc., REIT | 1,230,960 | ||||
| 42,150 | Hospitality Properties Trust, REIT | 1,252,698 | ||||
| 31,400 | RMR Group, Inc. (The), Class A | 1,191,316 | ||||
| 54,750 | Senior Housing Properties Trust, REIT | 1,243,373 | ||||
| 64,850 | Ventas, Inc., REIT | 4,580,355 | ||||
| 47,150 | VEREIT, Inc., REIT | 488,945 | ||||
|
| |||||
| 11,410,455 | ||||||
|
| |||||
Retailing — 0.3% |
| |||||
| 12,250 | Lowe’s Cos., Inc. | 884,573 | ||||
|
| |||||
Semiconductors & Semiconductor |
| |||||
| 150,450 | Applied Materials, Inc. | 4,536,067 | ||||
| 25,200 | Broadcom, Ltd. | 4,347,504 | ||||
Continued
60
Sterling Capital Behavioral Large Cap Value Equity Fund
|
Schedule of Portfolio Investments — (continued) |
September 30, 2016
|
Shares | Fair Value | |||||
COMMON STOCKS — (continued) | ||||||
Semiconductors & Semiconductor Equipment — (continued) |
| |||||
| 39,250 | QUALCOMM, Inc. | $ | 2,688,625 | |||
|
| |||||
| 11,572,196 | ||||||
|
| |||||
Software & Services — 3.7% | ||||||
| 17,550 | Citrix Systems, Inc.(a) | 1,495,611 | ||||
| 128,200 | eBay, Inc.(a) | 4,217,780 | ||||
| 60,050 | VMware, Inc., Class A(a) | 4,404,667 | ||||
|
| |||||
| 10,118,058 | ||||||
|
| |||||
Technology Hardware & Equipment — 3.5% |
| |||||
| 12,500 | Arrow Electronics, Inc.(a) | 799,625 | ||||
| 271,350 | Cisco Systems, Inc. | 8,607,222 | ||||
|
| |||||
| 9,406,847 | ||||||
|
| |||||
Telecommunication Services — 5.0% |
| |||||
| 196,500 | AT&T, Inc. | 7,979,865 | ||||
| 105,950 | Verizon Communications, Inc. | 5,507,281 | ||||
|
| |||||
| 13,487,146 | ||||||
|
| |||||
Transportation — 1.0% | ||||||
| 15,050 | Copa Holdings SA, Class A | 1,323,347 | ||||
| 1,850 | Southwest Airlines Co. | 71,947 | ||||
| 12,900 | United Parcel Service, Inc., Class B | 1,410,744 | ||||
|
| |||||
| 2,806,038 | ||||||
|
| |||||
Utilities — 6.5% | ||||||
| 65,950 | American Electric Power Co., Inc. | 4,234,649 | ||||
| 60,250 | Consolidated Edison, Inc. | 4,536,825 | ||||
Shares | Fair Value | |||||
COMMON STOCKS — (continued) | ||||||
Utilities — (continued) | ||||||
| 66,500 | Exelon Corp. | $ | 2,213,785 | |||
| 19,400 | PG&E Corp. | 1,186,698 | ||||
| 108,050 | Southern Co. (The) | 5,542,965 | ||||
|
| |||||
| 17,714,922 | ||||||
|
| |||||
Total Common Stocks | 268,178,528 | |||||
|
| |||||
MONEY MARKET FUND — 1.6% | ||||||
| 4,355,626 | Federated Treasury Obligations Fund, Institutional Shares, 0.180%(b) | 4,355,626 | ||||
|
| |||||
Total Money Market Fund | 4,355,626 | |||||
|
| |||||
Total Investments — 100.1% | 272,534,154 | |||||
Net Other Assets (Liabilities) — (0.1)% | (275,435 | ) | ||||
|
| |||||
NET ASSETS — 100.0% | $ | 272,258,719 | ||||
|
| |||||
| (a) | Represents non-income producing security. |
| (b) | Represents the current yield as of report date. |
REIT — Real Estate Investment Trust |
See accompanying Notes to the Financial Statements.
61
Sterling Capital Mid Value Fund
|
Schedule of Portfolio Investments |
September 30, 2016
|
Shares | Fair Value | |||||
COMMON STOCKS — 97.1% | ||||||
Automobiles & Components — 3.3% |
| |||||
| 1,112,975 | Gentex Corp. | $ | 19,543,841 | |||
|
| |||||
Capital Goods — 7.0% | ||||||
| 55,740 | Air Lease Corp. | 1,593,049 | ||||
| 420,825 | Allison Transmission Holdings, Inc. | 12,069,261 | ||||
| 224,325 | EnPro Industries, Inc. | 12,746,147 | ||||
| 285,600 | Jacobs Engineering Group, Inc.(a) | 14,771,232 | ||||
|
| |||||
| 41,179,689 | ||||||
|
| |||||
Commercial & Professional Services — 3.2% |
| |||||
| 76,500 | CEB, Inc. | 4,166,955 | ||||
| 1,006,720 | Civeo Corp.(a) | 1,147,661 | ||||
| 378,675 | Tetra Tech, Inc. | 13,431,602 | ||||
|
| |||||
| 18,746,218 | ||||||
|
| |||||
Diversified Financials — 16.7% | ||||||
| 122,700 | Affiliated Managers Group, Inc.(a) | 17,754,690 | ||||
| 1,399,725 | Annaly Capital Management, Inc., REIT | 14,697,113 | ||||
| 891,900 | E*TRADE Financial Corp.(a) | 25,972,128 | ||||
| 1,456,550 | Leucadia National Corp. | 27,732,712 | ||||
| 180,675 | T. Rowe Price Group, Inc. | 12,014,887 | ||||
|
| |||||
| 98,171,530 | ||||||
|
| |||||
Energy — 0.6% | ||||||
| 571,525 | Noble Corp. PLC | 3,623,469 | ||||
|
| |||||
Health Care Equipment & Services — 8.7% |
| |||||
| 118,640 | HCA Holdings, Inc.(a) | 8,972,743 | ||||
| 143,725 | Laboratory Corp. of America Holdings(a) | 19,759,313 | ||||
| 171,775 | Zimmer Biomet Holdings, Inc. | 22,334,185 | ||||
|
| |||||
| 51,066,241 | ||||||
|
| |||||
Insurance — 13.4% | ||||||
| 317,000 | Assured Guaranty, Ltd. | 8,796,750 | ||||
| 79,450 | Enstar Group, Ltd.(a) | 13,067,141 | ||||
| 315,425 | Lincoln National Corp. | 14,818,667 | ||||
| 18,350 | Markel Corp.(a) | 17,042,929 | ||||
| 187,375 | Willis Towers Watson PLC | 24,877,779 | ||||
|
| |||||
| 78,603,266 | ||||||
|
| |||||
Materials — 3.6% | ||||||
| 627,675 | Axalta Coating Systems, Ltd.(a) | 17,744,372 | ||||
| 263,600 | Rayonier Advanced Materials, Inc. | 3,524,332 | ||||
|
| |||||
| 21,268,704 | ||||||
|
| |||||
Media — 9.9% | ||||||
| 337,850 | CBS Corp., Class B | 18,493,909 | ||||
| 1,337,425 | News Corp., Class B | 19,018,183 | ||||
| 185,125 | Omnicom Group, Inc. | 15,735,625 | ||||
| 126,400 | Viacom, Inc., Class B | 4,815,840 | ||||
|
| |||||
| 58,063,557 | ||||||
|
| |||||
Shares | Fair Value | |||||
COMMON STOCKS — (continued) | ||||||
Real Estate — 5.3% | ||||||
| 603,475 | CBRE Group, Inc., Class A(a) | $ | 16,885,231 | |||
| 293,825 | Ryman Hospitality Properties, Inc., REIT | 14,150,612 | ||||
|
| |||||
| 31,035,843 | ||||||
|
| |||||
Retailing — 3.1% | ||||||
| 1,245,200 | Ascena Retail Group, Inc.(a) | 6,960,668 | ||||
| 653,925 | Chico’s FAS, Inc. | 7,781,707 | ||||
| 80,875 | Kohl’s Corp. | 3,538,281 | ||||
|
| |||||
| 18,280,656 | ||||||
|
| |||||
Software & Services — 13.1% | ||||||
| 995,250 | DHI Group, Inc.(a) | 7,852,523 | ||||
| 80,550 | DST Systems, Inc. | 9,498,456 | ||||
| 713,650 | eBay, Inc.(a) | 23,479,085 | ||||
| 206,775 | Fidelity National Information Services, Inc. | 15,927,878 | ||||
| 56,285 | MicroStrategy, Inc., Class A(a) | 9,424,360 | ||||
| 525,625 | Western Union Co. (The) | 10,943,513 | ||||
|
| |||||
| 77,125,815 | ||||||
|
| |||||
Technology Hardware & Equipment — 7.9% |
| |||||
| 499,475 | II-VI, Inc.(a) | 12,152,227 | ||||
| 715,725 | Knowles Corp.(a) | 10,055,936 | ||||
| 748,825 | NCR Corp.(a) | 24,104,677 | ||||
|
| |||||
| 46,312,840 | ||||||
|
| |||||
Transportation — 1.3% | ||||||
| 191,635 | Hertz Global Holdings, Inc.(a) | 7,696,062 | ||||
|
| |||||
Total Common Stocks | 570,717,731 | |||||
|
| |||||
MONEY MARKET FUND — 2.4% | ||||||
| 14,217,452 | Federated Treasury Obligations Fund, Institutional Shares, 0.180%(b) | 14,217,452 | ||||
|
| |||||
Total Money Market Fund | 14,217,452 | |||||
|
| |||||
Total Investments — 99.5% | 584,935,183 | |||||
Net Other Assets (Liabilities) — 0.5% | 2,939,866 | |||||
|
| |||||
NET ASSETS — 100.0% | $ | 587,875,049 | ||||
|
| |||||
| (a) | Represents non-income producing security. |
| (b) | Represents the current yield as of report date. |
REIT — Real Estate Investment Trust
See accompanying Notes to the Financial Statements.
62
Sterling Capital Behavioral Small Cap Value Equity Fund
|
Schedule of Portfolio Investments |
September 30, 2016
|
Shares | Fair Value | |||||
COMMON STOCKS — 97.9% | ||||||
Automobiles & Components — 4.0% |
| |||||
| 33,551 | American Axle & Manufacturing Holdings, Inc.(a) | $ | 577,748 | |||
| 27,702 | Cooper Tire & Rubber Co. | 1,053,230 | ||||
| 9,584 | Cooper-Standard Holding, Inc.(a) | 946,899 | ||||
| 65,420 | Dana, Inc. | 1,019,898 | ||||
| 6,678 | Lear Corp. | 809,507 | ||||
| 32,926 | Stoneridge, Inc.(a) | 605,838 | ||||
| 19,515 | Superior Industries International, Inc. | 569,057 | ||||
| 10,395 | Tenneco, Inc.(a) | 605,717 | ||||
| 5,748 | Thor Industries, Inc. | 486,856 | ||||
|
| |||||
| 6,674,750 | ||||||
|
| |||||
Banks — 20.0% | ||||||
| 19,467 | 1st Source Corp. | 694,875 | ||||
| 49,420 | Banc of California, Inc. | 862,873 | ||||
| 9,939 | BancFirst Corp. | 720,677 | ||||
| 14,240 | Camden National Corp. | 679,818 | ||||
| 32,714 | Cathay General Bancorp | 1,006,937 | ||||
| 29,267 | Central Pacific Financial Corp. | 737,236 | ||||
| 17,910 | Community Trust Bancorp, Inc. | 664,640 | ||||
| 31,552 | Customers Bancorp, Inc.(a) | 793,848 | ||||
| 28,172 | Enterprise Financial Services Corp. | 880,375 | ||||
| 20,992 | FCB Financial Holdings, Inc., Class A(a) | 806,723 | ||||
| 18,519 | Federal Agricultural Mortgage Corp., Class C | 731,501 | ||||
| 38,469 | Fidelity Southern Corp. | 707,445 | ||||
| 21,016 | Financial Institutions, Inc. | 569,744 | ||||
| 142,370 | First BanCorp(a) | 740,324 | ||||
| 75,914 | First Commonwealth Financial Corp. | 765,972 | ||||
| 14,380 | First Defiance Financial Corp. | 641,923 | ||||
| 35,405 | Flagstar Bancorp, Inc.(a) | 982,489 | ||||
| 30,766 | Flushing Financial Corp. | 729,770 | ||||
| 71,755 | Fulton Financial Corp. | 1,041,883 | ||||
| 26,612 | Great Western Bancorp, Inc. | 886,712 | ||||
| 29,902 | Hanmi Financial Corp. | 787,619 | ||||
| 17,369 | Heartland Financial USA, Inc. | 626,500 | ||||
| 40,220 | Hilltop Holdings, Inc.(a) | 903,341 | ||||
| 32,364 | HomeStreet, Inc.(a) | 811,042 | ||||
| 49,283 | Hope Bancorp, Inc. | 856,046 | ||||
| 22,040 | Horizon Bancorp | 647,535 | ||||
| 17,121 | IBERIABANK Corp. | 1,149,162 | ||||
| 48,282 | Meta Financial Group, Inc. | 2,926,372 | ||||
| 34,380 | PennyMac Financial Services, Inc., Class A(a) | 584,804 | ||||
| 49,790 | PHH Corp.(a) | 719,465 | ||||
| 19,213 | Popular, Inc. | 734,321 | ||||
| 85,338 | Radian Group, Inc. | 1,156,330 | ||||
| 4,400 | Southside Bancshares, Inc. | 141,592 | ||||
| 40,083 | TCF Financial Corp. | 581,604 | ||||
| 102,559 | TrustCo Bank Corp. | 727,143 | ||||
| 35,232 | Trustmark Corp. | 970,994 | ||||
| 38,433 | United Community Banks, Inc. | 807,862 | ||||
| 31,372 | Univest Corp. of Pennsylvania | 732,850 | ||||
| 40,706 | Washington Federal, Inc. | 1,086,036 | ||||
| 2,472 | Western Alliance Bancorp(a) | 92,799 | ||||
| 20,749 | Zions Bancorporation | 643,634 | ||||
|
| |||||
| 33,332,816 | ||||||
|
| |||||
Capital Goods — 9.9% | ||||||
| 32,775 | Aegion Corp.(a) | 625,019 | ||||
| 10,020 | Argan, Inc. | 593,084 | ||||
| 21,179 | Chart Industries, Inc.(a) | 695,307 | ||||
| 34,239 | DigitalGlobe, Inc.(a) | 941,573 | ||||
Shares | Fair Value | |||||
COMMON STOCKS — (continued) | ||||||
Capital Goods — (continued) | ||||||
| 11,667 | Douglas Dynamics, Inc. | $ | 372,644 | |||
| 14,989 | EnerSys | 1,037,089 | ||||
| 30,037 | Global Brass & Copper Holdings, Inc. | 867,769 | ||||
| 22,695 | Greenbrier Cos., Inc. (The) | 801,133 | ||||
| 4,692 | Huntington Ingalls Industries, Inc. | 719,847 | ||||
| 19,122 | Insteel Industries, Inc. | 692,981 | ||||
| 10,609 | Jacobs Engineering Group, Inc.(a) | 548,698 | ||||
| 38,879 | MasTec, Inc.(a) | 1,156,261 | ||||
| 22,840 | MYR Group, Inc.(a) | 687,484 | ||||
| 13,015 | Owens Corning | 694,871 | ||||
| 29,661 | Quanta Services, Inc.(a) | 830,211 | ||||
| 24,400 | Sparton Corp.(a) | 640,744 | ||||
| 11,187 | Spirit AeroSystems Holdings, Inc., Class A(a) | 498,269 | ||||
| 71,550 | Titan International, Inc. | 724,086 | ||||
| 7,337 | United Rentals, Inc.(a) | 575,881 | ||||
| 10,211 | Universal Forest Products, Inc. | 1,005,681 | ||||
| 8,370 | Veritiv Corp.(a) | 419,923 | ||||
| 56,687 | Wabash National Corp.(a) | 807,223 | ||||
| 9,788 | Woodward, Inc. | 611,554 | ||||
|
| |||||
| 16,547,332 | ||||||
|
| |||||
Commercial & Professional Services — 3.2% |
| |||||
| 70,559 | ACCO Brands Corp.(a) | 680,189 | ||||
| 66,845 | Casella Waste Systems, Inc., Class A(a) | 688,503 | ||||
| 12,503 | Insperity, Inc. | 908,218 | ||||
| 20,620 | Kelly Services, Inc., Class A | 396,316 | ||||
| 22,280 | McGrath RentCorp | 706,499 | ||||
| 29,770 | Mistras Group, Inc.(a) | 698,702 | ||||
| 25,054 | Quad/Graphics, Inc. | 669,443 | ||||
| 25,447 | West Corp. | 561,870 | ||||
|
| |||||
| 5,309,740 | ||||||
|
| |||||
Consumer Durables & Apparel — 1.4% |
| |||||
| 80,737 | JAKKS Pacific, Inc.(a) | 697,568 | ||||
| 48,862 | KB Home | 787,655 | ||||
| 30,002 | Smith & Wesson Holding Corp.(a) | 797,753 | ||||
|
| |||||
| 2,282,976 | ||||||
|
| |||||
Consumer Services — 1.7% | ||||||
| 767 | Boyd Gaming Corp.(a) | 15,171 | ||||
| 30,911 | DeVry Education Group, Inc. | 712,808 | ||||
| 42,907 | Intrawest Resorts Holdings, Inc.(a) | 695,952 | ||||
| 48,130 | K12, Inc.(a) | 690,665 | ||||
| 56,403 | Scientific Games Corp., Class A(a) | 635,662 | ||||
|
| |||||
| 2,750,258 | ||||||
|
| |||||
Diversified Financials — 9.3% | ||||||
| 143,871 | Anworth Mortgage Asset Corp., REIT | 707,845 | ||||
| 59,428 | Ares Commercial Real Estate Corp., REIT | 748,793 | ||||
| 70,424 | Capstead Mortgage Corp., REIT | 664,098 | ||||
| 37,829 | Chimera Investment Corp., REIT | 603,373 | ||||
| 89,632 | CYS Investments, Inc., REIT | 781,591 | ||||
| 89,988 | Dynex Capital, Inc., REIT | 667,711 | ||||
| 41,204 | Great Ajax Corp., REIT | 562,435 | ||||
| 64,357 | Invesco Mortgage Capital, Inc., REIT | 980,157 | ||||
| 49,291 | KCG Holdings, Inc., Class A(a) | 765,489 | ||||
| 78,440 | MFA Financial, Inc., REIT | 586,731 | ||||
| 40,564 | Navient Corp. | 586,961 | ||||
| 18,074 | Nelnet, Inc., Class A | 729,647 | ||||
| 79,722 | New Residential Investment Corp., REIT | 1,100,961 | ||||
| 106,444 | New York Mortgage Trust, Inc., REIT | 640,793 | ||||
Continued
63
Sterling Capital Behavioral Small Cap Value Equity Fund
|
Schedule of Portfolio Investments — (continued) |
September 30, 2016
|
Shares | Fair Value | |||||
COMMON STOCKS — (continued) | ||||||
Diversified Financials — (continued) |
| |||||
| 62,980 | Orchid Island Capital, Inc., REIT | $ | 656,252 | |||
| 13,127 | Piper Jaffray Cos.(a) | 634,034 | ||||
| 64,801 | Redwood Trust, Inc., REIT | 917,582 | ||||
| 28,340 | Regional Management Corp.(a) | 613,561 | ||||
| 51,632 | Santander Consumer USA Holdings, Inc.(a) | 627,845 | ||||
| 77,450 | SLM Corp.(a) | 578,551 | ||||
| 77,015 | Two Harbors Investment Corp., REIT | 656,938 | ||||
| 13,480 | World Acceptance Corp.(a) | 661,059 | ||||
|
| |||||
| 15,472,407 | ||||||
|
| |||||
Energy — 4.6% | ||||||
| 64,560 | Archrock, Inc. | 844,445 | ||||
| 64,667 | Atwood Oceanics, Inc. | 561,956 | ||||
| 63,067 | Bill Barrett Corp.(a) | 350,652 | ||||
| 274,210 | Denbury Resources, Inc.(a) | 885,698 | ||||
| 178,666 | EP Energy Corp., Class A(a) | 782,557 | ||||
| 30,459 | Forum Energy Technologies, Inc.(a) | 604,916 | ||||
| 58,590 | Nabors Industries, Ltd. | 712,454 | ||||
| 28,374 | Patterson-UTI Energy, Inc. | 634,726 | ||||
| 40,100 | Superior Energy Services, Inc. | 717,790 | ||||
| 49,057 | Unit Corp.(a) | 912,460 | ||||
| 12,600 | World Fuel Services Corp. | 582,876 | ||||
|
| |||||
| 7,590,530 | ||||||
|
| |||||
Food & Staples Retailing — 0.4% | ||||||
| 24,824 | SpartanNash Co. | 717,910 | ||||
|
| |||||
Food, Beverage & Tobacco — 2.2% | ||||||
| 75,123 | Darling Ingredients, Inc.(a) | 1,014,912 | ||||
| 38,045 | Dean Foods Co. | 623,938 | ||||
| 5,370 | Fresh Del Monte Produce, Inc. | 321,663 | ||||
| 1,154 | Ingredion, Inc. | 153,551 | ||||
| 27,020 | Omega Protein Corp.(a) | 631,457 | ||||
| 9,918 | Sanderson Farms, Inc. | 955,401 | ||||
|
| |||||
| 3,700,922 | ||||||
|
| |||||
Health Care Equipment & Services — 3.5% |
| |||||
| 14,206 | Amsurg Corp.(a) | 952,512 | ||||
| 13,812 | HealthSouth Corp. | 560,353 | ||||
| 10,550 | LifePoint Health, Inc.(a) | 624,877 | ||||
| 10,057 | Molina Healthcare, Inc.(a) | 586,524 | ||||
| 66,830 | OraSure Technologies, Inc.(a) | 532,635 | ||||
| 46,206 | Select Medical Holdings Corp.(a) | 623,781 | ||||
| 13,232 | Surgical Care Affiliates, Inc.(a) | 645,192 | ||||
| 27,360 | Triple-S Management Corp., Class B(a) | 600,005 | ||||
| 6,034 | WellCare Health Plans, Inc.(a) | 706,521 | ||||
|
| |||||
| 5,832,400 | ||||||
|
| |||||
Household & Personal Products — 0.8% |
| |||||
| 56,188 | Central Garden & Pet Co., Class A(a) | 1,393,462 | ||||
|
| |||||
Insurance — 11.4% | ||||||
| 13,964 | Allied World Assurance Co. Holdings AG | 564,425 | ||||
| 40,894 | Ambac Financial Group, Inc.(a) | 752,041 | ||||
| 51,759 | American Equity Investment Life Holding Co. | 917,687 | ||||
| 8,219 | American Financial Group, Inc. | 616,425 | ||||
| 15,565 | AMERISAFE, Inc. | 914,911 | ||||
| 18,141 | Argo Group International Holdings, Ltd. | 1,023,515 | ||||
| 11,928 | Aspen Insurance Holdings, Ltd. | 555,726 | ||||
| 20,086 | Assured Guaranty, Ltd. | 557,387 | ||||
| 63,399 | CNO Financial Group, Inc. | 968,103 | ||||
| 30,496 | Employers Holdings, Inc. | 909,696 | ||||
| 14,444 | Endurance Specialty Holdings, Ltd. | 945,360 | ||||
Shares | Fair Value | |||||
COMMON STOCKS — (continued) | ||||||
Insurance — (continued) | ||||||
| 11,165 | FBL Financial Group, Inc., Class A | $ | 714,225 | |||
| 209,930 | Genworth Financial, Inc., Class A(a) | 1,041,253 | ||||
| 7,411 | Hanover Insurance Group, Inc. (The) | 558,938 | ||||
| 27,123 | HCI Group, Inc. | 823,454 | ||||
| 52,216 | Maiden Holdings, Ltd. | 662,621 | ||||
| 31,379 | Old Republic International Corp. | 552,898 | ||||
| 20,820 | Primerica, Inc. | 1,104,085 | ||||
| 6,251 | Reinsurance Group of America, Inc. | 674,733 | ||||
| 4,969 | RenaissanceRe Holdings, Ltd. | 597,075 | ||||
| 31,206 | Selective Insurance Group, Inc. | 1,243,871 | ||||
| 23,763 | United Fire Group, Inc. | 1,005,650 | ||||
| 24,890 | Universal Insurance Holdings, Inc. | 627,228 | ||||
| 13,992 | Validus Holdings, Ltd. | 697,081 | ||||
|
| |||||
| 19,028,388 | ||||||
|
| |||||
Materials — 3.2% | ||||||
| 159,126 | AK Steel Holding Corp.(a) | 768,579 | ||||
| 12,963 | Cabot Corp. | 679,391 | ||||
| 30,804 | Commercial Metals Co. | 498,717 | ||||
| 23,270 | Steel Dynamics, Inc. | 581,517 | ||||
| 97,900 | SunCoke Energy, Inc. | 785,158 | ||||
| 13,705 | Trinseo SA | 775,155 | ||||
| 26,696 | Worthington Industries, Inc. | 1,282,209 | ||||
|
| |||||
| 5,370,726 | ||||||
|
| |||||
Pharmaceuticals, Biotechnology & Life |
| |||||
| 15,092 | Five Prime Therapeutics, Inc.(a) | 792,179 | ||||
| 13,870 | Lexicon Pharmaceuticals, Inc.(a) | 250,631 | ||||
| 203,270 | PDL BioPharma, Inc. | 680,955 | ||||
|
| |||||
| 1,723,765 | ||||||
|
| |||||
Real Estate — 1.2% | ||||||
| 49,616 | Forest City Realty Trust, Inc., Class A, REIT | 1,147,618 | ||||
| 32,581 | Getty Realty Corp., REIT | 779,663 | ||||
|
| |||||
| 1,927,281 | ||||||
|
| |||||
Retailing — 2.5% | ||||||
| 38,007 | American Eagle Outfitters, Inc. | 678,805 | ||||
| 42,600 | Big 5 Sporting Goods Corp. | 580,212 | ||||
| 11,736 | Big Lots, Inc. | 560,394 | ||||
| 12,273 | Children’s Place, Inc. (The) | 980,244 | ||||
| 10,176 | Finish Line, Inc. (The), Class A | 234,862 | ||||
| 23,500 | Shoe Carnival, Inc. | 626,510 | ||||
| 15,760 | Urban Outfitters, Inc.(a) | 544,035 | ||||
|
| |||||
| 4,205,062 | ||||||
|
| |||||
Semiconductors & Semiconductor |
| |||||
| 105,318 | Amkor Technology, Inc.(a) | 1,023,691 | ||||
| 60,465 | Photronics, Inc.(a) | 623,394 | ||||
| 11,772 | Teradyne, Inc. | 254,040 | ||||
|
| |||||
| 1,901,125 | ||||||
|
| |||||
Software & Services — 1.6% | ||||||
| 16,404 | CSG Systems International, Inc. | 677,977 | ||||
| 73,989 | EarthLink Holdings Corp. | 458,732 | ||||
| 20,743 | ManTech International Corp., Class A | 781,804 | ||||
| 25,979 | NeuStar, Inc., Class A(a) | 690,782 | ||||
|
| |||||
| 2,609,295 | ||||||
|
| |||||
Continued
64
Sterling Capital Behavioral Small Cap Value Equity Fund
|
Schedule of Portfolio Investments — (continued) |
September 30, 2016
|
Shares | Fair Value | |||||
COMMON STOCKS — (continued) | ||||||
Technology Hardware & Equipment — 6.3% |
| |||||
| 13,865 | Arrow Electronics, Inc.(a) | $ | 886,944 | |||
| 32,630 | Benchmark Electronics, Inc.(a) | 814,119 | ||||
| 25,595 | Insight Enterprises, Inc.(a) | 833,117 | ||||
| 7,350 | InterDigital, Inc. | 582,120 | ||||
| 14,826 | NCR Corp.(a) | 477,249 | ||||
| 22,006 | NETGEAR, Inc.(a) | 1,331,143 | ||||
| 17,632 | Plexus Corp.(a) | 824,825 | ||||
| 39,232 | Sanmina Corp.(a) | 1,116,935 | ||||
| 72,837 | Sonus Networks, Inc.(a) | 566,672 | ||||
| 11,136 | SYNNEX Corp. | 1,270,729 | ||||
| 68,391 | TTM Technologies, Inc.(a) | 783,077 | ||||
| 66,404 | Vishay Intertechnology, Inc. | 935,632 | ||||
|
| |||||
| 10,422,562 | ||||||
|
| |||||
Telecommunication Services — 0.4% |
| |||||
| 86,650 | Iridium Communications, Inc.(a) | 702,731 | ||||
|
| |||||
Transportation — 1.8% | ||||||
| 17,121 | Atlas Air Worldwide Holdings, Inc.(a) | 733,121 | ||||
| 23,127 | Hawaiian Holdings, Inc.(a) | 1,123,972 | �� | |||
| 45,989 | SkyWest, Inc. | 1,214,569 | ||||
|
| |||||
| 3,071,662 | ||||||
|
| |||||
Utilities — 6.4% | ||||||
| 24,127 | Avista Corp. | 1,008,267 | ||||
| 42,256 | Calpine Corp.(a) | 534,116 | ||||
| 20,960 | Great Plains Energy, Inc. | 571,998 | ||||
| 4,586 | Hawaiian Electric Industries, Inc. | 136,892 | ||||
| 18,019 | IDACORP, Inc. | 1,410,527 | ||||
| 23,320 | MDU Resources Group, Inc. | 593,261 | ||||
| 9,190 | National Fuel Gas Co. | 496,903 | ||||
| 41,544 | NRG Energy, Inc. | 465,708 | ||||
| 20,530 | ONE Gas, Inc. | 1,269,575 | ||||
| 16,022 | Otter Tail Corp. | 554,201 | ||||
| 12,132 | Pinnacle West Capital Corp. | 921,911 | ||||
| 29,960 | Portland General Electric Co. | 1,275,996 | ||||
| 17,338 | SJW Corp. | 757,324 | ||||
| 19,830 | Spark Energy, Inc., Class A | 577,648 | ||||
|
| |||||
| 10,574,327 | ||||||
|
| |||||
Total Common Stocks | 163,142,427 | |||||
|
| |||||
EXCHANGE TRADED FUND — 1.3% | ||||||
| 20,430 | iShares Russell 2000 Value ETF | 2,140,042 | ||||
|
| |||||
Total Exchange Traded Fund | 2,140,042 | |||||
|
| |||||
Shares | Fair Value | |||||
MONEY MARKET FUND — 0.8% | ||||||
| 1,347,250 | Federated Treasury Obligations Fund, Institutional Shares, 0.180%(b) | $ | 1,347,250 | |||
|
| |||||
Total Money Market Fund | 1,347,250 | |||||
|
| |||||
Total Investments — 100.0% | 166,629,719 | |||||
Net Other Assets (Liabilities) — 0.0% | (25,419 | ) | ||||
|
| |||||
NET ASSETS — 100.0% | $ | 166,604,300 | ||||
|
| |||||
| (a) | Represents non-income producing security. |
| (b) | Represents the current yield as of report date. |
ETF — Exchange Traded Fund
REIT — Real Estate Investment Trust
See accompanying Notes to the Financial Statements.
65
Sterling Capital Special Opportunities Fund
|
Schedule of Portfolio Investments |
September 30, 2016
|
Shares | Fair Value | |||||
COMMON STOCKS — 97.6% | ||||||
Automobiles & Components — 5.9% |
| |||||
| 506,500 | Delphi Automotive PLC | $ | 36,123,580 | |||
| 2,514,000 | Ford Motor Co. | 30,343,980 | ||||
|
| |||||
| 66,467,560 | ||||||
|
| |||||
Commercial & Professional Services — 7.8% |
| |||||
| 820,000 | Nielsen Holdings PLC | 43,927,400 | ||||
| 531,500 | Verisk Analytics, Inc.(a) | 43,200,320 | ||||
|
| |||||
| 87,127,720 | ||||||
|
| |||||
Consumer Durables & Apparel — 4.3% |
| |||||
| 598,000 | Lennar Corp., Class A | 25,319,320 | ||||
| 439,002 | Newell Brands, Inc. | 23,117,845 | ||||
|
| |||||
| 48,437,165 | ||||||
|
| |||||
Consumer Services — 3.6% | ||||||
| 1,084,000 | Norwegian Cruise Line Holdings, | 40,866,800 | ||||
|
| |||||
Diversified Financials — 3.6% | ||||||
| 556,000 | Capital One Financial Corp. | 39,937,480 | ||||
|
| |||||
Food, Beverage & Tobacco — 1.3% |
| |||||
| 320,956 | Mondelez International, Inc., Class A | 14,089,969 | ||||
|
| |||||
Health Care Equipment & Services — 17.0% |
| |||||
| 629,000 | HCA Holdings, Inc.(a) | 47,571,270 | ||||
| 1,285,000 | IMS Health Holdings, Inc.(a) | 40,271,900 | ||||
| 572,000 | MEDNAX, Inc.(a) | 37,895,000 | ||||
| 297,000 | UnitedHealth Group, Inc. | 41,580,000 | ||||
| 182,500 | Zimmer Biomet Holdings, Inc. | 23,728,650 | ||||
|
| |||||
| 191,046,820 | ||||||
|
| |||||
Media — 13.7% | ||||||
| 757,000 | CBS Corp., Class B | 41,438,180 | ||||
| 738,000 | Comcast Corp., Class A | 48,958,920 | ||||
| 1,301,415 | Discovery Communications, Inc., Class C(a) | 34,240,229 | ||||
| 1,074,000 | Live Nation Entertainment, Inc.(a) | 29,513,520 | ||||
|
| |||||
| 154,150,849 | ||||||
|
| |||||
Pharmaceuticals, Biotechnology & Life Sciences — 8.3% |
| |||||
| 510,000 | Bristol-Myers Squibb Co. | 27,499,200 | ||||
| 567,000 | Gilead Sciences, Inc. | 44,861,040 | ||||
| 988,250 | Myriad Genetics, Inc.(a) | 20,338,185 | ||||
|
| |||||
| 92,698,425 | ||||||
|
| |||||
Shares | Fair Value | |||||
COMMON STOCKS — (continued) | ||||||
Real Estate — 4.9% | ||||||
| 627,000 | CBRE Group, Inc., Class A(a) | $ | 17,543,460 | |||
| 764,920 | Ryman Hospitality Properties, Inc., REIT | 36,838,547 | ||||
|
| |||||
| 54,382,007 | ||||||
|
| |||||
Software & Services — 21.5% | ||||||
| 1,090,000 | Activision Blizzard, Inc.(b) | 48,287,000 | ||||
| 710,000 | Akamai Technologies, Inc.(a) | 37,622,900 | ||||
| 134,600 | Alliance Data Systems Corp.(a) | 28,875,738 | ||||
| 63,800 | Alphabet, Inc., Class C(a) | 49,591,102 | ||||
| 532,000 | Check Point Software Technologies, | 41,288,520 | ||||
| 325,000 | Intuit, Inc. | 35,753,250 | ||||
|
| |||||
| 241,418,510 | ||||||
|
| |||||
Technology Hardware & Equipment — 4.1% |
| |||||
| 1,446,000 | Cisco Systems, Inc. | 45,867,120 | ||||
|
| |||||
Transportation — 1.6% | ||||||
| 222,000 | J.B. Hunt Transport Services, Inc. | 18,013,080 | ||||
|
| |||||
Total Common Stocks | 1,094,503,505 | |||||
|
| |||||
MONEY MARKET FUND — 2.2% | ||||||
| 25,213,544 | Federated Treasury Obligations Fund, Institutional Shares, 0.180%(c) | 25,213,544 | ||||
|
| |||||
Total Money Market Fund | 25,213,544 | |||||
|
| |||||
Total Investments — 99.8% | 1,119,717,049 | |||||
Net Other Assets (Liabilities) — 0.2% | 1,947,782 | |||||
|
| |||||
NET ASSETS — 100.0% | $ | 1,121,664,831 | ||||
|
| |||||
| (a) | Represents non-income producing security. |
| (b) | All or a portion of security was held as collateral for written call options. |
| (c) | Represents the current yield as of report date. |
REIT — Real Estate Investment Trust
See accompanying Notes to the Financial Statements.
66
Sterling Capital Equity Income Fund
|
Schedule of Portfolio Investments |
September 30, 2016
|
Shares | Fair Value | |||||
COMMON STOCKS — 94.9% | ||||||
Automobiles & Components — 2.7% |
| |||||
| 1,419,000 | General Motors Co. | $ | 45,081,630 | |||
|
| |||||
Banks — 3.5% | ||||||
| 1,324,000 | Wells Fargo & Co. | 58,626,720 | ||||
|
| |||||
Capital Goods — 2.1% | ||||||
| 309,600 | Honeywell International, Inc. | 36,096,264 | ||||
|
| |||||
Commercial & Professional Services — 2.1% |
| |||||
| 939,000 | Robert Half International, Inc. | 35,550,540 | ||||
|
| |||||
Consumer Durables & Apparel — 1.9% |
| |||||
| 1,587,000 | PulteGroup, Inc. | 31,803,480 | ||||
|
| |||||
Consumer Services — 5.4% | ||||||
| 1,269,700 | Dunkin’ Brands Group, Inc. | 66,125,976 | ||||
| 220,000 | McDonald’s Corp. | 25,379,200 | ||||
|
| |||||
| 91,505,176 | ||||||
|
| |||||
Diversified Financials — 6.3% | ||||||
| 1,141,000 | Discover Financial Services | 64,523,550 | ||||
| 1,308,000 | Invesco, Ltd. | 40,901,160 | ||||
|
| |||||
| 105,424,710 | ||||||
|
| |||||
Energy — 4.9% | ||||||
| 1,938,000 | Spectra Energy Corp.(a) | 82,849,500 | ||||
|
| |||||
Food, Beverage & Tobacco — 3.9% |
| |||||
| 45,000 | Mead Johnson Nutrition Co.(a) | 3,555,450 | ||||
| 574,000 | PepsiCo, Inc. | 62,433,980 | ||||
|
| |||||
| 65,989,430 | ||||||
|
| |||||
Health Care Equipment & Services — 7.3% |
| |||||
| 1,517,000 | Abbott Laboratories | 64,153,930 | ||||
| 473,000 | Anthem, Inc. | 59,271,630 | ||||
|
| |||||
| 123,425,560 | ||||||
|
| |||||
Household & Personal Products — 4.2% |
| |||||
| 1,492,000 | Unilever PLC, ADR | 70,720,800 | ||||
|
| |||||
Materials — 3.3% | ||||||
| 661,000 | Scotts Miracle-Gro Co. (The), Class A(a) | 55,041,470 | ||||
|
| |||||
Media — 5.8% | ||||||
| 717,600 | Omnicom Group, Inc. | 60,996,000 | ||||
| 466,000 | Time Warner, Inc. | 37,098,260 | ||||
|
| |||||
| 98,094,260 | ||||||
|
| |||||
Pharmaceuticals, Biotechnology & Life |
| |||||
| 888,000 | AbbVie, Inc. | 56,006,160 | ||||
| 456,000 | Johnson & Johnson | 53,867,280 | ||||
Shares | Fair Value | |||||
COMMON STOCKS — (continued) | ||||||
Pharmaceuticals, Biotechnology & Life Sciences — (continued) |
| |||||
| 840,000 | Merck & Co., Inc. | $ | 52,424,400 | |||
| 645,000 | Novartis AG, ADR | 50,929,200 | ||||
| 1,147,000 | Pfizer, Inc. | 38,848,890 | ||||
|
| |||||
| 252,075,930 | ||||||
|
| |||||
Real Estate — 2.0% | ||||||
| 2,200,000 | Host Hotels & Resorts, Inc., REIT | 34,254,000 | ||||
|
| |||||
Semiconductors & Semiconductor |
| |||||
| 1,535,900 | Maxim Integrated Products, Inc. | 61,328,487 | ||||
| 1,143,000 | QUALCOMM, Inc. | 78,295,500 | ||||
|
| |||||
| 139,623,987 | ||||||
|
| |||||
Software & Services — 8.0% | ||||||
| 614,000 | Accenture PLC, Class A | 75,012,380 | ||||
| 1,035,000 | Microsoft Corp. | 59,616,000 | ||||
|
| |||||
| 134,628,380 | ||||||
|
| |||||
Telecommunication Services — 4.5% |
| |||||
| 1,470,000 | Verizon Communications, Inc. | 76,410,600 | ||||
|
| |||||
Transportation — 3.7% | ||||||
| 564,900 | United Parcel Service, Inc., Class B | 61,777,464 | ||||
|
| |||||
Total Common Stocks | 1,598,979,901 | |||||
|
| |||||
MONEY MARKET FUND — 5.3% | ||||||
| 89,829,143 | Federated Treasury Obligations Fund, Institutional Shares, 0.180%(b) | 89,829,143 | ||||
|
| |||||
Total Money Market Fund | 89,829,143 | |||||
|
| |||||
Total Investments — 100.2% | 1,688,809,044 | |||||
Net Other Assets (Liabilities) — (0.2)% | (3,297,820 | ) | ||||
|
| |||||
NET ASSETS — 100.0% | $ | 1,685,511,224 | ||||
|
| |||||
| (a) | All or a portion of security was held as collateral for written call options. |
| (b) | Represents the current yield as of report date. |
ADR — American Depositary Receipt
REIT — Real Estate Investment Trust
See accompanying Notes to the Financial Statements.
67
Sterling Capital Long/Short Equity Fund
|
Schedule of Portfolio Investments |
September 30, 2016
|
Shares | Fair Value | |||||
COMMON STOCKS — 81.0% | ||||||
Banks — 1.6% | ||||||
| 700 | Capstar Financial Holdings, Inc.(a) | $ | 11,865 | |||
| 7,488 | Citigroup, Inc.(b) | 353,658 | ||||
| 42,400 | NMI Holdings, Inc., Class A(a) | 323,088 | ||||
|
| |||||
| 688,611 | ||||||
|
| |||||
Consumer Durables & Apparel — 3.3% |
| |||||
| 23,031 | Kate Spade & Co.(a) | 394,521 | ||||
| 1,945 | Lululemon Athletica, Inc.(a) | 118,606 | ||||
| 4,788 | Michael Kors Holdings, Ltd.(a) | 224,031 | ||||
| 3,494 | PVH Corp.(b) | 386,087 | ||||
| 7,407 | Under Armour, Inc.(a) | 250,801 | ||||
|
| |||||
| 1,374,046 | ||||||
|
| |||||
Consumer Services — 4.4% | ||||||
| 47,727 | Belmond, Ltd., Class A(a)(b) | 606,610 | ||||
| 21,122 | BFC Financial Corp., Class A | 81,320 | ||||
| 11,808 | Boyd Gaming Corp.(a) | 233,562 | ||||
| 16,662 | MGM Resorts International(a)(b) | 433,712 | ||||
| 5,897 | Norwegian Cruise Line Holdings, Ltd.(a) | 222,317 | ||||
| 18,799 | Penn National Gaming, Inc.(a) | 255,103 | ||||
|
| |||||
| 1,832,624 | ||||||
|
| |||||
Diversified Financials — 11.6% |
| |||||
| 15,000 | Ally Financial, Inc.(b) | 292,050 | ||||
| 4,200 | Ameriprise Financial, Inc. | 419,034 | ||||
| 16,524 | Ares Management LP | 287,683 | ||||
| 9,700 | Blackstone Group LP (The) | 247,641 | ||||
| 23,500 | Carlyle Group LP (The)(b) | 365,895 | ||||
| 22,000 | Colony Capital, Inc., REIT(b) | 401,060 | ||||
| 73,900 | Cowen Group, Inc., Class A(a) | 268,257 | ||||
| 7,000 | Invesco, Ltd. | 218,890 | ||||
| 30,700 | KKR & Co. LP(b) | 437,782 | ||||
| 7,500 | Morgan Stanley | 240,450 | ||||
| 20,200 | OM Asset Management PLC | 280,982 | ||||
| 10,300 | OneMain Holdings, Inc.(a) | 318,785 | ||||
| 13,191 | Oppenheimer Holdings, Inc., Class A(b) | 188,499 | ||||
| 3,300 | Raymond James Financial, Inc. | 192,093 | ||||
| 33,600 | SLM Corp.(a) | 250,992 | ||||
| 16,900 | Voya Financial, Inc.(b) | 487,058 | ||||
|
| |||||
| 4,897,151 | ||||||
|
| |||||
Energy — 14.6% | ||||||
| 4,000 | ARC Resources, Ltd. | 72,840 | ||||
| 12,471 | Black Stone Minerals LP(b) | 222,109 | ||||
| 2,700 | Cimarex Energy Co.(b) | 362,799 | ||||
| 1,000 | ConocoPhillips(b) | 43,470 | ||||
| 10,111 | Cross Timbers Royalty Trust | 185,132 | ||||
| 6,000 | Devon Energy Corp.(b) | 264,660 | ||||
| 38,812 | Dorchester Minerals LP(b) | 598,093 | ||||
| 30,301 | Enduro Royalty Trust | 107,266 | ||||
| 6,050 | EOG Resources, Inc.(b) | 585,096 | ||||
| 68,700 | Freehold Royalties, Ltd. | 667,764 | ||||
| 11,300 | Freehold Royalties, Ltd. | 108,956 | ||||
| 1,500 | Hess Corp. | 80,430 | ||||
| 1,000 | Magellan Midstream Partners LP | 70,740 | ||||
| 7,600 | Marathon Oil Corp.(b) | 120,156 | ||||
| 5,900 | Mesa Royalty Trust | 49,206 | ||||
| 5,800 | MPLX LP | 196,388 | ||||
| 5,800 | Newfield Exploration Co.(a) | 252,068 | ||||
| 5,800 | Occidental Petroleum Corp.(b) | 422,936 | ||||
| 3,000 | Pacific Coast Oil Trust | 5,400 | ||||
Shares | Fair Value | |||||
COMMON STOCKS — (continued) | ||||||
Energy — (continued) | ||||||
| 38,200 | Permian Basin Royalty Trust | $ | 266,254 | |||
| 800 | Pioneer Natural Resources Co. | 148,520 | ||||
| 2,000 | Royal Dutch Shell PLC, Class B, ADR | 105,660 | ||||
| 16,743 | Sabine Royalty Trust(b) | 615,473 | ||||
| 2,335 | Shell Midstream Partners LP | 74,907 | ||||
| 11,700 | Western Gas Equity Partners LP | 497,133 | ||||
|
| |||||
| 6,123,456 | ||||||
|
| |||||
Food, Beverage & Tobacco — 3.9% |
| |||||
| 6,760 | Molson Coors Brewing Co., Class B(b)(c) | 742,248 | ||||
| 2,561 | Post Holdings, Inc.(a) | 197,632 | ||||
| 7,923 | TreeHouse Foods, Inc.(a)(b) | 690,806 | ||||
|
| |||||
| 1,630,686 | ||||||
|
| |||||
Health Care Equipment & Services — 6.4% |
| |||||
| 1,430 | AAC Holdings, Inc.(a)(b) | 24,868 | ||||
| 7,000 | Abbott Laboratories(b) | 296,030 | ||||
| 4,541 | Amedisys, Inc.(a)(b) | 215,425 | ||||
| 3,199 | Amsurg Corp.(a) | 214,493 | ||||
| 2,110 | HCA Holdings, Inc.(a) | 159,579 | ||||
| 2,412 | Hologic, Inc.(a) | 93,658 | ||||
| 6,024 | Innocoll Holdings PLC(a) | 35,421 | ||||
| 6,930 | K2M Group Holdings, Inc.(a)(b) | 123,215 | ||||
| 4,077 | LHC Group, Inc.(a)(b) | 150,360 | ||||
| 1,054 | McKesson Corp. | 175,755 | ||||
| 3,777 | NuVasive, Inc.(a)(b) | 251,775 | ||||
| 4,000 | Penumbra, Inc.(a)(b) | 303,960 | ||||
| 5,641 | PharMerica Corp.(a)(b) | 158,343 | ||||
| 17,616 | Streamline Health Solutions, Inc.(a) | 32,413 | ||||
| 5,003 | Surgery Partners, Inc.(a) | 101,261 | ||||
| 4,912 | Surgical Care Affiliates, Inc.(a)(b) | 239,509 | ||||
| 5,124 | Tenet Healthcare Corp.(a) | 116,110 | ||||
|
| |||||
| 2,692,175 | ||||||
|
| |||||
Household & Personal Products — 0.0% |
| |||||
| 99 | Procter & Gamble Co. (The) | 8,885 | ||||
|
| |||||
Insurance — 1.9% | ||||||
| 44,194 | Ambac Financial Group, Inc.(a)(b) | 812,728 | ||||
|
| |||||
Media — 1.6% | ||||||
| 43,503 | Global Eagle Entertainment, Inc.(a)(b) | 361,510 | ||||
| 14,297 | World Wrestling Entertainment, Inc., Class A(b) | 304,526 | ||||
|
| |||||
| 666,036 | ||||||
|
| |||||
Pharmaceuticals, Biotechnology & Life |
| |||||
| 2,700 | AC Immune SA, Class A(a) | 44,469 | ||||
| 732 | Agile Therapeutics, Inc.(a) | 5,109 | ||||
| 5,685 | Alder Biopharmaceuticals, Inc.(a)(b) | 186,297 | ||||
| 45,000 | Amarin Corp. PLC, ADR(a)(b) | 143,550 | ||||
| 2,258 | Array BioPharma, Inc.(a) | 15,241 | ||||
| 603 | Avexis, Inc.(a) | 24,850 | ||||
| 1,907 | Bio-Rad Laboratories, Inc., Class A(a)(b) | 312,386 | ||||
| 2,000 | Bio-Techne Corp.(b) | 219,000 | ||||
| 1,092 | CareDx, Inc.(a) | 3,877 | ||||
| 9,766 | Cempra, Inc.(a)(b) | 236,337 | ||||
| 3,018 | Clovis Oncology, Inc.(a) | 108,799 | ||||
| 4,500 | Coherus Biosciences, Inc.(a)(b) | 120,510 | ||||
| 12,000 | Collegium Pharmaceutical, Inc.(a)(b) | 231,120 | ||||
| 3,890 | Depomed, Inc.(a)(b) | 97,211 | ||||
| 30,658 | Endocyte, Inc.(a)(b) | 94,733 | ||||
Continued
68
Sterling Capital Long/Short Equity Fund
|
Schedule of Portfolio Investments — (continued) |
September 30, 2016
|
Shares | Fair Value | |||||
COMMON STOCKS — (continued) | ||||||
Pharmaceuticals, Biotechnology & Life Sciences — (continued) |
| |||||
| 3,015 | Horizon Pharma PLC(a) | $ | 54,662 | |||
| 1,962 | ICON Plc(a)(b) | 151,800 | ||||
| 755 | Jazz Pharmaceuticals PLC(a)(b) | 91,717 | ||||
| 4,154 | Merck & Co., Inc.(b) | 259,251 | ||||
| 22,843 | Minerva Neurosciences, Inc.(a)(b) | 322,429 | ||||
| 1,655 | Neurocrine Biosciences, Inc.(a)(b) | 83,809 | ||||
| 2,799 | Ophthotech Corp.(a)(b) | 129,118 | ||||
| 6,116 | Otonomy, Inc.(a)(b) | 111,250 | ||||
| 1,000 | Pacira Pharmaceuticals, Inc.(a)(b) | 34,220 | ||||
| 5,505 | Patheon NV(a)(b) | 163,113 | ||||
| 9,702 | ProQR Therapeutics NV(a)(b) | 64,712 | ||||
| 1,568 | TESARO, Inc.(a) | 157,176 | ||||
| 7,602 | Xenon Pharmaceuticals, Inc.(a) | 61,576 | ||||
|
| |||||
| 3,528,322 | ||||||
|
| |||||
Real Estate — 1.3% |
| |||||
| 16,414 | Gaming and Leisure Properties, Inc., REIT(b) | 549,048 | ||||
|
| |||||
Retailing — 1.5% |
| |||||
| 6,835 | Aaron’s, Inc. | 173,746 | ||||
| 220 | Amazon.com, Inc.(a)(b) | 184,208 | ||||
| 2,187 | Monro Muffler Brake, Inc. | 133,779 | ||||
| 4,426 | Restoration Hardware Holdings, Inc.(a) | 153,051 | ||||
|
| |||||
| 644,784 | ||||||
|
| |||||
Software & Services — 13.9% |
| |||||
| 10,957 | Activision Blizzard, Inc. | 485,395 | ||||
| 100,000 | Bazaarvoice, Inc.(a) | 591,000 | ||||
| 3,975 | Electronic Arts, Inc.(a)(b) | 339,465 | ||||
| 2,381 | Facebook, Inc., Class A(a)(b) | 305,411 | ||||
| 103,957 | Guidance Software, Inc.(a) | 619,584 | ||||
| 14,217 | Intralinks Holdings, Inc.(a) | 143,023 | ||||
| 72,669 | LivePerson, Inc.(a) | 611,146 | ||||
| 5,000 | Microsoft Corp.(b) | 288,000 | ||||
| 130,274 | Numerex Corp., Class A(a)(b) | 1,013,532 | ||||
| 92,700 | Rosetta Stone, Inc.(a) | 786,096 | ||||
| 15,122 | Upland Software, Inc.(a) | 133,225 | ||||
| 75,037 | YuMe, Inc.(a) | 297,897 | ||||
| 76,744 | Zynga, Inc., Class A(a)(b) | 223,325 | ||||
|
| |||||
| 5,837,099 | ||||||
|
| |||||
Technology Hardware & Equipment — 3.8% |
| |||||
| 47,729 | Extreme Networks, Inc.(a)(b) | 214,303 | ||||
| 284,784 | ID Systems, Inc.(a)(b) | 1,395,442 | ||||
|
| |||||
| 1,609,745 | ||||||
|
| |||||
Telecommunication Services — 2.8% |
| |||||
| 49,019 | Boingo Wireless, Inc.(a)(b) | 503,915 | ||||
| 105,000 | Vonage Holdings Corp.(a)(b) | 694,050 | ||||
|
| |||||
| 1,197,965 | ||||||
|
| |||||
Total Common Stocks | 34,093,361 | |||||
|
| |||||
Shares | Fair Value | |||||
PREFERRED STOCKS — 0.9% | ||||||
Banks — 0.9% | ||||||
| 119,922 | Fannie Mae, Series R, 7.625%(b) | $ | 353,770 | |||
|
| |||||
Total Preferred Stocks | 353,770 | |||||
|
| |||||
Contracts | ||||||
CALL OPTIONS PURCHASED — 0.4% | ||||||
Consumer Services — 0.0% | ||||||
| 69 | Belmond Ltd., Expires 12/16/16, Strike Price $12.5 | 4,830 | ||||
| 123 | Penn National Gaming Inc., Expires 10/21/16, Strike Price $14 | 2,460 | ||||
|
| |||||
| 7,290 | ||||||
|
| |||||
Food, Beverage & Tobacco — 0.0% |
| |||||
| 12 | Molson Coors Brewing Co., Expires 10/21/16, Strike Price $105 | 7,224 | ||||
|
| |||||
Health Care Equipment & Services — 0.1% |
| |||||
| 554 | Abbott Laboratories., Expires 11/18/16, Strike Price $44 | 31,024 | ||||
|
| |||||
Pharmaceuticals, Biotechnology & Life Sciences — 0.3% |
| |||||
| 150 | AstraZeneca PLC., Expires 04/21/17, Strike Price $32.5 | 36,150 | ||||
| 19 | Biogen Inc., Expires 01/20/17, Strike Price $350 | 19,000 | ||||
| 45 | Eli Lilly & Co., Expires 01/20/17, Strike Price $82.5 | 21,825 | ||||
| 406 | Merck & Co Inc., Expires 10/14/16, Strike Price $63 | 43,848 | ||||
|
| |||||
| 120,823 | ||||||
|
| |||||
Total Call Options Purchased | 166,361 | |||||
|
| |||||
PUT OPTIONS PURCHASED — 0.3% | ||||||
Exchange Traded Funds — 0.3% |
| |||||
| 259 | Direxion Daily Financial Bull 3X Shares, Expires 01/20/17, Strike Price $28.75 | 71,484 | ||||
| 100 | SPDR S&P Biotech ETF, Expires 11/18/16, Strike Price $67 | 37,250 | ||||
| 18 | SPDR S&P500 ETF Trust, Expires 10/21/16, Strike Price $213 | 2,448 | ||||
| 24 | SPDR S&P500 ETF Trust, Expires 10/21/16, Strike Price $218 | 7,416 | ||||
| 31 | SPDR S&P500 ETF Trust, Expires 11/18/16, Strike Price $214 | 10,385 | ||||
|
| |||||
| 128,983 | ||||||
|
| |||||
Retailing — 0.0% | ||||||
| 13 | Netflix Inc., Expires 10/21/16, Strike Price $93 | 3,510 | ||||
|
| |||||
Total Put Options Purchased | 132,493 | |||||
|
| |||||
Continued
69
Sterling Capital Long/Short Equity Fund
|
Schedule of Portfolio Investments — (continued) |
September 30, 2016
|
Shares | Fair Value | |||||
WARRANTS — 3.1% | ||||||
Banks — 2.1% | ||||||
| 8,477 | JPMorgan Chase & Co. (Issued/exercisable 10/28/08, 1 Share for 1 Warrant, Expires 10/28/18, Strike Price $42.13) | $ | 208,789 | |||
| 600 | PNC Financial Services Group, Inc., (Issued/exercisable 12/31/08, 1 Share for 1 Warrant, Expires 12/31/18, Strike Price $67.33) | 14,094 | ||||
| 5,200 | SunTrust Banks, Inc., (Issued/exercisable 11/14/08, 1 Share for 1 Warrant, Expires 11/14/18, Strike Price $44.15) | 27,560 | ||||
| 4,800 | Wells Fargo & Co., (Issued/exercisable 10/28/08, 1 Share for 1 Warrant, Expires 10/28/18, Strike Price $33.84) | 59,904 | ||||
| 139,486 | Zions Bancorporation, (Issued/exercisable 05/20/10, 1 Share for 1 Warrant, Expires 05/22/20, Strike Price $35.89)(b) | 571,893 | ||||
| 11,399 | Zions Bancorporation, (Issued/exercisable 11/14/08, 1 Share for 1 Warrant, Expires 11/14/18, Strike Price $36.27)(b) | 24,280 | ||||
|
| |||||
| 906,520 | ||||||
|
| |||||
Diversified Financials — 1.0% |
| |||||
| 279,979 | Bank of America Corp., (Issued/exercisable 01/09/09, 1 Share for 1 Warrant, Expires 10/28/18, Strike Price $30.79)(b) | 27,998 | ||||
| 12,400 | Capital One Financial Corp., (Issued/exercisable 11/14/08, 1 Share for 1 Warrant, Expires 11/14/18, Strike Price $42.04)(b) | 377,332 | ||||
|
| |||||
| 405,330 | ||||||
|
| |||||
Insurance — 0.0% | ||||||
| 300 | American International Group, Inc., (Issued/exercisable 01/19/11, 1 Share for 1 Warrant, Expires 01/19/21, Strike Price $44.55) | 6,360 | ||||
|
| |||||
Total Warrants | 1,318,210 | |||||
|
| |||||
Total Long-Term Investments — 85.7% | 36,064,195 | |||||
|
| |||||
MONEY MARKET FUND — 10.9% | ||||||
| 4,577,923 | Federated Treasury Obligations Fund, Institutional Shares, 0.180%(d) | 4,577,923 | ||||
|
| |||||
Total Money Market Fund | 4,577,923 | |||||
|
| |||||
Total Investments Before Investments Sold | 40,642,118 | |||||
|
| |||||
Shares | Fair Value | |||||
INVESTMENTS SOLD SHORT — (39.0)% | ||||||
Automobiles & Components — (1.0)% |
| |||||
| (24,822) | Gentex Corp. | $ | (435,874 | ) | ||
|
| |||||
Banks — (1.0)% | ||||||
| (8,900) | Old National Bancorp | (125,134 | ) | |||
| (13,600) | People’s United Financial, Inc. | (215,152 | ) | |||
| (2,400) | Webster Financial Corp. | (91,224 | ) | |||
|
| |||||
| (431,510 | ) | |||||
|
| |||||
Consumer Durables & Apparel — (2.9)% |
| |||||
| (3,927) | Best Buy Co., Inc. | (149,933 | ) | |||
| (3,548) | Polaris Industries, Inc. | (274,757 | ) | |||
| (1,774) | Ralph Lauren Corp. | (179,422 | ) | |||
| (7,407) | Under Armour, Inc., Class A(a) | (286,503 | ) | |||
| (6,059) | VF Corp. | (339,607 | ) | |||
|
| |||||
| (1,230,222 | ) | |||||
|
| |||||
Consumer Services — (2.8)% | ||||||
| (14,712) | Bloomin’ Brands, Inc. | (253,635 | ) | |||
| (4,339) | Dunkin’ Brands Group, Inc. | (225,975 | ) | |||
| (4,893) | Hilton Worldwide Holdings, Inc. | (112,195 | ) | |||
| (2,063) | Las Vegas Sands Corp. | (118,705 | ) | |||
| (4,054) | Marriott International, Inc./MD, Class A | (272,956 | ) | |||
| (1,933) | Restaurant Brands International, Inc. | (86,173 | ) | |||
| (3,241) | SeaWorld Entertainment, Inc. | (43,689 | ) | |||
| (1,198) | Six Flags Entertainment Corp. | (64,225 | ) | |||
|
| |||||
| (1,177,553 | ) | |||||
|
| |||||
Diversified Financials — (0.9)% | ||||||
| (300) | FactSet Research Systems, Inc. | (48,630 | ) | |||
| (3,400) | Financial Engines, Inc. | (101,014 | ) | |||
| (1,200) | Franklin Resources, Inc. | (42,684 | ) | |||
| (23,000) | LendingClub Corp.(a) | (142,140 | ) | |||
| (1,660) | Virtu Financial, Inc., Class A | (24,850 | ) | |||
|
| |||||
| (359,318 | ) | |||||
|
| |||||
Energy — (4.3)% | ||||||
| (8,000) | Callon Petroleum Co.(a) | (125,600 | ) | |||
| (4,000) | Exxon Mobil Corp. | (349,120 | ) | |||
| (13,500) | Helmerich & Payne, Inc. | (908,550 | ) | |||
| (25,000) | Hugoton Royalty Trust | (59,000 | ) | |||
| (4,000) | MV Oil Trust | (22,880 | ) | |||
| (6,500) | SandRidge Mississippian Trust I | (9,100 | ) | |||
| (11,000) | SandRidge Mississippian Trust II | (15,070 | ) | |||
| (55,000) | SandRidge Permian Trust | (156,750 | ) | |||
| (9,000) | Unit Corp.(a) | (167,400 | ) | |||
|
| |||||
| (1,813,470 | ) | |||||
|
| |||||
Exchange Traded Funds — (8.4)% |
| |||||
| (8,989) | Consumer Staples Select Sector Standard and Poors Fund | (478,305 | ) | |||
| (4,800) | Direxion Daily Financial Bear 3X Shares(a) | (152,736 | ) | |||
| (20,200) | Direxion Daily Financial Bull 3X Shares(a) | (588,830 | ) | |||
| (2,500) | Energy Select Sector SPDR Fund | (176,525 | ) | |||
| (1,438) | iShares iBoxx $ High Yield Corporate Bond ETF | (125,480 | ) | |||
| (3,835) | iShares U.S. Home Construction ETF | (105,654 | ) | |||
| (19,600) | iShares U.S. Real Estate ETF | (1,580,544 | ) | |||
| (613) | SPDR S&P500 ETF Trust(c) | (132,592 | ) | |||
| (5,000) | VanEck Vectors Oil Services ETF | (146,400 | ) | |||
| (2,165) | VelocityShares Daily 2x VIX Short Term ETN(a) | (39,295 | ) | |||
|
| |||||
| (3,526,361 | ) | |||||
|
| |||||
Continued
70
Sterling Capital Long/Short Equity Fund
|
Schedule of Portfolio Investments — (continued) |
September 30, 2016
|
Shares | Fair Value | |||||
INVESTMENTS SOLD SHORT — (continued) |
| |||||
Food & Staples Retailing — (0.6)% |
| |||||
| (4,486) | Sysco Corp. | $ | (219,859 | ) | ||
| (320) | Walgreens Boots Alliance, Inc. | (25,798 | ) | |||
|
| |||||
| (245,657 | ) | |||||
|
| |||||
Food, Beverage & Tobacco — (0.5)% |
| |||||
| (2,040) | Sanderson Farms, Inc. | (196,513 | ) | |||
|
| |||||
Health Care Equipment & Services — (3.4)% |
| |||||
| (4,539) | Adeptus Health, Inc., Class A(a) | (195,404 | ) | |||
| (1,042) | Aetna, Inc. | (120,299 | ) | |||
| (2,951) | Cerner Corp.(a) | (182,224 | ) | |||
| (2,597) | DENTSPLY SIRONA, Inc. | (154,340 | ) | |||
| (452) | DexCom, Inc.(a) | (39,622 | ) | |||
| (1,458) | Fresenius Medical Care AG & Co. KGaA, ADR | (63,817 | ) | |||
| (1,200) | HealthSouth Corp. | (48,684 | ) | |||
| (908) | Henry Schein, Inc.(a) | (147,986 | ) | |||
| (1,500) | MEDNAX, Inc.(a) | (99,375 | ) | |||
| (2,000) | ResMed, Inc. | (129,580 | ) | |||
| (12,262) | Select Medical Holdings Corp.(a) | (165,537 | ) | |||
| (872) | Stryker Corp. | (101,510 | ) | |||
|
| |||||
| (1,448,378 | ) | |||||
|
| |||||
Pharmaceuticals, Biotechnology & Life Sciences — (4.4)% |
| |||||
| (1,500) | Aerie Pharmaceuticals, Inc.(a) | (56,610 | ) | |||
| (725) | Alexion Pharmaceuticals, Inc.(a) | (88,843 | ) | |||
| (936) | Amgen, Inc. | (156,134 | ) | |||
| (1,171) | BioMarin Pharmaceutical, Inc.(a) | (108,341 | ) | |||
| (2,294) | Bluebird Bio, Inc.(a) | (155,487 | ) | |||
| (627) | Illumina, Inc.(a) | (113,901 | ) | |||
| (5,444) | Intrexon Corp.(a) | (152,541 | ) | |||
| (5,000) | Ionis Pharmaceuticals, Inc.(a) | (183,200 | ) | |||
| (1,000) | Johnson & Johnson | (118,130 | ) | |||
| (5,000) | Luminex Corp.(a) | (113,600 | ) | |||
| (11,507) | MediciNova, Inc.(a) | (86,187 | ) | |||
| (2,423) | Quintiles Transnational Holdings, | (196,408 | ) | |||
| (241) | Regeneron Pharmaceuticals, Inc.(a) | (96,887 | ) | |||
| (1,300) | Sage Therapeutics, Inc.(a) | (59,865 | ) | |||
| (750) | Taro Pharmaceutical Industries, | (82,883 | ) | |||
| (3,768) | Valeant Pharmaceuticals International, | (92,504 | ) | |||
|
| |||||
| (1,861,521 | ) | |||||
|
| |||||
Real Estate — (0.9)% | ||||||
| (5,400) | Iron Mountain, Inc., REIT | (202,662 | ) | |||
| (5,093) | LaSalle Hotel Properties, REIT | (121,570 | ) | |||
| (2,991) | Silver Bay Realty Trust Corp., REIT | (52,432 | ) | |||
|
| |||||
| (376,664 | ) | |||||
|
| |||||
Retailing — (2.2)% | ||||||
| (2,357) | Dick’s Sporting Goods, Inc. | (133,689 | ) | |||
| (1,475) | Home Depot, Inc. (The) | (189,803 | ) | |||
| (2,349) | L Brands, Inc. | (166,239 | ) | |||
Shares | Fair Value | |||||
INVESTMENTS SOLD SHORT — (continued) |
| |||||
Retailing — (continued) | ||||||
| (1,641) | Netflix, Inc.(a)(c) | $ | (161,721 | ) | ||
| (484) | Pool Corp. | (45,748 | ) | |||
| (2,203) | Ross Stores, Inc. | (141,653 | ) | |||
| (5,009) | Tailored Brands, Inc. | (78,641 | ) | |||
|
| |||||
| (917,494 | ) | |||||
|
| |||||
Semiconductors & Semiconductor |
| |||||
| (2,000) | Texas Instruments, Inc. | (140,360 | ) | |||
|
| |||||
Software & Services — (3.4)% | ||||||
| (5,000) | Akamai Technologies, Inc.(a) | (264,950 | ) | |||
| (2,500) | Autodesk, Inc.(a) | (180,825 | ) | |||
| (500) | Check Point Software Technologies, Ltd.(a) | (38,805 | ) | |||
| (3,373) | Cimpress NV(a) | (341,280 | ) | |||
| (1,000) | International Business Machines Corp. | (158,850 | ) | |||
| (502) | Match Group, Inc.(a) | (8,931 | ) | |||
| (1,473) | Take-Two Interactive Software, Inc.(a) | (66,403 | ) | |||
| (500) | Tyler Technologies, Inc.(a) | (85,615 | ) | |||
| (9,800) | Western Union Co. (The) | (204,036 | ) | |||
| (2,500) | Zillow Group, Inc.(a) | (86,625 | ) | |||
|
| |||||
| (1,436,320 | ) | |||||
|
| |||||
Technology Hardware & Equipment — (1.4)% |
| |||||
| (1,500) | F5 Networks, Inc.(a) | (186,960 | ) | |||
| (5,100) | ViaSat, Inc.(a) | (380,715 | ) | |||
|
| |||||
| (567,675 | ) | |||||
|
| |||||
Transportation — (0.6)% | ||||||
| (6,860) | American Airlines Group, Inc. | (251,145 | ) | |||
|
| |||||
Total Investments Sold Short — (39.0)% | (16,416,035 | ) | ||||
|
| |||||
Total Investments — 57.6% | 24,226,083 | |||||
Net Other Assets (Liabilities) — 42.4% | 17,867,339 | |||||
|
| |||||
NET ASSETS — 100.0% | $ | 42,093,422 | ||||
|
| |||||
| (a) | Represents non-income producing security. |
| (b) | Represents that all or a portion of the security was pledged as collateral in connection with short sales. |
| (c) | All or a portion of security was held as collateral for written call options. |
| (d) | Represents the current yield as of report date. |
ADR — American Depositary Receipt
ETF — Exchange Traded Funds
ETN — Exchange Traded Notes
REIT — Real Estate Investment Trust
See accompanying Notes to the Financial Statements.
71
Sterling Capital Behavioral International Equity Fund
|
Schedule of Portfolio Investments |
September 30, 2016
|
Shares | Fair Value | |||||
COMMON STOCKS — 98.2% | ||||||
Australia — 9.3% | ||||||
| 505,150 | AusNet Services | $ | 636,704 | |||
| 47,150 | Australia & New Zealand Banking Group, Ltd. | 1,004,370 | ||||
| 92,300 | Challenger Ltd/Australia | 722,776 | ||||
| 83,400 | Coca-Cola Amatil, Ltd. | 657,622 | ||||
| 10,775 | Flight Centre Travel Group, Ltd. | 301,642 | ||||
| 65,200 | LendLease Group | 706,539 | ||||
| 13,100 | Macquarie Group, Ltd. | 828,504 | ||||
| 172,400 | Telstra Corp, Ltd. | 687,380 | ||||
| 45,125 | Westpac Banking Corp. | 1,026,693 | ||||
|
| |||||
| 6,572,230 | ||||||
|
| |||||
Austria — 0.9% | ||||||
| 23,000 | OMV AG | 662,220 | ||||
|
| |||||
Denmark — 2.0% | ||||||
| 25,250 | Danske Bank A/S | 738,712 | ||||
| 112,575 | TDC A/S(a) | 662,997 | ||||
|
| |||||
| 1,401,709 | ||||||
|
| |||||
Finland — 1.5% | ||||||
| 15,850 | Neste OYJ | 676,101 | ||||
| 16,800 | UPM-Kymmene OYJ | 354,727 | ||||
|
| |||||
| 1,030,828 | ||||||
|
| |||||
France — 7.6% | ||||||
| 7,775 | Arkema SA | 719,831 | ||||
| 3,625 | Atos SE | 390,265 | ||||
| 36,475 | CNP Assurances | 612,816 | ||||
| 12,600 | Credit Agricole SA | 124,286 | ||||
| 8,375 | Eiffage SA | 650,862 | ||||
| 48,275 | Engie SA | 748,494 | ||||
| 45,050 | Peugeot SA(a) | 687,952 | ||||
| 7,750 | Renault SA | 637,590 | ||||
| 19,300 | Societe Generale SA | 667,673 | ||||
| 2,275 | Valeo SA | 132,790 | ||||
|
| |||||
| 5,372,559 | ||||||
|
| |||||
Germany — 6.9% | ||||||
| 10,650 | Bayer AG | 1,069,588 | ||||
| 3,450 | Continental AG | 726,923 | ||||
| 12,725 | Covestro AG(b) | 753,045 | ||||
| 44,725 | Deutsche Lufthansa AG | 498,613 | ||||
| 5,050 | Henkel AG & Co. KGaA | 589,005 | ||||
| 1,450 | Merck KGaA | 156,405 | ||||
| 22,250 | METRO AG | 662,292 | ||||
| 3,475 | Siemens AG | 407,482 | ||||
|
| |||||
| 4,863,353 | ||||||
|
| |||||
Hong Kong — 4.9% | ||||||
| 215,450 | BOC Hong Kong Holdings, Ltd. | 733,047 | ||||
| 393,925 | NWS Holdings, Ltd. | 660,143 | ||||
| 912,900 | WH Group, Ltd.(b) | 737,845 | ||||
| 91,950 | Wharf Holdings, Ltd. (The) | 674,598 | ||||
| 106,350 | Wheelock & Co., Ltd. | 631,694 | ||||
|
| |||||
| 3,437,327 | ||||||
|
| |||||
Ireland — 0.2% | ||||||
| 8,200 | Experian PLC | 163,818 | ||||
|
| |||||
Israel — 2.4% | ||||||
| 61,075 | Bank Hapoalim BM | 346,794 | ||||
| 5,300 | Taro Pharmaceutical Industries, Ltd.(a) | 585,703 | ||||
Shares | Fair Value | |||||
COMMON STOCKS — (continued) | ||||||
Israel — (continued) | ||||||
| 16,375 | Teva Pharmaceutical Industries, Ltd. | $ | 760,044 | |||
|
| |||||
| 1,692,541 | ||||||
|
| |||||
Italy — 2.1% | ||||||
| 28,875 | Prysmian SpA | 756,110 | ||||
| 127,475 | Snam Rete Gas SpA | 706,835 | ||||
|
| |||||
| 1,462,945 | ||||||
|
| |||||
Japan — 26.0% | ||||||
| 24,900 | Alfresa Holdings Corp. | 527,242 | ||||
| 186,000 | Aozora Bank, Ltd. | 641,098 | ||||
| 55,300 | Astellas Pharma, Inc. | 863,734 | ||||
| 7,000 | Daiichi Sankyo Co., Ltd. | 168,199 | ||||
| 11,100 | FamilyMart UNY Holdings Co., Ltd. | 740,996 | ||||
| 153,000 | Fuji Electric Co., Ltd. | 703,159 | ||||
| 19,800 | Fuji Heavy Industries, Ltd. | 742,886 | ||||
| 143,000 | Fujitsu, Ltd. | 769,573 | ||||
| 32,500 | Hitachi Chemical Co., Ltd. | 746,750 | ||||
| 38,500 | Hitachi Construction Machinery Co., Ltd. | 767,731 | ||||
| 159,000 | Hitachi, Ltd. | 745,167 | ||||
| 29,600 | Idemitsu Kosan Co., Ltd. | 612,844 | ||||
| 33,200 | Iida Group Holdings Co., Ltd. | 668,074 | ||||
| 56,300 | ITOCHU Corp. | 708,793 | ||||
| 18,600 | Japan Airlines Co., Ltd. | 546,756 | ||||
| 164,500 | JX Holdings, Inc. | 665,824 | ||||
| 31,200 | KDDI Corp. | 966,639 | ||||
| 51,500 | Mitsubishi Gas Chemical Co., Inc. | 737,329 | ||||
| 2,700 | Mixi, Inc. | 97,823 | ||||
| 19,100 | Nippon Telegraph & Telephone Corp. | 873,557 | ||||
| 62,400 | Obayashi Corp. | 618,932 | ||||
| 155,000 | Oji Holdings Corp. | 614,348 | ||||
| 176,100 | Resona Holdings, Inc. | 740,606 | ||||
| 14,100 | Shionogi & Co., Ltd. | 722,393 | ||||
| 42,600 | Sumitomo Rubber Industries, Ltd. | 644,363 | ||||
| 85,000 | Taisei Corp. | 637,693 | ||||
| 12,800 | Teijin, Ltd. | 248,321 | ||||
| 57,400 | Yokogawa Electric Corp. | 764,673 | ||||
|
| |||||
| 18,285,503 | ||||||
|
| |||||
Netherlands — 1.3% | ||||||
| 6,950 | AerCap Holdings NV(a) | 267,505 | ||||
| 20,100 | NN Group NV | 617,082 | ||||
|
| |||||
| 884,587 | ||||||
|
| |||||
Norway — 1.3% | ||||||
| 40,875 | Marine Harvest ASA | 733,219 | ||||
| 8,925 | Telenor ASA | 153,473 | ||||
|
| |||||
| 886,692 | ||||||
|
| |||||
Portugal — 1.0% | ||||||
| 203,475 | EDP - Energias de Portugal SA | 682,867 | ||||
|
| |||||
Singapore — 2.9% | ||||||
| 280,700 | CapitaLand, Ltd. | 662,668 | ||||
| 22,800 | Jardine Cycle & Carriage, Ltd. | 720,174 | ||||
| 283,700 | Wilmar International, Ltd. | 673,557 | ||||
|
| |||||
| 2,056,399 | ||||||
|
| |||||
Spain — 2.2% | ||||||
| 4,675 | Aena SA(b) | 690,080 | ||||
| 46,500 | Mapfre SA | 130,099 | ||||
Continued
72
Sterling Capital Behavioral International Equity Fund
|
Schedule of Portfolio Investments — (continued) |
September 30, 2016
|
Shares | Fair Value | |||||
COMMON STOCKS — (continued) |
| |||||
Spain — (continued) | ||||||
| 53,000 | Repsol SA | $ | 719,968 | |||
|
| |||||
| 1,540,147 | ||||||
|
| |||||
Sweden — 2.2% | ||||||
| 31,075 | Industrivarden AB, Class C | 575,170 | ||||
| 24,225 | Svenska Cellulosa AB, Class B | 719,019 | ||||
| 9,925 | Swedbank AB, Class A | 233,204 | ||||
|
| |||||
| 1,527,393 | ||||||
|
| |||||
Switzerland — 8.4% | ||||||
| 25,925 | ABB, Ltd. | 584,297 | ||||
| 6,250 | Adecco Group AG | 352,286 | ||||
| 381,975 | Glencore PLC(a) | 1,045,909 | ||||
| 6,525 | Roche Holding AG | 1,621,453 | ||||
| 2,550 | Swiss Life Holding AG | 661,273 | ||||
| 8,925 | Swiss Re AG | 806,092 | ||||
| 3,375 | Zurich Insurance Group AG | 870,392 | ||||
|
| |||||
| 5,941,702 | ||||||
|
| |||||
United Kingdom — 15.1% | ||||||
| 82,225 | 3i Group PLC | 693,269 | ||||
| 78,350 | Barratt Developments PLC | 501,597 | ||||
| 20,525 | British American Tobacco PLC | 1,308,996 | ||||
| 81,150 | BT Group PLC | 408,289 | ||||
| 38,650 | Burberry Group PLC | 689,678 | ||||
| 160,800 | GKN PLC | 667,238 | ||||
| 17,875 | Imperial Brands PLC | 920,032 | ||||
| 953,600 | Lloyds Banking Group PLC | 673,730 | ||||
| 112,750 | Meggitt PLC | 658,085 | ||||
| 256,725 | Old Mutual PLC | 672,932 | ||||
| 19,100 | Persimmon PLC | 449,088 | ||||
| 56,575 | Petrofac, Ltd. | 654,828 | ||||
| 27,800 | Rio Tinto PLC | 923,962 | ||||
| 96,325 | Royal Mail PLC | 611,239 | ||||
| 33,950 | WPP PLC | 798,012 | ||||
|
| |||||
| 10,630,975 | ||||||
|
| |||||
Total Common Stocks | 69,095,795 | |||||
|
| |||||
Shares | Fair Value | |||||
MONEY MARKET FUND — 1.2% | ||||||
United States — 1.2% | ||||||
| 863,945 | Federated Treasury Obligations Fund, Institutional Shares, 0.180%(c) | $ | 863,945 | |||
|
| |||||
Total Money Market Fund | 863,945 | |||||
|
| |||||
Total Investments — 99.4% | 69,959,740 | |||||
Net Other Assets (Liabilities) — 0.6% | 395,794 | |||||
|
| |||||
NET ASSETS — 100.0% | $ | 70,355,534 | ||||
|
| |||||
| (a) | Represents non-income producing security. |
| (b) | Rule 144A, Section 4(2) or other security that is restricted as to resale to qualified institutional investors. The Investment Advisor, using Board approved procedures, has deemed these securities or a portion of these securities to be liquid. |
| (c) | Represents the current yield as of report date. |
Industry | Percentage of net assets | ||||
Automobiles & Components | 6.0 | % | |||
Banks | 9.9 | % | |||
Capital Goods | 10.6 | % | |||
Commercial & Professional Services | 0.7 | % | |||
Consumer Durables & Apparel | 3.3 | % | |||
Consumer Services | 0.4 | % | |||
Diversified Financials | 4.0 | % | |||
Energy | 5.7 | % | |||
Food & Staples Retailing | 2.0 | % | |||
Food, Beverage & Tobacco | 7.2 | % | |||
Health Care Equipment & Services | 0.8 | % | |||
Household & Personal Products | 1.9 | % | |||
Insurance | 6.2 | % | |||
Materials | 8.7 | % | |||
Media | 1.1 | % | |||
Money Market Fund | 1.2 | % | |||
Pharmaceuticals, Biotechnology & Life Sciences | 8.5 | % | |||
Real Estate | 3.8 | % | |||
Retailing | 1.0 | % | |||
Software & Services | 1.8 | % | |||
Technology Hardware & Equipment | 2.1 | % | |||
Telecommunication Services | 5.3 | % | |||
Transportation | 3.3 | % | |||
Utilities | 3.9 | % | |||
|
| ||||
| 99.4 | % | ||||
|
| ||||
See accompanying Notes to the Financial Statements.
73
Sterling Capital Stratton Mid Cap Value Fund
|
Schedule of Portfolio Investments |
September 30, 2016
|
Shares | Fair Value | |||||
COMMON STOCKS — 97.3% | ||||||
Automobiles & Components — 4.5% |
| |||||
| 29,540 | Magna International, Inc. | $ | 1,268,743 | |||
| 19,000 | Thor Industries, Inc. | 1,609,300 | ||||
|
| |||||
| 2,878,043 | ||||||
|
| |||||
Banks — 6.8% | ||||||
| 25,100 | East West Bancorp, Inc. | 921,421 | ||||
| 17,400 | First Republic Bank/CA | 1,341,714 | ||||
| 93,300 | Huntington Bancshares, Inc. | 919,938 | ||||
| 92,100 | KeyCorp | 1,120,857 | ||||
|
| |||||
| 4,303,930 | ||||||
|
| |||||
Capital Goods — 5.3% | ||||||
| 9,500 | Carlisle Cos., Inc. | 974,415 | ||||
| 35,300 | HD Supply Holdings, Inc.(a) | 1,128,894 | ||||
| 15,700 | United Rentals, Inc.(a) | 1,232,293 | ||||
|
| |||||
| 3,335,602 | ||||||
|
| |||||
Consumer Durables & Apparel — 5.8% |
| |||||
| 10,000 | Mohawk Industries, Inc.(a) | 2,003,400 | ||||
| 49,700 | PulteGroup, Inc. | 995,988 | ||||
| 12,200 | VF Corp. | 683,810 | ||||
|
| |||||
| 3,683,198 | ||||||
|
| |||||
Consumer Services — 1.8% | ||||||
| 15,400 | Royal Caribbean Cruises, Ltd. | 1,154,230 | ||||
|
| |||||
Diversified Financials — 3.5% | ||||||
| 7,200 | Affiliated Managers Group, Inc.(a) | 1,041,840 | ||||
| 11,800 | Ameriprise Financial, Inc. | 1,177,286 | ||||
|
| |||||
| 2,219,126 | ||||||
|
| |||||
Energy — 7.6% | ||||||
| 39,300 | Cabot Oil & Gas Corp. | 1,013,940 | ||||
| 34,200 | Devon Energy Corp. | 1,508,562 | ||||
| 16,300 | Phillips 66 | 1,312,965 | ||||
| 56,800 | Superior Energy Services, Inc. | 1,016,720 | ||||
|
| |||||
| 4,852,187 | ||||||
|
| |||||
Food & Staples Retailing — 3.1% |
| |||||
| 16,300 | Casey’s General Stores, Inc. | 1,958,445 | ||||
|
| |||||
Food, Beverage & Tobacco — 2.3% |
| |||||
| 10,800 | Ingredion, Inc. | 1,437,048 | ||||
|
| |||||
Health Care Equipment & Services — 4.8% |
| |||||
| 7,800 | Becton Dickinson & Co. | 1,401,894 | ||||
| 12,900 | Zimmer Biomet Holdings, Inc. | 1,677,258 | ||||
|
| |||||
| 3,079,152 | ||||||
|
| |||||
Household & Personal Products — 1.7% |
| |||||
| 13,200 | Edgewell Personal Care Co.(a) | 1,049,664 | ||||
|
| |||||
Insurance — 5.1% | ||||||
| 15,000 | American Financial Group, Inc. | 1,125,000 | ||||
| 10,500 | Hanover Insurance Group, Inc. (The) | 791,910 | ||||
| 20,400 | Torchmark Corp. | 1,303,356 | ||||
|
| |||||
| 3,220,266 | ||||||
|
| |||||
Materials — 7.3% | ||||||
| 25,700 | Avery Dennison Corp. | 1,999,203 | ||||
| 35,100 | Berry Plastics Group, Inc.(a) | 1,539,135 | ||||
| 20,400 | Westlake Chemical Corp. | 1,091,400 | ||||
|
| |||||
| 4,629,738 | ||||||
|
| |||||
Shares | Fair Value | |||||
COMMON STOCKS — (continued) | ||||||
Pharmaceuticals, Biotechnology & Life Sciences — 5.7% |
| |||||
| 17,400 | ICON Plc(a) | $ | 1,346,238 | |||
| 16,300 | PerkinElmer, Inc. | 914,593 | ||||
| 8,500 | Thermo Fisher Scientific, Inc. | 1,352,010 | ||||
|
| |||||
| 3,612,841 | ||||||
|
| |||||
Real Estate — 11.9% | ||||||
| 49,600 | DDR Corp., REIT | 864,528 | ||||
| 15,600 | Eastgroup Properties, Inc., REIT | 1,147,536 | ||||
| 32,900 | Highwoods Properties, Inc., REIT | 1,714,748 | ||||
| 30,000 | Hudson Pacific Properties, Inc., REIT | 986,100 | ||||
| 21,300 | Macerich Co. (The), REIT | 1,722,531 | ||||
| 12,300 | Mid-America Apartment Communities, Inc., REIT | 1,156,077 | ||||
|
| |||||
| 7,591,520 | ||||||
|
| |||||
Semiconductors & Semiconductor |
| |||||
| 12,400 | NXP Semiconductors NV(a) | 1,264,924 | ||||
| 13,900 | Skyworks Solutions, Inc. | 1,058,346 | ||||
|
| |||||
| 2,323,270 | ||||||
|
| |||||
Software & Services — 8.0% | ||||||
| 43,000 | Activision Blizzard, Inc. | 1,904,900 | ||||
| 12,600 | Fiserv, Inc.(a) | 1,253,322 | ||||
| 43,600 | PTC, Inc.(a) | 1,931,916 | ||||
|
| |||||
| 5,090,138 | ||||||
|
| |||||
Technology Hardware & Equipment — 5.5% |
| |||||
| 12,000 | Arrow Electronics, Inc.(a) | 767,640 | ||||
| 27,600 | CDW Corp. | 1,262,148 | ||||
| 24,800 | CommScope Holding Co., Inc.(a) | 746,728 | ||||
| 24,900 | NetScout Systems, Inc.(a) | 728,325 | ||||
|
| |||||
| 3,504,841 | ||||||
|
| |||||
Utilities — 2.9% | ||||||
| 26,600 | Southwest Gas Corp. | 1,858,276 | ||||
|
| |||||
Total Common Stocks | 61,781,515 | |||||
|
| |||||
MONEY MARKET FUND — 2.9% | ||||||
| 1,863,684 | Federated Treasury Obligations Fund, Institutional Shares, 0.180%(b) | 1,863,684 | ||||
|
| |||||
Total Money Market Fund | 1,863,684 | |||||
|
| |||||
Total Investments — 100.2% | 63,645,199 | |||||
Net Other Assets (Liabilities) — (0.2)% | (111,700 | ) | ||||
|
| |||||
NET ASSETS — 100.0% | $ | 63,533,499 | ||||
|
| |||||
| (a) | Represents non-income producing security. |
| (b) | Represents the current yield as of report date. |
REIT — Real Estate Investment Trust
See accompanying Notes to the Financial Statements.
74
Sterling Capital Stratton Real Estate Fund
|
Schedule of Portfolio Investments |
September 30, 2016
|
Shares | Fair Value | |||||
COMMON STOCKS — 97.9% | ||||||
Diversified — 5.8% | ||||||
| 42,000 | American Assets Trust, Inc. | $ | 1,821,960 | |||
| 55,000 | Liberty Property Trust | 2,219,250 | ||||
| 150,000 | Spirit Realty Capital, Inc. | 1,999,500 | ||||
|
| |||||
| 6,040,710 | ||||||
|
| |||||
Health Care — 9.8% | ||||||
| 71,500 | Healthcare Trust of America, Inc., Class A | 2,332,330 | ||||
| 150,000 | Medical Properties Trust, Inc. | 2,215,500 | ||||
| 53,000 | Ventas, Inc. | 3,743,390 | ||||
| 26,000 | Welltower, Inc. | 1,944,020 | ||||
|
| |||||
| 10,235,240 | ||||||
|
| |||||
Hotel & Resort — 4.7% | ||||||
| 21,000 | Marriott International, Inc/MD, Class A | 1,413,930 | ||||
| 46,000 | Ryman Hospitality Properties, Inc. | 2,215,360 | ||||
| 100,000 | Summit Hotel Properties, Inc. | 1,316,000 | ||||
|
| |||||
| 4,945,290 | ||||||
|
| |||||
Industrial — 4.2% | ||||||
| 29,000 | Eastgroup Properties | 2,133,240 | ||||
| 80,000 | First Industrial Realty Trust, Inc. | 2,257,600 | ||||
|
| |||||
| 4,390,840 | ||||||
|
| |||||
Office — 14.1% | ||||||
| 23,000 | Alexandria Real Estate Equities, Inc. | 2,501,710 | ||||
| 65,000 | Corporate Office Properties Trust | 1,842,750 | ||||
| 42,000 | Highwoods Properties, Inc. | 2,189,040 | ||||
| 74,000 | Hudson Pacific Properties, Inc. | 2,432,380 | ||||
| 26,000 | SL Green Realty Corp. | 2,810,600 | ||||
| 30,000 | Vornado Realty Trust | 3,036,300 | ||||
|
| |||||
| 14,812,780 | ||||||
|
| |||||
Residential — 14.9% | ||||||
| 46,000 | American Campus Communities, Inc. | 2,340,020 | ||||
| 52,000 | Apartment Investment & Management Co., Class A | 2,387,320 | ||||
| 27,000 | Equity LifeStyle Properties, Inc. | 2,083,860 | ||||
| 16,000 | Essex Property Trust, Inc. | 3,563,200 | ||||
| 22,000 | Mid-America Apartment Communities, Inc. | 2,067,780 | ||||
| 90,000 | UDR, Inc. | 3,239,100 | ||||
|
| |||||
| 15,681,280 | ||||||
|
| |||||
Shares | Fair Value | |||||
COMMON STOCKS — (continued) | ||||||
Retail — 24.8% | ||||||
| 75,500 | Acadia Realty Trust | $ | 2,736,120 | |||
| 16,000 | Federal Realty Investment Trust | 2,462,880 | ||||
| 104,000 | General Growth Properties, Inc. | 2,870,400 | ||||
| 55,000 | Kite Realty Group Trust | 1,524,600 | ||||
| 40,000 | Macerich Co. (The) | 3,234,800 | ||||
| 50,000 | National Retail Properties, Inc. | 2,542,500 | ||||
| 42,757 | Simon Property Group, Inc. | 8,851,127 | ||||
| 45,000 | Tanger Factory Outlet Centers, Inc. | 1,753,200 | ||||
|
| |||||
| 25,975,627 | ||||||
|
| |||||
Specialized — 19.6% | ||||||
| 75,000 | Communications Sales & Leasing, Inc. | 2,355,750 | ||||
| 40,000 | Crown Castle International Corp. | 3,768,400 | ||||
| 90,000 | CubeSmart | 2,453,400 | ||||
| 36,000 | Digital Realty Trust, Inc. | 3,496,320 | ||||
| 32,000 | EPR Properties | 2,519,680 | ||||
| 10,000 | Equinix, Inc. | 3,602,500 | ||||
| 27,000 | Life Storage, Inc. | 2,401,380 | ||||
|
| |||||
| 20,597,430 | ||||||
|
| |||||
Total Common Stocks | 102,679,197 | |||||
|
| |||||
MONEY MARKET FUND — 1.8% | ||||||
| 1,868,152 | Federated Treasury Obligations Fund, Institutional Shares, 0.180%(a) | 1,868,152 | ||||
|
| |||||
Total Money Market Fund | 1,868,152 | |||||
|
| |||||
Total Investments — 99.7% | 104,547,349 | |||||
Net Other Assets (Liabilities) — 0.3% | 275,871 | |||||
|
| |||||
NET ASSETS — 100.0% | $ | 104,823,220 | ||||
|
| |||||
| (a) | Represents the current yield as of report date. |
See accompanying Notes to the Financial Statements.
75
Sterling Capital Stratton Small Cap Value Fund
|
Schedule of Portfolio Investments |
September 30, 2016
|
Shares | Fair Value | |||||
COMMON STOCKS — 93.8% | ||||||
Automobiles & Components — 3.7% |
| |||||
| 470,200 | Cooper Tire & Rubber Co. | $ | 17,877,004 | |||
| 324,600 | Thor Industries, Inc. | 27,493,620 | ||||
|
| |||||
| 45,370,624 | ||||||
|
| |||||
Banks — 19.1% | ||||||
| 446,040 | Chemical Financial Corp. | 19,683,745 | ||||
| 446,350 | Community Bank System, Inc. | 21,473,899 | ||||
| 804,150 | First Midwest Bancorp, Inc. | 15,568,344 | ||||
| 569,600 | Glacier Bancorp, Inc. | 16,244,992 | ||||
| 245,350 | IBERIABANK Corp. | 16,467,892 | ||||
| 493,950 | MB Financial, Inc. | 18,789,858 | ||||
| 947,921 | Northwest Bancshares, Inc. | 14,891,839 | ||||
| 167,200 | Signature Bank(a) | 19,804,840 | ||||
| 142,400 | SVB Financial Group(a) | 15,740,896 | ||||
| 891,891 | Umpqua Holdings Corp. | 13,422,959 | ||||
| 478,950 | United Bankshares, Inc. | 18,042,047 | ||||
| 578,700 | Webster Financial Corp. | 21,996,387 | ||||
| 357,000 | Wintrust Financial Corp. | 19,838,490 | ||||
|
| |||||
| 231,966,188 | ||||||
|
| |||||
Capital Goods — 10.7% | ||||||
| 314,900 | Crane Co. | 19,841,849 | ||||
| 428,850 | EnerSys | 29,672,131 | ||||
| 710,850 | MasTec, Inc.(a) | 21,140,679 | ||||
| 375,325 | Moog, Inc., Class A(a) | 22,346,851 | ||||
| 340,900 | Oshkosh Corp. | 19,090,400 | ||||
| 220,541 | United Rentals, Inc.(a) | 17,310,263 | ||||
|
| |||||
| 129,402,173 | ||||||
|
| |||||
Consumer Services — 1.7% | ||||||
| 411,900 | Brinker International, Inc. | 20,772,117 | ||||
|
| |||||
Diversified Financials — 1.4% | ||||||
| 115,700 | Affiliated Managers Group, Inc.(a) | 16,741,790 | ||||
|
| |||||
Energy — 4.0% | ||||||
| 400,700 | Cabot Oil & Gas Corp. | 10,338,060 | ||||
| 1,448,000 | Callon Petroleum Co.(a) | 22,733,600 | ||||
| 385,150 | Carrizo Oil & Gas, Inc.(a) | 15,644,793 | ||||
|
| |||||
| 48,716,453 | ||||||
|
| |||||
Food & Staples Retailing — 2.8% |
| |||||
| 277,800 | Casey’s General Stores, Inc. | 33,377,670 | ||||
|
| |||||
Health Care Equipment & Services — 2.7% |
| |||||
| 435,300 | West Pharmaceutical Services, Inc. | 32,429,850 | ||||
|
| |||||
Insurance — 3.2% | ||||||
| 215,000 | Hanover Insurance Group, Inc. (The) | 16,215,300 | ||||
| 558,250 | Selective Insurance Group, Inc. | 22,251,845 | ||||
|
| |||||
| 38,467,145 | ||||||
|
| |||||
Materials — 4.8% | ||||||
| 735,000 | PolyOne Corp. | 24,850,350 | ||||
| 434,800 | Silgan Holdings, Inc. | 21,996,532 | ||||
| 243,200 | U.S. Concrete, Inc.(a) | 11,203,008 | ||||
|
| |||||
| 58,049,890 | ||||||
|
| |||||
Media — 1.5% | ||||||
| 576,300 | Starz, Class A(a) | 17,974,797 | ||||
|
| |||||
Pharmaceuticals, Biotechnology & Life Sciences — 2.8% |
| |||||
| 492,750 | PAREXEL International Corp.(a) | 34,221,487 | ||||
|
| |||||
Shares | Fair Value | |||||
COMMON STOCKS — (continued) | ||||||
Real Estate — 9.2% | ||||||
| 414,900 | American Campus Communities, Inc., REIT | $ | 21,105,963 | |||
| 500,000 | First Industrial Realty Trust, Inc., REIT | 14,110,000 | ||||
| 406,564 | Highwoods Properties, Inc., REIT | 21,190,116 | ||||
| 1,268,750 | Medical Properties Trust, Inc., REIT | 18,739,437 | ||||
| 377,600 | Ryman Hospitality Properties, Inc., REIT | 18,185,216 | ||||
| 173,300 | SL Green Realty Corp., REIT | 18,733,730 | ||||
|
| |||||
| 112,064,462 | ||||||
|
| |||||
Retailing — 1.4% | ||||||
| 307,189 | Cabela’s, Inc.(a) | 16,873,892 | ||||
|
| |||||
Semiconductors & Semiconductor |
| |||||
| 1,614,850 | ON Semiconductor Corp.(a) | 19,894,952 | ||||
| 368,150 | Qorvo, Inc.(a) | 20,520,681 | ||||
|
| |||||
| 40,415,633 | ||||||
|
| |||||
Software & Services — 7.7% | ||||||
| 206,800 | CACI International, Inc., Class A(a) | 20,866,120 | ||||
| 350,375 | Cardtronics PLC, Class A(a) | 15,626,725 | ||||
| 619,950 | PTC, Inc.(a) | 27,469,985 | ||||
| 660,100 | Take-Two Interactive Software, Inc.(a) | 29,757,308 | ||||
|
| |||||
| 93,720,138 | ||||||
|
| |||||
Technology Hardware & Equipment — 5.3% |
| |||||
| 267,800 | Anixter International, Inc.(a) | 17,273,100 | ||||
| 428,400 | Belden, Inc. | 29,555,316 | ||||
| 615,150 | NetScout Systems, Inc.(a) | 17,993,137 | ||||
|
| |||||
| 64,821,553 | ||||||
|
| |||||
Transportation — 1.7% | ||||||
| 1,198,800 | JetBlue Airways Corp.(a) | 20,667,312 | ||||
|
| |||||
Utilities — 6.8% | ||||||
| 489,586 | Avista Corp. | 20,459,799 | ||||
| 419,631 | El Paso Electric Co. | 19,626,142 | ||||
| 504,750 | Portland General Electric Co. | 21,497,303 | ||||
| 296,960 | Southwest Gas Corp. | 20,745,625 | ||||
|
| |||||
| 82,328,869 | ||||||
|
| |||||
Total Common Stocks | 1,138,382,043 | |||||
|
| |||||
MONEY MARKET FUND — 6.2% | ||||||
| 74,753,176 | Federated Treasury Obligations Fund, Institutional Shares, 0.180%(b) | 74,753,176 | ||||
|
| |||||
Total Money Market Fund | 74,753,176 | |||||
|
| |||||
Total Investments — 100.0% | 1,213,135,219 | |||||
Net Other Assets (Liabilities) — 0.0% | 361,225 | |||||
|
| |||||
NET ASSETS — 100.0%. | $ | 1,213,496,444 | ||||
|
| |||||
| (a) | Represents non-income producing security. |
| (b) | Represents the current yield as of report date. |
REIT — Real Estate Investment Trust
See accompanying Notes to the Financial Statements.
76
Sterling Capital Ultra Short Bond Fund
|
Schedule of Portfolio Investments |
September 30, 2016
|
Principal | Fair Value | |||||
ASSET BACKED SECURITIES — 16.4% | ||||||
| $156,896 | AmeriCredit Automobile Receivables Trust, Series 2012-4, Class C, 1.930%, 8/8/18 | $ | 157,098 | |||
| 380,000 | AmeriCredit Automobile Receivables Trust, Series 2013-5, Class C, 2.290%, 11/8/19 | 382,268 | ||||
| 600,000 | Americredit Automobile Receivables Trust, Series 2014-4, Class C, 2.470%, 11/9/20 | 608,878 | ||||
| 133,333 | Avis Budget Rental Car Funding AESOP, LLC, Series 2011-3A, Class A, 3.410%, 11/20/17(a) | 133,569 | ||||
| 365,000 | Avis Budget Rental Car Funding AESOP, LLC, Series 2012-2A, Class A, 2.802%, 5/20/18(a) | 367,009 | ||||
| 140,000 | Capital Auto Receivables Asset Trust, Series 2013-3, Class B, 2.320%, 7/20/18 | 140,510 | ||||
| 386,047 | Capital Auto Receivables Asset Trust, Series 2013-1, Class C, 1.740%, 10/22/18 | 386,441 | ||||
| 450,000 | Capital Auto Receivables Asset Trust, Series 2014-2, Class C, 2.410%, 5/20/19 | 454,153 | ||||
| 62,207 | CarMax Auto Owner Trust, Series 2013-4, Class A3, 0.800%, 7/16/18 | 62,183 | ||||
| 213,235 | CarMax Auto Owner Trust, Series 2014-1, Class A3, 0.790%, 10/15/18 | 213,112 | ||||
| 280,000 | CarMax Auto Owner Trust, Series 2013-3, Class C, 2.150%, 5/15/19 | 282,042 | ||||
| 500,000 | CarMax Auto Owner Trust, Series 2014-2, Class C, 2.080%, 1/15/20 | 503,670 | ||||
| 304,589 | Citicorp Residential Mortgage Trust, STEP, Series 2007-2, Class A6, 5.432%, 6/25/37 | 313,693 | ||||
| 91,011 | Enterprise Fleet Financing, LLC, Series 2014-1, Class A2, 0.870%, 9/20/19(a) | 90,858 | ||||
| 492,602 | Enterprise Fleet Financing, LLC, Series 2014-2, Class A2, 1.050%, 3/20/20(a) | 491,798 | ||||
| 236,912 | Enterprise Fleet Financing, LLC, Series 2015-2, Class A2, 1.590%, 2/22/21(a) | 237,458 | ||||
| 250,016 | First Franklin Mortgage Loan Trust, Series 2006-FF1, Class 2A3, 0.765%, 1/25/36(b) | 248,149 | ||||
| 500,000 | Hertz Vehicle Financing, LLC, Series 2011-1A, Class A2, 3.290%, 3/25/18(a) | 502,430 | ||||
| 420,000 | Hyundai Auto Receivables Trust, Series 2012-C, Class B, 1.060%, 6/15/18 | 420,106 | ||||
| 310,000 | JP Morgan Mortgage Acquisition Corp., Series 2005-OPT2, Class M1, 0.955%, 12/25/35(b) | 305,453 | ||||
| 212,436 | New Century Home Equity Loan Trust, Series 2005-4, Class M1, 1.005%, 9/25/35(b) | 210,254 | ||||
| 46,811 | Option One Mortgage Loan Trust, Asset-Backed Certificates, Series 2005-4, Class A3, 0.785%, 11/25/35(b) | 46,662 | ||||
| 21,501 | Park Place Securities, Inc. Pass Through Certificates, Series 2005-WHQ1, Class M2, 1.275%, 3/25/35(b) | 21,505 | ||||
| 300,956 | RAMP Trust, Series 2005-RZ4, Class A3, 0.925%, 11/25/35(b) | 299,116 | ||||
| 319,768 | RASC Series 2006-EMX1 Trust, Series 2006-EMX1, Class A3, 0.845%, 1/25/36(b) | 317,333 | ||||
| 457,268 | RASC Series 2006-KS5 Trust, Series 2006-KS5, Class A3, 0.685%, 7/25/36(b) | 449,098 | ||||
| 81,686 | Santander Drive Auto Receivables Trust, Series 2014-1, Class B, 1.590%, 10/15/18 | 81,726 | ||||
| 144,180 | Santander Drive Auto Receivables Trust, Series 2014-2, Class B, 1.620%, 2/15/19 | 144,291 | ||||
| 350,000 | Santander Drive Auto Receivables Trust, Series 2014-5, Class C, 2.460%, 6/15/20 | 353,892 | ||||
Principal | Fair Value | |||||
ASSET BACKED SECURITIES — (continued) |
| |||||
| $500,000 | Santander Drive Auto Receivables Trust, Series 2016-2, Class B, 2.080%, 2/16/21 | $ | 503,579 | |||
| 650,000 | Wheels SPV 2, LLC, Series 2014-1A, Class A3, 1.460%, 3/20/23(a) | 650,185 | ||||
| 500,000 | Wheels SPV 2, LLC, Series 2016-1A, Class A2, 1.590%, 5/20/25(a) | 501,551 | ||||
Total Asset Backed Securities (Cost $9,862,521) | 9,880,070 | |||||
|
| |||||
COLLATERALIZED MORTGAGE OBLIGATIONS — 0.1% | ||||||
| 30,155 | Fannie Mae, Series 2009-114, Class AC, 2.500%, 12/25/23 | 30,263 | ||||
|
| |||||
Total Collateralized Mortgage Obligations | 30,263 | |||||
|
| |||||
COMMERCIAL MORTGAGE-BACKED SECURITIES — 13.3% | ||||||
| 16,838 | Banc of America Merrill Lynch Commercial Mortgage, Inc., Series 2005-1, Class AJ, 5.527%, 11/10/42(b) | 16,821 | ||||
| 220,000 | Bear Stearns Commercial Mortgage Securities Trust, Series 2006-PW14, Class AM, 5.243%, 12/11/38 | 220,200 | ||||
| 250,000 | Bear Stearns Commercial Mortgage Securities Trust, Series 2007-T28, Class AM, 5.835%, 9/11/42(b) | 258,241 | ||||
| 420,000 | Citigroup Commercial Mortgage Trust, Series 2007-C6, Class A4, 5.900%, 12/10/49(b) | 427,617 | ||||
| 400,000 | COMM Mortgage Trust, Series 2006-C8, Class AM, 5.347%, 12/10/46 | 401,606 | ||||
| 407,989 | COMM Mortgage Trust, Series 2007-C9, Class A4, 6.007%, 12/10/49(b) | 417,480 | ||||
| 402,794 | Commercial Mortgage Trust, Series 2007-GG9, Class A4, 5.444%, 3/10/39 | 403,387 | ||||
| 379,983 | Credit Suisse Commercial Mortgage Trust, Series 2007-C3, Class A4, 5.881%, 6/15/39(b) | 383,947 | ||||
| 380,645 | Credit Suisse Commercial Mortgage Trust, Series 2007-C5, Class A4, 5.695%, 9/15/40(b) | 389,377 | ||||
| 280,000 | Credit Suisse Commercial Mortgage Trust, Series 2008-C1, Class A3, 6.267%, 2/15/41(b) | 288,081 | ||||
| 140,000 | JP Morgan Chase Commercial Mortgage Securities Trust, Series 2013-LC11, Class A2, 1.855%, 4/15/46 | 140,814 | ||||
| 441,822 | JP Morgan Chase Commercial Mortgage Securities Trust, Series 2007-CB20, Class A4, 5.794%, 2/12/51(b) | 453,316 | ||||
| 126,920 | JPMorgan Chase Commercial Mortgage Securities Trust, Series 2006-CB16, Class AM, 5.593%, 5/12/45 | 126,823 | ||||
| 240,471 | JPMorgan Chase Commercial Mortgage Securities Trust, Series 2007-CB18, Class A4, 5.440%, 6/12/47 | 241,693 | ||||
| 234,545 | JPMorgan Chase Commercial Mortgage Securities Trust, Series 2007-LDPX, Class A3, 5.420%, 1/15/49 | 236,291 | ||||
| 342,390 | LB-UBS Commercial Mortgage Trust, Series 2007-C7, Class A3, 5.866%, 9/15/45(b) | 354,683 | ||||
Continued
77
Sterling Capital Ultra Short Bond Fund
|
Schedule of Portfolio Investments — (continued) |
September 30, 2016
|
Principal | Fair Value | |||||
COMMERCIAL MORTGAGE-BACKED SECURITIES — (continued) | ||||||
| $415,000 | LB-UBS Commercial Mortgage Trust, Series 2007-C7, Class AM, 6.368%, 9/15/45(b) | $ | 432,978 | |||
| 450,000 | Merrill Lynch Mortgage Trust, Series 2008-C1, Class AM, 6.472%, 2/12/51(b) | 472,708 | ||||
| 437,750 | ML-CFC Commercial Mortgage Trust, Series 2007-8, Class A3, 6.069%, 8/12/49(b) | 447,299 | ||||
| 516,935 | ML-CFC Commercial Mortgage Trust, Series 2007-7, Class A4, 5.810%, 6/12/50(b) | 525,577 | ||||
| 147,602 | Morgan Stanley Capital I Trust, Series 2006-HQ10, Class AM, 5.360%, 11/12/41 | 147,479 | ||||
| 450,000 | Morgan Stanley Capital I Trust, Series 2007-T27, Class AM, 5.818%, 6/11/42(b) | 459,815 | ||||
| 360,000 | Morgan Stanley Capital I Trust, Series 2008-T29, Class AM, 6.477%, 1/11/43(b) | 376,169 | ||||
| 343,001 | Morgan Stanley Capital I Trust, Series 2007-IQ15, Class A4, 6.103%, 6/11/49(b) | 352,139 | ||||
| 26,973 | Wachovia Bank Commercial Mortgage Trust, Series 2006-C29, Class A4, 5.308%, 11/15/48 | 26,951 | ||||
| 46,829 | WFRBS Commercial Mortgage Trust, Series 2011-C3, Class A3, 3.998%, 3/15/44(a) | 48,560 | ||||
|
| |||||
Total Commercial Mortgage-Backed Securities (Cost $8,265,307) | 8,050,052 | |||||
|
| |||||
CORPORATE BONDS — 52.4% | ||||||
Automobiles & Components — 3.5% |
| |||||
| 300,000 | American Honda Finance Corp., 1.600%, 2/16/18(a) | 301,901 | ||||
| 500,000 | Daimler Finance North America, LLC, 2.375%, 8/1/18(a) | 507,520 | ||||
| 425,000 | Ford Motor Credit Co., LLC, 1.483%, 3/27/17(b) | 425,320 | ||||
| 250,000 | General Motors Financial Co., Inc., 2.400%, 4/10/18 | 251,805 | ||||
| 400,000 | Hyundai Capital America, 2.000%, 3/19/18(a) | 402,272 | ||||
| 250,000 | Nissan Motor Acceptance Corp., 1.800%, 3/15/18(a) | 251,480 | ||||
|
| |||||
| 2,140,298 | ||||||
|
| |||||
Banks — 13.9% | ||||||
| 450,000 | ABN AMRO Bank NV, 1.543%, 10/28/16(a)(b) | 450,247 | ||||
| 400,000 | Bank of America Corp., 2.000%, 1/11/18 | 401,842 | ||||
| 225,000 | Bank of Nova Scotia (The), 1.375%, 12/18/17 | 225,142 | ||||
| 250,000 | Bank of Tokyo-Mitsubishi UFJ, Ltd. (The), 1.700%, 3/5/18(a) | 250,354 | ||||
| 250,000 | BNP Paribas SA, MTN, 1.375%, 3/17/17 | 250,149 | ||||
| 300,000 | Capital One NA, BKNT, 1.650%, 2/5/18 | 300,352 | ||||
| 500,000 | Citigroup, Inc., 1.424%, 4/27/18(b) | 501,025 | ||||
| 507,000 | Comerica Bank, BKNT, 5.750%, 11/21/16 | 509,878 | ||||
| 250,000 | Compass Bank, BKNT, 1.850%, 9/29/17 | 249,695 | ||||
| 300,000 | Credit Suisse, GMTN, 1.315%, 5/26/17(b) | 300,077 | ||||
| 185,000 | Fifth Third Bancorp, 1.277%, 12/20/16(b) | 185,107 | ||||
| 220,000 | Huntington National Bank (The), BKNT, 1.300%, 11/20/16 | 220,073 | ||||
| 250,000 | ING Bank NV, 3.750%, 3/7/17(a) | 252,590 | ||||
| 425,000 | JPMorgan Chase & Co., MTN, 1.350%, 2/15/17 | 425,204 | ||||
| 250,000 | KeyBank NA, BKNT, 1.650%, 2/1/18 | 250,993 | ||||
| 250,000 | Lloyds Bank PLC, 4.200%, 3/28/17 | 253,754 | ||||
| 223,000 | Macquarie Bank, Ltd., 5.000%, 2/22/17(a) | 226,044 | ||||
Principal | Fair Value | |||||
CORPORATE BONDS — (continued) | ||||||
Banks — (continued) | ||||||
| $300,000 | Manufacturers & Traders Trust Co., BKNT, 1.250%, 1/30/17 | $ | 300,064 | |||
| 250,000 | Nordea Bank AB, 1.625%, 5/15/18(a) | 250,687 | ||||
| 261,000 | Regions Bank/Birmingham AL, BKNT, 2.250%, 9/14/18 | 263,090 | ||||
| 200,000 | Santander UK PLC, GMTN, 1.675%, 8/24/18(b) | 200,100 | ||||
| 225,000 | Sumitomo Mitsui Banking Corp., 1.750%, 1/16/18 | 225,649 | ||||
| 250,000 | SunTrust Bank, BKNT, 1.350%, 2/15/17 | 250,085 | ||||
| 250,000 | Svenska Handelsbanken AB, 2.875%, 4/4/17 | 252,249 | ||||
| 250,000 | Swedbank AB, 1.600%, 3/2/18(a) | 250,570 | ||||
| 250,000 | UBS, GMTN, 1.375%, 8/14/17 | 249,982 | ||||
| 400,000 | US Bancorp, MTN, 1.650%, 5/15/17 | 401,165 | ||||
| 500,000 | Wachovia Corp., 1.120%, 6/15/17(b) | 500,065 | ||||
|
| |||||
| 8,396,232 | ||||||
|
| |||||
Capital Goods — 0.9% | ||||||
| 325,000 | General Electric Co., GMTN, 1.600%, 11/20/17 | 327,161 | ||||
| 225,000 | Penske Truck Leasing Co. LP / PTL Finance Corp., 3.375%, 3/15/18(a) | 230,633 | ||||
|
| |||||
| 557,794 | ||||||
|
| |||||
Commercial & Professional Services — 0.5% |
| |||||
| 275,000 | Republic Services, Inc., 3.800%, 5/15/18 | 285,680 | ||||
|
| |||||
Consumer Durables & Apparel — 0.5% |
| |||||
| 318,000 | Whirlpool Corp., 1.350%, 3/1/17 | 318,188 | ||||
|
| |||||
Consumer Services — 0.8% | ||||||
| 185,000 | Carnival Corp., 1.875%, 12/15/17 | 186,456 | ||||
| 300,000 | ERAC USA Finance, LLC, 6.375%, 10/15/17(a) | 314,370 | ||||
|
| |||||
| 500,826 | ||||||
|
| |||||
Diversified Financials — 6.4% | ||||||
| 250,000 | AIG Global Funding, 1.650%, 12/15/17(a) | 251,026 | ||||
| 175,000 | Ally Financial, Inc., 2.750%, 1/30/17 | 175,328 | ||||
| 325,000 | American Express Co., 1.401%, 5/22/18(b) | 325,809 | ||||
| 325,000 | Berkshire Hathaway, Inc., 0.931%, 8/6/18(b) | 325,083 | ||||
| 300,000 | BlackRock, Inc., 6.250%, 9/15/17 | 314,489 | ||||
| 300,000 | Capital One Bank USA NA, BKNT, 1.150%, 11/21/16 | 300,088 | ||||
| 200,000 | Charles Schwab Corp., MTN (The), 6.375%, 9/1/17 | 209,566 | ||||
| 250,000 | HSBC Bank USA NA, BKNT, 6.000%, 8/9/17 | 259,471 | ||||
| 250,000 | International Lease Finance Corp., 3.875%, 4/15/18 | 255,937 | ||||
| 300,000 | Macquarie Group, Ltd., 1.759%, 1/31/17(a)(b) | 300,529 | ||||
| 500,000 | Morgan Stanley, 1.598%, 1/5/18(b) | 500,821 | ||||
| 419,000 | Murray Street Investment Trust I, STEP, 4.647%, 3/9/17 | 423,236 | ||||
| 250,000 | Principal Life Global Funding II, 1.125%, 2/24/17(a) | 249,897 | ||||
|
| |||||
| 3,891,280 | ||||||
|
| |||||
Energy — 3.1% | ||||||
| 250,000 | BP Capital Markets PLC, 1.375%, 11/6/17 | 250,023 | ||||
| 300,000 | Enterprise Products Operating, LLC, 6.650%, 4/15/18 | 322,393 | ||||
| 250,000 | Magellan Midstream Partners LP, 5.650%, 10/15/16 | 250,278 | ||||
| 250,000 | Phillips 66, 2.950%, 5/1/17 | 252,250 | ||||
Continued
78
Sterling Capital Ultra Short Bond Fund
|
Schedule of Portfolio Investments — (continued) |
September 30, 2016
|
Principal Amount | Fair Value | |||||
CORPORATE BONDS — (continued) | ||||||
Energy — (continued) | ||||||
| $135,000 | Pioneer Natural Resources Co., 6.650%, 3/15/17 | $ | 138,091 | |||
| 250,000 | Schlumberger Investment SA, 1.250%, 8/1/17(a) | 250,012 | ||||
| 140,000 | Spectra Energy Capital, LLC, 6.200%, 4/15/18 | 148,083 | ||||
| 245,000 | Total Capital International SA, 1.550%, 6/28/17 | 245,699 | ||||
|
| |||||
| 1,856,829 | ||||||
|
| |||||
Food & Staples Retailing — 0.4% |
| |||||
| 250,000 | Anheuser-Busch InBev Finance, Inc., 1.250%, 1/17/18 | 249,945 | ||||
|
| |||||
Food, Beverage & Tobacco — 2.5% |
| |||||
| 225,000 | Cargill, Inc., 1.900%, 3/1/17(a) | 225,798 | ||||
| 300,000 | Ingredion, Inc., 1.800%, 9/25/17 | 300,654 | ||||
| 250,000 | Kraft Heinz Foods Co., 2.250%, 6/5/17 | 251,561 | ||||
| 250,000 | Kraft Heinz Foods Co., 2.000%, 7/2/18 | 252,307 | ||||
| 250,000 | Reynolds American, Inc., 2.300%, 8/21/17 | 252,133 | ||||
| 250,000 | SABMiller Holdings, Inc., 2.450%, 1/15/17(a) | 250,749 | ||||
|
| |||||
| 1,533,202 | ||||||
|
| |||||
Health Care Equipment & Services — 2.6% |
| |||||
| 579,000 | Aetna, Inc., 1.700%, 6/7/18 | 580,845 | ||||
| 296,000 | Becton Dickinson and Co., 1.750%, 11/8/16 | 296,198 | ||||
| 300,000 | UnitedHealth Group, Inc., 1.400%, 12/15/17 | 300,871 | ||||
| 375,000 | Zimmer Biomet Holdings, Inc., 1.450%, 4/1/17 | 375,188 | ||||
|
| |||||
| 1,553,102 | ||||||
|
| |||||
Insurance — 3.3% | ||||||
| 250,000 | Jackson National Life Global Funding, 1.250%, 2/21/17(a) | 250,065 | ||||
| 400,000 | Metropolitan Life Global Funding I, 1.300%, 4/10/17(a) | 400,420 | ||||
| 300,000 | Pricoa Global Funding I, 1.150%, 11/25/16(a) | 300,125 | ||||
| 480,000 | Pricoa Global Funding I, 1.350%, 8/18/17(a) | 479,936 | ||||
| 300,000 | Reinsurance Group of America, Inc., 5.625%, 3/15/17 | 305,388 | ||||
| 250,000 | Sirius International Group, Ltd., 6.375%, 3/20/17(a) | 253,961 | ||||
|
| |||||
| 1,989,895 | ||||||
|
| |||||
Materials — 0.8% | ||||||
| 200,000 | Ecolab, Inc., 3.000%, 12/8/16 | 200,705 | ||||
| 250,000 | Glencore Finance Canada, Ltd., 5.800%, 11/15/16(a) | 250,875 | ||||
|
| |||||
| 451,580 | ||||||
|
| |||||
Media — 0.5% | ||||||
| 300,000 | Interpublic Group of Cos., Inc. (The), 2.250%, 11/15/17 | 301,295 | ||||
|
| |||||
Pharmaceuticals, Biotechnology & Life Sciences — 2.5% |
| |||||
| 250,000 | AbbVie, Inc., 1.750%, 11/6/17 | 250,821 | ||||
| 415,000 | Actavis Funding SCS, 1.925%, 3/12/18(b) | 418,275 | ||||
| 240,000 | Amgen, Inc., 1.250%, 5/22/17 | 240,082 | ||||
| 300,000 | Celgene Corp., 2.125%, 8/15/18 | 303,205 | ||||
| 280,000 | Teva Pharmaceutical Finance Netherlands III BV, 1.400%, 7/20/18 | 279,131 | ||||
|
| |||||
| 1,491,514 | ||||||
|
| |||||
Real Estate — 4.4% | ||||||
| 291,000 | ERP Operating L.P., 5.750%, 6/15/17 | 299,780 | ||||
Principal Amount | Fair Value | |||||
CORPORATE BONDS — (continued) | ||||||
Real Estate — (continued) | ||||||
| $250,000 | Essex Portfolio LP, REIT, 5.500%, 3/15/17 | $ | 254,321 | |||
| 330,000 | HCP, Inc., REIT, 6.000%, 1/30/17 | 334,720 | ||||
| 250,000 | Highwoods Realty LP, REIT, 5.850%, 3/15/17 | 254,493 | ||||
| 128,000 | National Retail Properties, Inc., REIT, 6.875%, 10/15/17 | 134,742 | ||||
| 250,000 | Realty Income Corp., 2.000%, 1/31/18 | 251,677 | ||||
| 300,000 | Simon Property Group LP, REIT, 2.800%, 1/30/17 | 300,382 | ||||
| 250,000 | Ventas Realty LP, REIT, 1.250%, 4/17/17 | 249,893 | ||||
| 250,000 | WEA Finance, LLC/Westfield UK & Europe Finance PLC, 1.750%, 9/15/17(a) | 250,453 | ||||
| 300,000 | Welltower Inc., REIT, 4.700%, 9/15/17 | 308,949 | ||||
|
| |||||
| 2,639,410 | ||||||
|
| |||||
Retailing — 0.8% | ||||||
| 250,000 | Dollar General Corp., 1.875%, 4/15/18 | 251,463 | ||||
| 210,000 | The Home Depot, Inc., 1.220%, 9/15/17(b) | 210,577 | ||||
|
| |||||
| 462,040 | ||||||
|
| |||||
Technology Hardware & Equipment — 0.3% |
| |||||
| 150,000 | Apple, Inc., 1.300%, 2/23/18 | 150,441 | ||||
|
| |||||
Telecommunication Services — 1.0% |
| |||||
| 225,000 | AT&T, Inc., 1.400%, 12/1/17 | 225,061 | ||||
| 400,000 | Verizon Communications, Inc., 1.350%, 6/9/17 | 400,491 | ||||
|
| |||||
| 625,552 | ||||||
|
| |||||
Transportation — 1.0% | ||||||
| 150,000 | Burlington Northern Santa Fe, LLC, 5.650%, 5/1/17 | 153,874 | ||||
| 250,000 | Kansas City Southern, 1.443%, 10/28/16(b) | 249,996 | ||||
| 224,000 | Ryder System, Inc., MTN, 2.500%, 3/1/17 | 224,842 | ||||
|
| |||||
| 628,712 | ||||||
|
| |||||
Utilities — 2.7% | ||||||
| 212,000 | American Electric Power Co., Inc., 1.650%, 12/15/17 | 212,400 | ||||
| 215,000 | Dominion Gas Holdings, LLC, 1.050%, 11/1/16 | 215,018 | ||||
| 400,000 | Duke Energy Corp., 1.226%, | 400,418 | ||||
| 250,000 | Edison International, 3.750%, 9/15/17 | 255,491 | ||||
| 250,000 | Pacific Gas & Electric Co., 5.625%, 11/30/17 | 262,528 | ||||
| 300,000 | Southern Co. (The), 2.450%, 9/1/18 | 305,806 | ||||
|
| |||||
| 1,651,661 | ||||||
|
| |||||
Total Corporate Bonds | 31,675,476 | |||||
|
| |||||
MUNICIPAL BONDS — 6.6% | ||||||
California — 1.8% | ||||||
| 200,000 | Municipal Improvement Corp. of Los Angeles, Taxable Series A Advance Refunding Revenue, 1.924%, 11/1/17 | 201,670 | ||||
| 900,000 | Peralta Community College District, Taxable Series B Refunding Revenue, 0.880%, 8/5/20 | 900,000 | ||||
|
| |||||
| 1,101,670 | ||||||
|
| |||||
Illinois — 1.8% | ||||||
| 500,000 | Chicago Midway International Airport, Airport and Marina Revenue, Series C, 0.880%, 1/1/35 | 500,000 | ||||
Continued
79
Sterling Capital Ultra Short Bond Fund
|
Schedule of Portfolio Investments — (continued) |
September 30, 2016
|
Principal | Fair Value | |||||
MUNICIPAL BONDS — (continued) | ||||||
Illinois — (continued) | ||||||
| $300,000 | Chicago, IL, Water Revenue, Taxable Series A, 2.000%, 11/1/16 | $ | 300,192 | |||
| 250,000 | State of Illinois, Public Improvements G.O., Series A (AGM), 5.000%, 6/1/17 | 256,395 | ||||
|
| |||||
| 1,056,587 | ||||||
|
| |||||
New Jersey — 0.3% | ||||||
| 210,000 | New Jersey Economic Development Authority, Pension Funding Revenue, Series B (NATL), OID, 0.000%, 2/15/17 | 208,952 | ||||
|
| |||||
| 208,952 | ||||||
|
| |||||
North Carolina — 1.3% | ||||||
| 805,000 | North Carolina Housing Finance Agency, State Housing Revenue, Series C, 0.820%, 7/1/32 | 805,000 | ||||
|
| |||||
| 805,000 | ||||||
|
| |||||
Pennsylvania — 1.2% | ||||||
| 700,000 | Emmaus General Authority, Misc. Purposes Revenue, Series A, 0.890%, 3/1/30 | 700,000 | ||||
|
| |||||
| 700,000 | ||||||
|
| |||||
Texas — 0.2% | ||||||
| 140,000 | Weatherford Independent School District, School Improvements G.O., 0.000%, 2/15/17 | 139,570 | ||||
|
| |||||
| 139,570 | ||||||
|
| |||||
Total Municipal Bonds | 4,011,779 | |||||
|
| |||||
COMMERCIAL PAPER — 2.0% | ||||||
Energy — 2.0% | ||||||
| 300,000 | Enbridge Energy Partners, 1.200%, 10/13/16(c) | 299,906 | ||||
| 300,000 | Energy Transfer Part, 1.250%, 10/11/16(c) | 299,912 | ||||
| 300,000 | Sempra Global, 0.850%, 10/24/16(c) | 299,839 | ||||
| 300,000 | Spectra Energy Partners, 0.850%, 10/12/16(c) | 299,923 | ||||
|
| |||||
| 1,199,580 | ||||||
|
| |||||
Total Commercial Paper | 1,199,580 | |||||
|
| |||||
Shares | Fair Value | |||||
MONEY MARKET FUND — 2.2% | ||||||
| 1,343,103 | Federated Treasury Obligations Fund, Institutional Shares, 0.180%(d) | $ | 1,343,103 | |||
|
| |||||
Total Investments — 93.0% | 56,190,323 | |||||
Net Other Assets (Liabilities) — 7.0% | 4,243,063 | |||||
|
| |||||
NET ASSETS — 100.0% | $ | 60,433,386 | ||||
|
| |||||
| (a) | Rule 144A, Section 4(2) or other security that is restricted as to resale to qualified institutional investors. The Advisor, using Board approved procedures, has deemed these securities or a portion of these securities to be liquid. |
| (b) | The interest rate for this variable rate note, which will change periodically, is based either on the prime rate or an index of market rates. The reflected rate is in effect as of September 30, 2016. The maturity date reflected is the final maturity date. |
| (c) | Rate disclosed represents the annualized yield from date of purchase. |
| (d) | Represents the current yield as of report date. |
AGM — Assured Guaranty Municipal Corp.
BKNT — Bank Note
G.O. — General Obligation
GMTN — Global Medium Term Note
MTN — Medium Term Note
NATL — National Public Finance Guarantee Corp.
OID — Original Issue Discount
REIT — Real Estate Investment Trust
STEP — Step Coupon Bond
See accompanying Notes to the Financial Statements.
80
Sterling Capital Short Duration Bond Fund
|
Schedule of Portfolio Investments |
September 30, 2016
|
Principal | Fair Value | |||||
ASSET BACKED SECURITIES — 14.8% | ||||||
| $ 400,000 | AmeriCredit Automobile Receivables, Series 2015-4, Class B, 2.110%, 1/8/21 | $ | 403,661 | |||
| 680,000 | AmeriCredit Automobile Receivables Trust, Series 2014-1, Class B, 1.680%, 7/8/19 | 681,705 | ||||
| 825,000 | AmeriCredit Automobile Receivables Trust, Series 2016-2, Class B, 2.210%, 5/10/21 | 834,260 | ||||
| 140,000 | Ameriquest Mortgage Securities, Inc. Asset-Backed Pass-Through Certificates, Series 2004-R6, Class M1, 2.624%, 7/25/34(a) | 139,819 | ||||
| 1,000,000 | Capital Auto Receivables Asset Trust, Series 2013-4, Class B, 2.060%, 10/22/18 | 1,003,997 | ||||
| 470,000 | Capital Auto Receivables Asset Trust, Series 2014-2, Class C, 2.410%, 5/20/19 | 474,337 | ||||
| 650,000 | Capital Auto Receivables Asset Trust, Series 2015-3, Class B, 2.430%, 9/21/20 | 659,911 | ||||
| 845,000 | Chase Issuance Trust, Series 2016-A4, Class A4, 1.490%, 7/15/22 | 847,816 | ||||
| 519,807 | Citicorp Residential Mortgage Trust, Series 2007-2, Class A6, STEP, 5.432%, 6/25/37 | 535,344 | ||||
| 368,224 | Enterprise Fleet Financing, LLC, Series 2014-2, Class A2, 1.050%, 3/20/20(b) | 367,623 | ||||
| 1,200,000 | Enterprise Fleet Financing, LLC, Series 2015-2, Class A3, 2.090%, 2/22/21(b) | 1,210,792 | ||||
| 444,472 | First Franklin Mortgage Loan Trust, Series 2006-FF1, Class 2A3, 0.765%, 1/25/36(a) | 441,154 | ||||
| 500,000 | Ford Credit Auto Owner Trust, Series 2012-D, Class B, 1.010%, 5/15/18 | 499,807 | ||||
| 950,000 | Hyundai Auto Receivables Trust, Series 2013-B, Class B, 1.450%, 2/15/19 | 952,662 | ||||
| 486,000 | JP Morgan Mortgage Acquisition Corp., Series 2005-OPT2, Class M1, 0.955%, 12/25/35(a) | 478,871 | ||||
| 37,874 | Option One Mortgage Loan Trust, Asset-Backed Certificates, Series 2005-4, Class A3, 0.785%, 11/25/35(a) | 37,753 | ||||
| 33,228 | Park Place Securities, Inc. Pass Through Certificates, Series 2005-WHQ1, Class M2, 1.275%, 3/25/35(a) | 33,235 | ||||
| 559,594 | RASC Series 2006-EMX1 Trust, Series 2006-EMX1, Class A3, 0.845%, 1/25/36(a) | 555,332 | ||||
| 103,964 | Santander Drive Auto Receivables Trust, Series 2014-1, Class B, 1.590%, 10/15/18 | 104,014 | ||||
| 335,139 | Santander Drive Auto Receivables Trust, Series 2013-5, Class C, 2.250%, 6/17/19 | 336,539 | ||||
| 1,000,000 | Santander Drive Auto Receivables Trust, Series 2015-1, Class B, 1.970%, 11/15/19 | 1,003,310 | ||||
| 500,000 | Santander Drive Auto Receivables Trust, Series 2015-4, Class B, 2.260%, 6/15/20 | 504,463 | ||||
| 471,908 | Sofi Professional Loan Program LLC, Series 2016-B, Class A1, 1.725%, 6/25/33(a)(b) | 476,277 | ||||
| 270,000 | Wheels SPV 2, LLC, Series 2016-1A, Class A3, 1.870%, 5/20/25(b) | 270,201 | ||||
|
| |||||
Total Asset Backed Securities | 12,852,883 | |||||
|
| |||||
COLLATERALIZED MORTGAGE OBLIGATIONS — 1.2% | ||||||
| 121,088 | Countrywide Alternative Loan Trust, Series 2004-22CB, Class 1A1, 6.000%, 10/25/34 | 129,461 | ||||
| 108,800 | Fannie Mae, Series 2003-66, Class PA, 3.500%, 2/25/33 | 111,307 | ||||
Principal | Fair Value | |||||
COLLATERALIZED MORTGAGE OBLIGATIONS — (continued) | ||||||
| $ 41,522 | Fannie Mae, Series 2005-67, Class HG, 5.500%, 1/25/35 | $ | 43,630 | |||
| 66,563 | Fannie Mae, Series 2009-100, Class PA, 4.500%, 4/25/39 | 68,556 | ||||
| 72,928 | Freddie Mac, Series 2770, Class UE, 4.500%, 3/15/19 | 74,765 | ||||
| 506,573 | Ginnie Mae, Series 2013-165, Class PB, 3.000%, 3/20/41 | 515,531 | ||||
| 49,961 | PHHMC Trust, Series 2007-6, Class A1, 5.438%, 12/18/37(a) | 49,999 | ||||
| 49,648 | Wells Fargo Mortgage Backed Securities Trust, Series 2007-16, Class 1A1, 6.000%, 12/28/37 | 51,279 | ||||
|
| |||||
Total Collateralized Mortgage Obligations | 1,044,528 | |||||
|
| |||||
COMMERCIAL MORTGAGE-BACKED SECURITIES — 12.8% | ||||||
| 8,961 | Banc of America Commercial Mortgage Trust, Series 2006-3, Class A4, 5.889%, 7/10/44(a) | 8,950 | ||||
| 611,066 | Banc of America Commercial Mortgage Trust, Series 2007-5, Class A4, 5.492%, 2/10/51 | 625,205 | ||||
| 44,781 | Banc of America Merrill Lynch Commercial Mortgage, Inc., Series 2005-1, Class AJ, 5.527%, 11/10/42(a) | 44,737 | ||||
| 29,307 | Banc of America Merrill Lynch Commercial Mortgage, Inc., Series 2005-3, Class AM, 4.727%, 7/10/43 | 29,184 | ||||
| 631,394 | BCAP, LLC Trust, Series 2013-RR4, Class A4A2, 2.000%, 2/13/51(b) | 628,381 | ||||
| 198,744 | Bear Stearns Commercial Mortgage Securities Trust, Series 2007-T26, Class A4, 5.471%, 1/12/45(a) | 200,564 | ||||
| 686,372 | Bear Stearns Commercial Mortgage Securities Trust, Series 2007-PW18, Class A4, 5.700%, 6/11/50 | 706,947 | ||||
| 204,841 | CD Commercial Mortgage Trust, Series 2007-CD4, Class A4, 5.322%, 12/11/49 | 205,716 | ||||
| 120,000 | Citigroup Commercial Mortgage Trust, Series 2007-C6, Class A4, 5.900%, 12/10/49(a) | 122,176 | ||||
| 655,000 | COMM Mortgage Trust, Series 2006-C8, Class AM, 5.347%, 12/10/46 | 657,629 | ||||
| 738,913 | COMM Mortgage Trust, Series 2007-C9, Class A4, 6.007%, 12/10/49(a) | 756,103 | ||||
| 568,901 | Commercial Mortgage Trust, Series 2007-GG9, Class A4, 5.444%, 3/10/39 | 569,739 | ||||
| 696,635 | Credit Suisse Commercial Mortgage Trust, Series 2007-C3, Class A4, 5.881%, 6/15/39(a) | 703,903 | ||||
| 575,000 | JPMBB Commercial Mortgage Securities Trust, Series 2014-C19, Class A2, 3.046%, 4/15/47 | 595,494 | ||||
152,304 | JPMorgan Chase Commercial Mortgage Securities Trust, Series 2006-CB16, Class AM, 5.593%, 5/12/45 |
| 152,188 |
| ||
| 267,524 | JPMorgan Chase Commercial Mortgage Securities Trust, Series 2007-CB18, Class A4, 5.440%, 6/12/47 | 268,884 | ||||
| 850,000 | JPMorgan Chase Commercial Mortgage Securities Trust, Series 2014-C20, Class A2, 2.872%, 7/15/47 | 877,757 | ||||
| Continued |
| 81 |
Sterling Capital Short Duration Bond Fund
|
Schedule of Portfolio Investments — (continued) |
September 30, 2016
|
Principal | Fair Value | |||||
COMMERCIAL MORTGAGE-BACKED SECURITIES — (continued) | ||||||
| $ 86,782 | JPMorgan Chase Commercial Mortgage Securities Trust, Series 2007-LDPX, Class A3, 5.420%, 1/15/49 | $ | 87,428 | |||
| 564,211 | ML-CFC Commercial Mortgage Trust, Series 2007-8, Class A3, 6.069%, 8/12/49(a) | 576,518 | ||||
| 301,545 | ML-CFC Commercial Mortgage Trust, Series 2007-7, Class A4, 5.810%, 6/12/50(a) | 306,587 | ||||
| 800,000 | Morgan Stanley Bank of America Merrill Lynch Trust, Series 2014-C17, Class A2, 3.119%, 8/15/47 | 833,506 | ||||
| 129,496 | Morgan Stanley Bank of America Merrill Lynch Trust, Series 2013-C8, Class A2, 1.689%, 12/15/48 | 129,667 | ||||
| 186,260 | Morgan Stanley Capital I Trust, Series 2006-HQ10, Class AM, 5.360%, 11/12/41 | 186,104 | ||||
| 640,000 | Morgan Stanley Capital I Trust, Series 2008-T29, Class AM, 6.477%, 1/11/43(a) | 668,745 | ||||
| 631,379 | Morgan Stanley Capital I Trust, Series 2008-T29, Class A4, 6.477%, 1/11/43(a) | 660,863 | ||||
| 468,295 | WFRBS Commercial Mortgage Trust, Series 2011-C3, Class A3, 3.998%, 3/15/44(b) | 485,598 | ||||
|
| |||||
Total Commercial Mortgage-Backed Securities | 11,088,573 | |||||
|
| |||||
CORPORATE BONDS — 61.9% | ||||||
Automobiles & Components — 3.6% |
| |||||
| 400,000 | American Honda Finance Corp., MTN, 1.650%, 7/12/21 | 396,428 | ||||
| 325,000 | BMW U.S. Capital, LLC, 1.500%, 4/11/19(b) | 325,511 | ||||
| 535,000 | Daimler Finance North America, LLC, 2.375%, 8/1/18(b) | 543,046 | ||||
| 500,000 | Ford Motor Credit Co., LLC, 3.200%, 1/15/21 | 513,311 | ||||
| 400,000 | General Motors Financial Co., Inc., 2.400%, 4/10/18 | 402,887 | ||||
| 400,000 | Hyundai Capital America, 2.500%, 3/18/19(b) | 406,735 | ||||
| 500,000 | Nissan Motor Acceptance Corp., 2.550%, 3/8/21(b) | 512,051 | ||||
|
| |||||
| 3,099,969 | ||||||
|
| |||||
Banks — 14.0% | ||||||
| 450,000 | Athene Global Funding, 2.875%, 10/23/18(b) | 448,991 | ||||
| 1,000,000 | Bank of America Corp., 5.750%, 12/1/17 | 1,047,743 | ||||
| 450,000 | Bank of Montreal, 1.400%, 4/10/18 | 450,433 | ||||
| 450,000 | Bank of Tokyo-Mitsubishi UFJ, Ltd. (The), 1.700%, 3/5/18(b) | 450,638 | ||||
| 550,000 | BNP Paribas SA, MTN, 2.400%, 12/12/18 | 558,369 | ||||
| 415,000 | Canadian Imperial Bank of Commerce, 1.600%, 9/6/19 | 415,003 | ||||
| 600,000 | Capital One NA, BKNT, 1.650%, 2/5/18 | 600,703 | ||||
| 350,000 | CIT Group, Inc., 4.250%, 8/15/17 | 356,563 | ||||
| 1,000,000 | Citigroup, Inc., 2.550%, 4/8/19 | 1,020,106 | ||||
| 600,000 | Compass Bank, BKNT, 1.850%, 9/29/17 | 599,269 | ||||
| 325,000 | Fifth Third Bank, MTN, 2.150%, 8/20/18 | 329,191 | ||||
| 575,000 | Huntington National Bank (The), 1.375%, 4/24/17 | 575,573 | ||||
| 400,000 | ING Bank NV, 2.050%, 8/17/18(b) | 402,925 | ||||
| 935,000 | JPMorgan Chase Bank NA, BKNT, 6.000%, 10/1/17 | 975,129 | ||||
| 505,000 | Macquarie Bank, Ltd., 5.000%, 2/22/17(b) | 511,894 | ||||
Principal | Fair Value | |||||
CORPORATE BONDS — (continued) | ||||||
Banks — (continued) | ||||||
| $250,000 | Mitsubishi UFJ Financial Group, Inc., 1.912%, 9/13/21(a) | $ | 249,714 | |||
| 330,000 | Nordea Bank AB, 4.875%, 1/27/20(b) | 362,516 | ||||
| 355,000 | PNC Funding Corp., 5.625%, 2/1/17 | 360,108 | ||||
| 485,000 | Royal Bank of Canada, GMTN, 2.500%, 1/19/21 | 500,556 | ||||
| 425,000 | Santander UK PLC, GMTN, 2.000%, 8/24/18 | 426,564 | ||||
| 600,000 | Sumitomo Mitsui Banking Corp., GMTN, 1.350%, 7/11/17 | 599,934 | ||||
| 500,000 | UBS, GMTN, 1.375%, 8/14/17 | 499,964 | ||||
| 400,000 | Wells Fargo & Co., 2.500%, 3/4/21 | 405,832 | ||||
|
| |||||
| 12,147,718 | ||||||
|
| |||||
Capital Goods — 1.7% | ||||||
| 95,000 | Fortive Corp., 1.800%, 6/15/19(b) | 95,261 | ||||
| 295,000 | LSB Industries, Inc., STEP, 8.500%, 8/1/19 | 296,475 | ||||
| 575,000 | Penske Truck Leasing Co. LP/PTL Finance Corp., 3.375%, 3/15/18(b) | 589,396 | ||||
| 485,000 | Waste Management, Inc., 6.100%, 3/15/18 | 518,750 | ||||
|
| |||||
| 1,499,882 | ||||||
|
| |||||
Commercial & Professional Services — 0.9% |
| |||||
| 350,000 | Equifax, Inc., 6.300%, 7/1/17 | 361,555 | ||||
| 400,000 | Republic Services, Inc., 3.800%, 5/15/18 | 415,534 | ||||
|
| |||||
| 777,089 | ||||||
|
| |||||
Consumer Durables & Apparel — 0.4% |
| |||||
| 355,000 | Whirlpool Corp., 1.350%, 3/1/17 | 355,209 | ||||
|
| |||||
Consumer Services — 1.1% | ||||||
| 500,000 | Carnival Corp., 3.950%, 10/15/20 | 540,491 | ||||
| 400,000 | ERAC USA Finance, LLC, 6.375%, 10/15/17(b) | 419,160 | ||||
|
| |||||
| 959,651 | ||||||
|
| |||||
Diversified Financials — 8.6% | ||||||
| 400,000 | AerCap Ireland Capital, Ltd./AerCap Global Aviation Trust, 4.250%, 7/1/20 | 415,000 | ||||
| 365,000 | Ally Financial, Inc., 3.600%, 5/21/18 | 370,475 | ||||
| 400,000 | Bank of New York Mellon Corp., MTN (The), 2.500%, 4/15/21 | 411,085 | ||||
| 240,000 | Berkshire Hathaway, Inc., 2.200%, 3/15/21 | 246,869 | ||||
| 400,000 | Caisse Centrale Desjardins, 1.550%, 9/12/17(b) | 400,636 | ||||
| 380,000 | Charles Schwab Corp., MTN (The), 6.375%, 9/1/17 | 398,176 | ||||
| 400,000 | Credit Suisse, 1.700%, 4/27/18 | 400,305 | ||||
| 300,000 | First Data Corp., 6.750%, 11/1/20(b) | 310,500 | ||||
| 500,000 | GE Capital International Funding Co. Unlimited Co., 2.342%, 11/15/20 | 513,545 | ||||
| 550,000 | Goldman Sachs Group, Inc. (The), 6.000%, 6/15/20 | 625,551 | ||||
| 575,000 | HSBC Bank USA NA, BKNT, 6.000%, 8/9/17 | 596,784 | ||||
| 350,000 | KKR Group Finance Co., LLC, 6.375%, 9/29/20(b) | 406,954 | ||||
| 900,000 | Morgan Stanley, 2.650%, 1/27/20 | 919,677 | ||||
| 425,000 | Protective Life Global Funding, 1.722%, 4/15/19(b) | 426,331 | ||||
| 500,000 | Ryder System, Inc., MTN, 2.350%, 2/26/19 | 507,595 | ||||
| 500,000 | State Street Corp., 4.956%, 3/15/18 | 521,989 | ||||
|
| |||||
| 7,471,472 | ||||||
|
| |||||
Energy — 6.4% | ||||||
| 200,000 | BP Capital Markets PLC, 1.676%, 5/3/19 | 200,780 | ||||
Continued
82
Sterling Capital Short Duration Bond Fund
|
Schedule of Portfolio Investments — (continued) |
September 30, 2016
|
Principal | Fair Value | |||||
CORPORATE BONDS — (continued) |
| |||||
Energy — (continued) | ||||||
| $400,000 | Chevron Phillips Chemical Co., LLC/Chevron Phillips Chemical Co. LP, 1.700%, 5/1/18(b) | $ | 399,611 | |||
| 250,000 | Columbia Pipeline Group, Inc., 2.450%, 6/1/18 | 251,489 | ||||
| 500,000 | Enbridge Energy Partners LP, Series B, 6.500%, 4/15/18 | 530,457 | ||||
| 385,000 | Energy Transfer Partners LP, 6.125%, 2/15/17 | 390,834 | ||||
| 326,000 | EnLink Midstream Partners LP, 2.700%, 4/1/19 | 323,854 | ||||
| 500,000 | Enterprise Products Operating, LLC, 1.650%, 5/7/18 | 500,181 | ||||
| 375,000 | Magellan Midstream Partners LP, 5.650%, 10/15/16 | 375,417 | ||||
| 400,000 | National Oilwell Varco, Inc., 1.350%, 12/1/17 | 398,316 | ||||
| 100,000 | Noble Holding International, Ltd., 2.500%, 3/15/17 | 99,000 | ||||
| 400,000 | Pioneer Natural Resources Co., 7.500%, 1/15/20 | 462,759 | ||||
| 450,000 | Schlumberger Holdings Corp., 2.350%, 12/21/18(b) | 458,402 | ||||
| 425,000 | Shell International Finance BV, 1.875%, 5/10/21 | 425,451 | ||||
| 260,000 | Spectra Energy Capital, LLC, 6.200%, 4/15/18 | 275,011 | ||||
| 425,000 | Western Gas Partners LP, 2.600%, 8/15/18 | 425,318 | ||||
|
| |||||
| 5,516,880 | ||||||
|
| |||||
Food & Staples Retailing — 0.5% | ||||||
| 250,000 | CVS Health Corp., 2.125%, 6/1/21 | 252,537 | ||||
| 175,000 | Reynolds American, Inc., 2.300%, 6/12/18 | 177,545 | ||||
|
| |||||
| 430,082 | ||||||
|
| |||||
Food, Beverage & Tobacco — 2.3% |
| |||||
| 415,000 | Anheuser-Busch InBev Finance, Inc., 2.650%, 2/1/21 | 428,237 | ||||
| 215,000 | Cott Beverages, Inc., 6.750%, 1/1/20 | 224,137 | ||||
| 500,000 | Ingredion, Inc., 1.800%, 9/25/17 | 501,091 | ||||
| 450,000 | Kraft Heinz Foods Co., 2.000%, 7/2/18 | 454,152 | ||||
| 392,000 | Reynolds American, Inc., 3.250%, 6/12/20 | 412,411 | ||||
|
| |||||
| 2,020,028 | ||||||
|
| |||||
Health Care Equipment & Services — 2.7% |
| |||||
| 425,000 | Aetna, Inc., 1.900%, 6/7/19 | 428,900 | ||||
| 450,000 | Boston Scientific Corp., 2.650%, 10/1/18 | 460,301 | ||||
| 475,000 | Humana, Inc., 7.200%, 6/15/18 | 519,827 | ||||
| 375,000 | Stryker Corp., 2.625%, 3/15/21 | 386,552 | ||||
| 500,000 | Zimmer Biomet Holdings, Inc., 2.000%, 4/1/18 | 503,341 | ||||
|
| |||||
| 2,298,921 | ||||||
|
| |||||
Insurance — 7.2% | ||||||
| 375,000 | Alleghany Corp., 5.625%, 9/15/20 | 414,941 | ||||
| 400,000 | Chubb INA Holdings, Inc., 2.300%, 11/3/20 | 410,400 | ||||
| 400,000 | Citizens Bank NA, BKNT, 2.300%, 12/3/18 | 404,622 | ||||
| 350,000 | Guardian Life Global Funding, 2.000%, 4/26/21(b) | 353,106 | ||||
| 645,000 | Jackson National Life Global Funding, 2.300%, 4/16/19(b) | 656,204 | ||||
| 500,000 | Lloyds Bank PLC, 1.750%, 3/16/18 | 500,287 | ||||
| 445,000 | MUFG Union Bank NA, 2.625%, 9/26/18 | 453,265 | ||||
| 425,000 | New York Life Global Funding, 2.000%, 4/13/21(b) | 428,902 | ||||
| 375,000 | PACCAR Financial Corp., MTN, 1.450%, 3/9/18 | 376,952 | ||||
| 500,000 | Pricoa Global Funding I, 2.200%, 5/16/19(b) | 509,279 | ||||
Principal | Fair Value | |||||
CORPORATE BONDS — (continued) |
| |||||
Insurance — (continued) | ||||||
| $350,000 | Principal Financial Group, Inc., 1.850%, 11/15/17 | $ | 351,941 | |||
| 570,000 | Reinsurance Group of America, Inc., 5.625%, 3/15/17 | 580,237 | ||||
| 450,000 | Reliance Standard Life Global Funding II, 2.150%, 10/15/18(b) | 453,905 | ||||
| 350,000 | Sirius International Group, Ltd., 6.375%, 3/20/17(b) | 355,545 | ||||
|
| |||||
| 6,249,586 | ||||||
|
| |||||
Materials — 0.6% | ||||||
| 250,000 | Air Liquide Finance SA, 1.375%, 9/27/19(b) | 249,991 | ||||
| 295,000 | Glencore Finance Canada, Ltd., 2.700%, 10/25/17(b) | 295,443 | ||||
|
| |||||
| 545,434 | ||||||
|
| |||||
Media — 1.0% | ||||||
| 400,000 | Interpublic Group of Cos., Inc. (The), 2.250%, 11/15/17 | 401,726 | ||||
| 400,000 | Omnicom Group, Inc., 6.250%, 7/15/19 | 449,195 | ||||
|
| |||||
| 850,921 | ||||||
|
| |||||
Pharmaceuticals, Biotechnology & Life Sciences — 1.9% |
| |||||
| 250,000 | AbbVie, Inc., 2.300%, 5/14/21 | 252,171 | ||||
| 450,000 | Actavis Funding SCS, 2.350%, 3/12/18 | 454,640 | ||||
| 100,000 | Actavis Funding SCS, 3.000%, 3/12/20 | 103,090 | ||||
| 425,000 | Shire Acquisitions Investments Ireland DAC, 2.400%, 9/23/21 | 425,535 | ||||
| 250,000 | Teva Pharmaceutical Finance Netherlands III BV, 1.700%, 7/19/19 | 249,434 | ||||
| 200,000 | Teva Pharmaceutical Finance Netherlands III BV, 2.200%, 7/21/21 | 199,246 | ||||
|
| |||||
| 1,684,116 | ||||||
|
| |||||
Real Estate — 4.4% | ||||||
| 400,000 | American Tower Corp., REIT, 5.050%, 9/1/20 | 442,230 | ||||
| 250,000 | Essex Portfolio LP, REIT, 5.500%, 3/15/17 | 254,321 | ||||
| 465,000 | iStar, Inc., REIT, 4.000%, 11/1/17 | 466,163 | ||||
| 450,000 | Kimco Realty Corp., REIT, MTN, 4.300%, 2/1/18 | 463,025 | ||||
| 500,000 | Simon Property Group LP, REIT, 1.500%, 2/1/18(b) | 501,547 | ||||
| 525,000 | Ventas Realty LP/Ventas Capital Corp., REIT, 4.000%, 4/30/19 | 551,541 | ||||
| 600,000 | WEA Finance, LLC/Westfield UK & Europe Finance PLC, 1.750%, 9/15/17(b) | 601,087 | ||||
| 525,000 | Welltower Inc., REIT, 4.700%, 9/15/17 | 540,661 | ||||
|
| |||||
| 3,820,575 | ||||||
|
| |||||
Retailing — 0.5% | ||||||
| 400,000 | Dollar General Corp., 1.875%, 4/15/18 | 402,341 | ||||
|
| |||||
Software & Services — 1.0% | ||||||
| 250,000 | Microsoft Corp., 1.100%, 8/8/19 | 249,203 | ||||
| 200,000 | Microsoft Corp., 1.550%, 8/8/21 | 199,183 | ||||
| 400,000 | Visa, Inc., 2.200%, 12/14/20 | 410,228 | ||||
|
| |||||
| 858,614 | ||||||
|
| |||||
Telecommunication Services — 1.7% |
| |||||
| 400,000 | AT&T, Inc., 2.450%, 6/30/20 | 407,390 | ||||
Continued
83
Sterling Capital Short Duration Bond Fund
|
Schedule of Portfolio Investments — (continued) |
September 30, 2016
|
Principal | Fair Value | |||||
CORPORATE BONDS — (continued) |
| |||||
Telecommunication Services — (continued) |
| |||||
| $1,000,000 | Verizon Communications, Inc., 2.550%, 6/17/19 | $ | 1,028,730 | |||
|
| |||||
| 1,436,120 | ||||||
|
| |||||
Utilities — 1.4% | ||||||
| 600,000 | American Electric Power Co., Inc., 1.650%, 12/15/17 | 601,132 | ||||
| 500,000 | CMS Energy Corp., 8.750%, 6/15/19 | 591,444 | ||||
|
| |||||
| 1,192,576 | ||||||
|
| |||||
Total Corporate Bonds | 53,617,184 | |||||
|
| |||||
FOREIGN GOVERNMENT BOND — 0.5% | ||||||
Columbia — 0.5% | ||||||
| 400,000 | Colombia Government International Bond, 7.375%, 1/27/17 | 407,400 | ||||
|
| |||||
Total Foreign Government Bond | 407,400 | |||||
|
| |||||
MUNICIPAL BONDS — 2.0% | ||||||
California — 0.7% | ||||||
| 575,000 | University Of California Revenue, Refunding, Taxable, Series AS, 1.490%, 5/15/20 | 576,196 | ||||
|
| |||||
Hawaii — 0.5% | ||||||
| 445,000 | Hawaii State Highway Revenue, Refunding, Taxable, Series C, 1.600%, 1/1/18 | 449,539 | ||||
|
| |||||
Puerto Rico — 0.4% | ||||||
| 325,000 | Puerto Rico Municipal Finance Agency, Public Improvements, G.O., Series A, Callable 11/7/16 @ 100 (AGM, Government GTD), 5.250%, 8/1/18 | 329,644 | ||||
|
| |||||
Washington — 0.4% | ||||||
| 390,000 | Providence Health & Services Obligated Group Revenue, Taxable, 1.796%, 10/1/17(a) | 391,033 | ||||
|
| |||||
Total Municipal Bonds | 1,746,412 | |||||
|
| |||||
U.S. GOVERNMENT AGENCIES — 1.5% |
| |||||
Federal Home Loan Bank — 1.5% |
| |||||
| 1,250,000 | 1.125%, 9/14/18 | 1,255,470 | ||||
|
| |||||
Total U.S. Government Agencies | 1,255,470 | |||||
|
| |||||
Principal | Fair Value | |||||
U.S. TREASURY NOTE — 4.1% | ||||||
| $1,246,100 | 1.750%, 10/31/20 | $ | 1,278,859 | |||
| 2,250,000 | 1.375%, 5/31/21 | 2,274,345 | ||||
|
| |||||
Total U.S. Treasury Note | 3,553,204 | |||||
|
| |||||
Shares | ||||||
MONEY MARKET FUND — 1.4% | ||||||
| 1,169,276 | Federated Treasury Obligations Fund, Institutional Shares, 0.180%(c) | 1,169,276 | ||||
|
| |||||
Total Money Market Fund | 1,169,276 | |||||
|
| |||||
Total Investments — 100.2% | 86,734,930 | |||||
Net Other Assets (Liabilities) — (0.2)% | (143,082 | ) | ||||
|
| |||||
NET ASSETS — 100.0% | $ | 86,591,848 | ||||
|
| |||||
| (a) | The interest rate for this variable rate note, which will change periodically, is based either on the prime rate or an index of market rates. The reflected rate is in effect as of September 30, 2016. The maturity date reflected is the final maturity date. |
| (b) | Rule 144A, Section 4(2) or other security that is restricted as to resale to qualified institutional investors. The Advisor, using Board approved procedures, has deemed these securities or a portion of these securities to be liquid. |
| (c) | Represents the current yield as of report date. |
AGM — Assured Guaranty Municipal Corp.
BKNT — Bank Note
G.O. — General Obligation
GMTN — Global Medium Term Note
GTD — Guaranteed
MTN — Medium Term Note
REIT — Real Estate Investment Trust
STEP — Step Coupon Bond
See accompanying Notes to the Financial Statements.
84
Sterling Capital Intermediate U.S. Government Fund
|
Schedule of Portfolio Investments |
September 30, 2016
|
Principal Amount | Fair Value | |||||
ASSET BACKED SECURITIES — 1.3% | ||||||
Asset Backed Securities — 1.3% | ||||||
| $238,292 | United States Small Business Administration, Series 2015-20G, Class 1, 2.880%, 7/1/35 | $ | 248,080 | |||
| 105,561 | United States Small Business Administration, Series 2015-20H, Class 1, 2.820%, 8/1/35 | 109,488 | ||||
|
| |||||
Total Asset Backed Securities | 357,568 | |||||
|
| |||||
COLLATERALIZED MORTGAGE OBLIGATIONS — 3.7% | ||||||
| 687,171 | Fannie Mae, Series 2010-129, Class NA, 3.500%, 3/25/25 | 713,804 | ||||
| 273,802 | Freddie Mac, Series 3644, Class BA, 4.500%, 2/15/29 | 278,875 | ||||
|
| |||||
Total Collateralized Mortgage Obligations | 992,679 | |||||
|
| |||||
COMMERCIAL MORTGAGE-BACKED SECURITIES — 0.6% | ||||||
| 140,000 | Freddie Mac Multifamily Structured Pass Through Certificates, Series K049, Class A2, 3.010%, 7/25/25 | 150,384 | ||||
|
| |||||
Total Commercial Mortgage-Backed Securities | 150,384 | |||||
|
| |||||
CORPORATE BONDS — 5.2% | ||||||
Automobiles & Components — 0.7% |
| |||||
| 180,000 | American Honda Finance Corp., MTN, 1.700%, 2/22/19 | 181,531 | ||||
|
| |||||
Banks — 2.3% | ||||||
| 200,000 | Lloyds Bank PLC, 2.050%, 1/22/19 | 200,840 | ||||
| 200,000 | State Street Corp., 2.550%, 8/18/20 | 207,422 | ||||
| 200,000 | Wells Fargo & Co., GMTN, 2.600%, 7/22/20 | 204,058 | ||||
|
| |||||
Diversified Financials — 2.2% | ||||||
| 500,000 | Morgan Stanley, 2.125%, 4/25/18 | 504,203 | ||||
| 100,000 | National Rural Utilities Cooperative Finance Corp., MTN, 0.950%, 4/24/17 | 99,877 | ||||
|
| |||||
Total Corporate Bonds | 1,397,931 | |||||
|
| |||||
MORTGAGE-BACKED SECURITIES — 8.1% |
| |||||
Fannie Mae — 3.9% | ||||||
| 859,265 | 3.585%, 9/1/20, Pool #FN0000 | 921,598 | ||||
| 104,016 | 5.500%, 1/1/33, Pool #678321 | 117,089 | ||||
|
| |||||
| 1,038,687 | ||||||
|
| |||||
Freddie Mac — 3.7% | ||||||
| 437,617 | 4.000%, 12/1/35, Pool #C91860 | 475,216 | ||||
| 468,237 | 3.500%, 6/1/36, Pool #C91875 | 499,235 | ||||
|
| |||||
| 974,451 | ||||||
|
| |||||
Ginnie Mae — 0.5% | ||||||
| 139,762 | 5.000%, 11/20/38, Pool #4283 | 144,260 | ||||
|
| |||||
Total Mortgage-Backed Securities | 2,157,398 | |||||
|
| |||||
Principal Amount | Fair Value | |||||
MUNICIPAL BONDS — 0.8% | ||||||
New York — 0.6% | ||||||
| $ 150,000 | New York, NY, Public Improvements, Taxable, G.O., Series A-1, 3.823%, 10/1/16 | $ | 150,013 | |||
|
| |||||
Texas — 0.2% | ||||||
| 60,000 | Bexar County, TX, Build America Bonds, Public Improvements G.O., Taxable, Series C, Callable 6/15/19 @ 100, 6.628%, 6/15/39 | 68,198 | ||||
|
| |||||
Total Municipal Bonds | 218,211 | |||||
|
| |||||
U.S. GOVERNMENT AGENCIES — 25.5% | ||||||
Fannie Mae — 8.3% | ||||||
| 1,000,000 | 6.250%, 5/15/29 | 1,443,820 | ||||
| 500,000 | 7.125%, 1/15/30 | 781,586 | ||||
|
| |||||
| 2,225,406 | ||||||
|
| |||||
Federal Farm Credit Bank — 12.8% |
| |||||
| 3,000,000 | 4.670%, 2/27/18 | 3,159,042 | ||||
| 250,000 | 3.480%, 9/11/30 | 252,396 | ||||
|
| |||||
| 3,411,438 | ||||||
|
| |||||
Freddie Mac — 4.4% | ||||||
| 500,000 | 4.875%, 6/13/18 | 534,069 | ||||
| 100,000 | 1.000%, 4/28/20, STEP | 100,005 | ||||
| 500,000 | 2.375%, 1/13/22 | 526,519 | ||||
|
| |||||
| 1,160,593 | ||||||
|
| |||||
Total U.S. Government Agencies | 6,797,437 | |||||
|
| |||||
U.S. TREASURY NOTES — 52.5% | ||||||
| 2,000,000 | 0.625%, 10/15/16 | 2,000,324 | ||||
| 1,000,000 | 3.000%, 2/28/17 | 1,010,773 | ||||
| 1,027,000 | 0.125%, 4/15/19(a) | 1,044,484 | ||||
| 250,000 | 1.250%, 4/30/19 | 252,568 | ||||
| 1,000,000 | 2.125%, 8/31/20 | 1,040,430 | ||||
| 1,000,000 | 2.000%, 2/28/21 | 1,037,148 | ||||
| 1,000,000 | 3.125%, 5/15/21 | 1,088,047 | ||||
| 500,000 | 1.625%, 8/15/22 | 509,024 | ||||
| 750,000 | 2.000%, 2/15/23 | 779,121 | ||||
| 1,135,000 | 2.750%, 2/15/24 | 1,238,480 | ||||
| 1,016,010 | 0.250%, 1/15/25(a) | 1,034,839 | ||||
| 500,000 | 2.125%, 5/15/25 | 522,735 | ||||
| 500,000 | 2.000%, 8/15/25 | 517,422 | ||||
| 500,000 | 2.250%, 11/15/25 | 527,813 | ||||
| 363,741 | 2.000%, 1/15/26(a) | 427,228 | ||||
| 1,000,000 | 1.625%, 2/15/26 | 1,001,719 | ||||
|
| |||||
Total U.S. Treasury Notes | 14,032,155 | |||||
|
| |||||
Shares | ||||||
MONEY MARKET FUND — 2.2% | ||||||
| 586,710 | Federated Treasury Obligations Fund, Institutional Shares, 0.180%(b) | 586,710 | ||||
|
| |||||
Total Money Market Fund | 586,710 | |||||
|
| |||||
Continued
85
Sterling Capital Intermediate U.S. Government Fund
|
Schedule of Portfolio Investments — (continued) |
September 30, 2016
|
| Fair Value | ||||||
Total Investments — 99.9% | $ | 26,690,473 | ||||
Net Other Assets (Liabilities) — 0.1% | 25,412 | |||||
|
| |||||
NET ASSETS — 100.0% | $ | 26,715,885 | ||||
|
| |||||
| (a) | Inflation protection security. Principal amount periodically adjusted for inflation. |
| (b) | Represents the current yield as of report date. |
G.O. — General Obligation
GMTN — Global Medium Term Note
MTN - Medium Term Note
STEP — Step Coupon Bond
See accompanying Notes to the Financial Statements.
86
Sterling Capital Total Return Bond Fund
|
Schedule of Portfolio Investments |
September 30, 2016
|
Principal | Fair Value | |||||
ASSET BACKED SECURITIES — 14.8% | ||||||
| $1,835,000 | Aegis Asset Backed Securities Trust 2005-5, Series 2005-5, Class 1A4, 0.875%, 12/25/35(a) | $ | 1,662,426 | |||
| 3,815,000 | American Express Credit Account Master Trust, Series 2013-1, Class A, 0.944%, 2/16/21(a) | 3,828,232 | ||||
| 3,000,000 | AmeriCredit Automobile Receivables Trust, Series 2014-4, Class B, 1.870%, 12/9/19 | 3,013,193 | ||||
| 4,120,000 | AmeriCredit Automobile Receivables Trust, Series 2015-1, Class B, 1.880%, 3/9/20 | 4,140,998 | ||||
| 4,000,000 | AmeriCredit Automobile Receivables Trust, Series 2016-3, Class B, 1.800%, 10/8/21 | 4,008,546 | ||||
| 835,350 | Argent Securities, Inc. Pass Through Certificates, Series 2005-W3, Class A2D, 0.865%, 11/25/35(a) | 815,800 | ||||
| 1,061,000 | BA Credit Card Trust, Series 2014-A1, Class A, 0.904%, 6/15/21(a) | 1,064,774 | ||||
| 2,320,000 | Bear Stearns Asset Backed Securities I Trust, Series 2004-BO1, Class M5, 1.925%, 10/25/34(a) | 2,354,320 | ||||
| 4,715,000 | Capital One Multi-Asset Execution Trust, Series 2007-A5, Class A5, 0.564%, 7/15/20(a) | 4,710,779 | ||||
| 8,679,000 | Capital One Multi-Asset Execution Trust, Series 2016-A1, Class A1, 0.974%, 2/15/22(a) | 8,732,129 | ||||
| 990,699 | CarMax Auto Owner Trust, Series 2013-2, Class A4, 0.840%, 11/15/18 | 989,541 | ||||
| 7,370,000 | Carmax Auto Owner Trust, Series 2016-3, Class A3, 1.390%, 5/17/21 | 7,390,366 | ||||
| 3,265,000 | Chase Issuance Trust, Series 2016-A1, Class A, 0.934%, 5/17/21(a) | 3,278,997 | ||||
| 7,340,000 | Chase Issuance Trust, Series 2016-A4, Class A4, 1.490%, 7/15/22 | 7,364,462 | ||||
| 2,478,000 | Chase Issuance Trust, Series 2014-A2, Class A2, 2.770%, 3/15/23 | 2,615,158 | ||||
| 3,280,256 | Citicorp Residential Mortgage Trust, STEP, Series 2007-2, Class A6, 5.432%, 6/25/37 | 3,378,304 | ||||
| 3,210,000 | Discover Card Execution Note Trust, Series 2014-A4, Class A4, 2.120%, 12/15/21 | 3,278,428 | ||||
| 6,360,000 | Encore Credit Receivables Trust, Series 2005-4, Class M2, 0.965%, 1/25/36(a) | 6,060,702 | ||||
| 6,034,000 | Ford Credit Auto Owner Trust, Series 2014-2, Class A, 2.310%, 4/15/26(b) | 6,169,042 | ||||
| 4,200,000 | Ford Credit Auto Owner Trust, Series 2015-1, Class A, 2.120%, 7/15/26(b) | 4,271,277 | ||||
| 1,600,000 | GSAMP Trust 2006-SEA1, Series 2006-SEA1, Class M1, 1.025%, 5/25/36(a)(b) | 1,527,474 | ||||
| 3,000,000 | JP Morgan Mortgage Acquisition Corp., Series 2005-OPT1, Class M2, 0.995%, 6/25/35(a) | 2,851,016 | ||||
| 1,191,084 | Long Beach Mortgage Loan Trust, Series 2006-WL2, Class 2A3, 0.725%, 1/25/36(a) | 1,155,467 | ||||
| 1,172,839 | New Century Home Equity Loan Trust, Series 2003-4, Class M1, 1.650%, 10/25/33(a) | 1,136,475 | ||||
| 3,550,000 | Park Place Securities, Inc., Series 2005-WHQ2, Class M2, 1.215%, 5/25/35(a) | 3,398,799 | ||||
| 83,070 | Park Place Securities, Inc. Pass Through Certificates, Series 2005-WHQ1, Class M2, 1.275%, 3/25/35(a) | 83,088 | ||||
| 2,680,000 | RAMP Trust, Series 2005-RZ4, Class M2, 1.025%, 11/25/35(a) | 2,549,550 | ||||
| 4,500,000 | Santander Drive Auto Receivables Trust, Series 2014- 5, Class B, 1.760%, 9/16/19 | 4,512,395 | ||||
| 2,418,000 | Santander Drive Auto Receivables Trust, Series 2015-3, Class B, 2.070%, 4/15/20 | 2,434,512 | ||||
Principal | Fair Value | |||||
ASSET BACKED SECURITIES — (continued) |
| |||||
| $7,910,000 | Santander Drive Auto Receivables Trust, Series 2015-4, Class B, 2.260%, 6/15/20 | $ | 7,980,613 | |||
| 3,675,351 | Saxon Asset Securities Trust, Series 2004-3, Class M1, 1.425%, 12/26/34(a) | 3,386,053 | ||||
| 2,953,787 | Securitized Asset Backed Receivables, LLC Trust, Series 2005-OP2, Class A2C, 0.845%, 10/25/35(a) | 2,926,977 | ||||
| 3,694,644 | United States Small Business Administration, Series 2015-20H, Class 1, 2.820%, 8/1/35 | 3,832,080 | ||||
|
| |||||
Total Asset Backed Securities | 116,901,973 | |||||
|
| |||||
COLLATERALIZED MORTGAGE OBLIGATIONS — 5.6% | ||||||
| 552,773 | Adjustable Rate Mortgage Trust, Series 2004-5, Class 4A1, 2.961%, 4/25/35(a) | 534,274 | ||||
| 634,260 | Banc of America Alternative Loan Trust, Series 2004-10, Class 1CB1, 6.000%, 11/25/34 | 665,780 | ||||
| 2,522,890 | Banc of America Funding Trust, Series 2005-B, Class 3A1, 0.762%, 4/20/35(a) | 2,388,318 | ||||
| 835,537 | Banc of America Funding Trust, Series 2006-2, Class 3A1, 6.000%, 3/25/36 | 860,350 | ||||
| 156,731 | Banc of America Mortgage Trust, Series 2005-3, Class 1A24, 5.500%, 4/25/35 | 158,038 | ||||
| 119,562 | Citigroup Mortgage Loan Trust, Inc., Series 2004-NCM2, Class 3CB2, 6.500%, 8/25/19 | 123,322 | ||||
| 690,200 | Countrywide Alternative Loan Trust, Series 2004-22CB, Class 1A1, 6.000%, 10/25/34 | 737,927 | ||||
| 196,318 | Countrywide Home Loan Mortgage Pass Through Trust, Series 2004-3, Class A4, 5.750%, 4/25/34 | 195,255 | ||||
| 62,133 | Credit Suisse First Boston Mortgage Securities Corp., Series 2005-2, Class 4A1, 5.250%, 2/25/20 | 62,038 | ||||
| 558,581 | Credit Suisse First Boston Mortgage Securities Corp., Series 2004-1, Class 2A1, 6.500%, 2/25/34 | 598,589 | ||||
| 6,249 | Credit Suisse First Boston Mortgage Securities Corp., Series 2005-6, Class 2A3, 5.500%, 7/25/35 | 6,304 | ||||
| 1,029,132 | Fannie Mae, Series 2013-133, Class AV, 4.000%, 12/25/26 | 1,124,896 | ||||
| 1,995,389 | Fannie Mae, Series 2014-39, Class VP, 3.000%, 8/25/27 | 2,112,696 | ||||
| 2,664,718 | Fannie Mae, Series 2011-38, Class D, 4.500%, 5/25/41(c) | 2,987,395 | ||||
| 3,814,111 | FirstKey Mortgage Trust, Series 2014-1, Class A12, 3.500%, 11/25/44(a)(b) | 3,899,093 | ||||
| 1,458,598 | Freddie Mac, Series 3768, Class V, 4.000%, 11/15/23 | 1,580,341 | ||||
| 2,805,932 | Freddie Mac, Series 4387, Class VM, 4.000%, 11/15/25 | 3,049,344 | ||||
| 1,942,706 | Freddie Mac, Series 4287, Class V, 4.500%, 10/15/26 | 2,188,033 | ||||
| 377,541 | Freddie Mac, Series 4136, Class HZ, 3.500%, 11/15/27 | 417,132 | ||||
| 2,846,069 | Freddie Mac, Series 4331, Class V, 4.000%, 11/15/28 | 3,120,809 | ||||
| 1,501,153 | Freddie Mac, Series 3632, Class PK, 5.000%, 2/15/40 | 1,661,101 | ||||
| 3,180,207 | Freddie Mac, Series 4077, Class PJ, 3.500%, 11/15/40 | 3,381,625 | ||||
Continued
87
Sterling Capital Total Return Bond Fund
|
Schedule of Portfolio Investments — (continued) |
September 30, 2016
|
Principal | Fair Value | |||||
COLLATERALIZED MORTGAGE OBLIGATIONS — (continued) | ||||||
| $1,930,001 | Freddie Mac, Series 4328, Class KD, 3.000%, 8/15/43 | $ | 2,026,744 | |||
| 778,665 | Ginnie Mae, Series 2008-51, Class PG, 5.000%, 6/20/38 | 842,921 | ||||
| 773,157 | MASTR Alternative Loan Trust, Series 2003-5, Class 8A1, 5.500%, 6/25/33 | 785,755 | ||||
| 752,872 | MASTR Alternative Loan Trust, Series 2004-13, Class 3A1, 6.500%, 1/25/35 | 747,371 | ||||
| 152,603 | MASTR Asset Securitization Trust, Series 2003-4, Class 5A1, 5.500%, 5/25/33 | 155,612 | ||||
| 205,131 | MASTR Seasoned Securitization Trust, Series 2005-2, Class 1A1, 5.130%, 10/25/32 | 205,040 | ||||
| 480,391 | PHHMC Trust, Series 2007-6, Class A1, 5.438%, 12/18/37(a) | 480,763 | ||||
| 30,647 | RAAC Trust, Series 2004-SP3, Class AI5, 4.890%, 12/25/32(a) | 31,080 | ||||
| 854,293 | RAAC Trust, Series 2004-SP1, Class AI3, STEP, 6.118%, 3/25/34 | 870,589 | ||||
| 806,688 | RALI Trust, Series 2005-QR1, Class A, 6.000%, 10/25/34 | 842,321 | ||||
| 399,951 | Residential Asset Securitization Trust, Series 2004-IP2, Class 4A, 2.944%, 12/25/34(a) | 388,197 | ||||
| 1,032,082 | Specialty Underwriting & Residential Finance Trust, Series 2004-AA1, Class 1A1, 5.000%, 10/25/34 | 1,036,751 | ||||
| 862,878 | Structured Adjustable Rate Mortgage Loan Trust, Series 2004-6, Class 4A1, 2.949%, 6/25/34(a) | 857,511 | ||||
| 234,858 | Structured Asset Securities Corp. Trust, Series 2005-6, Class 5A2, 5.000%, 5/25/35 | 236,622 | ||||
| 130,229 | Structured Asset Securities Corp. Trust, Series 2005-6, Class 5A1, 5.000%, 5/25/35 | 130,765 | ||||
| 90,216 | Wells Fargo Mortgage Backed Securities Trust, Series 2007-3, Class 3A1, 5.500%, 4/25/22 | 92,175 | ||||
| 747,690 | Wells Fargo Mortgage Backed Securities Trust, Series 2004-BB, Class A2, 2.863%, 1/25/35(a) | 746,348 | ||||
| 249,899 | Wells Fargo Mortgage Backed Securities Trust, Series 2005-4, Class A4, 5.000%, 4/25/35 | 251,747 | ||||
| 1,480,474 | Wells Fargo Mortgage Backed Securities Trust, Series 2005-AR16, Class 6A3, 3.070%, 10/25/35(a) | 1,492,112 | ||||
| 159,967 | Wells Fargo Mortgage Backed Securities Trust, Series 2007-16, Class 1A1, 6.000%, 12/28/37 | 165,222 | ||||
|
| |||||
Total Collateralized Mortgage Obligations | 44,238,306 | |||||
|
| |||||
COMMERCIAL MORTGAGE-BACKED SECURITIES — 14.0% | ||||||
| 52,522 | Banc of America Commercial Mortgage Trust, Series 2006-3, Class A4, 5.889%, 7/10/44(a) | 52,454 | ||||
| 2,945,183 | Banc of America Commercial Mortgage Trust, Series 2007-5, Class A4, 5.492%, 2/10/51 | 3,013,328 | ||||
| 447,809 | Banc of America Merrill Lynch Commercial Mortgage, Inc., Series 2005-1, Class AJ, 5.527%, 11/10/42(a) | 447,374 | ||||
| 228,594 | Banc of America Merrill Lynch Commercial Mortgage, Inc., Series 2005-3, Class AM, 4.727%, 7/10/43 | 227,635 | ||||
Principal | Fair Value | |||||
COMMERCIAL MORTGAGE-BACKED SECURITIES — (continued) | ||||||
| $4,580,857 | BCAP, LLC Trust, Series 2013-RR4, Class A4A2, 2.000%, 2/13/51(b)(c) | $ | 4,558,995 | |||
| 2,500,000 | Bear Stearns Commercial Mortgage Securities Trust, Series 2007-T28, Class AM, 5.835%, 9/11/42(a) | 2,582,411 | ||||
| 1,933,899 | Bear Stearns Commercial Mortgage Securities Trust, Series 2007-PW18, Class A4, 5.700%, 6/11/50 | 1,991,870 | ||||
| 1,223,872 | CD Commercial Mortgage Trust, Series 2007-CD4, Class A4, 5.322%, 12/11/49 | 1,229,097 | ||||
| 1,575,000 | Citigroup Commercial Mortgage Trust, Series 2007-C6, Class A4, 5.900%, 12/10/49(a) | 1,603,564 | ||||
| 1,000,000 | COMM 2012-CCRE1 Mortgage Trust, Series 2012-CR1, Class AM, 3.912%, 5/15/45 | 1,080,033 | ||||
| 3,545,000 | COMM Mortgage Trust, Series 2013-CR12, Class A4, 4.046%, 10/10/46 | 3,949,481 | ||||
| 4,050,000 | COMM Mortgage Trust, Series 2006-C8, Class AM, 5.347%, 12/10/46 | 4,066,259 | ||||
| 892,000 | COMM Mortgage Trust, Series 2014-CR16, Class A4, 4.051%, 4/10/47 | 991,338 | ||||
| 1,208,000 | COMM Mortgage Trust, Series 2014-LC17, Class A5, 3.917%, 10/10/47 | 1,334,659 | ||||
| 1,344,000 | COMM Mortgage Trust, Series 2014-CR20, Class A4, 3.590%, 11/10/47 | 1,458,408 | ||||
| 2,221,273 | COMM Mortgage Trust, Series 2007-C9, Class A4, 6.007%, 12/10/49(a) | 2,272,947 | ||||
| 1,500,000 | Commercial Mortgage Loan Trust, Series 2008-LS1, Class ASM, 6.296%, 12/10/49(a) | 1,539,559 | ||||
| 1,010,876 | Credit Suisse Commercial Mortgage Trust, Series 2007-C4, Class A4, 6.134%, 9/15/39(a) | 1,033,836 | ||||
| 2,085,473 | Credit Suisse Commercial Mortgage Trust Series 2007-C3, Series 2007-C3, Class A4, 5.881%, 6/15/39(a) | 2,107,228 | ||||
| 1,416,000 | Credit Suisse Commercial Mortgage Trust Series 2008-C1, Series 2008-C1, Class A3, 6.267%, 2/15/41(a) | 1,456,869 | ||||
| 1,900,000 | DBUBS Mortgage Trust, Series 2011-LC1A, Class C, 5.884%, 11/10/46(a)(b) | 2,159,116 | ||||
| 2,524,000 | GS Mortgage Securities Trust, Series 2014-GC24, Class A5, 3.931%, 9/10/47 | 2,787,657 | ||||
| 184,749 | JP Morgan Chase Commercial Mortgage Securities Trust 2006-LDP9, Series 2006-LDP9, Class A3, 5.336%, 5/15/47 | 184,778 | ||||
| 1,680,000 | JP Morgan Chase Commercial Mortgage Securities Trust 2013-C10, Series 2013-C10, Class AS, 3.372%, 12/15/47 | 1,761,312 | ||||
| 1,397,000 | JPMBB Commercial Mortgage Securities Trust, Series 2014-C23, Class A5, 3.934%, 9/15/47 | 1,546,881 | ||||
| 4,000,000 | JPMorgan Chase Commercial Mortgage Securities Trust, Series 2010-C1, Class B, 5.951%, 6/15/43(b) | 4,330,730 | ||||
| 596,526 | JPMorgan Chase Commercial Mortgage Securities Trust, Series 2006-CB16, Class AM, 5.593%, 5/12/45 | 596,070 | ||||
| 4,000,000 | JPMorgan Chase Commercial Mortgage Securities Trust, Series 2011-C3, Class B, 5.013%, 2/15/46(a)(b) | 4,426,292 | ||||
| 795,793 | LB-UBS Commercial Mortgage Trust, Series 2007-C1, Class A4, 5.424%, 2/15/40 | 799,574 | ||||
Continued
88
Sterling Capital Total Return Bond Fund
|
Schedule of Portfolio Investments — (continued) |
September 30, 2016
|
Principal | Fair Value | |||||
COMMERCIAL MORTGAGE-BACKED SECURITIES — (continued) | ||||||
| $1,730,000 | LB-UBS Commercial Mortgage Trust, Series 2007-C7, Class AM, 6.368%, 9/15/45(a) | $ | 1,804,945 | |||
| 4,797,915 | Merrill Lynch Mortgage Trust, Series 2008-C1, Class A4, 5.690%, 2/12/51 | 4,936,378 | ||||
| 1,680,000 | Merrill Lynch Mortgage Trust, Series 2008-C1, Class AM, 6.472%, 2/12/51(a) | 1,764,777 | ||||
| 1,459,167 | ML-CFC Commercial Mortgage Trust, Series 2007-8, Class A3, 6.069%, 8/12/49(a) | 1,490,996 | ||||
| 6,852,836 | ML-CFC Commercial Mortgage Trust, Series 2007-7, Class A4, 5.810%, 6/12/50(a) | 6,967,402 | ||||
| 660,000 | Morgan Stanley Bank of America Merrill Lynch Trust, Series 2014-C18, Class A4, 3.923%, 10/15/47 | 733,734 | ||||
| 1,950,000 | Morgan Stanley Capital I Trust, Series 2007-T27, Class AM, 5.818%, 6/11/42(a) | 1,992,530 | ||||
| 3,805,273 | Morgan Stanley Capital I Trust, Series 2008-T29, Class A4, 6.477%, 1/11/43(a) | 3,982,968 | ||||
| 2,355,000 | Morgan Stanley Capital I Trust, Series 2008-T29, Class AM, 6.477%, 1/11/43(a) | 2,460,772 | ||||
| 4,000,000 | Morgan Stanley Capital I Trust, Series 2011-C1, Class B, 5.601%, 9/15/47(a)(b) | 4,504,021 | ||||
| 640,000 | Morgan Stanley Capital I Trust, Series 2011-C1, Class C, 5.601%, 9/15/47(a)(b) | 718,605 | ||||
| 4,535,000 | Morgan Stanley Capital I Trust, Series 2007-IQ14, Class A5, 5.696%, 4/15/49(a) | 4,612,436 | ||||
| 2,879,838 | Morgan Stanley Capital I Trust, Series 2007-IQ15, Class A4, 6.103%, 6/11/49(a) | 2,956,560 | ||||
| 2,000,000 | Wells Fargo Commercial Mortgage Trust, Series 2010-C1, Class A2, 4.393%, 11/15/43(b) | 2,182,714 | ||||
| 2,306,000 | Wells Fargo Commercial Mortgage Trust, Series 2015-P2, Class A4, 3.809%, 12/15/48 | 2,544,546 | ||||
| 825,000 | WF-RBS Commercial Mortgage Trust, Series 2011-C2, Class A4, 4.869%, 2/15/44(a)(b) | 917,971 | ||||
| 2,000,000 | WF-RBS Commercial Mortgage Trust, Series 2011-C2, Class B, 5.174%, 2/15/44(a)(b) | 2,222,688 | ||||
| 1,000,000 | WF-RBS Commercial Mortgage Trust, Series 2011-C3, Class A4, 4.375%, 3/15/44(b) | 1,096,896 | ||||
| 1,250,000 | WF-RBS Commercial Mortgage Trust, Series 2012-C8, Class AS, 3.660%, 8/15/45 | 1,341,454 | ||||
| 3,716,000 | WF-RBS Commercial Mortgage Trust, Series 2014-C22, Class A5, 3.752%, 9/15/57 | 4,050,038 | ||||
| 1,008,000 | WF-RBS Commercial Mortgage Trust, Series 2014-C23, Class A5, 3.917%, 10/15/57 | 1,110,876 | ||||
|
| |||||
Total Commercial Mortgage-Backed Securities | 109,983,062 | |||||
|
| |||||
CORPORATE BONDS — 37.2% | ||||||
Automobiles & Components — 1.7% |
| |||||
| 1,875,000 | Daimler Finance North America, LLC, 1.600%, 8/3/17(b) | 1,879,149 | ||||
| 1,556,000 | Ford Motor Co., 7.450%, 7/16/31 | 2,058,115 | ||||
| 2,915,000 | Ford Motor Credit Co., LLC, 1.483%, 3/27/17(a) | 2,917,195 | ||||
| 3,100,000 | General Motors Financial Co., Inc., 3.200%, 7/13/20 | 3,174,239 | ||||
| 1,233,000 | Hyundai Capital America, 2.400%, 10/30/18(b) | 1,250,126 | ||||
| 1,633,000 | Lear Corp., 5.375%, 3/15/24 | 1,753,434 | ||||
|
| |||||
| 13,032,258 | ||||||
|
| |||||
Principal | Fair Value | |||||
CORPORATE BONDS — (continued) | ||||||
Banks — 7.9% | ||||||
| $1,800,000 | Athene Global Funding, 2.875%, 10/23/18(b) | $ | 1,795,963 | |||
| 1,839,000 | Bank of America Corp., 1.720%, 1/15/19(a) | 1,850,788 | ||||
| 4,035,000 | Bank of America Corp., MTN, 6.875%, 4/25/18 | 4,353,192 | ||||
| 1,572,000 | Bank of America Corp., MTN, 5.875%, 2/7/42 | 2,049,423 | ||||
| 1,874,000 | Bank of America Corp., Series K, 8.000%, 7/29/49(a) | 1,911,480 | ||||
| 1,993,000 | Bank of Nova Scotia (The), BKNT, 2.450%, 3/22/21 | 2,041,261 | ||||
| 1,950,000 | CIT Group, Inc., 4.250%, 8/15/17 | 1,986,563 | ||||
| 2,500,000 | Citigroup, Inc., 2.517%, 5/15/18(a) | 2,539,285 | ||||
| 2,031,000 | Citigroup, Inc., 4.400%, 6/10/25 | 2,150,405 | ||||
| 1,815,000 | Credit Suisse, MTN, 3.625%, 9/9/24 | 1,894,237 | ||||
| 1,412,000 | GE Capital International Funding Co. Unlimited Co., 4.418%, 11/15/35(c) | 1,584,779 | ||||
| 2,337,000 | Goldman Sachs Group, Inc. (The), 6.750%, 10/1/37 | 2,975,725 | ||||
| 2,785,000 | Huntington National Bank (The), 2.000%, 6/30/18 | 2,806,960 | ||||
| 5,111,000 | JPMorgan Chase & Co., 3.875%, 9/10/24 | 5,380,728 | ||||
| 1,597,000 | JPMorgan Chase & Co., Series 1, 7.900%, 12/29/49(a) | 1,640,918 | ||||
| 2,000,000 | KeyBank NA, BKNT, 2.500%, 12/15/19 | 2,051,008 | ||||
| 1,798,000 | Mitsubishi UFJ Financial Group, Inc., 2.950%, 3/1/21 | 1,851,268 | ||||
| 3,560,000 | Morgan Stanley, 4.300%, 1/27/45 | 3,810,749 | ||||
| 4,588,000 | Morgan Stanley, GMTN, 6.625%, 4/1/18(c) | 4,915,950 | ||||
| 500,000 | PNC Bank NA, BKNT, 4.875%, 9/21/17 | 515,786 | ||||
| 1,007,000 | PNC Bank NA, BKNT, 6.000%, 12/7/17(c) | 1,059,423 | ||||
| 1,505,000 | Prudential Financial, Inc., 8.875%, 6/15/38(a)(c) | 1,670,550 | ||||
| 1,670,000 | Royal Bank of Canada, GMTN, 2.200%, 7/27/18 | 1,693,500 | ||||
| 2,592,000 | Toronto-Dominion Bank (The), 1.467%, 8/13/19(a) | 2,603,226 | ||||
| 1,226,000 | Toronto-Dominion Bank (The), 3.625%, 9/15/31(a) | 1,229,381 | ||||
| 1,595,000 | Wachovia Corp., 5.500%, 8/1/35 | 1,856,688 | ||||
| 1,856,000 | Wells Fargo & Co., 1.256%, 9/14/18(a) | 1,852,722 | ||||
|
| |||||
| 62,071,958 | ||||||
|
| |||||
Capital Goods — 0.9% | ||||||
| 1,066,000 | Fortive Corp., 4.300%, 6/15/46(b) | 1,140,845 | ||||
| 1,599,000 | General Electric Co., Series D, 5.000%, 12/29/49(a) | 1,700,457 | ||||
| 1,478,000 | LSB Industries, Inc., STEP, 8.500%, 8/1/19 | 1,485,390 | ||||
| 1,769,000 | Masco Corp., 4.375%, 4/1/26 | 1,861,873 | ||||
| 1,245,000 | SBA Tower Trust, 2.898%, 10/15/19(b) | 1,262,496 | ||||
|
| |||||
| 7,451,061 | ||||||
|
| |||||
Commercial & Professional Services — 0.6% |
| |||||
| 1,400,000 | Republic Services, Inc., 3.550%, 6/1/22 | 1,504,355 | ||||
| 1,560,000 | Verisk Analytics, Inc., 5.800%, | 1,780,386 | ||||
| 1,335,000 | Waste Management, Inc., 4.100%, 3/1/45 | 1,462,897 | ||||
|
| |||||
| 4,747,638 | ||||||
|
| |||||
Consumer Services — 0.2% | ||||||
| 1,212,000 | Carnival Corp., 3.950%, 10/15/20 | 1,310,149 | ||||
|
| |||||
Diversified Financials — 2.7% | ||||||
| 1,928,000 | AerCap Ireland Capital, Ltd./AerCap Global Aviation Trust, 4.250%, 7/1/20 | 2,000,300 | ||||
| 2,230,000 | Ally Financial, Inc., 3.600%, 5/21/18 | 2,263,450 | ||||
Continued
89
Sterling Capital Total Return Bond Fund
|
Schedule of Portfolio Investments — (continued) |
September 30, 2016
|
Principal | Fair Value | |||||
CORPORATE BONDS — (continued) | ||||||
Diversified Financials — (continued) |
| |||||
| $1,545,000 | Ares Finance Co., LLC, 4.000%, 10/8/24(b) | $ | 1,496,872 | |||
| 1,500,000 | Berkshire Hathaway, Inc., 2.750%, 3/15/23 | 1,558,777 | ||||
| 2,292,000 | Capital One Financial Corp., 3.200%, 2/5/25 | 2,336,407 | ||||
| 974,000 | General Electric Capital Corp., GMTN, 6.875%, 1/10/39(c) | 1,467,110 | ||||
| 3,366,000 | Goldman Sachs Group, Inc. (The), 1.875%, 4/23/20(a) | 3,386,889 | ||||
| 2,052,000 | Goldman Sachs Group, Inc. (The), 6.250%, 2/1/41 | 2,683,142 | ||||
| 1,900,000 | Morgan Stanley, 5.000%, 11/24/25 | 2,119,830 | ||||
| 1,670,000 | National Rural Utilities Cooperative Finance Corp., 4.750%, 4/30/43(a) | 1,695,584 | ||||
|
| |||||
| 21,008,361 | ||||||
|
| |||||
Energy — 3.3% | ||||||
| 1,865,000 | Apache Corp., 4.750%, 4/15/43 | 1,905,584 | ||||
| 2,090,000 | Buckeye Partners LP, 4.150%, 7/1/23 | 2,128,974 | ||||
| 1,760,000 | Energy Transfer Partners LP, 4.750%, 1/15/26 | 1,818,346 | ||||
| 654,000 | EnLink Midstream Partners LP, 2.700%, 4/1/19 | 649,694 | ||||
| 1,330,000 | EnLink Midstream Partners LP, 5.050%, 4/1/45 | 1,177,344 | ||||
| 1,180,000 | Enterprise Products Operating, LLC, 5.950%, 2/1/41(c) | 1,366,785 | ||||
| 2,100,000 | Hess Corp., 4.300%, 4/1/27 | 2,116,351 | ||||
| 1,754,000 | Magellan Midstream Partners LP, 6.550%, 7/15/19 | 1,964,668 | ||||
| 570,000 | Noble Holding International, Ltd., 2.500%, 3/15/17 | 564,300 | ||||
| 856,000 | NuStar Logistics LP, 8.150%, 4/15/18(c) | 924,480 | ||||
| 1,577,000 | Phillips 66, 5.875%, 5/1/42 | 1,978,876 | ||||
| 1,734,000 | Pioneer Natural Resources Co., 3.950%, 7/15/22 | 1,845,212 | ||||
| 1,629,000 | Regency Energy Partners LP/Regency Energy Finance Corp., 6.500%, 7/15/21 | 1,685,763 | ||||
| 1,868,000 | Shell International Finance BV, 4.550%, 8/12/43 | 2,060,419 | ||||
| 1,536,000 | Spectra Energy Capital, LLC, 8.000%, 10/1/19 | 1,772,673 | ||||
| 2,337,000 | Williams Partners LP, 3.900%, 1/15/25 | 2,332,127 | ||||
|
| |||||
| 26,291,596 | ||||||
|
| |||||
Food & Staples Retailing — 0.3% |
| |||||
| 2,013,000 | Reynolds American, Inc., 5.850%, 8/15/45 | 2,617,117 | ||||
|
| |||||
Food, Beverage & Tobacco — 1.3% |
| |||||
| 1,351,000 | Altria Group, Inc., 5.375%, 1/31/44 | 1,700,950 | ||||
| 2,500,000 | Anheuser-Busch InBev Finance, Inc., 4.900%, 2/1/46 | 2,974,453 | ||||
| 1,675,000 | Constellation Brands, Inc., 4.750%, 11/15/24 | 1,813,187 | ||||
| 1,812,000 | Cott Beverages, Inc., 6.750%, 1/1/20 | 1,889,010 | ||||
| 1,915,000 | Kraft Heinz Foods Co., 3.000%, 6/1/26 | 1,930,278 | ||||
|
| |||||
| 10,307,878 | ||||||
|
| |||||
Health Care Equipment & Services — 0.9% |
| |||||
| 1,754,000 | Boston Scientific Corp., 3.375%, 5/15/22 | 1,844,513 | ||||
| 1,133,000 | Humana, Inc., 4.950%, 10/1/44 | 1,257,622 | ||||
| 2,458,000 | Medtronic, Inc., 4.375%, 3/15/35 | 2,785,361 | ||||
| 1,300,000 | UnitedHealth Group, Inc., 2.700%, 7/15/20 | 1,350,752 | ||||
|
| |||||
| 7,238,248 | ||||||
|
| |||||
Insurance — 5.9% | ||||||
| 1,570,000 | ACE INA Holdings, Inc., 4.350%, 11/3/45 | 1,814,724 | ||||
| 1,857,000 | Allied World Assurance Co. Holdings, Ltd., 4.350%, 10/29/25 | 1,942,883 | ||||
Principal | Fair Value | |||||
CORPORATE BONDS — (continued) | ||||||
Insurance — (continued) | ||||||
| $1,051,000 | American Financial Group, Inc., 3.500%, 8/15/26 | $ | 1,051,465 | |||
| 1,624,000 | Aspen Insurance Holdings, Ltd., 4.650%, 11/15/23 | 1,727,525 | ||||
| 2,892,000 | CBRE Services, Inc., 5.250%, 3/15/25 | 3,099,648 | ||||
| 1,315,000 | Dai-ichi Life Insurance Co., Ltd. (The), 5.100%, 10/29/49(a)(b) | 1,440,057 | ||||
| 1,570,000 | Horace Mann Educators Corp., 4.500%, 12/1/25 | 1,632,260 | ||||
| 1,680,000 | KKR Group Finance Co. III, LLC, 5.125%, 6/1/44(b) | 1,709,640 | ||||
| 1,275,000 | Liberty Mutual Group, Inc., 7.800%, 3/15/37(b) | 1,491,750 | ||||
| 1,081,000 | Loews Corp., 3.750%, 4/1/26 | 1,148,208 | ||||
| 870,000 | Massachusetts Mutual Life Insurance Co., 8.875%, 6/1/39(b) | 1,369,086 | ||||
| 1,750,000 | Meiji Yasuda Life Insurance Co., 5.200%, 10/20/45(a)(b) | 1,968,750 | ||||
| 1,000,000 | MetLife, Inc., 7.717%, 2/15/19 | 1,144,243 | ||||
| 987,000 | Nationwide Mutual Insurance Co., 9.375%, 8/15/39(b) | 1,556,188 | ||||
| 1,655,000 | Nippon Life Insurance Co., 5.100%, 10/16/44(a)(b) | 1,824,803 | ||||
| 1,000,000 | Ohio National Life Insurance Co., 6.875%, 6/15/42(b) | 1,238,878 | ||||
| 1,650,000 | Old Republic International Corp., 4.875%, 10/1/24 | 1,784,125 | ||||
| 1,447,000 | Pacific LifeCorp, 5.125%, 1/30/43(b) | 1,578,474 | ||||
| 1,065,000 | Reinsurance Group of America, Inc., 5.625%, 3/15/17 | 1,084,127 | ||||
| 1,450,000 | Royal Bank of Scotland Group PLC, 4.700%, 7/3/18 | 1,489,317 | ||||
| 1,895,000 | Sirius International Group, Ltd., 6.375%, 3/20/17(b) | 1,925,022 | ||||
| 1,735,000 | Symetra Financial Corp., 4.250%, 7/15/24 | 1,801,254 | ||||
| 3,140,000 | TIAA Asset Management Finance Co., LLC, 2.950%, 11/1/19(b) | 3,235,425 | ||||
| 1,380,000 | Transatlantic Holdings, Inc., 8.000%, 11/30/39 | 1,900,381 | ||||
| 1,100,000 | Validus Holdings, Ltd., 8.875%, 1/26/40 | 1,536,700 | ||||
| 1,652,000 | Ventas Realty LP, REIT, 5.700%, 9/30/43 | 1,990,192 | ||||
| 1,883,000 | XLIT, Ltd., 4.450%, 3/31/25 | 1,911,375 | ||||
|
| |||||
| 46,396,500 | ||||||
|
| |||||
Materials — 0.7% | ||||||
| 1,753,000 | Glencore Funding, LLC, 1.739%, 4/16/18(a)(b) | 1,733,279 | ||||
| 1,950,000 | International Paper Co., 4.400%, 8/15/47 | 1,971,971 | ||||
| 1,820,000 | West Fraser Timber Co., Ltd., 4.350%, 10/15/24(b) | 1,748,909 | ||||
|
| |||||
| 5,454,159 | ||||||
|
| |||||
Media — 1.3% | ||||||
| 1,393,000 | 21st Century Fox America, Inc., 5.400%, 10/1/43 | 1,658,822 | ||||
| 1,920,000 | Charter Communications Operating, LLC / Charter Communications Operating Capital, 6.484%, 10/23/45(b) | 2,321,898 | ||||
| 2,365,000 | Comcast Corp., 4.200%, 8/15/34 | 2,615,004 | ||||
| 1,830,000 | Interpublic Group of Cos., Inc. (The), 4.200%, 4/15/24 | 1,965,222 | ||||
| 1,620,000 | Time Warner, Inc., 4.850%, 7/15/45 | 1,810,933 | ||||
|
| |||||
| 10,371,879 | ||||||
|
| |||||
Continued
90
Sterling Capital Total Return Bond Fund
|
Schedule of Portfolio Investments — (continued) |
September 30, 2016
|
Principal | Fair Value | |||||
CORPORATE BONDS — (continued) | ||||||
Pharmaceuticals, Biotechnology & Life Sciences — 1.0% |
| |||||
| $2,925,000 | Actavis Funding SCS, 3.800%, 3/15/25 | $ | 3,095,685 | |||
| 1,195,000 | Johnson & Johnson, 3.700%, 3/1/46 | 1,331,645 | ||||
| 1,730,000 | Quintiles Transnational Corp., 4.875%, 5/15/23(b) | 1,777,575 | ||||
| 1,589,000 | Shire Acquisitions Investments Ireland DAC, 3.200%, 9/23/26 | 1,597,547 | ||||
|
| |||||
| 7,802,452 | ||||||
|
| |||||
Real Estate — 4.0% | ||||||
| 2,175,000 | Alexandria Real Estate Equities, Inc., REIT, 2.750%, 1/15/20 | 2,207,897 | ||||
| 1,137,000 | American Tower Corp., REIT, 5.050%, 9/1/20(c) | 1,257,038 | ||||
| 1,203,000 | Brixmor Operating Partnership LP, REIT, 4.125%, 6/15/26 | 1,246,747 | ||||
| 103,000 | Care Capital Properties LP, REIT, 5.125%, 8/15/26(b) | 102,983 | ||||
| 1,600,000 | Crown Castle International Corp., REIT, 4.450%, 2/15/26 | 1,757,238 | ||||
| 1,849,000 | CubeSmart LP, REIT, 4.800%, 7/15/22 | 2,058,564 | ||||
| 739,000 | Duke Realty LP, REIT, 3.250%, 6/30/26 | 755,446 | ||||
| 1,730,000 | Goodman Australia Industrial Fund Bond Issuer Pty, Ltd., REIT, 3.400%, 9/30/26(b) | 1,738,970 | ||||
| 1,275,000 | Goodman Funding Pty, Ltd., REIT, 6.375%, 11/12/20(b) | 1,477,190 | ||||
| 2,136,000 | HCP, Inc., REIT, 4.000%, 6/1/25 | 2,193,281 | ||||
| 1,976,000 | Healthcare Trust of America Holdings LP, REIT, 3.700%, 4/15/23 | 2,044,366 | ||||
| 1,622,000 | Host Hotels & Resorts LP, REIT, Series D, 3.750%, 10/15/23 | 1,642,705 | ||||
| 1,560,000 | iStar, Inc., REIT, 4.000%, 11/1/17 | 1,563,900 | ||||
| 1,872,000 | Jones Lang LaSalle, Inc., 4.400%, 11/15/22 | 2,003,931 | ||||
| 1,331,000 | Kimco Realty Corp., REIT, 3.400%, 11/1/22 | 1,402,185 | ||||
| 1,565,000 | Prologis LP, 3.750%, 11/1/25 | 1,683,721 | ||||
| 1,473,000 | Simon Property Group LP, REIT, 10.350%, 4/1/19(c) | 1,758,436 | ||||
| 2,501,000 | Spirit Realty LP, REIT, 4.450%, 9/15/26(b) | 2,484,418 | ||||
| 1,350,000 | WEA Finance, LLC / Westfield UK & Europe Finance PLC, 4.750%, 9/17/44(b) | 1,459,185 | ||||
| 709,000 | Weingarten Realty Investors, REIT, 3.250%, 8/15/26 | 709,756 | ||||
|
| |||||
| 31,547,957 | ||||||
|
| |||||
Retailing — 0.7% | ||||||
| 1,642,000 | Dollar General Corp., 3.250%, 4/15/23 | 1,695,230 | ||||
| 1,291,000 | The Home Depot, Inc., 5.875%, 12/16/36 | 1,770,708 | ||||
| 2,027,000 | O’Reilly Automotive, Inc., 3.550%, 3/15/26 | 2,148,809 | ||||
|
| |||||
| 5,614,747 | ||||||
|
| |||||
Software & Services — 0.5% | ||||||
| 1,709,000 | First Data Corp., 5.000%, 1/15/24(b) | 1,734,635 | ||||
| 1,673,000 | Microsoft Corp., 4.750%, 11/3/55 | 1,932,451 | ||||
|
| |||||
| 3,667,086 | ||||||
|
| |||||
Telecommunication Services — 1.4% |
| |||||
| 1,813,000 | AT&T, Inc., 3.000%, 6/30/22 | 1,863,960 | ||||
| 1,130,000 | British Telecommunications PLC, 9.375%, 12/15/30 | 1,829,308 | ||||
| 1,185,000 | Crown Castle Towers, LLC, 6.113%, 1/15/20(b) | 1,313,276 | ||||
| 1,710,000 | Level 3 Financing, Inc., 5.625%, 2/1/23 | 1,776,263 | ||||
Principal | Fair Value | |||||
CORPORATE BONDS — (continued) | ||||||
Telecommunication Services — (continued) |
| |||||
| $3,391,000 | Verizon Communications, Inc., 6.550%, 9/15/43 | $ | 4,584,920 | |||
|
| |||||
| 11,367,727 | ||||||
|
| |||||
Transportation — 0.8% | ||||||
| 1,619,000 | Burlington Northern Santa Fe, LLC, 4.950%, 9/15/41 | 1,949,053 | ||||
| 1,655,000 | Penske Truck Leasing Co. LP/PTL Finance Corp., 4.875%, 7/11/22(b) | 1,846,808 | ||||
| 2,100,000 | Ryder System, Inc., MTN, 2.500%, 5/11/20 | 2,127,166 | ||||
|
| |||||
| 5,923,027 | ||||||
|
| |||||
Utilities — 1.1% | ||||||
| 2,275,000 | CMS Energy Corp., 4.700%, 3/31/43 | 2,600,427 | ||||
| 1,872,000 | Georgia Power Co., 4.300%, 3/15/42 | 2,039,039 | ||||
| 1,650,000 | Indiana Michigan Power Co., Series K, 4.550%, 3/15/46 | 1,857,067 | ||||
| 1,903,000 | Progress Energy, Inc., 3.150%, 4/1/22 | 1,993,282 | ||||
|
| |||||
| 8,489,815 | ||||||
|
| |||||
Total Corporate Bonds | 292,711,613 | |||||
|
| |||||
MORTGAGE-BACKED SECURITIES — 10.4% |
| |||||
Fannie Mae — 6.7% | ||||||
| 18,561 | 5.000%, 8/1/20, Pool #832058 | 19,072 | ||||
| 118,551 | 6.000%, 7/1/22, Pool #944967 | 123,677 | ||||
| 101,507 | 5.000%, 9/1/25, Pool #255892 | 112,646 | ||||
| 1,266,509 | 4.000%, 2/1/32, Pool #MA0977 | 1,371,650 | ||||
| 2,961,143 | 4.000%, 6/1/34, Pool #MA1922 | 3,206,867 | ||||
| 2,759,463 | 3.500%, 11/1/34, Pool #MA2077 | 2,934,802 | ||||
| 89,256 | 6.500%, 1/1/35, Pool #809198 | 102,811 | ||||
| 2,842,763 | 4.000%, 3/1/35, Pool #MA2211 | 3,083,720 | ||||
| 52,522 | 7.000%, 6/1/35, Pool #255820 | 60,178 | ||||
| 170,444 | 6.500%, 3/1/36, Pool #866062 | 207,671 | ||||
| 115,138 | 6.500%, 7/1/36, Pool #885493 | 132,624 | ||||
| 1,205,513 | 5.500%, 8/1/37, Pool #995082 | 1,372,584 | ||||
| 695,827 | 4.500%, 10/1/39, Pool #AC2645 | 763,709 | ||||
| 560,702 | 5.000%, 6/1/40, Pool #AD4927 | 623,889 | ||||
| 389,174 | 5.000%, 6/1/40, Pool #AD8718 | 432,200 | ||||
| 1,540,979 | 4.500%, 12/1/40, Pool #AH1100 | 1,690,422 | ||||
| 1,119,917 | 4.500%, 5/1/41, Pool #AI1023 | 1,226,771 | ||||
| 679,854 | 4.500%, 11/1/41, Pool #AJ4994 | 746,590 | ||||
| 1,111,194 | 4.500%, 12/1/41, Pool #AJ7696 | 1,221,691 | ||||
| 2,281,089 | 3.500%, 6/1/42, Pool #AB5373 | 2,418,724 | ||||
| 3,285,447 | 3.500%, 5/1/43, Pool #AB9368 | 3,474,016 | ||||
| 1,973,828 | 3.500%, 5/1/43, Pool #AL3605 | 2,118,038 | ||||
| 3,271,095 | 3.500%, 8/1/43, Pool #AU0613 | 3,499,257 | ||||
| 1,716,413 | 4.500%, 11/1/44, Pool #MA2100 | 1,880,180 | ||||
| 3,380,650 | 4.500%, 1/1/45, Pool #MA2158 | 3,710,470 | ||||
| 5,665,724 | 4.000%, 3/1/45, Pool #MA2217(c) | 6,086,711 | ||||
| 3,431,325 | 4.000%, 6/1/46, Pool #MA2653 | 3,696,588 | ||||
| 5,931,006 | 4.500%, 7/1/46, Pool #AS7568 | 6,515,480 | ||||
|
| |||||
| 52,833,038 | ||||||
|
| |||||
Freddie Mac — 3.5% | ||||||
| 112,721 | 5.500%, 10/1/21, Pool #G12425 | 121,026 | ||||
| 101,197 | 5.000%, 12/1/21, Pool #J04025 | 103,955 | ||||
| 162,861 | 5.000%, 7/1/25, Pool #C90908 | 180,341 | ||||
| 448,160 | 2.500%, 1/1/28, Pool #J22069 | 465,378 | ||||
| 1,817,844 | 3.500%, 7/1/30, Pool #G18562 | 1,923,285 | ||||
| 297,518 | 4.000%, 11/1/31, Pool #C91410 | 319,623 | ||||
| Continued |
91
Sterling Capital Total Return Bond Fund
|
Schedule of Portfolio Investments — (continued) |
September 30, 2016
|
Principal | Fair Value | |||||
MORTGAGE-BACKED SECURITIES — (continued) |
| |||||
Freddie Mac — (continued) | ||||||
| $ 140,610 | 5.000%, 3/1/36, Pool #G08115 | $ | 156,460 | |||
| 19,841 | 6.500%, 5/1/36, Pool #A48509 | 22,730 | ||||
| 6,768,725 | 3.500%, 6/1/36, Pool #C91875(c) | 7,216,830 | ||||
| 41,250 | 5.000%, 7/1/36, Pool #G02291 | 45,928 | ||||
| 3,822,349 | 3.500%, 8/1/36, Pool #C91888 | 4,075,415 | ||||
| 447,166 | 6.500%, 9/1/36, Pool #G08152 | 521,875 | ||||
| 161,828 | 5.000%, 2/1/37, Pool #A57714 | 179,197 | ||||
| 175,138 | 4.500%, 10/1/39, Pool #A89346 | 191,903 | ||||
| 604,981 | 5.000%, 6/1/40, Pool #C03479 | 670,571 | ||||
| 1,488,048 | 5.000%, 7/1/40, Pool #A93070 | 1,649,792 | ||||
| 1,908,298 | 4.000%, 12/1/42, Pool #G07266 | 2,055,871 | ||||
| 1,490,108 | 3.500%, 5/1/43, Pool #Q18305 | 1,577,003 | ||||
| 1,318,174 | 4.000%, 5/1/44, Pool #V81186 | 1,413,828 | ||||
| 611,280 | 4.000%, 7/1/44, Pool #G08595 | 655,638 | ||||
| 629,399 | 4.000%, 9/1/44, Pool #Q28299 | 675,488 | ||||
| 2,717,369 | 4.000%, 8/1/46, Pool #G08717 | 2,925,529 | ||||
|
| |||||
| 27,147,666 | ||||||
|
| |||||
Ginnie Mae — 0.2% | ||||||
| 335,047 | 5.000%, 2/15/40, Pool #737037 | 375,564 | ||||
| 1,363,215 | 4.500%, 9/20/40, Pool #4801 | 1,492,875 | ||||
|
| |||||
| 1,868,439 | ||||||
|
| |||||
Total Mortgage-Backed Securities | 81,849,143 | |||||
|
| |||||
MUNICIPAL BONDS — 6.5% | ||||||
California — 2.1% | ||||||
| 1,889,000 | California Institute of Technology, 4.283%, 9/1/16 | 1,846,180 | ||||
| 3,700,000 | Metropolitan Water District of Southern California, Build America Bonds, Water Utility Improvements Revenue, Callable 7/1/19 @ 100, 6.538%, 7/1/39 | 4,192,137 | ||||
| 2,100,000 | Sacramento County Sanitation Districts Financing Authority, Refunding Revenue, Taxable, Series B, 2.810%, 12/1/21 | 2,208,990 | ||||
| 1,285,000 | State of California, Build America Bonds, School Improvements G.O., 7.625%, 3/1/40 | 2,045,155 | ||||
| 4,050,000 | University Of California, Limited Project, Refunding Revenue, Taxable, Series J, 3.359%, 5/15/25 | 4,301,829 | ||||
| 1,850,000 | University of California, Univ. & College Improvements, Taxable Revenue, Series AN, 3.338%, 5/15/22 | 1,999,258 | ||||
|
| |||||
| 16,593,549 | ||||||
|
| |||||
Connecticut — 0.4% | ||||||
| 3,000,000 | State of Connecticut Special Tax Revenue, Build America Bonds, Transition Infrastructure, Series B, 4.126%, 11/1/20 | 3,269,490 | ||||
|
| |||||
District of Columbia — 0.2% | ||||||
| 1,835,000 | George Washington University (The), Series 2012, 3.485%, 9/15/22 | 1,964,107 | ||||
|
| |||||
Hawaii — 0.1% | ||||||
| 750,000 | State Of Hawaii, Public Improvements G.O., Taxable, Series FJ, 1.921%, 10/1/22(d) | 753,473 | ||||
|
| |||||
Illinois — 0.4% | ||||||
| 3,130,000 | State Of Illinois, Public Improvements, Taxable Revenue, Series B, 2.620%, 6/15/26 | 3,124,397 | ||||
|
| |||||
Principal | Fair Value | |||||
MUNICIPAL BONDS — (continued) | ||||||
New Jersey — 0.2% | ||||||
| $ 1,305,000 | New Jersey Economic Development Authority, School Facilities Construction, Refunding Revenue, Series 00, 1.648%, 3/1/18 | $ | 1,302,299 | |||
|
| |||||
New York — 1.5% | ||||||
| 5,875,000 | New York City Transitional Finance Authority, Public Improvements, Revenue Bonds, 2.590%, 8/1/26 | 5,977,343 | ||||
| 2,000,000 | New York State Dormitory Authority, Public Improvements, Taxable Revenue, Series D, 2.550%, 3/15/21 | 2,087,940 | ||||
| 750,000 | New York State Environmental Facilities Corp., State Revolving Funds, Refunding Revenue, Taxable, Series C, 2.445%, 6/15/20 | 772,508 | ||||
| 900,000 | New York State Environmental Facilities Corp., State Revolving Funds, Refunding Revenue, Taxable, Series C, 2.745%, 6/15/22 | 928,755 | ||||
| 1,640,000 | New York, NY, Build America Bonds, Public Improvements G.O., 4.874%, 3/1/21 | 1,850,314 | ||||
|
| |||||
| 11,616,860 | ||||||
|
| |||||
Ohio — 0.7% | ||||||
| 5,658,000 | Premier Health Partners, Series G, 2.911%, 11/15/26 | 5,684,830 | ||||
|
| |||||
Pennsylvania — 0.9% | ||||||
| 4,375,000 | Lehigh University, 3.479%, 11/15/46 | 4,381,633 | ||||
| 2,260,000 | Philadelphia Authority for Industrial Development, Refunding Revenue, Taxable, 3.664%, 4/15/22 | 2,336,501 | ||||
|
| |||||
| 6,718,134 | ||||||
|
| |||||
Total Municipal Bonds | 51,027,139 | |||||
|
| |||||
U.S. TREASURY BONDS — 4.7% | ||||||
| 26,746,800 | 3.125%, 2/15/43 | 31,163,151 | ||||
| 5,722,864 | 0.750%, 2/15/45(e) | 5,898,768 | ||||
|
| |||||
Total U.S. Treasury Bonds | 37,061,919 | |||||
|
| |||||
U.S. TREASURY NOTES — 5.4% | ||||||
| 21,628,200 | 1.000%, 11/30/19 | 21,671,283 | ||||
| 20,057,335 | 0.375%, 7/15/25(e) | 20,714,012 | ||||
|
| |||||
Total U.S. Treasury Notes | 42,385,295 | |||||
|
| |||||
Continued
92
Sterling Capital Total Return Bond Fund
|
Schedule of Portfolio Investments — (continued) |
September 30, 2016
|
Shares | Fair Value | |||||
PREFERRED STOCKS — 0.2% | ||||||
Banks — 0.2% | ||||||
| 65,135 | US Bancorp, Series F, 6.500% | $ | 1,961,866 | |||
|
| |||||
Total Preferred Stocks | 1,961,866 | |||||
|
| |||||
MONEY MARKET FUND — 2.3% | ||||||
18,589,113 | Federated Treasury Obligations Fund, Institutional Shares, 0.180%(f) | 18,589,113 | ||||
|
| |||||
Total Money Market Fund | 18,589,113 | |||||
|
| |||||
Total Investments — 101.1% | 796,709,429 | |||||
Net Other Assets (Liabilities) — (1.1)% | (9,047,737 | ) | ||||
|
| |||||
NET ASSETS — 100.0% | $ | 787,661,692 | ||||
|
| |||||
| (a) | The interest rate for this variable rate note, which will change periodically, is based either on the prime rate or an index of market rates. The reflected rate is in effect as of September 30, 2016. The maturity date reflected is the final maturity date. |
| (b) | Rule 144A, Section 4(2) or other security that is restricted as to resale to qualified institutional investors. The Advisor, using Board approved procedures, has deemed these securities or a portion of these securities to be liquid. |
| (c) | Represents that all or a portion of the security was pledged as collateral for securities purchased on a when-issued basis. |
| (d) | Represents security purchased on a when-issued basis. At September 30, 2016, total cost of investments purchased on a when-issued basis was $752,100. |
| (e) | Inflation protection security. Principal amount periodically adjusted for inflation. |
| (f) | Represents the current yield as of report date. |
BKNT — Bank Note
G.O. — General Obligation
GMTN — Global Medium Term Note
MTN — Medium Term Note
REIT — Real Estate Investment Trust
STEP — Step Coupon Bond
See accompanying Notes to the Financial Statements.
93
Sterling Capital Corporate Fund
|
Schedule of Portfolio Investments |
September 30, 2016
|
Principal | Fair Value | |||||
CORPORATE BONDS — 98.8% |
| |||||
Automobiles & Components — 2.6% |
| |||||
| $315,000 | General Motors Financial Co., Inc., 3.200%, 7/13/20 | $ | 322,544 | |||
| 250,000 | Hyundai Capital America, 2.000%, 3/19/18(a) | 251,420 | ||||
| 255,000 | Lear Corp., 5.375%, 3/15/24 | 273,806 | ||||
|
| |||||
| 847,770 | ||||||
|
| |||||
Banks — 13.8% | ||||||
| 200,000 | Associated Banc-Corp, 2.750%, 11/15/19 | 203,934 | ||||
| 350,000 | Athene Global Funding, 2.875%, 10/23/18(a) | 349,215 | ||||
| 375,000 | Bank of America Corp., Series K, 8.000%, 7/29/49(b) | 382,500 | ||||
| 335,000 | CIT Group, Inc., 4.250%, 8/15/17 | 341,281 | ||||
| 235,000 | Citigroup, Inc., 2.650%, 10/26/20 | 240,050 | ||||
| 400,000 | Citigroup, Inc., 4.400%, 6/10/25 | 423,516 | ||||
| 475,000 | JPMorgan Chase & Co., 3.875%, 9/10/24 | 500,068 | ||||
| 370,000 | JPMorgan Chase & Co., Series 1, 7.900%, 4/29/49(b) | 380,175 | ||||
| 225,000 | KeyCorp, MTN, 5.100%, 3/24/21 | 253,999 | ||||
| 457,000 | Morgan Stanley, GMTN, 6.625%, 4/1/18 | 489,666 | ||||
| 255,000 | National City Corp., 6.875%, 5/15/19 | 287,239 | ||||
| 145,000 | Prudential Financial, Inc., 8.875%, 6/15/38(b) | 160,950 | ||||
| 107,000 | Toronto-Dominion Bank (The), 3.625%, 9/15/31(b) | 107,295 | ||||
| 325,000 | US Bancorp, MTN, 2.950%, 7/15/22 | 338,582 | ||||
|
| |||||
| 4,458,470 | ||||||
|
| |||||
Capital Goods — 4.7% | ||||||
| 327,000 | General Electric Co., Series D, 5.000%, 12/29/49(b) | 347,748 | ||||
| 290,000 | LSB Industries, Inc., STEP, 8.500%, 8/1/19 | 291,450 | ||||
| 210,000 | Masco Corp., 4.375%, 4/1/26 | 221,025 | ||||
| 300,000 | SBA Tower Trust, 2.898%, 10/15/19(a) | 304,216 | ||||
| 345,000 | Textron, Inc., 3.650%, 3/1/21 | 364,308 | ||||
|
| |||||
| 1,528,747 | ||||||
|
| |||||
Commercial & Professional Services — 1.6% |
| |||||
| 195,000 | Verisk Analytics, Inc., 5.800%, 5/1/21 | 222,548 | ||||
| 260,000 | Waste Management, Inc., 4.600%, 3/1/21 | 288,799 | ||||
|
| |||||
| 511,347 | ||||||
|
| |||||
Consumer Durables & Apparel — 0.8% |
| |||||
| 230,000 | Mohawk Industries, Inc., 3.850%, 2/1/23 | 241,772 | ||||
|
| |||||
Consumer Services — 0.8% |
| |||||
| 225,000 | Carnival Corp., 3.950%, 10/15/20 | 243,221 | ||||
|
| |||||
Diversified Financials — 15.5% | ||||||
| 249,000 | AerCap Ireland Capital, Ltd./AerCap Global Aviation Trust, 4.250%, 7/1/20 | 258,337 | ||||
| 360,000 | Ally Financial, Inc., 3.600%, 5/21/18 | 365,400 | ||||
| 380,000 | Ares Finance Co., LLC, 4.000%, 10/8/24(a) | 368,163 | ||||
| 335,000 | Blackstone Holdings Finance Co., LLC, 6.625%, 8/15/19(a) | 379,703 | ||||
| 385,000 | Capital One Financial Corp., 3.200%, 2/5/25 | 392,459 | ||||
| 330,000 | Carlyle Holdings Finance, LLC, 3.875%, 2/1/23(a) | 344,887 | ||||
| 355,000 | First American Financial Corp., 4.300%, 2/1/23 | 363,970 | ||||
| 270,000 | Goldman Sachs Group, Inc. (The), 1.875%, 4/23/20(b) | 271,676 | ||||
| 315,000 | Goldman Sachs Group, Inc. (The), 3.625%, 1/22/23 | 332,812 | ||||
| 378,000 | Goldman Sachs Group, Inc. (The), 4.250%, 10/21/25 | 397,805 | ||||
Principal | Fair Value | |||||
CORPORATE BONDS — (continued) | ||||||
Diversified Financials — (continued) |
| |||||
| $350,000 | KKR Group Finance Co., LLC, 6.375%, 9/29/20(a) | $ | 406,954 | |||
| 210,000 | Nationwide Financial Services, Inc., 5.375%, 3/25/21(a) | 235,516 | ||||
| 336,000 | Ryder System, Inc., MTN, 2.350%, 2/26/19 | 341,104 | ||||
| 500,000 | Wells Fargo & Co., GMTN, 4.300%, 7/22/27 | 538,869 | ||||
|
| |||||
| 4,997,655 | ||||||
|
| |||||
Energy — 11.0% | ||||||
| 150,000 | BP Capital Markets PLC, 3.506%, 3/17/25 | 158,996 | ||||
| 210,000 | Buckeye Partners LP, 2.650%, 11/15/18 | 212,100 | ||||
| 250,000 | Columbia Pipeline Group, Inc., 3.300%, 6/1/20 | 259,111 | ||||
| 180,000 | Energy Transfer Partners LP, 4.750%, 1/15/26 | 185,967 | ||||
| 170,000 | EnLink Midstream Partners LP, 2.700%, 4/1/19 | 168,881 | ||||
| 225,000 | Hess Corp., 4.300%, 4/1/27 | 226,752 | ||||
| 275,000 | Magellan Midstream Partners LP, 6.550%, 7/15/19 | 308,029 | ||||
| 94,000 | Noble Holding International, Ltd., 2.500%, 3/15/17 | 93,060 | ||||
| 303,000 | NuStar Logistics LP, 4.750%, 2/1/22 | 299,970 | ||||
| 350,000 | Pioneer Natural Resources Co., 6.650%, 3/15/17 | 358,015 | ||||
| 235,000 | Regency Energy Partners LP/Regency Energy Finance Corp., 6.500%, 7/15/21 | 243,189 | ||||
| 200,000 | Schlumberger Holdings Corp., 3.000%, 12/21/20(a) | 208,547 | ||||
| 305,000 | Spectra Energy Capital, LLC, 8.000%, 10/1/19 | 351,996 | ||||
| 243,000 | Western Gas Partners LP, 4.000%, 7/1/22 | 248,468 | ||||
| 230,000 | Williams Partners LP, 3.900%, 1/15/25 | 229,520 | ||||
|
| |||||
| 3,552,601 | ||||||
|
| |||||
Food & Staples Retailing — 1.1% |
| |||||
| 325,000 | Reynolds American, Inc., 4.450%, 6/12/25 | 362,611 | ||||
|
| |||||
Food, Beverage & Tobacco — 2.0% |
| |||||
| 205,000 | Altria Group, Inc., 4.750%, 5/5/21 | 231,723 | ||||
| 200,000 | Constellation Brands, Inc., 4.750%, 11/15/24 | 216,500 | ||||
| 175,000 | Cott Beverages, Inc., 6.750%, 1/1/20 | 182,438 | ||||
|
| |||||
| 630,661 | ||||||
|
| |||||
Health Care Equipment & Services — 0.6% |
| |||||
| 190,000 | Boston Scientific Corp., 3.375%, 5/15/22 | 199,805 | ||||
|
| |||||
Insurance — 16.0% | ||||||
| 255,000 | Alleghany Corp., 4.950%, 6/27/22 | 283,157 | ||||
| 233,000 | Allied World Assurance Co. Holdings, Ltd., 4.350%, 10/29/25 | 243,776 | ||||
| 115,000 | American Financial Group, Inc., 3.500%, 8/15/26 | 115,051 | ||||
| 260,000 | Aspen Insurance Holdings, Ltd., 4.650%, 11/15/23 | 276,574 | ||||
| 280,000 | CBRE Services, Inc., 5.250%, 3/15/25 | 300,104 | ||||
| 303,000 | Horace Mann Educators Corp., 4.500%, 12/1/25 | 315,016 | ||||
| 245,000 | Liberty Mutual Group, Inc., 4.250%, 6/15/23(a) | 265,043 | ||||
| 475,000 | Morgan Stanley, GMTN, 3.700%, 10/23/24 | 501,200 | ||||
| 255,000 | Old Republic International Corp., 4.875%, 10/1/24 | 275,728 | ||||
| 200,000 | Pacific LifeCorp, 6.000%, 2/10/20(a) | 221,896 | ||||
| 325,000 | Reliance Standard Life Global Funding II, 2.150%, 10/15/18(a) | 327,820 | ||||
| 165,000 | Royal Bank of Scotland Group PLC, 4.700%, 7/3/18 | 169,474 | ||||
| Continued |
94
Sterling Capital Corporate Fund
|
Schedule of Portfolio Investments — (continued) |
September 30, 2016
|
Principal | Fair Value | |||||
CORPORATE BONDS — (continued) | ||||||
Insurance — (continued) | ||||||
| $467,000 | Sirius International Group, Ltd., 6.375%, 3/20/17(a) | $ | 474,399 | |||
| 270,000 | Symetra Financial Corp., 4.250%, 7/15/24 | 280,310 | ||||
| 360,000 | TIAA Asset Management Finance Co., LLC, 2.950%, 11/1/19(a) | 370,940 | ||||
| 390,000 | WR Berkley Corp., 4.625%, 3/15/22 | 427,823 | ||||
| 295,000 | XLIT, Ltd., 4.450%, 3/31/25 | 299,445 | ||||
|
| |||||
| 5,147,756 | ||||||
|
| |||||
Materials — 1.4% | ||||||
| 217,000 | Glencore Funding, LLC, 1.739%, 4/16/18(a)(b) | 214,559 | ||||
| 250,000 | West Fraser Timber Co., Ltd., 4.350%, 10/15/24(a) | 240,235 | ||||
|
| |||||
| 454,794 | ||||||
|
| |||||
Media — 4.9% | ||||||
| 350,000 | Charter Communications Operating, LLC / Charter Communications Operating Capital, 4.464%, 7/23/22(a) | 377,672 | ||||
| 225,000 | Comcast Cable Communications Holdings, Inc., 9.455%, 11/15/22 | 316,468 | ||||
| 240,000 | ERAC USA Finance, LLC, 2.800%, 11/1/18(a) | 245,449 | ||||
| 330,000 | Interpublic Group of Cos., Inc. (The), 3.750%, 2/15/23 | 344,720 | ||||
| 265,000 | Omnicom Group, Inc., 3.650%, 11/1/24 | 281,602 | ||||
|
| |||||
| 1,565,911 | ||||||
|
| |||||
Pharmaceuticals, Biotechnology & Life Sciences — 2.4% |
| |||||
| 125,000 | Celgene Corp., 2.875%, 8/15/20 | 129,310 | ||||
| 295,000 | Quintiles Transnational Corp., 4.875%, 5/15/23(a) | 303,113 | ||||
| 151,000 | Shire Acquisitions Investments Ireland DAC, 3.200%, 9/23/26 | 151,812 | ||||
| 175,000 | Teva Pharmaceutical Finance Netherlands III BV, 2.800%, 7/21/23 | 175,449 | ||||
|
| |||||
| 759,684 | ||||||
|
| |||||
Real Estate — 11.8% | ||||||
| 192,000 | Alexandria Real Estate Equities, Inc., REIT, 4.600%, 4/1/22 | 208,872 | ||||
| 300,000 | American Tower Corp., REIT, 5.050%, 9/1/20 | 331,672 | ||||
| 141,000 | Brixmor Operating Partnership LP, REIT, 4.125%, 6/15/26 | 146,127 | ||||
| 11,000 | Care Capital Properties LP, REIT, 5.125%, 8/15/26(a) | 10,998 | ||||
| 297,000 | CubeSmart LP, REIT, 4.800%, 7/15/22 | 330,662 | ||||
| 218,000 | Goodman Australia Industrial Fund Bond Issuer Pty, Ltd., 3.400%, 9/30/26(a) | 219,130 | ||||
| 300,000 | Goodman Funding Pty, Ltd., REIT, 6.375%, 11/12/20(a) | 347,574 | ||||
| 200,000 | HCP, Inc., REIT, 4.000%, 6/1/25 | 205,363 | ||||
| 230,000 | Healthcare Trust of America Holdings LP, REIT, 3.375%, 7/15/21 | 238,344 | ||||
| 233,000 | Host Hotels & Resorts LP, REIT, Series D, 3.750%, 10/15/23 | 235,974 | ||||
| 240,000 | iStar, Inc., REIT, 4.000%, 11/1/17 | 240,600 | ||||
| 233,000 | Jones Lang LaSalle, Inc., 4.400%, 11/15/22 | 249,421 | ||||
| 208,000 | Kimco Realty Corp. REIT, 3.400%, 11/1/22 | 219,124 | ||||
| 193,000 | Prologis LP, 3.750%, 11/1/25 | 207,641 | ||||
Principal | Fair Value | |||||
CORPORATE BONDS — (continued) | ||||||
Real Estate — (continued) | ||||||
| $261,000 | Spirit Realty LP, REIT, 4.450%, 9/15/26(a) | $ | 259,270 | |||
| 250,000 | WEA Finance, LLC/Westfield UK & Europe Finance PLC, 2.700%, 9/17/19(a) | 256,304 | ||||
| 106,000 | Weingarten Realty Investors, REIT, 3.250%, 8/15/26 | 106,113 | ||||
|
| |||||
| 3,813,189 | ||||||
|
| |||||
Retailing — 0.7% | ||||||
| 220,000 | O’Reilly Automotive, Inc., 3.550%, 3/15/26 | 233,220 | ||||
|
| |||||
Software & Services — 0.7% | ||||||
| 227,000 | First Data Corp., 5.000%, 1/15/24(a) | 230,405 | ||||
|
| |||||
Telecommunication Services — 3.3% |
| |||||
| 235,000 | AT&T, Inc., 3.000%, 6/30/22 | 241,605 | ||||
| 300,000 | Crown Castle Towers, LLC, 6.113%, 1/15/20(a) | 332,475 | ||||
| 175,000 | Level 3 Financing, Inc., 5.625%, 2/1/23 | 181,781 | ||||
| 277,000 | Verizon Communications, Inc., 5.150%, 9/15/23 | 322,685 | ||||
|
| |||||
| 1,078,546 | ||||||
|
| |||||
Transportation — 0.9% | ||||||
| 250,000 | Penske Truck Leasing Co. LP/PTL Finance Corp., 4.875%, 7/11/22(a) | 278,974 | ||||
|
| |||||
Utilities — 2.2% | ||||||
| 213,000 | CMS Energy Corp., 8.750%, 6/15/19 | 251,955 | ||||
| 200,000 | Dominion Resources, Inc., 5.200%, 8/15/19 | 219,007 | ||||
| 235,000 | Southern Co. (The), 2.750%, 6/15/20 | 242,397 | ||||
|
| |||||
| 713,359 | ||||||
|
| |||||
Total Corporate Bonds | 31,850,498 | |||||
|
| |||||
Shares | ||||||
MONEY MARKET FUND — 0.5% | ||||||
| 168,021 | Federated Treasury Obligations Fund, Institutional Shares, 0.180%(c) | 168,021 | ||||
|
| |||||
Total Money Market Fund | 168,021 | |||||
|
| |||||
Total Investments — 99.3% | 32,018,519 | |||||
Net Other Assets (Liabilities) — 0.7% | 235,486 | |||||
|
| |||||
NET ASSETS — 100.0% | $ | 32,254,005 | ||||
|
| |||||
| (a) | Rule 144A, Section 4(2) or other security that is restricted as to resale to qualified institutional investors. The Advisor, using Board approved procedures, has deemed these securities or a portion of these securities to be liquid. |
| (b) | The interest rate for this variable rate note, which will change periodically, is based either on the prime rate or an index of market rates. The reflected rate is in effect as of September 30, 2016. The maturity date reflected is the final maturity date. |
| (c) | Represents the current yield as of report date. |
GMTN — Global Medium Term Note
MTN — Medium Term Note
REIT — Real Estate Investment Trust
STEP — Step Coupon Bond
See accompanying Notes to the Financial Statements.
95
Sterling Capital Securitized Opportunities Fund
|
Schedule of Portfolio Investments |
September 30, 2016
|
Principal | Fair Value | |||||
ASSET BACKED SECURITIES — 24.5% | ||||||
| $565,000 | Aegis Asset Backed Securities Trust, Series 2005-5, Class 1A4, 0.875%, 12/25/35(a) | $ | 511,864 | |||
| 400,000 | AmeriCredit Automobile Receivables Trust, Series 2015-3, Class B, 2.080%, 9/8/20 | 403,097 | ||||
| 300,000 | AmeriCredit Automobile Receivables Trust, Series 2014-3, Class C, 2.580%, 9/8/20 | 304,877 | ||||
| 262,539 | Argent Securities, Inc. Pass Through Certificates, Series 2005-W3, Class A2D, 0.865%, 11/25/35(a) | 256,394 | ||||
| 300,000 | Bear Stearns Asset Backed Securities I Trust, Series 2004-BO1, Class M5, 1.925%, 10/25/34(a) | 304,438 | ||||
| 350,000 | Capital Auto Receivables Asset Trust, Series 2015-3, Class B, 2.430%, 9/21/20 | 355,337 | ||||
| 500,000 | Capital Auto Receivables Asset Trust, Series 2015-4, Class B, 2.390%, 11/20/20 | 507,338 | ||||
| 450,000 | Citibank Credit Card Issuance Trust, Series 2007-A3, Class A3, 6.150%, 6/15/39 | 655,265 | ||||
| 318,268 | Citicorp Residential Mortgage Trust, STEP, Series 2007-2, Class A6, 5.432%, 6/25/37 | 327,781 | ||||
| 640,000 | Encore Credit Receivables Trust, Series 2005-4, Class M2, 0.965%, 1/25/36(a) | 609,882 | ||||
| 15,000 | Ford Credit Auto Owner Trust, Series 2014-B, Class C, 1.950%, 2/15/20 | 15,095 | ||||
| 500,000 | GSAMP Trust, Series 2006-SEA1, Class M1, 1.025%, 5/25/36(a)(b) | 477,336 | ||||
| 460,000 | Home Equity Asset Trust, Series 2005-7, Class M1, 0.975%, 1/25/36(a) | 443,058 | ||||
| 200,000 | Home Equity Asset Trust, Series 2005-8, Class M1, 0.955%, 2/25/36(a) | 188,303 | ||||
| 500,000 | JP Morgan Mortgage Acquisition Corp., Series 2005-OPT1, Class M2, 1.239%, 6/25/35(a) | 475,169 | ||||
| 306,980 | Long Beach Mortgage Loan Trust, Series 2006-WL2, Class 2A3, 0.725%, 1/25/36(a) | 297,801 | ||||
| 381,886 | Morgan Stanley Home Equity Loan Trust, Series 2005-3, Class M2, 1.230%, 8/25/35(a) | 373,134 | ||||
| 500,000 | New Century Home Equity Loan Trust, Series 2005-4, Class M2, 1.035%, 9/25/35(a) | 472,991 | ||||
| 450,000 | Park Place Securities, Inc., Series 2005-WHQ2, Class M2, 1.215%, 5/25/35(a) | 430,834 | ||||
| 400,000 | Park Place Securities, Inc. Pass Through Certificates, Series 2005-WCW3, Class M1, 1.005%, 8/25/35(a) | 376,962 | ||||
| 320,000 | RAMP Trust, Series 2005-RZ4, Class M2, 1.025%, 11/25/35(a) | 304,424 | ||||
| 500,000 | Santander Drive Auto Receivables Trust, Series 2015-4, Class C, 2.970%, 3/15/21 | 509,178 | ||||
| 525,000 | Santander Drive Auto Receivables Trust, Series 2015-2, Class C, 2.440%, 4/15/21 | 530,792 | ||||
| 226,815 | Saxon Asset Securities Trust, Series 2004-3, Class M1, 1.425%, 12/26/34(a) | 208,962 | ||||
| 323,037 | Securitized Asset Backed Receivables, LLC Trust, Series 2005-OP2, Class A2C, 0.845%, 10/25/35(a) | 320,105 | ||||
| 471,908 | Sofi Professional Loan Program LLC, Series 2016-B, Class A1, 1.725%, 6/25/33(a)(b) | 476,277 | ||||
| 253,388 | United States Small Business Administration, Series 2010-20D, Class 1, 4.360%, 4/1/30 | 277,170 | ||||
| 476,585 | United States Small Business Administration, Series 2015-20G, Class 1, 2.880%, 7/1/35 | 496,159 | ||||
Principal | Fair Value | |||||
ASSET BACKED SECURITIES — (continued) |
| |||||
| $529,595 | United States Small Business Administration, Series 2015-20I, Class 1, 2.820%, 9/1/35 | $ | 549,041 | |||
|
| |||||
Total Asset Backed Securities | 11,459,064 | |||||
|
| |||||
COLLATERALIZED MORTGAGE OBLIGATIONS — 16.8% | ||||||
| 160,646 | Banc of America Alternative Loan Trust, Series 2004-10, Class 1CB1, 6.000%, 11/25/34 | 168,629 | ||||
| 433,622 | Banc of America Funding Trust, Series 2005-B, Class 3A1, 0.762%, 4/20/35(a) | 410,492 | ||||
| 104,487 | Banc of America Mortgage Trust, Series 2005-3, Class 1A24, 5.500%, 4/25/35 | 105,359 | ||||
| 123,881 | Citicorp Mortgage Securities, Inc., Series 2005-1, Class 1A4, 5.500%, 2/25/35 | 126,004 | ||||
| 119,263 | Citigroup Mortgage Loan Trust, Inc., Series 2004-NCM2, Class 3CB2, 6.500%, 8/25/19 | 123,013 | ||||
| 181,632 | Countrywide Alternative Loan Trust, Series 2004-22CB, Class 1A1, 6.000%, 10/25/34 | 194,192 | ||||
| 117,791 | Countrywide Home Loan Mortgage Pass Through Trust, Series 2004-3, Class A4, 5.750%, 4/25/34 | 117,153 | ||||
| 81,138 | Credit Suisse First Boston Mortgage Securities Corp., Series 2005-2, Class 4A1, 5.250%, 2/25/20 | 81,015 | ||||
| 216,086 | Credit Suisse First Boston Mortgage Securities Corp., Series 2004-1, Class 2A1, 6.500%, 2/25/34 | 231,563 | ||||
| 3,787 | Credit Suisse First Boston Mortgage Securities Corp., Series 2005-6, Class 2A3, 5.500%, 7/25/35 | 3,820 | ||||
| 14,615 | Fannie Mae, Series 2003-19, Class AR, 5.500%, 3/25/33 | 16,552 | ||||
| 180,000 | Fannie Mae, Series 2011-131, Class PB, 4.500%, 12/25/41 | 207,648 | ||||
| 443,000 | Fannie Mae, Series 2013-2, Class LB, 3.000%, 2/25/43 | 457,801 | ||||
| 451,000 | Fannie Mae, Series 2013-30, Class PY, 3.000%, 4/25/43 | 472,660 | ||||
| 225,038 | FirstKey Mortgage Trust, Series 2014-1, Class A12, 3.500%, 11/25/44(a)(b) | 230,052 | ||||
| 100,000 | Freddie Mac, Series 3558, Class G, 4.000%, 8/15/24 | 108,667 | ||||
| 34,417 | Freddie Mac, Series 4079, Class WV, 3.500%, 3/15/27 | 36,529 | ||||
| 324,714 | Freddie Mac, Series 4136, Class HZ, 3.500%, 11/15/27 | 358,766 | ||||
| 578,700 | Freddie Mac, Series 2525, Class AM, 4.500%, 4/15/32 | 643,401 | ||||
| 231,927 | Freddie Mac, Series 2485, Class WG, 6.000%, 8/15/32 | 260,545 | ||||
| 132,220 | Freddie Mac, Series 2702, Class CE, 4.500%, 11/15/33 | 144,946 | ||||
| 182,426 | Freddie Mac, Series 3440, Class EM, 5.000%, 4/15/38 | 203,396 | ||||
| 466,306 | Freddie Mac, Series 3816, Class HM, 4.500%, 5/15/40 | 509,056 | ||||
| 150,984 | Freddie Mac, Series 3803, Class PJ, 4.250%, 1/15/41 | 161,395 | ||||
| 132,574 | Ginnie Mae, Series 2010-85, Class DQ, 3.000%, 12/20/39 | 135,118 | ||||
Continued
96
Sterling Capital Securitized Opportunities Fund
|
Schedule of Portfolio Investments — (continued) |
September 30, 2016
|
Principal Amount | Fair Value | |||||
COLLATERALIZED MORTGAGE OBLIGATIONS — (continued) | ||||||
| $575,000 | Ginnie Mae, Series 2012-16, Class GC, 3.500%, 12/20/39 | $ | 613,034 | |||
| 274,793 | MASTR Alternative Loan Trust, Series 2003-5, Class 8A1, 5.500%, 6/25/33 | 279,270 | ||||
| 71,919 | MASTR Alternative Loan Trust, Series 2004-13, Class 3A1, 6.500%, 1/25/35 | 71,394 | ||||
| 77,252 | MASTR Seasoned Securitization Trust, Series 2005-2, Class 1A1, 5.130%, 10/25/32 | 77,218 | ||||
| 86,470 | PHHMC Trust, Series 2007-6, Class A1, 5.438%, 12/18/37(a) | 86,537 | ||||
| 117,557 | RALI Trust, Series 2005-QR1, Class A, 6.000%, 10/25/34 | 122,750 | ||||
| 85,417 | RBSGC Mortgage Loan Trust, Series 2007-B, Class 3A1, 5.527%, 7/25/35(a) | 87,761 | ||||
| 210,629 | Specialty Underwriting & Residential Finance Trust, Series 2004-AA1, Class 1A1, 5.000%, 10/25/34 | 211,582 | ||||
| 464,671 | Structured Adjustable Rate Mortgage Loan Trust, Series 2004-6, Class 4A1, 2.949%, 6/25/34(a) | 461,781 | ||||
| 84,643 | Structured Asset Securities Corp. Trust, Series 2005-6, Class 4A1, 5.000%, 5/25/35 | 85,637 | ||||
| 28,183 | Structured Asset Securities Corp. Trust, Series 2005-6, Class 5A1, 5.000%, 5/25/35 | 28,299 | ||||
| 18,742 | Structured Asset Securities Corp. Trust, Series 2005-6, Class 5A2, 5.000%, 5/25/35 | 18,882 | ||||
| 28,489 | Wells Fargo Mortgage Backed Securities Trust, Series 2007-3, Class 3A1, 5.500%, 4/25/22 | 29,108 | ||||
| 184,708 | Wells Fargo Mortgage Backed Securities Trust, Series 2005-4, Class A4, 5.000%, 4/25/35 | 186,074 | ||||
|
| |||||
Total Collateralized Mortgage Obligations | 7,867,099 | |||||
|
| |||||
COMMERCIAL MORTGAGE-BACKED SECURITIES — 20.5% | ||||||
| 154,859 | Banc of America Commercial Mortgage Trust, Series 2007-5, Class A4, 5.492%, 2/10/51 | 158,442 | ||||
| 29,307 | Banc of America Merrill Lynch Commercial Mortgage, Inc., Series 2005-3, Class AM, 4.727%, 7/10/43 | 29,184 | ||||
| 446,913 | BCAP, LLC Trust, Series 2013-RR4, Class A4A2, 2.000%, 2/13/51(b) | 444,780 | ||||
| 300,000 | Bear Stearns Commercial Mortgage Securities Trust, Series 2006-PW14, Class AM, 5.243%, 12/11/38 | 300,273 | ||||
| 250,000 | Bear Stearns Commercial Mortgage Securities Trust, Series 2007-T28, Class AM, 5.835%, 9/11/42(a) | 258,241 | ||||
| 300,000 | Citigroup Commercial Mortgage Trust, Series 2013-GC17, Class AS, 4.544%, 11/10/46 | 335,652 | ||||
| 180,000 | COMM Mortgage Trust, Series 2014-CR20, Class A4, 3.590%, 11/10/47 | 195,323 | ||||
| 211,248 | COMM Mortgage Trust, Series 2007-C9, Class A4, 6.007%, 12/10/49(a) | 216,162 | ||||
| 100,000 | Commercial Mortgage Loan Trust, Series 2008-LS1, Class ASM, 6.296%, | 102,637 | ||||
| 157,693 | Credit Suisse Commercial Mortgage Trust, Series 2007-C3, Class A4, 5.881%, 6/15/39(a) | 159,338 | ||||
Principal | Fair Value | |||||
COMMERCIAL MORTGAGE-BACKED SECURITIES — (continued) | ||||||
| $205,754 | Credit Suisse Commercial Mortgage Trust, Series 2007-C5, Class A4, 5.695%, | $ | 210,474 | |||
| 500,000 | CSAIL Commercial Mortgage Trust, Series 2015-C3, Class A4, 3.718%, 8/15/48 | 548,187 | ||||
| 200,000 | DBUBS Mortgage Trust, Series 2011-LC1A, Class C, 5.884%, 11/10/46(a)(b) | 227,275 | ||||
| 175,000 | GS Mortgage Securities Trust, Series 2010-C1, Class B, 5.148%, 8/10/43(b) | 190,856 | ||||
| 450,000 | GS Mortgage Securities Trust, Series 2010-C2, Class A2, 5.162%, 12/10/43(a)(b) | 505,687 | ||||
| 300,000 | GS Mortgage Securities Trust, Series 2012-GCJ7, Class AS, 4.085%, 5/10/45 | 328,753 | ||||
| 370,000 | GS Mortgage Securities Trust, Series 2014-GC24, Class A5, 3.931%, 9/10/47 | 408,650 | ||||
| 70,000 | JPMorgan Chase Commercial Mortgage Securities Trust, Series 2010-C1, Class B, 5.951%, 6/15/43(b) | 75,788 | ||||
| 76,152 | JPMorgan Chase Commercial Mortgage Securities Trust, Series 2006-CB16, Class AM, 5.593%, 5/12/45 | 76,094 | ||||
| 500,000 | JPMorgan Chase Commercial Mortgage Securities Trust, Series 2011-C3, Class B, 5.013%, 2/15/46(a)(b) | 553,287 | ||||
| 44,563 | JPMorgan Chase Commercial Mortgage Securities Trust, Series 2007-LDPX, Class A3, 5.420%, 1/15/49 | 44,895 | ||||
| 57,452 | LB-UBS Commercial Mortgage Trust, Series 2007-C1, Class A4, 5.424%, 2/15/40 | 57,725 | ||||
| 185,000 | LB-UBS Commercial Mortgage Trust, Series 2007-C7, Class AM, 6.368%, 9/15/45(a) | 193,014 | ||||
| 87,000 | Merrill Lynch Mortgage Trust, Series 2008-C1, Class AM, 6.472%, 2/12/51(a) | 91,390 | ||||
| 389,111 | ML-CFC Commercial Mortgage Trust, Series 2007-8, Class A3, 6.069%, | 397,599 | ||||
| 258,468 | ML-CFC Commercial Mortgage Trust, Series 2007-7, Class A4, 5.810%, | 262,789 | ||||
| 100,000 | Morgan Stanley Bank of America Merrill Lynch Trust, Series 2014-C18, Class A4, 3.923%, 10/15/47 | 111,172 | ||||
| 400,000 | Morgan Stanley Capital I Trust, Series 2011-C2, Class A4, 4.661%, 6/15/44(b) | 445,152 | ||||
| 153,000 | Morgan Stanley Capital I Trust, Series 2007-IQ14, Class A5, 5.696%, 4/15/49(a) | 155,613 | ||||
| 760,000 | Wells Fargo Commercial Mortgage Trust, Series 2010-C1, Class B, 5.276%, 11/15/43(a)(b) | 843,865 | ||||
| 300,000 | Wells Fargo Commercial Mortgage Trust, Series 2015-P2, Class A4, 3.809%, 12/15/48 | 331,034 | ||||
| 400,000 | WF-RBS Commercial Mortgage Trust, Series 2011-C2, Class B, 5.174%, 2/15/44(a)(b) | 444,538 | ||||
| 100,000 | WF-RBS Commercial Mortgage Trust, Series 2011-C2, Class C, 5.392%, 2/15/44(a)(b) | 110,030 | ||||
| 529,000 | WF-RBS Commercial Mortgage Trust, Series 2014-C22, Class A5, 3.752%, 9/15/57 | 576,553 | ||||
| 164,000 | WF-RBS Commercial Mortgage Trust, Series 2014-C23, Class A5, 3.917%, 10/15/57 | 180,738 | ||||
|
| |||||
Total Commercial Mortgage-Backed Securities (Cost $9,516,945) | 9,571,190 | |||||
|
| |||||
Continued
97
Sterling Capital Securitized Opportunities Fund
|
Schedule of Portfolio Investments — (continued) |
September 30, 2016
|
Principal Amount | Fair Value | |||||
MORTGAGE-BACKED SECURITIES — 35.9% |
| |||||
Fannie Mae — 22.2% | ||||||
| $318,688 | 4.000%, 6/1/34, Pool #MA1922 | $ | 345,134 | |||
| 206,489 | 4.000%, 9/1/34, Pool #MA2019 | 223,898 | ||||
| 428,255 | 4.000%, 3/1/35, Pool #MA2211 | 464,555 | ||||
| 655,759 | 3.500%, 5/1/35, Pool #MA2260 | 697,132 | ||||
| 177,139 | 5.000%, 4/1/36, Pool #AB0111 | 197,227 | ||||
| 221,709 | 5.500%, 6/1/38, Pool #984277 | 251,104 | ||||
| 142,030 | 5.500%, 8/1/38, Pool #995072 | 161,921 | ||||
| 167,128 | 4.500%, 9/1/39, Pool #AC1830 | 183,356 | ||||
| 124,243 | 5.000%, 12/1/39, Pool #AC8518 | 138,146 | ||||
| 112,376 | 4.500%, 9/1/40, Pool #AE0411 | 123,953 | ||||
| 181,246 | 4.500%, 10/1/40, Pool #AE4855 | 198,833 | ||||
| 203,155 | 5.000%, 1/1/41, Pool #AH3373 | 227,090 | ||||
| 241,563 | 3.500%, 2/1/41, Pool #AH5646 | 259,824 | ||||
| 472,234 | 4.000%, 3/1/41, Pool #AH4008 | 508,691 | ||||
| 669,076 | 4.500%, 3/1/41, Pool #AB2467 | 742,842 | ||||
| 123,236 | 4.500%, 6/1/41, Pool #AC9298 | 135,524 | ||||
| 308,126 | 5.000%, 7/1/41, Pool #AI5595 | 344,437 | ||||
| 374,490 | 4.000%, 9/1/41, Pool #AJ1717 | 403,744 | ||||
| 382,398 | 3.500%, 6/1/42, Pool #AB5373 | 405,471 | ||||
| 596,239 | 3.500%, 6/1/43, Pool #AT3868 | 631,476 | ||||
| 324,594 | 4.000%, 4/1/44, Pool #AW2882 | 348,712 | ||||
| 429,101 | 5.000%, 5/1/44, Pool #AL5853 | 476,852 | ||||
| 169,773 | 4.500%, 10/1/44, Pool #MA2066 | 185,971 | ||||
| 406,753 | 4.500%, 11/1/44, Pool #MA2100 | 445,562 | ||||
| 600,354 | 4.000%, 12/1/44, Pool #MA2127 | 644,962 | ||||
| 559,065 | 4.500%, 1/1/45, Pool #MA2158 | 613,608 | ||||
| 518,040 | 3.500%, 3/1/45, Pool #AS4552 | 551,135 | ||||
| 456,231 | 4.500%, 7/1/46, Pool #AS7568 | 501,191 | ||||
|
| |||||
| 10,412,351 | ||||||
|
| |||||
Freddie Mac — 13.6% | ||||||
| 496,857 | 3.500%, 1/1/31, Pool #G18583 | 525,976 | ||||
| 644,626 | 3.500%, 5/1/32, Pool #C91458 | 688,350 | ||||
| 529,902 | 3.500%, 7/1/32, Pool #C91467 | 565,606 | ||||
| 197,404 | 4.000%, 11/1/32, Pool #G30616 | 213,658 | ||||
| 389,376 | 3.500%, 6/1/36, Pool #C91875 | 415,154 | ||||
| 98,973 | 5.500%, 10/1/39, Pool #A89387 | 111,066 | ||||
| 166,444 | 5.000%, 4/1/40, Pool #A91812 | 186,578 | ||||
| 321,028 | 5.500%, 4/1/40, Pool #C03467 | 364,057 | ||||
| 145,671 | 5.000%, 8/1/40, Pool #C03491 | 161,544 | ||||
| 246,063 | 4.000%, 11/1/40, Pool #A94742 | 267,713 | ||||
| 271,189 | 4.000%, 12/1/40, Pool #A95447 | 295,088 | ||||
| 533,466 | 4.000%, 1/1/41, Pool #A96312 | 574,495 | �� | |||
| 189,536 | 3.500%, 3/1/42, Pool #G08479 | 200,548 | ||||
| 437,100 | 3.500%, 4/1/42, Pool #C03858 | 465,420 | ||||
Principal Amount | Fair Value | |||||
MORTGAGE-BACKED SECURITIES — (continued) |
| |||||
Freddie Mac — (continued) | ||||||
| $581,619 | 3.500%, 8/1/42, Pool #Q10324 | $ | 615,699 | |||
| 649,169 | 4.000%, 4/1/46, Pool #Q40048 | 697,233 | ||||
|
| |||||
| 6,348,185 | ||||||
|
| |||||
Ginnie Mae — 0.1% | ||||||
| 30,659 | 4.000%, 12/20/40, Pool #755678 | 33,583 | ||||
|
| |||||
Total Mortgage-Backed Securities (Cost $16,424,151) | 16,794,119 | |||||
|
| |||||
U.S. TREASURY NOTES — 0.9% | ||||||
| 405,908 | 0.375%, 7/15/25(c) | 419,197 | ||||
|
| |||||
Total U.S. Treasury Notes | 419,197 | |||||
|
| |||||
Shares | ||||||
MONEY MARKET FUND — 1.3% | ||||||
| 635,431 | Federated Treasury Obligations Fund, Institutional Shares, 0.180%(d) | 635,431 | ||||
|
| |||||
Total Money Market Fund | 635,431 | |||||
|
| |||||
Total Investments — 99.9% | 46,746,100 | |||||
Net Other Assets (Liabilities) — 0.1% | 34,704 | |||||
|
| |||||
NET ASSETS — 100.0% | $ | 46,780,804 | ||||
|
| |||||
| (a) | The interest rate for this variable rate note, which will change periodically, is based either on the prime rate or an index of market rates. The reflected rate is in effect as of September 30, 2016. The maturity date reflected is the final maturity date. |
| (b) | Rule 144A, Section 4(2) or other security that is restricted as to resale to qualified institutional investors. The Advisor, using Board approved procedures, has deemed these securities or a portion of these securities to be liquid. |
| (c) | Inflation protection security. Principal amount periodically adjusted for inflation. |
| (d) | Represents the current yield as of report date. |
STEP — Step Coupon Bond
See accompanying Notes to the Financial Statements.
98
Sterling Capital Kentucky Intermediate Tax-Free Fund
|
Schedule of Portfolio Investments |
September 30, 2016
|
Principal Amount | Fair Value | |||||
MUNICIPAL BONDS — 92.5% | ||||||
Kentucky — 92.5% | ||||||
| $300,000 | Bowling Green, KY, Refunding G.O., Series C, Callable 6/1/26 @ 102, 4.000%, 6/1/27 | $ | 357,546 | |||
| 440,000 | Commonwealth of Kentucky, Certificate of Participation, Public Improvements, 5.000%, 6/15/25 | 550,559 | ||||
| 300,000 | Commonwealth of Kentucky, Certificate of Participation, Public Improvements, Callable 6/15/25 @ 100, 5.000%, 6/15/34 | 355,260 | ||||
| 400,000 | Eastern Kentucky University, Refunding Revenue, Series A, (State Intercept), 5.000%, 4/1/24 | 494,360 | ||||
| 500,000 | Fayette County, KY, School District Finance Corp., Lease Payable from Local Revenues, Series A, 5.000%, 10/1/21 | 586,010 | ||||
| 300,000 | Jefferson County School District Finance Corp. School Imps. Revenue Bonds (State Intercept), Series C, Callable 12/1/25 @ 100, 4.000%, 12/1/28 | 348,030 | ||||
| 250,000 | Jefferson County, KY, School District Finance Corp., School Improvements Revenue, Series A, Callable 4/1/25 @ 100, 5.000%, 4/1/27 | 311,087 | ||||
| 510,000 | Kentucky Asset/Liability Commission, Project Notes, Federal Highway Trust Transit Improvements Revenue, First Series, Callable 9/1/23 @ 100, 5.250%, 9/1/25 | 624,225 | ||||
| 400,000 | Kentucky Association Of Counties Finance Corp., Public Improvements Revenue, First Series B, 4.000%, 2/1/25 | 462,212 | ||||
| 400,000 | Kentucky Economic Development Finance Authority, Baptist Healthcare System, Improvements Refunding Revenue, Series A, Callable 8/15/18 @ 100, OID, 4.750%, 8/15/19 | 423,828 | ||||
| 555,000 | Kentucky Economic Development Finance Authority, Saint Elizabeth Medical Center, Inc. Refunding & Improvement Revenue, Series A, Callable 5/1/19 @ 100, OID, 5.000%, 5/1/24 | 611,982 | ||||
| 500,000 | Kentucky Rural Water Finance Corp., Flexible Term Program, Refunding & Improvements Revenue, Series B, Callable 2/1/20 @ 100, 4.000%, 2/1/21 | 543,270 | ||||
| 410,000 | Kentucky State Property & Buildings Commission, Project No. 76, Refunding Revenue, (AMBAC), 5.500%, 8/1/21 | 488,150 | ||||
| 460,000 | Kentucky State Property & Buildings Commission, Project No. 83, Refunding Revenue, (AMBAC), 5.000%, 10/1/19 | 511,690 | ||||
| 400,000 | Kentucky Turnpike Authority, Revitalization Projects, Refunding Revenue, Series A, Callable 7/1/19 @ 100, 5.000%, 7/1/25 | 444,140 | ||||
| 400,000 | Kentucky Turnpike Authority, Revitalization Projects, Revenue, Series A, 4.000%, 7/1/21 | 446,480 | ||||
| 300,000 | Laurel County, KY, School District Finance Corp., Refunding Revenue, Callable 3/1/25 @ 100 (State Intercept), 4.000%, 6/1/25 | 351,714 | ||||
| 300,000 | Lexington-Fayette Urban County Government G.O., Public Imps. Series B, Callable 1/1/25 @100, 5.000%, 1/1/27 | 372,528 | ||||
Principal Amount | Fair Value | |||||
MUNICIPAL BONDS — (continued) | ||||||
Kentucky — (continued) | ||||||
| $525,000 | Lexington-Fayette Urban County, KY, Airport Board, Refunding Revenue, Series A, 5.000%, 7/1/19 | $ | 580,661 | |||
| 250,000 | Louisville & Jefferson County, KY, Metropolitan Government, Refunding G.O., Series F, Callable 11/1/24 @ 100, 4.000%, 11/1/26 | 293,125 | ||||
| 500,000 | Louisville & Jefferson County, KY, Metropolitan Sewer District, Sewer Refunding Revenue, Series A, Callable 11/15/21 @ 100, 5.000%, 5/15/30 | 586,415 | ||||
| 410,000 | Louisville & Jefferson County, Metropolitan Government, Catholic Health Initiatives, Prerefunded Revenue, Callable 6/1/22 @ 100, 5.000%, 12/1/35 | 496,206 | ||||
| 125,000 | Louisville & Jefferson County, Metropolitan Government, Catholic Health Initiatives, Unrefunded Revenue, Callable 6/1/22 @ 100, 5.000%, 12/1/35 | 139,597 | ||||
| 250,000 | Owensboro, KY, Public Improvements G.O., Series A, 4.000%, 5/1/22 | 285,343 | ||||
| 400,000 | Pulaski County, KY, Public Properties Corp., Administration Office of the Court Judicial Facility, Public Improvement Revenue, Callable 12/1/18 @ 100, OID, 5.500%, 12/1/24 | 439,452 | ||||
| 270,000 | Pulaski County, KY, Public Properties Corp., Administration Office of the Court Judicial Facility, Public Improvement Revenue, Callable 12/1/18 @ 100, OID, 5.625%, 12/1/25 | 297,354 | ||||
| 200,000 | Russell, KY, Bon Secours Health System, Refunding Revenue, Callable 11/1/22 @ 100, 5.000%, 11/1/26 | 236,522 | ||||
| 300,000 | University of Kentucky, Refunding Revenue, Series D (State Intercept), 5.250%, 10/1/20 | 349,263 | ||||
|
| |||||
Total Municipal Bonds | 11,987,009 | |||||
|
| |||||
Shares | ||||||
MONEY MARKET FUND — 6.5% | ||||||
| 838,159 | Dreyfus Tax Exempt Cash Management, 0.550%(a) | 838,159 | ||||
|
| |||||
Total Money Market Fund | 838,159 | |||||
|
| |||||
Total Investments — 99.0% | 12,825,168 | |||||
Net Other Assets (Liabilities) — 1.0% | 133,498 | |||||
|
| |||||
NET ASSETS — 100.0% | $ | 12,958,666 | ||||
|
| |||||
| (a) | Represents the current yield as of report date. |
AMBAC — American Municipal Bond Assurance Corp.
G.O. — General Obligation
OID — Original Issue Discount
See accompanying Notes to the Financial Statements.
99
Sterling Capital Maryland Intermediate Tax-Free Fund
|
Schedule of Portfolio Investments |
September 30, 2016
|
Principal Amount | Fair Value | |||||
MUNICIPAL BONDS — 97.1% | ||||||
Maryland — 97.1% | ||||||
| $1,000,000 | Anne Arundel County, MD, Consolidated Water & Sewer Utility Improvements G.O., 5.000%, 4/1/22 | $ | 1,210,230 | |||
| 810,000 | Anne Arundel County, MD, Economic Development, Anne Arundel Community College Project, Refunding Revenue, 4.000%, 9/1/20 | 891,340 | ||||
| 500,000 | Charles County, MD, Consolidated Public School Improvements G.O., 5.000%, 7/15/22 | 609,005 | ||||
| 890,000 | Charles County, MD, Consolidated Public School Improvements G.O., Callable 7/15/23 @ 100, 5.000%, 7/15/25 | 1,093,587 | ||||
| 1,000,000 | Harford County, MD, Consolidated Public Improvements G.O., 5.000%, 9/15/23 | 1,251,610 | ||||
| 705,000 | Howard County Housing Commission, Gateway Village Apartments, Local Multifamily Housing, Revenue Bonds, Callable 6/1/26 @ 100, 4.000%, 6/1/27 | 798,349 | ||||
| 1,000,000 | Howard County, MD, Consolidated Public Improvements, Series A, Refunding G.O., 5.000%, 2/15/20 | 1,136,080 | ||||
| 300,000 | Howard County, MD, Housing Commission, Columbia Commons Apartments, Local Multifamily Housing Revenue, Series A, 3.000%, 6/1/21 | 319,053 | ||||
| 275,000 | Howard County, MD, Housing Commission, General Capital Improvement Program, Local Multifamily Housing Revenue, 4.000%, 6/1/22 | 307,571 | ||||
| 125,000 | Howard County, MD, Miscellaneous Purpose Certificate of Participation, Series A, 8.050%, 2/15/21 | 161,743 | ||||
| 135,000 | Howard County, MD, Public Improvements Certificate of Participation, Series B, 8.250%, 2/15/20 | 166,992 | ||||
| 690,000 | Maryland Community Development Administration, Residential Single Family Housing Revenue, Series A, Callable 9/1/18 @ 100, 4.750%, 9/1/29 | 717,283 | ||||
| 250,000 | Maryland Economic Development Corp., Electricity Lights & Power Improvements, Refunding Revenue, Callable 3/1/19 @ 100, 6.200%, 9/1/22 | 280,207 | ||||
| 90,000 | Maryland Economic Development Corp., Lutheran World Relief Refugee, Refunding Revenue, Callable 4/1/17 @ 100, (Lutheran Center Corp.), 5.250%, 4/1/19 | 91,925 | ||||
| 1,175,000 | Maryland Economic Development Corp., Public Health Laboratory Public Improvements Revenue, 5.000%, 6/1/20 | 1,341,016 | ||||
| 420,000 | Maryland Economic Development Corp., Public Health Laboratory Public Improvements Revenue, Callable 6/1/21 @ 100, 5.000%, 6/1/26 | 488,817 | ||||
| 1,000,000 | Maryland Health & Higher Educational Facilities Authority, Calvert Health System, Health, Hospital, Nursing Home Improvements, Refunding Revenue, Callable 07/01/23 @ 100, OID, 5.000%, 7/1/38 | 1,142,400 | ||||
Principal Amount | Fair Value | |||||
MUNICIPAL BONDS — (continued) | ||||||
Maryland — (continued) | ||||||
| $1,090,000 | Maryland Health & Higher Educational Facilities Authority, Carroll Hospital, Refunding Revenue, Series A, 5.000%, 7/1/19 | $ | 1,206,815 | |||
| 900,000 | Maryland Health & Higher Educational Facilities Authority, College of Notre Dame, Refunding Revenue, 4.000%, 10/1/19 | 961,029 | ||||
| 1,000,000 | Maryland Health & Higher Educational Facilities Authority, Frederick Memorial Hospital, Refunding Revenue, Series A, 5.000%, 7/1/22 | 1,175,320 | ||||
| 500,000 | Maryland Health & Higher Educational Facilities Authority, Greater Baltimore Medical Center, Refunding Revenue, Series A, Callable 7/1/22 @ 100, 5.000%, 7/1/26 | 590,355 | ||||
| 1,000,000 | Maryland Health & Higher Educational Facilities Authority, Johns Hopkins Health System, Health, Hospital, Nursing Home Improvements Revenue, Callable 7/1/22 @ 100, 5.000%, 7/1/25 | 1,190,690 | ||||
| 530,000 | Maryland Health & Higher Educational Facilities Authority, Maryland Institute College of Art, Refunding Revenue, Callable 6/1/22 @ 100, 5.000%, 6/1/23 | 620,026 | ||||
| 1,000,000 | Maryland Health & Higher Educational Facilities Authority, MedStar Health Inc., Health, Hospital, Nursing Home Improvements Revenue, Series B, Callable 8/15/23 @ 100, 5.000%, 8/15/38 | 1,152,890 | ||||
| 400,000 | Maryland Health & Higher Educational Facilities Authority, Meritus Medical Center Issue, Refunding Revenue, 5.000%, 7/1/22 | 474,456 | ||||
| 400,000 | Maryland Health & Higher Educational Facilities Authority, University of Maryland Medical System, Refunding Revenue, 5.000%, 7/1/19 | 441,604 | ||||
| 1,160,000 | Maryland Stadium Authority, Refunding Revenue, 5.000%, 6/15/23 | 1,422,624 | ||||
| 500,000 | Maryland State Department of Transportation, Transit Improvements Revenue, Second Issue, Callable 9/1/18 @ 100, 5.000%, 9/1/23 | 538,785 | ||||
| 1,000,000 | Maryland State Transportation Authority, Transportation Facilities Project, Highway Revenue, Series A, Callable 7/1/19 @ 100, 5.000%, 7/1/22 | 1,110,930 | ||||
| 500,000 | Montgomery County, MD, Department Liquor Control Public Improvements Revenue, Series A, Callable 4/1/21 @ 100, OID, 4.500%, 4/1/26 | 567,475 | ||||
| 1,025,000 | Montgomery County, MD, Revenue Authority, Refunding Revenue, 5.000%, 5/1/22 | 1,223,020 | ||||
| 750,000 | Montgomery County, MD, Water Quality Public Improvements Revenue, Series A, Callable 4/1/20 @ 100, 5.000%, 4/1/30 | 849,338 | ||||
| 890,000 | Montgomery County, MD, West Germantown Development District, Refunding, Special Tax, 4.000%, 7/1/23 | 1,017,626 | ||||
| 1,000,000 | Prince George’s County, MD, Consolidated Public School Improvements, G.O., Series A, Callable 9/01/24 @ 100, 4.000%, 9/1/25 | 1,190,940 | ||||
Continued
100
Sterling Capital Maryland Intermediate Tax-Free Fund
|
Schedule of Portfolio Investments — (continued) |
September 30, 2016
|
Principal Amount | Fair Value | |||||
MUNICIPAL BONDS — (continued) | ||||||
Maryland — (continued) | ||||||
| $1,000,000 | State of Maryland, Refunding G.O., Series B, 4.000%, 8/1/23 | $ | 1,182,940 | |||
| 1,140,000 | Washington County, MD, Refunding G.O., 4.000%, 1/1/21 | 1,281,018 | ||||
| 700,000 | Washington Suburban Sanitary Commission, Consolidated Public Water Utility Improvements, G.O., 4.000%, 6/1/24 | 837,669 | ||||
|
| |||||
| 31,042,758 | ||||||
|
| |||||
Total Municipal Bonds | 31,042,758 | |||||
|
| |||||
| Fair Value | |||||
MONEY MARKET FUND — 2.1% | ||||||
| 651,369 | Dreyfus Tax Exempt Cash Management, 0.550%(a) | $ | 651,369 | |||
|
| |||||
Total Money Market Fund | 651,369 | |||||
|
| |||||
Total Investments — 99.2% | 31,694,127 | |||||
Net Other Assets (Liabilities) — 0.8% | 266,394 | |||||
|
| |||||
NET ASSETS — 100.0% | $ | 31,960,521 | ||||
|
| |||||
| (a) | Represents the current yield as of report date. |
G.O. — General Obligation
OID — Original Issue Discount
See accompanying Notes to the Financial Statements.
101
Sterling Capital North Carolina Intermediate Tax-Free Fund
|
Schedule of Portfolio Investments |
September 30, 2016
|
Principal Amount | Fair Value | |||||
MUNICIPAL BONDS — 97.7% | ||||||
North Carolina — 97.7% | ||||||
| $2,335,000 | Appalachian State University, University & College Improvements Revenue, Callable 10/1/21 @ 100, 5.000%, 10/1/24 | $ | 2,739,469 | |||
| 2,405,000 | Appalachian State University, University & College Improvements Revenue, Callable 10/1/21 @ 100, 4.750%, 10/1/27 | 2,777,535 | ||||
| 1,000,000 | Beaufort County, NC, Refunding Revenue Limited Obligation, Callable 6/1/22 @ 100, 5.000%, 6/1/24 | 1,193,280 | ||||
| 1,000,000 | Beaufort County, NC, Refunding Revenue Limited Obligation, Callable 6/1/22 @ 100, 5.000%, 6/1/26 | 1,181,830 | ||||
| 1,000,000 | Broad River Water Authority, Water System Refunding Revenue, 5.000%, 6/1/24 | 1,238,760 | ||||
| 1,025,000 | Buncombe County Metropolitan Sewerage District, Sewer Improvements Revenue, Callable 7/1/24 @ 100, 5.000%, 7/1/39 | 1,218,049 | ||||
| 1,985,000 | Buncombe County, NC, Public Improvements Revenue, Series A, 4.000%, 6/1/17 | 2,027,380 | ||||
| 2,000,000 | Buncombe County, NC, Refunding Revenue, Limited Obligations, Series A, 5.000%, 6/1/20 | 2,282,580 | ||||
| 1,000,000 | Cabarrus County, NC Installment Fing Contract Public Imps. Revenue Bonds, Callable 4/1/26 @ 100, 5.000%, 4/1/28 | 1,264,890 | ||||
| 1,000,000 | Cabarrus County, NC, Installment Financing Contract, Correctional Facility Improvements Certificate of Participation, Series C, Callable 6/1/18 @ 100, OID, 5.000%, 6/1/23 | 1,068,780 | ||||
| 1,685,000 | Cabarrus County, NC, Installment Financing Contract, School Improvements Certificate of Participation, Callable 1/1/19 @ 100, 5.000%, 1/1/20 | 1,839,885 | ||||
| 1,730,000 | Cabarrus County, NC, Installment Financing Contract, School Improvements Certificate of Participation, Callable 1/1/19 @ 100, 5.000%, 1/1/23 | 1,889,022 | ||||
| 1,240,000 | Cape Fear Public Utility Authority, Water & Sewer System, Improvements Refunding Revenue, 5.000%, 8/1/21 | 1,467,230 | ||||
| 1,475,000 | Cape Fear Public Utility Authority, Water & Sewer System, Improvements Refunding Revenue, Callable 8/1/21 @ 100, 5.000%, 8/1/26 | 1,738,774 | ||||
| 1,535,000 | Cape Fear Public Utility Authority, Water & Sewer System, Improvements Refunding Revenue, Callable 8/1/21 @ 100, 5.000%, 8/1/28 | 1,801,599 | ||||
| 1,160,000 | Cape Fear Public Utility Authority, Water & Sewer System, Improvements Revenue, Callable 8/1/18 @ 100, 5.000%, 8/1/26 | 1,246,803 | ||||
| 1,030,000 | Cape Fear Public Utility Authority, Water & Sewer System, Improvements Revenue, Callable 8/1/18 @ 100, 5.000%, 8/1/31 | 1,107,075 | ||||
| 1,120,000 | Cary, NC, Combined Utility Systems, Refunding Revenue, Callable 12/1/25 @ 100, 4.000%, 12/1/29 | 1,312,326 | ||||
| 1,000,000 | Catawba County, NC, School Improvements Refunding Revenue, 4.000%, 10/1/19 | 1,087,280 | ||||
| 1,000,000 | Catawba County, NC, School Improvements Refunding Revenue, 4.000%, 10/1/20 | 1,110,970 | ||||
Principal Amount | Fair Value | |||||
MUNICIPAL BONDS — (continued) | ||||||
North Carolina — (continued) | ||||||
| $1,000,000 | Charlotte, NC, Charlotte Douglas International Airport Refunding Revenue, Callable 7/1/24 @ 100, 5.000%, 7/1/31 | $ | 1,200,120 | |||
| 1,000,000 | Charlotte, NC, Port, Airport & Marina Improvements Revenue, Series A, Callable 7/1/20 @ 100, 5.000%, 7/1/27 | 1,140,400 | ||||
| 1,000,000 | Charlotte, NC, Water & Sewer System, Refunding Revenue, Series B, Callable 7/1/20 @ 100, 5.000%, 7/1/25 | 1,144,770 | ||||
| 2,000,000 | Chatham County, NC, Refunding Revenue (County Guaranteed), 5.000%, 12/1/28 | 2,584,220 | ||||
| 2,000,000 | Concord, NC, Utilities Systems, Refunding Revenue, Series B, Callable 12/1/19 @ 100, 5.000%, 12/1/22 | 2,217,260 | ||||
| 1,220,000 | Davidson County, NC, Advance Refunding Revenue, G.O., 5.000%, 6/1/26 | 1,588,538 | ||||
| 1,000,000 | Durham Capital Financing Corp., Limited Obligation Refunding Revenue, 5.000%, 6/1/21 | 1,175,860 | ||||
| 1,410,000 | Durham County, NC, Industrial Facilities & Pollution Control Financing Authority, Research Triangle Institute, University & College Improvements Revenue, 5.000%, 2/1/20 | 1,584,924 | ||||
| 2,000,000 | Durham County, NC, Public Improvements Certificate of Participation, Series A, Callable 6/1/19 @ 100, 5.000%, 6/1/24 | 2,215,400 | ||||
| 1,000,000 | Durham, NC, Refunding, G.O., 4.000%, 9/1/25 | 1,216,350 | ||||
| 2,465,000 | Fayetteville, NC, Public Works Commission Revenue, Multi Utility Improvements, Advance Refunding Revenue Bonds, 5.000%, 3/1/26 | 3,196,859 | ||||
| 1,750,000 | Fayetteville, NC, Public Works Commission, Electric Light & Power Improvements Revenue, Callable 3/1/24 @ 100, 4.000%, 3/1/27 | 2,022,877 | ||||
| 1,000,000 | Fayetteville, NC, Public Works Commission, Multi Utility Improvements Refunding Revenue, 5.000%, 3/1/25 | 1,275,870 | ||||
| 1,085,000 | Franklin County, NC, Public Facilities Projects, Certificate of Participation, Callable 9/1/17 @ 100 (NATL), 5.000%, 9/1/22 | 1,124,071 | ||||
| 1,890,000 | Greensboro, NC, Public Improvements Refunding Revenue, General Obligation, G.O., Callable 8/1/26 @ 100, 5.000%, 2/1/28 | 2,446,624 | ||||
| 2,000,000 | Guilford County, NC, Advance Refunding, G.O., Series A, 5.000%, 2/1/26 | 2,612,380 | ||||
| 1,030,000 | Henderson County, NC, University & College Improvements Revenue, Series B, 4.000%, 12/1/16 | 1,035,665 | ||||
| 1,010,000 | Holly Springs, NC, Public Improvements Revenue, Callable 10/1/24 @ 100, 5.000%, 10/1/27 | 1,253,066 | ||||
| 2,335,000 | Iredell County, NC, Refunding G.O., Series B, 5.000%, 2/1/19 | 2,557,409 | ||||
| 2,125,000 | Iredell County, NC, Refunding G.O., Series B, 5.000%, 2/1/20 | 2,407,923 | ||||
| 2,470,000 | Iredell County, NC, Refunding G.O., Series B, 5.000%, 2/1/21 | 2,885,133 | ||||
| 1,000,000 | Johnston County, NC, Public Improvement, G.O., 5.000%, 2/1/23 | 1,229,330 | ||||
Continued
102
Sterling Capital North Carolina Intermediate Tax-Free Fund
|
Schedule of Portfolio Investments — (continued) |
September 30, 2016
|
Principal Amount | Fair Value | |||||
MUNICIPAL BONDS — (continued) | ||||||
North Carolina — (continued) | ||||||
| $1,405,000 | Johnston County, NC, Public Improvements, G.O., 5.000%, 2/1/24 | $ | 1,768,797 | |||
| 1,570,000 | Lenoir County, NC, Refunding G.O., 4.000%, 2/1/19 | 1,679,162 | ||||
| 1,705,000 | Lenoir County, NC, Refunding G.O., 4.000%, 2/1/20 | 1,869,055 | ||||
| 1,750,000 | Lincoln County, NC, Refunding G.O., Series A, 5.000%, 6/1/18 | 1,869,210 | ||||
| 2,535,000 | Lincoln County, NC, Refunding G.O., Series A, 4.000%, 6/1/19 | 2,739,118 | ||||
| 2,000,000 | Mecklenburg County, NC, Refunding G.O., 5.000%, 2/1/21 | 2,344,320 | ||||
| 1,195,000 | Monroe, NC, Advance Refunding Revenue Bonds, Callable 3/1/26 @ 100, 5.000%, 3/1/29 | 1,482,457 | ||||
| 1,280,000 | Monroe, NC, Combined Enterprise System, Refunding Revenue (AGM), 4.000%, 3/1/19 | 1,368,486 | ||||
| 1,000,000 | Monroe, NC, Enterprise System, Advance Refunding Revenue, Callable 3/1/26 @ 100, 5.000%, 3/1/27 | 1,260,160 | ||||
| 1,020,000 | Mooresville Town, NC, Advance Refunding, G.O., 5.000%, 4/1/23 | 1,258,904 | ||||
| 1,365,000 | Mooresville Town, NC, Advance Refunding, G.O., 5.000%, 4/1/22 | 1,645,685 | ||||
| 1,855,000 | New Hanover County, NC, New Hanover County Projects, Refunding Revenue, 5.000%, 12/1/19 | 2,086,300 | ||||
| 1,015,000 | New Hanover County, NC, New Hanover County Projects, Refunding Revenue, 5.000%, 12/1/20 | 1,176,618 | ||||
| 1,270,000 | New Hanover County, NC, New Hanover Regional Medical, Refunding Revenue, Callable 10/1/21 @ 100, 5.000%, 10/1/23 | 1,485,138 | ||||
| 1,000,000 | New Hanover County, NC, Regional Medical Center, Health Hospital, Nursing Home Improvements Revenue, Series A, Callable 10/1/19 @ 100 (AGM), 5.000%, 10/1/21 | 1,124,210 | ||||
| 1,050,000 | New Hanover County, NC, Regional Medical Center, Health Hospital, Nursing Home Improvements Revenue, Series A, Callable 10/1/19 @ 100 (AGM), 5.000%, 10/1/22 | 1,179,003 | ||||
| 1,000,000 | North Carolina Agricultural & Technical State University, Series A, Refunding Revenue, Callable 10/1/25 @ 100, 5.000%, 10/1/32 | 1,210,290 | ||||
| 1,215,000 | North Carolina Agricultural & Technical State University, Series A, Refunding Revenue, Callable 10/1/25 @ 100, 5.000%, 10/1/34 | 1,462,860 | ||||
| 1,305,000 | North Carolina Capital Facilities Finance Agency, Johnson & Wales University Project, Refunding Revenue, 5.000%, 4/1/21 | 1,506,557 | ||||
| 1,000,000 | North Carolina Capital Facilities Finance Agency, Johnson & Wales University Project, Refunding Revenue, Callable 4/1/23 @ 100, 5.000%, 4/1/25 | 1,202,020 | ||||
| 1,750,000 | North Carolina Capital Facilities Finance Agency, Wake Forest University, Advance Refunding Revenue, Callable 7/1/26@ 100, 4.000%, 1/1/35 | 1,974,280 | ||||
Principal Amount | Fair Value | |||||
MUNICIPAL BONDS — (continued) | ||||||
North Carolina — (continued) | ||||||
| $1,000,000 | North Carolina Eastern Municipal Power Agency, Electric, Lights & Power Improvements Revenue, Series A, Callable 7/1/22 @ 100, 5.000%, 1/1/25 | $ | 1,215,270 | |||
| 1,640,000 | North Carolina Eastern Municipal Power Agency, Electric, Lights & Power Improvements Revenue, Series A, OID, 6.400%, 1/1/21 | 1,835,390 | ||||
| 1,005,000 | North Carolina Medical Care Commission, First Mortgage Deerfield, Health, Hospital, Nursing Home Improvements Revenue, Series A, Callable 11/1/18 @ 100, OID, 6.000%, 11/1/33 | 1,110,535 | ||||
| 1,500,000 | North Carolina Medical Care Commission, Firsthealth Carolina, Refunding Revenue, Series C, OID, 4.000%, 10/1/18 | 1,587,165 | ||||
| 2,000,000 | North Carolina Medical Care Commission, Health Care Facilities, Deerfield Episcopal Retirement, Advance Refunding Revenue, Callable 11/1/26 @ 100, 5.000%, 11/1/31 | 2,447,260 | ||||
| 2,000,000 | North Carolina Medical Care Commission, Health Care Facilities, Deerfield Episcopal Retirement, Advance Refunding Revenue, Callable 11/1/26 @ 100, 5.000%, 11/1/37 | 2,403,740 | ||||
| 5,000,000 | North Carolina Medical Care Commission, Health Care Facilities, Duke University Health System, Health, Hospital, Nursing Home Improvements Revenue, Callable 6/1/22 @ 100, Series A, 5.000%, 6/1/32 | 5,846,800 | ||||
| 915,000 | North Carolina Medical Care Commission, Health Care Facilities, Refunding Revenue, Appalachian Regional Healthcare System, Series A, 5.000%, 7/1/19 | 994,294 | ||||
| 1,180,000 | North Carolina Medical Care Commission, Health Care Facilities, Refunding Revenue, Appalachian Regional Healthcare System, Series A, 5.375%, 7/1/20 | 1,328,727 | ||||
| 1,000,000 | North Carolina Medical Care Commission, Mission Health Combine Group, Refunding Revenue, Callable 10/1/17 @ 100 (AGM-CR), 5.000%, 10/1/25 | 1,042,220 | ||||
| 3,030,000 | North Carolina Medical Care Commission, North Carolina Baptist Hospital, Refunding Revenue, 5.000%, 6/1/20 | 3,436,808 | ||||
| 1,530,000 | North Carolina Medical Care Commission, North Carolina Baptist Hospital, Refunding Revenue, Callable 6/1/20 @ 100, 5.250%, 6/1/29 | 1,731,684 | ||||
| 1,500,000�� | North Carolina Medical Care Commission, United Methodist Retirement, Health, Hospital, Nurshing Home Improvements, Refunding Revenue, Callable 10/1/26 @ 100, 5.000%, 10/1/35 | 1,773,240 | ||||
| 2,780,000 | North Carolina Medical Care Commission, Vidant Health Care Facilities, Refunding Revenue, Series A, Callable 6/1/22 @ 100, 5.000%, 6/1/24 | 3,296,635 | ||||
| 2,000,000 | North Carolina State University at Raleigh, Refunding Revenue, Series A, Callable 10/1/23 @ 100, 5.000%, 10/1/28 | 2,464,420 | ||||
Continued
103
Sterling Capital North Carolina Intermediate Tax-Free Fund
|
Schedule of Portfolio Investments — (continued) |
September 30, 2016
|
Principal Amount | Fair Value | |||||
MUNICIPAL BONDS — (continued) | ||||||
North Carolina — (continued) | ||||||
| $4,550,000 | North Carolina State, Public Improvements, Revenue, Series C, Callable 5/1/21 @ 100, 4.000%, 5/1/23 | $ | 5,109,650 | |||
| 2,000,000 | North Carolina State, Public Improvements, Series A, Callable 5/1/23 @ 100, 5.000%, 5/1/24 | 2,466,580 | ||||
| 1,250,000 | Onslow County, NC, Refunding G.O., 5.000%, 12/1/21 | 1,483,800 | ||||
| 1,365,000 | Orange County, NC, Public Facilities Co., Public Improvements, Revenue, Callable 10/1/21 @ 100, 5.000%, 10/1/23 | 1,617,948 | ||||
| 1,105,000 | Pasquotank County, NC, Refunding Certificate of Participation (NATL), 5.250%, 6/1/18 | 1,173,201 | ||||
| 1,000,000 | Pasquotank County, NC, Refunding Certificate of Participation (NATL), 5.250%, 6/1/19 | 1,096,230 | ||||
| 1,210,000 | Pender County, NC, Limited Obligation Refunding Revenue, Callable 6/1/22 @ 100, 5.000%, 6/1/26 | 1,452,569 | ||||
| 1,025,000 | Pender County, NC, School Improvements G.O.,, 5.000%, 3/1/25 | 1,313,373 | ||||
| 1,015,000 | Pender County, NC, School Improvements, G.O., Callable 3/1/26 @ 100, 5.000%, 3/1/27 | 1,310,527 | ||||
| 1,390,000 | Pitt County, NC, Certificate of Participation, Refunding, Callable 4/1/22 @ 100, 5.000%, 4/1/24 | 1,653,127 | ||||
| 1,395,000 | Pitt County, NC, Certificate of Participation, Refunding, Callable 4/1/22 @ 100, 5.000%, 4/1/25 | 1,650,773 | ||||
| 2,160,000 | Raleigh Durham Airport Authority, Refunding Revenue, Series B1, Callable 5/1/20 @ 100, 5.000%, 11/1/28 | 2,446,697 | ||||
| 1,500,000 | Raleigh, NC, Combined Enterprise System, Refunding Revenue, Series A, Callable 3/1/23 @ 100, 5.000%, 3/1/27 | 1,842,480 | ||||
| 1,615,000 | Raleigh, NC, Combined Enterprise System, Refunding Revenue, Series A, Callable 3/1/23 @ 100, 5.000%, 3/1/28 | 1,975,016 | ||||
| 1,070,000 | Raleigh, NC, Public Improvements, Revenue, Series A, Callable 10/1/24 @ 100, 4.000%, 10/1/31 | 1,221,587 | ||||
| 1,560,000 | Rockingham County, NC, Public Improvements Certificate of Participation (Assured Guaranty), 5.000%, 4/1/17 | 1,593,134 | ||||
| 1,510,000 | Rockingham County, NC, Refunding Revenue, 5.000%, 4/1/18 | 1,601,733 | ||||
| 1,985,000 | Sampson County, NC, Refunding Revenue, Callable 12/1/25 @ 100, 5.000%, 12/1/26 | 2,490,401 | ||||
| 1,000,000 | Union County, NC, Enterprise Systems, Refunding Revenue, Series A, Callable 12/1/21 @ 100, 4.000%, 12/1/22 | 1,138,220 | ||||
| 2,205,000 | Union County, NC, Refunding G.O., Series A, 5.000%, 3/1/22 | 2,661,192 | ||||
| 1,000,000 | Union County, NC, Refunding Revenue, 5.000%, 12/1/23 | 1,248,470 | ||||
| 2,285,000 | University of North Carolina at Greensboro, Refunding Revenue, Callable 4/1/21 @ 100, 5.000%, 4/1/23 | 2,672,742 | ||||
| 1,695,000 | University of North Carolina at Greensboro, University & College Improvements Revenue, Callable 4/1/24 @ 100, 5.000%, 4/1/28 | 2,054,865 | ||||
Principal Amount | Fair Value | |||||
MUNICIPAL BONDS — (continued) | ||||||
North Carolina — (continued) | ||||||
| $3,260,000 | University of North Carolina System, Appalachian State University, Refunding Revenue, Series B1, Callable 4/1/20 @ 100, 5.250%, 10/1/22 | $ | 3,742,741 | |||
| 3,130,000 | University of North Carolina System, Asheville/Wilmington, Refunding Revenue, Series C, Callable 4/1/20 @ 100 (Assured Guaranty), 5.000%, 10/1/20 | 3,581,127 | ||||
| 1,485,000 | University of North Carolina System, Asheville/Wilmington, Refunding Revenue, Series C, Callable 4/1/20 @ 100 (Assured Guaranty), 5.250%, 10/1/24 | 1,702,686 | ||||
| 255,000 | University Of North Carolina System, Prerefunded Revenue, Series A, Callable 10/1/16 @ 100, (NATL-RE), 5.000%, 10/1/17 | 255,031 | ||||
| 1,975,000 | University of North Carolina System, The University of North Carolina at Greensboro, Refunding Revenue, Series B2, 5.000%, 4/1/17 | 2,015,270 | ||||
| 1,000,000 | University of North Carolina System, University & College Improvements, General Trust Indenture Revenue, Series C, 4.500%, 10/1/17 | 1,037,140 | ||||
| 120,000 | University Of North Carolina System, University & College Improvements, Prefunded Revenue, Series A, Callable 10/1/16 @ 100, (NATL-RE), 5.000%, 10/1/17 | 120,014 | ||||
| 250,000 | University of North Carolina System, University & College Improvements, Prerefunded Revenue, Series A, Callable 10/1/16 @ 100, 5.000%, 10/1/17 | 250,030 | ||||
| 150,000 | University Of North Carolina System, University & College Improvements, Unrefunded Revenue, Series A, Callable 11/14/16 @ 100, (NATL-RE), 5.000%, 10/1/17 | 150,543 | ||||
| 3,000,000 | Wake County Industrial Facilities & Pollution Control Financing Authority, Duke Energy Progress, Refunding Revenue, Callable 6/1/23 @ 100, 4.000%, 6/1/41 | 3,270,930 | ||||
| 2,125,000 | Watauga Public Facilities Corp., Revenue, Series A, Callable 6/1/22 @ 100, 5.000%, 6/1/24 | 2,536,995 | ||||
| 1,000,000 | Watauga Public Facilities Corp., Revenue, Series A, Callable 6/1/22 @ 100, 5.000%, 6/1/26 | 1,181,230 | ||||
| 1,000,000 | Wilmington, NC, Advance Refunding Revenue Bonds, Callable 6/1/26 @ 100, 4.000%, 6/1/35 | 1,130,860 | ||||
| 1,000,000 | Winston-Salem State University Foundation LLC, Refunding Revenue, Callable 4/1/22 @ 100, 5.000%, 4/1/25 | 1,157,720 | ||||
| 1,000,000 �� | Winston-Salem, NC, Transit Improvements, Refunding Revenue, Series C, Callable 6/1/24 @ 100, 5.000%, 6/1/30 | 1,216,260 | ||||
| 1,165,000 | Winston-Salem, NC, Water & Sewer System, Refunding Revenue, Series A, 5.000%, 6/1/24 | 1,478,898 | ||||
Continued
104
Sterling Capital North Carolina Intermediate Tax-Free Fund
|
Schedule of Portfolio Investments — (continued) |
September 30, 2016
|
Principal Amount | Fair Value | |||||
MUNICIPAL BONDS — (continued) | ||||||
North Carolina — (continued) | ||||||
| $1,000,000 | Winston-Salem, NC, Water & Sewer System, Refunding Revenue, Series A, Callable 6/1/17 @ 100, 5.000%, 6/1/19 | $ | 1,027,840 | |||
| 1,875,000 | Winston-Salem, NC, Water & Sewer System, Refunding Revenue, Series A, Callable 6/1/24 @ 100, 5.000%, 6/1/25 | 2,355,319 | ||||
| 1,000,000 | Winston-Salem, NC, Water & Sewer System, Refunding Revenue, Series A, Callable 6/1/24 @ 100, 5.000%, 6/1/28 | 1,245,340 | ||||
|
| |||||
Total Municipal Bonds | 210,645,673 | |||||
|
| |||||
| Fair Value | |||||
MONEY MARKET FUND — 2.3% | ||||||
| 4,845,465 | Federated North Carolina Municipal Cash Trust, Institutional Shares, 0.17%(a) | $ | 4,845,465 | |||
|
| |||||
Total Money Market Fund | 4,845,465 | |||||
|
| |||||
Total Investments — 100.0% | 215,491,138 | |||||
Net Other Assets (Liabilities) — 0.0% | 30,346 | |||||
|
| |||||
NET ASSETS — 100.0% | $ | 215,521,484 | ||||
|
| |||||
| (a) | Represents the current yield as of report date. |
AGM — Assured Guaranty Municipal Corp.
CR — Custodial Receipts
G.O. — General Obligation
NATL — National Public Finance Guarantee Corp.
OID — Original Issue Discount
RE — Reinsurance
See accompanying Notes to the Financial Statements.
105
Sterling Capital South Carolina Intermediate Tax-Free Fund
|
Schedule of Portfolio Investments |
September 30, 2016
|
Principal Amount | Fair Value | |||||
MUNICIPAL BONDS — 97.0% | ||||||
South Carolina — 97.0% | ||||||
| $1,515,000 | Anderson County, SC, School District No 4, Refunding, G.O., Series A, Callable 3/1/25 @ 100, (SCSDE), 5.000%, 3/1/28 | $ | 1,878,358 | |||
| 1,190,000 | Anderson County, SC, School District No 5, Advance Refunding, G.O., (SCSDE), 5.000%, 3/1/23 | 1,461,725 | ||||
| 1,215,000 | Anderson County, SC, School District No 5, School Improvements, G.O., (SCSDE), 5.000%, 3/1/25 | 1,541,398 | ||||
| 1,000,000 | Anderson Regional Joint Water System, Refunding Revenue, Series A, Callable 7/15/21 @ 100, 5.000%, 7/15/25 | 1,159,030 | ||||
| 1,095,000 | Anderson, SC, Water & Sewer, Refunding Revenue (AGM), 5.000%, 7/1/19 | 1,212,351 | ||||
| 1,000,000 | Beaufort County, SC, School District, Advance Refunding, G.O., (SCSDE), 5.000%, 3/1/22 | 1,201,350 | ||||
| 1,000,000 | Beaufort County, SC, School District, Refunding G.O., Series A, Callable 3/1/17 @ 100 (AGM, SCSDE), 5.000%, 3/1/27 | 1,017,770 | ||||
| 1,000,000 | Charleston County, SC, Capital Improvements Transportation Sales Tax, Public Improvements G.O., Callable 11/1/21 @ 100 (State Aid Withholding), 5.000%, 11/1/22 | 1,190,830 | ||||
| 1,000,000 | Charleston County, SC, Port, Airport & Marina Improvements Revenue, 5.000%, 12/1/22 | 1,216,550 | ||||
| 2,500,000 | Charleston Educational Excellence Finance Corp., Charleston County School Refunding Revenue, 5.000%, 12/1/21 | 2,974,275 | ||||
| 1,000,000 | Charleston, SC, Refunding, Series B, Callable 1/1/27 @ 100, 5.000%, 1/1/30 | 1,288,610 | ||||
| 1,075,000 | Cherokee County, SC, School District No 1, School Improvements, G.O., Series A (SCSDE), 5.000%, 3/1/25 | 1,365,723 | ||||
| 1,910,000 | Clover School District No. 2, Advance Refunding, G.O., (SCSDE), 5.000%, 3/1/18 | 2,020,742 | ||||
| 1,000,000 | Clover, SC, School District No 2, Advance Refunding, G.O., (SCSDE), 5.000%, 3/1/20 | 1,134,010 | ||||
| 1,355,000 | Coastal Carolina University, University & College Improvements Revenue, Callable 6/1/24 @ 100, 5.000%, 6/1/34 | 1,601,447 | ||||
| 1,295,000 | College of Charleston, University & College Improvements Refunding Revenue, Series A, Callable 4/1/21 @ 100, 5.000%, 4/1/25 | 1,499,765 | ||||
| 1,000,000 | College of Charleston, University & College Improvements Revenue, Series A, Callable 4/1/24 @ 100, 5.000%, 4/1/25 | 1,228,590 | ||||
| 1,095,000 | Columbia, SC, Recreational Facilities Improvements Revenue, Callable 2/1/24 @ 100, 4.000%, 2/1/31 | 1,208,300 | ||||
| 1,170,000 | Easley Combined Utility System, Refunding Revenue, Callable 12/1/19 @ 100, (Assured Guaranty), 5.000%, 12/1/24 | 1,324,452 | ||||
| 1,135,000 | East Richland County Public Service District, Refunding Revenue, 4.000%, 1/1/22 | 1,287,011 | ||||
| 600,000 | Educational Facilities Authority, Wofford College, University & College Improvements Revenue, Series B, 2.000%, 4/1/27(a) | 600,252 | ||||
| 1,000,000 | Florence County, SC, McLeod Regional Medical Center Project, Refunding Revenue, Callable 11/1/24 @ 100, 5.000%, 11/1/28 | 1,209,090 | ||||
Principal | Fair Value | |||||
MUNICIPAL BONDS — (continued) | ||||||
South Carolina — (continued) | ||||||
| $1,100,000 | Florence County, SC, McLeod Regional Medical Center Project, Refunding Revenue, Callable 11/1/24 @ 100, 5.000%, 11/1/33 | $ | 1,301,069 | |||
| 1,895,000 | Florence County, SC, Public Improvements, G.O., (State Aid Withholding), 4.000%, 6/1/20 | 2,097,613 | ||||
| 1,000,000 | Greenville County, SC, School District Building Refunding Revenue, 5.000%, 12/1/22 | 1,213,200 | ||||
| 1,075,000 | Greenville County, SC, School District Building Refunding Revenue, Callable 12/1/16 @ 100, 5.000%, 12/1/22 | 1,082,837 | ||||
| 570,000 | Greenville County, SC, School District Building Refunding Revenue, Callable 12/1/16 @ 100, OID, 4.250%, 12/1/21 | 573,431 | ||||
| 1,340,000 | Greenville Health System, Hospital System Board, Refunding Revenue, 5.000%, 5/1/21 | 1,553,114 | ||||
| 1,000,000 | Greenville Health System, Hospital System Board, Refunding Revenue, Callable 5/1/22 @ 100, 5.000%, 5/1/31 | 1,150,950 | ||||
| 1,000,000 | Greenwood County, SC, Self Regional Healthcare Refunding Revenue, Series B, Callable 4/1/22 @ 100, 5.000%, 10/1/24 | 1,168,930 | ||||
| 530,000 | Greenwood County, SC, Self Regional Healthcare Revenue, Callable 10/1/19 @ 100, OID, 5.000%, 10/1/23 | 588,645 | ||||
| 1,175,000 | Greenwood, SC, Combined Public Utility Revenue, Series A, 4.000%, 12/1/18 | 1,245,136 | ||||
| 1,000,000 | Greenwood, SC, Metropolitan District, Advance Refunding, Revenue Bonds, Callable 10/1/26 @ 100, 5.000%, 10/1/28 | 1,262,470 | ||||
| 1,000,000 | Horry County, SC, School District, Refunding, G.O., Series B (SCSDE), 5.000%, 3/1/23 | 1,231,800 | ||||
| 1,000,000 | Kershaw County, SC, Kershaw County School District Project, Refunding Revenue, 5.000%, 12/1/23 | 1,210,430 | ||||
| 500,000 | Kershaw County, SC, Kershaw County School District Project, Refunding Revenue (AGC), 5.000%, 12/1/16 | 503,615 | ||||
| 1,460,000 | Lancaster Educational Assistance Program, Inc., SC, Lancaster County School District Refunding Revenue, Series B, Callable 12/1/23 @ 100, 5.000%, 12/1/24 | 1,782,572 | ||||
| 1,170,000 | Lexington County Health Services District, Inc. Lexington Medical Center, Callable 5/1/26 @ 100, 5.000%, 11/1/35 | 1,399,191 | ||||
| 645,000 | Lexington County, SC, Health Services District, Inc., Refunding Revenue, Callable 11/1/17 @ 100, 5.000%, 11/1/19 | 673,270 | ||||
| 1,000,000 | Lexington County, SC, Health Services District, Inc., Refunding Revenue, Callable 11/1/17 @ 100, 5.000%, 11/1/23 | 1,043,300 | ||||
| 785,000 | Lexington County, SC, Health Services District, Inc., Refunding Revenue, Callable 11/1/21 @ 100, 5.000%, 11/1/22 | 925,931 | ||||
| 1,000,000 | Lexington County, SC, School District No. 1, G.O.,Series C (SCSDE), 5.000%, 2/1/21 | 1,166,680 | ||||
| 1,500,000 | Lexington County, SC, School District No. 2 School Improvements, G.O., (SCSDE), 5.000%, 3/1/24 | 1,873,500 | ||||
Continued
106
Sterling Capital South Carolina Intermediate Tax-Free Fund
|
Schedule of Portfolio Investments — (continued) |
September 30, 2016
|
Principal | Fair Value | |||||
MUNICIPAL BONDS — (continued) | ||||||
South Carolina — (continued) | ||||||
| $1,000,000 | Lexington One School Facilities Corp., Lexington County School District No. 1 Revenue, 5.000%, 12/1/16 | $ | 1,007,250 | |||
| 940,000 | Lexington, SC, Combined Waterworks & Sewer System Refunding Revenue, Callable 4/1/21 @ 100, 5.000%, 4/1/22 | 1,086,960 | ||||
| 1,000,000 | Lugoff-Elgin Water Authority, Refunding Revenue, Series B, Callable 7/1/26 @ 100, 5.000%, 7/1/30 | 1,242,550 | ||||
| 1,000,000 | Myrtle Beach, SC, Water & Sewer Revenue, Advance Refunding, Revenue Bonds, Callable 3/1/26 @ 100, 5.000%, 3/1/28 | 1,249,250 | ||||
| 1,460,000 | Newberry, SC, Refunding Revenue (AGM), 5.000%, 4/1/24 | 1,782,806 | ||||
| 1,135,000 | Oconee County, SC, Duke Power Co. Project Refunding Revenue, 3.600%, 2/1/17 | 1,144,647 | ||||
| 1,140,000 | Oconee County, SC, School District, School Improvements, G.O., (SCSDE), Series A, 5.000%, 3/1/24 | 1,427,508 | ||||
| 810,000 | Orangeburg County, SC, School District No. 5, Refunding G.O. (SCSDE), 5.000%, 3/1/21 | 940,839 | ||||
| 600,000 | Piedmont Municipal Power Agency, Power System Refunding Revenue, Series A3 (Assured Guaranty), 5.000%, 1/1/18 | 629,412 | ||||
| 1,000,000 | Piedmont Municipal Power Agency, Power System Refunding Revenue, Series B, Callable 1/1/22 @ 100, 4.000%, 1/1/23 | 1,127,970 | ||||
| 230,000 | Piedmont Municipal Power Agency, Power System, Prerefunded, Refunding Revenue (NATL), OID, 5.375%, 1/1/25 | 253,660 | ||||
| 1,000,000 | Renewable Water Resources Sewage System, Refunding Revenue, 4.000%, 1/1/20 | 1,091,060 | ||||
| 1,000,000 | Rock Hill, SC, Combined Utility System, Refunding Revenue, Series A, Callable 1/1/22 @ 100 (AGM), 5.000%, 1/1/23 | 1,175,580 | ||||
| 1,000,000 | Rock Hill, SC, Hospital Fee Pledge, Refunding Revenue, Callable 4/1/23 @ 100, 5.000%, 4/1/33 | 1,142,740 | ||||
| 1,090,000 | Rock Hill, SC, Ltd. Obligations, Hospitality Fee Pledge, Refunding Revenue, 5.000%, 4/1/21 | 1,255,004 | ||||
| 1,500,000 | SCAGO Educational Facilities Corp. for Cherokee School District No. 1, Refunding Revenue, 5.000%, 12/1/24 | 1,843,590 | ||||
| 1,135,000 | SCAGO Educational Facilities Corp. for Colleton School District, Refunding Revenue, 5.000%, 12/1/20 | 1,293,718 | ||||
| 825,000 | SCAGO Educational Facilities Corp. for Pickens School District, Pickens County Project, School Improvements Revenue, Callable 12/1/16 @ 100, (AGM), 5.000%, 12/1/19 | 830,948 | ||||
| 790,000 | SCAGO Educational Facilities Corp. for Union School District, Refunding Revenue, 5.000%, 12/1/21 | 921,733 | ||||
| 500,000 | SCAGO Public Facilities Corp. for Georgetown County, Georgetown County Project, Refunding Revenue, Series A, 5.000%, 12/1/18 | 541,305 | ||||
Principal Amount | Fair Value | |||||
MUNICIPAL BONDS — (continued) | ||||||
South Carolina — (continued) | ||||||
| $ 500,000 | SCAGO Public Facilities Corp. for Georgetown County, Georgetown County Project, Refunding Revenue, Series A, 5.000%, 12/1/19 | $ | 558,300 | |||
| 550,000 | South Carolina Jobs-Economic Development Authority, AnMed Health Project, Refunding & Improvement Revenue, Series B (Assured Guaranty), 5.000%, 2/1/19 | 596,887 | ||||
| 1,000,000 | South Carolina Jobs-Economic Development Authority, Bons Secours Health System, Inc., Refunding Revenue, Callable 11/1/22 @ 100, 5.000%, 11/1/24 | 1,202,610 | ||||
| 1,500,000 | South Carolina Jobs-Economic Development Authority, Conway Hospital Income Project, Health, Hospital, Nursing Home Improvements Revenue, Callable 7/1/22 @ 100, 5.000%, 7/1/23 | 1,753,140 | ||||
| 580,000 | South Carolina Jobs-Economic Development Authority, Furman University, Refunding Revenue, 5.000%, 10/1/24 | 722,889 | ||||
| 1,000,000 | South Carolina Jobs-Economic Development Authority, Furman University, Refunding Revenue, Callable 10/1/25 @ 100, OID, 4.000%, 10/1/38 | 1,083,310 | ||||
| 500,000 | South Carolina Jobs-Economic Development Authority, Palmetto Health Facilities, Refunding Revenue, Series A (AGM), 5.000%, 8/1/19 | 548,205 | ||||
| 500,000 | South Carolina Jobs-Economic Development Authority, Palmetto Health, Refunding & Improvement Facilities Revenue, OID, 5.000%, 8/1/18 | 533,355 | ||||
| 1,150,000 | South Carolina Ports Authority, Port, Airport & Marina Improvements Revenue, 5.000%, 7/1/19 | 1,267,300 | ||||
| 335,000 | South Carolina State Public Service Authority, Prerefunded, Current Refunding, Revenue Bonds, Series A, Callable 1/1/19 @ 100, 5.000%, 1/1/27 | 365,244 | ||||
| 345,000 | South Carolina State Public Service Authority, Prerefunded, Current Refunding, Revenue Bonds, Series A, Callable 1/1/19 @ 100, 5.000%, 1/1/32 | 376,147 | ||||
| 695,000 | South Carolina State Public Service Authority, Unrefunded, Current Refunding, Revenue Bonds, Series A, Callable 1/1/19 @ 100, 5.000%, 1/1/27 | 753,512 | ||||
| 670,000 | South Carolina State Public Service Authority, Unrefunded, Current Refunding, Revenue Bonds, Series A, Callable 1/1/19 @ 100, 5.000%, 1/1/32 | 723,915 | ||||
| 600,000 | Spartanburg Regional Health Services District, Refunding Revenue, Series A, Callable 4/15/18 @ 100, (Assured Guaranty), 5.250%, 4/15/21 | 639,486 | ||||
| 1,000,000 | University Of South Carolina Refunding Revenue, Callable 5/1/26 @ 100, 4.000%, 5/1/39 | 1,100,260 | ||||
Continued
107
Sterling Capital South Carolina Intermediate Tax-Free Fund
|
Schedule of Portfolio Investments — (continued) |
September 30, 2016
|
Principal Amount | Fair Value | |||||
MUNICIPAL BONDS — (continued) | ||||||
South Carolina — (continued) | ||||||
| $500,000 | University of South Carolina, Refunding Revenue, Series A, Callable 5/1/20 @ 100, 5.000%, 5/1/28 | $ | 562,425 | |||
|
| |||||
Total Municipal Bonds | 90,444,828 | |||||
|
| |||||
Shares | ||||||
MONEY MARKET FUND — 1.9% | ||||||
| 1,731,687 | Dreyfus Tax Exempt Cash Management, 0.550%(b) | 1,731,687 | ||||
|
| |||||
Total Money Market Fund | 1,731,687 | |||||
|
| |||||
Total Investments — 98.9% | 92,176,515 | |||||
Net Other Assets (Liabilities) — 1.1% | 1,033,872 | |||||
|
| |||||
NET ASSETS — 100.0% | $ | 93,210,387 | ||||
|
| |||||
| (a) | The interest rate for this variable rate note, which will change periodically, is based either on the prime rate or an index of market rates. The reflected rate is in effect as of September 30, 2016. The maturity date reflected is the final maturity date. |
| (b) | Represents the current yield as of report date. |
AGC — Assured Guaranty Corp.
AGM — Assured Guaranty Municipal Corp.
G.O. — General Obligation
NATL — National Public Finance Guarantee Corp.
OID — Original Issue Discount
SCAGO — South Carolina Association of Governmental Organizations
SCSDE — South Carolina School District Enhancement
See accompanying Notes to the Financial Statements.
108
Sterling Capital Virginia Intermediate Tax-Free Fund
|
Schedule of Portfolio Investments |
September 30, 2016
|
Principal Amount | Fair Value | |||||
MUNICIPAL BONDS — 97.1% | ||||||
District of Columbia — 1.7% | ||||||
| $1,160,000 | Metropolitan Washington Airports Authority, Port, Airport & Marina Improvement Revenue, Series A, Callable 10/1/20 @ 100, 5.000%, 10/1/23 | $ | 1,331,889 | |||
| 625,000 | Metropolitan Washington Airports Authority, Refunding Revenue, Series B, Callable 10/1/19 @ 100, 5.000%, 10/1/21 | 697,100 | ||||
|
| |||||
| 2,028,989 | ||||||
|
| |||||
Virginia — 95.4% | ||||||
| 1,000,000 | Albemarle County, VA, Economic Development Authority, Albemarle County Project, Public Improvements Revenue, 5.000%, 6/1/21 | 1,173,860 | ||||
| 1,730,000 | Albemarle County, VA, Economic Development Authority, Albemarle County Project, Public Improvements Revenue, Callable 6/1/22 @ 100, 5.000%, 6/1/23 | 2,062,731 | ||||
| 2,760,000 | Albemarle County, VA, Economic Development Authority, Refunding Revenue, 5.000%, 6/1/20 | 3,148,884 | ||||
| 1,000,000 | Alexandria, VA, Refunding G.O. (State Aid Withholding), 5.000%, 6/15/21 | 1,182,720 | ||||
| 1,000,000 | Arlington County, VA, Industrial Development Authority, VA Hospital Center Arlington, Refunding Revenue, 5.000%, 7/1/18 | 1,066,960 | ||||
| 1,100,000 | Chesterfield County, VA, Economic Development Authority, Electric & Power, Refunding Revenue, Series A, Callable 5/1/19 @ 100, 5.000%, 5/1/23 | 1,212,244 | ||||
| 1,145,000 | Culpeper County, VA, Economic Development Authority, VA Capital Projects, Refunding Revenue, Callable 6/1/24 @ 100, 4.000%, 6/1/26 | 1,324,914 | ||||
| 1,410,000 | Fairfax County, VA, Economic Development Authority, Community Services Facilities Project, Health, Hospital, Nursing, Home Improvements, Revenue, Series A, 4.500%, 3/1/21 | 1,613,407 | ||||
| 1,875,000 | Fairfax County, VA, Economic Development Authority, Goodwin House Inc., Refunding Revenue, Callable 10/1/17 @ 100, 5.000%, 10/1/27 | 1,953,787 | ||||
| 2,500,000 | Fairfax County, VA, Economic Development Authority, Laurel Hill Public Facilities Project, Refunding Revenue, Series A, 5.000%, 6/1/22 | 2,996,150 | ||||
| 770,000 | Fairfax County, VA, Industrial Development Authority, Inova Health System Project, Refunding Revenue, (AGM-CR), OID, 5.250%, 8/15/19 | 829,529 | ||||
| 495,000 | Fairfax County, VA, Industrial Development Authority, Inova Health Systems Project, Refunding Revenue, Series C, 5.000%, 5/15/18 | 528,348 | ||||
| 1,455,000 | Fairfax County, VA, Public Improvements, Advance Refunding G.O., Series A, Callable 4/1/26 @ 100 (State Aid Withholding), 4.000%, 10/1/26 | 1,761,699 | ||||
| 2,600,000 | Fairfax County, VA, Refunding Revenue, Series A, Callable 7/15/26 @ 100, 4.000%, 7/15/38 | 2,927,158 | ||||
Principal Amount | Fair Value | |||||
MUNICIPAL BONDS — (continued) | ||||||
Virginia — (continued) | ||||||
| $2,000,000 | Fairfax County, VA, School Improvements G.O., Series A, Callable 10/1/24 @ 100, 5.000%, 10/1/26 | $ | 2,539,840 | |||
| 2,160,000 | Fairfax County, VA, Sewer Improvements Revenue, Callable 7/15/21 @ 100, 5.000%, 7/15/22 | 2,565,022 | ||||
| 1,000,000 | Fredericksburg Economic Development Authority, Mary Washington Healthcare Obligation Group, Refunding Revenue, Callable 6/15/24 @ 100, 5.000%, 6/15/26 | 1,208,820 | ||||
| 1,000,000 | Hampton, VA, Public Improvements, Refunding G.O., Series A, Callable 1/15/19 @ 100, 5.000%, 1/15/21 | 1,093,150 | ||||
| 1,700,000 | Leesburg, VA, Refunding G.O., Callable 1/15/24 @ 100, (State Aid Withholding), 4.000%, 1/15/27 | 1,965,489 | ||||
| 1,000,000 | Leesburg, VA, Refunding G.O., Callable 1/15/25 @ 100, (State Aid Withholding), 5.000%, 1/15/27 | 1,258,380 | ||||
| 1,000,000 | Loudoun County, VA, Economic Development Authority, Public Improvements Revenue, Callable 12/1/24 @ 100, 5.000%, 12/1/27 | 1,242,500 | ||||
| 1,665,000 | Loudoun County, VA, Industrial Development Authority, Refunding Revenue, 4.000%, 12/15/22 | 1,940,308 | ||||
| 1,465,000 | Montgomery County, VA, Economic Development Authority, Virginia Tech Foundation, Refunding Revenue, Series A, Callable 6/1/20 @ 100, 5.000%, 6/1/27 | 1,657,325 | ||||
| 2,460,000 | Montgomery County, VA, Economic Development Authority, Virginia Tech Foundation, Refunding Revenue, Series A, Callable 6/1/21 @ 100, 5.000%, 6/1/24 | 2,869,123 | ||||
| 1,315,000 | Montgomery County, VA, Industrial Development Authority, Public Projects, Public Improvements, Revenue, 5.000%, 2/1/18 | 1,385,168 | ||||
| 1,445,000 | Montgomery County, VA, Industrial Development Authority, Public Projects, Public Improvements, Revenue, Callable 2/1/18 @ 100, 5.000%, 2/1/24 | 1,524,880 | ||||
| 1,250,000 | New River Valley Regional Jail Authority Correctional Facilities Improvement Advance Refunding Revenue, Callable 10/1/26 @ 100, 5.000%, 10/1/27 | 1,588,113 | ||||
| 2,000,000 | Newport News, VA, General Water Improvements, Refunding G.O., Series A, 4.000%, 7/15/20 | 2,225,600 | ||||
| 1,000,000 | Newport News, VA, General Water Improvements, Refunding G.O., Series B, 5.250%, 7/1/21 | 1,194,200 | ||||
| 1,000,000 | Norfolk, VA, Economic Development Authority, Bon Secours Health System, Inc., Refunding Revenue, Callable 11/1/22 @ 100, 5.000%, 11/1/29 | 1,165,990 | ||||
| 1,000,000 | Norfolk, VA, Economic Development Authority, Sentara Healthcare Facilities, Refunding Revenue, Series B, Callable 11/1/22 @ 100, 5.000%, 11/1/25 | 1,192,990 | ||||
Continued
109
Sterling Capital Virginia Intermediate Tax-Free Fund
|
Schedule of Portfolio Investments — (continued) |
September 30, 2016
|
Principal Amount | Fair Value | |||||
MUNICIPAL BONDS — (continued) | ||||||
Virginia — (continued) | ||||||
| $1,000,000 | Norfolk, VA, Economic Development Authority, Sentara Healthcare, Refunding Revenue, Series B, Callable 11/1/22 @ 100, 5.000%, 11/1/24 | $ | 1,201,430 | |||
| 1,465,000 | Norfolk, VA, Economic Development Authority, Sentara Healthcare, Refunding Revenue, Series B, Callable 11/1/22 @ 100, 5.000%, 11/1/36 | 1,706,666 | ||||
| 1,000,000 | Norfolk, VA, Water Utility Improvements Revenue, Callable 11/1/18 @ 100, 5.000%, 11/1/23 | 1,085,040 | ||||
| 1,000,000 | Pittsylvania County, VA, School Improvements G.O., Series B, 5.000%, 2/1/19 | 1,094,760 | ||||
| 1,775,000 | Pittsylvania County, VA, School Improvements G.O., Series B, Callable 2/1/19 @ 100, OID, 5.375%, 2/1/21 | 1,959,777 | ||||
| 1,160,000 | Poquoson, VA, Refunding G.O., (State Aid Withholding), 5.000%, 2/15/21 | 1,359,218 | ||||
| 1,700,000 | Portsmouth, VA, Public Improvements, Refunding G.O., Series A, Callable 2/1/23 @ 100, (State Aid Withholding), 5.000%, 2/1/27 | 2,068,152 | ||||
| 1,325,000 | Portsmouth, VA, Public Utilities, Refunding G.O., Series A, Callable 7/15/22 @ 100, (State Aid Withholding), 5.000%, 7/15/24 | 1,606,509 | ||||
| 825,000 | Portsmouth, VA, Refunding G.O., Series B, Callable 7/15/19 @ 100, 5.250%, 7/15/23 | 923,909 | ||||
| 615,000 | Portsmouth, VA, Refunding G.O., Series B, Callable 7/15/19 @ 100, 5.250%, 7/15/23 | 685,411 | ||||
| 1,390,000 | Portsmouth, VA Refunding G.O., Series A, 5.000%, 8/1/26 | 1,816,063 | ||||
| 1,520,000 | Powhatan County Economic Development Authority, School Improvements, Callable 10/15/26 @ 100, 5.000%, 10/15/27 | 1,950,008 | ||||
| 1,150,000 | Prince William County, VA, County Facilities, Refunding Certificate of Participation, 5.000%, 10/1/21 | 1,361,876 | ||||
| 1,245,000 | Rappahannock Regional Jail Authority, Refunding Revenue, Callable 10/1/2025 @ 100, 5.000%, 10/1/26 | 1,581,561 | ||||
| 2,000,000 | Richmond, VA, Public Improvements, Refunding G.O., Series A, Callable 3/1/24 @ 100 (State Aid Withholding), 5.000%, 3/1/28 | 2,445,220 | ||||
| 1,470,000 | Riverside Regional Jail Authority, Refunding Revenue, Callable 7/1/25 @ 100, 5.000%, 7/1/27 | 1,839,896 | ||||
| 885,000 | Smyth County, VA, Industrial Development Authority, Mountain States Health Alliance Refunding Revenue, 5.000%, 7/1/20 | 979,828 | ||||
| 1,000,000 | Smyth County, VA, Industrial Development Authority, Mountain States Health Alliance Refunding Revenue, Callable 7/1/20 @ 100, OID, 5.000%, 7/1/23 | 1,112,520 | ||||
| 1,530,000 | Smyth County, VA, Public Improvement, Refunding G.O., Series A, Callable 11/1/21 @ 100 (State Aid Withholding), 5.000%, 11/1/25 | 1,782,144 | ||||
| 1,220,000 | Spotsylvania County, VA, Economic Development Authority, Refunding Revenue, 5.000%, 6/1/22 | 1,463,597 | ||||
Principal | Fair Value | |||||
MUNICIPAL BONDS — (continued) | ||||||
Virginia — (continued) | ||||||
| $1,420,000 | Spotsylvania County, VA, Water & Sewer System, Refunding Revenue, Series A, Callable 6/1/20 @ 100, 5.000%, 6/1/28 | $ | 1,597,173 | |||
| 1,780,000 | Virginia Beach, VA, Water & Sewer System Refunding Revenue, Series B, Callable 10/1/26 @ 100, 4.000%, 10/1/28 | 2,123,967 | ||||
| 1,100,000 | Virginia Biotechnology Research Partnership Authority, Constructions Laboratories Project, Refunding Revenue, 5.000%, 9/1/19 | 1,226,500 | ||||
| 2,500,000 | Virginia College Building Authority, 21st Century College & Equipment, University & College Improvements Revenue, Series A, 5.000%, 2/1/22 | 2,995,525 | ||||
| 1,750,000 | Virginia College Building Authority, Advance Refunding Revenue, Series B, Callable 9/1/24 @ 100 (State Aid Withholding), 4.000%, 9/1/25 | 2,042,793 | ||||
| 1,000,000 | Virginia College Building Authority, Educational Refunding Revenue, Series A, (State Intercept), 5.000%, 9/1/19 | 1,116,840 | ||||
| 1,805,000 | Virginia College Building Authority, Public Higher Education Financing Program, Refunding Revenue, Series B, (State Intercept), 5.000%, 9/1/20 | 2,077,790 | ||||
| 1,065,000 | Virginia Commonwealth Transportation Board Refunding Revenue, Series B, 5.000%, 5/15/25 | 1,363,307 | ||||
| 1,850,000 | Virginia Commonwealth Transportation Board, Federal Transportation Grant, Transit Improvements, Revenue, Series B, Callable 9/15/22 @ 100, 5.000%, 3/15/23 | 2,246,418 | ||||
| 1,500,000 | Virginia Port Authority Commonwealth Port Fund, Port, Airport & Marina Improvements Revenue, Callable 7/1/20 @ 100, 5.000%, 7/1/28 | 1,712,385 | ||||
| 2,000,000 | Virginia Public Building Authority, Public Improvements Revenue, Series A, Callable 8/1/21 @ 100, 5.000%, 8/1/26 | 2,374,820 | ||||
| 2,000,000 | Virginia Public School Authority, Refunding Revenue, (State Aid Withholding), 5.000%, 8/1/20 | 2,304,940 | ||||
| 1,150,000 | Virginia Resources Authority, State Revolving Fund, Refunding Revenue, 5.500%, 10/1/17 | 1,203,751 | ||||
| 1,835,000 | Virginia Small Business Financing Authority, Sentara Healthcare Refunding Revenue, 4.000%, 11/1/16 | 1,840,175 | ||||
| 1,500,000 | Western Regional Jail Authority, Advance Refunding Revenue, Callable 12/1/26 @ 100, 5.000%, 12/1/34 | 1,846,965 | ||||
| 1,525,000 | Western Regional Jail Authority, Refunding Revenue, Callable 12/1/26 @ 100, 5.000%, 12/1/34 | 1,929,369 | ||||
| 700,000 | Winchester, VA, Economic Development Authority, Valley Health System Obligated Group, Hospital Refunding Revenue, 5.000%, 1/1/22 | 830,298 | ||||
Continued
110
Sterling Capital Virginia Intermediate Tax-Free Fund
|
Schedule of Portfolio Investments — (continued) |
September 30, 2016
|
Principal | Fair Value | |||||
MUNICIPAL BONDS — (continued) | ||||||
Virginia — (continued) | ||||||
| $920,000 | Winchester, VA, Economic Development Authority, Valley Health System Obligated Group, Hospital Refunding Revenue, Series A, Callable 1/1/24 @ 100, 5.000%, 1/1/26 | $ | 1,111,654 | |||
|
| |||||
| 114,367,544 | ||||||
|
| |||||
Total Municipal Bonds | 116,396,533 | |||||
|
| |||||
Shares | ||||||
MONEY MARKET FUND — 1.9% | ||||||
| 2,267,098 | Federated Virginia Municipal Money Market Portfolio, Institutional Shares, 0.360%(a) | 2,267,098 | ||||
|
| |||||
Total Money Market Fund | 2,267,098 | |||||
|
| |||||
Total Investments — 99.0% | 118,663,631 | |||||
Net Other Assets (Liabilities) — 1.0% | 1,162,305 | |||||
|
| |||||
NET ASSETS — 100.0% | $ | 119,825,936 | ||||
|
| |||||
| (a) | Represents the current yield as of report date. |
AGM — Assured Guaranty Municipal Corp.
CR — Custodial Receipts
G.O. — General Obligation
OID — Original Issue Discount
See accompanying Notes to the Financial Statements.
111
Sterling Capital West Virginia Intermediate Tax-Free Fund
|
Schedule of Portfolio Investments |
September 30, 2016
|
Principal | Fair Value | |||||
MUNICIPAL BONDS — 96.7% |
| |||||
| $1,060,000 | Berkeley County, WV, Building Commission, Judicial Center Project, Refunding Revenue, Callable 9/1/21 @ 100, 4.500%, 9/1/23 | $ | 1,200,736 | |||
| 1,085,000 | Berkeley County, WV, Building Commission, Lease Refunding Revenue, Callable 12/1/22 @ 100, 4.000%, 12/1/26 | 1,208,104 | ||||
| 1,015,000 | Berkeley County, WV, Public Service Sewer District, Current Refunding Sewer Revenue, Callable 6/1/26 @ 100 (BAM), 5.000%, 6/1/31 | 1,214,376 | ||||
| 1,500,000 | Berkeley County, WV, Public Service Sewer District, Miscellaneous Purposes Revenue, Series C, Callable 10/1/23 @ 100, (BAM), 4.500%, 10/1/32 | 1,702,965 | ||||
| 765,000 | Berkeley County, WV, Public Service Sewer District, Sewer Improvements Revenue, Series A, 5.000%, 3/1/22 | 767,494 | ||||
| 670,000 | Braxton County, WV, Board of Education, Public School Improvements G.O., Callable 5/1/18 @ 100, (AGM, West Virginia Board Commission), 5.000%, 5/1/23 | 713,711 | ||||
| 1,080,000 | Braxton County, WV, Board of Education, Public School, Advance Refunding G.O., Callable 5/1/26 @ 100, (West Virginia Board Commission), 5.000%, 5/1/28 | 1,341,824 | ||||
| 1,090,000 | Charles Town, WV, Waterworks & Sewerage System, Water Utility Improvements Revenue, 4.500%, 3/1/36 | 1,237,641 | ||||
| 490,000 | Charleston, WV, Sewer Improvements Revenue, Callable 7/1/26 @ 100, 4.000%, 7/1/28 | 566,332 | ||||
| 590,000 | Charleston, WV, Sewer Improvements Revenue, Callable 7/1/26 @ 100, 4.000%, 7/1/29 | 676,889 | ||||
| 310,000 | Charleston, WV, Sewer Improvements Revenue, Callable 7/1/26 @ 100, 4.000%, 7/1/30 | 353,471 | ||||
| 1,215,000 | Fairmont State University, WV, University & College Improvements, Refunding Revenue, Series B, 4.000%, 6/1/19 | 1,302,881 | ||||
| 1,005,000 | Fairmont State University, WV, University & College Improvements, Refunding Revenue, Series A, Callable 6/1/21 @ 100, 5.000%, 6/1/23 | 1,171,358 | ||||
| 1,495,000 | Fairmont State University, WV, University & College Improvements, Refunding Revenue, Series B, Callable 6/1/21 @ 100, 5.000%, 6/1/23 | 1,742,467 | ||||
| 1,100,000 | Fairmont, WV, Waterworks Refunding Revenue, Series D, Callable 7/1/19 @100, (AGM), 4.000%, 7/1/24 | 1,167,892 | ||||
| 2,150,000 | Greenbrier County, WV, Board of Education, Public School Improvements G.O., (AGM), 5.000%, 5/1/18 | 2,290,266 | ||||
| 1,250,000 | Greenbrier County, WV, Board of Education, Public School, Advance Refunding G.O., (West Virginia Board Commission), 4.000%, 5/1/24 | 1,460,275 | ||||
| 1,505,000 | Jefferson County, WV, Board of Education Public School, Refunding G.O., (West Virginia Board Commission), 4.000%, 5/1/19 | 1,613,842 | ||||
| 1,700,000 | Marshall University, WV, Refunding Revenue, 5.000%, 5/1/19 | 1,867,960 | ||||
Principal | Fair Value | |||||
MUNICIPAL BONDS — (continued) |
| |||||
| $1,390,000 | Marshall University, WV, University & College Improvements Revenue, Callable 5/1/21 @ 100, 5.000%, 5/1/26 | $ | 1,607,743 | |||
| 1,560,000 | Marshall University, WV, University & College Improvements Revenue, Callable 5/1/21 @ 100, 5.000%, 5/1/27 | 1,800,614 | ||||
| 1,000,000 | Mason County, WV, Appalachian Power Co., Industrial Improvements Revenue, Series L, 1.625%, | 1,005,210 | ||||
| 1,545,000 | Monongalia County, WV, Board of Education, Public School Refunding G.O., (West Virginia Board Commission), 5.000%, 5/1/20 | 1,751,242 | ||||
| 1,000,000 | Monongalia County, WV, Board of Education, Public School Refunding G.O., Callable 5/1/22 @ 100, (West Virginia Board Commission), 5.000%, 5/1/23 | 1,190,220 | ||||
| 675,000 | Monongalia County, WV, Board of Education, Public School Refunding G.O., Callable 5/1/22 @ 100, (West Virginia Board Commission), 5.000%, 5/1/31 | 799,288 | ||||
| 965,000 | Monongalia County, WV, Board of Education, Public School Refunding G.O., Callable 5/1/22 @ 100, (West Virginia Board Commission), 5.000%, 5/1/33 | 1,137,031 | ||||
| 915,000 | Monongalia County, WV, Building Commission, Health System Obligated Group Refunding Revenue, Callable 7/1/21 @ 100, OID, 6.250%, 7/1/31 | 1,087,697 | ||||
| 2,000,000 | Monongalia County, WV, Building Commission, Monongalia Health System Group Refunding Revenue, Callable 7/1/25 @ 100, 5.000%, 7/1/26 | 2,459,720 | ||||
| 200,000 | Ohio County, WV, County Commission, Fort Henry Centre Financing District, Public Improvement, Tax Allocation, Series A, 5.350%, 6/1/17 | 205,966 | ||||
| 1,000,000 | Ohio County, WV, Country Commission, Fort Henry Centre Financing District, Public Improvement, Tax Allocation, Callable 6/1/22 @ 100, 4.750%, 6/1/31 | 1,086,770 | ||||
| 1,000,000 | Ohio County, WV, Special District Excise Tax, Refunding Revenue, Series B, 4.375%, 3/1/35 | 1,020,570 | ||||
| 1,000,000 | Parkersburg, WV, Combined Waterworks & Sewerage System, Refunding Revenue, Series A, Callable 8/1/21 @ 100, (BAM), 4.000%, 8/1/22 | 1,112,810 | ||||
| 1,210,000 | Pleasants County, WV, Board of Education, Public School Improvements G.O., Callable 5/1/21 @ 100, 4.000%, 5/1/23 | 1,348,327 | ||||
| 1,165,000 | Pleasants County, WV, Board of Education, Public School Improvements G.O., Callable 5/1/21 @ 100, 4.000%, 5/1/24 | 1,297,624 | ||||
| 1,000,000 | Preston County, WV, Board of Education, Public School Improvements G.O., (West Virginia Board Commission), 3.000%, 5/1/19 | 1,051,540 | ||||
| 1,655,000 | Preston County, WV, Board of Education, Public School Improvements G.O., (West Virginia Board Commission), 4.000%, 5/1/21 | 1,863,811 | ||||
| 1,285,000 | Princeton, WV, Princeton Community Hospital Project, Refunding Revenue, Series A, 5.000%, 5/1/22 | 1,494,686 | ||||
Continued
112
Sterling Capital West Virginia Intermediate Tax-Free Fund
|
Schedule of Portfolio Investments — (continued) |
September 30, 2016
|
Principal | Fair Value | |||||
MUNICIPAL BONDS — (continued) |
| |||||
| $1,410,000 | Princeton, WV, Princeton Community Hospital Project, Refunding Revenue, Series A, Callable 5/1/22 @ 100, 5.000%, 5/1/27 | $ | 1,611,151 | |||
| 2,005,000 | Putnam County, WV, Board of Education, Public School Improvements, G.O., (West Virginia Board Commission), 4.000%, 5/1/19 | 2,161,550 | ||||
| 1,000,000 | Putnam County, WV, Board of Education, Public School Improvements, G.O., Callable 5/1/20 @ 100, (West Virginia Board Commission), 4.000%, 5/1/22 | 1,097,510 | ||||
| 1,105,000 | School Building Authority of West Virginia, Capital Improvements, Refunding Revenue, Series A, Callable 7/1/17 @ 100 (NATL), 5.000%, 7/1/18 | 1,139,664 | ||||
| 3,700,000 | School Building Authority of West Virginia, Capital Improvements, Refunding Revenue, Series A, Callable 7/1/17 @ 100 (NATL), 5.000%, 7/1/20 | 3,814,071 | ||||
| 500,000 | School Building Authority of West Virginia, Lottery Capital Improvements Revenue, Callable 7/1/24 @ 100, Series A, 5.000%, 7/1/27 | 617,325 | ||||
| 1,265,000 | School Building Authority of West Virginia, Lottery Capital Improvements Revenue, Callable 7/1/24 @ 100, Series A, 5.000%, 7/1/28 | 1,552,560 | ||||
| 1,675,000 | School Building Authority Of West Virginia, School Improvements Revenue, Series A, 5.000%, 7/1/28 | 2,084,219 | ||||
| 1,000,000 | School Building Authority of West Virginia, School Improvements Revenue, Series B, Callable 7/1/20 @ 100, 5.000%, 7/1/30 | 1,132,520 | ||||
| 1,290,000 | Shepherd University Board of Governors, Residence Facilities Projects, University & College Improvements, Revenue, (NATL), 5.000%, 6/1/25 | 1,294,670 | ||||
| 500,000 | West Virginia Economic Development Authority, Appalachian Power Co. Amos Plant Project, Refunding Revenue, 1.900%, 3/1/40(a) | 502,650 | ||||
| 1,215,000 | West Virginia Economic Development Authority, Correctional Juvenile Public Safety Facilities Lease, Refunding Revenue, Series A, 5.000%, 6/1/19 | 1,340,084 | ||||
| 3,000,000 | West Virginia Economic Development Authority, Correctional Juvenile Public Safety Facilities Lease, Refunding Revenue, Series A, Callable 6/1/22 @ 100, 5.000%, 6/1/25 | 3,527,100 | ||||
| 3,685,000 | West Virginia Economic Development Authority, Correctional Juvenile Public Safety Facilities Lease, Refunding Revenue, Series A, Callable 6/1/22 @ 100, 5.000%, 6/1/26 | 4,323,758 | ||||
| 250,000 | West Virginia Economic Development Authority, Department of Environmental Protection Lease, Refunding Revenue, Series B, 4.000%, 11/1/21 | 283,683 | ||||
| 1,015,000 | West Virginia Economic Development Authority, State Office Building 3, Public Improvements Revenue, Series D, Callable 6/1/25 @ 100, 5.000%, 6/1/26 | 1,261,422 | ||||
Principal | Fair Value | |||||
MUNICIPAL BONDS — (continued) |
| |||||
| $1,210,000 | West Virginia Economic Development Authority, The Diamond Project, Refunding Revenue, 3.000%, 12/15/18 | $ | 1,260,917 | |||
| 1,890,000 | West Virginia Economic Development Authority, The Diamond Project, Refunding Revenue, Callable 12/15/18 @ 100, 3.000%, 12/15/19 | 1,969,871 | ||||
| 1,600,000 | West Virginia Higher Education Policy Commission, Higher Education Facilities, Refunding Revenue, Series A, 5.000%, 4/1/20 | 1,809,120 | ||||
| 2,000,000 | West Virginia Hospital Finance Authority, United Health System Obligation, Health, Hospital, Nursing Home Improvements Refunding Revenue, Series A, Callable 6/1/23 @ 100, OID, 5.375%, 6/1/38 | 2,353,820 | ||||
| 515,000 | West Virginia Hospital Finance Authority, Valley Health System Obligated Group, Refunding Revenue, 5.000%, 1/1/24 | 637,622 | ||||
| 630,000 | West Virginia Hospital Finance Authority, Valley Health System Obligated Group, Refunding Revenue, Callable 1/1/24 @ 100, 5.000%, 1/1/26 | 763,144 | ||||
| 1,555,000 | West Virginia Housing Development Fund, Refunding Revenue, Series A, 2.750%, 11/1/20 | 1,623,358 | ||||
| 1,890,000 | West Virginia State Building Commission, Regional Jail Refunding Revenue, Series A, (AMBAC), 5.375%, 7/1/21 | 2,133,356 | ||||
| 2,000,000 | West Virginia State Parkways Economic Development & Tourism Authority, Refunding Revenue (NATL), 5.250%, 5/15/19 | 2,214,980 | ||||
| 1,000,000 | West Virginia State Water Development Authority, Loan Program II, Refunding Revenue, Series A-II, Callable 11/1/23 @ 100, 5.000%, 11/1/26 | 1,233,180 | ||||
| 2,525,000 | West Virginia State Water Development Authority, Loan Program II, Refunding Revenue, Series A-II, Callable 11/1/23 @ 100, 5.000%, 11/1/27 | 3,106,457 | ||||
| 1,500,000 | West Virginia University, University Projects, University & College Improvements Revenue, Series B, 5.000%, 10/1/20 | 1,727,190 | ||||
| 1,750,000 | West Virginia University, University Projects, University & College Improvements Revenue, Series B, Callable 10/1/21 @ 100, 5.000%, 10/1/30 | 2,037,718 | ||||
| 1,530,000 | West Virginia University, University Projects, University & College Improvements, Refunding Revenue, Series A, Callable 10/1/22 @ 100, 5.000%, 10/1/35 | 1,818,895 | ||||
|
| |||||
Total Municipal Bonds | 99,354,918 | |||||
|
| |||||
Continued
113
Sterling Capital West Virginia Intermediate Tax-Free Fund
|
Schedule of Portfolio Investments — (continued) |
September 30, 2016
|
Shares | Fair Value | |||||
MONEY MARKET FUND — 2.2% |
| |||||
| 2,280,200 | Dreyfus Tax Exempt Cash Management, 0.550%(b) | $ | 2,280,200 | |||
|
| |||||
Total Money Market Fund | 2,280,200 | |||||
|
| |||||
Total Investments — 98.9% | 101,635,118 | |||||
Net Other Assets (Liabilities) — 1.1% | 1,100,721 | |||||
|
| |||||
NET ASSETS — 100.0% | $ | 102,735,839 | ||||
|
| |||||
| (a) | The interest rate for this variable rate note, which will change periodically, is based either on the prime rate or an index of market rates. The reflected rate is in effect as of September 30, 2016. The maturity date reflected is the final maturity date. |
| (b) | Represents the current yield as of report date. |
AGM — Assured Guaranty Municipal Corp.
AMBAC — American Municipal Bond Assurance Corp.
BAM — Build America Mutual
G.O. — General Obligation
NATL — National Public Finance Guarantee Corp.
OID — Original Issue Discount
See accompanying Notes to the Financial Statements.
114
Sterling Capital Diversified Income Fund
|
Schedule of Portfolio Investments |
September 30, 2016
|
Shares | Fair Value | |||||
EQUITY FUNDS — 47.3% |
| |||||
| 95,586 | First Trust DJ Global Select Dividend Index Fund | $ | 2,246,080 | |||
| 92,746 | First Trust North American Energy Infrastructure Fund ETF | 2,348,329 | ||||
| 275,208 | Madison Covered Call & Equity Income Fund | 2,559,434 | ||||
| 31,811 | PowerShares S&P 500 BuyWrite Portfolio | 669,303 | ||||
| 34,998 | SPDR S&P Global Dividend ETF | 2,224,123 | ||||
| 220,442 | VanEck Vectors Fallen Angel High Yield Bond ETF | 6,377,387 | ||||
| 11,045 | Vanguard Global ex-U.S. Real Estate ETF | 620,398 | ||||
| 31,513 | Vanguard High Dividend Yield ETF | 2,273,348 | ||||
| 11,029 | Vanguard REIT ETF | 956,655 | ||||
|
| |||||
Total Equity Funds | 20,275,057 | |||||
|
| |||||
FIXED INCOME FUNDS — 51.6% |
| |||||
| 188,926 | DoubleLine Total Return Bond Fund | 2,063,069 | ||||
| 232,680 | Goldman Sachs Investment Grade Credit Fund | 2,182,542 | ||||
| 137,918 | Guggenheim Floating Rate Strategies Fund | 3,577,585 | ||||
| 1 | Hotchkis and Wiley High Yield Fund | 15 | ||||
| 29,408 | iShares 10-20 Year Treasury Bond ETF | 4,258,866 | ||||
| 23 | iShares 20+ Year Treasury Bond ETF | 3,163 | ||||
| 238,809 | MFS Municipal High Income Fund | 2,020,325 | ||||
| 293,895 | Pioneer ILS Interval Fund | 3,224,032 | ||||
Shares | Fair Value | |||||
FIXED INCOME FUNDS — (continued) |
| |||||
| 104,665 | PowerShares Emerging Markets Sovereign Debt Portfolio | $ | 3,205,889 | |||
| 153,049 | Principal Preferred Securities Fund | 1,567,217 | ||||
|
| |||||
Total Fixed Income Funds | 22,102,703 | |||||
|
| |||||
MONEY MARKET FUND — 1.3% |
| |||||
| 539,466 | Federated Treasury Obligations Fund, Institutional Shares, 0.180%(a) | 539,466 | ||||
|
| |||||
Total Money Market Fund | 539,466 | |||||
|
| |||||
Total Investments — 100.2% | 42,917,226 | |||||
Net Other Assets (Liabilities) — (0.2)% | (81,560 | ) | ||||
|
| |||||
NET ASSETS — 100.0% | $ | 42,835,666 | ||||
|
| |||||
| (a) | Represents the current yield as of report date. |
ETF — Exchange Traded Fund
REIT — Real Estate Investment Trust
See accompanying Notes to the Financial Statements.
115
Sterling Capital Strategic Allocation Balanced Fund
|
Schedule of Portfolio Investments |
September 30, 2016
|
Shares | Fair Value | |||||
EQUITY FUNDS — 66.5% |
| |||||
| 978,903 | Sterling Capital Behavioral International Equity Fund, Institutional Shares(a) | $ | 9,485,569 | |||
| 249,903 | Sterling Capital Equity Income Fund, Institutional Shares(a) | 4,583,224 | ||||
| 394,484 | Sterling Capital Long/Short Equity Fund, Institutional Shares(a)(b) | 3,424,121 | ||||
| 198,428 | Sterling Capital Special Opportunities Fund, Institutional Shares(a)(b) | 4,460,660 | ||||
|
| |||||
Total Equity Funds | 21,953,574 | |||||
|
| |||||
FIXED INCOME FUND — 32.9% |
| |||||
| 1,002,672 | Sterling Capital Total Return Bond Fund, Institutional Shares(a) | 10,848,908 | ||||
|
| |||||
Total Fixed Income Fund | 10,848,908 | |||||
|
| |||||
MONEY MARKET FUND — 0.6% |
| |||||
| 212,651 | Federated Treasury Obligations Fund, Institutional Shares, 0.180%(c) | 212,651 | ||||
|
| |||||
Total Money Market Fund | 212,651 | |||||
|
| |||||
Total Investments — 100.0% | 33,015,133 | |||||
Net Other Assets (Liabilities) — (0.0)% | 16,344 | |||||
|
| |||||
NET ASSETS — 100.0% | $ | 33,031,477 | ||||
|
| |||||
| (a) | Investments in issuers considered to be an affiliate of the Fund for purposes of Section 2(a)(3) of the Investment Company Act of 1940. |
| (b) | Represents non-income producing security. |
| (c) | Represents the current yield as of report date. |
See accompanying Notes to the Financial Statements.
116
Sterling Capital Strategic Allocation Growth Fund
|
Schedule of Portfolio Investments |
September 30, 2016
|
Shares | Fair Value | |||||
EQUITY FUNDS — 82.5% |
| |||||
| 873,758 | Sterling Capital Behavioral International Equity Fund, Institutional Shares(a) | $ | 8,466,719 | |||
| 219,741 | Sterling Capital Equity Income Fund, Institutional Shares(a) | 4,030,051 | ||||
| 337,422 | Sterling Capital Long/Short Equity Fund, Institutional Shares(a)(b) | 2,928,823 | ||||
| 172,910 | Sterling Capital Special Opportunities Fund, Institutional Shares(a)(b) | 3,887,026 | ||||
|
| |||||
Total Equity Funds | 19,312,619 | |||||
|
| |||||
FIXED INCOME FUND — 16.9% |
| |||||
| 365,718 | Sterling Capital Total Return Bond Fund, Institutional Shares(a) | 3,957,070 | ||||
|
| |||||
Total Fixed Income Fund | 3,957,070 | |||||
|
| |||||
MONEY MARKET FUND — 0.6% |
| |||||
| 125,335 | Federated Treasury Obligations Fund, Institutional Shares, 0.180%(c) | 125,335 | ||||
|
| |||||
Total Money Market Fund | 125,335 | |||||
|
| |||||
Total Investments — 100.0% | 23,395,024 | |||||
Net Other Assets (Liabilities) — 0.0% | 8,270 | |||||
|
| |||||
NET ASSETS — 100.0% | $ | 23,403,294 | ||||
|
| |||||
| (a) | Investments in issuers considered to be an affiliate of the Fund for purposes of Section 2(a)(3) of the Investment Company Act of 1940. |
| (b) | Represents non-income producing security. |
| (c) | Represents the current yield as of report date. |
See accompanying Notes to the Financial Statements.
117
|
Statements of Assets and Liabilities |
September 30, 2016
|
| Assets: | Sterling Capital Behavioral Large Cap Value Equity Fund | Sterling Capital Mid Value Fund | ||||||||
Investments at fair value (a) | $ | 272,534,154 | $ | 584,935,183 | ||||||
Cash | — | — | ||||||||
Cash held at broker for securities sold short | — | — | ||||||||
Foreign currency, at value | — | — | ||||||||
Interest and dividends receivable | 165,293 | 1,045,999 | ||||||||
Receivable for investments sold | — | 2,917,711 | ||||||||
Receivable for capital shares issued | 11,125 | 1,003,008 | ||||||||
Prepaid and other expenses | 21,884 | 26,724 | ||||||||
|
|
|
| |||||||
Total Assets | 272,732,456 | 589,928,625 | ||||||||
|
|
|
| |||||||
Liabilities: | ||||||||||
Call options written | — | — | ||||||||
Securities sold short, at value | — | — | ||||||||
Distributions payable | — | — | ||||||||
Payable for investments purchased | 162,155 | 914,160 | ||||||||
Payable for capital shares redeemed | 106,718 | 603,141 | ||||||||
Payable for dividends on short sales | — | — | ||||||||
Payable to broker for service fee on short sales | — | — | ||||||||
Accrued expenses and other payables: | ||||||||||
Investment advisory fees | 119,516 | 337,766 | ||||||||
Accounting out-of-pocket fees | 2,406 | 3,158 | ||||||||
Administration fees | 18,678 | 40,261 | ||||||||
Compliance service fees | 306 | 579 | ||||||||
Distribution (12b-1) fees | 7,134 | 11,093 | ||||||||
Trustee fees | 412 | 917 | ||||||||
Other fees and liabilities | 56,412 | 142,501 | ||||||||
|
|
|
| |||||||
Total Liabilities | 473,737 | 2,053,576 | ||||||||
|
|
|
| |||||||
Net Assets | $ | 272,258,719 | $ | 587,875,049 | ||||||
|
|
|
| |||||||
Net Assets Consist of: | ||||||||||
Capital | $ | 267,156,759 | $ | 506,626,592 | ||||||
Undistributed (distributions in excess of) net investment income (loss) | 214,238 | — | ||||||||
Accumulated realized gain (loss) | (18,959,728 | ) | 6,703,128 | |||||||
Net unrealized appreciation (depreciation) | 23,847,450 | 74,545,329 | ||||||||
|
|
|
| |||||||
Net Assets | $ | 272,258,719 | $ | 587,875,049 | ||||||
|
|
|
| |||||||
Net Assets | ||||||||||
Class A Shares | $ | 30,159,477 | $ | 31,625,256 | ||||||
Class B Shares | 209,198 | 270,656 | ||||||||
Class C Shares | 919,391 | 5,282,353 | ||||||||
Institutional Shares | 240,970,653 | 550,696,576 | ||||||||
Class R Shares | — | 208 | ||||||||
|
|
|
| |||||||
Total | $ | 272,258,719 | $ | 587,875,049 | ||||||
|
|
|
| |||||||
Shares of Beneficial Interest Outstanding (Unlimited number of shares authorized, no par value) | ||||||||||
Class A Shares | 1,705,873 | 1,892,739 | ||||||||
Class B Shares | 12,014 | 17,797 | ||||||||
Class C Shares | 53,464 | 349,433 | ||||||||
Institutional Shares | 13,555,640 | 32,548,602 | ||||||||
Class R Shares | — | 13 | ||||||||
|
|
|
| |||||||
Total | 15,326,991 | 34,808,584 | ||||||||
|
|
|
| |||||||
Net Asset Value | ||||||||||
Class A Shares - redemption price per share | $ | 17.68 | $ | 16.71 | ||||||
|
|
|
| |||||||
Class B Shares - offering price per share** | $ | 17.41 | $ | 15.21 | ||||||
|
|
|
| |||||||
Class C Shares - offering price per share** | $ | 17.20 | $ | 15.12 | ||||||
|
|
|
| |||||||
Institutional Shares | $ | 17.78 | $ | 16.92 | ||||||
|
|
|
| |||||||
Class R Shares | $ | — | $ | 16.25 | * | |||||
|
|
|
| |||||||
Maximum Sales Charge - Class A Shares | 5.75 | % | 5.75 | % | ||||||
|
|
|
| |||||||
Maximum Offering Price (100%/(100% - Maximum Sales Charge)) of net asset value adjusted to the nearest cent per share - Class A Shares | $ | 18.76 | $ | 17.73 | ||||||
|
|
|
| |||||||
(a) Investments at cost | $ | 248,686,704 | $ | 510,389,854 | ||||||
| * | The Sterling Capital Mid Value Fund and Sterling Capital Behavioral Small Cap Value Equity Fund net asset value for Class R and Sterling Capital Stratton Mid Cap Value Fund net asset value for Class A and Class C Shares is calculated using unrounded net assets of $208.49, $190.89, $19,129.11 and $1,094.20 divided by the unrounded shares of 12.834, 12.606, 342.384 and 19.697 respectively. |
| ** | Redemption price per share varies by length of time shares are held. |
See accompanying Notes to the Financial Statements.
118
|
|
|
| Sterling Capital Behavioral Small Cap Value Equity Fund | Sterling Capital Special Opportunities Fund | Sterling Capital Equity Income Fund | Sterling Capital Long/Short Equity Fund | Sterling Capital Behavioral International Equity Fund | Sterling Capital Stratton Mid Cap Value Fund | |||||||||||||||||||||||
| $ | 166,629,719 | $ | 1,119,717,049 | $ | 1,688,809,044 | $ | 40,642,118 | $ | 69,959,740 | $ | 63,645,199 | |||||||||||||||||
| — | — | — | 684,988 | — | — | |||||||||||||||||||||||
| — | — | — | 17,799,478 | — | — | |||||||||||||||||||||||
| — | — | — | — | 115,943 | — | |||||||||||||||||||||||
| 324,411 | 814,542 | 1,393,132 | 23,569 | 323,968 | 39,106 | |||||||||||||||||||||||
| — | 7,726,992 | 763,261 | 2,076,028 | — | 930,445 | |||||||||||||||||||||||
| 10,231 | 1,965,818 | 2,312,055 | 28,588 | 72 | 791,267 | |||||||||||||||||||||||
| 13,182 | 68,833 | 41,738 | 13,591 | 1,982 | 9,384 | |||||||||||||||||||||||
|
|
|
|
|
|
|
|
|
|
|
| |||||||||||||||||
| 166,977,543 | 1,130,293,234 | 1,693,319,230 | 61,268,360 | 70,401,705 | 65,415,401 | |||||||||||||||||||||||
|
|
|
|
|
|
|
|
|
|
|
| |||||||||||||||||
|
| — |
| 1,005,000 | 304,400 | 8,620 | — | — | |||||||||||||||||||||
|
| — |
| — | — | 16,416,035 | — | — | |||||||||||||||||||||
| — | — | 142 | — | — | — | |||||||||||||||||||||||
| — | 5,075,169 | 684,431 | 2,619,509 | — | 979,572 | |||||||||||||||||||||||
| 241,350 | 1,356,227 | 4,944,576 | 37,618 | 102 | 842,168 | |||||||||||||||||||||||
| — | — | — | 14,050 | — | — | |||||||||||||||||||||||
| — | — | — | 588 | — | — | |||||||||||||||||||||||
| 81,426 | 610,276 | 947,981 | 49,938 | 22,875 | 35,638 | |||||||||||||||||||||||
| 3,696 | 4,895 | 7,302 | 3,975 | 10,444 | 1,347 | |||||||||||||||||||||||
| 11,324 | 76,164 | 114,655 | 2,855 | 4,772 | 4,374 | |||||||||||||||||||||||
| 210 | 1,047 | 1,517 | 105 | 126 | 123 | |||||||||||||||||||||||
| 2,163 | 220,266 | 319,645 | 260 | 106 | 5 | |||||||||||||||||||||||
| 203 | 1,464 | 2,347 | 99 | 9 | 91 | |||||||||||||||||||||||
| 32,871 | 277,895 | 481,010 | 21,286 | 7,737 | 18,584 | |||||||||||||||||||||||
|
|
|
|
|
|
|
|
|
|
|
| |||||||||||||||||
| 373,243 | 8,628,403 | 7,808,006 | 19,174,938 | 46,171 | 1,881,902 | |||||||||||||||||||||||
|
|
|
|
|
|
|
|
|
|
|
| |||||||||||||||||
| $ | 166,604,300 | $ | 1,121,664,831 | $ | 1,685,511,224 | $ | 42,093,422 | $ | 70,355,534 | $ | 63,533,499 | |||||||||||||||||
|
|
|
|
|
|
|
|
|
|
|
| |||||||||||||||||
| $ | 147,621,339 | $ | 844,160,653 | $ | 1,297,447,878 | $ | 63,779,299 | $ | 69,356,122 | $ | 48,180,349 | |||||||||||||||||
| 299,031 | — | 1,928,638 | — | 844,070 | 85,802 | |||||||||||||||||||||||
| (3,733,138 | ) | 17,855,422 | (9,556,022 | ) | (23,430,204 | ) | (1,215,624 | ) | (605,334 | ) | ||||||||||||||||||
| 22,417,068 | 259,648,756 | 395,690,730 | 1,744,327 | 1,370,966 | 15,872,682 | |||||||||||||||||||||||
|
|
|
|
|
|
|
|
|
|
|
| |||||||||||||||||
| $ | 166,604,300 | $ | 1,121,664,831 | $ | 1,685,511,224 | $ | 42,093,422 | $ | 70,355,534 | $ | 63,533,499 | |||||||||||||||||
|
|
|
|
|
|
|
|
|
|
|
| |||||||||||||||||
| $ | 8,713,901 | $ | 351,467,226 | $ | 467,469,692 | $ | 361,749 | $ | 354,457 | $ | 19,129 | |||||||||||||||||
| 112,827 | 1,626,305 | 1,421,145 | — | — | — | |||||||||||||||||||||||
| 364,171 | 181,060,960 | 271,598,240 | 210,790 | 46,718 | 1,094 | |||||||||||||||||||||||
| 157,413,210 | 587,319,675 | 943,101,114 | 41,520,883 | 69,954,359 | 63,513,276 | |||||||||||||||||||||||
| 191 | 190,665 | 1,921,033 | — | — | — | |||||||||||||||||||||||
|
|
|
|
|
|
|
|
|
|
|
| |||||||||||||||||
| $ | 166,604,300 | $ | 1,121,664,831 | $ | 1,685,511,224 | $ | 42,093,422 | $ | 70,355,534 | $ | 63,533,499 | |||||||||||||||||
|
|
|
|
|
|
|
|
|
|
|
| |||||||||||||||||
| 573,698 | 16,322,902 | 25,547,601 | 42,014 | 36,611 | 342 | |||||||||||||||||||||||
| 7,658 | 87,801 | 77,579 | — | — | — | |||||||||||||||||||||||
| 24,782 | 9,765,532 | 14,971,511 | 24,992 | 4,857 | 20 | |||||||||||||||||||||||
| 10,291,238 | 26,131,463 | 51,419,582 | 4,786,279 | 7,217,770 | 1,134,783 | |||||||||||||||||||||||
| 13 | 8,735 | 105,639 | — | — | — | |||||||||||||||||||||||
|
|
|
|
|
|
|
|
|
|
|
| |||||||||||||||||
| 10,897,389 | 52,316,433 | 92,121,912 | 4,853,285 | 7,259,238 | 1,135,145 | |||||||||||||||||||||||
|
|
|
|
|
|
|
|
|
|
|
| |||||||||||||||||
| $ | 15.19 | $ | 21.53 | $ | 18.30 | $ | 8.61 | $ | 9.68 | $ | 55.87 | * | ||||||||||||||||
|
|
|
|
|
|
|
|
|
|
|
| |||||||||||||||||
| $ | 14.73 | $ | 18.52 | $ | 18.32 | $ | — | $ | — | $ | — | |||||||||||||||||
|
|
|
|
|
|
|
|
|
|
|
| |||||||||||||||||
| $ | 14.70 | $ | 18.54 | $ | 18.14 | $ | 8.43 | $ | 9.62 | $ | 55.55 | * | ||||||||||||||||
|
|
|
|
|
|
|
|
|
|
|
| |||||||||||||||||
| $ | 15.30 | $ | 22.48 | $ | 18.34 | $ | 8.67 | $ | 9.69 | $ | 55.97 | |||||||||||||||||
|
|
|
|
|
|
|
|
|
|
|
| |||||||||||||||||
| $ | 15.14 | * | $ | 21.83 | $ | 18.18 | $ | — | $ | — | $ | — | ||||||||||||||||
|
|
|
|
|
|
|
|
|
|
|
| |||||||||||||||||
| 5.75 | % | 5.75 | % | 5.75 | % | 5.75 | % | 5.75 | % | 5.75 | % | |||||||||||||||||
|
|
|
|
|
|
|
|
|
|
|
| |||||||||||||||||
| $ | 16.11 |
| $ | 22.84 | $ | 19.42 | $ | 9.14 | $ | 10.27 | $ | 59.28 | ||||||||||||||||
|
|
|
|
|
|
|
|
|
|
|
| |||||||||||||||||
| $ | 144,212,651 | $ | 859,700,209 | $ | 1,293,127,005 | $ | 39,353,243 | $ | 68,587,172 | $ | 47,772,517 | |||||||||||||||||
119
Sterling Capital Funds
|
Statements of Assets and Liabilities |
September 30, 2016
|
| Sterling Capital Stratton Real Estate Fund | Sterling Capital Stratton Small Cap Value Fund | |||||||||
Assets: | ||||||||||
Investments at fair value (a) | $ | 104,547,349 | $ | 1,213,135,219 | ||||||
Interest and dividends receivable | 359,112 | 1,680,923 | ||||||||
Receivable for investments sold | — | — | ||||||||
Receivable for capital shares issued | 573,426 | 1,355,200 | ||||||||
Prepaid expenses | 13,722 | 26,353 | ||||||||
|
|
|
| |||||||
Total Assets | 105,493,609 | 1,216,197,695 | ||||||||
|
|
|
| |||||||
Liabilities: | ||||||||||
Distributions payable | — | — | ||||||||
Payable for investments purchased | — | — | ||||||||
Payable for capital shares redeemed | 583,501 | 1,406,695 | ||||||||
Accrued expenses and other payables: | ||||||||||
Investment advisory fees | 47,023 | 833,745 | ||||||||
Accounting out-of-pocket fees | 1,420 | 5,876 | ||||||||
Administration fees | 7,336 | 81,848 | ||||||||
Compliance service fees | 161 | 1,071 | ||||||||
Distribution (12b-1) fees | 32 | 67 | ||||||||
Trustee fees | 145 | 1,654 | ||||||||
Printing fees | 8,365 | 92,428 | ||||||||
Transfer agent fees | 8,775 | 116,291 | ||||||||
Other fees | 13,631 | 161,576 | ||||||||
|
|
|
| |||||||
Total Liabilities | 670,389 | 2,701,251 | ||||||||
|
|
|
| |||||||
Net Assets | $ | 104,823,220 | $ | 1,213,496,444 | ||||||
|
|
|
| |||||||
Net Assets Consist of: | ||||||||||
Capital | $ | 63,377,094 | $ | 620,813,938 | ||||||
Undistributed (distributions in excess of) net investment income | 1,613,104 | 1,646,853 | ||||||||
Accumulated realized gain (loss) | 4,201,367 | 61,360,362 | ||||||||
Net unrealized appreciation (depreciation) | 35,631,655 | 529,675,291 | ||||||||
|
|
|
| |||||||
Net Assets | $ | 104,823,220 | $ | 1,213,496,444 | ||||||
|
|
|
| |||||||
Net Assets | ||||||||||
Class A Shares | $ | 115,078 | $ | 87,300 | ||||||
Class B Shares | — | — | ||||||||
Class C Shares | 19,910 | 65,339 | ||||||||
Institutional Shares | 104,688,232 | 1,213,343,805 | ||||||||
Class R Shares | — | — | ||||||||
|
|
|
| |||||||
Total | $ | 104,823,220 | $ | 1,213,496,444 | ||||||
|
|
|
| |||||||
Shares of Beneficial Interest Outstanding (Unlimited number of shares authorized, no par value) | ||||||||||
Class A Shares | 2,901 | 1,114 | ||||||||
Class B Shares | — | — | ||||||||
Class C Shares | 504 | 839 | ||||||||
Institutional Shares | 2,634,419 | 15,463,902 | ||||||||
Class R Shares | — | — | ||||||||
|
|
|
| |||||||
Total | 2,637,824 | 15,465,855 | ||||||||
|
|
|
| |||||||
Net Asset Value | ||||||||||
Class A Shares - redemption price per share | $ | 39.67 | $ | 78.34 | * | |||||
|
|
|
| |||||||
Class B Shares - offering price per share** | $ | — | $ | — | ||||||
|
|
|
| |||||||
Class C Shares - offering price per share** | $ | 39.50 | $ | 77.88 | ||||||
|
|
|
| |||||||
Institutional Shares | $ | 39.74 | $ | 78.46 | ||||||
|
|
|
| |||||||
Class R Shares | $ | — | $ | — | ||||||
|
|
|
| |||||||
Maximum Sales Charge - Class A Shares | 5.75 | % | 5.75 | % | ||||||
|
|
|
| |||||||
Maximum Offering Price (100%/(100% - Maximum Sales Charge)) of net asset value adjusted to the nearest cent per share - Class A Shares | $ | 42.09 | $ | 83.12 | ||||||
|
|
|
| |||||||
(a) Investments at cost | $ | 68,915,694 | $ | 683,459,928 | ||||||
| * | The Sterling Capital Stratton Small Cap Value Fund net asset value for Class A Shares is calculated using unrounded net assets of $87,300.22 divided by the unrounded shares of 1,114.392. |
| ** | Redemption price per share varies by length of time shares are held. |
See accompanying Notes to the Financial Statements.
120
|
|
|
| Sterling Capital Ultra Short Bond Fund | Sterling Capital Short Duration Bond Fund | Sterling Capital Intermediate U.S. Government Fund | Sterling Capital Total Return Bond Fund | Sterling Capital Corporate Fund | Sterling Capital Securitized Opportunities Fund | Sterling Capital Kentucky Intermediate Tax-Free Fund | |||||||||||||||||||||||||||
| $ | 56,190,323 | $ | 86,734,930 | $ | 26,690,473 | $ | 796,709,429 | $ | 32,018,519 | $ | 46,746,100 | $ | 12,825,168 | ||||||||||||||||||||
| 229,863 | 518,494 | 125,431 | 4,628,806 | 332,525 | 138,584 | 159,799 | |||||||||||||||||||||||||||
| — | 1,356,930 | — | 1,889,547 | 8,102 | — | — | |||||||||||||||||||||||||||
| 5,007,628 | 47,852 | 6,773 | 1,288,628 | 14,460 | — | 4,998 | |||||||||||||||||||||||||||
| 10,579 | 11,931 | 6,819 | 28,129 | 3,960 | 9,153 | 1,836 | |||||||||||||||||||||||||||
|
|
|
|
|
|
|
|
|
|
|
|
|
| ||||||||||||||||||||
| 61,438,393 | 88,670,137 | 26,829,496 | 804,544,539 | 32,377,566 | 46,893,837 | 12,991,801 | |||||||||||||||||||||||||||
|
|
|
|
|
|
|
|
|
|
|
|
|
| ||||||||||||||||||||
| 5,644 | 127,490 | 21,715 | 643,355 | 626 | — | 15,001 | |||||||||||||||||||||||||||
| 956,349 | 1,855,764 | — | 12,364,979 | — | 13,600 | — | |||||||||||||||||||||||||||
| 15,088 | 43,437 | 72,178 | 3,440,803 | 94,317 | 66,005 | 8,135 | |||||||||||||||||||||||||||
| 4,162 | 14,174 | 6,998 | 171,738 | 9,300 | 11,933 | 3,674 | |||||||||||||||||||||||||||
| 7,162 | 9,794 | 2,165 | 20,764 | 6,588 | 7,842 | 1,637 | |||||||||||||||||||||||||||
| 3,474 | 5,916 | 1,826 | 53,090 | 2,218 | 3,213 | 876 | |||||||||||||||||||||||||||
| 110 | 141 | 91 | 724 | 96 | 108 | 78 | |||||||||||||||||||||||||||
| 1,282 | 3,084 | 2,109 | 20,498 | 136 | 109 | 908 | |||||||||||||||||||||||||||
| 68 | 127 | 46 | 975 | 102 | 73 | 20 | |||||||||||||||||||||||||||
| 1,699 | 3,113 | 1,091 | 25,358 | 1,915 | 1,754 | 472 | |||||||||||||||||||||||||||
| 4,739 | 3,091 | 2,260 | 60,898 | 3,342 | 3,026 | 915 | |||||||||||||||||||||||||||
| 5,230 | 12,158 | 3,132 | 79,665 | 4,921 | 5,370 | 1,419 | |||||||||||||||||||||||||||
|
|
|
|
|
|
|
|
|
|
|
|
|
| ||||||||||||||||||||
| 1,005,007 | 2,078,289 | 113,611 | 16,882,847 | 123,561 | 113,033 | 33,135 | |||||||||||||||||||||||||||
|
|
|
|
|
|
|
|
|
|
|
|
|
| ||||||||||||||||||||
| $ | 60,433,386 | $ | 86,591,848 | $ | 26,715,885 | $ | 787,661,692 | $ | 32,254,005 | $ | 46,780,804 | $ | 12,958,666 | ||||||||||||||||||||
|
|
|
|
|
|
|
|
|
|
|
|
|
| ||||||||||||||||||||
| $ | 61,339,719 | $ | 93,438,875 | $ | 33,084,546 | $ | 778,667,218 | $ | 31,198,877 | $ | 47,449,875 | $ | 11,969,875 | ||||||||||||||||||||
| (1,684 | ) | (327 | ) | 228,161 | 442,328 | 3,022 | 77 | 12,514 | |||||||||||||||||||||||||
| (728,443 | ) | (6,766,112 | ) | (7,402,610 | ) | (10,923,635 | ) | 77,934 | (1,653,138 | ) | 163,887 | ||||||||||||||||||||||
| (176,206 | ) | (80,588 | ) | 805,788 | 19,475,781 | 974,172 | 983,990 | 812,390 | |||||||||||||||||||||||||
|
|
|
|
|
|
|
|
|
|
|
|
|
| ||||||||||||||||||||
| $ | 60,433,386 | $ | 86,591,848 | $ | 26,715,885 | $ | 787,661,692 | $ | 32,254,005 | $ | 46,780,804 | $ | 12,958,666 | ||||||||||||||||||||
|
|
|
|
|
|
|
|
|
|
|
|
|
| ||||||||||||||||||||
| $ | 6,250,326 | $ | 7,332,232 | $ | 7,066,033 | $ | 70,257,445 | $ | 441,228 | $ | 377,153 | $ | 4,357,982 | ||||||||||||||||||||
| — | — | 73,219 | 362,617 | — | — | — | |||||||||||||||||||||||||||
| — | 1,885,907 | 705,939 | 7,933,330 | 58,174 | 40,021 | 20,276 | |||||||||||||||||||||||||||
| 54,183,060 | 77,373,709 | 18,870,694 | 709,102,906 | 31,754,603 | 46,363,630 | 8,580,408 | |||||||||||||||||||||||||||
| — | — | — | 5,394 | — | — | — | |||||||||||||||||||||||||||
|
|
|
|
|
|
|
|
|
|
|
|
|
| ||||||||||||||||||||
| $ | 60,433,386 | $ | 86,591,848 | $ | 26,715,885 | $ | 787,661,692 | $ | 32,254,005 | $ | 46,780,804 | $ | 12,958,666 | ||||||||||||||||||||
|
|
|
|
|
|
|
|
|
|
|
|
|
| ||||||||||||||||||||
| 636,758 | 832,616 | 690,274 | 6,498,668 | 42,568 | 37,359 | 409,440 | |||||||||||||||||||||||||||
| — | — | 7,180 | 33,508 | — | — | — | |||||||||||||||||||||||||||
| — | 214,233 | 69,077 | 732,739 | 5,622 | 3,968 | 1,904 | |||||||||||||||||||||||||||
| 5,521,349 | 8,786,355 | 1,841,672 | 65,558,886 | 3,064,850 | 4,589,635 | 807,304 | |||||||||||||||||||||||||||
| — | — | — | 501 | — | — | — | |||||||||||||||||||||||||||
|
|
|
|
|
|
|
|
|
|
|
|
|
| ||||||||||||||||||||
| 6,158,107 | 9,833,204 | 2,608,203 | 72,824,302 | 3,113,040 | 4,630,962 | 1,218,648 | |||||||||||||||||||||||||||
|
|
|
|
|
|
|
|
|
|
|
|
|
| ||||||||||||||||||||
| $ | 9.82 | $ | 8.81 | $ | 10.24 | $ | 10.81 | $ | 10.37 | $ | 10.10 | $ | 10.64 | ||||||||||||||||||||
|
|
|
|
|
|
|
|
|
|
|
|
|
| ||||||||||||||||||||
| $ | — | $ | — | $ | 10.20 | $ | 10.82 | $ | — | $ | — | $ | — | ||||||||||||||||||||
|
|
|
|
|
|
|
|
|
|
|
|
|
| ||||||||||||||||||||
| $ | — | $ | 8.80 | $ | 10.22 | $ | 10.83 | $ | 10.35 | $ | 10.09 | $ | 10.65 | ||||||||||||||||||||
|
|
|
|
|
|
|
|
|
|
|
|
|
| ||||||||||||||||||||
| $ | 9.81 | $ | 8.81 | $ | 10.25 | $ | 10.82 | $ | 10.36 | $ | 10.10 | $ | 10.63 | ||||||||||||||||||||
|
|
|
|
|
|
|
|
|
|
|
|
|
| ||||||||||||||||||||
| $ | — | $ | — | $ | — | $ | 10.77 | $ | — | $ | — | $ | — | ||||||||||||||||||||
|
|
|
|
|
|
|
|
|
|
|
|
|
| ||||||||||||||||||||
| 0.50 | % | 2.00 | % | 2.00 | % | 5.75 | % | 2.00 | % | 2.00 | % | 2.00 | % | ||||||||||||||||||||
|
|
|
|
|
|
|
|
|
|
|
|
|
| ||||||||||||||||||||
| $ | 9.87 |
| $ | 8.99 | $ | 10.45 | $ | 11.47 | $ | 10.58 | $ | 10.31 | $ | 10.86 | |||||||||||||||||||
|
|
|
|
|
|
|
|
|
|
|
|
|
| ||||||||||||||||||||
| $ | 56,366,529 | $ | 86,815,518 | $ | 25,884,685 | $ | 777,233,648 | $ | 31,044,347 | $ | 45,762,110 | $ | 12,012,778 | ||||||||||||||||||||
121
Sterling Capital Funds
|
Statements of Assets and Liabilities |
September 30, 2016
|
| Assets: | Sterling Capital Maryland Intermediate Tax-Free Fund | Sterling Capital North Carolina Intermediate Tax-Free Fund | ||||||||
Investments at fair value - unaffiliated (a) | $ | 31,694,127 | $ | 215,491,138 | ||||||
Investments at fair value - affiliated (b) | — | — | ||||||||
Interest and dividends receivable - unaffiliated | 323,279 | 2,846,863 | ||||||||
Dividends receivable - affiliated | — | — | ||||||||
Receivable for capital shares issued | 11,810 | 565,993 | ||||||||
Prepaid and other expenses | 5,383 | 7,572 | ||||||||
|
|
|
| |||||||
Total Assets | 32,034,599 | 218,911,566 | ||||||||
|
|
|
| |||||||
Liabilities: | ||||||||||
Distributions payable | 30,849 | 226,472 | ||||||||
Payable for investments purchased | — | 2,441,880 | ||||||||
Payable for capital shares redeemed | 20,036 | 580,160 | ||||||||
Accrued expenses and other payables: | ||||||||||
Investment advisory fees | 9,143 | 61,459 | ||||||||
Administration fees | 2,181 | 14,658 | ||||||||
Audit fees | 1,936 | 11,361 | ||||||||
Compliance service fees | 95 | 253 | ||||||||
Distribution (12b-1) fees | 1,994 | 15,590 | ||||||||
Trustee fees | 55 | 293 | ||||||||
Legal fees | 810 | 5,455 | ||||||||
Printing fees | 1,251 | 7,463 | ||||||||
Transfer agent fees | 2,490 | 13,599 | ||||||||
Other fees | 3,238 | 11,439 | ||||||||
|
|
|
| |||||||
Total Liabilities | 74,078 | 3,390,082 | ||||||||
|
|
|
| |||||||
Net Assets | $ | 31,960,521 | $ | 215,521,484 | ||||||
|
|
|
| |||||||
Net Assets Consist of: | ||||||||||
Capital | $ | 29,929,634 | $ | 202,867,109 | ||||||
Undistributed net investment income (loss) | 3,966 | 98,229 | ||||||||
Accumulated realized gain (loss) | 228,665 | 715,261 | ||||||||
Net unrealized appreciation | 1,798,256 | 11,840,885 | ||||||||
|
|
|
| |||||||
Net Assets | $ | 31,960,521 | $ | 215,521,484 | ||||||
|
|
|
| |||||||
Net Assets | ||||||||||
Class A Shares | $ | 6,537,469 | $ | 52,129,573 | ||||||
Class B Shares | — | — | ||||||||
Class C Shares | 802,404 | 6,108,194 | ||||||||
Institutional Shares | 24,620,648 | 157,283,717 | ||||||||
|
|
|
| |||||||
Total | $ | 31,960,521 | $ | 215,521,484 | ||||||
|
|
|
| |||||||
Shares of Beneficial Interest Outstanding (Unlimited number of shares authorized, no par value) | ||||||||||
Class A Shares | 578,118 | 4,704,154 | ||||||||
Class B Shares | — | — | ||||||||
Class C Shares | 70,937 | 551,582 | ||||||||
Institutional Shares | 2,173,751 | 14,193,674 | ||||||||
|
|
|
| |||||||
Total | 2,822,806 | 19,449,410 | ||||||||
|
|
|
| |||||||
Net Asset Value | ||||||||||
Class A Shares - redemption price per share | $ | 11.31 | $ | 11.08 | ||||||
|
|
|
| |||||||
Class B Shares - offering price per share* | $ | — | $ | — | ||||||
|
|
|
| |||||||
Class C Shares - offering price per share* | $ | 11.31 | $ | 11.07 | ||||||
|
|
|
| |||||||
Institutional Shares | $ | 11.33 | $ | 11.08 | ||||||
|
|
|
| |||||||
Maximum Sales Charge - Class A Shares | 2.00 | % | 2.00 | % | ||||||
|
|
|
| |||||||
Maximum Offering Price (100%/(100% - Maximum Sales Charge)) of net asset value adjusted to the nearest cent per share - Class A Shares | $ | 11.55 | $ | 11.32 | ||||||
|
|
|
| |||||||
Investments at cost: | ||||||||||
(a) Investments at cost - unaffiliated | $ | 29,895,871 | $ | 203,650,253 | ||||||
(b) Investments at cost - affiliated | $ | — | $ | — | ||||||
| * | Redemption price per share varies by length of time shares are held. |
See accompanying Notes to the Financial Statements.
122
|
|
|
| Sterling Capital South Carolina Intermediate Tax-Free Fund | Sterling Capital Virginia Intermediate Tax-Free Fund | Sterling Capital West Virginia Intermediate Tax-Free Fund | Sterling Capital Diversified Income Fund | Sterling Capital Strategic Allocation Balanced Fund | Sterling Capital Strategic Allocation Growth Fund | ||||||||||||||||||||||||
| $ | 92,176,515 | $ | 118,663,631 | $ | 101,635,118 | $ | 42,917,226 | $ | 212,651 | $ | 125,335 | ||||||||||||||||||
| — | — | — | — | 32,802,482 | 23,269,689 | ||||||||||||||||||||||||
| 1,081,719 | 1,354,765 | 1,375,050 | 69,368 | — | — | ||||||||||||||||||||||||
| — | — | — | — | 27,092 | 9,840 | ||||||||||||||||||||||||
| 279,244 | 696,687 | 23,760 | 40,827 | 261 | 872 | ||||||||||||||||||||||||
| 3,694 | 7,197 | 8,418 | 4,378 | 7,326 | 8,215 | ||||||||||||||||||||||||
|
|
|
|
|
|
|
|
|
|
|
| ||||||||||||||||||
| 93,541,172 | 120,722,280 | 103,042,346 | 43,031,799 | 33,049,812 | 23,413,951 | ||||||||||||||||||||||||
|
|
|
|
|
|
|
|
|
|
|
| ||||||||||||||||||
| 94,565 | 122,293 | 110,367 | 8,196 | 1,207 | 216 | ||||||||||||||||||||||||
| — | — | — | 69,259 | — | — | ||||||||||||||||||||||||
| 175,637 | 693,294 | 125,092 | 93,001 | 2,034 | 45 | ||||||||||||||||||||||||
| 26,537 | 34,545 | 29,387 | 8,776 | — | — | ||||||||||||||||||||||||
| 6,329 | 8,239 | 7,009 | 2,930 | — | — | ||||||||||||||||||||||||
| 4,718 | 6,649 | 5,629 | 2,365 | 1,882 | 1,332 | ||||||||||||||||||||||||
| 146 | 172 | 154 | 103 | 95 | 87 | ||||||||||||||||||||||||
| 5,260 | 8,093 | 8,372 | 4,214 | 7,358 | 5,094 | ||||||||||||||||||||||||
| 119 | 177 | 151 | 64 | 52 | 37 | ||||||||||||||||||||||||
| 2,351 | 3,063 | 2,591 | 1,080 | 837 | 590 | ||||||||||||||||||||||||
| 3,079 | 4,371 | 3,626 | 1,510 | 1,211 | 858 | ||||||||||||||||||||||||
| 6,229 | 8,176 | 7,714 | 3,226 | 2,531 | 1,504 | ||||||||||||||||||||||||
| 5,815 | 7,272 | 6,415 | 1,409 | 1,128 | 894 | ||||||||||||||||||||||||
|
|
|
|
|
|
|
|
|
|
|
| ||||||||||||||||||
| 330,785 | 896,344 | 306,507 | 196,133 | 18,335 | 10,657 | ||||||||||||||||||||||||
|
|
|
|
|
|
|
|
|
|
|
| ||||||||||||||||||
| $ | 93,210,387 | $ | 119,825,936 | $ | 102,735,839 | $ | 42,835,666 | $ | 33,031,477 | $ | 23,403,294 | ||||||||||||||||||
|
|
|
|
|
|
|
|
|
|
|
| ||||||||||||||||||
| $ | 89,130,687 | $ | 112,743,702 | $ | 96,843,123 | $ | 47,703,115 | $ | 36,590,112 | $ | 29,605,869 | ||||||||||||||||||
| 28,193 | 63,196 | 67,729 | 83,292 | 15,503 | 3,172 | ||||||||||||||||||||||||
| 9,915 | 783,744 | 461,576 | (6,413,779 | ) | (4,384,950 | ) | (6,714,197 | ) | |||||||||||||||||||||
| 4,041,592 | 6,235,294 | 5,363,411 | 1,463,038 | 810,812 | 508,450 | ||||||||||||||||||||||||
|
|
|
|
|
|
|
|
|
|
|
| ||||||||||||||||||
| $ | 93,210,387 | $ | 119,825,936 | $ | 102,735,839 | $ | 42,835,666 | $ | 33,031,477 | $ | 23,403,294 | ||||||||||||||||||
|
|
|
|
|
|
|
|
|
|
|
| ||||||||||||||||||
| $ | 18,682,546 | $ | 34,691,023 | $ | 37,720,445 | $ | 15,125,860 | $ | 31,950,811 | $ | 21,912,079 | ||||||||||||||||||
| — | — | — | 224,823 | 259,839 | 329,986 | ||||||||||||||||||||||||
| 1,805,730 | 1,170,271 | 816,591 | 1,156,814 | 741,095 | 436,361 | ||||||||||||||||||||||||
| 72,722,111 | 83,964,642 | 64,198,803 | 26,328,169 | 79,732 | 724,868 | ||||||||||||||||||||||||
|
|
|
|
|
|
|
|
|
|
|
| ||||||||||||||||||
| $ | 93,210,387 | $ | 119,825,936 | $ | 102,735,839 | $ | 42,835,666 | $ | 33,031,477 | $ | 23,403,294 | ||||||||||||||||||
|
|
|
|
|
|
|
|
|
|
|
| ||||||||||||||||||
| 1,653,419 | 2,860,211 | 3,672,621 | 1,398,038 | 2,953,855 | 2,080,096 | ||||||||||||||||||||||||
| — | — | — | 20,740 | 24,468 | 32,260 | ||||||||||||||||||||||||
| 159,837 | 96,502 | 79,477 | 107,771 | 69,809 | 42,866 | ||||||||||||||||||||||||
| 6,479,876 | 6,924,455 | 6,243,710 | 2,405,648 | 7,317 | 68,662 | ||||||||||||||||||||||||
|
|
|
|
|
|
|
|
|
|
|
| ||||||||||||||||||
| 8,293,132 | 9,881,168 | 9,995,808 | 3,932,197 | 3,055,449 | 2,223,884 | ||||||||||||||||||||||||
|
|
|
|
|
|
|
|
|
|
|
| ||||||||||||||||||
| $ | 11.30 | $ | 12.13 | $ | 10.27 | $ | 10.82 | $ | 10.82 | $ | 10.53 | ||||||||||||||||||
|
|
|
|
|
|
|
|
|
|
|
| ||||||||||||||||||
| $ | — | $ | — | $ | — | $ | 10.84 | $ | 10.62 | $ | 10.23 | ||||||||||||||||||
|
|
|
|
|
|
|
|
|
|
|
| ||||||||||||||||||
| $ | 11.30 | $ | 12.13 | $ | 10.27 | $ | 10.73 | $ | 10.62 | $ | 10.18 | ||||||||||||||||||
|
|
|
|
|
|
|
|
|
|
|
| ||||||||||||||||||
| $ | 11.22 | $ | 12.13 | $ | 10.28 | $ | 10.94 | $ | 10.90 | $ | 10.56 | ||||||||||||||||||
|
|
|
|
|
|
|
|
|
|
|
| ||||||||||||||||||
| 2.00 | % | 2.00 | % | 2.00 | % | 5.75 | % | 5.75 | % | 5.75 | % | ||||||||||||||||||
|
|
|
|
|
|
|
|
|
|
|
| ||||||||||||||||||
| $ | 11.52 |
| $ | 12.39 | $ | 10.48 | $ | 11.48 | $ | 11.48 | $ | 11.17 | |||||||||||||||||
|
|
|
|
|
|
|
|
|
|
|
| ||||||||||||||||||
| $ | 88,134,923 | $ | 112,428,337 | $ | 96,271,707 | $ | 41,454,188 | $ | 212,651 | $ | 125,335 | ||||||||||||||||||
| $ | — | $ | — | $ | — | $ | — | $ | 31,991,670 | $ | 22,761,239 | ||||||||||||||||||
123
Sterling Capital Funds
|
Statements of Operations |
For the Year Ended September 30, 2016
|
| Sterling Capital Behavioral Large Cap Value Equity Fund | Sterling Capital Mid Value Fund | |||||||||
Investment Income: | ||||||||||
Interest income | $ | — | $ | — | ||||||
Dividend income | 7,102,754 | 8,002,912 | ||||||||
Foreign tax withholding | (1,548 | ) | — | |||||||
|
|
|
| |||||||
Total investment income | 7,101,206 | 8,002,912 | ||||||||
|
|
|
| |||||||
Expenses: | ||||||||||
Investment advisory fees (See Note 5) | 1,912,843 | 4,192,267 | ||||||||
Administration fees (See Note 5) | 237,584 | 520,447 | ||||||||
Distribution fees - Class A Shares (See Note 5) | 77,728 | 81,230 | ||||||||
Distribution fees - Class B Shares (See Note 5) | 3,778 | 4,832 | ||||||||
Distribution fees - Class C Shares (See Note 5) | 10,115 | 53,970 | ||||||||
Distribution fees - Class R Shares (See Note 5) | — | 1 | ||||||||
Compliance service fees (See Note 5) | 2,845 | 5,906 | ||||||||
Trustee fees | 24,411 | 54,632 | ||||||||
Accounting and out-of-pocket fees | 3,273 | 4,956 | ||||||||
Audit fees | 24,368 | 53,626 | ||||||||
Custodian fees | 13,119 | 28,101 | ||||||||
Fund accounting fees (See Note 5) | 20,534 | 44,917 | ||||||||
Interest expense (See Note 7) | — | 106 | ||||||||
Legal fees | 37,167 | 83,384 | ||||||||
Offering costs | — | — | ||||||||
Printing fees | 28,067 | 64,355 | ||||||||
Registration fees | 49,809 | 64,169 | ||||||||
Transfer agent fees (See Note 5) | 96,054 | 412,301 | ||||||||
Taxes other than income taxes | — | — | ||||||||
Other fees | 18,727 | 41,630 | ||||||||
|
|
|
| |||||||
Total expenses excluding dividend expense and service fee on securities sold short | 2,560,422 | 5,710,830 | ||||||||
Dividend expense | — | — | ||||||||
Service fee on securities sold short | — | — | ||||||||
|
|
|
| |||||||
Total expenses before waivers | 2,560,422 | 5,710,830 | ||||||||
Less expenses waived by the Investment Advisor (See Note 5) | (379,877 | ) | — | |||||||
|
|
|
| |||||||
Net expenses | 2,180,545 | 5,710,830 | ||||||||
|
|
|
| |||||||
Net investment income (loss) | 4,920,661 | 2,292,082 | ||||||||
|
|
|
| |||||||
Realized and Unrealized Gain (Loss): | ||||||||||
Net realized gain (loss) from: | ||||||||||
Investments | 1,705,485 | 26,467,705 | ||||||||
Written options | — | — | ||||||||
Foreign currency transactions | — | — | ||||||||
Short sales | — | — | ||||||||
Change in unrealized appreciation/depreciation on: | ||||||||||
Investments | 15,175,012 | 47,976,839 | ||||||||
Written options | — | — | ||||||||
Foreign currency transactions | — | — | ||||||||
Short sales | — | — | ||||||||
|
|
|
| |||||||
Total realized and unrealized gain (loss) | 16,880,497 | 74,444,544 | ||||||||
|
|
|
| |||||||
Change in net assets from operations | $ | 21,801,158 | $ | 76,736,626 | ||||||
|
|
|
| |||||||
* For the period January 1, 2016 to September 30, 2016.
** Year ended December 31, 2015.
See accompanying Notes to the Financial Statements.
124
|
|
|
| Sterling Capital Behavioral Small Cap Value Equity Fund | Sterling Capital Special Opportunities Fund | Sterling Capital Equity Income Fund | Sterling Capital Long/Short Equity Fund | Sterling Capital Behavioral International Equity Fund | Sterling Capital Stratton Mid Cap Value Fund* | Sterling Capital Stratton Mid Cap Value Fund** | |||||||||||||||||||||||||||
| $ | — | $ | — | $ | — | $ | 207,117 | $ | — | $ | — | $ | 320 | ||||||||||||||||||||
| 3,562,072 | 12,355,813 | 48,312,402 | 586,004 | 1,190,868 | 525,298 | 933,950 | |||||||||||||||||||||||||||
| (2,402 | ) | — | (285,745 | ) | (11,763 | ) | (80,652 | ) | (3,323 | ) | (4,335 | ) | |||||||||||||||||||||
|
|
|
|
|
|
|
|
|
|
|
|
|
| ||||||||||||||||||||
| 3,559,670 | 12,355,813 | 48,026,657 | 781,358 | 1,110,216 | 521,975 | 929,935 | |||||||||||||||||||||||||||
|
|
|
|
|
|
|
|
|
|
|
|
|
| ||||||||||||||||||||
| 1,107,554 | 7,762,661 | 11,211,537 | 838,530 | 270,857 | 324,174 | 531,035 | |||||||||||||||||||||||||||
| 127,880 | 900,103 | 1,391,414 | 48,974 | 28,984 | 39,751 | 7,393 | |||||||||||||||||||||||||||
| 24,920 | 792,437 | 1,131,288 | 1,819 | 971 | 30 | — | |||||||||||||||||||||||||||
| 1,544 | 32,293 | 27,860 | — | — | — | — | |||||||||||||||||||||||||||
| 3,507 | 1,651,346 | 2,750,579 | 2,838 | 296 | 8 | 1 | |||||||||||||||||||||||||||
| 1 | 591 | 9,912 | — | — | — | — | |||||||||||||||||||||||||||
| 1,653 | 10,258 | 15,554 | 776 | 570 | 714 | 45 | |||||||||||||||||||||||||||
| 12,816 | 90,482 | 143,031 | 6,244 | 2,590 | 3,992 | 7,021 | |||||||||||||||||||||||||||
| 6,611 | 8,476 | 14,460 | 12,212 | 30,878 | 990 | 6,302 | |||||||||||||||||||||||||||
| 13,124 | 92,363 | 143,442 | 5,881 | 2,641 | 5,504 | 3,080 | |||||||||||||||||||||||||||
| 7,153 | 50,444 | 76,377 | 3,427 | 17,671 | 3,285 | 13,049 | |||||||||||||||||||||||||||
| 11,076 | 77,948 | 120,271 | 56,182 | 2,539 | 3,473 | 69,769 | |||||||||||||||||||||||||||
| — | 372 | — | 1,462 | 26 | — | — | |||||||||||||||||||||||||||
| 19,688 | 137,397 | 219,370 | 35,586 | 3,815 | 6,016 | 3,320 | |||||||||||||||||||||||||||
| — | — | — | — | 2,337 | — | — | |||||||||||||||||||||||||||
| 16,120 | 109,234 | 176,030 | 11,083 | 3,261 | 9,698 | 6,234 | |||||||||||||||||||||||||||
| 47,479 | 97,116 | 86,004 | 29,155 | 10,104 | 26,020 | 29,775 | |||||||||||||||||||||||||||
| 63,744 | 711,160 | 1,701,246 | 44,910 | 6,396 | 20,867 | 53,563 | |||||||||||||||||||||||||||
| — | — | — | — | — | — | 5,700 | |||||||||||||||||||||||||||
| 11,026 | 60,874 | 99,194 | 7,132 | 10,262 | 4,265 | 7,482 | |||||||||||||||||||||||||||
|
|
|
|
|
|
|
|
|
|
|
|
|
| ||||||||||||||||||||
| 1,475,896 | 12,585,555 | 19,317,569 | 1,106,211 | 394,198 | 448,787 | 743,769 | |||||||||||||||||||||||||||
| — | — | — | 366,330 | — | — | — | |||||||||||||||||||||||||||
| — | — | — | 395,658 | — | — | — | |||||||||||||||||||||||||||
|
|
|
|
|
|
|
|
|
|
|
|
|
| ||||||||||||||||||||
| 1,475,896 | 12,585,555 | 19,317,569 | 1,868,199 | 394,198 | 448,787 | 743,769 | |||||||||||||||||||||||||||
| (153,109 | ) | (541,338 | ) | — | (15,640 | ) | (122,189 | ) | (8,426 | ) | — | ||||||||||||||||||||||
|
|
|
|
|
|
|
|
|
|
|
|
|
| ||||||||||||||||||||
| 1,322,787 | 12,044,217 | 19,317,569 | 1,852,559 | 272,009 | 440,361 | 743,769 | |||||||||||||||||||||||||||
|
|
|
|
|
|
|
|
|
|
|
|
|
| ||||||||||||||||||||
| 2,236,883 | 311,596 | 28,709,088 | (1,071,201 | ) | 838,207 | 81,614 | 186,166 | ||||||||||||||||||||||||||
|
|
|
|
|
|
|
|
|
|
|
|
|
| ||||||||||||||||||||
| (1,298,426 | ) | 24,123,820 | (6,680,264 | ) | (21,019,419 | ) | (183,716 | ) | (895,187 | ) | 3,434,727 | ||||||||||||||||||||||
| — | 172,668 | 1,880,239 | 113,101 | — | — | — | |||||||||||||||||||||||||||
| — | — | (31,290 | ) | 1,977 | (3,848 | ) | — | — | |||||||||||||||||||||||||
| — | — | — | (221,848 | ) | — | — | — | ||||||||||||||||||||||||||
| 13,544,642 | 55,290,384 | 195,983,321 | 21,275,975 | 2,238,929 | 4,734,573 | (4,693,757 | ) | ||||||||||||||||||||||||||
| — | (698,468 | ) | (239,553 | ) | 2,898 | — | — | — | |||||||||||||||||||||||||
| — | — | — | 2 | (1,650 | ) | — | — | ||||||||||||||||||||||||||
| — | — | — | (2,771,178 | ) | — | — | — | ||||||||||||||||||||||||||
|
|
|
|
|
|
|
|
|
|
|
|
|
| ||||||||||||||||||||
| 12,246,216 | 78,888,404 | 190,912,453 | (2,618,492 | ) | 2,049,715 | 3,839,386 | (1,259,030 | ) | |||||||||||||||||||||||||
|
|
|
|
|
|
|
|
|
|
|
|
|
| ||||||||||||||||||||
| $ | 14,483,099 | $ | 79,200,000 | $ | 219,621,541 | $ | (3,689,693 | ) | $ | 2,887,922 | $ | 3,921,000 | $ | (1,072,864 | ) | ||||||||||||||||||
|
|
|
|
|
|
|
|
|
|
|
|
|
| ||||||||||||||||||||
125
Sterling Capital Funds
|
Statements of Operations |
For the Year Ended September 30, 2016
|
| Sterling Capital Stratton Real Estate Fund* | Sterling Capital Stratton Real Estate Fund** | Sterling Capital Stratton Small Cap Value Fund* | Sterling Capital Stratton Small Cap Value Fund** | |||||||||||||||||
Investment Income: | ||||||||||||||||||||
Interest income | $ | — | $ | 309 | $ | — | $ | 6,963 | ||||||||||||
Dividend income | 2,240,871 | 2,672,960 | 10,692,262 | 16,079,418 | ||||||||||||||||
|
|
|
|
|
|
|
| |||||||||||||
Total investment income | 2,240,871 | 2,673,269 | 10,692,262 | 16,086,381 | ||||||||||||||||
|
| �� |
|
|
|
|
|
| ||||||||||||
Expenses: | ||||||||||||||||||||
Investment advisory fees (See Note 5) | 435,944 | 610,411 | 7,126,434 | 11,916,075 | ||||||||||||||||
Administration fees (See Note 5) | 65,028 | 10,650 | 719,603 | 133,062 | ||||||||||||||||
Distribution fees - Class A Shares (See Note 5) | 116 | — | 103 | — | ||||||||||||||||
Distribution fees - Class B Shares (See Note 5) | — | — | — | — | ||||||||||||||||
Distribution fees - Class C Shares (See Note 5) | 59 | 1 | 223 | 1 | ||||||||||||||||
Distribution fees - Class R Shares (See Note 5) | — | — | — | — | ||||||||||||||||
Compliance service fees (See Note 5) | 1,017 | 64 | 8,890 | 788 | ||||||||||||||||
Trustee fees | 6,497 | 9,942 | 71,865 | 133,037 | ||||||||||||||||
Accounting and out-of-pocket fees | 1,017 | 6,361 | 10,154 | 9,120 | ||||||||||||||||
Audit fees | 9,053 | 4,210 | 98,753 | 58,365 | ||||||||||||||||
Custodian fees | 4,655 | 16,016 | 33,886 | 137,984 | ||||||||||||||||
Fund accounting fees (See Note 5) | 5,686 | 71,167 | 62,880 | 626,848 | ||||||||||||||||
Legal fees | 9,699 | 4,639 | 110,891 | 62,071 | ||||||||||||||||
Printing fees | 15,125 | 8,891 | 151,853 | 181,956 | ||||||||||||||||
Registration fees | 30,779 | 31,559 | 52,281 | 57,587 | ||||||||||||||||
Transfer agent fees (See Note 5) | 52,616 | 89,405 | 553,022 | 1,310,349 | ||||||||||||||||
Taxes other than income taxes | — | 7,725 | — | 100,350 | ||||||||||||||||
Other fees | 5,391 | 8,162 | 47,152 | 91,054 | ||||||||||||||||
|
|
|
|
|
|
|
| |||||||||||||
Total expenses before waivers | 642,682 | 879,203 | 9,047,990 | 14,818,647 | ||||||||||||||||
Less expenses waived by the Investment Advisor (See Note 5) | (14,939 | ) | — | — | — | |||||||||||||||
|
|
|
|
|
|
|
| |||||||||||||
Net expenses | 627,743 | 879,203 | 9,047,990 | 14,818,647 | ||||||||||||||||
|
|
|
|
|
|
|
| |||||||||||||
Net investment income | 1,613,128 | 1,794,066 | 1,644,272 | 1,267,734 | ||||||||||||||||
|
|
|
|
|
|
|
| |||||||||||||
Realized and Unrealized Gain (Loss): | ||||||||||||||||||||
Net realized gain (loss) from: | ||||||||||||||||||||
Investments | 2,500,157 | 2,114,745 | 66,753,095 | 27,326,647 | ||||||||||||||||
Distributions from unaffiliated funds | — | — | — | — | ||||||||||||||||
Change in unrealized appreciation/depreciation on investments | 6,959,598 | (2,819,062 | ) | 60,734,126 | (83,141,134 | ) | ||||||||||||||
|
|
|
|
|
|
|
| |||||||||||||
Total realized and unrealized gain | 9,459,755 | (704,317 | ) | 127,487,221 | (55,814,487 | ) | ||||||||||||||
|
|
|
|
|
|
|
| |||||||||||||
Change in net assets from operations | $ | 11,072,883 | $ | 1,089,749 | $ | 129,131,493 | $ | (54,546,753 | ) | |||||||||||
|
|
|
|
|
|
|
| |||||||||||||
* For the period ended January 1, 2016 to
September 30, 2016.
** Year ended December 31, 2015.
See accompanying Notes to the Financial Statements.
126
|
|
|
| Sterling Capital Ultra Short Bond Fund | Sterling Capital Short Duration Bond Fund | Sterling Capital Intermediate U.S. Government Fund | Sterling Capital Total Return Bond Fund | Sterling Capital Corporate Fund | Sterling Capital Securitized Opportunities Fund | Sterling Capital Kentucky Intermediate Tax-Free Fund | |||||||||||||||||||||||||||
| $ | 635,237 | $ | 1,524,058 | $ | 609,601 | $ | 21,734,322 | $ | 1,892,005 | $ | 1,322,058 | $ | 410,234 | ||||||||||||||||||||
| 7,407 | 21,518 | 668 | 280,792 | 38,046 | 1,174 | 778 | |||||||||||||||||||||||||||
|
|
|
|
|
|
|
|
|
|
|
|
|
| ||||||||||||||||||||
| 642,644 | 1,545,576 | 610,269 | 22,015,114 | 1,930,051 | 1,323,232 | 411,012 | |||||||||||||||||||||||||||
|
|
|
|
|
|
|
|
|
|
|
|
|
| ||||||||||||||||||||
| 94,362 | 254,347 | 125,559 | 2,575,786 | 184,353 | 167,390 | 58,590 | |||||||||||||||||||||||||||
| 40,907 | 73,605 | 25,370 | 603,202 | 45,997 | 41,518 | 11,314 | |||||||||||||||||||||||||||
| 20,561 | 19,200 | 18,636 | 149,406 | 975 | 3,041 | 10,816 | |||||||||||||||||||||||||||
| — | — | 1,239 | 6,879 | — | — | — | |||||||||||||||||||||||||||
| — | 21,736 | 8,373 | 64,150 | 366 | 393 | 200 | |||||||||||||||||||||||||||
| — | — | — | 26 | — | — | — | |||||||||||||||||||||||||||
| 685 | 1,045 | 513 | 6,903 | 728 | 692 | 358 | |||||||||||||||||||||||||||
| 4,210 | 7,718 | 2,684 | 62,095 | 5,147 | 4,227 | 1,199 | |||||||||||||||||||||||||||
| 22,574 | 23,582 | 3,389 | 58,104 | 18,916 | 25,974 | 1,737 | |||||||||||||||||||||||||||
| 4,197 | 7,521 | 2,608 | 61,511 | 4,654 | 4,217 | 1,156 | |||||||||||||||||||||||||||
| 2,358 | 4,150 | 1,508 | 33,179 | 2,567 | 2,415 | 715 | |||||||||||||||||||||||||||
| 3,539 | 6,358 | 2,190 | 52,211 | 3,950 | 3,587 | 977 | |||||||||||||||||||||||||||
| 6,380 | 11,620 | 4,004 | 141,292 | 11,959 | 9,815 | 1,815 | |||||||||||||||||||||||||||
| 5,160 | 9,017 | 3,675 | 69,435 | 6,022 | 5,139 | 1,708 | |||||||||||||||||||||||||||
| 29,295 | 35,349 | 23,211 | 49,129 | 19,821 | 24,765 | 13,188 | |||||||||||||||||||||||||||
| 38,308 | 33,447 | 12,251 | 356,137 | 28,285 | 17,179 | 4,842 | |||||||||||||||||||||||||||
| — | — | — | — | — | — | — | |||||||||||||||||||||||||||
| 3,891 | 6,803 | 4,125 | 41,266 | 5,416 | 4,600 | 2,601 | |||||||||||||||||||||||||||
|
|
|
|
|
|
|
|
|
|
|
|
|
| ||||||||||||||||||||
| 276,427 | 515,498 | 239,335 | 4,330,711 | 339,156 | 314,952 | 111,216 | |||||||||||||||||||||||||||
| (42,572 | ) | (61,788 | ) | (34,443 | ) | (696,159 | ) | — | (19,130 | ) | (14,466 | ) | |||||||||||||||||||||
|
|
|
|
|
|
|
|
|
|
|
|
|
| ||||||||||||||||||||
| 233,855 | 453,710 | 204,892 | 3,634,552 | 339,156 | 295,822 | 96,750 | |||||||||||||||||||||||||||
|
|
|
|
|
|
|
|
|
|
|
|
|
| ||||||||||||||||||||
| 408,789 | 1,091,866 | 405,377 | 18,380,562 | 1,590,895 | 1,027,410 | 314,262 | |||||||||||||||||||||||||||
|
|
|
|
|
|
|
|
|
|
|
|
|
| ||||||||||||||||||||
| 624 | (81,804 | ) | 122,704 | 3,232,622 | 215,255 | 305,310 | 179,245 | ||||||||||||||||||||||||||
| — | — | — | — | — | — | 65 | |||||||||||||||||||||||||||
|
| 157,845 |
| 791,096 | 193,451 | 19,293,448 | 967,977 | 424,797 | (1,263 | ) | ||||||||||||||||||||||||
|
|
|
|
|
|
|
|
|
|
|
|
|
| ||||||||||||||||||||
| 158,469 | 709,292 | 316,155 | 22,526,070 | 1,183,232 | 730,107 | 178,047 | |||||||||||||||||||||||||||
|
|
|
|
|
|
|
|
|
|
|
|
|
| ||||||||||||||||||||
| $ | 567,258 | $ | 1,801,158 | $ | 721,532 | $ | 40,906,632 | $ | 2,774,127 | $ | 1,757,517 | $ | 492,309 | ||||||||||||||||||||
|
|
|
|
|
|
|
|
|
|
|
|
|
| ||||||||||||||||||||
127
Sterling Capital Funds
|
Statements of Operations |
For the Year Ended September 30, 2016
|
| Sterling Capital Maryland Intermediate Tax-Free Fund | Sterling Capital North Carolina Intermediate Tax-Free Fund | |||||||||
Investment Income: | ||||||||||
Interest income | $ | 903,162 | $ | 5,853,773 | ||||||
Dividend income - unaffiliated | 969 | 703 | ||||||||
Dividend income - affiliated | — | — | ||||||||
|
|
|
| |||||||
Total investment income | 904,131 | 5,854,476 | ||||||||
|
|
|
| |||||||
Expenses: | ||||||||||
Investment advisory fees (See Note 5) | 155,700 | 913,753 | ||||||||
Administration fees (See Note 5) | 30,055 | 176,111 | ||||||||
Distribution fees - Class A Shares (See Note 5) | 16,065 | 122,479 | ||||||||
Distribution fees - Class B Shares (See Note 5) | — | — | ||||||||
Distribution fees - Class C Shares (See Note 5) | 7,065 | 49,136 | ||||||||
Compliance service fees (See Note 5) | 563 | 2,185 | ||||||||
Trustee fees | 3,176 | 18,168 | ||||||||
Accounting and out-of-pocket fees | 4,050 | 16,037 | ||||||||
Audit fees | 3,069 | 18,021 | ||||||||
Custodian fees | 1,732 | 9,817 | ||||||||
Fund accounting fees (See Note 5) | 2,596 | 15,229 | ||||||||
Legal fees | 4,782 | 27,416 | ||||||||
Printing fees | 4,007 | 20,528 | ||||||||
Registration fees | 15,553 | 13,397 | ||||||||
Transfer agent fees (See Note 5) | 15,896 | 76,452 | ||||||||
Other fees | 3,878 | 13,143 | ||||||||
|
|
|
| |||||||
Total expenses before waivers | 268,187 | 1,491,872 | ||||||||
Less expenses waived by the Investment Advisor (See Note 5) | (34,600 | ) | (203,056 | ) | ||||||
|
|
|
| |||||||
Net expenses | 233,587 | 1,288,816 | ||||||||
|
|
|
| |||||||
Net investment income | 670,544 | 4,565,660 | ||||||||
|
|
|
| |||||||
Realized and Unrealized Gain (Loss): | ||||||||||
Net realized gain (loss) from: | ||||||||||
Investments - unaffiliated | 255,734 | 758,138 | ||||||||
Investments - affiliated | — | — | ||||||||
Distributions from unaffiliated funds | 91 | — | ||||||||
Distributions from affiliated funds | — | — | ||||||||
Change in unrealized appreciation/depreciation on investments | 423,216 | 2,178,199 | ||||||||
|
|
|
| |||||||
Total realized and unrealized gain | 679,041 | 2,936,337 | ||||||||
|
|
|
| |||||||
Change in net assets from operations | $ | 1,349,585 | $ | 7,501,997 | ||||||
|
|
|
| |||||||
See accompanying Notes to the Financial Statements.
128
|
| Sterling Capital South Carolina Intermediate Tax-Free Fund | Sterling Capital Virginia Intermediate Tax-Free Fund | Sterling Capital West Virginia Intermediate Tax-Free Fund | Sterling Capital Diversified Income Fund | Sterling Capital Strategic Allocation Balanced Fund | Sterling Capital Strategic Allocation Growth Fund | |||||||||||||||||||||||
| $ | 2,187,051 | $ | 3,322,740 | $ | 2,881,057 | $ | — | $ | — | $ | — | |||||||||||||||||
| 4,758 | 782 | 2,302 | 1,527,126 | 588 | 399 | |||||||||||||||||||||||
| — | — | — | 84,246 | 690,561 | 419,169 | |||||||||||||||||||||||
|
|
|
|
|
|
|
|
|
|
|
| |||||||||||||||||
| 2,191,809 | 3,323,522 | 2,883,359 | 1,611,372 | 691,149 | 419,568 | |||||||||||||||||||||||
|
|
|
|
|
|
|
|
|
|
|
| |||||||||||||||||
| 379,591 | 534,928 | 452,972 | 105,619 | 83,990 | 59,448 | |||||||||||||||||||||||
| 73,084 | 103,112 | 87,366 | 23,574 | — | — | |||||||||||||||||||||||
| 44,095 | 90,287 | 90,750 | 36,093 | 80,520 | 54,766 | |||||||||||||||||||||||
| — | — | — | 3,623 | 5,592 | 5,916 | |||||||||||||||||||||||
| 17,095 | 12,729 | 5,248 | 10,246 | 7,473 | 4,431 | |||||||||||||||||||||||
| 1,046 | 1,374 | 1,197 | 632 | 549 | 458 | |||||||||||||||||||||||
| 7,418 | 10,734 | 9,127 | 3,741 | 2,983 | 2,101 | |||||||||||||||||||||||
| 8,208 | 9,740 | 8,525 | — | — | — | |||||||||||||||||||||||
| 7,443 | 10,546 | 8,924 | 3,389 | 2,597 | 3,153 | |||||||||||||||||||||||
| 4,129 | 5,764 | 4,889 | 2,113 | 1,687 | 1,223 | |||||||||||||||||||||||
| 6,326 | 8,915 | 7,550 | 3,168 | 2,520 | 1,784 | |||||||||||||||||||||||
| 11,265 | 16,136 | 13,741 | 5,667 | 4,512 | 3,190 | |||||||||||||||||||||||
| 8,990 | 12,412 | 10,333 | 5,985 | 4,875 | 3,671 | |||||||||||||||||||||||
| 13,454 | 15,838 | 15,651 | 25,297 | 17,061 | 17,183 | |||||||||||||||||||||||
| 34,785 | 44,001 | 45,280 | 18,543 | 13,337 | 8,680 | |||||||||||||||||||||||
| 6,229 | 8,511 | 7,594 | 2,339 | 1,886 | 1,817 | |||||||||||||||||||||||
|
|
|
|
|
|
|
|
|
|
|
| |||||||||||||||||
| 623,158 | 885,027 | 769,147 | 250,029 | 229,582 | 167,821 | |||||||||||||||||||||||
| (84,354 | ) | (118,873 | ) | (100,660 | ) | (36,566 | ) | (83,990 | ) | (59,448 | ) | |||||||||||||||||
|
|
|
|
|
|
|
|
|
|
|
| |||||||||||||||||
| 538,804 | 766,154 | 668,487 | 213,463 | 145,592 | 108,373 | |||||||||||||||||||||||
|
|
|
|
|
|
|
|
|
|
|
| |||||||||||||||||
| 1,653,005 | 2,557,368 | 2,214,872 | 1,397,909 | 545,557 | 311,195 | |||||||||||||||||||||||
|
|
|
|
|
|
|
|
|
|
|
| |||||||||||||||||
| 9,748 | 875,904 | 522,840 | (1,452,396 | ) | 183 | 28 | ||||||||||||||||||||||
| — | — | — | 42,719 | (207,779 | ) | (97,562 | ) | |||||||||||||||||||||
| 357 | 369 | 346 | 196,451 | — | — | |||||||||||||||||||||||
| — | — | — | — | 1,032,494 | 913,680 | |||||||||||||||||||||||
| 1,396,055 | 958,768 | 1,257,070 | 3,733,112 | 842,888 | 567,271 | |||||||||||||||||||||||
|
|
|
|
|
|
|
|
|
|
|
| |||||||||||||||||
| 1,406,160 | 1,835,041 | 1,780,256 | 2,519,886 | 1,667,786 | 1,383,417 | |||||||||||||||||||||||
|
|
|
|
|
|
|
|
|
|
|
| |||||||||||||||||
| $ | 3,059,165 | $ | 4,392,409 | $ | 3,995,128 | $ | 3,917,795 | $ | 2,213,343 | $ | 1,694,612 | |||||||||||||||||
|
|
|
|
|
|
|
|
|
|
|
| |||||||||||||||||
129
Sterling Capital Funds
|
Statements of Changes in Net Assets |
| Sterling Capital | ||||||||
| Behavioral Large Cap | ||||||||
| Value Equity Fund | ||||||||
For the Year Ended | For the Year Ended September 30, 2015 | |||||||
From Investment Activities: | ||||||||
Operations: | ||||||||
Net investment income (loss) | $ | 4,920,661 | $ | 4,100,885 | ||||
Net realized gain (loss) | 1,705,485 | 20,236,440 | ||||||
Change in unrealized appreciation/depreciation | 15,175,012 | (30,556,150 | ) | |||||
|
|
|
| |||||
Change in net assets from operations | 21,801,158 | (6,218,825 | ) | |||||
|
|
|
| |||||
Distributions to Class A Shareholders From: | ||||||||
Net investment income | (490,042 | ) | (462,866 | ) | ||||
Net realized gains | — | — | ||||||
Distributions to Class B Shareholders From: | ||||||||
Net investment income | (2,410 | ) | (3,997 | ) | ||||
Net realized gains | — | — | ||||||
Distributions to Class C Shareholders From: | ||||||||
Net investment income | (9,659 | ) | (5,366 | ) | ||||
Net realized gains | — | — | ||||||
Distributions to Institutional Class Shareholders From: | ||||||||
Net investment income | (4,422,340 | ) | (3,834,713 | ) | ||||
Net realized gains | — | — | ||||||
Distributions to Class R Shareholders From: | ||||||||
Net investment income | — | — | ||||||
Net realized gains | — | — | ||||||
|
|
|
| |||||
Change in net assets from shareholder distributions | (4,924,451 | ) | (4,306,942 | ) | ||||
|
|
|
| |||||
Capital Transactions: | ||||||||
Change in net assets from capital transactions | 1,480,428 | (6,300,271 | ) | |||||
|
|
|
| |||||
Change in net assets | 18,357,135 | (16,826,038 | ) | |||||
Net Assets: | ||||||||
Beginning of year | 253,901,584 | 270,727,622 | ||||||
|
|
|
| |||||
End of year | $ | 272,258,719 | $ | 253,901,584 | ||||
|
|
|
| |||||
Undistributed net investment income | $ | 214,238 | $ | 177,072 | ||||
|
|
|
| |||||
See accompanying Notes to the Financial Statements.
130
|
| Sterling Capital Mid Value Fund | Sterling Capital Behavioral Small Cap Value Equity Fund | Sterling Capital Special Opportunities Fund | ||||||||||||||||||||
For the Year Ended | For the Year Ended September 30, 2015 | For the Year Ended September 30, 2016 | For the Year Ended September 30, 2015 | For the Year Ended September 30, 2016 | For the Year Ended September 30, 2015 | |||||||||||||||||
| $ | 2,292,082 | $ | 3,929,543 | $ | 2,236,883 | $ | 1,904,206 | $ | 311,596 | $ | (2,092,663 | ) | ||||||||||
| 26,467,705 | 108,655,777 | (1,298,426 | ) | 1,320,822 | 24,296,488 | 138,968,722 | ||||||||||||||||
| 47,976,839 | (109,726,999 | ) | 13,544,642 | 321,112 | 54,591,916 | (96,092,383 | ) | |||||||||||||||
|
|
|
|
|
|
|
|
|
|
|
| |||||||||||
| 76,736,626 | 2,858,321 | 14,483,099 | 3,546,140 | 79,200,000 | 40,783,676 | |||||||||||||||||
|
|
|
|
|
|
|
|
|
|
|
| |||||||||||
| — | (247,243 | ) | (126,331 | ) | (164,833 | ) | — | — | ||||||||||||||
| (6,361,505 | ) | (2,510,139 | ) | (6,036 | ) | (294,991 | ) | (40,021,707 | ) | (19,330,945 | ) | |||||||||||
| — | — | (654 | ) | (490 | ) | — | — | |||||||||||||||
| (129,103 | ) | (79,254 | ) | (86 | ) | (9,790 | ) | (650,328 | ) | (411,768 | ) | |||||||||||
| — | (4,312 | ) | (1,838 | ) | (887 | ) | — | — | ||||||||||||||
| (1,066,172 | ) | (313,445 | ) | (154 | ) | (9,874 | ) | (24,141,758 | ) | (7,118,548 | ) | |||||||||||
| (700,298 | ) | (5,881,265 | ) | (1,963,779 | ) | (2,133,120 | ) | — | — | |||||||||||||
| (103,244,329 | ) | (41,702,231 | ) | (53,644 | ) | (3,571,652 | ) | (70,796,454 | ) | (26,427,999 | ) | |||||||||||
| — | (1 | ) | (2 | ) | (2 | ) | — | — | ||||||||||||||
| (35 | ) | (12 | ) | — | (5 | ) | (13,392 | ) | (2,187 | ) | ||||||||||||
|
|
|
|
|
|
|
|
|
|
|
| |||||||||||
| (111,501,442 | ) | (50,737,902 | ) | (2,152,524 | ) | (6,185,644 | ) | (135,623,639 | ) | (53,291,447 | ) | |||||||||||
|
|
|
|
|
|
|
|
|
|
|
| |||||||||||
| (6,685,898 | ) | (66,636,304 | ) | 28,722,387 | (3,137,288 | ) | 273,741,629 | (150,495,703 | ) | |||||||||||||
|
|
|
|
|
|
|
|
|
|
|
| |||||||||||
| (41,450,714 | ) | (114,515,885 | ) | 41,052,962 | (5,776,792 | ) | 217,317,990 | (163,003,474 | ) | |||||||||||||
| 629,325,763 | 743,841,648 | 125,551,338 | 131,328,130 | 904,346,841 | 1,067,350,315 | |||||||||||||||||
|
|
|
|
|
|
|
|
|
|
|
| |||||||||||
| $ | 587,875,049 | $ | 629,325,763 | $ | 166,604,300 | $ | 125,551,338 | $ | 1,121,664,831 | $ | 904,346,841 | |||||||||||
|
|
|
|
|
|
|
|
|
|
|
| |||||||||||
| $ | — | $ | 176,187 | $ | 299,031 | $ | 154,817 | $ | — | $ | — | |||||||||||
|
|
|
|
|
|
|
|
|
|
|
| |||||||||||
131
Sterling Capital Funds
|
Statements of Changes in Net Assets (continued) |
| Sterling Capital Equity Income Fund | ||||||||
For the Year Ended | For the Year Ended September 30, 2015 | |||||||
From Investment Activities: | ||||||||
Operations: | ||||||||
Net investment income (loss) | $ | 28,709,088 | $ | 30,577,629 | ||||
Net realized gain (loss) | (4,831,315 | ) | 95,927,171 | |||||
Change in unrealized appreciation/depreciation | 195,743,768 | (184,331,736 | ) | |||||
|
|
|
| |||||
Change in net assets from operations | 219,621,541 | (57,826,936 | ) | |||||
|
|
|
| |||||
Distributions to Class A Shareholders From: | ||||||||
Net investment income | (8,174,103 | ) | (9,860,486 | ) | ||||
Net realized gains | (27,622,613 | ) | (17,395,887 | ) | ||||
Distributions to Class B Shareholders From: | ||||||||
Net investment income | (24,417 | ) | (50,462 | ) | ||||
Net realized gains | (220,992 | ) | (186,425 | ) | ||||
Distributions to Class C Shareholders From: | ||||||||
Net investment income | (2,993,617 | ) | (3,076,571 | ) | ||||
Net realized gains | (17,598,263 | ) | (8,563,173 | ) | ||||
Distributions to Institutional Class Shareholders From: | ||||||||
Net investment income | (18,004,115 | ) | (18,447,955 | ) | ||||
Net realized gains | (50,804,852 | ) | (27,425,380 | ) | ||||
Distributions to Class R Shareholders From: | ||||||||
Net investment income | (31,335 | ) | (29,820 | ) | ||||
Net realized gains | (126,200 | ) | (48,537 | ) | ||||
|
|
|
| |||||
Change in net assets from shareholder distributions | (125,600,507 | ) | (85,084,696 | ) | ||||
|
|
|
| |||||
Capital Transactions: | ||||||||
Change in net assets from capital transactions | 20,172,055 | (363,515,354 | ) | |||||
Redemption Fees | — | — | ||||||
|
|
|
| |||||
Change in net assets | 114,193,089 | (506,426,986 | ) | |||||
Net Assets: | ||||||||
Beginning of year | 1,571,318,135 | 2,077,745,121 | ||||||
|
|
|
| |||||
End of year | $ | 1,685,511,224 | $ | 1,571,318,135 | ||||
|
|
|
| |||||
Undistributed (distributions in excess of) net investment income (loss) | $ | 1,928,638 | $ | 2,252,541 | ||||
|
|
|
| |||||
* Commencement of operations.
See accompanying Notes to the Financial Statements.
132
|
Sterling Capital Long/Short Equity Fund | Sterling Capital Behavioral International Equity Fund | Sterling Capital Stratton Mid Cap Value Fund |
For the | For the | For the | For the Period | For the Period | For the | For the Year Ended December 31, 2014 | ||||||||||||||||||||||||||||
| $ | (1,071,201 | ) | $ | (1,773,049 | ) | $ | 838,207 | $ | 537,691 | $ | 81,614 | $ | 186,166 | $ | 30,175 | |||||||||||||||||||
| (21,126,189 | ) | 1,710,584 | (187,564 | ) | (1,069,214 | ) | (895,187 | ) | 3,434,727 | 10,312,526 | ||||||||||||||||||||||||
| 18,507,697 | (19,605,549 | ) | 2,237,279 | (866,313 | ) | 4,734,573 | (4,693,757 | ) | (4,899,028 | ) | ||||||||||||||||||||||||
|
|
|
|
|
|
|
|
|
|
|
|
|
| |||||||||||||||||||||
| (3,689,693 | ) | (19,668,014 | ) | 2,887,922 | (1,397,836 | ) | 3,921,000 | (1,072,864 | ) | 5,443,673 | ||||||||||||||||||||||||
|
|
|
|
|
|
|
|
|
|
|
|
|
| |||||||||||||||||||||
| — | — | (10,316 | ) | (232 | ) | — | (3 | ) | — | |||||||||||||||||||||||||
| (25,974 | ) | (72,426 | ) | — | — | — | (34 | ) | — | |||||||||||||||||||||||||
| — | — | — | — | — | — | — | ||||||||||||||||||||||||||||
| — | — | — | — | — | — | — | ||||||||||||||||||||||||||||
| — | — | (437 | ) | (2 | ) | — | (2 | ) | — | |||||||||||||||||||||||||
| (8,379 | ) | (11,557 | ) | — | — | — | (34 | ) | — | |||||||||||||||||||||||||
| — | — | (425,049 | ) | (64,536 | ) | — | (182,047 | ) | (30,101 | ) | ||||||||||||||||||||||||
| (1,760,963 | ) | (3,014,603 | ) | — | — | — | (2,143,152 | ) | — | |||||||||||||||||||||||||
| — | — | — | — | — | — | — | ||||||||||||||||||||||||||||
| — | — | — | — | — | — | — | ||||||||||||||||||||||||||||
|
|
|
|
|
|
|
|
|
|
|
|
|
| |||||||||||||||||||||
| (1,795,316 | ) | (3,098,586 | ) | (435,802 | ) | (64,770 | ) | — | (2,325,272 | ) | (30,101 | ) | ||||||||||||||||||||||
|
|
|
|
|
|
|
|
|
|
|
|
|
| |||||||||||||||||||||
| (56,339,230 | ) | 18,863,488 | 48,751,547 | 20,614,473 | (4,753,401 | ) | (6,874,381 | ) | 1,257,308 | |||||||||||||||||||||||||
| — | — | — | — | — | 1,267 | 29,275 | ||||||||||||||||||||||||||||
|
|
|
|
|
|
|
|
|
|
|
|
|
| |||||||||||||||||||||
| (61,824,239 | ) | (3,903,112 | ) | 51,203,667 | 19,151,867 | (832,401 | ) | (10,271,250 | ) | 6,700,155 | ||||||||||||||||||||||||
| 103,917,661 | 107,820,773 | 19,151,867 | — | 64,365,900 | 74,637,150 | 67,936,995 | ||||||||||||||||||||||||||||
|
|
|
|
|
|
|
|
|
|
|
|
|
| |||||||||||||||||||||
| $ | 42,093,422 | $ | 103,917,661 | $ | 70,355,534 | $ | 19,151,867 | $ | 63,533,499 | $ | 64,365,900 | $ | 74,637,150 | |||||||||||||||||||||
|
|
|
|
|
|
|
|
|
|
|
|
|
| |||||||||||||||||||||
| $ | — | $ | — | $ | 844,070 | $ | 391,171 | $ | 85,802 | $ | 4,188 | $ | 74 | |||||||||||||||||||||
|
|
|
|
|
|
|
|
|
|
|
|
|
| |||||||||||||||||||||
133
Sterling Capital Funds
|
Statements of Changes in Net Assets (continued) |
| Sterling Capital Stratton Real Estate Fund | |||||||||||||||
| For the Period January 1, 2016 to September 30, 2016 | For the Year Ended December 31, 2015 | For the Year Ended December 31, 2014 | |||||||||||||
From Investment Activities: | |||||||||||||||
Operations: | |||||||||||||||
Net investment income | $ | 1,613,128 | $ | 1,794,066 | $ | 1,542,532 | |||||||||
Net realized gain | 2,500,157 | 2,114,745 | 1,263,459 | ||||||||||||
Change in unrealized appreciation/depreciation | 6,959,598 | (2,819,062 | ) | 19,932,754 | |||||||||||
|
|
|
|
|
| ||||||||||
Change in net assets from operations | 11,072,883 | 1,089,749 | 22,738,745 | ||||||||||||
|
|
|
|
|
| ||||||||||
Distributions to Class A Shareholders From: | |||||||||||||||
Net investment income | (982 | ) | — | — | |||||||||||
Net realized gains | — | (14 | ) | — | |||||||||||
Distributions to Class C Shareholders From: | |||||||||||||||
Net investment income | (108 | ) | — | — | |||||||||||
Net realized gains | — | (14 | ) | — | |||||||||||
Distributions to Institutional Class Shareholders From: | |||||||||||||||
Net investment income | (1,308,182 | ) | (1,627,288 | ) | (1,517,996 | ) | |||||||||
Net realized gains | — | (1,262,436 | ) | (4,671,939 | ) | ||||||||||
|
|
|
|
|
| ||||||||||
Change in net assets from shareholder distributions | (1,309,272 | ) | (2,889,752 | ) | (6,189,935 | ) | |||||||||
|
|
|
|
|
| ||||||||||
Capital Transactions: | |||||||||||||||
Change in net assets from capital transactions | (1,140,944 | ) | 3,999,047 | (1,156,978 | ) | ||||||||||
Redemption Fees | — | 17,326 | 3,306 | ||||||||||||
|
|
|
|
|
| ||||||||||
Change in net assets | 8,622,667 | 2,216,370 | 15,395,138 | ||||||||||||
Net Assets: | |||||||||||||||
Beginning of year | 96,200,553 | 93,984,183 | 78,589,045 | ||||||||||||
|
|
|
|
|
| ||||||||||
End of year | $ | 104,823,220 | $ | 96,200,553 | $ | 93,984,183 | |||||||||
|
|
|
|
|
| ||||||||||
Undistributed (distributions in excess of) net investment income | $ | 1,613,104 | $ | 1,309,248 | $ | 1,142,491 | |||||||||
|
|
|
|
|
| ||||||||||
See accompanying Notes to the Financial Statements.
134
|
Sterling Capital Stratton Small Cap Value Fund | Sterling Capital Ultra Short Bond Fund |
| For the Period January 1, 2016 to September 30, 2016 | For the Year Ended December 31, 2015 | For the Year Ended December 31, 2014 | For the Year Ended September 30, 2016 | For the Year Ended September 30, 2015 | |||||||||||||||||||
| $ | 1,644,272 | $ | 1,267,734 | $ | 429,232 | $ | 408,789 | $ | 299,908 | ||||||||||||||
| 66,753,095 | 27,326,647 | 17,393,182 | 624 | (9,340 | ) | ||||||||||||||||||
| 60,734,126 | (83,141,134 | ) | 12,733,881 | 157,845 | (118,860 | ) | |||||||||||||||||
|
|
|
|
|
|
|
|
|
| ||||||||||||||
| 129,131,493 | (54,546,753 | ) | 30,556,295 | 567,258 | 171,708 | ||||||||||||||||||
|
|
|
|
|
|
|
|
|
| ||||||||||||||
| — | (1 | ) | — | (123,196 | ) | (78,927 | ) | ||||||||||||||||
| — | (14 | ) | — | — | — | ||||||||||||||||||
| — | — | — | — | — | |||||||||||||||||||
| — | (14 | ) | — | — | — | ||||||||||||||||||
| — | (1,265,088 | ) | (432,809 | ) | (677,327 | ) | (473,901 | ) | |||||||||||||||
| — | (16,420,880 | ) | (27,799,849 | ) | — | — | |||||||||||||||||
|
|
|
|
|
|
|
|
|
| ||||||||||||||
| — | (17,685,997 | ) | (28,232,658 | ) | (800,523 | ) | (552,828 | ) | |||||||||||||||
|
|
|
|
|
|
|
|
|
| ||||||||||||||
| (72,213,719 | ) | (184,968,586 | ) | 249,929,146 | 16,987,987 | (14,321,152 | ) | ||||||||||||||||
| 4 | 86,432 | 111,763 | — | — | |||||||||||||||||||
|
|
|
|
|
|
|
|
|
| ||||||||||||||
| 56,917,778 | (257,114,904 | ) | 252,364,546 | 16,754,722 | (14,702,272 | ) | |||||||||||||||||
| 1,156,578,666 | 1,413,693,570 | 1,161,329,024 | 43,678,664 | 58,380,936 | |||||||||||||||||||
|
|
|
|
|
|
|
|
|
| ||||||||||||||
| $ | 1,213,496,444 | $ | 1,156,578,666 | $ | 1,413,693,570 | $ | 60,433,386 | $ | 43,678,664 | ||||||||||||||
|
|
|
|
|
|
|
|
|
| ||||||||||||||
| $ | 1,646,853 | $ | 2,581 | — | $ | (1,684 | ) | $ | (1,971 | ) | |||||||||||||
|
|
|
|
|
|
|
|
|
| ||||||||||||||
135
Sterling Capital Funds
|
Statements of Changes in Net Assets (continued) |
| Sterling Capital Short Duration Bond Fund | ||||||||
For the Year Ended | For the Year Ended September 30, 2015 | |||||||
From Investment Activities: | ||||||||
Operations: | ||||||||
Net investment income | $ | 1,091,866 | $ | 1,236,409 | ||||
Net realized gain (loss) | (81,804 | ) | (326,041 | ) | ||||
Change in unrealized appreciation/depreciation | 791,096 | (235,357 | ) | |||||
|
|
|
| |||||
Change in net assets from operations | 1,801,158 | 675,011 | ||||||
|
|
|
| |||||
Distributions to Class A Shareholders From: | ||||||||
Net investment income | (194,613 | ) | (275,128 | ) | ||||
Net realized gains | — | — | ||||||
Return of capital | — | — | ||||||
Distributions to Class B Shareholders From: | ||||||||
Net investment income | — | — | ||||||
Distributions to Class C Shareholders From: | ||||||||
Net investment income | (39,043 | ) | (48,158 | ) | ||||
Net realized gains | — | — | ||||||
Return of capital | — | — | ||||||
Distributions to Institutional Class Shareholders From: | ||||||||
Net investment income | (2,081,589 | ) | (2,511,205 | ) | ||||
Net realized gains | — | — | ||||||
Return of capital | — | — | ||||||
Distributions to Class R Shareholders From: | ||||||||
Net investment income | — | — | ||||||
|
|
|
| |||||
Change in net assets from shareholder distributions | (2,315,245 | ) | (2,834,491 | ) | ||||
|
|
|
| |||||
Capital Transactions: | ||||||||
Change in net assets from capital transactions | (1,773,747 | ) | (2,540,713 | ) | ||||
|
|
|
| |||||
Change in net assets | (2,287,834 | ) | (4,700,193 | ) | ||||
Net Assets: | ||||||||
Beginning of year | 88,879,682 | 93,579,875 | ||||||
|
|
|
| |||||
End of year | $ | 86,591,848 | $ | 88,879,682 | ||||
|
|
|
| |||||
Undistributed (distributions in excess of) net investment income | $ | (327 | ) | $ | (9,326 | ) | ||
|
|
|
| |||||
See accompanying Notes to the Financial Statements.
136
|
Sterling Capital Intermediate U.S. Government Fund | Sterling Capital Total Return Bond Fund | Sterling Capital Corporate Fund |
For the Year Ended | For the Year Ended | For the Year Ended | For the Year Ended | For the Year Ended | For the Year Ended September 30, 2015 | ||||||||||||||||||||||||
| $ | 405,377 | $ | 482,920 | $ | 18,380,562 | $ | 18,970,600 | $ | 1,590,895 | $ | 1,863,004 | ||||||||||||||||||
| 122,704 | 300,814 | 3,232,622 | 384,257 | 215,255 | (134,816 | ) | |||||||||||||||||||||||
| 193,451 | (210,070 | ) | 19,293,448 | (6,339,132 | ) | 967,977 | (825,504 | ) | |||||||||||||||||||||
|
|
|
|
|
|
|
|
|
|
|
| ||||||||||||||||||
| 721,532 | 573,664 | 40,906,632 | 13,015,725 | 2,774,127 | 902,684 | ||||||||||||||||||||||||
|
|
|
|
|
|
|
|
|
|
|
| ||||||||||||||||||
| (130,952 | ) | (195,671 | ) | (1,821,689 | ) | (1,509,771 | ) | (10,805 | ) | (8,731 | ) | ||||||||||||||||||
| — | — | — | — | — | (295 | ) | |||||||||||||||||||||||
| — | — | — | — | — | (147 | ) | |||||||||||||||||||||||
| (1,179 | ) | (2,554 | ) | (16,144 | ) | (31,362 | ) | — | — | ||||||||||||||||||||
| (8,319 | ) | (9,428 | ) | (147,024 | ) | (155,968 | ) | (741 | ) | (184 | ) | ||||||||||||||||||
| — | — | — | — | — | (9 | ) | |||||||||||||||||||||||
| — | — | — | — | — | (3 | ) | |||||||||||||||||||||||
| (415,851 | ) | (475,820 | ) | (20,773,454 | ) | (21,390,337 | ) | (1,579,316 | ) | (1,823,294 | ) | ||||||||||||||||||
| — | — | — | — | — | (60,169 | ) | |||||||||||||||||||||||
| — | — | — | — | — | (30,642 | ) | |||||||||||||||||||||||
| — | — | (149 | ) | (173 | ) | — | — | ||||||||||||||||||||||
|
|
|
|
|
|
|
|
|
|
|
| ||||||||||||||||||
| (556,301 | ) | (683,473 | ) | (22,758,460 | ) | (23,087,611 | ) | (1,590,862 | ) | (1,923,474 | ) | ||||||||||||||||||
|
|
|
|
|
|
|
|
|
|
|
| ||||||||||||||||||
| (3,667,237 | ) | (2,657,019 | ) | 101,505,879 | 198,918,590 | (33,278,249 | ) | 14,740,001 | |||||||||||||||||||||
|
|
|
|
|
|
|
|
|
|
|
| ||||||||||||||||||
| (3,502,006 | ) | (2,766,828 | ) | 119,654,051 | 188,846,704 | (32,094,984 | ) | 13,719,211 | |||||||||||||||||||||
| 30,217,891 | 32,984,719 | 668,007,641 | 479,160,937 | 64,348,989 | 50,629,778 | ||||||||||||||||||||||||
|
|
|
|
|
|
|
|
|
|
|
| ||||||||||||||||||
| $ | 26,715,885 | $ | 30,217,891 | $ | 787,661,692 | $ | 668,007,641 | $ | 32,254,005 | $ | 64,348,989 | ||||||||||||||||||
|
|
|
|
|
|
|
|
|
|
|
| ||||||||||||||||||
| $ | 228,161 | $ | 189,582 | $ | 442,328 | $ | 304,909 | $ | 3,022 | $ | (442 | ) | |||||||||||||||||
|
|
|
|
|
|
|
|
|
|
|
| ||||||||||||||||||
137
Sterling Capital Funds
|
Statements of Changes in Net Assets (continued)
|
| Sterling Capital Securitized Opportunities Fund | ||||||||
For the Year Ended | For the Year Ended September 30, 2015 | |||||||
From Investment Activities: | ||||||||
Operations: | ||||||||
Net investment income | $ | 1,027,410 | $ | 951,039 | ||||
Net realized gain | 305,310 | 149,237 | ||||||
Change in unrealized appreciation/depreciation | 424,797 | 292,812 | ||||||
|
|
|
| |||||
Change in net assets from operations | 1,757,517 | 1,393,088 | ||||||
|
|
|
| |||||
Distributions to Class A Shareholders From: | ||||||||
Net investment income | (27,939 | ) | (2,743 | ) | ||||
Net realized gains | — | — | ||||||
Distributions to Class C Shareholders From: | ||||||||
Net investment income | (627 | ) | (687 | ) | ||||
Net realized gains | — | — | ||||||
Distributions to Institutional Class Shareholders From: | ||||||||
Net investment income | (1,209,058 | ) | (1,150,964 | ) | ||||
Net realized gains | — | — | ||||||
|
|
|
| |||||
Change in net assets from shareholder distributions | (1,237,624 | ) | (1,154,394 | ) | ||||
|
|
|
| |||||
Capital Transactions: | ||||||||
Change in net assets from capital transactions | (151,687 | ) | 9,425,368 | |||||
|
|
|
| |||||
Change in net assets | 368,206 | 9,664,062 | ||||||
Net Assets: | ||||||||
Beginning of year | 46,412,598 | 36,748,536 | ||||||
|
|
|
| |||||
End of year | $ | 46,780,804 | $ | 46,412,598 | ||||
|
|
|
| |||||
Undistributed (distributions in excess of) net investment income | $ | 77 | $ | — | ||||
|
|
|
| |||||
See accompanying Notes to the Financial Statements.
138
|
Sterling Capital Kentucky Intermediate Tax-Free Fund | Sterling Capital Maryland Intermediate Tax-Free Fund | Sterling Capital North Carolina Intermediate Tax-Free Fund |
For the Year Ended | For the Year Ended September 30, 2015 | For the Year Ended September 30, 2016 | For the Year Ended September 30, 2015 | For the Year Ended September 30, 2016 | For the Year Ended September 30, 2015 | |||||||||||||||||||||||
| $ | 314,262 | $ | 374,662 | $ | 670,544 | $ | 746,392 | $ | 4,565,660 | $ | 4,722,447 | |||||||||||||||||
| 179,310 | 208,252 | 255,825 | 216,610 | 758,138 | 1,061,019 | |||||||||||||||||||||||
| (1,263 | ) | (281,514 | ) | 423,216 | (234,543 | ) | 2,178,199 | (1,034,641 | ) | |||||||||||||||||||
|
|
|
|
|
|
|
|
|
|
|
| |||||||||||||||||
| 492,309 | 301,400 | 1,349,585 | 728,459 | 7,501,997 | 4,748,825 | |||||||||||||||||||||||
|
|
|
|
|
|
|
|
|
|
|
| |||||||||||||||||
| (97,033 | ) | (108,101 | ) | (112,324 | ) | (123,134 | ) | (1,018,136 | ) | (1,024,534 | ) | |||||||||||||||||
| (52,381 | ) | (75,342 | ) | (43,187 | ) | (33,661 | ) | (249,326 | ) | (76,229 | ) | |||||||||||||||||
| (301 | ) | (318 | ) | (7,056 | ) | (7,677 | ) | (64,479 | ) | (46,711 | ) | |||||||||||||||||
| (235 | ) | (319 | ) | (4,146 | ) | (3,482 | ) | (21,666 | ) | (5,096 | ) | |||||||||||||||||
| (216,582 | ) | (266,191 | ) | (548,940 | ) | (613,407 | ) | (3,478,684 | ) | (3,648,473 | ) | |||||||||||||||||
| (110,771 | ) | (171,504 | ) | (187,004 | ) | (147,308 | ) | (787,697 | ) | (241,858 | ) | |||||||||||||||||
|
|
|
|
|
|
|
|
|
|
|
| |||||||||||||||||
| (477,303 | ) | (621,775 | ) | (902,657 | ) | (928,669 | ) | (5,619,988 | ) | (5,042,901 | ) | |||||||||||||||||
|
|
|
|
|
|
|
|
|
|
|
| |||||||||||||||||
| (1,141,252 | ) | (761,209 | ) | (5,060,938 | ) | (1,254,247 | ) | 17,301,063 | (5,924,173 | ) | ||||||||||||||||||
|
|
|
|
|
|
|
|
|
|
|
| |||||||||||||||||
| (1,126,246 | ) | (1,081,584 | ) | (4,614,010 | ) | (1,454,457 | ) | 19,183,072 | (6,218,249 | ) | ||||||||||||||||||
| 14,084,912 | 15,166,496 | 36,574,531 | 38,028,988 | 196,338,412 | 202,556,661 | |||||||||||||||||||||||
|
|
|
|
|
|
|
|
|
|
|
| |||||||||||||||||
| $ | 12,958,666 | $ | 14,084,912 | $ | 31,960,521 | $ | 36,574,531 | $ | 215,521,484 | $ | 196,338,412 | |||||||||||||||||
|
|
|
|
|
|
|
|
|
|
|
| |||||||||||||||||
| $ | 12,514 | $ | 12,184 | $ | 3,966 | $ | 3,676 | $ | 98,229 | $ | 82,181 | |||||||||||||||||
|
|
|
|
|
|
|
|
|
|
|
| |||||||||||||||||
139
Sterling Capital Funds
|
Statements of Changes in Net Assets (continued) |
| Sterling Capital South Carolina Intermediate Tax-Free Fund | ||||||||
| For the Year Ended September 30, 2016 | For the Year Ended September 30, 2015 | |||||||
From Investment Activities: | ||||||||
Operations: | ||||||||
Net investment income | $ | 1,653,005 | $ | 1,489,941 | ||||
Net realized gain | 10,105 | 275,258 | ||||||
Change in unrealized appreciation/depreciation | 1,396,055 | (167,796 | ) | |||||
|
|
|
| |||||
Change in net assets from operations | 3,059,165 | 1,597,403 | ||||||
|
|
|
| |||||
Distributions to Class A Shareholders From: | ||||||||
Net investment income | (314,527 | ) | (331,220 | ) | ||||
Net realized gains | (54,170 | ) | (27,810 | ) | ||||
Distributions to Class C Shareholders From: | ||||||||
Net investment income | (17,488 | ) | (18,902 | ) | ||||
Net realized gains | (4,526 | ) | (2,712 | ) | ||||
Distributions to Institutional Class Shareholders From: | ||||||||
Net investment income | (1,319,920 | ) | (1,140,264 | ) | ||||
Net realized gains | (191,305 | ) | (81,197 | ) | ||||
|
|
|
| |||||
Change in net assets from shareholder distributions | (1,901,936 | ) | (1,602,105 | ) | ||||
|
|
|
| |||||
Capital Transactions: | ||||||||
Change in net assets from capital transactions | 15,602,827 | 8,086,043 | ||||||
|
|
|
| |||||
Change in net assets | 16,760,056 | 8,081,341 | ||||||
Net Assets: | ||||||||
Beginning of year | 76,450,331 | 68,368,990 | ||||||
|
|
|
| |||||
End of year | $ | 93,210,387 | $ | 76,450,331 | ||||
|
|
|
| |||||
Undistributed net investment income | $ | 28,193 | $ | 26,999 | ||||
|
|
|
| |||||
See accompanying Notes to the Financial Statements.
140
|
Sterling Capital Virginia Intermediate Tax-Free Fund | Sterling Capital West Virginia Intermediate Tax-Free Fund |
| For the Year Ended September 30, 2016 | For the Year Ended September 30, 2015 | For the Year Ended September 30, 2016 | For the Year Ended September 30, 2015 | |||||||||||||||
| $ | 2,557,368 | $ | 2,686,997 | $ | 2,214,872 | $ | 2,352,587 | |||||||||||
| 876,273 | 412,758 | 523,186 | 478,892 | |||||||||||||||
| 958,768 | (553,965 | ) | 1,257,070 | (374,084 | ) | |||||||||||||
|
|
|
|
|
|
|
| |||||||||||
| 4,392,409 | 2,545,790 | 3,995,128 | 2,457,395 | |||||||||||||||
|
|
|
|
|
|
|
| |||||||||||
| (718,628 | ) | (813,175 | ) | (741,370 | ) | (748,083 | ) | |||||||||||
| (130,362 | ) | (222,245 | ) | (187,693 | ) | (90,668 | ) | |||||||||||
| (15,771 | ) | (17,657 | ) | (6,729 | ) | (5,266 | ) | |||||||||||
| (4,426 | ) | (7,394 | ) | (2,185 | ) | (1,175 | ) | |||||||||||
| (1,822,391 | ) | (1,856,397 | ) | (1,463,917 | ) | (1,585,389 | ) | |||||||||||
| (280,165 | ) | (438,730 | ) | (339,731 | ) | (180,075 | ) | |||||||||||
|
|
|
|
|
|
|
| |||||||||||
| (2,971,743 | ) | (3,355,598 | ) | (2,741,625 | ) | (2,610,656 | ) | |||||||||||
|
|
|
|
|
|
|
| |||||||||||
| 1,982,849 | (5,282,537 | ) | (921,673 | ) | (3,362,373 | ) | ||||||||||||
|
|
|
|
|
|
|
| |||||||||||
| 3,403,515 | (6,092,345 | ) | 331,830 | (3,515,634 | ) | |||||||||||||
| 116,422,421 | 122,514,766 | 102,404,009 | 105,919,643 | |||||||||||||||
|
|
|
|
|
|
|
| |||||||||||
| $ | 119,825,936 | $ | 116,422,421 | $ | 102,735,839 | $ | 102,404,009 | |||||||||||
|
|
|
|
|
|
|
| |||||||||||
| $ | 63,196 | $ | 62,618 | $ | 67,729 | $ | 67,571 | |||||||||||
|
|
|
|
|
|
|
| |||||||||||
141
Sterling Capital Funds
|
Statements of Changes in Net Assets (continued) |
| Sterling Capital Diversified Income Fund | ||||||||
For the | For the Year Ended September 30, 2015 | |||||||
From Investment Activities: | ||||||||
Operations: | ||||||||
Net investment income | $ | 1,397,909 | $ | 804,830 | ||||
Net realized gain/loss | (1,213,226 | ) | 1,545,401 | |||||
Change in unrealized appreciation/depreciation | 3,733,112 | (3,944,009 | ) | |||||
|
|
|
| |||||
Change in net assets from operations | 3,917,795 | (1,593,778 | ) | |||||
|
|
|
| |||||
Distributions to Class A Shareholders From: | ||||||||
Net investment income | (522,708 | ) | (334,461 | ) | ||||
Distributions to Class B Shareholders From: | ||||||||
Net investment income | (9,870 | ) | (10,148 | ) | ||||
Distributions to Class C Shareholders From: | ||||||||
Net investment income | (30,445 | ) | (8,832 | ) | ||||
Distributions to Institutional Class Shareholders From: | ||||||||
Net investment income | (1,008,635 | ) | (391,658 | ) | ||||
|
|
|
| |||||
Change in net assets from shareholder distributions | (1,571,658 | ) | (745,099 | ) | ||||
|
|
|
| |||||
Capital Transactions: | ||||||||
Change in net assets from capital transactions | (3,036,176 | ) | 26,877,456 | |||||
|
|
|
| |||||
Change in net assets | (690,039 | ) | 24,538,579 | |||||
Net Assets: | ||||||||
Beginning of year | 43,525,705 | 18,987,126 | ||||||
|
|
|
| |||||
End of year | $ | 42,835,666 | $ | 43,525,705 | ||||
|
|
|
| |||||
Undistributed net investment income | $ | 83,292 | $ | 127,669 | ||||
|
|
|
| |||||
See accompanying Notes to the Financial Statements.
142
|
| Sterling Capital Strategic Allocation Balanced Fund | Sterling Capital Strategic Allocation Growth Fund | |||||||||||||
| For the Year Ended September 30, 2016 | For the Year Ended September 30, 2015 | For the Year Ended September 30, 2016 | For the Year Ended September 30, 2015 | |||||||||||
| $ | 545,557 | $ | 429,275 | $ | 311,195 | $ | 174,106 | |||||||
| 824,898 | 3,050,374 | 816,146 | 2,584,952 | |||||||||||
| 842,888 | (4,123,398 | ) | 567,271 | (3,515,566 | ) | |||||||||
|
|
|
|
|
|
|
| |||||||
| 2,213,343 | (643,749 | ) | 1,694,612 | (756,508 | ) | |||||||||
|
|
|
|
|
|
|
| |||||||
| (640,508 | ) | (492,183 | ) | (384,818 | ) | (228,424 | ) | |||||||
| (7,812 | ) | (9,918 | ) | (9,374 | ) | (6,950 | ) | |||||||
| (9,577 | ) | (5,115 | ) | (5,409 | ) | (2,384 | ) | |||||||
| (1,789 | ) | (3,244 | ) | (13,447 | ) | (11,458 | ) | |||||||
|
|
|
|
|
|
|
| |||||||
| (659,686 | ) | (510,460 | ) | (413,048 | ) | (249,216 | ) | |||||||
|
|
|
|
|
|
|
| |||||||
| (4,322,550 | ) | (1,424,319 | ) | (3,618,924 | ) | (203,780 | ) | |||||||
|
|
|
|
|
|
|
| |||||||
| (2,768,893 | ) | (2,578,528 | ) | (2,337,360 | ) | (1,209,504 | ) | |||||||
| 35,800,370 | 38,378,898 | 25,740,654 | 26,950,158 | |||||||||||
|
|
|
|
|
|
|
| |||||||
| $ | 33,031,477 | $ | 35,800,370 | $ | 23,403,294 | $ | 25,740,654 | |||||||
|
|
|
|
|
|
|
| |||||||
| $ | 15,503 | $ | 20,031 | $ | 3,172 | $ | 10,031 | |||||||
|
|
|
|
|
|
|
| |||||||
143
Sterling Capital Funds
|
Statements of Changes in Net Assets (continued) |
| Sterling Capital Behavioral Large Cap Value Equity Fund | ||||||||
| For the Year Ended September 30, 2016 | For the Year Ended September 30, 2015 | |||||||
Capital Transactions: | ||||||||
Class A Shares: | ||||||||
Proceeds from shares issued | $ | 1,648,432 | $ | 2,614,509 | ||||
Distributions reinvested | 477,904 | 447,660 | ||||||
Value of shares redeemed | (5,028,277 | ) | (5,136,006 | ) | ||||
|
|
|
| |||||
Change in net assets from Class A Share transactions | (2,901,941 | ) | (2,073,837 | ) | ||||
Class B Shares: | ||||||||
Proceeds from shares issued | — | 7,486 | ||||||
Distributions reinvested | 2,390 | 3,968 | ||||||
Value of shares redeemed | (354,880 | ) | (458,373 | ) | ||||
|
|
|
| |||||
Change in net assets from Class B Share transactions | (352,490 | ) | (446,919 | ) | ||||
Class C Shares: | ||||||||
Proceeds from shares issued | 334,208 | 438,703 | ||||||
Distributions reinvested | 7,605 | 3,637 | ||||||
Value of shares redeemed | (278,620 | ) | (122,888 | ) | ||||
|
|
|
| |||||
Change in net assets from Class C Share transactions | 63,193 | 319,452 | ||||||
Institutional Shares: | ||||||||
Proceeds from shares issued | 33,119,823 | 20,184,490 | ||||||
Distributions reinvested | 4,394,065 | 3,816,267 | ||||||
Value of shares redeemed | (32,842,222 | ) | (28,099,724 | ) | ||||
|
|
|
| |||||
Change in net assets from Institutional Share transactions | 4,671,666 | (4,098,967 | ) | |||||
Class R Shares: | ||||||||
Proceeds from shares issued | — | — | ||||||
Distributions reinvested | — | — | ||||||
Value of shares redeemed | — | — | ||||||
|
|
|
| |||||
Change in net assets from Class R Share transactions | — | — | ||||||
|
|
|
| |||||
Change in net assets from capital transactions | $ | 1,480,428 | $ | (6,300,271 | ) | |||
|
|
|
| |||||
Share Transactions: | ||||||||
Class A Shares: | ||||||||
Issued | 94,866 | 146,143 | ||||||
Reinvested | 27,577 | 25,402 | ||||||
Redeemed | (296,745 | ) | (287,021 | ) | ||||
|
|
|
| |||||
Change in Class A Shares | (174,302 | ) | (115,476 | ) | ||||
Class B Shares: | ||||||||
Issued | — | 430 | ||||||
Reinvested | 140 | 227 | ||||||
Redeemed | (21,147 | ) | (26,085 | ) | ||||
|
|
|
| |||||
Change in Class B Shares | (21,007 | ) | (25,428 | ) | ||||
Class C Shares: | ||||||||
Issued | 19,386 | 25,212 | ||||||
Reinvested | 452 | 212 | ||||||
Redeemed | (16,417 | ) | (7,175 | ) | ||||
|
|
|
| |||||
Change in Class C Shares | 3,421 | 18,249 | ||||||
Institutional Shares: | ||||||||
Issued | 1,878,655 | 1,130,083 | ||||||
Reinvested | 252,191 | 215,497 | ||||||
Redeemed | (1,902,199 | ) | (1,569,993 | ) | ||||
|
|
|
| |||||
Change in Institutional Shares | 228,647 | (224,413 | ) | |||||
Class R Shares: | ||||||||
Issued | — | — | ||||||
Reinvested | — | — | ||||||
Redeemed | — | — | ||||||
|
|
|
| |||||
Change in Class R Shares | — | — | ||||||
|
|
|
| |||||
Change in Shares | 36,759 | (347,068 | ) | |||||
|
|
|
| |||||
See accompanying Notes to the Financial Statements.
144
|
| Sterling Capital Mid Value Fund | Sterling Capital Behavioral Small Cap Value Equity Fund | Sterling Capital Special Opportunities Fund | ||||||||||||||||||||
For the | For the | For the | For the | For the | For the | |||||||||||||||||
| $ | 2,121,637 | $ | 3,995,030 | $ | 639,729 | $ | 6,293,476 | $ | 123,426,679 | $ | 62,671,497 | |||||||||||
| 5,600,796 | 2,534,757 | 128,035 | 435,815 | 37,784,514 | 18,786,909 | |||||||||||||||||
| (8,309,555 | ) | (10,670,041 | ) | (6,046,139 | ) | (2,699,126 | ) | (57,683,989 | ) | (172,645,137 | ) | |||||||||||
|
|
|
|
|
|
|
|
|
|
|
| |||||||||||
| (587,122 | ) | (4,140,254 | ) | (5,278,375 | ) | 4,030,165 | 103,527,204 | (91,186,731 | ) | |||||||||||||
| 2,248 | 6,419 | 10 | 965 | 56,817 | 14,852 | |||||||||||||||||
| 129,038 | 79,231 | 741 | 10,280 | 639,576 | 405,267 | |||||||||||||||||
| (466,690 | ) | (660,809 | ) | (100,946 | ) | (135,254 | ) | (3,142,892 | ) | (3,556,143 | ) | |||||||||||
|
|
|
|
|
|
|
|
|
|
|
| |||||||||||
| (335,404 | ) | (575,159 | ) | (100,195 | ) | (124,009 | ) | (2,446,499 | ) | (3,136,024 | ) | |||||||||||
| 1,391,141 | 1,973,415 | 34,839 | 130,839 | 52,389,456 | 33,010,471 | |||||||||||||||||
| 866,589 | 231,333 | 1,840 | 9,780 | 22,875,216 | 6,765,229 | |||||||||||||||||
| (1,835,476 | ) | (1,108,607 | ) | (29,732 | ) | (112,466 | ) | (25,279,463 | ) | (12,994,833 | ) | |||||||||||
|
|
|
|
|
|
|
|
|
|
|
| |||||||||||
| 422,254 | 1,096,141 | 6,947 | 28,153 | 49,985,209 | 26,780,867 | |||||||||||||||||
| 147,129,910 | 123,909,927 | 49,471,199 | 13,339,610 | 258,214,223 | 258,227,694 | |||||||||||||||||
| 95,000,641 | 44,182,703 | 1,987,871 | 5,662,040 | 58,697,993 | 23,151,425 | |||||||||||||||||
| (248,316,212 | ) | (231,109,674 | ) | (17,365,062 | ) | (26,073,254 | ) | (194,387,011 | ) | (364,352,863 | ) | |||||||||||
|
|
|
|
|
|
|
|
|
|
|
| |||||||||||
| (6,185,661 | ) | (63,017,044 | ) | 34,094,008 | (7,071,604 | ) | 122,525,205 | (82,973,744 | ) | |||||||||||||
| — | — | — | — | 167,384 | 95,793 | |||||||||||||||||
| 35 | 12 | 2 | 7 | 9,484 | 1,665 | |||||||||||||||||
| — | — | — | — | (26,358 | ) | (77,529 | ) | |||||||||||||||
|
|
|
|
|
|
|
|
|
|
|
| |||||||||||
| 35 | 12 | 2 | 7 | 150,510 | 19,929 | |||||||||||||||||
|
|
|
|
|
|
|
|
|
|
|
| |||||||||||
| $ | (6,685,898 | ) | $ | (66,636,304 | ) | $ | 28,722,387 | $ | (3,137,288 | ) | $ | 273,741,629 | $ | (150,495,703 | ) | |||||||
|
|
|
|
|
|
|
|
|
|
|
| |||||||||||
| 131,632 | 203,628 | 44,758 | 421,106 | 5,705,594 | 2,698,968 | |||||||||||||||||
| 362,511 | 134,503 | 8,818 | 29,897 | 1,802,865 | 850,856 | |||||||||||||||||
| (537,458 | ) | (543,986 | ) | (424,672 | ) | (181,097 | ) | (2,694,723 | ) | (7,659,540 | ) | |||||||||||
|
|
|
|
|
|
|
|
|
|
|
| |||||||||||
| (43,315 | ) | (205,855 | ) | (371,096 | ) | 269,906 | 4,813,736 | (4,109,716 | ) | |||||||||||||
| 127 | 344 | 1 | 66 | 3,242 | 712 | |||||||||||||||||
| 9,126 | 4,517 | 52 | 732 | 35,219 | 20,614 | |||||||||||||||||
| (32,537 | ) | (36,079 | ) | (7,289 | ) | (9,250 | ) | (168,588 | ) | (171,412 | ) | |||||||||||
|
|
|
|
|
|
|
|
|
|
|
| |||||||||||
| (23,284 | ) | (31,218 | ) | (7,236 | ) | (8,452 | ) | (130,127 | ) | (150,086 | ) | |||||||||||
| 92,022 | 108,419 | 2,491 | 8,850 | 2,811,678 | 1,588,331 | |||||||||||||||||
| 61,674 | 13,237 | 130 | 699 | 1,258,951 | 343,762 | |||||||||||||||||
| (122,752 | ) | (61,255 | ) | (2,132 | ) | (7,727 | ) | (1,364,911 | ) | (622,148 | ) | |||||||||||
|
|
|
|
|
|
|
|
|
|
|
| |||||||||||
| 30,944 | 60,401 | 489 | 1,822 | 2,705,718 | 1,309,945 | |||||||||||||||||
| 9,037,428 | 6,305,423 | 3,450,437 | 884,167 | 11,570,304 | 10,967,320 | |||||||||||||||||
| 6,079,031 | 2,320,846 | 135,832 | 384,102 | 2,686,675 | 1,014,523 | |||||||||||||||||
| (15,018,081 | ) | (11,898,139 | ) | (1,200,414 | ) | (1,725,858 | ) | (8,817,130 | ) | (15,184,425 | ) | |||||||||||
|
|
|
|
|
|
|
|
|
|
|
| |||||||||||
| 98,378 | (3,271,870 | ) | 2,385,855 | (457,589 | ) | 5,439,849 | (3,202,582 | ) | ||||||||||||||
| — | — | — | — | 7,482 | 4,055 | |||||||||||||||||
| 2 | 1 | 1 | — | 445 | 74 | |||||||||||||||||
| — | — | — | — | (1,149 | ) | (3,288 | ) | |||||||||||||||
|
|
|
|
|
|
|
|
|
|
|
| |||||||||||
| 2 | 1 | 1 | — | 6,778 | 841 | |||||||||||||||||
|
|
|
|
|
|
|
|
|
|
|
| |||||||||||
| 62,725 | (3,448,541 | ) | 2,008,013 | (194,313 | ) | 12,835,954 | (6,151,598 | ) | ||||||||||||||
|
|
|
|
|
|
|
|
|
|
|
| |||||||||||
145
Sterling Capital Funds
|
Statements of Changes in Net Assets (continued) |
| Sterling Capital Equity Income Fund | ||||||||||
For the | For the | |||||||||
Capital Transactions: | ||||||||||
Class A Shares: | ||||||||||
Proceeds from shares issued | $ | 91,700,954 | $ | 96,426,885 | ||||||
Distributions reinvested | 33,032,277 | 25,697,968 | ||||||||
Value of shares redeemed | (162,382,364 | ) | (313,978,501 | ) | ||||||
|
|
|
| |||||||
Change in net assets from Class A Share transactions | (37,649,133 | ) | (191,853,648 | ) | ||||||
Class B Shares: | ||||||||||
Proceeds from shares issued | — | 13,603 | ||||||||
Distributions reinvested | 238,670 | 232,254 | ||||||||
Value of shares redeemed | (2,781,222 | ) | (3,495,236 | ) | ||||||
|
|
|
| |||||||
Change in net assets from Class B Share transactions | (2,542,552 | ) | (3,249,379 | ) | ||||||
Class C Shares: | ||||||||||
Proceeds from shares issued | 20,441,233 | 29,610,611 | ||||||||
Distributions reinvested | 19,514,637 | 10,900,826 | ||||||||
Value of shares redeemed | (61,841,786 | ) | (51,663,697 | ) | ||||||
|
|
|
| |||||||
Change in net assets from Class C Share transactions | (21,885,916 | ) | (11,152,260 | ) | ||||||
Institutional Shares: | ||||||||||
Proceeds from shares issued | 373,054,511 | 176,964,153 | ||||||||
Distributions reinvested | 61,688,923 | 40,823,997 | ||||||||
Value of shares redeemed | (352,354,402 | ) | (375,371,954 | ) | ||||||
|
|
|
| |||||||
Change in net assets from Institutional Share transactions | 82,389,032 | (157,583,804 | ) | |||||||
Class R Shares: | ||||||||||
Proceeds from shares issued | 221,370 | 558,881 | ||||||||
Distributions reinvested | 157,535 | 78,357 | ||||||||
Value of shares redeemed | (518,281 | ) | (313,501 | ) | ||||||
|
|
|
| |||||||
Change in net assets from Class R Share transactions | (139,376 | ) | 323,737 | |||||||
|
|
|
| |||||||
Change in net assets from capital transactions | $ | 20,172,055 | $ | (363,515,354 | ) | |||||
|
|
|
| |||||||
Share Transactions: | ||||||||||
Class A Shares: | ||||||||||
Issued | 5,326,559 | 5,125,334 | ||||||||
Reinvested | 1,973,144 | 1,399,852 | ||||||||
Redeemed | (9,330,149 | ) | (16,667,881 | ) | ||||||
|
|
|
| |||||||
Change in Class A Shares | (2,030,446 | ) | (10,142,695 | ) | ||||||
Class B Shares: | ||||||||||
Issued | — | 720 | ||||||||
Reinvested | 14,367 | 12,678 | ||||||||
Redeemed | (160,821 | ) | (186,907 | ) | ||||||
|
|
|
| |||||||
Change in Class B Shares | (146,454 | ) | (173,509 | ) | ||||||
Class C Shares: | ||||||||||
Issued | 1,198,628 | 1,598,787 | ||||||||
Reinvested | 1,181,597 | 599,348 | ||||||||
Redeemed | (3,639,420 | ) | (2,774,922 | ) | ||||||
|
|
|
| |||||||
Change in Class C Shares | (1,259,195 | ) | (576,787 | ) | ||||||
Institutional Shares: | ||||||||||
Issued | 21,587,101 | 9,468,157 | ||||||||
Reinvested | 3,672,381 | 2,218,624 | ||||||||
Redeemed | (20,300,270 | ) | (19,907,095 | ) | ||||||
|
|
|
| |||||||
Change in Institutional Shares | 4,959,212 | (8,220,314 | ) | |||||||
Class R Shares: | ||||||||||
Issued | 13,067 | 29,720 | ||||||||
Reinvested | 9,484 | 4,298 | ||||||||
Redeemed | (30,400 | ) | (16,676 | ) | ||||||
|
|
|
| |||||||
Change in Class R Shares | (7,849 | ) | 17,342 | |||||||
|
|
|
| |||||||
Change in Shares | 1,515,268 | (19,095,963 | ) | |||||||
|
|
|
| |||||||
| ||||||
* Commencement of operations. ** Includes capital stock transactions for the predecessor fund: Stratton Mid Cap Value Fund. | ||||||
See accompanying Notes to the Financial Statements.
146
|
Sterling Capital Long/Short Equity Fund | Sterling Capital Behavioral International Equity Fund | Sterling Capital Stratton Mid Cap Value Fund |
For the | For the | For the | For the Period | For the Period | For the | For the | |||||||||||||||||||||||||||||
| $ | 49,731 | $ | 986,187 | $ | 53,257 | $ | 586,586 | $ | 16,038 | $ | 1,026 | $ | — | ||||||||||||||||||||||
| 25,974 | 60,355 | 10,255 | 232 | — | 36 | — | |||||||||||||||||||||||||||||
| (919,009 | ) | (1,777,119 | ) | (250,616 | ) | (149 | ) | (500 | ) | — | — | ||||||||||||||||||||||||
|
|
|
|
|
|
|
|
|
|
|
|
|
| ||||||||||||||||||||||
| (843,304 | ) | (730,577 | ) | (187,104 | ) | 586,669 | 15,538 | 1,062 | — | ||||||||||||||||||||||||||
| — | — | — | — | — | — | — | |||||||||||||||||||||||||||||
| — | — | — | — | — | — | — | |||||||||||||||||||||||||||||
| — | — | — | — | — | — | — | |||||||||||||||||||||||||||||
|
|
|
|
|
|
|
|
|
|
|
|
|
| ||||||||||||||||||||||
| — | — | — | — | — | — | — | |||||||||||||||||||||||||||||
| 15,753 | 273,042 | 19,376 | 58,909 | — | 1,026 | — | |||||||||||||||||||||||||||||
| 8,039 | 10,371 | 437 | 2 | — | 36 | — | |||||||||||||||||||||||||||||
| (194,009 | ) | (124,040 | ) | (2,521 | ) | (26,318 | ) | — | — | — | |||||||||||||||||||||||||
|
|
|
|
|
|
|
|
|
|
|
|
|
| ||||||||||||||||||||||
| (170,217 | ) | 159,373 | 17,292 | 32,593 | — | 1,062 | — | ||||||||||||||||||||||||||||
| 15,037,076 | 87,912,677 | 50,773,294 | 26,452,117 | 130,665 | 854,761 | 38,128,201 | |||||||||||||||||||||||||||||
| 987,160 | 1,447,368 | 5,373 | 129 | — | 1,917,811 | 24,927 | |||||||||||||||||||||||||||||
| (71,349,945 | ) | (69,925,353 | ) | (1,857,308 | ) | (6,457,035 | ) | (4,899,604 | ) | (9,649,077 | ) | (36,895,820 | ) | ||||||||||||||||||||||
|
|
|
|
|
|
|
|
|
|
|
|
|
| ||||||||||||||||||||||
| (55,325,709 | ) | 19,434,692 | 48,921,359 | 19,995,211 | (4,768,939 | ) | (6,876,505 | ) | 1,257,308 | ||||||||||||||||||||||||||
| — | — | — | — | — | — | — | |||||||||||||||||||||||||||||
| — | — | — | — | — | — | — | |||||||||||||||||||||||||||||
| — | — | — | — | — | — | — | |||||||||||||||||||||||||||||
|
|
|
|
|
|
|
|
|
|
|
|
|
| ||||||||||||||||||||||
| — | — | — | — | — | — | — | |||||||||||||||||||||||||||||
|
|
|
|
|
|
|
|
|
|
|
|
|
| ||||||||||||||||||||||
| $ | (56,339,230 | ) | $ | 18,863,488 | $ | 48,751,547 | $ | 20,614,473 | $ | (4,753,401 | ) | $ | (6,874,381 | ) | $ | 1,257,308 | |||||||||||||||||||
|
|
|
|
|
|
|
|
|
|
|
|
|
| ||||||||||||||||||||||
| 6,250 | 98,964 | 5,803 | 57,632 | 331 | 19 | — | |||||||||||||||||||||||||||||
| 3,107 | 6,171 | 1,067 | 24 | — | 1 | — | |||||||||||||||||||||||||||||
| (114,696 | ) | (181,333 | ) | (27,899 | ) | (16 | ) | (9 | ) | — | — | ||||||||||||||||||||||||
|
|
|
|
|
|
|
|
|
|
|
|
|
| ||||||||||||||||||||||
| (105,339 | ) | (76,198 | ) | (21,029 | ) | 57,640 | 322 | 20 | — | ||||||||||||||||||||||||||
| — | — | — | — | — | — | — | |||||||||||||||||||||||||||||
| — | — | — | — | — | — | — | |||||||||||||||||||||||||||||
| — | — | — | — | — | — | — | |||||||||||||||||||||||||||||
|
|
|
| �� |
|
|
|
|
|
|
|
|
|
| |||||||||||||||||||||
| — | — | — | — | — | — | — | |||||||||||||||||||||||||||||
| 1,813 | 27,148 | 2,003 | 5,627 | — | 19 | — | |||||||||||||||||||||||||||||
| 976 | 1,068 | 45 | — | — | 1 | — | |||||||||||||||||||||||||||||
| (23,730 | ) | (12,722 | ) | (262 | ) | (2,556 | ) | — | — | — | |||||||||||||||||||||||||
|
|
|
|
|
|
|
|
|
|
|
|
|
| ||||||||||||||||||||||
| (20,941 | ) | 15,494 | 1,786 | 3,071 | — | 20 | — | ||||||||||||||||||||||||||||
| 1,790,200 | 8,840,835 | 5,398,540 | 2,645,568 | 2,332 | 15,241 | 698,557 | |||||||||||||||||||||||||||||
| 117,379 | 147,540 | 559 | 13 | (63 | ) | 37,319 | 451 | ||||||||||||||||||||||||||||
| (8,589,797 | ) | (7,135,189 | ) | (194,473 | ) | (632,437 | ) | (92,275 | ) | (172,529 | ) | (670,088 | ) | ||||||||||||||||||||||
|
|
|
|
|
|
|
|
|
|
|
|
|
| ||||||||||||||||||||||
| (6,682,218 | ) | 1,853,186 | 5,204,626 | 2,013,144 | (90,006 | ) | (119,969 | ) | 28,920 | ||||||||||||||||||||||||||
| — | — | — | — | — | — | ||||||||||||||||||||||||||||||
| — | — | — | — | — | — | ||||||||||||||||||||||||||||||
| — | — | — | — | — | — | ||||||||||||||||||||||||||||||
|
|
|
|
|
|
|
|
|
|
|
|
|
| ||||||||||||||||||||||
| — | — | — | — | — | — | — | |||||||||||||||||||||||||||||
|
|
|
|
|
|
|
|
|
|
|
|
|
| ||||||||||||||||||||||
| (6,808,498 | ) | 1,792,482 | 5,185,383 | 2,073,855 | (89,684 | ) | (119,929 | ) | 28,920 | ||||||||||||||||||||||||||
|
|
|
|
|
|
|
|
|
|
|
|
|
| ||||||||||||||||||||||
147
Sterling Capital Funds
|
Statements of Changes in Net Assets (continued) |
| Sterling Capital Stratton Real Estate Fund | |||||||||||||||
| For the Period January 1, 2016 to September 30, 2016 |
For the Year Ended | For the | |||||||||||||
Capital Transactions: | |||||||||||||||
Class A Shares: | |||||||||||||||
Proceeds from shares issued | $ | 106,941 | $ | 1,026 | $ | — | |||||||||
Distributions reinvested | 982 | 14 | — | ||||||||||||
Value of shares redeemed | (500 | ) | — | — | |||||||||||
|
|
|
|
|
| ||||||||||
Change in net assets from Class A Share transactions | 107,423 | 1,040 | — | ||||||||||||
Class C Shares: | |||||||||||||||
Proceeds from shares issued | 20,159 | 1,026 | — | ||||||||||||
Distributions reinvested | 108 | 14 | — | ||||||||||||
Value of shares redeemed | (2,210 | ) | — | — | |||||||||||
|
|
|
|
|
| ||||||||||
Change in net assets from Class C Share transactions | 18,057 | 1,040 | — | ||||||||||||
Institutional Shares: | |||||||||||||||
Proceeds from shares issued | 12,077,203 | 16,116,223 | 3,335,380 | ||||||||||||
Distributions reinvested | 1,098,322 | 2,369,591 | 5,043,300 | ||||||||||||
Value of shares redeemed | (14,441,949 | ) | (14,488,847 | ) | (9,535,658 | ) | |||||||||
|
|
|
|
|
| ||||||||||
Change in net assets from Institutional Share transactions | (1,266,424 | ) | 3,996,967 | (1,156,978 | ) | ||||||||||
|
|
|
|
|
| ||||||||||
Change in net assets from capital transactions | $ | (1,140,944 | ) | $ | 3,999,047 | $ | (1,156,978 | ) | |||||||
|
|
|
|
|
| ||||||||||
Share Transactions: | |||||||||||||||
Class A Shares: | |||||||||||||||
Issued | 2,859 | 29 | — | ||||||||||||
Reinvested | 25 | 1 | — | ||||||||||||
Redeemed | (13 | ) | — | — | |||||||||||
|
|
|
|
|
| ||||||||||
Change in Class A Shares | 2,871 | 30 | — | ||||||||||||
Class C Shares: | |||||||||||||||
Issued | 525 | 29 | — | ||||||||||||
Reinvested | 3 | 1 | — | ||||||||||||
Redeemed | (54 | ) | — | — | |||||||||||
|
|
|
|
|
| ||||||||||
Change in Class C Shares | 474 | 30 | — | ||||||||||||
Institutional Shares: | |||||||||||||||
Issued | 308,879 | 429,902 | 96,164 | ||||||||||||
Reinvested | 27,369 | 67,718 | 140,602 | ||||||||||||
Redeemed | (373,157 | ) | (405,726 | ) | (289,564 | ) | |||||||||
|
|
|
|
|
| ||||||||||
Change in Institutional Shares | (36,909 | ) | 91,894 | (52,798 | ) | ||||||||||
|
|
|
|
|
| ||||||||||
Change in Shares | (33,564 | ) | 91,954 | (52,798 | ) | ||||||||||
|
|
|
|
|
| ||||||||||
| ||||
* Includes capital stock transactions for the predecessor funds: Stratton Real Estate Fund and Stratton Small Cap Value Fund. | ||||
See accompanying Notes to the Financial Statements.
148
|
Sterling Capital Stratton Small Cap Value Fund | Sterling Capital Ultra Short Bond Fund |
| For the Period January 1, 2016 to September 30, 2016 |
For the | For the Year Ended December 31, 2014 | For the Year Ended September 30, 2016 | For the Year Ended September 30, 2015 | ||||||||||||||||||||
| $ | 75,496 | $ | 1,026 | $ | — | $ | 8,627,882 | $ | 10,746,221 | |||||||||||||||
| — | 15 | — | 108,295 | 68,470 | ||||||||||||||||||||
| (500 | ) | — | — | (10,734,334 | ) | (13,633,265 | ) | |||||||||||||||||
|
|
|
|
|
|
|
|
|
| |||||||||||||||
| 74,996 | 1,041 | — | (1,998,157 | ) | (2,818,574 | ) | ||||||||||||||||||
| 59,199 | 1,026 | — | — | — | ||||||||||||||||||||
| — | 14 | — | — | — | ||||||||||||||||||||
| — | — | — | — | — | ||||||||||||||||||||
|
|
|
|
|
|
|
|
|
| |||||||||||||||
| 59,199 | 1,040 | — | — | — | ||||||||||||||||||||
| 192,336,393 | 263,411,131 | 436,608,836 | 27,102,369 | 11,100,036 | ||||||||||||||||||||
| — | 12,073,101 | 21,444,005 | 638,111 | 437,754 | ||||||||||||||||||||
| (264,684,307 | ) | (460,454,899 | ) | (208,123,695 | ) | (8,754,336 | ) | (23,040,368 | ) | |||||||||||||||
|
|
|
|
|
|
|
|
|
| |||||||||||||||
| (72,347,914 | ) | (184,970,667 | ) | 249,929,146 | 18,986,144 | (11,502,578 | ) | |||||||||||||||||
|
|
|
|
|
|
|
|
|
| |||||||||||||||
| $ | (72,213,719 | ) | (184,968,586 | ) | $ | 249,929,146 | $ | 16,987,987 | $ | (14,321,152 | ) | |||||||||||||
|
|
|
|
|
|
|
|
|
| |||||||||||||||
| 1,105 | 14 | — | 876,356 | 1,083,791 | ||||||||||||||||||||
| — | — | — | 11,345 | 6,912 | ||||||||||||||||||||
| (6 | ) | — | — | (1,091,443 | ) | (1,375,048 | ) | |||||||||||||||||
|
|
|
|
|
|
|
|
|
| |||||||||||||||
| 1,099 | 14 | — | (203,742 | ) | (284,345 | ) | ||||||||||||||||||
| 825 | 14 | — | — | — | ||||||||||||||||||||
| — | 1 | — | — | — | ||||||||||||||||||||
| — | — | — | — | — | ||||||||||||||||||||
|
|
|
|
|
|
|
|
|
| |||||||||||||||
| 825 | 15 | — | — | — | ||||||||||||||||||||
| 2,676,373 | 3,579,007 | 5,734,660 | 2,759,543 | 1,119,396 | ||||||||||||||||||||
| — | 175,712 | 292,991 | 64,588 | 44,220 | ||||||||||||||||||||
| (3,760,802 | ) | (6,296,511 | ) | (2,779,146 | ) | (890,332 | ) | (2,323,600 | ) | |||||||||||||||
|
|
|
|
|
|
|
|
|
| |||||||||||||||
| (1,084,429 | ) | (2,541,792 | ) | 3,248,505 | 1,933,799 | (1,159,984 | ) | |||||||||||||||||
|
|
|
|
|
|
|
|
|
| |||||||||||||||
| (1,082,505 | ) | (2,541,763 | ) | 3,248,505 | 1,730,057 | (1,444,329 | ) | |||||||||||||||||
|
|
|
|
|
|
|
|
|
| |||||||||||||||
149
Sterling Capital Funds
|
Statements of Changes in Net Assets (continued)
|
| Sterling Capital Short Duration Bond Fund | ||||||||||
| For the Year Ended September 30, 2016 | For the Year Ended September 30, 2015 | |||||||||
Capital Transactions: | ||||||||||
Class A Shares: | ||||||||||
Proceeds from shares issued | $ | 1,670,085 | $ | 1,780,844 | ||||||
Distributions reinvested | 147,990 | 195,572 | ||||||||
Value of shares redeemed | (2,514,299 | ) | (4,147,988 | ) | ||||||
|
|
|
| |||||||
Change in net assets from Class A Share transactions | (696,224 | ) | (2,171,572 | ) | ||||||
Class B Shares: | ||||||||||
Proceeds from shares issued | — | — | ||||||||
Distributions reinvested | — | — | ||||||||
Value of shares redeemed | — | — | ||||||||
|
|
|
| |||||||
Change in net assets from Class B Share transactions | — | — | ||||||||
Class C Shares: | ||||||||||
Proceeds from shares issued | 999,391 | 866,184 | ||||||||
Distributions reinvested | 24,636 | 38,764 | ||||||||
Value of shares redeemed | (1,537,914 | ) | (340,975 | ) | ||||||
|
|
|
| |||||||
Change in net assets from Class C Share transactions | (513,887 | ) | 563,973 | |||||||
Institutional Shares: | ||||||||||
Proceeds from shares issued | 25,251,964 | 40,419,740 | ||||||||
Distributions reinvested | 648,944 | 723,318 | ||||||||
Value of shares redeemed | (26,464,544 | ) | (42,076,172 | ) | ||||||
|
|
|
| |||||||
Change in net assets from Institutional Share transactions | (563,636 | ) | (933,114 | ) | ||||||
Class R Shares: | ||||||||||
Proceeds from shares issued | — | — | ||||||||
Distributions reinvested | — | — | ||||||||
Value of shares redeemed | — | — | ||||||||
|
|
|
| |||||||
Change in net assets from Class R Share transactions | — | — | ||||||||
|
|
|
| |||||||
Change in net assets from capital transactions | $ | (1,773,747 | ) | $ | (2,540,713 | ) | ||||
|
|
|
| |||||||
Share Transactions: | ||||||||||
Class A Shares: | ||||||||||
Issued | 189,618 | 198,119 | ||||||||
Reinvested | 16,801 | 21,793 | ||||||||
Redeemed | (285,363 | ) | (462,323 | ) | ||||||
|
|
|
| |||||||
Change in Class A Shares | (78,944 | ) | (242,411 | ) | ||||||
Class B Shares: | ||||||||||
Issued | — | — | ||||||||
Reinvested | — | — | ||||||||
Redeemed | — | — | ||||||||
|
|
|
| |||||||
Change in Class B Shares | — | — | ||||||||
Class C Shares: | ||||||||||
Issued | 113,425 | 96,176 | ||||||||
Reinvested | 2,798 | 4,326 | ||||||||
Redeemed | (174,718 | ) | (37,932 | ) | ||||||
|
|
|
| |||||||
Change in Class C Shares | (58,495 | ) | 62,570 | |||||||
Institutional Shares: | ||||||||||
Issued | 2,867,575 | 4,499,707 | ||||||||
Reinvested | 73,673 | 80,754 | ||||||||
Redeemed | (3,003,989 | ) | (4,683,385 | ) | ||||||
|
|
|
| |||||||
Change in Institutional Shares | (62,741 | ) | (102,924 | ) | ||||||
Class R Shares: | ||||||||||
Issued | — | — | ||||||||
Reinvested | — | — | ||||||||
Redeemed | — | — | ||||||||
|
|
|
| |||||||
Change in Class R Shares | — | — | ||||||||
|
|
|
| |||||||
Change in Shares | (200,180 | ) | (282,765 | ) | ||||||
|
|
|
| |||||||
See accompanying Notes to the Financial Statements.
150
|
Sterling Capital Intermediate U.S. Government Fund | Sterling Capital Total Return Bond Fund | Sterling Capital Corporate Fund |
| For the Year Ended September 30, 2016 | For the Year Ended September 30, 2015 | For the Year Ended September 30, 2016 | For the Year Ended September 30, 2015 | For the Year Ended September 30, 2016 | For the Year Ended September 30, 2015 | ||||||||||||||||||||||||
| $ | 951,217 | $ | 5,617,921 | $ | 31,405,121 | $ | 17,808,421 | $ | 100,692 | $ | 102,581 | ||||||||||||||||||
| 117,101 | 176,965 | 1,623,798 | 1,313,403 | 10,509 | 8,740 | ||||||||||||||||||||||||
| (1,666,038 | ) | (6,858,288 | ) | (12,325,574 | ) | (9,566,217 | ) | (28,660 | ) | (25,718 | ) | ||||||||||||||||||
|
|
|
|
|
|
|
|
|
|
|
| ||||||||||||||||||
| (597,720 | ) | (1,063,402 | ) | 20,703,345 | 9,555,607 | 82,541 | 85,603 | ||||||||||||||||||||||
| — | 4,242 | 19,523 | 61,690 | — | — | ||||||||||||||||||||||||
| 1,128 | 2,500 | 14,699 | 29,761 | — | — | ||||||||||||||||||||||||
| (95,545 | ) | (103,686 | ) | (617,111 | ) | (601,269 | ) | — | — | ||||||||||||||||||||
|
|
|
|
|
|
|
|
|
|
|
| ||||||||||||||||||
| (94,417 | ) | (96,944 | ) | (582,889 | ) | (509,818 | ) | — | — | ||||||||||||||||||||
| 364,738 | 45,149 | 2,511,381 | 1,912,192 | 46,799 | — | ||||||||||||||||||||||||
| 8,036 | 9,045 | 113,317 | 121,462 | 657 | 196 | ||||||||||||||||||||||||
| (448,186 | ) | (100,278 | ) | (1,212,917 | ) | (1,155,506 | ) | — | — | ||||||||||||||||||||
|
|
|
|
|
|
|
|
|
|
|
| ||||||||||||||||||
| (75,412 | ) | (46,084 | ) | 1,411,781 | 878,148 | 47,456 | 196 | ||||||||||||||||||||||
| 7,250,602 | 9,866,530 | 253,141,796 | 310,192,582 | 14,366,119 | 32,047,361 | ||||||||||||||||||||||||
| 113,612 | 161,461 | 13,104,869 | 13,629,682 | 1,570,135 | 1,854,765 | ||||||||||||||||||||||||
| (10,263,902 | ) | (11,478,580 | ) | (186,272,472 | ) | (134,827,838 | ) | (49,344,500 | ) | (19,247,924 | ) | ||||||||||||||||||
|
|
|
|
|
|
|
|
|
|
|
| ||||||||||||||||||
| (2,899,688 | ) | (1,450,589 | ) | 79,974,193 | 188,994,426 | (33,408,246 | ) | 14,654,202 | |||||||||||||||||||||
| — | — | — | 54 | — | — | ||||||||||||||||||||||||
| — | — | 149 | 173 | — | — | ||||||||||||||||||||||||
| — | — | (700 | ) | — | — | — | |||||||||||||||||||||||
|
|
|
|
|
|
|
|
|
|
|
| ||||||||||||||||||
| — | — | (551 | ) | 227 | — | — | |||||||||||||||||||||||
|
|
|
|
|
|
|
|
|
|
|
| ||||||||||||||||||
| $ | (3,667,237 | ) | $ | (2,657,019 | ) | $ | 101,505,879 | $ | 198,918,590 | $ | (33,278,249 | ) | $ | 14,740,001 | |||||||||||||||
|
|
|
|
|
|
|
|
|
|
|
| ||||||||||||||||||
| 93,282 | 545,502 | 2,973,620 | 1,661,183 | 9,910 | 9,931 | ||||||||||||||||||||||||
| 11,467 | 17,275 | 152,688 | 123,015 | 1,031 | 854 | ||||||||||||||||||||||||
| (163,211 | ) | (675,060 | ) | (1,164,439 | ) | (898,029 | ) | (2,821 | ) | (2,527 | ) | ||||||||||||||||||
|
|
|
|
|
|
|
|
|
|
|
| ||||||||||||||||||
| (58,462 | ) | (112,283 | ) | 1,961,869 | 886,169 | 8,120 | 8,258 | ||||||||||||||||||||||
| — | 417 | 1,818 | 5,720 | — | — | ||||||||||||||||||||||||
| 111 | 245 | 1,388 | 2,781 | — | — | ||||||||||||||||||||||||
| (9,414 | ) | (10,149 | ) | (57,911 | ) | (56,277 | ) | — | — | ||||||||||||||||||||
|
|
|
|
|
|
|
|
|
|
|
| ||||||||||||||||||
| (9,303 | ) | (9,487 | ) | (54,705 | ) | (47,776 | ) | — | — | ||||||||||||||||||||
| 35,847 | 4,418 | 233,674 | 177,979 | 4,686 | — | ||||||||||||||||||||||||
| 788 | 884 | 10,648 | 11,360 | 65 | 19 | ||||||||||||||||||||||||
| (43,964 | ) | (9,774 | ) | (114,733 | ) | (108,440 | ) | — | — | ||||||||||||||||||||
|
|
|
|
|
|
|
|
|
|
|
| ||||||||||||||||||
| (7,329 | ) | (4,472 | ) | 129,589 | 80,899 | 4,751 | 19 | ||||||||||||||||||||||
| 710,646 | 963,312 | 23,735,844 | 28,947,287 | 1,424,265 | 3,125,906 | ||||||||||||||||||||||||
| 11,120 | 15,746 | 1,232,539 | 1,275,687 | 154,853 | 181,138 | ||||||||||||||||||||||||
| (1,003,905 | ) | (1,120,290 | ) | (17,573,416 | ) | (12,661,006 | ) | (4,851,586 | ) | (1,881,928 | ) | ||||||||||||||||||
|
|
|
|
|
|
|
|
|
|
|
| ||||||||||||||||||
| (282,139 | ) | (141,232 | ) | 7,394,967 | 17,561,968 | (3,272,468 | ) | 1,425,116 | |||||||||||||||||||||
| — | — | — | 5 | — | — | ||||||||||||||||||||||||
| — | — | 14 | 16 | — | — | ||||||||||||||||||||||||
| — | — | (67 | ) | — | — | — | |||||||||||||||||||||||
|
|
|
|
|
|
|
|
|
|
|
| ||||||||||||||||||
| — | — | (53 | ) | 21 | — | — | |||||||||||||||||||||||
|
|
|
|
|
|
|
|
|
|
|
| ||||||||||||||||||
| (357,233 | ) | (267,474 | ) | 9,431,667 | 18,481,281 | (3,259,597 | ) | 1,433,393 | |||||||||||||||||||||
|
|
|
|
|
|
|
|
|
|
|
| ||||||||||||||||||
151
Sterling Capital Funds
|
Statements of Changes in Net Assets (continued) |
| Sterling Capital Securitized Opportunities Fund | ||||||||||
For the | For the Year Ended September 30, 2015 | |||||||||
Capital Transactions: | ||||||||||
Class A Shares: | ||||||||||
Proceeds from shares issued | $ | 5,118,423 | $ | 44,803 | ||||||
Distributions reinvested | 18,420 | 2,729 | ||||||||
Value of shares redeemed | (4,833,096 | ) | (10,517 | ) | ||||||
|
|
|
| |||||||
Change in net assets from Class A Share transactions | 303,747 | 37,015 | ||||||||
Class C Shares: | ||||||||||
Proceeds from shares issued | — | — | ||||||||
Distributions reinvested | 627 | 687 | ||||||||
Value of shares redeemed | — | — | ||||||||
|
|
|
| |||||||
Change in net assets from Class C Share transactions | 627 | 687 | ||||||||
Institutional Shares: | ||||||||||
Proceeds from shares issued | 12,158,576 | 16,013,633 | ||||||||
Distributions reinvested | 1,206,476 | 1,131,660 | ||||||||
Value of shares redeemed | (13,821,113 | ) | (7,757,627 | ) | ||||||
|
|
|
| |||||||
Change in net assets from Institutional Share transactions | (456,061 | ) | 9,387,666 | |||||||
|
|
|
| |||||||
Change in net assets from capital transactions | $ | (151,687 | ) | $ | 9,425,368 | |||||
|
|
|
| |||||||
Share Transactions: | ||||||||||
Class A Shares: | ||||||||||
Issued | 512,888 | 4,462 | ||||||||
Reinvested | 1,850 | 273 | ||||||||
Redeemed | (489,826 | ) | (1,057 | ) | ||||||
|
|
|
| |||||||
Change in Class A Shares | 24,912 | 3,678 | ||||||||
Class C Shares: | ||||||||||
Issued | — | — | ||||||||
Reinvested | 62 | 69 | ||||||||
Redeemed | — | — | ||||||||
|
|
|
| |||||||
Change in Class C Shares | 62 | 69 | ||||||||
Institutional Shares: | ||||||||||
Issued | 1,218,996 | 1,601,075 | ||||||||
Reinvested | 120,522 | 113,147 | ||||||||
Redeemed | (1,382,696 | ) | (777,454 | ) | ||||||
|
|
|
| |||||||
Change in Institutional Shares | (43,178 | ) | 936,768 | |||||||
|
|
|
| |||||||
Change in Shares | (18,204 | ) | 940,515 | |||||||
|
|
|
| |||||||
See accompanying Notes to the Financial Statements.
152
|
Sterling Capital Kentucky Intermediate Tax-Free Fund | Sterling Capital Maryland Intermediate Tax-Free Fund | Sterling Capital North Carolina Intermediate Tax-Free Fund |
| For the Year Ended September 30, 2016 | For the Year Ended September 30, 2015 | For the Year Ended September 30, 2016 | For the Year Ended September 30, 2015 | For the Year Ended September 30, 2016 | For the Year Ended September 30, 2015 | ||||||||||||||||||||||||
| $ | 242,712 | $ | 173,580 | $ | 498,882 | $ | 993,275 | $ | 9,996,560 | $ | 3,271,634 | ||||||||||||||||||
| 129,238 | 157,983 | 109,686 | 110,293 | 1,008,520 | 856,621 | ||||||||||||||||||||||||
| (551,767 | ) | (317,405 | ) | (1,010,470 | ) | (967,867 | ) | (5,270,210 | ) | (6,565,206 | ) | ||||||||||||||||||
|
|
|
|
|
|
|
|
|
|
|
| ||||||||||||||||||
| (179,817 | ) | 14,158 | (401,902 | ) | 135,701 | 5,734,870 | (2,436,951 | ) | |||||||||||||||||||||
| — | — | 157,489 | 82,459 | 3,795,704 | 1,136,424 | ||||||||||||||||||||||||
| 536 | 637 | 11,132 | 10,790 | 75,915 | 41,063 | ||||||||||||||||||||||||
| — | — | (114,652 | ) | (95,561 | ) | (1,154,608 | ) | (685,456 | ) | ||||||||||||||||||||
|
|
|
|
|
|
|
|
|
|
|
| ||||||||||||||||||
| 536 | 637 | 53,969 | (2,312 | ) | 2,717,011 | 492,031 | |||||||||||||||||||||||
| 2,040,861 | 2,443,555 | 2,975,581 | 6,010,967 | 37,514,719 | 35,818,542 | ||||||||||||||||||||||||
| 50,004 | 71,870 | 258,996 | 247,424 | 1,048,470 | 885,369 | ||||||||||||||||||||||||
| (3,052,836 | ) | (3,291,429 | ) | (7,947,582 | ) | (7,646,027 | ) | (29,714,007 | ) | (40,683,164 | ) | ||||||||||||||||||
|
|
|
|
|
|
|
|
|
|
|
| ||||||||||||||||||
| (961,971 | ) | (776,004 | ) | (4,713,005 | ) | (1,387,636 | ) | 8,849,182 | (3,979,253 | ) | |||||||||||||||||||
|
|
|
|
|
|
|
|
|
|
|
| ||||||||||||||||||
| $ | (1,141,252 | ) | $ | (761,209 | ) | $ | (5,060,938 | ) | $ | (1,254,247 | ) | $ | 17,301,063 | $ | (5,924,173 | ) | |||||||||||||
|
|
|
|
|
|
|
|
|
|
|
| ||||||||||||||||||
| 22,770 | 16,327 | 44,128 | 89,218 | 901,371 | 298,779 | ||||||||||||||||||||||||
| 12,225 | 14,790 | 9,763 | 9,851 | 91,378 | 78,025 | ||||||||||||||||||||||||
| (52,139 | ) | (29,673 | ) | (90,214 | ) | (86,735 | ) | (475,823 | ) | (598,065 | ) | ||||||||||||||||||
|
|
|
|
|
|
|
|
|
|
|
| ||||||||||||||||||
| (17,144 | ) | 1,444 | (36,323 | ) | 12,334 | 516,926 | (221,261 | ) | |||||||||||||||||||||
| — | — | 13,877 | 7,385 | 343,270 | 103,490 | ||||||||||||||||||||||||
| 50 | 60 | 991 | 964 | 6,884 | 3,743 | ||||||||||||||||||||||||
| — | — | (10,249 | ) | (8,520 | ) | (104,171 | ) | (62,562 | ) | ||||||||||||||||||||
|
|
|
|
|
|
|
|
|
|
|
| ||||||||||||||||||
| 50 | 60 | 4,619 | (171 | ) | 245,983 | 44,671 | |||||||||||||||||||||||
| 192,296 | 229,733 | 263,680 | 535,757 | 3,380,713 | 3,254,656 | ||||||||||||||||||||||||
| 4,733 | 6,748 | 23,009 | 22,079 | 94,922 | 80,670 | ||||||||||||||||||||||||
| (288,271 | ) | (309,523 | ) | (701,539 | ) | (682,029 | ) | (2,685,371 | ) | (3,703,277 | ) | ||||||||||||||||||
|
|
|
|
|
|
|
|
|
|
|
| ||||||||||||||||||
| (91,242 | ) | (73,042 | ) | (414,850 | ) | (124,193 | ) | 790,264 | (367,951 | ) | |||||||||||||||||||
|
|
|
|
|
|
|
|
|
|
|
| ||||||||||||||||||
| (108,336 | ) | (71,538 | ) | (446,554 | ) | (112,030 | ) | 1,553,173 | (544,541 | ) | |||||||||||||||||||
|
|
|
|
|
|
|
|
|
|
|
| ||||||||||||||||||
153
Sterling Capital Funds
|
Statements of Changes in Net Assets (continued)
|
| Sterling Capital South Carolina Intermediate Tax-Free Fund | ||||||||||
For the | For the Year Ended September 30, 2015 | |||||||||
Capital Transactions: | ||||||||||
Class A Shares: | ||||||||||
Proceeds from shares issued | $ | 2,651,886 | $ | 1,137,270 | ||||||
Distributions reinvested | 314,627 | 297,069 | ||||||||
Value of shares redeemed | (1,333,071 | ) | (407,404 | ) | ||||||
|
|
|
| |||||||
Change in net assets from Class A Share transactions | 1,633,442 | 1,026,935 | ||||||||
Class C Shares: | ||||||||||
Proceeds from shares issued | 1,049,922 | 443,217 | ||||||||
Distributions reinvested | 19,676 | 16,351 | ||||||||
Value of shares redeemed | (803,474 | ) | (2,376,040 | ) | ||||||
|
|
|
| |||||||
Change in net assets from Class C Share transactions | 266,124 | (1,916,472 | ) | |||||||
Institutional Shares: | ||||||||||
Proceeds from shares issued | 24,412,603 | 15,028,426 | ||||||||
Distributions reinvested | 388,362 | 287,136 | ||||||||
Value of shares redeemed | (11,097,704 | ) | (6,339,982 | ) | ||||||
|
|
|
| |||||||
Change in net assets from Institutional Share transactions | 13,703,261 | 8,975,580 | ||||||||
|
|
|
| |||||||
Change in net assets from capital transactions | $ | 15,602,827 | $ | 8,086,043 | ||||||
|
|
|
| |||||||
Share Transactions: | ||||||||||
Class A Shares: | ||||||||||
Issued | 235,183 | 102,254 | ||||||||
Reinvested | 27,972 | 26,667 | ||||||||
Redeemed | (118,390 | ) | (213,198 | ) | ||||||
|
|
|
| |||||||
Change in Class A Shares | 144,765 | (84,277 | ) | |||||||
Class C Shares: | ||||||||||
Issued | 93,348 | 39,731 | ||||||||
Reinvested | 1,749 | 1,468 | ||||||||
Redeemed | (71,470 | ) | (36,461 | ) | ||||||
|
|
|
| |||||||
Change in Class C Shares | 23,627 | 4,738 | ||||||||
Institutional Shares: | ||||||||||
Issued | 2,178,180 | 1,360,106 | ||||||||
Reinvested | 34,737 | 25,956 | ||||||||
Redeemed | (988,162 | ) | (572,809 | ) | ||||||
|
|
|
| |||||||
Change in Institutional Shares | 1,224,755 | 813,253 | ||||||||
|
|
|
| |||||||
Change in Shares | 1,393,147 | 733,714 | ||||||||
|
|
|
| |||||||
See accompanying Notes to the Financial Statements.
154
|
| Sterling Capital Virginia Intermediate Tax-Free Fund | Sterling Capital West Virginia Intermediate Tax-Free Fund | |||||||||||||
| For the Year Ended September 30, 2016 | For the Year Ended September 30, 2015 | For the Year Ended September 30, 2016 | For the Year Ended September 30, 2015 | |||||||||||
| $ | 997,012 | $ | 647,538 | $ | 3,027,987 | $ | 3,689,399 | |||||||
| 665,639 | 805,613 | 755,715 | 677,107 | |||||||||||
| (4,094,900 | ) | (5,638,506 | ) | (1,792,075 | ) | (4,210,504 | ) | |||||||
|
|
|
|
|
|
|
| |||||||
| (2,432,249 | ) | (4,185,355 | ) | 1,991,627 | 156,002 | |||||||||
| 167,437 | 92,545 | 446,769 | 76,104 | |||||||||||
| 17,964 | 22,214 | 6,685 | 5,600 | |||||||||||
| (276,899 | ) | (351,479 | ) | (49,782 | ) | (129,627 | ) | |||||||
|
|
|
|
|
|
|
| |||||||
| (91,498 | ) | (236,720 | ) | 403,672 | (47,923 | ) | ||||||||
| 16,920,406 | 17,263,590 | 10,647,187 | 13,932,544 | |||||||||||
| 517,419 | 500,475 | 399,153 | 308,998 | |||||||||||
| (12,931,229 | ) | (18,624,527 | ) | (14,363,312 | ) | (17,711,994 | ) | |||||||
|
|
|
|
|
|
|
| |||||||
| 4,506,596 | (860,462 | ) | (3,316,972 | ) | (3,470,452 | ) | ||||||||
|
|
|
|
|
|
|
| |||||||
| $ | 1,982,849 | $ | (5,282,537 | ) | $ | (921,673 | ) | $ | (3,362,373 | ) | ||||
|
|
|
|
|
|
|
| |||||||
| 82,609 | 53,868 | 295,616 | 363,040 | |||||||||||
| 55,102 | 67,076 | 73,984 | 66,738 | |||||||||||
| (338,022 | ) | (471,168 | ) | (175,645 | ) | (415,158 | ) | |||||||
|
|
|
|
|
|
|
| |||||||
| (200,311 | ) | (350,224 | ) | 193,955 | 14,620 | |||||||||
| 13,843 | 7,781 | 43,324 | 7,559 | |||||||||||
| 1,488 | 1,850 | 655 | 552 | |||||||||||
| (22,763 | ) | (29,287 | ) | (4,851 | ) | (12,715 | ) | |||||||
|
|
|
|
|
|
|
| |||||||
| (7,432 | ) | (19,656 | ) | 39,128 | (4,604 | ) | ||||||||
| 1,396,949 | 1,436,452 | 1,037,646 | 1,371,642 | |||||||||||
| 42,802 | 41,712 | 39,088 | 30,430 | |||||||||||
| (1,068,827 | ) | (1,551,666 | ) | (1,404,223 | ) | (1,740,598 | ) | |||||||
|
|
|
|
|
|
|
| |||||||
| 370,924 | (73,502 | ) | (327,489 | ) | (338,526 | ) | ||||||||
|
|
|
|
|
|
|
| |||||||
| 163,181 | (443,382 | ) | (94,406 | ) | (328,510 | ) | ||||||||
|
|
|
|
|
|
|
| |||||||
155
Sterling Capital Funds
|
Statements of Changes in Net Assets (continued)
|
| Sterling Capital Diversified Income Fund | ||||||||||
| For the Year Ended September 30, 2016 | For the Year Ended September 30, 2015 | |||||||||
Capital Transactions: | ||||||||||
Class A Shares: | ||||||||||
Proceeds from shares issued | $ | 1,547,665 | $ | 1,887,859 | ||||||
Distributions reinvested | 473,054 | 308,203 | ||||||||
Value of shares redeemed | (2,047,138 | ) | (2,937,504 | ) | ||||||
|
|
|
| |||||||
Change in net assets from Class A Share transactions | (26,419 | ) | (741,442 | ) | ||||||
Class B Shares: | ||||||||||
Proceeds from shares issued | 2,070 | — | ||||||||
Distributions reinvested | 9,744 | 9,755 | ||||||||
Value of shares redeemed | (317,580 | ) | (287,067 | ) | ||||||
|
|
|
| |||||||
Change in net assets from Class B Share transactions | (305,766 | ) | (277,312 | ) | ||||||
Class C Shares: | ||||||||||
Proceeds from shares issued | 526,578 | 555,913 | ||||||||
Distributions reinvested | 18,624 | 6,249 | ||||||||
Value of shares redeemed | (239,308 | ) | (27,698 | ) | ||||||
|
|
|
| |||||||
Change in net assets from Class C Share transactions | 305,894 | 534,464 | ||||||||
Institutional Shares: | ||||||||||
Proceeds from shares issued | 4,869,619 | 30,753,764 | ||||||||
Distributions reinvested | 994,186 | 386,573 | ||||||||
Value of shares redeemed | (8,873,690 | ) | (3,778,591 | ) | ||||||
|
|
|
| |||||||
Change in net assets from Institutional Share transactions | (3,009,885 | ) | 27,361,746 | |||||||
|
|
|
| |||||||
Change in net assets from capital transactions | $ | (3,036,176 | ) | $ | 26,877,456 | |||||
|
|
|
| |||||||
Share Transactions: | ||||||||||
Class A Shares: | ||||||||||
Issued | 147,958 | 176,782 | ||||||||
Reinvested | 45,677 | 29,144 | ||||||||
Redeemed | (198,129 | ) | (274,990 | ) | ||||||
|
|
|
| |||||||
Change in Class A Shares | (4,494 | ) | (69,064 | ) | ||||||
Class B Shares: | ||||||||||
Issued | 202 | — | ||||||||
Reinvested | 942 | 917 | ||||||||
Redeemed | (30,595 | ) | (26,758 | ) | ||||||
|
|
|
| |||||||
Change in Class B Shares | (29,451 | ) | (25,841 | ) | ||||||
Class C Shares: | ||||||||||
Issued | 50,840 | 52,905 | ||||||||
Reinvested | 1,813 | 599 | ||||||||
Redeemed | (23,396 | ) | (2,590 | ) | ||||||
|
|
|
| |||||||
Change in Class C Shares | 29,257 | 50,914 | ||||||||
Institutional Shares: | ||||||||||
Issued | 465,723 | 2,805,133 | ||||||||
Reinvested | 94,911 | 36,774 | ||||||||
Redeemed | (856,953 | ) | (354,765 | ) | ||||||
|
|
|
| |||||||
Change in Institutional Shares | (296,319 | ) | 2,487,142 | |||||||
|
|
|
| |||||||
Change in Shares | (301,007 | ) | 2,443,151 | |||||||
|
|
|
| |||||||
See accompanying Notes to the Financial Statements.
156
|
| Sterling Capital Strategic Allocation Balanced Fund | Sterling Capital Strategic Allocation Growth Fund | |||||||||||||
| For the Year Ended September 30, 2016 | For the Year Ended September 30, 2015 | For the Year Ended September 30, 2016 | For the Year Ended September 30, 2015 | |||||||||||
| $ | 1,404,386 | $ | 4,039,105 | $ | 1,408,636 | $ | 2,672,841 | |||||||
| 627,559 | 481,066 | 380,173 | 225,466 | |||||||||||
| (5,620,261 | ) | (4,799,807 | ) | (3,890,979 | ) | (2,848,121 | ) | |||||||
|
|
|
|
|
|
|
| |||||||
| (3,588,316 | ) | (279,636 | ) | (2,102,170 | ) | 50,186 | ||||||||
| — | 8,241 | 710 | 11,967 | |||||||||||
| 7,812 | 9,918 | 9,375 | 6,950 | |||||||||||
| (664,396 | ) | (1,048,427 | ) | (581,853 | ) | (976,831 | ) | |||||||
|
|
|
|
|
|
|
| |||||||
| (656,584 | ) | (1,030,268 | ) | (571,768 | ) | (957,914 | ) | |||||||
| 75,280 | 174,979 | 57,866 | 96,199 | |||||||||||
| 9,576 | 5,115 | 5,147 | 1,997 | |||||||||||
| (131,762 | ) | (159,492 | ) | (139,880 | ) | (93,956 | ) | |||||||
|
|
|
|
|
|
|
| |||||||
| (46,906 | ) | 20,602 | (76,867 | ) | 4,240 | |||||||||
| 28 | 44 | 98,435 | 860,482 | |||||||||||
| 1,789 | 1,785 | 13,445 | 11,035 | |||||||||||
| (32,561 | ) | (136,846 | ) | (979,999 | ) | (171,809 | ) | |||||||
|
|
|
|
|
|
|
| |||||||
| (30,744 | ) | (135,017 | ) | (868,119 | ) | 699,708 | ||||||||
|
|
|
|
|
|
|
| |||||||
| $ | (4,322,550 | ) | $ | (1,424,319 | ) | $ | (3,618,924 | ) | $ | (203,780 | ) | |||
|
|
|
|
|
|
|
| |||||||
| 134,456 | 373,614 | 140,419 | 251,786 | |||||||||||
| 60,259 | 44,976 | 37,620 | 21,649 | |||||||||||
| (542,145 | ) | (442,468 | ) | (385,153 | ) | (268,419 | ) | |||||||
|
|
|
|
|
|
|
| |||||||
| (347,430 | ) | (23,878 | ) | (207,114 | ) | 5,016 | ||||||||
| — | 799 | 70 | 1,186 | |||||||||||
| 768 | 947 | 953 | 687 | |||||||||||
| (64,884 | ) | (98,893 | ) | (59,787 | ) | (94,604 | ) | |||||||
|
|
|
|
|
|
|
| |||||||
| (64,116 | ) | (97,147 | ) | (58,764 | ) | (92,731 | ) | |||||||
| 7,574 | 16,293 | 5,923 | 9,377 | |||||||||||
| 941 | 488 | 526 | 198 | |||||||||||
| (12,837 | ) | (14,971 | ) | (14,281 | ) | (9,025 | ) | |||||||
|
|
|
|
|
|
|
| |||||||
| (4,322 | ) | 1,810 | (7,832 | ) | 550 | |||||||||
| 3 | 4 | 9,593 | 83,195 | |||||||||||
| 170 | 166 | 1,325 | 1,062 | |||||||||||
| (3,069 | ) | (12,721 | ) | (93,735 | ) | (16,514 | ) | |||||||
|
|
|
|
|
|
|
| |||||||
| (2,896 | ) | (12,551 | ) | (82,817 | ) | 67,743 | ||||||||
|
|
|
|
|
|
|
| |||||||
| (418,764 | ) | (131,766 | ) | (356,527 | ) | (19,422 | ) | |||||||
|
|
|
|
|
|
|
| |||||||
157
Sterling Capital Funds
|
Statement of Cash Flows |
For the Year Ended September 30, 2016
|
| Sterling Capital Long/Short Equity Fund | ||||
Cash Used for Operating Activities: | ||||
Net decrease in net assets from operations | $ | (3,689,693 | ) | |
|
| |||
Adjustments to reconcile net decrease in net assets resulting from operations to net cash provided by operating activities: | ||||
Decrease in cash held at broker for securities short sales | 17,072,484 | |||
Decrease in interest and dividends receivable | 37,594 | |||
Decrease in prepaid expenses | 155 | |||
Increase in payable for dividends on short sales | 721 | |||
Decrease in payable to broker for service fee on short sales | (180 | ) | ||
Decrease in investment advisory fees payable | (83,381 | ) | ||
Increase in accounting out-of-pocket fees payable | 1,884 | |||
Decrease in administration fees payable | (5,622 | ) | ||
Decrease in audit fees payable | (6,018 | ) | ||
Decrease in transfer agent fees payable | (11,409 | ) | ||
Decrease in distribution (12b-1) fees payable | (356 | ) | ||
Increase in service fees payable | 105 | |||
Increase in Trustee fees payable | 86 | |||
Increase in other fees | 5,955 | |||
Amortization of premium and accretion of discount on investments | (47,446 | ) | ||
Net realized gain (loss) on investments | 21,128,166 | |||
Net unrealized gain (loss) on investments and foreign currency translations | (18,507,697 | ) | ||
Premiums received from options written | 218,812 | |||
Premiums paid on closing options written | (94,194 | ) | ||
Proceeds from investments sold short | 138,396,086 | |||
Purchases to cover investments sold short | (152,889,366 | ) | ||
Purchases of long-term investments | (140,385,393 | ) | ||
Proceeds from sales of long-term investments | 186,155,028 | |||
Net proceeds of short-term securities | 12,047,317 | |||
|
| |||
Net cash provided by operating activities | 59,343,638 | |||
|
| |||
Cash Provided by (Used for) Financing Activities: | ||||
Proceeds from issuance of capital shares | 15,319,881 | |||
Payments on redemption of capital shares | (73,209,152 | ) | ||
Cash dividends paid to shareholders | (774,143 | ) | ||
|
| |||
Net cash used for financing activities | (58,663,414 | ) | ||
|
| |||
Cash: | ||||
Net increase in cash | 680,224 | |||
Cash at beginning of Year | 4,764 | |||
|
| |||
Cash at end of Year | $ | 684,988 | ||
|
| |||
Supplemental Disclosure of Cash Flow Information: | ||||
Cash paid during the year for dividend expense and service fee on securities sold short | $ | (762,529 | ) | |
|
| |||
Non-Cash Financing Activities: | ||||
Capital shares issued in reinvestment of distributions paid to shareholders | $ | 1,021,173 | ||
|
| |||
See accompanying Notes to the Financial Statements.
158
(This page has been left blank intentionally.)
Sterling Capital Funds
|
Financial Highlights, Class A Shares |
The financial highlights table is intended to help you understand the Funds’ financial performance for the past 5 years or, if shorter, the period of the Funds’ operations. Certain information reflects financial results for a single Fund share. The total returns in the table represent the rate that an investor would have earned (or lost) on an investment in the Fund (assuming reinvestment of all dividends and distributions).
| Investment Activities | Distributions | |||||||||||||||||||||||||||||||||||||||
| Net Asset Value, Beginning of Period | Net investment income (loss)(a) |
Net realized/ | Total from Investment Activities | Net investment income | Net realized gains on investments | Total Distributions | ||||||||||||||||||||||||||||||||||
Sterling Capital Behavioral Large Cap Value Equity Fund |
| |||||||||||||||||||||||||||||||||||||||
Year Ended September 30, 2016 | $ | 16.53 | 0.27 | 1.15 | 1.42 | (0.27 | ) | — | (0.27 | ) | ||||||||||||||||||||||||||||||
Year Ended September 30, 2015 | $ | 17.24 | 0.22 | (0.69 | ) | (0.47 | ) | (0.24 | ) | — | (0.24 | ) | ||||||||||||||||||||||||||||
Year Ended September 30, 2014 | $ | 14.16 | 0.18 | 3.06 | 3.24 | (0.16 | ) | — | (0.16 | ) | ||||||||||||||||||||||||||||||
Year Ended September 30, 2013 | $ | 12.80 | 0.13 | 1.36 | 1.49 | (0.13 | ) | — | (0.13 | ) | ||||||||||||||||||||||||||||||
Year Ended September 30, 2012 | $ | 9.90 | 0.11 | 2.90 | 3.01 | (0.11 | ) | — | (0.11 | ) | ||||||||||||||||||||||||||||||
Sterling Capital Mid Value Fund | ||||||||||||||||||||||||||||||||||||||||
Year Ended September 30, 2016 | $ | 17.97 | 0.02 | 2.06 | 2.08 | — | (3.34 | ) | (3.34 | ) | ||||||||||||||||||||||||||||||
Year Ended September 30, 2015 | $ | 19.33 | 0.06 | (0.14 | ) | (0.08 | ) | (0.11 | ) | (1.17 | ) | (1.28 | ) | |||||||||||||||||||||||||||
Year Ended September 30, 2014 | $ | 18.78 | 0.05 | 1.76 | 1.81 | (0.06 | ) | (1.20 | ) | (1.26 | ) | |||||||||||||||||||||||||||||
Year Ended September 30, 2013 | $ | 14.28 | 0.13 | 4.47 | 4.60 | (0.10 | ) | — | (0.10 | ) | ||||||||||||||||||||||||||||||
Year Ended September 30, 2012 | $ | 11.37 | 0.10 | 2.91 | 3.01 | (0.10 | ) | — | (0.10 | ) | ||||||||||||||||||||||||||||||
Sterling Capital Behavioral Small Cap Value Equity Fund |
| |||||||||||||||||||||||||||||||||||||||
Year Ended September 30, 2016 | $ | 14.04 | 0.18 | 1.15 | 1.33 | (0.17 | ) | (0.01 | ) | (0.18 | ) | |||||||||||||||||||||||||||||
Year Ended September 30, 2015 | $ | 14.34 | 0.18 | 0.16 | 0.34 | (0.20 | ) | (0.44 | ) | (0.64 | ) | |||||||||||||||||||||||||||||
Year Ended September 30, 2014 | $ | 15.25 | 0.11 | 0.93 | 1.04 | (0.08 | ) | (1.87 | ) | (1.95 | ) | |||||||||||||||||||||||||||||
Year Ended September 30, 2013 | $ | 12.01 | 0.05 | 3.37 | 3.42 | (0.03 | ) | (0.15 | ) | (0.18 | ) | |||||||||||||||||||||||||||||
Year Ended September 30, 2012 | $ | 10.79 | 0.03 | 2.17 | 2.20 | — | (0.98 | ) | (0.98 | ) | ||||||||||||||||||||||||||||||
Sterling Capital Special Opportunities Fund | ||||||||||||||||||||||||||||||||||||||||
Year Ended September 30, 2016 | $ | 22.96 | — | 1.88 | 1.88 | — | (3.31 | ) | (3.31 | ) | ||||||||||||||||||||||||||||||
Year Ended September 30, 2015 | $ | 23.33 | (0.06 | ) | 0.89 | 0.83 | — | (1.20 | ) | (1.20 | ) | |||||||||||||||||||||||||||||
Year Ended September 30, 2014 | $ | 21.38 | (0.02 | ) | 4.26 | 4.24 | (0.01 | ) | (2.28 | ) | (2.29 | ) | ||||||||||||||||||||||||||||
Year Ended September 30, 2013 | $ | 18.51 | 0.05 | (e) | 3.78 | 3.83 | (0.01 | ) | (0.95 | ) | (0.96 | ) | ||||||||||||||||||||||||||||
Year Ended September 30, 2012 | $ | 15.25 | — | (f) | 3.57 | 3.57 | — | (0.31 | ) | (0.31 | ) | |||||||||||||||||||||||||||||
Sterling Capital Equity Income Fund | ||||||||||||||||||||||||||||||||||||||||
Year Ended September 30, 2016 | $ | 17.35 | 0.31 | 2.05 | 2.36 | (0.31 | ) | (1.10 | ) | (1.41 | ) | |||||||||||||||||||||||||||||
Year Ended September 30, 2015 | $ | 18.94 | 0.31 | (1.06 | ) | (0.75 | ) | (0.33 | ) | (0.51 | ) | (0.84 | ) | |||||||||||||||||||||||||||
Year Ended September 30, 2014 | $ | 18.14 | 0.34 | 1.40 | 1.74 | (0.31 | ) | (0.63 | ) | (0.94 | ) | |||||||||||||||||||||||||||||
Year Ended September 30, 2013 | $ | 16.03 | 0.29 | 2.23 | 2.52 | (0.25 | ) | (0.16 | ) | (0.41 | ) | |||||||||||||||||||||||||||||
Year Ended September 30, 2012 | $ | 13.25 | 0.25 | 2.72 | 2.97 | (0.19 | ) | — | (0.19 | ) | ||||||||||||||||||||||||||||||
Sterling Capital Long/Short Equity Fund | ||||||||||||||||||||||||||||||||||||||||
Year Ended September 30, 2016 | $ | 8.87 | (0.17 | ) | 0.11 | (0.06 | ) | — | (0.20 | ) | (0.20 | ) | ||||||||||||||||||||||||||||
Year Ended September 30, 2015 | $ | 10.90 | (0.19 | ) | (1.54 | ) | (1.73 | ) | — | (0.30 | ) | (0.30 | ) | |||||||||||||||||||||||||||
December 13, 2013 to September 30, 2014(j) | $ | 10.00 | (0.13 | ) | 1.03 | 0.90 | — | — | — | |||||||||||||||||||||||||||||||
| * | During the periods certain fees were waived (See Note 5 in the Notes to the Financial Statements). If such reductions had not occurred, the ratios would have been as indicated. |
| ** | Portfolio turnover rate is calculated on the basis of the Fund as a whole without distinguishing between classes of shares issued. |
| (a) | Per share net investment income (loss) has been calculated using the average daily shares method. |
| (b) | Not annualized for periods less than one year. |
| (c) | Annualized for periods less than one year. |
| (d) | Includes proceeds received from a settlement of litigation, which impacted the Fund’s total return. Not including these proceeds, the Fund’s total return would have been 11.56%. |
| (e) | Net investment income per share reflects a special dividend, which amounted to $0.01 per share. Excluding the special dividend, the ratio of net investment income to average net assets would have been 0.19% per share. |
| (f) | Amount is less than $0.005. |
| (g) | Ratio is below 0.005%. |
| (h) | Net expense ratio excluding dividend expense and service fee on securities sold short would have been 2.19% per share. |
| (i) | Net expense ratio excluding dividend expense and service fee on securities sold short would have been 2.08% per share. |
| (j) | Period from commencement of operations. |
| (k) | Net expense ratio excluding dividend expense and service fee on securities sold short would have been 2.04% per share. |
See accompanying Notes to the Financial Statements.
160
|
|
|
| Ratios/Supplementary Data | |||||||||||||||||||||||||||||||||
| Net Asset Value, End of Period | Total Return (excludes sales charge) (b) | Net Assets, End of Period (000) | Ratio of net expenses to average net assets (c) | Ratio of net investment income (loss) to average net assets (c) | Ratio of expenses to average net assets*(c) | Portfolio turnover rate**(b) | |||||||||||||||||||||||||||
| $ | 17.68 | 8.66 | % | $ | 30,159 | 1.01 | % | 1.58 | % | 1.15 | % | 145.53 | % | ||||||||||||||||||||
| $ | 16.53 | (2.81 | )% | $ | 31,079 | 1.06 | % | 1.25 | % | 1.16 | % | 135.05 | % | ||||||||||||||||||||
| $ | 17.24 | 22.96 | % | $ | 34,395 | 1.06 | % | 1.09 | % | 1.16 | % | 113.75 | % | ||||||||||||||||||||
| $ | 14.16 | 11.72 | %(d) | $ | 28,682 | 1.09 | % | 0.97 | % | 1.19 | % | 164.27 | % | ||||||||||||||||||||
| $ | 12.80 | 30.52 | % | $ | 28,618 | 1.08 | % | 0.98 | % | 1.28 | % | 68.75 | % | ||||||||||||||||||||
| $ | 16.71 | 13.07 | % | $ | 31,625 | 1.18 | % | 0.15 | % | 1.18 | % | 25.45 | % | ||||||||||||||||||||
| $ | 17.97 | (0.69 | )% | $ | 34,792 | 1.19 | % | 0.29 | % | 1.19 | % | 30.61 | % | ||||||||||||||||||||
| $ | 19.33 | 9.91 | % | $ | 41,403 | 1.18 | % | 0.26 | % | 1.18 | % | 27.30 | % | ||||||||||||||||||||
| $ | 18.78 | 32.36 | % | $ | 36,094 | 1.17 | % | 0.79 | % | 1.17 | % | 34.03 | % | ||||||||||||||||||||
| $ | 14.28 | 26.57 | % | $ | 21,976 | 1.19 | % | 0.78 | % | 1.20 | % | 21.62 | % | ||||||||||||||||||||
| $ | 15.19 | 9.52 | % | $ | 8,714 | 1.13 | % | 1.29 | % | 1.21 | % | 120.42 | % | ||||||||||||||||||||
| $ | 14.04 | 2.20 | % | $ | 13,261 | 1.25 | % | 1.18 | % | 1.25 | % | 101.99 | % | ||||||||||||||||||||
| $ | 14.34 | 7.09 | % | $ | 9,681 | 1.24 | % | 0.74 | % | 1.24 | % | 68.50 | % | ||||||||||||||||||||
| $ | 15.25 | 28.74 | % | $ | 8,813 | 1.29 | % | 0.36 | % | 1.29 | % | 176.62 | % | ||||||||||||||||||||
| $ | 12.01 | 21.31 | % | $ | 6,720 | 1.33 | % | 0.22 | % | 1.44 | % | 32.86 | % | ||||||||||||||||||||
| $ | 21.53 | 8.57 | % | $ | 351,467 | 1.17 | % | 0.02 | % | 1.22 | % | 27.32 | % | ||||||||||||||||||||
| $ | 22.96 | 3.75 | % | $ | 264,294 | 1.22 | % | (0.25 | )% | 1.22 | % | 26.98 | % | ||||||||||||||||||||
| $ | 23.33 | 21.71 | % | $ | 364,368 | 1.21 | % | (0.11 | )% | 1.21 | % | 32.35 | % | ||||||||||||||||||||
| $ | 21.38 | 21.59 | % | $ | 269,300 | 1.24 | % | 0.27 | %(e) | 1.24 | % | 53.76 | % | ||||||||||||||||||||
| $ | 18.51 | 23.67 | % | $ | 174,085 | 1.29 | % | (0.00 | )%(g) | 1.38 | % | 19.38 | % | ||||||||||||||||||||
| $ | 18.30 | 14.50 | % | $ | 467,470 | 1.21 | % | 1.78 | % | 1.21 | % | 20.64 | % | ||||||||||||||||||||
| $ | 17.35 | (4.16 | )% | $ | 478,393 | 1.21 | % | 1.66 | % | 1.21 | % | 27.53 | % | ||||||||||||||||||||
| $ | 18.94 | 9.76 | % | $ | 714,457 | 1.20 | % | 1.79 | % | 1.20 | % | 16.13 | % | ||||||||||||||||||||
| $ | 18.14 | 16.02 | % | $ | 690,106 | 1.20 | % | 1.69 | % | 1.20 | % | 30.56 | % | ||||||||||||||||||||
| $ | 16.03 | 22.47 | % | $ | 371,659 | 1.19 | % | 1.61 | % | 1.26 | % | 21.30 | % | ||||||||||||||||||||
| $ | 8.61 | (0.57 | )% | $ | 362 | 3.51 | %(h) | (2.06 | )% | 3.54 | % | 370.28 | % | ||||||||||||||||||||
| $ | 8.87 | (16.16 | )% | $ | 1,307 | 3.19 | %(i) | (1.93 | )% | 3.19 | % | 265.99 | % | ||||||||||||||||||||
| $ | 10.90 | 9.00 | % | $ | 2,437 | 3.44 | %(k) | (1.55 | )% | 3.44 | % | 193.58 | % | ||||||||||||||||||||
161
Sterling Capital Funds
|
Financial Highlights, Class A Shares |
The financial highlights table is intended to help you understand the Funds’ financial performance for the past 5 years or, if shorter, the period of the Funds’ operations. Certain information reflects financial results for a single Fund share. The total returns in the table represent the rate that an investor would have earned (or lost) on an investment in the Fund (assuming reinvestment of all dividends and distributions).
| Investment Activities | Distributions | ||||||||||||||||||||||||||||||||||
| Net Asset Value, Beginning of Period | Net investment income (loss)(a) |
Net realized/ | Total from Investment Activities | Net investment income | Net realized gains on investments | Total Distributions | |||||||||||||||||||||||||||||
Sterling Capital Behavioral International Equity Fund | |||||||||||||||||||||||||||||||||||
Year Ended September 30, 2016 | $ | 9.22 | 0.21 | 0.46 | 0.67 | (0.21 | ) | — | (0.21 | ) | |||||||||||||||||||||||||
November 28, 2014 to September 30, 2015(d) | $ | 10.00 | 0.18 | (0.94 | ) | (0.76 | ) | (0.02 | ) | — | (0.02 | ) | |||||||||||||||||||||||
Sterling Capital Stratton Mid Cap Value Fund | |||||||||||||||||||||||||||||||||||
Period Ended September 30, 2016 | $ | 52.55 | (0.02 | ) | 3.34 | 3.32 | — | — | — | ||||||||||||||||||||||||||
November 16, 2015 to December 31, 2015(d) | $ | 53.97 | 0.05 | 0.44 | 0.49 | (0.13 | ) | (1.78 | ) | (1.91 | ) | ||||||||||||||||||||||||
Sterling Capital Stratton Real Estate Fund | |||||||||||||||||||||||||||||||||||
Period Ended September 30, 2016 | $ | 36.00 | 0.57 | 3.58 | 4.15 | (0.48 | ) | — | (0.48 | ) | |||||||||||||||||||||||||
November 16, 2015 to December 31, 2015(d) | $ | 34.90 | 0.15 | 1.42 | 1.57 | — | (0.47 | ) | (0.47 | ) | |||||||||||||||||||||||||
Sterling Capital Stratton Small Cap Value Fund | |||||||||||||||||||||||||||||||||||
Period Ended September 30, 2016 | $ | 69.90 | (0.02 | ) | 8.46 | 8.44 | — | — | — | ||||||||||||||||||||||||||
November 16, 2015 to December 31, 2015(d) | $ | 71.71 | 0.05 | (0.81 | ) | (0.76 | ) | (0.05 | ) | (1.00 | ) | (1.05 | ) | ||||||||||||||||||||||
Sterling Capital Ultra Short Bond Fund | |||||||||||||||||||||||||||||||||||
Year Ended September 30, 2016 | $ | 9.87 | 0.07 | 0.03 | 0.10 | (0.15 | ) | — | (0.15 | ) | |||||||||||||||||||||||||
Year Ended September 30, 2015 | $ | 9.94 | 0.04 | (0.02 | ) | 0.02 | (0.09 | ) | — | (0.09 | ) | ||||||||||||||||||||||||
Year Ended September 30, 2014 | $ | 9.98 | 0.05 | (0.03 | ) | 0.02 | (0.06 | ) | — | (0.06 | ) | ||||||||||||||||||||||||
November 30, 2012 to September 30, 2013(d) | $ | 10.00 | 0.03 | (0.02 | ) | 0.01 | (0.03 | ) | — | (0.03 | ) | ||||||||||||||||||||||||
| * | During the periods certain fees were waived (See Note 5 in the Notes to the Financial Statements). If such reductions had not occurred, the ratios would have been as indicated. |
| ** | Portfolio turnover rate is calculated on the basis of the Fund as a whole without distinguishing between classes of shares issued. |
| (a) | Per share net investment income (loss) has been calculated using the average daily shares method. |
| (b) | Not annualized for periods less than one year. |
| (c) | Annualized for periods less than one year. |
| (d) | Period from commencement of operations. |
See accompanying Notes to the Financial Statements.
162
|
|
|
| Ratios/Supplementary Data | |||||||||||||||||||||||||||||||||
| Net Asset Value, End of Period | Total Return (excludes sales charge) (b) | Net Assets, End of Period (000) | Ratio of net expenses to average net assets (c) | Ratio of net investment income (loss) to average net assets (c) | Ratio of expenses to average net assets*(c) | Portfolio turnover rate**(b) | |||||||||||||||||||||||||||
| $ | 9.68 | 7.24 | % | $ | 354 | 1.05 | % | 2.26 | % | 1.36 | % | 125.35 | % | ||||||||||||||||||||
| $ | 9.22 | (7.57 | )% | $ | 531 | 1.28 | % | 2.16 | % | 1.44 | % | 133.50 | % | ||||||||||||||||||||
| $ | 55.87 | 6.32 | % | $ | 19 | 1.20 | % | (0.04 | )% | 1.22 | % | 11.16 | % | ||||||||||||||||||||
| $ | 52.55 | 1.00 | % | $ | 1 | 0.91 | % | 0.72 | % | 0.91 | % | 19.28 | % | ||||||||||||||||||||
| $ | 39.67 | 11.50 | % | $ | 115 | 1.08 | % | 1.93 | % | 1.11 | % | 18.43 | % | ||||||||||||||||||||
| $ | 36.00 | 4.54 | % | $ | 1 | 0.86 | % | 3.30 | % | 0.86 | % | 15.47 | % | ||||||||||||||||||||
| $ | 78.34 | 12.07 | % | $ | 87 | 1.33 | % | (0.04 | )% | 1.33 | % | 3.42 | % | ||||||||||||||||||||
| $ | 69.90 | (1.03 | )% | $ | 1 | 1.33 | % | 0.58 | % | 1.33 | % | 6.33 | % | ||||||||||||||||||||
| $ | 9.82 | 0.99 | % | $ | 6,250 | 0.71 | % | 0.72 | % | 0.80 | % | 43.02 | % | ||||||||||||||||||||
| $ | 9.87 | 0.25 | % | $ | 8,295 | 0.78 | % | 0.43 | % | 0.80 | % | 66.19 | % | ||||||||||||||||||||
| $ | 9.94 | 0.21 | % | $ | 11,184 | 0.73 | % | 0.51 | % | 0.73 | % | 79.98 | % | ||||||||||||||||||||
| $ | 9.98 | 0.15 | % | $ | 13,526 | 0.73 | % | 0.41 | % | 0.73 | % | 55.18 | % | ||||||||||||||||||||
163
Sterling Capital Funds
|
Financial Highlights, Class A Shares |
The financial highlights table is intended to help you understand the Funds’ financial performance for the past 5 years or, if shorter, the period of the Funds’ operations. Certain information reflects financial results for a single Fund share. The total returns in the table represent the rate that an investor would have earned (or lost) on an investment in the Fund (assuming reinvestment of all dividends and distributions).
| Investment Activities | Distributions | |||||||||||||||||||||||||||||||||||||||
| Net Asset Value, Beginning of Period | Net investment income(a) |
Net realized/ | Total from Investment Activities | Net investment income | Net realized gains on investments | Return of capital | Total Distributions | |||||||||||||||||||||||||||||||||
Sterling Capital Short Duration Bond Fund | ||||||||||||||||||||||||||||||||||||||||
Year Ended September 30, 2016 | $ | 8.86 | 0.10 | 0.07 | 0.17 | (0.22 | ) | — | — | (0.22 | ) | |||||||||||||||||||||||||||||
Year Ended September 30, 2015 | $ | 9.07 | 0.10 | (0.05 | ) | 0.05 | (0.26 | ) | — | — | (0.26 | ) | ||||||||||||||||||||||||||||
Year Ended September 30, 2014 | $ | 9.24 | 0.14 | (0.04 | ) | 0.10 | (0.27 | ) | — | — | (0.27 | ) | ||||||||||||||||||||||||||||
Year Ended September 30, 2013 | $ | 9.47 | 0.17 | (0.10 | ) | 0.07 | (0.30 | ) | — | — | (0.30 | ) | ||||||||||||||||||||||||||||
Year Ended September 30, 2012 | $ | 9.36 | 0.19 | 0.24 | 0.43 | (0.32 | ) | — | — | (0.32 | ) | |||||||||||||||||||||||||||||
Sterling Capital Intermediate U.S. Government Fund | ||||||||||||||||||||||||||||||||||||||||
Year Ended September 30, 2016 | $ | 10.18 | 0.13 | 0.11 | 0.24 | (0.18 | ) | — | — | (0.18 | ) | |||||||||||||||||||||||||||||
Year Ended September 30, 2015 | $ | 10.19 | 0.13 | 0.05 | 0.18 | (0.19 | ) | — | — | (0.19 | ) | |||||||||||||||||||||||||||||
Year Ended September 30, 2014 | $ | 10.29 | 0.14 | 0.09 | 0.23 | (0.33 | ) | — | — | (0.33 | ) | |||||||||||||||||||||||||||||
Year Ended September 30, 2013 | $ | 10.86 | 0.16 | (0.43 | ) | (0.27 | ) | (0.30 | ) | — | — | (0.30 | ) | |||||||||||||||||||||||||||
Year Ended September 30, 2012 | $ | 10.79 | 0.20 | 0.16 | 0.36 | (0.29 | ) | — | — | (0.29 | ) | |||||||||||||||||||||||||||||
Sterling Capital Total Return Bond Fund | ||||||||||||||||||||||||||||||||||||||||
Year Ended September 30, 2016 | $ | 10.53 | 0.26 | 0.34 | 0.60 | (0.32 | ) | — | — | (0.32 | ) | |||||||||||||||||||||||||||||
Year Ended September 30, 2015 | $ | 10.66 | 0.28 | (0.06 | ) | 0.22 | (0.35 | ) | — | — | (0.35 | ) | ||||||||||||||||||||||||||||
Year Ended September 30, 2014 | $ | 10.52 | 0.31 | 0.21 | 0.52 | (0.37 | ) | (0.01 | ) | — | (0.38 | ) | ||||||||||||||||||||||||||||
Year Ended September 30, 2013 | $ | 11.15 | 0.29 | (0.46 | ) | (0.17 | ) | (0.38 | ) | (0.08 | ) | — | (0.46 | ) | ||||||||||||||||||||||||||
Year Ended September 30, 2012 | $ | 11.05 | 0.29 | 0.46 | 0.75 | (0.38 | ) | (0.27 | ) | — | (0.65 | ) | ||||||||||||||||||||||||||||
Sterling Capital Corporate Fund | ||||||||||||||||||||||||||||||||||||||||
Year Ended September 30, 2016 | $ | 10.10 | 0.28 | 0.27 | 0.55 | (0.28 | ) | — | — | (0.28 | ) | |||||||||||||||||||||||||||||
Year Ended September 30, 2015 | $ | 10.25 | 0.29 | (0.14 | ) | 0.15 | (0.29 | ) | (0.01 | ) | — | (d) | (0.30 | ) | ||||||||||||||||||||||||||
Year Ended September 30, 2014 | $ | 10.15 | 0.31 | 0.20 | 0.51 | (0.31 | ) | (0.10 | ) | — | (0.41 | ) | ||||||||||||||||||||||||||||
February 1, 2013 to September 30, 2013(e) | $ | 10.53 | 0.22 | (0.38 | ) | (0.16 | ) | (0.22 | ) | — | — | (0.22 | ) | |||||||||||||||||||||||||||
Sterling Capital Securitized Opportunities Fund | ||||||||||||||||||||||||||||||||||||||||
Year Ended September 30, 2016 | $ | 9.98 | 0.19 | 0.16 | 0.35 | (0.23 | ) | — | — | (0.23 | ) | |||||||||||||||||||||||||||||
Year Ended September 30, 2015 | $ | 9.90 | 0.20 | 0.13 | 0.33 | (0.25 | ) | — | — | (0.25 | ) | |||||||||||||||||||||||||||||
Year Ended September 30, 2014 | $ | 9.85 | 0.22 | 0.11 | 0.33 | (0.28 | ) | — | — | (0.28 | ) | |||||||||||||||||||||||||||||
February 1, 2013 to September 30, 2013(e) | $ | 10.16 | 0.11 | (0.21 | ) | (0.10 | ) | (0.21 | ) | — | — | (0.21 | ) | |||||||||||||||||||||||||||
Sterling Capital Kentucky Intermediate Tax-Free Fund | ||||||||||||||||||||||||||||||||||||||||
Year Ended September 30, 2016 | $ | 10.62 | 0.24 | 0.15 | 0.39 | (0.24 | ) | (0.13 | ) | — | (0.37 | ) | ||||||||||||||||||||||||||||
Year Ended September 30, 2015 | $ | 10.86 | 0.25 | (0.06 | ) | 0.19 | (0.25 | ) | (0.18 | ) | — | (0.43 | ) | |||||||||||||||||||||||||||
Year Ended September 30, 2014 | $ | 10.67 | 0.27 | 0.18 | 0.45 | (0.26 | ) | — | — | (0.26 | ) | |||||||||||||||||||||||||||||
Year Ended September 30, 2013 | $ | 11.17 | 0.24 | (0.44 | ) | (0.20 | ) | (0.24 | ) | (0.06 | ) | — | (0.30 | ) | ||||||||||||||||||||||||||
Year Ended September 30, 2012 | $ | 10.80 | 0.27 | 0.40 | 0.67 | (0.27 | ) | (0.03 | ) | — | (0.30 | ) | ||||||||||||||||||||||||||||
Sterling Capital Maryland Intermediate Tax-Free Fund | ||||||||||||||||||||||||||||||||||||||||
Year Ended September 30, 2016 | $ | 11.17 | 0.20 | 0.21 | 0.41 | (0.20 | ) | (0.07 | ) | — | (0.27 | ) | ||||||||||||||||||||||||||||
Year Ended September 30, 2015 | $ | 11.23 | 0.20 | — | (d) | 0.20 | (0.20 | ) | (0.06 | ) | — | (0.26 | ) | |||||||||||||||||||||||||||
Year Ended September 30, 2014 | $ | 10.96 | 0.19 | 0.27 | 0.46 | (0.19 | ) | — | — | (0.19 | ) | |||||||||||||||||||||||||||||
Year Ended September 30, 2013 | $ | 11.56 | 0.19 | (0.45 | ) | (0.26 | ) | (0.19 | ) | (0.15 | ) | — | (0.34 | ) | ||||||||||||||||||||||||||
Year Ended September 30, 2012 | $ | 11.23 | 0.24 | 0.41 | 0.65 | (0.24 | ) | (0.08 | ) | — | (0.32 | ) | ||||||||||||||||||||||||||||
| * | During the periods certain fees were waived (See Note 5 in the Notes to the Financial Statements). If such reductions had not occurred, the ratios would have been as indicated. |
| ** | Portfolio turnover rate is calculated on the basis of the Fund as a whole without distinguishing between classes of shares issued. |
| (a) | Per share net investment income has been calculated using the average daily shares method. |
| (b) | Not annualized for periods less than one year. |
| (c) | Annualized for periods less than one year. |
| (d) | Amount is less than $0.005. |
| (e) | Period from commencement of operations. |
See accompanying Notes to the Financial Statements.
164
|
|
|
| Ratios/Supplementary Data | |||||||||||||||||||||||||||||||||
| Net Asset Value, End of Period | Total Return (excludes sales charge) (b) | Net Assets, End of Period (000) | Ratio of net expenses to average net assets (c) |
Ratio of net | Ratio of expenses to average net assets*(c) | Portfolio turnover rate**(b) | |||||||||||||||||||||||||||
| $ | 8.81 | 1.98 | % | $ | 7,332 | 0.74 | % | 1.09 | % | 0.81 | % | 54.68 | % | ||||||||||||||||||||
| $ | 8.86 | 0.56 | % | $ | 8,075 | 0.79 | % | 1.17 | % | 0.81 | % | 55.74 | % | ||||||||||||||||||||
| $ | 9.07 | 1.13 | % | $ | 10,468 | 0.76 | % | 1.48 | % | 0.80 | % | 56.10 | % | ||||||||||||||||||||
| $ | 9.24 | 0.72 | % | $ | 13,812 | 0.77 | % | 1.83 | % | 0.81 | % | 56.09 | % | ||||||||||||||||||||
| $ | 9.47 | 4.68 | % | $ | 8,965 | 0.81 | % | 2.04 | % | 0.91 | % | 85.13 | % | ||||||||||||||||||||
| $ | 10.24 | 2.37 | % | $ | 7,066 | 0.85 | % | 1.24 | % | 0.97 | % | 49.39 | % | ||||||||||||||||||||
| $ | 10.18 | 1.81 | % | $ | 7,625 | 0.91 | % | 1.29 | % | 0.98 | % | 62.02 | % | ||||||||||||||||||||
| $ | 10.19 | 2.23 | % | $ | 8,778 | 0.93 | % | 1.41 | % | 0.93 | % | 35.74 | % | ||||||||||||||||||||
| $ | 10.29 | (2.54 | )% | $ | 10,172 | 0.93 | % | 1.50 | % | 0.93 | % | 66.16 | % | ||||||||||||||||||||
| $ | 10.86 | 3.41 | % | $ | 12,788 | 0.97 | % | 1.81 | % | 1.10 | % | 71.68 | % | ||||||||||||||||||||
| $ | 10.81 | 5.84 | % | $ | 70,257 | 0.74 | % | 2.42 | % | 0.84 | % | 65.47 | % | ||||||||||||||||||||
| $ | 10.53 | 2.04 | % | $ | 47,782 | 0.73 | % | 2.63 | % | 0.83 | % | 41.37 | % | ||||||||||||||||||||
| $ | 10.66 | 5.03 | % | $ | 38,929 | 0.81 | % | 2.90 | % | 0.83 | % | 75.21 | % | ||||||||||||||||||||
| $ | 10.52 | (1.51 | )% | $ | 42,774 | 0.82 | % | 2.68 | % | 0.84 | % | 149.09 | % | ||||||||||||||||||||
| $ | 11.15 | 7.13 | % | $ | 50,063 | 0.88 | % | 2.65 | % | 0.99 | % | 110.82 | % | ||||||||||||||||||||
| $ | 10.37 | 5.55 | % | $ | 441 | 0.89 | % | 2.77 | % | 0.89 | % | 83.88 | % | ||||||||||||||||||||
| $ | 10.10 | 1.51 | % | $ | 348 | 0.88 | % | 2.87 | % | 0.88 | % | 33.94 | % | ||||||||||||||||||||
| $ | 10.25 | 5.16 | % | $ | 269 | 0.86 | % | 3.04 | % | 0.86 | % | 105.03 | % | ||||||||||||||||||||
| $ | 10.15 | (1.54 | )% | $ | 160 | 0.85 | % | 3.21 | % | 0.85 | % | 99.48 | % | ||||||||||||||||||||
| $ | 10.10 | 3.60 | % | $ | 377 | 0.84 | % | 1.89 | % | 0.88 | % | 43.63 | % | ||||||||||||||||||||
| $ | 9.98 | 3.39 | % | $ | 124 | 0.84 | % | 2.01 | % | 0.88 | % | 19.85 | % | ||||||||||||||||||||
| $ | 9.90 | 3.38 | % | $ | 87 | 0.85 | % | 2.20 | % | 0.88 | % | 98.34 | % | ||||||||||||||||||||
| $ | 9.85 | (1.00 | )% | $ | 38 | 0.90 | % | 1.71 | % | 0.90 | % | 193.21 | % | ||||||||||||||||||||
| $ | 10.64 | 3.69 | % | $ | 4,358 | 0.91 | % | 2.25 | % | 1.02 | % | 16.44 | % | ||||||||||||||||||||
| $ | 10.62 | 1.80 | % | $ | 4,532 | 0.95 | % | 2.37 | % | 1.04 | % | 17.34 | % | ||||||||||||||||||||
| $ | 10.86 | 4.31 | % | $ | 4,615 | 0.97 | % | 2.47 | % | 0.97 | % | 11.13 | % | ||||||||||||||||||||
| $ | 10.67 | (1.83 | )% | $ | 5,849 | 0.96 | % | 2.21 | % | 0.96 | % | 22.05 | % | ||||||||||||||||||||
| $ | 11.17 | 6.21 | % | $ | 10,969 | 0.95 | % | 2.43 | % | 1.04 | % | 16.52 | % | ||||||||||||||||||||
| $ | 11.31 | 3.71 | % | $ | 6,537 | 0.86 | % | 1.75 | % | 0.96 | % | 14.36 | % | ||||||||||||||||||||
| $ | 11.17 | 1.79 | % | $ | 6,865 | 0.90 | % | 1.82 | % | 0.96 | % | 18.38 | % | ||||||||||||||||||||
| $ | 11.23 | 4.26 | % | $ | 6,763 | 0.94 | % | 1.74 | % | 0.94 | % | 19.90 | % | ||||||||||||||||||||
| $ | 10.96 | (2.31 | )% | $ | 8,036 | 0.95 | % | 1.70 | % | 0.95 | % | 70.60 | % | ||||||||||||||||||||
| $ | 11.56 | 5.80 | % | $ | 9,877 | 0.95 | % | 2.08 | % | 1.05 | % | 34.94 | % | ||||||||||||||||||||
165
Sterling Capital Funds
|
Financial Highlights, Class A Shares |
The financial highlights table is intended to help you understand the Funds’ financial performance for the past 5 years or, if shorter, the period of the Funds’ operations. Certain information reflects financial results for a single Fund share. The total returns in the table represent the rate that an investor would have earned (or lost) on an investment in the Fund (assuming reinvestment of all dividends and distributions).
| Investment Activities | Distributions | |||||||||||||||||||||||||||||||||||||||
| Net Asset Value, Beginning of Period | Net investment income(a) |
Net realized/ | Total from Investment Activities | Net investment income | Net realized gains on investments | Total Distributions | ||||||||||||||||||||||||||||||||||
Sterling Capital North Carolina Intermediate Tax-Free Fund |
| |||||||||||||||||||||||||||||||||||||||
Year Ended September 30, 2016 | $ | 10.97 | 0.23 | 0.17 | 0.40 | (0.23 | ) | (0.06 | ) | (0.29 | ) | |||||||||||||||||||||||||||||
Year Ended September 30, 2015 | $ | 10.98 | 0.24 | 0.01 | 0.25 | (0.24 | ) | (0.02 | ) | (0.26 | ) | |||||||||||||||||||||||||||||
Year Ended September 30, 2014 | $ | 10.74 | 0.24 | 0.24 | 0.48 | (0.24 | ) | — | (0.24 | ) | ||||||||||||||||||||||||||||||
Year Ended September 30, 2013 | $ | 11.36 | 0.25 | (0.54 | ) | (0.29 | ) | (0.25 | ) | (0.08 | ) | (0.33 | ) | |||||||||||||||||||||||||||
Year Ended September 30, 2012 | $ | 11.02 | 0.27 | 0.41 | 0.68 | (0.27 | ) | (0.07 | ) | (0.34 | ) | |||||||||||||||||||||||||||||
Sterling Capital South Carolina Intermediate Tax-Free Fund |
| |||||||||||||||||||||||||||||||||||||||
Year Ended September 30, 2016 | $ | 11.14 | 0.20 | 0.20 | 0.40 | (0.20 | ) | (0.04 | ) | (0.24 | ) | |||||||||||||||||||||||||||||
Year Ended September 30, 2015 | $ | 11.14 | 0.21 | 0.02 | 0.23 | (0.21 | ) | (0.02 | ) | (0.23 | ) | |||||||||||||||||||||||||||||
Year Ended September 30, 2014 | $ | 10.85 | 0.22 | 0.29 | 0.51 | (0.22 | ) | — | (0.22 | ) | ||||||||||||||||||||||||||||||
Year Ended September 30, 2013 | $ | 11.36 | 0.21 | (0.43 | ) | (0.22 | ) | (0.21 | ) | (0.08 | ) | (0.29 | ) | |||||||||||||||||||||||||||
Year Ended September 30, 2012 | $ | 10.97 | 0.24 | 0.46 | 0.70 | (0.24 | ) | (0.07 | ) | (0.31 | ) | |||||||||||||||||||||||||||||
Sterling Capital Virginia Intermediate Tax-Free Fund |
| |||||||||||||||||||||||||||||||||||||||
Year Ended September 30, 2016 | $ | 11.98 | 0.24 | 0.19 | 0.43 | (0.24 | ) | (0.04 | ) | (0.28 | ) | |||||||||||||||||||||||||||||
Year Ended September 30, 2015 | $ | 12.06 | 0.25 | (0.01 | ) | 0.24 | (0.25 | ) | (0.07 | ) | (0.32 | ) | ||||||||||||||||||||||||||||
Year Ended September 30, 2014 | $ | 11.79 | 0.24 | 0.27 | 0.51 | (0.24 | ) | — | (0.24 | ) | ||||||||||||||||||||||||||||||
Year Ended September 30, 2013 | $ | 12.45 | 0.24 | (0.56 | ) | (0.32 | ) | (0.24 | ) | (0.10 | ) | (0.34 | ) | |||||||||||||||||||||||||||
Year Ended September 30, 2012 | $ | 12.12 | 0.28 | 0.40 | 0.68 | (0.28 | ) | (0.07 | ) | (0.35 | ) | |||||||||||||||||||||||||||||
Sterling Capital West Virginia Intermediate Tax-Free Fund | ||||||||||||||||||||||||||||||||||||||||
Year Ended September 30, 2016 | $ | 10.14 | 0.21 | 0.18 | 0.39 | (0.21 | ) | (0.05 | ) | (0.26 | ) | |||||||||||||||||||||||||||||
Year Ended September 30, 2015 | $ | 10.16 | 0.21 | 0.01 | 0.22 | (0.21 | ) | (0.03 | ) | (0.24 | ) | |||||||||||||||||||||||||||||
Year Ended September 30, 2014 | $ | 9.90 | 0.21 | 0.26 | 0.47 | (0.21 | ) | — | (0.21 | ) | ||||||||||||||||||||||||||||||
Year Ended September 30, 2013 | $ | 10.51 | 0.22 | (0.49 | ) | (0.27 | ) | (0.22 | ) | (0.12 | ) | (0.34 | ) | |||||||||||||||||||||||||||
Year Ended September 30, 2012 | $ | 10.16 | 0.27 | 0.39 | 0.66 | (0.27 | ) | (0.04 | ) | (0.31 | ) | |||||||||||||||||||||||||||||
Sterling Capital Diversified Income Fund(c) | ||||||||||||||||||||||||||||||||||||||||
Year Ended September 30, 2016 | $ | 10.21 | 0.33 | 0.65 | 0.98 | (0.37 | ) | — | (0.37 | ) | ||||||||||||||||||||||||||||||
Year Ended September 30, 2015 | $ | 10.59 | 0.26 | (0.40 | ) | (0.14 | ) | (0.24 | ) | — | (0.24 | ) | ||||||||||||||||||||||||||||
Year Ended September 30, 2014 | $ | 9.95 | 0.22 | 0.65 | 0.87 | (0.23 | ) | — | (0.23 | ) | ||||||||||||||||||||||||||||||
Year Ended September 30, 2013 | $ | 9.68 | 0.22 | 0.28 | 0.50 | (0.23 | ) | — | (0.23 | ) | ||||||||||||||||||||||||||||||
Year Ended September 30, 2012 | $ | 8.74 | 0.20 | 0.94 | 1.14 | (0.20 | ) | — | (0.20 | ) | ||||||||||||||||||||||||||||||
Sterling Capital Strategic Allocation Balanced Fund(c) |
| |||||||||||||||||||||||||||||||||||||||
Year Ended September 30, 2016 | $ | 10.31 | 0.17 | 0.55 | 0.72 | (0.21 | ) | — | (0.21 | ) | ||||||||||||||||||||||||||||||
Year Ended September 30, 2015 | $ | 10.66 | 0.13 | (0.33 | ) | (0.20 | ) | (0.15 | ) | — | (0.15 | ) | ||||||||||||||||||||||||||||
Year Ended September 30, 2014 | $ | 9.77 | 0.17 | 0.90 | 1.07 | (0.18 | ) | — | (0.18 | ) | ||||||||||||||||||||||||||||||
Year Ended September 30, 2013 | $ | 9.13 | 0.16 | 0.65 | 0.81 | (0.17 | ) | — | (0.17 | ) | ||||||||||||||||||||||||||||||
Year Ended September 30, 2012 | $ | 7.95 | 0.14 | 1.18 | 1.32 | (0.14 | ) | — | (0.14 | ) | ||||||||||||||||||||||||||||||
Sterling Capital Strategic Allocation Growth Fund(c) |
| |||||||||||||||||||||||||||||||||||||||
Year Ended September 30, 2016 | $ | 9.99 | 0.14 | 0.57 | 0.71 | (0.17 | ) | — | (0.17 | ) | ||||||||||||||||||||||||||||||
Year Ended September 30, 2015 | $ | 10.39 | 0.07 | (0.37 | ) | (0.30 | ) | (0.10 | ) | — | (0.10 | ) | ||||||||||||||||||||||||||||
Year Ended September 30, 2014 | $ | 9.35 | 0.12 | 1.06 | 1.18 | (0.14 | ) | — | (0.14 | ) | ||||||||||||||||||||||||||||||
Year Ended September 30, 2013 | $ | 8.47 | 0.11 | 0.89 | 1.00 | (0.12 | ) | — | (0.12 | ) | ||||||||||||||||||||||||||||||
Year Ended September 30, 2012 | $ | 7.20 | 0.10 | 1.27 | 1.37 | (0.10 | ) | — | (0.10 | ) | ||||||||||||||||||||||||||||||
| * | During the periods certain fees were waived (See Note 5 in the Notes to the Financial Statements). If such reductions had not occurred, the ratios would have been as indicated. |
| ** | Portfolio turnover rate is calculated on the basis of the Fund as a whole without distinguishing between classes of shares issued. |
| (a) | Per share net investment income has been calculated using the average daily shares method. |
| (b) | Not annualized for periods less than one year. |
| (c) | The expense ratios exclude the impact of fees/expenses paid by each underlying fund. |
See accompanying Notes to the Financial Statements.
166
XXUPDATEXXX
|
|
|
| Ratios/Supplementary Data | |||||||||||||||||||||||||||||||||
| Net Asset Value, End of Period | Total Return (excludes sales charge) (b) | Net Assets, End of Period (000) | Ratio of net expenses to average net assets |
Ratio of net | Ratio of expenses to average net assets* | Portfolio turnover rate** | |||||||||||||||||||||||||||
| $ | 11.08 | 3.69 | % | $ | 52,130 | 0.80 | % | 2.08 | % | 0.90 | % | 10.05 | % | ||||||||||||||||||||
| $ | 10.97 | 2.28 | % | $ | 45,940 | 0.84 | % | 2.19 | % | 0.91 | % | 16.80 | % | ||||||||||||||||||||
| $ | 10.98 | 4.55 | % | $ | 48,426 | 0.91 | % | 2.25 | % | 0.91 | % | 11.67 | % | ||||||||||||||||||||
| $ | 10.74 | (2.63 | )% | $ | 55,416 | 0.92 | % | 2.23 | % | 0.92 | % | 22.38 | % | ||||||||||||||||||||
| $ | 11.36 | 6.25 | % | $ | 65,544 | 0.92 | % | 2.39 | % | 1.00 | % | 19.76 | % | ||||||||||||||||||||
| $ | 11.30 | 3.59 | % | $ | 18,683 | 0.82 | % | 1.78 | % | 0.92 | % | 2.69 | % | ||||||||||||||||||||
| $ | 11.14 | 2.11 | % | $ | 16,802 | 0.86 | % | 1.93 | % | 0.93 | % | 12.53 | % | ||||||||||||||||||||
| $ | 11.14 | 4.76 | % | $ | 17,748 | 0.93 | % | 2.02 | % | 0.93 | % | 15.51 | % | ||||||||||||||||||||
| $ | 10.85 | (1.93 | )% | $ | 21,569 | 0.94 | % | 1.92 | % | 0.94 | % | 35.38 | % | ||||||||||||||||||||
| $ | 11.36 | 6.48 | % | $ | 22,398 | 0.95 | % | 2.16 | % | 1.02 | % | 26.49 | % | ||||||||||||||||||||
| $ | 12.13 | 3.65 | % | $ | 34,691 | 0.81 | % | 1.99 | % | 0.91 | % | 16.18 | % | ||||||||||||||||||||
| $ | 11.98 | 1.98 | % | $ | 36,672 | 0.85 | % | 2.08 | % | 0.92 | % | 16.01 | % | ||||||||||||||||||||
| $ | 12.06 | 4.39 | % | $ | 41,130 | 0.91 | % | 2.04 | % | 0.91 | % | 20.48 | % | ||||||||||||||||||||
| $ | 11.79 | (2.60 | )% | $ | 46,616 | 0.93 | % | 1.98 | % | 0.93 | % | 40.00 | % | ||||||||||||||||||||
| $ | 12.45 | 5.68 | % | $ | 50,835 | 0.93 | % | 2.25 | % | 1.01 | % | 21.63 | % | ||||||||||||||||||||
| $ | 10.27 | 3.92 | % | $ | 37,720 | 0.82 | % | 2.05 | % | 0.92 | % | 11.31 | % | ||||||||||||||||||||
| $ | 10.14 | 2.19 | % | $ | 35,279 | 0.85 | % | 2.12 | % | 0.92 | % | 10.34 | % | ||||||||||||||||||||
| $ | 10.16 | 4.82 | % | $ | 35,190 | 0.91 | % | 2.14 | % | 0.91 | % | 21.09 | % | ||||||||||||||||||||
| $ | 9.90 | (2.65 | )% | $ | 37,266 | 0.93 | % | 2.13 | % | 0.93 | % | 22.18 | % | ||||||||||||||||||||
| $ | 10.51 | 6.59 | % | $ | 40,019 | 0.93 | % | 2.60 | % | 0.93 | % | 26.70 | % | ||||||||||||||||||||
| $ | 10.82 | 9.87 | % | $ | 15,126 | 0.64 | % | 3.17 | % | 0.72 | % | 67.18 | % | ||||||||||||||||||||
| $ | 10.21 | (1.40 | )% | $ | 14,321 | 0.45 | % | 2.45 | % | 0.70 | % | 126.46 | % | ||||||||||||||||||||
| $ | 10.59 | 8.81 | % | $ | 15,589 | 0.45 | % | 2.11 | % | 0.70 | % | 8.67 | % | ||||||||||||||||||||
| $ | 9.95 | 5.25 | % | $ | 14,381 | 0.54 | % | 2.18 | % | 0.69 | % | 60.51 | % | ||||||||||||||||||||
| $ | 9.68 | 13.10 | % | $ | 13,704 | 0.69 | % | 2.09 | % | 0.77 | % | 7.99 | % | ||||||||||||||||||||
| $ | 10.82 | 7.02 | % | $ | 31,951 | 0.40 | % | 1.65 | % | 0.65 | % | 5.19 | % | ||||||||||||||||||||
| $ | 10.31 | (1.92 | )% | $ | 34,047 | 0.40 | % | 1.16 | % | 0.65 | % | 49.24 | % | ||||||||||||||||||||
| $ | 10.66 | 11.05 | % | $ | 35,437 | 0.39 | % | 1.64 | % | 0.64 | % | 5.70 | % | ||||||||||||||||||||
| $ | 9.77 | 8.95 | % | $ | 30,638 | 0.51 | % | 1.70 | % | 0.66 | % | 81.00 | % | ||||||||||||||||||||
| $ | 9.13 | 16.76 | % | $ | 28,375 | 0.66 | % | 1.65 | % | 0.75 | % | 17.65 | % | ||||||||||||||||||||
| $ | 10.53 | 7.22 | % | $ | 21,912 | 0.43 | % | 1.34 | % | 0.68 | % | 5.95 | % | ||||||||||||||||||||
| $ | 9.99 | (2.93 | )% | $ | 22,848 | 0.42 | % | 0.69 | % | 0.67 | % | 58.40 | % | ||||||||||||||||||||
| $ | 10.39 | 12.65 | % | $ | 23,709 | 0.41 | % | 1.23 | % | 0.66 | % | 8.60 | % | ||||||||||||||||||||
| $ | 9.35 | 11.89 | % | $ | 21,833 | 0.52 | % | 1.24 | % | 0.68 | % | 96.94 | % | ||||||||||||||||||||
| $ | 8.47 | 19.14 | % | $ | 18,827 | 0.68 | % | 1.30 | % | 0.76 | % | 20.21 | % | ||||||||||||||||||||
167
Sterling Capital Funds
|
Financial Highlights, Class B Shares |
The financial highlights table is intended to help you understand the Funds’ financial performance for the past 5 years or, if shorter, the period of the Funds’ operations. Certain information reflects financial results for a single Fund share. The total returns in the table represent the rate that an investor would have earned (or lost) on an investment in the Fund (assuming reinvestment of all dividends and distributions).
| Investment Activities | Distributions | |||||||||||||||||||||||||||||||||||||||
| Net Asset Value, Beginning of Period | Net investment income (loss)(a) |
Net realized/ | Total from Investment Activities | Net investment income | Net realized gains on investments | Total Distributions | ||||||||||||||||||||||||||||||||||
Sterling Capital Behavioral Large Cap Value Equity Fund |
| |||||||||||||||||||||||||||||||||||||||
Year Ended September 30, 2016 | $ | 16.26 | 0.14 | 1.13 | 1.27 | (0.12 | ) | — | (0.12 | ) | ||||||||||||||||||||||||||||||
Year Ended September 30, 2015 | $ | 16.94 | 0.08 | (0.67 | ) | (0.59 | ) | (0.09 | ) | — | (0.09 | ) | ||||||||||||||||||||||||||||
Year Ended September 30, 2014 | $ | 13.91 | 0.05 | 3.02 | 3.07 | (0.04 | ) | — | (0.04 | ) | ||||||||||||||||||||||||||||||
Year Ended September 30, 2013 | $ | 12.58 | 0.03 | 1.33 | 1.36 | (0.03 | ) | — | (0.03 | ) | ||||||||||||||||||||||||||||||
Year Ended September 30, 2012 | $ | 9.73 | 0.03 | 2.84 | 2.87 | (0.02 | ) | — | (0.02 | ) | ||||||||||||||||||||||||||||||
Sterling Capital Mid Value Fund |
| |||||||||||||||||||||||||||||||||||||||
Year Ended September 30, 2016 | $ | 16.75 | (0.10 | ) | 1.90 | 1.80 | — | (3.34 | ) | (3.34 | ) | |||||||||||||||||||||||||||||
Year Ended September 30, 2015 | $ | 18.13 | (0.09 | ) | (0.12 | ) | (0.21 | ) | — | (1.17 | ) | (1.17 | ) | |||||||||||||||||||||||||||
Year Ended September 30, 2014 | $ | 17.76 | (0.10 | ) | 1.67 | 1.57 | — | (1.20 | ) | (1.20 | ) | |||||||||||||||||||||||||||||
Year Ended September 30, 2013 | $ | 13.55 | — | (d) | 4.24 | 4.24 | (0.03 | ) | — | (0.03 | ) | |||||||||||||||||||||||||||||
Year Ended September 30, 2012 | $ | 10.80 | — | (d) | 2.77 | 2.77 | (0.02 | ) | — | (0.02 | ) | |||||||||||||||||||||||||||||
Sterling Capital Behavioral Small Cap Value Equity Fund |
| |||||||||||||||||||||||||||||||||||||||
Year Ended September 30, 2016 | $ | 13.61 | 0.07 | 1.12 | 1.19 | (0.06 | ) | (0.01 | ) | (0.07 | ) | |||||||||||||||||||||||||||||
Year Ended September 30, 2015 | $ | 13.88 | 0.06 | 0.14 | 0.20 | (0.03 | ) | (0.44 | ) | (0.47 | ) | |||||||||||||||||||||||||||||
Year Ended September 30, 2014 | $ | 14.89 | (0.01 | ) | 0.93 | 0.92 | (0.06 | ) | (1.87 | ) | (1.93 | ) | ||||||||||||||||||||||||||||
Year Ended September 30, 2013 | $ | 11.80 | (0.05 | ) | 3.29 | 3.24 | — | (0.15 | ) | (0.15 | ) | |||||||||||||||||||||||||||||
Year Ended September 30, 2012 | $ | 10.69 | (0.06 | ) | 2.15 | 2.09 | — | (0.98 | ) | (0.98 | ) | |||||||||||||||||||||||||||||
Sterling Capital Special Opportunities Fund |
| |||||||||||||||||||||||||||||||||||||||
Year Ended September 30, 2016 | $ | 20.32 | (0.13 | ) | 1.64 | 1.51 | — | (3.31 | ) | (3.31 | ) | |||||||||||||||||||||||||||||
Year Ended September 30, 2015 | $ | 20.93 | (0.21 | ) | 0.80 | 0.59 | — | (1.20 | ) | (1.20 | ) | |||||||||||||||||||||||||||||
Year Ended September 30, 2014 | $ | 19.53 | (0.17 | ) | 3.85 | 3.68 | — | (2.28 | ) | (2.28 | ) | |||||||||||||||||||||||||||||
Year Ended September 30, 2013 | $ | 17.11 | (0.08 | )(e) | 3.45 | 3.37 | — | (0.95 | ) | (0.95 | ) | |||||||||||||||||||||||||||||
Year Ended September 30, 2012 | $ | 14.22 | (0.12 | ) | 3.32 | 3.20 | — | (0.31 | ) | (0.31 | ) | |||||||||||||||||||||||||||||
Sterling Capital Equity Income Fund |
| |||||||||||||||||||||||||||||||||||||||
Year Ended September 30, 2016 | $ | 17.33 | 0.18 | 2.06 | 2.24 | (0.15 | ) | (1.10 | ) | (1.25 | ) | |||||||||||||||||||||||||||||
Year Ended September 30, 2015 | $ | 18.91 | 0.17 | (1.07 | ) | (0.90 | ) | (0.17 | ) | (0.51 | ) | (0.68 | ) | |||||||||||||||||||||||||||
Year Ended September 30, 2014 | $ | 18.10 | 0.19 | 1.41 | 1.60 | (0.16 | ) | (0.63 | ) | (0.79 | ) | |||||||||||||||||||||||||||||
Year Ended September 30, 2013 | $ | 15.99 | 0.16 | 2.22 | 2.38 | (0.11 | ) | (0.16 | ) | (0.27 | ) | |||||||||||||||||||||||||||||
Year Ended September 30, 2012 | $ | 13.21 | 0.13 | 2.72 | 2.85 | (0.07 | ) | — | (0.07 | ) | ||||||||||||||||||||||||||||||
Sterling Capital Intermediate U.S. Government Fund |
| |||||||||||||||||||||||||||||||||||||||
Year Ended September 30, 2016 | $ | 10.15 | 0.04 | 0.11 | 0.15 | (0.10 | ) | — | (0.10 | ) | ||||||||||||||||||||||||||||||
Year Ended September 30, 2015 | $ | 10.16 | 0.06 | 0.05 | 0.11 | (0.12 | ) | — | (0.12 | ) | ||||||||||||||||||||||||||||||
Year Ended September 30, 2014 | $ | 10.25 | 0.07 | 0.09 | 0.16 | (0.25 | ) | — | (0.25 | ) | ||||||||||||||||||||||||||||||
Year Ended September 30, 2013 | $ | 10.82 | 0.08 | (0.43 | ) | (0.35 | ) | (0.22 | ) | — | (0.22 | ) | ||||||||||||||||||||||||||||
Year Ended September 30, 2012 | $ | 10.75 | 0.12 | 0.16 | 0.28 | (0.21 | ) | — | (0.21 | ) | ||||||||||||||||||||||||||||||
| * | During the periods certain fees were waived (See Note 5 in the Notes to the Financial Statements). If such reductions had not occurred, the ratios would have been as indicated. |
| ** | Portfolio turnover rate is calculated on the basis of the Fund as a whole without distinguishing between classes of shares issued. |
| (a) | Per share net investment income (loss) has been calculated using the average daily shares method. |
| (b) | Not annualized for periods less than one year. |
| (c) | Includes proceeds received from a settlement of litigation, which impacted the Fund’s total return. Not including these proceeds, the Fund’s total return would have been 10.59%. |
| (d) | Amount is less than $0.005. |
| (e) | Net investment loss per share reflects a special dividend, which amounted to $0.02 per share. Excluding the special dividend, the ratio of net investment loss to average net assets would have been (0.55)% per share. |
See accompanying Notes to the Financial Statements.
168
|
|
|
| Ratios/Supplementary Data | |||||||||||||||||||||||||||||||||
| Net Asset Value, End of Period | Total Return (excludes sales charge) (b) | Net Assets, End of Period (000) | Ratio of net expenses to average net assets | Ratio of net investment income (loss) to average net assets | Ratio of expenses to average net assets* | Portfolio turnover rate** | |||||||||||||||||||||||||||
| $ | 17.41 | 7.82 | % | $ | 209 | 1.77 | % | 0.80 | % | 1.90 | % | 145.53 | % | ||||||||||||||||||||
| $ | 16.26 | (3.52 | )% | $ | 537 | 1.81 | % | 0.48 | % | 1.91 | % | 135.05 | % | ||||||||||||||||||||
| $ | 16.94 | 22.08 | % | $ | 990 | 1.81 | % | 0.33 | % | 1.91 | % | 113.75 | % | ||||||||||||||||||||
| $ | 13.91 | 10.83 | %(c) | $ | 1,261 | 1.84 | % | 0.23 | % | 1.94 | % | 164.27 | % | ||||||||||||||||||||
| $ | 12.58 | 29.55 | % | $ | 1,638 | 1.83 | % | 0.24 | % | 1.95 | % | 68.75 | % | ||||||||||||||||||||
| $ | 15.21 | 12.23 | % | $ | 271 | 1.93 | % | (0.65 | )% | 1.93 | % | 25.45 | % | ||||||||||||||||||||
| $ | 16.75 | (1.45 | )% | $ | 688 | 1.94 | % | (0.50 | )% | 1.94 | % | 30.61 | % | ||||||||||||||||||||
| $ | 18.13 | 9.09 | % | $ | 1,311 | 1.93 | % | (0.53 | )% | 1.93 | % | 27.30 | % | ||||||||||||||||||||
| $ | 17.76 | 31.34 | % | $ | 2,002 | 1.92 | % | (0.01 | )% | 1.92 | % | 34.03 | % | ||||||||||||||||||||
| $ | 13.55 | 25.72 | % | $ | 1,996 | 1.93 | % | (0.01 | )% | 1.95 | % | 21.62 | % | ||||||||||||||||||||
| $ | 14.73 | 8.72 | % | $ | 113 | 1.88 | % | 0.47 | % | 1.97 | % | 120.42 | % | ||||||||||||||||||||
| $ | 13.61 | 1.34 | % | $ | 203 | 2.00 | % | 0.42 | % | 2.00 | % | 101.99 | % | ||||||||||||||||||||
| $ | 13.88 | 6.33 | % | $ | 324 | 1.99 | % | (0.04 | )% | 1.99 | % | 68.50 | % | ||||||||||||||||||||
| $ | 14.89 | 27.74 | % | $ | 425 | 2.04 | % | (0.41 | )% | 2.04 | % | 176.62 | % | ||||||||||||||||||||
| $ | 11.80 | 20.43 | % | $ | 432 | 2.08 | % | (0.53 | )% | 2.11 | % | 32.86 | % | ||||||||||||||||||||
| $ | 18.52 | 7.76 | % | $ | 1,626 | 1.92 | % | (0.69 | )% | 1.97 | % | 27.32 | % | ||||||||||||||||||||
| $ | 20.32 | 2.99 | % | $ | 4,429 | 1.97 | % | (1.00 | )% | 1.97 | % | 26.98 | % | ||||||||||||||||||||
| $ | 20.93 | 20.78 | % | $ | 7,704 | 1.96 | % | (0.86 | )% | 1.96 | % | 32.35 | % | ||||||||||||||||||||
| $ | 19.53 | 20.64 | % | $ | 8,921 | 1.99 | % | (0.45 | )%(e) | 1.99 | % | 53.76 | % | ||||||||||||||||||||
| $ | 17.11 | 22.76 | % | $ | 12,466 | 2.04 | % | (0.77 | )% | 2.04 | % | 19.38 | % | ||||||||||||||||||||
| $ | 18.32 | 13.67 | % | $ | 1,421 | 1.96 | % | 1.05 | % | 1.96 | % | 20.64 | % | ||||||||||||||||||||
| $ | 17.33 | (4.93 | )% | $ | 3,883 | 1.96 | % | 0.90 | % | 1.96 | % | 27.53 | % | ||||||||||||||||||||
| $ | 18.91 | 8.97 | % | $ | 7,516 | 1.95 | % | 1.02 | % | 1.95 | % | 16.13 | % | ||||||||||||||||||||
| $ | 18.10 | 15.13 | % | $ | 10,335 | 1.95 | % | 0.94 | % | 1.95 | % | 30.56 | % | ||||||||||||||||||||
| $ | 15.99 | 21.60 | % | $ | 12,653 | 1.93 | % | 0.85 | % | 1.93 | % | 21.30 | % | ||||||||||||||||||||
| $ | 10.20 | 1.51 | % | $ | 73 | 1.61 | % | 0.44 | % | 1.72 | % | 49.39 | % | ||||||||||||||||||||
| $ | 10.15 | 1.06 | % | $ | 167 | 1.67 | % | 0.55 | % | 1.72 | % | 62.02 | % | ||||||||||||||||||||
| $ | 10.16 | 1.56 | % | $ | 264 | 1.68 | % | 0.66 | % | 1.68 | % | 35.74 | % | ||||||||||||||||||||
| $ | 10.25 | (3.30 | )% | $ | 533 | 1.69 | % | 0.77 | % | 1.69 | % | 66.16 | % | ||||||||||||||||||||
| $ | 10.82 | 2.64 | % | $ | 896 | 1.72 | % | 1.10 | % | 1.76 | % | 71.68 | % | ||||||||||||||||||||
169
Sterling Capital Funds
|
Financial Highlights, Class B Shares |
The financial highlights table is intended to help you understand the Funds’ financial performance for the past 5 years or, if shorter, the period of the Funds’ operations. Certain information reflects financial results for a single Fund share. The total returns in the table represent the rate that an investor would have earned (or lost) on an investment in the Fund (assuming reinvestment of all dividends and distributions).
| Investment Activities | Distributions | |||||||||||||||||||||||||||||||||||||||
| Net Asset Value, Beginning of Period | Net investment income(a) |
Net realized/ | Total from Investment Activities | Net investment income | Net realized gains on investments | Total Distributions | ||||||||||||||||||||||||||||||||||
Sterling Capital Total Return Bond Fund |
| |||||||||||||||||||||||||||||||||||||||
Year Ended September 30, 2016 | $ | 10.54 | 0.18 | 0.34 | 0.52 | (0.24 | ) | — | (0.24 | ) | ||||||||||||||||||||||||||||||
Year Ended September 30, 2015 | $ | 10.67 | 0.20 | (0.06 | ) | 0.14 | (0.27 | ) | — | (0.27 | ) | |||||||||||||||||||||||||||||
Year Ended September 30, 2014 | $ | 10.53 | 0.23 | 0.21 | 0.44 | (0.29 | ) | (0.01 | ) | (0.30 | ) | |||||||||||||||||||||||||||||
Year Ended September 30, 2013 | $ | 11.16 | 0.21 | (0.46 | ) | (0.25 | ) | (0.30 | ) | (0.08 | ) | (0.38 | ) | |||||||||||||||||||||||||||
Year Ended September 30, 2012 | $ | 11.06 | 0.22 | 0.45 | 0.67 | (0.30 | ) | (0.27 | ) | (0.57 | ) | |||||||||||||||||||||||||||||
Sterling Capital Diversified Income Fund(c) |
| |||||||||||||||||||||||||||||||||||||||
Year Ended September 30, 2016 | $ | 10.23 | 0.26 | 0.64 | 0.90 | (0.29 | ) | — | (0.29 | ) | ||||||||||||||||||||||||||||||
Year Ended September 30, 2015 | $ | 10.62 | 0.17 | (0.40 | ) | (0.23 | ) | (0.16 | ) | — | (0.16 | ) | ||||||||||||||||||||||||||||
Year Ended September 30, 2014 | $ | 9.98 | 0.14 | 0.66 | 0.80 | (0.16 | ) | — | (0.16 | ) | ||||||||||||||||||||||||||||||
Year Ended September 30, 2013 | $ | 9.70 | 0.14 | 0.29 | 0.43 | (0.15 | ) | — | (0.15 | ) | ||||||||||||||||||||||||||||||
Year Ended September 30, 2012 | $ | 8.76 | 0.12 | 0.94 | 1.06 | (0.12 | ) | — | (0.12 | ) | ||||||||||||||||||||||||||||||
Sterling Capital Strategic Allocation Balanced Fund(c) |
| |||||||||||||||||||||||||||||||||||||||
Year Ended September 30, 2016 | $ | 10.11 | 0.10 | 0.52 | 0.62 | (0.11 | ) | — | (0.11 | ) | ||||||||||||||||||||||||||||||
Year Ended September 30, 2015 | $ | 10.45 | 0.04 | (0.32 | ) | (0.28 | ) | (0.06 | ) | — | (0.06 | ) | ||||||||||||||||||||||||||||
Year Ended September 30, 2014 | $ | 9.57 | 0.09 | 0.89 | 0.98 | (0.10 | ) | — | (0.10 | ) | ||||||||||||||||||||||||||||||
Year Ended September 30, 2013 | $ | 8.94 | 0.09 | 0.63 | 0.72 | (0.09 | ) | — | (0.09 | ) | ||||||||||||||||||||||||||||||
Year Ended September 30, 2012 | $ | 7.79 | 0.07 | 1.16 | 1.23 | (0.08 | ) | — | (0.08 | ) | ||||||||||||||||||||||||||||||
Sterling Capital Strategic Allocation Growth Fund(c) |
| |||||||||||||||||||||||||||||||||||||||
Year Ended September 30, 2016 | $ | 9.73 | 0.08 | 0.54 | 0.62 | (0.12 | ) | — | (0.12 | ) | ||||||||||||||||||||||||||||||
Year Ended September 30, 2015 | $ | 10.14 | (0.01 | ) | (0.36 | ) | (0.37 | ) | (0.04 | ) | — | (0.04 | ) | |||||||||||||||||||||||||||
Year Ended September 30, 2014 | $ | 9.12 | 0.04 | 1.04 | 1.08 | (0.06 | ) | — | (0.06 | ) | ||||||||||||||||||||||||||||||
Year Ended September 30, 2013 | $ | 8.26 | 0.05 | 0.86 | 0.91 | (0.05 | ) | — | (0.05 | ) | ||||||||||||||||||||||||||||||
Year Ended September 30, 2012 | $ | 7.03 | 0.04 | 1.24 | 1.28 | (0.05 | ) | — | (0.05 | ) | ||||||||||||||||||||||||||||||
| * | During the periods certain fees were waived (See Note 5 in the Notes to the Financial Statements). If such reductions had not occurred, the ratios would have been as indicated. |
| ** | Portfolio turnover rate is calculated on the basis of the Fund as a whole without distinguishing between classes of shares issued. |
| (a) | Per share net investment income (loss) has been calculated using the average daily shares method. |
| (b) | Not annualized for periods less than one year. |
| (c) | The expense ratios exclude the impact of fees/expenses paid by each underlying fund. |
See accompanying Notes to the Financial Statements.
170
|
|
|
| Ratios/Supplementary Data | |||||||||||||||||||||||||||||||||
| Net Asset Value, End of Period | Total Return (excludes sales charge) (b) | Net Assets, End of Period (000) | Ratio of net expenses to average net assets |
Ratio of net | Ratio of expenses to average net assets* | Portfolio turnover rate** | |||||||||||||||||||||||||||
| $ | 10.82 | 5.05 | % | $ | 363 | 1.49 | % | 1.74 | % | 1.59 | % | 65.47 | % | ||||||||||||||||||||
| $ | 10.54 | 1.26 | % | $ | 930 | 1.48 | % | 1.86 | % | 1.58 | % | 41.37 | % | ||||||||||||||||||||
| $ | 10.67 | 4.25 | % | $ | 1,452 | 1.56 | % | 2.16 | % | 1.58 | % | 75.21 | % | ||||||||||||||||||||
| $ | 10.53 | (2.25 | )% | $ | 1,943 | 1.57 | % | 1.93 | % | 1.59 | % | 149.09 | % | ||||||||||||||||||||
| $ | 11.16 | 6.33 | % | $ | 3,132 | 1.63 | % | 1.97 | % | 1.67 | % | 110.82 | % | ||||||||||||||||||||
| $ | 10.84 | 8.98 | % | $ | 225 | 1.39 | % | 2.49 | % | 1.49 | % | 67.18 | % | ||||||||||||||||||||
| $ | 10.23 | (2.17 | )% | $ | 513 | 1.20 | % | 1.58 | % | 1.45 | % | 126.46 | % | ||||||||||||||||||||
| $ | 10.62 | 8.07 | % | $ | 807 | 1.20 | % | 1.35 | % | 1.45 | % | 8.67 | % | ||||||||||||||||||||
| $ | 9.98 | 4.49 | % | $ | 1,020 | 1.30 | % | 1.41 | % | 1.44 | % | 60.51 | % | ||||||||||||||||||||
| $ | 9.70 | 12.16 | % | $ | 1,397 | 1.44 | % | 1.34 | % | 1.44 | % | 7.99 | % | ||||||||||||||||||||
| $ | 10.62 | 6.23 | % | $ | 260 | 1.16 | % | 1.02 | % | 1.41 | % | 5.19 | % | ||||||||||||||||||||
| $ | 10.11 | (2.69 | )% | $ | 896 | 1.15 | % | 0.41 | % | 1.40 | % | 49.24 | % | ||||||||||||||||||||
| $ | 10.45 | 10.26 | % | $ | 1,940 | 1.14 | % | 0.85 | % | 1.39 | % | 5.70 | % | ||||||||||||||||||||
| $ | 9.57 | 8.14 | % | $ | 3,264 | 1.28 | % | 0.94 | % | 1.41 | % | 81.00 | % | ||||||||||||||||||||
| $ | 8.94 | 15.80 | % | $ | 5,184 | 1.41 | % | 0.87 | % | 1.41 | % | 17.65 | % | ||||||||||||||||||||
| $ | 10.23 | 6.43 | % | $ | 330 | 1.19 | % | 0.77 | % | 1.44 | % | 5.95 | % | ||||||||||||||||||||
| $ | 9.73 | (3.63 | )% | $ | 885 | 1.17 | % | (0.07 | )% | 1.42 | % | 58.40 | % | ||||||||||||||||||||
| $ | 10.14 | 11.84 | % | $ | 1,863 | 1.16 | % | 0.44 | % | 1.41 | % | 8.60 | % | ||||||||||||||||||||
| $ | 9.12 | 11.04 | % | $ | 2,986 | 1.28 | % | 0.53 | % | 1.41 | % | 96.94 | % | ||||||||||||||||||||
| $ | 8.26 | 18.19 | % | $ | 4,346 | 1.43 | % | 0.52 | % | 1.43 | % | 20.21 | % | ||||||||||||||||||||
171
Sterling Capital Funds
|
Financial Highlights, Class C Shares |
The financial highlights table is intended to help you understand the Funds’ financial performance for the past 5 years or, if shorter, the period of the Funds’ operations. Certain information reflects financial results for a single Fund share. The total returns in the table represent the rate that an investor would have earned (or lost) on an investment in the Fund (assuming reinvestment of all dividends and distributions).
| Investment Activities | Distributions | |||||||||||||||||||||||||||||||||||||||
| Net Asset Value, Beginning of Period | Net investment income (loss)(a) |
Net realized/ unrealized | Total from Investment Activities | Net investment income | Net realized gains on investments | Return of capital | Total Distributions | |||||||||||||||||||||||||||||||||
Sterling Capital Behavioral Large Cap Value Equity Fund | ||||||||||||||||||||||||||||||||||||||||
Year Ended September 30, 2016 | $16.09 | 0.14 | 1.12 | 1.26 | (0.15 | ) | — | — | (0.15 | ) | ||||||||||||||||||||||||||||||
Year Ended September 30, 2015 | $16.79 | 0.09 | (0.67 | ) | (0.58 | ) | (0.12 | ) | — | — | (0.12 | ) | ||||||||||||||||||||||||||||
Year Ended September 30, 2014 | $13.81 | 0.05 | 3.00 | 3.05 | (0.07 | ) | — | — | (0.07 | ) | ||||||||||||||||||||||||||||||
Year Ended September 30, 2013 | $12.49 | 0.03 | 1.32 | 1.35 | (0.03 | ) | — | — | (0.03 | ) | ||||||||||||||||||||||||||||||
Year Ended September 30, 2012 | $ 9.67 | 0.03 | 2.82 | 2.85 | (0.03 | ) | — | — | (0.03 | ) | ||||||||||||||||||||||||||||||
Sterling Capital Mid Value Fund | ||||||||||||||||||||||||||||||||||||||||
Year Ended September 30, 2016 | $16.67 | (0.09 | ) | 1.88 | 1.79 | — | (3.34 | ) | — | (3.34 | ) | |||||||||||||||||||||||||||||
Year Ended September 30, 2015 | $18.06 | (0.08 | ) | (0.13 | ) | (0.21 | ) | (0.01 | ) | (1.17 | ) | — | (1.18 | ) | ||||||||||||||||||||||||||
Year Ended September 30, 2014 | $17.72 | (0.07 | ) | 1.63 | 1.56 | (0.02 | ) | (1.20 | ) | — | (1.22 | ) | ||||||||||||||||||||||||||||
Year Ended September 30, 2013 | $13.51 | 0.01 | 4.23 | 4.24 | (0.03 | ) | — | — | (0.03 | ) | ||||||||||||||||||||||||||||||
Year Ended September 30, 2012 | $10.78 | — | (e) | 2.76 | 2.76 | (0.03 | ) | — | — | (0.03 | ) | |||||||||||||||||||||||||||||
Sterling Capital Behavioral Small Cap Value Equity Fund | ||||||||||||||||||||||||||||||||||||||||
Year Ended September 30, 2016 | $13.60 | 0.07 | 1.11 | 1.18 | (0.07 | ) | (0.01 | ) | — | (0.08 | ) | |||||||||||||||||||||||||||||
Year Ended September 30, 2015 | $13.87 | 0.06 | 0.15 | 0.21 | (0.04 | ) | (0.44 | ) | — | (0.48 | ) | |||||||||||||||||||||||||||||
Year Ended September 30, 2014 | $14.88 | — | (e) | 0.92 | 0.92 | (0.06 | ) | (1.87 | ) | — | (1.93 | ) | ||||||||||||||||||||||||||||
Year Ended September 30, 2013 | $11.79 | (0.05 | ) | 3.29 | 3.24 | — | (0.15 | ) | — | (0.15 | ) | |||||||||||||||||||||||||||||
Year Ended September 30, 2012 | $10.69 | (0.06 | ) | 2.14 | 2.08 | — | (0.98 | ) | — | (0.98 | ) | |||||||||||||||||||||||||||||
Sterling Capital Special Opportunities Fund | ||||||||||||||||||||||||||||||||||||||||
Year Ended September 30, 2016 | $20.34 | (0.14 | ) | 1.65 | 1.51 | — | (3.31 | ) | — | (3.31 | ) | |||||||||||||||||||||||||||||
Year Ended September 30, 2015 | $20.95 | (0.20 | ) | 0.79 | 0.59 | — | (1.20 | ) | — | (1.20 | ) | |||||||||||||||||||||||||||||
Year Ended September 30, 2014 | $19.55 | (0.17 | ) | 3.85 | 3.68 | — | (2.28 | ) | — | (2.28 | ) | |||||||||||||||||||||||||||||
Year Ended September 30, 2013 | $17.12 | (0.08 | )(f) | 3.46 | 3.38 | — | (0.95 | ) | — | (0.95 | ) | |||||||||||||||||||||||||||||
Year Ended September 30, 2012 | $14.23 | (0.12 | ) | 3.32 | 3.20 | — | (0.31 | ) | — | (0.31 | ) | |||||||||||||||||||||||||||||
Sterling Capital Equity Income Fund | ||||||||||||||||||||||||||||||||||||||||
Year Ended September 30, 2016 | $17.21 | 0.18 | 2.03 | 2.21 | (0.18 | ) | (1.10 | ) | — | (1.28 | ) | |||||||||||||||||||||||||||||
Year Ended September 30, 2015 | $18.80 | 0.17 | (1.06 | ) | (0.89 | ) | (0.19 | ) | (0.51 | ) | — | (0.70 | ) | |||||||||||||||||||||||||||
Year Ended September 30, 2014 | $18.01 | 0.19 | 1.40 | 1.59 | (0.17 | ) | (0.63 | ) | — | (0.80 | ) | |||||||||||||||||||||||||||||
Year Ended September 30, 2013 | $15.92 | 0.16 | 2.22 | 2.38 | (0.13 | ) | (0.16 | ) | — | (0.29 | ) | |||||||||||||||||||||||||||||
Year Ended September 30, 2012 | $13.17 | 0.13 | 2.70 | 2.83 | (0.08 | ) | — | — | (0.08 | ) | ||||||||||||||||||||||||||||||
Sterling Capital Long/Short Equity Fund | ||||||||||||||||||||||||||||||||||||||||
Year Ended September 30, 2016 | $ 8.76 | (0.24 | ) | 0.11 | (0.13 | ) | — | (0.20 | ) | — | (0.20 | ) | ||||||||||||||||||||||||||||
Year Ended September 30, 2015 | $10.85 | (0.26 | ) | (1.53 | ) | (1.79 | ) | — | (0.30 | ) | — | (0.30 | ) | |||||||||||||||||||||||||||
December 13, 2013 to September 30, 2014(i) | $10.00 | (0.21 | ) | 1.06 | 0.85 | — | — | — | — | |||||||||||||||||||||||||||||||
Sterling Capital Behavioral International Equity Fund | ||||||||||||||||||||||||||||||||||||||||
Year Ended September 30, 2016 | $ 9.18 | 0.17 | 0.42 | 0.59 | (0.15 | ) | — | — | (0.15 | ) | ||||||||||||||||||||||||||||||
November 28, 2014 to September 30, 2015(i) | $10.00 | 0.19 | (0.99 | ) | (0.80 | ) | (0.02 | ) | — | — | (0.02 | ) | ||||||||||||||||||||||||||||
| * | During the periods certain fees were waived (See Note 5 in the Notes to the Financial Statements). If such reductions had not occurred, the ratios would have been as indicated. |
| ** | Portfolio turnover rate is calculated on the basis of the Fund as a whole without distinguishing between classes of shares issued. |
| (a) | Per share net investment income (loss) has been calculated using the average daily shares method. |
| (b) | Not annualized for periods less than one year. |
| (c) | Annualized for periods less than one year. |
| (d) | Includes proceeds received from a settlement of litigation, which impacted the Fund’s total return. Not including these proceeds, the Fund’s total return would have been 10.72%. |
| (e) | Amount is less than $0.005. |
| (f) | Net investment loss per share reflects a special dividend, which amounted to $0.02 per share. Excluding the special dividend, the ratio of net investment loss to average net assets would have been (0.55)% per share. |
| (g) | Net expense ratio excluding dividend expense and service fee on securities sold short would have been 2.94% per share. |
| (h) | Net expense ratio excluding dividend expense and service fee on securities sold short would have been 2.84% per share. |
| (i) | Period from commencement of operations. |
| (j) | Net expense ratio excluding dividend expense and service fee on securities sold short would have been 2.79% per share. |
See accompanying Notes to the Financial Statements.
172
|
|
|
| Ratios/Supplementary Data | |||||||||||||||||||||||||||||||||
| Net Asset Value, End of Period | Total Return (excludes sales charge) (b) |
Net Assets, End of | Ratio of net expenses to average net assets (c) | Ratio of net investment income (loss) to average net assets (c) | Ratio of expenses to average net assets*(c) | Portfolio turnover rate**(b) | |||||||||||||||||||||||||||
| $17.20 | 7.87 | % | $ 919 | 1.76 | % | 0.81 | % | 1.90 | % | 145.53 | % | ||||||||||||||||||||||
| $16.09 | (3.52 | )% | $ 805 | 1.81 | % | 0.52 | % | 1.91 | % | 135.05 | % | ||||||||||||||||||||||
| $16.79 | 22.09 | % | $ 534 | 1.81 | % | 0.34 | % | 1.92 | % | 113.75 | % | ||||||||||||||||||||||
| $13.81 | 10.88 | %(d) | $ 199 | 1.84 | % | 0.21 | % | 1.94 | % | 164.27 | % | ||||||||||||||||||||||
| $12.49 | 29.51 | % | $ 167 | 1.83 | % | 0.22 | % | 1.95 | % | 68.75 | % | ||||||||||||||||||||||
| $15.12 | 12.22 | % | $ 5,282 | 1.93 | % | (0.61 | )% | 1.93 | % | 25.45 | % | ||||||||||||||||||||||
| $16.67 | (1.43 | )% | $ 5,309 | 1.94 | % | (0.41 | )% | 1.94 | % | 30.61 | % | ||||||||||||||||||||||
| $18.06 | 9.12 | % | $ 4,661 | 1.94 | % | (0.40 | )% | 1.94 | % | 27.30 | % | ||||||||||||||||||||||
| $17.72 | 31.37 | % | $ 1,309 | 1.92 | % | 0.04 | % | 1.92 | % | 34.03 | % | ||||||||||||||||||||||
| $13.51 | 25.67 | % | $ 538 | 1.94 | % | 0.03 | % | 1.95 | % | 21.62 | % | ||||||||||||||||||||||
| $14.70 | 8.68 | % | $ 364 | 1.88 | % | 0.52 | % | 1.98 | % | 120.42 | % | ||||||||||||||||||||||
| $13.60 | 1.37 | % | $ 330 | 2.00 | % | 0.45 | % | 2.00 | % | 101.99 | % | ||||||||||||||||||||||
| $13.87 | 6.38 | % | $ 312 | 1.99 | % | (0.01 | )% | 1.99 | % | 68.50 | % | ||||||||||||||||||||||
| $14.88 | 27.77 | % | $ 216 | 2.03 | % | (0.38 | )% | 2.03 | % | 176.62 | % | ||||||||||||||||||||||
| $11.79 | 20.33 | % | $ 108 | 2.08 | % | (0.52 | )% | 2.11 | % | 32.86 | % | ||||||||||||||||||||||
| $18.54 | 7.76 | % | $181,061 | 1.92 | % | (0.73 | )% | 1.97 | % | 27.32 | % | ||||||||||||||||||||||
| $20.34 | 2.99 | % | $143,597 | 1.98 | % | (0.98 | )% | 1.98 | % | 26.98 | % | ||||||||||||||||||||||
| $20.95 | 20.76 | % | $120,469 | 1.96 | % | (0.86 | )% | 1.96 | % | 32.35 | % | ||||||||||||||||||||||
| $19.55 | 20.69 | % | $ 94,718 | 1.99 | % | (0.46 | )%(f) | 1.99 | % | 53.76 | % | ||||||||||||||||||||||
| $17.12 | 22.75 | % | $ 82,536 | 2.04 | % | (0.75 | )% | 2.04 | % | 19.38 | % | ||||||||||||||||||||||
| $18.14 | 13.66 | % | $271,598 | 1.96 | % | 1.03 | % | 1.96 | % | 20.64 | % | ||||||||||||||||||||||
| $17.21 | (4.92 | )% | $279,355 | 1.97 | % | 0.91 | % | 1.97 | % | 27.53 | % | ||||||||||||||||||||||
| $18.80 | 8.98 | % | $315,948 | 1.95 | % | 1.04 | % | 1.95 | % | 16.13 | % | ||||||||||||||||||||||
| $18.01 | 15.17 | % | $280,841 | 1.95 | % | 0.93 | % | 1.95 | % | 30.56 | % | ||||||||||||||||||||||
| $15.92 | 21.54 | % | $194,345 | 1.94 | % | 0.86 | % | 1.94 | % | 21.30 | % | ||||||||||||||||||||||
| $ 8.43 | (1.27 | )% | $ 211 | 4.35 | %(g) | (2.98 | )% | 4.38 | % | 370.28 | % | ||||||||||||||||||||||
| $ 8.76 | (16.80 | )% | $ 402 | 3.93 | %(h) | (2.67 | )% | 3.93 | % | 265.99 | % | ||||||||||||||||||||||
| $10.85 | 8.50 | % | $ 330 | 4.15 | %(j) | (2.37 | )% | 4.15 | % | 193.58 | % | ||||||||||||||||||||||
| $ 9.62 | 6.38 | % | $ 47 | 1.80 | % | 1.83 | % | 2.13 | % | 125.35 | % | ||||||||||||||||||||||
| $ 9.18 | (8.03 | )% | $ 28 | 2.03 | % | 2.26 | % | 2.19 | % | 133.50 | % | ||||||||||||||||||||||
173
Sterling Capital Funds
|
Financial Highlights, Class C Shares |
The financial highlights table is intended to help you understand the Funds’ financial performance for the past 5 years or, if shorter, the period of the Funds’ operations. Certain information reflects financial results for a single Fund share. The total returns in the table represent the rate that an investor would have earned (or lost) on an investment in the Fund (assuming reinvestment of all dividends and distributions).
| Net Asset Value, Beginning of Period | Net investment income (loss)(a) | Net realized/ unrealized gains (losses) on investments | Total from Investment Activities | Net investment income | Net realized gains on investments | Return of capital | Total Distributions | |||||||||||||||||||||||||||||||||
Sterling Capital Stratton Mid Cap Value Fund | ||||||||||||||||||||||||||||||||||||||||
Period Ended September 30, 2016 | $ | 52.54 | (0.32 | ) | 3.33 | 3.01 | — | — | — | — | ||||||||||||||||||||||||||||||
November 16, 2015 to December 31, 2015(d) | $ | 53.97 | — | 0.45 | 0.45 | (0.10 | ) | (1.78 | ) | — | (1.88 | ) | ||||||||||||||||||||||||||||
Sterling Capital Stratton Real Estate Fund | ||||||||||||||||||||||||||||||||||||||||
Period Ended September 30, 2016 | $ | 35.97 | 0.34 | 3.58 | 3.92 | (0.39 | ) | — | — | (0.39 | ) | |||||||||||||||||||||||||||||
November 16, 2015 to December 31, 2015(d) | $ | 34.90 | 0.12 | 1.42 | 1.54 | — | (0.47 | ) | — | (0.47 | ) | |||||||||||||||||||||||||||||
Sterling Capital Stratton Small Cap Value Fund | ||||||||||||||||||||||||||||||||||||||||
Period Ended September 30, 2016 | $ | 69.88 | (0.41 | ) | 8.41 | 8.00 | — | — | — | — | ||||||||||||||||||||||||||||||
November 16, 2015 to December 31, 2015(d) | $ | 71.71 | (0.01 | ) | (0.81 | ) | (0.82 | ) | (0.01 | ) | (1.00 | ) | — | (1.01 | ) | |||||||||||||||||||||||||
Sterling Capital Short Duration Bond Fund | ||||||||||||||||||||||||||||||||||||||||
Year Ended September 30, 2016 | $ | 8.85 | 0.03 | 0.07 | 0.10 | (0.16 | ) | — | — | (0.16 | ) | |||||||||||||||||||||||||||||
Year Ended September 30, 2015 | $ | 9.07 | 0.04 | (0.07 | ) | (0.03 | ) | (0.19 | ) | — | — | (0.19 | ) | |||||||||||||||||||||||||||
Year Ended September 30, 2014 | $ | 9.24 | 0.06 | (0.03 | ) | 0.03 | (0.20 | ) | — | — | (0.20 | ) | ||||||||||||||||||||||||||||
Year Ended September 30, 2013 | $ | 9.47 | 0.09 | (0.09 | ) | — | (0.23 | ) | — | — | (0.23 | ) | ||||||||||||||||||||||||||||
February 1, 2012 to September 30, 2012(d) | $ | 9.45 | 0.08 | 0.10 | 0.18 | (0.16 | ) | — | — | (0.16 | ) | |||||||||||||||||||||||||||||
| * | During the periods certain fees were waived (See Note 5 in the Notes to the Financial Statements). If such reductions had not occurred, the ratios would have been as indicated. |
| ** | Portfolio turnover rate is calculated on the basis of the Fund as a whole without distinguishing between classes of shares issued. |
| (a) | Per share net investment income (loss) has been calculated using the average daily shares method. |
| (b) | Not annualized for periods less than one year. |
| (c) | Annualized for periods less than one year. |
| (d) | Period from commencement of operations. |
See accompanying Notes to the Financial Statements.
174
|
|
|
| Net Asset Value, End of Period | Total Return (excludes sales charge) (b) | Net Assets, End of Period (000) | Ratio of net expenses to average net assets (c) | Ratio of net investment income (loss) to average net assets (c) | Ratio of expenses to average net assets*(c) | Portfolio turnover rate**(b) | ||||||||||||||||||||||||||||
| $ | 55.55 | 5.73 | % | $ 1 | 1.95 | % | (0.82 | )% | 1.95 | % | 11.16 | % | ||||||||||||||||||||||
| $ | 52.54 | 0.91 | % | $ 1 | 1.64 | % | (0.01 | )% | 1.64 | % | 19.28 | % | ||||||||||||||||||||||
| $ | 39.50 | 10.90 | % | $ 20 | 1.83 | % | 1.21 | % | 1.85 | % | 18.43 | % | ||||||||||||||||||||||
| $ | 35.97 | 4.45 | % | $ 1 | 1.59 | % | 2.57 | % | 1.59 | % | 15.47 | % | ||||||||||||||||||||||
| $ | 77.88 | 11.45 | % | $ 65 | 2.08 | % | (0.74 | )% | 2.08 | % | 3.42 | % | ||||||||||||||||||||||
| $ | 69.88 | (1.12 | )% | $ 1 | 2.06 | % | (0.15 | )% | 2.06 | % | 6.33 | % | ||||||||||||||||||||||
| $ | 8.80 | 1.22 | % | $1,886 | 1.49 | % | 0.35 | % | 1.56 | % | 54.68 | % | ||||||||||||||||||||||
| $ | 8.85 | (0.29 | )% | $2,415 | 1.55 | % | 0.39 | % | 1.57 | % | 55.74 | % | ||||||||||||||||||||||
| $ | 9.07 | 0.37 | % | $1,906 | 1.53 | % | 0.69 | % | 1.56 | % | 56.10 | % | ||||||||||||||||||||||
| $ | 9.24 | (0.03 | )% | $ 556 | 1.52 | % | 1.02 | % | 1.56 | % | 56.09 | % | ||||||||||||||||||||||
| $ | 9.47 | 1.90 | % | $ 216 | 1.57 | % | 1.22 | % | 1.57 | % | 85.13 | % | ||||||||||||||||||||||
175
Sterling Capital Funds
|
Financial Highlights, Class C Shares
|
The financial highlights table is intended to help you understand the Funds’ financial performance for the past 5 years or, if shorter, the period of the Funds’ operations. Certain information reflects financial results for a single Fund share. The total returns in the table represent the rate that an investor would have earned (or lost) on an investment in the Fund (assuming reinvestment of all dividends and distributions).
| Investment Activities | Distributions | |||||||||||||||||||||||||||||||||||||||
Net Asset | Net investment income(a) | Net realized/ unrealized gains (losses) on investments | Total from Investment Activities | Net investment income | Net realized gains on investments | Return of capital | Total Distributions | |||||||||||||||||||||||||||||||||
Sterling Capital Intermediate U.S. Government Fund | ||||||||||||||||||||||||||||||||||||||||
Year Ended September 30, 2016 | $10.17 | 0.05 | 0.10 | 0.15 | (0.10 | ) | — | — | (0.10 | ) | ||||||||||||||||||||||||||||||
Year Ended September 30, 2015 | $10.18 | 0.06 | 0.05 | 0.11 | (0.12 | ) | — | — | (0.12 | ) | ||||||||||||||||||||||||||||||
Year Ended September 30, 2014 | $10.27 | 0.07 | 0.09 | 0.16 | (0.25 | ) | — | — | (0.25 | ) | ||||||||||||||||||||||||||||||
Year Ended September 30, 2013 | $10.84 | 0.08 | (0.43 | ) | (0.35 | ) | (0.22 | ) | — | — | (0.22 | ) | ||||||||||||||||||||||||||||
Year Ended September 30, 2012 | $10.77 | 0.11 | 0.17 | 0.28 | (0.21 | ) | — | — | (0.21 | ) | ||||||||||||||||||||||||||||||
Sterling Capital Total Return Bond Fund | ||||||||||||||||||||||||||||||||||||||||
Year Ended September 30, 2016 | $10.55 | 0.18 | 0.35 | 0.53 | (0.25 | ) | — | �� | — | (0.25 | ) | |||||||||||||||||||||||||||||
Year Ended September 30, 2015 | $10.68 | 0.20 | (0.06 | ) | 0.14 | (0.27 | ) | — | — | (0.27 | ) | |||||||||||||||||||||||||||||
Year Ended September 30, 2014 | $10.54 | 0.23 | 0.21 | 0.44 | (0.29 | ) | (0.01 | ) | — | (0.30 | ) | |||||||||||||||||||||||||||||
Year Ended September 30, 2013 | $11.17 | 0.21 | (0.46 | ) | (0.25 | ) | (0.30 | ) | (0.08 | ) | — | (0.38 | ) | |||||||||||||||||||||||||||
Year Ended September 30, 2012 | $11.07 | 0.21 | 0.46 | 0.67 | (0.30 | ) | (0.27 | ) | — | (0.57 | ) | |||||||||||||||||||||||||||||
Sterling Capital Corporate Fund | ||||||||||||||||||||||||||||||||||||||||
Year Ended September 30, 2016 | $10.09 | 0.21 | 0.26 | 0.47 | (0.21 | ) | — | — | (0.21 | ) | ||||||||||||||||||||||||||||||
Year Ended September 30, 2015 | $10.24 | 0.22 | (0.14 | ) | 0.08 | (0.22 | ) | (0.01 | ) | — | (d) | (0.23 | ) | |||||||||||||||||||||||||||
Year Ended September 30, 2014 | $10.15 | 0.24 | 0.18 | 0.42 | (0.23 | ) | (0.10 | ) | — | (0.33 | ) | |||||||||||||||||||||||||||||
February 1, 2013 to September 30, 2013(e) | $10.53 | 0.18 | (0.39 | ) | (0.21 | ) | (0.17 | ) | — | — | (0.17 | ) | ||||||||||||||||||||||||||||
Sterling Capital Securitized Opportunities Fund | ||||||||||||||||||||||||||||||||||||||||
Year Ended September 30, 2016 | $ 9.97 | 0.12 | 0.16 | 0.28 | (0.16 | ) | — | — | (0.16 | ) | ||||||||||||||||||||||||||||||
Year Ended September 30, 2015 | $ 9.89 | 0.13 | 0.13 | 0.26 | (0.18 | ) | — | — | (0.18 | ) | ||||||||||||||||||||||||||||||
Year Ended September 30, 2014 | $ 9.84 | 0.16 | 0.11 | 0.27 | (0.22 | ) | — | — | (0.22 | ) | ||||||||||||||||||||||||||||||
February 1, 2013 to September 30, 2013(e) | $10.16 | 0.08 | (0.23 | ) | (0.15 | ) | (0.17 | ) | — | — | (0.17 | ) | ||||||||||||||||||||||||||||
Sterling Capital Kentucky Intermediate Tax-Free Fund | ||||||||||||||||||||||||||||||||||||||||
Year Ended September 30, 2016 | $10.63 | 0.16 | 0.15 | 0.31 | (0.16 | ) | (0.13 | ) | — | (0.29 | ) | |||||||||||||||||||||||||||||
Year Ended September 30, 2015 | $10.86 | 0.17 | (0.05 | ) | 0.12 | (0.17 | ) | (0.18 | ) | — | (0.35 | ) | ||||||||||||||||||||||||||||
Year Ended September 30, 2014 | $10.67 | 0.19 | 0.18 | 0.37 | (0.18 | ) | — | — | (0.18 | ) | ||||||||||||||||||||||||||||||
Year Ended September 30, 2013 | $11.16 | 0.16 | (0.43 | ) | (0.27 | ) | (0.16 | ) | (0.06 | ) | — | (0.22 | ) | |||||||||||||||||||||||||||
February 1, 2012 to September 30, 2012(e) | $11.08 | 0.11 | 0.09 | 0.20 | (0.12 | ) | — | — | (0.12 | ) | ||||||||||||||||||||||||||||||
Sterling Capital Maryland Intermediate Tax-Free Fund | ||||||||||||||||||||||||||||||||||||||||
Year Ended September 30, 2016 | $11.18 | 0.11 | 0.20 | 0.31 | (0.11 | ) | (0.07 | ) | — | (0.18 | ) | |||||||||||||||||||||||||||||
Year Ended September 30, 2015 | $11.24 | 0.12 | — | (d) | 0.12 | (0.12 | ) | (0.06 | ) | — | (0.18 | ) | ||||||||||||||||||||||||||||
Year Ended September 30, 2014 | $10.96 | 0.11 | 0.28 | 0.39 | (0.11 | ) | — | — | (0.11 | ) | ||||||||||||||||||||||||||||||
Year Ended September 30, 2013 | $11.56 | 0.11 | (0.45 | ) | (0.34 | ) | (0.11 | ) | (0.15 | ) | — | (0.26 | ) | |||||||||||||||||||||||||||
February 1, 2012 to September 30, 2012(e) | $11.47 | 0.09 | 0.09 | 0.18 | (0.09 | ) | — | — | (0.09 | ) | ||||||||||||||||||||||||||||||
Sterling Capital North Carolina Intermediate Tax-Free Fund | ||||||||||||||||||||||||||||||||||||||||
Year Ended September 30, 2016 | $10.96 | 0.15 | 0.17 | 0.32 | (0.15 | ) | (0.06 | ) | — | (0.21 | ) | |||||||||||||||||||||||||||||
Year Ended September 30, 2015 | $10.98 | 0.16 | — | (d) | 0.16 | (0.16 | ) | (0.02 | ) | — | (0.18 | ) | ||||||||||||||||||||||||||||
Year Ended September 30, 2014 | $10.74 | 0.16 | 0.24 | 0.40 | (0.16 | ) | — | — | (0.16 | ) | ||||||||||||||||||||||||||||||
Year Ended September 30, 2013 | $11.35 | 0.16 | (0.53 | ) | (0.37 | ) | (0.16 | ) | (0.08 | ) | — | (0.24 | ) | |||||||||||||||||||||||||||
February 1, 2012 to September 30, 2012(e) | $11.25 | 0.11 | 0.11 | 0.22 | (0.12 | ) | — | — | (0.12 | ) | ||||||||||||||||||||||||||||||
| * | During the periods certain fees were waived (See Note 5 in the Notes to the Financial Statements). If such reductions had not occurred, the ratios would have been as indicated. |
| ** | Portfolio turnover rate is calculated on the basis of the Fund as a whole without distinguishing between classes of shares issued. |
| (a) | Per share net investment income has been calculated using the average daily shares method. |
| (b) | Not annualized for periods less than one year. |
| (c) | Annualized for periods less than one year. |
| (d) | Amount is less than $0.005. |
| (e) | Period from commencement of operations. |
See accompanying Notes to the Financial Statements.
176
|
| Ratios/Supplementary Data | |||||||||||||||||||||||||||||||||
| Net Asset Value, End of Period | Total Return (excludes sales charge) (b) | Net Assets, End of Period (000) | Ratio of net expenses to average net assets (c) |
Ratio of net | Ratio of expenses to average net assets*(c) | Portfolio turnover rate**(b) | |||||||||||||||||||||||||||
| $10.22 | 1.51 | % | $ 706 | 1.60 | % | 0.48 | % | 1.72 | % | 49.39 | % | ||||||||||||||||||||||
| $10.17 | 1.06 | % | $ 777 | 1.67 | % | 0.56 | % | 1.73 | % | 62.02 | % | ||||||||||||||||||||||
| $10.18 | 1.56 | % | $ 823 | 1.68 | % | 0.66 | % | 1.68 | % | 35.74 | % | ||||||||||||||||||||||
| $10.27 | (3.29 | )% | $1,080 | 1.68 | % | 0.74 | % | 1.68 | % | 66.16 | % | ||||||||||||||||||||||
| $10.84 | 2.64 | % | $1,097 | 1.72 | % | 1.06 | % | 1.75 | % | 71.68 | % | ||||||||||||||||||||||
| $10.83 | 5.05 | % | $7,933 | 1.49 | % | 1.66 | % | 1.59 | % | 65.47 | % | ||||||||||||||||||||||
| $10.55 | 1.28 | % | $6,362 | 1.48 | % | 1.87 | % | 1.58 | % | 41.37 | % | ||||||||||||||||||||||
| $10.68 | 4.24 | % | $5,578 | 1.56 | % | 2.15 | % | 1.58 | % | 75.21 | % | ||||||||||||||||||||||
| $10.54 | (2.24 | )% | $5,362 | 1.57 | % | 1.92 | % | 1.59 | % | 149.09 | % | ||||||||||||||||||||||
| $11.17 | 6.32 | % | $5,845 | 1.63 | % | 1.90 | % | 1.66 | % | 110.82 | % | ||||||||||||||||||||||
| $10.35 | 4.69 | % | $ 58 | 1.64 | % | 2.03 | % | 1.64 | % | 83.88 | % | ||||||||||||||||||||||
| $10.09 | 0.75 | % | $ 9 | 1.63 | % | 2.12 | % | 1.63 | % | 33.94 | % | ||||||||||||||||||||||
| $10.24 | 4.25 | % | $ 9 | 1.59 | % | 2.31 | % | 1.59 | % | 105.03 | % | ||||||||||||||||||||||
| $10.15 | (2.02 | )% | $ 15 | 1.59 | % | 2.58 | % | 1.59 | % | 99.48 | % | ||||||||||||||||||||||
| $10.09 | 2.83 | % | $ 40 | 1.61 | % | 1.16 | % | 1.65 | % | 43.63 | % | ||||||||||||||||||||||
| $ 9.97 | 2.62 | % | $ 39 | 1.59 | % | 1.30 | % | 1.63 | % | 19.85 | % | ||||||||||||||||||||||
| $ 9.89 | 2.72 | % | $ 38 | 1.58 | % | 1.59 | % | 1.62 | % | 98.34 | % | ||||||||||||||||||||||
| $ 9.84 | (1.49 | )% | $ 3 | 1.64 | % | 1.17 | % | 1.64 | % | 193.21 | % | ||||||||||||||||||||||
| $10.65 | 2.93 | % | $ 20 | 1.65 | % | 1.50 | % | 1.76 | % | 16.44 | % | ||||||||||||||||||||||
| $10.63 | 1.13 | % | $ 20 | 1.71 | % | 1.62 | % | 1.79 | % | 17.34 | % | ||||||||||||||||||||||
| $10.86 | 3.53 | % | $ 19 | 1.71 | % | 1.72 | % | 1.71 | % | 11.13 | % | ||||||||||||||||||||||
| $10.67 | (2.47 | )% | $ 67 | 1.71 | % | 1.48 | % | 1.71 | % | 22.05 | % | ||||||||||||||||||||||
| $11.16 | 1.82 | % | $ 209 | 1.71 | % | 1.45 | % | 1.71 | % | 16.52 | % | ||||||||||||||||||||||
| $11.31 | 2.85 | % | $ 802 | 1.61 | % | 1.01 | % | 1.71 | % | 14.36 | % | ||||||||||||||||||||||
| $11.18 | 1.04 | % | $ 741 | 1.65 | % | 1.07 | % | 1.71 | % | 18.38 | % | ||||||||||||||||||||||
| $11.24 | 3.58 | % | $ 747 | 1.69 | % | 0.99 | % | 1.69 | % | 19.90 | % | ||||||||||||||||||||||
| $10.96 | (3.04 | )% | $1,206 | 1.70 | % | 0.95 | % | 1.70 | % | 70.60 | % | ||||||||||||||||||||||
| $11.56 | 1.57 | % | $1,321 | 1.71 | % | 1.12 | % | 1.71 | % | 34.94 | % | ||||||||||||||||||||||
| $11.07 | 2.91 | % | $6,108 | 1.55 | % | 1.31 | % | 1.65 | % | 10.05 | % | ||||||||||||||||||||||
| $10.96 | 1.43 | % | $3,350 | 1.59 | % | 1.44 | % | 1.66 | % | 16.80 | % | ||||||||||||||||||||||
| $10.98 | 3.77 | % | $2,864 | 1.66 | % | 1.52 | % | 1.66 | % | 11.67 | % | ||||||||||||||||||||||
| $10.74 | (3.27 | )% | $4,776 | 1.67 | % | 1.48 | % | 1.67 | % | 22.38 | % | ||||||||||||||||||||||
| $11.35 | 1.93 | % | $3,251 | 1.67 | % | 1.49 | % | 1.67 | % | 19.76 | % | ||||||||||||||||||||||
177
Sterling Capital Funds
|
Financial Highlights, Class C Shares |
The financial highlights table is intended to help you understand the Funds’ financial performance for the past 5 years or, if shorter, the period of the Funds’ operations. Certain information reflects financial results for a single Fund share. The total returns in the table represent the rate that an investor would have earned (or lost) on an investment in the Fund (assuming reinvestment of all dividends and distributions).
| Investment Activities | Distributions | ||||||||||||||||||||||||||||||||||
| Net Asset Value, Beginning of Period | Net investment income(a) | Net realized/ unrealized gains (losses) on investments | Total from Investment Activities | Net investment income | Net realized gains on investments | Total Distributions | |||||||||||||||||||||||||||||
Sterling Capital South Carolina Intermediate Tax-Free Fund | |||||||||||||||||||||||||||||||||||
Year Ended September 30, 2016 | $ | 11.14 | 0.12 | 0.20 | 0.32 | (0.12 | ) | (0.04 | ) | (0.16 | ) | ||||||||||||||||||||||||
Year Ended September 30, 2015 | $ | 11.14 | 0.13 | 0.02 | 0.15 | (0.13 | ) | (0.02 | ) | (0.15 | ) | ||||||||||||||||||||||||
Year Ended September 30, 2014 | $ | 10.85 | 0.14 | 0.29 | 0.43 | (0.14 | ) | — | (0.14 | ) | |||||||||||||||||||||||||
Year Ended September 30, 2013 | $ | 11.36 | 0.13 | (0.43 | ) | (0.30 | ) | (0.13 | ) | (0.08 | ) | (0.21 | ) | ||||||||||||||||||||||
February 1, 2012 to September 30, 2012(d) | $ | 11.25 | 0.10 | 0.11 | 0.21 | (0.10 | ) | — | (0.10 | ) | |||||||||||||||||||||||||
Sterling Capital Virginia Intermediate Tax-Free Fund | |||||||||||||||||||||||||||||||||||
Year Ended September 30, 2016 | $ | 11.98 | 0.15 | 0.19 | 0.34 | (0.15 | ) | (0.04 | ) | (0.19 | ) | ||||||||||||||||||||||||
Year Ended September 30, 2015 | $ | 12.06 | 0.16 | (0.01 | ) | 0.15 | (0.16 | ) | (0.07 | ) | (0.23 | ) | |||||||||||||||||||||||
Year Ended September 30, 2014 | $ | 11.79 | 0.15 | 0.27 | 0.42 | (0.15 | ) | — | (0.15 | ) | |||||||||||||||||||||||||
Year Ended September 30, 2013 | $ | 12.44 | 0.15 | (0.55 | ) | (0.40 | ) | (0.15 | ) | (0.10 | ) | (0.25 | ) | ||||||||||||||||||||||
February 1, 2012 to September 30, 2012(d) | $ | 12.37 | 0.11 | 0.07 | 0.18 | (0.11 | ) | — | (0.11 | ) | |||||||||||||||||||||||||
Sterling Capital West Virginia Intermediate Tax-Free Fund | |||||||||||||||||||||||||||||||||||
Year Ended September 30, 2016 | $ | 10.14 | 0.13 | 0.18 | 0.31 | (0.13 | ) | (0.05 | ) | (0.18 | ) | ||||||||||||||||||||||||
Year Ended September 30, 2015 | $ | 10.16 | 0.14 | 0.01 | 0.15 | (0.14 | ) | (0.03 | ) | (0.17 | ) | ||||||||||||||||||||||||
Year Ended September 30, 2014 | $ | 9.91 | 0.14 | 0.25 | 0.39 | (0.14 | ) | — | (0.14 | ) | |||||||||||||||||||||||||
Year Ended September 30, 2013 | $ | 10.51 | 0.14 | (0.48 | ) | (0.34 | ) | (0.14 | ) | (0.12 | ) | (0.26 | ) | ||||||||||||||||||||||
February 1, 2012 to September 30, 2012(d) | $ | 10.38 | 0.11 | 0.14 | 0.25 | (0.12 | ) | — | (0.12 | ) | |||||||||||||||||||||||||
Sterling Capital Diversified Income Fund(e) | |||||||||||||||||||||||||||||||||||
Year Ended September 30, 2016 | $ | 10.13 | 0.24 | 0.66 | 0.90 | (0.30 | ) | — | (0.30 | ) | |||||||||||||||||||||||||
Year Ended September 30, 2015 | $ | 10.53 | 0.22 | (0.44 | ) | (0.22 | ) | (0.18 | ) | — | (0.18 | ) | |||||||||||||||||||||||
Year Ended September 30, 2014 | $ | 9.90 | 0.14 | 0.66 | 0.80 | (0.17 | ) | — | (0.17 | ) | |||||||||||||||||||||||||
Year Ended September 30, 2013 | $ | 9.64 | 0.14 | 0.28 | 0.42 | (0.16 | ) | — | (0.16 | ) | |||||||||||||||||||||||||
Year Ended September 30, 2012 | $ | 8.71 | 0.12 | 0.94 | 1.06 | (0.13 | ) | — | (0.13 | ) | |||||||||||||||||||||||||
Sterling Capital Strategic Allocation Balanced Fund(e) | |||||||||||||||||||||||||||||||||||
Year Ended September 30, 2016 | $ | 10.13 | 0.09 | 0.53 | 0.62 | (0.13 | ) | — | (0.13 | ) | |||||||||||||||||||||||||
Year Ended September 30, 2015 | $ | 10.47 | 0.04 | (0.31 | ) | (0.27 | ) | (0.07 | ) | — | (0.07 | ) | |||||||||||||||||||||||
Year Ended September 30, 2014 | $ | 9.60 | 0.09 | 0.89 | 0.98 | (0.11 | ) | — | (0.11 | ) | |||||||||||||||||||||||||
Year Ended September 30, 2013 | $ | 8.98 | 0.09 | 0.63 | 0.72 | (0.10 | ) | — | (0.10 | ) | |||||||||||||||||||||||||
Year Ended September 30, 2012 | $ | 7.82 | 0.08 | 1.16 | 1.24 | (0.08 | ) | — | (0.08 | ) | |||||||||||||||||||||||||
Sterling Capital Strategic Allocation Growth Fund(e) | |||||||||||||||||||||||||||||||||||
Year Ended September 30, 2016 | $ | 9.68 | 0.05 | 0.57 | 0.62 | (0.12 | ) | — | (0.12 | ) | |||||||||||||||||||||||||
Year Ended September 30, 2015 | $ | 10.09 | (0.01 | ) | (0.35 | ) | (0.36 | ) | (0.05 | ) | — | (0.05 | ) | ||||||||||||||||||||||
Year Ended September 30, 2014 | $ | 9.09 | 0.05 | 1.02 | 1.07 | (0.07 | ) | — | (0.07 | ) | |||||||||||||||||||||||||
Year Ended September 30, 2013 | $ | 8.24 | 0.04 | 0.87 | 0.91 | (0.06 | ) | — | (0.06 | ) | |||||||||||||||||||||||||
Year Ended September 30, 2012 | $ | 7.01 | 0.04 | 1.24 | 1.28 | (0.05 | ) | — | (0.05 | ) | |||||||||||||||||||||||||
| * | During the periods certain fees were waived (See Note 5 in the Notes to the Financial Statements). If such reductions had not occurred, the ratios would have been as indicated. |
| ** | Portfolio turnover rate is calculated on the basis of the Fund as a whole without distinguishing between classes of shares issued. |
| (a) | Per share net investment income (loss) has been calculated using the average daily shares method. |
| (b) | Not annualized for periods less than one year. |
| (c) | Annualized for periods less than one year. |
| (d) | Period from commencement of operations. |
| (e) | The expense ratios exclude the impact of fees/expenses paid by each underlying fund. |
See accompanying Notes to the Financial Statements.
178
XXUPDATEXXX
|
| Ratios/Supplementary Data | ||||||||||||||||||||||||||||||||||
| Net Asset Value, End of Period | Total Return (excludes sales charge) (b) | Net Assets, End of Period (000) | Ratio of net expenses to average net assets (c) | Ratio of net investment income to average net assets (c) | Ratio of expenses to average net assets*(c) | Portfolio turnover rate**(b) | ||||||||||||||||||||||||||||
| $ | 11.30 | 2.82 | % | $ | 1,806 | 1.56 | % | 1.02 | % | 1.66 | % | 2.69 | % | |||||||||||||||||||||
| $ | 11.14 | 1.35 | % | $ | 1,517 | 1.61 | % | 1.18 | % | 1.68 | % | 12.53 | % | |||||||||||||||||||||
| $ | 11.14 | 3.97 | % | $ | 1,465 | 1.67 | % | 1.26 | % | 1.67 | % | 15.51 | % | |||||||||||||||||||||
| $ | 10.85 | (2.67 | )% | $ | 899 | 1.69 | % | 1.14 | % | 1.69 | % | 35.38 | % | |||||||||||||||||||||
| $ | 11.36 | 1.86 | % | $ | 507 | 1.69 | % | 1.29 | % | 1.69 | % | 26.49 | % | |||||||||||||||||||||
| $ | 12.13 | 2.88 | % | $ | 1,170 | 1.56 | % | 1.24 | % | 1.66 | % | 16.18 | % | |||||||||||||||||||||
| $ | 11.98 | 1.22 | % | $ | 1,245 | 1.60 | % | 1.32 | % | 1.67 | % | 16.01 | % | |||||||||||||||||||||
| $ | 12.06 | 3.61 | % | $ | 1,490 | 1.66 | % | 1.30 | % | 1.66 | % | 20.48 | % | |||||||||||||||||||||
| $ | 11.79 | (3.25 | )% | $ | 2,687 | 1.68 | % | 1.22 | % | 1.68 | % | 40.00 | % | |||||||||||||||||||||
| $ | 12.44 | 1.48 | % | $ | 2,884 | 1.68 | % | 1.36 | % | 1.68 | % | 21.63 | % | |||||||||||||||||||||
| $ | 10.27 | 3.14 | % | $ | 817 | 1.57 | % | 1.29 | % | 1.67 | % | 11.31 | % | |||||||||||||||||||||
| $ | 10.14 | 1.42 | % | $ | 409 | 1.61 | % | 1.36 | % | 1.67 | % | 10.34 | % | |||||||||||||||||||||
| $ | 10.16 | 3.93 | % | $ | 457 | 1.66 | % | 1.39 | % | 1.66 | % | 21.09 | % | |||||||||||||||||||||
| $ | 9.91 | (3.28 | )% | $ | 764 | 1.68 | % | 1.38 | % | 1.68 | % | 22.18 | % | |||||||||||||||||||||
| $ | 10.51 | 2.41 | % | $ | 729 | 1.64 | % | 1.63 | % | 1.64 | % | 26.70 | % | |||||||||||||||||||||
| $ | 10.73 | 9.07 | % | $ | 1,157 | 1.39 | % | 2.43 | % | 1.47 | % | 67.18 | % | |||||||||||||||||||||
| $ | 10.13 | (2.14 | )% | $ | 795 | 1.20 | % | 2.04 | % | 1.45 | % | 126.46 | % | |||||||||||||||||||||
| $ | 10.53 | 8.07 | % | $ | 291 | 1.20 | % | 1.35 | % | 1.45 | % | 8.67 | % | |||||||||||||||||||||
| $ | 9.90 | 4.40 | % | $ | 241 | 1.28 | % | 1.42 | % | 1.44 | % | 60.51 | % | |||||||||||||||||||||
| $ | 9.64 | 12.23 | % | $ | 207 | 1.44 | % | 1.33 | % | 1.44 | % | 7.99 | % | |||||||||||||||||||||
| $ | 10.62 | 6.18 | % | $ | 741 | 1.15 | % | 0.89 | % | 1.40 | % | 5.19 | % | |||||||||||||||||||||
| $ | 10.13 | (2.60 | )% | $ | 751 | 1.15 | % | 0.42 | % | 1.40 | % | 49.24 | % | |||||||||||||||||||||
| $ | 10.47 | 10.24 | % | $ | 757 | 1.14 | % | 0.88 | % | 1.40 | % | 5.70 | % | |||||||||||||||||||||
| $ | 9.60 | 8.10 | % | $ | 570 | 1.25 | % | 0.94 | % | 1.41 | % | 81.00 | % | |||||||||||||||||||||
| $ | 8.98 | 15.88 | % | $ | 420 | 1.41 | % | 0.91 | % | 1.41 | % | 17.65 | % | |||||||||||||||||||||
| $ | 10.18 | 6.46 | % | $ | 436 | 1.18 | % | 0.56 | % | 1.43 | % | 5.95 | % | |||||||||||||||||||||
| $ | 9.68 | (3.62 | )% | $ | 491 | 1.17 | % | (0.06 | )% | 1.42 | % | 58.40 | % | |||||||||||||||||||||
| $ | 10.09 | 11.75 | % | $ | 506 | 1.16 | % | 0.48 | % | 1.41 | % | 8.60 | % | |||||||||||||||||||||
| $ | 9.09 | 11.07 | % | $ | 452 | 1.27 | % | 0.50 | % | 1.43 | % | 96.94 | % | |||||||||||||||||||||
| $ | 8.24 | 18.29 | % | $ | 294 | 1.43 | % | 0.55 | % | 1.43 | % | 20.21 | % | |||||||||||||||||||||
179
Sterling Capital Funds
|
Financial Highlights, Institutional Shares |
The financial highlights table is intended to help you understand the Funds’ financial performance for the past 5 years or, if shorter, the period of the Funds’ operations. Certain information reflects financial results for a single Fund share. The total returns in the table represent the rate that an investor would have earned (or lost) on an investment in the Fund (assuming reinvestment of all dividends and distributions).
| Investment Activities | Distributions | ||||||||||||||||||||||||||||||||||
| Net Asset Value, Beginning of Period | Net investment income (loss)(a) | Net realized/ unrealized gains (losses) on investments | Total from Investment Activities | Net investment income | Net realized gains on investments | Total Distributions | |||||||||||||||||||||||||||||
Sterling Capital Behavioral Large Cap Value Equity Fund | |||||||||||||||||||||||||||||||||||
Year Ended September 30, 2016 | $ | 16.62 | 0.32 | 1.16 | 1.48 | (0.32 | ) | — | (0.32 | ) | |||||||||||||||||||||||||
Year Ended September 30, 2015 | $ | 17.33 | 0.27 | (0.70 | ) | (0.43 | ) | (0.28 | ) | — | (0.28 | ) | |||||||||||||||||||||||
Year Ended September 30, 2014 | $ | 14.23 | 0.22 | 3.08 | 3.30 | (0.20 | ) | — | (0.20 | ) | |||||||||||||||||||||||||
Year Ended September 30, 2013 | $ | 12.87 | 0.16 | 1.36 | 1.52 | (0.16 | ) | — | (0.16 | ) | |||||||||||||||||||||||||
Year Ended September 30, 2012 | $ | 9.95 | 0.14 | 2.92 | 3.06 | (0.14 | ) | — | (0.14 | ) | |||||||||||||||||||||||||
Sterling Capital Mid Value Fund | |||||||||||||||||||||||||||||||||||
Year Ended September 30, 2016 | $ | 18.14 | 0.07 | 2.07 | 2.14 | (0.02 | ) | (3.34 | ) | (3.36 | ) | ||||||||||||||||||||||||
Year Ended September 30, 2015 | $ | 19.50 | 0.11 | (0.14 | ) | (0.03 | ) | (0.16 | ) | (1.17 | ) | (1.33 | ) | ||||||||||||||||||||||
Year Ended September 30, 2014 | $ | 18.91 | 0.10 | 1.77 | 1.87 | (0.08 | ) | (1.20 | ) | (1.28 | ) | ||||||||||||||||||||||||
Year Ended September 30, 2013 | $ | 14.37 | 0.17 | 4.50 | 4.67 | (0.13 | ) | — | (0.13 | ) | |||||||||||||||||||||||||
Year Ended September 30, 2012 | $ | 11.43 | 0.14 | 2.94 | 3.08 | (0.14 | ) | — | (0.14 | ) | |||||||||||||||||||||||||
Sterling Capital Behavioral Small Cap Value Equity Fund | |||||||||||||||||||||||||||||||||||
Year Ended September 30, 2016 | $ | 14.14 | 0.22 | 1.16 | 1.38 | (0.21 | ) | (0.01 | ) | (0.22 | ) | ||||||||||||||||||||||||
Year Ended September 30, 2015 | $ | 14.47 | 0.22 | 0.15 | 0.37 | (0.26 | ) | (0.44 | ) | (0.70 | ) | ||||||||||||||||||||||||
Year Ended September 30, 2014 | $ | 15.34 | 0.15 | 0.94 | 1.09 | (0.09 | ) | (1.87 | ) | (1.96 | ) | ||||||||||||||||||||||||
Year Ended September 30, 2013 | $ | 12.08 | 0.08 | 3.39 | 3.47 | (0.06 | ) | (0.15 | ) | (0.21 | ) | ||||||||||||||||||||||||
Year Ended September 30, 2012 | $ | 10.82 | 0.06 | 2.18 | 2.24 | — | (0.98 | ) | (0.98 | ) | |||||||||||||||||||||||||
Sterling Capital Special Opportunities Fund | |||||||||||||||||||||||||||||||||||
Year Ended September 30, 2016 | $ | 23.78 | 0.06 | 1.95 | 2.01 | — | (3.31 | ) | (3.31 | ) | |||||||||||||||||||||||||
Year Ended September 30, 2015 | $ | 24.06 | — | (e) | 0.92 | 0.92 | — | (1.20 | ) | (1.20 | ) | ||||||||||||||||||||||||
Year Ended September 30, 2014 | $ | 21.96 | 0.03 | 4.39 | 4.42 | (0.04 | ) | (2.28 | ) | (2.32 | ) | ||||||||||||||||||||||||
Year Ended September 30, 2013 | $ | 18.99 | 0.11 | (f) | 3.87 | 3.98 | (0.06 | ) | (0.95 | ) | (1.01 | ) | |||||||||||||||||||||||
Year Ended September 30, 2012 | $ | 15.60 | 0.04 | 3.66 | 3.70 | — | (0.31 | ) | (0.31 | ) | |||||||||||||||||||||||||
Sterling Capital Equity Income Fund | |||||||||||||||||||||||||||||||||||
Year Ended September 30, 2016 | $ | 17.39 | 0.35 | 2.06 | 2.41 | (0.36 | ) | (1.10 | ) | (1.46 | ) | ||||||||||||||||||||||||
Year Ended September 30, 2015 | $ | 18.98 | 0.36 | (1.07 | ) | (0.71 | ) | (0.37 | ) | (0.51 | ) | (0.88 | ) | ||||||||||||||||||||||
Year Ended September 30, 2014 | $ | 18.18 | 0.38 | 1.41 | 1.79 | (0.36 | ) | (0.63 | ) | (0.99 | ) | ||||||||||||||||||||||||
Year Ended September 30, 2013 | $ | 16.06 | 0.33 | 2.25 | 2.58 | (0.30 | ) | (0.16 | ) | (0.46 | ) | ||||||||||||||||||||||||
Year Ended September 30, 2012 | $ | 13.27 | 0.28 | 2.74 | 3.02 | (0.23 | ) | — | (0.23 | ) | |||||||||||||||||||||||||
Sterling Capital Long/Short Equity Fund | |||||||||||||||||||||||||||||||||||
Year Ended September 30, 2016 | $ | 8.91 | (0.16 | ) | 0.12 | (0.04 | ) | — | (0.20 | ) | (0.20 | ) | |||||||||||||||||||||||
Year Ended September 30, 2015 | $ | 10.93 | (0.17 | ) | (1.55 | ) | (1.72 | ) | — | (0.30 | ) | (0.30 | ) | ||||||||||||||||||||||
December 13, 2013 to September 30, 2014(i) | $ | 10.00 | (0.11 | ) | 1.04 | 0.93 | — | — | — | ||||||||||||||||||||||||||
| * | During the periods certain fees were waived (See Note 5 in the Notes to the Financial Statements). If such reductions had not occurred, the ratios would have been as indicated. |
| ** | Portfolio turnover rate is calculated on the basis of the Fund as a whole without distinguishing between classes of shares issued. |
| (a) | Per share net investment income (loss) has been calculated using the average daily shares method. |
| (b) | Not annualized for periods less than one year. |
| (c) | Annualized for periods less than one year. |
| (d) | Includes proceeds received from a settlement of litigation, which impacted the Fund’s total return. Not including these proceeds, the Fund’s total return would have been 11.78%. |
| (e) | Amount is less than $0.005. |
| (f) | Net investment income per share reflects a special dividend, which amounted to $0.02 per share. Excluding the special dividend, the ratio of net investment income to average net assets would have been 0.45% per share. |
| (g) | Net expense ratio excluding dividend expense and service fee on securities sold short would have been 1.94% per share. |
| (h) | Net expense ratio excluding dividend expense and service fee on securities sold short would have been 1.83% per share. |
| (i) | Period from commencement of operations. |
| (j) | Net expense ratio excluding dividend expense and service fee on securities sold short would have been 1.77% per share. |
See accompanying Notes to the Financial Statements.
180
XXUPDATEXXX
|
| Ratios/Supplementary Data | |||||||||||||||||||||||||||||||||
| Net Asset Value, End of Period | Total Return (b) | Net Assets, End of Period (000) | Ratio of net expenses to average net assets (c) | Ratio of net investment income (loss) to average net assets (c) | Ratio of expenses to average net assets*(c) | Portfolio turnover rate**(b) | |||||||||||||||||||||||||||
| $ | 17.78 | 8.94 | % | $ | 240,971 | 0.76 | % | 1.83 | % | 0.90 | % | 145.53 | % | ||||||||||||||||||||
| $ | 16.62 | (2.55 | )% | $ | 221,481 | 0.81 | % | 1.50 | % | 0.91 | % | 135.05 | % | ||||||||||||||||||||
| $ | 17.33 | 23.29 | % | $ | 234,809 | 0.81 | % | 1.34 | % | 0.91 | % | 113.75 | % | ||||||||||||||||||||
| $ | 14.23 | 11.94 | %(d) | $ | 194,921 | 0.84 | % | 1.23 | % | 0.94 | % | 164.27 | % | ||||||||||||||||||||
| $ | 12.87 | 30.89 | % | $ | 189,252 | 0.83 | % | 1.22 | % | 0.95 | % | 68.75 | % | ||||||||||||||||||||
| $ | 16.92 | 13.32 | % | $ | 550,697 | 0.93 | % | 0.41 | % | 0.93 | % | 25.45 | % | ||||||||||||||||||||
| $ | 18.14 | (0.43 | )% | $ | 588,537 | 0.94 | % | 0.55 | % | 0.94 | % | 30.61 | % | ||||||||||||||||||||
| $ | 19.50 | 10.17 | % | $ | 696,468 | 0.93 | % | 0.53 | % | 0.93 | % | 27.30 | % | ||||||||||||||||||||
| $ | 18.91 | 32.65 | % | $ | 548,624 | 0.92 | % | 1.03 | % | 0.92 | % | 34.03 | % | ||||||||||||||||||||
| $ | 14.37 | 27.00 | % | $ | 340,577 | 0.93 | % | 1.02 | % | 0.95 | % | 21.62 | % | ||||||||||||||||||||
| $ | 15.30 | 9.80 | % | $ | 157,413 | 0.88 | % | 1.54 | % | 0.98 | % | 120.42 | % | ||||||||||||||||||||
| $ | 14.14 | 2.42 | % | $ | 111,757 | 1.00 | % | 1.44 | % | 1.00 | % | 101.99 | % | ||||||||||||||||||||
| $ | 14.47 | 7.40 | % | $ | 121,011 | 0.99 | % | 0.99 | % | 0.99 | % | 68.50 | % | ||||||||||||||||||||
| $ | 15.34 | 29.03 | % | $ | 101,999 | 1.04 | % | 0.61 | % | 1.04 | % | 176.62 | % | ||||||||||||||||||||
| $ | 12.08 | 21.65 | % | $ | 71,711 | 1.08 | % | 0.47 | % | 1.11 | % | 32.86 | % | ||||||||||||||||||||
| $ | 22.48 | 8.86 | % | $ | 587,320 | 0.92 | % | 0.27 | % | 0.97 | % | 27.32 | % | ||||||||||||||||||||
| $ | 23.78 | 4.02 | % | $ | 491,982 | 0.97 | % | 0.01 | % | 0.97 | % | 26.98 | % | ||||||||||||||||||||
| $ | 24.06 | 22.00 | % | $ | 574,783 | 0.96 | % | 0.14 | % | 0.96 | % | 32.35 | % | ||||||||||||||||||||
| $ | 21.96 | 21.90 | % | $ | 452,155 | 0.99 | % | 0.53 | %(f) | 0.99 | % | 53.76 | % | ||||||||||||||||||||
| $ | 18.99 | 23.97 | % | $ | 386,543 | 1.04 | % | 0.25 | % | 1.04 | % | 19.38 | % | ||||||||||||||||||||
| $ | 18.34 | 14.75 | % | $ | 943,101 | 0.96 | % | 2.04 | % | 0.96 | % | 20.64 | % | ||||||||||||||||||||
| $ | 17.39 | (3.90 | )% | $ | 807,729 | 0.97 | % | 1.91 | % | 0.97 | % | 27.53 | % | ||||||||||||||||||||
| $ | 18.98 | 10.01 | % | $ | 1,038,013 | 0.95 | % | 2.03 | % | 0.95 | % | 16.13 | % | ||||||||||||||||||||
| $ | 18.18 | 16.33 | % | $ | 936,400 | 0.95 | % | 1.92 | % | 0.95 | % | 30.56 | % | ||||||||||||||||||||
| $ | 16.06 | 22.80 | % | $ | 635,360 | 0.94 | % | 1.86 | % | 0.94 | % | 21.30 | % | ||||||||||||||||||||
| $ | 8.67 | (0.33 | )% | $ | 41,521 | 3.31 | %(g) | (1.91 | )% | 3.33 | % | 370.28 | % | ||||||||||||||||||||
| $ | 8.91 | (15.92 | )% | $ | 102,208 | 2.94 | %(h) | (1.66 | )% | 2.94 | % | 265.99 | % | ||||||||||||||||||||
| $ | 10.93 | 9.30 | % | $ | 105,053 | 3.10 | %(j) | (1.23 | )% | 3.10 | % | 193.58 | % | ||||||||||||||||||||
181
Sterling Capital Funds
|
Financial Highlights, Institutional Shares |
The financial highlights table is intended to help you understand the Funds’ financial performance for the past 5 years or, if shorter, the period of the Funds’ operations. Certain information reflects financial results for a single Fund share. The total returns in the table represent the rate that an investor would have earned (or lost) on an investment in the Fund (assuming reinvestment of all dividends and distributions).
| Investment Activities | Distributions | |||||||||||||||||||||||||||||||||||||||
| Net Asset Value, Beginning of Period | Net investment income (loss)(a) | Net realized/ unrealized gains (losses) on investments | Total from Investment Activities | Net investment income | Net realized gains on investments | Total Distributions | Redemption Fees | |||||||||||||||||||||||||||||||||
Sterling Capital Behavioral International Equity Fund | ||||||||||||||||||||||||||||||||||||||||
Year Ended September 30, 2016 | $ | 9.24 | 0.23 | 0.44 | 0.67 | (0.22 | ) | — | (0.22 | ) | — | |||||||||||||||||||||||||||||
November 30, 2014 to September 30, 2015(d) | $ | 10.00 | 0.24 | (0.97 | ) | (0.73 | ) | (0.03 | ) | — | (0.03 | ) | — | |||||||||||||||||||||||||||
Sterling Capital Stratton Mid Cap Value Fund(e) | ||||||||||||||||||||||||||||||||||||||||
Period Ended September 30, 2016 | $ | 52.55 | 0.07 | 3.35 | 3.42 | — | — | — | — | |||||||||||||||||||||||||||||||
Year Ended December 31, 2015 | $ | 55.50 | 0.15 | (1.17 | ) | (1.02 | ) | (0.15 | ) | (1.78 | ) | (1.93 | ) | — | (f) | |||||||||||||||||||||||||
Year Ended December 31, 2014 | $ | 51.63 | 0.02 | 3.85 | 3.87 | (0.02 | ) | — | (0.02 | ) | 0.02 | |||||||||||||||||||||||||||||
Year Ended December 31, 2013 | $ | 37.47 | (0.01 | ) | 14.17 | 14.16 | — | — | — | — | (f) | |||||||||||||||||||||||||||||
Year Ended December 31, 2012 | $ | 32.65 | 0.19 | 4.84 | 5.03 | (0.21 | ) | — | (0.21 | ) | — | (f) | ||||||||||||||||||||||||||||
Year Ended December 31, 2011 | $ | 37.20 | 0.13 | (4.53 | ) | (4.40 | ) | (0.15 | ) | — | (0.15 | ) | — | (f) | ||||||||||||||||||||||||||
Sterling Capital Stratton Real Estate Fund(e) | ||||||||||||||||||||||||||||||||||||||||
Period Ended September 30, 2016 | $ | 36.01 | 0.61 | 3.62 | 4.23 | (0.50 | ) | — | (0.50 | ) | — | |||||||||||||||||||||||||||||
Year Ended December 31, 2015 | $ | 36.44 | 0.66 | (0.04 | ) | 0.62 | (0.59 | ) | (0.47 | ) | (1.06 | ) | 0.01 | |||||||||||||||||||||||||||
Year Ended December 31, 2014 | $ | 29.86 | 0.62 | 8.47 | 9.09 | (0.62 | ) | (1.89 | ) | (2.51 | ) | — | (f) | |||||||||||||||||||||||||||
Year Ended December 31, 2013 | $ | 29.98 | 0.49 | 0.21 | 0.70 | (0.15 | ) | (0.67 | ) | (0.82 | ) | — | (f) | |||||||||||||||||||||||||||
Year Ended December 31, 2012 | $ | 26.98 | 0.44 | 4.50 | 4.94 | (0.38 | ) | (1.56 | ) | (1.94 | ) | — | (f) | |||||||||||||||||||||||||||
Year Ended December 31, 2011 | $ | 26.49 | 0.41 | 0.99 | 1.40 | (0.60 | ) | (0.31 | ) | (0.91 | ) | — | (f) | |||||||||||||||||||||||||||
Sterling Capital Stratton Small Cap Value Fund(e) | ||||||||||||||||||||||||||||||||||||||||
Period Ended September 30, 2016 | $ | 69.89 | 0.10 | 8.47 | 8.57 | — | — | — | ||||||||||||||||||||||||||||||||
Year Ended December 31, 2015 | $ | 74.05 | 0.07 | (3.15 | ) | (3.08 | ) | (0.08 | ) | (1.00 | ) | (1.08 | ) | — | (f) | |||||||||||||||||||||||||
Year Ended December 31, 2014 | $ | 73.31 | 0.02 | 2.21 | 2.23 | (0.02 | ) | (1.48 | ) | (1.50 | ) | 0.01 | ||||||||||||||||||||||||||||
Year Ended December 31, 2013 | $ | 55.38 | (0.01 | ) | 21.47 | 21.46 | — | (3.53 | ) | (3.53 | ) | — | (f) | |||||||||||||||||||||||||||
Year Ended December 31, 2012 | $ | 49.79 | 0.07 | 7.39 | 7.46 | (0.08 | ) | (1.79 | ) | (1.87 | ) | — | (f) | |||||||||||||||||||||||||||
Year Ended December 31, 2011 | $ | 49.62 | (0.06 | ) | 0.23 | 0.17 | — | — | — | — | (f) | |||||||||||||||||||||||||||||
Sterling Capital Ultra Short Bond Fund | ||||||||||||||||||||||||||||||||||||||||
Year Ended September 30, 2016 | $ | 9.86 | 0.09 | 0.03 | 0.12 | (0.17 | ) | — | (0.17 | ) | ||||||||||||||||||||||||||||||
Year Ended September 30, 2015 | $ | 9.94 | 0.07 | (0.03 | ) | 0.04 | (0.12 | ) | — | (0.12 | ) | — | ||||||||||||||||||||||||||||
Year Ended September 30, 2014 | $ | 9.98 | 0.08 | (0.03 | ) | 0.05 | (0.09 | ) | — | (0.09 | ) | — | ||||||||||||||||||||||||||||
November 30, 2012 to September 30, 2013(d) | $ | 10.00 | 0.05 | (0.01 | ) | 0.04 | (0.06 | ) | — | (0.06 | ) | — | ||||||||||||||||||||||||||||
| * | During the periods certain fees were waived (See Note 5 in the Notes to the Financial Statements). If such reductions had not occurred, the ratios would have been as indicated. |
| ** | Portfolio turnover rate is calculated on the basis of the Fund as a whole without distinguishing between classes of shares issued. |
| (a) | Per share net investment income (loss) has been calculated using the average daily shares method. |
| (b) | Not annualized for periods less than one year. |
| (c) | Annualized for periods less than one year. |
| (d) | Period from commencement of operations. |
| (e) | Each of the Stratton Mid Cap Value Fund, the Stratton Real Estate Fund, and the Stratton Small Cap Value Fund (collectively, the “Predecessor Funds”) transferred its assets and liabilities to, Sterling Capital Stratton Mid Cap Value Fund, Sterling Capital Stratton Real Estate Fund and Sterling Capital Stratton Small Cap Value Fund, respectively (collectively, the “Fund Mergers”) at the close of business on November 13, 2015. Because the Funds had no investment operations prior to the closing of the Fund Mergers, and based on the similarity of the Funds to the Predecessor Funds, each Predecessor Fund is treated as the survivor of the relevant Fund Merger for accounting and performance reporting purposes. |
| (f) | Amount is less than $0.005. |
See accompanying Notes to the Financial Statements.
182
XXUPDATEXXX
|
| Ratios/Supplementary Data | |||||||||||||||||||||||||||||||||
| Net Asset Value, End of Period | Total Return (b) | Net Assets, End of Period (000) | Ratio of net expenses to average net assets (c) | Ratio of net investment income (loss) to average net assets (c) | Ratio of expenses to average net assets* | Portfolio turnover rate**(b) | |||||||||||||||||||||||||||
| $ | 9.69 | 7.30 | % | $ | 69,954 | 0.80 | % | 2.48 | % | 1.16 | % | 125.35 | % | ||||||||||||||||||||
| $ | 9.24 | (7.36 | )% | $ | 18,592 | 1.03 | % | 2.82 | % | 1.18 | % | 133.50 | % | ||||||||||||||||||||
| $ | 55.97 | 6.51 | % | $ | 63,513 | 0.95 | % | 0.18 | % | 0.97 | % | 11.16 | % | ||||||||||||||||||||
| $ | 52.55 | (1.75 | )% | $ | 64,364 | 1.04 | % | 0.26 | % | 1.04 | % | 19.28 | % | ||||||||||||||||||||
| $ | 55.50 | 7.54 | % | $ | 74,637 | 1.05 | % | 0.03 | % | 1.05 | % | 55.45 | % | ||||||||||||||||||||
| $ | 51.63 | 37.79 | % | $ | 67,937 | 1.16 | % | (0.02 | )% | 1.16 | % | 24.21 | % | ||||||||||||||||||||
| $ | 37.47 | 15.40 | % | $ | 52,697 | 1.21 | % | 0.54 | % | 1.21 | % | 63.11 | % | ||||||||||||||||||||
| $ | 32.65 | (11.84 | )% | $ | 52,374 | 1.18 | % | 0.36 | % | 1.18 | % | 33.56 | % | ||||||||||||||||||||
| $ | 39.74 | 11.73 | % | $ | 104,688 | 0.83 | % | 2.13 | % | 0.85 | % | 18.43 | % | ||||||||||||||||||||
| $ | 36.01 | 1.85 | % | $ | 96,198 | 0.89 | % | 1.82 | % | 0.89 | % | 15.47 | % | ||||||||||||||||||||
| $ | 36.44 | 30.69 | % | $ | 93,984 | 0.96 | % | 1.81 | % | 0.96 | % | 14.20 | % | ||||||||||||||||||||
| $ | 29.86 | 2.35 | % | $ | 78,589 | 0.97 | % | 1.55 | % | 0.97 | % | 17.75 | % | ||||||||||||||||||||
| $ | 29.98 | 18.61 | % | $ | 84,081 | 1.01 | % | 1.47 | % | 1.01 | % | 27.62 | % | ||||||||||||||||||||
| $ | 26.98 | 5.35 | % | $ | 78,321 | 1.03 | % | 1.53 | % | 1.03 | % | 14.66 | % | ||||||||||||||||||||
| $ | 78.46 | 12.26 | % | $ | 1,213,344 | 1.08 | % | 0.20 | % | 1.08 | % | 3.42 | % | ||||||||||||||||||||
| $ | 69.89 | (4.14 | )% | $ | 1,156,577 | 1.11 | % | 0.10 | % | 1.11 | % | 6.33 | % | ||||||||||||||||||||
| $ | 74.05 | 3.09 | % | $ | 1,413,694 | 1.11 | % | 0.03 | % | 1.11 | % | 11.15 | % | ||||||||||||||||||||
| $ | 73.31 | 39.24 | % | $ | 1,161,329 | 1.15 | % | (0.02 | )% | 1.15 | % | 9.18 | % | ||||||||||||||||||||
| $ | 55.38 | 15.10 | % | $ | 829,725 | 1.19 | % | 0.12 | % | 1.19 | % | 11.02 | % | ||||||||||||||||||||
| $ | 49.79 | 0.34 | % | $ | 771,646 | 1.20 | % | (0.11 | )% | 1.20 | % | 15.58 | % | ||||||||||||||||||||
| $ | 9.81 | 1.24 | % | $ | 54,183 | 0.45 | % | 0.90 | % | 0.54 | % | 43.02 | % | ||||||||||||||||||||
| $ | 9.86 | 0.40 | % | $ | 35,384 | 0.53 | % | 0.66 | % | 0.55 | % | 66.19 | % | ||||||||||||||||||||
| $ | 9.94 | 0.46 | % | $ | 47,197 | 0.48 | % | 0.76 | % | 0.48 | % | 79.98 | % | ||||||||||||||||||||
| $ | 9.98 | 0.35 | % | $ | 40,625 | 0.48 | % | 0.65 | % | 0.48 | % | 55.18 | % | ||||||||||||||||||||
183
Sterling Capital Funds
|
Financial Highlights, Institutional Shares |
The financial highlights table is intended to help you understand the Funds’ financial performance for the past 5 years or, if shorter, the period of the Funds’ operations. Certain information reflects financial results for a single Fund share. The total returns in the table represent the rate that an investor would have earned (or lost) on an investment in the Fund (assuming reinvestment of all dividends and distributions).
| Investment Activities | Distributions | |||||||||||||||||||||||||||||||||||||||
| Net Asset Value, Beginning of Period | Net investment income(a) | Net realized/ unrealized gains (losses) on investments | Total from Investment Activities | Net investment income | Net realized gains on investments | Return of capital | Total Distributions | |||||||||||||||||||||||||||||||||
Sterling Capital Short Duration Bond Fund | ||||||||||||||||||||||||||||||||||||||||
Year Ended September 30, 2016 | $ | 8.86 | 0.12 | 0.07 | 0.19 | (0.24 | ) | — | — | (0.24 | ) | |||||||||||||||||||||||||||||
Year Ended September 30, 2015 | $ | 9.07 | 0.13 | (0.06 | ) | 0.07 | (0.28 | ) | — | — | (0.28 | ) | ||||||||||||||||||||||||||||
Year Ended September 30, 2014 | $ | 9.24 | 0.16 | (0.03 | ) | 0.13 | (0.30 | ) | — | — | (0.30 | ) | ||||||||||||||||||||||||||||
Year Ended September 30, 2013 | $ | 9.47 | 0.19 | (0.10 | ) | 0.09 | (0.32 | ) | — | — | (0.32 | ) | ||||||||||||||||||||||||||||
Year Ended September 30, 2012 | $ | 9.36 | 0.22 | 0.24 | 0.46 | (0.35 | ) | — | — | (0.35 | ) | |||||||||||||||||||||||||||||
Sterling Capital Intermediate U.S. Government Fund | ||||||||||||||||||||||||||||||||||||||||
Year Ended September 30, 2016 | $ | 10.19 | 0.15 | 0.12 | 0.27 | (0.21 | ) | — | — | (0.21 | ) | |||||||||||||||||||||||||||||
Year Ended September 30, 2015 | $ | 10.21 | 0.16 | 0.04 | 0.20 | (0.22 | ) | — | — | (0.22 | ) | |||||||||||||||||||||||||||||
Year Ended September 30, 2014 | $ | 10.30 | 0.17 | 0.09 | 0.26 | (0.35 | ) | — | — | (0.35 | ) | |||||||||||||||||||||||||||||
Year Ended September 30, 2013 | $ | 10.87 | 0.19 | (0.44 | ) | (0.25 | ) | (0.32 | ) | — | — | (0.32 | ) | |||||||||||||||||||||||||||
Year Ended September 30, 2012 | $ | 10.80 | 0.23 | 0.16 | 0.39 | (0.32 | ) | — | — | (0.32 | ) | |||||||||||||||||||||||||||||
Sterling Capital Total Return Bond Fund | ||||||||||||||||||||||||||||||||||||||||
Year Ended September 30, 2016 | $ | 10.54 | 0.28 | 0.35 | 0.63 | (0.35 | ) | — | — | (0.35 | ) | |||||||||||||||||||||||||||||
Year Ended September 30, 2015 | $ | 10.67 | 0.31 | (0.07 | ) | 0.24 | (0.37 | ) | — | — | (0.37 | ) | ||||||||||||||||||||||||||||
Year Ended September 30, 2014 | $ | 10.53 | 0.34 | 0.21 | 0.55 | (0.40 | ) | (0.01 | ) | — | (0.41 | ) | ||||||||||||||||||||||||||||
Year Ended September 30, 2013 | $ | 11.16 | 0.32 | (0.46 | ) | (0.14 | ) | (0.41 | ) | (0.08 | ) | — | (0.49 | ) | ||||||||||||||||||||||||||
Year Ended September 30, 2012 | $ | 11.06 | 0.32 | 0.46 | 0.78 | (0.41 | ) | (0.27 | ) | — | (0.68 | ) | ||||||||||||||||||||||||||||
Sterling Capital Corporate Fund | ||||||||||||||||||||||||||||||||||||||||
Year Ended September 30, 2016 | $ | 10.10 | 0.31 | 0.26 | 0.57 | (0.31 | ) | — | — | (0.31 | ) | |||||||||||||||||||||||||||||
Year Ended September 30, 2015 | $ | 10.25 | 0.32 | (0.14 | ) | 0.18 | (0.31 | ) | (0.01 | ) | (0.01 | ) | (0.33 | ) | ||||||||||||||||||||||||||
Year Ended September 30, 2014 | $ | 10.15 | 0.34 | 0.20 | 0.54 | (0.34 | ) | (0.10 | ) | — | (0.44 | ) | ||||||||||||||||||||||||||||
Year Ended September 30, 2013 | $ | 10.70 | 0.37 | (0.44 | ) | (0.07 | ) | (0.37 | ) | (0.11 | ) | — | (0.48 | ) | ||||||||||||||||||||||||||
Year Ended September 30, 2012 | $ | 9.94 | 0.36 | 0.77 | 1.13 | (0.36 | ) | (0.01 | ) | — | (0.37 | ) | ||||||||||||||||||||||||||||
Sterling Capital Securitized Opportunities Fund | ||||||||||||||||||||||||||||||||||||||||
Year Ended September 30, 2016 | $ | 9.98 | 0.22 | 0.16 | 0.38 | (0.26 | ) | — | — | (0.26 | ) | |||||||||||||||||||||||||||||
Year Ended September 30, 2015 | $ | 9.91 | 0.23 | 0.12 | 0.35 | (0.28 | ) | — | — | (0.28 | ) | |||||||||||||||||||||||||||||
Year Ended September 30, 2014 | $ | 9.85 | 0.25 | 0.11 | 0.36 | (0.30 | ) | — | — | (0.30 | ) | |||||||||||||||||||||||||||||
Year Ended September 30, 2013 | $ | 10.29 | 0.24 | (0.34 | ) | (0.10 | ) | (0.34 | ) | — | — | (0.34 | ) | |||||||||||||||||||||||||||
Year Ended September 30, 2012 | $ | 10.11 | 0.26 | 0.30 | 0.56 | (0.37 | ) | (0.01 | ) | — | (0.38 | ) | ||||||||||||||||||||||||||||
Sterling Capital Kentucky Intermediate Tax-Free Fund | ||||||||||||||||||||||||||||||||||||||||
Year Ended September 30, 2016 | $ | 10.61 | 0.27 | 0.14 | 0.41 | (0.26 | ) | (0.13 | ) | — | (0.39 | ) | ||||||||||||||||||||||||||||
Year Ended September 30, 2015 | $ | 10.84 | 0.28 | (0.05 | ) | 0.23 | (0.28 | ) | (0.18 | ) | — | (0.46 | ) | |||||||||||||||||||||||||||
Year Ended September 30, 2014 | $ | 10.65 | 0.29 | 0.19 | 0.48 | (0.29 | ) | — | — | (0.29 | ) | |||||||||||||||||||||||||||||
Year Ended September 30, 2013 | $ | 11.15 | 0.27 | (0.44 | ) | (0.17 | ) | (0.27 | ) | (0.06 | ) | — | (0.33 | ) | ||||||||||||||||||||||||||
Year Ended September 30, 2012 | $ | 10.79 | 0.29 | 0.39 | 0.68 | (0.29 | ) | (0.03 | ) | — | (0.32 | ) | ||||||||||||||||||||||||||||
Sterling Capital Maryland Intermediate Tax-Free Fund | ||||||||||||||||||||||||||||||||||||||||
Year Ended September 30, 2016 | $ | 11.19 | 0.23 | 0.21 | 0.44 | (0.23 | ) | (0.07 | ) | — | (0.30 | ) | ||||||||||||||||||||||||||||
Year Ended September 30, 2015 | $ | 11.25 | 0.23 | — | (d) | 0.23 | (0.23 | ) | (0.06 | ) | — | (0.29 | ) | |||||||||||||||||||||||||||
Year Ended September 30, 2014 | $ | 10.97 | 0.22 | 0.28 | 0.50 | (0.22 | ) | — | — | (0.22 | ) | |||||||||||||||||||||||||||||
Year Ended September 30, 2013 | $ | 11.58 | 0.22 | (0.46 | ) | (0.24 | ) | (0.22 | ) | (0.15 | ) | — | (0.37 | ) | ||||||||||||||||||||||||||
Year Ended September 30, 2012 | $ | 11.25 | 0.26 | 0.41 | 0.67 | (0.26 | ) | (0.08 | ) | — | (0.34 | ) | ||||||||||||||||||||||||||||
| * | During the periods certain fees were waived (See Note 5 in the Notes to the Financial Statements). If such reductions had not occurred, the ratios would have been as indicated. |
| ** | Portfolio turnover rate is calculated on the basis of the Fund as a whole without distinguishing between classes of shares issued. |
| (a) | Per share net investment income (loss) has been calculated using the average daily shares method. |
| (b) | Not annualized for periods less than one year. |
| (c) | Annualized for periods less than one year. |
| (d) | Amount is less than $0.005. |
See accompanying Notes to the Financial Statements.
184
| Ratios/Supplementary Data | ||||||||||||||||||||||||||||||||||
| Net Asset Value, End of Period | Total Return (b) | Net Assets, End of Period (000) | Ratio of net expenses to average net assets (c) | Ratio of net investment income to average net assets (c) | Ratio of expenses to average net assets*(c) | Portfolio turnover rate**(b) | ||||||||||||||||||||||||||||
| $ | 8.81 | 2.24 | % | $ | 77,374 | 0.49 | % | 1.34 | % | 0.56 | % | 54.68 | % | |||||||||||||||||||||
| $ | 8.86 | 0.82 | % | $ | 78,390 | 0.55 | % | 1.41 | % | 0.57 | % | 55.74 | % | |||||||||||||||||||||
| $ | 9.07 | 1.38 | % | $ | 81,206 | 0.52 | % | 1.72 | % | 0.55 | % | 56.10 | % | |||||||||||||||||||||
| $ | 9.24 | 0.98 | % | $ | 62,115 | 0.52 | % | 2.08 | % | 0.56 | % | 56.09 | % | |||||||||||||||||||||
| $ | 9.47 | 4.94 | % | $ | 47,235 | 0.56 | % | 2.30 | % | 0.58 | % | 85.13 | % | |||||||||||||||||||||
| $ | 10.25 | 2.63 | % | $ | 18,871 | 0.61 | % | 1.48 | % | 0.72 | % | 49.39 | % | |||||||||||||||||||||
| $ | 10.19 | 1.98 | % | $ | 21,648 | 0.67 | % | 1.56 | % | 0.73 | % | 62.02 | % | |||||||||||||||||||||
| $ | 10.21 | 2.58 | % | $ | 23,119 | 0.68 | % | 1.66 | % | 0.68 | % | 35.74 | % | |||||||||||||||||||||
| $ | 10.30 | (2.30 | )% | $ | 46,686 | 0.68 | % | 1.76 | % | 0.68 | % | 66.16 | % | |||||||||||||||||||||
| $ | 10.87 | 3.67 | % | $ | 77,460 | 0.72 | % | 2.12 | % | 0.77 | % | 71.68 | % | |||||||||||||||||||||
| $ | 10.82 | 6.10 | % | $ | 709,103 | 0.49 | % | 2.67 | % | 0.59 | % | 65.47 | % | |||||||||||||||||||||
| $ | 10.54 | 2.29 | % | $ | 612,927 | 0.48 | % | 2.88 | % | 0.58 | % | 41.37 | % | |||||||||||||||||||||
| $ | 10.67 | 5.29 | % | $ | 433,198 | 0.56 | % | 3.15 | % | 0.58 | % | 75.21 | % | |||||||||||||||||||||
| $ | 10.53 | (1.26 | )% | $ | 436,641 | 0.57 | % | 2.93 | % | 0.59 | % | 149.09 | % | |||||||||||||||||||||
| $ | 11.16 | 7.39 | % | $ | 514,368 | 0.62 | % | 2.90 | % | 0.66 | % | 110.82 | % | |||||||||||||||||||||
| $ | 10.36 | 5.70 | % | $ | 31,755 | 0.64 | % | 3.02 | % | 0.64 | % | 83.88 | % | |||||||||||||||||||||
| $ | 10.10 | 1.76 | % | $ | 63,992 | 0.63 | % | 3.12 | % | 0.63 | % | 33.94 | % | |||||||||||||||||||||
| $ | 10.25 | 5.42 | % | $ | 50,353 | 0.60 | % | 3.30 | % | 0.60 | % | 105.03 | % | |||||||||||||||||||||
| $ | 10.15 | (0.65 | )% | $ | 85,609 | 0.51 | % | 3.54 | % | 0.59 | % | 99.48 | % | |||||||||||||||||||||
| $ | 10.70 | 11.54 | % | $ | 92,946 | 0.34 | % | 3.52 | % | 0.59 | % | 73.74 | % | |||||||||||||||||||||
| $ | 10.10 | 3.86 | % | $ | 46,364 | 0.61 | % | 2.16 | % | 0.65 | % | 43.63 | % | |||||||||||||||||||||
| $ | 9.98 | 3.54 | % | $ | 46,249 | 0.59 | % | 2.28 | % | 0.63 | % | 19.85 | % | |||||||||||||||||||||
| $ | 9.91 | 3.75 | % | $ | 36,624 | 0.61 | % | 2.50 | % | 0.63 | % | 98.34 | % | |||||||||||||||||||||
| $ | 9.85 | (0.97 | )% | $ | 58,503 | 0.51 | % | 2.33 | % | 0.62 | % | 193.21 | % | |||||||||||||||||||||
| $ | 10.29 | 5.61 | % | $ | 88,523 | 0.34 | % | 2.54 | % | 0.59 | % | 113.69 | % | |||||||||||||||||||||
| $ | 10.63 | 3.95 | % | $ | 8,580 | 0.66 | % | 2.50 | % | 0.77 | % | 16.44 | % | |||||||||||||||||||||
| $ | 10.61 | 2.15 | % | $ | 9,533 | 0.70 | % | 2.62 | % | 0.79 | % | 17.34 | % | |||||||||||||||||||||
| $ | 10.84 | 4.57 | % | $ | 10,532 | 0.72 | % | 2.72 | % | 0.72 | % | 11.13 | % | |||||||||||||||||||||
| $ | 10.65 | (1.59 | )% | $ | 11,859 | 0.71 | % | 2.47 | % | 0.71 | % | 22.05 | % | |||||||||||||||||||||
| $ | 11.15 | 6.39 | % | $ | 14,546 | 0.70 | % | 2.68 | % | 0.72 | % | 16.52 | % | |||||||||||||||||||||
| $ | 11.33 | 3.97 | % | $ | 24,621 | 0.61 | % | 2.00 | % | 0.71 | % | 14.36 | % | |||||||||||||||||||||
| $ | 11.19 | 2.05 | % | $ | 28,968 | 0.65 | % | 2.07 | % | 0.71 | % | 18.38 | % | |||||||||||||||||||||
| $ | 11.25 | 4.61 | % | $ | 30,519 | 0.69 | % | 1.99 | % | 0.69 | % | 19.90 | % | |||||||||||||||||||||
| $ | 10.97 | (2.14 | )% | $ | 34,574 | 0.70 | % | 1.94 | % | 0.70 | % | 70.60 | % | |||||||||||||||||||||
| $ | 11.58 | 6.05 | % | $ | 33,974 | 0.70 | % | 2.31 | % | 0.72 | % | 34.94 | % | |||||||||||||||||||||
185
Sterling Capital Funds
|
Financial Highlights, Institutional Shares |
The financial highlights table is intended to help you understand the Funds’ financial performance for the past 5 years or, if shorter, the period of the Funds’ operations. Certain information reflects financial results for a single Fund share. The total returns in the table represent the rate that an investor would have earned (or lost) on an investment in the Fund (assuming reinvestment of all dividends and distributions).
| Investment Activities | Distributions | ||||||||||||||||||||||||||||||||||
| Net Asset Value, Beginning of Period | Net investment income(a) | Net realized/ unrealized gains (losses) on investments | Total from Investment Activities | Net investment income | Net realized gains on investments | Total Distributions | |||||||||||||||||||||||||||||
Sterling Capital North Carolina Intermediate Tax-Free Fund | |||||||||||||||||||||||||||||||||||
Year Ended September 30, 2016 | $ | 10.97 | 0.26 | 0.17 | 0.43 | (0.26 | ) | (0.06 | ) | (0.32 | ) | ||||||||||||||||||||||||
Year Ended September 30, 2015 | $ | 10.98 | 0.27 | 0.01 | 0.28 | (0.27 | ) | (0.02 | ) | (0.29 | ) | ||||||||||||||||||||||||
Year Ended September 30, 2014 | $ | 10.74 | 0.27 | 0.24 | 0.51 | (0.27 | ) | — | (0.27 | ) | |||||||||||||||||||||||||
Year Ended September 30, 2013 | $ | 11.36 | 0.28 | (0.54 | ) | (0.26 | ) | (0.28 | ) | (0.08 | ) | (0.36 | ) | ||||||||||||||||||||||
Year Ended September 30, 2012 | $ | 11.02 | 0.30 | 0.40 | 0.70 | (0.29 | ) | (0.07 | ) | (0.36 | ) | ||||||||||||||||||||||||
Sterling Capital South Carolina Intermediate Tax-Free Fund | |||||||||||||||||||||||||||||||||||
Year Ended September 30, 2016 | $ | 11.06 | 0.23 | 0.20 | 0.43 | (0.23 | ) | (0.04 | ) | (0.27 | ) | ||||||||||||||||||||||||
Year Ended September 30, 2015 | $ | 11.07 | 0.24 | 0.01 | 0.25 | (0.24 | ) | (0.02 | ) | (0.26 | ) | ||||||||||||||||||||||||
Year Ended September 30, 2014 | $ | 10.78 | 0.25 | 0.29 | 0.54 | (0.25 | ) | — | (0.25 | ) | |||||||||||||||||||||||||
Year Ended September 30, 2013 | $ | 11.28 | 0.24 | (0.42 | ) | (0.18 | ) | (0.24 | ) | (0.08 | ) | (0.32 | ) | ||||||||||||||||||||||
Year Ended September 30, 2012 | $ | 10.90 | 0.27 | 0.45 | 0.72 | (0.27 | ) | (0.07 | ) | (0.34 | ) | ||||||||||||||||||||||||
Sterling Capital Virginia Intermediate Tax-Free Fund | |||||||||||||||||||||||||||||||||||
Year Ended September 30, 2016 | $ | 11.98 | 0.27 | 0.19 | 0.46 | (0.27 | ) | (0.04 | ) | (0.31 | ) | ||||||||||||||||||||||||
Year Ended September 30, 2015 | $ | 12.06 | 0.28 | (0.01 | ) | 0.27 | (0.28 | ) | (0.07 | ) | (0.35 | ) | |||||||||||||||||||||||
Year Ended September 30, 2014 | $ | 11.79 | 0.27 | 0.27 | 0.54 | (0.27 | ) | — | (0.27 | ) | |||||||||||||||||||||||||
Year Ended September 30, 2013 | $ | 12.44 | 0.27 | (0.55 | ) | (0.28 | ) | (0.27 | ) | (0.10 | ) | (0.37 | ) | ||||||||||||||||||||||
Year Ended September 30, 2012 | $ | 12.12 | 0.31 | 0.39 | 0.70 | (0.31 | ) | (0.07 | ) | (0.38 | ) | ||||||||||||||||||||||||
Sterling Capital West Virginia Intermediate Tax-Free Fund | |||||||||||||||||||||||||||||||||||
Year Ended September 30, 2016 | $ | 10.15 | 0.24 | 0.17 | 0.41 | (0.23 | ) | (0.05 | ) | (0.28 | ) | ||||||||||||||||||||||||
Year Ended September 30, 2015 | $ | 10.17 | 0.24 | 0.01 | 0.25 | (0.24 | ) | (0.03 | ) | (0.27 | ) | ||||||||||||||||||||||||
Year Ended September 30, 2014 | $ | 9.92 | 0.24 | 0.25 | 0.49 | (0.24 | ) | — | (0.24 | ) | |||||||||||||||||||||||||
Year Ended September 30, 2013 | $ | 10.52 | 0.24 | (0.48 | ) | (0.24 | ) | (0.24 | ) | (0.12 | ) | (0.36 | ) | ||||||||||||||||||||||
Year Ended September 30, 2012 | $ | 10.17 | 0.29 | 0.39 | 0.68 | (0.29 | ) | (0.04 | ) | (0.33 | ) | ||||||||||||||||||||||||
Sterling Capital Diversified Income Fund | |||||||||||||||||||||||||||||||||||
Year Ended September 30, 2016 | $ | 10.32 | 0.36 | 0.66 | 1.02 | (0.40 | ) | — | (0.40 | ) | |||||||||||||||||||||||||
Year Ended September 30, 2015 | $ | 10.71 | 0.46 | (0.58 | ) | (0.12 | ) | (0.27 | ) | — | (0.27 | ) | |||||||||||||||||||||||
Year Ended September 30, 2014 | $ | 10.05 | 0.24 | 0.68 | 0.92 | (0.26 | ) | — | (0.26 | ) | |||||||||||||||||||||||||
Year Ended September 30, 2013(c) | $ | 9.79 | 0.24 | 0.28 | 0.52 | (0.26 | ) | — | (0.26 | ) | |||||||||||||||||||||||||
Year Ended September 30, 2012 | $ | 8.83 | 0.22 | 0.96 | 1.18 | (0.22 | ) | — | (0.22 | ) | |||||||||||||||||||||||||
Sterling Capital Strategic Allocation Balanced Fund | |||||||||||||||||||||||||||||||||||
Year Ended September 30, 2016 | $ | 10.39 | 0.20 | 0.54 | 0.74 | (0.23 | ) | — | (0.23 | ) | |||||||||||||||||||||||||
Year Ended September 30, 2015 | $ | 10.73 | 0.16 | (0.32 | ) | (0.16 | ) | (0.18 | ) | — | (0.18 | ) | |||||||||||||||||||||||
Year Ended September 30, 2014 | $ | 9.83 | 0.19 | 0.92 | 1.11 | (0.21 | ) | — | (0.21 | ) | |||||||||||||||||||||||||
Year Ended September 30, 2013 | $ | 9.18 | 0.18 | 0.66 | 0.84 | (0.19 | ) | — | (0.19 | ) | |||||||||||||||||||||||||
Year Ended September 30, 2012(c) | $ | 8.00 | 0.17 | 1.18 | 1.35 | (0.17 | ) | — | (0.17 | ) | |||||||||||||||||||||||||
Sterling Capital Strategic Allocation Growth Fund | |||||||||||||||||||||||||||||||||||
Year Ended September 30, 2016 | $ | 10.01 | 0.14 | 0.61 | 0.75 | (0.20 | ) | — | (0.20 | ) | |||||||||||||||||||||||||
Year Ended September 30, 2015 | $ | 10.41 | 0.11 | (0.38 | ) | (0.27 | ) | (0.13 | ) | — | (0.13 | ) | |||||||||||||||||||||||
Year Ended September 30, 2014 | $ | 9.37 | 0.15 | 1.05 | 1.20 | (0.16 | ) | — | (0.16 | ) | |||||||||||||||||||||||||
Year Ended September 30, 2013 | $ | 8.48 | 0.13 | 0.90 | 1.03 | (0.14 | ) | — | (0.14 | ) | |||||||||||||||||||||||||
Year Ended September 30, 2012 | $ | 7.21 | 0.12 | 1.27 | 1.39 | (0.12 | ) | — | (0.12 | ) | |||||||||||||||||||||||||
| * | During the periods certain fees were waived (See Note 5 in the Notes to the Financial Statements). If such reductions had not occurred, the ratios would have been as indicated. |
| ** | Portfolio turnover rate is calculated on the basis of the Fund as a whole without distinguishing between classes of shares issued. |
| (a) | Per share net investment income has been calculated using the average daily shares method. |
| (b) | Annualized for periods less than one year. |
| (c) | The expense ratios exclude the impact of fees/expenses paid by each underlying fund. |
See accompanying Notes to the Financial Statements.
186
| Ratios/Supplementary Data | ||||||||||||||||||||||||||||||||||||
| Net Asset Value, End of Period | Total Return | Net Assets, End of Period (000) | Ratio of net expenses to average net assets (b) | Ratio of net investment income to average net assets | Ratio of expenses to average net assets* | Portfolio turnover rate** | ||||||||||||||||||||||||||||||
| $ | 11.08 | 3.94 | % | $ | 157,284 | 0.55 | % | 2.33 | % | 0.65 | % | 10.05 | % | |||||||||||||||||||||||
| $ | 10.97 | 2.53 | % | $ | 147,048 | 0.59 | % | 2.44 | % | 0.66 | % | 16.80 | % | |||||||||||||||||||||||
| $ | 10.98 | 4.81 | % | $ | 151,267 | 0.66 | % | 2.50 | % | 0.66 | % | 11.67 | % | |||||||||||||||||||||||
| $ | 10.74 | (2.38 | )% | $ | 159,039 | 0.67 | % | 2.49 | % | 0.67 | % | 22.38 | % | |||||||||||||||||||||||
| $ | 11.36 | 6.51 | % | $ | 190,055 | 0.67 | % | 2.64 | % | 0.67 | % | 19.76 | % | |||||||||||||||||||||||
| $ | 11.22 | 3.87 | % | $ | 72,722 | 0.57 | % | 2.03 | % | 0.67 | % | 2.69 | % | |||||||||||||||||||||||
| $ | 11.06 | 2.27 | % | $ | 58,132 | 0.61 | % | 2.17 | % | 0.68 | % | 12.53 | % | |||||||||||||||||||||||
| $ | 11.07 | 5.03 | % | $ | 49,157 | 0.68 | % | 2.27 | % | 0.68 | % | �� | 15.51 | % | ||||||||||||||||||||||
| $ | 10.78 | (1.62 | )% | $ | 49,340 | 0.69 | % | 2.17 | % | 0.69 | % | 35.38 | % | |||||||||||||||||||||||
| $ | 11.28 | 6.68 | % | $ | 52,526 | 0.70 | % | 2.41 | % | 0.70 | % | 26.49 | % | |||||||||||||||||||||||
| $ | 12.13 | 3.91 | % | $ | 83,965 | 0.56 | % | 2.23 | % | 0.66 | % | 16.18 | % | |||||||||||||||||||||||
| $ | 11.98 | 2.24 | % | $ | 78,506 | 0.60 | % | 2.33 | % | 0.67 | % | 16.01 | % | |||||||||||||||||||||||
| $ | 12.06 | 4.65 | % | $ | 79,895 | 0.66 | % | 2.29 | % | 0.66 | % | 20.48 | % | |||||||||||||||||||||||
| $ | 11.79 | (2.28 | )% | $ | 81,703 | 0.68 | % | 2.23 | % | 0.68 | % | 40.00 | % | |||||||||||||||||||||||
| $ | 12.44 | 5.87 | % | $ | 91,770 | 0.68 | % | 2.50 | % | 0.68 | % | 21.63 | % | |||||||||||||||||||||||
| $ | 10.28 | 4.18 | % | $ | 64,199 | 0.57 | % | 2.30 | % | 0.67 | % | 11.31 | % | |||||||||||||||||||||||
| $ | 10.15 | 2.44 | % | $ | 66,716 | 0.60 | % | 2.37 | % | 0.67 | % | 10.34 | % | |||||||||||||||||||||||
| $ | 10.17 | 4.98 | % | $ | 70,273 | 0.66 | % | 2.39 | % | 0.66 | % | 21.09 | % | |||||||||||||||||||||||
| $ | 9.92 | (2.30 | )% | $ | 68,936 | 0.68 | % | 2.38 | % | 0.68 | % | 22.18 | % | |||||||||||||||||||||||
| $ | 10.52 | 6.85 | % | $ | 85,125 | 0.68 | % | 2.85 | % | 0.68 | % | 26.70 | % | |||||||||||||||||||||||
| $ | 10.94 | 10.13 | % | $ | 26,328 | 0.39 | % | 3.43 | % | 0.47 | % | 67.18 | % | |||||||||||||||||||||||
| $ | 10.32 | (1.23 | )% | $ | 27,896 | 0.20 | % | 4.29 | % | 0.45 | % | 126.46 | % | |||||||||||||||||||||||
| $ | 10.71 | 9.19 | % | $ | 2,300 | 0.20 | % | 2.32 | % | 0.45 | % | 8.67 | % | |||||||||||||||||||||||
| $ | 10.05 | 5.35 | % | $ | 3,153 | 0.29 | % | 2.42 | % | 0.44 | % | 60.51 | % | |||||||||||||||||||||||
| $ | 9.79 | 13.47 | % | $ | 3,346 | 0.44 | % | 2.33 | % | 0.44 | % | �� | 7.99 | % | ||||||||||||||||||||||
| $ | 10.90 | 7.24 | % | $ | 80 | 0.16 | % | 1.89 | % | 0.40 | % | 5.19 | % | |||||||||||||||||||||||
| $ | 10.39 | (1.57 | )% | $ | 106 | 0.15 | % | 1.43 | % | 0.40 | % | 49.24 | % | |||||||||||||||||||||||
| $ | 10.73 | 11.36 | % | $ | 244 | 0.14 | % | 1.87 | % | 0.39 | % | 5.70 | % | |||||||||||||||||||||||
| $ | 9.83 | 9.28 | % | $ | 321 | 0.26 | % | 1.85 | % | 0.39 | % | 81.00 | % | |||||||||||||||||||||||
| $ | 9.18 | 16.94 | % | $ | 474 | 0.42 | % | 1.98 | % | 0.42 | % | 17.65 | % | |||||||||||||||||||||||
| $ | 10.56 | 7.58 | % | $ | 725 | 0.18 | % | 1.35 | % | 0.43 | % | 5.95 | % | |||||||||||||||||||||||
| $ | 10.01 | (2.67 | )% | $ | 1,516 | 0.17 | % | 1.00 | % | 0.42 | % | 58.40 | % | |||||||||||||||||||||||
| $ | 10.41 | 12.89 | % | $ | 872 | 0.16 | % | 1.46 | % | 0.41 | % | 8.60 | % | |||||||||||||||||||||||
| $ | 9.37 | 12.27 | % | $ | 1,007 | 0.28 | % | 1.46 | % | 0.42 | % | 96.94 | % | |||||||||||||||||||||||
| $ | 8.48 | 19.40 | % | $ | 936 | 0.43 | % | 1.54 | % | 0.43 | % | 20.21 | % | |||||||||||||||||||||||
187
Sterling Capital Funds
|
Financial Highlights, Class R Shares |
The financial highlights table is intended to help you understand the Funds’ financial performance for the past 5 years or, if shorter, the period of the Funds’ operations. Certain information reflects financial results for a single Fund share. The total returns in the table represent the rate that an investor would have earned (or lost) on an investment in the Fund (assuming reinvestment of all dividends and distributions).
| Investment Activities | Distributions | |||||||||||||||||||||||||||||||||||||||
| Net Asset Value, Beginning of Year | Net investment income (loss)(a) |
Net realized/ | Total from Investment Activities | Net investment income | Net realized gains on investments | Total Distributions | ||||||||||||||||||||||||||||||||||
Sterling Capital Mid Value Fund |
| |||||||||||||||||||||||||||||||||||||||
Year Ended September 30, 2016 | $ | 17.59 | (0.02 | ) | 2.02 | 2.00 | — | (3.34 | ) | (3.34 | ) | |||||||||||||||||||||||||||||
Year Ended September 30, 2015 | $ | 18.93 | 0.02 | (0.14 | ) | (0.12 | ) | (0.05 | ) | (1.17 | ) | (1.22 | ) | |||||||||||||||||||||||||||
Year Ended September 30, 2014 | $ | 18.47 | — | (c) | 1.74 | 1.74 | (0.08 | ) | (1.20 | ) | (1.28 | ) | ||||||||||||||||||||||||||||
Year Ended September 30, 2013 | $ | 14.20 | (0.18 | ) | 4.51 | 4.33 | (0.06 | ) | — | (0.06 | ) | |||||||||||||||||||||||||||||
Year Ended September 30, 2012 | $ | 11.36 | 0.08 | 2.90 | 2.98 | (0.14 | ) | — | (0.14 | ) | ||||||||||||||||||||||||||||||
Sterling Capital Behavioral Small Cap Value Equity Fund |
| |||||||||||||||||||||||||||||||||||||||
Year Ended September 30, 2016 | $ | 14.00 | 0.14 | 1.15 | 1.29 | (0.14 | ) | (0.01 | ) | (0.15 | ) | |||||||||||||||||||||||||||||
Year Ended September 30, 2015 | $ | 14.28 | 0.13 | 0.15 | 0.28 | (0.12 | ) | (0.44 | ) | (0.56 | ) | |||||||||||||||||||||||||||||
Year Ended September 30, 2014 | $ | 15.21 | 0.10 | 0.93 | 1.03 | (0.09 | ) | (1.87 | ) | (1.96 | ) | |||||||||||||||||||||||||||||
Year Ended September 30, 2013 | $ | 12.03 | 0.03 | 3.36 | 3.39 | (0.06 | ) | (0.15 | ) | (0.21 | ) | |||||||||||||||||||||||||||||
Year Ended September 30, 2012 | $ | 10.79 | 0.05 | 2.17 | 2.22 | — | (0.98 | ) | (0.98 | ) | ||||||||||||||||||||||||||||||
Sterling Capital Special Opportunities Fund |
| |||||||||||||||||||||||||||||||||||||||
Year Ended September 30, 2016 | $ | 23.28 | (0.05 | ) | 1.91 | 1.86 | — | (3.31 | ) | (3.31 | ) | |||||||||||||||||||||||||||||
Year Ended September 30, 2015 | $ | 23.69 | (0.11 | ) | 0.90 | 0.79 | — | (1.20 | ) | (1.20 | ) | |||||||||||||||||||||||||||||
Year Ended September 30, 2014 | $ | 21.72 | (0.09 | ) | 4.34 | 4.25 | — | (2.28 | ) | (2.28 | ) | |||||||||||||||||||||||||||||
Year Ended September 30, 2013 | $ | 18.83 | 0.01 | (d) | 3.83 | 3.84 | — | (0.95 | ) | (0.95 | ) | |||||||||||||||||||||||||||||
Year Ended September 30, 2012 | $ | 15.54 | (0.04 | ) | 3.64 | 3.60 | — | (0.31 | ) | (0.31 | ) | |||||||||||||||||||||||||||||
Sterling Capital Equity Income Fund |
| |||||||||||||||||||||||||||||||||||||||
Year Ended September 30, 2016 | $ | 17.25 | 0.26 | 2.04 | 2.30 | (0.27 | ) | (1.10 | ) | (1.37 | ) | |||||||||||||||||||||||||||||
Year Ended September 30, 2015 | $ | 18.84 | 0.26 | (1.06 | ) | (0.80 | ) | (0.28 | ) | (0.51 | ) | (0.79 | ) | |||||||||||||||||||||||||||
Year Ended September 30, 2014 | $ | 18.04 | 0.29 | 1.40 | 1.69 | (0.26 | ) | (0.63 | ) | (0.89 | ) | |||||||||||||||||||||||||||||
Year Ended September 30, 2013 | $ | 15.95 | 0.24 | 2.22 | 2.46 | (0.21 | ) | (0.16 | ) | (0.37 | ) | |||||||||||||||||||||||||||||
Year Ended September 30, 2012 | $ | 13.19 | 0.20 | 2.72 | 2.92 | (0.16 | ) | — | (0.16 | ) | ||||||||||||||||||||||||||||||
Sterling Capital Total Return Bond Fund |
| |||||||||||||||||||||||||||||||||||||||
Year Ended September 30, 2016 | $ | 10.49 | 0.23 | 0.35 | 0.58 | (0.30 | ) | — | (0.30 | ) | ||||||||||||||||||||||||||||||
Year Ended September 30, 2015 | $ | 10.62 | 0.25 | (0.06 | ) | 0.19 | (0.32 | ) | — | (0.32 | ) | |||||||||||||||||||||||||||||
Year Ended September 30, 2014 | $ | 10.48 | 0.28 | 0.22 | 0.50 | (0.35 | ) | (0.01 | ) | (0.36 | ) | |||||||||||||||||||||||||||||
Year Ended September 30, 2013 | $ | 11.11 | 0.25 | (0.45 | ) | (0.20 | ) | (0.35 | ) | (0.08 | ) | (0.43 | ) | |||||||||||||||||||||||||||
Year Ended September 30, 2012 | $ | 11.02 | 0.26 | 0.46 | 0.72 | (0.36 | ) | (0.27 | ) | (0.63 | ) | |||||||||||||||||||||||||||||
| * | During the periods certain fees were waived (See Note 5 in the Notes to the Financial Statements). If such reductions had not occurred, the ratios would have been as indicated. |
| ** | Portfolio turnover rate is calculated on the basis of the Fund as a whole without distinguishing between classes of shares issued. |
| (a) | Per share net investment income (loss) has been calculated using the average daily shares method. |
| (b) | Net Assets are below $1,000. |
| (c) | Amount is less than $0.005. |
| (d) | Net investment income per share reflects a special dividend, which amounted to $0.02 per share. Excluding the special dividend, the ratio of net investment income to average net assets would have been (0.05)% per share. |
See accompanying Notes to the Financial Statements.
188
| Ratios/Supplementary Data | |||||||||||||||||||||||||||||||||
| Net Asset Value, End of Year | Total Return (excludes sales charge) | Net Assets, End of Year (000) | Ratio of net expenses to average net assets | Ratio of net investment income loss to average net assets | Ratio of expenses to average net assets* | Portfolio turnover rate** | |||||||||||||||||||||||||||
| $ | 16.25 | 12.82 | % | $ | — | (b) | 1.43 | % | (0.12 | )% | 1.43 | % | 25.45 | % | |||||||||||||||||||
| $ | 17.59 | (0.89 | )% | $ | — | (b) | 1.44 | % | 0.08 | % | 1.44 | % | 30.61 | % | |||||||||||||||||||
| $ | 18.93 | 9.68 | % | $ | — | (b) | 1.39 | % | 0.02 | % | 1.39 | % | 27.30 | % | |||||||||||||||||||
| $ | 18.47 | 30.65 | % | $ | — | (b) | 1.42 | % | (1.04 | )% | 1.42 | % | 34.03 | % | |||||||||||||||||||
| $ | 14.20 | 26.17 | % | $ | — | (b) | 1.44 | % | 0.59 | % | 1.44 | % | 21.62 | % | |||||||||||||||||||
| $ | 15.14 | 9.22 | % | $ | — | (b) | 1.38 | % | 0.99 | % | 1.38 | % | 120.42 | % | |||||||||||||||||||
| $ | 14.00 | 1.84 | % | $ | — | (b) | 1.50 | % | 0.89 | % | 1.50 | % | 101.99 | % | |||||||||||||||||||
| $ | 14.28 | 7.01 | % | $ | — | (b) | 1.45 | % | 0.65 | % | 1.45 | % | 68.50 | % | |||||||||||||||||||
| $ | 15.21 | 28.48 | % | $ | — | (b) | 1.55 | % | 0.24 | % | 1.55 | % | 176.62 | % | |||||||||||||||||||
| $ | 12.03 | 21.49 | % | $ | — | (b) | 1.57 | % | 0.44 | % | 1.59 | % | 32.86 | % | |||||||||||||||||||
| $ | 21.83 | 8.34 | % | $ | 191 | 1.42 | % | (0.25 | )% | 1.48 | % | 27.32 | % | ||||||||||||||||||||
| $ | 23.28 | 3.51 | % | $ | 46 | 1.47 | % | (0.44 | )% | 1.47 | % | 26.98 | % | ||||||||||||||||||||
| $ | 23.69 | 21.36 | % | $ | 26 | 1.46 | % | (0.41 | )% | 1.46 | % | 32.35 | % | ||||||||||||||||||||
| $ | 21.72 | 21.28 | % | $ | 450 | 1.49 | % | 0.04 | %(d) | 1.49 | % | 53.76 | % | ||||||||||||||||||||
| $ | 18.83 | 23.41 | % | $ | 357 | 1.54 | % | (0.25 | )% | 1.54 | % | 19.38 | % | ||||||||||||||||||||
| $ | 18.18 | 14.18 | % | $ | 1,921 | 1.46 | % | 1.54 | % | 1.46 | % | 20.64 | % | ||||||||||||||||||||
| $ | 17.25 | (4.40 | )% | $ | 1,957 | 1.47 | % | 1.40 | % | 1.47 | % | 27.53 | % | ||||||||||||||||||||
| $ | 18.84 | 9.52 | % | $ | 1,811 | 1.45 | % | 1.56 | % | 1.45 | % | 16.13 | % | ||||||||||||||||||||
| $ | 18.04 | 15.69 | % | �� | $ | 2,781 | 1.45 | % | 1.40 | % | 1.45 | % | 30.56 | % | |||||||||||||||||||
| $ | 15.95 | 22.19 | % | $ | 1,454 | 1.44 | % | 1.35 | % | 1.44 | % | 21.30 | % | ||||||||||||||||||||
| $ | 10.77 | 5.59 | % | $ | 5 | 0.99 | % | 2.20 | % | 1.07 | % | 65.47 | % | ||||||||||||||||||||
| $ | 10.49 | 1.77 | % | $ | 6 | 0.98 | % | 2.39 | % | 1.09 | % | 41.37 | % | ||||||||||||||||||||
| $ | 10.62 | 4.81 | % | $ | 6 | 1.04 | % | 2.65 | % | 1.04 | % | 75.21 | % | ||||||||||||||||||||
| $ | 10.48 | (1.83 | )% | $ | 5 | 1.07 | % | 2.34 | % | 1.08 | % | 149.09 | % | ||||||||||||||||||||
| $ | 11.11 | 6.79 | % | $ | 6 | 1.12 | % | 2.41 | % | 1.16 | % | 110.82 | % | ||||||||||||||||||||
189
Sterling Capital Funds
|
September 30, 2016
|
| 1. | Organization: |
Sterling Capital Funds (the “Trust”) commenced operations on October 5, 1992 and is registered under the Investment Company Act of 1940, as amended (“the 1940 Act”), as an open-end investment company established as a Massachusetts business trust.
The Trust offers shares of Sterling Capital Behavioral Large Cap Value Equity Fund, Sterling Capital Mid Value Fund, Sterling Capital Behavioral Small Cap Value Equity Fund, Sterling Capital Special Opportunities Fund, Sterling Capital Equity Income Fund, Sterling Capital Long/Short Equity Fund, Sterling Capital Behavioral International Equity Fund, Sterling Capital Stratton Mid Cap Value Fund, Sterling Capital Stratton Real Estate Fund, Sterling Capital Stratton Small Cap Value Fund, Sterling Capital Ultra Short Bond Fund, Sterling Capital Short Duration Bond Fund, Sterling Capital Intermediate U.S. Government Fund, Sterling Capital Total Return Bond Fund, Sterling Capital Corporate Fund, Sterling Capital Securitized Opportunities Fund, Sterling Capital Kentucky Intermediate Tax-Free Fund, Sterling Capital Maryland Intermediate Tax-Free Fund, Sterling Capital North Carolina Intermediate Tax-Free Fund, Sterling Capital South Carolina Intermediate Tax-Free Fund, Sterling Capital Virginia Intermediate Tax-Free Fund, Sterling Capital West Virginia Intermediate Tax-Free Fund, Sterling Capital Diversified Income Fund, Sterling Capital Strategic Allocation Balanced Fund and Sterling Capital Strategic Allocation Growth Fund (referred to individually as a “Fund” and collectively as the “Funds”). Sterling Capital Kentucky Intermediate Tax-Free Fund, Sterling Capital Maryland Intermediate Tax-Free Fund, Sterling Capital North Carolina Intermediate Tax-Free Fund, Sterling Capital South Carolina Intermediate Tax-Free Fund, Sterling Capital Virginia Intermediate Tax-Free Fund and Sterling Capital West Virginia Intermediate Tax-Free Fund are referred to as the “Tax-Free Funds.” Sterling Capital Diversified Income Fund, Sterling Capital Strategic Allocation Balanced Fund and Sterling Capital Strategic Allocation Growth Fund are referred to as the “Funds of Funds.” The Funds, excluding the Funds of Funds, are referred to as the “Variable Net Asset Value Funds.” The Funds of Funds invest in underlying mutual funds as opposed to individual securities.
All Funds, other than the Tax-Free Funds, are “diversified” funds, as defined in the 1940 Act. The Tax-Free Funds are non-diversified funds, which means they may invest in the securities of a limited number of issuers.
By owning shares of underlying investment companies, each of the Funds of Funds invests, to varying degrees, in securities of U.S. and non-U.S. companies, including small and medium sized companies, and in debt securities. Funds of Funds with exposure to underlying equity funds may include funds that invest in real estate related securities. In addition, underlying investment companies may invest in derivatives and may engage in long/short equity strategies and in option writing strategies. The Funds of Funds except for Sterling Capital Diversified Income Fund currently invest only in other Funds that are part of the Sterling Capital Funds group of investment companies (not including cash sweep vehicles). Financial information for those Sterling Capital Funds is included in this report and also is available at www.sec.gov. Financial information for the other underlying Funds is available at www.sec.gov.
The Funds are authorized to issue an unlimited amount of shares. As of September 30, 2016, the Funds discussed herein offered up to five classes of shares: Class A Shares, Class B Shares, Class C Shares, Class R Shares and Institutional Shares. Class B Shares of the Funds are closed to new accounts and additional purchases by existing shareholders. Sterling Capital Corporate Fund and Sterling Capital Securitized Opportunities Fund converted Class S Shares into Institutional Shares effective February 1, 2013. Sterling Capital Mid Value Fund, Sterling Capital Behavioral Small Cap Value Equity Fund, Sterling Capital Special Opportunities Fund, Sterling Capital Equity Income Fund and Sterling Capital Total Return Bond Fund offer Class R Shares. Class B Shares automatically convert to Class A Shares after eight years. Class A Shares of the Variable Net Asset Value Funds and Funds of Funds, excluding Sterling Capital Ultra Short Bond Fund, Sterling Capital Short Duration Bond Fund, Sterling Capital Intermediate U.S. Government Fund, Sterling Capital Corporate Fund, Sterling Capital Securitized Opportunities Fund, and the Tax-Free Funds, have a maximum sales charge of 5.75% as a percentage of original purchase price. Class A Shares of Sterling Capital Ultra Short Bond Fund have a maximum sales charge of 0.50%, and Class A Shares of Sterling Capital Short Duration Bond Fund, Sterling Capital Intermediate U.S. Government Fund, Sterling Capital Corporate Fund, Sterling Capital Securitized Opportunities Fund, and the Tax-Free Funds have a maximum sales charge of 2.00% as a percentage of the original purchase price. Purchases of $1 million or more of Class A Shares are not subject to a front-end sales charge but will be subject to a Contingent Deferred Sales Charge (“CDSC”) of 1.00% of the purchase price if redeemed within two years after purchase for all Funds except the Tax-Free Funds, Sterling Capital Short Duration Bond Fund, Sterling Capital Intermediate U.S. Government Fund, Sterling Capital Corporate Fund and Sterling Capital Securitized Opportunities Fund. With respect to the Tax-Free Funds, Sterling Capital Short Duration Bond Fund, Sterling Capital Intermediate U.S. Government Fund, Sterling Capital Corporate Fund and Sterling Capital Securitized Opportunities Fund, sales of Class A shares over $500,000 are not
190
Sterling Capital Funds
|
Notes to Financial Statements — (continued) |
September 30, 2016
|
subject to a sales load but will be subject to a CDSC of 0.50% of the purchase price if redeemed within 18 months of purchase. This charge is based on the lower of the price paid for the shares or their net asset value at the time of redemption. The Class B Shares of the Funds will be subject to a CDSC ranging from a maximum of 5.00% if redeemed less than one year after purchase to 0.00% if redeemed more than six years after purchase. Class C Shares of the Funds are offered without any front-end sales charge but will be subject to a maximum CDSC of 1.00% if redeemed less than one year after purchase.
Each class of shares has identical rights and privileges except with respect to the fees paid under the distribution plan, voting rights on matters affecting a single class of shares and the exchange privilege of each class of shares.
Under the Trust’s organizational documents, its Officers and Trustees are indemnified against certain liabilities arising out of the performance of their duties to the Trust. In addition, in the normal course of business, the Funds may enter into contracts with their vendors and others that provide for general indemnifications. The Funds’ maximum exposure under these arrangements is unknown, as this would involve future claims that may be made against the Funds. However, based on experience, the Funds expect that risk of loss to be remote.
| 2. | Significant Accounting Policies: |
The following is a summary of significant accounting policies followed by the Funds. The policies are in conformity with United States generally accepted accounting principles (“U.S. GAAP”). The preparation of these financial statements requires management to make estimates and assumptions that affect the reported amounts of assets and liabilities and disclosure of contingent assets and liabilities at the date of the financial statements and the reported amounts of income and expenses for the reporting period. Actual results could differ from those estimates.
Securities Valuation — Investments of the Sterling Capital Funds (the “Funds”) in securities traded on a national securities exchange or in the over-the-counter market are valued at the closing price on the principal exchange or market (including the NASDAQ Closing Price for securities traded on NASDAQ), typically 4:00 PM ET or, absent such a price, by reference to the latest available bid prices in the principal market in which such securities are normally traded. The Variable Net Asset Value Funds may also use an independent pricing service approved by the Board of Trustees (the “Board”) to value certain securities, including the use of electronic and matrix techniques. Investments in open-end investment companies, including underlying funds invested in by the Funds of Funds, are valued at their respective net asset values as reported by such companies. Investments in closed-end investment companies and exchange-traded funds are valued at their market values based upon the latest available sale price or, absent such a price, by reference to the latest available bid prices in the principal market in which such securities are normally traded. The differences between cost and fair value of investments are reflected as either unrealized appreciation or depreciation. Securities for which market quotations are not readily available or deemed unreliable (e.g., an approved pricing service does not provide a price, a furnished price is in error, certain stale prices, or an event occurs that materially affects the furnished price) will be fair valued in accordance with procedures established in good faith under the general supervision of the Board.
Fair value pricing may be used if events materially affecting the value of foreign securities occur between the time when the exchange on which they are traded closes and the time when the Sterling Capital Behavioral International Equity Fund’s net asset value is calculated; such securities may be valued at fair value in accordance with procedures adopted by the Board.
Fair Value Measurements — The objective of a fair value measurement is to determine the price that would be received to sell an asset or paid to transfer a liability in an orderly transaction between market participants at the measurement date (an exit price). Accordingly, the fair value hierarchy gives the highest priority to quoted prices (unadjusted) in active markets for identical assets or liabilities (Level 1) and the lowest priority to unobservable inputs (Level 3). The three levels of the fair value hierarchy are described as follows:
● Level 1 – quoted prices in active markets for identical securities
● Level 2 – based on other significant observable inputs (including quoted prices for similar securities, interest rates, prepayment speeds, credit risk, etc.)
● Level 3 – based on significant unobservable inputs (including a Fund’s own assumptions in determining the fair value of investments)
The inputs or methodology used for valuing securities are not necessarily an indication of the risk associated with investing in those securities. During the year or period ended September 30, 2016, there were no significant changes to the valuation
191
Sterling Capital Funds
|
Notes to Financial Statements — (continued) |
September 30, 2016
|
policies and procedures.
The summary of inputs used to determine the fair value of each Fund’s investments as of September 30, 2016 is as follows:
| Level 1– Quoted Prices | Level 2– Other Significant Observable Inputs | Level 3– Significant Unobservable Inputs | Total | |||||||||||||
Assets: | ||||||||||||||||
Investments in Securities | ||||||||||||||||
Sterling Capital Behavioral Large Cap Value Equity Fund | $ | 272,534,154( | a) | $ | — | $— | $ | 272,534,154 | ||||||||
Sterling Capital Mid Value Fund | 584,935,183( | a) | — | — | 584,935,183 | |||||||||||
Sterling Capital Behavioral Small Cap Value Equity Fund | 166,629,719( | a) | — | — | 166,629,719 | |||||||||||
Sterling Capital Special Opportunities Fund | 1,119,717,049( | a) | — | — | 1,119,717,049 | |||||||||||
Sterling Capital Equity Income Fund | 1,688,809,044( | a) | — | — | 1,688,809,044 | |||||||||||
Sterling Capital Long/Short Equity Fund | 40,642,118( | a) | — | — | 40,642,118 | |||||||||||
Sterling Capital Behavioral International Equity Fund | 1,717,153( | a) | 68,242,587(a) | — | 69,959,740 | |||||||||||
Sterling Capital Stratton Mid Cap Value Fund | 63,645,199( | a) | — | — | 63,645,199 | |||||||||||
Sterling Capital Stratton Real Estate Fund | 104,547,349( | a) | — | — | 104,547,349 | |||||||||||
Sterling Capital Stratton Small Cap Value Fund | 1,213,135,219( | a) | — | — | 1,213,135,219 | |||||||||||
Sterling Capital Ultra Short Bond Fund | 1,343,103( | b) | 54,847,220(a) | — | 56,190,323 | |||||||||||
Sterling Capital Short Duration Bond Fund | 1,169,276( | b) | 85,565,654(a) | — | 86,734,930 | |||||||||||
Sterling Capital Intermediate U.S. Government Fund | 586,710( | b) | 26,103,763(a) | — | 26,690,473 | |||||||||||
Sterling Capital Total Return Bond Fund | 20,550,979( | b) | 776,158,450(a) | — | 796,709,429 | |||||||||||
Sterling Capital Corporate Fund | 168,021( | b) | 31,850,498(a) | — | 32,018,519 | |||||||||||
Sterling Capital Securitized Opportunities Fund | 635,431( | b) | 46,110,669(a) | — | 46,746,100 | |||||||||||
Sterling Capital Kentucky Intermediate Tax-Free Fund | 838,159( | b) | 11,987,009(a) | — | 12,825,168 | |||||||||||
Sterling Capital Maryland Intermediate Tax-Free Fund | 651,369( | b) | 31,042,758(a) | — | 31,694,127 | |||||||||||
Sterling Capital North Carolina Intermediate Tax-Free Fund | 4,845,465( | b) | 210,645,673(a) | — | 215,491,138 | |||||||||||
Sterling Capital South Carolina Intermediate Tax-Free Fund | 1,731,687( | b) | 90,444,828(a) | — | 92,176,515 | |||||||||||
Sterling Capital Virginia Intermediate Tax-Free Fund | 2,267,098( | b) | 116,396,533(a) | — | 118,663,631 | |||||||||||
Sterling Capital West Virginia Intermediate Tax-Free Fund | 2,280,200( | b) | 99,354,918(a) | — | 101,635,118 | |||||||||||
Sterling Capital Diversified Income Fund | 42,917,226( | a) | — | — | 42,917,226 | |||||||||||
Sterling Capital Strategic Allocation Balanced Fund | 33,015,133( | a) | — | — | 33,015,133 | |||||||||||
Sterling Capital Strategic Allocation Growth Fund | 23,395,024( | a) | — | — | 23,395,024 | |||||||||||
Liabilities: | ||||||||||||||||
Investments Sold Short | ||||||||||||||||
Sterling Capital Long/Short Equity Fund | $ | 16,416,035( | a) | — | — | $ | 16,416,035 | |||||||||
Other Financial Instruments- | ||||||||||||||||
Written Options (Equity Risk) | ||||||||||||||||
Sterling Capital Special Opportunities Fund (c) | 1,005,000 | — | — | 1,005,000 | ||||||||||||
Sterling Capital Equity Income Fund (c) | 304,400 | — | 304,400 | |||||||||||||
Sterling Capital Long/Short Equity Fund (c) | 8,620 | — | — | 8,620 | ||||||||||||
| (a) | Industries, countries or security types are disclosed in the Schedules of Portfolio Investments. |
| (b) | Represents money market funds and/or certain preferred stocks. |
| (c) | Other financial instruments are written options shown at value. |
The Funds’ policy is to recognize transfers in and transfers out as of the beginning of the reporting period. There were no transfers between Level 1 and Level 2 during the fiscal year ended September 30, 2016.
Cash and Cash Equivalents — The Funds consider liquid assets deposited with a bank, and certain short term debt instruments with original maturities of three months or less to be cash equivalents. These investments represent amounts held with financial institutions that are readily accessible to pay Fund expenses or investments. The Funds may invest their excess cash in the Federated Treasury Obligations Fund or a similar money market fund or other short-term investment.
Credit Enhancements — Certain obligations held in the Funds have credit enhancement or liquidity features that may, under certain circumstances, provide for repayment of principal and interest on the obligation upon demand date, interest rate reset date or final maturity. These enhancements may include: letters of credit; liquidity guarantees; security purchase agreements; tender option purchase agreements; and third party insurance (i.e., AMBAC).
192
Sterling Capital Funds
|
Notes to Financial Statements — (continued) |
September 30, 2016
|
Derivative Instruments Categorized by Risk Exposure — The Funds’ derivative contracts held at September 30, 2016, are not accounted for as hedging instruments under U.S. GAAP. The following is a summary of the location of the derivative instruments held by the Funds on the Statements of Assets and Liabilities and the category of primary risk exposure as of September 30, 2016:
Fair Values of Derivative Instruments | Statements of Assets and Liabilities Location | Sterling Capital Special Opportunities Fund | Sterling Capital Equity Income Fund | Sterling Capital Long/Short Equity Fund | ||||
Liabilities | ||||||||
Equity contracts | Call options written | $1,005,000 | $304,400 | $8,620 |
The effect of derivative financial instruments on the Statements of Operations for the fiscal year ended September 30, 2016:
Net Realized Gain (Loss) | Sterling Capital Special Opportunities Fund | Sterling Capital Equity Income Fund | Sterling Capital Long/Short Equity Fund | |||
Options (equity contracts)* | $172,668 | $1,880,239 | $(154,354) | |||
| ||||||
| * | Purchased options gain/loss are included in realized gain (loss) on investments. |
Net Change in Unrealized Appreciation (Depreciation) | Sterling Capital Special Opportunities Fund | Sterling Capital Equity Income Fund | Sterling Capital Long/Short Equity Fund | |||
Written options (equity contracts) | $(698,468) | $(239,553) | $2,898 |
For the fiscal year ended September 30, 2016, the average quarterly balance of derivative financial instruments were as follows:
| Sterling Capital Special Opportunities Fund | Sterling Capital Equity Income Fund | Sterling Capital Long/Short Equity Fund | |||||||||||||
Options (Equity Risk) | |||||||||||||||
Average number of written option contracts | 3,925 | 3,089 | 44 | ||||||||||||
Average premium of written option contracts | $ | 729,060 | $ | 578,190 | $ | 6,190 | |||||||||
Average number of purchased option contracts | — | — | 1,050 | ||||||||||||
Average premium of purchased option contracts | $ | — | $ | — | $ | 347,332 | |||||||||
Distributions to Shareholders — Dividends from net investment income are declared daily and paid monthly for Sterling Capital Ultra Short Bond Fund, Sterling Capital Short Duration Bond Fund, Sterling Capital Intermediate U.S. Government Fund, Sterling Capital Total Return Bond Fund, Sterling Capital Corporate Bond Fund, Sterling Capital Securitized Opportunities Fund, the Tax-Free Funds, and Sterling Capital Diversified Income Fund. Dividends from net investment income are declared and paid semiannually for Sterling Capital Stratton Mid Cap Value Fund, Sterling Capital Stratton Real Estate Fund, and Sterling Capital Stratton Small Cap Value Fund. Dividends from net investment income are declared and paid quarterly for Sterling Capital Behavioral Large Cap Value Equity Fund, Sterling Capital Mid Value Fund, Sterling Capital Behavioral Small Cap Value Equity Fund, Sterling Capital Special Opportunities Fund, Sterling Capital Equity Income Fund, Sterling Capital Strategic Allocation Balanced Fund, and Sterling Capital Strategic Allocation Growth Fund if the annualized yield of the distribution exceeds an amount determined annually by the Board. Dividends from net investment income for Sterling Capital Long/Short Equity Fund and Sterling Capital Behavioral International Equity Fund are declared and paid annually. Distributable net realized gains, if any, are declared and distributed at least annually. Distributions to shareholders that exceed net investment income and net realized gains for tax purposes are reported as distributions of capital.
Expenses and Allocation Methodology — Expenses directly attributable to a Fund are charged to that Fund. Expenses not directly attributable to a Fund are allocated proportionately among all Funds daily in relation to the net assets of each
193
Sterling Capital Funds
|
Notes to Financial Statements — (continued) |
September 30, 2016
|
Fund or on another reasonable basis. Each class of shares bears its pro-rata portion of expenses attributable to its series, except that each class separately bears expenses related specifically to that class, such as distribution fees. Income and realized and unrealized gains or losses on investments are allocated to each class of shares based on its relative net assets or another appropriate basis.
Foreign Currency Translation — The accounting records of the Sterling Capital Behavioral International Equity Fund are maintained in U.S. dollars. Foreign currency amounts are translated into U.S. dollars at the latest foreign exchange bid quotation (from an approved pricing vendor) to determine the fair value of investments, assets and liabilities. Purchases and sales of securities, income and expenses are translated at the prevailing rate of exchange, on the respective dates of such transactions. The Sterling Capital Behavioral International Equity Fund does not isolate that portion of the results of operations resulting from changes in foreign exchange rates on investments from fluctuations arising from changes in market prices of securities held. Such fluctuations are included with the net realized and unrealized gain or loss from investments and foreign currencies.
Forward Foreign Currency Exchange Contracts — The Sterling Capital Behavioral International Equity Fund, the Sterling Capital Long/Short Equity Fund, the Sterling Capital Ultra Short Bond Fund, the Sterling Capital Short Duration Bond Fund, the Sterling Capital Total Return Bond Fund and the Sterling Capital Corporate Fund may enter into forward foreign currency exchange contracts (foreign currency exchange risk) in connection with planned purchases or sales of securities or to hedge the U.S. dollar value of Funds securities denominated in a particular currency. A foreign currency exchange contract is an agreement between two parties to buy and sell a currency at a set exchange rate on a future date. The Funds can be exposed to risks if the counterparties to the contracts are unable to meet the terms of their contracts and from unanticipated movements in the value of a foreign currency relative to the U.S. dollar. In the event of default by the counterparty to the transaction, the Funds’ maximum amount of loss, as either the buyer or seller, is the unrealized gain of the contract. The forward foreign currency exchange contracts are adjusted by the daily exchange rate of the underlying currency and any gains or losses are recorded for financial statement purposes as unrealized gains or losses until the contract settlement date. When the contract is closed, the Funds record a realized gain (loss) equal to the difference between the value at the time it was opened and the value at the time it was closed.
Mortgage Dollar Rolls — The Variable Net Asset Value Funds may sell mortgage-backed securities for delivery in the current month and simultaneously contract to repurchase substantially similar (same type, coupon and maturity) securities on a specific future date at an agreed-upon price. The market value of the securities that a Fund is required to purchase may decline below the agreed upon repurchase price of those securities. Pools of mortgages collateralizing those securities may have different prepayment histories than those sold. During the period between the sale and repurchase, a Fund will not be entitled to receive interest and principal payments on the securities sold. Proceeds of the sale will be invested in additional instruments for a Fund, and the income from these investments will generate income for a Fund. If such income does not exceed the income, capital appreciation and gain or loss that would have been realized on the securities sold as part of the dollar roll, the use of this technique will diminish the investment performance of a Fund compared with what the performance would have been without the use of dollar rolls. The Funds account for mortgage dollar roll transactions as purchases and sales. The Funds did not hold any mortgage dollar rolls during the year.
Offering Costs — Offering costs are amortized on a straight-line basis over one year from each Fund’s respective commencement of operations. In the event that any of the initial shares are redeemed during the period of amortization of a Fund’s offering costs, the redemption proceeds will be reduced by any such unamortized offering costs in the same proportion as the number of shares being redeemed bears to the number of those shares outstanding at the time of redemption.
Options Contracts — Sterling Capital Special Opportunities Fund, Sterling Capital Equity Income Fund, and Sterling Capital Long/Short Equity Fund write (sell) “covered” call options on securities and purchase options on securities to close out options previously written by them. Sterling Capital Long/Short Equity Fund purchases put options, which gives a Fund the right to sell a specified amount of an underlying security at a specified price within a specified time. These transactions are entered into to hedge against changes in security prices (equity risk) or for the purposes of earning additional income (i.e., speculation). Sterling Capital Diversified Income Fund may invest in underlying funds that engage in options writing strategies (including cash-secured put writing and covered call writing).
194
Sterling Capital Funds
|
Notes to Financial Statements — (continued) |
September 30, 2016
|
The risk associated with purchasing an option is that a Fund pays a premium whether or not the option is exercised. Additionally, the Funds bear the risk of loss of the premium and change in value should the counterparty not perform under the contract. Put and call options purchased are accounted for in the same manner as other securities owned. The cost of securities acquired through the exercise of call options is increased by the premiums paid. The proceeds from securities sold through the exercise of put options are decreased by the premiums paid.
In writing an option, a Fund contracts with a specified counterparty to purchase (put option written) or sell (call option written) a specified quantity (notional amount) of an underlying asset at a specified price during a specified period upon demand of the counterparty. The risk associated with writing an option is that the Funds bear the market risk of an unfavorable change in the price of an underlying asset and are required to buy or sell an underlying asset under the contractual terms of the option at a price different from the current value. The Funds execute transactions in both listed and over-the-counter options. When purchasing over-the-counter options, a Fund bears the risk of economic loss from counterparty default, equal to the market value of the option. Listed options involve minimal counterparty risk since the listed options are guaranteed against default by the exchange on which they trade. Transactions in over-the-counter options expose the Funds to the risk of default by the counterparty to the transaction. In the event of default by the counterparty to the over-the-counter transaction, the Funds’ maximum amount of loss is the premium paid (as the purchaser) or the unrealized depreciation of the contract (as the writer).
Sterling Capital Special Opportunities Fund, Sterling Capital Equity Income Fund and Sterling Capital Long/Short Equity Fund invested in written options to economically hedge the downside exposure by collecting a premium when sold against the equity holding. Details of written option activity for the year ended September 30, 2016 are as follows:
| Sterling Capital Special Opportunities Fund | Sterling Capital Equity Income Fund | Sterling Capital Long/Short Equity Fund | ||||||||||||||||||||||||||||
Covered Options | Number of Contracts | Premiums Received | Number of Contracts | Premiums Received | Number of Contracts | Premiums Received | ||||||||||||||||||||||||
Balance at beginning of period | 5,400 | $ | 604,184 | 4,325 | $ | 1,150,294 | — | $ | — | |||||||||||||||||||||
Options written | 11,500 | 2,291,573 | 11,380 | 1,740,260 | 1,992 | 218,812 | ||||||||||||||||||||||||
Options closed | (8,100 | ) | (1,268,115 | ) | (5,600 | ) | (976,017 | ) | (671 | ) | (81,888 | ) | ||||||||||||||||||
Options expired | (6,400 | ) | (990,726 | ) | (7,275 | ) | (1,601,446 | ) | (1,025 | ) | (94,824 | ) | ||||||||||||||||||
Options exercised | — | — | — | — | (225 | ) | (30,582 | ) | ||||||||||||||||||||||
|
|
|
|
|
|
|
|
|
|
|
| |||||||||||||||||||
Balance at end of period | 2,400 | $ | 636,916 | 2,830 | $ | 313,091 | 71 | $ | 11,518 | |||||||||||||||||||||
|
|
|
|
|
|
|
|
|
|
|
| |||||||||||||||||||
The following is a summary of written options outstanding as of September 30, 2016:
| Number of Contracts | Value | |||||||||
Sterling Capital Special Opportunities Fund | ||||||||||
Activision Blizzard, Inc., $41.00, 11/18/16 | 900 | $ | (355,500 | ) | ||||||
Activision Blizzard, Inc., $41.00, 01/20/17 | 600 | (285,000 | ) | |||||||
Activision Blizzard, Inc., $42.00, 01/20/17 | 900 | (364,500 | ) | |||||||
|
|
|
| |||||||
| 2,400 | $ | (1,005,000 | ) | |||||||
|
|
|
| |||||||
Sterling Capital Equity Income Fund | ||||||||||
Mead Johnson Nutrition Co., $100.00, 11/18/16 | 450 | (900 | ) | |||||||
Spectra Energy Corp., $45.00, 01/20/17 | 1,380 | (103,500 | ) | |||||||
The Scotts Miracle-Gro Co., $85.00, 12/16/16 | 1,000 | (200,000 | ) | |||||||
|
|
|
| |||||||
| 2,830 | $ | (304,400 | ) | |||||||
|
|
|
| |||||||
195
Sterling Capital Funds
|
Notes to Financial Statements — (continued) |
September 30, 2016
|
| Number of Contracts | Value | |||||||||
Sterling Capital Long/Short Equity Fund | ||||||||||
SPDR S&P 500 ETF Trust, $205.00, 10/21/16 | 6 | $ | (240 | ) | ||||||
SPDR S&P 500 ETF Trust, $205.00, 11/18/16 | 16 | (2,416 | ) | |||||||
Netflix, Inc., $85.00, 10/21/16 | 13 | (1,144 | ) | |||||||
Netflix, Inc., $90.00, 10/21/16 | 13 | (2,405 | ) | |||||||
Molson Coors Brewing Co., $113.00, 10/21/16 | 23 | (2,415 | ) | |||||||
|
|
|
| |||||||
| 71 | $ | (8,620 | ) | |||||||
|
|
|
| |||||||
Risks Associated with Foreign Securities and Currencies — Investments in securities of foreign issuers carry certain risks not ordinarily associated with investments in securities of domestic issuers. Such risks include future political and economic developments and the possible imposition of exchange controls or other foreign governmental laws and restrictions. In addition, with respect to certain countries, there is the possibility of expropriation of assets, confiscatory taxation, political or social instability or diplomatic developments which could adversely affect investments in those countries. Certain foreign investments may also be subject to foreign withholding taxes.
Securities Transactions and Related Income — During the period, security transactions are accounted for no later than one business day after the trade date. For financial reporting purposes, however, security transactions as of the last business day of the reporting period are accounted for on the trade date. Interest income is recognized on the accrual basis and includes, where applicable, the amortization/accretion of premium or discount. Dividend income is recorded on the ex-dividend date. Gains or losses realized from sales of securities are determined by comparing the identified cost of the security lot sold with the net sales proceeds.
Short Sales — Sterling Capital Long/Short Equity Fund enters into short sale transactions in which it sells a security it may not hold in anticipation of a decline in the market price of that security. When the Fund makes a short sale, it will borrow the security sold short and deliver the security to the counterparty to which it sold the security short. An amount equal to the proceeds received by the Fund is reflected as an asset and an equivalent liability. The amount of the liability is subsequently marked-to-market to reflect the market value of the short sale. The Fund is required to repay the counterparty any dividends received on the security sold short, which is shown as dividend expense in the Statements of Operations. The Fund may pay a fee on the assets borrowed from the counterparty, which is shown as a Service fee on securities sold short in the Statements of Operations. The Fund maintains a segregated account of deposits of cash with the broker-dealer as collateral for the short sales. The Fund may receive interest on the cash collateral deposited with the broker-dealer. These positions are speculative and may be more risky than “long” positions because the cost of the replacement security or derivative is unknown. Short selling strategies typically reduce returns relative to “long only” strategies during rising equity markets, and involve risk of significant losses; potential loss on uncovered short positions is unlimited. Short selling strategies also involve significant transaction costs. Sterling Capital Diversified Income Fund may invest in underlying funds that engage in long/short equity strategies.
When-Issued and Forward Commitments — The Funds may purchase securities on a “when-issued” basis. Sterling Capital Behavioral Large Cap Value Equity Fund, Sterling Capital Mid Value Fund, Sterling Capital Behavioral Small Cap Value Equity Fund, Sterling Capital Special Opportunities Fund and Sterling Capital Equity Income Fund may also purchase or sell securities on a forward commitment basis. The Funds record when-issued securities on the trade date and pledge assets with a value at least equal to the purchase commitment for payment of the securities purchased. The value of the securities underlying when-issued or forward commitments to purchase securities, and any subsequent fluctuation in their value, is taken into account when determining the net asset value of the Funds commencing with the date the Funds agree to purchase the securities. The Funds do not accrue interest or dividends on “when-issued” securities until the underlying securities are received.
| 3. | Purchases and Sales of Securities: |
Purchases and sales of securities (excluding U.S. government securities and securities maturing less than one year from acquisition) for the fiscal year ended September 30, 2016 were as follows:
196
Sterling Capital Funds
|
Notes to Financial Statements — (continued) |
September 30, 2016
|
| Purchases | Sales | |||||||
Sterling Capital Behavioral Large Cap Value Equity Fund | $ | 393,499,074 | $ | 391,739,562 | ||||
Sterling Capital Mid Value Fund | 148,626,589 | 269,318,688 | ||||||
Sterling Capital Behavioral Small Cap Value Equity Fund | 204,628,159 | 175,508,623 | ||||||
Sterling Capital Special Opportunities Fund | 403,278,335 | 271,146,029 | ||||||
Sterling Capital Equity Income Fund | 317,405,184 | 455,521,547 | ||||||
Sterling Capital Long/Short Equity Fund | 131,556,659 | 181,746,509 | ||||||
Sterling Capital Behavioral International Equity Fund | 90,038,877 | 41,618,526 | ||||||
Sterling Capital Stratton Mid Cap Value Fund | 6,687,390 | 10,907,728 | ||||||
Sterling Capital Stratton Real Estate Fund | 18,403,954 | 19,513,765 | ||||||
Sterling Capital Stratton Small Cap Value Fund | 37,742,315 | 161,099,511 | ||||||
Sterling Capital Ultra Short Bond Fund | 38,872,552 | 17,860,255 | ||||||
Sterling Capital Short Duration Bond Fund | 36,894,099 | 33,339,008 | ||||||
Sterling Capital Intermediate U.S. Government Fund | 1,078,845 | 1,836,233 | ||||||
Sterling Capital Total Return Bond Fund | 304,319,826 | 241,855,086 | ||||||
Sterling Capital Corporate Fund | 24,486,760 | 56,194,201 | ||||||
Sterling Capital Securitized Opportunities Fund | 13,027,767 | 10,140,600 | ||||||
Sterling Capital Kentucky Intermediate Tax-Free Fund | 2,062,840 | 3,577,725 | ||||||
Sterling Capital Maryland Intermediate Tax-Free Fund | 4,828,710 | 10,046,459 | ||||||
Sterling Capital North Carolina Intermediate Tax-Free Fund | 42,027,247 | 19,825,309 | ||||||
Sterling Capital South Carolina Intermediate Tax-Free Fund | 17,404,623 | 2,183,674 | ||||||
Sterling Capital Virginia Intermediate Tax-Free Fund | 18,944,989 | 18,778,156 | ||||||
Sterling Capital West Virginia Intermediate Tax-Free Fund | 11,100,496 | 12,437,500 | ||||||
Sterling Capital Diversified Income Fund | 28,275,867 | 31,399,129 | ||||||
Sterling Capital Strategic Allocation Balanced Fund | 1,723,494 | 4,480,000 | ||||||
Sterling Capital Strategic Allocation Growth Fund | 1,400,682 | 3,782,000 | ||||||
Purchases and sales of U.S. government securities (excluding securities maturing less than one year from acquisition) for the fiscal year ended September 30, 2016 were as follows:
| Purchases | Sales | |||||||
Sterling Capital Long/Short Equity Fund | $ | 64,565 | $ | 380,172 | ||||
Sterling Capital Short Duration Bond Fund | 17,090,886 | 12,319,439 | ||||||
Sterling Capital Intermediate U.S. Government Fund | 11,630,836 | 10,551,394 | ||||||
Sterling Capital Total Return Bond Fund | 296,375,655 | 208,620,860 | ||||||
Sterling Capital Corporate Fund | 18,138,175 | 18,406,800 | ||||||
Sterling Capital Securitized Opportunities Fund | 13,823,603 | 10,619,749 | ||||||
| 4. | Investments in Affiliated Issuers: |
A summary of the Funds’ transactions in the shares of affiliated issuers during the fiscal year ended September 30, 2016 is as follows:
| Shares Held at September 30, 2015 | Shares Purchased | Shares Sold | Shares Held at September 30, 2016 | Value at September 30, 2016 | Dividend Income October 1, 2015- September 30, 2016 | Distributions and Net Realized Gain (Loss) October 1, 2015- September 30, 2016 | |||||||||||||||||||||||||||||
Sterling Capital Diversified Income Fund | |||||||||||||||||||||||||||||||||||
Sterling Capital Corporate Fund, Institutional Shares | 216,414 | 7,586 | 224,000 | — | — | $ | 45,657 | $ | 15,880 | ||||||||||||||||||||||||||
Sterling Capital Securitized Opportunities Fund, Institutional Shares | 219,233 | 11,574 | 230,807 | — | — | 38,589 | 26,839 | ||||||||||||||||||||||||||||
|
|
|
|
|
|
|
|
|
|
|
|
|
| ||||||||||||||||||||||
Total Affiliates | 435,647 | 19,160 | 454,807 | — | — | $ | 84,246 | $ | 42,719 | ||||||||||||||||||||||||||
|
|
|
|
|
|
|
|
|
|
|
|
|
| ||||||||||||||||||||||
197
Sterling Capital Funds
|
Notes to Financial Statements — (continued) |
September 30, 2016
|
| Shares Held at September 30, 2015 | Shares Purchased | Shares Sold | Shares Held at September 30, 2016 | Value at September 30, 2016 | Dividend Income October 1, 2015- September 30, 2016 | Distributions and Net Realized Gain (Loss) October 1, 2015- September 30, 2016 | |||||||||||||||||||||||||||||
Sterling Capital Strategic Allocation Balanced Fund | |||||||||||||||||||||||||||||||||||
Sterling Capital Behavioral International Equity Fund, Institutional Shares | 1,040,079 | 31,852 | 93,028 | 978,903 | $ | 9,485,569 | $ | 222,000 | $ | (48,420 | ) | ||||||||||||||||||||||||
Sterling Capital Equity Income Fund, Institutional Shares | 277,201 | 17,919 | 45,217 | 249,903 | 4,583,224 | 96,513 | 267,377 | ||||||||||||||||||||||||||||
Sterling Capital Long/Short Equity Fund, Institutional Shares | 392,836 | 32,704 | 31,056 | 394,484 | 3,424,121 | — | 28,050 | ||||||||||||||||||||||||||||
Sterling Capital Special Opportunities Fund, Institutional Shares | 202,824 | 30,609 | 35,005 | 198,428 | 4,460,660 | — | 650,475 | ||||||||||||||||||||||||||||
Sterling Capital Total Return Bond Fund, Institutional Shares | 1,154,248 | 19,061 | 170,637 | 1,002,672 | 10,848,908 | 372,048 | (72,767 | ) | |||||||||||||||||||||||||||
|
|
|
|
|
|
|
|
|
|
|
|
|
| ||||||||||||||||||||||
Total Affiliates | 3,067,188 | 132,145 | 374,943 | 2,824,390 | $ | 32,802,482 | $ | 690,561 | $ | 824,715 | |||||||||||||||||||||||||
|
|
|
|
|
|
|
|
|
|
|
|
|
| ||||||||||||||||||||||
Sterling Capital Strategic Allocation Growth Fund | |||||||||||||||||||||||||||||||||||
Sterling Capital Behavioral International Equity Fund, Institutional Shares | 948,804 | 25,302 | 100,348 | 873,758 | $ | 8,466,719 | $ | 197,676 | $ | (30,040 | ) | ||||||||||||||||||||||||
Sterling Capital Equity Income Fund, Institutional Shares | 252,935 | 16,022 | 49,216 | 219,741 | 4,030,051 | 85,399 | 247,943 | ||||||||||||||||||||||||||||
Sterling Capital Long/Short Equity Fund, Institutional Shares | 342,793 | 27,077 | 32,448 | 337,422 | 2,928,823 | — | 25,911 | ||||||||||||||||||||||||||||
Sterling Capital Special Opportunities Fund, Institutional Shares | 185,048 | 26,396 | 38,534 | 172,910 | 3,887,026 | — | 606,250 | ||||||||||||||||||||||||||||
Sterling Capital Total Return Bond Fund, Institutional Shares | 432,415 | 9,955 | 76,652 | 365,718 | 3,957,070 | 136,094 | (33,946 | ) | |||||||||||||||||||||||||||
|
|
|
|
|
|
|
|
|
|
|
|
|
| ||||||||||||||||||||||
Total Affiliates | 2,161,995 | 104,752 | 297,198 | 1,969,549 | $ | 23,269,689 | $ | 419,169 | $ | 816,118 | |||||||||||||||||||||||||
|
|
|
|
|
|
|
|
|
|
|
|
|
| ||||||||||||||||||||||
| 5. | Related Party Transactions: |
Under the terms of the investment advisory agreement, Sterling Capital Management LLC (“Sterling Capital” or the “Advisor”) is entitled to receive fees based on a percentage of the average daily net assets of the Funds. These fees are accrued daily and payable on a monthly basis and are reflected on the Statements of Operations as “Investment advisory fees.” Sterling Capital’s waived investment advisory fees are included on the Statements of Operations as “Less expenses waived by the Investment Advisor.” Information regarding these transactions is as follows for the fiscal year ended September 30, 2016:
| Prior to February 1, 2016 | Effective February 1, 2016 | |||||||||||||||||||
| Contractual Fee Rate | Fee Rate after Contractual Waivers | Contractual Fee Rate | Fee Rate after Contractual Waivers | |||||||||||||||||
Sterling Capital Behavioral Large Cap Value Equity Fund | 0.70 | % | 0.60 | %(1) | 0.70 | %(8) | 0.54 | %(2),(8) | ||||||||||||
Sterling Capital Mid Value Fund | 0.70 | % | 0.70 | % | 0.70 | % | 0.70 | % | ||||||||||||
Sterling Capital Behavioral Small Cap Value Equity Fund | 0.75 | % | 0.75 | % | 0.75 | % | 0.60 | %(2) | ||||||||||||
Sterling Capital Special Opportunities Fund | 0.75 | %(3) | 0.75 | %(3) | 0.75 | %(3),(8) | 0.67 | %(2),(3),(8) | ||||||||||||
Sterling Capital Equity Income Fund | 0.70 | %(4) | 0.70 | %(4) | 0.70 | %(4),(8) | 0.70 | %(4),(8) | ||||||||||||
Sterling Capital Long/Short Equity Fund | 1.50 | %(5) | 1.50 | %(5) | 1.50 | % | 1.50 | %(5) | ||||||||||||
Sterling Capital Behavioral International Equity Fund | 0.80 | %(5) | 0.65 | %(5),(6) | 0.80 | % | 0.40 | %(2),(5) | ||||||||||||
Sterling Capital Stratton Mid Cap Value Fund | 0.70 | % | 0.70 | % | 0.70 | % | 0.70 | %(5) | ||||||||||||
Sterling Capital Stratton Real Estate Fund | 0.58 | % | 0.58 | % | 0.58 | % | 0.58 | %(5) | ||||||||||||
198
Sterling Capital Funds
|
Notes to Financial Statements — (continued) |
September 30, 2016
|
| Prior to February 1, 2016 | Effective February 1, 2016 | |||||||||||||||||||
| Contractual Fee Rate | Fee Rate after Contractual Waivers | Contractual Fee Rate | Fee Rate after Contractual Waivers | |||||||||||||||||
Sterling Capital Stratton Small Cap Value Fund | 0.85 | % | 0.85 | % | 0.85 | % | 0.85 | % | ||||||||||||
Sterling Capital Ultra Short Bond Fund | 0.20 | % | 0.20 | %(5) | 0.20 | % | 0.10 | %(2),(5) | ||||||||||||
Sterling Capital Short Duration Bond Fund | 0.30 | % | 0.28 | %(1) | 0.30 | % | 0.20 | %(2) | ||||||||||||
Sterling Capital Intermediate U.S. Government Fund | 0.43 | % | 0.35 | %(1),(5) | 0.43 | % | 0.32 | %(2)(5) | ||||||||||||
Sterling Capital Total Return Bond Fund | 0.37 | % | 0.27 | %(7) | 0.37 | % | 0.27 | %(2) | ||||||||||||
Sterling Capital Corporate Fund | 0.35 | % | 0.35 | % | 0.35 | % | 0.35 | % | ||||||||||||
Sterling Capital Securitized Opportunities Fund | 0.35 | % | 0.31 | %(1) | 0.35 | % | 0.31 | %(2) | ||||||||||||
Sterling Capital Kentucky Intermediate Tax-Free Fund | 0.45 | % | 0.35 | %(1),(5) | 0.45 | % | 0.35 | %(2)(5) | ||||||||||||
Sterling Capital Maryland Intermediate Tax-Free Fund | 0.45 | % | 0.35 | %(1) | 0.45 | % | 0.35 | %(2) | ||||||||||||
Sterling Capital North Carolina Intermediate Tax-Free Fund | 0.45 | % | 0.35 | %(1) | 0.45 | % | 0.35 | %(2) | ||||||||||||
Sterling Capital South Carolina Intermediate Tax-Free Fund | 0.45 | % | 0.35 | %(1) | 0.45 | % | 0.35 | %(2) | ||||||||||||
Sterling Capital Virginia Intermediate Tax-Free Fund | 0.45 | % | 0.35 | %(1) | 0.45 | % | 0.35 | %(2) | ||||||||||||
Sterling Capital West Virginia Intermediate Tax-Free Fund | 0.45 | % | 0.35 | %(1) | 0.45 | % | 0.35 | %(2) | ||||||||||||
Sterling Capital Diversified Income Fund | 0.25 | % | 0.00 | %(1) | 0.25 | % | 0.25 | % | ||||||||||||
Sterling Capital Strategic Allocation Balanced Fund | 0.25 | % | 0.00 | %(1) | 0.25 | % | 0.00 | %(2) | ||||||||||||
Sterling Capital Strategic Allocation Growth Fund | 0.25 | % | 0.00 | %(1) | 0.25 | % | 0.00 | %(2) | ||||||||||||
| ||||||||||||||||||||
| (1) | Sterling Capital contractually agreed to limit the advisory fees paid by the Fund from February 1, 2015 through January 31, 2016. |
| (2) | Sterling Capital contractually agreed to limit the advisory fees paid by the Fund from February 1, 2016 through January 31, 2017. |
| (3) | The Fund pays 0.75% on the first $1 billion of average daily net assets, 0.70% on the next $1 billion of average daily net assets, 0.65% on the next $2 billion of average daily net assets, and 0.60% of average daily net assets over $4 billion. |
| (4) | The Fund pays 0.70% on the first $2 billion of average daily net assets, 0.65% on the next $2 billion of average daily net assets, and 0.60% of average daily net assets over $4 billion. |
| (5) | For all or a portion of the fiscal year ended September 30, 2016, Sterling Capital voluntarily waived and/or reimbursed certain expenses of the Funds. Voluntary waivers and reimbursements of expenses may be discontinued at any time. |
| (6) | Effective on November 28, 2014, Sterling Capital contractually agreed to limit the advisory fees paid by the Fund to 0.65% from November 28, 2014 through January 31, 2016. |
| (7) | Sterling Capital contractually agreed to limit advisory fees paid by the Fund to 0.27% from September 29, 2014 through January 31, 2016. |
| (8) | Effective September 29, 2016, the contractual investment advisory fee for the Sterling Capital Behavioral Large Cap Value Equity Fund, Sterling Capital Special Opportunities Fund and the Sterling Capital Equity Income Fund were restated to 0.45%, 0.65% and 0.55%, respectively. |
Effective June 1, 2016, for the Sterling Capital Behavioral International Equity Fund, Sterling Capital has contractually agreed to waive its fees, pay Fund operating expenses, and/or reimburse fees or expenses, in order to limit expenses, excluding interest expense, tax expense, acquired funds fees and extraordinary expenses. The expense limitations are 1.00%, 1.75% and 0.75% of the average daily net assets of the Fund’s Class A Shares, Class C Shares and Institutional Shares, respectively. The expense limitations are for the period June 1, 2016 through January 31, 2018.
Sterling Capital has contractually agreed to limit the expenses of the shares based on average daily net assets of the following funds from November 16, 2015, the date of commencement of operations, through January 31, 2017 as follows:
| Class A | Class C | Institutional | ||||||||
Sterling Capital Stratton Mid Cap Value | 1.30% | 2.05% | 1.05% | |||||||
Sterling Capital Stratton Real Estate Fund | 1.21% | 1.96% | 0.96% | |||||||
Sterling Capital Stratton Small Cap Value Fund | 1.36% | 2.11% | 1.11% | |||||||
Pursuant to sub-advisory agreements with Sterling Capital during the reporting period, Highland Capital Healthcare Advisors, L.P., Gator Capital Management, Lucas Capital Management LLC, Emancipation Capital, LLC and Caerus Investors, LLC served as the sub-advisor to the Sterling Capital Long/Short Equity Fund, subject to the general supervision of the Funds’ Board of Trustees and Sterling Capital. Caerus Investors, LLC began to serve as sub-advisors to the Sterling Capital Long/Short Equity Fund beginning on February 1, 2016. For their services, sub-advisors are entitled to a fee, payable by Sterling Capital.
Sterling Capital serves as the administrator to the Funds pursuant to an administration agreement. The Funds (except the Sterling Capital Strategic Allocation Balanced Fund and Sterling Capital Strategic Allocation Growth Fund) pay their portion of a fee to Sterling Capital for providing administration services based on the aggregate assets of the Funds, excluding the assets of the Funds of Funds, at a rate of 0.1075% on the first $3.5 billion of average net assets, 0.075% on the next $1 billion of average
199
Sterling Capital Funds
|
Notes to Financial Statements — (continued) |
September 30, 2016
|
net assets; 0.06% on the next $1.5 billion of average net assets; and 0.04% of average net assets over $6 billion. Expenses incurred are reflected on the Statements of Operations as “Administration fees.” Pursuant to a sub-administration agreement with Sterling Capital, BNY Mellon Investment Servicing (US) Inc. (“BNY Mellon” or the “Sub-Administrator”), serves as the sub-administrator to the Funds subject to the general supervision of the Board and Sterling Capital. For these services, BNY Mellon is entitled to a fee payable by Sterling Capital.
BNY Mellon serves as the Funds’ fund accountant and transfer agent and receives compensation by the Funds for these services. Expenses incurred are reflected on the Statements of Operations as “Fund accounting fees” and “Transfer agent fees.”
Sterling Capital’s Chief Compliance Officer (“CCO”) serves as the Funds’ CCO. The CCO’s compensation is reviewed and approved by the Funds’ Board and paid by Sterling Capital. However, the Funds reimburse Sterling Capital for their allocable portion of the CCO’s base salary and incentive pay. As a result, the CCO fee paid by the Funds is only part of the total compensation received by the CCO.
For the year ended September 30, 2016, the Funds paid $100,813 in brokerage fees to BB&T Securities LLC on the execution of purchases and sales of the Funds’ portfolio investments.
The Funds have adopted a Distribution and Shareholder Services Plan (the “Plan”) in accordance with Rule 12b-1 under the 1940 Act. Sterling Capital Distributors, LLC (“the Distributor”) serves as distributor to the Funds pursuant to an underwriting agreement. The Plan provides for payments to the Distributor of up to 0.25%, 1.00%, 1.00% and 0.50% of the average daily net assets of the Class A Shares, Class B Shares, Class C Shares, and Class R Shares, respectively. The Distributor is entitled to receive commissions on sales of shares of the Variable Net Asset Value Funds. For the year ended September 30, 2016, the Distributor received $908,318 from commissions earned on sales of shares of the Variable Net Asset Value Funds. Commissions paid to affiliated broker-dealers during the year ended September 30, 2016 were $485,201. The fees may be used by the Distributor to pay banks, broker dealers and other institutions, including affiliates of the Advisor.
Sterling Capital, the Distributor and/or their affiliates may pay out of their own assets (and not as an additional charge to a fund) compensation to selected affiliated and unaffiliated brokers, dealers and other financial intermediaries in connection with the sale and distribution of the shares and/or the retention and/or servicing of Fund investors and Fund shares. These payments, sometimes referred to as “revenue sharing” payments are payments over and above any sales charges (including Rule 12b-1 fees) and service fees paid by the Funds. The amount of these payments is determined at the discretion of the Advisor, the Distributor and/or their affiliates from time to time, may be substantial, and may be different for different financial advisors. Receipt of, or the prospect of receiving, this additional compensation may influence your financial intermediary’s recommendation of a Fund or of a particular share class of a Fund.
Certain Officers and a Trustee of the Funds are affiliated with Sterling Capital or the Sub-Administrator. Such Officers and Trustee receive no compensation from the Funds for serving in their respective roles. Each of the Trustees who are not interested persons (as defined in the 1940 Act) of the Trust who serve on the Board are compensated at the annual rate of $70,000 plus $5,000 for each regularly scheduled quarterly meeting attended, $4,000 for each special meeting attended in person and $1,500 for each special meeting attended by telephone, plus reimbursement for certain out of pocket expenses. Each Trustee serving on a Committee of the Board receives a fee of $4,000 for each Committee meeting attended in person and $1,500 for each Committee meeting attended by telephone, plus reimbursement for certain out of pocket expenses. Committee meeting fees are only paid when such Committee meetings are not held in conjunction with a regular board meeting. Additionally, the Chairman of the Board receives additional compensation at the annual rate of $20,000, the Audit Committee Chairman receives additional compensation at the annual rate of $15,000, and the Chairman of the Nominations Committee receives additional compensation at the annual rate of $6,000. The fees are allocated across the Trust based upon relative net assets.
| 6. | Concentration of Credit Risk: |
The Tax-Free Funds invest primarily in debt instruments of municipal issuers in their respective states. The issuers’ abilities to meet their obligations may be affected by economic developments in a specific state or region.
| 7. | Line of Credit: |
U.S. Bank, N.A. has made available a credit facility to the Trust, pursuant to an umbrella credit agreement (“the Agreement”). The primary purpose of the Agreement is to allow the Trust to avoid security liquidations that Sterling Capital believes are unfavorable to shareholders. Under the Agreement, an aggregate uncommitted amount of $100,000,000 has been made available
200
Sterling Capital Funds
|
Notes to Financial Statements — (continued) |
September 30, 2016
|
for use by all funds of the Trust. Outstanding principal amounts under the Agreement bear interest at a rate per annum equal to the Prime Rate minus two percent (2%), but never at a rate of less than one percent (1%) per annum. The Agreement will expire on March 28, 2017. During the year ended September 30, 2016, each of the following Funds utilized its line of credit:
| Average Interest Rate | Average Loan Balance | Number of Days Outstanding | Interest Expense Incurred | Maximum Amount Borrowed | |||||||||||||||||||||
Sterling Capital Mid Value Fund | 1.25 | % | $ | 1,013,000 | 3 | $ | 106 | $ | 1,013,000 | ||||||||||||||||
Sterling Capital Special Opportunities Fund | 1.50 | % | 1,790,000 | 5 | 372 | 3,940,000 | |||||||||||||||||||
Sterling Capital Long/Short Equity Fund | 1.40 | % | 1,373,759 | 29 | 1,462 | 5,680,000 | |||||||||||||||||||
Sterling Capital Behavioral International Equity Fund | 1.35 | % | 127,600 | 5 | 26 | 214,000 | |||||||||||||||||||
| 8. | Federal Tax Information: |
It is the policy of each Fund to continue to qualify as a regulated investment company as defined in the Internal Revenue Code of 1986, as amended (the “Code”), by complying with the applicable provisions of the Code and to make distributions of net investment income and net realized capital gains sufficient to relieve it from all, or substantially all, federal income taxes. Accordingly, no provision for federal income tax was required in the Funds’ financial statements.
Management evaluates its tax positions to determine if the tax positions taken meet the minimum recognition threshold in connection with accounting for uncertainties in income tax positions taken or expected to be taken for the purposes of measuring and recognizing tax liabilities in the financial statements. Recognition of tax benefits of an uncertain tax position is required only when the position is “more likely than not” to be sustained assuming examination by taxing authorities. The Funds recognize interest and penalties, if any, related to unrecognized tax benefits as income tax expense. During the period, the Funds did not incur any interest or penalties.
Management has analyzed the Funds’ tax positions taken on federal income tax returns for all open tax years (current and prior three tax years), and has concluded that no provision for federal income tax was required in the Funds’ financial statements. The Funds’ federal income and excise tax returns for tax years for which the applicable statutes of limitations have not expired are subject to examination by the Internal Revenue Service and state departments of revenue.
Capital Losses originating in taxable years beginning on or before December 22, 2010 are permitted to be carried forward for eight taxable years; in the year to which they are carried forward, such losses are treated as short-term capital losses that first offset any short-term capital gains, and then offset any long-term capital gains. Under the Regulated Investment Company Modernization Act of 2010, capital losses originating in taxable years beginning after December 22, 2010 (“post-2010 capital losses”) are carried forward indefinitely. Furthermore, post-2010 capital losses will retain their character as either short-term or long-term capital losses rather than being considered all short-term capital losses as under previous law.
At September 30, 2016, the following Funds had net capital loss carryforwards available to offset future net capital gains, if any, to the extent provided by the Treasury regulations:
| Amount With No Expiration* | ||||||||||||||||||||
| Short-term Losses | Long-term Losses | Amount | Expires | |||||||||||||||||
Sterling Capital Behavioral Large Cap Value Equity Fund | $ | — | $ | — | $ | 6,747,050 | 2017 | |||||||||||||
Sterling Capital Behavioral Large Cap Value Equity Fund | — | — | 10,325,708 | 2018 | ||||||||||||||||
Sterling Capital Mid Value Fund | — | — | 3,177,091 | 2017 | ||||||||||||||||
Sterling Capital Behavioral Small Cap Value Equity Fund | — | — | 2,202,715 | 2017 | ||||||||||||||||
Sterling Capital Long/Short Equity Fund | 11,167,786 | 9,883,734 | — | — | ||||||||||||||||
Sterling Capital Behavioral International Equity Fund | 1,208,495 | — | — | — | ||||||||||||||||
Sterling Capital Stratton Mid Cap Value Fund | 78,560 | 816,627 | — | — | ||||||||||||||||
Sterling Capital Ultra Short Bond Fund | 133,475 | 594,968 | — | — | ||||||||||||||||
Sterling Capital Short Duration Bond Fund | 1,265,186 | 3,957,780 | — | — | ||||||||||||||||
Sterling Capital Short Duration Bond Fund | — | — | 385,647 | 2019 | ||||||||||||||||
Sterling Capital Intermediate U.S. Government Fund | 215,137 | 119,028 | — | — | ||||||||||||||||
Sterling Capital Intermediate U.S. Government Fund | — | — | 37,850 | 2019 | ||||||||||||||||
Sterling Capital Total Return Bond Fund | 1,739,080 | 5,124,567 | — | — | ||||||||||||||||
Sterling Capital Securitized Opportunities Fund | 1,356,637 | 287,896 | — | — | ||||||||||||||||
201
Sterling Capital Funds
|
Notes to Financial Statements — (continued) |
September 30, 2016
|
| Amount With No Expiration* | ||||||||||||||||||||
| Short-term Losses | Long-term Losses | Amount | Expires | |||||||||||||||||
Sterling Capital Diversified Income Fund | 1,352,405 | — | — | — | ||||||||||||||||
Sterling Capital Diversified Income Fund | — | — | 5,021,746 | 2018 | ||||||||||||||||
Sterling Capital Strategic Allocation Balanced Fund | — | — | 337,139 | 2018 | ||||||||||||||||
Sterling Capital Strategic Allocation Balanced Fund | — | — | 3,964,763 | 2019 | ||||||||||||||||
Sterling Capital Strategic Allocation Growth Fund | — | — | 1,979,351 | 2018 | ||||||||||||||||
Sterling Capital Strategic Allocation Growth Fund | — | — | 4,640,596 | 2019 | ||||||||||||||||
| ||||||||||||||||||||
| * | Post-2010 Capital Losses: Must be utilized prior to losses subject to expiration. |
Capital loss carryforwards utilized in the current year were as follows:
Utilized Capital Loss Carryforwards | |||||
Sterling Capital Behavioral Large Cap Value Equity Fund | $ | 2,111,507 | |||
Sterling Capital Mid Value Fund | 3,177,091 | ||||
Sterling Capital Behavioral Small Cap Value Equity Fund | 168,089 | ||||
Sterling Capital Intermediate U.S. Government Fund | 35,518 | ||||
Sterling Capital Total Return Bond Fund | 2,490,532 | ||||
Sterling Capital Corporate Fund | 128,610 | ||||
Sterling Capital Securitized Opportunities Fund | 96,086 | ||||
Sterling Capital Strategic Allocation Balanced Fund | 746,425 | ||||
Sterling Capital Strategic Allocation Growth Fund | 761,566 | ||||
Sterling Capital Short Duration Bond Fund and Sterling Capital Intermediate U.S. Government Fund had capital loss carryforwards of $160,380 and $6,852,937, respectively, expire in the current year. For Sterling Capital Behavioral Small Cap Value Equity Fund and Sterling Capital Mid Value Fund capital losses acquired in the reorganization are subject to limitations under Internal Revenue Code Section 382-384.
The character of income and gains distributed is determined in accordance with federal income tax regulations, which may differ from U.S.GAAP. These “book/tax” differences are either considered temporary or permanent in nature. To the extent these differences are permanent in nature (e.g., reclass of net operating losses, disposition of market discount and market premium bonds, paydown gains and losses, mortgage dollar roll gains and losses, short dividend expense, the character of distributions and investments in RICs, partnerships, distributions in connection with fund share redemptions, royalty trusts and PFICs), such amounts are reclassified within the composition of net assets based on their federal tax-basis treatment; temporary differences do not require reclassification. These reclassifications have no impact on net assets or net asset values per share.
As of September 30, 2016, these reclassifications were as follows:
| Decrease Paid-in-Capital | Increase/ (Decrease) Net Investment Income (Loss) | Increase/ (Decrease) Realized Gain (Loss) | ||||||||||
Sterling Capital Behavioral Large Cap Value Equity Fund | $ | — | $ | 40,956 | $ | (40,956 | ) | |||||
Sterling Capital Mid Value Fund | — | (1,767,971) | 1,767,971 | |||||||||
Sterling Capital Behavioral Small Cap Value Equity Fund | — | (65) | 65 | |||||||||
Sterling Capital Special Opportunities Fund | 1,849,707 | (311,596) | (1,538,111 | ) | ||||||||
Sterling Capital Equity Income Fund | (15) | 194,596 | (194,581 | ) | ||||||||
Sterling Capital Long/Short Equity Fund | (1,409,374) | 1,071,201 | 338,173 | |||||||||
Sterling Capital Behavioral International Equity Fund | (2,337) | 50,494 | (48,157 | ) | ||||||||
Sterling Capital Stratton Real Estate Fund | 298,118 | — | (298,118 | ) | ||||||||
Sterling Capital Stratton Small Cap Value Fund | 5,392,734 | — | (5,392,734 | ) | ||||||||
Sterling Capital Ultra Short Bond Fund | — | 392,021 | (392,021 | ) | ||||||||
Sterling Capital Short Duration Bond Fund | (160,380) | 1,232,378 | (1,071,998 | ) | ||||||||
Sterling Capital Intermediate U.S. Government Fund | — | 189,503 | (189,503 | ) | ||||||||
Sterling Capital Total Return Bond Fund | — | 4,515,317 | (4,515,317 | ) | ||||||||
202
Sterling Capital Funds
|
Notes to Financial Statements — (continued) |
September 30, 2016
|
| Decrease Paid-in-Capital | Increase/ (Decrease) Net Investment Income (Loss) | Increase/ (Decrease) Realized Gain (Loss) | |||||||||||||
Sterling Capital Corporate Fund | — | 3,431 | (3,431 | ) | |||||||||||
Sterling Capital Securitized Opportunities Fund | — | 210,291 | (210,291 | ) | |||||||||||
Sterling Capital Kentucky Intermediate Tax-Free Fund | 15,738 | (16 | ) | (15,722 | ) | ||||||||||
Sterling Capital Maryland Intermediate Tax-Free Fund | 23,800 | (1,934 | ) | (21,866 | ) | ||||||||||
Sterling Capital North Carolina Intermediate Tax-Free Fund | 52,604 | 11,686 | (64,290 | ) | |||||||||||
Sterling Capital South Carolina Intermediate Tax-Free Fund | — | 124 | (124 | ) | |||||||||||
Sterling Capital Virginia Intermediate Tax-Free Fund | 48,882 | — | (48,882 | ) | |||||||||||
Sterling Capital West Virginia Intermediate Tax-Free Fund | 21,289 | (2,698 | ) | (18,591 | ) | ||||||||||
Sterling Capital Diversified Income Fund | — | 129,372 | (129,372 | ) | |||||||||||
Sterling Capital Strategic Allocation Balanced Fund | — | 109,601 | (109,601 | ) | |||||||||||
Sterling Capital Strategic Allocation Growth Fund | — | 94,994 | (94,994 | ) | |||||||||||
The tax character of distributions paid to shareholders during the fiscal year ended September 30, 2016 was as follows:
| Distributions paid from | ||||||||||||||||||||||||||||||
| Ordinary Income | Net Long-Term Gains | Total Taxable Distributions | Return Of Capital | Tax Exempt Distributions | Total Distributions Paid* | |||||||||||||||||||||||||
Sterling Capital Behavioral Large Cap Value Equity Fund | $ | 4,924,451 | $ | — | $ | 4,924,451 | $ | — | $ | — | $ | 4,924,451 | ||||||||||||||||||
Sterling Capital Mid Value Fund | 2,468,270 | 109,033,172 | 111,501,442 | — | — | 111,501,442 | ||||||||||||||||||||||||
Sterling Capital Behavioral Small Cap Value Equity Fund | 2,092,669 | 59,855 | 2,152,524 | — | — | 2,152,524 | ||||||||||||||||||||||||
Sterling Capital Special Opportunities Fund | 4,076,621 | 133,396,725 | 137,473,346 | — | — | 137,473,346 | ||||||||||||||||||||||||
Sterling Capital Equity Income Fund | 29,228,593 | 96,372,920 | 125,601,513 | — | — | 125,601,513 | ||||||||||||||||||||||||
Sterling Capital Long/Short Equity Fund | 1,790,646 | 4,670 | 1,795,316 | — | — | 1,795,316 | ||||||||||||||||||||||||
Sterling Capital Behavioral International Equity Fund | 435,802 | — | 435,802 | — | — | 435,802 | ||||||||||||||||||||||||
Sterling Capital Stratton Real Estate Fund | 1,309,272 | 298,118 | 1,607,390 | — | — | 1,607,390 | ||||||||||||||||||||||||
Sterling Capital Stratton Small Cap Value Fund | — | 5,392,734 | 5,392,734 | — | — | 5,392,734 | ||||||||||||||||||||||||
Sterling Capital Ultra Short Bond Fund | 796,850 | — | 796,850 | — | — | 796,850 | ||||||||||||||||||||||||
Sterling Capital Short Duration Bond Fund | 2,316,309 | — | 2,316,309 | — | — | 2,316,309 | ||||||||||||||||||||||||
Sterling Capital Intermediate U.S. Government Fund | 559,195 | �� | — | 559,195 | — | — | 559,195 | |||||||||||||||||||||||
Sterling Capital Total Return Bond Fund | 22,801,104 | — | 22,801,104 | — | — | 22,801,104 | ||||||||||||||||||||||||
Sterling Capital Corporate Fund | 1,590,678 | — | 1,590,678 | — | — | 1,590,678 | ||||||||||||||||||||||||
Sterling Capital Securitized Opportunities Fund | 1,237,624 | — | 1,237,624 | — | — | 1,237,624 | ||||||||||||||||||||||||
Sterling Capital Kentucky Intermediate Tax-Free Fund | 883 | 178,259 | 179,142 | — | 317,274 | 496,416 | ||||||||||||||||||||||||
Sterling Capital Maryland Intermediate Tax-Free Fund | 26 | 258,137 | 258,163 | — | 673,175 | 931,338 | ||||||||||||||||||||||||
Sterling Capital North Carolina Intermediate Tax-Free Fund | 43,681 | 1,081,034 | 1,124,715 | — | 4,557,365 | 5,682,080 | ||||||||||||||||||||||||
Sterling Capital South Carolina Intermediate Tax-Free Fund | 99 | 250,001 | 250,100 | — | 1,634,846 | 1,884,946 | ||||||||||||||||||||||||
Sterling Capital Virginia Intermediate Tax-Free Fund | — | 463,835 | 463,835 | — | 2,565,284 | 3,029,119 | ||||||||||||||||||||||||
Sterling Capital West Virginia Intermediate Tax-Free Fund | 217 | 550,783 | 551,000 | — | 2,215,922 | 2,766,922 | ||||||||||||||||||||||||
Sterling Capital Diversified Income Fund | 1,577,980 | — | 1,577,980 | — | — | 1,577,980 | ||||||||||||||||||||||||
Sterling Capital Strategic Allocation Balanced Fund | 660,133 | — | 660,133 | — | — | 660,133 | ||||||||||||||||||||||||
Sterling Capital Strategic Allocation Growth Fund | 413,129 | — | 413,129 | — | — | 413,129 | ||||||||||||||||||||||||
| ||||||||||||||||||||||||||||||
| * | Total distributions paid may differ from the Statements of Changes in Net Assets because distributions are recognized when actually paid for tax purposes. |
| * | The Funds may utilize equalization accounting for tax purposes and designate earnings and profits, including net realized gains distributed to shareholders on redemption of shares, as part of the dividends. |
The tax character of distributions paid to shareholders during the fiscal year ended September 30, 2015 was as follows:
| Distributions paid from | ||||||||||||||||||||||||||||||
| Ordinary Income | Net Long-Term Gains | Total Taxable Distributions | Return Of Capital | Tax Exempt Distributions | Total Distributions Paid* | |||||||||||||||||||||||||
Sterling Capital Behavioral Large Cap Value Equity Fund | $ | 4,306,942 | $ | — | $ | 4,306,942 | $ | — | $ | — | $ | 4,306,942 | ||||||||||||||||||
Sterling Capital Mid Value Fund | 13,589,934 | 37,147,968 | 50,737,902 | — | — | 50,737,902 | ||||||||||||||||||||||||
203
Sterling Capital Funds
|
Notes to Financial Statements — (continued) |
September 30, 2016
|
| Distributions paid from | ||||||||||||||||||||||||||||||
| Ordinary Income | Net Long-Term Gains | Total Taxable Distributions | Return Of Capital | Tax Exempt Distributions | Total Distributions Paid* | |||||||||||||||||||||||||
Sterling Capital Behavioral Small Cap Value Equity Fund | 4,117,892 | 2,067,752 | 6,185,644 | — | — | 6,185,644 | ||||||||||||||||||||||||
Sterling Capital Special Opportunities Fund | 15,443,582 | 37,847,865 | 53,291,447 | — | — | 53,291,447 | ||||||||||||||||||||||||
Sterling Capital Equity Income Fund | 31,465,335 | 53,619,402 | 85,084,737 | — | — | 85,084,737 | ||||||||||||||||||||||||
Sterling Capital Long/Short Equity Fund | 3,051,801 | 46,785 | 3,098,586 | — | — | 3,098,586 | ||||||||||||||||||||||||
Sterling Capital Behavioral International Equity Fund | 64,770 | — | 64,770 | — | — | 64,770 | ||||||||||||||||||||||||
Sterling Capital Ultra Short Bond Fund | 558,799 | — | 558,799 | — | — | 558,799 | ||||||||||||||||||||||||
Sterling Capital Short Duration Bond Fund | 2,880,133 | — | 2,880,133 | — | — | 2,880,133 | ||||||||||||||||||||||||
Sterling Capital Intermediate U.S. Government Fund | 689,893 | — | 689,893 | — | — | 689,893 | ||||||||||||||||||||||||
Sterling Capital Total Return Bond Fund | 22,999,367 | — | 22,999,367 | — | — | 22,999,367 | ||||||||||||||||||||||||
Sterling Capital Corporate Fund | 1,861,461 | 60,465 | 1,921,926 | 30,792 | — | 1,952,718 | ||||||||||||||||||||||||
Sterling Capital Securitized Opportunities Fund | 1,157,473 | — | 1,157,473 | — | — | 1,157,473 | ||||||||||||||||||||||||
Sterling Capital Kentucky Intermediate Tax-Free Fund | 7,426 | 247,165 | 254,591 | — | 372,666 | 627,257 | ||||||||||||||||||||||||
Sterling Capital Maryland Intermediate Tax-Free Fund | 16 | 184,451 | 184,467 | — | 752,870 | 937,337 | ||||||||||||||||||||||||
Sterling Capital North Carolina Intermediate Tax-Free Fund | 190 | 323,183 | 323,373 | — | 4,766,517 | 5,089,890 | ||||||||||||||||||||||||
Sterling Capital South Carolina Intermediate Tax-Free Fund | 20 | 111,719 | 111,739 | — | 1,490,837 | 1,602,576 | ||||||||||||||||||||||||
Sterling Capital Virginia Intermediate Tax-Free Fund | 41,448 | 626,853 | 668,301 | — | 2,703,034 | 3,371,335 | ||||||||||||||||||||||||
Sterling Capital West Virginia Intermediate Tax-Free Fund | 70,946 | 271,918 | 342,864 | — | 2,292,554 | 2,635,418 | ||||||||||||||||||||||||
Sterling Capital Diversified Income Fund | 736,807 | — | 736,807 | — | — | 736,807 | ||||||||||||||||||||||||
Sterling Capital Strategic Allocation Balanced Fund | 512,549 | — | 512,549 | — | — | 512,549 | ||||||||||||||||||||||||
Sterling Capital Strategic Allocation Growth Fund | 249,557 | — | 249,557 | — | — | 249,557 | ||||||||||||||||||||||||
| ||||||||||||||||||||||||||||||
| * | Total distributions paid may differ from the Statements of Changes in Net Assets because distributions are recognized when actually paid for tax purposes. |
The tax character of distributions paid to shareholders during the fiscal year ended December 31, 2015 was as follows:
| Distributions paid from | ||||||||||||||||||||||||||||||
| Ordinary Income | Net Long-Term Gains | Total Taxable Distributions | Return Of Capital | Tax Exempt Distributions | Total Distributions Paid | |||||||||||||||||||||||||
Sterling Capital Stratton Mid Cap Value Fund | $ | 182,052 | $ | 2,143,220 | $ | 2,325,272 | $ | — | $ | — | $ | 2,325,272 | ||||||||||||||||||
Sterling Capital Stratton Real Estate Fund | 1,631,781 | 1,257,971 | 2,889,752 | — | — | 2,889,752 | ||||||||||||||||||||||||
Sterling Capital Stratton Small Cap Value Fund | 1,265,153 | 16,420,844 | 17,685,997 | — | — | 17,685,997 | ||||||||||||||||||||||||
The tax character of distributions paid to shareholders during the fiscal year ended December 31, 2014 was as follows:
| Distributions paid from | |||||||||||||||||||||||||
| Ordinary Income | Net Long-Term Gains | Total Taxable Distributions | Tax Exempt Distributions | Total Distributions Paid | |||||||||||||||||||||
Sterling Capital Stratton Mid Cap Value Fund | $ | 30,101 | $ | — | $ | 30,101 | $ | — | $ | 30,101 | |||||||||||||||
Sterling Capital Stratton Real Estate Fund | 1,517,996 | 4,671,939 | 6,189,935 | — | 6,189,935 | ||||||||||||||||||||
Sterling Capital Stratton Small Cap Value Fund | 432,809 | 27,799,849 | 28,232,658 | — | 28,232,658 | ||||||||||||||||||||
As of September 30, 2016, the components of accumulated earnings (deficit) on a tax basis were as follows:
| Undistributed Ordinary Income/Tax Exempt Income | Undistributed Long Term Capital Gains | Accumulated Earnings | Distributions Payable | Accumulated Capital and Other Losses | Unrealized Appreciation (Depreciation)* | Total Accumulated Earnings (Deficit) | |||||||||||||||||||||||||||||
Sterling Capital Behavioral Large Cap Value Equity Fund | $ | 214,240 | $ | — | $ | 214,240 | $ | — | $ | (17,072,758 | ) | $ | 21,960,478 | $ | 5,101,960 | ||||||||||||||||||||
Sterling Capital Mid Value Fund | — | 17,283,829 | 17,283,829 | — | (3,177,091 | ) | 67,141,719 | 81,248,457 | |||||||||||||||||||||||||||
Sterling Capital Behavioral Small Cap Value Equity Fund | 299,031 | — | 299,031 | — | (3,560,875 | ) | 22,244,805 | 18,982,961 | |||||||||||||||||||||||||||
Sterling Capital Special Opportunities Fund | — | 18,558,053 | 18,558,053 | — | — | 258,946,125 | 277,504,178 | ||||||||||||||||||||||||||||
204
Sterling Capital Funds
|
Notes to Financial Statements — (continued) |
September 30, 2016
|
| Undistributed Ordinary Income/Tax Exempt Income | Undistributed Long Term Capital Gains | Accumulated Earnings | Distributions Payable | Accumulated Capital and Other Losses | Unrealized Appreciation (Depreciation)* | Total Accumulated Earnings (Deficit) | |||||||||||||||||||||||||||||
Sterling Capital Equity Income Fund | 1,928,780 | 1,984,666 | 3,913,446 | (142 | ) | (11,430,309 | ) | 395,580,351 | 388,063,346 | ||||||||||||||||||||||||||
Sterling Capital Long/Short Equity Fund | — | — | — | — | (21,051,520 | ) | (634,357 | ) | (21,685,877 | ) | |||||||||||||||||||||||||
Sterling Capital Behavioral International Equity Fund | 964,216 | — | 964,216 | — | (1,208,495 | ) | 1,243,691 | 999,412 | |||||||||||||||||||||||||||
Sterling Capital Stratton Mid Cap Value Fund | 85,802 | 293,885 | 379,687 | — | (895,187 | ) | 15,868,650 | 15,353,150 | |||||||||||||||||||||||||||
Sterling Capital Stratton Real Estate Fund | 1,613,104 | 4,315,998 | 5,929,102 | — | — | 35,517,024 | 41,446,126 | ||||||||||||||||||||||||||||
Sterling Capital Stratton Small Cap Value Fund | 1,646,853 | 61,360,362 | 63,007,215 | — | — | 529,675,291 | 592,682,506 | ||||||||||||||||||||||||||||
Sterling Capital Ultra Short Bond Fund | 3,960 | — | 3,960 | (5,644 | ) | (728,443 | ) | (176,206 | ) | (906,333 | ) | ||||||||||||||||||||||||
Sterling Capital Short Duration Bond Fund | 127,163 | — | 127,163 | (127,490 | ) | (5,608,613 | ) | (1,238,087 | ) | (6,847,027 | ) | ||||||||||||||||||||||||
Sterling Capital Intermediate U.S. Government Fund | 249,876 | — | 249,876 | (21,715 | ) | (372,015 | ) | (6,224,807 | ) | (6,368,661 | ) | ||||||||||||||||||||||||
Sterling Capital Total Return Bond Fund | 1,086,206 | — | 1,086,206 | (643,355 | ) | (6,863,647 | ) | 15,415,270 | 8,994,474 | ||||||||||||||||||||||||||
Sterling Capital Corporate Fund | 83,157 | — | 83,157 | (626 | ) | — | 972,597 | 1,055,128 | |||||||||||||||||||||||||||
Sterling Capital Securitized Opportunities Fund | 77 | — | 77 | — | (1,644,533 | ) | 975,385 | (669,071 | ) | ||||||||||||||||||||||||||
Sterling Capital Kentucky Intermediate Tax-Free Fund | 27,516 | 164,127 | 191,643 | (15,001 | ) | — | 812,149 | 988,791 | |||||||||||||||||||||||||||
Sterling Capital Maryland Intermediate Tax-Free Fund | 34,815 | 215,645 | 250,460 | (30,849 | ) | — | 1,811,276 | 2,030,887 | |||||||||||||||||||||||||||
Sterling Capital North Carolina Intermediate Tax-Free Fund | 336,047 | 699,697 | 1,035,744 | (226,472 | ) | — | 11,845,103 | 12,654,375 | |||||||||||||||||||||||||||
Sterling Capital South Carolina Intermediate Tax-Free Fund | 122,758 | 9,915 | 132,673 | (94,565 | ) | — | 4,041,592 | 4,079,700 | |||||||||||||||||||||||||||
Sterling Capital Virginia Intermediate Tax-Free Fund | 185,489 | 783,744 | 969,233 | (122,293 | ) | — | 6,235,294 | 7,082,234 | |||||||||||||||||||||||||||
Sterling Capital West Virginia Intermediate Tax-Free Fund | 178,094 | 452,688 | 630,782 | (110,366 | ) | — | 5,372,300 | 5,892,716 | |||||||||||||||||||||||||||
Sterling Capital Diversified Income Fund | 91,488 | — | 91,488 | (8,196 | ) | (6,374,151 | ) | 1,423,410 | (4,867,449 | ) | |||||||||||||||||||||||||
Sterling Capital Strategic Allocation Balanced Fund | 16,710 | — | 16,710 | (1,207 | ) | (4,301,902 | ) | 727,764 | (3,558,635 | ) | |||||||||||||||||||||||||
Sterling Capital Strategic Allocation Growth Fund | 3,388 | — | 3,388 | (216 | ) | (6,619,947 | ) | 414,200 | (6,202,575 | ) | |||||||||||||||||||||||||
| |||||||||||||||||||||||||||||||||||
| * | The primary differences between book basis and tax basis unrealized appreciation (depreciation) were due to the deferral of losses on wash sales and straddles, recognition of gain on constructive sales, basis adjustments on partnership interests, hybrid securities, royalty trusts, PFICs and the deferral of market discount and premium until point of sale. |
Under current tax law, net capital losses or, if there are no such losses, net long-term capital losses or net short-term capital losses realized after October 31, net ordinary losses from the sale, exchange or other taxable disposition of property realized after October 31 and other net ordinary losses realized after December 31 of a Fund’s fiscal year may be deferred and treated as occurring on the first business day of the following fiscal year for tax purposes. The following Fund had deferred qualified late-year losses, which will be treated as arising on the first business day of the fiscal year ending September 30, 2016:
| Qualified Late-Year Capital Losses | ||||
Sterling Capital Behavioral Small Cap Value Equity Fund | $ | 1,358,160 | ||
Sterling Capital Equity Income Fund | 11,430,309 | |||
As of September 30, 2016, federal income tax cost, gross unrealized appreciation and gross unrealized depreciation on securities were as follows:
205
Sterling Capital Funds
|
Notes to Financial Statements — (continued) |
September 30, 2016
|
| Tax Cost | Gross Tax Unrealized Appreciation | Gross Tax Unrealized Depreciation | Net Tax Unrealized Appreciation (Depreciation) | |||||||||||||
Sterling Capital Behavioral Large Cap Value Equity Fund | $ | 250,573,676 | $ | 26,328,829 | $ | (4,368,351 | ) | $ | 21,960,478 | |||||||
Sterling Capital Mid Value Fund | 517,793,464 | 128,634,269 | (61,492,550 | ) | 67,141,719 | |||||||||||
Sterling Capital Behavioral Small Cap Value Equity Fund | 144,384,914 | 23,872,150 | (1,627,345 | ) | 22,244,805 | |||||||||||
Sterling Capital Special Opportunities Fund | 860,402,840 | 285,081,789 | (25,767,580 | ) | 259,314,209 | |||||||||||
Sterling Capital Equity Income Fund | 1,293,237,384 | 411,016,705 | (15,445,045 | ) | 395,571,660 | |||||||||||
Sterling Capital Long/Short Equity Fund | 24,863,340 | 5,023,312 | (5,660,567 | ) | (637,255 | ) | ||||||||||
Sterling Capital Behavioral International Equity Fund | 68,714,447 | 3,288,798 | (2,043,505 | ) | 1,245,293 | |||||||||||
Sterling Capital Stratton Mid Cap Value Fund | 47,776,549 | 17,321,105 | (1,452,455 | ) | 15,868,650 | |||||||||||
Sterling Capital Stratton Real Estate Fund | 69,030,325 | 35,766,862 | (249,838 | ) | 35,517,024 | |||||||||||
Sterling Capital Stratton Small Cap Value Fund | 683,459,928 | 531,771,693 | (2,096,402 | ) | 529,675,291 | |||||||||||
Sterling Capital Ultra Short Bond Fund | 56,366,529 | 58,392 | (234,598 | ) | (176,206 | ) | ||||||||||
Sterling Capital Short Duration Bond Fund | 87,973,017 | 472,050 | (1,710,137 | ) | (1,238,087 | ) | ||||||||||
Sterling Capital Intermediate U.S. Government Fund | 32,915,280 | 861,195 | (7,086,002 | ) | (6,224,807 | ) | ||||||||||
Sterling Capital Total Return Bond Fund | 781,294,159 | 24,437,140 | (9,021,870 | ) | 15,415,270 | |||||||||||
Sterling Capital Corporate Fund | 31,045,922 | 1,084,684 | (112,087 | ) | 972,597 | |||||||||||
Sterling Capital Securitized Opportunities Fund | 45,770,715 | 1,103,121 | (127,736 | ) | 975,385 | |||||||||||
Sterling Capital Kentucky Intermediate Tax-Free Fund | 12,013,019 | 812,390 | (241 | ) | 812,149 | |||||||||||
Sterling Capital Maryland Intermediate Tax-Free Fund | 29,882,851 | 1,811,276 | — | 1,811,276 | ||||||||||||
Sterling Capital North Carolina Intermediate Tax-Free Fund | 203,646,035 | 11,952,726 | (107,623 | ) | 11,845,103 | |||||||||||
Sterling Capital South Carolina Intermediate Tax-Free Fund | 88,134,923 | 4,088,892 | (47,300 | ) | 4,041,592 | |||||||||||
Sterling Capital Virginia Intermediate Tax-Free Fund | 112,428,337 | 6,278,530 | (43,236 | ) | 6,235,294 | |||||||||||
Sterling Capital West Virginia Intermediate Tax-Free Fund | 96,262,818 | 5,373,433 | (1,133 | ) | 5,372,300 | |||||||||||
Sterling Capital Diversified Income Fund | 41,493,816 | 1,614,227 | (190,817 | ) | 1,423,410 | |||||||||||
Sterling Capital Strategic Allocation Balanced Fund | 32,287,369 | 1,482,246 | (754,482 | ) | 727,764 | |||||||||||
Sterling Capital Strategic Allocation Growth Fund | 22,980,824 | 1,099,621 | (685,421 | ) | 414,200 | |||||||||||
| 9. | Subsequent Events: |
Management has evaluated the need for the disclosure and/or adjustments resulting from subsequent events through the date the financial statements were issued, and has noted no events that require recognition or disclosure in the financial statements.
206
Report of Independent Registered Public Accounting Firm
The Board of Trustees and Shareholders of Sterling Capital Funds:
We have audited the accompanying statements of assets and liabilities, including the schedules of portfolio investments, of the Sterling Capital Funds (the Funds) comprised of the Sterling Capital Behavioral Large Cap Value Equity Fund, Sterling Capital Mid Value Fund, Sterling Capital Behavioral Small Cap Value Equity Fund, Sterling Capital Special Opportunities Fund, Sterling Capital Equity Income Fund, Sterling Capital Long/Short Equity Fund, Sterling Capital Behavioral International Equity Fund, Sterling Capital Ultra Short Bond Fund, Sterling Capital Short Duration Bond Fund, Sterling Capital Intermediate U.S. Government Fund, Sterling Capital Total Return Bond Fund, Sterling Capital Corporate Fund, Sterling Capital Securitized Opportunities Fund, Sterling Capital Kentucky Intermediate Tax-Free Fund, Sterling Capital Maryland Intermediate Tax-Free Fund, Sterling Capital North Carolina Intermediate Tax-Free Fund, Sterling Capital South Carolina Intermediate Tax-Free Fund, Sterling Capital Virginia Intermediate Tax-Free Fund, Sterling Capital West Virginia Intermediate Tax-Free Fund, Sterling Capital Diversified Income Fund, Sterling Capital Strategic Allocation Balanced Fund, and Sterling Capital Strategic Allocation Growth Fund (twenty-two of the twenty-five funds constituting Sterling Capital Funds), as of September 30, 2016, and the related statements of operations for the year then ended, the statements of changes in net assets for each of the years or periods in the two-year period then ended, the statement of cash flows for Sterling Capital Long/Short Equity Fund for the year then ended, and the financial highlights for each of the years or periods in the five-year period then ended. We also have audited the accompanying statements of assets and liabilities, including the schedules of portfolio investments, of the Sterling Capital Stratton Mid Cap Value Fund, Sterling Capital Stratton Real Estate Fund and Sterling Capital Stratton Small Cap Value Fund (three of the twenty-five funds constituting the Sterling Capital Funds), as of September 30, 2016, and the related statements of operations for the period January 1, 2016 through September 30, 2016 and for the year ended December 31, 2015, the statements of changes in net assets for the period January 1, 2016 through September 30, 2016 and for the year ended December 31, 2015, and the financial highlights for the period January 1, 2016 through September 30, 2016 and for the year or period ended December 31, 2015. These financial statements and financial highlights are the responsibility of the Funds’ management. Our responsibility is to express an opinion on these financial statements and financial highlights based on our audits. The statements of changes in net assets of Sterling Capital Stratton Mid Cap Value Fund, Sterling Capital Stratton Real Estate Fund, and Sterling Capital Stratton Small Cap Value Fund for the year ended December 31, 2014, and the financial highlights for each of the years or periods in the four-year period ended December 31, 2014, were audited by other auditors. Those auditors also expressed an unqualified opinion on those statements of changes in net assets and financial highlights in their report dated February 18, 2015.
We conducted our audits in accordance with the standards of the Public Company Accounting Oversight Board (United States). Those standards require that we plan and perform the audit to obtain reasonable assurance about whether the financial statements and financial highlights are free of material misstatement. An audit includes examining, on a test basis, evidence supporting the amounts and disclosures in the financial statements. Our procedures included confirmation of securities owned as of September 30, 2016, by correspondence with the custodian, prime broker, transfer agent of the underlying fund, and brokers, or other appropriate auditing procedures. An audit also includes assessing the accounting principles used and significant estimates made by management, as well as evaluating the overall financial statement presentation. We believe that our audits provide a reasonable basis for our opinion.
In our opinion, the financial statements and financial highlights referred to above present fairly, in all material respects, the financial position of each of the Funds comprising Sterling Capital Funds as of September 30, 2016, the results of their operations, the changes in their net assets, cash flows for the Sterling Capital Long/Short Equity Fund, and the financial highlights for the periods presented in the first paragraph, in conformity with U.S. generally accepted accounting principles.

Philadelphia, Pennsylvania
November 23, 2016
207
Sterling Capital Funds
|
September 30, 2016 |
Notice to Shareholders (Unaudited) |
All amounts and percentages below are based on financial information available as of the date of this annual report and, accordingly are subject to change. For each item it is the intention of the Funds to report the maximum amount permitted under the Internal Revenue Code and the regulations thereunder.
For the fiscal year ended September 30, 2016, each Fund is reporting the following items with regard to distributions paid during the year.
| Long-Term Capital Gain | Qualified Dividend Income % | (for corporate shareholders) Dividends Received Deduction % | Exempt- Interest Dividend | U.S. Government Income | Foreign Taxes Paid | Foreign Source Income | |||||||||||||||||||||||||||||
Sterling Capital Behavioral Large Cap Value Equity Fund | $ | — | 100.00 | % | 100.00 | % | $ | — | — | $ | — | — | |||||||||||||||||||||||
Sterling Capital Mid Value Fund | 109,033,172 | 100.00 | % | 100.00 | % | — | — | — | — | ||||||||||||||||||||||||||
Sterling Capital Behavioral Small Cap Value Equity Fund | 59,855 | 99.59 | % | 99.53 | % | — | — | — | — | ||||||||||||||||||||||||||
Sterling Capital Special Opportunities Fund | 133,396,725 | 100.00 | % | 100.00 | % | — | — | — | — | ||||||||||||||||||||||||||
Sterling Capital Equity Income Fund | 96,372,920 | 100.00 | % | 100.00 | % | — | — | — | — | ||||||||||||||||||||||||||
Sterling Capital Long/Short Equity Fund | 4,670 | 34.34 | % | 28.97 | % | — | — | — | — | ||||||||||||||||||||||||||
Sterling Capital Behavioral International Equity Fund | — | 99.32 | % | — | — | — | 32,378 | 87.36 | % | ||||||||||||||||||||||||||
Sterling Capital Stratton Real Estate Fund | 298,118 | 4.06 | % | 4.06 | % | — | — | — | — | ||||||||||||||||||||||||||
Sterling Capital Stratton Small Cap Value Fund | 5,392,734 | — | — | — | — | — | — | ||||||||||||||||||||||||||||
Sterling Capital Short Duration Bond Fund | — | 0.39 | % | 0.40 | % | — | 1.29 | % | — | — | |||||||||||||||||||||||||
Sterling Capital Intermediate U.S. Government Fund | — | — | — | — | 28.81 | % | — | — | |||||||||||||||||||||||||||
Sterling Capital Total Return Bond Fund | — | 0.64 | % | 0.64 | % | — | 3.97 | % | — | — | |||||||||||||||||||||||||
Sterling Capital Corporate Fund | — | 0.44 | % | 0.44 | % | — | 0.59 | % | — | — | |||||||||||||||||||||||||
Sterling Capital Securitized Opportunities Fund | — | — | — | — | 0.48 | % | — | — | |||||||||||||||||||||||||||
Sterling Capital Kentucky Intermediate Tax-Free Fund | 178,259 | — | — | 317,274 | — | — | — | ||||||||||||||||||||||||||||
Sterling Capital Maryland Intermediate Tax-Free Fund | 258,137 | — | — | 673,175 | — | — | — | ||||||||||||||||||||||||||||
Sterling Capital North Carolina Intermediate Tax-Free Fund | 1,081,034 | — | — | 4,557,365 | — | — | — | ||||||||||||||||||||||||||||
Sterling Capital South Carolina Intermediate Tax-Free Fund | 250,001 | — | — | 1,634,846 | — | — | — | ||||||||||||||||||||||||||||
Sterling Capital Virginia Intermediate Tax-Free Fund | 463,835 | — | — | 2,565,284 | — | — | — | ||||||||||||||||||||||||||||
Sterling Capital West Virginia Intermediate Tax-Free Fund | 550,783 | — | — | 2,215,922 | — | — | — | ||||||||||||||||||||||||||||
Sterling Capital Diversified Income Fund | — | 21.07 | % | 1.04 | % | — | 2.96 | % | 14,400 | 7.74 | % | ||||||||||||||||||||||||
Sterling Capital Strategic Allocation Balanced Fund | — | 55.16 | % | 22.61 | % | — | 1.69 | % | 18,196 | 27.72 | % | ||||||||||||||||||||||||
Sterling Capital Strategic Allocation Growth Fund | — | 78.23 | % | 31.69 | % | — | 0.93 | % | 16,202 | 38.42 | % | ||||||||||||||||||||||||
208
| Sterling Capital Funds |
September 30, 2016 |
A description of the policies and procedures that the Funds use to determine how to vote proxies relating to portfolio securities is available (i) without charge, upon request, by calling 1-800-228-1872; and (ii) on the Securities and Exchange Commission’s (the “Commission”) website at www.sec.gov.
Information regarding how the Funds voted proxies relating to portfolio securities during the most recent 12-month period ended June 30th is available (i) without charge, upon request, by calling 1-800-228-1872 and (ii) on the Commission’s website at www.sec.gov.
The Funds file complete Schedules of Portfolio Holdings with the Commission for the first and third quarters of each fiscal year on Form N-Q. The Funds’ Forms N-Q are available without charge on the Commission’s website at www.sec.gov, or may be reviewed and copied at the Commission’s Public Reference Room in Washington, D.C. Information on the operation of the Public Reference Room may be obtained by calling 1-800-SEC-0330.
209
Sterling Capital Funds
|
Information about Trustees and Officers (Unaudited)
Overall responsibility for the management of the Funds rests with its Board of Trustees (“Trustees”), who are elected by the shareholders of the Funds. The Trustees elect the officers of the Funds to supervise actively its day-to-day operations. The names of the Trustees, birthdates, term of office and length of time served, principal occupations during the past five years, number of portfolios overseen and directorships held outside of the Funds are listed in the two tables immediately following. The business address of the persons listed below is 3605 Glenwood Avenue, Suite 100, Raleigh, North Carolina 27612.
| INDEPENDENT TRUSTEES | ||||||||||
Name and Birthdate | Position(s) Held With the Funds | Term of Office/ Time Served | Principal Occupation | Number of Portfolios in Fund Complex Overseen by Trustee | Other Directorships Held by Trustee | |||||
Drew T. Kagan Birthdate: 02/48 | Trustee, Chairman of the Board of Trustees | Indefinite, 08/00 — Present | Retired; from September 2010 to March 2013, Chairman, Montecito Advisors, Inc.; from December 2003 to September 2010, CEO, Montecito Advisors, Inc.; from March 1996 to December 2003, President, Investment Affiliate, Inc. | 25 | None | |||||
Laura C. Bingham Birthdate: 11/56 | Trustee | Indefinite, 02/01 — Present | From March 2013 to present, Partner, Newport Board Group; from July 2010 to February 2013, governance and leadership consultant; from July 1998 to June 2010, President of Peace College | 25 | None | |||||
| Douglas R. Van Scoy Birthdate: 11/43 | Trustee | Indefinite, 05/04 — Present | Retired; from November 1974 to July 2001, employee of Smith Barney (investment banking), most recently as Director of Private Client Group and Senior Executive Vice President | 25 | None | |||||
James L. Roberts Birthdate: 11/42 | Trustee | Indefinite, 11/04 — Present | Retired; from November 2006 to present, Director, Grand Mountain Bancshares, Inc.; from January 1999 to December 2003, President, CEO and Director, Covest Bancshares, Inc. | 25 | None | |||||
Alan G. Priest Birthdate: 05/52 | Trustee | Indefinite, 7/12 — Present | Retired; from April 1993 to April 2012, Partner, Ropes & Gray LLP | 25 | None | |||||
210
Sterling Capital Funds
|
The following table shows information for the trustee who is an “interested person” of the Funds as defined in the 1940 Act:
| INTERESTED TRUSTEES | ||||||||||
Name and Birthdate | Position(s) Held | Term of Office/ Length of Time Served | Principal Occupation During the Past 5 Years | Number of in Fund by Trustee | Other by Trustee | |||||
Alexander W. McAlister* Birthdate: 03/60 | Trustee | Indefinite, 11/10 — Present | President, Sterling Capital Management LLC | 25 | Director, Sterling Capital Management LLC | |||||
| * | Mr. McAlister is treated by the Funds as an “interested person” (as defined in Section 2(a)(19) of the 1940Act) of the Funds because he is an officer of the Advisor. |
The following table shows information for officers of Funds:
Name and Birthdate | Position(s) Held With the Funds | Term of Office/ Time Served | Principal Occupation During the Past 5 Years | |||
James T. Gillespie Birthdate: 11/66 | President | Indefinite, 12/12 — Present | From March 2012 to present, Executive Director, Sterling Capital Management LLC; From June 2010 to March 2012, Director, Sterling Capital Management LLC and its predecessors; from August 2008 to June 2010, Vice President Relationship Management, JPMorgan Chase & Co.; from February 2005 to August 2008, Senior Vice President and Manager of Mutual Fund Administration, Sterling Capital Management LLC and its predecessors | |||
Todd M. Miller Birthdate: 09/71 | Treasurer and Secretary | Indefinite, Vice President, 08/05 — Present; Treasurer, 01/15 — Present; Secretary, 08/10 — Present | From June 2009 to present, Director, Sterling Capital Management LLC and its predecessors; from June 2005 to May 2009, Mutual Fund Administrator; from May 2001 to May 2005, Manager, BISYS Fund Services | |||
Krystle Edwards Birthdate: 02/86 | Vice President | Indefinite, 11/14 — Present | From May 2013 to present, Associate, Sterling Capital Management LLC; from March 2012-December 2012, Financial Advisor, First Command Financial Planning; from September 2009-May 2012, student at Campbell University School of Law | |||
Brian M. Moran Birthdate: 05/60 | Chief Compliance and Anti-Money Laundering Officer | Indefinite, 01/15 — Present | From July 2014 to present, Chief Compliance Officer and Executive Director, Sterling Capital Management LLC; from December 2006 to June 2014, Chief Compliance Officer and Director, TIAA-CREF and Teachers Personal Investors Services, Inc. | |||
John A. Bruggeman Birthdate: 12/71 | Assistant Treasurer | Indefinite, Assistant Treasurer, 08/16 — Present | From January 2010 to present, Vice President and Senior Director, Fund Accounting and Administration Department, BNY Mellon Investment Servicing | |||
211
Sterling Capital Funds
|
Name and Birthdate | Position(s) Held With the Funds | Term of Office/ Time Served | Principal Occupation During the Past 5 Years | |||
Julie M. Powers Birthdate: 10/69 | Assistant Secretary | Indefinite, 11/11 — Present | From November 2011 to present, Vice President; from March 2009 to October 2011, Senior Manager and Vice President; from August 2005 to February 2009, Manager and Assistant Vice President, Regulatory Administration Department, BNY Mellon Investment Servicing (US) Inc. | |||
The Funds’ Statement of Additional Information includes additional information about the Funds’ Trustees and Officers. To receive your free copy of the Statement of Additional Information, call toll free: 1-800-228-1872.
212
(This page has been left blank intentionally.)
(This page has been left blank intentionally.)
INVESTMENT ADVISOR
Sterling Capital Management LLC
4350 Congress Street, Suite 1000
Charlotte, NC 28209
DISTRIBUTOR
Sterling Capital Distributors, LLC
400 Berwyn Park
899 Cassatt Road
Berwyn, PA 19312
LEGAL COUNSEL
Ropes & Gray LLP
Prudential Tower
800 Boylston Street
Boston, MA 02199
TRANSFER AGENT
BNY Mellon Investment Servicing (US) Inc.
301 Bellevue Parkway
Wilmington, DE 19809
INDEPENDENT REGISTERED PUBLIC ACCOUNTING FIRM
KPMG LLP
1601 Market Street
Philadelphia, PA 19103

Item 2. Code of Ethics.
| (a) | The registrant, as of the end of the period covered by this report, has adopted a code of ethics that applies to the registrant’s principal executive officer, principal financial officer, principal accounting officer or controller, or persons performing similar functions, regardless of whether these individuals are employed by the registrant or a third party (the “Code of Ethics”). |
| (c) | There have been no amendments, during the period covered by this report, to a provision of the Code of Ethics that applies to the registrant’s principal executive officer, principal financial officer, principal accounting officer or controller, or persons performing similar functions, regardless of whether these individuals are employed by the registrant or a third party, and that relates to any element of the code of ethics definition enumerated in Item 2(b) of Form N-CSR. |
| (d) | The registrant has not granted any waivers, including an implicit waiver, from a provision of the code of ethics that applies to the registrant’s principal executive officer, principal financial officer, principal accounting officer or controller, or persons performing similar functions, regardless of whether these individuals are employed by the registrant or a third party, that relates to one or more of the items set forth in Item 2(b) of Form N-CSR. |
Item 3. Audit Committee Financial Expert.
As of the end of the period covered by the report, the registrant’s board of trustees has determined that Drew Kagan is qualified to serve as an audit committee financial expert serving on its audit committee and that he is “independent,” as defined by Item 3 of Form N-CSR.
Item 4. Principal Accountant Fees and Services.
Audit Fees
| (a) | The aggregate fees billed for each of the last two fiscal years for professional services rendered by the principal accountant for the audit of the registrant’s annual financial statements or services that are normally provided by the accountant in connection with statutory and regulatory filings or engagements for those fiscal years are $493,600 for 2016 and $430,000 for 2015. |
Audit-Related Fees
| (b) | The aggregate fees billed in each of the last two fiscal years for assurance and related services by the principal accountant that are reasonably related to the performance of the audit of the registrant’s financial statements and are not reported under paragraph (a) of this Item are $0 for 2016 and $2,500 for 2015. These audit-related services include issuance of consents to use the name of the auditor in new Fund filings. |
Tax Fees
| (c) | The aggregate fees billed in each of the last two fiscal years for professional services rendered by the principal accountant for tax compliance, tax advice, and tax planning are $95,792 for 2016 and $87,705 for 2015. Fees for both 2016 and 2015 relate to the preparation of federal income and excise tax returns and review of capital gains distribution calculations. |
All Other Fees
| (d) | The aggregate fees billed in each of the last two fiscal years for products and services provided by the principal accountant, other than the services reported in paragraphs (a) through (c) of this Item are $0 for 2016 and $0 for 2015. |
| (e)(1) | Except as permitted by Rule 2-01(c)(7)(i)(C) of Regulation S-X, the Trust’s Audit Committee must pre-approve all audit and non-audit services provided by the independent accountants relating to the operations or financial reporting of the funds. Prior to the commencement of any audit or non-audit services to a fund, the Audit Committee reviews the services to determine whether they are appropriate and permissible under applicable law. |
| (e)(2) | The percentage of services described in each of paragraphs (b) through (d) of this Item that were approved by the audit committee pursuant to paragraph (c)(7)(i)(C) of Rule 2-01 of Regulation S-X are as follows: |
| (b) | 100% |
| (c) | 100% |
| (d) | N/A |
| (f) | The percentage of hours expended on the principal accountant’s engagement to audit the registrant’s financial statements for the most recent fiscal year that were attributed to work performed by persons other than the principal accountant’s full-time, permanent employees was less than fifty percent. |
| (g) | The aggregate non-audit fees billed by the registrant’s accountant for services rendered to the registrant, and rendered to the registrant’s investment adviser (not including any sub-adviser whose role is primarily portfolio management and is subcontracted with or overseen by another investment adviser), and any entity controlling, controlled by, or under common control with the adviser that provides ongoing services to the registrant for each of the last two fiscal years of the registrant was $0 for 2016 and $0 for 2015. |
| (h) | The audit committee of the registrant’s board of trustees has considered whether the provision of non-audit services that were rendered to the registrant’s investment adviser (not including any sub-adviser whose role is primarily portfolio management and is subcontracted with or overseen by another investment adviser), and any entity controlling, controlled by, or under common control with the investment adviser that provides ongoing services to the registrant that were not pre-approved pursuant to paragraph (c)(7)(ii) of Rule 2-01 of Regulation S-X is compatible with maintaining the principal accountant’s independence. |
Item 5. Audit Committee of Listed Registrants.
Not applicable.
Item 6. Investments.
| (a) | Schedule of Investments in securities of unaffiliated issuers as of the close of the reporting period is included as part of the report to shareholders filed under Item 1 of this form. |
| (b) | Not applicable. |
| Item 7. | Disclosure of Proxy Voting Policies and Procedures for Closed-End Management Investment Companies. |
Not applicable.
Item 8. Portfolio Managers of Closed-End Management Investment Companies.
Not applicable.
| Item 9. | Purchases of Equity Securities by Closed-End Management Investment Company and Affiliated Purchasers. |
Not applicable.
Item 10. Submission of Matters to a Vote of Security Holders.
There have been no material changes to the procedures by which shareholders may recommend nominees to the registrant’s board of trustees, where those changes were implemented after the registrant last provided disclosure in response to the requirements of Item 407(c)(2)(iv) of Regulation S-K (17 CFR 229.407) (as required by Item 22(b)(15) of Schedule 14A (17 CFR 240.14a-101)), or this Item.
Item 11. Controls and Procedures.
| (a) | The registrant’s principal executive officer and principal financial officer have concluded, based on their evaluation of the effectiveness of the design and operation of the registrant’s disclosure controls and procedures (as defined in Rule 30a-3(c) under the Investment Company Act of 1940 (17 CFR 270.30a-3(c))) as of a date within 90 days of the filing date of this report, that the design and operation of such procedures are effective to provide reasonable assurance that information required to be disclosed by the registrant on Form N-CSR is recorded, processed, summarized and reported within the time periods specified in the Securities and Exchange Commission’s rules and forms, and that information required to be disclosed by the registrant in the reports that it files or submits on Form N-CSR is accumulated and communicated to the registrant’s management, including its principal executive and principal financial officers, as appropriate to allow timely decisions regarding required disclosure. |
| (b) | There were no changes in the registrant’s internal control over financial reporting (as defined in Rule 30a-3(d) under the 1940 Act (17 CFR 270.30a-3(d))) that occurred during the second fiscal quarter of the period covered by this report that have materially affected, or are reasonably likely to materially affect, the registrant’s internal control over financial reporting. |
Item 12. Exhibits.
| (a)(1) | The registrant’s Code of Ethics is attached hereto. |
| (a)(2) | Certifications pursuant to Rule 30a-2(a) under the 1940 Act and Section 302 of the Sarbanes-Oxley Act of 2002 are attached hereto. |
| (a)(3) | Not applicable. |
| (b) | Certifications pursuant to Rule 30a-2(b) under the 1940 Act and Section 906 of the Sarbanes- Oxley Act of 2002 are attached hereto. |
(12.other) Not applicable.
SIGNATURES
Pursuant to the requirements of the Securities Exchange Act of 1934 and the Investment Company Act of 1940, the registrant has duly caused this report to be signed on its behalf by the undersigned, thereunto duly authorized.
(Registrant) Sterling Capital Funds
By (Signature and Title) /s/ James T. Gillespie
James T. Gillespie, President
(principal executive officer)
Date 11/22/2016
Pursuant to the requirements of the Securities Exchange Act of 1934 and the Investment Company Act of 1940, this report has been signed below by the following persons on behalf of the registrant and in the capacities and on the dates indicated.
By (Signature and Title) /s/ James T. Gillespie
James T. Gillespie, President
(principal executive officer)
Date 11/22/2016
By (Signature and Title) /s/ Todd M. Miller
Todd M. Miller, Treasurer
(principal financial officer)
Date 11/22/2016