UNITED STATES
SECURITIES AND EXCHANGE COMMISSION
Washington, D.C. 20549
FORM N-CSR
CERTIFIED SHAREHOLDER REPORT OF REGISTERED MANAGEMENT
INVESTMENT COMPANIES
Investment Company Act file number 811-06719
Sterling Capital Funds
(Exact name of registrant as specified in charter)
3605 Glenwood Ave., Suite 100
Raleigh, NC 27612
(Address of principal executive offices) (Zip code)
James T. Gillespie, President
Sterling Capital Funds
3605 Glenwood Ave., Suite 100
Raleigh, NC 27612
(Name and address of agent for service)
Registrant’s telephone number, including area code: (800) 228-1872
Date of fiscal year end: September 30
Date of reporting period: September 30, 2018
Form N-CSR is to be used by management investment companies to file reports with the Commission not later than 10 days after the transmission to stockholders of any report that is required to be transmitted to stockholders under Rule 30e-1 under the Investment Company Act of 1940 (17 CFR 270.30e-1). The Commission may use the information provided on Form N-CSR in its regulatory, disclosure review, inspection, and policymaking roles.
A registrant is required to disclose the information specified by Form N-CSR, and the Commission will make this information public. A registrant is not required to respond to the collection of information contained in Form N-CSR unless the Form displays a currently valid Office of Management and Budget (“OMB”) control number. Please direct comments concerning the accuracy of the information collection burden estimate and any suggestions for reducing the burden to Secretary, Securities and Exchange Commission, 450 Fifth Street, NW, Washington, DC 20549-0609. The OMB has reviewed this collection of information under the clearance requirements of 44 U.S.C. § 3507.
Item 1. Reports to Stockholders.
The Report to Shareholders is attached herewith.

Notice of Privacy Policy & Practices
Sterling Capital Funds provide this notice to you so that you will know what kinds of information we collect about shareholders1, prospective investors, and individuals (such as beneficiaries), and the circumstances in which that information may be disclosed to third parties who are not affiliated with Sterling Capital Funds.
Collection of Personal Information
We collect nonpublic personal information about you from the following sources:
| | ● | | Account Applications and other forms, which may include your name, address, social security number, and information about your investment goals and risk tolerance; |
| | ● | | Account History, including information about the transactions and balances in your account(s); |
| | ● | | Correspondence, written, telephonic or electronic between you and Sterling Capital Funds or service providers working on behalf of Sterling Capital Funds; |
| | ● | | Online, your name and e-mail address if you provide them; and |
| | ● | | Third Parties, such as your financial intermediary in connection with your transactions, or third-party data services used to verify or update personal information that you provide. |
To comply with federal regulations, information we receive from you or a third party will be used to verify your identity.
Disclosure of Personal Information
We may disclose your personal information as permitted by law to third parties who are not affiliated with the Sterling Capital Funds, including:
| | ● | | in connection with legal proceedings, such as responding to a subpoena; |
| | ● | | to service providers who maintain or service shareholder accounts for Sterling Capital Funds or to a shareholder’s broker or agent; or to companies that mail account-related materials, such as shareholder reports; and |
| | ● | | to perform marketing services on our behalf, or pursuant to a joint marketing agreement with another financial institution. |
Safeguarding of Personal Information
Sterling Capital Funds employs policies, practices and procedures for safeguarding your personal information that we believe comply with applicable law, however no security measures are perfect or impenetrable.
We request that all service providers to Sterling Capital Funds:
| | ● | | maintain policies and procedures designed to assure only appropriate access to, and use of your personal information; and |
| | ● | | maintain physical, electronic and procedural safeguards that comply with applicable legal standards to guard your nonpublic personal information. |
When information is shared with third parties, they are not permitted to use the information for any purpose other than to assist our servicing of your account(s), including helping us improve the services we offer.
1 For purposes of this notice, the terms “shareholder” or “shareholders” includes both individual shareholders (both current and former) of the Sterling Capital Funds and individuals (such as beneficiaries, for example) whose nonpublic personal information is provided to the Sterling Capital Funds, even though they do not invest in Sterling Capital Funds shares.
(This page has been left blank intentionally.)
Letter from the President and the Investment Advisor
Dear Shareholders:
We are pleased to present this Sterling Capital Funds annual report covering the 12 months between October 1, 2017, and September 30, 2018.
U.S. equity markets delivered strong returns during the period under review amid business-friendly tax reform, robust corporate earnings and rising consumer spending. Geopolitical turmoil, climbing interest rates and rapidly-changing trade policy created uncertainty in an overall positive economic environment, however, causing periods of high volatility for U.S. stocks and mixed results for international equities. Fixed income markets lost ground during the period as the U.S. Federal Reserve raised the benchmark interest rate four times during the 12-month period, for a total increase of 100 basis points. Rising interest rates drove bond prices lower, while the expectation of additional rate hikes, along with a flattening yield curve, also weighed on fixed income markets.
A Positive Economic Environment
U.S. economic growth picked up significantly during the period, driven by strong consumer spending and rising business investment. The economic environment was summed up in September by the president of the Federal Reserve Bank of Chicago with his remark that “the U.S. economy is firing from all cylinders.” Gross domestic product (GDP) grew at a modest pace of 2.3% during the fourth quarter of 2017 and 2.2% in the first quarter of 2018, but then picked up significantly. In the second quarter of 2018 the economy expanded at a rate of 4.2%, and preliminary estimates suggest that third quarter growth will be in a similar range.
Economic indicators in the U.S. reflected the positive economic climate. Industrial production surged, and labor productivity grew significantly during the 12-month period. The unemployment rate dipped to 3.7% late in the period, reaching its lowest level since 1969. The tighter job market helped generate positive consumer-related data showing rising personal income, wages and consumer confidence. Consumer spending rose steadily during the period and the housing market appeared healthy, although rising mortgage interest rates began to drag on home sales.
The U.S. trade deficit continued to expand even as U.S. exports increased. Inflation picked up moderately overall, but oil prices rose more sharply amid increasing geopolitical tensions in the Middle East.
U.S. Equities Make Strong Gains
The S&P 500® Index1 (S&P 500) climbed 17.91% during the 12 months under review. Large-cap stocks outperformed smaller company shares. The Russell 2000® Index2 (Russell 2000) of small-cap stocks delivered a total return of 15.24%, compared to a 17.77% return for the Russell 1000® Index3 (Russell 1000), which measures large-cap stocks. The Bloomberg Barclays U.S. Aggregate Bond Index fell 1.22%. The Federal Reserve’s increases to short-term interest rates, along with declines in long-term rates, created a flatter yield curve.
Stocks rose steadily in the first months of the period under review amid broad global economic expansion, rising corporate profits and expectations that the major tax legislation signed into law in December would provide a boost to U.S. economic growth. Equities entered a more volatile period beginning in February as investors grew increasingly concerned about protectionist trade policies and increases in inflation and interest rates. Despite these headwinds, stocks continued to trend upwards through the remainder of the period. During the final quarter of the period stocks made particularly impressive gains as the positive impact of the recent tax legislation on corporate profits became more tangible with the release of strong earnings reports. Stocks in the information technology and consumer discretionary sectors contributed most to gains during the period, while stocks in the consumer staples and materials sectors dragged considerably.
Gains in Foreign Stocks
International stocks in developed markets edged up slightly during the period. The MSCI EAFE Net Index of developed markets rose 2.74%. The prospect of a growing trade war between the U.S. and its trading partners was a major factor dragging on international equities, along with sluggish economic growth in Asia, the U.K.’s protracted “Brexit” process and Turkey’s currency crisis. Concerns about rising inflation and the prospect of less accommodative monetary policy also weighed on returns.
Emerging markets suffered most in this climate, pushing the MSCI Emerging Markets Index down 0.81%. The Chinese economy continued to experience slowing rates of growth, with weakening industrial production especially apparent throughout the period. Growing trade barriers
with the U.S. also dealt a blow to the Chinese economy, while renewed diplomacy between the United States and North Korea created uncertainty in the region.
Our Perspective
The current economy is growing at a rate we’ve not experienced in nearly a decade and our view is that this pace is not sustainable. It appears likely, in our view, that consumer demand will flatten and synchronized global growth will weaken in the near future as European growth levels off and Chinese expansion begins to slow due to trade concerns. However, we think a recession in the near-term is unlikely. The U.S. economy continued to benefit from strong economic momentum fueled by tax cuts, reduced regulation and stable monetary policy.
Given the current climate, we continue to recommend that investors stay focused on the long term, while managing risk through asset class diversification. We will continue to monitor events and manage the Sterling Capital Funds accordingly.
Thank you for your confidence in Sterling Capital Management. We look forward to serving your future investment needs. If you have any questions, please call us at 1-800-228-1872.
Sincerely,

James T. Gillespie
President
Sterling Capital Funds

Jeffrey J. Schappe, CFA
Managing Director
Sterling Capital Management LLC
| 1 | “S&P 500®” is a registered service mark of Standard & Poor’s Corporation, which does not sponsor and is in no way affiliated with the Sterling Capital Funds. The S&P 500® Index is generally considered to be representative of the performance of the stock market as a whole. The index does not reflect the deduction of expenses associated with a mutual fund, such as investment management and fund accounting fees. A Fund’s performance reflects the deduction of fees for these services. Investors cannot invest directly in an index, although they can invest in its underlying securities. |
| 2 | “Russell 2000®” is a registered service mark of FTSE Russell, which does not sponsor and is in no way affiliated with the Sterling Capital Funds. The Russell 2000® Index is a small-cap market index of the bottom 2,000 stocks in the Russell 3000® Index. The index does not reflect the deduction of expenses associated with a mutual fund, such as investment management and fund accounting fees. A Fund’s performance reflects the deduction of fees for these services. Investors cannot invest directly in an index, although they can invest in its underlying securities. |
| 3 | “Russell 1000®” is a registered service mark of FTSE Russell, which does not sponsor and is in no way affiliated with the Sterling Capital Funds. The Russell 1000® Index is a large-cap market index of the largest stocks in the U.S. equity markets. The index does not reflect the deduction of expenses associated with a mutual fund, such as investment management and fund accounting fees. A Fund’s performance reflects the deduction of fees for these services. Investors cannot invest directly in an index, although they can invest in its underlying securities. |
Past performance does not guarantee future results. Mutual fund investing involves risk including the possible loss of principal.
This report is authorized for distribution only when preceded or accompanied by a prospectus. Please read the prospectus carefully before investing or sending money. Sterling Capital Management LLC (“Sterling Capital”) serves as investment advisor to the Sterling Capital Funds (each a “Fund” and collectively, the “Funds”) and is paid a fee for its services. Shares of the Funds are not deposits or obligations of, or guaranteed or endorsed by, Branch Banking and Trust Company or its affiliates. The Funds are not insured by the FDIC or any other government agency. The Funds currently are distributed by Sterling Capital Distributors, LLC. The distributor is not affiliated with Branch Banking and Trust Company or its affiliates.
The foregoing information and opinions are for general information only. Sterling Capital does not guarantee their accuracy or completeness, nor assume liability for any loss, which may result from the reliance by any person upon any such information or opinions. Such information and opinions are subject to change without notice, are for general information only and are not intended as an offer or solicitation with respect to the purchase or sale of any security or as offering individual or personalized investment advice.
Sterling Capital Behavioral Large Cap Value Equity Fund
Portfolio Managers
Sterling Capital Behavioral Large Cap Value Equity Fund (the “Fund”) is managed by Robert W. Bridges, CFA, and Robert O. Weller, CFA, Executive Directors and portfolio managers for Sterling Capital Management LLC (“Sterling Capital”), advisor to the Fund.
Robert W. Bridges, CFA
Mr. Bridges, CFA, Executive Director joined Sterling Capital in 1996 and has been a co-portfolio manager of the Fund since 2013. He has investment experience since 1991. He is a graduate of Wake Forest University where he received his BS in Business.
Robert O. Weller, CFA
Mr. Weller, CFA, Executive Director joined Sterling Capital in 2012 and has been a co-portfolio manager of the Fund since 2013. He has investment experience since 1996. He is a graduate of Loyola University Maryland where he received his BBA in Finance.
Investment Considerations
The overall results of the Fund will be dependent on the process and ability of the Adviser to apply “behavioral finance” principles to recognize a company’s value, earnings revisions and price momentum. The Fund may invest in undervalued securities which may not appreciate in value as anticipated or remain undervalued for longer than anticipated. The overall results of the Fund will be dependent on the process and ability of the Adviser to recognize a company’s value. The Fund may invest in REITs (Real Estate Investment Trusts), the value of which will be affected by conditions of the real estate industry. The Fund may also invest in exchange-traded funds (ETFs); thus shareholders may bear additional costs and the ETF may not exactly replicate the performance it seeks to track.
Q. How did the Fund perform during the 12-month period between October 1, 2017 and September 30, 2018?
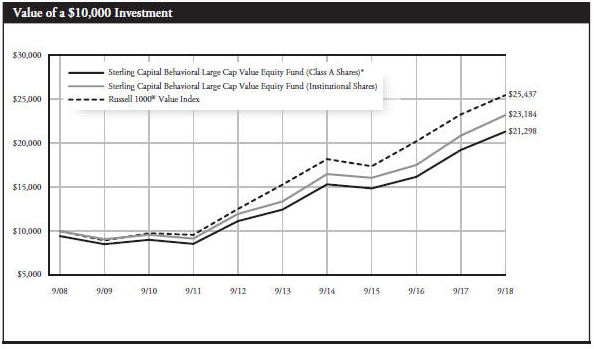
A. The Fund’s Institutional Shares outperformed its current benchmark, the Russell 1000® Value Index.
Q. What factors affected the Fund’s performance?
A. Historically low interest rates continued to benefit U.S. stocks during the 12-month period. The Federal Reserve’s gradual, and much anticipated, increases in interest rates did not slow equity gains much, in part due to the boost from lower corporate tax rates. Corporate earnings growth accelerated over the period, which also added to absolute returns.
The Fund’s outperformance relative to its benchmark is in large part due to its strategy of applying principles of behavioral finance to its investment decisions. This process is specifically designed to capitalize upon known investor biases and heuristics (mental shortcuts) by accounting for the impact on markets of behavioral factors such as greed, fear and ego. The Fund’s exposure to momentum-based behavioral strategies also benefited relative returns.
Stock selection in the financials and health care sectors helped the Fund’s performance, particularly investments in the banks, pharmaceuticals, and biotechnology and life sciences subsectors. Investments in two major banks performed well, as rising interest rates aided the expansion of net interest margin, and accelerating core loan growth kept expectations high for continued growth across the banking sector. The Fund’s strategy of maintaining an average market capitalization profile that was smaller than the benchmark also contributed modestly to returns as smaller stocks generally outperformed.
The Fund’s exposure to value-based behavioral strategies hurt relative returns. Value provided neutral returns during the first three months of the period, only to weigh on returns during the following nine months. Stock selection in technology and financial services also detracted on relative performance. Shares of a data storage company lagged the benchmark over most of the year due to a down cycle in demand for flash memory products coupled with lower margins and a weakening environment.
Portfolio composition is as of September 30, 2018 and is subject to change and risk.
| | * | Reflects 5.75% maximum sales charge. |
| | ** | Reflects the applicable maximum CDSC of 1.00% (applicable only to redemptions within one year of purchase, and as such, are not reflected in the Average Annual Total Returns table since the periods reflected are for a year or longer). |
| | | | | | | | | | | | | | | | |
Average Annual Total Returns | |
| | | | | |
As of September 30, 2018 | | Inception
Date | | | 1 Year | | | 5 Years | | | 10 Years | |
| | | | | |
Class A Shares* | | | 10/9/92 | | | | 4.52% | | | | 10.05% | | | | 7.85% | |
| | | | | |
Class C Shares** | | | 2/1/01 | | | | 10.11% | | | | 10.55% | | | | 7.69% | |
| | | | | |
Institutional Shares | | | 10/9/92 | | | | 11.19% | | | | 11.64% | | | | 8.77% | |
| | | | | |
Class R6 Shares | | | 2/1/181 | | | | 11.22% | | | | 11.65% | | | | 8.77% | |
| | | | | |
Russell 1000® Value Index | | | N/A | | | | 9.45% | | | | 10.72% | | | | 9.79% | |
Past performance does not guarantee future results. The performance data quoted represents past performance and current returns may be lower or higher. Total return figures include change in share price, reinvestment of dividends and capital gains, and do not reflect taxes that a shareholder would pay on fund distributions or on the redemption of fund shares. The investment return and principal value will fluctuate so that an investor’s shares, when redeemed, may be worth more or less than the original cost. To obtain performance information current to the most recent month end, please visit www.sterlingcapitalfunds.com.
The chart above represents a comparison of a hypothetical $10,000 investment in the indicated share class versus a similar investment in the Fund’s benchmark.
| 1 | Class R6 Shares were not in existence prior to 2/1/18. Performance for periods prior to 2/1/18 is based on the performance of Institutional Shares. |
The Russell 1000® Value Index is a widely recognized index of common stocks that measures the performance of the large-cap value sector of the U.S. equity market. The index is unmanaged and does not reflect the deduction of expenses associated with a mutual fund, such as investment management and fund accounting fees. Investors cannot invest directly in an index, although they can invest in its underlying securities.
Sterling Capital Mid Value Fund
Portfolio Manager
Timothy P. Beyer, CFA
Sterling Capital Mid Value Fund (the “Fund”)is managed by Timothy P. Beyer, CFA, Managing Director and portfolio manager for Sterling Capital Management LLC (“Sterling Capital”), advisor to the Fund. Mr. Beyer joined Sterling Capital in 2004 and has been the lead portfolio manager of the Fund since 2005. He has investment experience since 1989. Mr. Beyer is a graduate of East Carolina University where he received his BSBA in Finance.
Investment Considerations
The Fund may invest in undervalued securities that may not appreciate in value as anticipated or remain undervalued for longer than anticipated. Investments made in small to mid-capitalization companies are subject to greater risks than large company stocks due to limited resources and inventory and are more sensitive to adverse conditions. The Fund may invest in foreign securities, which may be more volatile and less liquid due to currency fluctuation, political instability, social and economic risks.
Q. How did the Fund perform during the 12-month period between October 1, 2017 and September 30, 2018?
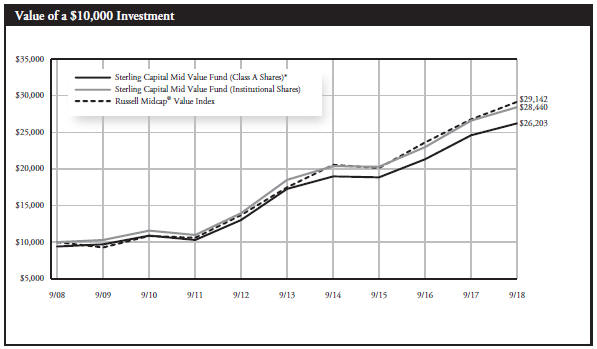
A. During this period, the Sterling Capital Mid Value Fund’s Institutional Shares returned 6.82% vs. 8.81% for our benchmark - the Russell Midcap® Value Index.
Q. What factors led to the fund’s strong returns?
A. Over the last year, market expectations continued to shift towards one of higher economic growth, higher inflation, and higher interest rates driven primarily by fiscal stimulus (lower taxes and higher government spending). This backdrop benefitted cyclical sectors such as energy and technology, while more defensive groups such as utilities, REITs, and consumer staples lagged the markets’ overall returns. We were well positioned for this shift to a higher rate and more pro-cyclical environment with overweight positions in cyclical sectors while underweight the more defensive ones; however, returns were impacted by subpar security selection. Further, we have little exposure to the energy sector which was one of the best performing sectors during the period.
Q. What specific stocks had the biggest impact on the portfolios returns during this period?
| | |
| Top Five Contributors | | Top Five Detractors |
| HCA Healthcare | | Affiliated Managers Group |
| E*TRADE | | NCR Corp. |
| SeaWorld Entertainment | | Realogy |
| Dollar General | | eBay |
| DST Systems | | Jefferies Financial Group |
*In order from largest to smallest
Portfolio composition is as of September 30, 2018 and is subject to change and risk.
As you can see, all of our largest detractors to performance were in the financial and technology sectors. We continue to hold all five of our largest detractors and believe they represent compelling values today. In some cases we have increased our position in them. Our largest detractor over the past year was Affiliated Managers Group. While its fundamentals continue to remain steady, its valuation has compressed meaningfully, leading to an even more compelling opportunity in our opinion. Of the top five contributors, we sold HCA Healthcare as it reached our estimate of fair value. We also sold DST Systems after it agreed to be acquired.
Q. What is your outlook for the market and the portfolio?
While market valuations are full, the fundamental backdrop for equities continues to be positive, in our view, with low interest rates and improving global economic growth. We believe that future equity returns will likely be lower than historic norms, but remain competitive with other asset classes.
While we have lowered our exposure to cyclicals on valuations, we still maintain a slight cyclical bias in the Fund. We also continue to have a bias towards higher interest rates. We have reached full employment and the global economy continued to strengthen which supports our current positioning.
| | * | Reflects 5.75% maximum sales charge. |
| | ** | Reflects the applicable maximum CDSC of 1.00% (applicable only to redemptions within one year of purchase, and as such, are not reflected in the Average Annual Total Returns table since the periods reflected are for a year or longer). |
| | | | | | | | | | | | | | | | |
Average Annual Total Returns | |
| | | | | |
As of September 30, 2018 | | Inception
Date | | | 1 Year | | | 5 Years | | | 10 Years | |
| | | | | |
Class A Shares* | | | 8/1/96 | | | | 0.42% | | | | 7.41% | | | | 10.11% | |
| | | | | |
Class C Shares** | | | 7/25/01 | | | | 5.72% | | | | 7.89% | | | | 9.90% | |
| | | | | |
Institutional Shares | | | 8/1/96 | | | | 6.82% | | | | 8.97% | | | | 11.02% | |
| | | | | |
Class R Shares | | | 2/1/101 | | | | 6.29% | | | | 8.47% | | | | 10.46% | |
| | | | | |
Class R6 Shares | | | 2/1/182 | | | | 6.93% | | | | 8.99% | | | | 11.03% | |
| | | | | |
Russell Midcap® Value Index | | | N/A | | | | 8.81% | | | | 10.72% | | | | 11.29% | |
Past performance does not guarantee future results. The performance data quoted represents past performance and current returns may be lower or higher. Total return figures include change in share price, reinvestment of dividends and capital gains, and do not reflect taxes that a shareholder would pay on fund distributions or on the redemption of fund shares. The investment return and principal value will fluctuate so that an investor’s shares, when redeemed, may be worth more or less than the original cost. To obtain performance information current to the most recent month end, please visit www.sterlingcapitalfunds.com.
The chart above represents a comparison of a hypothetical $10,000 investment in the indicated share class versus a similar investment in the Fund’s benchmark.
| 1 | Class R Shares were not in existence prior to 2/1/10. Performance for periods prior to 2/1/10 is based on the performance of the Institutional Shares, but such performance does not reflect Class R Shares’ 12b-1 fees, which if reflected, would have caused performance to be lower. |
| 2 | Class R6 Shares were not in existence prior to 2/1/18. Performance for periods prior to 2/1/18 is based on the performance of the Institutional Shares. |
The Fund is measured against the Russell Midcap® Value Index, an unmanaged index, which measures the performance of the mid-cap value segment of the U.S. equity universe. It includes those Russell Midcap® Index companies with lower price-to-book ratios and lower forecasted growth values. The index is unmanaged and does not reflect the deduction of expenses associated with a mutual fund, such as investment management and fund accounting fees. Investors cannot invest directly in an index, although they can invest in its underlying securities.
Sterling Capital Behavioral Small Cap Value Equity Fund
Portfolio Managers
Sterling Capital Behavioral Small Cap Value Equity Fund (the “Fund”) is managed by Robert W. Bridges, CFA, and Robert O. Weller, CFA, Executive Directors and portfolio managers for Sterling Capital Management LLC (“Sterling Capital”), advisor to the Fund.
Robert W. Bridges, CFA
Mr. Bridges, CFA, Executive Director joined Sterling Capital in 1996 and has been a co-portfolio manager of the Fund since 2013. He has investment experience since 1991. He is a graduate of Wake Forest University where he received his BS in Business.
Robert O. Weller, CFA
Mr. Weller, CFA, Executive Director joined Sterling Capital in 2012 and has been a co-portfolio manager of the Fund since 2013. He has investment experience since 1996. He is a graduate of Loyola University Maryland where he received his BBA in Finance.
Investment Considerations
The overall results of the Fund will be dependent on the process and ability of the Adviser to apply “behavioral finance” principles to recognize a company’s value, earnings revisions and price momentum. The Fund may invest in undervalued securities which may not appreciate in value as anticipated or remain undervalued for longer than anticipated. Investments made in small to mid-capitalization companies are subject to greater risks than large company stocks due to limited resources and inventory as well as more sensitive to adverse conditions.
Q. How did the Fund perform during the 12-month period between October 1, 2017 and September 30, 2018?
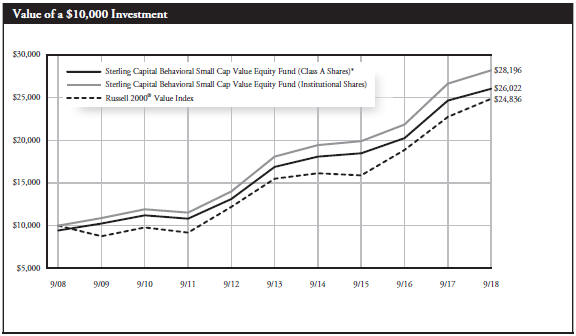
A. The Fund’s Institutional Shares underperformed its current benchmark, the Russell 2000® Value Index.
Q. What factors affected the Fund’s performance?
A. Lower U.S. corporate tax rates that went into effect in late 2017 and accelerating earnings growth each provided a boost to the U.S. stock market during the period. Equities posted healthy double-digit gains, with smaller cap stocks in particular benefiting from the lower tax rates. Small cap stocks tend to source a greater percentage of their profits inside the U.S., magnifying the impacts of the shift in tax rates. Rising interest rates, meanwhile, did not impact absolute returns.
The Fund applies principles of behavioral finance to its investment strategy. This process is designed to capitalize on known investor biases and heuristics (mental shortcuts) by accounting for the impact on markets of behavioral factors such as greed, fear and ego.
The Fund’s behavioral strategies had a mixed effect on the portfolio’s performance relative to its benchmark, resulting in an overall negative
Portfolio composition is as of September 30, 2018 and is subject to change and risk.
impact. Value exposure had a net negative effect, as a neutral contribution in the first four months became a negative contribution in the next eight months. This underperformance was partly offset by the positive performance of the Fund’s momentum strategy, which helped boost relative performance for the entire 12-month period.
Stock selection in the consumer discretionary and health care sectors detracted from relative returns. In particular, shares of a pharmaceutical manufacturer experienced a sell off after it was dropped from a strategic distribution agreement. Meanwhile, the Fund’s strategy of maintaining an average market capitalization profile larger than the benchmark ended up detracting slightly from returns as smaller companies generally outperformed for the period.
Stock selection in the utilities and financials sectors added to the Fund’s relative performance during the period. The stock price of a mobile communications company increased significantly in May after the company won approval to provide services to the Global Maritime Distress Safety System.
| | * | Reflects 5.75% maximum sales charge. |
| | ** | Reflects the applicable maximum CDSC of 1.00% (applicable only to redemptions within one year of purchase, and as such, are not reflected in the Average Annual Total Returns table since the periods reflected are for a year or longer). |
| | | | | | | | | | | | | | | | |
Average Annual Total Returns | |
| | | | | |
As of September 30, 2018 | | Inception
Date | | | 1 Year | | | 5 Years | | | 10 Years | |
| | | | | |
Class A Shares* | | | 1/29/101 | | | | -0.38% | | | | 7.75% | | | | 10.04% | |
| | | | | |
Class C Shares** | | | 1/29/101 | | | | 4.88% | | | | 8.21% | | | | 9.96% | |
| | | | | |
Institutional Shares | | | 1/2/97 | | | | 5.96% | | | | 9.30% | | | | 10.92% | |
| | | | | |
Class R Shares | | | 2/1/101 | | | | 5.44% | | | | 8.81% | | | | 10.58% | |
| | | | | |
Class R6 Shares | | | 2/1/182 | | | | 6.07% | | | | 9.32% | | | | 10.93% | |
| | | | | |
Russell 2000® Value Index | | | N/A | | | | 9.33% | | | | 9.91% | | | | 9.52% | |
Past performance does not guarantee future results. The performance data quoted represents past performance and current returns may be lower or higher. Total return figures include change in share price, reinvestment of dividends and capital gains, and do not reflect taxes that a shareholder would pay on fund distributions or on the redemption of fund shares. The investment return and principal value will fluctuate so that an investor’s shares, when redeemed, may be worth more or less than the original cost. To obtain performance information current to the most recent month end, please visit www.sterlingcapitalfunds.com. Performance would have been lower without waivers in effect.
The chart above represents a comparison of a hypothetical $10,000 investment in the indicated share class versus a similar investment in the Fund’s benchmark.
| 1 | Class A, C and R Shares were not in existence prior to 2/1/10. Performance for periods prior to 2/1/10 is based on the performance of Institutional Shares and have been adjusted for maximum CDSC to the applicable class but does not include 12b-1 fees, which if reflected, would have caused performance of Class A, B C and R Shares to be lower. The performance information for Institutional Shares (formerly known as Sterling Shares) prior to 12/18/06 is based on the performance of the Institutional Shares of the Fund’s predecessor, Sterling Capital Small Cap Value Fund, a series of The Advisors’ Inner Circle Fund (the “Predecessor Fund”), which transferred all of its assets and liabilities to the Fund pursuant to a reorganization. The performance of the Fund’s Institutional Shares would have been different because the Fund’s Institutional Shares have different expenses than the Predecessor’s Institutional Shares. |
| 2 | Class R6 Shares were not in existence prior to 2/1/18. Performance for periods prior to 2/1/18 is based on the performance of Institutional Shares. |
The Russell 2000® Value Index is a widely recognized index of common stocks that measures the performance of the small-cap value sector of the U.S. equity market. The index is unmanaged and does not reflect the deduction of expenses associated with a mutual fund, such as investment management and fund accounting fees. Investors cannot invest directly in an index, although they can invest in its underlying securities.
Sterling Capital Special Opportunities Fund
Portfolio Manager
George F. Shipp, CFA
Sterling Capital Special Opportunities Fund (the “Fund”) is managed by George F. Shipp, CFA, Senior Managing Director and portfolio manager for Sterling Capital Management LLC (“Sterling Capital”), advisor to the Fund. Mr. Shipp joined the CHOICE Asset Management Team of Scott & Stringfellow in 2000 and Sterling Capital as part of a business realignment in 2013. He has been the Fund’s lead portfolio manager since inception and also manages the Sterling Capital Equity Income Fund. He has investment experience since 1982. Mr. Shipp is a graduate of the University of Virginia and received his MBA at the Darden Graduate School of Business.
Investment Considerations
The Fund is subject to investment style risk, which depends on the market segment in which the Fund is primarily invested. An investment in growth stocks may be particularly sensitive to market conditions while value stocks may be undervalued for longer than anticipated. The Fund may invest in foreign securities subject to risks such as currency volatility and political and social instability or small capitalization companies subject to greater volatility and less liquidity due to limited resources or product lines. The Fund may engage in writing covered call options on securities. By writing covered call options, the Fund limits its opportunity to profit from an increase in the price of the underlying stock above the premium and the strike price, but continues to bear the risk of a decline in the stock price. While the Fund receives premiums for writing covered call options, the price it realizes from the exercise of an option could be substantially below a stock’s current market price.
Q. How did the Fund perform during the 12-month period between October 1, 2017 and September 30, 2018?
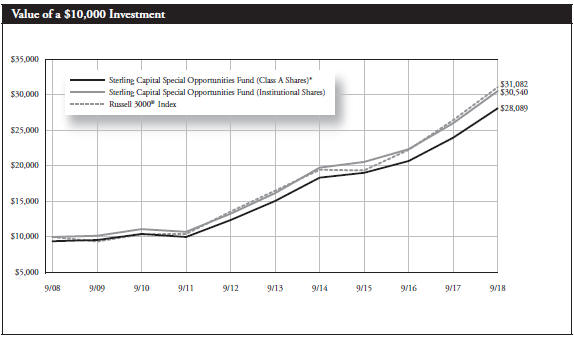
A. The Sterling Capital Special Opportunities Fund’s Institutional Shares provided a 17.46% return during the 12-months ended September 30, 2018, compared to its Russell 3000® Index primary benchmark return of 17.58%.
Q. What factors affected the Fund’s performance?
A. The December 2017 Tax Cuts and Jobs Act turbo charged corporate earnings, and led to improved investor psychology. As the Federal Reserve’s long-standing goals of full employment and 2% Consumer Price Inflation finally were attained, monetary policymakers responded with four increases in overnight interest rates. By year end, investors pondered the implications of the lowest unemployment rate since the Vietnam War, and how much further the Fed might choose to “normalize” policy.
US equities handily out-performed international markets (MSCI World ex-US +2.67%), while so called “growth” stocks dominated those labeled as “value.” The Russell index of 1000 large-company Growth stocks surged by 26.3%, while the Russell 1000® Value Index benchmark gained only 9.5%. We reiterate: While the Fund’s goal is growth of capital, we also seek value in our stock selections to provide downside protection.
Our strongest contributors to relative performance were Healthcare and Technology; we were over weight in both sectors, and stock selection proved to be above average. Hospital leader HCA gained 76% as strong earnings combined with a rising valuation - investors appeared to gravitate towards domestic companies less affected by impending tariffs or other uncertainties. United Healthcare’s (38%) results continued to out pace others in managed care, and showed the strength of its integrated, data-driven platform. Analytical tool maker Danaher gained 27% as recent diagnostic acquisitions were efficiently assimilated.
Portfolio composition is as of September 30, 2018 and is subject to change and risk.
Five of our top-ten contributors were technology providers; our average portfolio constituent surged 35.6%, albeit the benchmark nearly kept pace with a 31.8% gain! Infrastructure providers Cisco (+49%) and Red Hat participated in the growth of “Cloud” spending; tax and accounting specialist Intuit (61%) and security leader Akamai were software standouts; and Alphabet climbed not just due to its eponymous Google search but also its YouTube video and Android mobile device platforms.
Bookings strength continued at group specialist Ryman Hospitality (46%), which will own 5 of the ten largest resort hotels in the country when Gaylord Rockies joins the Opryland-owner’s family this fall.
Discovery Communications rebounded 46% once its merger with Scripps Networks closed, but results elsewhere within our Consumer Discretionary holdings were poor on balance. We thought Newell Brands’ line up of Elmer’s glue, Sharpies, Rubbermaid and more would mesh well with housewares such as Yankee Candle, Coleman, and Mr. Coffee acquired from Jarden, but the deal proved a cultural disaster and the shares fell 41%. We also sold Ford, optically a “cheap” stock but one which seems to have lost its way and is materially downsizing. Homebuilder Lennar (-10%) posted record orders and earnings, but could not escape the fear of higher interest rates ahead. Cable and entertainment giant Comcast (-6%) found itself in a bidding war it eventually “won” for European programmer and broadcaster Sky, distracting investors from otherwise solid results.
Although credit card lender Capital One posted a solid 14% gain, our Financials under weight detracted from relative performance. Within Industrials, a 45% gain from insurance and financial services database provider Verisk was more than offset by a 45% plunge in media and consumer goods database leader Nielsen, where surprising operational shortfalls were made worse by financial leverage.
As always, we thank our valued shareholders for their confidence in our strategies.
| | * | Reflects 5.75% maximum sales charge. |
| | ** | Reflects the applicable maximum CDSC of 1.00% (applicable only to redemptions within one year of purchase, and as such, are not reflected in the Average Annual Total Returns table since the periods reflected are for a year or longer). |
| | | | | | | | | | | | | | | | |
Average Annual Total Returns | |
| | | | | |
As of September 30, 2018 | | Inception
Date | | | 1 Year | | | 5 Years | | | 10 Years | |
| | | | | |
Class A Shares* | | | 6/2/03 | | | | 10.40% | | | | 11.92% | | | | 10.88% | |
| | | | | |
Class C Shares** | | | 6/2/03 | | | | 16.27% | | | | 12.39% | | | | 10.71% | |
| | | | | |
Institutional Shares | | | 6/2/03 | | | | 17.46% | | | | 13.53% | | | | 11.81% | |
| | | | | |
Class R Shares | | | 2/1/101 | | | | 16.80% | | | | 12.95% | | | | 11.38% | |
| | | | | |
Class R6 Shares | | | 2/1/182 | | | | 17.54% | | | | 13.54% | | | | 11.82% | |
| | | | | |
Russell 3000® Index | | | N/A | | | | 17.58% | | | | 13.46% | | | | 12.01% | |
Past performance does not guarantee future results. The performance data quoted represents past performance and current returns may be lower or higher. Total return figures include change in share price, reinvestment of dividends and capital gains, and do not reflect taxes that a shareholder would pay on fund distributions or on the redemption of fund shares. The investment return and principal value will fluctuate so that an investor’s shares, when redeemed, may be worth more or less than the original cost. To obtain performance information current to the most recent month end, please visit www.sterlingcapitalfunds.com.
The chart above represents a comparison of a hypothetical $10,000 investment in the indicated share class versus a similar investment in the Fund’s benchmark.
| 1 | Class R Shares were not in existence prior to 2/1/10. Performance for periods prior to 2/1/10 is based on the performance of Institutional Shares, but such performance does not reflect Class R Shares’ 12b-1 fees, which if reflected, would have caused performance to be lower. |
| 2 | Class R6 Shares were not in existence prior to 2/1/18. Performance for periods prior to 2/1/18 is based on the performance of Institutional Shares. |
The Fund is measured against the Russell 3000® Index, an unmanaged index that is generally considered to be representative of the performance of the stock market as a whole. The index does not reflect the deduction of expenses associated with a mutual fund, such as investment management and fund accounting fees. Investors cannot invest directly in an index, although they can invest in its underlying securities.
Sterling Capital Equity Income Fund
Portfolio Manager
George F. Shipp, CFA
Sterling Capital Equity Income Fund (the “Fund”) is managed by George F. Shipp, CFA, Senior Managing Director and portfolio manager for Sterling Capital Management LLC (“Sterling Capital”), advisor to the Fund. Mr. Shipp joined the CHOICE Asset Management Team of Scott & Stringfellow in 2000 and Sterling Capital as part of a business realignment in 2013. He has been the Fund’s lead portfolio manager since inception and also manages the Sterling Capital Special Opportunities Fund. He has investment experience since 1982. Mr. Shipp is a graduate of the University of Virginia and received his MBA at the Darden Graduate School of Business.
Investment Considerations
The Fund invests primarily in dividend-paying securities. These securities may be undervalued and their value could be negatively affected by a rise in interest rates. The Fund may engage in writing covered call options on securities. By writing covered call options, the Fund limits its opportunity to profit from an increase in the price of the underlying stock above the premium and the strike price, but continues to bear the risk of a decline in the stock price. While the Fund receives premiums for writing covered call options, the price it realizes from the exercise of an option could be substantially below a stock’s current market price.
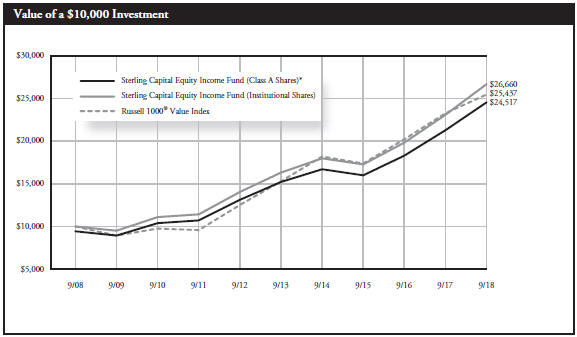
Q. How did the Fund perform during the 12-month period between October 1, 2017 and September 30, 2018?
A. The Sterling Capital Equity Income Fund’s Institutional Shares generated a 15.58% total return during the 12-months ended September 30, 2018. The result compared favorably to the 9.45% gain of its primary benchmark, the Russell 1000® Value Index (Russell 1000 Value).
Q. What factors affected the Fund’s performance?
A. US economic growth accelerated during the period, and the December 2017 Tax Cuts and Jobs Act turbo charged corporate earnings. The Federal Reserve increased overnight interest rates four times, as its long-standing goals of “full employment” and 2% Consumer Price Inflation finally were attained. Ten-year Treasury yields rose from 2.33% to 3.06% in response, so long-term bond investors suffered a (rare) loss of (3.55%).
We were gratified that our income-oriented equity portfolio performed so well during a period of rising rates. Yes, profit and dividend growth can more than offset that headwind! And yes, “safe” securities such as US government bonds are not necessarily safe if one overpays for that attribute. The quaint concept of “value” does matter.
We mention that, because the overriding characteristic within equity markets was the preeminence of so-called “growth” stocks over those labeled as “value”: the Russell 1000® Growth Index surged by 26.3%, while our Value benchmark gained only 9.5%. We reiterate: While the Fund is purposely conservative and risk-averse in style, we seek both growth and value in our stock selections.
Our 18% Technology sector weighting was double that of the benchmark. Combined with our holdings’ 35% average return, we achieved 392 basis points (3.92%) of out performance. Microsoft gained 56% as investors became increasingly comfortable it is a formidable competitor in the “cloud,” i.e. hosting others’ business processes on its datacenters. Revenue surpassed $100 billion, earnings grew by 18%, the company raised its dividend by 10%, and its (June
Portfolio composition is as of September 30, 2018 and is subject to change and risk.
30) balance sheet boasted over $50 billion of net cash. Global consultant Accenture, which advises companies how to safely and securely make that transformation, was our 4th-largest contributor with a 28% return. Wireless semiconductor maker Qualcomm joined our top-5 stocks with a 44% total return, offset by a smaller position size.
The Healthcare industry was our other successful over weight: Our eight stocks represented an average 27% of the portfolio, and they gained over 22%. Abbott advanced 40% to lead our picks, on the strength of broad-based gains in diagnostics, devices, and nutrition. The company raised its dividend for the 46th consecutive year. Managed care leader Anthem (+46%) and device leader Medtronic (+29%) also were top-10 contributors.
Building supply retailer Lowe’s is undergoing an extreme makeover under new CEO Marvin Ellison. Lowe’s provided a spiffy 46% total return to lead our Consumer Discretionary selections, with underlying earnings improvement helped by both a 17% dividend increase and a $5 billion repurchase.
Holdings in Financials and Energy (the two largest weights in the Value benchmark) penalized results, even though Occidental Petroleum provided a 33% return on the strength of its Permian Basin operations, and credit card provider Discover Financial charged almost 21% higher. Those successes were more than offset by: the 32% plunge in money manager Invesco, which suffered from industrywide fee pressure and outflows from its “active” strategies; and an 18% loss from pipeline leader Enbridge, which is pursuing a series of “simplification” transactions to bring publicly-traded partnership interests back under the corporate umbrella.
General Motors fell 13% despite record earnings and clear progress in its effort to launch autonomous cars, as the lagged effect of tighter credit conditions and the possible effects of tariffs on costs investors became concerns. Data provider Nielsen dropped 21% as results were squeezed by cost-cutting upheaval among its Consumer Staples customers, although it appears as we go to press that the discounted share price may have attracted takeover interest.
| | * | Reflects 5.75% maximum sales charge. |
| | ** | Reflects the applicable maximum CDSC of 1.00% (applicable only to redemptions within one year of purchase, and as such, are not reflected in the Average Annual Total Returns table since the periods reflected are for a year or longer). |
| | | | | | | | | | | | | | | | |
Average Annual Total Returns | |
| | | | | |
As of September 30, 2018 | | Inception
Date | | | 1 Year | | | 5 Years | | | 10 Years | |
| | | | | |
Class A Shares* | | | 6/30/04 | | | | 8.66% | | | | 8.74% | | | | 9.38% | |
| | | | | |
Class C Shares** | | | 6/30/04 | | | | 14.41% | | | | 9.22% | | | | 9.20% | |
| | | | | |
Institutional Shares | | | 6/30/04 | | | | 15.58% | | | | 10.32% | | | | 10.30% | |
| | | | | |
Class R Shares | | | 2/1/101 | | | | 14.97% | | | | 9.77% | | | | 9.84% | |
| | | | | |
Class R6 Shares | | | 2/1/182 | | | | 15.64% | | | | 10.33% | | | | 10.31% | |
| | | | | |
Russell 1000® Value Index | | | N/A | | | | 9.45% | | | | 10.72% | | | | 9.79% | |
Past performance does not guarantee future results. The performance data quoted represents past performance and current returns may be lower or higher. Total return figures include change in share price, reinvestment of dividends and capital gains, and do not reflect taxes that a shareholder would pay on fund distributions or on the redemption of fund shares. The investment return and principal value will fluctuate so that an investor’s shares, when redeemed, may be worth more or less than the original cost. To obtain performance information current to the most recent month end, please visit www.sterlingcapitalfunds.com.
The chart above represents a comparison of a hypothetical $10,000 investment in the indicated share class versus a similar investment in the Fund’s benchmark.
| 1 | Class R Shares were not in existence prior to 2/1/10. Performance for periods prior to 2/1/10 is based on the performance of Institutional Shares, but such performance does not reflect Class R Shares’ 12b-1 fees, which if reflected, would have caused performance to be lower. |
| 2 | Class R6 Shares were not in existence prior to 2/1/18. Performance for periods prior to 2/1/18 is based on the performance of Institutional Shares. |
The Fund is measured against the Russell 1000® Value Index, an unmanaged index that is generally considered to be representative of the performance of the stock market as a whole. The index does not reflect the deduction of expenses associated with a mutual fund, such as investment management and fund accounting fees. Investors cannot invest directly in an index, although they can invest in its underlying securities.
Sterling Capital Behavioral International Equity Fund
Portfolio Managers
Sterling Capital Behavioral International Equity Fund (the “Fund”) is managed by Robert W. Bridges, CFA and Robert O. Weller, CFA Executive Directors and portfolio managers for Sterling Capital Management LLC (“Sterling Capital”), advisor to the Fund.
Robert W. Bridges, CFA
Mr. Bridges, CFA, Executive Director joined Sterling Capital in 1996 and has been a co-portfolio manager of the Fund since inception. He has investment experience since 1991. He is a graduate of Wake Forest University where he received his BS in Business.
Robert O. Weller, CFA
Mr. Weller, CFA, Executive Director joined Sterling Capital in 2012 and has been a co-portfolio manager of the Fund since inception. He has investment experience since 1996. He is a graduate of Loyola University Maryland where he received his BBA in Finance.
Investment Considerations
The overall results of the Fund will be dependent on the process and ability of the Adviser to apply “behavioral finance” principles to recognize a company’s value, earnings revisions and market momentum. The Fund will invest in foreign securities which may be more volatile and less liquid due to currency fluctuation, political instability, and social and economic risks. The Fund may invest in REITs (Real Estate Investment Trusts), the value of which will be affected by conditions of the real estate industry, and exchange-traded funds (ETFs). Investing in ETFs may cause shareholders to bear additional costs, and an ETF may not exactly replicate the performance it seeks to track.
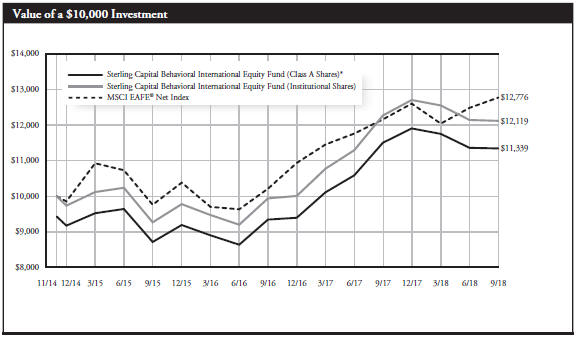
Q. How did the Fund perform during the 12-month period between October 1, 2017 and September 30, 2018?
A. The Fund’s Institutional Shares underperformed its current benchmark, the MSCI EAFE® Net Index.
Q. What factors affected the Fund’s performance?
A. Higher oil prices and investor concerns over the impact of a growing trade war between the U.S. and its trading partners generated headwinds for international equities. The prospect of higher inflation rates also dragged on returns, which were held in the single digits for the 12-month period. Accommodative central bank policies and low interest rates helped offset those concerns, however, fostering an environment for stable growth. Growth rates accelerated modestly as the period unfolded and helped support a strengthening outlook for the global economy.
The Fund applies principles of behavioral finance to its investment strategy. This process is designed to capitalize on known investor biases and heuristics (mental shortcuts) by accounting for the impact on
markets of behavioral factors such as greed, fear and ego.
Stock selection in industrials and financials detracted from relative returns. Shares of a global construction contractor and industrial supplier declined after reporting it had exceeded its projected costs on key projects during the year. The Fund’s strategy of maintaining an average market capitalization profile that was smaller than the benchmark detracted modestly from returns, as larger companies in international markets generally outperformed their smaller counterparts.
The Fund’s value-related behavioral strategy contributed positively to relative performance. Momentum also boosted the Fund’s performance relative to its benchmark. Momentum was a steady contributor throughout the 12-month period, while value contributed modestly during the first half and was neutral during the second half. Stock selection in the energy and health care sectors also added to the Fund’s relative performance during the period.
Portfolio composition is as of September 30, 2018 and is subject to change and risk.
| | * | Reflects 5.75% maximum sales charge. |
| | ** | Reflects the applicable maximum CDSC of 1.00% (applicable only to redemptions within one year of purchase, and as such, are not reflected in the Average Annual Total Returns table since the periods reflected are for a year or longer). |
| | | | | | | | | | | | |
Average Annual Total Returns | |
| | | | |
As of September 30, 2018 | | Inception
Date | | | 1 Year | | | Since Inception | |
| | | | |
Class A Shares* | | | 11/28/14 | | | | -7.16% | | | | 3.33% | |
| | | | |
Class C Shares** | | | 11/28/14 | | | | -2.18% | | | | 4.16% | |
| | | | |
Institutional Shares | | | 11/28/14 | | | | -1.25% | | | | 5.13% | |
| | | | |
Class R6 Shares | | | 2/1/181 | | | | -1.24% | | | | 5.14% | |
| | | | |
MSCI EAFE® Net Index | | | 11/30/14 | | | | 2.74% | | | | 4.69% | |
Past performance does not guarantee future results. The performance data quoted represents past performance and current returns may be lower or higher. Total return figures include change in share price, reinvestment of dividends and capital gains, and do not reflect taxes that a shareholder would pay on fund distributions or on the redemption of fund shares. The investment return and principal value will fluctuate so that an investor’s shares, when redeemed, may be worth more or less than the original cost. To obtain performance information current to the most recent month end, please visit www.sterlingcapitalfunds.com. Performance would have been lower without limitations and/or waivers in effect.
The chart above represents a comparison of a hypothetical $10,000 investment in the indicated share class versus a similar investment in the Fund’s benchmark.
| 1 | Class R6 Shares were not in existence prior to 2/1/18. Performance for periods prior to 2/1/18 is based on the performance of Institutional Shares. |
Fund is measured against the MSCI EAFE® Net Index, an unmanaged Index which is generally representative of large- and mid-cap equity across developed markets countries around the world, excluding the U.S. and Canada. The index does not reflect the deduction of expenses associated with a mutual fund, such as investment management and fund accounting fees. Investors cannot invest directly in an index, although they can invest in its underlying securities.
Sterling Capital SMID Opportunities Fund
Portfolio Managers
Sterling Capital SMID Opportunities Fund (the “Fund”) is managed by Joshua L. Haggerty, CFA, Executive Director and portfolio manager for Sterling Capital Management LLC (“Sterling Capital”), advisor to the Fund.
Joshua L. Haggerty, CFA
Mr. Haggerty, CFA, Executive Director joined the CHOICE Asset Management Team of Scott & Stringfellow in 2005 and Sterling Capital as part of a business realignment in 2013 and has been a co-portfolio manager of the Fund since 2016. He has investment experience since 1998. He is a graduate of James Madison University where he received his BBA in Finance.
Investment Considerations
The newly formed fund has no operating history to evaluate and the risk that it may not attract sufficient assets to achieve or maximize investment and operational efficiencies. The Fund uses a multi-style approach and invests in both growth and value-oriented companies. A growth investment style may be particularly sensitive to market conditions. Value investing involves the risk that an investment made in undervalued securities may not appreciate in value as anticipated or remain undervalued for long periods of time. The Fund invests in small and middle capitalization companies which may be riskier, more volatile and vulnerable to economic, market and industry changes than investments in larger more established companies. As a result, share price changes may be more erratic or trade less frequently in lesser quantities.
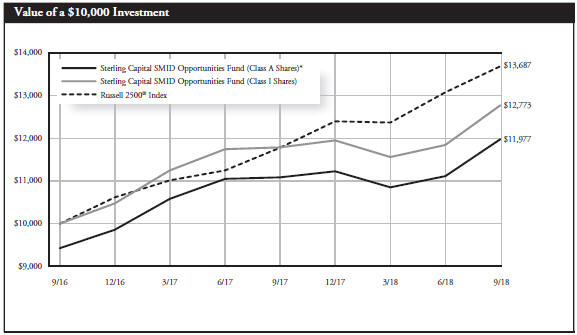
Q. How did the Fund perform during the 12-month period between October 1, 2017 and September 30, 2018?
A. Sterling Capital SMID Opportunities Fund’s Institutional Shares generated a 8.4% total return during the fiscal year ending September 30, 2018, trailing the Russell 2500® Index (Russell 2500), which gained 16.2%.
Q. What factors affected the Fund’s performance?
A. Growth and momentum were winning trades, with the Russell 2500® Growth Index outperforming its value counterpart by nearly 13%. Only three of 10 sectors beat the index — Healthcare, Technology and Energy — suggesting returns were narrowly driven. Drilling deeper, only a third of Russell 2500 constituents (869 of the 2509 to be exact) outperformed during the 12-month period. A third (292) of the outperformers were unprofitable, according to Bloomberg data, excluding them from consideration for the fund; recall we don’t invest in unprofitable companies, which have generated a negative cumulative return with high volatility over more than three decades.
More important to the SMID Opportunities Fund, valuation and growth factors that have stood the test of time posed a headwind this past year. Since 1985, Ned Davis Research shows the most expensive stocks in its Small Cap Equity Series generated negative annualized returns and trailed the cheapest group by more than 12% annualized. However, during the past fiscal year, the cheapest stocks gained only 2.4% and trailed the most expensive group by more than 15%. The average holding in the fund has maintained a below average value. Similarly, companies with the highest returns on equity (ROE) outperformed the lowest ROE cohort by 14% annualized since 1985, but the differential was nearly the mirror opposite this past year. Both of these fundamental factors contributed to the fund’s underperformance
Portfolio composition is as of September 30, 2018 and is subject to change and risk.
during the past 12 months. Despite recent anomalies, we continue to believe we can achieve our goal of delivering above-average returns with below average risk by steering the fund into cheaper securities of companies that generate high returns on equity, employ low leverage and deliver rapid and consistent earnings growth.
The biggest individual contributors to performance were: government-focused health insurer Centene (50%), which benefited from solid underwriting and member growth. Looking forward, growth should be supported by the growing number of seniors and increasing penetration of government programs by managed care; ServiceMaster (33%) improved service levels and retention at Terminix and successfully spun its home warranty business; merchant acquirer and payments software provider Global Payments (34%) benefited from its vertically integrated strategy. Management believes penetration of integrated solutions, which include vertical specific software combined with merchant acquiring solutions, is only in the 3rd or 4th inning in the U.S. and the 1st inning in international markets.
The biggest detractors included: distressed debt acquirer Colony Capital (-52%), which suffered from what turned out to be a highly dilutive acquisition that failed to generate meaningful cash flows, leading to a 59% dividend cut and the stock’s removal from the fund; flexible spending account processor WageWorks (-30%) unexpectedly delayed its annual filing and subsequently removed several executives including the CEO, CFO and CAO. The accounting issue appears to be relatively minor, but a lengthy delay and key personnel changes led us to exit the position; contract research organization Syneos Health (-31%) made an ill-timed acquisition that led to a lowered outlook post its first full quarter as a combined company. Subsequent departures of the CFO and Chief Legal Counsel contributed to our decision to sell.
| | * | Reflects 5.75% maximum sales charge. |
| | ** | Reflects the applicable maximum CDSC of 1.00% (applicable only to redemptions within one year of purchase, and as such, are not reflected in the Average Annual Total Returns table since the periods reflected are for a year or longer). |
| | | | | | | | | | | | |
Average Annual Total Returns | |
| | | | |
As of September 30, 2018 | | Inception
Date | | | 1 Year | | | Since Inception | |
| | | | |
Class A Shares* | | | 09/30/16 | | | | 1.83% | | | | 9.44% | |
| | | | |
Class C Shares** | | | 09/30/16 | | | | 7.25% | | | | 11.88% | |
| | | | |
Institutional Shares | | | 09/30/16 | | | | 8.39% | | | | 13.02% | |
| | | | |
Russell 2500® Index | | | N/A | | | | 16.19% | | | | 16.99% | |
Past performance does not guarantee future results. The performance data quoted represents past performance and current returns may be lower or higher. Total return figures include change in share price, reinvestment of dividends and capital gains, and do not reflect taxes that a shareholder would pay on fund distributions or on the redemption of fund shares. The investment return and principal value will fluctuate so that an investor’s shares, when redeemed, may be worth more or less than the original cost. To obtain performance information current to the most recent month end, please visit www.sterlingcapitalfunds.com. Performance would have been lower without limitations and/or waivers in effect.
The chart above represents a comparison of a hypothetical $10,000 investment in the indicated share class versus a similar investment in the Fund’s benchmark.
The Russell 2500® Index is a widely recognized index of common stocks that measures the performance of the small and mid cap sector of the U.S. equity market. The index is unmanaged and does not reflect the deduction of expenses associated with a mutual fund, such as investment management and fund accounting fees. Investors cannot invest directly in an index, although they can invest in its underlying securities.
Sterling Capital Stratton Mid Cap Value Fund
Portfolio Manager
Shawn M. Gallagher, CFA
Sterling Capital Stratton Mid Cap Value Fund (the “Fund”) is managed by Shawn M. Gallagher, CFA Director and portfolio manager for Sterling Capital Management LLC (“Sterling Capital”), advisor to the Fund. Mr. Gallagher joined the Stratton Funds Team of Stratton Management Company in 2005 and Sterling Capital Management as part of a business acquisition in 2015. He has been the lead portfolio manager to the Fund since 2015 and the Predecessor Fund since 2012. Mr. Gallagher has investment experience since 2003. He is a graduate of Pennsylvania State University where he received his BS in Finance.
Investment Considerations
Mid-capitalization companies are generally riskier than large company stocks due to greater volatility and less liquidity. Value stocks can perform differently than other types of stocks and can continue to be undervalued by the market for long periods of time.
Q. How did the Fund perform during the 12-month period between October 1, 2017 and September 30, 2018?
A. The Fund’s Institutional Shares underperformed its current benchmark, the Russell Midcap® Value Index.
Q. What factors affected the Fund’s performance?
A. U.S. mid-cap stocks posted solid gains for the period, driven by surging corporate earnings, equity-friendly corporate tax reform, low unemployment and broadly rising investor confidence. The boost in earnings more than offset the headwinds generated by rising interest rates, trade war rhetoric and inconsistent global macroeconomic data. Stocks with high earnings growth, high price momentum and higher valuations tended to lead markets higher during the period.
The Fund’s absolute performance benefited from gains in the health care, technology and producer durables sectors, as companies in these sectors posted strong earnings growth. By comparison, the consumer discretionary sector dragged on the Fund’s absolute returns.
Stock selection within the consumer discretionary sector weighed on relative performance. Shares of an RV manufacturer underperformed due to elevated dealer inventory levels, rising input costs and fears of future tariffs. Meanwhile, shares of a flooring producer declined as investments in capacity cut into its profit margins. Stock selection in the energy sector also detracted from relative returns. In particular, the Fund’s below-benchmark exposure to specific oil exploration and production companies that did well during a period of strengthening crude oil prices dragged on returns.
Stock selection in the health care sector added to relative performance, and each of the Fund’s five health care holdings outperformed the overall sector. The common theme for all five names involved strong earnings reports driven in part by organic earnings growth, as well as successful integration efforts of strategic acquisitions. The Fund’s above-benchmark exposure to the technology sector, the benchmark’s top-performing sector for the period, also boosted relative returns.
Portfolio composition is as of September 30, 2018 and is subject to change and risk.

| | * | Reflects 5.75% maximum sales charge. |
| | ** | Reflects the applicable maximum CDSC of 1.00% (applicable only to redemptions within one year of purchase, and as such, are not reflected in the Average Annual Total Returns table since the periods reflected are for a year or longer). |
| | | | | | | | | | | | | | | | |
Average Annual Total Returns | |
| | | | | |
As of September 30, 2018 | | Inception
Date | | | 1 Year | | | 5 Years | | | 10 Years | |
| | | | | |
Class A Shares* | | | 11/13/15 | | | | 1.36% | | | | 8.72% | | | | 7.63% | |
| | | | | |
Class C Shares** | | | 11/13/15 | | | | 6.70% | | | | 9.54% | | | | 8.04% | |
| | | | | |
Institutional Shares | | | 09/30/72 | | | | 7.81% | | | | 10.18% | | | | 8.35% | |
| | | | | |
Russell Midcap® Value Index | | | N/A | | | | 8.81% | | | | 10.72% | | | | 11.29% | |
Past performance does not guarantee future results. The performance data quoted represents past performance and current returns may be lower or higher. Total return figures include change in share price, reinvestment of dividends and capital gains, and do not reflect taxes that a shareholder would pay on fund distributions or on the redemption of fund shares. The investment return and principal value will fluctuate so that an investor’s shares, when redeemed, may be worth more or less than the original cost. The performance shown here (for periods prior to the date of commencement of operations on November 16, 2015) is that of Stratton Mid Cap Value Fund (the “Predecessor Fund”), whose shares were reorganized into Institutional Shares of the Fund at the close of business on November 13, 2015. Because the Fund had no investment operations prior to the closing of the reorganization, and based on the similarity of the Fund to the Predecessor Fund, the Predecessor Fund is treated as the survivor of the reorganization for accounting and performance reporting purposes. Accordingly, all performance and other information shown for the Fund for periods prior to November 16, 2015 is that of the Predecessor Fund. Performance for Class A Shares and Class C Shares, prior to the date of commencement of operations on November 16, 2015, is based on the performance of the shares of the Predecessor Fund. To obtain performance information current to the most recent month end, please visit www.sterlingcapitalfunds.com. Performance would have been lower without waivers in effect.
The chart above represents a comparison of a hypothetical $10,000 investment in the indicated share class versus a similar investment in the Fund’s benchmark.
The Fund is measured against the Russell Midcap® Value Index, an unmanaged index, which measures the performance of the mid-cap value segment of the U.S. equity universe. It includes those Russell Midcap® Index companies with lower price-to-book ratios and lower forecasted growth values. The index is unmanaged and does not reflect the deduction of expenses associated with a mutual fund, such as investment management and fund accounting fees. Investors cannot invest directly in an index, although they can invest in its underlying securities.
Sterling Capital Stratton Real Estate Fund
Portfolio Manager
Andrew T. DiZio, CFA
Sterling Capital Stratton Real Estate Fund (the “Fund”) is managed by Andrew T. DiZio, CFA, Director and portfolio manager for Sterling Capital Management LLC (“Sterling Capital”), advisor to the Fund. Mr. DiZio joined the Stratton Funds Team of Stratton Management Company in 2012 and Sterling Capital Management as part of a business acquisition in 2015. He has been the lead portfolio manager of the Fund since 2015 and the Predecessor Fund since 2012. Mr. DiZio has investment experience since 2003. He is a graduate of Pennsylvania State University where he received his BS in Finance.
Investment Considerations
Real Estate Funds may be subject to a higher degree of market risk because of concentration in a specific industry or geographic sector. Risks include declines in value of real estate, general and economic conditions, changes in the value of the underlying property and defaults by borrowers.
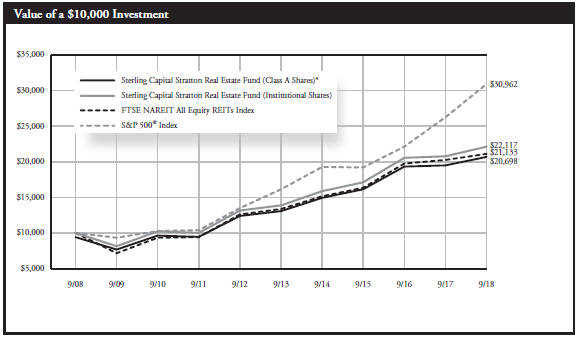
Q. How did the Fund perform during the 12-month period between October 1, 2017 and September 30, 2018?
A. The Fund’s Institutional Shares outperformed its benchmark, the FTSE NAREIT All Equity REITs Index.
Q. What factors affected the Fund’s performance?
A. Rising interest rates acted as a headwind for real estate investment trust (REIT) share prices during the 12-month period under review. The benchmark still managed to post a meaningful gain for the period, however. Strong performance from the lodging, infrastructure and self storage subsectors added to the Fund’s absolute performance. Lodging REITs benefited as increasing demand for hotel rooms overtook the pace of new hotel development. Network development among wireless companies boosted demand among tower landlords in the infrastructure subsector, while the self storage subsector rebounded from multi-year underperformance. Health care and office REITs weighed most heavily on the Fund’s absolute performance.
Stock selection in the lodging and infrastructure subsectors added the
most to the Fund’s performance relative to its benchmark. In particular, the Fund’s above-benchmark investment in a REIT that specializes in large, group-oriented destination properties was the lodging subsector’s top performer and added to relative results. Within infrastructure, the Fund’s focus on REITs with ownership of both cell towers and fiber optics added to relative returns, as cell phone providers have favored landlords with communication assets that span multiple channels. Stock selection in the self storage subsector also added to relative returns, as did the Fund’s underweight allocation to the diversified REIT subsector.
Stock selection in the residential subsector weighed most heavily on the Fund’s relative returns. The Fund’s investment in a student housing REIT detracted as the company’s earnings growth did not keep pace with its peers. The Fund’s stock selection in the industrial subsector also weighed on returns, driven in large part by a lack of exposure to the subsector’s largest constituent, a global warehouse REIT, which outperformed for the 12-month period under review.
Portfolio composition is as of September 30, 2018 and is subject to change and risk.
| | * | Reflects 5.75% maximum sales charge. |
| | ** | Reflects the applicable maximum CDSC of 1.00% (applicable only to redemptions within one year of purchase, and as such, are not reflected in the Average Annual Total Returns table since the periods reflected are for a year or longer). |
| | | | | | | | | | | | | | | | |
Average Annual Total Returns | |
| | | | | |
As of September 30, 2018 | | Inception
Date | | | 1 Year | | | 5 Years | | | 10 Years | |
| | | | | |
Class A Shares* | | | 11/13/15 | | | | 0.06% | | | | 8.34% | | | | 7.54% | |
| | | | | |
Class C Shares** | | | 11/13/15 | | | | 5.39% | | | | 9.17% | | | | 7.96% | |
| | | | | |
Institutional Shares | | | 05/31/80 | | | | 6.42% | | | | 9.78% | | | | 8.26% | |
| | | | | |
FTSE NAREIT All Equity REITs Index | | | N/A | | | | 4.31% | | | | 9.57% | | | | 7.77% | |
| | | | | |
S&P 500® Index | | | N/A | | | | 17.91% | | | | 13.95% | | | | 11.97% | |
Past performance does not guarantee future results. The performance data quoted represents past performance and current returns may be lower or higher. Total return figures include change in share price, reinvestment of dividends and capital gains, and do not reflect taxes that a shareholder would pay on fund distributions or on the redemption of fund shares. The investment return and principal value will fluctuate so that an investor’s shares, when redeemed, may be worth more or less than the original cost. The performance shown here (for periods prior to the date of commencement of operations on November 16, 2015) is that of Stratton Real Estate Fund (the “Predecessor Fund”), whose shares were reorganized into Institutional Shares of the Fund at the close of business on November 13, 2015. Because the Fund had no investment operations prior to the closing of the reorganization, and based on the similarity of the Fund to the Predecessor Fund, the Predecessor Fund is treated as the survivor of the reorganization for accounting and performance reporting purposes. Accordingly, all performance and other information shown for the Fund for periods prior to November 16, 2015 is that of the Predecessor Fund. Performance for Class A Shares and Class C Shares, prior to the date of commencement of operations on November 16, 2015, is based on the performance of the shares of the Predecessor Fund. To obtain performance information current to the most recent month end, please visit www.sterlingcapitalfunds.com. Performance would have been lower without waivers in effect.
The chart above represents a comparison of a hypothetical $10,000 investment in the indicated share class versus a similar investment in the Fund’s benchmarks.
The Fund is measured against the FTSE NAREIT All Equity REIT Index, an unmanaged index, which contains all tax-qualified REITs with more than 50 percent of total assets in qualifying real estate assets other than mortgages secured by real property that also meet minimum size and liquidity criteria. The Fund is also measured against the S&P 500® Index, an unmanaged index, which is generally considered to be representative of the performance of the stock market as a whole. The indices do not reflect the deduction of expenses associated with a mutual fund, such as investment management and fund accounting fees. Investors cannot invest directly in an index, although they can invest in its underlying securities.
Sterling Capital Stratton Small Cap Value Fund
Portfolio Manager
Gerald M. Van Horn, CFA
Sterling Capital Stratton Small Cap Value Fund (the “Fund”) is managed by Gerald M. Van Horn, CFA, Executive Director and portfolio manager for Sterling Capital Management LLC (“Sterling Capital”), advisor to the Fund. Mr. Van Horn, joined the Stratton Funds Team of Stratton Management Company in 1998 and Sterling Capital Management as part of a business acquisition in 2015. He has been the lead portfolio manager to the Fund since 2015 and the Predecessor Fund since 2000. Mr. Van Horn has investment experience since 1996. He is a graduate of the College of New Jersey where he received his BA in Economics.
Investment Considerations
Small cap company stocks are generally riskier than large company stocks due to greater volatility and less liquidity. Value stocks can perform differently than other types of stocks and can continue to be undervalued by the market for long periods of time.
Q. How did the Fund perform during the 12-month period between October 1, 2017 and September 30, 2018?
A. The Fund’s Institutional Shares underperformed its current benchmark, the Russell 2000® Value Index.
Q. What factors affected the Fund’s performance?
A. Small-cap equity markets posted positive absolute returns for the 12-month period under review, based on continued strength in domestic macroeconomic data and corporate earnings. Rising interest rates, trade war rhetoric and global macroeconomic data triggered intermittent periods of volatility and weakness, however. The Fund’s exposure to the health care, technology and financial services sectors added to its absolute performance during the period. Health care and technology benefited as investors sought more predictable, above-average earnings growth, while the regional banks among the Fund’s financial services holdings benefited from exposure to the rising rate environment.
Stock selection in the consumer discretionary sector weighed on the Fund’s relative performance during the period. Investments in a
recreational vehicle manufacturer and an automobile tire manufacturer underperformed following weaker-than-expected earnings reports. Stock selection in the materials sector also weighed on relative results, as weather hurt results for a concrete production company held by the Fund. Within the energy sector, the Fund’s choice of stocks detracted, as its portfolio failed to keep pace during a strong rally among the benchmark’s holdings.
These negative impacts were partially offset by stock selection in the financial services sector. The Fund’s bank holdings boosted relative results, benefiting from their exposure to rising interest rates. Stock selection in the technology sector also added: The Fund’s investments in a product management and development company, a video game publisher and distributor, and a government-focused IT solutions firm outperformed after reporting above-average profit growth during the period. Stock selection in the health care sector, most notably investments in a health monitoring technology firm and a manufacturer and marketer of health care products, also buoyed relative results.
Portfolio composition is as of September 30, 2018 and is subject to change and risk.
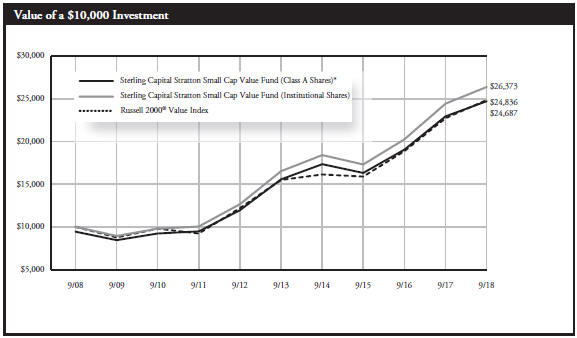
| | * | Reflects 5.75% maximum sales charge. |
| | ** | Reflects the applicable maximum CDSC of 1.00% (applicable only to redemptions within one year of purchase, and as such, are not reflected in the Average Annual Total Returns table since the periods reflected are for a year or longer). |
| | | | | | | | | | | | | | | | |
Average Annual Total Returns | |
| | | | | |
As of September 30, 2018 | | Inception
Date | | | 1 Year | | | 5 Years | | | 10 Years | |
| | | | | |
Class A Shares* | | | 11/13/15 | | | | 1.51% | | | | 8.38% | | | | 9.46% | |
| | | | | |
Class C Shares** | | | 11/13/15 | | | | 6.90% | | | | 9.20% | | | | 9.87% | |
| | | | | |
Institutional Shares | | | 4/12/93 | | | | 7.98% | | | | 9.82% | | | | 10.18% | |
| | | | | |
Russell 2000® Value Index | | | N/A | | | | 9.33% | | | | 9.91% | | | | 9.52% | |
Past performance does not guarantee future results. The performance data quoted represents past performance and current returns may be lower or higher. Total return figures include change in share price, reinvestment of dividends and capital gains, and do not reflect taxes that a shareholder would pay on fund distributions or on the redemption of fund shares. The investment return and principal value will fluctuate so that an investor’s shares, when redeemed, may be worth more or less than the original cost. The performance shown here (for periods prior to the date of commencement of operations on November 16, 2015) is that of Stratton Small Cap Value Fund (the “Predecessor Fund”), whose shares were reorganized into Institutional Shares of the Fund at the close of business on November 13, 2015. Because the Fund had no investment operations prior to the closing of the reorganization, and based on the similarity of the Fund to the Predecessor Fund, the Predecessor Fund is treated as the survivor of the reorganization for accounting and performance reporting purposes. Accordingly, all performance and other information shown for the Fund for periods prior to November 16, 2015 is that of the Predecessor Fund. Performance for Class A Shares and Class C Shares, prior to the date of commencement of operations on November 16, 2015, is based on the performance of the shares of the Predecessor Fund. To obtain performance information current to the most recent month end, please visit www.sterlingcapitalfunds.com.
The chart above represents a comparison of a hypothetical $10,000 investment in the indicated share class versus a similar investment in the Fund’s benchmark.
The Russell 2000® Value Index is a widely recognized index of common stocks that measures the performance of the small-cap value sector of the U.S. equity market. The index is unmanaged and does not reflect the deduction of expenses associated with a mutual fund, such as investment management and fund accounting fees. Investors cannot invest directly in an index, although they can invest in its underlying securities.
Sterling Capital Ultra Short Bond Fund
Portfolio Managers
Sterling Capital Ultra Short Bond Fund (the “Fund”) is managed by Mark Montgomery, CFA and Richard LaCoff, Senior Managing Directors and portfolio managers for Sterling Capital Management LLC (“Sterling Capital”), advisor to the Fund.
Mark Montgomery, CFA
Mr. Montgomery, Senior Managing Director joined Sterling Capital in 1997 and has been a co-portfolio manager of the Fund since inception. He is co-head of Sterling Capital’s Fixed Income Portfolio Management. He has investment experience since 1990. He is a graduate of West Chester University and received his MBA from Drexel University.
Richard T. LaCoff
Mr. LaCoff, Senior Managing Director joined Sterling Capital in 2007 and has been a co-portfolio manager of the Fund since inception. He is co-head of Sterling Capital’s Fixed Income Portfolio Management. He has investment experience since 1991. He is a graduate of Villanova University and received his MS in Finance from Drexel University.
Investment Considerations
The Fund is subject to the same risks as the underlying bonds in the portfolio such as credit, prepayment, call and interest rate risk. As interest rates rise, the value of bond prices will decline and an investor may lose money. The Fund may invest in more aggressive investments, such as foreign securities, which may expose the Fund to currency and exchange rate fluctuations; mortgage-backed securities sensitive to interest rates; and high yield debt (also known as junk bonds), all of which may cause greater volatility and less liquidity.
Q. How did the Fund perform during the 12-month period between October 1, 2017 and September 30, 2018?
A. The Fund’s Institutional Shares underperformed its current benchmark, the FTSE 6 Month Treasury Bill Index.
Q. What factors affected the Fund’s performance?
A. The Federal Reserve raised short-term interest rates four times during the 12-month period under review due to the strengthening economy. The result was a cumulative increase in the federal funds target rate of one percentage point. This tighter monetary policy put upward pressure on bond rates, which caused prices of existing bonds to fall. Demand for investments that could counteract rising interest rates helped floating-rate securities outperform during the period. Coupons for floating-rate securities regularly reset higher to reflect the higher interest rates, thus generating increasingly higher levels of income throughout the period. Sub-investment grade corporate bonds also generated
positive returns as corporate default rates declined thanks in part to the strengthening economy. The Fund’s overall return was driven primarily by income and price performance of the securities it held.
The Fund’s underperformance relative to its benchmark was due in large part to its strategy of maintaining an average duration that was slightly longer on a relative basis than its benchmark. As interest rates rose, longer duration bond values were hurt more than were their shorter duration counterparts. Exposure to longer duration bonds dragged on the Fund’s relative performance.
This underperformance was partly offset by the Fund’s other allocation decisions. The Fund’s underweight allocation to Treasuries and overweight allocation to higher risk sectors added to relative performance. Treasuries were among the poorest performing securities during the period as investors sought riskier investments.
Portfolio composition is as of September 30, 2018 and is subject to change and risk.
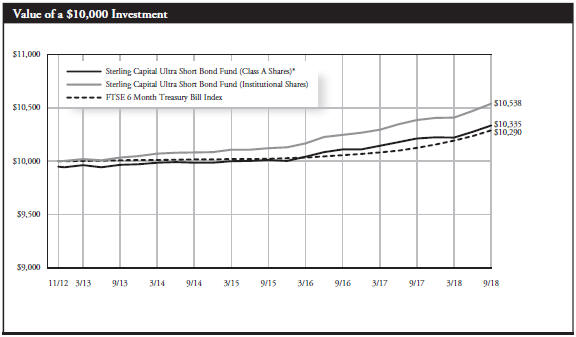
| | * | Reflects 0.50% maximum sales charge. |
| | | | | | | | | | | | |
Average Annual Total Returns | |
| | | | |
As of September 30, 2018 | | Inception
Date | | | 1 Year | | | Since Inception | |
| | | | |
Class A Shares* | | | 11/30/12 | | | | 0.69% | | | | 0.56% | |
| | | | |
Institutional Shares | | | 11/30/12 | | | | 1.46% | | | | 0.90% | |
| | | | |
FTSE 6 Month Treasury Bill Index | | | 11/30/12 | | | | 1.62% | | | | 0.49% | |
Past performance does not guarantee future results. The performance data quoted represents past performance and current returns may be lower or higher. Total return figures include change in share price, reinvestment of dividends and capital gains, and do not reflect taxes that a shareholder would pay on fund distributions or on the redemption of fund shares. The investment return and principal value will fluctuate so that an investor’s shares, when redeemed, may be worth more or less than the original cost. To obtain performance information current to the most recent month end, please visit www.sterlingcapitalfunds.com. Performance would have been lower without limitations and/or waivers in effect.
The chart above represents a comparison of a hypothetical $10,000 investment in the indicated share class versus a similar investment in the Fund’s benchmark.
The Fund is measured against the FTSE 6 Month Treasury Bill Index, which measures the performance of Treasury bills with a maturity of six months or less. The index does not reflect the deduction of expenses associated with a mutual fund, such as investment management and fund accounting fees. Investors cannot invest directly in an index, although they can invest in its underlying securities.
Sterling Capital Short Duration Bond Fund
Portfolio Managers
Sterling Capital Short Duration Bond Fund (the “Fund”) is managed by Mark Montgomery, CFA and Richard LaCoff, Senior Managing Directors and portfolio managers for Sterling Capital Management LLC (“Sterling Capital”), advisor to the Fund.
Mark Montgomery, CFA
Mr. Montgomery, Senior Managing Director joined Sterling Capital in 1997 and has been a co-portfolio manager of the Fund since 2011. He is co-head of Sterling Capital’s Fixed Income Portfolio Management. He has investment experience since 1990. He is a graduate of West Chester University and received his MBA from Drexel University.
Richard T. LaCoff
Mr. LaCoff, Senior Managing Director joined Sterling Capital in 2007 and has been a co-portfolio manager of the Fund since 2011. He is co-head of Sterling Capital’s Fixed Income Portfolio Management. He has investment experience since 1991. He is a graduate of Villanova University and received his MS in Finance from Drexel University.
Investment Considerations
The Fund is subject to the same risks as the underlying bonds in the portfolio such as credit, prepayment, call and interest rate risk. As interest rates rise, the value of bond prices will decline and an investor may lose money. The Fund may invest in more aggressive investments, such as foreign securities, which may expose the Fund to currency and exchange rate fluctuations; mortgage-backed securities sensitive to interest rates; and high yield debt (also known as junk bonds), all of which may cause greater volatility and less liquidity.
Q. How did the Fund perform during the 12-month period between October 1, 2017, and September 30, 2018?
A. The Fund’s Institutional Shares outperformed its current benchmark, the ICE BofA Merrill Lynch 1–3 Year U.S. Corporate Government Index.
Q. What factors affected the Fund’s performance?
A. The Federal Reserve raised short-term interest rates four times during the period, resulting in a cumulative 1% increase in the federal funds target rate. Tighter monetary policy put upward pressure on bond rates, which caused prices of existing bonds to fall. Demand for investments that could counteract rising interest rates helped floating-rate securities outperform during the period. Coupons for floating-rate securities regularly reset to reflect the higher rates, which allows them to generate increasingly higher levels of income. Sub-investment grade corporate bonds also generated positive total returns as corporate default rates
declined thanks in part to the strengthening economy. The Fund’s overall return was driven primarily by income and price performance of the securities it held.
The Fund outperformed its benchmark due in large part to its defensive positioning that allowed it to take advantage of rising interest rates. The Fund’s overweight allocation to securities with higher credit risk boosted relative return as that class of bonds outperformed in an environment where investors sought out riskier bonds to help buffer the impact of rising interest rates. An underweight allocation to Treasury Bonds also benefited, since Treasuries were among the worst performing securities during the period.
The Fund’s relative performance was hurt by an underweight allocation to sovereign debt. This sector posted excess returns during the period as investors were comfortable buying riskier assets.
Portfolio composition is as of September 30, 2018 and is subject to change and risk.
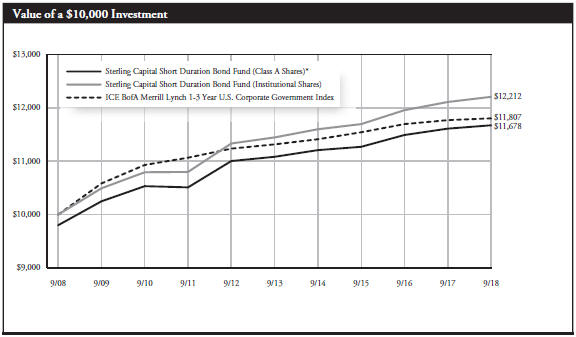
| | * | Reflects 2.00% maximum sales charge. |
| | ** | Reflects the applicable maximum CDSC of 1.00% (applicable only to redemptions within one year of purchase, and as such, are not reflected in the Average Annual Total Returns table since the periods reflected are for a year or longer). |
| | | | | | | | | | | | | | | | |
Average Annual Total Returns | |
| | | | | |
As of September 30, 2018 | | Inception
Date | | | 1 Year | | | 5 Years | | | 10 Years | |
| | | | | |
Class A Shares* | | | 11/30/92 | | | | -1.49% | | | | 0.64% | | | | 1.56% | |
| | | | | |
Class C Shares** | | | 1/31/121 | | | | -0.32% | | | | 0.27% | | | | 1.25% | |
| | | | | |
Institutional Shares | | | 11/30/92 | | | | 0.80% | | | | 1.30% | | | | 2.02% | |
| | | | | |
ICE BofA Merrill Lynch 1-3 Year U.S. Corporate Government Index | | | N/A | | | | 0.27% | | | | 0.85% | | | | 1.68% | |
Past performance does not guarantee future results. The performance data quoted represents past performance and current returns may be lower or higher. Total return figures include change in share price, reinvestment of dividends and capital gains, and do not reflect taxes that a shareholder would pay on fund distributions or on the redemption of fund shares. The investment return and principal value will fluctuate so that an investor’s shares, when redeemed, may be worth more or less than the original cost. To obtain performance information current to the most recent month end, please visit www.sterlingcapitalfunds.com. Performance would have been lower without limitations and/or waivers in effect.
The chart above represents a comparison of a hypothetical $10,000 investment in the indicated share class versus a similar investment in the Fund’s benchmark.
| 1 | Class C Shares were not in existence prior to 2/1/12. Performance for periods prior to 2/1/12 is based on the performance of Class A Shares. Such performance could differ only to the extent that the Classes have different expenses. |
The Fund is measured against the ICE BofA Merrill Lynch 1-3 Year U.S. Corporate Government Index, which consists of securities with a maturity from one to three years. The index does not reflect the deduction of expenses associated with a mutual fund, such as investment management and fund accounting fees. Investors cannot invest directly in an index, although they can invest in its underlying securities.
Sterling Capital Intermediate U.S. Government Fund
Portfolio Manager
Brad D. Eppard, CFA
Sterling Capital Intermediate U.S. Government Fund (the “Fund”) is managed by Brad D. Eppard, CFA, Director and portfolio manager for Sterling Capital Management LLC (“Sterling Capital”), advisor to the Fund. Mr. Eppard joined BB&T Asset Management in 2003 and Sterling Capital through merger in 2010 and has been lead portfolio manager to the Fund since 2003. He has investment experience since 1985. Mr. Eppard is a graduate of Radford University where he received his BS in Business Administration/Accounting.
Investment Considerations
The Fund is subject to the same risks as the underlying bonds in the portfolio such as credit, prepayment, call and interest rate risk. As interest rates rise, the value of bond prices will decline and an investor may lose money. The Fund may invest in mortgage-backed securities, which tend to be more sensitive to changes in interest rates. The Fund invests in securities issued or guaranteed by the U.S. government or its agencies (such as Fannie Mae or Freddie Mac). Although U.S. government securities issued directly by the U.S. government are guaranteed by the U.S. Treasury, other U.S. government securities issued by an agency or instrumentality of the U.S. government may not be. No assurance can be given that the U.S. government would provide financial support to its agencies and instrumentalities if not required to do so by law.
Q. How did the Fund perform during the 12-month period between October 1, 2017, and September 30, 2018?
A. The Fund’s Institutional Shares underperformed its current benchmark, the Bloomberg Barclays U.S. Government Intermediate Index.
Q. What factors affected the Fund’s performance?
A. Amid a strong economic backdrop, the Federal Reserve raised interest rates four times over the 12-month period for a total increase of 100 basis points. Bond yields rose in this environment, pushing down bond prices. With expectations of more rate hikes to come and a flattening yield curve, investors favored riskier investments with higher return potential.
In absolute terms, the Fund was negatively impacted by the rise in interest rates. Yields on 2-year Treasuries rose more than 133 basis points, while 10-year Treasury yields climbed more than 72 basis points.
The decline in bond prices was partially offset by the total income received from the securities.
For a portion of the period, the Fund maintained a duration positioning longer than that of its benchmark. That dragged on relative performance as interest rates rose during the period. However, the Fund’s duration position was shortened later in the period to bring it closer to that of its benchmark. Exposure to callable agency issues also hurt the fund amid rising interest rates.
The Fund’s relative performance was buoyed by an overweight position in agency bonds, which offered additional income compared to Treasuries. The Fund also benefited from modest exposure to high-quality corporate and taxable municipal bonds, which added income and performed well from a price basis. The Fund’s modest barbell yield curve structure was beneficial as the yield curve flattened.
Portfolio composition is as of September 30, 2018 and is subject to change and risk.
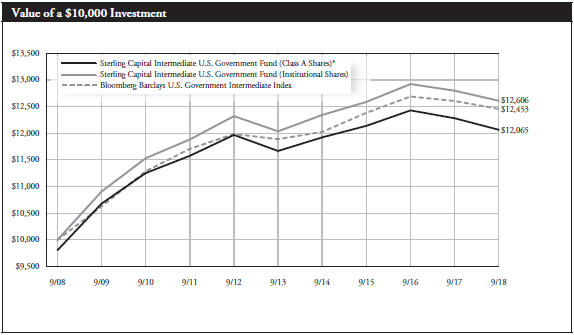
| | * | Reflects 2.00% maximum sales charge. |
| | ** | Reflects the applicable maximum CDSC of 1.00% (applicable only to redemptions within one year of purchase, and as such, are not reflected in the Average Annual Total Returns table since the periods reflected are for a year or longer). |
| | | | | | | | | | | | | | | | |
Average Annual Total Returns | |
| | | | | |
As of September 30, 2018 | | Inception
Date | | | 1 Year | | | 5 Years | | | 10 Years | |
| | | | | |
Class A Shares* | | | 10/9/92 | | | | -3.67% | | | | 0.27% | | | | 1.89% | |
| | | | | |
Class C Shares** | | | 2/1/01 | | | | -2.37% | | | | -0.05% | | | | 1.35% | |
| | | | | |
Institutional Shares | | | 10/9/92 | | | | -1.48% | | | | 0.93% | | | | 2.34% | |
| | | | | |
Bloomberg Barclays U.S. Government Intermediate Index | | | N/A | | | | -1.18% | | | | 0.93% | | | | 2.22% | |
Past performance does not guarantee future results. The performance data quoted represents past performance and current returns may be lower or higher. Total return figures include change in share price, reinvestment of dividends and capital gains, and do not reflect taxes that a shareholder would pay on fund distributions or on the redemption of fund shares. The investment return and principal value will fluctuate so that an investor’s shares, when redeemed, may be worth more or less than the original cost. To obtain performance information current to the most recent month end, please visit www.sterlingcapitalfunds.com. Performance would have been lower without waivers in effect.
The chart above represents a comparison of a hypothetical $10,000 investment in the indicated share class versus a similar investment in the Fund’s benchmark.
The Fund is measured against the Bloomberg Barclays U.S. Government Intermediate Index, an unmanaged index comprised of all publicly issued non-convertible domestic debt of the U.S. government or any agency there of, or corporate debt guaranteed by the U.S. government all with outstanding principal of $1 million and maturity between one and ten years. The index does not reflect the deduction of expenses associated with a mutual fund, such as investment management and fund accounting fees. Investors cannot invest directly in an index, although they can invest in its underlying securities.
Sterling Capital Total Return Bond Fund
Portfolio Managers
Sterling Capital Total Return Bond Fund (the “Fund”) is managed by Mark Montgomery, CFA and Richard LaCoff, Senior Managing Directors and portfolio managers for Sterling Capital Management LLC (“Sterling Capital”), advisor to the Fund.
Mark Montgomery, CFA
Mr. Montgomery, Senior Managing Director joined Sterling Capital in 1997 and has been a co-portfolio manager of the Fund since 2008. He is co-head of Sterling Capital’s Fixed Income Portfolio Management. He has investment experience since 1990. He is a graduate of West Chester University and received his MBA from Drexel University.
Richard T. LaCoff
Mr. LaCoff, Senior Managing Director joined Sterling Capital in 2007 and has been a co-portfolio manager of the Fund since 2011. He is co-head of Sterling Capital’s Fixed Income Portfolio Management. He has investment experience since 1991. He is a graduate of Villanova University and received his MS in Finance from Drexel University.
Investment Considerations
The Fund is subject to the same risks as the underlying bonds in the portfolio such as credit, prepayment, call and interest rate risk. As interest rates rise, the value of bond prices will decline and an investor may lose money. The Fund may invest in foreign securities, which may expose the fund to currency and exchange rate fluctuations; and mortgage-backed securities sensitive to interest rates; and high yield debt (also known as junk bonds), all of which may cause greater volatility and less liquidity. Derivatives may be more sensitive to changes in market conditions and may amplify risks.
Q. How did the Fund perform during the 12-month period between October 1, 2017 and September 30, 2018?
A. The Fund’s Institutional Shares outperformed its current benchmark, the Bloomberg Barclays U.S. Aggregate Bond Index.
Q. What factors affected the Fund’s performance?
A. During the period, the Federal Reserve raised short-term interest rates four times for a cumulative increase of one percentage point. The rate increases helped drive bond rates upwards, which caused the prices of existing bonds to fall. High-quality asset-backed securities offset some of the negative performance caused by the rate hikes as these securities posted positive returns for the period. Consumers bought floating rate securities as a means to protect their portfolios against the rising interest rates. Prices on this class of bonds rose as a result. Ultimately, income derived from the Fund’s investments was the main contributor to the Funds absolute return.
The Fund outperformed its benchmark for the period due in large part to its strategic positioning for a rising rate environment. The Fund’s overweight allocation to higher-risk sectors such as high-yield bonds was part of this tactical positioning and helped boost relative returns. These sub-investment grade bonds outperformed for the period as the corporate default rate declined, which added to the Fund’s relative return. The Fund’s overweight allocation to risk assets helped it generate more income on a relative basis, which added to its relative performance. An underweight allocation to the Treasury sector also benefited, as Treasury bonds were among the worst-performing securities during the period as investors sought out riskier bonds.
The Fund’s underweight allocation to overseas sovereign debt hurt relative performance as this sector posted solid excess returns.
Portfolio composition is as of September 30, 2018 and is subject to change and risk.
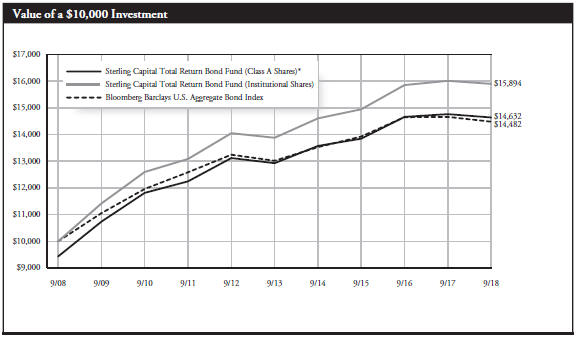
| | * | Reflects 5.75% maximum sales charge. |
| | ** | Reflects the applicable maximum CDSC of 1.00% (applicable only to redemptions within one year of purchase, and as such, are not reflected in the Average Annual Total Returns table since the periods reflected are for a year or longer). |
| | | | | | | | | | | | | | | | |
Average Annual Total Returns | |
| | | | | |
As of September 30, 2018 | | Inception
Date | | | 1 Year | | | 5 Years | | | 10 Years | |
| | | | | |
Class A Shares* | | | 11/30/99 | | | | -6.63% | | | | 1.31% | | | | 3.88% | |
| | | | | |
Class C Shares** | | | 2/1/01 | | | | -1.73% | | | | 1.74% | | | | 3.71% | |
| | | | | |
Institutional Shares | | | 11/30/99 | | | | -0.74% | | | | 2.76% | | | | 4.74% | |
| | | | | |
Class R Shares | | | 2/1/101 | | | | -1.13% | | | | 2.28% | | | | 4.27% | |
| | | | | |
Class R6 Shares | | | 2/1/182 | | | | -0.67% | | | | 2.77% | | | | 4.75% | |
| | | | | |
Bloomberg Barclays U.S. Aggregate Bond Index | | | N/A | | | | -1.22% | | | | 2.16% | | | | 3.77% | |
Past performance does not guarantee future results. The performance data quoted represents past performance and current returns may be lower or higher. Total return figures include change in share price, reinvestment of dividends and capital gains, and do not reflect taxes that a shareholder would pay on fund distributions or on the redemption of fund shares. The investment return and principal value will fluctuate so that an investor’s shares, when redeemed, may be worth more or less than the original cost. To obtain performance information current to the most recent month end, please visit www.sterlingcapitalfunds.com. Performance would have been lower without limitations and/or waivers in effect.
The chart above represents a comparison of a hypothetical $10,000 investment in the indicated share class versus a similar investment in the Fund’s benchmark.
| 1 | Class R Shares were not in existence prior to 2/1/10. Performance for periods prior to 2/1/10 is based on the performance of Institutional Shares, but such performance does not reflect Class R Shares’ 12b-1 fees, which if reflected, would have caused performance to be lower. |
| 2 | Class R6 Shares were not in existence prior to 2/1/18. Performance for periods prior to 2/1/18 is based on the performance of Institutional Shares. |
The Fund is measured against the Bloomberg Barclays U.S. Aggregate Bond Index, an unmanaged index, which is a market value-weighted performance benchmark for investment-grade fixed-rate debt issues, including government, corporate, asset-backed, and mortgage-backed securities, with maturities of at least one year. The index is unmanaged and does not reflect the deduction of expenses associated with a mutual fund, such as investment management and fund accounting fees. Investors cannot invest directly in an index, although they can invest in its underlying securities.
Sterling Capital Corporate Fund
Portfolio Managers
Sterling Capital Corporate Fund (the “Fund”) is managed by Mark Montgomery, CFA and Richard LaCoff, Senior Managing Directors and portfolio managers for Sterling Capital Management LLC (“Sterling Capital”), advisor to the Fund.
Mark Montgomery, CFA
Mr. Montgomery, Senior Managing Director joined Sterling Capital in 1997 and has been a co-portfolio manager of the Fund since inception. He is co-head of Sterling Capital’s Fixed Income Portfolio Management. He has investment experience since 1990. He is a graduate of West Chester University and received his MBA from Drexel University.
Richard T. LaCoff
Mr. LaCoff, Senior Managing Director joined Sterling Capital in 2007 and has been a co-portfolio manager of the Fund since inception. He is co-head of Sterling Capital’s Fixed Income Portfolio Management. He has investment experience since 1991. He is a graduate of Villanova University and received his MS in Finance from Drexel University.
Investment Considerations
The Fund is subject to the same risks as the underlying bonds in the portfolio such as credit, prepayment, call and interest rate risk. As interest rates rise, the value of bond prices will decline and an investor may lose money. The Fund may invest in more aggressive investments, such as foreign securities, which may expose the fund to currency and exchange rate fluctuations; mortgage-backed securities sensitive to interest rates; and high yield debt (also known as junk bonds), all of which may cause greater volatility and less liquidity. Derivatives may be more sensitive to changes in market conditions and may amplify risks.
Q. How did the Fund perform during the 12-month period between October 1, 2017 and September 30, 2018?
A. The Fund’s Institutional Shares outperformed its current benchmark, the Bloomberg Barclays Corporate Intermediate Bond Index.
Q. What factors affected the Fund’s performance?
A. The Federal Reserve raised interest rates four times during the 12-month period, resulting in a cumulative increase of one percentage point. These rate increases put upward pressure on bond yields, leading to declines in bond prices. The result was negative returns across most longer-dated fixed income instruments. Meanwhile, the Tax Cuts and Jobs Act created favorable conditions for corporations to repatriate cash, which many did by selling off corporate bonds held overseas. This wave of selling coupled with lower demand from overseas investors caused credit spreads to widen by five basis points, pushing corporate bonds price lower.
Amid rising interest rates and widening credit spreads, the Fund outperformed its benchmark due in part to its strategic decision to
target a shorter-than-benchmark duration. The Fund’s overweight allocation to floating rate bonds also added to relative performance. Increasing demand for floating rate bonds among investors seeking protection from rising interest rates helped drive prices higher. An overweight allocation to below-investment grade securities boosted relative performance as well, since these securities benefited from an improving economic outlook and a declining corporate default rate. These higher yield securities also avoided the technical issues surrounding supply and demand that weighed on investment grade securities. The Fund’s overweight allocation to the energy, basics and communication sectors and an underweight allocation to consumer non-cyclicals also boosted relative return.
Rising interest rates and a flatter yield curve led investors away from investments they saw as sensitive to interest rate hikes, such as financials. As a result, an overweight sector allocation to financials hurt relative performance as financials underperformed industrials.
Portfolio composition is as of September 30, 2018 and is subject to change and risk.
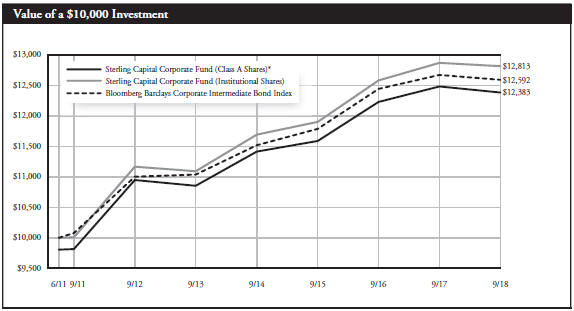
| | * | Reflects 2.00% maximum sales charge. |
| | ** | Reflects the applicable maximum contingent deferred sales charge (CDSC) of 1.00% (applicable only to redemptions within one year of purchase, and as such, are not reflected in the Annual Total Returns table since the periods reflected are for a year or longer). |
| | | | | | | | | | | | | | | | |
Average Annual Total Returns | |
| | | | | |
As of September 30, 2018 | | Inception
Date | | | 1 Year | | | 5 Year | | | Since Inception | |
| | | | | |
Class A Shares* | | | 1/31/131 | | | | -2.79% | | | | 2.25% | | | | 2.99% | |
| | | | | |
Class C Shares** | | | 1/31/131 | | | | -1.44% | | | | 1.88% | | | | 2.66% | |
| | | | | |
Institutional Shares | | | 6/30/112 | | | | -0.45% | | | | 2.92% | | | | 3.48% | |
| | | | | |
Bloomberg Barclays Corporate Intermediate Bond Index | | | 6/30/11 | | | | -0.64% | | | | 2.66% | | | | 3.23% | |
Past performance does not guarantee future results. The performance data quoted represents past performance and current returns may be lower or higher. Total return figures include change in share price, reinvestment of dividends and capital gains, and do not reflect taxes that a shareholder would pay on fund distributions or on the redemption of fund shares. The investment return and principal value will fluctuate so that an investor’s shares, when redeemed, may be worth more or less than the original cost. To obtain performance information current to the most recent month end, please call 1-888-228-1872.
The chart above represents a comparison of a hypothetical $10,000 investment in the indicated share class versus a similar investment in the Fund’s benchmark.
| 1 | Class A and C Shares were not in existence prior to 2/1/13. Performance for periods prior to 2/1/13 is based on the performance of Institutional Shares and has been adjusted for maximum CDSC to the class applicable but does not include 12b-1 fees, which if reflected, would have caused performance of Class A and C Shares to be lower. |
| 2 | The Fund converted Class S Shares into Institutional Shares effective 2/1/13. |
The Fund is measured against the Bloomberg Barclays Corporate Intermediate Bond Index, an unmanaged index consisting of dollar-denominated debt from U.S. industrial, utility and financial institutions issuers with a duration of 1 to 10 years. The index does not reflect the deduction of expenses associated with a mutual fund, such as investment management and fund accounting fees. Investors cannot invest directly in an index, although they can invest in its underlying securities.
Sterling Capital Securitized Opportunities Fund
Portfolio Managers
Sterling Capital Securitized Opportunities Fund (the “Fund”) is managed by Executive Director Michael Sun, CFA, Jeffrey Ormsby, CFA and Byron Mims, CFA, Directors and portfolio managers for Sterling Capital Management LLC (“Sterling Capital”), advisor to the Fund.
Michael Z. Sun, CFA
Mr. Sun, Executive Director, joined Sterling Capital in 2009 and has been a co-portfolio manager to the Fund since 2014. Mr. Sun has investment experience since 1998 and is a graduate of Nanjing University and received his MS from Beijing University and his MA from Bowling Green State University.
Byron G. Mims, CFA
Mr. Mims, Director, joined Sterling Capital in 2012 and has been a co-portfolio manager to the Fund since 2016. Mr. Mims has investment experience since 2006. He is a graduate of North Carolina State University where he received his BS in Economics. He was a summa cum laude graduate and was recognized as valedictorian.
Jeffrey D. Ormsby, CFA
Mr. Ormsby, Director, joined Sterling Capital in 2011 and has been a co-portfolio manager to the Fund since 2016. Mr. Ormsby has investment experience since 2006. He is a graduate of North Carolina State University where he received his BS in Economics. He was a summa cum laude graduate and was recognized as Valedictorian. Mr. Ormsby received his MBA from the University of North Carolina at Chapel Hill’s Kenan-Flagler Business School, where he was the Norman Block Valedictorian Award recipient.
Investment Considerations
The Fund is subject to the same risks as the underlying bonds in the portfolio such as credit, prepayment, call and interest rate risk. As interest rates rise, the value of bond prices will decline and an investor may lose money. The Fund may invest in more aggressive investments, such as foreign securities, which may expose the Fund to currency and exchange rate fluctuations; mortgage-backed securities sensitive to interest rates; and high yield debt (also known as junk bonds), all of which may cause greater volatility and less liquidity.
Q. How did the Fund perform during the 12-month period between October 1, 2017 and September 30, 2018?
A. The Fund’s Institutional Shares outperformed its current benchmark, the Bloomberg Barclays U.S. Mortgage Backed Securities Index.
Q. What factors affected the Fund’s performance?
A. Most major sub-sectors within the Fund had negative absolute returns for the period due to the sharp increase in interest rates. The consumer asset-backed securities sector was the only sub-sector with positive absolute returns during this period as the sector’s interest income was enough to offset the negative price effect of higher interest rates due to the sector’s lower duration relative to the index. Each of the non-agency sectors outperformed the agency MBS sector as credit-risk premiums decreased for non-agency residential mortgage-backed securities, commercial mortgage-backed securities, and consumer asset-backed securities. Investors added these asset classes given attractive yields and healthy fundamental performance in the underlying real estate and consumer lending markets. Agency MBS was the worst performing sector as the Federal Reserve’s balance sheet reduction program added significant supply to the market.
The Fund overweight to each of the non-agency sub-sectors contributed positively to relative performance, as the non-agency sub-sectors posted higher total returns than the agency mortgage-backed security sub-sector, where the Fund is underweight relative to the benchmark. Additionally, the fund’s duration and yield-curve positioning were positive for relative performance. The Fund was shorter duration relative to the benchmark throughout the year and interest rates rose significantly. On the yield curve, the Fund was overweight longer-duration key rates, which benefited from the flattening of the yield curve.
The primary detractor of performance during the period came from the Fund’s exposure to several longer-duration bonds in agency CMOs and agency CMBS. While credit-risk premiums in these securities compressed, their long durations resulted in large negative absolute returns given the rise in interest rates.
Portfolio composition is as of September 30, 2018 and is subject to change and risk.
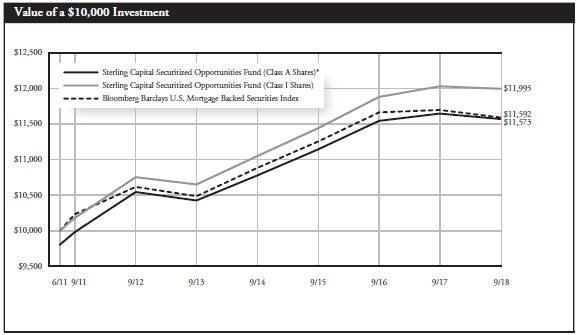
| | * | Reflects 2.00% maximum sales charge. |
| | ** | Reflects the applicable maximum contingent deferred sales charge (CDSC) of 1.00% (applicable only to redemptions within one year of purchase, and as such, are not reflected in the Annual Total Returns table since the periods reflected are for a year or longer). |
| | | | | | | | | | | | | | | | |
Average Annual Total Returns | |
| | | | | |
As of September 30, 2018 | | Inception
Date | | | 1 Year | | | 5 Year | | | Since Inception | |
| | | | | |
Class A Shares* | | | 1/31/131 | | | | -2.60% | | | | 1.70% | | | | 2.03% | |
| | | | | |
Class C Shares** | | | 1/31/131 | | | | -1.27% | | | | 1.39% | | | | 1.75% | |
| | | | | |
Institutional Shares | | | 6/30/112 | | | | -0.28% | | | | 2.41% | | | | 2.54% | |
| | | | | |
Bloomberg Barclays U.S. Mortgage Backed Securities Index | | | N/A | | | | -0.92% | | | | 2.02% | | | | 2.06% | |
Past performance does not guarantee future results. The performance data quoted represents past performance and current returns may be lower or higher. Total return figures include change in share price, reinvestment of dividends and capital gains, and do not reflect taxes that a shareholder would pay on fund distributions or on the redemption of fund shares. The investment return and principal value will fluctuate so that an investor’s shares, when redeemed, may be worth more or less than the original cost. To obtain performance information current to the most recent month end, please call 1-888-228-1872. Performance would have been lower without limitations and/or waivers in effect.
The chart above represents a comparison of a hypothetical $10,000 investment in the indicated share class versus a similar investment in the Fund’s benchmark.
| 1 | Class A and C Shares were not in existence prior to 2/1/13. Performance for periods prior to 2/1/13 is based on the performance of Institutional Shares and has been adjusted for maximum CDSC to the class applicable but does not include 12b-1 fees, which if reflected, would have caused performance of Class A and C Shares to be lower. |
| 2 | The Fund converted Class S Shares into Institutional Shares effective 2/1/13. |
The Fund is measured against the Bloomberg Barclays U.S. Mortgage Backed Securities Index. The index measures the performance of investment grade fixed-rate mortgage-backed pass-through securities of Ginnie Mae, Fannie Mae, and Freddie Mac. The index is unmanaged and does not reflect the deduction of expenses associated with a mutual fund, such as investment management and fund accounting fees. Investors cannot invest directly in an index, although they can invest in its underlying securities.
Sterling Capital Kentucky Intermediate Tax-Free Fund
Portfolio Manager
Robert F. Millikan, CFA
Sterling Capital Kentucky Intermediate Tax-Free Fund (the “Fund”) is managed by Robert F. Millikan, CFA, Executive Director and portfolio manager for Sterling Capital Management LLC (“Sterling Capital”), advisor to the Fund. Mr. Millikan joined BB&T Asset Management in 2000 and Sterling Capital through merger in 2010. He is lead portfolio manager of the Fund and has managed or been a member of the team that manages the state-specific municipal bond fund portfolios since 2000 and has investment experience since 1990. Mr. Millikan is a graduate of Wake Forest University where he received his BA in Economics.
Investment Considerations
The Fund is subject to the same risks as the underlying bonds in the portfolios such as credit, prepayment and interest rate risk. As interest rates rise, the value of bond prices will decline and an investor may lose money. The Fund is non-diversified and may invest a greater percentage of its assets in a single issuer than funds that are more diversified. Furthermore, the Fund invests primarily in municipal obligations issued by Kentucky and its political subdivisions and therefore will be affected by economic, political or other events affecting Kentucky.
Q. How did the Fund perform during the 12-month period between October 1, 2017 and September 30, 2018?
A. The Fund’s Institutional Shares underperformed its current benchmark, the ICE BofA Merrill Lynch 2-17 Year Municipal Bond Index.
Q. What factors affected the Fund’s performance?
A. Investors favored risk assets such as equities during the period. Demand remained relatively strong in the municipal bond market, with municipal bonds outperforming Treasury bonds. Bond yields rose, particularly among short-term issues, as the Federal Reserve raised interest rates four times during the period in response to continued economic growth. Bond prices fell in that environment.
In absolute terms, the rising interest rates negatively affected the Fund’s performance. The Fund’s relative performance was hurt by an underweight exposure to bonds with maturities of 12 to 17 years. Those
bonds performed relatively well as interest rates didn’t rise as much on longer-term issues. The Fund also was hurt by a bias towards lower quality bonds, which outperformed higher quality bonds during the year. The Fund was underweight in BBB bonds, which returned 1.78% compared to AAA bonds, which returned -0.86%. We continued to believe that lower-rated issues did not adequately compensate investors for the additional risk they bring.
In May, Kentucky’s debt rating was downgraded from A+ to A by rating agency Standard & Poor’s due to “uneven budgetary management.” The downgrade dragged on the Fund’s results relative to its benchmark.
The Fund’s relative performance benefited from its overweight position in revenue bonds, which outperformed general obligation bonds during the period. The Fund also maintained an average maturity shorter than that of its benchmark, which helped relative performance in a rising-rate environment.
Portfolio composition is as of September 30, 2018 and is subject to change and risk.
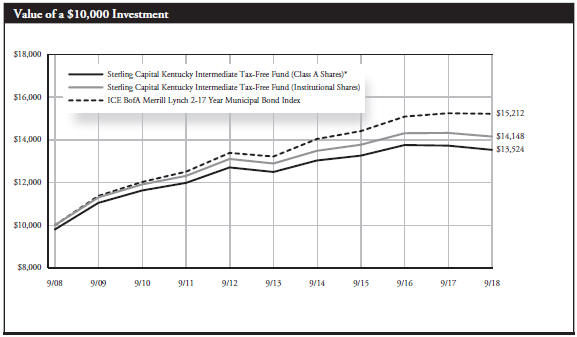
| | * | Reflects 2.00% maximum sales charge. |
| | ** | Reflects the applicable maximum contingent deferred sales charge of 1.00% (applicable only to redemptions within one year of purchase, and as such, are not reflected in the Average Annual Total Returns table since the periods reflected are for a year or longer). |
| | | | | | | | | | | | | | | | |
Average Annual Total Returns | |
| | | | | |
As of September 30, 2018 | | Inception
Date | | | 1 Year | | | 5 Years | | | 10 Years | |
| | | | | |
Class A Shares* | | | 2/24/03 | | | | -3.42% | | | | 1.19% | | | | 3.07% | |
| | | | | |
Class C Shares** | | | 1/31/121 | | | | -1.93% | | | | 0.96% | | | | 2.82% | |
| | | | | |
Institutional Shares | | | 2/24/03 | | | | -1.19% | | | | 1.88% | | | | 3.53% | |
| | | | | |
ICE BofA Merrill Lynch 2-17 Year Municipal Bond Index | | | N/A | | | | -0.23% | | | | 2.85% | | | | 4.28% | |
Past performance does not guarantee future results. The performance data quoted represents past performance and current returns may be lower or higher. Total return figures include change in share price, reinvestment of dividends and capital gains, and do not reflect taxes that a shareholder would pay on fund distributions or on the redemption of fund shares. The investment return and principal value will fluctuate so that an investor’s shares, when redeemed, may be worth more or less than the original cost. To obtain performance information current to the most recent month end, please visit www.sterlingcapitalfunds.com. Performance would have been lower without waivers in effect.
The chart above represents a comparison of a hypothetical $10,000 investment in the indicated share class versus a similar investment in the Fund’s benchmark.
| 1 | Class C Shares were not in existence prior to 2/1/12. Performance for periods prior to 2/1/12 is based on the performance of Class A Shares. Such performance would differ only to the extent that the Classes have different expenses. |
The Fund is measured against the ICE BofA Merrill Lynch 2-17 Year Municipal Bond Index, an unmanaged index that is representative of municipal bonds. The index does not reflect the deduction of expenses associated with a mutual fund, such as investment management and fund accounting fees. Investors cannot invest directly in an index, although they can invest in its underlying securities.
Sterling Capital Maryland Intermediate Tax-Free Fund
Portfolio Manager
Robert F. Millikan, CFA
Sterling Capital Maryland Intermediate Tax-Free Fund (the “Fund”) is managed by Robert F. Millikan, CFA, Executive Director and portfolio manager for Sterling Capital Management LLC (“Sterling Capital”), advisor to the Fund. Mr. Millikan joined BB&T Asset Management in 2000 and Sterling Capital through merger in 2010. He is lead portfolio manager of the Fund and has managed or been a member of the team that manages the state-specific municipal bond fund portfolios since 2000 and has investment experience since 1990. Mr. Millikan is a graduate of Wake Forest University where he received his BA in Economics.
Investment Considerations
The Fund is subject to the same risks as the underlying bonds in the portfolios such as credit, prepayment and interest rate risk. As interest rates rise, the value of bond prices will decline and an investor may lose money. The Fund is non-diversified and may invest a greater percentage of its assets in a single issuer than funds that are more diversified. Furthermore, the Fund invests primarily in municipal obligations issued by Maryland and its political subdivisions and therefore will be affected by economic, political or other events affecting Maryland.
Q. How did the Fund perform during the 12-month period between October 1, 2017 and September 30, 2018?
A. The Fund’s Institutional Shares underperformed its current benchmark, the ICE BofA Merrill Lynch 2-17 Year Municipal Bond Index.
Q. What factors affected the Fund’s performance?
A. Investors favored risk assets such as equities during the period. Demand remained relatively strong in the municipal bond market, with municipal bonds outperforming Treasury bonds. Bond yields rose, particularly among short-term issues, as the Federal Reserve raised interest rates four times during the period in response to continued economic growth. Bond prices fell in that environment.
In absolute terms, the rising interest rates negatively affected the Fund’s performance. The Fund’s relative performance was hurt by an
underweight exposure to bonds with maturities of 12 to 17 years. Those bonds performed relatively well as interest rates didn’t rise as much on longer-term issues. The Fund also was hurt by a bias towards lower quality bonds, which outperformed higher quality bonds during the year. The Fund was underweight in BBB bonds, which returned 1.78% compared to AAA bonds, which returned -0.86%. We continued to believe that lower-rated issues did not adequately compensate investors for the additional risk they bring.
The Fund’s relative performance benefited from its overweight position in revenue bonds, which outperformed general obligation bonds during the period. The Fund also maintained an average maturity shorter than that of its benchmark, which helped relative performance in a rising-rate environment.
Portfolio composition is as of September 30, 2018 and is subject to change and risk.
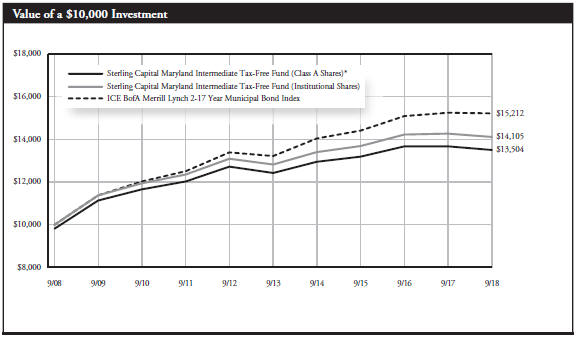
| | * | Reflects 2.00% maximum sales charge. |
| | ** | Reflects the applicable maximum contingent deferred sales charge of 1.00% (applicable only to redemptions within one year of purchase, and as such, are not reflected in the Average Annual Total Returns table since the periods reflected are for a year or longer). |
| | | | | | | | | | | | | | | | |
Average Annual Total Returns | |
| | | | | |
As of September 30, 2018 | | Inception
Date | | | 1 Year | | | 5 Years | | | 10 Years | |
| | | | | |
Class A Shares* | | | 2/24/03 | | | | -3.16% | | | | 1.28% | | | | 3.05% | |
| | | | | |
Class C Shares** | | | 1/31/121 | | | | -1.97% | | | | 0.93% | | | | 2.74% | |
| | | | | |
Institutional Shares | | | 2/24/03 | | | | -1.07% | | | | 1.94% | | | | 3.50% | |
| | | | | |
ICE BofA Merrill Lynch 2-17 Year Municipal Bond Index | | | N/A | | | | -0.23% | | | | 2.85% | | | | 4.28% | |
Past performance does not guarantee future results. The performance data quoted represents past performance and current returns may be lower or higher. Total return figures include change in share price, reinvestment of dividends and capital gains, and do not reflect taxes that a shareholder would pay on fund distributions or on the redemption of fund shares. The investment return and principal value will fluctuate so that an investor’s shares, when redeemed, may be worth more or less than the original cost. To obtain performance information current to the most recent month end, please visit www.sterlingcapitalfunds.com.
The chart above represents a comparison of a hypothetical $10,000 investment in the indicated share class versus a similar investment in the Fund’s benchmark.
| 1 | Class C Shares were not in existence prior to 2/1/12. Performance for periods prior to 2/1/12 is based on the performance of Class A Shares. Such performance would differ only to the extent that the Classes have different expenses. |
The Fund is measured against the ICE BofA Merrill Lynch 2-17 Year Municipal Bond Index, an unmanaged index, which is representative of municipal bonds. The index does not reflect the deduction of expenses associated with a mutual fund, such as investment management and fund accounting fees. Investors cannot invest directly in an index, although they can invest in its underlying securities.
Sterling Capital North Carolina Intermediate Tax-Free Fund
Portfolio Manager
Robert F. Millikan, CFA
Sterling Capital North Carolina Intermediate Tax-Free Fund (the “Fund”) is managed by Robert F. Millikan, CFA, Executive Director and portfolio manager for Sterling Capital Management LLC (“Sterling Capital”), advisor to the Fund. Mr. Millikan joined BB&T Asset Management in 2000 and Sterling Capital through merger in 2010. He is lead portfolio manager of the Fund and has managed or been a member of the team that manages the state-specific municipal bond fund portfolios since 2000 and has investment experience since 1990. Mr. Millikan is a graduate of Wake Forest University where he received his BA in Economics.
Investment Considerations
The Fund is subject to the same risks as the underlying bonds in the portfolios such as credit, prepayment and interest rate risk. As interest rates rise, the value of bond prices will decline and an investor may lose money. The Fund is non-diversified and may invest a greater percentage of its assets in a single issuer than funds that are more diversified. Furthermore, the Fund invests primarily in municipal obligations issued by North Carolina and its political subdivisions and therefore will be affected by economic, political or other events affecting North Carolina.
Q. How did the Fund perform during the 12-month period between October 1, 2017 and September 30, 2018?
A. The Fund’s Institutional Shares underperformed its current benchmark, the ICE BofA Merrill Lynch 2-17 Year Municipal Bond Index.
Q. What factors affected the Fund’s performance?
A. Investors favored risk assets such as equities during the period. Demand remained relatively strong in the municipal bond market, with municipal bonds outperforming Treasury bonds. Bond yields rose, particularly among short-term issues, as the Federal Reserve raised interest rates four times during the period in response to continued economic growth. Bond prices fell in that environment.
In absolute terms, the rising interest rates negatively affected the Fund’s performance. The Fund’s relative performance was hurt by an
underweight exposure to bonds with maturities of 12 to 17 years. Those bonds performed relatively well as interest rates didn’t rise as much on longer-term issues. The Fund also was hurt by a bias towards lower quality bonds, which outperformed higher quality bonds during the year. The Fund was underweight in BBB bonds, which returned 1.78% compared to AAA bonds, which returned -0.86%. We continued to believe that lower-rated issues did not adequately compensate investors for the additional risk they bring.
The Fund’s relative performance benefited from its overweight position in revenue bonds, which outperformed general obligation bonds during the period. The Fund also maintained an average maturity shorter than that of its benchmark, which helped relative performance in a rising-rate environment.
Portfolio composition is as of September 30, 2018 and is subject to change and risk.
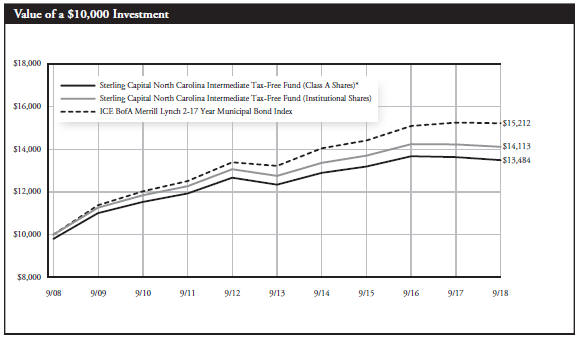
| | * | Reflects 2.00% maximum sales charge. |
| | ** | Reflects the applicable maximum contingent deferred sales charge of 1.00% (applicable only to redemptions within one year of purchase, and as such, are not reflected in the Average Annual Total Returns table since the periods reflected are for a year or longer). |
| | | | | | | | | | | | | | | | |
Average Annual Total Returns | |
| | | | | |
As of September 30, 2018 | | Inception
Date | | | 1 Year | | | 5 Years | | | 10 Years | |
| | | | | |
Class A Shares* | | | 10/16/92 | | | | -3.04% | | | | 1.39% | | | | 3.04% | |
| | | | | |
Class C Shares** | | | 1/31/121 | | | | -1.80% | | | | 1.03% | | | | 2.72% | |
| | | | | |
Institutional Shares | | | 10/16/92 | | | | -0.81% | | | | 2.06% | | | | 3.50% | |
| | | | | |
ICE BofA Merrill Lynch 2-17 Year Municipal Bond Index | | | N/A | | | | -0.23% | | | | 2.85% | | | | 4.28% | |
Past performance does not guarantee future results. The performance data quoted represents past performance and current returns may be lower or higher. Total return figures include change in share price, reinvestment of dividends and capital gains, and do not reflect taxes that a shareholder would pay on fund distributions or on the redemption of fund shares. The investment return and principal value will fluctuate so that an investor’s shares, when redeemed, may be worth more or less than the original cost. To obtain performance information current to the most recent month end, please visit www.sterlingcapitalfunds.com.
The chart above represents a comparison of a hypothetical $10,000 investment in the indicated share class versus a similar investment in the Fund’s benchmark.
| 1 | Class C Shares were not in existence prior to 2/1/12. Performance for periods prior to 2/1/12 is based on the performance of Class A Shares. Such performance would differ only to the extent that the Classes have different expenses. |
The Fund is measured against the ICE BofA Merrill Lynch 2-17 Year Municipal Bond Index, an unmanaged index, which is representative of municipal bonds. The index does not reflect the deduction of expenses associated with a mutual fund, such as investment management and fund accounting fees. Investors cannot invest directly in an index, although they can invest in its underlying securities.
Sterling Capital South Carolina Intermediate Tax-Free Fund
Portfolio Manager
Robert F. Millikan, CFA
Sterling Capital South Carolina Intermediate Tax-Free Fund (the “Fund”) is managed by Robert F. Millikan, CFA, Executive Director and portfolio manager for Sterling Capital Management LLC (“Sterling Capital”), advisor to the Fund. Mr. Millikan joined BB&T Asset Management in 2000 and Sterling Capital through merger in 2010. He is lead portfolio manager of the Fund and has managed or been a member of the team that manages the state-specific municipal bond fund portfolios since 2000 and has investment experience since 1990. Mr. Millikan is a graduate of Wake Forest University where he received his BA in Economics.
Investment Considerations
The Fund is subject to the same risks as the underlying bonds in the portfolios such as credit, prepayment and interest rate risk. As interest rates rise, the value of bond prices will decline and an investor may lose money. The Fund is non-diversified and may invest a greater percentage of its assets in a single issuer than funds that are more diversified. Furthermore, the Fund invests primarily in municipal obligations issued by South Carolina and its political subdivisions and therefore will be affected by economic, political or other events affecting South Carolina.
Q. How did the Fund perform during the 12-month period between October 1, 2017 and September 30, 2018?
A. The Fund’s Institutional Shares underperformed its current benchmark, the ICE BofA Merrill Lynch 2-17 Year Municipal Bond Index.
Q. What factors affected the Fund’s performance?
A. Investors favored risk assets such as equities during the period. Demand remained relatively strong in the municipal bond market, with municipal bonds outperforming Treasury bonds. Bond yields rose, particularly among short-term issues, as the Federal Reserve raised interest rates four times during the period in response to continued economic growth. Bond prices fell in that environment.
In absolute terms, the rising interest rates negatively affected the Fund’s performance. The Fund’s relative performance was hurt by an
underweight exposure to bonds with maturities of 12 to 17 years. Those bonds performed relatively well as interest rates didn’t rise as much on longer-term issues. The Fund also was hurt by a bias towards lower quality bonds, which outperformed higher quality bonds during the year. The Fund was underweight in BBB bonds, which returned 1.78% compared to AAA bonds, which returned -0.86%. We continued to believe that lower-rated issues did not adequately compensate investors for the additional risk they bring.
The Fund’s relative performance benefited from its overweight position in revenue bonds, which outperformed general obligation bonds during the period. The Fund also maintained an average maturity shorter than that of its benchmark, which helped relative performance in a rising-rate environment.
Portfolio composition is as of September 30, 2018 and is subject to change and risk.
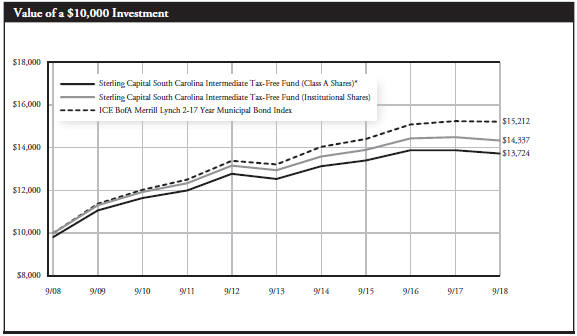
| | * | Reflects 2.00% maximum sales charge. |
| | ** | Reflects the applicable maximum contingent deferred sales charge of 1.00% (applicable only to redemptions within one year of purchase, and as such, are not reflected in the Average Annual Total Returns table since the periods reflected are for a year or longer). |
| | | | | | | | | | | | | | | | |
Average Annual Total Returns | |
| | | | | |
As of September 30, 2018 | | Inception
Date | | | 1 Year | | | 5 Years | | | 10 Years | |
| | | | | |
Class A Shares* | | | 10/20/97 | | | | -3.16% | | | | 1.43% | | | | 3.22% | |
| | | | | |
Class C Shares** | | | 1/31/121 | | | | -1.98% | | | | 1.06% | | | | 2.90% | |
| | | | | |
Institutional Shares | | | 10/20/97 | | | | -1.02% | | | | 2.07% | | | | 3.67% | |
| | | | | |
ICE BofA Merrill Lynch 2-17 Year Municipal Bond Index | | | N/A | | | | -0.23% | | | | 2.85% | | | | 4.28% | |
Past performance does not guarantee future results. The performance data quoted represents past performance and current returns may be lower or higher. Total return figures include change in share price, reinvestment of dividends and capital gains, and do not reflect taxes that a shareholder would pay on fund distributions or on the redemption of fund shares. The investment return and principal value will fluctuate so that an investor’s shares, when redeemed, may be worth more or less than the original cost. To obtain performance information current to the most recent month end, please visit www.sterlingcapitalfunds.com.
The chart above represents a comparison of a hypothetical $10,000 investment in the indicated share class versus a similar investment in the Fund’s benchmark.
| 1 | Class C Shares were not in existence prior to 2/1/12. Performance for periods prior to 2/1/12 is based on the performance of Class A Shares. Such performance would differ only to the extent that the Classes have different expenses. |
The Fund is measured against the ICE BofA Merrill Lynch 2-17 Year Municipal Bond Index, an unmanaged index, which is representative of municipal bonds. The index does not reflect the deduction of expenses associated with a mutual fund, such as investment management and fund accounting fees. Investors cannot invest directly in an index, although they can invest in its underlying securities.
Sterling Capital Virginia Intermediate Tax-Free Fund
Portfolio Manager
Robert F. Millikan, CFA
Sterling Capital Virginia Intermediate Tax-Free Fund (the “Fund”) is managed by Robert F. Millikan, CFA, Executive Director and portfolio manager for Sterling Capital Management LLC (“Sterling Capital”), advisor to the Fund. Mr. Millikan joined BB&T Asset Management in 2000 and Sterling Capital through merger in 2010. He is lead portfolio manager of the Fund and has managed or been a member of the team that manages the state-specific municipal bond fund portfolios since 2000 and has investment experience since 1990. Mr. Millikan is a graduate of Wake Forest University where he received his BA in Economics.
Investment Considerations
The Fund is subject to the same risks as the underlying bonds in the portfolios such as credit, prepayment and interest rate risk. As interest rates rise, the value of bond prices will decline and an investor may lose money. The Fund is non-diversified and may invest a greater percentage of its assets in a single issuer than funds that are more diversified. Furthermore, the Fund invests primarily in municipal obligations issued by Virginia and its political subdivisions and therefore will be affected by economic, political or other events affecting Virginia.
Q. How did the Fund perform during the 12-month period between October 1, 2017 and September 30, 2018?
A. The Fund’s Institutional Shares underperformed its current benchmark, the ICE BofA Merrill Lynch 2-17 Year Municipal Bond Index.
Q. What factors affected the Fund’s performance?
A. Investors favored risk assets such as equities during the period. Demand remained relatively strong in the municipal bond market, with municipal bonds outperforming Treasury bonds. Bond yields rose, particularly among short-term issues, as the Federal Reserve raised interest rates four times during the period in response to continued economic growth. Bond prices fell in that environment.
In absolute terms, the rising interest rates negatively affected the Fund’s performance. The Fund’s relative performance was hurt by an
underweight exposure to bonds with maturities of 12 to 17 years. Those bonds performed relatively well as interest rates didn’t rise as much on longer-term issues. The Fund also was hurt by a bias towards lower quality bonds, which outperformed higher quality bonds during the year. The Fund was underweight in BBB bonds, which returned 1.78% compared to AAA bonds, which returned -0.86%. We continued to believe that lower-rated issues did not adequately compensate investors for the additional risk they bring.
The Fund’s relative performance benefited from its overweight position in revenue bonds, which outperformed general obligation bonds during the period. The Fund also maintained an average maturity shorter than that of its benchmark, which helped relative performance in a rising-rate environment.
Portfolio composition is as of September 30, 2018 and is subject to change and risk.
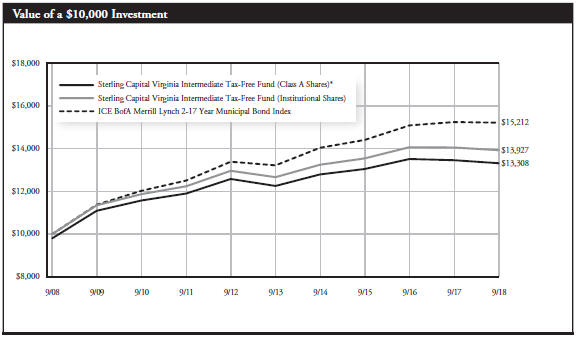
| | * | Reflects 2.00% maximum sales charge. |
| | ** | Reflects the applicable maximum contingent deferred sales charge of 1.00% (applicable only to redemptions within one year of purchase, and as such, are not reflected in the Average Annual Total Returns table since the periods reflected are for a year or longer). |
| | | | | | | | | | | | | | | | |
Average Annual Total Returns | |
| | | | | |
As of September 30, 2018 | | Inception
Date | | | 1 Year | | | 5 Years | | | 10 Years | |
| | | | | |
Class A Shares* | | | 5/17/99 | | | | -3.11% | | | | 1.27% | | | | 2.90% | |
| | | | | |
Class C Shares** | | | 1/31/121 | | | | -1.87% | | | | 0.92% | | | | 2.59% | |
| | | | | |
Institutional Shares | | | 5/17/99 | | | | -0.88% | | | | 1.93% | | | | 3.37% | |
| | | | | |
ICE BofA Merrill Lynch 2-17 Year Municipal Bond Index | | | N/A | | | | -0.23% | | | | 2.85% | | | | 4.28% | |
Past performance does not guarantee future results. The performance data quoted represents past performance and current returns may be lower or higher. Total return figures include change in share price, reinvestment of dividends and capital gains, and do not reflect taxes that a shareholder would pay on fund distributions or on the redemption of fund shares. The investment return and principal value will fluctuate so that an investor’s shares, when redeemed, may be worth more or less than the original cost. To obtain performance information current to the most recent month end, please visit www.sterlingcapitalfunds.com.
The chart above represents a comparison of a hypothetical $10,000 investment in the indicated share class versus a similar investment in the Fund’s benchmark.
| 1 | Class C Shares were not in existence prior to 2/1/12. Performance for periods prior to 2/1/12 is based on the performance of Class A Shares. Such performance would differ only to the extent that the Classes have different expenses. |
The Fund is measured against the ICE BofA Merrill Lynch 2-17 Year Municipal Bond Index, an unmanaged index, which is representative of municipal bonds. The index does not reflect the deduction of expenses associated with a mutual fund, such as investment management and fund accounting fees. Investors cannot invest directly in an index, although they can invest in its underlying securities.
Sterling Capital West Virginia Intermediate Tax-Free Fund
Portfolio Manager
Robert F. Millikan, CFA
Sterling Capital West Virginia Intermediate Tax-Free Fund (the “Fund”) is managed by Robert F. Millikan, CFA, Executive Director and portfolio manager for Sterling Capital Management LLC (“Sterling Capital”), advisor to the Fund. Mr. Millikan joined BB&T Asset Management in 2000 and Sterling Capital through merger in 2010. He is lead portfolio manager of the Fund and has managed or been a member of the team that manages the state-specific municipal bond fund portfolios since 2000 and has investment experience since 1990. Mr. Millikan is a graduate of Wake Forest University where he received his BA in Economics.
Investment Considerations
The Fund is subject to the same risks as the underlying bonds in the portfolios such as credit, prepayment and interest rate risk. As interest rates rise, the value of bond prices will decline and an investor may lose money. The Fund is non-diversified and may invest a greater percentage of its assets in a single issuer than funds that are more diversified. Furthermore, the Fund invests primarily in municipal obligations issued by West Virginia and its political subdivisions and therefore will be affected by economic, political or other events affecting West Virginia.
Q. How did the Fund perform during the 12-month period between October 1, 2017 and September 30, 2018?
A. The Fund’s Institutional Shares underperformed its current benchmark, the ICE BofA Merrill Lynch 2-17 Year Municipal Bond Index.
Q. What factors affected the Fund’s performance?
A. Investors favored risk assets such as equities during the period. Demand remained relatively strong in the municipal bond market, with municipal bonds outperforming Treasury bonds. Bond yields rose, particularly among short-term issues, as the Federal Reserve raised interest rates four times during the period in response to continued economic growth. Bond prices fell in that environment.
In absolute terms, the rising interest rates negatively affected the Fund’s performance. The Fund’s relative performance was hurt by an
underweight exposure to bonds with maturities of 12 to 17 years. Those bonds performed relatively well as interest rates didn’t rise as much on longer-term issues. The Fund also was hurt by a bias towards lower quality bonds, which outperformed higher quality bonds during the year. The Fund was underweight in BBB bonds, which returned 1.78% compared to AAA bonds, which returned -0.86%. We continued to believe that lower-rated issues did not adequately compensate investors for the additional risk they bring.
The Fund’s relative performance benefited from its overweight position in revenue bonds, which outperformed general obligation bonds during the period. The Fund also maintained an average maturity shorter than that of its benchmark, which helped relative performance in a rising-rate environment.
Portfolio composition is as of September 30, 2018 and is subject to change and risk.
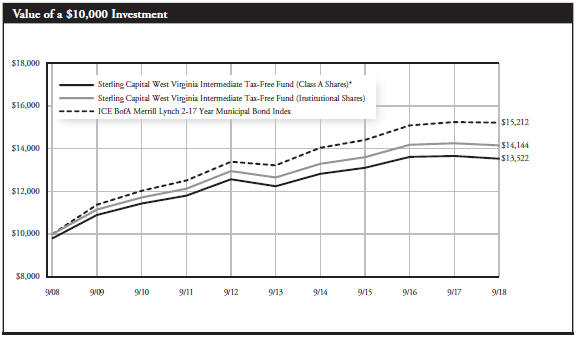
| | * | Reflects 2.00% maximum sales charge. |
| | ** | Reflects the applicable maximum contingent deferred sales charge of 1.00% (applicable only to redemptions within one year of purchase, and as such, are not reflected in the Average Annual Total Returns table since the periods reflected are for a year or longer). |
| | | | | | | | | | | | | | | | |
Average Annual Total Returns | |
| | | | | |
As of September 30, 2018 | | Inception
Date | | | 1 Year | | | 5 Years | | | 10 Years | |
| | | | | |
Class A Shares* | | | 12/17/93 | | | | -2.91% | | | | 1.61% | | | | 3.06% | |
| | | | | |
Class C Shares** | | | 01/31/12 | | | | -1.82% | | | | 1.24% | | | | 2.76% | |
| | | | | |
Institutional Shares | | | 12/01/93 | | | | -0.73% | | | | 2.26% | | | | 3.53% | |
| | | | | |
ICE BofA Merrill Lynch 2-17 Year Municipal Bond Index | | | N/A | | | | -0.23% | | | | 2.85% | | | | 4.28% | |
Past performance does not guarantee future results. The performance data quoted represents past performance and current returns may be lower or higher. Total return figures include change in share price, reinvestment of dividends and capital gains, and do not reflect taxes that a shareholder would pay on fund distributions or on the redemption of fund shares. The investment return and principal value will fluctuate so that an investor’s shares, when redeemed, may be worth more or less than the original cost. To obtain performance information current to the most recent month end, please visit www.sterlingcapitalfunds.com.
The chart above represents a comparison of a hypothetical $10,000 investment in the indicated share class versus a similar investment in the Fund’s benchmark.
| 1 | Class C Shares were not in existence prior to 2/1/12. Performance for periods prior to 2/1/12 is based on the performance of Class A Shares. Such performance would differ only to the extent that the Classes have different expenses. |
The Fund is measured against the ICE BofA Merrill Lynch 2-17 Year Municipal Bond Index, an unmanaged index, which is representative of municipal bonds. The index does not reflect the deduction of expenses associated with a mutual fund, such as investment management and fund accounting fees. Investors cannot invest directly in an index, although they can invest in its underlying securities.
Sterling Capital Diversified Income Fund
Portfolio Managers
Sterling Capital Diversified Income Fund (the “Fund”) is managed by Shane A. Burke, and Brandon W. Carl, CFA, Directors and portfolio managers for Sterling Capital Management LLC (“Sterling Capital”), advisor to the fund, and members of the Sterling Capital Advisory Solutions Team.
Shane A. Burke
Mr. Burke, Director, joined Sterling Capital in 2013 and has been a co-portfolio manager of the Fund since 2015. He has investment experience since 2002. He is a graduate of the University of North Carolina at Wilmington where he received his BS in Finance. He received his MBA from San Francisco-Golden Gate University.
Brandon W. Carl, CFA
Mr. Carl, Director, joined BB&T Asset Management in 2001 and Sterling Capital through merger in 2010. Mr. Carl has been a co-portfolio manager to the Fund since 2016. Mr. Carl has investment experience since 2001. He is a graduate of the University of South Carolina where he received his BS in Finance and Management.
Investment Considerations
The Fund is primarily concentrated in underlying funds and is therefore subject to the same risks as the underlying funds it is invested in and may entail higher expenses. The underlying funds may invest in undervalued securities, which may not appreciate in value as anticipated or may remain undervalued for longer than anticipated. The underlying funds may invest in equity securities including more aggressive investments that engage in long/short equity strategies and in options writing strategies and that invest in derivatives, preferred stocks, exchange-traded funds (ETFs), Master Limited Partnerships (MLPs, the value of which will be affected by the natural resources sector of the economy and regulation) and real estate investment trusts (REITs, the value of which will be affected by conditions of the real estate industry). The Fund’s volatility may be amplified by its use of short sales and derivatives. The Fund is subject to the same risks as the debt securities held by the underlying funds such as credit, prepayment, call and interest rate risk. As interest rates rise, the value of debt securities will decline and an investor may lose money. Investing in high yield debt (also known as junk bonds) involves greater risks and less liquidity than investment grade bonds.
Q. How did the Fund perform during the 12-month period between October 1, 2017 and September 30, 2018?
A. The Fund’s Institutional Shares underperformed its current benchmark, 40% MSCI World Index/60% Bloomberg Barclays U.S. Aggregate Bond Index.
Q. What factors affected the Fund’s performance?
A. While most of the Fund’s dividend focused equity managers outperformed the blended benchmark, the underlying allocations lagged the broader equity index. The Fund’s absence of exposure to non-dividend paying companies was a headwind for relative
performance. MLPs detracted from returns as oil price volatility and proposed changes to the MLP tax structure negatively impacted returns.
The Fund’s allocation to insurance linked securities was the top contributor to performance over the one-year period. Following a historically bad hurricane season in 2017, reinsurance pricing improved, leading to higher yields across the space. Allocations to floating rate credit added to returns as the underlying managers were able to benefit from a rising rate environment.
Portfolio composition is as of September 30, 2018 and is subject to change and risk.
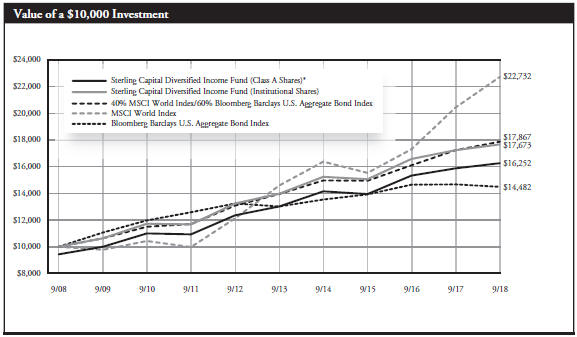
| | * | Reflects 5.75% maximum sales charge. |
| | ** | Reflects the applicable maximum CDSC of 1.00% (applicable only to redemptions within one year of purchase, and as such, are not reflected in the Average Annual Total Returns table since the periods reflected are for a year or longer). |
| | | | | | | | | | | | | | | | |
Average Annual Total Returns | |
| | | | | |
As of September 30, 2018 | | Inception
Date | | | 1 Year | | | 5 Years | | | 10 Years | |
| | | | | |
Class A Shares* | | | 1/29/98 | | | | -3.52% | | | | 3.33% | | | | 4.98% | |
| | | | | |
Class C Shares** | | | 2/1/01 | | | | 1.64% | | | | 3.81% | | | | 4.81% | |
| | | | | |
Institutional Shares | | | 10/2/97 | | | | 2.61% | | | | 4.83% | | | | 5.86% | |
| | | | | |
40% MSCI World Index/ 60% Bloomberg Barclays U.S. Aggregate Bond Index | | | N/A | | | | 3.69% | | | | 5.08% | | | | 5.98% | |
| | | | | |
MSCI World Index | | | N/A | | | | 11.24% | | | | 9.28% | | | | 8.56% | |
| | | | | |
Bloomberg Barclays U.S. Aggregate Bond Index | | | N/A | | | | -1.22% | | | | 2.16% | | | | 3.77% | |
Past performance does not guarantee future results. The performance data quoted represents past performance and current returns may be lower or higher. Total return figures include change in share price, reinvestment of dividends and capital gains, and do not reflect taxes that a shareholder would pay on fund distributions or on the redemption of fund shares. The investment return and principal value will fluctuate so that an investor’s shares, when redeemed, may be worth more or less than the original cost. To obtain performance information current to the most recent month end, please visit www.sterlingcapitalfunds.com.
The chart above represents a comparison of a hypothetical $10,000 investment in the indicated share class versus a similar investment in the Fund’s benchmarks.
The Fund is measured against the 40% MSCI World Index/60% Bloomberg Barclays U.S. Aggregate Bond Index. The indices are unmanaged and do not reflect the deduction of expenses associated with a mutual fund, such as investment management and, fund accounting fees. Investors cannot invest directly in an index, although they can invest in its underlying securities.
Sterling Capital Strategic Allocation Funds
Portfolio Managers
Team Managed
Sterling Capital Strategic Allocation Funds (the “Funds”) are managed by the Sterling Capital Advisory Solutions Team, which is led by James C. Willis, CFA, Managing Director & Director of Advisory Solutions, Jeffrey J. Schappe, CFA, Managing Director and Kevin J. Stoll, CFA, Executive Director. Mr. Willis, Mr. Schappe and Mr. Stoll have managed the Funds since 2010, 2005 and 2016, respectively.
James C. Willis, CFA
Mr. Willis, Managing Director, joined BB&T Asset Management in 2003 and Sterling Capital Management LLC (“Sterling Capital”) through merger in October 2010 and has been a co-portfolio manager of the Fund since 2010. He has investment experience since 1996. He is a graduate of Rice University where he received a BA in Economics and Political Science and a MBA from Georgetown University.
Jeffrey J. Schappe, CFA
Mr. Schappe, Managing Director, joined BB&T Asset Management in 2004 and Sterling Capital through merger in October 2010 and has been a co-portfolio manager of the Fund since 2005. He has investment experience since 1991. He is a graduate of University of Wisconsin-Madison where he received a BA in Journalism and a MBA in Finance.
Kevin J. Stoll, CFA
Mr. Stoll, Executive Director, joined Sterling Capital in 2013 and has been a co-portfolio manager to the Funds since 2016. He has investment experience since 1998. He is a graduate of Northwestern University where he received his BA in Economics and Mathematical Methods in the Social Sciences and his MBA from Duke University’s Fuqua School of Business.
Investment Considerations
The Funds are primarily concentrated in underlying funds and are therefore subject to the same risks as the underlying funds and bear a portion of the expenses of the underlying funds. The underlying funds may be invested in equity securities and are subject to market risk. Investments in bonds are subject to credit risk, call risk and interest rate risk (as interest rates rise the value of bond prices will decline). The underlying funds may invest in foreign securities, which involve certain risks such as currency volatility, political and social instability and reduced market liquidity; small capitalization companies which are subject to greater volatility and less liquidity due to limited resources or product lines and are more sensitive to economic factors; and high-yield debt securities (also known as junk bonds), which involve greater risks than investment grade bonds. The underlying funds may also be money market funds.
Sterling Capital Strategic Allocation Balanced Fund (the “Balanced Fund”)
Sterling Capital Strategic Allocation Growth Fund (the “Growth Fund”)
(Collectively, “Sterling Capital Strategic Allocation Funds”)
Q. How did the Funds perform during the 12-month period between October 1, 2017 and September 30, 2018?
A. The Growth Fund’s Institutional Shares underperformed its current benchmark, 75% MSCI World Index/25% Bloomberg Barclays U.S. Aggregate Bond Index.
The Balanced Fund’s Institutional Shares underperformed its current benchmark, 60% MSCI World Index/40% Bloomberg Barclays U.S. Aggregate Bond Index.
Q. What factors affected the Funds’ performance?
A. The Strategic Allocation Funds held five underlying funds: The Sterling Capital Special Opportunities Fund, the Sterling Capital Equity Income Fund, the Sterling Capital Total Return Bond Fund, the Sterling Capital Long/Short Equity Fund and the Sterling Capital Behavioral International Equity Fund.
Domestic equities posted strong gains during the 12-month period under review, boosted by corporate earnings growth and a reduction in corporate tax rates. U.S. equities outperformed overseas developed markets as well as fixed income markets, as rising interest rates weighed on bond prices. Both the Sterling Capital Equity Income Fund Institutional Shares (BEGIX) and Sterling Capital Special Opportunities Fund Institutional Shares (BOPIX) posted returns in excess of 15% for the period, while the Bloomberg Barclays Aggregate Bond Index declined 1.22% for the year.
Both Strategic Allocation Funds posted positive absolute returns but underperformed their benchmarks. The Funds’ overweight allocation to developed non-U.S. equities weighed on the Funds’ relative performance, as domestic stocks materially outperformed their international counterparts during the period under review. The Sterling Capital Behavioral International Equity Fund Institutional Shares (SBIIX) was the biggest detractor among the underlying funds, trailing its benchmark, the MSCI EAFE Index, by nearly four percentage points.
The Funds’ overweight allocation to equities added to relative performance as stocks strongly outperformed bonds for the period. And though bonds weighed on the Funds’ absolute returns, they benefited performance relative to their benchmarks. The Sterling Capital Total Return Bond Fund outperformed its benchmark, the Bloomberg Barclays Aggregate Index, by 0.48% for the year.
Portfolio composition is as of September 30, 2018 and is subject to change and risk.
Sterling Capital Strategic Allocation Balanced Fund
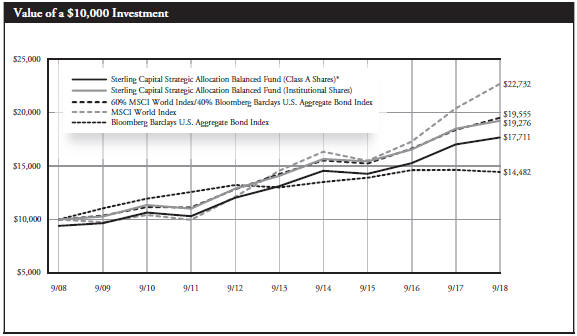
| | * | Reflects 5.75% maximum sales charge. |
| | ** | Reflects the applicable maximum CDSC of 1.00% (applicable only to redemptions within one year of purchase, and as such, are not reflected in the Annual Average Total Returns table since the periods reflected are for a year or longer). |
| | | | | | | | | | | | | | | | |
Average Annual Total Returns | |
| | | | | |
As of September 30, 2018 | | Inception
Date | | | 1 Year | | | 5 Years | | | 10 Years | |
| | | | | |
Class A Shares* | | | 1/29/98 | | | | -2.13% | | | | 4.92% | | | | 5.88% | |
| | | | | |
Class C Shares** | | | 2/1/01 | | | | 3.09% | | | | 5.40% | | | | 5.71% | |
| | | | | |
Institutional Shares | | | 10/2/97 | | | | 4.11% | | | | 6.46% | | | | 6.78% | |
| | | | | |
60% MSCI World Index/ 40% Bloomberg Barclays U.S. Aggregate Bond Index | | | N/A | | | | 6.18% | | | | 6.51% | | | | 6.94% | |
| | | | | |
MSCI World Index | | | N/A | | | | 11.24% | | | | 9.28% | | | | 8.56% | |
| | | | | |
Bloomberg Barclays U.S. Aggregate Bond Index | | | N/A | | | | -1.22% | | | | 2.16% | | | | 3.77% | |
Past performance does not guarantee future results. The performance data quoted represents past performance and current returns may be lower or higher. Total return figures include change in share price, reinvestment of dividends and capital gains, and do not reflect taxes that a shareholder would pay on fund distributions or on the redemption of fund shares. The investment return and principal value will fluctuate so that an investor’s shares, when redeemed, may be worth more or less than the original cost. To obtain performance information current to the most recent month end, please visit www.sterlingcapitalfunds.com. Performance would have been lower without limitations and/or waivers in effect.
The chart above represents a comparison of a hypothetical $10,000 investment in the indicated share class versus a similar investment in the Fund’s benchmarks.
The Fund is measured against the 60% MSCI World Index/40% Bloomberg Barclays U.S. Aggregate Bond Index. The index is unmanaged and do not reflect the deduction of expenses associated with a mutual fund, such as investment management and, fund accounting fees. Investors cannot invest directly in an index, although they can invest in its underlying securities.
Sterling Capital Strategic Allocation Growth Fund

| | * | Reflects 5.75% maximum sales charge. |
| | ** | Reflects the applicable maximum CDSC of 1.00% (applicable only to redemptions within one year of purchase, and as such, are not reflected in the Annual Average Total Returns table since the periods reflected are for a year or longer). |
| | | | | | | | | | | | | | | | |
Average Annual Total Returns | |
| | | | | |
As of September 30, 2018 | | Inception
Date | | | 1 Year | | | 5 Years | | | 10 Years | |
| | | | | |
Class A Shares* | | | 1/29/98 | | | | -1.00% | | | | 5.81% | | | | 6.20% | |
| | | | | |
Class C Shares** | | | 2/1/01 | | | | 4.27% | | | | 6.27% | | | | 6.05% | |
| | | | | |
Institutional Shares | | | 10/2/97 | | | | 5.33% | | | | 7.34% | | | | 7.12% | |
| | | | | |
75% MSCI World Index/ 25% Bloomberg Barclays U.S. Aggregate Bond Index | | | N/A | | | | 8.07% | | | | 7.56% | | | | 7.59% | |
| | | | | |
MSCI World Index | | | N/A | | | | 11.24% | | | | 9.28% | | | | 8.56% | |
| | | | | |
Bloomberg Barclays U.S. Aggregate Bond Index | | | N/A | | | | -1.22% | | | | 2.16% | | | | 3.77% | |
Past performance does not guarantee future results. The performance data quoted represents past performance and current returns may be lower or higher. Total return figures include change in share price, reinvestment of dividends and capital gains, and do not reflect taxes that a shareholder would pay on fund distributions or on the redemption of fund shares. The investment return and principal value will fluctuate so that an investor’s shares, when redeemed, may be worth more or less than the original cost. To obtain performance information current to the most recent month end, please visit www.sterlingcapitalfunds.com. Performance would have been lower without limitations and/or waivers in effect.
The chart above represents a comparison of a hypothetical $10,000 investment in the indicated share class versus a similar investment in the Fund’s benchmarks.
The Fund is measured against the 75% MSCI World Index/25% Bloomberg Barclays U.S. Aggregate Bond Index. The index is unmanaged and do not reflect the deduction of expenses associated with a mutual fund, such as investment management and, fund accounting fees. Investors cannot invest directly in an index, although they can invest in its underlying securities.
|
Sterling Capital Funds |
Summary of Portfolio Holdings (Unaudited) |
| |
Sterling Capital Funds invested, as a percentage of net assets, in the following industries, countries, states, funds or security types, as of September 30, 2018:
| | | | | |
| Sterling Capital Behavioral Large Cap Value Equity Fund | | Percentage
of net assets |
Aerospace & Defense | | | | 1.6 | % |
Airlines | | | | 0.5 | % |
Auto Components | | | | 0.1 | % |
Banks | | | | 10.3 | % |
Biotechnology | | | | 4.1 | % |
Capital Markets | | | | 1.1 | % |
Chemicals | | | | 1.9 | % |
Communications Equipment | | | | 1.0 | % |
Consumer Finance | | | | 4.7 | % |
Diversified Consumer Services | | | | 0.5 | % |
Diversified Telecommunication Services | | | | 4.7 | % |
Electric Utilities | | | | 2.5 | % |
Electrical Equipment | | | | 1.7 | % |
Equity Real Estate Investment Trusts (REITS) | | | | 4.0 | % |
Food & Staples Retailing | | | | 0.7 | % |
Food Products | | | | 2.6 | % |
Health Care Providers & Services | | | | 7.7 | % |
Hotels, Restaurants & Leisure | | | | 0.4 | % |
Household Durables | | | | 0.4 | % |
Household Products | | | | 0.4 | % |
Independent Power and Renewable Electricity Producers | | | | 0.5 | % |
Insurance | | | | 4.8 | % |
IT Services | | | | 3.0 | % |
Machinery | | | | 3.1 | % |
Media | | | | 1.9 | % |
Metals & Mining | | | | 1.3 | % |
Mortgage Real Estate Investment Trusts (REITS) | | | | 0.4 | % |
Multiline Retail | | | | 2.6 | % |
Multi-Utilities | | | | 1.6 | % |
Oil, Gas & Consumable Fuels | | | | 11.8 | % |
Paper & Forest Products | | | | 0.5 | % |
Personal Products | | | | 0.7 | % |
Pharmaceuticals | | | | 5.2 | % |
Road & Rail | | | | 0.6 | % |
Semiconductors & Semiconductor Equipment | | | | 4.4 | % |
Software | | | | 0.9 | % |
Technology Hardware, Storage & Peripherals | | | | 3.3 | % |
Textiles, Apparel & Luxury Goods | | | | 1.1 | % |
Trading Companies & Distributors | | | | 0.6 | % |
Money Market Fund | | | | 0.7 | % |
| | | | | |
| |
| | | | 99.9 | % |
| | | | | |
| | | | | |
| Sterling Capital Mid Value Fund | | Percentage
of net assets |
Auto Components | | | | 3.7 | % |
Capital Markets | | | | 9.8 | % |
Chemicals | | | | 5.0 | % |
Commercial Services & Supplies | | | | 1.6 | % |
Construction & Engineering | | | | 2.2 | % |
Consumer Finance | | | | 4.2 | % |
Containers & Packaging | | | | 3.6 | % |
Diversified Financial Services | | | | 3.9 | % |
Diversified Telecommunication Services | | | | 1.9 | % |
Electrical Equipment | | | | 3.4 | % |
Electronic Equipment, Instruments & Components | | | | 1.6 | % |
Health Care Equipment & Supplies | | | | 3.6 | % |
Health Care Providers & Services | | | | 5.9 | % |
Household Products | | | | 3.0 | % |
Insurance | | | | 8.7 | % |
Internet Software & Services | | | | 3.2 | % |
IT Services | | | | 3.1 | % |
Machinery | | | | 1.7 | % |
Media | | | | 7.1 | % |
Multiline Retail | | | | 3.7 | % |
Oil, Gas & Consumable Fuels | | | | 2.1 | % |
Real Estate Management & Development | | | | 5.6 | % |
Specialty Retail | | | | 3.5 | % |
Technology Hardware, Storage & Peripherals | | | | 4.3 | % |
Money Market Fund | | | | 3.6 | % |
| | | | | |
| |
| | | | 100.0 | % |
| | | | | |
51
|
Sterling Capital Funds |
Summary of Portfolio Holdings (Unaudited) |
| |
| | | | | |
| Sterling Capital Behavioral Small Cap Value Equity Fund | | Percentage
of net assets |
Air Freight & Logistics | | | | 0.5 | % |
Airlines | | | | 1.4 | % |
Banks | | | | 14.8 | % |
Biotechnology | | | | 0.4 | % |
Building Products | | | | 0.4 | % |
Capital Markets | | | | 0.4 | % |
Chemicals | | | | 1.5 | % |
Commercial Services & Supplies | | | | 0.8 | % |
Communications Equipment | | | | 1.3 | % |
Construction & Engineering | | | | 1.2 | % |
Consumer Finance | | | | 2.0 | % |
Distributors | | | | 0.5 | % |
Electric Utilities | | | | 2.5 | % |
Electrical Equipment | | | | 0.8 | % |
Electronic Equipment, Instruments & Components | | | | 3.9 | % |
Energy Equipment & Services | | | | 1.5 | % |
Equity Real Estate Investment Trusts (REITS) | | | | 6.8 | % |
Food Products | | | | 1.4 | % |
Gas Utilities | | | | 1.0 | % |
Health Care Providers & Services | | | | 3.6 | % |
Hotels, Restaurants & Leisure | | | | 0.7 | % |
Household Durables | | | | 0.4 | % |
Independent Power and Renewable Electricity Producers | | | | 2.4 | % |
Insurance | | | | 3.9 | % |
Internet Software & Services | | | | 0.3 | % |
IT Services | | | | 0.7 | % |
Leisure Products | | | | 0.9 | % |
Machinery | | | | 2.5 | % |
Marine | | | | 0.9 | % |
Media | | | | 0.4 | % |
Metals & Mining | | | | 1.5 | % |
Mortgage Real Estate Investment Trusts (REITS) | | | | 4.6 | % |
Multiline Retail | | | | 0.6 | % |
Multi-Utilities | | | | 0.7 | % |
Oil, Gas & Consumable Fuels | | | | 4.8 | % |
Paper & Forest Products | | | | 2.3 | % |
Personal Products | | | | 0.1 | % |
Pharmaceuticals | | | | 0.8 | % |
Professional Services | | | | 2.1 | % |
Real Estate Management & Development | | | | 0.3 | % |
Road & Rail | | | | 1.0 | % |
Semiconductors & Semiconductor Equipment | | | | 2.5 | % |
Software | | | | 0.6 | % |
Specialty Retail | | | | 6.6 | % |
Textiles, Apparel & Luxury Goods | | | | 2.7 | % |
Thrifts & Mortgage Finance | | | | 6.2 | % |
Trading Companies & Distributors | | | | 0.5 | % |
Exchange Traded Fund | | | | 0.8 | % |
Money Market Fund | | | | 1.1 | % |
| | | | | |
| |
| | | | 99.6 | % |
| | | | | |
| | | | | |
| Sterling Capital Special Opportunities Fund | | Percentage
of net assets |
Airlines | | | | 2.6 | % |
Auto Components | | | | 3.3 | % |
Biotechnology | | | | 3.8 | % |
Chemicals | | | | 3.8 | % |
Communications Equipment | | | | 5.5 | % |
Consumer Finance | | | | 3.3 | % |
Electronic Equipment, Instruments & Components | | | | 2.4 | % |
Energy Equipment & Services | | | | 3.3 | % |
Equity Real Estate Investment Trusts (REITS) | | | | 1.2 | % |
Food & Staples Retailing | | | | 1.7 | % |
Health Care Equipment & Supplies | | | | 6.1 | % |
Health Care Providers & Services | | | | 7.0 | % |
Health Care Technology | | | | 3.8 | % |
Hotels, Restaurants & Leisure | | | | 4.2 | % |
Household Durables | | | | 2.3 | % |
Internet Software & Services | | | | 9.2 | % |
Media | | | | 13.3 | % |
Pharmaceuticals | | | | 3.1 | % |
Professional Services | | | | 4.5 | % |
Real Estate Management & Development | | | | 2.4 | % |
Semiconductors & Semiconductor Equipment | | | | 2.1 | % |
Software | | | | 10.8 | % |
Money Market Fund | | | | 0.3 | % |
| | | | | |
| |
| | | | 100.0 | % |
| | | | | |
| |
| Sterling Capital Equity Income Fund | | Percentage
of net assets |
Air Freight & Logistics | | | | 3.1 | % |
Automobiles | | | | 2.8 | % |
Banks | | | | 2.7 | % |
Beverages | | | | 3.5 | % |
Biotechnology | | | | 3.7 | % |
Capital Markets | | | | 2.6 | % |
Consumer Finance | | | | 4.5 | % |
Diversified Telecommunication Services | | | | 5.2 | % |
Equity Real Estate Investment Trusts (REITS) | | | | 3.4 | % |
Health Care Equipment & Supplies | | | | 8.2 | % |
Health Care Providers & Services | | | | 6.0 | % |
Hotels, Restaurants & Leisure | | | | 4.5 | % |
Industrial Conglomerates | | | | 3.8 | % |
Insurance | | | | 0.7 | % |
IT Services | | | | 4.3 | % |
Machinery | | | | 1.4 | % |
Media | | | | 2.0 | % |
Oil, Gas & Consumable Fuels | | | | 6.1 | % |
Pharmaceuticals | | | | 9.8 | % |
Professional Services | | | | 1.6 | % |
Semiconductors & Semiconductor Equipment | | | | 9.0 | % |
Software | | | | 5.0 | % |
Specialty Retail | | | | 3.7 | % |
Money Market Fund | | | | 2.5 | % |
| | | | | |
| |
| | | | 100.1 | % |
| | | | | |
52
|
Sterling Capital Funds |
Summary of Portfolio Holdings (Unaudited) |
| |
| | | | | |
| Sterling Capital Behavioral International Equity Fund | | Percentage
of net assets |
Australia | | | | 6.7 | % |
Austria | | | | 1.0 | % |
Belgium | | | | 1.1 | % |
Denmark | | | | 0.7 | % |
Finland | | | | 0.2 | % |
France | | | | 10.1 | % |
Germany | | | | 7.2 | % |
Hong Kong | | | | 4.7 | % |
Israel | | | | 2.4 | % |
Italy | | | | 3.1 | % |
Japan | | | | 26.3 | % |
Netherlands | | | | 4.0 | % |
Norway | | | | 2.5 | % |
Singapore | | | | 0.2 | % |
Spain | | | | 4.3 | % |
Sweden | | | | 2.7 | % |
Switzerland | | | | 5.9 | % |
United Kingdom | | | | 15.3 | % |
Money Market Fund | | | | 0.7 | % |
| | | | | |
| |
| | | | 99.1 | % |
| | | | | |
| |
| Sterling Capital SMID Opportunities Fund | | Percentage
of net assets |
Airlines | | | | 2.1 | % |
Auto Components | | | | 3.1 | % |
Banks | | | | 6.2 | % |
Commercial Services & Supplies | | | | 3.3 | % |
Containers & Packaging | | | | 5.7 | % |
Diversified Consumer Services | | | | 4.2 | % |
Electronic Equipment, Instruments & Components | | | | 3.2 | % |
Food Products | | | | 3.7 | % |
Health Care Providers & Services | | | | 13.6 | % |
Hotels, Restaurants & Leisure | | | | 8.8 | % |
Household Durables | | | | 1.0 | % |
Household Products | | | | 1.6 | % |
Insurance | | | | 1.0 | % |
Internet Software & Services | | | | 3.3 | % |
IT Services | | | | 16.4 | % |
Oil, Gas & Consumable Fuels | | | | 4.4 | % |
Real Estate Management & Development | | | | 3.0 | % |
Road & Rail | | | | 3.8 | % |
Software | | | | 3.6 | % |
Specialty Retail | | | | 3.2 | % |
Money Market Fund | | | | 4.7 | % |
| | | | | |
| |
| | | | 99.9 | % |
| | | | | |
| | | | | |
| Sterling Capital Stratton Mid Cap Value Fund | | Percentage
of net assets |
Auto Components | | | | 1.3 | % |
Banks | | | | 8.9 | % |
Building Products | | | | 1.4 | % |
Capital Markets | | | | 1.6 | % |
Chemicals | | | | 1.7 | % |
Communications Equipment | | | | 1.3 | % |
Construction & Engineering | | | | 1.6 | % |
Containers & Packaging | | | | 4.5 | % |
Electronic Equipment, Instruments & Components | | | | 3.7 | % |
Equity Real Estate Investment Trusts (REITS) | | | | 11.3 | % |
Food & Staples Retailing | | | | 3.9 | % |
Food Products | | | | 4.0 | % |
Gas Utilities | | | | 5.0 | % |
Health Care Equipment & Supplies | | | | 4.5 | % |
Hotels, Restaurants & Leisure | | | | 1.7 | % |
Household Durables | | | | 2.9 | % |
Industrial Conglomerates | | | | 1.8 | % |
Insurance | | | | 7.1 | % |
IT Services | | | | 2.5 | % |
Life Sciences Tools & Services | | | | 7.6 | % |
Machinery | | | | 1.5 | % |
Oil, Gas & Consumable Fuels | | | | 7.6 | % |
Semiconductors & Semiconductor Equipment | | | | 1.3 | % |
Software | | | | 3.8 | % |
Trading Companies & Distributors | | | | 4.4 | % |
Money Market Fund | | | | 3.1 | % |
| | | | | |
| |
| | | | 100.0 | % |
| | | | | |
| |
| Sterling Capital Stratton Real Estate Fund | | Percentage
of net assets |
Diversified | | | | 2.5 | % |
Health Care | | | | 9.7 | % |
Hotel & Resort | | | | 8.0 | % |
Industrial | | | | 5.5 | % |
Office | | | | 9.2 | % |
Residential | | | | 17.8 | % |
Retail | | | | 18.1 | % |
Specialized | | | | 27.0 | % |
Money Market Fund | | | | 1.8 | % |
| | | | | |
| |
| | | | 99.6 | % |
| | | | | |
53
|
Sterling Capital Funds |
Summary of Portfolio Holdings (Unaudited) |
| |
| | | | | |
| Sterling Capital Stratton Small Cap Value Fund | | Percentage
of net assets |
Aerospace & Defense | | | | 2.5 | % |
Airlines | | | | 2.0 | % |
Automobiles | | | | 1.2 | % |
Banks | | | | 22.7 | % |
Capital Markets | | | | 1.2 | % |
Chemicals | | | | 3.6 | % |
Communications Equipment | | | | 1.0 | % |
Construction & Engineering | | | | 2.4 | % |
Construction Materials | | | | 0.9 | % |
Electric Utilities | | | | 4.1 | % |
Electrical Equipment | | | | 2.9 | % |
Electronic Equipment, Instruments & Components | | | | 3.7 | % |
Equity Real Estate Investment Trusts (REITS) | | | | 10.6 | % |
Food & Staples Retailing | | | | 3.9 | % |
Gas Utilities | | | | 2.1 | % |
Health Care Equipment & Supplies | | | | 2.9 | % |
Health Care Providers & Services | | | | 2.8 | % |
Insurance | | | | 4.3 | % |
IT Services | | | | 2.9 | % |
Machinery | | | | 4.7 | % |
Oil, Gas & Consumable Fuels | | | | 3.7 | % |
Semiconductors & Semiconductor Equipment | | | | 3.2 | % |
Software | | | | 4.4 | % |
Thrifts & Mortgage Finance | | | | 1.4 | % |
Trading Companies & Distributors | | | | 2.3 | % |
Exchange Traded Fund | | | | 1.0 | % |
Money Market Fund | | | | 1.6 | % |
| | | | | |
| |
| | | | 100.0 | % |
| | | | | |
| |
| Sterling Capital Ultra Short Bond Fund | | Percentage
of net assets |
Asset Backed Securities | | | | 16.6 | % |
Collateralized Mortgage Obligations | | | | 2.3 | % |
Commercial Mortgage-Backed Securities | | | | 3.0 | % |
Commercial Paper | | | | 2.9 | % |
Corporate Bonds | | | | 72.1 | % |
Municipal Bonds | | | | 2.1 | % |
Money Market Fund | | | | 19.5 | % |
| | | | | |
| |
| | | | 118.5 | % |
| | | | | |
| |
| Sterling Capital Short Duration Bond Fund | | Percentage
of net assets |
Asset Backed Securities | | | | 18.4 | % |
Collateralized Mortgage Obligations | | | | 1.8 | % |
Commercial Mortgage-Backed Securities | | | | 8.0 | % |
Corporate Bonds | | | | 65.3 | % |
Municipal Bonds | | | | 1.3 | % |
U.S. Government Agencies | | | | 0.6 | % |
U.S. Treasury Notes | | | | 2.3 | % |
Money Market Fund | | | | 1.4 | % |
| | | | | |
| |
| | | | 99.1 | % |
| | | | | |
| |
| Sterling Capital Intermediate U.S. Government Fund | | Percentage
of net assets |
Asset Backed Securities | | | | 1.2 | % |
Collateralized Mortgage Obligations | | | | 9.6 | % |
Commercial Mortgage-Backed Securities | | | | 4.3 | % |
Corporate Bonds | | | | 2.5 | % |
Mortgage-Backed Securities | | | | 9.6 | % |
Municipal Bonds | | | | 3.6 | % |
U.S. Government Agencies | | | | 33.7 | % |
U.S. Treasury Notes | | | | 25.8 | % |
Money Market Fund | | | | 3.8 | % |
| | | | | |
| |
| | | | 94.1 | % |
| | | | | |
| | | | | |
| Sterling Capital Total Return Bond Fund | | Percentage
of net assets |
Asset Backed Securities | | | | 17.7 | % |
Collateralized Mortgage Obligations | | | | 8.1 | % |
Commercial Mortgage-Backed Securities | | | | 14.1 | % |
Corporate Bonds | | | | 36.0 | % |
Mortgage-Backed Securities | | | | 11.8 | % |
Municipal Bonds | | | | 4.9 | % |
Preferred Stocks | | | | 0.4 | % |
U.S. Government Agencies | | | | 0.9 | % |
U.S. Treasury Bonds | | | | 4.4 | % |
Money Market Fund | | | | 1.0 | % |
| | | | | |
| |
| | | | 99.3 | % |
| | | | | |
| |
| Sterling Capital Corporate Fund | | Percentage
of net assets |
Corporate Bonds | | | | 97.2 | % |
Preferred Stocks | | | | 0.4 | % |
Money Market Fund | | | | 1.5 | % |
| | | | | |
| |
| | | | 99.1 | % |
| | | | | |
| |
| Sterling Capital Securitized Opportunities Fund | | Percentage
of net assets |
Asset Backed Securities | | | | 23.0 | % |
Collateralized Mortgage Obligations | | | | 26.9 | % |
Commercial Mortgage-Backed Securities | | | | 22.5 | % |
Corporate Bonds | | | | 1.6 | % |
Mortgage-Backed Securities | | | | 25.4 | % |
Money Market Fund | | | | 0.6 | % |
| | | | | |
| |
| | | | 100.0 | % |
| | | | | |
| |
| Sterling Capital Kentucky Intermediate Tax-Free Fund | | Percentage
of net assets |
Kentucky Municipal Bonds | | | | 95.5 | % |
Money Market Fund | | | | 3.3 | % |
| | | | | |
| |
| | | | 98.8 | % |
| | | | | |
| |
| Sterling Capital Maryland Intermediate Tax-Free Fund | | Percentage
of net assets |
District of Columbia Municipal Bonds | | | | 3.3 | % |
Maryland Municipal Bonds | | | | 95.2 | % |
Money Market Fund | | | | 1.7 | % |
| | | | | |
| |
| | | | 100.2 | % |
| | | | | |
| |
| Sterling Capital North Carolina Intermediate Tax-Free Fund | | Percentage
of net assets |
North Carolina Municipal Bonds | | | | 97.0 | % |
Money Market Fund | | | | 1.8 | % |
| | | | | |
| |
| | | | 98.8 | % |
| | | | | |
| |
| Sterling Capital South Carolina Intermediate Tax-Free Fund | | Percentage
of net assets |
South Carolina Municipal Bonds | | | | 97.1 | % |
Money Market Fund | | | | 1.8 | % |
| | | | | |
| |
| | | | 98.9 | % |
| | | | | |
| |
| Sterling Capital Virginia Intermediate Tax-Free Fund | | Percentage
of net assets |
District of Columbia Municipal Bonds | | | | 4.5 | % |
Virginia Municipal Bonds | | | | 93.7 | % |
Money Market Fund | | | | 0.9 | % |
| | | | | |
| |
| | | | 99.1 | % |
| | | | | |
54
|
Sterling Capital Funds |
Summary of Portfolio Holdings (Unaudited) |
| |
| | | | | |
| Sterling Capital West Virginia Intermediate Tax-Free Fund | | Percentage
of net assets |
West Virginia Municipal Bonds | | | | 97.5 | % |
Money Market Fund | | | | 1.3 | % |
| | | | | |
| |
| | | | 98.8 | % |
| | | | | |
| |
| Sterling Capital Diversified Income Fund | | Percentage
of net assets |
Equity Funds | | | | 38.4 | % |
Fixed Income Fund | | | | 60.7 | % |
Money Market Fund | | | | 1.0 | % |
| | | | | |
| |
| | | | 100.1 | % |
| | | | | |
| |
| Sterling Capital Strategic Allocation Balanced Fund | | Percentage
of net assets |
Equity Funds | | | | 62.5 | % |
Fixed Income Fund | | | | 36.5 | % |
Money Market Fund | | | | 0.9 | % |
| | | | | |
| |
| | | | 99.9 | % |
| | | | | |
| | | | | |
| Sterling Capital Strategic Allocation Growth Fund | | Percentage
of net assets |
Equity Funds | | | | 76.3 | % |
Fixed Income Fund | | | | 21.9 | % |
Money Market Fund | | | | 1.8 | % |
| | | | | |
| |
| | | | 100.0 | % |
| | | | | |
55
|
Sterling Capital Funds |
Expense Example (Unaudited) |
| |
As a shareholder of the Sterling Capital Funds (each, a “Fund” and collectively, the “Funds”), you incur two types of costs: (1) transaction costs, including sales charges (loads) on purchases and (2) ongoing costs, including management fees; distribution and/or service (12b-1) fees; and other Fund expenses.
These examples are intended to help you understand your ongoing costs (in dollars) of investing in the Funds and to compare these costs with the ongoing costs of investing in other mutual funds. These examples are based on an investment of $1,000 invested at the beginning of the period and held for the entire period from April 1, 2018 through September 30, 2018.
Actual Example
The table below provides information about actual account values and actual expenses. You may use the information below, together with the amount you invested, to estimate the expenses that you paid over the period. Simply divide your account value by $1,000 (for example, an $8,600 account value divided by $1,000 = 8.6), then multiply the result by the number in the table under the heading entitled “Expenses Paid During Period” to estimate the expenses you paid on your account during this period.
| | | | | | | | | | | | | | | | | | | | |
| | | Beginning
Account Value
4/1/18 | | Ending
Account Value
9/30/18 | | Expenses Paid
During Period*
4/1/18 - 9/30/18 | | Annualized
Expense Ratio
During Period
4/1/18 - 9/30/18 |
Sterling Capital Behavioral Large Cap Value Equity Fund | | | | | | | | | | | | | | | | | | | | |
Class A Shares | | | $ | 1,000.00 | | | | $ | 1,057.62 | | | | $ | 4.49 | | | | | 0.87 | % |
Class C Shares | | | | 1,000.00 | | | | | 1,054.20 | | | | | 8.34 | | | | | 1.62 | % |
Institutional Shares | | | | 1,000.00 | | | | | 1,059.19 | | | | | 3.10 | | | | | 0.60 | % |
Class R6 Shares | | | | 1,000.00 | | | | | 1,059.39 | | | | | 2.99 | | | | | 0.58 | % |
Sterling Capital Mid Value Fund | | | | | | | | | | | | | | | | | | | | |
Class A Shares | | | | 1,000.00 | | | | | 1,020.32 | | | | | 5.93 | | | | | 1.17 | % |
Class C Shares | | | | 1,000.00 | | | | | 1,016.89 | | | | | 9.71 | | | | | 1.92 | % |
Institutional Shares | | | | 1,000.00 | | | | | 1,022.11 | | | | | 4.66 | | | | | 0.92 | % |
Class R Shares | | | | 1,000.00 | | | | | 1,019.36 | | | | | 7.24 | | | | | 1.43 | % |
Class R6 Shares | | | | 1,000.00 | | | | | 1,023.17 | | | | | 4.21 | | | | | 0.83 | % |
Sterling Capital Behavioral Small Cap Value Equity Fund | | | | | | | | | | | | | | | | | | | | |
Class A Shares | | | | 1,000.00 | | | | | 1,053.07 | | | | | 5.30 | | | | | 1.03 | % |
Class C Shares | | | | 1,000.00 | | | | | 1,049.27 | | | | | 9.14 | | | | | 1.78 | % |
Institutional Shares | | | | 1,000.00 | | | | | 1,054.33 | | | | | 3.97 | | | | | 0.77 | % |
Class R Shares | | | | 1,000.00 | | | | | 1,051.68 | | | | | 6.58 | | | | | 1.28 | % |
Class R6 Shares | | | | 1,000.00 | | | | | 1,054.87 | | | | | 3.76 | | | | | 0.73 | % |
Sterling Capital Special Opportunities Fund | | | | | | | | | | | | | | | | | | | | |
Class A Shares | | | | 1,000.00 | | | | | 1,108.44 | | | | | 5.81 | | | | | 1.10 | % |
Class C Shares | | | | 1,000.00 | | | | | 1,103.97 | | | | | 9.76 | | | | | 1.85 | % |
Institutional Shares | | | | 1,000.00 | | | | | 1,110.09 | | | | | 4.50 | | | | | 0.85 | % |
Class R Shares | | | | 1,000.00 | | | | | 1,106.82 | | | | | 7.13 | | | | | 1.35 | % |
Class R6 Shares | | | | 1,000.00 | | | | | 1,110.44 | | | | | 4.13 | | | | | 0.78 | % |
Sterling Capital Equity Income Fund | | | | | | | | | | | | | | | | | | | | |
Class A Shares | | | | 1,000.00 | | | | | 1,110.56 | | | | | 5.40 | | | | | 1.02 | % |
Class C Shares | | | | 1,000.00 | | | | | 1,106.20 | | | | | 9.35 | | | | | 1.77 | % |
Institutional Shares | | | | 1,000.00 | | | | | 1,112.27 | | | | | 4.08 | | | | | 0.77 | % |
Class R Shares | | | | 1,000.00 | | | | | 1,109.26 | | | | | 6.72 | | | | | 1.27 | % |
Class R6 Shares | | | | 1,000.00 | | | | | 1,112.83 | | | | | 3.50 | | | | | 0.66 | % |
Sterling Capital Behavioral International Equity Fund | | | | | | | | | | | | | | | | | | | | |
Class A Shares | | | | 1,000.00 | | | | | 964.60 | | | | | 4.43 | | | | | 0.90 | % |
Class C Shares | | | | 1,000.00 | | | | | 960.90 | | | | | 8.16 | | | | | 1.66 | % |
Institutional Shares | | | | 1,000.00 | | | | | 965.46 | | | | | 3.20 | | | | | 0.65 | % |
Class R6 Shares | | | | 1,000.00 | | | | | 966.32 | | | | | 3.06 | | | | | 0.62 | % |
Sterling Capital SMID Opportunities Fund | | | | | | | | | | | | | | | | | | | | |
Class A Shares | | | | 1,000.00 | | | | | 1,103.81 | | | | | 5.48 | | | | | 1.04 | % |
Class C Shares | | | | 1,000.00 | | | | | 1,099.20 | | | | | 9.37 | | | | | 1.78 | % |
Institutional Shares | | | | 1,000.00 | | | | | 1,105.40 | | | | | 4.22 | | | | | 0.80 | % |
Sterling Capital Stratton Mid Cap Value Fund | | | | | | | | | | | | | | | | | | | | |
Class A Shares | | | | 1,000.00 | | | | | 1,038.52 | | | | | 6.18 | | | | | 1.21 | % |
Class C Shares | | | | 1,000.00 | | | | | 1,034.36 | | | | | 10.05 | | | | | 1.97 | % |
Institutional Shares | | | | 1,000.00 | | | | | 1,039.79 | | | | | 4.96 | | | | | 0.97 | % |
Sterling Capital Stratton Real Estate Fund | | | | | | | | | | | | | | | | | | | | |
Class A Shares | | | | 1,000.00 | | | | | 1,095.47 | | | | | 5.67 | | | | | 1.08 | % |
Class C Shares | | | | 1,000.00 | | | | | 1,091.18 | | | | | 9.59 | | | | | 1.83 | % |
Institutional Shares | | | | 1,000.00 | | | | | 1,096.73 | | | | | 4.31 | | | | | 0.82 | % |
56
|
Sterling Capital Funds |
Expense Example (Unaudited) |
| |
| | | | | | | | | | | | | | | | | | | | |
| | | Beginning
Account Value
4/1/18 | | Ending
Account Value
9/30/18 | | Expenses Paid
During Period*
4/1/18 - 9/30/18 | | Annualized
Expense Ratio
During Period
4/1/18 - 9/30/18 |
Sterling Capital Stratton Small Cap Value Fund | | | | | | | | | | | | | | | | | | | | |
Class A Shares | | | $ | 1,000.00 | | | | $ | 1,055.80 | | | | $ | 6.60 | | | | | 1.28 | % |
Class C Shares | | | | 1,000.00 | | | | | 1,051.82 | | | | | 10.39 | | | | | 2.02 | % |
Institutional Shares | | | | 1,000.00 | | | | | 1,057.20 | | | | | 5.21 | | | | | 1.01 | % |
Sterling Capital Ultra Short Bond Fund | | | | | | | | | | | | | | | | | | | | |
Class A Shares | | | | 1,000.00 | | | | | 1,011.11 | | | | | 3.33 | | | | | 0.66 | % |
Institutional Shares | | | | 1,000.00 | | | | | 1,012.38 | | | | | 2.07 | | | | | 0.41 | % |
Sterling Capital Short Duration Bond Fund | | | | | | | | | | | | | | | | | | | | |
Class A Shares | | | | 1,000.00 | | | | | 1,010.47 | | | | | 3.38 | | | | | 0.67 | % |
Class C Shares | | | | 1,000.00 | | | | | 1,005.49 | | | | | 7.14 | | | | | 1.42 | % |
Institutional Shares | | | | 1,000.00 | | | | | 1,011.71 | | | | | 2.12 | | | | | 0.42 | % |
Sterling Capital Intermediate U.S. Government Fund | | | | | | | | | | | | | | | | | | | | |
Class A Shares | | | | 1,000.00 | | | | | 994.67 | | | | | 4.55 | | | | | 0.91 | % |
Class C Shares | | | | 1,000.00 | | | | | 991.94 | | | | | 8.29 | | | | | 1.66 | % |
Institutional Shares | | | | 1,000.00 | | | | | 995.93 | | | | | 3.25 | | | | | 0.65 | % |
Sterling Capital Total Return Bond Fund | | | | | | | | | | | | | | | | | | | | |
Class A Shares | | | | 1,000.00 | | | | | 1,000.05 | | | | | 3.51 | | | | | 0.70 | % |
Class C Shares | | | | 1,000.00 | | | | | 995.35 | | | | | 7.25 | | | | | 1.45 | % |
Institutional Shares | | | | 1,000.00 | | | | | 1,000.33 | | | | | 2.26 | | | | | 0.45 | % |
Class R Shares | | | | 1,000.00 | | | | | 999.03 | | | | | 4.61 | | | | | 0.92 | % |
Class R6 Shares | | | | 1,000.00 | | | | | 1,000.83 | | | | | 1.76 | | | | | 0.35 | % |
Sterling Capital Corporate Fund | | | | | | | | | | | | | | | | | | | | |
Class A Shares | | | | 1,000.00 | | | | | 1,004.76 | | | | | 4.47 | | | | | 0.89 | % |
Class C Shares | | | | 1,000.00 | | | | | 1,002.01 | | | | | 8.23 | | | | | 1.64 | % |
Institutional Shares | | | | 1,000.00 | | | | | 1,007.01 | | | | | 3.22 | | | | | 0.64 | % |
Sterling Capital Securitized Opportunities Fund | | | | | | | | | | | | | | | | | | | | |
Class A Shares | | | | 1,000.00 | | | | | 1,001.03 | | | | | 4.16 | | | | | 0.83 | % |
Class C Shares | | | | 1,000.00 | | | | | 997.32 | | | | | 7.91 | | | | | 1.58 | % |
Institutional Shares | | | | 1,000.00 | | | | | 1,003.36 | | | | | 2.91 | | | | | 0.58 | % |
Sterling Capital Kentucky Intermediate Tax-Free Fund | | | | | | | | | | | | | | | | | | | | |
Class A Shares | | | | 1,000.00 | | | | | 1,001.50 | | | | | 4.67 | | | | | 0.93 | % |
Class C Shares | | | | 1,000.00 | | | | | 999.16 | | | | | 9.62 | | | | | 1.92 | % |
Institutional Shares | | | | 1,000.00 | | | | | 1,002.79 | | | | | 3.41 | | | | | 0.68 | % |
Sterling Capital Maryland Intermediate Tax-Free Fund | | | | | | | | | | | | | | | | | | | | |
Class A Shares | | | | 1,000.00 | | | | | 1,001.83 | | | | | 4.42 | | | | | 0.88 | % |
Class C Shares | | | | 1,000.00 | | | | | 998.10 | | | | | 8.16 | | | | | 1.63 | % |
Institutional Shares | | | | 1,000.00 | | | | | 1,003.11 | | | | | 3.16 | | | | | 0.63 | % |
Sterling Capital North Carolina Intermediate Tax-Free Fund | | | | | | | | | | | | | | | | | | | | |
Class A Shares | | | | 1,000.00 | | | | | 1,001.79 | | | | | 3.96 | | | | | 0.79 | % |
Class C Shares | | | | 1,000.00 | | | | | 997.08 | | | | | 7.71 | | | | | 1.54 | % |
Institutional Shares | | | | 1,000.00 | | | | | 1,003.04 | | | | | 2.71 | | | | | 0.54 | % |
Sterling Capital South Carolina Intermediate Tax-Free Fund | | | | | | | | | | | | | | | | | | | | |
Class A Shares | | | | 1,000.00 | | | | | 1,001.93 | | | | | 4.01 | | | | | 0.80 | % |
Class C Shares | | | | 1,000.00 | | | | | 997.26 | | | | | 7.76 | | | | | 1.55 | % |
Institutional Shares | | | | 1,000.00 | | | | | 1,002.19 | | | | | 2.76 | | | | | 0.55 | % |
Sterling Capital Virginia Intermediate Tax-Free Fund | | | | | | | | | | | | | | | | | | | | |
Class A Shares | | | | 1,000.00 | | | | | 1,002.09 | | | | | 4.02 | | | | | 0.80 | % |
Class C Shares | | | | 1,000.00 | | | | | 998.34 | | | | | 7.76 | | | | | 1.55 | % |
Institutional Shares | | | | 1,000.00 | | | | | 1,003.36 | | | | | 2.76 | | | | | 0.55 | % |
Sterling Capital West Virginia Intermediate Tax-Free Fund | | | | | | | | | | | | | | | | | | | | |
Class A Shares | | | | 1,000.00 | | | | | 1,002.68 | | | | | 3.97 | | | | | 0.79 | % |
Class C Shares | | | | 1,000.00 | | | | | 997.86 | | | | | 7.71 | | | | | 1.54 | % |
Institutional Shares | | | | 1,000.00 | | | | | 1,003.93 | | | | | 2.71 | | | | | 0.54 | % |
Sterling Capital Diversified Income Fund | | | | | | | | | | | | | | | | | | | | |
Class A Shares | | | | 1,000.00 | | | | | 1,027.71 | | | | | 4.07 | | | | | 0.80 | % |
Class C Shares | | | | 1,000.00 | | | | | 1,023.96 | | | | | 7.86 | | | | | 1.55 | % |
Institutional Shares | | | | 1,000.00 | | | | | 1,028.69 | | | | | 2.80 | | | | | 0.55 | % |
Sterling Capital Strategic Allocation Balanced Fund | | | | | | | | | | | | | | | | | | | | |
Class A Shares | | | | 1,000.00 | | | | | 1,020.71 | | | | | 2.08 | | | | | 0.41 | % |
Class C Shares | | | | 1,000.00 | | | | | 1,017.14 | | | | | 5.92 | | | | | 1.17 | % |
Institutional Shares | | | | 1,000.00 | | | | | 1,021.00 | | | | | 0.81 | | | | | 0.16 | % |
Sterling Capital Strategic Allocation Growth Fund | | | | | | | | | | | | | | | | | | | | |
Class A Shares | | | | 1,000.00 | | | | | 1,025.86 | | | | | 2.29 | | | | | 0.45 | % |
Class C Shares | | | | 1,000.00 | | | | | 1,022.55 | | | | | 6.08 | | | | | 1.20 | % |
Institutional Shares | | | | 1,000.00 | | | | | 1,027.14 | | | | | 1.02 | | | | | 0.20 | % |
| * | Expenses are equal to the average account value over the period multiplied by the Fund’s annualized expense ratio, multiplied by 183 days divided by 365 (to reflect the six month period). |
57
|
Sterling Capital Funds |
Expense Example (Unaudited) |
| |
Hypothetical Example for Comparison Purposes
The table below provides information about hypothetical account values and hypothetical expenses based on the Fund’s actual expense ratio and an assumed rate of return of 5% per year before expenses, which is not the Funds’ actual return. The hypothetical account values and expenses may not be used to estimate the actual ending account balance or expenses you paid for the year. You may use this information to compare the ongoing costs of investing in a Fund and other funds. To do so, compare this 5% hypothetical example with the 5% hypothetical examples that appear in the shareholder reports of other funds.
Please note that the expenses shown in the table are meant to highlight your ongoing costs only and do not reflect any transactional costs, such as sales charges (loads), redemption fees, or exchange fees. Therefore, the table is useful in comparing ongoing costs only, and will not help you determine the relative total costs of owning different funds. In addition, if these transactional costs were included, your costs would have been higher.
| | | | | | | | | | | | | | | | | | | | |
| | | Beginning
Account Value
4/1/18 | | Ending
Account Value
9/30/18 | | Expenses Paid
During Period*
4/1/18 - 9/30/18 | | Annualized
Expense Ratio
During Period
4/1/18 - 9/30/18 |
Sterling Capital Behavioral Large Cap Value Equity Fund | | | | | | | | | | | | | | | | | | | | |
Class A Shares | | | $ | 1,000.00 | | | | $ | 1,020.71 | | | | $ | 4.41 | | | | | 0.87 | % |
Class C Shares | | | | 1,000.00 | | | | | 1,016.95 | | | | | 8.19 | | | | | 1.62 | % |
Institutional Shares | | | | 1,000.00 | | | | | 1,022.06 | | | | | 3.04 | | | | | 0.60 | % |
Class R6 Shares | | | | 1,000.00 | | | | | 1,022.16 | | | | | 2.94 | | | | | 0.58 | % |
Sterling Capital Mid Value Fund | | | | | | | | | | | | | | | | | | | | |
Class A Shares | | | | 1,000.00 | | | | | 1,019.20 | | | | | 5.92 | | | | | 1.17 | % |
Class C Shares | | | | 1,000.00 | | | | | 1,015.44 | | | | | 9.70 | | | | | 1.92 | % |
Institutional Shares | | | | 1,000.00 | | | | | 1,020.46 | | | | | 4.66 | | | | | 0.92 | % |
Class R Shares | | | | 1,000.00 | | | | | 1,017.90 | | | | | 7.23 | | | | | 1.43 | % |
Class R6 Shares | | | | 1,000.00 | | | | | 1,020.91 | | | | | 4.20 | | | | | 0.83 | % |
Sterling Capital Behavioral Small Cap Value Equity Fund | | | | | | | | | | | | | | | | | | | | |
Class A Shares | | | | 1,000.00 | | | | | 1,019.90 | | | | | 5.22 | | | | | 1.03 | % |
Class C Shares | | | | 1,000.00 | | | | | 1,016.14 | | | | | 9.00 | | | | | 1.78 | % |
Institutional Shares | | | | 1,000.00 | | | | | 1,021.21 | | | | | 3.90 | | | | | 0.77 | % |
Class R Shares | | | | 1,000.00 | | | | | 1,018.65 | | | | | 6.48 | | | | | 1.28 | % |
Class R6 Shares | | | | 1,000.00 | | | | | 1,021.41 | | | | | 3.70 | | | | | 0.73 | % |
Sterling Capital Special Opportunities Fund | | | | | | | | | | | | | | | | | | | | |
Class A Shares | | | | 1,000.00 | | | | | 1,019.55 | | | | | 5.57 | | | | | 1.10 | % |
Class C Shares | | | | 1,000.00 | | | | | 1,015.79 | | | | | 9.35 | | | | | 1.85 | % |
Institutional Shares | | | | 1,000.00 | | | | | 1,020.81 | | | | | 4.31 | | | | | 0.85 | % |
Class R Shares | | | | 1,000.00 | | | | | 1,018.30 | | | | | 6.83 | | | | | 1.35 | % |
Class R6 Shares | | | | 1,000.00 | | | | | 1,021.16 | | | | | 3.95 | | | | | 0.78 | % |
Sterling Capital Equity Income Fund | | | | | | | | | | | | | | | | | | | | |
Class A Shares | | | | 1,000.00 | | | | | 1,019.95 | | | | | 5.16 | | | | | 1.02 | % |
Class C Shares | | | | 1,000.00 | | | | | 1,016.19 | | | | | 8.95 | | | | | 1.77 | % |
Institutional Shares | | | | 1,000.00 | | | | | 1,021.21 | | | | | 3.90 | | | | | 0.77 | % |
Class R Shares | | | | 1,000.00 | | | | | 1,018.70 | | | | | 6.43 | | | | | 1.27 | % |
Class R6 Shares | | | | 1,000.00 | | | | | 1,021.76 | | | | | 3.35 | | | | | 0.66 | % |
Sterling Capital Behavioral International Equity Fund | | | | | | | | | | | | | | | | | | | | |
Class A Shares | | | | 1,000.00 | | | | | 1,020.56 | | | | | 4.56 | | | | | 0.90 | % |
Class C Shares | | | | 1,000.00 | | | | | 1,016.75 | | | | | 8.39 | | | | | 1.66 | % |
Institutional Shares | | | | 1,000.00 | | | | | 1,021.81 | | | | | 3.29 | | | | | 0.65 | % |
Class R6 Shares | | | | 1,000.00 | | | | | 1,021.96 | | | | | 3.14 | | | | | 0.62 | % |
Sterling Capital SMID Opportunities Fund | | | | | | | | | | | | | | | | | | | | |
Class A Shares | | | | 1,000.00 | | | | | 1,019.85 | | | | | 5.27 | | | | | 1.04 | % |
Class C Shares | | | | 1,000.00 | | | | | 1,016.14 | | | | | 9.00 | | | | | 1.78 | % |
Institutional Shares | | | | 1,000.00 | | | | | 1,021.06 | | | | | 4.05 | | | | | 0.80 | % |
Sterling Capital Stratton Mid Cap Value Fund | | | | | | | | | | | | | | | | | | | | |
Class A Shares | | | | 1,000.00 | | | | | 1,019.00 | | | | | 6.12 | | | | | 1.21 | % |
Class C Shares | | | | 1,000.00 | | | | | 1,015.19 | | | | | 9.95 | | | | | 1.97 | % |
Institutional Shares | | | | 1,000.00 | | | | | 1,020.21 | | | | | 4.91 | | | | | 0.97 | % |
Sterling Capital Stratton Real Estate Fund | | | | | | | | | | | | | | | | | | | | |
Class A Shares | | | | 1,000.00 | | | | | 1,019.65 | | | | | 5.47 | | | | | 1.08 | % |
Class C Shares | | | | 1,000.00 | | | | | 1,015.89 | | | | | 9.25 | | | | | 1.83 | % |
Institutional Shares | | | | 1,000.00 | | | | | 1,020.96 | | | | | 4.15 | | | | | 0.82 | % |
Sterling Capital Stratton Small Cap Value Fund | | | | | | | | | | | | | | | | | | | | |
Class A Shares | | | | 1,000.00 | | | | | 1,018.65 | | | | | 6.48 | | | | | 1.28 | % |
Class C Shares | | | | 1,000.00 | | | | | 1,014.94 | | | | | 10.20 | | | | | 2.02 | % |
Institutional Shares | | | | 1,000.00 | | | | | 1,020.00 | | | | | 5.11 | | | | | 1.01 | % |
58
|
Sterling Capital Funds |
Expense Example (Unaudited) |
| |
| | | | | | | | | | | | | | | | | | | | |
| | | Beginning
Account Value
4/1/18 | | Ending
Account Value
9/30/18 | | Expenses Paid
During Period*
4/1/18 - 9/30/18 | | Annualized
Expense Ratio
During Period
4/1/18 - 9/30/18 |
Sterling Capital Ultra Short Bond Fund | | | | | | | | | | | | | | | | | | | | |
Class A Shares | | | $ | 1,000.00 | | | | $ | 1,021.76 | | | | $ | 3.35 | | | | | 0.66 | % |
Institutional Shares | | | | 1,000.00 | | | | | 1,023.01 | | | | | 2.08 | | | | | 0.41 | % |
Sterling Capital Short Duration Bond Fund | | | | | | | | | | | | | | | | | | | | |
Class A Shares | | | | 1,000.00 | | | | | 1,021.71 | | | | | 3.40 | | | | | 0.67 | % |
Class C Shares | | | | 1,000.00 | | | | | 1,017.95 | | | | | 7.18 | | | | | 1.42 | % |
Institutional Shares | | | | 1,000.00 | | | | | 1,022.96 | | | | | 2.13 | | | | | 0.42 | % |
Sterling Capital Intermediate U.S. Government Fund | | | | | | | | | | | | | | | | | | | | |
Class A Shares | | | | 1,000.00 | | | | | 1,020.51 | | | | | 4.61 | | | | | 0.91 | % |
Class C Shares | | | | 1,000.00 | | | | | 1,016.75 | | | | | 8.39 | | | | | 1.66 | % |
Institutional Shares | | | | 1,000.00 | | | | | 1,021.81 | | | | | 3.29 | | | | | 0.65 | % |
Sterling Capital Total Return Bond Fund | | | | | | | | | | | | | | | | | | | | |
Class A Shares | | | | 1,000.00 | | | | | 1,021.56 | | | | | 3.55 | | | | | 0.70 | % |
Class C Shares | | | | 1,000.00 | | | | | 1,017.80 | | | | | 7.33 | | | | | 1.45 | % |
Institutional Shares | | | | 1,000.00 | | | | | 1,022.81 | | | | | 2.28 | | | | | 0.45 | % |
Class R Shares | | | | 1,000.00 | | | | | 1,020.46 | | | | | 4.66 | | | | | 0.92 | % |
Class R6 Shares | | | | 1,000.00 | | | | | 1,023.31 | | | | | 1.78 | | | | | 0.35 | % |
Sterling Capital Corporate Fund | | | | | | | | | | | | | | | | | | | | |
Class A Shares | | | | 1,000.00 | | | | | 1,020.61 | | | | | 4.51 | | | | | 0.89 | % |
Class C Shares | | | | 1,000.00 | | | | | 1,016.85 | | | | | 8.29 | | | | | 1.64 | % |
Institutional Shares | | | | 1,000.00 | | | | | 1,021.86 | | | | | 3.24 | | | | | 0.64 | % |
Sterling Capital Securitized Opportunities Fund | | | | | | | | | | | | | | | | | | | | |
Class A Shares | | | | 1,000.00 | | | | | 1,020.91 | | | | | 4.20 | | | | | 0.83 | % |
Class C Shares | | | | 1,000.00 | | | | | 1,017.15 | | | | | 7.99 | | | | | 1.58 | % |
Institutional Shares | | | | 1,000.00 | | | | | 1,022.16 | | | | | 2.94 | | | | | 0.58 | % |
Sterling Capital Kentucky Intermediate Tax-Free Fund | | | | | | | | | | | | | | | | | | | | |
Class A Shares | | | | 1,000.00 | | | | | 1,020.41 | | | | | 4.71 | | | | | 0.93 | % |
Class C Shares | | | | 1,000.00 | | | | | 1,015.44 | | | | | 9.70 | | | | | 1.92 | % |
Institutional Shares | | | | 1,000.00 | | | | | 1,021.66 | | | | | 3.45 | | | | | 0.68 | % |
Sterling Capital Maryland Intermediate Tax-Free Fund | | | | | | | | | | | | | | | | | | | | |
Class A Shares | | | | 1,000.00 | | | | | 1,020.66 | | | | | 4.46 | | | | | 0.88 | % |
Class C Shares | | | | 1,000.00 | | | | | 1,016.90 | | | | | 8.24 | | | | | 1.63 | % |
Institutional Shares | | | | 1,000.00 | | | | | 1,021.91 | | | | | 3.19 | | | | | 0.63 | % |
Sterling Capital North Carolina Intermediate Tax-Free Fund | | | | | | | | | | | | | | | | �� | | | | |
Class A Shares | | | | 1,000.00 | | | | | 1,021.11 | | | | | 4.00 | | | | | 0.79 | % |
Class C Shares | | | | 1,000.00 | | | | | 1,017.35 | | | | | 7.79 | | | | | 1.54 | % |
Institutional Shares | | | | 1,000.00 | | | | | 1,022.36 | | | | | 2.74 | | | | | 0.54 | % |
Sterling Capital South Carolina Intermediate Tax-Free Fund | | | | | | | | | | | | | | | | | | | | |
Class A Shares | | | | 1,000.00 | | | | | 1,021.06 | | | | | 4.05 | | | | | 0.80 | % |
Class C Shares | | | | 1,000.00 | | | | | 1,017.30 | | | | | 7.84 | | | | | 1.55 | % |
Institutional Shares | | | | 1,000.00 | | | | | 1,022.31 | | | | | 2.79 | | | | | 0.55 | % |
Sterling Capital Virginia Intermediate Tax-Free Fund | | | | | | | | | | | | | | | | | | | | |
Class A Shares | | | | 1,000.00 | | | | | 1,021.06 | | | | | 4.05 | | | | | 0.80 | % |
Class C Shares | | | | 1,000.00 | | | | | 1,017.30 | | | | | 7.84 | | | | | 1.55 | % |
Institutional Shares | | | | 1,000.00 | | | | | 1,022.31 | | | | | 2.79 | | | | | 0.55 | % |
Sterling Capital West Virginia Intermediate Tax-Free Fund | | | | | | | | | | | | | | | | | | | | |
Class A Shares | | | | 1,000.00 | | | | | 1,021.11 | | | | | 4.00 | | | | | 0.79 | % |
Class C Shares | | | | 1,000.00 | | | | | 1,017.35 | | | | | 7.79 | | | | | 1.54 | % |
Institutional Shares | | | | 1,000.00 | | | | | 1,022.36 | | | | | 2.74 | | | | | 0.54 | % |
Sterling Capital Diversified Income Fund | | | | | | | | | | | | | | | | | | | | |
Class A Shares | | | | 1,000.00 | | | | | 1,021.06 | | | | | 4.05 | | | | | 0.80 | % |
Class C Shares | | | | 1,000.00 | | | | | 1,017.30 | | | | | 7.84 | | | | | 1.55 | % |
Institutional Shares | | | | 1,000.00 | | | | | 1,022.31 | | | | | 2.79 | | | | | 0.55 | % |
Sterling Capital Strategic Allocation Balanced Fund | | | | | | | | | | | | | | | | | | | | |
Class A Shares | | | | 1,000.00 | | | | | 1,023.01 | | | | | 2.08 | | | | | 0.41 | % |
Class C Shares | | | | 1,000.00 | | | | | 1,019.20 | | | | | 5.92 | | | | | 1.17 | % |
Institutional Shares | | | | 1,000.00 | | | | | 1,024.27 | | | | | 0.81 | | | | | 0.16 | % |
Sterling Capital Strategic Allocation Growth Fund | | | | | | | | | | | | | | | | | | | | |
Class A Shares | | | | 1,000.00 | | | | | 1,022.81 | | | | | 2.28 | | | | | 0.45 | % |
Class C Shares | | | | 1,000.00 | | | | | 1,019.05 | | | | | 6.07 | | | | | 1.20 | % |
Institutional Shares | | | | 1,000.00 | | | | | 1,024.07 | | | | | 1.01 | | | | | 0.20 | % |
| * | Expenses are equal to the average account value over the period multiplied by the Fund’s annualized expense ratio, multiplied by 183 days divided by 365 (to reflect the six month period). |
59
|
Sterling Capital Behavioral Large Cap Value Equity Fund |
Schedule of Portfolio Investments |
September 30, 2018 |
| | | | | | | | | | |
| Shares | | | | Fair Value | |
| | COMMON STOCKS — 99.2% | | | | | | |
| | | |
| | | | Aerospace & Defense — 1.6% | | | | | | |
| | 13,450 | | | Boeing Co. (The) | | | | $ | 5,002,055 | |
| | | | | | | | | | |
| | | | Airlines — 0.5% | | | | | | |
| | 17,250 | | | United Continental Holdings, Inc.(a) | | | | | 1,536,285 | |
| | | | | | | | | | |
| | | | Auto Components — 0.1% | | | | | | |
| | 20,150 | | | Gentex Corp. | | | | | 432,419 | |
| | | | | | | | | | |
| | | | Banks — 10.3% | | | | | | |
| | 15,150 | | | Comerica, Inc. | | | | | 1,366,530 | |
| | 40,600 | | | Huntington Bancshares, Inc. | | | | | 605,752 | |
| | 119,300 | | | JPMorgan Chase & Co. | | | | | 13,461,812 | |
| | 53,300 | | | KeyCorp | | | | | 1,060,137 | |
| | 29,300 | | | M&T Bank Corp. | | | | | 4,821,022 | |
| | 26,450 | | | PacWest Bancorp | | | | | 1,260,343 | |
| | 30,300 | | | Popular, Inc. | | | | | 1,552,875 | |
| | 73,650 | | | Regions Financial Corp. | | | | | 1,351,477 | |
| | 75,450 | | | SunTrust Banks, Inc. | | | | | 5,039,305 | |
| | 67,100 | | | TCF Financial Corp. | | | | | 1,597,651 | |
| | | | | | | | | | |
| | | | | | | | | 32,116,904 | |
| | | | | | | | | | |
| | | | Biotechnology — 4.1% | | | | | | |
| | 32,250 | | | AbbVie, Inc. | | | | | 3,050,205 | |
| | 24,550 | | | Amgen, Inc. | | | | | 5,088,969 | |
| | 13,000 | | | Biogen, Inc.(a) | | | | | 4,593,030 | |
| | | | | | | | | | |
| | | | | | | | | 12,732,204 | |
| | | | | | | | | | |
| | | | Capital Markets — 1.1% | | | | | | |
| | 122,700 | | | BGC Partners, Inc., Class A | | | | | 1,450,314 | |
| | 9,450 | | | Goldman Sachs Group, Inc. (The) | | | | | 2,119,068 | |
| | | | | | | | | | |
| | | | | | | | | 3,569,382 | |
| | | | | | | | | | |
| | | | Chemicals — 1.9% | | | | | | |
| | 46,100 | | | Huntsman Corp. | | | | | 1,255,303 | |
| | 45,150 | | | LyondellBasell Industries NV, Class A | | | | | 4,628,327 | |
| | | | | | | | | | |
| | | | | | | | | 5,883,630 | |
| | | | | | | | | | |
| | | | Communications Equipment — 1.0% | |
| | 66,700 | | | Cisco Systems, Inc. | | | | | 3,244,955 | |
| | | | | | | | | | |
| | | | Consumer Finance — 4.7% | | | | | | |
| | 56,500 | | | Capital One Financial Corp. | | | | | 5,363,545 | |
| | 66,400 | | | Discover Financial Services | | | | | 5,076,280 | |
| | 101,500 | | | Navient Corp. | | | | | 1,368,220 | |
| | 40,650 | | | OneMain Holdings, Inc.(a) | | | | | 1,366,247 | |
| | 72,250 | | | Santander Consumer USA Holdings, Inc. | | | | | 1,447,890 | |
| | | | | | | | | | |
| | | | | | | | | 14,622,182 | |
| | | | | | | | | | |
| | | | Diversified Consumer Services — 0.5% | |
| | 2,500 | | | Graham Holdings Co., Class B | | | | | 1,448,250 | |
| | | | | | | | | | |
| | | | Diversified Telecommunication Services — 4.7% | | | | |
| | 146,000 | | | AT&T, Inc. | | | | | 4,902,680 | |
| | 185,800 | | | Verizon Communications, Inc. | | | | | 9,919,862 | |
| | | | | | | | | | |
| | | | | | | | | 14,822,542 | |
| | | | | | | | | | |
| | | | Electric Utilities — 2.5% | | | | | | |
| | 16,750 | | | Entergy Corp. | | | | | 1,358,927 | |
| | 11,000 | | | FirstEnergy Corp. | | | | | 408,870 | |
| | 37,050 | | | NextEra Energy, Inc. | | | | | 6,209,580 | |
| | | | | | | | | | |
| | | | | | | | | 7,977,377 | |
| | | | | | | | | | |
| | | | Electrical Equipment — 1.7% | | | | | | |
| | 60,650 | | | Eaton Corp. PLC | | | | | 5,260,175 | |
| | | | | | | | | | |
| | | | | | | | | | |
| Shares | | | | Fair Value | |
| | COMMON STOCKS — (continued) | | | | | | |
| |
| | | | Equity Real Estate Investment Trusts (REITS) — 4.0% | |
| | 22,900 | | | EPR Properties | | | | $ | 1,566,589 | |
| | 37,350 | | | Gaming and Leisure Properties, Inc. | | | | | 1,316,587 | |
| | 71,500 | | | Host Hotels & Resorts, Inc. | | | | | 1,508,650 | |
| | 2,900 | | | Life Storage, Inc. | | | | | 275,964 | |
| | 44,000 | | | Omega Healthcare Investors, Inc. | | | | | 1,441,880 | |
| | 48,450 | | | Park Hotels & Resorts, Inc. | | | | | 1,590,129 | |
| | 16,950 | | | Simon Property Group, Inc. | | | | | 2,995,913 | |
| | 60,950 | | | STORE Capital Corp. | | | | | 1,693,801 | |
| | | | | | | | | | |
| | | | | | | | | 12,389,513 | |
| | | | | | | | | | |
| | | | Food & Staples Retailing — 0.7% | |
| | 29,650 | | | Walgreens Boots Alliance, Inc. | | | | | 2,161,485 | |
| | | | | | | | | | |
| | | | Food Products — 2.6% | | | | | | |
| | 100,650 | | | Archer-Daniels-Midland Co. | | | | | 5,059,675 | |
| | 22,700 | | | Bunge, Ltd. | | | | | 1,559,717 | |
| | 28,600 | | | TreeHouse Foods, Inc.(a) | | | | | 1,368,510 | |
| | | | | | | | | | |
| | | | | | | | | 7,987,902 | |
| | | | | | | | | | |
| | | | Health Care Providers & Services — 7.7% | |
| | 23,550 | | | Anthem, Inc. | | | | | 6,453,877 | |
| | 83,400 | | | CVS Health Corp. | | | | | 6,565,248 | |
| | 37,950 | | | HCA Healthcare, Inc. | | | | | 5,279,604 | |
| | 3,300 | | | Humana, Inc. | | | | | 1,117,116 | |
| | 17,850 | | | UnitedHealth Group, Inc. | | | | | 4,748,814 | |
| | | | | | | | | | |
| | | | | | | | | 24,164,659 | |
| | | | | | | | | | |
| | | | Hotels, Restaurants & Leisure — 0.4% | |
| | 60,950 | | | Extended Stay America, Inc. | | | | | 1,233,019 | |
| | | | | | | | | | |
| | | | Household Durables — 0.4% | | | | | | |
| | 51,350 | | | PulteGroup, Inc. | | | | | 1,271,939 | |
| | | | | | | | | | |
| | | | Household Products — 0.4% | | | | | | |
| | 19,100 | | | Energizer Holdings, Inc. | | | | | 1,120,215 | |
| | | | | | | | | | |
| | | | Independent Power and Renewable Electricity
Producers — 0.5% | |
| | 105,200 | | | AES Corp. | | | | | 1,472,800 | |
| | | | | | | | | | |
| | | | Insurance — 4.8% | | | | | | |
| | 118,150 | | | Aflac, Inc. | | | | | 5,561,321 | |
| | 47,200 | | | Allstate Corp. (The) | | | | | 4,658,640 | |
| | 1,400 | | | MetLife, Inc. | | | | | 65,408 | |
| | 67,300 | | | Progressive Corp. (The) | | | | | 4,780,992 | |
| | | | | | | | | | |
| | | | | | | | | 15,066,361 | |
| | | | | | | | | | |
| | | | IT Services — 3.0% | | | | | | |
| | 69,650 | | | Conduent, Inc.(a) | | | | | 1,568,518 | |
| | 53,200 | | | DXC Technology Co. | | | | | 4,975,264 | |
| | 62,150 | | | First Data Corp., Class A(a) | | | | | 1,520,811 | |
| | 56,450 | | | Sabre Corp. | | | | | 1,472,216 | |
| | | | | | | | | | |
| | | | | | | | | 9,536,809 | |
| | | | | | | | | | |
| | | | Machinery — 3.1% | | | | | | |
| | 32,950 | | | Allison Transmission Holdings, Inc. | | | | | 1,713,729 | |
| | 31,050 | | | Caterpillar, Inc. | | | | | 4,734,815 | |
| | 12,400 | | | Cummins, Inc. | | | | | 1,811,268 | |
| | 14,000 | | | Ingersoll-Rand PLC | | | | | 1,432,200 | |
| | | | | | | | | | |
| | | | | | | | | 9,692,012 | |
| | | | | | | | | | |
| | | | Media — 1.9% | | | | | | |
| | 23,650 | | | AMC Networks, Inc., Class A(a) | | | | | 1,568,941 | |
| | 58,300 | | | Discovery, Inc., Class A(a) | | | | | 1,865,600 | |
Continued
60
|
Sterling Capital Behavioral Large Cap Value Equity Fund |
Schedule of Portfolio Investments — (continued) |
September 30, 2018 |
| | | | | | | | | | |
| Shares | | | | | | Fair Value | |
| | COMMON STOCKS — (continued) | | | | | | |
| | | |
| | | | Media — (continued) | | | | | | |
| | 61,500 | | | Discovery, Inc., Class C(a) | | | | $ | 1,819,170 | |
| | 6,050 | | | Walt Disney Co. (The) | | | | | 707,487 | |
| | | | | | | | | | |
| | | | | | | | | 5,961,198 | |
| | | | | | | | | | |
| | | | Metals & Mining — 1.3% | | | | | | |
| | 22,100 | | | Nucor Corp. | | | | | 1,402,245 | |
| | 16,000 | | | Reliance Steel & Aluminum Co. | | | | | 1,364,640 | |
| | 32,250 | | | Steel Dynamics, Inc. | | | | | 1,457,377 | |
| | | | | | | | | | |
| | | | | | | | | 4,224,262 | |
| | | | | | | | | | |
| | | | Mortgage Real Estate Investment Trusts (REITS) — 0.4% | |
| | 64,950 | | | Starwood Property Trust, Inc. | | | | | 1,397,724 | |
| | | | | | | | | | |
| | | | Multiline Retail — 2.6% | | | | | | |
| | 12,950 | | | Dollar General Corp. | | | | | 1,415,435 | |
| | 14,300 | | | Macy’s, Inc. | | | | | 496,639 | |
| | 69,100 | | | Target Corp. | | | | | 6,095,311 | |
| | | | | | | | | | |
| | | | | | | | | 8,007,385 | |
| | | | | | | | | | |
| | | | Multi-Utilities — 1.6% | | | | | | |
| | 96,000 | | | Public Service Enterprise Group, Inc. | | | | | 5,067,840 | |
| | | | | | | | | | |
| | | | Oil, Gas & Consumable Fuels — 11.8% | |
| | 14,450 | | | Chevron Corp. | | | | | 1,766,946 | |
| | 91,250 | | | ConocoPhillips | | | | | 7,062,750 | |
| | 92,950 | | | Exxon Mobil Corp. | | | | | 7,902,609 | |
| | 24,950 | | | HollyFrontier Corp. | | | | | 1,744,005 | |
| | 69,000 | | | Marathon Petroleum Corp. | | | | | 5,517,930 | |
| | 36,950 | | | PBF Energy, Inc., Class A | | | | | 1,844,175 | |
| | 48,550 | | | Phillips 66 | | | | | 5,472,556 | |
| | 50,775 | | | Valero Energy Corp. | | | | | 5,775,655 | |
| | | | | | | | | | |
| | | | | | | | | 37,086,626 | |
| | | | | | | | | | |
| | | | Paper & Forest Products — 0.5% | | | | | | |
| | 29,500 | | | Domtar Corp. | | | | | 1,539,015 | |
| | | | | | | | | | |
| | | | Personal Products — 0.7% | | | | | | |
| | 12,100 | | | Herbalife Nutrition, Ltd.(a) | | | | | 660,055 | |
| | 17,950 | | | Nu Skin Enterprises, Inc., Class A | | | | | 1,479,439 | |
| | | | | | | | | | |
| | | | | | | | | 2,139,494 | |
| | | | | | | | | | |
| | | | Pharmaceuticals — 5.2% | | | | | | |
| | 54,250 | | | Eli Lilly & Co. | | | | | 5,821,567 | |
| | 240,750 | | | Pfizer, Inc. | | | | | 10,609,853 | |
| | | | | | | | | | |
| | | | | | | | | 16,431,420 | |
| | | | | | | | | | |
| | | | Road & Rail — 0.6% | | | | | | |
| | 11,350 | | | Union Pacific Corp. | | | | | 1,848,120 | |
| | | | | | | | | | |
| | | | | | | | | | |
| Shares | | | | | | Fair Value | |
| | COMMON STOCKS — (continued) | |
| | | | Semiconductors & Semiconductor Equipment — 4.4% | |
| | 11,850 | | | Broadcom, Inc. | | | | $ | 2,923,751 | |
| | 91,900 | | | Micron Technology, Inc.(a) | | | | | 4,156,637 | |
| | 93,950 | | | QUALCOMM, Inc. | | | | | 6,767,219 | |
| | | | | | | | | | |
| | | | | | | | | 13,847,607 | |
| | | | | | | | | | |
| | | | Software — 0.9% | | | | | | |
| | 17,600 | | | VMware, Inc., Class A(a) | | | | | 2,746,656 | |
| | | | | | | | | | |
| | | | Technology Hardware, Storage & Peripherals — 3.3% | |
| | 20,750 | | | Apple, Inc. | | | | | 4,684,105 | |
| | 219,650 | | | HP, Inc. | | | | | 5,660,381 | |
| | | | | | | | | | |
| | | | | | | | | 10,344,486 | |
| | | | | | | | | | |
| | | | Textiles, Apparel & Luxury Goods — 1.1% | |
| | 23,450 | | | Michael Kors Holdings, Ltd.(a) | | | | | 1,607,732 | |
| | 12,400 | | | Ralph Lauren Corp. | | | | | 1,705,620 | |
| | | | | | | | | | |
| | | | | | | | | 3,313,352 | |
| | | | | | | | | | |
| | | | Trading Companies & Distributors — 0.6% | |
| | 36,600 | | | HD Supply Holdings, Inc.(a) | | | | | 1,566,114 | |
| | 1,850 | | | United Rentals, Inc.(a) | | | | | 302,660 | |
| | | | | | | | | | |
| | | | | | | | | 1,868,774 | |
| | | | | | | | | | |
| | | | Total Common Stocks
(Cost $262,062,538) | | | | | 310,569,033 | |
| | | | | | | | | | |
|
| | MONEY MARKET FUND — 0.7% | |
| | 2,233,049 | | | Federated Treasury Obligations Fund, Institutional Shares, 1.92%(b) | | | | | 2,233,049 | |
| | | | | | | | | | |
| | | | Total Money Market Fund
(Cost $2,233,049) | | | | | 2,233,049 | |
| | | | | | | | | | |
| Total Investments — 99.9%
(Cost $264,295,587) | | | | | 312,802,082 | |
| | Net Other Assets (Liabilities) — 0.1% | | | | | 177,393 | |
| | | | | | | | | | |
| | NET ASSETS — 100.0% | | | | $ | 312,979,475 | |
| | | | | | | | | | |
| (a) | Represents non-income producing security. |
| (b) | Represents the current yield as of report date. |
See accompanying Notes to the Financial Statements.
61
|
Sterling Capital Mid Value Fund |
Schedule of Portfolio Investments |
September 30, 2018 |
| | | | | | | | | | |
| Shares | | | | Fair Value | |
| | COMMON STOCKS — 96.4% | | | | | | |
| | | |
| | | | Auto Components — 3.7% | | | | | | |
| | 1,101,775 | | | Gentex Corp. | | | | $ | 23,644,091 | |
| | | | | | | | | | |
| | | | Capital Markets — 9.8% | | | | | | |
| | 172,925 | | | Affiliated Managers Group, Inc. | | | | | 23,642,306 | |
| | 427,350 | | | E*TRADE Financial Corp.(a) | | | | | 22,388,867 | |
| | 157,675 | | | T. Rowe Price Group, Inc. | | | | | 17,214,957 | |
| | | | | | | | | | |
| | | | | | | | | 63,246,130 | |
| | | | | | | | | | |
| | | | Chemicals — 5.0% | | | | | | |
| | 771,075 | | | Axalta Coating Systems, Ltd.(a) | | | | | 22,484,547 | |
| | 520,485 | | | Rayonier Advanced Materials, Inc. | | | | | 9,592,539 | |
| | | | | | | | | | |
| | | | | | | | | 32,077,086 | |
| | | | | | | | | | |
| | | | Commercial Services & Supplies — 1.6% | |
| | 1,174,000 | | | Civeo Corp.(a) | | | | | 4,872,100 | |
| | 95,800 | | | Stericycle, Inc.(a) | | | | | 5,621,544 | |
| | | | | | | | | | |
| | | | | | | | | 10,493,644 | |
| | | | | | | | | | |
| | | | Construction & Engineering — 2.2% | |
| | 181,725 | | | Jacobs Engineering Group, Inc. | | | | | 13,901,963 | |
| | | | | | | | | | |
| | | | Consumer Finance — 4.2% | | | | | | |
| | 1,156,880 | | | SLM Corp.(a) | | | | | 12,899,212 | |
| | 454,950 | | | Synchrony Financial | | | | | 14,139,846 | |
| | | | | | | | | | |
| | | | | | | | | 27,039,058 | |
| | | | | | | | | | |
| | | | Containers & Packaging — 3.6% | | | | | | |
| | 481,350 | | | Crown Holdings, Inc.(a) | | | | | 23,104,800 | |
| | | | | | | | | | |
| | | | Diversified Financial Services — 3.9% | | | | | | |
| | 1,156,314 | | | Jefferies Financial Group, Inc. | | | | | 25,392,655 | |
| | | | | | | | | | |
| | | | Diversified Telecommunication Services — 1.9% | |
| | 576,075 | | | CenturyLink, Inc. | | | | | 12,212,790 | |
| | | | | | | | | | |
| | | | Electrical Equipment — 3.4% | | | | | | |
| | 441,975 | | | Sensata Technologies Holding PLC(a) | | | | | 21,899,861 | |
| | | | | | | | | | |
| | | | Electronic Equipment, Instruments &
Components — 1.6% | |
| | 624,400 | | | Knowles Corp.(a) | | | | | 10,377,528 | |
| | | | | | | | | | |
| | | | Health Care Equipment & Supplies — 3.6% | |
| | 178,700 | | | Zimmer Biomet Holdings, Inc. | | | | | 23,493,689 | |
| | | | | | | | | | |
| | | | Health Care Providers & Services — 5.9% | |
| | 125,425 | | | Laboratory Corp. of America Holdings(a) | | | | | 21,783,814 | |
| | 120,350 | | | McKesson Corp. | | | | | 15,964,428 | |
| | | | | | | | | | |
| | | | | | | | | 37,748,242 | |
| | | | | | | | | | |
| | | | Household Products — 3.0% | | | | | | |
| | 261,450 | | | Spectrum Brands Holdings, Inc. | | | | | 19,535,544 | |
| | | | | | | | | | |
| | | | Insurance — 8.7% | | | | | | |
| | 154,375 | | | Assured Guaranty, Ltd. | | | | | 6,519,256 | |
| | 69,300 | | | Enstar Group, Ltd.(a) | | | | | 14,449,050 | |
| | 240,925 | | | Lincoln National Corp. | | | | | 16,300,985 | |
| | 16,025 | | | Markel Corp.(a) | | | | | 19,045,552 | |
| | | | | | | | | | |
| | | | | | | | | 56,314,843 | |
| | | | | | | | | | |
| | | | | | | | | | |
| Shares | | | | Fair Value | |
| | COMMON STOCKS — (continued) | | | | | | |
| | | |
| | | | Internet Software & Services — 3.2% | | | | | | |
| | 824,500 | | | DHI Group, Inc.(a) | | | | $ | 1,731,450 | |
| | 578,550 | | | eBay, Inc.(a) | | | | | 19,103,721 | |
| | | | | | | | | | |
| | | | | | | | | 20,835,171 | |
| | | | | | | | | | |
| | | | IT Services — 3.1% | | | | | | |
| | 180,400 | | | Fidelity National Information Services, Inc. | | | | | 19,676,228 | |
| | | | | | | | | | |
| | | | Machinery — 1.7% | | | | | | |
| | 294,450 | | | Trinity Industries, Inc. | | | | | 10,788,648 | |
| | | | | | | | | | |
| | | | Media — 7.1% | | | | | | |
| | 295,625 | | | CBS Corp., Class B | | | | | 16,983,656 | |
| | 972,200 | | | News Corp., Class B | | | | | 13,221,920 | |
| | 223,550 | | | Omnicom Group, Inc. | | | | | 15,205,871 | |
| | | | | | | | | | |
| | | | | | | | | 45,411,447 | |
| | | | | | | | | | |
| | | | Multiline Retail — 3.7% | | | | | | |
| | 216,050 | | | Dollar General Corp. | | | | | 23,614,265 | |
| | | | | | | | | | |
| | | | Oil, Gas & Consumable Fuels — 2.1% | | | | | | |
| | 2,606,775 | | | Southwestern Energy Co.(a) | | | | | 13,320,620 | |
| | | | | | | | | | |
| | | | Real Estate Management & Development — 5.6% | |
| | 468,850 | | | CBRE Group, Inc., Class A(a) | | | | | 20,676,285 | |
| | 752,325 | | | Realogy Holdings Corp. | | | | | 15,527,988 | |
| | | | | | | | | | |
| | | | | | | | | 36,204,273 | |
| | | | | | | | | | |
| | | | Specialty Retail — 3.5% | | | | | | |
| | 302,550 | | | CarMax, Inc.(a) | | | | | 22,591,409 | |
| | | | | | | | | | |
| | | | Technology Hardware, Storage & Peripherals — 4.3% | |
| | 970,975 | | | NCR Corp.(a) | | | | | 27,585,400 | |
| | | | | | | | | | |
| | | | Total Common Stocks
(Cost $489,666,204) | | | | | 620,509,385 | |
| | | | | | | | | | |
| | MONEY MARKET FUND — 3.6% | | | | | | |
| | 23,338,414 | | | Federated Treasury Obligations Fund, Institutional Shares, 1.92%(b) | | | | | 23,338,414 | |
| | | | | | | | | | |
| | | | Total Money Market Fund
(Cost $23,338,414) | | | | | 23,338,414 | |
| | | | | | | | | | |
| Total Investments — 100.0%
(Cost $513,004,618) | | | | | 643,847,799 | |
| | Net Other Assets (Liabilities) — 0.0% | | | | | (32,495 | ) |
| | | | | | | | | | |
| | NET ASSETS — 100.0% | | | | $ | 643,815,304 | |
| | | | | | | | | | |
| (a) | Represents non-income producing security. |
| (b) | Represents the current yield as of report date. |
See accompanying Notes to the Financial Statements.
62
|
Sterling Capital Behavioral Small Cap Value Equity Fund |
Schedule of Portfolio Investments |
September 30, 2018 |
| | | | | | | | | | |
| Shares | | | | Fair Value | |
| | COMMON STOCKS — 97.7% | | | | | | |
| |
| | | | Air Freight & Logistics — 0.5% | |
| | 17,121 | | | Atlas Air Worldwide Holdings, Inc.(a) | | | | $ | 1,091,464 | |
| | | | | | | | | | |
| | | | Airlines — 1.4% | |
| | 8,305 | | | Copa Holdings SA, Class A | | | | | 663,071 | |
| | 45,989 | | | SkyWest, Inc. | | | | | 2,708,752 | |
| | | | | | | | | | |
| | | | | | | | | 3,371,823 | |
| | | | | | | | | | |
| | | | Banks — 14.8% | | | | | | |
| | 38,443 | | | Associated Banc-Corp. | | | | | 999,518 | |
| | 22,712 | | | BankUnited, Inc. | | | | | 804,005 | |
| | 12,926 | | | Berkshire Hills Bancorp, Inc. | | | | | 526,088 | |
| | 24,860 | | | Camden National Corp. | | | | | 1,079,918 | |
| | 36,986 | | | Cathay General Bancorp | | | | | 1,532,700 | |
| | 16,312 | | | CIT Group, Inc. | | | | | 841,862 | |
| | 22,581 | | | Community Trust Bancorp, Inc. | | | | | 1,046,629 | |
| | 36,981 | | | Customers Bancorp, Inc.(a) | | | | | 870,163 | |
| | 31,833 | | | Enterprise Financial Services Corp. | | | | | 1,688,741 | |
| | 28,097 | | | Financial Institutions, Inc. | | | | | 882,246 | |
| | 145,439 | | | First BanCorp(a) | | | | | 1,323,495 | |
| | 27,513 | | | First Bancorp | | | | | 1,114,552 | |
| | 77,080 | | | First Commonwealth Financial Corp. | | | | | 1,244,071 | |
| | 30,927 | | | First Financial Bancorp | | | | | 918,532 | |
| | 23,453 | | | Franklin Financial Network, Inc.(a) | | | | | 917,012 | |
| | 33,997 | | | Great Western Bancorp, Inc. | | | | | 1,434,333 | |
| | 35,309 | | | Hancock Whitney Corp. | | | | | 1,678,943 | |
| | 73,918 | | | Hope Bancorp, Inc. | | | | | 1,195,254 | |
| | 22,111 | | | IBERIABANK Corp. | | | | | 1,798,730 | |
| | 39,366 | | | Independent Bank Corp. | | | | | 931,006 | |
| | 31,515 | | | Live Oak Bancshares, Inc. | | | | | 844,602 | |
| | 69,276 | | | OFG Bancorp | | | | | 1,118,807 | |
| | 87,987 | | | Old National Bancorp | | | | | 1,698,149 | |
| | 33,493 | | | Peapack Gladstone Financial Corp. | | | | | 1,034,599 | |
| | 25,981 | | | Peoples Bancorp, Inc. | | | | | 910,114 | |
| | 20,915 | | | Popular, Inc. | | | | | 1,071,894 | |
| | 32,223 | | | RBB Bancorp | | | | | 789,463 | |
| | 45,575 | | | Simmons First National Corp., Class A | | | | | 1,342,184 | |
| | 17,218 | | | Synovus Financial Corp. | | | | | 788,412 | |
| | 51,771 | | | TCF Financial Corp. | | | | | 1,232,668 | |
| | 8,514 | | | TriState Capital Holdings, Inc.(a) | | | | | 234,986 | |
| | 27,656 | | | Zions Bancorp NA | | | | | 1,386,948 | |
| | | | | | | | | | |
| | | | | | | | | 35,280,624 | |
| | | | | | | | | | |
| | | | Biotechnology — 0.4% | | | | | | |
| | 47,735 | | | AMAG Pharmaceuticals, Inc.(a) | | | | | 954,700 | |
| | | | | | | | | | |
| | | | Building Products — 0.4% | | | | | | |
| | 22,036 | | | Continental Building Products, Inc.(a) | | | | | 827,452 | |
| | | | | | | | | | |
| | | | Capital Markets — 0.4% | | | | | | |
| | 12,179 | | | Piper Jaffray Cos | | | | | 929,867 | |
| | | | | | | | | | |
| | | | Chemicals — 1.5% | | | | | | |
| | 29,296 | | | Huntsman Corp. | | | | | 797,730 | |
| | 22,136 | | | Kraton Corp.(a) | | | | | 1,043,712 | |
| | 37,965 | | | Rayonier Advanced Materials, Inc. | | | | | 699,695 | |
| | 14,326 | | | Trinseo SA | | | | | 1,121,726 | |
| | | | | | | | | | |
| | | | | | | | | 3,662,863 | |
| | | | | | | | | | |
| | | | Commercial Services & Supplies — 0.8% | |
| | 84,384 | | | ACCO Brands Corp. | | | | | 953,539 | |
| | 41,222 | | | Heritage-Crystal Clean, Inc.(a) | | | | | 880,090 | |
| | 3,452 | | | McGrath RentCorp | | | | | 188,030 | |
| | | | | | | | | | |
| | | | | | | | | 2,021,659 | |
| | | | | | | | | | |
| | | | | | | | | | |
| Shares | | | | Fair Value | |
| | COMMON STOCKS — (continued) | | | | | | |
| | | |
| | | | Communications Equipment — 1.3% | | | | | | |
| | 58,966 | | | Ciena Corp.(a) | | | | $ | 1,842,098 | |
| | 15,022 | | | Comtech Telecommunications Corp. | | | | | 544,848 | |
| | 10,045 | | | InterDigital, Inc. | | | | | 803,600 | |
| | | | | | | | | | |
| | | | | | | | | 3,190,546 | |
| | | | | | | | | | |
| | | | Construction & Engineering — 1.2% | | | | | | |
| | 39,733 | | | Aegion Corp.(a) | | | | | 1,008,424 | |
| | 24,272 | | | Quanta Services, Inc.(a) | | | | | 810,199 | |
| | 50,058 | | | Tutor Perini Corp.(a) | | | | | 941,090 | |
| | | | | | | | | | |
| | | | | �� | | | | 2,759,713 | |
| | | | | | | | | | |
| | | | Consumer Finance — 2.0% | | | | | | |
| | 58,517 | | | Navient Corp. | | | | | 788,809 | |
| | 24,777 | | | Nelnet, Inc., Class A | | | | | 1,416,501 | |
| | 25,589 | | | OneMain Holdings, Inc.(a) | | | | | 860,046 | |
| | 25,190 | | | Regional Management Corp.(a) | | | | | 726,228 | |
| | 51,028 | | | Santander Consumer USA Holdings, Inc. | | | | | 1,022,601 | |
| | | | | | | | | | |
| | | | | | | | | 4,814,185 | |
| | | | | | | | | | |
| | | | Distributors — 0.5% | | | | | | |
| | 34,057 | | | Core-Mark Holding Co., Inc. | | | | | 1,156,576 | |
| | | | | | | | | | |
| | | | Electric Utilities — 2.5% | | | | | | |
| | 5,496 | | | Hawaiian Electric Industries, Inc. | | | | | 195,603 | |
| | 19,621 | | | IDACORP, Inc. | | | | | 1,946,992 | |
| | 22,247 | | | OGE Energy Corp. | | | | | 808,011 | |
| | 15,185 | | | Pinnacle West Capital Corp. | | | | | 1,202,348 | |
| | 40,603 | | | Portland General Electric Co. | | | | | 1,851,903 | |
| | | | | | | | | | |
| | | | | | | | | 6,004,857 | |
| | | | | | | | | | |
| | | | Electrical Equipment — 0.8% | | | | | | |
| | 38,837 | | | Atkore International Group, Inc.(a) | | | | | 1,030,346 | |
| | 17,236 | | | Generac Holdings, Inc.(a) | | | | | 972,283 | |
| | | | | | | | | | |
| | | | | | | | | 2,002,629 | |
| | | | | | | | | | |
| | | | Electronic Equipment, Instruments & Components — 3.9% | | | | | | |
| | 33,359 | | | AVX Corp. | | | | | 602,130 | |
| | 48,505 | | | Electro Scientific Industries, Inc.(a) | | | | | 846,412 | |
| | 26,308 | | | Fabrinet(a) | | | | | 1,217,008 | |
| | 20,455 | | | Insight Enterprises, Inc.(a) | | | | | 1,106,411 | |
| | 33,916 | | | Jabil, Inc. | | | | | 918,445 | |
| | 41,032 | | | KEMET Corp.(a) | | | | | 761,144 | |
| | 24,230 | | | PC Connection, Inc. | | | | | 942,305 | |
| | 78,917 | | | TTM Technologies, Inc.(a) | | | | | 1,255,569 | |
| | 81,424 | | | Vishay Intertechnology, Inc. | | | | | 1,656,978 | |
| | | | | | | | | | |
| | | | | | | | | 9,306,402 | |
| | | | | | | | | | |
| | | | Energy Equipment & Services — 1.5% | |
| | 39,940 | | | Matrix Service Co.(a) | | | | | 984,521 | |
| | 187,224 | | | Noble Corp. PLC(a) | | | | | 1,316,185 | |
| | 88,780 | | | Transocean, Ltd.(a) | | | | | 1,238,481 | |
| | | | | | | | | | |
| | | | | | | | | 3,539,187 | |
| | | | | | | | | | |
| | | | Equity Real Estate Investment Trusts (REITS) — 6.8% | |
| | 48,348 | | | Apple Hospitality REIT, Inc. | | | | | 845,607 | |
| | 50,454 | | | Brixmor Property Group, Inc. | | | | | 883,450 | |
| | 86,275 | | | CBL & Associates Properties, Inc. | | | | | 344,237 | |
| | 50,825 | | | Chatham Lodging Trust | | | | | 1,061,734 | |
| | 37,238 | | | Columbia Property Trust, Inc. | | | | | 880,306 | |
| | 18,446 | | | Cousins Properties, Inc. | | | | | 163,985 | |
| | 15,386 | | | DiamondRock Hospitality Co. | | | | | 179,555 | |
Continued
63
|
Sterling Capital Behavioral Small Cap Value Equity Fund |
Schedule of Portfolio Investments — (continued) |
September 30, 2018 |
| | | | | | | | | | |
| Shares | | | | Fair Value | |
| | COMMON STOCKS — (continued) | | | | | | |
| |
| | | | Equity Real Estate Investment Trusts (REITS) — (continued) | |
| | 43,110 | | | Getty Realty Corp. | | | | $ | 1,231,222 | |
| | 29,618 | | | Hospitality Properties Trust | | | | | 854,183 | |
| | 50,495 | | | InfraREIT, Inc. | | | | | 1,067,969 | |
| | 18,290 | | | Innovative Industrial Properties, Inc. | | | | | 882,310 | |
| | 50,437 | | | Kimco Realty Corp. | | | | | 844,315 | |
| | 85,359 | | | MedEquities Realty Trust, Inc. | | | | | 829,689 | |
| | 67,064 | | | Medical Properties Trust, Inc. | | | | | 999,924 | |
| | 28,014 | | | Monmouth Real Estate Investment Corp. | | | | | 468,394 | |
| | 30,467 | | | Park Hotels & Resorts, Inc. | | | | | 999,927 | |
| | 36,919 | | | Piedmont Office Realty Trust, Inc., Class A | | | | | 698,877 | |
| | 30,316 | | | Rexford Industrial Realty, Inc. | | | | | 968,899 | |
| | 39,386 | | | Sabra Health Care REIT, Inc. | | | | | 910,604 | |
| | 17,428 | | | Terreno Realty Corp. | | | | | 657,036 | |
| | 24,512 | | | Tier REIT, Inc. | | | | | 590,739 | |
| | | | | | | | | | |
| | | | | | | | | 16,362,962 | |
| | | | | | | | | | |
| | | | Food Products — 1.4% | | | | | | |
| | 20,992 | | | Cal-Maine Foods, Inc. | | | | | 1,013,914 | |
| | 11,627 | | | John B Sanfilippo & Son, Inc. | | | | | 829,935 | |
| | 8,501 | | | Post Holdings, Inc.(a) | | | | | 833,438 | |
| | 15,881 | | | TreeHouse Foods, Inc.(a) | | | | | 759,906 | |
| | | | | | | | | | |
| | | | | | | | | 3,437,193 | |
| | | | | | | | | | |
| | | | Gas Utilities — 1.0% | | | | | | |
| | 15,751 | | | National Fuel Gas Co. | | | | | 883,001 | |
| | 45,165 | | | South Jersey Industries, Inc. | | | | | 1,592,970 | |
| | | | | | | | | | |
| | | | | | | | | 2,475,971 | |
| | | | | | | | | | |
| | | | Health Care Providers & Services — 3.6% | |
| | 18,457 | | | Encompass Health Corp. | | | | | 1,438,723 | |
| | 11,341 | | | Molina Healthcare, Inc.(a) | | | | | 1,686,407 | |
| | 14,308 | | | Premier, Inc., Class A(a) | | | | | 655,020 | |
| | 93,358 | | | RadNet, Inc.(a) | | | | | 1,405,038 | |
| | 29,907 | | | Tenet Healthcare Corp.(a) | | | | | 851,153 | |
| | 39,867 | | | Triple-S Management Corp., Class B(a) | | | | | 753,088 | |
| | 5,493 | | | WellCare Health Plans, Inc.(a) | | | | | 1,760,452 | |
| | | | | | | | | | |
| | | | | | | | | 8,549,881 | |
| | | | | | | | | | |
| | | | Hotels, Restaurants & Leisure — 0.7% | |
| | 50,200 | | | Penn National Gaming, Inc.(a) | | | | | 1,652,584 | |
| | | | | | | | | | |
| | | | Household Durables — 0.4% | | | | | | |
| | 43,636 | | | Turtle Beach Corp.(a) | | | | | 870,102 | |
| | | | | | | | | | |
| | | | Independent Power and Renewable Electricity Producers — 2.4% | | | | | | |
| | 87,889 | | | AES Corp. | | | | | 1,230,446 | |
| | 111,558 | | | Clearway Energy, Inc., Class A | | | | | 2,124,064 | |
| | 65,442 | | | Clearway Energy, Inc., Class C | | | | | 1,259,759 | |
| | 59,176 | | | Pattern Energy Group, Inc., Class A | | | | | 1,175,827 | |
| | | | | | | | | | |
| | | | | | | | | 5,790,096 | |
| | | | | | | | | | |
| | | | Insurance — 3.9% | | | | | | |
| | 58,428 | | | American Equity Investment Life Holding Co. | | | | | 2,066,014 | |
| | 22,618 | | | Assured Guaranty, Ltd. | | | | | 955,158 | |
| | 86,045 | | | CNO Financial Group, Inc. | | | | | 1,825,875 | |
| | 25,398 | | | Employers Holdings, Inc. | | | | | 1,150,529 | |
| | 19,999 | | | HCI Group, Inc. | | | | | 874,956 | |
| | 8,494 | | | Reinsurance Group of America, Inc. | | | | | 1,227,893 | |
| | 26,500 | | | Universal Insurance Holdings, Inc. | | | | | 1,286,575 | |
| | | | | | | | | | |
| | | | | | | | | 9,387,000 | |
| | | | | | | | | | |
| | | | | | | | | | |
| Shares | | | | Fair Value | |
| | COMMON STOCKS — (continued) | | | | | | |
| |
| | | | Internet Software & Services — 0.3% | |
| | 92,220 | | | Endurance International Group Holdings, Inc.(a) | | | | $ | 811,536 | |
| | | | | | | | | | |
| | | | IT Services — 0.7% | | | | | | |
| | 32,182 | | | Sabre Corp. | | | | | 839,307 | |
| | 44,668 | | | Unisys Corp.(a) | | | | | 911,227 | |
| | | | | | | | | | |
| | | | | | | | | 1,750,534 | |
| | | | | | | | | | |
| | | | Leisure Products — 0.9% | | | | | | |
| | 65,112 | | | American Outdoor Brands Corp.(a) | | | | | 1,011,189 | |
| | 60,120 | | | Vista Outdoor, Inc.(a) | | | | | 1,075,547 | |
| | | | | | | | | | |
| | | | | | | | | 2,086,736 | |
| | | | | | | | | | |
| | | | Machinery — 2.5% | | | | | | |
| | 19,062 | | | Allison Transmission Holdings, Inc. | | | | | 991,415 | |
| | 23,175 | | | Global Brass & Copper Holdings, Inc. | | | | | 855,157 | |
| | 23,701 | | | Greenbrier Cos., Inc. (The) | | | | | 1,424,430 | |
| | 17,858 | | | Hillenbrand, Inc. | | | | | 933,973 | |
| | 19,953 | | | Terex Corp. | | | | | 796,324 | |
| | 27,957 | | | Trinity Industries, Inc. | | | | | 1,024,344 | |
| | | | | | | | | | |
| | | | | | | | | 6,025,643 | |
| | | | | | | | | | |
| | | | Marine — 0.9% | | | | | | |
| | 150,580 | | | Costamare, Inc. | | | | | 977,264 | |
| | 27,823 | | | Matson, Inc. | | | | | 1,102,904 | |
| | | | | | | | | | |
| | | | | | | | | 2,080,168 | |
| | | | | | | | | | |
| | | | Media — 0.4% | | | | | | |
| | 99,849 | | | Gannett Co., Inc. | | | | | 999,488 | |
| | | | | | | | | | |
| | | | Metals & Mining — 1.5% | | | | | | |
| | 18,611 | | | Materion Corp. | | | | | 1,125,965 | |
| | 32,938 | | | Schnitzer Steel Industries, Inc., Class A | | | | | 890,973 | |
| | 20,815 | | | U.S. Steel Corp. | | | | | 634,441 | |
| | 35,372 | | | Warrior Met Coal, Inc. | | | | | 956,459 | |
| | | | | | | | | | |
| | | | | | | | | 3,607,838 | |
| | | | | | | | | | |
| | | | Mortgage Real Estate Investment Trusts (REITS) — 4.6% | |
| | 44,622 | | | AGNC Investment Corp. | | | | | 831,308 | |
| | 45,909 | | | ARMOUR Residential REIT, Inc. | | | | | 1,030,657 | |
| | 48,136 | | | Cherry Hill Mortgage Investment Corp. | | | | | 871,262 | |
| | 45,236 | | | Chimera Investment Corp. | | | | | 820,129 | |
| | 35,822 | | | Dynex Capital, Inc. | | | | | 228,544 | |
| | 41,204 | | | Great Ajax Corp. | | | | | 560,786 | |
| | 68,582 | | | Ladder Capital Corp. | | | | | 1,161,779 | |
| | 102,913 | | | MFA Financial, Inc. | | | | | 756,411 | |
| | 90,030 | | | New Residential Investment Corp. | | | | | 1,604,335 | |
| | 158,351 | | | New York Mortgage Trust, Inc. | | | | | 962,774 | |
| | 54,635 | | | PennyMac Mortgage Investment Trust | | | | | 1,105,812 | |
| | 67,500 | | | Redwood Trust, Inc. | | | | | 1,096,200 | |
| | | | | | | | | | |
| | | | | | | | | 11,029,997 | |
| | | | | | | | | | |
| | | | Multiline Retail — 0.6% | | | | | | |
| | 17,337 | | | Dillard’s, Inc., Class A | | | | | 1,323,507 | |
| | | | | | | | | | |
| | | | Multi-Utilities — 0.7% | | | | | | |
| | 26,701 | | | North Western Corp. | | | | | 1,566,281 | |
| | | | | | | | | | |
| | | | Oil, Gas & Consumable Fuels — 4.8% | |
| | 13,987 | | | Arch Coal, Inc., Class A | | | | | 1,250,438 | |
| | 283,899 | | | Denbury Resources, Inc.(a) | | | | | 1,760,174 | |
| | 23,156 | | | HollyFrontier Corp. | | | | | 1,618,604 | |
| | 27,573 | | | Murphy Oil Corp. | | | | | 919,284 | |
Continued
64
|
Sterling Capital Behavioral Small Cap Value Equity Fund |
Schedule of Portfolio Investments — (continued) |
September 30, 2018 |
| | | | | | | | | | |
| Shares | | | | Fair Value | |
| | COMMON STOCKS — (continued) | | | | | | |
| |
| | | | Oil, Gas & Consumable Fuels — (continued) | |
| | 25,812 | | | PBF Energy, Inc., Class A | | | | $ | 1,288,277 | |
| | 35,607 | | | Peabody Energy Corp. | | | | | 1,269,033 | |
| | 38,459 | | | Renewable Energy Group, Inc.(a) | | | | | 1,107,619 | |
| | 148,334 | | | W&T Offshore, Inc.(a) | | | | | 1,429,940 | |
| | 17,124 | | | Whiting Petroleum Corp.(a) | | | | | 908,257 | |
| | | | | | | | | | |
| | | | | | | | | 11,551,626 | |
| | | | | | | | | | |
| | | | Paper & Forest Products — 2.3% | | | | | | |
| | 27,183 | | | Boise Cascade Co. | | | | | 1,000,334 | |
| | 23,085 | | | Domtar Corp. | | | | | 1,204,344 | |
| | 55,193 | | | Louisiana-Pacific Corp. | | | | | 1,462,063 | |
| | 54,123 | | | Verso Corp., Class A(a) | | | | | 1,822,321 | |
| | | | | | | | | | |
| | | | | | | | | 5,489,062 | |
| | | | | | | | | | |
| | | | Personal Products — 0.1% | | | | | | |
| | 3,954 | | | Nu Skin Enterprises, Inc., Class A | | | | | 325,889 | |
| | | | | | | | | | |
| | | | Pharmaceuticals — 0.8% | | | | | | |
| | 29,129 | | | Innoviva, Inc.(a) | | | | | 443,926 | |
| | 46,029 | | | Mallinckrodt PLC(a) | | | | | 1,349,110 | |
| | | | | | | | | | |
| | | | | | | | | 1,793,036 | |
| | | | | | | | | | |
| | | | Professional Services — 2.1% | | | | | | |
| | 12,222 | | | Barrett Business Services, Inc. | | | | | 816,185 | |
| | 19,587 | | | FTI Consulting, Inc.(a) | | | | | 1,433,573 | |
| | 30,384 | | | Heidrick & Struggles International, Inc. | | | | | 1,028,498 | |
| | 22,541 | | | Kforce, Inc. | | | | | 847,542 | |
| | 17,445 | | | Korn/Ferry International | | | | | 858,992 | |
| | | | | | | | | | |
| | | | | | | | | 4,984,790 | |
| | | | | | | | | | |
| | | | Real Estate Management & Development — 0.3% | |
| | 7,014 | | | RMR Group, Inc. (The), Class A | | | | | 650,899 | |
| | | | | | | | | | |
| | | | Road & Rail — 1.0% | | | | | | |
| | 28,482 | | | ArcBest Corp. | | | | | 1,382,801 | |
| | 26,771 | | | Universal Logistics Holdings, Inc. | | | | | 985,173 | |
| | | | | | | | | | |
| | | | | | | | | 2,367,974 | |
| | | | | | | | | | |
| | | | Semiconductors & Semiconductor Equipment — 2.5% | |
| | 35,164 | | | Diodes, Inc.(a) | | | | | 1,170,610 | |
| | 20,536 | | | First Solar, Inc.(a) | | | | | 994,353 | |
| | 23,417 | | | Nanometrics, Inc.(a) | | | | | 878,606 | |
| | 48,276 | | | ON Semiconductor Corp.(a) | | | | | 889,727 | |
| | 101,127 | | | Photronics, Inc.(a) | | | | | 996,101 | |
| | 28,407 | | | Teradyne, Inc. | | | | | 1,050,491 | |
| | | | | | | | | | |
| | | | | | | | | 5,979,888 | |
| | | | | | | | | | |
| | | | Software — 0.6% | | | | | | |
| | 62,991 | | | Avaya Holdings Corp.(a) | | | | | 1,394,621 | |
| | | | | | | | | | |
| | | | Specialty Retail — 6.6% | | | | | | |
| | 59,358 | | | Abercrombie & Fitch Co., Class A | | | | | 1,253,641 | |
| | 38,667 | | | American Eagle Outfitters, Inc. | | | | | 960,102 | |
| | 11,570 | | | Asbury Automotive Group, Inc.(a) | | | | | 795,437 | |
| | 39,704 | | | Cato Corp. (The), Class A | | | | | 834,578 | |
| | 33,147 | | | Citi Trends, Inc. | | | | | 953,639 | |
| | 22,812 | | | Dick’s Sporting Goods, Inc. | | | | | 809,370 | |
| | 41,334 | | | DSW, Inc., Class A | | | | | 1,400,396 | |
| | 21,856 | | | Genesco, Inc.(a) | | | | | 1,029,418 | |
| | 8,748 | | | RH(a) | | | | | 1,146,075 | |
| | 28,140 | | | Shoe Carnival, Inc. | | | | | 1,083,390 | |
| | | | | | | | | | |
| Shares | | | | Fair Value | |
| | COMMON STOCKS — (continued) | | | | | | |
| |
| | | | Specialty Retail — (continued) | |
| | 25,087 | | | Signet Jewelers, Ltd. | | | | $ | 1,653,986 | |
| | 45,586 | | | Tailored Brands, Inc. | | | | | 1,148,311 | |
| | 22,631 | | | Urban Outfitters, Inc.(a) | | | | | 925,608 | |
| | 12,539 | | | Williams-Sonoma, Inc. | | | | | 824,063 | |
| | 33,141 | | | Zumiez, Inc.(a) | | | | | 873,265 | |
| | | | | | | | | | |
| | | | | | | | | 15,691,279 | |
| | | | | | | | | | |
| | | | Textiles, Apparel & Luxury Goods — 2.7% | |
| | 14,863 | | | Deckers Outdoor Corp.(a) | | | | | 1,762,455 | |
| | 77,567 | | | Fossil Group, Inc.(a) | | | | | 1,805,760 | |
| | 12,911 | | | Michael Kors Holdings, Ltd.(a) | | | | | 885,178 | |
| | 7,412 | | | Ralph Lauren Corp. | | | | | 1,019,521 | |
| | 64,018 | | | Vera Bradley, Inc.(a) | | | | | 976,915 | |
| | | | | | | | | | |
| | | | | | | | | 6,449,829 | |
| | | | | | | | | | |
| | | | Thrifts & Mortgage Finance — 6.2% | |
| | 3,541 | | | Axos Financial, Inc.(a) | | | | | 121,775 | |
| | 21,294 | | | Federal Agricultural Mortgage Corp., Class C | | | | | 1,537,001 | |
| | 36,980 | | | Flagstar Bancorp, Inc.(a) | | | | | 1,163,761 | |
| | 32,431 | | | Merchants Bancorp | | | | | 824,396 | |
| | 170,146 | | | MGIC Investment Corp.(a) | | | | | 2,264,643 | |
| | 61,826 | | | Oritani Financial Corp. | | | | | 961,394 | |
| | 40,350 | | | PennyMac Financial Services, Inc., Class A | | | | | 843,315 | |
| | 91,304 | | | Radian Group, Inc. | | | | | 1,887,254 | |
| | 126,029 | | | TrustCo Bank Corp. | | | | | 1,071,247 | |
| | 67,435 | | | United Financial Bancorp, Inc. | | | | | 1,134,931 | |
| | 30,207 | | | Walker & Dunlop, Inc. | | | | | 1,597,346 | |
| | 46,263 | | | Washington Federal, Inc. | | | | | 1,480,416 | |
| | | | | | | | | | |
| | | | | | | | | 14,887,479 | |
| | | | | | | | | | |
| | | | Trading Companies & Distributors — 0.5% | |
| | 7,657 | | | United Rentals, Inc.(a) | | | | | 1,252,685 | |
| | | | | | | | | | |
| | | | Total Common Stocks
(Cost $201,780,467) | | | | | 233,541,121 | |
| | | | | | | | | | |
| | EXCHANGE TRADED FUND — 0.8% | | | | |
| | 14,226 | | | iShares Russell 2000 Value ETF | | | | | 1,892,058 | |
| | | | | | | | | | |
| | | | Total Exchange Traded Fund
(Cost $1,819,078) | | | | | 1,892,058 | |
| | | | | | | | | | |
| | MONEY MARKET FUND — 1.1% | | | | | | |
| | 2,738,129 | | | Federated Treasury Obligations Fund,
Institutional Shares, 1.92%(b) | | | | | 2,738,129 | |
| | | | | | | | | | |
| | | | Total Money Market Fund
(Cost $2,738,129) | | | | | 2,738,129 | |
| | | | | | | | | | |
| Total Investments — 99.6%
(Cost $206,337,674) | | | | | 238,171,308 | |
| | Net Other Assets (Liabilities) — 0.4% | | | | | 881,012 | |
| | | | | | | | | | |
| | NET ASSETS — 100.0% | | | | $ | 239,052,320 | |
| | | | | | | | | | |
| (a) | Represents non-income producing security. |
| (b) | Represents the current yield as of report date. |
ETF — Exchange Traded Fund
See accompanying Notes to the Financial Statements.
65
|
Sterling Capital Special Opportunities Fund |
Schedule of Portfolio Investments |
September 30, 2018 |
| | | | | | | | | | |
| Shares | | | | Fair Value | |
| | COMMON STOCKS — 99.7% | | | | | | |
| | | |
| | | | Airlines — 2.6% | | | | | | |
| | 460,000 | | | Alaska Air Group, Inc. | | | | $ | 31,675,600 | |
| | | | | | | | | | |
| | | | Auto Components — 3.3% | | | | | | |
| | 415,000 | | | APTIV PLC | | | | | 34,818,500 | |
| | 167,333 | | | Delphi Technologies PLC | | | | | 5,247,563 | |
| | | | | | | | | | |
| | | | | | | | | 40,066,063 | |
| | | | | | | | | | |
| | | | Biotechnology — 3.8% | | | | | | |
| | 592,800 | | | Gilead Sciences, Inc. | | | | | 45,770,088 | |
| | | | | | | | | | |
| | | | Chemicals — 3.8% | | | | | | |
| | 293,800 | | | Ecolab, Inc. | | | | | 46,061,964 | |
| | | | | | | | | | |
| | | | Communications Equipment — 5.5% | |
| | 1,362,500 | | | Cisco Systems, Inc. | | | | | 66,285,625 | |
| | | | | | | | | | |
| | | | Consumer Finance — 3.3% | | | | | | |
| | 415,000 | | | Capital One Financial Corp. | | | | | 39,395,950 | |
| | | | | | | | | | |
| | | | Electronic Equipment, Instruments & | | | | | | |
| | | | Components — 2.4% | | | | | | |
| | 167,500 | | | Coherent, Inc.(a) | | | | | 28,841,825 | |
| | | | | | | | | | |
| | | | Energy Equipment & Services — 3.3% | |
| | 974,500 | | | Halliburton Co. | | | | | 39,496,485 | |
| | | | | | | | | | |
| | | | Equity Real Estate Investment Trusts (REITS) — 1.2% | |
| | 162,700 | | | Ryman Hospitality Properties, Inc. | | | | | 14,019,859 | |
| | | | | | | | | | |
| | | | Food & Staples Retailing — 1.7% | | | | | | |
| | 286,000 | | | Walgreens Boots Alliance, Inc. | | | | | 20,849,400 | |
| | | | | | | | | | |
| | | | Health Care Equipment & Supplies — 6.1% | |
| | 360,830 | | | Danaher Corp. | | | | | 39,207,788 | |
| | 822,000 | | | Hologic, Inc.(a) | | | | | 33,685,560 | |
| | | | | | | | | | |
| | | | | | | | | 72,893,348 | |
| | | | | | | | | | |
| | | | Health Care Providers & Services — 7.0% | |
| | 362,100 | | | HCA Healthcare, Inc. | | | | | 50,375,352 | |
| | 128,400 | | | UnitedHealth Group, Inc. | | | | | 34,159,536 | |
| | | | | | | | | | |
| | | | | | | | | 84,534,888 | |
| | | | | | | | | | |
| | | | Health Care Technology — 3.8% | | | | | | |
| | 705,000 | | | Cerner Corp.(a) | | | | | 45,409,050 | |
| | | | | | | | | | |
| | | | Hotels, Restaurants & Leisure — 4.2% | |
| | 871,400 | | | Norwegian Cruise Line Holdings, Ltd.(a) | | | | | 50,044,502 | |
| | | | | | | | | | |
| | | | Household Durables — 2.3% | | | | | | |
| | 587,000 | | | Lennar Corp., Class A | | | | | 27,407,030 | |
| | | | | | | | | | |
| | | | Internet Software & Services — 9.2% | | | | | | |
| | 560,120 | | | Akamai Technologies, Inc.(a) | | | | | 40,972,778 | |
| | 57,800 | | | Alphabet, Inc., Class C(a) | | | | | 68,982,566 | |
| | | | | | | | | | |
| | | | | | | | | 109,955,344 | |
| | | | | | | | | | |
| | | | | | | | | | |
| Shares | | | | Fair Value | |
| | COMMON STOCKS — (continued) | | | | | | |
| | | |
| | | | Media — 13.3% | | | | | | |
| | 763,000 | | | CBS Corp., Class B | | | | $ | 43,834,350 | |
| | 1,377,000 | | | Comcast Corp., Class A | | | | | 48,759,570 | |
| | 1,543,000 | | | Discovery, Inc., Class C(a) | | | | | 45,641,940 | |
| | 402,000 | | | Live Nation Entertainment, Inc.(a) | | | | | 21,896,940 | |
| | | | | | | | | | |
| | | | | | | | | 160,132,800 | |
| | | | | | | | | | |
| | | | Pharmaceuticals — 3.1% | | | | | | |
| | 598,000 | | | Bristol-Myers Squibb Co. | | | | | 37,123,840 | |
| | | | | | | | | | |
| | | | Professional Services — 4.5% | | | | | | |
| | 450,900 | | | Verisk Analytics, Inc.(a) | | | | | 54,355,995 | |
| | | | | | | | | | |
| | | | Real Estate Management & Development — 2.4% | |
| | 650,000 | | | CBRE Group, Inc., Class A(a) | | | | | 28,665,000 | |
| | | | | | | | | | |
| | | | Semiconductors & Semiconductor Equipment — 2.1% | |
| | 294,001 | | | NXP Semiconductors NV | | | | | 25,137,085 | |
| | | | | | | | | | |
| | | | Software — 10.8% | | | | | | |
| | 415,300 | | | Activision Blizzard, Inc. | | | | | 34,548,807 | |
| | 247,200 | | | Check Point Software Technologies, Ltd.(a) | | | | | 29,088,024 | |
| | 159,000 | | | Intuit, Inc. | | | | | 36,156,600 | |
| | 221,000 | | | Red Hat, Inc.(a) | | | | | 30,117,880 | |
| | | | | | | | | | |
| | | | | | | | | 129,911,311 | |
| | | | | | | | | | |
| | | | Total Common Stocks
(Cost $775,722,309) | | | | | 1,198,033,052 | |
| | | | | | | | | | |
| | MONEY MARKET FUND — 0.3% | | | | | | |
| | 3,850,959 | | | Federated Treasury Obligations Fund,
Institutional Shares, 1.92%(b) | | | | | 3,850,959 | |
| | | | | | | | | | |
| | | | Total Money Market Fund
(Cost $3,850,959) | | | | | 3,850,959 | |
| | | | | | | | | | |
| | |
| Total Investments — 100.0%
(Cost $779,573,268) | | | | | 1,201,884,011 | |
| | Net Other Assets (Liabilities) — 0.0% | | | | | 52,765 | |
| | | | | | | | | | |
| | NET ASSETS — 100.0% | | | | $ | 1,201,936,776 | |
| | | | | | | | | | |
| (a) | Represents non-income producing security. |
| (b) | Represents the current yield as of report date. |
See accompanying Notes to the Financial Statements.
66
|
Sterling Capital Equity Income Fund |
Schedule of Portfolio Investments |
September 30, 2018 |
| | | | | | | | | | |
| Shares | | | | Fair Value | |
| | COMMON STOCKS — 97.6% | | | | | | |
| | | |
| | | | Air Freight & Logistics — 3.1% | | | | | | |
| | 439,000 | | | United Parcel Service, Inc., Class B | | | | $ | 51,253,250 | |
| | | | | | | | | | |
| | | | Automobiles — 2.8% | | | | | | |
| | 1,384,000 | | | General Motors Co. | | | | | 46,599,280 | |
| | | | | | | | | | |
| | | | Banks — 2.7% | | | | | | |
| | 850,000 | | | Wells Fargo & Co. | | | | | 44,676,000 | |
| | | | | | | | | | |
| | | | Beverages — 3.5% | | | | | | |
| | 526,900 | | | PepsiCo, Inc. | | | | | 58,907,420 | |
| | | | | | | | | | |
| | | | Biotechnology — 3.7% | | | | | | |
| | 662,000 | | | AbbVie, Inc. | | | | | 62,611,960 | |
| | | | | | | | | | |
| | | | Capital Markets — 2.6% | | | | | | |
| | 995,000 | | | Invesco, Ltd. | | | | | 22,765,600 | |
| | 250,000 | | | Nasdaq, Inc. | | | | | 21,450,000 | |
| | | | | | | | | | |
| | | | | | | | | 44,215,600 | |
| | | | | | | | | | |
| | | | Consumer Finance — 4.5% | | | | | | |
| | 990,800 | | | Discover Financial Services | | | | | 75,746,660 | |
| | | | | | | | | | |
| | | | Diversified Telecommunication Services — 5.2% | |
| | 505,698 | | | AT&T, Inc. | | | | | 16,981,339 | |
| | 1,303,000 | | | Verizon Communications, Inc. | | | | | 69,567,170 | |
| | | | | | | | | | |
| | | | | | | | | 86,548,509 | |
| | | | | | | | | | |
| | | | Equity Real Estate Investment Trusts (REITS) — 3.4% | |
| | 511,000 | | | Crown Castle International Corp. | | | | | 56,889,630 | |
| | | | | | | | | | |
| | | | Health Care Equipment & Supplies — 8.2% | |
| | 1,133,000 | | | Abbott Laboratories | | | | | 83,116,880 | |
| | 549,000 | | | Medtronic PLC | | | | | 54,005,130 | |
| | | | | | | | | | |
| | | | | | | | | 137,122,010 | |
| | | | | | | | | | |
| | | | Health Care Providers & Services — 6.0% | |
| | 128,500 | | | Anthem, Inc. | | | | | 35,215,425 | |
| | 829,319 | | | CVS Health Corp. | | | | | 65,283,992 | |
| | | | | | | | | | |
| | | | | | | | | 100,499,417 | |
| | | | | | | | | | |
| | | | Hotels, Restaurants & Leisure — 4.5% | |
| | 254,800 | | | Carnival Corp. | | | | | 16,248,596 | |
| | 1,022,000 | | | Starbucks Corp. | | | | | 58,090,480 | |
| | | | | | | | | | |
| | | | | | | | | 74,339,076 | |
| | | | | | | | | | |
| | | | Industrial Conglomerates — 3.8% | | | | | | |
| | 384,100 | | | Honeywell International, Inc. | | | | | 63,914,240 | |
| | | | | | | | | | |
| | | | Insurance — 0.7% | | | | | | |
| | 87,000 | | | Chubb, Ltd. | | | | | 11,626,680 | |
| | | | | | | | | | |
| | | | IT Services — 4.3% | | | | | | |
| | 422,500 | | | Accenture PLC, Class A | | | | | 71,909,500 | |
| | | | | | | | | | |
| | | | | | | | | | |
| Shares | | | | Fair Value | |
| | COMMON STOCKS — (continued) | | | | | | |
| | | | Machinery — 1.4% | | | | | | |
| | 128,000 | | | Snap-on, Inc. | | | | $ | 23,500,800 | |
| | | | | | | | | | |
| | | | Media — 2.0% | | | | | | |
| | 490,000 | | | Omnicom Group, Inc. | | | | | 33,329,800 | |
| | | | | | | | | | |
| | | | Oil, Gas & Consumable Fuels — 6.1% | |
| | 1,735,500 | | | Enbridge, Inc. | | | | | 56,039,295 | |
| | 568,700 | | | Occidental Petroleum Corp. | | | | | 46,730,079 | |
| | | | | | | | | | |
| | | | | | | | | 102,769,374 | |
| | | | | | | | | | |
| | | | Pharmaceuticals — 9.8% | | | | | | |
| | 409,300 | | | Johnson & Johnson | | | | | 56,552,981 | |
| | 961,000 | | | Merck & Co., Inc. | | | | | 68,173,340 | |
| | 889,000 | | | Pfizer, Inc. | | | | | 39,178,230 | |
| | | | | | | | | | |
| | | | | | | | | 163,904,551 | |
| | | | | | | | | | |
| | | | Professional Services — 1.6% | | | | | | |
| | 978,413 | | | Nielsen Holdings PLC | | | | | 27,062,903 | |
| | | | | | | | | | |
| | | | Semiconductors & Semiconductor Equipment — 9.0% | | | | | | |
| | 682,600 | | | Analog Devices, Inc. | | | | | 63,113,196 | |
| | 1,062,500 | | | Maxim Integrated Products, Inc. | | | | | 59,914,375 | |
| | 389,500 | | | QUALCOMM, Inc. | | | | | 28,055,685 | |
| | | | | | | | | | |
| | | | | | | | | 151,083,256 | |
| | | | | | | | | | |
| | | | Software — 5.0% | | | | | | |
| | 724,500 | | | Microsoft Corp. | | | | | 82,861,065 | |
| | | | | | | | | | |
| | | | Specialty Retail — 3.7% | | | | | | |
| | 538,900 | | | Lowe’s Cos., Inc. | | | | | 61,876,498 | |
| | | | | | | | | | |
| | | | Total Common Stocks
(Cost $1,124,682,659) | | | | | 1,633,247,479 | |
| | | | | | | | | | |
| | MONEY MARKET FUND — 2.5% | |
| | 41,674,690 | | | Federated Treasury Obligations Fund,
Institutional Shares, 1.92%(a) | | | | | 41,674,690 | |
| | | | | | | | | | |
| | | | Total Money Market Fund
(Cost $41,674,690) | | | | | 41,674,690 | |
| | | | | | | | | | |
| Total Investments — 100.1%
(Cost $1,166,357,349) | | | | | 1,674,922,169 | |
| | Net Other Assets (Liabilities) — (0.1)% | | | | | (2,035,789 | ) |
| | | | | | | | | | |
| | NET ASSETS — 100.0% | | | | $ | 1,672,886,380 | |
| | | | | | | | | | |
| (a) | Represents the current yield as of report date. |
See accompanying Notes to the Financial Statements.
67
|
Sterling Capital Behavioral International Equity Fund |
Schedule of Portfolio Investments |
September 30, 2018 |
| | | | | | | | | | |
| Shares | | | | Fair Value | |
| | COMMON STOCKS — 97.6% | | | | | | |
| | | |
| | | | Australia — 6.7% | | | | | | |
| | 376,400 | | | Alumina, Ltd. | | | | $ | 753,665 | |
| | 55,175 | | | Australia & New Zealand Banking Group, Ltd. | | | | | 1,123,912 | |
| | 61,400 | | | BlueScope Steel, Ltd. | | | | | 753,625 | |
| | 9,275 | | | Macquarie Group, Ltd. | | | | | 845,029 | |
| | 181,625 | | | Qantas Airways, Ltd. | | | | | 774,599 | |
| | 11,975 | | | Rio Tinto, Ltd. | | | | | 681,758 | |
| | 227,825 | | | South32, Ltd. | | | | | 645,560 | |
| | | | | | | | | | |
| | | | | | | | | 5,578,148 | |
| | | | | | | | | | |
| | | | Austria — 1.0% | | | | | | |
| | 15,075 | | | OMV AG | | | | | 846,961 | |
| | | | | | | | | | |
| | | | Belgium — 1.1% | | | | | | |
| | 9,875 | | | UCB SA | | | | | 887,419 | |
| | | | | | | | | | |
| | | | Denmark — 0.7% | | | | | | |
| | 4,650 | | | Carlsberg A/S, Class B | | | | | 557,748 | |
| | | | | | | | | | |
| | | | Finland — 0.2% | | | | | | |
| | 7,225 | | | Fortum OYJ | | | | | 181,109 | |
| | | | | | | | | | |
| | | | France — 10.1% | | | | | | |
| | 28,725 | | | ArcelorMittal | | | | | 893,810 | |
| | 1,400 | | | Atos SE | | | | | 166,611 | |
| | 16,500 | | | BNP Paribas SA | | | | | 1,009,782 | |
| | 29,975 | | | CNP Assurances | | | | | 722,499 | |
| | 1,900 | | | Eiffage SA | | | | | 212,128 | |
| | 60,525 | | | Engie SA | | | | | 890,001 | |
| | 10,425 | | | Faurecia | | | | | 627,468 | |
| | 107,900 | | | Natixis SA | | | | | 732,120 | |
| | 34,375 | | | Peugeot SA | | | | | 927,134 | |
| | 9,725 | | | Publicis Groupe SA | | | | | 581,271 | |
| | 8,575 | | | Renault SA | | | | | 741,722 | |
| | 21,200 | | | Societe Generale SA | | | | | 909,988 | |
| | | | | | | | | | |
| | | | | | | | | 8,414,534 | |
| | | | | | | | | | |
| | | | Germany — 6.4% | | | | | | |
| | 2,175 | | | Allianz SE | | | | | 484,854 | |
| | 9,050 | | | Covestro AG(b) | | | | | 734,054 | |
| | 22,375 | | | Deutsche Lufthansa AG | | | | | 549,704 | |
| | 21,950 | | | Deutsche Telekom AG | | | | | 353,860 | |
| | 5,150 | | | Deutsche Wohnen SE | | | | | 247,069 | |
| | 4,775 | | | Henkel AG & Co. KGaA | | | | | 507,000 | |
| | 4,650 | | | HOCHTIEF AG | | | | | 770,960 | |
| | 4,200 | | | Muenchener Rueckversicherungs-
Gesellschaft AG in Muenchen | | | | | 930,174 | |
| | 28,400 | | | ProSiebenSat.1 Media SE | | | | | 737,624 | |
| | | | | | | | | | |
| | | | | | | | | 5,315,299 | |
| | | | | | | | | | |
| | | | Hong Kong — 4.7% | | | | | | |
| | 30,325 | | | CK Hutchison Holdings, Ltd. | | | | | 349,411 | |
| | 59,875 | | | Galaxy Entertainment Group, Ltd. | | | | | 379,747 | |
| | 95,275 | | | Henderson Land Development Co., Ltd. | | | | | 478,910 | |
| | 162,300 | | | Kerry Properties, Ltd. | | | | | 550,444 | |
| | 424,750 | | | NWS Holdings, Ltd. | | | | | 839,913 | |
| | 904,000 | | | WH Group, Ltd.(b) | | | | | 636,282 | |
| | 234,650 | | | Wharf Holdings, Ltd. (The) | | | | | 638,454 | |
| | | | | | | | | | |
| | | | | | | | | 3,873,161 | |
| | | | | | | | | | |
| | | | Israel — 2.4% | | | | | | |
| | 576,950 | | | Bezeq The Israeli Telecommunication Corp., Ltd. | | | | | 663,491 | |
| | 4,000 | | | Check Point Software Technologies, Ltd.(a) | | | | | 470,680 | |
| | | | | | | | | | |
| Shares | | | | Fair Value | |
| | COMMON STOCKS — (continued) | | | | | | |
| | | |
| | | | Israel — (continued) | | | | | | |
| | 38,050 | | | Teva Pharmaceutical Industries, Ltd., ADR | | | | $ | 819,597 | |
| | | | | | | | | | |
| | | | | | | | | 1,953,768 | |
| | | | | | | | | | |
| | | | Italy — 3.1% | | | | | | |
| | 46,225 | | | Fiat Chrysler Automobiles NV(a) | | | | | 812,771 | |
| | 3,390 | | | GEDI Gruppo Editoriale SpA(a) | | | | | 1,525 | |
| | 74,175 | | | Mediobanca Banca di Credito Finanziario SpA | | | | | 740,984 | |
| | 90,675 | | | Poste Italiane SpA(b) | | | | | 724,524 | |
| | 520,425 | | | Telecom Italia SpA/Milano | | | | | 280,004 | |
| | | | | | | | | | |
| | | | | | | | | 2,559,808 | |
| | | | | | | | | | |
| | | | Japan — 26.3% | | | | | | |
| | 33,600 | | | Alfresa Holdings Corp. | | | | | 898,997 | |
| | 10,700 | | | Aozora Bank, Ltd. | | | | | 382,345 | |
| | 59,700 | | | Astellas Pharma, Inc. | | | | | 1,041,413 | |
| | 3,000 | | | Central Japan Railway Co. | | | | | 624,714 | |
| | 131,400 | | | Daiwa Securities Group, Inc. | | | | | 799,363 | |
| | 6,700 | | | FUJIFILM Holdings Corp. | | | | | 301,624 | |
| | 28,400 | | | Hitachi, Ltd. | | | | | 964,830 | |
| | 16,800 | | | Idemitsu Kosan Co., Ltd. | | | | | 888,646 | |
| | 52,500 | | | ITOCHU Corp. | | | | | 961,098 | |
| | 141,700 | | | JXTG Holdings, Inc. | | | | | 1,070,420 | |
| | 43,000 | | | Kajima Corp. | | | | | 624,828 | |
| | 32,800 | | | Kirin Holdings Co., Ltd. | | | | | 840,352 | |
| | 97,800 | | | Marubeni Corp. | | | | | 895,194 | |
| | 10,500 | | | Medipal Holdings Corp. | | | | | 219,112 | |
| | 37,300 | | | Mitsubishi Corp. | | | | | 1,149,334 | |
| | 10,800 | | | Mitsubishi Gas Chemical Co., Inc. | | | | | 229,935 | |
| | 53,900 | | | Mitsui & Co., Ltd. | | | | | 958,502 | |
| | 478,400 | | | Mizuho Financial Group, Inc. | | | | | 834,526 | |
| | 60,700 | | | Nexon Co., Ltd.(a) | | | | | 793,342 | |
| | 20,200 | | | Nippon Telegraph & Telephone Corp. | | | | | 912,396 | |
| | 36,000 | | | NTT DOCOMO, Inc. | | | | | 967,963 | |
| | 74,000 | | | Resona Holdings, Inc. | | | | | 415,721 | |
| | 9,000 | | | Shionogi & Co., Ltd. | | | | | 588,065 | |
| | 41,800 | | | Showa Shell Sekiyu KK | | | | | 885,518 | |
| | 9,800 | | | Sony Corp. | | | | | 600,834 | |
| | 55,700 | | | Sumitomo Corp. | | | | | 928,742 | |
| | 3,000 | | | Tokyo Electron, Ltd. | | | | | 412,163 | |
| | 12,800 | | | Toyota Motor Corp. | | | | | 799,296 | |
| | 23,100 | | | Toyota Tsusho Corp. | | | | | 872,197 | |
| | | | | | | | | | |
| | | | | | | | | 21,861,470 | |
| | | | | | | | | | |
| | | | Netherlands — 4.0% | | | | | | |
| | 132,400 | | | Aegon NV | | | | | 859,004 | |
| | 18,250 | | | Coca-Cola European Partners PLC | | | | | 829,827 | |
| | 41,000 | | | Koninklijke Ahold Delhaize NV | | | | | 940,160 | |
| | 12,600 | | | Randstad NV | | | | | 672,651 | |
| | | | | | | | | | |
| | | | | | | | | 3,301,642 | |
| | | | | | | | | | |
| | | | Norway — 2.5% | | | | | | |
| | 20,500 | | | Aker BP ASA | | | | | 869,998 | |
| | 41,100 | | | DNB ASA | | | | | 864,798 | |
| | 13,500 | | | Equinor ASA | | | | | 380,679 | |
| | | | | | | | | | |
| | | | | | | | | 2,115,475 | |
| | | | | | | | | | |
| | | | Singapore — 0.2% | | | | | | |
| | 35,700 | | | Keppel Corp., Ltd. | | | | | 181,758 | |
| | | | | | | | | | |
| | | | Spain — 4.3% | | | | | | |
| | 18,350 | | | ACS Actividades de Construccion y Servicios SA | | | | | 781,477 | |
Continued
68
|
Sterling Capital Behavioral International Equity Fund |
Schedule of Portfolio Investments — (continued) |
September 30, 2018 |
| | | | | | | | | | |
| Shares | | | | Fair Value | |
| | COMMON STOCKS — (continued) | | | | | | |
| | | | Spain — (continued) | | | | | | |
| | 6,775 | | | Enagas SA | | | | $ | 182,887 | |
| | 33,750 | | | Endesa SA | | | | | 729,240 | |
| | 96,600 | | | International Consolidated Airlines Group SA | | | | | 830,189 | |
| | 52,016 | | | Repsol SA | | | | | 1,036,648 | |
| | | | | | | | | | |
| | | | | | | | | 3,560,441 | |
| | | | | | | | | | |
| | | | Sweden — 2.7% | | | | | | |
| | 22,500 | | | Boliden AB | | | | | 627,602 | |
| | 76,125 | | | Skandinaviska Enskilda Banken AB, Class A | | | | | 850,040 | |
| | 29,875 | | | Swedbank AB, Class A | | | | | 740,539 | |
| | | | | | | | | | |
| | | | | | | | | 2,218,181 | |
| | | | | | | | | | |
| | | | Switzerland — 5.9% | | | | | | |
| | 10,425 | | | Adecco Group AG | | | | | 547,488 | |
| | 11,075 | | | Cie Financiere Richemont SA | | | | | 902,792 | |
| | 7,250 | | | Roche Holding AG | | | | | 1,756,356 | |
| | 825 | | | Swiss Life Holding AG | | | | | 312,717 | |
| | 67,200 | | | UBS Group AG | | | | | 1,061,341 | |
| | 1,125 | | | Zurich Insurance Group AG | | | | | 355,589 | |
| | | | | | | | | | |
| | | | | | | | | 4,936,283 | |
| | | | | | | | | | |
| | | | United Kingdom — 15.3% | | | | | | |
| | 41,700 | | | Anglo American PLC | | | | | 936,486 | |
| | 103,700 | | | Barratt Developments PLC | | | | | 766,376 | |
| | 15,850 | | | Berkeley Group Holdings PLC | | | | | 760,045 | |
| | 3,650 | | | BHP Billiton PLC | | | | | 79,506 | |
| | 118,250 | | | Centrica PLC | | | | | 238,744 | |
| | 63,675 | | | GlaxoSmithKline PLC | | | | | 1,275,459 | |
| | 27,825 | | | Imperial Brands PLC | | | | | 968,700 | |
| | 193,300 | | | J Sainsbury PLC | | | | | 810,771 | |
| | 243,875 | | | Legal & General Group PLC | | | | | 833,451 | |
| | 12,050 | | | Micro Focus International PLC | | | | | 224,518 | |
| | 11,175 | | | Next PLC | | | | | 800,233 | |
| | 24,975 | | | Persimmon PLC | | | | | 769,869 | |
| | 23,650 | | | Rio Tinto PLC | | | | | 1,196,032 | |
| | 50,175 | | | SSE PLC | | | | | 749,466 | |
| | 88,275 | | | Tate & Lyle PLC | | | | | 785,618 | |
| | 19,200 | | | Unilever PLC | | | | | 1,055,072 | |
| | 27,975 | | | WPP PLC | | | | | 410,024 | |
| | | | | | | | | | |
| | | | | | | | | 12,660,370 | |
| | | | | | | | | | |
| | | | Total Common Stocks
(Cost $74,729,391) | | | | | 81,003,575 | |
| | | | | | | | | | |
| | PREFERRED STOCKS — 0.8% | | | | | | |
| | | | Germany — 0.8% | | | | | | |
| | 51,825 | | | Schaeffler AG | | | | | 662,487 | |
| | | | | | | | | | |
| | | | Total Preferred Stocks
(Cost $793,297) | | | | | 662,487 | |
| | | | | | | | | | |
| | | | | | | | | | |
| Shares | | | | Fair Value | |
| | MONEY MARKET FUND — 0.7% | | | | | | |
| | | | United States — 0.7% | | | | | | |
| | 567,705 | | | Federated Treasury Obligations Fund, Institutional Shares, 1.92%(c) | | | | $ | 567,705 | |
| | | | | | | | | | |
| | | | Total Money Market Fund
(Cost $567,705) | | | | | 567,705 | |
| | | | | | | | | | |
| Total Investments — 99.1%
(Cost $76,090,393) | | | | | 82,233,767 | |
| | Net Other Assets (Liabilities) — 0.9% | | | | | 724,846 | |
| | | | | | | | | | |
| | NET ASSETS — 100.0% | | | | $ | 82,958,613 | |
| | | | | | | | | | |
| (a) | Represents non-income producing security. |
| (b) | Rule 144A, Section 4(2) or other security that is restricted as to resale to qualified institutional investors. The Investment Advisor, using Board approved procedures, has deemed these securities or a portion of these securities to be liquid. |
| (c) | Represents the current yield as of report date. |
ADR — American Depository Receipts
| | | | | |
Industry | | Percentage
of net assets |
Airlines | | | | 2.6 | % |
Auto Components | | | | 1.5 | % |
Automobiles | | | | 3.9 | % |
Banks | | | | 9.5 | % |
Beverages | | | | 2.7 | % |
Capital Markets | | | | 4.1 | % |
Chemicals | | | | 1.2 | % |
Construction & Engineering | | | | 2.9 | % |
Diversified Telecommunication Services | | | | 2.7 | % |
Electric Utilities | | | | 2.0 | % |
Electronic Equipment, Instruments & Components | | | | 1.2 | % |
Food & Staples Retailing | | | | 2.1 | % |
Food Products | | | | 1.7 | % |
Health Care Providers & Services | | | | 1.3 | % |
Hotels, Restaurants & Leisure | | | | 0.4 | % |
Household Durables | | | | 3.5 | % |
Household Products | | | | 0.6 | % |
Industrial Conglomerates | | | | 1.6 | % |
Insurance | | | | 6.3 | % |
IT Services | | | | 0.2 | % |
Media | | | | 2.1 | % |
Metals & Mining | | | | 7.9 | % |
Money Market Fund | | | | 0.7 | % |
Multiline Retail | | | | 1.0 | % |
Multi-Utilities | | | | 1.4 | % |
Oil, Gas & Consumable Fuels | | | | 7.4 | % |
Personal Products | | | | 1.3 | % |
Pharmaceuticals | | | | 7.7 | % |
Professional Services | | | | 1.5 | % |
Real Estate Management & Development | | | | 2.3 | % |
Road & Rail | | | | 0.7 | % |
Semiconductors & Semiconductor Equipment | | | | 0.5 | % |
Software | | | | 1.8 | % |
Technology Hardware, Storage & Peripherals | | | | 0.4 | % |
Textiles, Apparel & Luxury Goods | | | | 1.1 | % |
Tobacco | | | | 1.2 | % |
Trading Companies & Distributors | | | | 6.9 | % |
Wireless Telecommunication Services | | | | 1.2 | % |
| | | | | |
| | | | 99.1 | % |
| | | | | |
See accompanying Notes to the Financial Statements.
69
|
Sterling Capital SMID Opportunities Fund |
Schedule of Portfolio Investments |
September 30, 2018 |
| | | | | | | | | | |
| Shares | | | | Fair Value | |
| | COMMON STOCKS — 95.2% | | | | | | |
| | | |
| | | | Airlines — 2.1% | | | | | | |
| | 2,759 | | | Alaska Air Group, Inc. | | | | $ | 189,985 | |
| | | | | | | | | | |
| | | | Auto Components — 3.1% | | | | | | |
| | 13,500 | | | Gentex Corp. | | | | | 289,710 | |
| | | | | | | | | | |
| | | | Banks — 6.2% | | | | | | |
| | 10,649 | | | Towne Bank/Portsmouth VA | | | | | 328,522 | |
| | 4,065 | | | Webster Financial Corp. | | | | | 239,672 | |
| | | | | | | | | | |
| | | | | | | | | 568,194 | |
| | | | | | | | | | |
| | | | Commercial Services & Supplies — 3.3% | |
| | 3,850 | | | Waste Connections, Inc. | | | | | 307,115 | |
| | | | | | | | | | |
| | | | Containers & Packaging — 5.7% | |
| | 11,900 | | | Ball Corp. | | | | | 523,481 | |
| | | | | | | | | | |
| | | | Diversified Consumer Services — 4.2% | |
| | 6,330 | | | ServiceMaster Global Holdings, Inc.(a) | | | | | 392,650 | |
| | | | | | | | | | |
| | | | Electronic Equipment, Instruments &
Components — 3.2% | |
| | 1,982 | | | Rogers Corp.(a) | | | | | 291,988 | |
| | | | | | | | | | |
| | | | Food Products — 3.7% | | | | | | |
| | 3,229 | | | Ingredion, Inc. | | | | | 338,916 | |
| | | | | | | | | | |
| | | | Health Care Providers & Services — 13.6% | |
| | 2,715 | | | AmerisourceBergen Corp. | | | | | 250,377 | |
| | 3,000 | | | Centene Corp.(a) | | | | | 434,340 | |
| | 3,520 | | | Premier, Inc., Class A(a) | | | | | 161,146 | |
| | 3,200 | | | Universal Health Services, Inc., Class B | | | | | 409,088 | |
| | | | | | | | | | |
| | | | | | | | | 1,254,951 | |
| | | | | | | | | | |
| | | | Hotels, Restaurants & Leisure — 8.8% | |
| | 9,910 | | | Aramark | | | | | 426,328 | |
| | 6,781 | | | Norwegian Cruise Line Holdings, Ltd.(a) | | | | | 389,433 | |
| | | | | | | | | | |
| | | | | | | | | 815,761 | |
| | | | | | | | | | |
| | | | Household Durables — 1.0% | | | | | | |
| | 3,874 | | | PulteGroup, Inc. | | | | | 95,959 | |
| | | | | | | | | | |
| | | | Household Products — 1.6% | | | | | | |
| | 2,424 | | | Church & Dwight Co., Inc. | | | | | 143,913 | |
| | | | | | | | | | |
| | | | Insurance — 1.0% | | | | | | |
| | 694 | | | RenaissanceRe Holdings, Ltd. | | | | | 92,704 | |
| | | | | | | | | | |
| | | | Internet Software & Services — 3.3% | |
| | 3,407 | | | LogMeIn, Inc. | | | | | 303,564 | |
| | | | | | | | | | |
| | | | | | | | | | |
| Shares | | | | Fair Value | |
| | COMMON STOCKS — (continued) | | | | | | |
| | | |
| | | | IT Services — 16.4% | | | | | | |
| | 5,700 | | | Amdocs, Ltd. | | | | $ | 376,086 | |
| | 4,800 | | | Fiserv, Inc.(a) | | | | | 395,424 | |
| | 9,291 | | | Genpact, Ltd. | | | | | 284,398 | |
| | 3,600 | | | Global Payments, Inc. | | | | | 458,640 | |
| | | | | | | | | | |
| | | | | | | | | 1,514,548 | |
| | | | | | | | | | |
| | | | Oil, Gas & Consumable Fuels — 4.4% | | | | | | |
| | 7,350 | | | Centennial Resource Development, Inc., Class A(a) | | | | | 160,597 | |
| | 8,577 | | | Newfield Exploration Co.(a) | | | | | 247,275 | |
| | | | | | | | | | |
| | | | | | | | | 407,872 | |
| | | | | | | | | | |
| | | | Real Estate Management & Development — 3.0% | |
| | 3,279 | | | FirstService Corp. | | | | | 277,600 | |
| | | | | | | | | | |
| | | | Road & Rail — 3.8% | | | | | | |
| | 3,100 | | | Kansas City Southern | | | | | 351,168 | |
| | | | | | | | | | |
| | | | Software — 3.6% | | | | | | |
| | 5,300 | | | CDK Global, Inc. | | | | | 331,568 | |
| | | | | | | | | | |
| | | | Specialty Retail — 3.2% | | | | | | |
| | 4,020 | | | CarMax, Inc.(a) | | | | | 300,173 | |
| | | | | | | | | | |
| | | | Total Common Stocks
(Cost $7,027,269) | | | | | 8,791,820 | |
| | | | | | | | | | |
| | MONEY MARKET FUND — 4.7% | | | | | | |
| | 431,871 | | | Federated Treasury Obligations Fund, Institutional Shares, 1.92%(b) | | | | | 431,871 | |
| | | | | | | | | | |
| | | | Total Money Market Fund
(Cost $431,871) | | | | | 431,871 | |
| | | | | | | | | | |
| Total Investments — 99.9%
(Cost $7,459,140) | | | | | 9,223,691 | |
| | Net Other Assets (Liabilities) — 0.1% | | | | | 7,549 | |
| | | | | | | | | | |
| | NET ASSETS — 100.0% | | | | $ | 9,231,240 | |
| | | | | | | | | | |
| (a) | Represents non-income producing security. |
| (b) | Represents the current yield as of report date. |
See accompanying Notes to the Financial Statements.
70
|
Sterling Capital Stratton Mid Cap Value Fund |
Schedule of Portfolio Investments |
September 30, 2018 |
| | | | | | | | | | |
| Shares | | | | Fair Value | |
| | COMMON STOCKS — 96.9% | | | | | | |
| | | | Auto Components — 1.3% | | | | | | |
| | 16,540 | | | Magna International, Inc. | | | | $ | 868,846 | |
| | | | | | | | | | |
| | | | Banks — 8.9% | | | | | | |
| | 21,700 | | | East West Bancorp, Inc. | | | | | 1,310,029 | |
| | 11,700 | | | First Republic Bank/CA | | | | | 1,123,200 | |
| | 81,700 | | | Huntington Bancshares, Inc. | | | | | 1,218,964 | |
| | 63,800 | | | KeyCorp | | | | | 1,268,982 | |
| | 12,100 | | | Wintrust Financial Corp. | | | | | 1,027,774 | |
| | | | | | | | | | |
| | | | | | | | | 5,948,949 | |
| | | | | | | | | | |
| | | | Building Products — 1.4% | | | | | | |
| | 14,500 | | | Masonite International Corp.(a) | | | | | 929,450 | |
| | | | | | | | | | |
| | | | Capital Markets — 1.6% | | | | | | |
| | 7,200 | | | Ameriprise Financial, Inc. | | | | | 1,063,152 | |
| | | | | | | | | | |
| | | | Chemicals — 1.7% | | | | | | |
| | 13,900 | | | Westlake Chemical Corp. | | | | | 1,155,229 | |
| | | | | | | | | | |
| | | | Communications Equipment — 1.3% | | | | | | |
| | 28,400 | | | CommScope Holding Co., Inc.(a) | | | | | 873,584 | |
| | | | | | | | | | |
| | | | Construction & Engineering — 1.6% | | | | | | |
| | 23,800 | | | MasTec, Inc.(a) | | | | | 1,062,670 | |
| | | | | | | | | | |
| | | | Containers & Packaging — 4.5% | | | | | | |
| | 14,700 | | | Avery Dennison Corp. | | | | | 1,592,745 | |
| | 29,100 | | | Berry Global Group, Inc.(a) | | | | | 1,408,149 | |
| | | | | | | | | | |
| | | | | | | | | 3,000,894 | |
| | | | | | | | | | |
| | | | Electronic Equipment, Instruments & Components — 3.7% | |
| | 10,500 | | | Arrow Electronics, Inc.(a) | | | | | 774,060 | |
| | 19,000 | | | CDW Corp. | | | | | 1,689,480 | |
| | | | | | | | | | |
| | | | | | | | | 2,463,540 | |
| | | | | | | | | | |
| | | | Equity Real Estate Investment Trusts (REITS) — 11.3% | |
| | 14,700 | | | CyrusOne, Inc. | | | | | 931,980 | |
| | 6,800 | | | Digital Realty Trust, Inc. | | | | | 764,864 | |
| | 13,900 | | | EastGroup Properties, Inc. | | | | | 1,329,118 | |
| | 26,000 | | | Highwoods Properties, Inc. | | | | | 1,228,760 | |
| | 30,000 | | | Hudson Pacific Properties, Inc. | | | | | 981,600 | |
| | 12,300 | | | Mid-America Apartment Communities, Inc. | | | | | 1,232,214 | |
| | 12,200 | | | Ryman Hospitality Properties, Inc. | | | | | 1,051,274 | |
| | | | | | | | | | |
| | | | | | | | | 7,519,810 | |
| | | | | | | | | | |
| | | | Food & Staples Retailing — 3.9% | | | | | | |
| | 6,900 | | | Casey’s General Stores, Inc. | | | | | 890,859 | |
| | 26,600 | | | Performance Food Group Co.(a) | | | | | 885,780 | |
| | 26,500 | | | U.S. Foods Holding Corp.(a) | | | | | 816,730 | |
| | | | | | | | | | |
| | | | | | | | | 2,593,369 | |
| | | | | | | | | | |
| | | | Food Products — 4.0% | | | | | | |
| | 9,400 | | | Ingredion, Inc. | | | | | 986,624 | |
| | 25,100 | | | Lamb Weston Holdings, Inc. | | | | | 1,671,660 | |
| | | | | | | | | | |
| | | | | | | | | 2,658,284 | |
| | | | | | | | | | |
| | | | Gas Utilities — 5.0% | | | | | | |
| | 26,600 | | | Southwest Gas Holdings, Inc. | | | | | 2,102,198 | |
| | 22,700 | | | UGI Corp. | | | | | 1,259,396 | |
| | | | | | | | | | |
| | | | | | | | | 3,361,594 | |
| | | | | | | | | | |
| | | | Health Care Equipment & Supplies — 4.5% | |
| | 6,200 | | | Becton Dickinson & Co. | | | | | 1,618,200 | |
| | | | | | | | | | |
| Shares | | | | Fair Value | |
| | COMMON STOCKS — (continued) | | | | | | |
| | | | Health Care Equipment & Supplies — (continued) | |
| | 10,400 | | | Zimmer Biomet Holdings, Inc. | | | | $ | 1,367,288 | |
| | | | | | | | | | |
| | | | | | | | | 2,985,488 | |
| | | | | | | | | | |
| | | | Hotels, Restaurants & Leisure — 1.7% | | | | | | |
| | 8,500 | | | Royal Caribbean Cruises, Ltd. | | | | | 1,104,490 | |
| | | | | | | | | | |
| | | | Household Durables — 2.9% | | | | | | |
| | 5,900 | | | Mohawk Industries, Inc.(a) | | | | | 1,034,565 | |
| | 35,700 | | | PulteGroup, Inc. | | | | | 884,289 | |
| | | | | | | | | | |
| | | | | | | | | 1,918,854 | |
| | | | | | | | | | |
| | | | Industrial Conglomerates — 1.8% | | | | | | |
| | 10,100 | | | Carlisle Cos., Inc. | | | | | 1,230,180 | |
| | | | | | | | | | |
| | | | Insurance — 7.1% | | | | | | |
| | 12,300 | | | American Financial Group, Inc. | | | | | 1,364,931 | |
| | 22,300 | | | First American Financial Corp. | | | | | 1,150,457 | |
| | 10,500 | | | Hanover Insurance Group, Inc. (The) | | | | | 1,295,385 | |
| | 10,700 | | | Torchmark Corp. | | | | | 927,583 | |
| | | | | | | | | | |
| | | | | | | | | 4,738,356 | |
| | | | | | | | | | |
| | | | IT Services — 2.5% | | | | | | |
| | 20,400 | | | Fiserv, Inc.(a) | | | | | 1,680,552 | |
| | | | | | | | | | |
| | | | Life Sciences Tools & Services — 7.6% | | | | | | |
| | 12,500 | | | ICON Plc(a) | | | | | 1,921,875 | |
| | 16,300 | | | PerkinElmer, Inc. | | | | | 1,585,501 | |
| | 6,400 | | | Thermo Fisher Scientific, Inc. | | | | | 1,562,112 | |
| | | | | | | | | | |
| | | | | | | | | 5,069,488 | |
| | | | | | | | | | |
| | | | Machinery — 1.5% | | | | | | |
| | 14,300 | | | Oshkosh Corp. | | | | | 1,018,732 | |
| | | | | | | | | | |
| | | | Oil, Gas & Consumable Fuels — 7.6% | | | | | | |
| | 42,800 | | | Cabot Oil & Gas Corp. | | | | | 963,856 | |
| | 90,800 | | | Callon Petroleum Co.(a) | | | | | 1,088,692 | |
| | 29,400 | | | Devon Energy Corp. | | | | | 1,174,236 | |
| | 16,300 | | | Phillips 66 | | | | | 1,837,336 | |
| | | | | | | | | | |
| | | | | | | | | 5,064,120 | |
| | | | | | | | | | |
| | | | Semiconductors & Semiconductor Equipment — 1.3% | |
| | 9,400 | | | Skyworks Solutions, Inc. | | | | | 852,674 | |
| | | | | | | | | | |
| | | | Software — 3.8% | | | | | | |
| | 14,700 | | | Activision Blizzard, Inc. | | | | | 1,222,893 | |
| | 12,100 | | | PTC, Inc.(a) | | | | | 1,284,899 | |
| | | | | | | | | | |
| | | | | | | | | 2,507,792 | |
| | | | | | | | | | |
| | | | Trading Companies & Distributors — 4.4% | |
| | 35,300 | | | HD Supply Holdings, Inc.(a) | | | | | 1,510,487 | |
| | 8,600 | | | United Rentals, Inc.(a) | | | | | 1,406,960 | |
| | | | | | | | | | |
| | | | | | | | | 2,917,447 | |
| | | | | | | | | | |
| | | | Total Common Stocks
(Cost $40,056,486) | | | | | 64,587,544 | |
| | | | | | | | | | |
Continued
71
|
Sterling Capital Stratton Mid Cap Value Fund |
Schedule of Portfolio Investments — (continued) |
September 30, 2018 |
| | | | | | | | | | |
| Shares | | | | Fair Value | |
| | MONEY MARKET FUND — 3.1% | |
| | 2,059,500 | | | Federated Treasury Obligations Fund,
Institutional Shares, 1.92%(b) | | | | $ | 2,059,500 | |
| | | | | | | | | | |
| | | | Total Money Market Fund
(Cost $2,059,500) | | | | | 2,059,500 | |
| | | | | | | | | | |
| Total Investments — 100.0%
(Cost $42,115,986) | | | | | 66,647,044 | |
| | Net Other Assets (Liabilities) — 0.0% | | | | | 14,621 | |
| | | | | | | | | | |
| | NET ASSETS — 100.0% | | | | $ | 66,661,665 | |
| | | | | | | | | | |
| (a) | Represents non-income producing security. |
| (b) | Represents the current yield as of report date. |
See accompanying Notes to the Financial Statements.
72
|
Sterling Capital Stratton Real Estate Fund |
Schedule of Portfolio Investments |
September 30, 2018 |
| | | | | | | | | | |
| Shares | | | | Fair Value | |
| | COMMON STOCKS — 97.8% | | | | | | |
| | | |
| | | | Diversified — 2.5% | | | | | | |
| | 55,000 | | | Liberty Property Trust | | | | $ | 2,323,750 | |
| | | | | | | | | | |
| | | | Health Care — 9.7% | | | | | | |
| | 62,500 | | | Healthcare Trust of America, Inc., Class A | | | | | 1,666,875 | |
| | 132,000 | | | Medical Properties Trust, Inc. | | | | | 1,968,120 | |
| | 53,000 | | | Ventas, Inc. | | | | | 2,882,140 | |
| | 37,000 | | | Welltower, Inc. | | | | | 2,379,840 | |
| | | | | | | | | | |
| | | | | | | | | 8,896,975 | |
| | | | | | | | | | |
| | | | Hotel & Resort — 8.0% | | | | | | |
| | 50,000 | | | Chesapeake Lodging Trust | | | | | 1,603,500 | |
| | 115,000 | | | DiamondRock Hospitality Co. | | | | | 1,342,050 | |
| | 8,500 | | | Marriott International, Inc., Class A | | | | | 1,122,255 | |
| | 40,000 | | | MGM Growth Properties, LLC, Class A | | | | | 1,179,600 | |
| | 25,000 | | | Ryman Hospitality Properties, Inc. | | | | | 2,154,250 | |
| | | | | | | | | | |
| | | | | | | | | 7,401,655 | |
| | | | | | | | | | |
| | | | Industrial — 5.5% | | | | | | |
| | 28,000 | | | EastGroup Properties, Inc. | | | | | 2,677,360 | |
| | 77,000 | | | First Industrial Realty Trust, Inc. | | | | | 2,417,800 | |
| | | | | | | | | | |
| | | | | | | | | 5,095,160 | |
| | | | | | | | | | |
| | | | Office — 9.2% | | | | | | |
| | 20,000 | | | Alexandria Real Estate Equities, Inc. | | | | | 2,515,800 | |
| | 37,000 | | | Highwoods Properties, Inc. | | | | | 1,748,620 | |
| | 70,000 | | | Hudson Pacific Properties, Inc. | | | | | 2,290,400 | |
| | 19,600 | | | SL Green Realty Corp. | | | | | 1,911,588 | |
| | | | | | | | | | |
| | | | | | | | | 8,466,408 | |
| | | | | | | | | | |
| | | | Residential — 17.8% | | | | | | |
| | 40,000 | | | American Campus Communities, Inc. | | | | | 1,646,400 | |
| | 85,000 | | | American Homes 4 Rent, Class A | | | | | 1,860,650 | |
| | 45,800 | | | Apartment Investment & Management Co., Class A | | | | | 2,021,154 | |
| | 22,400 | | | Equity LifeStyle Properties, Inc. | | | | | 2,160,480 | |
| | 14,000 | | | Essex Property Trust, Inc. | | | | | 3,453,940 | |
| | 22,000 | | | Mid-America Apartment Communities, Inc. | | | | | 2,203,960 | |
| | 75,000 | | | UDR, Inc. | | | | | 3,032,250 | |
| | | | | | | | | | |
| | | | | | | | | 16,378,834 | |
| | | | | | | | | | |
| | | | Retail — 18.1% | | | | | | |
| | 57,500 | | | Acadia Realty Trust | | | | | 1,611,725 | |
| | | | | | | | | | |
| Shares | | | | Fair Value | |
| | COMMON STOCKS — (continued) | | | | | | |
| | | |
| | | | Retail — (continued) | | | | | | |
| | 85,000 | | | Essential Properties Realty Trust, Inc. | | | | $ | 1,206,150 | |
| | 17,700 | | | Federal Realty Investment Trust | | | | | 2,238,519 | |
| | 43,000 | | | National Retail Properties, Inc. | | | | | 1,927,260 | |
| | 89,000 | | | Retail Opportunity Investments Corp. | | | | | 1,661,630 | |
| | 111,000 | | | Retail Properties of America, Inc. | | | | | 1,353,090 | |
| | 38,057 | | | Simon Property Group, Inc. | | | | | 6,726,575 | |
| | | | | | | | | | |
| | | | | | | | | 16,724,949 | |
| | | | | | | | | | |
| | | | Specialized — 27.0% | | | | | | |
| | 46,700 | | | Crown Castle International Corp. | | | | | 5,199,111 | |
| | 83,000 | | | CubeSmart | | | | | 2,367,990 | |
| | 30,000 | | | CyrusOne, Inc. | | | | | 1,902,000 | |
| | 30,000 | | | Digital Realty Trust, Inc. | | | | | 3,374,400 | |
| | 26,000 | | | EPR Properties | | | | | 1,778,660 | |
| | 9,700 | | | Equinix, Inc. | | | | | 4,199,033 | |
| | 18,000 | | | Life Storage, Inc. | | | | | 1,712,880 | |
| | 13,500 | | | SBA Communications Corp.(a) | | | | | 2,168,505 | |
| | 50,000 | | | Uniti Group, Inc. | | | | | 1,007,500 | |
| | 35,000 | | | Weyerhaeuser Co. | | | | | 1,129,450 | |
| | | | | | | | | | |
| | | | | | | | | 24,839,529 | |
| | | | | | | | | | |
| | | | Total Common Stocks
(Cost $58,465,804) | | | | | 90,127,260 | |
| | | | | | | | | | |
| | |
| | MONEY MARKET FUND — 1.8% | | | | | | |
| | | |
| | 1,607,391 | | | Federated Treasury Obligations Fund, Institutional Shares, 1.92%(b) | | | | | 1,607,391 | |
| | | | | | | | | | |
| | | | Total Money Market Fund
(Cost $1,607,391) | | | | | 1,607,391 | |
| | | | | | | | | | |
| Total Investments — 99.6%
(Cost $60,073,195) | | | | | 91,734,651 | |
| | Net Other Assets (Liabilities) — 0.4% | | | | | 386,438 | |
| | | | | | | | | | |
| | NET ASSETS — 100.0% | | | | $ | 92,121,089 | |
| | | | | | | | | | |
| (a) | Represents non-income producing security. |
| (b) | Represents the current yield as of report date. |
See accompanying Notes to the Financial Statements.
73
|
Sterling Capital Stratton Small Cap Value Fund |
Schedule of Portfolio Investments |
September 30, 2018 |
| | | | | | | | | | |
| Shares | | | | Fair Value | |
| | COMMON STOCKS — 97.4% | | | | | | |
| | | | Aerospace & Defense — 2.5% | | | | | | |
| | 382,625 | | | Moog, Inc., Class A | | | | $ | 32,894,271 | |
| | | | | | | | | | |
| | | | Airlines — 2.0% | | | | | | |
| | 1,347,300 | | | JetBlue Airways Corp.(a) | | | | | 26,083,728 | |
| | | | | | | | | | |
| | | | Automobiles — 1.2% | | | | | | |
| | 193,758 | | | Thor Industries, Inc. | | | | | 16,217,545 | |
| | | | | | | | | | |
| | | | Banks — 22.7% | | | | | | |
| | 462,840 | | | Chemical Financial Corp. | | | | | 24,715,656 | |
| | 467,550 | | | Community Bank System, Inc. | | | | | 28,553,279 | |
| | 904,650 | | | First Midwest Bancorp, Inc. | | | | | 24,054,643 | |
| | 560,130 | | | Glacier Bancorp, Inc. | | | | | 24,136,002 | |
| | 275,250 | | | IBERIABANK Corp. | | | | | 22,391,587 | |
| | 528,250 | | | MB Financial, Inc. | | | | | 24,357,607 | |
| | 173,600 | | | Signature Bank | | | | | 19,936,224 | |
| | 93,900 | | | SVB Financial Group(a) | | | | | 29,186,937 | |
| | 905,691 | | | Umpqua Holdings Corp. | | | | | 18,838,373 | |
| | 448,250 | | | United Bankshares, Inc. | | | | | 16,293,887 | |
| | 531,000 | | | Webster Financial Corp. | | | | | 31,307,760 | |
| | 368,300 | | | Wintrust Financial Corp. | | | | | 31,283,402 | |
| | | | | | | | | | |
| | | | | | | | | 295,055,357 | |
| | | | | | | | | | |
| | | | Capital Markets — 1.2% | | | | | | |
| | 115,700 | | | Affiliated Managers Group, Inc. | | | | | 15,818,504 | |
| | | | | | | | | | |
| | | | Chemicals — 3.6% | | | | | | |
| | 495,298 | | | AdvanSix, Inc.(a) | | | | | 16,815,367 | |
| | 682,947 | | | PolyOne Corp. | | | | | 29,858,443 | |
| | | | | | | | | | |
| | | | | | | | | 46,673,810 | |
| | | | | | | | | | |
| | | | Communications Equipment — 1.0% | | | | | | |
| | 500,000 | | | NetScout Systems, Inc.(a) | | | | | 12,625,000 | |
| | | | | | | | | | |
| | | | Construction & Engineering — 2.4% | | | | | | |
| | 694,550 | | | MasTec, Inc.(a) | | | | | 31,011,657 | |
| | | | | | | | | | |
| | | | Construction Materials — 0.9% | | | | | | |
| | 254,200 | | | U.S. Concrete, Inc.(a) | | | | | 11,655,070 | |
| | | | | | | | | | |
| | | | Electric Utilities — 4.1% | | | | | | |
| | 478,131 | | | El Paso Electric Co. | | | | | 27,349,093 | |
| | 577,150 | | | Portland General Electric Co. | | | | | 26,323,811 | |
| | | | | | | | | | |
| | | | | | | | | 53,672,904 | |
| | | | | | | | | | |
| | | | Electrical Equipment — 2.9% | | | | | | |
| | 433,450 | | | EnerSys | | | | | 37,766,499 | |
| | | | | | | | | | |
| | | | Electronic Equipment, Instruments & Components — 3.7% | | | | | | |
| | 300,100 | | | Anixter International, Inc.(a) | | | | | 21,097,030 | |
| | 380,808 | | | Belden, Inc. | | | | | 27,193,499 | |
| | | | | | | | | | |
| | | | | | | | | 48,290,529 | |
| | | | | | | | | | |
| | | | Equity Real Estate Investment Trusts (REITS) — 10.6% | |
| | 495,200 | | | American Campus Communities, Inc. | | | | | 20,382,432 | |
| | 760,813 | | | First Industrial Realty Trust, Inc. | | | | | 23,889,528 | |
| | 472,064 | | | Highwoods Properties, Inc. | | | | | 22,309,745 | |
| | 1,181,600 | | | Medical Properties Trust, Inc. | | | | | 17,617,656 | |
| | 418,800 | | | Ryman Hospitality Properties, Inc. | | | | | 36,087,996 | |
| | 173,300 | | | SL Green Realty Corp. | | | | | 16,901,949 | |
| | | | | | | | | | |
| | | | | | | | | 137,189,306 | |
| | | | | | | | | | |
| | | | Food & Staples Retailing — 3.9% | | | | | | |
| | 202,800 | | | Casey’s General Stores, Inc. | | | | | 26,183,508 | |
| | | | | | | | | | |
| Shares | | | | Fair Value | |
| | COMMON STOCKS — (continued) | | | | | | |
| | | | Food & Staples Retailing — (continued) | |
| | 720,000 | | | Performance Food Group Co.(a) | | | | $ | 23,976,000 | |
| | | | | | | | | | |
| | | | | | | | | 50,159,508 | |
| | | | | | | | | | |
| | | | Gas Utilities — 2.1% | | | | | | |
| | 338,260 | | | Southwest Gas Holdings, Inc. | | | | | 26,732,688 | |
| | | | | | | | | | |
| | | | Health Care Equipment & Supplies — 2.9% | |
| | 308,073 | | | West Pharmaceutical Services, Inc. | | | | | 38,037,773 | |
| | | | | | | | | | |
| | | | Health Care Providers & Services — 2.8% | |
| | 556,788 | | | BioTelemetry, Inc.(a) | | | | | 35,884,987 | |
| | | | | | | | | | |
| | | | Insurance — 4.3% | | | | | | |
| | 216,400 | | | Hanover Insurance Group, Inc. (The) | | | | | 26,697,268 | |
| | 469,550 | | | Selective Insurance Group, Inc. | | | | | 29,816,425 | |
| | | | | | | | | | |
| | | | | | | | | 56,513,693 | |
| | | | | | | | | | |
| | | | IT Services — 2.9% | | | | | | |
| | 202,700 | | | CACI International, Inc., Class A(a) | | | | | 37,327,205 | |
| | | | | | | | | | |
| | | | Machinery — 4.7% | | | | | | |
| | 347,500 | | | Crane Co. | | | | | 34,176,625 | |
| | 373,700 | | | Oshkosh Corp. | | | | | 26,622,388 | |
| | | | | | | | | | |
| | | | | | | | | 60,799,013 | |
| | | | | | | | | | |
| | | | Oil, Gas & Consumable Fuels — 3.7% | |
| | 400,700 | | | Cabot Oil & Gas Corp. | | | | | 9,023,764 | |
| | 1,915,500 | | | Callon Petroleum Co.(a) | | | | | 22,966,845 | |
| | 617,400 | | | Carrizo Oil & Gas, Inc.(a) | | | | | 15,558,480 | |
| | | | | | | | | | |
| | | | | | | | | 47,549,089 | |
| | | | | | | | | | |
| | | | Semiconductors & Semiconductor Equipment — 3.2% | |
| | 1,065,707 | | | ON Semiconductor Corp.(a) | | | | | 19,640,980 | |
| | 291,844 | | | Qorvo, Inc.(a) | | | | | 22,439,885 | |
| | | | | | | | | | |
| | | | | | | | | 42,080,865 | |
| | | | | | | | | | |
| | | | Software — 4.4% | | | | | | |
| | 299,830 | | | PTC, Inc.(a) | | | | | 31,838,948 | |
| | 187,710 | | | Take-Two Interactive Software, Inc.(a) | | | | | 25,902,103 | |
| | | | | | | | | | |
| | | | | | | | | 57,741,051 | |
| | | | | | | | | | |
| | | | Thrifts & Mortgage Finance — 1.4% | |
| | 1,036,521 | | | Northwest Bancshares, Inc. | | | | | 17,952,544 | |
| | | | | | | | | | |
| | | | Trading Companies & Distributors — 2.3% | |
| | 183,041 | | | United Rentals, Inc.(a) | | | | | 29,945,508 | |
| | | | | | | | | | |
| | | | Total Common Stocks
(Cost $606,478,049) | | | | | 1,265,678,104 | |
| | | | | | | | | | |
| | EXCHANGE TRADED FUND — 1.0% | | | | | | |
| | 102,000 | | | iShares Russell 2000 Value ETF | | | | | 13,566,000 | |
| | | | | | | | | | |
| | | | Total Exchange Traded Fund
(Cost $12,808,609) | | | | | 13,566,000 | |
| | | | | | | | | | |
Continued
74
|
Sterling Capital Stratton Small Cap Value Fund |
Schedule of Portfolio Investments — (continued) |
September 30, 2018 |
| | | | | | | | | | |
| Shares | | | | Fair Value | |
| | MONEY MARKET FUND — 1.6% | | | | | | |
| | 20,110,431 | | | Federated Treasury Obligations Fund, Institutional Shares, 1.92%(b) | | | | $ | 20,110,431 | |
| | | | | | | | | | |
| | | | Total Money Market Fund
(Cost $20,110,431) | | | | | 20,110,431 | |
| | | | | | | | | | |
| Total Investments — 100.0%
(Cost $639,397,089) | | | | | 1,299,354,535 | |
| | Net Other Assets (Liabilities) — 0.0% | | | | | (185,926 | ) |
| | | | | | | | | | |
| | NET ASSETS — 100.0% | | | | $ | 1,299,168,609 | |
| | | | | | | | | | |
| (a) | Represents non-income producing security. |
| (b) | Represents the current yield as of report date. |
ETF — Exchange Traded Fund
See accompanying Notes to the Financial Statements.
75
|
Sterling Capital Ultra Short Bond Fund |
Schedule of Portfolio Investments |
September 30, 2018 |
| | | | | | | | | | |
Principal
Amount | | | | Fair Value | |
| | ASSET BACKED SECURITIES — 16.6% | | | | | | |
| | $135,000 | | | Ally Auto Receivables Trust, Series 2016-2, Class B, 2.150%, 4/15/21 | | | | $ | 134,049 | |
| | 170,000 | | | AmeriCredit Automobile Receivables Trust, Series 2017-4, Class B, 2.360%, 12/19/22 | | | | | 166,549 | |
| | 450,000 | | | Avis Budget Rental Car Funding AESOP, LLC, Series 2014-1A, Class A, 2.460%,
7/20/20(a) | | | | | 448,817 | |
| | 165,000 | | | Avis Budget Rental Car Funding AESOP, LLC, Series 2015-1A, Class A, 2.500%,
7/20/21(a) | | | | | 162,816 | |
| | 355,000 | | | Capital Auto Receivables Asset Trust, Series 2017-1, Class B, 2.430%, 5/20/22(a) | | | | | 348,006 | |
| | 285,000 | | | CarMax Auto Owner Trust 2015-3, Series 2015-3, Class B, 2.280%, 4/15/21 | | | | | 283,109 | |
| | 66,858 | | | Citicorp Residential Mortgage Trust, STEP, Series 2007-2, Class A6, 5.154%, 6/25/37 | | | | | 67,937 | |
| | 145,074 | | | Countrywide Asset-Backed Certificates, Series 2004-12, Class MV4, 3.641%, (LIBOR USD 1-Month plus 1.43%), 3/25/35(b) | | | | | 145,636 | |
| | 362,900 | | | Countrywide Asset-Backed Certificates, Series 2006-3, Class 2A3, 2.506%, (LIBOR USD 1-Month plus 0.29%), 6/25/36(b) | | | | | 361,096 | |
| | 57,209 | | | Enterprise Fleet Financing, LLC, Series 2016-1, Class A2, 1.830%, 9/20/21(a) | | | | | 57,160 | |
| | 70,000 | | | Ford Credit Auto Owner Trust, Series 2014-C, Class C, 2.160%, 8/15/20 | | | | | 69,876 | |
| | 750,000 | | | Hertz Vehicle Financing II L.P., Series 2016-3A, Class A, 2.270%, 7/25/20(a) | | | | | 745,000 | |
| | 106,830 | | | JP Morgan Mortgage Acquisition Corp., Series 2005-OPT2, Class M1, 2.646%, (LIBOR USD 1-Month plus 0.43%), 12/25/35(b) | | | | | 106,846 | |
| | 300,000 | | | New Century Home Equity Loan Trust, Series 2005-3, Class M3, 2.981%, (LIBOR USD 1-Month plus 0.77%), 7/25/35(b) | | | | | 300,525 | |
| | 5,995 | | | RASC Series 2006-KS5 Trust, Series 2006-KS5, Class A3, 2.376%, (LIBOR USD 1-Month plus 0.16%), 7/25/36(b) | | | | | 5,994 | |
| | 42,012 | | | Santander Drive Auto Receivables Trust, Series 2014-5, Class C, 2.460%, 6/15/20 | | | | | 42,024 | |
| | 73,704 | | | Santander Drive Auto Receivables Trust, Series 2015-2, Class C, 2.440%, 4/15/21 | | | | | 73,659 | |
| | 127,957 | | | Santander Drive Auto Receivables Trust 2015-1, Series 2015-1, Class C, 2.570%, 4/15/21 | | | | | 127,928 | |
| | 215,000 | | | Santander Drive Auto Receivables Trust 2018-2, Series 2018-2, Class A3, 2.750%, 9/15/21 | | | | | 214,561 | |
| | 184,205 | | | Saxon Asset Securities Trust, Series 2006-2, Class A3C, 2.366%, (LIBOR USD 1-Month plus 0.15%), 9/25/36(b) | | | | | 183,396 | |
| | 121,583 | | | Sofi Professional Loan Program, LLC, Series 2016-E, Class A1, 3.066%, (LIBOR USD 1-Month plus 0.85%), 7/25/39(a)(b) | | | | | 122,143 | |
| | 193,839 | | | Wheels SPV 2, LLC, Series 2017-1A, Class A2, 1.880%, 4/20/26(a) | | | | | 192,197 | |
| | 125,000 | | | World Omni Auto Receivables Trust, Series 2015-B, Class B, 2.150%, 8/15/22 | | | | | 123,856 | |
| | | | | | | | | | |
| | | | Total Asset Backed Securities (Cost $4,488,287) | | | | | 4,483,180 | |
| | | | | | | | | | |
|
| | COLLATERALIZED MORTGAGE OBLIGATIONS — 2.3% | |
| | 216,414 | | | Fannie Mae, Series 2011-141, Class EA, 1.750%, 7/25/21 | | | | | 214,923 | |
| | 166,944 | | | Fannie Mae, Series 2011-55, Class AC, 3.000%, 7/25/25 | | | | | 166,720 | |
| | | | | | | | | | |
Principal
Amount | | | | Fair Value | |
| COLLATERALIZED MORTGAGE OBLIGATIONS —
(continued) |
|
| $ | 80,647 | | | Freddie Mac, Series -3805, Class EK, 4.000%, 6/15/40 | | | | $ | 81,324 | |
| | 171,762 | | | MASTR Seasoned Securitization Trust, Series 2005-2, Class 1A1, 5.130%, 10/25/32 | | | | | 171,639 | |
| | | | | | | | | | |
| | | | Total Collateralized Mortgage Obligations
(Cost $638,197) | | | | | 634,606 | |
| | | | | | | | | | |
| COMMERCIAL MORTGAGE-BACKED
SECURITIES — 3.0% | | | | | | |
| | 350,000 | | | COMM 2013-CCRE11 Mortgage Trust, Series 2013-CR11, Class A2, 3.047%, 8/10/50 | | | | | 350,113 | |
| | 399,970 | | | DBUBS 2011-LC2 Mortgage Trust, Series 2011-LC2A, Class A4, 4.537%, 7/10/44(a) | | | | | 410,346 | |
| | 48,000 | | | JPMorgan Chase Commercial Mortgage Securities Trust, Series 2014-C20, Class A2, 2.872%, 7/15/47 | | | | | 47,971 | |
| | 8,214 | | | WFRBS Commercial Mortgage Trust, Series 2011-C3, Class A3, 3.998%, 3/15/44(a) | | | | | 8,260 | |
| | | | | | | | | | |
| | | | Total Commercial Mortgage-Backed Securities (Cost $830,284) | | | | | 816,690 | |
| | | | | | | | | | |
| | |
| | CORPORATE BONDS — 72.1% | | | | | | |
| | | |
| | | | Aerospace & Defense — 2.1% | | | | | | |
| | 350,000 | | | General Dynamics Corp., 2.628%, (LIBOR USD 3-Month plus 0.29%), 5/11/20(b) | | | | | 350,982 | |
| | 215,000 | | | Spirit AeroSystems, Inc., 3.134%, (LIBOR USD 3-Month plus 0.8%), 6/15/21(b) | | | | | 215,465 | |
| | | | | | | | | | |
| | | | | | | | | 566,447 | |
| | | | | | | | | | |
| | | | Automobiles — 4.8% | | | | | | |
| | 400,000 | | | Ford Motor Credit Co., LLC, 1.897%, 8/12/19 | | | | | 395,674 | |
| | 400,000 | | | General Motors Financial Co., Inc., 3.100%, 1/15/19 | | | | | 400,311 | |
| | 250,000 | | | Hyundai Capital America, 3.260%, (LIBOR USD 3-Month plus 0.94%), 7/8/21(a)(b) | | | | | 250,638 | |
| | 250,000 | | | Nissan Motor Acceptance Corp., 2.854%, (LIBOR USD 3-Month plus 0.52%), 3/15/21(a)(b) | | | | | 250,464 | |
| | | | | | | | | | |
| | | | | | | | | 1,297,087 | |
| | | | | | | | | | |
| | | | Banks — 16.9% | | | | | | |
| | 300,000 | | | Associated Banc-Corp., 2.750%, 11/15/19 | | | | | 298,812 | |
| | 250,000 | | | Bank of Montreal, MTN, 2.934%, (LIBOR USD 3-Month plus 0.60%), 12/12/19(b) | | | | | 251,486 | |
| | 277,000 | | | Bank of Nova Scotia (The), 2.788%, (LIBOR USD 3-Month plus 0.44%), 4/20/21(b) | | | | | 277,881 | |
| | 300,000 | | | Barclays Bank PLC, GMTN, 2.893%, (LIBOR USD 3-Month plus 0.55%), 8/7/19(b) | | | | | 300,686 | |
| | 250,000 | | | BPCE SA, MTN, 2.250%, 1/27/20 | | | | | 246,727 | |
| | 250,000 | | | Canadian Imperial Bank of Commerce, 2.664%, (LIBOR USD 3-Month plus 0.32%), 2/2/21(b) | | | | | 250,212 | |
| | 380,000 | | | Citizens Bank NA / Providence RI, BKNT, 2.200%, 5/26/20 | | | | | 372,651 | |
| | 250,000 | | | Compass Bank, BKNT, 2.750%, 9/29/19 | | | | | 249,246 | |
| | 250,000 | | | Credit Agricole SA/London, 2.500%,
4/15/19(a) | | | | | 249,653 | |
| | 250,000 | | | DBS Group Holdings, Ltd., 2.817%, (LIBOR USD 3-Month plus 0.49%), 6/8/20(a)(b) | | | | | 250,327 | |
Continued
76
|
Sterling Capital Ultra Short Bond Fund |
Schedule of Portfolio Investments — (continued) |
September 30, 2018 |
| | | | | | | | | | |
Principal
Amount | | | | Fair Value | |
| | CORPORATE BONDS — (continued) | | | | | | |
| | | | Banks — (continued) | | | | | | |
| | $250,000 | | | DNB Bank ASA, 2.768%, (LIBOR USD 3-Month plus 0.37%), 10/2/20(a)(b) | | | | $ | 250,849 | |
| | 250,000 | | | ERAC USA Finance, LLC, 2.800%,
11/1/18(a) | | | | | 250,037 | |
| | 200,000 | | | Lloyds Bank PLC, 2.300%, 11/27/18 | | | | | 199,930 | |
| | 250,000 | | | Sumitomo Mitsui Banking Corp., 2.686%, (LIBOR USD 3-Month plus 0.35%),
1/17/20(b) | | | | | 250,453 | |
| | 300,000 | | | Svenska Handelsbanken AB, 2.687%, (LIBOR USD 3-Month plus 0.36%), 9/8/20(b) | | | | | 300,576 | |
| | 300,000 | | | Toronto-Dominion Bank (The), 2.611%, (LIBOR USD 3-Month plus 0.28%),
6/11/20(b) | | | | | 300,545 | |
| | 250,000 | | | Westpac Banking Corp., 1.950%, 11/23/18 | | | | | 249,812 | |
| | | | | | | | | | |
| | | | | | | | | 4,549,883 | |
| | | | | | | | | | |
| | | | Beverages — 1.0% | | | | | | |
| | 273,000 | | | Coca-Cola Femsa SAB de CV, 2.375%, 11/26/18 | | | | | 272,282 | |
| | | | | | | | | | |
| | | | Capital Goods — 0.9% | | | | | | |
| | 250,000 | | | Caterpillar Financial Services Corp., MTN, 2.564%, (LIBOR USD 3-Month plus 0.23%), 3/15/21(b) | | | | | 250,409 | |
| | | | | | | | | | |
| | | | Chemicals — 0.9% | | | | | | |
| | 231,000 | | | INVISTA Finance, LLC, 4.250%, 10/15/19(a) | | | | | 230,711 | |
| | | | | | | | | | |
| | | | Communications Equipment — 4.0% | | | | | | |
| | 225,000 | | | CenturyLink, Inc., 6.150%, 9/15/19 | | | | | 229,219 | |
| | 200,000 | | | CommScope, Inc., 5.000%, 6/15/21(a) | | | | | 200,250 | |
| | 250,000 | | | Sprint Communications, Inc., 9.000%,
11/15/18(a) | | | | | 251,550 | |
| | 400,000 | | | Verizon Communications, Inc., 2.860%, (LIBOR USD 3-Month plus 0.55%),
5/22/20(b) | | | | | 402,280 | |
| | | | | | | | | | |
| | | | | | | | | 1,083,299 | |
| | | | | | | | | | |
| | | | Construction Materials — 0.9% | | | | | | |
| | 240,000 | | | Vulcan Materials Co., 2.971%, (LIBOR USD 3-Month plus 0.65%), 3/1/21(b) | | | | | 240,884 | |
| | | | | | | | | | |
| | | | Diversified Financial Services — 1.5% | | | | | | |
| | 200,000 | | | Ally Financial, Inc., 8.000%, 12/31/18 | | | | | 202,000 | |
| | 200,000 | | | Export-Import Bank of Korea, 2.375%, 8/12/19 | | | | | 198,859 | |
| | | | | | | | | | |
| | | | | | | | | 400,859 | |
| | | | | | | | | | |
| | | | Diversified Telecommunication Services — 0.7% | |
| | 187,500 | | | Sprint Spectrum Co., LLC / Sprint Spectrum Co. II LLC / Sprint Spectrum Co. III LLC, 3.360%, 9/20/21(a) | | | | | 186,797 | |
| | | | | | | | | | |
| | | | Electric Utilities — 3.3% | | | | | | |
| | 300,000 | | | Dominion Energy, Inc., 1.875%, 12/15/18(a) | | | | | 299,502 | |
| | 125,000 | | | Duke Energy Florida, LLC, 2.100%, 12/15/19 | | | | | 124,247 | |
| | 215,000 | | | Mississippi Power Co., 3.058%, (LIBOR USD 3-Month plus 0.65%), 3/27/20(b) | | | | | 215,026 | |
| | 250,000 | | | Pennsylvania Electric Co., 5.200%, 4/1/20 | | | | | 255,727 | |
| | | | | | | | | | |
| | | | | | | | | 894,502 | |
| | | | | | | | | | |
| | | | Electronic Equipment, Instruments &
Components — 0.8% | |
| | 200,000 | | | Anixter, Inc., 5.625%, 5/1/19 | | | | | 202,250 | |
| | | | | | | | | | |
| | | | | | | | | | |
Principal
Amount | | | | Fair Value | |
| | CORPORATE BONDS — (continued) | | | | | | |
| | | | Energy — 2.6% | | | | | | |
| | $404,000 | | | Schlumberger Holdings Corp., 2.350%,
12/21/18(a) | | | | $ | 403,814 | |
| | 288,000 | | | Williams Partners L.P., 5.250%, 3/15/20 | | | | | 295,567 | |
| | | | | | | | | | |
| | | | | | | | | 699,381 | |
| | | | | | | | | | |
| | | | Energy Equipment & Services — 2.2% | | | | | | |
| | 250,000 | | | Buckeye Partners LP, 2.650%, 11/15/18 | | | | | 249,957 | |
| | 250,000 | | | Enable Midstream Partners LP, 2.400%, 5/15/19 | | | | | 248,952 | |
| | 100,000 | | | EnLink Midstream Partners LP, 2.700%, 4/1/19 | | | | | 99,674 | |
| | | | | | | | | | |
| | | | | | | | | 598,583 | |
| | | | | | | | | | |
| | | | Equity Real Estate Investment Trusts (REITS) — 6.5% | |
| | 300,000 | | | American Tower Corp., 3.400%, 2/15/19 | | | | | 300,519 | |
| | 300,000 | | | iStar, Inc., 4.625%, 9/15/20 | | | | | 299,250 | |
| | 250,000 | | | Realogy Group, LLC / Realogy Co-Issuer Corp., 4.500%, 4/15/19(a) | | | | | 250,625 | |
| | 250,000 | | | Scentre Group Trust 1 / Scentre Group Trust 2, 2.375%, 11/5/19(a) | | | | | 247,277 | |
| | 300,000 | | | SL Green Operating Partnership L.P., 3.345%, (LIBOR USD 3-Month plus 0.98%),
8/16/21(b) | | | | | 300,362 | |
| | 360,000 | | | WEA Finance, LLC / Westfield UK & Europe Finance PLC, 2.700%, 9/17/19(a) | | | | | 359,090 | |
| | | | | | | | | | |
| | | | | | | | | 1,757,123 | |
| | | | | | | | | | |
| | | | Food & Staples Retailing — 2.9% | | | | | | |
| | 310,000 | | | CVS Health Corp., 3.047%, (LIBOR USD 3-Month plus 0.72%), 3/9/21(b) | | | | | 312,434 | |
| | 225,000 | | | Dollar Tree, Inc., 3.036%, (LIBOR USD 3-Month plus 0.7%), 4/17/20(b) | | | | | 225,342 | |
| | 250,000 | | | GlaxoSmithKline Capital PLC, 2.669%, (LIBOR USD 3-Month plus 0.35%), 5/14/21(b) | | | | | 251,344 | |
| | | | | | | | | | |
| | | | | | | | | 789,120 | |
| | | | | | | | | | |
| | | | Food Products — 1.1% | | | | | | |
| | 300,000 | | | Tyson Foods, Inc., 2.650%, 8/15/19 | | | | | 299,470 | |
| | | | | | | | | | |
| | | | Health Care Providers & Services — 3.6% | |
| | 200,000 | | | Becton Dickinson and Co., 3.261%, (LIBOR USD 3-Month plus 0.88%), 12/29/20(b) | | | | | 200,296 | |
| | 180,000 | | | Centene Corp., 5.625%, 2/15/21 | | | | | 183,150 | |
| | 250,000 | | | Tenet Healthcare Corp., 5.500%, 3/1/19 | | | | | 251,563 | |
| | 325,000 | | | UnitedHealth Group, Inc., 2.594%, (LIBOR USD 3-Month plus 0.26%), 6/15/21(b) | | | | | 325,460 | |
| | | | | | | | | | |
| | | | | | | | | 960,469 | |
| | | | | | | | | | |
| | | | Household Durables — 1.9% | | | | | | |
| | 260,000 | | | DR Horton, Inc., 3.750%, 3/1/19 | | | | | 260,325 | |
| | 250,000 | | | TRI Pointe Group, Inc. / TRI Pointe Homes, Inc., 4.375%, 6/15/19 | | | | | 251,250 | |
| | | | | | | | | | |
| | | | | | | | | 511,575 | |
| | | | | | | | | | |
| | | | Insurance — 5.8% | | | | | | |
| | 158,000 | | | Assurant, Inc., 3.624%, (LIBOR USD 3-Month plus 1.25%), 3/26/21(b) | | | | | 158,304 | |
| | 125,000 | | | Athene Global Funding, 2.875%, 10/23/18(a) | | | | | 125,024 | |
| | 250,000 | | | AXIS Specialty Finance PLC, 2.650%, 4/1/19 | | | | | 249,576 | |
| | 100,000 | | | AXIS Specialty Finance, LLC, 5.875%, 6/1/20 | | | | | 103,656 | |
| | 325,000 | | | Nuveen Finance, LLC, 2.950%, 11/1/19(a) | | | | | 324,554 | |
Continued
77
|
Sterling Capital Ultra Short Bond Fund |
Schedule of Portfolio Investments — (continued) |
September 30, 2018 |
| | | | | | | | | | |
Principal
Amount | | | | Fair Value | |
| | CORPORATE BONDS — (continued) | | | | | | |
| | | |
| | | | Insurance — (continued) | | | | | | |
| | $250,000 | | | Principal Life Global Funding II, 2.375%, 9/11/19(a) | | | | $ | 248,818 | |
| | 150,000 | | | Protective Life Global Funding, 2.906%, (LIBOR USD 3-Month plus 0.52%), 6/28/21(a)(b) | | | | | 150,232 | |
| | 200,000 | | | XLIT, Ltd., 2.300%, 12/15/18 | | | | | 199,866 | |
| | | | | | | | | | |
| | | | | | | | | 1,560,030 | |
| | | | | | | | | | |
| | | | Machinery — 0.1% | | | | | | |
| | 35,000 | | | Fortive Corp., 1.800%, 6/15/19 | | | | | 34,666 | |
| | | | | | | | | | |
| | | | Materials — 0.9% | | | | | | |
| | 250,000 | | | Glencore Funding, LLC, 3.125%, 4/29/19(a) | | | | | 249,365 | |
| | | | | | | | | | |
| | | | Media — 0.7% | | | | | | |
| | 200,000 | | | Discovery Communications, LLC, 2.200%, 9/20/19 | | | | | 198,434 | |
| | | | | | | | | | |
| | | | Multi-Utilities — 1.4% | | | | | | |
| | 85,000 | | | Public Service Electric & Gas Co., 1.800%, 6/1/19 | | | | | 84,424 | |
| | 300,000 | | | Sempra Energy, 2.589%, (LIBOR USD 3-Month plus 0.25%), 7/15/19(b) | | | | | 300,136 | |
| | | | | | | | | | |
| | | | | | | | | 384,560 | |
| | | | | | | | | | |
| | | | Oil, Gas & Consumable Fuels — 0.9% | |
| | 250,000 | | | Phillips 66, 3.089%, (LIBOR USD 3-Month plus 0.75%), 4/15/20(a)(b) | | | | | 250,102 | |
| | | | | | | | | | |
| | | | Road & Rail — 1.1% | | | | | | |
| | 300,000 | | | Ryder System, Inc., MTN, 2.350%, 2/26/19 | | | | | 299,487 | |
| | | | | | | | | | |
| | | | Software — 1.9% | | | | | | |
| | 250,000 | | | Dell International, LLC / EMC Corp., 3.480%, 6/1/19(a) | | | | | 250,632 | |
| | 250,000 | | | DXC Technology Co., 2.875%, 3/27/20 | | | | | 247,915 | |
| | | | | | | | | | |
| | | | | | | | | 498,547 | |
| | | | | | | | | | |
| | | | Utilities — 0.7% | | | | | | |
| | 200,000 | | | Korea Hydro & Nuclear Power Co., Ltd., 2.375%, 10/28/19(a) | | | | | 197,777 | |
| | | | | | | | | | |
| | | | Total Corporate Bonds
(Cost $19,515,085) | | | | | 19,464,099 | |
| | | | | | | | | | |
| | MUNICIPAL BONDS — 2.1% | | | | | | |
| | | | Illinois — 0.9% | | | | | | |
| | 240,000 | | | State Of Illinois, Public Improvements, G.O., Series A, 5.000%, 5/1/19 | | | | | 243,264 | |
| | | | | | | | | | |
| | | | | | | | | | |
Principal
Amount | | | | Fair Value | |
| | MUNICIPAL BONDS — (continued) | | | | | | |
| | | | New Jersey — 1.2% | | | | | | |
| $ | 325,000 | | | New Jersey Economic Development Authority, School Facilities Construction Refunding Revenue, Series AA, 5.000%, 12/15/18 | | | | $ | 326,843 | |
| | | | | | | | | | |
| | | | Total Municipal Bonds
(Cost $569,541) | | | | | 570,107 | |
| | | | | | | | | | |
| | |
| | COMMERCIAL PAPER — 2.9% | | | | | | |
| | | | Diversified Telecommunication Services — 2.0% | |
| | 525,000 | | | AT&T, Inc., 2.840%, 12/6/18 | | | | | 522,399 | |
| | | | | | | | | | |
| | | | Energy Equipment & Services — 0.9% | | | | | | |
| | 250,000 | | | Air Liquide U.S., LLC, 2.470%, 11/9/18 | | | | | 249,357 | |
| | | | | | | | | | |
| | | | Total Commercial Paper
(Cost $771,641) | | | | | 771,756 | |
| | | | | | | | | | |
| Shares | | | | | |
| | MONEY MARKET FUND — 19.5% | | | | | | |
| | 5,258,829 | | | Federated Treasury Obligations Fund, Institutional Shares, 1.92%(c) | | | | | 5,258,829 | |
| | | | | | | | | | |
| | | | Total Money Market Fund
(Cost $5,258,829) | | | | | 5,258,829 | |
| | | | | | | | | | |
| Total Investments — 118.5%
(Cost $32,071,864) | | | | | 31,999,267 | |
| | Net Other Assets (Liabilities) — (18.5)% | | | | | (4,999,086 | ) |
| | | | | | | | | | |
| | NET ASSETS — 100.0% | | | | $ | 27,000,181 | |
| | | | | | | | | | |
| (a) | Rule 144A, Section 4(2) or other security that is restricted as to resale to qualified institutional investors.The Advisor, using Board approved procedures, has deemed these securities or a portion of these securities to be liquid. |
| (b) | The interest rate for this floating rate note, which will change periodically, is based either on the prime rate or an index of market rates. The reflected rate is in effect as of September 30, 2018. The maturity date reflected is the final maturity date. |
| (c) | Represents the current yield as of report date. |
BKNT — Bank Note
G.O. — General Obligation
GMTN — Global Medium Term Note
MTN — Medium Term Note
STEP — Step Coupon Bond
See accompanying Notes to the Financial Statements.
78
|
Sterling Capital Short Duration Bond Fund |
Schedule of Portfolio Investments |
September 30, 2018 |
| | | | | | | | | | |
Principal
Amount | | | | Fair Value | |
| | ASSET BACKED SECURITIES — 18.4% | | | | | | |
| | $ 400,000 | | | AmeriCredit Automobile Receivables Trust, Series 2015-4, Class B, 2.110%, 1/8/21 | | | | $ | 399,466 | |
| | 275,000 | | | AmeriCredit Automobile Receivables Trust, Series 2015-3, Class C, 2.730%, 3/8/21 | | | | | 274,758 | |
| | 825,000 | | | AmeriCredit Automobile Receivables Trust, Series 2016-2, Class B, 2.210%, 5/10/21 | | | | | 821,921 | |
| | 965,000 | | | AmeriCredit Automobile Receivables Trust, Series 2016-4, Class B, 1.830%, 12/8/21 | | | | | 952,582 | |
| | 1,060,000 | | | AmeriCredit Automobile Receivables Trust, Series 2017-4, Class B, 2.360%, 12/19/22 | | | | | 1,038,481 | |
| | 124,555 | | | Ameriquest Mortgage Securities, Inc. Asset-Backed Pass-Through Certificates, Series 2004-R6, Class M1, 4.316%, (LIBOR USD 1-Month plus 2.10%), 7/25/34(a) | | | | | 124,966 | |
| | 800,000 | | | Avis Budget Rental Car Funding AESOP, LLC, Series 2014-2A, Class A, 2.500%, 2/20/21(b) . | | | | | 793,746 | |
| | 800,000 | | | Avis Budget Rental Car Funding AESOP, LLC, Series 2015-1A, Class A, 2.500%, 7/20/21(b) . | | | | | 789,413 | |
| | 850,000 | | | Avis Budget Rental Car Funding AESOP, LLC, Series 2015-2A, Class A, 2.630%, 12/20/21(b) | | | | | 837,221 | |
| | 650,000 | | | Capital Auto Receivables Asset Trust, Series 2015-3, Class B, 2.430%, 9/21/20 | | | | | 648,865 | |
| | 250,000 | | | Capital Auto Receivables Asset Trust, Series 2015-4, Class B, 2.390%, 11/20/20 | | | | | 249,224 | |
| | 750,000 | | | Capital Auto Receivables Asset Trust, Series 2016-3, Class B, 1.890%, 5/20/21 | | | | | 740,017 | |
| | 900,000 | | | Capital Auto Receivables Asset Trust, Series 2016-3, Class C, 2.350%, 9/20/21 | | | | | 889,073 | |
| | 795,000 | | | Capital Auto Receivables Asset Trust, Series 2017-1, Class B, 2.430%, 5/20/22(b) | | | | | 779,337 | |
| | 215,725 | | | CarMax Auto Owner Trust, Series 2015-4, Class A3, 1.560%, 11/16/20 | | | | | 214,898 | |
| | 755,199 | | | Carmax Auto Owner Trust, Series 2016-3, Class A3, 1.390%, 5/17/21 | | | | | 749,184 | |
| | 1,250,000 | | | CarMax Auto Owner Trust, Series 2016-2, Class A4, 1.680%, 9/15/21 | | | | | 1,224,914 | |
| | 419,181 | | | Chesapeake Funding II, LLC, Series 2017-2A, Class A1, 1.990%, 5/15/29(b) | | | | | 415,225 | |
| | 700,000 | | | Chesapeake Funding II, LLC, Series 2018-1A, Class A1, 3.040%, 4/15/30(b) | | | | | 698,244 | |
| | 114,099 | | | Citicorp Residential Mortgage Trust, STEP, Series 2007-2, Class A6, 5.154%, 6/25/37 | | | | | 115,940 | |
| | 609,200 | | | Citigroup Mortgage Loan Trust, Inc., Series 2005-HE1, Class M3, 3.191%, (LIBOR USD 1-Month plus 0.98%), 5/25/35(a) | | | | | 616,736 | |
| | 229,480 | | | Countrywide Asset-Backed Certificates, Series 2004-12, Class MV4, 3.641%, (LIBOR USD 1-Month plus 1.43%), 3/25/35(a) | | | | | 230,370 | |
| | 851,302 | | | Enterprise Fleet Financing, LLC, Series 2015-2, Class A3, 2.090%, 2/22/21(b) | | | | | 848,967 | |
| | 1,195,000 | | | Enterprise Fleet Financing, LLC, Series 2017-2, Class A3, 2.220%, 1/20/23(b) | | | | | 1,168,755 | |
| | 975,000 | | | Ford Credit Auto Owner Trust, Series 2015-1, Class A, 2.120%, 7/15/26(b) | | | | | 963,620 | |
| | 385,000 | | | Hertz Vehicle Financing II L.P., Series 2016-3A, Class A, 2.270%, 7/25/20(b) | | | | | 382,433 | |
| | 1,600,000 | | | Hertz Vehicle Financing II L.P., Series 2015-1A, Class A, 2.730%, 3/25/21(b) | | | | | 1,586,105 | |
| | 167,482 | | | JP Morgan Mortgage Acquisition Corp., Series 2005-OPT2, Class M1, 2.646%, (LIBOR USD 1-Month plus 0.43%), 12/25/35(a) | | | | | 167,507 | |
| | | | | | | | | | |
Principal
Amount | | | | Fair Value | |
| | ASSET BACKED SECURITIES — (continued) | | | | | | |
| | $ 892,000 | | | Santander Drive Auto Receivables Trust, Series 2016-2, Class C, 2.660%, 11/15/21 | | | | $ | 889,789 | |
| | 1,645,000 | | | Santander Drive Auto Receivables Trust, Series 2016-1, Class C, 3.090%, 4/15/22 | | | | | 1,647,245 | |
| | 482,528 | | | Sofi Professional Loan Program, LLC, Series 2016-B, Class A1, 3.416%, (LIBOR USD 1-Month plus 1.20%), 6/25/33(a)(b) | | | | | 490,043 | |
| | 193,102 | | | Sofi Professional Loan Program, LLC, Series 2016-E, Class A1, 3.066%, (LIBOR USD 1-Month plus 0.85%), 7/25/39(a)(b) | | | | | 193,992 | |
| | 270,000 | | | Wheels SPV 2, LLC, Series 2016-1A, Class A3, 1.870%, 5/20/25(b) | | | | | 267,151 | |
| | 1,085,499 | | | Wheels SPV 2, LLC, Series 2017-1A, Class A2, 1.880%, 4/20/26(b) | | | | | 1,076,303 | |
| | 305,000 | | | Wheels SPV 2, LLC, Series 2017-1A, Class A4, 2.400%, 4/20/26(b) | | | | | 298,288 | |
| | 758,303 | | | World Omni Auto Receivables Trust, Series 2016-B, Class A3, 1.300%, 2/15/22 | | | | | 749,450 | |
| | | | | | | | | | |
| | | | Total Asset Backed Securities
(Cost $24,425,579) | | | | | 24,334,229 | |
| | | | | | | | | | |
| | |
| COLLATERALIZED MORTGAGE
OBLIGATIONS — 1.8% | | | | | | |
| | 529,740 | | | Banc of America Funding 2004-C Trust, Series 2004-C, Class 4A3, 3.065%, (LIBOR USD 1-Month plus 0.9%), 12/20/34(a) | | | | | 527,094 | |
| | 82,365 | | | Countrywide Alternative Loan Trust, Series 2004-22CB, Class 1A1, 6.000%, 10/25/34 | | | | | 84,671 | |
| | 14,022 | | | Fannie Mae, Series 2003-66, Class PA, 3.500%, 2/25/33 | | | | | 14,144 | |
| | 66,127 | | | Fannie Mae, Series 2005-67, Class HG, 5.500%, 1/25/35 | | | | | 67,392 | |
| | 780,000 | | | Fannie Mae, Series 2014-76, Class BC, 3.000%, 5/25/37 | | | | | 770,834 | |
| | 172,795 | | | Fannie Mae, Series 2013-72, Class NA, 2.500%, 8/25/42 | | | | | 168,453 | |
| | 6,729 | | | Freddie Mac, Series -2770, Class UE, 4.500%, 3/15/19 | | | | | 6,731 | |
| | 124,013 | | | Freddie Mac, Series -3815, Class GD, 4.000%, 9/15/25 | | | | | 124,261 | |
| | 404,315 | | | Freddie Mac, Series -4030, Class PD, 3.000%, 6/15/40 | | | | | 394,024 | |
| | 247,796 | | | Galton Funding Mortgage Trust, Series 2018-1, Class A43, 3.500%, 11/25/57(b)(c) | | | | | 246,615 | |
| | 5,004 | | | Ginnie Mae, Series 2013-165, Class PB, 3.000%, 3/20/41 | | | | | 4,999 | |
| | 105 | | | PHHMC Trust, Series 2007-6, Class A1, 5.863%, 12/18/37(c) | | | | | 105 | |
| | 19,191 | | | Wells Fargo Mortgage Backed Securities Trust, Series 2007-16, Class 1A1, 6.000%, 12/28/37 | | | | | 19,227 | |
| | | | | | | | | | |
| | | | Total Collateralized Mortgage Obligations
(Cost $2,473,660) | | | | | 2,428,550 | |
| | | | | | | | | | |
Continued
79
|
Sterling Capital Short Duration Bond Fund |
Schedule of Portfolio Investments — (continued) |
September 30, 2018 |
| | | | | | | | | | |
Principal
Amount | | | | Fair Value | |
| COMMERCIAL MORTGAGE-BACKED
SECURITIES — 8.0% | | | | | | |
| | | |
| | $1,196,389 | | | COMM 2014-CCRE15 Mortgage Trust, Series 2014-CR15, Class A2, 2.928%, 2/10/47 | | | | $ | 1,196,237 | |
| | 160,000 | | | COMM 2014-CCRE16 Mortgage Trust, Series 2014-CR16, Class A2, 3.042%, 4/10/47 | | | | | 160,117 | |
| | 104,992 | | | DBUBS 2011-LC2 Mortgage Trust, Series 2011-LC2A, Class A4, 4.537%, 7/10/44(b) | | | | | 107,716 | |
| | 750,000 | | | DBUBS Mortgage Trust, Series 2011-LC1A, Class B, 5.471%, 11/10/46(b)(c) | | | | | 782,924 | |
| | 600,000 | | | GS Mortgage Securities Trust, Series 2010-C1, Class A2, 4.592%, 8/10/43(b) | | | | | 611,779 | |
| | 300,000 | | | GS Mortgage Securities Trust, Series 2010-C1, Class B, 5.148%, 8/10/43(b) | | | | | 305,146 | |
| | 900,000 | | | GS Mortgage Securities Trust, Series 2010-C2, Class A2, 5.162%, 12/10/43(b)(c) | | | | | 929,476 | |
| | 496,615 | | | JP Morgan Chase Commercial Mortgage Securities Trust, Series 2011-C3, Class A4, 4.717%, 2/15/46(b) | | | | | 509,225 | |
| | 523,888 | | | JPMBB Commercial Mortgage Securities Trust, Series 2014-C19, Class A2, 3.046%, 4/15/47 | | | | | 523,989 | |
| | 850,000 | | | JPMorgan Chase Commercial Mortgage Securities Trust, Series 2014-C20, Class A2, 2.872%, 7/15/47 | | | | | 849,481 | |
| | 795,225 | | | Morgan Stanley Bank of America Merrill Lynch Trust, Series 2014-C17, Class A2, 3.119%, 8/15/47 | | | | | 795,974 | |
| | 1,500,000 | | | Morgan Stanley Capital I Trust, Series 2016-BNK2, Class A2, 2.454%, 11/15/49 | | | | | 1,455,777 | |
| | 998,076 | | | WFRBS Commercial Mortgage Trust, Series 2011-C2, Class A4, 4.869%, 2/15/44(b)(c) | | | | | 1,026,609 | |
| | 82,138 | | | WFRBS Commercial Mortgage Trust, Series 2011-C3, Class A3, 3.998%, 3/15/44(b) | | | | | 82,604 | |
| | 1,200,000 | | | WFRBS Commercial Mortgage Trust, Series 2011-C3, Class A4, 4.375%, 3/15/44(b) | | | | | 1,223,744 | |
| | 63,945 | | | WFRBS Commercial Mortgage Trust, Series 2014-C20, Class A2, 3.036%, 5/15/47 | | | | | 63,955 | |
| | | | | | | | | | |
| | | | Total Commercial Mortgage-Backed Securities (Cost $10,836,826) | | | | | 10,624,753 | |
| | | | | | | | | | |
| | |
| | CORPORATE BONDS — 65.3% | | | | | | |
| | | | Automobiles — 3.0% | | | | | | |
| | 750,000 | | | American Honda Finance Corp., 2.594%, (LIBOR USD 3-Month plus 0.26%),
6/16/20(a) | | | | | 751,365 | |
| | 750,000 | | | Daimler Finance North America, LLC, 2.760%, (LIBOR USD 3-Month plus 0.45%),
2/22/21(a)(b) | | | | | 750,376 | |
| | 500,000 | | | Ford Motor Credit Co., LLC, 3.200%, 1/15/21 | | | | | 492,590 | |
| | 495,000 | | | General Motors Co., 3.143%, (LIBOR USD 3-Month plus 0.80%), 8/7/20(a) | | | | | 496,662 | |
| | 300,000 | | | General Motors Financial Co., Inc., 3.696%, (LIBOR USD 3-Month plus 1.31%),
6/30/22(a) | | | | | 303,192 | |
| | 400,000 | | | Hyundai Capital America, 2.500%, 3/18/19(b) | | | | | 399,108 | |
| | 298,000 | | | Hyundai Capital America, 2.600%, 3/19/20(b) | | | | | 293,672 | |
| | 500,000 | | | Nissan Motor Acceptance Corp., 2.550%, 3/8/21(b) | | | | | 488,520 | |
| | | | | | | | | | |
| | | | | | | | | 3,975,485 | |
| | | | | | | | | | |
| | | | | | | | | | |
Principal
Amount | | | | Fair Value | |
| | CORPORATE BONDS — (continued) | |
| | | |
| | | | Automobiles & Components — 0.3% | | | | | | |
| | $ 400,000 | | | PACCAR Financial Corp., MTN, 2.800%, 3/1/21 | | | | $ | 395,844 | |
| | | | | | | | | | |
| | | | Banks — 16.4% | | | | | | |
| | 1,100,000 | | | Australia & New Zealand Banking Group Ltd, 3.180%, (LIBOR USD 3-Month plus 0.87%), 11/23/21(a)(b) | | | | | 1,113,386 | |
| | 1,275,000 | | | Bank of America Corp., MTN, 2.151%, 11/9/20 | | | | | 1,247,688 | |
| | 750,000 | | | BPCE SA, MTN, 2.250%, 1/27/20 | | | | | 740,181 | |
| | 600,000 | | | CIT Group, Inc., 5.375%, 5/15/20 | | | | | 616,560 | |
| | 700,000 | | | Citigroup, Inc., 2.550%, 4/8/19 | | | | | 699,271 | |
| | 400,000 | | | Citizens Bank NA, BKNT, 2.300%, 12/3/18 | | | | | 399,821 | |
| | 1,000,000 | | | Cooperatieve Rabobank UA, GMTN, 2.500%, 1/19/21 | | | | | 979,743 | |
| | 750,000 | | | Credit Agricole SA/London, 2.500%, 4/15/19 | | | | | 748,958 | |
| | 450,000 | | | DNB Bank ASA, 2.125%, 10/2/20(b) | | | | | 438,259 | |
| | 850,000 | | | Fifth Third Bank/Cincinnati OH, BKNT, 1.625%, 9/27/19 | | | | | 839,568 | |
| | 575,000 | | | HSBC Bank PLC, 4.125%, 8/12/20(b) | | | | | 583,982 | |
| | 800,000 | | | ING Bank NV, 2.450%, 3/16/20(b) | | | | | 790,125 | |
| | 900,000 | | | JPMorgan Chase & Co., 2.550%, 3/1/21 | | | | | 883,848 | |
| | 600,000 | | | KeyBank NA/Cleveland OH, BKNT, 3.350%, 6/15/21 | | | | | 599,207 | |
| | 500,000 | | | Macquarie Bank, Ltd., 2.350%, 1/15/19(b) | | | | | 499,532 | |
| | 600,000 | | | Macquarie Bank, Ltd., 2.400%, 1/21/20(b) | | | | | 592,659 | |
| | 450,000 | | | Manufacturers & Traders Trust Co., BKNT, 2.932%, (LIBOR USD 3-Month plus 0.61%), 5/18/22(a) | | | | | 452,687 | |
| | 1,100,000 | | | Mitsubishi UFJ Financial Group, Inc., 3.394%,
(LIBOR USD 3-Month plus 1.06%),
9/13/21(a) | | | | | 1,117,550 | |
| | 450,000 | | | MUFG Bank, Ltd., 2.300%, 3/5/20(b) | | | | | 443,894 | |
| | 500,000 | | | National City Corp., 6.875%, 5/15/19 | | | | | 512,878 | |
| | 1,055,000 | | | Nordea Bank AB, 4.875%, 1/27/20(b) | | | | | 1,078,041 | |
| | 450,000 | | | Regions Bank/Birmingham AL, BKNT, 2.776%, (LIBOR USD 3-Month plus 0.38%), 4/1/21(a) | | | | | 450,077 | |
| | 750,000 | | | Santander UK PLC, 2.350%, 9/10/19 | | | | | 745,864 | |
| | 235,000 | | | Sumitomo Mitsui Financial Group, Inc., 3.482%, (LIBOR USD 3-Month plus 1.14%), 10/19/21(a) | | | | | 238,968 | |
| | 275,000 | | | SunTrust Bank, BKNT, 2.250%, 1/31/20 | | | | | 271,927 | |
| | 450,000 | | | SunTrust Bank, BKNT, 2.929%, (LIBOR USD 3-Month plus 0.59%), 8/2/22(a) | | | | | 451,003 | |
| | 800,000 | | | Svenska Handelsbanken AB, BKNT, 1.500%, 9/6/19 | | | | | 789,744 | |
| | 750,000 | | | Swedbank AB, 2.650%, 3/10/21(b) | | | | | 735,611 | |
| | 850,000 | | | UBS AG/London, 2.450%, 12/1/20(b) | | | | | 832,372 | |
| | 1,125,000 | | | Wells Fargo & Co., 2.500%, 3/4/21 | | | | | 1,101,815 | |
| | 750,000 | | | Zions Bancorp NA, 3.500%, 8/27/21 | | | | | 745,666 | |
| | | | | | | | | | |
| | | | | | | | | 21,740,885 | |
| | | | | | | | | | |
| | | | Biotechnology — 0.4% | | | | | | |
| | 250,000 | | | AbbVie, Inc., 2.300%, 5/14/21 | | | | | 243,325 | |
| | 350,000 | | | Allergan Funding SCS, 3.000%, 3/12/20 | | | | | 349,566 | |
| | | | | | | | | | |
| | | | | | | | | 592,891 | |
| | | | | | | | | | |
| | | | Capital Goods — 1.4% | | | | | | |
| | 1,000,000 | | | Caterpillar Financial Services Corp., MTN, 2.564%, (LIBOR USD 3-Month plus 0.23%), 3/15/21(a) | | | | | 1,001,634 | |
| | 11,000 | | | Fortive Corp., 1.800%, 6/15/19 | | | | | 10,895 | |
Continued
80
|
Sterling Capital Short Duration Bond Fund |
Schedule of Portfolio Investments — (continued) |
September 30, 2018 |
| | | | | | | | | | |
Principal
Amount | | | | Fair Value | |
| | CORPORATE BONDS — (continued) | | | | | | |
| | | | Capital Goods — (continued) | | | | | | |
| | $ 800,000 | | | Keysight Technologies, Inc., 3.300%, 10/30/19 | | | | $ | 799,634 | |
| | | | | | | | | | |
| | | | | | | | | 1,812,163 | |
| | | | | | | | | | |
| | | | Capital Markets — 0.9% | | | | | | |
| | 1,200,000 | | | Morgan Stanley, 2.650%, 1/27/20 | | | | | 1,192,310 | |
| | | | | | | | | | |
| | | | Chemicals — 1.7% | | | | | | |
| | 700,000 | | | Chevron Phillips Chemical Co., LLC / Chevron Phillips Chemical Co. LP, 2.450%, 5/1/20(b) | | | | | 692,012 | |
| | 505,000 | | | EI du Pont de Nemours & Co., 2.200%, 5/1/20 | | | | | 498,370 | |
| | 338,000 | | | INVISTA Finance, LLC, 4.250%, 10/15/19(b) | | | | | 337,578 | |
| | 680,000 | | | Sherwin-Williams Co. (The), 2.250%, 5/15/20 | | | | | 670,034 | |
| | | | | | | | | | |
| | | | | | | | | 2,197,994 | |
| | | | | | | | | | |
| | | | Communications Equipment — 0.5% | | | | | | |
| | 615,000 | | | CommScope, Inc., 5.000%, 6/15/21(b) | | | | | 615,769 | |
| | | | | | | | | | |
| | | | Construction Materials — 0.6% | | | | | | |
| | 830,000 | | | Vulcan Materials Co., 2.971%, (LIBOR USD 3-Month plus 0.65%), 3/1/21(a) | | | | | 833,059 | |
| | | | | | | | | | |
| | | | Consumer Finance — 0.3% | | | | | | |
| | 425,000 | | | Capital One Financial Corp., 2.789%, (LIBOR USD 3-Month plus 0.45%), 10/30/20(a) | | | | | 424,144 | |
| | | | | | | | | | |
| | | | Diversified Financial Services — 5.0% | | | | | | |
| | 400,000 | | | AerCap Ireland Capital, DAC/AerCap Global Aviation Trust, 4.250%, 7/1/20 | | | | | 404,034 | |
| | 300,000 | | | Ally Financial, Inc., 8.000%, 12/31/18 | | | | | 303,000 | |
| | 600,000 | | | Ally Financial, Inc., 4.125%, 3/30/20 | | | | | 602,250 | |
| | 500,000 | | | American Express Co., 2.961%, (LIBOR USD 3-Month plus 0.65%), 2/27/23(a) | | | | | 499,735 | |
| | 440,000 | | | American Express Credit Corp., MTN, 2.200%, 3/3/20 | | | | | 435,072 | |
| | 400,000 | | | Bank of New York Mellon Corp., MTN (The), 2.500%, 4/15/21 | | | | | 392,752 | |
| | 850,000 | | | Blackstone Holdings Finance Co., LLC, 5.875%, 3/15/21(b) | | | | | 896,419 | |
| | 869,000 | | | Credit Suisse Group Funding Guernsey, Ltd., 2.750%, 3/26/20 | | | | | 861,057 | |
| | 400,000 | | | Export-Import Bank of Korea, 2.500%, 11/1/20 | | | | | 392,510 | |
| | 900,000 | | | Goldman Sachs Group, Inc. (The), Series D, 6.000%, 6/15/20 | | | | | 940,761 | |
| | 459,000 | | | KKR Group Finance Co., LLC, 6.375%, 9/29/20(b) | | | | | 483,320 | |
| | 450,000 | | | Nationwide Financial Services, Inc., 5.375%, 3/25/21(b) | | | | | 465,543 | |
| | | | | | | | | | |
| | | | | | | | | 6,676,453 | |
| | | | | | | | | | |
| | | | Diversified Financials — 0.3% | | | | | | |
| | 425,000 | | | Protective Life Global Funding, 2.161%, 9/25/20(b) | | | | | 415,092 | |
| | | | | | | | | | |
| | | | Diversified Telecommunication Services — 2.0% | |
| | 400,000 | | | AT&T, Inc., 2.800%, 2/17/21 | | | | | 394,109 | |
| | 440,000 | | | CenturyLink, Inc., 6.150%, 9/15/19 | | | | | 448,250 | |
| | 500,000 | | | Sprint Communications, Inc., 9.000%, 11/15/18(b) | | | | | 503,100 | |
| | 570,000 | | | Sprint Spectrum Co., LLC / Sprint Spectrum Co. II LLC / Sprint Spectrum Co. III LLC, 3.360%, 9/20/21(b) | | | | | 567,863 | |
| | 750,000 | | | Telefonica Emisiones SAU, 5.134%, 4/27/20 | | | | | 770,815 | |
| | | | | | | | | | |
| | | | | | | | | 2,684,137 | |
| | | | | | | | | | |
| | | | | | | | | | |
Principal
Amount | | | | Fair Value | |
| | CORPORATE BONDS — (continued) | | | | | | |
| | | | Electric Utilities — 1.5% | | | | | | |
| | $500,000 | | | Dominion Energy, Inc., 2.579%, 7/1/20 | | | | $ | 493,277 | |
| | 800,000 | | | Exelon Generation Co., LLC, 2.950%, 1/15/20 | | | | | 797,782 | |
| | 475,000 | | | Pennsylvania Electric Co., 5.200%, 4/1/20 | | | | | 485,882 | |
| | 200,000 | | | Sempra Energy, 2.589%, (LIBOR USD 3-Month plus 0.25%), 7/15/19(a) | | | | | 200,091 | |
| | | | | | | | | | |
| | | | | | | | | 1,977,032 | |
| | | | | | | | | | |
| | | | Electrical Equipment — 0.4% | | | | | | |
| | 525,000 | | | Textron, Inc., 3.650%, 3/1/21 | | | | | 524,543 | |
| | | | | | | | | | |
| | | | Electronic Equipment, Instruments & Components — 0.5% | | | | | | |
| | 610,000 | | | Anixter, Inc., 5.625%, 5/1/19 | | | | | 616,864 | |
| | | | | | | | | | |
| | | | Energy Equipment & Services — 5.3% | | | | | | |
| | 800,000 | | | Buckeye Partners LP, 4.875%, 2/1/21 | | | | | 814,441 | |
| | 800,000 | | | Energy Transfer Partners LP, 4.150%, 10/1/20 | | | | | 810,306 | |
| | 726,000 | | | EnLink Midstream Partners LP, 2.700%, 4/1/19 | | | | | 723,631 | |
| | 800,000 | | | Enterprise Products Operating, LLC, 2.550%, 10/15/19 | | | | | 796,819 | |
| | 400,000 | | | Kinder Morgan Energy Partners L.P., 5.300%, 9/15/20 | | | | | 414,140 | |
| | 537,000 | | | Magellan Midstream Partners L.P., 4.250%, 2/1/21 | | | | | 545,541 | |
| | 510,000 | | | MPLX L.P., 5.500%, 2/15/23 | | | | | 520,354 | |
| | 300,000 | | | NuStar Logistics L.P., 4.800%, 9/1/20 | | | | | 302,625 | |
| | 850,000 | | | Penske Truck Leasing Co. LP/PTL Finance Corp., 3.200%, 7/15/20(b) | | | | | 845,563 | |
| | 400,000 | | | Pioneer Natural Resources Co., 7.500%, 1/15/20 | | | | | 421,064 | |
| | 760,000 | | | Sabine Pass Liquefaction, LLC, 5.625%, 2/1/21 | | | | | 790,515 | |
| | | | | | | | | | |
| | | | | | | | | 6,984,999 | |
| | | | | | | | | | |
| | | | Equity Real Estate Investment Trusts (REITS) — 5.1% | |
| | 750,000 | | | American Tower Corp., 5.050%, 9/1/20 | | | | | 773,397 | |
| | 400,000 | | | AvalonBay Communities, Inc., MTN, 2.769%, (LIBOR USD 3-Month plus 0.43%),
1/15/21(a) | | | | | 399,748 | |
| | 750,000 | | | Crown Castle International Corp., 3.400%, 2/15/21 | | | | | 748,076 | |
| | 400,000 | | | ERP Operating L.P., 4.750%, 7/15/20 | | | | | 408,578 | |
| | 430,000 | | | HCP, Inc., 2.625%, 2/1/20 | | | | | 426,302 | |
| | 403,000 | | | iStar, Inc., 5.000%, 7/1/19 | | | | | 403,675 | |
| | 71,000 | | | iStar, Inc., 4.625%, 9/15/20 | | | | | 70,823 | |
| | 800,000 | | | Ontario Teachers’ Cadillac Fairview Properties Trust, 3.125%, 3/20/22(b) | | | | | 784,465 | |
| | 500,000 | | | Realogy Group, LLC / Realogy Co-Issuer Corp., 4.500%, 4/15/19(b) | | | | | 501,250 | |
| | 754,000 | | | Scentre Group Trust 1 / Scentre Group Trust 2, 2.375%, 11/5/19(b) | | | | | 745,788 | |
| | 354,000 | | | Starwood Property Trust, Inc., 3.625%, 2/1/21(b) | | | | | 346,920 | |
| | 630,000 | | | VEREIT Operating Partnership L.P., 4.125%, 6/1/21 | | | | | 635,725 | |
| | 475,000 | | | WEA Finance, LLC / Westfield UK & Europe Finance PLC, 2.700%, 9/17/19(b) | | | | | 473,799 | |
| | | | | | | | | | |
| | | | | | | | | 6,718,546 | |
| | | | | | | | | | |
| | | | Food & Staples Retailing — 1.4% | | | | | | |
| | 700,000 | | | Cargill, Inc., 3.050%, 4/19/21(b) | | | | | 694,996 | |
| | 650,000 | | | CVS Health Corp., 2.125%, 6/1/21 | | | | | 627,397 | |
Continued
81
|
Sterling Capital Short Duration Bond Fund |
Schedule of Portfolio Investments — (continued) |
September 30, 2018 |
| | | | | | | | | | |
Principal
Amount | | | | Fair Value | |
| | CORPORATE BONDS — (continued) | | | | | | |
| |
| | | | Food & Staples Retailing — (continued) | |
| | $500,000 | | | Seven & i Holdings Co., Ltd., 3.350%,
9/17/21(b) | | | | $ | 500,385 | |
| | | | | | | | | | |
| | | | | | | | | 1,822,778 | |
| | | | | | | | | | |
| | | | Health Care Providers & Services — 2.3% | |
| | 500,000 | | | Bayer U.S. Finance II, LLC, 3.003%, (LIBOR USD 3-Month plus 0.63%), 6/25/21(a)(b) | | | | | 501,942 | |
| | 510,000 | | | Centene Corp., 5.625%, 2/15/21 | | | | | 518,925 | |
| | 750,000 | | | Halfmoon Parent, Inc., 3.200%, 9/17/20(b) | | | | | 747,248 | |
| | 610,000 | | | HCA, Inc., 4.250%, 10/15/19 | | | | | 614,575 | |
| | 630,000 | | | Tenet Healthcare Corp., 5.500%, 3/1/19 | | | | | 633,938 | |
| | | | | | | | | | |
| | | | | | | | | 3,016,628 | |
| | | | | | | | | | |
| | | | Hotels, Restaurants & Leisure — 0.4% | |
| | 400,000 | | | Prime Security Services Borrower, LLC / Prime Finance, Inc., 9.250%, 5/15/23(b) | | | | | 427,800 | |
| | 100,000 | | | Royal Caribbean Cruises, Ltd., 2.650%, 11/28/20 | | | | | 98,331 | |
| | | | | | | | | | |
| | | | | | | | | 526,131 | |
| | | | | | | | | | |
| | | | Household Durables — 0.6% | | | | | | |
| | 400,000 | | | D.R. Horton, Inc., 4.000%, 2/15/20 | | | | | 402,414 | |
| | 450,000 | | | TRI Pointe Group, Inc. / TRI Pointe Homes, Inc., 4.375%, 6/15/19 | | | | | 452,250 | |
| | | | | | | | | | |
| | | | | | | | | 854,664 | |
| | | | | | | | | | |
| | | | Insurance — 5.8% | | | | | | |
| | 775,000 | | | Alleghany Corp., 5.625%, 9/15/20 | | | | | 807,850 | |
| | 261,000 | | | American International Group, Inc., 2.300%, 7/16/19 | | | | | 259,832 | |
| | 375,000 | | | Aspen Insurance Holdings, Ltd., 6.000%, 12/15/20 | | | | | 391,894 | |
| | 396,000 | | | Assurant, Inc., 3.624%, (LIBOR USD 3-Month plus 1.25%), 3/26/21(a) | | | | | 396,761 | |
| | 450,000 | | | Athene Global Funding, 2.875%, 10/23/18(b) | | | | | 450,086 | |
| | 350,000 | | | AXIS Specialty Finance, LLC, 5.875%, 6/1/20 | | | | | 362,795 | |
| | 350,000 | | | Guardian Life Global Funding, 2.000%, 4/26/21(b) | | | | | 338,810 | |
| | 650,000 | | | Jackson National Life Global Funding, 3.300%, 6/11/21(b) | | | | | 647,148 | |
| | 450,000 | | | MassMutual Global Funding II, 1.950%, 9/22/20(b) | | | | | 440,267 | |
| | 600,000 | | | Metropolitan Life Global Funding I, 2.050%, 6/12/20(b) | | | | | 588,308 | |
| | 425,000 | | | New York Life Global Funding, 2.000%, 4/13/21(b) | | | | | 412,382 | |
| | 600,000 | | | Ohio National Financial Services, Inc., 6.375%, 4/30/20(b) | | | | | 624,274 | |
| | 800,000 | | | Principal Life Global Funding II, 2.150%, 1/10/20(b) | | | | | 791,496 | |
| | 400,000 | | | Reinsurance Group of America, Inc., 5.000%, 6/1/21 | | | | | 414,997 | |
| | 800,000 | | | Reliance Standard Life Global Funding II, 2.500%, 1/15/20(b) | | | | | 791,844 | |
| | | | | | | | | | |
| | | | | | | | | 7,718,744 | |
| | | | | | | | | | |
| | | | Materials — 0.3% | | | | | | |
| | 325,000 | | | Masco Corp., 7.125%, 3/15/20 | | | | | 341,346 | |
| | | | | | | | | | |
| | | | Media — 1.6% | | | | | | |
| | 750,000 | | | Charter Communications Operating, LLC / Charter Communications Operating Capital, 3.579%, 7/23/20 | | | | | 750,424 | |
| | | | | | | | | | |
Principal
Amount | | | | Fair Value | |
| | CORPORATE BONDS — (continued) | | | | | | |
| | | | Media — (continued) | | | | | | |
| | $250,000 | | | Discovery Communications, LLC, 2.200%, 9/20/19 | | | | $ | 248,043 | |
| | 565,000 | | | Interpublic Group of Cos., Inc. (The), 3.750%, 10/1/21 | | | | | 566,120 | |
| | 400,000 | | | Omnicom Group, Inc., 6.250%, 7/15/19 | | | | | 410,233 | |
| | 96,000 | | | Univision Communications, Inc., 6.750%, 9/15/22(b) | | | | | 98,160 | |
| | | | | | | | | | |
| | | | | | | | | 2,072,980 | |
| | | | | | | | | | |
| | | | Metals & Mining — 0.1% | | | | | | |
| | 186,000 | | | Glencore Funding, LLC, 2.500%, 1/15/19(b) | | | | | 185,712 | |
| | | | | | | | | | |
| | | | Multiline Retail — 0.6% | | | | | | |
| | 525,000 | | | Dollar Tree, Inc., 3.036%, (LIBOR USD 3-Month plus 0.70%), 4/17/20(a) | | | | | 525,798 | |
| | 325,000 | | | Family Dollar Stores, Inc., 5.000%, 2/1/21 | | | | | 333,531 | |
| | | | | | | | | | |
| | | | | | | | | 859,329 | |
| | | | | | | | | | |
| | | | Multi-Utilities — 0.4% | | | | | | |
| | 500,000 | | | Southern Power Co., 2.375%, 6/1/20 | | | | | 491,826 | |
| | | | | | | | | | |
| | | | Oil, Gas & Consumable Fuels — 0.4% | | | | | | |
| | 275,000 | | | Andeavor LLC, 5.375%, 10/1/22 | | | | | 279,576 | |
| | 250,000 | | | Phillips 66, 3.089%, (LIBOR USD 3-Month plus 0.75%), 4/15/20(a)(b) | | | | | 250,102 | |
| | | | | | | | | | |
| | | | | | | | | 529,678 | |
| | | | | | | | | | |
| | | | Road & Rail — 0.6% | | | | | | |
| | 750,000 | | | Ryder System, Inc., MTN, 3.500%, 6/1/21 | | | | | 749,313 | |
| | | | | | | | | | |
| | | | Semiconductors & Semiconductor Equipment — 0.6% | |
| | 450,000 | | | Microchip Technology, Inc., 3.922%,
6/1/21(b) | | | | | 447,364 | |
| | 400,000 | | | NXP BV / NXP Funding, LLC, 4.125%,
6/15/20(b) | | | | | 402,500 | |
| | | | | | | | | | |
| | | | | | | | | 849,864 | |
| | | | | | | | | | |
| | | | Software — 0.8% | | | | | | |
| | 125,000 | | | DXC Technology Co., 2.875%, 3/27/20 | | | | | 123,958 | |
| | 400,000 | | | DXC Technology Co., 3.271%, (LIBOR USD 3-Month plus 0.95%), 3/1/21(a) | | | | | 400,006 | |
| | 557,000 | | | VMware, Inc., 2.300%, 8/21/20 | | | | | 546,032 | |
| | | | | | | | | | |
| | | | | | | | | 1,069,996 | |
| | | | | | | | | | |
| | | | Specialty Retail — 1.6% | | | | | | |
| | 670,000 | | | Advance Auto Parts, Inc., 5.750%, 5/1/20 | | | | | 690,705 | |
| | 502,000 | | | Ashtead Capital, Inc., 5.625%, 10/1/24(b) | | | | | 520,198 | |
| | 850,000 | | | ERAC USA Finance, LLC, 2.350%, 10/15/19(b) | | | | | 844,706 | |
| | | | | | | | | | |
| | | | | | | | | 2,055,609 | |
| | | | | | | | | | |
| | | | Technology Hardware, Storage & Peripherals — 1.7% | |
| | 600,000 | | | Dell International, LLC/EMC Corp., 5.875%, 6/15/21(b) | | | | | 617,986 | |
| | 447,000 | | | Harris Corp., 2.700%, 4/27/20 | | | | | 442,579 | |
| | 450,000 | | | Spirit AeroSystems, Inc., 3.134%, (LIBOR USD 3-Month plus 0.8%), 6/15/21(a) | | | | | 450,973 | |
| | 700,000 | | | United Technologies Corp., 3.350%, 8/16/21 | | | | | 699,019 | |
| | | | | | | | | | |
| | | | | | | | | 2,210,557 | |
| | | | | | | | | | |
| | | | Tobacco — 0.5% | | | | | | |
| | 340,000 | | | BAT Capital Corp., 2.297%, 8/14/20(b) | | | | | 333,189 | |
Continued
82
|
Sterling Capital Short Duration Bond Fund |
Schedule of Portfolio Investments — (continued) |
September 30, 2018 |
| | | | | | | | | | |
Principal
Amount | | | | Fair Value | |
| | CORPORATE BONDS — (continued) | | | | | | |
| | | |
| | | | Tobacco — (continued) | | | | | | |
| $ | 392,000 | | | Reynolds American, Inc., 3.250%, 6/12/20 | | | | $ | 391,200 | |
| | | | | | | | | | |
| | | | | | | | | 724,389 | |
| | | | | | | | | | |
| | | | Total Corporate Bonds
(Cost $87,116,005) | | | | | 86,457,754 | |
| | | | | | | | | | |
| | |
| | MUNICIPAL BONDS — 1.3% | | | | | | |
| | | |
| | | | California — 0.4% | | | | | | |
| | 575,000 | | | University of California Revenue, Refunding, Taxable, Series AS, 1.490%, 5/15/20 | | | | | 562,586 | |
| | | | | | | | | | |
| | | | Illinois — 0.6% | | | | | | |
| | 760,000 | | | State Of Illinois, Public Improvements, G.O., Series A, 5.000%, 5/1/19 | | | | | 770,336 | |
| | | | | | | | | | |
| | | | New Jersey — 0.3% | | | | | | |
| | 325,000 | | | New Jersey Economic Development Authority, School Facilities Construction Refunding Revenue, Taxable, Series C, 4.521%, 6/15/21 | | | | | 330,811 | |
| | | | | | | | | | |
| | | | Total Municipal Bonds
(Cost $1,678,476) | | | | | 1,663,733 | |
| | | | | | | | | | |
| | |
| | U.S. GOVERNMENT AGENCIES — 0.6% | | | | | | |
| | | |
| | | | Freddie Mac — 0.6% | | | | | | |
| | 750,000 | | | 2.400%, 4/26/23, STEP | | | | | 749,918 | |
| | | | | | | | | | |
| | | | Total U.S. Government Agencies
(Cost $749,117) | | | | | 749,918 | |
| | | | | | | | | | |
| | |
| | U.S. TREASURY NOTES — 2.3% | | | | | | |
| | 3,150,000 | | | 1.375%, 5/31/20 | | | | | 3,077,525 | |
| | | | | | | | | | |
| | | | Total U.S. Treasury Notes
(Cost $3,087,302) | | | | | 3,077,525 | |
| | | | | | | | | | |
| | | | | | | | | | |
Shares | | | | Fair Value | |
| | MONEY MARKET FUND — 1.4% | | | | | | |
| | 1,864,988 | | | Federated Treasury Obligations Fund, Institutional Shares, 1.92%(d) | | | | $ | 1,864,988 | |
| | | | | | | | | | |
| | | | Total Money Market Fund
(Cost $1,864,988) | | | | | 1,864,988 | |
| | | | | | | | | | |
| Total Investments — 99.1%
(Cost $132,231,953) | | | | | 131,201,450 | |
| | Net Other Assets (Liabilities) — 0.9% | | | | | 1,160,317 | |
| | | | | | | | | | |
| | NET ASSETS — 100.0% | | | | $ | 132,361,767 | |
| | | | | | | | | | |
| (a) | The interest rate for this floating rate note, which will change periodically, is based either on the prime rate or an index of market rates. The reflected rate is in effect as of September 30, 2018. The maturity date reflected is the final maturity date. |
| (b) | Rule 144A, Section 4(2) or other security that is restricted as to resale to qualified institutional investors. The Advisor, using Board approved procedures, has deemed these securities or a portion of these securities to be liquid. |
| (c) | The interest rate for this variable rate note, which will change periodically, is based either on the prime rate or an index of market rates. The reflected rate is in effect as of September 30, 2018. The maturity date reflected is the final maturity date. |
| (d) | Represents the current yield as of report date. |
BKNT — Bank Note
G.O. — General Obligation
GMTN — Global Medium Term Note
MTN — Medium Term Note
STEP — Step Coupon Bond
See accompanying Notes to the Financial Statements.
83
|
Sterling Capital Intermediate U.S. Government Fund |
Schedule of Portfolio Investments |
September 30, 2018 |
| | | | | | | | | | |
Principal
Amount | | | | Fair Value | |
| | ASSET BACKED SECURITIES — 1.2% | | | | | | |
| | | |
| | | | Asset Backed Securities — 1.2% | | | | | | |
| | $ 198,209 | | | United States Small Business Administration, Series 2015-20G, Class 1, 2.880%, 7/1/35 | | | | $ | 194,020 | |
| | 87,818 | | | United States Small Business Administration, Series 2015-20H, Class 1, 2.820%, 8/1/35 | | | | | 85,722 | |
| | | | | | | | | | |
| | | | Total Asset Backed Securities
(Cost $286,027) | | | | | 279,742 | |
| | | | | | | | | | |
| | |
| COLLATERALIZED MORTGAGE
OBLIGATIONS — 9.6% | | | | | | |
| | 299,161 | | | Fannie Mae, Series 2010-129, Class NA, 3.500%, 3/25/25 | | | | | 300,419 | |
| | 425,683 | | | Fannie Mae, Series 2016-49, Class DA, 3.500%, 10/25/42 | | | | | 424,854 | |
| | 561,805 | | | Fannie Mae, Series 2016-49, Class PA, 3.000%, 9/25/45 | | | | | 547,161 | |
| | 301,211 | | | Freddie Mac, Series 4281, Class GA, 3.000%, 2/15/39 | | | | | 297,531 | |
| | 184,351 | | | Freddie Mac, Series 4648, Class E, 3.500%, 8/15/43 | | | | | 183,055 | |
| | 427,923 | | | Freddie Mac, Series 4656, Class PA, 3.500%, 10/15/45 | | | | | 427,696 | |
| | | | | | | | | | |
| | | | Total Collateralized Mortgage Obligations
(Cost $2,198,282) | | | | | 2,180,716 | |
| | | | | | | | | | |
| | |
| COMMERCIAL MORTGAGE-BACKED
SECURITIES — 4.3% | | | | | | |
| | 140,000 | | | Freddie Mac Multifamily Structured Pass Through Certificates, Series K049, Class A2, 3.010%, 7/25/25 | | | | | 136,990 | |
| | 220,000 | | | Freddie Mac Multifamily Structured Pass Through Certificates, Series KS07, Class A2, 2.735%, 9/25/25 | | | | | 209,517 | |
| | 210,000 | | | Freddie Mac Multifamily Structured Pass Through Certificates, Series K060, Class A2, 3.300%, 10/25/26 | | | | | 207,235 | |
| | 210,000 | | | Freddie Mac Multifamily Structured Pass Through Certificates, Series K061, Class A2, 3.347%, 11/25/26(a) | | | | | 207,767 | |
| | 160,000 | | | Freddie Mac Multifamily Structured Pass Through Certificates, Series K069, Class A2, 3.187%, 9/25/27(a) | | | | | 155,277 | |
| | 71,133 | | | FRESB Mortgage Trust, Series 2016-SB23, Class A5H, 1.980%, (LIBOR USD 1-Month plus 2.12%), 9/25/36(b) | | | | | 68,882 | |
| | | | | | | | | | |
| | | | Total Commercial Mortgage-Backed
Securities
(Cost $1,030,080) | | | | | 985,668 | |
| | | | | | | | | | |
| | CORPORATE BONDS — 2.5% | | | | | | |
| | | |
| | | | Automobiles — 0.8% | | | | | | |
| | 180,000 | | | American Honda Finance Corp., MTN, 1.700%, 2/22/19 | | | | | 179,320 | |
| | | | | | | | | | |
| | | | Banks — 1.7% | | | | | | |
| | 200,000 | | | State Street Corp., 2.550%, 8/18/20 | | | | | 198,459 | |
| | 200,000 | | | Wells Fargo & Co., GMTN, 2.600%, 7/22/20 | | | | | 198,016 | |
| | | | | | | | | | |
| | | | Total Corporate Bonds
(Cost $579,775) | | | | | 575,795 | |
| | | | | | | | | | |
| | | | | | | | | | |
Principal
Amount | | | | Fair Value | |
| | MORTGAGE-BACKED SECURITIES — 9.6% | | | | | | |
| | | |
| | | | Fannie Mae — 6.5% | | | | | | |
| $ | 525,662 | | | 3.587%, 9/1/20, Pool #FN0000 | | | | $ | 529,994 | |
| | 210,000 | | | 3.030%, 1/1/28, Pool #AN7807 | | | | | 199,492 | |
| | 154,282 | | | 4.000%, 12/1/36, Pool #MA2856 | | | | | 157,679 | |
| | 169,387 | | | 4.000%, 2/1/37, Pool #MA2914 | | | | | 172,908 | |
| | 397,794 | | | 5.000%, 8/1/48, Pool #CA2219 | | | | | 418,141 | |
| | | | | | | | | | |
| | | | | | | | | 1,478,214 | |
| | | | | | | | | | |
| | | | Freddie Mac — 2.8% | | | | | | |
| | 304,757 | | | 4.000%, 12/1/35, Pool #C91860 | | | | | 311,620 | |
| | 343,503 | | | 3.500%, 6/1/36, Pool #C91875 | | | | | 343,819 | |
| | | | | | | | | | |
| | | | | | | | | 655,439 | |
| | | | | | | | | | |
| | | | Ginnie Mae — 0.3% | | | | | | |
| | 62,080 | | | 5.000%, 11/20/38, Pool #4283 | | | | | 63,816 | |
| | | | | | | | | | |
| | | | Total Mortgage-Backed Securities
(Cost $2,233,011) | | | | | 2,197,469 | |
| | | | | | | | | | |
| | |
| | MUNICIPAL BONDS — 3.6% | | | | | | |
| | | |
| | | | California — 0.3% | | | | | | |
| | 75,000 | | | State Of California, Refunding G.O., Taxable, 6.200%, 10/1/19 | | | | | 77,470 | |
| | | | | | | | | | |
| | | | New York — 1.9% | | | | | | |
| | 400,000 | | | New York City Water & Sewer System, Build America Bonds, Water Utility Improvements Revenue, Taxable, Series DD, Callable 6/15/20 @ 100, 6.452%, 6/15/41 | | | | | 420,180 | |
| | | | | | | | | | |
| | | | North Carolina — 1.1% | | | | | | |
| | 250,000 | | | Durham County, NC, Build America Bonds, Public Improvements G.O., Taxable, Series B, Callable 10/1/20 @ 100, 4.845%, 10/1/29 | | | | | 257,807 | |
| | | | | | | | | | |
| | | | Texas — 0.3% | | | | | | |
| | 60,000 | | | Bexar County, TX, Build America Bonds, Public Improvements G.O., Taxable, Series C, Callable 6/15/19 @ 100, 6.628%, 6/15/39 | | | | | 61,339 | |
| | | | | | | | | | |
| | | | Total Municipal Bonds (Cost $861,911) | | | | | 816,796 | |
| | | | | | | | | | |
| | U.S. GOVERNMENT AGENCIES — 33.7% | | | | | | |
| | | |
| | | | Fannie Mae — 10.5% | | | | | | |
| | 500,000 | | | 1.875%, 9/24/26 | | | | | 453,403 | |
| | 1,000,000 | | | 6.250%, 5/15/29 | | | | | 1,260,993 | |
| | 500,000 | | | 7.125%, 1/15/30 | | | | | 674,275 | |
| | | | | | | | | | |
| | | | | | | | | 2,388,671 | |
| | | | | | | | | | |
| | | | Federal Farm Credit Bank — 6.2% | | | | | | |
| | 500,000 | | | 2.720%, 4/3/24 | | | | | 480,793 | |
| | 248,000 | | | 3.100%, 6/21/27 | | | | | 238,032 | |
| | 500,000 | | | 2.670%, 12/20/27 | | | | | 458,654 | |
| | 250,000 | | | 3.480%, 9/11/30 | | | | | 237,791 | |
| | | | | | | | | | |
| | | | | | | | | 1,415,270 | |
| | | | | | | | | | |
| | | | Federal Home Loan Bank — 2.1% | | | | | | |
| | 500,000 | | | 3.270%, 2/7/28 | | | | | 483,229 | |
| | | | | | | | | | |
| | | | Freddie Mac — 14.9% | | | | | | |
| | 500,000 | | | 2.000%, 3/30/21, STEP | | | | | 492,943 | |
| | 500,000 | | | 2.375%, 1/13/22 | | | | | 491,363 | |
| | 450,000 | | | 2.400%, 4/26/23, STEP | | | | | 449,951 | |
| | 500,000 | | | 3.100%, 6/28/23, STEP | | | | | 496,155 | |
| | 1,000,000 | | | 3.150%, 6/28/23, STEP | | | | | 995,006 | |
Continued
84
|
Sterling Capital Intermediate U.S. Government Fund |
Schedule of Portfolio Investments — (continued) |
September 30, 2018 |
| | | | | | | | | | |
Principal
Amount | | | | Fair Value | |
| | U.S. GOVERNMENT AGENCIES — (continued) | | | | | | |
| | | | Freddie Mac — (continued) | | | | | | |
| | $ 500,000 | | | 2.000%, 12/29/25, STEP | | | | $ | 471,675 | |
| | | | | | | | | | |
| | | | | | | | | 3,397,093 | |
| | | | | | | | | | |
| | | | Total U.S. Government Agencies
(Cost $7,782,525) | | | | | 7,684,263 | |
| | | | | | | | | | |
| | |
| | U.S. TREASURY NOTES — 25.8% | | | | | | |
| | 1,000,000 | | | 1.250%, 10/31/18 | | | | | 999,340 | |
| | 537,740 | | | 0.125%, 4/15/19 | | | | | 534,316 | |
| | 100,000 | | | 1.250%, 4/30/19 | | | | | 99,309 | |
| | 500,000 | | | 2.125%, 8/31/20 | | | | | 493,496 | |
| | 250,000 | | | 2.000%, 2/28/21 | | | | | 244,990 | |
| | 700,000 | | | 3.125%, 5/15/21 | | | | | 704,430 | |
| | 285,000 | | | 1.625%, 8/15/22 | | | | | 271,451 | |
| | 535,000 | | | 2.000%, 2/15/23 | | | | | 514,394 | |
| | 1,000,000 | | | 2.750%, 2/15/24 | | | | | 989,336 | |
| | 500,000 | | | 2.125%, 5/15/25 | | | | | 473,418 | |
| | 280,000 | | | 2.000%, 8/15/25 | | | | | 262,391 | |
| | 300,000 | | | 2.250%, 11/15/25 | | | | | 285,152 | |
| | | | | | | | | | |
| | | | Total U.S. Treasury Notes
(Cost $6,081,630) | | | | | 5,872,023 | |
| | | | | | | | | | |
| | | | | | | | | | |
| Shares | | | | Fair Value | |
| MONEY MARKET FUND — 3.8% | | | | | | |
| | 868,505 | | | Federated Treasury Obligations Fund, Institutional Shares, 1.92%(c) | | | | $ | 868,505 | |
| | | | | | | | | | |
| | | | Total Money Market Fund
(Cost $868,505) | | | | | 868,505 | |
| | | | | | | | | | |
| | |
| Total Investments — 94.1%
(Cost $21,921,746) | | | | | 21,460,977 | |
| Net Other Assets (Liabilities) — 5.9% | | | | | 1,337,850 | |
| | | | | | | | | | |
| | NET ASSETS — 100.0% | | | | $ | 22,798,827 | |
| | | | | | | | | | |
| (a) | The interest rate for this variable rate note, which will change periodically, is based either on the prime rate or an index of market rates. The reflected rate is in effect as of September 30, 2018. The maturity date reflected is the final maturity date. |
| (b) | The interest rate for this floating rate note, which will change periodically, is based either on the prime rate or an index of market rates. The reflected rate is in effect as of September 30, 2018. The maturity date reflected is the final maturity date. |
| (c) | Represents the current yield as of report date. |
G.O. — General Obligation
GMTN — Global Medium Term Note
MTN — Medium Term Note
STEP — Step Coupon Bond
See accompanying Notes to the Financial Statements.
85
|
Sterling Capital Total Return Bond Fund |
Schedule of Portfolio Investments |
September 30, 2018 |
| | | | | | | | | | |
Principal
Amount | | | | Fair Value | |
| | ASSET BACKED SECURITIES — 17.7% | | | | | | |
| | | |
| | $ 1,583,119 | | | Aegis Asset Backed Securities Trust, Series 2005-5, Class 1A4, 2.566%, (LIBOR USD 1-Month plus 0.35%), 12/25/35(a) | | | | $ | 1,574,222 | |
| | 4,000,000 | | | AmeriCredit Automobile Receivables Trust, Series 2016-3, Class B, 1.800%, 10/8/21 | | | | | 3,952,815 | |
| | 4,565,000 | | | AmeriCredit Automobile Receivables Trust, Series 2016-4, Class B, 1.830%, 12/8/21 | | | | | 4,506,254 | |
| | 4,600,000 | | | AmeriCredit Automobile Receivables Trust, Series 2017-4, Class B, 2.360%, 12/19/22 | | | | | 4,506,615 | |
| | 10,757,000 | | | AmeriCredit Automobile Receivables Trust 2017-4, Series 2017-4, Class C, 2.600%, 9/18/23 | | | | | 10,512,829 | |
| | 421,904 | | | Argent Securities, Inc. Pass Through Certificates, Series 2005-W3, Class A2D, 2.556%, (LIBOR USD 1-Month plus 0.34%), 11/25/35(a) | | | | | 421,629 | |
| | 4,550,000 | | | Avis Budget Rental Car Funding AESOP, LLC, Series 2015-1A, Class A, 2.500%,
7/20/21(b) | | | | | 4,489,787 | |
| | 6,000,000 | | | Avis Budget Rental Car Funding AESOP, LLC, Series 2016-1A, Class A, 2.990%,
6/20/22(b) | | | | | 5,921,993 | |
| | 7,060,000 | | | Avis Budget Rental Car Funding AESOP, LLC, Series 2017-1A, Class A, 3.070%,
9/20/23(b) | | | | | 6,880,042 | |
| | 2,320,000 | | | Bear Stearns Asset Backed Securities I Trust, Series 2004-BO1, Class M5, 3.616%, (LIBOR USD 1-Month plus 1.40%), 10/25/34(a) | | | | | 2,332,230 | |
| | 2,585,000 | | | Capital Auto Receivables Asset Trust, Series 2016-3, Class A4, 1.690%, 3/20/21 | | | | | 2,559,843 | |
| | 4,110,000 | | | Capital Auto Receivables Asset Trust, Series 2016-3, Class B, 1.890%, 5/20/21 | | | | | 4,055,295 | |
| | 4,210,000 | | | Capital Auto Receivables Asset Trust, Series 2016-3, Class C, 2.350%, 9/20/21 | | | | | 4,158,887 | |
| | 9,320,000 | | | Capital Auto Receivables Asset Trust, Series 2018-1, Class B, 3.090%, 8/22/22(b) | | | | | 9,251,871 | |
| | 2,478,000 | | | Chase Issuance Trust, Series 2014-A2, Class A2, 2.770%, 3/15/23 | | | | | 2,460,778 | |
| | 6,500,000 | | | Citibank Credit Card Issuance Trust, Series 2017-A5, Class A5, 2.832%, (LIBOR USD 1-Month plus 0.62%), 4/22/26(a) | | | | | 6,564,531 | |
| | 9,000,000 | | | Citibank Credit Card Issuance Trust, Series 2017-A6, Class A6, 2.904%, (LIBOR USD 1-Month plus 0.77%), 5/14/29(a) | | | | | 9,067,010 | |
| | 2,175,000 | | | Citibank Credit Card Issuance Trust, Series 2007-A3, Class A3, 6.150%, 6/15/39 | | | | | 2,680,935 | |
| | 720,024 | | | Citicorp Residential Mortgage Trust, STEP, Series 2007-2, Class A6, 5.154%, 6/25/37 | | | | | 731,645 | |
| | 1,065,633 | | | Countrywide Asset-Backed Certificates, Series 2004-12, Class MV4, 3.641%, (LIBOR USD 1-Month plus 1.43%), 3/25/35(a) | | | | | 1,069,764 | |
| | 3,210,000 | | | Discover Card Execution Note Trust, Series 2014-A4, Class A4, 2.120%, 12/15/21 | | | | | 3,195,477 | |
| | 9,200,000 | | | Discover Card Execution Note Trust, Series 2017-A4, Class A4, 2.530%, 10/15/26 | | | | | 8,798,460 | |
| | 8,540,000 | | | Discover Card Execution Note Trust, Series 2017-A5, Class A5, 2.758%, (LIBOR USD 1-Month plus 0.60%), 12/15/26(a) | | | | | 8,610,591 | |
| | 5,452,789 | | | Encore Credit Receivables Trust, Series 2005-4, Class M2, 2.656%, (LIBOR USD 1-Month plus 0.44%), 1/25/36(a) | | | | | 5,440,806 | |
| | 12,338,000 | | | Enterprise Fleet Financing 2018-2, LLC, Series 2018-2, Class A3, 3.340%,
2/20/24(b) | | | | | 12,322,288 | |
| | | | | | | | | | |
Principal
Amount | | | | Fair Value | |
| | ASSET BACKED SECURITIES — (continued) | | | | | | |
| $ | 3,494,824 | | | Enterprise Fleet Financing, LLC, Series 2016-2, Class A2, 1.740%, 2/22/22(b) | | | | $ | 3,483,138 | |
| | 4,510,000 | | | Enterprise Fleet Financing, LLC, Series 2017-1, Class A3, 2.600%, 7/20/22(b) | | | | | 4,475,820 | |
| | 9,010,000 | | | Enterprise Fleet Financing, LLC, Series 2018-1, Class A3, 3.100%, 10/20/23(b) | | | | | 8,958,680 | |
| | 6,034,000 | | | Ford Credit Auto Owner Trust, Series 2014-2, Class A, 2.310%, 4/15/26(b) | | | | | 5,995,147 | |
| | 4,200,000 | | | Ford Credit Auto Owner Trust, Series 2015-1, Class A, 2.120%, 7/15/26(b) | | | | | 4,150,979 | |
| | 975,000 | | | Ford Credit Auto Owner Trust, Series 2017-2, Class A, 2.360%, 3/15/29(b) | | | | | 934,808 | |
| | 15,415,000 | | | Ford Credit Auto Owner Trust, Series 2018-1, Class A, 3.190%, 7/15/31(b) | | | | | 15,028,307 | |
| | 4,080,000 | | | GM Financial Consumer Automobile Receivables Trust, Series 2018-1, Class A3, 2.320%, 7/18/22 | | | | | 4,022,706 | |
| | 952,687 | | | GSAMP Trust, Series 2006-SEA1, Class M1, 2.716%, (LIBOR USD 1-Month plus 0.50%), 5/25/36(a)(b) | | | | | 942,123 | |
| | 2,868,000 | | | Hertz Vehicle Financing II L.P., Series 2016-3A, Class A, 2.270%, 7/25/20(b) | | | | | 2,848,879 | |
| | 7,564,000 | | | Hertz Vehicle Financing II L.P., Series 2015-3A, Class A, 2.670%, 9/25/21(b) | | | | | 7,428,196 | |
| | 1,823,520 | | | Home Equity Mortgage Loan Asset-Backed Trust, Series 2005-B, Class M3, 2.951%, (LIBOR USD 1-Month plus 0.74%),
8/25/35(a) | | | | | 1,821,471 | |
| | 2,346,896 | | | JP Morgan Mortgage Acquisition Corp., Series 2005-OPT1, Class M2, 2.921%, (LIBOR USD 1-Month plus 0.71%), 6/25/35(a) | | | | | 2,348,479 | |
| | 879,812 | | | New Century Home Equity Loan Trust, Series 2003-4, Class M1, 3.341%, (LIBOR USD 1-Month plus 1.13%), 10/25/33(a) | | | | | 879,508 | |
| | 3,067,712 | | | Park Place Securities, Inc., Series 2005-WHQ2, Class M2, 2.906%, (LIBOR USD 1-Month plus 0.69%), 5/25/35(a) | | | | | 3,073,724 | |
| | 2,680,000 | | | RAMP Trust, Series 2005-RZ4, Class M2, 2.716%, (LIBOR USD 1-Month plus 0.50%), 11/25/35(a) | | | | | 2,671,785 | |
| | 5,960,000 | | | Santander Drive Auto Receivables Trust, Series 2018-4, Class B, 3.270%, 1/17/23 | | | | | 5,941,417 | |
| | 3,582,922 | | | Saxon Asset Securities Trust, Series 2004-3, Class M1, 3.116%, (LIBOR USD 1-Month plus 0.90%), 12/26/34(a) | | | | | 3,550,191 | |
| | 520,310 | | | Securitized Asset Backed Receivables, LLC Trust, Series 2005-OP2, Class A2C, 2.536%, (LIBOR USD 1-Month plus 0.32%), 10/25/35(a) | | | | | 520,294 | |
| | 827,834 | | | Sofi Professional Loan Program, LLC, Series 2016-E, Class A1, 3.066%, (LIBOR USD 1-Month plus 0.85%), 7/25/39(a)(b) | | | | | 831,652 | |
| | 3,073,632 | | | United States Small Business Administration, Series 2015-20H, Class 1, 2.820%, 8/1/35 | | | | | 3,000,279 | |
| | 3,810,000 | | | Volkswagen Auto Loan Enhanced Trust 2018-1, Series 2018-1, Class A3, 3.020%, 11/21/22 | | | | | 3,807,400 | |
| | 3,580,000 | | | Wheels SPV 2, LLC, Series 2018-1A, Class A4, 3.410%, 4/20/27(b) | | | | | 3,562,298 | |
| | | | | | | | | | |
| | | | Total Asset Backed Securities
(Cost $216,905,230) | | | | | 216,343,878 | |
| | | | | | | | | | |
Continued
86
|
Sterling Capital Total Return Bond Fund |
Schedule of Portfolio Investments — (continued) |
September 30, 2018 |
| | | | | | | | | | |
Principal
Amount | | | | Fair Value | |
| COLLATERALIZED MORTGAGE
OBLIGATIONS — 8.1% | | | | | | |
| $ | 320,789 | | | Adjustable Rate Mortgage Trust, Series 2004-5, Class 4A1, 3.823%, 4/25/35(c) | | | | $ | 316,146 | |
| | 394,204 | | | Banc of America Alternative Loan Trust, Series 2004-10, Class 1CB1, 6.000%, 11/25/34 | | | | | 413,677 | |
| | 2,760,570 | | | Banc of America Funding 2004-C Trust, Series 2004-C, Class4A1, 2.825%, (LIBOR USD 1-Month plus 0.66%), 12/20/34(a) | | | | | 2,756,754 | |
| | 941,591 | | | Banc of America Funding Trust, Series 2005-B, Class 3A1, 2.625%, (LIBOR USD 1-Month plus 0.46%), 4/20/35(a) | | | | | 939,624 | |
| | 577,587 | | | Banc of America Funding Trust, Series 2006-2, Class 3A1, 6.000%, 3/25/36 | | | | | 580,642 | |
| | 98,263 | | | Banc of America Mortgage Trust, Series 2005-3, Class 1A24, 5.500%, 4/25/35 | | | | | 99,412 | |
| | 32,765 | | | Citigroup Mortgage Loan Trust, Inc., Series 2004-NCM2, Class 3CB2, 6.500%, 8/25/19 | | | | | 32,944 | |
| | 469,482 | | | Countrywide Alternative Loan Trust, Series 2004-22CB, Class 1A1, 6.000%, 10/25/34 | | | | | 482,626 | |
| | 114,067 | | | Countrywide Home Loan Mortgage Pass Through Trust, Series 2004-3, Class A4, 5.750%, 4/25/34 | | | | | 117,017 | |
| | 369,573 | | | Credit Suisse First Boston Mortgage Securities Corp., Series 2004-1, Class 2A1, 6.500%, 2/25/34 | | | | | 384,116 | |
| | 62 | | | Credit Suisse First Boston Mortgage Securities Corp., Series 2005-6, Class 2A3, 5.500%, 7/25/35 | | | | | 62 | |
| | 856,559 | | | Fannie Mae, Series 2013-133, Class AV, 4.000%, 12/25/26 | | | | | 875,961 | |
| | 1,673,681 | | | Fannie Mae, Series 2014-39, Class VP, 3.000%, 8/25/27 | | | | | 1,639,610 | |
| | 1,929,433 | | | Fannie Mae, Series 2011-38, Class D, 4.500%, 5/25/41 | | | | | 2,014,520 | |
| | 1,281,899 | | | Fannie Mae, Series 2017-64, Class PD, 2.500%, 7/25/47 | | | | | 1,193,903 | |
| | 2,398,039 | | | FirstKey Mortgage Trust, Series 2014-1, Class A12, 3.500%, 11/25/44(b)(c) | | | | | 2,328,251 | |
| | 1,090,464 | | | Freddie Mac, Series -3768, Class V, 4.000%, 11/15/23 | | | | | 1,104,351 | |
| | 2,277,284 | | | Freddie Mac, Series -4387, Class VM, 4.000%, 11/15/25 | | | | | 2,321,787 | |
| | 1,621,334 | | | Freddie Mac, Series -4287, Class V, 4.500%, 10/15/26 | | | | | 1,686,009 | |
| | 404,875 | | | Freddie Mac, Series -4136, Class HZ, 3.500%, 11/15/27 | | | | | 397,245 | |
| | 2,467,450 | | | Freddie Mac, Series -4331, Class V, 4.000%, 11/15/28 | | | | | 2,516,993 | |
| | 569,000 | | | Freddie Mac, Series -4120, Class YK, 2.000%, 10/15/32 | | | | | 462,938 | |
| | 1,100,000 | | | Freddie Mac, Series 4160, Class HH, 2.500%, 12/15/32 | | | | | 1,003,429 | |
| | 10,000,000 | | | Freddie Mac, Series -4655, Class GV, 3.500%, 12/15/36 | | | | | 9,847,985 | |
| | 5,500,000 | | | Freddie Mac, Series -4657, Class VT, 3.500%, 6/15/37 | | | | | 5,330,939 | |
| | 1,253,463 | | | Freddie Mac, Series -3632, Class PK, 5.000%, 2/15/40 | | | | | 1,320,430 | |
| | 2,137,315 | | | Freddie Mac, Series -4077, Class PJ, 3.500%, 11/15/40 | | | | | 2,142,162 | |
| | 819,000 | | | Freddie Mac, Series -3762, Class LN, 4.000%, 11/15/40 | | | | | 821,045 | |
| | | | | | | | | | |
Principal
Amount | | | | Fair Value | |
| COLLATERALIZED MORTGAGE
OBLIGATIONS — (continued) | | | | | | |
| | $ 4,184,765 | | | Freddie Mac, Series -4100, Class PA, 3.000%, 1/15/42 | | | | $ | 4,068,209 | |
| | 1,647,107 | | | Freddie Mac, Series 4508, Class UZ, 3.000%, 7/15/43 | | | | | 1,457,710 | |
| | 1,557,251 | | | Freddie Mac, Series -4328, Class KD, 3.000%, 8/15/43 | | | | | 1,528,263 | |
| | 8,708,763 | | | Freddie Mac, Series -4648, Class E, 3.500%, 8/15/43 | | | | | 8,647,503 | |
| | 4,837,000 | | | Freddie Mac, Series -4801, Class LT, 4.000%, 12/15/43 | | | | | 4,937,382 | |
| | 4,293,539 | | | Freddie Mac, Series -4710, Class GA, 3.000%, 3/15/44 | | | | | 4,155,472 | |
| | 8,000,000 | | | Freddie Mac, Series -4752, Class HB, 3.500%, 4/15/44 | | | | | 7,826,864 | |
| | 10,000,000 | | | Freddie Mac, Series -4776, Class DW, 4.000%, 9/15/44 | | | | | 10,072,834 | |
| | 4,365,931 | | | Freddie Mac, Series -4654, Class KA, 3.000%, 6/15/45 | | | | | 4,275,417 | |
| | 3,980,223 | | | Galton Funding Mortgage Trust, Series 2018-1, Class A43, 3.500%, 11/25/57(b)(c) | | | | | 3,961,256 | |
| | 471,873 | | | Ginnie Mae, Series 2008-51, Class PG, 5.000%, 6/20/38 | | | | | 494,163 | |
| | 721,668 | | | MASTR Alternative Loan Trust, Series 2003-5, Class 8A1, 5.500%, 6/25/33 | | | | | 734,379 | |
| | 587,477 | | | MASTR Alternative Loan Trust, Series 2004-13, Class 3A1, 6.500%, 1/25/35 | | | | | 587,501 | |
| | 42,941 | | | MASTR Seasoned Securitization Trust, Series 2005-2, Class 1A1, 5.130%, 10/25/32 | | | | | 42,910 | |
| | 1,005 | | | PHHMC Trust, Series 2007-6, Class A1, 5.863%, 12/18/37(c) | | | | | 1,007 | |
| | 4,316 | | | RAAC Trust, Series 2004-SP3, Class AI5, 4.890%, 12/25/32(c) | | | | | 4,367 | |
| | 548,877 | | | RAAC Trust, STEP, Series 2004-SP1, Class AI3, 6.118%, 3/25/34 | | | | | 558,094 | |
| | 268,689 | | | Residential Asset Securitization Trust, Series 2004-IP2, Class 4A, 4.205%, 12/25/34(c) | | | | | 267,597 | |
| | 309,870 | | | Specialty Underwriting & Residential Finance Trust, Series 2004-AA1, Class 1A1, 5.000%, 10/25/34 | | | | | 309,799 | |
| | 35,103 | | | Wells Fargo Mortgage Backed Securities Trust, Series 2007-3, Class 3A1, 5.500%, 4/25/22 | | | | | 35,632 | |
| | 405,978 | | | Wells Fargo Mortgage Backed Securities Trust, Series 2004-BB, Class A2, 3.783%, 1/25/35(c) | | | | | 411,604 | |
| | 41,468 | | | Wells Fargo Mortgage Backed Securities Trust, Series 2005-4, Class A4, 5.000%, 4/25/35 | | | | | 41,433 | |
| | 636,184 | | | Wells Fargo Mortgage Backed Securities Trust, Series 2005-AR16, Class 6A3, 4.477%, 10/25/35(c) | | | | | 642,331 | |
| | 61,833 | | | Wells Fargo Mortgage Backed Securities Trust, Series 2007-16, Class 1A1, 6.000%, 12/28/37 | | | | | 61,949 | |
| | | | | | | | | | |
| | | | Total Collateralized Mortgage Obligations
(Cost $100,810,974) | | | | | 98,254,254 | |
| | | | | | | | | | |
| | |
| COMMERCIAL MORTGAGE-BACKED
SECURITIES — 14.1% | | | | | | |
| | 4,842,000 | | | CD Mortgage Trust, Series 2016-CD2, Class A4, 3.526%, 11/10/49(c) | | | | | 4,778,126 | |
| | 2,868,000 | | | CFCRE Commercial Mortgage Trust, Series 2016-C7, Class A3, 3.839%, 12/10/54 | | | | | 2,868,665 | |
Continued
87
|
Sterling Capital Total Return Bond Fund |
Schedule of Portfolio Investments — (continued) |
September 30, 2018 |
| | | | | | | | | | |
Principal
Amount | | | | Fair Value | |
| COMMERCIAL MORTGAGE-BACKED
SECURITIES — (continued) | | | | | | |
| $ | 1,540,000 | | | CFCRE Commercial Mortgage Trust 2016-C4, Series 2016-C4, Class A2, 2.707%, 5/10/58 | | | | $ | 1,514,037 | |
| | 1,500,000 | | | Citigroup Commercial Mortgage Trust, Series 2017-P7, Class A4, 3.712%, 4/14/50 | | | | | 1,488,102 | |
| | 5,730,000 | | | Citigroup Commercial Mortgage Trust, Series 2018-B2, Class A4, 4.009%, 3/10/51 | | | | | 5,811,793 | |
| | 1,000,000 | | | COMM Mortgage Trust, Series 2012-CR1, Class AM, 3.912%, 5/15/45 | | | | | 1,006,447 | |
| | 3,545,000 | | | COMM Mortgage Trust, Series 2013-CR12, Class A4, 4.046%, 10/10/46 | | | | | 3,636,820 | |
| | 892,000 | | | COMM Mortgage Trust, Series 2014-CR16, Class A4, 4.051%, 4/10/47 | | | | | 913,592 | |
| | 1,208,000 | | | COMM Mortgage Trust, Series 2014-LC17, Class A5, 3.917%, 10/10/47 | | | | | 1,227,031 | |
| | 1,844,000 | | | COMM Mortgage Trust, Series 2014-CR20, Class A4, 3.590%, 11/10/47 | | | | | 1,842,895 | |
| | 8,030,000 | | | COMM Mortgage Trust, Series 2017-COR2, Class A3, 3.510%, 9/10/50 | | | | | 7,840,377 | |
| | 94,109 | | | Commercial Mortgage Loan Trust, Series 2008-LS1, Class ASM, 6.253%, 12/10/49(c) | | | | | 93,961 | |
| | 2,650,000 | | | DBUBS Mortgage Trust, Series 2011-LC1A, Class C, 5.884%, 11/10/46(b)(c) | | | | | 2,772,905 | |
| | 6,795,000 | | | Freddie Mac Multifamily Structured Pass Through Certificates, Series -KS07, Class A2, 2.735%, 9/25/25 | | | | | 6,471,226 | |
| | 6,410,000 | | | Freddie Mac Multifamily Structured Pass Through Certificates, Series -K064, Class A2, 3.224%, 3/25/27 | | | | | 6,273,962 | |
| | 3,350,000 | | | Freddie Mac Multifamily Structured Pass Through Certificates, Series -K068, Class A2, 3.244%, 8/25/27 | | | | | 3,269,401 | |
| | 3,920,000 | | | Freddie Mac Multifamily Structured Pass Through Certificates, Series -K069, Class A2, 3.187%, 9/25/27(c) | | | | | 3,804,277 | |
| | 3,800,000 | | | Freddie Mac Multifamily Structured Pass Through Certificates, Series -K153, Class A3, 3.117%, 10/25/31(c) | | | | | 3,531,959 | |
| | 9,580,000 | | | Freddie Mac Multifamily Structured Pass Through Certificates, Series -K155, Class A3, 3.750%, 4/25/33 | | | | | 9,516,556 | |
| | 7,994,174 | | | FRESB 2018-SB52 Mortgage Trust, Series 2018-SB52, Class A10F, 3.480%, 6/1/28(c) | | | | | 7,873,768 | |
| | 5,561,487 | | | FRESB Mortgage Trust, Series 2017-SB37, Class A10F, 2.750%, 7/25/27(c) | | | | | 5,275,123 | |
| | 1,813,902 | | | FRESB Mortgage Trust, Series 2016-SB23, Class A5H, 1.980%, (LIBOR USD 1-Month plus 2.12%), 9/25/36(a) | | | | | 1,756,501 | |
| | 3,000,000 | | | GS Mortgage Securities Trust, Series 2010-C1, Class B, 5.148%, 8/10/43(b) | | | | | 3,051,461 | |
| | 2,524,000 | | | GS Mortgage Securities Trust, Series 2014-GC24, Class A5, 3.931%, 9/10/47 | | | | | 2,567,822 | |
| | 2,044,000 | | | GS Mortgage Securities Trust, Series 2016-GS4, Class A4, 3.442%, 11/10/49(c) | | | | | 1,999,912 | |
| | 1,680,000 | | | JP Morgan Chase Commercial Mortgage Securities Trust, Series 2013-C10, Class AS, 3.372%, 12/15/47 | | | | | 1,657,940 | |
| | 1,702,000 | | | JP Morgan Chase Commercial Mortgage Securities Trust, Series 2016-JP4, Class A4, 3.648%, 12/15/49(c) | | | | | 1,683,718 | |
| | 1,397,000 | | | JPMBB Commercial Mortgage Securities Trust, Series 2014-C23, Class A5, 3.934%, 9/15/47 | | | | | 1,420,791 | |
| | | | | | | | | | |
Principal
Amount | | | | Fair Value | |
| COMMERCIAL MORTGAGE-BACKED
SECURITIES — (continued) | | | | | | |
| $ | 4,200,000 | | | JPMCC Commercial Mortgage Securities Trust 2017-JP5, Series 2017-JP5, Class A5, 3.723%, 3/15/50 | | | | $ | 4,173,090 | |
| | 4,000,000 | | | JPMorgan Chase Commercial Mortgage Securities Trust, Series 2011-C3, Class B, 5.013%, 2/15/46(b)(c) | | | | | 4,080,979 | |
| | 660,000 | | | Morgan Stanley Bank of America Merrill Lynch Trust, Series 2014-C18, Class A4, 3.923%, 10/15/47 | | | | | 665,997 | |
| | 5,834,000 | | | Morgan Stanley Bank of America Merrill Lynch Trust, Series 2016-C32, Class A4, 3.720%, 12/15/49 | | | | | 5,800,288 | |
| | 4,000,000 | | | Morgan Stanley Capital I Trust, Series 2011-C1, Class B, 5.599%,
9/15/47(b)(c) | | | | | 4,138,702 | |
| | 640,000 | | | Morgan Stanley Capital I Trust, Series 2011-C1, Class C, 5.599%,
9/15/47(b)(c) | | | | | 660,361 | |
| | 2,562,000 | | | Morgan Stanley Capital I Trust, Series 2016-BNK2, Class A4, 3.049%, 11/15/49 | | | | | 2,422,223 | |
| | 10,000,000 | | | Morgan Stanley Capital I, Inc., Series 2017-HR2, Class A4, 3.587%, 12/15/50 | | | | | 9,795,759 | |
| | 10,335,000 | | | Morgan Stanley Capital I, Inc., Series 2018-H3, Class A5, 4.177%, 7/15/51 | | | | | 10,584,543 | |
| | 2,500,000 | | | Wells Fargo Commercial Mortgage Trust, Series 2010-C1, Class A2, 4.393%,
11/15/43(b) | | | | | 2,545,455 | |
| | 3,156,000 | | | Wells Fargo Commercial Mortgage Trust, Series 2015-P2, Class A4, 3.809%, 12/15/48 | | | | | 3,172,409 | |
| | 9,642,000 | | | Wells Fargo Commercial Mortgage Trust, Series 2017-C40, Class A4, 3.581%, 10/15/50 | | | | | 9,469,415 | |
| | 1,719,017 | | | WFRBS Commercial Mortgage Trust, Series 2011-C2, Class A4, 4.869%, 2/15/44(b)(c) | | | | | 1,768,160 | |
| | 2,000,000 | | | WFRBS Commercial Mortgage Trust, Series 2011-C2, Class B, 5.174%, 2/15/44(b)(c) | | | | | 2,050,524 | |
| | 8,005,000 | | | WFRBS Commercial Mortgage Trust, Series 2011-C3, Class A4, 4.375%, 3/15/44(b) | | | | | 8,163,394 | |
| | 1,500,000 | | | WFRBS Commercial Mortgage Trust, Series 2012-C8, Class AS, 3.660%, 8/15/45 | | | | | 1,495,802 | |
| | 3,716,000 | | | WFRBS Commercial Mortgage Trust, Series 2014-C22, Class A5, 3.752%, 9/15/57 | | | | | 3,735,907 | |
| | 1,008,000 | | | WFRBS Commercial Mortgage Trust, Series 2014-C23, Class A5, 3.917%, 10/15/57 | | | | | 1,021,729 | |
| | | | | | | | | | |
| | | | Total Commercial Mortgage-Backed Securities
(Cost $178,589,852) | | | | | 171,693,905 | |
| | | | | | | | | | |
| | |
| | CORPORATE BONDS — 36.0% | | | | | | |
| | | | Aerospace & Defense — 0.0% | | | | | | |
| | 665,000 | | | United Technologies Corp., 4.125%, 11/16/28 | | | | | 660,458 | |
| | | | | | | | | | |
| | | | Automobiles — 1.5% | | | | | | |
| | 3,653,000 | | | American Honda Finance Corp., MTN, 2.618%, (LIBOR USD 3-Month plus 0.27%), 7/20/20(a) | | | | | 3,661,751 | |
| | 2,854,000 | | | General Motors Financial Co., Inc., 3.200%, 7/6/21 | | | | | 2,818,311 | |
| | 2,695,000 | | | Hyundai Capital America, 2.400%,
10/30/18(b) | | | | | 2,694,836 | |
| | 5,035,000 | | | Hyundai Capital America, 3.260%, (LIBOR USD 3-Month plus 0.94%), 7/8/21(a)(b) | | | | | 5,047,852 | |
| | 3,910,000 | | | Toyota Industries Corp., 3.235%,
3/16/23(b) | | | | | 3,848,185 | |
| | | | | | | | | | |
| | | | | | | | | 18,070,935 | |
| | | | | | | | | | |
Continued
88
|
Sterling Capital Total Return Bond Fund |
Schedule of Portfolio Investments — (continued) |
September 30, 2018 |
| | | | | | | | | | |
Principal
Amount | | | | Fair Value | |
| | CORPORATE BONDS — (continued) | | | | | | |
| | | |
| | | | Banks — 6.0% | | | | | | |
| | $3,287,000 | | | ABN AMRO Bank NV, 2.650%, 1/19/21(b) | | | | $ | 3,226,263 | |
| | 3,278,000 | | | Associated Banc-Corp., 2.750%, 11/15/19 | | | | | 3,265,017 | |
| | 1,839,000 | | | Bank of America Corp., 3.342%, (LIBOR USD 3-Month plus 1.00%), 4/24/23(a) | | | | | 1,863,495 | |
| | 4,927,000 | | | Bank of Nova Scotia (The), 2.788%, (LIBOR USD 3-Month plus 0.44%), 4/20/21(a) | | | | | 4,942,667 | |
| | 2,717,000 | | | CIT Group, Inc., 4.750%, 2/16/24 | | | | | 2,723,657 | |
| | 5,545,000 | | | Citigroup, Inc., 3.751%, (LIBOR USD 3-Month plus 1.43%), 9/1/23(a) | | | | | 5,676,037 | |
| | 1,024,000 | | | Citigroup, Inc., 3.412%, (LIBOR USD 3-Month plus 1.10%), 5/17/24(a) | | | | | 1,032,143 | |
| | 2,715,000 | | | Citigroup, Inc., 4.400%, 6/10/25 | | | | | 2,715,452 | |
| | 2,825,000 | | | Citigroup, Inc., Series N, 5.800%,(d)(e) | | | | | 2,884,325 | |
| | 3,908,000 | | | Citizens Bank NA, BKNT, 3.121%, (LIBOR USD 3-Month plus 0.81%), 5/26/22(a) | | | | | 3,924,682 | |
| | 2,810,000 | | | Cooperatieve Rabobank UA, 3.950%, 11/9/22 | | | | | 2,794,025 | |
| | 5,641,000 | | | Credit Agricole SA/London, 2.750%, 6/10/20(b) | | | | | 5,577,499 | |
| | 2,725,000 | | | HSBC Holdings PLC, 4.250%, 3/14/24 | | | | | 2,710,534 | |
| | 3,284,000 | | | JPMorgan Chase & Co., 3.001%, (LIBOR USD 3-Month plus 0.68%), 6/1/21(a) | | | | | 3,302,282 | |
| | 2,902,000 | | | JPMorgan Chase & Co., Series 1, 5.809%,(c)(d) | | | | | 2,914,334 | |
| | 2,000,000 | | | KeyBank NA, BKNT, 2.500%, 12/15/19 | | | | | 1,989,300 | |
| | 2,836,000 | | | Lloyds Banking Group PLC, 2.907%,
11/7/23(e) | | | | | 2,705,580 | |
| | 1,411,000 | | | Macquarie Bank, Ltd., 6.625%, 4/7/21(b) | | | | | 1,500,180 | |
| | 510,000 | | | National City Corp., 6.875%, 5/15/19 | | | | | 523,136 | |
| | 3,409,000 | | | Nordea Bank AB, 2.787%, (LIBOR USD 3-Month plus 0.47%), 5/29/20(a)(b) | | | | | 3,421,354 | |
| | 3,723,000 | | | Svenska Handelsbanken AB, 2.782%, (LIBOR USD 3-Month plus 0.47%), 5/24/21(a) | | | | | 3,734,781 | |
| | 1,050,000 | | | Swedbank AB, 2.650%, 3/10/21(b) | | | | | 1,029,856 | |
| | 3,360,000 | | | Toronto-Dominion Bank (The), 3.625%, 9/15/31(c) | | | | | 3,157,827 | |
| | 2,600,000 | | | U.S. Bancorp, MTN, 2.982%, (LIBOR USD 3-Month plus 0.64%), 1/24/22(a) | | | | | 2,622,812 | |
| | 1,338,000 | | | Wells Fargo & Co., Class K, 6.104%,(c)(d) | | | | | 1,355,983 | |
| | 2,112,000 | | | Westpac Banking Corp., GMTN, 4.322%, 11/23/31(c) | | | | | 2,035,123 | |
| | | | | | | | | | |
| | | | | | | | | 73,628,344 | |
| | | | | | | | | | |
| | | |
| | | | Beverages — 0.3% | | | | | | |
| | 2,465,000 | | | Cott Holdings, Inc., 5.500%, 4/1/25(b) | | | | | 2,406,456 | |
| | 1,970,000 | | | PepsiCo, Inc., 3.450%, 10/6/46 | | | | | 1,776,383 | |
| | | | | | | | | | |
| | | | | | | | | 4,182,839 | |
| | | | | | | | | | |
| | | |
| | | | Biotechnology — 0.3% | | | | | | |
| | 3,166,000 | | | Celgene Corp., 5.000%, 8/15/45 | | | | | 3,146,253 | |
| | | | | | | | | | |
| | | |
| | | | Capital Goods — 0.1% | | | | | | |
| | 1,245,000 | | | SBA Tower Trust, 2.898%, 10/15/19(b) | | | | | 1,242,500 | |
| | | | | | | | | | |
| | | |
| | | | Capital Markets — 0.4% | | | | | | |
| | 2,250,000 | | | Morgan Stanley, 5.500%, 1/26/20 | | | | | 2,317,245 | |
| | 2,732,000 | | | Morgan Stanley, 4.375%, 1/22/47 | | | | | 2,654,932 | |
| | | | | | | | | | |
| | | | | | | | | 4,972,177 | |
| | | | | | | | | | |
| | | |
| | | | Chemicals — 1.5% | | | | | | |
| | 2,542,000 | | | Albemarle Corp., 5.450%, 12/1/44 | | | | | 2,653,416 | |
| | 4,643,000 | | | Chevron Phillips Chemical Co., LLC / Chevron Phillips Chemical Co. LP, 2.450%, 5/1/20(b) .. | | | | | 4,590,007 | |
| | | | | | | | | | |
Principal
Amount | | | | Fair Value | |
| | CORPORATE BONDS — (continued) | | | | | | |
| | | |
| | | | Chemicals — (continued) | | | | | | |
| | $1,713,000 | | | EI du Pont de Nemours & Co., 2.873%, (LIBOR USD 3-Month plus 0.53%), 5/1/20(a) | | | | $ | 1,723,306 | |
| | 2,208,000 | | | INVISTA Finance, LLC, 4.250%, 10/15/19(b) | | | | | 2,205,240 | |
| | 1,493,000 | | | NOVA Chemicals Corp., 4.875%, 6/1/24(b) | | | | | 1,437,386 | |
| | 3,241,000 | | | Westlake Chemical Corp., 5.000%, 8/15/46 | | | | | 3,188,225 | |
| | 2,815,000 | | | Yara International ASA, 4.750%, 6/1/28(b) | | | | | 2,833,962 | |
| | | | | | | | | | |
| | | | | | | | | 18,631,542 | |
| | | | | | | | | | |
| |
| | | | Commercial Services & Supplies — 0.6% | |
| | 2,783,000 | | | IHS Markit, Ltd., 4.000%, 3/1/26(b) | | | | | 2,662,983 | |
| | 1,400,000 | | | Republic Services, Inc., 3.550%, 6/1/22 | | | | | 1,399,638 | |
| | 500,000 | | | Waste Management, Inc., 3.900%, 3/1/35 | | | | | 488,479 | |
| | 2,692,000 | | | Waste Management, Inc., 4.100%, 3/1/45 | | | | | 2,645,040 | |
| | | | | | | | | | |
| | | | | | | | | 7,196,140 | |
| | | | | | | | | | |
| | | |
| | | | Construction Materials — 0.6% | | | | | | |
| | 2,714,000 | | | CRH America Finance, Inc., 4.400%, 5/9/47(b) | | | | | 2,452,994 | |
| | 3,092,000 | | | Martin Marietta Materials, Inc., 3.450%, 6/1/27 | | | | | 2,840,222 | |
| | 2,667,000 | | | Vulcan Materials Co., 4.500%, 6/15/47 | | | | | 2,388,180 | |
| | | | | | | | | | |
| | | | | | | | | 7,681,396 | |
| | | | | | | | | | |
| |
| | | | Diversified Financial Services — 1.7% | |
| | 795,000 | | | Ally Financial, Inc., 4.125%, 3/30/20 | | | | | 797,981 | |
| | 1,962,000 | | | Ally Financial, Inc., 4.250%, 4/15/21 | | | | | 1,971,810 | |
| | 2,609,000 | | | Blackstone Holdings Finance Co., LLC, 4.450%, 7/15/45(b) | | | | | 2,423,566 | |
| | 6,820,000 | | | Goldman Sachs Group, Inc. (The), 3.507%,
(LIBOR USD 3-Month plus 1.16%),
4/23/20(a) | | | | | 6,906,613 | |
| | 2,577,000 | | | Goldman Sachs Group, Inc. (The), 6.250%, 2/1/41 | | | | | 3,097,382 | |
| | 3,082,000 | | | National Rural Utilities Cooperative Finance Corp., 4.750%, 4/30/43(e) | | | | | 3,103,621 | |
| | 2,077,000 | | | Voya Financial, Inc., 6.125%,(c)(d) | | | | | 2,110,751 | |
| | | | | | | | | | |
| | | | | | | | | 20,411,724 | |
| | | | | | | | | | |
| |
| | | | Diversified Telecommunication Services — 1.6% | |
| | 5,409,000 | | | AT&T, Inc., 3.514%, (LIBOR USD 3-Month plus 1.18%), 6/12/24(a) | | | | | 5,433,341 | |
| | 1,858,000 | | | Sprint Communications, Inc., 9.000%,
11/15/18(b) | | | | | 1,869,520 | |
| | 3,700,000 | | | Sprint Spectrum Co., LLC / Sprint Spectrum Co. II LLC / Sprint Spectrum Co. III LLC, 4.738%, 3/20/25(b) | | | | | 3,698,335 | |
| | 3,393,000 | | | Verizon Communications, Inc., 5.012%, 4/15/49 | | | | | 3,465,087 | |
| | 2,939,000 | | | Vodafone Group PLC, 3.329%, (LIBOR USD 3-Month plus 0.99%), 1/16/24(a) | | | | | 2,946,154 | |
| | 2,849,000 | | | West Corp., 8.500%, 10/15/25(b) | | | | | 2,613,958 | |
| | | | | | | | | | |
| | | | | | | | | 20,026,395 | |
| | | | | | | | | | |
| | | |
| | | | Electric Utilities — 0.8% | | | | | | |
| | 2,385,000 | | | Dominion Energy, Inc., 2.579%, 7/1/20 | | | | | 2,352,933 | |
| | 2,700,000 | | | Indiana Michigan Power Co., Series K, 4.550%, 3/15/46 | | | | | 2,773,432 | |
| | 3,042,000 | | | Korea East-West Power Co., Ltd., 2.500%,
6/2/20(b) | | | | | 2,979,715 | |
| | 2,164,000 | | | Mississippi Power Co., 3.058%, (LIBOR USD 3-Month plus 0.65%), 3/27/20(a) | | | | | 2,164,260 | |
| | | | | | | | | | |
| | | | | | | | | 10,270,340 | |
| | | | | | | | | | |
Continued
89
|
Sterling Capital Total Return Bond Fund |
Schedule of Portfolio Investments — (continued) |
September 30, 2018 |
| | | | | | | | | | |
Principal
Amount | | | | Fair Value | |
| | CORPORATE BONDS — (continued) | | | | | | |
| |
| | | | Electrical Equipment — 0.3% | |
| | $3,128,000 | | | Textron, Inc., 3.650%, 3/1/21 | | | | $ | 3,125,274 | |
| | | | | | | | | | |
| |
| | | | Energy Equipment & Services — 2.5% | |
| | 3,101,000 | | | Apache Corp., 4.375%, 10/15/28 | | | | | 3,041,370 | |
| | 3,722,000 | | | Cenovus Energy, Inc., 4.250%, 4/15/27 | | | | | 3,597,873 | |
| | 1,100,000 | | | Cheniere Corpus Christi Holdings, LLC, 5.125%, 6/30/27 | | | | | 1,104,125 | |
| | 2,135,000 | | | Cheniere Energy Partners L.P., 5.625%,
10/1/26(b) | | | | | 2,150,372 | |
| | 1,968,000 | | | Diamondback Energy, Inc., 4.750%, 11/1/24 | | | | | 1,970,460 | |
| | 3,364,000 | | | Enable Midstream Partners L.P., 3.900%, 5/15/24 | | | | | 3,255,229 | |
| | 2,633,000 | | | Energy Transfer LP/Regency Energy Finance Corp., 5.000%, 10/1/22 | | | | | 2,726,935 | |
| | 3,311,000 | | | EnLink Midstream Partners LP, 5.050%, 4/1/45 | | | | | 2,747,385 | |
| | 1,180,000 | | | Enterprise Products Operating, LLC, 5.950%, 2/1/41 | | | | | 1,366,256 | |
| | 1,410,000 | | | Hess Corp., 7.875%, 10/1/29 | | | | | 1,704,444 | |
| | 435,000 | | | Murphy Oil Corp., 6.875%, 8/15/24 | | | | | 460,502 | |
| | 2,186,000 | | | Nabors Industries, Inc., 5.750%, 2/1/25(b) | | | | | 2,095,640 | |
| | 2,420,000 | | | Sabine Pass Liquefaction, LLC, 5.625%, 3/1/25 | | | | | 2,581,040 | |
| | 1,212,000 | | | Shell International Finance BV, 4.550%, 8/12/43 | | | | | 1,273,429 | |
| | | | | | | | | | |
| | | | | | | | | 30,075,060 | |
| | | | | | | | | | |
| |
| | | | Equity Real Estate Investment Trusts (REITS) — 3.4% | |
| | 2,895,000 | | | Alexandria Real Estate Equities, Inc., 4.000%, 1/15/24 | | | | | 2,901,887 | |
| | 2,769,000 | | | American Homes 4 Rent LP, 4.250%, 2/15/28 | | | | | 2,649,064 | |
| | 1,137,000 | | | American Tower Corp., 5.050%, 9/1/20 | | | | | 1,172,470 | |
| | 3,680,000 | | | American Tower Trust, 3.652%, 3/23/28(b) | | | | | 3,609,432 | |
| | 739,000 | | | Duke Realty L.P., 3.250%, 6/30/26 | | | | | 695,194 | |
| | 3,215,000 | | | Healthcare Realty Trust, Inc., 3.625%, 1/15/28 | | | | | 2,991,634 | |
| | 1,622,000 | | | Host Hotels & Resorts LP, Series D, 3.750%, 10/15/23 | | | | | 1,582,772 | |
| | 2,539,000 | | | Hudson Pacific Properties L.P., 3.950%, 11/1/27 | | | | | 2,363,789 | |
| | 155,000 | | | iStar, Inc., 4.625%, 9/15/20 | | | | | 154,613 | |
| | 2,504,000 | | | iStar, Inc., 5.250%, 9/15/22 | | | | | 2,466,440 | |
| | 2,853,000 | | | Jones Lang LaSalle, Inc., 4.400%, 11/15/22 | | | | | 2,894,793 | |
| | 1,331,000 | | | Kimco Realty Corp., 3.400%, 11/1/22 | | | | | 1,309,335 | |
| | 3,350,000 | | | Ontario Teachers’ Cadillac Fairview Properties Trust, 3.875%, 3/20/27(b) | | | | | 3,289,656 | |
| | 3,039,000 | | | Physicians Realty L.P., 4.300%, 3/15/27 | | | | | 2,927,060 | |
| | 2,858,000 | | | Realogy Group, LLC / Realogy Co-Issuer Corp., 4.500%, 4/15/19(b) | | | | | 2,865,145 | |
| | 2,635,000 | | | Spirit Realty L.P., 4.450%, 9/15/26 | | | | | 2,526,001 | |
| | 429,000 | | | Starwood Property Trust, Inc., 3.625%, 2/1/21(b) | | | | | 420,420 | |
| | 2,906,000 | | | VEREIT Operating Partnership L.P., 3.950%, 8/15/27 | | | | | 2,733,211 | |
| | 2,500,000 | | | WEA Finance, LLC / Westfield UK & Europe Finance PLC, 4.750%, 9/17/44(b) | | | | | 2,531,750 | |
| | | | | | | | | | |
| | | | | | | | | 42,084,666 | |
| | | | | | | | | | |
| | | |
| | | | Food & Staples Retailing — 0.7% | | | | | | |
| | 1,968,000 | | | AbbVie, Inc., 4.875%, 11/14/48 | | | | | 1,936,297 | |
| | 2,919,000 | | | CVS Health Corp., 5.050%, 3/25/48 | | | | | 2,985,681 | |
| | 1,985,000 | | | GlaxoSmithKline Capital PLC, 2.669%, (LIBOR USD 3-Month plus 0.35%), 5/14/21(a) | | | | | 1,995,668 | |
| | | | | | | | | | |
Principal
Amount | | | | Fair Value | |
| | CORPORATE BONDS — (continued) | | | | | | |
| |
| | | | Food & Staples Retailing — (continued) | |
| | $2,013,000 | | | Reynolds American, Inc., 5.850%, 8/15/45 | | | | $ | 2,189,089 | |
| | | | | | | | | | |
| | | | | | | | | 9,106,735 | |
| | | | | | | | | | |
| |
| | | | Food, Beverage & Tobacco — 0.1% | |
| | 1,300,000 | | | PepsiCo, Inc., 4.450%, 4/14/46 | | | | | 1,370,307 | |
| | | | | | | | | | |
| | | |
| | | | Gas Utilities — 0.2% | | | | | | |
| | 2,366,000 | | | Sempra Energy, 3.800%, 2/1/38 | | | | | 2,134,566 | |
| | | | | | | | | | |
| |
| | | | Health Care Providers & Services — 0.7% | |
| | 3,852,000 | | | Becton Dickinson and Co., 3.261%, (LIBOR USD 3-Month plus 0.88%), 12/29/20(a) | | | | | 3,857,708 | |
| | 1,360,000 | | | DaVita, Inc., 5.000%, 5/1/25 | | | | | 1,297,100 | |
| | 3,431,000 | | | Magellan Health, Inc., 4.400%, 9/22/24 | | | | | 3,310,847 | |
| | | | | | | | | | |
| | | | | | | | | 8,465,655 | |
| | | | | | | | | | |
| | | |
| | | | Hotels, Restaurants & Leisure — 0.5% | | | | | | |
| | 3,110,000 | | | Hyatt Hotels Corp., 4.375%, 9/15/28 | | | | | 3,057,834 | |
| | 2,617,000 | | | Prime Security Services Borrower, LLC / Prime Finance, Inc., 9.250%, 5/15/23(b) | | | | | 2,798,882 | |
| | | | | | | | | | |
| | | | | | | | | 5,856,716 | |
| | | | | | | | | | |
| | | |
| | | | Household Durables — 0.5% | | | | | | |
| | 1,100,000 | | | Mohawk Industries, Inc., 3.850%, 2/1/23 | | | | | 1,101,452 | |
| | 3,539,000 | | | NVR, Inc., 3.950%, 9/15/22 | | | | | 3,541,246 | |
| | 1,244,000 | | | TRI Pointe Group, Inc. / TRI Pointe Homes, Inc., 4.375%, 6/15/19 | | | | | 1,250,220 | |
| | | | | | | | | | |
| | | | | | | | | 5,892,918 | |
| | | | | | | | | | |
| | | |
| | | | Insurance — 5.3% | | | | | | |
| | 2,975,000 | | | Aegon NV, 5.500%, 4/11/48(e) | | | | | 2,878,610 | |
| | 575,000 | | | Alleghany Corp., 4.900%, 9/15/44 | | | | | 573,240 | |
| | 3,217,000 | | | American Equity Investment Life Holding Co., 5.000%, 6/15/27 | | | | | 3,117,758 | |
| | 2,424,000 | | | Aspen Insurance Holdings, Ltd., 4.650%, 11/15/23 | | | | | 2,449,458 | |
| | 2,213,000 | | | Assurant, Inc., 3.624%, (LIBOR USD 3-Month plus 1.25%), 3/26/21(a) | | | | | 2,217,252 | |
| | 2,028,000 | | | Athene Global Funding, 2.750%, 4/20/20(b) | | | | | 2,002,639 | |
| | 2,093,000 | | | Athene Holding, Ltd., 4.125%, 1/12/28 | | | | | 1,955,487 | |
| | 2,561,000 | | | Brighthouse Financial, Inc., 4.700%, 6/22/47 | | | | | 2,119,439 | |
| | 2,915,000 | | | Carlyle Finance, LLC, 5.650%, 9/15/48(b) | | | | | 2,919,462 | |
| | 2,779,000 | | | CBRE Services, Inc., 5.250%, 3/15/25 | | | | | 2,887,927 | |
| | 1,373,000 | | | Fidelity & Guaranty Life Holdings, Inc., 5.500%, 5/1/25(b) | | | | | 1,360,918 | |
| | 3,757,000 | | | Five Corners Funding Trust, 4.419%, 11/15/23(b) | | | | | 3,855,608 | |
| | 3,282,000 | | | Jackson National Life Global Funding, 2.811%, (LIBOR USD 3-Month plus 0.48%),
6/11/21(a)(b) | | | | | 3,297,365 | |
| | 2,680,000 | | | KKR Group Finance Co. III, LLC, 5.125%,
6/1/44(b) | | | | | 2,660,913 | |
| | 1,750,000 | | | Liberty Mutual Group, Inc., 7.800%, 3/15/37(b). | | | | | 2,047,500 | |
| | 2,097,000 | | | Manulife Financial Corp., 4.061%, 2/24/32(c) | | | | | 1,998,286 | |
| | 2,007,000 | | | Massachusetts Mutual Life Insurance Co., 8.875%, 6/1/39(b) | | | | | 3,082,239 | |
| | 2,000,000 | | | Meiji Yasuda Life Insurance Co., 5.200%,
10/20/45(b)(c) | | | | | 2,027,500 | |
| | 3,140,000 | | | Nuveen Finance, LLC, 2.950%, 11/1/19(b) | | | | | 3,135,692 | |
| | 2,205,000 | | | Ohio National Life Insurance Co., 6.875%,
6/15/42(b) | | | | | 2,697,657 | |
| | 1,715,000 | | | Oil Insurance, Ltd., 5.378%,(b)(c)(d) | | | | | 1,633,779 | |
Continued
90
|
Sterling Capital Total Return Bond Fund |
Schedule of Portfolio Investments — (continued) |
September 30, 2018 |
| | | | | | | | | | |
Principal
Amount | | | | Fair Value | |
| | CORPORATE BONDS — (continued) | | | | | | |
| | | |
| | | | Insurance — (continued) | | | | | | |
| | $3,449,000 | | | Sammons Financial Group, Inc., 4.450%,
5/12/27(b) | | | | $ | 3,307,865 | |
| | 2,925,000 | | | Securian Financial Group, Inc., 4.800%,
4/15/48(b) | | | | | 2,871,751 | |
| | 2,049,000 | | | Symetra Financial Corp., 4.250%, 7/15/24 | | | | | 2,013,489 | |
| | 2,975,000 | | | Torchmark Corp., 4.550%, 9/15/28 | | | | | 2,989,367 | |
| | 2,117,000 | | | Transatlantic Holdings, Inc., 8.000%, 11/30/39 | | | | | 2,892,049 | |
| | | | | | | | | | |
| | | | | | | | | 64,993,250 | |
| | | | | | | | | | |
| | | |
| | | | Media — 1.2% | | | | | | |
| | 1,406,000 | | | AMC Networks, Inc., 4.750%, 8/1/25 | | | | | 1,344,487 | |
| | 1,996,000 | | | CSC Holdings, LLC, 6.625%, 10/15/25(b) | | | | | 2,103,285 | |
| | 3,331,000 | | | Discovery Communications, LLC, 4.875%, 4/1/43 | | | | | 3,121,246 | |
| | 4,684,000 | | | NBCUniversal Enterprise, Inc., 2.796%, (LIBOR USD 3-Month plus 0.40%), 4/1/21(a)(b) | | | | | 4,694,148 | |
| | 3,250,000 | | | Warner Media, LLC, 3.400%, 6/15/22 | | | | | 3,214,654 | |
| | | | | | | | | | |
| | | | | | | | | 14,477,820 | |
| | | | | | | | | | |
| | | |
| | | | Metals & Mining — 0.6% | | | | | | |
| | 2,512,000 | | | Freeport-McMoRan, Inc., 3.100%, 3/15/20 | | | | | 2,483,740 | |
| | 1,356,000 | | | Nucor Corp., 4.400%, 5/1/48 | | | | | 1,325,147 | |
| | 2,726,000 | | | Southern Copper Corp., 5.875%, 4/23/45 | | | | | 2,976,040 | |
| | | | | | | | | | |
| | | | | | | | | 6,784,927 | |
| | | | | | | | | | |
| | | |
| | | | Multi-Utilities — 0.5% | | | | | | |
| | 2,275,000 | | | CMS Energy Corp., 4.700%, 3/31/43 | | | | | 2,301,305 | |
| | 2,009,000 | | | Consolidated Edison Co. of New York, Inc., 2.773%, (LIBOR USD 3-Month plus 0.4%), 6/25/21(a) | | | | | 2,019,648 | |
| | 1,903,000 | | | Progress Energy, Inc., 3.150%, 4/1/22 | | | | | 1,870,768 | |
| | | | | | | | | | |
| | | | | | | | | 6,191,721 | |
| | | | | | | | | | |
| |
| | | | Oil, Gas & Consumable Fuels — 1.3% | |
| | 2,966,000 | | | Anadarko Petroleum Corp., 5.550%, 3/15/26 | | | | | 3,147,193 | |
| | 2,071,000 | | | Andeavor LLC, 5.375%, 10/1/22 | | | | | 2,105,462 | |
| | 2,970,000 | | | Andeavor Logistics L.P. / Tesoro Logistics Finance Corp., 5.200%, 12/1/47 | | | | | 2,965,863 | |
| | 781,000 | | | Diamondback Energy, Inc., 5.375%, 5/31/25 | | | | | 796,620 | |
| | 803,000 | | | Energy Transfer Partners L.P., 6.125%, 12/15/45 | | | | | 856,521 | |
| | 1,552,000 | | | HollyFrontier Corp., 5.875%, 4/1/26 | | | | | 1,654,347 | |
| | 700,000 | | | Occidental Petroleum Corp., 4.100%, 2/15/47 | | | | | 678,343 | |
| | 3,198,000 | | | Valero Energy Partners L.P., 4.500%, 3/15/28 | | | | | 3,141,384 | |
| | | | | | | | | | |
| | | | | | | | | 15,345,733 | |
| | | | | | | | | | |
| | | |
| | | | Road & Rail — 0.5% | | | | | | |
| | 2,619,000 | | | Burlington Northern Santa Fe, LLC, 4.950%, 9/15/41 | | | | | 2,878,778 | |
| | 3,044,000 | | | CH Robinson Worldwide, Inc., 4.200%, 4/15/28 | | | | | 2,997,620 | |
| | | | | | | | | | |
| | | | | | | | | 5,876,398 | |
| | | | | | | | | | |
| |
| | | | Semiconductors & Semiconductor Equipment — 0.3% | |
| | 1,088,000 | | | Entegris, Inc., 4.625%, 2/10/26(b) | | | | | 1,034,851 | |
| | 2,210,000 | | | Microchip Technology, Inc., 3.922%, 6/1/21(b) | | | | | 2,197,052 | |
| | | | | | | | | | |
| | | | | | | | | 3,231,903 | |
| | | | | | | | | | |
| | | | | | | | | | |
Principal
Amount | | | | Fair Value | |
| | CORPORATE BONDS — (continued) | | | | | | |
| | | |
| | | | Software — 0.5% | | | | | | |
| | $ 3,301,000 | | | DXC Technology Co., 3.271%, (LIBOR USD 3-Month plus 0.95%), 3/1/21(a) | | | | $ | 3,301,048 | |
| | 2,298,000 | | | Microsoft Corp., 4.750%, 11/3/55 | | | | | 2,597,851 | |
| | | | | | | | | | |
| | | | | | | | | 5,898,899 | |
| | | | | | | | | | |
| | | |
| | | | Specialty Retail — 0.5% | | | | | | |
| | 2,991,000 | | | Dollar Tree, Inc., 3.700%, 5/15/23 | | | | | 2,952,316 | |
| | 3,150,000 | | | ERAC USA Finance, LLC, 4.200%, 11/1/46(b) | | | | | 2,821,199 | |
| | | | | | | | | | |
| | | | | | | | | 5,773,515 | |
| | | | | | | | | | |
| |
| | | | Telecommunication Services — 0.3% | |
| | 3,723,000 | | | AT&T, Inc., 4.750%, 5/15/46 | | | | | 3,401,467 | |
| | | | | | | | | | |
| |
| | | | Textiles, Apparel & Luxury Goods — 0.5% | |
| | 3,089,000 | | | Cintas Corp. No 2, 3.700%, 4/1/27 | | | | | 3,008,451 | |
| | 3,076,000 | | | Tapestry, Inc., 4.125%, 7/15/27 | | | | | 2,917,189 | |
| | | | | | | | | | |
| | | | | | | | | 5,925,640 | |
| | | | | | | | | | |
| |
| | | | Trading Companies & Distributors — 0.2% | |
| | 2,026,000 | | | Ashtead Capital, Inc., 5.625%, 10/1/24(b) | | | | | 2,099,443 | |
| | | | | | | | | | |
| | | | Total Corporate Bonds
(Cost $445,979,260) | | | | | 438,233,656 | |
| | | | | | | | | | |
|
| | MORTGAGE-BACKED SECURITIES — 11.8% | |
| | | |
| | | | Fannie Mae — 8.4% | | | | | | |
| | 6,743 | | | 5.000%, 8/1/20, Pool #832058 | | | | | 6,946 | |
| | 27,998 | | | 6.000%, 7/1/22, Pool #944967 | | | | | 28,047 | |
| | 62,003 | | | 5.000%, 9/1/25, Pool #255892 | | | | | 65,089 | |
| | 12,745,000 | | | 2.930%, 10/1/27, Pool #AN7060 | | | | | 12,003,329 | |
| | 9,531,286 | | | 3.010%, 11/1/27, Pool #AN7299 | | | | | 9,068,178 | |
| | 6,400,000 | | | 3.030%, 1/1/28, Pool #AN7807 | | | | | 6,079,747 | |
| | 11,240,000 | | | 3.520%, 4/1/28, Pool #AN8853 | | | | | 11,167,783 | |
| | 13,614,000 | | | 3.640%, 6/1/28, Pool #AN9354 | | | | | 13,506,269 | |
| | 2,022,824 | | | 4.000%, 6/1/34, Pool #MA1922 | | | | | 2,073,571 | |
| | 83,282 | | | 6.500%, 1/1/35, Pool #809198 | | | | | 91,305 | |
| | 1,877,905 | | | 4.000%, 3/1/35, Pool #MA2211 | | | | | 1,925,021 | |
| | 25,991 | | | 7.000%, 6/1/35, Pool #255820 | | | | | 27,563 | |
| | 77,973 | | | 6.500%, 3/1/36, Pool #866062 | | | | | 85,485 | |
| | 56,371 | | | 6.500%, 7/1/36, Pool #885493 | | | | | 61,802 | |
| | 769,028 | | | 5.500%, 8/1/37, Pool #995082 | | | | | 830,659 | |
| | 475,913 | | | 4.500%, 10/1/39, Pool #AC2645 | | | | | 495,639 | |
| | 335,420 | | | 5.000%, 6/1/40, Pool #AD4927 | | | | | 356,879 | |
| | 254,244 | | | 5.000%, 6/1/40, Pool #AD8718 | | | | | 270,440 | |
| | 990,131 | | | 4.500%, 12/1/40, Pool #AH1100 | | | | | 1,030,365 | |
| | 352,588 | | | 4.500%, 3/1/41, Pool #AB2467 | | | | | 367,005 | |
| | 675,433 | | | 4.500%, 5/1/41, Pool #AI1023 | | | | | 702,330 | |
| | 486,297 | | | 4.500%, 11/1/41, Pool #AJ4994 | | | | | 506,059 | |
| | 731,172 | | | 4.500%, 12/1/41, Pool #AJ7696 | | | | | 760,479 | |
| | 1,661,917 | | | 3.500%, 6/1/42, Pool #AB5373 | | | | | 1,648,467 | |
| | 2,220,173 | | | 3.500%, 5/1/43, Pool #AB9368 | | | | | 2,199,245 | |
| | 1,949,268 | | | 3.500%, 5/1/43, Pool #AL3605 | | | | | 1,933,518 | |
| | 2,378,983 | | | 3.500%, 8/1/43, Pool #AU0613 | | | | | 2,354,071 | |
| | 1,042,827 | | | 4.500%, 11/1/44, Pool #MA2100 | | | | | 1,081,917 | |
| | 2,320,505 | | | 4.500%, 1/1/45, Pool #MA2158 | | | | | 2,405,588 | |
| | 3,358,970 | | | 4.000%, 3/1/45, Pool #MA2217 | | | | | 3,398,367 | |
| | 2,984,940 | | | 4.000%, 6/1/46, Pool #MA2653 | | | | | 3,017,676 | |
| | 3,594,177 | | | 4.500%, 7/1/46, Pool #AS7568 | | | | | 3,711,523 | |
| | 1,641,451 | | | 4.000%, 11/1/46, Pool #MA2808 | | | | | 1,658,806 | |
| | 6,208,253 | | | 4.000%, 8/1/47, Pool #BH5117 | | | | | 6,272,515 | |
| | 10,929,378 | | | 5.000%, 8/1/48, Pool #CA2219 | | | | | 11,488,428 | |
| | | | | | | | | | |
| | | | | | | | | 102,680,111 | |
| | | | | | | | | | |
Continued
91
|
Sterling Capital Total Return Bond Fund |
Schedule of Portfolio Investments — (continued) |
September 30, 2018 |
| | | | | | | | | | |
Principal
Amount | | | | Fair Value | |
| | MORTGAGE-BACKED SECURITIES — (continued) | |
| | | |
| | | | Freddie Mac — 3.4% | | | | | | |
| | $ 46,027 | | | 5.500%, 10/1/21, Pool #G12425 | | | | $ | 47,095 | |
| | 51,379 | | | 5.000%, 12/1/21, Pool #J04025 | | | | | 51,665 | |
| | 91,769 | | | 5.000%, 7/1/25, Pool #C90908 | | | | | 96,362 | |
| | 311,351 | | | 2.500%, 1/1/28, Pool #J22069 | | | | | 302,466 | |
| | 1,174,327 | | | 3.500%, 7/1/30, Pool #G18562 | | | | | 1,182,268 | |
| | 196,062 | | | 4.000%, 11/1/31, Pool #C91410 | | | | | 199,535 | |
| | 95,464 | | | 5.000%, 3/1/36, Pool #G08115 | | | | | 101,319 | |
| | 3,420,754 | | | 4.000%, 4/1/36, Pool #C91874 | | | | | 3,494,025 | |
| | 4,965,592 | | | 3.500%, 6/1/36, Pool #C91875 | | | | | 4,970,165 | |
| | 26,495 | | | 5.000%, 7/1/36, Pool #G02291 | | | | | 28,119 | |
| | 2,764,702 | | | 3.500%, 8/1/36, Pool #C91888 | | | | | 2,767,248 | |
| | 287,270 | | | 6.500%, 9/1/36, Pool #G08152 | | | | | 317,799 | |
| | 5,963,922 | | | 3.500%, 11/1/36, Pool #C91906 | | | | | 5,969,423 | |
| | 88,395 | | | 5.000%, 2/1/37, Pool #A57714 | | | | | 93,721 | |
| | 3,505,609 | | | 4.000%, 5/1/37, Pool #C91938 | | | | | 3,580,805 | |
| | 121,602 | | | 4.500%, 10/1/39, Pool #A89346 | | | | | 126,861 | |
| | 374,110 | | | 5.000%, 6/1/40, Pool #C03479 | | | | | 397,323 | |
| | 1,009,909 | | | 5.000%, 7/1/40, Pool #A93070 | | | | | 1,072,569 | |
| | 125,069 | | | 5.000%, 9/1/40, Pool #C03518 | | | | | 132,830 | |
| | 1,293,015 | | | 4.000%, 12/1/42, Pool #G07266 | | | | | 1,317,178 | |
| | 1,029,447 | | | 3.500%, 5/1/43, Pool #Q18305 | | | | | 1,021,153 | |
| | 775,210 | | | 4.000%, 5/1/44, Pool #V81186 | | | | | 785,122 | |
| | 391,191 | | | 4.000%, 7/1/44, Pool #G08595 | | | | | 396,204 | |
| | 436,864 | | | 4.000%, 9/1/44, Pool #Q28299 | | | | | 442,438 | |
| | 2,122,028 | | | 4.000%, 8/1/46, Pool #G08717 | | | | | 2,146,561 | |
| | 9,860,772 | | | 3.500%, 9/1/47, Pool #Q50962 | | | | | 9,713,694 | |
| | | | | | | | | | |
| | | | | | | | | 40,753,948 | |
| | | | | | | | | | |
| | | |
| | | | Ginnie Mae — 0.0% | | | | | | |
| | 187,910 | | | 5.000%, 2/15/40, Pool #737037 | | | | | 199,547 | |
| | | | | | | | | | |
| | | | Total Mortgage-Backed Securities
(Cost $147,262,225) | | | | | 143,633,606 | |
| | | | | | | | | | |
| | |
| | MUNICIPAL BONDS — 4.9% | | | | | | |
| | | |
| | | | Alabama — 0.2% | | | | | | |
| | 3,000,000 | | | Alabama Economic Settlement Authority, Economic Imports, Taxable BP - Settlement Revenue, Series B, 4.263%, 9/15/32 | | | | | 3,055,260 | |
| | | | | | | | | | |
| | | |
| | | | California — 0.8% | | | | | | |
| | 1,889,000 | | | California Institute of Technology, 4.283%, 9/1/16 | | | | | 1,767,331 | |
| | 3,700,000 | | | Metropolitan Water District of Southern California, Build America Bonds, Water Utility Improvements Revenue, Callable 7/1/19 @ 100, 6.538%, 7/1/39 | | | | | 3,798,050 | |
| | 1,285,000 | | | State of California, Build America Bonds, School Improvements G.O., 7.625%, 3/1/40 | | | | | 1,871,153 | |
| | 1,850,000 | | | University of California, University & College Improvements, Taxable Revenue, Series AN, 3.338%, 5/15/22 | | | | | 1,859,250 | |
| | | | | | | | | | |
| | | | | | | | | 9,295,784 | |
| | | | | | | | | | |
| | | |
| | | | Connecticut — 0.2% | | | | | | |
| | 3,000,000 | | | State of Connecticut Special Tax Revenue, Build America Bonds, Transition Infrastructure, Series B, 4.126%, 11/1/20 | | | | | 3,030,810 | |
| | | | | | | | | | |
| | | |
| | | | Hawaii — 0.1% | | | | | | |
| | 750,000 | | | State of Hawaii, Public Improvements G.O., Taxable, Series FJ, 1.921%, 10/1/22 | | | | | 712,088 | |
| | | | | | | | | | |
| | | | | | | | | | |
Principal
Amount | | | | Fair Value | |
| | MUNICIPAL BONDS — (continued) | | | | | | |
| | | |
| | | | Illinois — 0.4% | | | | | | |
| | $1,800,000 | | | State of Illinois, Public Improvements, Taxable Building Revenue, 3.481%, 6/15/26 | | | | $ | 1,725,642 | |
| | 3,130,000 | | | State of Illinois, Public Improvements, Taxable Revenue, Series B, 2.620%, 6/15/26 | | | | | 2,824,324 | |
| | | | | | | | | | |
| | | | | | | | | 4,549,966 | |
| | | | | | | | | | |
| | | |
| | | | Kentucky — 0.2% | | | | | | |
| | 2,900,000 | | | Lexington-Fayette Urban County Airport Board, Taxable Revenue, Series C, 2.450%, 7/1/23 | | | | | 2,766,020 | |
| | | | | | | | | | |
| | | |
| | | | New Jersey — 0.3% | | | | | | |
| | 1,335,000 | | | New Jersey Economic Development Authority, Advance Refunding Revenue, Series B, 5.000%, 11/1/19 | | | | | 1,372,500 | |
| | 2,375,000 | | | New Jersey Economic Development Authority, School Facilities Construction Refunding Revenue, Taxable, Series C, 4.521%, 6/15/21 | | | | | 2,417,465 | |
| | | | | | | | | | |
| | | | | | | | | 3,789,965 | |
| | | | | | | | | | |
| | | |
| | | | New York — 0.7% | | | | | | |
| | 3,020,000 | | | New York City Transitional Finance Authority Future Tax Secured Revenue, Public Improvements, Taxable Revenue, Callable 2/1/27 @ 100, 3.330%, 2/1/28 | | | | | 2,884,009 | |
| | 2,000,000 | | | New York State Dormitory Authority, Public Improvements, Taxable Revenue, Series D, 2.550%, 3/15/21 | | | | | 1,966,940 | |
| | 750,000 | | | New York State Environmental Facilities Corp., State Revolving Funds, Refunding Revenue, Taxable, Series C, 2.445%, 6/15/20 | | | | | 742,733 | |
| | 900,000 | | | New York State Environmental Facilities Corp., State Revolving Funds, Refunding Revenue, Taxable, Series C, 2.745%, 6/15/22 | | | | | 883,251 | |
| | 1,640,000 | | | New York, NY, Build America Bonds, Public Improvements G.O., 4.874%, 3/1/21 | | | | | 1,701,533 | |
| | | | | | | | | | |
| | | | | | | | | 8,178,466 | |
| | | | | | | | | | |
| | | |
| | | | North Carolina — 0.2% | | | | | | |
| | 2,600,000 | | | Duke University, 3.299%, 10/1/46 | | | | | 2,285,365 | |
| | | | | | | | | | |
| | | |
| | | | Ohio — 0.4% | | | | | | |
| | 5,658,000 | | | Premier Health Partners, Series G, Callable 5/15/26 @ 100, 2.911%, 11/15/26 | | | | | 5,120,383 | |
| | | | | | | | | | |
| | | |
| | | | Pennsylvania — 0.6% | | | | | | |
| | 1,005,000 | | | Commonwealth Financing Authority, School Improvements, Taxable Revenue, Series A, 4.014%, 6/1/33 | | | | | 995,583 | |
| | 4,375,000 | | | Lehigh University, 3.479%, 11/15/46 | | | | | 3,892,676 | |
| | 2,260,000 | | | Philadelphia Authority for Industrial Development, Refunding Revenue, Taxable, 3.664%, 4/15/22 | | | | | 2,232,066 | |
| | | | | | | | | | |
| | | | | | | | | 7,120,325 | |
| | | | | | | | | | |
| | | |
| | | | Texas — 0.6% | | | | | | |
| | 2,825,000 | | | City of Houston, TX, Combined Utility System Revenue, Taxable Revenue, 1St Lien-Series B, Current Refunding Revenue Bonds, 3.428%, 5/15/23 | | | | | 2,835,453 | |
Continued
92
|
Sterling Capital Total Return Bond Fund |
Schedule of Portfolio Investments — (continued) |
September 30, 2018 |
| | | | | | | | | | |
Principal
Amount | | | | Fair Value | |
| | MUNICIPAL BONDS — (continued) | | | | | | |
| | | |
| | | | Texas — (continued) | | | | | | |
| | $ 4,100,000 | | | New Hope Cultural Education Facilities Finance Corp., Texas A&M University Cain Hall Red & College Improvements, Taxable Revenue, 1.806%, 4/1/21 | | | | $ | 3,949,653 | |
| | | | | | | | | | |
| | | | | | | | | 6,785,106 | |
| | | | | | | | | | |
| | | |
| | | | Washington — 0.2% | | | | | | |
| | 3,000,000 | | | Port of Seattle, WA, Refunding Revenue, Taxable, Intermediate Lien-Ser, Advance Refunding Revenue Bonds, 2.430%, 5/1/22 | | | | | 2,926,470 | |
| | | | | | | | | | |
| | | | Total Municipal Bonds
(Cost $61,655,156) | | | | | 59,616,008 | |
| | | | | | | | | | |
| | |
| | U.S. GOVERNMENT AGENCIES — 0.9% | | | | | | |
| | | |
| | | | Federal Farm Credit Bank — 0.6% | | | | | | |
| | 7,730,000 | | | 3.700%, 1/25/27 | | | | | 7,640,270 | |
| | | | | | | | | | |
| | | |
| | | | Federal Home Loan Bank — 0.3% | | | | | | |
| | 4,105,000 | | | 2.900%, 6/28/27 | | | | | 3,904,561 | |
| | | | | | | | | | |
| | | | Total U.S. Government Agencies
(Cost $11,812,450) | | | | | 11,544,831 | |
| | | | | | | | | | |
| | U.S. TREASURY BONDS — 4.4% | | | | | | |
| | 11,863,000 | | | 3.125%, 2/15/43 | | | | | 11,719,346 | |
| | 47,816,800 | | | 2.500%, 2/15/45 | | | | | 41,878,925 | |
| | | | | | | | | | |
| | | | Total U.S. Treasury Bonds
(Cost $54,764,070) | | | | | 53,598,271 | |
| | | | | | | | | | |
| Shares | | | | | |
| | PREFERRED STOCKS — 0.4% | | | | | | |
| | | |
| | | | Banks — 0.2% | | | | | | |
| | 110,135 | | | US Bancorp, Series F, 6.500% | | | | | 2,998,976 | |
| | | | | | | | | | |
| | | |
| | | | Energy Equipment & Services — 0.2% | | | | | | |
| | 90,000 | | | Energy Transfer Partners L.P., 7.625%(c) | | | | | 2,328,300 | |
| | | | | | | | | | |
| | | | Total Preferred Stocks
(Cost $5,262,956) | | | | | 5,327,276 | |
| | | | | | | | | | |
| | | | | | | | | | |
| | MONEY MARKET FUND — 1.0% | | | | | | |
| | 12,384,615 | | | Federated Treasury Obligations Fund, Institutional Shares, 1.92%(f) | | | | $ | 12,384,615 | |
| | | | | | | | | | |
| | | | Total Money Market Fund
(Cost $12,384,615) | | | | | 12,384,615 | |
| | | | | | | | | | |
| | |
| Total Investments — 99.3%
(Cost $1,235,426,788) | | | | | 1,210,630,300 | |
| | Net Other Assets (Liabilities) — 0.7% | | | | | 7,924,851 | |
| | | | | | | | | | |
| | NET ASSETS — 100.0% | | | | $ | 1,218,555,151 | |
| | | | | | | | | | |
| (a) | The interest rate for this floating rate note, which will change periodically, is based either on the prime rate or an index of market rates. The reflected rate is in effect as of September 30, 2018. The maturity date reflected is the final maturity date. |
| (b) | Rule 144A, Section 4(2) or other security that is restricted as to resale to qualified institutional investors. The Advisor, using Board approved procedures, has deemed these securities or a portion of these securities to be liquid. |
| (c) | The interest rate for this variable rate note, which will change periodically, is based either on the prime rate or an index of market rates. The reflected rate is in effect as of September 30, 2018. The maturity date reflected is the final maturity date. |
| (d) | Security is perpetual in nature and has no stated maturity date. |
| (e) | Security is a fix-to-float security, which carries a fixed coupon until a certain date, upon which it switches to a floating rate. Rate shown is the fixed rate. |
| (f) | Represents the current yield as of report date. |
BKNT — Bank Note
G.O. — General Obligation
GMTN — Global Medium Term Note
MTN — Medium Term Note
STEP — Step Coupon Bond
See accompanying Notes to the Financial Statements.
93
|
Sterling Capital Corporate Fund |
Schedule of Portfolio Investments |
September 30, 2018 |
| | | | | | | | | | |
Principal
Amount | | | | Fair Value | |
| | CORPORATE BONDS — 97.2% | | | | | | |
| | | |
| | | | Aerospace & Defense — 0.2% | | | | | | |
| | $ 50,000 | | | United Technologies Corp., 4.125%, 11/16/28 | | | | $ | 49,659 | |
| | | | | | | | | | |
| | | | Automobiles — 0.4% | | | | | | |
| | 142,000 | | | General Motors Financial Co., Inc., 3.200%, 7/6/21 | | | | | 140,224 | |
| | | | | | | | | | |
| | | |
| | | | Banks — 17.8% | | | | | | |
| | 240,000 | | | ABN AMRO Bank NV, 2.650%, 1/19/21(a) | | | | | 235,565 | |
| | 200,000 | | | Associated Banc-Corp., 2.750%, 11/15/19 | | | | | 199,208 | |
| | 65,000 | | | Bank of America Corp., 2.503%, 10/21/22 | | | | | 62,241 | |
| | 185,000 | | | Bank of America Corp., 3.342%, (LIBOR USD 3-Month plus 1.00%), 4/24/23(b) | | | | | 187,464 | |
| | 225,000 | | | Bank of America Corp., 3.366%, 1/23/26(c) | | | | | 216,381 | |
| | 165,000 | | | Bank of America Corp., GMTN, 3.300%, 1/11/23 | | | | | 162,709 | |
| | 185,000 | | | Capital One Financial Corp., 3.200%, 2/5/25 | | | | | 174,079 | |
| | 228,000 | | | CIT Group, Inc., 4.750%, 2/16/24 | | | | | 228,559 | |
| | 235,000 | | | Citigroup, Inc., 2.650%, 10/26/20 | | | | | 231,945 | |
| | 400,000 | | | Citigroup, Inc., 4.400%, 6/10/25 | | | | | 400,067 | |
| | 250,000 | | | Citizens Bank NA, BKNT, 3.121%, (LIBOR USD 3-Month plus 0.81%), 5/26/22(b) | | | | | 251,067 | |
| | 250,000 | | | Cooperatieve Rabobank UA, 3.950%, 11/9/22 | | | | | 248,579 | |
| | 140,000 | | | ERAC USA Finance, LLC, 2.800%, 11/1/18(a) | | | | | 140,021 | |
| | 300,000 | | | HSBC Holdings PLC, 3.262%, 3/13/23(c) | | | | | 293,941 | |
| | 275,000 | | | JPMorgan Chase & Co., 3.875%, 9/10/24 | | | | | 272,376 | |
| | 370,000 | | | JPMorgan Chase & Co., Series 1, 5.809%,(d)(e) | | | | | 371,573 | |
| | 225,000 | | | KeyCorp, MTN, 5.100%, 3/24/21 | | | | | 234,065 | |
| | 200,000 | | | Lloyds Banking Group PLC, 2.907%, 11/7/23(c) | | | | | 190,803 | |
| | 130,000 | | | National City Corp., 6.875%, 5/15/19 | | | | | 133,348 | |
| | 260,000 | | | Nationwide Building Society, 4.302%, 3/8/29(a)(c) | | | | | 248,757 | |
| | 300,000 | | | Svenska Handelsbanken AB, BKNT, 2.782%, (LIBOR USD 3-Month plus 0.47%), 5/24/21(b) | | | | | 300,949 | |
| | 200,000 | | | Toronto-Dominion Bank (The), 3.625%, 9/15/31(e) | | | | | 187,966 | |
| | 150,000 | | | US Bancorp, MTN, 2.950%, 7/15/22 | | | | | 146,881 | |
| | 200,000 | | | Westpac Banking Corp., 2.800%, 1/11/22 | | | | | 195,499 | |
| | 250,000 | | | Zions Bancorp NA, 3.500%, 8/27/21 | | | | | 248,555 | |
| | | | | | | | | | |
| | | | | | | | | 5,562,598 | |
| | | | | | | | | | |
| | | |
| | | | Beverages — 0.6% | | | | | | |
| | 185,000 | | | Cott Holdings, Inc., 5.500%, 4/1/25(a) | | | | | 180,606 | |
| | | | | | | | | | |
| | | |
| | | | Capital Goods — 1.0% | | | | | | |
| | 300,000 | | | SBA Tower Trust, 2.898%, 10/15/19(a) | | | | | 299,398 | |
| | | | | | | | | | |
| | | |
| | | | Capital Markets — 0.5% | | | | | | |
| | 157,000 | | | Morgan Stanley, GMTN, 5.500%, 7/24/20 | | | | | 162,892 | |
| | | | | | | | | | |
| | | |
| | | | Chemicals — 3.0% | | | | | | |
| | 200,000 | | | Chevron Phillips Chemical Co., LLC / Chevron Phillips Chemical Co. LP, 2.450%, 5/1/20(a) | | | | | 197,717 | |
| | 140,000 | | | FMC Corp., 3.950%, 2/1/22 | | | | | 140,606 | |
| | 105,000 | | | INVISTA Finance, LLC, 4.250%, 10/15/19(a) | | | | | 104,869 | |
| | 86,000 | | | NOVA Chemicals Corp., 4.875%, 6/1/24(a) | | | | | 82,797 | |
| | 225,000 | | | Westlake Chemical Corp., 3.600%, 8/15/26 | | | | | 211,601 | |
| | 192,000 | | | Yara International ASA, 4.750%, 6/1/28(a) | | | | | 193,293 | |
| | | | | | | | | | |
| | | | | | | | | 930,883 | |
| | | | | | | | | | |
| |
| | | | Commercial Services & Supplies — 1.8% | |
| | 170,000 | | | IHS Markit, Ltd., 4.000%, 3/1/26(a) | | | | | 162,669 | |
| | | | | | | | | | |
Principal
Amount | | | | Fair Value | |
| | CORPORATE BONDS — (continued) | | | | | | |
| | | | Commercial Services & Supplies — (continued) | |
| | $200,000 | | | Interpublic Group of Cos., Inc. (The), 4.200%, 4/15/24 | | | | $ | 200,266 | |
| | 200,000 | | | WPP Finance 2010, 3.625%, 9/7/22 | | | | | 197,041 | |
| | | | | | | | | | |
| | | | | | | | | 559,976 | |
| | | | | | | | | | |
| | | |
| | | | Construction Materials — 0.7% | | | | | | |
| | 230,000 | | | Martin Marietta Materials, Inc., 3.450%, 6/1/27 . | | | | | 211,271 | |
| | | | | | | | | | |
| | | |
| | | | Diversified Financial Services — 9.2% | | | | | | |
| | 249,000 | | | AerCap Ireland Capital, DAC/AerCap Global Aviation Trust, 4.250%, 7/1/20 | | | | | 251,511 | |
| | 190,000 | | | Ares Finance Co., LLC, 4.000%, 10/8/24(a) | | | | | 179,667 | |
| | 60,000 | | | Carlyle Holdings Finance, LLC, 3.875%, 2/1/23(a) | | | | | 59,849 | |
| | 200,000 | | | Export-Import Bank of Korea, 2.500%, 11/1/20 . | | | | | 196,255 | |
| | 270,000 | | | Goldman Sachs Group, Inc. (The), 3.507%, (LIBOR USD 3-Month plus 1.16%), 4/23/20(b) | | | | | 273,429 | |
| | 315,000 | | | Goldman Sachs Group, Inc. (The), 3.625%, 1/22/23 | | | | | 313,826 | |
| | 378,000 | | | Goldman Sachs Group, Inc. (The), 4.250%, 10/21/25 | | | | | 374,555 | |
| | 60,000 | | | Jefferies Group, LLC / Jefferies Group Capital Finance, Inc., 4.850%, 1/15/27 | | | | | 58,992 | |
| | 200,000 | | | KKR Group Finance Co., LLC, 6.375%, 9/29/20(a) | | | | | 210,597 | |
| | 250,000 | | | Macquarie Group, Ltd., 6.250%, 1/14/21(a) | | | | | 263,510 | |
| | 150,000 | | | National Rural Utilities Cooperative Finance Corp., 4.750%, 4/30/43(c) | | | | | 151,052 | |
| | 210,000 | | | Nationwide Financial Services, Inc., 5.375%,
3/25/21(a) | | | | | 217,253 | |
| | 190,000 | | | ORIX Corp., 2.900%, 7/18/22 | | | | | 183,741 | |
| | 136,000 | | | Voya Financial, Inc., 6.125%,(d)(e) | | | | | 138,210 | |
| | | | | | | | | | |
| | | | | | | | | 2,872,447 | |
| | | | | | | | | | |
| |
| | | | Diversified Telecommunication Services — 3.3% | |
| | 230,000 | | | AT&T, Inc., 3.000%, 6/30/22 | | | | | 224,305 | |
| | 255,000 | | | AT&T, Inc., 3.514%, (LIBOR USD 3-Month plus 1.18%), 6/12/24(b) | | | | | 256,147 | |
| | 200,000 | | | Sprint Spectrum Co., LLC / Sprint Spectrum Co. II LLC / Sprint Spectrum Co. III LLC, 4.738%, 3/20/25(a) | | | | | 199,910 | |
| | 100,000 | | | Verizon Communications, Inc., 5.150%, 9/15/23 | | | | | 107,045 | |
| | 128,000 | | | Vodafone Group PLC, 3.329%, (LIBOR USD 3-Month plus 0.99%), 1/16/24(b) | | | | | 128,312 | |
| | 144,000 | | | West Corp., 8.500%, 10/15/25(a) | | | | | 132,120 | |
| | | | | | | | | | |
| | | | | | | | | 1,047,839 | |
| | | | | | | | | | |
| | | |
| | | | Electric Utilities — 2.6% | | | | | | |
| | 200,000 | | | Appalachian Power Co., 4.600%, 3/30/21 | | | | | 205,153 | |
| | 200,000 | | | Dominion Energy, Inc., 5.200%, 8/15/19 | | | | | 203,815 | |
| | 220,000 | | | Dominion Energy, Inc., 2.579%, 7/1/20 | | | | | 217,042 | |
| | 200,000 | | | Exelon Corp., 3.950%, 6/15/25 | | | | | 199,418 | |
| | | | | | | | | | |
| | | | | | | | | 825,428 | |
| | | | | | | | | | |
| | | |
| | | | Electrical Equipment — 0.6% | | | | | | |
| | 185,000 | | | Textron, Inc., 3.650%, 3/1/21 | | | | | 184,839 | |
| | | | | | | | | | |
| | | |
| | | | Energy Equipment & Services — 8.1% | | | | | | |
| | 228,000 | | | Apache Corp., 4.375%, 10/15/28 | | | | | 223,616 | |
| | 200,000 | | | Cenovus Energy, Inc., 4.250%, 4/15/27 | | | | | 193,330 | |
Continued
94
|
Sterling Capital Corporate Fund |
Schedule of Portfolio Investments — (continued) |
September 30, 2018 |
| | | | | | | | | | |
Principal
Amount | | | | Fair Value | |
| | CORPORATE BONDS — (continued) | | | | | | |
| |
| | | | Energy Equipment & Services — (continued) | |
| | $ 80,000 | | | Cheniere Corpus Christi Holdings, LLC, 5.125%, 6/30/27 | | | | $ | 80,300 | |
| | 108,000 | | | Cheniere Energy Partners L.P., 5.625%, 10/1/26(a) | | | | | 108,778 | |
| | 189,000 | | | Diamondback Energy, Inc., 4.750%, 11/1/24 | | | | | 189,236 | |
| | 223,000 | | | Enable Midstream Partners L.P., 3.900%, 5/15/24 | | | | | 215,790 | |
| | 275,000 | | | Energy Transfer Partners L.P., 4.050%, 3/15/25 | | | | | 269,186 | |
| | 89,000 | | | Hess Corp., 7.875%, 10/1/29 | | | | | 107,585 | |
| | 213,000 | | | MPLX L.P., 4.125%, 3/1/27 | | | | | 207,465 | |
| | 20,000 | | | Murphy Oil Corp., 6.875%, 8/15/24 | | | | | 21,173 | |
| | 95,000 | | | Nabors Industries, Inc., 5.750%, 2/1/25(a) | | | | | 91,073 | |
| | 214,000 | | | ONEOK, Inc., 7.500%, 9/1/23 | | | | | 244,024 | |
| | 272,000 | | | Sabine Pass Liquefaction, LLC, 5.625%, 3/1/25 | | | | | 290,100 | |
| | 288,000 | | | Western Gas Partners LP, 4.000%, 7/1/22 | | | | | 286,743 | |
| | | | | | | | | | |
| | | | | | | | | 2,528,399 | |
| | | | | | | | | | |
| | | | Equity Real Estate Investment Trusts (REITS) — 12.4% | |
| | 192,000 | | | Alexandria Real Estate Equities, Inc., 4.600%, 4/1/22 | | | | | 197,068 | |
| | 210,000 | | | American Homes 4 Rent LP, 4.250%, 2/15/28 | | | | | 200,904 | |
| | 300,000 | | | American Tower Corp., 5.050%, 9/1/20 | | | | | 309,359 | |
| | 157,000 | | | American Tower Trust, 3.652%, 3/23/28(a) | | | | | 153,989 | |
| | 225,000 | | | Crown Castle International Corp., 4.450%, 2/15/26 | | | | | 226,193 | |
| | 235,000 | | | Duke Realty L.P., 3.250%, 6/30/26 | | | | | 221,070 | |
| | 200,000 | | | Essex Portfolio L.P., 3.250%, 5/1/23 | | | | | 194,519 | |
| | 186,000 | | | Healthcare Realty Trust, Inc., 3.625%, 1/15/28 | | | | | 173,077 | |
| | 233,000 | | | Host Hotels & Resorts LP, Series D, 3.750%, 10/15/23 | | | | | 227,365 | |
| | 160,000 | | | Hudson Pacific Properties L.P., 3.950%, 11/1/27 | | | | | 148,959 | |
| | 18,000 | | | iStar, Inc., 4.625%, 9/15/20 | | | | | 17,955 | |
| | 141,000 | | | iStar, Inc., 5.250%, 9/15/22 | | | | | 138,885 | |
| | 233,000 | | | Jones Lang LaSalle, Inc., 4.400%, 11/15/22 | | | | | 236,413 | |
| | 208,000 | | | Kimco Realty Corp., 3.400%, 11/1/22 | | | | | 204,614 | |
| | 189,000 | | | Physicians Realty L.P., 4.300%, 3/15/27 | | | | | 182,038 | |
| | 125,000 | | | Realogy Group, LLC / Realogy Co-Issuer Corp., 4.500%, 4/15/19(a) | | | | | 125,313 | |
| | 265,000 | | | Realty Income Corp., 4.650%, 8/1/23 | | | | | 274,622 | |
| | 106,000 | | | Scentre Group Trust 1 / Scentre Group Trust 2, 3.750%, 3/23/27(a) | | | | | 101,700 | |
| | 250,000 | | | Spirit Realty L.P., 4.450%, 9/15/26 | | | | | 239,659 | |
| | 21,000 | | | Starwood Property Trust, Inc., 3.625%, 2/1/21(a) | | | | | 20,580 | |
| | 86,000 | | | VEREIT Operating Partnership L.P., 3.950%, 8/15/27 | | | | | 80,887 | |
| | 200,000 | | | WEA Finance, LLC / Westfield UK & Europe | | | | | | |
| | | | Finance PLC, 2.700%, 9/17/19(a) | | | | | 199,494 | |
| | | | | | | | | | |
| | | | | | | | | 3,874,663 | |
| | | | | | | | | | |
| | | | Food & Staples Retailing — 0.7% | | | | | | |
| | 214,000 | | | Bayer U.S. Finance II, LLC, 4.375%, 12/15/28(a) | | | | | 209,666 | |
| | | | | | | | | | |
| | | | Food, Beverage & Tobacco — 1.8% | | | | | | |
| | 200,000 | | | BAT International Finance PLC, 3.500%, 6/15/22(a) | | | | | 197,944 | |
| | 260,000 | | | CVS Health Corp., 3.700%, 3/9/23 | | | | | 258,639 | |
| | 100,000 | | | Tyson Foods, Inc., 2.650%, 8/15/19 | | | | | 99,823 | |
| | | | | | | | | | |
| | | | | | | | | 556,406 | |
| | | | | | | | | | |
| | | | | | | | | | |
Principal
Amount | | | | Fair Value | |
| | |
| | CORPORATE BONDS — (continued) | | | | | | |
| |
| | | | Health Care Providers & Services — 2.1% | |
| | $200,000 | | | Becton Dickinson and Co., 3.261%, (LIBOR USD 3-Month plus 0.88%), 12/29/20(b) | | | | $ | 200,296 | |
| | 200,000 | | | Celgene Corp., 3.250%, 8/15/22 | | | | | 197,262 | |
| | 69,000 | | | DaVita, Inc., 5.000%, 5/1/25 | | | | | 65,809 | |
| | 217,000 | | | Magellan Health, Inc., 4.400%, 9/22/24 | | | | | 209,401 | |
| | | | | | | | | | |
| | | | | | | | | 672,768 | |
| | | | | | | | | | |
| | | | Hotels, Restaurants & Leisure — 1.3% | |
| | 154,000 | | | Hyatt Hotels Corp., 4.375%, 9/15/28 | | | | | 151,417 | |
| | 200,000 | | | Prime Security Services Borrower, LLC / Prime Finance, Inc., 9.250%, 5/15/23(a) | | | | | 213,900 | |
| | 55,000 | | | Royal Caribbean Cruises, Ltd., 2.650%, 11/28/20 | | | | | 54,082 | |
| | | | | | | | | | |
| | | | | | | | | 419,399 | |
| | | | | | | | | | |
| | | | Household Durables — 2.1% | |
| | 230,000 | | | Mohawk Industries, Inc., 3.850%, 2/1/23 | | | | | 230,304 | |
| | 220,000 | | | NVR, Inc., 3.950%, 9/15/22 | | | | | 220,140 | |
| | 200,000 | | | TRI Pointe Group, Inc. / TRI Pointe Homes, Inc., 4.375%, 6/15/19 | | | | | 201,000 | |
| | | | | | | | | | |
| | | | | | | | | 651,444 | |
| | | | | | | | | | |
| | | | Industrial Conglomerates — 0.6% | |
| | 214,000 | | | Carlisle Cos., Inc., 3.500%, 12/1/24 | | | | | 204,982 | |
| | | | | | | | | | |
| | | | Insurance — 12.4% | |
| | 255,000 | | | Alleghany Corp., 4.950%, 6/27/22 | | | | | 265,219 | |
| | 299,000 | | | American Equity Investment Life Holding Co., 5.000%, 6/15/27 | | | | | 289,776 | |
| | 260,000 | | | Aspen Insurance Holdings, Ltd., 4.650%, 11/15/23 | | | | | 262,731 | |
| | 220,000 | | | Athene Global Funding, 2.750%, 4/20/20(a) | | | | | 217,249 | |
| | 92,000 | | | AXA Equitable Holdings, Inc., 3.900%, 4/20/23(a) | | | | | 91,328 | |
| | 180,000 | | | CBRE Services, Inc., 5.250%, 3/15/25 | | | | | 187,055 | |
| | 60,000 | | | Fidelity & Guaranty Life Holdings, Inc., 5.500%, 5/1/25(a) | | | | | 59,472 | |
| | 195,000 | | | Five Corners Funding Trust, 4.419%, 11/15/23(a) | | | | | 200,118 | |
| | 303,000 | | | Horace Mann Educators Corp., 4.500%, 12/1/25 | | | | | 303,932 | |
| | 245,000 | | | Liberty Mutual Group, Inc., 4.250%, 6/15/23(a) | | | | | 247,725 | |
| | 475,000 | | | Morgan Stanley, GMTN, 3.700%, 10/23/24 | | | | | 467,688 | |
| | 224,000 | | | Nuveen Finance, LLC, 2.950%, 11/1/19(a) | | | | | 223,693 | |
| | 200,000 | | | Ohio National Financial Services, Inc., 6.375%, 4/30/20(a) | | | | | 208,091 | |
| | 165,000 | | | Oil Insurance, Ltd., 5.378%,(a)(d)(e) | | | | | 157,186 | |
| | 220,000 | | | Sammons Financial Group, Inc., 4.450%, 5/12/27(a) | | | | | 210,997 | |
| | 270,000 | | | Symetra Financial Corp., 4.250%, 7/15/24 | | | | | 265,321 | |
| | 229,000 | | | Torchmark Corp., 4.550%, 9/15/28 | | | | | 230,106 | |
| | | | | | | | | | |
| | | | | | | | | 3,887,687 | |
| | | | | | | | | | |
| | | | Media — 1.5% | | | | | | |
| | 69,000 | | | AMC Networks, Inc., 4.750%, 8/1/25 | | | | | 65,981 | |
| | 110,000 | | | Comcast Cable Communications Holdings, Inc., 9.455%, 11/15/22 | | | | | 134,074 | |
| | 62,000 | | | CSC Holdings, LLC, 6.625%, 10/15/25(a) | | | | | 65,333 | |
| | 218,000 | | | Discovery Communications, LLC, 3.950%, 3/20/28 | | | | | 207,089 | |
| | | | | | | | | | |
| | | | | | | | | 472,477 | |
| | | | | | | | | | |
Continued
95
|
Sterling Capital Corporate Fund |
Schedule of Portfolio Investments — (continued) |
September 30, 2018 |
| | | | | | | | | | |
Principal
Amount | | | | Fair Value | |
| | CORPORATE BONDS — (continued) | | | | | | |
| | | |
| | | | Metals & Mining — 3.0% | | | | | | |
| | $200,000 | | | Anglo American Capital PLC, 3.625%, 9/11/24(a) | | | | $ | 190,412 | |
| | 246,000 | | | Glencore Funding, LLC, 4.125%, 5/30/23(a) | | | | | 245,700 | |
| | 244,000 | | | Nucor Corp., 3.950%, 5/1/28 | | | | | 243,625 | |
| | 255,000 | | | Southern Copper Corp., 3.500%, 11/8/22 | | | | | 251,690 | |
| | | | | | | | | | |
| | | | | | | | | 931,427 | |
| | | | | | | | | | |
| | | | Multi-Utilities — 1.5% | | | | | | |
| | 200,000 | | | Entergy Louisiana, LLC, 4.440%, 1/15/26 | | | | | 205,400 | |
| | 275,000 | | | Progress Energy, Inc., 3.150%, 4/1/22 | | | | | 270,342 | |
| | | | | | | | | | |
| | | | | | | | | 475,742 | |
| | | | | | | | | | |
| | | | Oil, Gas & Consumable Fuels — 1.7% | |
| | 175,000 | | | Anadarko Petroleum Corp., 5.550%, 3/15/26 | | | | | 185,691 | |
| | 146,000 | | | Andeavor LLC, 5.375%, 10/1/22 | | | | | 148,429 | |
| | 210,000 | | | Andeavor Logistics L.P. / Tesoro Logistics | | | | | | |
| | | | Finance Corp., 5.250%, 1/15/25 | | | | | 215,078 | |
| | | | | | | | | | |
| | | | | | | | | 549,198 | |
| | | | | | | | | | |
| | | | Retailing — 1.7% | | | | | | |
| | 180,000 | | | Advance Auto Parts, Inc., 5.750%, 5/1/20 | | | | | 185,563 | |
| | 195,000 | | | Dollar Tree, Inc., 3.036%, (LIBOR USD 3-Month plus 0.7%), 4/17/20(b) | | | | | 195,296 | |
| | 150,000 | | | Tapestry, Inc., 3.000%, 7/15/22 | | | | | 144,598 | |
| | | | | | | | | | |
| | | | | | | | | 525,457 | |
| | | | | | | | | | |
| | | | Road & Rail — 0.5% | | | | | | |
| | 146,000 | | | Ryder System, Inc., MTN, 2.350%, 2/26/19 | | | | | 145,750 | |
| | | | | | | | | | |
| | | | Semiconductors & Semiconductor Equipment — 1.3% | |
| | 71,000 | | | Entegris, Inc., 4.625%, 2/10/26(a) | | | | | 67,532 | |
| | 130,000 | | | Microchip Technology, Inc., 3.922%, 6/1/21(a) | | | | | 129,238 | |
| | 200,000 | | | NXP BV / NXP Funding, LLC, 4.125%, 6/1/21(a) | | | | | 199,784 | |
| | | | | | | | | | |
| | | | | | | | | 396,554 | |
| | | | | | | | | | |
| | | | Software — 1.1% | | | | | | |
| | 125,000 | | | Trimble, Inc., 4.150%, 6/15/23 | | | | | 125,074 | |
| | 225,000 | | | VMware, Inc., 2.950%, 8/21/22 | | | | | 216,573 | |
| | | | | | | | | | |
| | | | | | | | | 341,647 | |
| | | | | | | | | | |
| | | | Specialty Retail — 0.4% | | | | | | |
| | 145,000 | | | Expedia Group, Inc., 3.800%, 2/15/28 | | | | | 133,647 | |
| | | | | | | | | | |
| | | | Textiles, Apparel & Luxury Goods — 0.6% | |
| | 200,000 | | | Cintas Corp. No 2, 3.700%, 4/1/27 | | | | | 194,785 | |
| | | | | | | | | | |
| | | | Trading Companies & Distributors — 0.7% | |
| | 200,000 | | | Ashtead Capital, Inc., 5.625%, 10/1/24(a) | | | | | 207,250 | |
| | | | | | | | | | |
| | | | Total Corporate Bonds
(Cost $30,763,409) | | | | | 30,407,408 | |
| | | | | | | | | | |
| | | | | | | | | | |
| Shares | | | | Fair Value | |
| | PREFERRED STOCKS — 0.4% | | | | | | |
| | | | Energy Equipment & Services — 0.4% | | | | | | |
| | 5,000 | | | Energy Transfer Partners L.P., 7.625%(e) | | | | $ | 129,350 | |
| | | | | | | | | | |
| | | | Total Preferred Stocks
(Cost $125,300) | | | | | 129,350 | |
| | | | | | | | | | |
| | | |
| | Shares | | | | | | | | | |
| | MONEY MARKET FUND — 1.5% | | | | | | |
| | 479,874 | | | Federated Treasury Obligations Fund, Institutional Shares, 1.92%(f) | | | | | 479,874 | |
| | | | | | | | | | |
| | | | Total Money Market Fund
(Cost $479,874) | | | | | 479,874 | |
| | | | | | | | | | |
| Total Investments — 99.1%
(Cost $31,368,583) | | | | | 31,016,632 | |
| | Net Other Assets (Liabilities) — 0.9% | | | | | 270,948 | |
| | | | | | | | | | |
| | NET ASSETS — 100.0% | | | | $ | 31,287,580 | |
| | | | | | | | | | |
| (a) | Rule 144A, Section 4(2) or other security that is restricted as to resale to qualified institutional investors. The Advisor, using Board approved procedures, has deemed these securities or a portion of these securities to be liquid. |
| (b) | The interest rate for this floating rate note, which will change periodically, is based either on the prime rate or an index of market rates. The reflected rate is in effect as of September 30, 2018. The maturity date reflected is the final maturity date. |
| (c) | Security is a fix-to-float security, which carries a fixed coupon until a certain date, upon which it switches to a floating rate. Rate shown is the fixed rate. |
| (d) | Security is perpetual in nature and has no stated maturity date. |
| (e) | The interest rate for this variable rate note, which will change periodically, is based either on the prime rate or an index of market rates. The reflected rate is in effect as of September 30, 2018. The maturity date reflected is the final maturity date. |
| (f) | Represents the current yield as of report date. |
BKNT — Bank Note
GMTN — Global Medium Term Note
MTN — Medium Term Note
See accompanying Notes to the Financial Statements.
96
|
Sterling Capital Securitized Opportunities Fund |
Schedule of Portfolio Investments |
September 30, 2018 |
| | | | | | | | | | |
Principal
Amount | | | | Fair Value | |
| | ASSET BACKED SECURITIES — 23.0% | | | | | | |
| | | |
| | $487,445 | | | Aegis Asset Backed Securities Trust, Series 2005-5, Class 1A4, 2.566%, (LIBOR USD 1-Month plus 0.35%), 12/25/35(a) | | | | | $484,706 | |
| | 794,000 | | | AmeriCredit Automobile Receivables Trust, Series 2017-1, Class C, 2.710%, 8/18/22 | | | | | 783,304 | |
| | 132,598 | | | Argent Securities, Inc. Pass Through Certificates, Series 2005-W3, Class A2D, 2.556%, (LIBOR USD 1-Month plus 0.34%), 11/25/35(a) | | | | | 132,512 | |
| | 500,000 | | | Avis Budget Rental Car Funding AESOP, LLC, Series 2017-1A, Class A, 3.070%, 9/20/23(b) | | | | | 487,255 | |
| | 300,000 | | | Avis Budget Rental Car Funding AESOP, LLC, Series 2017-2A, Class A, 2.970%, 3/20/24(b) | | | | | 290,757 | |
| | 300,000 | | | Bear Stearns Asset Backed Securities I Trust, Series 2004-BO1, Class M5, 3.616%, (LIBOR USD 1-Month plus 1.40%), 10/25/34(a) | | | | | 301,582 | |
| | 110,103 | | | Bear Stearns Asset Backed Securities I Trust, Series 2004-HE11, Class M2, 3.791%, (LIBOR USD 1-Month plus 1.58%), 12/25/34(a) | | | | | 112,579 | |
| | 100,000 | | | Capital Auto Receivables Asset Trust, Series 2016-3, Class B, 1.890%, 5/20/21 | | | | | 98,669 | |
| | 450,000 | | | Citibank Credit Card Issuance Trust, Series 2007-A3, Class A3, 6.150%, 6/15/39 | | | | | 554,676 | |
| | 69,861 | | | Citicorp Residential Mortgage Trust, STEP, Series 2007-2, Class A6, 5.154%, 6/25/37 | | | | | 70,988 | |
| | 548,708 | | | Encore Credit Receivables Trust, Series 2005-4, Class M2, 2.656%, (LIBOR USD 1-Month plus 0.44%), 1/25/36(a) | | | | | 547,504 | |
| | 350,000 | | | Ford Credit Auto Owner Trust, Series 2018-1, Class A, 3.190%, 7/15/31(b) | | | | | 341,220 | |
| | 297,715 | | | GSAMP Trust, Series 2006-SEA1, Class M1, 2.716%, (LIBOR USD 1-Month plus 0.50%), 5/25/36(a)(b) | | | | | 294,413 | |
| | 750,000 | | | Hertz Vehicle Financing II L.P., Series 2015-3A, Class A, 2.670%, 9/25/21(b) | | | | | 736,536 | |
| | 353,205 | | | Home Equity Asset Trust, Series 2005-7, Class M1, 2.666%, (LIBOR USD 1-Month plus 0.45%), 1/25/36(a) | | | | | 354,435 | |
| | 147,585 | | | Home Equity Asset Trust, Series 2005-8, Class M1, 2.646%, (LIBOR USD 1-Month plus 0.43%), 2/25/36(a) | | | | | 147,990 | |
| | 391,149 | | | JP Morgan Mortgage Acquisition Corp., Series 2005-OPT1, Class M2, 2.921%, (LIBOR USD 1-Month plus 0.71%), 6/25/35(a) | | | | | 391,413 | |
| | 179,607 | | | Morgan Stanley Home Equity Loan Trust, Series 2005-3, Class M2, 2.921%, (LIBOR USD 1-Month plus 0.71%), 8/25/35(a) | | | | | 180,201 | |
| | 418,137 | | | New Century Home Equity Loan Trust, Series 2005-4, Class M2, 2.726%, (LIBOR USD 1-Month plus 0.51%), 9/25/35(a) | | | | | 417,062 | |
| | 388,865 | | | Park Place Securities, Inc., Series 2005-WHQ2, Class M2, 2.906%, (LIBOR USD 1-Month plus 0.69%), 5/25/35(a) | | | | | 389,627 | |
| | 274,992 | | | Park Place Securities, Inc. Pass Through Certificates, Series 2005-WCW3, Class M1, 2.696%, (LIBOR USD 1-Month plus 0.48%), 8/25/35(a) | | | | | 275,164 | |
| | 320,000 | | | RAMP Trust, Series 2005-RZ4, Class M2, 2.716%, (LIBOR USD 1-Month plus 0.50%), 11/25/35(a) | | | | | 319,019 | |
| | | | | | | | | | |
Principal
Amount | | | | Fair Value | |
| | ASSET BACKED SECURITIES — (continued) | | | | | | |
| | | |
| | $400,000 | | | Santander Drive Auto Receivables Trust 2018-4, Series 2018-4, Class B, 3.270%, 1/17/23 | | | | $ | 398,753 | |
| | 221,111 | | | Saxon Asset Securities Trust, Series 2004-3, Class M1, 3.116%, (LIBOR USD 1-Month plus 0.90%), 12/26/34(a) | | | | | 219,091 | |
| | 56,903 | | | Securitized Asset Backed Receivables, LLC Trust, Series 2005-OP2, Class A2C, 2.536%, (LIBOR USD 1-Month plus 0.32%), 10/25/35(a) | | | | | 56,901 | |
| | 170,448 | | | United States Small Business Administration, Series 2010-20D, Class 1, 4.360%, 4/1/30 | | | | | 175,395 | |
| | | | | | | | | | |
| | | | Total Asset Backed Securities
(Cost $8,340,764) | | | | | 8,561,752 | |
| | | | | | | | | | |
|
| COLLATERALIZED MORTGAGE
OBLIGATIONS — 26.9% |
|
| | 99,844 | | | Banc of America Alternative Loan Trust, Series 2004-10, Class 1CB1, 6.000%, 11/25/34 | | | | | 104,776 | |
| | 161,836 | | | Banc of America Funding Trust, Series 2005-B, Class 3A1, 2.625%, (LIBOR USD 1-Month plus 0.46%), 4/20/35(a) | | | | | 161,498 | |
| | 65,509 | | | Banc of America Mortgage Trust, Series 2005-3, Class 1A24, 5.500%, 4/25/35 | | | | | 66,275 | |
| | 78,839 | | | Citicorp Mortgage Securities, Inc., Series 2005-1, Class 1A4, 5.500%, 2/25/35 | | | | | 80,667 | |
| | 32,683 | | | Citigroup Mortgage Loan Trust, Inc., Series 2004-NCM2, Class 3CB2, 6.500%, 8/25/19 | | | | | 32,861 | |
| | 123,548 | | | Countrywide Alternative Loan Trust, Series 2004-22CB, Class 1A1, 6.000%, 10/25/34 | | | | | 127,007 | |
| | 68,440 | | | Countrywide Home Loan Mortgage Pass Through Trust, Series 2004-3, Class A4, 5.750%, 4/25/34 | | | | | 70,210 | |
| | 142,969 | | | Credit Suisse First Boston Mortgage Securities Corp., Series 2004-1, Class 2A1, 6.500%, 2/25/34 | | | | | 148,595 | |
| | 38 | | | Credit Suisse First Boston Mortgage Securities Corp., Series 2005-6, Class 2A3, 5.500%, 7/25/35 | | | | | 38 | |
| | 26,599 | | | Fannie Mae, Series 2003-19, Class AR, 5.500%, 3/25/33 | | | | | 28,408 | |
| | 526,000 | | | Fannie Mae, Series 2005-110, Class GL, 5.500%, 12/25/35 | | | | | 566,148 | |
| | 228,539 | | | Fannie Mae, Series 2014-42, Class A, 3.000%, 8/25/36 | | | | | 225,192 | |
| | 380,000 | | | Fannie Mae, Series 2011-131, Class PB, 4.500%, 12/25/41 | | | | | 400,259 | |
| | 482,000 | | | Fannie Mae, Series 2013-2, Class LB, 3.000%, 2/25/43 | | | | | 431,668 | |
| | 541,000 | | | Fannie Mae, Series 2013-30, Class PY, 3.000%, 4/25/43 | | | | | 516,695 | |
| | 141,488 | | | FirstKey Mortgage Trust, Series 2014-1, Class A12, 3.500%, 11/25/44(b)(c) | | | | | 137,370 | |
| | 28,763 | | | Freddie Mac, Series 4079, Class WV, 3.500%, 3/15/27 | | | | | 28,497 | |
| | 195,000 | | | Freddie Mac, Series 4097, Class CU, 1.500%, 8/15/27 | | | | | 166,805 | |
| | 348,223 | | | Freddie Mac, Series 4136, Class HZ, 3.500%, 11/15/27 | | | | | 341,661 | |
| | 180,000 | | | Freddie Mac, Series 4230, Class VB, 2.500%, 12/15/31 | | | | | 170,005 | |
| | 188,603 | | | Freddie Mac, Series 2485, Class WG, 6.000%, 8/15/32 | | | | | 203,827 | |
Continued
97
|
Sterling Capital Securitized Opportunities Fund |
Schedule of Portfolio Investments — (continued) |
September 30, 2018 |
| | | | | | | | | | |
Principal
Amount | | | | Fair Value | |
| COLLATERALIZED MORTGAGE
OBLIGATIONS — (continued) | | | | |
| | $533,000 | | | Freddie Mac, Series -4136, Class PY, 2.000%, 11/15/32 | | | | $ | 433,094 | |
| | 400,000 | | | Freddie Mac, Series 4160, Class HH, 2.500%, 12/15/32 | | | | | 364,883 | |
| | 259,988 | | | Freddie Mac, Series 3440, Class EM, 5.000%, 4/15/38 | | | | | 274,959 | |
| | 466,249 | | | Freddie Mac, Series 3816, Class HM, 4.500%, 5/15/40 | | | | | 479,630 | |
| | 500,000 | | | Freddie Mac, Series 3714, Class PB, 4.750%, 8/15/40 | | | | | 539,384 | |
| | 665,000 | | | Freddie Mac, Series 3762, Class LN, 4.000%, 11/15/40 | | | | | 666,661 | |
| | 105,300 | | | Freddie Mac, Series 3803, Class PJ, 4.250%, 1/15/41 | | | | | 107,346 | |
| | 200,000 | | | Freddie Mac, Series 3815, Class TB, 4.500%, 2/15/41 | | | | | 208,449 | |
| | 155,494 | | | Freddie Mac, Series 4293, Class MH, 3.000%, 12/15/41 | | | | | 150,759 | |
| | 400,000 | | | Freddie Mac, Series 3989, Class JW, 3.500%, 1/15/42 | | | | | 389,317 | |
| | 500,000 | | | Freddie Mac, Series 4650, Class BC, 3.500%, 5/15/43 | | | | | 487,654 | |
| | 547,578 | | | Freddie Mac, Series 4508, Class UZ, 3.000%, 7/15/43 | | | | | 484,613 | |
| | 368,703 | | | Freddie Mac, Series 4648, Class E, 3.500%, 8/15/43 | | | | | 366,109 | |
| | 193,591 | | | Galton Funding Mortgage Trust, Series 2018-1, Class A43, 3.500%, 11/25/57(b)(c) | | | | | 192,668 | |
| | 69,071 | | | Ginnie Mae, Series 2010-85, Class DQ, 3.000%, 12/20/39 | | | | | 68,637 | |
| | 256,493 | | | MASTR Alternative Loan Trust, Series 2003-5, Class 8A1, 5.500%, 6/25/33 | | | | | 261,010 | |
| | 56,120 | | | MASTR Alternative Loan Trust, Series 2004-13, Class 3A1, 6.500%, 1/25/35 | | | | | 56,122 | |
| | 273,814 | | | MASTR Seasoned Securitization Trust, Series 2005-2, Class 1A1, 5.130%, 10/25/32 | | | | | 273,618 | |
| | 181 | | | PHHMC Trust, Series 2007-6, Class A1, 5.863%, 12/18/37(c) | | | | | 181 | |
| | 58,910 | | | RBSGC Mortgage Loan Trust, Series 2007-B, Class 3A1, 4.788%, 7/25/35(c) | | | | | 58,677 | |
| | 63,239 | | | Specialty Underwriting & Residential Finance Trust, Series 2004-AA1, Class 1A1, 5.000%, 10/25/34 | | | | | 63,224 | |
| | 11,085 | | | Wells Fargo Mortgage Backed Securities Trust, Series 2007-3, Class 3A1, 5.500%, 4/25/22 | | | | | 11,252 | |
| | 30,651 | | | Wells Fargo Mortgage Backed Securities Trust, Series 2005-4, Class A4, 5.000%, 4/25/35 | | | | | 30,625 | |
| | | | | | | | | | |
| | | | Total Collateralized Mortgage Obligations
(Cost $10,220,001) | | | | | 9,977,334 | |
| | | | | | | | | | |
| | |
| COMMERCIAL MORTGAGE-BACKED
SECURITIES — 22.5% | | | | | | |
| | 500,000 | | | CD Mortgage Trust, Series 2016-CD2, Class A4, 3.526%, 11/10/49(c) | | | | | 493,404 | |
| | 300,000 | | | Citigroup Commercial Mortgage Trust, Series 2013-GC17, Class AS, 4.544%, 11/10/46 | | | | | 310,091 | |
| | 180,000 | | | COMM Mortgage Trust, Series 2014-CR20, Class A4, 3.590%, 11/10/47 | | | | | 179,892 | |
| | 250,000 | | | COMM Mortgage Trust, Series 2017-COR2, Class A3, 3.510%, 9/10/50 | | | | | 244,096 | |
| | | | | | | | | | |
Principal
Amount | | | | Fair Value | |
| COMMERCIAL MORTGAGE-BACKED
SECURITIES — (continued) |
|
| | $ 6,274 | | | Commercial Mortgage Loan Trust, Series 2008-LS1, Class ASM, 6.253%, 12/10/49(c) | | | | $ | 6,264 | |
| | 500,000 | | | CSAIL Commercial Mortgage Trust, Series 2015-C3, Class A4, 3.718%, 8/15/48 | | | | | 499,854 | |
| | 200,000 | | | DBUBS Mortgage Trust, Series 2011-LC1A, Class C, 5.884%, 11/10/46(b)(c) | | | | | 209,276 | |
| | 500,000 | | | Freddie Mac Multifamily Structured Pass Through Certificates, Series K153, Class A3, 3.117%, 10/25/31(c) | | | | | 464,731 | |
| | 495,962 | | | FRESB Mortgage Trust, Series 2017-SB36, Class A10F, 2.880%, 7/25/27(c) | | | | | 474,471 | |
| | 150,000 | | | Ginnie Mae, Series 2011-20, Class C, 3.562%, 4/16/41(c) | | | | | 148,815 | |
| | 175,000 | | | GS Mortgage Securities Trust, Series 2010-C1, Class B, 5.148%, 8/10/43(b) | | | | | 178,002 | |
| | 475,000 | | | GS Mortgage Securities Trust, Series 2012-GCJ7, Class AS, 4.085%, 5/10/45 | | | | | 482,807 | |
| | 500,000 | | | GS Mortgage Securities Trust, Series 2016-GS4, Class A4, 3.442%, 11/10/49(c) | | | | | 489,215 | |
| | 500,000 | | | JPMorgan Chase Commercial Mortgage Securities Trust, Series 2011-C3, Class B, 5.013%, 2/15/46(b)(c) | | | | | 510,122 | |
| | 100,000 | | | Morgan Stanley Bank of America Merrill Lynch Trust, Series 2014-C18, Class A4, 3.923%, 10/15/47 | | | | | 100,909 | |
| | 500,000 | | | Morgan Stanley Bank of America Merrill Lynch Trust, Series 2016-C32, Class A4, 3.720%, 12/15/49 | | | | | 497,111 | |
| | 400,000 | | | Morgan Stanley Capital I, Inc., Series 2018-H3, Class A5, 4.177%, 7/15/51 | | | | | 409,658 | |
| | 760,000 | | | Wells Fargo Commercial Mortgage Trust, Series 2010-C1, Class B, 5.276%, 11/15/43(b)(c) | | | | | 779,796 | |
| | 300,000 | | | Wells Fargo Commercial Mortgage Trust, Series 2015-P2, Class A4, 3.809%, 12/15/48 | | | | | 301,560 | |
| | 400,000 | | | WF-RBS Commercial Mortgage Trust, Series 2011-C2, Class B, 5.174%, 2/15/44(b)(c) | | | | | 410,105 | |
| | 100,000 | | | WF-RBS Commercial Mortgage Trust, Series 2011-C2, Class C, 5.392%, 2/15/44(b)(c) | | | | | 102,318 | |
| | 350,000 | | | WF-RBS Commercial Mortgage Trust, Series 2012-C8, Class AS, 3.660%, 8/15/45 | | | | | 349,021 | |
| | 529,000 | | | WF-RBS Commercial Mortgage Trust, Series 2014-C22, Class A5, 3.752%, 9/15/57 | | | | | 531,834 | |
| | 164,000 | | | WF-RBS Commercial Mortgage Trust, Series 2014-C23, Class A5, 3.917%, 10/15/57 | | | | | 166,234 | |
| | | | | | | | | | |
| | | | Total Commercial Mortgage-Backed Securities (Cost $8,740,859) | | | | | 8,339,586 | |
| | | | | | | | | | |
| | |
| | CORPORATE BONDS — 1.6% | | | | | | |
| |
| | | | Diversified Telecommunication Services — 0.9% | |
| | 350,000 | | | Sprint Spectrum Co., LLC / Sprint Spectrum Co. II LLC / Sprint Spectrum Co. III LLC, 4.738%, 3/20/25(b) | | | | | 349,844 | |
| | | | | | | | | | |
| | | | Equity Real Estate Investment Trusts (REITS) — 0.7% | |
| | 250,000 | | | American Tower Trust, 3.652%, 3/23/28(b) | | | | | 245,206 | |
| | | | | | | | | | |
| | | | Total Corporate Bonds
(Cost $600,000) | | | | | 595,050 | |
| | | | | | | | | | |
Continued
98
|
Sterling Capital Securitized Opportunities Fund |
Schedule of Portfolio Investments — (continued) |
September 30, 2018 |
| | | | | | | | | | |
Principal
Amount | | | | Fair Value | |
| | MORTGAGE-BACKED SECURITIES — 25.4% | |
| | $425,000 | | | 3.110%, 11/1/27, Pool #AN7537 | | | | $ | 405,800 | |
| | 600,000 | | | 3.640%, 6/1/28, Pool #AN9354 | | | | | 595,252 | |
| | 200,000 | | | 3.220%, 9/1/32, Pool #AN6850 | | | | | 187,610 | |
| | 306,965 | | | 4.500%, 11/1/47, Pool #BM3286 | | | | | 316,870 | |
| | | | | | | | | | |
| | | | | | | | | 1,505,532 | |
| | | | | | | | | | |
| | | |
| | | | Fannie Mae — 13.6% | | | | | | |
| | 345,694 | | | 3.010%, 11/1/27, Pool #AN7299 | | | | | 328,898 | |
| | 500,000 | | | 3.515%, 4/1/28, Pool #AN9042 | | | | | 491,110 | |
| | 144,265 | | | 5.500%, 6/1/38, Pool #984277 | | | | | 155,560 | |
| | 81,075 | | | 5.500%, 8/1/38, Pool #995072 | | | | | 87,976 | |
| | 114,412 | | | 4.500%, 9/1/39, Pool #AC1830 | | | | | 119,139 | |
| | 109,627 | | | 4.500%, 10/1/40, Pool #AE4855 | | | | | 114,079 | |
| | 175,570 | | | 3.500%, 2/1/41, Pool #AH5646 | | | | | 174,133 | |
| | 334,603 | | | 4.000%, 3/1/41, Pool #AH4008 | | | | | 340,371 | |
| | 86,387 | | | 4.500%, 6/1/41, Pool #AC9298 | | | | | 89,880 | |
| | 228,276 | | | 5.000%, 7/1/41, Pool #AI5595 | | | | | 242,884 | |
| | 303,742 | | | 4.000%, 9/1/41, Pool #AJ1717 | | | | | 309,032 | |
| | 278,601 | | | 3.500%, 6/1/42, Pool #AB5373 | | | | | 276,347 | |
| | 227,251 | | | 4.000%, 4/1/44, Pool #AW2882 | | | | | 230,085 | |
| | 121,293 | | | 4.500%, 10/1/44, Pool #MA2066 | | | | | 125,836 | |
| | 420,387 | | | 4.000%, 12/1/44, Pool #MA2127 | | | | | 425,431 | |
| | 383,747 | | | 4.500%, 1/1/45, Pool #MA2158 | | | | | 397,817 | |
| | 388,496 | | | 3.500%, 3/1/45, Pool #AS4552 | | | | | 383,967 | |
| | 339,269 | | | 4.000%, 11/1/46, Pool #MA2808 | | | | | 342,856 | |
| | 408,071 | | | 4.500%, 5/1/48, Pool #CA1711 | | | | | 421,220 | |
| | | | | | | | | | |
| | | | | | | | | 5,056,621 | |
| | | | | | | | | | |
| | | |
| | | | Freddie Mac — 7.6% | | | | | | |
| | 487,930 | | | 3.500%, 5/1/32, Pool #C91458 | | | | | 489,886 | |
| | 364,371 | | | 3.500%, 7/1/32, Pool #C91467 | | | | | 365,831 | |
| | 135,444 | | | 4.000%, 11/1/32, Pool #G30616 | | | | | 138,847 | |
| | 55,352 | | | 5.500%, 10/1/39, Pool #A89387 | | | | | 59,124 | |
| | 104,669 | | | 5.000%, 4/1/40, Pool #A91812 | | | | | 111,139 | |
| | 177,399 | | | 5.500%, 4/1/40, Pool #C03467 | | | | | 191,142 | |
| | 88,981 | | | 5.000%, 8/1/40, Pool #C03491 | | | | | 94,502 | |
| | 168,414 | | | 4.000%, 11/1/40, Pool #A94742 | | | | | 171,555 | |
| | 199,042 | | | 4.000%, 12/1/40, Pool #A95447 | | | | | 202,761 | |
| | 139,601 | | | 3.500%, 3/1/42, Pool #G08479 | | | | | 138,476 | |
| | 422,310 | | | 3.500%, 8/1/42, Pool #Q10324 | | | | | 418,907 | |
| | | | | | | | | | |
Principal
Amount | | | | Fair Value | |
| | MORTGAGE-BACKED SECURITIES — (continued) | |
| | | |
| | | | Freddie Mac — (continued) | | | | | | |
| | $454,627 | | | 4.000%, 4/1/46, Pool #Q40048 | | | | $ | 459,871 | |
| | | | | | | | | | |
| | | | | | | | | 2,842,041 | |
| | | | | | | | | | |
| | | |
| | | | Ginnie Mae — 0.1% | | | | | | |
| | 20,816 | | | 4.000%, 12/20/40, Pool #755678 | | | | | 21,368 | |
| | | | | | | | | | |
| | | | Total Mortgage-Backed Securities
(Cost $9,642,308) | | | | | 9,425,562 | |
| | | | | | | | | | |
| Shares | | | | | | | |
| | MONEY MARKET FUND — 0.6% | | | | | | |
| | 239,765 | | | Federated Treasury Obligations Fund, Institutional Shares, 1.92%(d) | | | | | 239,765 | |
| | | | | | | | | | |
| | | | Total Money Market Fund
(Cost $239,765) | | | | | 239,765 | |
| | | | | | | | | | |
| | |
| Total Investments — 100.0%
(Cost $37,783,697) | | | | | 37,139,049 | |
| | Net Other Assets (Liabilities) — 0.0% | | | | | 7 | |
| | | | | | | | | | |
| | NET ASSETS — 100.0% | | | | $ | 37,139,056 | |
| | | | | | | | | | |
| (a) | The interest rate for this floating rate note, which will change periodically, is based either on the prime rate or an index of market rates. The reflected rate is in effect as of September 30, 2018. The maturity date reflected is the final maturity date. |
| (b) | Rule 144A, Section 4(2) or other security that is restricted as to resale to qualified institutional investors. The Advisor, using Board approved procedures, has deemed these securities or a portion of these securities to be liquid. |
| (c) | The interest rate for this variable rate note, which will change periodically, is based either on the prime rate or an index of market rates. The reflected rate is in effect as of September 30, 2018. The maturity date reflected is the final maturity date. |
(d) Represents the current yield as of report date.
STEP — Step Coupon Bond
See accompanying Notes to the Financial Statements.
99
|
Sterling Capital Kentucky Intermediate Tax-Free Fund |
Schedule of Portfolio Investments |
September 30, 2018 |
| | | | | | | | | | |
Principal
Amount | | | | Fair Value | |
| | MUNICIPAL BONDS — 95.5% | | | | | | |
| | | |
| | | | Kentucky — 95.5% | | | | | | |
| | $300,000 | | | Bowling Green Independent School District Finance Corp., School Improvements Revenue, (State Intercept), 5.000%, 8/1/24 | | | | | $337,671 | |
| | 250,000 | | | Campbell & Kenton Counties Sanitation District No. 1, Refunding Revenue, Callable 8/1/26 @ 100, 4.000%, 8/1/31 | | | | | 261,980 | |
| | 440,000 | | | Commonwealth of Kentucky, Certificate of Participation, Public Improvements, 5.000%, 6/15/25 | | | | | 497,904 | |
| | 300,000 | | | Commonwealth of Kentucky, Certificate of Participation, Public Improvements, Callable 6/15/25 @ 100, 5.000%, 6/15/34 | | | | | 328,539 | |
| | 400,000 | | | Eastern Kentucky University, Refunding Revenue, Series A, (State Intercept), 5.000%, 4/1/24 | | | | | 445,412 | |
| | 300,000 | | | Eastern Kentucky University, University & College Improvements Revenue, Series A (State Intercept), 5.000%, 4/1/25 | | | | | 338,010 | |
| | 250,000 | | | Fayette County, KY, School District Finance Corp., Lease Payable from Local Revenues, Series A, 5.000%, 10/1/21 | | | | | 268,840 | |
| | 300,000 | | | Jefferson County School District Finance Corp., School Improvements Revenue Bonds (State Intercept), Series C, Callable 12/1/25 @ 100, 4.000%, 12/1/28 | | | | | 318,405 | |
| | 250,000 | | | Jefferson County, KY, School District Finance Corp., School Improvements Revenue, Series A, Callable 4/1/25 @ 100, 5.000%, 4/1/27 | | | | | 281,833 | |
| | 250,000 | | | Kenton County, KY, Refunding Revenue, G.O., Series A, 5.000%, 4/1/27 | | | | | 292,777 | |
| | 250,000 | | | Kentucky Asset/Liability Commission, Project Notes, Federal Highway Trust Transit Improvements Revenue, First Series, Callable 9/1/23 @ 100, 5.250%, 9/1/25 | | | | | 280,370 | |
| | 400,000 | | | Kentucky Association of Counties Finance Corp., Public Improvements Revenue, First Series B, 4.000%, 2/1/25 | | | | | 429,580 | |
| | 250,000 | | | Kentucky Rural Water Finance Corp., Flexible Term Program, Refunding & Improvements Revenue, Series B, Callable 2/1/20 @ 100, 4.000%, 2/1/21 | | | | | 255,730 | |
| | 250,000 | | | Kentucky State Property & Building Commission, Project No. 116, University & College Improvements Revenue, (AGM-State Intercept), 5.000%, 10/1/26 | | | | | 284,745 | |
| | 280,000 | | | Kentucky State Property & Building Commission, Refunding Revenue, Callable 8/01/25 @ 100, 5.000%, 8/1/31 | | | | | 310,330 | |
| | 410,000 | | | Kentucky State Property & Buildings Commission, Project No. 76, Refunding Revenue, (AMBAC), 5.500%, 8/1/21 | | | | | 444,333 | |
| | 280,000 | | | Kentucky Turnpike Authority Revitalization Projs-Ser A Highway Imps. Revenue Bonds, 5.000%, 7/1/20 | | | | | 293,406 | |
| | 275,000 | | | Kentucky Turnpike Authority Revitalization Projs-Ser A Highway Imps. Revenue Bonds, Callable 7/1/22 @ 100, 5.000%, 7/1/24 | | | | | 302,959 | |
| | 400,000 | | | Kentucky Turnpike Authority, Revitalization Projects, Revenue, Series A, 4.000%, 7/1/21 | | | | | 417,992 | |
| | | | | | | | | | |
Principal
Amount | | | | Fair Value | |
| | MUNICIPAL BONDS — (continued) | | | | | | |
| | | |
| | | | Kentucky — (continued) | | | | | | |
| | $250,000 | | | Laurel County, KY, Correctional Facilities Improvements G.O., Series A, Callable 5/1/27 @ 100, (BAM), 5.000%, 5/1/28 | | | | $ | 286,555 | |
| | 300,000 | | | Laurel County, KY, School District Finance Corp., Refunding Revenue, Callable 3/1/25 @ 100 (State Intercept), 4.000%, 6/1/25 | | | | | 321,726 | |
| | 250,000 | | | Lexington-Fayette Urban County Government Public Facilities Corp., Court Facilities Project, Current Refunding Revenue Bonds, Callable 10/1/26 @ 100, 5.000%, 10/1/27 | | | | | 286,657 | |
| | 215,000 | | | Lexington-Fayette Urban County Government Ref-A Current Refunding G.O. Unlimited, 5.000%, 10/1/21 | | | | | 232,955 | |
| | 275,000 | | | Lexington-Fayette Urban County, KY, Airport Board, Refunding Revenue, Series A, 5.000%, 7/1/19 | | | | | 280,833 | |
| | 250,000 | | | Louisville & Jefferson County, KY, Metropolitan Government, Refunding G.O., Series F, Callable 11/1/24 @ 100, 4.000%, 11/1/26 | | | | | 269,417 | |
| | 500,000 | | | Louisville & Jefferson County, KY, Metropolitan Sewer District, Sewer Refunding Revenue, Series A, Callable 11/15/21 @ 100, 5.000%, 5/15/30 | | | | | 538,520 | |
| | 410,000 | | | Louisville & Jefferson County, Metropolitan Government, Catholic Health Initiatives, Prerefunded Revenue, Callable 6/1/22 @ 100, 5.000%, 12/1/35 | | | | | 450,947 | |
| | 325,000 | | | Louisville & Jefferson County, Metropolitan Government, Center City Project, Refunding Notes, G.O., Callable 12/1/25 @ 100, 5.000%, 12/1/28 | | | | | 374,524 | |
| | 300,000 | | | Murray, KY, School District Finance Corp., School Improvements Revenue, (State Intercept), 5.000%, 3/1/27 | | | | | 345,762 | |
| | 250,000 | | | Owensboro, KY, Public Improvements G.O., Series A, 4.000%, 5/1/22 | | | | | 261,800 | |
| | 200,000 | | | Russell, KY, Bon Secours Health System, Refunding Revenue, Callable 11/1/22 @ 100, 5.000%, 11/1/26 | | | | | 218,546 | |
| | 300,000 | | | University of Kentucky, Refunding Revenue, Series D (State Intercept), 5.250%, 10/1/20 | | | | | 318,510 | |
| | 250,000 | | | University of Kentucky, Refunding Revenue, University & College Improvements, Series A, Callable 04/1/26 @ 100 (State Intercept), 4.000%, 10/1/29 | | | | | 266,673 | |
| | | | | | | | | | |
| | | | Total Municipal Bonds
(Cost $10,836,146) | | | | | 10,844,241 | |
| | | | | | | | | | |
Continued
100
|
Sterling Capital Kentucky Intermediate Tax-Free Fund |
Schedule of Portfolio Investments — (continued) |
September 30, 2018 |
| | | | | | | | | | |
| Shares | | | | Fair Value | |
| | MONEY MARKET FUND — 3.3% | | | | | | |
| | 372,453 | | | Federated Treasury Obligations Fund, Institutional Shares, 1.92%(a) | | | | $ | 372,453 | |
| | | | | | | | | | |
| | | | Total Money Market Fund
(Cost $372,453) | | | | | 372,453 | |
| | | | | | | | | | |
| Total Investments — 98.8%
(Cost $11,208,599) | | | | | 11,216,694 | |
| | Net Other Assets (Liabilities) — 1.2% | | | | | 137,423 | |
| | | | | | | | | | |
| | NET ASSETS — 100.0% | | | | $ | 11,354,117 | |
| | | | | | | | | | |
| (a) | Represents the current yield as of report date. |
AGM — Assured Guaranty Municipal Corp.
AMBAC — American Municipal Bond Assurance Corp.
BAM — Build America Mutual
G.O. — General Obligation
See accompanying Notes to the Financial Statements.
101
|
Sterling Capital Maryland Intermediate Tax-Free Fund |
Schedule of Portfolio Investments |
September 30, 2018 |
| | | | | | | | | | |
Principal
Amount | | | | Fair Value | |
| | MUNICIPAL BONDS — 98.5% | | | | | | |
| | | |
| | | | District of Columbia — 3.3% | | | | | | |
| | $290,000 | | | Washington Metropolitan Area Transit Authority, Series A-1, Advance Refunding Revenue Bonds, 5.000%, 7/1/26 | | | | $ | 337,876 | |
| | 250,000 | | | Washington Metropolitan Area Transit Authority, Transit Improvements, Revenue Bonds, Series B, Callable 7/1/27 @ 100, 5.000%, 7/1/33 | | | | | 287,378 | |
| | | | | | | | | | |
| | | | | | | | | 625,254 | |
| | | | | | | | | | |
| | | |
| | | | Maryland — 95.2% | | | | | | |
| | 500,000 | | | Anne Arundel County, MD, Consolidated Water & Sewer Utility Improvements G.O., 5.000%, 4/1/22 | | | | | 548,290 | |
| | 510,000 | | | Anne Arundel County, MD, Economic Development, Anne Arundel Community College Project, Refunding Revenue, 4.000%, 9/1/20 | | | | | 526,039 | |
| | 650,000 | | | Cecil County, MD, Consolidated Public School Improvements, Refunding G.O., 4.000%, 2/1/24 | | | | | 702,748 | |
| | 500,000 | | | Charles County, MD, Consolidated Public School Improvements G.O., 5.000%, 7/15/22 | | | | | 551,915 | |
| | 500,000 | | | Charles County, MD, Consolidated Public School Improvements G.O., Callable 7/15/23 @ 100, 5.000%, 7/15/25 | | | | | 563,495 | |
| | 475,000 | | | City Of Baltimore, MD, Consolidated Public Improvements, Refunding G.O., Series B, Callable 10/15/22 @ 100, 5.000%, 10/15/23 | | | | | 525,317 | |
| | 500,000 | | | City Of Baltimore, MD, Senior Refunding Revenue Bonds, Series D, Callable 1/1/25 @ 100, 5.000%, 7/1/30 | | | | | 565,685 | |
| | 300,000 | | | Howard County, MD, Housing Commission, Columbia Commons Apartments, Local Multifamily Housing Revenue, Series A, 3.000%, 6/1/21 | | | | | 302,832 | |
| | 275,000 | | | Howard County, MD, Housing Commission, General Capital Improvement Program, Local Multifamily Housing Revenue, 4.000%, 6/1/22 | | | | | 288,857 | |
| | 430,000 | | | Howard County, MD, Metropolitan District, Series E, Advance Refunding G.O., 5.000%, 2/15/24 | | | | | 488,781 | |
| | 500,000 | | | Howard County, MD, Metropolitan District, Series E, Advance Refunding G.O., Callable 2/15/28 @ 100, 5.000%, 2/15/31 | | | | | 590,990 | |
| | 125,000 | | | Howard County, MD, Miscellaneous Purpose Certificate of Participation, Series A, 8.050%, 2/15/21 | | | | | 142,036 | |
| | 135,000 | | | Howard County, MD, Public Improvements Certificate of Participation, Series B, 8.250%, 2/15/20 | | | | | 146,298 | |
| | 250,000 | | | Maryland Economic Development Corp., Electricity Lights & Power Improvements, Refunding Revenue, Callable 3/1/19 @ 100, 6.200%, 9/1/22 | | | | | 254,195 | |
| | 30,000 | | | Maryland Economic Development Corp., Lutheran World Relief Refugee, Refunding Revenue, Callable 11/5/18 @ 100, (Lutheran Center Corp.), 5.250%, 4/1/19 | | | | | 30,087 | |
| | | | | | | | | | |
Principal
Amount | | | | Fair Value | |
| | MUNICIPAL BONDS — (continued) | | | | | | |
| | | |
| | | | Maryland — (continued) | | | | | | |
| | $475,000 | | | Maryland Economic Development Corp., Public Health Laboratory Public Improvements Revenue, 5.000%, 6/1/20 | | | | | $498,275 | |
| | 420,000 | | | Maryland Economic Development Corp., Public Health Laboratory Public Improvements Revenue, Callable 6/1/21 @ 100, 5.000%, 6/1/26 | | | | | 450,253 | |
| | 250,000 | | | Maryland Health & Higher Educational Facilities Authority, Anne Arundel Health System, Advance Refunding Revenue Bonds, Callable 7/1/27 @ 100, 5.000%, 7/1/28 | | | | | 285,110 | |
| | 500,000 | | | Maryland Health & Higher Educational Facilities Authority, Calvert Health System, Health, Hospital, Nursing Home Improvements, Refunding Revenue, Callable 07/01/23 @ 100, OID, 5.000%, 7/1/38 | | | | | 535,905 | |
| | 500,000 | | | Maryland Health & Higher Educational Facilities Authority, Greater Baltimore Medical Center, Refunding Revenue, Series A, Callable 7/1/22 @ 100, 5.000%, 7/1/26 | | | | | 548,185 | |
| | 500,000 | | | Maryland Health & Higher Educational Facilities Authority, Johns Hopkins Health System, Health, Hospital, Nursing Home Improvements Revenue, Callable 7/1/22 @ 100, 5.000%, 7/1/25 | | | | | 549,130 | |
| | 470,000 | | | Maryland Health & Higher Educational Facilities Authority, Lifebridge Health, Current Refunding Revenue Bonds, Callable 7/1/27 @ 100, 5.000%, 7/1/32 | | | | | 531,401 | |
| | 530,000 | | | Maryland Health & Higher Educational Facilities Authority, Maryland Institute College of Art, Refunding Revenue, Callable 6/1/22 @ 100, 5.000%, 6/1/23 | | | | | 573,582 | |
| | 400,000 | | | Maryland Health & Higher Educational Facilities Authority, Meritus Medical Center Issue, Refunding Revenue, 5.000%, 7/1/22 | | | | | 434,200 | |
| | 500,000 | | | Maryland Stadium Authority, Construction & Revitalization, School Improvements Revenue, Callable 5/1/28 @ 100, 5.000%, 5/1/35 | | | | | 571,525 | |
| | 660,000 | | | Maryland Stadium Authority, Refunding Revenue, 5.000%, 6/15/23 | | | | | 738,665 | |
| | 500,000 | | | Maryland State Transportation Authority, Transportation Facilities Project, Highway Revenue, Series A, Callable 7/1/19 @ 100, 5.000%, 7/1/22 | | | | | 511,170 | |
| | 500,000 | | | Montgomery County, MD, Crossover Refunding, G.O., Series D, 4.000%, 11/1/27 | | | | | 555,430 | |
| | 500,000 | | | Montgomery County, MD, Department Liquor Control Public Improvements Revenue, Series A, Callable 4/1/21 @ 100, OID, 4.500%, 4/1/26 | | | | | 526,670 | |
| | 500,000 | | | Montgomery County, MD, Water Quality Public Improvements Revenue, Series A, Callable 4/1/20 @ 100, 5.000%, 4/1/30 | | | | | 521,035 | |
| | 500,000 | | | Montgomery County, MD, West Germantown Development District, Refunding, Special Tax, 4.000%, 7/1/23 | | | | | 534,285 | |
| | 700,000 | | | Prince George’s County, MD, Consolidated Public School Improvements, G.O., Series A, Callable 9/1/24 @ 100, 4.000%, 9/1/25 | | | | | 763,007 | |
Continued
102
|
Sterling Capital Maryland Intermediate Tax-Free Fund |
Schedule of Portfolio Investments — (continued) |
September 30, 2018 |
| | | | | | | | | | |
Principal
Amount | | | | Fair Value | |
| | MUNICIPAL BONDS — (continued) | | | | | | |
| | | |
| | | | Maryland — (continued) | | | | | | |
| | $500,000 | | | St Mary’s College of Maryland, Academic Fees & Auxiliary, Refunding Revenue, (BAM), 4.000%, 9/1/25 | | | | $ | 542,710 | |
| | 500,000 | | | State of Maryland, Refunding G.O., Series B, 4.000%, 8/1/23 | | | | | 539,590 | |
| | 400,000 | | | Washington Suburban Sanitary Commission, Consolidated Public Water Utility Improvements, G.O., 4.000%, 6/1/24 | | | | | 435,244 | |
| | 400,000 | | | Washington Suburban Sanitary Commission, Consolidated Public Water Utility Improvements, G.O., Callable 6/1/26 @ 100, 5.000%, 6/1/27 | | | | | 467,516 | |
| | 500,000 | | | Washington Suburban Sanitary Commission, Consolidated Public Water Utility Improvements, G.O., Callable 6/1/26 @ 100, 5.000%, 6/1/38 | | | | | 564,705 | |
| | | | | | | | | | |
| | | | | | | | | 17,905,158 | |
| | | | | | | | | | |
| | | |
| | | | Total Municipal Bonds
(Cost $18,449,061) | | | | | 18,530,412 | |
| | | | | | | | | | |
| | | | | | | | | | |
Shares | | | | Fair Value | |
| | MONEY MARKET FUND — 1.7% | | | | | | |
| | 322,623 | | | Federated Treasury Obligations Fund, Institutional Shares, 1.92%(a) | | | | $ | 322,623 | |
| | | | | | | | | | |
| | | | Total Money Market Fund
(Cost $322,623) | | | | | 322,623 | |
| | | | | | | | | | |
| Total Investments — 100.2%
(Cost $18,771,684) | | | | | 18,853,035 | |
| | Net Other Assets (Liabilities) — (0.2)% | | | | | (35,574 | ) |
| | | | | | | | | | |
| | NET ASSETS — 100.0% | | | | $ | 18,817,461 | |
| | | | | | | | | | |
| (a) | Represents the current yield as of report date. |
BAM — Build America Mutual
G.O. — General Obligation
OID — Original Issue Discount
See accompanying Notes to the Financial Statements.
103
|
Sterling Capital North Carolina Intermediate Tax-Free Fund |
Schedule of Portfolio Investments |
September 30, 2018 |
| | | | | | | | | | |
Principal
Amount | | | | Fair Value | |
| | MUNICIPAL BONDS — 97.0% | | | | | | |
| | | |
| | | | North Carolina — 97.0% | | | | | | |
| | $2,335,000 | | | Appalachian State University, University & College Improvements Revenue, Callable 10/1/21 @ 100, 5.000%, 10/1/24 | | | | | $2,529,295 | |
| | 2,405,000 | | | Appalachian State University, University & College Improvements Revenue, Callable 10/1/21 @ 100, 4.750%, 10/1/27 | | | | | 2,587,732 | |
| | 1,000,000 | | | Beaufort County, NC, Refunding Revenue Limited Obligation, Callable 6/1/22 @ 100, 5.000%, 6/1/24 | | | | | 1,082,600 | |
| | 1,000,000 | | | Beaufort County, NC, Refunding Revenue Limited Obligation, Callable 6/1/22 @ 100, 5.000%, 6/1/26 | | | | | 1,081,140 | |
| | 1,000,000 | | | Broad River Water Authority, Water System Refunding Revenue, 5.000%, 6/1/24 | | | | | 1,122,810 | |
| | 1,025,000 | | | Buncombe County Metropolitan Sewerage District, Sewer Improvements Revenue, Callable 7/1/24 @ 100, 5.000%, 7/1/39 | | | | | 1,139,298 | |
| | 1,475,000 | | | Buncombe County, NC, Advance Refunding Revenue Limited Obligation, Callable 6/1/25 @ 100, 5.000%, 6/1/28 | | | | | 1,686,382 | |
| | 1,000,000 | | | Cabarrus County, NC Installment Financing Contract Public Imps. Revenue Bonds, Callable 4/1/26 @ 100, 5.000%, 4/1/28 | | | | | 1,152,960 | |
| | 1,010,000 | | | Cape Fear Public Utility Authority, Advance Refunding Revenue Bonds, 5.000%, 8/1/25 | | | | | 1,173,115 | |
| | 1,240,000 | | | Cape Fear Public Utility Authority, Water & Sewer System, Improvements Refunding Revenue, 5.000%, 8/1/21 | | | | | 1,340,068 | |
| | 1,475,000 | | | Cape Fear Public Utility Authority, Water & Sewer System, Improvements Refunding Revenue, Callable 8/1/21 @ 100, 5.000%, 8/1/26 | | | | | 1,592,336 | |
| | 1,535,000 | | | Cape Fear Public Utility Authority, Water & Sewer System, Improvements Refunding Revenue, Callable 8/1/21 @ 100, 5.000%, 8/1/28 | | | | | 1,657,109 | |
| | 1,000,000 | | | Catawba County, NC, School Improvements Refunding Revenue, 4.000%, 10/1/20 | | | | | 1,038,970 | |
| | 1,000,000 | | | Charlotte, NC, Charlotte Douglas International Airport Refunding Revenue, Callable 7/1/24 @ 100, 5.000%, 7/1/31 | | | | | 1,118,820 | |
| | 1,000,000 | | | Charlotte, NC, Port, Airport & Marina Improvements Revenue, Series A, Callable 7/1/20 @ 100, 5.000%, 7/1/27 | | | | | 1,049,990 | |
| | 1,000,000 | | | Charlotte, NC, Water & Sewer System, Refunding Revenue, Series B, Callable 7/1/20 @ 100, 5.000%, 7/1/25 | | | | | 1,051,760 | |
| | 2,035,000 | | | Chatham County, NC, Refunding Revenue (County Guaranteed), 5.000%, 12/1/28 | | | | | 2,374,947 | |
| | 1,280,000 | | | City of Asheville, NC, Refunding Revenue, Callable 10/1/27 @ 100, 5.000%, 10/1/28 | | | | | 1,512,653 | |
| | 2,735,000 | | | City of Durham NC, Parking Facility Improvements, Revenue, 4.000%, 4/1/23 | | | | | 2,942,258 | |
| | 2,000,000 | | | Concord, NC, Utilities Systems, Refunding Revenue, Series B, Callable 12/1/19 @ 100, 5.000%, 12/1/22 | | | | | 2,064,880 | |
| | 1,410,000 | | | Durham County, NC, Industrial Facilities & Pollution Control Financing Authority, Research Triangle Institute, University & College Improvements Revenue, 5.000%, 2/1/20 | | | | | 1,465,413 | |
| | | | | | | | | | |
Principal
Amount | | | | Fair Value | |
| | MUNICIPAL BONDS — (continued) | | | | | | |
| | | |
| | | | North Carolina — (continued) | | | | | | |
| | $1,225,000 | | | East Carolina University, University & College Improvements Revenue, Series A, Callable 4/1/26 @ 100, 5.000%, 10/1/27 | | | | | $1,423,193 | |
| | 1,750,000 | | | Fayetteville, NC, Public Works Commission, Electric Light & Power Improvements Revenue, Callable 3/1/24 @ 100, 4.000%, 3/1/27 | | | | | 1,859,305 | |
| | 2,200,000 | | | Forsyth County NC, Refunding Revenue, G.O., 5.000%, 7/1/26 | | | | | 2,591,886 | |
| | 3,650,000 | | | Guilford County, NC, Advance Refunding, G.O., 4.000%, 3/1/26 | | | | | 4,026,169 | |
| | 1,675,000 | | | Guilford County, NC, Advance Refunding, G.O., Series A, Callable 2/1/26 @ 100, 5.000%, 2/1/28 | | | | | 1,947,740 | |
| | 2,075,000 | | | High Point, NC, Combined Water & Sewer System, Advance Refunding Revenue Bonds, 5.000%, 11/1/26 | | | | | 2,440,760 | |
| | 1,010,000 | | | Holly Springs, NC, Public Improvements Revenue, Callable 10/1/24 @ 100, 5.000%, 10/1/27 | | | | | 1,133,069 | |
| | 1,000,000 | | | Mecklenburg County, NC, Refunding G.O., 5.000%, 2/1/21 | | | | | 1,068,190 | |
| | 1,195,000 | | | Monroe, NC, Advance Refunding Revenue Bonds, Callable 3/1/26 @ 100, 5.000%, 3/1/29 | | | | | 1,361,296 | |
| | 1,020,000 | | | Mooresville Town, NC, Advance Refunding, G.O., 5.000%, 4/1/23 | | | | | 1,139,340 | |
| | 1,855,000 | | | New Hanover County, NC, New Hanover County Projects, Refunding Revenue, 5.000%, 12/1/19 | | | | | 1,920,185 | |
| | 1,015,000 | | | New Hanover County, NC, New Hanover County Projects, Refunding Revenue, 5.000%, 12/1/20 | | | | | 1,078,255 | |
| | 1,270,000 | | | New Hanover County, NC, New Hanover Regional Medical, Refunding Revenue, Callable 10/1/21 @ 100, 5.000%, 10/1/23 | | | | | 1,366,469 | |
| | 1,000,000 | | | New Hanover County, NC, Regional Medical Center, Health Hospital, Nursing Home Improvements Revenue, Series A, Callable 10/1/19 @ 100 (AGM), 5.000%, 10/1/21 | | | | | 1,029,880 | |
| | 1,050,000 | | | New Hanover County, NC, Regional Medical Center, Health Hospital, Nursing Home Improvements Revenue, Series A, Callable 10/1/19 @ 100 (AGM), 5.000%, 10/1/22 | | | | | 1,081,374 | |
| | 1,000,000 | | | North Carolina Agricultural & Technical State University, Series A, Refunding Revenue, Callable 10/1/25 @ 100, 5.000%, 10/1/32 | | | | | 1,127,410 | |
| | 1,215,000 | | | North Carolina Agricultural & Technical State University, Series A, Refunding Revenue, Callable 10/1/25 @100, 5.000%, 10/1/34 | | | | | 1,361,651 | |
| | 1,305,000 | | | North Carolina Capital Facilities Finance Agency, Johnson & Wales University Project, Refunding Revenue, 5.000%, 4/1/21 | | | | | 1,385,140 | |
| | 1,000,000 | | | North Carolina Capital Facilities Finance Agency, Johnson & Wales University Project, Refunding Revenue, Callable 4/1/23 @ 100, 5.000%, 4/1/25 | | | | | 1,101,690 | |
| | 840,000 | | | North Carolina Capital Facilities Finance Agency, Meredith College Project, Refunding Revenue, 5.000%, 6/1/24 | | | | | 930,107 | |
Continued
104
|
Sterling Capital North Carolina Intermediate Tax-Free Fund |
Schedule of Portfolio Investments — (continued) |
September 30, 2018 |
| | | | | | | | | | |
Principal
Amount | | | | Fair Value | |
| | MUNICIPAL BONDS — (continued) | | | | | | |
| | | |
| | | | North Carolina — (continued) | | | | | | |
| | $ 750,000 | | | North Carolina Capital Facilities Finance Agency, Meredith College Project, Refunding Revenue, 5.000%, 6/1/25 | | | | $ | 836,603 | |
| | 1,045,000 | | | North Carolina Capital Facilities Finance Agency, The Arc of North Carolina Project, Refunding Revenue, (Housing and Urban Development, Section 8), 5.000%, 10/1/25 | | | | | 1,174,517 | |
| | 1,750,000 | | | North Carolina Capital Facilities Finance Agency, The Arc of North Carolina Project, Refunding Revenue, Callable 10/1/27 @ 100 (Housing and Urban Development, Section 8), 5.000%, 10/1/34 | | | | | 1,943,970 | |
| | 1,040,000 | | | North Carolina Eastern Municipal Power Agency, Electric, Lights & Power Improvements Revenue, Series A, OID, 6.400%, 1/1/21 | | | | | 1,093,123 | |
| | 1,005,000 | | | North Carolina Medical Care Commission, First Mortgage Deerfield, Health, Hospital, Nursing Home Improvements Revenue, Series A, Callable 11/1/18 @ 100, OID, 6.000%, 11/1/33 | | | | | 1,008,347 | |
| | 4,315,000 | | | North Carolina Medical Care Commission, Health Care Facilities, Deerfield Episcopal Retirement, Advance Refunding Revenue, Callable 11/1/26 @ 100, 5.000%, 11/1/37 | | | | | 4,713,016 | |
| | 5,000,000 | | | North Carolina Medical Care Commission, Health Care Facilities, Duke University Health System, Health, Hospital, Nursing Home Improvements Revenue, Callable 6/1/22 @ 100, Series A, 5.000%, 6/1/32 | | | | | 5,449,550 | |
| | 915,000 | | | North Carolina Medical Care Commission, Health Care Facilities, Refunding Revenue, Appalachian Regional Healthcare System, Series A, 5.000%, 7/1/19 | | | | | 928,588 | |
| | 1,180,000 | | | North Carolina Medical Care Commission, Health Care Facilities, Refunding Revenue, Appalachian Regional Healthcare System, Series A, 5.375%, 7/1/20 | | | | | 1,227,707 | |
| | 3,030,000 | | | North Carolina Medical Care Commission, North Carolina Baptist Hospital, Refunding Revenue, 5.000%, 6/1/20 | | | | | 3,169,804 | |
| | 1,530,000 | | | North Carolina Medical Care Commission, North Carolina Baptist Hospital, Refunding Revenue, Callable 6/1/20 @ 100, 5.250%, 6/1/29 | | | | | 1,603,991 | |
| | 635,000 | | | North Carolina Medical Care Commission, United Methodist Retirement Homes, Refunding Revenue, Callable 10/1/23 @ 103, 5.000%, 10/1/30 | | | | | 698,665 | |
| | 650,000 | | | North Carolina Medical Care Commission, United Methodist Retirement Homes, Refunding Revenue, Callable 10/1/23 @ 103, 5.000%, 10/1/31 | | | | | 713,583 | |
| | 1,000,000 | | | North Carolina Medical Care Commission, United Methodist Retirement Homes, Refunding Revenue, Callable 10/1/23 @ 103, 5.000%, 10/1/37 | | | | | 1,077,100 | |
| | 2,780,000 | | | North Carolina Medical Care Commission, Vidant Health Care Facilities, Refunding Revenue, Series A, Callable 6/1/22 @ 100, 5.000%, 6/1/24 | | | | | 3,030,951 | |
| | | | | | | | | | |
Principal
Amount | | | | Fair Value | |
| | MUNICIPAL BONDS — (continued) | | | | | | |
| | | |
| | | | North Carolina — (continued) | | | | | | |
| | $2,000,000 | | | North Carolina State University at Raleigh, Refunding Revenue, Series A, Callable 10/1/23 @ 100, 5.000%, 10/1/28 | | | | $ | 2,247,520 | |
| | 3,000,000 | | | North Carolina State, Advance Refunding Revenue Bonds, Series B, Callable 5/1/27 @ 100, 5.000%, 5/1/28 | | | | | 3,535,320 | |
| | 4,395,000 | | | North Carolina State, Advance Refunding Revenue Bonds, Series B, Callable 5/1/27 @ 100, 5.000%, 5/1/29 | | | | | 5,146,149 | |
| | 4,550,000 | | | North Carolina State, Public Improvements, Revenue, Series C, Callable 5/1/21 @ 100, 4.000%, 5/1/23 | | | | | 4,775,362 | |
| | 2,645,000 | | | North Carolina State, Refunding Revenue G.O., Series B, 5.000%, 6/1/25 | | | | | 3,076,717 | |
| | 1,250,000 | | | North Carolina Turnpike Authority, Senior Lien, Advance Refunding Revenue (AGM), 5.000%, 1/1/26 | | | | | 1,428,313 | |
| | 1,500,000 | | | North Carolina Turnpike Authority, Senior Lien, Advance Refunding Revenue (AGM), 5.000%, 1/1/27 | | | | | 1,724,775 | |
| | 2,100,000 | | | North Carolina Turnpike Authority, Senior Lien, Advance Refunding Revenue (AGM), Callable 1/1/27 @ 100, 5.000%, 1/1/28 | | | | | 2,399,796 | |
| | 1,660,000 | | | Northern Hospital District Of Surry County, Advance Refunding Revenue, 5.000%, 10/1/27 | | | | | 1,829,220 | |
| | 1,210,000 | | | Pender County, NC, Limited Obligation Refunding Revenue, Callable 6/1/22 @ 100, 5.000%, 6/1/26 | | | | | 1,317,012 | |
| | 1,060,000 | | | Pitt County, NC, Advance Refunding Revenue Bonds, Series B, Callable 10/1/26 @ 100, 5.000%, 4/1/30 | | | | | 1,208,124 | |
| | 1,395,000 | | | Pitt County, NC, Certificate of Participation, Refunding, Callable 4/1/22 @ 100, 5.000%, 4/1/25 | | | | | 1,519,392 | |
| | 2,160,000 | | | Raleigh Durham Airport Authority, Refunding Revenue, Series B1, Callable 5/1/20 @ 100, 5.000%, 11/1/28 | | | | | 2,251,346 | |
| | 1,500,000 | | | Raleigh, NC, Combined Enterprise System, Refunding Revenue, Series A, Callable 3/1/23 @ 100, 5.000%, 3/1/27 | | | | | 1,665,045 | |
| | 1,615,000 | | | Raleigh, NC, Combined Enterprise System, Refunding Revenue, Series A, Callable 3/1/23 @ 100, 5.000%, 3/1/28 | | | | | 1,787,692 | |
| | 1,000,000 | | | Raleigh, NC, Refunding Revenue, Callable 02/1/26 @ 100, 5.000%, 2/1/27 | | | | | 1,159,210 | |
| | 1,985,000 | | | Sampson County, NC, Refunding Revenue, Callable 12/1/25 @ 100, 5.000%, 12/1/26 | | | | | 2,272,150 | |
| | 870,000 | | | Town of Oak Island, NC, Combined Enterprise System, Advance Refunding Revenue (AGM), 5.000%, 6/1/25 | | | | | 1,000,413 | |
| | 1,000,000 | | | Union County, NC, Enterprise Systems, Refunding Revenue, Series A, Callable 12/1/21 @ 100, 4.000%, 12/1/22 | | | | | 1,055,960 | |
| | 2,205,000 | | | Union County, NC, Refunding G.O., Series A, 5.000%, 3/1/22 | | | | | 2,417,606 | |
| | 1,000,000 | | | Union County, NC, Refunding Revenue, 5.000%, 12/1/23 | | | | | 1,128,650 | |
| 1,150,000 | | | University of North Carolina at Greensboro, Advance Refunding Revenue, Callable 4/1/28 @ 100, 4.000%, 4/1/33 | | | | | 1,210,375 | |
Continued
105
|
Sterling Capital North Carolina Intermediate Tax-Free Fund |
Schedule of Portfolio Investments — (continued) |
September 30, 2018 |
| | | | | | | | | | |
Principal
Amount | | | | Fair Value | |
| | MUNICIPAL BONDS — (continued) | | | | | | |
| | | |
| | | | North Carolina — (continued) | | | | | | |
| | $1,695,000 | | | University of North Carolina at Greensboro, University & College Improvements Revenue, Callable 4/1/24 @ 100, 5.000%, 4/1/28 | | | | | $1,906,756 | |
| | 2,080,000 | | | University of North Carolina at Greensboro, University & College Improvements, Prerefunded Revenue, Callable 4/1/21 @ 100, 5.000%, 4/1/23 | | | | | 2,225,475 | |
| | 2,735,000 | | | University of North Carolina System, Appalachian State University, Unrefunded Revenue, Callable 4/1/20 @ 100, 5.250%, 10/1/22 | | | | | 2,865,049 | |
| | 3,130,000 | | | University of North Carolina System, Asheville/Wilmington, Refunding Revenue, Series C, Callable 4/1/20 @ 100 (Assured Guaranty), 5.000%, 10/1/20 | | | | | 3,267,814 | |
| | 1,485,000 | | | University of North Carolina System, Asheville/Wilmington, Refunding Revenue, Series C, Callable 4/1/20 @ 100 (Assured Guaranty), 5.250%, 10/1/24 | | | | | 1,556,057 | |
| | 3,985,000 | | | Wake County, NC, Advance Refunding Revenue Bonds, Series A, Callable 12/1/26 @ 100, 5.000%, 12/1/28 | | | | | 4,668,308 | |
| | 1,585,000 | | | Wake County, NC, Public Improvements, G.O., Series A, Callable 3/1/28 @ 100, 5.000%, 3/1/30 | | | | | 1,886,213 | |
| | 2,125,000 | | | Watauga Public Facilities Corp., Revenue, Series A, Callable 6/1/22 @ 100, 5.000%, 6/1/24 | | | | | 2,310,598 | |
| | 1,000,000 | | | Watauga Public Facilities Corp., Revenue, Series A, Callable 6/1/22 @ 100, 5.000%, 6/1/26 | | | | | 1,080,780 | |
| | 1,135,000 | | | Wayne County, NC, School Improvements Revenue, Callable 6/1/27 @ 100, 4.000%, 6/1/29 | | | | | 1,215,619 | |
| | 1,000,000 | | | Winston-Salem State University Foundation LLC, Refunding Revenue, Callable 4/1/22 @ 100, 5.000%, 4/1/25 | | | | | 1,074,190 | |
| | 1,000,000 | | | Winston-Salem, NC, Transit Improvements, Refunding Revenue, Series C, Callable 6/1/24 @ 100, 5.000%, 6/1/30 | | | | | 1,120,570 | |
| | | | | | | | | | |
Principal
Amount | | | | Fair Value | |
| | MUNICIPAL BONDS — (continued) | | | | | | |
| | | |
| | | | North Carolina — (continued) | | | | | | |
| | $1,165,000 | | | Winston-Salem, NC, Water & Sewer System, Refunding Revenue, Series A, 5.000%, 6/1/24 | | | | $ | 1,333,110 | |
| | 1,875,000 | | | Winston-Salem, NC, Water & Sewer System, Refunding Revenue, Series A, Callable 6/1/24 @ 100, 5.000%, 6/1/25 | | | | | 2,132,738 | |
| | 1,000,000 | | | Winston-Salem, NC, Water & Sewer System, Refunding Revenue, Series A, Callable 6/1/24 @ 100, 5.000%, 6/1/28 | | | | | 1,126,170 | |
| | | | | | | | | | |
| | | | Total Municipal Bonds
(Cost $166,761,256) | | | | | 168,732,754 | |
| | | | | | | | | | |
| | | |
| Shares | | | | | | | |
| | MONEY MARKET FUND — 1.8% | | | | | | |
| | 3,178,433 | | | Federated Treasury Obligations Fund, Institutional Shares, 1.92%(a) | | | | | 3,178,433 | |
| | | | | | | | | | |
| | | | Total Money Market Fund
(Cost $3,178,433) | | | | | 3,178,433 | |
| | | | | | | | | | |
| Total Investments — 98.8%
(Cost $169,939,689) | | | | | 171,911,187 | |
| | Net Other Assets (Liabilities) — 1.2% | | | | | 2,117,528 | |
| | | | | | | | | | |
| | NET ASSETS — 100.0% | | | | $ | 174,028,715 | |
| | | | | | | | | | |
| (a) | Represents the current yield as of report date. |
AGM — Assured Guaranty Municipal Corp.
G.O. — General Obligation
OID — Original Issue Discount
See accompanying Notes to the Financial Statements.
106
|
Sterling Capital South Carolina Intermediate Tax-Free Fund |
Schedule of Portfolio Investments |
September 30, 2018 |
| | | | | | | | | | |
Principal
Amount | | | | Fair Value | |
| | MUNICIPAL BONDS — 97.1% | | | | | | |
| | | |
| | | | South Carolina — 97.1% | | | | | | |
| | $1,770,000 | | | Anderson County, SC, School District No. 2, Refunding, G.O., (SCSDE), 5.000%, 3/1/24 | | | | | $2,008,065 | |
| | 1,515,000 | | | Anderson County, SC, School District No. 4, Refunding, G.O., Series A, Callable 3/1/25 @ 100, (SCSDE), 5.000%, 3/1/28 | | | | | 1,711,299 | |
| | 1,190,000 | | | Anderson County, SC, School District No. 5, Advance Refunding, G.O., (SCSDE), 5.000%, 3/1/23 | | | | | 1,327,279 | |
| | 1,000,000 | | | Anderson Regional Joint Water System, Refunding Revenue, Series A, Callable 7/15/21 @ 100, 5.000%, 7/15/25 | | | | | 1,071,030 | |
| | 1,010,000 | | | Beaufort County, SC, Public Improvements, G.O., Series B (State Aid Withholding), 5.000%, 5/1/22 | | | | | 1,109,404 | |
| | 1,000,000 | | | Beaufort County, SC, School District, Advance Refunding, G.O., (SCSDE), 5.000%, 3/1/22 | | | | | 1,095,040 | |
| | 1,170,000 | | | Beaufort County, SC, School District, Advance Refunding, G.O., Series A (SCSDE), 5.000%, 3/1/24 | | | | | 1,328,640 | |
| | 1,000,000 | | | Beaufort-Jasper Water & Sewer Authority, Advance Refunding Revenue, Series B, 5.000%, 3/1/24 | | | | | 1,135,590 | |
| | 1,000,000 | | | Beaufort-Jasper Water & Sewer Authority, Advance Refunding Revenue, Series B, 5.000%, 3/1/25 | | | | | 1,151,120 | |
| | 1,000,000 | | | Charleston County, SC, Capital Improvements Transportation Sales Tax, Public Improvements G.O., Callable 11/1/21 @ 100 (State Aid Withholding), 5.000%, 11/1/22 | | | | | 1,086,990 | |
| | 1,000,000 | | | Charleston County, SC, Port, Airport & Marina Improvements Revenue, 5.000%, 12/1/22 | | | | | 1,108,270 | |
| | 1,500,000 | | | Charleston Educational Excellence Finance Corp., Charleston County School Refunding Revenue, 5.000%, 12/1/21 | | | | | 1,627,635 | |
| | 1,000,000 | | | Charleston Public Facilities Corp., Charleston City Project Series, Parking Facilities Improvement Revenue, Callable 9/1/27 @ 100, 5.000%, 9/1/29 | | | | | 1,174,190 | |
| | 1,355,000 | | | Coastal Carolina University, University & College Improvements Revenue, Callable 6/1/24 @ 100, 5.000%, 6/1/34 | | | | | 1,486,259 | |
| | 1,295,000 | | | College of Charleston, University & College Improvements Refunding Revenue, Series A, Callable 4/1/21 @ 100, 5.000%, 4/1/25 | | | | | 1,379,382 | |
| | 1,000,000 | | | College of Charleston, University & College Improvements Revenue, Series A, Callable 4/1/24 @ 100, 5.000%, 4/1/25 | | | | | 1,120,570 | |
| | 1,000,000 | | | College of Charleston, University & College Improvements Revenue, Series B, 5.000%, 4/1/27 | | | | | 1,162,060 | |
| | 1,170,000 | | | Easley Combined Utility System, Refunding Revenue, Callable 12/1/19 @ 100, (Assured Guaranty), 5.000%, 12/1/24 | | | | | 1,210,833 | |
| | 1,135,000 | | | East Richland County Public Service District, Refunding Revenue, 4.000%, 1/1/22 | | | | | 1,192,465 | |
| | 1,000,000 | | | Florence County, SC, McLeod Regional Medical Center Project, Refunding Revenue, Callable 11/1/24 @ 100, 5.000%, 11/1/28 | | | | | 1,121,600 | |
| | 1,100,000 | | | Florence County, SC, McLeod Regional Medical Center Project, Refunding Revenue, Callable 11/1/24 @ 100, 5.000%, 11/1/33 | | | | | 1,214,983 | |
| | | | | | | | | | |
Principal
Amount | | | | Fair Value | |
| | MUNICIPAL BONDS — (continued) | | | | | | |
| | | |
| | | | South Carolina — (continued) | | | | | | |
| | $1,350,000 | | | Fort Mill School District No. 4, Advance Refunding, G.O., Series D (SCSDE), 5.000%, 3/1/22 | | | | | $1,478,304 | |
| | 1,000,000 | | | Greenville County, SC, School District Building Refunding Revenue, 5.000%, 12/1/22 | | | | | 1,106,180 | |
| | 1,000,000 | | | Greenville Health System, Hospital System Board, Refunding Revenue, Callable 5/1/22 @ 100, 5.000%, 5/1/31 | | | | | 1,073,380 | |
| | 1,415,000 | | | Greenville Health System, Hospital System Board, Series B, Callable 05/01/24 @ 100, 5.000%, 5/1/31 | | | | | 1,553,288 | |
| | 1,000,000 | | | Greenwood County, SC, Self Regional Healthcare Refunding Revenue, Series B, Callable 4/1/22 @ 100, 5.000%, 10/1/24 | | | | | 1,083,570 | |
| | 2,025,000 | | | Horry County, SC, School District, Refunding, G.O., Series B (SCSDE), 5.000%, 3/1/23 | | | | | 2,261,318 | |
| | 1,000,000 | | | Kershaw County, SC, Kershaw County School District Project, Refunding Revenue, 5.000%, 12/1/23 | | | | | 1,114,220 | |
| | 1,460,000 | | | Lancaster Educational Assistance Program, Inc., SC, Lancaster County School District Refunding Revenue, Callable 12/1/23 @ 100, 5.000%, 12/1/24 | | | | | 1,622,279 | |
| | 1,000,000 | | | Lexington County, SC, School District No. 1, G.O., Series C (SCSDE), 5.000%, 2/1/21 | | | | | 1,066,770 | |
| | 1,500,000 | | | Lexington County, School District No. 2 , G.O., Series C, Callable 3/1/27 @ 100, (SCSDE), 5.000%, 3/1/29 | | | | | 1,753,170 | |
| | 1,345,000 | | | Lexington County, School District No. 2, G.O., Series C, Callable 3/1/27 @ 100, (SCSDE), 5.000%, 3/1/30 | | | | | 1,566,508 | |
| | 1,000,000 | | | Lugoff-Elgin Water Authority, Refunding Revenue, Series B, Callable 7/1/26 @ 100, 5.000%, 7/1/30 | | | | | 1,129,920 | |
| | 1,460,000 | | | Newberry, SC, Refunding Revenue (AGM), 5.000%, 4/1/24 | | | | | 1,633,652 | |
| | 1,485,000 | | | Orangeburg County, SC, Correctional Facilities Improvements, Installment Purchase Revenue Bonds, Callable 12/1/27 @ 100, 5.000%, 12/1/29 | | | | | 1,711,076 | |
| | 1,570,000 | | | Orangeburg County, SC, School District No. 4, School Improvements Refunding, G.O., Series A (SCSDE), 5.000%, 3/1/24 | | | | | 1,785,451 | |
| | 1,000,000 | | | Piedmont Municipal Power Agency, Power System Refunding Revenue, Series B, Callable 1/1/22 @ 100, 4.000%, 1/1/23 | | | | | 1,044,880 | |
| | 1,075,000 | | | Richland County, SC, School District No. 1, Refunding Bonds, G.O., Series A, Callable 9/1/21 @ 100, (SCSDE), 4.000%, 3/1/23 | | | | | 1,126,826 | |
| | 1,640,000 | | | Richland County, SC, School District No. 2, Refunding Bonds, G.O., Series B, Callable 3/1/27 @ 100, (SCSDE), 4.000%, 3/1/29 | | | | | 1,775,070 | |
| | 1,000,000 | | | Rock Hill, SC, Combined Utility System, Refunding Revenue, Series A, Callable 1/1/22 @100 (AGM), 5.000%, 1/1/23 | | | | | 1,081,050 | |
| | 1,000,000 | | | Rock Hill, SC, Hospital Fee Pledge, Refunding Revenue, Callable 4/1/23 @100, 5.000%, 4/1/33 | | | | | 1,086,630 | |
| | 1,090,000 | | | Rock Hill, SC, Ltd. Obligations, Hospitality Fee Pledge, Refunding Revenue, 5.000%, 4/1/21 | | | | | 1,162,670 | |
Continued
107
|
Sterling Capital South Carolina Intermediate Tax-Free Fund |
Schedule of Portfolio Investments — (continued) |
September 30, 2018 |
| | | | | | | | | | |
Principal
Amount | | | | Fair Value | |
| | MUNICIPAL BONDS — (continued) | | | | | | |
| | | |
| | | | South Carolina — (continued) | | | | | | |
| | $1,500,000 | | | SCAGO Educational Facilities Corp. for Cherokee School District No. 1, Refunding Revenue, 5.000%, 12/1/24 | | | | | $1,700,100 | |
| | 1,135,000 | | | SCAGO Educational Facilities Corp. for Colleton School District, Refunding Revenue, 5.000%, 12/1/20 | | | | | 1,198,310 | |
| | 790,000 | | | SCAGO Educational Facilities Corp. for Union School District, Refunding Revenue, 5.000%, 12/1/21 | | | | | 846,454 | |
| | 500,000 | | | SCAGO Public Facilities Corp. for Georgetown County, Georgetown County Project, Refunding Revenue, Series A, 5.000%, 12/1/19 | | | | | 517,040 | |
| | 850,000 | | | South Carolina Jobs-Economic Development Authority, AnMed Health Project, Advance Refunding Revenue Bonds, Callable 2/1/26 @ 100, 5.000%, 2/1/29 | | | | | 953,360 | |
| | 1,000,000 | | | South Carolina Jobs-Economic Development Authority, Bons Secours Health System, Inc., Refunding Revenue, Callable 11/1/22 @ 100, 5.000%, 11/1/24 | | | | | 1,096,800 | |
| | 1,500,000 | | | South Carolina Jobs-Economic Development Authority, Conway Hospital Income Project, Health, Hospital, Nursing Home Improvements Revenue, Callable 7/1/22 @ 100, 5.000%, 7/1/23 | | | | | 1,613,235 | |
| | 580,000 | | | South Carolina Jobs-Economic Development Authority, Furman University, Refunding Revenue, 5.000%, 10/1/24 | | | | | 653,063 | |
| | 500,000 | | | South Carolina Jobs-Economic Development Authority, Palmetto Health Facilities, Refunding Revenue, Series A (AGM), 5.000%, 8/1/19 | | | | | 512,660 | |
| | 500,000 | | | South Carolina Public Service Authority Obligations, Santee Cooper, Refunding Revenue, Series B, 5.000%, 12/1/18 | | | | | 502,575 | |
| | 1,400,000 | | | South Carolina State Fiscal Accountability Authority, Department of Mental Health Project, Callable 04/01/27 @ 100, 5.000%, 10/1/37 | | | | | 1,578,416 | |
| | 1,250,000 | | | South Carolina Transportation Infrastructure Bank, Advance Refunding Revenue, Series A, 5.000%, 10/1/23 | | | | | 1,400,938 | |
| | 1,500,000 | | | South Carolina Transportation Infrastructure Bank, Refunding Revenue, Series A, Callable 10/1/25 @ 100, 4.000%, 10/1/30 | | | | | 1,575,660 | |
| | | | | | | | | | |
Principal
Amount | | | | Fair Value | |
| | MUNICIPAL BONDS — (continued) | | | | | | |
| | | |
| | | | South Carolina — (continued) | | | | | | |
| | $1,360,000 | | | State of South Carolina, College Improvements, G.O., Series A (State Aid Withholding), 5.000%, 4/1/27 | | | | $ | 1,618,835 | |
| | 1,235,000 | | | State Of South Carolina, Refunding Revenue, G.O., Series D, Callable 4/1/26 @ 100 (State Aid Withholding), 5.000%, 4/1/28 | | | | | 1,439,380 | |
| | 1,195,000 | | | State of South Carolina, University & College Improvements, G.O., Series B, Callable 10/1/27 @ 100 (State Aid Withholding), 5.000%, 4/1/30 | | | | | 1,415,346 | |
| | 185,000 | | | Town Of Lexington, South Carolina Waterworks & Sewer System Revenue, Prefunded Refunding Revenue Bonds, Callable 4/1/2021 @ 100, 5.000%, 4/1/22 | | | | | 197,939 | |
| | 755,000 | | | Town Of Lexington, South Carolina Waterworks & Sewer System Revenue, Unrefunded Refunding Revenue Bonds, Callable 4/1/2021 @ 100, 5.000%, 4/1/22 | | | | | 806,287 | |
| | | | | | | | | | |
| | | | Total Municipal Bonds
(Cost $75,347,448) | | | | | 75,665,314 | |
| | | | | | | | | | |
| | | |
| Shares | | | | | | | |
| | MONEY MARKET FUND — 1.8% | | | | | | |
| | 1,393,716 | | | Federated Treasury Obligations Fund, Institutional Shares, 1.92%(a) | | | | | 1,393,716 | |
| | | | | | | | | | |
| | | | Total Money Market Fund
(Cost $1,393,716) | | | | | 1,393,716 | |
| | | | | | | | | | |
| Total Investments — 98.9%
(Cost $76,741,164) | | | | | 77,059,030 | |
| | Net Other Assets (Liabilities) — 1.1% | | | | | 886,356 | |
| | | | | | | | | | |
| | NET ASSETS — 100.0% | | | | $ | 77,945,386 | |
| | | | | | | | | | |
| (a) | Represents the current yield as of report date. |
AGM — Assured Guaranty Municipal Corp.
G.O. — General Obligation
SCAGO — South Carolina Association of Governmental Organizations
SCSDE — South Carolina School District Enhancement
See accompanying Notes to the Financial Statements.
108
|
Sterling Capital Virginia Intermediate Tax-Free Fund |
Schedule of Portfolio Investments |
September 30, 2018 |
| | | | | | | | | | |
Principal
Amount | | | | Fair Value | |
| | MUNICIPAL BONDS — 98.2% | | | | | | |
| | | |
| | | | District of Columbia — 4.5% | | | | | | |
| | $1,160,000 | | | Metropolitan Washington Airports Authority, Port, Airport & Marina Improvement Revenue, Series A, Callable 10/1/20 @ 100, 5.000%, 10/1/23 | | | | $ | 1,225,691 | |
| | 625,000 | | | Metropolitan Washington Airports Authority, Refunding Revenue, Series B, Callable 10/1/19 @ 100, 5.000%, 10/1/21 | | | | | 643,169 | |
| | 1,640,000 | | | Washington Metropolitan Area Transit Authority, Transit Improvements, Revenue Bonds, Series B, Callable 7/1/27 @ 100, 5.000%, 7/1/33 | | | | | 1,885,196 | |
| | | | | | | | | | |
| | | | | | | | | 3,754,056 | |
| | | | | | | | | | |
| | | |
| | | | Virginia — 93.7% | | | | | | |
| | 1,240,000 | | | Albemarle County, VA, Economic Development Authority, Public Improvements Revenue, 5.000%, 6/1/27 | | | | | 1,463,163 | |
| | 1,730,000 | | | Albemarle County, VA, Economic Development Authority, Albemarle County Project, Public Improvements Revenue, Callable 6/1/22 @ 100, 5.000%, 6/1/23 | | | | | 1,898,935 | |
| | 1,365,000 | | | Albemarle County, VA, School Improvements G.O., (State Aid Withholding), 5.000%, 6/1/26 | | | | | 1,608,912 | |
| | 1,000,000 | | | Alexandria, VA, Refunding G.O. (State Aid Withholding), 5.000%, 6/15/21 | | | | | 1,077,150 | |
| | 1,500,000 | | | Arlington County, VA, Public Improvements G.O., Series A, Callable 8/15/27 @ 100, 5.000%, 8/15/29 | | | | | 1,779,555 | |
| | 1,085,000 | | | Chesapeake Bay Bridge & Tunnel District, First Tier General Resolution, Highway Improvements, Revenue Bonds, Callable 7/1/26 @ 100 (AGM), 5.000%, 7/1/41 | | | | | 1,210,133 | |
| | 1,770,000 | | | Chesapeake, VA, Public Improvements, Refunding G.O., Series A, Callable 8/1/27 @ 100, 5.000%, 8/1/30 | | | | | 2,080,281 | |
| | 1,100,000 | | | Chesterfield County, VA, Economic Development Authority, Electric & Power, Refunding Revenue, Series A, Callable 5/1/19 @ 100, 5.000%, 5/1/23 | | | | | 1,117,842 | |
| | 1,000,000 | | | Chesterfield County, VA, School District, School Public Improvement, G.O., Series A, Callable 1/1/28 @ 100 (State Aid Withholding), 4.000%, 1/1/31 | | | | | 1,089,470 | |
| | 1,145,000 | | | Culpeper County, VA, Economic Development Authority, VA Capital Projects, Refunding Revenue, Callable 6/1/24 @ 100, 4.000%, 6/1/26 | | | | | 1,227,016 | |
| | 2,500,000 | | | Fairfax County, VA, Economic Development Authority, Laurel Hill Public Facilities Project, Refunding Revenue, Series A, 5.000%, 6/1/22 | | | | | 2,742,275 | |
| | 1,000,000 | | | Fredericksburg Economic Development Authority, Mary Washington Healthcare Obligation Group, Refunding Revenue, Callable 6/15/24 @ 100, 5.000%, 6/15/26 | | | | | 1,101,870 | |
| | 1,700,000 | | | Leesburg, VA, Refunding G.O., Callable 1/15/24 @ 100, (State Aid Withholding), 4.000%, 1/15/27 | | | | | 1,821,992 | |
| | | | | | | | | | |
Principal
Amount | | | | Fair Value | |
| | MUNICIPAL BONDS — (continued) | | | | | | |
| | | |
| | | | Virginia — (continued) | | | | | | |
| | $1,000,000 | | | Leesburg, VA, Refunding G.O., Callable 1/15/25 @ 100, (State Aid Withholding), 5.000%, 1/15/27 | | | | | $1,149,580 | |
| | 1,250,000 | | | Loudoun Country, VA, Public Improvements, Advance Refunding G.O., Series A, Callable 12/1/25 @ 100, 5.000%, 12/1/26 | | | | | 1,459,125 | |
| | 1,000,000 | | | Loudoun County, VA, Economic Development Authority, Public Improvements Revenue, Callable 12/1/24 @ 100, 5.000%, 12/1/27 | | | | | 1,138,280 | |
| | 1,365,000 | | | Loudoun County, VA, Industrial Development Authority, Refunding Revenue, 4.000%, 12/15/22 | | | | | 1,460,250 | |
| | 1,000,000 | | | Lynchburg Economic Development Authority, Current Refunding Revenue Bonds, Series A, 5.000%, 1/1/26 | | | | | 1,137,730 | |
| | 2,460,000 | | | Montgomery County, VA, Economic Development Authority, Virginia Tech Foundation, Refunding Revenue, Series A, Callable 6/1/21 @ 100, 5.000%, 6/1/24 | | | | | 2,649,125 | |
| | 1,000,000 | | | Newport News, VA, General Water Improvements, Refunding G.O., Series B, 5.250%, 7/1/21 | | | | | 1,084,750 | |
| | 1,000,000 | | | Norfolk, VA, Economic Development Authority, Bon Secours Health System, Inc., Refunding Revenue, Callable 11/1/22 @ 100, 5.000%, 11/1/29 | | | | | 1,091,520 | |
| | 1,000,000 | | | Norfolk, VA, Economic Development Authority, Sentara Healthcare Facilities, Refunding Revenue, Series B, Callable 11/1/22 @ 100, 5.000%, 11/1/25 | | | | | 1,103,750 | |
| | 1,000,000 | | | Norfolk, VA, Economic Development Authority, Sentara Healthcare, Refunding Revenue, Series B, Callable 11/1/22 @ 100, 5.000%, 11/1/24 | | | | | 1,102,930 | |
| | 1,465,000 | | | Norfolk, VA, Economic Development Authority, Sentara Healthcare, Refunding Revenue, Series B, Callable 11/1/22 @ 100, 5.000%, 11/1/36 | | | | | 1,599,077 | |
| | 2,000,000 | | | Norfolk, VA, Public Improvements, G.O., Series A, Callable 10/1/26 @ 100, 5.000%, 10/1/30 | | | | | 2,317,960 | |
| | 1,160,000 | | | Poquoson, VA, Refunding G.O., (State Aid Withholding), 5.000%, 2/15/21 | | | | | 1,240,388 | |
| | 1,500,000 | | | Portsmouth, VA, Public Improvements, Refunding G.O., Callable 2/1/23 @ 100, (State Aid Withholding), 5.000%, 2/1/27 | | | | | 1,669,260 | |
| | 200,000 | | | Portsmouth, VA, Public Improvements, Refunding G.O., Callable 2/1/23 @ 100, (State Aid Withholding), 5.000%, 2/1/27 | | | | | 222,044 | |
| | 530,000 | | | Portsmouth, VA, Public Utilities, Refunding G.O., Callable 7/15/22 @ 100, (State Aid Withholding), 5.000%, 7/15/24 | | | | | 584,420 | |
| | 1,150,000 | | | Prince William County, VA, County Facilities, Refunding Certificate of Participation, 5.000%, 10/1/21 | | | | | 1,248,129 | |
| | 1,245,000 | | | Rappahannock Regional Jail Authority, Refunding Revenue, Callable 10/1/2025 @ 100, 5.000%, 10/1/26 | | | | | 1,435,896 | |
| | 2,000,000 | | | Richmond, VA, Public Improvements, Refunding G.O., Series A, Callable 3/1/24 @ 100 (State Aid Withholding), 5.000%, 3/1/28 | | | | | 2,277,740 | |
Continued
109
|
Sterling Capital Virginia Intermediate Tax-Free Fund |
Schedule of Portfolio Investments — (continued) |
September 30, 2018 |
| | | | | | | | | | |
Principal
Amount | | | | Fair Value | |
| | MUNICIPAL BONDS — (continued) | | | | | | |
| | | |
| | | | Virginia — (continued) | | | | | | |
| | $1,250,000 | | | Richmond, VA, Public Utility Advance Refunding Revenue Bonds, Callable 1/15/26 @ 100, 5.000%, 1/15/27 | | | | | $1,456,025 | |
| | 885,000 | | | Smyth County, VA, Industrial Development Authority, Mountain States Health Alliance Refunding Revenue, 5.000%, 7/1/20 | | | | | 929,091 | |
| | 1,000,000 | | | Smyth County, VA, Industrial Development Authority, Mountain States Health Alliance Refunding Revenue, Callable 7/1/20 @ 100, OID, 5.000%, 7/1/23 | | | | | 1,049,820 | |
| | 1,530,000 | | | Smyth County, VA, Public Improvement, Refunding G.O., Series A, Callable 11/1/21 @ 100 (State Aid Withholding), 5.000%, 11/1/25 | | | | | 1,658,795 | |
| | 1,220,000 | | | Spotsylvania County, VA, Economic Development Authority, Refunding Revenue, 5.000%, 6/1/22 | | | | | 1,339,133 | |
| | 1,420,000 | | | Spotsylvania County, VA, Water & Sewer System, Refunding Revenue, Series A, Callable 6/1/20 @ 100, 5.000%, 6/1/28 | | | | | 1,483,616 | |
| | 1,135,000 | | | Virginia Beach, VA, Public Improvements, G.O., Series A, Callable 4/1/22 @ 100 (State Aid Withholding), 5.000%, 4/1/23 | | | | | 1,246,230 | |
| | 1,850,000 | | | Virginia College Building Authority, 21st Century College Programs, University & College Improvements Revenue, Callable 2/1/27 @ 100, 5.000%, 2/1/31 | | | | | 2,144,520 | |
| | 2,500,000 | | | Virginia College Building Authority, 21st Century College & Equipment, University & College Improvements Revenue, Series A, 5.000%, 2/1/22 | | | | | 2,728,600 | |
| | 1,750,000 | | | Virginia College Building Authority, Advance Refunding Revenue, Series B, Callable 9/1/24 @100 (State Intercept), 4.000%, 9/1/25 | | | | | 1,881,477 | |
| | 1,805,000 | | | Virginia College Building Authority, Public Higher Education Financing Program, Refunding Revenue, Series B, (State Intercept), 5.000%, 9/1/20 | | | | | 1,905,105 | |
| | 2,000,000 | | | Virginia Commonwealth Transportation Board, Federal Transportation Grant, Anticipation Advance Refunding Revenue, Callable 9/15/27 @ 100, 5.000%, 9/15/31 | | | | | 2,334,200 | |
| | 1,850,000 | | | Virginia Commonwealth Transportation Board, Federal Transportation Grant, Transit Improvements, Revenue, Series B, Callable 9/15/22 @ 100, 5.000%, 3/15/23 | | | | | 2,049,504 | |
| | | | | | | | | | |
Principal
Amount | | | | Fair Value | |
| | MUNICIPAL BONDS — (continued) | | | | | | |
| | | |
| | | | Virginia — (continued) | | | | | | |
| | $1,500,000 | | | Virginia Port Authority Commonwealth Port Fund, Port, Airport & Marina Improvements Revenue, Callable 7/1/20 @ 100, 5.000%, 7/1/28 | | | | $ | 1,577,370 | |
| | 1,000,000 | | | Virginia Public Building Authority, Advance Refunding Revenue, Series A, Callable 8/1/27 @ 100, 5.000%, 8/1/28 | | | | | 1,177,020 | |
| | 2,000,000 | | | Virginia Public Building Authority, Public Improvements Revenue, Series A, Callable 8/1/21 @ 100, 5.000%, 8/1/26 | | | | | 2,162,540 | |
| | 1,515,000 | | | Virginia Public School Authority, Advance Refunding Revenue, Callable 8/1/25 @ 100 (State Aid Withholding), 5.000%, 8/1/26 | | | | | 1,746,280 | |
| | 1,525,000 | | | Western Regional Jail Authority, Refunding Revenue, Callable 12/1/25 @ 100, 5.000%, 12/1/26 | | | | | 1,763,846 | |
| | 920,000 | | | Winchester, VA, Economic Development Authority, Valley Health System Obligated Group, Hospital Refunding Revenue, Series A, Callable 1/1/24 @ 100, 5.000%, 1/1/26 | | | | | 1,019,986 | |
| | | | | | | | | | |
| | | | | | | | | 77,843,706 | |
| | | | | | | | | | |
| | | | Total Municipal Bonds
(Cost $80,827,302) | | | | | 81,597,762 | |
| | | | | | | | | | |
| | | |
| Shares | | | | | | | |
| | MONEY MARKET FUND — 0.9% | | | | | | |
| | 725,073 | | | Federated Treasury Obligations Fund, Institutional Shares, 1.92%(a) | | | | | 725,073 | |
| | | | | | | | | | |
| | | | Total Money Market Fund
(Cost $725,073) | | | | | 725,073 | |
| | | | | | | | | | |
| Total Investments — 99.1%
(Cost $81,552,375) | | | | | 82,322,835 | |
| | Net Other Assets (Liabilities) — 0.9% | | | | | 782,996 | |
| | | | | | | | | | |
| | NET ASSETS — 100.0% | | | | $ | 83,105,831 | |
| | | | | | | | | | |
| (a) | Represents the current yield as of report date. |
AGM — Assured Guaranty Municipal Corp.
G.O. — General Obligation
OID — Original Issue Discount
See accompanying Notes to the Financial Statements.
110
|
Sterling Capital West Virginia Intermediate Tax-Free Fund |
Schedule of Portfolio Investments |
September 30, 2018 |
| | | | | | | | | | |
Principal
Amount | | | | Fair Value | |
| | MUNICIPAL BONDS — 97.5% | | | | | | |
| | | |
| | | | West Virginia — 97.5% | | | | | | |
| | $1,060,000 | | | Berkeley County, WV, Building Commission, Judicial Center Project, Refunding Revenue, Callable 9/1/21 @ 100, 4.500%, 9/1/23 | | | | | $1,118,894 | |
| | 1,085,000 | | | Berkeley County, WV, Building Commission, Lease Refunding Revenue, Callable 12/1/22 @ 100, 4.000%, 12/1/26 | | | | | 1,129,301 | |
| | 1,500,000 | | | Berkeley County, WV, Public Service Sewer District, Miscellaneous Purposes Revenue, Series C, Callable 10/1/23 @ 100, (BAM), 4.500%, 10/1/32 | | | | | 1,583,010 | |
| | 535,000 | | | Berkeley County, WV, Public Service Sewer District, Sewer Improvements Revenue, Series A, Callable 11/13/18 @ 100, 5.000%, 3/1/22 | | | | | 536,445 | |
| | 1,080,000 | | | Braxton County, WV, Board of Education, Public School, Advance Refunding G.O., Callable 5/1/26 @ 100, (West Virginia Board Commission), 5.000%, 5/1/28 | | | | | 1,223,899 | |
| | 1,090,000 | | | Charles Town, WV, Waterworks & Sewerage System, Water Utility Improvements Revenue, Series A, Callable 3/1/26 @ 100, (BAM), 4.500%, 3/1/36 | | | | | 1,148,947 | |
| | 1,005,000 | | | Fairmont State University, WV, University & College Improvements, Refunding Revenue, Series A, Callable 6/1/21 @ 100, 5.000%, 6/1/23 | | | | | 1,071,199 | |
| | 1,495,000 | | | Fairmont State University, WV, University & College Improvements, Refunding Revenue, Series B, Callable 6/1/21 @ 100, 5.000%, 6/1/23 | | | | | 1,593,476 | |
| | 1,390,000 | | | Marshall University, WV, University & College Improvements Revenue, Callable 5/1/21 @ 100, 5.000%, 5/1/26 | | | | | 1,482,046 | |
| | 1,560,000 | | | Marshall University, WV, University & College Improvements Revenue, Callable 5/1/21 @ 100, 5.000%, 5/1/27 | | | | | 1,662,492 | |
| | 1,000,000 | | | Monongalia County, WV, Board of Education, Public School Refunding G.O., Callable 5/1/22 @ 100, (West Virginia Board Commission), 5.000%, 5/1/23 | | | | | 1,091,550 | |
| | 675,000 | | | Monongalia County, WV, Board of Education, Public School Refunding G.O., Callable 5/1/22 @ 100, (West Virginia Board Commission), 5.000%, 5/1/31 | | | | | 728,588 | |
| | 965,000 | | | Monongalia County, WV, Board of Education, Public School Refunding G.O., Callable 5/1/22 @ 100, (West Virginia Board Commission), 5.000%, 5/1/33 | | | | | 1,040,241 | |
| | 915,000 | | | Monongalia County, WV, Building Commission, Health System Obligated Group Refunding Revenue, Callable 7/1/21 @ 100, OID, 6.250%, 7/1/31 | | | | | 1,002,447 | |
| | 2,000,000 | | | Monongalia County, WV, Building Commission, Monongalia Health System Group Refunding Revenue, Callable 7/1/25 @ 100, 5.000%, 7/1/26 | | | | | 2,218,100 | |
| | 1,000,000 | | | Ohio County, WV, Country Commission, Fort Henry Centre Financing District, Public Improvement, Tax Allocation, Callable 6/1/22 @ 100, 4.750%, 6/1/31 | | | | | 1,037,710 | |
| | | | | | | | | | |
Principal
Amount | | | | Fair Value | |
| | MUNICIPAL BONDS — (continued) | | | | | | |
| | | |
| | | | West Virginia — (continued) | | | | | | |
| | $1,210,000 | | | Pleasants County, WV, Board of Education, Public School Improvements G.O., Callable 5/1/21 @ 100, 4.000%, 5/1/23 | | | | | $1,265,575 | |
| | 1,165,000 | | | Pleasants County, WV, Board of Education, Public School Improvements G.O., Callable 5/1/21 @ 100, 4.000%, 5/1/24 | | | | | 1,214,326 | |
| | 1,000,000 | | | Preston County, WV, Board of Education, Public School Improvements G.O., (West Virginia Board Commission), 4.000%, 5/1/21 | | | | | 1,044,650 | |
| | 1,285,000 | | | Princeton, WV, Princeton Community Hospital Project, Refunding Revenue, 5.000%, 5/1/22 | | | | | 1,376,119 | |
| | 1,000,000 | | | Putnam County, WV, Board of Education, Public School Improvements, G.O., Callable 5/1/20 @ 100, (West Virginia Board Commission), 4.000%, 5/1/22 | | | | | 1,028,740 | |
| | 500,000 | | | School Building Authority of West Virginia, Lottery Capital Improvements Revenue, Callable 7/1/24 @ 100, Series A, 5.000%, 7/1/27 | | | | | 565,370 | |
| | 1,265,000 | | | School Building Authority of West Virginia, Lottery Capital Improvements Revenue, Callable 7/1/24 @ 100, Series A, 5.000%, 7/1/28 | | | | | 1,426,781 | |
| | 1,675,000 | | | School Building Authority of West Virginia, School Improvements Revenue, Series A, Callable 7/1/25 @100, 5.000%, 7/1/28 | | | | | 1,906,686 | |
| | 2,720,000 | | | State of West Virginia, Current Refunding G.O., Series A, 5.000%, 6/1/24 | | | | | 3,092,341 | |
| | 1,000,000 | | | State of West Virginia, Highway Improvements, G.O., Series B, Callable 6/1/28 @ 100, 5.000%, 6/1/33 | | | | | 1,162,110 | |
| | 2,000,000 | | | State of West Virginia, Refunding G.O., 5.000%, 11/1/26 | | | | | 2,349,360 | |
| | 1,295,000 | | | Wayne County, WV, Board of Education, Public School Improvements, G.O., Callable 6/1/24 @ 100,, 4.000%, 6/1/25 | | | | | 1,396,243 | |
| | 2,000,000 | | | West Virginia Commissioner of Highways, Highway Improvements Revenue, Series A, 5.000%, 9/1/21 | | | | | 2,162,480 | |
| | 510,000 | | | West Virginia Economic Development Authority, Clarksburg Office Building, Public Improvements Revenue, Series C, Callable 6/1/25 @ 100, OID, 4.000%, 6/1/40 | | | | | 510,571 | |
| | 3,000,000 | | | West Virginia Economic Development Authority, Correctional Juvenile Public Safety Facilities Lease, Refunding Revenue, Callable 6/1/22 @ 100, 5.000%, 6/1/25 | | | | | 3,259,830 | |
| | 3,685,000 | | | West Virginia Economic Development Authority, Correctional Juvenile Public Safety Facilities Lease, Refunding Revenue, Callable 6/1/22 @ 100, 5.000%, 6/1/26 | | | | | 4,000,104 | |
| | 1,185,000 | | | West Virginia Economic Development Authority, Lottery Recreational Facilities Improvements Revenue, Series A, 5.000%, 7/1/27 | | | | | 1,378,973 | |
| | 1,145,000 | | | West Virginia Economic Development Authority, Lottery Recreational Facilities Improvements Revenue, Series A, Callable 7/1/27 @ 100, 5.000%, 7/1/28 | | | | | 1,330,501 | |
Continued
111
|
Sterling Capital West Virginia Intermediate Tax-Free Fund |
Schedule of Portfolio Investments — (continued) |
September 30, 2018 |
| | | | | | | | | | |
Principal
Amount | | | | Fair Value | |
| | MUNICIPAL BONDS — (continued) | | | | | | |
| | | |
| | | | West Virginia — (continued) | | | | | | |
| | $1,050,000 | | | West Virginia Economic Development Authority, Lottery Recreational Facilities Improvements Revenue, Series A, Callable 7/1/27 @ 100, 5.000%, 7/1/37 | | | | $ | 1,176,137 | |
| | 1,015,000 | | | West Virginia Economic Development Authority, State Office Building 3, Public Improvements Revenue, Series D, Callable 6/1/25 @ 100, 5.000%, 6/1/26 | | | | | 1,151,832 | |
| | 1,890,000 | | | West Virginia Economic Development Authority, The Diamond Project, Refunding Revenue, Callable 12/15/18 @ 100, 3.000%, 12/15/19 | | | | | 1,893,553 | |
| | 1,000,000 | | | West Virginia Higher Education Policy Commission, Community & Technological Colleges Capital, Advance Refunding Revenue, Callable 7/1/27 @ 100, 5.000%, 7/1/29 | | | | | 1,148,680 | |
| | 1,500,000 | | | West Virginia Higher Education Policy Commission, Community & Technological Colleges Capital, Advance Refunding Revenue, Callable 7/1/27 @ 100, 5.000%, 7/1/38 | | | | | 1,669,395 | |
| | 945,000 | | | West Virginia Hospital Finance Authority, Charleston Area Medical Center Inc., Health, Hospital, Nursing Home Improvements, Refunding Revenue, Callable 9/1/24 @100, 5.000%, 9/1/25 | | | | | 1,025,883 | |
| | 2,000,000 | | | West Virginia Hospital Finance Authority, United Health System Obligation, Health, Hospital, Nursing Home Improvements Refunding Revenue, Series A, Callable 6/1/23 @ 100, OID, 5.375%, 6/1/38 | | | | | 2,172,540 | |
| | 515,000 | | | West Virginia Hospital Finance Authority, Valley Health System Obligated Group, Refunding Revenue, 5.000%, 1/1/24 | | | | | 580,899 | |
| | 630,000 | | | West Virginia Hospital Finance Authority, Valley Health System Obligated Group, Refunding Revenue, Callable 1/1/24 @ 100, 5.000%, 1/1/26 | | | | | 700,100 | |
| | 1,650,000 | | | West Virginia Parkways Authority, Senior Turnpike Toll Revenue, Highway Improvements, 5.000%, 6/1/26 | | | | | 1,927,249 | |
| | 1,890,000 | | | West Virginia State Building Commission, Regional Jail Refunding Revenue, Series A, (AMBAC), 5.375%, 7/1/21 | | | | | 2,031,240 | |
| | 1,000,000 | | | West Virginia State Water Development Authority, Loan Program II, Refunding Revenue, Series A-II, Callable 11/1/23 @ 100, 5.000%, 11/1/26 | | | | | 1,117,050 | |
| | 2,525,000 | | | West Virginia State Water Development Authority, Loan Program II, Refunding Revenue, Series A-II, Callable 11/1/23 @ 100, 5.000%, 11/1/27 | | | | | 2,817,976 | |
| | | | | | | | | | |
Principal
Amount | | | | Fair Value | |
| | MUNICIPAL BONDS — (continued) | | | | | | |
| | | |
| | | | West Virginia — (continued) | | | | | | |
| | $1,750,000 | | | West Virginia University, University Projects, University & College Improvements Revenue, Series B, Callable 10/1/21 @ 100, 5.000%, 10/1/30 | | | | $ | 1,874,530 | |
| | 1,530,000 | | | West Virginia University, University Projects, University & College Improvements, Refunding Revenue, Series A, Callable 10/1/22 @ 100, 5.000%, 10/1/35 | | | | | 1,658,872 | |
| | 520,000 | | | West Virginia Water Development Authority, Loan Program II, Refunding Revenue, Series A-II, 5.000%, 11/1/24 | | | | | 589,763 | |
| | 1,000,000 | | | West Virginia Water Development Authority, Loan Program II, Refunding Revenue, Series A-II, 5.000%, 11/1/25 | | | | | 1,147,310 | |
| | 1,205,000 | | | Wood County, WV, Board of Education, Public School Improvements, G.O., (West Virginia Board Commission), 4.000%, 6/1/25 | | | | | 1,304,509 | |
| | 1,295,000 | | | Wood County, WV, Board Of Education, Public School Improvements, G.O., (West Virginia Board Commission), 4.000%, 6/1/26 | | | | | 1,408,934 | |
| | | | | | | | | | |
| | | | Total Municipal Bonds
(Cost $77,060,421) | | | | | 77,535,557 | |
| | | | | | | | | | |
| Shares | | | | | | | |
| | MONEY MARKET FUND — 1.3% | | | | | | |
| | 1,073,231 | | | Federated Treasury Obligations Fund, Institutional Shares, 1.92%(a) | | | | | 1,073,231 | |
| | | | | | | | | | |
| | | | Total Money Market Fund
(Cost $1,073,231) | | | | | 1,073,231 | |
| | | | | | | | | | |
| Total Investments — 98.8%
(Cost $78,133,652) | | | | | 78,608,788 | |
| | Net Other Assets (Liabilities) — 1.2% | | | | | 937,794 | |
| | | | | | | | | | |
| | NET ASSETS — 100.0% | | | | $ | 79,546,582 | |
| | | | | | | | | | |
| (a) | Represents the current yield as of report date. |
AMBAC — American Municipal Bond Assurance Corp.
BAM — Build America Mutual
G.O. — General Obligation
OID — Original Issue Discount
See accompanying Notes to the Financial Statements.
112
|
Sterling Capital Diversified Income Fund |
Schedule of Portfolio Investments |
September 30, 2018 |
| | | | | | | | | | |
| Shares | | | | Fair Value | |
| | EQUITY FUNDS — 38.4% | | | | | | |
| | 57,795 | | | First Trust DJ Global Select Dividend Index Fund | | | | $ | 1,450,747 | |
| | 35,871 | | | Global Super Dividend U.S. ETF | | | | | 906,101 | |
| | 207,724 | | | Madison Covered Call & Equity Income Fund | | | | | 1,935,990 | |
| | 125,402 | | | Oppenheimer SteelPath MLP Select 40 Fund | | | | | 1,053,373 | |
| | 21,302 | | | SPDR S&P Global Dividend ETF | | | | | 1,445,980 | |
| | 11,619 | | | Vanguard High Dividend Yield ETF | | | | | 1,011,899 | |
| | | | | | | | | | |
| | | | Total Equity Funds
(Cost $7,056,042) | | | | | 7,804,090 | |
| | | | | | | | | | |
| | |
| | FIXED INCOME FUNDS — 60.7% | | | | | | |
| | 217,200 | | | Ashmore Emerging Markets Short Duration Fund | | | | | 2,095,978 | |
| | 61,181 | | | DoubleLine Total Return Bond Fund | | | | | 632,616 | |
| | 146,432 | | | Federated Institutional High-Yield Bond Fund | | | | | 1,429,176 | |
| | 38,948 | | | Fidelity Intermediate Treasury Bond Index Fund | | | | | 400,000 | |
| | 32,600 | | | Fidelity Long-Term Treasury Bond Index Fund. | | | | | 399,348 | |
| | 64,288 | | | Hotchkis and Wiley High Yield Fund | | | | | 769,531 | |
| | 243,115 | | | Loomis Sayles Senior Floating Rate and Fixed Income Fund | | | | | 2,387,388 | |
| | 73,502 | | | Principal Preferred Securities Fund | | | | | 728,406 | |
| | 214,403 | | | Stone Ridge High Yield Reinsurance Risk Premium Fund | | | | | 2,036,833 | |
| | | | | | | | | | |
| Shares | | | | Fair Value | |
| | FIXED INCOME FUNDS — (continued) | | | | | | |
| | 49,716 | | | VanEck Vectors Fallen Angel High Yield Bond ETF | | | | $ | 1,445,741 | |
| | | | | | | | | | |
| | | | Total Fixed Income Funds
(Cost $12,530,124) | | | | | 12,325,017 | |
| | | | | | | | | | |
| | |
| | MONEY MARKET FUND — 1.0% | | | | | | |
| | 207,589 | | | Federated Treasury Obligations Fund, Institutional Shares, 1.92%(a) | | | | | 207,589 | |
| | | | | | | | | | |
| | | | Total Money Market Fund
(Cost $207,589) | | | | | 207,589 | |
| | | | | | | | | | |
| Total Investments — 100.1%
(Cost $19,793,755) | | | | | 20,336,696 | |
| | Net Other Assets (Liabilities) — (0.1)% | | | | | (11,034 | ) |
| | | | | | | | | | |
| | NET ASSETS — 100.0% | | | | $ | 20,325,662 | |
| | | | | | | | | | |
| (a) | Represents the current yield as of report date. |
ETF — Exchange Traded Fund
MLP — Master Limited Partnership
See accompanying Notes to the Financial Statements.
113
|
Sterling Capital Strategic Allocation Balanced Fund |
Schedule of Portfolio Investments |
September 30, 2018 |
| | | | | | | | | | |
| Shares | | | | Fair Value | |
| | EQUITY FUNDS — 62.5% | | | | | | |
| | 792,962 | | | Sterling Capital Behavioral International Equity Fund, Institutional Shares(a) | | | | $ | 8,865,316 | |
| | 217,045 | | | Sterling Capital Equity Income Fund, Institutional Shares(a) | | | | | 4,690,340 | |
| | 171,506 | | | Sterling Capital Special Opportunities Fund, Institutional Shares(a) | | | | | 4,755,872 | |
| | | | | | | | | | |
| | | | Total Equity Funds
(Cost $15,071,617) | | | | | 18,311,528 | |
| | | | | | | | | | |
| | |
| | FIXED INCOME FUND — 36.5% | | | | | | |
| | 1,047,448 | | | Sterling Capital Total Return Bond Fund, Institutional Shares(a) | | | | | 10,683,966 | |
| | | | | | | | | | |
| | | | Total Fixed Income Fund
(Cost $10,840,624) | | | | | 10,683,966 | |
| | | | | | | | | | |
| | |
| | MONEY MARKET FUND — 0.9% | | | | | | |
| | 253,584 | | | Federated Treasury Obligations Fund, Institutional Shares, 1.92%(b) | | | | | 253,584 | |
| | | | | | | | | | |
| | | | Total Money Market Fund
(Cost $253,584) | | | | | 253,584 | |
| | | | | | | | | | |
| Total Investments — 99.9%
(Cost $26,165,825) | | | | | 29,249,078 | |
| | Net Other Assets (Liabilities) — 0.1% | | | | | 19,486 | |
| | | | | | | | | | |
| | NET ASSETS — 100.0% | | | | $ | 29,268,564 | |
| | | | | | | | | | |
| (a) | Investments in issuers considered to be an affiliate of the Fund for purposes of Section 2(a)(3) of the Investment Company Act of 1940. |
| (b) | Represents the current yield as of report date. |
See accompanying Notes to the Financial Statements.
114
|
Sterling Capital Strategic Allocation Growth Fund |
Schedule of Portfolio Investments |
September 30, 2018 |
| | | | | | | | | | |
| Shares | | | | Fair Value | |
| | EQUITY FUNDS — 76.3% | | | | | | |
| | 778,451 | | | Sterling Capital Behavioral International Equity Fund, Institutional Shares(a) | | | | $ | 8,703,078 | |
| | 201,092 | | | Sterling Capital Equity Income Fund, Institutional Shares(a) | | | | | 4,345,606 | |
| | 159,279 | | | Sterling Capital Special Opportunities Fund, Institutional Shares(a) | | | | | 4,416,798 | |
| | | | | | | | | | |
| | | | Total Equity Funds
(Cost $14,234,677) | | | | | 17,465,482 | |
| | | | | | | | | | |
| | |
| | FIXED INCOME FUND — 21.9% | | | | | | |
| | 491,157 | | | Sterling Capital Total Return Bond Fund, Institutional Shares(a) | | | | | 5,009,803 | |
| | | | | | | | | | |
| | | | Total Fixed Income Fund
(Cost $5,207,987) | | | | | 5,009,803 | |
| | | | | | | | | | |
| | |
| | MONEY MARKET FUND — 1.8% | | | | | | |
| | 408,379 | | | Federated Treasury Obligations Fund, Institutional Shares, 1.92%(b) | | | | | 408,379 | |
| | | | | | | | | | |
| | | | Total Money Market Fund
(Cost $408,379) | | | | | 408,379 | |
| | | | | | | | | | |
| Total Investments — 100.0%
(Cost $19,851,043) | | | | | 22,883,664 | |
| | Net Other Assets (Liabilities) — 0.0% | | | | | 7,075 | |
| | | | | | | | | | |
| | NET ASSETS — 100.0% | | | | $ | 22,890,739 | |
| | | | | | | | | | |
| (a) | Investments in issuers considered to be an affiliate of the Fund for purposes of Section 2(a)(3) of the Investment Company Act of 1940. |
| (b) | Represents the current yield as of report date. |
See accompanying Notes to the Financial Statements.
115
|
Sterling Capital Funds |
Statements of Assets and Liabilities |
September 30, 2018 |
| | | | | | | | | | |
| | | Sterling Capital
Behavioral Large Cap
Value Equity Fund | | Sterling Capital
Mid
Value Fund |
Assets: | | | | | | | | | | |
Investments at fair value (a) | | | $ | 312,802,082 | | | | $ | 643,847,799 | |
Foreign currency, at value
(cost $ — , $ — , $ — , $ — , $ — , $192,845, $ — , and $ — , respectively) | | | | — | | | | | — | |
Dividends receivable | | | | 208,521 | | | | | 432,395 | |
Receivable for investments sold | | | | — | | | | | — | |
Receivable for capital shares issued | | | | 130,296 | | | | | 675,146 | |
Prepaid and other expenses | | | | 24,339 | | | | | 48,449 | |
| | | | | | | | | | |
Total Assets | | | | 313,165,238 | | | | | 645,003,789 | |
| | | | | | | | | | |
Liabilities: | | | | | | | | | | |
Payable for investments purchased | | | | — | | | | | — | |
Payable for capital shares redeemed | | | | 670 | | | | | 634,508 | |
Accrued expenses and other payables: | | | | | | | | | | |
Investment advisory fees | | | | 116,383 | | | | | 377,486 | |
Accounting out-of-pocket fees | | | | 2,791 | | | | | 4,435 | |
Administration fees | | | | 13,340 | | | | | 27,171 | |
Audit fees | | | | 16,164 | | | | | 37,537 | |
Compliance service fees | | | | 306 | | | | | 610 | |
Distribution (12b-1) fees | | | | 7,589 | | | | | 9,914 | |
Custodian fees | | | | 2,389 | | | | | 5,047 | |
Transfer agent fees | | | | 8,804 | | | | | 54,832 | |
Other fees and liabilities | | | | 17,327 | | | | | 36,945 | |
| | | | | | | | | | |
Total Liabilities | | | | 185,763 | | | | | 1,188,485 | |
| | | | | | | | | | |
Net Assets | | | $ | 312,979,475 | | | | $ | 643,815,304 | |
| | | | | | | | | | |
Net Assets Consist of: | | | | | | | | | | |
Capital | | | $ | 240,527,744 | | | | $ | 476,485,746 | |
Total distributable earnings | | | | 72,451,731 | | | | | 167,329,558 | |
| | | | | | | | | | |
Net Assets | | | $ | 312,979,475 | | | | $ | 643,815,304 | |
| | | | | | | | | | |
Net Assets | | | | | | | | | | |
Class A Shares | | | $ | 33,125,910 | | | | $ | 30,856,765 | |
Class C Shares | | | | 887,068 | | | | | 4,096,976 | |
Institutional Shares | | | | 8,861,765 | | | | | 323,011,702 | |
Class R Shares | | | | — | | | | | 2,909 | |
Class R6 Shares | | | | 270,104,732 | | | | | 285,846,952 | |
| | | | | | | | | | |
Total | | | $ | 312,979,475 | | | | $ | 643,815,304 | |
| | | | | | | | | | |
Shares of Beneficial Interest Outstanding (Unlimited number of shares authorized, no par value) | | | | | | | | | | |
Class A Shares | | | | 1,485,286 | | | | | 1,616,898 | |
Class C Shares | | | | 40,942 | | | | | 242,955 | |
Institutional Shares | | | | 395,091 | | | | | 16,632,270 | |
Class R Shares | | | | — | | | | | 158 | |
Class R6 Shares | | | | 12,041,524 | | | | | 14,707,245 | |
| | | | | | | | | | |
Total | | | | 13,962,843 | | | | | 33,199,526 | |
| | | | | | | | | | |
Net Asset Value | | | | | | | | | | |
Class A Shares - redemption price per share | | | $ | 22.30 | | | | $ | 19.08 | |
| | | | | | | | | | |
Class C Shares - offering price per share* | | | $ | 21.67 | | | | $ | 16.86 | |
| | | | | | | | | | |
Institutional Shares | | | $ | 22.43 | | | | $ | 19.42 | |
| | | | | | | | | | |
Class R Shares | | | $ | — | | | | $ | 18.43 | ** |
| | | | | | | | | | |
Class R6 Shares | | | $ | 22.43 | | | | $ | 19.44 | |
| | | | | | | | | | |
Maximum Sales Charge - Class A Shares | | | | 5.75 | % | | | | 5.75 | % |
| | | | | | | | | | |
Maximum Offering Price (100%/(100% - Maximum Sales Charge)) of net asset value adjusted to the nearest cent per share - Class A Shares | | | $ | 23.66 | | | | $ | 20.24 | |
| | | | | | | | | | |
(a) Investments at cost | | | $ | 264,295,587 | | | | $ | 513,004,618 | |
| * | Redemption price per share varies by length of time shares are held. |
| ** | The Sterling Capital Mid Value Fund net asset value for Class R, Sterling Capital Behavioral Small Cap Value Equity Fund net asset value for Class R and Sterling Capital Stratton Mid Cap Value Fund net asset value for Class C Shares is calculated using unrounded net assets of $2,908.80, $62,893.47 and $1,380.84 divided by the unrounded shares of 157.85, 3,396.74 and 20.47, respectively. |
See accompanying Notes to the Financial Statements.
116
| | | | | | | | | | | | | | | | | | | | | | | | | | | | |
Sterling Capital
Behavioral Small Cap
Value Equity Fund | | Sterling Capital
Special
Opportunities Fund | | Sterling Capital
Equity
Income Fund | | Sterling Capital
Behavioral International
Equity Fund | | Sterling Capital
SMID
Opportunities Fund | | Sterling Capital
Stratton Mid Cap
Value Fund |
| | | | | | | | | | | | | | | | | | | | | | | | | | | | | |
| | $ | 238,171,308 | | | | $ | 1,201,884,011 | | | | $ | 1,674,922,169 | | | | $ | 82,233,767 | | | | $ | 9,223,691 | | | | $ | 66,647,044 | |
| |
|
— |
| | | | — | | | | | — | | | | | 191,934 | | | | | — | | | | | — | |
| | | 413,480 | | | | | 511,704 | | | | | 1,582,041 | | | | | 585,067 | | | | | 7,673 | | | | | 68,168 | |
| | | 287,277 | | | | | 2,418,883 | | | | | 556,560 | | | | | — | | | | | — | | | | | — | |
| | | 337,522 | | | | | 1,047,313 | | | | | 1,811,283 | | | | | — | | | | | — | | | | | — | |
| | | 11,628 | | | | | 5,681 | | | | | 21,655 | | | | | 5,040 | | | | | 12,422 | | | | | 7,943 | |
| | | | | | | | | | | | | | | | | | | | | | | | | | | | | |
| | | 239,221,215 | | | | | 1,205,867,592 | | | | | 1,678,893,708 | | | | | 83,015,808 | | | | | 9,243,786 | | | | | 66,723,155 | |
| | | | | | | | | | | | | | | | | | | | | | | | | | | | | |
| | | | | | | | | | | | | | | | | | | | | | | | | | | | | |
| | | — | | | | | 1,877,982 | | | | | 2,026,503 | | | | | — | | | | | — | | | | | — | |
| | | 106 | | | | | 880,019 | | | | | 2,535,095 | | | | | — | | | | | — | | | | | 3,936 | |
| | | | | | | | | | | | | | | | | | | | | | | | | | | | | |
| | | 119,555 | | | | | 638,454 | | | | | 758,384 | | | | | 26,962 | | | | | 6,844 | | | | | 39,161 | |
| | | 4,473 | | | | | 6,902 | | | | | 9,939 | | | | | 11,308 | | | | | 628 | | | | | 1,193 | |
| | | 8,014 | | | | | 92,432 | | | | | 95,030 | | | | | 2,759 | | | | | 602 | | | | | 4,459 | |
| | | 11,482 | | | | | 59,418 | | | | | 81,144 | | | | | 4,366 | | | | | 482 | | | | | 3,470 | |
| | | 253 | | | | | 973 | | | | | 1,284 | | | | | 132 | | | | | 72 | | | | | 118 | |
| | | 2,001 | | | | | 187,549 | | | | | 238,082 | | | | | 215 | | | | | 1,789 | | | | | 23 | |
| | | 1,843 | | | | | 8,898 | | | | | 12,376 | | | | | 4,745 | | | | | 68 | | | | | 523 | |
| | | 8,218 | | | | | 104,085 | | | | | 160,472 | | | | | 2,181 | | | | | 1,355 | | | | | 4,802 | |
| | | 12,950 | | | | | 74,104 | | | | | 89,019 | | | | | 4,527 | | | | | 706 | | | | | 3,805 | |
| | | | | | | | | | | | | | | | | | | | | | | | | | | | | |
| | | 168,895 | | | | | 3,930,816 | | | | | 6,007,328 | | | | | 57,195 | | | | | 12,546 | | | | | 61,490 | |
| | | | | | | | | | | | | | | | | | | | | | | | | | | | | |
| | $ | 239,052,320 | | | | $ | 1,201,936,776 | | | | $ | 1,672,886,380 | | | | $ | 82,958,613 | | | | $ | 9,231,240 | | | | $ | 66,661,665 | |
| | | | | | | | | | | | | | | | | | | | | | | | | | | | | |
| | | | | | | | | | | | | | | | | | | | | | | | | | | | | |
| | $ | 181,056,654 | | | | $ | 704,194,442 | | | | $ | 1,047,669,185 | | | | $ | 71,703,651 | | | | $ | 7,500,983 | | | | $ | 38,046,675 | |
| | | 57,995,666 | | | | | 497,742,334 | | | | | 625,217,195 | | | | | 11,254,962 | | | | | 1,730,257 | | | | | 28,614,990 | |
| | | | | | | | | | | | | | | | | | | | | | | | | | | | | |
| | $ | 239,052,320 | | | | $ | 1,201,936,776 | | | | $ | 1,672,886,380 | | | | $ | 82,958,613 | | | | $ | 9,231,240 | | | | $ | 66,661,665 | |
| | | | | | | | | | | | | | | | | | | | | | | | | | | | | |
| | | | | | | | | | | | | | | | | | | | | | | | | | | | | |
| | $ | 8,710,908 | | | | $ | 334,687,241 | | | | $ | 316,245,321 | | | | $ | 827,512 | | | | $ | 2,869,825 | | | | $ | 106,691 | |
| | | 180,306 | | | | | 144,099,641 | | | | | 207,658,531 | | | | | 61,061 | | | | | 1,475,831 | | | | | 1,381 | |
| | | 39,046,734 | | | | | 350,029,656 | | | | | 828,607,376 | | | | | 19,265,990 | | | | | 4,885,584 | | | | | 66,553,593 | |
| | | 62,893 | | | | | 172,723 | | | | | 2,548,450 | | | | | — | | | | | — | | | | | — | |
| | | 191,051,479 | | | | | 372,947,515 | | | | | 317,826,702 | | | | | 62,804,050 | | | | | — | | | | | — | |
| | | | | | | | | | | | | | | | | | | | | | | | | | | | | |
| | $ | 239,052,320 | | | | $ | 1,201,936,776 | | | | $ | 1,672,886,380 | | | | $ | 82,958,613 | | | | $ | 9,231,240 | | | | $ | 66,661,665 | |
| | | | | | | | | | | | | | | | | | | | | | | | | | | | | |
| | | | | | | | | | | | | | | | | | | | | | | | | | | | | |
| | | 467,123 | | | | | 12,693,655 | | | | | 14,674,735 | | | | | 74,087 | | | | | 230,662 | | | | | 1,552 | |
| | | 10,080 | | | | | 6,554,817 | | | | | 9,730,150 | | | | | 5,522 | | | | | 119,941 | | | | | 20 | |
| | | 2,074,508 | | | | | 12,624,043 | | | | | 38,348,716 | | | | | 1,722,803 | | | | | 391,514 | | | | | 964,308 | |
| | | 3,397 | | | | | 6,486 | | | | | 119,129 | | | | | — | | | | | — | | | | | — | |
| | | 10,142,343 | | | | | 13,441,660 | | | | | 14,707,322 | | | | | 5,614,888 | | | | | — | | | | | — | |
| | | | | | | | | | | | | | | | | | | | | | | | | | | | | |
| | | 12,697,451 | | | | | 45,320,661 | | | | | 77,580,052 | | | | | 7,417,300 | | | | | 742,117 | | | | | 965,880 | |
| | | | | | | | | | | | | | | | | | | | | | | | | | | | | |
| | | | | | | | | | | | | | | | | | | | | | | | | | | | | |
| | $ | 18.65 | | | | $ | 26.37 | | | | $ | 21.55 | | | | $ | 11.17 | | | | $ | 12.44 | | | | $ | 68.74 | |
| | | | | | | | | | | | | | | | | | | | | | | | | | | | | |
| | $ | 17.89 | | | | $ | 21.98 | | | | $ | 21.34 | | | | $ | 11.06 | | | | $ | 12.30 | | | | $ | 67.46 | ** |
| | | | | | | | | | | | | | | | | | | | | | | | | | | | | |
| | $ | 18.82 | | | | $ | 27.73 | | | | $ | 21.61 | | | | $ | 11.18 | | | | $ | 12.48 | | | | $ | 69.02 | |
| | | | | | | | | | | | | | | | | | | | | | | | | | | | | |
| | $ | 18.52 | ** | | | $ | 26.63 | | | | $ | 21.39 | | | | $ | — | | | | $ | — | | | | $ | — | |
| | | | | | | | | | | | | | | | | | | | | | | | | | | | | |
| | $ | 18.84 | | | | $ | 27.75 | | | | $ | 21.61 | | | | $ | 11.19 | | | | $ | — | | | | $ | — | |
| | | | | | �� | | | | | | | | | | | | | | | | | | | | | | | |
| | | 5.75 | % | | | | 5.75 | % | | | | 5.75 | % | | | | 5.75 | % | | | | 5.75 | % | | | | 5.75 | % |
| | | | | | | | | | | | | | | | | | | | | | | | | | | | | |
| |
$ |
19.79 |
| | | $ | 27.98 | | | | $ | 22.86 | | | | $ | 11.85 | | | | $ | 13.20 | | | | $ | 72.93 | |
| | | | | | | | | | | | | | | | | | | | | | | | | | | | | |
| | $ | 206,337,674 | | | | $ | 779,573,268 | | | | $ | 1,166,357,349 | | | | $ | 76,090,393 | | | | $ | 7,459,140 | | | | $ | 42,115,986 | |
117
|
Sterling Capital Funds |
Statements of Assets and Liabilities |
September 30, 2018 |
| | | | | | | | | | |
| | | Sterling Capital
Stratton
Real Estate
Fund | | Sterling Capital
Stratton
Small Cap
Value Fund |
Assets: | | | | | | | | | | |
Investments at fair value (a) | | | $ | 91,734,651 | | | | $ | 1,299,354,535 | |
Cash | | | | — | | | | | — | |
Interest and dividends receivable | | | | 436,054 | | | | | 2,114,206 | |
Receivable for investments sold | | | | — | | | | | — | |
Receivable for capital shares issued | | | | 16,932 | | | | | 871,635 | |
Prepaid expenses | | | | 8,384 | | | | | 15,943 | |
| | | | | | | | | | |
Total Assets | | | | 92,196,021 | | | | | 1,302,356,319 | |
| | | | | | | | | | |
Liabilities: | | | | | | | | | | |
Cash overdraft | | | | — | | | | | — | |
Distributions payable | | | | — | | | | | — | |
Payable for investments purchased | | | | — | | | | | — | |
Payable for capital shares redeemed | | | | 5,072 | | | | | 1,975,799 | |
Accrued expenses and other payables: | | | | | | | | | | |
Investment advisory fees | | | | 44,171 | | | | | 863,096 | |
Accounting out-of-pocket fees | | | | 1,223 | | | | | 8,993 | |
Administration fees | | | | 6,125 | | | | | 85,995 | |
Audit Fees | | | | 4,557 | | | | | 64,689 | |
Compliance service fees | | | | 136 | | | | | 1,071 | |
Distribution (12b-1) fees | | | | 165 | | | | | 541 | |
Transfer agent fees | | | | 7,693 | | | | | 107,764 | |
Other fees | | | | 5,790 | | | | | 79,762 | |
| | | | | | | | | | |
Total Liabilities | | | | 74,932 | | | | | 3,187,710 | |
| | | | | | | | | | |
Net Assets | | | $ | 92,121,089 | | | | $ | 1,299,168,609 | |
| | | | | | | | | | |
Net Assets Consist of: | | | | | | | | | | |
Capital | | | $ | 56,758,854 | | | | $ | 567,273,468 | |
Total distributable earnings | | | | 35,362,235 | | | | | 731,895,141 | |
| | | | | | | | | | |
Net Assets | | | $ | 92,121,089 | | | | $ | 1,299,168,609 | |
| | | | | | | | | | |
Net Assets | | | | | | | | | | |
Class A Shares | | | $ | 397,628 | | | | $ | 2,159,865 | |
Class C Shares | | | | 97,930 | | | | | 112,059 | |
Institutional Shares | | | | 91,625,531 | | | | | 1,296,896,685 | |
Class R Shares | | | | — | | | | | — | |
Class R6 Shares | | | | — | | | | | — | |
| | | | | | | | | | |
Total | | | $ | 92,121,089 | | | | $ | 1,299,168,609 | |
| | | | | | | | | | |
Shares of Beneficial Interest Outstanding (Unlimited number of shares authorized, no par value) | | | | | | | | | | |
Class A Shares | | | | 10,584 | | | | | 24,343 | |
Class C Shares | | | | 2,619 | | | | | 1,289 | |
Institutional Shares | | | | 2,434,711 | | | | | 14,554,101 | |
Class R Shares | | | | — | | | | | — | |
Class R6 Shares | | | | — | | | | | — | |
| | | | | | | | | | |
Total | | | | 2,447,914 | | | | | 14,579,733 | |
| | | | | | | | | | |
Net Asset Value | | | | | | | | | | |
Class A Shares - redemption price per share | | | $ | 37.57 | | | | $ | 88.73 | |
| | | | | | | | | | |
Class C Shares - offering price per share* | | | $ | 37.40 | ** | | | $ | 86.92 | ** |
| | | | | | | | | | |
Institutional Shares | | | $ | 37.63 | | | | $ | 89.11 | |
| | | | | | | | | | |
Class R Shares | | | $ | — | | | | $ | — | |
| | | | | | | | | | |
Class R6 Shares | | | $ | — | | | | $ | — | |
| | | | | | | | | | |
Maximum Sales Charge - Class A Shares | | | | 5.75 | % | | | | 5.75 | % |
| | | | | | | | | | |
Maximum Offering Price (100%/(100% - Maximum Sales Charge)) of net asset value adjusted to the nearest cent per share - Class A Shares | | | $ | 39.86 | | | | $ | 94.14 | |
| | | | | | | | | | |
(a) Investments at cost | | | $ | 60,073,195 | | | | $ | 639,397,089 | |
| * | Redemption price per share varies by length of time shares are held. |
| ** | The Sterling Capital Stratton Real Estate Fund net asset value for Class C Shares, Sterling Capital Stratton Small Cap Value Fund net asset value for Class C Shares and Sterling Capital Kentucky Tax-Free Intermediate Fund net asset value for Class C Shares is calculated using unrounded net assets of $97,930.25, $112,058.90 and $1,534.44 divided by the unrounded shares of 2,618.56, 1,289.25 and 154.80, respectively. |
See accompanying Notes to the Financial Statements.
118
| | | | | | | | | | | | | | | | | | | | | | | | | | | | | | | | | |
Sterling Capital
Ultra Short
Bond Fund | | Sterling Capital
Short Duration
Bond Fund | | Sterling Capital
Intermediate U.S.
Government Fund | | Sterling Capital
Total Return
Bond Fund | | Sterling Capital
Corporate
Fund | | Sterling Capital
Securitized
Opportunities
Fund | | Sterling Capital
Kentucky Intermediate
Tax-Free Fund |
| | | | | | | | | | | | | | | | | | | | | | | | | | | | | | | | | | |
| | $ | 31,999,267 | | | | $ | 131,201,450 | | | | $ | 21,460,977 | | | | $ | 1,210,630,300 | | | | $ | 31,016,632 | | | | $ | 37,139,049 | | | | $ | 11,216,694 | |
| | | 2,718 | | | | | 3,757 | | | | | — | | | | | 44,348 | | | | | 3,866 | | | | | — | | | | | — | |
| | | 152,686 | | | | | 809,138 | | | | | 148,004 | | | | | 7,305,218 | | | | | 310,207 | | | | | 110,633 | | | | | 157,904 | |
| | | — | | | | | — | | | | | 1,200,000 | | | | | 8,433,345 | | | | | — | | | | | — | | | | | — | |
| | | — | | | | | 619,544 | | | | | 34,134 | | | | | 2,221,551 | | | | | 57,131 | | | | | — | | | | | — | |
| | | 12,986 | | | | | 15,202 | | | | | 5,282 | | | | | 42,114 | | | | | 6,767 | | | | | 7,683 | | | | | 3,438 | |
| | | | | | | | | | | | | | | | | | | | | | | | | | | | | | | | | | |
| | | 32,167,657 | | | | | 132,649,091 | | | | | 22,848,397 | | | | | 1,228,676,876 | | | | | 31,394,603 | | | | | 37,257,365 | | | | | 11,378,036 | |
| | | | | | | | | | | | | | | | | | | | | | | | | | | | | | | | | | |
| | | | | | | | | | | | | | | | | | | | | | | | | | | | | | | | | | |
| | | — | | | | | — | | | | | — | | | | | — | | | | | — | | | | | 1,299 | | | | | — | |
| | | 14,925 | | | | | 64,325 | | | | | 30,869 | | | | | 1,172,856 | | | | | 80 | | | | | 5,480 | | | | | 13,383 | |
| | | — | | | | | — | | | | | — | | | | | 6,302,380 | | | | | — | | | | | — | | | | | — | |
| | | 5,131,478 | | | | | 164,103 | | | | | 3,172 | | | | | 2,104,837 | | | | | 86,056 | | | | | 84,535 | | | | | 1,614 | |
| | | | | | | | | | | | | | | | | | | | | | | | | | | | | | | | | | |
| | | 2,700 | | | | | 21,291 | | | | | 5,998 | | | | | 221,984 | | | | | 8,925 | | | | | 9,771 | | | | | 3,361 | |
| | | 8,840 | | | | | 11,058 | | | | | 3,213 | | | | | 28,879 | | | | | 5,631 | | | | | 9,267 | | | | | 2,089 | |
| | | 2,154 | | | | | 8,485 | | | | | 1,495 | | | | | 47,940 | | | | | 2,033 | | | | | 2,514 | | | | | 766 | |
| | | 1,994 | | | | | 4,536 | | | | | 989 | | | | | 58,195 | | | | | 1,379 | | | | | 1,927 | | | | | 627 | |
| | | 101 | | | | | 153 | | | | | 83 | | | | | 986 | | | | | 88 | | | | | 95 | | | | | 75 | |
| | | 1,053 | | | | | 1,832 | | | | | 1,299 | | | | | 20,195 | | | | | 125 | | | | | 30 | | | | | 751 | |
| | | 1,721 | | | | | 4,375 | | | | | 1,008 | | | | | 91,222 | | | | | 753 | | | | | 922 | | | | | 463 | |
| | | 2,510 | | | | | 7,166 | | | | | 1,444 | | | | | 72,251 | | | | | 1,953 | | | | | 2,469 | | | | | 790 | |
| | | | | | | | | | | | | | | | | | | | | | | | | | | | | | | | | | |
| | | 5,167,476 | | | | | 287,324 | | | | | 49,570 | | | | | 10,121,725 | | | | | 107,023 | | | | | 118,309 | | | | | 23,919 | |
| | | | | | | | | | | | | | | | | | | | | | | | | | | | | | | | | | |
| | $ | 27,000,181 | | | | $ | 132,361,767 | | | | $ | 22,798,827 | | | | $ | 1,218,555,151 | | | | $ | 31,287,580 | | | | $ | 37,139,056 | | | | $ | 11,354,117 | |
| | | | | | | | | | | | | | | | | | | | | | | | | | | | | | | | | | |
| | | | | | | | | | | | | | | | | | | | | | | | | | | | | | | | | | |
| | $ | 28,207,482 | | | | $ | 142,075,882 | | | | $ | 24,033,094 | | | | $ | 1,268,471,761 | | | | $ | 31,809,708 | | | | $ | 39,782,301 | | | | $ | 11,268,428 | |
| | | (1,207,301 | ) | | | | (9,714,115 | ) | | | | (1,234,267 | ) | | | | (49,916,610 | ) | | | | (522,128 | ) | | | | (2,643,245 | ) | | | | 85,689 | |
| | | | | | | | | | | | | | | | | | | | | | | | | | | | | | | | | | |
| | $ | 27,000,181 | | | | $ | 132,361,767 | | | | $ | 22,798,827 | | | | $ | 1,218,555,151 | | | | $ | 31,287,580 | | | | $ | 37,139,056 | | | | $ | 11,354,117 | |
| | | | | | | | | | | | | | | | | | | | | | | | | | | | | | | | | | |
| | | | | | | | | | | | | | | | | | | | | | | | | | | | | | | | | | |
| | $ | 5,074,451 | | | | $ | 4,392,929 | | | | $ | 4,350,008 | | | | $ | 68,981,590 | | | | $ | 439,855 | | | | $ | 18,424 | | | | $ | 3,647,469 | |
| | | — | | | | | 1,090,653 | | | | | 487,858 | | | | | 7,463,951 | | | | | 42,281 | | | | | 32,759 | | | | | 1,534 | |
| | | 21,925,730 | | | | | 126,878,185 | | | | | 17,960,961 | | | | | 860,436,774 | | | | | 30,805,444 | | | | | 37,087,873 | | | | | 7,705,114 | |
| | | — | | | | | — | | | | | — | | | | | 35,600 | | | | | — | | | | | — | | | | | — | |
| | | — | | | | | — | | | | | — | | | | | 281,637,236 | | | | | — | | | | | — | | | | | | |
| | | | | | | | | | | | | | | | | | | | | | | | | | | | | | | | | | |
| | $ | 27,000,181 | | | | $ | 132,361,767 | | | | $ | 22,798,827 | | | | $ | 1,218,555,151 | | | | $ | 31,287,580 | | | | $ | 37,139,056 | | | | $ | 11,354,117 | |
| | | | | | | | | | | | | | | | | | | | | | | | | | | | | | | | | | |
| | | | | | | | | | | | | | | | | | | | | | | | | | | | | | | | | | |
| | | 520,559 | | | | | 515,781 | | | | | 458,674 | | | | | 6,766,105 | | | | | 44,828 | | | | | 1,919 | | | | | 368,287 | |
| | | — | | | | | 128,127 | | | | | 51,523 | | | | | 731,028 | | | | | 4,316 | | | | | 3,412 | | | | | 155 | |
| | | 2,248,834 | | | | | 14,896,820 | | | | | 1,892,017 | | | | | 84,353,587 | | | | | 3,140,818 | | | | | 3,857,284 | | | | | 779,113 | |
| | | — | | | | | — | | | | | — | | | | | 3,504 | | | | | — | | | | | — | | | | | — | |
| | | — | | | | | — | | | | | — | | | | | 27,612,809 | | | | | — | | | | | — | | | | | — | |
| | | | | | | | | | | | | | | | | | | | | | | | | | | | | | | | | | |
| | | 2,769,393 | | | | | 15,540,728 | | | | | 2,402,214 | | | | | 119,467,033 | | | | | 3,189,962 | | | | | 3,862,615 | | | | | 1,147,555 | |
| | | | | | | | | | | | | | | | | | | | | | | | | | | | | | | | | | |
| | | | | | | | | | | | | | | | | | | | | | | | | | | | | | | | | | |
| | $ | 9.75 | | | | $ | 8.52 | | | | $ | 9.48 | | | | $ | 10.20 | | | | $ | 9.81 | | | | $ | 9.60 | | | | $ | 9.90 | |
| | | | | | | | | | | | | | | | | | | | | | | | | | | | | | | | | | |
| | $ | — | | | | $ | 8.51 | | | | $ | 9.47 | | | | $ | 10.21 | | | | $ | 9.80 | | | | $ | 9.60 | | | | $ | 9.91 | ** |
| | | | | | | | | | | | | | | | | | | | | | | | | | | | | | | | | | |
| | $ | 9.75 | | | | $ | 8.52 | | | | $ | 9.49 | | | | $ | 10.20 | | | | $ | 9.81 | | | | $ | 9.62 | | | | $ | 9.89 | |
| | | | | | | | | | | | | | | | | | | | | | | | | | | | | | | | | | |
| | $ | — | | | | $ | — | | | | $ | — | | | | $ | 10.16 | | | | $ | — | | | | $ | — | | | | $ | — | |
| | | | | | | | | | | | | | | | | | | | | | | | | | | | | | | | | | |
| | $ | — | | | | $ | — | | | | $ | — | | | | $ | 10.20 | | | | $ | — | | | | $ | — | | | | $ | — | |
| | | | | | | | | | | | | | | | | | | | | | | | | | | | | | | | | | |
| | | 0.50 | % | | | | 2.00 | % | | | | 2.00 | % | | | | 5.75 | % | | | | 2.00 | % | | | | 2.00 | % | | | | 2.00 | % |
| | | | | | | | | | | | | | | | | | | | | | | | | | | | | | | | | | |
| | | | | | | | | | | | | | | | | | | | | | | | | | | | | | | | | | |
| | $ | 9.80 | | | | $ | 8.69 | | | | $ | 9.67 | | | | $ | 10.82 | | | | $ | 10.01 | | | | $ | 9.80 | | | | $ | 10.10 | |
| | | | | | | | | | | | | | | | | | | | | | | | | | | | | | | | | | |
| | $ | 32,071,864 | | | | $ | 132,231,953 | | | | $ | 21,921,746 | | | | $ | 1,235,426,788 | | | | $ | 31,368,583 | | | | $ | 37,783,697 | | | | $ | 11,208,599 | |
119
|
Sterling Capital Funds |
Statements of Assets and Liabilities |
September 30, 2018 |
| | | | | | | | | | |
| | | Sterling Capital
Maryland
Intermediate
Tax-Free Fund | | Sterling Capital
North Carolina
Intermediate
Tax-Free Fund |
Assets: | | | | | | | | | | |
Investments at fair value - unaffiliated (a) | | | $ | 18,853,035 | | | | $ | 171,911,187 | |
Investments at fair value - affiliated (b) | | | | — | | | | | — | |
Interest and dividends receivable - unaffiliated | | | | 218,510 | | | | | 2,663,532 | |
Dividends receivable - affiliated | | | | — | | | | | — | |
Receivable for capital shares issued | | | | 13 | | | | | 25,647 | |
Prepaid and other expenses | | | | 8,094 | | | | | 10,393 | |
| | | | | | | | | | |
Total Assets | | | | 19,079,652 | | | | | 174,610,759 | |
| | | | | | | | | | |
Liabilities: | | | | | | | | | | |
Distributions payable | | | | 20,621 | | | | | 201,576 | |
Payable for investments purchased | | | | — | | | | | — | |
Payable for capital shares redeemed | | | | 227,336 | | | | | 272,826 | |
Accrued expenses and other payables: | | | | | | | | | | |
Investment advisory fees | | | | 5,564 | | | | | 50,201 | |
Administration fees | | | | 1,268 | | | | | 11,439 | |
Audit fees | | | | 1,155 | | | | | 9,402 | |
Compliance service fees | | | | 81 | | | | | 203 | |
Distribution (12b-1) fees | | | | 1,521 | | | | | 10,382 | |
Printing fees | | | | 588 | | | | | 4,935 | |
Transfer agent fees | | | | 888 | | | | | 7,201 | |
Other fees | | | | 3,169 | | | | | 13,879 | |
| | | | | | | | | | |
Total Liabilities | | | | 262,191 | | | | | 582,044 | |
| | | | | | | | | | |
Net Assets | | | $ | 18,817,461 | | | | $ | 174,028,715 | |
| | | | | | | | | | |
Net Assets Consist of: | | | | | | | | | | |
Capital | | | $ | 18,496,086 | | | | $ | 173,256,119 | |
Total distributable earnings | | | | 321,375 | | | | | 772,596 | |
| | | | | | | | | | |
Net Assets | | | $ | 18,817,461 | | | | $ | 174,028,715 | |
| | | | | | | | | | |
Net Assets | | | | | | | | | | |
Class A Shares | | | $ | 4,991,275 | | | | $ | 36,857,143 | |
Class C Shares | | | | 590,518 | | | | | 3,359,117 | |
Institutional Shares | | | | 13,235,668 | | | | | 133,812,455 | |
| | | | | | | | | | |
Total | | | $ | 18,817,461 | | | | $ | 174,028,715 | |
| | | | | | | | | | |
Shares of Beneficial Interest Outstanding (Unlimited number of shares authorized, no par value) | | | | | | | | | | |
Class A Shares | | | | 470,106 | | | | | 3,533,899 | |
Class C Shares | | | | 55,603 | | | | | 322,302 | |
Institutional Shares | | | | 1,244,543 | | | | | 12,830,463 | |
| | | | | | | | | | |
Total | | | | 1,770,252 | | | | | 16,686,664 | |
| | | | | | | | | | |
Net Asset Value | | | | | | | | | | |
Class A Shares - redemption price per share | | | $ | 10.62 | | | | $ | 10.43 | |
| | | | | | | | | | |
Class C Shares - offering price per share* | | | $ | 10.62 | | | | $ | 10.42 | |
| | | | | | | | | | |
Institutional Shares | | | $ | 10.63 | | | | $ | 10.43 | |
| | | | | | | | | | |
Maximum Sales Charge - Class A Shares | | | | 2.00 | % | | | | 2.00 | % |
| | | | | | | | | | |
Maximum Offering Price (100%/(100% - Maximum Sales Charge)) of net asset value adjusted to the nearest cent per share - Class A Shares | | | $ | 10.84 | | | | $ | 10.64 | |
| | | | | | | | | | |
Investments at cost: | | | | | | | | | | |
(a) Investments at cost - unaffiliated | | | $ | 18,771,684 | | | | $ | 169,939,689 | |
(b) Investments at cost - affiliated | | | $ | — | | | | $ | — | |
| * | Redemption price per share varies by length of time shares are held. |
See accompanying Notes to the Financial Statements.
120
| | | | | | | | | | | | | | | | | | | | | | | | | | | | |
Sterling Capital
South Carolina
Intermediate
Tax-Free Fund | | Sterling Capital
Virginia
Intermediate
Tax-Free Fund | | Sterling Capital
West Virginia
Intermediate
Tax-Free Fund | | Sterling Capital
Diversified
Income Fund | | Sterling Capital
Strategic Allocation
Balanced Fund | | Sterling Capital
Strategic Allocation
Growth Fund |
| | | | | | | | | | | | | | | | | | | | | | | | | | | | | |
| | $ | 77,059,030 | | | | $ | 82,322,835 | | | | $ | 78,608,788 | | | | $ | 20,336,696 | | | | $ | 253,584 | | | | $ | 408,379 | |
| | | — | | | | | — | | | | | — | | | | | — | | | | | 28,995,494 | | | | | 22,475,285 | |
| | | 999,585 | | | | | 968,782 | | | | | 1,101,924 | | | | | 51,755 | | | | | — | | | | | — | |
| | | — | | | | | — | | | | | — | | | | | — | | | | | 29,945 | | | | | 14,505 | |
| | | 50,185 | | | | | 14 | | | | | — | | | | | 3,846 | | | | | 52 | | | | | 116 | |
| | | 6,601 | | | | | 10,191 | | | | | 5,930 | | | | | 2,666 | | | | | 3,925 | | | | | 2,470 | |
| | | | | | | | | | | | | | | | | | | | | | | | | | | | | |
| | | 78,115,401 | | | | | 83,301,822 | | | | | 79,716,642 | | | | | 20,394,963 | | | | | 29,283,000 | | | | | 22,900,755 | |
| | | | | | | | | | | | | | | | | | | | | | | | | | | | | |
| | | | | | | | | | | | | | | | | | | | | | | | | | | | | |
| | | 86,077 | | | | | 107,915 | | | | | 107,077 | | | | | 2,573 | | | | | 98 | | | | | 103 | |
| | | — | | | | | — | | | | | — | | | | | 30,612 | | | | | — | | | | | — | |
| | | 34,030 | | | | | 34,623 | | | | | 12,040 | | | | | 22,579 | | | | | 2,587 | | | | | 769 | |
| | | | | | | | | | | | | | | | | | | | | | | | | | | | | |
| | | 22,822 | | | | | 24,222 | | | | | 23,044 | | | | | 4,212 | | | | | — | | | | | — | |
| | | 5,201 | | | | | 5,520 | | | | | 5,251 | | | | | 1,344 | | | | | — | | | | | — | |
| | | 4,440 | | | | | 4,801 | | | | | 4,516 | | | | | 1,240 | | | | | 1,573 | | | | | 1,229 | |
| | | 133 | | | | | 133 | | | | | 132 | | | | | 82 | | | | | 88 | | | | | 83 | |
| | | 3,673 | | | | | 4,998 | | | | | 5,612 | | | | | 3,453 | | | | | 6,317 | | | | | 4,800 | |
| | | 2,342 | | | | | 2,494 | | | | | 2,364 | | | | | 640 | | | | | 819 | | | | | 639 | |
| | | 3,499 | | | | | 3,368 | | | | | 2,840 | | | | | 1,785 | | | | | 1,554 | | | | | 1,234 | |
| | | 7,798 | | | | | 7,917 | | | | | 7,184 | | | | | 781 | | | | | 1,400 | | | | | 1,159 | |
| | | | | | | | | | | | | | | | | | | | | | | | | | | | | |
| | | 170,015 | | | | | 195,991 | | | | | 170,060 | | | | | 69,301 | | | | | 14,436 | | | | | 10,016 | |
| | | | | | | | | | | | | | | | | | | | | | | | | | | | | |
| | $ | 77,945,386 | | | | $ | 83,105,831 | | | | $ | 79,546,582 | | | | $ | 20,325,662 | | | | $ | 29,268,564 | | | | $ | 22,890,739 | |
| | | | | | | | | | | | | | | | | | | | | | | | | | | | | |
| | | | | | | | | | | | | | | | | | | | | | | | | | | | | |
| | $ | 78,199,395 | | | | $ | 82,672,650 | | | | $ | 78,873,750 | | | | $ | 20,806,700 | | | | $ | 29,399,706 | | | | $ | 24,583,739 | |
| | | (254,009 | ) | | | | 433,181 | | | | | 672,832 | | | | | (481,038 | ) | | | | (131,142 | ) | | | | (1,693,000 | ) |
| | | | | | | | | | | | | | | | | | | | | | | | | | | | | |
| | $ | 77,945,386 | | | | $ | 83,105,831 | | | | $ | 79,546,582 | | | | $ | 20,325,662 | | | | $ | 29,268,564 | | | | $ | 22,890,739 | |
| | | | | | | | | | | | | | | | | | | | | | | | | | | | | |
| | | | | | | | | | | | | | | | | | | | | | | | | | | | | |
| | $ | 13,863,649 | | | | $ | 20,842,244 | | | | $ | 23,832,658 | | | | $ | 12,467,770 | | | | $ | 28,469,879 | | | | $ | 21,714,765 | |
| | | 991,340 | | | | | 843,958 | | | | | 725,612 | | | | | 1,051,280 | | | | | 575,968 | | | | | 427,247 | |
| | | 63,090,397 | | | | | 61,419,629 | | | | | 54,988,312 | | | | | 6,806,612 | | | | | 222,717 | | | | | 748,727 | |
| | | | | | | | | | | | | | | | | | | | | | | | | | | | | |
| | $ | 77,945,386 | | | | $ | 83,105,831 | | | | $ | 79,546,582 | | | | $ | 20,325,662 | | | | $ | 29,268,564 | | | | $ | 22,890,739 | |
| | | | | | | | | | | | | | | | | | | | | | | | | | | | | |
| | | | | | | | | | | | | | | | | | | | | | | | | | | | | |
| | | 1,287,477 | | | | | 1,828,475 | | | | | 2,451,914 | | | | | 1,173,122 | | | | | 2,356,694 | | | | | 1,772,251 | |
| | | 92,106 | | | | | 74,052 | | | | | 74,623 | | | | | 99,773 | | | | | 48,623 | | | | | 36,234 | |
| | | 5,899,451 | | | | | 5,389,785 | | | | | 5,650,763 | | | | | 632,332 | | | | | 18,293 | | | | | 60,968 | |
| | | | | | | | | | | | | | | | | | | | | | | | | | | | | |
| | | 7,279,034 | | | | | 7,292,312 | | | | | 8,177,300 | | | | | 1,905,227 | | | | | 2,423,610 | | | | | 1,869,453 | |
| | | | | | | | | | | | | | | | | | | | | | | | | | | | | |
| | | | | | | | | | | | | | | | | | | | | | | | | | | | | |
| | $ | 10.77 | | | | $ | 11.40 | | | | $ | 9.72 | | | | $ | 10.63 | | | | $ | 12.08 | | | | $ | 12.25 | |
| | | | | | | | | | | | | | | | | | | | | | | | | | | | | |
| | $ | 10.76 | | | | $ | 11.40 | | | | $ | 9.72 | | | | $ | 10.54 | | | | $ | 11.85 | | | | $ | 11.79 | |
| | | | | | | | | | | | | | | | | | | | | | | | | | | | | |
| | $ | 10.69 | | | | $ | 11.40 | | | | $ | 9.73 | | | | $ | 10.76 | | | | $ | 12.17 | | | | $ | 12.28 | |
| | | | | | | | | | | | | | | | | | | | | | | | | | | | | |
| | | 2.00 | % | | | | 2.00 | % | | | | 2.00 | % | | | | 5.75 | % | | | | 5.75 | % | | | | 5.75 | % |
| | | | | | | | | | | | | | | | | | | | | | | | | | | | | |
| | | | | | | | | | | | | | | | | | | | | | | | | | | | | |
| | $ | 10.99 | | | | $ | 11.63 | | | | $ | 9.92 | | | | $ | 11.28 | | | | $ | 12.82 | | | | $ | 13.00 | |
| | | | | | | | | | | | | | | | | | | | | | | | | | | | | |
| | | | | | | | | | | | | | | | | | | | | | | | | | | | | |
| | $ | 76,741,164 | | | | $ | 81,552,375 | | | | $ | 78,133,652 | | | | $ | 19,793,755 | | | | $ | 253,584 | | | | $ | 408,379 | |
| | $ | — | | | | $ | — | | | | $ | — | | | | $ | — | | | | $ | 25,912,241 | | | | $ | 19,442,664 | |
121
|
Sterling Capital Funds |
Statements of Operations |
For the year Ended September 30, 2018 |
| | | | | | | | | | |
| | | Sterling Capital
Behavioral Large Cap
Value Equity Fund | | Sterling Capital
Mid
Value Fund |
Investment Income: | | | | | | | | | | |
Dividend income | | | | 7,263,861 | | | | | 7,153,652 | |
Foreign tax withholding | | | | — | | | | | — | |
| | | | | | | | | | |
Total investment income | | | | 7,263,861 | | | | | 7,153,652 | |
| | | | | | | | | | |
Expenses: | | | | | | | | | | |
Investment advisory fees (See Note 6) | | | | 1,418,500 | | | | | 4,954,466 | |
Administration fees (See Note 6) | | | | 253,589 | | | | | 569,469 | |
Distribution fees - Class A Shares (See Note 6) | | | | 84,604 | | | | | 81,466 | |
Distribution fees - Class C Shares (See Note 6) | | | | 9,284 | | | | | 43,474 | |
Distribution fees - Class R Shares (See Note 6) | | | | — | | | | | 11 | |
Compliance service fees (See Note 6) | | | | 2,945 | | | | | 6,921 | |
Trustee fees | | | | 25,306 | | | | | 58,572 | |
Accounting and out-of-pocket fees | | | | 11,727 | | | | | 18,949 | |
Audit fees | | | | 25,794 | | | | | 57,972 | |
Custodian fees | | | | 14,865 | | | | | 33,322 | |
Fund accounting fees (See Note 6) | | | | 23,642 | | | | | 53,084 | |
Interest expense (See Note 8) | | | | — | | | | | — | |
Legal fees | | | | 33,900 | | | | | 77,863 | |
Printing fees | | | | 18,974 | | | | | 46,068 | |
Registration fees | | | | 42,656 | | | | | 59,683 | |
Transfer agent fees (See Note 6) | | | | 71,578 | | | | | 512,383 | |
Other fees | | | | 25,296 | | | | | 47,491 | |
| | | | | | | | | | |
Total expenses before waivers | | | | 2,062,660 | | | | | 6,621,194 | |
Less expenses waived by the Investment Advisor (See Note 6) | | | | — | | | | | — | |
Less expenses waived by the Administrator (See Note 6) | | | | (54,966 | ) | | | | (130,510 | ) |
| | | | | | | | | | |
Net expenses | | | | 2,007,694 | | | | | 6,490,684 | |
| | | | | | | | | | |
Net investment income (loss) | | | | 5,256,167 | | | | | 662,968 | |
| | | | | | | | | | |
Realized and Unrealized Gain (Loss): | | | | | | | | | | |
Net realized gain (loss) from: | | | | | | | | | | |
Investments | | | | 28,260,872 | | | | | 47,322,662 | |
Written options | | | | — | | | | | — | |
Foreign currency transactions | | | | — | | | | | — | |
Change in unrealized appreciation/depreciation on: | | | | | | | | | | |
Investments | | | | (421,809 | ) | | | | 2,857,171 | |
Written options | | | | — | | | | | — | |
Foreign currency transactions | | | | — | | | | | — | |
| | | | | | | | | | |
Total realized and unrealized gain (loss) | | | | 27,839,063 | | | | | 50,179,833 | |
| | | | | | | | | | |
Change in net assets from operations | | | $ | 33,095,230 | | | | $ | 50,842,801 | |
| | | | | | | | | | |
See accompanying Notes to the Financial Statements.
122
| | | | | | | | | | | | | | | | | | | | | | | | | | | | |
Sterling Capital
Behavioral Small Cap
Value Equity Fund | | Sterling Capital
Special
Opportunities Fund | | Sterling Capital
Equity
Income Fund | | Sterling Capital
Behavioral International
Equity Fund | | Sterling Capital
SMID
Opportunities Fund | | Sterling Capital
Stratton Mid Cap
Value Fund |
| | | | | | | | | | | | | | | | | | | | | | | | | | | | | |
| | | 4,485,260 | | | | $ | 13,591,072 | | | | | 43,812,236 | | | | | 3,473,840 | | | | | 61,463 | | | | | 920,377 | |
| | | (501 | ) | | | | (7,624 | ) | | | | (523,803 | ) | | | | (274,052 | ) | | | | (588 | ) | | | | (3,138 | ) |
| | | | | | | | | | | | | | | | | | | | | | | | | | | | | |
| | | 4,484,759 | | | | | 13,583,448 | | | | | 43,288,433 | | | | | 3,199,788 | | | | | 60,875 | | | | | 917,239 | |
| | | | | | | | | | | | | | | | | | | | | | | | | | | | | |
| | | | | | | | | | | | | | | | | | | | | | | | | | | | | |
| | | 1,389,188 | | | | | 7,586,696 | | | | | 8,838,157 | | | | | 506,433 | | | | | 64,721 | | | | | 475,877 | |
| | | 186,239 | | | | | 938,949 | | | | | 1,292,670 | | | | | 67,906 | | | | | 7,439 | | | | | 54,690 | |
| | | 22,572 | | | | | 842,861 | | | | | 834,437 | | | | | 1,680 | | | | | 8,142 | | | | | 266 | |
| | | 1,832 | | | | | 1,457,811 | | | | | 2,182,705 | | | | | 617 | | | | | 14,200 | | | | | 14 | |
| | | 252 | | | | | 1,325 | | | | | 16,236 | | | | | — | | | | | — | | | | | — | |
| | | 2,289 | | | | | 11,425 | | | | | 16,008 | | | | | 1,097 | | | | | 489 | | | | | 1,092 | |
| | | 18,264 | | | | | 96,005 | | | | | 132,122 | | | | | 6,784 | | | | | 770 | | | | | 5,641 | |
| | | 14,157 | | | | | 28,729 | | | | | 38,914 | | | | | 33,483 | | | | | 2,772 | | | | | 4,982 | |
| | | 18,958 | | | | | 95,494 | | | | | 131,839 | | | | | 6,877 | | | | | 682 | | | | | 5,548 | |
| | | 10,928 | | | | | 55,030 | | | | | 75,657 | | | | | 31,142 | | | | | 436 | | | | | 3,221 | |
| | | 17,365 | | | | | 87,539 | | | | | 120,520 | | | | | 6,330 | | | | | 693 | | | | | 5,099 | |
| | | — | | | | | — | | | | | 3,020 | | | | | 204 | | | | | — | | | | | — | |
| | | 24,836 | | | | | 128,417 | | | | | 178,104 | | | | | 8,964 | | | | | 1,107 | | | | | 7,605 | |
| | | 14,475 | | | | | 75,103 | | | | | 101,213 | | | | | 5,374 | | | | | 1,217 | | | | | 4,783 | |
| | | 35,035 | | | | | 99,382 | | | | | 74,643 | | | | | 7,655 | | | | | 3,099 | | | | | 20,571 | |
| | | 62,339 | | | | | 770,964 | | | | | 1,313,882 | | | | | 17,684 | | | | | 8,960 | | | | | 47,919 | |
| | | 20,565 | | | | | 71,678 | | | | | 97,112 | | | | | 20,729 | | | | | 3,482 | | | | | 8,169 | |
| | | | | | | | | | | | | | | | | | | | | | | | | | | | | |
| | | 1,839,294 | | | | | 12,347,408 | | | | | 15,447,239 | | | | | 722,959 | | | | | 118,209 | | | | | 645,477 | |
| | | — | | | | | — | | | | | — | | | | | (168,811 | ) | | | | (22,698 | ) | | | | — | |
| | | (48,013 | ) | | | | (118,528 | ) | | | | (160,073 | ) | | | | (13,082 | ) | | | | — | | | | | — | |
| | | | | | | | | | | | | | | | | | | | | | | | | | | | | |
| | | 1,791,281 | | | | | 12,228,880 | | | | | 15,287,166 | | | | | 541,066 | | | | | 95,511 | | | | | 645,477 | |
| | | | | | | | | | | | | | | | | | | | | | | | | | | | | |
| | | 2,693,478 | | | | | 1,354,568 | | | | | 28,001,267 | | | | | 2,658,722 | | | | | (34,636 | ) | | | | 271,762 | |
| | | | | | | | | | | | | | | | | | | | | | | | | | | | | |
| | | | | | | | | | | | | | | | | | | | | | | | | | | | | |
| | | | | | | | | | | | | | | | | | | | | | | | | | | | | |
| | | 25,196,365 | | | | | 94,144,139 | | | | | 155,810,534 | | | | | 3,061,628 | | | | | 35,926 | | | | | 4,739,674 | |
| | | — | | | | | 484,147 | | | | | 321,432 | | | | | — | | | | | — | | | | | — | |
| | | — | | | | | — | | | | | — | | | | | (76,103 | ) | | | | — | | | | | — | |
| | | | | | | | | | | | | | | | | | | | | | | | | | | | | |
| | | (15,060,171 | ) | | | | 89,731,290 | | | | | 46,082,607 | | | | | (6,854,855 | ) | | | | 672,203 | | | | | 52,071 | |
| | | — | | | | | 323,969 | | | | | 62,202 | | | | | — | | | | | — | | | | | — | |
| | | — | | | | | — | | | | | — | | | | | (5,967 | ) | | | | — | | | | | — | |
| | | | | | | | | | | | | | | | | | | | | | | | | | | | | |
| | | 10,136,194 | | | | | 184,683,545 | | | | | 202,276,775 | | | | | (3,875,297 | ) | | | | 708,129 | | | | | 4,791,745 | |
| | | | | | | | | | | | | | | | | | | | | | | | | | | | | |
| | $ | 12,829,672 | | | | $ | 186,038,113 | | | | $ | 230,278,042 | | | | $ | (1,216,575 | ) | | | $ | 673,493 | | | | $ | 5,063,507 | |
| | | | | | | | | | | | | | | | | | | | | | | | | | | | | |
123
|
Sterling Capital Funds |
Statements of Operations |
For the year Ended September 30, 2018 |
| | | | | | | | | | | | | | | | | | | | |
| | | Sterling Capital
Stratton Real
Estate Fund | | Sterling Capital
Stratton Small Cap
Value Fund | | Sterling Capital
Ultra Short
Bond Fund | | Sterling Capital
Short Duration
Bond Fund |
Investment Income: | | | | | | | | | | | | | | | | | | | | |
Interest income | | | | — | | | | $ | — | | | | $ | 770,972 | | | | $ | 2,657,279 | |
Dividend income | | | $ | 2,788,374 | | | | | 16,734,204 | | | | | 13,908 | | | | | 24,918 | |
| | | | | | | | | | | | | | | | | | | | |
Total investment income | | | | 2,788,374 | | | | | 16,734,204 | | | | | 784,880 | | | | | 2,682,197 | |
| | | | | | | | | | | | | | | | | | | | |
Expenses: | | | | | | | | | | | | | | | | | | | | |
Investment advisory fees (See Note 6) | | | | 530,148 | | | | | 10,761,717 | | | | | 76,354 | | | | | 306,819 | |
Administration fees (See Note 6) | | | | 74,183 | | | | | 1,018,450 | | | | | 30,719 | | | | | 82,222 | |
Distribution fees - Class A Shares (See Note 6) | | | | 795 | | | | | 2,800 | | | | | 14,186 | | | | | 12,407 | |
Distribution fees - Class C Shares (See Note 6) | | | | 791 | | | | | 1,102 | | | | | — | | | | | 12,743 | |
Distribution fees - Class R Shares (See Note 6) | | | | — | | | | | — | | | | | — | | | | | — | |
Compliance service fees (See Note 6) | | | | 1,335 | | | | | 13,327 | | | | | 797 | | | | | 1,432 | |
Trustee fees | | | | 7,804 | | | | | 103,589 | | | | | 3,265 | | | | | 8,080 | |
Accounting and out-of-pocket fees | | | | 4,900 | | | | | 31,870 | | | | | 22,000 | | | | | 29,362 | |
Audit fees | | | | 7,320 | | | | | 105,815 | | | | | 3,154 | | | | | 8,355 | |
Custodian fees | | | | 4,344 | | | | | 60,211 | | | | | 1,865 | | | | | 4,850 | |
Fund accounting fees (See Note 6) | | | | 6,915 | | | | | 94,956 | | | | | 2,863 | | | | | 7,671 | |
Interest expense (See Note 8) | | | | 51 | | | | | — | | | | | — | | | | | 4 | |
Legal fees | | | | 10,307 | | | | | 140,270 | | | | | 4,263 | | | | | 11,303 | |
Printing fees | | | | 6,555 | | | | | 78,502 | | | | | 2,683 | | | | | 6,332 | |
Registration fees | | | | 24,467 | | | | | 45,741 | | | | | 27,881 | | | | | 30,141 | |
Transfer agent fees (See Note 6) | | | | 63,507 | | | | | 926,464 | | | | | 11,598 | | | | | 31,991 | |
Other fees | | | | 9,831 | | | | | 52,398 | | | | | 6,729 | | | | | 9,512 | |
| | | | | | | | | | | | | | | | | | | | |
Total expenses before waivers | | | | 753,253 | | | | | 13,437,212 | | | | | 208,357 | | | | | 563,224 | |
Less expenses waived by the Investment Advisor (See Note 6) | | | | — | | | | | (429,913 | ) | | | | (38,177 | ) | | | | (102,273 | ) |
Less expenses waived by the Administrator (See Note 6) | | | | — | | | | | — | | | | | — | | | | | — | |
| | | | | | | | | | | | | | | | | | | | |
Net expenses | | | | 753,253 | | | | | 13,007,299 | | | | | 170,180 | | | | | 460,951 | |
| | | | | | | | | | | | | | | | | | | | |
Net investment income | | | | 2,035,121 | | | | | 3,726,905 | | | | | 614,700 | | | | | 2,221,246 | |
| | | | | | | | | | | | | | | | | | | | |
Realized and Unrealized Gain (Loss): | | | | | | | | | | | | | | | | | | | | |
Net realized gain (loss) from: | | | | | | | | | | | | | | | | | | | | |
Investments | | | | 2,932,979 | | | | | 106,702,424 | | | | | (53,414 | ) | | | | (189,432 | ) |
Change in unrealized appreciation/depreciation on investments | | | | 433,930 | | | | | (17,527,452 | ) | | | | (14,558 | ) | | | | (983,819 | ) |
| | | | | | | | | | | | | | | | | | | | |
Total realized and unrealized gain | | | | 3,366,909 | | | | | 89,174,972 | | | | | (67,972 | ) | | | | (1,173,251 | ) |
| | | | | | | | | | | | | | | | | | | | |
Change in net assets from operations | | | $ | 5,402,030 | | | | $ | 92,901,877 | | | | $ | 546,728 | | | | $ | 1,047,995 | |
| | | | | | | | | | | | | | | | | | | | |
See accompanying Notes to the Financial Statements.
124
| | | | | | | | | | | | | | | | | | | | | | | |
Sterling Capital
Intermediate U.S.
Government Fund | | Sterling Capital
Total Return
Bond Fund | | Sterling Capital
Corporate
Fund | | Sterling Capital
Securitized
Opportunities Fund | | Sterling Capital
Kentucky Intermediate
Tax-Free Fund |
| | | | | | | | | | | | | | | | | | | | | | | | |
| | $ | 538,103 | | | | $ | 37,689,641 | | | | $ | 1,078,404 | | | | $ | 1,348,587 | | | | $ | 343,049 | |
| | | 6,284 | | | | | 363,010 | | | | | 5,639 | | | | | 6,168 | | | | | 6,107 | |
| | | | | | | | | | | | | | | | | | | | | | | | |
| | | 544,387 | | | | | 38,052,651 | | | | | 1,084,043 | | | | | 1,354,755 | | | | | 349,156 | |
| | | | | | | | | | | | | | | | | | | | | | | | |
| | | | | | | | | | | | | | | | | | | | | | | | |
| | | 66,115 | | | | | 4,301,010 | | | | | 99,378 | | | | | 133,645 | | | | | 42,479 | |
| | | 16,621 | | | | | 935,098 | | | | | 22,842 | | | | | 30,721 | | | | | 9,765 | |
| | | 12,010 | | | | | 181,063 | | | | | 981 | | | | | 122 | | | | | 9,793 | |
| | | 5,108 | | | | | 74,289 | | | | | 424 | | | | | 332 | | | | | 15 | |
| | | — | | | | | 46 | | | | | — | | | | | — | | | | | — | |
| | | 604 | | | | | 11,699 | | | | | 683 | | | | | 786 | | | | | 520 | |
| | | 1,720 | | | | | 94,532 | | | | | 2,354 | | | | | 3,239 | | | | | 1,029 | |
| | | 9,047 | | | | | 88,416 | | | | | 16,482 | | | | | 23,552 | | | | | 6,728 | |
| | | 1,702 | | | | | 94,557 | | | | | 2,327 | | | | | 3,137 | | | | | 996 | |
| | | 975 | | | | | 55,471 | | | | | 1,330 | | | | | 1,808 | | | | | 571 | |
| | | 1,549 | | | | | 87,183 | | | | | 2,130 | | | | | 2,864 | | | | | 910 | |
| | | — | | | | | — | | | | | 26 | | | | | 22 | | | | | — | |
| | | 7,482 | | | | | 135,277 | | | | | 3,291 | | | | | 4,445 | | | | | 1,351 | |
| | | 1,811 | | | | | 73,413 | | | | | 2,092 | | | | | 2,590 | | | | | 1,244 | |
| | | 16,982 | | | | | 56,692 | | | | | 15,039 | | | | | 15,996 | | | | | 9,971 | |
| | | 7,589 | | | | | 658,362 | | | | | 6,552 | | | | | 8,361 | | | | | 3,499 | |
| | | 5,183 | | | | | 67,157 | | | | | 5,547 | | | | | 5,815 | | | | | 3,485 | |
| | | | | | | | | | | | | | | | | | | | | | | | |
| | | 154,498 | | | | | 6,914,265 | | | | | 181,478 | | | | | 237,435 | | | | | 92,356 | |
| | | | | | | | | | | | | | | | | | | | | | | | |
| | | (2,541 | ) | | | | (1,383,726 | ) | | | | — | | | | | (15,274 | ) | | | | — | |
| | | | | | | | | | | | | | | | | | | | | | | | |
| | | — | | | | | (147,010 | ) | | | | — | | | | | — | | | | | — | |
| | | | | | | | | | | | | | | | | | | | | | | | |
| | | 151,957 | | | | | 5,383,529 | | | | | 181,478 | | | | | 222,161 | | | | | 92,356 | |
| | | | | | | | | | | | | | | | | | | | | | | | |
| | | 392,430 | | | | | 32,669,122 | | | | | 902,565 | | | | | 1,132,594 | | | | | 256,800 | |
| | | | | | | | | | | | | | | | | | | | | | | | |
| | | | | | | | | | | | | | | | | | | | | | | | |
| | | | | | | | | | | | | | | | | | | | | | | | |
| | | (131,836 | ) | | | | (6,406,390 | ) | | | | (123,986 | ) | | | | (144,404 | ) | | | | 70,740 | |
| | | | | | | | | | | | | | | | | | | | | | | | |
| | | (550,383 | ) | | | | (34,574,914 | ) | | | | (883,886 | ) | | | | (1,096,353 | ) | | | | (478,198 | ) |
| | | | | | | | | | | | | | | | | | | | | | | | |
| | | (682,219 | ) | | | | (40,981,304 | ) | | | | (1,007,872 | ) | | | | (1,240,757 | ) | | | | (407,458 | ) |
| | | | | | | | | | | | | | | | | | | | | | | | |
| | $ | (289,789 | ) | | | $ | (8,312,182 | ) | | | $ | (105,307 | ) | | | $ | (108,163 | ) | | | $ | (150,658 | ) |
| | | | | | | | | | | | | | | | | | | | | | | | |
125
|
Sterling Capital Funds |
Statements of Operations |
For the year Ended September 30, 2018 |
| | | | | | | | | | |
| | | Sterling Capital
Maryland
Intermediate
Tax-Free Fund | | Sterling Capital
North Carolina
Intermediate
Tax-Free Fund |
Investment Income: | | | | | | | | | | |
Interest income | | | $ | 588,267 | | | | $ | 5,407,365 | |
Dividend income - unaffiliated | | | | 7,044 | | | | | 41,883 | |
Dividend income - affiliated* | | | | — | | | | | — | |
| | | | | | | | | | |
Total investment income | | | | 595,311 | | | | | 5,449,248 | |
| | | | | | | | | | |
Expenses: | | | | | | | | | | |
Investment advisory fees (See Note 6) | | | | 75,313 | | | | | 631,224 | |
Administration fees (See Note 6) | | | | 17,317 | | | | | 145,120 | |
Distribution fees - Class A Shares (See Note 6) | | | | 13,560 | | | | | 102,189 | |
Distribution fees - Class C Shares (See Note 6) | | | | 6,310 | | | | | 39,548 | |
Compliance service fees (See Note 6) | | | | 615 | | | | | 2,241 | |
Trustee fees | | | | 1,865 | | | | | 15,431 | |
Accounting and out-of-pocket fees | | | | 7,027 | | | | | 21,405 | |
Audit fees | | | | 1,778 | | | | | 14,798 | |
Custodian fees | | | | 1,001 | | | | | 8,375 | |
Fund accounting fees (See Note 6) | | | | 1,614 | | | | | 13,526 | |
Interest expense (See Note 8) | | | | — | | | | | — | |
Legal fees | | | | 2,410 | | | | | 22,935 | |
Printing fees | | | | 1,780 | | | | | 10,856 | |
Registration fees | | | | 12,880 | | | | | 12,149 | |
Transfer agent fees (See Note 6) | | | | 6,785 | | | | | 56,376 | |
Other fees | | | | 4,630 | | | | | 13,731 | |
| | | | | | | | | | |
Total expenses before waivers | | | | 154,885 | | | | | 1,109,904 | |
Less expenses waived by the Investment Advisor (See Note 6) | | | | — | | | | | — | |
| | | | | | | | | | |
Net expenses | | | | 154,885 | | | | | 1,109,904 | |
| | | | | | | | | | |
Net investment income | | | | 440,426 | | | | | 4,339,344 | |
| | | | | | | | | | |
Realized and Unrealized Gain (Loss): | | | | | | | | | | |
Net realized gain (loss) from: | | | | | | | | | | |
Investments - unaffiliated | | | | 293,987 | | | | | 11,029 | |
Investments - affiliated | | | | — | | | | | — | |
Distributions from affiliated funds | | | | — | | | | | — | |
Change in unrealized appreciation/depreciation on investments | | | | (986,187 | ) | | | | (6,002,811 | ) |
| | | | | | | | | | |
Total realized and unrealized gain | | | | (692,200 | ) | | | | (5,991,782 | ) |
| | | | | | | | | | |
Change in net assets from operations | | | $ | (251,774 | ) | | | $ | (1,652,438 | ) |
| | | | | | | | | | |
* This dividend income is derived from affiliates other than controlled companies.
See accompanying Notes to the Financial Statements.
126
| | | | | | | | | | | | | | | | | | | | | | | | | | | | |
Sterling Capital
South Carolina
Intermediate
Tax-Free Fund | | Sterling Capital
Virginia
Intermediate
Tax-Free Fund | | Sterling Capital
West Virginia
Intermediate
Tax-Free Fund | | Sterling Capital
Diversified
Income Fund | | Sterling Capital
Strategic Allocation
Balanced
Fund | | Sterling Capital
Strategic Allocation
Growth Fund |
| | | | | | | | | | | | | | | | | | | | | | | | | | | | | |
| | $ | 2,235,936 | | | | $ | 2,488,357 | | | | $ | 2,504,330 | | | | $ | — | | | | $ | — | | | | $ | — | |
| | | 26,954 | | | | | 19,935 | | | | | 17,479 | | | | | 918,650 | | | | | 5,738 | | | | | 3,934 | |
| | | — | | | | | — | | | | | — | | | | | — | | | | | 701,026 | | | | | 507,680 | |
| | | | | | | | | | | | | | | | | | | | | | | | | | | | | |
| | | 2,262,890 | | | | | 2,508,292 | | | | | 2,521,809 | | | | | 918,650 | | | | | 706,764 | | | | | 511,614 | |
| | | | | | | | | | | | | | | | | | | | | | | | | | | | | |
| | | | | | | | | | | | | | | | | | | | | | | | | | | | | |
| | | 298,309 | | | | | 317,513 | | | | | 300,562 | | | | | 57,349 | | | | | 75,417 | | | | | 58,984 | |
| | | 68,579 | | | | | 73,005 | | | | | 69,101 | | | | | 18,460 | | | | | — | | | | | — | |
| | | 38,170 | | | | | 59,031 | | | | | 69,373 | | | | | 34,143 | | | | | 73,300 | | | | | 56,127 | |
| | | 12,880 | | | | | 8,771 | | | | | 7,262 | | | | | 11,156 | | | | | 7,022 | | | | | 4,162 | |
| | | 1,276 | | | | | 1,325 | | | | | 1,280 | | | | | 630 | | | | | 704 | | | | | 637 | |
| | | 7,271 | | | | | 7,819 | | | | | 7,342 | | | | | 1,963 | | | | | 2,548 | | | | | 1,987 | |
| | | 13,796 | | | | | 13,193 | | | | | 12,155 | | | | | 2,031 | | | | | 2,063 | | | | | 1,910 | |
| | | 6,990 | | | | | 7,471 | | | | | 7,063 | | | | | 1,911 | | | | | 2,472 | | | | | 1,928 | |
| | | 3,997 | | | | | 4,226 | | | | | 4,025 | | | | | 1,083 | | | | | 1,410 | | | | | 1,105 | |
| | | 6,392 | | | | | 6,804 | | | | | 6,441 | | | | | 1,721 | | | | | 2,263 | | | | | 1,770 | |
| | | — | | | | | — | | | | | — | | | | | — | | | | | 28 | | | | | 52 | |
| | | 9,451 | | | | | 10,158 | | | | | 9,596 | | | | | 2,579 | | | | | 3,414 | | | | | 2,666 | |
| | | 5,585 | | | | | 5,818 | | | | | 5,574 | | | | | 1,964 | | | | | 2,726 | | | | | 2,349 | |
| | | 10,757 | | | | | 14,630 | | | | | 15,708 | | | | | 17,926 | | | | | 14,387 | | | | | 16,087 | |
| | | 28,527 | | | | | 27,895 | | | | | 23,335 | | | | | 14,129 | | | | | 11,830 | | | | | 9,785 | |
| | | 7,836 | | | | | 8,890 | | | | | 8,385 | | | | | 5,412 | | | | | 5,035 | | | | | 4,849 | |
| | | | | | | | | | | | | | | | | | | | | | | | | | | | | |
| | | 519,816 | | | | | 566,549 | | | | | 547,202 | | | | | 172,457 | | | | | 204,619 | | | | | 164,398 | |
| | | — | | | | | — | | | | | — | | | | | (2,302 | ) | | | | (75,416 | ) | | | | (58,984 | ) |
| | | | | | | | | | | | | | | | | | | | | | | | | | | | | |
| | | 519,816 | | | | | 566,549 | | | | | 547,202 | | | | | 170,155 | | | | | 129,203 | | | | | 105,414 | |
| | | | | | | | | | | | | | | | | | | | | | | | | | | | | |
| | | 1,743,074 | | | | | 1,941,743 | | | | | 1,974,607 | | | | | 748,495 | | | | | 577,561 | | | | | 406,200 | |
| | | | | | | | | | | | | | | | | | | | | | | | | | | | | |
| | | | | | | | | | | | | | | | | | | | | | | | | | | | | |
| | | | | | | | | | | | | | | | | | | | | | | | | | | | | |
| | | (17,226 | ) | | | | 107,829 | | | | | 124,013 | | | | | 139,840 | | | | | 441 | | | | | 67 | |
| | | — | | | | | — | | | | | — | | | | | — | | | | | 233,478 | | | | | 201,380 | |
| | | — | | | | | — | | | | | — | | | | | — | | | | | 757,415 | | | | | 758,611 | |
| | | (2,585,296 | ) | | | | (3,023,583 | ) | | | | (2,851,084 | ) | | | | (390,086 | ) | | | | (419,774 | ) | | | | (185,060 | ) |
| | | | | | | | | | | | | | | | | | | | | | | | | | | | | |
| | | (2,602,522 | ) | | | | (2,915,754 | ) | | | | (2,727,071 | ) | | | | (250,246 | ) | | | | 571,560 | | | | | 774,998 | |
| | | | | | | | | | | | | | | | | | | | | | | | | | | | | |
| | $ | (859,448 | ) | | | $ | (974,011 | ) | | | $ | (752,464 | ) | | | $ | 498,249 | | | | $ | 1,149,121 | | | | $ | 1,181,198 | |
| | | | | | | | | | | | | | | | | | | | | | | | | | | | | |
127
|
Sterling Capital Funds |
Statements of Changes in Net Assets |
| |
| | | | | | | | |
| | | Sterling Capital
Behavioral Large Cap
Value Equity Fund | |
| | |
| | | For the | | | For the | |
| | | Year Ended | | | Year Ended | |
| | | September 30, | | | September 30, | |
| | | 2018 | | | 2017 | |
From Investment Activities: | | | | | | | | |
Operations: | | | | | | | | |
Net investment income | | $ | 5,256,167 | | | $ | 6,076,557 | |
Net realized gain (loss) | | | 28,260,872 | | | | 19,515,133 | |
Change in unrealized appreciation/depreciation | | | (421,809 | ) | | | 25,080,854 | |
| | | | | | | | |
Change in net assets from operations | | | 33,095,230 | | | | 50,672,544 | |
| | | | | | | | |
Distributions to Shareholders*: | | | | | | | | |
Class A | | | (990,196 | ) | | | (491,567 | ) |
Class B | | | — | | | | (643 | ) |
Class C | | | (21,258 | ) | | | (8,310 | ) |
Institutional Class | | | (6,190,611 | ) | | | (4,597,729 | ) |
Class R | | | — | | | | — | |
Class R6 | | | (2,717,325 | ) | | | — | |
| | | | | | | | |
Change in net assets from shareholder distributions | | $ | (9,919,390 | ) | | $ | (5,098,249 | ) |
| | | | | | | | |
Capital Transactions: | | | | | | | | |
Change in net assets from capital transactions | | | (17,023,853 | ) | | | (11,005,526 | ) |
| | | | | | | | |
Change in net assets | | | 6,151,987 | | | | 34,568,769 | |
| | |
Net Assets: | | | | | | | | |
Beginning of year | | | 306,827,488 | | | | 272,258,719 | |
| | | | | | | | |
End of year | | | 312,979,475 | | | | 306,827,488 | |
| | | | | | | | |
*Distribution classification for the year ended September 30, 2017 can be found in Note 2.
See accompanying Notes to the Financial Statements.
128
| | | | | | | | | | | | | | | | | | | | | | |
| Sterling Capital | | | Sterling Capital | | | Sterling Capital | |
| Mid Value | | | Behavioral Small Cap | | | Special Opportunities | |
| Fund | | | Value Equity Fund | | | Fund | |
| | | | | |
| For the | | | For the | | | For the | | | For the | | | For the | | | For the | |
| Year Ended | | | Year Ended | | | Year Ended | | | Year Ended | | | Year Ended | | | Year Ended | |
| September 30, | | | September 30, | | | September 30, | | | September 30, | | | September 30, | | | September 30, | |
| 2018 | | | 2017 | | | 2018 | | | 2017 | | | 2018 | | | 2017 | |
| | | | | | | | | | | | | | | | | | | | | | |
| | | | | | | | | | | | | | | | | | | | | | |
| $ | 662,968 | | | $ | 859,274 | | | $ | 2,693,478 | | | $ | 1,965,199 | | | $ | 1,354,568 | | | $ | 1,013,494 | |
| | 47,322,662 | | | | 36,656,141 | | | | 25,196,365 | | | | 11,740,082 | | | | 94,628,286 | | | | 93,847,885 | |
| | 2,857,171 | | | | 53,440,681 | | | | (15,060,171 | ) | | | 24,476,737 | | | | 90,055,259 | | | | 72,606,728 | |
| | | | | | | | | | | | | | | | | | | | | | |
| | 50,842,801 | | | | 90,956,096 | | | | 12,829,672 | | | | 38,182,018 | | | | 186,038,113 | | | | 167,468,107 | |
| | | | | | | | | | | | | | | | | | | | | | |
| | | | | | | | | | | | | | | | | | | | | | |
| | (1,456,516 | ) | | | (991,131 | ) | | | (376,877 | ) | | | (48,544 | ) | | | (28,254,937 | ) | | | (6,462,864 | ) |
| | — | | | | (7,484 | ) | | | — | | | | (127 | ) | | | — | | | | (26,525 | ) |
| | (215,133 | ) | | | (179,472 | ) | | | (6,737 | ) | | | (1,321 | ) | | | (14,014,589 | ) | | | (3,913,050 | ) |
| | (30,863,123 | ) | | | (17,545,255 | ) | | | (9,282,877 | ) | | | (1,042,074 | ) | | | (54,218,748 | ) | | | (10,812,975 | ) |
| | (80 | ) | | | (6 | ) | | | (1,463 | ) | | | (1 | ) | | | (31,772 | ) | | | (8,322 | ) |
| | — | | | | — | | | | — | | | | — | | | | (3 | ) | | | — | |
| | | | | | | | | | | | | | | | | | | | | | |
| $ | (32,534,852 | ) | | $ | (18,723,348 | ) | | $ | (9,667,954 | ) | | $ | (1,092,067 | ) | | $ | (96,520,049 | ) | | $ | (21,223,736 | ) |
| | | | | | | | | | | | | | | | | | | | | | |
| | | | | | | | | | | | | | | | | | | | | | |
| | (45,226,819 | ) | | | 10,626,377 | | | | 17,982,337 | | | | 14,214,014 | | | | (33,823,588 | ) | | | (121,666,902 | ) |
| | | | | | | | | | | | | | | | | | | | | | |
| | (26,918,870 | ) | | | 82,859,125 | | | | 21,144,055 | | | | 51,303,965 | | | | 55,694,476 | | | | 24,577,469 | |
| | | | | |
| | | | | | | | | | | | | | | | | | | | | | |
| | 670,734,174 | | | | 587,875,049 | | | | 217,908,265 | | | | 166,604,300 | | | | 1,146,242,300 | | | | 1,121,664,831 | |
| | | | | | | | | | | | | | | | | | | | | | |
| | 643,815,304 | | | | 670,734,174 | | | | 239,052,320 | | | | 217,908,265 | | | | 1,201,936,776 | | | | 1,146,242,300 | |
| | | | | | | | | | | | | | | | | | | | | | |
129
|
Sterling Capital Funds |
Statements of Changes in Net Assets (continued) |
| |
| | | | | | | | |
| | | Sterling Capital
Equity Income
Fund | |
| | |
| | | For the | | | For the | |
| | | Year Ended | | | Year Ended | |
| | | September 30, | | | September 30, | |
| | | 2018 | | | 2017 | |
From Investment Activities: | | | | | | | | |
Operations: | | | | | | | | |
Net investment income (loss) | | $ | 28,001,267 | | | $ | 29,168,293 | |
Net realized gain (loss) | | | 156,131,966 | | | | 145,082,928 | |
Change in unrealized appreciation/depreciation | | | 46,144,809 | | | | 66,729,281 | |
| | | | | | | | |
Change in net assets from operations | | | 230,278,042 | | | | 240,980,502 | |
| | | | | | | | |
Distributions to Shareholders**: | | | | | | | | |
Class A | | | (36,580,437 | ) | | | (8,685,632 | ) |
Class B | | | — | | | | (4,371 | ) |
Class C | | | (22,777,251 | ) | | | (3,262,746 | ) |
Institutional Class | | | (108,613,745 | ) | | | (21,027,721 | ) |
Class R | | | (380,583 | ) | | | (54,242 | ) |
Class R6 | | | (3,308,989 | ) | | | — | |
| | | | | | | | |
Change in net assets from shareholder distributions | | | (171,661,005 | ) | | | (33,034,712 | ) |
| | | | | | | | |
Capital Transactions: | | | | | | | | |
Change in net assets from capital transactions | | | 47,058,558 | | | | (326,246,229 | ) |
| | | | | | | | |
Change in net assets | | | 105,675,595 | | | | (118,300,439 | ) |
| | |
Net Assets: | | | | | | | | |
Beginning of period | | | 1,567,210,785 | | | | 1,685,511,224 | |
| | | | | | | | |
End of period | | $ | 1,672,886,380 | | | $ | 1,567,210,785 | |
| | | | | | | | |
* Commencement of operations was October 3, 2016.
**Distribution classification for the year ended September 30, 2017 can be found in Note 2.
See accompanying Notes to the Financial Statements.
130
| | | | | | | | | | | | | | | | | | | | | | |
| Sterling Capital | | | Sterling Capital | | | Sterling Capital | |
| Behavioral International | | | SMID | | | Stratton Mid Cap | |
| Equity Fund | | | Opportunities Fund | | | Value Fund | |
| | | | | |
| For the | | | For the | | | For the | | | For the | | | For the | | | For the | |
| Year Ended | | | Year Ended | | | Year Ended | | | Period Ended | | | Year Ended | | | Year Ended | |
| September 30, | | | September 30, | | | September 30, | | | September 30, | | | September 30, | | | September 30, | |
| 2018 | | | 2017 | | | 2018 | | | 2017* | | | 2018 | | | 2017 | |
| | | | | | | | | | | | | | | | | | | | | | |
| | | | | | | | | | | | | | | | | | | | | | |
| | $ 2,658,722 | | | $ | 1,914,461 | | | $ | (34,636 | ) | | $ | (2,567 | ) | | $ | 271,762 | | | $ | 202,233 | |
| | 2,985,525 | | | | 2,312,708 | | | | 35,926 | | | | 151,598 | | | | 4,739,674 | | | | 2,543,953 | |
| | (6,860,822 | ) | | | 11,631,146 | | | | 672,203 | | | | 1,092,348 | | | | 52,071 | | | | 8,606,305 | |
| | | | | | | | | | | | | | | | | | | | | | |
| | (1,216,575 | ) | | | 15,858,315 | | | | 673,493 | | | | 1,241,379 | | | | 5,063,507 | | | | 11,352,491 | |
| | | | | | | | | | | | | | | | | | | | | | |
| | | | | | | | | | | | | | | | | | | | | | |
| | (18,632 | ) | | | (5,337 | ) | | | (67,906 | ) | | | (1,611 | ) | | | (3,985 | ) | | | (375 | ) |
| | — | | | | — | | | | — | | | | — | | | | — | | | | — | |
| | (1,747 | ) | | | (451 | ) | | | (23,727 | ) | | | — | | | | (45 | ) | | | (5 | ) |
| | (3,136,628 | ) | | | (1,170,042 | ) | | | (97,308 | ) | | | (4,317 | ) | | | (2,556,507 | ) | | | (379,324 | ) |
| | — | | | | — | | | | — | | | | — | | | | — | | | | — | |
| | — | | | | — | | | | — | | | | — | | | | — | | | | — | |
| | | | | | | | | | | | | | | | | | | | | | |
| | (3,157,007 | ) | | | (1,175,830) | | | | (188,941 | ) | | | (5,928 | ) | | | (2,560,537 | ) | | | (379,704 | ) |
| | | | | | | | | | | | | | | | | | | | | | |
| | | | | | | | | | | | | | | | | | | | | | |
| | 4,887,175 | | | | (2,592,999 | ) | | | (1,165,195 | ) | | | 8,676,432 | | | | (1,980,103 | ) | | | (8,367,488 | ) |
| | | | | | | | | | | | | | | | | | | | | | |
| | 513,593 | | | | 12,089,486 | | | | (680,643 | ) | | | 9,911,883 | | | | 522,867 | | | | 2,605,299 | |
| | | | | |
| | | | | | | | | | | | | | | | | | | | | | |
| | 82,445,020 | | | | 70,355,534 | | | | 9,911,883 | | | | — | | | | 66,138,798 | | | | 63,533,499 | |
| | | | | | | | | | | | | | | | | | | | | | |
| | $82,958,613 | | | $ | 82,445,020 | | | $ | 9,231,240 | | | $ | 9,911,883 | | | $ | 66,661,665 | | | $ | 66,138,798 | |
| | | | | | | | | | | | | | | | | | | | | | |
131
|
Sterling Capital Funds |
Statements of Changes in Net Assets (continued) |
| |
| | | | | | | | |
| | | Sterling Capital
Stratton Real
Estate Fund | |
| | | For the | | | For the | |
| | | Year Ended | | | Year Ended | |
| | | September 30, | | | September 30, | |
| | | 2018 | | | 2017 | |
From Investment Activities: | | | | | | | | |
Operations: | | | | | | | | |
Net investment income | | $ | 2,035,121 | | | $ | 2,122,913 | |
Net realized gain | | | 2,932,979 | | | | 2,939,296 | |
Change in unrealized appreciation/depreciation | | | 433,930 | | | | (4,404,129 | ) |
| | | | | | | | |
Change in net assets from operations | | | 5,402,030 | | | | 658,080 | |
| | | | | | | | |
Distributions to Shareholders*: | | | | | | | | |
Class A | | | (14,105 | ) | | | (11,005 | ) |
Class C | | | (2,786 | ) | | | (1,463 | ) |
Institutional Class | | | (4,544,554 | ) | | | (7,361,695 | ) |
| | | | | | | | |
Change in net assets from shareholder distributions | | | (4,561,445 | ) | | | (7,374,163 | ) |
| | | | | | | | |
Capital Transactions: | | | | | | | | |
Change in net assets from capital transactions | | | (5,285,085 | ) | | | (1,541,548 | ) |
Redemption Fees | | | — | | | | — | |
| | | | | | | | |
Change in net assets | | | (4,444,500 | ) | | | (8,257,631 | ) |
Net Assets: | | | | | | | | |
Beginning of period | | | 96,565,589 | | | | 104,823,220 | |
| | | | | | | | |
End of period | | $ | 92,121,089 | | | $ | 96,565,589 | |
| | | | | | | | |
*Distribution classification for the year ended September 30, 2017 can be found in Note 2.
See accompanying Notes to the Financial Statements.
132
| | | | | | | | | | | | | | |
| Sterling Capital | | | Sterling Capital | |
| Stratton Small Cap | | | Ultra Short | |
| Value Fund | | | Bond Fund | |
| For the | | | For the | | | For the | | | For the | |
| Year Ended | | | Year Ended | | | Year Ended | | | Year Ended | |
| September 30, | | | September 30, | | | September 30, | | | September 30, | |
| 2018 | | | 2017 | | | 2018 | | | 2017 | |
| | | | | | | | | | | | | | |
| | | | | | | | | | | | | | |
| $ | 3,726,905 | | | $ | 2,337,308 | | | $ | 614,700 | | | $ | 424,144 | |
| | 106,702,424 | | | | 82,152,610 | | | | (53,414 | ) | | | 5,950 | |
| | (17,527,452 | ) | | | 147,809,607 | | | | (14,558 | ) | | | 118,167 | |
| | | | | | | | | | | | | | |
| | 92,901,877 | | | | 232,299,525 | | | | 546,728 | | | | 548,261 | |
| | | | | | | | | | | | | | |
| | | | | | | | | | | | | | |
| | (49,681 | ) | | | (8,602 | ) | | | (90,901 | ) | | | (71,543 | ) |
| | (9,281 | ) | | | (3,494 | ) | | | — | | | | — | |
| | (103,370,613 | ) | | | (63,427,909 | ) | | | (602,875 | ) | | | (630,638 | ) |
| | | | | | | | | | | | | | |
| | (103,429,575 | ) | | | (63,440,005 | ) | | | (693,776 | ) | | | (702,181 | ) |
| | | | | | | | | | | | | | |
| | | | | | | | | | | | | | |
| | 125,085,570 | | | | (197,746,684 | ) | | | (11,394,380 | ) | | | (21,737,857 | ) |
| | — | | | | 1,457 | | | | — | | | | — | |
| | | | | | | | | | | | | | |
| | 114,557,872 | | | | (28,885,707 | ) | | | (11,541,428 | ) | | | (21,891,777 | ) |
| | | | | | | | | | | | | | |
| | 1,184,610,737 | | | | 1,213,496,444 | | | | 38,541,609 | | | | 60,433,386 | |
| | | | | | | | | | | | | | |
| $ | 1,299,168,609 | | | $ | 1,184,610,737 | | | $ | 27,000,181 | | | $ | 38,541,609 | |
| | | | | | | | | | | | | | |
133
|
Sterling Capital Funds |
Statements of Changes in Net Assets (continued) |
| |
| | | | | | | | |
| | | Sterling Capital
Short Duration
Bond Fund | |
| | |
| | | For the | | | For the | |
| | | Year Ended | | | Year Ended | |
| | | September 30, | | | September 30, | |
| | | 2018 | | | 2017 | |
From Investment Activities: | | | | | | | | |
Operations: | | | | | | | | |
Net investment income | | $ | 2,221,246 | | | $ | 1,092,466 | |
Net realized gain (loss) | | | (189,432 | ) | | | (87,137 | ) |
Change in unrealized appreciation/depreciation | | | (983,819 | ) | | | 33,904 | |
| | | | | | | | |
Change in net assets from operations | | | 1,047,995 | | | | 1,039,233 | |
| | | | | | | | |
Distributions to Shareholders*: | | | | | | | | |
Class A | | | (125,174 | ) | | | (156,953 | ) |
Class B | | | — | | | | — | |
Class C | | | (22,585 | ) | | | (29,145 | ) |
Institutional Class | | | (2,667,343 | ) | | | (1,953,116 | ) |
Class R | | | — | | | | — | |
Class R6 | | | — | | | | — | |
| | | | | | | | |
Change in net assets from shareholder distributions | | | (2,815,102 | ) | | | (2,139,214 | ) |
| | | | | | | | |
Capital Transactions: | | | | | | | | |
Change in net assets from capital transactions | | | 59,370,236 | | | | (10,733,229 | ) |
| | | | | | | | |
Change in net assets | | | 57,603,129 | | | | (11,833,210 | ) |
Net Assets: | | | | | | | | |
Beginning of period | | | 74,758,638 | | | | 86,591,848 | |
| | | | | | | | |
End of period | | $ | 132,361,767 | | | $ | 74,758,638 | |
| | | | | | | | |
*Distribution classification for the year ended September 30, 2017 can be found in Note 2.
See accompanying Notes to the Financial Statements.
134
| | | | | | | | | | | | | | | | | | | | | | |
| Sterling Capital | | | Sterling Capital | | | Sterling Capital | |
| Intermediate U.S. | | | Total Return | | | Corporate | |
| Government Fund | | | Bond Fund | | | Fund | |
| For the | | | For the | | | For the | | | For the | | | For the | | | For the | |
| Year Ended | | | Year Ended | | | Year Ended | | | Year Ended | | | Year Ended | | | Year Ended | |
| September 30, | | | September 30, | | | September 30, | | | September 30, | | | September 30, | | | September 30, | |
| 2018 | | | 2017 | | | 2018 | | | 2017 | | | 2018 | | | 2017 | |
| | | | | | | | | | | | | | | | | | | | | | |
| | | | | | | | | | | | | | | | | | | | | | |
| $ | 392,430 | | | $ | 422,930 | | | $ | 32,669,122 | | | $ | 21,373,848 | | | $ | 902,565 | | | $ | 936,402 | |
| | (131,836 | ) | | | (326 | ) | | | (6,406,390 | ) | | | 1,138,610 | | | | (123,986 | ) | | | 191,973 | |
| | (550,383 | ) | | | (716,174 | ) | | | (34,574,914 | ) | | | (9,697,355 | ) | | | (883,886 | ) | | | (442,237 | ) |
| | | | | | | | | | | | | | | | | | | | | | |
| | (289,789 | ) | | | (293,570 | ) | | | (8,312,182 | ) | | | 12,815,103 | | | | (105,307 | ) | | | 686,138 | |
| | | | | | | | | | | | | | | | | | | | | | |
| | | | | | | | | | | | | | | | | | | | | | |
| | (129,138 | ) | | | (126,044 | ) | | | (2,065,674 | ) | | | (1,963,457 | ) | | | (14,226 | ) | | | (13,808 | ) |
| | — | | | | (281 | ) | | | — | | | | (2,480 | ) | | | — | | | | — | |
| | (9,904 | ) | | | (8,445 | ) | | | (156,059 | ) | | | (160,528 | ) | | | (1,207 | ) | | | (1,129 | ) |
| | (445,387 | ) | | | (415,985 | ) | | | (29,603,997 | ) | | | (25,297,071 | ) | | | (1,073,071 | ) | | | (1,036,045 | ) |
| | — | | | | — | | | | (248 | ) | | | (136 | ) | | | — | | | | — | |
| | — | | | | — | | | | (4,164,355 | ) | | | — | | | | — | | | | — | |
| | | | | | | | | | | | | | | | | | | | | | |
| | (584,429 | ) | | | (550,755 | ) | | | (35,990,333 | ) | | | (27,423,672 | ) | | | (1,088,504 | ) | | | (1,050,982 | ) |
| | | | | | | | | | | | | | | | | | | | | | |
| | | | | | | | | | | | | | | | | | | | | | |
| | 1,265,840 | | | | (3,464,355 | ) | | | 186,165,642 | | | | 303,638,901 | | | | 2,595,179 | | | | (2,002,949 | ) |
| | | | | | | | | | | | | | | | | | | | | | |
| | 391,622 | | | | (4,308,680 | ) | | | 141,863,127 | | | | 289,030,332 | | | | 1,401,368 | | | | (2,367,793 | ) |
| | | | | |
| | | | | | | | | | | | | | | | | | | | | | |
| | 22,407,205 | | | | 26,715,885 | | | | 1,076,692,024 | | | | 787,661,692 | | | | 29,886,212 | | | | 32,254,005 | |
| | | | | | | | | | | | | | | | | | | | | | |
| $ | 22,798,827 | | | $ | 22,407,205 | | | $ | 1,218,555,151 | | | $ | 1,076,692,024 | | | $ | 31,287,580 | | | $ | 29,886,212 | |
| | | | | | | | | | | | | | | | | | | | | | |
135
|
Sterling Capital Funds |
Statements of Changes in Net Assets (continued) |
| |
| | | | | | | | |
| | | Sterling Capital
Securitized Opportunities
Fund | |
| | |
| | | For the | | | For the | |
| | | Year Ended | | | Year Ended | |
| | | September 30, | | | September 30, | |
| | | 2018 | | | 2017 | |
From Investment Activities: | | | | | | | | |
Operations: | | | | | | | | |
Net investment income | | $ | 1,132,594 | | | $ | 980,679 | |
Net realized gain (loss) | | | (144,404 | ) | | | 20,227 | |
Change in unrealized appreciation/depreciation | | | (1,096,353 | ) | | | (532,285 | ) |
| | | | | | | | |
Change in net assets from operations | | | (108,163 | ) | | | 468,621 | |
| | | | | | | | |
Distributions to Shareholders*: | | | | | | | | |
Class A | | | (1,330 | ) | | | (3,640 | ) |
Class C | | | (696 | ) | | | (620 | ) |
Institutional Class | | | (1,178,896 | ) | | | (1,149,450 | ) |
| | | | | | | | |
Change in net assets from shareholder distributions | | | (1,180,922 | ) | | | (1,153,710 | ) |
| | | | | | | | |
Capital Transactions: | | | | | | | | |
Change in net assets from capital transactions | | | (1,232,768 | ) | | | (6,434,806 | ) |
| | | | | | | | |
Change in net assets | | | (2,521,853 | ) | | | (7,119,895 | ) |
Net Assets: | | | | | | | | |
Beginning of period | | | 39,660,909 | | | | 46,780,804 | |
| | | | | | | | |
End of period | | $ | 37,139,056 | | | $ | 39,660,909 | |
| | | | | | | | |
*Distribution classification for the year ended September 30, 2017 can be found in Note 2.
See accompanying Notes to the Financial Statements.
136
| | | | | | | | | | | | | | | | | | | | | | |
| Sterling Capital | | | Sterling Capital | | | Sterling Capital | |
| Kentucky | | | Maryland | | | North Carolina | |
| Intermediate | | | Intermediate | | | Intermediate | |
| Tax-Free Fund | | | Tax-Free Fund | | | Tax-Free Fund | |
| | | | | |
| For the | | | For the | | | For the | | | For the | | | For the | | | For the | |
| Year Ended | | | Year Ended | | | Year Ended | | | Year Ended | | | Year Ended | | | Year Ended | |
| September 30, | | | September 30, | | | September 30, | | | September 30, | | | September 30, | | | September 30, | |
| 2018 | | | 2017 | | | 2018 | | | 2017 | | | 2018 | | | 2017 | |
| | | | | | | | | | | | | | | | | | | | | | |
| | | | | | | | | | | | | | | | | | | | | | |
| $ | 256,800 | | | $ | 272,123 | | | $ | 440,426 | | | $ | 568,603 | | | $ | 4,339,344 | | | $ | 4,576,412 | |
| | 70,740 | | | | 32,828 | | | | 293,987 | | | | 90,250 | | | | 11,029 | | | | (1,316,007 | ) |
| | (478,198 | ) | | | (326,097 | ) | | | (986,187 | ) | | | (730,718 | ) | | | (6,002,811 | ) | | | (3,866,576 | ) |
| | | | | | | | | | | | | | | | | | | | | | |
| | (150,658 | ) | | | (21,146 | ) | | | (251,774 | ) | | | (71,865 | ) | | | (1,652,438 | ) | | | (606,171 | ) |
| | | | | | | | | | | | | | | | | | | | | | |
| | | | | | | | | | | | | | | | | | | | | | |
| | (87,277 | ) | | | (141,113 | ) | | | (134,728 | ) | | | (159,348 | ) | | | (912,555 | ) | | | (1,155,319 | ) |
| | (26 | ) | | | (72 | ) | | | (11,004 | ) | | | (13,124 | ) | | | (58,619 | ) | | | (89,200 | ) |
| | (202,693 | ) | | | (294,771 | ) | | | (425,743 | ) | | | (611,052 | ) | | | (3,366,222 | ) | | | (4,041,255 | ) |
| | | | | | | | | | | | | | | | | | | | | | |
| | (289,996 | ) | | | (435,956 | ) | | | (571,475 | ) | | | (783,524 | ) | | | (4,337,396 | ) | | | (5,285,774 | ) |
| | | | | | | | | | | | | | | | | | | | | | |
| | | | | | | | | | | | | | | | | | | | | | |
| | (305,281 | ) | | | (401,512 | ) | | | (3,795,441 | ) | | | (7,668,981 | ) | | | (10,412,980 | ) | | | (19,198,010 | ) |
| | | | | | | | | | | | | | | | | | | | | | |
| | (745,935 | ) | | | (858,614 | ) | | | (4,618,690 | ) | | | (8,524,370 | ) | | | (16,402,814 | ) | | | (25,089,955 | ) |
| | | | | | | | | | | | | | | | | | | | | | |
| | 12,100,052 | | | | 12,958,666 | | | | 23,436,151 | | | | 31,960,521 | | | | 190,431,529 | | | | 215,521,484 | |
| | | | | | | | | | | | | | | | | | | | | | |
| $ | 11,354,117 | | | $ | 12,100,052 | | | $ | 18,817,461 | | | $ | 23,436,151 | | | $ | 174,028,715 | | | $ | 190,431,529 | |
| | | | | | | | | | | | | | | | | | | | | | |
137
|
Sterling Capital Funds |
Statements of Changes in Net Assets (continued) |
| |
| | | | | | | | |
| | | Sterling Capital
South Carolina
Intermediate
Tax-Free Fund | |
| | | For the | | | For the | |
| | | Year Ended | | | Year Ended | |
| | | September 30, | | | September 30, | |
| | | 2018 | | | 2017 | |
From Investment Activities: | | | | | | | | |
Operations: | | | | | | | | |
Net investment income | | $ | 1,743,074 | | | $ | 1,761,642 | |
Net realized gain | | | (17,226 | ) | | | (582,808 | ) |
Change in unrealized appreciation/depreciation | | | (2,585,296 | ) | | | (1,138,430 | ) |
| | | | | | | | |
Change in net assets from operations | | | (859,448 | ) | | | 40,404 | |
| | | | | | | | |
Distributions to Shareholders*: | | | | | | | | |
Class A | | | (283,214 | ) | | | (304,811 | ) |
Class C | | | (14,253 | ) | | | (17,784 | ) |
Institutional Class | | | (1,445,607 | ) | | | (1,448,996 | ) |
| | | | | | | | |
Change in net assets from shareholder distributions | | | (1,743,074 | ) | | | (1,771,591 | ) |
| | | | | | | | |
Capital Transactions: | | | | | | | | |
Change in net assets from capital transactions | | | (6,469,460 | ) | | | (4,461,832 | ) |
| | | | | | | | |
Change in net assets | | | (9,071,982 | ) | | | (6,193,019 | ) |
Net Assets: | | | | | | | | |
Beginning of period | | | 87,017,368 | | | | 93,210,387 | |
| | | | | | | | |
End of period | | $ | 77,945,386 | | | $ | 87,017,368 | |
| | | | | | | | |
*Distribution classification for the year ended September 30, 2017 can be found in Note 2.
See accompanying Notes to the Financial Statements.
138
| | | | | | | | | | | | | | |
| Sterling Capital | | | Sterling Capital | |
| Virginia | | | West Virginia | |
| Intermediate | | | Intermediate | |
| Tax-Free Fund | | | Tax-Free Fund | |
| For the | | | For the | | | For the | | | For the | |
| Year Ended | | | Year Ended | | | Year Ended | | | Year Ended | |
| September 30, | | | September 30, | | | September 30, | | | September 30, | |
| 2018 | | | 2017 | | | 2018 | | | 2017 | |
| | | | | | | | | | | | | | |
| | | | | | | | | | | | | | |
| $ | 1,941,743 | | | $ | 2,248,949 | | | $ | 1,974,607 | | | $ | 2,147,703 | |
| | 107,829 | | | | (421,377 | ) | | | 124,013 | | | | 104,033 | |
| | (3,023,583 | ) | | | (2,441,251 | ) | | | (2,851,084 | ) | | | (2,037,191 | ) |
| | | | | | | | | | | | | | |
| | (974,011 | ) | | | (613,679 | ) | | | (752,464 | ) | | | 214,545 | |
| | | | | | | | | | | | | | |
| | | | | | | | | | | | | | |
| | (463,739 | ) | | | (835,282 | ) | | | (627,314 | ) | | | (850,733 | ) |
| | (10,664 | ) | | | (20,715 | ) | | | (10,940 | ) | | | (14,265 | ) |
| | (1,467,336 | ) | | | (2,263,627 | ) | | | (1,439,698 | ) | | | (1,732,476 | ) |
| | | | | | | | | | | | | | |
| | (1,941,739 | ) | | | (3,119,624 | ) | | | (2,077,952 | ) | | | (2,597,474 | ) |
| | | | | | | | | | | | | | |
| | | | | | | | | | | | | | |
| | (13,174,353 | ) | | | (16,896,699 | ) | | | (8,062,488 | ) | | | (9,913,424 | ) |
| | | | | | | | | | | | | | |
| | (16,090,103 | ) | | | (20,630,002 | ) | | | (10,892,904 | ) | | | (12,296,353 | ) |
| | | | | | | | | | | | | | |
| | 99,195,934 | | | | 119,825,936 | | | | 90,439,486 | | | | 102,735,839 | |
| | | | | | | | | | | | | | |
| $ | 83,105,831 | | | $ | 99,195,934 | | | $ | 79,546,582 | | | $ | 90,439,486 | |
| | | | | | | | | | | | | | |
139
|
Sterling Capital Funds |
Statements of Changes in Net Assets (continued) |
| |
| | | | | | | | |
| | | Sterling Capital
Diversified
Income Fund | |
| | |
| | | For the | | | For the | |
| | | Year Ended | | | Year Ended | |
| | | September 30, | | | September 30, | |
| | | 2018 | | | 2017 | |
From Investment Activities: | | | | | | | | |
Operations: | | | | | | | | |
Net investment income | | $ | 748,495 | | | $ | 1,288,920 | |
Net realized gain (loss) | | | 139,840 | | | | 271,905 | |
Change in unrealized appreciation/depreciation | | | (390,086 | ) | | | (530,011 | ) |
| | | | | | | | |
Change in net assets from operations | | | 498,249 | | | | 1,030,814 | |
| | | | | | | | |
Distributions to Shareholders*: | | | | | | | | |
Class A | | | (523,412 | ) | | | (567,986 | ) |
Class B | | | — | | | | (2,237 | ) |
Class C | | | (34,796 | ) | | | (34,231 | ) |
Institutional Class | | | (330,547 | ) | | | (671,189 | ) |
| | | | | | | | |
Change in net assets from shareholder distributions | | | (888,755 | ) | | | (1,275,643 | ) |
| | | | | | | | |
Capital Transactions: | | | | | | | | |
Change in net assets from capital transactions | | | (3,155,120 | ) | | | (18,719,549 | ) |
| | | | | | | | |
Change in net assets | | | (3,545,626 | ) | | | (18,964,378 | ) |
Net Assets: | | | | | | | | |
Beginning of period | | | 23,871,288 | | | | 42,835,666 | |
| | | | | | | | |
End of period | | $ | 20,325,662 | | | $ | 23,871,288 | |
| | | | | | | | |
*Distribution classification for the year ended September 30, 2017 can be found in Note 2.
See accompanying Notes to the Financial Statements.
140
| | | | | | | | | | | | | | |
| Sterling Capital | | | Sterling Capital | |
| Strategic Allocation | | | Strategic Allocation | |
| Balanced Fund | | | Growth Fund | |
| For the | | | For the | | | For the | | | For the | |
| Year Ended | | | Year Ended | | | Year Ended | | | Year Ended | |
| September 30, | | | September 30, | | | September 30, | | | September 30, | |
| 2018 | | | 2017 | | | 2018 | | | 2017 | |
| | | | | | | | | | | | | | |
| | | | | | | | | | | | | | |
| $ | 577,561 | | | $ | 424,352 | | | $ | 406,200 | | | $ | 239,723 | |
| | 991,334 | | | | 265,964 | | | | 960,058 | | | | 145,557 | |
| | (419,774 | ) | | | 2,692,215 | | | | (185,060 | ) | | | 2,709,231 | |
| | | | | | | | | | | | | | |
| | 1,149,121 | | | | 3,382,531 | | | | 1,181,198 | | | | 3,094,511 | |
| | | | | | | | | | | | | | |
| | | | | | | | | | | | | | |
| | (651,806 | ) | | | (429,055 | ) | | | (466,835 | ) | | | (234,587 | ) |
| | — | | | | (1,247 | ) | | | — | | | | (931 | ) |
| | (11,239 | ) | | | (5,300 | ) | | | (5,908 | ) | | | (2,531 | ) |
| | (3,510 | ) | | | (2,002 | ) | | | (16,605 | ) | | | (9,486 | ) |
| | | | | | | | | | | | | | |
| | (666,555 | ) | | | (437,604 | ) | | | (489,348 | ) | | | (247,535 | ) |
| | | | | | | | | | | | | | |
| | | | | | | | | | | | | | |
| | (2,290,246 | ) | | | (4,900,160 | ) | | | (1,735,373 | ) | | | (2,316,008 | ) |
| | | | | | | | | | | | | | |
| | (1,807,680 | ) | | | (1,955,233 | ) | | | (1,043,523 | ) | | | 530,968 | |
| | | | | | | | | | | | | | |
| | 31,076,244 | | | | 33,031,477 | | | | 23,934,262 | | | | 23,403,294 | |
| | | | | | | | | | | | | | |
| $ | 29,268,564 | | | $ | 31,076,244 | | | $ | 22,890,739 | | | $ | 23,934,262 | |
| | | | | | | | | | | | | | |
141
|
Sterling Capital Funds |
Statements of Changes in Net Assets |
| |
| | | | | | | | | | |
| | | Sterling Capital
Behavioral Large Cap
Value Equity Fund |
| | |
| | | For the
Year Ended
September 30,
2018 | | For the
Year Ended
September 30,
2017 |
Capital Transactions: | | | | | | | | | | |
Class A Shares: | | | | | | | | | | |
Proceeds from shares issued1 | | | $ | 695,001 | | | | $ | 674,247 | |
Distributions reinvested | | | | 967,715 | | | | | 478,214 | |
Value of shares redeemed | | | | (4,387,955 | ) | | | | (2,979,194 | ) |
| | | | | | | | | | |
Change in net assets from Class A Share transactions | | | | (2,725,239 | ) | | | | (1,826,733 | ) |
Class B Shares: | | | | | | | | | | |
Proceeds from shares issued | | | | — | | | | | — | |
Distributions reinvested | | | | — | | | | | 639 | |
Value of shares redeemed | | | | — | | | | | (226,941 | ) |
| | | | | | | | | | |
Change in net assets from Class B Share transactions2 | | | | — | | | | | (226,302 | ) |
Class C Shares: | | | | | | | | | | |
Proceeds from shares issued | | | | 10,788 | | | | | 131,224 | |
Distributions reinvested | | | | 19,650 | | | | | 7,399 | |
Value of shares redeemed | | | | (176,181 | ) | | | | (247,106 | ) |
| | | | | | | | | | |
Change in net assets from Class C Share transactions | | | | (145,743 | ) | | | | (108,483 | ) |
Institutional Shares: | | | | | | | | | | |
Proceeds from shares issued | | | | 8,002,945 | | | | | 15,314,059 | |
Distributions reinvested | | | | 6,159,674 | | | | | 4,569,679 | |
Value of shares redeemed | | | | (286,588,176 | ) | | | | (28,727,746 | ) |
| | | | | | | | | | |
Change in net assets from Institutional Share transactions | | | | (272,425,557 | ) | | | | (8,844,008 | ) |
Class R Shares: | | | | | | | | | | |
Proceeds from shares issued | | | | — | | | | | — | |
Distributions reinvested | | | | — | | | | | — | |
Value of shares redeemed | | | | — | | | | | — | |
| | | | | | | | | | |
Change in net assets from Class R Share transactions | | | | — | | | | | — | |
| | | | | | | | | | |
Class R6 Shares: | | | | | | | | | | |
Proceeds from shares issued | | | | 271,539,471 | | | | | — | |
Distributions reinvested | | | | 2,717,326 | | | | | — | |
Value of shares redeemed | | | | (15,984,111 | ) | | | | — | |
| | | | | | | | | | |
Change in net assets from Class R6 Share transactions | | | | 258,272,686 | | | | | — | |
| | | | | | | | | | |
Change in net assets from capital transactions | | | $ | (17,023,853 | ) | | | $ | (11,005,526 | ) |
| | | | | | | | | | |
| | |
Share Transactions: | | | | | | | | | | |
Class A Shares: | | | | | | | | | | |
Issued1 | | | | 31,995 | | | | | 35,125 | |
Reinvested | | | | 44,503 | | | | | 24,525 | |
Redeemed | | | | (202,109 | ) | | | | (154,626 | ) |
| | | | | | | | | | |
Change in Class A Shares | | | | (125,611 | ) | | | | (94,976 | ) |
Class B Shares: | | | | | | | | | | |
Issued | | | | — | | | | | — | |
Reinvested | | | | — | | | | | 34 | |
Redeemed | | | | — | | | | | (12,048 | ) |
| | | | | | | | | | |
Change in Class B Shares2 | | | | — | | | | | (12,014 | ) |
Class C Shares: | | | | | | | | | | |
Issued | | | | 511 | | | | | 7,005 | |
Reinvested | | | | 929 | | | | | 394 | |
Redeemed | | | | (8,454 | ) | | | | (12,907 | ) |
| | | | | | | | | | |
Change in Class C Shares | | | | (7,014 | ) | | | | (5,508 | ) |
Institutional Shares: | | | | | | | | | | |
Issued | | | | 362,623 | | | | | 786,049 | |
Reinvested | | | | 282,164 | | | | | 232,754 | |
Redeemed | | | | (13,335,368 | ) | | | | (1,488,771 | ) |
| | | | | | | | | | |
Change in Institutional Shares. | | | | (12,690,581 | ) | | | | (469,968 | ) |
Class R Shares: | | | | | | | | | | |
Issued | | | | — | | | | | — | |
Reinvested | | | | — | | | | | — | |
Redeemed | | | | — | | | | | — | |
| | | | | | | | | | |
Change in Class R Shares | | | | — | | | | | — | |
| | | | | | | | | | |
Class R6 Shares: | | | | | | | | | | |
Issued | | | | 12,642,561 | | | | | — | |
Reinvested | | | | 123,904 | | | | | — | |
Redeemed | | | | (724,941 | ) | | | | — | |
| | | | | | | | | | |
Change in Class R6 Shares | | | | 12,041,524 | | | | | — | |
| | | | | | | | | | |
Change in Shares | | | | (781,682 | ) | | | | (582,466 | ) |
| | | | | | | | | | |
1Includes 1,751, 1,887, 278, 8,666 shares and $33,961, $33,910, $4,737, 203,123 for the year ended September 30, 2017, due to the conversion of Class B Shares into Class A Shares for the Sterling Capital Behavioral Large Cap Value Fund, the Sterling Capital Mid Value Fund, the Sterling Capital Behavioral Small Cap Value Fund, and the Sterling Capital Special Opportunities Fund, respectively.
2Class B Shares of the Funds closed effective May 26, 2017.
See accompanying Notes to the Financial Statements.
142
| | | | | | | | | | | | | | | | | | | | | | |
Sterling Capital
Mid Value
Fund | | | Sterling Capital
Behavioral Small Cap
Value Equity Fund | | | Sterling Capital
Special Opportunities
Fund | |
| | | | | |
For the
Year Ended
September 30,
2018 | | | For the
Year Ended
September 30,
2017 | | | For the
Year Ended
September 30,
2018 | | | For the
Year Ended
September 30,
2017 | | | For the
Year Ended
September 30,
2018 | | | For the
Year Ended
September 30,
2017 | |
| | | | | | | | | | | | | | | | | | | | | | |
| | | | | | | | | | | | | | | | | | | | | | |
| $ | 1,890,208 | | | $ | 4,343,902 | | | $ | 455,475 | | | $ | 709,058 | | | $ | 26,916,779 | | | $ | 36,743,182 | |
| | 1,413,723 | | | | 946,688 | | | | 368,244 | | | | 46,754 | | | | 27,232,699 | | | | 6,033,116 | |
| | (6,664,281 | ) | | | (7,180,262 | ) | | | (1,517,076 | ) | | | (1,958,445 | ) | | | (88,609,565 | ) | | | (95,968,887 | ) |
| | | | | | | | | | | | | | | | | | | | | | |
| | (3,360,350 | ) | | | (1,889,672 | ) | | | (693,357 | ) | | | (1,202,633 | ) | | | (34,460,087 | ) | | | (53,192,589 | ) |
| | | | | | | | | | | | | | | | | | | | | | |
| | — | | | | 2,970 | | | | — | | | | — | | | | — | | | | 4,346 | |
| | — | | | | 7,483 | | | | — | | | | 129 | | | | — | | | | 26,333 | |
| | — | | | | (299,115 | ) | | | — | | | | (127,631 | ) | | | — | | | | (1,733,762 | ) |
| | | | | | | | | | | | | | | | | | | | | | |
| | — | | | | (288,662 | ) | | | — | | | | (127,502 | ) | | | — | | | | (1,703,083 | ) |
| | | | | | | | | | | | | | | | | | | | | | |
| | 316,302 | | | | 556,357 | | | | 19,222 | | | | 14,347 | | | | 9,116,398 | | | | 14,125,863 | |
| | 199,111 | | | | 144,501 | | | | 6,576 | | | | 1,289 | | | | 13,385,364 | | | | 3,641,709 | |
| | (815,506 | ) | | | (2,150,491 | ) | | | (38,465 | ) | | | (252,227 | ) | | | (36,254,964 | ) | | | (69,306,861 | ) |
| | | | | | | | | | | | | | | | | | | | | | |
| | (300,093 | ) | | | (1,449,633 | ) | | | (12,667 | ) | | | (236,591 | ) | | | (13,753,202 | ) | | | (51,539,289 | ) |
| | | | | | | | | | | | | | | | | | | | | | |
| | 135,204,402 | | | | 111,117,696 | | | | 18,628,260 | | | | 33,280,116 | | | | 109,653,337 | | | | 133,167,163 | |
| | 30,067,843 | | | | 16,510,873 | | | | 9,153,125 | | | | 1,026,322 | | | | 45,402,061 | | | | 9,057,456 | |
| | (487,070,043 | ) | | | (113,375,498 | ) | | | (191,104,113 | ) | | | (18,556,309 | ) | | | (476,418,274 | ) | | | (157,492,117 | ) |
| | | | | | | | | | | | | | | | | | | | | | |
| | (321,797,798 | ) | | | 14,253,071 | | | | (163,322,728 | ) | | | 15,750,129 | | | | (321,362,876 | ) | | | (15,267,498 | ) |
| | | | | | | | | | | | | | | | | | | | | | |
| | 1,271 | | | | 1,273 | | | | 28,634 | | | | 30,622 | | | | 155,088 | | | | 376,666 | |
| | 80 | | | | — | | | | 1,463 | | | | — | | | | 31,773 | | | | 3,361 | |
| | (9 | ) | | | — | | | | (1,112 | ) | | | (11 | ) | | | (289,447 | ) | | | (344,470 | ) |
| | | | | | | | | | | | | | | | | | | | | | |
| | 1,342 | | | | 1,273 | | | | 28,985 | | | | 30,611 | | | | (102,586 | ) | | | 35,557 | |
| | | | | | | | | | | | | | | | | | | | | | |
| | | | | | | | | | | | | | | | | | | | | | |
| | 294,949,675 | | | | — | | | | 187,352,514 | | | | — | | | | 352,969,195 | | | | — | |
| | — | | | | — | | | | — | | | | — | | | | — | | | | — | |
| | (14,719,595 | ) | | | — | | | | (5,370,410 | ) | | | — | | | | (17,114,032 | ) | | | — | |
| | | | | | | | | | | | | | | | | | | | | | |
| | 280,230,080 | | | | — | | | | 181,982,104 | | | | — | | | | 335,855,163 | | | | — | |
| | | | | | | | | | | | | | | | | | | | | | |
| $ | (45,226,819 | ) | | $ | 10,626,377 | | | $ | 17,982,337 | | | $ | 14,214,014 | | | $ | (33,823,588 | ) | | $ | (121,666,902 | ) |
| | | | | | | | | | | | | | | | | | | | | | |
| | | | | |
| | | | | | | | | | | | | | | | | | | | | | |
| | | | | | | | | | | | | | | | | | | | | | |
| | 98,778 | | | | 241,699 | | | | 24,245 | | | | 41,055 | | | | 1,086,976 | | | | 1,609,590 | |
| | 76,171 | | | | 53,942 | | | | 20,113 | | | | 2,658 | | | | 1,157,456 | | | | 275,825 | |
| | (347,539 | ) | | | (398,892 | ) | | | (81,894 | ) | | | (112,752 | ) | | | (3,579,537 | ) | | | (4,179,557 | ) |
| | | | | | | | | | | | | | | | | | | | | | |
| | (172,590 | ) | | | (103,251 | ) | | | (37,536 | ) | | | (69,039 | ) | | | (1,335,105 | ) | | | (2,294,142 | ) |
| | | | | | | | | | | | | | | | | | | | | | |
| | — | | | | 179 | | | | — | | | | — | | | | — | | | | 224 | |
| | — | | | | 471 | | | | — | | | | 7 | | | | — | | | | 1,406 | |
| | — | | | | (18,447 | ) | | | — | | | | (7,665 | ) | | | — | | | | (89,431 | ) |
| | | | | | | | | | | | | | | | | | | | | | |
| | — | | | | (17,797 | ) | | | — | | | | (7,658 | ) | | | — | | | | (87,801 | ) |
| | | | | | | | | | | | | | | | | | | | | | |
| | 18,696 | | | | 34,326 | | | | 1,061 | | | | 864 | | | | 441,714 | | | | 724,893 | |
| | 12,067 | | | | 9,146 | | | | 375 | | | | 76 | | | | 678,899 | | | | 194,308 | |
| | (48,148 | ) | | | (132,565 | ) | | | (2,164 | ) | | | (14,914 | ) | | | (1,742,917 | ) | | | (3,507,612 | ) |
| | | | | | | | | | | | | | | | | | | | | | |
| | (17,385 | ) | | | (89,093 | ) | | | (728 | ) | | | (13,974 | ) | | | (622,304 | ) | | | (2,588,411 | ) |
| | | | | | | | | | | | | | | | | | | | | | |
| | 7,022,935 | | | | 6,085,489 | | | | 996,647 | | | | 1,956,248 | | | | 4,229,093 | | | | 5,517,811 | |
| | 1,594,947 | | | | 929,668 | | | | 495,180 | | | | 57,919 | | | | 1,836,334 | | | | 396,534 | |
| | (25,293,509 | ) | | | (6,255,862 | ) | | | (10,649,128 | ) | | | (1,073,596 | ) | | | (18,865,288 | ) | | | (6,621,904 | ) |
| | | | | | | | | | | | | | | | | | | | | | |
| | (16,675,627 | ) | | | 759,295 | | | | (9,157,301 | ) | | | 940,571 | | | | (12,799,861 | ) | | | (707,559 | ) |
| | | | | | | | | | | | | | | | | | | | | | |
| | 69 | | | | 72 | | | | 1,601 | | | | 1,763 | | | | 6,177 | | | | 16,897 | |
| | 5 | | | | — | | | | 80 | | | | — | | | | 1,335 | | | | 152 | |
| | (1 | ) | | | — | | | | (59 | ) | | | (1 | ) | | | (11,754 | ) | | | (15,056 | ) |
| | | | | | | | | | | | | | | | | | | | | | |
| | 73 | | | | 72 | | | | 1,622 | | | | 1,762 | | | | (4,242 | ) | | | 1,993 | |
| | | | | | | | | | | | | | | | | | | | | | |
| | | | | |
| | 15,457,973 | | | | — | | | | 10,427,613 | | | | — | | | | 14,092,446 | | | | — | |
| | — | | | | — | | | | — | | | | — | | | | — | | | | — | |
| | (750,728 | ) | | | — | | | | (285,270 | ) | | | — | | | | (650,786 | ) | | | — | |
| | | | | | | | | | | | | | | | | | | | | | |
| | 14,707,245 | | | | — | | | | 10,142,343 | | | | — | | | | 13,441,660 | | | | — | |
| | | | | | | | | | | | | | | | | | | | | | |
| | (2,158,284 | ) | | | 549,226 | | | | 948,400 | | | | 851,662 | | | | (1,319,852 | ) | | | (5,675,920 | ) |
| | | | | | | | | | | | | | | | | | | | | | |
143
|
Sterling Capital Funds |
Statements of Changes in Net Assets (continued) |
| |
| | | | | | | | | | |
| | | Sterling Capital
Equity Income
Fund |
| | |
| | | For the Year
Ended
September 30,
2018 | | For the
Year Ended
September 30,
2017 |
Capital Transactions: | | | | | | | | | | |
Class A Shares: | | | | | | | | | | |
Proceeds from shares issued1 | | | $ | 17,261,515 | | | | $ | 48,847,040 | |
Distributions reinvested | | | | 34,930,386 | | | | | 7,782,389 | |
Value of shares redeemed | | | | (95,382,911 | ) | | | | (230,002,765 | ) |
| | | | | | | | | | |
Change in net assets from Class A Share transactions | | | | (43,191,010 | ) | | | | (173,373,336 | ) |
Class B Shares: | | | | | | | | | | |
Proceeds from shares issued | | | | — | | | | | 770 | |
Distributions reinvested | | | | — | | | | | 4,275 | |
Value of shares redeemed | | | | — | | | | | (1,485,282 | ) |
| | | | | | | | | | |
Change in net assets from Class B Share transactions2 | | | | — | | | | | (1,480,237 | ) |
Class C Shares: | | | | | | | | | | |
Proceeds from shares issued | | | | 10,292,839 | | | | | 9,106,010 | |
Distributions reinvested | | | | 22,170,768 | | | | | 3,019,207 | |
Value of shares redeemed | | | | (65,951,870 | ) | | | | (82,332,579 | ) |
| | | | | | | | | | |
Change in net assets from Class C Share transactions | | | | (33,488,263 | ) | | | | (70,207,362 | ) |
Institutional Shares: | | | | | | | | | | |
Proceeds from shares issued | | | | 199,599,403 | | | | | 247,053,532 | |
Distributions reinvested | | | | 91,165,619 | | | | | 17,810,637 | |
Value of shares redeemed | | | | (455,884,460 | ) | | | | (347,435,423 | ) |
| | | | | | | | | | |
Change in net assets from Institutional Share transactions | | | | (165,119,438 | ) | | | | (82,571,254 | ) |
Class R Shares: | | | | | | | | | | |
Proceeds from shares issued | | | | 168,020 | | | | | 1,451,626 | |
Distributions reinvested | | | | 380,583 | | | | | 54,243 | |
Value of shares redeemed | | | | (1,773,434 | ) | | | | (119,909 | ) |
| | | | | | | | | | |
Change in net assets from Class R Share transactions | | | | (1,224,831 | ) | | | | 1,385,960 | |
Class R6 Shares: | | | | | | | | | | |
Proceeds from shares issued | | | | 303,183,215 | | | | | — | |
Distributions reinvested | | | | 3,308,989 | | | | | — | |
Value of shares redeemed | | | | (16,410,104 | ) | | | | — | |
| | | | | | | | | | |
Change in net assets from Class R6 Share transactions | | | | 290,082,100 | | | | | — | |
| | | | | | | | | | |
Change in net assets from capital transactions | | | $ | 47,058,558 | | | | $ | (326,246,229 | ) |
| | | | | | | | | | |
| | |
Share Transactions: | | | | | | | | | | |
Class A Shares: | | | | | | | | | | |
Issued1 | | | | 832,543 | | | | | 2,573,771 | |
Reinvested | | | | 1,729,173 | | | | | 398,999 | |
Redeemed | | | | (4,607,856 | ) | | | | (11,799,496 | ) |
| | | | | | | | | | |
Change in Class A Shares | | | | (2,046,140 | ) | | | | (8,826,726 | ) |
Class B Shares: | | | | | | | | | | |
Issued | | | | — | | | | | 40 | |
Reinvested | | | | — | | | | | 226 | |
Redeemed | | | | — | | | | | (77,845 | ) |
| | | | | | | | | | |
Change in Class B Shares2 | | | | — | | | | | (77,579 | ) |
Class C Shares: | | | | | | | | | | |
Issued | | | | 501,096 | | | | | 483,859 | |
Reinvested | | | | 1,109,613 | | | | | 156,743 | |
Redeemed | | | | (3,214,105 | ) | | | | (4,278,567 | ) |
| | | | | | | | | | |
Change in Class C Shares | | | | (1,603,396 | ) | | | | (3,637,965 | ) |
Institutional Shares: | | | | | | | | | | |
Issued | | | | 9,619,889 | | | | | 12,693,555 | |
Reinvested | | | | 4,497,406 | | | | | 907,290 | |
Redeemed | | | | (22,736,323 | ) | | | | (18,052,683 | ) |
| | | | | | | | | | |
Change in Institutional Shares | | | | (8,619,028 | ) | | | | (4,451,838 | ) |
Class R Shares: | | | | | | | | | | |
Issued | | | | 8,149 | | | | | 76,183 | |
Reinvested | | | | 18,990 | | | | | 2,778 | |
Redeemed | | | | (86,486 | ) | | | | (6,124 | ) |
| | | | | | | | | | |
Change in Class R Shares | | | | (59,347 | ) | | | | 72,837 | |
| | | | | | | | | | |
Class R6 Shares: | | | | | | | | | | |
Issued | | | | 15,336,819 | | | | | — | |
Reinvested | | | | 158,621 | | | | | — | |
Redeemed | | | | (788,118 | ) | | | | — | |
| | | | | | | | | | |
Change in Class R6 Shares | | | | 14,707,322 | | | | | — | |
| | | | | | | | | | |
Change in Shares | | | | 2,379,411 | | | | | (16,921,271 | ) |
| | | | | | | | | | |
* Commencement of operations was October 3, 2016.
1Includes 4,692 shares and $91,822 for the year ended September 30, 2017, due to the conversion of Class B Shares into Class A Shares for the Sterling Capital Equity Income Fund.
2Class B Shares of the Sterling Capital Equity Income Fund closed effective May 26, 2017.
See accompanying Notes to the Financial Statements.
144
| | | | | | | | | | | | | | | | | | | | | | |
Sterling Capital
Behavioral International
Equity Fund | | | Sterling Capital
SMID
Opportunities Fund | | | Sterling Capital
Stratton Mid Cap
Value Fund | |
| | | | | |
For the
Year Ended
September 30,
2018 | | | For the
Year Ended
September 30,
2017 | | | For the
Year Ended
September 30,
2018 | | | For the
Period Ended
September 30,
2017* | | | For the
Year Ended
September 30,
2018 | | | For the
Year Ended
September 30,
2017 | |
| | | | | | | | | | | | | | | | | | | | | | |
| | | | | | | | | | | | | | | | | | | | | | |
| $ | 548,941 | | | $ | 92,688 | | | $ | 1,043,516 | | | $ | 4,430,264 | | | $ | 6,558 | | | $ | 81,511 | |
| | 18,535 | | | | 5,263 | | | | 67,890 | | | | 1,331 | | | | 3,985 | | | | 375 | |
| | (207,111 | ) | | | (28,072 | ) | | | (2,399,337 | ) | | | (812,537 | ) | | | (15,201 | ) | | | (6,574 | ) |
| | | | | | | | | | | | | | | | | | | | | | |
| | 360,365 | | | | 69,879 | | | | (1,287,931 | ) | | | 3,619,058 | | | | (4,658 | ) | | | 75,312 | |
| | | | | | | | | | | | | | | | | | | | | | |
| | — | | | | — | | | | — | | | | — | | | | — | | | | — | |
| | — | | | | — | | | | — | | | | — | | | | — | | | | — | |
| | — | | | | — | | | | — | | | | — | | | | — | | | | — | |
| | | | | | | | | | | | | | | | | | | | | | |
| | — | | | | — | | | | — | | | | — | | | | — | | | | — | |
| | | | | | | | | | | | | | | | | | | | | | |
| | 3,957 | | | | 28,100 | | | | 241,260 | | | | 1,613,608 | | | | — | | | | — | |
| | 1,747 | | | | 451 | | | | 23,727 | | | | — | | | | — | | | | — | |
| | (38 | ) | | | (26,807 | ) | | | (280,538 | ) | | | (373,570 | ) | | | — | | | | — | |
| | | | | | | | | | | | | | | | | | | | | | |
| | 5,666 | | | | 1,744 | | | | (15,551 | ) | | | 1,240,038 | | | | — | | | | — | |
| | | | | | | | | | | | | | | | | | | | | | |
| | 3,376,195 | | | | 125,675 | | | | 317,828 | | | | 4,607,084 | | | | 2,447,622 | | | | 836,470 | |
| | 2,644,718 | | | | 886,316 | | | | 97,308 | | | | 4,026 | | | | 2,411,974 | | | | 361,848 | |
| | (67,284,550 | ) | | | (3,676,613 | ) | | | (276,849 | ) | | | (793,774 | ) | | | (6,835,041 | ) | | | (9,641,118 | ) |
| | | | | | | | | | | | | | | | | | | | | | |
| | (61,263,637 | ) | | | (2,664,622 | ) | | | 138,287 | | | | 3,817,336 | | | | (1,975,445 | ) | | | (8,442,800 | ) |
| | | | | | | | | | | | | | | | | | | | | | |
| | — | | | | — | | | | — | | | | — | | | | — | | | | — | |
| | — | | | | — | | | | — | | | | — | | | | — | | | | — | |
| | — | | | | — | | | | — | | | | — | | | | — | | | | — | |
| | | | | | | | | | | | | | | | | | | | | | |
| | — | | | | — | | | | — | | | | — | | | | — | | | | — | |
| | | | | | | | | | | | | | | | | | | | | | |
| | 65,784,781 | | | | — | | | | — | | | | — | | | | — | | | | — | |
| | — | | | | — | | | | — | | | | — | | | | — | | | | — | |
| | — | | | | — | | | | — | | | | — | | | | — | | | | — | |
| | | | | | | | | | | | | | | | | | | | | | |
| | 65,784,781 | | | | — | | | | — | | | | — | | | | — | | | | — | |
| | | | | | | | | | | | | | | | | | | | | | |
| $ | 4,887,175 | | | $ | (2,592,999 | ) | | $ | (1,165,195 | ) | | $ | 8,676,432 | | | $ | (1,980,103 | ) | | $ | (8,367,488 | ) |
| | | | | | | | | | | | | | | | | | | | | | |
| | | | | |
| | | | | | | | | | | | | | | | | | | | | | |
| | | | | | | | | | | | | | | | | | | | | | |
| | 46,928 | | | | 8,840 | | | | 88,686 | | | | 419,022 | | | | 97 | | | | 1,383 | |
| | 1,571 | | | | 550 | | | | 5,887 | | | | 127 | | | | 59 | | | | 6 | |
| | (17,810 | ) | | | (2,603 | ) | | | (207,677 | ) | | | (75,383 | ) | | | (229 | ) | | | (106 | ) |
| | | | | | | | | | | | | | | | | | | | | | |
| | 30,689 | | | | 6,787 | | | | (113,104 | ) | | | 343,766 | | | | (73 | ) | | | 1,283 | |
| | | | | | | | | | | | | | | | | | | | | | |
| | — | | | | — | | | | — | | | | — | | | | — | | | | — | |
| | — | | | | — | | | | — | | | | — | | | | — | | | | — | |
| | — | | | | — | | | | — | | | | — | | | | — | | | | — | |
| | | | | | | | | | | | | | | | | | | | | | |
| | — | | | | — | | | | — | | | | — | | | | — | | | | — | |
| | | | | | | | | | | | | | | | | | | | | | |
| | 329 | | | | 2,840 | | | | 20,618 | | | | 154,551 | | | | — | | | | — | |
| | 149 | | | | 47 | | | | 2,064 | | | | — | | | | — | | | | — | |
| | (3 | ) | | | (2,697 | ) | | | (23,963 | ) | | | (33,328 | ) | | | — | | | | — | |
| | | | | | | | | | | | | | | | | | | | | | |
| | 475 | | | | 190 | | | | (1,281 | ) | | | 121,223 | | | | — | | | | — | |
| | | | | | | | | | | | | | | | | | | | | | |
| | 277,788 | | | | 11,739 | | | | 27,509 | | | | 453,247 | | | | 35,437 | | | | 13,831 | |
| | 224,238 | | | | 92,711 | | | | 8,450 | | | | 384 | | | | 35,512 | | | | 6,147 | |
| | (5,740,263 | ) | | | (361,180 | ) | | | (23,400 | ) | | | (74,676 | ) | | | (100,081 | ) | | | (161,321 | ) |
| | | | | | | | | | | | | | | | | | | | | | |
| | (5,238,237 | ) | | | (256,730 | ) | | | 12,559 | | | | 378,955 | | | | (29,132 | ) | | | (141,343 | ) |
| | | | | | | | | | | | | | | | | | | | | | |
| | — | | | | — | | | | — | | | | — | | | | — | | | | — | |
| | — | | | | — | | | | — | | | | — | | | | — | | | | — | |
| | — | | | | — | | | | — | | | | — | | | | — | | | | — | |
| | | | | | | | | | | | | | | | | | | | | | |
| | — | | | | — | | | | — | | | | — | | | | — | | | | — | |
| | | | | | | | | | | | | | | | | | | | | | |
| | | | | | | | | | | | | | | | | | | | | | |
| | 5,614,888 | | | | — | | | | — | | | | — | | | | — | | | | — | |
| | — | | | | — | | | | — | | | | — | | | | — | | | | — | |
| | — | | | | — | | | | — | | | | — | | | | — | | | | — | |
| | | | | | | | | | | | | | | | | | | | | | |
| | 5,614,888 | | | | — | | | | — | | | | — | | | | — | | | | — | |
| | | | | | | | | | | | | | | | | | | | | | |
| | 407,815 | | | | (249,753 | ) | | | (101,826 | ) | | | 843,944 | | | | (29,205 | ) | | | (140,060 | ) |
| | | | | | | | | | | | | | | | | | | | | | |
145
|
Sterling Capital Funds |
Statements of Changes in Net Assets (continued) |
| |
| | | | | | | | | | |
| | | Sterling Capital
Stratton Real
Estate Fund |
| | |
| | | For the
Year Ended
September 30,
2018 | | For the
Year Ended
September 30,
2017 |
Capital Transactions: | | | | | | | | | | |
Class A Shares: | | | | | | | | | | |
Proceeds from shares issued | | | $ | 199,930 | | | | $ | 202,166 | |
Distributions reinvested | | | | 12,636 | | | | | 10,702 | |
Value of shares redeemed | | | | (118,705 | ) | | | | (18,317 | ) |
| | | | | | | | | | |
Change in net assets from Class A Share transactions | | | | 93,861 | | | | | 194,551 | |
Class C Shares: | | | | | | | | | | |
Proceeds from shares issued | | | | 38,003 | | | | | 45,614 | |
Distributions reinvested | | | | 2,786 | | | | | 1,259 | |
Value of shares redeemed | | | | (8,746 | ) | | | | (1,266 | ) |
| | | | | | | | | | |
Change in net assets from Class C Share transactions | | | | 32,043 | | | | | 45,607 | |
Institutional Shares: | | | | | | | | | | |
Proceeds from shares issued | | | | 6,722,737 | | | | | 13,015,551 | |
Distributions reinvested | | | | 4,044,383 | | | | | 6,438,662 | |
Value of shares redeemed | | | | (16,178,109 | ) | | | | (21,235,919 | ) |
| | | | | | | | | | |
Change in net assets from Institutional Share transactions | | | | (5,410,989 | ) | | | | (1,781,706 | ) |
| | | | | | | | | | |
Change in net assets from capital transactions | | | $ | (5,285,085 | ) | | | $ | (1,541,548 | ) |
| | | | | | | | | | |
| | |
Share Transactions: | | | | | | | | | | |
Class A Shares: | | | | | | | | | | |
Issued | | | | 5,304 | | | | | 5,445 | |
Reinvested | | | | 341 | | | | | 296 | |
Redeemed | | | | (3,210 | ) | | | | (493 | ) |
| | | | | | | | | | |
Change in Class A Shares | | | | 2,435 | | | | | 5,248 | |
Class C Shares: | | | | | | | | | | |
Issued | | | | 1,049 | | | | | 1,239 | |
Reinvested | | | | 75 | | | | | 35 | |
Redeemed | | | | (247 | ) | | | | (36 | ) |
| | | | | | | | | | |
Change in Class C Shares | | | | 877 | | | | | 1,238 | |
Institutional Shares: | | | | | | | | | | |
Issued | | | | 182,158 | | | | | 352,541 | |
Reinvested | | | | 109,143 | | | | | 178,417 | |
Redeemed | | | | (449,637 | ) | | | | (572,330 | ) |
| | | | | | | | | | |
Change in Institutional Shares | | | | (158,336 | ) | | | | (41,372 | ) |
| | | | | | | | | | |
Change in Shares | | | | (155,024 | ) | | | | (34,886 | ) |
| | | | | | | | | | |
See accompanying Notes to the Financial Statements.
146
| | | | | | | | | | | | | | |
Sterling Capital
Stratton Small Cap
Value Fund | | | Sterling Capital
Ultra Short
Bond Fund | |
| | | |
For the
Year Ended
September 30,
2018 | | | For the
Year Ended
September 30,
2017 | | | For the
Year Ended
September 30,
2018 | | | For the
Year Ended
September 30,
2017 | |
| | | | | | | | | | | | | | |
| | | | | | | | | | | | | | |
| $ | 1,687,322 | | | $ | 394,368 | | | $ | 4,735,145 | | | $ | 2,194,481 | |
| | 44,946 | | | | 8,601 | | | | 77,021 | | | | 64,325 | |
| | (118,054 | ) | | | — | | | | (4,376,419 | ) | | | (3,827,246 | ) |
| | | | | | | | | | | | | | |
| | 1,614,214 | | | | 402,969 | | | | 435,747 | | | | (1,568,440 | ) |
| | | | | | | | | | | | | | |
| | 3,625 | | | | 65,685 | | | | — | | | | — | |
| | 9,282 | | | | 3,494 | | | | — | | | | — | |
| | (6,219 | ) | | | (39,053 | ) | | | — | | | | — | |
| | | | | | | | | | | | | | |
| | 6,688 | | | | 30,126 | | | | — | | | | — | |
| | | | | | | | | | | | | | |
| | 292,065,741 | | | | 172,185,996 | | | | 7,550,761 | | | | 10,080,208 | |
| | 82,688,186 | | | | 45,985,577 | | | | 540,774 | | | | 535,956 | |
| | (251,289,259 | ) | | | (416,351,352 | ) | | | (19,921,662 | ) | | | (30,785,581 | ) |
| | | | | | | | | | | | | | |
| | 123,464,668 | | | | (198,179,779 | ) | | | (11,830,127 | ) | | | (20,169,417 | ) |
| | | | | | | | | | | | | | |
| $ | 125,085,570 | | | | (197,746,684 | ) | | $ | (11,394,380 | ) | | $ | (21,737,857 | ) |
| | | | | | | | | | | | | | |
| | | |
| | | | | | | | | | | | | | |
| | | | | | | | | | | | | | |
| | 19,281 | | | | 4,672 | | | | 484,332 | | | | 223,984 | |
| | 526 | | | | 102 | | | | 7,901 | | | | 6,569 | |
| | (1,352 | ) | | | — | | | | (448,147 | ) | | | (390,838 | ) |
| | | | | | | | | | | | | | |
| | 18,455 | | | | 4,774 | | | | 44,086 | | | | (160,285 | ) |
| | | | | | | | | | | | | | |
| | 43 | | | | 787 | | | | — | | | | — | |
| | 110 | | | | 42 | | | | — | | | | — | |
| | (71 | ) | | | (461 | ) | | | — | | | | — | |
| | | | | | | | | | | | | | |
| | 82 | | | | 368 | | | | — | | | | — | |
| | | | | | | | | | | | | | |
| | 3,325,502 | | | | 2,056,541 | | | | 774,686 | | | | 1,029,490 | |
| | 964,732 | | | | 544,409 | | | | 55,470 | | | | 54,733 | |
| | (2,864,279 | ) | | | (4,936,706 | ) | | | (2,043,410 | ) | | | (3,143,484 | ) |
| | | | | | | | | | | | | | |
| | 1,425,955 | | | | (2,335,756 | ) | | | (1,213,254 | ) | | | (2,059,261 | ) |
| | | | | | | | | | | | | | |
| | 1,444,492 | | | | (2,330,614 | ) | | | (1,169,168 | ) | | | (2,219,546 | ) |
| | | | | | | | | | | | | | |
147
|
Sterling Capital Funds |
Statements of Changes in Net Assets (continued) |
| |
| | | | | | | | | | |
| | | Sterling Capital
Short Duration
Bond Fund |
| | |
| | | For the
Year Ended
September 30,
2018 | | For the
Year Ended
September 30,
2017 |
Capital Transactions: | | | | | | | | | | |
Class A Shares: | | | | | | | | | | |
Proceeds from shares issued1 | | | $ | 470,987 | | | | $ | 938,772 | |
Distributions reinvested | | | | 110,645 | | | | | 126,305 | |
Value of shares redeemed | | | | (1,829,666 | ) | | | | (2,559,563 | ) |
| | | | | | | | | | |
Change in net assets from Class A Share transactions | | | | (1,248,034 | ) | | | | (1,494,486 | ) |
Class B Shares: | | | | | | | | | | |
Distributions reinvested | | | | — | | | | | — | |
Value of shares redeemed | | | | — | | | | | — | |
| | | | | | | | | | |
Change in net assets from Class B Share transactions2 | | | | — | | | | | — | |
Class C Shares: | | | | | | | | | | |
Proceeds from shares issued | | | | 6,324 | | | | | 254,128 | |
Distributions reinvested | | | | 19,529 | | | | | 18,328 | |
Value of shares redeemed | | | | (453,677 | ) | | | | (588,672 | ) |
| | | | | | | | | | |
Change in net assets from Class C Share transactions | | | | (427,824 | ) | | | | (316,216 | ) |
Institutional Shares: | | | | | | | | | | |
Proceeds from shares issued | | | | 83,320,675 | | | | | 29,138,991 | |
Distributions reinvested | | | | 1,811,206 | | | | | 720,706 | |
Value of shares redeemed | | | | (24,085,787 | ) | | | | (38,782,224 | ) |
| | | | | | | | | | |
Change in net assets from Institutional Share transactions | | | | 61,046,094 | | | | | (8,922,527 | ) |
Class R Shares: | | | | | | | | | | |
Proceeds from shares issued | | | | — | | | | | — | |
Distributions reinvested | | | | — | | | | | — | |
Value of shares redeemed | | | | — | | | | | — | |
| | | | | | | | | | |
Change in net assets from Class R Share transactions | | | | — | | | | | — | |
| | | | | | | | | | |
Class R6 Shares: | | | | | | | | | | |
Proceeds from shares issued | | | | — | | | | | — | |
Distributions reinvested | | | | — | | | | | — | |
Value of shares redeemed | | | | — | | | | | — | |
| | | | | | | | | | |
Change in net assets from Class R6 Share transactions | | | | — | | | | | — | |
| | | | | | | | | | |
Change in net assets from capital transactions | | | $ | 59,370,236 | | | | $ | (10,733,229 | ) |
| | | | | | | | | | |
| | |
Share Transactions: | | | | | | | | | | |
Class A Shares: | | | | | | | | | | |
Issued1 | | | | 55,182 | | | | | 107,646 | |
Reinvested | | | | 12,910 | | | | | 14,490 | |
Redeemed | | | | (213,397 | ) | | | | (293,666 | ) |
| | | | | | | | | | |
Change in Class A Shares | | | | (145,305 | ) | | | | (171,530 | ) |
Class B Shares: | | | | | | | | | | |
Reinvested | | | | — | | | | | — | |
Redeemed | | | | — | | | | | — | |
| | | | | | | | | | |
Change in Class B Shares2 | | | | — | | | | | — | |
Class C Shares: | | | | | | | | | | |
Issued | | | | 738 | | | | | 29,219 | |
Reinvested | | | | 2,280 | | | | | 2,103 | |
Redeemed | | | | (52,881 | ) | | | | (67,565 | ) |
| | | | | | | | | | |
Change in Class C Shares | | | | (49,863 | ) | | | | (36,243 | ) |
Institutional Shares: | | | | | | | | | | |
Issued | | | | 9,731,130 | | | | | 3,343,791 | |
Reinvested | | | | 211,938 | | | | | 82,705 | |
Redeemed | | | | (2,808,942 | ) | | | | (4,450,157 | ) |
| | | | | | | | | | |
Change in Institutional Shares | | | | 7,134,126 | | | | | (1,023,661 | ) |
Class R Shares: | | | | | | | | | | |
Issued | | | | — | | | | | — | |
Reinvested | | | | — | | | | | — | |
Redeemed | | | | — | | | | | — | |
| | | | | | | | | | |
Change in Class R Shares | | | | — | | | | | — | |
| | | | | | | | | | |
Class R6 Shares: | | | | | | | | | | |
Issued | | | | — | | | | | — | |
Reinvested | | | | — | | | | | — | |
Redeemed | | | | — | | | | | — | |
| | | | | | | | | | |
Change in Class R6 Shares | | | | — | | | | | — | |
| | | | | | | | | | |
Change in Shares | | | | 6,938,958 | | | | | (1,231,434 | ) |
| | | | | | | | | | |
1Includes 1,325 and 380 shares and $13,207 and $4,018 for the year ended September 30, 2017, due to the conversion of Class B Shares into Class A Shares for the Sterling Capital Intermediate U.S. Government Fund and the Sterling Capital Total Return Bond Fund, respectively.
2Class B Shares of the Sterling Capital Intermediate U.S. Government Fund and the Sterling Capital Total Return Fund closed effective May 26, 2017.
See accompanying Notes to the Financial Statements.
148
| | | | | | | | | | | | | | | | | | | | | | |
Sterling Capital
Intermediate U.S.
Government Fund | | | Sterling Capital
Total Return
Bond Fund | | | Sterling Capital
Corporate Fund | |
| | | | | |
For the
Year Ended
September 30,
2018 | | | For the
Year Ended
September 30,
2017 | | | For the
Year Ended
September 30,
2018 | | | For the
Year Ended
September 30,
2017 | | | For the
Year Ended
September 30,
2018 | | | For the
Year Ended
September 30,
2017 | |
| | | | | | | | | | | | | | | | | | | | | | |
| | | | | | | | | | | | | | | | | | | | | | |
| $ | 32,004 | | | $ | 111,043 | | | $ | 14,575,793 | | | $ | 31,854,988 | | | $ | 133,619 | | | $ | 37,468 | |
| | 122,083 | | | | 112,816 | | | | 1,992,744 | | | | 1,806,087 | | | | 14,122 | | | | 13,500 | |
| | (1,010,069 | ) | | | (1,650,754 | ) | | | (16,806,056 | ) | | | (30,480,865 | ) | | | (63,236 | ) | | | (115,435 | ) |
| | | | | | | | | | | | | | | | | | | | | | |
| | (855,982 | ) | | | (1,426,895 | ) | | | (237,519 | ) | | | 3,180,210 | | | | 84,505 | | | | (64,467 | ) |
| | | | | | | | | | | | | | | | | | | | | | |
| | — | | | | 223 | | | | — | | | | 1,773 | | | | — | | | | — | |
| | — | | | | (71,823 | ) | | | — | | | | (354,051 | ) | | | — | | | | — | |
| | | | | | | | | | | | | | | | | | | | | | |
| | — | | | | (71,600 | ) | | | — | | | | (352,278 | ) | | | — | | | | — | |
| | | | | | | | | | | | | | | | | | | | | | |
| | 7,656 | | | | 53,587 | | | | 2,517,014 | | | | 2,182,694 | | | | — | | | | — | |
| | 9,886 | | | | 8,353 | | | | 122,808 | | | | 123,885 | | | | 1,206 | | | | 1,110 | |
| | (84,443 | ) | | | (168,791 | ) | | | (2,470,980 | ) | | | (2,490,364 | ) | | | — | | | | (15,719 | ) |
| | | | | | | | | | | | | | | | | | | | | | |
| | (66,901 | ) | | | (106,851 | ) | | | 168,842 | | | | (183,785 | ) | | | 1,206 | | | | (14,609 | ) |
| | | | | | | | | | | | | | | | | | | | | | |
| | 8,934,794 | | | | 2,646,464 | | | | 377,719,394 | | | | 476,910,643 | | | | 9,455,433 | | | | 4,062,269 | |
| | 82,950 | | | | 116,820 | | | | 16,766,290 | | | | 15,532,066 | | | | 1,071,268 | | | | 1,031,909 | |
| | (6,829,021 | ) | | | (4,622,293 | ) | | | (493,447,788 | ) | | | (191,448,091 | ) | | | (8,017,233 | ) | | | (7,018,051 | ) |
| | | | | | | | | | | | | | | | | | | | | | |
| | 2,188,723 | | | | (1,859,009 | ) | | | (98,962,104 | ) | | | 300,994,618 | | | | 2,509,468 | | | | (1,923,873 | ) |
| | | | | | | | | | | | | | | | | | | | | | |
| | — | | | | — | | | | 30,426 | | | | — | | | | — | | | | — | |
| | — | | | | — | | | | 248 | | | | 136 | | | | — | | | | — | |
| | — | | | | — | | | | (55 | ) | | | — | | | | — | | | | — | |
| | | | | | | | | | | | | | | | | | | | | | |
| | — | | | | — | | | | 30,619 | | | | 136 | | | | — | | | | — | |
| | | | | | | | | | | | | | | | | | | | | | |
| | | | | | | | | | | | | | | | | | | | | | |
| | — | | | | — | | | | 298,303,123 | | | | — | | | | — | | | | — | |
| | — | | | | — | | | | 4,164,349 | | | | — | | | | — | | | | — | |
| | — | | | | — | | | | (17,301,668 | ) | | | — | | | | — | | | | — | |
| | | | | | | | | | | | | | | | | | | | | | |
| | — | | | | — | | | | 285,165,804 | | | | — | | | | — | | | | — | |
| | | | | | | | | | | | | | | | | | | | | | |
| $ | 1,265,840 | | | $ | (3,464,355 | ) | | $ | 186,165,642 | | | $ | 303,638,901 | | | $ | 2,595,179 | | | $ | (2,002,949 | ) |
| | | | | | | | | | | | | | | | | | | | | | |
| | | | | |
| | | | | | | | | | | | | | | | | | | | | | |
| | | | | | | | | | | | | | | | | | | | | | |
| | 3,302 | | | | 11,119 | | | | 1,399,318 | | | | 3,017,726 | | | | 13,427 | | | | 3,678 | |
| | 12,647 | | | | 11,321 | | | | 192,297 | | | | 171,241 | | | | 1,414 | | | | 1,326 | |
| | (104,135 | ) | | | (165,854 | ) | | | (1,625,612 | ) | | | (2,887,533 | ) | | | (6,310 | ) | | | (11,275 | ) |
| | | | | | | | | | | | | | | | | | | | | | |
| | (88,186 | ) | | | (143,414 | ) | | | (33,997 | ) | | | 301,434 | | | | 8,531 | | | | (6,271 | ) |
| | | | | | | | | | | | | | | | | | | | | | |
| | — | | | | 22 | | | | — | | | | 168 | | | | — | | | | — | |
| | — | | | | (7,202 | ) | | | — | | | | (33,676 | ) | | | — | | | | — | |
| | | | | | | | | | | | | | | | | | | | | | |
| | — | | | | (7,180 | ) | | | — | | | | (33,508 | ) | | | — | | | | — | |
| | | | | | | | | | | | | | | | | | | | | | |
| | 787 | | | | 5,375 | | | | 242,058 | | | | 206,244 | | | | — | | | | — | |
| | 1,026 | | | | 840 | | | | 11,835 | | | | 11,728 | | | | 120 | | | | 109 | |
| | (8,644 | ) | | | (16,938 | ) | | | (237,640 | ) | | | (235,936 | ) | | | — | | | | (1,535 | ) |
| | | | | | | | | | | | | | | | | | | | | | |
| | (6,831 | ) | | | (10,723 | ) | | | 16,253 | | | | (17,964 | ) | | | 120 | | | | (1,426 | ) |
| | | | | | | | | | | | | | | | | | | | | | |
| | 934,128 | | | | 265,519 | | | | 36,365,096 | | | | 45,239,726 | | | | 960,307 | | | | 399,391 | |
| | 8,580 | | | | 11,712 | | | | 1,613,303 | | | | 1,471,267 | | | | 107,332 | | | | 101,294 | |
| | (705,599 | ) | | | (463,995 | ) | | | (47,710,560 | ) | | | (18,184,131 | ) | | | (803,488 | ) | | | (688,868 | ) |
| | | | | | | | | | | | | | | | | | | | | | |
| | 237,109 | | | | (186,764 | ) | | | (9,732,161 | ) | | | 28,526,862 | | | | 264,151 | | | | (188,183 | ) |
| | | | | | | | | | | | | | | | | | | | | | |
| | — | | | | — | | | | 2,972 | | | | — | | | | — | | | | — | |
| | — | | | | — | | | | 24 | | | | 13 | | | | ��� | | | | — | |
| | — | | | | — | | | | (5 | ) | | | — | | | | — | | | | — | |
| | | | | | | | | | | | | | | | | | | | | | |
| | — | | | | — | | | | 2,991 | | | | 13 | | | | — | | | | — | |
| | | | | | | | | | | | | | | | | | | | | | |
| | | | | | | | | | | | | | | | | | | | | | |
| | — | | | | — | | | | 28,894,822 | | | | — | | | | — | | | | — | |
| | — | | | | — | | | | 405,977 | | | | — | | | | — | | | | — | |
| | — | | | | — | | | | (1,687,990 | ) | | | — | | | | — | | | | — | |
| | | | | | | | | | | | | | | | | | | | | | |
| | — | | | | — | | | | 27,612,809 | | | | — | | | | — | | | | — | |
| | | | | | | | | | | | | | | | | | | | | | |
| | 142,092 | | | | (348,081 | ) | | | 17,865,895 | | | | 28,776,837 | | | | 272,802 | | | | (195,880 | ) |
| | | | | | | | | | | | | | | | | | | | | | |
149
|
Sterling Capital Funds |
Statements of Changes in Net Assets (continued) |
| |
| | | | | | | | | | |
| | |
Sterling Capital
Securitized Opportunities
Fund |
| | |
| | | For the
Year Ended
September 30,
2018 | | For the
Year Ended
September 30,
2017 |
Capital Transactions: | | | | | | | | | | |
Class A Shares: | | | | | | | | | | |
Proceeds from shares issued | | | $ | 422 | | | | $ | 17,906 | |
Distributions reinvested | | | | 1,330 | | | | | 3,533 | |
Value of shares redeemed | | | | (75,841 | ) | | | | (301,975 | ) |
| | | | | | | | | | |
Change in net assets from Class A Share transactions | | | | (74,089 | ) | | | | (280,536 | ) |
Class C Shares: | | | | | | | | | | |
Proceeds from shares issued | | | | — | | | | | — | |
Distributions reinvested | | | | 696 | | | | | 614 | |
Value of shares redeemed | | | | (546 | ) | | | | (6,227 | ) |
| | | | | | | | | | |
Change in net assets from Class C Share transactions | | | | 150 | | | | | (5,613 | ) |
Institutional Shares: | | | | | | | | | | |
Proceeds from shares issued | | | | 5,670,308 | | | | | 2,113,567 | |
Distributions reinvested | | | | 1,144,285 | | | | | 1,137,751 | |
Value of shares redeemed | | | | (7,973,422 | ) | | | | (9,399,975 | ) |
| | | | | | | | | | |
Change in net assets from Institutional Share transactions | | | | (1,158,829 | ) | | | | (6,148,657 | ) |
| | | | | | | | | | |
Change in net assets from capital transactions | | | $ | (1,232,768 | ) | | | $ | (6,434,806 | ) |
| | | | | | | | | | |
| | |
Share Transactions: | | | | | | | | | | |
Class A Shares: | | | | | | | | | | |
Issued | | | | 43 | | | | | 1,816 | |
Reinvested | | | | 136 | | | | | 356 | |
Redeemed | | | | (7,750 | ) | | | | (30,041 | ) |
| | | | | | | | | | |
Change in Class A Shares | | | | (7,571 | ) | | | | (27,869 | ) |
Class C Shares: | | | | | | | | | | |
Issued | | | | — | | | | | — | |
Reinvested | | | | 71 | | | | | 62 | |
Redeemed | | | | (56 | ) | | | | (633 | ) |
| | | | | | | | | | |
Change in Class C Shares. | | | | 15 | | | | | (571 | ) |
Institutional Shares: | | | | | | | | | | |
Issued | | | | 586,820 | | | | | 213,092 | |
Reinvested | | | | 117,388 | | | | | 114,458 | |
Redeemed | | | | (820,358 | ) | | | | (943,751 | ) |
| | | | | | | | | | |
Change in Institutional Shares | | | | (116,150 | ) | | | | (616,201 | ) |
| | | | | | | | | | |
Change in Shares | | | | (123,706 | ) | | | | (644,641 | ) |
| | | | | | | | | | |
See accompanying Notes to the Financial Statements.
150
| | | | | | | | | | | | | | | | | | | | | | |
Sterling Capital
Kentucky
Intermediate
Tax-Free Fund | | | Sterling Capital
Maryland
Intermediate
Tax-Free Fund | | | Sterling Capital
North Carolina
Intermediate
Tax-Free Fund | |
| | | | | |
For the
Year Ended
September 30,
2018 | | | For the
Year Ended
September 30,
2017 | | | For the
Year Ended
September 30,
2018 | | | For the
Year Ended
September 30,
2017 | | | For the
Year Ended
September 30,
2018 | | | For the
Year Ended
September 30,
2017 | |
| | | | | | | | | | | | | | | | | | | | | | |
| | | | | | | | | | | | | | | | | | | | | | |
| $ | 12,851 | | | $ | 77,209 | | | $ | 208,485 | | | $ | 104,097 | | | $ | 2,537,656 | | | $ | 2,670,602 | |
| | 84,773 | | | | 124,254 | | | | 109,475 | | | | 114,904 | | | | 792,745 | | | | 951,142 | |
| | (378,208 | ) | | | (331,819 | ) | | | (939,490 | ) | | | (762,604 | ) | | | (10,459,959 | ) | | | (8,946,496 | ) |
| | | | | | | | | | | | | | | | | | | | | | |
| | (280,584 | ) | | | (130,356 | ) | | | (621,530 | ) | | | (543,603 | ) | | | (7,129,558 | ) | | | (5,324,752 | ) |
| | | | | | | | | | | | | | | | | | | | | | |
| | — | | | | 1,533 | | | | 103,365 | | | | 53,854 | | | | 975,837 | | | | 353,532 | |
| | 26 | | | | 61 | | | | 11,004 | | | | 13,100 | | | | 57,854 | | | | 78,171 | |
| | — | | | | (19,711 | ) | | | (127,076 | ) | | | (221,816 | ) | | | (2,130,630 | ) | | | (1,778,404 | ) |
| | | | | | | | | | | | | | | | | | | | | | |
| | 26 | | | | (18,117 | ) | | | (12,707 | ) | | | (154,862 | ) | | | (1,096,939 | ) | | | (1,346,701 | ) |
| | | | | | | | | | | | | | | | | | | | | | |
| | 1,336,803 | | | | 2,541,134 | | | | 764,677 | | | | 2,861,004 | | | | 27,347,433 | | | | 33,197,391 | |
| | 15,888 | | | | 37,709 | | | | 78,432 | | | | 178,778 | | | | 900,556 | | | | 1,095,218 | |
| | (1,377,414 | ) | | | (2,831,882 | ) | | | (4,004,313 | ) | | | (10,010,298 | ) | | | (30,434,472 | ) | | | (46,819,166 | ) |
| | | | | | | | | | | | | | | | | | | | | | |
| | (24,723 | ) | | | (253,039 | ) | | | (3,161,204 | ) | | | (6,970,516 | ) | | | (2,186,483 | ) | | | (12,526,557 | ) |
| | | | | | | | | | | | | | | | | | | | | | |
| $ | (305,281 | ) | | $ | (401,512 | ) | | $ | (3,795,441 | ) | | $ | (7,668,981 | ) | | $ | (10,412,980 | ) | | $ | (19,198,010 | ) |
| | | | | | | | | | | | | | | | | | | | | | |
| | | | | |
| | | | | | | | | | | | | | | | | | | | | | |
| | | | | | | | | | | | | | | | | | | | | | |
| | 1,275 | | | | 7,295 | | | | 19,485 | | | | 9,394 | | | | 238,687 | | | | 248,011 | |
| | 8,435 | | | | 12,177 | | | | 10,146 | | | | 10,525 | | | | 75,036 | | | | 88,591 | |
| | (37,818 | ) | | | (32,517 | ) | | | (87,455 | ) | | | (70,107 | ) | | | (987,278 | ) | | | (833,304 | ) |
| | | | | | | | | | | | | | | | | | | | | | |
| | (28,108 | ) | | | (13,045 | ) | | | (57,824 | ) | | | (50,188 | ) | | | (673,555 | ) | | | (496,702 | ) |
| | | | | | | | | | | | | | | | | | | | | | |
| | — | | | | 148 | | | | 9,546 | | | | 4,877 | | | | 91,894 | | | | 32,852 | |
| | 3 | | | | 6 | | | | 1,019 | | | | 1,199 | | | | 5,479 | | | | 7,295 | |
| | — | | | | (1,906 | ) | | | (11,840 | ) | | | (20,135 | ) | | | (201,199 | ) | | | (165,600 | ) |
| | | | | | | | | | | | | | | | | | | | | | |
| | 3 | | | | (1,752 | ) | | | (1,275 | ) | | | (14,059 | ) | | | (103,826 | ) | | | (125,453 | ) |
| | | | | | | | | | | | | | | | | | | | | | |
| | 133,119 | | | | 247,367 | | | | 70,464 | | | | 260,773 | | | | 2,587,873 | | | | 3,099,533 | |
| | 1,582 | | | | 3,698 | | | | 7,262 | | | | 16,336 | | | | 85,310 | | | | 102,014 | |
| | (138,001 | ) | | | (275,956 | ) | | | (372,473 | ) | | | (911,570 | ) | | | (2,874,906 | ) | | | (4,363,035 | ) |
| | | | | | | | | | | | | | | | | | | | | | |
| | (3,300 | ) | | | (24,891 | ) | | | (294,747 | ) | | | (634,461 | ) | | | (201,723 | ) | | | (1,161,488 | ) |
| | | | | | | | | | | | | | | | | | | | | | |
| | (31,405 | ) | | | (39,688 | ) | | | (353,846 | ) | | | (698,708 | ) | | | (979,104 | ) | | | (1,783,643 | ) |
| | | | | | | | | | | | | | | | | | | | | | |
151
|
Sterling Capital Funds |
Statements of Changes in Net Assets (continued) |
| |
| | | | | | | | | | |
| | | Sterling Capital
South Carolina
Intermediate
Tax-Free Fund |
| | |
| | | For the
Year Ended
September 30,
2018 | | For the
Year Ended
September 30,
2017 |
Capital Transactions: | | | | | | | | | | |
Class A Shares: | | | | | | | | | | |
Proceeds from shares issued | | | $ | 2,214,300 | | | | $ | 648,471 | |
Distributions reinvested | | | | 275,293 | | | | | 266,413 | |
Value of shares redeemed | | | | (3,992,034 | ) | | | | (3,424,373 | ) |
| | | | | | | | | | |
Change in net assets from Class A Share transactions | | | | (1,502,441 | ) | | | | (2,509,489 | ) |
Class C Shares: | | | | | | | | | | |
Proceeds from shares issued | | | | 9,569 | | | | | 375,128 | |
Distributions reinvested | | | | 14,215 | | | | | 16,331 | |
Value of shares redeemed | | | | (432,827 | ) | | | | (723,675 | ) |
| | | | | | | | | | |
Change in net assets from Class C Share transactions | | | | (409,043 | ) | | | | (332,216 | ) |
Institutional Shares: | | | | | | | | | | |
Proceeds from shares issued | | | | 14,435,688 | | | | | 16,394,614 | |
Distributions reinvested | | | | 378,336 | | | | | 345,285 | |
Value of shares redeemed | | | | (19,372,000 | ) | | | | (18,360,026 | ) |
| | | | | | | | | | |
Change in net assets from Institutional Share transactions | | | | (4,557,976 | ) | | | | (1,620,127 | ) |
| | | | | | | | | | |
Change in net assets from capital transactions | | | $ | (6,469,460 | ) | | | $ | (4,461,832 | ) |
| | | | | | | | | | |
| | |
Share Transactions: | | | | | | | | | | |
Class A Shares: | | | | | | | | | | |
Issued | | | | 202,414 | | | | | 58,854 | |
Reinvested | | | | 25,275 | | | | | 24,130 | |
Redeemed | | | | (366,316 | ) | | | | (310,299 | ) |
| | | | | | | | | | |
Change in Class A Shares | | | | (138,627 | ) | | | | (227,315 | ) |
Class C Shares: | | | | | | | | | | |
Issued | | | | 868 | | | | | 34,231 | |
Reinvested | | | | 1,305 | | | | | 1,480 | |
Redeemed | | | | (39,796 | ) | | | | (65,819 | ) |
| | | | | | | | | | |
Change in Class C Shares | | | | (37,623 | ) | | | | (30,108 | ) |
Institutional Shares: | | | | | | | | | | |
Issued | | | | 1,328,951 | | | | | 1,498,678 | |
Reinvested | | | | 34,972 | | | | | 31,477 | |
Redeemed | | | | (1,790,163 | ) | | | | (1,684,343 | ) |
| | | | | | | | | | |
Change in Institutional Shares | | | | (426,240 | ) | | | | (154,188 | ) |
| | | | | | | | | | |
Change in Shares | | | | (602,490 | ) | | | | (411,611 | ) |
| | | | | | | | | | |
See accompanying Notes to the Financial Statements.
152
| | | | | | | | | | | | | | |
Sterling Capital
Virginia
Intermediate
Tax-Free Fund | | | Sterling Capital
West Virginia
Intermediate
Tax-Free Fund | |
| | | |
For the
Year Ended
September 30,
2018 | | | For the
Year Ended
September 30,
2017 | | | For the
Year Ended
September 30,
2018 | | | For the
Year Ended
September 30,
2017 | |
| | | | | | | | | | | | | | |
| | | | | | | | | | | | | | |
| $ | 127,607 | | | $ | 528,328 | | | $ | 489,092 | | | $ | 720,477 | |
| | 402,911 | | | | 680,708 | | | | 565,984 | | | | 687,934 | |
| | (6,408,355 | ) | | | (7,343,890 | ) | | | (6,439,300 | ) | | | (8,091,281 | ) |
| | | | | | | | | | | | | | |
| | (5,877,837 | ) | | | (6,134,854 | ) | | | (5,384,224 | ) | | | (6,682,870 | ) |
| | | | | | | | | | | | | | |
| | 1,074 | | | | 16,637 | | | | 12,856 | | | | 10,000 | |
| | 10,205 | | | | 18,579 | | | | 10,940 | | | | 11,695 | |
| | (75,043 | ) | | | (233,626 | ) | | | (12,951 | ) | | | (81,644 | ) |
| | | | | | | | | | | | | | |
| | (63,764 | ) | | | (198,410 | ) | | | 10,845 | | | | (59,949 | ) |
| | | | | | | | | | | | | | |
| | 7,846,063 | | | | 16,571,968 | | | | 9,470,740 | | | | 10,716,379 | |
| | 197,739 | | | | 449,673 | | | | 136,406 | | | | 312,834 | |
| | (15,276,554 | ) | | | (27,585,076 | ) | | | (12,296,255 | ) | | | (14,199,818 | ) |
| | | | | | | | | | | | | | |
| | (7,232,752 | ) | | | (10,563,435 | ) | | | (2,689,109 | ) | | | (3,170,605 | ) |
| | | | | | | | | | | | | | |
| $ | (13,174,353 | ) | | $ | (16,896,699 | ) | | $ | (8,062,488 | ) | | $ | (9,913,424 | ) |
| | | | | | | | | | | | | | |
| | | |
| | | | | | | | | | | | | | |
| | | | | | | | | | | | | | |
| | 11,053 | | | | 44,688 | | | | 49,296 | | | | 71,330 | |
| | 34,924 | | | | 58,264 | | | | 57,489 | | | | 68,957 | |
| | (553,854 | ) | | | (626,811 | ) | | | (655,601 | ) | | | (812,178 | ) |
| | | | | | | | | | | | | | |
| | (507,877 | ) | | | (523,859 | ) | | | (548,816 | ) | | | (671,891 | ) |
| | | | | | | | | | | | | | |
| | 93 | | | | 1,425 | | | | 1,309 | | | | 978 | |
| | 885 | | | | 1,593 | | | | 1,111 | | | | 1,173 | |
| | (6,455 | ) | | | (19,991 | ) | | | (1,321 | ) | | | (8,105 | ) |
| | | | | | | | | | | | | | |
| | (5,477 | ) | | | (16,973 | ) | | | 1,099 | | | | (5,954 | ) |
| | | | | | | | | | | | | | |
| | 679,539 | | | | 1,420,477 | | | | 961,065 | | | | 1,069,141 | |
| | 17,156 | | | | 38,531 | | | | 13,819 | | | | 31,393 | |
| | (1,326,202 | ) | | | (2,364,171 | ) | | | (1,249,228 | ) | | | (1,419,137 | ) |
| | | | | | | | | | | | | | |
| | (629,507 | ) | | | (905,163 | ) | | | (274,344 | ) | | | (318,603 | ) |
| | | | | | | | | | | | | | |
| | (1,142,861 | ) | | | (1,445,995 | ) | | | (822,061 | ) | | | (996,448 | ) |
| | | | | | | | | | | | | | |
153
|
Sterling Capital Funds |
Statements of Changes in Net Assets (continued) |
| |
| | | | | | | | | | |
| | | Sterling Capital
Diversified
Income Fund |
| | |
| | | For the
Year Ended
September 30,
2018 | | For the
Year Ended
September 30,
2017 |
Capital Transactions: | | | | | | | | | | |
Class A Shares: | | | | | | | | | | |
Proceeds from shares issued1 | | | $ | 623,110 | | | | $ | 1,747,062 | |
Distributions reinvested | | | | 514,960 | | | | | 508,624 | |
Value of shares redeemed | | | | (3,226,948 | ) | | | | (2,587,858 | ) |
| | | | | | | | | | |
Change in net assets from Class A Share transactions | | | | (2,088,878 | ) | | | | (332,172 | ) |
Class B Shares: | | | | | | | | | | |
Distributions reinvested | | | | — | | | | | 2,230 | |
Value of shares redeemed | | | | — | | | | | (224,406 | ) |
| | | | | | | | | | |
Change in net assets from Class B Share transactions2 | | | | — | | | | | (222,176 | ) |
Class C Shares: | | | | | | | | | | |
Proceeds from shares issued | | | | 5,041 | | | | | 436,323 | |
Distributions reinvested | | | | 34,796 | | | | | 25,726 | |
Value of shares redeemed | | | | (127,071 | ) | | | | (458,425 | ) |
| | | | | | | | | | |
Change in net assets from Class C Share transactions | | | | (87,234 | ) | | | | 3,624 | |
Institutional Shares: | | | | | | | | | | |
Proceeds from shares issued | | | | 3,391,639 | | | | | 2,563,776 | |
Distributions reinvested | | | | 288,712 | | | | | 593,471 | |
Value of shares redeemed | | | | (4,659,359 | ) | | | | (21,326,072 | ) |
| | | | | | | | | | |
Change in net assets from Institutional Share transactions | | | | (979,008 | ) | | | | (18,168,825 | ) |
| | | | | | | | | | |
Change in net assets from capital transactions | | | $ | (3,155,120 | ) | | | $ | (18,719,549 | ) |
| | | | | | | | | | |
| | |
Share Transactions: | | | | | | | | | | |
Class A Shares: | | | | | | | | | | |
Issued1 | | | | 58,371 | | | | | 163,312 | |
Reinvested | | | | 48,139 | | | | | 47,637 | |
Redeemed | | | | (301,022 | ) | | | | (241,353 | ) |
| | | | | | | | | | |
Change in Class A Shares | | | | (194,512 | ) | | | | (30,404 | ) |
Class B Shares: | | | | | | | | | | |
Reinvested | | | | — | | | | | 211 | |
Redeemed | | | | — | | | | | (20,951 | ) |
| | | | | | | | | | |
Change in Class B Shares2 | | | | — | | | | | (20,740 | ) |
Class C Shares: | | | | | | | | | | |
Issued | | | | 467 | | | | | 41,109 | |
Reinvested | | | | 3,281 | | | | | 2,430 | |
Redeemed | | | | (11,968 | ) | | | | (43,317 | ) |
| | | | | | | | | | |
Change in Class C Shares. | | | | (8,220 | ) | | | | 222 | |
Institutional Shares: | | | | | | | | | | |
Issued | | | | 309,419 | | | | | 235,780 | |
Reinvested | | | | 26,648 | | | | | 55,329 | |
Redeemed | | | | (432,816 | ) | | | | (1,967,676 | ) |
| | | | | | | | | | |
Change in Institutional Shares | | | | (96,749 | ) | | | | (1,676,567 | ) |
| | | | | | | | | | |
Change in Shares | | | | (299,481 | ) | | | | (1,727,489 | ) |
| | | | | | | | | | |
1Includes 4,169, 1,478, 992 shares and $45,151, $16,779, $11,136, for the year ended September 30, 2017, due to the conversion of Class B Shares into Class A Shares for the Sterling Capital Diversified Income Fund, the Sterling Capital Strategic Allocation Balanced Fund, and the Sterling Capital Strategic Allocation Growth Fund, respectively.
2Class B Shares of the Funds closed effective May 26, 2017.
See accompanying Notes to the Financial Statements.
154
| | | | | | | | | | | | | | |
Sterling Capital
Strategic Allocation
Balanced Fund | | | Sterling Capital
Strategic Allocation
Growth Fund | |
| | | |
For the
Year Ended
September 30,
2018 | | | For the
Year Ended
September 30,
2017 | | | For the
Year Ended
September 30,
2018 | | | For the
Year Ended
September 30,
2017 | |
| | | | | | | | | | | | | | |
| | | | | | | | | | | | | | |
| $ | 773,902 | | | $ | 773,282 | | | $ | 298,745 | | | $ | 770,418 | |
| | 650,429 | | | | 420,490 | | | | 465,075 | | | | 231,090 | |
| | (3,606,861 | ) | | | (5,819,188 | ) | | | (2,544,309 | ) | | | (2,782,419 | ) |
| | | | | | | | | | | | | | |
| | (2,182,530 | ) | | | (4,625,416 | ) | | | (1,780,489 | ) | | | (1,780,911 | ) |
| | | | | | | | | | | | | | |
| | — | | | | 1,247 | | | | — | | | | 931 | |
| | — | | | | (267,509 | ) | | | — | | | | (340,392 | ) |
| | | | | | | | | | | | | | |
| | — | | | | (266,262 | ) | | | — | | | | (339,461 | ) |
| | | | | | | | | | | | | | |
| | 7,916 | | | | 100,614 | | | | 26,390 | | | | 32,456 | |
| | 11,239 | | | | 5,294 | | | | 5,540 | | | | 2,396 | |
| | (237,097 | ) | | | (133,952 | ) | | | (22,952 | ) | | | (112,371 | ) |
| | | | | | | | | | | | | | |
| | (217,942 | ) | | | (28,044 | ) | | | 8,978 | | | | (77,519 | ) |
| | | | | | | | | | | | | | |
| | 114,410 | | | | 50,806 | | | | 31,181 | | | | 37,599 | |
| | 3,510 | | | | 2,003 | | | | 16,607 | | | | 9,485 | |
| | (7,694 | ) | | | (33,247 | ) | | | (11,650 | ) | | | (165,201 | ) |
| | | | | | | | | | | | | | |
| | 110,226 | | | | 19,562 | | | | 36,138 | | | | (118,117 | ) |
| | | | | | | | | | | | | | |
| $ | (2,290,246 | ) | | $ | (4,900,160 | ) | | $ | (1,735,373 | ) | | $ | (2,316,008 | ) |
| | | | | | | | | | | | | | |
| | | |
| | | | | | | | | | | | | | |
| | | | | | | | | | | | | | |
| | 64,193 | | | | 69,675 | | | | 24,657 | | | | 70,463 | |
| | 53,984 | | | | 37,993 | | | | 38,281 | | | | 21,422 | |
| | (299,224 | ) | | | (523,782 | ) | | | (209,052 | ) | | | (253,617 | ) |
| | | | | | | | | | | | | | |
| | (181,047 | ) | | | (416,114 | ) | | | (146,114 | ) | | | (161,732 | ) |
| | | | | | | | | | | | | | |
| | — | | | | 118 | | | | — | | | | 91 | |
| | — | | | | (24,586 | ) | | | — | | | | (32,351 | ) |
| | | | | | | | | | | | | | |
| | — | | | | (24,468 | ) | | | — | | | | (32,260 | ) |
| | | | | | | | | | | | | | |
| | 671 | | | | 8,871 | | | | 2,250 | | | | 3,094 | |
| | 949 | | | | 498 | | | | 472 | | | | 235 | |
| | (20,240 | ) | | | (11,935 | ) | | | (1,960 | ) | | | (10,723 | ) |
| | | | | | | | | | | | | | |
| | (18,620 | ) | | | (2,566 | ) | | | 762 | | | | (7,394 | ) |
| | | | | | | | | | | | | | |
| | 9,385 | | | | 4,673 | | | | 2,571 | | | | 3,411 | |
| | 290 | | | | 179 | | | | 1,364 | | | | 873 | |
| | (632 | ) | | | (2,919 | ) | | | (947 | ) | | | (14,966 | ) |
| | | | | | | | | | | | | | |
| | 9,043 | | | | 1,933 | | | | 2,988 | | | | (10,682 | ) |
| | | | | | | | | | | | | | |
| | (190,624 | ) | | | (441,215 | ) | | | (142,364 | ) | | | (212,068 | ) |
| | | | | | | | | | | | | | |
155
|
Sterling Capital Funds |
Financial Highlights, Class A Shares |
|
The financial highlights table is intended to help you understand the Funds’ financial performance for the past 5 years or, if shorter, the period of the Funds’ operations. Certain information reflects financial results for a single Fund share. The total returns in the table represent the rate that an investor would have earned (or lost) on an investment in the Fund (assuming reinvestment of all dividends and distributions).
| | | | | | | | | | | | | | | | | | | | | | | | | | | | | | | | | | | |
| | | | | Investment Activities | | Distributions |
| | | | | | | |
| | | Net Asset
Value,
Beginning
of Year | | Net
investment
income
(loss)(a) | | Net realized/
unrealized
gains (losses)
on investments | | Total from
Investment
Activities | | Net
investment
income | | Net realized
gains on
investments | | Total
Distributions |
Sterling Capital Behavioral Large Cap Value Equity Fund | | | | | | | | | | | | | | | | | | | | | | | | | | |
Year Ended September 30, 2018 | | | $ | 20.71 | | | | | 0.31 | | | | | 1.91 | | | | | 2.22 | | | | | (0.44 | ) | | | | (0.19 | ) | | | | (0.63 | ) |
Year Ended September 30, 2017 | | | $ | 17.68 | | | | | 0.36 | | | | | 2.97 | | | | | 3.33 | | | | | (0.30 | ) | | | | — | | | | | (0.30 | ) |
Year Ended September 30, 2016 | | | $ | 16.53 | | | | | 0.27 | | | | | 1.15 | | | | | 1.42 | | | | | (0.27 | ) | | | | — | | | | | (0.27 | ) |
Year Ended September 30, 2015 | | | $ | 17.24 | | | | | 0.22 | | | | | (0.69 | ) | | | | (0.47 | ) | | | | (0.24 | ) | | | | — | | | | | (0.24 | ) |
Year Ended September 30, 2014 | | | $ | 14.16 | | | | | 0.18 | | | | | 3.06 | | | | | 3.24 | | | | | (0.16 | ) | | | | — | | | | | (0.16 | ) |
Sterling Capital Mid Value Fund | | | | | | | | | | | | | | | | | | | | | | | | | | | | | | | | | | | |
Year Ended September 30, 2018 | | | $ | 18.72 | | | | | (0.03 | ) | | | | 1.23 | | | | | 1.20 | | | | | — | | | | | (0.84 | ) | | | | (0.84 | ) |
Year Ended September 30, 2017 | | | $ | 16.71 | | | | | (0.02 | ) | | | | 2.56 | | | | | 2.54 | | | | | — | | | | | (0.53 | ) | | | | (0.53 | ) |
Year Ended September 30, 2016 | | | $ | 17.97 | | | | | 0.02 | | | | | 2.06 | | | | | 2.08 | | | | | — | | | | | (3.34 | ) | | | | (3.34 | ) |
Year Ended September 30, 2015 | | | $ | 19.33 | | | | | 0.06 | | | | | (0.14 | ) | | | | (0.08 | ) | | | | (0.11 | ) | | | | (1.17 | ) | | | | (1.28 | ) |
Year Ended September 30, 2014 | | | $ | 18.78 | | | | | 0.05 | | | | | 1.76 | | | | | 1.81 | | | | | (0.06 | ) | | | | (1.20 | ) | | | | (1.26 | ) |
Sterling Capital Behavioral Small Cap Value Equity Fund | | | | | | | | | | | | | | | | | | | | | | | | | | |
Year Ended September 30, 2018 | | | $ | 18.39 | | | | | 0.17 | | | | | 0.86 | | | | | 1.03 | | | | | (0.12 | ) | | | | (0.65 | ) | | | | (0.77 | ) |
Year Ended September 30, 2017 | | | $ | 15.19 | | | | | 0.12 | | | | | 3.17 | | | | | 3.29 | | | | | (0.09 | ) | | | | — | | | | | (0.09 | ) |
Year Ended September 30, 2016 | | | $ | 14.04 | | | | | 0.18 | | | | | 1.15 | | | | | 1.33 | | | | | (0.17 | ) | | | | (0.01 | ) | | | | (0.18 | ) |
Year Ended September 30, 2015 | | | $ | 14.34 | | | | | 0.18 | | | | | 0.16 | | | | | 0.34 | | | | | (0.20 | ) | | | | (0.44 | ) | | | | (0.64 | ) |
Year Ended September 30, 2014 | | | $ | 15.25 | | | | | 0.11 | | | | | 0.93 | | | | | 1.04 | | | | | (0.08 | ) | | | | (1.87 | ) | | | | (1.95 | ) |
Sterling Capital Special Opportunities Fund | | | | | | | | | | | | | | | | | | | | | | | | | | | | | | | | | | | |
Year Ended September 30, 2018 | | | $ | 24.51 | | | | | 0.01 | | | | | 3.93 | | | | | 3.94 | | | | | (0.14 | ) | | | | (1.94 | ) | | | | (2.08 | ) |
Year Ended September 30, 2017 | | | $ | 21.53 | | | | | 0.02 | | | | | 3.37 | | | | | 3.39 | | | | | — | | | | | (0.41 | ) | | | | (0.41 | ) |
Year Ended September 30, 2016 | | | $ | 22.96 | | | | | — | | | | | 1.88 | | | | | 1.88 | | | | | — | | | | | (3.31 | ) | | | | (3.31 | ) |
Year Ended September 30, 2015 | | | $ | 23.33 | | | | | (0.06 | ) | | | | 0.89 | | | | | 0.83 | | | | | — | | | | | (1.20 | ) | | | | (1.20 | ) |
Year Ended September 30, 2014 | | | $ | 21.38 | | | | | (0.02 | ) | | | | 4.26 | | | | | 4.24 | | | | | (0.01 | ) | | | | (2.28 | ) | | | | (2.29 | ) |
Sterling Capital Equity Income Fund | | | | | | | | | | | | | | | | | | | | | | | | | | | | | | | | | | | |
Year Ended September 30, 2018 | | | $ | 20.84 | | | | | 0.34 | | | | | 2.66 | | | | | 3.00 | | | | | (0.34 | ) | | | | (1.95 | ) | | | | (2.29 | ) |
Year Ended September 30, 2017 | | | $ | 18.30 | | | | | 0.34 | | | | | 2.59 | | | | | 2.93 | | | | | (0.37 | ) | | | | (0.02 | ) | | | | (0.39 | ) |
Year Ended September 30, 2016 | | | $ | 17.35 | | | | | 0.31 | | | | | 2.05 | | | | | 2.36 | | | | | (0.31 | ) | | | | (1.10 | ) | | | | (1.41 | ) |
Year Ended September 30, 2015 | | | $ | 18.94 | | | | | 0.31 | | | | | (1.06 | ) | | | | (0.75 | ) | | | | (0.33 | ) | | | | (0.51 | ) | | | | (0.84 | ) |
Year Ended September 30, 2014 | | | $ | 18.14 | | | | | 0.34 | | | | | 1.40 | | | | | 1.74 | | | | | (0.31 | ) | | | | (0.63 | ) | | | | (0.94 | ) |
| * | During the periods certain fees were waived (See Note 6 in the Notes to the Financial Statements). If such reductions had not occurred, the ratios would have been as indicated. |
| ** | Portfolio turnover rate is calculated on the basis of the Fund as a whole without distinguishing between classes of shares issued. |
| (a) | Per share net investment income (loss) has been calculated using the average daily shares method. |
See accompanying Notes to the Financial Statements.
156
| | | | | | | | | | | | | | | | | | | | | | | | | | | | | | | | | |
| | | | | Ratios/Supplementary Data |
Net Asset
Value,
End of
Year | | Total
Return
(excludes
sales charge) | | Net Assets,
End of
Year
(000) | | Ratio of
net expenses
to average
net assets | | Ratio of net
investment
income
(loss) to
average net
assets | | Ratio of
expenses to
average
net assets* | | Portfolio
turnover rate** |
| | | | | | | | | | | | | | | | | | | | | | | | | | | | | | | | | | |
| | $ | 22.30 | | | | | 10.87 | % | | | $ | 33,126 | | | | | 0.87 | % | | | | 1.44 | % | | | | 0.87 | % | | | | 127.89 | % |
| | $ | 20.71 | | | | | 18.94 | % | | | $ | 33,358 | | | | | 0.89 | % | | | | 1.87 | % | | | | 0.89 | % | | | | 144.85 | % |
| | $ | 17.68 | | | | | 8.66 | % | | | $ | 30,159 | | | | | 1.01 | % | | | | 1.58 | % | | | | 1.15 | % | | | | 145.53 | % |
| | $ | 16.53 | | | | | (2.81 | )% | | | $ | 31,079 | | | | | 1.06 | % | | | | 1.25 | % | | | | 1.16 | % | | | | 135.05 | % |
| | $ | 17.24 | | | | | 22.96 | % | | | $ | 34,395 | | | | | 1.06 | % | | | | 1.09 | % | | | | 1.16 | % | | | | 113.75 | % |
| | | | | | | | | | | | | | | | | | | | | | | | | | | | | | | | | | |
| | $ | 19.08 | | | | | 6.54 | % | | | $ | 30,857 | | | | | 1.17 | % | | | | (0.16 | )% | | | | 1.17 | % | | | | 34.62 | % |
| | $ | 18.72 | | | | | 15.42 | % | | | $ | 33,503 | | | | | 1.15 | % | | | | (0.09 | )% | | | | 1.15 | % | | | | 24.83 | % |
| | $ | 16.71 | | | | | 13.07 | % | | | $ | 31,625 | | | | | 1.18 | % | | | | 0.15 | % | | | | 1.18 | % | | | | 25.45 | % |
| | $ | 17.97 | | | | | (0.69 | )% | | | $ | 34,792 | | | | | 1.19 | % | | | | 0.29 | % | | | | 1.19 | % | | | | 30.61 | % |
| | $ | 19.33 | | | | | 9.91 | % | | | $ | 41,403 | | | | | 1.18 | % | | | | 0.26 | % | | | | 1.18 | % | | | | 27.30 | % |
| | | | | | | | | | | | | | | | | | | | | | | | | | | | | | | | | | |
| | $ | 18.65 | | | | | 5.69 | % | | | $ | 8,711 | | | | | 1.03 | % | | | | 0.91 | % | | | | 1.03 | % | | | | 89.85 | % |
| | $ | 18.39 | | | | | 21.65 | % | | | $ | 9,281 | | | | | 1.05 | % | | | | 0.72 | % | | | | 1.10 | % | | | | 109.05 | % |
| | $ | 15.19 | | | | | 9.52 | % | | | $ | 8,714 | | | | | 1.13 | % | | | | 1.29 | % | | | | 1.21 | % | | | | 120.42 | % |
| | $ | 14.04 | | | | | 2.20 | % | | | $ | 13,261 | | | | | 1.25 | % | | | | 1.18 | % | | | | 1.25 | % | | | | 101.99 | % |
| | $ | 14.34 | | | | | 7.09 | % | | | $ | 9,681 | | | | | 1.24 | % | | | | 0.74 | % | | | | 1.24 | % | | | | 68.50 | % |
| | | | | | | | | | | | | | | | | | | | | | | | | | | | | | | | | | |
| | $ | 26.37 | | | | | 17.16 | % | | | $ | 334,687 | | | | | 1.11 | % | | | | 0.05 | % | | | | 1.11 | % | | | | 22.78 | % |
| | $ | 24.51 | | | | | 15.97 | % | | | $ | 343,873 | | | | | 1.12 | % | | | | 0.07 | % | | | | 1.12 | % | | | | 18.92 | % |
| | $ | 21.53 | | | | | 8.57 | % | | | $ | 351,467 | | | | | 1.17 | % | | | | 0.02 | % | | | | 1.22 | % | | | | 27.32 | % |
| | $ | 22.96 | | | | | 3.75 | % | | | $ | 264,294 | | | | | 1.22 | % | | | | (0.25 | )% | | | | 1.22 | % | | | | 26.98 | % |
| | $ | 23.33 | | | | | 21.71 | % | | | $ | 364,368 | | | | | 1.21 | % | | | | (0.11 | )% | | | | 1.21 | % | | | | 32.35 | % |
| | | | | | | | | | | | | | | | | | | | | | | | | | | | | | | | | | |
| | $ | 21.55 | | | | | 15.28 | % | | | $ | 316,245 | | | | | 1.02 | % | | | | 1.66 | % | | | | 1.02 | % | | | | 19.49 | % |
| | $ | 20.84 | | | | | 16.19 | % | | | $ | 348,427 | | | | | 1.03 | % | | | | 1.78 | % | | | | 1.03 | % | | | | 16.93 | % |
| | $ | 18.30 | | | | | 14.50 | % | | | $ | 467,470 | | | | | 1.21 | % | | | | 1.78 | % | | | | 1.21 | % | | | | 20.64 | % |
| | $ | 17.35 | | | | | (4.16 | )% | | | $ | 478,393 | | | | | 1.21 | % | | | | 1.66 | % | | | | 1.21 | % | | | | 27.53 | % |
| | $ | 18.94 | | | | | 9.76 | % | | | $ | 714,457 | | | | | 1.20 | % | | | | 1.79 | % | | | | 1.20 | % | | | | 16.13 | % |
157
|
Sterling Capital Funds |
Financial Highlights, Class A Shares |
|
The financial highlights table is intended to help you understand the Funds’ financial performance for the past 5 years or, if shorter, the period of the Funds’ operations. Certain information reflects financial results for a single Fund share. The total returns in the table represent the rate that an investor would have earned (or lost) on an investment in the Fund (assuming reinvestment of all dividends and distributions).
| | | | | | | | | | | | | | | | | | | | | | | | | | | | | | | | | | | |
| | | | | Investment Activities | | Distributions |
| | | | | | | |
| | | Net Asset
Value,
Beginning
of Period | | Net
investment
income
(loss)(a) | | Net realized/
unrealized
gains (losses)
on investments | | Total from
Investment
Activities | | Net
investment
income | | Net realized
gains on
investments | | Total
Distributions |
Sterling Capital Behavioral International Equity Fund | | | | | | | | | | | | | | | | | | | | | | | | | | |
Year Ended September 30, 2018 | | | $ | 11.75 | | | | | 0.37 | | | | | (0.52 | ) | | | | (0.15 | ) | | | | (0.32 | ) | | | | (0.11 | ) | | | | (0.43 | ) |
Year Ended September 30, 2017 | | | $ | 9.68 | | | | | 0.25 | | | | | 1.96 | | | | | 2.21 | | | | | (0.14 | ) | | | | — | | | | | (0.14 | ) |
Year Ended September 30, 2016 | | | $ | 9.22 | | | | | 0.21 | | | | | 0.46 | | | | | 0.67 | | | | | (0.21 | ) | | | | — | | | | | (0.21 | ) |
November 28, 2014 to September 30, 2015(d) | | | $ | 10.00 | | | | | 0.18 | | | | | (0.94 | ) | | | | (0.76 | ) | | | | (0.02 | ) | | | | — | | | | | (0.02 | ) |
Sterling Capital SMID Opportunities Fund | | | | | | | | | | | | | | | | | | | | | | | | | | |
Year Ended September 30, 2018 | | | $ | 11.75 | | | | | (0.05 | ) | | | | 0.98 | | | | | 0.93 | | | | | (0.06 | ) | | | | (0.18 | ) | | | | (0.24 | ) |
October 3, 2016 to September 30, 2017(d) | | | $ | 10.00 | | | | | — | (e) | | | | 1.76 | | | | | 1.76 | | | | | (0.01 | ) | | | | — | | | | | (0.01 | ) |
Sterling Capital Stratton Mid Cap Value Fund | | | | | | | | | | | | | | | | | | | | | | | | | | |
Year Ended September 30, 2018 | | | $ | 66.23 | | | | | 0.10 | | | | | 4.85 | | | | | 4.95 | | | | | (0.15 | ) | | | | (2.29 | ) | | | | (2.44 | ) |
Year Ended September 30, 2017 | | | $ | 55.87 | | | | | 0.02 | | | | | 10.65 | | | | | 10.67 | | | | | (0.04 | ) | | | | (0.27 | ) | | | | (0.31 | ) |
Period Ended September 30, 2016 | | | $ | 52.55 | | | | | (0.02 | ) | | | | 3.34 | | | | | 3.32 | | | | | — | | | | | — | | | | | — | |
November 16, 2015 to December 31, 2015(d) | | | $ | 53.97 | | | | | 0.05 | | | | | 0.44 | | | | | 0.49 | | | | | (0.13 | ) | | | | (1.78 | ) | | | | (1.91 | ) |
Sterling Capital Stratton Real Estate Fund | | | | | | | | | | | | | | | | | | | | | | | | | | |
Year Ended September 30, 2018 | | | $ | 37.04 | | | | | 0.74 | | | | | 1.50 | | | | | 2.24 | | | | | (0.49 | ) | | | | (1.22 | ) | | | | (1.71 | ) |
Year Ended September 30, 2017 | | | $ | 39.67 | | | | | 0.75 | | | | | (0.54 | ) | | | | 0.21 | | | | | (1.09 | ) | | | | (1.75 | ) | | | | (2.84 | ) |
Period Ended September 30, 2016 | | | $ | 36.00 | | | | | 0.57 | | | | | 3.58 | | | | | 4.15 | | | | | (0.48 | ) | | | | — | | | | | (0.48 | ) |
November 16, 2015 to December 31, 2015(d) | | | $ | 34.90 | | | | | 0.15 | | | | | 1.42 | | | | | 1.57 | | | | | — | | | | | (0.47 | ) | | | | (0.47 | ) |
Sterling Capital Stratton Small Cap Value Fund | | | | | | | | | | | | | | | | | | | | | | | | | | |
Year Ended September 30, 2018 | | | $ | 89.91 | | | | | 0.12 | | | | | 6.49 | | | | | 6.61 | | | | | (0.10 | ) | | | | (7.69 | ) | | | | (7.79 | ) |
Year Ended September 30, 2017 | | | $ | 78.34 | | | | | — | (e) | | | | 15.72 | | | | | 15.72 | | | | | (0.05 | ) | | | | (4.10 | ) | | | | (4.15 | ) |
Period Ended September 30, 2016 | | | $ | 69.90 | | | | | (0.02 | ) | | | | 8.46 | | | | | 8.44 | | | | | — | | | | | — | | | | | — | |
November 16, 2015 to December 31, 2015(d) | | | $ | 71.71 | | | | | 0.05 | | | | | (0.81 | ) | | | | (0.76 | ) | | | | (0.05 | ) | | | | (1.00 | ) | | | | (1.05 | ) |
Sterling Capital Ultra Short Bond Fund | | | | | | | | | | | | | | | | | | | | | | | | | | |
Year Ended September 30, 2018 | | | $ | 9.79 | | | | | 0.14 | | | | | (0.02 | ) | | | | 0.12 | | | | | (0.16 | ) | | | | — | | | | | (0.16 | ) |
Year Ended September 30, 2017 | | | $ | 9.82 | | | | | 0.07 | | | | | 0.03 | | | | | 0.10 | | | | | (0.13 | ) | | | | — | | | | | (0.13 | ) |
Year Ended September 30, 2016 | | | $ | 9.87 | | | | | 0.07 | | | | | 0.03 | | | | | 0.10 | | | | | (0.15 | ) | | | | — | | | | | (0.15 | ) |
Year Ended September 30, 2015 | | | $ | 9.94 | | | | | 0.04 | | | | | (0.02 | ) | | | | 0.02 | | | | | (0.09 | ) | | | | — | | | | | (0.09 | ) |
Year Ended September 30, 2014 | | | $ | 9.98 | | | | | 0.05 | | | | | (0.03 | ) | | | | 0.02 | | | | | (0.06 | ) | | | | — | | | | | (0.06 | ) |
| * | During the periods certain fees were waived (See Note 6 in the Notes to the Financial Statements). If such reductions had not occurred, the ratios would have been as indicated. |
| ** | Portfolio turnover rate is calculated on the basis of the Fund as a whole without distinguishing between classes of shares issued. |
| (a) | Per share net investment income (loss) has been calculated using the average daily shares method. |
| (b) | Not annualized for periods less than one year. |
| (c) | Annualized for periods less than one year. |
| (d) | Period from commencement of operations. |
| (e) | Amount is less than $0.005. |
See accompanying Notes to the Financial Statements.
158
| | | | | | | | | | | | | | | | | | | | | | | | | | | | | | | | | |
| | | | | Ratios/Supplementary Data |
Net Asset
Value,
End of
Period | | Total
Return
(excludes
sales charge) (b) | | Net Assets,
End of
Period
(000) | | Ratio of
net expenses
to average
net assets (c) | | Ratio of net
investment
income
(loss) to
average net
assets (c) | | Ratio of
expenses to
average
net assets*(c) | | Portfolio
turnover rate**(b) |
| | | | | | | | | | | | | | | | | | | | | | | | | | | | | | | | | | |
| | $ | 11.17 | | | | | (1.47 | )% | | | $ | 828 | | | | | 0.90 | % | | | | 3.17 | % | | | | 1.10 | % | | | | 96.65 | % |
| | $ | 11.75 | | | | | 23.19 | % | | | $ | 510 | | | | | 0.93 | % | | | | 2.38 | % | | | | 1.19 | % | | | | 91.65 | % |
| | $ | 9.68 | | | | | 7.24 | % | | | $ | 354 | | | | | 1.05 | % | | | | 2.26 | % | | | | 1.36 | % | | | | 125.35 | % |
| | $ | 9.22 | | | | | (7.57 | )% | | | $ | 531 | | | | | 1.28 | % | | | | 2.16 | % | | | | 1.44 | % | | | | 133.50 | % |
| | | | | | | | | | | | | | | | | | | | | | | | | | | | | | | | | | |
| | $ | 12.44 | | | | | 8.07 | % | | | $ | 2,870 | | | | | 1.04 | % | | | | (0.39 | )% | | | | 1.29 | % | | | | 45.64 | % |
| | $ | 11.75 | | | | | 17.59 | % | | | $ | 4,038 | | | | | 1.04 | % | | | | (0.03 | )% | | | | 1.66 | % | | | | 37.97 | % |
| | | | | | | | | | | | | | | | | | | | | | | | | | | | | | | | | | |
| | $ | 68.74 | | | | | 7.54 | % | | | $ | 107 | | | | | 1.20 | % | | | | 0.15 | % | | | | 1.20 | % | | | | 14.47 | % |
| | $ | 66.23 | | | | | 19.16 | % | | | $ | 108 | | | | | 1.16 | % | | | | 0.03 | % | | | | 1.16 | % | | | | 12.19 | % |
| | $ | 55.87 | | | | | 6.32 | % | | | $ | 19 | | | | | 1.20 | % | | | | (0.04 | )% | | | | 1.22 | % | | | | 11.16 | % |
| | $ | 52.55 | | | | | 1.00 | % | | | $ | 1 | | | | | 0.91 | % | | | | 0.72 | % | | | | 0.91 | % | | | | 19.28 | % |
| | | | | | | | | | | | | | | | | | | | | | | | | | | | | | | | | | |
| | $ | 37.57 | | | | | 6.17 | % | | | $ | 398 | | | | | 1.07 | % | | | | 2.04 | % | | | | 1.07 | % | | | | 8.34 | % |
| | $ | 37.04 | | | | | 0.90 | % | | | $ | 302 | | | | | 1.04 | % | | | | 2.03 | % | | | | 1.05 | % | | | | 13.52 | % |
| | $ | 39.67 | | | | | 11.50 | % | | | $ | 115 | | | | | 1.08 | % | | | | 1.93 | % | | | | 1.11 | % | | | | 18.43 | % |
| | $ | 36.00 | | | | | 4.54 | % | | | $ | 1 | | | | | 0.86 | % | | | | 3.30 | % | | | | 0.86 | % | | | | 15.47 | % |
| | | | | | | | | | | | | | | | | | | | | | | | | | | | | | | | | | |
| | $ | 88.73 | | | | | 7.71 | % | | | $ | 2,160 | | | | | 1.28 | % | | | | 0.14 | % | | | | 1.32 | % | | | | 15.51 | % |
| | $ | 89.91 | | | | | 20.43 | % | | | $ | 529 | | | | | 1.31 | % | | | | 0.01 | % | | | | 1.31 | % | | | | 7.04 | % |
| | $ | 78.34 | | | | | 12.07 | % | | | $ | 87 | | | | | 1.33 | % | | | | (0.04 | )% | | | | 1.33 | % | | | | 3.42 | % |
| | $ | 69.90 | | | | | (1.03 | )% | | | $ | 1 | | | | | 1.33 | % | | | | 0.58 | % | | | | 1.33 | % | | | | 6.33 | % |
| | | | | | | | | | | | | | | | | | | | | | | | | | | | | | | | | | |
| | $ | 9.75 | | | | | 1.20 | % | | | $ | 5,074 | | | | | 0.66 | % | | | | 1.39 | % | | | | 0.76 | % | | | | 74.56 | % |
| | $ | 9.79 | | | | | 1.00 | % | | | $ | 4,663 | | | | | 0.68 | % | | | | 0.71 | % | | | | 0.78 | % | | | | 59.57 | % |
| | $ | 9.82 | | | | | 0.99 | % | | | $ | 6,250 | | | | | 0.71 | % | | | | 0.72 | % | | | | 0.80 | % | | | | 43.02 | % |
| | $ | 9.87 | | | | | 0.25 | % | | | $ | 8,295 | | | | | 0.78 | % | | | | 0.43 | % | | | | 0.80 | % | | | | 66.19 | % |
| | $ | 9.94 | | | | | 0.21 | % | | | $ | 11,184 | | | | | 0.73 | % | | | | 0.51 | % | | | | 0.73 | % | | | | 79.98 | % |
159
|
Sterling Capital Funds |
Financial Highlights, Class A Shares |
|
The financial highlights table is intended to help you understand the Funds’ financial performance for the past 5 years or, if shorter, the period of the Funds’ operations. Certain information reflects financial results for a single Fund share. The total returns in the table represent the rate that an investor would have earned (or lost) on an investment in the Fund (assuming reinvestment of all dividends and distributions).
| | | | | | | | | | | | | | | | | | | | | | | | | | | | | | | | | | | | | | | | |
| | | | | Investment Activities | | Distributions |
| | | | | | | | |
| | | Net Asset
Value,
Beginning
of Year | | Net
investment
income(a) | | Net realized/
unrealized
gains (losses)
on investments | | Total from
Investment
Activities | | Net
investment
income | | Net realized
gains on
investments | | Return
of
capital | | Total
Distributions |
Sterling Capital Short Duration Bond Fund | | | | | | | | | | | | | | | | | | | | | | | | | | | | | | | |
Year Ended September 30, 2018 | | | $ | 8.69 | | | | | 0.16 | | | | | (0.11 | ) | | | | 0.05 | | | | | (0.22 | ) | | | | — | | | | | — | | | | | (0.22 | ) |
Year Ended September 30, 2017 | | | $ | 8.81 | | | | | 0.10 | | | | | (0.01 | ) | | | | 0.09 | | | | | (0.21 | ) | | | | — | | | | | — | | | | | (0.21 | ) |
Year Ended September 30, 2016 | | | $ | 8.86 | | | | | 0.10 | | | | | 0.07 | | | | | 0.17 | | | | | (0.22 | ) | | | | — | | | | | — | | | | | (0.22 | ) |
Year Ended September 30, 2015 | | | $ | 9.07 | | | | | 0.10 | | | | | (0.05 | ) | | | | 0.05 | | | | | (0.26 | ) | | | | — | | | | | — | | | | | (0.26 | ) |
Year Ended September 30, 2014 | | | $ | 9.24 | | | | | 0.14 | | | | | (0.04 | ) | | | | 0.10 | | | | | (0.27 | ) | | | | — | | | | | — | | | | | (0.27 | ) |
Sterling Capital Intermediate U.S. Government Fund | | | | | | | | | | | | | | | | | | | | | | | | | | | | | | | |
Year Ended September 30, 2018 | | | $ | 9.91 | | | | | 0.17 | | | | | (0.34 | ) | | | | (0.17 | ) | | | | (0.26 | ) | | | | — | | | | | — | | | | | (0.26 | ) |
Year Ended September 30, 2017 | | | $ | 10.24 | | | | | 0.15 | | | | | (0.27 | ) | | | | (0.12 | ) | | | | (0.21 | ) | | | | — | | | | | — | | | | | (0.21 | ) |
Year Ended September 30, 2016 | | | $ | 10.18 | | | | | 0.13 | | | | | 0.11 | | | | | 0.24 | | | | | (0.18 | ) | | | | — | | | | | — | | | | | (0.18 | ) |
Year Ended September 30, 2015 | | | $ | 10.19 | | | | | 0.13 | | | | | 0.05 | | | | | 0.18 | | | | | (0.19 | ) | | | | — | | | | | — | | | | | (0.19 | ) |
Year Ended September 30, 2014 | | | $ | 10.29 | | | | | 0.14 | | | | | 0.09 | | | | | 0.23 | | | | | (0.33 | ) | | | | — | | | | | — | | | | | (0.33 | ) |
Sterling Capital Total Return Bond Fund | | | | | | | | | | | | | | | | | | | | | | | | | | | | | | | |
Year Ended September 30, 2018 | | | $ | 10.59 | | | | | 0.27 | | | | | (0.36 | ) | | | | (0.09 | ) | | | | (0.30 | ) | | | | — | | | | | — | | | | | (0.30 | ) |
Year Ended September 30, 2017 | | | $ | 10.81 | | | | | 0.23 | | | | | (0.15 | ) | | | | 0.08 | | | | | (0.30 | ) | | | | — | | | | | — | | | | | (0.30 | ) |
Year Ended September 30, 2016 | | | $ | 10.53 | | | | | 0.26 | | | | | 0.34 | | | | | 0.60 | | | | | (0.32 | ) | | | | — | | | | | — | | | | | (0.32 | ) |
Year Ended September 30, 2015 | | | $ | 10.66 | | | | | 0.28 | | | | | (0.06 | ) | | | | 0.22 | | | | | (0.35 | ) | | | | — | | | | | — | | | | | (0.35 | ) |
Year Ended September 30, 2014 | | | $ | 10.52 | | | | | 0.31 | | | | | 0.21 | | | | | 0.52 | | | | | (0.37 | ) | | | | (0.01 | ) | | | | — | | | | | (0.38 | ) |
Sterling Capital Corporate Fund | | | | | | | | | | | | | | | | | | | | | | | | | | | | | | | |
Year Ended September 30, 2018 | | | $ | 10.25 | | | | | 0.29 | | | | | (0.37 | ) | | | | (0.08 | ) | | | | (0.29 | ) | | | | (0.07 | ) | | | | — | | | | | (0.36 | ) |
Year Ended September 30, 2017 | | | $ | 10.37 | | | | | 0.29 | | | | | (0.08 | ) | | | | 0.21 | | | | | (0.29 | ) | | | | (0.04 | ) | | | | — | | | | | (0.33 | ) |
Year Ended September 30, 2016 | | | $ | 10.10 | | | | | 0.28 | | | | | 0.27 | | | | | 0.55 | | | | | (0.28 | ) | | | | — | | | | | — | | | | | (0.28 | ) |
Year Ended September 30, 2015 | | | $ | 10.25 | | | | | 0.29 | | | | | (0.14 | ) | | | | 0.15 | | | | | (0.29 | ) | | | | (0.01 | ) | | | | — | (b) | | | | (0.30 | ) |
Year Ended September 30, 2014 | | | $ | 10.15 | | | | | 0.31 | | | | | 0.20 | | | | | 0.51 | | | | | (0.31 | ) | | | | (0.10 | ) | | | | — | | | | | (0.41 | ) |
Sterling Capital Securitized Opportunities Fund | | | | | | | | | | | | | | | | | | | | | | | | | | | | | | | |
Year Ended September 30, 2018 | | | $ | 9.94 | | | | | 0.25 | | | | | (0.31 | ) | | | | (0.06 | ) | | | | (0.28 | ) | | | | — | | | | | — | | | | | (0.28 | ) |
Year Ended September 30, 2017 | | | $ | 10.10 | | | | | 0.21 | | | | | (0.12 | ) | | | | 0.09 | | | | | (0.25 | ) | | | | — | | | | | — | | | | | (0.25 | ) |
Year Ended September 30, 2016 | | | $ | 9.98 | | | | | 0.19 | | | | | 0.16 | | | | | 0.35 | | | | | (0.23 | ) | | | | — | | | | | — | | | | | (0.23 | ) |
Year Ended September 30, 2015 | | | $ | 9.90 | | | | | 0.20 | | | | | 0.13 | | | | | 0.33 | | | | | (0.25 | ) | | | | — | | | | | — | | | | | (0.25 | ) |
Year Ended September 30, 2014 | | | $ | 9.85 | | | | | 0.22 | | | | | 0.11 | | | | | 0.33 | | | | | (0.28 | ) | | | | — | | | | | — | | | | | (0.28 | ) |
Sterling Capital Kentucky Intermediate Tax-Free Fund | | | | | | | | | | | | | | | | | | | | | | | | | | | | | | | |
Year Ended September 30, 2018 | | | $ | 10.27 | | | | | 0.20 | | | | | (0.34 | ) | | | | (0.14 | ) | | | | (0.20 | ) | | | | (0.03 | ) | | | | — | | | | | (0.23 | ) |
Year Ended September 30, 2017 | | | $ | 10.64 | | | | | 0.21 | | | | | (0.23 | ) | | | | (0.02 | ) | | | | (0.21 | ) | | | | (0.14 | ) | | | | — | | | | | (0.35 | ) |
Year Ended September 30, 2016 | | | $ | 10.62 | | | | | 0.24 | | | | | 0.15 | | | | | 0.39 | | | | | (0.24 | ) | | | | (0.13 | ) | | | | — | | | | | (0.37 | ) |
Year Ended September 30, 2015 | | | $ | 10.86 | | | | | 0.25 | | | | | (0.06 | ) | | | | 0.19 | | | | | (0.25 | ) | | | | (0.18 | ) | | | | — | | | | | (0.43 | ) |
Year Ended September 30, 2014 | | | $ | 10.67 | | | | | 0.27 | | | | | 0.18 | | | | | 0.45 | | | | | (0.26 | ) | | | | — | | | | | — | | | | | (0.26 | ) |
Sterling Capital Maryland Intermediate Tax-Free Fund | | | | | | | | | | | | | | | | | | | | | | | | | | | | | | | |
Year Ended September 30, 2018 | | | $ | 11.02 | | | | | 0.20 | | | | | (0.34 | ) | | | | (0.14 | ) | | | | (0.20 | ) | | | | (0.06 | ) | | | | — | | | | | (0.26 | ) |
Year Ended September 30, 2017 | | | $ | 11.31 | | | | | 0.21 | | | | | (0.21 | ) | | | | — | | | | | (0.21 | ) | | | | (0.08 | ) | | | | — | | | | | (0.29 | ) |
Year Ended September 30, 2016 | | | $ | 11.17 | | | | | 0.20 | | | | | 0.21 | | | | | 0.41 | | | | | (0.20 | ) | | | | (0.07 | ) | | | | — | | | | | (0.27 | ) |
Year Ended September 30, 2015 | | | $ | 11.23 | | | | | 0.20 | | | | | — | (b) | | | | 0.20 | | | | | (0.20 | ) | | | | (0.06 | ) | | | | — | | | | | (0.26 | ) |
Year Ended September 30, 2014 | | | $ | 10.96 | | | | | 0.19 | | | | | 0.27 | | | | | 0.46 | | | | | (0.19 | ) | | | | — | | | | | — | | | | | (0.19 | ) |
| * | During the periods certain fees were waived (See Note 6 in the Notes to the Financial Statements). If such reductions had not occurred, the ratios would have been as indicated. |
| ** | Portfolio turnover rate is calculated on the basis of the Fund as a whole without distinguishing between classes of shares issued. |
| (a) | Per share net investment income has been calculated using the average daily shares method. |
| (b) | Amount is less than $0.005. |
See accompanying Notes to the Financial Statements.
160
| | | | | | | | | | | | | | | | | | | | | | | | | | | | | | | | | |
| | | | | Ratios/Supplementary Data |
| | | | | | |
Net Asset
Value,
End of
Year | | Total
Return
(excludes
sales charge) | | Net Assets,
End of
Year
(000) | | Ratio of
net expenses
to average
net assets | | Ratio of net
investment
income to
average net
assets | | Ratio of
expenses to
average
net assets* | | Portfolio
turnover rate** |
| | | | | | | | | | | | | | | | | | | | | | | | | | | | | | | | | | |
| | $ | 8.52 | | | | | 0.55 | % | | | $ | 4,393 | | | | | 0.68 | % | | | | 1.84 | % | | | | 0.78 | % | | | | 62.02 | % |
| | $ | 8.69 | | | | | 1.02 | % | | | $ | 5,746 | | | | | 0.70 | % | | | | 1.11 | % | | | | 0.80 | % | | | | 78.77 | % |
| | $ | 8.81 | | | | | 1.98 | % | | | $ | 7,332 | | | | | 0.74 | % | | | | 1.09 | % | | | | 0.81 | % | | | | 54.68 | % |
| | $ | 8.86 | | | | | 0.56 | % | | | $ | 8,075 | | | | | 0.79 | % | | | | 1.17 | % | | | | 0.81 | % | | | | 55.74 | % |
| | $ | 9.07 | | | | | 1.13 | % | | | $ | 10,468 | | | | | 0.76 | % | | | | 1.48 | % | | | | 0.80 | % | | | | 56.10 | % |
| | | | | | | | | | | | | | | | | | | | | | | | | | | | | | | | | | |
| | $ | 9.48 | | | | | (1.73 | )% | | | $ | 4,350 | | | | | 0.91 | % | | | | 1.73 | % | | | | 0.92 | % | | | | 40.85 | % |
| | $ | 9.91 | | | | | (1.20 | )% | | | $ | 5,418 | | | | | 0.87 | % | | | | 1.54 | % | | | | 0.91 | % | | | | 32.44 | % |
| | $ | 10.24 | | | | | 2.37 | % | | | $ | 7,066 | | | | | 0.85 | % | | | | 1.24 | % | | | | 0.97 | % | | | | 49.39 | % |
| | $ | 10.18 | | | | | 1.81 | % | | | $ | 7,625 | | | | | 0.91 | % | | | | 1.29 | % | | | | 0.98 | % | | | | 62.02 | % |
| | $ | 10.19 | | | | | 2.23 | % | | | $ | 8,778 | | | | | 0.93 | % | | | | 1.41 | % | | | | 0.93 | % | | | | 35.74 | % |
| | | | | | | | | | | | | | | | | | | | | | | | | | | | | | | | | | |
| | $ | 10.20 | | | | | (0.90 | )% | | | $ | 68,982 | | | | | 0.70 | % | | | | 2.56 | % | | | | 0.82 | % | | | | 62.28 | % |
| | $ | 10.59 | | | | | 0.75 | % | | | $ | 72,030 | | | | | 0.72 | % | | | | 2.13 | % | | | | 0.82 | % | | | | 64.07 | % |
| | $ | 10.81 | | | | | 5.84 | % | | | $ | 70,257 | | | | | 0.74 | % | | | | 2.42 | % | | | | 0.84 | % | | | | 65.47 | % |
| | $ | 10.53 | | | | | 2.04 | % | | | $ | 47,782 | | | | | 0.73 | % | | | | 2.63 | % | | | | 0.83 | % | | | | 41.37 | % |
| | $ | 10.66 | | | | | 5.03 | % | | | $ | 38,929 | | | | | 0.81 | % | | | | 2.90 | % | | | | 0.83 | % | | | | 75.21 | % |
| | | | | | | | | | | | | | | | | | | | | | | | | | | | | | | | | | |
| | $ | 9.81 | | | | | (0.80 | )% | | | $ | 440 | | | | | 0.89 | % | | | | 2.94 | % | | | | 0.89 | % | | | | 66.82 | % |
| | $ | 10.25 | | | | | 2.07 | % | | | $ | 372 | | | | | 0.88 | % | | | | 2.84 | % | | | | 0.88 | % | | | | 78.79 | % |
| | $ | 10.37 | | | | | 5.55 | % | | | $ | 441 | | | | | 0.89 | % | | | | 2.77 | % | | | | 0.89 | % | | | | 83.88 | % |
| | $ | 10.10 | | | | | 1.51 | % | | | $ | 348 | | | | | 0.88 | % | | | | 2.87 | % | | | | 0.88 | % | | | | 33.94 | % |
| | $ | 10.25 | | | | | 5.16 | % | | | $ | 269 | | | | | 0.86 | % | | | | 3.04 | % | | | | 0.86 | % | | | | 105.03 | % |
| | | | | | | | | | | | | | | | | | | | | | | | | | | | | | | | | | |
| | $ | 9.60 | | | | | (0.63 | )% | | | $ | 18 | | | | | 0.83 | % | | | | 2.54 | % | | | | 0.87 | % | | | | 19.17 | % |
| | $ | 9.94 | | | | | 0.89 | % | | | $ | 94 | | | | | 0.85 | % | | | | 2.06 | % | | | | 0.89 | % | | | | 34.72 | % |
| | $ | 10.10 | | | | | 3.60 | % | | | $ | 377 | | | | | 0.84 | % | | | | 1.89 | % | | | | 0.88 | % | | | | 43.63 | % |
| | $ | 9.98 | | | | | 3.39 | % | | | $ | 124 | | | | | 0.84 | % | | | | 2.01 | % | | | | 0.88 | % | | | | 19.85 | % |
| | $ | 9.90 | | | | | 3.38 | % | | | $ | 87 | | | | | 0.85 | % | | | | 2.20 | % | | | | 0.88 | % | | | | 98.34 | % |
| | | | | | | | | | | | | | | | | | | | | | | | | | | | | | | | | | |
| | $ | 9.90 | | | | | (1.44 | )% | | | $ | 3,647 | | | | | 0.93 | % | | | | 1.95 | % | | | | 0.93 | % | | | | 20.37 | % |
| | $ | 10.27 | | | | | (0.19 | )% | | | $ | 4,072 | | | | | 0.93 | % | | | | 2.01 | % | | | | 0.96 | % | | | | 17.93 | % |
| | $ | 10.64 | | | | | 3.69 | % | | | $ | 4,358 | | | | | 0.91 | % | | | | 2.25 | % | | | | 1.02 | % | | | | 16.44 | % |
| | $ | 10.62 | | | | | 1.80 | % | | | $ | 4,532 | | | | | 0.95 | % | | | | 2.37 | % | | | | 1.04 | % | | | | 17.34 | % |
| | $ | 10.86 | | | | | 4.31 | % | | | $ | 4,615 | | | | | 0.97 | % | | | | 2.47 | % | | | | 0.97 | % | | | | 11.13 | % |
| | | | | | | | | | | | | | | | | | | | | | | | | | | | | | | | | | |
| | $ | 10.62 | | | | | (1.23 | )% | | | $ | 4,991 | | | | | 0.88 | % | | | | 1.89 | % | | | | 0.88 | % | | | | 31.12 | % |
| | $ | 11.02 | | | | | 0.00 | % | | | $ | 5,818 | | | | | 0.86 | % | | | | 1.88 | % | | | | 0.90 | % | | | | 5.89 | % |
| | $ | 11.31 | | | | | 3.71 | % | | | $ | 6,537 | | | | | 0.86 | % | | | | 1.75 | % | | | | 0.96 | % | | | | 14.36 | % |
| | $ | 11.17 | | | | | 1.79 | % | | | $ | 6,865 | | | | | 0.90 | % | | | | 1.82 | % | | | | 0.96 | % | | | | 18.38 | % |
| | $ | 11.23 | | | | | 4.26 | % | | | $ | 6,763 | | | | | 0.94 | % | | | | 1.74 | % | | | | 0.94 | % | | | | 19.90 | % |
161
|
Sterling Capital Funds |
Financial Highlights, Class A Shares |
|
The financial highlights table is intended to help you understand the Funds’ financial performance for the past 5 years or, if shorter, the period of the Funds’ operations. Certain information reflects financial results for a single Fund share. The total returns in the table represent the rate that an investor would have earned (or lost) on an investment in the Fund (assuming reinvestment of all dividends and distributions).
| | | | | | | | | | | | | | | | | | | | | | | | | | | | | | | | | | | |
| | | | | Investment Activities | | Distributions |
| | | Net Asset
Value,
Beginning
of Year | | Net
investment
income(a) | | Net realized/
unrealized
gains (losses)
on investments | | Total from
Investment
Activities | | Net
investment
income | | Net realized
gains on
investments | | Total
Distributions |
Sterling Capital North Carolina Intermediate Tax-Free Fund | | | | | | | | | | | | | | | | | | | | | | | | | | |
Year Ended September 30, 2018 | | | $ | 10.78 | | | | | 0.24 | | | | | (0.35 | ) | | | | (0.11 | ) | | | | (0.24 | ) | | | | — | | | | | (0.24 | ) |
Year Ended September 30, 2017 | | | $ | 11.08 | | | | | 0.23 | | | | | (0.27 | ) | | | | (0.04 | ) | | | | (0.22 | ) | | | | (0.04 | ) | | | | (0.26 | ) |
Year Ended September 30, 2016 | | | $ | 10.97 | | | | | 0.23 | | | | | 0.17 | | | | | 0.40 | | | | | (0.23 | ) | | | | (0.06 | ) | | | | (0.29 | ) |
Year Ended September 30, 2015 | | | $ | 10.98 | | | | | 0.24 | | | | | 0.01 | | | | | 0.25 | | | | | (0.24 | ) | | | | (0.02 | ) | | | | (0.26 | ) |
Year Ended September 30, 2014 | | | $ | 10.74 | | | | | 0.24 | | | | | 0.24 | | | | | 0.48 | | | | | (0.24 | ) | | | | — | | | | | (0.24 | ) |
Sterling Capital South Carolina Intermediate Tax-Free Fund | | | | | | | | | | | | | | | | | | | | | | | | | | |
Year Ended September 30, 2018 | | | $ | 11.10 | | | | | 0.20 | | | | | (0.33 | ) | | | | (0.13 | ) | | | | (0.20 | ) | | | | — | | | | | (0.20 | ) |
Year Ended September 30, 2017 | | | $ | 11.30 | | | | | 0.20 | | | | | (0.20 | ) | | | | — | | | | | (0.20 | ) | | | | — | | | | | (0.20 | ) |
Year Ended September 30, 2016 | | | $ | 11.14 | | | | | 0.20 | | | | | 0.20 | | | | | 0.40 | | | | | (0.20 | ) | | | | (0.04 | ) | | | | (0.24 | ) |
Year Ended September 30, 2015 | | | $ | 11.14 | | | | | 0.21 | | | | | 0.02 | | | | | 0.23 | | | | | (0.21 | ) | | | | (0.02 | ) | | | | (0.23 | ) |
Year Ended September 30, 2014 | | | $ | 10.85 | | | | | 0.22 | | | | | 0.29 | | | | | 0.51 | | | | | (0.22 | ) | | | | — | | | | | (0.22 | ) |
Sterling Capital Virginia Intermediate Tax-Free Fund | | | | | | | | | | | | | | | | | | | | | | | | | | |
Year Ended September 30, 2018 | | | $ | 11.76 | | | | | 0.23 | | | | | (0.36 | ) | | | | (0.13 | ) | | | | (0.23 | ) | | | | — | | | | | (0.23 | ) |
Year Ended September 30, 2017 | | | $ | 12.13 | | | | | 0.23 | | | | | (0.28 | ) | | | | (0.05 | ) | | | | (0.23 | ) | | | | (0.09 | ) | | | | (0.32 | ) |
Year Ended September 30, 2016 | | | $ | 11.98 | | | | | 0.24 | | | | | 0.19 | | | | | 0.43 | | | | | (0.24 | ) | | | | (0.04 | ) | | | | (0.28 | ) |
Year Ended September 30, 2015 | | | $ | 12.06 | | | | | 0.25 | | | | | (0.01 | ) | | | | 0.24 | | | | | (0.25 | ) | | | | (0.07 | ) | | | | (0.32 | ) |
Year Ended September 30, 2014 | | | $ | 11.79 | | | | | 0.24 | | | | | 0.27 | | | | | 0.51 | | | | | (0.24 | ) | | | | — | | | | | (0.24 | ) |
Sterling Capital West Virginia Intermediate Tax-Free Fund | | | | | | | | | | | | | | | | | | | | | | | | | | |
Year Ended September 30, 2018 | | | $ | 10.04 | | | | | 0.21 | | | | | (0.31 | ) | | | | (0.10 | ) | | | | (0.21 | ) | | | | (0.01 | ) | | | | (0.22 | ) |
Year Ended September 30, 2017 | | | $ | 10.27 | | | | | 0.21 | | | | | (0.18 | ) | | | | 0.03 | | | | | (0.21 | ) | | | | (0.05 | ) | | | | (0.26 | ) |
Year Ended September 30, 2016 | | | $ | 10.14 | | | | | 0.21 | | | | | 0.18 | | | | | 0.39 | | | | | (0.21 | ) | | | | (0.05 | ) | | | | (0.26 | ) |
Year Ended September 30, 2015 | | | $ | 10.16 | | | | | 0.21 | | | | | 0.01 | | | | | 0.22 | | | | | (0.21 | ) | | | | (0.03 | ) | | | | (0.24 | ) |
Year Ended September 30, 2014 | | | $ | 9.90 | | | | | 0.21 | | | | | 0.26 | | | | | 0.47 | | | | | (0.21 | ) | | | | — | | | | | (0.21 | ) |
Sterling Capital Diversified Income Fund(b) | | | | | | | | | | | | | | | | | | | | | | | | | | |
Year Ended September 30, 2018 | | | $ | 10.79 | | | | | 0.35 | | | | | (0.10 | ) | | | | 0.25 | | | | | (0.41 | ) | | | | — | | | | | (0.41 | ) |
Year Ended September 30, 2017 | | | $ | 10.82 | | | | | 0.41 | | | | | (0.03 | ) | | | | 0.38 | | | | | (0.41 | ) | | | | — | | | | | (0.41 | ) |
Year Ended September 30, 2016 | | | $ | 10.21 | | | | | 0.33 | | | | | 0.65 | | | | | 0.98 | | | | | (0.37 | ) | | | | — | | | | | (0.37 | ) |
Year Ended September 30, 2015 | | | $ | 10.59 | | | | | 0.26 | | | | | (0.40 | ) | | | | (0.14 | ) | | | | (0.24 | ) | | | | — | | | | | (0.24 | ) |
Year Ended September 30, 2014 | | | $ | 9.95 | | | | | 0.22 | | | | | 0.65 | | | | | 0.87 | | | | | (0.23 | ) | | | | — | | | | | (0.23 | ) |
Sterling Capital Strategic Allocation Balanced Fund(b) | | | | | | | | | | | | | | | | | | | | | | | | | | |
Year Ended September 30, 2018 | | | $ | 11.89 | | | | | 0.23 | | | | | 0.23 | | | | | 0.46 | | | | | (0.27 | ) | | | | — | | | | | (0.27 | ) |
Year Ended September 30, 2017 | | | $ | 10.82 | | | | | 0.15 | | | | | 1.08 | | | | | 1.23 | | | | | (0.16 | ) | | | | — | | | | | (0.16 | ) |
Year Ended September 30, 2016 | | | $ | 10.31 | | | | | 0.17 | | | | | 0.55 | | | | | 0.72 | | | | | (0.21 | ) | | | | — | | | | | (0.21 | ) |
Year Ended September 30, 2015 | | | $ | 10.66 | | | | | 0.13 | | | | | (0.33 | ) | | | | (0.20 | ) | | | | (0.15 | ) | | | | — | | | | | (0.15 | ) |
Year Ended September 30, 2014 | | | $ | 9.77 | | | | | 0.17 | | | | | 0.90 | | | | | 1.07 | | | | | (0.18 | ) | | | | — | | | | | (0.18 | ) |
Sterling Capital Strategic Allocation Growth Fund(b) | | | | | | | | | | | | | | | | | | | | | | | | | | |
Year Ended September 30, 2018 | | | $ | 11.90 | | | | | 0.21 | | | | | 0.39 | | | | | 0.60 | | | | | (0.25 | ) | | | | — | | | | | (0.25 | ) |
Year Ended September 30, 2017 | | | $ | 10.53 | | | | | 0.11 | | | | | 1.38 | | | | | 1.49 | | | | | (0.12 | ) | | | | — | | | | | (0.12 | ) |
Year Ended September 30, 2016 | | | $ | 9.99 | | | | | 0.14 | | | | | 0.57 | | | | | 0.71 | | | | | (0.17 | ) | | | | — | | | | | (0.17 | ) |
Year Ended September 30, 2015 | | | $ | 10.39 | | | | | 0.07 | | | | | (0.37 | ) | | | | (0.30 | ) | | | | (0.10 | ) | | | | — | | | | | (0.10 | ) |
Year Ended September 30, 2014 | | | $ | 9.35 | | | | | 0.12 | | | | | 1.06 | | | | | 1.18 | | | | | (0.14 | ) | | | | — | | | | | (0.14 | ) |
| * | During the periods certain fees were waived (See Note 6 in the Notes to the Financial Statements). If such reductions had not occurred, the ratios would have been as indicated. |
| ** | Portfolio turnover rate is calculated on the basis of the Fund as a whole without distinguishing between classes of shares issued. |
| (a) | Per share net investment income has been calculated using the average daily shares method. |
| (b) | The expense ratios exclude the impact of fees/expenses paid by each underlying fund. |
See accompanying Notes to the Financial Statements.
162
| | | | | | | | | | | | | | | | | | | | | | | | | | | | | | | | | |
| | | | | Ratios/Supplementary Data |
| | | | | | |
Net Asset
Value,
End of
Year | | Total
Return
(excludes
sales charge) | | Net Assets,
End of
Year
(000) | | Ratio of
net expenses
to average
net assets | | Ratio of net
investment
income to
average net
assets | | Ratio of
expenses to
average
net assets* | | Portfolio
turnover rate** |
| | | | | | | | | | | | | | | | | | | | | | | | | | | | | | | | | | |
| | $ | 10.43 | | | | | (1.06 | )% | | | $ | 36,857 | | | | | 0.79 | % | | | | 2.23 | % | | | | 0.79 | % | | | | 22.06 | % |
| | $ | 10.78 | | | | | (0.31 | )% | | | $ | 45,357 | | | | | 0.79 | % | | | | 2.09 | % | | | | 0.83 | % | | | | 25.92 | % |
| | $ | 11.08 | | | | | 3.69 | % | | | $ | 52,130 | | | | | 0.80 | % | | | | 2.08 | % | | | | 0.90 | % | | | | 10.05 | % |
| | $ | 10.97 | | | | | 2.28 | % | | | $ | 45,940 | | | | | 0.84 | % | | | | 2.19 | % | | | | 0.91 | % | | | | 16.80 | % |
| | $ | 10.98 | | | | | 4.55 | % | | | $ | 48,426 | | | | | 0.91 | % | | | | 2.25 | % | | | | 0.91 | % | | | | 11.67 | % |
| | | | | | | | | | | | | | | | | | | | | | | | | | | | | | | | | | |
| | $ | 10.77 | | | | | (1.15 | )% | | | $ | 13,864 | | | | | 0.80 | % | | | | 1.85 | % | | | | 0.80 | % | | | | 27.71 | % |
| | $ | 11.10 | | | | | 0.01 | % | | | $ | 15,832 | | | | | 0.81 | % | | | | 1.78 | % | | | | 0.84 | % | | | | 31.17 | % |
| | $ | 11.30 | | | | | 3.59 | % | | | $ | 18,683 | | | | | 0.82 | % | | | | 1.78 | % | | | | 0.92 | % | | | | 2.69 | % |
| | $ | 11.14 | | | | | 2.11 | % | | | $ | 16,802 | | | | | 0.86 | % | | | | 1.93 | % | | | | 0.93 | % | | | | 12.53 | % |
| | $ | 11.14 | | | | | 4.76 | % | | | $ | 17,748 | | | | | 0.93 | % | | | | 2.02 | % | | | | 0.93 | % | | | | 15.51 | % |
| | | | | | | | | | | | | | | | | | | | | | | | | | | | | | | | | | |
| | $ | 11.40 | | | | | (1.14 | )% | | | $ | 20,842 | | | | | 0.80 | % | | | | 1.96 | % | | | | 0.80 | % | | | | 21.08 | % |
| | $ | 11.76 | | | | | (0.39 | )% | | | $ | 27,481 | | | | | 0.80 | % | | | | 1.93 | % | | | | 0.84 | % | | | | 23.25 | % |
| | $ | 12.13 | | | | | 3.65 | % | | | $ | 34,691 | | | | | 0.81 | % | | | | 1.99 | % | | | | 0.91 | % | | | | 16.18 | % |
| | $ | 11.98 | | | | | 1.98 | % | | | $ | 36,672 | | | | | 0.85 | % | | | | 2.08 | % | | | | 0.92 | % | | | | 16.01 | % |
| | $ | 12.06 | | | | | 4.39 | % | | | $ | 41,130 | | | | | 0.91 | % | | | | 2.04 | % | | | | 0.91 | % | | | | 20.48 | % |
| | | | | | | | | | | | | | | | | | | | | | | | | | | | | | | | | | |
| | $ | 9.72 | | | | | (0.98 | )% | | | $ | 23,833 | | | | | 0.80 | % | | | | 2.14 | % | | | | 0.80 | % | | | | 17.53 | % |
| | $ | 10.04 | | | | | 0.28 | % | | | $ | 30,134 | | | | | 0.81 | % | | | | 2.08 | % | | | | 0.85 | % | | | | 21.00 | % |
| | $ | 10.27 | | | | | 3.92 | % | | | $ | 37,720 | | | | | 0.82 | % | | | | 2.05 | % | | | | 0.92 | % | | | | 11.31 | % |
| | $ | 10.14 | | | | | 2.19 | % | | | $ | 35,279 | | | | | 0.85 | % | | | | 2.12 | % | | | | 0.92 | % | | | | 10.34 | % |
| | $ | 10.16 | | | | | 4.82 | % | | | $ | 35,190 | | | | | 0.91 | % | | | | 2.14 | % | | | | 0.91 | % | | | | 21.09 | % |
| | | | | | | | | | | | | | | | | | | | | | | | | | | | | | | | | | |
| | $ | 10.63 | | | | | 2.38 | % | | | $ | 12,468 | | | | | 0.79 | % | | | | 3.25 | % | | | | 0.80 | % | | | | 48.19 | % |
| | $ | 10.79 | | | | | 3.57 | % | | | $ | 14,754 | | | | | 0.77 | % | | | | 3.84 | % | | | | 0.77 | % | | | | 43.86 | % |
| | $ | 10.82 | | | | | 9.87 | % | | | $ | 15,126 | | | | | 0.64 | % | | | | 3.17 | % | | | | 0.72 | % | | | | 67.18 | % |
| | $ | 10.21 | | | | | (1.40 | )% | | | $ | 14,321 | | | | | 0.45 | % | | | | 2.45 | % | | | | 0.70 | % | | | | 126.46 | % |
| | $ | 10.59 | | | | | 8.81 | % | | | $ | 15,589 | | | | | 0.45 | % | | | | 2.11 | % | | | | 0.70 | % | | | | 8.67 | % |
| | | | | | | | | | | | | | | | | | | | | | | | | | | | | | | | | | |
| | $ | 12.08 | | | | | 3.88 | % | | | $ | 28,470 | | | | | 0.41 | % | | | | 1.93 | % | | | | 0.66 | % | | | | 14.41 | % |
| | $ | 11.89 | | | | | 11.46 | % | | | $ | 30,181 | | | | | 0.42 | % | | | | 1.37 | % | | | | 0.67 | % | | | | 0.80 | % |
| | $ | 10.82 | | | | | 7.02 | % | | | $ | 31,951 | | | | | 0.40 | % | | | | 1.65 | % | | | | 0.65 | % | | | | 5.19 | % |
| | $ | 10.31 | | | | | (1.92 | )% | | | $ | 34,047 | | | | | 0.40 | % | | | | 1.16 | % | | | | 0.65 | % | | | | 49.24 | % |
| | $ | 10.66 | | | | | 11.05 | % | | | $ | 35,437 | | | | | 0.39 | % | | | | 1.64 | % | | | | 0.64 | % | | | | 5.70 | % |
| | | | | | | | | | | | | | | | | | | | | | | | | | | | | | | | | | |
| | $ | 12.25 | | | | | 5.08 | % | | | $ | 21,715 | | | | | 0.44 | % | | | | 1.73 | % | | | | 0.69 | % | | | | 17.81 | % |
| | $ | 11.90 | | | | | 14.24 | % | | | $ | 22,836 | | | | | 0.44 | % | | | | 1.04 | % | | | | 0.69 | % | | | | 1.92 | % |
| | $ | 10.53 | | | | | 7.22 | % | | | $ | 21,912 | | | | | 0.43 | % | | | | 1.34 | % | | | | 0.68 | % | | | | 5.95 | % |
| | $ | 9.99 | | | | | (2.93 | )% | | | $ | 22,848 | | | | | 0.42 | % | | | | 0.69 | % | | | | 0.67 | % | | | | 58.40 | % |
| | $ | 10.39 | | | | | 12.65 | % | | | $ | 23,709 | | | | | 0.41 | % | | | | 1.23 | % | | | | 0.66 | % | | | | 8.60 | % |
163
|
Sterling Capital Funds |
Financial Highlights, Class C Shares |
|
The financial highlights table is intended to help you understand the Funds’ financial performance for the past 5 years or, if shorter, the period of the Funds’ operations. Certain information reflects financial results for a single Fund share. The total returns in the table represent the rate that an investor would have earned (or lost) on an investment in the Fund (assuming reinvestment of all dividends and distributions).
| | | | | | | | | | | | | | | | | | | | | | | | | | | | | | | | | | | |
| | | | | Investment Activities | | Distributions |
| | | | | | | |
| | | Net Asset
Value,
Beginning
of Period | | Net
investment
income
(loss)(a) | | Net realized/
unrealized
gains (losses)
on investments | | Total from
Investment
Activities | | Net
investment
income | | Net realized
gains on
investments | | Total
Distributions |
Sterling Capital Behavioral Large Cap Value Equity Fund | | | | | | | | | | | | | | | | | | | | | |
Year Ended September 30, 2018 | | | $ | 20.13 | | | | | 0.15 | | | | | 1.86 | | | | | 2.01 | | | | | (0.28 | ) | | | | (0.19 | ) | | | | (0.47 | ) |
Year Ended September 30, 2017 | | | $ | 17.20 | | | | | 0.21 | | | | | 2.87 | | | | | 3.08 | | | | | (0.15 | ) | | | | — | | | | | (0.15 | ) |
Year Ended September 30, 2016 | | | $ | 16.09 | | | | | 0.14 | | | | | 1.12 | | | | | 1.26 | | | | | (0.15 | ) | | | | — | | | | | (0.15 | ) |
Year Ended September 30, 2015 | | | $ | 16.79 | | | | | 0.09 | | | | | (0.67 | ) | | | | (0.58 | ) | | | | (0.12 | ) | | | | — | | | | | (0.12 | ) |
Year Ended September 30, 2014 | | | $ | 13.81 | | | | | 0.05 | | | | | 3.00 | | | | | 3.05 | | | | | (0.07 | ) | | | | — | | | | | (0.07 | ) |
Sterling Capital Mid Value Fund | | | | | | | | | | | | | | | | | | | | | | | | | | | | | | | | | | | |
Year Ended September 30, 2018 | | | $ | 16.76 | | | | | (0.15 | ) | | | | 1.09 | | | | | 0.94 | | | | | — | | | | | (0.84 | ) | | | | (0.84 | ) |
Year Ended September 30, 2017 | | | $ | 15.12 | | | | | (0.14 | ) | | | | 2.31 | | | | | 2.17 | | | | | — | | | | | (0.53 | ) | | | | (0.53 | ) |
Year Ended September 30, 2016 | | | $ | 16.67 | | | | | (0.09 | ) | | | | 1.88 | | | | | 1.79 | | | | | — | | | | | (3.34 | ) | | | | (3.34 | ) |
Year Ended September 30, 2015 | | | $ | 18.06 | | | | | (0.08 | ) | | | | (0.13 | ) | | | | (0.21 | ) | | | | (0.01 | ) | | | | (1.17 | ) | | | | (1.18 | ) |
Year Ended September 30, 2014 | | | $ | 17.72 | | | | | (0.07 | ) | | | | 1.63 | | | | | 1.56 | | | | | (0.02 | ) | | | | (1.20 | ) | | | | (1.22 | ) |
Sterling Capital Behavioral Small Cap Value Equity Fund | | | | | | | | | | | | | | | | | | | | | | | | | | |
Year Ended September 30, 2018 | | | $ | 17.69 | | | | | 0.03 | | | | | 0.82 | | | | | 0.85 | | | | | — | | | | | (0.65 | ) | | | | (0.65 | ) |
Year Ended September 30, 2017 | | | $ | 14.70 | | | | | (0.02 | ) | | | | 3.07 | | | | | 3.05 | | | | | (0.06 | ) | | | | — | | | | | (0.06 | ) |
Year Ended September 30, 2016 | | | $ | 13.60 | | | | | 0.07 | | | | | 1.11 | | | | | 1.18 | | | | | (0.07 | ) | | | | (0.01 | ) | | | | (0.08 | ) |
Year Ended September 30, 2015 | | | $ | 13.87 | | | | | 0.06 | | | | | 0.15 | | | | | 0.21 | | | | | (0.04 | ) | | | | (0.44 | ) | | | | (0.48 | ) |
Year Ended September 30, 2014 | | | $ | 14.88 | | | | | — | (d) | | | | 0.92 | | | | | 0.92 | | | | | (0.06 | ) | | | | (1.87 | ) | | | | (1.93 | ) |
Sterling Capital Special Opportunities Fund | | | | | | | | | | | | | | | | | | | | | | | | | | |
Year Ended September 30, 2018 | | | $ | 20.88 | | | | | (0.14 | ) | | | | 3.29 | | | | | 3.15 | | | | | (0.11 | ) | | | | (1.94 | ) | | | | (2.05 | ) |
Year Ended September 30, 2017 | | | $ | 18.54 | | | | | (0.13 | ) | | | | 2.88 | | | | | 2.75 | | | | | — | | | | | (0.41 | ) | | | | (0.41 | ) |
Year Ended September 30, 2016 | | | $ | 20.34 | | | | | (0.14 | ) | | | | 1.65 | | | | | 1.51 | | | | | — | | | | | (3.31 | ) | | | | (3.31 | ) |
Year Ended September 30, 2015 | | | $ | 20.95 | | | | | (0.20 | ) | | | | 0.79 | | | | | 0.59 | | | | | — | | | | | (1.20 | ) | | | | (1.20 | ) |
Year Ended September 30, 2014 | | | $ | 19.55 | | | | | (0.17 | ) | | | | 3.85 | | | | | 3.68 | | | | | — | | | | | (2.28 | ) | | | | (2.28 | ) |
Sterling Capital Equity Income Fund | | | | | | | | | | | | | | | | | | | | | | | | | | | | | | | | | | | |
Year Ended September 30, 2018 | | | $ | 20.66 | | | | | 0.19 | | | | | 2.62 | | | | | 2.81 | | | | | (0.18 | ) | | | | (1.95 | ) | | | | (2.13 | ) |
Year Ended September 30, 2017 | | | $ | 18.14 | | | | | 0.20 | | | | | 2.56 | | | | | 2.76 | | | | | (0.22 | ) | | | | (0.02 | ) | | | | (0.24 | ) |
Year Ended September 30, 2016 | | | $ | 17.21 | | | | | 0.18 | | | | | 2.03 | | | | | 2.21 | | | | | (0.18 | ) | | | | (1.10 | ) | | | | (1.28 | ) |
Year Ended September 30, 2015 | | | $ | 18.80 | | | | | 0.17 | | | | | (1.06 | ) | | | | (0.89 | ) | | | | (0.19 | ) | | | | (0.51 | ) | | | | (0.70 | ) |
Year Ended September 30, 2014 | | | $ | 18.01 | | | | | 0.19 | | | | | 1.40 | | | | | 1.59 | | | | | (0.17 | ) | | | | (0.63 | ) | | | | (0.80 | ) |
Sterling Capital Behavioral International Equity Fund | | | | | | | | | | | | | | | | | | | | | | | | | | |
Year Ended September 30, 2018 | | | $ | 11.64 | | | | | 0.25 | | | | | (0.48 | ) | | | | (0.23 | ) | | | | (0.24 | ) | | | | (0.11 | ) | | | | (0.35 | ) |
Year Ended September 30, 2017 | | | $ | 9.62 | | | | | 0.15 | | | | | 1.96 | | | | | 2.11 | | | | | (0.09 | ) | | | | — | | | | | (0.09 | ) |
Year Ended September 30, 2016 | | | $ | 9.18 | | | | | 0.17 | | | | | 0.42 | | | | | 0.59 | | | | | (0.15 | ) | | | | — | | | | | (0.15 | ) |
November 28, 2014 to September 30, 2015(e) | | | $ | 10.00 | | | | | 0.19 | | | | | (0.99 | ) | | | | (0.80 | ) | | | | (0.02 | ) | | | | — | | | | | (0.02 | ) |
| * | During the periods certain fees were waived (See Note 6 in the Notes to the Financial Statements). If such reductions had not occurred, the ratios would have been as indicated. |
| ** | Portfolio turnover rate is calculated on the basis of the Fund as a whole without distinguishing between classes of shares issued. |
| (a) | Per share net investment income (loss) has been calculated using the average daily shares method. |
| (b) | Not annualized for periods less than one year. |
| (c) | Annualized for periods less than one year. |
| (d) | Amount is less than $0.005. |
| (e) | Period from commencement of operations. |
See accompanying Notes to the Financial Statements.
164
| | | | | | | | | | | | | | | | | | | | | | | | | | | | | | | | | |
| | | | | Ratios/Supplementary Data |
| | | | | | |
Net Asset
Value,
End of
Period | | Total Return
(excludes
sales charge) (b) | | Net Assets,
End of
Period
(000) | | Ratio of
net expenses
to average
net assets (c) | | Ratio of net
investment
income (loss) to
average net assets (c) | | Ratio of
expenses to
average
net assets*(c) | | Portfolio
turnover rate**(b) |
| | | | | | | | | | | | | | | | | | | | | | | | | | | | | | | | | | |
| | $ | 21.67 | | | | | 10.11 | % | | | $ | 887 | | | | | 1.62 | % | | | | 0.69 | % | | | | 1.62 | % | | | | 127.89 | % |
| | $ | 20.13 | | | | | 18.00 | % | | | $ | 966 | | | | | 1.64 | % | | | | 1.12 | % | | | | 1.64 | % | | | | 144.85 | % |
| | $ | 17.20 | | | | | 7.87 | % | | | $ | 919 | | | | | 1.76 | % | | | | 0.81 | % | | | | 1.90 | % | | | | 145.53 | % |
| | $ | 16.09 | | | | | (3.52 | )% | | | $ | 805 | | | | | 1.81 | % | | | | 0.52 | % | | | | 1.91 | % | | | | 135.05 | % |
| | $ | 16.79 | | | | | 22.09 | % | | | $ | 534 | | | | | 1.81 | % | | | | 0.34 | % | | | | 1.92 | % | | | | 113.75 | % |
| | | | | | | | | | | | | | | | | | | | | | | | | | | | | | | | | | |
| | $ | 16.86 | | | | | 5.72 | % | | | $ | 4,097 | | | | | 1.92 | % | | | | (0.91 | )% | | | | 1.92 | % | | | | 34.62 | % |
| | $ | 16.76 | | | | | 14.58 | % | | | $ | 4,363 | | | | | 1.90 | % | | | | (0.87 | )% | | | | 1.90 | % | | | | 24.83 | % |
| | $ | 15.12 | | | | | 12.22 | % | | | $ | 5,282 | | | | | 1.93 | % | | | | (0.61 | )% | | | | 1.93 | % | | | | 25.45 | % |
| | $ | 16.67 | | | | | (1.43 | )% | | | $ | 5,309 | | | | | 1.94 | % | | | | (0.41 | )% | | | | 1.94 | % | | | | 30.61 | % |
| | $ | 18.06 | | | | | 9.12 | % | | | $ | 4,661 | | | | | 1.94 | % | | | | (0.40 | )% | | | | 1.94 | % | | | | 27.30 | % |
| | | | | | | | | | | | | | | | | | | | | | | | | | | | | | | | | | |
| | $ | 17.89 | | | | | 4.88 | % | | | $ | 180 | | | | | 1.78 | % | | | | 0.17 | % | | | | 1.78 | % | | | | 89.85 | % |
| | $ | 17.69 | | | | | 20.73 | % | | | $ | 191 | | | | | 1.80 | % | | | | (0.10 | )% | | | | 1.85 | % | | | | 109.05 | % |
| | $ | 14.70 | | | | | 8.68 | % | | | $ | 364 | | | | | 1.88 | % | | | | 0.52 | % | | | | 1.98 | % | | | | 120.42 | % |
| | $ | 13.60 | | | | | 1.37 | % | | | $ | 330 | | | | | 2.00 | % | | | | 0.45 | % | | | | 2.00 | % | | | | 101.99 | % |
| | $ | 13.87 | | | | | 6.38 | % | | | $ | 312 | | | | | 1.99 | % | | | | (0.01 | )% | | | | 1.99 | % | | | | 68.50 | % |
| | | | | | | | | | | | | | | | | | | | | | | | | | | | | | | | | | |
| | $ | 21.98 | | | | | 16.27 | % | | | $ | 144,100 | | | | | 1.86 | % | | | | (0.70 | )% | | | | 1.86 | % | | | | 22.78 | % |
| | $ | 20.88 | | | | | 15.08 | % | | | $ | 149,892 | | | | | 1.87 | % | | | | (0.68 | )% | | | | 1.87 | % | | | | 18.92 | % |
| | $ | 18.54 | | | | | 7.76 | % | | | $ | 181,061 | | | | | 1.92 | % | | | | (0.73 | )% | | | | 1.97 | % | | | | 27.32 | % |
| | $ | 20.34 | | | | | 2.99 | % | | | $ | 143,597 | | | | | 1.98 | % | | | | (0.98 | )% | | | | 1.98 | % | | | | 26.98 | % |
| | $ | 20.95 | | | | | 20.76 | % | | | $ | 120,469 | | | | | 1.96 | % | | | | (0.86 | )% | | | | 1.96 | % | | | | 32.35 | % |
| | | | | | | | | | | | | | | | | | | | | | | | | | | | | | | | | | |
| | $ | 21.34 | | | | | 14.41 | % | | | $ | 207,659 | | | | | 1.77 | % | | | | 0.91 | % | | | | 1.77 | % | | | | 19.49 | % |
| | $ | 20.66 | | | | | 15.36 | % | | | $ | 234,108 | | | | | 1.78 | % | | | | 1.03 | % | | | | 1.78 | % | | | | 16.93 | % |
| | $ | 18.14 | | | | | 13.66 | % | | | $ | 271,598 | | | | | 1.96 | % | | | | 1.03 | % | | | | 1.96 | % | | | | 20.64 | % |
| | $ | 17.21 | | | | | (4.92 | )% | | | $ | 279,355 | | | | | 1.97 | % | | | | 0.91 | % | | | | 1.97 | % | | | | 27.53 | % |
| | $ | 18.80 | | | | | 8.98 | % | | | $ | 315,948 | | | | | 1.95 | % | | | | 1.04 | % | | | | 1.95 | % | | | | 16.13 | % |
| | | | | | | | | | | | | | | | | | | | | | | | | | | | | | | | | | |
| | $ | 11.06 | | | | | (2.18 | )% | | | $ | 61 | | | | | 1.65 | % | | | | 2.15 | % | | | | 1.85 | % | | | | 96.65 | % |
| | $ | 11.64 | | | | | 22.19 | % | | | $ | 59 | | | | | 1.68 | % | | | | 1.44 | % | | | | 1.94 | % | | | | 91.65 | % |
| | $ | 9.62 | | | | | 6.38 | % | | | $ | 47 | | | | | 1.80 | % | | | | 1.83 | % | | | | 2.13 | % | | | | 125.35 | % |
| | $ | 9.18 | | | | | (8.03 | )% | | | $ | 28 | | | | | 2.03 | % | | | | 2.26 | % | | | | 2.19 | % | | | | 133.50 | % |
165
|
Sterling Capital Funds |
Financial Highlights, Class C Shares |
|
The financial highlights table is intended to help you understand the Funds’ financial performance for the past 5 years or, if shorter, the period of the Funds’ operations. Certain information reflects financial results for a single Fund share. The total returns in the table represent the rate that an investor would have earned (or lost) on an investment in the Fund (assuming reinvestment of all dividends and distributions).
| | | | | | | | | | | | | | | | | | | | | | | | | | | | | | | | | | | |
| | | | | Investment Activities | | Distributions |
| | | | | | | |
| | | Net Asset
Value,
Beginning
of Period | | Net
investment
income
(loss)(a) | | Net realized/
unrealized
gains (losses)
on investments | | Total from
Investment
Activities | | Net
investment
income | | Net realized
gains on
investments | | Total
Distributions |
Sterling Capital SMID Opportunities Fund | | | | | | | | | | | | | | | | | | | | | | | | | | |
Year Ended September 30, 2018 | | | $ | 11.67 | | | | | (0.13 | ) | | | | 0.96 | | | | | 0.83 | | | | | (0.02 | ) | | | | (0.18 | ) | | | | (0.20 | ) |
October 3, 2016 to September 30, 2017(d) | | | $ | 10.00 | | | | | (0.09 | ) | | | | 1.76 | | | | | 1.67 | | | | | — | | | | | — | | | | | — | |
Sterling Capital Stratton Mid Cap Value Fund | | | | | | | | | | | | | | | | | | | | | | | | | | |
Year Ended September 30, 2018 | | | $ | 65.40 | | | | | (0.42 | ) | | | | 4.77 | | | | | 4.35 | | | | | — | | | | | (2.29 | ) | | | | (2.29 | ) |
Year Ended September 30, 2017 | | | $ | 55.55 | | | | | (0.41 | ) | | | | 10.53 | | | | | 10.12 | | | | | — | | | | | (0.27 | ) | | | | (0.27 | ) |
Period Ended September 30, 2016 | | | $ | 52.54 | | | | | (0.32 | ) | | | | 3.33 | | | | | 3.01 | | | | | — | | | | | — | | | | | — | |
November 16, 2015 to December 31, 2015(d) | | | $ | 53.97 | | | | | — | | | | | 0.45 | | | | | 0.45 | | | | | (0.10 | ) | | | | (1.78 | ) | | | | (1.88 | ) |
Sterling Capital Stratton Real Estate Fund | | | | | | | | | | | | | | | | | | | | | | | | | | |
Year Ended September 30, 2018 | | | $ | 36.91 | | | | | 0.51 | | | | | 1.45 | | | | | 1.96 | | | | | (0.25 | ) | | | | (1.22 | ) | | | | (1.47 | ) |
Year Ended September 30, 2017 | | | $ | 39.50 | | | | | 0.43 | | | | | (0.49 | ) | | | | (0.06 | ) | | | | (0.78 | ) | | | | (1.75 | ) | | | | (2.53 | ) |
Period Ended September 30, 2016 | | | $ | 35.97 | | | | | 0.34 | | | | | 3.58 | | | | | 3.92 | | | | | (0.39 | ) | | | | — | | | | | (0.39 | ) |
November 16, 2015 to December 31, 2015(d) | | | $ | 34.90 | | | | | 0.12 | | | | | 1.42 | | | | | 1.54 | | | | | — | | | | | (0.47 | ) | | | | (0.47 | ) |
Sterling Capital Stratton Small Cap Value Fund | | | | | | | | | | | | | | | | | | | | | | | | | | |
Year Ended September 30, 2018 | | | $ | 88.75 | | | | | (0.62 | ) | | | | 6.48 | | | | | 5.86 | | | | | — | | | | | (7.69 | ) | | | | (7.69 | ) |
Year Ended September 30, 2017 | | | $ | 77.88 | | | | | (0.64 | ) | | | | 15.61 | | | | | 14.97 | | | | | — | | | | | (4.10 | ) | | | | (4.10 | ) |
Period Ended September 30, 2016 | | | $ | 69.88 | | | | | (0.41 | ) | | | | 8.41 | | | | | 8.00 | | | | | — | | | | | — | | | | | — | |
November 16, 2015 to December 31, 2015(d) | | | $ | 71.71 | | | | | (0.01 | ) | | | | (0.81 | ) | | | | (0.82 | ) | | | | (0.01 | ) | | | | (1.00 | ) | | | | (1.01 | ) |
Sterling Capital Short Duration Bond Fund | | | | | | | | | | | | | | | | | | | | | | | | | | |
Year Ended September 30, 2018 | | | $ | 8.69 | | | | | 0.09 | | | | | (0.12 | ) | | | | (0.03 | ) | | | | (0.15 | ) | | | | — | | | | | (0.15 | ) |
Year Ended September 30, 2017 | | | $ | 8.80 | | | | | 0.03 | | | | | — | | | | | 0.03 | | | | | (0.14 | ) | | | | — | | | | | (0.14 | ) |
Year Ended September 30, 2016 | | | $ | 8.85 | | | | | 0.03 | | | | | 0.07 | | | | | 0.10 | | | | | (0.16 | ) | | | | — | | | | | (0.16 | ) |
Year Ended September 30, 2015 | | | $ | 9.07 | | | | | 0.04 | | | | | (0.07 | ) | | | | (0.03 | ) | | | | (0.19 | ) | | | | — | | | | | (0.19 | ) |
Year Ended September 30, 2014 | | | $ | 9.24 | | | | | 0.06 | | | | | (0.03 | ) | | | | 0.03 | | | | | (0.20 | ) | | | | — | | | | | (0.20 | ) |
| * | During the periods certain fees were waived (See Note 6 in the Notes to the Financial Statements). If such reductions had not occurred, the ratios would have been as indicated. |
| ** | Portfolio turnover rate is calculated on the basis of the Fund as a whole without distinguishing between classes of shares issued. |
| (a) | Per share net investment income (loss) has been calculated using the average daily shares method. |
| (b) | Not annualized for periods less than one year. |
| (c) | Annualized for periods less than one year. |
| (d) | Period from commencement of operations. |
See accompanying Notes to the Financial Statements.
166
| | | | | | | | | | | | | | | | | | | | | | | | | | | | | | | | | |
| | | | | Ratios/Supplementary Data |
| | | | | | |
Net Asset
Value,
End of
Period | | Total
Return
(excludes
sales charge) (b) | | Net Assets,
End of
Period
(000) | | Ratio of
net expenses
to average
net assets (c) | | Ratio of net
investment
income (loss) to
average net assets (c) | | Ratio of
expenses to
average
net assets*(c) | | Portfolio
turnover rate**(b) |
| | | | | | | | | | | | | | | | | | | | | | | | | | | | | | | | | | |
| | $ | 12.30 | | | | | 7.25 | % | | | $ | 1,476 | | | | | 1.79 | % | | | | (1.13 | )% | | | | 2.04 | % | | | | 45.64 | % |
| | $ | 11.67 | | | | | 16.70 | % | | | $ | 1,414 | | | | | 1.79 | % | | | | (0.80 | )% | | | | 2.38 | % | | | | 37.97 | % |
| | | | | | | | | | | | | | | | | | | | | | | | | | | | | | | | | | |
| | $ | 67.46 | | | | | 6.70 | % | | | $ | 1 | | | | | 1.95 | % | | | | (0.63 | )% | | | | 1.95 | % | | | | 14.47 | % |
| | $ | 65.40 | | | | | 18.27 | % | | | $ | 1 | | | | | 1.89 | % | | | | (0.68 | )% | | | | 1.89 | % | | | | 12.19 | % |
| | $ | 55.55 | | | | | 5.73 | % | | | $ | 1 | | | | | 1.95 | % | | | | (0.82 | )% | | | | 1.95 | % | | | | 11.16 | % |
| | $ | 52.54 | | | | | 0.91 | % | | | $ | 1 | | | | | 1.64 | % | | | | (0.01 | )% | | | | 1.64 | % | | | | 19.28 | % |
| | | | | | | | | | | | | | | | | | | | | | | | | | | | | | | | | | |
| | $ | 37.40 | | | | | 5.38 | % | | | $ | 98 | | | | | 1.82 | % | | | | 1.41 | % | | | | 1.82 | % | | | | 8.34 | % |
| | $ | 36.91 | | | | | 0.16 | % | | | $ | 64 | | | | | 1.79 | % | | | | 1.18 | % | | | | 1.80 | % | | | | 13.52 | % |
| | $ | 39.50 | | | | | 10.90 | % | | | $ | 20 | | | | | 1.83 | % | | | | 1.21 | % | | | | 1.85 | % | | | | 18.43 | % |
| | $ | 35.97 | | | | | 4.45 | % | | | $ | 1 | | | | | 1.59 | % | | | | 2.57 | % | | | | 1.59 | % | | | | 15.47 | % |
| | | | | | | | | | | | | | | | | | | | | | | | | | | | | | | | | | |
| | $ | 86.92 | | | | | 6.90 | % | | | $ | 112 | | | | | 2.03 | % | | | | (0.71 | )% | | | | 2.06 | % | | | | 15.51 | % |
| | $ | 88.75 | | | | | 19.55 | % | | | $ | 107 | | | | | 2.06 | % | | | | 0.78 | % | | | | 2.06 | % | | | | 7.04 | % |
| | $ | 77.88 | | | | | 11.45 | % | | | $ | 65 | | | | | 2.08 | % | | | | (0.74 | )% | | | | 2.08 | % | | | | 3.42 | % |
| | $ | 69.88 | | | | | (1.12 | )% | | | $ | 1 | | | | | 2.06 | % | | | | (0.15 | )% | | | | 2.06 | % | | | | 6.33 | % |
| | | | | | | | | | | | | | | | | | | | | | | | | | | | | | | | | | |
| | $ | 8.51 | | | | | (0.32 | )% | | | $ | 1,091 | | | | | 1.43 | % | | | | 1.07 | % | | | | 1.53 | % | | | | 62.02 | % |
| | $ | 8.69 | | | | | 0.38 | % | | | $ | 1,546 | | | | | 1.45 | % | | | | 0.37 | % | | | | 1.55 | % | | | | 78.77 | % |
| | $ | 8.80 | | | | | 1.22 | % | | | $ | 1,886 | | | | | 1.49 | % | | | | 0.35 | % | | | | 1.56 | % | | | | 54.68 | % |
| | $ | 8.85 | | | | | (0.29 | )% | | | $ | 2,415 | | | | | 1.55 | % | | | | 0.39 | % | | | | 1.57 | % | | | | 55.74 | % |
| | $ | 9.07 | | | | | 0.37 | % | | | $ | 1,906 | | | | | 1.53 | % | | | | 0.69 | % | | | | 1.56 | % | | | | 56.10 | % |
167
|
Sterling Capital Funds |
Financial Highlights, Class C Shares |
|
The financial highlights table is intended to help you understand the Funds’ financial performance for the past 5 years or, if shorter, the period of the Funds’ operations. Certain information reflects financial results for a single Fund share. The total returns in the table represent the rate that an investor would have earned (or lost) on an investment in the Fund (assuming reinvestment of all dividends and distributions).
| | | | | | | | | | | | | | | | | | | | | | | | | | | | | | | | | | | | | | | | |
| | | | | Investment Activities | | Distributions |
| | | | | | | | |
| | | Net Asset
Value,
Beginning
of Year | | Net
investment
income(a) | | Net realized/
unrealized
gains (losses)
on investments | | Total from
Investment
Activities | | Net
investment
income | | Net realized
gains on
investments | | Return
of
capital | | Total
Distributions |
Sterling Capital Intermediate U.S. Government Fund | | | | | | | | | | | | | | | | | | | | | | | | | | |
Year Ended September 30, 2018 | | | $ | 9.89 | | | | | 0.09 | | | | | (0.32 | ) | | | | (0.23 | ) | | | | (0.19 | ) | | | | — | | | | | — | | | | | (0.19 | ) |
Year Ended September 30, 2017 | | | $ | 10.22 | | | | | 0.08 | | | | | (0.28 | ) | | | | (0.20 | ) | | | | (0.13 | ) | | | | — | | | | | — | | | | | (0.13 | ) |
Year Ended September 30, 2016 | | | $ | 10.17 | | | | | 0.05 | | | | | 0.10 | | | | | 0.15 | | | | | (0.10 | ) | | | | — | | | | | — | | | | | (0.10 | ) |
Year Ended September 30, 2015 | | | $ | 10.18 | | | | | 0.06 | | | | | 0.05 | | | | | 0.11 | | | | | (0.12 | ) | | | | — | | | | | — | | | | | (0.12 | ) |
Year Ended September 30, 2014 | | | $ | 10.27 | | | | | 0.07 | | | | | 0.09 | | | | | 0.16 | | | | | (0.25 | ) | | | | — | | | | | — | | | | | (0.25 | ) |
Sterling Capital Total Return Bond Fund | | | | | | | | | | | | | | | | | | | | | | | | | | |
Year Ended September 30, 2018 | | | $ | 10.61 | | | | | 0.19 | | | | | (0.37 | ) | | | | (0.18 | ) | | | | (0.22 | ) | | | | — | | | | | — | | | | | (0.22 | ) |
Year Ended September 30, 2017 | | | $ | 10.83 | | | | | 0.15 | | | | | (0.15 | ) | | | | — | | | | | (0.22 | ) | | | | — | | | | | — | | | | | (0.22 | ) |
Year Ended September 30, 2016 | | | $ | 10.55 | | | | | 0.18 | | | | | 0.35 | | | | | 0.53 | | | | | (0.25 | ) | | | | — | | | | | — | | | | | (0.25 | ) |
Year Ended September 30, 2015 | | | $ | 10.68 | | | | | 0.20 | | | | | (0.06 | ) | | | | 0.14 | | | | | (0.27 | ) | | | | — | | | | | — | | | | | (0.27 | ) |
Year Ended September 30, 2014 | | | $ | 10.54 | | | | | 0.23 | | | | | 0.21 | | | | | 0.44 | | | | | (0.29 | ) | | | | (0.01 | ) | | | | — | | | | | (0.30 | ) |
Sterling Capital Corporate Fund | | | | | | | | | | | | | | | | | | | | | | | | | | |
Year Ended September 30, 2018 | | | $ | 10.23 | | | | | 0.22 | | | | | (0.36 | ) | | | | (0.14 | ) | | | | (0.22 | ) | | | | (0.07 | ) | | | | — | | | | | (0.29 | ) |
Year Ended September 30, 2017 | | | $ | 10.35 | | | | | 0.21 | | | | | (0.08 | ) | | | | 0.13 | | | | | (0.21 | ) | | | | (0.04 | ) | | | | — | | | | | (0.25 | ) |
Year Ended September 30, 2016 | | | $ | 10.09 | | | | | 0.21 | | | | | 0.26 | | | | | 0.47 | | | | | (0.21 | ) | | | | — | | | | | — | | | | | (0.21 | ) |
Year Ended September 30, 2015 | | | $ | 10.24 | | | | | 0.22 | | | | | (0.14 | ) | | | | 0.08 | | | | | (0.22 | ) | | | | (0.01 | ) | | | | — | (b) | | | | (0.23 | ) |
Year Ended September 30, 2014 | | | $ | 10.15 | | | | | 0.24 | | | | | 0.18 | | | | | 0.42 | | | | | (0.23 | ) | | | | (0.10 | ) | | | | — | | | | | (0.33 | ) |
Sterling Capital Securitized Opportunities Fund | | | | | | | | | | | | | | | | | | | | | | | | | | |
Year Ended September 30, 2018 | | | $ | 9.93 | | | | | 0.19 | | | | | (0.32 | ) | | | | (0.13 | ) | | | | (0.20 | ) | | | | — | | | | | — | | | | | (0.20 | ) |
Year Ended September 30, 2017 | | | $ | 10.09 | | | | | 0.13 | | | | | (0.12 | ) | | | | 0.01 | | | | | (0.17 | ) | | | | — | | | | | — | | | | | (0.17 | ) |
Year Ended September 30, 2016 | | | $ | 9.97 | | | | | 0.12 | | | | | 0.16 | | | | | 0.28 | | | | | (0.16 | ) | | | | — | | | | | — | | | | | (0.16 | ) |
Year Ended September 30, 2015 | | | $ | 9.89 | | | | | 0.13 | | | | | 0.13 | | | | | 0.26 | | | | | (0.18 | ) | | | | — | | | | | — | | | | | (0.18 | ) |
Year Ended September 30, 2014 | | | $ | 9.84 | | | | | 0.16 | | | | | 0.11 | | | | | 0.27 | | | | | (0.22 | ) | | | | — | | | | | — | | | | | (0.22 | ) |
Sterling Capital Kentucky Intermediate Tax-Free Fund | | | | | | | | | | | | | | | | | | | | | | | | | | |
Year Ended September 30, 2018 | | | $ | 10.28 | | | | | 0.15 | | | | | (0.34 | ) | | | | (0.19 | ) | | | | (0.15 | ) | | | | (0.03 | ) | | | | — | | | | | (0.18 | ) |
Year Ended September 30, 2017 | | | $ | 10.65 | | | | | 0.14 | | | | | (0.22 | ) | | | | (0.08 | ) | | | | (0.15 | ) | | | | (0.14 | ) | | | | — | | | | | (0.29 | ) |
Year Ended September 30, 2016 | | | $ | 10.63 | | | | | 0.16 | | | | | 0.15 | | | | | 0.31 | | | | | (0.16 | ) | | | | (0.13 | ) | | | | — | | | | | (0.29 | ) |
Year Ended September 30, 2015 | | | $ | 10.86 | | | | | 0.17 | | | | | (0.05 | ) | | | | 0.12 | | | | | (0.17 | ) | | | | (0.18 | ) | | | | — | | | | | (0.35 | ) |
Year Ended September 30, 2014 | | | $ | 10.67 | | | | | 0.19 | | | | | 0.18 | | | | | 0.37 | | | | | (0.18 | ) | | | | — | | | | | — | | | | | (0.18 | ) |
Sterling Capital Maryland Intermediate Tax-Free Fund | | | | | | | | | | | | | | | | | | | | | | | | | | |
Year Ended September 30, 2018 | | | $ | 11.02 | | | | | 0.12 | | | | | (0.34 | ) | | | | (0.22 | ) | | | | (0.12 | ) | | | | (0.06 | ) | | | | — | | | | | (0.18 | ) |
Year Ended September 30, 2017 | | | $ | 11.31 | | | | | 0.12 | | | | | (0.21 | ) | | | | (0.09 | ) | | | | (0.12 | ) | | | | (0.08 | ) | | | | — | | | | | (0.20 | ) |
Year Ended September 30, 2016 | | | $ | 11.18 | | | | | 0.11 | | | | | 0.20 | | | | | 0.31 | | | | | (0.11 | ) | | | | (0.07 | ) | | | | — | | | | | (0.18 | ) |
Year Ended September 30, 2015 | | | $ | 11.24 | | | | | 0.12 | | | | | — | (b) | | | | 0.12 | | | | | (0.12 | ) | | | | (0.06 | ) | | | | — | | | | | (0.18 | ) |
Year Ended September 30, 2014 | | | $ | 10.96 | | | | | 0.11 | | | | | 0.28 | | | | | 0.39 | | | | | (0.11 | ) | | | | — | | | | | — | | | | | (0.11 | ) |
Sterling Capital North Carolina Intermediate Tax-Free Fund | | | | | | | | | | | | | | | | | | | | | | | | | | |
Year Ended September 30, 2018 | | | $ | 10.77 | | | | | 0.16 | | | | | (0.35 | ) | | | | (0.19 | ) | | | | (0.16 | ) | | | | — | | | | | — | | | | | (0.16 | ) |
Year Ended September 30, 2017 | | | $ | 11.07 | | | | | 0.14 | | | | | (0.26 | ) | | | | (0.12 | ) | | | | (0.14 | ) | | | | (0.04 | ) | | | | — | | | | | (0.18 | ) |
Year Ended September 30, 2016 | | | $ | 10.96 | | | | | 0.15 | | | | | 0.17 | | | | | 0.32 | | | | | (0.15 | ) | | | | (0.06 | ) | | | | — | | | | | (0.21 | ) |
Year Ended September 30, 2015 | | | $ | 10.98 | | | | | 0.16 | | | | | — | (b) | | | | 0.16 | | | | | (0.16 | ) | | | | (0.02 | ) | | | | — | | | | | (0.18 | ) |
Year Ended September 30, 2014 | | | $ | 10.74 | | | | | 0.16 | | | | | 0.24 | | | | | 0.40 | | | | | (0.16 | ) | | | | — | | | | | — | | | | | (0.16 | ) |
| * | During the periods certain fees were waived (See Note 6 in the Notes to the Financial Statements). If such reductions had not occurred, the ratios would have been as indicated. |
| ** | Portfolio turnover rate is calculated on the basis of the Fund as a whole without distinguishing between classes of shares issued. |
| (a) | Per share net investment income has been calculated using the average daily shares method. |
| (b) | Amount is less than $0.005. |
See accompanying Notes to the Financial Statements.
168
| | | | | | | | | | | | | | | | | | | | | | | | | | | | | | | | | |
| | | | | Ratios/Supplementary Data |
| | | | | | |
Net Asset
Value,
End of
Year | | Total
Return
(excludes
sales charge) | | Net Assets,
End of
Year
(000) | | Ratio of
net expenses
to average
net assets | | Ratio of net
investment
income to
average net
assets | | Ratio of
expenses to
average
net assets* | | Portfolio
turnover rate** |
| | | | | | | | | | | | | | | | | | | | | | | | | | | | | | | | | | |
| | $ | 9.47 | | | | | (2.37 | )% | | | $ | 488 | | | | | 1.66 | % | | | | 0.98 | % | | | | 1.67 | % | | | | 40.85 | % |
| | $ | 9.89 | | | | | (1.94 | )% | | | $ | 577 | | | | | 1.62 | % | | | | 0.80 | % | | | | 1.66 | % | | | | 32.44 | % |
| | $ | 10.22 | | | | | 1.51 | % | | | $ | 706 | | | | | 1.60 | % | | | | 0.48 | % | | | | 1.72 | % | | | | 49.39 | % |
| | $ | 10.17 | | | | | 1.06 | % | | | $ | 777 | | | | | 1.67 | % | | | | 0.56 | % | | | | 1.73 | % | | | | 62.02 | % |
| | $ | 10.18 | | | | | 1.56 | % | | | $ | 823 | | | | | 1.68 | % | | | | 0.66 | % | | | | 1.68 | % | | | | 35.74 | % |
| | | | | | | | | | | | | | | | | | | | | | | | | | | | | | | | | | |
| | $ | 10.21 | | | | | (1.73 | )% | | | $ | 7,464 | | | | | 1.45 | % | | | | 1.81 | % | | | | 1.57 | % | | | | 62.28 | % |
| | $ | 10.61 | | | | | 0.00 | % | | | $ | 7,582 | | | | | 1.47 | % | | | | 1.38 | % | | | | 1.57 | % | | | | 64.07 | % |
| | $ | 10.83 | | | | | 5.05 | % | | | $ | 7,933 | | | | | 1.49 | % | | | | 1.66 | % | | | | 1.59 | % | | | | 65.47 | % |
| | $ | 10.55 | | | | | 1.28 | % | | | $ | 6,362 | | | | | 1.48 | % | | | | 1.87 | % | | | | 1.58 | % | | | | 41.37 | % |
| | $ | 10.68 | | | | | 4.24 | % | | | $ | 5,578 | | | | | 1.56 | % | | | | 2.15 | % | | | | 1.58 | % | | | | 75.21 | % |
| | | | | | | | | | | | | | | | | | | | | | | | | | | | | | | | | | |
| | $ | 9.80 | | | | | (1.44 | )% | | | $ | 42 | | | | | 1.63 | % | | | | 2.19 | % | | | | 1.63 | % | | | | 66.82 | % |
| | $ | 10.23 | | | | | 1.30 | % | | | $ | 43 | | | | | 1.64 | % | | | | 2.09 | % | | | | 1.64 | % | | | | 78.79 | % |
| | $ | 10.35 | | | | | 4.69 | % | | | $ | 58 | | | | | 1.64 | % | | | | 2.03 | % | | | | 1.64 | % | | | | 83.88 | % |
| | $ | 10.09 | | | | | 0.75 | % | | | $ | 9 | | | | | 1.63 | % | | | | 2.12 | % | | | | 1.63 | % | | | | 33.94 | % |
| | $ | 10.24 | | | | | 4.25 | % | | | $ | 9 | | | | | 1.59 | % | | | | 2.31 | % | | | | 1.59 | % | | | | 105.03 | % |
| | | | | | | | | | | | | | | | | | | | | | | | | | | | | | | | | | |
| | $ | 9.60 | | | | | (1.27 | )% | | | $ | 33 | | | | | 1.58 | % | | | | 1.97 | % | | | | 1.62 | % | | | | 19.17 | % |
| | $ | 9.93 | | | | | 0.12 | % | | | $ | 34 | | | | | 1.60 | % | | | | 1.31 | % | | | | 1.64 | % | | | | 34.72 | % |
| | $ | 10.09 | | | | | 2.83 | % | | | $ | 40 | | | | | 1.61 | % | | | | 1.16 | % | | | | 1.65 | % | | | | 43.63 | % |
| | $ | 9.97 | | | | | 2.62 | % | | | $ | 39 | | | | | 1.59 | % | | | | 1.30 | % | | | | 1.63 | % | | | | 19.85 | % |
| | $ | 9.89 | | | | | 2.72 | % | | | $ | 38 | | | | | 1.58 | % | | | | 1.59 | % | | | | 1.62 | % | | | | 98.34 | % |
| | | | | | | | | | | | | | | | | | | | | | | | | | | | | | | | | | |
| | $ | 9.91 | | | | | (1.93 | )% | | | $ | 2 | | | | | 1.68 | % | | | | 1.45 | % | | | | 1.68 | % | | | | 20.37 | % |
| | $ | 10.28 | | | | | (0.74 | )% | | | $ | 2 | | | | | 1.58 | % | | | | 1.32 | % | | | | 1.65 | % | | | | 17.93 | % |
| | $ | 10.65 | | | | | 2.93 | % | | | $ | 20 | | | | | 1.65 | % | | | | 1.50 | % | | | | 1.76 | % | | | | 16.44 | % |
| | $ | 10.63 | | | | | 1.13 | % | | | $ | 20 | | | | | 1.71 | % | | | | 1.62 | % | | | | 1.79 | % | | | | 17.34 | % |
| | $ | 10.86 | | | | | 3.53 | % | | | $ | 19 | | | | | 1.71 | % | | | | 1.72 | % | | | | 1.71 | % | | | | 11.13 | % |
| | | | | | | | | | | | | | | | | | | | | | | | | | | | | | | | | | |
| | $ | 10.62 | | | | | (1.97 | )% | | | $ | 591 | | | | | 1.63 | % | | | | 1.14 | % | | | | 1.63 | % | | | | 31.12 | % |
| | $ | 11.02 | | | | | (0.74 | )% | | | $ | 627 | | | | | 1.61 | % | | | | 1.13 | % | | | | 1.65 | % | | | | 5.89 | % |
| | $ | 11.31 | | | | | 2.85 | % | | | $ | 802 | | | | | 1.61 | % | | | | 1.01 | % | | | | 1.71 | % | | | | 14.36 | % |
| | $ | 11.18 | | | | | 1.04 | % | | | $ | 741 | | | | | 1.65 | % | | | | 1.07 | % | | | | 1.71 | % | | | | 18.38 | % |
| | $ | 11.24 | | | | | 3.58 | % | | | $ | 747 | | | | | 1.69 | % | | | | 0.99 | % | | | | 1.69 | % | | | | 19.90 | % |
| | | | | | | | | | | | | | | | | | | | | | | | | | | | | | | | | | |
| | $ | 10.42 | | | | | (1.80 | )% | | | $ | 3,359 | | | | | 1.54 | % | | | | 1.48 | % | | | | 1.54 | % | | | | 22.06 | % |
| | $ | 10.77 | | | | | (1.06 | )% | | | $ | 4,591 | | | | | 1.54 | % | | | | 1.34 | % | | | | 1.58 | % | | | | 25.92 | % |
| | $ | 11.07 | | | | | 2.91 | % | | | $ | 6,108 | | | | | 1.55 | % | | | | 1.31 | % | | | | 1.65 | % | | | | 10.05 | % |
| | $ | 10.96 | | | | | 1.43 | % | | | $ | 3,350 | | | | | 1.59 | % | | | | 1.44 | % | | | | 1.66 | % | | | | 16.80 | % |
| | $ | 10.98 | | | | | 3.77 | % | | | $ | 2,864 | | | | | 1.66 | % | | | | 1.52 | % | | | | 1.66 | % | | | | 11.67 | % |
169
|
Sterling Capital Funds |
Financial Highlights, Class C Shares |
|
The financial highlights table is intended to help you understand the Funds’ financial performance for the past 5 years or, if shorter, the period of the Funds’ operations. Certain information reflects financial results for a single Fund share. The total returns in the table represent the rate that an investor would have earned (or lost) on an investment in the Fund (assuming reinvestment of all dividends and distributions).
| | | | | | | | | | | | | | | | | | | | | | | | | | | | | | | | | | | |
| | | | | Investment Activities | | Distributions |
| | | | | | | |
| | | Net Asset
Value,
Beginning
of Year | | Net
investment
income(a) | | Net realized/
unrealized
gains (losses)
on investments | | Total from
Investment
Activities | | Net
investment
income | | Net realized
gains on
investments | | Total
Distributions |
Sterling Capital South Carolina Intermediate Tax-Free Fund | | | | | | | | | | | | | | | | | | | | | | | | | | |
Year Ended September 30, 2018 | | | $ | 11.10 | | | | | 0.12 | | | | | (0.34 | ) | | | | (0.22 | ) | | | | (0.12 | ) | | | | — | | | | | (0.12 | ) |
Year Ended September 30, 2017 | | | $ | 11.30 | | | | | 0.11 | | | | | (0.20 | ) | | | | (0.09 | ) | | | | (0.11 | ) | | | | — | | | | | (0.11 | ) |
Year Ended September 30, 2016 | | | $ | 11.14 | | | | | 0.12 | | | | | 0.20 | | | | | 0.32 | | | | | (0.12 | ) | | | | (0.04 | ) | | | | (0.16 | ) |
Year Ended September 30, 2015 | | | $ | 11.14 | | | | | 0.13 | | | | | 0.02 | | | | | 0.15 | | | | | (0.13 | ) | | | | (0.02 | ) | | | | (0.15 | ) |
Year Ended September 30, 2014 | | | $ | 10.85 | | | | | 0.14 | | | | | 0.29 | | | | | 0.43 | | | | | (0.14 | ) | | | | — | | | | | (0.14 | ) |
Sterling Capital Virginia Intermediate Tax-Free Fund | | | | | | | | | | | | | | | | | | | | | | | | | | |
Year Ended September 30, 2018 | | | $ | 11.76 | | | | | 0.14 | | | | | (0.36 | ) | | | | (0.22 | ) | | | | (0.14 | ) | | | | — | | | | | (0.14 | ) |
Year Ended September 30, 2017 | | | $ | 12.13 | | | | | 0.14 | | | | | (0.28 | ) | | | | (0.14 | ) | | | | (0.14 | ) | | | | (0.09 | ) | | | | (0.23 | ) |
Year Ended September 30, 2016 | | | $ | 11.98 | | | | | 0.15 | | | | | 0.19 | | | | | 0.34 | | | | | (0.15 | ) | | | | (0.04 | ) | | | | (0.19 | ) |
Year Ended September 30, 2015 | | | $ | 12.06 | | | | | 0.16 | | | | | (0.01 | ) | | | | 0.15 | | | | | (0.16 | ) | | | | (0.07 | ) | | | | (0.23 | ) |
Year Ended September 30, 2014 | | | $ | 11.79 | | | | | 0.15 | | | | | 0.27 | | | | | 0.42 | | | | | (0.15 | ) | | | | — | | | | | (0.15 | ) |
Sterling Capital West Virginia Intermediate Tax-Free Fund | | | | | | | | | | | | | | | | | | | | | | | | | | |
Year Ended September 30, 2018 | | | $ | 10.05 | | | | | 0.14 | | | | | (0.32 | ) | | | | (0.18 | ) | | | | (0.14 | ) | | | | (0.01 | ) | | | | (0.15 | ) |
Year Ended September 30, 2017 | | | $ | 10.27 | | | | | 0.13 | | | | | (0.17 | ) | | | | (0.04 | ) | | | | (0.13 | ) | | | | (0.05 | ) | | | | (0.18 | ) |
Year Ended September 30, 2016 | | | $ | 10.14 | | | | | 0.13 | | | | | 0.18 | | | | | 0.31 | | | | | (0.13 | ) | | | | (0.05 | ) | | | | (0.18 | ) |
Year Ended September 30, 2015 | | | $ | 10.16 | | | | | 0.14 | | | | | 0.01 | | | | | 0.15 | | | | | (0.14 | ) | | | | (0.03 | ) | | | | (0.17 | ) |
Year Ended September 30, 2014 | | | $ | 9.91 | | | | | 0.14 | | | | | 0.25 | | | | | 0.39 | | | | | (0.14 | ) | | | | — | | | | | (0.14 | ) |
Sterling Capital Diversified Income Fund(b) | | | | | | | | | | | | | | | | | | | | | | | | | | |
Year Ended September 30, 2018 | | | $ | 10.70 | | | | | 0.27 | | | | | (0.10 | ) | | | | 0.17 | | | | | (0.33 | ) | | | | — | | | | | (0.33 | ) |
Year Ended September 30, 2017 | | | $ | 10.73 | | | | | 0.33 | | | | | (0.03 | ) | | | | 0.30 | | | | | (0.33 | ) | | | | — | | | | | (0.33 | ) |
Year Ended September 30, 2016 | | | $ | 10.13 | | | | | 0.24 | | | | | 0.66 | | | | | 0.90 | | | | | (0.30 | ) | | | | — | | | | | (0.30 | ) |
Year Ended September 30, 2015 | | | $ | 10.53 | | | | | 0.22 | | | | | (0.44 | ) | | | | (0.22 | ) | | | | (0.18 | ) | | | | — | | | | | (0.18 | ) |
Year Ended September 30, 2014 | | | $ | 9.90 | | | | | 0.14 | | | | | 0.66 | | | | | 0.80 | | | | | (0.17 | ) | | | | — | | | | | (0.17 | ) |
Sterling Capital Strategic Allocation Balanced Fund(b) | | | | | | | | | | | | | | | | | | | | | | | | | | |
Year Ended September 30, 2018 | | | $ | 11.67 | | | | | 0.15 | | | | | 0.21 | | | | | 0.36 | | | | | (0.18 | ) | | | | — | | | | | (0.18 | ) |
Year Ended September 30, 2017 | | | $ | 10.62 | | | | | 0.07 | | | | | 1.06 | | | | | 1.13 | | | | | (0.08 | ) | | | | — | | | | | (0.08 | ) |
Year Ended September 30, 2016 | | | $ | 10.13 | | | | | 0.09 | | | | | 0.53 | | | | | 0.62 | | | | | (0.13 | ) | | | | — | | | | | (0.13 | ) |
Year Ended September 30, 2015 | | | $ | 10.47 | | | | | 0.04 | | | | | (0.31 | ) | | | | (0.27 | ) | | | | (0.07 | ) | | | | — | | | | | (0.07 | ) |
Year Ended September 30, 2014 | | | $ | 9.60 | | | | | 0.09 | | | | | 0.89 | | | | | 0.98 | | | | | (0.11 | ) | | | | — | | | | | (0.11 | ) |
Sterling Capital Strategic Allocation Growth Fund(b) | | | | | | | | | | | | | | | | | | | | | | | | | | |
Year Ended September 30, 2018 | | | $ | 11.47 | | | | | 0.11 | | | | | 0.38 | | | | | 0.49 | | | | | (0.17 | ) | | | | — | | | | | (0.17 | ) |
Year Ended September 30, 2017 | | | $ | 10.18 | | | | | 0.03 | | | | | 1.32 | | | | | 1.35 | | | | | (0.06 | ) | | | | — | | | | | (0.06 | ) |
Year Ended September 30, 2016 | | | $ | 9.68 | | | | | 0.05 | | | | | 0.57 | | | | | 0.62 | | | | | (0.12 | ) | | | | — | | | | | (0.12 | ) |
Year Ended September 30, 2015 | | | $ | 10.09 | | | | | (0.01 | ) | | | | (0.35 | ) | | | | (0.36 | ) | | | | (0.05 | ) | | | | — | | | | | (0.05 | ) |
Year Ended September 30, 2014 | | | $ | 9.09 | | | | | 0.05 | | | | | 1.02 | | | | | 1.07 | | | | | (0.07 | ) | | | | — | | | | | (0.07 | ) |
| * | During the periods certain fees were waived (See Note 6 in the Notes to the Financial Statements). If such reductions had not occurred, the ratios would have been as indicated. |
| ** | Portfolio turnover rate is calculated on the basis of the Fund as a whole without distinguishing between classes of shares issued. |
| (a) | Per share net investment income (loss) has been calculated using the average daily shares method. |
| (b) | The expense ratios exclude the impact of fees/expenses paid by each underlying fund. |
See accompanying Notes to the Financial Statements.
170
| | | | | | | | | | | | | | | | | | | | | | | | | | | | | | | | | |
| | | | | Ratios/Supplementary Data |
| | | | | | |
Net Asset
Value,
End of
Year | | Total
Return
(excludes
sales charge) | | Net Assets,
End of
Year
(000) | | Ratio of
net expenses
to average
net assets | | Ratio of net
investment
income to
average net
assets | | Ratio of
expenses to
average
net assets* | | Portfolio
turnover rate** |
| | | | | | | | | | | | | | | | | | | | | | | | | | | | | | | | | | |
| | $ | 10.76 | | | | | (1.98 | )% | | | $ | 991 | | | | | 1.55 | % | | | | 1.11 | % | | | | 1.55 | % | | | | 27.71 | % |
| | $ | 11.10 | | | | | (0.74 | )% | | | $ | 1,440 | | | | | 1.56 | % | | | | 1.04 | % | | | | 1.59 | % | | | | 31.17 | % |
| | $ | 11.30 | | | | | 2.82 | % | | | $ | 1,806 | | | | | 1.56 | % | | | | 1.02 | % | | | | 1.66 | % | | | | 2.69 | % |
| | $ | 11.14 | | | | | 1.35 | % | | | $ | 1,517 | | | | | 1.61 | % | | | | 1.18 | % | | | | 1.68 | % | | | | 12.53 | % |
| | $ | 11.14 | | | | | 3.97 | % | | | $ | 1,465 | | | | | 1.67 | % | | | | 1.26 | % | | | | 1.67 | % | | | | 15.51 | % |
| | | | | | | | | | | | | | | | | | | | | | | | | | | | | | | | | | |
| | $ | 11.40 | | | | | (1.87 | )% | | | $ | 844 | | | | | 1.55 | % | | | | 1.22 | % | | | | 1.55 | % | | | | 21.08 | % |
| | $ | 11.76 | | | | | (1.14 | )% | | | $ | 935 | | | | | 1.55 | % | | | | 1.18 | % | | | | 1.59 | % | | | | 23.25 | % |
| | $ | 12.13 | | | | | 2.88 | % | | | $ | 1,170 | | | | | 1.56 | % | | | | 1.24 | % | | | | 1.66 | % | | | | 16.18 | % |
| | $ | 11.98 | | | | | 1.22 | % | | | $ | 1,245 | | | | | 1.60 | % | | | | 1.32 | % | | | | 1.67 | % | | | | 16.01 | % |
| | $ | 12.06 | | | | | 3.61 | % | | | $ | 1,490 | | | | | 1.66 | % | | | | 1.30 | % | | | | 1.66 | % | | | | 20.48 | % |
| | | | | | | | | | | | | | | | | | | | | | | | | | | | | | | | | | |
| | $ | 9.72 | | | | | (1.82 | )% | | | $ | 726 | | | | | 1.55 | % | | | | 1.39 | % | | | | 1.55 | % | | | | 17.53 | % |
| | $ | 10.05 | | | | | (0.38 | )% | | | $ | 739 | | | | | 1.56 | % | | | | 1.34 | % | | | | 1.59 | % | | | | 21.00 | % |
| | $ | 10.27 | | | | | 3.14 | % | | | $ | 817 | | | | | 1.57 | % | | | | 1.29 | % | | | | 1.67 | % | | | | 11.31 | % |
| | $ | 10.14 | | | | | 1.42 | % | | | $ | 409 | | | | | 1.61 | % | | | | 1.36 | % | | | | 1.67 | % | | | | 10.34 | % |
| | $ | 10.16 | | | | | 3.93 | % | | | $ | 457 | | | | | 1.66 | % | | | | 1.39 | % | | | | 1.66 | % | | | | 21.09 | % |
| | | | | | | | | | | | | | | | | | | | | | | | | | | | | | | | | | |
| | $ | 10.54 | | | | | 1.64 | % | | | $ | 1,051 | | | | | 1.54 | % | | | | 2.52 | % | | | | 1.55 | % | | | | 48.19 | % |
| | $ | 10.70 | | | | | 2.84 | % | | | $ | 1,155 | | | | | 1.52 | % | | | | 3.08 | % | | | | 1.52 | % | | | | 43.86 | % |
| | $ | 10.73 | | | | | 9.07 | % | | | $ | 1,157 | | | | | 1.39 | % | | | | 2.43 | % | | | | 1.47 | % | | | | 67.18 | % |
| | $ | 10.13 | | | | | (2.14 | )% | | | $ | 795 | | | | | 1.20 | % | | | | 2.04 | % | | | | 1.45 | % | | | | 126.46 | % |
| | $ | 10.53 | | | | | 8.07 | % | | | $ | 291 | | | | | 1.20 | % | | | | 1.35 | % | | | | 1.45 | % | | | | 8.67 | % |
| | | | | | | | | | | | | | | | | | | | | | | | | | | | | | | | | | |
| | $ | 11.85 | | | | | 3.09 | % | | | $ | 576 | | | | | 1.16 | % | | | | 1.23 | % | | | | 1.41 | % | | | | 14.41 | % |
| | $ | 11.67 | | | | | 10.68 | % | | | $ | 785 | | | | | 1.17 | % | | | | 0.62 | % | | | | 1.42 | % | | | | 0.80 | % |
| | $ | 10.62 | | | | | 6.18 | % | | | $ | 741 | | | | | 1.15 | % | | | | 0.89 | % | | | | 1.40 | % | | | | 5.19 | % |
| | $ | 10.13 | | | | | (2.60 | )% | | | $ | 751 | | | | | 1.15 | % | | | | 0.42 | % | | | | 1.40 | % | | | | 49.24 | % |
| | $ | 10.47 | | | | | 10.24 | % | | | $ | 757 | | | | | 1.14 | % | | | | 0.88 | % | | | | 1.40 | % | | | | 5.70 | % |
| | | | | | | | | | | | | | | | | | | | | | | | | | | | | | | | | | |
| | $ | 11.79 | | | | | 4.27 | % | | | $ | 427 | | | | | 1.19 | % | | | | 0.95 | % | | | | 1.44 | % | | | | 17.81 | % |
| | $ | 11.47 | | | | | 13.36 | % | | | $ | 407 | | | | | 1.19 | % | | | | 0.31 | % | | | | 1.44 | % | | | | 1.92 | % |
| | $ | 10.18 | | | | | 6.46 | % | | | $ | 436 | | | | | 1.18 | % | | | | 0.56 | % | | | | 1.43 | % | | | | 5.95 | % |
| | $ | 9.68 | | | | | (3.62 | )% | | | $ | 491 | | | | | 1.17 | % | | | | (0.06 | )% | | | | 1.42 | % | | | | 58.40 | % |
| | $ | 10.09 | | | | | 11.75 | % | | | $ | 506 | | | | | 1.16 | % | | | | 0.48 | % | | | | 1.41 | % | | | | 8.60 | % |
171
|
Sterling Capital Funds |
Financial Highlights, Institutional Shares |
|
The financial highlights table is intended to help you understand the Funds’ financial performance for the past 5 years or, if shorter, the period of the Funds’ operations. Certain information reflects financial results for a single Fund share. The total returns in the table represent the rate that an investor would have earned (or lost) on an investment in the Fund (assuming reinvestment of all dividends and distributions).
| | | | | | | | | | | | | | | | | | | | | | | | | | | | | | | | | | | |
| | | | | Investment Activities | | Distributions |
| | | | | | | |
| | | Net Asset
Value,
Beginning
of Year | | Net
investment
income
(loss)(a) | | Net realized/
unrealized
gains (losses)
on investments | | Total from
Investment
Activities | | Net
investment
income | | Net realized
gains on
investments | | Total
Distributions |
Sterling Capital Behavioral Large Cap Value Equity Fund | | | | | | | | | | | | | | | | | | | | | | | | | | |
Year Ended September 30, 2018 | | | $ | 20.82 | | | | | 0.33 | | | | | 1.97 | | | | | 2.30 | | | | | (0.50 | ) | | | | (0.19 | ) | | | | (0.69 | ) |
Year Ended September 30, 2017 | | | $ | 17.78 | | | | | 0.41 | | | | | 2.98 | | | | | 3.39 | | | | | (0.35 | ) | | | | — | | | | | (0.35 | ) |
Year Ended September 30, 2016 | | | $ | 16.62 | | | | | 0.32 | | | | | 1.16 | | | | | 1.48 | | | | | (0.32 | ) | | | | — | | | | | (0.32 | ) |
Year Ended September 30, 2015 | | | $ | 17.33 | | | | | 0.27 | | | | | (0.70 | ) | | | | (0.43 | ) | | | | (0.28 | ) | | | | — | | | | | (0.28 | ) |
Year Ended September 30, 2014 | | | $ | 14.23 | | | | | 0.22 | | | | | 3.08 | | | | | 3.30 | | | | | (0.20 | ) | | | | — | | | | | (0.20 | ) |
Sterling Capital Mid Value Fund | | | | | | | | | | | | | | | | | | | | | | | | | | |
Year Ended September 30, 2018 | | | $ | 19.00 | | | | | 0.01 | | | | | 1.26 | | | | | 1.27 | | | | | (0.01 | ) | | | | (0.84 | ) | | | | (0.85 | ) |
Year Ended September 30, 2017 | | | $ | 16.92 | | | | | 0.03 | | | | | 2.59 | | | | | 2.62 | | | | | (0.01 | ) | | | | (0.53 | ) | | | | (0.54 | ) |
Year Ended September 30, 2016 | | | $ | 18.14 | | | | | 0.07 | | | | | 2.07 | | | | | 2.14 | | | | | (0.02 | ) | | | | (3.34 | ) | | | | (3.36 | ) |
Year Ended September 30, 2015 | | | $ | 19.50 | | | | | 0.11 | | | | | (0.14 | ) | | | | (0.03 | ) | | | | (0.16 | ) | | | | (1.17 | ) | | | | (1.33 | ) |
Year Ended September 30, 2014 | | | $ | 18.91 | | | | | 0.10 | | | | | 1.77 | | | | | 1.87 | | | | | (0.08 | ) | | | | (1.20 | ) | | | | (1.28 | ) |
Sterling Capital Behavioral Small Cap Value Equity Fund | | | | | | | | | | | | | | | | | | | | | | | | | | |
Year Ended September 30, 2018 | | | $ | 18.55 | | | | | 0.19 | | | | | 0.89 | | | | | 1.08 | | | | | (0.16 | ) | | | | (0.65 | ) | | | | (0.81 | ) |
Year Ended September 30, 2017 | | | $ | 15.30 | | | | | 0.17 | | | | | 3.18 | | | | | 3.35 | | | | | (0.10 | ) | | | | — | | | | | (0.10 | ) |
Year Ended September 30, 2016 | | | $ | 14.14 | | | | | 0.22 | | | | | 1.16 | | | | | 1.38 | | | | | (0.21 | ) | | | | (0.01 | ) | | | | (0.22 | ) |
Year Ended September 30, 2015 | | | $ | 14.47 | | | | | 0.22 | | | | | 0.15 | | | | | 0.37 | | | | | (0.26 | ) | | | | (0.44 | ) | | | | (0.70 | ) |
Year Ended September 30, 2014 | | | $ | 15.34 | | | | | 0.15 | | | | | 0.94 | | | | | 1.09 | | | | | (0.09 | ) | | | | (1.87 | ) | | | | (1.96 | ) |
Sterling Capital Special Opportunities Fund | | | | | | | | | | | | | | | | | | | | | | | | | | |
Year Ended September 30, 2018 | | | $ | 25.65 | | | | | 0.09 | | | | | 4.11 | | | | | 4.20 | | | | | (0.18 | ) | | | | (1.94 | ) | | | | (2.12 | ) |
Year Ended September 30, 2017 | | | $ | 22.48 | | | | | 0.08 | | | | | 3.51 | | | | | 3.59 | | | | | (0.01 | ) | | | | (0.41 | ) | | | | (0.42 | ) |
Year Ended September 30, 2016 | | | $ | 23.78 | | | | | 0.06 | | | | | 1.95 | | | | | 2.01 | | | | | — | | | | | (3.31 | ) | | | | (3.31 | ) |
Year Ended September 30, 2015 | | | $ | 24.06 | | | | | — | (b) | | | | 0.92 | | | | | 0.92 | | | | | — | | | | | (1.20 | ) | | | | (1.20 | ) |
Year Ended September 30, 2014 | | | $ | 21.96 | | | | | 0.03 | | | | | 4.39 | | | | | 4.42 | | | | | (0.04 | ) | | | | (2.28 | ) | | | | (2.32 | ) |
Sterling Capital Equity Income Fund | | | | | | | | | | | | | | | | | | | | | | | | | | |
Year Ended September 30, 2018 | | | $ | 20.89 | | | | | 0.40 | | | | | 2.66 | | | | | 3.06 | | | | | (0.39 | ) | | | | (1.95 | ) | | | | (2.34 | ) |
Year Ended September 30, 2017 | | | $ | 18.34 | | | | | 0.39 | | | | | 2.60 | | | | | 2.99 | | | | | (0.42 | ) | | | | (0.02 | ) | | | | (0.44 | ) |
Year Ended September 30, 2016 | | | $ | 17.39 | | | | | 0.35 | | | | | 2.06 | | | | | 2.41 | | | | | (0.36 | ) | | | | (1.10 | ) | | | | (1.46 | ) |
Year Ended September 30, 2015 | | | $ | 18.98 | | | | | 0.36 | | | | | (1.07 | ) | | | | (0.71 | ) | | | | (0.37 | ) | | | | (0.51 | ) | | | | (0.88 | ) |
Year Ended September 30, 2014 | | | $ | 18.18 | | | | | 0.38 | | | | | 1.41 | | | | | 1.79 | | | | | (0.36 | ) | | | | (0.63 | ) | | | | (0.99 | ) |
| * | During the periods certain fees were waived (See Note 6 in the Notes to the Financial Statements). If such reductions had not occurred, the ratios would have been as indicated. |
| ** | Portfolio turnover rate is calculated on the basis of the Fund as a whole without distinguishing between classes of shares issued. |
| (a) | Per share net investment income (loss) has been calculated using the average daily shares method. |
| (b) | Amount is less than $0.005. |
See accompanying Notes to the Financial Statements.
172
| | | | | | | | | | | | | | | | | | | | | | | | | | | | | | | | | |
| | | | | Ratios/Supplementary Data |
Net Asset
Value,
End of
Year | | Total
Return | | Net Assets,
End of
Year
(000) | | Ratio of
net expenses
to average
net assets | | Ratio of net
investment
income
(loss) to
average net
assets | | Ratio of
expenses to
average
net assets* | | Portfolio
turnover rate** |
| | | | | | | | | | | | | | | | | | | | | | | | | | | | | | | | | | |
| | $ | 22.43 | | | | | 11.19 | % | | | $ | 8,862 | | | | | 0.63 | % | | | | 1.51 | % | | | | 0.63 | % | | | | 127.89 | % |
| | $ | 20.82 | | | | | 19.18 | % | | | $ | 272,504 | | | | | 0.64 | % | | | | 2.12 | % | | | | 0.64 | % | | | | 144.85 | % |
| | $ | 17.78 | | | | | 8.94 | % | | | $ | 240,971 | | | | | 0.76 | % | | | | 1.83 | % | | | | 0.90 | % | | | | 145.53 | % |
| | $ | 16.62 | | | | | (2.55 | )% | | | $ | 221,481 | | | | | 0.81 | % | | | | 1.50 | % | | | | 0.91 | % | | | | 135.05 | % |
| | $ | 17.33 | | | | | 23.29 | % | | | $ | 234,809 | | | | | 0.81 | % | | | | 1.34 | % | | | | 0.91 | % | | | | 113.75 | % |
| | | | | | | | | | | | | | | | | | | | | | | | | | | | | | | | | | |
| | $ | 19.42 | | | | | 6.82 | % | | | $ | 323,012 | | | | | 0.92 | % | | | | 0.08 | % | | | | 0.92 | % | | | | 34.62 | % |
| | $ | 19.00 | | | | | 15.73 | % | | | $ | 632,867 | | | | | 0.90 | % | | | | 0.15 | % | | | | 0.90 | % | | | | 24.83 | % |
| | $ | 16.92 | | | | | 13.32 | % | | | $ | 550,697 | | | | | 0.93 | % | | | | 0.41 | % | | | | 0.93 | % | | | | 25.45 | % |
| | $ | 18.14 | | | | | (0.43 | )% | | | $ | 588,537 | | | | | 0.94 | % | | | | 0.55 | % | | | | 0.94 | % | | | | 30.61 | % |
| | $ | 19.50 | | | | | 10.17 | % | | | $ | 696,468 | | | | | 0.93 | % | | | | 0.53 | % | | | | 0.93 | % | | | | 27.30 | % |
| | | | | | | | | | | | | | | | | | | | | | | | | | | | | | | | | | |
| | $ | 18.82 | | | | | 5.96 | % | | | $ | 39,047 | | | | | 0.78 | % | | | | 1.04 | % | | | | 0.78 | % | | | | 89.85 | % |
| | $ | 18.55 | | | | | 21.89 | % | | | $ | 208,404 | | | | | 0.80 | % | | | | 0.99 | % | | | | 0.85 | % | | | | 109.05 | % |
| | $ | 15.30 | | | | | 9.80 | % | | | $ | 157,413 | | | | | 0.88 | % | | | | 1.54 | % | | | | 0.98 | % | | | | 120.42 | % |
| | $ | 14.14 | | | | | 2.42 | % | | | $ | 111,757 | | | | | 1.00 | % | | | | 1.44 | % | | | | 1.00 | % | | | | 101.99 | % |
| | $ | 14.47 | | | | | 7.40 | % | | | $ | 121,011 | | | | | 0.99 | % | | | | 0.99 | % | | | | 0.99 | % | | | | 68.50 | % |
| | | | | | | | | | | | | | | | | | | | | | | | | | | | | | | | | | |
| | $ | 27.73 | | | | | 17.46 | % | | | $ | 350,030 | | | | | 0.86 | % | | | | 0.35 | % | | | | 0.86 | % | | | | 22.78 | % |
| | $ | 25.65 | | | | | 16.22 | % | | | $ | 652,211 | | | | | 0.87 | % | | | | 0.32 | % | | | | 0.87 | % | | | | 18.92 | % |
| | $ | 22.48 | | | | | 8.86 | % | | | $ | 587,320 | | | | | 0.92 | % | | | | 0.27 | % | | | | 0.97 | % | | | | 27.32 | % |
| | $ | 23.78 | | | | | 4.02 | % | | | $ | 491,982 | | | | | 0.97 | % | | | | 0.01 | % | | | | 0.97 | % | | | | 26.98 | % |
| | $ | 24.06 | | | | | 22.00 | % | | | $ | 574,783 | | | | | 0.96 | % | | | | 0.14 | % | | | | 0.96 | % | | | | 32.35 | % |
| | | | | | | | | | | | | | | | | | | | | | | | | | | | | | | | | | |
| | $ | 21.61 | | | | | 15.58 | % | | | $ | 828,607 | | | | | 0.77 | % | | | | 1.91 | % | | | | 0.77 | % | | | | 19.49 | % |
| | $ | 20.89 | | | | | 16.51 | % | | | $ | 980,982 | | | | | 0.78 | % | | | | 2.04 | % | | | | 0.78 | % | | | | 16.93 | % |
| | $ | 18.34 | | | | | 14.75 | % | | | $ | 943,101 | | | | | 0.96 | % | | | | 2.04 | % | | | | 0.96 | % | | | | 20.64 | % |
| | $ | 17.39 | | | | | (3.90 | )% | | | $ | 807,729 | | | | | 0.97 | % | | | | 1.91 | % | | | | 0.97 | % | | | | 27.53 | % |
| | $ | 18.98 | | | | | 10.01 | % | | | $ | 1,038,013 | | | | | 0.95 | % | | | | 2.03 | % | | | | 0.95 | % | | | | 16.13 | % |
173
|
Sterling Capital Funds |
Financial Highlights, Institutional Shares |
|
The financial highlights table is intended to help you understand the Funds’ financial performance for the past 5 years or, if shorter, the period of the Funds’ operations. Certain information reflects financial results for a single Fund share. The total returns in the table represent the rate that an investor would have earned (or lost) on an investment in the Fund (assuming reinvestment of all dividends and distributions).
| | | | | | | | | | | | | | | | | | | | | | | | | | | | | | | | | | | | | | | | |
| | | | | Investment Activities | | Distributions | | |
| | | | | | | | |
| | | Net Asset
Value,
Beginning
of Period | | Net
investment
income
(loss)(a) | | Net realized/
unrealized
gains (losses)
on investments | | Total from
Investment
Activities | | Net
investment
income | | Net realized
gains on
investments | | Total
Distributions | | Redemption
Fees |
Sterling Capital Behavioral International Equity Fund | | | | | | | | | | | | | | | | | | | | | | | | | | |
Year Ended September 30, 2018 | | | $ | 11.76 | | | | | 0.28 | | | | | (0.40 | ) | | | | (0.12 | ) | | | | (0.35 | ) | | | | (0.11 | ) | | | | (0.46 | ) | | | | — | |
Year Ended September 30, 2017 | | | $ | 9.69 | | | | | 0.27 | | | | | 1.97 | | | | | 2.24 | | | | | (0.17 | ) | | | | — | | | | | (0.17 | ) | | | | — | |
Year Ended September 30, 2016 | | | $ | 9.24 | | | | | 0.23 | | | | | 0.44 | | | | | 0.67 | | | | | (0.22 | ) | | | | — | | | | | (0.22 | ) | | | | — | |
November 30, 2014 to September 30, 2015(d) | | | $ | 10.00 | | | | | 0.24 | | | | | (0.97 | ) | | | | (0.73 | ) | | | | (0.03 | ) | | | | — | | | | | (0.03 | ) | | | | — | |
Sterling Capital SMID Opportunities Fund | | | | | | | | | | | | | | | | | | | | | | | | | | |
Year Ended September 30, 2018 | | | $ | 11.77 | | | | | (0.02 | ) | | | | 0.99 | | | | | 0.97 | | | | | (0.08 | ) | | | | (0.18 | ) | | | | (0.26 | ) | | | | — | |
October 3, 2016 to September 30, 2017(d) | | | $ | 10.00 | | | | | 0.02 | | | | | 1.76 | | | | | 1.78 | | | | | (0.01 | ) | | | | — | | | | | (0.01 | ) | | | | — | |
Sterling Capital Stratton Mid Cap Value Fund(e) | | | | | | | | | | | | | | | | | | | | | | | | | | |
Year Ended September 30, 2018 | | | $ | 66.47 | | | | | 0.27 | | | | | 4.87 | | | | | 5.14 | | | | | (0.30 | ) | | | | (2.29 | ) | | | | (2.59 | ) | | | | — | |
Year Ended September 30, 2017 | | | $ | 55.97 | | | | | 0.19 | | | | | 10.66 | | | | | 10.85 | | | | | (0.08 | ) | | | | (0.27 | ) | | | | (0.35 | ) | | | | — | |
Period Ended September 30, 2016 | | | $ | 52.55 | | | | | 0.07 | | | | | 3.35 | | | | | 3.42 | | | | | — | | | | | — | | | | | — | | | | | — | |
Year Ended December 31, 2015 | | | $ | 55.50 | | | | | 0.15 | | | | | (1.17 | ) | | | | (1.02 | ) | | | | (0.15 | ) | | | | (1.78 | ) | | | | (1.93 | ) | | | | — | (f) |
Year Ended December 31, 2014 | | | $ | 51.63 | | | | | 0.02 | | | | | 3.85 | | | | | 3.87 | | | | | (0.02 | ) | | | | — | | | | | (0.02 | ) | | | | 0.02 | |
Sterling Capital Stratton Real Estate Fund | | | | | | | | | | | | | | | | | | | | | | | | | | |
Year Ended September 30, 2018 | | | $ | 37.10 | | | | | 0.81 | | | | | 1.52 | | | | | 2.33 | | | | | (0.58 | ) | | | | (1.22 | ) | | | | (1.80 | ) | | | | — | |
Year Ended September 30, 2017 | | | $ | 39.74 | | | | | 0.83 | | | | | (0.53 | ) | | | | 0.30 | | | | | (1.19 | ) | | | | (1.75 | ) | | | | (2.94 | ) | | | | — | |
Period Ended September 30, 2016 | | | $ | 36.01 | | | | | 0.61 | | | | | 3.62 | | | | | 4.23 | | | | | (0.50 | ) | | | | — | | | | | (0.50 | ) | | | | — | |
Year Ended December 31, 2015 | | | $ | 36.44 | | | | | 0.66 | | | | | (0.04 | ) | | | | 0.62 | | | | | (0.59 | ) | | | | (0.47 | ) | | | | (1.06 | ) | | | | 0.01 | |
Year Ended December 31, 2014 | | | $ | 29.86 | | | | | 0.62 | | | | | 8.47 | | | | | 9.09 | | | | | (0.62 | ) | | | | (1.89 | ) | | | | (2.51 | ) | | | | — | (f) |
Sterling Capital Stratton Small Cap Value Fund(e) | | | | | | | | | | | | | | | | | | | | | | | | | | |
Year Ended September 30, 2018 | | | $ | 90.19 | | | | | 0.26 | | | | | 6.60 | | | | | 6.86 | | | | | (0.25 | ) | | | | (7.69 | ) | | | | (7.94 | ) | | | | — | |
Year Ended September 30, 2017 | | | $ | 78.46 | | | | | 0.16 | | | | | 15.81 | | | | | 15.97 | | | | | (0.14 | ) | | | | (4.10 | ) | | | | (4.24 | ) | | | | — | (f) |
Period Ended September 30, 2016 | | | $ | 69.89 | | | | | 0.10 | | | | | 8.47 | | | | | 8.57 | | | | | — | | | | | — | | | | | — | | | | | — | (f) |
Year Ended December 31, 2015 | | | $ | 74.05 | | | | | 0.07 | | | | | (3.15 | ) | | | | (3.08 | ) | | | | (0.08 | ) | | | | (1.00 | ) | | | | (1.08 | ) | | | | — | (f) |
Year Ended December 31, 2014 | | | $ | 73.31 | | | | | 0.02 | | | | | 2.21 | | | | | 2.23 | | | | | (0.02 | ) | | | | (1.48 | ) | | | | (1.50 | ) | | | | 0.01 | |
Sterling Capital Ultra Short Bond Fund | | | | | | | | | | | | | | | | | | | | | | | | | | |
Year Ended September 30, 2018 | | | $ | 9.79 | | | | | 0.16 | | | | | (0.02 | ) | | | | 0.14 | | | | | (0.18 | ) | | | | — | | | | | (0.18 | ) | | | | — | |
Year Ended September 30, 2017 | | | $ | 9.81 | | | | | 0.09 | | | | | 0.04 | | | | | 0.13 | | | | | (0.15 | ) | | | | — | | | | | (0.15 | ) | | | | — | |
Year Ended September 30, 2016 | | | $ | 9.86 | | | | | 0.09 | | | | | 0.03 | | | | | 0.12 | | | | | (0.17 | ) | | | | — | | | | | (0.17 | ) | | | | — | |
Year Ended September 30, 2015 | | | $ | 9.94 | | | | | 0.07 | | | | | (0.03 | ) | | | | 0.04 | | | | | (0.12 | ) | | | | — | | | | | (0.12 | ) | | | | — | |
Year Ended September 30, 2014 | | | $ | 9.98 | | | | | 0.08 | | | | | (0.03 | ) | | | | 0.05 | | | | | (0.09 | ) | | | | — | | | | | (0.09 | ) | | | | — | |
| * | During the periods certain fees were waived (See Note 6 in the Notes to the Financial Statements). If such reductions had not occurred, the ratios would have been as indicated. |
| ** | Portfolio turnover rate is calculated on the basis of the Fund as a whole without distinguishing between classes of shares issued. |
| (a) | Per share net investment income (loss) has been calculated using the average daily shares method. |
| (b) | Not annualized for periods less than one year. |
| (c) | Annualized for periods less than one year. |
| (d) | Period from commencement of operations. |
| (e) | Each of the Stratton Mid Cap Value Fund, the Stratton Real Estate Fund, and the Stratton Small Cap Value Fund (collectively, the “Predecessor Funds”) transferred its assets and liabilities to, Sterling Capital Stratton Mid Cap Value Fund, Sterling Capital Stratton Real Estate Fund and Sterling Capital Stratton Small Cap Value Fund, respectively (collectively, the “Fund Mergers”) at the close of business on November 13, 2015. Because the Funds had no investment operations prior to the closing of the Fund Mergers, and based on the similarity of the Funds to the Predecessor Funds, each Predecessor Fund is treated as the survivor of the relevant Fund Merger for accounting and performance reporting purposes. |
| (f) | Amount is less than $0.005. |
See accompanying Notes to the Financial Statements.
174
| | | | | | | | | | | | | | | | | | | | | | | | | | | | | | | | | |
| | | | | Ratios/Supplementary Data |
Net Asset
Value,
End of
Period | | Total
Return (b) | | Net Assets,
End of
Period
(000) | | Ratio of
net expenses
to average
net assets (c) | | Ratio of net
investment
income
(loss) to
average net
assets (c) | | Ratio of
expenses to
average
net assets*(c) | | Portfolio
turnover rate**(b) |
| | | | | | | | | | | | | | | | | | | | | | | | | | | | | | | | | | |
| | $ | 11.18 | | | | | (1.25 | )% | | | $ | 19,266 | | | | | 0.65 | % | | | | 2.33 | % | | | | 0.85 | % | | | | 96.65 | % |
| | $ | 11.76 | | | | | 23.46 | % | | | $ | 81,876 | | | | | 0.68 | % | | | | 2.59 | % | | | | 0.95 | % | | | | 91.65 | % |
| | $ | 9.69 | | | | | 7.30 | % | | | $ | 69,954 | | | | | 0.80 | % | | | | 2.48 | % | | | | 1.16 | % | | | | 125.35 | % |
| | $ | 9.24 | | | | | (7.36 | )% | | | $ | 18,592 | | | | | 1.03 | % | | | | 2.82 | % | | | | 1.18 | % | | | | 133.50 | % |
| | | | | | | | | | | | | | | | | | | | | | | | | | | | | | | | | | |
| | $ | 12.48 | | | | | 8.39 | % | | | $ | 4,886 | | | | | 0.79 | % | | | | (0.13 | )% | | | | 1.04 | % | | | | 45.64 | % |
| | $ | 11.77 | | | | | 17.84 | % | | | $ | 4,460 | | | | | 0.79 | % | | | | 0.19 | % | | | | 1.35 | % | | | | 37.97 | % |
| | | | | | | | | | | | | | | | | | | | | | | | | | | | | | | | | | |
| | $ | 69.02 | | | | | 7.81 | % | | | $ | 66,554 | | | | | 0.95 | % | | | | 0.40 | % | | | | 0.95 | % | | | | 14.47 | % |
| | $ | 66.47 | | | | | 19.47 | % | | | $ | 66,030 | | | | | 0.91 | % | | | | 0.32 | % | | | | 0.92 | % | | | | 12.19 | % |
| | $ | 55.97 | | | | | 6.51 | % | | | $ | 63,513 | | | | | 0.95 | % | | | | 0.18 | % | | | | 0.97 | % | | | | 11.16 | % |
| | $ | 52.55 | | | | | (1.75 | )% | | | $ | 64,364 | | | | | 1.04 | % | | | | 0.26 | % | | | | 1.04 | % | | | | 19.28 | % |
| | $ | 55.50 | | | | | 7.54 | % | | | $ | 74,637 | | | | | 1.05 | % | | | | 0.03 | % | | | | 1.05 | % | | | | 55.45 | % |
| | | | | | | | | | | | | | | | | | | | | | | | | | | | | | | | | | |
| | $ | 37.63 | | | | | 6.42 | % | | | $ | 91,626 | | | | | 0.82 | % | | | | 2.21 | % | | | | 0.82 | % | | | | 8.34 | % |
| | $ | 37.10 | | | | | 1.16 | % | | | $ | 96,199 | | | | | 0.79 | % | | | | 2.23 | % | | | | 0.81 | % | | | | 13.52 | % |
| | $ | 39.74 | | | | | 11.73 | % | | | $ | 104,688 | | | | | 0.83 | % | | | | 2.13 | % | | | | 0.85 | % | | | | 18.43 | % |
| | $ | 36.01 | | | | | 1.85 | % | | | $ | 96,198 | | | | | 0.89 | % | | | | 1.82 | % | | | | 0.89 | % | | | | 15.47 | % |
| | $ | 36.44 | | | | | 30.69 | % | | | $ | 93,984 | | | | | 0.96 | % | | | | 1.81 | % | | | | 0.96 | % | | | | 14.20 | % |
| | | | | | | | | | | | | | | | | | | | | | | | | | | | | | | | | | |
| | $ | 89.11 | | | | | 7.98 | % | | | $ | 1,296,897 | | | | | 1.03 | % | | | | 0.29 | % | | | | 1.06 | % | | | | 15.51 | % |
| | $ | 90.19 | | | | | 20.73 | % | | | $ | 1,183,974 | | | | | 1.06 | % | | | | 0.19 | % | | | | 1.06 | % | | | | 7.04 | % |
| | $ | 78.46 | | | | | 12.26 | % | | | $ | 1,213,344 | | | | | 1.08 | % | | | | 0.20 | % | | | | 1.08 | % | | | | 3.42 | % |
| | $ | 69.89 | | | | | (4.14 | )% | | | $ | 1,156,577 | | | | | 1.11 | % | | | | 0.10 | % | | | | 1.11 | % | | | | 6.33 | % |
| | $ | 74.05 | | | | | 3.09 | % | | | $ | 1,413,694 | | | | | 1.11 | % | | | | 0.03 | % | | | | 1.11 | % | | | | 11.15 | % |
| | | | | | | | | | | | | | | | | | | | | | | | | | | | | | | | | | |
| | $ | 9.75 | | | | | 1.46 | % | | | $ | 21,926 | | | | | 0.41 | % | | | | 1.65 | % | | | | 0.51 | % | | | | 74.56 | % |
| | $ | 9.79 | | | | | 1.36 | % | | | $ | 33,879 | | | | | 0.43 | % | | | | 0.95 | % | | | | 0.53 | % | | | | 59.57 | % |
| | $ | 9.81 | | | | | 1.24 | % | | | $ | 54,183 | | | | | 0.45 | % | | | | 0.90 | % | | | | 0.54 | % | | | | 43.02 | % |
| | $ | 9.86 | | | | | 0.40 | % | | | $ | 35,384 | | | | | 0.53 | % | | | | 0.66 | % | | | | 0.55 | % | | | | 66.19 | % |
| | $ | 9.94 | | | | | 0.46 | % | | | $ | 47,197 | | | | | 0.48 | % | | | | 0.76 | % | | | | 0.48 | % | | | | 79.98 | % |
175
|
Sterling Capital Funds |
Financial Highlights, Institutional Shares |
|
The financial highlights table is intended to help you understand the Funds’ financial performance for the past 5 years or, if shorter, the period of the Funds’ operations. Certain information reflects financial results for a single Fund share. The total returns in the table represent the rate that an investor would have earned (or lost) on an investment in the Fund (assuming reinvestment of all dividends and distributions).
| | | | | | | | | | | | | | | | | | | | | | | | | | | | | | | | | | | | | | | | |
| | | | | Investment Activities | | Distributions |
| | | | | | | | |
| | | Net Asset
Value,
Beginning
of Year | | Net
investment
income(a) | | Net realized/
unrealized
gains (losses)
on investments | | Total from
Investment
Activities | | Net
investment
income | | Net realized
gains on
investments | | Return
of
capital | | Total
Distributions |
Sterling Capital Short Duration Bond Fund | | | | | | | | | | | | | | | | | | | | | | | | | | |
Year Ended September 30, 2018 | | | $ | 8.69 | | | | | 0.19 | | | | | (0.12 | ) | | | | 0.07 | | | | | (0.24 | ) | | | | — | | | | | — | | | | | (0.24 | ) |
Year Ended September 30, 2017 | | | $ | 8.81 | | | | | 0.12 | | | | | (0.01 | ) | | | | 0.11 | | | | | (0.23 | ) | | | | — | | | | | — | | | | | (0.23 | ) |
Year Ended September 30, 2016 | | | $ | 8.86 | | | | | 0.12 | | | | | 0.07 | | | | | 0.19 | | | | | (0.24 | ) | | | | — | | | | | — | | | | | (0.24 | ) |
Year Ended September 30, 2015 | | | $ | 9.07 | | | | | 0.13 | | | | | (0.06 | ) | | | | 0.07 | | | | | (0.28 | ) | | | | — | | | | | — | | | | | (0.28 | ) |
Year Ended September 30, 2014 | | | $ | 9.24 | | | | | 0.16 | | | | | (0.03 | ) | | | | 0.13 | | | | | (0.30 | ) | | | | — | | | | | — | | | | | (0.30 | ) |
Sterling Capital Intermediate U.S. Government Fund | | | | | | | | | | | | | | | | | | | | | | | | | | |
Year Ended September 30, 2018 | | | $ | 9.92 | | | | | 0.19 | | | | | (0.34 | ) | | | | (0.15 | ) | | | | (0.28 | ) | | | | — | | | | | — | | | | | (0.28 | ) |
Year Ended September 30, 2017 | | | $ | 10.25 | | | | | 0.18 | | | | | (0.28 | ) | | | | (0.10 | ) | | | | (0.23 | ) | | | | — | | | | | — | | | | | (0.23 | ) |
Year Ended September 30, 2016 | | | $ | 10.19 | | | | | 0.15 | | | | | 0.12 | | | | | 0.27 | | | | | (0.21 | ) | | | | — | | | | | — | | | | | (0.21 | ) |
Year Ended September 30, 2015 | | | $ | 10.21 | | | | | 0.16 | | | | | 0.04 | | | | | 0.20 | | | | | (0.22 | ) | | | | — | | | | | — | | | | | (0.22 | ) |
Year Ended September 30, 2014 | | | $ | 10.30 | | | | | 0.17 | | | | | 0.09 | | | | | 0.26 | | | | | (0.35 | ) | | | | — | | | | | — | | | | | (0.35 | ) |
Sterling Capital Total Return Bond Fund | | | | | | | | | | | | | | | | | | | | | | | | | | |
Year Ended September 30, 2018 | | | $ | 10.60 | | | | | 0.29 | | | | | (0.37 | ) | | | | (0.08 | ) | | | | (0.32 | ) | | | | — | | | | | — | | | | | (0.32 | ) |
Year Ended September 30, 2017 | | | $ | 10.82 | | | | | 0.25 | | | | | (0.15 | ) | | | | 0.10 | | | | | (0.32 | ) | | | | — | | | | | — | | | | | (0.32 | ) |
Year Ended September 30, 2016 | | | $ | 10.54 | | | | | 0.28 | | | | | 0.35 | | | | | 0.63 | | | | | (0.35 | ) | | | | — | | | | | — | | | | | (0.35 | ) |
Year Ended September 30, 2015 | | | $ | 10.67 | | | | | 0.31 | | | | | (0.07 | ) | | | | 0.24 | | | | | (0.37 | ) | | | | — | | | | | — | | | | | (0.37 | ) |
Year Ended September 30, 2014 | | | $ | 10.53 | | | | | 0.34 | | | | | 0.21 | | | | | 0.55 | | | | | (0.40 | ) | | | | (0.01 | ) | | | | — | | | | | (0.41 | ) |
Sterling Capital Corporate Fund | | | | | | | | | | | | | | | | | | | | | | | | | | |
Year Ended September 30, 2018 | | | $ | 10.24 | | | | | 0.32 | | | | | (0.36 | ) | | | | (0.04 | ) | | | | (0.32 | ) | | | | (0.07 | ) | | | | — | | | | | (0.39 | ) |
Year Ended September 30, 2017 | | | $ | 10.36 | | | | | 0.32 | | | | | (0.09 | ) | | | | 0.23 | | | | | (0.31 | ) | | | | (0.04 | ) | | | | — | | | | | (0.35 | ) |
Year Ended September 30, 2016 | | | $ | 10.10 | | | | | 0.31 | | | | | 0.26 | | | | | 0.57 | | | | | (0.31 | ) | | | | — | | | | | — | | | | | (0.31 | ) |
Year Ended September 30, 2015 | | | $ | 10.25 | | | | | 0.32 | | | | | (0.14 | ) | | | | 0.18 | | | | | (0.31 | ) | | | | (0.01 | ) | | | | (0.01 | ) | | | | (0.33 | ) |
Year Ended September 30, 2014 | | | $ | 10.15 | | | | | 0.34 | | | | | 0.20 | | | | | 0.54 | | | | | (0.34 | ) | | | | (0.10 | ) | | | | — | | | | | (0.44 | ) |
Sterling Capital Securitized Opportunities Fund | | | | | | | | | | | | | | | | | | | | | | | | | | |
Year Ended September 30, 2018 | | | $ | 9.95 | | | | | 0.29 | | | | | (0.32 | ) | | | | (0.03 | ) | | | | (0.30 | ) | | | | — | | | | | — | | | | | (0.30 | ) |
Year Ended September 30, 2017 | | | $ | 10.10 | | | | | 0.23 | | | | | (0.11 | ) | | | | 0.12 | | | | | (0.27 | ) | | | | — | | | | | — | | | | | (0.27 | ) |
Year Ended September 30, 2016 | | | $ | 9.98 | | | | | 0.22 | | | | | 0.16 | | | | | 0.38 | | | | | (0.26 | ) | | | | — | | | | | — | | | | | (0.26 | ) |
Year Ended September 30, 2015 | | | $ | 9.91 | | | | | 0.23 | | | | | 0.12 | | | | | 0.35 | | | | | (0.28 | ) | | | | — | | | | | — | | | | | (0.28 | ) |
Year Ended September 30, 2014 | | | $ | 9.85 | | | | | 0.25 | | | | | 0.11 | | | | | 0.36 | | | | | (0.30 | ) | | | | — | | | | | — | | | | | (0.30 | ) |
Sterling Capital Kentucky Intermediate Tax-Free Fund | | | | | | | | | | | | | | | | | | | | | | | | | | |
Year Ended September 30, 2018 | | | $ | 10.26 | | | | | 0.22 | | | | | (0.34 | ) | | | | (0.12 | ) | | | | (0.22 | ) | | | | (0.03 | ) | | | | — | | | | | (0.25 | ) |
Year Ended September 30, 2017 | | | $ | 10.63 | | | | | 0.23 | | | | | (0.23 | ) | | | | — | | | | | (0.23 | ) | | | | (0.14 | ) | | | | — | | | | | (0.37 | ) |
Year Ended September 30, 2016 | | | $ | 10.61 | | | | | 0.27 | | | | | 0.14 | | | | | 0.41 | | | | | (0.26 | ) | | | | (0.13 | ) | | | | — | | | | | (0.39 | ) |
Year Ended September 30, 2015 | | | $ | 10.84 | | | | | 0.28 | | | | | (0.05 | ) | | | | 0.23 | | | | | (0.28 | ) | | | | (0.18 | ) | | | | — | | | | | (0.46 | ) |
Year Ended September 30, 2014 | | | $ | 10.65 | | | | | 0.29 | | | | | 0.19 | | | | | 0.48 | | | | | (0.29 | ) | | | | — | | | | | — | | | | | (0.29 | ) |
Sterling Capital Maryland Intermediate Tax-Free Fund | | | | | | | | | | | | | | | | | | | | | | | | | | |
Year Ended September 30, 2018 | | | $ | 11.04 | | | | | 0.23 | | | | | (0.35 | ) | | | | (0.12 | ) | | | | (0.23 | ) | | | | (0.06 | ) | | | | — | | | | | (0.29 | ) |
Year Ended September 30, 2017 | | | $ | 11.33 | | | | | 0.23 | | | | | (0.21 | ) | | | | 0.02 | | | | | (0.23 | ) | | | | (0.08 | ) | | | | — | | | | | (0.31 | ) |
Year Ended September 30, 2016 | | | $ | 11.19 | | | | | 0.23 | | | | | 0.21 | | | | | 0.44 | | | | | (0.23 | ) | | | | (0.07 | ) | | | | — | | | | | (0.30 | ) |
Year Ended September 30, 2015 | | | $ | 11.25 | | | | | 0.23 | | | | | — | (b) | | | | 0.23 | | | | | (0.23 | ) | | | | (0.06 | ) | | | | — | | | | | (0.29 | ) |
Year Ended September 30, 2014 | | | $ | 10.97 | | | | | 0.22 | | | | | 0.28 | | | | | 0.50 | | | | | (0.22 | ) | | | | — | | | | | — | | | | | (0.22 | ) |
| * | During the periods certain fees were waived (See Note 6 in the Notes to the Financial Statements). If such reductions had not occurred, the ratios would have been as indicated. |
| ** | Portfolio turnover rate is calculated on the basis of the Fund as a whole without distinguishing between classes of shares issued. |
| (a) | Per share net investment income (loss) has been calculated using the average daily shares method. |
| (b) | Amount is less than $0.005. |
See accompanying Notes to the Financial Statements.
176
| | | | | | | | | | | | | | | | | | | | | | | | | | | | | | | | | |
| | | | | Ratios/Supplementary Data |
| | | | | | |
Net Asset
Value,
End of
Year | | Total
Return | | Net Assets,
End of
Year
(000) | | Ratio of
net expenses
to average
net assets | | Ratio of net
investment
income to
average net
assets | | Ratio of
expenses to
average
net assets* | | Portfolio
turnover rate** |
| | | | | | | | | | | | | | | | | | | | | | | | | | | | | | | | | | |
| | $ | 8.52 | | | | | 0.80 | % | | | $ | 126,878 | | | | | 0.43 | % | | | | 2.20 | % | | | | 0.53 | % | | | | 62.02 | % |
| | $ | 8.69 | | | | | 1.28 | % | | | $ | 67,467 | | | | | 0.45 | % | | | | 1.37 | % | | | | 0.55 | % | | | | 78.77 | % |
| | $ | 8.81 | | | | | 2.24 | % | | | $ | 77,374 | | | | | 0.49 | % | | | | 1.34 | % | | | | 0.56 | % | | | | 54.68 | % |
| | $ | 8.86 | | | | | 0.82 | % | | | $ | 78,390 | | | | | 0.55 | % | | | | 1.41 | % | | | | 0.57 | % | | | | 55.74 | % |
| | $ | 9.07 | | | | | 1.38 | % | | | $ | 81,206 | | | | | 0.52 | % | | | | 1.72 | % | | | | 0.55 | % | | | | 56.10 | % |
| | | | | | | | | | | | | | | | | | | | | | | | | | | | | | | | | | |
| | $ | 9.49 | | | | | (1.48 | )% | | | $ | 17,961 | | | | | 0.65 | % | | | | 1.99 | % | | | | 0.66 | % | | | | 40.85 | % |
| | $ | 9.92 | | | | | (0.95 | )% | | | $ | 16,412 | | | | | 0.62 | % | | | | 1.80 | % | | | | 0.66 | % | | | | 32.44 | % |
| | $ | 10.25 | | | | | 2.63 | % | | | $ | 18,871 | | | | | 0.61 | % | | | | 1.48 | % | | | | 0.72 | % | | | | 49.39 | % |
| | $ | 10.19 | | | | | 1.98 | % | | | $ | 21,648 | | | | | 0.67 | % | | | | 1.56 | % | | | | 0.73 | % | | | | 62.02 | % |
| | $ | 10.21 | | | | | 2.58 | % | | | $ | 23,119 | | | | | 0.68 | % | | | | 1.66 | % | | | | 0.68 | % | | | | 35.74 | % |
| | | | | | | | | | | | | | | | | | | | | | | | | | | | | | | | | | |
| | $ | 10.20 | | | | | (0.74 | )% | | | $ | 860,437 | | | | | 0.45 | % | | | | 2.79 | % | | | | 0.57 | % | | | | 62.28 | % |
| | $ | 10.60 | | | | | 1.00 | % | | | $ | 997,074 | | | | | 0.47 | % | | | | 2.38 | % | | | | 0.57 | % | | | | 64.07 | % |
| | $ | 10.82 | | | | | 6.10 | % | | | $ | 709,103 | | | | | 0.49 | % | | | | 2.67 | % | | | | 0.59 | % | | | | 65.47 | % |
| | $ | 10.54 | | | | | 2.29 | % | | | $ | 612,927 | | | | | 0.48 | % | | | | 2.88 | % | | | | 0.58 | % | | | | 41.37 | % |
| | $ | 10.67 | | | | | 5.29 | % | | | $ | 433,198 | | | | | 0.56 | % | | | | 3.15 | % | | | | 0.58 | % | | | | 75.21 | % |
| | | | | | | | | | | | | | | | | | | | | | | | | | | | | | | | | | |
| | $ | 9.81 | | | | | (0.45 | )% | | | $ | 30,805 | | | | | 0.63 | % | | | | 3.18 | % | | | | 0.63 | % | | | | 66.82 | % |
| | $ | 10.24 | | | | | 2.32 | % | | | $ | 29,471 | | | | | 0.63 | % | | | | 3.09 | % | | | | 0.63 | % | | | | 78.79 | % |
| | $ | 10.36 | | | | | 5.70 | % | | | $ | 31,755 | | | | | 0.64 | % | | | | 3.02 | % | | | | 0.64 | % | | | | 83.88 | % |
| | $ | 10.10 | | | | | 1.76 | % | | | $ | 63,992 | | | | | 0.63 | % | | | | 3.12 | % | | | | 0.63 | % | | | | 33.94 | % |
| | $ | 10.25 | | | | | 5.42 | % | | | $ | 50,353 | | | | | 0.60 | % | | | | 3.30 | % | | | | 0.60 | % | | | | 105.03 | % |
| | | | | | | | | | | | | | | | | | | | | | | | | | | | | | | | | | |
| | $ | 9.62 | | | | | (0.28 | )% | | | $ | 37,088 | | | | | 0.58 | % | | | | 2.97 | % | | | | 0.62 | % | | | | 19.17 | % |
| | $ | 9.95 | | | | | 1.23 | % | | | $ | 39,533 | | | | | 0.60 | % | | | | 2.31 | % | | | | 0.64 | % | | | | 34.72 | % |
| | $ | 10.10 | | | | | 3.86 | % | | | $ | 46,364 | | | | | 0.61 | % | | | | 2.16 | % | | | | 0.65 | % | | | | 43.63 | % |
| | $ | 9.98 | | | | | 3.54 | % | | | $ | 46,249 | | | | | 0.59 | % | | | | 2.28 | % | | | | 0.63 | % | | | | 19.85 | % |
| | $ | 9.91 | | | | | 3.75 | % | | | $ | 36,624 | | | | | 0.61 | % | | | | 2.50 | % | | | | 0.63 | % | | | | 98.34 | % |
| | | | | | | | | | | | | | | | | | | | | | | | | | | | | | | | | | |
| | $ | 9.89 | | | | | (1.19 | )% | | | $ | 7,705 | | | | | 0.68 | % | | | | 2.20 | % | | | | 0.68 | % | | | | 20.37 | % |
| | $ | 10.26 | | | | | 0.05 | % | | | $ | 8,026 | | | | | 0.68 | % | | | | 2.26 | % | | | | 0.71 | % | | | | 17.93 | % |
| | $ | 10.63 | | | | | 3.95 | % | | | $ | 8,580 | | | | | 0.66 | % | | | | 2.50 | % | | | | 0.77 | % | | | | 16.44 | % |
| | $ | 10.61 | | | | | 2.15 | % | | | $ | 9,533 | | | | | 0.70 | % | | | | 2.62 | % | | | | 0.79 | % | | | | 17.34 | % |
| | $ | 10.84 | | | | | 4.57 | % | | | $ | 10,532 | | | | | 0.72 | % | | | | 2.72 | % | | | | 0.72 | % | | | | 11.13 | % |
| | | | | | | | | | | | | | | | | | | | | | | | | | | | | | | | | | |
| | $ | 10.63 | | | | | (1.07 | )% | | | $ | 13,236 | | | | | 0.63 | % | | | | 2.14 | % | | | | 0.63 | % | | | | 31.12 | % |
| | $ | 11.04 | | | | | 0.26 | % | | | $ | 16,991 | | | | | 0.61 | % | | | | 2.13 | % | | | | 0.65 | % | | | | 5.89 | % |
| | $ | 11.33 | | | | | 3.97 | % | | | $ | 24,621 | | | | | 0.61 | % | | | | 2.00 | % | | | | 0.71 | % | | | | 14.36 | % |
| | $ | 11.19 | | | | | 2.05 | % | | | $ | 28,968 | | | | | 0.65 | % | | | | 2.07 | % | | | | 0.71 | % | | | | 18.38 | % |
| | $ | 11.25 | | | | | 4.61 | % | | | $ | 30,519 | | | | | 0.69 | % | | | | 1.99 | % | | | | 0.69 | % | | | | 19.90 | % |
177
|
Sterling Capital Funds |
Financial Highlights, Institutional Shares |
|
The financial highlights table is intended to help you understand the Funds’ financial performance for the past 5 years or, if shorter, the period of the Funds’ operations. Certain information reflects financial results for a single Fund share. The total returns in the table represent the rate that an investor would have earned (or lost) on an investment in the Fund (assuming reinvestment of all dividends and distributions).
| | | | | | | | | | | | | | | | | | | | | | | | | | | | | | | | | | | |
| | | | | Investment Activities | | Distributions |
| | | | | | | |
| | | Net Asset
Value,
Beginning
of Year | | Net
investment
income(a) | | Net realized/
unrealized
gains (losses)
on investments | | Total from
Investment
Activities | | Net
investment
income | | Net realized
gains on
investments | | Total
Distributions |
Sterling Capital North Carolina Intermediate Tax-Free Fund | | | | | | | | | | | | | | | | | | | | | | | | | | |
Year Ended September 30, 2018 | | | $ | 10.78 | | | | | 0.26 | | | | | (0.35 | ) | | | | (0.09 | ) | | | | (0.26 | ) | | | | — | | | | | (0.26 | ) |
Year Ended September 30, 2017 | | | $ | 11.08 | | | | | 0.25 | | | | | (0.26 | ) | | | | (0.01 | ) | | | | (0.25 | ) | | | | (0.04 | ) | | | | (0.29 | ) |
Year Ended September 30, 2016 | | | $ | 10.97 | | | | | 0.26 | | | | | 0.17 | | | | | 0.43 | | | | | (0.26 | ) | | | | (0.06 | ) | | | | (0.32 | ) |
Year Ended September 30, 2015 | | | $ | 10.98 | | | | | 0.27 | | | | | 0.01 | | | | | 0.28 | | | | | (0.27 | ) | | | | (0.02 | ) | | | | (0.29 | ) |
Year Ended September 30, 2014 | | | $ | 10.74 | | | | | 0.27 | | | | | 0.24 | | | | | 0.51 | | | | | (0.27 | ) | | | | — | | | | | (0.27 | ) |
Sterling Capital South Carolina Intermediate Tax-Free Fund | | | | | | | | | | | | | | | | | | | | | | | | | | |
Year Ended September 30, 2018 | | | $ | 11.03 | | | | | 0.23 | | | | | (0.34 | ) | | | | (0.11 | ) | | | | (0.23 | ) | | | | — | | | | | (0.23 | ) |
Year Ended September 30, 2017 | | | $ | 11.22 | | | | | 0.22 | | | | | (0.19 | ) | | | | 0.03 | | | | | (0.22 | ) | | | | — | | | | | (0.22 | ) |
Year Ended September 30, 2016 | | | $ | 11.06 | | | | | 0.23 | | | | | 0.20 | | | | | 0.43 | | | | | (0.23 | ) | | | | (0.04 | ) | | | | (0.27 | ) |
Year Ended September 30, 2015 | | | $ | 11.07 | | | | | 0.24 | | | | | 0.01 | | | | | 0.25 | | | | | (0.24 | ) | | | | (0.02 | ) | | | | (0.26 | ) |
Year Ended September 30, 2014 | | | $ | 10.78 | | | | | 0.25 | | | | | 0.29 | | | | | 0.54 | | | | | (0.25 | ) | | | | — | | | | | (0.25 | ) |
Sterling Capital Virginia Intermediate Tax-Free Fund | | | | | | | | | | | | | | | | | | | | | | | | | | |
Year Ended September 30, 2018 | | | $ | 11.76 | | | | | 0.26 | | | | | (0.36 | ) | | | | (0.10 | ) | | | | (0.26 | ) | | | | — | | | | | (0.26 | ) |
Year Ended September 30, 2017 | | | $ | 12.13 | | | | | 0.26 | | | | | (0.28 | ) | | | | (0.02 | ) | | | | (0.26 | ) | | | | (0.09 | ) | | | | (0.35 | ) |
Year Ended September 30, 2016 | | | $ | 11.98 | | | | | 0.27 | | | | | 0.19 | | | | | 0.46 | | | | | (0.27 | ) | | | | (0.04 | ) | | | | (0.31 | ) |
Year Ended September 30, 2015 | | | $ | 12.06 | | | | | 0.28 | | | | | (0.01 | ) | | | | 0.27 | | | | | (0.28 | ) | | | | (0.07 | ) | | | | (0.35 | ) |
Year Ended September 30, 2014 | | | $ | 11.79 | | | | | 0.27 | | | | | 0.27 | | | | | 0.54 | | | | | (0.27 | ) | | | | — | | | | | (0.27 | ) |
Sterling Capital West Virginia Intermediate Tax-Free Fund | | | | | | | | | | | | | | | | | | | | | | | | | | |
Year Ended September 30, 2018 | | | $ | 10.05 | | | | | 0.24 | | | | | (0.31 | ) | | | | (0.07 | ) | | | | (0.24 | ) | | | | (0.01 | ) | | | | (0.25 | ) |
Year Ended September 30, 2017 | | | $ | 10.28 | | | | | 0.23 | | | | | (0.18 | ) | | | | 0.05 | | | | | (0.23 | ) | | | | (0.05 | ) | | | | (0.28 | ) |
Year Ended September 30, 2016 | | | $ | 10.15 | | | | | 0.24 | | | | | 0.17 | | | | | 0.41 | | | | | (0.23 | ) | | | | (0.05 | ) | | | | (0.28 | ) |
Year Ended September 30, 2015 | | | $ | 10.17 | | | | | 0.24 | | | | | 0.01 | | | | | 0.25 | | | | | (0.24 | ) | | | | (0.03 | ) | | | | (0.27 | ) |
Year Ended September 30, 2014 | | | $ | 9.92 | | | | | 0.24 | | | | | 0.25 | | | | | 0.49 | | | | | (0.24 | ) | | | | — | | | | | (0.24 | ) |
Sterling Capital Diversified Income Fund(b) | | | | | | | | | | | | | | | | | | | | | | | | | | |
Year Ended September 30, 2018 | | | $ | 10.92 | | | | | 0.37 | | | | | (0.09 | ) | | | | 0.28 | | | | | (0.44 | ) | | | | — | | | | | (0.44 | ) |
Year Ended September 30, 2017 | | | $ | 10.94 | | | | | 0.45 | | | | | (0.04 | ) | | | | 0.41 | | | | | (0.43 | ) | | | | — | | | | | (0.43 | ) |
Year Ended September 30, 2016 | | | $ | 10.32 | | | | | 0.36 | | | | | 0.66 | | | | | 1.02 | | | | | (0.40 | ) | | | | — | | | | | (0.40 | ) |
Year Ended September 30, 2015 | | | $ | 10.71 | | | | | 0.46 | | | | | (0.58 | ) | | | | (0.12 | ) | | | | (0.27 | ) | | | | — | | | | | (0.27 | ) |
Year Ended September 30, 2014 | | | $ | 10.05 | | | | | 0.24 | | | | | 0.68 | | | | | 0.92 | | | | | (0.26 | ) | | | | — | | | | | (0.26 | ) |
Sterling Capital Strategic Allocation Balanced Fund(b) | | | | | | | | | | | | | | | | | | | | | | | | | | |
Year Ended September 30, 2018 | | | $ | 11.98 | | | | | 0.25 | | | | | 0.24 | | | | | 0.49 | | | | | (0.30 | ) | | | | — | | | | | (0.30 | ) |
Year Ended September 30, 2017 | | | $ | 10.90 | | | | | 0.19 | | | | | 1.08 | | | | | 1.27 | | | | | (0.19 | ) | | | | — | | | | | (0.19 | ) |
Year Ended September 30, 2016 | | | $ | 10.39 | | | | | 0.20 | | | | | 0.54 | | | | | 0.74 | | | | | (0.23 | ) | | | | — | | | | | (0.23 | ) |
Year Ended September 30, 2015 | | | $ | 10.73 | | | | | 0.16 | | | | | (0.32 | ) | | | | (0.16 | ) | | | | (0.18 | ) | | | | — | | | | | (0.18 | ) |
Year Ended September 30, 2014 | | | $ | 9.83 | | | | | 0.19 | | | | | 0.92 | | | | | 1.11 | | | | | (0.21 | ) | | | | — | | | | | (0.21 | ) |
Sterling Capital Strategic Allocation Growth Fund(b) | | | | | | | | | | | | | | | | | | | | | | | | | | |
Year Ended September 30, 2018 | | | $ | 11.93 | | | | | 0.24 | | | | | 0.39 | | | | | 0.63 | | | | | (0.28 | ) | | | | — | | | | | (0.28 | ) |
Year Ended September 30, 2017 | | | $ | 10.56 | | | | | 0.15 | | | | | 1.36 | | | | | 1.51 | | | | | (0.14 | ) | | | | — | | | | | (0.14 | ) |
Year Ended September 30, 2016 | | | $ | 10.01 | | | | | 0.14 | | | | | 0.61 | | | | | 0.75 | | | | | (0.20 | ) | | | | — | | | | | (0.20 | ) |
Year Ended September 30, 2015 | | | $ | 10.41 | | | | | 0.11 | | | | | (0.38 | ) | | | | (0.27 | ) | | | | (0.13 | ) | | | | — | | | | | (0.13 | ) |
Year Ended September 30, 2014 | | | $ | 9.37 | | | | | 0.15 | | | | | 1.05 | | | | | 1.20 | | | | | (0.16 | ) | | | | — | | | | | (0.16 | ) |
| * | During the periods certain fees were waived (See Note 6 in the Notes to the Financial Statements). If such reductions had not occurred, the ratios would have been as indicated. |
| ** | Portfolio turnover rate is calculated on the basis of the Fund as a whole without distinguishing between classes of shares issued. |
| (a) | Per share net investment income has been calculated using the average daily shares method. |
| (b) | The expense ratios exclude the impact of fees/expenses paid by each underlying fund. |
See accompanying Notes to the Financial Statements.
178
| | | | | | | | | | | | | | | | | | | | | | | | | | | | | | | | | |
| | | | | Ratios/Supplementary Data |
| | | | | | |
Net Asset
Value,
End of
Year | | Total
Return | | Net Assets,
End of
Year
(000) | | Ratio of
net expenses
to average
net assets | | Ratio of net
investment
income to
average net
assets | | Ratio of
expenses to
average
net assets* | | Portfolio
turnover rate** |
| | | | | | | | | | | | | | | | | | | | | | | | | | | | | | | | | | |
| | $ | 10.43 | | | | | (0.81 | )% | | | $ | 133,812 | | | | | 0.54 | % | | | | 2.49 | % | | | | 0.54 | % | | | | 22.06 | % |
| | $ | 10.78 | | | | | (0.06 | )% | | | $ | 140,484 | | | | | 0.54 | % | | | | 2.34 | % | | | | 0.58 | % | | | | 25.92 | % |
| | $ | 11.08 | | | | | 3.94 | % | | | $ | 157,284 | | | | | 0.55 | % | | | | 2.33 | % | | | | 0.65 | % | | | | 10.05 | % |
| | $ | 10.97 | | | | | 2.53 | % | | | $ | 147,048 | | | | | 0.59 | % | | | | 2.44 | % | | | | 0.66 | % | | | | 16.80 | % |
| | $ | 10.98 | | | | | 4.81 | % | | | $ | 151,267 | | | | | 0.66 | % | | | | 2.50 | % | | | | 0.66 | % | | | | 11.67 | % |
| | | | | | | | | | | | | | | | | | | | | | | | | | | | | | | | | | |
| | $ | 10.69 | | | | | (1.02 | )% | | | $ | 63,090 | | | | | 0.55 | % | | | | 2.10 | % | | | | 0.55 | % | | | | 27.71 | % |
| | $ | 11.03 | | | | | 0.34 | % | | | $ | 69,746 | | | | | 0.56 | % | | | | 2.03 | % | | | | 0.59 | % | | | | 31.17 | % |
| | $ | 11.22 | | | | | 3.87 | % | | | $ | 72,722 | | | | | 0.57 | % | | | | 2.03 | % | | | | 0.67 | % | | | | 2.69 | % |
| | $ | 11.06 | | | | | 2.27 | % | | | $ | 58,132 | | | | | 0.61 | % | | | | 2.17 | % | | | | 0.68 | % | | | | 12.53 | % |
| | $ | 11.07 | | | | | 5.03 | % | | | $ | 49,157 | | | | | 0.68 | % | | | | 2.27 | % | | | | 0.68 | % | | | | 15.51 | % |
| | | | | | | | | | | | | | | | | | | | | | | | | | | | | | | | | | |
| | $ | 11.40 | | | | | (0.88 | )% | | | $ | 61,420 | | | | | 0.55 | % | | | | 2.22 | % | | | | 0.55 | % | | | | 21.08 | % |
| | $ | 11.76 | | | | | (0.14 | )% | | | $ | 70,780 | | | | | 0.55 | % | | | | 2.18 | % | | | | 0.59 | % | | | | 23.25 | % |
| | $ | 12.13 | | | | | 3.91 | % | | | $ | 83,965 | | | | | 0.56 | % | | | | 2.23 | % | | | | 0.66 | % | | | | 16.18 | % |
| | $ | 11.98 | | | | | 2.24 | % | | | $ | 78,506 | | | | | 0.60 | % | | | | 2.33 | % | | | | 0.67 | % | | | | 16.01 | % |
| | $ | 12.06 | | | | | 4.65 | % | | | $ | 79,895 | | | | | 0.66 | % | | | | 2.29 | % | | | | 0.66 | % | | | | 20.48 | % |
| | | | | | | | | | | | | | | | | | | | | | | | | | | | | | | | | | |
| | $ | 9.73 | | | | | (0.73 | )% | | | $ | 54,988 | | | | | 0.55 | % | | | | 2.39 | % | | | | 0.55 | % | | | | 17.53 | % |
| | $ | 10.05 | | | | | 0.52 | % | | | $ | 59,567 | | | | | 0.56 | % | | | | 2.34 | % | | | | 0.59 | % | | | | 21.00 | % |
| | $ | 10.28 | | | | | 4.18 | % | | | $ | 64,199 | | | | | 0.57 | % | | | | 2.30 | % | | | | 0.67 | % | | | | 11.31 | % |
| | $ | 10.15 | | | | | 2.44 | % | | | $ | 66,716 | | | | | 0.60 | % | | | | 2.37 | % | | | | 0.67 | % | | | | 10.34 | % |
| | $ | 10.17 | | | | | 4.98 | % | | | $ | 70,273 | | | | | 0.66 | % | | | | 2.39 | % | | | | 0.66 | % | | | | 21.09 | % |
| | | | | | | | | | | | | | | | | | | | | | | | | | | | | | | | | | |
| | $ | 10.76 | | | | | 2.61 | % | | | $ | 6,807 | | | | | 0.55 | % | | | | 3.39 | % | | | | 0.55 | % | | | | 48.19 | % |
| | $ | 10.92 | | | | | 3.88 | % | | | $ | 7,962 | | | | | 0.50 | % | | | | 4.11 | % | | | | 0.50 | % | | | | 43.86 | % |
| | $ | 10.94 | | | | | 10.13 | % | | | $ | 26,328 | | | | | 0.39 | % | | | | 3.43 | % | | | | 0.47 | % | | | | 67.18 | % |
| | $ | 10.32 | | | | | (1.23 | )% | | | $ | 27,896 | | | | | 0.20 | % | | | | 4.29 | % | | | | 0.45 | % | | | | 126.46 | % |
| | $ | 10.71 | | | | | 9.19 | % | | | $ | 2,300 | | | | | 0.20 | % | | | | 2.32 | % | | | | 0.45 | % | | | | 8.67 | % |
| | | | | | | | | | | | | | | | | | | | | | | | | | | | | | | | | | |
| | $ | 12.17 | | | | | 4.11 | % | | | $ | 223 | | | | | 0.16 | % | | | | 2.06 | % | | | | 0.41 | % | | | | 14.41 | % |
| | $ | 11.98 | | | | | 11.75 | % | | | $ | 111 | | | | | 0.17 | % | | | | 1.67 | % | | | | 0.42 | % | | | | 0.80 | % |
| | $ | 10.90 | | | | | 7.24 | % | | | $ | 80 | | | | | 0.16 | % | | | | 1.89 | % | | | | 0.40 | % | | | | 5.19 | % |
| | $ | 10.39 | | | | | (1.57 | )% | | | $ | 106 | | | | | 0.15 | % | | | | 1.43 | % | | | | 0.40 | % | | | | 49.24 | % |
| | $ | 10.73 | | | | | 11.36 | % | | | $ | 244 | | | | | 0.14 | % | | | | 1.87 | % | | | | 0.39 | % | | | | 5.70 | % |
| | | | | | | | | | | | | | | | | | | | | | | | | | | | | | | | | | |
| | $ | 12.28 | | | | | 5.33 | % | | | $ | 749 | | | | | 0.19 | % | | | | 1.95 | % | | | | 0.44 | % | | | | 17.81 | % |
| | $ | 11.93 | | | | | 14.48 | % | | | $ | 692 | | | | | 0.19 | % | | | | 1.34 | % | | | | 0.44 | % | | | | 1.92 | % |
| | $ | 10.56 | | | | | 7.58 | % | | | $ | 725 | | | | | 0.18 | % | | | | 1.35 | % | | | | 0.43 | % | | | | 5.95 | % |
| | $ | 10.01 | | | | | (2.67 | )% | | | $ | 1,516 | | | | | 0.17 | % | | | | 1.00 | % | | | | 0.42 | % | | | | 58.40 | % |
| | $ | 10.41 | | | | | 12.89 | % | | | $ | 872 | | | | | 0.16 | % | | | | 1.46 | % | | | | 0.41 | % | | | | 8.60 | % |
179
|
Sterling Capital Funds |
Financial Highlights, Class R Shares |
|
The financial highlights table is intended to help you understand the Funds’ financial performance for the past 5 years or, if shorter, the period of the Funds’ operations. Certain information reflects financial results for a single Fund share. The total returns in the table represent the rate that an investor would have earned (or lost) on an investment in the Fund (assuming reinvestment of all dividends and distributions).
| | | | | | | | | | | | | | | | | | | | | | | | | | | | | | | | | | | |
| | | | | Investment Activities | | Distributions |
| | | | | | | |
| | | Net Asset
Value,
Beginning
of Year | | Net
investment
income (loss)(a) | | Net realized/
unrealized
gains (loss)
on investments | | Total from
Investment
Activities | | Net
investment
income | | Net realized
gains on
investments | | Total
Distributions |
Sterling Capital Mid Value Fund | | | | | | | | | | | | | | | | | | | | | | | | | | |
Year Ended September 30, 2018 | | | $ | 18.15 | | | | | (0.07 | ) | | | | 1.19 | | | | | 1.12 | | | | | — | | | | | (0.84 | ) | | | | (0.84 | ) |
Year Ended September 30, 2017 | | | $ | 16.25 | | | | | — | (b) | | | | 2.43 | | | | | 2.43 | | | | | — | | | | | (0.53 | ) | | | | (0.53 | ) |
Year Ended September 30, 2016 | | | $ | 17.59 | | | | | (0.02 | ) | | | | 2.02 | | | | | 2.00 | | | | | — | | | | | (3.34 | ) | | | | (3.34 | ) |
Year Ended September 30, 2015 | | | $ | 18.93 | | | | | 0.02 | | | | | (0.14 | ) | | | | (0.12 | ) | | | | (0.05 | ) | | | | (1.17 | ) | | | | (1.22 | ) |
Year Ended September 30, 2014 | | | $ | 18.47 | | | | | — | (b) | | | | 1.74 | | | | | 1.74 | | | | | (0.08 | ) | | | | (1.20 | ) | | | | (1.28 | ) |
Sterling Capital Behavioral Small Cap Value Equity Fund | | | | | | | | | | | | | | | | | | | | | | | | | | |
Year Ended September 30, 2018 | | | $ | 18.32 | | | | | 0.13 | | | | | 0.85 | | | | | 0.98 | | | | | (0.13 | ) | | | | (0.65 | ) | | | | (0.78 | ) |
Year Ended September 30, 2017 | | | $ | 15.14 | | | | | 0.18 | | | | | 3.08 | | | | | 3.26 | | | | | (0.08 | ) | | | | — | | | | | (0.08 | ) |
Year Ended September 30, 2016 | | | $ | 14.00 | | | | | 0.14 | | | | | 1.15 | | | | | 1.29 | | | | | (0.14 | ) | | | | (0.01 | ) | | | | (0.15 | ) |
Year Ended September 30, 2015 | | | $ | 14.28 | | | | | 0.13 | | | | | 0.15 | | | | | 0.28 | | | | | (0.12 | ) | | | | (0.44 | ) | | | | (0.56 | ) |
Year Ended September 30, 2014 | | | $ | 15.21 | | | | | 0.10 | | | | | 0.93 | | | | | 1.03 | | | | | (0.09 | ) | | | | (1.87 | ) | | | | (1.96 | ) |
Sterling Capital Special Opportunities Fund | | | | | | | | | | | | | | | | | | | | | | | | | | |
Year Ended September 30, 2018 | | | $ | 24.79 | | | | | (0.04 | ) | | | | 3.94 | | | | | 3.90 | | | | | (0.12 | ) | | | | (1.94 | ) | | | | (2.06 | ) |
Year Ended September 30, 2017 | | | $ | 21.83 | | | | | (0.04 | ) | | | | 3.41 | | | | | 3.37 | | | | | — | | | | | (0.41 | ) | | | | (0.41 | ) |
Year Ended September 30, 2016 | | | $ | 23.28 | | | | | (0.05 | ) | | | | 1.91 | | | | | 1.86 | | | | | — | | | | | (3.31 | ) | | | | (3.31 | ) |
Year Ended September 30, 2015 | | | $ | 23.69 | | | | | (0.11 | ) | | | | 0.90 | | | | | 0.79 | | | | | — | | | | | (1.20 | ) | | | | (1.20 | ) |
Year Ended September 30, 2014 | | | $ | 21.72 | | | | | (0.09 | ) | | | | 4.34 | | | | | 4.25 | | | | | — | | | | | (2.28 | ) | | | | (2.28 | ) |
Sterling Capital Equity Income Fund | | | | | | | | | | | | | | | | | | | | | | | | | | |
Year Ended September 30, 2018 | | | $ | 20.70 | | | | | 0.29 | | | | | 2.63 | | | | | 2.92 | | | | | (0.28 | ) | | | | (1.95 | ) | | | | (2.23 | ) |
Year Ended September 30, 2017 | | | $ | 18.18 | | | | | 0.29 | | | | | 2.58 | | | | | 2.87 | | | | | (0.33 | ) | | | | (0.02 | ) | | | | (0.35 | ) |
Year Ended September 30, 2016 | | | $ | 17.25 | | | | | 0.26 | | | | | 2.04 | | | | | 2.30 | | | | | (0.27 | ) | | | | (1.10 | ) | | | | (1.37 | ) |
Year Ended September 30, 2015 | | | $ | 18.84 | | | | | 0.26 | | | | | (1.06 | ) | | | | (0.80 | ) | | | | (0.28 | ) | | | | (0.51 | ) | | | | (0.79 | ) |
Year Ended September 30, 2014 | | | $ | 18.04 | | | | | 0.29 | | | | | 1.40 | | | | | 1.69 | | | | | (0.26 | ) | | | | (0.63 | ) | | | | (0.89 | ) |
Sterling Capital Total Return Bond Fund | | | | | | | | | | | | | | | | | | | | | | | | | | |
Year Ended September 30, 2018 | | | $ | 10.55 | | | | | 0.25 | | | | | (0.37 | ) | | | | (0.12 | ) | | | | (0.27 | ) | | | | — | | | | | (0.27 | ) |
Year Ended September 30, 2017 | | | $ | 10.77 | | | | | 0.20 | | | | | (0.15 | ) | | | | 0.05 | | | | | (0.27 | ) | | | | — | | | | | (0.27 | ) |
Year Ended September 30, 2016 | | | $ | 10.49 | | | | | 0.23 | | | | | 0.35 | | | | | 0.58 | | | | | (0.30 | ) | | | | — | | | | | (0.30 | ) |
Year Ended September 30, 2015 | | | $ | 10.62 | | | | | 0.25 | | | | | (0.06 | ) | | | | 0.19 | | | | | (0.32 | ) | | | | — | | | | | (0.32 | ) |
Year Ended September 30, 2014 | | | $ | 10.48 | | | | | 0.28 | | | | | 0.22 | | | | | 0.50 | | | | | (0.35 | ) | | | | (0.01 | ) | | | | (0.36 | ) |
| * | During the periods certain fees were waived (See Note 6 in the Notes to the Financial Statements). If such reductions had not occurred, the ratios would have been as indicated. |
| ** | Portfolio turnover rate is calculated on the basis of the Fund as a whole without distinguishing between classes of shares issued. |
| (a) | Per share net investment income (loss) has been calculated using the average daily shares method. |
| (b) | Amount is less than $0.005. |
| (c) | Net Assets are below $1,000. |
See accompanying Notes to the Financial Statements.
180
| | | | | | | | | | | | | | | | | | | | | | | | | | | | | | | | | |
| | | | | Ratios/Supplementary Data |
Net Asset
Value,
End of
Year | | Total
Return
(excludes
sales charge) | | Net Assets,
End of
Year
(000) | | Ratio of
net expenses
to average
net assets | | Ratio of net
investment
income
(loss) to
average net
assets | | Ratio of
expenses to
average
net assets* | | Portfolio
turnover rate** |
| | | | | | | | | | | | | | | | | | | | | | | | | | | | | | | | | | |
| | $ | 18.43 | | | | | 6.29 | % | | | $ | 3 | | | | | 1.42 | % | | | | (0.39 | )% | | | | 1.42 | % | | | | 34.62 | % |
| | $ | 18.15 | | | | | 15.18 | % | | | $ | 2 | | | | | 1.39 | % | | | | (0.01 | )% | | | | 1.39 | % | | | | 24.83 | % |
| | $ | 16.25 | | | | | 12.82 | % | | | $ | — | (c) | | | | 1.43 | % | | | | (0.12 | )% | | | | 1.43 | % | | | | 25.45 | % |
| | $ | 17.59 | | | | | (0.89 | )% | | | $ | — | (c) | | | | 1.44 | % | | | | 0.08 | % | | | | 1.44 | % | | | | 30.61 | % |
| | $ | 18.93 | | | | | 9.68 | % | | | $ | — | (c) | | | | 1.39 | % | | | | 0.02 | % | | | | 1.39 | % | | | | 27.30 | % |
| | | | | | | | | | | | | | | | | | | | | | | | | | | | | | | | | | |
| | $ | 18.52 | | | | | 5.44 | % | | | $ | 63 | | | | | 1.28 | % | | | | 0.69 | % | | | | 1.28 | % | | | | 89.85 | % |
| | $ | 18.32 | | | | | 21.52 | % | | | $ | 33 | | | | | 1.29 | % | | | | 1.09 | % | | | | 1.29 | % | | | | 109.05 | % |
| | $ | 15.14 | | | | | 9.22 | % | | | $ | — | (c) | | | | 1.38 | % | | | | 0.99 | % | | | | 1.38 | % | | | | 120.42 | % |
| | $ | 14.00 | | | | | 1.84 | % | | | $ | — | (c) | | | | 1.50 | % | | | | 0.89 | % | | | | 1.50 | % | | | | 101.99 | % |
| | $ | 14.28 | | | | | 7.01 | % | | | $ | — | (c) | | | | 1.45 | % | | | | 0.65 | % | | | | 1.45 | % | | | | 68.50 | % |
| | | | | | | | | | | | | | | | | | | | | | | | | | | | | | | | | | |
| | $ | 26.63 | | | | | 16.80 | % | | | $ | 173 | | | | | 1.36 | % | | | | (0.18 | )% | | | | 1.36 | % | | | | 22.78 | % |
| | $ | 24.79 | | | | | 15.66 | % | | | $ | 266 | | | | | 1.36 | % | | | | (0.16 | )% | | | | 1.36 | % | | | | 18.92 | % |
| | $ | 21.83 | | | | | 8.34 | % | | | $ | 191 | | | | | 1.42 | % | | | | (0.25 | )% | | | | 1.48 | % | | | | 27.32 | % |
| | $ | 23.28 | | | | | 3.51 | % | | | $ | 46 | | | | | 1.47 | % | | | | (0.44 | )% | | | | 1.47 | % | | | | 26.98 | % |
| | $ | 23.69 | | | | | 21.36 | % | | | $ | 26 | | | | | 1.46 | % | | | | (0.41 | )% | | | | 1.46 | % | | | | 32.35 | % |
| | | | | | | | | | | | | | | | | | | | | | | | | | | | | | | | | | |
| | $ | 21.39 | | | | | 14.97 | % | | | $ | 2,548 | | | | | 1.27 | % | | | | 1.41 | % | | | | 1.27 | % | | | | 19.49 | % |
| | $ | 20.70 | | | | | 15.96 | % | | | $ | 3,694 | | | | | 1.28 | % | | | | 1.52 | % | | | | 1.28 | % | | | | 16.93 | % |
| | $ | 18.18 | | | | | 14.18 | % | | | $ | 1,921 | | | | | 1.46 | % | | | | 1.54 | % | | | | 1.46 | % | | | | 20.64 | % |
| | $ | 17.25 | | | | | (4.40 | )% | | | $ | 1,957 | | | | | 1.47 | % | | | | 1.40 | % | | | | 1.47 | % | | | | 27.53 | % |
| | $ | 18.84 | | | | | 9.52 | % | | | $ | 1,811 | | | | | 1.45 | % | | | | 1.56 | % | | | | 1.45 | % | | | | 16.13 | % |
| | | | | | | | | | | | | | | | | | | | | | | | | | | | | | | | | | |
| | $ | 10.16 | | | | | (1.13 | )% | | | $ | 36 | | | | | 0.93 | % | | | | 2.45 | % | | | | 1.08 | % | | | | 62.28 | % |
| | $ | 10.55 | | | | | 0.50 | % | | | $ | 5 | | | | | 0.96 | % | | | | 1.90 | % | | | | 1.04 | % | | | | 64.07 | % |
| | $ | 10.77 | | | | | 5.59 | % | | | $ | 5 | | | | | 0.99 | % | | | | 2.20 | % | | | | 1.07 | % | | | | 65.47 | % |
| | $ | 10.49 | | | | | 1.77 | % | | | $ | 6 | | | | | 0.98 | % | | | | 2.39 | % | | | | 1.09 | % | | | | 41.37 | % |
| | $ | 10.62 | | | | | 4.81 | % | | | $ | 6 | | | | | 1.04 | % | | | | 2.65 | % | | | | 1.04 | % | | | | 75.21 | % |
181
|
Sterling Capital Funds |
Financial Highlights, Class R6 Shares |
|
Selected data for a share of beneficial interest outstanding throughout the periods indicated.
| | | | | | | | | | | | | | | | | | | | | | | | | | | | | | | | | | | |
| | | | | Investment Activities | | Distributions |
| | | | | | | |
| | | Net Asset
Value,
Beginning
of Period | | Net
investment
income(a) | | Net realized/
unrealized
gains
on investments | | Total from
Investment
Activities | | Net
investment
income | | Net realized
gains on
investments | | Total
Distributions |
Sterling Capital Behavioral Large Cap Value Equity Fund | | | | | | | | | | | | | | | | | | | | | | | | | | |
February 1, 2018 to September 30, 2018(d) | | | $ | 22.89 | | | | | 0.28 | | | | | (0.45 | ) | | | | (0.17 | ) | | | | (0.29 | ) | | | | — | | | | | (0.29 | ) |
| | | | | | |
Sterling Capital Mid Value Fund | | | | | | | | | | | | | | | | | | | | | | | | | | | | | | | |
February 1, 2018 to September 30, 2018(d) | | | $ | 20.22 | | | | | 0.03 | | | | | (0.81 | ) | | | | (0.78 | ) | | | | — | | | | | — | | | | | — | |
| | | | | | |
Sterling Capital Behavioral Small Cap Value Equity Fund | | | | | | | | | | | | | | | | | | | | | | | | | | | | | | | |
February 1, 2018 to September 30, 2018(d) | | | $ | 18.59 | | | | | 0.17 | | | | | 0.08 | | | | | 0.25 | | | | | — | | | | | — | | | | | — | |
| | | | | | | |
Sterling Capital Special Opportunities Fund | | | | | | | | | | | | | | | | | | | | | | | | | | | | | | | | | | | |
February 1, 2018 to September 30, 2018(d) | | | $ | 26.44 | | | | | 0.04 | | | | | 1.42 | | | | | 1.46 | | | | | (0.15 | ) | | | | — | | | | | (0.15 | ) |
| | | | | | |
Sterling Capital Equity Income Fund | | | | | | | | | | | | | | | | | | | | | | | | | | | | | | | |
February 1, 2018 to September 30, 2018(d) | | | $ | 21.49 | | | | | 0.30 | | | | | 0.12 | | | | | 0.42 | | | | | (0.30 | ) | | | | — | | | | | (0.30 | ) |
| | | | | | |
Sterling Capital Behavioral International Equity Fund | | | | | | | | | | | | | | | | | | | | | | | | | | | | | | | |
February 1, 2018 to September 30, 2018(d) | | | $ | 12.35 | | | | | 0.35 | | | | | (1.51 | ) | | | | (1.16 | ) | | | | — | | | | | — | | | | | — | |
| | | | | | |
Sterling Capital Total Return Bond Fund | | | | | | | | | | | | | | | | | | | | | | | | | | | | | | | |
February 1, 2018 to September 30, 2018(d) | | | $ | 10.48 | | | | | 0.21 | | | | | (0.27 | ) | | | | (0.06 | ) | | | | (0.22 | ) | | | | — | | | | | (0.22 | ) |
| * | During the periods certain fees were waived (See Note 6 in the Notes to the Financial Statements). If such reductions had not occurred, the ratios would have been as indicated. |
| ** | Portfolio turnover rate is calculated on the basis of the Fund as a whole without distinguishing between classes of shares issued. |
| (a) | Per share net investment income (loss) has been calculated using the average daily shares method. |
| (b) | Not annualized for periods less than one year. |
| (c) | Annualized for periods less than one year. |
| (d) | Period from commencement of operations. |
See accompanying Notes to the Financial Statements.
182
| | | | | | | | | | | | | | | | | | | | | | | | | | | | | | | | | |
| | | | | Ratios/Supplementary Data |
| | | | | | |
Net Asset
Value,
End of
Period | | Total
Return
(excludes
sales charge) (b) | | Net Assets,
End of
Period
(000) | | Ratio of
net expenses
to average
net assets (c) | | Ratio of net
investment
income to
average net
assets (c) | | Ratio of
expenses to
average
net assets*(c) | | Portfolio
turnover rate**(b) |
| | | | | | | | | | | | | | | | | | | | | | | | | | | | | | | | | | |
| | $ | 22.43 | | | | | (0.69 | )% | | | $ | 270,105 | | | | | 0.58 | % | | | | 1.94 | % | | | | 0.63 | % | | | | 127.89 | % |
| | | | | | |
| | | | | | | | | | | | | | | | | | | | | | | | | | | | | | | | | | |
| | $ | 19.44 | | | | | (3.86 | )% | | | $ | 285,847 | | | | | 0.83 | % | | | | 0.26 | % | | | | 0.93 | % | | | | 34.62 | % |
| | | | | | |
| | | | | | | | | | | | | | | | | | | | | | | | | | | | | | | | | | |
| | $ | 18.84 | | | | | 1.34 | % | | | $ | 191,051 | | | | | 0.73 | % | | | | 1.38 | % | | | | 0.79 | % | | | | 89.85 | % |
| | | | | | |
| | | | | | | | | | | | | | | | | | | | | | | | | | | | | | | | | | |
| | $ | 27.75 | | | | | 5.60 | % | | | $ | 372,948 | | | | | 0.78 | % | | | | 0.21 | % | | | | 0.85 | % | | | | 22.78 | % |
| | | | | | |
| | | | | | | | | | | | | | | | | | | | | | | | | | | | | | | | | | |
| | $ | 21.61 | | | | | 2.03 | % | | | $ | 317,827 | | | | | 0.66 | % | | | | 2.16 | % | | | | 0.77 | % | | | | 19.49 | % |
| | | | | | |
| | | | | | | | | | | | | | | | | | | | | | | | | | | | | | | | | | |
| | $ | 11.19 | | | | | (9.39 | )% | | | $ | 62,804 | | | | | 0.62 | % | | | | 4.63 | % | | | | 0.87 | % | | | | 96.65 | % |
| | | | | | |
| | | | | | | | | | | | | | | | | | | | | | | | | | | | | | | | | | |
| | $ | 10.20 | | | | | (0.52 | )% | | | $ | 281,637 | | | | | 0.35 | % | | | | 3.16 | % | | | | 0.59 | % | | | | 62.28 | % |
183
|
Sterling Capital Funds |
Notes to Financial Statements |
September 30, 2018 |
Sterling Capital Funds (the “Trust”) commenced operations on October 5, 1992 and is registered under the Investment Company Act of 1940, as amended (“the 1940 Act”), as an open-end investment company established as a Massachusetts business trust.
The Trust offers shares of Sterling Capital Behavioral Large Cap Value Equity Fund, Sterling Capital Mid Value Fund, Sterling Capital Behavioral Small Cap Value Equity Fund, Sterling Capital Special Opportunities Fund, Sterling Capital Equity Income Fund, Sterling Capital Behavioral International Equity Fund, Sterling Capital SMID Opportunities Fund, Sterling Capital Stratton Mid Cap Value Fund, Sterling Capital Stratton Real Estate Fund, Sterling Capital Stratton Small Cap Value Fund, Sterling Capital Ultra Short Bond Fund, Sterling Capital Short Duration Bond Fund, Sterling Capital Intermediate U.S. Government Fund, Sterling Capital Total Return Bond Fund, Sterling Capital Corporate Fund, Sterling Capital Securitized Opportunities Fund, Sterling Capital Kentucky Intermediate Tax-Free Fund, Sterling Capital Maryland Intermediate Tax-Free Fund, Sterling Capital North Carolina Intermediate Tax-Free Fund, Sterling Capital South Carolina Intermediate Tax-Free Fund, Sterling Capital Virginia Intermediate Tax-Free Fund, Sterling Capital West Virginia Intermediate Tax-Free Fund, Sterling Capital Diversified Income Fund, Sterling Capital Strategic Allocation Balanced Fund and Sterling Capital Strategic Allocation Growth Fund (referred to individually as a “Fund” and collectively as the “Funds”). Sterling Capital Kentucky Intermediate Tax-Free Fund, Sterling Capital Maryland Intermediate Tax-Free Fund, Sterling Capital North Carolina Intermediate Tax-Free Fund, Sterling Capital South Carolina Intermediate Tax-Free Fund, Sterling Capital Virginia Intermediate Tax-Free Fund and Sterling Capital West Virginia Intermediate Tax-Free Fund are referred to as the “Tax-Free Funds.” Sterling Capital Diversified Income Fund, Sterling Capital Strategic Allocation Balanced Fund and Sterling Capital Strategic Allocation Growth Fund are referred to as the “Funds of Funds.” The Funds, excluding the Funds of Funds, are referred to as the “Variable Net Asset Value Funds.” The Funds of Funds invest in underlying mutual funds as opposed to individual securities.
All Funds, other than the Tax-Free Funds, are “diversified” funds, as defined in the 1940 Act. The Tax-Free Funds are non-diversified funds, which means they may invest in the securities of a limited number of issuers.
By owning shares of underlying investment companies, each of the Funds of Funds invests, to varying degrees, in securities of U.S. and non-U.S. companies, including small and medium sized companies, and in debt securities. Funds of Funds with exposure to underlying equity funds may include funds that invest in real estate related securities. In addition, underlying investment companies may invest in derivatives and may engage in long/short equity strategies and in option writing strategies. The Funds of Funds except for Sterling Capital Diversified Income Fund currently invest only in other Funds that are part of the Sterling Capital Funds group of investment companies (not including cash sweep vehicles). Financial information for those Sterling Capital Funds is included in this report and also is available at www.sec.gov. Financial information for the other underlying Funds is available at www.sec.gov.
The Funds are authorized to issue an unlimited amount of shares. As of September 30, 2018, the Funds discussed herein offered up to five classes of shares: Class A Shares, Class C Shares, Class R Shares, Class R6 Shares and Institutional Shares. Class B Shares of the Funds closed effective May 26, 2017. Class A Shares of the Variable Net Asset Value Funds and Funds of Funds, excluding Sterling Capital Ultra Short Bond Fund, Sterling Capital Short Duration Bond Fund, Sterling Capital Intermediate U.S. Government Fund, Sterling Capital Corporate Fund, Sterling Capital Securitized Opportunities Fund, and the Tax-Free Funds, have a maximum sales charge of 5.75% as a percentage of original purchase price. Class A Shares of Sterling Capital Ultra Short Bond Fund have a maximum sales charge of 0.50%, and Class A Shares of Sterling Capital Short Duration Bond Fund, Sterling Capital Intermediate U.S. Government Fund, Sterling Capital Corporate Fund, Sterling Capital Securitized Opportunities Fund, and the Tax-Free Funds have a maximum sales charge of 2.00% as a percentage of the original purchase price. Purchases of $1 million or more of Class A Shares are not subject to a front-end sales charge but will be subject to a Contingent Deferred Sales Charge (“CDSC”) of 1.00% of the purchase price if redeemed within two years after purchase for all Funds except the Tax-Free Funds, Sterling Capital Short Duration Bond Fund, Sterling Capital Intermediate U.S. Government Fund, Sterling Capital Corporate Fund and Sterling Capital Securitized Opportunities Fund. With respect to the Tax-Free Funds, Sterling Capital Short Duration Bond Fund, Sterling Capital Intermediate U.S. Government Fund, Sterling Capital Corporate Fund and Sterling Capital Securitized Opportunities Fund, sales of Class A shares over $500,000 are not subject to a sales load but will be subject to a CDSC of 0.50% of the purchase price if redeemed within 18 months of purchase. This charge is based on the lower of the price paid for the shares or their net asset value at the time of redemption. Class C Shares of the Funds are offered without any front-end sales charge but will be subject to a maximum CDSC of 1.00% if redeemed less than one year after purchase.
184
|
Sterling Capital Funds |
Notes to Financial Statements — (continued) |
September 30, 2018 |
Each class of shares has identical rights and privileges except with respect to the fees paid under the distribution plan, voting rights on matters affecting a single class of shares and the exchange privilege of each class of shares.
Under the Trust’s organizational documents, its Officers and Trustees are indemnified against certain liabilities arising out of the performance of their duties to the Trust. In addition, in the normal course of business, the Funds may enter into contracts with their vendors and others that provide for general indemnifications. The Funds’ maximum exposure under these arrangements is unknown, as this would involve future claims that may be made against the Funds. However, based on experience, the Funds expect that risk of loss to be remote.
| | 2. | Significant Accounting Policies: |
The Funds are investment companies and accordingly follow the investment company accounting and reporting guidance of the Financial Accounting Standards Board (“FASB”) Accounting Standard Codification Topic 946 Financial Services-Investment Companies. The following is a summary of significant accounting policies followed by the Funds. The policies are in conformity with United States generally accepted accounting principles (“U.S. GAAP”). The preparation of these financial statements requires management to make estimates and assumptions that affect the reported amounts of assets and liabilities and disclosure of contingent assets and liabilities at the date of the financial statements and the reported amounts of income and expenses for the reporting period. Actual results could differ from those estimates.
Securities Valuation — Investments of the Variable Net Asset Value Funds in securities traded on a national securities exchange or in the over-the-counter market are valued at the closing price on the principal exchange or market (including the NASDAQ Closing Price for securities traded on NASDAQ), typically 4:00 PM ET or, absent such a price, by reference to the latest available bid prices in the principal market in which such securities are normally traded. The Variable Net Asset Value Funds may also use an independent pricing service approved by the Board of Trustees (the “Board”) to value certain securities, including the use of electronic and matrix techniques. Investments in open-end investment companies, including underlying funds invested in by the Funds of Funds, are valued at their respective net asset values as reported by such companies. Investments in closed-end investment companies and exchange-traded funds are valued at their market values based upon the latest available sale price or, absent such a price, by reference to the latest available bid prices in the principal market in which such securities are normally traded. The differences between cost and fair value of investments are reflected as either unrealized appreciation or depreciation. Securities for which market quotations are not readily available or deemed unreliable (e.g., an approved pricing service does not provide a price, a furnished price is in error, certain stale prices, or an event occurs that materially affects the furnished price) will be fair valued in accordance with procedures established in good faith under the general supervision of the Board.
Fair value pricing may be used if events materially affecting the value of foreign securities occur between the time when the exchange on which they are traded closes and the time when the Sterling Capital Behavioral International Equity Fund’s net asset value is calculated; such securities may be valued at fair value in accordance with procedures adopted by the Board.
Fair Value Measurements — The objective of a fair value measurement is to determine the price that would be received to sell an asset or paid to transfer a liability in an orderly transaction between market participants at the measurement date (an exit price). Accordingly, the fair value hierarchy gives the highest priority to quoted prices (unadjusted) in active markets for identical assets or liabilities (Level 1) and the lowest priority to unobservable inputs (Level 3). The three levels of the fair value hierarchy are described as follows:
• Level 1 – quoted prices in active markets for identical securities
• Level 2 – based on other significant observable inputs (including quoted prices for similar securities, interest rates, prepayment speeds, credit risk, etc.)
• Level 3 – based on significant unobservable inputs (including a Fund’s own assumptions in determining the fair value of investments)
The inputs or methodology used for valuing securities are not necessarily an indication of the risk associated with investing in those securities. During the year ended September 30, 2018, there were no significant changes to the valuation policies and procedures.
185
|
Sterling Capital Funds |
Notes to Financial Statements — (continued) |
September 30, 2018 |
The summary of inputs used to determine the fair value of each Fund’s investments as of September 30, 2018 is as follows:
| | | | | | | | | | | | | | | | |
| | | Level 1– Quoted Prices | | | Level 2–
Other Significant
Observable Inputs | | | Level 3–
Significant
Unobservable Inputs | | | Total | |
Assets: | | | | | | | | | | | | | | | | |
Investments in Securities | | | | | | | | | | | | | | | | |
Sterling Capital Behavioral Large Cap Value Equity Fund | | $ | 312,802,082(a) | | | $ | — | | | | $— | | | $ | 312,802,082 | |
Sterling Capital Mid Value Fund | | | 643,847,799(a) | | | | — | | | | — | | | | 643,847,799 | |
Sterling Capital Behavioral Small Cap Value Equity Fund | | | 238,171,308(a) | | | | — | | | | — | | | | 238,171,308 | |
Sterling Capital Special Opportunities Fund | | | 1,201,884,011(a) | | | | — | | | | — | | | | 1,201,884,011 | |
Sterling Capital Equity Income Fund | | | 1,674,922,169(a) | | | | — | | | | — | | | | 1,674,922,169 | |
Sterling Capital Behavioral International Equity Fund | | | 82,233,767(a) | | | | — | | | | — | | | | 82,233,767 | |
Sterling Capital SMID Opportunities Fund | | | 9,223,691(a) | | | | — | | | | — | | | | 9,223,691 | |
Sterling Capital Stratton Mid Cap Value Fund | | | 66,647,044(a) | | | | — | | | | — | | | | 66,647,044 | |
Sterling Capital Stratton Real Estate Fund | | | 91,734,651(a) | | | | — | | | | — | | | | 91,734,651 | |
Sterling Capital Stratton Small Cap Value Fund | | | 1,299,354,535(a) | | | | — | | | | — | | | | 1,299,354,535 | |
Sterling Capital Ultra Short Bond Fund | | | 5,258,829(b) | | | | 26,740,438(a) | | | | — | | | | 31,999,267 | |
Sterling Capital Short Duration Bond Fund | | | 1,864,988(b) | | | | 129,336,462(a) | | | | — | | | | 131,201,450 | |
Sterling Capital Intermediate U.S. Government Fund | | | 868,505(b) | | | | 20,592,472(a) | | | | — | | | | 21,460,977 | |
Sterling Capital Total Return Bond Fund | | | 17,711,891(b) | | | | 1,192,918,409(a) | | | | — | | | | 1,210,630,300 | |
Sterling Capital Corporate Fund | | | 609,224(b) | | | | 30,407,408(a) | | | | — | | | | 31,016,632 | |
Sterling Capital Securitized Opportunities Fund | | | 239,765(b) | | | | 36,899,284(a) | | | | — | | | | 37,139,049 | |
Sterling Capital Kentucky Intermediate Tax-Free Fund | | | 372,453(b) | | | | 10,844,241(a) | | | | — | | | | 11,216,694 | |
Sterling Capital Maryland Intermediate Tax-Free Fund | | | 322,623(b) | | | | 18,530,412(a) | | | | — | | | | 18,853,035 | |
Sterling Capital North Carolina Intermediate Tax-Free Fund | | | 3,178,433(b) | | | | 168,732,754(a) | | | | — | | | | 171,911,187 | |
Sterling Capital South Carolina Intermediate Tax-Free Fund | | | 1,393,716(b) | | | | 75,665,314(a) | | | | — | | | | 77,059,030 | |
Sterling Capital Virginia Intermediate Tax-Free Fund | | | 725,073(b) | | | | 81,597,762(a) | | | | — | | | | 82,322,835 | |
Sterling Capital West Virginia Intermediate Tax-Free Fund | | | 1,073,231(b) | | | | 77,535,557(a) | | | | — | | | | 78,608,788 | |
Sterling Capital Diversified Income Fund | | | 20,336,696(a) | | | | — | | | | — | | | | 20,336,696 | |
Sterling Capital Strategic Allocation Balanced Fund | | | 29,249,078(a) | | | | — | | | | — | | | | 29,249,078 | |
Sterling Capital Strategic Allocation Growth Fund | | | 22,883,664(a) | | | | — | | | | — | | | | 22,883,664 | |
| | (a) | Industries, countries or security types are disclosed in the Schedules of Portfolio Investments. |
| | (b) | Represents money market funds and/or certain preferred stocks. |
The Funds’ policy is to recognize transfers in and transfers out as of the beginning of the reporting period. There were no transfers between Level 1 and Level 2 during the year ended September 30, 2018.
Cash and Cash Equivalents — The Funds consider liquid assets deposited with a bank, and certain short term debt instruments with original maturities of three months or less to be cash equivalents. These investments represent amounts held with financial institutions that are readily accessible to pay Fund expenses or investments. The Funds may invest their excess cash in the Federated Treasury Obligations Fund or a similar money market fund or other short-term investment.
Credit Enhancements — Certain obligations held in the Funds have credit enhancement or liquidity features that may, under certain circumstances, provide for repayment of principal and interest on the obligation upon demand date, interest rate reset date or final maturity. These enhancements may include: letters of credit; liquidity guarantees; security purchase agreements; tender option purchase agreements; and third party insurance (i.e., AMBAC).
186
|
Sterling Capital Funds |
Notes to Financial Statements — (continued) |
September 30, 2018 |
Derivative Instruments Categorized by Risk Exposure — The Funds’ derivative contracts held at September 30, 2018, if any, are not accounted for as hedging instruments under U.S. GAAP. The effect of derivative financial instruments on the Statements of Operations categorized by primary risk exposure for the fiscal year ended September 30, 2018:
| | | | | | | | | | | | | | | |
Net Realized Gain (Loss) | | Sterling Capital
Special
Opportunities
Fund | | | | Sterling Capital
Equity
Income Fund |
Options (equity contracts)* | | | $ | 484,147 | | | | | | | | | $ | 321,432 | |
| | * | Purchased options gain/loss are included in realized gain (loss) on investments. |
| | | | | | | | | | | | | | | |
Net Change in Unrealized Appreciation (Depreciation) | | Sterling Capital
Special
Opportunities
Fund | | | | Sterling Capital
Equity
Income Fund |
Written options (equity contracts) | | | $ | 323,969 | | | | | | | | | $ | 62,202 | |
For the fiscal year ended September 30, 2018, the average quarterly balance of derivative financial instruments were as follows:
| | | | | | | | | | | | | | | |
| | | Sterling Capital
Special
Opportunities
Fund | | | | Sterling Capital
Equity
Income Fund |
Options (Equity Risk) | | | | | | | | | | | | | | | |
Average number of written option contracts | | | | 625 | | | | | | | | | | 923 | |
Average premium of written option contracts | | | $ | 118,103 | | | | | | | | | $ | 220,934 | |
Distributions to Shareholders — Dividends from net investment income are declared daily and paid monthly for Sterling Capital Ultra Short Bond Fund, Sterling Capital Short Duration Bond Fund, Sterling Capital Intermediate U.S. Government Fund, Sterling Capital Total Return Bond Fund, Sterling Capital Corporate Fund, Sterling Capital Securitized Opportunities Fund, and the Tax-Free Funds. Dividends from net investment income are declared and paid monthly for Sterling Capital Diversified Income Fund. Dividends from net investment income are declared and paid quarterly for Sterling Capital Stratton Mid Cap Value Fund, Sterling Capital Stratton Real Estate Fund, Sterling Capital Stratton Small Cap Value Fund, Sterling Capital Behavioral Large Cap Value Equity Fund, Sterling Capital Mid Value Fund, Sterling Capital Behavioral Small Cap Value Equity Fund, Sterling Capital Special Opportunities Fund, Sterling Capital Equity Income Fund, Sterling Capital SMID Opportunities Fund, Sterling Capital Strategic Allocation Balanced Fund, and Sterling Capital Strategic Allocation Growth Fund if the annualized yield of the distribution exceeds an amount determined annually by the Board. Dividends from net investment income for Sterling Capital Behavioral International Equity Fund is declared and paid annually. Distributable net realized gains, if any, are declared and distributed at least annually. Distributions to shareholders that exceed net investment income and net realized gains for tax purposes are reported as distributions of capital.
The U.S. GAAP basis of distributions paid to shareholders during the fiscal year ended September 30, 2017 was as follows:
| | | | | | | | | | | | | | | | | | | | | | | | | | | | | | | | | | | | | | | | | | | | | | | | | | |
| | | Class A | | Class B | | Class C | | Institutional | | Class R |
| | | Net | | Net | | Net | | Net | | Net | | Net | | Net | | Net | | Net | | Net |
| | | Investment | | Realized | | Investment | | Realized | | Investment | | Realized | | Investment | | Realized | | Investment | | Realized |
| | | Income | | Gains | | Income | | Gains | | Income | | Gains | | Income | | Gains | | Income | | Gains |
Sterling Capital Behavioral Large Cap Value Equity Fund | | | $ | 491,567 | | | | $ | — | | | | $ | 643 | | | | $ | — | | | | $ | 8,310 | | | | $ | — | | | | $ | 4,597,729 | | | | $ | — | | | | $ | — | | | | $ | — | |
Sterling Capital Mid Value Fund | | | | — | | | | | 991,131 | | | | | — | | | | | 7,484 | | | | | — | | | | | 179,472 | | | | | 392,245 | | | | | 17,153,010 | | | | | — | | | | | 6 | |
Sterling Capital Behavioral Small Cap Value Equity Fund | | | | 48,544 | | | | | — | | | | | 127 | | | | | — | | | | | 1,321 | | | | | — | | | | | 1,042,074 | | | | | — | | | | | 1 | | | | | — | |
Sterling Capital Special Opportunities Fund | | | | — | | | | | 6,462,864 | | | | | — | | | | | 26,525 | | | | | — | | | | | 3,913,050 | | | | | 376,646 | | | | | 10,436,329 | | | | | — | | | | | 8,322 | |
Sterling Capital Equity Income Fund | | | | 8,134,764 | | | | | 550,868 | | | | | 3,110 | | | | | 1,261 | | | | | 2,941,750 | | | | | 320,996 | | | | | 19,918,050 | | | | | 1,109,671 | | | | | 51,646 | | | | | 2,596 | |
Sterling Capital Behavioral International Equity Fund | | | | 5,337 | | | | | — | | | | | — | | | | | — | | | | | 451 | | | | | — | | | | | 1,170,042 | | | | | — | | | | | — | | | | | — | |
187
|
Sterling Capital Funds |
Notes to Financial Statements — (continued) |
September 30, 2018 |
| | | | | | | | | | | | | | | | | | | | | | | | | | | | | | | | | | | | | | | | | | | | | | | | | | |
| | | Class A | | Class B | | Class C | | Institutional | | Class R |
| | | Net | | Net | | Net | | Net | | Net | | Net | | Net | | Net | | Net | | Net |
| | | Investment | | Realized | | Investment | | Realized | | Investment | | Realized | | Investment | | Realized | | Investment | | Realized |
| | | Income | | Gains | | Income | | Gains | | Income | | Gains | | Income | | Gains | | Income | | Gains |
Sterling Capital SMID Opportunities Fund | | | | 1,611 | | | | | — | | | | | — | | | | | — | | | | | — | | | | | — | | | | | 4,317 | | | | | — | | | | | — | | | | | — | |
Sterling Capital Stratton Mid Cap Value Fund | | | | 47 | | | | | 328 | | | | | — | | | | | — | | | | | — | | | | | 5 | | | | | 85,765 | | | | | 293,559 | | | | | — | | | | | — | |
Sterling Capital Stratton Real Estate Value Fund | | | | 5,791 | | | | | 5,214 | | | | | — | | | | | — | | | | | 479 | | | | | 984 | | | | | 3,051,930 | | | | | 4,309,765 | | | | | — | | | | | — | |
Sterling Capital Stratton Small Cap Value Fund | | | | 115 | | | | | 8,487 | | | | | — | | | | | — | | | | | — | | | | | 3,494 | | | | | 2,079,928 | | | | | 61,347,981 | | | | | — | | | | | — | |
Sterling Capital Ultra Short Bond Fund | | | | 71,543 | | | | | — | | | | | — | | | | | — | | | | | — | | | | | — | | | | | 630,638 | | | | | — | | | | | — | | | | | — | |
Sterling Capital Short Duration Bond Fund | | | | 156,953 | | | | | — | | | | | — | | | | | — | | | | | 29,145 | | | | | — | | | | | 1,953,116 | | | | | — | | | | | — | | | | | — | |
Sterling Capital Intermediate U.S. Government Fund | | | | 126,044 | | | | | — | | | | | 281 | | | | | — | | | | | 8,445 | | | | | — | | | | | 415,985 | | | | | — | | | | | — | | | | | — | |
Sterling Capital Total Return Bond Fund | | | | 1,963,457 | | | | | — | | | | | 2,480 | | | | | — | | | | | 160,528 | | | | | — | | | | | 25,297,071 | | | | | — | | | | | 136 | | | | | — | |
Sterling Capital Corporate Fund | | | | 12,187 | | | | | 1,621 | | | | | — | | | | | — | | | | | 950 | | | | | 179 | | | | | 923,283 | | | | | 112,762 | | | | | — | | | | | — | |
Sterling Capital Securitized Opportunities Fund | | | | 3,640 | | | | | — | | | | | — | | | | | — | | | | | 620 | | | | | — | | | | | 1,149,450 | | | | | — | | | | | — | | | | | — | |
Sterling Capital Kentucky Intermediate Tax-Free Fund | | | | 84,071 | | | | | 57,042 | | | | | — | | | | | — | | | | | 52 | | | | | 20 | | | | | 187,705 | | | | | 107,066 | | | | | — | | | | | — | |
Sterling Capital Maryland Intermediate Tax-Free Fund | | | | 113,724 | | | | | 45,624 | | | | | — | | | | | — | | | | | 7,862 | | | | | 5,262 | | | | | 446,268 | | | | | 164,784 | | | | | — | | | | | — | |
Sterling Capital North Carolina Intermediate Tax-Free Fund | | | | 989,324 | | | | | 165,995 | | | | | — | | | | | — | | | | | 70,080 | | | | | 19,120 | | | | | 3,515,161 | | | | | 526,094 | | | | | — | | | | | — | |
Sterling Capital South Carolina Intermediate Tax-Free Fund | | | | 302,916 | | | | | 1,895 | | | | | — | | | | | — | | | | | 17,591 | | | | | 193 | | | | | 1,441,135 | | | | | 7,861 | | | | | — | | | | | — | |
Sterling Capital Virginia Intermediate Tax-Free Fund | | | | 585,943 | | | | | 249,339 | | | | | — | | | | | — | | | | | 12,158 | | | | | 8,557 | | | | | 1,650,832 | | | | | 612,795 | | | | | — | | | | | — | |
Sterling Capital West Virginia Intermediate Tax-Free Fund | | | | 688,584 | | | | | 162,149 | | | | | — | | | | | — | | | | | 10,623 | | | | | 3,642 | | | | | 1,445,525 | | | | | 286,951 | | | | | — | | | | | — | |
Sterling Capital Diversified Income Fund | | | | 567,986 | | | | | — | | | | | 2,237 | | | | | — | | | | | 34,231 | | | | | — | | | | | 671,189 | | | | | — | | | | | — | | | | | — | |
Sterling Capital Strategic Allocation Balanced Fund | | | | 429,055 | | | | | — | | | | | 1,247 | | | | | — | | | | | 5,300 | | | | | — | | | | | 2,002 | | | | | — | | | | | — | | | | | — | |
Sterling Capital Strategic Allocation Growth Fund | | | | 234,587 | | | | | — | | | | | 931 | | | | | — | | | | | 2,531 | | | | | — | | | | | 9,486 | | | | | — | | | | | — | | | | | — | |
Expenses and Allocation Methodology — Expenses directly attributable to a Fund are charged to that Fund. Expenses not directly attributable to a Fund are allocated proportionately among all Funds daily in relation to the net assets of each Fund or on another reasonable basis. Each class of shares bears its pro-rata portion of expenses attributable to its series, except that each class separately bears expenses related specifically to that class, such as distribution fees. Income and realized and unrealized gains or losses on investments are allocated to each class of shares based on its relative net assets or another appropriate basis.
Foreign Currency Translation — The accounting records of the Sterling Capital Behavioral International Equity Fund are maintained in U.S. dollars. Foreign currency amounts are translated into U.S. dollars at the latest foreign exchange bid quotation (from an approved pricing vendor) to determine the fair value of investments, assets and liabilities. Purchases and sales of securities, income and expenses are translated at the prevailing rate of exchange, on the respective dates of such transactions. The Sterling Capital Behavioral International Equity Fund does not isolate that portion of the results of operations resulting from changes in foreign exchange rates on investments from fluctuations arising from changes in market prices of securities held. Such fluctuations are included with the net realized and unrealized gain or loss from investments and foreign currencies.
188
|
Sterling Capital Funds |
Notes to Financial Statements — (continued) |
September 30, 2018 |
Forward Foreign Currency Exchange Contracts — The Sterling Capital Behavioral International Equity Fund, Sterling Capital Ultra Short Bond Fund, Sterling Capital Short Duration Bond Fund, Sterling Capital Total Return Bond Fund and Sterling Capital Corporate Fund may enter into forward foreign currency exchange contracts (foreign currency exchange risk) in connection with planned purchases or sales of securities or to hedge the U.S. dollar value of Funds securities denominated in a particular currency. A foreign currency exchange contract is an agreement between two parties to buy and sell a currency at a set exchange rate on a future date. The Funds can be exposed to risks if the counterparties to the contracts are unable to meet the terms of their contracts and from unanticipated movements in the value of a foreign currency relative to the U.S. dollar. In the event of default by the counterparty to the transaction, the Funds’ maximum amount of loss, as either the buyer or seller, is the unrealized gain of the contract. The forward foreign currency exchange contracts are adjusted by the daily exchange rate of the underlying currency and any gains or losses are recorded for financial statement purposes as unrealized gains or losses until the contract settlement date. When the contract is closed, the Funds record a realized gain (loss) equal to the difference between the value at the time it was opened and the value at the time it was closed.
Mortgage Dollar Rolls — The Variable Net Asset Value Funds may sell mortgage-backed securities for delivery in the current month and simultaneously contract to repurchase substantially similar (same type, coupon and maturity) securities on a specific future date at an agreed-upon price. The market value of the securities that a Fund is required to purchase may decline below the agreed upon repurchase price of those securities. Pools of mortgages collateralizing those securities may have different prepayment histories than those sold. During the period between the sale and repurchase, a Fund will not be entitled to receive interest and principal payments on the securities sold. Proceeds of the sale will be invested in additional instruments for a Fund, and the income from these investments will generate income for a Fund. If such income does not exceed the income, capital appreciation and gain or loss that would have been realized on the securities sold as part of the dollar roll, the use of this technique will diminish the investment performance of a Fund compared with what the performance would have been without the use of dollar rolls. The Funds account for mortgage dollar roll transactions as purchases and sales. The Funds did not hold any mortgage dollar rolls during the year.
Offering Costs — Offering costs are amortized on a straight-line basis over one year from each Fund’s respective commencement of operations. In the event that any of the initial shares are redeemed during the period of amortization of a Fund’s offering costs, the redemption proceeds will be reduced by any such unamortized offering costs in the same proportion as the number of shares being redeemed bears to the number of those shares outstanding at the time of redemption.
Options Contracts — Sterling Capital Special Opportunities Fund and Sterling Capital Equity Income Fund write (sell) “covered” call options on securities and purchase options on securities to close out options previously written by them. Sterling Capital Diversified Income Fund may invest in underlying funds that engage in options writing strategies (including cash-secured put writing and covered call writing).
In writing an option, a Fund contracts with a specified counterparty to purchase (put option written) or sell (call option written) a specified quantity (notional amount) of an underlying asset at a specified price during a specified period upon demand of the counterparty. The risk associated with writing an option is that the Funds bear the market risk of an unfavorable change in the price of an underlying asset and are required to buy or sell an underlying asset under the contractual terms of the option at a price different from the current value. The Funds execute transactions in both listed and over-the-counter options. When purchasing over-the-counter options, a Fund bears the risk of economic loss from counterparty default, equal to the market value of the option. Listed options involve minimal counterparty risk since the listed options are guaranteed against default by the exchange on which they trade. Transactions in over-the-counter options expose the Funds to the risk of default by the counterparty to the transaction. In the event of default by the counterparty to the over-the-counter transaction, the Funds’ maximum amount of loss is the premium paid (as the purchaser) or the unrealized depreciation of the contract (as the writer).
Sterling Capital Special Opportunities Fund and Sterling Capital Equity Income Fund invested in written options to economically hedge the downside exposure by collecting a premium when sold against the equity holding.
Risks Associated with Foreign Securities and Currencies — Investments in securities of foreign issuers carry certain risks not ordinarily associated with investments in securities of domestic issuers. Such risks include future political and economic developments and the possible imposition of exchange controls or other foreign governmental laws and restrictions. In addition, with respect to certain countries, there is the possibility of expropriation of assets, confiscatory taxation, political
189
|
Sterling Capital Funds |
Notes to Financial Statements — (continued) |
September 30, 2018 |
or social instability or diplomatic developments which could adversely affect investments in those countries. Certain foreign investments may also be subject to foreign withholding taxes.
Securities Transactions and Related Income — During the period, security transactions are accounted for no later than one business day after the trade date. For financial reporting purposes, however, security transactions as of the last business day of the reporting period are accounted for on the trade date. Interest income is recognized on the accrual basis and includes, where applicable, the amortization/accretion of premium or discount. Dividend income is recorded on the ex-dividend date. Gains or losses realized from sales of securities are determined by comparing the identified cost of the security lot sold with the net sales proceeds.
When-Issued and Forward Commitments — The Funds may purchase securities on a “when-issued” basis. Sterling Capital Behavioral Large Cap Value Equity Fund, Sterling Capital Mid Value Fund, Sterling Capital Behavioral Small Cap Value Equity Fund, Sterling Capital Special Opportunities Fund and Sterling Capital Equity Income Fund may also purchase or sell securities on a forward commitment basis. The Funds record when-issued securities on the trade date and pledge assets with a value at least equal to the purchase commitment for payment of the securities purchased. The value of the securities underlying when-issued or forward commitments to purchase securities, and any subsequent fluctuation in their value, is taken into account when determining the net asset value of the Funds commencing with the date the Funds agree to purchase the securities. The Funds do not accrue interest or dividends on “when-issued” securities until the underlying securities are received.
| | 3. | New Accounting Pronouncements: |
In August 2018, the FASB issued Accounting Standards Update 2018-13, Fair Value Measurement (Topic 820). The new guidance includes additions and modifications to disclosures requirements for fair value measurements. For public entities, the amendments are effective for financial statements issued for fiscal years beginning after December 15, 2019, and interim periods within those fiscal years. At this time, management is currently evaluating the impact of this new guidance on the financial statements and disclosures.
| | 4. | Purchases and Sales of Securities: |
Purchases and sales of securities (excluding U.S. government securities and securities maturing less than one year from acquisition) for the fiscal year ended September 30, 2018 were as follows:
| | | | | | | | | | |
| | | Purchases | | Sales |
Sterling Capital Behavioral Large Cap Value Equity Fund | | | $ | 396,651,339 | | | | $ | 413,730,250 | |
Sterling Capital Mid Value Fund | | | | 236,063,661 | | | | | 316,275,325 | |
Sterling Capital Behavioral Small Cap Value Equity Fund | | | | 215,664,792 | | | | | 203,350,046 | |
Sterling Capital Special Opportunities Fund | | | | 259,514,485 | | | | | 360,542,380 | |
Sterling Capital Equity Income Fund | | | | 309,031,563 | | | | | 422,551,331 | |
Sterling Capital Behavioral International Equity Fund | | | | 83,756,594 | | | | | 80,158,109 | |
Sterling Capital SMID Opportunities Fund | | | | 3,992,343 | | | | | 4,740,187 | |
Sterling Capital Stratton Mid Cap Value Fund | | | | 9,408,009 | | | | | 13,691,571 | |
Sterling Capital Stratton Real Estate Fund | | | | 7,602,254 | | | | | 14,987,828 | |
Sterling Capital Stratton Small Cap Value Fund | | | | 209,815,881 | | | | | 189,529,890 | |
Sterling Capital Ultra Short Bond Fund | | | | 22,693,663 | | | | | 28,043,496 | |
Sterling Capital Short Duration Bond Fund | | | | 90,817,884 | | | | | 31,529,442 | |
Sterling Capital Intermediate U.S. Government Fund | | | | 58,205 | | | | | 500,000 | |
Sterling Capital Total Return Bond Fund | | | | 528,553,888 | | | | | 355,682,011 | |
Sterling Capital Corporate Fund | | | | 19,157,399 | | | | | 17,186,858 | |
Sterling Capital Securitized Opportunities Fund | | | | 5,066,760 | | | | | 2,536,331 | |
Sterling Capital Kentucky Intermediate Tax-Free Fund | | | | 2,358,874 | | | | | 2,883,489 | |
Sterling Capital Maryland Intermediate Tax-Free Fund | | | | 6,473,272 | | | | | 9,979,505 | |
Sterling Capital North Carolina Intermediate Tax-Free Fund | | | | 38,937,775 | | | | | 46,576,916 | |
Sterling Capital South Carolina Intermediate Tax-Free Fund | | | | 22,802,380 | | | | | 28,396,283 | |
Sterling Capital Virginia Intermediate Tax-Free Fund | | | | 18,659,672 | | | | | 30,498,375 | |
Sterling Capital West Virginia Intermediate Tax-Free Fund | | | | 14,706,056 | | | | | 21,536,130 | |
Sterling Capital Diversified Income Fund | | | | 10,923,620 | | | | | 14,043,054 | |
Sterling Capital Strategic Allocation Balanced Fund | | | | 4,277,415 | | | | | 5,955,247 | |
Sterling Capital Strategic Allocation Growth Fund | | | | 4,133,611 | | | | | 5,510,106 | |
190
|
Sterling Capital Funds |
Notes to Financial Statements — (continued) |
September 30, 2018 |
Purchases and sales of U.S. government securities (excluding securities maturing less than one year from acquisition) for the fiscal year ended September 30, 2018 were as follows:
| | | | | | | | | | |
| | | Purchases | | Sales |
Sterling Capital Short Duration Bond Fund | | | $ | 34,303,717 | | | | $ | 30,940,545 | |
Sterling Capital Intermediate U.S. Government Fund | | | | 7,712,311 | | | | | 7,599,465 | |
Sterling Capital Total Return Bond Fund | | | | 432,002,438 | | | | | 357,918,835 | |
Sterling Capital Corporate Fund | | | | 1,504,902 | | | | | 1,501,642 | |
Sterling Capital Securitized Opportunities Fund | | | | 6,306,415 | | | | | 4,710,384 | |
Sterling Capital Ultra Short Bond Fund | | | | 1,165,430 | | | | | — | |
| | 5. | Investments in Affiliated Issuers: |
A summary of the Funds’ transactions in the shares of affiliated issuers during the fiscal year ended September 30, 2018 is as follows:
| | | | | | | | | | | | | | | | | | | | | | | | | | | | | | | | | | | | | | | | |
| | | Shares Held at
September 30,
2017 | | Shares
Purchased | | Shares
Sold | �� | Shares Held at
September 30,
2018 | | Value at
September 30,
2018 | | Dividend
Income
October 1, 2017-
September 30, 2018 | | Distributions
and Net Realized
Gain (Loss)
October 1, 2017-
September 30, 2018 | | Change in
Unrealized
Appreciation/
Depreciation
October 1, 2017-
September 30, 2018 |
Sterling Capital Strategic Allocation Balanced Fund | | | | | | | | | | | | | | | | | | | | | | | | | | | | | | | | | | | | | | | | |
Sterling Capital Behavioral International Equity Fund, Institutional Shares | | | | 758,440 | | | | | 83,819 | | | | | 49,297 | | | | | 792,962 | | | | $ | 8,865,316 | | | | $ | 248,941 | | | | $ | 167,069 | | | | $ | (586,007 | ) |
Sterling Capital Equity Income Fund, Institutional Shares | | | | 209,374 | | | | | 37,535 | | | | | 29,864 | | | | | 217,045 | | | | | 4,690,340 | | | | | 85,116 | | | | | 436,516 | | | | | 105,007 | |
Sterling Capital Long/Short Equity Fund, Institutional Shares | | | | 337,412 | | | | | — | | | | | 337,412 | | | | | — | | | | | — | | | | | — | | | | | 95,657 | | | | | 109,793 | |
Sterling Capital Special Opportunities Fund, Institutional Shares | | | | 165,887 | | | | | 25,183 | | | | | 19,564 | | | | | 171,506 | | | | | 4,755,872 | | | | | 32,399 | | | | | 342,447 | | | | | 328,434 | |
Sterling Capital Total Return Bond Fund, Institutional Shares | | | | 958,185 | | | | | 173,936 | | | | | 84,673 | | | | | 1,047,448 | | | | | 10,683,966 | | | | | 334,570 | | | | | (50,796 | ) | | | | (377,001 | ) |
| | | | | | | | | | | | | | | | | | | | | | | | | | | | | | | | | | | | | | | | |
| | | | | | | | |
Total Affiliates | | | | 2,429,298 | | | | | 320,473 | | | | | 520,810 | | | | | 2,228,961 | | | | $ | 28,995,494 | | | | $ | 701,026 | | | | $ | 990,893 | | | | $ | (419,774 | ) |
| | | | | | | | | | | | | | | | | | | | | | | | | | | | | | | | | | | | | | | | |
| | | | | | | | |
Sterling Capital Strategic Allocation Growth Fund | | | | | | | | | | | | | | | | | | | | | | | | | | | | | | | | | | | | | | | | |
Sterling Capital Behavioral International Equity Fund, Institutional Shares | | | | 742,596 | | | | | 94,742 | | | | | 58,887 | | | | | 778,451 | | | | $ | 8,703,078 | | | | $ | 242,969 | | | | $ | 163,056 | | | | $ | (577,912 | ) |
Sterling Capital Equity Income Fund, Institutional Shares | | | | 199,299 | | | | | 30,898 | | | | | 29,105 | | | | | 201,092 | | | | | 4,345,606 | | | | | 82,603 | | | | | 404,160 | | | | | 128,086 | |
Sterling Capital Long/Short Equity Fund, Institutional Shares | | | | 313,902 | | | | | — | | | | | 313,902 | | | | | — | | | | | — | | | | | — | | | | | 94,649 | | | | | 100,470 | |
Sterling Capital Special Opportunities Fund, Institutional Shares | | | | 158,748 | | | | | 23,846 | | | | | 23,315 | | | | | 159,279 | | | | | 4,416,798 | | | | | 31,888 | | | | | 328,130 | | | | | 331,793 | |
Sterling Capital Total Return Bond Fund, Institutional Shares | | | | 370,972 | | | | | 163,941 | | | | | 43,756 | | | | | 491,157 | | | | | 5,009,803 | | | | | 150,220 | | | | | (30,004 | ) | | | | (167,497 | ) |
| | | | | | | | | | | | | | | | | | | | | | | | | | | | | | | | | | | | | | | | |
| | | | | | | | |
Total Affiliates | | | | 1,785,517 | | | | | 313,427 | | | | | 468,965 | | | | | 1,629,979 | | | | $ | 22,475,285 | | | | $ | 507,680 | | | | $ | 959,991 | | | | $ | (185,060 | ) |
| | | | | | | | | | | | | | | | | | | | | | | | | | | | | | | | | | | | | | | | |
191
|
Sterling Capital Funds |
Notes to Financial Statements — (continued) |
September 30, 2018 |
| | 6. | Related Party Transactions: |
Under the terms of the investment advisory agreement, Sterling Capital Management LLC (“Sterling Capital” or the “Advisor”) is entitled to receive fees based on a percentage of the average daily net assets of the Funds. These fees are accrued daily and payable on a monthly basis and are reflected on the Statements of Operations as “Investment advisory fees.” Sterling Capital’s waived investment advisory fees are included on the Statements of Operations as “Less expenses waived by the Investment Advisor.” Information regarding these transactions is as follows for the fiscal year ended September 30, 2018:
| | | | | | | | | | | | | | | | | | | | |
| | | Prior to February 1, 2018 | | Effective February 1, 2018 |
| | | Contractual
Fee Rate | | Fee Rate after Contractual
Waivers | | Contractual
Fee Rate | | Fee Rate after
Contractual
Waivers |
Sterling Capital Behavioral Large Cap Value Equity Fund | | | | 0.45 | % | | | | 0.45 | % | | | | 0.45 | % | | | | 0.45 | % |
Sterling Capital Mid Value Fund | | | | 0.70 | % | | | | 0.70 | % | | | | 0.70 | % | | | | 0.70 | % |
Sterling Capital Behavioral Small Cap Value Equity Fund | | | | 0.60 | % | | | | 0.60 | % | | | | 0.60 | % | | | | 0.60 | % |
Sterling Capital Special Opportunities Fund | | | | 0.65 | % | | | | 0.65 | % | | | | 0.65 | % | | | | 0.65 | % |
Sterling Capital Equity Income Fund | | | | 0.55 | % | | | | 0.55 | % | | | | 0.55 | % | | | | 0.55 | % |
Sterling Capital Behavioral International Equity Fund | | | | 0.60 | % | | | | 0.40 | %(1) | | | | 0.60 | % | | | | 0.40 | %(2) |
Sterling Capital SMID Opportunities Fund | | | | 0.70 | % | | | | 0.54 | %(1) | | | | 0.70 | % | | | | 0.54 | %(2) |
Sterling Capital Stratton Mid Cap Value Fund | | | | 0.70 | % | | | | 0.70 | % | | | | 0.70 | % | | | | 0.70 | % |
Sterling Capital Stratton Real Estate Fund | | | | 0.58 | % | | | | 0.58 | % | | | | 0.58 | % | | | | 0.58 | % |
Sterling Capital Stratton Small Cap Value Fund | | | | 0.85 | % | | | | 0.85 | % | | | | 0.85 | % | | | | 0.80 | %(2) |
Sterling Capital Ultra Short Bond Fund | | | | 0.20 | % | | | | 0.10 | %(1) | | | | 0.20 | % | | | | 0.10 | %(2) |
Sterling Capital Short Duration Bond Fund | | | | 0.30 | % | | | | 0.20 | %(1) | | | | 0.30 | % | | | | 0.20 | %(2) |
Sterling Capital Intermediate U.S. Government Fund | | | | 0.32 | % | | | | 0.32 | %(3) | | | | 0.32 | % | | | | 0.32 | %(3) |
Sterling Capital Total Return Bond Fund | | | | 0.37 | % | | | | 0.27 | %(1) | | | | 0.37 | % | | | | 0.25 | %(2) |
Sterling Capital Corporate Fund | | | | 0.35 | % | | | | 0.35 | % | | | | 0.35 | % | | | | 0.35 | % |
Sterling Capital Securitized Opportunities Fund | | | | 0.35 | % | | | | 0.31 | %(1) | | | | 0.35 | % | | | | 0.31 | %(2) |
Sterling Capital Kentucky Intermediate Tax-Free Fund | | | | 0.35 | % | | | | 0.35 | % | | | | 0.35 | % | | | | 0.35 | % |
Sterling Capital Maryland Intermediate Tax-Free Fund | | | | 0.35 | % | | | | 0.35 | % | | | | 0.35 | % | | | | 0.35 | % |
Sterling Capital North Carolina Intermediate Tax-Free Fund | | | | 0.35 | % | | | | 0.35 | % | | | | 0.35 | % | | | | 0.35 | % |
Sterling Capital South Carolina Intermediate Tax-Free Fund | | | | 0.35 | % | | | | 0.35 | % | | | | 0.35 | % | | | | 0.35 | % |
Sterling Capital Virginia Intermediate Tax-Free Fund | | | | 0.35 | % | | | | 0.35 | % | | | | 0.35 | % | | | | 0.35 | % |
Sterling Capital West Virginia Intermediate Tax-Free Fund | | | | 0.35 | % | | | | 0.35 | % | | | | 0.35 | % | | | | 0.35 | % |
Sterling Capital Diversified Income Fund | | | | 0.25 | % | | | | 0.25 | %(3) | | | | 0.25 | % | | | | 0.25 | %(3) |
Sterling Capital Strategic Allocation Balanced Fund | | | | 0.25 | % | | | | 0.00 | %(1) | | | | 0.25 | % | | | | 0.00 | %(2) |
Sterling Capital Strategic Allocation Growth Fund | | | | 0.25 | % | | | | 0.00 | %(1) | | | | 0.25 | % | | | | 0.00 | %(2) |
| | (1) | Sterling Capital contractually agreed to limit the advisory fees paid by the Fund from February 1, 2017 through January 31, 2018. |
| | (2) | Sterling Capital contractually agreed to limit the advisory fees paid by the Fund from February 1, 2018 through January 31, 2019. |
| | (3) | For all or a portion of the fiscal year ended September 30, 2018, Sterling Capital voluntarily waived and/or reimbursed certain expenses of the Funds. Voluntary waivers and reimbursements of expenses may be discontinued at any time. |
Effective February 1, 2018, for the following funds, Sterling Capital has contractually agreed to waive its fees, pay Fund operating expenses, and/or reimburse fees or expenses, in order to limit expenses of the shares based on average daily net assets, excluding interest, taxes, acquired funds fees and extraordinary expenses. The expense limitations are for the period February 1, 2018 through January 31, 2019 are as follows:
| | | | | | | | | | | | | | | | | | | | |
| | | Class A | | Class C | | Institutional | | Class R |
Sterling Capital Behavioral International Equity Fund | | | | 1.00 | % | | | | 1.75 | % | | | | 0.75 | % | | | | — | |
Sterling Capital SMID Opportunities Fund | | | | 1.04 | % | | | | 1.79 | % | | | | 0.79 | % | | | | — | |
Sterling Capital Stratton Small Cap Value Fund | | | | 1.30 | % | | | | 2.05 | % | | | | 1.05 | % | | | | — | |
Sterling Capital Total Return Bond Fund | | | | 0.70 | % | | | | 1.45 | % | | | | 0.45 | % | | | | 0.95 | % |
192
|
Sterling Capital Funds |
Notes to Financial Statements — (continued) |
September 30, 2018 |
In addition, Sterling Capital has contractually agreed to limit the expenses of the Class R6 shares based on average daily net assets for the following funds for the period February 1, 2018 through January 31, 2019 as follows:
| | | | | |
| | | Class R6 |
Sterling Capital Behavioral Large Cap Value Equity Fund | | 0.58% |
Sterling Capital Mid Value Fund | | 0.83% |
Sterling Capital Behavioral Small Cap Value Equity Fund | | 0.73% |
Sterling Capital Special Opportunities Fund | | 0.78% |
Sterling Capital Equity Income Fund | | 0.66% |
Sterling Capital Behavioral International Equity Fund | | 0.62% |
Sterling Capital Total Return Bond Fund | | 0.35% |
Sterling Capital serves as the administrator to the Funds pursuant to an administration agreement. The Funds (except the Sterling Capital Strategic Allocation Balanced Fund and Sterling Capital Strategic Allocation Growth Fund) pay their portion of a fee to Sterling Capital for providing administration services based on the aggregate assets of the Funds, excluding the assets of the Funds of Funds, at a rate of 0.1075% on the first $3.5 billion of average net assets, 0.075% on the next $1 billion of average net assets; 0.06% on the next $1.5 billion of average net assets; and 0.04% of average net assets over $6 billion. Expenses incurred are reflected on the Statements of Operations as “Administration fees.” Pursuant to a sub-administration agreement with Sterling Capital, The Bank of New York Mellon (“the “Sub-Administrator”), serves as the sub-administrator to the Funds subject to the general supervision of the Board and Sterling Capital. For these services, The Bank of New York Mellon is entitled to a fee payable by Sterling Capital. The Bank of New York Mellon also serves as the Funds’ fund accountant and receives compensation by the Funds for these services. Expenses incurred are reflected on the Statements of Operations as “Fund accounting fees.”
BNY Mellon Investment Servicing (US) Inc. serves as the Funds’ transfer agent and receives compensation by the Funds for these services. Expenses incurred are reflected on the Statements of Operations as “Transfer agent fees.”
Sterling Capital’s Chief Compliance Officer (“CCO”) serves as the Funds’ CCO. The CCO’s compensation is reviewed and approved by the Funds’ Board and paid by Sterling Capital. However, the Funds reimburse Sterling Capital for their allocable portion of the CCO’s base salary and incentive pay. As a result, the CCO fee paid by the Funds is only part of the total compensation received by the CCO.
For the fiscal year ended September 30, 2018, the Funds paid $13,970 in brokerage fees to BB&T Securities LLC on the execution of purchases and sales of the Funds’ portfolio investments.
The Funds have adopted a Distribution and Shareholder Services Plan (the “Plan”) in accordance with Rule 12b-1 under the 1940 Act. Sterling Capital Distributors, LLC (“the Distributor”) serves as distributor to the Funds pursuant to an underwriting agreement. The Plan provides for payments to the Distributor of up to 0.25%, 1.00% and 0.50% of the average daily net assets of the Class A Shares, Class C Shares, and Class R Shares, respectively. The Distributor is entitled to receive commissions on sales of shares of the Variable Net Asset Value Funds. For the fiscal year ended September 30, 2018, the Distributor received $263,260 from commissions earned on sales of shares of the Variable Net Asset Value Funds. Commissions paid to affiliated broker-dealers during the fiscal year ended September 30, 2018 were $2,458. The fees may be used by the Distributor to pay banks, broker dealers and other institutions, including affiliates of the Advisor.
Sterling Capital, the Distributor and/or their affiliates may pay out of their own assets (and not as an additional charge to a fund) compensation to selected affiliated and unaffiliated brokers, dealers and other financial intermediaries in connection with the sale and distribution of the shares and/or the retention and/or servicing of Fund investors and Fund shares. These payments, sometimes referred to as “revenue sharing” payments are payments over and above any sales charges (including Rule 12b-1 fees) and service fees paid by the Funds. The amount of these payments is determined at the discretion of the Advisor, the Distributor and/or their affiliates from time to time, may be substantial, and may be different for different financial advisors. Receipt of, or the prospect of receiving, this additional compensation may influence your financial intermediary’s recommendation of a Fund or of a particular share class of a Fund.
Certain Officers and a Trustee of the Funds are affiliated with Sterling Capital or the Sub-Administrator. Such Officers and Trustee receive no compensation from the Funds for serving in their respective roles. Each of the Trustees who are not interested persons (as defined in the 1940 Act) of the Trust who serve on the Board are compensated at the annual rate of $80,000 plus
193
|
Sterling Capital Funds |
Notes to Financial Statements — (continued) |
September 30, 2018 |
$5,000 for each regularly scheduled quarterly meeting attended, $4,000 for each special meeting attended in person and $1,500 for each special meeting attended by telephone, plus reimbursement for certain out of pocket expenses. Each Trustee serving on a Committee of the Board receives a fee of $4,000 for each Committee meeting attended in person and $1,500 for each Committee meeting attended by telephone, plus reimbursement for certain out of pocket expenses. Committee meeting fees are only paid when such Committee meetings are not held in conjunction with a regular board meeting. Additionally, the Chairman of the Board receives additional compensation at the annual rate of $20,000, the Audit Committee Chairman receives additional compensation at the annual rate of $15,000, and the Chairman of the Nominations Committee receives additional compensation at the annual rate of $6,000. The fees are allocated across the Trust based upon relative net assets.
| | 7. | Concentration of Credit Risk: |
The Tax-Free Funds invest primarily in debt instruments of municipal issuers in their respective states. The issuers’ abilities to meet their obligations may be affected by economic developments in a specific state or region.
U.S. Bank, N.A. has made available a credit facility to the Trust, pursuant to an umbrella credit agreement (“the Agreement”). The primary purpose of the Agreement is to allow the Trust to avoid security liquidations that Sterling Capital believes are unfavorable to shareholders. Under the Agreement, an aggregate uncommitted amount of $100,000,000 has been made available for use by all funds of the Trust. Outstanding principal amounts under the Agreement bear interest at a rate per annum equal to the Prime Rate minus two percent (2%), but never at a rate of less than one percent (1%) per annum. The Agreement will expire on March 27, 2019. During the fiscal year ended September 30, 2018, each of the following Funds utilized its line of credit:
| | | | | | | | | | | | | | | | | | | | | | | | | |
| | | Average
Interest Rate | | Average
Loan Balance | | Number of
Days Outstanding | | Interest Expense
Incurred | | Maximum Amount
Borrowed |
Sterling Capital Equity Income Fund | | | | 2.50 | % | | | $ | 10,871,500 | | | | | 4 | | | | $ | 3,020 | | | | $ | 12,736,000 | |
Sterling Capital Stratton Real Estate | | | | 2.58 | % | | | | 227,000 | | | | | 3 | | | | | 51 | | | | | 511,000 | |
Sterling Capital Short Duration Bond Fund | | | | 2.25 | % | | | | 17,000 | | | | | 4 | | | | | 4 | | | | | 38,000 | |
Sterling Capital Corporate Fund | | | | 2.75 | % | | | | 115,000 | | | | | 3 | | | | | 26 | | | | | 115,000 | |
Sterling Capital Securitized Opportunities Fund | | | | 3.00 | % | | | | 264,000 | | | | | 1 | | | | | 22 | | | | | 264,000 | |
| | 9. | Federal Tax Information: |
It is the policy of each Fund to continue to qualify as a regulated investment company as defined in the Internal Revenue Code of 1986, as amended (the “Code”), by complying with the applicable provisions of the Code and to make distributions of net investment income and net realized capital gains sufficient to relieve it from all, or substantially all, federal income taxes. Accordingly, no provision for federal income tax was required in the Funds’ financial statements.
Management evaluates its tax positions to determine if the tax positions taken meet the minimum recognition threshold in connection with accounting for uncertainties in income tax positions taken or expected to be taken for the purposes of measuring and recognizing tax liabilities in the financial statements. Recognition of tax benefits of an uncertain tax position is required only when the position is “more likely than not” to be sustained assuming examination by taxing authorities. The Funds recognize interest and penalties, if any, related to unrecognized tax benefits as income tax expense. During the period, the Funds did not incur any interest or penalties.
Management has analyzed the Funds’ tax positions taken on federal income tax returns for all open tax years (current and prior three tax years), and has concluded that no provision for federal income tax was required in the Funds’ financial statements. The Funds’ federal income and excise tax returns for tax years for which the applicable statutes of limitations have not expired are subject to examination by the Internal Revenue Service and state departments of revenue.
Capital losses originating in taxable years beginning on or before December 22, 2010 are permitted to be carried forward for eight taxable years; in the year to which they are carried forward, such losses are treated as short-term capital losses that first offset any short-term capital gains, and then offset any long-term capital gains. Under the Regulated Investment Company Modernization Act of 2010, capital losses originating in taxable years beginning after December 22, 2010 (“post-2010 capital losses”) are carried forward indefinitely. Furthermore, post-2010 capital losses will retain their character as either short-term or long-term capital losses rather than being considered all short-term capital losses as under previous law.
194
|
Sterling Capital Funds |
Notes to Financial Statements — (continued) |
September 30, 2018 |
At September 30, 2018, the following Funds had net capital loss carryforwards available to offset future net capital gains, if any, to the extent provided by the Code and the Treasury regulations:
| | | | | | | | | | | | | | | | | | | | |
| | | Amount With No Expiration* | | | | |
| | | Short-term | | Long-term | | | | |
| | | Losses | | Losses | | Amount | | Expires |
Sterling Capital Ultra Short Bond Fund | | | $ | 184,261 | | | | $ | 830,198 | | | | $ | — | | | | | — | |
Sterling Capital Short Duration Bond Fund | | | | 1,526,578 | | | | | 6,186,114 | | | | | — | | | | | — | |
Sterling Capital Short Duration Bond Fund | | | | — | | | | | — | | | | | 385,647 | | | | | 2019 | |
Sterling Capital Intermediate U.S. Government Fund | | | | 287,649 | | | | | 488,276 | | | | | — | | | | | — | |
Sterling Capital Intermediate U.S. Government Fund | | | | — | | | | | — | | | | | 37,850 | | | | | 2019 | |
Sterling Capital Total Return Bond Fund | | | | 4,836,186 | | | | | 5,960,736 | | | | | — | | | | | — | |
Sterling Capital Securitized Opportunities Fund | | | | 1,402,606 | | | | | 409,309 | | | | | — | | | | | — | |
Sterling Capital North Carolina Intermediate Tax-Free Fund | | | | 1,309,715 | | | | | — | | | | | — | | | | | — | |
Sterling Capital South Carolina Intermediate Tax-Free Fund | | | | 600,034 | | | | | — | | | | | — | | | | | — | |
Sterling Capital Virginia Intermediate Tax-Free Fund | | | | 400,485 | | | | | — | | | | | — | | | | | — | |
Sterling Capital Diversified Income Fund | | | | 1,120,037 | | | | | — | | | | | — | | | | | — | |
Sterling Capital Strategic Allocation Balanced Fund | | | | — | | | | | — | | | | | 3,143,583 | | | | | 2019 | |
Sterling Capital Strategic Allocation Growth Fund | | | | — | | | | | — | | | | | 4,640,596 | | | | | 2019 | |
| | * | Post-2010 Capital Losses: Must be utilized prior to losses subject to expiration. |
Capital loss carryforwards utilized in the current year were as follows:
| | | | | |
| | | Utilized
Capital Loss
Carryforwards |
Sterling Capital Diversified Income Fund | | | $ | 33,521 | |
Sterling Capital Strategic Allocation Balanced Fund | | | | 895,539 | |
Sterling Capital Strategic Allocation Growth Fund | | | | 869,169 | |
The character of income and gains distributed is determined in accordance with the Code and the Treasury regulations, which may differ from U.S. GAAP. These “book/tax” differences are either considered temporary or permanent in nature. To the extent these differences are permanent in nature (e.g., reclass of net operating losses, disposition of market discount and market premium bonds, paydown gains and losses, mortgage dollar roll gains and losses, short dividend expense, the character of distributions and investments in regulated investment companies, partnerships, distributions in connection with fund share redemptions, royalty trusts and passive foreign investment companies (“PFICs”), such amounts are reclassified within the composition of net assets based on their federal tax-basis treatment; temporary differences do not require reclassification. These reclassifications have no impact on net assets or net asset values per share.
As of September 30, 2018, these reclassifications were as follows:
| | | | | | | | | | |
| | | Increase/
(Decrease)
Paid-in-Capital | | Increase/
(Decrease)
Distributable Earnings |
Sterling Capital Behavioral Large Cap Value Equity Fund | | | $ | 1,385,999 | | | | $ | (1,385,999 | ) |
Sterling Capital Mid Value Fund | | | | 2,635,350 | | | | | (2,635,350 | ) |
Sterling Capital Behavioral Small Cap Value Equity Fund | | | | 788,410 | | | | | (788,410 | ) |
Sterling Capital Special Opportunities Fund | | | | 5,545,350 | | | | | (5,545,350 | ) |
Sterling Capital Equity Income Fund | | | | 11,856,126 | | | | | (11,856,126 | ) |
Sterling Capital Behavioral International Equity Fund | | | | 25,138 | | | | | (25,138 | ) |
Sterling Capital SMID Opportunities Fund | | | | (26,644 | ) | | | | 26,644 | |
Sterling Capital Stratton Mid Cap Value Fund | | | | 133,262 | | | | | (133,262 | ) |
Sterling Capital Stratton Real Estate Fund | | | | 284,170 | | | | | (284,170 | ) |
Sterling Capital Stratton Small Cap Value Fund | | | | 8,224,188 | | | | | (8,224,188 | ) |
Sterling Capital Kentucky Intermediate Tax-Free Fund | | | | 5,346 | | | | | (5,346 | ) |
Sterling Capital Maryland Intermediate Tax-Free Fund | | | | 30,874 | | | | | (30,874 | ) |
Sterling Capital West Virginia Intermediate Tax-Free Fund | | | | 6,539 | | | | | (6,539 | ) |
195
|
Sterling Capital Funds |
Notes to Financial Statements — (continued) |
September 30, 2018 |
| | | | | | | | | | |
| | | Increase/
(Decrease)
Paid-in-Capital | | Increase/
(Decrease)
Distributable Earnings |
Sterling Capital Diversified Income Fund | | | | (5,148,573 | ) | | | | 5,148,573 | |
Sterling Capital Strategic Allocation Growth Fund | | | | (970,749 | ) | | | | 970,749 | |
The tax character of distributions paid to shareholders during the fiscal year ended September 30, 2018 was as follows:
| | | | | | | | | | | | | | | | | | | | | | | | | | | | | | |
| | | Distributions paid from | | | | | | | | |
| | | Ordinary
Income | | Net
Long-Term
Gains | | Total Taxable
Distributions | | Return
Of Capital | | Tax Exempt
Distributions | | Total
Distributions
Paid* |
Sterling Capital Behavioral Large Cap Value Equity Fund | | | $ | 7,229,983 | | | | $ | 4,075,406 | | | | $ | 11,305,389 | | | | $ | — | | | | $ | — | | | | $ | 11,305,389 | |
Sterling Capital Mid Value Fund | | | | 1,268,408 | | | | | 33,901,796 | | | | | 35,170,204 | | | | | — | | | | | — | | | | | 35,170,204 | |
Sterling Capital Behavioral Small Cap Value Equity Fund | | | | 2,095,349 | | | | | 8,361,015 | | | | | 10,456,364 | | | | | — | | | | | — | | | | | 10,456,364 | |
Sterling Capital Special Opportunities Fund | | | | 8,064,108 | | | | | 94,001,292 | | | | | 102,065,400 | | | | | — | | | | | — | | | | | 102,065,400 | |
Sterling Capital Equity Income Fund | | | | 28,256,090 | | | | | 155,261,074 | | | | | 183,517,164 | | | | | — | | | | | — | | | | | 183,517,164 | |
Sterling Capital Behavioral International Equity Fund | | | | 3,066,437 | | | | | 115,708 | | | | | 3,182,145 | | | | | — | | | | | — | | | | | 3,182,145 | |
Sterling Capital SMID Opportunities Fund | | | | 147,580 | | | | | 41,361 | | | | | 188,941 | | | | | — | | | | | — | | | | | 188,941 | |
Sterling Capital Stratton Mid Cap Value Fund | | | | 308,630 | | | | | 2,385,169 | | | | | 2,693,799 | | | | | — | | | | | — | | | | | 2,693,799 | |
Sterling Capital Stratton Real Estate Fund | | | | 2,129,991 | | | | | 2,715,815 | | | | | 4,845,806 | | | | | — | | | | | — | | | | | 4,845,806 | |
Sterling Capital Stratton Small Cap Value Fund | | | | 3,688,565 | | | | | 107,965,197 | | | | | 111,653,762 | | | | | — | | | | | — | | | | | 111,653,762 | |
Sterling Capital Ultra Short Bond Fund | | | | 682,478 | | | | | — | | | | | 682,478 | | | | | — | | | | | — | | | | | 682,478 | |
Sterling Capital Short Duration Bond Fund | | | | 2,844,454 | | | | | — | | | | | 2,844,454 | | | | | — | | | | | — | | | | | 2,844,454 | |
Sterling Capital Intermediate U.S. Government Fund | | | | 579,826 | | | | | — | | | | | 579,826 | | | | | — | | | | | — | | | | | 579,826 | |
Sterling Capital Total Return Bond Fund | | | | 35,749,155 | | | | | — | | | | | 35,749,155 | | | | | — | | | | | — | | | | | 35,749,155 | |
Sterling Capital Corporate Fund | | | | 903,406 | | | | | 185,154 | | | | | 1,088,560 | | | | | — | | | | | — | | | | | 1,088,560 | |
Sterling Capital Securitized Opportunities Fund | | | | 1,177,848 | | | | | — | | | | | 1,177,848 | | | | | — | | | | | — | | | | | 1,177,848 | |
Sterling Capital Kentucky Intermediate Tax-Free Fund | | | | 4,994 | | | | | 38,542 | | | | | 43,536 | | | | | — | | | | | 252,800 | | | | | 296,336 | |
Sterling Capital Maryland Intermediate Tax-Free Fund | | | | 5,822 | | | | | 161,923 | | | | | 167,745 | | | | | — | | | | | 441,393 | | | | | 609,138 | |
Sterling Capital North Carolina Intermediate Tax-Free Fund | | | | 42,277 | | | | | — | | | | | 42,277 | | | | | — | | | | | 4,312,450 | | | | | 4,354,727 | |
Sterling Capital South Carolina Intermediate Tax-Free Fund | | | | 23,099 | | | | | — | | | | | 23,099 | | | | | — | | | | | 1,724,027 | | | | | 1,747,126 | |
Sterling Capital Virginia Intermediate Tax-Free Fund | | | | 17,056 | | | | | — | | | | | 17,056 | | | | | — | | | | | 1,933,651 | | | | | 1,950,707 | |
Sterling Capital West Virginia Intermediate Tax-Free Fund | | | | 26,262 | | | | | 112,664 | | | | | 138,926 | | | | | — | | | | | 1,948,245 | | | | | 2,087,171 | |
Sterling Capital Diversified Income Fund | | | | 887,840 | | | | | — | | | | | 887,840 | | | | | — | | | | | — | | | | | 887,840 | |
Sterling Capital Strategic Allocation Balanced Fund | | | | 666,598 | | | | | — | | | | | 666,598 | | | | | — | | | | | — | | | | | 666,598 | |
Sterling Capital Strategic Allocation Growth Fund | | | | 489,319 | | | | | — | | | | | 489,319 | | | | | — | | | | | — | | | | | 489,319 | |
| | * | Total distributions paid may differ from the Statements of Changes in Net Assets because distributions are recognized when actually paid for tax purposes. The Funds may also utilize equalization accounting for tax purposes and designate earnings and profits, including net realized gains distributed to shareholders on redemption of shares, as part of the dividends. |
196
|
Sterling Capital Funds |
Notes to Financial Statements — (continued) |
September 30, 2018 |
The tax character of distributions paid to shareholders during the fiscal year ended September 30, 2017 was as follows:
| | | | | | | | | | | | | | | | | | | | | | | | | | | | | | |
| | | Distributions paid from | | | | | | | | |
| | | Ordinary
Income | | Net
Long-Term
Gains | | Total Taxable
Distributions | | Return
Of Capital | | Tax Exempt
Distributions | | Total
Distributions
Paid* |
Sterling Capital Behavioral Large Cap Value Equity Fund | | | $ | 5,098,249 | | | | $ | 14,365 | | | | $ | 5,112,614 | | | | $ | — | | | | $ | — | | | | $ | 5,112,614 | |
Sterling Capital Mid Value Fund | | | | 859,274 | | | | | 19,688,320 | | | | | 20,547,594 | | | | | — | | | | | — | | | | | 20,547,594 | |
Sterling Capital Behavioral Small Cap Value Equity Fund | | | | 1,165,485 | | | | | 377,136 | | | | | 1,542,621 | | | | | — | | | | | — | | | | | 1,542,621 | |
Sterling Capital Special Opportunities Fund | | | | 3,161,157 | | | | | 28,041,508 | | | | | 31,202,665 | | | | | — | | | | | — | | | | | 31,202,665 | |
Sterling Capital Equity Income Fund | | | | 31,049,429 | | | | | 19,540,561 | | | | | 50,589,990 | | | | | — | | | | | — | | | | | 50,589,990 | |
Sterling Capital Behavioral International Equity Fund | | | | 1,203,608 | | | | | 437 | | | | | 1,204,045 | | | | | — | | | | | — | | | | | 1,204,045 | |
Sterling Capital SMID Opportunities Fund | | | | 22,172 | | | | | 146 | | | | | 22,318 | | | | | — | | | | | — | | | | | 22,318 | |
Sterling Capital Stratton Mid Cap Value Fund | | | | 91,752 | | | | | 368,607 | | | | | 460,359 | | | | | — | | | | | — | | | | | 460,359 | |
Sterling Capital Stratton Real Estate Value Fund | | | | 2,833,402 | | | | | 4,765,485 | | | | | 7,598,887 | | | | | — | | | | | — | | | | | 7,598,887 | |
Sterling Capital Stratton Small Cap Value Fund | | | | 2,313,979 | | | | | 72,021,026 | | | | | 74,335,005 | | | | | — | | | | | — | | | | | 74,335,005 | |
Sterling Capital Ultra Short Bond Fund | | | | 704,198 | | | | | — | | | | | 704,198 | | | | | — | | | | | — | | | | | 704,198 | |
Sterling Capital Short Duration Bond Fund | | | | 2,151,401 | | | | | — | | | | | 2,151,401 | | | | | — | | | | | 21,626 | | | | | 2,173,027 | |
Sterling Capital Intermediate U.S. Government Fund | | | | 546,204 | | | | | — | | | | | 546,204 | | | | | — | | | | | — | | | | | 546,204 | |
Sterling Capital Total Return Bond Fund | | | | 27,102,666 | | | | | — | | | | | 27,102,666 | | | | | — | | | | | 32,682 | | | | | 27,135,348 | |
Sterling Capital Corporate Fund | | | | 1,019,559 | | | | | 50,514 | | | | | 1,070,073 | | | | | — | | | | | — | | | | | 1,070,073 | |
Sterling Capital Securitized Opportunities Fund | | | | 1,151,304 | | | | | — | | | | | 1,151,304 | | | | | — | | | | | — | | | | | 1,151,304 | |
Sterling Capital Kentucky Intermediate Tax-Free Fund | | | | — | | | | | 164,128 | | | | | 164,128 | | | | | — | | | | | 272,452 | | | | | 436,580 | |
Sterling Capital Maryland Intermediate Tax-Free Fund | | | | 13,521 | | | | | 215,670 | | | | | 229,191 | | | | | — | | | | | 557,772 | | | | | 786,963 | |
Sterling Capital North Carolina Intermediate Tax-Free Fund | | | | 11,347 | | | | | 699,697 | | | | | 711,044 | | | | | — | | | | | 4,582,294 | | | | | 5,293,338 | |
Sterling Capital South Carolina Intermediate Tax-Free Fund | | | | — | | | | | 9,915 | | | | | 9,915 | | | | | — | | | | | 1,766,112 | | | | | 1,776,027 | |
Sterling Capital Virginia Intermediate Tax-Free Fund | | | | — | | | | | 870,685 | | | | | 870,685 | | | | | — | | | | | 2,254,349 | | | | | 3,125,034 | |
Sterling Capital West Virginia Intermediate Tax-Free Fund | | | | — | | | | | 452,742 | | | | | 452,742 | | | | | — | | | | | 2,145,342 | | | | | 2,598,084 | |
Sterling Capital Diversified Income Fund | | | | 1,282,181 | | | | | — | | | | | 1,282,181 | | | | | — | | | | | — | | | | | 1,282,181 | |
Sterling Capital Strategic Allocation Balanced Fund | | | | 438,670 | | | | | — | | | | | 438,670 | | | | | — | | | | | — | | | | | 438,670 | |
Sterling Capital Strategic Allocation Growth Fund | | | | 247,677 | | | | | — | | | | | 247,677 | | | | | — | | | | | — | | | | | 247,677 | |
| | * | Total distributions paid may differ from the Statements of Changes in Net Assets because distributions are recognized when actually paid for tax purposes. The Funds also may utilize equalization accounting for tax purposes and designate earnings and profits, including net realized gains distributed to shareholders on redemption of shares, as part of the dividends. |
As of September 30, 2018, the components of accumulated earnings (deficit) on a tax basis were as follows:
| | | | | | | | | | | | | | | | | | | | | | | | | | | | | | | | | | | |
| | | Undistributed
Ordinary
Income/Tax
Exempt Income | | Undistributed
Long Term
Capital Gains | | Accumulated
Earnings | | Distributions
Payable | | Accumulated
Capital and
Other Losses | | Unrealized
Appreciation
(Depreciation)* | | Total
Accumulated
Earnings
(Deficit) |
Sterling Capital Behavioral Large Cap Value Equity Fund | | | $ | — | | | | $ | 23,981,551 | | | | $ | 23,981,551 | | | | $ | — | | | | $ | — | | | | $ | 48,470,180 | | | | $ | 72,451,731 | |
Sterling Capital Mid Value Fund | | | | 15,472,873 | | | | | 28,630,115 | | | | | 44,102,988 | | | | | — | | | | | — | | | | | 123,226,570 | | | | | 167,329,558 | |
Sterling Capital Behavioral Small Cap Value Equity Fund | | | | 2,496,875 | | | | | 23,774,664 | | | | | 26,271,539 | | | | | — | | | | | — | | | | | 31,724,127 | | | | | 57,995,666 | |
Sterling Capital Special Opportunities Fund | | | | — | | | | | 75,872,012 | | | | | 75,872,012 | | | | | — | | | | | — | | | | | 421,870,322 | | | | | 497,742,334 | |
Sterling Capital Equity Income Fund | | | | 2,911,821 | | | | | 113,890,331 | | | | | 116,802,152 | | | | | — | | | | | — | | | | | 508,415,043 | | | | | 625,217,195 | |
Sterling Capital Behavioral International Equity Fund | | | | 2,224,994 | | | | | 2,948,087 | | | | | 5,173,081 | | | | | — | | | | | — | | | | | 6,081,881 | | | | | 11,254,962 | |
Sterling Capital SMID Opportunities Fund | | | | — | | | | | — | | | | | — | | | | | — | | | | | (19,335 | ) | | | | 1,749,592 | | | | | 1,730,257 | |
Sterling Capital Stratton Mid Cap Value Fund | | | | 159,415 | | | | | 3,928,548 | | | | | 4,087,963 | | | | | — | | | | | — | | | | | 24,527,027 | | | | | 28,614,990 | |
Sterling Capital Stratton Real Estate Fund | | | | 471,849 | | | | | 2,986,060 | | | | | 3,457,909 | | | | | — | | | | | — | | | | | 31,904,326 | | | | | 35,362,235 | |
Sterling Capital Stratton Small Cap Value Fund | | | | 1,710,570 | | | | | 70,227,126 | | | | | 71,937,696 | | | | | — | | | | | — | | | | | 659,957,445 | | | | | 731,895,141 | |
Sterling Capital Ultra Short Bond Fund | | | | 13,242 | | | | | — | | | | | 13,242 | | | | | (14,925 | ) | | | | (1,133,021 | ) | | | | (72,597 | ) | | | | (1,207,301 | ) |
Sterling Capital Short Duration Bond Fund | | | | 49,624 | | | | | — | | | | | 49,624 | | | | | (64,325 | ) | | | | (8,098,340 | ) | | | | (1,601,074 | ) | | | | (9,714,115 | ) |
Sterling Capital Intermediate U.S. Government Fund | | | | 167,398 | | | | | — | | | | | 167,398 | | | | | (30,869 | ) | | | | (813,775 | ) | | | | (557,021 | ) | | | | (1,234,267 | ) |
197
|
Sterling Capital Funds |
Notes to Financial Statements — (continued) |
September 30, 2018 |
| | | | | | | | | | | | | | | | | | | | | | | | | | | | | | | | | | | |
| | | Undistributed
Ordinary
Income/Tax
Exempt Income | | Undistributed
Long Term
Capital Gains | | Accumulated
Earnings | | Distributions
Payable | | Accumulated
Capital and
Other Losses | | Unrealized
Appreciation
(Depreciation)* | | Total
Accumulated
Earnings
(Deficit) |
Sterling Capital Total Return Bond Fund | | | | 2,102,966 | | | | | — | | | | | 2,102,966 | | | | | (1,172,856 | ) | | | | (21,992,213 | ) | | | | (28,854,507 | ) | | | | (49,916,610 | ) |
Sterling Capital Corporate Fund | | | | — | | | | | — | | | | | — | | | | | (80 | ) | | | | (170,097 | ) | | | | (351,951 | ) | | | | (522,128 | ) |
Sterling Capital Securitized Opportunities Fund | | | | 5,560 | | | | | — | | | | | 5,560 | | | | | (5,480 | ) | | | | (1,986,246 | ) | | | | (657,079 | ) | | | | (2,643,245 | ) |
Sterling Capital Kentucky Intermediate Tax- Free Fund | | | | 26,193 | | | | | 65,025 | | | | | 91,218 | | | | | (13,383 | ) | | | | — | | | | | 7,854 | | | | | 85,689 | |
Sterling Capital Maryland Intermediate Tax- Free Fund | | | | 38,355 | | | | | 222,289 | | | | | 260,644 | | | | | (20,621 | ) | | | | — | | | | | 81,352 | | | | | 321,375 | |
Sterling Capital North Carolina Intermediate Tax-Free Fund | | | | 306,963 | | | | | — | | | | | 306,963 | | | | | (201,576 | ) | | | | (1,309,715 | ) | | | | 1,976,924 | | | | | 772,596 | |
Sterling Capital South Carolina Intermediate Tax-Free Fund | | | | 114,236 | | | | | — | | | | | 114,236 | | | | | (86,077 | ) | | | | (600,034 | ) | | | | 317,866 | | | | | (254,009 | ) |
Sterling Capital Virginia Intermediate Tax- Free Fund | | | | 171,119 | | | | | — | | | | | 171,119 | | | | | (107,915 | ) | | | | (400,485 | ) | | | | 770,462 | | | | | 433,181 | |
Sterling Capital West Virginia Intermediate Tax-Free Fund | | | | 188,203 | | | | | 116,568 | | | | | 304,771 | | | | | (107,077 | ) | | | | — | | | | | 475,138 | | | | | 672,832 | |
Sterling Capital Diversified Income Fund | | | | 27,633 | | | | | — | | | | | 27,633 | | | | | (2,573 | ) | | | | (1,120,037 | ) | | | | 613,939 | | | | | (481,038 | ) |
Sterling Capital Strategic Allocation Balanced Fund | | | | 5,914 | | | | | — | | | | | 5,914 | | | | | (98 | ) | | | | (3,143,583 | ) | | | | 3,006,625 | | | | | (131,142 | ) |
Sterling Capital Strategic Allocation Growth Fund | | | | 2,821 | | | | | — | | | | | 2,821 | | | | | (103 | ) | | | | (4,640,596 | ) | | | | 2,944,878 | | | | | (1,693,000 | ) |
| | * | The primary differences between book basis and tax basis unrealized appreciation (depreciation) were due to the deferral of losses on wash sales, recognition of gain on constructive sales, basis adjustments on partnership interests, hybrid securities, royalty trusts, PFICs and the deferral of market discount and premium until point of sale. |
Under current tax law, net capital losses or, if there are no such losses, net long-term capital losses or net short-term capital losses realized after October 31, net ordinary losses from the sale, exchange or other taxable disposition of property realized after October 31 and other net ordinary losses realized after December 31 of a Fund’s taxable year may be deferred and treated as occurring on the first business day of the following taxable year for tax purposes. The following Funds had deferred qualified late-year losses, which will be treated as arising on the first business day of the taxable year ending September 30, 2018:
| | | | | | | | | | | | | | | |
| | | Qualified
Late-Year
Ordinary
Losses | | Qualified
Late Year
Short-term
Capital Losses | | Qualified
Late Year
Long-term
Capital Losses |
Sterling Capital SMID Opportunities Fund | | | $ | 14,748 | | | | $ | 4,587 | | | | $ | — | |
Sterling Capital Ultra Short Bond Fund | | | | — | | | | | 20,977 | | | | | 97,585 | |
Sterling Capital Total Return Bond Fund | | | | — | | | | | 5,374,826 | | | | | 5,820,465 | |
Sterling Capital Corporate Fund | | | | — | | | | | 184,590 | | | | | (14,493 | ) |
Sterling Capital Securitized Opportunities Fund | | | | — | | | | | 19,424 | | | | | 154,907 | |
198
|
Sterling Capital Funds |
Notes to Financial Statements — (continued) |
September 30, 2018 |
As of September 30, 2018, federal income tax cost, gross unrealized appreciation and gross unrealized depreciation on securities were as follows:
| | | | | | | | | | | | | | | | | | | | |
| | | Tax Cost | | Gross Tax
Unrealized
Appreciation | | Gross Tax
Unrealized
Depreciation | | Net Tax
Unrealized
Appreciation
(Depreciation) |
Sterling Capital Behavioral Large Cap Value Equity Fund | | | $ | 264,331,900 | | | | $ | 50,508,801 | | | | $ | (2,038,619) | | | | $ | 48,470,182 | |
Sterling Capital Mid Value Fund | | | | 520,621,229 | | | | | 155,021,645 | | | | | (31,795,075 | ) | | | | 123,226,570 | |
Sterling Capital Behavioral Small Cap Value Equity Fund | | | | 206,447,181 | | | | | 36,021,490 | | | | | (4,297,363 | ) | | | | 31,724,127 | |
Sterling Capital Special Opportunities Fund | | | | 780,013,690 | | | | | 428,337,185 | | | | | (6,466,864 | ) | | | | 421,870,321 | |
Sterling Capital Equity Income Fund | | | | 1,166,507,125 | | | | | 522,196,678 | | | | | (13,781,634 | ) | | | | 508,415,044 | |
Sterling Capital Behavioral International Equity Fund | | | | 76,149,801 | | | | | 8,902,080 | | | | | (2,818,114 | ) | | | | 6,083,966 | |
Sterling Capital SMID Opportunities Fund | | | | 7,474,098 | | | | | 1,845,486 | | | | | (95,893 | ) | | | | 1,749,593 | |
Sterling Capital Stratton Mid Cap Value Fund | | | | 42,120,018 | | | | | 25,270,810 | | | | | (743,784 | ) | | | | 24,527,026 | |
Sterling Capital Stratton Real Estate Fund | | | | 59,830,324 | | | | | 32,233,201 | | | | | (328,874 | ) | | | | 31,904,327 | |
Sterling Capital Stratton Small Cap Value Fund | | | | 639,397,089 | | | | | 668,992,265 | | | | | (9,034,819 | ) | | | | 659,957,446 | |
Sterling Capital Ultra Short Bond Fund | | | | 32,071,864 | | | | | 29,967 | | | | | (102,564 | ) | | | | (72,597 | ) |
Sterling Capital Short Duration Bond Fund | | | | 132,802,523 | | | | | 189,666 | | | | | (1,790,739 | ) | | | | (1,601,073 | ) |
Sterling Capital Intermediate U.S. Government Fund | | | | 22,017,998 | | | | | 83,940 | | | | | (640,961 | ) | | | | (557,021 | ) |
Sterling Capital Total Return Bond Fund | | | | 1,239,484,806 | | | | | 4,619,823 | | | | | (33,474,329 | ) | | | | (28,854,506 | ) |
Sterling Capital Corporate Fund | | | | 31,368,584 | | | | | 72,203 | | | | | (424,155 | ) | | | | (351,952 | ) |
Sterling Capital Securitized Opportunities Fund | | | | 37,796,127 | | | | | 320,002 | | | | | (977,080 | ) | | | | (657,078 | ) |
Sterling Capital Kentucky Intermediate Tax-Free Fund | | | | 11,208,840 | | | | | 137,390 | | | | | (129,536 | ) | | | | 7,854 | |
Sterling Capital Maryland Intermediate Tax-Free Fund | | | | 18,771,684 | | | | | 219,099 | | | | | (137,748 | ) | | | | 81,351 | |
Sterling Capital North Carolina Intermediate Tax-Free Fund | | | | 169,934,264 | | | | | 2,741,785 | | | | | (764,862 | ) | | | | 1,976,923 | |
Sterling Capital South Carolina Intermediate Tax-Free Fund | | | | 76,741,164 | | | | | 706,880 | | | | | (389,014 | ) | | | | 317,866 | |
Sterling Capital Virginia Intermediate Tax-Free Fund | | | | 81,552,373 | | | | | 1,127,252 | | | | | (356,790 | ) | | | | 770,462 | |
Sterling Capital West Virginia Intermediate Tax-Free Fund | | | | 78,133,650 | | | | | 1,162,322 | | | | | (687,184 | ) | | | | 475,138 | |
Sterling Capital Diversified Income Fund | | | | 19,722,757 | | | | | 975,746 | | | | | (361,807 | ) | | | | 613,939 | |
Sterling Capital Strategic Allocation Balanced Fund | | | | 26,242,453 | | | | | 3,239,911 | | | | | (233,286 | ) | | | | 3,006,625 | |
Sterling Capital Strategic Allocation Growth Fund | | | | 19,938,786 | | | | | 3,230,805 | | | | | (285,927 | ) | | | | 2,944,878 | |
Management has evaluated the need for the disclosure and/or adjustments resulting from subsequent events through the date the financial statements were issued, and has noted no events that require recognition or disclosure in the financial statements.
199
Report of Independent Registered Public Accounting Firm
The Board of Trustees and Shareholders of Sterling Capital Funds:
Opinion on the Financial Statements
We have audited the accompanying statements of assets and liabilities, including the schedules of portfolio investments, of the Sterling Capital Funds (the “Funds”) comprised of the Sterling Capital Behavioral Large Cap Value Equity Fund, Sterling Capital Mid Value Fund, Sterling Capital Behavioral Small Cap Value Equity Fund, Sterling Capital Special Opportunities Fund, Sterling Capital Equity Income Fund, Sterling Capital Behavioral International Equity Fund, Sterling Capital SMID Opportunities Fund, Sterling Capital Stratton Mid Cap Value Fund, Sterling Capital Stratton Real Estate Fund, Sterling Capital Stratton Small Cap Value Fund, Sterling Capital Ultra Short Bond Fund, Sterling Capital Short Duration Bond Fund, Sterling Capital Intermediate U.S. Government Fund, Sterling Capital Total Return Bond Fund, Sterling Capital Corporate Fund, Sterling Capital Securitized Opportunities Fund, Sterling Capital Kentucky Intermediate Tax-Free Fund, Sterling Capital Maryland Intermediate Tax-Free Fund, Sterling Capital North Carolina Intermediate Tax-Free Fund, Sterling Capital South Carolina Intermediate Tax-Free Fund, Sterling Capital Virginia Intermediate Tax-Free Fund, Sterling Capital West Virginia Intermediate Tax-Free Fund, Sterling Capital Diversified Income Fund, Sterling Capital Strategic Allocation Balanced Fund and Sterling Capital Strategic Allocation Growth Fund, as of September 30, 2018, the related statements of operations for the year then ended, the statements of changes in net assets for each of the years in the two year period then ended except for the Sterling Capital SMID Opportunities Fund, for which the period is from October 3, 2016 (commencement of operations) through September 30, 2018, and the related notes (collectively, the financial statements) and the financial highlights for each of the years or periods indicated therein. In our opinion, the financial statements and financial highlights present fairly, in all material respects, the financial position of the Funds as of September 30, 2018, the results of their operations for the year then ended, the changes in their net assets for each of the years or periods in the two year period then ended, and the financial highlights for each of the years or periods indicated therein, in conformity with U.S. generally accepted accounting principles. The financial highlights for each of the years or periods in the two-year period ended December 31, 2014 for the Sterling Capital Stratton Mid Cap Value Fund, Sterling Capital Stratton Real Estate Fund, and Sterling Capital Stratton Small Cap Value Fund were audited by other independent registered public accountants whose report, dated February 18, 2015, expressed an unqualified opinion on those financial highlights.
Basis for Opinion
These financial statements and financial highlights are the responsibility of the Funds’ management. Our responsibility is to express an opinion on these financial statements and financial highlights based on our audits. We are a public accounting firm registered with the Public Company Accounting Oversight Board (United States) (PCAOB) and are required to be independent with respect to the Funds in accordance with the U.S. federal securities laws and the applicable rules and regulations of the Securities and Exchange Commission and the PCAOB.
We conducted our audits in accordance with the standards of the PCAOB. Those standards require that we plan and perform the audit to obtain reasonable assurance about whether the financial statements and financial highlights are free of material misstatement, whether due to error or fraud. Our audits included performing procedures to assess the risks of material misstatement of the financial statements and financial highlights, whether due to error or fraud, and performing procedures that respond to those risks. Such procedures included examining, on a test basis, evidence regarding the amounts and disclosures in the financial statements and financial highlights. Such procedures also included confirmation of securities owned as of September 30, 2018, by correspondence with the custodian, the transfer agent of the underlying funds, and brokers or by other appropriate auditing procedures when replies from brokers were not received. Our audits also included evaluating the accounting principles used and significant estimates made by management, as well as evaluating the overall presentation of the financial statements and financial highlights. We believe that our audits provide a reasonable basis for our opinion.

We have served as the auditor of one or more Sterling Capital Funds investment companies since 1992.
Philadelphia, Pennsylvania
November 21, 2018
200
|
Sterling Capital Funds |
September 30, 2018 |
|
Notice to Shareholders (Unaudited)
All amounts and percentages below are based on financial information available as of the date of this annual report and, accordingly are subject to change. For each item it is the intention of the Funds to report the maximum amount permitted under the Internal Revenue Code and the regulations thereunder.
For the fiscal year ended September 30, 2018, each Fund is reporting the following items with regard to distributions paid during the year.
| | | | | | | | | | | | | | | | | | | | | | | | | | | | | | | | | | | |
| | | Long-Term
Capital
Gain | | Qualified
Dividend
Income % | | (for corporate
shareholders)
Dividends
Received
Deduction % | | Exempt-
Interest
Dividend | | U.S.
Government
Income | | Foreign
Taxes
Paid | | Foreign
Source
Income |
Sterling Capital Behavioral Large Cap Value Equity Fund | | | $ | 4,075,406 | | | | | 100.00 | % | | | | 100.00 | % | | | $ | — | | | | | — | | | | $ | — | | | | | — | |
Sterling Capital Mid Value Fund | | | | 33,901,796 | | | | | 35.85 | % | | | | 39.27 | % | | | | — | | | | | — | | | | | — | | | | | — | |
Sterling Capital Behavioral Small Cap Value Equity Fund | | | | 8,361,015 | | | | | 95.13 | % | | | | 93.18 | % | | | | — | | | | | — | | | | | — | | | | | — | |
Sterling Capital Special Opportunities Fund | | | | 94,001,292 | | | | | 100.00 | % | | | | 93.21 | % | | | | — | | | | | — | | | | | — | | | | | — | |
Sterling Capital Equity Income Fund | | | | 155,261,074 | | | | | 100.00 | % | | | | 100.00 | % | | | | — | | | | | — | | | | | — | | | | | — | |
Sterling Capital Behavioral International Equity Fund | | | | 115,708 | | | | | 79.49 | % | | | | 0.13 | % | | | | — | | | | | — | | | | | 156,830 | | | | | 100.00 | % |
Sterling Capital SMID Opportunities Fund | | | | 41,361 | | | | | 29.50 | % | | | | 30.69 | % | | | | — | | | | | — | | | | | — | | | | | — | |
Sterling Capital Stratton Mid Cap Value Fund | | | | 2,385,169 | | | | | 100.00 | % | | | | 100.00 | % | | | | — | | | | | — | | | | | — | | | | | — | |
Sterling Capital Stratton Real Estate Fund | | | | 2,715,815 | | | | | 4.11 | % | | | | 23.17 | % | | | | — | | | | | — | | | | | — | | | | | — | |
Sterling Capital Stratton Small Cap Value Fund | | | | 107,965,197 | | | | | 100.00 | % | | | | 100.00 | % | | | | — | | | | | — | | | | | — | | | | | — | |
Sterling Capital Ultra Short Bond Fund | | | | — | | | | | — | | | | | — | | | | | — | | | | | — | | | | | — | | | | | — | |
Sterling Capital Short Duration Bond Fund | | | | — | | | | | 0.02 | % | | | | 0.02 | % | | | | — | | | | | 0.82 | % | | | | — | | | | | — | |
Sterling Capital Intermediate U.S. Government Fund | | | | — | | | | | — | | | | | — | | | | | — | | | | | 34.38 | % | | | | — | | | | | — | |
Sterling Capital Total Return Bond Fund | | | | — | | | | | 0.48 | % | | | | 0.48 | % | | | | — | | | | | 4.95 | % | | | | — | | | | | — | |
Sterling Capital Corporate Fund | | | | 185,154 | | | | | — | | | | | — | | | | | — | | | | | 0.17 | % | | | | — | | | | | — | |
Sterling Capital Securitized Opportunities Fund | | | | — | | | | | — | | | | | — | | | | | — | | | | | 0.00 | % | | | | — | | | | | — | |
Sterling Capital Kentucky Intermediate Tax-Free Fund | | | | 38,542 | | | | | — | | | | | — | | | | | 252,800 | | | | | — | | | | | — | | | | | — | |
Sterling Capital Maryland Intermediate Tax-Free Fund | | | | 161,923 | | | | | — | | | | | — | | | | | 441,393 | | | | | — | | | | | — | | | | | — | |
Sterling Capital North Carolina Intermediate Tax-Free Fund | | | | — | | | | | — | | | | | — | | | | | 4,312,450 | | | | | — | | | | | — | | | | | — | |
Sterling Capital South Carolina Intermediate Tax-Free Fund | | | | — | | | | | — | | | | | — | | | | | 1,724,027 | | | | | — | | | | | — | | | | | — | |
Sterling Capital Virginia Intermediate Tax-Free Fund | | | | — | | | | | — | | | | | — | | | | | 1,933,651 | | | | | — | | | | | — | | | | | — | |
Sterling Capital West Virginia Intermediate Tax-Free Fund | | | | 112,664 | | | | | — | | | | | — | | | | | 1,948,245 | | | | | — | | | | | — | | | | | — | |
Sterling Capital Diversified Income Fund | | | | — | | | | | 1.81 | % | | | | 0.52 | % | | | | — | | | | | — | | | | | 5,453 | | | | | 6.34 | % |
Sterling Capital Strategic Allocation Balanced Fund | | | | — | | | | | 57.81 | % | | | | 20.95 | % | | | | — | | | | | 0.02 | % | | | | 10,021 | | | | | 31.40 | % |
Sterling Capital Strategic Allocation Growth Fund | | | | — | | | | | 75.92 | % | | | | 27.41 | % | | | | — | | | | | 1.20 | % | | | | 9,780 | | | | | 40.77 | % |
201
|
Sterling Capital Funds |
September 30, 2018 |
|
Other Information (Unaudited)
A description of the policies and procedures that the Funds use to determine how to vote proxies relating to portfolio securities is available (i) without charge, upon request, by calling 1-800-228-1872; and (ii) on the Securities and Exchange Commission’s (the “Commission”) website at www.sec.gov.
Information regarding how the Funds voted proxies relating to portfolio securities during the most recent 12-month period ended June 30th is available (i) without charge, upon request, by calling 1-800-228-1872 and (ii) on the Commission’s website at www.sec.gov.
The Funds file complete Schedules of Portfolio Holdings with the Commission for the first and third quarters of each fiscal year on Form N-Q. The Funds’ Forms N-Q are available without charge on the Commission’s website at www.sec.gov, or may be reviewed and copied at the Commission’s Public Reference Room in Washington, D.C. Information on the operation of the Public Reference Room may be obtained by calling 1-800-SEC-0330.
On March 28, 2018, the Sterling Capital Special Opportunities Fund Class A Shares, Class C Shares, Institutional Shares, Class R Shares and Class R6 Shares paid distributions of $0.13868, $0.10644, $0.15246, $0.12455 and $0.15246 per share respectively. The following table shows the portion of that distribution that is estimated to have been made from each of net investment income, accumulated undistributed net profits from the sale of securities and return of capital as of the date of the distribution:
| | | | | | | | | | | | | | | | | | | | |
| | | Ordinary Income | | Net Long Term Capital Gains | | Return of Capital | | Total Distributions Paid |
Class A Shares | | | $ | 0.01578 | | | | $ | 0.12290 | | | | $ | — | | | | $ | 0.13868 | |
Class C Shares | | | | 0.01211 | | | | | 0.09433 | | | | | — | | | | | 0.10644 | |
Institutional Shares | | | | 0.01735 | | | | | 0.13511 | | | | | — | | | | | 0.15246 | |
Class R Shares | | | | 0.01417 | | | | | 0.11038 | | | | | — | | | | | 0.12455 | |
Class R6 Shares | | | | 0.01735 | | | | | 0.13511 | | | | | — | | | | | 0.15246 | |
The actual amounts and sources for tax reporting purposes will depend on the Fund’s investment experience during the remainder of the year, and can only be determined after the end of the Fund’s fiscal year. In early 2019, the Fund will send a Form 1099-DIV to applicable shareholders that will specify how to report this distribution for federal income tax purposes.
On March 28, 2018, the Sterling Capital SMID Opportunities Fund Class A Shares, Class C Shares and Institutional Shares paid distributions of $0.058150, $0.022250 and $0.075430 per share respectively. The following table shows the portion of that distribution that is estimated to have been made from each of net investment income, accumulated undistributed net profits from the sale of securities, and return of capital as of the date of the distribution:
| | | | | | | | | | | | | | | | | | | | |
| | | Ordinary Income | | Net Long Term Capital Gains | | Return of Capital | | Total Distributions Paid |
Class A Shares | | | $ | — | | | | $ | 0.00873 | | | | $ | 0.04942 | | | | $ | 0.05815 | |
Class C Shares | | | | — | | | | | 0.00334 | | | | | 0.01891 | | | | | 0.02225 | |
Institutional Shares | | | | — | | | | | 0.01133 | | | | | 0.06410 | | | | | 0.07543 | |
The actual amounts and sources for tax reporting purposes will depend on the Fund’s investment experience during the remainder of the year, and can only be determined after the end of the Fund’s fiscal year. In early 2019, the Fund will send a Form 1099-DIV to applicable shareholders that will specify how to report this distribution for federal income tax purposes.
202
Information about Trustees and Officers (Unaudited)
Overall responsibility for the management of the Funds rests with its Board of Trustees (“Trustees”), who are elected by the shareholders of the Funds. The Trustees elect the officers of the Funds to supervise actively its day-to-day operations. The names of the Trustees, birthdates, term of office and length of time served, principal occupations during the past five years, number of portfolios overseen and directorships held outside of the Funds are listed in the two tables immediately following. The business address of the persons listed below is 3605 Glenwood Avenue, Suite 100, Raleigh, North Carolina 27612.
INDEPENDENT TRUSTEES
| | | | | | | | | | |
Name and Birthdate | | Position(s) Held With the Funds | | Term of Office/ Length of Time Served | | Principal Occupation
During the Past 5 Years | | Number of Portfolios in Fund Complex Overseen by Trustee | | Other
Directorships
Held by Trustee |
| | | | | |
Drew T. Kagan Birthdate: 02/48 | | Trustee, Chairman of the Board of Trustees | | Indefinite, 08/00 — Present | | Retired; from September 2010 to March 2013, Chairman, Montecito Advisors, Inc.; from December 2003 to September 2010, CEO, Montecito Advisors, Inc.; from March 1996 to December 2003, President, Investment Affiliate, Inc. | | 25 | | None |
| | | | | |
Laura C. Bingham Birthdate: 11/56 | | Trustee | | Indefinite, 02/01 — Present | | From March 2013 to present, Partner, Newport Board Group; from July 2010 to March 2013, governance and leadership consultant; from June 1998 to July 2010, President and CEO of Peace College | | 25 | | None |
| | | | | |
Douglas R. Van Scoy Birthdate: 11/43 | | Trustee | | Indefinite, 05/04 — Present | | Retired; from November 1974 to July 2001, employee of Smith Barney (investment banking), most recently as Director of Private Client Group and Senior Executive Vice President | | 25 | | None |
| | | | | |
James L. Roberts Birthdate: 11/42 | | Trustee | | Indefinite, 11/04 — Present | | Retired; from December 2009 to present, Consultant, Asphalt Systems, Inc.; from December 2007 to present, Consultant, Grand Mountain Bank | | 25 | | None |
| | | | | |
Alan G. Priest Birthdate: 05/52 | | Trustee | | Indefinite, 07/12 — Present | | Retired; from April 1993 to April 2012, Partner, Ropes & Gray LLP | | 25 | | None |
203
The following table shows information for the trustee who is an “interested person” of the Funds as defined in the 1940 Act:
INTERESTED TRUSTEES
| | | | | | | | | | |
Name and Birthdate | | Position(s) Held With the Funds | | Term of Office/ Length of Time Served | | Principal Occupation
During the Past 5 Years | | Number of Portfolios in Fund Complex Overseen by Trustee | | Other Directorships Held by Trustee |
| | | | | |
| Alexander W. McAlister* Birthdate: 03/60 | | Trustee | | Indefinite, 11/10 — Present | | From August 1981 to present, President, Sterling Capital Management LLC | | 25 | | Director, Sterling Capital Management LLC |
| | * | Mr. McAlister is treated by the Funds as an “interested person” (as defined in Section 2(a)(19) of the 1940Act) of the Funds because he is an officer of the Advisor. |
The following table shows information for officers of Funds:
| | | | | | |
Name and Birthdate | | Position(s) Held With the Funds | | Term of Office/ Length of Time Served | | Principal Occupation During the Past 5 Years |
| | | |
James T. Gillespie Birthdate: 11/66 | | President | | Indefinite, 12/12 — Present | | From March 2012 to present, Executive Director, Sterling Capital Management LLC; From June 2010 to March 2012, Director, Sterling Capital Management LLC and its predecessors |
| | | |
Todd M. Miller Birthdate: 09/71 | | Treasurer and Secretary | | Indefinite, Vice President, 08/05 — Present; Treasurer, 01/15 — Present; Secretary, 08/10 — Present | | From June 2009 to present, Director, Sterling Capital Management LLC and its predecessors |
| | | |
Michelle A. Whalen Birthdate: 04/69 | | Vice President | | Indefinite, 11/15 — Present | | From August 2015 to present, Associate Director & Senior Mutual Fund Administrator, Sterling Capital; from September 2000 to July 2015, Supervisor Mutual Fund Administration, Stratton Management Co. |
| | | |
Charles A. Durham Birthdate: 06/79 | | Chief Compliance and Anti-Money Laundering Officer | | Indefinite, 06/18 — Present | | From June 2018 to present, Chief Compliance Officer and Executive Director, Sterling Capital; from September 2010 to June 2018, Vice President, Senior Compliance Manager, Brown Brothers Harriman & Co. |
| | | |
John A. Bruggeman Birthdate: 12/71 | | Assistant Treasurer | | Indefinite, Assistant Treasurer, 08/16 — Present | | From January 2010 to present, Vice President and Senior Director, Fund Accounting and Administration Department, The Bank of New York Mellon |
| | | |
Julie M. Powers Birthdate: 10/69 | | Assistant Secretary | | Indefinite, 11/11 — Present | | From November 2011 to present, Vice President, Regulatory Administration Department, The Bank of New York Mellon |
The Funds’ Statement of Additional Information includes additional information about the Funds’ Trustees and Officers. To receive your free copy of the Statement of Additional Information, call toll free: 1-800-228-1872.
204
(This page has been left blank intentionally.)
(This page has been left blank intentionally.)
INVESTMENT ADVISOR
Sterling Capital Management LLC
4350 Congress Street, Suite 1000
Charlotte, NC 28209
DISTRIBUTOR
Sterling Capital Distributors, LLC
400 Berwyn Park
899 Cassatt Road
Berwyn, PA 19312
LEGAL COUNSEL
Ropes & Gray LLP
Prudential Tower
800 Boylston Street
Boston, MA 02199
TRANSFER AGENT
BNY Mellon Investment Servicing (US) Inc.
301 Bellevue Parkway
Wilmington, DE 19809
INDEPENDENT REGISTERED PUBLIC ACCOUNTING FIRM
KPMG LLP
1601 Market Street
Philadelphia, PA 19103

Item 2. Code of Ethics.
| | (a) | The registrant, as of the end of the period covered by this report, has adopted a code of ethics that applies to the registrant’s principal executive officer, principal financial officer, principal accounting officer or controller, or persons performing similar functions, regardless of whether these individuals are employed by the registrant or a third party (the “Code of Ethics”). |
| | (c) | There have been no amendments, during the period covered by this report, to a provision of the Code of Ethics that applies to the registrant’s principal executive officer, principal financial officer, principal accounting officer or controller, or persons performing similar functions, regardless of whether these individuals are employed by the registrant or a third party, and that relates to any element of the code of ethics definition enumerated in Item 2(b) of Form N-CSR. |
| | (d) | The registrant has not granted any waivers, including an implicit waiver, from a provision of the code of ethics that applies to the registrant’s principal executive officer, principal financial officer, principal accounting officer or controller, or persons performing similar functions, regardless of whether these individuals are employed by the registrant or a third party, that relates to one or more of the items set forth in Item 2(b) of Form N-CSR. |
Item 3. Audit Committee Financial Expert.
As of the end of the period covered by the report, the registrant’s board of trustees has determined that Drew Kagan is qualified to serve as an audit committee financial expert serving on its audit committee and that he is “independent,” as defined by Item 3 of Form N-CSR.
Item 4. Principal Accountant Fees and Services.
Audit Fees
| | (a) | The aggregate fees billed for each of the last two fiscal years for professional services rendered by the principal accountant for the audit of the registrant’s annual financial statements or services that are normally provided by the accountant in connection with statutory and regulatory filings or engagements for those fiscal years are $516,941 for 2018 and $527,719 for 2017. |
Audit-Related Fees
| | (b) | The aggregate fees billed in each of the last two fiscal years for assurance and related services by the principal accountant that are reasonably related to the performance of the audit of the registrant’s financial statements and are not reported under paragraph (a) of this Item are $0 for 2018 and $0 for 2017. These audit-related services include issuance of consents to use the name of the auditor in new Fund filings. |
Tax Fees
| | (c) | The aggregate fees billed in each of the last two fiscal years for professional services rendered by the principal accountant for tax compliance, tax advice, and tax planning are $104,445 for 2018 and $101,556 for 2017. Fees for both 2018 and 2017 relate to the preparation of federal income and excise tax returns and review of capital gains distribution calculations. |
All Other Fees
| | | | | | |
| | (d) | | | | The aggregate fees billed in each of the last two fiscal years for products and services provided by the principal accountant, other than the services reported in paragraphs (a) through (c) of this Item are $0 for 2018 and $0 for 2017. |
| | (e)(1) | | | | Except as permitted by Rule 2-01(c)(7)(i)(C) of Regulation S-X, the Trust’s Audit Committee must pre-approve all audit and non-audit services provided by the independent accountants relating to the operations or financial reporting of the funds. Prior to the commencement of any audit or non-audit services to a fund, the Audit Committee reviews the services to determine whether they are appropriate and permissible under applicable law. |
| | (e)(2) | | | | The percentage of services described in each of paragraphs (b) through (d) of this Item that were approved by the audit committee pursuant to paragraph (c)(7)(i)(C) of Rule 2-01 of Regulation S-X are as follows: |
(b) N/A
(c) 100%
(d) N/A
| | (f) | The percentage of hours expended on the principal accountant’s engagement to audit the registrant’s financial statements for the most recent fiscal year that were attributed to work performed by persons other than the principal accountant’s full-time, permanent employees was less than fifty percent. |
| | (g) | The aggregate non-audit fees billed by the registrant’s accountant for services rendered to the registrant, and rendered to the registrant’s investment adviser (not including any sub-adviser whose role is primarily portfolio management and is subcontracted with or overseen by another investment adviser), and any entity controlling, controlled by, or under common control with the adviser that provides ongoing services to the registrant for each of the last two fiscal years of the registrant was $0 for 2018 and $0 for 2017. |
| | (h) | The audit committee of the registrant’s board of trustees has considered whether the provision of non-audit services that were rendered to the registrant’s investment adviser (not including any sub-adviser whose role is primarily portfolio management and is subcontracted with or overseen by another investment adviser), and any entity controlling, controlled by, or under common control with the investment adviser that provides ongoing services to the registrant that were not pre-approved pursuant to paragraph (c)(7)(ii) of Rule 2-01 of Regulation S-X is compatible with maintaining the principal accountant’s independence. |
Item 5. Audit Committee of Listed Registrants.
Not applicable.
Item 6. Investments.
| (a) | Schedule of Investments in securities of unaffiliated issuers as of the close of the reporting period is included as part of the report to shareholders filed under Item 1 of this form. |
| Item 7. | Disclosure of Proxy Voting Policies and Procedures for Closed-End Management Investment Companies. |
Not applicable.
Item 8. Portfolio Managers of Closed-End Management Investment Companies.
Not applicable.
| Item 9. | Purchases of Equity Securities by Closed-End Management Investment Company and Affiliated Purchasers. |
Not applicable.
Item 10. Submission of Matters to a Vote of Security Holders.
There have been no material changes to the procedures by which shareholders may recommend nominees to the registrant’s board of trustees, where those changes were implemented after the registrant last provided disclosure in response to the requirements of Item 407(c)(2)(iv) of Regulation S-K (17 CFR 229.407) (as required by Item 22(b)(15) of Schedule 14A (17 CFR 240.14a-101)), or this Item.
Item 11. Controls and Procedures.
| | (a) | The registrant’s principal executive officer and principal financial officer have concluded, based on their evaluation of the effectiveness of the design and operation of the registrant’s disclosure controls and procedures (as defined in Rule 30a-3(c) under the Investment Company Act of 1940 (17 CFR 270.30a-3(c))) as of a date within 90 days of the filing date of this report, that the design and operation of such procedures are effective to provide reasonable assurance that information required to be disclosed by the registrant on Form N-CSR is recorded, processed, summarized and reported within the time periods specified in the Securities and Exchange Commission’s rules and forms, and that information required to be disclosed by the registrant in the reports that it files or submits on Form N-CSR is accumulated and communicated to the |
| | registrant’s management, including its principal executive and principal financial officers, as appropriate to allow timely decisions regarding required disclosure. |
| | (b) | There were no changes in the registrant’s internal control over financial reporting (as defined in Rule 30a-3(d) under the 1940 Act (17 CFR 270.30a-3(d))) that occurred during the last fiscal quarter that have materially affected, or are reasonably likely to materially affect, the registrant’s internal control over financial reporting. |
Item 12. Disclosure of Securities Lending Activities for Closed-End Management Investment Companies.
Item 13. Exhibits.
| | | | |
| | (a)(1) | | The registrant’s Code of Ethics is attached hereto. |
| | (a)(2) | | Certifications pursuant to Rule 30a-2(a) under the 1940 Act and Section 302 of the Sarbanes-Oxley Act of 2002 are attached hereto. |
| | (a)(3) | | Not applicable. |
| | (a)(4) | | Not applicable. |
| | (b) | | Certifications pursuant to Rule 30a-2(b) under the 1940 Act and Section 906 of the Sarbanes-Oxley Act of 2002 are attached hereto. |
SIGNATURES
Pursuant to the requirements of the Securities Exchange Act of 1934 and the Investment Company Act of 1940, the registrant has duly caused this report to be signed on its behalf by the undersigned, thereunto duly authorized.
(Registrant) Sterling Capital Funds
| | |
By (Signature and Title) /s/ James T. Gillespie |
| | James T. Gillespie, President |
| | (principal executive officer) |
Date 11/27/2018
Pursuant to the requirements of the Securities Exchange Act of 1934 and the Investment Company Act of 1940, this report has been signed below by the following persons on behalf of the registrant and in the capacities and on the dates indicated.
| | |
By (Signature and Title) /s/ James T. Gillespie |
| | James T. Gillespie, President |
| | (principal executive officer) |
Date 11/27/2018
| | |
By (Signature and Title) /s/ Todd M. Miller |
| | Todd M. Miller, Treasurer |
| | (principal financial officer) |
Date 11/27/2018