UNITED STATES
SECURITIES AND EXCHANGE COMMISSION
Washington, D.C. 20549
FORM N-CSR
CERTIFIED SHAREHOLDER REPORT OF REGISTERED MANAGEMENT
INVESTMENT COMPANIES
Investment Company Act file number 811-06719
Sterling Capital Funds
(Exact name of registrant as specified in charter)
3605 Glenwood Ave., Suite 100
Raleigh, NC 27612
(Address of principal executive offices) (Zip code)
James T. Gillespie, President
Sterling Capital Funds
3605 Glenwood Ave., Suite 100
Raleigh, NC 27612
(Name and address of agent for service)
Registrant’s telephone number, including area code: (800) 228-1872
Date of fiscal year end: September 30
Date of reporting period: September 30, 2021
Form N-CSR is to be used by management investment companies to file reports with the Commission not later than 10 days after the transmission to stockholders of any report that is required to be transmitted to stockholders under Rule 30e-1 under the Investment Company Act of 1940 (17 CFR 270.30e-1). The Commission may use the information provided on Form N-CSR in its regulatory, disclosure review, inspection, and policymaking roles.
A registrant is required to disclose the information specified by Form N-CSR, and the Commission will make this information public. A registrant is not required to respond to the collection of information contained in Form N-CSR unless the Form displays a currently valid Office of Management and Budget ("OMB") control number. Please direct comments concerning the accuracy of the information collection burden estimate and any suggestions for reducing the burden to Secretary, Securities and Exchange Commission, 450 Fifth Street, NW, Washington, DC 20549-0609. The OMB has reviewed this collection of information under the clearance requirements of 44 U.S.C. § 3507.
Item 1. Reports to Stockholders.
| (a) | The Report to Shareholders is attached herewith. |

(This page is intentionally left blank.)
Letter from the President and the Investment Advisor
Dear Shareholders: We are pleased to present this Sterling Capital Funds annual report covering the 12 months between October 1, 2020 and September 30, 2021. Equity markets posted strong returns during a remarkable 12-month period that included the launch of vaccines against COVID-19; the lifting of restrictions and closures on businesses and the public; rising inflation; and a recovering job market. Stocks posted double-digit gains, marching steadily higher for much of the period. Stocks began the 12-month period with strong performances across all major segments of the equity markets. In the final months of 2020, small- and mid-cap stocks significantly outpaced their large-cap counterparts. This pattern represented a shift from earlier in the year when most of the gains were concentrated among just a few large-cap, technology-oriented companies. Positive developments around vaccines helped buoy investor sentiments in these final months, while encouraging employment and income data further supported the broad rise in stocks. The improving outlook among investors in the final months of 2020 carried over into the first quarter of 2021. Investors responded positively to the early rollout of COVID-19 vaccines, the Biden administration’s $1.9 trillion stimulus package, and the Federal Reserve’s pledge to continue its accommodative monetary policies. Investors regained their appetite for risk, rotating into overlooked sectors such as Energy, where companies were benefiting from a sharp rise in oil prices. The Financial sector rallied on a steepening yield curve as inflation concerns pushed interest rates higher. Meanwhile, the industrials and materials sectors rose on hopes for passage of the Biden administration’s ambitious infrastructure spending bill. In contrast, Technology, Health Care, and Consumer Discretionary sectors languished during the opening months of 2021. The rise in interest rates also led investors to favor value-oriented names—rising inflation often weighs on the valuations of growth stocks. The second quarter of 2021 saw the continuation of many of the positive trends from earlier in the period. The rising pace of vaccinations and a drop in COVID-19 cases helped drive widespread re-opening of businesses and led to an uptick in travel. Optimism that the U.S. economy would soon return to pre-pandemic levels helped drive stock prices higher, with many growth-oriented names benefiting from a shift in tone from the Federal Reserve that it might begin adjusting monetary policy to reflect the threat of rising inflation from a strong economic recovery. | | Steady stock market gains continued through the start of the third quarter of 2021, but investor enthusiasm waned in the final month of the 12-month period. Rising inflation, hints of a shift in Federal Reserve policy, and the emergence of the COVID-19 Delta variant weighed on investors’ appetite for risk. While large-cap stocks managed to stay in positive territory for the third quarter of 2021, the broader markets slipped into negative territory. Even so, the major equity indices managed to finish the 12-month period posting double digit gains. The S&P 500® Index1 returned 30.00% during the 12 months under review. Small-cap stocks generally fared better than large-caps during the downturn, with the Russell 2000® Index2 of small-cap stocks returning 47.72%. Value outperformed growth for the period, with the Russell 1000 Value Index3 returning 35.01% compared to a 27.34% return for the Russell 1000 Growth Index4. International equity markets marginally underperformed U.S. markets, with the MSCI EAFE Index5 gaining 25.73% (net return); emerging markets fared less well with the MSCI Emerging Markets Index6 returning 18.22% (net return). During the 12 months under review, the Energy and Financials sectors generally outperformed the broader markets as interest rates rose and energy prices recovered, while Consumer Staples and Utilities stocks lagged their peers. Fixed income markets responded largely as expected in a period marked by a steepening yield curve and rising inflation concerns. The Fed’s promise to anchor short-term rates near 0% through the end of 2021 allowed the yield curve to steepen and corporate yield spreads to tighten over the final months of 2020 and into 2021. The yield on 10-year Treasuries began the 12-month period at 0.69% before rising to 0.93% by the end of 2020. The 10-year Treasury yield reached 1.52% by the end of the period under review. Rising interest rates drove bond prices downward for most of the period. Demand for investment grade bonds lagged as investors sought out risk, however, which helped drive prices higher among high-yield bonds and generally led high-yield corporate bonds to outperform their investment grade counterparts. This trend reversed in the final month of the period, as investors sought to reduce risk, leading to wider yield spreads between Treasuries and corporate issues. Spreads ultimately ended the third quarter of 2021 where they started, with the spread between the 10-year Treasury and the BBB Corporate Bond Index at 82 basis points. But high yield still strongly outperformed investment-grade bonds—the Bloomberg Barclay’s U.S. Aggregate Bond Index7 returned -0.90% for the period, while the Bloomberg Barclay’s U.S. High Yield Corporate Bond Index8 returned 11.29%. | | In the U.S. economy, GDP increased at an annualized rate of 4.5% in the final quarter of 2020, followed by increases of 6.3% and 6.7% in the first and second quarters of 2020, respectively. In similar fashion, the monthly unemployment rate began the 12-month period at 6.9% in October 2020 and declined to 4.8% by September 2021. We will continue to monitor the evolving economic and market climate and will manage the Sterling Capital Funds accordingly. Thank you for your confidence in Sterling Capital Management. We look forward to serving your investment needs during the months and years ahead. If you have any questions, please call us at 1-800-228-1872. Sincerely, 
James T. Gillespie President Sterling Capital Funds 
Jeffrey J. Schappe, CFA Managing Director Sterling Capital Management LLC |
| 1 | “S&P 500®” is a registered service mark of Standard & Poor’s Corporation, which does not sponsor and is in no way affiliated with the Sterling Capital Funds. The S&P 500® Index is generally considered to be representative of the performance of the stock market as a whole. The index does not reflect the deduction of expenses associated with a mutual fund, such as investment management and fund accounting fees. A Fund’s performance reflects the deduction of fees for these services. Investors cannot invest directly in an index, although they can invest in its underlying securities. |
| 2 | “Russell 2000®” Index is a registered service mark of FTSE Russell, which does not sponsor and is in no way affiliated with the Sterling Capital Funds. The Russell 2000® Index is a small-cap market index of the bottom 2,000 stocks in the Russell 3000® Index. The index does not reflect the deduction of expenses associated with a mutual fund, such as investment management and fund accounting fees. A Fund’s performance reflects the deduction of fees for these services. Investors cannot invest directly in an index, although they can invest in its underlying securities. |
| 3 | “Russell 1000®” Value Index measures the performance of the large-cap value segment of the U.S. equity universe. It includes those Russell 1000® companies with lower price-to-book ratios and lower expected growth values. The Russell 1000® Value Index is constructed to provide a comprehensive and unbiased barometer for the large-cap value segment. The index is completely reconstituted annually to ensure new and growing equities are included and that the represented companies continue to reflect value characteristics. |
| 4 | “Russell 1000®” Growth Index measures the performance of the large-cap growth segment of the U.S. equity universe. It includes those Russell 1000® companies with higher price-to-book ratios and higher forecasted growth values. The Russell 1000® Growth Index is constructed to provide a comprehensive and unbiased barometer for the large-cap growth segment. The index is completely reconstituted annually to ensure new and growing equities are included and that the represented companies continue to reflect growth characteristics. |
| 5 | The MSCI EAFE® Index measures the performance of the developed stock markets of Europe, Australia, and the Far East. |
| 6 | The MSCI Emerging Markets Index captures large and mid cap equity representation across 27 developing market countries. The Index covers approximately 85% of the free float-adjusted market capitalization in each country. |
| 7 | The Bloomberg Barclays U.S. Aggregate Bond Index is an unmanaged index composed of securities that are SEC-registered, taxable, and dollar denominated. The index covers the U.S. investment grade fixed rate bond market, with index components for government and corporate securities, mortgage pass-through securities, and asset-backed securities. It is not possible to invest in the Bloomberg Barclays U.S. Aggregate Bond Index, which is unmanaged and does not incur fees and charges. |
| 8 | The Bloomberg Barclays U.S. High Yield Corporate Index measures performance of the US corporate market of non-investment grade, fixed-rate corporate bonds. Securities are classified as high yield if the middle rating of Moody’s, Fitch, and S&P is Ba1/BB+/BB+ or below. |
Past performance does not guarantee future results. Mutual fund investing involves risk including the possible loss of principal.
This report is authorized for distribution only when preceded or accompanied by a prospectus. Please read the prospectus carefully before investing or sending money. Sterling Capital Management LLC (“Sterling Capital”) serves as investment advisor to the Sterling Capital Funds (each a “Fund” and collectively, the “Funds”) and is paid a fee for its services. Shares of the Funds are not deposits or obligations of, or guaranteed or endorsed by, Truist Financial Corporation or its affiliates. The Funds are not insured by the FDIC or any other government agency. The Funds currently are distributed by Sterling Capital Distributors, LLC. The distributor is not affiliated with Truist Financial Corporation or its affiliates.
The foregoing information and opinions are for general information only. Sterling Capital does not guarantee their accuracy or completeness, nor assume liability for any loss, which may result from the reliance by any person upon any such information or opinions. Such information and opinions are subject to change without notice, are for general information only and are not intended as an offer or solicitation with respect to the purchase or sale of any security or as offering individual or personalized investment advice. The credit rating source referenced in the fund commentaries, if applicable, was the S&P 500.
Sterling Capital Behavioral Large Cap Value Equity Fund
Portfolio Managers
Sterling Capital Behavioral Large Cap Value Equity Fund (the “Fund”) is managed by Portfolio Managers Robert W. Bridges, CFA, Senior Managing Director, and Robert O. Weller, CFA, Executive Director, for Sterling Capital Management LLC (“Sterling Capital”), advisor to the Fund.
Robert W. Bridges, CFA
Robert W. Bridges, CFA, Senior Managing Director, CIO and Head of Equity, joined Sterling Capital in 1996 and has investment experience since 1991. He has been co-portfolio manager of the Behavioral Large Cap Value Equity Fund since August 2013. Bob is a graduate of Wake Forest University, where he received a B.S. in Business. He holds the Chartered Financial Analyst designation.
Robert O. Weller, CFA
Robert O. Weller, CFA, Executive Director, joined Sterling Capital in 2012 and has investment experience since 1996. He has been co-portfolio manager of the Behavioral Large Cap Value Equity Fund since August 2013. Rob is a graduate of Loyola University Maryland, where he received a B.B.A. in Finance. He holds the Chartered Financial Analyst designation.
Investment Considerations
The overall results of the Fund will be dependent on the process and ability of the Adviser to apply “behavioral finance” principles to recognize a company’s value, earnings revisions and price momentum. The Fund may invest in undervalued securities which may not appreciate in value as anticipated or remain undervalued for longer than anticipated. The overall results of the Fund will be dependent on the process and ability of the Adviser to recognize a company’s value. The Fund may invest in REITs (Real Estate Investment Trusts), the value of which will be affected by conditions of the real estate industry. The Fund may also invest in exchange-traded funds (ETFs); thus shareholders may bear additional costs and the ETF may not exactly replicate the performance it seeks to track.
Q. How did the Fund perform during the 12-month period between October 1, 2020 and September 30, 2021?
A. The Fund’s Institutional Shares outperformed its current benchmark, the Russell 1000® Value Index.
Q. What factors affected the Fund’s performance?
A. U.S. large-cap stocks posted strong gains for the period under review. Stocks trended sharply upward during the fourth quarter of 2020, representing a continuation of the stock market’s rebound from pandemic-related lows earlier that year. Vaccine breakthroughs and the gradual reopening of the economy in the final months of 2020 helped drive additional gains among U.S. large-cap stocks through the start of 2021. However, growing supply chain issues and labor shortages later in the period tempered these gains in the final months of the period. Even so, large-cap value equities outperformed their growth counterparts for the period, following a significant multi-year relative underperformance. The Fund’s absolute returns benefited from its strong exposure to value-oriented stocks. Value returns were strongest in the Consumer Discretionary sector, as well as in Life and Health Insurance subsector within Financials.
The Fund applies principles of behavioral finance to its investment strategy. This process is designed to capitalize on known investor biases and heuristics (mental shortcuts) by accounting for the impact on markets of behavioral factors such as greed, fear, and ego.
The Fund’s positive performance relative to its benchmark was primarily driven by a higher exposure to value compared to its benchmark. This focus on value beyond that of the value-based benchmark is a feature of its behavioral finance-based strategy.
The Fund's momentum strategy detracted from absolute and relative returns. The market's overall shift from growth to value during the period was not fully captured as a result of the Fund's overweight exposure to momentum, resulting in a drag on relative results.
Portfolio composition is as of September 30, 2021 and is subject to change and risk.
| Average Annual Total Returns |
| As of September 30, 2021 | Inception Date | 1 Year | 5 Years | 10 Years |
| Class A Shares* | 10/9/92 | 29.68% | 8.69% | 11.13% |
| Class C Shares** | 2/1/01 | 36.56% | 9.18% | 10.96% |
| Institutional Shares | 10/9/92 | 37.90% | 10.25% | 12.07% |
| Class R6 Shares | 2/1/181 | 37.92% | 10.29% | 12.09% |
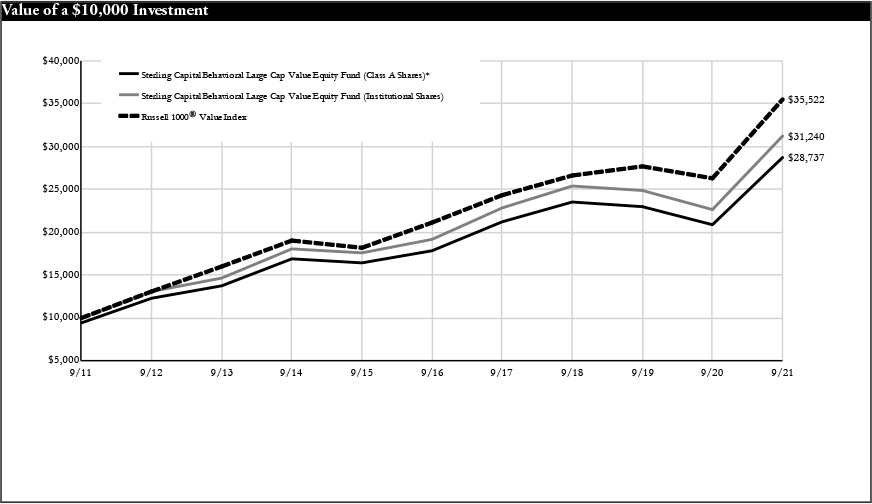
| Russell 1000® Value Index | N/A | 35.01% | 10.94% | 13.51% |
Past performance does not guarantee future results. The performance data quoted represents past performance and current returns may be lower or higher. Total return figures include change in share price, reinvestment of dividends and capital gains, and do not reflect taxes that a shareholder would pay on fund distributions or on the redemption of fund shares. The investment return and principal value will fluctuate so that an investor’s shares, when redeemed, may be worth more or less than the original cost. To obtain performance information current to the most recent month end, please visit www.sterlingcapitalfunds.com.
The chart above represents a comparison of a hypothetical $10,000 investment in the indicated share class versus a similar investment in the Fund’s benchmark.
| * | Reflects 5.75% maximum sales charge. |
| ** | Reflects the applicable maximum CDSC of 1.00% (applicable only to redemptions within one year of purchase, and as such, are not reflected in the Average Annual Total Returns table since the periods reflected are for a year or longer). |
| 1 | Class R6 Shares were not in existence prior to 2/1/18. Performance for periods prior to 2/1/18 is based on the performance of Institutional Shares. |
The Russell 1000® Value Index is a widely recognized index of common stocks that measures the performance of the large-cap value sector of the U.S. equity market. The index is unmanaged and does not reflect the deduction of expenses associated with a mutual fund, such as investment management and fund accounting fees. Investors cannot invest directly in an index, although they can invest in its underlying securities.
Sterling Capital Mid Value Fund
Portfolio Managers
Sterling Capital Mid Value Fund (the “Fund”) is managed by Portfolio Managers Patrick W. Rau, CFA, Managing Director, William C. Smith, CFA, Executive Director and Lee D. Houser, CFA, Executive Director for Sterling Capital Management LLC (“Sterling Capital”), advisor to the Fund.
Patrick W. Rau, CFA
Patrick W. Rau, CFA, Managing Director, joined Sterling Capital Management in 2001 and has investment experience since 1993. Patrick has been co-portfolio manager of Mid Value Fund since August 2021. Patrick received his A.B. in Political Science from Duke University and his MBA from Vanderbilt University. He holds the Chartered Financial Analyst designation.
William C. Smith, CFA
William C. Smith, CFA, Executive Director, joined Sterling Capital Management in 2015 and has investment experience since 2002. Will has been co-portfolio manager of the Mid Value Fund since August 2021 and served as associate portfolio manager of the Fund from February 2021 to August 2021. Will received his B.E. in Structural Engineering from Vanderbilt University and his MBA from the London Business School. He holds the Chartered Financial Analyst designation.
Lee D. Houser, CFA
Lee D. Houser, CFA, Executive Director, joined Sterling Capital Management in 2006 and has investment experience since 1999. Lee has been associate portfolio manager of the Mid Value Fund since February 2021. Lee received his B.S. in Mathematics and Economics from James Madison University, where he was a summa cum laude graduate, and his MBA from Duke University. He holds the Chartered Financial Analyst designation.
Investment Considerations
The Fund may invest in undervalued securities that may not appreciate in value as anticipated or remain undervalued for longer than anticipated. Investments made in small to mid-capitalization companies are subject to greater risks than large company stocks due to limited resources and inventory and are more sensitive to adverse conditions. The Fund may invest in foreign securities, which may be more volatile and less liquid due to currency fluctuation, political instability, social and economic risks.
Q. How did the Fund perform during the 12-month period between October 1, 2020 and September 30, 2021?
A. The Fund’s Institutional Shares outperformend its current benchmark, the Russell Midcap® Value Index.
Q. What factors affected the Fund’s performance?
A. U.S. mid-cap value stocks posted strong gains for the period. The positive economic impacts of government actions to stimulate the economy helped stocks, particularly those in economically sensitive sectors. These actions benefitted the Fund’s procyclical positioning.
Favorable stock selection in the Industrial and Technology sectors as well as the Fund’s significant underweighting of the poor-performing Utility sector contributed to the Fund’s relative performance. Adverse stock selection within the Energy and Healthcare sectors hindered relative performance. A reluctance to make the investments needed to increase production, and OPEC’s limited production increases, contributed to higher energy prices. Two buyout offers also aided the Fund’s relative performance.
Portfolio composition is as of September 30, 2021 and is subject to change and risk.
| Average Annual Total Returns |
| As of September 30, 2021 | Inception Date | 1 Year | 5 Years | 10 Years |
| Class A Shares* | 8/1/96 | 35.11% | 8.76% | 12.15% |
| Class C Shares** | 7/25/01 | 42.28% | 9.23% | 11.98% |
| Institutional Shares | 8/1/96 | 43.72% | 10.35% | 13.11% |
| Class R Shares | 2/1/101 | 42.97% | 9.80% | 12.43% |
| Class R6 Shares | 2/1/182 | 43.85% | 10.40% | 13.13% |
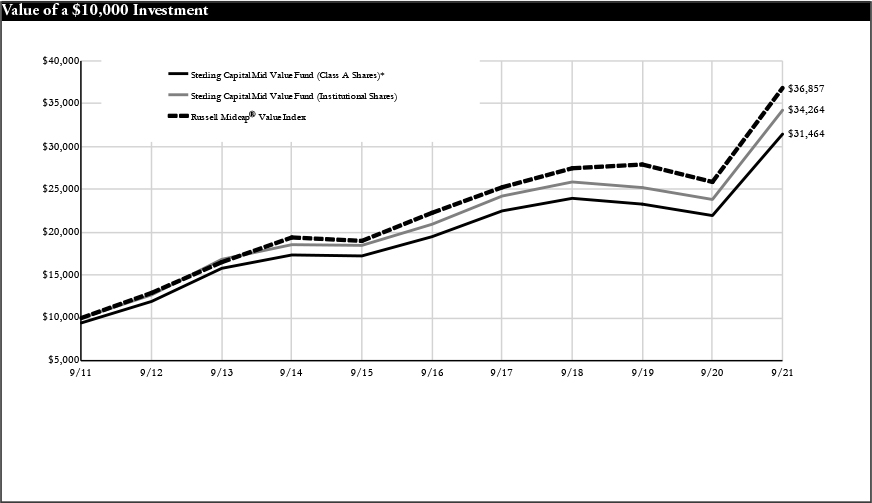
| Russell Midcap® Value Index | N/A | 42.40% | 10.59% | 13.93% |
Past performance does not guarantee future results. The performance data quoted represents past performance and current returns may be lower or higher. Total return figures include change in share price, reinvestment of dividends and capital gains, and do not reflect taxes that a shareholder would pay on fund distributions or on the redemption of fund shares. The investment return and principal value will fluctuate so that an investor’s shares, when redeemed, may be worth more or less than the original cost. To obtain performance information current to the most recent month end, please visit www.sterlingcapitalfunds.com.
The chart above represents a comparison of a hypothetical $10,000 investment in the indicated share class versus a similar investment in the Fund’s benchmark.
| * | Reflects 5.75% maximum sales charge. |
| ** | Reflects the applicable maximum CDSC of 1.00% (applicable only to redemptions within one year of purchase, and as such, are not reflected in the Average Annual Total Returns table since the periods reflected are for a year or longer). |
| 1 | Class R Shares were not in existence prior to 2/1/10. Performance for periods prior to 2/1/10 is based on the performance of the Institutional Shares, but such performance does not reflect Class R Shares’ 12b-1 fees, which if reflected, would have caused performance to be lower. |
| 2 | Class R6 Shares were not in existence prior to 2/1/18. Performance for periods prior to 2/1/18 is based on the performance of Institutional Shares. |
The Fund is measured against the Russell Midcap® Value Index, an unmanaged index, which measures the performance of the mid-cap value segment of the U.S. equity universe. It includes those Russell Midcap® Index companies with lower price-to-book ratios and lower forecasted growth values. The index is unmanaged and does not reflect the deduction of expenses associated with a mutual fund, such as investment management and fund accounting fees. Investors cannot invest directly in an index, although they can invest in its underlying securities.
Sterling Capital Behavioral Small Cap Value Equity Fund
Portfolio Managers
Sterling Capital Behavioral Small Cap Value Equity Fund (the “Fund”) is managed by Portfolio Managers Robert W. Bridges, CFA, Senior Managing Director, and Robert O. Weller, CFA, Executive Director, for Sterling Capital Management LLC (“Sterling Capital”), advisor to the Fund.
Robert W. Bridges, CFA
Robert W. Bridges, CFA, Senior Managing Director, CIO and Head of Equity, joined Sterling Capital in 1996 and has investment experience since 1991. He has been co-portfolio manager of the Behavioral Small Cap Value Equity Fund since June 2013. Bob is a graduate of Wake Forest University, where he received a B.S. in Business. He holds the Chartered Financial Analyst designation.
Robert O. Weller, CFA
Robert O. Weller, CFA, Executive Director, joined Sterling Capital in 2012 and has investment experience since 1996. He has been co-portfolio manager of the Behavioral Small Cap Value Equity Fund since June 2013. Rob is a graduate of Loyola University Maryland, where he received a B.B.A. in Finance. He holds the Chartered Financial Analyst designation.
Investment Considerations
The overall results of the Fund will be dependent on the process and ability of the Adviser to apply “behavioral finance” principles to recognize a company’s value, earnings revisions and price momentum. The Fund may invest in undervalued securities which may not appreciate in value as anticipated or remain undervalued for longer than anticipated. Investments made in small to mid-capitalization companies are subject to greater risks than large company stocks due to limited resources and inventory as well as more sensitive to adverse conditions.
Q. How did the Fund perform during the 12-month period between October 1, 2020 and September 30, 2021?
A. The Fund’s Institutional Shares outperformed its benchmark, the Russell 2000® Value Index.
Q. What factors affected the Fund’s performance?
A. In general, small-cap equities posted healthy returns during the 12-month period under review. The final quarter of 2020 saw a particularly strong showing from small-cap stocks, as the development of COVID-19 vaccines and the lifting of pandemic-related closures and restrictions led to renewed investor optimism. Performance from small-cap stocks was subdued after March 2021, however, as smaller companies have been disproportionately affected by the economic challenges facing the U.S., such as supply chain bottlenecks and labor shortages. Even so, small-cap value equities outperformed both their growth-oriented counterparts and the broader markets after a significant multi-year relative underperformance. The Fund’s absolute performance benefited the most from holdings in the Consumer Discretionary, Financials, Health Care, and Industrials sectors.
The Fund applies principles of behavioral finance to its investment strategy. This process is designed to capitalize on known investor biases and heuristics (mental shortcuts) by accounting for the impact on markets of behavioral factors such as greed, fear, and ego.
The Fund’s positive performance relative to its benchmark was primarily driven by a higher exposure to value compared to its benchmark. This focus on value beyond that of the value-based benchmark is a feature of its behavioral finance-based strategy.
The Fund's momentum strategy detracted from absolute and relative returns, offsetting some of these gains. The market's overall shift from growth to value during the period was not fully captured as a result of the Fund's overweight exposure to momentum, resulting in a drag on relative results.
Portfolio composition is as of September 30, 2021 and is subject to change and risk.
| Average Annual Total Returns |
| As of September 30, 2021 | Inception Date | 1 Year | 5 Years | 10 Years |
| Class A Shares* | 1/29/10 | 55.29% | 8.20% | 10.75% |
| Class C Shares** | 1/29/10 | 63.65% | 8.67% | 10.57% |
| Institutional Shares | 1/2/97 | 65.21% | 9.77% | 11.69% |
| Class R Shares | 2/1/10 | 64.43% | 9.26% | 11.20% |
| Class R6 Shares | 2/1/181 | 65.36% | 9.82% | 11.72% |
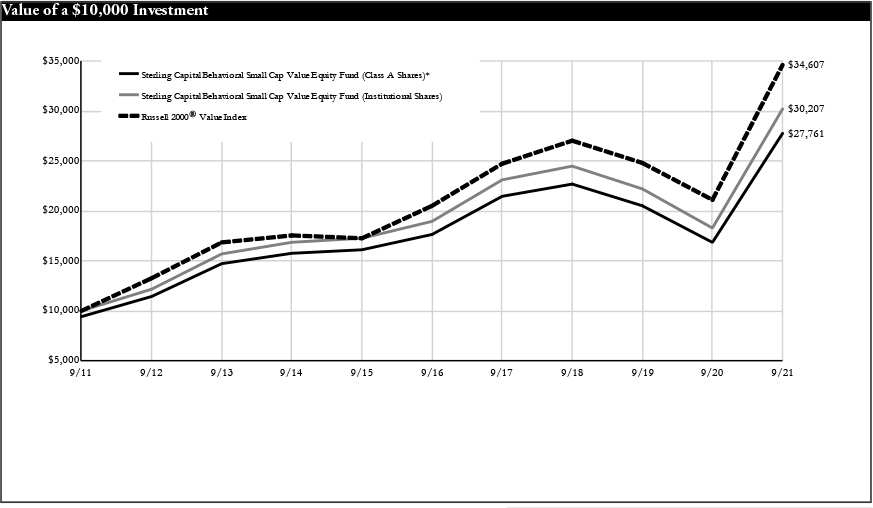
| Russell 2000® Value Index | N/A | 63.92% | 11.03% | 13.22% |
Past performance does not guarantee future results. The performance data quoted represents past performance and current returns may be lower or higher. Total return figures include change in share price, reinvestment of dividends and capital gains, and do not reflect taxes that a shareholder would pay on fund distributions or on the redemption of fund shares. The investment return and principal value will fluctuate so that an investor’s shares, when redeemed, may be worth more or less than the original cost. To obtain performance information current to the most recent month end, please visit www.sterlingcapitalfunds.com. Performance would have been lower without waivers in effect.
The chart above represents a comparison of a hypothetical $10,000 investment in the indicated share class versus a similar investment in the Fund’s benchmark.
| * | Reflects 5.75% maximum sales charge. |
| ** | Reflects the applicable maximum CDSC of 1.00% (applicable only to redemptions within one year of purchase, and as such, are not reflected in the Average Annual Total Returns table since the periods reflected are for a year or longer). |
| 1 | Class R6 Shares were not in existence prior to 2/1/18. Performance for periods prior to 2/1/18 is based on the performance of Institutional Shares. |
The Russell 2000® Value Index is a widely recognized index of common stocks that measures the performance of the small-cap value sector of the U.S. equity market. The index is unmanaged and does not reflect the deduction of expenses associated with a mutual fund, such as investment management and fund accounting fees. Investors cannot invest directly in an index, although they can invest in its underlying securities.
Sterling Capital Special Opportunities Fund
Portfolio Managers
Sterling Capital Special Opportunities Fund (the “Fund”) is managed by Portfolio Managers George F. Shipp, CFA, Managing Director, Joshua L. Haggerty, CFA, Executive Director and Daniel A. Morrall, Executive Director for Sterling Capital Management LLC (“Sterling Capital”), advisor to the Fund.
George F. Shipp, CFA
George F. Shipp, CFA, Managing Director, founded the CHOICE Asset Management team of BB&T Scott & Stringfellow in 2000, which integrated with Sterling Capital in January 2013. George has investment experience since 1982 and has been co-portfolio manager of the Special Opportunities Fund since July 2021. He served as lead portfolio manager of the Fund from inception to July 2021. George received his B.A. in Biology from the University of Virginia and his MBA from the University of Virginia's Darden School of Business. He holds the Chartered Financial Analyst designation.
Joshua L. Haggerty, CFA
Joshua L. Haggerty, CFA, Executive Director, joined the CHOICE Asset Management team of BB&T Scott & Stringfellow in 2005, which integrated with Sterling Capital in January 2013. He has investment experience since 1998. He has been co-portfolio manager of the Special Opportunities Fund since July 2021 and was associate portfolio manager of the Fund from February 2016 to July 2021. Josh is a graduate of James Madison University where he received his B.B.A. in Finance. He holds the Chartered Financial Analyst designation.
Daniel A. Morrall
Daniel A. Morrall, Executive Director, joined Sterling Capital Management in 2014 and has investment experience since 2001. Dan has been associate portfolio manager of the Special Opportunities Fund since July 2021. Dan received his B.S. in Business and Economics from Washington and Lee University, his MBA from Columbia Business School, and his M.S.I.T. from Capella University.
Investment Considerations
The overall results of the Fund will be dependent on the process and ability of the Adviser to apply “behavioral finance” principles to recognize a company’s value, earnings revisions and price momentum. The Fund may invest in undervalued securities which may not appreciate in value as anticipated or remain undervalued for longer than anticipated. The overall results of the Fund will be dependent on the process and ability of the Adviser to recognize a company’s value. The Fund may invest in REITs (Real Estate Investment Trusts), the value of which will be affected by conditions of the real estate industry. The Fund may also invest in exchange-traded funds (ETFs); thus shareholders may bear additional costs and the ETF may not exactly replicate the performance it seeks to track.
Q. How did the Fund perform during the 12-month period between October 1, 2020 and September 30, 2021?
A. The Fund’s Institutional shares outperformed its current benchmark, the Russell 3000 Index.
Q. What factors affected the Fund’s performance?
A. As with most well-diversified portfolios, the Fund took its lumps during the brief, but frightening, COVID-19 downturn, but the results suggest we made good choices distinguishing between companies that would suffer negative longer-term impacts (example, our former travel-related holdings) from those whose stocks were unfairly punished.
The Hospital leader HCA was in the latter category, plunging 54% to March 2020 lows in less than a month on fears its corridors would be overwhelmed by uncompensated care. From that point through September 30, 2021, it rallied 259% (96% in the Fund’s fiscal year) to fulfill its role as a vital line of defense against the pandemic. Likewise, credit card stalwart Capital One was one of our worst performers in the first quarter of 2020 (-59%), but our confidence in its intelligent underwriting of risk was rewarded with a 292% surge from the lows (+129% in the year ended September 30, 2021).
“Re-normalization” companies were joined in the annual winner’s circle by many of our technology holdings that were ideally positioned for society’s shift to a digital existence. Alphabet, also known as Google, (+81% in the 12 months) was a prime example as its search and YouTube platforms (just two of nine businesses with more than one billion users) cemented their value to both consumers and advertisers. F5 Networks gained 62% on the strength of its internet security and application delivery offerings, while Intuit’s (+66%) QuickBooks and TurboTax software facilitated online accounting, billing and payments.
Cloud enabler Rackspace (-26% though, thankfully, a half position) was our largest disappointment. We misread the need for stepped-up investments (i.e., lower margins) that management believes will accelerate growth in the future. Federal Express (-12%) posted record earnings throughout the period, driven by exceptional yields (price) and the e-commerce volume surge, but investors still appear to want more margin urgency from a management team that is notable for adding capacity. Internet infrastructure pioneer and security leader Akamai (-5%) also enjoyed robust growth early in the pandemic as the world turned to its solutions at the “Edge;” we believe concerns about slowing growth when compared to pandemic-assisted results are misplaced.
U.S. GDP growth of 12% “real” – and more than 17% “nominal” when including year-over-year inflation that rose to 5% - will not soon be repeated. It was the best 12-month economic performance in nearly 70 years. Though it committed to hold overnight rates at 0% well into 2022, the Federal Reserve may have to re-discover the price-stability half of its dual mandate (kudos to its success supporting economic growth). In short, the future will be just as “uncertain” and tricky as the last 18 years were.
We believe our team’s relentless focus on time-tested “pillars” such as return on capital, financial flexibility, above average earnings growth, and favorable valuations will continue to serve investors well as navigation instruments that cut through fog of uncertainty in the years ahead. We will continue to be eager, disciplined, and centered on client success. Thank you for your ongoing confidence in us.
Portfolio composition is as of September 30, 2021 and is subject to change and risk.

| Average Annual Total Returns |
| As of September 30, 2021 | Inception Date | 1 Year | 5 Years | 10 Years |
| Class A Shares* | 6/2/03 | 29.27% | 13.42% | 14.49% |
| Class C Shares** | 6/2/03 | 36.19% | 13.91% | 14.30% |
| Institutional Shares | 6/2/03 | 37.55% | 15.05% | 15.45% |
| Class R Shares | 2/1/10 | 36.95% | 14.48% | 14.89% |
| Class R6 Shares | 2/1/181 | 37.67% | 15.12% | 15.49% |
| Russell 3000® Index | N/A | 31.88% | 16.85% | 16.60% |
Past performance does not guarantee future results. The performance data quoted represents past performance and current returns may be lower or higher. Total return figures include change in share price, reinvestment of dividends and capital gains, and do not reflect taxes that a shareholder would pay on fund distributions or on the redemption of fund shares. The investment return and principal value will fluctuate so that an investor’s shares, when redeemed, may be worth more or less than the original cost. To obtain performance information current to the most recent month end, please visit www.sterlingcapitalfunds.com.
The chart above represents a comparison of a hypothetical $10,000 investment in the indicated share class versus a similar investment in the Fund’s benchmark.
| * | Reflects 5.75% maximum sales charge. |
| ** | Reflects the applicable maximum CDSC of 1.00% (applicable only to redemptions within one year of purchase, and as such, are not reflected in the Average Annual Total Returns table since the periods reflected are for a year or longer). |
| 1 | Class R6 Shares were not in existence prior to 2/1/18. Performance for periods prior to 2/1/18 is based on the performance of Institutional Shares. |
The Fund is measured against the Russell 3000® Index, an unmanaged index that is generally considered to be representative of the performance of the stock market as a whole. The index does not reflect the deduction of expenses associated with a mutual fund, such as investment management and fund accounting fees. Investors cannot invest directly in an index, although they can invest in its underlying securities.
Sterling Capital Equity Income Fund
Portfolio Managers
Sterling Capital Equity Income Fund (the “Fund”) is managed by Portfolio Managers George F. Shipp, CFA, Managing Director, Adam B. Bergman, CFA, Executive Director and Charles J. Wittmann, CFA, Executive Director for Sterling Capital Management LLC (“Sterling Capital”), advisor to the Fund.
George F. Shipp, CFA
George F. Shipp, CFA, Managing Director, founded the CHOICE Asset Management team of BB&T Scott & Stringfellow in 2000, which integrated with Sterling Capital in January 2013. George has investment experience since 1982 and has been co-portfolio manager of the Equity Income Fund since July 2021. He served as lead portfolio manager of the Fund from inception to July 2021. George received his B.A. in Biology from the University of Virginia and his MBA from the University of Virginia's Darden School of Business. He holds the Chartered Financial Analyst designation.
Adam B. Bergman, CFA
Adam B. Bergman, CFA, Executive Director, joined the CHOICE Asset Management team of Scott & Stringfellow in 2007, which integrated with Sterling Capital Management in January 2013. He has investment experience since 1996. He has been co-portfolio manager of the Equity Income Fund since July 2021 and was associate portfolio manager of the Fund from February 2016 to July 2021. Adam is a graduate of the University of Virginia’s McIntire School of Commerce where he received his B.S. in Commerce. He holds the Chartered Financial Analyst designation.
Charles J. Wittmann, CFA
Charles J. Wittmann, CFA, Executive Director, joined Sterling Capital Management in 2014 and has investment experience since 1995. He has been associate portfolio manager of the Equity Income Fund since July 2021. Chip received his B.A. in Economics from Davidson College and his MBA from Duke University's Fuqua School of Business. He earned the Certificate in ESG Investing, which is developed, administered and awarded by the CFA Society of the United Kingdom. He holds the Chartered Financial Analyst designation.
Investment Considerations
The Fund invests primarily in dividend-paying securities. These securities may be undervalued and their value could be negatively affected by a rise in interest rates. The Fund may engage in writing covered call options on securities. By writing covered call options, the Fund limits its opportunity to profit from an increase in the price of the underlying stock above the premium and the strike price, but continues to bear the risk of a decline in the stock price. While the Fund receives premiums for writing covered call options, the price it realizes from the exercise of an option could be substantially below a stock’s current market price.
Q. How did the Fund perform during the 12-month period between October 1, 2020 and September 30, 2021?
A. The Fund’s Institutional Shares underperformed its current benchmark, the Russell 1000® Value Index.
Q. What factors affected the Fund’s performance?
A. Buoyed by unprecedented fiscal spending for COVID-19 relief, the U.S. economy roared back to life during the year, as real GDP surged over 12% and 17% when including 5% year-over-year inflation. The Federal Reserve’s cooperative 0% monetary policy achieved the objective of re-igniting entrepreneurial sprits in the private sector, fueling a hiring spree that allowed the unemployment rate to plunge from its 14.8% peak in April 2020 to 4.8% by September 2021. The Fed’s message that low interest rates would endure, combined with rebounding business activity and surging profits, invigorated a risk-taking spirit among investors.
The Fund fully benefited, posting a 34.5% total return for the Institutional share class. That return bested the 30.0% gain of the S&P 500® Index, but for the first time in years, “Value” stocks represented by the Fund’s primary benchmark, the Russell 1000® Value, led the way with a 35.0% surge versus 27.3% for the Russell 1000® Growth Index.
Efficient “branchless bank” and credit card specialist Discover Financial was the Fund’s top contributor, as superlative underwriting results led to a surge in earnings and a 116.5% gain. That long-standing holding was joined on our winners list by relatively new holding, Goldman Sachs (+91.4%); our hypothesis that corporations would clamor for its M&A advisory and money-raising expertise proved accurate. Leading property and casualty insurer Chubb posted a 52.3% total return as industry pricing firmed. In hindsight, we should have carried a larger position in low cost oil and gas producer EOG Resources, but when we bought the shares amidst an energy “glut” in summer and fall 2020, it was hard to foresee its 132.4% surge.
The Fund’s “losers” primarily represented opportunity costs rather than capital destroyers. For example, Merck shares fell 1.8%, perhaps due to COVID-19-related delays in providing treatments such as Keytruda or vaccines such as Gardasil. By the second quarter of 2021, those products showed 23% and 88% respective growth rates versus the depressed period a year ago. Verizon’s 5.2% decline reflected ongoing hyper-competitive conditions among wireless providers, and the high cost of spectrum acquisitions and its roll out of speedier “5G” services. Still, Verizon added 900,000 new customers and over ten million devices during the year, grew revenue by 4% and earnings by 13%, and increased its dividend for the 15th straight year. New position Cummins (-12.4%) has strong global demand for its engines, evidenced by 20-24% forecast revenue growth in 2021, but supply chain disruptions cost an estimated $200 million. The company is recognized for its emissions and power technologies, thus should be in an ideal position to help solve the current shortage of logistics capacity.
We believe our team’s relentless focus on time-tested “pillars” such as return on capital, financial flexibility, above average earnings growth, and favorable valuations will continue to serve investors well as navigation instruments that cut through fog of uncertainty in the years ahead. We will continue to be eager, disciplined, and centered on client success. Thank you for your ongoing confidence in us.
Portfolio composition is as of September 30, 2021 and is subject to change and risk.
| Average Annual Total Returns |
| As of September 30, 2021 | Inception Date | 1 Year | 5 Years | 10 Years |
| Class A Shares* | 6/30/04 | 26.42% | 12.90% | 12.12% |
| Class C Shares** | 6/30/04 | 33.15% | 13.40% | 11.95% |
| Institutional Shares | 6/30/04 | 34.47% | 14.55% | 13.07% |
| Class R Shares | 2/1/10 | 33.81% | 13.97% | 12.51% |
| Class R6 Shares | 2/1/181 | 34.61% | 14.63% | 13.12% |
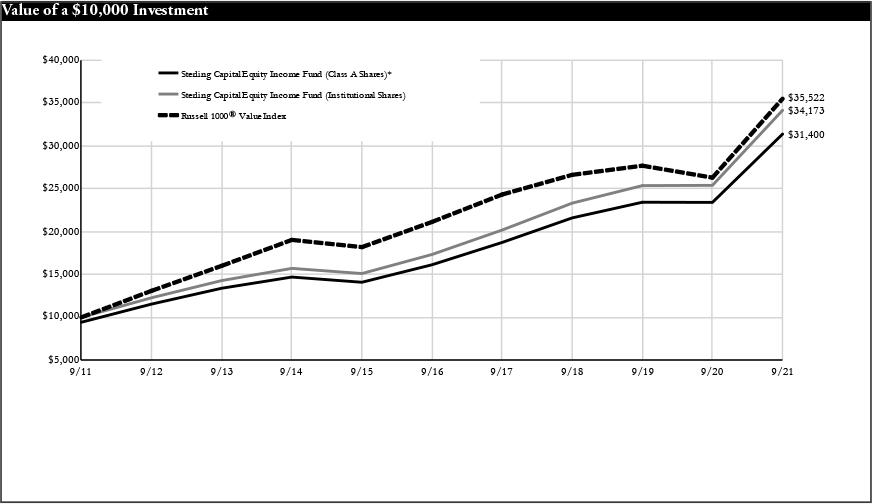
| Russell 1000® Value Index | N/A | 35.01% | 10.94% | 13.51% |
Past performance does not guarantee future results. The performance data quoted represents past performance and current returns may be lower or higher. Total return figures include change in share price, reinvestment of dividends and capital gains, and do not reflect taxes that a shareholder would pay on fund distributions or on the redemption of fund shares. The investment return and principal value will fluctuate so that an investor’s shares, when redeemed, may be worth more or less than the original cost. To obtain performance information current to the most recent month end, please visit www.sterlingcapitalfunds.com.
The chart above represents a comparison of a hypothetical $10,000 investment in the indicated share class versus a similar investment in the Fund’s benchmark.
| * | Reflects 5.75% maximum sales charge. |
| ** | Reflects the applicable maximum CDSC of 1.00% (applicable only to redemptions within one year of purchase, and as such, are not reflected in the Average Annual Total Returns table since the periods reflected are for a year or longer). |
| 1 | Class R6 Shares were not in existence prior to 2/1/18. Performance for periods prior to 2/1/18 is based on the performance of Institutional Shares. |
The Fund is measured against the Russell 1000® Value Index, an unmanaged index that is generally considered to be representative of the performance of the stock market as a whole. The index does not reflect the deduction of expenses associated with a mutual fund, such as investment management and fund accounting fees. Investors cannot invest directly in an index, although they can invest in its underlying securities.
Sterling Capital Behavioral International Equity Fund
Portfolio Managers
Sterling Capital Behavioral International Equity Fund (the “Fund”) is managed by Portfolio Managers Robert W. Bridges, CFA, Senior Managing Director, and Robert O. Weller, CFA, Executive Director, for Sterling Capital Management LLC (“Sterling Capital”), advisor to the Fund.
Robert W. Bridges, CFA
Robert W. Bridges, CFA, Senior Managing Director, CIO and Head of Equity, joined Sterling Capital in 1996 and has investment experience since 1991. He has been co-portfolio manager of the Behavioral International Equity Fund since inception. Bob is a graduate of Wake Forest University, where he received a B.S. in Business. He holds the Chartered Financial Analyst designation.
Robert O. Weller, CFA
Robert O. Weller, CFA, Executive Director, joined Sterling Capital in 2012 and has investment experience since 1996. He has been co-portfolio manager of the Behavioral International Equity Fund since inception. Rob is a graduate of Loyola University Maryland, where he received a B.B.A. in Finance. He holds the Chartered Financial Analyst designation.
Investment Considerations
The overall results of the Fund will be dependent on the process and ability of the Adviser to apply “behavioral finance” principles to recognize a company’s value, earnings revisions and market momentum. The Fund will invest in foreign securities which may be more volatile and less liquid due to currency fluctuation, political instability, and social and economic risks. The Fund may invest in REITs (Real Estate Investment Trusts), the value of which will be affected by conditions of the real estate industry, and exchange-traded funds (ETFs). Investing in ETFs may cause shareholders to bear additional costs, and an ETF may not exactly replicate the performance it seeks to track.
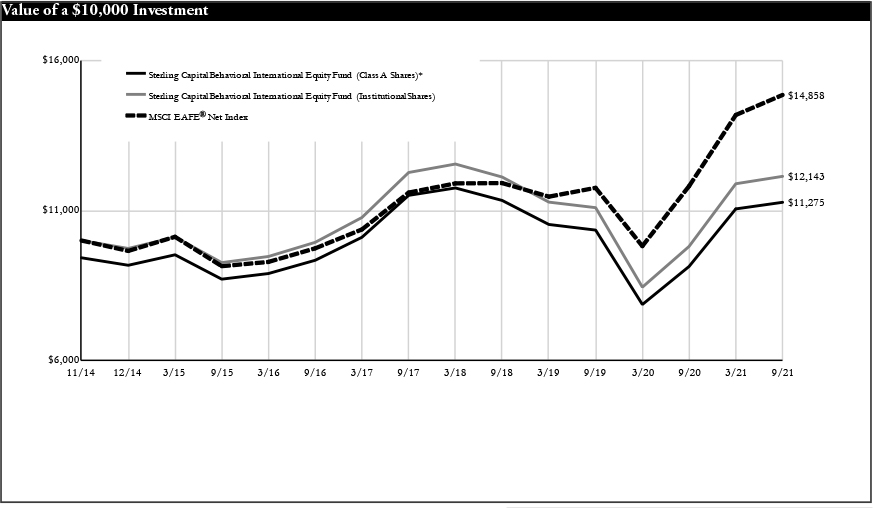
Q. How did the Fund perform during the 12-month period between October 1, 2019 and September 30, 2020?
A. The Fund’s Institutional Shares underperformed its current benchmark, the MSCI EAFE Net Index.
Q. What factors affected the Fund’s performance?
A. International equities posted strong gains over the 12-month period. This trend was a continuation of their rebound from pandemic-related lows in early 2020. Global markets received a boost in the fourth quarter of 2020 on rising optimism surrounding the vaccine rollout and the lifting of some pandemic-related closures and restrictions. These gains persisted into the first part of 2021, but disruption to global trade caused by shipping constraints and other supply chain issues, as well as an emerging energy crisis and concerns about the COVID-19 Delta variant, kept markets in check during the final months of the period. International value-oriented companies typically outperformed their growth-oriented counterparts during the period.
The Fund applies principles of behavioral finance to its investment strategy. This process is designed to capitalize on known investor biases and heuristics (mental shortcuts) by accounting for the impact on markets of behavioral factors such as greed, fear and ego.
Stock selection, which explains the return that is not associated with the Fund’s behaviorally-based value and momentum exposures, hurt relative returns. The Fund's holdings in the Metals and Mining sector were particularly detrimental to relative performance.
The Fund’s value exposure was the single largest contributor to the portfolio's performance relative to its benchmark. Value returns were strongest in the Consumer Discretionary, Financials and Industrials sectors, all of which added to relative results. The Fund's momentum strategy was also a modest contributor to relative returns during the period.
Portfolio composition is as of September 30, 2021 and is subject to change and risk.
| Average Annual Total Returns |
| As of September 30, 2021 | Inception Date | 1 Year | 5 Years | Since Inception |
| Class A Shares* | 11/28/14 | 16.31% | 2.61% | 1.77% |
| Class C Shares** | 11/28/14 | 22.44% | 3.03% | 1.88% |
| Institutional Shares | 11/28/14 | 23.86% | 4.09% | 2.88% |
| Class R6 Shares | 2/1/181 | 23.70% | 4.10% | 2.89% |
| MSCI EAFE® Net Index | 11/30/14 | 25.73% | 8.81% | 5.97% |
Past performance does not guarantee future results. The performance data quoted represents past performance and current returns may be lower or higher. Total return figures include change in share price, reinvestment of dividends and capital gains, and do not reflect taxes that a shareholder would pay on fund distributions or on the redemption of fund shares. The investment return and principal value will fluctuate so that an investor’s shares, when redeemed, may be worth more or less than the original cost. To obtain performance information current to the most recent month end, please visit ww.sterlingcapitalfunds.com. Performance would have been lower without limitations and/or waivers in effect.
The chart above represents a comparison of a hypothetical $10,000 investment in the indicated share class versus a similar investment in the Fund’s benchmark.
| * | Reflects 5.75% maximum sales charge. |
| ** | Reflects the applicable maximum CDSC of 1.00% (applicable only to redemptions within one year of purchase, and as such, are not reflected in the Average Annual Total Returns table since the periods reflected are for a year or longer). |
| 1 | Class R6 Shares were not in existence prior to 2/1/18. Performance for periods prior to 2/1/18 is based on the performance of Institutional Shares. |
Fund is measured against the MSCI EAFE® Index, an unmanaged Index which is generally representative of large- and mid-cap equity across developed markets countries around the world, excluding the U.S. and Canada. The index does not reflect the deduction of expenses associated with a mutual fund, such as investment management and fund accounting fees. Investors cannot invest directly in an index, although they can invest in its underlying securities.
Sterling Capital SMID Opportunities Fund
Portfolio Managers
Sterling Capital SMID Opportunities Fund (the “Fund”) is managed by Portfolio Managers Lee D. Houser, CFA, Executive Director and James L. Curtis, CFA, Director for Sterling Capital Management LLC (“Sterling Capital”), advisor to the Fund.
Lee D. Houser, CFA
Lee D. Houser, CFA, Executive Director, joined Sterling Capital Management in 2006 and has investment experience since 1999. Lee has been co-portfolio manager of the SMID Opportunities Fund since August 2021. Lee received his B.S. in Mathematics and Economics from James Madison University, where he was a summa cum laude graduate, and his MBA from Duke University. He holds the Chartered Financial Analyst designation.
James L. Curtis, CFA
James L. Curtis, CFA, Director, first worked at Sterling Capital Management from 1999 to 2001 and rejoined the firm in 2020. He has investment experience since 1996. Jim has been co-portfolio manager of the SMID Opportunities Fund since August 2021. Jim received his B.S.B.A. in Finance from the University of North Carolina at Chapel Hill’s Kenan-Flagler Business School and his MBA in Finance from Emory University’s Goizueta Business School. He holds the Chartered Financial Analyst designation.
Investment Considerations
The Fund uses a multi-style approach and invests in both growth and value-oriented companies. A growth investment style may be particularly sensitive to market conditions. Value investing involves the risk that an investment made in undervalued securities may not appreciate in value as anticipated or remain undervalued for long periods of time. The Fund invests in small and middle capitalization companies which may be riskier, more volatile and vulnerable to economic, market and industry changes than investments in larger more established companies. As a result, share price changes may be more erratic or trade less frequently in lesser quantities.
Q. How did the Fund perform during the period from its inception on October 1, 2020, to September 30, 2021?
A. The Fund’s Institutional Shares underperformed its current benchmark, the Russell 2500 Index.
Q. What factors affected the Fund’s performance?
A. U.S. SMID-cap stocks posted strong gains for the period. The announcements and introduction of three COVID-19 vaccines in the U.S. sparked a strong market rally early in the period. The positive economic impacts of continued government actions to stimulate the economy also helped stocks, particularly those in economically-sensitive sectors.
Unfavorable stock selection in the technology, materials and healthcare sectors, as well as the Fund’s underweighting of the well-performing energy sector, contributed to the Fund’s relative performance. Positive stock selection within the utility and financial sectors in addition to the portfolio’s underweighting of the poorly-performing consumer staples sector helped the Fund’s relative performance. The proposed acquisition of one portfolio holding, Magnachip Semiconductor Corp., led to its being one of the top contributors to the Fund’s performance during the period. FMC Corp. was one of the top detractors, as it suffered from near-term cost headwinds including elevated raw materials, logistics and shipping expenses.
Portfolio composition is as of September 30, 2021 and is subject to change and risk.

| Average Annual Total Returns |
| As of September 30, 2021 | Inception Date | 1 Year | 5 Years | Since Inception |
| Class A Shares* | 9/30/16 | 21.73% | 10.14% | 10.14% |
| Class C Shares** | 9/30/16 | 28.22% | 10.63% | 10.63% |
| Institutional Shares | 9/30/16 | 29.48% | 11.73% | 11.73% |
| Russell 2500® Index | N/A | 45.03% | 14.25% | 14.25% |
Past performance does not guarantee future results. The performance data quoted represents past performance and current returns may be lower or higher. Total return figures include change in share price, reinvestment of dividends and capital gains, and do not reflect taxes that a shareholder would pay on fund distributions or on the redemption of fund shares. The investment return and principal value will fluctuate so that an investor’s shares, when redeemed, may be worth more or less than the original cost. To obtain performance information current to the most recent month end, please visit www.sterlingcapitalfunds.com. Performance would have been lower without limitations and/or waivers in effect.
The chart above represents a comparison of a hypothetical $10,000 investment in the indicated share class versus a similar investment in the Fund’s benchmark.
| * | Reflects 5.75% maximum sales charge. |
| ** | Reflects the applicable maximum CDSC of 1.00% (applicable only to redemptions within one year of purchase, and as such, are not reflected in the Average Annual Total Returns table since the periods reflected are for a year or longer). |
The Russell 2500® Index is a widely recognized index of common stocks that measures the performance of the small and mid cap sector of the U.S. equity market. The index is unmanaged and does not reflect the deduction of expenses associated with a mutual fund, such as investment management and fund accounting fees. Investors cannot invest directly in an index, although they can invest in its underlying securities.
| Sterling Capital Stratton Mid Cap Value Fund |
Portfolio Managers
Sterling Capital Stratton Mid Cap Value Fund (the “Fund”) is managed by Portfolio Managers Shawn M. Gallagher, CFA, Executive Director and Andrew T. DiZio, CFA, Executive Director for Sterling Capital Management LLC (“Sterling Capital”), advisor to the Fund.
Shawn M. Gallagher, CFA
Shawn M. Gallagher, CFA, Executive Director, joined Stratton Management Company in 2005 and Sterling Capital Management as part of a business acquisition in 2015. He has investment experience since 2003 and has been co-portfolio manager of the Stratton Mid Cap Value Fund since November 2015. Shawn received his B.S. in Finance from Pennsylvania State University. He holds the Chartered Financial Analyst designation and is a member of the CFA Society of Philadelphia and the CFA Institute.
Andrew T. DiZio, CFA
Andrew T. DiZio, CFA, Executive Director, joined Stratton Management Company in 2012 and Sterling Capital Management as part of a business acquisition in 2015. He has investment experience since 2003. Andy has been co-portfolio manager of the Stratton Mid Cap Value Fund since August 2021 and was associate portfolio manager of the Fund from November 2015 to August 2021. Andy received his B.S. in Finance with a minor in Economics from Pennsylvania State University. He holds the Chartered Financial Analyst designation and is a member of the CFA Society of Philadelphia and the CFA Institute.
Investment Considerations
Mid-capitalization companies are generally riskier than large company stocks due to greater volatility and less liquidity. Value stocks can perform differently than other types of stocks and can continue to be undervalued by the market for long periods of time.
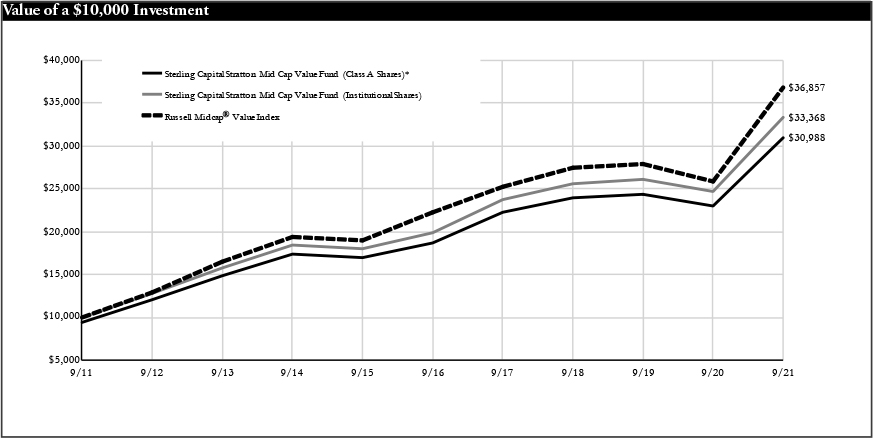
Q. How did the Fund perform during the 12-month period between October 1, 2020 and September 30, 2021?
A. The Fund’s Institutional Shares underperformed its benchmark, the Russell Midcap® Value Index.
Q. What factors affected the Fund’s performance?
A. U.S. mid-cap stocks posted very strong gains for the 12-month period ended September 30, 2021. Stocks began the period continuing a positive trend from the previous period, as equity markets recovered from their pandemic lows. Within the mid-cap space, investors’ risk-on attitude helped drive gains amid the highest beta stocks in the benchmark index. Early in the period under review, positive vaccine breakthroughs built on momentum from the Federal Reserve’s accommodative policies and the gradual re-opening of the economy. These factors drove gains among cyclical performers, with the Financials, Industrials, and Materials sectors posting strong absolute gains for the period. By comparison, traditionally defensive sectors, such as Communication Services, Consumer Staples, Real Estate, and Utilities, lagged among mid-cap equities.
Stock selection within the Real Estate and Communication Services sectors were the biggest detractors to the Fund’s relative performance. A handful of the Fund’s holdings within these sectors, including two data center Real Estate Investment Trusts (REITs) and two videogame publishers, lagged after having benefitted from pandemic-related consumer trends in the previous period. The Fund’s lack of exposure to oil-focused exploration and production companies also weighed on relative results, as this highly cyclical and volatile group was the third-best performing industry during the period under review.
Stock selection within the Industrials sector was the biggest contributor to relative results. Several holdings benefited from the ongoing domestic cyclical recovery, as well as the prospect of future large-scale U.S. government spending on infrastructure projects. The Fund’s below-benchmark exposure to the Utilities sector also added to relative performance, as this was the worst performing sector within the index during the period.
Portfolio composition is as of September 30, 2021 and is subject to change and risk.
| Average Annual Total Returns |
| As of September 30, 2021 | Inception Date | 1 Year | 5 Years | 10 Years |
| Class A Shares* | 11/13/15 | 26.91% | 9.32% | 11.97% |
| Class C Shares** | 11/13/15 | 33.80% | 9.86% | 12.18% |
| Institutional Shares | 9/30/72 | 35.02% | 10.90% | 12.81% |
| Russell Midcap® Value Index | N/A | 42.40% | 10.59% | 13.93% |
Past performance does not guarantee future results. The performance data quoted represents past performance and current returns may be lower or higher. Total return figures include change in share price, reinvestment of dividends and capital gains, and do not reflect taxes that a shareholder would pay on fund distributions or on the redemption of fund shares. The investment return and principal value will fluctuate so that an investor’s shares, when redeemed, may be worth more or less than the original cost. The performance shown here (for periods prior to the date of commencement of operations on November 16, 2015) is that of Stratton Mid Cap Value Fund (the “Predecessor Fund”), whose shares were reorganized into Institutional Shares of the Fund at the close of business on November 13, 2015. Because the Fund had no investment operations prior to the closing of the reorganization, and based on the similarity of the Fund to the Predecessor Fund, the Predecessor Fund is treated as the survivor of the reorganization for accounting and performance reporting purposes. Accordingly, all performance and other information shown for the Fund for periods prior to November 16, 2015 is that of the Predecessor Fund. Performance for Class A Shares and Class C Shares, prior to the date of commencement of operations on November 16, 2015, is based on the performance of the shares of the Predecessor Fund. To obtain performance information current to the most recent month end, please visit www.sterlingcapitalfunds.com. Performance would have been lower without waivers in effect.
The chart above represents a comparison of a hypothetical $10,000 investment in the indicated share class versus a similar investment in the Fund’s benchmark.
| * | Reflects 5.75% maximum sales charge. |
| ** | Reflects the applicable maximum CDSC of 1.00% (applicable only to redemptions within one year of purchase, and as such, are not reflected in the Average Annual Total Returns table since the periods reflected are for a year or longer). |
The Fund is measured against the Russell Midcap® Value Index, an unmanaged index, which measures the performance of the mid-cap value segment of the U.S. equity universe. It includes those Russell Midcap® Index companies with lower price-to-book ratios and lower forecasted growth values. The index is unmanaged and does not reflect the deduction of expenses associated with a mutual fund, such as investment management and fund accounting fees. Investors cannot invest directly in an index, although they can invest in its underlying securities.
Sterling Capital Stratton Real Estate Fund
Portfolio Managers
Sterling Capital Stratton Real Estate Fund (the “Fund”) is managed by Portfolio Managers Andrew T. DiZio, CFA, Executive Director and Shawn M. Gallagher, CFA, Executive Director for Sterling Capital Management LLC (“Sterling Capital”), advisor to the Fund.
Andrew T. DiZio, CFA
Andrew T. DiZio, CFA, Executive Director, joined Stratton Management Company in 2012 and Sterling Capital Management as part of a business acquisition in 2015. He has investment experience since 2003. Andy is co-portfolio manager of the Stratton Real Estate Fund and has managed the Fund since November 2015. Andy received his B.S. in Finance with a minor in Economics from Pennsylvania State University. He holds the Chartered Financial Analyst designation and is a member of the CFA Society of Philadelphia and the CFA Institute.
Shawn M. Gallagher, CFA
Shawn M. Gallagher, CFA, Executive Director, joined Stratton Management Company in 2005 and Sterling Capital Management as part of a business acquisition in 2015. He has investment experience since 2003. Shawn has been co-portfolio manager of the Stratton Real Estate Fund since August 2021 and was associate portfolio manager of the Fund from November 2015 to August 2021. Shawn received his B.S. in Finance from Pennsylvania State University. He holds the Chartered Financial Analyst designation and is a member of the CFA Society of Philadelphia and the CFA Institute.
Investment Considerations
Real Estate Funds may be subject to a higher degree of market risk because of concentration in a specific industry or geographic sector. Risks include declines in value of real estate, general and economic conditions, changes in the value of the underlying property and defaults by borrowers.
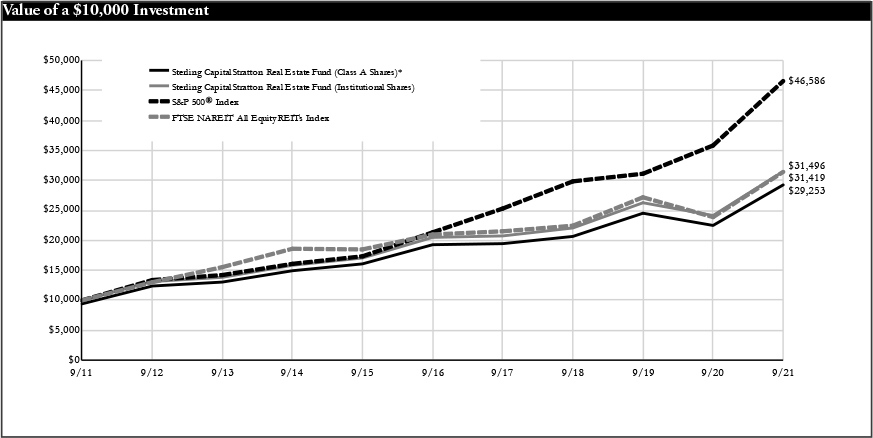
Q. How did the Fund perform during the 12-month period between October 1, 2020 and September 30, 2021?
A. The Fund’s Institutional Shares underperformed its benchmark, the FTSE NAREIT All Equity REITs Index.
Q. What factors affected the Fund’s performance?
A. The economic recovery from the global pandemic had the largest impact on real estate investment trust (REIT) share prices during the 12-month period under review. Broader markets experienced steady gains throughout most of the period as vaccines allowed global economies to cautiously reopen, although share prices weakened in the final month of the period. Shares in REITs mirrored the trend in the broader markets. The lodging and retail subsectors of the Fund’s portfolio experienced the strongest gains in absolute terms, as they rebounded from their position as the worst performers in the previous period. The upswing in these two spaces corresponded with the approval of vaccines and the lifting of virus-driven restrictions at the state and local level. The self storage subsector also posted strong absolute gains for the period, as workers rented space to clear out their homes to create home-office space. Self storage REITs also benefited from a rise in inter-state relocations. By contrast, the data center and infrastructure subsectors generally underperformed the broader REIT sector. Both subsectors had outperformed during the early stages of the pandemic and lagged during the economic recovery.
The Fund’s overweight position to data centers was the largest detractor from relative results. Stock selection within the office subsector also weighed on results. The Fund’s limited exposure to downtown locations in major coastal cities detracted, as shares of REITs with those attributes outperformed during the period. Meanwhile, the Fund’s largest holding in the office subsector, a life sciences landlord, lagged during the economic recovery after performing well during the early stages of the pandemic.
Stock selection within the health care and self storage subsectors contributed the most to relative performance. Within health care, an overweight position to REITs with significant senior housing exposure added to results as demand rebounded with the rollout of vaccines. Meanwhile, the Fund’s above-benchmark exposure to a self storage REIT with high concentrations of assets in the South and Southwest—the sunbelt region—benefited relative results, as that region experienced elevated demand throughout the pandemic and economic recovery.
Portfolio composition is as of September 30, 2021 and is subject to change and risk.
| Average Annual Total Returns |
| As of September 30, 2021 | Inception Date | 1 Year | 5 Years | 10 Years |
| Class A Shares* | 11/13/15 | 22.61% | 7.41% | 11.33% |
| Class C Shares** | 11/13/15 | 29.14% | 7.89% | 11.51% |
| Institutional Shares | 5/31/08 | 30.40% | 8.97% | 12.16% |
| Class R6 Shares | 1/31/201 | 30.67% | 9.03% | 12.19% |
| S&P 500® Index | N/A | 30.00% | 16.90% | 16.63% |
| FTSE NAREIT All Equity REITs Index | N/A | 31.54% | 8.41% | 12.13% |
Past performance does not guarantee future results. The performance data quoted represents past performance and current returns may be lower or higher. Total return figures include change in share price, reinvestment of dividends and capital gains, and do not reflect taxes that a shareholder would pay on fund distributions or on the redemption of fund shares. The investment return and principal value will fluctuate so that an investor’s shares, when redeemed, may be worth more or less than the original cost. The performance shown here (for periods prior to the date of commencement of operations on November 16, 2015) is that of Stratton Real Estate Fund (the “Predecessor Fund”), whose shares were reorganized into Institutional Shares of the Fund at the close of business on November 13, 2015. Because the Fund had no investment operations prior to the closing of the reorganization, and based on the similarity of the Fund to the Predecessor Fund, the Predecessor Fund is treated as the survivor of the reorganization for accounting and performance reporting purposes. Accordingly, all performance and other information shown for the Fund for periods prior to November 16, 2015 is that of the Predecessor Fund. Performance for Class A Shares and Class C Shares, prior to the date of commencement of operations on November 16, 2015, is based on the performance of the shares of the Predecessor Fund. To obtain performance information current to the most recent month end, please visit www.sterlingcapitalfunds.com. Performance would have been lower without waivers in effect.
The chart above represents a comparison of a hypothetical $10,000 investment in the indicated share class versus a similar investment in the Fund’s benchmarks.
| * | Reflects 5.75% maximum sales charge. |
| ** | Reflects the applicable maximum CDSC of 1.00% (applicable only to redemptions within one year of purchase, and as such, are not reflected in the Average Annual Total Returns table since the periods reflected are for a year or longer). |
| 1 | Class R6 Shares were not in existence prior to 01/31/20. Performance for periods prior to 01/31/20 is based on the performance of Institutional Shares. |
The Fund is measured against the FTSE NAREIT All Equity REIT Index, an unmanaged index, which contains all tax-qualified REITs with more than 50 percent of total assets in qualifying real estate assets other than mortgages secured by real property that also meet minimum size and liquidity criteria. The Fund is also measured against the S&P 500® Index, an unmanaged index, which is generally considered to be representative of the performance of the stock market as a whole. The indices do not reflect the deduction of expenses associated with a mutual fund, such as investment management and fund accounting fees. Investors cannot invest directly in an index, although they can invest in its underlying securities.
Sterling Capital Stratton Small Cap Value Fund
Portfolio Managers
Sterling Capital Stratton Small Cap Value Fund (the “Fund”) is managed by Portfolio Managers Gerald M. Van Horn, CFA, Executive Director, Shawn M. Gallagher, CFA, Executive Director and Andrew T. DiZio, CFA, Executive Director for Sterling Capital Management LLC (“Sterling Capital”), advisor to the Fund.
Gerald M. Van Horn, CFA
Gerald M. Van Horn, CFA, Executive Director, joined Stratton Management Company in 1998 and Sterling Capital as part of a business acquisition in August 2015. He has investment experience since 1996. Jerry has been lead portfolio manager for the Stratton Small Cap Value Fund since inception on November 2015 and the predecessor fund since 2000. He received his B.A. in Economics from The College of New Jersey and holds the Chartered Financial Analyst designation.
Shawn M. Gallagher, CFA
Shawn M. Gallagher, CFA, Executive Director, joined Stratton Management Company in 2005 and Sterling Capital Management as part of a business acquisition in 2015. He has investment experience since 2003 and is associate portfolio manager of the Stratton Small Cap Value Fund. Shawn received his B.S. in Finance from Pennsylvania State University. He holds the Chartered Financial Analyst designation and is a member of the CFA Society of Philadelphia and the CFA Institute.
Andrew T. DiZio, CFA
Andrew T. DiZio, CFA, Executive Director, joined Stratton Management Company in 2012 and Sterling Capital Management as part of a business acquisition in 2015. He has investment experience since 2003 and is associate portfolio manager of the Stratton Small Cap Value Fund. Andy received his B.S. in Finance with a minor in Economics from Pennsylvania State University. He holds the Chartered Financial Analyst designation and is a member of the CFA Society of Philadelphia and the CFA Institute.
Investment Considerations
Small cap company stocks are generally riskier than large company stocks due to greater volatility and less liquidity. Value stocks can perform differently than other types of stocks and can continue to be undervalued by the market for long periods of time.
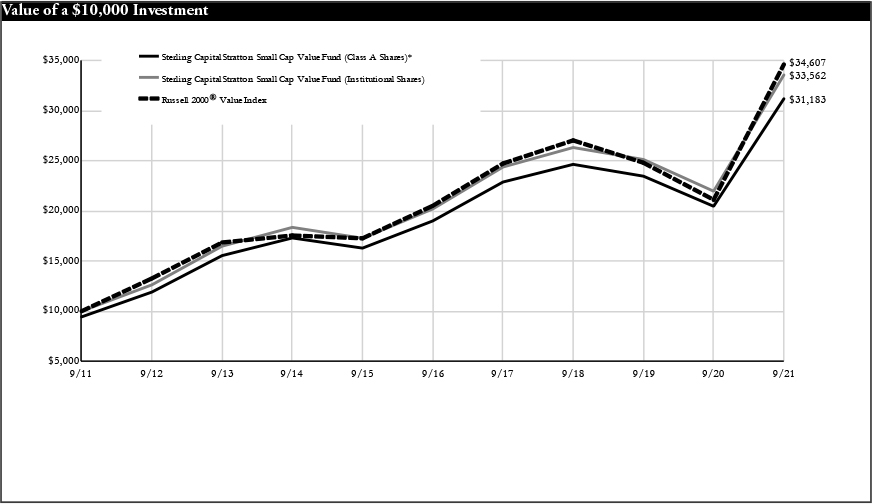
Q. How did the Fund perform during the 12-month period between October 1, 2020 and September 30, 2021?
A. The Fund’s Institutional Shares underperformed its benchmark, the Russell 2000® Value Index.
Q. What factors affected the Fund’s performance?
A. Small-cap equities posted very strong returns during the 12-month period under review. The successful development of COVID-19 vaccines along with the lifting of pandemic-related closures and restrictions on businesses and the public helped drive the strong rally. Within the benchmark, the Energy, Communication Services, and Materials sectors outperformed, while the Industrials, Real Estate, Consumer Staples, Health Care, and Utilities sectors underperformed. However, all sectors of the Index posted positive returns for the period. Within the Fund’s portfolio, the Financials, Materials, and Information Technology sectors added the most to absolute returns, while the Consumer Discretionary and Communication Services sectors weighed on the Fund’s absolute results.
Stock selection within the Consumer Staples sector was the biggest detractor from relative results for the period, particularly holdings of a convenience store operator and a warehouse club operator. These companies underperformed after posting strong performance in the previous period and as investors turned to lower quality names within the sector. Stock selection and a below-benchmark exposure to the Consumer Discretionary sector also weighed on results, as did a below-benchmark exposure to the Energy sector. Stock selection in the Communication Services sector also detracted, as the Fund’s holdings of an underperforming video game maker weighed on relative results. The Fund’s lack of exposure to an entertainment company whose share prices rose due to social media exposure also weighed on relative results.
Stock selection within the Financials sector helped boost relative returns, with several of the Fund’s bank holdings outperforming amid the economic recovery during the period. The Fund’s below-benchmark exposure to the Health Care sector also added to relative results, as that sector generally underperformed following strong performance in the prior period.
Portfolio composition is as of September 30, 2021 and is subject to change and risk.
| Average Annual Total Returns |
| As of September 30, 2021 | Inception Date | 1 Year | 5 Years | 10 Years |
| Class A Shares* | 11/13/15 | 43.67% | 9.12% | 12.05% |
| Class C Shares** | 11/13/15 | 51.27% | 9.60% | 12.22% |
| Institutional Shares | 4/12/93 | 52.78% | 10.70% | 12.87% |
| Class R6 Shares | 1/31/201 | 52.98% | 10.73% | 12.89% |
| Russell 2000® Value Index | N/A | 63.92% | 11.03% | 13.22% |
Past performance does not guarantee future results. The performance data quoted represents past performance and current returns may be lower or higher. Total return figures include change in share price, reinvestment of dividends and capital gains, and do not reflect taxes that a shareholder would pay on fund distributions or on the redemption of fund shares. The investment return and principal value will fluctuate so that an investor’s shares, when redeemed, may be worth more or less than the original cost. The performance shown here (for periods prior to the date of commencement of operations on November 16, 2015) is that of Stratton Small Cap Value Fund (the “Predecessor Fund”), whose shares were reorganized into Institutional Shares of the Fund at the close of business on November 13, 2015. Because the Fund had no investment operations prior to the closing of the reorganization, and based on the similarity of the Fund to the Predecessor Fund, the Predecessor Fund is treated as the survivor of the reorganization for accounting and performance reporting purposes. Accordingly, all performance and other information shown for the Fund for periods prior to November 16, 2015 is that of the Predecessor Fund. Performance for Class A Shares and Class C Shares, prior to the date of commencement of operations on November 16, 2015, is based on the performance of the shares of the Predecessor Fund. To obtain performance information current to the most recent month end, please visit www.sterlingcapitalfunds.com.
The chart above represents a comparison of a hypothetical $10,000 investment in the indicated share class versus a similar investment in the Fund’s benchmark.
| * | Reflects 5.75% maximum sales charge. |
| ** | Reflects the applicable maximum CDSC of 1.00% (applicable only to redemptions within one year of purchase, and as such, are not reflected in the Average Annual Total Returns table since the periods reflected are for a year or longer). |
| 1 | Class R6 Shares were not in existence prior to 01/31/20. Performance for periods prior to 01/31/20 is based on the performance of Institutional Shares. |
The Russell 2000® Value Index is a widely recognized index of common stocks that measures the performance of the small-cap value sector of the U.S. equity market. The index is unmanaged and does not reflect the deduction of expenses associated with a mutual fund, such as investment management and fund accounting fees. Investors cannot invest directly in an index, although they can invest in its underlying securities.
Sterling Capital Ultra Short Bond Fund
Portfolio Managers
Sterling Capital Ultra Short Bond Fund (the “Fund”) is managed by Portfolio Managers Mark M. Montgomery, CFA, Senior Managing Director, Byron G. Mims, CFA, Executive Director, and Jeffrey D. Ormsby, CFA, Executive Director, for Sterling Capital Management LLC (“Sterling Capital”), advisor to the Fund.
Mark M. Montgomery, CFA
Mark M. Montgomery, CFA, Senior Managing Director, CIO and Head of Fixed Income, joined Sterling Capital in 1997 and has investment experience since 1990. He has been co-portfolio manager of the Ultra Short Bond Fund since its inception. Mark received his B.S. in Marketing with a minor in Public Administration and his MBA from Drexel University. He holds the Chartered Financial Analyst designation.
Byron G. Mims, CFA
Byron G. Mims, CFA, Executive Director, joined Sterling Capital in 2012 and has investment experience since 2006. He has been co-portfolio manager of the Ultra Short Bond Fund since February 2020. Byron received his B.S. in Economics from North Carolina State University. He holds the Chartered Financial Analyst designation.
Jeffrey D. Ormsby, CFA
Jeffrey D. Ormsby, CFA, Executive Director, joined Sterling Capital in 2011 and has investment experience since 2006. He has been co-portfolio manager of the Ultra Short Bond Fund since February 2020. Jeff received his B.S. in Economics from North Carolina State University and his MBA from UNC’s Kenan-Flagler Business School. He holds the Chartered Financial Analyst designation.
Investment Considerations
The overall results of the Fund will be dependent on the process and ability of the Adviser to apply “behavioral finance” principles to recognize a company’s value, earnings revisions and price momentum. The Fund may invest in undervalued securities which may not appreciate in value as anticipated or remain undervalued for longer than anticipated. The overall results of the Fund will be dependent on the process and ability of the Adviser to recognize a company’s value. The Fund may invest in Real Estate Investment Trusts (REITs), the value of which will be affected by conditions of the real estate industry. The Fund may also invest in exchange-traded funds (ETFs); thus shareholders may bear additional costs and the ETF may not exactly replicate the performance it seeks to track.
Q. How did the Fund perform during the 12-month period between October 1, 2020 and September 30, 2021?
A. The Fund’s Institutional Shares outperformed its current benchmark, the FTSE 6 Month Treasury Bill Index.
Q. What factors affected the Fund’s performance?
A. The economy continued to recover from the COVID-19-related shock and both fiscal and monetary policy remained extremely accommodative, boosting consumer balance sheets. Given this favorable economic and fundamental backdrop, investors continued to reach for yield, causing most risk assets to outperform Treasuries.
The Fund’s exposure to corporate bonds boosted absolute returns. Continued accommodative fiscal and monetary stimulus throughout the year boosted corporate fundamentals, consumer spending, and the supply of investable dollars looking for investment options. Exposure to securitized investments also improved absolute returns. Attractive relative value in asset-backed securities (ABS) and commercial mortgage-backed securities (CMBS) encouraged investments in those sectors and pandemic-related concerns faded and fundamental performance improved. Along with the improvement in economic fundamentals, taxable municipal bonds also outperformed the benchmark for the year.
The Fund was managed with longer duration than the benchmark throughout the year, and this positioning detracted from relative performance as rates longer than one year rose over the year. The Fund’s exposure to longer key rates, which underperformed shorter key rates as the curve steepened, also detracted from relative performance as did the small exposure to Treasuries, which provided the lowest absolute returns of any sector in which the Fund was invested.
Portfolio composition is as of September 30, 2021 and is subject to change and risk.
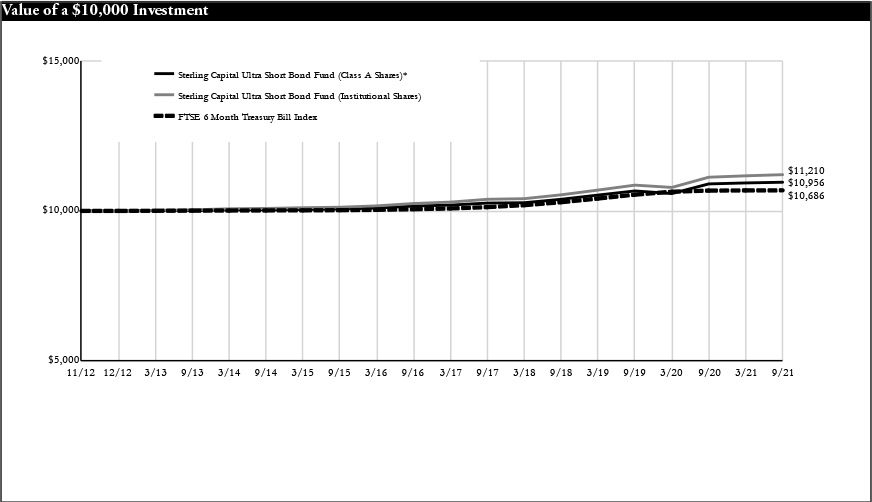
| Average Annual Total Returns |
| As of September 30, 2021 | Inception Date | 1 Year | 5 Years | Since Inception |
| Class A Shares* | 11/30/12 | 0.51% | 1.52% | 1.04% |
| Institutional Shares | 11/30/12 | 0.75% | 1.81% | 1.30% |
| FTSE 6 Month Treasury Bill Index | 11/30/12 | 0.08% | 1.22% | 0.75% |
Past performance does not guarantee future results. The performance data quoted represents past performance and current returns may be lower or higher. Total return figures include change in share price, reinvestment of dividends and capital gains, and do not reflect taxes that a shareholder would pay on fund distributions or on the redemption of fund shares. The investment return and principal value will fluctuate so that an investor’s shares, when redeemed, may be worth more or less than the original cost. To obtain performance information current to the most recent month end, please visit www.sterlingcapitalfunds.com. Performance would have been lower without limitations and/or waivers in effect.
The chart above represents a comparison of a hypothetical $10,000 investment in the indicated share class versus a similar investment in the Fund’s benchmark.
| * | Reflects 0.5% maximum sales charge. |
The Fund is measured against the FTSE 6 Month Treasury Bill Index, which measures the performance of Treasury bills with a maturity of six months or less. The index does not reflect the deduction of expenses associated with a mutual fund, such as investment management and fund accounting fees. Investors cannot invest directly in an index, although they can invest in its underlying securities.
Sterling Capital Short Duration Bond Fund
Portfolio Managers
Sterling Capital Short Duration Bond Fund (the “Fund”) is managed by Portfolio Managers Mark M. Montgomery, CFA, Senior Managing Director, and Peter L. Brown, CFA, Executive Director, for Sterling Capital Management LLC (“Sterling Capital”), advisor to the Fund.
Mark M. Montgomery, CFA
Mark M. Montgomery, CFA, Senior Managing Director, CIO and Head of Fixed Income, joined Sterling Capital in 1997 and has investment experience since 1990. He has been co-portfolio manager of the Short Duration Bond Fund since February 2011. Mark received his B.S. in Marketing with a minor in Public Administration and his MBA from Drexel University. He holds the Chartered Financial Analyst designation.
Peter L. Brown, CFA
Peter L. Brown, CFA, Executive Director, joined Sterling Capital in 2004 and has investment experience since 2000. He has been co-portfolio manager of the Short Duration Bond Fund since February 2020. Pete received a B.S. in Statistics with minors in Business Management, Marketing and Communications from Cornell University, and a MBA from Wake Forest University. He holds the Chartered Financial Analyst designation.
Investment Considerations
The Fund is subject to the same risks as the underlying bonds in the portfolio such as credit, prepayment, call and interest rate risk. As interest rates rise, the value of bond prices will decline and an investor may lose money. The Fund may invest in more aggressive investments, such as foreign securities, which may expose the Fund to currency and exchange rate fluctuations; mortgage-backed securities sensitive to interest rates; and high yield debt (also known as junk bonds), all of which may cause greater volatility and less liquidity.
Q. How did the Fund perform during the 12-month period between October 1, 2020, and September 30, 2021?
A. The Fund’s Institutional Shares outperformed its current benchmark, the ICE BofA Merrill Lynch 1-3 Year U.S. Corporate Government Index.
Q. What factors affected the Fund’s performance?
A. As the U.S. economy recovered from the COVID-19 pandemic, investors grew more comfortable taking on risk, which caused a decline in the risk premia on corporate bonds. Corporate earnings surged during the period under review, which helped companies pay down their debt and led to stronger corporate balance sheets. Accommodative monetary policy from central banks around the world also contributed to the strong performance of corporate bonds in general, and corporate bond yields remained relatively stable despite rising Treasury yields.
By early 2021, the strength of the economic recovery and the introduction of COVID-19 vaccines caused market participants to expect the Federal Reserve might soon begin to tighten monetary policy. Inflationary pressures and labor market dislocations also added to concerns among bond investors, helping to drive a steep rise in interest rates and a decline in bond prices late in the period. This trend dragged on the Fund’s absolute returns.
The Fund’s overweight allocation to non-government securities and its underweight exposure to U.S. Treasuries boosted returns relative to its benchmark. The higher risk non-government securities outperformed and the safer Treasuries underperformed as investors sought out riskier investments. The economic recovery helped improve the financial situation among corporations, consumers, and municipalities, in general, which in turn helped corporate bonds, agency-backed securities, and municipal bonds outperform Treasuries. The Fund’s allocation to off-benchmark, below-investment grade bonds added to relative results. As they regained their appetite for risks, investors sought out the higher yields of lower quality bonds, particularly in sectors affected by the pandemic-related downturn in the economy. This trend helped lower quality bonds in the corporate bond universe outperform investment-grade bonds.
The Fund’s relative performance also benefitted from its neutral to short duration positioning versus its benchmark as interest rates rose over the past year. Although the Fund benefitted from carrying less overall interest rate sensitivity than its benchmark, curve positioning was a detractor. The Fund’s overweight position relative to the benchmark’s exposure to the 3-year portion of the yield curve weighed on relative performance. The yield curve steepened during the period and 3-year rates rose more than shorter maturities.
Portfolio composition is as of September 30, 2021 and is subject to change and risk.
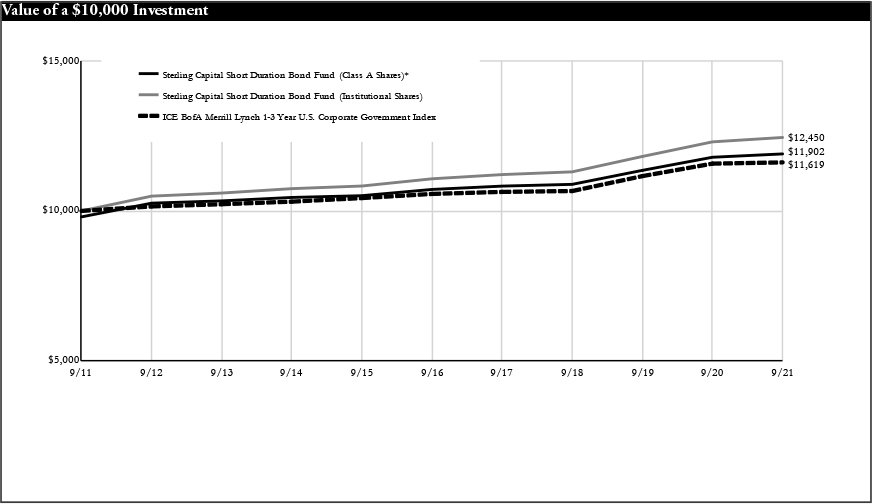
| Average Annual Total Returns |
| As of September 30, 2021 | Inception Date | 1 Year | 5 Years | 10 Years |
| Class A Shares* | 11/30/92 | -1.09% | 1.71% | 1.76% |
| Class C Shares** | 1/31/12 | 0.29% | 1.38% | 1.23% |
| Institutional Shares | 11/30/92 | 1.19% | 2.37% | 2.22% |
| Class R6 Shares | 2/1/211 | 1.21% | 2.17% | 1.99% |
| ICE BofA Merrill | | | | |
| Lynch 1-3 Year | | | | |
| U.S. Corporate Government Index | N/A | 0.35% | 1.92% | 1.51% |
Past performance does not guarantee future results. The performance data quoted represents past performance and current returns may be lower or higher. Total return figures include change in share price, reinvestment of dividends and capital gains, and do not reflect taxes that a shareholder would pay on fund distributions or on the redemption of fund shares. The investment return and principal value will fluctuate so that an investor’s shares, when redeemed, may be worth more or less than the original cost. To obtain performance information current to the most recent month end, please visit www.sterlingcapitalfunds.com. Performance would have been lower without limitations and/or waivers in effect.
The chart above represents a comparison of a hypothetical $10,000 investment in the indicated share class versus a similar investment in the Fund’s benchmark.
| * | Reflects 5.75% maximum sales charge. |
| ** | Reflects the applicable maximum CDSC of 1.00% (applicable only to redemptions within one year of purchase, and as such, are not reflected in the Average Annual Total Returns table since the periods reflected are for a year or longer). |
| 1 | Class R6 Shares were not in existence prior to 2/1/2021. Performance for the period prior to 2/1/2021 is based on the performance of Institutional Shares. |
The Fund is measured against the ICE BofA Merrill Lynch 1-3 Year U.S. Corporate Government Index, which consists of securities with a maturity from one to three years. The index does not reflect the deduction of expenses associated with a mutual fund, such as investment management and fund accounting fees. Investors cannot invest directly in an index, although they can invest in its underlying securities.
Sterling Capital Intermediate U.S. Government Fund
Portfolio Managers
Sterling Capital Intermediate U.S. Government Fund (the “Fund”) is managed by Managing Director and portfolio manager Neil Grant and Executive Director and portfolio manager Michael Sun, CFA for Sterling Capital Management LLC (“Sterling Capital”), advisor to the Fund.
Neil T. Grant, CFA
Neil T. Grant, CFA, Managing Director, joined Sterling Capital in 2004 and has investment experience since 1991. He has been co-portfolio manager of the Intermediate U.S. Government Fund since February 2019 and was associate portfolio manager of the Fund from February 2016 until February 2019. Neil received his B.S. in Finance from Syracuse University and his MBA from Emory University. He holds the Chartered Financial Analyst designation.
Michael Z. Sun, CFA
Michael Z. Sun, CFA, Executive Director, joined Sterling Capital in 2009 and has investment experience since 1998. He has been co-portfolio manager of the Intermediate U.S. Government Fund since February 2019. Michael received his M.A. in Economics from Bowling Green State University, his M.S. in Urban & Regional Study from Beijing University and his B.S. in Geography from Nanjing University. He holds the Chartered Financial Analyst designation.
Investment Considerations
The Fund is subject to the same risks as the underlying bonds in the portfolio such as credit, prepayment, call and interest rate risk. As interest rates rise, the value of bond prices will decline and an investor may lose money. The Fund may invest in mortgage-backed securities, which tend to be more sensitive to changes in interest rates. The Fund invests in securities issued or guaranteed by the U.S. government or its agencies (such as Fannie Mae or Freddie Mac). Although U.S. government securities issued directly by the U.S. government are guaranteed by the U.S. Treasury, other U.S. government securities issued by an agency or instrumentality of the U.S. government may not be. No assurance can be given that the U.S. government would provide financial support to its agencies and instrumentalities if not required to do so by law.
Q. How did the Fund perform during the 12-month period between October 1, 2020 and September 30, 2021?
A. The Fund’s Institutional Shares outperformed its benchmark, the Bloomberg Barclays U.S. Government Intermediate Index.
Q. What factors affected the Fund’s performance?
A. The accommodative monetary policies adopted by the Federal Reserve (Fed) in response to the COVID-19 pandemic persisted throughout the 12-month period under review. Fiscal stimulus by the new Administration early in 2021 helped support investors’ appetite for risk, which weighed on demand for Treasuries. Rising inflation concerns and a shift to a more hawkish tone by the Fed helped drive Treasury yields even higher, particularly on longer term bonds. The two-year Treasury yield rose approximately 15 basis points while the 10-year Treasury yield rose approximately 80 basis points during the period.
In absolute terms, these rising yields hurt the Fund’s performance as rising interest rates drive bond prices lower. The decline in bond prices produced a negative total return for the Fund during the period.
The Fund’s relative performance benefitted from its off-benchmark exposure to securitized loan products including mortgage-backed securities, collateralized mortgage obligations, commercial mortgage-backed securities, asset-backed securities, and corporate bonds. These holdings all outperformed Treasuries of similar duration. The Fund also maintained a shorter duration positioning relative to its benchmark for most of the period, which added to relative results as Treasury yields increased.
The Fund’s overweight cash position relative to the benchmark was a drag on performance during the period, offsetting some of these positive effects.
Portfolio composition is as of September 30, 2021 and is subject to change and risk.
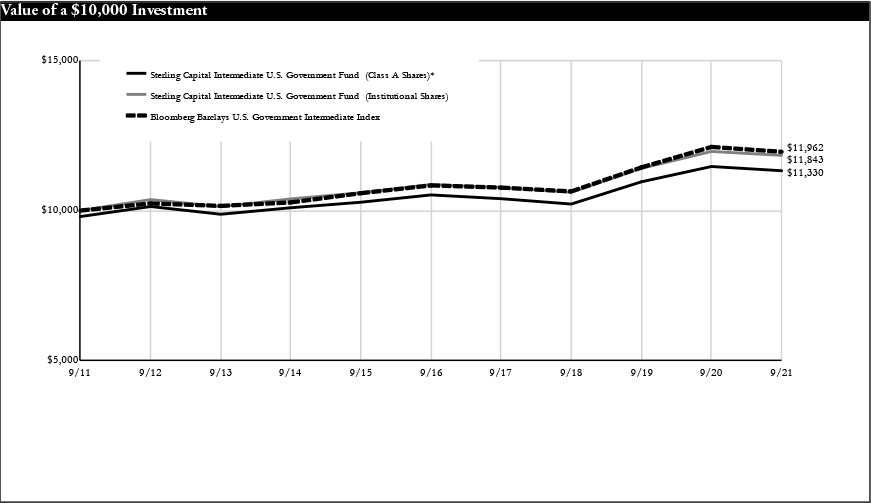
��
| Average Annual Total Returns |
| As of September 30, 2021 | Inception Date | 1 Year | 5 Years | 10 Years |
| Class A Shares* | 10/9/92 | -3.23% | 1.08% | 1.26% |
| Class C Shares** | 2/1/01 | -1.97% | 0.73% | 0.70% |
| Institutional Shares | 10/9/92 | -1.08% | 1.72% | 1.71% |
| Bloomberg Barclays | | | | |
| U.S. Government Intermediate Index | N/A | -1.33% | 1.99% | 1.81% |
Past performance does not guarantee future results. The performance data quoted represents past performance and current returns may be lower or higher. Total return figures include change in share price, reinvestment of dividends and capital gains, and do not reflect taxes that a shareholder would pay on fund distributions or on the redemption of fund shares. The investment return and principal value will fluctuate so that an investor’s shares, when redeemed, may be worth more or less than the original cost. To obtain performance information current to the most recent month end, please visit www.sterlingcapitalfunds.com. Performance would have been lower without limitations and/or waivers in effect.
The chart above represents a comparison of a hypothetical $10,000 investment in the indicated share class versus a similar investment in the Fund’s benchmark.
| * | Reflects 2% maximum sales charge. |
| ** | Reflects the applicable maximum CDSC of 1.00% (applicable only to redemptions within one year of purchase, and as such, are not reflected in the Average Annual Total Returns table since the periods reflected are for a year or longer). |
The Fund is measured against the Bloomberg Barclays U.S. Government Intermediate Index, an unmanaged index comprised of all publicly issued non-convertible domestic debt of the U.S. government or any agency there of, or corporate debt guaranteed by the U.S. government all with outstanding principal of $1 million and maturity between one and ten years. The index does not reflect the deduction of expenses associated with a mutual fund, such as investment management and fund accounting fees. Investors cannot invest directly in an index, although they can invest in its underlying securities.
Sterling Capital Total Return Bond Fund
Portfolio Managers
Sterling Capital Total Return Bond Fund (the “Fund”) is managed by Portfolio Managers Mark M. Montgomery, CFA, Senior Managing Director, and Peter L. Brown, CFA, Executive Director, for Sterling Capital Management LLC (“Sterling Capital”), advisor to the Fund.
Mark M. Montgomery, CFA
Mark M. Montgomery, CFA, Senior Managing Director, CIO and Head of Fixed Income, joined Sterling Capital in 1997 and has investment experience since 1990. He has been co-portfolio manager of the Total Return Bond Fund since January 2008. Mark received his B.S. in Marketing with a minor in Public Administration and his MBA from Drexel University. He holds the Chartered Financial Analyst designation.
Peter L. Brown, CFA
Peter L. Brown, CFA, Executive Director, joined Sterling Capital in 2004 and has investment experience since 2000. He has been co-portfolio manager of the Total Return Bond Fund since February 2020. Pete received a B.S. in Statistics with minors in Business Management, Marketing and Communications from Cornell University, and a MBA from Wake Forest University. He holds the Chartered Financial Analyst designation.
Investment Considerations
The Fund is subject to the same risks as the underlying bonds in the portfolio such as credit, prepayment, call and interest rate risk. As interest rates rise, the value of bond prices will decline and an investor may lose money. The Fund may invest in foreign securities, which may expose the fund to currency and exchange rate fluctuations; and mortgage-backed securities sensitive to interest rates; and high yield debt (also known as junk bonds), all of which may cause greater volatility and less liquidity. Derivatives may be more sensitive to changes in market conditions and may amplify risks.
Q. How did the Fund perform during the 12-month period between October 1, 2020 and September 30, 2021?
A. The Fund’s Institutional Shares outperformed its current benchmark, the Bloomberg Barclays U.S. Aggregate Bond Index.
Q. What factors affected the Fund’s performance?
A. As the U.S. economy recovered from the COVID-19 pandemic, investors grew more comfortable taking on risk, which caused a decline in the risk premia on corporate bonds. Corporate earnings surged during the period under review, which helped companies pay down their debt and led to stronger corporate balance sheets. Accommodative monetary policy from central banks around the world also contributed to the strong performance of corporate bonds in general, and corporate bond yields remained relatively stable despite rising Treasury yields.
By early 2021, the strength of the economic recovery and the introduction of COVID-19 vaccines caused market participants to anticipate a tightening of the Federal Reserve’s monetary policy. Inflationary pressures and labor market dislocations also added to concerns among bond investors, helping to drive a steep rise in interest rates and a decline in bond prices late in the period. This trend dragged on the Fund’s absolute returns.
The Fund’s overweight allocation to non-government securities and its underweight exposure to U.S. Treasuries boosted returns relative to its benchmark. The higher risk non-government securities outperformed and the safer Treasuries underperformed as investors sought out riskier investments. The economic recovery helped improve the financial situation among corporations, consumers, and municipalities, in general, which in turn helped corporate bonds, agency-backed securities, and municipal bonds outperform Treasuries. The Fund’s allocation to off-benchmark, below-investment grade bonds added to relative results. As they regained their appetite for risk, investors sought out the higher yields of lower quality bonds, particularly in sectors affected by the pandemic-related downturn in the economy. This trend helped lower quality bonds in the corporate bond universe outperform investment-grade bonds. The Fund’s underweight allocation to agency mortgage-backed securities (MBS) also boosted relative returns. Interest rate volatility and investor preference for higher yielding instruments led agency MBS to underperform Treasuries and non-agency securitized products over the period.
The Fund’s relative performance benefitted from its neutral to short duration positioning versus its benchmark as interest rates rose over the past year. Although the Fund benefitted from carrying less overall interest rate sensitivity than its benchmark, its curve positioning was a detractor. The Fund’s overweight position relative to the benchmark’s exposure to the 5- to 10-year part of the yield curve weighed on relative performance. The yield curve steepened during the period as 5- to 10-year rates rose while the 10- to 30-year yield curve flattened.
Portfolio composition is as of September 30, 2021 and is subject to change and risk.
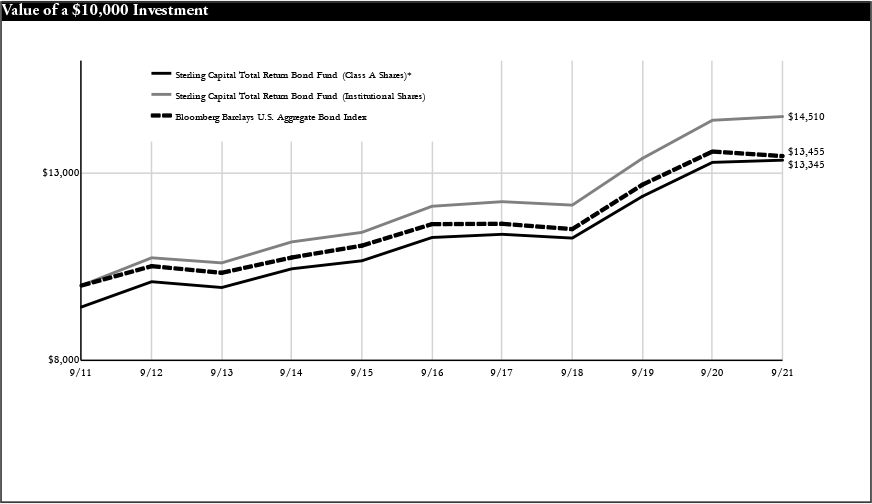
| Average Annual Total Returns |
| As of September 30, 2021 | Inception Date | 1 Year | 5 Years | 10 Years |
| Class A Shares* | 11/30/99 | -5.30% | 2.20% | 2.93% |
| Class C Shares** | 2/1/01 | -0.31% | 2.64% | 2.76% |
| Institutional Shares | 11/30/99 | 0.69% | 3.67% | 3.79% |
| Class R Shares | 1/29/10 | 0.18% | 3.17% | 3.27% |
| Class R6 Shares | 1/31/181 | 0.79% | 3.75% | 3.83% |
| Bloomberg Barclays | | | | |
| U.S. Aggregate Bond Index | N/A | -0.90% | 2.94% | 3.01% |
Past performance does not guarantee future results. The performance data quoted represents past performance and current returns may be lower or higher. Total return figures include change in share price, reinvestment of dividends and capital gains, and do not reflect taxes that a shareholder would pay on fund distributions or on the redemption of fund shares. The investment return and principal value will fluctuate so that an investor’s shares, when redeemed, may be worth more or less than the original cost. To obtain performance information current to the most recent month end, please visit www.sterlingcapitalfunds.com. Performance would have been lower without limitations and/or waivers in effect.
The chart above represents a comparison of a hypothetical $10,000 investment in the indicated share class versus a similar investment in the Fund’s benchmark.
| * | Reflects 5.75% maximum sales charge. |
| ** | Reflects the applicable maximum CDSC of 1.00% (applicable only to redemptions within one year of purchase, and as such, are not reflected in the Average Annual Total Returns table since the periods reflected are for a year or longer). |
| 1 | Class R6 Shares were not in existence prior to 2/1/18. Performance for periods prior to 2/1/18 is based on the performance of Institutional Shares. |
The Fund is measured against the Bloomberg Barclays U.S. Aggregate Bond Index, an unmanaged index, which is a market value-weighted performance benchmark for investment-grade fixed-rate debt issues, including government, corporate, asset-backed, and mortgage-backed securities, with maturities of at least one year. The index is unmanaged and does not reflect the deduction of expenses associated with a mutual fund, such as investment management and fund accounting fees. Investors cannot invest directly in an index, although they can invest in its underlying securities.
Sterling Capital Corporate Fund
Portfolio Managers
Sterling Capital Corporate Fund (the “Fund”) is managed by Portfolio Managers Mark M. Montgomery, CFA, Senior Managing Director, and Peter L. Brown, CFA, Executive Director, for Sterling Capital Management LLC (“Sterling Capital”), advisor to the Fund.
Mark M. Montgomery, CFA
Mark M. Montgomery, CFA, Senior Managing Director, CIO and Head of Fixed Income, joined Sterling Capital in 1997 and has investment experience since 1990. He has been co-portfolio manager of the Corporate Fund since inception. Mark received his B.S. in Marketing with a minor in Public Administration and his MBA from Drexel University. He holds the Chartered Financial Analyst designation.
Peter L. Brown, CFA
Peter L. Brown, CFA, Executive Director, joined Sterling Capital in 2004 and has investment experience since 2000. He has been co-portfolio manager of the Corporate Fund since February 2020. Pete received a B.S. in Statistics with minors in Business Management, Marketing and Communications from Cornell University, and a MBA from Wake Forest University. He holds the Chartered Financial Analyst designation.
Investment Considerations
The Fund is subject to the same risks as the underlying bonds in the portfolio such as credit, prepayment, call and interest rate risk. As interest rates rise, the value of bond prices will decline and an investor may lose money. The Fund may invest in more aggressive investments, such as foreign securities, which may expose the fund to currency and exchange rate fluctuations; mortgage-backed securities sensitive to interest rates; and high yield debt (also known as junk bonds), all of which may cause greater volatility and less liquidity. Derivatives may be more sensitive to changes in market conditions and may amplify risks.
Q. How did the Fund perform during the 12-month period between October 1, 2020 and September 30, 2021?
A. The Fund’s Institutional Shares outperformed its current benchmark, the Bloomberg Barclays Corporate Intermediate Bond Index.
Q. What factors affected the Fund’s performance?
A. As the U.S. economy recovered from the COVID-19 pandemic, investors grew more comfortable taking on risk, which caused a decline in the risk premia on corporate bonds. Corporate earnings surged during the period under review, which helped companies pay down their debt and led to stronger corporate balance sheets. Accommodative monetary policy from central banks around the world also contributed to the strong performance of corporate bonds in general, and corporate bond yields remained relatively stable despite rising Treasury yields.
By early 2021, the strength of the economic recovery and the introduction of COVID-19 vaccines caused market participants to expect the Federal Reserve might soon begin to tighten monetary policy. Inflationary pressures and labor market concerns also added to concerns among bond investors, helping to drive a steep rise in interest rates and a decline in bond prices late in the period. This trend dragged on the Fund’s absolute returns.
The Fund’s allocation to off-benchmark, below-investment grade bonds added to relative results. As they regained their appetite for risks, investors sought out the higher yields of lower quality bonds, particularly in sectors affected by the pandemic-related downturn in the economy. This trend helped lower quality bonds in the corporate bond universe outperform investment-grade bonds. The Fund’s relative performance also benefitted from its neutral to short duration positioning versus its benchmark as interest rates rose over the past year.
The Fund’s underweight allocation and security selection within the utilities sector detracted from relative performance. In particular, a lack of exposure to major California power companies weighed on results, as these riskier names outperformed during the period.
Portfolio composition is as of September 30, 2021 and is subject to change and risk.
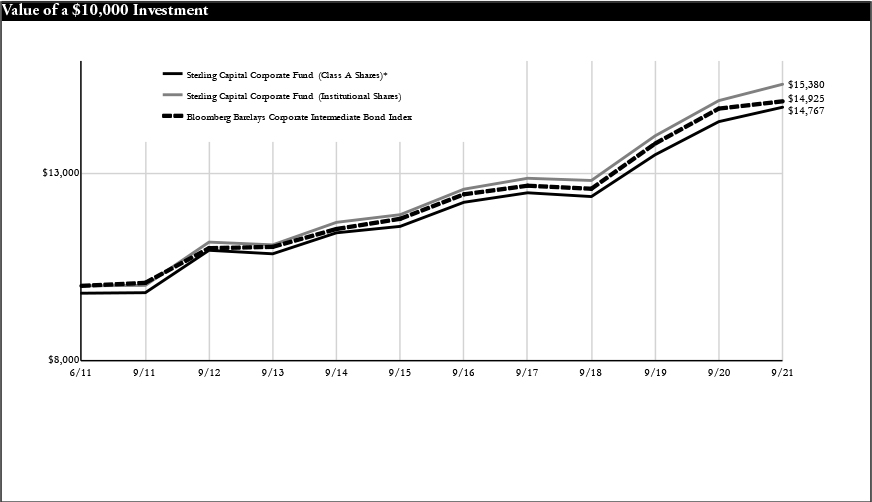
| Average Annual Total Returns |
| As of September 30, 2021 | Inception Date | 1 Year | 5 Years | 10 Years | Since Inception |
| Class A Shares* | 1/31/131 | 0.61% | 3.43% | 3.96% | 3.88% |
| Class C Shares** | 1/31/131 | 1.98% | 3.11% | 3.50% | 3.42% |
| Institutional Shares | 6/30/112 | 2.92% | 4.10% | 4.39% | 4.29% |
| Bloomberg Barclays Corporate Intermediate Bond Index | 6/30/11 | 1.31% | 3.70% | 4.00% | 3.98% |
Past performance does not guarantee future results. The performance data quoted represents past performance and current returns may be lower or higher. Total return figures include change in share price, reinvestment of dividends and capital gains, and do not reflect taxes that a shareholder would pay on fund distributions or on the redemption of fund shares. The investment return and principal value will fluctuate so that an investor’s shares, when redeemed, may be worth more or less than the original cost. To obtain performance information current to the most recent month end, please visit www.sterlingcapitalfunds.com.
The chart above represents a comparison of a hypothetical $10,000 investment in the indicated share class versus a similar investment in the Fund’s benchmark.
| * | Reflects 2% maximum sales charge. |
| ** | Reflects the applicable maximum CDSC of 1.00% (applicable only to redemptions within one year of purchase, and as such, are not reflected in the Average Annual Total Returns table since the periods reflected are for a year or longer). |
| 1 | Class A and C Shares were not in existence prior to 2/1/13. Performance for periods prior to 2/1/13 is based on the performance of Institutional Shares and has been adjusted for maximum CDSC to the class applicable but does not include 12b-1 fees, which if reflected, would have caused performance of Class A and C Shares to be lower. |
| 2 | The Fund converted Class S Shares into Institutional Shares effective 2/1/13. |
The Fund is measured against the Bloomberg Barclays Corporate Intermediate Bond Index, an unmanaged index consisting of dollar-denominated debt from U.S. industrial, utility and financial institutions issuers with a duration of 1 to 10 years. The index does not reflect the deduction of expenses associated with a mutual fund, such as investment management and fund accounting fees. Investors cannot invest directly in an index, although they can invest in its underlying securities.
Sterling Capital Quality Income Fund
Portfolio Managers
Sterling Capital Quality Income Fund (the “Fund”) is managed by Executive Directors and portfolio managers Michael Z. Sun, CFA, Jeffrey D. Ormsby, CFA and Byron G. Mims, CFA, for Sterling Capital Management LLC (“Sterling Capital”), advisor to the Fund.
Michael Z. Sun, CFA
Michael Z. Sun, CFA, Executive Director, joined Sterling Capital in 2009 and has investment experience since 1998. He has been co-portfolio manager of the Quality Income Fund since February 2014. Michael received his M.A. in Economics from Bowling Green State University, his M.S. in Urban & Regional Study from Beijing University and his B.S. in Geography from Nanjing University. He holds the Chartered Financial Analyst designation.
Jeffrey D. Ormsby, CFA
Jeffrey D. Ormsby, CFA, Executive Director, joined Sterling Capital in 2011 and has investment experience since 2006. He has been co-portfolio manager of the Quality Income Fund since February 2016. Jeff received his B.S. in Economics from North Carolina State University and his MBA from UNC’s Kenan-Flagler Business School. He holds the Chartered Financial Analyst designation.
Byron G. Mims, CFA
Byron G. Mims, CFA, Executive Director, joined Sterling Capital in 2012 and has investment experience since 2006. He has been co-portfolio manager of the Quality Income Fund since February 2016. Byron received his B.S. in Economics from North Carolina State University. He holds the Chartered Financial Analyst designation.
Q. How did the Fund perform during the 12-month period between October 1, 2020 and September 30, 2021?
A. The Fund’s Institutional Shares outperformed its benchmark, the Bloomberg Barclays U.S. Mortgage Backed Securities Index.
Q. What factors affected the Fund’s performance?
A. The economy continued to recover from the COVID-19-related shock, and both fiscal and monetary policy remained extremely accommodative, boosting consumer balance sheets and economic growth more broadly. Given this favorable economic and fundamental backdrop, investors continued to reach for yield, causing most risk assets to outperform Treasuries. Further, significant progress toward the Federal Reserve’s employment and inflation goals resulted in rates moving higher and the yield curve steepening, with two-year U.S. Treasury rates rising 15 basis points, while ten-year U.S. Treasury rates rose 80 basis points during the period.
Absolute performance was mixed during the period as the Fund’s collateralized mortgage obligations (CMO), many of which are longer duration, posted negative performance for the year, while the Fund’s asset-backed securities (ABS), non-agency commercial-backed securities (CMBS), and agency mortgage-backed securities (MBS) posted positive performance. The Fund’s overweight to non-agency CMBS was the largest contributor to relative outperformance, offering strong relative value as real estate fundamentals improved and the economy continued to re-open. Likewise, robust consumer balance sheets resulted in strong fundamental performance of the consumer ABS sector, helping the asset class to deliver solid absolute and relative performance. Security selection within our agency MBS holdings also contributed to relative outperformance due to our emphasis on higher coupon securities, which outperformed lower coupon securities as concerns about the Federal Reserve tapering its asset purchases grew late in the fiscal year. Detracting from relative performance was the Fund’s agency CMBS holdings, which posted negative absolute and relative returns compared to the benchmark. Additionally, the Fund’s interest rate curve positioning detracted from relative performance as the yield curve steepened.
Portfolio composition is as of September 30, 2021 and is subject to change and risk.
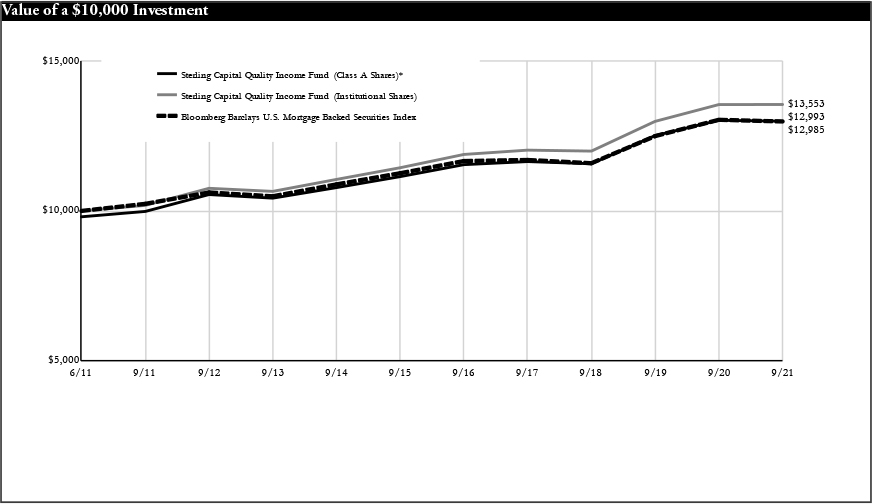
| Average Annual Total Returns |
| As of September 30, 2021 | Inception Date | 1 Year | 5 Years | 10 Years |
| Class A Shares* | 1/31/131 | -2.23% | 1.97% | 2.46% |
| Class C Shares** | 1/31/131 | -0.92% | 1.65% | 2.03% |
| Institutional Shares | 6/30/112 | 0.02% | 2.66% | 2.90% |
| Bloomberg Barclays U.S. Mortgage Backed Securities Index | N/A | -0.43% | 2.17% | 2.41% |
Past performance does not guarantee future results. The performance data quoted represents past performance and current returns may be lower or higher. Total return figures include change in share price, reinvestment of dividends and capital gains, and do not reflect taxes that a shareholder would pay on fund distributions or on the redemption of fund shares. The investment return and principal value will fluctuate so that an investor’s shares, when redeemed, may be worth more or less than the original cost. To obtain performance information current to the most recent month end, please visit www.sterlingcapitalfunds.com.
The chart above represents a comparison of a hypothetical $10,000 investment in the indicated share class versus a similar investment in the Fund’s benchmark.
| * | Reflects 2% maximum sales charge. |
| ** | Reflects the applicable maximum CDSC of 1.00% (applicable only to redemptions within one year of purchase, and as such, are not reflected in the Average Annual Total Returns table since the periods reflected are for a year or longer). |
| 1 | Class A and C Shares were not in existence prior to 2/1/13. Performance for periods prior to 2/1/13 is based on the performance of Institutional Shares and has been adjusted for maximum CDSC to the class applicable but does not include 12b-1 fees, which if reflected, would have caused performance of Class A and C Shares to be lower. |
| 2 | The Fund converted Class S Shares into Institutional Shares effective 2/1/13. |
The Fund is measured against the Bloomberg Barclays U.S. Mortgage Backed Securities Index. The index measures the performance of investment grade fixed-rate mortgage-backed pass-through securities of Ginnie Mae, Fannie Mae, and Freddie Mac. The index is unmanaged and does not reflect the deduction of expenses associated with a mutual fund, such as investment management and fund accounting fees. Investors cannot invest directly in an index, although they can invest in its underlying securities.
Sterling Capital North Carolina Intermediate Tax-Free Fund
Portfolio Managers
Sterling Capital North Carolina Intermediate Tax-Free Fund (the “Fund”) is managed by Portfolio Managers Robert F. Millikan, CFA, Executive Director and Michael P. McVicker, Executive Director for Sterling Capital Management LLC (“Sterling Capital”), advisor to the Fund.
Robert F. Millikan, CFA
Robert F. Millikan, CFA, Executive Director, joined BB&T Asset Management in 2000 and Sterling Capital through merger in October 2010. He has investment experience since 1990 and joined the team that manages each of the Tax-Free Bond Funds in February 2000. He is a graduate of Wake Forest University where he received his B.A. in Economics. He holds the Chartered Financial Analyst designation.
Michael P. McVicker
Michael P. McVicker, Executive Director, joined Sterling Capital in 1992 and has investment experience since 1992. He has been associate portfolio manager for each of the Tax-Free Bond Funds since February 2016. Michael is a graduate of the University of North Carolina – Charlotte where he received his B.S.B.A. in Finance with a minor in Psychology.
Investment Considerations
The Fund is subject to the same risks as the underlying bonds in the portfolios such as credit, prepayment and interest rate risk. As interest rates rise, the value of bond prices will decline and an investor may lose money. The Fund is non-diversified and may invest a greater percentage of its assets in a single issuer than funds that are more diversified. Furthermore, the Fund invests primarily in municipal obligations issued by North Carolina and its political subdivisions and therefore will be affected by economic, political or other events affecting North Carolina.
Q. How did the Fund perform during the 12-month period between October 1, 2020 and September 30, 2021?
A. The Fund’s Institutional Shares underperformed its current benchmark, the ICE BofA Merrill Lynch 2-17 Year Municipal Bond Index.
Q. What factors affected the Fund’s performance?
A. Accommodative monetary policies adopted by the Federal Reserve (Fed) in response to the COVID-19 pandemic, improving economic activity, and fiscal stimulus enacted by the new Administration early in 2021 all combined to raise investors’ appetite for risk early in the period. Municipal bond yields began the period at relatively low levels and rose during the period thanks in part to rising inflation concerns and a shift toward a more hawkish tone by the Fed in the second quarter of 2021. Yields for five-year municipal bonds rose 24 basis points on average, while seven-year bond yields rose 33 basis points and 10-year yields rose 27 basis points. By contrast, one-year bond yields rose only 1 basis point and 15-year yields rose 10 basis points. Many states received higher tax receipts than anticipated and federal financial aid boosted government balance sheets, reducing premia for higher-quality bonds. Low yields at the beginning of the period led to lower absolute income levels for the Fund than historical averages, which weighed on the Fund’s absolute performance.
Although the Fund maintained an overall duration close to neutral with the benchmark during the period, its overweight position in durations of five to 10 years hurt its relative performance during the period. The increasing yields experienced among bonds of this duration led to lower bond prices, which move in the opposite direction of yields.
The Fund’s exposure to higher average credit quality also weighed on relative performance, as the period’s risk-on environment and federal intervention favored the performance of lower quality bonds from states such as New Jersey and Illinois. Overweight positions in AA bonds and underweight positions in A-rated and BBB-rated bonds compared to the index also hurt the Fund’s relative performance during the period.
The Fund’s overweight exposure to revenue bonds compared to general obligations bonds helped offset some of these negative effects during the period. The benefits of this positioning were most noteworthy in economically sensitive areas such as Transportation and Health Care.
Portfolio composition is as of September 30, 2021 and is subject to change and risk.

| Average Annual Total Returns |
| As of September 30, 2021 | Inception Date | 1 Year | 5 Years | 10 Years |
| Class A Shares* | 10/16/92 | -2.04% | 1.36% | 2.07% |
| Class C Shares** | 1/31/121 | -0.85% | 1.02% | 1.53% |
| Institutional Shares | 10/16/92 | 0.24% | 2.03% | 2.53% |
| ICE BofA Merrill Lynch 2-17 Year Municipal Bond Index | N/A | 2.07% | 2.92% | 3.37% |
Past performance does not guarantee future results. The performance data quoted represents past performance and current returns may be lower or higher. Total return figures include change in share price, reinvestment of dividends and capital gains, and do not reflect taxes that a shareholder would pay on fund distributions or on the redemption of fund shares. The investment return and principal value will fluctuate so that an investor’s shares, when redeemed, may be worth more or less than the original cost. To obtain performance information current to the most recent month end, please visit www.sterlingcapitalfunds.com.
The chart above represents a comparison of a hypothetical $10,000 investment in the indicated share class versus a similar investment in the Fund’s benchmark.
| * | Reflects 2% maximum sales charge. |
| ** | Reflects the applicable maximum CDSC of 1.00% (applicable only to redemptions within one year of purchase, and as such, are not reflected in the Average Annual Total Returns table since the periods reflected are for a year or longer). |
| 1 | Class C Shares were not in existence prior to 2/1/12. Performance for periods prior to 2/1/12 is based on the performance of Class A Shares. Such performance would differ only to the extent that the Classes have different expenses. |
The Fund is measured against the ICE BofA Merrill Lynch 2-17 Year Municipal Bond Index, an unmanaged index, which is representative of municipal bonds. The index does not reflect the deduction of expenses associated with a mutual fund, such as investment management and fund accounting fees. Investors cannot invest directly in an index, although they can invest in its underlying securities.
Sterling Capital South Carolina Intermediate Tax-Free Fund
Portfolio Managers
Sterling Capital South Carolina Intermediate Tax-Free Fund (the “Fund”) is managed by Portfolio Managers Robert F. Millikan, CFA, Executive Director and Michael P. McVicker, Executive Director for Sterling Capital Management LLC (“Sterling Capital”), advisor to the Fund.
Robert F. Millikan, CFA
Robert F. Millikan, CFA, Executive Director, joined BB&T Asset Management in 2000 and Sterling Capital through merger in October 2010. He has investment experience since 1990 and joined the team that manages each of the Tax-Free Bond Funds in February 2000. He is a graduate of Wake Forest University where he received his B.A. in Economics. He holds the Chartered Financial Analyst designation.
Michael P. McVicker
Michael P. McVicker, Executive Director, joined Sterling Capital in 1992 and has investment experience since 1992. He has been associate portfolio manager for each of the Tax-Free Bond Funds since February 2016. Michael is a graduate of the University of North Carolina – Charlotte where he received his B.S.B.A. in Finance with a minor in Psychology.
Investment Considerations
The Fund is subject to the same risks as the underlying bonds in the portfolios such as credit, prepayment and interest rate risk. As interest rates rise, the value of bond prices will decline and an investor may lose money. The Fund is non-diversified and may invest a greater percentage of its assets in a single issuer than funds that are more diversified. Furthermore, the Fund invests primarily in municipal obligations issued by South Carolina and its political subdivisions and therefore will be affected by economic, political or other events affecting South Carolina.
Q. How did the Fund perform during the 12-month period between October 1, 2020 and September 30, 2021?
A. The Fund’s Institutional Shares underperformed its current benchmark, the ICE BofA Merrill Lynch 2-17 Year Municipal Bond Index.
Q. What factors affected the Fund’s performance?
A. Accommodative monetary policies adopted by the Federal Reserve (Fed) in response to the COVID-19 pandemic, improving economic activity, and fiscal stimulus enacted by the new Administration early in 2021 all combined to raise investors’ appetite for risk early in the period. Municipal bond yields began the period at relatively low levels and rose during the period thanks in part to rising inflation concerns and a shift toward a more hawkish tone by the Fed in the second quarter of 2021. Yields for five-year municipal bonds rose 24 basis points on average, while seven-year bond yields rose 33 basis points and 10-year yields rose 27 basis points. By contrast, one-year bond yields rose only 1 basis point and 15-year yields rose 10 basis points. Many states received higher tax receipts than anticipated and federal financial aid boosted government balance sheets, reducing premia for higher-quality bonds. Low yields at the beginning of the period led to lower absolute income levels for the Fund than historical averages, which weighed on the Fund’s absolute performance.
Although the Fund maintained an overall duration close to neutral with the benchmark during the period, its overweight position in durations of five to 10 years hurt its relative performance during the period. The increasing yields experienced among bonds of this duration led to lower bond prices, which move in the opposite direction of yields.
The Fund’s exposure to higher average credit quality also weighed on relative performance, as the period’s risk-on environment and federal intervention favored the performance of lower quality bonds from states such as New Jersey and Illinois. Overweight positions in AA bonds and underweight positions in A-rated and BBB-rated bonds compared to the index also hurt the Fund’s relative performance during the period.
The Fund’s overweight exposure to revenue bonds compared to general obligations bonds helped offset some of these negative effects during the period. The benefits of this positioning were most noteworthy in economically sensitive areas such as Transportation and Health Care.
Portfolio composition is as of September 30, 2021 and is subject to change and risk.

| Average Annual Total Returns |
| As of September 30, 2021 | Inception Date | 1 Year | 5 Years | 10 Years |
| Class A Shares* | 10/20/97 | -1.13% | 1.53% | 2.25% |
| Class C Shares** | 1/31/121 | 0.10% | 1.17% | 1.70% |
| Institutional Shares | 10/20/97 | 1.10% | 2.20% | 2.70% |
| ICE BofA Merrill Lynch 2-17 Year Municipal Bond Index | N/A | 2.07% | 2.92% | 3.37% |
Past performance does not guarantee future results. The performance data quoted represents past performance and current returns may be lower or higher. Total return figures include change in share price, reinvestment of dividends and capital gains, and do not reflect taxes that a shareholder would pay on fund distributions or on the redemption of fund shares. The investment return and principal value will fluctuate so that an investor’s shares, when redeemed, may be worth more or less than the original cost. To obtain performance information current to the most recent month end, please visit www.sterlingcapitalfunds.com.
The chart above represents a comparison of a hypothetical $10,000 investment in the indicated share class versus a similar investment in the Fund’s benchmark.
| * | Reflects 2% maximum sales charge. |
| ** | Reflects the applicable maximum CDSC of 1.00% (applicable only to redemptions within one year of purchase, and as such, are not reflected in the Average Annual Total Returns table since the periods reflected are for a year or longer). |
| 1 | Class C Shares were not in existence prior to 2/1/12. Performance for periods prior to 2/1/12 is based on the performance of Class A Shares. Such performance would differ only to the extent that the Classes have different expenses. |
The Fund is measured against the ICE BofA Merrill Lynch 2-17 Year Municipal Bond Index, an unmanaged index, which is representative of municipal bonds. The index does not reflect the deduction of expenses associated with a mutual fund, such as investment management and fund accounting fees. Investors cannot invest directly in an index, although they can invest in its underlying securities.
Sterling Capital Virginia Intermediate Tax-Free Fund
Portfolio Managers
Sterling Capital Virginia Intermediate Tax-Free Fund (the “Fund”) is managed by Portfolio Managers Robert F. Millikan, CFA, Executive Director and Michael P. McVicker, Executive Director for Sterling Capital Management LLC (“Sterling Capital”), advisor to the Fund.
Robert F. Millikan, CFA
Robert F. Millikan, CFA, Executive Director, joined BB&T Asset Management in 2000 and Sterling Capital through merger in October 2010. He has investment experience since 1990 and joined the team that manages each of the Tax-Free Bond Funds in February 2000. He is a graduate of Wake Forest University where he received his B.A. in Economics. He holds the Chartered Financial Analyst designation.
Michael P. McVicker
Michael P. McVicker, Executive Director, joined Sterling Capital in 1992 and has investment experience since 1992. He has been associate portfolio manager for each of the Tax-Free Bond Funds since February 2016. Michael is a graduate of the University of North Carolina – Charlotte where he received his B.S.B.A. in Finance with a minor in Psychology.
Investment Considerations
The Fund is subject to the same risks as the underlying bonds in the portfolios such as credit, prepayment and interest rate risk. As interest rates rise, the value of bond prices will decline and an investor may lose money. The Fund is non-diversified and may invest a greater percentage of its assets in a single issuer than funds that are more diversified. Furthermore, the Fund invests primarily in municipal obligations issued by Virginia and its political subdivisions and therefore will be affected by economic, political or other events affecting Virginia.
Q. How did the Fund perform during the 12-month period between October 1, 2020 and September 30, 2021?
A. The Fund’s Institutional Shares underperformed its current benchmark, the ICE BofA Merrill Lynch 2-17 Year Municipal Bond Index.
Q. What factors affected the Fund’s performance?
A. Accommodative monetary policies adopted by the Federal Reserve (Fed) in response to the COVID-19 pandemic, improving economic activity, and fiscal stimulus enacted by the new Administration early in 2021 all combined to raise investors’ appetite for risk early in the period. Municipal bond yields began the period at relatively low levels and rose during the period thanks in part to rising inflation concerns and a shift toward a more hawkish tone by the Fed in the second quarter of 2021. Yields for five-year municipal bonds rose 24 basis points on average, while seven-year bond yields rose 33 basis points and 10-year yields rose 27 basis points. By contrast, one-year bond yields rose only 1 basis point and 15-year yields rose 10 basis points. Many states received higher tax receipts than anticipated and federal financial aid boosted government balance sheets, reducing premia for higher-quality bonds. Low yields at the beginning of the period led to lower absolute income levels for the Fund than historical averages, which weighed on the Fund’s absolute performance.
Although the Fund maintained an overall duration close to neutral with the benchmark during the period, its overweight position in durations of five to 10 years hurt its relative performance during the period. The increasing yields experienced among bonds of this duration led to lower bond prices, which move in the opposite direction of yields.
The Fund’s exposure to higher average credit quality also weighed on relative performance, as the period’s risk-on environment and federal intervention favored the performance of lower quality bonds from states such as New Jersey and Illinois. Overweight positions in AA bonds and underweight positions in A-rated and BBB-rated bonds compared to the index also hurt the Fund’s relative performance during the period.
The Fund’s overweight exposure to revenue bonds compared to general obligations bonds helped offset some of these negative effects during the period. The benefits of this positioning were most noteworthy in economically sensitive areas like Transportation and Health Care.
Portfolio composition is as of September 30, 2021 and is subject to change and risk.
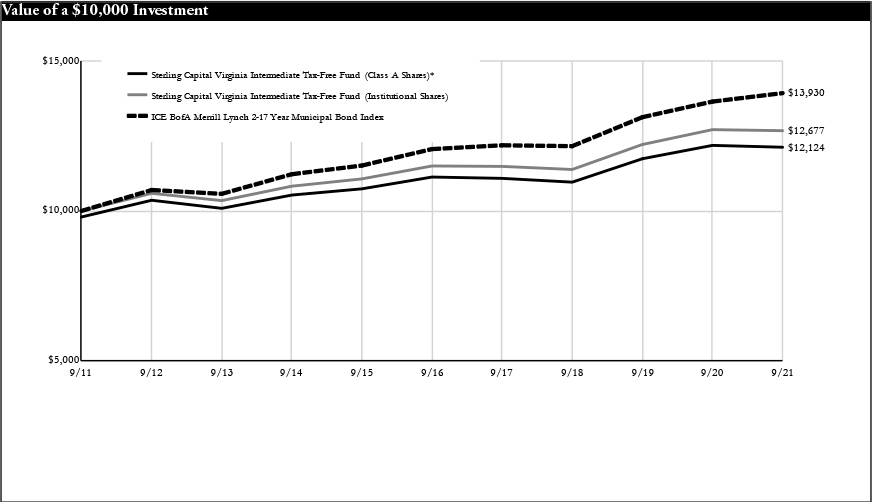
| Average Annual Total Returns |
| As of September 30, 2021 | Inception Date | 1 Year | 5 Years | 10 Years |
| Class A Shares* | 5/17/99 | -2.51% | 1.31% | 1.94% |
| Class C Shares** | 1/31/121 | -1.27% | 0.95% | 1.40% |
| Institutional Shares | 5/17/99 | -0.27% | 1.97% | 2.40% |
| ICE BofA Merrill Lynch 2-17 Year Municipal Bond Index | N/A | 2.07% | 2.92% | 3.37% |
Past performance does not guarantee future results. The performance data quoted represents past performance and current returns may be lower or higher. Total return figures include change in share price, reinvestment of dividends and capital gains, and do not reflect taxes that a shareholder would pay on fund distributions or on the redemption of fund shares. The investment return and principal value will fluctuate so that an investor’s shares, when redeemed, may be worth more or less than the original cost. To obtain performance information current to the most recent month end, please visit www.sterlingcapitalfunds.com.
The chart above represents a comparison of a hypothetical $10,000 investment in the indicated share class versus a similar investment in the Fund’s benchmark.
| * | Reflects 2% maximum sales charge. |
| ** | Reflects the applicable maximum CDSC of 1.00% (applicable only to redemptions within one year of purchase, and as such, are not reflected in the Average Annual Total Returns table since the periods reflected are for a year or longer). |
| 1 | Class C Shares were not in existence prior to 2/1/12. Performance for periods prior to 2/1/12 is based on the performance of Class A Shares. Such performance would differ only to the extent that the Classes have different expenses. |
The Fund is measured against the ICE BofA Merrill Lynch 2-17 Year Municipal Bond Index, an unmanaged index, which is representative of municipal bonds. The index does not reflect the deduction of expenses associated with a mutual fund, such as investment management and fund accounting fees. Investors cannot invest directly in an index, although they can invest in its underlying securities.
Sterling Capital West Virginia Intermediate Tax-Free Fund
Portfolio Managers
Sterling Capital West Virginia Intermediate Tax-Free Fund (the “Fund”) is managed by Portfolio Managers Robert F. Millikan, CFA, Executive Director and Michael P. McVicker, Executive Director for Sterling Capital Management LLC (“Sterling Capital”), advisor to the Fund.
Robert F. Millikan, CFA
Robert F. Millikan, CFA, Executive Director, joined BB&T Asset Management in 2000 and Sterling Capital through merger in October 2010. He has investment experience since 1990 and joined the team that manages each of the Tax-Free Bond Funds in February 2000. He is a graduate of Wake Forest University where he received his B.A. in Economics. He holds the Chartered Financial Analyst designation.
Michael P. McVicker
Michael P. McVicker, Executive Director, joined Sterling Capital in 1992 and has investment experience since 1992. He has been associate portfolio manager for each of the Tax-Free Bond Funds since February 2016. Michael is a graduate of the University of North Carolina – Charlotte where he received his B.S.B.A. in Finance with a minor in Psychology.
Investment Considerations
The Fund is subject to the same risks as the underlying bonds in the portfolios such as credit, prepayment and interest rate risk. As interest rates rise, the value of bond prices will decline and an investor may lose money. The Fund is non-diversified and may invest a greater percentage of its assets in a single issuer than funds that are more diversified. Furthermore, the Fund invests primarily in municipal obligations issued by West Virginia and its political subdivisions and therefore will be affected by economic, political or other events affecting West Virginia.
Q. How did the Fund perform during the 12-month period between October 1, 2020 and September 30, 2021?
A. The Fund’s Institutional Shares underperformed its current benchmark, the ICE BofA Merrill Lynch 2-17 Year Municipal Bond Index.
Q. What factors affected the Fund’s performance?
A. Accommodative monetary policies adopted by the Federal Reserve (Fed) in response to the COVID-19 pandemic, improving economic activity, and fiscal stimulus enacted by the new Administration early in 2021 all combined to raise investors’ appetite for risk early in the period. Municipal bond yields began the period at relatively low levels and rose during the period thanks in part to rising inflation concerns and a shift toward a more hawkish tone by the Fed in the second quarter of 2021. Yields for five-year municipal bonds rose 24 basis points on average, while seven-year bond yields rose 33 basis points and 10-year yields rose 27 basis points. By contrast, one-year bond yields rose only 1 basis point and 15-year yields rose 10 basis points. Many states received higher tax receipts than anticipated and federal financial aid boosted government balance sheets, reducing premia for higher-quality bonds. Low yields at the beginning of the period led to lower absolute income levels for the Fund than historical averages, which weighed on the Fund’s absolute performance.
Although the Fund maintained an overall duration close to neutral with the benchmark during the period, its overweight position in durations of five to 10 years hurt its relative performance during the period. The increasing yields experienced among bonds of this duration led to lower bond prices, which move in the opposite direction of yields.
The Fund’s exposure to higher average credit quality also weighed on relative performance, as the period’s risk-on environment and federal intervention favored the performance of lower quality bonds from states such as New Jersey and Illinois. Overweight positions in AA bonds and underweight positions in A-rated and BBB-rated bonds compared to the index also hurt the Fund’s relative performance during the period.he Fund’s.
The Fund’s overweight exposure to revenue bonds compared to general obligations bonds helped offset some of these negative effects during the period. The benefits of this positioning were most noteworthy in economically sensitive areas such as Transportation and Health Care.
Portfolio composition is as of September 30, 2021 and is subject to change and risk.
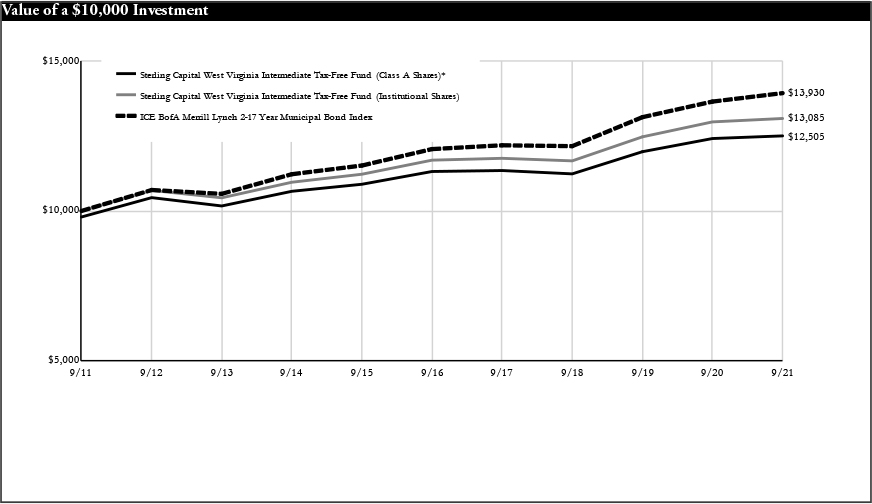
| Average Annual Total Returns |
| As of September 30, 2021 | Inception Date | 1 Year | 5 Years | 10 Years |
| Class A Shares* | 12/17/93 | -1.29% | 1.61% | 2.26% |
| Class C Shares** | 1/31/121 | -0.13% | 1.26% | 1.73% |
| Institutional Shares | 12/1/93 | 0.88% | 2.27% | 2.73% |
| ICE BofA Merrill Lynch 2-17 Year Municipal Bond Index | N/A | 2.07% | 2.92% | 3.37% |
Past performance does not guarantee future results. The performance data quoted represents past performance and current returns may be lower or higher. Total return figures include change in share price, reinvestment of dividends and capital gains, and do not reflect taxes that a shareholder would pay on fund distributions or on the redemption of fund shares. The investment return and principal value will fluctuate so that an investor’s shares, when redeemed, may be worth more or less than the original cost. To obtain performance information current to the most recent month end, please visit www.sterlingcapitalfunds.com.
The chart above represents a comparison of a hypothetical $10,000 investment in the indicated share class versus a similar investment in the Fund’s benchmark.
| * | Reflects 2% maximum sales charge. |
| ** | Reflects the applicable maximum CDSC of 1.00% (applicable only to redemptions within one year of purchase, and as such, are not reflected in the Average Annual Total Returns table since the periods reflected are for a year or longer). |
| 1 | Class C Shares were not in existence prior to 2/1/12. Performance for periods prior to 2/1/12 is based on the performance of Class A Shares. Such performance would differ only to the extent that the Classes have different expenses. |
The Fund is measured against the ICE BofA Merrill Lynch 2-17 Year Municipal Bond Index, an unmanaged index, which is representative of municipal bonds. The index does not reflect the deduction of expenses associated with a mutual fund, such as investment management and fund accounting fees. Investors cannot invest directly in an index, although they can invest in its underlying securities.
Sterling Capital Funds
Summary of Portfolio Holdings (Unaudited)
Sterling Capital Funds invested, as a percentage of net assets, in the following industries, countries, states, funds or security types, as of September 30, 2021:
| Sterling Capital Behavioral Large Cap Value Equity Fund | | Percentage of net assets | |
| Aerospace & Defense | | | 1.5 | % |
| Air Freight & Logistics | | | 0.9 | % |
| Automobiles | | | 2.1 | % |
| Banks | | | 7.9 | % |
| Biotechnology | | | 4.3 | % |
| Building Products | | | 2.6 | % |
| Capital Markets | | | 6.4 | % |
| Chemicals | | | 1.9 | % |
| Communications Equipment | | | 1.2 | % |
| Consumer Finance | | | 2.8 | % |
| Diversified Telecommunication Services | | | 2.4 | % |
| Electric Utilities | | | 3.0 | % |
| Electrical Equipment | | | 2.8 | % |
| Electronic Equipment, Instruments & Components | | | 0.5 | % |
| Energy Equipment & Services | | | 1.4 | % |
| Equity Real Estate Investment Trusts (REITS) | | | 3.8 | % |
| Food & Staples Retailing | | | 1.1 | % |
| Food Products | | | 0.5 | % |
| Gas Utilities | | | 0.1 | % |
| Health Care Providers & Services | | | 8.0 | % |
| Hotels, Restaurants & Leisure | | | 0.9 | % |
| Household Durables | | | 2.0 | % |
| Independent Power and Renewable Electricity Producers | | | 0.8 | % |
| Insurance | | | 5.1 | % |
| Interactive Media & Services | | | 2.0 | % |
| IT Services | | | 2.5 | % |
| Machinery | | | 1.8 | % |
| Media | | | 2.7 | % |
| Metals & Mining | | | 2.5 | % |
| Mortgage Real Estate Investment Trusts (REITS) | | | 0.5 | % |
| Multiline Retail | | | 1.5 | % |
| Oil, Gas & Consumable Fuels | | | 5.0 | % |
| Personal Products | | | 1.0 | % |
| Pharmaceuticals | | | 4.3 | % |
| Professional Services | | | 0.3 | % |
| Road & Rail | | | 0.5 | % |
| Semiconductors & Semiconductor Equipment | | | 3.8 | % |
| Software | | | 1.4 | % |
| Specialty Retail | | | 1.1 | % |
| Technology Hardware, Storage & Peripherals | | | 2.1 | % |
| Tobacco | | | 1.9 | % |
| Trading Companies & Distributors | | | 0.6 | % |
| Money Market Fund | | | 0.4 | % |
| | | | 99.9 | % |
| Sterling Capital Mid Value Fund | | Percentage of net assets | |
| Auto Components | | | 2.7 | % |
| Banks | | | 5.2 | % |
| Chemicals | | | 6.1 | % |
| Consumer Finance | | | 4.9 | % |
| Containers & Packaging | | | 3.6 | % |
| Electric Utilities | | | 5.4 | % |
| Electrical Equipment | | | 2.7 | % |
| Energy Equipment & Services | | | 1.1 | % |
| Food Products | | | 1.6 | % |
| Health Care Equipment & Supplies | | | 2.2 | % |
| Health Care Providers & Services | | | 8.0 | % |
| Hotels, Restaurants & Leisure | | | 4.6 | % |
| Household Durables | | | 2.6 | % |
| Household Products | | | 1.7 | % |
| Insurance | | | 6.3 | % |
| Internet & Direct Marketing Retail | | | 2.0 | % |
| IT Services | | | 5.7 | % |
| Machinery | | | 3.2 | % |
| Media | | | 4.8 | % |
| Oil, Gas & Consumable Fuels | | | 1.3 | % |
| Professional Services | | | 5.9 | % |
| Real Estate Management & Development | | | 3.5 | % |
| Specialty Retail | | | 2.7 | % |
| Technology Hardware, Storage & Peripherals | | | 2.5 | % |
| Thrifts & Mortgage Finance | | | 2.9 | % |
| Trading Companies & Distributors | | | 2.4 | % |
| Money Market Fund | | | 4.4 | % |
| | | | 100.0 | % |
Sterling Capital Funds
Summary of Portfolio Holdings (Unaudited)
| Sterling Capital Behavioral Small Cap Value Equity Fund | | Percentage of net assets | |
| Air Freight & Logistics | | | 0.9 | % |
| Airlines | | | 0.6 | % |
| Auto Components | | | 0.7 | % |
| Banks | | | 13.3 | % |
| Beverages | | | 0.3 | % |
| Building Products | | | 1.2 | % |
| Capital Markets | | | 1.7 | % |
| Chemicals | | | 2.6 | % |
| Commercial Services & Supplies | | | 0.8 | % |
| Communications Equipment | | | 0.5 | % |
| Construction & Engineering | | | 2.2 | % |
| Consumer Finance | | | 3.6 | % |
| Containers & Packaging | | | 0.2 | % |
| Electric Utilities | | | 1.1 | % |
| Electrical Equipment | | | 0.2 | % |
| Electronic Equipment, Instruments & Components | | | 1.9 | % |
| Energy Equipment & Services | | | 0.8 | % |
| Equity Real Estate Investment Trusts (REITS) | | | 8.7 | % |
| Food & Staples Retailing | | | 1.3 | % |
| Food Products | | | 0.7 | % |
| Gas Utilities | | | 1.2 | % |
| Health Care Equipment & Supplies | | | 1.0 | % |
| Health Care Providers & Services | | | 6.6 | % |
| Health Care Technology | | | 0.8 | % |
| Household Durables | | | 0.1 | % |
| Household Products | | | 0.7 | % |
| Independent Power and Renewable Electricity Producers | | | 0.5 | % |
| Insurance | | | 1.9 | % |
| Interactive Media & Services | | | 0.3 | % |
| IT Services | | | 0.4 | % |
| Leisure Products | | | 1.1 | % |
| Machinery | | | 0.9 | % |
| Marine | | | 1.8 | % |
| Media | | | 3.4 | % |
| Metals & Mining | | | 1.5 | % |
| Mortgage Real Estate Investment Trusts (REITS) | | | 2.6 | % |
| Multiline Retail | | | 1.4 | % |
| Multi-Utilities | | | 1.1 | % |
| Oil, Gas & Consumable Fuels | | | 5.3 | % |
| Paper & Forest Products | | | 0.3 | % |
| Pharmaceuticals | | | 2.5 | % |
| Professional Services | | | 1.6 | % |
| Real Estate Management & Development | | | 2.0 | % |
| Road & Rail | | | 1.3 | % |
| Semiconductors & Semiconductor Equipment | | | 2.6 | % |
| Specialty Retail | | | 4.4 | % |
| Thrifts & Mortgage Finance | | | 2.0 | % |
| Trading Companies & Distributors | | | 3.7 | % |
| Exchange Traded Fund | | | 2.7 | % |
| Money Market Fund | | | 0.9 | % |
| | | | 99.9 | % |
| Sterling Capital Special Opportunities Fund | | Percentage of net assets | |
| Aerospace & Defense | | | 2.3 | % |
| Air Freight & Logistics | | | 2.4 | % |
| Auto Components | | | 2.0 | % |
| Biotechnology | | | 2.1 | % |
| Capital Markets | | | 4.4 | % |
| Communications Equipment | | | 3.9 | % |
| Consumer Finance | | | 2.3 | % |
| Containers & Packaging | | | 3.6 | % |
| Electronic Equipment, Instruments & Components | | | 1.3 | % |
| Entertainment | | | 2.9 | % |
| Health Care Equipment & Supplies | | | 8.3 | % |
| Health Care Providers & Services | | | 9.6 | % |
| Household Durables | | | 1.6 | % |
| Interactive Media & Services | | | 6.5 | % |
| IT Services | | | 15.5 | % |
| Media | | | 4.4 | % |
| Pharmaceuticals | | | 3.3 | % |
| Professional Services | | | 6.3 | % |
| Real Estate Management & Development | | | 2.5 | % |
| Semiconductors & Semiconductor Equipment | | | 4.8 | % |
| Software | | | 6.4 | % |
| Specialty Retail | | | 2.1 | % |
| Money Market Fund | | | 1.7 | % |
| | | | 100.2 | % |
| Sterling Capital Equity Income Fund | | Percentage of net assets | |
| Aerospace & Defense | | | 2.4 | % |
| Air Freight & Logistics | | | 3.3 | % |
| Banks | | | 2.1 | % |
| Beverages | | | 4.8 | % |
| Biotechnology | | | 2.9 | % |
| Capital Markets | | | 5.1 | % |
| Communications Equipment | | | 3.9 | % |
| Consumer Finance | | | 3.9 | % |
| Diversified Telecommunication Services | | | 2.2 | % |
| Electronic Equipment, Instruments & Components | | | 2.5 | % |
| Equity Real Estate Investment Trusts (REITS) | | | 2.6 | % |
| Food Products | | | 2.5 | % |
| Health Care Equipment & Supplies | | | 6.7 | % |
| Health Care Providers & Services | | | 7.0 | % |
| Hotels, Restaurants & Leisure | | | 4.1 | % |
| Industrial Conglomerates | | | 2.9 | % |
| Insurance | | | 5.7 | % |
| IT Services | | | 6.1 | % |
| Machinery | | | 2.8 | % |
| Oil, Gas & Consumable Fuels | | | 5.0 | % |
| Pharmaceuticals | | | 6.1 | % |
| Professional Services | | | 1.6 | % |
| Semiconductors & Semiconductor Equipment | | | 4.1 | % |
| Software | | | 4.3 | % |
| Specialty Retail | | | 3.6 | % |
| Money Market Fund | | | 1.8 | % |
| | | | 100.0 | % |
Sterling Capital Funds
Summary of Portfolio Holdings (Unaudited)
| Sterling Capital Behavioral International Equity Fund | | Percentage of net assets | |
| Australia | | | 4.7 | % |
| Austria | | | 2.2 | % |
| Belgium | | | 0.0 | %* |
| Denmark | | | 0.7 | % |
| Finland | | | 3.1 | % |
| France | | | 11.7 | % |
| Germany | | | 10.1 | % |
| Hong Kong | | | 3.3 | % |
| Israel | | | 1.4 | % |
| Italy | | | 4.3 | % |
| Japan | | | 25.9 | % |
| Netherlands | | | 4.5 | % |
| Norway | | | 1.0 | % |
| Spain | | | 1.9 | % |
| Sweden | | | 4.4 | % |
| Switzerland | | | 7.5 | % |
| United Kingdom | | | 11.7 | % |
| Money Market Fund | | | 0.3 | % |
| | | | 98.7 | % |
| * | Amount represents less than 0.05%. |
| Sterling Capital SMID Opportunities Fund | | Percentage of net assets | |
| Auto Components | | | 4.0 | % |
| Capital Markets | | | 3.3 | % |
| Chemicals | | | 3.1 | % |
| Commercial Services & Supplies | | | 5.0 | % |
| Communications Equipment | | | 3.7 | % |
| Consumer Finance | | | 3.3 | % |
| Containers & Packaging | | | 4.6 | % |
| Entertainment | | | 1.1 | % |
| Equity Real Estate Investment Trusts (REITS) | | | 3.4 | % |
| Health Care Equipment & Supplies | | | 8.3 | % |
| Health Care Providers & Services | | | 5.8 | % |
| Household Durables | | | 1.5 | % |
| Independent Power and Renewable Electricity Producers | | | 4.2 | % |
| Insurance | | | 3.9 | % |
| IT Services | | | 22.4 | % |
| Machinery | | | 4.0 | % |
| Media | | | 1.8 | % |
| Oil, Gas & Consumable Fuels | | | 2.6 | % |
| Professional Services | | | 4.9 | % |
| Real Estate Management & Development | | | 1.7 | % |
| Software | | | 3.4 | % |
| Specialty Retail | | | 1.6 | % |
| Money Market Fund | | | 2.4 | % |
| | | | 100.0 | % |
| Sterling Capital Stratton Mid Cap Value Fund | | Percentage of net assets | |
| Auto Components | | | 2.2 | % |
| Banks | | | 8.6 | % |
| Building Products | | | 2.5 | % |
| Capital Markets | | | 2.9 | % |
| Chemicals | | | 2.2 | % |
| Communications Equipment | | | 1.1 | % |
| Construction & Engineering | | | 1.8 | % |
| Containers & Packaging | | | 5.5 | % |
| Electronic Equipment, Instruments & Components | | | 4.7 | % |
| Entertainment | | | 3.2 | % |
| Equity Real Estate Investment Trusts (REITS) | | | 9.1 | % |
| Food & Staples Retailing | | | 3.8 | % |
| Food Products | | | 1.4 | % |
| Gas Utilities | | | 4.5 | % |
| Health Care Equipment & Supplies | | | 3.6 | % |
| Hotels, Restaurants & Leisure | | | 1.1 | % |
| Household Durables | | | 1.4 | % |
| Insurance | | | 7.1 | % |
| IT Services | | | 2.0 | % |
| Leisure Products | | | 1.8 | % |
| Life Sciences Tools & Services | | | 9.1 | % |
| Machinery | | | 2.6 | % |
| Oil, Gas & Consumable Fuels | | | 3.6 | % |
| Professional Services | | | 2.7 | % |
| Real Estate Management & Development | | | 1.4 | % |
| Semiconductors & Semiconductor Equipment | | | 2.7 | % |
| Software | | | 2.4 | % |
| Trading Companies & Distributors | | | 3.1 | % |
| Money Market Fund | | | 1.9 | % |
| | | | 100.0 | % |
| Sterling Capital Stratton Real Estate Fund | | Percentage of net assets | |
| Health Care | | | 8.7 | % |
| Hotel & Resort | | | 3.3 | % |
| Industrial | | | 15.1 | % |
| Office | | | 6.2 | % |
| Real Estate Development | | | 1.5 | % |
| Residential | | | 16.8 | % |
| Retail | | | 8.5 | % |
| Specialized | | | 39.0 | % |
| Money Market Fund | | | 0.9 | % |
| | | | 100.0 | % |
Sterling Capital Funds
Summary of Portfolio Holdings (Unaudited)
| Sterling Capital Stratton Small Cap Value Fund | | Percentage of net assets | |
| Aerospace & Defense | | | 2.2 | % |
| Auto Components | | | 1.1 | % |
| Banks | | | 21.5 | % |
| Capital Markets | | | 1.9 | % |
| Chemicals | | | 3.5 | % |
| Construction & Engineering | | | 3.6 | % |
| Consumer Finance | | | 1.0 | % |
| Electric Utilities | | | 2.2 | % |
| Electrical Equipment | | | 2.6 | % |
| Electronic Equipment, Instruments & Components | | | 3.4 | % |
| Entertainment | | | 1.8 | % |
| Equity Real Estate Investment Trusts (REITS) | | | 9.2 | % |
| Food & Staples Retailing. | | | 7.0 | % |
| Gas Utilities | | | 2.1 | % |
| Health Care Equipment & Supplies | | | 3.7 | % |
| Household Durables | | | 2.5 | % |
| Insurance | | | 6.1 | % |
| Machinery | | | 6.6 | % |
| Professional Services | | | 3.2 | % |
| Semiconductors & Semiconductor Equipment | | | 6.8 | % |
| Software | | | 2.4 | % |
| Specialty Retail | | | 0.3 | % |
| Trading Companies & Distributors | | | 3.7 | % |
| Money Market Fund | | | 1.6 | % |
| | | | 100.0 | % |
| Sterling Capital Ultra Short Bond Fund | | Percentage of net assets | |
| Asset Backed Securities. | | | 20.1 | % |
| Collateralized Mortgage Obligations | | | 0.5 | % |
| Commercial Mortgage-Backed Securities | | | 14.8 | % |
| Corporate Bonds | | | 61.5 | % |
| Municipal Bonds | | | 1.3 | % |
| Money Market Fund | | | 5.3 | % |
| | | | 103.5 | % |
| Sterling Capital Short Duration Bond Fund | | Percentage of net assets | |
| Asset Backed Securities | | | 15.5 | % |
| Collateralized Mortgage Obligations | | | 1.6 | % |
| Commercial Mortgage-Backed Securities | | | 6.2 | % |
| Corporate Bonds | | | 67.1 | % |
| Municipal Bonds | | | 8.5 | % |
| Money Market Fund | | | 1.2 | % |
| | | | 100.1 | % |
| Sterling Capital Intermediate U.S. Government Fund | | Percentage of net assets | |
| Asset Backed Securities | | | 2.1 | % |
| Collateralized Mortgage Obligations | | | 15.2 | % |
| Commercial Mortgage-Backed Securities | | | 19.3 | % |
| Corporate Bonds | | | 2.0 | % |
| Mortgage-Backed Securities | | | 40.7 | % |
| Municipal Bonds | | | 0.9 | % |
| U.S. Government Agencies | | | 10.4 | % |
| U.S. Treasury Notes | | | 10.8 | % |
| Money Market Fund | | | 0.2 | % |
| | | | 101.6 | % |
| Sterling Capital Total Return Bond Fund | | Percentage of net assets | |
| Asset Backed Securities | | | 14.0 | % |
| Collateralized Mortgage Obligations | | | 2.9 | % |
| Commercial Mortgage-Backed Securities | | | 15.0 | % |
| Corporate Bonds | | | 41.0 | % |
| Mortgage-Backed Securities | | | 16.2 | % |
| Municipal Bonds | | | 3.9 | % |
| U.S. Treasury Bonds | | | 2.2 | % |
| U.S. Treasury Notes | | | 4.4 | % |
| Money Market Fund | | | 1.1 | % |
| | | | 100.7 | % |
| Sterling Capital Corporate Fund | | Percentage of net assets | |
| Corporate Bonds | | | 96.8 | % |
| Preferred Stocks | | | 0.8 | % |
| U.S. Treasury Bonds | | | 0.5 | % |
| Money Market Fund | | | 1.2 | % |
| | | | 99.3 | % |
| Sterling Capital Quality Income Fund | | Percentage of net assets | |
| Asset Backed Securities | | | 20.3 | % |
| Collateralized Mortgage Obligations | | | 18.3 | % |
| Commercial Mortgage-Backed Securities | | | 30.6 | % |
| Corporate Bonds | | | 1.3 | % |
| Mortgage-Backed Securities | | | 32.1 | % |
| U.S. Treasury Notes | | | 2.4 | % |
| Money Market Fund | | | 1.4 | % |
| | | | 106.4 | % |
| Sterling Capital North Carolina Intermediate Tax-Free Fund | | Percentage of net assets | |
| North Carolina Municipal Bonds | | | 96.2 | % |
| Money Market Fund | | | 2.8 | % |
| | | | 99.0 | % |
| Sterling Capital South Carolina Intermediate Tax-Free Fund | | Percentage of net assets | |
| South Carolina Municipal Bonds | | | 98.1 | % |
| Money Market Fund | | | 0.9 | % |
| | | | 99.0 | % |
| Sterling Capital Virginia Intermediate Tax-Free Fund | | Percentage of net assets | |
| District of Columbia Municipal Bonds | | | 4.4 | % |
| Virginia Municipal Bonds | | | 92.6 | % |
| Money Market Fund | | | 2.1 | % |
| | | | 99.1 | % |
| Sterling Capital West Virginia Intermediate Tax-Free Fund | | Percentage of net assets | |
| West Virginia Municipal Bonds | | | 97.4 | % |
| Money Market Fund | | | 1.6 | % |
| | | | 99.0 | % |
Sterling Capital Funds
Expense Example (Unaudited)
As a shareholder of the Sterling Capital Funds (each, a “Fund” and collectively, the “Funds”), you incur two types of costs: (1) transaction costs, including sales charges (loads) on purchases and (2) ongoing costs, including management fees; distribution and/or service (12b-1) fees; and other Fund expenses.
These examples are intended to help you understand your ongoing costs (in dollars) of investing in the Funds and to compare these costs with the ongoing costs of investing in other mutual funds. These examples are based on an investment of $1,000 invested at the beginning of the period and held for the entire period from April 1, 2021 through September 30, 2021.
Actual Example
The table below provides information about actual account values and actual expenses. You may use the information below, together with the amount you invested, to estimate the expenses that you paid over the period. Simply divide your account value by $1,000 (for example, an $8,600 account value divided by $1,000 = 8.6), then multiply the result by the number in the table under the heading entitled “Expenses Paid During Period” to estimate the expenses you paid on your account during this period.
| | | Beginning Account Value 4/1/21 | | | Ending Account Value 9/30/21 | | | Expenses Paid During Period* 4/1/21 - 9/30/21 | | | Annualized Expense Ratio During Period 4/1/21 - 9/30/21 | |
| Sterling Capital Behavioral Large Cap Value Equity Fund | | | | | | | | | | | | |
| Class A Shares | | $ | 1,000.00 | | | $ | 1,051.30 | | | $ | 4.53 | | | | 0.88 | % |
| Class C Shares | | | 1,000.00 | | | | 1,047.40 | | | | 8.01 | | | | 1.56 | % |
| Institutional Shares | | | 1,000.00 | | | | 1,052.26 | | | | 3.34 | | | | 0.65 | % |
| Class R6 Shares | | | 1,000.00 | | | | 1,053.15 | | | | 2.88 | | | | 0.56 | % |
| Sterling Capital Mid Value Fund | | | | | | | | | | | | | | | | |
| Class A Shares | | | 1,000.00 | | | | 1,004.52 | | | | 5.43 | | | | 1.08 | % |
| Class C Shares | | | 1,000.00 | | | | 1,001.18 | | | | 9.13 | | | | 1.82 | % |
| Institutional Shares | | | 1,000.00 | | | | 1,006.38 | | | | 4.17 | | | | 0.83 | % |
| Class R Shares | | | 1,000.00 | | | | 1,003.15 | | | | 6.93 | | | | 1.38 | % |
| Class R6 Shares | | | 1,000.00 | | | | 1,006.37 | | | | 3.72 | | | | 0.74 | % |
| Sterling Capital Behavioral Small Cap Value Equity Fund | | | | | | | | | | | | | | | | |
| Class A Shares | | | 1,000.00 | | | | 1,061.96 | | | | 5.43 | | | | 1.05 | % |
| Class C Shares | | | 1,000.00 | | | | 1,057.89 | | | | 9.29 | | | | 1.80 | % |
| Institutional Shares | | | 1,000.00 | | | | 1,063.55 | | | | 4.14 | | | | 0.80 | % |
| Class R Shares | | | 1,000.00 | | | | 1,060.87 | | | | 6.72 | | | | 1.30 | % |
| Class R6 Shares | | | 1,000.00 | | | | 1,063.48 | | | | 3.88 | | | | 0.75 | % |
| Sterling Capital Special Opportunities Fund | | | | | | | | | | | | | | | | |
| Class A Shares | | | 1,000.00 | | | | 1,075.93 | | | | 5.72 | | | | 1.10 | % |
| Class C Shares | | | 1,000.00 | | | | 1,071.88 | | | | 9.61 | | | | 1.85 | % |
| Institutional Shares | | | 1,000.00 | | | | 1,077.52 | | | | 4.43 | | | | 0.85 | % |
| Class R Shares | | | 1,000.00 | | | | 1,075.55 | | | | 6.30 | | | | 1.21 | % |
| Class R6 Shares | | | 1,000.00 | | | | 1,077.69 | | | | 4.01 | | | | 0.77 | % |
| Sterling Capital Equity Income Fund | | | | | | | | | | | | | | | | |
| Class A Shares | | | 1,000.00 | | | | 1,075.55 | | | | 5.36 | | | | 1.03 | % |
| Class C Shares | | | 1,000.00 | | | | 1,071.38 | | | | 9.24 | | | | 1.78 | % |
| Institutional Shares | | | 1,000.00 | | | | 1,076.98 | | | | 4.06 | | | | 0.78 | % |
| Class R Shares | | | 1,000.00 | | | | 1,074.22 | | | | 6.66 | | | | 1.28 | % |
| Class R6 Shares | | | 1,000.00 | | | | 1,077.39 | | | | 3.54 | | | | 0.68 | % |
| Sterling Capital Behavioral International Equity Fund | | | | | | | | | | | | | | | | |
| Class A Shares | | | 1,000.00 | | | | 1,019.77 | | | | 4.61 | | | | 0.91 | % |
| Class C Shares | | | 1,000.00 | | | | 1,014.66 | | | | 8.33 | | | | 1.65 | % |
| Institutional Shares | | | 1,000.00 | | | | 1,020.81 | | | | 3.44 | | | | 0.68 | % |
| Class R6 Shares | | | 1,000.00 | | | | 1,020.81 | | | | 3.14 | | | | 0.62 | % |
| Sterling Capital SMID Opportunities Fund | | | | | | | | | | | | | | | | |
| Class A Shares | | | 1,000.00 | | | | 1,017.08 | | | | 5.26 | | | | 1.04 | % |
| Class C Shares | | | 1,000.00 | | | | 1,013.71 | | | | 9.04 | | | | 1.79 | % |
| Institutional Shares | | | 1,000.00 | | | | 1,018.18 | | | | 4.00 | | | | 0.79 | % |
Expense Example (Unaudited)
| | | Beginning Account Value 4/1/21 | | | Ending Account Value 9/30/21 | | | Expenses Paid During Period* 4/1/21 - 9/30/21 | | | Annualized Expense Ratio During Period 4/1/21 - 9/30/21 | |
| Sterling Capital Stratton Mid Cap Value Fund | | | | | | | | | | | | |
| Class A Shares | | $ | 1,000.00 | | | $ | 1,013.42 | | | $ | 5.35 | | | | 1.06 | % |
| Class C Shares | | | 1,000.00 | | | | 1,010.17 | | | | 9.57 | | | | 1.90 | % |
| Institutional Shares | | | 1,000.00 | | | | 1,014.75 | | | | 4.04 | | | | 0.80 | % |
| Sterling Capital Stratton Real Estate Fund | | | | | | | | | | | | | | | | |
| Class A Shares | | | 1,000.00 | | | | 1,122.71 | | | | 4.90 | | | | 0.92 | % |
| Class C Shares | | | 1,000.00 | | | | 1,118.79 | | | | 8.60 | | | | 1.62 | % |
| Institutional Shares | | | 1,000.00 | | | | 1,124.03 | | | | 3.51 | | | | 0.66 | % |
| Class R6 Shares | | | 1,000.00 | | | | 1,124.75 | | | | 3.09 | | | | 0.58 | % |
| Sterling Capital Stratton Small Cap Value Fund | | | | | | | | | | | | | | | | |
| Class A Shares | | | 1,000.00 | | | | 1,015.63 | | | | 6.11 | | | | 1.21 | % |
| Class C Shares | | | 1,000.00 | | | | 1,011.97 | | | | 9.89 | | | | 1.96 | % |
| Institutional Shares | | | 1,000.00 | | | | 1,017.00 | | | | 4.90 | | | | 0.97 | % |
| Class R6 Shares | | | 1,000.00 | | | | 1,017.37 | | | | 4.40 | | | | 0.87 | % |
| Sterling Capital Ultra Short Bond Fund | | | | | | | | | | | | | | | | |
| Class A Shares | | | 1,000.00 | | | | 1,002.12 | | | | 2.56 | | | | 0.51 | % |
| Institutional Shares | | | 1,000.00 | | | | 1,003.32 | | | | 1.36 | | | | 0.27 | % |
| Sterling Capital Short Duration Bond Fund | | | | | | | | | | | | | | | | |
| Class A Shares | | | 1,000.00 | | | | 1,002.97 | | | | 3.36 | | | | 0.67 | % |
| Class C Shares | | | 1,000.00 | | | | 1,000.34 | | | | 7.12 | | | | 1.42 | % |
| Institutional Shares | | | 1,000.00 | | | | 1,005.40 | | | | 2.11 | | | | 0.42 | % |
| Class R6 Shares | | | 1,000.00 | | | | 1,005.01 | | | | 2.06 | | | | 0.41 | % |
| Sterling Capital Intermediate U.S. Government Fund | | | | | | | | | | | | | | | | |
| Class A Shares | | | 1,000.00 | | | | 1,004.13 | | | | 3.32 | | | | 0.66 | % |
| Class C Shares | | | 1,000.00 | | | | 1,000.36 | | | | 7.07 | | | | 1.41 | % |
| Institutional Shares | | | 1,000.00 | | | | 1,004.37 | | | | 2.06 | | | | 0.41 | % |
| Sterling Capital Total Return Bond Fund | | | | | | | | | | | | | | | | |
| Class A Shares | | | 1,000.00 | | | | 1,020.21 | | | | 3.55 | | | | 0.70 | % |
| Class C Shares | | | 1,000.00 | | | | 1,016.37 | | | | 7.33 | | | | 1.45 | % |
| Institutional Shares | | | 1,000.00 | | | | 1,021.47 | | | | 2.28 | | | | 0.45 | % |
| Class R Shares | | | 1,000.00 | | | | 1,018.02 | | | | 4.81 | | | | 0.95 | % |
| Class R6 Shares | | | 1,000.00 | | | | 1,021.99 | | | | 1.77 | | | | 0.35 | % |
| Sterling Capital Corporate Fund | | | | | | | | | | | | | | | | |
| Class A Shares | | | 1,000.00 | | | | 1,021.06 | | | | 4.51 | | | | 0.89 | % |
| Class C Shares | | | 1,000.00 | | | | 1,017.54 | | | | 8.70 | | | | 1.72 | % |
| Institutional Shares | | | 1,000.00 | | | | 1,022.35 | | | | 3.14 | | | | 0.62 | % |
| Sterling Capital Quality Income Fund | | | | | | | | | | | | | | | | |
| Class A Shares | | | 1,000.00 | | | | 1,004.71 | | | | 4.02 | | | | 0.80 | % |
| Class C Shares | | | 1,000.00 | | | | 1,000.33 | | | | 7.97 | | | | 1.59 | % |
| Institutional Shares | | | 1,000.00 | | | | 1,005.97 | | | | 2.82 | | | | 0.56 | % |
| Sterling Capital North Carolina Intermediate Tax-Free Fund | | | | | | | | | | | | | | | | |
| Class A Shares | | | 1,000.00 | | | | 1,002.18 | | | | 3.91 | | | | 0.78 | % |
| Class C Shares | | | 1,000.00 | | | | 998.38 | | | | 7.66 | | | | 1.53 | % |
| Institutional Shares | | | 1,000.00 | | | | 1,003.41 | | | | 2.66 | | | | 0.53 | % |
| Sterling Capital South Carolina Intermediate Tax-Free Fund | | | | | | | | | | | | | | | | |
| Class A Shares | | | 1,000.00 | | | | 1,006.41 | | | | 4.02 | | | | 0.80 | % |
| Class C Shares | | | 1,000.00 | | | | 1,001.77 | | | | 7.78 | | | | 1.55 | % |
| Institutional Shares | | | 1,000.00 | | | | 1,007.70 | | | | 2.77 | | | | 0.55 | % |
| Sterling Capital Virginia Intermediate Tax-Free Fund | | | | | | | | | | | | | | | | |
| Class A Shares | | | 1,000.00 | | | | 1,001.38 | | | | 4.01 | | | | 0.80 | % |
| Class C Shares | | | 1,000.00 | | | | 996.78 | | | | 7.76 | | | | 1.55 | % |
| Institutional Shares | | | 1,000.00 | | | | 1,001.81 | | | | 2.76 | | | | 0.55 | % |
Sterling Capital Funds
Expense Example (Unaudited)
| | | Beginning Account Value 4/1/21 | | | Ending Account Value 9/30/21 | | | Expenses Paid During Period* 4/1/21 - 9/30/21 | | | Annualized Expense Ratio During Period 4/1/21 - 9/30/21 | |
| Sterling Capital West Virginia Intermediate Tax-Free Fund | | | | | | | | | | | | |
| Class A Shares | | $ | 1,000.00 | | | $ | 1,005.53 | | | $ | 3.97 | | | | 0.79 | % |
| Class C Shares | | | 1,000.00 | | | | 1,001.75 | | | | 7.73 | | | | 1.54 | % |
| Institutional Shares | | | 1,000.00 | | | | 1,006.79 | | | | 2.72 | | | | 0.54 | % |
| * | Expenses are equal to the average account value over the period multiplied by the Fund’s annualized expense ratio, multiplied by 182 days divided by 365 (to reflect the six month period). |
Sterling Capital Funds
Expense Example (Unaudited)
Hypothetical Example for Comparison Purposes
The table below provides information about hypothetical account values and hypothetical expenses based on the Fund’s actual expense ratio and an assumed rate of return of 5% per year before expenses, which is not the Fund’s actual return. The hypothetical account values and expenses may not be used to estimate the actual ending account balance or expenses you paid for the year. You may use this information to compare the ongoing costs of investing in a Fund and other funds. To do so, compare this 5% hypothetical example with the 5% hypothetical examples that appear in the shareholder reports of other funds.
Please note that the expenses shown in the table are meant to highlight your ongoing costs only and do not reflect any transactional costs, such as sales charges (loads), redemption fees, or exchange fees. Therefore, the table is useful in comparing ongoing costs only, and will not help you determine the relative total costs of owning different funds. In addition, if these transactional costs were included, your costs would have been higher.
| | | Beginning Account Value 4/1/21 | | | Ending Account Value 9/30/21 | | | Expenses Paid During Period* 4/1/21 - 9/30/21 | | | Annualized Expense Ratio During Period 4/1/21 - 9/30/21 | |
| Sterling Capital Behavioral Large Cap Value Equity Fund | | | | | | | | | | | | |
| Class A Shares | | $ | 1,000.00 | | | $ | 1,020.66 | | | $ | 4.46 | | | | 0.88 | % |
| Class C Shares | | | 1,000.00 | | | | 1,017.25 | | | | 7.89 | | | | 1.56 | % |
| Institutional Shares | | | 1,000.00 | | | | 1,021.81 | | | | 3.29 | | | | 0.65 | % |
| Class R6 Shares | | | 1,000.00 | | | | 1,022.26 | | | | 2.84 | | | | 0.56 | % |
| Sterling Capital Mid Value Fund | | | | | | | | | | | | | | | | |
| Class A Shares | | | 1,000.00 | | | | 1,019.65 | | | | 5.47 | | | | 1.08 | % |
| Class C Shares | | | 1,000.00 | | | | 1,015.94 | | | | 9.20 | | | | 1.82 | % |
| Institutional Shares | | | 1,000.00 | | | | 1,020.91 | | | | 4.20 | | | | 0.83 | % |
| Class R Shares | | | 1,000.00 | | | | 1,018.15 | | | | 6.98 | | | | 1.38 | % |
| Class R6 Shares | | | 1,000.00 | | | | 1,021.36 | | | | 3.75 | | | | 0.74 | % |
| Sterling Capital Behavioral Small Cap Value Equity Fund | | | | | | | | | | | | | | | | |
| Class A Shares | | | 1,000.00 | | | | 1,019.80 | | | | 5.32 | | | | 1.05 | % |
| Class C Shares | | | 1,000.00 | | | | 1,016.04 | | | | 9.10 | | | | 1.80 | % |
| Institutional Shares | | | 1,000.00 | | | | 1,021.06 | | | | 4.05 | | | | 0.80 | % |
| Class R Shares | | | 1,000.00 | | | | 1,018.55 | | | | 6.58 | | | | 1.30 | % |
| Class R6 Shares | | | 1,000.00 | | | | 1,021.31 | | | | 3.80 | | | | 0.75 | % |
| Sterling Capital Special Opportunities Fund | | | | | | | | | | | | | | | | |
| Class A Shares | | | 1,000.00 | | | | 1,019.55 | | | | 5.57 | | | | 1.10 | % |
| Class C Shares | | | 1,000.00 | | | | 1,015.79 | | | | 9.35 | | | | 1.85 | % |
| Institutional Shares | | | 1,000.00 | | | | 1,020.81 | | | | 4.31 | | | | 0.85 | % |
| Class R Shares | | | 1,000.00 | | | | 1,019.00 | | | | 6.12 | | | | 1.21 | % |
| Class R6 Shares | | | 1,000.00 | | | | 1,021.21 | | | | 3.90 | | | | 0.77 | % |
| Sterling Capital Equity Income Fund | | | | | | | | | | | | | | | | |
| Class A Shares | | | 1,000.00 | | | | 1,019.90 | | | | 5.22 | | | | 1.03 | % |
| Class C Shares | | | 1,000.00 | | | | 1,016.14 | | | | 9.00 | | | | 1.78 | % |
| Institutional Shares | | | 1,000.00 | | | | 1,021.16 | | | | 3.95 | | | | 0.78 | % |
| Class R Shares | | | 1,000.00 | | | | 1,018.65 | | | | 6.48 | | | | 1.28 | % |
| Class R6 Shares | | | 1,000.00 | | | | 1,021.66 | | | | 3.45 | | | | 0.68 | % |
| Sterling Capital Behavioral International Equity Fund | | | | | | | | | | | | | | | | |
| Class A Shares | | | 1,000.00 | | | | 1,020.51 | | | | 4.61 | | | | 0.91 | % |
| Class C Shares | | | 1,000.00 | | | | 1,016.80 | | | | 8.34 | | | | 1.65 | % |
| Institutional Shares | | | 1,000.00 | | | | 1,021.66 | | | | 3.45 | | | | 0.68 | % |
| Class R6 Shares | | | 1,000.00 | | | | 1,021.96 | | | | 3.14 | | | | 0.62 | % |
| Sterling Capital SMID Opportunities Fund | | | | | | | | | | | | | | | | |
| Class A Shares | | | 1,000.00 | | | | 1,019.85 | | | | 5.27 | | | | 1.04 | % |
| Class C Shares | | | 1,000.00 | | | | 1,016.09 | | | | 9.05 | | | | 1.79 | % |
| Institutional Shares | | | 1,000.00 | | | | 1,021.11 | | | | 4.00 | | | | 0.79 | % |
| Sterling Capital Stratton Mid Cap Value Fund | | | | | | | | | | | | | | | | |
| Class A Shares | | | 1,000.00 | | | | 1,019.75 | | | | 5.37 | | | | 1.06 | % |
| Class C Shares | | | 1,000.00 | | | | 1,015.54 | | | | 9.60 | | | | 1.90 | % |
| Institutional Shares | | | 1,000.00 | | | | 1,021.06 | | | | 4.05 | | | | 0.80 | % |
Sterling Capital Funds
Expense Example (Unaudited)
| | | Beginning Account Value 4/1/21 | | | Ending Account Value 9/30/21 | | | Expenses Paid During Period* 4/1/21 - 9/30/21 | | | Annualized Expense Ratio During Period 4/1/21 - 9/30/21 | |
| Sterling Capital Stratton Real Estate Fund | | | | | | | | | | | | |
| Class A Shares | | $ | 1,000.00 | | | $ | 1,020.46 | | | $ | 4.66 | | | | 0.92 | % |
| Class C Shares | | | 1,000.00 | | | | 1,016.95 | | | | 8.19 | | | | 1.62 | % |
| Institutional Shares | | | 1,000.00 | | | | 1,021.76 | | | | 3.35 | | | | 0.66 | % |
| Class R6 Shares | | | 1,000.00 | | | | 1,022.16 | | | | 2.94 | | | | 0.58 | % |
| Sterling Capital Stratton Small Cap Value Fund | | | | | | | | | | | | | | | | |
| Class A Shares | | | 1,000.00 | | | | 1,019.00 | | | | 6.12 | | | | 1.21 | % |
| Class C Shares | | | 1,000.00 | | | | 1,015.24 | | | | 9.90 | | | | 1.96 | % |
| Institutional Shares | | | 1,000.00 | | | | 1,020.21 | | | | 4.91 | | | | 0.97 | % |
| Class R6 Shares | | | 1,000.00 | | | | 1,020.71 | | | | 4.41 | | | | 0.87 | % |
| Sterling Capital Ultra Short Bond Fund | | | | | | | | | | | | | | | | |
| Class A Shares | | | 1,000.00 | | | | 1,022.51 | | | | 2.59 | | | | 0.51 | % |
| Institutional Shares | | | 1,000.00 | | | | 1,023.71 | | | | 1.37 | | | | 0.27 | % |
| Sterling Capital Short Duration Bond Fund | | | | | | | | | | | | | | | | |
| Class A Shares | | | 1,000.00 | | | | 1,021.71 | | | | 3.40 | | | | 0.67 | % |
| Class C Shares | | | 1,000.00 | | | | 1,017.95 | | | | 7.18 | | | | 1.42 | % |
| Institutional Shares | | | 1,000.00 | | | | 1,022.96 | | | | 2.13 | | | | 0.42 | % |
| Class R6 Shares | | | 1,000.00 | | | | 1,023.01 | | | | 2.08 | | | | 0.41 | % |
| Sterling Capital Intermediate U.S. Government Fund | | | | | | | | | | | | | | | | |
| Class A Shares | | | 1,000.00 | | | | 1,021.76 | | | | 3.35 | | | | 0.66 | % |
| Class C Shares | | | 1,000.00 | | | | 1,018.00 | | | | 7.13 | | | | 1.41 | % |
| Institutional Shares | | | 1,000.00 | | | | 1,023.01 | | | | 2.08 | | | | 0.41 | % |
| Sterling Capital Total Return Bond Fund | | | | | | | | | | | | | | | | |
| Class A Shares | | | 1,000.00 | | | | 1,021.56 | | | | 3.55 | | | | 0.70 | % |
| Class C Shares | | | 1,000.00 | | | | 1,017.80 | | | | 7.33 | | | | 1.45 | % |
| Institutional Shares | | | 1,000.00 | | | | 1,022.81 | | | | 2.28 | | | | 0.45 | % |
| Class R Shares | | | 1,000.00 | | | | 1,020.31 | | | | 4.81 | | | | 0.95 | % |
| Class R6 Shares | | | 1,000.00 | | | | 1,023.31 | | | | 1.78 | | | | 0.35 | % |
| Sterling Capital Corporate Fund | | | | | | | | | | | | | | | | |
| Class A Shares | | | 1,000.00 | | | | 1,020.61 | | | | 4.51 | | | | 0.89 | % |
| Class C Shares | | | 1,000.00 | | | | 1,016.44 | | | | 8.69 | | | | 1.72 | % |
| Institutional Shares | | | 1,000.00 | | | | 1,021.96 | | | | 3.14 | | | | 0.62 | % |
| Sterling Capital Quality Income Fund | | | | | | | | | | | | | | | | |
| Class A Shares | | | 1,000.00 | | | | 1,021.06 | | | | 4.05 | | | | 0.80 | % |
| Class C Shares | | | 1,000.00 | | | | 1,017.10 | | | | 8.04 | | | | 1.59 | % |
| Institutional Shares | | | 1,000.00 | | | | 1,022.26 | | | | 2.84 | | | | 0.56 | % |
| Sterling Capital North Carolina Intermediate Tax-Free Fund | | | | | | | | | | | | | | | | |
| Class A Shares | | | 1,000.00 | | | | 1,021.16 | | | | 3.95 | | | | 0.78 | % |
| Class C Shares | | | 1,000.00 | | | | 1,017.40 | | | | 7.74 | | | | 1.53 | % |
| Institutional Shares | | | 1,000.00 | | | | 1,022.41 | | | | 2.69 | | | | 0.53 | % |
| Sterling Capital South Carolina Intermediate Tax-Free Fund | | | | | | | | | | | | | | | | |
| Class A Shares | | | 1,000.00 | | | | 1,021.06 | | | | 4.05 | | | | 0.80 | % |
| Class C Shares | | | 1,000.00 | | | | 1,017.30 | | | | 7.84 | | | | 1.55 | % |
| Institutional Shares | | | 1,000.00 | | | | 1,022.31 | | | | 2.79 | | | | 0.55 | % |
| Sterling Capital Virginia Intermediate Tax-Free Fund | | | | | | | | | | | | | | | | |
| Class A Shares | | | 1,000.00 | | | | 1,021.06 | | | | 4.05 | | | | 0.80 | % |
| Class C Shares | | | 1,000.00 | | | | 1,017.30 | | | | 7.84 | | | | 1.55 | % |
| Institutional Shares | | | 1,000.00 | | | | 1,022.31 | | | | 2.79 | | | | 0.55 | % |
Sterling Capital Funds
Expense Example (Unaudited)
| | | Beginning Account Value 4/1/21 | | | Ending Account Value 9/30/21 | | | Expenses Paid During Period* 4/1/21 - 9/30/21 | | | Annualized Expense Ratio During Period 4/1/21 - 9/30/21 | |
| Sterling Capital West Virginia Intermediate Tax-Free Fund | | | | | | | | | | | | |
| Class A Shares | | $ | 1,000.00 | | | $ | 1,021.11 | | | $ | 4.00 | | | | 0.79 | % |
| Class C Shares | | | 1,000.00 | | | | 1,017.35 | | | | 7.79 | | | | 1.54 | % |
| Institutional Shares | | | 1,000.00 | | | | 1,022.36 | | | | 2.74 | | | | 0.54 | % |
| * | Expenses are equal to the average account value over the period multiplied by the Fund’s annualized expense ratio, multiplied by 182 days divided by 365 (to reflect the six month period). |
Sterling Capital Behavioral Large Cap Value Equity Fund
Schedule of Portfolio Investments
September 30, 2021
| Shares | | | | | Fair Value | |
| COMMON STOCKS —99.5% | | |
| | | | | Aerospace & Defense —1.5% | | | | |
| | 2,600 | | | General Dynamics Corp. | | $ | 509,678 | |
| | | | | | | | | |
| | | | | Air Freight & Logistics —0.9% | | | | |
| | 1,350 | | | FedEx Corp. | | | 296,041 | |
| | | | | | | | | |
| | | | | Automobiles —2.1% | | | | |
| | 38,750 | | | Ford Motor Co.(a) | | | 548,700 | |
| | 3,100 | | | General Motors Co.(a) | | | 163,401 | |
| | | | | | | | 712,101 | |
| | | | | | | | | |
| | | | | Banks —7.9% | | | | |
| | 4,453 | | | Bank OZK | | | 191,390 | |
| | 129 | | | Citigroup, Inc. | | | 9,053 | |
| | 2,600 | | | Comerica, Inc. | | | 209,300 | |
| | 3,044 | | | JPMorgan Chase & Co. | | | 498,272 | |
| | 2,950 | | | PNC Financial Services Group, Inc. (The) | | | 577,138 | |
| | 2,000 | | | Popular, Inc. | | | 155,340 | |
| | 3,750 | | | Synovus Financial Corp. | | | 164,588 | |
| | 10,200 | | | U.S. Bancorp | | | 606,288 | |
| | 8,050 | | | Umpqua Holdings Corp. | | | 163,012 | |
| | 750 | | | Wells Fargo & Co. | | | 34,808 | |
| | | | | | | | 2,609,189 | |
| | | | | | | | | |
| | | | | Biotechnology — 4.3% | | | | |
| | 3,656 | | | AbbVie, Inc. | | | 394,373 | |
| | 5,450 | | | Gilead Sciences, Inc. | | | 380,683 | |
| | 1,000 | | | Moderna, Inc.(a) | | | 384,860 | |
| | 650 | | | Novavax, Inc.(a) | | | 134,751 | |
| | 750 | | | United Therapeutics Corp.(a) | | | 138,435 | |
| | | | | | | | 1,433,102 | |
| | | | | | | | | |
| | | | | Building Products — 2.6% | | | | |
| | 4,700 | | | Carrier Global Corp. | | | 243,272 | |
| | 7,200 | | | Johnson Controls International PLC | | | 490,176 | |
| | 1,500 | | | Owens Corning | | | 128,250 | |
| | | | | | | | 861,698 | |
| | | | | | | | | |
| | | | | Capital Markets — 6.4% | | | | |
| | 1,650 | | | Goldman Sachs Group, Inc. (The) | | | 623,750 | |
| | 2,000 | | | Janus Henderson Group PLC | | | 82,660 | |
| | 4,850 | | | KKR & Co., Inc. | | | 295,268 | |
| | 6,875 | | | Morgan Stanley | | | 669,006 | |
| | 2,300 | | | T. Rowe Price Group, Inc. | | | 452,410 | |
| | | | | | | | 2,123,094 | |
| | | | | | | | | |
| | | | | Chemicals —1.9% | | | | |
| | 8,050 | | | Dow, Inc. | | | 463,358 | |
| | 1,850 | | | LyondellBasell Industries NV, Class A | | | 173,622 | |
| | | | | | | | 636,980 | |
| | | | | | | | | |
| | | | | Communications Equipment —1.2% | | | | |
| | 7,050 | | | Cisco Systems, Inc. | | | 383,731 | |
| | | | | | | | | |
| | | | | Consumer Finance —2.8% | | | | |
| | 3,400 | | | Capital One Financial Corp. | | | 550,698 | |
| | 1,550 | | | Discover Financial Services | | | 190,418 | |
| Shares | | | | | Fair Value | |
| COMMON STOCKS — (continued) | |
| | | | | Consumer Finance — (continued) | | | | |
| | 3,150 | | | OneMain Holdings, Inc. | | $ | 174,289 | |
| | | | | | | | 915,405 | |
| | | | | | | | | |
| | | | | Diversified Telecommunication Services — 2.4% | | | | |
| | 14,807 | | | Verizon Communications, Inc. | | | 799,726 | |
| | | | | | | | | |
| | | | | Electric Utilities — 3.0% | | | | |
| | 2,450 | | | Duke Energy Corp. | | | 239,096 | |
| | 10,812 | | | Exelon Corp. | | | 522,652 | |
| | 4,000 | | | Southern Co. (The) | | | 247,880 | |
| | | | | | | | 1,009,628 | |
| | | | | | | | | |
| | | | | Electrical Equipment — 2.8% | | | | |
| | 2,591 | | | Eaton Corp. PLC | | | 386,862 | |
| | 5,600 | | | Emerson Electric Co. | | | 527,520 | |
| | | | | | | | 914,382 | |
| | | | | | | | | |
| | | | | Electronic Equipment, Instruments & Components —0.5% | | | | |
| | 1,500 | | | Arrow Electronics, Inc.(a) | | | 168,435 | |
| | | | | | | | | |
| | | | | Energy Equipment & Services —1.4% | | | | |
| | 15,250 | | | Schlumberger NV | | | 452,010 | |
| | | | | | | | | |
| | | | | Equity Real Estate Investment Trusts (REITS)—3.8% | | | | |
| | 7,350 | | | Brixmor Property Group, Inc. | | | 162,508 | |
| | 3,200 | | | EPR Properties | | | 158,016 | |
| | 3,700 | | | Iron Mountain, Inc. | | | 160,765 | |
| | 450 | | | Public Storage | | | 133,695 | |
| | 3,800 | | | Simon Property Group, Inc. | | | 493,886 | |
| | 3,000 | | | Spirit Realty Capital, Inc. | | | 138,120 | |
| | | | | | | | 1,246,990 | |
| | | | | | | | | |
| | | | | Food & Staples Retailing —1.1% | | | | |
| | 6,450 | | | Albertsons Cos., Inc., Class A | | | 200,789 | |
| | 3,550 | | | Kroger Co. (The) | | | 143,526 | |
| | 700 | | | Walgreens Boots Alliance, Inc. | | | 32,935 | |
| | | | | | | | 377,250 | |
| | | | | | | | | |
| | | | | Food Products —0.5% | | | | |
| | 2,050 | | | Tyson Foods, Inc., Class A | | | 161,827 | |
| | | | | | | | | |
| | | | | Gas Utilities — 0.1% | | | | |
| | 550 | | | National Fuel Gas Co. | | | 28,886 | |
| | | | | | | | | |
| | | | | Health Care Providers & Services —8.0% | | | | |
| | 1,000 | | | Acadia Healthcare Co., Inc.(a) | | | 63,780 | |
| | 1,300 | | | AmerisourceBergen Corp. | | | 155,285 | |
| | 1,374 | | | Anthem, Inc. | | | 512,227 | |
| | 2,400 | | | Cigna Corp. | | | 480,384 | |
| | 7,300 | | | CVS Health Corp. | | | 619,478 | |
| | 1,800 | | | HCA Healthcare, Inc. | | | 436,896 | |
| | 500 | | | Laboratory Corp. of America Holdings(a) | | | 140,720 | |
| | 974 | | | McKesson Corp. | | | 194,196 | |
| | 250 | | | Molina Healthcare, Inc.(a) | | | 67,828 | |
| | | | | | | | 2,670,794 | |
See accompanying Notes to the Financial Statements.
Sterling Capital Behavioral Large Cap Value Equity Fund
Schedule of Portfolio Investments — (continued)
September 30, 2021
| Shares | | | Fair Value | |
| COMMON STOCKS — (continued) | |
| | | | | Hotels, Restaurants & Leisure —0.9% | | | | |
| | 2,600 | | | Boyd Gaming Corp.(a) | | $ | 164,476 | |
| | 2,250 | | | Travel + Leisure Co. | | | 122,692 | |
| | | | | | | | 287,168 | |
| | | | | | | | | |
| | | | | Household Durables —2.0% | | | | |
| | 2,150 | | | DR Horton, Inc. | | | 180,536 | |
| | 1,750 | | | Lennar Corp., Class A | | | 163,940 | |
| | 3,328 | | | PulteGroup, Inc. | | | 152,822 | |
| | 750 | | | Toll Brothers, Inc. | | | 41,467 | |
| | 700 | | | Whirlpool Corp. | | | 142,702 | |
| | | | | | | | 681,467 | |
| | | | | | | | | |
| | | | | Independent Power and Renewable Electricity Producers —0.8% | | | | |
| | 5,950 | | | AES Corp. (The) | | | 135,839 | |
| | 8,450 | | | Vistra Corp. | | | 144,495 | |
| | | | | | | | 280,334 | |
| | | | | | | | | |
| | | | | Insurance —5.1% | | | | |
| | 600 | | | Aflac, Inc. | | | 31,278 | |
| | 9,450 | | | American International Group, Inc. | | | 518,711 | |
| | 2,650 | | | Fidelity National Financial, Inc. | | | 120,151 | |
| | 8,480 | | | MetLife, Inc. | | | 523,470 | |
| | 4,750 | | | Prudential Financial, Inc. | | | 499,700 | |
| | | | | | | | 1,693,310 | |
| | | | | | | | | |
| | | | | Interactive Media & Services —2.0% | | | | |
| | 200 | | | Alphabet, Inc., Class A(a) | | | 534,704 | |
| | 50 | | | Alphabet, Inc., Class C(a) | | | 133,265 | |
| | | | | | | | 667,969 | |
| | | | | | | | | |
| | | | | IT Services —2.5% | | | | |
| | 1,850 | | | Alliance Data Systems Corp. | | | 186,646 | |
| | 4,550 | | | International Business Machines Corp. | | | 632,132 | |
| | | | | | | | 818,778 | |
| | | | | | | | | |
| | | | | Machinery —1.8% | | | | |
| | 1,200 | | | AGCO Corp. | | | 147,036 | |
| | 1,300 | | | Deere & Co. | | | 435,591 | |
| | | | | | | | 582,627 | |
| | | | | | | | | |
| | | | | Media —2.7% | | | | |
| | 950 | | | Comcast Corp., Class A | | | 53,134 | |
| | 4,000 | | | DISH Network Corp., Class A(a) | | | 173,840 | |
| | 4,050 | | | Fox Corp., Class A | | | 162,445 | |
| | 5,450 | | | Interpublic Group of Cos., Inc. (The) | | | 199,852 | |
| | 2,700 | | | John Wiley & Sons, Inc., Class A | | | 140,967 | |
| | 1,144 | | | Nexstar Media Group, Inc., Class A | | | 173,842 | |
| | | | | | | | 904,080 | |
| | | | | | | | | |
| | | | | Metals & Mining —2.5% | | | | |
| | 13,649 | | | Freeport-McMoRan, Inc. | | | 444,002 | |
| | 300 | | | Nucor Corp. | | | 29,547 | |
| | 6,651 | | | Southern Copper Corp. | | | 373,387 | |
| | | | | | | | 846,936 | |
| Shares | | | | | Fair Value | |
| COMMON STOCKS — (continued) | | |
| | | | | Mortgage Real Estate Investment Trusts (REITS) —0.5% | | | | |
| | 6,350 | | | Starwood Property Trust, Inc. | | $ | 155,003 | |
| | | | | | | | | |
| | | | | Multiline Retail —1.5% | | | | |
| | 2,249 | | | Target Corp. | | | 514,504 | |
| | | | | | | | | |
| | | | | Oil, Gas & Consumable Fuels —5.0% | | | | |
| | 7,300 | | | EOG Resources, Inc. | | | 585,971 | |
| | 9,950 | | | Exxon Mobil Corp. | | | 585,259 | |
| | 2,900 | | | Pioneer Natural Resources Co. | | | 482,879 | |
| | | | | | | | 1,654,109 | |
| | | | | | | | | |
| | | | | Personal Products —1.0% | | | | |
| | 550 | | | Estee Lauder Cos., Inc. (The), Class A | | | 164,962 | |
| | 1,144 | | | Herbalife Nutrition, Ltd.(a) | | | 48,483 | |
| | 3,201 | | | Nu Skin Enterprises, Inc., Class A | | | 129,544 | |
| | | | | | | | 342,989 | |
| | | | | | | | | |
| | | | | Pharmaceuticals —4.3% | | | | |
| | 10,250 | | | Bristol-Myers Squibb Co. | | | 606,493 | |
| | 19,150 | | | Pfizer, Inc. | | | 823,641 | |
| | | | | | | | 1,430,134 | |
| | | | | | | | | |
| | | | | Professional Services —0.3% | | | | |
| | 950 | | | ManpowerGroup, Inc. | | | 102,866 | |
| | | | | | | | | |
| | | | | Road & Rail —0.5% | | | | |
| | 1,850 | | | Ryder System, Inc. | | | 153,013 | |
| | | | | | | | | |
| | | | | Semiconductors & Semiconductor Equipment —3.8% | | | | |
| | 3,350 | | | Applied Materials, Inc. | | | 431,246 | |
| | 926 | | | Broadcom, Inc. | | | 449,045 | |
| | 600 | | | KLA Corp. | | | 200,706 | |
| | 600 | | | Microchip Technology, Inc. | | | 92,094 | |
| | 700 | | | QUALCOMM, Inc. | | | 90,286 | |
| | | | | | | | 1,263,377 | |
| | | | | | | | | |
| | | | | Software —1.4% | | | | |
| | 5,194 | | | Oracle Corp. | | | 452,553 | |
| | | | | | | | | |
| | | | | Specialty Retail —1.1% | | | | |
| | 1,650 | | | Bath & Body Works, Inc. | | | 104,000 | |
| | 1,071 | | | Lowe's Cos., Inc. | | | 217,263 | |
| | 50 | | | O'Reilly Automotive, Inc.(a) | | | 30,553 | |
| | | | | | | | 351,816 | |
| | | | | | | | | |
| | | | | Technology Hardware, Storage & Peripherals —2.1% | | | | |
| | 4,775 | | | Dell Technologies, Inc., Class C(a) | | | 496,791 | |
| | 6,400 | | | HP, Inc. | | | 175,104 | |
| | 600 | | | Western Digital Corp.(a) | | | 33,864 | |
| | | | | | | | 705,759 | |
| | | | | | | | | |
| | | | | Tobacco —1.9% | | | | |
| | 6,000 | | | Altria Group, Inc. | | | 273,120 | |
Continued
Sterling Capital Behavioral Large Cap Value Equity Fund
Schedule of Portfolio Investments — (continued)
September 30, 2021
| Shares | | | | | Fair Value | |
| | COMMON STOCKS — (continued) | | | | |
| | | | | Tobacco — (continued) | | | | |
| | 3,850 | | | Philip Morris International, Inc. | | $ | 364,942 | |
| | | | | | | | 638,062 | |
| | | | | | | | | |
| | | | | Trading Companies & Distributors — 0.6% | | | | |
| | 574 | | | United Rentals, Inc.(a) | | | 201,434 | |
| | | | | | | | | |
| | | | | Total Common Stocks | | | | |
| | | | | (Cost $27,557,336) | | | 33,039,235 | |
| | MONEY MARKET FUND —0.4% | | | | |
| | 126,674 | | | Federated Treasury Obligations Fund,
Institutional Shares, 0.01%(b) | | | 126,674 | |
| | | | | | | | | |
| | | | | Total Money Market Fund | | | | |
| | | | | (Cost $126,674) | | | 126,674 | |
| | Total Investments —99.9% | | | | |
| | (Cost $27,684,010) | | | 33,165,909 | |
| | Net Other Assets (Liabilities) — 0.1% | | | 31,503 | |
| | NET ASSETS — 100.0% | | $ | 33,197,412 | |
| (a) | Represents non-income producing security. |
| (b) | Represents the current yield as of report date. |
Continued
Sterling Capital Mid Value Fund
Schedule of Portfolio Investments
September 30, 2021
| Shares | | | | | Fair Value | |
| COMMON STOCKS —95.6% | | | |
| | | | | Auto Components —2.7% | | | | |
| | 63,500 | | | Gentex Corp. | | $ | 2,094,230 | |
| | | | | | | | | |
| | | | | Banks —5.2% | | | | |
| | 17,673 | | | M&T Bank Corp. | | | 2,639,286 | |
| | 17,893 | | | SouthState Corp. | | | 1,336,070 | |
| | | | | | | | 3,975,356 | |
| | | | | Chemicals —6.1% | | | | |
| | 72,736 | | | Axalta Coating Systems, Ltd.(a) | | | 2,123,164 | |
| | 61,161 | | | Corteva, Inc. | | | 2,573,655 | |
| | | | | | | | 4,696,819 | |
| | | | | | | | | |
| | | | | Consumer Finance —4.9% | | | | |
| | 124,724 | | | SLM Corp. | | | 2,195,142 | |
| | 32,376 | | | Synchrony Financial | | | 1,582,539 | |
| | | | | | | | 3,777,681 | |
| | | | | | | | | |
| | | | | Containers & Packaging —3.6% | | | | |
| | 27,501 | | | Crown Holdings, Inc. | | | 2,771,551 | |
| | | | | | | | | |
| | | | | Electric Utilities —5.4% | | | | |
| | 32,359 | | | ALLETE, Inc. | | | 1,926,008 | |
| | 47,211 | | | Portland General Electric Co. | | | 2,218,445 | |
| | | | | | | | 4,144,453 | |
| | | | | | | | | |
| | | | | Electrical Equipment —2.7% | | | | |
| | 37,523 | | | Sensata Technologies Holding PLC(a) | | | 2,053,259 | |
| | | | | | | | | |
| | | | | Energy Equipment & Services —1.1% | | | | |
| | 31,244 | | | Core Laboratories NV | | | 867,021 | |
| | | | | | | | | |
| | | | | Food Products —1.6% | | | | |
| | 32,654 | | | Cal-Maine Foods, Inc. | | | 1,180,769 | |
| | | | | | | | | |
| | | | | Health Care Equipment & Supplies —2.2% | | | | |
| | 11,504 | | | Zimmer Biomet Holdings, Inc. | | | 1,683,725 | |
| | | | | | | | | |
| | | | | Health Care Providers & Services —8.0% | | | | |
| | 33,280 | | | Centene Corp.(a) | | | 2,073,677 | |
| | 7,530 | | | Laboratory Corp. of America Holdings(a) | | | 2,119,243 | |
| | 9,793 | | | McKesson Corp. | | | 1,952,528 | |
| | | | | | | | 6,145,448 | |
| | | | | | | | | |
| | | | | Hotels, Restaurants & Leisure —4.6% | | | | |
| | 13,095 | | | Cracker Barrel Old Country Store, Inc. | | | 1,831,205 | |
| | 12,911 | | | Hilton Worldwide Holdings, Inc.(a) | | | 1,705,672 | |
| | | | | | | | 3,536,877 | |
| | | | | | | | | |
| | | | | Household Durables —2.6% | | | | |
| | 10,973 | | | Mohawk Industries, Inc.(a) | | | 1,946,610 | |
| | | | | | | | | |
| | | | | Household Products —1.7% | | | | |
| | 13,507 | | | Spectrum Brands Holdings, Inc. | | | 1,292,215 | |
| | | | | | | | | |
| | | | | Insurance —6.3% | | | | |
| | 7,171 | | | Enstar Group, Ltd.(a) | | | 1,683,249 | |
| | 12,751 | | | Lincoln National Corp. | | | 876,631 | |
| Shares | | | | Fair Value | |
| COMMON STOCKS — (continued) | | | |
| | | | | Insurance — (continued) | | | | |
| | 1,907 | | | Markel Corp.(a) | | $ | 2,279,113 | |
| | | | | | | | 4,838,993 | |
| | | | | | | | | |
| | | | | Internet & Direct Marketing Retail —2.0% | | | | |
| | 22,031 | | | eBay, Inc. | | | 1,534,900 | |
| | | | | | | | | |
| | | | | IT Services —5.7% | | | | |
| | 19,599 | | | Euronet Worldwide, Inc.(a) | | | 2,494,561 | |
| | 12,014 | | | Global Payments, Inc. | | | 1,893,166 | |
| | | | | | | | 4,387,727 | |
| | | | | | | | | |
| | | | | Machinery —3.2% | | | | |
| | 90,152 | | | Trinity Industries, Inc. | | | 2,449,430 | |
| | | | | | | | | |
| | | | | Media —4.8% | | | | |
| | 12,690 | | | Liberty Broadband Corp., Class C(a) | | | 2,191,563 | |
| | 63,415 | | | News Corp., Class B | | | 1,473,130 | |
| | | | | | | | 3,664,693 | |
| | | | | | | | | |
| | | | | Oil, Gas & Consumable Fuels —1.3% | | | | |
| | 77,462 | | | CNX Resources Corp.(a) | | | 977,570 | |
| | | | | | | | | |
| | | | | Professional Services —5.9% | | | | |
| | 20,288 | | | ASGN, Inc.(a) | | | 2,295,384 | |
| | 16,672 | | | Jacobs Engineering Group, Inc. | | | 2,209,540 | |
| | | | | | | | 4,504,924 | |
| | | | | | | | | |
| | | | | Real Estate Management & Development —3.5% | | | | |
| | 27,028 | | | CBRE Group, Inc., Class A(a) | | | 2,631,446 | |
| | | | | | | | | |
| | | | | Specialty Retail —2.7% | | | | |
| | 16,212 | | | CarMax, Inc.(a) | | | 2,074,487 | |
| | | | | | | | | |
| | | | | Technology Hardware, Storage & Peripherals —2.5% | | | | |
| | 49,739 | | | NCR Corp.(a) | | | 1,927,884 | |
| | | | | | | | | |
| | | | | Thrifts & Mortgage Finance —2.9% | | | | |
| | 97,904 | | | Radian Group, Inc. | | | 2,224,379 | |
| | | | | | | | | |
| | | | | Trading Companies & Distributors —2.4% | | | | |
| | 46,159 | | | Air Lease Corp. | | | 1,815,895 | |
| | | | | | | | | |
| | | | | Total Common Stocks | | | | |
| | | | | (Cost $48,129,847) | | | 73,198,342 | |
See accompanying Notes to the Financial Statements.
Sterling Capital Mid Value Fund
Schedule of Portfolio Investments — (continued)
September 30, 2021
| Shares | | | Fair Value | |
| | | | MONEY MARKET FUND —4.4% | | | |
| | 3,364,273 | | | Federated Treasury Obligations Fund,
Institutional Shares, 0.01%(b) | | $ | 3,364,273 | |
| | | | | | | | | |
| | | | | Total Money Market Fund | | | | |
| | | | | (Cost $3,364,273) | | | 3,364,273 | |
| | | | | | | | | |
| Total Investments —100.0% | | | | |
| (Cost $51,494,120) | | | 76,562,615 | |
| Net Other Assets (Liabilities) — (0.0)% | | | (23,825 | ) |
| NET ASSETS — 100.0% | | $ | 76,538,790 | |
| (a) | Represents non-income producing security. |
| (b) | Represents the current yield as of report date. |
Continued
Sterling Capital Behavioral Small Cap Value Equity Fund
Schedule of Portfolio Investments
September 30, 2021
| Shares | | | | | Fair Value | |
| COMMON STOCKS —96.3% | | | |
| | | | | Air Freight & Logistics —0.9% | | | | |
| | 11,813 | | | Atlas Air Worldwide Holdings, Inc.(a) | | $ | 964,886 | |
| | | | | | | | | |
| | | | | Airlines —0.6% | | | | |
| | 7,961 | | | Mesa Air Group, Inc.(a) | | | 60,981 | |
| | 10,850 | | | SkyWest, Inc.(a) | | | 535,339 | |
| | | | | | | | 596,320 | |
| | | | | | | | | |
| | | | | Auto Components —0.7% | | | | |
| | 40,111 | | | Goodyear Tire & Rubber Co. (The)(a) | | | 709,965 | |
| | | | | | | | | |
| | | | | Banks —13.3% | | | | |
| | 13,036 | | | Bank OZK | | | 560,287 | |
| | 14,305 | | | ConnectOne Bancorp, Inc. | | | 429,293 | |
| | 20,549 | | | Customers Bancorp, Inc.(a) | | | 884,018 | |
| | 15,417 | | | Eagle Bancorp, Inc. | | | 886,477 | |
| | 42,538 | | | First BanCorp. | | | 559,375 | |
| | 13,907 | | | First Financial Corp. | | | 584,789 | |
| | 6,640 | | | First Horizon Corp. | | | 108,166 | |
| | 16,260 | | | Flushing Financial Corp. | | | 367,476 | |
| | 32,210 | | | Fulton Financial Corp. | | | 492,169 | |
| | 14,880 | | | Great Western Bancorp, Inc. | | | 487,171 | |
| | 13,550 | | | Hancock Whitney Corp. | | | 638,476 | |
| | 19,510 | | | Hanmi Financial Corp. | | | 391,371 | |
| | 9,702 | | | Heartland Financial USA, Inc. | | | 466,472 | |
| | 26,754 | | | Hilltop Holdings, Inc. | | | 874,053 | |
| | 55,342 | | | Hope Bancorp, Inc. | | | 799,138 | |
| | 21,194 | | | Horizon Bancorp, Inc. | | | 385,095 | |
| | 14,144 | | | Independent Bank Corp. | | | 303,813 | |
| | 18,162 | | | OFG Bancorp | | | 458,046 | |
| | 8,464 | | | Popular, Inc. | | | 657,399 | |
| | 14,693 | | | QCR Holdings, Inc. | | | 755,808 | |
| | 13,710 | | | RBB Bancorp | | | 345,629 | |
| | 13,009 | | | Synovus Financial Corp. | | | 570,965 | |
| | 6,735 | | | UMB Financial Corp. | | | 651,342 | |
| | 16,651 | | | Umpqua Holdings Corp. | | | 337,183 | |
| | 14,150 | | | Univest Financial Corp. | | | 387,568 | |
| | 4,213 | | | Wintrust Financial Corp. | | | 338,599 | |
| | 6,101 | | | Zions Bancorp NA | | | 377,591 | |
| | | | | | | | 14,097,769 | |
| | | | | | | | | |
| | | | | Beverages —0.3% | | | | |
| | 803 | | | Coca-Cola Consolidated, Inc. | | | 316,527 | |
| | | | | | | | | |
| | | | | Building Products —1.2% | | | | |
| | 26,224 | | | Cornerstone Building Brands, Inc.(a) | | | 383,133 | |
| | 10,160 | | | Insteel Industries, Inc. | | | 386,588 | |
| | 6,256 | | | Owens Corning | | | 534,888 | |
| | | | | | | | 1,304,609 | |
| | | | | | | | | |
| | | | | Capital Markets —1.7% | | | | |
| | 19,935 | | | Cowen, Inc., Class A | | | 683,970 | |
| | 17,018 | | | Jefferies Financial Group, Inc. | | | 631,878 | |
| | 3,610 | | | Piper Sandler Cos. | | | 499,840 | |
| | | | | | | | 1,815,688 | |
| Shares | | | | | Fair Value | |
| COMMON STOCKS — (continued) | | | | |
| | | | | Chemicals —2.6% | | | | |
| | 10,250 | | | AdvanSix, Inc.(a) | | $ | 407,437 | |
| | 3,839 | | | CF Industries Holdings, Inc. | | | 214,293 | |
| | 17,996 | | | Chemours Co. (The) | | | 522,964 | |
| | 19,604 | | | Mosaic Co. (The) | | | 700,255 | |
| | 23,594 | | | Tronox Holdings PLC, Class A | | | 581,592 | |
| | 3,652 | | | Westlake Chemical Corp. | | | 332,843 | |
| | | | | | | | 2,759,384 | |
| | | | | | | | | |
| | | | | Commercial Services & Supplies —0.8% | | | | |
| | 44,210 | | | CoreCivic, Inc.(a) | | | 393,469 | |
| | 25,228 | | | Interface, Inc. | | | 382,204 | |
| | | | | | | | 775,673 | |
| | | | | | | | | |
| | | | | Communications Equipment —0.5% | | | | |
| | 16,382 | | | NETGEAR, Inc.(a) | | | 522,750 | |
| | | | | | | | | |
| | | | | Construction & Engineering —2.2% | | | | |
| | 3,331 | | | EMCOR Group, Inc. | | | 384,331 | |
| | 11,370 | | | Granite Construction, Inc. | | | 449,683 | |
| | 7,013 | | | MasTec, Inc.(a) | | | 605,082 | |
| | 6,436 | | | MYR Group, Inc.(a) | | | 640,382 | |
| | 11,840 | | | Sterling Construction Co., Inc.(a) | | | 268,413 | |
| | | | | | | | 2,347,891 | |
| | | | | | | | | |
| | | | | Consumer Finance —3.6% | | | | |
| | 12,210 | | | Ally Financial, Inc. | | | 623,320 | |
| | 2,280 | | | Encore Capital Group, Inc.(a) | | | 112,336 | |
| | 12,400 | | | Enova International, Inc.(a) | | | 428,420 | |
| | 52,941 | | | Navient Corp. | | | 1,044,526 | |
| | 5,140 | | | Nelnet, Inc., Class A | | | 407,294 | |
| | 10,461 | | | OneMain Holdings, Inc. | | | 578,807 | |
| | 5,750 | | | Regional Management Corp. | | | 334,535 | |
| | 17,390 | | | SLM Corp. | | | 306,064 | |
| | | | | | | | 3,835,302 | |
| | | | | | | | | |
| | | | | Containers & Packaging —0.2% | | | | |
| | 3,561 | | | Westrock Co. | | | 177,445 | |
| | | | | | | | | |
| | | | | Electric Utilities —1.1% | | | | |
| | 9,682 | | | Otter Tail Corp. | | | 541,901 | |
| | 12,805 | | | Portland General Electric Co. | | | 601,707 | |
| | | | | | | | 1,143,608 | |
| | | | | | | | | |
| | | | | Electrical Equipment —0.2% | | | | |
| | 2,408 | | | Atkore, Inc.(a) | | | 209,303 | |
| | | | | | | | | |
| | | | | Electronic Equipment, Instruments & | | | | |
| | | | | Components —1.9% | | | | |
| | 4,856 | | | Arrow Electronics, Inc.(a) | | | 545,280 | |
| | 3,925 | | | Jabil, Inc. | | | 229,102 | |
| | 12,508 | | | Sanmina Corp.(a) | | | 482,059 | |
| | 3,032 | | | SYNNEX Corp. | | | 315,631 | |
| | 32,628 | | | TTM Technologies, Inc.(a) | | | 410,134 | |
| | | | | | | | 1,982,206 | |
| | | | | | | | | |
| | | | | Energy Equipment & Services —0.8% | | | | |
| | 4,488 | | | Nabors Industries, Ltd.(a) | | | 433,002 | |
See accompanying Notes to the Financial Statements.
Sterling Capital Behavioral Small Cap Value Equity Fund
Schedule of Portfolio Investments — (continued)
September 30, 2021
| Shares | | | | | Fair Value | |
| COMMON STOCKS — (continued) | | |
| | | | | Energy Equipment & Services — (continued) | | | | |
| | 33,718 | | | Oceaneering International, Inc.(a) | | $ | 449,124 | |
| | | | | | | | 882,126 | |
| | | | | | | | | |
| | | | | Equity Real Estate Investment Trusts (REITS)—8.7% | | | | |
| | 43,569 | | | Acadia Realty Trust | | | 889,244 | |
| | 19,420 | | | Alexander & Baldwin, Inc. | | | 455,205 | |
| | 28,567 | | | City Office REIT, Inc. | | | 510,207 | |
| | 24,610 | | | CorePoint Lodging, Inc.(a) | | | 381,455 | |
| | 6,200 | | | CTO Realty Growth, Inc. | | | 333,312 | |
| | 18,622 | | | Essential Properties Realty Trust, Inc. | | | 519,926 | |
| | 13,213 | | | Getty Realty Corp. | | | 387,273 | |
| | 20,704 | | | Healthcare Realty Trust, Inc. | | | 616,565 | |
| | 16,677 | | | Industrial Logistics Properties Trust | | | 423,763 | |
| | 29,499 | | | Kimco Realty Corp. | | | 612,104 | |
| | 35,773 | | | Macerich Co. (The) | | | 597,767 | |
| | 17,868 | | | Medical Properties Trust, Inc. | | | 358,611 | |
| | 6,891 | | | National Retail Properties, Inc. | | | 297,622 | |
| | 10,874 | | | PotlatchDeltic Corp. | | | 560,881 | |
| | 30,170 | | | Preferred Apartment Communities, Inc. | | | 368,979 | |
| | 4,700 | | | Regency Centers Corp. | | | 316,451 | |
| | 16,475 | | | Retail Value, Inc. | | | 433,787 | |
| | 13,422 | | | RPT Realty | | | 171,265 | |
| | 4,636 | | | SL Green Realty Corp. | | | 328,414 | |
| | 18,455 | | | VICI Properties, Inc. | | | 524,306 | |
| | 33,210 | | | Whitestone REIT | | | 324,794 | |
| | | | | | | | 9,411,931 | |
| | | | | | | | | |
| | | | | Food & Staples Retailing —1.3% | | | | |
| | 10,370 | | | Albertsons Cos., Inc., Class A | | | 322,818 | |
| | 28,166 | | | SpartanNash Co. | | | 616,835 | |
| | 18,297 | | | Sprouts Farmers Market, Inc.(a) | | | 423,942 | |
| | | | | | | | 1,363,595 | |
| | | | | | | | | |
| | | | | Food Products —0.7% | | | | |
| | 12,741 | | | Fresh Del Monte Produce, Inc. | | | 410,515 | |
| | 3,942 | | | John B Sanfilippo & Son, Inc. | | | 322,140 | |
| | | | | | | | 732,655 | |
| | | | | | | | | |
| | | | | Gas Utilities —1.2% | | | | |
| | 6,010 | | | National Fuel Gas Co. | | | 315,645 | |
| | 9,238 | | | Southwest Gas Holdings, Inc. | | | 617,838 | |
| | 6,950 | | | UGI Corp. | | | 296,209 | |
| | | | | | | | 1,229,692 | |
| | | | | | | | | |
| | | | | Health Care Equipment & Supplies —1.0% | | | | |
| | 7,348 | | | Envista Holdings Corp.(a) | | | 307,220 | |
| | 15,107 | | | Natus Medical, Inc.(a) | | | 378,884 | |
| | 9,337 | | | Orthofix Medical, Inc.(a) | | | 355,926 | |
| | | | | | | | 1,042,030 | |
| | | | | | | | | |
| | | | | Health Care Providers & Services —6.6% | | | | |
| | 5,013 | | | Acadia Healthcare Co., Inc.(a) | | | 319,729 | |
| | 3,381 | | | AMN Healthcare Services, Inc.(a) | | | 387,970 | |
| | 36,355 | | | Community Health Systems, Inc.(a) | | | 425,354 | |
| | 4,275 | | | DaVita, Inc.(a) | | | 497,011 | |
| Shares | | | | | Fair Value | |
| COMMON STOCKS — (continued) | | | | |
| | | | | Health Care Providers & Services — (continued) | | | | |
| | 4,002 | | | Encompass Health Corp. | | $ | 300,310 | |
| | 3,893 | | | Ensign Group, Inc. (The) | | | 291,547 | |
| | 4,630 | | | Fulgent Genetics, Inc.(a) | | | 416,468 | |
| | 14,247 | | | Hanger, Inc.(a) | | | 312,864 | |
| | 5,562 | | | MEDNAX, Inc.(a) | | | 158,128 | |
| | 3,352 | | | ModivCare, Inc.(a) | | | 608,790 | |
| | 1,230 | | | Molina Healthcare, Inc.(a) | | | 333,711 | |
| | 17,095 | | | Owens & Minor, Inc. | | | 534,903 | |
| | 17,571 | | | Select Medical Holdings Corp. | | | 635,543 | |
| | 14,354 | | | Tenet Healthcare Corp.(a) | | | 953,680 | |
| | 14,937 | | | Tivity Health, Inc.(a) | | | 344,447 | |
| | 3,457 | | | Universal Health Services, Inc., Class B | | | 478,345 | |
| | | | | | | | 6,998,800 | |
| | | | | | | | | |
| | | | | Health Care Technology —0.8% | | | | |
| | 10,977 | | | Computer Programs & Systems, Inc. | | | 389,244 | |
| | 12,268 | | | HealthStream, Inc.(a) | | | 350,620 | |
| | 22,386 | | | Multiplan Corp.(a) | | | 126,033 | |
| | | | | | | | 865,897 | |
| | | | | | | | | |
| | | | | Household Durables —0.1% | | | | |
| | 2,112 | | | Century Communities, Inc. | | | 129,782 | |
| | | | | | | | | |
| | | | | Household Products —0.7% | | | | |
| | 7,360 | | | Central Garden & Pet Co.(a) | | | 353,280 | |
| | 9,722 | | | Central Garden & Pet Co., Class A(a) | | | 418,046 | |
| | | | | | | | 771,326 | |
| | | | | | | | | |
| | | | | Independent Power and Renewable Electricity Producers —0.5% | | | | |
| | 21,165 | | | AES Corp. (The) | | | 483,197 | |
| | | | | | | | | |
| | | | | Insurance —1.9% | | | | |
| | 7,006 | | | Brighthouse Financial, Inc.(a) | | | 316,881 | |
| | 6,700 | | | Fidelity National Financial, Inc. | | | 303,778 | |
| | 4,620 | | | First American Financial Corp. | | | 309,771 | |
| | 4,760 | | | Lincoln National Corp. | | | 327,250 | |
| | 13,670 | | | Old Republic International Corp. | | | 316,187 | |
| | 7,010 | | | Stewart Information Services Corp. | | | 443,453 | |
| | | | | | | | 2,017,320 | |
| | | | | | | | | |
| | | | | Interactive Media & Services —0.3% | | | | |
| | 9,094 | | | Yelp, Inc.(a) | | | 338,661 | |
| | | | | | | | | |
| | | | | IT Services —0.4% | | | | |
| | 3,449 | | | Alliance Data Systems Corp. | | | 347,970 | |
| | 4,288 | | | BM Technologies, Inc.(a) | | | 38,163 | |
| | | | | | | | 386,133 | |
| | | | | | | | | |
| | | | | Leisure Products —1.1% | | | | |
| | 19,632 | | | Smith & Wesson Brands, Inc. | | | 407,561 | |
| | 17,620 | | | Vista Outdoor, Inc.(a) | | | 710,262 | |
| | | | | | | | 1,117,823 | |
| | | | | | | | | |
| | | | | Machinery —0.9% | | | | |
| | 2,435 | | | AGCO Corp. | | | 298,361 | |
| | 16,740 | | | Manitowoc Co., Inc. (The)(a) | | | 358,571 | |
Continued
Sterling Capital Behavioral Small Cap Value Equity Fund
Schedule of Portfolio Investments — (continued)
September 30, 2021
| Shares | | | | | Fair Value | |
| COMMON STOCKS — (continued) | | | | |
| | | | | Machinery — (continued) | | | | |
| | 6,945 | | | Terex Corp. | | $ | 292,384 | |
| | | | | | | | 949,316 | |
| | | | | | | | | |
| | | | | Marine —1.8% | | | | |
| | 33,013 | | | Costamare, Inc. | | | 511,371 | |
| | 21,306 | | | Genco Shipping & Trading, Ltd. | | | 428,890 | |
| | 11,714 | | | Matson, Inc. | | | 945,437 | |
| | | | | | | | 1,885,698 | |
| | | | | | | | | |
| | | | | Media —3.4% | | | | |
| | 7,845 | | | AMC Networks, Inc., Class A(a) | | | 365,498 | |
| | 18,329 | | | EW Scripps Co. (The), Class A | | | 331,022 | |
| | 60,750 | | | Gannett Co., Inc.(a) | | | 405,810 | |
| | 35,855 | | | Gray Television, Inc. | | | 818,211 | |
| | 10,743 | | | Interpublic Group of Cos., Inc. (The) | | | 393,946 | |
| | 8,696 | | | John Wiley & Sons, Inc., Class A | | | 454,018 | |
| | 2,199 | | | Nexstar Media Group, Inc., Class A | | | 334,160 | |
| | 14,672 | | | Sinclair Broadcast Group, Inc., Class A | | | 464,809 | |
| | | | | | | | 3,567,474 | |
| | | | | | | | | |
| | | | | Metals & Mining —1.5% | | | | |
| | 19,962 | | | Commercial Metals Co. | | | 608,043 | |
| | 2,177 | | | Reliance Steel & Aluminum Co. | | | 310,048 | |
| | 26,921 | | | TimkenSteel Corp.(a) | | | 352,127 | |
| | 12,020 | | | U.S. Steel Corp. | | | 264,079 | |
| | | | | | | | 1,534,297 | |
| | | | | | | | | |
| | | | | Mortgage Real Estate Investment Trusts (REITS) —2.6% | | | | |
| | 17,070 | | | Apollo Commercial Real Estate Finance, | | | | |
| | | | | Inc. | | | 253,148 | |
| | 36,528 | | | Chimera Investment Corp. | | | 542,441 | |
| | 37,395 | | | Ellington Financial, Inc. | | | 683,954 | |
| | 1,020 | | | Great Ajax Corp. | | | 13,760 | |
| | 100,563 | | | MFA Financial, Inc. | | | 459,573 | |
| | 25,076 | | | Ready Capital Corp. | | | 361,846 | |
| | 35,026 | | | Redwood Trust, Inc. | | | 451,485 | |
| | | | | | | | 2,766,207 | |
| | | | | | | | | |
| | | | | Multiline Retail —1.4% | | | | |
| | 3,645 | | | Dillard's, Inc., Class A | | | 628,836 | |
| | 6,013 | | | Kohl's Corp. | | | 283,152 | |
| | 27,470 | | | Macy's, Inc. | | | 620,822 | |
| | | | | | | | 1,532,810 | |
| | | | | | | | | |
| | | | | Multi-Utilities —1.1% | | | | |
| | 12,662 | | | Avista Corp. | | | 495,337 | |
| | 10,100 | | | MDU Resources Group, Inc. | | | 299,667 | |
| | 6,620 | | | NorthWestern Corp. | | | 379,326 | |
| | | | | | | | 1,174,330 | |
| | | | | | | | | |
| | | | | Oil, Gas & Consumable Fuels —5.3% | | | | |
| | 43,080 | | | Antero Resources Corp.(a) | | | 810,335 | |
| | 10,082 | | | Bonanza Creek Energy, Inc. | | | 482,928 | |
| | 71,070 | | | Centennial Resource Development, Inc., | | | | |
| | | | | Class A(a) | | | 476,169 | |
| Shares | | | | | Fair Value | |
| COMMON STOCKS — (continued) | | | | |
| | | | | Oil, Gas & Consumable Fuels — (continued) | | | | |
| | 6,300 | | | CONSOL Energy, Inc.(a) | | $ | 163,926 | |
| | 27,640 | | | Marathon Oil Corp. | | | 377,839 | |
| | 26,260 | | | Murphy Oil Corp. | | | 655,712 | |
| | 19,898 | | | PDC Energy, Inc. | | | 942,966 | |
| | 45,383 | | | SM Energy Co. | | | 1,197,204 | |
| | 9,103 | | | Whiting Petroleum Corp.(a) | | | 531,706 | |
| | | | | | | | 5,638,785 | |
| | | | | | | | | |
| | | | | Paper & Forest Products —0.3% | | | | |
| | 5,420 | | | Louisiana-Pacific Corp. | | | 332,625 | |
| | | | | | | | | |
| | | | | Pharmaceuticals —2.5% | | | | |
| | 60,844 | | | Amneal Pharmaceuticals, Inc.(a) | | | 324,907 | |
| | 19,376 | | | Amphastar Pharmaceuticals, Inc.(a) | | | 368,338 | |
| | 15,210 | | | Atea Pharmaceuticals, Inc.(a) | | | 533,262 | |
| | 72,790 | | | BioDelivery Sciences International, Inc.(a) | | | 262,772 | |
| | 1,872 | | | Jazz Pharmaceuticals PLC(a) | | | 243,753 | |
| | 9,789 | | | Prestige Consumer Healthcare, Inc.(a) | | | 549,261 | |
| | 15,330 | | | Supernus Pharmaceuticals, Inc.(a) | | | 408,851 | |
| | | | | | | | 2,691,144 | |
| | | | | | | | | |
| | | | | Professional Services —1.6% | | | | |
| | 3,778 | | | CRA International, Inc. | | | 375,306 | |
| | 8,300 | | | Heidrick & Struggles International, Inc. | | | 370,429 | |
| | 5,226 | | | Kforce, Inc. | | | 311,679 | |
| | 2,706 | | | ManpowerGroup, Inc. | | | 293,006 | |
| | 14,143 | | | TrueBlue, Inc.(a) | | | 382,992 | |
| | | | | | | | 1,733,412 | |
| | | | | | | | | |
| | | | | Real Estate Management & Development—2.0% | | | | |
| | 28,628 | | | Forestar Group, Inc.(a) | | | 533,339 | |
| | 2,112 | | | Jones Lang LaSalle, Inc.(a) | | | 523,966 | |
| | 39,312 | | | Newmark Group, Inc., Class A | | | 562,555 | |
| | 26,481 | | | Realogy Holdings Corp.(a) | | | 464,477 | |
| | | | | | | | 2,084,337 | |
| | | | | | | | | |
| | | | | Road & Rail —1.3% | | | | |
| | 12,178 | | | ArcBest Corp. | | | 995,795 | |
| | 3,997 | | | Ryder System, Inc. | | | 330,592 | |
| | | | | | | | 1,326,387 | |
| | | | | | | | | |
| | | | | Semiconductors & Semiconductor Equipment —2.6% | | | | |
| | 34,333 | | | Amkor Technology, Inc. | | | 856,608 | |
| | 23,880 | | | Photronics, Inc.(a) | | | 325,484 | |
| | 37,448 | | | Rambus, Inc.(a) | | | 831,346 | |
| | 11,251 | | | SMART Global Holdings, Inc.(a) | | | 500,670 | |
| | 6,745 | | | Ultra Clean Holdings, Inc.(a) | | | 287,337 | |
| | | | | | | | 2,801,445 | |
| | | | | | | | | |
| | | | | Specialty Retail —4.4% | | | | |
| | 16,149 | | | Abercrombie & Fitch Co., Class A(a) | | | 607,687 | |
| | 5,959 | | | AutoNation, Inc.(a) | | | 725,568 | |
| | 14,850 | | | Conn's, Inc.(a) | | | 339,026 | |
| | 4,714 | | | Dick's Sporting Goods, Inc. | | | 564,596 | |
Continued
Sterling Capital Behavioral Small Cap Value Equity Fund
Schedule of Portfolio Investments — (continued)
September 30, 2021
| Shares | | | | | Fair Value | |
| COMMON STOCKS — (continued) | | | | |
| | | | | Specialty Retail — (continued) | | | | |
| | 5,973 | | | Foot Locker, Inc. | | $ | 272,727 | |
| | 16,746 | | | Guess? Inc. | | | 351,833 | |
| | 9,562 | | | Haverty Furniture Cos., Inc. | | | 322,335 | |
| | 5,369 | | | Hibbett, Inc. | | | 379,803 | |
| | 7,279 | | | MarineMax, Inc.(a) | | | 353,177 | |
| | 9,742 | | | Signet Jewelers, Ltd. | | | 769,228 | |
| | | | | | | | 4,685,980 | |
| | | | | Thrifts & Mortgage Finance —2.0% | | | | |
| | 9,787 | | | HomeStreet, Inc. | | | 402,735 | |
| | 20,670 | | | MGIC Investment Corp. | | | 309,223 | |
| | 14,791 | | | Mr Cooper Group, Inc.(a) | | | 608,946 | |
| | 13,854 | | | Premier Financial Corp. | | | 441,111 | |
| | 17,897 | | | Waterstone Financial, Inc. | | | 366,710 | |
| | | | | | | | 2,128,725 | |
| | | | | | | | | |
| | | | | Trading Companies & Distributors —3.7% | | | | |
| | 5,770 | | | BlueLinx Holdings, Inc.(a) | | | 282,038 | |
| | 14,070 | | | Boise Cascade Co. | | | 759,499 | |
| | 4,861 | | | Herc Holdings, Inc.(a) | | | 794,579 | |
| | 17,216 | | | Rush Enterprises, Inc., Class A | | | 777,474 | |
| | 15,762 | | | Textainer Group Holdings, Ltd.(a) | | | 550,251 | |
| | 13,791 | | | Titan Machinery, Inc.(a) | | | 357,325 | |
| | 4,530 | | | Veritiv Corp.(a) | | | 405,707 | |
| | | | | | | | 3,926,873 | |
| | | | | | | | | |
| | | | | Total Common Stocks | | | | |
| | | | | (Cost $78,678,433) | | | 102,090,139 | |
| | | | | | | | | |
| WARRANTS —0.0% | | | |
| | | | | Energy Equipment & Services —0.0% | | | | |
| | 2,227 | | | Nabors Industries, Ltd., 8/30/2021(a) | | | 13,006 | |
| | | | | | | | | |
| | | | | Total Warrants | | | | |
| | | | | (Cost $–) | | | 13,006 | |
| | | | | | | | | |
| EXCHANGE TRADED FUND —2.7% | | | |
| | 17,500 | | | iShares Russell 2000 Value ETF | | | 2,804,025 | |
| | | | | | | | | |
| | | | | Total Exchange Traded Fund | | | | |
| | | | | (Cost $2,831,680) | | | 2,804,025 | |
| | | | | | | | | |
| MONEY MARKET FUND —0.9% | | | | |
| | 984,459 | | | Federated Treasury Obligations Fund,
Institutional Shares, 0.01%(b) | | | 984,459 | |
| | | | | | | | | |
| | | | | Total Money Market Fund | | | | |
| | | | | (Cost $984,459) | | | 984,459 | |
| | | | | | | | | |
| Total Investments —99.9% | | | | |
| (Cost $82,494,572) | | 105,891,629 | |
| Net Other Assets (Liabilities) — 0.1% | | 77,581 | |
| NET ASSETS — 100.0% | | $ | 105,969,210 | |
| (a) | Represents non-income producing security. |
| (b) | Represents the current yield as of report date. |
ETF Exchange Traded Fund
Continued
Sterling Capital Special Opportunities Fund
Schedule of Portfolio Investments
September 30, 2021
| Shares | | | | | Fair Value | |
| COMMON STOCKS —98.5% | | | | |
| | | | | Aerospace & Defense — 2.3% | | | | |
| | 79,500 | | | General Dynamics Corp. | | $ | 15,584,385 | |
| | | | | | | | | |
| | | | | Air Freight & Logistics —2.4% | | | | |
| | 74,000 | | | FedEx Corp. | | | 16,227,460 | |
| | | | | | | | | |
| | | | | Auto Components —2.0% | | | | |
| | 88,000 | | | Aptiv PLC(a) | | | 13,109,360 | |
| | | | | | | | | |
| | | | | Biotechnology —2.1% | | | | |
| | 23,000 | | | Regeneron Pharmaceuticals, Inc.(a) | | | 13,919,140 | |
| | | | | | | | | |
| | | | | Capital Markets — 4.4% | | | | |
| | 215,000 | | | Charles Schwab Corp. (The) | | | 15,660,600 | |
| | 32,500 | | | S&P Global, Inc. | | | 13,808,925 | |
| | | | | | | | 29,469,525 | |
| | | | | | | | | |
| | | | | Communications Equipment —3.9% | | | | |
| | 132,000 | | | F5 Networks, Inc.(a) | | | 26,238,960 | |
| | | | | | | | | |
| | | | | Consumer Finance —2.3% | | | | |
| | 94,000 | | | Capital One Financial Corp. | | | 15,225,180 | |
| | | | | | | | | |
| | | | | Containers & Packaging —3.6% | | | | |
| | 265,000 | | | Ball Corp. | | | 23,842,050 | |
| | | | | | | | | |
| | | | | Electronic Equipment, Instruments & | | | | |
| | | | | Components —1.3% | | | | |
| | 118,500 | | | Amphenol Corp., Class A | | | 8,677,755 | |
| | | | | | | | | |
| | | | | Entertainment —2.9% | | | | |
| | 251,000 | | | Activision Blizzard, Inc. | | | 19,424,890 | |
| | | | | | | | | |
| | | | | Health Care Equipment & Supplies — 8.3% | | | | |
| | 111,500 | | | Danaher Corp. | | | 33,945,060 | |
| | 294,500 | | | Hologic, Inc.(a) | | | 21,737,045 | |
| | | | | | | | 55,682,105 | |
| | | | | | | | | |
| | | | | Health Care Providers & Services —9.6% | | | | |
| | 145,000 | | | HCA Healthcare, Inc. | | | 35,194,400 | |
| | 74,000 | | | UnitedHealth Group, Inc. | | | 28,914,760 | |
| | | | | | | | 64,109,160 | |
| | | | | | | | | |
| | | | | Household Durables —1.6% | | | | |
| | 115,000 | | | Lennar Corp., Class A | | | 10,773,200 | |
| | | | | | | | | |
| | | | | Interactive Media & Services —6.5% | | | | |
| | 16,200 | | | Alphabet, Inc., Class C(a) | | | 43,178,022 | |
| | | | | | | | | |
| | | | | IT Services —15.5% | | | | |
| | 265,000 | | | Akamai Technologies, Inc.(a) | | | 27,716,350 | |
| | 236,500 | | | Fiserv, Inc.(a) | | | 25,660,250 | |
| | 138,000 | | | Global Payments, Inc. | | | 21,746,040 | |
| | 406,000 | | | Rackspace Technology, Inc.(a) | | | 5,773,320 | |
| | 103,000 | | | Visa, Inc., Class A | | | 22,943,250 | |
| | | | | | | | 103,839,210 | |
| | | | | | | | | |
| | | | | Media —4.4% | | | | |
| | 527,000 | | | Comcast Corp., Class A | | | 29,475,110 | |
| Shares | | | | | Fair Value | |
| COMMON STOCKS — (continued) | | | | |
| | | | | Pharmaceuticals —3.3% | | | | |
| | 372,000 | | | Bristol-Myers Squibb Co. | | $ | 22,011,240 | |
| | | | | | | | | |
| | | | | Professional Services —6.3% | | | | |
| | 179,200 | | | TransUnion | | | 20,125,952 | |
| | 111,000 | | | Verisk Analytics, Inc. | | | 22,229,970 | |
| | | | | | | | 42,355,922 | |
| | | | | | | | | |
| | | | | Real Estate Management & Development—2.5% | | | | |
| | 170,000 | | | CBRE Group, Inc., Class A(a) | | | 16,551,200 | |
| | | | | | | | | |
| | | | | Semiconductors & Semiconductor Equipment—4.8% | | | | |
| | 163,000 | | | NXP Semiconductors NV | | | 31,926,810 | |
| | | | | | | | | |
| | | | | Software —6.4% | | | | |
| | 46,000 | | | Intuit, Inc. | | | 24,817,460 | |
| | 149,000 | | | PTC, Inc.(a) | | | 17,848,710 | |
| | | | | | | | 42,666,170 | |
| | | | | | | | | |
| | | | | Specialty Retail —2.1% | | | | |
| | 8,100 | | | AutoZone, Inc.(a) | | | 13,753,719 | |
| | | | | | | | | |
| | | | | Total Common Stocks | | | | |
| | | | | (Cost $345,830,967) | | | 658,040,573 | |
| | | | | | | | | |
| MONEY MARKET FUND —1.7% | | | | |
| | 11,639,522 | | | Federated Treasury Obligations Fund,
Institutional Shares, 0.01%(b) | | | 11,639,522 | |
| | | | | | | | | |
| | | | | Total Money Market Fund | | | | |
| | | | | (Cost $11,639,522) | | | 11,639,522 | |
| | | | | | | | | |
| | | | | | | | | |
| Total Investments —100.2% | | | | |
| (Cost $357,470,489) | | 669,680,095 | |
| Net Other Assets (Liabilities) — (0.2)% | | | (1,030,331 | ) |
| NET ASSETS — 100.0% | | $ | 668,649,764 | |
| (a) | Represents non-income producing security. |
| (b) | Represents the current yield as of report date. |
See accompanying Notes to the Financial Statements.
Sterling Capital Equity Income Fund
Schedule of Portfolio Investments
September 30, 2021
| Shares | | | | | Fair Value | |
| COMMON STOCKS — 98.2% | | | |
| | | | Aerospace & Defense — 2.4% | | | |
| | 241,000 | | | L3Harris Technologies, Inc. | | $ | 53,077,840 | |
| | | | | | | | | |
| | | | | Air Freight & Logistics — 3.3% | | | | |
| | 411,000 | | | United Parcel Service, Inc., Class B | | | 74,843,100 | |
| | | | | | | | | |
| | | | | Banks — 2.1% | | | | |
| | 678,000 | | | Citigroup, Inc. | | | 47,582,040 | |
| | | | | | | | | |
| | | | | Beverages — 4.8% | | | | |
| | 839,000 | | | Coca-Cola Co. (The) | | | 44,022,330 | |
| | 419,000 | | | PepsiCo, Inc. | | | 63,021,790 | |
| | | | | | | | 107,044,120 | |
| | | | | | | | | |
| | | | | Biotechnology — 2.9% | | | | |
| | 598,000 | | | AbbVie, Inc. | | | 64,506,260 | |
| | | | | | | | | |
| | | | | Capital Markets — 5.1% | | | | |
| | 186,000 | | | Goldman Sachs Group, Inc. (The) | | | 70,313,580 | |
| | 403,000 | | | Northern Trust Corp. | | | 43,447,430 | |
| | | | | | | | 113,761,010 | |
| | | | | | | | | |
| | | | | Communications Equipment — 3.9% | | | | |
| | 868,000 | | | Cisco Systems, Inc. | | | 47,245,240 | |
| | 172,000 | | | Motorola Solutions, Inc. | | | 39,959,040 | |
| | | | | | | | 87,204,280 | |
| | | | | | | | | |
| | | | | Consumer Finance — 3.9% | | | | |
| | 719,000 | | | Discover Financial Services | | | 88,329,150 | |
| | | | | | | | | |
| | | | | Diversified Telecommunication Services — 2.2% | | | | |
| | 903,000 | | | Verizon Communications, Inc. | | | 48,771,030 | |
| | | | | | | | | |
| | | | | Electronic Equipment, Instruments & Components — 2.5% | | | | |
| | 1,534,000 | | | Corning, Inc. | | | 55,975,660 | |
| | | | | | | | | |
| | | | | Equity Real Estate Investment Trusts (REITS) — 2.6% | | | | |
| | 331,000 | | | Crown Castle International Corp. | | | 57,368,920 | |
| | | | | | | | | |
| | | | | Food Products — 2.5% | | | | |
| | 709,000 | | | Tyson Foods, Inc., Class A | | | 55,968,460 | |
| | | | | | | | | |
| | | | | Health Care Equipment & Supplies — 6.7% | | | | |
| | 704,000 | | | Abbott Laboratories | | | 83,163,520 | |
| | 532,000 | | | Medtronic PLC | | | 66,686,200 | |
| | | | | | | | 149,849,720 | |
| | | | | | | | | |
| | | | | Health Care Providers & Services — 7.0% | | | | |
| | 226,000 | | | Anthem, Inc. | | | 84,252,800 | |
| | 861,500 | | | CVS Health Corp. | | | 73,106,890 | |
| | | | | | | | 157,359,690 | |
| | | | | | | | | |
| | | | | Hotels, Restaurants & Leisure — 4.1% | | | | |
| | 909,000 | | | Restaurant Brands International, Inc. | | | 55,621,710 | |
| | 335,000 | | | Starbucks Corp. | | | 36,953,850 | |
| | | | | | | | 92,575,560 | |
| Shares | | | | | Fair Value | |
| COMMON STOCKS — (continued) | | | |
| | | | | Industrial Conglomerates — 2.9% | | | | |
| | 306,000 | | | Honeywell International, Inc. | | $ | 64,957,680 | |
| | | | | | | | | |
| | | | | Insurance — 5.7% | | | | |
| | 476,000 | | | Chubb, Ltd | | | 82,576,480 | |
| | 295,000 | | | Marsh & McLennan Cos., Inc. | | | 44,671,850 | |
| | | | | | | | 127,248,330 | |
| | | | | | | | | |
| | | | | IT Services — 6.1% | | | | |
| | 289,000 | | | Accenture PLC, Class A | | | 92,456,880 | |
| | 570,000 | | | Amdocs, Ltd. | | | 43,154,700 | |
| | | | | | | | 135,611,580 | |
| | | | | | | | | |
| | | | | Machinery — 2.8% | | | | |
| | 274,000 | | | Cummins, Inc. | | | 61,529,440 | |
| | | | | | | | | |
| | | | | Oil, Gas & Consumable Fuels — 5.0% | | | | |
| | 2,477,000 | | | Cabot Oil & Gas Corp. | | | 53,899,520 | |
| | 718,000 | | | EOG Resources, Inc. | | | 57,633,860 | |
| | | | | | | | 111,533,380 | |
| | | | | | | | | |
| | | | | Pharmaceuticals — 6.1% | | | | |
| | 442,000 | | | Johnson & Johnson | | | 71,383,000 | |
| | 853,000 | | | Merck & Co., Inc. | | | 64,068,830 | |
| | | | | | | | 135,451,830 | |
| | | | | | | | | |
| | | | | Professional Services — 1.6% | | | | |
| | 463,000 | | | Booz Allen Hamilton Holding Corp. | | | 36,739,050 | |
| | | | | | | | | |
| | | | | Semiconductors & Semiconductor Equipment — 4.1% | | | | |
| | 543,000 | | | Analog Devices, Inc. | | | 90,941,640 | |
| | | | | | | | | |
| | | | | Software — 4.3% | | | | |
| | 344,000 | | | Microsoft Corp. | | | 96,980,480 | |
| | | | | | | | | |
| | | | | Specialty Retail — 3.6% | | | | |
| | 246,000 | | | Home Depot, Inc. (The) | | | 80,751,960 | |
| | | | | | | | | |
| | | | | Total Common Stocks | | | | |
| | | | | (Cost $1,361,476,885) | | | 2,195,962,210 | |
| | | | | | | | | |
| MONEY MARKET FUND — 1.8% | | | | |
| | 39,825,781 | | | Federated Treasury Obligations Fund, Institutional Shares, 0.01%(a) | | | 39,825,781 | |
| | | | | | | | | |
| | | | | Total Money Market Fund | | | | |
| | | | | (Cost $39,825,781) | | | 39,825,781 | |
| | | | | | | | | |
| Total Investments — 100.0% |
| (Cost $1,401,302,666) | | | 2,235,787,991 | |
| Net Other Assets (Liabilities) — (0.0)% | | | (435,829 | ) |
| NET ASSETS — 100.0% | | $ | 2,235,352,162 | |
| (a) | Represents the current yield as of report date. |
See accompanying Notes to the Financial Statements.
Sterling Capital Behavioral International Equity Fund
Schedule of Portfolio Investments
September 30, 2021
| Shares | | | | | Fair Value | |
| COMMON STOCKS — 97.3% | | | |
| | | | Australia — 4.7% | | | |
| | 50,275 | | | Australia & New Zealand Banking Group, Ltd. | | $ | 1,009,650 | |
| | 47,100 | | | BlueScope Steel, Ltd. | | | 682,460 | |
| | 3,200 | | | Commonwealth Bank of Australia | | | 237,473 | |
| | 825 | | | Rio Tinto, Ltd. | | | 58,733 | |
| | 28,300 | | | Sonic Healthcare, Ltd. | | | 817,847 | |
| | 334,725 | | | South32, Ltd. | | | 830,632 | |
| | 50,550 | | | Suncorp Group, Ltd. | | | 449,490 | |
| | | | | | | | 4,086,285 | |
| | | | | | | | | |
| | | | | Austria — 2.2% | | | | |
| | 13,875 | | | ANDRITZ AG | | | 760,430 | |
| | 14,400 | | | OMV AG | | | 867,105 | |
| | 7,800 | | | voestalpine AG | | | 288,122 | |
| | | | | | | | 1,915,657 | |
| | | | | | | | | |
| | | | | Belgium — 0.0% | | | | |
| | 875 | | | Telenet Group Holding NV | | | 33,409 | |
| | | | | | | | | |
| | | | | Denmark — 0.7% | | | | |
| | 3,750 | | | Carlsberg A/S, Class B | | | 611,787 | |
| | | | | | | | | |
| | | | | Finland — 3.1% | | | | |
| | 31,825 | | | Fortum OYJ | | | 966,401 | |
| | 24,600 | | | Kesko OYJ, Class B | | | 848,538 | |
| | 157,900 | | | Nokia OYJ(a) | | | 870,867 | |
| | | | | | | | 2,685,806 | |
| | | | | | | | | |
| | | | | France — 11.7% | | | | |
| | 30,575 | | | ArcelorMittal SA | | | 935,981 | |
| | 22,350 | | | AXA SA | | | 619,391 | |
| | 19,000 | | | Bouygues SA | | | 785,980 | |
| | 4,550 | | | Capgemini SE | | | 943,564 | |
| | 14,625 | | | Cie de Saint-Gobain | | | 984,219 | |
| | 6,175 | | | Cie Generale des Etablissements Michelin SCA | | | 946,877 | |
| | 62,100 | | | Credit Agricole SA | | | 853,592 | |
| | 14,075 | | | Danone SA | | | 959,605 | |
| | 4,025 | | | Eiffage SA. | | | 406,795 | |
| | 8,225 | | | Ipsen SA | | | 783,761 | |
| | 14,025 | | | Publicis Groupe SA | | | 942,169 | |
| | 4,525 | | | Sanofi | | | 435,595 | |
| | 11,150 | | | TotalEnergies SE | | | 532,947 | |
| | | | | | | | 10,130,476 | |
| | | | | | | | | |
| | | | | Germany — 9.0% | | | | |
| | 5,500 | | | Bayerische Motoren Werke AG | | | 522,385 | |
| | 6,625 | | | Beiersdorf AG | | | 714,838 | |
| | 13,925 | | | Daimler AG | | | 1,228,626 | |
| | 17,600 | | | Deutsche Post AG | | | 1,103,693 | |
| | 53,725 | | | Deutsche Telekom AG | | | 1,077,412 | |
| | 69,800 | | | E.ON SE | | | 851,958 | |
| | 18,800 | | | Fresenius SE & Co. KGaA | | | 899,865 | |
| | 2,025 | | | HeidelbergCement AG | | | 151,072 | |
| | 5,250 | | | Henkel AG & Co. KGaA | | | 451,632 | |
| | 2,700 | | | Volkswagen AG | | | 832,689 | |
| | | | | | | | 7,834,170 | |
| Shares | | | | | Fair Value | |
| COMMON STOCKS — (continued) | | | |
| | | | Hong Kong — 3.3% | | | |
| | 56,600 | | | ASM Pacific Technology, Ltd. | | $ | 617,862 | |
| | 143,000 | | | CK Asset Holdings, Ltd. | | | 825,078 | |
| | 165,000 | | | Henderson Land Development Co., Ltd. | | | 630,039 | |
| | 66,000 | | | Sun Hung Kai Properties, Ltd. | | | 824,099 | |
| | | | | | | | 2,897,078 | |
| | | | | | | | | |
| | | | | Israel — 1.4% | | | | |
| | 3,000 | | | Check Point Software Technologies, Ltd.(a) | | | 339,120 | |
| | 90,900 | | | Teva Pharmaceutical Industries, Ltd., ADR(a) | | | 885,366 | |
| | | | | | | | 1,224,486 | |
| | | | | | | | | |
| | | | | Italy — 4.3% | | | | |
| | 61,050 | | | CNH Industrial NV | | | 1,026,193 | |
| | 67,550 | | | Mediobanca Banca di Credito Finanziario SpA(a) | | | 812,696 | |
| | 32,700 | | | Poste Italiane SpA(b) | | | 449,033 | |
| | 133,975 | | | Snam SpA | | | 741,135 | |
| | 103,075 | | | Terna Rete Elettrica Nazionale SpA | | | 731,503 | |
| | | | | | | | 3,760,560 | |
| | | | | | | | | |
| | | | | Japan — 25.9% | | | | |
| | 18,800 | | | Asahi Group Holdings, Ltd. | | | 907,201 | |
| | 53,400 | | | Astellas Pharma, Inc. | | | 878,914 | |
| | 38,000 | | | Brother Industries, Ltd. | | | 836,199 | |
| | 146,300 | | | Daiwa Securities Group, Inc. | | | 852,745 | |
| | 15,400 | | | Dentsu Group, Inc. | | | 592,511 | |
| | 169,800 | | | ENEOS Holdings, Inc. | | | 689,788 | |
| | 4,800 | | | Fujitsu, Ltd. | | | 867,411 | |
| | 16,200 | | | Hitachi, Ltd. | | | 958,404 | |
| | 34,600 | | | Iida Group Holdings Co., Ltd. | | | 889,971 | |
| | 121,800 | | | Inpex Corp. | | | 948,376 | |
| | 43,500 | | | Japan Tobacco, Inc. | | | 852,350 | |
| | 29,600 | | | KDDI Corp. | | | 974,524 | |
| | 103,600 | | | Marubeni Corp. | | | 857,106 | |
| | 328,200 | | | Mebuki Financial Group, Inc. | | | 719,051 | |
| | 31,200 | | | Mitsubishi Corp. | | | 979,756 | |
| | 41,300 | | | Mitsui & Co., Ltd. | | | 903,107 | |
| | 61,580 | | | Mizuho Financial Group, Inc. | | | 871,182 | |
| | 9,800 | | | Nippon Yusen KK | | | 734,298 | |
| | 20,000 | | | Otsuka Holdings Co., Ltd. | | | 855,254 | |
| | 75,500 | | | Renesas Electronics Corp.(a) | | | 929,206 | |
| | 40,900 | | | Seiko Epson Corp. | | | 825,770 | |
| | 30,800 | | | SUMCO Corp. | | | 614,478 | |
| | 90,400 | | | Sumitomo Chemical Co., Ltd. | | | 469,199 | |
| | 54,600 | | | Sumitomo Corp. | | | 769,147 | |
| | 37,400 | | | Sumitomo Dainippon Pharma Co., Ltd. | | | 668,489 | |
| | 28,800 | | | Sumitomo Mitsui Financial Group, Inc. | | | 1,013,166 | |
| | 3,500 | | | Suntory Beverage & Food, Ltd. | | | 145,094 | |
| | 17,400 | | | Toyota Tsusho Corp. | | | 730,685 | |
| | 39,900 | | | Yamada Holdings Co., Ltd. | | | 167,563 | |
| | | | | | | | 22,500,945 | |
| | | | | | | | | |
| | | | | Netherlands — 4.5% | | | | |
| | 58,125 | | | ABN AMRO Bank NV(a)(b) | | | 838,591 | |
| | 70,600 | | | ING Groep NV | | | 1,026,419 | |
See accompanying Notes to the Financial Statements.
Sterling Capital Behavioral International Equity Fund
Schedule of Portfolio Investments — (continued)
September 30, 2021
| Shares | | | | | Fair Value | |
| COMMON STOCKS — (continued) | | | |
| | | | | | | |
| | | | Netherlands — (continued) | | | |
| | 8,725 | | | Koninklijke Ahold Delhaize NV | | $ | 290,526 | |
| | 18,375 | | | NN Group NV | | | 962,524 | |
| | 11,800 | | | Randstad NV | | | 794,460 | |
| | | | | | | | 3,912,520 | |
| | | | | | | | | |
| | | | | Norway — 1.0% | | | | |
| | 38,975 | | | DNB Bank ASA | | | 886,084 | |
| | | | | | | | | |
| | | | | Spain — 1.9% | | | | |
| | 65,425 | | | Repsol SA | | | 854,029 | |
| | 177,150 | | | Telefonica SA | | | 831,290 | |
| | | | | | | | 1,685,319 | |
| | | | | | | | | |
| | | | | Sweden — 4.4% | | | | |
| | 28,775 | | | Electrolux AB, Class B | | | 664,810 | |
| | 42,575 | | | Investor AB, Class B | | | 915,549 | |
| | 44,225 | | | Securitas AB, Class B | | | 699,976 | |
| | 29,350 | | | Skanska AB, Class B | | | 736,321 | |
| | 36,650 | | | Volvo AB, Class B | | | 818,266 | |
| | | | | | | | 3,834,922 | |
| | | | | | | | | |
| | | | | Switzerland — 7.5% | | | | |
| | 3,625 | | | Adecco Group AG | | | 181,633 | |
| | 9,775 | | | Cie Financiere Richemont SA | | | 1,013,493 | |
| | 15,450 | | | Holcim, Ltd. | | | 744,458 | |
| | 20,125 | | | Novartis AG | | | 1,650,234 | |
| | 3,250 | | | Roche Holding AG | | | 1,274,788 | |
| | 2,875 | | | Swatch Group AG (The) | | | 750,035 | |
| | 10,325 | | | Swiss Re AG | | | 881,241 | |
| | | | | | | | 6,495,882 | |
| | | | | | | | | |
| | | | | United Kingdom — 11.7% | | | | |
| | 28,525 | | | Anglo American PLC | | | 999,763 | |
| | 152,800 | | | Aviva PLC | | | 809,821 | |
| | 83,900 | | | Barratt Developments PLC | | | 741,658 | |
| | 8,875 | | | BHP Group PLC | | | 223,600 | |
| | 15,050 | | | Entain PLC(a) | | | 429,852 | |
| | 110,050 | | | Evraz PLC | | | 873,137 | |
| | 41,850 | | | Imperial Brands PLC | | | 875,362 | |
| | 212,050 | | | J Sainsbury PLC | | | 812,742 | |
| | 184,675 | | | Kingfisher PLC | | | 833,600 | |
| | 238,675 | | | Legal & General Group PLC | | | 896,723 | |
| | 255,975 | | | M&G PLC | | | 699,377 | |
| | 14,725 | | | Rio Tinto PLC | | | 965,255 | |
| | 4,200 | | | Unilever PLC | | | 227,381 | |
| | 60,700 | | | WPP PLC | | | 813,232 | |
| | | | | | | | 10,201,503 | |
| | | | | | | | | |
| | | | | Total Common Stocks | | | | |
| | | | | (Cost $77,629,209) | | | 84,696,889 | |
| Shares | | | | | Fair Value | |
| PREFERRED STOCKS — 1.1% | | | | |
| | | | | | | | | |
| | | | | Germany — 1.1% | | | | |
| | 4,400 | | | Volkswagen AG | | $ | 980,772 | |
| | | | | | | | | |
| | | | | Total Preferred Stocks | | | | |
| | | | | (Cost $828,282) | | | 980,772 | |
| | | | | | | | | |
| MONEY MARKET FUND — 0.3% | | | | |
| | | | | United States — 0.3% | | | | |
| | 259,321 | | | Federated Treasury Obligations Fund, Institutional Shares, 0.01%(c) | | | 259,321 | |
| | | | | | | | | |
| | | | | Total Money Market Fund | | | | |
| | | | | (Cost $259,321) | | | 259,321 | |
| | | | | | | | | |
| Total Investments — 98.7% | | | | |
| (Cost $78,716,812) | | | 85,936,982 | |
| Net Other Assets (Liabilities) — 1.2% | | | 1,005,099 | |
| NET ASSETS - 100.0% | | $ | 86,942,081 | |
| (a) | Represents non-income producing security. |
| (b) | Rule 144A, Section 4(2) or other security that is restricted as to resale to qualified institutional investors. Sterling Capital Management LLC (the “Advisor”), using Board approved procedures, has deemed these securities or a portion of these securities to be liquid. |
| (c) | Represents the current yield as of report date. |
ADR American Depositary Receipt
Continued
Sterling Capital Behavioral International Equity Fund
Schedule of Portfolio Investments — (continued)
September 30, 2021
| Industry | | Percentage of net assets | |
| Air Freight & Logistics | | | 1.3 | % |
| Auto Components | | | 1.1 | % |
| Automobiles | | | 4.1 | % |
| Banks | | | 9.5 | % |
| Beverages | | | 1.9 | % |
| Building Products | | | 1.1 | % |
| Capital Markets | | | 1.0 | % |
| Chemicals | | | 0.5 | % |
| Commercial Services & Supplies | | | 0.8 | % |
| Communications Equipment | | | 1.0 | % |
| Construction & Engineering | | | 2.2 | % |
| Construction Materials | | | 1.0 | % |
| Diversified Financial Services | | | 1.9 | % |
| Diversified Telecommunication Services | | | 2.3 | % |
| Electric Utilities | | | 2.0 | % |
| Food & Staples Retailing | | | 2.2 | % |
| Food Products | | | 1.1 | % |
| Gas Utilities | | | 0.9 | % |
| Health Care Providers & Services | | | 2.0 | % |
| Hotels, Restaurants & Leisure | | | 0.4 | % |
| Household Durables | | | 2.7 | % |
| Household Products | | | 0.5 | % |
| Industrial Conglomerates | | | 1.1 | % |
| Insurance | | | 5.8 | % |
| IT Services | | | 2.1 | % |
| Machinery | | | 3.0 | % |
| Marine | | | 0.8 | % |
| Media | | | 2.7 | % |
| Metals & Mining | | | 6.6 | % |
| Money Market Fund | | | 0.3 | % |
| Multi-Utilities | | | 1.0 | % |
| Oil, Gas & Consumable Fuels | | | 4.5 | % |
| Personal Products | | | 1.1 | % |
| Pharmaceuticals | | | 8.5 | % |
| Professional Services | | | 1.1 | % |
| Real Estate Management & Development | | | 2.6 | % |
| Semiconductors & Semiconductor Equipment | | | 2.5 | % |
| Software | | | 0.4 | % |
| Specialty Retail | | | 1.2 | % |
| Technology Hardware, Storage & Peripherals | | | 1.9 | % |
| Textiles, Apparel & Luxury Goods | | | 2.0 | % |
| Tobacco | | | 2.0 | % |
| Trading Companies & Distributors | | | 4.9 | % |
| Wireless Telecommunication Services | | | 1.1 | % |
| | | | 98.7 | % |
Continued
Sterling Capital SMID Opportunities Fund
Schedule of Portfolio Investments
September 30, 2021
| Shares | | | | | Fair Value | |
| COMMON STOCKS — 97.6% | | | |
| | | | Auto Components — 4.0% | | | |
| | 1,558 | | | Aptiv PLC(a) | | $ | 232,095 | |
| | 6,655 | | | Gentex Corp. | | | 219,482 | |
| | | | | | | | 451,577 | |
| | | | | | | | | |
| | | | | Capital Markets — 3.3% | | | | |
| | 1,440 | | | Morningstar, Inc. | | | 373,003 | |
| | | | | | | | | |
| | | | | Chemicals — 3.1% | | | | |
| | 3,763 | | | FMC Corp. | | | 344,540 | |
| | | | | | | | | |
| | | | | Commercial Services & Supplies — 5.0% | | | | |
| | 4,442 | | | Waste Connections, Inc. | | | 559,381 | |
| | | | | | | | | |
| | | | | Communications Equipment — 3.7% | | | | |
| | 2,060 | | | F5 Networks, Inc.(a) | | | 409,487 | |
| | | | | | | | | |
| | | | | Consumer Finance — 3.3% | | | | |
| | 21,108 | | | SLM Corp. | | | 371,501 | |
| | | | | | | | | |
| | | | | Containers & Packaging — 4.6% | | | | |
| | 5,680 | | | Ball Corp. | | | 511,029 | |
| | | | | | | | | |
| | | | | Entertainment — 1.1% | | | | |
| | 766 | | | Take-Two Interactive Software, Inc.(a) | | | 118,018 | |
| | | | | | | | | |
| | | | | Equity Real Estate Investment Trusts (REITS) — 3.4% | | | | |
| | 12,790 | | | Healthcare Realty Trust, Inc. | | | 380,886 | |
| | | | | | | | | |
| | | | | | | | | |
| | | | | | | | | |
| | | | | Health Care Equipment & Supplies — 8.3% | | | | |
| | 5,469 | | | Hologic, Inc.(a) | | | 403,667 | |
| | 1,407 | | | Teleflex, Inc. | | | 529,806 | |
| | | | | | | | 933,473 | |
| | | | | | | | | |
| | | | | Health Care Providers & Services — 5.8% | | | | |
| | 3,942 | | | Centene Corp.(a) | | | 245,626 | |
| | 2,900 | | | Universal Health Services, Inc., Class B | | | 401,273 | |
| | | | | | | | 646,899 | |
| | | | | | | | | |
| | | | | Household Durables — 1.5% | | | | |
| | 35 | | | NVR, Inc.(a) | | | 167,793 | |
| | | | | | | | | |
| | | | | Independent Power and Renewable Electricity Producers — 4.2% | | | | |
| | 6,229 | | | NextEra Energy Partners L.P. | | | 469,417 | |
| | | | | | | | | |
| | | | | Insurance — 3.9% | | | | |
| | 2,906 | | | Arthur J Gallagher & Co. | | | 431,977 | |
| | | | | | | | | |
| | | | | IT Services — 22.4% | | | | |
| | 3,138 | | | Akamai Technologies, Inc.(a) | | | 328,203 | |
| | 5,615 | | | Amdocs, Ltd. | | | 425,112 | |
| | 621 | | | Broadridge Financial Solutions, Inc. | | | 103,484 | |
| | 5,120 | | | Fiserv, Inc.(a) | | | 555,520 | |
| | 8,389 | | | Genpact, Ltd. | | | 398,561 | |
| | 3,074 | | | Global Payments, Inc. | | | 484,401 | |
| | 15,264 | | | Rackspace Technology, Inc.(a) | | | 217,054 | |
| | | | | | | | 2,512,335 | |
| Shares | | | | | Fair Value | |
| COMMON STOCKS — (continued) | | | |
| | | | | Machinery — 4.0% | | | | |
| | 12,022 | | | Evoqua Water Technologies Corp.(a) | | $ | 451,546 | |
| | | | | | | | | |
| | | | | Media — 1.8% | | | | |
| | 114 | | | Cable One, Inc. | | | 206,697 | |
| | | | | | | | | |
| | | | | Oil, Gas & Consumable Fuels — 2.6% | | | | |
| | 1,774 | | | Pioneer Natural Resources Co. | | | 295,389 | |
| | | | | | | | | |
| | | | | Professional Services — 4.9% | | | | |
| | 4,870 | | | TransUnion | | | 546,950 | |
| | | | | | | | | |
| | | | | Real Estate Management & Development — 1.7% | | | | |
| | 1,040 | | | FirstService Corp. | | | 187,699 | |
| | | | | | | | | |
| | | | | Software — 3.4% | | | | |
| | 1,537 | | | Black Knight, Inc.(a) | | | 110,664 | |
| | 2,282 | | | PTC, Inc.(a) | | | 273,361 | |
| | | | | | | | 384,025 | |
| | | | | | | | | |
| | | | | Specialty Retail — 1.6% | | | | |
| | 1,431 | | | CarMax, Inc.(a) | | | 183,111 | |
| | | | | | | | | |
| | | | | Total Common Stocks | | | | |
| | | | | (Cost $7,523,296) | | | 10,936,733 | |
| | | | | | | | | |
| MONEY MARKET FUND — 2.4% | | | | |
| | 264,892 | | | Federated Treasury Obligations Fund, Institutional Shares, 0.01%(b) | | | 264,892 | |
| | | | | | | | | |
| | | | | Total Money Market Fund | | | | |
| | | | | (Cost $264,892) | | | 264,892 | |
| | | | | | | | | |
| Total Investments — 100.0% | | | | |
| (Cost $7,788,188) | | | 11,201,625 | |
| Net Other Assets (Liabilities) — (0.0)% | | | (2,455 | ) |
| NET ASSETS — 100.0% | | $ | 11,199,170 | |
| (a) | Represents non-income producing security. |
| (b) | Represents the current yield as of report date. |
See accompanying Notes to the Financial Statements.
Sterling Capital Stratton Mid Cap Value Fund
Schedule of Portfolio Investments
September 30, 2021
| Shares | | | | | Fair Value | |
| COMMON STOCKS — 98.1% | | | |
| | | | | Auto Components — 2.2% | | | | |
| | 19,540 | | | Magna International, Inc. | | $ | 1,470,189 | |
| | | | | | | | | |
| | | | | Banks — 8.6% | | | | |
| | 18,700 | | | East West Bancorp, Inc. | | | 1,449,998 | |
| | 8,100 | | | First Republic Bank | | | 1,562,328 | |
| | 55,700 | | | Huntington Bancshares, Inc. | | | 861,122 | |
| | 37,700 | | | KeyCorp | | | 815,074 | |
| | 12,100 | | | Wintrust Financial Corp. | | | 972,477 | |
| | | | | | | | 5,660,999 | |
| | | | | | | | | |
| | | | | Building Products — 2.5% | | | | |
| | 8,400 | | | Carlisle Cos., Inc. | | | 1,669,836 | |
| | | | | | | | | |
| | | | | Capital Markets — 2.9% | | | | |
| | 7,200 | | | Ameriprise Financial, Inc. | | | 1,901,664 | |
| | | | | | | | | |
| | | | | Chemicals — 2.2% | | | | |
| | 15,700 | | | Westlake Chemical Corp. | | | 1,430,898 | |
| | | | | | | | | |
| | | | | Communications Equipment — 1.1% | | | | |
| | 14,500 | | | Ciena Corp.(a) | | | 744,575 | |
| | | | | | | | | |
| | | | | Construction & Engineering — 1.8% | | | | |
| | 13,900 | | | MasTec, Inc.(a) | | | 1,199,292 | |
| | | | | | | | | |
| | | | | Containers & Packaging — 5.5% | | | | |
| | 9,100 | | | Avery Dennison Corp. | | | 1,885,611 | |
| | 29,100 | | | Berry Global Group, Inc.(a) | | | 1,771,608 | |
| | | | | | | | 3,657,219 | |
| | | | | | | | | |
| | | | | Electronic Equipment, Instruments &Components — 4.7% | | | | |
| | 10,500 | | | Arrow Electronics, Inc.(a) | | | 1,179,045 | |
| | 10,500 | | | CDW Corp. | | | 1,911,210 | |
| | | | | | | | 3,090,255 | |
| | | | | | | | | |
| | | | | Entertainment — 3.2% | | | | |
| | 12,700 | | | Activision Blizzard, Inc. | | | 982,853 | |
| | 7,300 | | | Take-Two Interactive Software, Inc.(a) | | | 1,124,711 | |
| | | | | | | | 2,107,564 | |
| | | | | | | | | |
| | | | | Equity Real Estate Investment Trusts (REITS) — 9.1% | | | | |
| | 29,600 | | | Americold Realty Trust | | | 859,880 | |
| | 6,900 | | | Digital Realty Trust, Inc. | | | 996,705 | |
| | 9,700 | | | EastGroup Properties, Inc. | | | 1,616,311 | |
| | 29,000 | | | Hudson Pacific Properties, Inc. | | | 761,830 | |
| | 9,500 | | | Mid-America Apartment Communities, Inc. | | | 1,774,125 | |
| | | | | | | | 6,008,851 | |
| | | | | | | | | |
| | | | | Food & Staples Retailing — 3.8% | | | | |
| | 6,900 | | | Casey's General Stores, Inc. | | | 1,300,305 | |
| | 25,300 | | | Performance Food Group Co.(a) | | | 1,175,438 | |
| | | | | | | | 2,475,743 | |
| Shares | | | | | Fair Value | |
| COMMON STOCKS — (continued) | | | |
| | | | Food Products — 1.4% | | | |
| | 15,100 | | | Lamb Weston Holdings, Inc. | | $ | 926,687 | |
| | | | | | | | | |
| | | | | Gas Utilities — 4.5% | | | | |
| | 21,800 | | | Southwest Gas Holdings, Inc. | | | 1,457,984 | |
| | 35,000 | | | UGI Corp. | | | 1,491,700 | |
| | | | | | | | 2,949,684 | |
| | | | | | | | | |
| | | | | Health Care Equipment & Supplies — 3.6% | | | | |
| | 3,400 | | | Becton Dickinson & Co. | | | 835,788 | |
| | 10,400 | | | Zimmer Biomet Holdings, Inc. | | | 1,522,144 | |
| | | | | | | | 2,357,932 | |
| | | | | | | | | |
| | | | | Hotels, Restaurants & Leisure — 1.1% | | | | |
| | 10,000 | | | Penn National Gaming, Inc.(a) | | | 724,600 | |
| | | | | | | | | |
| | | | | Household Durables — 1.4% | | | | |
| | 19,700 | | | PulteGroup, Inc. | | | 904,624 | |
| | | | | | | | | |
| | | | | Insurance — 7.1% | | | | |
| | 8,300 | | | American Financial Group, Inc. | | | 1,044,389 | |
| | 22,300 | | | First American Financial Corp. | | | 1,495,215 | |
| | 12,200 | | | Globe Life, Inc. | | | 1,086,166 | |
| | 8,300 | | | Hanover Insurance Group, Inc. (The) | | | 1,075,846 | |
| | | | | | | | 4,701,616 | |
| | | | | IT Services — 2.0% | | | | |
| | 12,000 | | | Fiserv, Inc.(a) | | | 1,302,000 | |
| | | | | | | | | |
| | | | | Leisure Products — 1.8% | | | | |
| | 10,000 | | | Polaris, Inc. | | | 1,196,600 | |
| | | | | | | | | |
| | | | | Life Sciences Tools & Services — 9.1% | | | | |
| | 7,900 | | | ICON PLC(a) | | | 2,069,958 | |
| | 4,610 | | | Medpace Holdings, Inc.(a) | | | 872,581 | |
| | 10,100 | | | PerkinElmer, Inc. | | | 1,750,229 | |
| | 2,300 | | | Thermo Fisher Scientific, Inc. | | | 1,314,059 | |
| | | | | | | | 6,006,827 | |
| | | | | | | | | |
| | | | | Machinery — 2.6% | | | | |
| | 16,500 | | | Oshkosh Corp. | | | 1,689,105 | |
| | | | | | | | | |
| | | | | Oil, Gas & Consumable Fuels — 3.6% | | | | |
| | 46,700 | | | Cabot Oil & Gas Corp. | | | 1,016,192 | |
| | 19,300 | | | Phillips 66 | | | 1,351,579 | |
| | | | | | | | 2,367,771 | |
| | | | | | | | | |
| | | | | Professional Services — 2.7% | | | | |
| | 6,800 | | | CACI International, Inc., Class A(a) | | | 1,782,280 | |
| | | | | | | | | |
| | | | | Real Estate Management & Development — 1.4% | | | | |
| | 10,200 | | | Howard Hughes Corp. (The)(a) | | | 895,662 | |
| | | | | | | | | |
| | | | | Semiconductors & Semiconductor Equipment — 2.7% | | | | |
| | 10,900 | | | Skyworks Solutions, Inc. | | | 1,796,102 | |
| | | | | | | | | |
| | | | | Software — 2.4% | | | | |
| | 21,000 | | | Dropbox, Inc., Class A(a) | | | 613,620 | |
See accompanying Notes to the Financial Statements.
Sterling Capital Stratton Mid Cap Value Fund
Schedule of Portfolio Investments — (continued)
September 30, 2021
| Shares | | | | | Fair Value | |
| COMMON STOCKS — (continued) | | | |
| | | | Software — (continued) | | | |
| | 7,900 | | | PTC, Inc.(a) | | $ | 946,341 | |
| | | | | | | | 1,559,961 | |
| | | | | | | | | |
| | | | | Trading Companies & Distributors — 3.1% | | | | |
| | 5,800 | | | United Rentals, Inc.(a) | | | 2,035,394 | |
| | | | | | | | | |
| | | | | Total Common Stocks | | | | |
| | | | | (Cost $33,026,797) | | | 64,613,930 | |
| | | | | | | | | |
| MONEY MARKET FUND — 1.9% | | | | |
| | 1,255,852 | | | Federated Treasury Obligations Fund, Institutional Shares, 0.01%(b) | | | 1,255,852 | |
| | | | | | | | | |
| | | | | Total Money Market Fund | | | | |
| | | | | (Cost $1,255,852) | | | 1,255,852 | |
| | | | | | | | | |
| Total Investments — 100.0% | | | | |
| (Cost $34,282,649) | | | 65,869,782 | |
| Net Other Assets (Liabilities) — 0.0% | | | 4,889 | |
| NET ASSETS — 100.0% | | $ | 65,874,671 | |
| (a) | Represents non-income producing security. |
| (b) | Represents the current yield as of report date. |
Continued
Sterling Capital Stratton Real Estate Fund
Schedule of Portfolio Investments
September 30, 2021
| Shares | | | | | Fair Value | |
| COMMON STOCKS — 99.1% | | | |
| | | | Health Care — 8.7% | | | |
| | 109,500 | | | Medical Properties Trust, Inc. | | $ | 2,197,665 | |
| | 42,000 | | | Ventas, Inc. | | | 2,318,820 | |
| | 47,200 | | | Welltower, Inc. | | | 3,889,280 | |
| | | | | | | | 8,405,765 | |
| | | | | | | | | |
| | | | | Hotel & Resort — 3.3% | | | | |
| | 150,000 | | | DiamondRock Hospitality Co.(a) | | | 1,417,500 | |
| | 22,000 | | | Ryman Hospitality Properties, Inc.(a) | | | 1,841,400 | |
| | | | | | | | 3,258,900 | |
| | | | | | | | | |
| | | | | Industrial — 15.1% | | | | |
| | 50,000 | | | Americold Realty Trust | | | 1,452,500 | |
| | 55,300 | | | Duke Realty Corp. | | | 2,647,211 | |
| | 12,500 | | | EastGroup Properties, Inc. | | | 2,082,875 | |
| | 41,100 | | | First Industrial Realty Trust, Inc. | | | 2,140,488 | |
| | 6,000 | | | Innovative Industrial Properties, Inc. | | | 1,387,020 | |
| | 39,575 | | | Prologis, Inc. | | | 4,963,892 | |
| | | | | | | | 14,673,986 | |
| | | | | | | | | |
| | | | | Office — 6.2% | | | | |
| | 16,300 | | | Alexandria Real Estate Equities, Inc. | | | 3,114,441 | |
| | 33,000 | | | Highwoods Properties, Inc. | | | 1,447,380 | |
| | 55,500 | | | Hudson Pacific Properties, Inc. | | | 1,457,985 | |
| | | | | | | | 6,019,806 | |
| | | | | | | | | |
| | | | | Real Estate Development — 1.5% | | | | |
| | 16,100 | | | Howard Hughes Corp. (The)(a) | | | 1,413,741 | |
| | | | | | | | | |
| | | | | Residential — 16.8% | | | | |
| | 34,800 | | | American Campus Communities, Inc. | | | 1,686,060 | |
| | 11,100 | | | Essex Property Trust, Inc. | | | 3,549,114 | |
| | 95,300 | | | Invitation Homes, Inc. | | | 3,652,849 | |
| | 19,000 | | | Mid-America Apartment Communities, Inc. | | | 3,548,250 | |
| | 72,300 | | | UDR, Inc. | | | 3,830,454 | |
| | | | | | | | 16,266,727 | |
| | | | | | | | | |
| | | | | Retail — 8.5% | | | | |
| | 114,500 | | | Kite Realty Group Trust | | | 2,331,220 | |
| | 40,350 | | | National Retail Properties, Inc. | | | 1,742,717 | |
| | 67,000 | | | NETSTREIT Corp. | | | 1,584,550 | |
| | 90,850 | | | Retail Opportunity Investments Corp. | | | 1,582,607 | |
| | 81,000 | | | Retail Properties of America, Inc., Class A | | | 1,043,280 | |
| | | | | | | | 8,284,374 | |
| | | | | | | | | |
| | | | | Specialized — 39.0% | | | | |
| | 32,000 | | | American Tower Corp. | | | 8,493,120 | |
| | 34,000 | | | Crown Castle International Corp. | | | 5,892,880 | |
| | 57,200 | | | CubeSmart | | | 2,771,340 | |
| | 28,000 | | | Digital Realty Trust, Inc. | | | 4,044,600 | |
| | 8,700 | | | Equinix, Inc. | | | 6,874,131 | |
| | 24,950 | | | Life Storage, Inc. | | | 2,862,763 | |
| | 44,900 | | | MGM Growth Properties, LLC, Class A | | | 1,719,670 | |
| | 28,000 | | | PotlatchDeltic Corp. | | | 1,444,240 | |
| Shares | | | | | Fair Value | |
| COMMON STOCKS — (continued) | | | |
| | | | Specialized — (continued) | | | |
| | 11,100 | | | SBA Communications Corp. | | $ | 3,669,327 | |
| | | | | | | | 37,772,071 | |
| | | | | | | | | |
| | | | | Total Common Stocks | | | | |
| | | | | (Cost $48,415,731) | | | 96,095,370 | |
| | | | | | | | | |
| MONEY MARKET FUND — 0.9% | | | | |
| | 888,175 | | | Federated Treasury Obligations Fund, Institutional Shares, 0.01%(b) | | | 888,175 | |
| | | | | | | | | |
| | | | | Total Money Market Fund | | | | |
| | | | | (Cost $888,175) | | | 888,175 | |
| | | | | | | | | |
| Total Investments — 100.0% | | | | |
| (Cost $49,303,906) | | | 96,983,545 | |
| Net Other Assets (Liabilities) — 0.0% | | | 8,391 | |
| NET ASSETS — 100.0% | | $ | 96,991,936 | |
| (a) | Represents non-income producing security. |
| (b) | Represents the current yield as of report date. |
See accompanying Notes to the Financial Statements.
Sterling Capital Stratton Small Cap Value Fund
Schedule of Portfolio Investments
September 30, 2021
| Shares | | | | | Fair Value | |
| COMMON STOCKS — 98.4% | | | |
| | | | Aerospace & Defense — 2.2% | | | |
| | 150,095 | | | Moog, Inc., Class A | | $ | 11,441,742 | |
| | | | | | | | | |
| | | | | Auto Components — 1.1% | | | | |
| | 63,000 | | | Dorman Products, Inc.(a) | | | 5,964,210 | |
| | | | | | | | | |
| | | | | Banks — 21.5% | | | | |
| | 220,670 | | | Community Bank System, Inc. | | | 15,098,241 | |
| | 185,803 | | | First Horizon Corp. | | | 3,026,731 | |
| | 293,200 | | | First Midwest Bancorp, Inc. | | | 5,573,732 | |
| | 274,090 | | | Glacier Bancorp, Inc. | | | 15,170,882 | |
| | 65,190 | | | Signature Bank | | | 17,749,933 | |
| | 23,650 | | | SVB Financial Group(a) | | | 15,298,712 | |
| | 345,861 | | | Umpqua Holdings Corp. | | | 7,003,685 | |
| | 147,540 | | | United Bankshares, Inc. | | | 5,367,505 | |
| | 237,510 | | | Webster Financial Corp. | | | 12,934,795 | |
| | 185,600 | | | Wintrust Financial Corp. | | | 14,916,672 | |
| | | | | | | | 112,140,888 | |
| | | | | | | | | |
| | | | | Capital Markets — 1.9% | | | | |
| | 66,510 | | | Affiliated Managers Group, Inc. | | | 10,048,996 | |
| | | | | | | | | |
| | | | | Chemicals — 3.5% | | | | |
| | 387,807 | | | Avient Corp. | | | 17,974,855 | |
| | | | | | | | | |
| | | | | Construction & Engineering — 3.6% | | | | |
| | 219,830 | | | MasTec, Inc.(a) | | | 18,966,932 | |
| | | | | | | | | |
| | | | | Consumer Finance — 1.0% | | | | |
| | 125,000 | | | PROG Holdings, Inc. | | | 5,251,250 | |
| | | | | | | | | |
| | | | | Electric Utilities — 2.2% | | | | |
| | 243,130 | | | Portland General Electric Co. | | | 11,424,679 | |
| | | | | | | | | |
| | | | | Electrical Equipment — 2.6% | | | | |
| | 183,090 | | | EnerSys | | | 13,629,220 | |
| | | | | | | | | |
| | | | | Electronic Equipment, Instruments & Components — 3.4% | | | | |
| | 198,368 | | | Belden, Inc. | | | 11,556,920 | |
| | 58,200 | | | ePlus, Inc.(a) | | | 5,971,902 | |
| | | | | | | | 17,528,822 | |
| | | | | | | | | |
| | | | | Entertainment — 1.8% | | | | |
| | 61,830 | | | Take-Two Interactive Software, Inc.(a) | | | 9,526,148 | |
| | | | | | | | | |
| | | | | Equity Real Estate Investment Trusts (REITS) — 9.2% | | | | |
| | 161,840 | | | American Campus Communities, Inc. | | | 7,841,148 | |
| | 318,263 | | | First Industrial Realty Trust, Inc. | | | 16,575,137 | |
| | 234,804 | | | Highwoods Properties, Inc. | | | 10,298,503 | |
| | 439,360 | | | Medical Properties Trust, Inc. | | | 8,817,955 | |
| | 60,617 | | | SL Green Realty Corp. | | | 4,294,108 | |
| | | | | | | | 47,826,851 | |
| | | | | | | | | |
| | | | | Food & Staples Retailing — 7.0% | | | | |
| | 243,220 | | | BJ's Wholesale Club Holdings, Inc.(a) | | | 13,357,642 | |
| | 81,000 | | | Casey's General Stores, Inc. | | | 15,264,450 | |
| Shares | | | | | Fair Value | |
| COMMON STOCKS — (continued) | | | |
| | | | Food & Staples Retailing — (continued) |
| | 164,860 | | | Performance Food Group Co.(a) | | $ | 7,659,396 | |
| | | | | | | | 36,281,488 | |
| | | | | | | | | |
| | | | | Gas Utilities — 2.1% | | | | |
| | 160,740 | | | Southwest Gas Holdings, Inc. | | | 10,750,291 | |
| | | | | | | | | |
| | | | | Health Care Equipment & Supplies — 3.7% | | | | |
| | 45,933 | | | West Pharmaceutical Services, Inc. | | | 19,500,396 | |
| | | | | | | | | |
| | | | | Household Durables — 2.5% | | | | |
| | 170,500 | | | Ethan Allen Interiors, Inc. | | | 4,040,850 | |
| | 90,650 | | | Meritage Homes Corp.(a) | | | 8,793,050 | |
| | | | | | | | 12,833,900 | |
| | | | | | | | | |
| | | | | Insurance — 6.1% | | | | |
| | 120,260 | | | Hanover Insurance Group, Inc. (The) | | | 15,588,101 | |
| | 213,730 | | | Selective Insurance Group, Inc. | | | 16,143,027 | |
| | | | | | | | 31,731,128 | |
| | | | | | | | | |
| | | | | Machinery — 6.6% | | | | |
| | 187,670 | | | Crane Co. | | | 17,792,993 | |
| | 164,570 | | | Oshkosh Corp. | | | 16,847,031 | |
| | | | | | | | 34,640,024 | |
| | | | | | | | | |
| | | | | Professional Services — 3.2% | | | | |
| | 63,250 | | | CACI International, Inc., Class A(a) | | | 16,577,825 | |
| | | | | | | | | |
| | | | | Semiconductors & Semiconductor Equipment — 6.8% | | | | |
| | 438,547 | | | ON Semiconductor Corp.(a) | | | 20,072,296 | |
| | 92,644 | | | Qorvo, Inc.(a) | | | 15,489,151 | |
| | | | | | | | 35,561,447 | |
| | | | | | | | | |
| | | | | Software — 2.4% | | | | |
| | 106,317 | | | PTC, Inc.(a) | | | 12,735,713 | |
| | | | | | | | | |
| | | | | Specialty Retail — 0.3% | | | | |
| | 30,000 | | | TravelCenters of America, Inc.(a) | | | 1,493,700 | |
| | | | | | | | | |
| | | | | Trading Companies & Distributors — 3.7% | | | | |
| | 10,000 | | | Herc Holdings, Inc.(a) | | | 1,634,600 | |
| | 50,351 | | | United Rentals, Inc.(a) | | | 17,669,676 | |
| | | | | | | | 19,304,276 | |
| | | | | | | | | |
| | | | | Total Common Stocks | | | | |
| | | | | (Cost $155,812,613) | | | 513,134,781 | |
See accompanying Notes to the Financial Statements.
Sterling Capital Stratton Small Cap Value Fund
Schedule of Portfolio Investments — (continued)
September 30, 2021
| Shares | | | | | Fair Value | |
| MONEY MARKET FUND — 1.6% | | | |
| | 8,264,134 | | | Federated Treasury Obligations Fund, Institutional Shares, 0.01%(b) | | $ | 8,264,134 | |
| | | | | | | | | |
| | | | | Total Money Market Fund | | | | |
| | | | | (Cost $8,264,134) | | | 8,264,134 | |
| | | | | | | | | |
| Total Investments — 100.0% | | | | |
| (Cost $164,076,747) | | | 521,398,915 | |
| Net Other Assets (Liabilities) — 0.0% | | | 124,846 | |
| NET ASSETS — 100.0% | | $ | 521,523,761 | |
| (a) | Represents non-income producing security. |
| (b) | Represents the current yield as of report date. |
Continued
Sterling Capital Ultra Short Bond Fund
Schedule of Portfolio Investments
September 30, 2021
| Principal Amount | | | | | Fair Value | |
| ASSET BACKED SECURITIES — 20.1% | | | |
| $ | 38,223 | | | AmeriCredit Automobile Receivables Trust, Series 2017-3, Class C, 2.690%, 6/19/23 | | $ | 38,368 | |
| | 15,632 | | | AmeriCredit Automobile Receivables Trust, Series 2018-1, Class B, 3.260%, 1/18/24 | | | 15,656 | |
| | 562,000 | | | AmeriCredit Automobile Receivables Trust, Series 2019-1, Class B, 3.130%, 2/18/25 | | | 569,166 | |
| | 350,000 | | | AmeriCredit Automobile Receivables Trust, Series 2019-3, Class C, 2.320%, 7/18/25 | | | 357,743 | |
| | 273,148 | | | ARI Fleet Lease Trust, Series 2018-A, Class A3, 2.840%, 10/15/26(a) | | | 273,964 | |
| | 124,255 | | | ARI Fleet Lease Trust, Series 2018-B, Class A2, 3.220%, 8/16/27(a) | | | 124,628 | |
| | 235,000 | | | ARI Fleet Lease Trust, Series 2018-B, Class A3, 3.430%, 8/16/27(a) | | | 238,419 | |
| | 410,911 | | | ARI Fleet Lease Trust, Series 2019-A, Class A2A, 2.410%, 11/15/27(a) | | | 413,857 | |
| | 116,667 | | | Avis Budget Rental Car Funding AESOP, LLC, Series 2016-2A, Class A, 2.720%, 11/20/22(a) | | | 116,900 | |
| | 525,000 | | | Avis Budget Rental Car Funding AESOP, LLC, Series 2018-1A, Class A, 3.700%, 9/20/24(a) | | | 553,366 | |
| | 450,000 | | | Avis Budget Rental Car Funding AESOP, LLC, Series 2019-1A, Class A, 3.450%, 3/20/23(a) | | | 453,559 | |
| | 30,014 | | | CarMax Auto Owner Trust, Series 2018-4, Class A3, 3.360%, 9/15/23 | | | 30,339 | |
| | 305,924 | | | Chesapeake Funding II, LLC, Series 2018- 2A, Class A1, 3.230%, 8/15/30(a) | | | 306,922 | |
| | 282,637 | | | Chesapeake Funding II, LLC, Series 2019- 1A, Class A1, 2.940%, 4/15/31(a) | | | 286,315 | |
| | 354,949 | | | Chesapeake Funding II, LLC, Series 2020- 1A, Class A1, 0.870%, 8/16/32(a) | | | 356,803 | |
| | 7,733 | | | Citicorp Residential Mortgage Trust, STEP, Series 2007-2, Class A6, 4.904%, 6/25/37 | | | 7,804 | |
| | 90,043 | | | Enterprise Fleet Financing, LLC, Series 2019-3, Class A2, 2.060%, 5/20/25(a) | | | 91,067 | |
| | 62,454 | | | GreatAmerica Leasing Receivables Funding, LLC, Series 2018-1, Class A4, 2.830%, 6/17/24(a) | | | 62,609 | |
| | 48,736 | | | GreatAmerica Leasing Receivables Funding, LLC, Series 2020-1, Class A2, 1.760%, 6/15/22(a) | | | 48,830 | |
| | 350,000 | | | GreatAmerica Leasing Receivables Funding, LLC, Series 2020-1, Class A4, 1.850%, 2/16/26(a) | | | 358,730 | |
| | 330,000 | | | GreatAmerica Leasing Receivables Funding, LLC, Series 2021-1, Class A3, 0.340%, 8/15/24(a) | | | 329,248 | |
| Principal Amount | | | | | Fair Value | |
| ASSET BACKED SECURITIES — (continued) | | | |
| $ | 125,650 | | | Nissan Auto Receivables Owner Trust, Series 2018-B, Class A3, 3.060%, 3/15/23 | | $ | 126,265 | |
| | 41,517 | | | Nissan Auto Receivables Owner Trust, Series 2019-C, Class A3, 1.930%, 7/15/24 | | | 41,931 | |
| | 57,018 | | | OneMain Financial Issuance Trust, Series 2015-3A, Class A, 3.630%, 11/20/28(a) | | | 57,089 | |
| | 111,568 | | | OneMain Financial Issuance Trust, Series 2016-3A, Class A, 3.830%, 6/18/31(a) | | | 112,243 | |
| | 193,907 | | | OneMain Financial Issuance Trust, Series 2018-1A, Class A, 3.300%, 3/14/29(a) | | | 194,395 | |
| | 224,000 | | | OneMain Financial Issuance Trust, Series 2018-2A, Class A, 3.570%, 3/14/33(a) | | | 233,469 | |
| | 200,000 | | | OneMain Financial Issuance Trust, Series 2020-1A, Class A, 3.840%, 5/14/32(a) | | | 206,724 | |
| | 390,000 | | | Santander Consumer Auto Receivables Trust 2020-B, Series 2020-BA, Class A3, 0.460%, 8/15/24(a) | | | 390,453 | |
| | 400,000 | | | Santander Drive Auto Receivables Trust, Series 2020-3, Class B, 0.690%, 3/17/25 | | | 400,908 | |
| | 375,000 | | | Santander Drive Auto Receivables Trust, Series 2021-3, Class B, 0.600%, 12/15/25 | | | 375,413 | |
| | 16,031 | | | SoFi Professional Loan Program Trust, Series 2020-A, Class A1FX, 2.060%, 5/15/46(a) | | | 16,061 | |
| | 13,048 | | | SoFi Professional Loan Program, LLC, Series 2016-E, Class A1, 0.936%, (LIBOR USD 1-Month plus 0.85%), 7/25/39(a)(b) | | | 13,067 | |
| | 129,894 | | | Wheels SPV 2, LLC, Series 2018-1A, Class A3, 3.240%, 4/20/27(a) | | | 130,476 | |
| | 45,644 | | | Wheels SPV 2, LLC, Series 2019-1A, Class A2, 2.300%, 5/22/28(a) | | | 45,872 | |
| | 300,000 | | | Wheels SPV 2, LLC, Series 2019-1A, Class A3, 2.350%, 5/22/28(a) | | | 305,318 | |
| | 16,552 | | | World Omni Auto Receivables Trust, Series 2017-B, Class A3, 1.950%, 2/15/23 | | | 16,575 | |
| | 290,000 | | | World Omni Select Auto Trust, Series 2021-A, Class A2, 0.290%, 2/18/25 | | | 289,962 | |
| | | | | | | | | |
| | | | | Total Asset Backed Securities | | | | |
| | | | | (Cost $7,999,416) | | | 7,990,514 | |
| | | | | | | | | |
| COLLATERALIZED MORTGAGE OBLIGATIONS — 0.5% |
| | 8,464 | | | Freddie Mac, Series 3959, Class PN, 2.000%, 1/15/26 | | | 8,465 | |
| | 96,531 | | | Freddie Mac, Series 4022, Class AH, 1.500%, 12/15/25 | | | 96,587 | |
| | 70,206 | | | Freddie Mac, Series 4172, Class PB, 1.500%, 7/15/40 | | | 70,644 | |
| | | | | | | | | |
| | | | | Total Collateralized Mortgage Obligations | | | | |
| | | | | (Cost $175,053) | | | 175,696 | |
See accompanying Notes to the Financial Statements.
Sterling Capital Ultra Short Bond Fund
Schedule of Portfolio Investments — (continued)
September 30, 2021
| Principal Amount | | | | | Fair Value | |
| COMMERCIAL MORTGAGE-BACKED SECURITIES — 14.8% | | | | |
| $ | 300,000 | | | Citigroup Commercial Mortgage Trust, Series 2013-GC15, Class A4, 4.371%, 9/10/46(c) | | $ | 319,481 | |
| | 25,000 | | | Citigroup Commercial Mortgage Trust, Series 2013-GC17, Class A4, 4.131%, 11/10/46 | | | 26,644 | |
| | 300,930 | | | COMM 2012-CCRE1 Mortgage Trust, Series 2012-CR1, Class A3, 3.391%, 5/15/45 | | | 303,333 | |
| | 370,290 | | | COMM 2012-CCRE2 Mortgage Trust, Series 2012-CR2, Class A4, 3.147%, 8/15/45 | | | 374,357 | |
| | 299,231 | | | COMM 2012-CCRE3 Mortgage Trust, Series 2012-CR3, Class A3, 2.822%, 10/15/45 | | | 303,409 | |
| | 270,000 | | | COMM 2013-CCRE10 Mortgage Trust, Series 2013-CR10, Class A4, 4.210%, 8/10/46(c) | | | 285,583 | |
| | 175,000 | | | COMM 2013-CCRE12 Mortgage Trust, Series 2013-CR12, Class A4, 4.046%, 10/10/46 | | | 185,844 | |
| | 350,000 | | | COMM 2013-CCRE13 Mortgage Trust, Series 2013-CR13, Class A4, 4.194%, 11/10/46(c) | | | 373,814 | |
| | 371,000 | | | COMM 2013-CCRE6 Mortgage Trust, Series 2013-CR6, Class A4, 3.101%, 3/10/46 | | | 377,229 | |
| | 350,000 | | | COMM 2013-CCRE8 Mortgage Trust, Series 2013-CR8, Class A5, 3.612%, 6/10/46(c) | | | 364,963 | |
| | 20,871 | | | COMM 2014-CCRE15 Mortgage Trust, Series 2014-CR15, Class A2, 2.928%, 2/10/47 | | | 20,654 | |
| | 34,271 | | | COMM 2015-CCRE22 Mortgage Trust, Series 2015-CR22, Class A2, 2.856%, 3/10/48 | | | 34,282 | |
| | 46,451 | | | COMM 2015-CCRE23 Mortgage Trust, Series 2015-CR23, Class A2, 2.852%, 5/10/48 | | | 46,988 | |
| | 350,000 | | | GS Mortgage Securities Trust, Series 2013- GC16, Class A4, 4.271%, 11/10/46. | | | 372,473 | |
| | 367,000 | | | GS Mortgage Securities Trust 2013-GCJ12, Series 2013-GC12, Class A4, 3.135%, 6/10/46 | | | 380,136 | |
| | 350,000 | | | GS Mortgage Securities Trust 2013-GCJ14, Series 2013-GC14, Class A5, 4.243%, 8/10/46 | | | 370,116 | |
| | 300,000 | | | JP Morgan Chase Commercial Mortgage Securities Trust, Series 2014-C20, Class A5, 3.805%, 7/15/47 | | | 319,306 | |
| | 188,000 | | | OPG Trust, Series 2021-PORT, Class C, 0.932%, (LIBOR USD 1-Month plus 0.83%), 10/15/36(a)(b) | | | 186,436 | |
| Principal Amount | | | | | Fair Value | |
| COMMERCIAL MORTGAGE-BACKED SECURITIES — (continued) | |
| $ | 263,585 | | | UBS-Barclays Commercial Mortgage Trust, Series 2012-C3, Class A4, 3.091%, 8/10/49 | | $ | 267,755 | |
| | 300,000 | | | UBS-Barclays Commercial Mortgage Trust, Series 2012-C4, Class A5, 2.850%, 12/10/45 | | | 305,620 | |
| | 190,000 | | | WFRBS Commercial Mortgage Trust, Series 2012-C10, Class A3, 2.875%, 12/15/45 | | | 193,686 | |
| | 320,000 | | | WFRBS Commercial Mortgage Trust, Series 2012-C7, Class A2, 3.431%, 6/15/45 | | | 323,583 | |
| | 25,000 | | | WFRBS Commercial Mortgage Trust, Series 2013-C13, Class A4, 3.001%, 5/15/45 | | | 25,705 | |
| | 121,184 | | | WFRBS Commercial Mortgage Trust, Series 2014-C19, Class A3, 3.660%, 3/15/47 | | | 120,190 | |
| | | | | | | | | |
| | | | | Total Commercial Mortgage-Backed Securities | | | | |
| | | | | (Cost $5,938,915) | | | 5,881,587 | |
| | | | | | | | | |
| CORPORATE BONDS — 61.5% | | | | |
| | | | | Aerospace & Defense — 0.9% | | | | |
| | 350,000 | | | Boeing Co. (The), 4.508%, 5/1/23 | | | 369,740 | |
| | | | | | | | | |
| | | | | Automobiles — 2.3% | | | | |
| | 250,000 | | | Ford Motor Credit Co., LLC, 3.813%, 10/12/21 | | | 250,125 | |
| | 300,000 | | | Ford Motor Credit Co., LLC, 5.596%, 1/7/22 | | | 303,585 | |
| | 150,000 | | | General Motors Financial Co., Inc., 1.683%, (LIBOR USD 3-Month plus 1.55%), 1/14/22(b) | | | 150,553 | |
| | 200,000 | | | Toyota Industries Corp., 3.110%, 3/12/22(a) | | | 202,069 | |
| | | | | | | | 906,332 | |
| | | | | | | | | |
| | | | | Banks — 13.7% | | | | |
| | 250,000 | | | Bank of America Corp., MTN, 2.503%, 10/21/22 | | | 250,267 | |
| | 350,000 | | | Bank of Nova Scotia (The), 0.330%, (SOFR plus 0.28%), 6/23/23(b) | | | 350,310 | |
| | 325,000 | | | Barclays PLC, 4.610%, (LIBOR USD 3-Month plus 1.40%), 2/15/23(d) | | | 329,986 | |
| | 200,000 | | | BNP Paribas SA, 2.950%, 5/23/22(a) | | | 203,426 | |
| | 250,000 | | | BPCE SA, 1.351%, (LIBOR USD 3-Month plus 1.22%), 5/22/22(a)(b) | | | 251,777 | |
| | 400,000 | | | Citigroup, Inc., 3.142%, (LIBOR USD 3-Month plus 0.72%), 1/24/23(d) | | | 403,351 | |
| | 250,000 | | | Credit Agricole SA, 1.549%, (LIBOR USD 3-Month plus 1.43%), 1/10/22(a)(b) | | | 250,955 | |
| | 300,000 | | | Credit Suisse Group Funding Guernsey, Ltd., 3.800%, 9/15/22 | | | 309,816 | |
Continued
Sterling Capital Ultra Short Bond Fund
Schedule of Portfolio Investments — (continued)
September 30, 2021
| Principal Amount | | | | | Fair Value | |
| CORPORATE BONDS — (continued) | | | |
| | | | Banks — (continued) | | | |
| $ | 200,000 | | | Federation des Caisses Desjardins du Quebec, 0.481%, (SOFR plus 0.43%), 5/21/24(a)(b) | | $ | 200,426 | |
| | 200,000 | | | Fifth Third Bank N.A., BKNT, 0.766%, (LIBOR USD 3-Month plus 0.64%), 2/1/22(b) | | | 200,432 | |
| | 525,000 | | | Goldman Sachs Group, Inc. (The), 0.881%, (LIBOR USD 3-Month plus 0.75%), 2/23/23(b) | | | 529,125 | |
| | 100,000 | | | Huntington Bancshares, Inc., 2.300%, 1/14/22 | | | 100,414 | |
| | 365,000 | | | JPMorgan Chase & Co., 2.776%, (LIBOR USD 3-Month plus 0.94%), 4/25/23(d) | | | 369,890 | |
| | 350,000 | | | KeyBank N.A., BKNT, 0.370%, (SOFR plus 0.32%), 6/14/24(b) | | | 351,314 | |
| | 325,000 | | | Lloyds Banking Group PLC, 1.326%, (1-Year Treasury Constant Maturity plus 1.10%), 6/15/23(c) | | | 327,007 | |
| | 250,000 | | | Morgan Stanley, MTN, 2.625%, 11/17/21 | | | 250,717 | |
| | 250,000 | | | NatWest Markets PLC, 1.712%, (SOFR plus 1.66%), 9/29/22(a)(b) | | | 253,787 | |
| | 250,000 | | | NatWest Markets PLC, 3.625%, 9/29/22(a) | | | 258,250 | |
| | 250,000 | | | PNC Bank N.A., BKNT, 0.629%, (LIBOR USD 3-Month plus 0.50%), 7/27/22(b) | | | 250,958 | |
| | | | | | | | 5,442,208 | |
| | | | | | | | | |
| | | | | Chemicals — 2.2% | | | | |
| | 160,000 | | | FMC Corp., 3.950%, 2/1/22 | | | 160,456 | |
| | 350,000 | | | International Flavors & Fragrances, Inc., 0.697%, 9/15/22(a) | | | 351,028 | |
| | 80,000 | | | Westlake Chemical Corp., 0.875%, 8/15/24 | | | 80,103 | |
| | 275,000 | | | Westlake Chemical Corp., 3.600%, 7/15/22 | | | 279,570 | |
| | | | | | | | 871,157 | |
| | | | | | | | | |
| | | | | Commercial Services — 0.3% | | | | |
| | 100,000 | | | ERAC USA Finance, LLC, 2.600%, 12/1/21(a) | | | 100,176 | |
| | | | | | | | | |
| | | | | Construction Materials — 1.4% | | | | |
| | 183,000 | | | Koppers, Inc., 6.000%, 2/15/25(a) | | | 187,117 | |
| | 350,000 | | | Martin Marietta Materials, Inc., 0.650%, 7/15/23 | | | 350,655 | |
| | | | | | | | 537,772 | |
| | | | | | | | | |
| | | | | Diversified Financial Services — 6.5% | | | | |
| | 200,000 | | | AerCap Ireland Capital DAC/AerCap Global Aviation Trust, 3.300%, 1/23/23 | | | 206,083 | |
| | 150,000 | | | AerCap Ireland Capital DAC/AerCap Global Aviation Trust, 3.950%, 2/1/22 | | | 151,256 | |
| | 225,000 | | | Air Lease Corp., 3.500%, 1/15/22 | | | 226,944 | |
| | 283,000 | | | Ally Financial, Inc., 4.125%, 2/13/22 | | | 286,730 | |
| | 300,000 | | | Ares Capital Corp., 3.625%, 1/19/22 | | | 301,977 | |
| | 300,000 | | | Capital One Financial Corp., 0.849%, (LIBOR USD 3-Month plus 0.72%), 1/30/23(b) | | | 302,390 | |
| Principal Amount | | | | | Fair Value | |
| CORPORATE BONDS — (continued) | | | |
| | | | Diversified Financial Services — (continued) |
| $ | 290,000 | | | Carlyle Holdings Finance, LLC, 3.875%, 2/1/23(a) | | $ | 302,119 | |
| | 83,000 | | | Discover Financial Services, 5.200%, 4/27/22 | | | 85,191 | |
| | 175,000 | | | OneMain Finance Corp., 6.125%, 3/15/24 | | | 186,988 | |
| | 300,000 | | | Park Aerospace Holdings, Ltd., 5.250%, 8/15/22(a) | | | 310,779 | |
| | 200,000 | | | Siemens Financieringsmaatschappij NV, 0.728%, (LIBOR USD 3-Month plus 0.61%), 3/16/22(a)(b) | | | 200,550 | |
| | | | | | | | 2,561,007 | |
| | | | | | | | | |
| | | | | Diversified Telecommunication Services — 1.5% | | | | |
| | 350,000 | | | America Movil SAB de CV, 3.125%, 7/16/22 | | | 357,352 | |
| | 250,000 | | | T-Mobile USA, Inc., 4.000%, 4/15/22 | | | 252,917 | |
| | | | | | | | 610,269 | |
| | | | | | | | | |
| | | | | Electric Utilities — 3.7% | | | | |
| | 260,000 | | | Consumers Energy Co., 0.350%, 6/1/23 | | | 259,835 | |
| | 250,000 | | | Dominion Energy, Inc., Series B, 2.750%, 9/15/22 | | | 254,362 | |
| | 350,000 | | | Duke Energy Progress, LLC, Series A, 0.305%, (LIBOR USD 3-Month plus 0.18%), 2/18/22(b) | | | 350,007 | |
| | 300,000 | | | Entergy Louisiana, LLC, 0.950%, 10/1/24 | | | 300,059 | |
| | 200,000 | | | Exelon Corp., 3.497%, 6/1/22 | | | 203,495 | |
| | 120,000 | | | Florida Power & Light Co., 0.300%, (SOFR plus 0.25%), 5/10/23(b) | | | 120,016 | |
| | | | | | | | 1,487,774 | |
| | | | | | | | | |
| | | | | Electrical Equipment — 1.2% | | | | |
| | 130,000 | | | Carlisle Cos., Inc., 0.550%, 9/1/23 | | | 129,934 | |
| | 61,000 | | | Honeywell International, Inc., 0.483%, 8/19/22 | | | 61,008 | |
| | 300,000 | | | Roper Technologies, Inc., 0.450%, 8/15/22 | | | 300,484 | |
| | | | | | | | 491,426 | |
| | | | | | | | | |
| | | | | Energy Equipment & Services — 7.0% | | | | |
| | 200,000 | | | Enbridge, Inc., 0.625%, (LIBOR USD 3-Month plus 0.50%), 2/18/22(b) | | | 200,366 | |
| | 300,000 | | | Energy Transfer L.P./Regency Energy Finance Corp., 5.000%, 10/1/22 | | | 309,488 | |
| | 300,000 | | | Enterprise Products Operating, LLC, 3.500%, 2/1/22 | | | 303,171 | |
| | 300,000 | | | Kinder Morgan, Inc., 3.150%, 1/15/23 | | | 309,797 | |
| | 225,000 | | | Midwest Connector Capital Co., LLC, 3.625%, 4/1/22(a) | | | 227,665 | |
| | 300,000 | | | MPLX L.P., 3.375%, 3/15/23 | | | 311,088 | |
| | 200,000 | | | ONEOK, Inc., 4.250%, 2/1/22 | | | 200,575 | |
| | 300,000 | | | Plains All American Pipeline L.P./PAA Finance Corp., 3.650%, 6/1/22 | | | 303,946 | |
| | 250,000 | | | Plains All American Pipeline L.P./PAA Finance Corp., 3.850%, 10/15/23 | | | 262,826 | |
| | 100,000 | | | Williams Cos., Inc. (The), 3.600%, 3/15/22 | | | 100,906 | |
Continued
Sterling Capital Ultra Short Bond Fund
Schedule of Portfolio Investments — (continued)
September 30, 2021
| Principal Amount | | | | | Fair Value | |
| CORPORATE BONDS — (continued) | | | |
| | | | Energy Equipment & Services — (continued) |
| $ | 250,000 | | | Williams Cos., Inc. (The), 3.700%, 1/15/23 | | $ | 258,191 | |
| | | | | | | | 2,788,019 | |
| | | | | | | | | |
| | | | | Equity Real Estate Investment Trusts (REITS) — 2.9% | | | | |
| | 265,000 | | | American Tower Corp., 4.700%, 3/15/22 | | | 270,110 | |
| | 250,000 | | | Jones Lang LaSalle, Inc., 4.400%, 11/15/22 | | | 258,374 | |
| | 205,000 | | | Public Storage, 0.520%, (SOFR plus 0.47%), 4/23/24(b) | | | 205,313 | |
| | 225,000 | | | SBA Tower Trust, 3.869%, 10/8/24(a) | | | 235,007 | |
| | 179,000 | | | Starwood Property Trust, Inc., 5.500%, 11/1/23(a) | | | 187,768 | |
| | | | | | | | 1,156,572 | |
| | | | | | | | | |
| | | | | Food & Staples Retailing — 0.3% | | | | |
| | 119,000 | | | Smithfield Foods, Inc., 3.350%, 2/1/22(a) | | | 119,678 | |
| | | | | | | | | |
| | | | | Health Care Equipment & Services — 1.4% | | | | |
| | 250,000 | | | HCA, Inc., 4.750%, 5/1/23 | | | 265,616 | |
| | 300,000 | | | Humana, Inc., 0.650%, 8/3/23 | | | 300,191 | |
| | | | | | | | 565,807 | |
| | | | | | | | | |
| | | | | Health Care Providers & Services — 0.8% | | | | |
| | 300,000 | | | AbbVie, Inc., 3.450%, 3/15/22 | | | 302,670 | |
| | | | | | | | | |
| | | | | Insurance — 3.8% | | | | |
| | 350,000 | | | Athene Global Funding, 3.000%, 7/1/22(a) | | | 357,014 | |
| | 100,000 | | | Brighthouse Financial Global Funding, 0.600%, 6/28/23(a) | | | 100,064 | |
| | 75,000 | | | Brighthouse Financial Global Funding, 0.810%, (SOFR plus 0.76%), 4/12/24(a) (b) | | | 75,528 | |
| | 290,000 | | | Fidelity National Financial, Inc., 5.500%, 9/1/22 | | | 303,452 | |
| | 165,000 | | | Guardian Life Global Funding, 1.950%, 10/27/21(a) | | | 165,202 | |
| | 175,000 | | | Principal Life Global Funding II, 2.375%, 11/21/21(a) | | | 175,494 | |
| | 325,000 | | | Reliance Standard Life Global Funding II, 2.625%, 7/22/22(a) | | | 331,183 | |
| | | | | | | | 1,507,937 | |
| | | | | | | | | |
| | | | | Media — 1.5% | | | | |
| | 300,000 | | | Charter Communications Operating, LLC/ Charter Communications Operating Capital, 4.464%, 7/23/22 | | | 307,625 | |
| | 280,000 | | | Interpublic Group of Cos., Inc. (The), 3.750%, 10/1/21 | | | 280,000 | |
| | | | | | | | 587,625 | |
| | | | | | | | | |
| | | | | Metals & Mining — 1.2% | | | | |
| | 175,000 | | | Freeport-McMoRan, Inc., 3.875%, 3/15/23 | | | 180,548 | |
| | 100,000 | | | Glencore Finance Canada, Ltd., 4.950%, 11/15/21(a) | | | 100,328 | |
| | 200,000 | | | Nucor Corp., 4.125%, 9/15/22 | | | 205,227 | |
| | | | | | | | 486,103 | |
| Principal Amount | | | | | Fair Value | |
| CORPORATE BONDS — (continued) | | | |
| | | | Oil, Gas & Consumable Fuels — 2.8% | | | |
| $ | 250,000 | | | CenterPoint Energy Resources Corp., 0.700%, 3/2/23 | | $ | 250,013 | |
| | 160,000 | | | Diamondback Energy, Inc., 0.900%, 3/24/23 | | | 159,942 | |
| | 145,000 | | | Range Resources Corp., 5.000%, 3/15/23 | | | 150,438 | |
| | 300,000 | | | Schlumberger Investment SA, 2.400%, 8/1/22(a) | | | 303,694 | |
| | 250,000 | | | Southern California Gas Co., 0.466%, (LIBOR USD 3-Month plus 0.35%), 9/14/23(b) | | | 250,090 | |
| | | | | | | | 1,114,177 | |
| | | | | | | | | |
| | | | | Road & Rail — 1.3% | | | | |
| | 375,000 | | | Penske Truck Leasing Co. L.P./PTL Finance Corp., 3.375%, 2/1/22(a) | | | 376,798 | |
| | 125,000 | | | Ryder System, Inc., MTN, 2.800%, 3/1/22 | | | 126,026 | |
| | | | | | | | 502,824 | |
| | | | | | | | | |
| | | | | Semiconductors & Semiconductor Equipment — 0.9% | | | | |
| | 90,000 | | | Broadcom Corp./Broadcom Cayman Finance, Ltd., 3.000%, 1/15/22 | | | 90,442 | |
| | 250,000 | | | Microchip Technology, Inc., 4.333%, 6/1/23 | | | 264,212 | |
| | | | | | | | 354,654 | |
| | | | | | | | | |
| | | | | Software — 1.3% | | | | |
| | 225,000 | | | Dell International, LLC/EMC Corp., 5.450%, 6/15/23 | | | 241,526 | |
| | 275,000 | | | VMware, Inc., 0.600%, 8/15/23 | | | 275,326 | |
| | | | | | | | 516,852 | |
| | | | | | | | | |
| | | | | Specialty Retail — 1.2% | | | | |
| | 300,000 | | | 7-Eleven, Inc., 0.625%, 2/10/23(a) | | | 300,033 | |
| | 161,000 | | | Nordstrom, Inc., 2.300%, 4/8/24 | | | 161,009 | |
| | | | | | | | 461,042 | |
| | | | | | | | | |
| | | | | Telecommunication Services — 1.0% | | | | |
| | 250,000 | | | AT&T, Inc., 0.690%, (SOFR plus 0.64%), 3/25/24(b) | | | 250,455 | |
| | 160,000 | | | Verizon Communications, Inc., 1.118%, (LIBOR USD 3-Month plus 1.00%), 3/16/22(b) | | | 160,699 | |
| | | | | | | | 411,154 | |
| | | | | | | | | |
| | | | | Tobacco — 0.4% | | | | |
| | 150,000 | | | BAT Capital Corp., 1.005%, (LIBOR USD 3-Month plus 0.88%), 8/15/22(b) | | | 150,818 | |
| | | | | | | | | |
| | | | | Total Corporate Bonds | | | | |
| | | | | (Cost $24,387,512) | | | 24,403,793 | |
Continued
Sterling Capital Ultra Short Bond Fund
Schedule of Portfolio Investments — (continued)
September 30, 2021
| Principal Amount | | | | | Fair Value | |
| MUNICIPAL BONDS — 1.3% | | | |
| | | | Illinois — 0.7% | | | |
| $ | 275,000 | | | Chicago O'Hare International Airport, IL, Refunding, Taxable Revenue Bonds, Series D, 0.959%, 1/1/23 | | $ | 276,925 | |
| | | | | | | | | |
| | | | | Pennsylvania — 0.6% | | | | |
| | 250,000 | | | Allegheny County, PA, Advance Refunding, Taxable Revenue Bonds, G.O., Series C79, 0.573%, 11/1/22 | | | 250,980 | |
| | | | | | | | | |
| | | | | Total Municipal Bonds | | | | |
| | | | | (Cost $525,000) | | | 527,905 | |
| Shares | | | | | | |
| MONEY MARKET FUND — 5.3% | | | |
| | 2,103,491 | | | Federated Treasury Obligations Fund, Institutional Shares, 0.01%(e) | | | 2,103,491 | |
| | | | | | | | | |
| | | | | Total Money Market Fund | | | | |
| | | | | (Cost $2,103,491) | | | 2,103,491 | |
| | | | | | | | | |
| Total Investments — 103.5% | | | | |
| (Cost $41,129,387) | | | 41,082,986 | |
| Net Other Assets (Liabilities) — (3.5)% | | | (1,371,847 | ) |
| NET ASSETS — 100.0% | | $ | 39,711,139 | |
| (a) | Rule 144A, Section 4(2) or other security that is restricted as to resale to qualified institutional investors. The Advisor, using Board approved procedures, has deemed these securities or a portion of these securities to be liquid. |
| (b) | The interest rate for this floating rate note, which will change periodically, is based either on the prime rate or an index of market rates. The reflected rate is in effect as of September 30, 2021. The maturity date reflected is the final maturity date. |
| (c) | The interest rate for this variable rate note, which will change periodically, is based either on the prime rate or an index of market rates. The reflected rate is in effect as of September 30, 2021. The maturity date reflected is the final maturity date. |
| (d) | Security is a fix-to-float security, which carries a fixed coupon until a certain date, upon which it switches to a floating rate. Rate shown is the fixed rate. |
| (e) | Represents the current yield as of report date. |
Continued
Sterling Capital Short Duration Bond Fund
Schedule of Portfolio Investments
September 30, 2021
| Principal Amount | | | | | Fair Value | |
| ASSET BACKED SECURITIES — 15.5% | | | |
| $ | 879,423 | | | AmeriCredit Automobile Receivables Trust, Series 2017-4, Class C, 2.600%, 9/18/23 | | $ | 884,052 | |
| | 1,290,000 | | | AmeriCredit Automobile Receivables Trust, Series 2018-3, Class C, 3.740%, 10/18/24 | | | 1,326,597 | |
| | 815,000 | | | AmeriCredit Automobile Receivables Trust, Series 2019-1, Class B, 3.130%, 2/18/25 | | | 825,392 | |
| | 643,503 | | | ARI Fleet Lease Trust, Series 2019-A, Class A2A, 2.410%, 11/15/27(a) | | | 648,115 | |
| | 770,000 | | | Avis Budget Rental Car Funding AESOP, LLC, Series 2017-1A, Class A, 3.070%, 9/20/23(a) | | | 785,975 | |
| | 1,387,000 | | | Avis Budget Rental Car Funding AESOP, LLC, Series 2017-2A, Class A, 2.970%, 3/20/24(a) | | | 1,431,905 | |
| | 1,250,000 | | | Capital One Prime Auto Receivables Trust, Series 2019-2, Class A4, 1.960%, 2/18/25 | | | 1,276,615 | |
| | 1,110,000 | | | CarMax Auto Owner Trust, Series 2020-3, Class A4, 0.770%, 3/16/26 | | | 1,117,278 | |
| | 815,000 | | | Carvana Auto Receivables Trust, Series 2021-P2, Class A3, 0.490%, 3/10/26 | | | 814,214 | |
| | 513,515 | | | Chesapeake Funding II, LLC, Series 2018- 2A, Class A1, 3.230%, 8/15/30(a) | | | 515,191 | |
| | 428,228 | | | Chesapeake Funding II, LLC, Series 2018- 3A, Class A1, 3.390%, 1/15/31(a) | | | 436,932 | |
| | 342,590 | | | Chesapeake Funding II, LLC, Series 2019- 1A, Class A1, 2.940%, 4/15/31(a) | | | 347,049 | |
| | 631,808 | | | Chesapeake Funding II, LLC, Series 2020- 1A, Class A1, 0.870%, 8/16/32(a) | | | 635,109 | |
| | 1,312,811 | | | Chesapeake Funding II, LLC, Series 2021- 1A, Class A1, 0.470%, 4/15/33(a) | | | 1,313,098 | |
| | 6,069 | | | Citicorp Residential Mortgage Trust, STEP, Series 2007-2, Class A6, 4.904%, 6/25/37 | | | 6,125 | |
| | 521,573 | | | Citigroup Mortgage Loan Trust, Inc., Series 2005-HE1, Class M3, 1.061%, (LIBOR USD 1-Month plus 0.98%), 5/25/35(b) | | | 521,880 | |
| | 2,966,000 | | | Enterprise Fleet Financing, LLC, Series 2019-1, Class A3, 3.070%, 10/20/24(a) | | | 3,039,966 | |
| | 1,500,000 | | | Enterprise Fleet Funding, LLC, Series 2021-1, Class A3, 0.700%, 12/21/26(a) | | | 1,496,603 | |
| | 1,146,000 | | | Ford Credit Auto Owner Trust, Series 2017-2, Class A, 2.360%, 3/15/29(a) | | | 1,168,946 | |
| | 1,165,000 | | | GreatAmerica Leasing Receivables Funding, LLC, Series 2020-1, Class A3, 1.760%, 8/15/23(a) | | | 1,177,731 | |
| | 1,490,000 | | | Hertz Vehicle Financing, LLC, Series 2021-1A, Class A, 1.210%, 12/26/25(a) | | | 1,494,517 | |
| | 1,120,352 | | | Onemain Financial Issuance Trust, Series 2018-1A, Class A, 3.300%, 3/14/29(a) | | | 1,123,170 | |
| | 641,660 | | | OneMain Financial Issuance Trust, Series 2016-3A, Class A, 3.830%, 6/18/31(a) | | | 645,540 | |
| Principal Amount | | | | | Fair Value | |
| ASSET BACKED SECURITIES — (continued) | | | |
| $ | 2,598,000 | | | Santander Drive Auto Receivables Trust, Series 2020-2, Class B, 0.960%, 11/15/24 | | $ | 2,605,778 | |
| | 2,000,000 | | | Santander Drive Auto Receivables Trust, Series 2020-3, Class B, 0.690%, 3/17/25 | | | 2,004,541 | |
| | 112,992 | | | Sofi Professional Loan Program, LLC, Series 2016-B, Class A1, 1.286%, (LIBOR USD 1-Month plus 1.20%), 6/25/33(a)(b) | | | 113,547 | |
| | 20,723 | | | Sofi Professional Loan Program, LLC, Series 2016-E, Class A1, 0.936%, (LIBOR USD 1-Month plus 0.85%), 7/25/39(a)(b) | | | 20,753 | |
| | 121,374 | | | SoFi Professional Loan Program Trust, Series 2020-A, Class A1FX, 2.060%, 5/15/46(a) | | | 121,602 | |
| | 1,250,000 | | | Wheels SPV 2, LLC, Series 2019-1A, Class A3, 2.350%, 5/22/28(a) | | | 1,272,158 | |
| | 1,290,000 | | | World Omni Select Auto Trust, Series 2021-A, Class A3, 0.530%, 3/15/27 | | | 1,287,857 | |
| | | | | | | | | |
| | | | | Total Asset Backed Securities | | | | |
| | | | | (Cost $30,215,489) | | | 30,458,236 | |
| | | | | | | | | |
| COLLATERALIZED MORTGAGE OBLIGATIONS — 1.6% | | | | |
| | 45,304 | | | Alternative Loan Trust, Series 2004-22CB, Class 1A1, 6.000%, 10/25/34 | | | 47,041 | |
| | 91,713 | | | Banc of America Funding Trust, Series 2004-C, Class 4A3, 0.987%, (LIBOR USD 1-Month plus 0.90%), 12/20/34(b) | | | 92,181 | |
| | 189,032 | | | Fannie Mae, Series 2012-152, Class PC, 1.750%, 8/25/42 | | | 192,313 | |
| | 812,015 | | | Fannie Mae, Series 2013-35, Class CB, 2.000%, 2/25/43 | | | 837,844 | |
| | 71,208 | | | Fannie Mae, Series 2013-72, Class NA, 2.500%, 8/25/42 | | | 73,745 | |
| | 408,759 | | | Fannie Mae, Series 2016-100, Class DA, 3.000%, 2/25/43 | | | 421,334 | |
| | 1,412,357 | | | Ginnie Mae, Series 2019-99, Class NC, 2.000%, 10/20/47 | | | 1,433,350 | |
| | | | | | | | | |
| | | | | Total Collateralized Mortgage Obligations | | | | |
| | | | | (Cost $3,058,839) | | | 3,097,808 | |
| | | | | | | | | |
| COMMERCIAL MORTGAGE-BACKED SECURITIES — 6.2% | | | | |
| | 1,332,692 | | | COMM 2012-CCRE1 Mortgage Trust, Series 2012-CR1, Class A3, 3.391%, 5/15/45 | | | 1,343,331 | |
| | 1,623,000 | | | COMM 2012-CCRE2 Mortgage Trust, Series 2012-CR2, Class A4, 3.147%, 8/15/45 | | | 1,640,828 | |
| | 454,000 | | | COMM 2013-CCRE11 Mortgage Trust, Series 2013-CR11, Class A4, 4.258%, 8/10/50 | | | 482,437 | |
See accompanying Notes to the Financial Statements.
Sterling Capital Short Duration Bond Fund
Schedule of Portfolio Investments — (continued)
September 30, 2021
| Principal Amount | | | | | Fair Value | |
| COMMERCIAL MORTGAGE-BACKED SECURITIES — (continued) | |
| $ | 37,738 | | | COMM 2014-CCRE15 Mortgage Trust, Series 2014-CR15, Class A2, 2.928%, 2/10/47 | | $ | 37,346 | |
| | 74,625 | | | GS Mortgage Securities Trust, Series 2010- C1, Class A2, 4.592%, 8/10/43(a) | | | 74,690 | |
| | 300,000 | | | GS Mortgage Securities Trust, Series 2010- C1, Class B, 5.148%, 8/10/43(a) | | | 301,345 | |
| | 409,367 | | | GS Mortgage Securities Trust, Series 2014- GC24, Class AAB, 3.650%, 9/10/47 | | | 425,964 | |
| | 1,800,000 | | | JP Morgan Chase Commercial Mortgage Securities Trust, Series 2014-C20, Class A5, 3.805%, 7/15/47 | | | 1,915,838 | |
| | 18,896 | | | Morgan Stanley Capital I Trust, Series 2016-BNK2, Class A2, 2.454%, 11/15/49 | | | 18,891 | |
| | 936,000 | | | OPG Trust, Series 2021-PORT, Class C, 0.932%, (LIBOR USD 1-Month plus 0.83%), 10/15/36(a)(b) | | | 928,213 | |
| | 1,233,545 | | | UBS-Barclays Commercial Mortgage Trust, Series 2012-C3, Class A4, 3.091%, 8/10/49 | | | 1,253,056 | |
| | 2,007,000 | | | Wells Fargo Commercial Mortgage Trust, Series 2014-LC18, Class A5, 3.405%, 12/15/47 | | | 2,149,434 | |
| | 1,700,000 | | | WFRBS Commercial Mortgage Trust, Series 2012-C7, Class A2, 3.431%, 6/15/45 | | | 1,719,033 | |
| | | | | | | | | |
| | | | | Total Commercial Mortgage-Backed Securities | | | | |
| | | | | (Cost $12,407,280) | | | 12,290,406 | |
| | | | | | | | | |
| CORPORATE BONDS — 67.1% | | | | |
| | | | | Automobiles — 4.0% | | | | |
| | 1,000,000 | | | American Honda Finance Corp., MTN, 0.875%, 7/7/23 | | | 1,007,745 | |
| | 1,250,000 | | | BMW U.S. Capital, LLC, 3.150%, 4/18/24(a) | | | 1,325,418 | |
| | 1,500,000 | | | Daimler Finance North America, LLC, 0.750%, 3/1/24(a) | | | 1,502,609 | |
| | 900,000 | | | Ford Motor Credit Co., LLC, 3.350%, 11/1/22 | | | 914,517 | |
| | 1,100,000 | | | General Motors Financial Co., Inc., 1.700%, 8/18/23 | | | 1,120,698 | |
| | 900,000 | | | Hyundai Capital America, 0.800%, 1/8/24(a) | | | 896,101 | |
| | 500,000 | | | Toyota Motor Corp., 0.681%, 3/25/24 | | | 500,571 | |
| | 540,000 | | | Toyota Motor Credit Corp., MTN, 2.900%, 3/30/23 | | | 560,785 | |
| | | | | | | | 7,828,444 | |
| | | | | | | | | |
| | | | | Banks — 16.9% | | | | |
| | 1,500,000 | | | Bank of America Corp., MTN, 0.981%, (SOFR plus 0.91%), 9/25/25(c) | | | 1,501,745 | |
| Principal Amount | | | | | Fair Value | |
| CORPORATE BONDS — (continued) | | | |
| | | | Banks — (continued) | | | |
| $ | 1,325,000 | | | Bank of Montreal, 0.450%, 12/8/23 | | $ | 1,326,073 | |
| | 1,250,000 | | | BNP Paribas SA, 3.800%, 1/10/24(a) | | | 1,332,837 | |
| | 950,000 | | | BPCE SA, 4.000%, 4/15/24 | | | 1,028,701 | |
| | 1,000,000 | | | Citigroup, Inc., 3.352%, (LIBOR USD 3-Month plus 0.90%), 4/24/25(c) | | | 1,062,103 | |
| | 1,075,000 | | | Citizens Bank N.A., BKNT, 0.932%, (LIBOR USD 3-Month plus 0.81%), 5/26/22(b) | | | 1,080,013 | |
| | 1,350,000 | | | Cooperatieve Rabobank UA, 0.375%, 1/12/24 | | | 1,343,746 | |
| | 400,000 | | | Credit Suisse AG, 0.495%, 2/2/24 | | | 398,508 | |
| | 1,155,000 | | | Credit Suisse AG, MTN, 3.625%, 9/9/24 | | | 1,244,944 | |
| | 1,000,000 | | | Danske Bank A/S, 0.976%, (1-Year Treasury Constant Maturity plus 0.55%), 9/10/25(a)(d) | | | 998,811 | |
| | 1,800,000 | | | Goldman Sachs Group, Inc. (The), 4.000%, 3/3/24 | | | 1,938,782 | |
| | 1,000,000 | | | Huntington National Bank (The), BKNT, 3.550%, 10/6/23 | | | 1,059,148 | |
| | 491,000 | | | JP Morgan Chase & Co., Series I, 3.599%, (LIBOR USD 3-Month plus 3.47%)(d)(e) | | | 493,687 | |
| | 1,700,000 | | | JPMorgan Chase & Co., 3.559%, (LIBOR USD 3-Month plus 0.73%), 4/23/24(c) | | | 1,779,374 | |
| | 1,200,000 | | | KeyBank N.A., BKNT, 1.250%, 3/10/23 | | | 1,215,924 | |
| | 1,000,000 | | | Lloyds Banking Group PLC, 2.907%, (LIBOR USD 3-Month plus 0.81%), 11/7/23(c) | | | 1,025,945 | |
| | 1,450,000 | | | Mitsubishi UFJ Financial Group, Inc., 0.848%, (1-Year Treasury Constant Maturity plus 0.68%), 9/15/24(d) | | | 1,456,336 | |
| | 1,150,000 | | | Morgan Stanley, Series F, 3.875%, 4/29/24 | | | 1,240,285 | |
| | 625,000 | | | National Securities Clearing Corp., 1.200%, 4/23/23(a) | | | 633,656 | |
| | 1,000,000 | | | Nationwide Building Society, 2.000%, 1/27/23(a) | | | 1,021,767 | |
| | 850,000 | | | NatWest Markets PLC, 0.810%, (SOFR plus 0.76%), 9/29/26(a)(b) | | | 851,925 | |
| | 400,000 | | | Nordea Bank Abp, 1.000%, 6/9/23(a) | | | 404,320 | |
| | 842,000 | | | PNC Financial Services Group, Inc. (The), Series O, 3.804%, (LIBOR USD 3-Month plus 3.68%)(d)(e) | | | 844,055 | |
| | 320,000 | | | Royal Bank of Canada, MTN, 0.500%, (SOFR plus 0.45%), 10/26/23(b) | | | 321,814 | |
| | 1,000,000 | | | Skandinaviska Enskilda Banken AB, 0.550%, 9/1/23(a) | | | 1,001,500 | |
| | 1,325,000 | | | Standard Chartered PLC, 0.991%, (1-Year Treasury Constant Maturity plus 0.78%), 1/12/25(a)(d) | | | 1,320,387 | |
| | 1,000,000 | | | Sumitomo Mitsui Financial Group, Inc., 2.696%, 7/16/24 | | | 1,050,218 | |
| | 500,000 | | | Sumitomo Mitsui Trust Bank, Ltd., 0.800%, 9/12/23(a) | | | 503,009 | |
Continued
Sterling Capital Short Duration Bond Fund
Schedule of Portfolio Investments — (continued)
September 30, 2021
| Principal Amount | | | | | Fair Value | |
| CORPORATE BONDS — (continued) | | | |
| | | | Banks — (continued) | | | |
| $ | 1,000,000 | | | Sumitomo Mitsui Trust Bank, Ltd., 0.850%, 3/25/24(a) | | $ | 1,002,296 | |
| | 1,250,000 | | | Svenska Handelsbanken AB, 0.625%, 6/30/23(a) | | | 1,255,907 | |
| | 1,500,000 | | | Wells Fargo & Co., MTN, 1.654%, (SOFR plus 1.60%), 6/2/24(c) | | | 1,529,215 | |
| | | | | | | | 33,267,031 | |
| | | | | | | | | |
| | | | | Chemicals — 1.4% | | | | |
| | 1,054,000 | | | NOVA Chemicals Corp., 4.875%, 6/1/24(a) | | | 1,101,430 | |
| | 1,000,000 | | | Tronox, Inc., 6.500%, 5/1/25(a) | | | 1,049,670 | |
| | 500,000 | | | Westlake Chemical Corp., 0.875%, 8/15/24 | | | 500,644 | |
| | | | | | | | 2,651,744 | |
| | | | | | | | | |
| | | | | Commercial Services & Supplies — 0.4% | | | | |
| | 707,000 | | | GFL Environmental, Inc., 4.250%, 6/1/25(a) | | | 729,094 | |
| | | | | | | | | |
| | | | | Construction Materials — 0.8% | | | | |
| | 929,000 | | | Koppers, Inc., 6.000%, 2/15/25(a) | | | 949,903 | |
| | 575,000 | | | Martin Marietta Materials, Inc., 4.250%, 7/2/24 | | | 623,806 | |
| | | | | | | | 1,573,709 | |
| | | | | | | | | |
| | | | | Diversified Financial Services — 9.5% | | | | |
| | 1,400,000 | | | AerCap Ireland Capital DAC/AerCap Global Aviation Trust, 3.150%, 2/15/24 | | | 1,459,645 | |
| | 315,000 | | | AIG Global Funding, 0.650%, 6/17/24(a) | | | 314,157 | |
| | 650,000 | | | AIG Global Funding, 0.800%, 7/7/23(a) | | | 655,119 | |
| | 1,010,000 | | | Air Lease Corp., MTN, 0.700%, 2/15/24 | | | 1,003,524 | |
| | 1,335,000 | | | Ally Financial, Inc., 1.450%, 10/2/23 | | | 1,354,947 | |
| | 1,000,000 | | | Blackstone Private Credit Fund, 1.750%, 9/15/24(a) | | | 998,527 | |
| | 875,000 | | | Capital One Financial Corp., 3.750%, 4/24/24 | | | 938,557 | |
| | 1,793,000 | | | Carlyle Holdings Finance, LLC, 3.875%, 2/1/23(a) | | | 1,867,928 | |
| | 1,500,000 | | | Charles Schwab Corp. (The), 0.570%, (SOFR plus 0.52%), 5/13/26(b) | | | 1,510,336 | |
| | 880,000 | | | Element Fleet Management Corp., 1.600%, 4/6/24(a) | | | 892,545 | |
| | 1,150,000 | | | ERAC USA Finance, LLC, 3.850%, 11/15/24(a) | | | 1,243,610 | |
| | 640,000 | | | Intercontinental Exchange, Inc., 0.700%, 6/15/23 | | | 642,381 | |
| | 1,200,000 | | | Jefferies Group, LLC, 5.125%, 1/20/23 | | | 1,269,161 | |
| | 833,000 | | | OneMain Finance Corp., 6.125%, 3/15/24 | | | 890,061 | |
| | 1,325,000 | | | Owl Rock Capital Corp., 5.250%, 4/15/24 | | | 1,443,395 | |
| | 900,000 | | | Park Aerospace Holdings, Ltd., 5.500%, 2/15/24(a) | | | 982,006 | |
| | 1,275,000 | | | Penske Truck Leasing Co. Lp/PTL Finance Corp., 2.700%, 3/14/23(a) | | | 1,310,973 | |
| | | | | | | | 18,776,872 | |
| | | | | | | | | |
| | | | | Diversified Telecommunication Services — 1.4% | | | | |
| | 1,400,000 | | | AT&T, Inc., 4.450%, 4/1/24 | | | 1,516,727 | |
| Principal Amount | | | | | Fair Value | |
| CORPORATE BONDS — (continued) | | | |
| | | | Diversified Telecommunication Services — (continued) | | | |
| $ | 375,000 | | | NTT Finance Corp., 0.583%, 3/1/24(a) | | $ | 374,466 | |
| | 856,625 | | | Sprint Spectrum Co., LLC/Sprint Spectrum Co. II, LLC/Sprint Spectrum Co. III, LLC, 4.738%, 3/20/25(a) | | | 914,875 | |
| | | | | | | | 2,806,068 | |
| | | | | | | | | |
| | | | | Electric Utilities — 4.8% | | | | |
| | 1,000,000 | | | American Electric Power Co., Inc., Series I, 3.650%, 12/1/21 | | | 1,005,415 | |
| | 1,000,000 | | | Baltimore Gas & Electric Co., 2.800%, 8/15/22 | | | 1,014,876 | |
| | 498,000 | | | CenterPoint Energy, Inc., 3.850%, 2/1/24 | | | 529,980 | |
| | 1,200,000 | | | CMS Energy Corp., 3.875%, 3/1/24 | | | 1,273,450 | |
| | 1,250,000 | | | Dominion Energy, Inc., 2.450%, 1/15/23(a) | | | 1,281,925 | |
| | 760,000 | | | Entergy Louisiana, LLC, 0.620%, 11/17/23 | | | 760,126 | |
| | 675,000 | | | NRG Energy, Inc., 3.750%, 6/15/24(a) | | | 719,878 | |
| | 1,250,000 | | | Sempra Energy, 4.050%, 12/1/23 | | | 1,331,209 | |
| | 600,000 | | | Southern Co. (The), Series 21-A, 0.600%, 2/26/24 | | | 598,566 | |
| | 825,000 | | | WESCO Distribution, Inc., 7.125%, 6/15/25(a) | | | 882,610 | |
| | | | | | | | 9,398,035 | |
| | | | | | | | | |
| | | | | Electrical Equipment — 0.9% | | | | |
| | 450,000 | | | Siemens Financieringsmaatschappij NV, 0.480%, (SOFR plus 0.43%), 3/11/24(a)(b) | | | 453,301 | |
| | 1,195,000 | | | Siemens Financieringsmaatschappij NV, 3.250%, 5/27/25(a) | | | 1,286,636 | |
| | | | | | | | 1,739,937 | |
| | | | | | | | | |
| | | | | Energy Equipment & Services — 3.4% | | | | |
| | 850,000 | | | Cheniere Corpus Christi Holdings, LLC, 7.000%, 6/30/24 | | | 961,259 | |
| | 900,000 | | | Energy Transfer L.P., 4.250%, 3/15/23 | | | 937,863 | |
| | 1,100,000 | | | Midwest Connector Capital Co., LLC, 3.625%, 4/1/22(a) | | | 1,113,030 | |
| | 1,420,000 | | | Plains All American Pipeline L.P./PAA Finance Corp., 3.600%, 11/1/24 | | | 1,515,420 | |
| | 900,000 | | | Sabine Pass Liquefaction, LLC, 6.250%, 3/15/22 | | | 910,332 | |
| | 1,155,000 | | | Williams Cos., Inc. (The), 4.500%, 11/15/23 | | | 1,237,160 | |
| | | | | | | | 6,675,064 | |
| | | | | | | | | |
| | | | | Entertainment — 0.5% | | | | |
| | 1,000,000 | | | Mattel, Inc., 3.375%, 4/1/26(a) | | | 1,031,100 | |
| | | | | | | | | |
| | | | | Equity Real Estate Investment Trusts (REITS) — 4.3% | | | | |
| | 790,000 | | | American Tower Corp., 5.000%, 2/15/24 | | | 867,976 | |
| | 700,000 | | | Crown Castle International Corp., 3.150%, 7/15/23 | | | 730,735 | |
| | 1,205,000 | | | Jones Lang LaSalle, Inc., 4.400%, 11/15/22 | | | 1,245,362 | |
| | 1,000,000 | | | Kimco Realty Corp., 2.700%, 3/1/24 | | | 1,041,495 | |
Continued
Sterling Capital Short Duration Bond Fund
Schedule of Portfolio Investments — (continued)
September 30, 2021
| Principal Amount | | | | | Fair Value | |
| CORPORATE BONDS — (continued) | | | |
| | | | Equity Real Estate Investment Trusts (REITS) — (continued) | | | |
| $ | 1,000,000 | | | Ladder Capital Finance Holdings LLLP/ Ladder Capital Finance Corp., 5.250%, 10/1/25(a) | | $ | 1,012,425 | |
| | 1,550,000 | | | Public Storage, 0.520%, (SOFR plus 0.47%), 4/23/24(b) | | | 1,552,367 | |
| | 1,000,000 | | | Retail Opportunity Investments Partnership L.P., 5.000%, 12/15/23 | | | 1,077,350 | |
| | 900,000 | | | Starwood Property Trust, Inc., 5.500%, 11/1/23(a) | | | 944,082 | |
| | | | | | | | 8,471,792 | |
| | | | | | | | | |
| | | | | Food Products — 0.7% | | | | |
| | 1,250,000 | | | Conagra Brands, Inc., 4.300%, 5/1/24 | | | 1,354,911 | |
| | | | | | | | | |
| | | | | Health Care Providers & Services — 0.6% | | | | |
| | 1,085,000 | | | Shire Acquisitions Investments Ireland DAC, 2.875%, 9/23/23 | | | 1,131,028 | |
| | | | | | | | | |
| | | | | Hotels, Restaurants & Leisure — 0.5% | | | | |
| | 830,000 | | | Prime Security Services Borrower, LLC/ Prime Finance, Inc., 5.250%, 4/15/24(a) | | | 885,237 | |
| | | | | | | | | |
| | | | | Insurance — 6.1% | | | | |
| | 1,300,000 | | | Athene Global Funding, 2.800%, 5/26/23(a) | | | 1,348,699 | |
| | 600,000 | | | Brighthouse Financial Global Funding, 0.600%, 6/28/23(a) | | | 600,382 | |
| | 450,000 | | | Brighthouse Financial Global Funding, 0.810%, (SOFR plus 0.76%), 4/12/24(a)(b) | | | 453,166 | |
| | 1,100,000 | | | F&G Global Funding, 0.900%, 9/20/24(a) | | | 1,097,805 | |
| | 1,320,000 | | | GA Global Funding Trust, 0.800%, 9/13/24(a) | | | 1,313,804 | |
| | 625,000 | | | Jackson National Life Global Funding, 3.875%, 6/11/25(a) | | | 680,890 | |
| | 1,150,000 | | | John Hancock Life Insurance Co., 7.375%, 2/15/24(a) | | | 1,321,053 | |
| | 1,325,000 | | | Metropolitan Life Global Funding I, 0.400%, 1/7/24(a) | | | 1,318,644 | |
| | 200,000 | | | New York Life Global Funding, 1.100%, 5/5/23(a) | | | 202,447 | |
| | 400,000 | | | New York Life Global Funding, 2.900%, 1/17/24(a) | | | 421,519 | |
| | 600,000 | | | Pacific Life Global Funding II, 0.500%, 9/23/23(a) | | | 601,102 | |
| | 1,275,000 | | | Protective Life Global Funding, 0.631%, 10/13/23(a) | | | 1,278,825 | |
| | 1,390,000 | | | Security Benefit Global Funding, 1.250%, 5/17/24(a) | | | 1,399,119 | |
| | | | | | | | 12,037,455 | |
| | | | | | | | | |
| | | | | Media — 1.9% | | | | |
| | 1,104,000 | | | Charter Communications Operating, LLC/ Charter Communications Operating Capital, 4.464%, 7/23/22 | | | 1,132,058 | |
| Principal Amount | | | | | Fair Value | |
| CORPORATE BONDS — (continued) | | | |
| | | | Media — (continued) | | | |
| $ | 1,175,000 | | | Comcast Corp., 3.600%, 3/1/24 | | $ | 1,259,949 | |
| | 1,250,000 | | | Discovery Communications, LLC, 3.800%, 3/13/24 | | | 1,332,957 | |
| | | | | | | | 3,724,964 | |
| | | | | | | | | |
| | | | | Metals & Mining — 0.6% | | | | |
| | 1,060,000 | | | Freeport-McMoRan, Inc., 3.875%, 3/15/23 | | | 1,093,602 | |
| | | | | | | | | |
| | | | | Multiline Retail — 0.4% | | | | |
| | 750,000 | | | Dollar Tree, Inc., 3.700%, 5/15/23 | | | 786,118 | |
| | | | | | | | | |
| | | | | Oil, Gas & Consumable Fuels — 3.2% | | | | |
| | 301,000 | | | Cenovus Energy, Inc., 5.375%, 7/15/25 | | | 342,746 | |
| | 1,300,000 | | | Devon Energy Corp., 5.250%, 9/15/24(a) | | | 1,439,743 | |
| | 1,381,000 | | | HollyFrontier Corp., 2.625%, 10/1/23 | | | 1,425,691 | |
| | 1,312,000 | | | Ovintiv Exploration, Inc., 5.375%, 1/1/26 | | | 1,482,897 | |
| | 640,000 | | | Pioneer Natural Resources Co., 0.550%, 5/15/23 | | | 640,609 | |
| | 900,000 | | | Range Resources Corp., 5.000%, 3/15/23 | | | 933,750 | |
| | | | | | | | 6,265,436 | |
| | | | | | | | | |
| | | | | Pharmaceuticals — 0.6% | | | | |
| | 1,100,000 | | | AbbVie, Inc., 3.750%, 11/14/23 | | | 1,171,827 | |
| | | | | | | | | |
| | | | | Road & Rail — 0.4% | | | | |
| | 825,000 | | | Ryder System, Inc., MTN, 3.650%, 3/18/24 | | | 879,952 | |
| | | | | | | | | |
| | | | | Semiconductors & Semiconductor Equipment — 1.1% | | | | |
| | 825,000 | | | Broadcom Corp./Broadcom Cayman Finance, Ltd., 3.625%, 1/15/24 | | | 875,880 | |
| | 1,325,000 | | | Microchip Technology, Inc., 0.972%, 2/15/24(a) | | | 1,325,669 | |
| | | | | | | | 2,201,549 | |
| | | | | | | | | |
| | | | | Software — 0.5% | | | | |
| | 1,000,000 | | | Dell International, LLC/EMC Corp., 5.450%, 6/15/23 | | | 1,073,447 | |
| | | | | | | | | |
| | | | | Specialty Retail — 0.9% | | | | |
| | 940,000 | | | 7-Eleven, Inc., 0.800%, 2/10/24(a) | | | 939,035 | |
| | 920,000 | | | Nordstrom, Inc., 2.300%, 4/8/24 | | | 920,055 | |
| | | | | | | | 1,859,090 | |
| | | | | | | | | |
| | | | | Telecommunication Services — 0.7% | | | | |
| | 1,425,000 | | | Verizon Communications, Inc., 0.840%, (SOFR plus 0.79%), 3/20/26(b) | | | 1,449,111 | |
| | | | | | | | | |
| | | | | Tobacco — 0.6% | | | | |
| | 1,200,000 | | | BAT Capital Corp., 3.222%, 8/15/24 | | | 1,271,950 | |
| | | | | | | | | |
| | | | | Total Corporate Bonds | | | | |
| | | | | (Cost $131,286,433) | | | 132,134,567 | |
Continued
Sterling Capital Short Duration Bond Fund
Schedule of Portfolio Investments — (continued)
September 30, 2021
| Principal Amount | | | | | Fair Value | |
| MUNICIPAL BONDS — 8.5% | | | | |
| | | | | California — 0.7% | | | | |
| $ | 650,000 | | | Beverly Hills Public Financing Authority, CA, Advance Refunding, Taxable Revenue Bonds, Series B, 0.730%, 6/1/24 | | $ | 649,831 | |
| | 715,000 | | | Port of Oakland, CA, Port, Airport & Marina Revenue, Advance Refunding Revenue Bonds, Series R, 1.081%, 5/1/24 | | | 722,515 | |
| | | | | | | | 1,372,346 | |
| | | | | | | | | |
| | | | | Hawaii — 0.1% | | | | |
| | 240,000 | | | State of Hawaii, HI, Public Improvements, Cash Flow Management G.O., 0.802%, 10/1/24 | | | 240,703 | |
| | | | | | | | | |
| | | | | Illinois — 1.3% | | | | |
| | 1,315,000 | | | Chicago O'Hare International Airport, IL, Refunding, Taxable Revenue Bonds, Series D, 1.168%, 1/1/24 | | | 1,329,347 | |
| | 1,200,000 | | | Chicago Transit Authority Sales Tax Receipts Fund, IL, Advance Refunding, Taxable Revenue Bonds, Series B, 1.708%, 12/1/22 | | | 1,216,860 | |
| | | | | | | | 2,546,207 | |
| | | | | | | | | |
| | | | | New Jersey — 0.1% | | | | |
| | 235,000 | | | New Jersey Turnpike Authority, Advance Refunding Revenue Bonds, Series B, 0.638%, 1/1/24 | | | 235,164 | |
| | | | | | | | | |
| | | | | New York — 0.5% | | | | |
| | 1,000,000 | | | New York State Urban Development Corp. Taxable Revenue, Series B, Economic Improvements Revenue Bonds, 1.910%, 3/15/23 | | | 1,018,840 | |
| | | | | | | | | |
| | | | | North Carolina — 0.3% | | | | |
| | 500,000 | | | North Carolina Eastern Municipal Power Agency, Refunding Revenue (AGM), 3.558%, 7/1/22 | | | 512,140 | |
| | | | | | | | | |
| | | | | Oklahoma — 0.3% | | | | |
| | 575,000 | | | Oklahoma Turnpike Authority, OK, Highway & Fuel Sales Tax Revenue, Advance Refunding Revenue Bonds, Series B, 0.627%, 1/1/23 | | | 577,380 | |
| | | | | | | | | |
| | | | | Pennsylvania — 1.3% | | | | |
| | 1,000,000 | | | Allegheny County, PA, Advance Refunding, Taxable Revenue Bonds, G.O., Series C79, 0.694%, 11/1/23 | | | 1,005,750 | |
| | 985,000 | | | Bucks County, PA, Advance Refunding, Taxable Revenue Bonds, G.O., 0.979%, 6/1/24 | | | 994,840 | |
| Principal Amount | | | | | Fair Value | |
| MUNICIPAL BONDS — (continued) | | | |
| | | | Pennsylvania — (continued) | | | |
| $ | 515,000 | | | Pennsylvania State University (The), PA, Refunding Notes, Taxable Revenue Bonds, Series D, 1.353%, 9/1/23 | | $ | 524,368 | |
| | | | | | | | 2,524,958 | |
| | | | | | | | | |
| | | | | South Carolina — 0.8% | | | | |
| | 1,500,000 | | | City of Columbia, SC, Waterworks & Sewer System Revenue, Taxable Revenue-Series B, Advance Refunding Revenue Bonds, 1.932%, 2/1/23 | | | 1,531,980 | |
| | | | | | | | | |
| | | | | Texas — 2.6% | | | | |
| | 970,000 | | | City of Houston, TX, Airport System Revenue, Refunding, Taxable Revenue Bonds, Series C, 1.054%, 7/1/23 | | | 980,069 | |
| | 1,250,000 | | | City of Houston, TX, Combined Utility System Revenue, Taxable Revenue, Series B, Advance Refunding G.O.,1.820%, 3/1/23 | | | 1,276,287 | |
| | 1,250,000 | | | City of Houston, TX, Combined Utility System Revenue, Taxable Revenue, First Lien-Series C, Advance Refunding Revenue Bonds, 1.746%, 11/15/23 | | | 1,284,700 | |
| | 1,475,000 | | | Texas State University System, Taxable Revenue, Series B, Advance Refunding Revenue Bonds, 2.043%, 3/15/23 | | | 1,509,058 | |
| | | | | | | | 5,050,114 | |
| | | | | | | | | |
| | | | | Virginia — 0.5% | | | | |
| | 1,000,000 | | | Hampton Roads Sanitation District, Taxable Revenue, Sub-Series A, Advance Refunding Revenue Bonds, 1.762%,2/1/23 | | | 1,017,470 | |
| | | | | | | | | |
| | | | | Total Municipal Bonds | | | | |
| | | | | (Cost $16,377,569) | | | 16,627,302 | |
| Shares | | | | | | |
| MONEY MARKET FUND — 1.2% | | | |
| | 2,437,896 | | | Federated Treasury Obligations Fund, Institutional Shares, 0.01%(f) | | | 2,437,896 | |
| | | | | | | | | |
| | | | | Total Money Market Fund | | | | |
| | | | | (Cost $2,437,896) | | | 2,437,896 | |
| | | | | | | | | |
| Total Investments — 100.1% | | | | |
| (Cost $195,783,506) | | | 197,046,215 | |
| Net Other Assets (Liabilities) — (0.1)% | | | (269,836 | ) |
| NET ASSETS — 100.0% | | $ | 196,776,379 | |
| (a) | Rule 144A, Section 4(2) or other security that is restricted as to resale to qualified institutional investors. The Advisor, using Board approved procedures, has deemed these securities or a portion of these securities to be liquid. |
Continued
Sterling Capital Short Duration Bond Fund
Schedule of Portfolio Investments — (continued)
September 30, 2021
| (b) | The interest rate for this floating rate note, which will change periodically, is based either on the prime rate or an index of market rates. The reflected rate is in effect as of September 30, 2021. The maturity date reflected is the final maturity date. |
| (c) | Security is a fix-to-float security, which carries a fixed coupon until a certain date, upon which it switches to a floating rate. Rate shown is the fixed rate. |
| (d) | The interest rate for this variable rate note, which will change periodically, is based either on the prime rate or an index of market rates. The reflected rate is in effect as of September 30, 2021. The maturity date reflected is the final maturity date. |
| (e) | Security is perpetual in nature and has no stated maturity date. |
| (f) | Represents the current yield as of report date. |
| AGM | Assured Guaranty Municipal Corp. |
| BKNT | Bank Note |
| G.O. | General Obligation |
| MTN | Medium Term Note |
| STEP | Step Coupon Bond |
Continued
Sterling Capital Intermediate U.S. Government Fund
Schedule of Portfolio Investments
September 30, 2021
| Principal Amount | | | | | Fair Value | |
| ASSET BACKED SECURITIES — 2.1% | | | |
| $ | 265,000 | | | Avis Budget Rental Car Funding AESOP, LLC, Series 2019-3A, Class A, 2.360%, 3/20/26(a) | | $ | 275,585 | |
| | 122,807 | | | United States Small Business Administration, Series 2015-20G, Class 1, 2.880%, 7/1/35 | | | 129,593 | |
| | | | | | | | | |
| | | | | Total Asset Backed Securities | | | | |
| | | | | (Cost $392,395) | | | 405,178 | |
| | | | | | | | | |
| COLLATERALIZED MORTGAGE OBLIGATIONS — 15.2% | | | | |
| | 62,453 | | | Fannie Mae, Series 2003-44, Class Q, 3.500%, 6/25/33 | | | 66,760 | |
| | 270,768 | | | Fannie Mae, Series 2005-31, Class PB, 5.500%, 4/25/35 | | | 307,367 | |
| | 227,919 | | | Fannie Mae, Series 2012-150, Class KA, 1.750%, 1/25/43 | | | 227,290 | |
| | 379,075 | | | Fannie Mae, Series 2012-87, Class MB, 2.000%, 5/25/42 | | | 392,048 | |
| | 128,078 | | | Fannie Mae, Series 2013-44, Class DJ, 1.850%, 5/25/33 | | | 130,997 | |
| | 219,111 | | | Fannie Mae, Series 2016-24, Class CD, 1.750%, 2/25/46 | | | 219,895 | |
| | 157,385 | | | Fannie Mae, Series 2016-49, Class DA, 3.500%, 10/25/42 | | | 161,908 | |
| | 305,996 | | | Fannie Mae, Series 2016-49, Class PA, 3.000%, 9/25/45 | | | 320,040 | |
| | 107,428 | | | Freddie Mac, Series 4122, Class BC, 3.000%, 5/15/40 | | | 114,206 | |
| | 282,284 | | | Freddie Mac, Series 4173, Class NB, 3.000%, 3/15/43 | | | 300,779 | |
| | 15,723 | | | Freddie Mac, Series 4648, Class E, 3.500%, 8/15/43 | | | 15,810 | |
| | 193,900 | | | Freddie Mac, Series 4656, Class PA, 3.500%, 10/15/45 | | | 203,741 | |
| | 286,847 | | | Freddie Mac, Series 4863, Class AJ, 3.500%, 7/15/38 | | | 311,381 | |
| | 18,491 | | | Ginnie Mae, Series 2011-71, Class QE, 3.500%, 9/16/40 | | | 18,729 | |
| | 112,288 | | | Ginnie Mae, Series 2013-133, Class PL, 3.500%, 2/16/37 | | | 120,764 | |
| | 87,727 | | | Ginnie Mae, Series 2015-162, Class EB, 2.500%, 9/20/44 | | | 90,193 | |
| | | | | | | | | |
| | | | | Total Collateralized Mortgage Obligations | | | | |
| | | | | (Cost $2,964,856) | | | 3,001,908 | |
| | | | | | | | | |
| COMMERCIAL MORTGAGE-BACKED SECURITIES — 19.3% | | | | |
| | 144,298 | | | Citigroup Commercial Mortgage Trust, Series 2015-GC29, Class A3, 2.935%, 4/10/48 | | | 149,925 | |
| | 102,677 | | | COMM 2012-CCRE3 Mortgage Trust, Series 2012-CR3, Class A3, 2.822%, 10/15/45 | | | 104,111 | |
| Principal Amount | | | | | Fair Value | |
| COMMERCIAL MORTGAGE-BACKED SECURITIES — (continued) | |
| $ | 706,257 | | | Fannie Mae-Aces, Series 2015-M17, Class A2, 2.982%, 11/25/25(b) | | $ | 752,395 | |
| | 450,000 | | | Fannie Mae-Aces, Series 2017-M7, Class A2, 2.961%, 2/25/27(b) | | | 483,868 | |
| | 275,000 | | | Fannie Mae-Aces, Series 2017-M8, Class A2, 3.061%, 5/25/27(b) | | | 298,476 | |
| | 300,000 | | | Freddie Mac Multifamily Structured Pass Through Certificates, Series K033, Class A2, 3.060%, 7/25/23(b) | | | 312,599 | |
| | 140,000 | | | Freddie Mac Multifamily Structured Pass Through Certificates, Series K049, Class A2, 3.010%, 7/25/25 | | | 150,302 | |
| | 210,000 | | | Freddie Mac Multifamily Structured Pass Through Certificates, Series K060, Class A2, 3.300%, 10/25/26 | | | 230,888 | |
| | 210,000 | | | Freddie Mac Multifamily Structured Pass Through Certificates, Series K061, Class A2, 3.347%, 11/25/26(b) | | | 231,417 | |
| | 160,000 | | | Freddie Mac Multifamily Structured Pass Through Certificates, Series K069, Class A2, 3.187%, 9/25/27(b) | | | 176,253 | |
| | 275,000 | | | Freddie Mac Multifamily Structured Pass Through Certificates, Series K079, Class A2, 3.926%, 6/25/28 | | | 317,286 | |
| | 250,000 | | | JPMBB Commercial Mortgage Securities Trust, Series 2014-C23, Class A5, 3.934%, 9/15/47 | | | 269,972 | |
| | 71,000 | | | Morgan Stanley Bank of America Merrill Lynch Trust, Series 2014-C18, Class A4, 3.923%, 10/15/47 | | | 76,525 | |
| | 250,000 | | | Morgan Stanley Bank of America Merrill Lynch Trust, Series 2014-C19, Class A4, 3.526%, 12/15/47 | | | 267,324 | |
| | | | | | | | | |
| | | | | Total Commercial Mortgage-Backed Securities | | | | |
| | | | | (Cost $3,737,344) | | | 3,821,341 | |
| | | | | | | | | |
| CORPORATE BONDS — 2.0% | | | | |
| | | | | Banks — 0.4% | | | | |
| | 70,000 | | | Bank of America Corp., GMTN, 3.500%, 4/19/26 | | | 76,456 | |
| | | | | | | | | |
| | | | | Electric Utilities — 0.4% | | | | |
| | 75,000 | | | Public Service Electric & Gas Co., MTN, 2.250%, 9/15/26 | | | 78,174 | |
| | | | | | | | | |
| | | | | Equity Real Estate Investment Trusts (REITS) — 1.2% | | | | |
| | 250,000 | | | Federal Realty Investment Trust, 1.250%, 2/15/26 | | | 247,751 | |
| | | | | | | | | |
| | | | | Total Corporate Bonds | | | | |
| | | | | (Cost $405,823) | | | 402,381 | |
See accompanying Notes to the Financial Statements.
Sterling Capital Intermediate U.S. Government Fund
Schedule of Portfolio Investments — (continued)
September 30, 2021
| Principal Amount | | | | | Fair Value | |
| MORTGAGE-BACKED SECURITIES — 40.7% | | | |
| | | | Fannie Mae — 30.8% | | | |
| $ | 262,090 | | | 4.000%, 12/1/33, Pool #MA1689 | | $ | 284,542 | |
| | 364,703 | | | 4.500%, 3/1/34, Pool #CA3294 | | | 400,707 | |
| | 400,401 | | | 2.500%, 11/1/35, Pool #CA7939 | | | 419,245 | |
| | 377,547 | | | 1.500%, 12/1/35, Pool #MA4205 | | | 381,498 | |
| | 74,872 | | | 4.000%, 12/1/36, Pool #MA2856 | | | 81,817 | |
| | 68,905 | | | 4.000%, 2/1/37, Pool #MA2914 | | | 75,403 | |
| | 461,648 | | | 1.500%, 12/1/40, Pool #MA4202 | | | 455,767 | |
| | 62,009 | | | 4.000%, 5/1/47, Pool #BE9598 | | | 67,017 | |
| | 156,510 | | | 3.500%, 12/1/47, Pool #CA0833 | | | 166,145 | |
| | 104,866 | | | 5.000%, 8/1/48, Pool #CA2219 | | | 115,666 | |
| | 93,961 | | | 3.500%, 9/1/49, Pool #BJ9608. | | | 99,373 | |
| | 107,901 | | | 3.500%, 10/1/49, Pool #CA4431 | | | 114,127 | |
| | 135,473 | | | 3.000%, 12/1/49, Pool #BO6225 | | | 141,967 | |
| | 138,272 | | | 3.000%, 3/1/50, Pool #FM2714 | | | 145,897 | |
| | 344,621 | | | 3.000%, 7/1/50, Pool #CA6421 | | | 361,884 | |
| | 330,857 | | | 3.000%, 7/1/50, Pool #CA6422 | | | 346,232 | |
| | 218,483 | | | 2.000%, 8/1/50, Pool #CA6799 | | | 220,057 | |
| | 337,503 | | | 2.000%, 9/1/50, Pool #CA7019 | | | 338,442 | |
| | 389,955 | | | 2.500%, 9/1/50, Pool #BQ2883 | | | 402,322 | |
| | 174,712 | | | 2.500%, 9/1/50, Pool #BQ0538 | | | 180,249 | |
| | 452,794 | | | 2.000%, 10/1/50, Pool #CA7224 | | | 454,706 | |
| | 435,859 | | | 2.500%, 10/1/50, Pool #FM4638 | | | 449,795 | |
| | 402,958 | | | 2.500%, 10/1/50, Pool #FM4530 | | | 415,600 | |
| | | | | | | | 6,118,458 | |
| | | | | | | | | |
| | | | | Freddie Mac — 9.7% | | | | |
| | 306,118 | | | 3.000%, 7/1/35, Pool #SB0361 | | | 325,016 | |
| | 155,190 | | | 4.000%, 12/1/35, Pool #ZA2401 | | | 169,160 | |
| | 144,566 | | | 3.500%, 6/1/36, Pool #ZA2414 | | | 155,712 | |
| | 96,990 | | | 4.000%, 3/1/39, Pool #ZA6403 | | | 103,918 | |
| | 249,613 | | | 2.000%, 12/1/40, Pool #RB5090 | | | 252,920 | |
| | 161,624 | | | 3.500%, 1/1/47, Pool #ZT0941 | | | 172,711 | |
| | 404,946 | | | 2.000%, 11/1/50, Pool #QB4916 | | | 406,073 | |
| | 306,854 | | | 2.500%, 11/1/50, Pool #QB5838 | | | 318,153 | |
| | | | | | | | 1,903,663 | |
| | | | | | | | | |
| | | | | Ginnie Mae II — 0.2% | | | | |
| | 28,719 | | | 5.000%, 11/20/38, Pool #4283 | | | 30,257 | |
| | | | | | | | | |
| | | | | Total Mortgage-Backed Securities | | | | |
| | | | | (Cost $8,074,303) | | | 8,052,378 | |
| | | | | | | | | |
| MUNICIPAL BONDS — 0.9% | | | | |
| | | | | Wisconsin — 0.9% | | | | |
| | 150,000 | | | State of Wisconsin, TXB, Revenue Bonds, Pension Funding, Series A, (AGM), 5.700%, 5/1/26 | | | 172,050 | |
| | | | | | | | | |
| | | | | Total Municipal Bonds | | | | |
| | | | | (Cost $158,541) | | | 172,050 | |
| | | | | | | | | |
| U.S. GOVERNMENT AGENCIES — 10.4% | | | | |
| | | | | Fannie Mae — 10.4% | | | | |
| | 1,000,000 | | | 6.250%, 5/15/29 | | | 1,343,379 | |
| Principal Amount | | | | | Fair Value | |
| U.S. GOVERNMENT AGENCIES — (continued) | | | |
| | | | Fannie Mae — (continued) | | | |
| $ | 500,000 | | | 7.125%, 1/15/30 | | $ | 717,450 | |
| | | | | | | | 2,060,829 | |
| | | | | | | | | |
| | | | | Total U.S. Government Agencies | | | | |
| | | | | (Cost $1,836,340) | | | 2,060,829 | |
| | | | | | | | | |
| U.S. TREASURY NOTES — 10.8% | | | | |
| | 1,450,000 | | | 0.250%, 9/30/25 | | | 1,418,395 | |
| | 750,000 | | | 1.125%, 2/15/31 | | | 725,742 | |
| | | | | | | | | |
| | | | | Total U.S. Treasury Notes | | | | |
| | | | | (Cost $2,160,733) | | | 2,144,137 | |
| Shares | | | | | | |
| MONEY MARKET FUND — 0.2% | | | |
| | 49,031 | | | Federated Treasury Obligations Fund, Institutional Shares, 0.01%(c) | | | 49,031 | |
| | | | | | | | | |
| | | | | Total Money Market Fund | | | | |
| | | | | (Cost $49,031) | | | 49,031 | |
| | | | | | | | | |
| Total Investments — 101.6% | | | | |
| (Cost $19,779,366) | | | 20,109,233 | |
| Net Other Assets (Liabilities) — (1.6)% | | | (324,905 | ) |
| NET ASSETS — 100.0% | | $ | 19,784,328 | |
| (a) | Rule 144A, Section 4(2) or other security that is restricted as to resale to qualified institutional investors. The Advisor, using Board approved procedures, has deemed these securities or a portion of these securities to be liquid. |
| (b) | The interest rate for this variable rate note, which will change periodically, is based either on the prime rate or an index of market rates. The reflected rate is in effect as of September 30, 2021. The maturity date reflected is the final maturity date. |
| (c) | Represents the current yield as of report date. |
| AGM | Assured Guaranty Municipal Corp. |
| GMTN | Global Medium Term Note |
Continued
Sterling Capital Total Return Bond Fund
Schedule of Portfolio Investments
September 30, 2021
| Principal Amount | | | | | Fair Value | |
| ASSET BACKED SECURITIES — 14.0% | | | |
| $ | 771,143 | | | Aegis Asset Backed Securities Trust, Series 2005-5, Class 1A4, 0.786%, (LIBOR USD 1-Month plus 0.70%), 12/25/35(a) | | $ | 771,253 | |
| | 8,200,000 | | | AmeriCredit Automobile Receivables Trust, Series 2020-3, Class B, 0.760%, 12/18/25 | | | 8,221,734 | |
| | 16,500,000 | | | AmeriCredit Automobile Receivables Trust, Series 2021-1, Class B, 0.680%, 10/19/26 | | | 16,483,700 | |
| | 42,971 | | | Argent Securities, Inc. Asset-Backed Pass- Through Certificates, Series 2005-W3, Class A2D, 0.766%, (LIBOR USD 1-Month plus 0.68%), 11/25/35(a) | | | 42,950 | |
| | 10,215,000 | | | ARI Fleet Lease Trust, Series 2019-A, Class A3, 2.530%, 11/15/27 | | | 10,475,414 | |
| | 2,143,000 | | | Avis Budget Rental Car Funding AESOP, LLC, Series 2017-2A, Class A, 2.970%, 3/20/24(b) | | | 2,212,381 | |
| | 8,000,000 | | | Avis Budget Rental Car Funding AESOP, LLC, Series 2019-2A, Class A, 3.350%, 9/22/25(b) | | | 8,526,296 | |
| | 2,030,000 | | | Avis Budget Rental Car Funding AESOP, LLC, Series 2019-3A, Class A, 2.360%, 3/20/26(b) | | | 2,111,082 | |
| | 3,000,000 | | | Avis Budget Rental Car Funding AESOP, LLC, Series 2020-2A, Class A, 2.020%, 2/20/27(b) | | | 3,073,447 | |
| | 6,250,000 | | | Avis Budget Rental Car Funding AESOP, LLC, Series 2021-1A, Class A, 1.380%, 8/20/27(b) | | | 6,233,765 | |
| | 12,034,000 | | | Capital One Multi-Asset Execution Trust, Series 2019-A3, Class A3, 2.060%, 8/15/28 | | | 12,561,993 | |
| | 1,199,016 | | | Chesapeake Funding II, LLC, Series 2020- 1A, Class A1, 0.870%, 8/16/32 | | | 1,205,280 | |
| | 2,361,000 | | | Citibank Credit Card Issuance Trust, Series 2007-A3, Class A3, 6.150%, 6/15/39 | | | 3,273,387 | |
| | 34,125 | | | Citicorp Residential Mortgage Trust, STEP, Series 2007-2, Class A6, 4.904%, 6/25/37 | | | 34,439 | |
| | 10,230,115 | | | Enterprise Fleet Financing, LLC, Series 2018-2, Class A3, 3.340%, 2/20/24 | | | 10,243,347 | |
| | 6,041,000 | | | Enterprise Fleet Financing, LLC, Series 2020-1, Class A3, 1.860%, 12/22/25 | | | 6,189,981 | |
| | 6,943,000 | | | Enterprise Fleet Funding, LLC, Series 2021-1, Class A3, 0.700%, 12/21/26(b) | | | 6,927,277 | |
| | 2,247,000 | | | Ford Credit Auto Owner Trust, Series 2017-2, Class A, 2.360%, 3/15/29. | | | 2,291,991 | |
| | 19,805,000 | | | Ford Credit Auto Owner Trust 2020- REV2, Series 2020-2, Class A, 1.060%, 4/15/33(b) | | | 19,724,833 | |
| | 3,750,000 | | | GM Financial Revolving Receivables Trust, Series 2021-1, Class A, 1.170%, 6/12/34(b) | | | 3,749,629 | |
| Principal Amount | | | | | Fair Value | |
| ASSET BACKED SECURITIES — (continued) | | | |
| $ | 6,000,000 | | | GreatAmerica Leasing Receivables Funding, LLC, Series 2021-1, Class A3, 0.340%, 8/15/24(b) | | $ | 5,986,331 | |
| | 15,735,000 | | | Hertz Vehicle Financing III L.P., Series 2021-2A, Class A, 1.680%, 12/27/27(b) | | | 15,744,055 | |
| | 270,086 | | | JP Morgan Mortgage Acquisition Corp., Series 2005-OPT1, Class M2, 0.791%, (LIBOR USD 1-Month plus 0.71%), 6/25/35(a) | | | 270,109 | |
| | 559,831 | | | New Century Home Equity Loan Trust, Series 2003-4, Class M1, 1.211%, (LIBOR USD 1-Month plus 1.13%), 10/25/33(a) | | | 559,865 | |
| | 18,790,000 | | | OneMain Financial Issuance Trust 2021-1, Series 2021-1A, Class A1, 1.550%, 6/16/36(b) | | | 18,756,798 | |
| | 332,475 | | | Park Place Securities, Inc. Asset-Backed Pass Through Certificates, Series 2005- WHQ2, Class M2, 0.776%, (LIBOR USD 1-Month plus 0.69%), 5/25/35(a) | | | 332,669 | |
| | 14,077,000 | | | Santander Drive Auto Receivables Trust, Series 2020-3, Class B, 0.690%, 3/17/25 | | | 14,108,958 | |
| | 8,583,000 | | | Santander Drive Auto Receivables Trust, Series 2020-4, Class B, 0.730%, 3/17/25 | | | 8,608,355 | |
| | 3,043,510 | | | Saxon Asset Securities Trust, Series 2004- 3, Class M1, 0.984%, (LIBOR USD 1-Month plus 0.90%), 12/26/34 | | | 3,047,533 | |
| | 79,171 | | | SoFi Professional Loan Program, LLC, Series 2016-E, Class A1, 0.936%, (LIBOR USD 1-Month plus 0.85%), 7/25/39(a)(b) | | | 79,285 | |
| | 8,405,000 | | | Toyota Auto Loan Extended Note Trust, Series 2019-1A, Class A, 2.560%, 11/25/31(b) | | | 8,811,667 | |
| | 5,150,000 | | | Toyota Auto Loan Extended Note Trust 2020-1, Series 2020-1A, Class A, 1.350%, 5/25/33(b) | | | 5,217,477 | |
| | 3,404,000 | | | Wheels SPV 2, LLC, Series 2018-1A, Class A4, 3.410%, 4/20/27(b). | | | 3,429,872 | |
| | 8,242,000 | | | Wheels SPV 2, LLC, Series 2019-1A, Class A3, 2.350%, 5/22/28(b). | | | 8,388,098 | |
| | | | | | | | | |
| | | | | Total Asset Backed Securities | | | | |
| | | | | (Cost $215,183,587) | | | 217,695,251 | |
| | | | | | | | | |
| COLLATERALIZED MORTGAGE OBLIGATIONS — 2.9% | | | | |
| | 83,342 | | | Adjustable Rate Mortgage Trust, Series 2004-5, Class 4A1, 2.855%, 4/25/35(c) | | | 85,155 | |
| | 230,066 | | | Alternative Loan Trust, Series 2004-22CB, Class 1A1, 6.000%, 10/25/34 | | | 238,891 | |
| | 425,810 | | | Banc of America Funding Trust, Series 2004-C, Class 4A1, 0.747%, (LIBOR USD 1-Month plus 0.66%), 12/20/34(a) | | | 426,026 | |
| | 273,720 | | | Banc of America Funding Trust, Series 2006-2, Class 3A1, 6.000%, 3/25/36 | | | 278,227 | |
See accompanying Notes to the Financial Statements.
Sterling Capital Total Return Bond Fund
Schedule of Portfolio Investments — (continued)
September 30, 2021
| Principal Amount | | | | | Fair Value | |
| COLLATERALIZED MORTGAGE OBLIGATIONS — (continued) | |
| $ | 9,840 | | | Citigroup Mortgage Loan Trust, Inc., Series 2004-NCM2, Class 3CB2, 6.500%, 8/25/19 | | $ | 9,829 | |
| | 69,145 | | | Countrywide Home Loan Mortgage Pass- Through Trust, Series 2004-3, Class A4, 5.750%, 4/25/34 | | | 72,471 | |
| | 163,887 | | | Credit Suisse First Boston Mortgage-Backed Pass-Through Certificates, Series 2004-1, Class 2A1, 6.500%, 2/25/34 | | | 169,624 | |
| | 967,295 | | | Fannie Mae, Series 2011-38, Class D, 4.500%, 5/25/41 | | | 1,078,895 | |
| | 315,921 | | | Fannie Mae, Series 2013-133, Class AV, 4.000%, 12/25/26 | | | 317,706 | |
| | 4,848,473 | | | Fannie Mae, Series 2013-16, Class A, 1.750%, 1/25/40 | | | 4,896,680 | |
| | 891,000 | | | Fannie Mae, Series 2013-70, Class CY, 3.500%, 7/25/43 | | | 950,294 | |
| | 1,153,485 | | | Fannie Mae, Series 2014-39, Class VP, 3.000%, 8/25/27 | | | 1,185,089 | |
| | 245,560 | | | Fannie Mae, Series 2017-64, Class PD, 2.500%, 7/25/47 | | | 252,481 | |
| | 405,688 | | | FirstKey Mortgage Trust, Series 2014-1, Class A12, 3.500%, 11/25/44(b)(c) | | | 412,808 | |
| | 492,176 | | | Freddie Mac, Series 3632, Class PK, 5.000%, 2/15/40 | | | 543,920 | |
| | 730,000 | | | Freddie Mac, Series 3762, Class LN, 4.000%, 11/15/40 | | | 837,139 | |
| | 427,758 | | | Freddie Mac, Series 3768, Class V, 4.000%, 11/15/23 | | | 439,556 | |
| | 809,804 | | | Freddie Mac, Series 4077, Class PJ, 3.500%, 11/15/40 | | | 847,229 | |
| | 1,706,591 | | | Freddie Mac, Series 4100, Class PA, 3.000%, 1/15/42 | | | 1,795,496 | |
| | 507,000 | | | Freddie Mac, Series 4120, Class YK, 2.000%, 10/15/32 | | | 499,309 | |
| | 400,609 | | | Freddie Mac, Series 4136, Class HZ, 3.500%, 11/15/27 | | | 432,573 | |
| | 474,000 | | | Freddie Mac, Series 4160, Class HH, 2.500%, 12/15/32 | | | 486,093 | |
| | 963,878 | | | Freddie Mac, Series 4287, Class V, 4.500%, 10/15/26 | | | 1,010,908 | |
| | 532,474 | | | Freddie Mac, Series 4328, Class KD, 3.000%, 8/15/43 | | | 557,368 | |
| | 1,213,370 | | | Freddie Mac, Series 4331, Class V, 4.000%, 11/15/28 | | | 1,227,237 | |
| | 2,485,102 | | | Freddie Mac, Series 4427, Class KA, 2.250%, 7/15/44 | | | 2,554,039 | |
| | 661,752 | | | Freddie Mac, Series 4648, Class E, 3.500%, 8/15/43 | | | 665,401 | |
| | 1,861,673 | | | Freddie Mac, Series 4654, Class KA, 3.000%, 6/15/45 | | | 1,932,355 | |
| | 8,910,000 | | | Freddie Mac, Series 4655, Class GV, 3.500%, 12/15/36 | | | 9,056,451 | |
| Principal Amount | | | | | Fair Value | |
| COLLATERALIZED MORTGAGE OBLIGATIONS — (continued) | |
| $ | 3,822,412 | | | Freddie Mac, Series 4657, Class VT, 3.500%, 6/15/37 | | $ | 3,860,792 | |
| | 808,814 | | | Freddie Mac, Series 4710, Class GA, 3.000%, 3/15/44 | | | 823,561 | |
| | 1,139,071 | | | Freddie Mac, Series 4752, Class HB, 3.500%, 4/15/44 | | | 1,141,641 | |
| | 305,627 | | | Freddie Mac, Series 4776, Class DW, 4.000%, 9/15/44 | | | 305,465 | |
| | 204,936 | | | Ginnie Mae, Series 2008-51, Class PG, 5.000%, 6/20/38 | | | 224,595 | |
| | 4,238,270 | | | Ginnie Mae, Series 2014-2, Class AG, 2.360%, 3/20/40 | | | 4,334,658 | |
| | 448,959 | | | MASTR Alternative Loan Trust, Series 2003-5, Class 8A1, 5.500%, 6/25/33 | | | 464,554 | |
| | 280,936 | | | MASTR Alternative Loan Trust, Series 2004-13, Class 3A1, 6.500%, 1/25/35 | | | 255,916 | |
| | 115 | | | RAAC Trust, Series 2004-SP3, Class AI5, 4.890%, 12/25/32(c) | | | 116 | |
| | 126,535 | | | RAAC Trust, STEP, Series 2004-SP1, Class AI3, 6.118%, 3/25/34 | | | 127,848 | |
| | 117,582 | | | Residential Asset Securitization Trust, Series 2004-IP2, Class 4A, 3.243%, 12/25/34(c) | | | 121,752 | |
| | | | | | | | | |
| | | | | Total Collateralized Mortgage Obligations | | | | |
| | | | | (Cost $44,405,859) | | | 44,920,148 | |
| | | | | | | | | |
| COMMERCIAL MORTGAGE-BACKED SECURITIES — 15.0% | | | | |
| | 14,468,000 | | | BANK 2020-BNK27, Series 2020-BN27, Class A5, 2.144%, 4/15/63 | | | 14,553,720 | |
| | 1,880,000 | | | BANK 2020-BNK29, Series 2020-BN29, Class A4, 1.997%, 11/15/53 | | | 1,859,890 | |
| | 3,186,000 | | | BBCMS Mortgage Trust, Series 2020-C7, Class A5, 2.037%, 4/15/53 | | | 3,176,489 | |
| | 5,389,000 | | | Benchmark Mortgage Trust, Series 2020- B18, Class A5, 1.925%, 7/15/53 | | | 5,321,287 | |
| | 3,603,000 | | | Benchmark Mortgage Trust, Series 2020- B21, Class A5, 1.978%, 12/17/53 | | | 3,557,091 | |
| | 4,314,000 | | | CD Mortgage Trust, Series 2016-CD2, Class A4, 3.526%, 11/10/49(c) | | | 4,713,542 | |
| | 530,000 | | | CD Mortgage Trust, Series 2017-CD3, Class A4, 3.631%, 2/10/50 | | | 581,710 | |
| | 3,447,000 | | | CFCRE Commercial Mortgage Trust, Series 2016-C7, Class A3, 3.839%, 12/10/54 | | | 3,793,324 | |
| | 1,337,000 | | | Citigroup Commercial Mortgage Trust, Series 2017-P7, Class A4, 3.712%, 4/14/50 | | | 1,473,636 | |
| | 5,806,000 | | | Citigroup Commercial Mortgage Trust, Series 2018-B2, Class A4, 4.009%, 3/10/51 | | | 6,551,750 | |
Continued
Sterling Capital Total Return Bond Fund
Schedule of Portfolio Investments — (continued)
September 30, 2021
| Principal Amount | | | | | Fair Value | |
| COMMERCIAL MORTGAGE-BACKED SECURITIES — (continued) | |
| $ | 3,159,000 | | | COMM 2013-CCRE12 Mortgage Trust, Series 2013-CR12, Class A4, 4.046%, 10/10/46 | | $ | 3,354,756 | |
| | 891,000 | | | COMM Mortgage Trust, Series 2012-CR1, Class AM, 3.912%, 5/15/45 | | | 903,096 | |
| | 795,000 | | | COMM Mortgage Trust, Series 2014- CR16, Class A4, 4.051%, 4/10/47 | | | 854,529 | |
| | 1,643,000 | | | COMM Mortgage Trust, Series 2014- CR20, Class A4, 3.590%, 11/10/47 | | | 1,754,475 | |
| | 1,208,000 | | | COMM Mortgage Trust, Series 2014- LC17, Class A5, 3.917%, 10/10/47 | | | 1,307,506 | |
| | 1,070,000 | | | COMM Mortgage Trust, Series 2014- UBS4, Class A5, 3.694%, 8/10/47 | | | 1,141,461 | |
| | 7,155,000 | | | COMM Mortgage Trust, Series 2017- COR2, Class A3, 3.510%, 9/10/50 | | | 7,850,704 | |
| | 1,337,000 | | | CSAIL Commercial Mortgage Trust, Series 2015-C4, Class A4, 3.808%, 11/15/48 | | | 1,461,724 | |
| | 3,639,000 | | | DBJPM 20-C9 Mortgage Trust, Series 2020-C9, Class A5, 1.926%, 8/15/53 | | | 3,591,717 | |
| | 3,775,000 | | | Fannie Mae-Aces, Series 2017-M8, Class A2, 3.061%, 5/25/27(c) | | | 4,097,256 | |
| | 2,228,000 | | | Fannie Mae-Aces, Series 2019-M9, Class A2, 2.937%, 6/25/29 | | | 2,438,853 | |
| | 2,985,000 | | | Freddie Mac Multifamily Structured Pass Through Certificates, Series K068, Class A2, 3.244%, 8/25/27 | | | 3,294,628 | |
| | 3,493,000 | | | Freddie Mac Multifamily Structured Pass Through Certificates, Series K069, Class A2, 3.187%, 9/25/27(c) | | | 3,847,815 | |
| | 7,569,000 | | | Freddie Mac Multifamily Structured Pass Through Certificates, Series K099, Class A2, 2.595%, 9/25/29 | | | 8,133,635 | |
| | 3,386,000 | | | Freddie Mac Multifamily Structured Pass Through Certificates, Series K153, Class A3, 3.117%, 10/25/31(c) | | | 3,787,498 | |
| | 8,536,000 | | | Freddie Mac Multifamily Structured Pass Through Certificates, Series K155, Class A3, 3.750%, 4/25/33 | | | 9,991,786 | |
| | 5,684,907 | | | FRESB Mortgage Trust, Series 2018-SB52, Class A10F, 3.480%, 6/25/28(c) | | | 6,050,776 | |
| | 195,021 | | | GS Mortgage Securities Trust, Series 2010- C1, Class A2, 4.592%, 8/10/43(b). | | | 195,191 | |
| | 2,673,000 | | | GS Mortgage Securities Trust, Series 2010- C1, Class B, 5.148%, 8/10/43 | | | 2,684,986 | |
| | 1,010,000 | | | GS Mortgage Securities Trust, Series 2012- GCJ7, Class AS, 4.085%, 5/10/45 | | | 1,022,164 | |
| | 2,249,000 | | | GS Mortgage Securities Trust, Series 2014- GC24, Class A5, 3.931%, 9/10/47 | | | 2,429,079 | |
| | 2,209,000 | | | GS Mortgage Securities Trust, Series 2016- GS4, Class A4, 3.442%, 11/10/49(c) | | | 2,402,199 | |
| | 6,706,000 | | | GS Mortgage Securities Trust, Series 2020- GC47, Class A5, 2.377%, 5/12/53 | | | 6,854,724 | |
| Principal Amount | | | | | Fair Value | |
| COMMERCIAL MORTGAGE-BACKED SECURITIES — (continued) | |
| $ | 3,053,557 | | | JP Morgan Chase Commercial Mortgage Securities Trust, Series 2011-C3, Class B, 5.013%,
2/15/46(b)(c) | | $ | 3,104,497 | |
| | 1,497,000 | | | JP Morgan Chase Commercial Mortgage Securities Trust, Series 2013-C10, Class AS, 3.372%, 12/15/47 | | | 1,543,533 | |
| | 3,600,000 | | | JP Morgan Chase Commercial Mortgage Securities Trust, Series 2014-C20, Class A5, 3.805%, 7/15/47 | | | 3,831,675 | |
| | 1,517,000 | | | JP Morgan Chase Commercial Mortgage Securities Trust, Series 2016-JP4, Class A4, 3.648%, 12/15/49(c) | | | 1,663,404 | |
| | 1,245,000 | | | JPMBB Commercial Mortgage Securities Trust, Series 2014-C23, Class A5, 3.934%, 9/15/47 | | | 1,344,463 | |
| | 3,742,000 | | | JPMCC Commercial Mortgage Securities Trust, Series 2017-JP5, Class A5, 3.723%, 3/15/50 | | | 4,123,018 | |
| | 2,998,000 | | | JPMDB Commercial Mortgage Securities Trust, Series 2020-COR7, Class A5, 2.180%, 5/13/53 | | | 3,017,944 | |
| | 589,000 | | | Morgan Stanley Bank of America Merrill Lynch Trust, Series 2014-C18, Class A4, 3.923%, 10/15/47 | | | 634,834 | |
| | 5,198,000 | | | Morgan Stanley Bank of America Merrill Lynch Trust, Series 2016-C32, Class A4, 3.720%, 12/15/49 | | | 5,721,156 | |
| | 2,562,000 | | | Morgan Stanley Capital I Trust, Series 2016-BNK2, Class A4, 3.049%, 11/15/49 | | | 2,741,151 | |
| | 9,850,000 | | | Morgan Stanley Capital I Trust, Series 2018-H3, Class A5, 4.177%, 7/15/51 | | | 11,148,386 | |
| | 7,147,000 | | | Morgan Stanley Capital I Trust, Series 2020-HR8, Class A4, 2.041%, 7/15/53 | | | 7,103,516 | |
| | 8,910,000 | | | Morgan Stanley Capital I, Inc., Series 2017-HR2, Class A4, 3.587%, 12/15/50 | | | 9,827,255 | |
| | 7,431,000 | | | OPG Trust, Series 2021-PORT, Class C, 0.932%, (LIBOR USD 1-Month plus 0.83%), 10/15/36 | | | 7,369,182 | |
| | 2,812,000 | | | Wells Fargo Commercial Mortgage Trust, Series 2015-P2, Class A4, 3.809%, 12/15/48 | | | 3,081,081 | |
| | 723,000 | | | Wells Fargo Commercial Mortgage Trust, Series 2016-C37, Class A5, 3.794%, 12/15/49 | | | 799,100 | |
| | 8,591,000 | | | Wells Fargo Commercial Mortgage Trust, Series 2017-C40, Class A4, 3.581%, 10/15/50 | | | 9,424,894 | |
| | 4,724,000 | | | Wells Fargo Commercial Mortgage Trust, Series 2020-C56, Class A5, 2.448%, 6/15/53 | | | 4,853,799 | |
| | 11,997,000 | | | Wells Fargo Commercial Mortgage Trust, Series 2020-C57, Class A4, 2.118%, 8/15/53 | | | 11,995,707 | |
Continued
Sterling Capital Total Return Bond Fund
Schedule of Portfolio Investments — (continued)
September 30, 2021
| Principal Amount | | | | | Fair Value | |
| COMMERCIAL MORTGAGE-BACKED SECURITIES — (continued) | |
| $ | 9,296,020 | | | WFRBS Commercial Mortgage Trust, Series 2012-C7, Class A2, 3.431%, 6/15/45 | | $ | 9,400,095 | |
| | 1,337,000 | | | WFRBS Commercial Mortgage Trust, Series 2012-C8, Class AS, 3.660%, 8/15/45 | | | 1,363,079 | |
| | 3,311,000 | | | WFRBS Commercial Mortgage Trust, Series 2014-C22, Class A5, 3.752%, 9/15/57 | | | 3,555,338 | |
| | 899,000 | | | WFRBS Commercial Mortgage Trust, Series 2014-C23, Class A5, 3.917%, 10/15/57 | | | 971,056 | |
| | | | | | | | | |
| | | | | Total Commercial Mortgage-Backed Securities | | | | |
| | | | | (Cost $227,005,897) | | | 233,651,160 | |
| | | | | | | | | |
| CORPORATE BONDS — 41.0% | | | | |
| | | | | Aerospace & Defense — 0.7% | | | | |
| | 3,382,000 | | | Boeing Co. (The), 5.705%, 5/1/40 | | | 4,307,653 | |
| | 3,499,000 | | | L3Harris Technologies, Inc., 3.832%, 4/27/25 | | | 3,802,956 | |
| | 1,730,000 | | | Raytheon Technologies Corp., 4.500%, 6/1/42 | | | 2,121,605 | |
| | | | | | | | 10,232,214 | |
| | | | | | | | | |
| | | | | Automobiles — 0.9% | | | | |
| | 3,916,000 | | | Daimler Finance North America, LLC, 1.450%, 3/2/26(b) | | | 3,931,496 | |
| | 3,844,000 | | | General Motors Financial Co., Inc., 2.750%, 6/20/25 | | | 4,017,536 | |
| | 2,382,000 | | | General Motors Financial Co., Inc., 4.350%, 4/9/25 | | | 2,614,678 | |
| | 3,936,000 | | | Hyundai Capital America, 0.800%, 1/8/24(b) | | | 3,918,950 | |
| | | | | | | | 14,482,660 | |
| | | | | | | | | |
| | | | | Banks — 9.4% | | | | |
| | 2,672,000 | | | Australia & New Zealand Banking Group, Ltd., 2.950%, (5-Year Treasury Constant Maturity plus 1.29%), 7/22/30(b)(c) | | | 2,776,311 | |
| | 4,441,000 | | | Bank of America Corp., 0.740%, (SOFR plus 0.69%), 4/22/25(a) | | | 4,484,607 | |
| | 6,181,000 | | | Bank of America Corp., 3.419%, (LIBOR USD 3-Month plus 1.04%), 12/20/28(d) | | | 6,695,491 | |
| | 5,536,000 | | | Bank of America Corp., MTN, 1.898%, (SOFR plus 1.53%), 7/23/31(d) | | | 5,332,286 | |
| | 2,845,000 | | | Bank of Montreal, MTN, 0.949%, (SOFR plus 0.60%), 1/22/27(d) | | | 2,799,557 | |
| | 3,593,000 | | | Barclays PLC, 4.338%, (LIBOR USD 3-Month plus 1.36%), 5/16/24(d) | | | 3,803,000 | |
| | 3,951,000 | | | BPCE SA, 2.375%, 1/14/25(b) | | | 4,079,143 | |
| | 5,696,000 | | | Canadian Imperial Bank of Commerce, 0.450%, 6/22/23 | | | 5,695,420 | |
| Principal Amount | | | | | Fair Value | |
| CORPORATE BONDS — (continued) | | | |
| | | | Banks — (continued) | | | |
| $ | 3,195,000 | | | Capital One Financial Corp., 3.300%, 10/30/24 | | $ | 3,427,176 | |
| | 7,766,000 | | | Citigroup, Inc., 0.719%, (SOFR plus 0.67%), 5/1/25(a) | | | 7,834,154 | |
| | 3,073,000 | | | Citigroup, Inc., 3.106%, (SOFR plus 2.84%), 4/8/26(d) | | | 3,261,685 | |
| | 2,292,000 | | | Citigroup, Inc., 5.316%, (SOFR plus 4.55%), 3/26/41(d) | | | 3,037,274 | |
| | 3,482,000 | | | Citizens Bank N.A., BKNT, 0.932%, (LIBOR USD 3-Month plus 0.81%), 5/26/22(a) | | | 3,498,237 | |
| | 5,484,000 | | | Commonwealth Bank of Australia, 0.450%, (SOFR plus 0.40%), 7/7/25(a)(b) | | | 5,492,281 | |
| | 3,172,000 | | | Cooperatieve Rabobank UA, 3.950%, 11/9/22 | | | 3,292,495 | |
| | 4,224,000 | | | Credit Suisse Group Funding Guernsey, Ltd., 3.800%, 9/15/22 | | | 4,362,209 | |
| | 3,336,000 | | | First Citizens BancShares, Inc., 3.375%, (SOFR plus 2.47%), 3/15/30(d) | | | 3,400,409 | |
| | 3,558,000 | | | Huntington Bancshares, Inc., 2.625%, 8/6/24 | | | 3,731,364 | |
| | 4,487,000 | | | JPMorgan Chase & Co., 0.935%, (SOFR plus 0.89%), 4/22/27(a) | | | 4,543,643 | |
| | 5,066,000 | | | JPMorgan Chase & Co., 2.083%, (SOFR plus 1.85%), 4/22/26(d) | | | 5,207,334 | |
| | 3,468,000 | | | JPMorgan Chase & Co., 3.157%, (SOFR plus 1.46%), 4/22/42(d) | | | 3,592,825 | |
| | 3,010,000 | | | Lloyds Banking Group PLC, 4.582%, 12/10/25 | | | 3,359,179 | |
| | 2,018,000 | | | Macquarie Group, Ltd., 1.340%, (SOFR plus 1.07%), 1/12/27(b)(d) | | | 1,999,565 | |
| | 4,305,000 | | | Mitsubishi UFJ Financial Group, Inc., 3.761%, 7/26/23 | | | 4,561,285 | |
| | 2,633,000 | | | Morgan Stanley, 0.790%, (SOFR plus 0.53%), 5/30/25(d) | | | 2,624,549 | |
| | 7,395,000 | | | NatWest Markets PLC, 3.625%, 9/29/22(b) | | | 7,639,042 | |
| | 3,039,000 | | | PNC Financial Services Group, Inc. (The), 2.550%, 1/22/30 | | | 3,158,827 | |
| | 3,758,000 | | | PNC Financial Services Group, Inc. (The), Series O, 3.804%, (LIBOR USD 3-Month plus 3.68%)(c)(e) | | | 3,767,173 | |
| | 4,449,000 | | | Royal Bank of Canada, GMTN, 0.620%, (SOFR plus 0.57%), 4/27/26(a) | | | 4,466,886 | |
| | 4,847,000 | | | Sumitomo Mitsui Financial Group, Inc., 2.130%, 7/8/30 | | | 4,771,747 | |
| | 2,994,000 | | | Toronto-Dominion Bank (The), 3.625%, (5 yr. Swap Semi 30/360 USD plus 2.21%), 9/15/31(c) | | | 3,287,952 | |
| | 2,507,000 | | | U.S. Bancorp, Series X, 3.150%, 4/27/27 | | | 2,735,110 | |
| | 5,633,000 | | | UBS Group AG, 1.075%, (LIBOR USD 3-Month plus 0.95%), 8/15/23(a)(b) | | | 5,674,613 | |
| | 1,194,000 | | | Visa, Inc., 2.700%, 4/15/40 | | | 1,219,074 | |
| | 4,074,000 | | | Wells Fargo & Co., 3.068%, (SOFR plus 2.53%), 4/30/41(d) | | | 4,177,355 | |
Continued
Sterling Capital Total Return Bond Fund
Schedule of Portfolio Investments — (continued)
September 30, 2021
| Principal Amount | | | | | Fair Value | |
| CORPORATE BONDS — (continued) | | | |
| | | | Banks — (continued) | | | |
| $ | 1,882,000 | | | Westpac Banking Corp., GMTN, 4.322%, (USD Swap Rate 11:00 am NY 5 plus 2.24%), 11/23/31(c) | | $ | 2,076,432 | |
| | | | | | | | 145,865,690 | |
| | | | | | | | | |
| | | | | Beverages — 0.8% | | | | |
| | 2,936,000 | | | Anheuser-Busch Cos., LLC/Anheuser- Busch InBev Worldwide, Inc., 4.700%, 2/1/36 | | | 3,542,800 | |
| | 2,298,000 | | | Anheuser-Busch InBev Worldwide, Inc., 5.800%, 1/23/59 | | | 3,265,883 | |
| | 3,445,000 | | | Bacardi, Ltd., 4.450%, 5/15/25(b) | | | 3,795,773 | |
| | 1,756,000 | | | PepsiCo, Inc., 3.450%, 10/6/46 | | | 1,938,822 | |
| | | | | | | | 12,543,278 | |
| | | | | | | | | |
| | | | | Capital Goods — 0.2% | | | | |
| | 3,080,000 | | | Keysight Technologies, Inc., 4.550%, 10/30/24 | | | 3,403,918 | |
| | | | | | | | | |
| | | | | Capital Markets — 0.5% | | | | |
| | 3,818,000 | | | Morgan Stanley, 2.188%, (SOFR plus 1.99%), 4/28/26(d) | | | 3,942,681 | |
| | 2,912,000 | | | Morgan Stanley, 3.971%, (LIBOR USD 3-Month plus 1.46%), 7/22/38(d) | | | 3,334,977 | |
| | | | | | | | 7,277,658 | |
| | | | | | | | | |
| | | | | Chemicals — 1.0% | | | | |
| | 3,186,000 | | | Albemarle Corp., 5.450%, 12/1/44 | | | 4,044,636 | |
| | 3,659,000 | | | FMC Corp., 3.450%, 10/1/29 | | | 3,945,123 | |
| | 3,620,000 | | | LYB International Finance III, LLC, 4.200%, 5/1/50 | | | 4,113,367 | |
| | 4,064,000 | | | Westlake Chemical Corp., 2.875%, 8/15/41 | | | 3,878,229 | |
| | | | | | | | 15,981,355 | |
| | | | | | | | | |
| | | | | Commercial Services & Supplies — 0.5% | | | | |
| | 4,130,000 | | | Sodexo, Inc., 1.634%, 4/16/26(b) | | | 4,153,142 | |
| | 2,276,000 | | | Waste Connections, Inc., 2.950%, 1/15/52 | | | 2,220,957 | |
| | 446,000 | | | Waste Management, Inc., 3.900%, 3/1/35 | | | 504,605 | |
| | | | | | | | 6,878,704 | |
| | | | | | | | | |
| | | | | Construction Materials — 0.1% | | | | |
| | 1,811,000 | | | Vulcan Materials Co., 4.500%, 6/15/47 | | | 2,192,031 | |
| | | | | | | | | |
| | | | | Diversified Financial Services — 3.3% | | | | |
| | 6,540,000 | | | AerCap Ireland Capital DAC/AerCap Global Aviation Trust, 4.450%, 10/1/25 | | | 7,145,886 | |
| | 3,733,000 | | | Avolon Holdings Funding, Ltd., 2.875%, 2/15/25(b) | | | 3,836,990 | |
| | 3,830,000 | | | Bain Capital Specialty Finance, Inc., 2.950%, 3/10/26 | | | 3,902,455 | |
| | 3,509,000 | | | BlackRock, Inc., 1.900%, 1/28/31 | | | 3,477,133 | |
| | 3,807,000 | | | Blue Owl Finance, LLC, 4.125%, 10/7/51 | | | 3,712,244 | |
| | 5,000,000 | | | Charles Schwab Corp. (The), 0.570%, (SOFR plus 0.52%), 5/13/26(a) | | | 5,034,455 | |
| | 5,343,000 | | | Goldman Sachs BDC, Inc., 2.875%, 1/15/26 | | | 5,491,482 | |
| Principal Amount | | | | | Fair Value | |
| CORPORATE BONDS — (continued) | | | |
| | | | Diversified Financial Services — (continued) |
| $ | 2,281,000 | | | Goldman Sachs Group, Inc. (The), 6.250%, 2/1/41 | | $ | 3,316,112 | |
| | 4,203,000 | | | Goldman Sachs Group, Inc. (The), Series VAR, 1.093%, (SOFR plus 0.79%), 12/9/26(d) | | | 4,140,072 | |
| | 3,491,000 | | | IHS Markit, Ltd., 4.000%, 3/1/26(b) | | | 3,840,833 | |
| | 2,088,000 | | | Jefferies Group, LLC/Jefferies Group Capital Finance, Inc., 4.150%, 1/23/30 | | | 2,346,195 | |
| | 4,552,000 | | | Owl Rock Capital Corp., 3.400%, 7/15/26 | | | 4,740,222 | |
| | | | | | | | 50,984,079 | |
| | | | | | | | | |
| | | | | Diversified Telecommunication Services — 1.1% | | | | |
| | 3,615,500 | | | Sprint Spectrum Co., LLC/Sprint Spectrum Co. II, LLC/Sprint Spectrum Co. III, LLC, 4.738%, 3/20/25(b) | | | 3,861,354 | |
| | 3,553,000 | | | T-Mobile USA, Inc., 3.500%, 4/15/25 | | | 3,826,442 | |
| | 3,961,000 | | | Verizon Communications, Inc., 1.450%, 3/20/26 | | | 3,997,679 | |
| | 2,240,000 | | | Verizon Communications, Inc., 2.987%, 10/30/56 | | | 2,079,903 | |
| | 2,805,000 | | | Verizon Communications, Inc., 4.812%, 3/15/39 | | | 3,473,160 | |
| | | | | | | | 17,238,538 | |
| | | | | | | | | |
| | | | | Electric Utilities — 1.5% | | | | |
| | 2,929,000 | | | CenterPoint Energy, Inc., 2.950%, 3/1/30 | | | 3,061,350 | |
| | 3,771,000 | | | Dominion Energy, Inc., STEP, 3.071%, 8/15/24 | | | 3,985,391 | |
| | 3,857,000 | | | Duke Energy Progress, LLC, 3.600%, 9/15/47 | | | 4,232,996 | |
| | 2,834,000 | | | Entergy Mississippi, LLC, 3.100%, 7/1/23 | | | 2,938,617 | |
| | 2,642,000 | | | Florida Power & Light Co., 3.990%, 3/1/49 | | | 3,158,186 | |
| | 3,386,000 | | | Indiana Michigan Power Co., Series K, 4.550%, 3/15/46 | | | 4,195,989 | |
| | 1,000,000 | | | Korea East-West Power Co., Ltd., 1.750%, 5/6/25(b) | | | 1,016,182 | |
| | | | | | | | 22,588,711 | |
| | | | | | | | | |
| | | | | Electrical Equipment — 0.5% | | | | |
| | 1,589,000 | | | General Electric Co., GMTN, 6.875%, 1/10/39 | | | 2,363,567 | |
| | 1,261,000 | | | Roper Technologies, Inc., 1.000%, 9/15/25 | | | 1,253,787 | |
| | 3,939,000 | | | Vontier Corp., 2.950%, 4/1/31(b) | | | 3,914,224 | |
| | | | | | | | 7,531,578 | |
| | | | | | | | | |
| | | | | Energy Equipment & Services — 1.7% | | | | |
| | 1,509,000 | | | Cheniere Corpus Christi Holdings, LLC, 3.700%, 11/15/29 | | | 1,636,493 | |
| | 1,919,000 | | | Enterprise Products Operating, LLC, 5.950%, 2/1/41 | | | 2,598,430 | |
| | 1,557,000 | | | Hess Corp., 7.875%, 10/1/29 | | | 2,121,635 | |
| | 2,990,000 | | | Kinder Morgan, Inc., 4.300%, 6/1/25 | | | 3,301,096 | |
| | 2,964,000 | | | Midwest Connector Capital Co., LLC, 3.900%, 4/1/24(b) | | | 3,099,580 | |
| | 3,496,000 | | | MPLX L.P., 4.125%, 3/1/27 | | | 3,901,716 | |
| | 228,000 | | | NuStar Logistics L.P., 6.000%, 6/1/26 | | | 246,240 | |
Continued
Sterling Capital Total Return Bond Fund
Schedule of Portfolio Investments — (continued)
September 30, 2021
| Principal Amount | | | | | Fair Value | |
| CORPORATE BONDS — (continued) | | | |
| | | | Energy Equipment & Services — (continued) |
| $ | 3,905,000 | | | Plains All American Pipeline LP/PAA Finance Corp., 4.900%, 2/15/45 | | $ | 4,200,323 | |
| | 4,846,000 | | | Sabine Pass Liquefaction, LLC, 5.625%, 3/1/25 | | | 5,494,990 | |
| | | | | | | | 26,600,503 | |
| | | | | | | | | |
| | | | | Equity Real Estate Investment Trusts (REITS) — 3.0% | | | | |
| | 3,279,000 | | | American Tower Trust, 3.652%, 3/23/28(b) | | | 3,491,969 | |
| | 3,723,000 | | | Brixmor Operating Partnership L.P., 4.125%, 5/15/29 | | | 4,191,847 | |
| | 3,564,000 | | | Federal Realty Investment Trust, 3.500%, 6/1/30 | | | 3,862,711 | |
| | 2,542,000 | | | Jones Lang LaSalle, Inc., 4.400%, 11/15/22 | | | 2,627,145 | |
| | 2,154,000 | | | Lexington Realty Trust, 2.700%, 9/15/30 | | | 2,177,452 | |
| | 2,985,000 | | | Ontario Teachers' Cadillac Fairview Properties Trust, 3.875%, 3/20/27(b) | | | 3,294,417 | |
| | 3,541,000 | | | Physicians Realty L.P., 4.300%, 3/15/27 | | | 4,003,233 | |
| | 2,673,000 | | | Prologis L.P., 2.125%, 10/15/50 | | | 2,275,863 | |
| | 3,439,000 | | | Sabra Health Care L.P., 5.125%, 8/15/26 | | | 3,850,198 | |
| | 5,037,000 | | | SBA Tower Trust, 3.869%, 10/8/24(b) | | | 5,261,025 | |
| | 3,261,000 | | | Scentre Group Trust 1/Scentre Group Trust 2, 4.375%, 5/28/30(b) | | | 3,763,842 | |
| | 3,119,000 | | | Spirit Realty L.P., 2.100%, 3/15/28 | | | 3,100,123 | |
| | 219,000 | | | Starwood Property Trust, Inc., 5.000%, 12/15/21 | | | 219,438 | |
| | 1,428,000 | | | STORE Capital Corp., 2.750%, 11/18/30 | | | 1,433,061 | |
| | 3,308,000 | | | Tanger Properties L.P., 2.750%, 9/1/31 | | | 3,196,144 | |
| | | | | | | | 46,748,468 | |
| | | | | | | | | |
| | | | | Food & Staples Retailing — 0.8% | | | | |
| | 3,028,000 | | | AbbVie, Inc., 4.875%, 11/14/48. | | | 3,876,413 | |
| | 4,164,000 | | | CVS Health Corp., 2.700%, 8/21/40 | | | 3,977,144 | |
| | 483,000 | | | CVS Health Corp., 3.700%, 3/9/23 | | | 504,340 | |
| | 736,000 | | | Hershey Co. (The), 1.700%, 6/1/30 | | | 723,392 | |
| | 2,891,000 | | | Smithfield Foods, Inc., 5.200%, 4/1/29(b) | | | 3,316,745 | |
| | | | | | | | 12,398,034 | |
| | | | | | | | | |
| | | | | Food, Beverage & Tobacco — 0.1% | | | | |
| | 1,159,000 | | | PepsiCo, Inc., 4.450%, 4/14/46 | | | 1,461,835 | |
| | | | | | | | | |
| | | | | Gas Utilities — 0.3% | | | | |
| | 4,120,000 | | | Sempra Energy, 3.800%, 2/1/38 | | | 4,551,509 | |
| | | | | | | | | |
| | | | | Health Care Equipment & Services — 0.3% | | | | |
| | 3,497,000 | | | HCA, Inc., 5.000%, 3/15/24 | | | 3,837,405 | |
| | | | | | | | | |
| | | | | Health Care Providers & Services — 0.3% | | | | |
| | 2,031,000 | | | Anthem, Inc., 3.600%, 3/15/51 | | | 2,213,270 | |
| | 2,633,000 | | | Viatris, Inc., 3.850%, 6/22/40(b) | | | 2,818,373 | |
| | | | | | | | 5,031,643 | |
| | | | | | | | | |
| | | | | Insurance — 4.8% | | | | |
| | 513,000 | | | Alleghany Corp., 4.900%, 9/15/44 | | | 639,724 | |
| | 3,474,000 | | | American International Group, Inc., 3.900%, 4/1/26 | | | 3,848,016 | |
| Principal Amount | | | | | Fair Value | |
| CORPORATE BONDS — (continued) | | | |
| | | | Insurance — (continued) | | | |
| $ | 2,160,000 | | | Aspen Insurance Holdings, Ltd., 4.650%, 11/15/23 | | $ | 2,330,680 | |
| | 4,489,000 | | | Athene Global Funding, 2.500%, 1/14/25(b) | | | 4,664,738 | |
| | 4,117,000 | | | Athene Holding, Ltd., 3.950%, 5/25/51 | | | 4,537,212 | |
| | 3,564,000 | | | AXIS Specialty Finance, LLC, 3.900%, 7/15/29 | | | 3,889,544 | |
| | 4,657,000 | | | Brighthouse Financial Global Funding, 1.550%, 5/24/26(b) | | | 4,675,630 | |
| | 2,598,000 | | | Carlyle Finance, LLC, 5.650%, 9/15/48(b) | | | 3,558,375 | |
| | 4,090,000 | | | Enstar Group, Ltd., 3.100%, 9/1/31 | | | 4,012,120 | |
| | 4,148,000 | | | F&G Global Funding, 1.750%, 6/30/26(b) | | | 4,168,971 | |
| | 2,369,000 | | | Fidelity National Financial, Inc., 3.200%, 9/17/51 | | | 2,259,190 | |
| | 2,156,000 | | | Global Atlantic Fin Co., 3.125%, 6/15/31(b) | | | 2,183,660 | |
| | 2,388,000 | | | KKR Group Finance Co. III, LLC, 5.125%, 6/1/44(b) | | | 3,080,490 | |
| | 1,346,000 | | | Loews Corp., 3.200%, 5/15/30 | | | 1,443,929 | |
| | 3,564,000 | | | Meiji Yasuda Life Insurance Co., 5.200%, (5 yr. Swap Semi 30/360 USD plus 4.23%), 10/20/45(b)(c) | | | 4,004,802 | |
| | 3,239,000 | | | Nationwide Mutual Insurance Co., 4.350%, 4/30/50(b) | | | 3,680,342 | |
| | 3,946,000 | | | Principal Life Global Funding II, 0.875%, 1/12/26(b) | | | 3,867,123 | |
| | 3,355,000 | | | Reinsurance Group of America, Inc., 3.900%, 5/15/29 | | | 3,744,791 | |
| | 4,042,000 | | | Sammons Financial Group, Inc., 3.350%, 4/16/31(b) | | | 4,196,572 | |
| | 3,846,000 | | | SBL Holdings, Inc., 5.000%, 2/18/31(b) | | | 4,099,061 | |
| | 1,826,000 | | | Symetra Financial Corp., 4.250%, 7/15/24 | | | 1,965,622 | |
| | 1,887,000 | | | Transatlantic Holdings, Inc., 8.000%, 11/30/39 | | | 2,903,453 | |
| | | | | | | | 73,754,045 | |
| | | | | | | | | |
| | | | | Internet & Direct Marketing Retail — 0.2% | | | | |
| | 3,517,000 | | | Amazon.com, Inc., 2.700%, 6/3/60 | | | 3,298,192 | |
| | | | | | | | | |
| | | | | IT Services — 0.2% | | | | |
| | 3,094,000 | | | Fiserv, Inc., 3.200%, 7/1/26 | | | 3,339,022 | |
| | | | | | | | | |
| | | | | Machinery — 0.2% | | | | |
| | 3,131,000 | | | Deere & Co., 3.750%, 4/15/50 | | | 3,727,947 | |
| | | | | | | | | |
| | | | | Media — 1.8% | | | | |
| | 4,741,000 | | | Comcast Corp., 2.887%, 11/1/51(b) | | | 4,533,033 | |
| | 3,389,000 | | | Comcast Corp., 3.700%, 4/15/24 | | | 3,644,157 | |
| | 6,095,000 | | | Discovery Communications, LLC, 5.200%, 9/20/47 | | | 7,584,481 | |
| | 3,790,000 | | | Omnicom Group, Inc., 2.600%, 8/1/31 | | | 3,855,582 | |
| | 4,937,000 | | | Time Warner Cable, LLC, 6.550%, 5/1/37 | | | 6,650,960 | |
| | 1,786,000 | | | ViacomCBS, Inc., 4.950%, 5/19/50 | | | 2,230,976 | |
| | | | | | | | 28,499,189 | |
Continued
Sterling Capital Total Return Bond Fund
Schedule of Portfolio Investments — (continued)
September 30, 2021
| Principal Amount | | | | | Fair Value | |
| CORPORATE BONDS — (continued) | | | |
| | | | Metals & Mining — 0.6% | | | |
| $ | 3,276,000 | | | Nucor Corp., 2.979%, 12/15/55(b) | | $ | 3,196,326 | |
| | 2,015,000 | | | Southern Copper Corp., 3.500%, 11/8/22 | | | 2,072,931 | |
| | 1,076,000 | | | Steel Dynamics, Inc., 2.400%, 6/15/25 | | | 1,119,482 | |
| | 2,311,000 | | | Teck Resources, Ltd., 6.000%, 8/15/40 | | | 2,993,383 | |
| | | | | | | | 9,382,122 | |
| | | | | | | | | |
| | | | | Multiline Retail — 0.1% | | | | |
| | 800,000 | | | TJX Cos., Inc. (The), 2.250%, 9/15/26 | | | 839,266 | |
| | | | | | | | | |
| | | | | Multi-Utilities — 0.5% | | | | |
| | 2,400,000 | | | CMS Energy Corp., 4.700%, 3/31/43 | | | 2,927,491 | |
| | 1,696,000 | | | Progress Energy, Inc., 3.150%, 4/1/22 | | | 1,707,595 | |
| | 3,056,000 | | | Puget Sound Energy, Inc., 4.223%, 6/15/48 | | | 3,662,509 | |
| | | | | | | | 8,297,595 | |
| | | | | | | | | |
| | | | | Oil, Gas & Consumable Fuels — 2.3% | | | | |
| | 2,265,000 | | | Cenovus Energy, Inc., 5.375%, 7/15/25 | | | 2,579,135 | |
| | 2,131,000 | | | Chevron USA, Inc., 5.050%, 11/15/44 | | | 2,837,356 | |
| | 4,185,000 | | | Devon Energy Corp., 5.600%, 7/15/41 | | | 5,205,031 | |
| | 3,606,000 | | | Devon Energy Corp., 5.875%, 6/15/28(b) | | | 3,973,874 | |
| | 3,054,000 | | | Diamondback Energy, Inc., 4.400%, 3/24/51 | | | 3,456,030 | |
| | 2,545,000 | | | Halliburton Co., 7.450%, 9/15/39 | | | 3,701,847 | |
| | 1,503,000 | | | Hess Corp., 5.800%, 4/1/47 | | | 1,953,469 | |
| | 1,725,000 | | | HollyFrontier Corp., 4.500%, 10/1/30 | | | 1,874,650 | |
| | 3,439,000 | | | HollyFrontier Corp., 5.875%, 4/1/26 | | | 3,946,147 | |
| | 3,260,000 | | | Pioneer Natural Resources Co., 1.900%, 8/15/30 | | | 3,116,625 | |
| | 2,917,000 | | | Schlumberger Investment SA, 2.650%, 6/26/30 | | | 3,006,160 | |
| | | | | | | | 35,650,324 | |
| | | | | | | | | |
| | | | | Pharmaceuticals — 0.2% | | | | |
| | 2,559,000 | | | SC Johnson & Son, Inc., 4.750%, 10/15/46(b) | | | 3,356,460 | |
| | | | | | | | | |
| | | | | Road & Rail — 0.5% | | | | |
| | 2,334,000 | | | Burlington Northern Santa Fe, LLC, 4.950%, 9/15/41 | | | 3,019,926 | |
| | 3,474,000 | | | Kansas City Southern, 4.200%, 11/15/69 | | | 4,011,497 | |
| | | | | | | | 7,031,423 | |
| | | | | | | | | |
| | | | | Semiconductors & Semiconductor Equipment — 0.5% | | | | |
| | 167,000 | | | Broadcom, Inc., 3.187%, 11/15/36 | | | 166,240 | |
| | 3,086,000 | | | Broadcom, Inc., 4.150%, 11/15/30 | | | 3,417,373 | |
| | 13,000 | | | NVIDIA Corp., 3.500%, 4/1/50 | | | 14,529 | |
| | 4,110,000 | | | TSMC Global, Ltd., 1.250%, 4/23/26(b) | | | 4,067,702 | |
| | | | | | | | 7,665,844 | |
| | | | | | | | | |
| | | | | Software — 0.3% | | | | |
| | 3,275,000 | | | Dell International, LLC/EMC Corp., 6.020%, 6/15/26 | | | 3,894,175 | |
| | 1,339,000 | | | VMware, Inc., 2.200%, 8/15/31 | | | 1,307,634 | |
| | | | | | | | 5,201,809 | |
| Principal Amount | | | | | Fair Value | |
| CORPORATE BONDS — (continued) | | | |
| | | | Specialty Retail — 0.3% | | | |
| $ | 3,331,000 | | | ERAC USA Finance, LLC, 4.200%, 11/1/46(b) | | $ | 3,904,774 | |
| | | | | | | | | |
| | | | | Telecommunication Services — 0.8% | | | | |
| | 1,694,000 | | | AT&T, Inc., 1.650%, 2/1/28 | | | 1,678,995 | |
| | 7,346,000 | | | AT&T, Inc., 3.550%, 9/15/55 | | | 7,222,720 | |
| | 3,858,000 | | | AT&T, Inc., 3.850%, 6/1/60 | | | 3,978,206 | |
| | | | | | | | 12,879,921 | |
| | | | | | | | | |
| | | | | Textiles, Apparel & Luxury Goods — 0.1% | | | | |
| | 2,181,000 | | | Ralph Lauren Corp., 1.700%, 6/15/22 | | | 2,202,949 | |
| | | | | | | | | |
| | | | | Tobacco — 0.6% | | | | |
| | 3,178,000 | | | BAT Capital Corp., 4.540%, 8/15/47 | | | 3,285,466 | |
| | 3,355,000 | | | BAT Capital Corp., 4.700%, 4/2/27 | | | 3,788,270 | |
| | 2,359,000 | | | Philip Morris International, Inc., 4.250%, 11/10/44 | | | 2,705,583 | |
| | | | | | | | 9,779,319 | |
| | | | | | | | | |
| | | | | Total Corporate Bonds | | | | |
| | | | | (Cost $610,983,346) | | | 636,640,012 | |
| | | | | | | | | |
| MORTGAGE-BACKED SECURITIES — 16.2% | | | | |
| | | | | Fannie Mae — 9.8% | | | | |
| | 20,618 | | | 5.000%, 9/1/25, Pool #255892 | | | 22,642 | |
| | 1,438,804 | | | 4.000%, 12/1/33, Pool #MA1689 | | | 1,562,060 | |
| | 884,111 | | | 4.000%, 6/1/34, Pool #MA1922 | | | 968,807 | |
| | 62,867 | | | 6.500%, 1/1/35, Pool #809198 | | | 73,258 | |
| | 801,740 | | | 4.000%, 3/1/35, Pool #MA2211 | | | 877,052 | |
| | 32,698 | | | 6.500%, 3/1/36, Pool #866062 | | | 37,343 | |
| | 350,436 | | | 5.500%, 8/1/37, Pool #995082 | | | 406,393 | |
| | 3,903,315 | | | 3.500%, 8/1/38, Pool #FM2472 | | | 4,190,028 | |
| | 150,335 | | | 4.500%, 10/1/39, Pool #AC2645 | | | 166,743 | |
| | 137,472 | | | 5.000%, 6/1/40, Pool #AD4927 | | | 154,577 | |
| | 122,281 | | | 5.000%, 6/1/40, Pool #AD8718 | | | 139,377 | |
| | 8,203,598 | | | 4.000%, 8/1/40, Pool #FM4673 | | | 8,997,035 | |
| | 14,563,914 | | | 1.500%, 12/1/40, Pool #MA4202 | | | 14,378,405 | |
| | 345,050 | | | 4.500%, 12/1/40, Pool #AH1100 | | | 382,667 | |
| | 170,956 | | | 4.500%, 3/1/41, Pool #AB2467 | | | 191,664 | |
| | 375,436 | | | 4.500%, 5/1/41, Pool #AI1023 | | | 421,384 | |
| | 201,801 | | | 4.500%, 11/1/41, Pool #AJ4994 | | | 224,203 | |
| | 283,987 | | | 4.500%, 12/1/41, Pool #AJ7696 | | | 315,592 | |
| | 646,881 | | | 3.500%, 6/1/42, Pool #AB5373 | | | 704,341 | |
| | 1,040,066 | | | 3.500%, 5/1/43, Pool #AL3605 | | | 1,132,656 | |
| | 567,714 | | | 3.500%, 5/1/43, Pool #AB9368 | | | 614,352 | |
| | 12,541,791 | | | 3.000%, 8/1/43, Pool #AL9500 | | | 13,629,651 | |
| | 1,297,509 | | | 3.500%, 8/1/43, Pool #AU0613 | | | 1,419,658 | |
| | 321,521 | | | 4.500%, 11/1/44, Pool #MA2100 | | | 355,338 | |
| | 901,194 | | | 4.500%, 1/1/45, Pool #MA2158 | | | 995,218 | |
| | 1,063,771 | | | 4.000%, 3/1/45, Pool #MA2217 | | | 1,167,194 | |
| | 1,008,914 | | | 4.000%, 6/1/46, Pool #MA2653 | | | 1,098,181 | |
| | 977,648 | | | 4.500%, 7/1/46, Pool #AS7568 | | | 1,069,776 | |
| | 1,283,317 | | | 4.000%, 11/1/46, Pool #MA2808 | | | 1,394,520 | |
| | 1,715,680 | | | 4.000%, 5/1/47, Pool #BE9598 | | | 1,854,254 | |
| | 1,616,758 | | | 4.000%, 8/1/47, Pool #BH5117 | | | 1,745,069 | |
Continued
Sterling Capital Total Return Bond Fund
Schedule of Portfolio Investments — (continued)
September 30, 2021
| Principal Amount | | | | | Fair Value | |
| MORTGAGE-BACKED SECURITIES — (continued) | |
| | | | Fannie Mae — (continued) | | | |
| $ | 5,239,807 | | | 4.000%, 4/1/48, Pool #BM3900 | | $ | 5,646,541 | |
| | 2,567,110 | | | 5.000%, 8/1/48, Pool #CA2219 | | | 2,831,508 | |
| | 4,294,213 | | | 3.000%, 11/1/48, Pool #BM5822 | | | 4,540,231 | |
| | 7,115,720 | | | 3.500%, 10/1/49, Pool #CA4431 | | | 7,526,284 | |
| | 1,790,504 | | | 3.000%, 12/1/49, Pool #BO6225 | | | 1,876,333 | |
| | 9,398,174 | | | 3.000%, 3/1/50, Pool #FM2714 | | | 9,916,481 | |
| | 4,410,715 | | | 2.500%, 5/1/50, Pool #FM3287 | | | 4,550,013 | |
| | 8,562,937 | | | 2.000%, 7/1/50, Pool #CA6301 | | | 8,624,641 | |
| | 7,791,334 | | | 2.500%, 7/1/50, Pool #CA6307 | | | 8,066,059 | |
| | 9,931,352 | | | 2.000%, 8/1/50, Pool #CA6799 | | | 10,002,916 | |
| | 11,002,688 | | | 2.500%, 9/1/50, Pool #BQ0538 | | | 11,351,427 | |
| | 4,604,749 | | | 2.500%, 9/1/50, Pool #BQ2883 | | | 4,750,783 | |
| | 6,271,384 | | | 3.000%, 9/1/50, Pool #CA7051 | | | 6,592,573 | |
| | 5,934,937 | | | 3.000%, 10/1/50, Pool #CA7381 | | | 6,240,168 | |
| | | | | | | | 153,205,396 | |
| | | | | | | | | |
| | | | | Freddie Mac — 6.4% | | | | |
| | 13 | | | 5.500%, 10/1/21, Pool #ZS5201 | | | 13 | |
| | 2,668 | | | 5.000%, 12/1/21, Pool #ZK0490 | | | 2,778 | |
| | 28,341 | | | 5.000%, 7/1/25, Pool #ZA1892 | | | 31,124 | |
| | 123,654 | | | 2.500%, 1/1/28, Pool #ZK4918 | | | 129,675 | |
| | 382,841 | | | 3.500%, 7/1/30, Pool #ZS8575 | | | 410,752 | |
| | 46,563 | | | 5.000%, 3/1/36, Pool #ZS4230 | | | 53,158 | |
| | 1,437,155 | | | 4.000%, 4/1/36, Pool #ZA2413 | | | 1,574,339 | |
| | 1,862,155 | | | 3.500%, 6/1/36, Pool #ZA2414 | | | 2,005,730 | |
| | 12,886 | | | 5.000%, 7/1/36, Pool #ZS1139 | | | 14,701 | |
| | 1,132,685 | | | 3.500%, 8/1/36, Pool #ZA2425 | | | 1,220,101 | |
| | 136,722 | | | 6.500%, 9/1/36, Pool #ZS4257 | | | 159,662 | |
| | 2,738,344 | | | 3.500%, 11/1/36, Pool #ZA2439 | | | 2,906,303 | |
| | 45,244 | | | 5.000%, 2/1/37, Pool #ZI5759 | | | 51,765 | |
| | 2,039,677 | | | 4.000%, 5/1/37, Pool #ZA2461 | | | 2,227,713 | |
| | 48,355 | | | 4.500%, 10/1/39, Pool #ZI9349 | | | 54,021 | |
| | 142,297 | | | 5.000%, 6/1/40, Pool #ZA1049 | | | 162,202 | |
| | 391,877 | | | 5.000%, 7/1/40, Pool #ZJ0194 | | | 443,160 | |
| | 43,918 | | | 5.000%, 9/1/40, Pool #ZA1066 | | | 49,965 | |
| | 7,767,942 | | | 2.000%, 12/1/40, Pool #RB5090 | | | 7,870,860 | |
| | 538,606 | | | 4.000%, 12/1/42, Pool #ZS3671 | | | 594,667 | |
| | 390,769 | | | 3.500%, 5/1/43, Pool #ZL5915 | | | 424,339 | |
| | 237,133 | | | 4.000%, 5/1/44, Pool #ZA4468 | | | 260,055 | |
| | 115,323 | | | 4.000%, 7/1/44, Pool #ZS4573 | | | 126,465 | |
| | 165,216 | | | 4.000%, 9/1/44, Pool #ZL8439 | | | 182,607 | |
| | 2,500,418 | | | 3.500%, 1/1/45, Pool #ZL8964 | | | 2,707,294 | |
| | 2,353,984 | | | 3.500%, 5/1/46, Pool #ZS4663 | | | 2,542,778 | |
| | 681,748 | | | 4.000%, 8/1/46, Pool #ZS4673 | | | 741,828 | |
| | 1,593,762 | | | 3.500%, 9/1/46, Pool #ZS4678 | | | 1,710,421 | |
| | 3,430,439 | | | 3.500%, 9/1/47, Pool #ZM4305 | | | 3,650,079 | |
| | 859,377 | | | 3.500%, 1/1/48, Pool #ZM5375 | | | 914,664 | |
| | 900,611 | | | 4.000%, 2/1/48, Pool #ZT1639 | | | 972,632 | |
| | 784,817 | | | 4.000%, 6/1/48, Pool #ZT0541 | | | 860,611 | |
| | 8,906,827 | | | 2.500%, 11/1/49, Pool #QA4396 | | | 9,186,270 | |
| | 4,042,868 | | | 3.000%, 11/1/49, Pool #QA4336 | | | 4,264,165 | |
| | 9,316,437 | | | 3.500%, 3/1/50, Pool #QA7838 | | | 10,253,646 | |
| | 4,127,793 | | | 3.500%, 6/1/50, Pool #RA2794 | | | 4,363,836 | |
| | 13,186,877 | | | 2.500%, 7/1/50, Pool #RA2970 | | | 13,638,235 | |
| | 7,501,104 | | | 2.000%, 8/1/50, Pool #RA3328 | | | 7,521,968 | |
| Principal Amount | | | | | Fair Value | |
| MORTGAGE-BACKED SECURITIES — (continued) | |
| | | | Freddie Mac — (continued) | | | |
| $ | 13,964,390 | | | 2.500%, 11/1/50, Pool #QB5838 | | $ | 14,478,600 | |
| | 341,003 | | | 3.000%, 1/1/51, Pool #SD8123 | | | 358,584 | |
| | | | | | | | 99,121,766 | |
| | | | | | | | | |
| | | | | Ginnie Mae — 0.0% | | | | |
| | 72,740 | | | 5.000%, 2/15/40, Pool #737037 | | | 83,698 | |
| | | | | | | | | |
| | | | | Total Mortgage-Backed Securities | | | | |
| | | | | (Cost $251,126,600) | | | 252,410,860 | |
| | | | | | | | | |
| MUNICIPAL BONDS — 3.9% | | | | |
| | | | | Alabama — 0.2% | | | | |
| | 2,675,000 | | | Alabama Economic Settlement Authority, Economic Imports, Taxable BP - Settlement Revenue, Series B, 4.263%, 9/15/32 | | | 3,073,736 | |
| | | | | | | | | |
| | | | | California — 0.6% | | | | |
| | 2,675,000 | | | Municipal Improvement Corp. of Los Angeles, Advance Refunding Revenue Bonds, Series A, 1.448%, 11/1/27. | | | 2,661,010 | |
| | 2,230,000 | | | Municipal Improvement Corp. of Los Angeles, Advance Refunding Revenue Bonds, Series A, 1.648%, 11/1/28. | | | 2,217,155 | |
| | 2,370,000 | | | San Diego County Water Authority, Taxable Green Bonds, Advance Refunding Revenue Bonds, Series A, 1.531%, 5/1/30 | | | 2,327,411 | |
| | 1,145,000 | | | State of California, Build America Bonds, School Improvements G.O., 7.625%, 3/1/40 | | | 1,904,330 | |
| | | | | | | | 9,109,906 | |
| | | | | | | | | |
| | | | | Florida — 0.2% | | | | |
| | 1,905,000 | | | Reedy Creek Improvement District, Advance Refunding, Taxable Revenue Bonds, G.O., Series A, 2.147%, 6/1/29 | | | 1,965,617 | |
| | 1,810,000 | | | Reedy Creek Improvement District, Advance Refunding, Taxable Revenue Bonds, G.O., Series A, 2.197%, 6/1/30 | | | 1,862,562 | |
| | | | | | | | 3,828,179 | |
| | | | | | | | | |
| | | | | Illinois — 0.8% | | | | |
| | 7,155,000 | | | Sales Tax Securitization Corp., Second Lien, Current Refunding, Taxable Revenue Bonds, Series B, 3.057%, 1/1/34 | | | 7,455,582 | |
| | 1,605,000 | | | State of Illinois Sales Tax Revenue, Public Improvements, Taxable Building Revenue, 3.481%, 6/15/26 | | | 1,740,301 | |
| | 2,790,000 | | | State of Illinois Sales Tax Revenue, Public Improvements, Taxable Revenue, Series B, 2.620%, 6/15/26 | | | 2,916,945 | |
| | | | | | | | 12,112,828 | |
Continued
Sterling Capital Total Return Bond Fund
Schedule of Portfolio Investments — (continued)
September 30, 2021
| Principal Amount | | | | | Fair Value | |
| MUNICIPAL BONDS — (continued) | | | |
| | | | New York — 1.1% | | | |
| $ | 4,630,000 | | | Metropolitan Transportation Authority, Taxable Green Bonds, Green Purpose Revenue Bonds, Series C2, 5.175%, 11/15/49 | | $ | 6,319,070 | |
| | 2,695,000 | | | New York City Transitional Finance Authority Future Tax Secured Revenue, Public Improvements, Taxable Revenue, Callable 2/1/27 @ 100, 3.330%, 2/1/28 | | | 2,929,573 | |
| | 7,130,000 | | | New York City Transitional Finance Authority Future Tax Secured Revenue Bonds, Public Improvements, Taxable Revenue, Sub Series B3, Callable 11/1/29 @ 100, 3.000%, 11/1/33 | | | 7,575,197 | |
| | | | | | | | 16,823,840 | |
| | | | | | | | | |
| | | | | North Carolina — 0.2% | | | | |
| | 2,317,000 | | | Duke University, 3.299%, 10/1/46 | | | 2,538,284 | |
| | | | | | | | | |
| | | | | Pennsylvania — 0.4% | | | | |
| | 2,320,000 | | | City of Pittsburgh, PA, Refunding, Taxable Revenue Bonds, G.O., Series B, 1.189%, 9/1/26 | | | 2,316,102 | |
| | 3,898,000 | | | Lehigh University, 3.479%, 11/15/46 | | | 4,308,381 | |
| | | | | | | | 6,624,483 | |
| | | | | | | | | |
| | | | | Texas — 0.4% | | | | |
| | 1,580,000 | | | Dallas Area Rapid Transit, Advance Refunding, Taxable Revenue Bonds, Series C, Callable 12/1/29 @ 100, 1.846%, 12/1/30 | | | 1,571,531 | |
| | 4,605,000 | | | Tarrant Regional Water District, Advance Refunding Revenue Bonds, Series S, 1.450%, 9/1/29 | | | 4,549,602 | |
| | | | | | | | 6,121,133 | |
| | | | | | | | | |
| | | | | Total Municipal Bonds | | | | |
| | | | | (Cost $57,154,662) | | | 60,232,389 | |
| | | | | | | | | |
| U.S. TREASURY BONDS — 2.2% | | | | |
| | 22,534,300 | | | 2.500%, 2/15/45 | | | 24,281,588 | |
| | 12,093,800 | | | 1.375%, 8/15/50 | | | 10,175,799 | |
| | | | | | | | | |
| | | | | Total U.S. Treasury Bonds | | | | |
| | | | | (Cost $34,423,070) | | | 34,457,387 | |
| | | | | | | | | |
| U.S. TREASURY NOTES — 4.4% | | | | |
| | 68,431,100 | | | 0.125%, 8/31/22 | | | 68,447,139 | |
| | | | | | | | | |
| | | | | Total U.S. Treasury Notes | | | | |
| | | | | (Cost $68,450,454) | | | 68,447,139 | |
Shares | | | | | Fair Value | |
| MONEY MARKET FUND — 1.1% | | | |
| | 16,898,581 | | | Federated Treasury Obligations Fund, | | | | |
| | | | | Institutional Shares, 0.01%(f) | | $ | 16,898,581 | |
| | | | | | | | | |
| | | | | | | | | |
| | | | | Total Money Market Fund | | | | |
| | | | | (Cost $16,898,581) | | | 16,898,581 | |
| | | | | | | | | |
| Total Investments — 100.7% | | | | |
| (Cost $1,525,632,056) | | | 1,565,352,927 | |
| Net Other Assets (Liabilities) — (0.7)% | | | (11,298,340 | ) |
| NET ASSETS — 100.0% | | $ | 1,554,054,587 | |
| (a) | The interest rate for this floating rate note, which will change periodically, is based either on the prime rate or an index of market rates. The reflected rate is in effect as of September 30, 2021. The maturity date reflected is the final maturity date. |
| (b) | Rule 144A, Section 4(2) or other security that is restricted as to resale to qualified institutional investors. The Advisor, using Board approved procedures, has deemed these securities or a portion of these securities to be liquid. |
| (c) | The interest rate for this variable rate note, which will change periodically, is based either on the prime rate or an index of market rates. The reflected rate is in effect as of September 30, 2021. The maturity date reflected is the final maturity date. |
| (d) | Security is a fix-to-float security, which carries a fixed coupon until a certain date, upon which it switches to a floating rate. Rate shown is the fixed rate. |
| (e) | Security is perpetual in nature and has no stated maturity date. |
| (f) | Represents the current yield as of report date. |
| BKNT | Bank Note |
| GMTN | Global Medium Term Note |
| G.O. | General Obligation |
| MTN | Medium Term Note |
| STEP | Step Coupon Bond |
Continued
Sterling Capital Corporate Fund
Schedule of Portfolio Investments
September 30, 2021
| Principal Amount | | | | | Fair Value | |
| CORPORATE BONDS — 96.8% | | | |
| | | | Aerospace & Defense — 0.5% | | | |
| $ | 34,000 | | | Raytheon Technologies Corp., 4.125%, 11/16/28 | | $ | 38,666 | |
| | | | | | | | | |
| | | | | Airlines — 0.7% | | | | |
| | 39,000 | | | American Airlines, Inc./AAdvantage Loyalty IP, Ltd., 5.500%, 4/20/26(a) | | | 40,998 | |
| | 7,000 | | | United Airlines, Inc., 4.375%, 4/15/26(a) | | | 7,184 | |
| | | | | | | | 48,182 | |
| | | | | | | | | |
| | | | | Automobiles — 2.6% | | | | |
| | 53,000 | | | Advance Auto Parts, Inc., 1.750%, 10/1/27 | | | 52,739 | |
| | 42,000 | | | Ford Motor Co., 8.500%, 4/21/23 | | | 46,198 | |
| | 86,000 | | | General Motors Financial Co., Inc., 2.750%, 6/20/25 | | | 89,882 | |
| | | | | | | | 188,819 | |
| | | | | | | | | |
| | | | | Banks — 22.0% | | | | |
| | 144,000 | | | Bank of America Corp., 3.419%, (LIBOR USD 3-Month plus 1.04%), 12/20/28(b) | | | 155,986 | |
| | 111,000 | | | Capital One Financial Corp., 3.200%, 2/5/25 | | | 118,608 | |
| | 119,000 | | | Citigroup, Inc., 4.412%, (SOFR plus 3.91%), 3/31/31(b) | | | 137,267 | |
| | 21,000 | | | Citigroup, Inc., Series U, 5.000%, (SOFR plus 3.81%)(b)(c) | | | 21,934 | |
| | 179,000 | | | Goldman Sachs Group, Inc. (The), 3.850%, 1/26/27 | | | 196,595 | |
| | 125,000 | | | JPMorgan Chase & Co., 2.739%, (SOFR plus 1.51%), 10/15/30(b) | | | 129,323 | |
| | 75,000 | | | JPMorgan Chase & Co., 3.797%, (LIBOR USD 3-Month plus 0.89%), 7/23/24(b) | | | 79,263 | |
| | 200,000 | | | Lloyds Banking Group PLC, 4.582%, 12/10/25 | | | 223,201 | |
| | 151,000 | | | Morgan Stanley, MTN, 3.622%, (SOFR plus 3.12%), 4/1/31(b) | | | 166,257 | |
| | 135,000 | | | PNC Financial Services Group, Inc. (The), Series O, 3.804%, (LIBOR USD 3-Month plus 3.68%)(c)(d) | | | 135,330 | |
| | 72,000 | | | Sumitomo Mitsui Financial Group, Inc., 3.364%, 7/12/27 | | | 79,074 | |
| | 60,000 | | | Toronto-Dominion Bank (The), 3.625%, (5 yr. Swap Semi 30/360 USD plus 2.21%), 9/15/31(d) | | | 65,891 | |
| | 58,000 | | | Wells Fargo & Co., MTN, 3.550%, 9/29/25 | | | 63,163 | |
| | | | | | | | 1,571,892 | |
| | | | | | | | | |
| | | | | Beverages — 0.9% | | | | |
| | 60,000 | | | Anheuser-Busch Cos., LLC/Anheuser- Busch InBev Worldwide, Inc., 3.650%, 2/1/26 | | | 65,785 | |
| | | | | | | | | |
| | | | | Capital Goods — 1.5% | | | | |
| | 39,000 | | | Imola Merger Corp., 4.750%, 5/15/29(a) | | | 40,330 | |
| Principal Amount | | | | | Fair Value | |
| CORPORATE BONDS — (continued) | | | |
| | | | Capital Goods — (continued) | | | |
| $ | 60,000 | | | Keysight Technologies, Inc., 4.550%, 10/30/24 | | $ | 66,310 | |
| | | | | | | | 106,640 | |
| | | | | | | | | |
| | | | | Chemicals — 1.6% | | | | |
| | 12,000 | | | NOVA Chemicals Corp., 4.250%, 5/15/29(a) | | | 12,000 | |
| | 43,000 | | | NOVA Chemicals Corp., 5.250%, 6/1/27(a) | | | 45,259 | |
| | 54,000 | | | Westlake Chemical Corp., 3.600%, 8/15/26 | | | 59,264 | |
| | | | | | | | 116,523 | |
| | | | | | | | | |
| | | | | Commercial Services & Supplies — 1.7% | | | | |
| | 51,000 | | | IHS Markit, Ltd., 4.000%, 3/1/26(a) | | | 56,111 | |
| | 23,000 | | | Seaspan Corp., 5.500%, 8/1/29(a) | | | 23,465 | |
| | 36,000 | | | Waste Connections, Inc., 3.500%, 5/1/29 | | | 39,425 | |
| | | | | | | | 119,001 | |
| | | | | | | | | |
| | | | | Diversified Financial Services — 12.5% | | | | |
| | 150,000 | | | AerCap Ireland Capital DAC/AerCap Global Aviation Trust, 4.450%, 10/1/25 | | | 163,897 | |
| | 100,000 | | | Air Lease Corp., 3.500%, 1/15/22 | | | 100,864 | |
| | 97,000 | | | Ares Finance Co., LLC, 4.000%, 10/8/24(a) | | | 103,281 | |
| | 120,000 | | | Avolon Holdings Funding, Ltd., 3.625%, 5/1/22(a) | | | 121,797 | |
| | 36,000 | | | Coinbase Global, Inc., 3.375%, 10/1/28(a) | | | 34,650 | |
| | 103,000 | | | Goldman Sachs BDC, Inc., 2.875%, 1/15/26 | | | 105,862 | |
| | 60,000 | | | Jefferies Group, LLC/Jefferies Group Capital Finance, Inc., 4.850%, 1/15/27 | | | 69,538 | |
| | 59,000 | | | KKR Group Finance Co. VI, LLC, 3.750%, 7/1/29(a) | | | 65,468 | |
| | 69,000 | | | Owl Rock Capital Corp., 3.400%, 7/15/26 | | | 71,853 | |
| | 50,000 | | | Stifel Financial Corp., 4.000%, 5/15/30 | | | 55,577 | |
| | | | | | | | 892,787 | |
| | | | | | | | | |
| | | | | Diversified Telecommunication Services — 2.6% | | | | |
| | 88,000 | | | AT&T, Inc., 2.550%, 12/1/33 | | | 86,451 | |
| | 75,000 | | | Verizon Communications, Inc., 4.016%, 12/3/29 | | | 84,875 | |
| | 18,000 | | | Viavi Solutions, Inc., 3.750%, 10/1/29(a) | | | 18,040 | |
| | | | | | | | 189,366 | |
| | | | | | | | | |
| | | | | Electric Utilities — 2.9% | | | | |
| | 54,000 | | | CenterPoint Energy, Inc., 2.950%, 3/1/30 | | | 56,440 | |
| | 90,000 | | | Dominion Energy, Inc., STEP, 3.071%, 8/15/24 | | | 95,117 | |
| | 55,000 | | | Pattern Energy Operations L.P./Pattern Energy Operations, Inc., 4.500%, 8/15/28(a) | | | 57,337 | |
| | | | | | | | 208,894 | |
| | | | | | | | | |
| | | | | Energy Equipment & Services — 5.1% | | | | |
| | 62,000 | | | Energy Transfer L.P., 4.050%, 3/15/25 | | | 66,864 | |
| | 60,000 | | | Genesis Energy L.P./Genesis Energy Finance Corp., 8.000%, 1/15/27 | | | 60,912 | |
See accompanying Notes to the Financial Statements.
Sterling Capital Corporate Fund
Schedule of Portfolio Investments — (continued) September 30, 2021
| Principal Amount | | | | | Fair Value | |
| CORPORATE BONDS — (continued) | | | |
| | | | Energy Equipment & Services — (continued) |
| $ | 51,000 | | | Hess Corp., 7.875%, 10/1/29 | | $ | 69,495 | |
| | 59,000 | | | Midwest Connector Capital Co., LLC, 3.900%, 4/1/24(a) | | | 61,699 | |
| | 10,000 | | | NuStar Logistics L.P., 5.750%, 10/1/25 | | | 10,803 | |
| | 34,000 | | | Renewable Energy Group, Inc., 5.875%, 6/1/28(a) | | | 35,147 | |
| | 50,000 | | | Sabine Pass Liquefaction, LLC, 5.625%, 3/1/25 | | | 56,696 | |
| | | | | | | | 361,616 | |
| | | | | | | | | |
| | | | | Entertainment — 0.3% | | | | |
| | 22,000 | | | Mattel, Inc., 3.750%, 4/1/29(a) | | | 22,935 | |
| | | | | | | | | |
| | | | | Equity Real Estate Investment Trusts (REITS) — 10.7% | | | | |
| | 157,000 | | | American Tower Trust, 3.652%, 3/23/28(a) | | | 167,197 | |
| | 52,000 | | | Crown Castle International Corp., 3.300%, 7/1/30 | | | 55,371 | |
| | 52,000 | | | Federal Realty Investment Trust, 3.500%, 6/1/30 | | | 56,358 | |
| | 11,000 | | | iStar, Inc., 4.750%, 10/1/24 | | | 11,633 | |
| | 44,000 | | | iStar, Inc., 5.500%, 2/15/26 | | | 45,980 | |
| | 118,000 | | | Jones Lang LaSalle, Inc., 4.400%, 11/15/22 | | | 121,952 | |
| | 36,000 | | | Kennedy-Wilson, Inc., 4.750%, 2/1/30 | | | 36,630 | |
| | 37,000 | | | Ladder Capital Finance Holdings LLLP/ Ladder Capital Finance Corp., 4.750%, 6/15/29(a) | | | 36,815 | |
| | 112,000 | | | Physicians Realty L.P., 4.300%, 3/15/27 | | | 126,620 | |
| | 52,000 | | | Sabra Health Care L.P., 5.125%, 8/15/26 | | | 58,218 | |
| | 8,000 | | | Starwood Property Trust, Inc., 3.625%, 7/15/26(a) | | | 8,030 | |
| | 39,000 | | | Tanger Properties L.P., 2.750%, 9/1/31 | | | 37,681 | |
| | | | | | | | 762,485 | |
| | | | | | | | | |
| | | | | Food Products — 0.9% | | | | |
| | 57,000 | | | Smithfield Foods, Inc., 5.200%, 4/1/29(a) | | | 65,394 | |
| | | | | | | | | |
| | | | | Health Care Providers & Services — 1.6% | | | | |
| | 39,000 | | | Bausch Health Cos., Inc., 5.000%, 1/30/28(a) | | | 37,000 | |
| | 71,000 | | | HCA, Inc., 5.000%, 3/15/24 | | | 77,911 | |
| | | | | | | | 114,911 | |
| | | | | | | | | |
| | | | | Hotels, Restaurants & Leisure — 1.3% | | | | |
| | 50,000 | | | Hilton Domestic Operating Co., Inc., 3.625%, 2/15/32(a) | | | 49,250 | |
| | 45,000 | | | Prime Security Services Borrower, LLC/ Prime Finance, Inc., 6.250%, 1/15/28(a) | | | 46,520 | |
| | | | | | | | 95,770 | |
| | | | | | | | | |
| | | | | Insurance — 9.0% | | | | |
| | 160,000 | | | Aspen Insurance Holdings, Ltd., 4.650%, 11/15/23 | | | 172,643 | |
| | 47,000 | | | Enstar Group, Ltd., 3.100%, 9/1/31 | | | 46,105 | |
| | 81,000 | | | Fidelity & Guaranty Life Holdings, Inc., 5.500%, 5/1/25(a) | | | 92,002 | |
| Principal Amount | | | | | Fair Value | |
| CORPORATE BONDS — (continued) | | | |
| | | | Insurance — (continued) | | | |
| $ | 27,000 | | | Global Atlantic Fin Co., 3.125%, 6/15/31(a) | | $ | 27,346 | |
| | 14,000 | | | MGIC Investment Corp., 5.250%, 8/15/28 | | | 14,939 | |
| | 96,000 | | | Radian Group, Inc., 4.875%, 3/15/27 | | | 104,628 | |
| | 43,000 | | | Sammons Financial Group, Inc., 3.350%, 4/16/31(a) | | | 44,644 | |
| | 36,000 | | | SBL Holdings, Inc., 5.000%, 2/18/31(a) | | | 38,369 | |
| | 93,000 | | | Symetra Financial Corp., 4.250%, 7/15/24 | | | 100,111 | |
| | | | | | | | 640,787 | |
| | | | | | | | | |
| | | | | Internet & Direct Marketing Retail — 0.5% | | | | |
| | 35,000 | | | Uber Technologies, Inc., 4.500%, 8/15/29(a) | | | 35,184 | |
| | | | | | | | | |
| | | | | IT Services — 0.6% | | | | |
| | 38,000 | | | Fiserv, Inc., 2.750%, 7/1/24 | | | 40,006 | |
| | | | | | | | | |
| | | | | Media — 3.6% | | | | |
| | 59,000 | | | Charter Communications Operating, LLC/ Charter Communications Operating Capital, 4.200%, 3/15/28 | | | 65,849 | |
| | 56,000 | | | Comcast Corp., 1.950%, 1/15/31 | | | 55,071 | |
| | 53,000 | | | Discovery Communications, LLC, 3.950%, 3/20/28 | | | 58,652 | |
| | 5,000 | | | Univision Communications, Inc., 4.500%, 5/1/29(a) | | | 5,081 | |
| | 70,000 | | | ViacomCBS, Inc., 3.875%, 4/1/24 | | | 74,683 | |
| | | | | | | | 259,336 | |
| | | | | | | | | |
| | | | | Metals & Mining — 2.1% | | | | |
| | 44,000 | | | Freeport-McMoRan, Inc., 4.125%, 3/1/28 | | | 45,595 | |
| | 27,000 | | | Kaiser Aluminum Corp., 4.500%, 6/1/31(a) | | | 27,675 | |
| | 19,000 | | | Novelis Corp., 3.250%, 11/15/26(a) | | | 19,269 | |
| | 50,000 | | | Nucor Corp., 3.950%, 5/1/28 | | | 56,114 | |
| | 2,000 | | | Roller Bearing Co. of America, Inc., 4.375%, 10/15/29(a) | | | 2,050 | |
| | | | | | | | 150,703 | |
| | | | | | | | | |
| | | | | Multi-Utilities — 2.6% | | | | |
| | 53,000 | | | Entergy Louisiana, LLC, 4.440%, 1/15/26 | | | 58,993 | |
| | 66,000 | | | Progress Energy, Inc., 3.150%, 4/1/22 | | | 66,451 | |
| | 56,000 | | | Sempra Energy, 3.550%, 6/15/24 | | | 59,658 | |
| | | | | | | | 185,102 | |
| | | | | | | | | |
| | | | | Oil, Gas & Consumable Fuels — 4.5% | | | | |
| | 23,000 | | | Antero Resources Corp., 8.375%, 7/15/26(a) | | | 26,053 | |
| | 42,000 | | | Devon Energy Corp., 5.875%, 6/15/28(a) | | | 46,285 | |
| | 63,000 | | | Diamondback Energy, Inc., 3.500%, 12/1/29 | | | 67,310 | |
| | 34,000 | | | EQT Corp., 3.125%, 5/15/26(a) | | | 34,854 | |
| | 60,000 | | | HollyFrontier Corp., 5.875%, 4/1/26 | | | 68,848 | |
| | 32,000 | | | Ovintiv Exploration, Inc., 5.375%, 1/1/26 | | | 36,168 | |
| | 39,000 | | | Schlumberger Investment SA, 2.650%, 6/26/30 | | | 40,192 | |
| | | | | | | | 319,710 | |
Continued
Sterling Capital Corporate Fund
Schedule of Portfolio Investments — (continued)
September 30, 2021
| Principal Amount | | | | | Fair Value | |
| CORPORATE BONDS — (continued) | | | |
| | | | Pharmaceuticals — 0.9% | | | |
| $ | 60,000 | | | AbbVie, Inc., 3.600%, 5/14/25 | | $ | 64,889 | |
| | | | | | | | | |
| | | | | Semiconductors & Semiconductor Equipment — 1.9% | | | | |
| | 60,000 | | | Broadcom, Inc., 4.150%, 11/15/30 | | | 66,443 | |
| | 65,000 | | | ON Semiconductor Corp., 3.875%, 9/1/28(a) | | | 67,158 | |
| | | | | | | | 133,601 | |
| | | | | | | | | |
| | | | | Software — 0.1% | | | | |
| | 5,000 | | | Twilio, Inc., 3.625%, 3/15/29 | | | 5,115 | |
| | | | | | | | | |
| | | | | Specialty Retail — 0.8% | | | | |
| | 51,000 | | | ERAC USA Finance, LLC, 3.800%, 11/1/25(a) | | | 55,793 | |
| | | | | | | | | |
| | | | | Tobacco — 0.6% | | | | |
| | 40,000 | | | BAT Capital Corp., 3.557%, 8/15/27 | | | 43,076 | |
| | | | | | | | | |
| | | | | Trading Companies & Distributors — 0.2% | | | | |
| | 11,000 | | | H&E Equipment Services, Inc., 3.875%, 12/15/28(a) | | | 10,972 | |
| | | | | | | | | |
| | | | | Total Corporate Bonds | | | | |
| | | | | (Cost $6,646,414) | | | 6,913,940 | |
| | | | | | | | | |
| U.S. TREASURY BONDS — 0.5% | | | | |
| | 36,100 | | | 2.500%, 2/15/45 | | | 38,899 | |
| | | | | | | | | |
| | | | | Total U.S. Treasury Bonds | | | | |
| | | | | (Cost $39,884) | | | 38,899 | |
| Shares | | | | | | |
| PREFERRED STOCKS — 0.8% | | | |
| | | | | Equity Real Estate Investment Trusts (REITS) — 0.8% | | | | |
| | 2,189 | | | Public Storage, 4.900%(c) | | | 54,922 | |
| | | | | | | | | |
| | | | | Total Preferred Stocks | | | | |
| | | | | (Cost $55,578) | | | 54,922 | |
| | | | | | | | | |
| MONEY MARKET FUND — 1.2% | | | | |
| | 87,884 | | | Federated Treasury Obligations Fund, Institutional Shares, 0.01%(e) | | | 87,884 | |
| | | | | | | | | |
| | | | | Total Money Market Fund | | | | |
| | | | | (Cost $87,884) | | | 87,884 | |
| | | | | | | | | |
| Total Investments — 99.3% | | | | |
| (Cost $6,829,760) | | | 7,095,645 | |
| Net Other Assets (Liabilities) — 0.7% | | | 47,886 | |
| NET ASSETS — 100.0% | | $ | 7,143,531 | |
| (a) | Rule 144A, Section 4(2) or other security that is restricted as to resale to qualified institutional investors. The Advisor, using Board approved procedures, has deemed these securities or a portion of these securities to be liquid. |
| (b) | Security is a fix-to-float security, which carries a fixed coupon until a certain date, upon which it switches to a floating rate. Rate shown is the fixed rate. |
| (c) | Security is perpetual in nature and has no stated maturity date. |
| (d) | The interest rate for this variable rate note, which will change periodically, is based either on the prime rate or an index of market rates. The reflected rate is in effect as of September 30, 2021. The maturity date reflected is the final maturity date. |
| (e) | Represents the current yield as of report date. |
| MTN | Medium Term Note |
| STEP | Step Coupon Bond |
Continued
| Sterling Capital Quality Income Fund |
Schedule of Portfolio Investments
September 30, 2021
| Principal Amount | | | | | Fair Value | |
| ASSET BACKED SECURITIES —_20.3% | | | |
| $ | 266,480 | | | Aegis Asset Backed Securities Trust, Series 2005-5, Class 1A4, 0.786%, (LIBOR USD 1-Month plus 0.70%), 12/25/35(a) | | $ | 266,519 | |
| | 230,000 | | | AmeriCredit Automobile Receivables Trust, Series 2019-2, Class B, 2.540%, 7/18/24 | | | 233,343 | |
| | 351,000 | | | AmeriCredit Automobile Receivables Trust, Series 2019-2, Class C, 2.740%, 4/18/25 | | | 360,614 | |
| | 225,000 | | | AmeriCredit Automobile Receivables Trust, Series 2020-3, Class B, 0.760%, 12/18/25 | | | 225,596 | |
| | 405,000 | | | AmeriCredit Automobile Receivables Trust, Series 2021-2, Class B, 0.690%, 1/19/27 | | | 404,159 | |
| | 15,150 | | | Argent Securities, Inc. Asset-Backed Pass- Through Certificates, Series 2005-W3, Class A2D, 0.766%, (LIBOR USD 1-Month plus 0.68%), 11/25/35(a) | | | 15,143 | |
| | 212,448 | | | ARI Fleet Lease Trust, Series 2018-A, Class A3, 2.840%, 10/15/26(b) | | | 213,083 | |
| | 170,000 | | | ARI Fleet Lease Trust, Series 2021-A, Class A3, 0.680%, 3/15/30(b) | | | 169,356 | |
| | 300,000 | | | Avis Budget Rental Car Funding AESOP, LLC, Series 2017-2A, Class A, 2.970%, 3/20/24(b) | | | 309,713 | |
| | 500,000 | | | Avis Budget Rental Car Funding AESOP, LLC, Series 2021-1A, Class A, 1.380%, 8/20/27(b) | | | 498,701 | |
| | 16,400 | | | Bear Stearns Asset Backed Securities I Trust, Series 2004-HE11, Class M2, 1.661%, (LIBOR USD 1-Month plus 1.58%), 12/25/34(a) | | | 16,429 | |
| | 350,000 | | | Carvana Auto Receivables Trust, Series 2021-P1, Class A4, 0.860%, 1/11/27 | | | 350,737 | |
| | 509,000 | | | Carvana Auto Receivables Trust, Series 2021-P2, Class B, 1.270%, 3/10/27 | | | 507,717 | |
| | 500,000 | | | Carvana Auto Receivables Trust, Series 2021-P3, Class B, 1.420%, 8/10/27 | | | 497,554 | |
| | 34,258 | | | Chesapeake Funding II, LLC, Series 2018- 3A, Class A1, 3.390%, 1/15/31(b) | | | 34,955 | |
| | 450,000 | | | Citibank Credit Card Issuance Trust, Series 2007-A3, Class A3, 6.150%, 6/15/39 | | | 623,898 | |
| | 3,716 | | | Citicorp Residential Mortgage Trust, STEP, Series 2007-2, Class A6, 4.904%, 6/25/37 | | | 3,750 | |
| | 500,000 | | | Enterprise Fleet Financing, LLC, Series 2019-2, Class A3, 2.380%, 2/20/25(b) | | | 513,817 | |
| | 300,000 | | | Enterprise Fleet Financing, LLC, Series 2021-2, Class A3, 0.740%, 5/20/27(b) | | | 297,616 | |
| | 375,000 | | | Enterprise Fleet Funding, LLC, Series 2021-1, Class A3, 0.700%, 12/21/26(b) | | | 374,151 | |
| | 350,000 | | | Ford Credit Auto Owner Trust 2020- REV1, Series 2020-1, Class A, 2.040%, 8/15/31(b) | | | 361,961 | |
| Principal Amount | | | | | Fair Value | |
| ASSET BACKED SECURITIES — (continued) | | | |
| $ | 642,000 | | | Ford Credit Auto Owner Trust 2020- REV2, Series 2020-2, Class A, 1.060%, 4/15/33(b) | | $ | 639,401 | |
| | 200,000 | | | GreatAmerica Leasing Receivables Funding, LLC, Series 2021-1, Class A3, 0.340%, 8/15/24(b) | | | 199,544 | |
| | 145,000 | | | GreatAmerica Leasing Receivables Funding, LLC, Series 2021-1, Class A4, 0.550%, 12/15/26(b) | | | 143,864 | |
| | 795,000 | | | Hertz Vehicle Financing III L.P., Series 2021-2A, Class A, 1.680%, 12/27/27(b) | | | 795,458 | |
| | 52,158 | | | Home Equity Asset Trust, Series 2005- 7, Class M1, 0.761%, (LIBOR USD 1-Month plus 0.68%), 1/25/36(a) | | | 52,138 | |
| | 10,480 | | | Home Equity Asset Trust, Series 2005- 8, Class M1, 0.731%, (LIBOR USD 1-Month plus 0.65%), 2/25/36(a) | | | 10,479 | |
| | 50,521 | | | JP Morgan Mortgage Acquisition Corp., Series 2005-OPT1, Class M2, 0.791%, (LIBOR USD 1-Month plus 0.71%), 6/25/35(a) | | | 50,525 | |
| | 500,000 | | | OneMain Financial Issuance Trust, Series 2020-1A, Class A, 3.840%, 5/14/32(b) | | | 516,811 | |
| | 630,000 | | | OneMain Financial Issuance Trust 2019- 2, Series 2019-2A, Class A, 3.140%, 10/14/36(b) | | | 673,498 | |
| | 480,000 | | | OneMain Financial Issuance Trust 2021-1, Series 2021-1A, Class A1, 1.550%, 6/16/36(b) | | | 479,152 | |
| | 76,942 | | | Park Place Securities, Inc. Asset-Backed Pass Through Certificates, Series 2005- WCW3, Class M1, 0.806%, (LIBOR USD 1-Month plus 0.72%), 8/25/35(a) | | | 78,038 | |
| | 87,980 | | | Park Place Securities, Inc. Asset-Backed Pass Through Certificates, Series 2005- WHQ2, Class M2, 0.776%, (LIBOR USD 1-Month plus 0.69%), 5/25/35(a) | | | 88,032 | |
| | 400,000 | | | Santander Drive Auto Receivables Trust, Series 2020-3, Class B, 0.690%, 3/17/25 | | | 400,908 | |
| | 530,000 | | | Santander Drive Auto Receivables Trust, Series 2020-3, Class C, 1.120%, 1/15/26 | | | 533,315 | |
| | 300,000 | | | Santander Drive Auto Receivables Trust, Series 2020-4, Class B, 0.730%, 3/17/25 | | | 300,886 | |
| | 210,791 | | | Saxon Asset Securities Trust, Series 2004- 3, Class M1, 0.984%, (LIBOR USD 1-Month plus 0.90%), 12/26/34(a) | | | 211,070 | |
| | 500,000 | | | SoFi Professional Loan Program Trust, Series 2020-A, Class A2FX, 2.540%, 5/15/46(b) | | | 513,152 | |
| | 500,000 | | | Toyota Auto Loan Extended Note Trust 2021-1, Series 2021-1A, Class A, 1.070%, 2/27/34(b) | | | 498,744 | |
| | 81,978 | | | U.S. Small Business Administration, Series 2010-20D, Class 1, 4.360%, 4/1/30 | | | 88,796 | |
See accompanying Notes to the Financial Statements.
| Sterling Capital Quality Income Fund |
Schedule of Portfolio Investments — (continued)
September 30, 2021
| Principal Amount | | | | | Fair Value | |
| ASSET BACKED SECURITIES — (continued) | | | |
| $ | 215,000 | | | Wheels SPV 2, LLC, Series 2020-1A, Class A3, 0.620%, 8/20/29(b). | | $ | 215,213 | |
| | | | | Total Asset Backed Securities
(Cost $12,645,303) | | | 12,767,836 | |
| | | | | | | | | |
| COLLATERALIZED MORTGAGE OBLIGATIONS —_18.3% | | | | |
| | 67,955 | | | Alternative Loan Trust, Series 2004-22CB, Class 1A1, 6.000%, 10/25/34 | | | 70,562 | |
| | 34,900 | | | Citicorp Mortgage Securities, Inc., Series 2005-1, Class 1A4, 5.500%, 2/25/35 | | | 35,967 | |
| | 9,815 | | | Citigroup Mortgage Loan Trust, Inc., Series 2004-NCM2, Class 3CB2, 6.500%, 8/25/19 | | | 9,805 | |
| | 41,487 | | | Countrywide Home Loan Mortgage Pass- Through Trust, Series 2004-3, Class A4, 5.750%, 4/25/34 | | | 43,482 | |
| | 71,158 | | | Credit Suisse First Boston Mortgage- Backed Pass-Through Certificates, Series 2004-1, Class 2A1, 6.500%, 2/25/34 | | | 73,648 | |
| | 54,086 | | | Fannie Mae, Series 2003-19, Class AR, 5.500%, 3/25/33 | | | 61,209 | |
| | 192,600 | | | Fannie Mae, Series 2003-21, Class OW, 4.000%, 3/25/33 | | | 210,275 | |
| | 682,000 | | | Fannie Mae, Series 2008-2, Class PH, 5.500%, 2/25/38 | | | 815,334 | |
| | 527,000 | | | Fannie Mae, Series 2009-28, Class HX, 5.000%, 5/25/39 | | | 613,549 | |
| | 380,000 | | | Fannie Mae, Series 2011-131, Class PB, 4.500%, 12/25/41 | | | 429,427 | |
| | 367,213 | | | Fannie Mae, Series 2011-74, Class QM, 4.500%, 11/25/40 | | | 385,293 | |
| | 585,000 | | | Fannie Mae, Series 2013-30, Class PY, 3.000%, 4/25/43 | | | 602,482 | |
| | 578,443 | | | Fannie Mae, Series 2013-91, Class DV, 3.000%, 10/25/26 | | | 606,891 | |
| | 177,935 | | | Fannie Mae, Series 2016-85, Class GA, 2.500%, 10/25/45 | | | 185,923 | |
| | 890,156 | | | Fannie Mae, Series 2017-26, Class CD, 3.500%, 1/25/43 | | | 905,750 | |
| | 900,000 | | | Fannie Mae-Aces, Series 2017-M7, Class A2, 2.961%, 2/25/27(c) | | | 967,736 | |
| | 26,862 | | | FirstKey Mortgage Trust, Series 2014-1, Class A12, 3.500%, 11/25/44(b)(c) | | | 27,334 | |
| | 95,164 | | | Freddie Mac, Series 2485, Class WG, 6.000%, 8/15/32 | | | 109,212 | |
| | 165,756 | | | Freddie Mac, Series 2768, Class PC, 4.000%, 3/15/34 | | | 176,797 | |
| | 136,010 | | | Freddie Mac, Series 3440, Class EM, 5.000%, 4/15/38 | | | 152,524 | |
| | 500,000 | | | Freddie Mac, Series 3714, Class PB, 4.750%, 8/15/40 | | | 590,956 | |
| | 23,512 | | | Freddie Mac, Series 3803, Class PJ, 4.250%, 1/15/41 | | | 24,619 | |
| | 200,000 | | | Freddie Mac, Series 3815, Class TB, 4.500%, 2/15/41 | | | 230,283 | |
| Principal Amount | | | | | Fair Value | |
| COLLATERALIZED MORTGAGE OBLIGATIONS — (continued) | | | |
| $ | 204,904 | | | Freddie Mac, Series 3816, Class HM, 4.500%, 5/15/40 | | $ | 217,184 | |
| | 400,000 | | | Freddie Mac, Series 3989, Class JW, 3.500%, 1/15/42 | | | 430,621 | |
| | 300,000 | | | Freddie Mac, Series 4094, Class ME, 2.500%, 8/15/42 | | | 307,820 | |
| | 195,000 | | | Freddie Mac, Series 4097, Class CU, 1.500%, 8/15/27 | | | 195,422 | |
| | 435,736 | | | Freddie Mac, Series 4136, Class HZ, 3.500%, 11/15/27 | | | 470,503 | |
| | 171,000 | | | Freddie Mac, Series 4160, Class HH, 2.500%, 12/15/32 | | | 175,363 | |
| | 197,599 | | | Freddie Mac, Series 4173, Class NB, 3.000%, 3/15/43 | | | 210,545 | |
| | 179,845 | | | Freddie Mac, Series 4215, Class LD, 2.000%, 7/15/41 | | | 183,343 | |
| | 57,516 | | | Freddie Mac, Series 4293, Class MH, 3.000%, 12/15/41 | | | 60,546 | |
| | 500,000 | | | Freddie Mac, Series 4650, Class BC, 3.500%, 5/15/43 | | | 510,370 | |
| | 460,951 | | | Freddie Mac, Series 5115, Class G, 2.500%, 9/25/50 | | | 477,074 | |
| | 330,858 | | | Freddie Mac Strips, Series 219, Class PO, 3/1/32 | | | 313,582 | |
| | 71,324 | | | Ginnie Mae, Series 2004-69, Class GC, 5.500%, 4/20/34 | | | 80,252 | |
| | 11,698 | | | Ginnie Mae, Series 2010-85, Class DQ, 3.000%, 12/20/39 | | | 11,882 | |
| | 275,000 | | | JP Morgan Mortgage Trust, Series 2017-5, Class A1B, 3.102%, 10/26/48(b)(c) | | | 283,838 | |
| | 179,088 | | | MASTR Alternative Loan Trust, Series 2003-5, Class 8A1, 5.500%, 6/25/33 | | | 185,309 | |
| | 26,837 | | | MASTR Alternative Loan Trust, Series 2004-13, Class 3A1, 6.500%, 1/25/35 | | | 24,447 | |
| | 19,584 | | | RBSGC Mortgage Loan Trust, Series 2007- B, Class 3A1, 3.816%, 7/25/35(c) | | | 19,639 | |
| | | | | Total Collateralized Mortgage Obligations
(Cost $11,288,080) | | | 11,486,798 | |
| | | | | | | | | |
| COMMERCIAL MORTGAGE-BACKED SECURITIES — 30.6% | | | | |
| | 589,492 | | | Benchmark Mortgage Trust, Series 2020- B18, Class A5, 1.925%, 7/15/53 | | | 582,085 | |
| | 500,000 | | | Benchmark Mortgage Trust, Series 2020- B21, Class A5, 1.978%, 12/17/53 | | | 493,629 | |
| | 589,000 | | | CD Mortgage Trust, Series 2016-CD2, Class A4, 3.526%, 11/10/49(c) | | | 643,550 | |
| | 700,000 | | | CD Mortgage Trust, Series 2017-CD3, Class A4, 3.631%, 2/10/50 | | | 768,296 | |
| | 365,000 | | | Citigroup Commercial Mortgage Trust, Series 2013-GC15, Class A4, 4.371%, 9/10/46(c) | | | 388,702 | |
Continued
| Sterling Capital Quality Income Fund |
Schedule of Portfolio Investments — (continued)
September 30, 2021
| Principal Amount | | | | | Fair Value | |
| COMMERCIAL MORTGAGE-BACKED SECURITIES— (continued) | | | |
| $ | 405,000 | | | Citigroup Commercial Mortgage Trust, Series 2013-GC17, Class AS, 4.544%, 11/10/46 | | $ | 430,693 | |
| | 500,000 | | | Citigroup Commercial Mortgage Trust, Series 2015-GC33, Class A4, 3.778%, 9/10/58 | | | 545,808 | |
| | 376,163 | | | COMM 2012-CCRE1 Mortgage Trust, Series 2012-CR1, Class A3, 3.391%, 5/15/45 | | | 379,166 | |
| | 476,228 | | | COMM 2012-CCRE3 Mortgage Trust, Series 2012-CR3, Class A3, 2.822%, 10/15/45 | | | 482,877 | |
| | 75,000 | | | COMM 2013-CCRE11 Mortgage Trust, Series 2013-CR11, Class A4, 4.258%, 8/10/50 | | | 79,698 | |
| | 75,000 | | | COMM 2013-CCRE13 Mortgage Trust, Series 2013-CR13, Class A4, 4.194%, 11/10/46(c) | | | 80,103 | |
| | 500,000 | | | COMM 2014-CCRE18 Mortgage Trust, Series 2014-CR18, Class A5, 3.828%, 7/15/47 | | | 536,790 | |
| | 125,000 | | | COMM Mortgage Trust, Series 2012-CR1, Class AM, 3.912%, 5/15/45 | | | 126,697 | |
| | 266,000 | | | COMM Mortgage Trust, Series 2014- CR20, Class A4, 3.590%, 11/10/47 | | | 284,048 | |
| | 520,000 | | | COMM Mortgage Trust, Series 2014- UBS2, Class A5, 3.961%, 3/10/47 | | | 554,948 | |
| | 455,000 | | | COMM Mortgage Trust, Series 2014- UBS4, Class A5, 3.694%, 8/10/47 | | | 485,388 | |
| | 250,000 | | | COMM Mortgage Trust, Series 2017- COR2, Class A3, 3.510%, 9/10/50 | | | 274,308 | |
| | 500,000 | | | CSAIL Commercial Mortgage Trust, Series 2015-C3, Class A4, 3.718%, 8/15/48 | | | 541,530 | |
| | 365,270 | | | FRESB Mortgage Trust, Series 2017-SB36, Class A10F, 2.880%, 7/25/27(c) | | | 373,032 | |
| | 837,069 | | | Ginnie Mae, Series 2014-126, Class A, 2.500%, 11/16/46 | | | 852,811 | |
| | 472,774 | | | Ginnie Mae, Series 2019-79, Class V, 2.800%, 3/16/29 | | | 490,335 | |
| | 175,000 | | | GS Mortgage Securities Trust, Series 2010- C1, Class B, 5.148%, 8/10/43(b) | | | 175,785 | |
| | 550,000 | | | GS Mortgage Securities Trust, Series 2012- GCJ7, Class AS, 4.085%, 5/10/45 | | | 556,624 | |
| | 300,000 | | | GS Mortgage Securities Trust, Series 2013- GC14, Class A5, 4.243%, 8/10/46 | | | 317,242 | |
| | 85,000 | | | GS Mortgage Securities Trust, Series 2014- GC24, Class A5, 3.931%, 9/10/47 | | | 91,806 | |
| | 500,000 | | | GS Mortgage Securities Trust, Series 2016- GS4, Class A4, 3.442%, 11/10/49(c) | | | 543,730 | |
| | 272,000 | | | GS Mortgage Securities Trust, Series 2020- GC47, Class A5, 2.377%, 5/12/53 | | | 278,032 | |
| | 500,000 | | | GS Mortgage Securities Trust, Series 2020- GSA2, Class A5, 2.012%, 12/12/53 | | | 492,908 | |
| Principal Amount | | | | | Fair Value | |
| COMMERCIAL MORTGAGE-BACKED SECURITIES— (continued) | | | |
| $ | 214,195 | | | JP Morgan Chase Commercial Mortgage Securities Trust, Series 2011-C3, Class B, 5.013%, 2/15/46(b)(c) | | $ | 217,768 | |
| | 500,000 | | | JP Morgan Chase Commercial Mortgage Securities Trust, Series 2014-C20, Class A5, 3.805%, 7/15/47 | | | 532,177 | |
| | 185,000 | | | JP Morgan Chase Commercial Mortgage Securities Trust, Series 2016-JP4, Class A4, 3.648%, 12/15/49(c) | | | 202,854 | |
| | 100,000 | | | Morgan Stanley Bank of America Merrill Lynch Trust, Series 2014-C18, Class A4, 3.923%, 10/15/47 | | | 107,782 | |
| | 300,167 | | | Morgan Stanley Bank of America Merrill Lynch Trust, Series 2014-C19, Class A4, 3.526%, 12/15/47 | | | 320,967 | |
| | 500,000 | | | Morgan Stanley Bank of America Merrill Lynch Trust, Series 2016-C32, Class A4, 3.720%, 12/15/49 | | | 550,323 | |
| | 149,000 | | | Morgan Stanley Capital I Trust, Series 2016-BNK2, Class A4, 3.049%, 11/15/49 | | | 159,419 | |
| | 435,000 | | | Morgan Stanley Capital I Trust, Series 2018-H3, Class A5, 4.177%, 7/15/51 | | | 492,340 | |
| | 279,333 | | | Morgan Stanley Capital I Trust, Series 2020-HR8, Class A4, 2.041%, 7/15/53 | | | 277,633 | |
| | 300,000 | | | OPG Trust, Series 2021-PORT, Class C, 0.932%, (LIBOR USD 1-Month plus 0.83%), 10/15/36(a)(b) | | | 297,504 | |
| | 487,155 | | | UBS-Barclays Commercial Mortgage Trust, Series 2012-C3, Class A4, 3.091%, 8/10/49 | | | 494,860 | |
| | 600,000 | | | Wells Fargo Commercial Mortgage Trust, Series 2014-LC18, Class A5, 3.405%, 12/15/47 | | | 642,581 | |
| | 644,000 | | | Wells Fargo Commercial Mortgage Trust, Series 2015-P2, Class A4, 3.809%, 12/15/48 | | | 705,625 | |
| | 50,000 | | | Wells Fargo Commercial Mortgage Trust, Series 2016-C37, Class A5, 3.794%, 12/15/49 | | | 55,263 | |
| | 300,000 | | | Wells Fargo Commercial Mortgage Trust, Series 2017-C40, Class A4, 3.581%, 10/15/50 | | | 329,120 | |
| | 220,800 | | | Wells Fargo Commercial Mortgage Trust, Series 2020-C56, Class A5, 2.448%, 6/15/53 | | | 226,867 | |
| | 500,000 | | | Wells Fargo Commercial Mortgage Trust, Series 2020-C57, Class A4, 2.118%, 8/15/53 | | | 499,946 | |
| | 162,000 | | | WFRBS Commercial Mortgage Trust, Series 2012-C10, Class A3, 2.875%, 12/15/45 | | | 165,142 | |
Continued
| Sterling Capital Quality Income Fund |
Schedule of Portfolio Investments — (continued)
September 30, 2021
| Principal Amount | | | | | Fair Value | |
| COMMERCIAL MORTGAGE-BACKED SECURITIES — (continued) | | | |
| $ | 485,000 | | | WFRBS Commercial Mortgage Trust, Series 2012-C7, Class A2, 3.431%, 6/15/45 | | $ | 490,430 | |
| | 200,000 | | | WFRBS Commercial Mortgage Trust, Series 2012-C8, Class AS, 3.660%, 8/15/45 | | | 203,901 | |
| | 84,650 | | | WFRBS Commercial Mortgage Trust, Series 2013-UBS1, Class A4, 4.079%, 3/15/46(c) | | | 89,686 | |
| | 302,000 | | | WFRBS Commercial Mortgage Trust, Series 2014-C23, Class A5, 3.917%, 10/15/57 | | | 326,206 | |
| | | | | Total Commercial Mortgage-Backed Securities
(Cost $19,195,873) | | | 19,239,015 | |
| | | | | | | | | |
| CORPORATE BONDS — 1.3% | | | | |
| | | | | | | | | |
| | | | | Diversified Telecommunication Services — 0.9% | | | | |
| | 493,750 | | | Sprint Spectrum Co., LLC/Sprint Spectrum Co. II, LLC/Sprint Spectrum Co. III, LLC, 4.738%, 3/20/25(b) | | | 527,325 | |
| | | | | | | | | |
| | | | | Equity Real Estate Investment Trusts (REITS) — 0.4% | | | | |
| | 250,000 | | | American Tower Trust, 3.652%, 3/23/28(b) | | | 266,237 | |
| | | | | Total Corporate Bonds
(Cost $769,438) | | | 793,562 | |
| | | | | | | | | |
| MORTGAGE-BACKED SECURITIES — 32.1% | | | | |
| | | | | | | | | |
| | | | | Fannie Mae — 14.7% | | | | |
| | 495,294 | | | 3.590%, 1/1/24, Pool #BL1146 | | | 509,343 | |
| | 171,891 | | | 3.000%, 1/1/31, Pool #BA6574 | | | 181,615 | |
| | 455,879 | | | 4.500%, 3/1/34, Pool #CA3294 | | | 500,883 | |
| | 400,401 | | | 2.500%, 11/1/35, Pool #CA7939 | | | 419,245 | |
| | 80,660 | | | 5.500%, 6/1/38, Pool #984277 | | | 94,076 | |
| | 41,471 | | | 5.500%, 8/1/38, Pool #995072 | | | 48,426 | |
| | 53,489 | | | 4.500%, 9/1/39, Pool #AC1830 | | | 59,940 | |
| | 48,865 | | | 4.500%, 10/1/40, Pool #AE4855 | | | 54,770 | |
| | 98,503 | | | 3.500%, 2/1/41, Pool #AH5646 | | | 108,244 | |
| | 149,304 | | | 4.000%, 3/1/41, Pool #AH4008 | | | 165,060 | |
| | 399,046 | | | 2.500%, 5/1/41, Pool #MA4334 | | | 413,130 | |
| | 41,286 | | | 4.500%, 6/1/41, Pool #AC9298 | | | 46,406 | |
| | 133,088 | | | 5.000%, 7/1/41, Pool #AI5595. | | | 151,371 | |
| | 193,872 | | | 4.000%, 9/1/41, Pool #AJ1717 | | | 214,449 | |
| | 167,224 | | | 3.500%, 6/1/42, Pool #AB5373 | | | 182,078 | |
| | 48,400 | | | 4.500%, 10/1/44, Pool #MA2066 | | | 53,574 | |
| | 154,073 | | | 4.000%, 12/1/44, Pool #MA2127 | | | 169,851 | |
| | 167,252 | | | 4.500%, 1/1/45, Pool #MA2158 | | | 184,702 | |
| | 178,165 | | | 3.500%, 3/1/45, Pool #AS4552 | | | 193,409 | |
| | 183,579 | | | 4.000%, 10/1/45, Pool #AL7487 | | | 200,997 | |
| | 131,024 | | | 4.000%, 11/1/46, Pool #MA2808 | | | 142,378 | |
| | 151,313 | | | 3.000%, 2/1/47, Pool #BE2329 | | | 160,089 | |
| Principal Amount | | | | | Fair Value | |
| MORTGAGE-BACKED SECURITIES — (continued) | | | |
| | | | | | | |
| | | | | Fannie Mae — (continued) | | | | |
| $ | 96,277 | | | 4.000%, 5/1/47, Pool #BE9598 | | $ | 104,053 | |
| | 96,053 | | | 4.500%, 11/1/47, Pool #BM3286 | | | 106,075 | |
| | 200,187 | | | 3.500%, 12/1/47, Pool #CA0833 | | | 212,511 | |
| | 107,638 | | | 4.500%, 5/1/48, Pool #CA1711 | | | 116,620 | |
| | 156,602 | | | 3.500%, 9/1/49, Pool #BJ9608 | | | 165,622 | |
| | 322,207 | | | 3.500%, 6/1/50, Pool #CA6097 | | | 341,431 | |
| | 344,621 | | | 3.000%, 7/1/50, Pool #CA6421 | | | 361,884 | |
| | 330,857 | | | 3.000%, 7/1/50, Pool #CA6422 | | | 346,232 | |
| | 671,009 | | | 2.500%, 8/1/50, Pool #FM4053 | | | 694,002 | |
| | 435,848 | | | 2.500%, 8/1/50, Pool #FM4055 | | | 451,046 | |
| | 426,829 | | | 3.000%, 9/1/50, Pool #CA7051 | | | 448,689 | |
| | 560,035 | | | 2.500%, 10/1/50, Pool #FM4702 | | | 580,619 | |
| | 640,264 | | | 2.500%, 3/1/51, Pool #FM6523 | | | 660,387 | |
| | 476,242 | | | 3.000%, 5/1/51, Pool #FM7346 | | | 498,918 | |
| | | | | | | | 9,342,125 | |
| | | | | | | | | |
| | | | | Fannie Mae or Freddie Mac — 5.7% | | | | |
| | 2,000,000 | | | 2.000%, 10/1/51 | | | 2,004,062 | |
| | 1,500,000 | | | 2.500%, 10/1/51 | | | 1,545,703 | |
| | | | | | | | 3,549,765 | |
| | | | | | | | | |
| | | | | Freddie Mac — 11.7% | | | | |
| | 60,920 | | | 4.000%, 11/1/32, Pool #ZS8993 | | | 66,264 | |
| | 270,025 | | | 3.500%, 5/1/35, Pool #ZA2378 | | | 292,231 | |
| | 191,051 | | | 4.000%, 5/1/37, Pool #ZA2461 | | | 208,664 | |
| | 25,641 | | | 5.500%, 10/1/39, Pool #ZI9359 | | | 29,833 | |
| | 43,294 | | | 5.000%, 4/1/40, Pool #ZI9910 | | | 49,543 | |
| | 79,024 | | | 5.500%, 4/1/40, Pool #ZA1042 | | | 91,639 | |
| | 35,340 | | | 5.000%, 8/1/40, Pool #ZA1056 | | | 40,078 | |
| | 91,373 | | | 4.000%, 11/1/40, Pool #ZJ0654 | | | 100,590 | |
| | 91,572 | | | 4.000%, 12/1/40, Pool #ZJ0811 | | | 100,807 | |
| | 209,756 | | | 3.500%, 8/1/42, Pool #ZL3508 | | | 228,690 | |
| | 847,719 | | | 3.000%, 12/1/42, Pool #Q14108 | | | 906,780 | |
| | 288,684 | | | 3.500%, 3/1/43, Pool #ZT1107 | | | 312,003 | |
| | 208,153 | | | 3.500%, 1/1/45, Pool #ZL8964 | | | 225,375 | |
| | 171,856 | | | 3.500%, 3/1/45, Pool #ZT1164 | | | 185,166 | |
| | 128,776 | | | 3.000%, 1/1/46, Pool #ZS4646 | | | 136,167 | |
| | 149,186 | | | 4.000%, 4/1/46, Pool #ZM1015 | | | 162,526 | |
| | 133,993 | | | 3.500%, 12/1/47, Pool #ZM5123 | | | 142,624 | |
| | 355,897 | | | 2.500%, 11/1/49, Pool #QA4396 | | | 367,063 | |
| | 163,520 | | | 3.000%, 1/1/50, Pool #QA6230 | | | 171,274 | |
| | 994,939 | | | 2.500%, 7/1/51, Pool #QC4230 | | | 1,029,607 | |
| | 456,994 | | | 3.000%, 7/1/51, Pool #RA5552 | | | 483,369 | |
| | 447,677 | | | 3.500%, 7/1/51, Pool #RA5549 | | | 477,969 | |
| | 1,372,557 | | | 3.000%, 8/1/51, Pool #SD8162 | | | 1,441,687 | |
| | | | | | | | 7,249,949 | |
| | | | | | | | | |
| | | | | Ginnie Mae — 0.0% | | | | |
| | 9,750 | | | 4.000%, 12/20/40, Pool #755678 | | | 10,657 | |
| | | | | | | | | |
| | | | | Total Mortgage-Backed Securities
(Cost $19,918,897) | | | 20,152,496 | |
Continued
| Sterling Capital Quality Income Fund |
Schedule of Portfolio Investments — (continued)
September 30, 2021
| Principal Amount | | | | | Fair Value | |
| U.S. TREASURY NOTES — 2.4% | | |
| $ | 1,500,000 | | | 0.875%, 6/30/26 | | $ | 1,494,082 | |
| | | | | Total U.S. Treasury Notes
(Cost $1,507,175) | | | 1,494,082 | |
| | | | | | | | | |
| Shares | | | | | | | |
| MONEY MARKET FUND — 1.4% | | |
| | 862,998 | | | Federated Treasury Obligations Fund, Institutional Shares, 0.01%(d) | | | 862,998 | |
| | | | | Total Money Market Fund
(Cost $862,998) | | | 862,998 | |
Total Investments —106.4%
(Cost $66,187,764) | | | 66,796,787 | |
| Net Other Assets (Liabilities) — (6.4)% | | | (4,045,424 | ) |
| NET ASSETS — 100.0% | | $ | 62,751,363 | |
| (a) | The interest rate for this floating rate note, which will change periodically, is based either on the prime rate or an index of market rates. The reflected rate is in effect as of September 30, 2021. The maturity date reflected is the final maturity date. |
| (b) | Rule 144A, Section 4(2) or other security that is restricted as to resale to qualified institutional investors. The Advisor, using Board approved procedures, has deemed these securities or a portion of these securities to be liquid. |
| (c) | The interest rate for this variable rate note, which will change periodically, is based either on the prime rate or an index of market rates. The reflected rate is in effect as of September 30, 2021. The maturity date reflected is the final maturity date. |
| (d) | Represents the current yield as of report date. |
Continued
| Sterling Capital North Carolina Intermediate Tax-Free Fund |
Schedule of Portfolio Investments
September 30, 2021
| Principal Amount | | | | | Fair Value | |
| MUNICIPAL BONDS — 96.2% | | | |
| | | | North Carolina — 96.2% | | | |
| $ | 1,000,000 | | | Beaufort County, NC, Refunding Revenue Limited Obligation, Callable 6/1/22 @ 100, 5.000%, 6/1/24 | | $ | 1,031,350 | |
| | 1,000,000 | | | Beaufort County, NC, Refunding Revenue Limited Obligation, Callable 6/1/22 @ 100, 5.000%, 6/1/26 | | | 1,031,350 | |
| | 1,000,000 | | | Broad River Water Authority, Water System Refunding Revenue, 5.000%, 6/1/24 | | | 1,119,780 | |
| | 1,025,000 | | | Buncombe County Metropolitan Sewerage District, Sewer Improvements Revenue, Callable 7/1/24 @ 100, 5.000%, 7/1/39 | | | 1,149,886 | |
| | 1,475,000 | | | Buncombe County, NC, Advance Refunding Revenue Limited Obligation, Callable 6/1/25 @ 100, 5.000%, 6/1/28 | | | 1,703,492 | |
| | 1,175,000 | | | Buncombe County, NC, School Improvements, Refunding Revenue, Series A, Callable 6/1/24 @ 100, 5.000%, 6/1/29 | | | 1,315,742 | |
| | 1,010,000 | | | Cape Fear Public Utility Authority, Advance Refunding Revenue Bonds, 5.000%, 8/1/25 | | | 1,183,417 | |
| | 1,895,000 | | | Cape Fear Public Utility Authority, Refunding Revenue Bonds, Series A, Callable 8/1/29 @ 100, 4.000%, 8/1/38 | | | 2,237,180 | |
| | 1,000,000 | | | Charlotte, NC, Charlotte Douglas International Airport Refunding Revenue, Callable 7/1/24 @ 100, 5.000%, 7/1/31 | | | 1,124,760 | |
| | 1,040,000 | | | Charlotte, NC, Convention Facility, Refunding Revenue, Certification of Participation, Callable 6/1/29 @ 100, 5.000%, 6/1/30 | | | 1,332,947 | |
| | 1,000,000 | | | Charlotte, NC, Convention Facility, Refunding Revenue, Certification of Participation, Callable 6/1/29 @ 100, 5.000%, 6/1/31 | | | 1,276,940 | |
| | 1,000,000 | | | Charlotte, NC, Convention Facility, Refunding Revenue, Certification of Participation, Callable 6/1/29 @ 100, 5.000%, 6/1/32 | | | 1,272,840 | |
| | 2,275,000 | | | Charlotte, NC, Recreational Facilities Improvements Revenue, Callable 12/1/28 @ 100, 5.000%, 12/1/33 | | | 2,864,566 | |
| | 1,520,000 | | | Charlotte, NC, Recreational Facilities Improvements Revenue, Callable 12/1/28 @ 100, 5.000%, 12/1/34 | | | 1,913,726 | |
| | 2,180,000 | | | Charlotte, NC, Refunding G.O., Series A, Callable 6/1/29 @ 100, 5.000%, 6/1/30 | | | 2,816,255 | |
| | 3,000,000 | | | Charlotte, NC, Water & Sewer System Refunding Revenue, Callable 7/1/28 @ 100, 5.000%, 7/1/36 | | | 3,745,260 | |
| | 2,295,000 | | | Charlotte, NC, Water & Sewer System Refunding Revenue, 5.000%, 7/1/27 | | | 2,852,846 | |
| Principal Amount | | | | | Fair Value | |
| MUNICIPAL BONDS — (continued) | | | |
| | | | North Carolina — (continued) | | | |
| $ | 3,100,000 | | | Charlotte-Mecklenburg Hospital Authority (The), NC, Current Refunding Revenue, Series A, Callable 1/15/22 @ 100, 5.000%, 1/15/30 | | $ | 3,142,067 | |
| | 2,035,000 | | | Chatham County, NC, Refunding Revenue (County Guaranteed), 5.000%, 12/1/28 | | | 2,444,300 | |
| | 1,350,000 | | | Dare County, NC, School Improvements Revenue Bonds, Series A, Callable 6/1/30 @ 100, 4.000%, 6/1/32 | | | 1,649,727 | |
| | 2,500,000 | | | Durham Capital Financing Corp., Refunding Revenue Limited Obligation, Callable 6/1/23 @ 100, 5.000%, 6/1/38 | | | 2,698,550 | |
| | 1,780,000 | | | Durham Capital Financing Corp., Revenue Bonds, Repayment of Bank Loan, Correctional Facilities Improvements, Callable 10/1/28 @ 100, 5.000%, 10/1/30 | | | 2,251,059 | |
| | 1,225,000 | | | East Carolina University, University & College Improvements Revenue, Series A, Callable 4/1/26 @ 100, 5.000%, 10/1/27 | | | 1,443,136 | |
| | 1,000,000 | | | Elizabeth City State University, Board of Governors of NC, Advance Refunding Revenue Bonds (AGM), Callable 4/1/29 @ 100, 5.000%, 4/1/40 | | | 1,202,750 | |
| | 1,750,000 | | | Fayetteville, NC, Public Works Commission, Electric Light & Power Improvements Revenue, Callable 3/1/24 @ 100, 4.000%, 3/1/27 | | | 1,892,503 | |
| | 1,690,000 | | | Fayetteville, NC, Public Works Commission, Multi-Utility Improvements Revenue, Callable 3/1/28 @ 100, 5.000%, 3/1/29 | | | 2,115,643 | |
| | 3,000,000 | | | Forsyth County NC, Public Improvements, G.O., Series B, Callable 3/1/29 @ 100, 5.000%, 3/1/31 | | | 3,830,640 | |
| | 2,200,000 | | | Forsyth County NC, Refunding Revenue, G.O., 5.000%, 7/1/26 | | | 2,658,084 | |
| | 2,000,000 | | | Forsyth County NC, School Improvements G.O., Series B, 4.000%, 3/1/30 | | | 2,473,520 | |
| | 1,850,000 | | | Gaston County, NC, Current Refunding G.O., 5.000%, 2/1/28 | | | 2,322,749 | |
| | 1,675,000 | | | Guilford County, NC, Advance Refunding, G.O., Series A, Callable 2/1/26 @ 100, 5.000%, 2/1/28 | | | 1,988,191 | |
| | 2,075,000 | | | High Point, NC, Combined Water & Sewer System, Advance Refunding Revenue Bonds, 5.000%, 11/1/26 | | | 2,531,583 | |
| | 3,000,000 | | | Johnston County, NC, Correctional Facilities Improvements, Current Refunding Revenue, Series A, 5.000%, 4/1/26 | | | 3,586,980 | |
See accompanying Notes to the Financial Statements.
| Sterling Capital North Carolina Intermediate Tax-Free Fund |
Schedule of Portfolio Investments — (continued)
September 30, 2021
| Principal Amount | | | | | Fair Value | |
| MUNICIPAL BONDS — (continued) | | | |
| | | | North Carolina — (continued) | | | |
| $ | 4,000,000 | | | Mecklenburg County, NC, Public Improvements, School Improvements, G.O., Series B, 5.000%, 12/1/26 | | $ | 4,894,000 | |
| | 1,195,000 | | | Monroe, NC, Advance Refunding Revenue Bonds, Callable 3/1/26 @ 100, 5.000%, 3/1/29 | | | 1,403,970 | |
| | 1,465,000 | | | Moore County, Advance Refunding Revenue, G.O., 5.000%, 6/1/28 | | | 1,854,133 | |
| | 1,250,000 | | | New Hanover County, NC, Public Facilities Revenue Bonds, Series A, 5.000%, 2/1/26 | | | 1,488,750 | |
| | 1,000,000 | | | North Carolina Agricultural & Technical State University, Series A, Refunding Revenue, Callable 10/1/25 @ 100, 5.000%, 10/1/32 | | | 1,163,530 | |
| | 1,215,000 | | | North Carolina Agricultural & Technical State University, Series A, Refunding Revenue, Callable 10/1/25 @ 100, 5.000%, 10/1/34 | | | 1,411,575 | |
| | 1,100,000 | | | North Carolina Capital Facilities Finance Agency, Johnson & Wales University Project, Refunding Revenue, Callable 4/1/23 @ 100, 5.000%, 4/1/25 | | | 1,168,948 | |
| | 840,000 | | | North Carolina Capital Facilities Finance Agency, Meredith College Project, Refunding Revenue, 5.000%, 6/1/24 | | | 935,642 | |
| | 750,000 | | | North Carolina Capital Facilities Finance Agency, Meredith College Project, Refunding Revenue, 5.000%, 6/1/25 | | | 861,855 | |
| | 1,045,000 | | | North Carolina Capital Facilities Finance Agency, The Arc of North Carolina Project, Refunding Revenue, (Housing and Urban Development, Section 8), 5.000%, 10/1/25 | | | 1,202,387 | |
| | 1,750,000 | | | North Carolina Capital Facilities Finance Agency, The Arc of North Carolina Project, Refunding Revenue, Callable 10/1/27 @ 100 (Housing and Urban Development, Section 8), 5.000%, 10/1/34 | | | 2,076,550 | |
| | 1,205,000 | | | North Carolina Central University, University & College Improvements, Revenue Bonds, Callable 4/1/29 @ 100, 5.000%, 4/1/33 | | | 1,478,921 | |
| | 1,000,000 | | | North Carolina Central University, University & College Improvements, Revenue Bonds, Callable 4/1/29 @ 100, 5.000%, 4/1/37 | | | 1,214,080 | |
| | 1,500,000 | | | North Carolina Medical Care Commission, Health Care Facilities, Nursinghome Improvement Revenue Bonds, Series A, Callable 1/1/30 @ 100, 5.000%, 7/1/32 | | | 1,914,105 | |
| Principal Amount | | | | | Fair Value | |
| MUNICIPAL BONDS — (continued) | | | |
| | | | North Carolina — (continued) | | | |
| $ | 3,175,000 | | | North Carolina Medical Care Commission, Health Care Facilities, Nursinghome Improvement Revenue Bonds, Series A, Callable 2/1/31 @ 100, 4.000%, 2/1/36 | | $ | 3,814,794 | |
| | 2,780,000 | | | North Carolina Medical Care Commission, Vidant Health Care Facilities, Refunding Revenue, Series A, Callable 6/1/22 @ 100, 5.000%, 6/1/24 | | | 2,869,043 | |
| | 1,960,000 | | | North Carolina State, Advance Refunding G.O., Series A, Callable 6/1/26 @ 100, 5.000%, 6/1/27 | | | 2,346,120 | |
| | 3,100,000 | | | North Carolina State, Advance Refunding Revenue Bonds, Series B, Callable 5/1/27 @ 100, 5.000%, 5/1/28 | | | 3,806,025 | |
| | 4,385,000 | | | North Carolina State, Advance Refunding Revenue Bonds, Series B, Callable 5/1/27 @ 100, 5.000%, 5/1/30 | | | 5,366,188 | |
| | 1,275,000 | | | North Carolina State, Build North Carolina Programs, Highway Improvements Revenue Bonds, Series B, Callable 5/1/30 @ 100, 4.000%, 5/1/35 | | | 1,545,313 | |
| | 5,000,000 | | | North Carolina State, Highway Improvements Revenue Bonds, Callable 3/1/31 @ 100, 4.000%, 3/1/34 | | | 6,024,400 | |
| | 2,645,000 | | | North Carolina State, Refunding Revenue G.O., Series B, 5.000%, 6/1/25 | | | 3,087,403 | |
| | 2,000,000 | | | North Carolina State University at Raleigh, Refunding Revenue, Series A, Callable 10/1/23 @ 100, 5.000%, 10/1/28 | | | 2,190,300 | |
| | 2,000,000 | | | North Carolina Turnpike Authority, Monroe Exressway System, Current Refunding Revenue, Callable 7/1/31 @ 100, 5.000%, 7/1/34 | | | 2,669,400 | |
| | 1,250,000 | | | North Carolina Turnpike Authority, Senior Lien, Advance Refunding Revenue (AGM), 5.000%, 1/1/26 | | | 1,472,763 | |
| | 1,500,000 | | | North Carolina Turnpike Authority, Senior Lien, Advance Refunding Revenue (AGM), 5.000%, 1/1/27 | | | 1,817,100 | |
| | 2,100,000 | | | North Carolina Turnpike Authority, Senior Lien, Advance Refunding Revenue (AGM), Callable 1/1/27 @ 100, 5.000%, 1/1/28 | | | 2,527,602 | |
| | 1,210,000 | | | Pender County, NC, Limited Obligation Refunding Revenue, Callable 6/1/22 @ 100, 5.000%, 6/1/26 | | | 1,248,756 | |
| | 1,060,000 | | | Pitt County, NC, Advance Refunding Revenue Bonds, Series B, Callable 10/1/26 @ 100, 5.000%, 4/1/30 | | | 1,268,841 | |
| | 1,395,000 | | | Pitt County, NC, Certificate of Participation, Refunding, Callable 4/1/22 @ 100, 5.000%, 4/1/25 | | | 1,428,020 | |
Continued
| Sterling Capital North Carolina Intermediate Tax-Free Fund |
Schedule of Portfolio Investments — (continued)
September 30, 2021
| Principal Amount | | | | | Fair Value | |
| MUNICIPAL BONDS — (continued) | | | |
| | | | North Carolina — (continued) | | | |
| $ | 1,500,000 | | | Raleigh, NC, Combined Enterprise System, Refunding Revenue, Series A, Callable 3/1/23 @ 100, 5.000%, 3/1/27 | | $ | 1,601,190 | |
| | 1,615,000 | | | Raleigh, NC, Combined Enterprise System, Refunding Revenue, Series A, Callable 3/1/23 @ 100, 5.000%, 3/1/28 | | | 1,723,948 | |
| | 1,000,000 | | | Raleigh, NC, Refunding Revenue, Callable 2/1/26 @ 100, 5.000%, 2/1/27 | | | 1,185,330 | |
| | 1,985,000 | | | Sampson County, NC, Refunding Revenue, Callable 12/1/25 @ 100, 5.000%, 12/1/26 | | | 2,329,378 | |
| | 1,135,000 | | | Surry County, Correctional Facilities Improvements Revenue Bonds, Callable 10/1/31 @ 100, 4.000%, 10/1/34 | | | 1,387,106 | |
| | 1,025,000 | | | Surry County, NC, School Improvements, Revenue Bonds, Callable 6/1/29 @ 100, 4.000%, 6/1/35 | | | 1,203,832 | |
| | 720,000 | | | Surry County, NC, School Improvements, Revenue Bonds, Callable 6/1/29 @ 100, 5.000%, 6/1/30 | | | 918,569 | |
| | 1,010,000 | | | Town of Holly Springs, NC, Public Improvements Revenue, Callable 10/1/24 @ 100, 5.000%, 10/1/27 | | | 1,146,724 | |
| | 870,000 | | | Town of Oak Island, NC, Combined Enterprise System, Advance Refunding Revenue (AGM), 5.000%, 6/1/25 | | | 1,006,912 | |
| | 1,000,000 | | | Union County, NC, Enterprise Systems, Refunding Revenue, Series A, Callable 12/1/21 @ 100, 4.000%, 12/1/22 | | | 1,006,070 | |
| | 2,235,000 | | | Union County, NC, Enterprise Systems, Water Utility Improvements, Refunding Revenue, Series A, Callable 6/1/29 @ 100, 4.000%, 6/1/38 | | | 2,635,780 | |
| | 2,205,000 | | | Union County, NC, Refunding G.O., Series A, 5.000%, 3/1/22 | | | 2,248,857 | |
| | 1,000,000 | | | Union County, NC, Refunding Revenue, 5.000%, 12/1/23 | | | 1,101,770 | |
| | 1,500,000 | | | University of North Carolina at Chapel Hill, Current Refunding Revenue Bonds, Series B, Callable 12/1/31 @ 100, 5.000%, 12/1/36 | | | 2,016,630 | |
| | 1,695,000 | | | University of North Carolina at Greensboro, University & College Improvements Revenue, Callable 4/1/24 @ 100, 5.000%, 4/1/28 | | | 1,891,247 | |
| | 410,000 | | | University of North Carolina System, Asheville/Wilmington, Refunding Revenue, Series C, Callable 8/2/21 @ 100 (Assured Guaranty), 5.250%, 10/1/24 | | | 411,546 | |
| | 1,985,000 | | | Wake County, NC, Advance Refunding Revenue Bonds, Series A, Callable 12/1/26 @ 100, 5.000%, 12/1/28 | | | 2,396,232 | |
| Principal Amount | | | | | Fair Value | |
| MUNICIPAL BONDS — (continued) | | | |
| | | | North Carolina — (continued) | | | |
| $ | 1,585,000 | | | Wake County, NC, Public Improvements, G.O., Series A, Callable 3/1/28 @ 100, 5.000%, 3/1/30 | | $ | 1,977,509 | |
| | 2,025,000 | | | Wake County, NC, Public Improvements, G.O., Series A, Callable 3/1/29 @ 100, 5.000%, 3/1/30 | | | 2,598,561 | |
| | 1,000,000 | | | Wake County, NC, Public Improvements, Refunding Notes, G.O., Series A, 5.000%, 3/1/28 | | | 1,263,800 | |
| | 2,000,000 | | | Wake County, NC, School Improvements, Revenue Bonds, Callable 9/1/29 @ 100, 5.000%, 9/1/30 | | | 2,590,300 | |
| | 1,270,000 | | | Wake County, NC, School Improvements, Revenue Bonds, Series A, 5.000%, 9/1/29 | | | 1,655,686 | |
| | 2,125,000 | | | Watauga Public Facilities Corp., Revenue, Series A, Callable 6/1/22 @ 100, 5.000%, 6/1/24 | | | 2,193,064 | |
| | 1,000,000 | | | Watauga Public Facilities Corp., Revenue, Series A, Callable 6/1/22 @ 100, 5.000%, 6/1/26 | | | 1,032,030 | |
| | 1,000,000 | | | Winston-Salem, NC, Transit Improvements, Refunding Revenue, Series C, Callable 6/1/24 @ 100, 5.000%, 6/1/30 | | | 1,119,780 | |
| | 1,165,000 | | | Winston-Salem, NC, Water & Sewer System, Refunding Revenue, Series A, 5.000%, 6/1/24 | | | 1,311,149 | |
| | 1,875,000 | | | Winston-Salem, NC, Water & Sewer System, Refunding Revenue, Series A, Callable 6/1/24 @ 100, 5.000%, 6/1/25 | | | 2,103,319 | |
| | 1,000,000 | | | Winston-Salem State University Foundation LLC, Refunding Revenue, Callable 4/1/22 @ 100, 5.000%, 4/1/25 | | | 1,023,170 | |
| | | | | Total Municipal Bonds
(Cost $171,502,101) | | | 179,833,822 | |
| | | | | | | | | |
| Shares | | | | | | | |
| MONEY MARKET FUND — 2.8% | | | | |
| | 5,319,676 | | | Federated Treasury Obligations Fund, Institutional Shares, 0.01%(a) | | | 5,319,676 | |
| | | | | Total Money Market Fund
(Cost $5,319,676) | | | 5,319,676 | |
Total Investments —99.0%
(Cost $176,821,777) | | | 185,153,498 | |
| Net Other Assets (Liabilities) — 1.0% | | | 1,919,903 | |
| NET ASSETS — 100.0% | | $ | 187,073,401 | |
| (a) | Represents the current yield as of report date. |
| AGM | Assured Guaranty Municipal Corp. |
Continued
| Sterling Capital South Carolina Intermediate Tax-Free Fund |
Schedule of Portfolio Investments
September 30, 2021
| Principal Amount | | | | | Fair Value | |
| MUNICIPAL BONDS —_98.1% | | | |
| | | | South Carolina —_98.1% | | | |
| $ | 1,000,000 | | | Aiken County, SC, Consolidated School District, School Improvements G.O., Series A, Callable 4/1/29 @ 100, (SCSDE), 4.000%, 4/1/34 | | $ | 1,189,420 | |
| | 1,000,000 | | | Aiken County, SC, Consolidated School District, Special Obligation Bonds, School Improvements Revenue, Callable 6/1/29 @ 100, 4.000%, 6/1/31 | | | 1,191,900 | |
| | 850,000 | | | Aiken County, SC, Consolidated School District, Special Obligation Bonds, School Improvements Revenue, Callable 6/1/29 @ 100, 4.000%, 6/1/33 | | | 1,003,391 | |
| | 1,515,000 | | | Anderson County, SC, School District No. 4, Refunding, G.O., Series A, Callable 3/1/25 @ 100, (SCSDE), 5.000%, 3/1/28 | | | 1,746,053 | |
| | 1,000,000 | | | Beaufort-Jasper Water & Sewer Authority, Advance Refunding Revenue, Series B, 5.000%, 3/1/25 | | | 1,155,450 | |
| | 1,000,000 | | | Camden, SC, Combined Public Utility System Revenue, Current Refunding Revenue Bonds, (AGM), 4.000%, 3/1/30 | | | 1,219,680 | |
| | 1,215,000 | | | Charleston, SC, Waterworks & Sewer System Revenue, Advance Refunding Revenue, Series A, Callable 7/1/26 @ 100, 4.000%, 1/1/41 | | | 1,373,679 | |
| | 450,000 | | | Charleston County, Airport District Port, Airport & Marina Improvements Revenue, Callable 7/1/29 @ 100, 5.000%, 7/1/30 | | | 575,820 | |
| | 1,000,000 | | | Charleston County, SC, Port, Airport & Marina Improvements Revenue, 5.000%, 12/1/22 | | | 1,056,040 | |
| | 1,235,000 | | | Charleston County Park & Recreation Commission, Recreational Facility Improvements G.O., 4.000%, 2/1/29 | | | 1,501,748 | |
| | 1,000,000 | | | Charleston Public Facilities Corp., Charleston City Project Series, Parking Facilities Improvement Revenue, Callable 9/1/27 @ 100, 5.000%, 9/1/29 | | | 1,237,540 | |
| | 2,000,000 | | | Charleston, SC, Waterworks & Sewer System Revenue, Water Utility Improvements Revenue Bonds, Callable 1/1/30 @ 100, 5.000%, 1/1/44 | | | 2,525,400 | |
| | 1,355,000 | | | Coastal Carolina University, University & College Improvements Revenue, Callable 6/1/24 @ 100, 5.000%, 6/1/34 | | | 1,513,467 | |
| | 1,000,000 | | | College of Charleston, University & College Improvements Revenue, Series A, Callable 4/1/24 @ 100, 5.000%, 4/1/25 | | | 1,112,200 | |
| | 1,000,000 | | | College of Charleston, University & College Improvements Revenue, Series B, 5.000%, 4/1/27 | | | 1,223,940 | |
| Principal Amount | | | | | Fair Value | |
| MUNICIPAL BONDS — (continued) | | | |
| | | | South Carolina — (continued) | | | |
| $ | 1,650,000 | | | Columbia, SC, Waterworks & Sewer System Revenue, Water & Sewer Utility Improvements Revenue, Callable 2/1/28 @ 100, 5.000%, 2/1/48 | | $ | 2,070,767 | |
| | 1,000,000 | | | Florence County, SC, McLeod Regional Medical Center Project, Refunding Revenue, Callable 11/1/24 @ 100, 5.000%, 11/1/28 | | | 1,133,110 | |
| | 1,100,000 | | | Florence County, SC, McLeod Regional Medical Center Project, Refunding Revenue, Callable 11/1/24 @ 100, 5.000%, 11/1/33 | | | 1,237,445 | |
| | 1,000,000 | | | Georgetown County, SC, School District, School Improvements, G.O., Callable 3/1/28 @ 100 (SCSDE), 4.000%, 3/1/30 | | | 1,185,720 | |
| | 1,000,000 | | | Georgetown County, SC, School District, School Improvements, Refunding Notes, G.O., Callable 3/1/28 @ 100, (SCSDE), 4.000%, 3/1/31 | | | 1,182,480 | |
| | 1,000,000 | | | Greenville County, SC, School District Building Refunding Revenue, 5.000%, 12/1/22 | | | 1,056,160 | |
| | 1,415,000 | | | Greenville Health System, Hospital System Board, Series B, Callable 5/1/24 @ 100, 5.000%, 5/1/31 | | | 1,571,768 | |
| | 1,000,000 | | | Greenwood County, SC, Self Regional Healthcare Refunding Revenue, Series B, Callable 4/1/22 @ 100, 5.000%, 10/1/24 | | | 1,023,420 | |
| | 2,025,000 | | | Horry County, SC, School District, Refunding, G.O., Series B (SCSDE), 5.000%, 3/1/23 | | | 2,161,728 | |
| | 1,040,000 | | | Kershaw County, SC, Kershaw County School District Project, Refunding Revenue, 5.000%, 12/1/23 | | | 1,142,274 | |
| | 1,855,000 | | | Lancaster County SC, Lancaster School District, School Improvements, G.O. (SCSDE), Callable 3/1/27 @ 100, 4.000%, 3/1/28 | | | 2,162,930 | |
| | 1,600,000 | | | Lancaster Educational Assistance Program, Inc., SC, Lancaster County School District Refunding Revenue, Callable 12/1/23 @ 100, 5.000%, 12/1/24 | | | 1,760,992 | |
| | 1,000,000 | | | Lexington County, School District No. 1, G.O., Series B, Callable 2/1/29 @ 100, (SCSDE), 5.000%, 2/1/32 | | | 1,266,640 | |
| | 1,500,000 | | | Lexington County, School District No. 2, G.O., Series C, Callable 3/1/27 @ 100, (SCSDE), 5.000%, 3/1/29 | | | 1,832,730 | |
| | 1,345,000 | | | Lexington County, School District No. 2, G.O., Series C, Callable 3/1/27 @ 100, (SCSDE), 5.000%, 3/1/30 | | | 1,639,380 | |
| | 1,085,000 | | | Lugoff-Elgin Water Authority, Refunding Revenue, Series B, Callable 7/1/26 @ 100, 5.000%, 7/1/30 | | | 1,283,479 | |
See accompanying Notes to the Financial Statements.
| Sterling Capital South Carolina Intermediate Tax-Free Fund |
Schedule of Portfolio Investments — (continued)
September 30, 2021
| Principal Amount | | | | | Fair Value | |
| MUNICIPAL BONDS — (continued) | | | |
| | | | South Carolina — (continued) | | | |
| $ | 1,460,000 | | | Newberry, SC, Refunding Revenue (AGM), 5.000%, 4/1/24 | | $ | 1,622,615 | |
| | 565,000 | | | North Charleston, SC, Tax Increment Pledge, Public Improvements, Tax Allocation, 5.000%, 10/1/28 | | | 719,703 | |
| | 1,485,000 | | | Orangeburg County, SC, Correctional Facilities Improvements, Installment Purchase Revenue Bonds, Callable 12/1/27 @ 100, 5.000%, 12/1/29 | | | 1,811,700 | |
| | 1,570,000 | | | Orangeburg County, SC, School District No. 4, School Improvements Refunding, G.O., Series A (SCSDE), 5.000%, 3/1/24 | | | 1,748,964 | |
| | 1,000,000 | | | Piedmont Municipal Power Agency, Power System Refunding Revenue, Series B, Callable 1/1/22 @ 100, 4.000%, 1/1/23 | | | 1,009,070 | |
| | 1,640,000 | | | Richland County, SC, School District No. 2, Refunding Bonds, G.O., Series B, Callable 3/1/27 @ 100, (SCSDE), 4.000%, 3/1/29 | | | 1,908,648 | |
| | 1,000,000 | | | Richland County, SC, School District No. 2, School Improvements, G.O., Series A, Callable 3/1/29 @ 100, (SCSDE), 4.000%, 3/1/30 | | | 1,207,310 | |
| | 1,000,000 | | | Rock Hill, SC, Combined Utility System, Refunding Revenue, Series A, Callable 1/1/22 @ 100 (AGM), 5.000%, 1/1/23 | | | 1,011,660 | |
| | 1,000,000 | | | Rock Hill, SC, Hospital Fee Pledge, Refunding Revenue, Callable 4/1/23 @ 100, 5.000%, 4/1/33 | | | 1,067,090 | |
| | 1,500,000 | | | SCAGO Educational Facilities Corp. for Cherokee School District No. 1, Refunding Revenue, 5.000%, 12/1/24 | | | 1,705,395 | |
| | 470,000 | | | SCAGO Educational Facilities Corp. for Spartanburg School District No. 1, Refunding Revenue, Series B, 4.000%, 6/1/24 | | | 511,933 | |
| | 585,000 | | | SCAGO Educational Facilities Corp. for Spartanburg School District No. 1, Refunding Revenue, Series B, 5.000%, 6/1/22 | | | 602,304 | |
| | 625,000 | | | SCAGO Educational Facilities Corp. for Spartanburg School District No. 1, Refunding Revenue, Series B, 5.000%, 6/1/25 | | | 720,900 | |
| | 600,000 | | | SCAGO Educational Facilities Corp. for Sumter County School 17, Refunding Revenue, 5.000%, 12/1/24 | | | 683,172 | |
| | 490,000 | | | SCAGO Educational Facilities Corp. for Sumter County School 17, Refunding Revenue, 5.000%, 12/1/25 | | | 575,451 | |
| | 790,000 | | | SCAGO Educational Facilities Corp. for Union School District, Refunding Revenue, 5.000%, 12/1/21 | | | 795,546 | |
| Principal Amount | | | | | Fair Value | |
| MUNICIPAL BONDS — (continued) | | | |
| | | | South Carolina — (continued) | | | |
| $ | 850,000 | | | South Carolina Jobs-Economic Development Authority, AnMed Health Project, Advance Refunding Revenue Bonds, Callable 2/1/26 @ 100, 5.000%, 2/1/29 | | $ | 993,106 | |
| | 1,540,000 | | | South Carolina Jobs-Economic Development Authority, Wofford College Project, University & College Improvements Revenue, Callable 4/1/29 @ 100, 5.000%, 4/1/44 | | | 1,849,663 | |
| | 1,000,000 | | | South Carolina Jobs-Economic Development Authority, Wofford College Project, University & College Improvements Revenue, Callable 4/1/29 @ 100, 5.000%, 4/1/49 | | | 1,194,450 | |
| | 1,000,000 | | | South Carolina Public Service Authority, Electricity, Lighting & Power Improvements, Refunding Revenue Bonds, Series A, Callable 12/1/30 @ 100, 4.000%, 12/1/40 | | | 1,168,880 | |
| | 1,000,000 | | | South Carolina Public Service Authority, Electricity, Lighting & Power Improvements, Refunding Revenue Bonds, Series A, Callable 12/1/30 @ 100, 4.000%, 12/1/42 | | | 1,160,390 | |
| | 1,400,000 | | | South Carolina State Fiscal Accountability Authority, Department of Mental Health Project, Callable 4/1/27 @ 100, 5.000%, 10/1/37 | | | 1,697,808 | |
| | 1,470,000 | | | South Carolina State Housing Finance & Development Authority, Refunding Revenue, Series A, 5.000%, 7/1/30 | | | 1,864,372 | |
| | 1,250,000 | | | South Carolina Transportation Infrastructure Bank, Advance Refunding Revenue, Series A, 5.000%, 10/1/23 | | | 1,368,312 | |
| | 1,000,000 | | | South Carolina Transportation Infrastructure Bank, Advance Refunding Revenue, Series A, Callable 10/1/27 @ 100 (AGM-CR), 5.000%, 10/1/38 | | | 1,221,560 | |
| | 1,740,000 | | | Spartanburg, SC, Water System Revenue, Water Utility Improvements Refunding Revenue, Series B, Callable 6/1/27 @ 100, 5.000%, 6/1/39 | | | 2,107,453 | |
| | 1,235,000 | | | State of South Carolina, Refunding Revenue, G.O., Series D, Callable 4/1/26 @ 100 (State Aid Withholding), 5.000%, 4/1/28 | | | 1,470,453 | |
| | 1,245,000 | | | State of South Carolina, University & College Improvements G.O., Citadel Military College of South Carolina, Series, 5.000%, 4/1/28 | | | 1,574,888 | |
Continued
| Sterling Capital South Carolina Intermediate Tax-Free Fund |
Schedule of Portfolio Investments — (continued)
September 30, 2021
| Principal Amount | | | | | Fair Value | |
| MUNICIPAL BONDS — (continued) | | | |
| | | | South Carolina — (continued) | | | |
| $ | 1,195,000 | | | State of South Carolina, University & College Improvements, G.O., Series B, Callable 10/1/27 @ 100 (State Aid Withholding), 5.000%, 4/1/30 | | $ | 1,487,309 | |
| | 1,150,000 | | | Town of Mount Pleasant, SC, Public Facilities, G.O., Callable 6/1/28 @ 100, 5.000%, 6/1/30 | | | 1,443,284 | |
| | | | | Total Municipal Bonds
(Cost $77,549,481) | | | 81,640,140 | |
| Shares | | | | | Fair Value | |
| MONEY MARKET FUND — 0.9% | | | |
| | 780,694 | | | Federated Treasury Obligations Fund, Institutional Shares, 0.01%(a) | | $ | 780,694 | |
| | | | | Total Money Market Fund
(Cost $780,694) | | | 780,694 | |
Total Investments —99.0%
(Cost $78,330,175) | | 82,420,834 | |
| Net Other Assets (Liabilities) — 1.0% | | 840,978 | |
| NET ASSETS — 100.0% | $ | 83,261,812 | |
| (a) | Represents the current yield as of report date. |
| AGM | Assured Guaranty Municipal Corp. |
| SCAGO | South Carolina Association of Governmental Organizations |
| SCSDE | South Carolina School District Enhancement |
Continued
| Sterling Capital Virginia Intermediate Tax-Free Fund |
Schedule of Portfolio Investments
September 30, 2021
| Principal Amount | | | | | Fair Value | |
| MUNICIPAL BONDS — 97.0% |
| | | | District of Columbia —_4.4% | | | |
| $ | 1,450,000 | | | Washington Metropolitan Area Transit Authority, DC, Transit Improvements Revenue, Callable 7/1/27 @ 100, 5.000%, 7/1/36 | | $ | 1,753,152 | |
| | 1,460,000 | | | Washington Metropolitan Area Transit Authority, DC, Transit Improvements Revenue, Series A, Callable 7/15/30 @ 100, 5.000%, 7/15/33 | | | 1,903,679 | |
| | | | | | | | 3,656,831 | |
| | | | | Virginia —_92.6% | | | | |
| | 1,730,000 | | | Albemarle County, VA, Economic Development Authority, Albemarle County Project, Public Improvements Revenue, Callable 6/1/22 @ 100, 5.000%, 6/1/23 | | | 1,784,149 | |
| | 1,240,000 | | | Albemarle County, VA, Economic Development Authority, Public Improvements Revenue, 5.000%, 6/1/27 | | | 1,528,722 | |
| | 1,365,000 | | | Albemarle County, VA, School Improvements G.O., (State Aid Withholding), 5.000%, 6/1/26 | | | 1,645,098 | |
| | 1,450,000 | | | Arlington County, VA, Public Improvements G.O., Callable 8/15/27 @ 100, 5.000%, 8/15/30 | | | 1,788,880 | |
| | 1,500,000 | | | Arlington County, VA, Public Improvements G.O., Series A, Callable 8/15/27 @ 100, 5.000%, 8/15/29 | | | 1,852,230 | |
| | 1,000,000 | | | Campbell County Industrial Development Authority, Public Facilities, School Improvements Revenue, Callable 6/1/30 @ 100, 5.000%, 6/1/32 | | | 1,288,580 | |
| | 1,770,000 | | | Chesapeake, VA, Public Improvements, Refunding G.O., Series A, Callable 8/1/27 @ 100, 5.000%, 8/1/30 | | | 2,188,286 | |
| | 1,085,000 | | | Chesapeake Bay Bridge & Tunnel District, First Tier General Resolution, Highway Improvements, Revenue Bonds, Callable 7/1/26 @ 100 (AGM), 5.000%, 7/1/41 | | | 1,274,170 | |
| | 1,085,000 | | | Chesapeake Hospital Authority, VA, Health, Hospital, Nursing Home Improvements Revenue Bonds, 5.000%, 7/1/29 | | | 1,374,424 | |
| | 1,000,000 | | | Chesterfield County, VA, School District, School Public Improvement, G.O., Series A, Callable 1/1/28 @ 100 (State Aid Withholding), 4.000%, 1/1/31 | | | 1,177,900 | |
| | 1,000,000 | | | Chesterfield County, VA, School Public Improvement, Advance Refunding, G.O., Callable 1/1/26 @ 100, 5.000%, 1/1/28 | | | 1,189,290 | |
| | 1,145,000 | | | Culpeper County, VA, Economic Development Authority, VA Capital Projects, Refunding Revenue, Callable 6/1/24 @ 100, 4.000%, 6/1/26 | | | 1,248,016 | |
| Principal Amount | | | | | Fair Value | |
| MUNICIPAL BONDS — (continued) | | | |
| | | | Virginia — (continued) | | | |
| $ | 1,500,000 | | | Fairfax County, VA, Public Improvement, Refunding G.O., Series A, Callable 4/1/26 @ 100, (State Aid Withholding), 4.000%, 10/1/26 | | $ | 1,727,805 | |
| | 2,000,000 | | | Fairfax County, VA, School District, School Public Improvements G.O., Series A, Callable 4/1/29 @ 100 (State Aid Withholding), 5.000%, 10/1/31 | | | 2,572,060 | |
| | 1,000,000 | | | Fredericksburg Economic Development Authority, Mary Washington Healthcare Obligation Group, Refunding Revenue, Callable 6/15/24 @ 100, 5.000%, 6/15/26 | | | 1,118,830 | |
| | 840,000 | | | Fredericksburg Economic Development Authority, VA, Medicorp Health Systems Obligation, Refunding Revenue Bonds, 5.250%, 6/15/22 | | | 868,661 | |
| | 1,700,000 | | | Leesburg, VA, Refunding G.O., Callable 1/15/24 @ 100, (State Aid Withholding), 4.000%, 1/15/27 | | | 1,835,490 | |
| | 1,000,000 | | | Leesburg, VA, Refunding G.O., Callable 1/15/25 @ 100, (State Aid Withholding), 5.000%, 1/15/27 | | | 1,152,110 | |
| | 1,755,000 | | | Loudoun County, VA, Current Refunding G.O., Series B, 4.000%, 12/1/31 | | | 2,227,253 | |
| | 1,000,000 | | | Loudoun County, VA, Economic Development Authority, Public Improvements Revenue, Callable 12/1/24 @ 100, 5.000%, 12/1/27 | | | 1,140,650 | |
| | 1,365,000 | | | Loudoun County, VA, Industrial Development Authority, Refunding Revenue, 4.000%, 12/15/22 | | | 1,427,708 | |
| | 1,250,000 | | | Loudoun County, VA, Public Improvements, Advance Refunding G.O., Series A, Callable 12/1/25 @ 100, 5.000%, 12/1/26 | | | 1,483,238 | |
| | 1,415,000 | | | Manassas, VA, Public Improvements, Current Refunding G.O., (State Aid Withholding), 5.000%, 1/1/29 | | | 1,818,303 | |
| | 1,810,000 | | | Manassas, VA, Public Improvements, Public Facilities G.O., Callable 7/1/29 @ 100 (State Aid Withholding), 4.000%, 7/1/33 | | | 2,162,805 | |
| | 1,500,000 | | | Newport News, VA, Public Improvements, G.O., Series A (State Aid Withholding), 5.000%, 2/1/29 | | | 1,918,935 | |
| | 1,000,000 | | | Norfolk, VA, Economic Development Authority, Bon Secours Health System, Inc., Refunding Revenue, Callable 11/1/22 @ 100, 5.000%, 11/1/29 | | | 1,051,620 | |
See accompanying Notes to the Financial Statements.
| Sterling Capital Virginia Intermediate Tax-Free Fund |
Schedule of Portfolio Investments — (continued)
September 30, 2021
| Principal Amount | | | | | Fair Value | |
| MUNICIPAL BONDS — (continued) | | | |
| | | | Virginia — (continued) | | | |
| $ | 1,000,000 | | | Norfolk, VA, Economic Development Authority, Sentara Healthcare Facilities, Inc., Current Refunding Revenue Bonds, Series B, Callable 11/1/28 @ 100, 4.000%, 11/1/48 | | $ | 1,127,060 | |
| | 1,000,000 | | | Norfolk, VA, Economic Development Authority, Sentara Healthcare Facilities, Refunding Revenue, Series B, Callable 11/1/22 @ 100, 5.000%, 11/1/25 | | | 1,050,720 | |
| | 1,465,000 | | | Norfolk, VA, Economic Development Authority, Sentara Healthcare, Refunding Revenue, Series B, Callable 11/1/22 @ 100, 5.000%, 11/1/36 | | | 1,535,071 | |
| | 1,445,000 | | | Norfolk, VA, Public Improvements, G.O., Callable 8/1/28 @ 100 (State Aid Withholding), 5.000%, 8/1/47 | | | 1,841,797 | |
| | 2,000,000 | | | Norfolk, VA, Public Improvements, G.O., Series A, Callable 10/1/26 @ 100, 5.000%, 10/1/30 | | | 2,434,300 | |
| | 1,245,000 | | | Rappahannock Regional Jail Authority, Refunding Revenue, Callable 10/1/25 @ 100, 5.000%, 10/1/26 | | | 1,469,349 | |
| | 2,000,000 | | | Richmond, VA, Public Improvements, Refunding G.O., Series A, Callable 3/1/24 @ 100 (State Aid Withholding), 5.000%, 3/1/28 | | | 2,226,400 | |
| | 1,250,000 | | | Richmond, VA, Public Utility Advance Refunding Revenue Bonds, Callable 1/15/26 @ 100, 5.000%, 1/15/27 | | | 1,486,675 | |
| | 2,000,000 | | | Richmond, VA, School Improvements, Refunding G.O., Series A, 5.000%, 7/15/29 | | | 2,605,620 | |
| | 1,200,000 | | | Southampton County Industrial Development Authority, Current Refunding Revenue Bonds, Southampton County Capital, 5.000%, 12/1/28 | | | 1,524,828 | |
| | 1,265,000 | | | Virginia Beach, VA, Advance Refunding, G.O., Series B, Callable 9/15/25 @ 100, (State Aid Withholding), 5.000%, 9/15/26 | | | 1,490,777 | |
| | 1,500,000 | | | Virginia College Building Authority, 21st Century College & Equipment, University & College Improvements Revenue, Series A, 5.000%, 2/1/22 | | | 1,523,775 | |
| | 1,850,000 | | | Virginia College Building Authority, 21st Century College Programs, University & College Improvements Revenue, Callable 2/1/27 @ 100, 5.000%, 2/1/31 | | | 2,233,523 | |
| | 1,500,000 | | | Virginia Commonwealth Transportation Board, Capital Projects, Highway Improvements, Revenue Bonds, Callable 5/15/29 @ 100, 5.000%, 5/15/30 | | | 1,937,205 | |
| Principal Amount | | | | | Fair Value | |
| MUNICIPAL BONDS — (continued) | | | |
| | | | Virginia — (continued) | | | |
| $ | 1,215,000 | | | Virginia Commonwealth Transportation Board, Federal Highway Transportation Grant, Callable 9/15/26 @ 100, 5.000%, 9/15/30 | | $ | 1,465,667 | |
| | 2,000,000 | | | Virginia Commonwealth Transportation Board, Federal Transportation Grant, Anticipation Advance Refunding Revenue, Callable 9/15/27 @ 100, 5.000%, 9/15/31 | | | 2,464,500 | |
| | 1,515,000 | | | Virginia Public School Authority, Advance Refunding Revenue, Callable 8/1/25 @ 100, 5.000%, 8/1/26 | | | 1,777,640 | |
| | 1,000,000 | | | Virginia Public School Authority, School Improvements Revenue Bonds, (State Aid Withholding), 4.000%, 10/1/29 | | | 1,223,320 | |
| | 1,000,000 | | | Virginia Public School Authority, School Improvements, Revenue Bonds, Series A, Callable 8/1/29 @ 100, 4.000%, 8/1/32 | | | 1,208,560 | |
| | 765,000 | | | Western Regional Jail Authority, Prerefunded Revenue, Callable 12/1/25 @ 100, 5.000%, 12/1/26 | | | 904,758 | |
| | 760,000 | | | Western Regional Jail Authority, Unrefunded Revenue, Callable 12/1/25 @ 100, 5.000%, 12/1/26 | | | 901,808 | |
| | 920,000 | | | Winchester, VA, Economic Development Authority, Valley Health System Obligated Group, Hospital Refunding Revenue, Series A, Callable 1/1/24 @ 100, 5.000%, 1/1/26 | | | 1,014,778 | |
| | | | | | | | 76,293,344 | |
| | | | | Total Municipal Bonds
(Cost $75,991,779) | | | 79,950,175 | |
| | | | | | | | | |
| Shares | | | | | | | |
| MONEY MARKET FUND —_2.1% | | | |
| | 1,758,856 | | | Federated Treasury Obligations Fund, Institutional Shares, 0.01%(a) | | | 1,758,856 | |
| | | | | Total Money Market Fund
(Cost $1,758,856) | | | 1,758,856 | |
Total Investments —99.1%
(Cost $77,750,635) | | | 81,709,031 | |
| Net Other Assets (Liabilities) — 0.9% | | | 710,735 | |
| NET ASSETS — 100.0% | | $ | 82,419,766 | |
| (a) | Represents the current yield as of report date. |
| AGM | Assured Guaranty Municipal Corp. |
Continued
| Sterling Capital West Virginia Intermediate Tax-Free Fund |
Schedule of Portfolio Investments
September 30, 2021
| Principal Amount | | | | | Fair Value | |
| MUNICIPAL BONDS — 97.4% |
| | | | West Virginia — 97.4% | | | |
| $ | 550,000 | | | Berkeley County, WV, Board of Education, Current Refunding G.O., 5.000%, 5/1/25 | | $ | 632,764 | |
| | 1,085,000 | | | Berkeley County, WV, Building Commission, Lease Refunding Revenue, Callable 12/1/22 @ 100, 4.000%, 12/1/26 | | | 1,133,315 | |
| | 1,500,000 | | | Berkeley County, WV, Public Service Sewer District, Miscellaneous Purposes Revenue, Series C, Callable 10/1/23 @ 100, (BAM), 4.500%, 10/1/32 | | | 1,613,265 | |
| | 145,000 | | | Berkeley County, WV, Public Service Sewer District, Sewer Improvements Revenue, Series A, Callable 8/2/21 @ 100, 5.000%, 3/1/22 | | | 145,625 | |
| | 1,080,000 | | | Braxton County, WV, Board of Education, Public School, Advance Refunding G.O., Callable 5/1/26 @ 100, (West Virginia Board Commission), 5.000%, 5/1/28 | | | 1,291,302 | |
| | 2,500,000 | | | Cabell County Board of Education, School Improvements G.O., (AGM West Virginia Board Commission), 3.000%, 6/1/29 | | | 2,809,050 | |
| | 400,000 | | | Fairmont, WV, Water Revenue, Current Refunding Revenue, Series A, (BAM), 3.000%, 7/1/23 | | | 415,456 | |
| | 530,000 | | | Fairmont, WV, Water Revenue, Current Refunding Revenue, Series A, (BAM), 3.000%, 7/1/24 | | | 559,500 | |
| | 1,535,000 | | | Jefferson County, WV, Board of Education, School Improvements G.O., (West Virginia Board Commission), 3.000%, 6/1/29 | | | 1,723,575 | |
| | 1,500,000 | | | Marshall University, WV, University & College Improvements Revenue Bonds, Series A, (AGM), 5.000%, 5/1/30 | | | 1,937,925 | |
| | 1,000,000 | | | Monongalia County, WV, Board of Education, Public School Refunding G.O., Callable 5/1/22 @ 100, (West Virginia Board Commission), 5.000%, 5/1/23 | | | 1,027,680 | |
| | 675,000 | | | Monongalia County, WV, Board of Education, Public School Refunding G.O., Callable 5/1/22 @ 100, (West Virginia Board Commission), 5.000%, 5/1/31 | | | 693,684 | |
| | 965,000 | | | Monongalia County, WV, Board of Education, Public School Refunding G.O., Callable 5/1/22 @ 100, (West Virginia Board Commission), 5.000%, 5/1/33 | | | 991,711 | |
| | 2,000,000 | | | Monongalia County, WV, Building Commission, Monongalia Health System Group Refunding Revenue, Callable 7/1/25 @ 100, 5.000%, 7/1/26 | | | 2,293,400 | |
| Principal Amount | | | | | Fair Value | |
| MUNICIPAL BONDS — (continued) |
| | | | West Virginia — (continued) | | | |
| $ | 705,000 | | | Morgantown Utility Board, WV, Combined Water Utility Improvements Revenue, Series B, Callable 6/1/28 @ 100, 5.000%, 12/1/34 | | $ | 872,818 | |
| | 660,000 | | | Morgantown Utility Board, WV, Refunding Revenue Green Bonds, Series A, (BAM), 4.000%, 12/1/27 | | | 776,147 | |
| | 555,000 | | | Morgantown Utility Board, WV, Refunding Revenue Green Bonds, Series A, (BAM), 4.000%, 12/1/29 | | | 671,877 | |
| | 2,275,000 | | | Ohio County, WV, Board of Education, School Improvements G.O., Callable 6/1/29 @ 100, (West Virginia Board Commission), 3.000%, 6/1/30 | | | 2,553,005 | |
| | 1,845,000 | | | Ohio County, WV, Board of Education, School Improvements G.O., Callable 6/1/29 @ 100, (West Virginia Board Commission), 3.000%, 6/1/31 | | | 2,059,573 | |
| | 1,810,000 | | | Ohio County, WV, Board of Education, School Improvements G.O., (West Virginia Board Commission), 4.000%, 6/1/29 | | | 2,184,326 | |
| | 1,000,000 | | | Ohio County, WV, Country Commission, Fort Henry Centre Financing District, Public Improvement, Tax Allocation, Callable 6/1/22 @ 100, 4.750%, 6/1/31 | | | 1,013,660 | |
| | 1,020,000 | | | Pleasants County, WV, Board of Education, Current Refunding G.O., 3.000%, 5/1/25 | | | 1,109,179 | |
| | 1,425,000 | | | Pleasants County, WV, Board of Education, Current Refunding G.O., 3.000%, 5/1/26 | | | 1,574,197 | |
| | 960,000 | | | Putnam Public Service District, WV, Current Refunding Revenue Bonds, Callable 11/1/30 @ 100, (BAM), 3.000%, 11/1/31 | | | 1,060,493 | |
| | 1,210,000 | | | Putnam Public Service District, WV, Current Refunding Revenue Bonds, Sewer Improvements, Series B, Callable 4/1/28 @ 100, (BAM), 3.000%, 4/1/30 | | | 1,328,991 | |
| | 695,000 | | | School Building Authority of West Virginia, Lottery Capital Improvements Revenue, Callable 7/1/24 @ 100, Series A, 5.000%, 7/1/27 | | | 781,507 | |
| | 1,265,000 | | | School Building Authority of West Virginia, Lottery Capital Improvements Revenue, Callable 7/1/24 @ 100, Series A, 5.000%, 7/1/28 | | | 1,420,228 | |
| | 1,775,000 | | | State of West Virginia, Current Refunding G.O., Series A, 5.000%, 6/1/24 | | | 1,996,165 | |
| | 800,000 | | | State Of West Virginia, Fuel Sales Tax Revenue, Group 1 Highway Improvements, G.O., Series S, Callable 6/1/29 @ 100, 5.000%, 6/1/32 | | | 1,022,976 | |
See accompanying Notes to the Financial Statements.
| Sterling Capital West Virginia Intermediate Tax-Free Fund |
Schedule of Portfolio Investments — (continued)
September 30, 2021
| Principal Amount | | | | | Fair Value | |
| MUNICIPAL BONDS — (continued) |
| | | | West Virginia — (continued) | | | |
| $ | 2,000,000 | | | State of West Virginia, Fuel Sales Tax Revenue, Group 1 Highway Improvements, G.O., Series S, Callable 6/1/29 @ 100, 5.000%, 12/1/33 | | $ | 2,546,140 | |
| | 1,000,000 | | | State Of West Virginia, Fuel Sales Tax Revenue, Group 1 Highway Improvements, G.O., Series S, Callable 6/1/29 @ 100, 5.000%, 12/1/35 | | | 1,267,450 | |
| | 1,765,000 | | | State of West Virginia, Fuel Sales Tax Revenue, Group 2 Highway Improvements, G.O., Series B, Callable 6/1/28 @ 100, 4.000%, 6/1/43 | | | 2,036,775 | |
| | 2,000,000 | | | State of West Virginia, Fuel Sales Tax Revenue, Group 2 Highway Improvements, G.O., Series B, Callable 6/1/28 @ 100, 5.000%, 12/1/39 | | | 2,478,300 | |
| | 1,000,000 | | | State of West Virginia, General Fund, Highway Improvements G.O., Series B, Callable 6/1/28 @ 100, 5.000%, 6/1/36 | | | 1,241,850 | |
| | 2,000,000 | | | West Virginia Economic Development Authority, Correctional Juvenile Public Safety Facilities Lease, Refunding Revenue, Callable 6/1/22 @ 100, 5.000%, 6/1/25 | | | 2,062,140 | |
| | 3,185,000 | | | West Virginia Economic Development Authority, Correctional Juvenile Public Safety Facilities Lease, Refunding Revenue, Callable 6/1/22 @ 100, 5.000%, 6/1/26 | | | 3,283,958 | |
| | 1,145,000 | | | West Virginia Economic Development Authority, Lottery Recreational Facilities Improvements Revenue, Series A, Callable 7/1/27 @ 100, 5.000%, 7/1/28 | | | 1,414,808 | |
| | 1,500,000 | | | West Virginia Economic Development Authority, Lottery Recreational Facilities Improvements Revenue, Series A, Callable 7/1/28 @ 100, 5.000%, 7/1/35 | | | 1,860,960 | |
| | 1,015,000 | | | West Virginia Economic Development Authority, State Office Building 3, Public Improvements Revenue, Series D, Callable 6/1/25 @ 100, 5.000%, 6/1/26 | | | 1,173,533 | |
| | 1,000,000 | | | West Virginia Higher Education Policy, Community & Technical College Capital, University & College Improvements Refunding Revenue, Callable 7/1/27 @ 100, 5.000%, 7/1/30 | | | 1,212,310 | |
| | 750,000 | | | West Virginia Higher Education Policy, Community & Technical College Capital, University & College Improvements Refunding Revenue, Callable 7/1/27 @ 100, 5.000%, 7/1/36 | | | 898,972 | |
| Principal Amount | | | | | Fair Value | |
| MUNICIPAL BONDS — (continued) |
| | | | West Virginia — (continued) | | | |
| $ | 775,000 | | | West Virginia Hospital Finance Authority, Cabell Huntington Hospital Obligated Group, Refunding Revenue, Callable 1/1/29 @ 100, 5.000%, 1/1/31 | | $ | 958,187 | |
| | 945,000 | | | West Virginia Hospital Finance Authority, Charleston Area Medical Center Inc., Health, Hospital, Nursing Home Improvements, Refunding Revenue, Callable 9/1/24 @ 100, 5.000%, 9/1/25 | | | 1,056,595 | |
| | 1,250,000 | | | West Virginia Hospital Finance Authority, Charleston Area Medical Center Inc., Health, Hospital, Nursing Home Improvements, Refunding Revenue, Callable 9/1/29 @ 100, 5.000%, 9/1/39 | | | 1,517,338 | |
| | 1,315,000 | | | West Virginia Hospital Finance Authority, United Health System Obligation, Health, Hospital, Nursing Home Improvements Refunding Revenue Bonds, 5.000%, 6/1/26 | | | 1,573,437 | |
| | 2,000,000 | | | West Virginia Hospital Finance Authority, United Health System Obligation, Health, Hospital, Nursing Home Improvements Refunding Revenue, Series A, Callable 6/1/23 @ 100, OID, 5.375%, 6/1/38 | | | 2,169,500 | |
| | 515,000 | | | West Virginia Hospital Finance Authority, Valley Health System Obligated Group, Refunding Revenue, 5.000%, 1/1/24 | | | 565,800 | |
| | 630,000 | | | West Virginia Hospital Finance Authority, Valley Health System Obligated Group, Refunding Revenue, Callable 1/1/24 @ 100, 5.000%, 1/1/26 | | | 695,646 | |
| | 1,700,000 | | | West Virginia Parkways Authority, Senior Turnpike Toll Revenue, Highway Improvements, 5.000%, 6/1/26 | | | 2,041,887 | |
| | 1,000,000 | | | West Virginia Parkways Authority, Senior Turnpike Toll Revenue, Highway Improvements Revenue Bonds, Callable 6/1/28 @ 100, 5.000%, 6/1/35 | | | 1,238,650 | |
| | 2,065,000 | | | West Virginia Parkways Authority, Senior Turnpike Toll Revenue, Highway Improvements, Callable 6/1/28 @ 100, 5.000%, 6/1/39 | | | 2,535,159 | |
| | 1,720,000 | | | West Virginia Parkways Authority, Senior Turnpike Toll Revenue, Highway Improvements, Callable 6/1/28 @ 100, 5.000%, 6/1/43 | | | 2,095,665 | |
| | 1,500,000 | | | West Virginia State School Building Authority Lottery Revenue, School Improvements Revenue, Series A, Callable 7/1/28 @ 100, 5.000%, 7/1/29 | | | 1,899,360 | |
Continued
| Sterling Capital West Virginia Intermediate Tax-Free Fund |
Schedule of Portfolio Investments — (continued)
September 30, 2021
| Principal Amount | | | | | Fair Value | |
| MUNICIPAL BONDS — (continued) |
| | | | West Virginia — (continued) | | | |
| $ | 1,050,000 | | | West Virginia State Water Development Authority, Loan Program II, Refunding Revenue, Series A-II, Callable 11/1/23 @ 100, 5.000%, 11/1/26 | | $ | 1,149,225 | |
| | 2,525,000 | | | West Virginia State Water Development Authority, Loan Program II, Refunding Revenue, Series A-II, Callable 11/1/23 @ 100, 5.000%, 11/1/27 | | | 2,760,305 | |
| | 1,000,000 | | | West Virginia University, University Projects, University & College Improvements Revenue, Callable 10/1/29 @ 100, 5.000%, 10/1/32 | | | 1,278,540 | |
| | 2,000,000 | | | West Virginia University, University Projects, University & College Improvements Revenue, Callable 10/1/29 @ 100, 5.000%, 10/1/33 | | | 2,549,160 | |
| | 1,530,000 | | | West Virginia University, University Projects, University & College Improvements, Refunding Revenue, Series A, Callable 10/1/22 @ 100, 5.000%, 10/1/35 | | | 1,603,807 | |
| | 515,000 | | | West Virginia Water Development Authority, Chesapeake Bay/Greenbrier River, Water Utility Improvements Revenue, Callable 7/1/24 @ 100, 5.000%, 7/1/25 | | | 581,363 | |
| | 1,170,000 | | | West Virginia Water Development Authority, Loan Program II, Refunding Revenue, Series A-II, 5.000%, 11/1/24 | | | 1,330,735 | |
| | 1,000,000 | | | West Virginia Water Development Authority, Loan Program II, Refunding Revenue, Series A-II, 5.000%, 11/1/25 | | | 1,174,990 | |
| | 1,000,000 | | | Wheeling, WV, Waterworks & Sewerage System Revenue, Multi-Utility Improvements Revenue Bonds, Series A, Callable 6/1/31 @ 100, (BAM), 4.000%, 6/1/41 | | | 1,194,140 | |
| | 1,205,000 | | | Wood County, WV, Board of Education, Public School Improvements, G.O., (West Virginia Board Commission), 4.000%, 6/1/25 | | | 1,351,600 | |
| | | | | Total Municipal Bonds
(Cost $88,456,076) | | | 92,491,679 | |
Shares | | | | | Fair Value | |
| MONEY MARKET FUND — 1.6% |
| | 1,530,700 | | | Federated Treasury Obligations Fund, Institutional Shares, 0.01%(a) | | $ | 1,530,700 | |
| | | | | Total Money Market Fund
(Cost $1,530,700) | | | 1,530,700 | |
Total Investments —99.0%
(Cost $89,986,776) | | | 94,022,379 | |
Net Other Assets (Liabilities) — 1.0% | | | 988,878 | |
NET ASSETS — 100.0% | | $ | 95,011,257 | |
| (a) | Represents the current yield as of report date. |
| AGM | Assured Guaranty Municipal Corp. |
| OID | Original Issue Discount |
Continued
(This page is intentionally left blank.)
Statement of Assets and Liabilities
September 30, 2021
| | | Sterling Capital Behavioral Large Cap Value Equity Fund | | | Sterling Capital Mid Value Fund | |
| Assets: | | | | | | |
| Investments at fair value (a) | | $ | 33,165,909 | | | $ | 76,562,615 | |
| Foreign currency, at value (cost $—, $—, $—, $—, $—, $286,257 and $—, respectively) | | | — | | | | — | |
| Dividends receivable | | | 39,102 | | | | 40,961 | |
| Receivable for investments sold | | | — | | | | — | |
| Receivable for capital shares issued | | | 2,020 | | | | 3,575 | |
| Prepaid and other expenses | | | 19,996 | | | | 12,472 | |
| Total Assets | | | 33,227,027 | | | | 76,619,623 | |
| Liabilities: | | | | | | | | |
| Payable for investments purchased | | | — | | | | — | |
| Payable for capital shares redeemed | | | 3,216 | | | | 11,695 | |
| Accrued expenses and other payables: | | | | | | | | |
| Investment advisory fees | | | 12,625 | | | | 38,409 | |
| Administration fees | | | 2,285 | | | | 5,486 | |
| Compliance service fees. | | | 114 | | | | 157 | |
| Distribution (12b-1) fees | | | 6,775 | | | | 5,874 | |
| Accounting out-of-pocket fees | | | 675 | | | | 590 | |
| Audit fees | | | 1,791 | | | | 4,809 | |
| Custodian fees | | | 569 | | | | 1,377 | |
| Printing fees | | | 1,311 | | | | 2,968 | |
| Transfer agent fees | | | 254 | | | | 6,805 | |
| Other fees and liabilities. | | | — | | | | 2,663 | |
| Total Liabilities | | | 29,615 | | | | 80,833 | |
| Net Assets | | $ | 33,197,412 | | | $ | 76,538,790 | |
| Net Assets Consist of: | | | | | | | | |
| Capital | | $ | 47,179,467 | | | $ | 46,864,410 | |
| Total distributable earnings | | | (13,982,055 | ) | | | 29,674,380 | |
| Net Assets | | $ | 33,197,412 | | | $ | 76,538,790 | |
| Net Assets | | | | | | | | |
| Class A Shares | | $ | 30,869,776 | | | $ | 23,421,020 | |
| Class C Shares | | | 304,431 | | | | 1,100,622 | |
| Institutional Shares | | | 2,022,593 | | | | 51,606,525 | |
| Class R Shares | | | – | | | | 8,165 | |
| Class R6 Shares | | | 612 | | | | 402,458 | |
| Total | | $ | 33,197,412 | | | $ | 76,538,790 | |
| Shares of Beneficial Interest Outstanding (Unlimited number of shares authorized, no par value) | | | | | | | | |
| Class A Shares | | | 1,356,899 | | | | 1,170,252 | |
| Class C Shares | | | 13,915 | | | | 65,267 | |
| Institutional Shares | | | 88,097 | | | | 2,516,750 | |
| Class R Shares | | | — | | | | 428 | |
| Class R6 Shares | | | 27 | | | | 19,583 | |
| Total | | | 1,458,938 | | | | 3,772,280 | |
| Net Asset Value | | | | | | | | |
| Class A Shares - redemption price per share | | $ | 22.75 | | | $ | 20.01 | |
| Class C Shares - offering price per share* | | $ | 21.88 | | | $ | 16.86 | |
| Institutional Shares | | $ | 22.96 | | | $ | 20.51 | |
| Class R Shares | | $ | — | | | $ | 19.08 | |
| Class R6 Shares | | $ | 22.99 | ** | | $ | 20.55 | |
| Maximum Sales Charge - Class A Shares | | | 5.75 | % | | | 5.75 | % |
Maximum Offering Price (100%/(100% - Maximum Sales Charge)) of net asset value adjusted to the nearest
cent per share - Class A Shares | | $ | 24.14 | | | $ | 21.23 | |
| (a) Investments at cost | | $ | 27,684,010 | | | $ | 51,494,120 | |
| * | Redemption price per share varies by length of time shares are held. |
| ** | Class R6 Shares of Sterling Capital Behavioral Large Cap Value Equity Fund and Class R Shares of Sterling Capital Special Opportunities Fund net asset values are calculated using unrounded net assets $611.46, and $1,412.34, divided by unrounded shares 26.60, and 42.05, respectively. |
See accompanying Notes to the Financial Statements.
Sterling Capital
Behavioral Small Cap
Value Equity Fund | | | Sterling Capital
Special
Opportunities Fund | | | Sterling Capital
Equity
Income Fund | | | Sterling Capital
Behavioral
International
Equity Fund | | | Sterling Capital
SMID
Opportunities Fund | |
| | | | | | | | | | | | | | |
| $ | 105,891,629 | | | $ | 669,680,095 | | | $ | 2,235,787,991 | | | $ | 85,936,982 | | | $ | 11,201,625 | |
| | — | | | | — | | | | — | | | | 283,769 | | | | — | |
| | 157,503 | | | | 345,423 | | | | 2,640,102 | | | | 783,497 | | | | 5,542 | |
| | — | | | | 1,114,338 | | | | — | | | | — | | | | — | |
| | 2,907 | | | | 352,518 | | | | 2,421,430 | | | | — | | | | 298 | |
| | 11,495 | | | | 19,312 | | | | 44,826 | | | | 2,307 | | | | 2,018 | |
| | 106,063,534 | | | | 671,511,686 | | | | 2,240,894,349 | | | | 87,006,555 | | | | 11,209,483 | |
| | | | | | | | | | | | | | | | | | | |
| | — | | | | 1,436,852 | | | | 1,781,124 | | | | — | | | | — | |
| | 3,250 | | | | 729,610 | | | | 1,868,936 | | | | — | | | | 562 | |
| | | | | | | | | | | | | | | | | | | |
| | 60,303 | | | | 374,564 | | | | 1,034,968 | | | | 29,466 | | | | 3,578 | |
| | 4,550 | | | | 46,468 | | | | 156,569 | | | | 2,718 | | | | 827 | |
| | 204 | | | | 726 | | | | 2,138 | | | | 164 | | | | 94 | |
| | 1,631 | | | | 122,043 | | | | 167,765 | | | | 152 | | | | 2,378 | |
| | 1,436 | | | | 3,114 | | | | 9,311 | | | | 6,092 | | | | — | |
| | 7,344 | | | | 38,875 | | | | 122,659 | | | | 5,344 | | | | 766 | |
| | 2,237 | | | | 10,662 | | | | 34,933 | | | | 10,747 | | | | 208 | |
| | 4,122 | | | | 26,323 | | | | 75,546 | | | | 3,893 | | | | 513 | |
| | 5,293 | | | | 49,211 | | | | 217,480 | | | | 2,574 | | | | 1,002 | |
| | 3,954 | | | | 23,474 | | | | 70,758 | | | | 3,324 | | | | 385 | |
| | 94,324 | | | | 2,861,922 | | | | 5,542,187 | | | | 64,474 | | | | 10,313 | |
| $ | 105,969,210 | | | $ | 668,649,764 | | | $ | 2,235,352,162 | | | $ | 86,942,081 | | | $ | 11,199,170 | |
| | | | | | | | | | | | | | | | | | | |
| $ | 80,856,974 | | | $ | 278,929,551 | | | $ | 1,380,046,394 | | | $ | 84,876,112 | | | $ | 6,890,821 | |
| | 25,112,236 | | | | 389,720,213 | | | | 855,305,768 | | | | 2,065,969 | | | | 4,308,349 | |
| $ | 105,969,210 | | | $ | 668,649,764 | | | $ | 2,235,352,162 | | | $ | 86,942,081 | | | $ | 11,199,170 | |
| | | | | | | | | | | | | | | | | | | |
| $ | 7,212,254 | | | $ | 355,672,741 | | | $ | 460,034,105 | | | $ | 489,715 | | | $ | 5,094,523 | |
| | 38,448 | | | | 52,182,324 | | | | 81,338,256 | | | | 54,222 | | | | 1,513,444 | |
| | 14,638,702 | | | | 216,341,137 | | | | 1,622,233,143 | | | | 661,938 | | | | 4,591,203 | |
| | 260,711 | | | | 1,412 | | | | 1,358,728 | | | | – | | | | – | |
| | 83,819,095 | | | | 44,452,150 | | | | 70,387,930 | | | | 85,736,206 | | | | – | |
| $ | 105,969,210 | | | $ | 668,649,764 | | | $ | 2,235,352,162 | | | $ | 86,942,081 | | | $ | 11,199,170 | |
| | | | | | | | | | | | | | | | | | | |
| | 372,288 | | | | 10,635,456 | | | | 17,311,332 | | | | 49,995 | | | | 316,775 | |
| | 2,083 | | | | 1,977,285 | | | | 3,090,223 | | | | 5,593 | | | | 97,414 | |
| | 747,786 | | | | 6,079,530 | | | | 60,847,314 | | | | 67,508 | | | | 282,457 | |
| | 13,603 | | | | 42 | | | | 51,542 | | | | — | | | | — | |
| | 4,276,100 | | | | 1,251,886 | | | | 2,638,819 | | | | 8,738,214 | | | | — | |
| | 5,411,860 | | | | 19,944,199 | | | | 83,939,230 | | | | 8,861,310 | | | | 696,646 | |
| | | | | | | | | | | | | | | | | | | |
| $ | 19.37 | | | $ | 33.44 | | | $ | 26.57 | | | $ | 9.80 | | | $ | 16.08 | |
| $ | 18.46 | | | $ | 26.39 | | | $ | 26.32 | | | $ | 9.69 | | | $ | 15.54 | |
| $ | 19.58 | | | $ | 35.59 | | | $ | 26.66 | | | $ | 9.81 | | | $ | 16.25 | |
| $ | 19.17 | | | $ | 33.59 | ** | | $ | 26.36 | | | $ | — | | | $ | — | |
| $ | 19.60 | | | $ | 35.51 | | | $ | 26.67 | | | $ | 9.81 | | | $ | — | |
| | 5.75 | % | | | 5.75 | % | | | 5.75 | % | | | 5.75 | % | | | 5.75 | % |
| $ | 20.55 | | | $ | 35.48 | | | $ | 28.20 | | | $ | 10.39 | | | $ | 17.06 | |
| $ | 82,494,572 | | | $ | 357,470,489 | | | $ | 1,401,302,666 | | | $ | 78,716,812 | | | $ | 7,788,188 | |
Statement of Assets and Liabilities
September 30, 2021
| | | Sterling Capital
Stratton Mid Cap
Value Fund | | | Sterling Capital
Stratton Real Estate Fund | |
| Assets: | | | | | | |
| Investments at fair value (a) | | $ | 65,869,782 | | | $ | 96,983,545 | |
| Cash | | | — | | | | — | |
| Interest and dividends receivable | | | 77,817 | | | | 256,218 | |
| Receivable for investments sold | | | — | | | | — | |
| Receivable for capital shares issued | | | 500 | | | | 6,845 | |
| Prepaid and other expenses | | | 7,854 | | | | 8,808 | |
| Total Assets | | | 65,955,953 | | | | 97,255,416 | |
| Liabilities: | | | | | | | | |
| Cash overdraft | | | 28,170 | | | | 148,175 | |
| Distributions payable. | | | — | | | | — | |
| Payable for investments purchased | | | — | | | | — | |
| Payable for capital shares redeemed | | | 884 | | | | 36,660 | |
| Accrued expenses and other payables: | | | | | | | | |
| Investment advisory fees | | | 33,319 | | | | 48,491 | |
| Administration fees | | | 4,790 | | | | 7,273 | |
| Compliance service fees. | | | 144 | | | | 180 | |
| Distribution (12b-1) fees | | | 80 | | | | 322 | |
| Audit fees | | | 3,982 | | | | 6,057 | |
| Transfer agent fees | | | 3,333 | | | | 6,781 | |
| Other fees and liabilities. | | | 6,580 | | | | 9,541 | |
| Total Liabilities | | | 81,282 | | | | 263,480 | |
| Net Assets | | $ | 65,874,671 | | | $ | 96,991,936 | |
| Net Assets Consist of: | | | | | | | | |
| Capital | | $ | 29,391,555 | | | $ | 42,762,077 | |
| Total distributable earnings | | | 36,483,116 | | | | 54,229,859 | |
| Net Assets | | $ | 65,874,671 | | | $ | 96,991,936 | |
| Net Assets | | | | | | | | |
| Class A Shares | | $ | 369,200 | | | $ | 718,534 | |
| Class C Shares | | | 2,880 | | | | 182,309 | |
| Institutional Shares | | | 65,502,591 | | | | 96,075,090 | |
| Class R Shares | | | – | | | | – | |
| Class R6 Shares | | | – | | | | 16,003 | |
| Total. | | $ | 65,874,671 | | | $ | 96,991,936 | |
| Shares of Beneficial Interest Outstanding (Unlimited number of shares authorized, no par value) | | | | | | | | |
| Class A Shares | | | 4,706 | | | | 15,591 | |
| Class C Shares | | | 38 | | | | 3,994 | |
| Institutional Shares | | | 830,037 | | | | 2,079,896 | |
| Class R Shares | | | — | | | | — | |
| Class R6 Shares | | | — | | | | 345 | |
| Total. | | | 834,781 | | | | 2,099,826 | |
| Net Asset Value | | | | | | | | |
| Class A Shares - redemption price per share | | $ | 78.45 | | | $ | 46.09 | |
| Class C Shares - offering price per share* | | $ | 76.32 | ** | | $ | 45.65 | |
| Institutional Shares | | $ | 78.92 | | | $ | 46.19 | |
| Class R Shares | | $ | — | | | $ | — | |
| Class R6 Shares | | $ | — | | | $ | 46.33 | ** |
| Maximum Sales Charge - Class A Shares | | | 5.75 | % | | | 5.75 | % |
Maximum Offering Price (100%/(100% - Maximum Sales Charge)) of net asset value adjusted
to the nearest cent per share - Class A Shares | | $ | 83.24 | | | $ | 48.90 | |
| (a) Investments at cost | | $ | 34,282,649 | | | $ | 49,303,906 | |
| * | Redemption price per share varies by length of time shares are held. |
| ** | Class C Shares of Sterling Capital Stratton Mid Cap Value Fund, Class R6 Shares of Sterling Capital Stratton Real Estate Fund, Class C Shares of Sterling Capital Stratton Small Cap Value Fund net asset values are calculated using unrounded net assets $2,880.15, $16,002.81, and $374,968.91, divided by unrounded shares 37.738, 345.40, and 4,718.51, respectively. |
See accompanying Notes to the Financial Statements.
Sterling Capital
Stratton Small Cap Value Fund | | | Sterling Capital
Ultra Short Bond Fund | | | Sterling Capital
Short Duration Bond Fund | | | Sterling Capital
Intermediate U.S. Government Fund | | | Sterling Capital
Total Return Bond Fund | |
| | | | | | | | | | | | | | |
| $ | 521,398,915 | | | $ | 41,082,986 | | | $ | 197,046,215 | | | $ | 20,109,233 | | | $ | 1,565,352,927 | |
| | — | | | | 88,929 | | | | — | | | | — | | | | 21,286 | |
| | 639,083 | | | | 168,250 | | | | 1,029,297 | | | | 72,194 | | | | 7,086,808 | |
| | — | | | | — | | | | — | | | | — | | | | 29,771,508 | |
| | 43,002 | | | | 170,067 | | | | 60,023 | | | | — | | | | 1,663,605 | |
| | 17,752 | | | | 8,489 | | | | 13,526 | | | | 5,139 | | | | 36,119 | |
| | 522,098,752 | | | | 41,518,721 | | | | 198,149,061 | | | | 20,186,566 | | | | 1,603,932,253 | |
| | | | | | | | | | | | | | | | | | | |
| | — | | | | — | | | | — | | | | — | | | | — | |
| | — | | | | 11,148 | | | | 63,850 | | | | 2,011 | | | | 809,234 | |
| | — | | | | 1,779,182 | | | | 928,213 | | | | 385,971 | | | | 46,293,561 | |
| | 70,583 | | | | 288 | | | | 284,066 | | | | 4,079 | | | | 1,973,561 | |
| | | | | | | | | | | | | | | | | | | |
| | 327,508 | | | | 5,973 | | | | 32,436 | | | | 1,962 | | | | 313,722 | |
| | 37,280 | | | | 2,582 | | | | 13,488 | | | | 1,407 | | | | 81,862 | |
| | 572 | | | | 113 | | | | 264 | | | | 100 | | | | 1,540 | |
| | 1,043 | | | | 1,436 | | | | 1,736 | | | | 805 | | | | 17,356 | |
| | 32,031 | | | | 2,019 | | | | 11,812 | | | | 1,335 | | | | 102,450 | |
| | 53,081 | | | | 1,158 | | | | 5,620 | | | | 790 | | | | 86,427 | |
| | 52,893 | | | | 3,683 | | | | 31,197 | | | | 3,778 | | | | 197,953 | |
| | 574,991 | | | | 1,807,582 | | | | 1,372,682 | | | | 402,238 | | | | 49,877,666 | |
| $ | 521,523,761 | | | $ | 39,711,139 | | | $ | 196,776,379 | | | $ | 19,784,328 | | | $ | 1,554,054,587 | |
| | | | | | | | | | | | | | | | | | | |
| $ | 58,138,301 | | | $ | 40,780,114 | | | $ | 203,146,216 | | | $ | 20,675,359 | | | $ | 1,505,919,575 | |
| | 463,385,460 | | | | (1,068,975 | ) | | | (6,369,837 | ) | | | (891,031 | ) | | | 48,135,012 | |
| $ | 521,523,761 | | | $ | 39,711,139 | | | $ | 196,776,379 | | | $ | 19,784,328 | | | $ | 1,554,054,587 | |
| | | | | | | | | | | | | | | | | | | |
| $ | 3,468,183 | | | $ | 7,218,865 | | | $ | 4,418,990 | | | $ | 3,388,424 | | | $ | 60,694,462 | |
| | 374,969 | | | | – | | | | 988,157 | | | | 123,577 | | | | 5,377,990 | |
| | 514,025,036 | | | | 32,492,274 | | | | 161,804,043 | | | | 16,272,327 | | | | 1,139,676,320 | |
| | – | | | | – | | | | – | | | | – | | | | 34,487 | |
| | 3,655,573 | | | | – | | | | 29,565,189 | | | | – | | | | 348,271,328 | |
| $ | 521,523,761 | | | $ | 39,711,139 | | | $ | 196,776,379 | | | $ | 19,784,328 | | | $ | 1,554,054,587 | |
| | | | | | | | | | | | | | | | | | | |
| | 41,780 | | | | 738,487 | | | | 508,976 | | | | 346,486 | | | | 5,495,908 | |
| | 4,719 | | | | — | | | | 113,879 | | | | 12,661 | | | | 486,233 | |
| | 6,150,351 | | | | 3,321,763 | | | | 18,640,150 | | | | 1,662,964 | | | | 103,155,317 | |
| | — | | | | — | | | | — | | | | — | | | | 3,134 | |
| | 43,664 | | | | — | | | | 3,404,329 | | | | — | | | | 31,528,212 | |
| | 6,240,514 | | | | 4,060,250 | | | | 22,667,334 | | | | 2,022,111 | | | | 140,668,804 | |
| | | | | | | | | | | | | | | | | | | |
| $ | 83.01 | | | $ | 9.78 | | | $ | 8.68 | | | $ | 9.78 | | | $ | 11.04 | |
| $ | 79.47 | ** | | $ | — | | | $ | 8.68 | | | $ | 9.76 | | | $ | 11.06 | |
| $ | 83.58 | | | $ | 9.78 | | | $ | 8.68 | | | $ | 9.79 | | | $ | 11.05 | |
| $ | — | | | $ | — | | | $ | — | | | $ | — | | | $ | 11.00 | |
| $ | 83.72 | | | $ | — | | | $ | 8.68 | | | $ | — | | | $ | 11.05 | |
| | 5.75 | % | | | 0.50 | % | | | 2.00 | % | | | 2.00 | % | | | 5.75 | % |
| $ | 88.07 | | | $ | 9.82 | | | $ | 8.86 | | | $ | 9.98 | | | $ | 11.72 | |
| $ | 164,076,747 | | | $ | 41,129,387 | | | $ | 195,783,506 | | | $ | 19,779,366 | | | $ | 1,525,632,056 | |
Statement of Assets and Liabilities
September 30, 2021
| | | Sterling Capital
Corporate Fund | | | Sterling Capital
Quality Income Fund | |
| Assets: | | | | | | |
| Investments at fair value (a) | | $ | 7,095,645 | | | $ | 66,796,787 | |
| Interest and dividends receivable | | | 69,124 | | | | 149,014 | |
| Receivable for investments sold | | | 4,020 | | | | — | |
| Receivable for capital shares issued | | | — | | | | — | |
| Prepaid and other expenses | | | 5,449 | | | | 7,117 | |
| Total Assets | | | 7,174,238 | | | | 66,952,918 | |
| Liabilities: | | | | | | | | |
| Cash overdraft | | | — | | | | 259 | |
| Distributions payable. | | | 12,129 | | | | 60,820 | |
| Payable for investments purchased | | | 6,000 | | | | 4,081,789 | |
| Payable for capital shares redeemed | | | 1,906 | | | | 25,754 | |
| Accrued expenses and other payables: | | | | | | | | |
| Investment advisory fees | | | 1,864 | | | | 16,115 | |
| Administration fees | | | 511 | | | | 4,503 | |
| Compliance service fees. | | | 89 | | | | 138 | |
| Distribution (12b-1) fees | | | 130 | | | | 8 | |
| Accounting out-of-pocket fees | | | 7,418 | | | | 3,529 | |
| Other fees and liabilities. | | | 660 | | | | 8,640 | |
| Total Liabilities | | | 30,707 | | | | 4,201,555 | |
| Net Assets | | $ | 7,143,531 | | | $ | 62,751,363 | |
| Net Assets Consist of: | | | | | | | | |
| Capital | | $ | 6,288,510 | | | $ | 64,065,865 | |
| Total distributable earnings | | | 855,021 | | | | (1,314,502 | ) |
| Net Assets | | $ | 7,143,531 | | | $ | 62,751,363 | |
| Net Assets | | | | | | | | |
| Class A Shares | | $ | 631,783 | | | $ | 29,393 | |
| Class C Shares | | | 3,483 | | | | 3,495 | |
| Institutional Shares | | | 6,508,265 | | | | 62,718,475 | |
| Total. | | $ | 7,143,531 | | | $ | 62,751,363 | |
| Shares of Beneficial Interest Outstanding (Unlimited number of shares authorized, no par value) | | | | | | | | |
| Class A Shares | | | 60,124 | | | | 2,929 | |
| Class C Shares | | | 332 | | | | 348 | |
| Institutional Shares | | | 619,597 | | | | 6,242,302 | |
| Total. | | | 680,053 | | | | 6,245,579 | |
| Net Asset Value | | | | | | | | |
| Class A Shares - redemption price per share | | $ | 10.51 | | | $ | 10.04 | |
| Class C Shares - offering price per share* | | $ | 10.49 | | | $ | 10.03 | ** |
| Institutional Shares | | $ | 10.50 | | | $ | 10.05 | |
| Maximum Sales Charge - Class A Shares | | | 2.00 | % | | | 2.00 | % |
Maximum Offering Price (100%/(100% - Maximum Sales Charge)) of net asset value adjusted to the nearest
cent per share - Class A Shares | | $ | 10.72 | | | $ | 10.24 | |
| (a) Investments at cost | | $ | 6,829,760 | | | $ | 66,187,764 | |
| * | Redemption price per share varies by length of time shares are held. |
| ** | Class C Shares of Sterling Capital Quality Income Fund and Class C Shares of Sterling Capital Virginia Intermediate Tax-Free Fund net asset values are calculated using unrounded net assets $3,494.36, and $56,740.94, divided by unrounded shares 348.32, and 4,738.32, respectively. |
See accompanying Notes to the Financial Statements.
| Sterling Capital North Carolina Intermediate Tax-Free Fund | | | Sterling Capital South Carolina Intermediate Tax-Free Fund | | | Sterling Capital Virginia Intermediate Tax-Free Fund | | | Sterling Capital West Virginia Intermediate Tax-Free Fund | |
| | | | | | | | | | | |
| $ | 185,153,498 | | | $ | 82,420,834 | | | $ | 81,709,031 | | | $ | 94,022,379 | |
| | 2,193,359 | | | | 983,801 | | | | 857,544 | | | | 1,231,039 | |
| | — | | | | — | | | | — | | | | — | |
| | 100,038 | | | | — | | | | 15 | | | | 14,388 | |
| | 7,523 | | | | 6,265 | | | | 6,448 | | | | 6,747 | |
| | 187,454,418 | | | | 83,410,900 | | | | 82,573,038 | | | | 95,274,553 | |
| | | | | | | | | | | | | | | |
| | — | | | | — | | | | — | | | | — | |
| | 125,395 | | | | 71,199 | | | | 73,515 | | | | 91,136 | |
| | — | | | | — | | | | — | | | | — | |
| | 141,655 | | | | 26,911 | | | | 29,326 | | | | 113,002 | |
| | | | | | | | | | | | | | | |
| | 54,036 | | | | 24,091 | | | | 23,884 | | | | 27,605 | |
| | 13,321 | | | | 5,934 | | | | 5,886 | | | | 6,804 | |
| | 254 | | | | 159 | | | | 158 | | | | 174 | |
| | 7,767 | | | | 2,847 | | | | 3,623 | | | | 5,644 | |
| | 3,842 | | | | 1,323 | | | | 1,444 | | | | 565 | |
| | 34,747 | | | | 16,624 | | | | 15,436 | | | | 18,366 | |
| | 381,017 | | | | 149,088 | | | | 153,272 | | | | 263,296 | |
| $ | 187,073,401 | | | $ | 83,261,812 | | | $ | 82,419,766 | | | $ | 95,011,257 | |
| | | | | | | | | | | | | | | |
| $ | 178,929,348 | | | $ | 79,187,111 | | | $ | 78,310,314 | | | $ | 90,886,669 | |
| | 8,144,053 | | | | 4,074,701 | | | | 4,109,452 | | | | 4,124,588 | |
| $ | 187,073,401 | | | $ | 83,261,812 | | | $ | 82,419,766 | | | $ | 95,011,257 | |
| | | | | | | | | | | | | | | |
| $ | 31,234,199 | | | $ | 11,203,720 | | | $ | 17,292,008 | | | $ | 27,207,993 | |
| | 1,541,998 | | | | 603,226 | | | | 56,741 | | | | 24,940 | |
| | 154,297,204 | | | | 71,454,866 | | | | 65,071,017 | | | | 67,778,324 | |
| $ | 187,073,401 | | | $ | 83,261,812 | | | $ | 82,419,766 | | | $ | 95,011,257 | |
| | | | | | | | | | | | | | | |
| | 2,846,661 | | | | 983,178 | | | | 1,443,827 | | | | 2,666,613 | |
| | 140,642 | | | | 52,962 | | | | 4,738 | | | | 2,444 | |
| | 14,063,039 | | | | 6,313,982 | | | | 5,434,811 | | | | 6,635,369 | |
| | 17,050,342 | | | | 7,350,122 | | | | 6,883,376 | | | | 9,304,426 | |
| | | | | | | | | | | | | | | |
| $ | 10.97 | | | $ | 11.40 | | | $ | 11.98 | | | $ | 10.20 | |
| $ | 10.96 | | | $ | 11.39 | | | $ | 11.97 | ** | | $ | 10.20 | |
| $ | 10.97 | | | $ | 11.32 | | | $ | 11.97 | | | $ | 10.21 | |
| | 2.00 | % | | | 2.00 | % | | | 2.00 | % | | | 2.00 | % |
| $ | 11.20 | | | $ | 11.63 | | | $ | 12.22 | | | $ | 10.41 | |
| $ | 176,821,777 | | | $ | 78,330,175 | | | $ | 77,750,635 | | | $ | 89,986,776 | |
Statements of Operations
For the Year Ended September 30, 2021
| | | Sterling Capital Behavioral Large Cap Value Equity Fund | | | Sterling Capital Mid Value Fund | |
| Investment Income: | | | | | | |
| Dividend income | | $ | 334,011 | | | $ | 813,710 | |
| Foreign tax withholding | | | (56 | ) | | | (210 | ) |
| Total investment income | | | 333,955 | | | | 813,500 | |
| Expenses: | | | | | | | | |
| Investment advisory fees (See Note 4) | | | 144,428 | | | | 494,200 | |
| Administration fees (See Note 4) | | | 28,552 | | | | 69,790 | |
| Distribution fees - Class A Shares (See Note 4) | | | 73,897 | | | | 58,498 | |
| Distribution fees - Class C Shares (See Note 4) | | | 3,737 | | | | 15,110 | |
| Distribution fees - Class R Shares (See Note 4) | | | — | | | | 35 | |
| Compliance service fees (See Note 4) | | | 847 | | | | 1,395 | |
| Trustee fees | | | 3,621 | | | | 8,800 | |
| Accounting and out-of-pocket fees | | | 3,251 | | | | 3,442 | |
| Audit fees | | | 1,997 | | | | 4,868 | |
| Custodian fees | | | 788 | | | | 3,924 | |
| Fund accounting fees (See Note 4) | | | 2,407 | | | | 5,885 | |
| Interest expense (See Note 7) | | | 6 | | | | — | |
| Legal fees | | | 3,413 | | | | 8,711 | |
| Printing fees | | | 3,299 | | | | 9,696 | |
| Registration fees | | | 34,005 | | | | 35,720 | |
| Transfer agent fees (See Note 4) | | | 11,557 | | | | 46,298 | |
| Other fees | | | 7,934 | | | | 10,609 | |
| Total expenses before waivers | | | 323,739 | | | | 776,981 | |
| Less expenses waived by the Investment Advisor (See Note 4) | | | (44,158 | ) | | | (21,068 | ) |
| Less expenses waived by the Administrator (See Note 4) | | | — | | | | (1,610 | ) |
| Net expenses | | | 279,581 | | | | 754,303 | |
| Net investment income (loss) | | | 54,374 | | | | 59,197 | |
| Realized and Unrealized Gain (Loss): | | | | | | | | |
| Net realized gain (loss) from: | | | | | | | | |
| Investments | | | 6,135,151 | | | | 8,240,216 | |
| Written options | | | — | | | | — | |
| Foreign currency transactions | | | — | | | | — | |
| Change in unrealized appreciation/depreciation on: | | | | | | | | |
| Investments | | | 3,545,183 | | | | 17,753,584 | |
| Foreign currency transactions | | | — | | | | — | |
| Total realized and unrealized gain | | | 9,680,334 | | | | 25,993,800 | |
| Change in net assets from operations | | $ | 9,734,708 | | | $ | 26,052,997 | |
See accompanying Notes to the Financial Statements.
| Sterling Capital Behavioral Small Cap Value Equity Fund | | | Sterling Capital Special Opportunities Fund | | | Sterling Capital Equity Income Fund | | | Sterling Capital Behavioral International Equity Fund | | | Sterling Capital SMID Opportunities Fund | |
| | | | | | | | | | | | | | |
| $ | 2,053,002 | | | $ | 4,865,105 | | | $ | 44,041,862 | | | $ | 3,479,990 | | | $ | 77,657 | |
| | (2,660 | ) | | | (54,928 | ) | | | (286,681 | ) | | | (371,359 | ) | | | (899 | ) |
| | 2,050,342 | | | | 4,810,177 | | | | 43,755,181 | | | | 3,108,631 | | | | 76,758 | |
| | | | | | | | | | | | | | | | | | | |
| | 719,107 | | | | 4,160,941 | | | | 11,023,346 | | | | 407,317 | | | | 87,611 | |
| | 106,478 | | | | 569,498 | | | | 1,781,580 | | | | 77,738 | | | | 11,140 | |
| | 17,033 | | | | 837,286 | | | | 1,028,489 | | | | 1,285 | | | | 13,313 | |
| | 695 | | | | 604,431 | | | | 1,080,052 | | | | 522 | | | | 14,916 | |
| | 1,223 | | | | 38 | | | | 9,967 | | | | — | | | | — | |
| | 1,887 | | | | 8,032 | | | | 24,091 | | | | 1,501 | | | | 615 | |
| | 13,224 | | | | 71,455 | | | | 219,375 | | | | 10,262 | | | | 1,437 | |
| | 5,672 | | | | 17,149 | | | | 48,633 | | | | 20,167 | | | | 1,478 | |
| | 7,436 | | | | 39,750 | | | | 124,419 | | | | 5,426 | | | | 777 | |
| | 6,010 | | | | 30,003 | | | | 97,733 | | | | 48,996 | | | | 627 | |
| | 8,989 | | | | 48,011 | | | | 150,318 | | | | 6,547 | | | | 939 | |
| | — | | | | — | | | | — | | | | 512 | | | | 7 | |
| | 12,689 | | | | 71,470 | | | | 216,597 | | | | 10,158 | | | | 1,410 | |
| | 13,815 | | | | 80,805 | | | | 248,469 | | | | 11,045 | | | | 1,567 | |
| | 30,764 | | | | 55,837 | | | | 91,572 | | | | 9,482 | | | | 12,995 | |
| | 30,236 | | | | 354,669 | | | | 1,560,901 | | | | 15,804 | | | | 8,579 | |
| | 14,543 | | | | 63,138 | | | | 170,612 | | | | 24,154 | | | | 3,643 | |
| | 989,801 | | | | 7,012,513 | | | | 17,876,154 | | | | 650,916 | | | | 161,054 | |
| | — | | | | (77,927 | ) | | | (152,087 | ) | | | (58,128 | ) | | | (33,942 | ) |
| | (63,595 | ) | | | (40,223 | ) | | | (71,175 | ) | | | (37,581 | ) | | | — | |
| | 926,206 | | | | 6,894,363 | | | | 17,652,892 | | | | 555,207 | | | | 127,112 | |
| | 1,124,136 | | | | (2,084,186 | ) | | | 26,102,289 | | | | 2,553,424 | | | | (50,354 | ) |
| | | | | | | | | | | | | | | | | | | |
| | 32,538,116 | | | | 93,006,573 | | | | 85,372,720 | | | | 17,241,103 | | | | 2,193,078 | |
| | — | | | | — | | | | (31,660 | ) | | | — | | | | — | |
| | — | | | | — | | | | — | | | | (50,642 | ) | | | — | |
| | 19,414,311 | | | | 101,866,100 | | | | 436,564,630 | | | | (1,062,641 | ) | | | 1,003,701 | |
| | — | | | | — | | | | — | | | | (13,729 | ) | | | — | |
| | 51,952,427 | | | | 194,872,673 | | | | 521,905,690 | | | | 16,114,091 | | | | 3,196,779 | |
| $ | 53,076,563 | | | $ | 192,788,487 | | | $ | 548,007,979 | | | $ | 18,667,515 | | | $ | 3,146,425 | |
Statements of Operations
For the Year Ended September 30, 2021
| | | Sterling Capital Stratton Mid Cap Value Fund | | | Sterling Capital Stratton Real Estate Fund | |
| Investment Income: | | | | | | |
| Interest income | | $ | — | | | $ | 81 | |
| Dividend income | | | 942,540 | | | | 1,790,261 | |
| Foreign tax withholding | | | (4,953 | ) | | | — | |
| Total investment income | | | 937,587 | | | | 1,790,342 | |
| Expenses: | | | | | | | | |
| Investment advisory fees (See Note 4) | | | 409,804 | | | | 568,515 | |
| Administration fees (See Note 4) | | | 57,805 | | | | 87,972 | |
| Distribution fees - Class A Shares (See Note 4) | | | 811 | | | | 1,702 | |
| Distribution fees - Class C Shares (See Note 4) | | | 20 | | | | 1,833 | |
| Distribution fees - Class R Shares (See Note 4) | | | — | | | | — | |
| Compliance service fees (See Note 4) | | | 1,234 | | | | 1,638 | |
| Trustee fees | | | 7,306 | | | | 11,198 | |
| Accounting and out-of-pocket fees | | | 3,159 | | | | 3,520 | |
| Audit fees | | | 4,036 | | | | 6,144 | |
| Custodian fees | | | 3,239 | | | | 4,851 | |
| Fund accounting fees (See Note 4) | | | 4,873 | | | | 7,416 | |
| Interest expense (See Note 7) | | | — | | | | 203 | |
| Legal fees | | | 7,342 | | | | 11,147 | |
| Printing fees | | | 8,173 | | | | 12,891 | |
| Registration fees | | | 20,017 | | | | 26,442 | |
| Transfer agent fees (See Note 4) | | | 23,347 | | | | 50,163 | |
| Other fees | | | 8,001 | | | | 11,693 | |
| Total expenses before waivers | | | 559,167 | | | | 807,328 | |
| Less expenses waived by the Investment Advisor (See Note 4) | | | (7,998 | ) | | | — | |
| Less expenses waived by the Administrator (See Note 4) | | | — | | | | (10 | ) |
| Net expenses | | | 551,169 | | | | 807,318 | |
| Net investment income | | | 386,418 | | | | 983,024 | |
| Realized and Unrealized Gain (Loss): | | | | | | | | |
| Net realized gain (loss) from: | | | | | | | | |
| Investments | | | 5,465,650 | | | | 7,216,823 | |
| In-kind redemptions | | | — | | | | — | |
| Change in unrealized appreciation/depreciation on: | | | | | | | | |
| Investments | | | 12,463,051 | | | | 18,097,538 | |
| Total realized and unrealized gain (loss) | | | 17,928,701 | | | | 25,314,361 | |
| Change in net assets from operations | | $ | 18,315,119 | | | $ | 26,297,385 | |
See accompanying Notes to the Financial Statements.
| Sterling Capital Stratton Small Cap Value Fund | | | Sterling Capital Ultra Short Bond Fund | | | Sterling Capital Short Duration Bond Fund | | | Sterling Capital Intermediate U.S. Government Fund | | | Sterling Capital Total Return Bond Fund | |
| | | | | | | | | | | | | | |
| $ | 48 | | | $ | 449,809 | | | $ | 3,524,117 | | | $ | 282,812 | | | $ | 37,185,777 | |
| | 6,414,146 | | | | 65 | | | | — | | | | 75 | | | | 2,068 | |
| | — | | | | — | | | | — | | | | — | | | | — | |
| | 6,414,194 | | | | 449,874 | | | | 3,524,117 | | | | 282,887 | | | | 37,187,845 | |
| | | | | | | | | | | | | | | | | | | |
| | 4,164,690 | | | | 65,783 | | | | 447,148 | | | | 69,441 | | | | 4,895,048 | |
| | 473,951 | | | | 29,296 | | | | 171,516 | | | | 19,365 | | | | 1,492,766 | |
| | 7,522 | | | | 11,642 | | | | 11,127 | | | | 9,093 | | | | 150,551 | |
| | 3,478 | | | | — | | | | 8,274 | | | | 2,057 | | | | 70,075 | |
| | — | | | | — | | | | — | | | | — | | | | 165 | |
| | 6,758 | | | | 860 | | | | 2,754 | | | | 724 | | | | 20,422 | |
| | 61,217 | | | | 3,908 | | | | 22,171 | | | | 2,269 | | | | 202,263 | |
| | 13,658 | | | | 25,186 | | | | 36,702 | | | | 9,214 | | | | 101,541 | |
| | 32,839 | | | | 2,037 | | | | 11,960 | | | | 1,348 | | | | 103,979 | |
| | 26,130 | | | | 1,647 | | | | 9,520 | | | | 1,057 | | | | 82,912 | |
| | 39,922 | | | | 2,467 | | | | 14,450 | | | | 1,627 | | | | 125,573 | |
| | 836 | | | | — | | | | — | | | | — | | | | — | |
| | 61,690 | | | | 3,935 | | | | 22,287 | | | | 2,864 | | | | 224,367 | |
| | 68,849 | | | | 4,253 | | | | 24,635 | | | | 3,074 | | | | 226,474 | |
| | 35,050 | | | | 15,596 | | | | 41,486 | | | | 11,100 | | | | 76,424 | |
| | 373,244 | | | | 7,267 | | | | 60,811 | | | | 6,163 | | | | 729,544 | |
| | 55,263 | | | | 4,554 | | | | 20,467 | | | | 4,083 | | | | 170,442 | |
| | 5,425,097 | | | | 178,431 | | | | 905,308 | | | | 143,479 | | | | 8,672,546 | |
| | (172,457 | ) | | | (70,472 | ) | | | (61,822 | ) | | | (40,067 | ) | | | (920,805 | ) |
| | (3,660 | ) | | | — | | | | (512 | ) | | | — | | | | (502,389 | ) |
| | 5,248,980 | | | | 107,959 | | | | 842,974 | | | | 103,412 | | | | 7,249,352 | |
| | 1,165,214 | | | | 341,915 | | | | 2,681,143 | | | | 179,475 | | | | 29,938,493 | |
| | | | | | | | | | | | | | | | | | | |
| | 130,272,724 | | | | 34,840 | | | | 1,276,704 | | | | 80,124 | | | | 27,073,773 | |
| | — | | | | — | | | | — | | | | — | | | | 4,885,432 | |
| | 89,329,899 | | | | (130,731 | ) | | | (1,665,303 | ) | | | (458,605 | ) | | | (53,496,254 | ) |
| | 219,602,623 | | | | (95,891 | ) | | | (388,599 | ) | | | (378,481 | ) | | | (21,537,049 | ) |
| $ | 220,767,837 | | | $ | 246,024 | | | $ | 2,292,544 | | | $ | (199,006 | ) | | $ | 8,401,444 | |
Statements of Operations
For the Year Ended September 30, 2021
| | | Sterling Capital Corporate Fund | | | Sterling Capital Quality Income Fund | |
| Investment Income: | | | | | | |
| Interest income | | $ | 332,319 | | | $ | 914,246 | |
| Dividend income | | | 10,286 | | | | 171 | |
| Total investment income | | | 342,605 | | | | 914,417 | |
| Expenses: | | | | | | | | |
| Investment advisory fees (See Note 4) | | | 36,001 | | | | 152,958 | |
| Administration fees (See Note 4) | | | 9,225 | | | | 38,828 | |
| Distribution fees - Class A Shares (See Note 4) | | | 1,486 | | | | 86 | |
| Distribution fees - Class C Shares (See Note 4) | | | 37 | | | | 32 | |
| Compliance service fees (See Note 4) | | | 591 | | | | 980 | |
| Trustee fees | | | 1,443 | | | | 4,508 | |
| Accounting and out-of-pocket fees | | | 17,152 | | | | 22,609 | |
| Audit fees | | | 639 | | | | 2,711 | |
| Custodian fees | | | 481 | | | | 1,932 | |
| Fund accounting fees (See Note 4) | | | 772 | | | | 3,278 | |
| Legal fees | | | 1,782 | | | | 4,926 | |
| Printing fees | | | 1,750 | | | | 5,007 | |
| Registration fees | | | 13,348 | | | | 15,985 | |
| Transfer agent fees (See Note 4) | | | 2,496 | | | | 8,967 | |
| Other fees | | | 3,715 | | | | 5,710 | |
| Total expenses before waivers | | | 90,918 | | | | 268,517 | |
| Less expenses waived by the Investment Advisor (See Note 4) | | | (15,914 | ) | | | (17,481 | ) |
| Net expenses | | | 75,004 | | | | 251,036 | |
| Net investment income | | | 267,601 | | | | 663,381 | |
| Realized and Unrealized Gain (Loss): | | | | | | | | |
| Net realized gain (loss) from: | | | | | | | | |
| Investments | | | 933,969 | | | | 74,208 | |
| Change in unrealized appreciation/depreciation on: | | | | | | | | |
| Investments | | | (779,557 | ) | | | (829,489 | ) |
| Total realized and unrealized gain (loss) | | | 154,412 | | | | (755,281 | ) |
| Change in net assets from operations | | $ | 422,013 | | | $ | (91,900 | ) |
See accompanying Notes to the Financial Statements.
| Sterling Capital North Carolina Intermediate Tax-Free Fund | | | Sterling Capital South Carolina Intermediate Tax-Free Fund | | | Sterling Capital Virginia Intermediate Tax-Free Fund | | | Sterling Capital West Virginia Intermediate Tax-Free Fund | |
| | | | | | | | | | | |
| $ | 3,935,373 | | | $ | 2,021,186 | | | $ | 1,748,628 | | | $ | 2,293,659 | |
| | 437 | | | | 192 | | | | 173 | | | | 237 | |
| | 3,935,810 | | | | 2,021,378 | | | | 1,748,801 | | | | 2,293,896 | |
| | | | | | | | | | | | | | | |
| | 643,198 | | | | 312,177 | | | | 288,787 | | | | 343,197 | |
| | 163,675 | | | | 79,499 | | | | 73,500 | | | | 87,341 | |
| | 82,935 | | | | 39,423 | | | | 43,795 | | | | 69,237 | |
| | 19,808 | | | | 7,610 | | | | 3,845 | | | | 1,362 | |
| | 2,649 | | | | 1,529 | | | | 1,448 | | | | 1,637 | |
| | 21,298 | | | | 10,501 | | | | 9,606 | | | | 11,460 | |
| | 18,453 | | | | 11,448 | | | | 9,645 | | | | 10,947 | |
| | 11,413 | | | | 5,541 | | | | 5,124 | | | | 6,089 | |
| | 8,981 | | | | 4,355 | | | | 4,027 | | | | 4,838 | |
| | 13,783 | | | | 6,689 | | | | 6,188 | | | | 7,354 | |
| | 21,618 | | | | 10,735 | | | | 9,756 | | | | 11,596 | |
| | 23,587 | | | | 11,397 | | | | 10,644 | | | | 12,688 | |
| | 13,911 | | | | 12,419 | | | | 16,269 | | | | 16,301 | |
| | 47,256 | | | | 22,028 | | | | 19,803 | | | | 20,807 | |
| | 19,404 | | | | 10,414 | | | | 9,924 | | | | 11,302 | |
| | 1,111,969 | | | | 545,765 | | | | 512,361 | | | | 616,156 | |
| | — | | | | — | | | | — | | | | — | |
| | 1,111,969 | | | | 545,765 | | | | 512,361 | | | | 616,156 | |
| | 2,823,841 | | | | 1,475,613 | | | | 1,236,440 | | | | 1,677,740 | |
| | | | | | | | | | | | | | | |
| | 224,918 | | | | 293,708 | | | | 87,883 | | | | 7,854 | |
| | (2,831,416 | ) | | | (849,869 | ) | | | (1,594,083 | ) | | | (800,187 | ) |
| | (2,606,498 | ) | | | (556,161 | ) | | | (1,506,200 | ) | | | (792,333 | ) |
| $ | 217,343 | | | $ | 919,452 | | | $ | (269,760 | ) | | $ | 885,407 | |
Statements of Changes in Net Assets
| | | Sterling Capital Behavioral Large Cap Value Equity Fund | |
| | | For the Year Ended September 30, 2021 | | | For the Year Ended September 30, 2020 | |
| From Investment Activities: | | | | | | |
| Operations: | | | | | | |
| Net investment income (loss) | | $ | 54,374 | | | $ | 4,594,058 | |
| Net realized gain (loss) | | | 6,135,151 | | | | (7,619,464 | ) |
| Change in unrealized appreciation/depreciation | | | 3,545,183 | | | | (23,882,038 | ) |
| Change in net assets from operations | | | 9,734,708 | | | | (26,907,444 | ) |
| Distributions to Shareholders: | | | | | | | | |
| Income distribution: | | | | | | | | |
| Class A | | | (60,964 | ) | | | (1,529,996 | ) |
| Class C | | | (690 | ) | | | (31,751 | ) |
| Institutional Class | | | (4,573 | ) | | | (319,890 | ) |
| Class R | | | – | | | | – | |
| Class R6 | | | (1 | ) | | | (10,771,551 | ) |
| Return of Capital: | | | | | | | | |
| Class A | | | (235,786 | ) | | | – | |
| Class C | | | (2,670 | ) | | | – | |
| Institutional Class | | | (17,684 | ) | | | – | |
| Class R6 | | | (4 | ) | | | – | |
| Change in net assets from shareholder distributions | | | (322,372 | ) | | | (12,653,188 | ) |
| Capital Transactions: | | | | | | | | |
| Change in net assets from capital transactions (See Note 5) | | | (3,228,795 | ) | | | (209,921,189 | ) |
| Change in net assets | | | 6,183,541 | | | | (249,481,821 | ) |
| Net Assets: | | | | | | | | |
| Beginning of year | | | 27,013,871 | | | | 276,495,692 | |
| End of year | | $ | 33,197,412 | | | $ | 27,013,871 | |
See accompanying Notes to the Financial Statements.
| Sterling Capital Mid Value Fund | | | Sterling Capital Behavioral Small Cap Value Equity Fund | | | Sterling Capital Special Opportunities Fund | |
| For the Year Ended September 30, 2021 | | | For the Year Ended September 30, 2020 | | | For the Year Ended September 30, 2021 | | | For the Year Ended September 30, 2020 | | | For the Year Ended September 30, 2021 | | | For the Year Ended September 30, 2020 | |
| | | | | | | | | | | | | | | | | |
| $ | 59,197 | | | $ | 205,841 | | | $ | 1,124,136 | | | $ | 1,058,785 | | | $ | (2,084,186 | ) | | $ | 917,635 | |
| | 8,240,216 | | | | 46,739,683 | | | | 32,538,116 | | | | (15,726,803 | ) | | | 93,006,573 | | | | 171,797,971 | |
| | 17,753,584 | | | | (64,433,692 | ) | | | 19,414,311 | | | | (10,642,628 | ) | | | 101,866,100 | | | | (150,860,810 | ) |
| | 26,052,997 | | | | (17,488,168 | ) | | | 53,076,563 | | | | (25,310,646 | ) | | | 192,788,487 | | | | 21,854,796 | |
| | | | | | | | | | | | | | | | | | | | | | | |
| | (43,324 | ) | | | (1,879,928 | ) | | | (40,840 | ) | | | (61,349 | ) | | | (3,637,292 | ) | | | (16,884,047 | ) |
| | – | | | | (242,428 | ) | | | – | | | | (1,205 | ) | | | (940,187 | ) | | | (5,356,907 | ) |
| | (185,412 | ) | | | (4,770,709 | ) | | | (73,763 | ) | | | (215,820 | ) | | | (2,285,619 | ) | | | (14,778,572 | ) |
| | (2 | ) | | | (455 | ) | | | (1,097 | ) | | | (1,536 | ) | | | (14 | ) | | | (4,838 | ) |
| | (14,498 | ) | | | (39 | ) | | | (851,534 | ) | | | (872,270 | ) | | | (713,339 | ) | | | (18,960,053 | ) |
| | | | | | | | | | | | | | | | | | | | | | | |
| | – | | | | – | | | | – | | | | – | | | | – | | | | – | |
| | – | | | | – | | | | – | | | | – | | | | – | | | | – | |
| | – | | | | – | | | | – | | | | – | | | | – | | | | – | |
| | – | | | | – | | | | – | | | | – | | | | – | | | | – | |
| | (243,236 | ) | | | (6,893,559 | ) | | | (967,234 | ) | | | (1,152,180 | ) | | | (7,576,451 | ) | | | (55,984,417 | ) |
| | | | | | | | | | | | | | | | | | | | | | | |
| | (10,023,315 | ) | | | (342,919,127 | ) | | | (28,556,308 | ) | | | (136,635,943 | ) | | | (64,806,980 | ) | | | (460,138,495 | ) |
| | 15,786,446 | | | | (367,300,854 | ) | | | 23,553,021 | | | | (163,098,769 | ) | | | 120,405,056 | | | | (494,268,116 | ) |
| | | | | | | | | | | | | | | | | | | | | | | |
| | 60,752,344 | | | | 428,053,198 | | | | 82,416,189 | | | | 245,514,958 | | | | 548,244,708 | | | | 1,042,512,824 | |
| $ | 76,538,790 | | | $ | 60,752,344 | | | $ | 105,969,210 | | | $ | 82,416,189 | | | $ | 668,649,764 | | | $ | 548,244,708 | |
Statements of Changes in Net Assets
| | | Sterling Capital Equity Income Fund | |
| | | For the Year Ended September 30, 2021 | | | For the Year Ended September 30, 2020 | |
| From Investment Activities: | | | | | | |
| Operations: | | | | | | |
| Net investment income (loss) | | $ | 26,102,289 | | | $ | 35,429,855 | |
| Net realized gain (loss) | | | 85,341,060 | | | | 40,840,818 | |
| Change in unrealized appreciation/depreciation | | | 436,564,630 | | | | (138,683,528 | ) |
| Change in net assets from operations | | | 548,007,979 | | | | (62,412,855 | ) |
| Distributions to Shareholders: | | | | | | | | |
| Income distribution: | | | | | | | | |
| Class A | | | (4,952,072 | ) | | | (19,225,030 | ) |
| Class C | | | (309,538 | ) | | | (7,565,163 | ) |
| Institutional Class | | | (20,357,408 | ) | | | (64,305,155 | ) |
| Class R | | | (16,774 | ) | | | (129,017 | ) |
| Class R6 | | | (964,112 | ) | | | (19,852,052 | ) |
| Change in net assets from shareholder distributions | | | (26,599,904 | ) | | | (111,076,417 | ) |
| Capital Transactions: | | | | | | | | |
| Change in net assets from capital transactions (See Note 5) | | | 158,467,099 | | | | (109,274,630 | ) |
| Change in net assets | | | 679,875,174 | | | | (282,763,902 | ) |
| Net Assets: | | | | | | | | |
| Beginning of year | | | 1,555,476,988 | | | | 1,838,240,890 | |
| End of year | | $ | 2,235,352,162 | | | $ | 1,555,476,988 | |
See accompanying Notes to the Financial Statements.
| Sterling Capital Behavioral International Equity Fund | | | Sterling Capital SMID Opportunities Fund | | | Sterling Capital Stratton Mid Cap Value Fund | |
| For the Year Ended September 30, 2021 | | | For the Year Ended September 30, 2020 | | | For the Year Ended September 30, 2021 | | | For the Year Ended September 30, 2020 | | | For the Year Ended September 30, 2021 | | | For the Year Ended September 30, 2020 | |
| | | | | | | | | | | | | | | | | |
| $ | 2,553,424 | | | $ | 2,726,299 | | | $ | (50,354 | ) | | $ | (19,698 | ) | | $ | 386,418 | | | $ | 376,164 | |
| | 17,190,461 | | | | (18,493,337 | ) | | | 2,193,078 | | | | (1,227,190 | ) | | | 5,465,650 | | | | (210,347 | ) |
| | (1,076,370 | ) | | | 4,940,450 | | | | 1,003,701 | | | | 567,884 | | | | 12,463,051 | | | | (3,504,691 | ) |
| | 18,667,515 | | | | (10,826,588 | ) | | | 3,146,425 | | | | (679,004 | ) | | | 18,315,119 | | | | (3,338,874 | ) |
| | | | | | | | | | | | | | | | | | | | | | | |
| | (12,833 | ) | | | (15,272 | ) | | | – | | | | (158,917 | ) | | | (2,010 | ) | | | (3,930 | ) |
| | (891 | ) | | | (986 | ) | | | – | | | | (58,816 | ) | | | (5 | ) | | | (34 | ) |
| | (350,947 | ) | | | (484,264 | ) | | | – | | | | (253,402 | ) | | | (508,411 | ) | | | (2,009,020 | ) |
| | – | | | | – | | | | – | | | | – | | | | – | | | | – | |
| | (2,082,632 | ) | | | (2,512,099 | ) | | | – | | | | – | | | | – | | | | – | |
| | (2,447,303 | ) | | | (3,012,621 | ) | | | – | | | | (471,135 | ) | | | (510,426 | ) | | | (2,012,984 | ) |
| | | | | | | | | | | | | | | | | | | | | | | |
| | (12,654,797 | ) | | | 1,587,180 | | | | (2,981,186 | ) | | | 2,513,789 | | | | (5,923,182 | ) | | | (2,690,807 | ) |
| | 3,565,415 | | | | (12,252,029 | ) | | | 165,239 | | | | 1,363,650 | | | | 11,881,511 | | | | (8,042,665 | ) |
| | | | | | | | | | | | | | | | | | | | | | | |
| | 83,376,666 | | | | 95,628,695 | | | | 11,033,931 | | | | 9,670,281 | | | | 53,993,160 | | | | 62,035,825 | |
| $ | 86,942,081 | | | $ | 8,376,666 | | | $ | 11,199,170 | | | $ | 11,033,931 | | | $ | 65,874,671 | | | $ | 53,993,160 | |
Statements of Changes in Net Assets
| | | Sterling Capital Stratton Real Estate Fund | |
| | | For the Year Ended September 30, 2021 | | | For the Year Ended September 30, 2020 | |
| From Investment Activities: | | | | | | |
| Operations: | | | | | | |
| Net investment income | | $ | 983,024 | | | $ | 1,463,925 | |
| Net realized gain | | | 7,216,823 | | | | 2,508,959 | |
| Change in unrealized appreciation/depreciation | | | 18,097,538 | | | | (13,233,054 | ) |
| Change in net assets from operations | | | 26,297,385 | | | | (9,260,170 | ) |
| Distributions to Shareholders: | | | | | | | | |
| Income distribution: | | | | | | | | |
| Class A | | | (20,780 | ) | | | (56,366 | ) |
| Class C | | | (4,951 | ) | | | (10,328 | ) |
| Institutional Class | | | (3,204,299 | ) | | | (5,651,172 | ) |
| Class R6 | | | (250 | ) | | | (9 | ) |
| Change in net assets from shareholder distributions | | | (3,230,280 | ) | | | (5,717,875 | ) |
| Capital Transactions: | | | | | | | | |
| Change in net assets from capital transactions (See Note 5) | | | (11,947,772 | ) | | | (5,370,588 | ) |
| Change in net assets | | | 11,119,333 | | | | (20,348,633 | ) |
| Net Assets: | | | | | | | | |
| Beginning of year | | | 85,872,603 | | | | 106,221,236 | |
| End of year | | $ | 96,991,936 | | | $ | 85,872,603 | |
See accompanying Notes to the Financial Statements.
| Sterling Capital Stratton Small Cap Value Fund | | | Sterling Capital Ultra Short Bond Fund | |
| For the Year Ended September 30, 2021 | | | For the Year Ended September 30, 2020 | | | For the Year Ended September 30, 2021 | | | For the Year Ended September 30, 2020 | |
| | | | | | | | | | | |
| $ | 1,165,214 | | | $ | 4,263,656 | | | $ | 341,915 | | | $ | 450,802 | |
| | 130,272,724 | | | | 88,415,592 | | | | 34,840 | | | | 36,747 | |
| | 89,329,899 | | | | (231,075,150 | ) | | | (130,731 | ) | | | 40,335 | |
| | 220,767,837 | | | | (138,395,902 | ) | | | 246,024 | | | | 527,884 | |
| | | | | | | | | | | | | | | |
| | (354,284 | ) | | | (176,450 | ) | | | (46,478 | ) | | | (40,911 | ) |
| | (42,126 | ) | | | (24,177 | ) | | | – | | | | – | |
| | (74,924,280 | ) | | | (64,382,924 | ) | | | (355,057 | ) | | | (414,182 | ) |
| | (527,073 | ) | | | – | | | | – | | | | – | |
| | (75,847,763 | ) | | | (64,583,551 | ) | | | (401,535 | ) | | | (455,093 | ) |
| | | | | | | | | | | | | | | |
| | (104,186,325 | ) | | | (279,158,884 | ) | | | 3,492,017 | | | | 18,740,067 | |
| | 40,733,749 | | | | (482,138,337 | ) | | | 3,336,506 | | | | 18,812,858 | |
| | | | | | | | | | | | | | | |
| | 480,790,012 | | | | 962,928,349 | | | | 36,374,633 | | | | 17,561,775 | |
| $ | 521,523,761 | | | $ | 480,790,012 | | | $ | 39,711,139 | | | $ | 36,374,633 | |
Statements of Changes in Net Assets
| | | Sterling Capital Short Duration Bond Fund | |
| | | For the Year Ended September 30, 2021 | | | For the Year Ended September 30, 2020 | |
| From Investment Activities: | | | | | | |
| Operations: | | | | | | |
| Net investment income | | $ | 2,681,143 | | | $ | 3,829,034 | |
| Net realized gain | | | 1,276,704 | | | | 1,927,039 | |
| Change in unrealized appreciation/depreciation | | | (1,665,303 | ) | | | 1,039,743 | |
| Change in net assets from operations | | | 2,292,544 | | | | 6,795,816 | |
| Distributions to Shareholders: | | | | | | | | |
| Income distribution: | | | | | | | | |
| Class A | | | (92,276 | ) | | | (73,507 | ) |
| Class C | | | (10,952 | ) | | | (14,615 | ) |
| Institutional Class | | | (4,334,091 | ) | | | (4,361,183 | ) |
| Class R | | | – | | | | – | |
| Class R6 | | | (14,207 | ) | | | – | |
| Change in net assets from shareholder distributions | | | (4,451,526 | ) | | | (4,449,305 | ) |
| Capital Transactions: | | | | | | | | |
| Change in net assets from capital transactions (See Note 5) | | | 18,891,274 | | | | 1,459,121 | |
| Change in net assets | | | 16,732,292 | | | | 3,805,632 | |
| Net Assets: | | | | | | | | |
| Beginning of year | | | 180,044,087 | | | | 176,238,455 | |
| End of year | | $ | 196,776,379 | | | $ | 180,044,087 | |
See accompanying Notes to the Financial Statements.
| Sterling Capital Intermediate U.S. Government Fund | | | Sterling Capital Total Return Bond Fund | |
| For the Year Ended September 30, 2021 | | | For the Year Ended September 30, 2020 | | | For the Year Ended September 30, 2021 | | | For the Year Ended September 30, 2020 | |
| | | | | | | | | | | |
| $ | 179,475 | | | $ | 254,969 | | | $ | 29,938,493 | | | $ | 40,028,582 | |
| | 80,124 | | | | 85,001 | | | | 31,959,205 | | | | 39,186,823 | |
| | (458,605 | ) | | | 307,636 | | | | (53,496,254 | ) | | | 39,961,602 | |
| | (199,006 | ) | | | 647,606 | | | | 8,401,444 | | | | 119,177,007 | |
| | | | | | | | | | | | | | | |
| | (82,287 | ) | | | (90,704 | ) | | | (2,073,169 | ) | | | (1,439,572 | ) |
| | (2,891 | ) | | | (6,038 | ) | | | (206,565 | ) | | | (150,558 | ) |
| | (441,390 | ) | | | (264,844 | ) | | | (40,602,235 | ) | | | (30,684,940 | ) |
| | – | | | | – | | | | (1,056 | ) | | | (867 | ) |
| | – | | | | – | | | | (20,737,575 | ) | | | (14,238,201 | ) |
| | (526,568 | ) | | | (361,586 | ) | | | (63,620,600 | ) | | | (46,514,138 | ) |
| | | | | | | | | | | | | | | |
| | 8,222,356 | | | | (2,958,620 | ) | | | (150,525,821 | ) | | | 207,853,743 | |
| | 7,496,782 | | | | (2,672,600 | ) | | | (205,744,977 | ) | | | 280,516,612 | |
| | | | | | | | | | | | | | | |
| | 12,287,546 | | | | 14,960,146 | | | | 1,759,799,564 | | | | 1,479,282,952 | |
| $ | 19,784,328 | | | $ | 12,287,546 | | | $ | 1,554,054,587 | | | $ | 1,759,799,564 | |
Statements of Changes in Net Assets
| | | Sterling Capital Corporate Fund | |
| | | For the Year Ended September 30, 2021 | | | For the Year Ended September 30, 2020 | |
| From Investment Activities: | | | | | | |
| Operations: | | | | | | |
| Net investment income | | $ | 267,601 | | | $ | 596,985 | |
| Net realized gain | | | 933,969 | | | | 554,955 | |
| Change in unrealized appreciation/depreciation | | | (779,557 | ) | | | 168,387 | |
| Change in net assets from operations | | | 422,013 | | | | 1,320,327 | |
| Distributions to Shareholders: | | | | | | | | |
| Income distribution: | | | | | | | | |
| Class A | | | (30,662 | ) | | | (12,277 | ) |
| Class C | | | (155 | ) | | | (59 | ) |
| Institutional Class | | | (606,311 | ) | | | (584,519 | ) |
| Change in net assets from shareholder distributions | | | (637,128 | ) | | | (596,855 | ) |
| Capital Transactions: | | | | | | | | |
| Change in net assets from capital transactions (See Note 5) | | | (11,653,318 | ) | | | (4,864,338 | ) |
| Change in net assets | | | (11,868,433 | ) | | | (4,140,866 | ) |
| Net Assets: | | | | | | | | |
| Beginning of year | | | 19,011,964 | | | | 23,152,830 | |
| End of year | | $ | 7,143,531 | | | $ | 19,011,964 | |
See accompanying Notes to the Financial Statements.
| Sterling Capital Quality Income Fund | | | Sterling Capital North Carolina Intermediate Tax-Free Fund | |
| For the Year Ended September 30, 2021 | | | For the Year Ended September 30, 2020 | | | For the Year Ended September 30, 2021 | | | For the Year Ended September 30, 2020 | |
| | | | | | | | | | | |
| $ | 663,381 | | | $ | 861,054 | | | $ | 2,823,841 | | | $ | 3,275,713 | |
| | 74,208 | | | | 335,207 | | | | 224,918 | | | | 351,826 | |
| | (829,489 | ) | | | 352,430 | | | | (2,831,416 | ) | | | 2,159,557 | |
| | (91,900 | ) | | | 1,548,691 | | | | 217,343 | | | | 5,787,096 | |
| | | | | | | | | | | | | | | |
| | (641 | ) | | | (498 | ) | | | (445,562 | ) | | | (618,328 | ) |
| | (37 | ) | | | (233 | ) | | | (11,791 | ) | | | (26,263 | ) |
| | (899,204 | ) | | | (975,676 | ) | | | (2,366,482 | ) | | | (2,630,444 | ) |
| | (899,882 | ) | | | (976,407 | ) | | | (2,823,835 | ) | | | (3,275,035 | ) |
| | | | | | | | | | | | | | | |
| | 27,906,592 | | | | (1,150,794 | ) | | | 12,280,498 | | | | (6,598,839 | ) |
| | 26,914,810 | | | | (578,510 | ) | | | 9,674,006 | | | | (4,086,778 | ) |
| | | | | | | | | | | | | | | |
| | 35,836,553 | | | | 36,415,063 | | | | 177,399,395 | | | | 181,486,173 | |
| $ | 62,751,363 | | | $ | 35,836,553 | | | $ | 187,073,401 | | | $ | 177,399,395 | |
Statements of Changes in Net Assets
| | | Sterling Capital South Carolina Intermediate Tax-Free Fund | |
| | | For the Year Ended September 30, 2021 | | | For the Year Ended September 30, 2020 | |
| From Investment Activities: | | | | | | |
| Operations: | | | | | | |
| Net investment income | | $ | 1,475,613 | | | $ | 1,616,031 | |
| Net realized gain | | | 293,708 | | | | 163,968 | |
| Change in unrealized appreciation/depreciation | | | (849,869 | ) | | | 1,193,350 | |
| Change in net assets from operations | | | 919,452 | | | | 2,973,349 | |
| Distributions to Shareholders: | | | | | | | | |
| Income distribution: | | | | | | | | |
| Class A | | | (226,979 | ) | | | (217,872 | ) |
| Class C | | | (5,485 | ) | | | (9,723 | ) |
| Institutional Class | | | (1,243,149 | ) | | | (1,388,129 | ) |
| Change in net assets from shareholder distributions | | | (1,475,613 | ) | | | (1,615,724 | ) |
| Capital Transactions: | | | | | | | | |
| Change in net assets from capital transactions (See Note 5) | | | (927,298 | ) | | | 3,601,217 | |
| Change in net assets | | | (1,483,459 | ) | | | 4,958,842 | |
| Net Assets: | | | | | | | | |
| Beginning of year | | | 84,745,271 | | | | 79,786,429 | |
| End of year | | $ | 83,261,812 | | | $ | 84,745,271 | |
See accompanying Notes to the Financial Statements.
| Sterling Capital Virginia Intermediate Tax-Free Fund | | | Sterling Capital West Virginia Intermediate Tax-Free Fund | |
| For the Year Ended September 30, 2021 | | | For the Year Ended September 30, 2020 | | | For the Year Ended September 30, 2021 | | | For the Year Ended September 30, 2020 | |
| | | | | | | | | | | |
| $ | 1,236,440 | | | $ | 1,442,566 | | | $ | 1,677,740 | | | $ | 1,709,502 | |
| | 87,883 | | | | 264,207 | | | | 7,854 | | | | 88,771 | |
| | (1,594,083 | ) | | | 1,281,687 | | | | (800,187 | ) | | | 1,420,110 | |
| | (269,760 | ) | | | 2,988,460 | | | | 885,407 | | | | 3,218,383 | |
| | | | | | | | | | | | | | | |
| | (270,661 | ) | | | (288,025 | ) | | | (442,079 | ) | | | (526,269 | ) |
| | (4,086 | ) | | | (7,450 | ) | | | (1,315 | ) | | | (3,932 | ) |
| | (1,159,430 | ) | | | (1,147,072 | ) | | | (1,295,123 | ) | | | (1,253,906 | ) |
| | (1,434,177 | ) | | | (1,442,547 | ) | | | (1,738,517 | ) | | | (1,784,107 | ) |
| | | | | | | | | | | | | | | |
| | 3,070,399 | | | | 1,578,521 | | | | 67,415 | | | | 18,286,559 | |
| | 1,366,462 | | | | 3,124,434 | | | | (785,695 | ) | | | 19,720,835 | |
| | | | | | | | | | | | | | | |
| | 81,053,304 | | | | 77,928,870 | | | | 95,796,952 | | | | 76,076,117 | |
| $ | 82,419,766 | | | $ | 81,053,304 | | | $ | 95,011,257 | | | $ | 95,796,952 | |
Financial Highlights, Class A Shares
The financial highlights table is intended to help you understand the Funds’ financial performance for the past 5 years or, if shorter, the period of the Funds’ operations. Certain information reflects financial results for a single Fund share. The total returns in the table represent the rate that an investor would have earned (or lost) on an investment in the Fund (assuming reinvestment of all dividends and distributions).
| | | | | | Investment Activities | | | Distributions | |
| | | Net Asset Value, Beginning of Year | | | Net investment income (loss)(a) | | | Net realized/ unrealized gains (losses) on investments | | | Total from Investment Activities | | | Net investment income | | | Net realized gains on investments | | | Return of capital | | | Total Distributions | |
| Sterling Capital Behavioral Large Cap Value Equity Fund |
| Year Ended September 30, 2021 | | $ | 16.72 | | | | 0.03 | | | | 6.21 | | | | 6.24 | | | | (0.04 | ) | | | — | | | | (0.17 | ) | | | (0.21 | ) |
| Year Ended September 30, 2020 | | $ | 19.49 | | | | 0.36 | | | | (2.07 | ) | | | (1.71 | ) | | | (0.48 | ) | | | (0.58 | ) | | | — | | | | (1.06 | ) |
| Year Ended September 30, 2019 | | $ | 22.30 | | | | 0.39 | | | | (1.07 | ) | | | (0.68 | ) | | | (0.38 | ) | | | (1.75 | ) | | | — | | | | (2.13 | ) |
| Year Ended September 30, 2018 | | $ | 20.71 | | | | 0.31 | | | | 1.91 | | | | 2.22 | | | | (0.44 | ) | | | (0.19 | ) | | | — | | | | (0.63 | ) |
| Year Ended September 30, 2017 | | $ | 17.68 | | | | 0.36 | | | | 2.97 | | | | 3.33 | | | | (0.30 | ) | | | — | | | | — | | | | (0.30 | ) |
| Sterling Capital Mid Value Fund |
| Year Ended September 30, 2021 | | $ | 13.99 | | | | (0.02 | ) | | | 6.07 | | | | 6.05 | | | | (0.03 | ) | | | — | | | | — | | | | (0.03 | ) |
| Year Ended September 30, 2020 | | $ | 16.10 | | | | 0.02 | | | | (0.80 | ) | | | (0.78 | ) | | | (0.20 | ) | | | (1.13 | ) | | | — | | | | (1.33 | ) |
| Year Ended September 30, 2019 | | $ | 19.08 | | | | 0.05 | | | | (0.77 | ) | | | (0.72 | ) | | | — | | | | (2.26 | ) | | | — | | | | (2.26 | ) |
| Year Ended September 30, 2018 | | $ | 18.72 | | | | (0.03 | ) | | | 1.23 | | | | 1.20 | | | | — | | | | (0.84 | ) | | | — | | | | (0.84 | ) |
| Year Ended September 30, 2017 | | $ | 16.71 | | | | (0.02 | ) | | | 2.56 | | | | 2.54 | | | | — | | | | (0.53 | ) | | | — | | | | (0.53 | ) |
| Sterling Capital Behavioral Small Cap Value Equity Fund |
| Year Ended September 30, 2021 | | $ | 11.83 | | | | 0.11 | | | | 7.53 | | | | 7.64 | | | | (0.10 | ) | | | — | | | | — | | | | (0.10 | ) |
| Year Ended September 30, 2020 | | $ | 14.54 | | | | 0.10 | | | | (2.67 | ) | | | (2.57 | ) | | | (0.14 | ) | | | — | | | | — | | | | (0.14 | ) |
| Year Ended September 30, 2019 | | $ | 18.65 | | | | 0.17 | | | | (2.07 | ) | | | (1.90 | ) | | | (0.23 | ) | | | (1.98 | ) | | | — | | | | (2.21 | ) |
| Year Ended September 30, 2018 | | $ | 18.39 | | | | 0.17 | | | | 0.86 | | | | 1.03 | | | | (0.12 | ) | | | (0.65 | ) | | | — | | | | (0.77 | ) |
| Year Ended September 30, 2017 | | $ | 15.19 | | | | 0.12 | | | | 3.17 | | | | 3.29 | | | | (0.09 | ) | | | — | | | | — | | | | (0.09 | ) |
| Sterling Capital Special Opportunities Fund |
| Year Ended September 30, 2021 | | $ | 24.67 | | | | (0.11 | ) | | | 9.21 | | | | 9.10 | | | | — | | | | (0.33 | ) | | | — | | | | (0.33 | ) |
| Year Ended September 30, 2020 | | $ | 24.63 | | | | (0.01 | ) | | | 1.38 | | | | 1.37 | | | | — | | | | (1.33 | ) | | | — | | | | (1.33 | ) |
| Year Ended September 30, 2019 | | $ | 26.37 | | | | 0.02 | | | | 0.10 | | | | 0.12 | | | | — | | | | (1.86 | ) | | | — | | | | (1.86 | ) |
| Year Ended September 30, 2018 | | $ | 24.51 | | | | 0.01 | | | | 3.93 | | | | 3.94 | | | | (0.14 | ) | | | (1.94 | ) | | | — | | | | (2.08 | ) |
| Year Ended September 30, 2017 | | $ | 21.53 | | | | 0.02 | | | | 3.37 | | | | 3.39 | | | | — | | | | (0.41 | ) | | | — | | | | (0.41 | ) |
| Sterling Capital Equity Income Fund |
| Year Ended September 30, 2021 | | $ | 20.04 | | | | 0.29 | | | | 6.53 | | | | 6.82 | | | | (0.29 | ) | | | — | | | | — | | | | (0.29 | ) |
| Year Ended September 30, 2020 | | $ | 21.27 | | | | 0.36 | | | | (0.39 | ) | | | (0.03 | ) | | | (0.36 | ) | | | (0.84 | ) | | | — | | | | (1.20 | ) |
| Year Ended September 30, 2019 | | $ | 21.55 | | | | 0.39 | | | | 1.23 | | | | 1.62 | | | | (0.38 | ) | | | (1.52 | ) | | | — | | | | (1.90 | ) |
| Year Ended September 30, 2018 | | $ | 20.84 | | | | 0.34 | | | | 2.66 | | | | 3.00 | | | | (0.34 | ) | | | (1.95 | ) | | | — | | | | (2.29 | ) |
| Year Ended September 30, 2017 | | $ | 18.30 | | | | 0.34 | | | | 2.59 | | | | 2.93 | | | | (0.37 | ) | | | (0.02 | ) | | | — | | | | (0.39 | ) |
| * | During the periods certain fees were waived (See Note 4 in the Notes to the Financial Statements). If such reductions had not occurred, the ratios would have been as indicated. |
| ** | Portfolio turnover rate is calculated on the basis of the Fund as a whole without distinguishing between classes of shares issued. |
| (a) | Per share net investment income (loss) has been calculated using the average daily shares method. |
See accompanying Notes to the Financial Statements.
| | | | | | | Ratios/Supplementary Data | |
| Net Asset Value, End of Year | | | Total Return (excludes sales charge) | | | Net Assets, End of Year (000) | | | Ratio of net expenses to average net assets | | | Ratio of net investment income (loss) to average net assets | | | Ratio of expenses to average net assets* | | | Portfolio turnover rate** | |
| | | | | | | | | | | | | | | | | | | | |
| $ | 22.75 | | | | 37.59 | % | | $ | 30,870 | | | | 0.88 | % | | | 0.16 | % | | | 1.02 | % | | | 122.64 | % |
| $ | 16.72 | | | | (9.15 | )% | | $ | 24,497 | | | | 0.89 | % | | | 2.00 | % | | | 0.96 | % | | | 167.34 | % |
| $ | 19.49 | | | | (2.34 | )% | | $ | 28,548 | | | | 0.89 | % | | | 2.04 | % | | | 0.89 | % | | | 142.59 | % |
| $ | 22.30 | | | | 10.87 | % | | $ | 33,126 | | | | 0.87 | % | | | 1.44 | % | | | 0.87 | % | | | 127.89 | % |
| $ | 20.71 | | | | 18.94 | % | | $ | 33,358 | | | | 0.89 | % | | | 1.87 | % | | | 0.89 | % | | | 144.85 | % |
| | | | | | | | | | | | | | | | | | | | | | | | | | | |
| $ | 20.01 | | | | 43.32 | % | | $ | 23,421 | | | | 1.12 | % | | | (0.08 | )% | | | 1.15 | % | | | 34.00 | % |
| $ | 13.99 | | | | (5.76 | )% | | $ | 18,851 | | | | 1.13 | % | | | 0.13 | % | | | 1.26 | % | | | 28.77 | % |
| $ | 16.10 | | | | (2.80 | )% | | $ | 23,013 | | | | 1.18 | % | | | 0.29 | % | | | 1.18 | % | | | 26.62 | % |
| $ | 19.08 | | | | 6.54 | % | | $ | 30,857 | | | | 1.17 | % | | | (0.16 | )% | | | 1.17 | % | | | 34.62 | % |
| $ | 18.72 | | | | 15.42 | % | | $ | 33,503 | | | | 1.15 | % | | | (0.09 | )% | | | 1.15 | % | | | 24.83 | % |
| | | | | | | | | | | | | | | | | | | | | | | | | | | |
| $ | 19.37 | | | | 64.73 | % | | $ | 7,212 | | | | 1.06 | % | | | 0.66 | % | | | 1.06 | % | | | 110.07 | % |
| $ | 11.83 | | | | (17.84 | )% | | $ | 4,948 | | | | 1.06 | % | | | 0.81 | % | | | 1.08 | % | | | 119.76 | % |
| $ | 14.54 | | | | (9.57 | )% | | $ | 6,599 | | | | 1.05 | % | | | 1.17 | % | | | 1.05 | % | | | 124.82 | % |
| $ | 18.65 | | | | 5.69 | % | | $ | 8,711 | | | | 1.03 | % | | | 0.91 | % | | | 1.03 | % | | | 89.85 | % |
| $ | 18.39 | | | | 21.65 | % | | $ | 9,281 | | | | 1.05 | % | | | 0.72 | % | | | 1.10 | % | | | 109.05 | % |
| | | | | | | | | | | | | | | | | | | | | | | | | | | |
| $ | 33.44 | | | | 37.18 | % | | $ | 355,673 | | | | 1.11 | % | | | (0.36 | )% | | | 1.12 | % | | | 27.20 | % |
| $ | 24.67 | | | | 5.55 | % | | $ | 276,975 | | | | 1.11 | % | | | (0.04 | )% | | | 1.11 | % | | | 17.50 | % |
| $ | 24.63 | | | | 1.21 | % | | $ | 322,003 | | | | 1.11 | % | | | 0.06 | % | | | 1.11 | % | | | 17.31 | % |
| $ | 26.37 | | | | 17.16 | % | | $ | 334,687 | | | | 1.11 | % | | | 0.05 | % | | | 1.11 | % | | | 22.78 | % |
| $ | 24.51 | | | | 15.97 | % | | $ | 343,873 | | | | 1.12 | % | | | 0.07 | % | | | 1.12 | % | | | 18.92 | % |
| | | | | | | | | | | | | | | | | | | | | | | | | | | |
| $ | 26.57 | | | | 34.11 | % | | $ | 460,034 | | | | 1.03 | % | | | 1.15 | % | | | 1.04 | % | | | 13.00 | % |
| $ | 20.04 | | | | (0.10 | )% | | $ | 320,255 | | | | 1.03 | % | | | 1.79 | % | | | 1.03 | % | | | 33.60 | % |
| $ | 21.27 | | | | 8.48 | % | | $ | 338,293 | | | | 1.02 | % | | | 1.92 | % | | | 1.02 | % | | | 23.20 | % |
| $ | 21.55 | | | | 15.28 | % | | $ | 316,245 | | | | 1.02 | % | | | 1.66 | % | | | 1.02 | % | | | 19.49 | % |
| $ | 20.84 | | | | 16.19 | % | | $ | 348,427 | | | | 1.03 | % | | | 1.78 | % | | | 1.03 | % | | | 16.93 | % |
Financial Highlights, Class A Shares
The financial highlights table is intended to help you understand the Funds’ financial performance for the past 5 years or, if shorter, the period of the Funds’ operations. Certain information reflects financial results for a single Fund share. The total returns in the table represent the rate that an investor would have earned (or lost) on an investment in the Fund (assuming reinvestment of all dividends and distributions).
| | | | | | Investment Activities | | | Distributions | |
| | | Net Asset Value, Beginning of Year | | | Net investment income (loss)(a) | | | Net realized/ unrealized gains (losses) on investments | | | Total from Investment Activities | | | Net investment income | | | Net realized gains on investments | | | Return of capital | | | Total Distributions | |
| Sterling Capital Behavioral International Equity Fund |
| Year Ended September 30, 2021 | | $ | 8.14 | | | | 0.26 | | | | 1.62 | | | | 1.88 | | | | (0.22 | ) | | | — | | | | — | | | | (0.22 | ) |
| Year Ended September 30, 2020 | | $ | 9.48 | | | | 0.24 | | | | (1.30 | ) | | | (1.06 | ) | | | (0.28 | ) | | | — | | | | — | | | | (0.28 | ) |
| Year Ended September 30, 2019 | | $ | 11.17 | | | | 0.31 | | | | (1.31 | ) | | | (1.00 | ) | | | (0.29 | ) | | | (0.40 | ) | | | — | | | | (0.69 | ) |
| Year Ended September 30, 2018 | | $ | 11.75 | | | | 0.37 | | | | (0.52 | ) | | | (0.15 | ) | | | (0.32 | ) | | | (0.11 | ) | | | — | | | | (0.43 | ) |
| Year Ended September 30, 2017 | | $ | 9.68 | | | | 0.25 | | | | 1.96 | | | | 2.21 | | | | (0.14 | ) | | | — | | | | — | | | | (0.14 | ) |
| Sterling Capital SMID Opportunities Fund |
| Year Ended September 30, 2021 | | $ | 12.45 | | | | (0.06 | ) | | | 3.69 | | | | 3.63 | | | | — | | | | — | | | | — | | | | — | |
| Year Ended September 30, 2020 | | $ | 13.24 | | | | (0.03 | ) | | | (0.13 | ) | | | (0.16 | ) | | | — | | | | (0.63 | ) | | | — | | | | (0.63 | ) |
| Year Ended September 30, 2019 | | $ | 12.44 | | | | (0.02 | ) | | | 0.82 | | | | 0.80 | | | | — | | | | — | | | | — | | | | — | |
| Year Ended September 30, 2018 | | $ | 11.75 | | | | (0.05 | ) | | | 0.98 | | | | 0.93 | | | | (0.06 | ) | | | (0.18 | ) | | | — | | | | (0.24 | ) |
| Year Ended September 30, 2017 | | $ | 10.00 | | | | — | (b) | | | 1.76 | | | | 1.76 | | | | (0.01 | ) | | | — | | | | — | | | | (0.01 | ) |
| Sterling Capital Stratton Mid Cap Value Fund |
| Year Ended September 30, 2021 | | $ | 58.67 | | | | 0.28 | | | | 19.97 | | | | 20.25 | | | | (0.24 | ) | | | (0.23 | ) | | | — | | | | (0.47 | ) |
| Year Ended September 30, 2020 | | $ | 64.04 | | | | 0.25 | | | | (3.65 | ) | | | (3.40 | ) | | | (0.46 | ) | | | (1.51 | ) | | | — | | | | (1.97 | ) |
| Year Ended September 30, 2019 | | $ | 68.74 | | | | 0.30 | | | | 0.17 | | | | 0.47 | | | | (0.15 | ) | | | (5.02 | ) | | | — | | | | (5.17 | ) |
| Year Ended September 30, 2018 | | $ | 66.23 | | | | 0.10 | | | | 4.85 | | | | 4.95 | | | | (0.15 | ) | | | (2.29 | ) | | | — | | | | (2.44 | ) |
| Year Ended September 30, 2017 | | $ | 55.87 | | | | 0.02 | | | | 10.65 | | | | 10.67 | | | | (0.04 | ) | | | (0.27 | ) | | | — | | | | (0.31 | ) |
| Sterling Capital Stratton Real Estate Fund |
| Year Ended September 30, 2021 | | $ | 36.61 | | | | 0.35 | | | | 10.46 | | | | 10.81 | | | | (0.51 | ) | | | (0.82 | ) | | | — | | | | (1.33 | ) |
| Year Ended September 30, 2020 | | $ | 42.28 | | | | 0.25 | | | | (3.72 | ) | | | (3.47 | ) | | | (0.68 | ) | | | (1.52 | ) | | | — | | | | (2.20 | ) |
| Year Ended September 30, 2019 | | $ | 37.57 | | | | 0.75 | | | | 5.98 | | | | 6.73 | | | | (0.78 | ) | | | (1.24 | ) | | | — | | | | (2.02 | ) |
| Year Ended September 30, 2018 | | $ | 37.04 | | | | 0.74 | | | | 1.50 | | | | 2.24 | | | | (0.49 | ) | | | (1.22 | ) | | | — | | | | (1.71 | ) |
| Year Ended September 30, 2017 | | $ | 39.67 | | | | 0.75 | | | | (0.54 | ) | | | 0.21 | | | | (1.09 | ) | | | (1.75 | ) | | | — | | | | (2.84 | ) |
| Sterling Capital Stratton Small Cap Value Fund |
| Year Ended September 30, 2021 | | $ | 63.67 | | | | (0.01 | ) | | | 30.82 | | | | 30.81 | | | | (0.25 | ) | | | (11.22 | ) | | | — | | | | (11.47 | ) |
| Year Ended September 30, 2020 | | $ | 78.00 | | | | 0.25 | | | | (9.36 | ) | | | (9.11 | ) | | | (0.29 | ) | | | (4.93 | ) | | | — | | | | (5.22 | ) |
| Year Ended September 30, 2019 | | $ | 88.73 | | | | 0.32 | | | | (5.00 | ) | | | (4.68 | ) | | | (0.15 | ) | | | (5.90 | ) | | | — | | | | (6.05 | ) |
| Year Ended September 30, 2018 | | $ | 89.91 | | | | 0.12 | | | | 6.49 | | | | 6.61 | | | | (0.10 | ) | | | (7.69 | ) | | | — | | | | (7.79 | ) |
| Year Ended September 30, 2017 | | $ | 78.34 | | | | — | (b) | | | 15.72 | | | | 15.72 | | | | (0.05 | ) | | | (4.10 | ) | | | — | | | | (4.15 | ) |
| Sterling Capital Ultra Short Bond Fund |
| Year Ended September 30, 2021 | | $ | 9.82 | | | | 0.08 | | | | (0.02 | ) | | | 0.06 | | | | (0.10 | ) | | | — | | | | — | | | | (0.10 | ) |
| Year Ended September 30, 2020 | | $ | 9.78 | | | | 0.17 | | | | 0.04 | | | | 0.21 | | | | (0.17 | ) | | | — | | | | — | | | | (0.17 | ) |
| Year Ended September 30, 2019 | | $ | 9.75 | | | | 0.23 | | | | 0.03 | | | | 0.26 | | | | (0.23 | ) | | | — | | | | — | | | | (0.23 | ) |
| Year Ended September 30, 2018 | | $ | 9.79 | | | | 0.14 | | | | (0.02 | ) | | | 0.12 | | | | (0.16 | ) | | | — | | | | — | | | | (0.16 | ) |
| Year Ended September 30, 2017 | | $ | 9.82 | | | | 0.07 | | | | 0.03 | | | | 0.10 | | | | (0.13 | ) | | | — | | | | — | | | | (0.13 | ) |
| * | During the periods certain fees were waived (See Note 4 in the Notes to the Financial Statements). If such reductions had not occurred, the ratios would have been as indicated. |
| ** | Portfolio turnover rate is calculated on the basis of the Fund as a whole without distinguishing between classes of shares issued. |
| (a) | Per share net investment income (loss) has been calculated using the average daily shares method. |
| (b) | Amount is less than $0.005. |
See accompanying Notes to the Financial Statements.
| | | | | | | Ratios/Supplementary Data | |
| Net Asset Value, End of Year | | | Total Return (excludes sales charge) | | | Net Assets, End of Year (000) | | | Ratio of net expenses to average net assets | | | Ratio of net investment income (loss) to average net assets | | | Ratio of expenses to average net assets* | | | Portfolio turnover rate** | |
| | | | | | | | | | | | | | | | | | | | |
| $ | 9.80 | | | | 23.46 | % | | $ | 490 | | | | 0.92 | % | | | 2.73 | % | | | 0.98 | % | | | 158.16 | % |
| $ | 8.14 | | | | (11.76 | )% | | $ | 426 | | | | 0.88 | % | | | 2.81 | % | | | 1.08 | % | | | 164.02 | % |
| $ | 9.48 | | | | (8.72 | )% | | $ | 537 | | | | 0.94 | % | | | 3.16 | % | | | 1.14 | % | | | 97.74 | % |
| $ | 11.17 | | | | (1.47 | )% | | $ | 828 | | | | 0.90 | % | | | 3.17 | % | | | 1.10 | % | | | 96.65 | % |
| $ | 11.75 | | | | 23.19 | % | | $ | 510 | | | | 0.93 | % | | | 2.38 | % | | | 1.19 | % | | | 91.65 | % |
| | | | | | | | | | | | | | | | | | | | | | | | | | | |
| $ | 16.08 | | | | 29.16 | % | | $ | 5,095 | | | | 1.04 | % | | | (0.42 | )% | | | 1.31 | % | | | 33.93 | % |
| $ | 12.45 | | | | (1.54 | )% | | $ | 4,425 | | | | 1.04 | % | | | (0.22 | )% | | | 1.34 | % | | | 60.03 | % |
| $ | 13.24 | | | | 6.43 | % | | $ | 3,097 | | | | 1.04 | % | | | (0.18 | )% | | | 1.45 | % | | | 45.11 | % |
| $ | 12.44 | | | | 8.07 | % | | $ | 2,870 | | | | 1.04 | % | | | (0.39 | )% | | | 1.29 | % | | | 45.64 | % |
| $ | 11.75 | | | | 17.59 | % | | $ | 4,038 | | | | 1.04 | % | | | (0.03 | )% | | | 1.66 | % | | | 37.97 | % |
| | | | | | | | | | | | | | | | | | | | | | | | | | | |
| $ | 78.45 | | | | 34.65 | % | | $ | 369 | | | | 1.10 | % | | | 0.38 | % | | | 1.11 | % | | | 8.23 | % |
| $ | 58.67 | | | | (5.63 | )% | | $ | 145 | | | | 1.16 | % | | | 0.42 | % | | | 1.19 | % | | | 9.21 | % |
| $ | 64.04 | | | | 1.72 | % | | $ | 126 | | | | 1.20 | % | | | 0.50 | % | | | 1.20 | % | | | 6.75 | % |
| $ | 68.74 | | | | 7.54 | % | | $ | 107 | | | | 1.20 | % | | | 0.15 | % | | | 1.20 | % | | | 14.47 | % |
| $ | 66.23 | | | | 19.16 | % | | $ | 108 | | | | 1.16 | % | | | 0.03 | % | | | 1.16 | % | | | 12.19 | % |
| | | | | | | | | | | | | | | | | | | | | | | | | | | |
| $ | 46.09 | | | | 30.08 | % | | $ | 719 | | | | 1.05 | % | | | 0.82 | % | | | 1.05 | % | | | 12.68 | % |
| $ | 36.61 | | | | (8.33 | )% | | $ | 537 | | | | 1.08 | % | | | 0.67 | % | | | 1.08 | % | | | 19.58 | % |
| $ | 42.28 | | | | 18.76 | % | | $ | 800 | | | | 1.07 | % | | | 1.92 | % | | | 1.07 | % | | | 14.56 | % |
| $ | 37.57 | | | | 6.17 | % | | $ | 398 | | | | 1.07 | % | | | 2.04 | % | | | 1.07 | % | | | 8.34 | % |
| $ | 37.04 | | | | 0.90 | % | | $ | 302 | | | | 1.04 | % | | | 2.03 | % | | | 1.05 | % | | | 13.52 | % |
| | | | | | | | | | | | | | | | | | | | | | | | | | | |
| $ | 83.01 | | | | 52.43 | % | | $ | 3,468 | | | | 1.23 | % | | | (0.01 | )% | | | 1.26 | % | | | 6.15 | % |
| $ | 63.67 | | | | (12.81 | )% | | $ | 2,048 | | | | 1.25 | % | | | 0.37 | % | | | 1.33 | % | | | 8.33 | % |
| $ | 78.00 | | | | (4.79 | )% | | $ | 2,775 | | | | 1.28 | % | | | 0.42 | % | | | 1.33 | % | | | 8.60 | % |
| $ | 88.73 | | | | 7.71 | % | | $ | 2,160 | | | | 1.28 | % | | | 0.14 | % | | | 1.32 | % | | | 15.51 | % |
| $ | 89.91 | | | | 20.43 | % | | $ | 529 | | | | 1.31 | % | | | 0.01 | % | | | 1.31 | % | | | 7.04 | % |
| | | | | | | | | | | | | | | | | | | | | | | | | | | |
| $ | 9.78 | | | | 0.51 | % | | $ | 7,219 | | | | 0.53 | % | | | 0.82 | % | | | 0.75 | % | | | 48.71 | % |
| $ | 9.82 | | | | 2.20 | % | | $ | 2,675 | | | | 0.63 | % | | | 1.73 | % | | | 0.81 | % | | | 43.45 | % |
| $ | 9.78 | | | | 2.70 | % | | $ | 2,219 | | | | 0.68 | % | | | 2.39 | % | | | 0.79 | % | | | 103.69 | % |
| $ | 9.75 | | | | 1.20 | % | | $ | 5,074 | | | | 0.66 | % | | | 1.39 | % | | | 0.76 | % | | | 74.56 | % |
| $ | 9.79 | | | | 1.00 | % | | $ | 4,663 | | | | 0.68 | % | | | 0.71 | % | | | 0.78 | % | | | 59.57 | % |
| | | | | | | | | | | | | | | | | | | | | | | | | | | |
Financial Highlights, Class A Shares
The financial highlights table is intended to help you understand the Funds’ financial performance for the past 5 years or, if shorter, the period of the Funds’ operations. Certain information reflects financial results for a single Fund share. The total returns in the table represent the rate that an investor would have earned (or lost) on an investment in the Fund (assuming reinvestment of all dividends and distributions).
| | | | | | Investment Activities | | | Distributions | |
| | | Net Asset Value, Beginning of Year | | | Net investment income(a) | | | Net realized/ unrealized gains (losses) on investments | | | Total from Investment Activities | | | Net investment income | | | Net realized gains on investments | | | Return of capital | | | Total Distributions | |
| Sterling Capital Short Duration Bond Fund |
| Year Ended September 30, 2021 | | $ | 8.78 | | | | 0.10 | | | | (0.02 | ) | | | 0.08 | | | | (0.18 | ) | | | — | | | | — | | | | (0.18 | ) |
| Year Ended September 30, 2020 | | $ | 8.65 | | | | 0.17 | | | | 0.16 | | | | 0.33 | | | | (0.20 | ) | | | — | | | | — | | | | (0.20 | ) |
| Year Ended September 30, 2019 | | $ | 8.52 | | | | 0.21 | | | | 0.15 | | | | 0.36 | | | | (0.23 | ) | | | — | | | | — | | | | (0.23 | ) |
| Year Ended September 30, 2018 | | $ | 8.69 | | | | 0.16 | | | | (0.11 | ) | | | 0.05 | | | | (0.22 | ) | | | — | | | | — | | | | (0.22 | ) |
| Year Ended September 30, 2017 | | $ | 8.81 | | | | 0.10 | | | | (0.01 | ) | | | 0.09 | | | | (0.21 | ) | | | — | | | | — | | | | (0.21 | ) |
| Sterling Capital Intermediate U.S. Government Fund |
| Year Ended September 30, 2021 | | $ | 10.13 | | | | 0.06 | | | | (0.18 | ) | | | (0.12 | ) | | | (0.23 | ) | | | — | | | | — | | | | (0.23 | ) |
| Year Ended September 30, 2020 | | $ | 9.92 | | | | 0.17 | | | | 0.29 | | | | 0.46 | | | | (0.25 | ) | | | — | | | | — | | | | (0.25 | ) |
| Year Ended September 30, 2019 | | $ | 9.48 | | | | 0.21 | | | | 0.47 | | | | 0.68 | | | | (0.24 | ) | | | — | | | | — | | | | (0.24 | ) |
| Year Ended September 30, 2018 | | $ | 9.91 | | | | 0.17 | | | | (0.34 | ) | | | (0.17 | ) | | | (0.26 | ) | | | — | | | | — | | | | (0.26 | ) |
| Year Ended September 30, 2017 | | $ | 10.24 | | | | 0.15 | | | | (0.27 | ) | | | (0.12 | ) | | | (0.21 | ) | | | — | | | | — | | | | (0.21 | ) |
| Sterling Capital Total Return Bond Fund |
| Year Ended September 30, 2021 | | $ | 11.38 | | | | 0.17 | | | | (0.12 | ) | | | 0.05 | | | | (0.24 | ) | | | (0.15 | ) | | | — | | | | (0.39 | ) |
| Year Ended September 30, 2020 | | $ | 10.88 | | | | 0.24 | | | | 0.55 | | | | 0.79 | | | | (0.29 | ) | | | — | (b) | | | — | | | | (0.29 | ) |
| Year Ended September 30, 2019 | | $ | 10.20 | | | | 0.30 | | | | 0.69 | | | | 0.99 | | | | (0.31 | ) | | | — | | | | — | | | | (0.31 | ) |
| Year Ended September 30, 2018 | | $ | 10.59 | | | | 0.27 | | | | (0.36 | ) | | | (0.09 | ) | | | (0.30 | ) | | | — | | | | — | | | | (0.30 | ) |
| Year Ended September 30, 2017 | | $ | 10.81 | | | | 0.23 | | | | (0.15 | ) | | | 0.08 | | | | (0.30 | ) | | | — | | | | — | | | | (0.30 | ) |
| Sterling Capital Corporate Fund |
| Year Ended September 30, 2021 | | $ | 10.78 | | | | 0.25 | | | | 0.03 | | | | 0.28 | | | | (0.25 | ) | | | (0.30 | ) | | | — | | | | (0.55 | ) |
| Year Ended September 30, 2020 | | $ | 10.38 | | | | 0.27 | | | | 0.40 | | | | 0.67 | | | | (0.27 | ) | | | — | | | | — | | | | (0.27 | ) |
| Year Ended September 30, 2019 | | $ | 9.81 | | | | 0.30 | | | | 0.57 | | | | 0.87 | | | | (0.30 | ) | | | — | | | | — | | | | (0.30 | ) |
| Year Ended September 30, 2018 | | $ | 10.25 | | | | 0.29 | | | | (0.37 | ) | | | (0.08 | ) | | | (0.29 | ) | | | (0.07 | ) | | | — | | | | (0.36 | ) |
| Year Ended September 30, 2017 | | $ | 10.37 | | | | 0.29 | | | | (0.08 | ) | | | 0.21 | | | | (0.29 | ) | | | (0.04 | ) | | | — | | | | (0.33 | ) |
| Sterling Capital Quality Income Fund |
| Year Ended September 30, 2021 | | $ | 10.25 | | | | 0.13 | | | | (0.15 | ) | | | (0.02 | ) | | | (0.19 | ) | | | — | | | | — | | | | (0.19 | ) |
| Year Ended September 30, 2020 | | $ | 10.09 | | | | 0.21 | | | | 0.20 | | | | 0.41 | | | | (0.25 | ) | | | — | | | | — | | | | (0.25 | ) |
| Year Ended September 30, 2019 | | $ | 9.60 | | | | 0.28 | | | | 0.49 | | | | 0.77 | | | | (0.28 | ) | | | — | | | | — | | | | (0.28 | ) |
| Year Ended September 30, 2018 | | $ | 9.94 | | | | 0.25 | | | | (0.31 | ) | | | (0.06 | ) | | | (0.28 | ) | | | — | | | | — | | | | (0.28 | ) |
| Year Ended September 30, 2017 | | $ | 10.10 | | | | 0.21 | | | | (0.12 | ) | | | 0.09 | | | | (0.25 | ) | | | — | | | | — | | | | (0.25 | ) |
| * | During the periods certain fees were waived (See Note 4 in the Notes to the Financial Statements). If such reductions had not occurred, the ratios would have been as indicated. |
| ** | Portfolio turnover rate is calculated on the basis of the Fund as a whole without distinguishing between classes of shares issued. |
| (a) | Per share net investment income (loss) has been calculated using the average daily shares method. |
| | (b) | Amount is less than $0.005. |
See accompanying Notes to the Financial Statements.
| | | | | | | Ratios/Supplementary Data | |
| Net Asset Value, End of Year | | | Total Return (excludes sales charge) | | | Net Assets, End of Year (000) | | | Ratio of net expenses to average net assets | | | Ratio of net investment income (loss) to average net assets | | | Ratio of expenses to average net assets* | | | Portfolio turnover rate** | |
| | | | | | | | | | | | | | | | | | | | |
| $ | 8.68 | | | | 0.94 | % | | $ | 4,419 | | | | 0.68 | % | | | 1.15 | % | | | 0.71 | % | | | 39.26 | % |
| $ | 8.78 | | | | 3.86 | % | | $ | 4,260 | | | | 0.67 | % | | | 1.93 | % | | | 0.77 | % | | | 64.69 | % |
| $ | 8.65 | | | | 4.29 | % | | $ | 3,197 | | | | 0.68 | % | | | 2.44 | % | | | 0.78 | % | | | 78.58 | % |
| $ | 8.52 | | | | 0.55 | % | | $ | 4,393 | | | | 0.68 | % | | | 1.84 | % | | | 0.78 | % | | | 62.02 | % |
| $ | 8.69 | | | | 1.02 | % | | $ | 5,746 | | | | 0.70 | % | | | 1.11 | % | | | 0.80 | % | | | 78.77 | % |
| | | | | | | | | | | | | | | | | | | | | | | | | | | |
| $ | 9.78 | | | | (1.23 | )% | | $ | 3,388 | | | | 0.68 | % | | | 0.64 | % | | | 0.86 | % | | | 71.31 | % |
| $ | 10.13 | | | | 4.66 | % | | $ | 3,930 | | | | 0.79 | % | | | 1.68 | % | | | 0.95 | % | | | 47.36 | % |
| $ | 9.92 | | | | 7.27 | % | | $ | 3,531 | | | | 0.81 | % | | | 2.12 | % | | | 0.91 | % | | | 40.13 | % |
| $ | 9.48 | | | | (1.73 | )% | | $ | 4,350 | | | | 0.91 | % | | | 1.73 | % | | | 0.92 | % | | | 40.85 | % |
| $ | 9.91 | | | | (1.20 | )% | | $ | 5,418 | | | | 0.87 | % | | | 1.54 | % | | | 0.91 | % | | | 32.44 | % |
| | | | | | | | | | | | | | | | | | | | | | | | | | | |
| $ | 11.04 | | | | 0.44 | % | | $ | 60,694 | | | | 0.70 | % | | | 1.52 | % | | | 0.75 | % | | | 48.80 | % |
| $ | 11.38 | | | | 7.33 | % | | $ | 57,202 | | | | 0.70 | % | | | 2.20 | % | | | 0.82 | % | | | 59.59 | % |
| $ | 10.88 | | | | 9.90 | % | | $ | 55,513 | | | | 0.70 | % | | | 2.87 | % | | | 0.83 | % | | | 79.40 | % |
| $ | 10.20 | | | | (0.90 | )% | | $ | 68,982 | | | | 0.70 | % | | | 2.56 | % | | | 0.82 | % | | | 62.28 | % |
| $ | 10.59 | | | | 0.75 | % | | $ | 72,030 | | | | 0.72 | % | | | 2.13 | % | | | 0.82 | % | | | 64.07 | % |
| | | | | | | | | | | | | | | | | | | | | | | | | | | |
| $ | 10.51 | | | | 2.67 | % | | $ | 632 | | | | 0.97 | % | | | 2.40 | % | | | 1.16 | % | | | 47.29 | % |
| $ | 10.78 | | | | 6.56 | % | | $ | 490 | | | | 0.92 | % | | | 2.57 | % | | | 0.94 | % | | | 52.28 | % |
| $ | 10.38 | | | | 9.01 | % | | $ | 498 | | | | 0.93 | % | | | 2.98 | % | | | 0.95 | % | | | 82.23 | % |
| $ | 9.81 | | | | (0.80 | )% | | $ | 440 | | | | 0.89 | % | | | 2.94 | % | | | 0.89 | % | | | 66.82 | % |
| $ | 10.25 | | | | 2.07 | % | | $ | 372 | | | | 0.88 | % | | | 2.84 | % | | | 0.88 | % | | | 78.79 | % |
| | | | | | | | | | | | | | | | | | | | | | | | | | | |
| $ | 10.04 | | | | (0.23 | )% | | $ | 29 | | | | 0.82 | % | | | 1.29 | % | | | 0.86 | % | | | 73.60 | % |
| $ | 10.25 | | | | 4.07 | % | | $ | 25 | | | | 0.84 | % | | | 2.06 | % | | | 0.88 | % | | | 35.96 | % |
| $ | 10.09 | | | | 8.13 | % | | $ | 20 | | | | 0.85 | % | | | 2.90 | % | | | 0.89 | % | | | 17.58 | % |
| $ | 9.60 | | | | (0.63 | )% | | $ | 18 | | | | 0.83 | % | | | 2.54 | % | | | 0.87 | % | | | 19.17 | % |
| $ | 9.94 | | | | 0.89 | % | | $ | 94 | | | | 0.85 | % | | | 2.06 | % | | | 0.89 | % | | | 34.72 | % |
Financial Highlights, Class A Shares
The financial highlights table is intended to help you understand the Funds’ financial performance for the past 5 years or, if shorter, the period of the Funds’ operations. Certain information reflects financial results for a single Fund share. The total returns in the table represent the rate that an investor would have earned (or lost) on an investment in the Fund (assuming reinvestment of all dividends and distributions).
| | | | | | Investment Activities | | | Distributions | |
| | | Net Asset Value, Beginning of Year | | | Net investment income(a) | | | Net realized/ unrealized gains (losses) on investments | | | Total from Investment Activities | | | Net investment income | | | Net realized gains on investments | | | Return of capital | | | Total Distributions | |
| Sterling Capital North Carolina Intermediate Tax-Free Fund |
| Year Ended September 30, 2021 | | $ | 11.12 | | | | 0.15 | | | | (0.15 | ) | | | — | | | | (0.15 | ) | | | — | | | | — | | | | (0.15 | ) |
| Year Ended September 30, 2020 | | $ | 10.91 | | | | 0.18 | | | | 0.21 | | | | 0.39 | | | | (0.18 | ) | | | — | | | | — | | | | (0.18 | ) |
| Year Ended September 30, 2019 | | $ | 10.43 | | | | 0.23 | | | | 0.48 | | | | 0.71 | | | | (0.23 | ) | | | — | | | | — | | | | (0.23 | ) |
| Year Ended September 30, 2018 | | $ | 10.78 | | | | 0.24 | | | | (0.35 | ) | | | (0.11 | ) | | | (0.24 | ) | | | — | | | | — | | | | (0.24 | ) |
| Year Ended September 30, 2017 | | $ | 11.08 | | | | 0.23 | | | | (0.27 | ) | | | (0.04 | ) | | | (0.22 | ) | | | (0.04 | ) | | | — | | | | (0.26 | ) |
| Sterling Capital South Carolina Intermediate Tax-Free Fund |
| Year Ended September 30, 2021 | | $ | 11.47 | | | | 0.17 | | | | (0.07 | ) | | | 0.10 | | | | (0.17 | ) | | | — | | | | — | | | | (0.17 | ) |
| Year Ended September 30, 2020 | | $ | 11.27 | | | | 0.20 | | | | 0.20 | | | | 0.40 | | | | (0.20 | ) | | | — | | | | — | | | | (0.20 | ) |
| Year Ended September 30, 2019 | | $ | 10.77 | | | | 0.21 | | | | 0.50 | | | | 0.71 | | | | (0.21 | ) | | | — | | | | — | | | | (0.21 | ) |
| Year Ended September 30, 2018 | | $ | 11.10 | | | | 0.20 | | | | (0.33 | ) | | | (0.13 | ) | | | (0.20 | ) | | | — | | | | — | | | | (0.20 | ) |
| Year Ended September 30, 2017 | | $ | 11.30 | | | | 0.20 | | | | (0.20 | ) | | | — | | | | (0.20 | ) | | | — | | | | — | | | | (0.20 | ) |
| Sterling Capital Virginia Intermediate Tax-Free Fund |
| Year Ended September 30, 2021 | | $ | 12.23 | | | | 0.16 | | | | (0.22 | ) | | | (0.06 | ) | | | (0.16 | ) | | | (0.03 | ) | | | — | | | | (0.19 | ) |
| Year Ended September 30, 2020 | | $ | 11.98 | | | | 0.20 | | | | 0.25 | | | | 0.45 | | | | (0.20 | ) | | | — | | | | — | | | | (0.20 | ) |
| Year Ended September 30, 2019 | | $ | 11.40 | | | | 0.23 | | | | 0.58 | | | | 0.81 | | | | (0.23 | ) | | | — | | | | — | | | | (0.23 | ) |
| Year Ended September 30, 2018 | | $ | 11.76 | | | | 0.23 | | | | (0.36 | ) | | | (0.13 | ) | | | (0.23 | ) | | | — | | | | — | | | | (0.23 | ) |
| Year Ended September 30, 2017 | | $ | 12.13 | | | | 0.23 | | | | (0.28 | ) | | | (0.05 | ) | | | (0.23 | ) | | | (0.09 | ) | | | — | | | | (0.32 | ) |
| Sterling Capital West Virginia Intermediate Tax-Free Fund |
| Year Ended September 30, 2021 | | $ | 10.29 | | | | 0.16 | | | | (0.08 | ) | | | 0.08 | | | | (0.16 | ) | | | (0.01 | ) | | | — | | | | (0.17 | ) |
| Year Ended September 30, 2020 | | $ | 10.12 | | | | 0.19 | | | | 0.18 | | | | 0.37 | | | | (0.19 | ) | | | (0.01 | ) | | | — | | | | (0.20 | ) |
| Year Ended September 30, 2019 | | $ | 9.72 | | | | 0.22 | | | | 0.42 | | | | 0.64 | | | | (0.22 | ) | | | (0.02 | ) | | | — | | | | (0.24 | ) |
| Year Ended September 30, 2018 | | $ | 10.04 | | | | 0.21 | | | | (0.31 | ) | | | (0.10 | ) | | | (0.21 | ) | | | (0.01 | ) | | | — | | | | (0.22 | ) |
| Year Ended September 30, 2017 | | $ | 10.27 | | | | 0.21 | | | | (0.18 | ) | | | 0.03 | | | | (0.21 | ) | | | (0.05 | ) | | | — | | | | (0.26 | ) |
| * | During the periods certain fees were waived (See Note 4 in the Notes to the Financial Statements). If such reductions had not occurred, the ratios would have been as indicated. |
| ** | Portfolio turnover rate is calculated on the basis of the Fund as a whole without distinguishing between classes of shares issued. |
| (a) | Per share net investment income (loss) has been calculated using the average daily shares method. |
See accompanying Notes to the Financial Statements.
| | | | | | | Ratios/Supplementary Data | |
| Net Asset Value, End of Year | | | Total Return (excludes sales charge) | | | Net Assets, End of Year (000) | | | Ratio of net expenses to average net assets | | | Ratio of net investment income (loss) to average net assets | | | Ratio of expenses to average net assets* | | | Portfolio turnover rate** | |
| | | | | | | | | | | | | | | | | | | | |
| $ | 10.97 | | | | (0.01 | )% | | $ | 31,234 | | | | 0.80 | % | | | 1.34 | % | | | 0.80 | % | | | 7.97 | % |
| $ | 11.12 | | | | 3.64 | % | | $ | 33,648 | | | | 0.79 | % | | | 1.68 | % | | | 0.79 | % | | | 17.06 | % |
| $ | 10.91 | | | | 6.84 | % | | $ | 38,587 | | | | 0.80 | % | | | 2.12 | % | | | 0.80 | % | | | 33.12 | % |
| $ | 10.43 | | | | (1.06 | )% | | $ | 36,857 | | | | 0.79 | % | | | 2.23 | % | | | 0.79 | % | | | 22.06 | % |
| $ | 10.78 | | | | (0.31 | )% | | $ | 45,357 | | | | 0.79 | % | | | 2.09 | % | | | 0.83 | % | | | 25.92 | % |
| | | | | | | | | | | | | | | | | | | | | | | | | | | |
| $ | 11.40 | | | | 0.86 | % | | $ | 11,204 | | | | 0.81 | % | | | 1.44 | % | | | 0.81 | % | | | 20.23 | % |
| $ | 11.47 | | | | 3.58 | % | | $ | 11,926 | | | | 0.81 | % | | | 1.76 | % | | | 0.81 | % | | | 4.84 | % |
| $ | 11.27 | | | | 6.62 | % | | $ | 12,478 | | | | 0.81 | % | | | 1.88 | % | | | 0.81 | % | | | 23.84 | % |
| $ | 10.77 | | | | (1.15 | )% | | $ | 13,864 | | | | 0.80 | % | | | 1.85 | % | | | 0.80 | % | | | 27.71 | % |
| $ | 11.10 | | | | 0.01 | % | | $ | 15,832 | | | | 0.81 | % | | | 1.78 | % | | | 0.84 | % | | | 31.17 | % |
| | | | | | | | | | | | | | | | | | | | | | | | | | | |
| $ | 11.98 | | | | (0.52 | )% | | $ | 17,292 | | | | 0.81 | % | | | 1.31 | % | | | 0.81 | % | | | 8.98 | % |
| $ | 12.23 | | | | 3.80 | % | | $ | 17,446 | | | | 0.81 | % | | | 1.67 | % | | | 0.81 | % | | | 15.44 | % |
| $ | 11.98 | | | | 7.13 | % | | $ | 17,795 | | | | 0.81 | % | | | 1.94 | % | | | 0.81 | % | | | 24.57 | % |
| $ | 11.40 | | | | (1.14 | )% | | $ | 20,842 | | | | 0.80 | % | | | 1.96 | % | | | 0.80 | % | | | 21.08 | % |
| $ | 11.76 | | | | (0.39 | )% | | $ | 27,481 | | | | 0.80 | % | | | 1.93 | % | | | 0.84 | % | | | 23.25 | % |
| | | | | | | | | | | | | | | | | | | | | | | | | | | |
| $ | 10.20 | | | | 0.72 | % | | $ | 27,208 | | | | 0.81 | % | | | 1.53 | % | | | 0.81 | % | | | 8.56 | % |
| $ | 10.29 | | | | 3.66 | % | | $ | 27,866 | | | | 0.81 | % | | | 1.84 | % | | | 0.81 | % | | | 3.28 | % |
| $ | 10.12 | | | | 6.59 | % | | $ | 22,389 | | | | 0.81 | % | | | 2.18 | % | | | 0.81 | % | | | 33.73 | % |
| $ | 9.72 | | | | (0.98 | )% | | $ | 23,833 | | | | 0.80 | % | | | 2.14 | % | | | 0.80 | % | | | 17.53 | % |
| $ | 10.04 | | | | 0.28 | % | | $ | 30,134 | | | | 0.81 | % | | | 2.08 | % | | | 0.85 | % | | | 21.00 | % |
Financial Highlights, Class C Shares
The financial highlights table is intended to help you understand the Funds’ financial performance for the past 5 years or, if shorter, the period of the Funds’ operations. Certain information reflects financial results for a single Fund share. The total returns in the table represent the rate that an investor would have earned (or lost) on an investment in the Fund (assuming reinvestment of all dividends and distributions).
| | | | | | Investment Activities | | | Distributions | |
| | | Net Asset Value, Beginning of Year | | | Net investment income (loss)(a) | | | Net realized/ unrealized gains (losses) on investments | | | Total from Investment Activities | | | Net investment income | | | Net realized gains on investments | | | Return of capital | | | Total Distributions | |
| Sterling Capital Behavioral Large Cap Value Equity Fund |
| Year Ended September 30, 2021 | | $ | 16.17 | | | | (0.04 | ) | | | 5.92 | | | | 5.88 | | | | (0.03 | ) | | | — | | | | (0.14 | ) | | | (0.17 | ) |
| Year Ended September 30, 2020 | | $ | 18.88 | | | | 0.21 | | | | (1.99 | ) | | | (1.78 | ) | | | (0.35 | ) | | | (0.58 | ) | | | — | | | | (0.93 | ) |
| Year Ended September 30, 2019 | | $ | 21.67 | | | | 0.24 | | | | (1.04 | ) | | | (0.80 | ) | | | (0.24 | ) | | | (1.75 | ) | | | — | | | | (1.99 | ) |
| Year Ended September 30, 2018 | | $ | 20.13 | | | | 0.15 | | | | 1.86 | | | | 2.01 | | | | (0.28 | ) | | | (0.19 | ) | | | — | | | | (0.47 | ) |
| Year Ended September 30, 2017 | | $ | 17.20 | | | | 0.21 | | | | 2.87 | | | | 3.08 | | | | (0.15 | ) | | | — | | | | — | | | | (0.15 | ) |
| Sterling Capital Mid Value Fund |
| Year Ended September 30, 2021 | | $ | 11.85 | | | | (0.13 | ) | | | 5.14 | | | | 5.01 | | | | — | | | | — | | | | — | | | | — | |
| Year Ended September 30, 2020 | | $ | 13.83 | | | | (0.07 | ) | | | (0.68 | ) | | | (0.75 | ) | | | (0.10 | ) | | | (1.13 | ) | | | — | | | | (1.23 | ) |
| Year Ended September 30, 2019 | | $ | 16.86 | | | | (0.07 | ) | | | (0.70 | ) | | | (0.77 | ) | | | — | | | | (2.26 | ) | | | — | | | | (2.26 | ) |
| Year Ended September 30, 2018 | | $ | 16.76 | | | | (0.15 | ) | | | 1.09 | | | | 0.94 | | | | — | | | | (0.84 | ) | | | — | | | | (0.84 | ) |
| Year Ended September 30, 2017 | | $ | 15.12 | | | | (0.14 | ) | | | 2.31 | | | | 2.17 | | | | — | | | | (0.53 | ) | | | — | | | | (0.53 | ) |
| Sterling Capital Behavioral Small Cap Value Equity Fund |
| Year Ended September 30, 2021 | | $ | 11.28 | | | | 0.01 | | | | 7.17 | | | | 7.18 | | | | — | | | | — | | | | — | | | | — | |
| Year Ended September 30, 2020 | | $ | 13.94 | | | | 0.01 | | | | (2.56 | ) | | | (2.55 | ) | | | (0.11 | ) | | | — | | | | — | | | | (0.11 | ) |
| Year Ended September 30, 2019 | | $ | 17.89 | | | | 0.06 | | | | (1.98 | ) | | | (1.92 | ) | | | (0.05 | ) | | | (1.98 | ) | | | — | | | | (2.03 | ) |
| Year Ended September 30, 2018 | | $ | 17.69 | | | | 0.03 | | | | 0.82 | | | | 0.85 | | | | — | | | | (0.65 | ) | | | — | | | | (0.65 | ) |
| Year Ended September 30, 2017 | | $ | 14.70 | | | | (0.02 | ) | | | 3.07 | | | | 3.05 | | | | (0.06 | ) | | | — | | | | — | | | | (0.06 | ) |
| Sterling Capital Special Opportunities Fund |
| Year Ended September 30, 2021 | | $ | 19.67 | | | | (0.27 | ) | | | 7.32 | | | | 7.05 | | | | — | | | | (0.33 | ) | | | — | | | | (0.33 | ) |
| Year Ended September 30, 2020 | | $ | 20.04 | | | | (0.15 | ) | | | 1.11 | | | | 0.96 | | | | — | | | | (1.33 | ) | | | — | | | | (1.33 | ) |
| Year Ended September 30, 2019 | | $ | 21.98 | | | | (0.14 | ) | | | 0.06 | | | | (0.08 | ) | | | — | | | | (1.86 | ) | | | — | | | | (1.86 | ) |
| Year Ended September 30, 2018 | | $ | 20.88 | | | | (0.14 | ) | | | 3.29 | | | | 3.15 | | | | (0.11 | ) | | | (1.94 | ) | | | — | | | | (2.05 | ) |
| Year Ended September 30, 2017 | | $ | 18.54 | | | | (0.13 | ) | | | 2.88 | | | | 2.75 | | | | — | | | | (0.41 | ) | | | — | | | | (0.41 | ) |
| Sterling Capital Equity Income Fund |
| Year Ended September 30, 2021 | | $ | 19.83 | | | | 0.10 | | | | 6.47 | | | | 6.57 | | | | (0.08 | ) | | | — | | | | — | | | | (0.08 | ) |
| Year Ended September 30, 2020 | | $ | 21.05 | | | | 0.21 | | | | (0.38 | ) | | | (0.17 | ) | | | (0.21 | ) | | | (0.84 | ) | | | — | | | | (1.05 | ) |
| Year Ended September 30, 2019 | | $ | 21.34 | | | | 0.24 | | | | 1.21 | | | | 1.45 | | | | (0.22 | ) | | | (1.52 | ) | | | — | | | | (1.74 | ) |
| Year Ended September 30, 2018 | | $ | 20.66 | | | | 0.19 | | | | 2.62 | | | | 2.81 | | | | (0.18 | ) | | | (1.95 | ) | | | — | | | | (2.13 | ) |
| Year Ended September 30, 2017 | | $ | 18.14 | | | | 0.20 | | | | 2.56 | | | | 2.76 | | | | (0.22 | ) | | | (0.02 | ) | | | — | | | | (0.24 | ) |
| Sterling Capital Behavioral International Equity Fund |
| Year Ended September 30, 2021 | | $ | 8.06 | | | | 0.19 | | | | 1.60 | | | | 1.79 | | | | (0.16 | ) | | | — | | | | — | | | | (0.16 | ) |
| Year Ended September 30, 2020 | | $ | 9.37 | | | | 0.18 | | | | (1.31 | ) | | | (1.13 | ) | | | (0.18 | ) | | | — | | | | — | | | | (0.18 | ) |
| Year Ended September 30, 2019 | | $ | 11.06 | | | | 0.26 | | | | (1.33 | ) | | | (1.07 | ) | | | (0.22 | ) | | | (0.40 | ) | | | — | | | | (0.62 | ) |
| Year Ended September 30, 2018 | | $ | 11.64 | | | | 0.25 | | | | (0.48 | ) | | | (0.23 | ) | | | (0.24 | ) | | | (0.11 | ) | | | — | | | | (0.35 | ) |
| Year Ended September 30, 2017 | | $ | 9.62 | | | | 0.15 | | | | 1.96 | | | | 2.11 | | | | (0.09 | ) | | | — | | | | — | | | | (0.09 | ) |
| * | During the periods certain fees were waived (See Note 4 in the Notes to the Financial Statements). If such reductions had not occurred, the ratios would have been as indicated. |
| ** | Portfolio turnover rate is calculated on the basis of the Fund as a whole without distinguishing between classes of shares issued. |
| (a) | Per share net investment income (loss) has been calculated using the average daily shares method. |
See accompanying Notes to the Financial Statements.
| | | | | | | Ratios/Supplementary Data | |
| Net Asset Value, End of Year | | | Total Return (excludes sales charge) | | | Net Assets, End of Year (000) | | | Ratio of net expenses to average net assets | | | Ratio of net investment income (loss) to average net assets | | | Ratio of expenses to average net assets* | | | Portfolio turnover rate** | |
| | | | | | | | | | | | | | | | | | | | |
| $ | 21.88 | | | | 36.56 | % | | $ | 304 | | | | 1.60 | % | | | (0.22 | )% | | | 1.79 | % | | | 122.64 | % |
| $ | 16.17 | | | | (9.81 | )% | | $ | 567 | | | | 1.64 | % | | | 1.26 | % | | | 1.71 | % | | | 167.34 | % |
| $ | 18.88 | | | | (3.08 | )% | | $ | 634 | | | | 1.64 | % | | | 1.29 | % | | | 1.64 | % | | | 142.59 | % |
| $ | 21.67 | | | | 10.11 | % | | $ | 887 | | | | 1.62 | % | | | 0.69 | % | | | 1.62 | % | | | 127.89 | % |
| $ | 20.13 | | | | 18.00 | % | | $ | 966 | | | | 1.64 | % | | | 1.12 | % | | | 1.64 | % | | | 144.85 | % |
| | | | | | | | | | | | | | | | | | | | | | | | | | | |
| $ | 16.86 | | | | 42.28 | % | | $ | 1,101 | | | | 1.87 | % | | | (0.85 | )% | | | 1.90 | % | | | 34.00 | % |
| $ | 11.85 | | | | (6.46 | )% | | $ | 1,584 | | | | 1.88 | % | | | (0.61 | )% | | | 2.02 | % | | | 28.77 | % |
| $ | 13.83 | | | | (3.52 | )% | | $ | 2,826 | | | | 1.93 | % | | | (0.46 | )% | | | 1.93 | % | | | 26.62 | % |
| $ | 16.86 | | | | 5.72 | % | | $ | 4,097 | | | | 1.92 | % | | | (0.91 | )% | | | 1.92 | % | | | 34.62 | % |
| $ | 16.76 | | | | 14.58 | % | | $ | 4,363 | | | | 1.90 | % | | | (0.87 | )% | | | 1.90 | % | | | 24.83 | % |
| | | | | | | | | | | | | | | | | | | | | | | | | | | |
| $ | 18.46 | | | | 63.65 | % | | $ | 38 | | | | 1.82 | % | | | 0.04 | % | | | 1.82 | % | | | 110.07 | % |
| $ | 11.28 | | | | (18.47 | )% | | $ | 100 | | | | 1.81 | % | | | 0.05 | % | | | 1.83 | % | | | 119.76 | % |
| $ | 13.94 | | | | (10.28 | )% | | $ | 150 | | | | 1.80 | % | | | 0.43 | % | | | 1.80 | % | | | 124.82 | % |
| $ | 17.89 | | | | 4.88 | % | | $ | 180 | | | | 1.78 | % | | | 0.17 | % | | | 1.78 | % | | | 89.85 | % |
| $ | 17.69 | | | | 20.73 | % | | $ | 191 | | | | 1.80 | % | | | (0.10 | )% | | | 1.85 | % | | | 109.05 | % |
| | | | | | | | | | | | | | | | | | | | | | | | | | | |
| $ | 26.39 | | | | 36.19 | % | | $ | 52,182 | | | | 1.86 | % | | | (1.11 | )% | | | 1.87 | % | | | 27.20 | % |
| $ | 19.67 | | | | 4.73 | % | | $ | 60,777 | | | | 1.86 | % | | | (0.79 | )% | | | 1.86 | % | | | 17.50 | % |
| $ | 20.04 | | | | 0.48 | % | | $ | 83,451 | | | | 1.86 | % | | | (0.71 | )% | | | 1.86 | % | | | 17.31 | % |
| $ | 21.98 | | | | 16.27 | % | | $ | 144,100 | | | | 1.86 | % | | | (0.70 | )% | | | 1.86 | % | | | 22.78 | % |
| $ | 20.88 | | | | 15.08 | % | | $ | 149,892 | | | | 1.87 | % | | | (0.68 | )% | | | 1.87 | % | | | 18.92 | % |
| | | | | | | | | | | | | | | | | | | | | | | | | | | |
| $ | 26.32 | | | | 33.15 | % | | $ | 81,338 | | | | 1.78 | % | | | 0.42 | % | | | 1.79 | % | | | 13.00 | % |
| $ | 19.83 | | | | (0.85 | )% | | $ | 119,475 | | | | 1.77 | % | | | 1.04 | % | | | 1.78 | % | | | 33.60 | % |
| $ | 21.05 | | | | 7.66 | % | | $ | 158,353 | | | | 1.77 | % | | | 1.17 | % | | | 1.77 | % | | | 23.20 | % |
| $ | 21.34 | | | | 14.41 | % | | $ | 207,659 | | | | 1.77 | % | | | 0.91 | % | | | 1.77 | % | | | 19.49 | % |
| $ | 20.66 | | | | 15.36 | % | | $ | 234,108 | | | | 1.78 | % | | | 1.03 | % | | | 1.78 | % | | | 16.93 | % |
| | | | | | | | | | | | | | | | | | | | | | | | | | | |
| $ | 9.69 | | | | 22.44 | % | | $ | 54 | | | | 1.67 | % | | | 1.99 | % | | | 1.73 | % | | | 158.16 | % |
| $ | 8.06 | | | | (12.41 | )% | | $ | 44 | | | | 1.63 | % | | | 2.03 | % | | | 1.83 | % | | | 164.02 | % |
| $ | 9.37 | | | | (9.44 | )% | | $ | 63 | | | | 1.69 | % | | | 2.68 | % | | | 1.89 | % | | | 97.74 | % |
| $ | 11.06 | | | | (2.18 | )% | | $ | 61 | | | | 1.65 | % | | | 2.15 | % | | | 1.85 | % | | | 96.65 | % |
| $ | 11.64 | | | | 22.19 | % | | $ | 59 | | | | 1.68 | % | | | 1.44 | % | | | 1.94 | % | | | 91.65 | % |
Financial Highlights, Class C Shares
The financial highlights table is intended to help you understand the Funds’ financial performance for the past 5 years or, if shorter, the period of the Funds’ operations. Certain information reflects financial results for a single Fund share. The total returns in the table represent the rate that an investor would have earned (or lost) on an investment in the Fund (assuming reinvestment of all dividends and distributions).
| | | | | | Investment Activities | | | Distributions | |
| | | Net Asset Value, Beginning of Year | | | Net investment income (loss)(a) | | | Net realized/ unrealized gains (losses) on investments | | | Total from Investment Activities | | | Net investment income | | | Net realized gains on investments | | | Return of capital | | | Total Distributions | |
| Sterling Capital SMID Opportunities Fund |
| Year Ended September 30, 2021 | | $ | 12.12 | | | | (0.17 | ) | | | 3.59 | | | | 3.42 | | | | — | | | | — | | | | — | | | | — | |
| Year Ended September 30, 2020 | | $ | 12.99 | | | | (0.11 | ) | | | (0.13 | ) | | | (0.24 | ) | | | — | | | | (0.63 | ) | | | — | | | | (0.63 | ) |
| Year Ended September 30, 2019 | | $ | 12.30 | | | | (0.11 | ) | | | 0.80 | | | | 0.69 | | | | — | | | | — | | | | — | | | | — | |
| Year Ended September 30, 2018 | | $ | 11.67 | | | | (0.13 | ) | | | 0.96 | | | | 0.83 | | | | (0.02 | ) | | | (0.18 | ) | | | — | | | | (0.20 | ) |
| Year Ended September 30, 2017 | | $ | 10.00 | | | | (0.09 | ) | | | 1.76 | | | | 1.67 | | | | — | | | | — | | | | — | | | | — | |
| Sterling Capital Stratton Mid Cap Value Fund |
| Year Ended September 30, 2021 | | $ | 57.24 | | | | (0.17 | ) | | | 19.48 | | | | 19.31 | | | | — | | | | (0.23 | ) | | | — | | | | (0.23 | ) |
| Year Ended September 30, 2020 | | $ | 62.48 | | | | (0.12 | ) | | | (3.60 | ) | | | (3.72 | ) | | | (0.01 | ) | | | (1.51 | ) | | | — | | | | (1.52 | ) |
| Year Ended September 30, 2019 | | $ | 67.46 | | | | (0.12 | ) | | | 0.16 | | | | 0.04 | | | | — | | | | (5.02 | ) | | | — | | | | (5.02 | ) |
| Year Ended September 30, 2018 | | $ | 65.40 | | | | (0.42 | ) | | | 4.77 | | | | 4.35 | | | | — | | | | (2.29 | ) | | | — | | | | (2.29 | ) |
| Year Ended September 30, 2017 | | $ | 55.55 | | | | (0.41 | ) | | | 10.53 | | | | 10.12 | | | | — | | | | (0.27 | ) | | | — | | | | (0.27 | ) |
| Sterling Capital Stratton Real Estate Fund |
| Year Ended September 30, 2021 | | $ | 36.33 | | | | 0.03 | | | | 10.37 | | | | 10.40 | | | | (0.26 | ) | | | (0.82 | ) | | | — | | | | (1.08 | ) |
| Year Ended September 30, 2020 | | $ | 42.06 | | | | 0.22 | | | | (3.94 | ) | | | (3.72 | ) | | | (0.49 | ) | | | (1.52 | ) | | | — | | | | (2.01 | ) |
| Year Ended September 30, 2019 | | $ | 37.40 | | | | 0.42 | | | | 5.99 | | | | 6.41 | | | | (0.51 | ) | | | (1.24 | ) | | | — | | | | (1.75 | ) |
| Year Ended September 30, 2018 | | $ | 36.91 | | | | 0.51 | | | | 1.45 | | | | 1.96 | | | | (0.25 | ) | | | (1.22 | ) | | | — | | | | (1.47 | ) |
| Year Ended September 30, 2017 | | $ | 39.50 | | | | 0.43 | | | | (0.49 | ) | | | (0.06 | ) | | | (0.78 | ) | | | (1.75 | ) | | | — | | | | (2.53 | ) |
| Sterling Capital Stratton Small Cap Value Fund |
| Year Ended September 30, 2021 | | $ | 61.56 | | | | (0.58 | ) | | | 29.71 | | | | 29.13 | | | | — | | | | (11.22 | ) | | | — | | | | (11.22 | ) |
| Year Ended September 30, 2020 | | $ | 75.87 | | | | (0.24 | ) | | | (9.11 | ) | | | (9.35 | ) | | | (0.03 | ) | | | (4.93 | ) | | | — | | | | (4.96 | ) |
| Year Ended September 30, 2019 | | $ | 86.92 | | | | (0.19 | ) | | | (4.96 | ) | | | (5.15 | ) | | | — | | | | (5.90 | ) | | | — | | | | (5.90 | ) |
| Year Ended September 30, 2018 | | $ | 88.75 | | | | (0.62 | ) | | | 6.48 | | | | 5.86 | | | | — | | | | (7.69 | ) | | | — | | | | (7.69 | ) |
| Year Ended September 30, 2017 | | $ | 77.88 | | | | (0.64 | ) | | | 15.61 | | | | 14.97 | | | | — | | | | (4.10 | ) | | | — | | | | (4.10 | ) |
| Sterling Capital Short Duration Bond Fund |
| Year Ended September 30, 2021 | | $ | 8.77 | | | | 0.04 | | | | (0.01 | ) | | | 0.03 | | | | (0.12 | ) | | | — | | | | — | | | | (0.12 | ) |
| Year Ended September 30, 2020 | | $ | 8.64 | | | | 0.11 | | | | 0.15 | | | | 0.26 | | | | (0.13 | ) | | | — | | | | — | | | | (0.13 | ) |
| Year Ended September 30, 2019 | | $ | 8.51 | | | | 0.14 | | | | 0.16 | | | | 0.30 | | | | (0.17 | ) | | | — | | | | — | | | | (0.17 | ) |
| Year Ended September 30, 2018 | | $ | 8.69 | | | | 0.09 | | | | (0.12 | ) | | | (0.03 | ) | | | (0.15 | ) | | | — | | | | — | | | | (0.15 | ) |
| Year Ended September 30, 2017 | | $ | 8.80 | | | | 0.03 | | | | — | | | | 0.03 | | | | (0.14 | ) | | | — | | | | — | | | | (0.14 | ) |
| * | During the periods certain fees were waived (See Note 4 in the Notes to the Financial Statements). If such reductions had not occurred, the ratios would have been as indicated. |
| ** | Portfolio turnover rate is calculated on the basis of the Fund as a whole without distinguishing between classes of shares issued. |
| (a) | Per share net investment income (loss) has been calculated using the average daily shares method. |
See accompanying Notes to the Financial Statements.
| | | | | | | Ratios/Supplementary Data | |
| Net Asset Value, End of Year | | | Total Return (excludes sales charge) | | | Net Assets, End of Year (000) | | | Ratio of net expenses to average net assets | | | Ratio of net investment income (loss) to average net assets | | | Ratio of expenses to average net assets* | | | Portfolio turnover rate** | |
| | | | | | | | | | | | | | | | | | | | |
| $ | 15.54 | | | | 28.22 | % | | $ | 1,513 | | | | 1.79 | % | | | (1.17 | )% | | | 2.06 | % | | | 33.93 | % |
| $ | 12.12 | | | | (2.22 | )% | | $ | 1,250 | | | | 1.79 | % | | | (0.97 | )% | | | 2.09 | % | | | 60.03 | % |
| $ | 12.99 | | | | 5.61 | % | | $ | 1,188 | | | | 1.79 | % | | | (0.95 | )% | | | 2.19 | % | | | 45.11 | % |
| $ | 12.30 | | | | 7.25 | % | | $ | 1,476 | | | | 1.79 | % | | | (1.13 | )% | | | 2.04 | % | | | 45.64 | % |
| $ | 11.67 | | | | 16.70 | % | | $ | 1,414 | | | | 1.79 | % | | | (0.80 | )% | | | 2.38 | % | | | 37.97 | % |
| | | | | | | | | | | | | | | | | | | | | | | | | | | |
| $ | 76.32 | | | | 33.80 | % | | $ | 3 | | | | 1.85 | % | | | (0.23 | )% | | | 1.85 | % | | | 8.23 | % |
| $ | 57.24 | | | | (6.21 | )% | | $ | 1 | | | | 1.92 | % | | | (0.20 | )% | | | 1.92 | % | | | 9.21 | % |
| $ | 62.48 | | | | 1.03 | % | | $ | 1 | | | | 1.95 | % | | | (0.21 | )% | | | 1.95 | % | | | 6.75 | % |
| $ | 67.46 | | | | 6.70 | % | | $ | 1 | | | | 1.95 | % | | | (0.63 | )% | | | 1.95 | % | | | 14.47 | % |
| $ | 65.40 | | | | 18.27 | % | | $ | 1 | | | | 1.89 | % | | | (0.68 | )% | | | 1.89 | % | | | 12.19 | % |
| | | | | | | | | | | | | | | | | | | | | | | | | | | |
| $ | 45.65 | | | | 29.14 | % | | $ | 182 | | | | 1.81 | % | | | 0.08 | % | | | 1.81 | % | | | 12.68 | % |
| $ | 36.33 | | | | (9.02 | )% | | $ | 192 | | | | 1.83 | % | | | 0.58 | % | | | 1.83 | % | | | 19.58 | % |
| $ | 42.06 | | | | 17.88 | % | | $ | 205 | | | | 1.82 | % | | | 1.08 | % | | | 1.82 | % | | | 14.56 | % |
| $ | 37.40 | | | | 5.38 | % | | $ | 98 | | | | 1.82 | % | | | 1.41 | % | | | 1.82 | % | | | 8.34 | % |
| $ | 36.91 | | | | 0.16 | % | | $ | 64 | | | | 1.79 | % | | | 1.18 | % | | | 1.80 | % | | | 13.52 | % |
| | | | | | | | | | | | | | | | | | | | | | | | | | | |
| $ | 79.47 | | | | 51.27 | % | | $ | 375 | | | | 1.98 | % | | | (0.75 | )% | | | 2.01 | % | | | 6.15 | % |
| $ | 61.56 | | | | (13.46 | )% | | $ | 245 | | | | 2.00 | % | | | (0.35 | )% | | | 2.08 | % | | | 8.33 | % |
| $ | 75.87 | | | | (5.49 | )% | | $ | 279 | | | | 2.03 | % | | | (0.25 | )% | | | 2.08 | % | | | 8.60 | % |
| $ | 86.92 | | | | 6.90 | % | | $ | 112 | | | | 2.03 | % | | | (0.71 | )% | | | 2.06 | % | | | 15.51 | % |
| $ | 88.75 | | | | 19.55 | % | | $ | 107 | | | | 2.06 | % | | | 0.78 | % | | | 2.06 | % | | | 7.04 | % |
| | | | | | | | | | | | | | | | | | | | | | | | | | | |
| $ | 8.68 | | | | 0.29 | % | | $ | 988 | | | | 1.43 | % | | | 0.40 | % | | | 1.46 | % | | | 39.26 | % |
| $ | 8.77 | | | | 3.09 | % | | $ | 893 | | | | 1.42 | % | | | 1.21 | % | | | 1.52 | % | | | 64.69 | % |
| $ | 8.64 | | | | 3.52 | % | | $ | 1,052 | | | | 1.43 | % | | | 1.68 | % | | | 1.53 | % | | | 78.58 | % |
| $ | 8.51 | | | | (0.32 | )% | | $ | 1,091 | | | | 1.43 | % | | | 1.07 | % | | | 1.53 | % | | | 62.02 | % |
| $ | 8.69 | | | | 0.38 | % | | $ | 1,546 | | | | 1.45 | % | | | 0.37 | % | | | 1.55 | % | | | 78.77 | % |
Financial Highlights, Class C Shares
The financial highlights table is intended to help you understand the Funds’ financial performance for the past 5 years or, if shorter, the period of the Funds’ operations. Certain information reflects financial results for a single Fund share. The total returns in the table represent the rate that an investor would have earned (or lost) on an investment in the Fund (assuming reinvestment of all dividends and distributions).
| | | | | | Investment Activities | | | Distributions | |
| | | Net Asset Value, Beginning of Year | | | Net investment income (loss)(a) | | | Net realized/ unrealized gains (losses) on investments | | | Total from Investment Activities | | | Net investment income | | | Net realized gains on investments | | | Return of capital | | | Total Distributions | |
| Sterling Capital Intermediate U.S. Government Fund |
| Year Ended September 30, 2021 | | $ | 10.11 | | | | (0.01 | ) | | | (0.19 | ) | | | (0.20 | ) | | | (0.15 | ) | | | — | | | | — | | | | (0.15 | ) |
| Year Ended September 30, 2020 | | $ | 9.91 | | | | 0.09 | | | | 0.28 | | | | 0.37 | | | | (0.17 | ) | | | — | | | | — | | | | (0.17 | ) |
| Year Ended September 30, 2019 | | $ | 9.47 | | | | 0.13 | | | | 0.48 | | | | 0.61 | | | | (0.17 | ) | | | — | | | | — | | | | (0.17 | ) |
| Year Ended September 30, 2018 | | $ | 9.89 | | | | 0.09 | | | | (0.32 | ) | | | (0.23 | ) | | | (0.19 | ) | | | — | | | | — | | | | (0.19 | ) |
| Year Ended September 30, 2017 | | $ | 10.22 | | | | 0.08 | | | | (0.28 | ) | | | (0.20 | ) | | | (0.13 | ) | | | — | | | | — | | | | (0.13 | ) |
| Sterling Capital Total Return Bond Fund |
| Year Ended September 30, 2021 | | $ | 11.40 | | | | 0.09 | | | | (0.13 | ) | | | (0.04 | ) | | | (0.15 | ) | | | (0.15 | ) | | | — | | | | (0.30 | ) |
| Year Ended September 30, 2020 | | $ | 10.90 | | | | 0.16 | | | | 0.54 | | | | 0.70 | | | | (0.20 | ) | | | — | (b) | | | — | | | | (0.20 | ) |
| Year Ended September 30, 2019 | | $ | 10.21 | | | | 0.22 | | | | 0.70 | | | | 0.92 | | | | (0.23 | ) | | | — | | | | — | | | | (0.23 | ) |
| Year Ended September 30, 2018 | | $ | 10.61 | | | | 0.19 | | | | (0.37 | ) | | | (0.18 | ) | | | (0.22 | ) | | | — | | | | — | | | | (0.22 | ) |
| Year Ended September 30, 2017 | | $ | 10.83 | | | | 0.15 | | | | (0.15 | ) | | | — | | | | (0.22 | ) | | | — | | | | — | | | | (0.22 | ) |
| Sterling Capital Corporate Fund |
| Year Ended September 30, 2021 | | $ | 10.76 | | | | 0.18 | | | | 0.03 | | | | 0.21 | | | | (0.18 | ) | | | (0.30 | ) | | | — | | | | (0.48 | ) |
| Year Ended September 30, 2020 | | $ | 10.36 | | | | 0.19 | | | | 0.40 | | | | 0.59 | | | | (0.19 | ) | | | — | | | | — | | | | (0.19 | ) |
| Year Ended September 30, 2019 | | $ | 9.80 | | | | 0.24 | | | | 0.55 | | | | 0.79 | | | | (0.23 | ) | | | — | | | | — | | | | (0.23 | ) |
| Year Ended September 30, 2018 | | $ | 10.23 | | | | 0.22 | | | | (0.36 | ) | | | (0.14 | ) | | | (0.22 | ) | | | (0.07 | ) | | | — | | | | (0.29 | ) |
| Year Ended September 30, 2017 | | $ | 10.35 | | | | 0.21 | | | | (0.08 | ) | | | 0.13 | | | | (0.21 | ) | | | (0.04 | ) | | | — | | | | (0.25 | ) |
| Sterling Capital Quality Income Fund |
| Year Ended September 30, 2021 | | $ | 10.24 | | | | 0.06 | | | | (0.15 | ) | | | (0.09 | ) | | | (0.12 | ) | | | — | | | | — | | | | (0.12 | ) |
| Year Ended September 30, 2020 | | $ | 10.08 | | | | 0.17 | | | | 0.16 | | | | 0.33 | | | | (0.17 | ) | | | — | | | | — | | | | (0.17 | ) |
| Year Ended September 30, 2019 | | $ | 9.60 | | | | 0.21 | | | | 0.48 | | | | 0.69 | | | | (0.21 | ) | | | — | | | | — | | | | (0.21 | ) |
| Year Ended September 30, 2018 | | $ | 9.93 | | | | 0.19 | | | | (0.32 | ) | | | (0.13 | ) | | | (0.20 | ) | | | — | | | | — | | | | (0.20 | ) |
| Year Ended September 30, 2017 | | $ | 10.09 | | | | 0.13 | | | | (0.12 | ) | | | 0.01 | | | | (0.17 | ) | | | — | | | | — | | | | (0.17 | ) |
| Sterling Capital North Carolina Intermediate Tax-Free Fund |
| Year Ended September 30, 2021 | | $ | 11.12 | | | | 0.07 | | | | (0.16 | ) | | | (0.09 | ) | | | (0.07 | ) | | | — | | | | — | | | | (0.07 | ) |
| Year Ended September 30, 2020 | | $ | 10.90 | | | | 0.10 | | | | 0.22 | | | | 0.32 | | | | (0.10 | ) | | | — | | | | — | | | | (0.10 | ) |
| Year Ended September 30, 2019 | | $ | 10.42 | | | | 0.15 | | | | 0.48 | | | | 0.63 | | | | (0.15 | ) | | | — | | | | — | | | | (0.15 | ) |
| Year Ended September 30, 2018 | | $ | 10.77 | | | | 0.16 | | | | (0.35 | ) | | | (0.19 | ) | | | (0.16 | ) | | | — | | | | — | | | | (0.16 | ) |
| Year Ended September 30, 2017 | | $ | 11.07 | | | | 0.14 | | | | (0.26 | ) | | | (0.12 | ) | | | (0.14 | ) | | | (0.04 | ) | | | — | | | | (0.18 | ) |
| * | During the periods certain fees were waived (See Note 4 in the Notes to the Financial Statements). If such reductions had not occurred, the ratios would have been as indicated. |
| ** | Portfolio turnover rate is calculated on the basis of the Fund as a whole without distinguishing between classes of shares issued. |
| (a) | Per share net investment income (loss) has been calculated using the average daily shares method. |
| (b) | Amount is less than $0.005. |
See accompanying Notes to the Financial Statements.
| | | | | | | Ratios/Supplementary Data | |
| Net Asset Value, End of Year | | | Total Return (excludes sales charge) | | | Net Assets, End of Year (000) | | | Ratio of net expenses to average net assets | | | Ratio of net investment income (loss) to average net assets | | | Ratio of expenses to average net assets* | | | Portfolio turnover rate** | |
| | | | | | | | | | | | | | | | | | | | |
| $ | 9.76 | | | | (1.97 | )% | | $ | 124 | | | | 1.43 | % | | | (0.11 | )% | | | 1.61 | % | | | 71.31 | % |
| $ | 10.11 | | | | 3.78 | % | | $ | 309 | | | | 1.54 | % | | | 0.93 | % | | | 1.70 | % | | | 47.36 | % |
| $ | 9.91 | | | | 6.48 | % | | $ | 378 | | | | 1.56 | % | | | 1.37 | % | | | 1.66 | % | | | 40.13 | % |
| $ | 9.47 | | | | (2.37 | )% | | $ | 488 | | | | 1.66 | % | | | 0.98 | % | | | 1.67 | % | | | 40.85 | % |
| $ | 9.89 | | | | (1.94 | )% | | $ | 577 | | | | 1.62 | % | | | 0.80 | % | | | 1.66 | % | | | 32.44 | % |
| | | | | | | | | | | | | | | | | | | | | | | | | | | |
| $ | 11.06 | | | | (0.31 | )% | | $ | 5,378 | | | | 1.45 | % | | | 0.78 | % | | | 1.51 | % | | | 48.80 | % |
| $ | 11.40 | | | | 6.53 | % | | $ | 8,332 | | | | 1.45 | % | | | 1.44 | % | | | 1.57 | % | | | 59.59 | % |
| $ | 10.90 | | | | 9.17 | % | | $ | 8,266 | | | | 1.45 | % | | | 2.11 | % | | | 1.58 | % | | | 79.40 | % |
| $ | 10.21 | | | | (1.73 | )% | | $ | 7,464 | | | | 1.45 | % | | | 1.81 | % | | | 1.57 | % | | | 62.28 | % |
| $ | 10.61 | | | | 0.00 | % | | $ | 7,582 | | | | 1.47 | % | | | 1.38 | % | | | 1.57 | % | | | 64.07 | % |
| | | | | | | | | | | | | | | | | | | | | | | | | | | |
| $ | 10.49 | | | | 1.98 | % | | $ | 3 | | | | 1.72 | % | | | 1.70 | % | | | 1.88 | % | | | 47.29 | % |
| $ | 10.76 | | | | 5.80 | % | | $ | 3 | | | | 1.64 | % | | | 1.86 | % | | | 1.65 | % | | | 52.28 | % |
| $ | 10.36 | | | | 8.18 | % | | $ | 3 | | | | 1.68 | % | | | 2.36 | % | | | 1.68 | % | | | 82.23 | % |
| $ | 9.80 | | | | (1.44 | )% | | $ | 42 | | | | 1.63 | % | | | 2.19 | % | | | 1.63 | % | | | 66.82 | % |
| $ | 10.23 | | | | 1.30 | % | | $ | 43 | | | | 1.64 | % | | | 2.09 | % | | | 1.64 | % | | | 78.79 | % |
| | | | | | | | | | | | | | | | | | | | | | | | | | | |
| $ | 10.03 | | | | (0.92 | )% | | $ | 3 | | | | 1.57 | % | | | 0.58 | % | | | 1.59 | % | | | 73.60 | % |
| $ | 10.24 | | | | 3.34 | % | | $ | 3 | | | | 1.57 | % | | | 1.63 | % | | | 1.61 | % | | | 35.96 | % |
| $ | 10.08 | | | | 7.21 | % | | $ | 34 | | | | 1.60 | % | | | 2.15 | % | | | 1.64 | % | | | 17.58 | % |
| $ | 9.60 | | | | (1.27 | )% | | $ | 33 | | | | 1.58 | % | | | 1.97 | % | | | 1.62 | % | | | 19.17 | % |
| $ | 9.93 | | | | 0.12 | % | | $ | 34 | | | | 1.60 | % | | | 1.31 | % | | | 1.64 | % | | | 34.72 | % |
| | | | | | | | | | | | | | | | | | | | | | | | | | | |
| $ | 10.96 | | | | (0.85 | )% | | $ | 1,542 | | | | 1.55 | % | | | 0.60 | % | | | 1.55 | % | | | 7.97 | % |
| $ | 11.12 | | | | 2.96 | % | | $ | 2,793 | | | | 1.54 | % | | | 0.92 | % | | | 1.54 | % | | | 17.06 | % |
| $ | 10.90 | | | | 6.05 | % | | $ | 2,878 | | | | 1.55 | % | | | 1.38 | % | | | 1.55 | % | | | 33.12 | % |
| $ | 10.42 | | | | (1.80 | )% | | $ | 3,359 | | | | 1.54 | % | | | 1.48 | % | | | 1.54 | % | | | 22.06 | % |
| $ | 10.77 | | | | (1.06 | )% | | $ | 4,591 | | | | 1.54 | % | | | 1.34 | % | | | 1.58 | % | | | 25.92 | % |
Financial Highlights, Class C Shares
The financial highlights table is intended to help you understand the Funds’ financial performance for the past 5 years or, if shorter, the period of the Funds’ operations. Certain information reflects financial results for a single Fund share. The total returns in the table represent the rate that an investor would have earned (or lost) on an investment in the Fund (assuming reinvestment of all dividends and distributions).
| | | | | | Investment Activities | | | Distributions | |
| | | Net Asset Value, Beginning of Year | | | Net investment income(a) | | | Net realized/ unrealized gains (losses) on investments | | | Total from Investment Activities | | | Net investment income | | | Net realized gains on investments | | | Return of capital | | | Total Distributions | |
| Sterling Capital South Carolina Intermediate Tax-Free Fund |
| Year Ended September 30, 2021 | | $ | 11.46 | | | | 0.08 | | | | (0.07 | ) | | | 0.01 | | | | (0.08 | ) | | | — | | | | — | | | | (0.08 | ) |
| Year Ended September 30, 2020 | | $ | 11.27 | | | | 0.11 | | | | 0.19 | | | | 0.30 | | | | (0.11 | ) | | | — | | | | — | | | | (0.11 | ) |
| Year Ended September 30, 2019 | | $ | 10.76 | | | | 0.12 | | | | 0.51 | | | | 0.63 | | | | (0.12 | ) | | | — | | | | — | | | | (0.12 | ) |
| Year Ended September 30, 2018 | | $ | 11.10 | | | | 0.12 | | | | (0.34 | ) | | | (0.22 | ) | | | (0.12 | ) | | | — | | | | — | | | | (0.12 | ) |
| Year Ended September 30, 2017 | | $ | 11.30 | | | | 0.11 | | | | (0.20 | ) | | | (0.09 | ) | | | (0.11 | ) | | | — | | | | — | | | | (0.11 | ) |
| Sterling Capital Virginia Intermediate Tax-Free Fund |
| Year Ended September 30, 2021 | | $ | 12.22 | | | | 0.07 | | | | (0.22 | ) | | | (0.15 | ) | | | (0.07 | ) | | | (0.03 | ) | | | — | | | | (0.10 | ) |
| Year Ended September 30, 2020 | | $ | 11.97 | | | | 0.11 | | | | 0.25 | | | | 0.36 | | | | (0.11 | ) | | | — | | | | — | | | | (0.11 | ) |
| Year Ended September 30, 2019 | | $ | 11.40 | | | | 0.14 | | | | 0.57 | | | | 0.71 | | | | (0.14 | ) | | | — | | | | — | | | | (0.14 | ) |
| Year Ended September 30, 2018 | | $ | 11.76 | | | | 0.14 | | | | (0.36 | ) | | | (0.22 | ) | | | (0.14 | ) | | | — | | | | — | | | | (0.14 | ) |
| Year Ended September 30, 2017 | | $ | 12.13 | | | | 0.14 | | | | (0.28 | ) | | | (0.14 | ) | | | (0.14 | ) | | | (0.09 | ) | | | — | | | | (0.23 | ) |
| Sterling Capital West Virginia Intermediate Tax-Free Fund |
| Year Ended September 30, 2021 | | $ | 10.30 | | | | 0.09 | | | | (0.10 | ) | | | (0.01 | ) | | | (0.08 | ) | | | (0.01 | ) | | | — | | | | (0.09 | ) |
| Year Ended September 30, 2020 | | $ | 10.13 | | | | 0.11 | | | | 0.18 | | | | 0.29 | | | | (0.11 | ) | | | (0.01 | ) | | | — | | | | (0.12 | ) |
| Year Ended September 30, 2019 | | $ | 9.72 | | | | 0.14 | | | | 0.43 | | | | 0.57 | | | | (0.14 | ) | | | (0.02 | ) | | | — | | | | (0.16 | ) |
| Year Ended September 30, 2018 | | $ | 10.05 | | | | 0.14 | | | | (0.32 | ) | | | (0.18 | ) | | | (0.14 | ) | | | (0.01 | ) | | | — | | | | (0.15 | ) |
| Year Ended September 30, 2017 | | $ | 10.27 | | | | 0.13 | | | | (0.17 | ) | | | (0.04 | ) | | | (0.13 | ) | | | (0.05 | ) | | | — | | | | (0.18 | ) |
| * | During the periods certain fees were waived (See Note 4 in the Notes to the Financial Statements). If such reductions had not occurred, the ratios would have been as indicated. |
| ** | Portfolio turnover rate is calculated on the basis of the Fund as a whole without distinguishing between classes of shares issued. |
| (a) | Per share net investment income (loss) has been calculated using the average daily shares method. |
See accompanying Notes to the Financial Statements.
| | | | | | | Ratios/Supplementary Data | |
| Net Asset Value, End of Year | | | Total Return (excludes sales charge) | | | Net Assets, End of Year (000) | | | Ratio of net expenses to average net assets | | | Ratio of net investment income (loss) to average net assets | | | Ratio of expenses to average net assets* | | | Portfolio turnover rate** | |
| | | | | | | | | | | | | | | | | | | | |
| $ | 11.39 | | | | 0.10 | % | | $ | 603 | | | | 1.56 | % | | | 0.72 | % | | | 1.56 | % | | | 20.23 | % |
| $ | 11.46 | | | | 2.72 | % | | $ | 955 | | | | 1.56 | % | | | 1.01 | % | | | 1.56 | % | | | 4.84 | % |
| $ | 11.27 | | | | 5.93 | % | | $ | 978 | | | | 1.56 | % | | | 1.13 | % | | | 1.56 | % | | | 23.84 | % |
| $ | 10.76 | | | | (1.98 | )% | | $ | 991 | | | | 1.55 | % | | | 1.11 | % | | | 1.55 | % | | | 27.71 | % |
| $ | 11.10 | | | | (0.74 | )% | | $ | 1,440 | | | | 1.56 | % | | | 1.04 | % | | | 1.59 | % | | | 31.17 | % |
| | | | | | | | | | | | | | | | | | | | | | | | | | | |
| $ | 11.97 | | | | (1.27 | )% | | $ | 57 | | | | 1.57 | % | | | 0.58 | % | | | 1.57 | % | | | 8.98 | % |
| $ | 12.22 | | | | 3.03 | % | | $ | 780 | | | | 1.56 | % | | | 0.92 | % | | | 1.56 | % | | | 15.44 | % |
| $ | 11.97 | | | | 6.25 | % | | $ | 822 | | | | 1.56 | % | | | 1.19 | % | | | 1.56 | % | | | 24.57 | % |
| $ | 11.40 | | | | (1.87 | )% | | $ | 844 | | | | 1.55 | % | | | 1.22 | % | | | 1.55 | % | | | 21.08 | % |
| $ | 11.76 | | | | (1.14 | )% | | $ | 935 | | | | 1.55 | % | | | 1.18 | % | | | 1.59 | % | | | 23.25 | % |
| | | | | | | | | | | | | | | | | | | | | | | | | | | |
| $ | 10.20 | | | | (0.13 | )% | | $ | 25 | | | | 1.56 | % | | | 0.83 | % | | | 1.56 | % | | | 8.56 | % |
| $ | 10.30 | | | | 2.89 | % | | $ | 304 | | | | 1.56 | % | | | 1.10 | % | | | 1.56 | % | | | 3.28 | % |
| $ | 10.13 | | | | 5.90 | % | | $ | 335 | | | | 1.56 | % | | | 1.45 | % | | | 1.56 | % | | | 33.73 | % |
| $ | 9.72 | | | | (1.82 | )% | | $ | 726 | | | | 1.55 | % | | | 1.39 | % | | | 1.55 | % | | | 17.53 | % |
| $ | 10.05 | | | | (0.38 | )% | | $ | 739 | | | | 1.56 | % | | | 1.34 | % | | | 1.59 | % | | | 21.00 | % |
Financial Highlights, Institutional Shares
The financial highlights table is intended to help you understand the Funds’ financial performance for the past 5 years or, if shorter, the period of the Funds’ operations. Certain information reflects financial results for a single Fund share. The total returns in the table represent the rate that an investor would have earned (or lost) on an investment in the Fund (assuming reinvestment of all dividends and distributions).
| | | | | | Investment Activities | | | Distributions | |
| | | Net Asset Value, Beginning of Year | | | Net investment income (loss)(a) | | | Net realized/ unrealized gains (losses) on investments | | | Total from Investment Activities | | | Net investment income | | | Net realized gains on investments | | | Return of capital | | | Total Distributions | |
| Sterling Capital Behavioral Large Cap Value Equity Fund |
| Year Ended September 30, 2021 | | $ | 16.83 | | | | 0.09 | | | | 6.24 | | | | 6.33 | | | | (0.04 | ) | | | — | | | | (0.16 | ) | | | (0.20 | ) |
| Year Ended September 30, 2020 | | $ | 19.62 | | | | 0.41 | | | | (2.10 | ) | | | (1.69 | ) | | | (0.52 | ) | | | (0.58 | ) | | | — | | | | (1.10 | ) |
| Year Ended September 30, 2019 | | $ | 22.43 | | | | 0.44 | | | | (1.07 | ) | | | (0.63 | ) | | | (0.43 | ) | | | (1.75 | ) | | | — | | | | (2.18 | ) |
| Year Ended September 30, 2018 | | $ | 20.82 | | | | 0.33 | | | | 1.97 | | | | 2.30 | | | | (0.50 | ) | | | (0.19 | ) | | | — | | | | (0.69 | ) |
| Year Ended September 30, 2017 | | $ | 17.78 | | | | 0.41 | | | | 2.98 | | | | 3.39 | | | | (0.35 | ) | | | — | | | | — | | | | (0.35 | ) |
| Sterling Capital Mid Value Fund |
| Year Ended September 30, 2021 | | $ | 14.33 | | | | 0.03 | | | | 6.22 | | | | 6.25 | | | | (0.07 | ) | | | — | | | | — | | | | (0.07 | ) |
| Year Ended September 30, 2020 | | $ | 16.46 | | | | 0.06 | | | | (0.81 | ) | | | (0.75 | ) | | | (0.25 | ) | | | (1.13 | ) | | | — | | | | (1.38 | ) |
| Year Ended September 30, 2019 | | $ | 19.42 | | | | 0.08 | | | | (0.77 | ) | | | (0.69 | ) | | | (0.01 | ) | | | (2.26 | ) | | | — | | | | (2.27 | ) |
| Year Ended September 30, 2018 | | $ | 19.00 | | | | 0.01 | | | | 1.26 | | | | 1.27 | | | | (0.01 | ) | | | (0.84 | ) | | | — | | | | (0.85 | ) |
| Year Ended September 30, 2017 | | $ | 16.92 | | | | 0.03 | | | | 2.59 | | | | 2.62 | | | | (0.01 | ) | | | (0.53 | ) | | | — | | | | (0.54 | ) |
| Sterling Capital Behavioral Small Cap Value Equity Fund |
| Year Ended September 30, 2021 | | $ | 11.95 | | | | 0.16 | | | | 7.60 | | | | 7.76 | | | | (0.13 | ) | | | — | | | | — | | | | (0.13 | ) |
| Year Ended September 30, 2020 | | $ | 14.66 | | | | 0.13 | | | | (2.69 | ) | | | (2.56 | ) | | | (0.15 | ) | | | — | | | | — | | | | (0.15 | ) |
| Year Ended September 30, 2019 | | $ | 18.82 | | | | 0.21 | | | | (2.09 | ) | | | (1.88 | ) | | | (0.30 | ) | | | (1.98 | ) | | | — | | | | (2.28 | ) |
| Year Ended September 30, 2018 | | $ | 18.55 | | | | 0.19 | | | | 0.89 | | | | 1.08 | | | | (0.16 | ) | | | (0.65 | ) | | | — | | | | (0.81 | ) |
| Year Ended September 30, 2017 | | $ | 15.30 | | | | 0.17 | | | | 3.18 | | | | 3.35 | | | | (0.10 | ) | | | — | | | | — | | | | (0.10 | ) |
| Sterling Capital Special Opportunities Fund |
| Year Ended September 30, 2021 | | $ | 26.20 | | | | (0.03 | ) | | | 9.79 | | | | 9.76 | | | | (0.04 | ) | | | (0.33 | ) | | | — | | | | (0.37 | ) |
| Year Ended September 30, 2020 | | $ | 26.07 | | | | 0.06 | | | | 1.45 | | | | 1.51 | | | | (0.05 | ) | | | (1.33 | ) | | | — | | | | (1.38 | ) |
| Year Ended September 30, 2019 | | $ | 27.73 | | | | 0.08 | | | | 0.12 | | | | 0.20 | | | | — | (b) | | | (1.86 | ) | | | — | | | | (1.86 | ) |
| Year Ended September 30, 2018 | | $ | 25.65 | | | | 0.09 | | | | 4.11 | | | | 4.20 | | | | (0.18 | ) | | | (1.94 | ) | | | — | | | | (2.12 | ) |
| Year Ended September 30, 2017 | | $ | 22.48 | | | | 0.08 | | | | 3.51 | | | | 3.59 | | | | (0.01 | ) | | | (0.41 | ) | | | — | | | | (0.42 | ) |
| Sterling Capital Equity Income Fund |
| Year Ended September 30, 2021 | | $ | 20.10 | | | | 0.35 | | | | 6.56 | | | | 6.91 | | | | (0.35 | ) | | | — | | | | — | | | | (0.35 | ) |
| Year Ended September 30, 2020 | | $ | 21.33 | | | | 0.41 | | | | (0.39 | ) | | | 0.02 | | | | (0.41 | ) | | | (0.84 | ) | | | — | | | | (1.25 | ) |
| Year Ended September 30, 2019 | | $ | 21.61 | | | | 0.44 | | | | 1.23 | | | | 1.67 | | | | (0.43 | ) | | | (1.52 | ) | | | — | | | | (1.95 | ) |
| Year Ended September 30, 2018 | | $ | 20.89 | | | | 0.40 | | | | 2.66 | | | | 3.06 | | | | (0.39 | ) | | | (1.95 | ) | | | — | | | | (2.34 | ) |
| Year Ended September 30, 2017 | | $ | 18.34 | | | | 0.39 | | | | 2.60 | | | | 2.99 | | | | (0.42 | ) | | | (0.02 | ) | | | — | | | | (0.44 | ) |
| * | During the periods certain fees were waived (See Note 4 in the Notes to the Financial Statements). If such reductions had not occurred, the ratios would have been as indicated. |
| ** | Portfolio turnover rate is calculated on the basis of the Fund as a whole without distinguishing between classes of shares issued. |
| (a) | Per share net investment income (loss) has been calculated using the average daily shares method. |
| (b) | Amount is less than $0.005. |
See accompanying Notes to the Financial Statements.
| | | | | | | Ratios/Supplementary Data | |
| Net Asset Value, End of Year | | | Total Return (excludes sales charge) | | | Net Assets, End of Year (000) | | | Ratio of net expenses to average net assets | | | Ratio of net investment income (loss) to average net assets | | | Ratio of expenses to average net assets* | | | Portfolio turnover rate** | |
| | | | | | | | | | | | | | | | | | | | |
| $ | 22.96 | | | | 37.90 | % | | $ | 2,023 | | | | 0.64 | % | | | 0.42 | % | | | 0.78 | % | | | 122.64 | % |
| $ | 16.83 | | | | (8.96 | )% | | $ | 1,949 | | | | 0.64 | % | | | 2.18 | % | | | 0.66 | % | | | 167.34 | % |
| $ | 19.62 | | | | (2.08 | )% | | $ | 7,550 | | | | 0.64 | % | | | 2.28 | % | | | 0.64 | % | | | 142.59 | % |
| $ | 22.43 | | | | 11.19 | % | | $ | 8,862 | | | | 0.63 | % | | | 1.51 | % | | | 0.63 | % | | | 127.89 | % |
| $ | 20.82 | | | | 19.18 | % | | $ | 272,504 | | | | 0.64 | % | | | 2.12 | % | | | 0.64 | % | | | 144.85 | % |
| | | | | | | | | | | | | | | | | | | | | | | | | | | |
| $ | 20.51 | | | | 43.72 | % | | $ | 51,607 | | | | 0.87 | % | | | 0.17 | % | | | 0.89 | % | | | 34.00 | % |
| $ | 14.33 | | | | (5.50 | )% | | $ | 36,835 | | | | 0.89 | % | | | 0.39 | % | | | 1.04 | % | | | 28.77 | % |
| $ | 16.46 | | | | (2.54 | )% | | $ | 154,259 | | | | 0.93 | % | | | 0.49 | % | | | 0.93 | % | | | 26.62 | % |
| $ | 19.42 | | | | 6.82 | % | | $ | 323,012 | | | | 0.92 | % | | | 0.08 | % | | | 0.92 | % | | | 34.62 | % |
| $ | 19.00 | | | | 15.73 | % | | $ | 632,867 | | | | 0.90 | % | | | 0.15 | % | | | 0.90 | % | | | 24.83 | % |
| | | | | | | | | | | | | | | | | | | | | | | | | | | |
| $ | 19.58 | | | | 65.21 | % | | $ | 14,639 | | | | 0.81 | % | | | 0.89 | % | | | 0.81 | % | | | 110.07 | % |
| $ | 11.95 | | | | (17.64 | )% | | $ | 6,820 | | | | 0.80 | % | | | 0.97 | % | | | 0.84 | % | | | 119.76 | % |
| $ | 14.66 | | | | (9.32 | )% | | $ | 28,223 | | | | 0.80 | % | | | 1.42 | % | | | 0.80 | % | | | 124.82 | % |
| $ | 18.82 | | | | 5.96 | % | | $ | 39,047 | | | | 0.78 | % | | | 1.04 | % | | | 0.78 | % | | | 89.85 | % |
| $ | 18.55 | | | | 21.89 | % | | $ | 208,404 | | | | 0.80 | % | | | 0.99 | % | | | 0.85 | % | | | 109.05 | % |
| | | | | | | | | | | | | | | | | | | | | | | | | | | |
| $ | 35.59 | | | | 37.55 | % | | $ | 216,341 | | | | 0.86 | % | | | (0.11 | )% | | | 0.87 | % | | | 27.20 | % |
| $ | 26.20 | | | | 5.79 | % | | $ | 170,323 | | | | 0.86 | % | | | 0.22 | % | | | 0.86 | % | | | 17.50 | % |
| $ | 26.07 | | | | 1.47 | % | | $ | 281,099 | | | | 0.86 | % | | | 0.30 | % | | | 0.86 | % | | | 17.31 | % |
| $ | 27.73 | | | | 17.46 | % | | $ | 350,030 | | | | 0.86 | % | | | 0.35 | % | | | 0.86 | % | | | 22.78 | % |
| $ | 25.65 | | | | 16.22 | % | | $ | 652,211 | | | | 0.87 | % | | | 0.32 | % | | | 0.87 | % | | | 18.92 | % |
| | | | | | | | | | | | | | | | | | | | | | | | | | | |
| $ | 26.66 | | | | 34.47 | % | | $ | 1,622,233 | | | | 0.78 | % | | | 1.40 | % | | | 0.79 | % | | | 13.00 | % |
| $ | 20.10 | | | | 0.15 | % | | $ | 1,057,722 | | | | 0.77 | % | | | 2.06 | % | | | 0.78 | % | | | 33.60 | % |
| $ | 21.33 | | | | 8.72 | % | | $ | 992,964 | | | | 0.77 | % | | | 2.17 | % | | | 0.77 | % | | | 23.20 | % |
| $ | 21.61 | | | | 15.58 | % | | $ | 828,607 | | | | 0.77 | % | | | 1.91 | % | | | 0.77 | % | | | 19.49 | % |
| $ | 20.89 | | | | 16.51 | % | | $ | 980,982 | | | | 0.78 | % | | | 2.04 | % | | | 0.78 | % | | | 16.93 | % |
Financial Highlights, Institutional Shares
The financial highlights table is intended to help you understand the Funds’ financial performance for the past 5 years or, if shorter, the period of the Funds’ operations. Certain information reflects financial results for a single Fund share. The total returns in the table represent the rate that an investor would have earned (or lost) on an investment in the Fund (assuming reinvestment of all dividends and distributions).
| | | | | | Investment Activities | | | Distributions | |
| | | Net Asset Value, Beginning of Year | | | Net investment income (loss)(a) | | | Net realized/ unrealized gains (losses) on investments | | | Total from Investment Activities | | | Net investment income | | | Net realized gains on investments | | | Return of capital | | | Total Distributions | |
| Sterling Capital Behavioral International Equity Fund |
| Year Ended September 30, 2021 | | $ | 8.14 | | | | 0.07 | | | | 1.84 | | | | 1.91 | | | | (0.24 | ) | | | — | | | | — | | | | (0.24 | ) |
| Year Ended September 30, 2020 | | $ | 9.49 | | | | 0.27 | | | | (1.32 | ) | | | (1.05 | ) | | | (0.30 | ) | | | — | | | | — | | | | (0.30 | ) |
| Year Ended September 30, 2019 | | $ | 11.18 | | | | 0.35 | | | | (1.33 | ) | | | (0.98 | ) | | | (0.31 | ) | | | (0.40 | ) | | | — | | | | (0.71 | ) |
| Year Ended September 30, 2018 | | $ | 11.76 | | | | 0.28 | | | | (0.40 | ) | | | (0.12 | ) | | | (0.35 | ) | | | (0.11 | ) | | | — | | | | (0.46 | ) |
| Year Ended September 30, 2017 | | $ | 9.69 | | | | 0.27 | | | | 1.97 | | | | 2.24 | | | | (0.17 | ) | | | — | | | | — | | | | (0.17 | ) |
| Sterling Capital SMID Opportunities Fund |
| Year Ended September 30, 2021 | | $ | 12.55 | | | | (0.03 | ) | | | 3.73 | | | | 3.70 | | | | — | | | | — | | | | — | | | | — | |
| Year Ended September 30, 2020 | | $ | 13.31 | | | | — | (b) | | | (0.13 | ) | | | (0.13 | ) | | | — | | | | (0.63 | ) | | | — | | | | (0.63 | ) |
| Year Ended September 30, 2019 | | $ | 12.48 | | | | 0.01 | | | | 0.82 | | | | 0.83 | | | | — | | | | — | | | | — | | | | — | |
| Year Ended September 30, 2018 | | $ | 11.77 | | | | (0.02 | ) | | | 0.99 | | | | 0.97 | | | | (0.08 | ) | | | (0.18 | ) | | | — | | | | (0.26 | ) |
| Year Ended September 30, 2017 | | $ | 10.00 | | | | 0.02 | | | | 1.76 | | | | 1.78 | | | | (0.01 | ) | | | — | | | | — | | | | (0.01 | ) |
| Sterling Capital Stratton Mid Cap Value Fund |
| Year Ended September 30, 2021 | | $ | 58.95 | | | | 0.45 | | | | 20.09 | | | | 20.54 | | | | (0.34 | ) | | | (0.23 | ) | | | — | | | | (0.57 | ) |
| Year Ended September 30, 2020 | | $ | 64.31 | | | | 0.40 | | | | (3.64 | ) | | | (3.24 | ) | | | (0.61 | ) | | | (1.51 | ) | | | — | | | | (2.12 | ) |
| Year Ended September 30, 2019 | | $ | 69.02 | | | | 0.45 | �� | | | 0.15 | | | | 0.60 | | | | (0.29 | ) | | | (5.02 | ) | | | — | | | | (5.31 | ) |
| Year Ended September 30, 2018 | | $ | 66.47 | | | | 0.27 | | | | 4.87 | | | | 5.14 | | | | (0.30 | ) | | | (2.29 | ) | | | — | | | | (2.59 | ) |
| Year Ended September 30, 2017 | | $ | 55.97 | | | | 0.19 | | | | 10.66 | | | | 10.85 | | | | (0.08 | ) | | | (0.27 | ) | | | — | | | | (0.35 | ) |
| Sterling Capital Stratton Real Estate Fund |
| Year Ended September 30, 2021 | | $ | 36.66 | | | | 0.43 | | | | 10.51 | | | | 10.94 | | | | (0.59 | ) | | | (0.82 | ) | | | — | | | | (1.41 | ) |
| Year Ended September 30, 2020 | | $ | 42.36 | | | | 0.59 | | | | (3.97 | ) | | | (3.38 | ) | | | (0.80 | ) | | | (1.52 | ) | | | — | | | | (2.32 | ) |
| Year Ended September 30, 2019 | | $ | 37.63 | | | | 0.79 | | | | 6.05 | | | | 6.84 | | | | (0.87 | ) | | | (1.24 | ) | | | — | | | | (2.11 | ) |
| Year Ended September 30, 2018 | | $ | 37.10 | | | | 0.81 | | | | 1.52 | | | | 2.33 | | | | (0.58 | ) | | | (1.22 | ) | | | — | | | | (1.80 | ) |
| Year Ended September 30, 2017 | | $ | 39.74 | | | | 0.83 | | | | (0.53 | ) | | | 0.30 | | | | (1.19 | ) | | | (1.75 | ) | | | — | | | | (2.94 | ) |
| Sterling Capital Stratton Small Cap Value Fund |
| Year Ended September 30, 2021 | | $ | 64.04 | | | | 0.17 | | | | 31.01 | | | | 31.18 | | | | (0.42 | ) | | | (11.22 | ) | | | — | | | | (11.64 | ) |
| Year Ended September 30, 2020 | | $ | 78.38 | | | | 0.41 | | | | (9.36 | ) | | | (8.95 | ) | | | (0.46 | ) | | | (4.93 | ) | | | — | | | | (5.39 | ) |
| Year Ended September 30, 2019 | | $ | 89.11 | | | | 0.49 | | | | (5.02 | ) | | | (4.53 | ) | | | (0.30 | ) | | | (5.90 | ) | | | — | | | | (6.20 | ) |
| Year Ended September 30, 2018 | | $ | 90.19 | | | | 0.26 | | | | 6.60 | | | | 6.86 | | | | (0.25 | ) | | | (7.69 | ) | | | — | | | | (7.94 | ) |
| Year Ended September 30, 2017 | | $ | 78.46 | | | | 0.16 | | | | 15.81 | | | | 15.97 | | | | (0.14 | ) | | | (4.10 | ) | | | — | | | | (4.24 | ) |
| * | During the periods certain fees were waived (See Note 4 in the Notes to the Financial Statements). If such reductions had not occurred, the ratios would have been as indicated. |
| ** | Portfolio turnover rate is calculated on the basis of the Fund as a whole without distinguishing between classes of shares issued. |
| (a) | Per share net investment income (loss) has been calculated using the average daily shares method. |
| (b) | Amount is less than $0.005. |
See accompanying Notes to the Financial Statements.
| | | | | | | Ratios/Supplementary Data | |
| Redemption Fees | | | Net Asset Value, End of Year | | | Total Return (excludes sales charge) | | | Net Assets, End of Year (000) | | | Ratio of net expenses to average net assets | | | Ratio of net investment income (loss) to average net assets | | | Ratio of expenses to average net assets* | | | Portfolio turnover rate** | |
| | | | | | | | | | | | | | | | | | | | | | | |
| | — | | | $ | 9.81 | | | | 23.86 | % | | $ | 662 | | | | 0.67 | % | | | 0.85 | % | | | 0.85 | % | | | 158.16 | % |
| | — | | | $ | 8.14 | | | | (11.65 | )% | | $ | 13,670 | | | | 0.63 | % | | | 3.09 | % | | | 0.83 | % | | | 164.02 | % |
| | — | | | $ | 9.49 | | | | (8.44 | )% | | $ | 16,721 | | | | 0.69 | % | | | 3.62 | % | | | 0.89 | % | | | 97.74 | % |
| | — | | | $ | 11.18 | | | | (1.25 | )% | | $ | 19,266 | | | | 0.65 | % | | | 2.33 | % | | | 0.85 | % | | | 96.65 | % |
| | — | | | $ | 11.76 | | | | 23.46 | % | | $ | 81,876 | | | | 0.68 | % | | | 2.59 | % | | | 0.95 | % | | | 91.65 | % |
| | | | | | | | | | | | | | | | | | | | | | | | | | | | | | | |
| | — | | | $ | 16.25 | | | | 29.48 | % | | $ | 4,591 | | | | 0.79 | % | | | (0.19 | )% | | | 1.06 | % | | | 33.93 | % |
| | — | | | $ | 12.55 | | | | (1.30 | )% | | $ | 5,359 | | | | 0.79 | % | | | 0.02 | % | | | 1.09 | % | | | 60.03 | % |
| | — | | | $ | 13.31 | | | | 6.65 | % | | $ | 5,386 | | | | 0.79 | % | | | 0.07 | % | | | 1.20 | % | | | 45.11 | % |
| | — | | | $ | 12.48 | | | | 8.39 | % | | $ | 4,886 | | | | 0.79 | % | | | (0.13 | )% | | | 1.04 | % | | | 45.64 | % |
| | — | | | $ | 11.77 | | | | 17.84 | % | | $ | 4,460 | | | | 0.79 | % | | | 0.19 | % | | | 1.35 | % | | | 37.97 | % |
| | | | | | | | | | | | | | | | | | | | | | | | | | | | | | | |
| | — | | | $ | 78.92 | | | | 35.02 | % | | $ | 65,503 | | | | 0.85 | % | | | 0.60 | % | | | 0.86 | % | | | 8.23 | % |
| | — | | | $ | 58.95 | | | | (5.39 | )% | | $ | 53,847 | | | | 0.91 | % | | | 0.67 | % | | | 0.94 | % | | | 9.21 | % |
| | — | | | $ | 64.31 | | | | 1.97 | % | | $ | 61,908 | | | | 0.95 | % | | | 0.73 | % | | | 0.95 | % | | | 6.75 | % |
| | — | | | $ | 69.02 | | | | 7.81 | % | | $ | 66,554 | | | | 0.95 | % | | | 0.40 | % | | | 0.95 | % | | | 14.47 | % |
| | — | | | $ | 66.47 | | | | 19.47 | % | | $ | 66,030 | | | | 0.91 | % | | | 0.32 | % | | | 0.92 | % | | | 12.19 | % |
| | | | | | | | | | | | | | | | | | | | | | | | | | | | | | | |
| | — | | | $ | 46.19 | | | | 30.40 | % | | $ | 96,075 | | | | 0.81 | % | | | 1.00 | % | | | 0.81 | % | | | 12.68 | % |
| | — | | | $ | 36.66 | | | | (8.09 | )% | | $ | 85,144 | | | | 0.82 | % | | | 1.55 | % | | | 0.82 | % | | | 9.21 | % |
| | — | | | $ | 42.36 | | | | 19.06 | % | | $ | 105,216 | | | | 0.82 | % | | | 2.03 | % | | | 0.82 | % | | | 14.56 | % |
| | — | | | $ | 37.63 | | | | 6.42 | % | | $ | 91,626 | | | | 0.82 | % | | | 2.21 | % | | | 0.82 | % | | | 8.34 | % |
| | — | | | $ | 37.10 | | | | 1.16 | % | | $ | 96,199 | | | | 0.79 | % | | | 2.23 | % | | | 0.81 | % | | | 13.52 | % |
| | | | | | | | | | | | | | | | | | | | | | | | | | | | | | | |
| | — | | | $ | 83.58 | | | | 52.78 | % | | $ | 514,025 | | | | 0.98 | % | | | 0.22 | % | | | 1.02 | % | | | 6.15 | % |
| | — | | | $ | 64.04 | | | | (12.59 | )% | | $ | 475,615 | | | | 1.01 | % | | | 0.58 | % | | | 1.08 | % | | | 8.33 | % |
| | — | | | $ | 78.38 | | | | (4.55 | )% | | $ | 959,875 | | | | 1.03 | % | | | 0.64 | % | | | 1.08 | % | | | 8.60 | % |
| | — | | | $ | 89.11 | | | | 7.98 | % | | $ | 1,296,897 | | | | 1.03 | % | | | 0.29 | % | | | 1.06 | % | | | 15.51 | % |
| | — | (b) | | $ | 90.19 | | | | 20.73 | % | | $ | 1,183,974 | | | | 1.06 | % | | | 0.19 | % | | | 1.06 | % | | | 7.04 | % |
Financial Highlights, Institutional Shares
The financial highlights table is intended to help you understand the Funds’ financial performance for the past 5 years or, if shorter, the period of the Funds’ operations. Certain information reflects financial results for a single Fund share. The total returns in the table represent the rate that an investor would have earned (or lost) on an investment in the Fund (assuming reinvestment of all dividends and distributions).
| | | | | | Investment Activities | | | Distributions | |
| | | Net Asset Value, Beginning of Year | | | Net investment income(a) | | | Net realized/ unrealized gains (losses) on investments | | | Total from Investment Activities | | | Net investment income | | | Net realized gains on investments | | | Return of capital | | | Total Distributions | |
| Sterling Capital Ultra Short Bond Fund |
| Year Ended September 30, 2021 | | $ | 9.83 | | | | 0.11 | | | | (0.04 | ) | | | 0.07 | | | | (0.12 | ) | | | — | | | | — | | | | (0.12 | ) |
| Year Ended September 30, 2020 | | $ | 9.79 | | | | 0.19 | | | | 0.05 | | | | 0.24 | | | | (0.20 | ) | | | — | | | | — | | | | (0.20 | ) |
| Year Ended September 30, 2019 | | $ | 9.75 | | | | 0.26 | | | | 0.03 | | | | 0.29 | | | | (0.25 | ) | | | — | | | | — | | | | (0.25 | ) |
| Year Ended September 30, 2018 | | $ | 9.79 | | | | 0.16 | | | | (0.02 | ) | | | 0.14 | | | | (0.18 | ) | | | — | | | | — | | | | (0.18 | ) |
| Year Ended September 30, 2017 | | $ | 9.81 | | | | 0.09 | | | | 0.04 | | | | 0.13 | | | | (0.15 | ) | | | — | | | | — | | | | (0.15 | ) |
| Sterling Capital Short Duration Bond Fund |
| Year Ended September 30, 2021 | | $ | 8.78 | | | | 0.12 | | | | (0.02 | ) | | | 0.10 | | | | (0.20 | ) | | | — | | | | — | | | | (0.20 | ) |
| Year Ended September 30, 2020 | | $ | 8.65 | | | | 0.19 | | | | 0.16 | | | | 0.35 | | | | (0.22 | ) | | | — | | | | — | | | | (0.22 | ) |
| Year Ended September 30, 2019 | | $ | 8.52 | | | | 0.23 | | | | 0.15 | | | | 0.38 | | | | (0.25 | ) | | | — | | | | — | | | | (0.25 | ) |
| Year Ended September 30, 2018 | | $ | 8.69 | | | | 0.19 | | | | (0.12 | ) | | | 0.07 | | | | (0.24 | ) | | | — | | | | — | | | | (0.24 | ) |
| Year Ended September 30, 2017 | | $ | 8.81 | | | | 0.12 | | | | (0.01 | ) | | | 0.11 | | | | (0.23 | ) | | | — | | | | — | | | | (0.23 | ) |
| Sterling Capital Intermediate U.S. Government Fund |
| Year Ended September 30, 2021 | | $ | 10.14 | | | | 0.09 | | | | (0.19 | ) | | | (0.10 | ) | | | (0.25 | ) | | | — | | | | — | | | | (0.25 | ) |
| Year Ended September 30, 2020 | | $ | 9.93 | | | | 0.20 | | | | 0.28 | | | | 0.48 | | | | (0.27 | ) | | | — | | | | — | | | | (0.27 | ) |
| Year Ended September 30, 2019 | | $ | 9.49 | | | | 0.23 | | | | 0.48 | | | | 0.71 | | | | (0.27 | ) | | | — | | | | — | | | | (0.27 | ) |
| Year Ended September 30, 2018 | | $ | 9.92 | | | | 0.19 | | | | (0.34 | ) | | | (0.15 | ) | | | (0.28 | ) | | | — | | | | — | | | | (0.28 | ) |
| Year Ended September 30, 2017 | | $ | 10.25 | | | | 0.18 | | | | (0.28 | ) | | | (0.10 | ) | | | (0.23 | ) | | | — | | | | — | | | | (0.23 | ) |
| Sterling Capital Total Return Bond Fund |
| Year Ended September 30, 2021 | | $ | 11.39 | | | | 0.20 | | | | (0.13 | ) | | | 0.07 | | | | (0.26 | ) | | | (0.15 | ) | | | — | | | | (0.41 | ) |
| Year Ended September 30, 2020 | | $ | 10.89 | | | | 0.27 | | | | 0.54 | | | | 0.81 | | | | (0.31 | ) | | | — | (b) | | | — | | | | (0.31 | ) |
| Year Ended September 30, 2019 | | $ | 10.20 | | | | 0.32 | | | | 0.71 | | | | 1.03 | | | | (0.34 | ) | | | — | | | | — | | | | (0.34 | ) |
| Year Ended September 30, 2018 | | $ | 10.60 | | | | 0.29 | | | | (0.37 | ) | | | (0.08 | ) | | | (0.32 | ) | | | — | | | | — | | | | (0.32 | ) |
| Year Ended September 30, 2017 | | $ | 10.82 | | | | 0.25 | | | | (0.15 | ) | | | 0.10 | | | | (0.32 | ) | | | — | | | | — | | | | (0.32 | ) |
| Sterling Capital Corporate Fund |
| Year Ended September 30, 2021 | | $ | 10.77 | | | | 0.28 | | | | 0.03 | | | | 0.31 | | | | (0.28 | ) | | | (0.30 | ) | | | — | | | | (0.58 | ) |
| Year Ended September 30, 2020 | | $ | 10.38 | | | | 0.30 | | | | 0.39 | | | | 0.69 | | | | (0.30 | ) | | | — | | | | — | | | | (0.30 | ) |
| Year Ended September 30, 2019 | | $ | 9.81 | | | | 0.33 | | | | 0.56 | | | | 0.89 | | | | (0.32 | ) | | | — | | | | — | | | | (0.32 | ) |
| Year Ended September 30, 2018 | | $ | 10.24 | | | | 0.32 | | | | (0.36 | ) | | | (0.04 | ) | | | (0.32 | ) | | | (0.07 | ) | | | — | | | | (0.39 | ) |
| Year Ended September 30, 2017 | | $ | 10.36 | | | | 0.32 | | | | (0.09 | ) | | | 0.23 | | | | (0.31 | ) | | | (0.04 | ) | | | — | | | | (0.35 | ) |
| * | During the periods certain fees were waived (See Note 4 in the Notes to the Financial Statements). If such reductions had not occurred, the ratios would have been as indicated. |
| ** | Portfolio turnover rate is calculated on the basis of the Fund as a whole without distinguishing between classes of shares issued. |
| (a) | Per share net investment income (loss) has been calculated using the average daily shares method. |
| (b) | Amount is less than $0.005. |
See accompanying Notes to the Financial Statements.
| | | | | | | | | | Ratios/Supplementary Data | |
| Redemption Fees | | | Net Asset Value, End of Year | | | Total Return (excludes sales charge) | | | Net Assets, End of Year (000) | | | Ratio of net expenses to average net assets | | | Ratio of net investment income (loss) to average net assets | | | Ratio of expenses to average net assets* | | | Portfolio turnover rate** | |
| | | | | | | | | | | | | | | | | | | | | | | |
| | — | | | $ | 9.78 | | | | 0.75 | % | | $ | 32,492 | | | | 0.29 | % | | | 1.08 | % | | | 0.51 | % | | | 48.71 | % |
| | — | | | $ | 9.83 | | | | 2.44 | % | | $ | 33,699 | | | | 0.38 | % | | | 1.90 | % | | | 0.55 | % | | | 43.45 | % |
| | — | | | $ | 9.79 | | | | 3.06 | % | | $ | 15,343 | | | | 0.42 | % | | | 2.70 | % | | | 0.52 | % | | | 103.69 | % |
| | — | | | $ | 9.75 | | | | 1.46 | % | | $ | 21,926 | | | | 0.41 | % | | | 1.65 | % | | | 0.51 | % | | | 74.56 | % |
| | — | | | $ | 9.79 | | | | 1.36 | % | | $ | 33,879 | | | | 0.43 | % | | | 0.95 | % | | | 0.53 | % | | | 59.57 | % |
| | | | | | | | | | | | | | | | | | | | | | | | | | | | | | | |
| | — | | | $ | 8.68 | | | | 1.19 | % | | $ | 161,804 | | | | 0.43 | % | | | 1.40 | % | | | 0.46 | % | | | 39.26 | % |
| | — | | | $ | 8.78 | | | | 4.12 | % | | $ | 174,891 | | | | 0.42 | % | | | 2.20 | % | | | 0.52 | % | | | 64.69 | % |
| | — | | | $ | 8.65 | | | | 4.55 | % | | $ | 171,989 | | | | 0.43 | % | | | 2.68 | % | | | 0.53 | % | | | 78.58 | % |
| | — | | | $ | 8.52 | | | | 0.80 | % | | $ | 126,878 | | | | 0.43 | % | | | 2.20 | % | | | 0.53 | % | | | 62.02 | % |
| | — | | | $ | 8.69 | | | | 1.28 | % | | $ | 67,467 | | | | 0.45 | % | | | 1.37 | % | | | 0.55 | % | | | 78.77 | % |
| | | | | | | | | | | | | | | | | | | | | | | | | | | | | | | |
| | — | | | $ | 9.79 | | | | (1.08 | )% | | $ | 16,272 | | | | 0.43 | % | | | 0.88 | % | | | 0.61 | % | | | 71.31 | % |
| | — | | | $ | 10.14 | | | | 4.92 | % | | $ | 8,049 | | | | 0.54 | % | | | 1.95 | % | | | 0.70 | % | | | 47.36 | % |
| | — | | | $ | 9.93 | | | | 7.54 | % | | $ | 11,052 | | | | 0.57 | % | | | 2.35 | % | | | 0.66 | % | | | 40.13 | % |
| | — | | | $ | 9.49 | | | | (1.48 | )% | | $ | 17,961 | | | | 0.65 | % | | | 1.99 | % | | | 0.66 | % | | | 40.85 | % |
| | — | | | $ | 9.92 | | | | (0.95 | )% | | $ | 16,412 | | | | 0.62 | % | | | 1.80 | % | | | 0.66 | % | | | 32.44 | % |
| | | | | | | | | | | | | | | | | | | | | | | | | | | | | | | |
| | — | | | $ | 11.05 | | | | 0.69 | % | | $ | 1,139,676 | | | | 0.45 | % | | | 1.77 | % | | | 0.50 | % | | | 48.80 | % |
| | — | | | $ | 11.39 | | | | 7.59 | % | | $ | 1,051,891 | | | | 0.45 | % | | | 2.45 | % | | | 0.57 | % | | | 59.59 | % |
| | — | | | $ | 10.89 | | | | 10.27 | % | | $ | 1,065,346 | | | | 0.45 | % | | | 3.10 | % | | | 0.58 | % | | | 79.40 | % |
| | — | | | $ | 10.20 | | | | (0.74 | )% | | $ | 860,437 | | | | 0.45 | % | | | 2.79 | % | | | 0.57 | % | | | 62.28 | % |
| | — | | | $ | 10.60 | | | | 1.00 | % | | $ | 997,074 | | | | 0.47 | % | | | 2.38 | % | | | 0.57 | % | | | 64.07 | % |
| | | | | | | | | | | | | | | | | | | | | | | | | | | | | | | |
| | — | | | $ | 10.50 | | | | 2.92 | % | | $ | 6,508 | | | | 0.71 | % | | | 2.61 | % | | | 0.87 | % | | | 47.29 | % |
| | — | | | $ | 10.77 | | | | 6.72 | % | | $ | 18,519 | | | | 0.67 | % | | | 2.83 | % | | | 0.70 | % | | | 52.28 | % |
| | — | | | $ | 10.38 | | | | 9.28 | % | | $ | 22,651 | | | | 0.68 | % | | | 3.25 | % | | | 0.69 | % | | | 82.23 | % |
| | — | | | $ | 9.81 | | | | (0.45 | )% | | $ | 30,805 | | | | 0.63 | % | | | 3.18 | % | | | 0.63 | % | | | 66.82 | % |
| | — | | | $ | 10.24 | | | | 2.32 | % | | $ | 29,471 | | | | 0.63 | % | | | 3.09 | % | | | 0.63 | % | | | 78.79 | % |
Financial Highlights, Institutional Shares
The financial highlights table is intended to help you understand the Funds’ financial performance for the past 5 years or, if shorter, the period of the Funds’ operations. Certain information reflects financial results for a single Fund share. The total returns in the table represent the rate that an investor would have earned (or lost) on an investment in the Fund (assuming reinvestment of all dividends and distributions).
| | | | | | Investment Activities | | | Distributions | |
| | | Net Asset Value, Beginning of Year | | | Net investment income(a) | | | Net realized/ unrealized gains (losses) on investments | | | Total from Investment Activities | | | Net investment income | | | Net realized gains on investments | | | Return of capital | | | Total Distributions | |
| Sterling Capital Quality Income Fund |
| Year Ended September 30, 2021 | | $ | 10.26 | | | | 0.15 | | | | (0.15 | ) | | | — | | | | (0.21 | ) | | | — | | | | — | | | | (0.21 | ) |
| Year Ended September 30, 2020 | | $ | 10.10 | | | | 0.24 | | | | 0.19 | | | | 0.43 | | | | (0.27 | ) | | | — | | | | — | | | | (0.27 | ) |
| Year Ended September 30, 2019 | | $ | 9.62 | | | | 0.31 | | | | 0.47 | | | | 0.78 | | | | (0.30 | ) | | | — | | | | — | | | | (0.30 | ) |
| Year Ended September 30, 2018 | | $ | 9.95 | | | | 0.29 | | | | (0.32 | ) | | | (0.03 | ) | | | (0.30 | ) | | | — | | | | — | | | | (0.30 | ) |
| Year Ended September 30, 2017 | | $ | 10.10 | | | | 0.23 | | | | (0.11 | ) | | | 0.12 | | | | (0.27 | ) | | | — | | | | — | | | | (0.27 | ) |
| Sterling Capital North Carolina Intermediate Tax-Free Fund |
| Year Ended September 30, 2021 | | $ | 11.12 | | | | 0.18 | | | | (0.15 | ) | | | 0.03 | | | | (0.18 | ) | | | — | | | | — | | | | (0.18 | ) |
| Year Ended September 30, 2020 | | $ | 10.91 | | | | 0.21 | | | | 0.21 | | | | 0.42 | | | | (0.21 | ) | | | — | | | | — | | | | (0.21 | ) |
| Year Ended September 30, 2019 | | $ | 10.43 | | | | 0.25 | | | | 0.48 | | | | 0.73 | | | | (0.25 | ) | | | — | | | | — | | | | (0.25 | ) |
| Year Ended September 30, 2018 | | $ | 10.78 | | | | 0.26 | | | | (0.35 | ) | | | (0.09 | ) | | | (0.26 | ) | | | — | | | | — | | | | (0.26 | ) |
| Year Ended September 30, 2017 | | $ | 11.08 | | | | 0.25 | | | | (0.26 | ) | | | (0.01 | ) | | | (0.25 | ) | | | (0.04 | ) | | | — | | | | (0.29 | ) |
| Sterling Capital South Carolina Intermediate Tax-Free Fund |
| Year Ended September 30, 2021 | | $ | 11.39 | | | | 0.20 | | | | (0.07 | ) | | | 0.13 | | | | (0.20 | ) | | | — | | | | — | | | | (0.20 | ) |
| Year Ended September 30, 2020 | | $ | 11.20 | | | | 0.23 | | | | 0.19 | | | | 0.42 | | | | (0.23 | ) | | | — | | | | — | | | | (0.23 | ) |
| Year Ended September 30, 2019 | | $ | 10.69 | | | | 0.23 | | | | 0.51 | | | | 0.74 | | | | (0.23 | ) | | | — | | | | — | | | | (0.23 | ) |
| Year Ended September 30, 2018 | | $ | 11.03 | | | | 0.23 | | | | (0.34 | ) | | | (0.11 | ) | | | (0.23 | ) | | | — | | | | — | | | | (0.23 | ) |
| Year Ended September 30, 2017 | | $ | 11.22 | | | | 0.22 | | | | (0.19 | ) | | | 0.03 | | | | (0.22 | ) | | | — | | | | — | | | | (0.22 | ) |
| Sterling Capital Virginia Intermediate Tax-Free Fund |
| Year Ended September 30, 2021 | | $ | 12.22 | | | | 0.19 | | | | (0.22 | ) | | | (0.03 | ) | | | (0.19 | ) | | | (0.03 | ) | | | — | | | | (0.22 | ) |
| Year Ended September 30, 2020 | | $ | 11.97 | | | | 0.23 | | | | 0.25 | | | | 0.48 | | | | (0.23 | ) | | | — | | | | — | | | | (0.23 | ) |
| Year Ended September 30, 2019 | | $ | 11.40 | | | | 0.26 | | | | 0.57 | | | | 0.83 | | | | (0.26 | ) | | | — | | | | — | | | | (0.26 | ) |
| Year Ended September 30, 2018 | | $ | 11.76 | | | | 0.26 | | | | (0.36 | ) | | | (0.10 | ) | | | (0.26 | ) | | | — | | | | — | | | | (0.26 | ) |
| Year Ended September 30, 2017 | | $ | 12.13 | | | | 0.26 | | | | (0.28 | ) | | | (0.02 | ) | | | (0.26 | ) | | | (0.09 | ) | | | — | | | | (0.35 | ) |
| Sterling Capital West Virginia Intermediate Tax-Free Fund |
| Year Ended September 30, 2021 | | $ | 10.31 | | | | 0.18 | | | | (0.09 | ) | | | 0.09 | | | | (0.18 | ) | | | (0.01 | ) | | | — | | | | (0.19 | ) |
| Year Ended September 30, 2020 | | $ | 10.13 | | | | 0.21 | | | | 0.19 | | | | 0.40 | | | | (0.21 | ) | | | (0.01 | ) | | | — | | | | (0.22 | ) |
| Year Ended September 30, 2019 | | $ | 9.73 | | | | 0.24 | | | | 0.42 | | | | 0.66 | | | | (0.24 | ) | | | (0.02 | ) | | | — | | | | (0.26 | ) |
| Year Ended September 30, 2018 | | $ | 10.05 | | | | 0.24 | | | | (0.31 | ) | | | (0.07 | ) | | | (0.24 | ) | | | (0.01 | ) | | | — | | | | (0.25 | ) |
| Year Ended September 30, 2017 | | $ | 10.28 | | | | 0.23 | | | | (0.18 | ) | | | 0.05 | | | | (0.23 | ) | | | (0.05 | ) | | | — | | | | (0.28 | ) |
| * | During the periods certain fees were waived (See Note 4 in the Notes to the Financial Statements). If such reductions had not occurred, the ratios would have been as indicated. |
| ** | Portfolio turnover rate is calculated on the basis of the Fund as a whole without distinguishing between classes of shares issued. |
| (a) | Per share net investment income (loss) has been calculated using the average daily shares method. |
See accompanying Notes to the Financial Statements.
| | | | | | | Ratios/Supplementary Data | |
| Net Asset Value, End of Year | | | Total Return (excludes sales charge) | | | Net Assets, End of Year (000) | | | Ratio of net expenses to average net assets | | | Ratio of net investment income (loss) to average net assets | | | Ratio of expenses to average net assets* | | | Portfolio turnover rate** | |
| | | | | | | | | | | | | | | | | | | | |
| $ | 10.05 | | | | 0.02 | % | | $ | 62,718 | | | | 0.57 | % | | | 1.52 | % | | | 0.61 | % | | | 73.60 | % |
| $ | 10.26 | | | | 4.33 | % | | $ | 35,808 | | | | 0.59 | % | | | 2.36 | % | | | 0.63 | % | | | 35.96 | % |
| $ | 10.10 | | | | 8.27 | % | | $ | 36,361 | | | | 0.60 | % | | | 3.15 | % | | | 0.64 | % | | | 17.58 | % |
| $ | 9.62 | | | | (0.28 | )% | | $ | 37,088 | | | | 0.58 | % | | | 2.97 | % | | | 0.62 | % | | | 19.17 | % |
| $ | 9.95 | | | | 1.23 | % | | $ | 39,533 | | | | 0.60 | % | | | 2.31 | % | | | 0.64 | % | | | 34.72 | % |
| | | | | | | | | | | | | | | | | | | | | | | | | | | |
| $ | 10.97 | | | | 0.24 | % | | $ | 154,297 | | | | 0.55 | % | | | 1.59 | % | | | 0.55 | % | | | 7.97 | % |
| $ | 11.12 | | | | 3.90 | % | | $ | 140,958 | | | | 0.54 | % | | | 1.92 | % | | | 0.54 | % | | | 17.06 | % |
| $ | 10.91 | | | | 7.10 | % | | $ | 140,022 | | | | 0.55 | % | | | 2.37 | % | | | 0.55 | % | | | 33.12 | % |
| $ | 10.43 | | | | (0.81 | )% | | $ | 133,812 | | | | 0.54 | % | | | 2.49 | % | | | 0.54 | % | | | 22.06 | % |
| $ | 10.78 | | | | (0.06 | )% | | $ | 140,484 | | | | 0.54 | % | | | 2.34 | % | | | 0.58 | % | | | 25.92 | % |
| | | | | | | | | | | | | | | | | | | | | | | | | | | |
| $ | 11.32 | | | | 1.10 | % | | $ | 71,455 | | | | 0.56 | % | | | 1.71 | % | | | 0.56 | % | | | 20.23 | % |
| $ | 11.39 | | | | 3.76 | % | | $ | 71,865 | | | | 0.56 | % | | | 2.01 | % | | | 0.56 | % | | | 4.84 | % |
| $ | 11.20 | | | | 7.02 | % | | $ | 66,331 | | | | 0.56 | % | | | 2.13 | % | | | 0.56 | % | | | 23.84 | % |
| $ | 10.69 | | | | (1.02 | )% | | $ | 63,090 | | | | 0.55 | % | | | 2.10 | % | | | 0.55 | % | | | 27.71 | % |
| $ | 11.03 | | | | 0.34 | % | | $ | 69,746 | | | | 0.56 | % | | | 2.03 | % | | | 0.59 | % | | | 31.17 | % |
| | | | | | | | | | | | | | | | | | | | | | | | | | | |
| $ | 11.97 | | | | (0.27 | )% | | $ | 65,071 | | | | 0.56 | % | | | 1.56 | % | | | 0.56 | % | | | 8.98 | % |
| $ | 12.22 | | | | 4.06 | % | | $ | 62,828 | | | | 0.56 | % | | | 1.91 | % | | | 0.56 | % | | | 15.44 | % |
| $ | 11.97 | | | | 7.31 | % | | $ | 59,312 | | | | 0.56 | % | | | 2.18 | % | | | 0.56 | % | | | 24.57 | % |
| $ | 11.40 | | | | (0.88 | )% | | $ | 61,420 | | | | 0.55 | % | | | 2.22 | % | | | 0.55 | % | | | 21.08 | % |
| $ | 11.76 | | | | (0.14 | )% | | $ | 70,780 | | | | 0.55 | % | | | 2.18 | % | | | 0.59 | % | | | 23.25 | % |
| | | | | | | | | | | | | | | | | | | | | | | | | | | |
| $ | 10.21 | | | | 0.88 | % | | $ | 67,778 | | | | 0.56 | % | | | 1.78 | % | | | 0.56 | % | | | 8.56 | % |
| $ | 10.31 | | | | 4.01 | % | | $ | 67,627 | | | | 0.56 | % | | | 2.08 | % | | | 0.56 | % | | | 3.28 | % |
| $ | 10.13 | | | | 6.85 | % | | $ | 53,352 | | | | 0.56 | % | | | 2.43 | % | | | 0.56 | % | | | 33.73 | % |
| $ | 9.73 | | | | (0.73 | )% | | $ | 54,988 | | | | 0.55 | % | | | 2.39 | % | | | 0.55 | % | | | 17.53 | % |
| $ | 10.05 | | | | 0.52 | % | | $ | 59,567 | | | | 0.56 | % | | | 2.34 | % | | | 0.59 | % | | | 21.00 | % |
Financial Highlights, Class R Shares
The financial highlights table is intended to help you understand the Funds’ financial performance for the past 5 years or, if shorter, the period of the Funds’ operations. Certain information reflects financial results for a single Fund share. The total returns in the table represent the rate that an investor would have earned (or lost) on an investment in the Fund (assuming reinvestment of all dividends and distributions).
| | | | | | Investment Activities | | | Distributions | |
| | | Net Asset Value, Beginning of Year | | | Net investment income (loss)(a) | | | Net realized/ unrealized gains (losses) on investments | | | Total from Investment Activities | | | Net investment income | | | Net realized gains on investments | | | Return of capital | | | Total Distributions | |
| Sterling Capital Mid Value Fund |
| Year Ended September 30, 2021 | | $ | 13.35 | | | | (0.06 | ) | | | 5.80 | | | | 5.74 | | | | (0.01 | ) | | | — | | | | — | | | | (0.01 | ) |
| Year Ended September 30, 2020 | | $ | 15.43 | | | | (0.01 | ) | | | (0.76 | ) | | | (0.77 | ) | | | (0.18 | ) | | | (1.13 | ) | | | — | | | | (1.31 | ) |
| Year Ended September 30, 2019 | | $ | 18.43 | | | | 0.03 | | | | (0.77 | ) | | | (0.74 | ) | | | — | | | | (2.26 | ) | | | — | | | | (2.26 | ) |
| Year Ended September 30, 2018 | | $ | 18.15 | | | | (0.07 | ) | | | 1.19 | | | | 1.12 | | | | — | | | | (0.84 | ) | | | — | | | | (0.84 | ) |
| Year Ended September 30, 2017 | | $ | 16.25 | | | | — | (b) | | | 2.43 | | | | 2.43 | | | | — | | | | (0.53 | ) | | | — | | | | (0.53 | ) |
| Sterling Capital Behavioral Small Cap Value Equity Fund |
| Year Ended September 30, 2021 | | $ | 11.71 | | | | 0.07 | | | | 7.47 | | | | 7.54 | | | | (0.08 | ) | | | — | | | | — | | | | (0.08 | ) |
| Year Ended September 30, 2020 | | $ | 14.42 | | | | 0.07 | | | | (2.65 | ) | | | (2.58 | ) | | | (0.13 | ) | | | — | | | | — | | | | (0.13 | ) |
| Year Ended September 30, 2019 | | $ | 18.52 | | | | 0.14 | | | | (2.07 | ) | | | (1.93 | ) | | | (0.19 | ) | | | (1.98 | ) | | | — | | | | (2.17 | ) |
| Year Ended September 30, 2018 | | $ | 18.32 | | | | 0.13 | | | | 0.85 | | | | 0.98 | | | | (0.13 | ) | | | (0.65 | ) | | | — | | | | (0.78 | ) |
| Year Ended September 30, 2017 | | $ | 15.14 | | | | 0.18 | | | | 3.08 | | | | 3.26 | | | | (0.08 | ) | | | — | | | | — | | | | (0.08 | ) |
| Sterling Capital Special Opportunities Fund |
| Year Ended September 30, 2021 | | $ | 24.82 | | | | 0.04 | | | | 9.06 | | | | 9.10 | | | | — | | | | (0.33 | ) | | | — | | | | (0.33 | ) |
| Year Ended September 30, 2020 | | $ | 24.83 | | | | (0.07 | ) | | | 1.39 | | | | 1.32 | | | | — | | | | (1.33 | ) | | | — | | | | (1.33 | ) |
| Year Ended September 30, 2019 | | $ | 26.63 | | | | (0.04 | ) | | | 0.10 | | | | 0.06 | | | | — | | | | (1.86 | ) | | | — | | | | (1.86 | ) |
| Year Ended September 30, 2018 | | $ | 24.79 | | | | (0.04 | ) | | | 3.94 | | | | 3.90 | | | | (0.12 | ) | | | (1.94 | ) | | | — | | | | (2.06 | ) |
| Year Ended September 30, 2017 | | $ | 21.83 | | | | (0.04 | ) | | | 3.41 | | | | 3.37 | | | | — | | | | (0.41 | ) | | | — | | | | (0.41 | ) |
| Sterling Capital Equity Income Fund |
| Year Ended September 30, 2021 | | $ | 19.87 | | | | 0.22 | | | | 6.49 | | | | 6.71 | | | | (0.22 | ) | | | — | | | | — | | | | (0.22 | ) |
| Year Ended September 30, 2020 | | $ | 21.10 | | | | 0.30 | | | | (0.38 | ) | | | (0.08 | ) | | | (0.31 | ) | | | (0.84 | ) | | | — | | | | (1.15 | ) |
| Year Ended September 30, 2019 | | $ | 21.39 | | | | 0.34 | | | | 1.22 | | | | 1.56 | | | | (0.33 | ) | | | (1.52 | ) | | | — | | | | (1.85 | ) |
| Year Ended September 30, 2018 | | $ | 20.70 | | | | 0.29 | | | | 2.63 | | | | 2.92 | | | | (0.28 | ) | | | (1.95 | ) | | | — | | | | (2.23 | ) |
| Year Ended September 30, 2017 | | $ | 18.18 | | | | 0.29 | | | | 2.58 | | | | 2.87 | | | | (0.33 | ) | | | (0.02 | ) | | | — | | | | (0.35 | ) |
| Sterling Capital Total Return Bond Fund |
| Year Ended September 30, 2021 | | $ | 11.34 | | | | 0.14 | | | | (0.12 | ) | | | 0.02 | | | | (0.21 | ) | | | (0.15 | ) | | | — | | | | (0.36 | ) |
| Year Ended September 30, 2020 | | $ | 10.84 | | | | 0.21 | | | | 0.55 | | | | 0.76 | | | | (0.26 | ) | | | — | (b) | | | — | | | | (0.26 | ) |
| Year Ended September 30, 2019 | | $ | 10.16 | | | | 0.27 | | | | 0.70 | | | | 0.97 | | | | (0.29 | ) | | | — | | | | — | | | | (0.29 | ) |
| Year Ended September 30, 2018 | | $ | 10.55 | | | | 0.25 | | | | (0.37 | ) | | | (0.12 | ) | | | (0.27 | ) | | | — | | | | — | | | | (0.27 | ) |
| Year Ended September 30, 2017 | | $ | 10.77 | | | | 0.20 | | | | (0.15 | ) | | | 0.05 | | | | (0.27 | ) | | | — | | | | — | | | | (0.27 | ) |
| * | During the periods certain fees were waived (See Note 4 in the Notes to the Financial Statements). If such reductions had not occurred, the ratios would have been as indicated. |
| ** | Portfolio turnover rate is calculated on the basis of the Fund as a whole without distinguishing between classes of shares issued. |
| (a) | Per share net investment income (loss) has been calculated using the average daily shares method. |
| (b) | Amount is less than $0.005. |
See accompanying Notes to the Financial Statements.
| | | | | | | Ratios/Supplementary Data | |
| Net Asset Value, End of Year | | | Total Return (excludes sales charge) | | | Net Assets, End of Year (000) | | | Ratio of net expenses to average net assets | | | Ratio of net investment income (loss) to average net assets | | | Ratio of expenses to average net assets* | | | Portfolio turnover rate** | |
| | | | | | | | | | | | | | | | | | | | |
| $ | 19.08 | | | | 42.97 | % | | $ | 8 | | | | 1.37 | % | | | (0.33 | )% | | | 1.40 | % | | | 34.00 | % |
| $ | 13.35 | | | | (5.97 | )% | | $ | 5 | | | | 1.34 | % | | | (0.08 | )% | | | 1.45 | % | | | 28.77 | % |
| $ | 15.43 | | | | (3.02 | )% | | $ | 5 | | | | 1.42 | % | | | 0.19 | % | | | 1.42 | % | | | 26.62 | % |
| $ | 18.43 | | | | 6.29 | % | | $ | 3 | | | | 1.42 | % | | | (0.39 | )% | | | 1.42 | % | | | 34.62 | % |
| $ | 18.15 | | | | 15.18 | % | | $ | 2 | | | | 1.39 | % | | | (0.01 | )% | | | 1.39 | % | | | 24.83 | % |
| | | | | | | | | | | | | | | | | | | | | | | | | | | |
| $ | 19.17 | | | | 64.43 | % | | $ | 261 | | | | 1.31 | % | | | 0.40 | % | | | 1.31 | % | | | 110.07 | % |
| $ | 11.71 | | | | (18.04 | )% | | $ | 175 | | | | 1.31 | % | | | 0.59 | % | | | 1.33 | % | | | 119.76 | % |
| $ | 14.42 | | | | (9.84 | )% | | $ | 107 | | | | 1.30 | % | | | 0.97 | % | | | 1.30 | % | | | 124.82 | % |
| $ | 18.52 | | | | 5.44 | % | | $ | 63 | | | | 1.28 | % | | | 0.69 | % | | | 1.28 | % | | | 89.85 | % |
| $ | 18.32 | | | | 21.52 | % | | $ | 33 | | | | 1.29 | % | | | 1.09 | % | | | 1.29 | % | | | 109.05 | % |
| | | | | | | | | | | | | | | | | | | | | | | | | | | |
| $ | 33.59 | | | | 36.95 | % | | $ | 1 | | | | 1.34 | % | | | 0.15 | % | | | 1.36 | % | | | 27.20 | % |
| $ | 24.82 | | | | 5.29 | % | | $ | 113 | | | | 1.35 | % | | | (0.32 | )% | | | 1.36 | % | | | 17.50 | % |
| $ | 24.83 | | | | 0.95 | % | | $ | 288 | | | | 1.36 | % | | | (0.18 | )% | | | 1.36 | % | | | 17.31 | % |
| $ | 26.63 | | | | 16.80 | % | | $ | 173 | | | | 1.36 | % | | | (0.18 | )% | | | 1.36 | % | | | 22.78 | % |
| $ | 24.79 | | | | 15.66 | % | | $ | 266 | | | | 1.36 | % | | | (0.16 | )% | | | 1.36 | % | | | 18.92 | % |
| | | | | | | | | | | | | | | | | | | | | | | | | | | |
| $ | 26.36 | | | | 33.81 | % | | $ | 1,359 | | | | 1.28 | % | | | 0.91 | % | | | 1.28 | % | | | 13.00 | % |
| $ | 19.87 | | | | (0.40 | )% | | $ | 1,749 | | | | 1.27 | % | | | 1.52 | % | | | 1.28 | % | | | 33.60 | % |
| $ | 21.10 | | | | 8.24 | % | | $ | 2,825 | | | | 1.28 | % | | | 1.67 | % | | | 1.28 | % | | | 23.20 | % |
| $ | 21.39 | | | | 14.97 | % | | $ | 2,548 | | | | 1.27 | % | | | 1.41 | % | | | 1.27 | % | | | 19.49 | % |
| $ | 20.70 | | | | 15.96 | % | | $ | 3,694 | | | | 1.28 | % | | | 1.52 | % | | | 1.28 | % | | | 16.93 | % |
| | | | | | | | | | | | | | | | | | | | | | | | | | | |
| $ | 11.00 | | | | 0.18 | % | | $ | 34 | | | | 0.95 | % | | | 1.27 | % | | | 1.00 | % | | | 48.80 | % |
| $ | 11.34 | | | | 7.08 | % | | $ | 32 | | | | 0.95 | % | | | 1.95 | % | | | 1.08 | % | | | 59.59 | % |
| $ | 10.84 | | | | 9.65 | % | | $ | 29 | | | | 0.95 | % | | | 2.62 | % | | | 1.08 | % | | | 79.40 | % |
| $ | 10.16 | | | | (1.13 | )% | | $ | 36 | | | | 0.93 | % | | | 2.45 | % | | | 1.08 | % | | | 62.28 | % |
| $ | 10.55 | | | | 0.50 | % | | $ | 5 | | | | 0.96 | % | | | 1.90 | % | | | 1.04 | % | | | 64.07 | % |
Financial Highlights, Class R6 Shares
The financial highlights table is intended to help you understand the Funds’ financial performance for the past 5 years or, if shorter, the period of the Funds’ operations. Certain information reflects financial results for a single Fund share. The total returns in the table represent the rate that an investor would have earned (or lost) on an investment in the Fund (assuming reinvestment of all dividends and distributions).
| | | | | | Investment Activities | | | Distributions | |
| | | Net Asset Value, Beginning of Year | | | Net investment income (loss)(a) | | | Net realized/ unrealized gains (losses) on investments | | | Total from Investment Activities | | | Net investment income | | | Net realized gains on investments | | | Return of capital | | | Total Distributions | |
| Sterling Capital Behavioral Large Cap Value Equity Fund |
| Year Ended September 30, 2021 | | $ | 16.85 | | | | 0.09 | | | | 6.25 | | | | 6.34 | | | | (0.04 | ) | | | — | | | | (0.16 | ) | | | (0.20 | ) |
| Year Ended September 30, 2020 | | $ | 19.62 | | | | 0.40 | | | | (2.07 | ) | | | (1.67 | ) | | | (0.52 | ) | | | (0.58 | ) | | | — | | | | (1.10 | ) |
| Year Ended September 30, 2019 | | $ | 22.43 | | | | 0.46 | | | | (1.08 | ) | | | (0.62 | ) | | | (0.44 | ) | | | (1.75 | ) | | | — | | | | (2.19 | ) |
| February 1, 2018 to September 30, 2018(e) | | $ | 22.89 | | | | 0.28 | | | | (0.45 | ) | | | (0.17 | ) | | | (0.29 | ) | | | — | | | | — | | | | (0.29 | ) | |
| Sterling Capital Mid Value Fund |
| Year Ended September 30, 2021 | | $ | 14.35 | | | | 0.03 | | | | 6.25 | | | | 6.28 | | | | (0.08 | ) | | | — | | | | — | | | | (0.08 | ) |
| Year Ended September 30, 2020 | | $ | 16.48 | | | | (0.02 | ) | | | (0.75 | ) | | | (0.77 | ) | | | (0.23 | ) | | | (1.13 | ) | | | — | | | | (1.36 | ) |
| Year Ended September 30, 2019 | | $ | 19.44 | | | | 0.11 | | | | (0.78 | ) | | | (0.67 | ) | | | (0.03 | ) | | | (2.26 | ) | | | — | | | | (2.29 | ) |
| February 1, 2018 to September 30, 2018(e) | | $ | 20.22 | | | | 0.03 | | | | (0.81 | ) | | | (0.78 | ) | | | — | | | | — | | | | — | | | | — | | |
| Sterling Capital Behavioral Small Cap Value Equity Fund |
| Year Ended September 30, 2021 | | $ | 11.97 | | | | 0.17 | | | | 7.60 | | | | 7.77 | | | | (0.14 | ) | | | — | | | | — | | | | (0.14 | ) |
| Year Ended September 30, 2020 | | $ | 14.67 | | | | 0.15 | | | | (2.70 | ) | | | (2.55 | ) | | | (0.15 | ) | | | — | | | | — | | | | (0.15 | ) |
| Year Ended September 30, 2019 | | $ | 18.84 | | | | 0.23 | | | | (2.10 | ) | | | (1.87 | ) | | | (0.32 | ) | | | (1.98 | ) | | | — | | | | (2.30 | ) |
| February 1, 2018 to September 30, 2018(e) | | $ | 18.59 | | | | 0.17 | | | | 0.08 | | | | 0.25 | | | | — | | | | — | | | | — | | | | — | | |
| Sterling Capital Special Opportunities Fund |
| Year Ended September 30, 2021 | | $ | 26.22 | | | | (0.01 | ) | | | 9.78 | | | | 9.77 | | | | (0.15 | ) | | | (0.33 | ) | | | — | | | | (0.48 | ) |
| Year Ended September 30, 2020 | | $ | 26.09 | | | | 0.09 | | | | 1.44 | | | | 1.53 | | | | (0.07 | ) | | | (1.33 | ) | | | — | | | | (1.40 | ) |
| Year Ended September 30, 2019 | | $ | 27.75 | | | | 0.10 | | | | 0.12 | | | | 0.22 | | | | (0.02 | ) | | | (1.86 | ) | | | — | | | | (1.88 | ) |
| February 1, 2018 to September 30, 2018(e) | | $ | 26.44 | | | | 0.04 | | | | 1.42 | | | | 1.46 | | | | (0.15 | ) | | | — | | | | — | | | | (0.15 | ) | |
| Sterling Capital Equity Income Fund |
| Year Ended September 30, 2021 | | $ | 20.09 | | | | 0.37 | | | | 6.56 | | | | 6.93 | | | | (0.35 | ) | | | — | | | | — | | | | (0.35 | ) |
| Year Ended September 30, 2020 | | $ | 21.34 | | | | 0.43 | | | | (0.40 | ) | | | 0.03 | | | | (0.44 | ) | | | (0.84 | ) | | | — | | | | (1.28 | ) |
| Year Ended September 30, 2019 | | $ | 21.61 | | | | 0.47 | | | | 1.23 | | | | 1.70 | | | | (0.45 | ) | | | (1.52 | ) | | | — | | | | (1.97 | ) |
| February 1, 2018 to September 30, 2018(e) | | $ | 21.49 | | | | 0.30 | | | | 0.12 | | | | 0.42 | | | | (0.30 | ) | | | — | | | | — | | | | (0.30 | ) | |
| Sterling Capital Behavioral International Equity Fund |
| Year Ended September 30, 2021 | | $ | 8.14 | | | | 0.29 | | | | 1.62 | | | | 1.91 | | | | (0.24 | ) | | | — | | | | — | | | | (0.24 | ) |
| Year Ended September 30, 2020 | | $ | 9.49 | | | | 0.27 | | | | (1.32 | ) | | | (1.05 | ) | | | (0.30 | ) | | | — | | | | — | | | | (0.30 | ) |
| Year Ended September 30, 2019 | | $ | 11.19 | | | | 0.36 | | | | (1.34 | ) | | | (0.98 | ) | | | (0.32 | ) | | | (0.40 | ) | | | — | | | | (0.72 | ) |
| February 1, 2018 to September 30, 2018(e) | | $ | 12.35 | | | | 0.35 | | | | (1.51 | ) | | | (1.16 | ) | | | — | | | | — | | | | — | | | | — | | |
| * | During the periods certain fees were waived (See Note 4 in the Notes to the Financial Statements). If such reductions had not occurred, the ratios would have been as indicated. |
| ** | Portfolio turnover rate is calculated on the basis of the Fund as a whole without distinguishing between classes of shares issued. |
| (a) | Per share net investment income (loss) has been calculated using the average daily shares method. |
| (b) | Not annualized for periods less than one year. |
| (c) | Annualized for periods less than one year. |
| (d) | Net Assets are below $1,000. |
| (e) | Period from commencement of operations. |
See accompanying Notes to the Financial Statements.
| | | | | | | Ratios/Supplementary Data | |
| Net Asset Value, End of Year | | | Total Return (excludes sales charge)(b) | | | Net Assets, End of Year (000) | | | Ratio of net expenses to average net assets(c) | | | Ratio of net investment income (loss) to average net assets(c) | | | Ratio of expenses to average net assets*(c) | | | Portfolio turnover rate**(b) | |
| | | | | | | | | | | | | | | | | | | | |
| $ | 22.99 | | | | 37.92 | % | | $ | 1 | | | | 0.58 | % | | | 0.43 | % | | | 0.63 | % | | | 122.64 | % |
| $ | 16.85 | | | | (8.88 | )% | | $ | — | (d) | | | 0.59 | % | | | 2.19 | % | | | 0.64 | % | | | 167.34 | % |
| $ | 19.62 | | | | (2.02 | )% | | $ | 239,763 | | | | 0.58 | % | | | 2.35 | % | | | 0.64 | % | | | 142.59 | % |
| $ | 22.43 | | | | (0.69 | )% | | $ | 270,105 | | | | 0.58 | % | | | 1.94 | % | | | 0.63 | % | | | 127.89 | % |
| | | | | | | | | | | | | | | | | | | | | | | | | | | |
| $ | 20.55 | | | | 43.85 | % | | $ | 402 | | | | 0.79 | % | | | 0.17 | % | | | 0.97 | % | | | 34.00 | % |
| $ | 14.35 | | | | (5.56 | )% | | $ | 3,477 | | | | 0.54 | % | | | (0.06 | )% | | | 0.56 | % | | | 28.77 | % |
| $ | 16.48 | | | | (2.45 | )% | | $ | 247,949 | | | | 0.82 | % | | | 0.68 | % | | | 0.93 | % | | | 26.62 | % |
| $ | 19.44 | | | | (3.86 | )% | | $ | 285,847 | | | | 0.83 | % | | | 0.26 | % | | | 0.93 | % | | | 34.62 | % |
| | | | | | | | | | | | | | | | | | | | | | | | | | | |
| $ | 19.60 | | | | 65.36 | % | | $ | 83,819 | | | | 0.75 | % | | | 0.96 | % | | | 0.81 | % | | | 110.07 | % |
| $ | 11.97 | | | | (17.63 | )% | | $ | 70,372 | | | | 0.74 | % | | | 1.11 | % | | | 0.82 | % | | | 119.76 | % |
| $ | 14.67 | | | | (9.29 | )% | | $ | 210,436 | | | | 0.73 | % | | | 1.53 | % | | | 0.80 | % | | | 124.82 | % |
| $ | 18.84 | | | | 1.34 | % | | $ | 191,051 | | | | 0.73 | % | | | 1.38 | % | | | 0.79 | % | | | 89.85 | % |
| | | | | | | | | | | | | | | | | | | | | | | | | | | |
| $ | 35.51 | | | | 37.67 | % | | $ | 44,452 | | | | 0.78 | % | | | (0.03 | )% | | | 0.87 | % | | | 27.20 | % |
| $ | 26.22 | | | | 5.87 | % | | $ | 40,057 | | | | 0.78 | % | | | 0.38 | % | | | 0.86 | % | | | 17.50 | % |
| $ | 26.09 | | | | 1.53 | % | | $ | 355,672 | | | | 0.77 | % | | | 0.40 | % | | | 0.86 | % | | | 17.31 | % |
| $ | 27.75 | | | | 5.60 | % | | $ | 372,948 | | | | 0.78 | % | | | 0.21 | % | | | 0.85 | % | | | 22.78 | % |
| | | | | | | | | | | | | | | | | | | | | | | | | | | |
| $ | 26.67 | | | | 34.61 | % | | $ | 70,388 | | | | 0.68 | % | | | 1.50 | % | | | 0.79 | % | | | 13.00 | % |
| $ | 20.09 | | | | 0.21 | % | | $ | 56,277 | | | | 0.67 | % | | | 2.18 | % | | | 0.78 | % | | | 33.60 | % |
| $ | 21.34 | | | | 8.89 | % | | $ | 345,806 | | | | 0.66 | % | | | 2.28 | % | | | 0.77 | % | | | 23.20 | % |
| $ | 21.61 | | | | 2.03 | % | | $ | 317,827 | | | | 0.66 | % | | | 2.16 | % | | | 0.77 | % | | | 19.49 | % |
| | | | | | | | | | | | | | | | | | | | | | | | | | | |
| $ | 9.81 | | | | 23.70 | % | | $ | 85,736 | | | | 0.63 | % | | | 3.04 | % | | | 0.74 | % | | | 158.16 | % |
| $ | 8.14 | | | | (11.49 | )% | | $ | 69,236 | | | | 0.63 | % | | | 3.10 | % | | | 0.83 | % | | | 164.02 | % |
| $ | 9.49 | | | | (8.48 | )% | | $ | 78,307 | | | | 0.61 | % | | | 3.77 | % | | | 0.89 | % | | | 97.74 | % |
| $ | 11.19 | | | | (9.39 | )% | | $ | 62,804 | | | | 0.62 | % | | | 4.63 | % | | | 0.87 | % | | | 96.65 | % |
Financial Highlights, Class R6 Shares
The financial highlights table is intended to help you understand the Funds’ financial performance for the past 5 years or, if shorter, the period of the Funds’ operations. Certain information reflects financial results for a single Fund share. The total returns in the table represent the rate that an investor would have earned (or lost) on an investment in the Fund (assuming reinvestment of all dividends and distributions).
| | | | | | Investment Activities | | | Distributions | |
| | | Net Asset Value, Beginning of Year | | | Net investment income(a) | | | Net realized/ unrealized gains (losses) on investments | | | Total from Investment Activities | | | Net investment income | | | Net realized gains on investments | | | Return of capital | | | Total Distributions | |
| Sterling Capital Stratton Real Estate Fund |
| Year Ended September 30, 2021 . | | $ | 36.69 | | | | 0.59 | | | | 10.46 | | | | 11.05 | | | | (0.59 | ) | | | (0.82 | ) | | | — | | | | (1.41 | ) |
| January 31, 2020 to September 30, 2020(d) | | $ | 41.35 | | | | 0.36 | | | | (4.26 | ) | | | (3.90 | ) | | | (0.76 | ) | | | — | | | | — | | | | (0.76 | ) |
| Sterling Capital Stratton Small Cap Value Fund | | | | | | | | | | | | | | | | | | | | | | | | | | | | | | | | |
| Year Ended September 30, 2021 . | | $ | 64.09 | | | | 0.29 | | | | 30.99 | | | | 31.28 | | | | (0.43 | ) | | | (11.22 | ) | | | — | | | | (11.65 | ) |
| January 31, 2020 to September 30, 2020(d) | | $ | 77.13 | | | | 0.49 | | | | (13.53 | ) | | | (13.04 | ) | | | — | | | | — | | | | — | | | | — | |
| Sterling Capital Short Duration Bond Fund | | | | | | | | | | | | | | | | | | | | | | | | | | | | | | | | |
| February 1, 2021 to September 30, 2021(d) | | $ | 8.78 | | | | 0.08 | | | | (0.04 | ) | | | 0.04 | | | | (0.14 | ) | | | — | | | | — | | | | (0.14 | ) |
| Sterling Capital Total Return Bond Fund | | | | | | | | | | | | | | | | | | | | | | | | | | | | | | | | |
| Year Ended September 30, 2021 . | | $ | 11.39 | | | | 0.21 | | | | (0.12 | ) | | | 0.09 | | | | (0.28 | ) | | | (0.15 | ) | | | — | | | | (0.43 | ) |
| Year Ended September 30, 2020 . | | $ | 10.89 | | | | 0.28 | | | | 0.54 | | | | 0.82 | | | | (0.32 | ) | | | — | (f) | | | — | | | | (0.32 | ) |
| Year Ended September 30, 2019 . | | $ | 10.20 | | | | 0.33 | | | | 0.71 | | | | 1.04 | | | | (0.35 | ) | | | — | | | | — | | | | (0.35 | ) |
| January 31, 2018 to September 30, 2018(d) | | $ | 10.48 | | | | 0.21 | | | | (0.27 | ) | | | (0.06 | ) | | | (0.22 | ) | | | — | | | | — | | | | (0.22 | ) |
| * | During the periods certain fees were waived (See Note 4 in the Notes to the Financial Statements). If such reductions had not occurred, the ratios would have been as indicated. |
| ** | Portfolio turnover rate is calculated on the basis of the Fund as a whole without distinguishing between classes of shares issued. |
| (a) | Per share net investment income (loss) has been calculated using the average daily shares method. |
| (b) | Not annualized for periods less than one year. |
| (c) | Annualized for periods less than one year. |
| (d) | Period from commencement of operations. |
| (e) | Net Assets are below $1,000. |
| (f) | Amount is less than $0.005. |
See accompanying Notes to the Financial Statements.
| | | | | | | Ratios/Supplementary Data | |
| Net Asset Value, End of Year | | | Total Return (excludes sales charge)(b) | | | Net Assets, End of Year (000) | | | Ratio of net expenses to average net assets(c) | | | Ratio of net investment income (loss) to average net assets(c) | | | Ratio of expenses to average net assets*(c) | | | Portfolio turnover rate**(b) | |
| | | | | | | | | | | | | | | | | | | | |
| $ | 46.33 | | | | 30.67 | % | | $ | 16 | | | | 0.62 | % | | | 1.33 | % | | | 0.73 | % | | | 12.68 | % |
| $ | 36.69 | | | | (9.30 | )% | | $ | — | (e) | | | 0.70 | % | | | 1.47 | % | | | 0.70 | % | | | 19.58 | % |
| | | | | | | | | | | | | | | | | | | | | | | | | | | |
| $ | 83.72 | | | | 52.98 | % | | $ | 3,656 | | | | 0.88 | % | | | 0.36 | % | | | 1.02 | % | | | 6.15 | % |
| $ | 64.09 | | | | (16.91 | )% | | $ | 2,882 | | | | 0.87 | % | | | 1.17 | % | | | 1.09 | % | | | 8.33 | % |
| | | | | | | | | | | | | | | | | | | | | | | | | | | |
| $ | 8.68 | | | | 0.44 | % | | $ | 29,565 | | | | 0.40 | % | | | 1.52 | % | | | 0.49 | % | | | 39.26 | % |
| | | | | | | | | | | | | | | | | | | | | | | | | | | |
| $ | 11.05 | | | | 0.79 | % | | $ | 348,271 | | | | 0.35 | % | | | 1.88 | % | | | 0.52 | % | | | 48.80 | % |
| $ | 11.39 | | | | 7.70 | % | | $ | 642,344 | | | | 0.35 | % | | | 2.52 | % | | | 0.58 | % | | | 59.59 | % |
| $ | 10.89 | | | | 10.38 | % | | $ | 350,129 | | | | 0.35 | % | | | 3.20 | % | | | 0.58 | % | | | 79.40 | % |
| $ | 10.20 | | | | (0.52 | )% | | $ | 281,637 | | | | 0.35 | % | | | 3.16 | % | | | 0.59 | % | | | 62.28 | % |
Notes to Financial Statements
September 30, 2021
1. Organization:
Sterling Capital Funds (the “Trust”) commenced operations on October 5, 1992 and is registered under the Investment Company Act of 1940, as amended (the “1940 Act”), as an open-end investment company established as a Massachusetts business trust.
The Trust offers shares of Sterling Capital Behavioral Large Cap Value Equity Fund, Sterling Capital Mid Value Fund, Sterling Capital Behavioral Small Cap Value Equity Fund, Sterling Capital Special Opportunities Fund, Sterling Capital Equity Income Fund, Sterling Capital Behavioral International Equity Fund, Sterling Capital SMID Opportunities Fund, Sterling Capital Stratton Mid Cap Value Fund, Sterling Capital Stratton Real Estate Fund, Sterling Capital Stratton Small Cap Value Fund, Sterling Capital Ultra Short Bond Fund, Sterling Capital Short Duration Bond Fund, Sterling Capital Intermediate U.S. Government Fund, Sterling Capital Total Return Bond Fund, Sterling Capital Corporate Fund, Sterling Capital Quality Income Fund, Sterling Capital North Carolina Intermediate Tax-Free Fund, Sterling Capital South Carolina Intermediate Tax-Free Fund, Sterling Capital Virginia Intermediate Tax-Free Fund and Sterling Capital West Virginia Intermediate Tax-Free Fund (referred to individually as a “Fund” and collectively as the “Funds”). Sterling Capital North Carolina Intermediate Tax-Free Fund, Sterling Capital South Carolina Intermediate Tax-Free Fund, Sterling Capital Virginia Intermediate Tax-Free Fund and Sterling Capital West Virginia Intermediate Tax-Free Fund are referred to as the “Tax-Free Funds.” All Funds are referred to as the “Variable Net Asset Value Funds.”
All Funds, other than the Tax-Free Funds, are “diversified” funds, as defined in the 1940 Act. The Tax-Free Funds are non-diversified funds, which means they may invest in the securities of a limited number of issuers.
The Funds are authorized to issue an unlimited amount of shares. As of September 30, 2021, the Funds discussed herein offered up to five classes of shares: Class A Shares, Class C Shares, Institutional Shares, Class R Shares and Class R6 Shares. Class A Shares of Sterling Capital Behavioral Large Cap Value Equity Fund, Sterling Capital Mid Value Fund, Sterling Capital Behavioral Small Cap Value Equity Fund, Sterling Capital Special Opportunities Fund, Sterling Capital Equity Income Fund, Sterling Capital Behavioral International Equity Fund, Sterling Capital SMID Opportunities Fund, Sterling Capital Stratton Mid Cap Value Fund, Sterling Capital Stratton Real Estate Fund, Sterling Capital Stratton Small Cap Value Fund and Sterling Capital Total Return Fund have a maximum sales charge of 5.75% as a percentage of original purchase price. Class A Shares of Sterling Capital Ultra Short Bond Fund have a maximum sales charge of 0.50%, and Class A Shares of Sterling Capital Short Duration Bond Fund, Sterling Capital Intermediate U.S. Government Fund, Sterling Capital Corporate Fund, Sterling Capital Quality Income Fund, and the Tax-Free Funds have a maximum sales charge of 2.00% as a percentage of the original purchase price. Purchases of $1 million or more of Class A Shares are not subject to a front-end sales charge but will be subject to a Contingent Deferred Sales Charge (“CDSC”) of up to 1.00% of the purchase price if redeemed within two years after purchase for all Funds except the Tax-Free Funds, Sterling Capital Short Duration Bond Fund, Sterling Capital Intermediate U.S. Government Fund, Sterling Capital Corporate Fund, Sterling Capital Total Return Bond Fund and Sterling Capital Quality Income Fund. With respect to the Tax-Free Funds, Sterling Capital Short Duration Bond Fund, Sterling Capital Intermediate U.S. Government Fund, Sterling Capital Corporate Fund, Sterling Capital Total Return Bond Fund, and Sterling Capital Quality Income Fund, sales of Class A shares of $250,000 or more are not subject to a sales load but will be subject to a CDSC of up to 0.50% of the purchase price if redeemed within 18 months of purchase. This charge is based on the lower of the price paid for the shares or their net asset value at the time of redemption. During the period ended September 30, 2021, Sterling Capital South Carolina Intermediate Tax-Free Fund had $24,891 in CDSC fees for Class A Shares. Class C Shares of the Funds are offered without any front-end sales charge but will be subject to a maximum CDSC of 1.00% if redeemed less than one year after purchase.
Each class of shares has identical rights and privileges except with respect to the fees paid under the distribution plan, voting rights on matters affecting a single class of shares and the exchange privilege of each class of shares.
Under the Trust’s organizational documents, its Officers and Trustees are indemnified against certain liabilities arising out of the performance of their duties to the Trust. In addition, in the normal course of business, the Funds may enter into contracts with their vendors and others that provide for general indemnifications. The Funds’ maximum exposure under these arrangements is unknown, as this would involve future claims that may be made against the Funds. However, based on experience, the Funds expect that risk of loss to be remote.
Notes to Financial Statements — (continued)
September 30, 2021
| 2. | Significant Accounting Policies: |
The Funds are investment companies and accordingly follow the investment company accounting and reporting guidance of the Financial Accounting Standards Board (“FASB”) Accounting Standards Codification Topic 946, Financial Services-Investment Companies. The following is a summary of significant accounting policies followed by the Funds. The policies are in conformity with United States generally accepted accounting principles (“U.S. GAAP”). The preparation of these financial statements requires management to make estimates and assumptions that affect the reported amounts of assets and liabilities and disclosure of contingent assets and liabilities at the date of the financial statements and the reported amounts of income and expenses for the reporting period. Actual results could differ from those estimates.
Securities Valuation — Investments of the Variable Net Asset Value Funds in securities traded on a national securities exchange or in the over-the-counter market are valued at the closing price on the principal exchange or market (including the NASDAQ Closing Price for securities traded on NASDAQ), typically 4:00 PM ET or, absent such a price, by reference to the latest available bid prices in the principal market in which such securities are normally traded. The Variable Net Asset Value Funds may also use an independent pricing service approved by the Board of Trustees (the “Board”) to value certain securities, including the use of electronic and matrix techniques. Investments in open-end investment companies are valued at their respective net asset values as reported by such companies. Investments in closed-end investment companies and exchange-traded funds are valued at their market values based upon the latest available sale price or, absent such a price, by reference to the latest available bid prices in the principal market in which such securities are normally traded. The differences between cost and fair value of investments are reflected as either unrealized appreciation or depreciation. Securities for which market quotations are not readily available or deemed unreliable (e.g., an approved pricing service does not provide a price, a furnished price is in error, certain stale prices, or an event occurs that materially affects the furnished price) will be fair valued in accordance with procedures established in good faith under the general supervision of the Board.
Fair value pricing may be used if events materially affecting the value of foreign securities occur between the time when the exchange on which they are traded closes and the time when the Sterling Capital Behavioral International Equity Fund’s net asset value is calculated; such securities may be valued at fair value in accordance with procedures adopted by the Board.
Fair Value Measurements — The objective of a fair value measurement is to determine the price that would be received to sell an asset or paid to transfer a liability in an orderly transaction between market participants at the measurement date (an exit price). Accordingly, the fair value hierarchy gives the highest priority to quoted prices (unadjusted) in active markets for identical assets or liabilities (Level 1) and the lowest priority to unobservable inputs (Level 3). The three levels of the fair value hierarchy are described as follows:
· Level 1 – quoted prices in active markets for identical securities
· Level 2 – based on other significant observable inputs (including quoted prices for similar securities, interest rates, prepayment speeds, credit risk, etc.)
· Level 3 – based on significant unobservable inputs (including a Fund’s own assumptions in determining the fair value of investments)
The inputs or methodology used for valuing securities are not necessarily an indication of the risk associated with investing in those securities. During the fiscal year ended September 30, 2021, there were no significant changes to the valuation policies and procedures.
Notes to Financial Statements — (continued)
September 30, 2021
The summary of inputs used to determine the fair value of each Fund’s investments as of September 30, 2021 is as follows:
| | | Level 1- Quoted Prices | | | Level 2- Other Significant Observable Inputs | | | Level 3- Significant Unobservable Inputs | | | Total | |
| Assets: | | | | | | | | | | | | |
| Investments in Securities | | | | | | | | | | | | |
| Sterling Capital Behavioral Large Cap Value Equity Fund | | $ | 33,165,909 | (a) | | $ | — | | | $ | — | | | $ | 33,165,909 | |
| Sterling Capital Mid Value Fund | | | 76,562,615 | (a) | | | — | | | | — | | | | 76,562,615 | |
| Sterling Capital Behavioral Small Cap Value Equity Fund | | | 105,891,629 | (a) | | | — | | | | — | | | | 105,891,629 | |
| Sterling Capital Special Opportunities Fund | | | 669,680,095 | (a) | | | — | | | | — | | | | 669,680,095 | |
| Sterling Capital Equity Income Fund | | | 2,235,787,991 | (a) | | | — | | | | — | | | | 2,235,787,991 | |
| Sterling Capital Behavioral International Equity Fund | | | 1,483,807 | (b) | | | 84,453,175 | (a) | | | — | | | | 85,936,982 | |
| Sterling Capital SMID Opportunities Fund | | | 11,201,625 | (a) | | | — | | | | — | | | | 11,201,625 | |
| Sterling Capital Stratton Mid Cap Value Fund | | | 65,869,782 | (a) | | | — | | | | — | | | | 65,869,782 | |
| Sterling Capital Stratton Real Estate Fund | | | 96,983,545 | (a) | | | — | | | | — | | | | 96,983,545 | |
| Sterling Capital Stratton Small Cap Value Fund | | | 521,398,915 | (a) | | | — | | | | — | | | | 521,398,915 | |
| Sterling Capital Ultra Short Bond Fund | | | 2,103,491 | (b) | | | 38,979,495 | (a) | | | — | | | | 41,082,986 | |
| Sterling Capital Short Duration Bond Fund | | | 2,437,896 | (b) | | | 194,608,319 | (a) | | | — | | | | 197,046,215 | |
| Sterling Capital Intermediate U.S. Government Fund | | | 49,031 | (b) | | | 20,060,202 | (a) | | | — | | | | 20,109,233 | |
| Sterling Capital Total Return Bond Fund | | | 16,898,581 | (b) | | | 1,548,454,346 | (a) | | | — | | | | 1,565,352,927 | |
| Sterling Capital Corporate Fund | | | 142,806 | (b) | | | 6,952,839 | (a) | | | — | | | | 7,095,645 | |
| Sterling Capital Quality Income Fund | | | 862,998 | (b) | | | 65,933,789 | (a) | | | — | | | | 66,796,787 | |
| Sterling Capital North Carolina Intermediate Tax-Free Fund | | | 5,319,676 | (b) | | | 179,833,822 | (a) | | | — | | | | 185,153,498 | |
| Sterling Capital South Carolina Intermediate Tax-Free Fund | | | 780,694 | (b) | | | 81,640,140 | (a) | | | — | | | | 82,420,834 | |
| Sterling Capital Virginia Intermediate Tax-Free Fund | | | 1,758,856 | (b) | | | 79,950,175 | (a) | | | — | | | | 81,709,031 | |
| Sterling Capital West Virginia Intermediate Tax-Free Fund | | | 1,530,700 | (b) | | | 92,491,679 | (a) | | | — | | | | 94,022,379 | |
| (a) | Industries, countries or security types are disclosed in the Schedules of Portfolio Investments. |
| (b) | Represents money market funds and/or certain preferred stocks. |
Cash and Cash Equivalents — The Funds consider liquid assets deposited with a bank, and certain short term debt instruments with original maturities of three months or less to be cash equivalents. These investments represent amounts held with financial institutions that are readily accessible to pay Fund expenses or investments. The Funds may invest their excess cash in the Federated Treasury Obligations Fund or a similar money market fund or other short-term investment.
Credit Enhancements — Certain obligations held in the Funds have credit enhancement or liquidity features that may, under certain circumstances, provide for repayment of principal and interest on the obligation upon demand date, interest rate reset date or final maturity. These enhancements may include: letters of credit; liquidity guarantees; security purchase agreements; tender option purchase agreements; and third party insurance (i.e., AMBAC).
Derivative Instruments Categorized by Risk Exposure— The Funds’ derivative contracts for the 12-month period ended September 30, 2021 are not accounted for as hedging instruments under U.S. GAAP. The following is a summary of the location of the derivative instruments held by the Funds on the Statements of Operations and the category of primary risk exposure as of September 30, 2021: The effect of derivative financial instruments on the Statements of Operations for the 12-month period ended September 30, 2021:
| | Sterling Capital Equity Income Fund |
| Realized gain (loss) on written options (equity contracts) | | $ | (31,660 | ) |
During the 12-month period ended September 30, 2021, the Equity Income Fund held an average number of contracts and an average notional amount of equity written options of 750 and $4,855,500, respectively.
Notes to Financial Statements — (continued)
September 30, 2021
Distributions to Shareholders — Dividends from net investment income are declared daily and paid monthly for Sterling Capital Ultra Short Bond Fund, Sterling Capital Short Duration Bond Fund, Sterling Capital Intermediate U.S. Government Fund, Sterling Capital Total Return Bond Fund, Sterling Capital Corporate Fund, Sterling Capital Quality Income Fund, and the Tax-Free Funds. Dividends from net investment income are declared and paid quarterly for Sterling Capital Stratton Mid Cap Value Fund, Sterling Capital Stratton Real Estate Fund, Sterling Capital Stratton Small Cap Value Fund, Sterling Capital Behavioral Large Cap Value Equity Fund, Sterling Capital Mid Value Fund, Sterling Capital Behavioral Small Cap Value Equity Fund, Sterling Capital Special Opportunities Fund, Sterling Capital Equity Income Fund and Sterling Capital SMID Opportunities Fund, if the annualized yield of the distribution exceeds an amount determined annually by the Board. Dividends from net investment income for Sterling Capital Behavioral International Equity Fund is declared and paid annually. Distributable net realized gains, if any, are declared and distributed at least annually. Distributions to shareholders that exceed net investment income and net realized gains for tax purposes are reported as distributions of capital. Distributions to shareholders are recorded on the ex-dividend date.
Expenses and Allocation Methodology — Expenses directly attributable to a Fund are charged to that Fund. Expenses not directly attributable to a Fund are allocated proportionately among all Funds daily in relation to the net assets of each Fund or on another reasonable basis. Each class of shares bears its pro-rata portion of expenses attributable to its series, except that each class separately bears expenses related specifically to that class, such as distribution fees. Income and realized and unrealized gains or losses on investments are allocated to each class of shares based on its relative net assets or another appropriate basis.
Foreign Currency Translation — The accounting records of the Sterling Capital Behavioral International Equity Fund are maintained in U.S. dollars. Foreign currency amounts are translated into U.S. dollars at the latest foreign exchange bid quotation (from an approved pricing vendor) to determine the fair value of investments, assets and liabilities. Purchases and sales of securities, income and expenses are translated at the prevailing rate of exchange, on the respective dates of such transactions. The Sterling Capital Behavioral International Equity Fund does not isolate that portion of the results of operations resulting from changes in foreign exchange rates on investments from fluctuations arising from changes in market prices of securities held. Such fluctuations are included with the net realized and unrealized gain or loss from investments and foreign currencies.
Forward Foreign Currency Exchange Contracts — All Funds, except Sterling Capital SMID Opportunities Fund, Sterling Capital Intermediate U.S. Government Fund and the Tax-Free Funds, may enter into forward foreign currency exchange contracts (foreign currency exchange risk) in connection with planned purchases or sales of securities or to hedge the U.S. dollar value of Funds securities denominated in a particular currency. A foreign currency exchange contract is an agreement between two parties to buy and sell a currency at a set exchange rate on a future date. The Funds can be exposed to risks if the counterparties to the contracts are unable to meet the terms of their contracts and from unanticipated movements in the value of a foreign currency relative to the U.S. dollar. In the event of default by the counterparty to the transaction, the Funds’ maximum amount of loss, as either the buyer or seller, is the unrealized gain of the contract. The forward foreign currency exchange contracts are adjusted by the daily exchange rate of the underlying currency and any gains or losses are recorded for financial statement purposes as unrealized gains or losses until the contract settlement date. When the contract is closed, the Funds record a realized gain (loss) equal to the difference between the value at the time it was opened and the value at the time it was closed.
Mortgage Dollar Rolls — The Variable Net Asset Value Funds may sell mortgage-backed securities for delivery in the current month and simultaneously contract to repurchase substantially similar (same type, coupon and maturity) securities on a specific future date at an agreed-upon price. The market value of the securities that a Fund is required to purchase may decline below the agreed upon repurchase price of those securities. Pools of mortgages collateralizing those securities may have different prepayment histories than those sold. During the period between the sale and repurchase, a Fund will not be entitled to receive interest and principal payments on the securities sold. Proceeds of the sale will be invested in additional instruments for a Fund, and the income from these investments will generate income for a Fund. If such income does not exceed the income, capital appreciation and gain or loss that would have been realized on the securities sold as part of the dollar roll, the use of this technique will diminish the investment performance of a Fund compared with what the performance would have been without the use of dollar rolls. The Funds account for mortgage dollar roll transactions as purchases and sales. The Funds did not hold any mortgage dollar rolls during the year.
Notes to Financial Statements — (continued)
September 30, 2021
Options Contracts — Sterling Capital Special Opportunities Fund and Sterling Capital Equity Income Fund write (sell) “covered” call options on securities and purchase options on securities to close out options previously written by them.
In writing an option, a Fund contracts with a specified counterparty to purchase (put option written) or sell (call option written) a specified quantity (notional amount) of an underlying asset at a specified price during a specified period upon demand of the counterparty. The risk associated with writing an option is that the Funds bear the market risk of an unfavorable change in the price of an underlying asset and are required to buy or sell an underlying asset under the contractual terms of the option at a price different from the current value. The Funds execute transactions in both listed and over-the-counter options. When purchasing over-the-counter options, a Fund bears the risk of economic loss from counterparty default, equal to the market value of the option. Listed options involve minimal counterparty risk since the listed options are guaranteed against default by the exchange on which they trade. Transactions in over-the-counter options expose the Funds to the risk of default by the counterparty to the transaction. In the event of default by the counterparty to the over-the-counter transaction, the Funds’ maximum amount of loss is the premium paid (as the purchaser) or the unrealized depreciation of the contract (as the writer).
Sterling Capital Special Opportunities Fund and Sterling Capital Equity Income Fund may invest in written options to economically hedge the downside exposure by collecting a premium when sold against the equity holding.
Risks Associated with Foreign Securities and Currencies — Investments in securities of foreign issuers carry certain risks not ordinarily associated with investments in securities of domestic issuers. Such risks include future political and economic developments and the possible imposition of exchange controls or other foreign governmental laws and restrictions. In addition, with respect to certain countries, there is the possibility of expropriation of assets, confiscatory taxation, political or social instability or diplomatic developments which could adversely affect investments in those countries. Certain foreign investments may also be subject to foreign withholding taxes.
Securities Transactions and Related Income — During the period, security transactions are accounted for no later than one business day after the trade date. For financial reporting purposes, however, security transactions as of the last business day of the reporting period are accounted for on the trade date. Interest income is recognized on the accrual basis and includes, where applicable, the amortization/accretion of premium or discount. Discounts and premiums on securities purchased are accreted and amortized over the lives of the respective securities. Dividend income is recorded on the ex-dividend date. Gains or losses realized from sales of securities are determined by comparing the identified cost of the security lot sold with the net sales proceeds.
When-Issued and Forward Commitments — The Funds may purchase securities on a “when-issued” basis. Sterling Capital Behavioral Large Cap Value Equity Fund, Sterling Capital Mid Value Fund, Sterling Capital Behavioral Small Cap Value Equity Fund, Sterling Capital Special Opportunities Fund and Sterling Capital Equity Income Fund may also purchase or sell securities on a forward commitment basis. The Funds record when-issued securities on the trade date and pledge assets with a value at least equal to the purchase commitment for payment of the securities purchased. The value of the securities underlying when-issued or forward commitments to purchase securities, and any subsequent fluctuation in their value, is taken into account when determining the net asset value of the Funds commencing with the date the Funds agree to purchase the securities. The Funds do not accrue interest or dividends on when-issued securities until the underlying securities are received.
Accounting Standards— In March 2020, the FASB issued ASU 2020-04, Reference Rate Reform (Topic 848) — Facilitation of the Effects of Reference Rate Reform on Financial Reporting, which provides optional, temporary relief with respect to the financial reporting of contracts subject to certain types of modifications due to the planned discontinuation of the London Interbank Offered Rate (LIBOR) and other interbank-offered based reference rates as of the end of 2021. The guidance is effective for certain reference rate-related contract modifications that occur during the period March 12, 2020 through December 31, 2022. Management is currently evaluating the impact, if any, of the ASU on the Funds’ financial statements.
Notes to Financial Statements — (continued)
September 30, 2021
| 3. | Purchases and Sales of Securities: |
Purchases and sales of securities (excluding U.S. government securities and securities maturing less than one year from acquisition) for the fiscal year ended September 30, 2021 were as follows:
| | | Purchases | | | Sales | |
| Sterling Capital Behavioral Large Cap Value Equity Fund | | $ | 38,431,828 | | | $ | 41,163,875 | |
| Sterling Capital Mid Value Fund | | | 25,458,628 | | | | 37,635,759 | |
| Sterling Capital Behavioral Small Cap Value Equity Fund | | | 127,073,784 | | | | 154,729,172 | |
| Sterling Capital Special Opportunities Fund | | | 169,131,578 | | | | 247,537,279 | |
| Sterling Capital Equity Income Fund | | | 380,669,584 | | | | 252,118,056 | |
| Sterling Capital Behavioral International Equity Fund | | | 133,860,245 | | | | 146,278,568 | |
| Sterling Capital SMID Opportunities Fund | | | 4,072,146 | | | | 7,222,721 | |
| Sterling Capital Stratton Mid Cap Value Fund | | | 5,146,239 | | | | 11,426,873 | |
| Sterling Capital Stratton Real Estate Fund | | | 12,251,307 | | | | 25,080,139 | |
| Sterling Capital Stratton Small Cap Value Fund | | | 31,904,546 | | | | 213,129,925 | |
| Sterling Capital Ultra Short Bond Fund | | | 27,702,463 | | | | 14,330,209 | |
| Sterling Capital Short Duration Bond Fund | | | 100,891,434 | | | | 68,049,030 | |
| Sterling Capital Intermediate U.S. Government Fund | | | 1,661,156 | | | | 721,582 | |
| Sterling Capital Total Return Bond Fund | | | 588,775,709 | | | | 520,195,033 | |
| Sterling Capital Corporate Fund | | | 4,002,303 | | | | 15,737,915 | |
| Sterling Capital Quality Income Fund | | | 22,220,974 | | | | 2,407,860 | |
| Sterling Capital North Carolina Intermediate Tax-Free Fund | | | 30,620,501 | | | | 14,145,778 | |
| Sterling Capital South Carolina Intermediate Tax-Free Fund | | | 17,483,749 | | | | 17,514,024 | |
| Sterling Capital Virginia Intermediate Tax-Free Fund | | | 11,810,187 | | | | 7,169,556 | |
| Sterling Capital West Virginia Intermediate Tax-Free Fund | | | 12,707,394 | | | | 8,097,193 | |
Purchases and sales of U.S. government securities (excluding securities maturing less than one year from acquisition) for the fiscal year ended September 30, 2021 were as follows:
| | | Purchases | | | Sales | |
| Sterling Capital Ultra Short Bond Fund | | $ | 185,696 | | | $ | — | |
| Sterling Capital Short Duration Bond Fund | | | 8,475,618 | | | | 6,798,130 | |
| Sterling Capital Intermediate U.S. Government Fund | | | 25,670,501 | | | | 13,933,657 | |
| Sterling Capital Total Return Bond Fund | | | 409,738,834 | | | | 279,264,284 | |
| Sterling Capital Corporate Fund | | | 898,234 | | | | 894,018 | |
| Sterling Capital Quality Income Fund | | | 52,429,059 | | | | 30,339,159 | |
During the year ended September 30, 2021, the Sterling Capital Total Return Bond Fund effected an in-kind redemption of its shares. The redemption in-kind occurred on March 29, 2021 and totaled $192,663,635.
| 4. | Related Party Transactions: |
Under the terms of the investment advisory agreement, Sterling Capital Management LLC (“Sterling Capital” or the “Advisor”) is entitled to receive fees based on a percentage of the average daily net assets of the Funds. These fees are accrued daily and payable on a monthly basis and are reflected on the Statements of Operations as “Investment advisory fees.”
Notes to Financial Statements — (continued)
September 30, 2021
Sterling Capital’s waived investment advisory fees are included on the Statements of Operations as “Less expenses waived by the Investment Advisor.” Information regarding these transactions is as follows for the fiscal year ended September 30, 2021:
| | | Prior to February 1, 2021 | | | Effective February 1, 2021 | |
| | | Contractual Fee Rate | | | Fee Rate after Contractual Waivers | | | Contractual Fee Rate | | | Fee Rate after Contractual Waivers | |
| Sterling Capital Behavioral Large Cap Value Equity Fund | | | 0.45 | % | | | 0.45 | %(1) | | | 0.45 | % | | | 0.45 | %(1) |
| Sterling Capital Mid Value Fund | | | 0.70 | % | | | 0.61 | %(2) | | | 0.60 | % | | | 0.60 | % |
| Sterling Capital Behavioral Small Cap Value Equity Fund | | | 0.60 | % | | | 0.60 | % | | | 0.60 | % | | | 0.60 | % |
| Sterling Capital Special Opportunities Fund | | | 0.65 | % | | | 0.65 | %(1) | | | 0.65 | % | | | 0.65 | % |
| Sterling Capital Equity Income Fund | | | 0.55 | % | | | 0.55 | %(1) | | | 0.55 | % | | | 0.55 | % |
| Sterling Capital Behavioral International Equity Fund | | | 0.60 | % | | | 0.40 | %(2) | | | 0.40 | % | | | 0.40 | % |
| Sterling Capital SMID Opportunities Fund | | | 0.70 | % | | | 0.70 | % | | | 0.70 | % | | | 0.70 | % |
| Sterling Capital Stratton Mid Cap Value Fund | | | 0.70 | % | | | 0.66 | %(2) | | | 0.60 | % | | | 0.60 | % |
| Sterling Capital Stratton Real Estate Fund | | | 0.58 | % | | | 0.58 | % | | | 0.58 | % | | | 0.58 | % |
| Sterling Capital Stratton Small Cap Value Fund | | | 0.85 | % | | | 0.75 | %(2) | | | 0.75 | % | | | 0.75 | % |
| Sterling Capital Ultra Short Bond Fund | | | 0.20 | % | | | 0.02 | %(2) | | | 0.20 | % | | | 0.20 | % |
| Sterling Capital Short Duration Bond Fund | | | 0.30 | % | | | 0.20 | %(2) | | | 0.20 | % | | | 0.20 | % |
| Sterling Capital Intermediate U.S. Government Fund | | | 0.32 | % | | | 0.16 | %(2) | | | 0.32 | % | | | 0.12 | %(3) |
| Sterling Capital Total Return Bond Fund | | | 0.37 | % | | | 0.24 | %(2) | | | 0.25 | % | | | 0.25 | % |
| Sterling Capital Corporate Fund | | | 0.35 | % | | | 0.31 | %(2) | | | 0.35 | % | | | 0.31 | %(1),(3) |
| Sterling Capital Quality Income Fund | | | 0.35 | % | | | 0.31 | %(2) | | | 0.35 | % | | | 0.31 | %(3) |
| Sterling Capital North Carolina Intermediate Tax-Free Fund | | | 0.35 | % | | | 0.35 | % | | | 0.35 | % | | | 0.35 | % |
| Sterling Capital South Carolina Intermediate Tax-Free Fund | | | 0.35 | % | | | 0.35 | % | | | 0.35 | % | | | 0.35 | % |
| Sterling Capital Virginia Intermediate Tax-Free Fund | | | 0.35 | % | | | 0.35 | % | | | 0.35 | % | | | 0.35 | % |
| Sterling Capital West Virginia Intermediate Tax-Free Fund | | | 0.35 | % | | | 0.35 | % | | | 0.35 | % | | | 0.35 | % |
| (1) | For all or a portion of the period ended September 30, 2021, Sterling Capital voluntarily waived and/or reimbursed certain expenses of the Funds. Voluntary waivers and reimbursements of expenses may be discontinued at any time. |
| (2) | Sterling Capital contractually agreed to limit the advisory fees paid by the Fund from February 1, 2020 through January 31, 2021. |
| (3) | Sterling Capital contractually agreed to limit the advisory fees paid by the Fund from February 1, 2021 through January 31, 2022. |
For the following Funds, Sterling Capital has contractually agreed to waive its investment advisory fees, pay Fund operating expenses, and/or reimburse fees or expenses, in order to limit expenses of the shares based on average daily net assets, excluding interest, taxes, acquired funds fees and extraordinary expenses. The expense limitations for the periods February 1, 2020 through January 31, 2021 and February 1, 2021 through January 31, 2022 are as follows:
| | | Effective February 1, 2021 | |
| | | Class A | | | Class C | | | Institutional | | | Class R | | | Class R6 | |
| Sterling Capital SMID Opportunities Fund | | | 1.04 | % | | | 1.79 | % | | | 0.79 | % | | | – | % | | | – | % |
| Sterling Capital Ultra Short Bond Fund | | | 0.52 | % | | | – | % | | | 0.27 | % | | | – | % | | | – | % |
| Sterling Capital Intermediate U.S. Government Fund | | | 0.75 | % | | | 1.50 | % | | | 0.50 | % | | | – | % | | | – | % |
| Sterling Capital Total Return Bond Fund | | | 0.70 | % | | | 1.45 | % | | | 0.45 | % | | | 0.95 | % | | | 0.45 | % |
| | | Prior to February 1, 2021 | |
| | | Class A | | | Class C | | | Institutional | | | Class R | |
| Sterling Capital Behavioral International Equity Fund | | | 1.00 | % | | | 1.75 | % | | | 0.75 | % | | | –% | |
| Sterling Capital SMID Opportunities Fund | | | 1.04 | % | | | 1.79 | % | | | 0.79 | % | | | –% | |
| Sterling Capital Stratton Small Cap Value Fund | | | 1.30 | % | | | 2.05 | % | | | 1.05 | % | | | –% | |
| Sterling Capital Total Return Bond Fund | | | 0.70 | % | | | 1.45 | % | | | 0.45 | % | | | 0.95 | % |
Notes to Financial Statements — (continued)
September 30, 2021
For the following Funds, Sterling Capital has contractually agreed to waive its administrative fees, pay Fund operating expenses, and/or reimburse a Fund the following levels with respect to the Funds' Class R6 Shares, effective for the period February 1, 2021 through January 31, 2022:
| | | Effective February 1, 2021 | |
| Sterling Capital Behavioral Large Cap Value Equity Fund | | | 0.05 | % |
| Sterling Capital Mid Value Fund | | | 0.09 | % |
| Sterling Capital Behavioral Small Cap Value Equity Fund | | | 0.05 | % |
| Sterling Capital Special Opportunities Fund | | | 0.08 | % |
| Sterling Capital Equity Income Fund | | | 0.10 | % |
| Sterling Capital Behavioral International Equity Fund | | | 0.05 | % |
| Sterling Capital Stratton Real Estate Fund | | | 0.09 | % |
| Sterling Capital Stratton Small Cap Value Fund | | | 0.10 | % |
| Sterling Capital Short Duration Bond Fund | | | 0.09 | % |
| Sterling Capital Total Return Bond Fund | | | 0.10 | % |
For the following Funds and with respect to R6 Shares of such Fund, Sterling Capital contractually agreed to waive its administration fees, pay Fund operating expenses of Class R6 Shares, and/or reimburse fees or expenses, in order to limit expenses of the shares based on average daily net assets, excluding interest, taxes, acquired funds fees and extraordinary expenses. The expense limitations effective for the period February 1, 2020 through January 31, 2021 were as follows:
| | | Prior to February 1, 2021 | |
| Sterling Capital Behavioral Large Cap Value Equity Fund | | | 0.59 | % |
| Sterling Capital Mid Value Fund | | | 0.81 | % |
| Sterling Capital Behavioral Small Cap Value Equity Fund | | | 0.74 | % |
| Sterling Capital Special Opportunities Fund | | | 0.78 | % |
| Sterling Capital Equity Income Fund | | | 0.67 | % |
| Sterling Capital Behavioral International Equity Fund | | | 0.64 | % |
| Sterling Capital Stratton Real Estate Fund | | | 0.73 | % |
| Sterling Capital Stratton Small Cap Value Fund | | | 0.87 | % |
| Sterling Capital Total Return Bond Fund | | | 0.35 | % |
Sterling Capital serves as the administrator to the Funds pursuant to an administration agreement. The Funds pay their portion of a fee to Sterling Capital for providing administration services based on the aggregate assets of the Funds, at a rate of 0.1075% on the first $3.5 billion of average net assets, 0.075% on the next $1 billion of average net assets; 0.06% on the next $1.5 billion of average net assets; and 0.04% of average net assets over $6 billion. Expenses incurred are reflected on the Statements of Operations as “Administration fees.” Pursuant to a sub-administration agreement with Sterling Capital, The Bank of New York Mellon (“the “Sub-Administrator”), serves as the sub-administrator to the Funds subject to the general supervision of the Board and Sterling Capital. For these services, The Bank of New York Mellon is entitled to a fee payable by Sterling Capital. The Bank of New York Mellon also serves as the Funds’ fund accountant and receives compensation by the Funds for these services. Expenses incurred are reflected on the Statements of Operations as “Fund accounting fees.”
BNY Mellon Investment Servicing (US) Inc. serves as the Funds’ transfer agent and receives compensation by the Funds for these services. Expenses incurred are reflected on the Statements of Operations as “Transfer agent fees.”
Sterling Capital’s Chief Compliance Officer (“CCO”) serves as the Funds’ CCO. The CCO’s compensation is reviewed and approved by the Funds’ Board and paid by Sterling Capital. However, the Funds reimburse Sterling Capital for their allocable portion of the CCO’s base salary and incentive pay. As a result, the CCO fee paid by the Funds is only part of the total compensation received by the CCO. Expenses incurred are reflected on the Statements of Operations as “Compliance Service Fees.”
For the fiscal year ended September 30, 2021, the Funds paid $16,000 in brokerage fees to Truist Securities on the execution of purchases and sales of the Funds’ portfolio investments.
The Funds have adopted a Distribution and Shareholder Services Plan (the “Plan”) in accordance with Rule 12b-1 under the 1940 Act. Sterling Capital Distributors, LLC (the “Distributor”) serves as distributor to the Funds pursuant to an underwriting agreement. The Plan provides for payments to the Distributor of up to 0.25%, 1.00% and 0.50% of the average daily net assets of the Class A Shares, Class C Shares, and Class R Shares, respectively. In addition, the Distributor is entitled to receive commissions on sales of shares of the Variable Net Asset Value Funds. For the fiscal year ended September 30, 2021, the Distributor received $193,775 from commissions earned on sales of shares of the Variable Net Asset Value Funds. The Distributor does not retain commissions for profit. These commissions and fees may be used by the Distributor to pay banks, broker dealers and other institutions, including affiliates of the Advisor.
Notes to Financial Statements — (continued)
September 30, 2021
The Advisor and/or its affiliates may pay out of their own assets (and not as an additional charge to a fund) compensation to selected affiliated and unaffiliated brokers, dealers and other financial intermediaries in connection with the sale and distribution of the shares and/or the retention and/or servicing of Fund investors and Fund shares. These payments, sometimes referred to as “revenue sharing” payments are payments over and above any sales charges (including Rule 12b-1 fees) and service fees paid by the Funds. The amount of these payments is determined at the discretion of the Advisor and/or its affiliates from time to time, may be substantial, and may be different for different financial advisors. Receipt of, or the prospect of receiving, this additional compensation may influence your financial intermediary’s recommendation of a Fund or of a particular share class of a Fund. Commissions and finder’s fees financed by the Advisor and paid by the Distributor to affiliated broker-dealers during the fiscal year ended September 30, 2021 were $1,619.
Certain Officers and a Trustee of the Funds are affiliated with Sterling Capital or the Sub-Administrator. Such Officers and Trustee receive no compensation from the Funds for serving in their respective roles. Each of the Trustees who are not interested persons (as defined in the 1940 Act) of the Trust who serve on the Board are compensated at the annual rate of $100,000 plus $7,500 for each regularly scheduled quarterly meeting attended, $4,000 for each special meeting attended in person and $1,500 for each special meeting attended by telephone, plus reimbursement for certain out of pocket expenses. Each Trustee serving on a Committee of the Board receives a fee of $4,000 for each Committee meeting attended in person and $1,500 for each Committee meeting attended by telephone, plus reimbursement for certain out of pocket expenses. Committee meeting fees are only paid when such Committee meetings are not held in conjunction with a regular board meeting. Additionally, the Chairman of the Board receives additional compensation at the annual rate of $24,000, the Audit Committee Chairman receives additional compensation at the annual rate of $18,000, and the Chairman of the Nominations Committee receives additional compensation at the annual rate of $7,500. The fees are allocated across the Trust based upon relative net assets.
Transactions in Class A, Class C, Institutional, Class R and Class R6 Shares were:
| | | For the Year Ended September 30, 2021 | | | For the Year Ended September 30, 2020 | |
| Sterling Capital Behavioral Large Cap Value Equity Fund | | | | | | | | | | |
| Class A | | Shares | | | Amount | | | Shares | | | Amount | |
| Issued | | | 41,838 | | | $ | 852,810 | | | | 153,400 | | | $ | 2,524,986 | |
| Reinvested | | | 15,398 | | | | 288,409 | | | | 81,556 | | | | 1,486,105 | |
| Redeemed | | | (165,155 | ) | | | (3,392,430 | ) | | | (234,670 | ) | | | (4,171,306 | ) |
| Total | | | (107,919 | ) | | $ | (2,251,211 | ) | | | 286 | | | $ | (160,215 | ) |
| Sterling Capital Behavioral Large Cap Value Equity Fund | | | | | | |
| Class C | | Shares | | | Amount | | | Shares | | | Amount | |
| Issued | | | 690 | | | $ | 13,830 | | | | 10,269 | | | $ | 133,361 | |
| Reinvested | | | 186 | | | | 3,360 | | | | 1,736 | | | | 30,756 | |
| Redeemed | | | (22,060 | ) | | | (406,813 | ) | | | (10,492 | ) | | | (167,857 | ) |
| Total | | | (21,184 | ) | | $ | (389,623 | ) | | | 1,513 | | | $ | (3,740 | ) |
Notes to Financial Statements — (continued)
September 30, 2021
| | | For the Year Ended September 30, 2021 | | | For the Year Ended September 30, 2020 | |
| Sterling Capital Behavioral Large Cap Value Equity Fund | | | | | | | | | | |
| Institutional | | Shares | | | Amount | | | Shares | | | Amount | |
| Issued | | | 20,803 | | | $ | 407,986 | | | | 8,460 | | | $ | 149,451 | |
| Reinvested | | | 981 | | | | 18,502 | | | | 15,145 | | | | 288,365 | |
| Redeemed | | | (49,484 | ) | | | (1,014,454 | ) | | | (292,703 | ) | | | (4,315,079 | ) |
| Total | | | (27,700 | ) | | $ | (587,966 | ) | | | (269,098 | ) | | $ | (3,877,263 | ) |
| Sterling Capital Behavioral Large Cap Value Equity Fund | | | | | | | | | | |
| Class R6 | | Shares | | | Amount | | | Shares | | | Amount | |
| Issued | | | — | | | $ | — | | | | 463,022 | | | $ | 8,106,412 | |
| Reinvested | | | 1 | | | | 5 | | | | 574,922 | | | | 10,771,551 | |
| Redeemed | | | — | | | | — | | | | (13,259,237 | ) | | | (224,757,934 | ) |
| Total | | | 1 | | | $ | 5 | | | | (12,221,293 | ) | | $ | (205,879,971 | ) |
| Sterling Capital Mid Value Fund | | | | | | | | | | | | |
| Class A | | Shares | | | Amount | | | Shares | | | Amount | |
| Issued | | | 50,933 | | | $ | 993,734 | | | | 44,410 | | | $ | 609,680 | |
| Reinvested | | | 2,391 | | | | 41,220 | | | | 113,825 | | | | 1,809,392 | |
| Redeemed | | | (230,271 | ) | | | (4,242,223 | ) | | | (240,368 | ) | | | (3,436,452 | ) |
| Total | | | (176,947 | ) | | $ | (3,207,269 | ) | | | (82,133 | ) | | $ | (1,017,380 | ) |
| Sterling Capital Mid Value Fund | | | | | | | | | | | | |
| Class C | | Shares | | | Amount | | | Shares | | | Amount | |
| Issued | | | 1,452 | | | $ | 23,154 | | | | 4,461 | | | $ | 46,636 | |
| Reinvested | | | — | | | | — | | | | 17,217 | | | | 231,932 | |
| Redeemed | | | (69,838 | ) | | | (1,099,637 | ) | | | (92,335 | ) | | | (1,074,073 | ) |
| Total | | | (68,386 | ) | | $ | (1,076,483 | ) | | | (70,657 | ) | | $ | (795,505 | ) |
| Sterling Capital Mid Value Fund | | | | | | | | | | | | |
| Institutional | | Shares | | | Amount | | | Shares | | | Amount | |
| Issued | | | 654,893 | | | $ | 12,446,868 | | | | 557,945 | | | $ | 8,007,600 | |
| Reinvested | | | 9,659 | | | | 170,284 | | | | 241,018 | | | | 3,922,615 | |
| Redeemed | | | (718,028 | ) | | | (14,337,942 | ) | | | (7,601,067 | ) | | | (117,763,003 | ) |
| Total | | | (53,476 | ) | | $ | (1,720,790 | ) | | | (6,802,104 | ) | | $ | (105,832,788 | ) |
| Sterling Capital Mid Value Fund | | | | | | | | | | | | |
| Class R | | Shares | | | Amount | | | Shares | | | Amount | |
| Issued | | | 54 | | | $ | 1,040 | | | | 1 | | | $ | 15 | |
| Reinvested | | | — | | | | 2 | | | | 30 | | | | 455 | |
| Redeemed | | | (1 | ) | | | (9 | ) | | | (1 | ) | | | (18 | ) |
| Total | | | 53 | | | $ | 1,033 | | | | 30 | | | $ | 452 | |
| Sterling Capital Mid Value Fund | | | | | | | | | | | | |
| Class R6 | | Shares | | | Amount | | | Shares | | | Amount | |
| Issued | | | 2,636 | | | $ | 43,186 | | | | 320,533 | | | $ | 4,401,107 | |
| Reinvested | | | 23 | | | | 394 | | | | 2 | | | | 39 | |
| Redeemed | | | (225,282 | ) | | | (4,063,386 | ) | | | (15,125,634 | ) | | | (239,675,052 | ) |
| Total | | | (222,623 | ) | | $ | (4,019,806 | ) | | | (14,805,099 | ) | | $ | (235,273,906 | ) |
Notes to Financial Statements — (continued)
September 30, 2021
| | | For the Year Ended September 30, 2021 | | | For the Year Ended September 30, 2020 | |
| Sterling Capital Behavioral Small Cap Value Equity Fund | | | | | | | | | | |
| Class A | | Shares | | | Amount | | | Shares | | | Amount | |
| Issued | | | 15,753 | | | $ | 278,950 | | | | 25,993 | | | $ | 288,173 | |
| Reinvested | | | 2,768 | | | | 40,284 | | | | 3,875 | | | | 60,376 | |
| Redeemed | | | (64,464 | ) | | | (1,091,075 | ) | | | (65,574 | ) | | | (833,998 | ) |
| Total | | | (45,943 | ) | | $ | (771,841 | ) | | | (35,706 | ) | | $ | (485,449 | ) |
| Sterling Capital Behavioral Small Cap Value Equity Fund | | | | | | | | | | | | |
| Class C | | Shares | | | Amount | | | Shares | | | Amount | |
| Issued | | | 373 | | | $ | 6,142 | | | | 687 | | | $ | 8,445 | |
| Reinvested | | | — | | | | — | | | | 78 | | | | 1,166 | |
| Redeemed | | | (7,176 | ) | | | (114,167 | ) | | | (2,636 | ) | | | (29,287 | ) |
| Total | | | (6,803 | ) | | $ | (108,025 | ) | | | (1,871 | ) | | $ | (19,676 | ) |
| Sterling Capital Behavioral Small Cap Value Equity Fund | | | | | | | | |
| Institutional | | Shares | | | Amount | | | Shares | | | Amount | |
| Issued | | | 425,935 | | | $ | 7,544,347 | | | | 98,215 | | | $ | 1,201,562 | |
| Reinvested | | | 4,254 | | | | 62,444 | | | | 9,919 | | | | 155,825 | |
| Redeemed | | | (253,018 | ) | | | (4,326,883 | ) | | | (1,463,078 | ) | | | (16,809,476 | ) |
| Total | | | 177,171 | | | $ | 3,279,908 | | | | (1,354,944 | ) | | $ | (15,452,089 | ) |
| Sterling Capital Behavioral Small Cap Value Equity Fund | | | | | | | | | | |
| Class R | | Shares | | | Amount | | | Shares | | | Amount | |
| Issued | | | 2,132 | | | $ | 35,302 | | | | 8,238 | | | $ | 109,023 | |
| Reinvested | | | 76 | | | | 1,097 | | | | 99 | | | | 1,536 | |
| Redeemed | | | (3,570 | ) | | | (62,311 | ) | | | (776 | ) | | | (7,952 | ) |
| Total | | | (1,362 | ) | | $ | (25,912 | ) | | | 7,561 | | | $ | 102,607 | |
| Sterling Capital Behavioral Small Cap Value Equity Fund | | | | | | | | | | |
| Class R6 | | Shares | | | Amount | | | Shares | | | Amount | |
| Issued | | | 3,271 | | | $ | 54,841 | | | | 92,534 | | | $ | 1,214,580 | |
| Reinvested | | | 57,955 | | | | 851,367 | | | | 55,488 | | | | 872,270 | |
| Redeemed | | | (1,665,031 | ) | | | (31,836,646 | ) | | | (8,615,520 | ) | | | (122,868,186 | ) |
| Total | | | (1,603,805 | ) | | $ | (30,930,438 | ) | | | (8,467,498 | ) | | $ | (120,781,336 | ) |
| Sterling Capital Special Opportunities Fund | | | | | | | | | | | | |
| Class A | | Shares | | | Amount | | | Shares | | | Amount | |
| Issued | | | 899,419 | | | $ | 28,108,301 | | | | 821,061 | | | $ | 19,038,037 | |
| Reinvested | | | 127,257 | | | | 3,532,665 | | | | 667,153 | | | | 16,465,521 | |
| Redeemed | | | (1,619,012 | ) | | | (49,005,620 | ) | | | (3,334,855 | ) | | | (74,966,780 | ) |
| Total | | | (592,336 | ) | | $ | (17,364,654 | ) | | | (1,846,641 | ) | | $ | (39,463,222 | ) |
| Sterling Capital Special Opportunities Fund | | | | | | | | | | | | |
| Class C | | Shares | | | Amount | | | Shares | | | Amount | |
| Issued | | | 85,196 | | | $ | 2,107,942 | | | | 193,408 | | | $ | 3,525,009 | |
| Reinvested | | | 41,122 | | | | 906,331 | | | | 257,473 | | | | 5,097,950 | |
| Redeemed | | | (1,238,202 | ) | | | (29,930,092 | ) | | | (1,526,477 | ) | | | (28,053,096 | ) |
| Total | | | (1,111,884 | ) | | $ | (26,915,819 | ) | | | (1,075,596 | ) | | $ | (19,430,137 | ) |
Notes to Financial Statements — (continued)
September 30, 2021
| | | For the Year Ended September 30, 2021 | | | For the Year Ended September 30, 2020 | |
| Sterling Capital Special Opportunities Fund | | | | | | | | | | | | |
| Institutional | | Shares | | | Amount | | | Shares | | | Amount | |
| Issued | | | 1,223,082 | | | $ | 40,695,174 | | | | 2,245,496 | | | $ | 52,543,075 | |
| Reinvested | | | 63,869 | | | | 1,886,861 | | | | 394,968 | | | | 10,359,812 | |
| Redeemed | | | (1,708,623 | ) | | | (54,171,179 | ) | | | (6,923,672 | ) | | | (161,840,614 | ) |
| Total | | | (421,672 | ) | | $ | (11,589,144 | ) | | | (4,283,208 | ) | | $ | (98,937,727 | ) |
| Sterling Capital Special Opportunities Fund | | | | | | | | | | | | |
| Class R | | Shares | | | Amount | | | Shares | | | Amount | |
| Issued | | | 28 | | | $ | 693 | | | | 817 | | | $ | 18,817 | |
| Reinvested | | | — | | | | 14 | | | | 194 | | | | 4,837 | |
| Redeemed | | | (4,520 | ) | | | (115,349 | ) | | | (8,059 | ) | | | (209,835 | ) |
| Total | | | (4,492 | ) | | $ | (114,642 | ) | | | (7,048 | ) | | $ | (186,181 | ) |
| Sterling Capital Special Opportunities Fund | | | | | | | | | | | | |
| Class R6 | | Shares | | | Amount | | | Shares | | | Amount | |
| Issued | | | 75,987 | | | $ | 2,356,511 | | | | 2,425,430 | | | $ | 58,697,590 | |
| Reinvested | | | 690 | | | | 20,418 | | | | 721,782 | | | | 18,960,051 | |
| Redeemed | | | (352,462 | ) | | | (11,199,650 | ) | | | (15,250,967 | ) | | | (379,778,869 | ) |
| Total | | | (275,785 | ) | | $ | (8,822,721 | ) | | | (12,103,755 | ) | | $ | (302,121,228 | ) |
| Sterling Capital Equity Income Fund | | | | | | | | | | | | |
| Class A | | Shares | | | Amount | | | Shares | | | Amount | |
| Issued | | | 3,995,959 | | | $ | 98,587,686 | | | | 3,135,753 | | | $ | 61,979,645 | |
| Reinvested | | | 171,179 | | | | 4,339,483 | | | | 894,160 | | | | 18,130,587 | |
| Redeemed | | | (2,838,113 | ) | | | (69,848,590 | ) | | | (3,952,671 | ) | | | (75,667,035 | ) |
| Total | | | 1,329,025 | | | $ | 33,078,579 | | | | 77,242 | | | $ | 4,443,197 | |
| Sterling Capital Equity Income Fund | | | | | | | | | | | | |
| Class C | | Shares | | | Amount | | | Shares | | | Amount | |
| Issued | | | 377,612 | | | $ | 9,167,208 | | | | 601,400 | | | $ | 11,942,453 | |
| Reinvested | | | 12,023 | | | | 296,015 | | | | 359,269 | | | | 7,273,756 | |
| Redeemed | | | (3,324,223 | ) | | | (80,466,176 | ) | | | (2,458,114 | ) | | | (47,264,406 | ) |
| Total | | | (2,934,588 | ) | | $ | (71,002,953 | ) | | | (1,497,445 | ) | | $ | (28,048,197 | ) |
| Sterling Capital Equity Income Fund | | | | | | | | | | | | |
| Institutional | | Shares | | | Amount | | | Shares | | | Amount | |
| Issued | | | 17,467,222 | | | $ | 430,631,193 | | | | 32,659,085 | | | $ | 657,438,047 | |
| Reinvested | | | 616,486 | | | | 15,718,369 | | | | 2,486,728 | | | | 50,554,803 | |
| Redeemed | | | (9,862,395 | ) | | | (244,303,420 | ) | | | (29,067,017 | ) | | | (538,369,044 | ) |
| Total | | | 8,221,313 | | | $ | 202,046,142 | | | | 6,078,796 | | | $ | 169,623,806 | |
| Sterling Capital Equity Income Fund | | | | | | | | | | | | |
| Class R | | Shares | | | Amount | | | Shares | | | Amount | |
| Issued | | | 30,887 | | | $ | 782,739 | | | | 13,967 | | | $ | 275,755 | |
| Reinvested | | | 671 | | | | 16,723 | | | | 6,290 | | | | 128,228 | |
| Redeemed | | | (68,015 | ) | | | (1,752,490 | ) | | | (66,172 | ) | | | (1,341,545 | ) |
| Total | | | (36,457 | ) | | $ | (953,028 | ) | | | (45,915 | ) | | $ | (937,562 | ) |
Notes to Financial Statements — (continued)
September 30, 2021
| | | For the Year Ended September 30, 2021 | | | For the Year Ended September 30, 2020 | |
| Sterling Capital Equity Income Fund | | | | | | | | | | | | |
| Class R6 | | Shares | | | Amount | | | Shares | | | Amount | |
| Issued | | | 944,445 | | | $ | 22,264,153 | | | | 7,276,798 | | | $ | 144,728,495 | |
| Reinvested | | | 18,346 | | | | 464,380 | | | | 958,953 | | | | 19,454,375 | |
| Redeemed | | | (1,124,786 | ) | | | (27,430,174 | ) | | | (21,642,399 | ) | | | (418,538,744 | ) |
| Total | | | (161,995 | ) | | $ | (4,701,641 | ) | | | (13,406,648 | ) | | $ | (254,355,874 | ) |
| Sterling Capital Behavioral International Equity Fund | | | | | | | | | | |
| Class A | | Shares | | | Amount | | | Shares | | | Amount | |
| Issued | | | 7,910 | | | $ | 69,621 | | | | 5,175 | | | $ | 48,933 | |
| Reinvested | | | 1,452 | | | | 12,832 | | | | 1,530 | | | | 15,210 | |
| Redeemed | | | (11,774 | ) | | | (113,208 | ) | | | (10,924 | ) | | | (92,152 | ) |
| Total | | | (2,412 | ) | | $ | (30,755 | ) | | | (4,219 | ) | | $ | (28,009 | ) |
| Sterling Capital Behavioral International Equity Fund | | | | | | | | | | |
| Class C | | Shares | | | Amount | | | Shares | | | Amount | |
| Issued | | | 71 | | | $ | 705 | | | | — | | | $ | — | |
| Reinvested | | | 101 | | | | 891 | | | | 100 | | | | 987 | |
| Redeemed | | | (74 | ) | | | (690 | ) | | | (1,362 | ) | | | (13,296 | ) |
| Total | | | 98 | | | $ | 906 | | | | (1,262 | ) | | $ | (12,309 | ) |
| Sterling Capital Behavioral International Equity Fund | | | | | | | | | | |
| Institutional | | Shares | | | Amount | | | Shares | | | Amount | |
| Issued | | | 935 | | | $ | 9,368 | | | | 64,545 | | | $ | 588,489 | |
| Reinvested | | | 2,040 | | | | 18,010 | | | | 2,342 | | | | 23,254 | |
| Redeemed | | | (1,614,353 | ) | | | (14,734,958 | ) | | | (150,716 | ) | | | (1,496,343 | ) |
| Total | | | (1,611,378 | ) | | $ | (14,707,580 | ) | | | (83,829 | ) | | $ | (884,600 | ) |
| Sterling Capital Behavioral International Equity Fund | | | | | | | | | | |
| Class R6 | | Shares | | | Amount | | | Shares | | | Amount | |
| Reinvested | | | 235,591 | | | $ | 2,082,632 | | | | 252,981 | | | $ | 2,512,098 | |
| Total | | | 235,591 | | | $ | 2,082,632 | | | | 252,981 | | | $ | 2,512,098 | |
| Sterling Capital SMID Opportunities Fund | | | | | | | | | | | | |
| Class A | | Shares | | | Amount | | | Shares | | | Amount | |
| Issued | | | 37,980 | | | $ | 587,546 | | | | 135,999 | | | $ | 1,803,928 | |
| Reinvested | | | — | | | | — | | | | 11,940 | | | | 158,917 | |
| Redeemed | | | (76,597 | ) | | | (1,218,610 | ) | | | (26,499 | ) | | | (304,881 | ) |
| Total | | | (38,617 | ) | | $ | (631,064 | ) | | | 121,440 | | | $ | 1,657,964 | |
| Sterling Capital SMID Opportunities Fund | | | | | | | | | | | | |
| Class C | | Shares | | | Amount | | | Shares | | | Amount | |
| Issued | | | 1,063 | | | $ | 16,863 | | | | 16,823 | | | $ | 218,546 | |
| Reinvested | | | — | | | | — | | | | 4,510 | | | | 58,816 | |
| Redeemed | | | (6,800 | ) | | | (101,769 | ) | | | (9,579 | ) | | | (106,746 | ) |
| Total | | | (5,737 | ) | | $ | (84,906 | ) | | | 11,754 | | | $ | 170,616 | |
| Sterling Capital SMID Opportunities Fund | | | | | | | | | | | | |
| Institutional | | Shares | | | Amount | | | Shares | | | Amount | |
| Issued | | | 14,716 | | | $ | 220,461 | | | | 332,630 | | | $ | 3,976,210 | |
| Reinvested | | | — | | | | — | | | | 18,925 | | | | 253,402 | |
| Redeemed | | | (159,154 | ) | | | (2,485,677 | ) | | | (329,334 | ) | | | (3,544,403 | ) |
| Total | | | (144,438 | ) | | $ | (2,265,216 | ) | | | 22,221 | | | $ | 685,209 | |
Notes to Financial Statements — (continued)
September 30, 2021
| | | For the Year Ended September 30, 2021 | | | For the Year Ended September 30, 2020 | |
| Sterling Capital Stratton Mid Cap Value Fund | | | | | | | | | | | | |
| Class A | | Shares | | | Amount | | | Shares | | | Amount | |
| Issued | | | 3,552 | | | $ | 228,722 | | | | 673 | | | $ | 42,699 | |
| Reinvested | | | 30 | | | | 2,010 | | | | 60 | | | | 3,928 | |
| Redeemed | | | (1,351 | ) | | | (83,360 | ) | | | (229 | ) | | | (10,801 | ) |
| Total | | | 2,231 | | | $ | 147,372 | | | | 504 | | | $ | 35,826 | |
| Sterling Capital Stratton Mid Cap Value Fund | | | | | | | | | | | | |
| Class C | | Shares | | | Amount | | | Shares | | | Amount | |
| Issued | | | 15 | | | $ | 1,149 | | | | — | | | $ | — | |
| Reinvested | | | — | | | | 5 | | | | 1 | | | | 34 | |
| Total | | | 15 | | | $ | 1,154 | | | | 1 | | | $ | 34 | |
| Sterling Capital Stratton Mid Cap Value Fund | | | | | | | | | | | | |
| Institutional | | Shares | | | Amount | | | Shares | | | Amount | |
| Issued | | | 17,072 | | | $ | 1,327,524 | | | | 33,549 | | | $ | 1,843,863 | |
| Reinvested | | | 6,931 | | | | 473,525 | | | | 28,066 | | | | 1,862,795 | |
| Redeemed | | | (107,394 | ) | | | (7,872,757 | ) | | | (110,782 | ) | | | (6,433,325 | ) |
| Total | | | (83,391 | ) | | $ | (6,071,708 | ) | | | (49,167 | ) | | $ | (2,726,667 | ) |
| Sterling Capital Stratton Real Estate Fund | | | | | | | | | | | | |
| Class A | | Shares | | | Amount | | | Shares | | | Amount | |
| Issued | | | 4,693 | | | $ | 196,046 | | | | 36,748 | | | $ | 1,481,184 | |
| Reinvested | | | 499 | | | | 20,159 | | | | 1,452 | | | | 53,827 | |
| Redeemed | | | (4,268 | ) | | | (186,034 | ) | | | (42,464 | ) | | | (1,569,461 | ) |
| Total | | | 924 | | | $ | 30,171 | | | | (4,264 | ) | | $ | (34,450 | ) |
| Sterling Capital Stratton Real Estate Fund | | | | | | | | | | | | |
| Class C | | Shares | | | Amount | | | Shares | | | Amount | |
| Issued | | | 21 | | | $ | 1,000 | | | | 284 | | | $ | 12,001 | |
| Reinvested | | | 127 | | | | 4,949 | | | | 272 | | | | 10,328 | |
| Redeemed | | | (1,426 | ) | | | (56,202 | ) | | | (147 | ) | | | (5,223 | ) |
| Total | | | (1,278 | ) | | $ | (50,253 | ) | | | 409 | | | $ | 17,106 | |
| Sterling Capital Stratton Real Estate Fund | | | | | | | | | | | | |
| Institutional | | Shares | | | Amount | | | Shares | | | Amount | |
| Issued | | | 265,204 | | | $ | 10,813,943 | | | | 247,551 | | | $ | 9,677,466 | |
| Reinvested | | | 71,046 | | | | 2,880,895 | | | | 133,980 | | | | 5,099,447 | |
| Redeemed | | | (578,908 | ) | | | (25,636,626 | ) | | | (542,622 | ) | | | (20,130,666 | ) |
| Total | | | (242,658 | ) | | $ | (11,941,788 | ) | | | (161,091 | ) | | $ | (5,353,753 | ) |
| Sterling Capital Stratton Real Estate Fund | | | | | | | | | | | | |
| Class R6 | | Shares | | | Amount | | | Shares | | | Amount | |
| Issued | | | 328 | | | $ | 13,868 | | | | 12 | | | $ | 500 | |
| Reinvested | | | 6 | | | | 250 | | | | — | | | | 9 | |
| Redeemed | | | (1 | ) | | | (20 | ) | | | — | | | | — | |
| Total | | | 333 | | | $ | 14,098 | | | | 12 | | | $ | 509 | |
Notes to Financial Statements — (continued)
September 30, 2021
| | | For the Year Ended September 30, 2021 | | | For the Year Ended September 30, 2020 | |
| Sterling Capital Stratton Small Cap Value Fund | | | | | | | | | | | | |
| Class A | | Shares | | | Amount | | | Shares | | | Amount | |
| Issued | | | 11,399 | | | $ | 910,833 | | | | 7,926 | | | $ | 553,247 | |
| Reinvested | | | 5,127 | | | | 349,012 | | | | 2,260 | | | | 174,082 | |
| Redeemed | | | (6,905 | ) | | | (524,432 | ) | | | (13,600 | ) | | | (944,522 | ) |
| Total | | | 9,621 | | | $ | 735,413 | | | | (3,414 | ) | | $ | (217,193 | ) |
| Sterling Capital Stratton Small Cap Value Fund | | | | | | | | | | | | |
| Class C | | Shares | | | Amount | | | Shares | | | Amount | |
| Issued | | | 908 | | | $ | 74,265 | | | | 1,598 | | | $ | 119,709 | |
| Reinvested | | | 643 | | | | 41,968 | | | | 312 | | | | 23,281 | |
| Redeemed | | | (814 | ) | | | (63,837 | ) | | | (1,601 | ) | | | (80,726 | ) |
| Total | | | 737 | | | $ | 52,396 | | | | 309 | | | $ | 62,264 | |
| Sterling Capital Stratton Small Cap Value Fund | | | | | | | | | | |
| Institutional | | Shares | | | Amount | | | Shares | | | Amount | |
| Issued | | | 655,128 | | | $ | 51,516,884 | | | | 1,728,136 | | | $ | 110,101,534 | |
| Reinvested | | | 916,791 | | | | 62,862,358 | | | | 590,269 | | | | 45,739,757 | |
| Redeemed | | | (2,848,814 | ) | | | (219,208,647 | ) | | | (7,138,073 | ) | | | (437,842,996 | ) |
| Total | | | (1,276,895 | ) | | $ | (104,829,405 | ) | | | (4,819,668 | ) | | $ | (282,001,705 | ) |
| Sterling Capital Stratton Small Cap Value Fund | | | | | | | | | | | | |
| Class R6 | | Shares | | | Amount | | | Shares | | | Amount | |
| Issued | | | 4,022 | | | $ | 339,541 | | | | 44,970 | | | $ | 2,997,750 | |
| Reinvested | | | 7,679 | | | | 527,073 | | | | — | | | | — | |
| Redeemed | | | (13,007 | ) | | | (1,011,343 | ) | | | — | | | | — | |
| Total | | | (1,306 | ) | | $ | (144,729 | ) | | | 44,970 | | | $ | 2,997,750 | |
| Sterling Capital Ultra Short Bond Fund | | | | | | | | | | | | |
| Class A | | Shares | | | Amount | | | Shares | | | Amount | |
| Issued | | | 514,235 | | | $ | 5,042,688 | | | | 78,800 | | | $ | 768,600 | |
| Reinvested | | | 3,821 | | | | 37,444 | | | | 3,993 | | | | 39,025 | |
| Redeemed | | | (51,979 | ) | | | (509,581 | ) | | | (37,182 | ) | | | (363,294 | ) |
| Total | | | 466,077 | | | $ | 4,570,551 | | | | 45,611 | | | $ | 444,331 | |
| Sterling Capital Ultra Short Bond Fund | | | | | | | | | | | | |
| Institutional | | Shares | | | Amount | | | Shares | | | Amount | |
| Issued | | | 1,483,876 | | | $ | 14,546,133 | | | | 2,531,059 | | | $ | 24,826,301 | |
| Reinvested | | | 20,855 | | | | 204,591 | | | | 28,634 | | | | 280,149 | |
| Redeemed | | | (1,612,690 | ) | | | (15,829,258 | ) | | | (697,381 | ) | | | (6,810,714 | ) |
| Total | | | (107,959 | ) | | $ | (1,078,534 | ) | | | 1,862,312 | | | $ | 18,295,736 | |
| Sterling Capital Short Duration Bond Fund | | | | | | | | | | | | |
| Class A | | Shares | | | Amount | | | Shares | | | Amount | |
| Issued | | | 87,395 | | | $ | 766,298 | | | | 175,935 | | | $ | 1,540,121 | |
| Reinvested | | | 9,195 | | | | 80,431 | | | | 7,457 | | | | 64,820 | |
| Redeemed | | | (72,934 | ) | | | (638,447 | ) | | | (67,674 | ) | | | (585,882 | ) |
| Total | | | 23,656 | | | $ | 208,282 | | | | 115,718 | | | $ | 1,019,059 | |
Notes to Financial Statements — (continued)
September 30, 2021
| | | For the Year Ended September 30, 2021 | | | For the Year Ended September 30, 2020 | |
| Sterling Capital Short Duration Bond Fund | | | | | | | | | | | | |
| Class C | | Shares | | | Amount | | | Shares | | | Amount | |
| Issued | | | 54,275 | | | $ | 473,163 | | | | 16,474 | | | $ | 142,762 | |
| Reinvested | | | 1,241 | | | | 10,850 | | | | 1,626 | | | | 14,118 | |
| Redeemed | | | (43,426 | ) | | | (380,462 | ) | | | (38,057 | ) | | | (329,079 | ) |
| Total | | | 12,090 | | | $ | 103,551 | | | | (19,957 | ) | | $ | (172,199 | ) |
| Sterling Capital Short Duration Bond Fund | | | | | | | | | | | | |
| Institutional | | Shares | | | Amount | | | Shares | | | Amount | |
| Issued | | | 5,459,027 | | | $ | 47,787,423 | | | | 4,175,301 | | | $ | 36,219,458 | |
| Reinvested | | | 400,471 | | | | 3,501,537 | | | | 395,450 | | | | 3,435,852 | |
| Redeemed | | | (7,144,887 | ) | | | (62,293,235 | ) | | | (4,531,536 | ) | | | (39,043,049 | ) |
| Total | | | (1,285,389 | ) | | $ | (11,004,275 | ) | | | 39,215 | | | $ | 612,261 | |
| Sterling Capital Short Duration Bond Fund | | | | | | | | | | | | |
| Class R6 | | Shares | | | Amount | | | Shares | | | Amount | |
| Issued | | | 3,417,306 | | | $ | 29,696,358 | | | | — | | | $ | — | |
| Reinvested | | | 65 | | | | 566 | | | | — | | | | — | |
| Redeemed | | | (13,042 | ) | | | (113,208 | ) | | | — | | | | — | |
| Total | | | 3,404,329 | | | $ | 29,583,716 | | | | — | | | $ | — | |
| Sterling Capital Intermediate U.S. Government Fund | | | | | | | | | | |
| Class A | | Shares | | | Amount | | | Shares | | | Amount | |
| Issued | | | 22,535 | | | $ | 226,038 | | | | 55,087 | | | $ | 554,319 | |
| Reinvested | | | 7,430 | | | | 73,839 | | | | 8,487 | | | | 85,392 | |
| Redeemed | | | (71,461 | ) | | | (713,584 | ) | | | (31,430 | ) | | | (315,048 | ) |
| Total | | | (41,496 | ) | | $ | (413,707 | ) | | | 32,144 | | | $ | 324,663 | |
| Sterling Capital Intermediate U.S. Government Fund | | | | | | | | | | |
| Class C | | Shares | | | Amount | | | Shares | | | Amount | |
| Issued | | | 672 | | | $ | 6,663 | | | | 11,185 | | | $ | 112,211 | |
| Reinvested | | | 284 | | | | 2,817 | | | | 598 | | | | 6,005 | |
| Redeemed | | | (18,808 | ) | | | (187,602 | ) | | | (19,381 | ) | | | (194,695 | ) |
| Total | | | (17,852 | ) | | $ | (178,122 | ) | | | (7,598 | ) | | $ | (76,479 | ) |
| Sterling Capital Intermediate U.S. Government Fund | | | | | | | | | | |
| Institutional | | Shares | | | Amount | | | Shares | | | Amount | |
| Issued | | | 1,548,650 | | | $ | 15,665,762 | | | | 126,341 | | | $ | 1,266,215 | |
| Reinvested | | | 39,617 | | | | 393,800 | | | | 4,106 | | | | 41,332 | |
| Redeemed | | | (719,213 | ) | | | (7,245,377 | ) | | | (449,326 | ) | | | (4,514,351 | ) |
| Total | | | 869,054 | | | $ | 8,814,185 | | | | (318,879 | ) | | $ | (3,206,804 | ) |
| Sterling Capital Total Return Bond Fund | | | | | | | | | | | | |
| Class A | | Shares | | | Amount | | | Shares | | | Amount | |
| Issued | | | 2,260,247 | | | $ | 25,551,361 | | | | 936,247 | | | $ | 10,424,297 | |
| Reinvested | | | 177,265 | | | | 1,985,976 | | | | 124,243 | | | | 1,378,467 | |
| Redeemed | | | (1,966,158 | ) | | | (22,210,629 | ) | | | (1,135,926 | ) | | | (12,578,428 | ) |
| Total | | | 471,354 | | | $ | 5,326,708 | | | | (75,436 | ) | | $ | (775,664 | ) |
Notes to Financial Statements — (continued)
September 30, 2021
| | | For the Year Ended September 30, 2021 | | | For the Year Ended September 30, 2020 | |
| Sterling Capital Total Return Bond Fund | | | | | | | | | | | | |
| Class C | | Shares | | | Amount | | | Shares | | | Amount | |
| Issued | | | 70,420 | | | $ | 793,444 | | | | 187,152 | | | $ | 2,084,221 | |
| Reinvested | | | 16,563 | | | | 186,308 | | | | 12,051 | | | | 133,900 | |
| Redeemed | | | (331,499 | ) | | | (3,696,750 | ) | | | (226,735 | ) | | | (2,514,880 | ) |
| Total | | | (244,516 | ) | | $ | (2,716,998 | ) | | | (27,532 | ) | | $ | (296,759 | ) |
| Sterling Capital Total Return Bond Fund | | | | | | | | | | | | |
| Institutional | | Shares | | | Amount | | | Shares | | | Amount | |
| Issued | | | 35,830,628 | | | $ | 399,920,995 | | | | 45,022,046 | | | $ | 500,763,875 | |
| Reinvested | | | 2,546,915 | | | | 28,542,253 | | | | 1,611,907 | | | | 17,896,942 | |
| Redeemed | | | (27,578,996 | ) | | | (307,935,662 | ) | | | (52,101,509 | ) | | | (578,148,682 | ) |
| Total | | | 10,798,547 | | | $ | 120,527,586 | | | | (5,467,556 | ) | | $ | (59,487,865 | ) |
| Sterling Capital Total Return Bond Fund | | | | | | | | | | | | |
| Class R | | Shares | | | Amount | | | Shares | | | Amount | |
| Issued | | | 241 | | | $ | 2,685 | | | | 2,233 | | | $ | 23,288 | |
| Reinvested | | | 95 | | | | 1,056 | | | | 77 | | | | 856 | |
| Redeemed | | | (7 | ) | | | (79 | ) | | | (2,208 | ) | | | (24,910 | ) |
| Total | | | 329 | | | $ | 3,662 | | | | 102 | | | $ | (766 | ) |
| Sterling Capital Total Return Bond Fund | | | | | | | | | | | | |
| Class R6 | | Shares | | | Amount | | | Shares | | | Amount | |
| Issued | | | 14,133,055 | | | $ | 157,869,661 | | | | 38,524,008 | | | $ | 428,138,587 | |
| Reinvested | | | 1,392,703 | | | | 15,644,998 | | | | 1,177,261 | | | | 13,099,276 | |
| Redeemed | | | (40,405,334 | ) | | | (447,181,438 | ) | | | (15,446,477 | ) | | | (172,823,066 | ) |
| Total | | | (24,879,576 | ) | | $ | (273,666,779 | ) | | | 24,254,792 | | | $ | 268,414,797 | |
| Sterling Capital Corporate Fund | | | | | | | | | | | | |
| Class A | | Shares | | | Amount | | | Shares | | | Amount | |
| Issued | | | 16,220 | | | $ | 173,572 | | | | 15,085 | | | $ | 156,446 | |
| Reinvested | | | 2,762 | | | | 29,278 | | | | 1,171 | | | | 12,278 | |
| Redeemed | | | (4,289 | ) | | | (45,247 | ) | | | (18,827 | ) | | | (193,295 | ) |
| Total | | | 14,693 | | | $ | 157,603 | | | | (2,571 | ) | | $ | (24,571 | ) |
| Sterling Capital Corporate Fund | | | | | | | | | | | | |
| Class C | | Shares | | | Amount | | | Shares | | | Amount | |
| Issued | | | 460 | | | $ | 4,839 | | | | — | | | $ | — | |
| Reinvested | | | 14 | | | | 153 | | | | 6 | | | | 59 | |
| Redeemed | | | (450 | ) | | | (4,724 | ) | | | — | | | | — | |
| Total | | | 24 | | | $ | 268 | | | | 6 | | | $ | 59 | |
| Sterling Capital Corporate Fund | | | | | | | | | | | | |
| Institutional | | Shares | | | Amount | | | Shares | | | Amount | |
| Issued | | | 50,064 | | | $ | 530,692 | | | | 180,117 | | | $ | 1,891,535 | |
| Reinvested | | | 50,597 | | | | 537,481 | | | | 55,573 | | | | 581,655 | |
| Redeemed | | | (1,199,766 | ) | | | (12,879,362 | ) | | | (699,692 | ) | | | (7,313,016 | ) |
| Total | | | (1,099,105 | ) | | $ | (11,811,189 | ) | | | (464,002 | ) | | $ | (4,839,826 | ) |
Notes to Financial Statements — (continued)
September 30, 2021
| | | For the Year Ended September 30, 2021 | | | For the Year Ended September 30, 2020 | |
| Sterling Capital Quality Income Fund | | | | | | | | | | | | |
| Class A | | Shares | | | Amount | | | Shares | | | Amount | |
| Issued | | | 1,831 | | | $ | 18,667 | | | | 442 | | | $ | 4,530 | |
| Reinvested | | | 63 | | | | 638 | | | | 49 | | | | 503 | |
| Redeemed | | | (1,429 | ) | | | (14,473 | ) | | | — | | | | — | |
| Total | | | 465 | | | $ | 4,832 | | | | 491 | | | $ | 5,033 | |
| Sterling Capital Quality Income Fund | | | | | | | | | | | | |
| Class C | | Shares | | | Amount | | | Shares | | | Amount | |
| Issued | | | 346 | | | $ | 3,504 | | | | — | | | $ | — | |
| Reinvested | | | 4 | | | | 37 | | | | 20 | | | | 193 | |
| Redeemed | | | (310 | ) | | | (3,129 | ) | | | (3,131 | ) | | | (31,480 | ) |
| Total | | | 40 | | | $ | 412 | | | | (3,111 | ) | | $ | (31,287 | ) |
| Sterling Capital Quality Income Fund | | | | | | | | | | | | |
| Institutional | | Shares | | | Amount | | | Shares | | | Amount | |
| Issued | | | 3,927,109 | | | $ | 39,815,276 | | | | 208,010 | | | $ | 2,105,011 | |
| Reinvested | | | 63,072 | | | | 640,709 | | | | 90,503 | | | | 920,397 | |
| Redeemed | | | (1,238,812 | ) | | | (12,554,637 | ) | | | (407,950 | ) | | | (4,149,948 | ) |
| Total | | | 2,751,369 | | | $ | 27,901,348 | | | | (109,437 | ) | | $ | (1,124,540 | ) |
| Sterling Capital North Carolina Intermediate Tax-Free Fund | | | | | | | | | | |
| Class A | | Shares | | | Amount | | | Shares | | | Amount | |
| Issued | | | 232,333 | | | $ | 2,573,680 | | | | 152,013 | | | $ | 1,667,914 | |
| Reinvested | | | 31,377 | | | | 347,725 | | | | 48,264 | | | | 530,626 | |
| Redeemed | | | (441,643 | ) | | | (4,901,297 | ) | | | (713,982 | ) | | | (7,727,144 | ) |
| Total | | | (177,933 | ) | | $ | (1,979,892 | ) | | | (513,705 | ) | | $ | (5,528,604 | ) |
| Sterling Capital North Carolina Intermediate Tax-Free Fund | | | | | | | | | | |
| Class C | | Shares | | | Amount | | | Shares | | | Amount | |
| Issued | | | 10,532 | | | $ | 116,978 | | | | 27,857 | | | $ | 308,701 | |
| Reinvested | | | 1,062 | | | | 11,761 | | | | 2,382 | | | | 26,154 | |
| Redeemed | | | (122,210 | ) | | | (1,350,921 | ) | | | (43,040 | ) | | | (470,613 | ) |
| Total | | | (110,616 | ) | | $ | (1,222,182 | ) | | | (12,801 | ) | | $ | (135,758 | ) |
| Sterling Capital North Carolina Intermediate Tax-Free Fund | | | | | | | | | | |
| Institutional | | Shares | | | Amount | | | Shares | | | Amount | |
| Issued | | | 2,947,749 | | | $ | 32,734,912 | | | | 2,377,741 | | | $ | 26,185,547 | |
| Reinvested | | | 87,037 | | | | 964,213 | | | | 88,821 | | | | 977,398 | |
| Redeemed | | | (1,642,723 | ) | | | (18,216,553 | ) | | | (2,635,408 | ) | | | (28,097,422 | ) |
| Total | | | 1,392,063 | | | $ | 15,482,572 | | | | (168,846 | ) | | $ | (934,477 | ) |
| Sterling Capital South Carolina Intermediate Tax-Free Fund | | | | | | | | | | |
| Class A | | Shares | | | Amount | | | Shares | | | Amount | |
| Issued | | | 971,065 | | | $ | 11,174,577 | | | | 184,616 | | | $ | 2,110,914 | |
| Reinvested | | | 16,620 | | | | 190,623 | | | | 18,872 | | | | 214,543 | |
| Redeemed | | | (1,044,630 | ) | | | (11,976,075 | ) | | | (270,196 | ) | | | (3,071,326 | ) |
| Total | | | (56,945 | ) | | $ | (610,875 | ) | | | (66,708 | ) | | $ | (745,869 | ) |
Notes to Financial Statements — (continued)
September 30, 2021
| | | For the Year Ended September 30, 2021 | | | For the Year Ended September 30, 2020 | |
| Sterling Capital South Carolina Intermediate Tax-Free Fund | | | | | | | | | | |
| Class C | | Shares | | | Amount | | | Shares | | | Amount | |
| Issued | | | 1,736 | | | $ | 20,002 | | | | 1,185 | | | $ | 13,353 | |
| Reinvested | | | 418 | | | | 4,787 | | | | 856 | | | | 9,725 | |
| Redeemed | | | (32,497 | ) | | | (372,615 | ) | | | (5,511 | ) | | | (62,283 | ) |
| Total | | | (30,343 | ) | | $ | (347,826 | ) | | | (3,470 | ) | | $ | (39,205 | ) |
| Sterling Capital South Carolina Intermediate Tax-Free Fund | | | | | | | | | | |
| Institutional | | Shares | | | Amount | | | Shares | | | Amount | |
| Issued | | | 1,163,980 | | | $ | 13,268,574 | | | | 1,270,610 | | | $ | 14,320,358 | |
| Reinvested | | | 32,208 | | | | 366,803 | | | | 31,100 | | | | 351,267 | |
| Redeemed | | | (1,193,275 | ) | | | (13,603,974 | ) | | | (915,223 | ) | | | (10,285,334 | ) |
| Total | | | 2,913 | | | $ | 31,403 | | | | 386,487 | | | $ | 4,386,291 | |
| Sterling Capital Virginia Intermediate Tax-Free Fund | | | | | | | | | | |
| Class A | | Shares | | | Amount | | | Shares | | | Amount | |
| Issued | | | 100,162 | | | $ | 1,214,360 | | | | 26,491 | | | $ | 324,486 | |
| Reinvested | | | 18,551 | | | | 225,127 | | | | 20,505 | | | | 247,942 | |
| Redeemed | | | (101,935 | ) | | | (1,235,438 | ) | | | (105,821 | ) | | | (1,266,893 | ) |
| Total | | | 16,778 | | | $ | 204,049 | | | | (58,825 | ) | | $ | (694,465 | ) |
| Sterling Capital Virginia Intermediate Tax-Free Fund | | | | | | | | | | |
| Class C | | Shares | | | Amount | | | Shares | | | Amount | |
| Issued | | | — | | | $ | — | | | | 9 | | | $ | 104 | |
| Reinvested | | | 311 | | | | 3,792 | | | | 594 | | | | 7,181 | |
| Redeemed | | | (59,368 | ) | | | (716,138 | ) | | | (5,468 | ) | | | (66,023 | ) |
| Total | | | (59,057 | ) | | $ | (712,346 | ) | | | (4,865 | ) | | $ | (58,738 | ) |
| Sterling Capital Virginia Intermediate Tax-Free Fund | | | | | | | | | | |
| Institutional | | Shares | | | Amount | | | Shares | | | Amount | |
| Issued | | | 743,170 | | | $ | 9,021,037 | | | | 681,495 | | | $ | 8,258,693 | |
| Reinvested | | | 12,238 | | | | 148,454 | | | | 13,400 | | | | 161,997 | |
| Redeemed | | | (461,354 | ) | | | (5,590,795 | ) | | | (508,256 | ) | | | (6,088,966 | ) |
| Total | | | 294,054 | | | $ | 3,578,696 | | | | 186,639 | | | $ | 2,331,724 | |
| Sterling Capital West Virginia Intermediate Tax-Free Fund | | | | | | | | | | |
| Class A | | Shares | | | Amount | | | Shares | | | Amount | |
| Issued | | | 122,328 | | | $ | 1,258,711 | | | | 634,144 | | | $ | 6,396,778 | |
| Reinvested | | | 37,602 | | | | 386,517 | | | | 47,135 | | | | 480,527 | |
| Redeemed | | | (200,474 | ) | | | (2,061,930 | ) | | | (185,534 | ) | | | (1,879,261 | ) |
| Total | | | (40,544 | ) | | $ | (416,702 | ) | | | 495,745 | | | $ | 4,998,044 | |
| Sterling Capital West Virginia Intermediate Tax-Free Fund | | | | | | | | | | |
| Class C | | Shares | | | Amount | | | Shares | | | Amount | |
| Issued | | | 1 | | | $ | 10 | | | | 1,517 | | | $ | 15,630 | |
| Reinvested | | | 119 | | | | 1,233 | | | | 386 | | | | 3,931 | |
| Redeemed | | | (27,162 | ) | | | (279,350 | ) | | | (5,507 | ) | | | (56,942 | ) |
| Total | | | (27,042 | ) | | $ | (278,107 | ) | | | (3,604 | ) | | $ | (37,381 | ) |
Notes to Financial Statements — (continued)
September 30, 2021
| | | For the Year Ended September 30, 2021 | | | For the Year Ended September 30, 2020 | |
| Sterling Capital West Virginia Intermediate Tax-Free Fund | | | | | | | | | | |
| Institutional | | Shares | | | Amount | | | Shares | | | Amount | |
| Issued | | | 1,406,990 | | | $ | 14,492,951 | | | | 2,043,897 | | | $ | 20,938,668 | |
| Reinvested | | | 10,738 | | | | 110,530 | | | | 11,342 | | | | 115,735 | |
| Redeemed | | | (1,344,741 | ) | | | (13,841,257 | ) | | | (757,217 | ) | | | (7,728,507 | ) |
| Total | | | 72,987 | | | $ | 762,224 | | | | 1,298,022 | | | $ | 13,325,896 | |
| 6. | Concentration of Credit Risk: |
The Tax-Free Funds invest primarily in debt instruments of municipal issuers in their respective states. The issuers’ abilities to meet their obligations may be affected by economic developments in a specific state or region.
| 7. | Focused Investment Risk: |
Focused Investment Risk are investments focused in asset classes, countries, regions, sectors, industries, or issuers that are subject to the same or similar risk factors and investments whose prices are closely correlated that are subject to greater overall risk than investments that are more diversified or whose prices are not as closely correlated. As of September 30, 2021, the Sterling Capital Behavioral International Equity Fund invested 25.9% of its net assets in Japanese securities. Additionally, the Sterling Capital Real Estate Fund invested 39.0% of its net assets in Specialized securities.
U.S. Bank, N.A. has made available a credit facility to the Trust, pursuant to an umbrella credit agreement (the “Agreement”). The primary purpose of the Agreement is to allow the Trust to avoid security liquidations that Sterling Capital believes are unfavorable to shareholders. Under the Agreement, an aggregate uncommitted amount of $100,000,000 has been made available for use by all Funds of the Trust for shareholder liquidations only. Outstanding principal amounts under the Agreement bear interest at a rate per annum equal to the Prime Rate minus two percent (2%), but never at a rate of less than one percent (1%) per annum. The Agreement will expire on March 25, 2022. During the fiscal year ended September 30, 2021, each of the following Funds utilized its line of credit due to shareholder liquidations:
| | | Average Interest Rate | | | Average Loan Balance* | | | Number of Days Outstanding | | | Interest Expense Incurred | | | Maximum Amount Borrowed | |
| Sterling Capital Behavioral Large Cap Value Equity Fund | | | 1.25 | % | | $ | 53,000 | | | | 3 | | | $ | 6 | | | $ | 53,000 | |
| Sterling Capital Behavioral Small Cap Value Equity Fund | | | 1.25 | % | | | 30,794,000 | | | | 1 | | | | – | | | | 30,794,000 | |
| Sterling Capital Behavioral International Equity Fund | | | 1.25 | % | | | 4,918,000 | | | | 3 | | | | 512 | | | | 11,363,000 | |
| Sterling Capital SMID Opportunities Fund | | | 1.25 | % | | | 106,000 | | | | 2 | | | | 7 | | | | 114,000 | |
| Sterling Capital Stratton Real Estate Fund | | | 1.25 | % | | | 730,875 | | | | 8 | | | | 203 | | | | 916,000 | |
| Sterling Capital Stratton Small Cap Value Fund | | | 1.25 | % | | | 4,813,600 | | | | 5 | | | | 836 | | | | 17,324,000 | |
| * | Average loan balance was calculated by taking the sum of the loans outstanding for each day divided by the number of days the loans were outstanding. |
Ownership of more than 25% of the voting securities of a fund creates presumptions of control of the fund, under section 2(a) (9) of the 1940 Act. As of September 30, 2021, one shareholder, owning 75%, held more than 25% of the shares outstanding of the Sterling Capital Intermediate U.S. Government Fund-Class I Shares and may be deemed to control this Fund.
| 10. | Federal Tax Information: |
It is the policy of each Fund to continue to qualify as a regulated investment company as defined in the Internal Revenue Code of 1986, as amended (the “Code”), by complying with the applicable provisions of the Code and to make distributions of net investment income and net realized capital gains sufficient to relieve it from all, or substantially all, federal income taxes. Accordingly, no provision for federal income tax was required in the Funds’ financial statements.
Notes to Financial Statements — (continued)
September 30, 2021
Management evaluates its tax positions to determine if the tax positions taken meet the minimum recognition threshold in connection with accounting for uncertainties in income tax positions taken or expected to be taken for the purposes of measuring and recognizing tax liabilities in the financial statements. Recognition of tax benefits of an uncertain tax position is required only when the position is “more likely than not” to be sustained assuming examination by taxing authorities. The Funds recognize interest and penalties, if any, related to unrecognized tax benefits as income tax expense. During the year, the Funds did not incur any interest or penalties.
Management has analyzed the Funds’ tax positions taken on federal income tax returns for all open tax years (current and prior three tax years), and has concluded that no provision for federal income tax was required in the Funds’ financial statements. The Funds’ federal income and excise tax returns for tax years for which the applicable statutes of limitations have not expired are subject to examination by the Internal Revenue Service and state departments of revenue.
Capital losses are permitted to be carried forward without expiration. Such capital losses will retain their character as either short-term or long-term capital losses.
At September 30, 2021, the following Funds had net capital loss carryforwards available to offset future net capital gains, if any, to the extent provided by the Code and the Treasury regulations:
| | | Amount With No Expiration | |
| | | Short-term Losses | | | Long-term Losses | |
| Sterling Capital Behavioral Large Cap Value Equity Fund | | $ | (19,364,855 | ) | | $ | — | |
| Sterling Capital Behavioral International Equity Fund | | | (9,028,383 | ) | | | — | |
| Sterling Capital Ultra Short Bond Fund | | | (70,510 | ) | | | (920,428 | ) |
| Sterling Capital Short Duration Bond Fund | | | (811,036 | ) | | | (5,509,135 | ) |
| Sterling Capital Intermediate U.S. Government Fund | | | (355,069 | ) | | | (722,871 | ) |
| Sterling Capital Quality Income Fund | | | (1,263,528 | ) | | | (453,940 | ) |
| Sterling Capital North Carolina Intermediate Tax-Free Fund | | | (300,235 | ) | | | — | |
| Sterling Capital South Carolina Intermediate Tax-Free Fund | | | (44,424 | ) | | | — | |
Capital loss carryforwards utilized in the current year were as follows:
| | | Utilized Capital Loss Carryforwards | |
| Sterling Capital Behavioral Large Cap Value Equity Fund | | $ | 5,986,942 | |
| Sterling Capital Behavioral Small Cap Value Equity Fund | | | 30,501,876 | |
| Sterling Capital Equity Income Fund | | | 62,718,536 | |
| Sterling Capital Behavioral International Equity Fund | | | 15,626,886 | |
| Sterling Capital SMID Opportunities Fund | | | 47,086 | |
| Sterling Capital Ultra Short Bond Fund | | | 5,404 | |
| Sterling Capital Short Duration Bond Fund | | | 676,117 | |
| Sterling Capital Quality Income Fund | | | 36,315 | |
| Sterling Capital North Carolina Intermediate Tax-Free Fund | | | 224,918 | |
| Sterling Capital South Carolina Intermediate Tax-Free Fund | | | 293,708 | |
The character of income and gains distributed is determined in accordance with the Code and the Treasury regulations, which may differ from U.S. GAAP. These “book/tax” differences are either considered temporary or permanent in nature. To the extent these differences are permanent in nature (e.g., redemptions in-kind and equalization utilized), such amounts are reclassified within the composition of net assets based on their federal tax-basis treatment; temporary differences do not require reclassification. These reclassifications have no impact on net assets or net asset values per share.
Notes to Financial Statements — (continued)
September 30, 2021
As of September 30, 2021, these reclassifications were as follows:
| | | Increase/ (Decrease) Paid-in-Capital | | | Increase/ (Decrease) Distributable Earnings | |
| Sterling Capital Behavioral Large Cap Value Equity Fund | | $ | 136,727 | | | $ | (136,727 | ) |
| Sterling Capital Mid Value Fund | | | 350,414 | | | | (350,414 | ) |
| Sterling Capital Behavioral Small Cap Value Equity Fund | | | 477,374 | | | | (477,374 | ) |
| Sterling Capital Special Opportunities Fund | | | 5,739,901 | | | | (5,739,901 | ) |
| Sterling Capital Equity Income Fund | | | 985,318 | | | | (985,318 | ) |
| Sterling Capital Stratton Mid Cap Value Fund | | | 197,612 | | | | (197,612 | ) |
| Sterling Capital Stratton Real Estate Fund | | | 610,302 | | | | (610,302 | ) |
| Sterling Capital Stratton Small Cap Value Fund | | | 18,707,220 | | | | (18,707,220 | ) |
| Sterling Capital Total Return Bond Fund | | | 4,769,432 | | | | (4,769,432 | ) |
| Sterling Capital Corporate Fund | | | 332,981 | | | | (332,981 | ) |
The tax character of distributions paid to shareholders during the fiscal year ended September 30, 2021 was as follows:
| | | Distributions paid from | | | | | | | | | | | | | |
| | | | Ordinary Income | | | | Net Long- Term Gains | | | | Total Taxable Distributions | | | | Return Of Capital | | | | Tax Exempt Distributions | | | | Total Distributions Paid* | |
| Sterling Capital Behavioral Large Cap Value Equity Fund | | $ | 66,228 | | | $ | — | | | $ | 66,228 | | | $ | 256,144 | | | $ | — | | | $ | 322,372 | |
| Sterling Capital Mid Value Fund | | | 460,102 | | | | 133,548 | | | | 593,650 | | | | — | | | | — | | | | 593,650 | |
| Sterling Capital Behavioral Small Cap Value Equity Fund | | | 1,079,648 | | | | 364,960 | | | | 1,444,608 | | | | — | | | | — | | | | 1,444,608 | |
| Sterling Capital Special Opportunities Fund | | | 665,760 | | | | 12,633,008 | | | | 13,298,768 | | | | — | | | | — | | | | 13,298,768 | |
| Sterling Capital Equity Income Fund | | | 26,618,496 | | | | 844,914 | | | | 27,463,410 | | | | — | | | | — | | | | 27,463,410 | |
| Sterling Capital Behavioral International Equity Fund | | | 2,447,303 | | | | — | | | | 2,447,303 | | | | — | | | | — | | | | 2,447,303 | |
| Sterling Capital Stratton Mid Cap Value Fund | | | 336,325 | | | | 371,713 | | | | 708,038 | | | | — | | | | — | | | | 708,038 | |
| Sterling Capital Stratton Real Estate Fund | | | 1,501,501 | | | | 2,345,379 | | | | 3,846,880 | | | | — | | | | — | | | | 3,846,880 | |
| Sterling Capital Stratton Small Cap Value Fund | | | 3,671,687 | | | | 90,883,296 | | | | 94,554,983 | | | | — | | | | — | | | | 94,554,983 | |
| Sterling Capital Ultra Short Bond Fund | | | 403,885 | | | | — | | | | 403,885 | | | | — | | | | — | | | | 403,885 | |
| Sterling Capital Short Duration Bond Fund | | | 4,457,417 | | | | — | | | | 4,457,417 | | | | — | | | | — | | | | 4,457,417 | |
| Sterling Capital Intermediate U.S. Government Fund | | | 540,540 | | | | — | | | | 540,540 | | | | — | | | | — | | | | 540,540 | |
| Sterling Capital Total Return Bond Fund | | | 60,987,228 | | | | 2,953,951 | | | | 63,941,179 | | | | — | | | | — | | | | 63,941,179 | |
| Sterling Capital Corporate Fund | | | 411,957 | | | | 546,278 | | | | 958,235 | | | | — | | | | — | | | | 958,235 | |
| Sterling Capital Quality Income Fund | | | 843,908 | | | | — | | | | 843,908 | | | | — | | | | — | | | | 843,908 | |
| Sterling Capital North Carolina Intermediate Tax-Free Fund | | | 5,954 | | | | — | | | | 5,954 | | | | — | | | | 2,810,460 | | | | 2,816,414 | |
| Sterling Capital South Carolina Intermediate Tax-Free Fund | | | 2,963 | | | | — | | | | 2,963 | | | | — | | | | 1,483,035 | | | | 1,485,998 | |
| | | | | | | | | | | | | | | | | | | | | | | | | |
| Sterling Capital Virginia Intermediate Tax-Free Fund | | | 78,444 | | | | 197,736 | | | | 276,180 | | | | — | | | | 1,159,903 | | | | 1,436,083 | |
| Sterling Capital West Virginia Intermediate Tax-Free Fund | | | 177 | | | | 60,776 | | | | 60,953 | | | | — | | | | 1,682,325 | | | | 1,743,278 | |
| * | Total distributions paid may differ from the Statements of Changes in Net Assets because distributions are recognized when actually paid for tax purposes. The Funds may also utilize equalization accounting for tax purposes and designate earnings and profits, including net realized gains distributed to shareholders on redemption of shares, as part of the dividends. |
Notes to Financial Statements — (continued)
September 30, 2021
The tax character of distributions paid to shareholders during the fiscal year ended September 30, 2020 was as follows:
| | | Distributions paid from | | | | | | | | | | |
| | | Ordinary Income | | | Net Long- Term Gains | | | Total Taxable Distributions | | | Tax Exempt Distributions | | | Total Distributions Paid* | |
| Sterling Capital Behavioral Large Cap Value Equity Fund | | $ | 4,582,204 | | | $ | 8,070,984 | | | $ | 12,653,188 | | | $ | — | | | $ | 12,653,188 | |
| Sterling Capital Mid Value Fund | | | 1,432,311 | | | | 5,461,248 | | | | 6,893,559 | | | | — | | | | 6,893,559 | |
| Sterling Capital Behavioral Small Cap Value Equity Fund | | | 1,152,180 | | | | — | | | | 1,152,180 | | | | — | | | | 1,152,180 | |
| Sterling Capital Special Opportunities Fund | | | 1,733,137 | | | | 83,258,457 | | | | 84,991,594 | | | | — | | | | 84,991,594 | |
| Sterling Capital Equity Income Fund | | | 34,913,648 | | | | 76,162,769 | | | | 111,076,417 | | | | — | | | | 111,076,417 | |
| Sterling Capital Behavioral International Equity Fund | | | 3,012,621 | | | | — | | | | 3,012,621 | | | | — | | | | 3,012,621 | |
| Sterling Capital SMID Opportunities Fund | | | — | | | | 471,135 | | | | 471,135 | | | | — | | | | 471,135 | |
| Sterling Capital Stratton Mid Cap Value Fund | | | 579,842 | | | | 1,433,142 | | | | 2,012,984 | | | | — | | | | 2,012,984 | |
| Sterling Capital Stratton Real Estate Fund | | | 1,738,242 | | | | 4,272,613 | | | | 6,010,855 | | | | — | | | | 6,010,855 | |
| Sterling Capital Stratton Small Cap Value Fund | | | 6,024,521 | | | | 77,944,204 | | | | 83,968,725 | | | | — | | | | 83,968,725 | |
| Sterling Capital Ultra Short Bond Fund | | | 444,854 | | | | — | | | | 444,854 | | | | — | | | | 444,854 | |
| Sterling Capital Intermediate U.S. Government Fund | | | 367,820 | | | | — | | | | 367,820 | | | | — | | | | 367,820 | |
| Sterling Capital Total Return Bond Fund | | | 46,351,977 | | | | 193,428 | | | | 46,545,405 | | | | — | | | | 46,545,405 | |
| Sterling Capital Corporate Fund | | | 609,261 | | | | 21,250 | | | | 630,511 | | | | — | | | | 630,511 | |
| Sterling Capital Quality Income Fund | | | 975,082 | | | | — | | | | 975,082 | | | | — | | | | 975,082 | |
| Sterling Capital North Carolina Intermediate Tax-Free | | | | | | | | | | | | | | | | | | | | |
| Fund | | | 143,649 | | | | — | | | | 143,649 | | | | 3,188,284 | | | | 3,331,933 | |
| Sterling Capital South Carolina Intermediate Tax-Free | | | | | | | | | | | | | | | | | | | | |
| Fund | | | 13,257 | | | | — | | | | 13,257 | | | | 1,608,335 | | | | 1,621,592 | |
| Sterling Capital Virginia Intermediate Tax-Free Fund | | | 72,152 | | | | — | | | | 72,152 | | | | 1,384,524 | | | | 1,456,676 | |
| Sterling Capital West Virginia Intermediate Tax-Free Fund | | | 19,612 | | | | 78,475 | | | | 98,087 | | | | 1,691,414 | | | | 1,789,501 | |
| * | Total distributions paid may differ from the Statements of Changes in Net Assets because distributions are recognized when actually paid for tax purposes. The Funds may also utilize equalization accounting for tax purposes and designate earnings and profits, including net realized gains distributed to shareholders on redemption of shares, as part of the dividends. |
Notes to Financial Statements — (continued)
September 30, 2021
As of September 30, 2021, the components of distributable earnings (accumulated deficit) on a tax basis were as follows:
| | | Undistributed Ordinary Income/ Tax Exempt Income | | | Undistributed Long Term Capital Gains | | | Distributable Earnings | | | Distributions Payable | | | Accumulated Capital and Other Losses | | | Unrealized Appreciation (Depreciation)* | | | Total Distributable Earnings (Accumulated Deficit) | |
| Sterling Capital Behavioral Large Cap Value Equity Fund | | $ | — | | | $ | — | | | $ | — | | | $ | — | | | $ | (19,364,855 | ) | | $ | 5,382,800 | | | $ | (13,982,055 | ) |
| Sterling Capital Mid Value Fund | | | 2,999,568 | | | | 1,996,940 | | | | 4,996,508 | | | | — | | | | — | | | | 24,677,872 | | | | 29,674,380 | |
| Sterling Capital Behavioral Small Cap Value Equity Fund | | | 332,124 | | | | 1,511,662 | | | | 1,843,786 | | | | — | | | | — | | | | 23,268,450 | | | | 25,112,236 | |
| Sterling Capital Special Opportunities Fund | | | 3,009,729 | | | | 74,720,224 | | | | 77,729,953 | | | | — | | | | — | | | | 311,990,260 | | | | 389,720,213 | |
| Sterling Capital Equity Income Fund | | | — | | | | 21,694,038 | | | | 21,694,038 | | | | — | | | | (163,807 | ) | | | 833,775,537 | | | | 855,305,768 | |
| Sterling Capital Behavioral International Equity Fund | | | 3,875,517 | | | | — | | | | 3,875,517 | | | | — | | | | (9,028,383 | ) | | | 7,218,835 | | | | 2,065,969 | |
| Sterling Capital SMID Opportunities Fund | | | 2,867 | | | | 947,826 | | | | 950,693 | | | | — | | | | — | | | | 3,357,656 | | | | 4,308,349 | |
| Sterling Capital Stratton Mid Cap Value Fund | | | 824,930 | | | | 4,075,085 | | | | 4,900,015 | | | | — | | | | — | | | | 31,583,101 | | | | 36,483,116 | |
| Sterling Capital Stratton Real Estate Fund | | | 712,243 | | | | 5,604,760 | | | | 6,317,003 | | | | — | | | | — | | | | 47,912,856 | | | | 54,229,859 | |
| Sterling Capital Stratton Small Cap Value Fund | | | 2,824,373 | | | | 103,238,919 | | | | 106,063,292 | | | | — | | | | — | | | | 357,322,168 | | | | 463,385,460 | |
| Sterling Capital Ultra Short Bond Fund | | | 9,699 | | | | — | | | | 9,699 | | | | (11,148 | ) | | | (1,021,125 | ) | | | (46,401 | ) | | | (1,068,975 | ) |
| Sterling Capital Short Duration Bond Fund. | | | 200,302 | | | | — | | | | 200,302 | | | | (63,850 | ) | | | (6,320,171 | ) | | | (186,118 | ) | | | (6,369,837 | ) |
| Sterling Capital Intermediate U.S. Government Fund | | | 126,886 | | | | — | | | | 126,886 | | | | (2,011 | ) | | | (1,077,940 | ) | | | 62,034 | | | | (891,031 | ) |
| Sterling Capital Total Return Bond Fund | | | 3,645,281 | | | | 11,121,245 | | | | 14,766,526 | | | | (809,234 | ) | | | — | | | | 34,177,720 | | | | 48,135,012 | |
| Sterling Capital Corporate Fund | | | 54,599 | | | | 546,689 | | | | 601,288 | | | | (12,129 | ) | | | — | | | | 265,862 | | | | 855,021 | |
| Sterling Capital Quality Income Fund | | | 60,754 | | | | — | | | | 60,754 | | | | (60,820 | ) | | | (1,910,230 | ) | | | 595,794 | | | | (1,314,502 | ) |
| Sterling Capital North Carolina Intermediate Tax- Free Fund | | | 237,962 | | | | — | | | | 237,962 | | | | (125,395 | ) | | | (300,235 | ) | | | 8,331,721 | | | | 8,144,053 | |
| Sterling Capital South Carolina Intermediate Tax- Free Fund | | | 99,665 | | | | — | | | | 99,665 | | | | (71,199 | ) | | | (44,424 | ) | | | 4,090,659 | | | | 4,074,701 | |
| Sterling Capital Virginia Intermediate Tax-Free Fund | | | 136,738 | | | | 87,833 | | | | 224,571 | | | | (73,515 | ) | | | — | | | | 3,958,396 | | | | 4,109,452 | |
| Sterling Capital West Virginia Intermediate Tax- Free Fund | | | 172,286 | | | | 7,835 | | | | 180,121 | | | | (91,136 | ) | | | — | | | | 4,035,603 | | | | 4,124,588 | |
| * | The primary differences between book basis and tax basis unrealized appreciation (depreciation) were due to the deferral of losses on wash sales, Passive Foreign Investment Companies and the deferral of market discount and premium until time of sale and real estate investment trust adjustments. |
Notes to Financial Statements — (continued)
September 30, 2021
Under current tax law, net capital losses or, if there are no such losses, net long-term capital losses or net short-term capital losses realized after October 31, net ordinary losses from the sale, exchange or other taxable disposition of property realized after October 31 and other net ordinary losses realized after December 31 of a Fund’s taxable year may be deferred and treated as occurring on the first business day of the following taxable year for tax purposes. The following Funds had deferred qualified late-year losses, which will be treated as arising on the first business day of the taxable year ending September 30, 2021:
| | | Qualified Late-Year Ordinary Losses | | | Qualified Late-Year Short-term Capital Losses | | | Qualified Late-Year Long-term Capital Losses | |
| Sterling Capital Ultra Short Bond Fund | | $ | — | | | $ | 5,348 | | | $ | 24,839 | |
| Sterling Capital Quality Income Fund | | | — | | | | 92,540 | | | | 100,222 | |
As of September 30, 2021, federal income tax cost, gross unrealized appreciation and gross unrealized depreciation on securities were as follows:
| | | Tax Cost | | | Gross Tax Unrealized Appreciation | | | Gross Tax Unrealized Depreciation | | | Net Tax Unrealized Appreciation (Depreciation) | |
| Sterling Capital Behavioral Large Cap Value Equity Fund | | $ | 27,783,109 | | | $ | 6,141,393 | | | $ | (758,593 | ) | | $ | 5,382,800 | |
| Sterling Capital Mid Value Fund | | | 51,884,743 | | | | 25,660,815 | | | | (982,943 | ) | | | 24,677,872 | |
| Sterling Capital Behavioral Small Cap Value Equity Fund | | | 82,623,179 | | | | 24,841,336 | | | | (1,572,886 | ) | | | 23,268,450 | |
| Sterling Capital Special Opportunities Fund | | | 357,689,836 | | | | 315,100,025 | | | | (3,109,766 | ) | | | 311,990,259 | |
| Sterling Capital Equity Income Fund | | | 1,402,012,454 | | | | 846,211,370 | | | | (12,435,833 | ) | | | 833,775,537 | |
| Sterling Capital Behavioral International Equity Fund | | | 78,719,895 | | | | 10,582,749 | | | | (3,365,662 | ) | | | 7,217,087 | |
| Sterling Capital SMID Opportunities Fund | | | 7,843,969 | | | | 3,550,013 | | | | (192,357 | ) | | | 3,357,656 | |
| Sterling Capital Stratton Mid Cap Value Fund | | | 34,286,681 | | | | 32,620,006 | | | | (1,036,905 | ) | | | 31,583,101 | |
| Sterling Capital Stratton Real Estate Fund | | | 49,070,689 | | | | 48,072,393 | | | | (159,537 | ) | | | 47,912,856 | |
| Sterling Capital Stratton Small Cap Value Fund | | | 164,076,747 | | | | 358,552,716 | | | | (1,230,548 | ) | | | 357,322,168 | |
| Sterling Capital Ultra Short Bond Fund | | | 41,129,387 | | | | 48,743 | | | | (95,144 | ) | | | (46,401 | ) |
| Sterling Capital Short Duration Bond Fund | | | 197,232,333 | | | | 1,604,174 | | | | (1,790,292 | ) | | | (186,118 | ) |
| Sterling Capital Intermediate U.S. Government Fund | | | 20,047,199 | | | | 475,242 | | | | (413,208 | ) | | | 62,034 | |
| Sterling Capital Total Return Bond Fund | | | 1,531,175,207 | | | | 48,944,924 | | | | (14,767,204 | ) | | | 34,177,720 | |
| Sterling Capital Corporate Fund | | | 6,829,783 | | | | 292,145 | | | | (26,283 | ) | | | 265,862 | |
| Sterling Capital Quality Income Fund | | | 66,200,993 | | | | 956,575 | | | | (360,781 | ) | | | 595,794 | |
| Sterling Capital North Carolina Intermediate Tax-Free Fund | | | 176,821,777 | | | | 8,654,500 | | | | (322,779 | ) | | | 8,331,721 | |
| Sterling Capital South Carolina Intermediate Tax-Free Fund | | | 78,330,175 | | | | 4,202,774 | | | | (112,115 | ) | | | 4,090,659 | |
| Sterling Capital Virginia Intermediate Tax-Free Fund | | | 77,750,635 | | | | 4,131,677 | | | | (173,281 | ) | | | 3,958,396 | |
| Sterling Capital West Virginia Intermediate Tax-Free Fund | | | 89,986,776 | | | | 4,165,722 | | | | (130,119 | ) | | | 4,035,603 | |
On November 18, 2020, the Board approved the liquidation of each of Sterling Capital Kentucky Intermediate Tax-Free Fund, Sterling Capital Maryland Intermediate Tax-Free Fund, Sterling Capital Diversified Income Fund, Sterling Capital Strategic Allocation Balanced Fund and Sterling Capital Strategic Allocation Growth Fund. On January 26, 2021, each Fund closed and assets were distributed in cash.
Management has evaluated the need for disclosure and/or adjustments resulting from subsequent events through the date the financial statements were issued, and has noted the following items:
Effective on or about the close of business on November 15, 2021, Class R Shares were converted into Class A Shares for the Sterling Capital Mid Value Fund, Sterling Capital Behavioral Small Cap Value Equity Fund, Sterling Capital Special Opportunities Fund, Sterling Capital Equity Income Fund, and Sterling Capital Total Return Bond Fund.
Additionally, on November 17, 2021 the Board approved the following fund name changes. Each of the respective name changes are expected to occur on February 1, 2022:
| Current Name | New Name |
| Sterling Capital Corporate Fund | Sterling Capital Long Duration Corporate Bond Fund |
| Sterling Capital Stratton Mid Cap Value Fund | Sterling Capital Mid Cap Relative Value Fund |
| Sterling Capital Stratton Real Estate Fund | Sterling Capital Real Estate Fund |
| Sterling Capital Stratton Small Cap Value Fund | Sterling Capital Small Cap Value Fund |

REPORT OF INDEPENDENT REGISTERED PUBLIC ACCOUNTING FIRM
To the Shareholders and Board of Trustees of
Sterling Capital Funds
Opinion on the Financial Statements
We have audited the accompanying statements of assets and liabilities, including the schedules of portfolio investments, of Sterling Capital Funds comprising Sterling Capital Behavioral Large Cap Value Equity Fund, Sterling Capital Mid Value Fund, Sterling Capital Behavioral Small Cap Value Equity Fund, Sterling Capital Special Opportunities Fund, Sterling Capital Equity Income Fund, Sterling Capital Behavioral International Equity Fund, Sterling Capital SMID Opportunities Fund, Sterling Capital Stratton Mid Cap Value Fund, Sterling Capital Stratton Real Estate Fund, Sterling Capital Stratton Small Cap Value Fund, Sterling Capital Ultra Short Bond Fund, Sterling Capital Short Duration Bond Fund, Sterling Capital Intermediate U.S. Government Fund, Sterling Capital Total Return Bond Fund, Sterling Capital Corporate Fund, Sterling Capital Quality Income Fund, Sterling Capital North Carolina Intermediate Tax-Free Fund, Sterling Capital South Carolina Intermediate Tax-Free Fund, Sterling Capital Virginia Intermediate Tax-Free Fund and Sterling Capital West Virginia Intermediate Tax-Free Fund (the “Funds”) as of September 30, 2021, the related statements of operations for the year then ended, the statements of changes in net assets for each of the two years in the period then ended, the related notes, and the financial highlights for each of the three years in the period then ended (collectively referred to as the “financial statements”). In our opinion, the financial statements present fairly, in all material respects, the financial position of each of the Funds as of September 30, 2021, the results of their operations for the year then ended, the changes in net assets for each of the two years in the period then ended, and the financial highlights for each of the three years in the period then ended, in conformity with accounting principles generally accepted in the United States of America.
The Funds’ financial highlights for the years ended September 30, 2018, and prior, were audited by other auditors whose report dated November 21, 2018, expressed an unqualified opinion on those financial highlights.
Basis for Opinion
These financial statements are the responsibility of the Funds’ management. Our responsibility is to express an opinion on the Funds’ financial statements based on our audits. We are a public accounting firm registered with the Public Company Accounting Oversight Board (United States) (“PCAOB”) and are required to be independent with respect to the Funds in accordance with the U.S. federal securities laws and the applicable rules and regulations of the Securities and Exchange Commission and the PCAOB.
We conducted our audits in accordance with the standards of the PCAOB. Those standards require that we plan and perform the audit to obtain reasonable assurance about whether the financial statements are free of material misstatement whether due to error or fraud.
COHEN & COMPANY, LTD
800.229.1099 | 866.818.4535 FAX| cohencpa.com
Registered with the Public Company Accounting Oversight Board
Our audits included performing procedures to assess the risks of material misstatement of the financial statements, whether due to error or fraud, and performing procedures that respond to those risks. Such procedures included examining, on a test basis, evidence regarding the amounts and disclosures in the financial statements. Our procedures included confirmation of securities owned as of September 30, 2021, by correspondence with the custodian and brokers; when replies were not received from brokers, we performed other auditing procedures. Our audits also included evaluating the accounting principles used and significant estimates made by management, as well as evaluating the overall presentation of the financial statements. We believe that our audits provide a reasonable basis for our opinion.
We have served as the Funds’ auditor since 2019.

COHEN & COMPANY, LTD.
Milwaukee, Wisconsin
November 23, 2021
September 30, 2021
Notice to Shareholders (Unaudited)
All amounts and percentages below are based on financial information available as of the date of this annual report and, accordingly are subject to change. For each item it is the intention of the Funds to report the maximum amount permitted under the Internal Revenue Code and the regulations thereunder.
For the fiscal year ended September 30, 2021, each Fund is reporting the following items with regard to distributions paid during the year.
| | | Long-Term Capital Gain | | | Qualified Dividend Income % | | | (for corporate shareholders) Dividends Received Deduction % | | | Exempt-Interest Dividend | | | U.S. Government Income | | | Foreign Taxes Paid | | | Foreign Source Income | |
| Sterling Capital Behavioral Large Cap Value Equity Fund | | $ | — | | | | 100.00 | % | | | 100.00 | % | | $ | — | | | | — | | | $ | — | | | $ | — | |
| Sterling Capital Mid Value Fund | | | 133,548 | | | | 23.43 | % | | | 23.42 | % | | | — | | | | — | | | | — | | | | — | |
| Sterling Capital Behavioral Small Cap Value Equity Fund | | | 364,960 | | | | 100.00 | % | | | 100.00 | % | | | — | | | | — | | | | — | | | | — | |
| Sterling Capital Special Opportunities Fund | | | 12,633,008 | | | | 100.00 | % | | | 100.00 | % | | | — | | | | — | | | | — | | | | — | |
| Sterling Capital Equity Income Fund | | | 844,914 | | | | 100.00 | % | | | 100.00 | % | | | — | | | | — | | | | — | | | | — | |
| Sterling Capital Behavioral International Equity Fund | | | — | | | | 96.22 | % | | | — | | | | — | | | | — | | | | 296,144 | | | | 3,476,206 | |
| Sterling Capital SMID Opportunities Fund | | | — | | | | — | | | | — | | | | — | | | | — | | | | — | | | | — | |
| Sterling Capital Stratton Mid Cap Value Fund | | | 371,713 | | | | 93.80 | % | | | 96.70 | % | | | — | | | | — | | | | — | | | | — | |
| Sterling Capital Stratton Real Estate Fund | | | 2,345,379 | | | | — | | | | — | | | | — | | | | — | | | | — | | | | — | |
| Sterling Capital Stratton Small Cap Value Fund | | | 90,883,296 | | | | 95.57 | % | | | 100.00 | % | | | — | | | | — | | | | — | | | | — | |
| Sterling Capital Ultra Short Duration Bond Fund | | | — | | | | — | | | | — | | | | — | | | | 0.01 | % | | | — | | | | — | |
| Sterling Capital Short Duration Bond Fund | | | — | | | | — | | | | — | | | | — | | | | 0.14 | % | | | — | | | | — | |
| Sterling Capital Intermediate U.S. Government Fund | | | — | | | | — | | | | — | | | | — | | | | 5.07 | % | | | — | | | | — | |
| Sterling Capital Total Return Bond Fund | | | 2,953,951 | | | | 0.02 | % | | | 0.02 | % | | | — | | | | 2.84 | % | | | — | | | | — | |
| Sterling Capital Corporate Fund | | | 546,278 | | | | 1.60 | % | | | 1.60 | % | | | — | | | | 0.02 | % | | | — | | | | — | |
| Sterling Capital Quality Income Fund | | | — | | | | — | | | | — | | | | — | | | | — | | | | — | | | | — | |
| Sterling Capital North Carolina Intermediate Tax-Free Fund | | | — | | | | — | | | | — | | | | — | | | | 99.65 | % | | | — | | | | — | |
| Sterling Capital South Carolina Intermediate Tax-Free Fund | | | — | | | | — | | | | — | | | | — | | | | 99.80 | % | | | — | | | | — | |
| Sterling Capital Virginia Intermediate Tax-Free Fund | | | 197,736 | | | | — | | | | — | | | | — | | | | 94.61 | % | | | — | | | | — | |
| Sterling Capital West Virginia Intermediate Tax-Free Fund | | | 60,776 | | | | — | | | | — | | | | — | | | | 99.99 | % | | | — | | | | — | |
Other Information (Unaudited)
A description of the policies and procedures that the Funds use to determine how to vote proxies relating to portfolio securities is available (i) without charge, upon request, by calling 1-800-228-1872; and (ii) on the Securities and Exchange Commission’s (the “Commission”) website at www.sec.gov.
Information regarding how the Funds voted proxies relating to portfolio securities during the most recent 12-month period ended June 30th is available (i) without charge, upon request, by calling 1-800-228-1872 and (ii) on the Commission’s website at www.sec.gov.
The Funds file complete Schedules of Portfolio Holdings with the Commission for the first and third quarters of each fiscal year as an exhibit to its reports on Form N-PORT. The Funds’ Forms N-PORT reports, once filed, will be available without charge on the Commission’s website at www.sec.gov.
September 30, 2021
Information about Trustees and Officers (Unaudited)
Overall responsibility for the management of the Funds rests with its Board of Trustees (“Trustees”), who are elected by the shareholders of the Funds. The Trustees elect the officers of the Funds to supervise actively its day-to-day operations. The names of the Trustees, birthdates, term of office and length of time served, principal occupations during the past five years, number of portfolios overseen and directorships held outside of the Funds are listed in the two tables immediately following. The business address of the persons listed below is 3605 Glenwood Avenue, Suite 100, Raleigh, North Carolina 27612.
| INDEPENDENT TRUSTEES |
| Name and Birthdate | Position(s) Held With the Funds | Term of Office/ Length of Time Served | Principal Occupation During the Past 5 Years | Number of Portfolios in Fund Complex Overseen by Trustee | Other Directorships Held by Trustee |
Drew T. Kagan
Birthdate: 02/48 | Trustee, Chairman of the Board of Trustees | Indefinite, 08/00 — Present | Retired; from September 2010 to March 2013, Chairman, Montecito Advisors, Inc.; from December 2003 to September 2010, CEO, Montecito Advisors, Inc.; from March 1996 to December 2003, President, Investment Affiliate, Inc. | 20 | None |
Laura C. Bingham
Birthdate: 11/56 | Trustee | Indefinite, 02/01 — Present | From March 2013 to present, Partner, Newport Board Group; from July 2010 to March 2013, governance and leadership consultant; from June 1998 to July 2010, President and CEO of Peace College | 20 | None |
Douglas R. Van Scoy
Birthdate: 11/43 | Trustee | Indefinite, 05/04 — Present | Retired; from November 1974 to July 2001, employee of Smith Barney (investment banking), most recently as Director of Private Client Group and Senior Executive Vice President | 20 | None |
James L. Roberts
Birthdate: 11/42 | Trustee | Indefinite, 11/04 — Present | Retired; from December 2009 to present, Consultant, Asphalt Systems, Inc.; from December 2007 to present, Consultant, Grand Mountain Bank | 20 | None |
Alan G. Priest
Birthdate: 05/52 | Trustee | Indefinite, 07/12 — Present | Retired; from April 1993 to April 2012, Partner, Ropes & Gray LLP | 20 | None |
The following table shows information for the trustee who is an “interested person” of the Funds as defined in the 1940 Act:
| INTERESTED TRUSTEES |
| Name and Birthdate | Position(s) Held With the Funds | Term of Office/ Length of Time Served | Principal Occupation During the Past 5 Years | Number of Portfolios in Fund Complex Overseen by Trustee | Other Directorships Held by Trustee |
Alexander W. McAlister*
Birthdate: 03/60 | Trustee | Indefinite, 11/10 — Present | From August 1981 to present, President, Sterling Capital Management LLC | 20 | Director, Sterling Capital Management LLC |
| * | Mr. McAlister is treated by the Funds as an “interested person” (as defined in Section 2(a)(19) of the 1940Act) of the Funds because he is an officer of the Advisor. |
September 30, 2021
The following table shows information for officers of Funds:
| Name and Birthdate | Position(s) Held With the Funds | Term of Office/ Length of Time Served | Principal Occupation During the Past 5 Years |
| James T. Gillespie Birthdate: 11/66 | President | Indefinite, 12/12 — Present | From August 2020 to present, Managing Director, Sterling Capital Management LLC; From March 2012 to August 2020, Executive Director, Sterling Capital Management LLC; From June 2010 to March 2012, Director, Sterling Capital Management LLC and its predecessors |
| Todd M. Miller Birthdate: 09/71 | Treasurer and Secretary | Indefinite, Treasurer, 01/15 — Present; Secretary, 08/10 — Present | From May 2021 to present, Executive Director, from June 2009 to May 2021, Director, Sterling Capital Management LLC and its predecessors |
| Michelle A. Whalen Birthdate: 04/69 | Vice President | Indefinite, 11/15 — Present | From May 2021 to present, Director, from August 2015 to May 2021 Associate Director & Senior Mutual Fund Administrator, Sterling Capital; from September 2000 to July 2015, Supervisor |
| Charles A. Durham Birthdate: 06/79 | Chief Compliance and Anti-Money Laundering Officer | Indefinite, 06/18 — Present | From June 2018 to present, Chief Compliance Officer and Executive Director, Sterling Capital; from September 2010 to June 2018, Vice President, Senior Compliance Manager, Brown Brothers Harriman & Co. |
| John A. Bruggeman Birthdate: 12/71 | Assistant Treasurer | Indefinite, Assistant Treasurer, 08/16 — Present | From January 2010 to present, Vice President and Senior Director, Fund Accounting and Administration Department, The Bank of New York Mellon |
| Julie M. Powers Birthdate: 10/69 | Assistant Secretary | Indefinite, 11/11 — Present | From November 2011 to present, Vice President, Regulatory Administration Department, The Bank of New York Mellon |
The Funds’ Statement of Additional Information includes additional information about the Funds’ Trustees and Officers. To receive your free copy of the Statement of Additional Information, call toll free: 1-800-228-1872.
Liquidity Risk Management Program
The Funds have adopted a liquidity risk management program pursuant to Rule 22e-4 under the Investment Company Act of 1940, as amended (the “Program”). The Funds’ board has designated Sterling Capital Management LLC (“Sterling Capital”) as the administrator of the Program. The Program’s principal objectives are to support the Funds’ compliance with limits on investments in illiquid assets and to mitigate the risk that a Fund is unable to meet its redemption obligations timely. In this regard, the Program includes a number of elements that support the management or assessment of liquidity risk, including an assessment of factors that influence a Fund’s liquidity and the periodic classification and, as determined necessary, re-classification of a Fund’s investments into buckets that reflect their relative liquidity under current market conditions.
The Funds’ Board reviewed a written report from Sterling Capital on May 18, 2021 addressing the Program’s operation, adequacy, and effectiveness (the “Report”). From January 1, 2020 through December 31, 2020, the period covered by the Report, the Program supported each Fund’s ability to honor redemption requests timely and Sterling Capital’s management of each Fund’s liquidity risk profile, including during any periods of market volatility and net redemptions.
There can be no assurance that the Program will achieve its objectives under all circumstances in the future. Please refer to your Fund’s prospectus for more information regarding the Fund’s exposure to liquidity risk and other risks to which it may be subject.
Notice of Privacy Policy & Practices
Sterling Capital Funds provide this notice to you so that you will know what kinds of information we collect about shareholders1, prospective investors, and individuals (such as beneficiaries), and the circumstances in which that information may be disclosed to third parties who are not affiliated with Sterling Capital Funds.
Collection of Personal Information
We collect nonpublic personal information about you from the following sources:
| · | Account Applications and other forms, which may include your name, address, social security number, and information about your investment goals and risk tolerance; |
| · | Account History, including information about the transactions and balances in your account(s); |
| · | Correspondence, written, telephonic or electronic between you and Sterling Capital Funds or service providers working on behalf of Sterling Capital Funds; |
| · | Online, your name and e-mail address if you provide them; and |
| · | Third Parties, such as your financial intermediary in connection with your transactions, or third-party data services used to verify or update personal information that you provide. |
To comply with federal regulations, information we receive from you or a third party will be used to verify your identity.
Disclosure of Personal Information
We may disclose your personal information as permitted by law to third parties who are not affiliated with the Sterling Capital Funds, including:
| · | in connection with legal proceedings, such as responding to a subpoena; |
| · | to service providers who maintain or service shareholder accounts for Sterling Capital Funds or to a shareholder’s broker or agent; or to companies that mail account-related materials, such as shareholder reports; and |
| · | to perform marketing services on our behalf, or pursuant to a joint marketing agreement with another financial institution. |
Safeguarding of Personal Information
Sterling Capital Funds employs policies, practices and procedures for safeguarding your personal information that we believe comply with applicable law, however no security measures are perfect or impenetrable.
We request that all service providers to Sterling Capital Funds:
| · | maintain policies and procedures designed to assure only appropriate access to, and use of your personal information; and |
| · | maintain physical, electronic and procedural safeguards that comply with applicable legal standards to guard your nonpublic personal information. |
When information is shared with third parties, they are not permitted to use the information for any purpose other than to assist our servicing of your account(s), including helping us improve the services we offer.
| 1 | For purposes of this notice, the terms “shareholder” or “shareholders” includes both individual shareholders (both current and former) of the Sterling Capital Funds and individuals (such as beneficiaries, for example) whose nonpublic personal information is provided to the Sterling Capital Funds, even though they do not invest in Sterling Capital Funds shares. |
(This page is intentionally left blank.)
(This page is intentionally left blank.)
(This page is intentionally left blank.)
INVESTMENT ADVISOR
Sterling Capital Management LLC
4350 Congress Street, Suite 1000
Charlotte, NC 28209
DISTRIBUTOR
Sterling Capital Distributors, LLC
400 Berwyn Park
899 Cassatt Road
Berwyn, PA 19312
LEGAL COUNSEL
Ropes & Gray LLP
Prudential Tower
800 Boylston Street
Boston, MA 02199
TRANSFER AGENT
BNY Mellon Investment Servicing (US) Inc.
301 Bellevue Parkway
Wilmington, DE 19809
INDEPENDENT REGISTERED PUBLIC ACCOUNTING FIRM
Cohen & Company, Ltd.
342 North Water Street, Suite 830
Milwaukee, WI 53202

Item 2. Code of Ethics.
| (a) | The registrant, as of the end of the period covered by this report, has adopted a code of ethics that applies to the registrant’s principal executive officer, principal financial officer, principal accounting officer or controller, or persons performing similar functions, regardless of whether these individuals are employed by the registrant or a third party (the “Code of Ethics”). |
| (c) | There have been no amendments, during the period covered by this report, to a provision of the Code of Ethics that applies to the registrant’s principal executive officer, principal financial officer, principal accounting officer or controller, or persons performing similar functions, regardless of whether these individuals are employed by the registrant or a third party, and that relates to any element of the code of ethics definition enumerated in Item 2(b) of Form N-CSR. |
| (d) | The registrant has not granted any waivers, including an implicit waiver, from a provision of the code of ethics that applies to the registrant’s principal executive officer, principal financial officer, principal accounting officer or controller, or persons performing similar functions, regardless of whether these individuals are employed by the registrant or a third party, that relates to one or more of the items set forth in Item 2(b) of Form N-CSR. |
Item 3. Audit Committee Financial Expert.
As of the end of the period covered by the report, the registrant’s board of trustees has determined that Drew Kagan is qualified to serve as an audit committee financial expert serving on its audit committee and that he is “independent,” as defined by Item 3 of Form N-CSR.
Item 4. Principal Accountant Fees and Services.
Audit Fees
| (a) | The aggregate fees billed for each of the last two fiscal years for professional services rendered by the principal accountant for the audit of the registrant's annual financial statements or services that are normally provided by the accountant in connection with statutory and regulatory filings or engagements for those fiscal years are $302,500 for 2021 and $365,500 for 2020. |
Audit-Related Fees
| (b) | The aggregate fees billed in each of the last two fiscal years for assurance and related services by the principal accountant that are reasonably related to the performance of the audit of the registrant's financial statements and are not reported under paragraph (a) of this Item are $0 for 2021 and $0 for 2020. These audit-related services include issuance of consents to use the name of the auditor in new Fund filings. |
Tax Fees
| (c) | The aggregate fees billed in each of the last two fiscal years for professional services rendered by the principal accountant for tax compliance, tax advice, and tax planning are $95,500 for 2021 and $95,500 for 2020. Fees for both 2021 and 2020 relate to the preparation of the registrant’s federal income and excise tax returns and review of the registrant’s capital gains distribution calculations. |
All Other Fees
| (d) | The aggregate fees billed in each of the last two fiscal years for products and services provided by the principal accountant, other than the services reported in paragraphs (a) through (c) of this Item are $0 for 2021 and $0 for 2020. |
| (e)(1) | Except as permitted by Rule 2-01(c)(7)(i)(C) of Regulation S-X, the Trust’s Audit Committee must pre-approve all audit and non-audit services provided by the independent accountants relating to the operations or financial reporting of the funds. Prior to the commencement of any audit or non-audit services to a fund, the Audit Committee reviews the services to determine whether they are appropriate and permissible under applicable law. |
| (e)(2) | The percentage of services described in each of paragraphs (b) through (d) of this Item that were approved by the audit committee pursuant to paragraph (c)(7)(i)(C) of Rule 2-01 of Regulation S-X are as follows: |
(b) N/A
(c) 100%
(d) N/A
| (f) | The percentage of hours expended on the principal accountant's engagement to audit the registrant's financial statements for the most recent fiscal year that were attributed to work performed by persons other than the principal accountant's full-time, permanent employees was less than fifty percent. |
| (g) | The aggregate non-audit fees billed by the registrant's accountant for services rendered to the registrant, and rendered to the registrant's investment adviser (not including any sub-adviser whose role is primarily portfolio management and is subcontracted with or overseen by another investment adviser), and any entity controlling, controlled by, or under common control with the adviser that provides ongoing services to the registrant for each of the last two fiscal years of the registrant was $0 for 2021 and $0 for 2020. |
Item 5. Audit Committee of Listed Registrants.
Not applicable.
Item 6. Investments.
| (a) | Schedule of Investments in securities of unaffiliated issuers as of the close of the reporting period is included as part of the report to shareholders filed under Item 1(a) of this form. |
Item 7. Disclosure of Proxy Voting Policies and Procedures for Closed-End Management Investment Companies.
Not applicable.
Item 8. Portfolio Managers of Closed-End Management Investment Companies.
Not applicable.
Item 9. Purchases of Equity Securities by Closed-End Management Investment Company and Affiliated Purchasers.
Not applicable.
Item 10. Submission of Matters to a Vote of Security Holders.
There have been no material changes to the procedures by which shareholders may recommend nominees to the registrant’s board of trustees, where those changes were implemented after the registrant last provided disclosure in response to the requirements of Item 407(c)(2)(iv) of Regulation S-K (17 CFR 229.407) (as required by Item 22(b)(15) of Schedule 14A (17 CFR 240.14a-101)), or this Item.
Item 11. Controls and Procedures.
| (a) | The registrant’s principal executive officer and principal financial officer have concluded, based on their evaluation of the effectiveness of the design and operation of the registrant’s disclosure controls and procedures (as defined in Rule 30a-3(c) under the Investment Company Act of 1940 (17 CFR 270.30a-3(c))) as of a date within 90 days of the filing date of this report, that the design and operation of such procedures are effective to provide reasonable assurance that information required to be disclosed by the registrant on Form N-CSR is recorded, processed, summarized and reported within the time periods specified in the Securities and Exchange Commission’s rules and forms, and that information required to be disclosed by the registrant in the reports that it files or submits on Form N-CSR is accumulated and communicated to the registrant’s management, including its principal executive and principal financial officers, as appropriate to allow timely decisions regarding required disclosure. |
| (b) | There were no changes in the registrant’s internal control over financial reporting (as defined in Rule 30a-3(d) under the 1940 Act (17 CFR 270.30a-3(d))) that occurred during the period covered by this report that have materially affected, or are reasonably likely to materially affect, the registrant’s internal control over financial reporting. |
Item 12. Disclosure of Securities Lending Activities for Closed-End Management Investment Companies.
Not applicable.
Item 13. Exhibits.
There were no written solicitations to purchase securities under Rule 23c-1 under the Act sent or given during the period covered by the report by or on behalf of the Registrant to 10 or more persons.
There was no change in the Registrant’s independent public accountant during the period covered by the report.
SIGNATURES
Pursuant to the requirements of the Securities Exchange Act of 1934 and the Investment Company Act of 1940, the registrant has duly caused this report to be signed on its behalf by the undersigned, thereunto duly authorized.
| (Registrant) | Sterling Capital Funds | |
| | | |
| By (Signature and Title) | /s/ James T. Gillespie | |
| | James T. Gillespie, President | |
| | (principal executive officer) | |
| | | |
| Date | November 23, 2021 | |
Pursuant to the requirements of the Securities Exchange Act of 1934 and the Investment Company Act of 1940, this report has been signed below by the following persons on behalf of the registrant and in the capacities and on the dates indicated.
| By (Signature and Title) | /s/ James T. Gillespie | |
| | James T. Gillespie, President | |
| | (principal executive officer) | |
| | | |
| Date | November 23, 2021 | |
| | | |
| By (Signature and Title) | /s/ Todd M. Miller | |
| | Todd M. Miller, Treasurer | |
| | (principal financial officer) | |
| | | |
| Date | November 23, 2021 | |