UNITED STATES
SECURITIES AND EXCHANGE COMMISSION
Washington, D.C. 20549
FORM N-CSR
CERTIFIED SHAREHOLDER REPORT OF REGISTERED
MANAGEMENT INVESTMENT COMPANIES
| | Investment Company Act file number | 811-06719 | |
Sterling Capital Funds
(Exact name of registrant as specified in charter)
3605 Glenwood Ave., Suite 100
Raleigh, NC 27612
(Address of principal executive offices) (Zip code)
James T. Gillespie, President
Sterling Capital Funds
3605 Glenwood Ave., Suite 100
Raleigh, NC 27612
(Name and address of agent for service)
Registrant’s telephone number, including area code: (800) 228-1872
Date of fiscal year end: September 30
Date of reporting period: September 30, 2020
Form N-CSR is to be used by management investment companies to file reports with the Commission not later than 10 days after the transmission to stockholders of any report that is required to be transmitted to stockholders under Rule 30e-1 under the Investment Company Act of 1940 (17 CFR 270.30e-1). The Commission may use the information provided on Form N-CSR in its regulatory, disclosure review, inspection, and policymaking roles.
A registrant is required to disclose the information specified by Form N-CSR, and the Commission will make this information public. A registrant is not required to respond to the collection of information contained in Form N-CSR unless the Form displays a currently valid Office of Management and Budget ("OMB") control number. Please direct comments concerning the accuracy of the information collection burden estimate and any suggestions for reducing the burden to Secretary, Securities and Exchange Commission, 450 Fifth Street, NW, Washington, DC 20549-0609. The OMB has reviewed this collection of information under the clearance requirements of 44 U.S.C. § 3507.
Item 1. Reports to Stockholders.
The Report to Shareholders is attached herewith.
Beginning on January 1, 2021, as permitted by regulations adopted by the U.S. Securities and Exchange Commission, paper copies of the shareholder reports of the Sterling Capital Funds (each, a “Fund” and, collectively, the “Funds”) like this one will no longer be sent by mail, unless you specifically request paper copies of the reports. Instead, the reports will be made available on the Funds’ website (www.sterlingcapitalfunds.com), and you will be notified by mail each time a report is posted and provided with a website link to access the report.
If you already elected to receive shareholder reports electronically, you will not be affected by this change and you need not take any action. You may elect to receive shareholder reports and other communications from a Fund electronically anytime by contacting your financial intermediary or, if you are a direct investor, by calling 1-800-228-1872 or by sending an e-mail request to fundinfo@sterlingcapital.com.
You may elect to receive all future reports in paper free of charge. If you invest through a financial intermediary, you can contact your financial intermediary to request that you continue to receive paper copies of your shareholder reports. If you invest directly with a Fund, you can call 1-800-228-1872 or send an email request to fundinfo@sterlingcapital.com to let the Fund know you wish to continue receiving paper copies of your shareholder reports. Your election to receive reports in paper will apply to all Funds held in your account if you invest through your financial intermediary or all Funds held with the fund complex if you invest directly with a Fund.
Table of Contents
(This page has been left blank intentionally.)
Letter from the President and the Investment Advisor
Dear Shareholders:
We are pleased to present this Sterling Capital Funds annual report covering the 12 months between October 1, 2019 and September 30, 2020.
Equity markets posted uneven results during a remarkable 12-month period that included a global pandemic, mixed economic reports, heightened social unrest, and considerable political uncertainty. Stocks largely weathered a sharp downturn in February and March to finish the 12-month period in positive territory, although performance was very uneven across sectors and asset classes.
Stocks began the period on a positive note. Following several months of falling interest rates and concerns about slowing economic growth, investor sentiment rose in late 2019 on improving economic data. That data eased fears of an economic recession and helped push both small-and large-cap equities higher. However, the rapid spread of the novel coronavirus in February and March sent investors on a sudden and dramatic retreat. After closing at a record-high on February 19, the S&P 500® Index1 declined more than 35% through the end of March, resulting the worst first-quarter equity decline since 1987.
The virus put a halt to consumption and capital investment, and essentially shut down global markets. Multiple trading days were volatile enough to trigger market “circuit breakers” that temporarily halted trading.The declines hit domestic and international markets alike, and no economic sector was immune from the selloff. Rate-sensitive sectors such as Energy, Financials and Materials fared the worst during the downturn. But even the better-performing sectors of Technology, Health Care, and Consumer Staples declined by double digits over just a handful of weeks.
After bottoming in late March, stocks rebounded during the three months through June, posting their best quarterly performance since 1987. The surge in stock prices was felt broadly across U.S. markets as all major equity indices jumped more than 20%. The second-quarter bounce was not enough to erase the declines from earlier in the year, but it breathed life into investors’ optimism about the ability of businesses to weather the pandemic. Growth-oriented stocks led the rebound, particularly Technology, Communication Services, and Consumer Discretionary stocks.
The rebound carried over into the third quarter of 2020 despite a weak September. The momentum helped stocks post their best back-to-back quarterly gains since 2009. Growth-oriented sectors such as Technology and Consumer Discretionary continued to lead the way during the third quarter amid signs that the U.S. economy was reopening and recovering. The Federal Reserve’s comments in early September that interest rates would remain low for the foreseeable future also helped improve investor sentiment. Meanwhile, the Energy and Financials sectors continued to lag.
Fixed income markets largely mirrored the tumultuous equity story for the period. Tighter credit spreads during the final months of 2019 helped drive positive returns for fixed income investors. But interest rates were extremely volatile in early 2020 amid liquidity concerns and market disruptions. Yields on taxable and municipal bonds fluctuated violently. And with equity markets in a freefall, investors flocked to the perceived safety ofTreasuries, which helped drive prices up and pushed the yield on 10-year Treasuries down to all-time lows in early March.
As stocks rebounded in the second and third quarters, fixed income markets responded accordingly. Investor confidence in an economic recovery grew slowly, which translated into tightening yield spreads.The spread between the 10-year Treasury and investment grade “BBB” bonds contracted from 354 basis point in early April to 193 basis points at the end of June, and again to 170 basis point by the end of the third quarter. The Bloomberg Barclay’s U.S. Aggregate Bond Index2 returned 6.98% for the period, while the Bloomberg Barclay’s U.S. High Yield Corporate Bond Index3 returned 3.25%.
Domestic macro-economic data reflected the story told by equity markets during the period. U.S. GDP increased at an annualized rate of 2.1% in the final quarter of 2019, but decreased at an annual rate of -5% in the first quarter of 2020 and an estimated decline of -31.4% in the second quarter. In similar fashion, the monthly unemployment rate ranged between 3.5% and 3.6% through the first five months of the 12-month period, only to jump to 4.4% in March. As layoffs rose sharply due to the economic fallout from COVID-19, that rate leapt up to 14.7% in April, before slowing ticking downward over the rest of the period. By September, the unemployment rate was down to 7.9%.
The S&P 500® Index returned 15.15% during the 12 months under review. However, small-cap stocks generally fared worse than large-caps during the downturn, with the Russell 2000® Index4 of small-cap stocks returning just 0.39%. Growth outperformed value for the period, with the Russell 1000® Growth Index5 returning 37.53% while the Russell 1000Value declined -5.03%. International markets underperformed the U.S. markets, with the MSCI EAFE Index6 gaining just 0.49%, although emerging markets fared better on strength in China and India, with the MSCI Emerging Markets Index7 returning 10.54% (net return).
During the 12 months under review, Information Technology, Consumer Discretionary and Communication Services generally outperformed the broader markets as growth-oriented stocks benefited from the robust market rebound over the second and third quarters of 2020. Financials and Energy stocks lagged their peers, with Energy underperforming by a significant margin on soft prices due to concerns over slowed global growth.
We will continue to monitor the evolving economic and market climate and will manage the Sterling Capital Funds accordingly. Thank you for your confidence in Sterling Capital Management. We look forward to serving your investment needs during the months and years ahead.
Sincerely,

James T. Gillespie
President
Sterling Capital Funds

Jeffrey J. Schappe, CFA
Managing Director
Sterling Capital Management LLC
| 1 | “S&P 500®” is a registered service mark of Standard & Poor’s Corporation, which does not sponsor and is in no way affiliated with the Sterling Capital Funds. The S&P 500® Index is generally considered to be representative of the performance of the stock market as a whole. The index does not reflect the deduction of expenses associated with a mutual fund, such as investment management and fund accounting fees. A Fund’s performance reflects the deduction of fees for these services. Investors cannot invest directly in an index, although they can invest in its underlying securities. |
| 2 | The Bloomberg Barclays U.S. Aggregate Bond Index is an unmanaged index composed of securities that are SEC-registered, taxable, and dollar denominated. The index covers the U.S. investment grade fixed rate bond market, with index components for government and corporate securities, mortgage pass-through securities, and asset-backed securities. It is not possible to invest in the Bloomberg Barclays U.S. Aggregate Bond Index, which is unmanaged and does not incur fees and charges. |
| 3 | The Bloomberg Barclays U.S. High Yield Corporate Index measures performance of the US corporate market of non-investment grade, fixed-rate corporate bonds. Securities are classified as high yield if the middle rating of Moody’s, Fitch, and S&P is Ba1/BB+/BB+ or below. |
| 4 | “Russell 2000®” Index is a registered service mark of FTSE Russell, which does not sponsor and is in no way affiliated with the Sterling Capital Funds. The Russell 2000® Index is a small-cap market index of the bottom 2,000 stocks in the Russell 3000® Index. The index does not reflect the deduction of expenses associated with a mutual fund, such as investment management and fund accounting fees. A Fund’s performance reflects the deduction of fees for these services. Investors cannot invest directly in an index, although they can invest in its underlying securities. |
| 5 | “Russell 1000®” Index is a registered service mark of FTSE Russell, which does not sponsor and is in no way affiliated with the Sterling Capital Funds. The Russell 1000® Index is a large-cap market index of the largest stocks in the U.S. equity markets. The index does not reflect the deduction of expenses associated with a mutual fund, such as investment management and fund accounting fees. A Fund’s performance reflects the deduction of fees for these services. Investors cannot invest directly in an index, although they can invest in its underlying securities. |
| 6 | The MSCI EAFE® Index measures the performance of the developed stock markets of Europe, Australia, and the Far East. |
| 7 | The MSCI Emerging Markets Index captures large and mid cap equity representation across 26 developing market countries. The Index covers approximately 85% of the free float-adjusted market capitalization in each country. |
Past performance does not guarantee future results. Mutual fund investing involves risk including the possible loss of principal.
This report is authorized for distribution only when preceded or accompanied by a prospectus. Please read the prospectus carefully before investing or sending money. Sterling Capital Management LLC (“Sterling Capital”) serves as investment advisor to the Sterling Capital Funds (each a “Fund” and collectively, the “Funds”) and is paid a fee for its services. Shares of the Funds are not deposits or obligations of, or guaranteed or endorsed by, Branch Banking and Trust Company or its affiliates. The Funds are not insured by the FDIC or any other government agency. The Funds currently are distributed by Sterling Capital Distributors, LLC. The distributor is not affiliated with Branch Banking and Trust Company or its affiliates.
The foregoing information and opinions are for general information only. Sterling Capital does not guarantee their accuracy or completeness, nor assume liability for any loss, which may result from the reliance by any person upon any such information or opinions. Such information and opinions are subject to change without notice, are for general information only and are not intended as an offer or solicitation with respect to the purchase or sale of any security or as offering individual or personalized investment advice. The credit rating source referenced in the fund commentaries, if applicable, was the S&P 500.
Sterling Capital Behavioral Large Cap Value Equity Fund
Portfolio Managers
Sterling Capital Behavioral Large Cap Value Equity Fund (the “Fund”) is managed by Portfolio Managers Robert W. Bridges, CFA, Senior Managing Director, and Robert O. Weller, CFA, Executive Director, for Sterling Capital Management LLC (“Sterling Capital”), advisor to the Fund.
Robert W. Bridges, CFA
Robert W. Bridges, CFA, Senior Managing Director, joined Sterling Capital in 1996 and is head of equity. He also leads Sterling Capital’s fundamental equity team and serves as co-head of the factor investing/behavioral finance portfolios. He has investment experience since 1991 and has co-managed the Fund since 2013. Bob is a graduate of Wake Forest University where he received a BS in Business. He holds the Chartered Financial Analyst designation.
Robert O. Weller, CFA
Robert O. Weller, CFA, Executive Director, joined Sterling Capital in 2012 and is co-head of the factor investing/behavioral finance. He has investment experience since 1996 and has co-managed the Fund since 2013. Rob is a graduate of Loyola University Maryland where he received a BBA in Finance. He holds the Chartered Financial Analyst designation.
Investment Considerations
The overall results of the Fund will be dependent on the process and ability of the Adviser to apply “behavioral finance” principles to recognize a company’s value, earnings revisions and price momentum. The Fund may invest in undervalued securities which may not appreciate in value as anticipated or remain undervalued for longer than anticipated. The overall results of the Fund will be dependent on the process and ability of the Adviser to recognize a company’s value. The Fund may invest in REITs (Real Estate Investment Trusts), the value of which will be affected by conditions of the real estate industry. The Fund may also invest in exchange-traded funds (ETFs); thus shareholders may bear additional costs and the ETF may not exactly replicate the performance it seeks to track.
Q. How did the Fund perform during the 12-month period between October 1, 2019 and September 30, 2020?
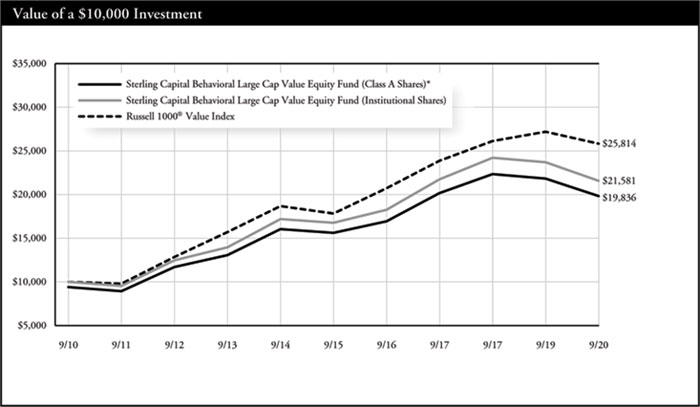
A. The Fund’s Institutional Shares underperformed its current benchmark, the Russell 1000® Value Index.
Q. What factors affected the Fund’s performance?
U.S. large-cap stocks weathered severe volatility to post modest gains during the period. Stocks performed well in the final months of 2019 and the first month and a half of 2020, but the negative economic impact of the COVID-19 pandemic sent global stocks into a freefall at the end of February. Stock markets bottomed in late March in response to economic stimulus efforts and the rebound gained momentum with the easing of some restrictions throughout the early summer. By mid summer, large-cap stocks in general had fully recovered their losses. But value-oriented companies continued to lag their growth-oriented counterparts.
The Fund applies principles of behavioral finance to its investment strategy. This process is designed to capitalize on known investor biases and heuristics (mental shortcuts) by accounting for the impact on markets of behavioral factors such as greed, fear and ego.
The Fund’s behavioral-driven factors had an overall negative effect on the portfolio’s performance relative to its benchmark. The Fund’s momentum strategy contributed marginally to relative returns, but those gains were more than offset by the Fund’s exposure to value stocks, which underperformed during the period.
Stock selection in REITs was a major detractor on the Fund’s relative performance. In particular, the Fund’s lack of exposure to more defensive healthcare REITs weighed on relative results, as those performed well during the period. The Fund’s strategy of maintaining a smaller-than-benchmark average market capitalization profile also detracted from returns, as larger stocks generally outperformed smaller ones during the period.
Although the Fund underperformed the benchmark during the year, its stock selection in industrials contributed to relative returns, particularly within the capital goods subsector. The Fund’s lack of exposure to two underperforming aerospace and defense companies also added to relative returns.
Portfolio composition is as of September 30, 2020 and is subject to change and risk.
| * | Reflects 5.75% maximum sales charge. |
| ** | Reflects the applicable maximum CDSC of 1.00% (applicable only to redemptions within one year of purchase, and as such, are not reflected in the Average Annual Total Returns table since the periods reflected are for a year or longer). |
| Average Annual Total Returns |
| As of September 30, 2020 | Inception
Date | 1 Year | 5 Years | 10 Years |
| Class A Shares* | 10/9/92 | -14.38% | 3.68% | 7.09% |
| Class C Shares** | 2/1/01 | -9.81% | 4.15% | 6.93% |
| Institutional Shares | 10/9/92 | -8.96% | 5.18% | 8.00% |
| Class R6 Shares | 2/1/181 | -8.88% | 5.21% | 8.01% |
| Russell 1000® Value Index | N/A | -5.03% | 7.66% | 9.95% |
Past performance does not guarantee future results. The performance data quoted represents past performance and current returns may be lower or higher. Total return figures include change in share price, reinvestment of dividends and capital gains, and do not reflect taxes that a shareholder would pay on fund distributions or on the redemption of fund shares. The investment return and principal value will fluctuate so that an investor’s shares, when redeemed, may be worth more or less than the original cost. To obtain performance information current to the most recent month end, please visit www.sterlingcapitalfunds.com.
The chart above represents a comparison of a hypothetical $10,000 investment in the indicated share class versus a similar investment in the Fund’s benchmark.
| 1 | Class R6 Shares were not in existence prior to 2/1/18. Performance for periods prior to 2/1/18 is based on the performance of Institutional Shares. |
The Russell 1000® Value Index is a widely recognized index of common stocks that measures the performance of the large-cap value sector of the U.S. equity market. The index is unmanaged and does not reflect the deduction of expenses associated with a mutual fund, such as investment management and fund accounting fees. Investors cannot invest directly in an index, although they can invest in its underlying securities.
Sterling Capital Mid Value Fund
Portfolio Manager
Sterling Capital Mid Value Fund (the “Fund”) is managed by Patrick W. Rau, CFA, Managing Director and portfolio manager for Sterling Capital Management LLC (“Sterling Capital”), advisor to the Fund.
Patrick W. Rau, CFA
Patrick W. Rau, CFA, Managing Director, joined Sterling Capital in 2001 and has investment experience since 1991. He has been an associate portfolio manager of the Fund since 2016 and became lead portfolio manager of the Fund in 2020. He received his AB in Political Science from Duke University and his MBA from Vanderbilt University. He holds the Chartered Financial Analyst designation.
Investment Considerations
The Fund may invest in undervalued securities that may not appreciate in value as anticipated or remain undervalued for longer than anticipated. Investments made in small to mid-capitalization companies are subject to greater risks than large company stocks due to limited resources and inventory and are more sensitive to adverse conditions. The Fund may invest in foreign securities, which may be more volatile and less liquid due to currency fluctuation, political instability, social and economic risks.
Q. How did the Fund perform during the 12-month period between October 1, 2019 and September 30, 2020?
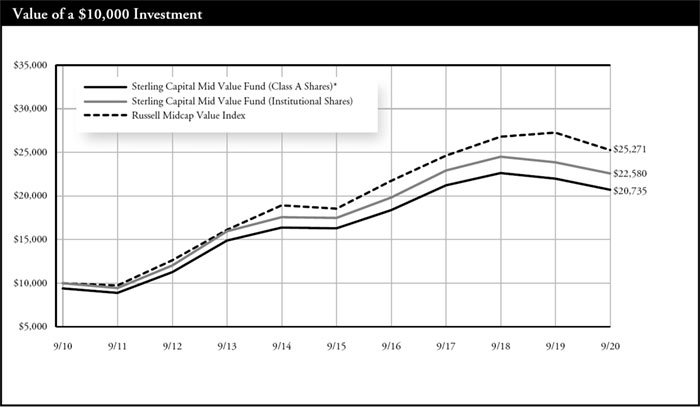
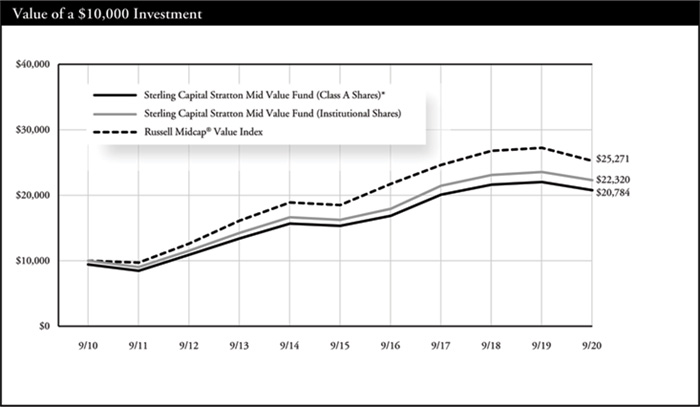
A. The Fund’s Institutional Shares outperformed its current benchmark, the Russell Midcap® Value Index.
Q. What factors affected the Fund’s performance?
A. U.S. mid-cap value stocks posted single-digit percentage losses for the period. The negative economic impacts stemming from actions taken to mitigate the COVID-19 pandemic weighed on economically sensitive stocks, particularly those associated with travel. Despite a nascent recovery, this economic damage from the pandemic negatively impacted the Fund’s absolute performance.
Favorable stock selection in consumer discretionary as well as the Fund’s
significant underweighting of poor-performing real estate and utilities stocks contributed to the Fund’s relative performance. Adverse stock selection among technology, materials and communications services stocks hindered relative performance.
An overweight allocation to financials, which underperformed meaningfully during the period, was more than overcome by strong stock selection among these stocks. Three buyout offers among our portfolio holdings also aided the Fund’s relative performance.
Actions taken by OPEC+ near the onset of the pandemic had a material negative impact on oil prices and led to the severe underperformance of energy stocks during the period. An underweighting to energy stocks during the period benefited the Fund’s relative performance.
Portfolio composition is as of September 30, 2020 and is subject to change and risk.
| * | Reflects 5.75% maximum sales charge. |
| ** | Reflects the applicable maximum CDSC of 1.00% (applicable only to redemptions within one year of purchase, and as such, are not reflected in the Average Annual Total Returns table since the periods reflected are for a year or longer). |
| Average Annual Total Returns |
| As of September 30, 2020 | Inception Date | 1 Year | 5 Years | 10 Years |
| Class A Shares* | 8/1/96 | -11.17% | 3.72% | 7.56% |
| Class C Shares** | 7/25/01 | -6.46% | 4.17% | 7.40% |
| Institutional Shares | 8/1/96 | -5.50% | 5.23% | 8.49% |
| Class R Shares | 2/1/101 | -5.97% | 4.72% | 7.84% |
| Class R6 Shares | 2/1/182 | -5.56% | 5.26% | 8.50% |
| Russell Midcap® Value Index | N/A | -7.30% | 6.38% | 9.71% |
Past performance does not guarantee future results. The performance data quoted represents past performance and current returns may be lower or higher. Total return figures include change in share price, reinvestment of dividends and capital gains, and do not reflect taxes that a shareholder would pay on fund distributions or on the redemption of fund shares. The investment return and principal value will fluctuate so that an investor’s shares, when redeemed, may be worth more or less than the original cost. To obtain performance information current to the most recent month end, please visit www.sterlingcapitalfunds.com.
The chart above represents a comparison of a hypothetical $10,000 investment in the indicated share class versus a similar investment in the Fund’s benchmark.
| 1 | Class R Shares were not in existence prior to 2/1/10. Performance for periods prior to 2/1/10 is based on the performance of the Institutional Shares, but such performance does not reflect Class R Shares’ 12b-1 fees, which if reflected, would have caused performance to be lower. |
| 2 | Class R6 Shares were not in existence prior to 2/1/18. Performance for periods prior to 2/1/18 is based on the performance of the Institutional Shares. |
The Fund is measured against the Russell Midcap® Value Index, an unmanaged index, which measures the performance of the mid-cap value segment of the U.S. equity universe. It includes those Russell Midcap® Index companies with lower price-to-book ratios and lower forecasted growth values. The index is unmanaged and does not reflect the deduction of expenses associated with a mutual fund, such as investment management and fund accounting fees. Investors cannot invest directly in an index, although they can invest in its underlying securities.
Sterling Capital Behavioral Small Cap Value Equity Fund
Portfolio Managers
Sterling Capital Behavioral Small Cap Value Equity Fund (the “Fund”) is managed by Portfolio Managers Robert W. Bridges, CFA, Senior Managing Director, and Robert O. Weller, CFA, Executive Director, for Sterling Capital Management LLC (“Sterling Capital”), advisor to the Fund.
Robert W. Bridges, CFA
Robert W. Bridges, CFA, Senior Managing Director, joined Sterling Capital in 1996 and is head of equity. He also leads Sterling Capital’s fundamental equity team and serves as co-head of the factor investing/behavioral finance portfolios. He has investment experience since 1991 and has co-managed the Fund since 2013. Bob is a graduate of Wake Forest University where he received a BS in Business. He holds the Chartered Financial Analyst designation.
Robert O. Weller, CFA
Robert O. Weller, CFA, Executive Director, joined Sterling Capital in 2012 and is co-head of the factor investing/behavioral finance. He has investment experience since 1991 and has co-managed the Fund since 2013. Rob is a graduate of Loyola University Maryland where he received a BBA in Finance. He holds the Chartered Financial Analyst designation.
Investment Considerations
The overall results of the Fund will be dependent on the process and ability of the Adviser to apply “behavioral finance” principles to recognize a company’s value, earnings revisions and price momentum. The Fund may invest in undervalued securities which may not appreciate in value as anticipated or remain undervalued for longer than anticipated. Investments made in small to mid-capitalization companies are subject to greater risks than large company stocks due to limited resources and inventory as well as more sensitive to adverse conditions.
Q. How did the Fund perform during the 12-month period between October 1, 2019 and September 30, 2020?
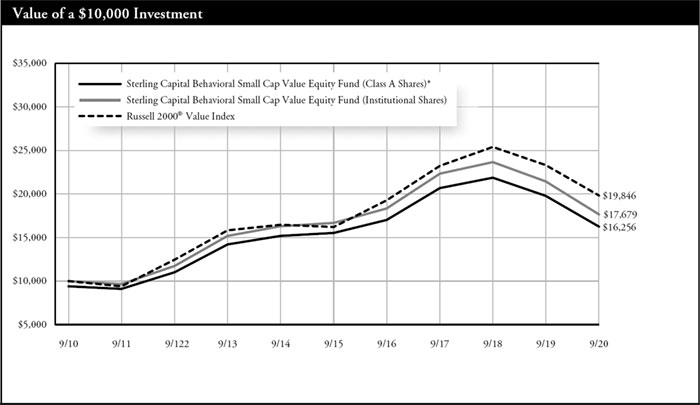
A. The Fund’s Institutional Shares underperformed its benchmark, the Russell 2000® Value Index.
Q. What factors affected the Fund’s performance?
A. Small-cap equities experienced a significant decline early in 2020 due to the economic fallout of the COVID-19 pandemic. Corporate earnings and stock prices suffered from late February to mid-March, as governments around the world implemented strict economic and social restrictions. Stocks rebounded later in the spring in response to economic stimulus efforts and the easing of some restrictions, but this partial recovery failed to boost prices to their pre-pandemic highs. Small-cap value equities ended the period at a loss, underperforming both small-cap growth stocks as well as large-cap equities in general, as the economic re-start benefited growth-oriented stocks and larger companies more than small-value names.
The Fund applies principles of behavioral finance to its investment strategy. This process is designed to capitalize on known investor biases and heuristics (mental shortcuts) by accounting for the impact on markets of behavioral factors such as greed, fear and ego.
The Fund’s behavioral-driven factors had an overall negative effect on the portfolio’s performance relative to its benchmark. The Fund’s momentum strategy contributed marginally to relative returns, but those gains were more than offset by the Fund’s value exposure, as value stocks underperformed their core counterparts during the period.
An overweight position and stock selection in the financials sector were the largest detractors to the Fund’s relative returns. This sector was among the hardest hit by the economic impact of the pandemic, and the Fund’s investments in banks, diversified financials and mortgage real estate investment trusts also weighed as those holdings underperformed.
Stock selection in health care equipment and services added to the Fund’s relative performance during the period. The Fund’s strategy of maintaining a larger-than-benchmark average market capitalization also benefited on a relative basis, as larger companies generally outperformed smaller companies for the period.
Portfolio composition is as of September 30, 2020 and is subject to change and risk.
| * | Reflects 5.75% maximum sales charge. |
| ** | Reflects the applicable maximum CDSC of 1.00% (applicable only to redemptions within one year of purchase, and as such, are not reflected in the Average Annual Total Returns table since the periods reflected are for a year or longer). |
| Average Annual Total Returns | |
| As of September 30, 2020 | Inception Date | 1 Year | 5 Years | 10 Years |
| Class A Shares* | 1/29/10 | -22.58% | -0.29% | 4.98% |
| Class C Shares** | 1/29/10 | -18.47% | 0.13% | 4.79% |
| Institutional Shares | 1/2/97 | -17.64% | 1.16% | 5.86% |
| Class R Shares | 2/1/10 | -18.04% | 0.67% | 5.44% |
| Class R6 Shares | 2/1/181 | -17.63% | 1.19% | 5.88% |
| Russell 2000® Value Index | N/A | -14.88% | 4.11% | 7.09% |
Past performance does not guarantee future results. The performance data quoted represents past performance and current returns may be lower or higher. Total return figures include change in share price, reinvestment of dividends and capital gains, and do not reflect taxes that a shareholder would pay on fund distributions or on the redemption of fund shares. The investment return and principal value will fluctuate so that an investor’s shares, when redeemed, may be worth more or less than the original cost. To obtain performance information current to the most recent month end, please visit www.sterlingcapitalfunds.com. Performance would have been lower without waivers in effect.
The chart above represents a comparison of a hypothetical $10,000 investment in the indicated share class versus a similar investment in the Fund’s benchmark.
| 1 | Class R6 Shares were not in existence prior to 2/1/18. Performance for periods prior to 2/1/18 is based on the performance of Institutional Shares. |
The Russell 2000® Value Index is a widely recognized index of common stocks that measures the performance of the small-cap value sector of the U.S. equity market. The index is unmanaged and does not reflect the deduction of expenses associated with a mutual fund, such as investment management and fund accounting fees. Investors cannot invest directly in an index, although they can invest in its underlying securities.
Sterling Capital Special Opportunities Fund
Portfolio Manager
Sterling Capital Special Opportunities Fund (the “Fund”) is managed by George F. Shipp, CFA, Managing Director and portfolio manager for Sterling Capital Management LLC (“Sterling Capital”), advisor to the Fund.
George F. Shipp, CFA
George F. Shipp, CFA, Managing Director, founded what is now the Sterling Capital Equity Opportunities group in December 2000, after serving for 18 years as a sell-side equity analyst with the broker-dealer BB&T Scott & Stringfellow. George has served as the lead portfolio manager for the Special Opportunities Fund since its inception. George is a graduate of the University of Virginia where he received a B.A. in Biology, and an MBA from its Darden Graduate School of Business in 1982. He holds the Chartered Financial Analyst designation.
Investment Considerations
The Fund is subject to investment style risk, which depends on the market segment in which the Fund is primarily invested. An investment in growth stocks may be particularly sensitive to market conditions while value stocks may be undervalued for longer than anticipated. The Fund may invest in foreign securities subject to risks such as currency volatility and political and social instability or small capitalization companies subject to greater volatility and less liquidity due to limited resources or product lines. The Fund may engage in writing covered call options on securities. By writing covered call options, the Fund limits its opportunity to profit from an increase in the price of the underlying stock above the premium and the strike price, but continues to bear the risk of a decline in the stock price. While the Fund receives premiums for writing covered call options, the price it realizes from the exercise of an option could be substantially below a stock’s current market price.
Q. How did the Fund perform during the 12-month period between October 1, 2019 and September 30, 2020?
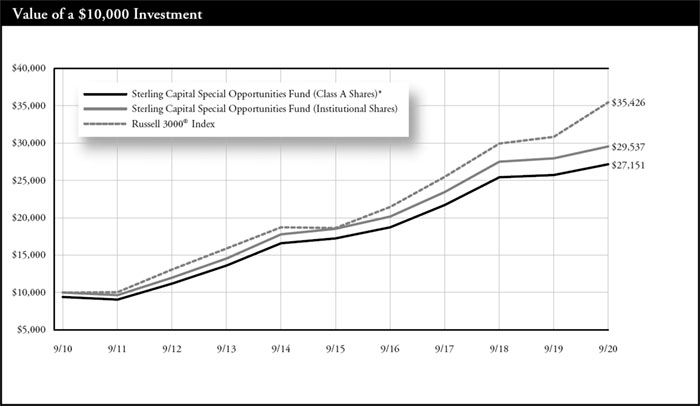
A. The Sterling Capital Special Opportunities Fund provided a +5.79% total return (Institutional Class) during its September 30, 2020 fiscal year. If we had known in advance that the year would be dominated by the COVID-19 pandemic causing the worst global economic downturn since the 1930s, not to mention social upheaval and the most acrimonious U.S. political climate in memory, we would have gladly accepted that result. The Fund nevertheless trailed the Russell 3000® Index by a disappointing 9.21%, the largest underperformance in its 17-year history.
Q. What factors affected the Fund’s performance?
A. As readers are well aware, in response to the pandemic, governments worldwide compelled many businesses not to conduct business, and workers not to work. Service sector industries such as travel and restaurants were crippled, even as established trends favoring technology spending enabling work, shop, and play from home accelerated. The equity markets reflected this world of “haves and have nots,” as “Growth” stocks beat those characterized as “Values” by an unprecedented 42 percentage points (+36% in 12 months versus -6%). Our “biggest mistake” was not owning Apple, Amazon and Microsoft; those three tech platforms alone contributed 8.18% to the Russell 3000® Index, but zero to the Fund.
Norwegian Cruise Lines, Alaska Airlines and destination hotelier Ryman Properties took a direct hit from COVID-19, transitioning from record earnings in 2019 almost overnight to docked, parked and closed. Sharp declines in those three stocks contributed a 7.95% combined loss to the Fund before we sold them.
Even with those errors of omission and commission, the Fund more than doubled the return of the equally-weighted equity market (effectively, the median stock). Ironically a “value” holding was our top contributor. Federal Express provided a +76% total return (portfolio contribution +2.3%, reflecting its 3% average weight), as initial evidence of a global freight collapse quickly blossomed to a tight market, confirming our thesis that the company’s services benefit from e-commerce and logistics scale.
Healthcare holdings Danaher (+50%; contribution +2.25%) and Hologic (+32%; +1.6%) were uniquely positioned to help solve the COVID-19 crisis. Danaher’s Cepheid diagnostics unit provides point-of-care tests, while its Cytiva instruments and bioprocessing subsidiary is a primary beneficiary of vaccine research and scale-up. Hologic’s “Panther” high-throughput testing equipment has become the gold standard for reference labs, accounting for approximately one-third of molecular tests. Insurance leader United Health Group is increasingly appreciated for its data analytics, supporting its 46% return (1.5% contribution).
Engagement in Activision Blizzard’s games surged, fueling its shares’ 54% gain (1.7% contribution). Alphabet, also known as Google (+21%; +1.7%), continues to benefit from more searches, more YouTube views, and its Android software’s 74% world share of mobile devices, while its datacenter infrastructure platform has witnessed high growth as more businesses move to the “Cloud.” Akamai (+21%, +1.4%) likewise benefits from exponential growth in data and the corresponding need to keep it secure; almost one third of internet traffic worldwide moves through its 250,000 “edge” servers.
We believe our portfolio is well positioned to benefit from a broadening of the emerging economic recovery. Improvement in the housing (Lennar) and auto industries (Aptiv, CDK Global, NXP Semiconductor) already is evident. Recoveries in consumer spending (Capital One), investor activity (Charles Schwab, Broadridge), and industrial investment (PTC, Flir Systems) should follow, and combine with ongoing technological deepening of everyday processes (Fiserv, F5, Verisk).
We greatly appreciate your continued confidence in our strategies, and in these high quality enterprises.
Portfolio composition is as of September 30, 2020 and is subject to change and risk.
| * | Reflects 5.75% maximum sales charge. |
| ** | Reflects the applicable maximum CDSC of 1.00% (applicable only to redemptions within one year of purchase, and as such, are not reflected in the Average Annual Total Returns table since the periods reflected are for a year or longer). |
| Average Annual Total Returns | |
| As of September 30, 2020 | Inception Date | 1 Year | 5 Years | 10 Years |
| Class A Shares* | 6/2/03 | -0.52% | 8.23% | 10.50% |
| Class C Shares** | 6/2/03 | 4.73% | 8.70% | 10.33% |
| Institutional Shares | 6/2/03 | 5.79% | 9.79% | 11.44% |
| Class R Shares | 2/1/10 | 5.29% | 9.24% | 10.88% |
| Class R6 Shares | 2/1/181 | 5.87% | 9.84% | 11.46% |
| Russell 3000® Index | N/A | 15.00% | 13.69% | 13.48% |
Past performance does not guarantee future results. The performance data quoted represents past performance and current returns may be lower or higher. Total return figures include change in share price, reinvestment of dividends and capital gains, and do not reflect taxes that a shareholder would pay on fund distributions or on the redemption of fund shares. The investment return and principal value will fluctuate so that an investor’s shares, when redeemed, may be worth more or less than the original cost. To obtain performance information current to the most recent month end, please visit www.sterlingcapitalfunds.com.
The chart above represents a comparison of a hypothetical $10,000 investment in the indicated share class versus a similar investment in the Fund’s benchmark.
| 1 | Class R6 Shares were not in existence prior to 2/1/18. Performance for periods prior to 2/1/18 is based on the performance of Institutional Shares. |
The Fund is measured against the Russell 3000® Index, an unmanaged index that is generally considered to be representative of the performance of the stock market as a whole. The index does not reflect the deduction of expenses associated with a mutual fund, such as investment management and fund accounting fees. Investors cannot invest directly in an index, although they can invest in its underlying securities.
Sterling Capital Equity Income Fund
Portfolio Manager
Sterling Capital Equity Income Fund (the “Fund”) is managed by George F. Shipp, CFA, Managing Director and portfolio manager for Sterling Capital Management LLC (“Sterling Capital”), advisor to the Fund.
George F. Shipp, CFA
George F. Shipp, CFA, Managing Director, founded what is now the Sterling Capital Equity Opportunities group in December 2000, after serving for 18 years as a sell-side equity analyst with the broker-dealer BB&T Scott & Stringfellow. George has served as the lead portfolio manager for the Equity Income Fund since its inception. George is a graduate of the University of Virginia where he received a B.A. in Biology, and an MBA from its Darden Graduate School of Business in 1982. He holds the Chartered Financial Analyst designation.
Investment Considerations
The Fund invests primarily in dividend-paying securities. These securities may be undervalued and their value could be negatively affected by a rise in interest rates. The Fund may engage in writing covered call options on securities. By writing covered call options, the Fund limits its opportunity to profit from an increase in the price of the underlying stock above the premium and the strike price, but continues to bear the risk of a decline in the stock price. While the Fund receives premiums for writing covered call options, the price it realizes from the exercise of an option could be substantially below a stock’s current market price.
Q. How did the Fund perform during the 12-month period between October 1, 2019 and September 30, 2020?
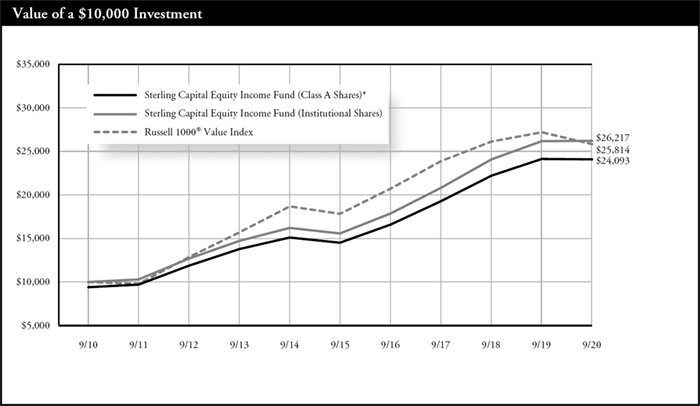
A. The Sterling Capital Equity Income Fund (Institutional shares) provided a +0.15% total return for the fiscal year ended September 30, 2020, a solid result considering the COVID-19 pandemic triggered the worst global economic downturn since the 1930s. The Fund comfortably beat the Russell 1000® Value Index by 5.18%, continuing a four-year streak of outperformance.
Q. What factors affected the Fund’s performance?
A. The virtually-unchanged result for 12 months belies volatility, which witnessed the Index’s 38% four-week plunge from all-time highs to the March 23 lows. Historically, the high quality orientation of the Fund’s holdings has allowed it to play “good defense” during market downturns, but the unique nature of this recession proved more difficult to navigate than usual. Delta Airlines and Royal Caribbean Cruise, for example, had just announced record 2019 earnings and upbeat outlooks, when suddenly they were forced to ground planes and dock fleets. The combined impact of our travel holdings hurt our return by 4.60% (annual effect) until sold.
General Motors shuttered all 84 production facilities and proactively eliminated its dividend, impacting the Fund by another -1.4%. Occidental Petroleum’s (-1.5% contribution) ill-fated buyout of Anadarko Petroleum just months earlier caused an unbearable debt burden as oil briefly plunged below $0/barrel in commodity markets. Despite the unanticipated events, the Fund managed to slightly beat the market drawdown from the beginning of the year to March lows by 0.98%.
One potential advantage active portfolio managers have is that we can at times monetize losses for tax benefit when circumstances change, pivoting to stronger companies positioned to thrive in a new reality. We don’t “passively” sit idle with impaired securities. While not claiming perfect execution, the Fund fully participated in the stock market’s recovery, gaining 46.8% from March 23 through September 30, compared to the 41.2% gain of the benchmark.
We “took advantage” of perceived bargains. The Fund upped its exposure to Financials as share prices for global leaders like Goldman Sachs (investment banking), Citigroup (treasury and card services), and Northern Trust (securities processing) became more attractive. We added communications software provider Amdocs and public safety software leader Motorola Solutions, believing in their relatively resilient cash flows. We became attracted to Coca Cola following its “30% off sale,” due to its competitive yield and 58-year history of dividend increases.
Our technology overweight proved favorable. Microsoft enables working, networking (LinkedIn) and playing (X-Box) from home, and its Azure Cloud infrastructure helps businesses of all sizes become more efficient. Its 53% total return for the year contributed 2.65% to the portfolio overall. Accenture (+19%; 1.0% contribution) is another net debt free global juggernaut helping clients securely move operations to the Cloud. Semiconductor maker Analog Devices agreed to buy fellow portfolio holding Maxim Integrated (+20%), building an even stronger platform to gain content in 5G networks, autos, factories, and datacenters.
Long standing e-commerce tailwinds helped UPS’ pricing as the trend accelerated; its 44% total return translated to a 1.9% contribution. Home Depot capitalized on booming “order online pick up at store” capabilities to capture out-sized share of home improvements (+23%, +1.2%). Abbott Labs’ (+30%, +1.5%) diagnostic platforms were perfectly positioned to benefit from COVID-19 testing, while its Libre diabetes monitor grew rapidly despite difficulties accessing healthcare providers.
With interest rates effectively pegged at zero “for as long as it takes” in Fed Chairman Powell’s words, we believe our income-producing holdings could prove attractive in a yield-starved world. We thank our clients for ongoing confidence in our strategies.
Portfolio composition is as of September 30, 2020 and is subject to change and risk.
| * | Reflects 5.75% maximum sales charge. |
| ** | Reflects the applicable maximum CDSC of 1.00% (applicable only to redemptions within one year of purchase, and as such, are not reflected in the Average Annual Total Returns table since the periods reflected are for a year or longer). |
| Average Annual Total Returns | |
| As of September 30, 2020 | Inception Date | 1 Year | 5 Years | 10 Years |
| Class A Shares* | 6/30/04 | -5.85% | 9.39% | 9.19% |
| Class C Shares** | 6/30/04 | -0.85% | 9.87% | 9.02% |
| Institutional Shares | 6/30/04 | 0.15% | 10.97% | 10.12% |
| Class R Shares | 2/1/10 | -0.40% | 10.41% | 9.58% |
| Class R6 Shares | 2/1/181 | 0.21% | 11.03% | 10.15% |
| Russell 1000® Value Index | N/A | -5.03% | 7.66% | 9.95% |
Past performance does not guarantee future results. The performance data quoted represents past performance and current returns may be lower or higher. Total return figures include change in share price, reinvestment of dividends and capital gains, and do not reflect taxes that a shareholder would pay on fund distributions or on the redemption of fund shares. The investment return and principal value will fluctuate so that an investor’s shares, when redeemed, may be worth more or less than the original cost. To obtain performance information current to the most recent month end, please visit www.sterlingcapitalfunds.com.
The chart above represents a comparison of a hypothetical $10,000 investment in the indicated share class versus a similar investment in the Fund’s benchmark.
| 1 | Class R6 Shares were not in existence prior to 2/1/18. Performance for periods prior to 2/1/18 is based on the performance of Institutional Shares. |
The Fund is measured against the Russell 1000® Value Index, an unmanaged index that is generally considered to be representative of the performance of the stock market as a whole. The index does not reflect the deduction of expenses associated with a mutual fund, such as investment management and fund accounting fees. Investors cannot invest directly in an index, although they can invest in its underlying securities.
Sterling Capital Behavioral International Equity Fund
Portfolio Managers
Sterling Capital Behavioral International Equity Fund (the “Fund”) is managed by Portfolio Managers Robert W. Bridges, CFA, Senior Managing Director, and Robert O. Weller, CFA, Executive Director, for Sterling Capital Management LLC (“Sterling Capital”), advisor to the Fund.
Robert W. Bridges, CFA
Robert W. Bridges, CFA, Senior Managing Director, joined Sterling Capital in 1996 and is head of equity. He also leads Sterling Capital’s fundamental equity team and serves as co-head of the factor investing/behavioral finance portfolios. He has investment experience since 1991 and has co-managed the Fund since its inception. Bob is a graduate of Wake Forest University where he received a BS in Business. He holds the Chartered Financial Analyst designation.
Robert O. Weller, CFA
Robert O. Weller, CFA, Executive Director, joined Sterling Capital in 2012 and is co-head of the factor investing/behavioral finance. He has investment experience since 1996 and has co-managed the Fund since its inception. Rob is a graduate of Loyola University Maryland where he received a BBA in Finance. He holds the Chartered Financial Analyst designation.
Investment Considerations
The overall results of the Fund will be dependent on the process and ability of the Adviser to apply “behavioral finance” principles to recognize a company’s value, earnings revisions and market momentum. The Fund will invest in foreign securities which may be more volatile and less liquid due to currency fluctuation, political instability, and social and economic risks. The Fund may invest in REITs (Real Estate Investment Trusts), the value of which will be affected by conditions of the real estate industry, and exchange-traded funds (ETFs). Investing in ETFs may cause shareholders to bear additional costs, and an ETF may not exactly replicate the performance it seeks to track.
Q. How did the Fund perform during the 12-month period between October 1, 2019 and September 30, 2020?
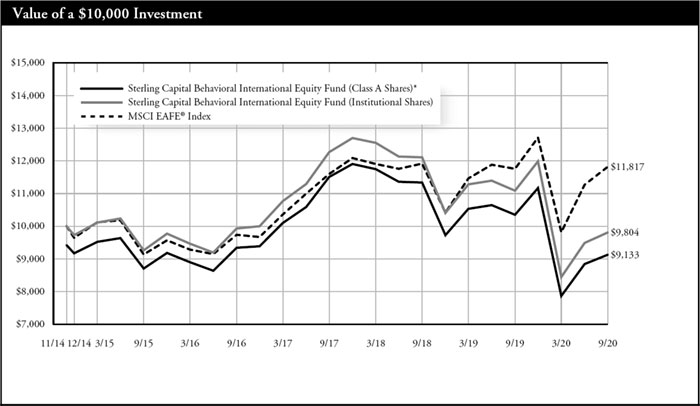
A. The Fund’s Institutional Shares underperformed its current benchmark, the MSCI EAFE Index.
Q. What factors affected the Fund’s performance?
A. International equities survived a turbulent period following the onset of the COVID-19 pandemic, and managed to post modest gains during the period. Global markets continued a long-term upward trend in the final months of 2019 and the first month and a half of 2020, but the negative economic impact of the pandemic sent stocks plunging in late February. Many international stocks hit a low point in late March in response to government-initiated shutdowns, but as economies around the world began to cautiously reopen, equity markets began to rebound. By midsummer, international large-cap stocks had largely recovered their losses, although value-oriented companies continued to lag their growth-oriented counterparts.
The Fund applies principles of behavioral finance to its investment strategy.
This process is designed to capitalize on known investor biases and heuristics (mental shortcuts) by accounting for the impact on markets of behavioral factors such as greed, fear and ego.
The Fund’s behavioral-driven factors had a net negative effect on the portfolio’s performance relative to its benchmark. Modest gains from the Fund’s momentum strategy were offset by the Fund’s exposure to stocks with value characteristics, resulting in a drag on relative returns.
Stock selection in the financials sector detracted the most from the Fund’s relative performance. The Fund’s holdings in global banks proved especially detrimental to returns, most notably a French multinational investment bank and an Australian bank that do business in Asia, the U.K. and the U.S.
Stock selection in the materials sector provided the largest boost to relative performance. The metals and mining subsector stood out as a leading contributor, with holdings in an Australian iron ore company and a British international mining company performing especially well.
Portfolio composition is as of September 30, 2020 and is subject to change and risk.
| * | Reflects 5.75% maximum sales charge. |
| ** | Reflects the applicable maximum CDSC of 1.00% (applicable only to redemptions within one year of purchase, and as such, are not reflected in the Average Annual Total Returns table since the periods reflected are for a year or longer). |
| Average Annual Total Returns | |
| As of September 30, 2020 | Inception Date | 1 Year | 5 Years | Since Inception |
| Class A Shares* | 11/28/14 | -16.84% | -0.23% | -1.54% |
| Class C Shares** | 11/28/14 | -12.41% | 0.17% | -1.28% |
| Institutional Shares | 11/28/14 | -11.65% | 1.14% | -0.34% |
| Class R6 Shares | 2/1/181 | -11.49% | 1.18% | -0.30% |
| MSCI EAFE® Index | 11/30/14 | 0.49% | 5.26% | 2.90% |
Past performance does not guarantee future results. The performance data quoted represents past performance and current returns may be lower or higher. Total return figures include change in share price, reinvestment of dividends and capital gains, and do not reflect taxes that a shareholder would pay on fund distributions or on the redemption of fund shares. The investment return and principal value will fluctuate so that an investor’s shares, when redeemed, may be worth more or less than the original cost. To obtain performance information current to the most recent month end, please visit www.sterlingcapitalfunds.com. Performance would have been lower without limitations and/or waivers in effect.
The chart above represents a comparison of a hypothetical $10,000 investment in the indicated share class versus a similar investment in the Fund’s benchmark.
| 1 | Class R6 Shares were not in existence prior to 2/1/18. Performance for periods prior to 2/1/18 is based on the performance of Institutional Shares. |
Fund is measured against the MSCI EAFE® Index, an unmanaged Index which is generally representative of large- and mid-cap equity across developed markets countries around the world, excluding the U.S. and Canada. The index does not reflect the deduction of expenses associated with a mutual fund, such as investment management and fund accounting fees. Investors cannot invest directly in an index, although they can invest in its underlying securities.
Sterling Capital SMID Opportunities Fund
Portfolio Manager
Sterling Capital SMID Opportunities Fund (the “Fund”) is managed by Joshua L. Haggerty, CFA, Executive Director and portfolio manager for Sterling Capital Management LLC (“Sterling Capital”), advisor to the Fund.
Joshua L. Haggerty, CFA
Joshua L. Haggerty, CFA, Executive Director, joined the CHOICE Asset Management team of BB&T Scott & Stringfellow in 2005, which integrated with Sterling Capital Management in January 2013. He has investment experience since 1998 and has managed the Fund since its inception. Josh is a graduate of James Madison University where he received his BBA in Finance. He holds the Chartered Financial Analyst designation.
Investment Considerations
The Fund uses a multi-style approach and invests in both growth and value-oriented companies. A growth investment style may be particularly sensitive to market conditions. Value investing involves the risk that an investment made in undervalued securities may not appreciate in value as anticipated or remain undervalued for long periods of time. The Fund invests in small and middle capitalization companies which may be riskier, more volatile and vulnerable to economic, market and industry changes than investments in larger more established companies. As a result, share price changes may be more erratic or trade less frequently in lesser quantities.
Q. How did the Fund perform during the 12-month period between October 1, 2019 and September 30, 2020?
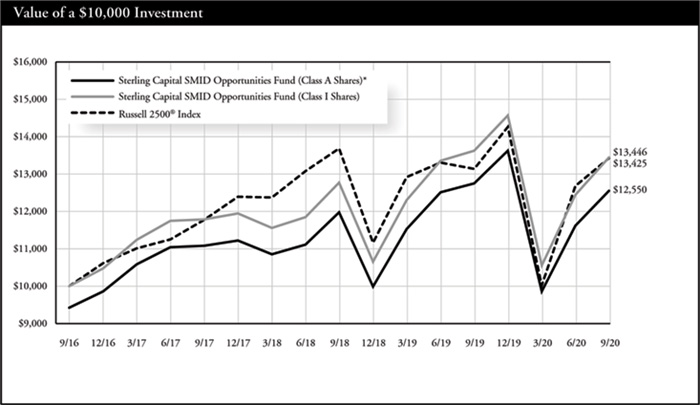
A. The Fund’s Institutional Shares fell 1.3% during the fiscal year ending September 30, 2020, trailing the Russell 2500® Index’s 2.2% gain. The Fund’s three year and since inception annualized returns of 4.49% and 7.7%, respectively, were both slightly ahead of the Russell 2500® Index’s 4.45% and 7.6% returns over the same periods.
Q. What factors affected the Fund’s performance?
A. During the fiscal year, larger companies outperformed, led by a narrow group of mega cap stocks. Apple crossed the $2 trillion market cap threshold and became more valuable than the entire small cap asset class, as measured by the Russell 2000. The dichotomy in returns between growth and value was similar, with growth outperforming by 30% over the past year, the largest spread since March 2000.
As a reminder, we strive to only invest in profitable companies. Coming into the fiscal year, every prior 15% pullback in the Russell 2500® Index has coincided with significant underperformance of unprofitable companies. During the pandemic-led decline in early 2020, the opposite occurred. The 645 profitless companies in the Russell 2500® Index gained 40.7% over the past year while profitable companies in the index fell 6.5%. Similarly at odds with historical data, the most expensive Russell 2500® Index constituents rose 17.4%, while the cheapest declined 28.8% and the highest ROE companies lost 1.1%, the second highest quintile slumped 20.6%, while the lowest return on equity cohort gained 12.9%. This year was an enigma.
The biggest contributors to the Fund’s performance were: (1) women’s health and diagnostics provider, Hologic (+43%, contribution 2.13%), which is expected to grow revenues nearly 60% in fiscal 2020 driven by COVID-19 diagnostic testing equipment and assays (the company is providing nearly 2 million tests per week, or around 40% of all tests in the U.S.); (2) health insurance provider Centene (+35%, 1.89%), which was the Fund’s largest detractor in the prior year, rebounding as Medicare-for-All concerns faded (we see more upside if/as Medicaid is expanded in new geographies); (3) railroad Kansas City Southern (43%, 1.76%), which reported significant productivity gains as precision scheduled railroading was implemented (we departed on news of a takeout offer that was subsequently rebuffed); and (4) Arthur Gallagher (+35%, 1.38%), an insurance broker benefiting from strong pricing supplemented by tuck-in acquisitions.
The biggest detractors were all directly impacted by COVID-19, including: (1) Norwegian Cruise Line (-84%, contribution -3.64%), which reported record earnings in late February only to halt all cruises a month later; (2) food service provider Aramark (-47%, -3.27%), which experienced shutdowns to many of its end markets, such as concerts and sporting events, as well as heretofore resilient verticals such as K-12 schools and universities; (3) Alaska Air (-43%, -2.08%), which is grappling with load factors down by more than half and is focused on reducing its cash burn, yet amazingly its leverage ended the fiscal year the same as it was entering the year; and (4) aerospace supplier Hexcel (-65%, -1.82%), which not only saw an eight-year backlog at Boeing and Airbus disappear into thin air, but called off its merger with Woodward as well.
We redeployed capital from three of the four detractors into businesses offering more reliable income streams, supported by secular growth in applications transitioning to the cloud, cybersecurity, industrial automation, and increased healthcare use due to an aging demographic.
Portfolio composition is as of September 30, 2020 and is subject to change and risk.
| * | Reflects 5.75% maximum sales charge. |
| ** | Reflects the applicable maximum CDSC of 1.00% (applicable only to redemptions within one year of purchase, and as such, are not reflected in the Average Annual Total Returns table since the periods reflected are for a year or longer). |
| Average Annual Total Returns | |
| As of September 30, 2020 | Inception Date | 1 Year | Since Inception |
| Class A Shares* | 09/30/16 | -7.22% | 5.84% |
| Class C Shares** | 09/30/16 | -2.22% | 6.63% |
| Institutional Shares | 09/30/16 | -1.30% | 7.68% |
| Russell 2500® Index | N/A | 2.22% | 7.64% |
Past performance does not guarantee future results. The performance data quoted represents past performance and current returns may be lower or higher. Total return figures include change in share price, reinvestment of dividends and capital gains, and do not reflect taxes that a shareholder would pay on fund distributions or on the redemption of fund shares. The investment return and principal value will fluctuate so that an investor’s shares, when redeemed, may be worth more or less than the original cost. To obtain performance information current to the most recent month end, please visit www.sterlingcapitalfunds.com. Performance would have been lower without limitations and/or waivers in effect.
The chart above represents a comparison of a hypothetical $10,000 investment in the indicated share class versus a similar investment in the Fund’s benchmark.
The Russell 2500® Index is a widely recognized index of common stocks that measures the performance of the small and mid cap sector of the U.S. equity market. The index is unmanaged and does not reflect the deduction of expenses associated with a mutual fund, such as investment management and fund accounting fees. Investors cannot invest directly in an index, although they can invest in its underlying securities.
Sterling Capital Stratton Mid Cap Value Fund
Portfolio Manager
Sterling Capital Stratton Mid Cap Value Fund (the “Fund”) is managed by Shawn M. Gallagher, CFA, Executive Director and portfolio manager for Sterling Capital Management LLC (“Sterling Capital”), advisor to the Fund.
Shawn M. Gallagher, CFA
Shawn M. Gallagher, CFA, Executive Director, joined the Stratton Funds team of Stratton Management Company in 2005 and Sterling Capital Management as part of a business acquisition in August 2015. He has managed the Fund since 2015 and the predecessor fund since 2012, when it was repositioned as a Mid Cap Value strategy. He has investment experience since 2003 and is a graduate of Pennsylvania State University where he received his BS in Finance. He holds the Chartered Financial Analyst designation.
Investment Considerations
Mid-capitalization companies are generally riskier than large company stocks due to greater volatility and less liquidity. Value stocks can perform differently than other types of stocks and can continue to be undervalued by the market for long periods of time.
Q. How did the Fund perform during the 12-month period between October 1, 2019 and September 30, 2020?
A. The Fund’s Institutional Shares outperformed its benchmark, the Russell Midcap® Value Index.
Q. What factors affected the Fund’s performance?
U.S. mid-cap stocks posted modest losses for the period despite opening with strong gains during the final months of 2019 and opening months of 2020. This positive initial trend gave way to steep declines in late February and early March as markets responded to the negative economic impacts of the global pandemic. U.S. mid-cap stocks declined more than 40% from their February peak through the market’s bottom in late March. A subsequent rebound through the end of the period was not enough to erase the impact of the earlier decline, however. The various government-led shutdown orders had an uneven impact on the economy, benefiting some sectors of the economy while hurting others. The energy sector was the largest drag on the Fund’s absolute returns, as the contraction in the global economy led to a decline in energy prices. Meanwhile, certain communication services holdings added the most to the Fund’s absolute returns as this sector benefited from the “stay-at-home” environment. The health care sector also added to absolute returns.
Stock selection within the health care sector was the biggest contributor to relative performance. Specific holdings benefited from strong demand for medical diagnostics, supplies, and outsourced drug research and development. Selection within the real estate sector also added to relative results, particularly investments in an industrial real estate investment trust (REIT) that benefited from increased demand for warehouse space due to a rise in e-commerce activity. Holdings of two data-center REITs also added to results as cloud migration and bandwidth demand accelerated during the pandemic.
Stock selection within the industrial and consumer staples sectors weighed the most on relative results. In particular, the Fund’s investment in an energy and communications infrastructure provider detracted amid a decline in energy pipeline construction. Meanwhile, two major domestic food distributors lagged the overall consumer staples sector as the economic lockdowns dealt a major blow to the restaurant industry. The Fund’s underweight position to the consumer discretionary sector also weighed on relative results, as that sector outperformed during the market rebound in the second half of the period.
Portfolio composition is as of September 30, 2020 and is subject to change and risk.
| * | Reflects 5.75% maximum sales charge. |
| ** | Reflects the applicable maximum CDSC of 1.00% (applicable only to redemptions within one year of purchase, and as such, are not reflected in the Average Annual Total Returns table since the periods reflected are for a year or longer). |
| Average Annual Total Returns | |
| As of September 30, 2020 | Inception Date | 1 Year | 5 Years | 10 Years |
| Class A Shares* | 11/13/15 | -11.06% | 5.01% | 7.59% |
| Class C Shares** | 11/13/15 | -6.21% | 5.53% | 7.85% |
| Institutional Shares | 09/30/72 | -5.39% | 6.52% | 8.36% |
| Russell Midcap® Value Index | N/A | -7.30% | 6.38% | 9.71% |
Past performance does not guarantee future results. The performance data quoted represents past performance and current returns may be lower or higher. Total return figures include change in share price, reinvestment of dividends and capital gains, and do not reflect taxes that a shareholder would pay on fund distributions or on the redemption of fund shares. The investment return and principal value will fluctuate so that an investor’s shares, when redeemed, may be worth more or less than the original cost. The performance shown here (for periods prior to the date of commencement of operations on November 16, 2015) is that of Stratton Mid Cap Value Fund (the “Predecessor Fund”), whose shares were reorganized into Institutional Shares of the Fund at the close of business on November 13, 2015. Because the Fund had no investment operations prior to the closing of the reorganization, and based on the similarity of the Fund to the Predecessor Fund, the Predecessor Fund is treated as the survivor of the reorganization for accounting and performance reporting purposes. Accordingly, all performance and other information shown for the Fund for periods prior to November 16, 2015 is that of the Predecessor Fund. Performance for Class A Shares and Class C Shares, prior to the date of commencement of operations on November 16, 2015, is based on the performance of the shares of the Predecessor Fund. To obtain performance information current to the most recent month end, please visit www.sterlingcapitalfunds.com. Performance would have been lower without waivers in effect.
The chart above represents a comparison of a hypothetical $10,000 investment in the indicated share class versus a similar investment in the Fund’s benchmark.
The Fund is measured against the Russell Midcap® Value Index, an unmanaged index, which measures the performance of the mid-cap value segment of the U.S. equity universe. It includes those Russell Midcap® Index companies with lower price-to-book ratios and lower forecasted growth values. The index is unmanaged and does not reflect the deduction of expenses associated with a mutual fund, such as investment management and fund accounting fees. Investors cannot invest directly in an index, although they can invest in its underlying securities.
Sterling Capital Stratton Real Estate Fund
Portfolio Manager
Sterling Capital Stratton Real Estate Fund (the “Fund”) is managed by Andrew T. DiZio, CFA, Executive Director and portfolio manager for Sterling Capital Management LLC (“Sterling Capital”), advisor to the Fund.
Andrew T. DiZio, CFA
Andrew T. DiZio, CFA, Executive Director, joined the Stratton Funds team of Stratton Management Company in 2012 and Sterling Capital Management as part of a business acquisition in August 2015. He has investment experience since 2003. He has managed the Fund since 2015 and the predecessor fund since 2012. Andy received his BS in Finance with a minor in Economics from Pennsylvania State University. He holds the Chartered Financial Analyst designation.
Investment Considerations
Real Estate Funds may be subject to a higher degree of market risk because of concentration in a specific industry or geographic sector. Risks include declines in value of real estate, general and economic conditions, changes in the value of the underlying property and defaults by borrowers.
Q. How did the Fund perform during the 12-month period between October 1, 2019 and September 30, 2020?
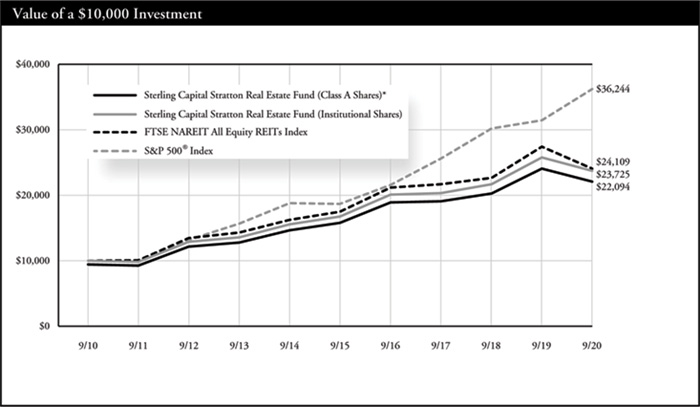
A. The Fund’s Institutional Shares outperformed its benchmark, the FTSE NAREIT All Equity REITs Index.
Q. What factors affected the Fund’s performance?
The global pandemic negatively impacted real estate investment trust (REIT) share prices during the 12-month period under review. The broader markets experienced a sharp downturn in late February that extended through the middle of March, driving significant losses across multiple sectors of the economy. Markets rebounded throughout the rest of the period, but not enough to offset the losses during the market freefall. The economic contraction resulting from government-led efforts to limit the spread of COVID-19 did not impact all REIT subsectors equally, however. Data center, infrastructure and industrial REITs outperformed their peers and added the most to the Fund’s absolute returns. The “stay-at-home” environment increased demand for computing power, which boosted data centers, while online shopping drove strong performance among warehouses in the industrial REIT space. Lodging and retail REITs weighed the most on the Fund’s absolute returns due to the negative impacts of social distancing and shutdown orders.
The Fund’s overweight position to data centers added the most to relative results. Stock selection within office and residential REITs also benefited, particularly a REIT that primarily leases lab space which has experienced steady demand amid the pandemic. Among the Fund’s residential REITs, exposure to the southeast U.S. benefited as that region maintained strong demand during the period. The Fund’s general tilt away from exposure to downtown apartments in major coastal cities also added to relative results, as demand in this space dropped meaningfully during the pandemic.
Stock selection in the retail subsector weighed the most on relative performance. The Fund’s investment in a REIT with more exposure to restaurants and fitness tenants than the average of its peers weighed on results given the concern that those businesses would not be able to meet their rent obligations during the shutdown. Stock selection in the diversified REIT subsector also detracted, driven by the Fund’s investment in a Hawaii-focused REIT. That state’s economy struggled as the pandemic triggered significant travel restrictions, and tourism represents a significant portion of its GDP.
Portfolio composition is as of September 30, 2020 and is subject to change and risk.
| * | Reflects 5.75% maximum sales charge. |
| ** | Reflects the applicable maximum CDSC of 1.00% (applicable only to redemptions within one year of purchase, and as such, are not reflected in the Average Annual Total Returns table since the periods reflected are for a year or longer). |
| Average Annual Total Returns | |
| As of September 30, 2020 | Inception Date | 1 Year | 5 Years | 10 Years |
| Class A Shares* | 11/13/15 | -13.60% | 5.67% | 8.25% |
| Class C Shares** | 11/13/15 | -9.02% | 6.16% | 8.50% |
| Institutional Shares | 05/31/80 | -8.09% | 7.19% | 9.02% |
| Class R6 Shares | 01/31/201 | -8.01% | 7.21% | 9.03% |
| FTSE NAREIT All Equity REITs Index | N/A | -12.15% | 6.61% | 9.20% |
| S&P 500® Index | N/A | 15.15% | 14.15% | 13.74% |
Past performance does not guarantee future results. The performance data quoted represents past performance and current returns may be lower or higher. Total return figures include change in share price, reinvestment of dividends and capital gains, and do not reflect taxes that a shareholder would pay on fund distributions or on the redemption of fund shares. The investment return and principal value will fluctuate so that an investor’s shares, when redeemed, may be worth more or less than the original cost. The performance shown here (for periods prior to the date of commencement of operations on November 16, 2015) is that of Stratton Real Estate Fund (the “Predecessor Fund”), whose shares were reorganized into Institutional Shares of the Fund at the close of business on November 13, 2015. Because the Fund had no investment operations prior to the closing of the reorganization, and based on the similarity of the Fund to the Predecessor Fund, the Predecessor Fund is treated as the survivor of the reorganization for accounting and performance reporting purposes. Accordingly, all performance and other information shown for the Fund for periods prior to November 16, 2015 is that of the Predecessor Fund. Performance for Class A Shares and Class C Shares, prior to the date of commencement of operations on November 16, 2015, is based on the performance of the shares of the Predecessor Fund. To obtain performance information current to the most recent month end, please visit www.sterlingcapitalfunds.com. Performance would have been lower without waivers in effect.
The chart above represents a comparison of a hypothetical $10,000 investment in the indicated share class versus a similar investment in the Fund’s benchmarks.
The Fund is measured against the FTSE NAREIT All Equity REIT Index, an unmanaged index, which contains all tax-qualified REITs with more than 50 percent of total assets in qualifying real estate assets other than mortgages secured by real property that also meet minimum size and liquidity criteria. The Fund is also measured against the S&P 500® Index, an unmanaged index, which is generally considered to be representative of the performance of the stock market as a whole. The indices do not reflect the deduction of expenses associated with a mutual fund, such as investment management and fund accounting fees. Investors cannot invest directly in an index, although they can invest in its underlying securities.
| 1 | Class R6 Shares were not in existence prior to 01/31/20. Performance for periods prior to 01/31/20 is based on the performance of Institutional Shares. |
Sterling Capital Stratton Small Cap Value Fund
Portfolio Manager
Sterling Capital Stratton Small Cap Value Fund (the “Fund”) is managed by Gerald M. Van Horn, CFA, Executive Director and portfolio manager for Sterling Capital Management LLC (“Sterling Capital”), advisor to the Fund.
Gerald M. Van Horn, CFA
Gerald M. Van Horn, CFA, Executive Director, joined the Stratton Funds team of Stratton Management Company in 1998 and Sterling Capital Management as part of a business acquisition in August 2015. He has investment experience since 1996. He has managed the Fund since 2015 and the predecessor fund since 2000. Jerry received his BA in Economics from The College of New Jersey. He holds the Chartered Financial Analyst designation.
Investment Considerations
Small cap company stocks are generally riskier than large company stocks due to greater volatility and less liquidity. Value stocks can perform differently than other types of stocks and can continue to be undervalued by the market for long periods of time.
Q. How did the Fund perform during the 12-month period between October 1, 2019 and September 30, 2020?
A. The Fund’s Institutional Shares outperformed its current benchmark, the Russell 2000® Value Index.
Q. What factors affected the Fund’s performance?
Small-cap equities experienced a sharp drawdown from late February to mid-March due to the negative economic impacts of the global pandemic. The economic and social restrictions put in place by various governments seeking to control the spread of COVID-19 severely impacted corporate earnings and equity prices during the period. Economic stimulus efforts and the easing of some restrictions helped stocks rebound from their late-March lows, but not enough to erase the earlier losses. U.S. small cap stocks ended the period with substantial losses. The Fund’s holdings in the energy, utilities and financials sectors weighed the most on absolute returns as these sectors suffered most from the contracting economic environment. The Fund’s health care and communication services sectors contributed the most to absolute returns, as these sectors were better insulated from the negative impacts of the economic and social restrictions.
Stock selection in the health care sector added to the Fund’s relative performance during the period. Investments in a manufacturer of injectable drug delivery systems outperformed amid the broader push for vaccine and therapeutic treatments for COVID-19. An underweight position in the energy sector also added to results on a relative basis, as did stock selection in the information technology sector as two holdings within the semiconductor industry outperformed.
An underweight position to consumer discretionary sector dragged the most on relative results, as those stocks rebounded strongly off the market low in March. Stock selection in the industrials sector also weighed on results, particularly holdings of a manufacturer of engineered industrial products and an infrastructure construction company, which both underperformed their peers for the period. Stock selection in the utilities sector also detracted on a relative basis as an investment in an electric utility company underperformed.
Portfolio composition is as of September 30, 2020 and is subject to change and risk.
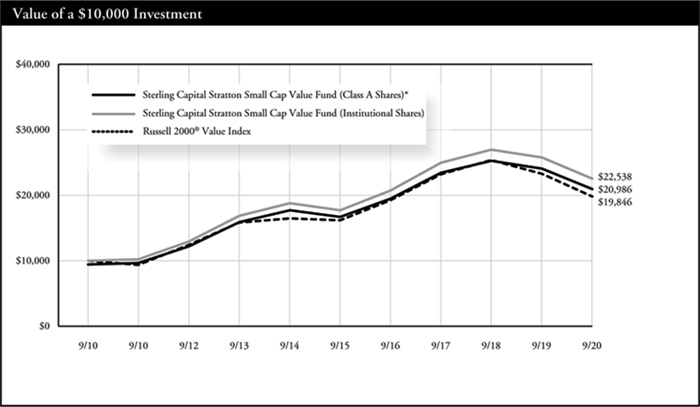
| * | Reflects 5.75% maximum sales charge. |
| ** | Reflects the applicable maximum CDSC of 1.00% (applicable only to redemptions within one year of purchase, and as such, are not reflected in the Average Annual Total Returns table since the periods reflected are for a year or longer). |
| Average Annual Total Returns | |
| As of September 30, 2020 | Inception Date | 1 Year | 5 Years | 10 Years |
| Class A Shares* | 11/13/15 | -17.83% | 3.44% | 7.69% |
| Class C Shares** | 11/13/15 | -13.46% | 3.92% | 7.94% |
| Institutional Shares | 4/12/93 | -12.59% | 4.92% | 8.47% |
| Class R6 Shares | 1/31/201 | -12.54% | 4.93% | 8.47% |
| Russell 2000® Index | N/A | 0.39% | 8.00% | 9.85% |
Past performance does not guarantee future results. The performance data quoted represents past performance and current returns may be lower or higher. Total return figures include change in share price, reinvestment of dividends and capital gains, and do not reflect taxes that a shareholder would pay on fund distributions or on the redemption of fund shares. The investment return and principal value will fluctuate so that an investor’s shares, when redeemed, may be worth more or less than the original cost. The performance shown here (for periods prior to the date of commencement of operations on November 16, 2015) is that of Stratton Small Cap Value Fund (the “Predecessor Fund”), whose shares were reorganized into Institutional Shares of the Fund at the close of business on November 13, 2015. Because the Fund had no investment operations prior to the closing of the reorganization, and based on the similarity of the Fund to the Predecessor Fund, the Predecessor Fund is treated as the survivor of the reorganization for accounting and performance reporting purposes. Accordingly, all performance and other information shown for the Fund for periods prior to November 16, 2015 is that of the Predecessor Fund. Performance for Class A Shares and Class C Shares, prior to the date of commencement of operations on November 16, 2015, is based on the performance of the shares of the Predecessor Fund. To obtain performance information current to the most recent month end, please visit www.sterlingcapitalfunds.com.
The chart above represents a comparison of a hypothetical $10,000 investment in the indicated share class versus a similar investment in the Fund’s benchmark.
The Russell 2000® Value Index is a widely recognized index of common stocks that measures the performance of the small-cap value sector of the U.S. equity market. The index is unmanaged and does not reflect the deduction of expenses associated with a mutual fund, such as investment management and fund accounting fees. Investors cannot invest directly in an index, although they can invest in its underlying securities.
| 1 | Class R6 Shares were not in existence prior to 01/31/20. Performance for periods prior to 01/31/20 is based on the performance of Institutional Shares. |
Sterling Capital Ultra Short Bond Fund
Portfolio Managers
Sterling Capital Ultra Short Bond Fund (the “Fund”) is managed by Portfolio Managers Mark M. Montgomery, CFA, Senior Managing Director, Byron G. Mims, CFA, Executive Director, and Jeffrey D. Ormsby, CFA, Executive Director, for Sterling Capital Management LLC (“Sterling Capital”), advisor to the Fund.
Mark Montgomery, CFA
Mark M. Montgomery, CFA, Senior Managing Director, joined Sterling Capital Management in 1997 and has co-managed the Fund since its inception. He has investment experience since 1990. Mark is a graduate of West Chester University where he received a BS in Marketing and a Minor in Public Administration and a MBA from Drexel University. He holds the Chartered Financial Analyst designation.
Byron G. Mims, CFA
Byron G. Mims, CFA, Executive Director, joined Sterling Capital in 2012 and has been a co-portfolio manager of the Fund since February 2020. He has investment experience since 2006. Byron is a summa cum laude graduate of North Carolina State University where he received his BS in Economics and was recognized as valedictorian. He holds the Chartered Financial Analyst designation.
Jeffrey D. Ormsby, CFA
Jeffrey D. Ormsby, CFA, Executive Director, joined Sterling Capital in 2011 and has been a co-portfolio manager of the Fund since February 2020. He has investment experience since 2006. Jeff is a summa cum laude graduate of North Carolina State University where he received his BS in Economics and was recognized as valedictorian. He received his MBA from UNC’s Kenan-Flagler Business School, where he was the Norman Block Valedictorian Award recipient. He holds the Chartered Financial Analyst designation.
Investment Considerations
The Fund is subject to the same risks as the underlying bonds in the portfolio such as credit, prepayment, call and interest rate risk. As interest rates rise, the value of bond prices will decline and an investor may lose money. The Fund may invest in more aggressive investments, such as foreign securities, which may expose the Fund to currency and exchange rate fluctuations; mortgage-backed securities sensitive to interest rates; and high yield debt (also known as junk bonds), all of which may cause greater volatility and less liquidity.
Q. How did the Fund perform during the 12-month period between October 1, 2019 and September 30, 2020?
A. The Fund’s Institutional Shares outperformed its current benchmark, the FTSE 6 Month Treasury Bill Index.
Q. What factors affected the Fund’s performance?
A. The Federal Reserve slashed interest rates to near zero in March 2020 and enacted emergency asset purchases to help address the economic impact of the COVID-19 pandemic. Lower interest rates and the Fed��s intervention in credit markets helped all major fixed-income sectors post positive absolute returns over the period.
The Fund’s exposure to corporate bonds boosted absolute returns. Strong economic performance in late 2019 and extreme fiscal and monetary stimulus in the second and third quarters of 2020 offset underperformance in the sector immediately surrounding the onset of the COVID-19 pandemic. Exposure to securitized investments also improved absolute returns. Attractive relative value in asset-backed securities (ABS) and commercial mortgage-backed securities (CMBS) encouraged investments in those sectors despite fundamental concerns related to the pandemic.
The portfolio was managed with longer duration than the benchmark throughout the year, and this positioning boosted relative performance when short-term interest rates declined. The Fund’s allocations to corporate bonds, ABS, and CMBS also outperformed the benchmark during the year.
The Fund’s exposure to longer key rates, which underperformed shorter key rates during the rate rally, detracted from relative performance. The portfolio’s exposure to local Municipal Bonds and Treasuries also hurt relative performance, as our holdings in these sectors underperformed the benchmark over the year on average. Local Municipal Bonds underperformed due to the ongoing COVID-19 pandemic, which continues to weigh on the sector’s underlying credit performance. Treasuries provided the lowest absolute returns among the major credit sectors during the year.
Portfolio composition is as of September 30, 2020 and is subject to change and risk.
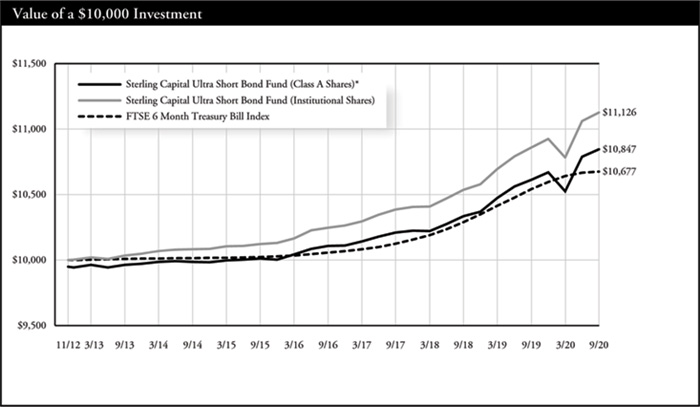
| * | Reflects 0.50% maximum sales charge. |
| Average Annual Total Returns | |
| As of September 30, 2020 | Inception
Date | 1 Year | 5 Year | Since
Inception |
| Class A Shares* | 11/30/12 | 1.68% | 1.51% | 1.04% |
| Institutional Shares | 11/30/12 | 2.44% | 1.91% | 1.37% |
| FTSE 6 Month Treasury Bill Index | 11/30/12 | 1.28% | 1.27% | 0.84% |
Past performance does not guarantee future results. The performance data quoted represents past performance and current returns may be lower or higher. Total return figures include change in share price, reinvestment of dividends and capital gains, and do not reflect taxes that a shareholder would pay on fund distributions or on the redemption of fund shares. The investment return and principal value will fluctuate so that an investor’s shares, when redeemed, may be worth more or less than the original cost. To obtain performance information current to the most recent month end, please visit www.sterlingcapitalfunds.com. Performance would have been lower without limitations and/or waivers in effect.
The chart above represents a comparison of a hypothetical $10,000 investment in the indicated share class versus a similar investment in the Fund’s benchmark.
The Fund is measured against the FTSE 6 Month Treasury Bill Index, which measures the performance of Treasury bills with a maturity of six months or less. The index does not reflect the deduction of expenses associated with a mutual fund, such as investment management and fund accounting fees. Investors cannot invest directly in an index, although they can invest in its underlying securities.
Sterling Capital Short Duration Bond Fund
Portfolio Managers
Sterling Capital Short Duration Bond Fund (the “Fund”) is managed by Portfolio Managers Mark M. Montgomery, CFA, Senior Managing Director, and Peter L. Brown, CFA, Executive Director, for Sterling Capital Management LLC (“Sterling Capital”), advisor to the Fund.
Mark Montgomery, CFA
Mark M. Montgomery, CFA, Senior Managing Director, joined Sterling Capital Management in 1997 and has co-managed the Fund since 2011. He has investment experience since 1990. Mark is a graduate of West Chester University where he received a BS in Marketing and a Minor in Public Administration and a MBA from Drexel University. He holds the Chartered Financial Analyst designation.
Peter L. Brown, CFA
Peter L. Brown, CFA, Executive Director, joined Sterling Capital Management in 2004 and has co-managed the Fund since February 2020. He has investment experience since 2000. Pete received a BS in Statistics with minors in Business Management, Marketing and Communications from Cornell University and a MBA from Wake Forest University. He holds the Chartered Financial Analyst designation.
Investment Considerations
The Fund is subject to the same risks as the underlying bonds in the portfolio such as credit, prepayment, call and interest rate risk. As interest rates rise, the value of bond prices will decline and an investor may lose money. The Fund may invest in more aggressive investments, such as foreign securities, which may expose the Fund to currency and exchange rate fluctuations; mortgage-backed securities sensitive to interest rates; and high yield debt (also known as junk bonds), all of which may cause greater volatility and less liquidity.
Q. How did the Fund perform during the 12-month period between October 1, 2019 and September 30, 2020?
A. The Fund’s Institutional Shares outperformed its current benchmark, the ICE BofA Merrill Lynch 1-3 Year U.S. Corporate Government Index.
Q. What factors affected the Fund’s performance?
A. The Federal Reserve (Fed) cut the federal funds rate to near zero in March 2020 in anticipation of severe economic disruption due to the COVID-19 outbreak. Lower interest rates boosted prices on fixed-income assets and helped the Fund post strong absolute returns. Additionally, the Federal Reserve announced other emergency measures to restore market function and liquidity, including a new round of asset purchases encompassing Treasuries, mortgage-backed securities, and, for the first time, corporate bonds with maturities less than five years. The Fed’s unprecedented intervention in credit markets sparked a significant rally in many of the asset classes held in the Fund, including corporate bonds, securitized assets and municipals.
The Fund’s overweight allocation to corporate bonds over the past year boosted relative returns.
Although corporate bonds suffered in early 2020 due to the COVID-19 crisis, the sector performed historically well over the remainder of the period as the Federal Reserve’s corporate bond purchase program drove credit spreads on bonds nearly back to their pre-COVID levels.
The Fund’s overweight allocation to other non-government asset classes, including securitized assets and taxable municipal bonds, also had a positive effect on relative performance.
Finally, by holding higher yielding assets like corporate bonds, securitized assets and municipals versus Treasuries, the Fund held a significant income advantage over the benchmark, which contributed positively to relative returns.
The Fund’s barbelled yield curve positioning — which included overweight allocations to bonds maturing in less than one year and those maturing longer than three years — hurt relative returns as the yield curve steepened in response to the Federal Reserve’s emergency rate cuts.
Portfolio composition is as of September 30, 2020 and is subject to change and risk.
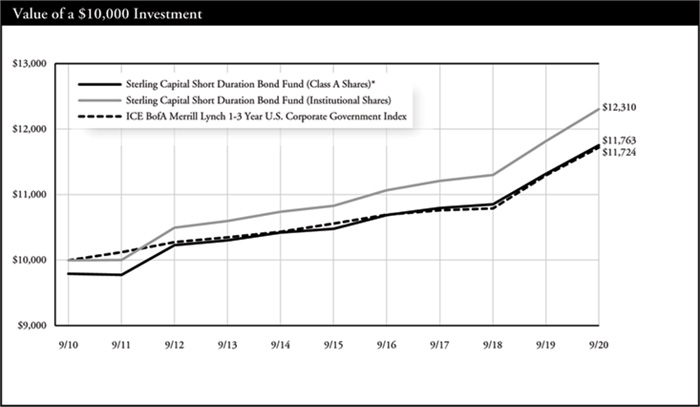
| * | Reflects 2.00% maximum sales charge. |
| ** | Reflects the applicable maximum CDSC of 1.00% (applicable only to redemptions within one year of purchase, and as such, are not reflected in the Average Annual Total Returns table since the periods reflected are for a year or longer). |
| Average Annual Total Returns | |
| As of September 30, 2020 | Inception Date | 1 Year | 5 Years | 10 Years |
| Class A Shares* | 11/30/92 | 1.74% | 1.92% | 1.64% |
| Class C Shares** | 1/31/121 | 3.09% | 1.57% | 1.18% |
| Institutional Shares | 11/30/92 | 4.12% | 2.59% | 2.10% |
| ICE BofA Merrill Lynch 1-3 Year U.S. Corporate Government Index | N/A | 3.74% | 2.11% | 1.60% |
Past performance does not guarantee future results. The performance data quoted represents past performance and current returns may be lower or higher. Total return figures include change in share price, reinvestment of dividends and capital gains, and do not reflect taxes that a shareholder would pay on fund distributions or on the redemption of fund shares. The investment return and principal value will fluctuate so that an investor’s shares, when redeemed, may be worth more or less than the original cost. To obtain performance information current to the most recent month end, please visit www.sterlingcapitalfunds.com. Performance would have been lower without limitations and/or waivers in effect.
The chart above represents a comparison of a hypothetical $10,000 investment in the indicated share class versus a similar investment in the Fund’s benchmark.
| 1 | Class C Shares were not in existence prior to 2/1/12. Performance for periods prior to 2/1/12 is based on the performance of Class A Shares. Such performance could differ only to the extent that the Classes have different expenses. |
The Fund is measured against the ICE BofA Merrill Lynch 1-3 Year U.S. Corporate Government Index, which consists of securities with a maturity from one to three years. The index does not reflect the deduction of expenses associated with a mutual fund, such as investment management and fund accounting fees. Investors cannot invest directly in an index, although they can invest in its underlying securities.
Sterling Capital Intermediate U.S. Government Fund
Portfolio Managers
Sterling Capital Intermediate U.S. Government Fund (the “Fund”) is managed by Managing Director and portfolio manager Neil Grant and Executive Director and portfolio manager Michael Sun, CFA for Sterling Capital Management LLC (“Sterling Capital”), advisor to the Fund.
Neil T. Grant, CFA
Neil T. Grant, CFA, Managing Director, joined Sterling Capital in 2004 and has been a co-portfolio manager of the Fund since 2019. He has investment experience since 1991. Neil received his BS in Finance from Syracuse University and his MBA from Emory University. He holds the Chartered Financial Analyst designation.
Michael Z. Sun, CFA
Michael Z. Sun, CFA, Executive Director, joined Sterling Capital in 2009 and has been a co-portfolio manager of the Fund since 2019. He has investment experience since 1998. Michael received his MA in Economics from Bowling Green State University, his MS in Urban & Regional Study from Beijing University and his BS in Geography from Nanjing University. He holds the Chartered Financial Analyst designation.
Investment Considerations
The Fund is subject to the same risks as the underlying bonds in the portfolio such as credit, prepayment, call and interest rate risk. As interest rates rise, the value of bond prices will decline and an investor may lose money. The Fund may invest in mortgage-backed securities, which tend to be more sensitive to changes in interest rates. The Fund invests in securities issued or guaranteed by the U.S. government or its agencies (such as Fannie Mae or Freddie Mac). Although U.S. government securities issued directly by the U.S. government are guaranteed by the U.S. Treasury, other U.S. government securities issued by an agency or instrumentality of the U.S. government may not be. No assurance can be given that the U.S. government would provide financial support to its agencies and instrumentalities if not required to do so by law.
Q. How did the Fund perform during the 12-month period between October 1, 2019 and September 30, 2020?
A. The Fund’s Institutional Shares underperformed its benchmark, the Bloomberg Barclays U.S. Government Intermediate Index.
Q. What factors affected the Fund’s performance?
In early 2020, the COVID-19 pandemic plunged the economy into recession and generated very high volatility in the broader financial markets. The Federal Reserve (Fed) and federal government took emergency measures to combat the crisis through a combination through fiscal stimulus and highly accommodative monetary policy. While these actions stabilized the financial markets and helped drive economic recovery, Treasury yields remained close to record lows. The Fed indicated its intention to hold short-term interest rates near zero until at least 2023. The Fed also resumed its policy of purchasing securities from the open market without limit, further depressing Treasury yields.
In absolute terms, the Fund benefited greatly from lower interest rates, which move in opposition to bond prices.
Yields on 2-year Treasuries fell 150 basis points, while 10-year Treasury yields fell 98 basis points during the period.
The Fund began the period with longer duration positioning compared to its benchmark. As yields fell, the Fund repositioned to shorter duration. However, Treasury yields continued to decline and the new positioning of shorter duration detracted from relative performance. The sharp drop in Treasury yields also encouraged borrowers to refinance mortgages and other large debts. This trend hurt the performance of the Fund’s bond holdings with prepayment features, mainly mortgage-backed securities and collateralized mortgage obligations. The low Treasury yields also hurt the performance of the Fund’s agency debentures.
The Fund’s modest exposure to taxable municipal bonds, commercial mortgage-backed securities and asset-backed securities helped the Fund’s relative returns. These holdings modestly outperformed Treasuries of similar duration.
Portfolio composition is as of September 30, 2020 and is subject to change and risk.
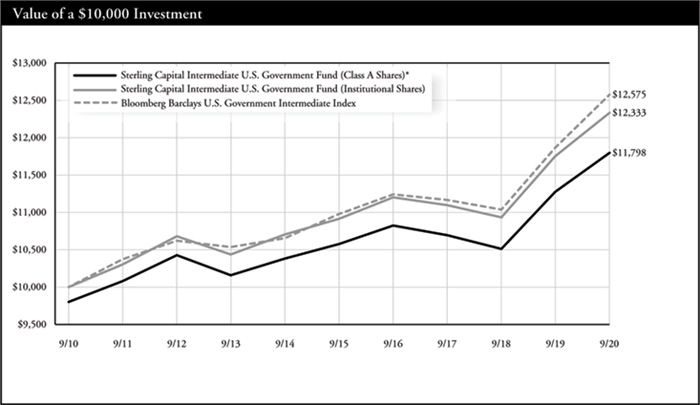
| * | Reflects 2.00% maximum sales charge. |
| ** | Reflects the applicable maximum CDSC of 1.00% (applicable only to redemptions within one year of purchase, and as such, are not reflected in the Average Annual Total Returns table since the periods reflected are for a year or longer). |
| Average Annual Total Returns | |
| As of September 30, 2020 | Inception
Date | 1 Year | 5 Years | 10 Years |
| Class A Shares* | 10/9/92 | 2.59% | 1.80% | 1.67% |
| Class C Shares** | 2/1/01 | 3.78% | 1.44% | 1.10% |
| Institutional Shares | 10/9/92 | 4.92% | 2.47% | 2.12% |
| Bloomberg Barclays U.S. Government Intermediate Index | N/A | 5.98% | 2.76% | 2.32% |
Past performance does not guarantee future results. The performance data quoted represents past performance and current returns may be lower or higher. Total return figures include change in share price, reinvestment of dividends and capital gains, and do not reflect taxes that a shareholder would pay on fund distributions or on the redemption of fund shares. The investment return and principal value will fluctuate so that an investor’s shares, when redeemed, may be worth more or less than the original cost. To obtain performance information current to the most recent month end, please visit www.sterlingcapitalfunds.com. Performance would have been lower without waivers in effect.
The chart above represents a comparison of a hypothetical $10,000 investment in the indicated share class versus a similar investment in the Fund’s benchmark.
The Fund is measured against the Bloomberg Barclays U.S. Government Intermediate Index, an unmanaged index comprised of all publicly issued non-convertible domestic debt of the U.S. government or any agency there of, or corporate debt guaranteed by the U.S. government all with outstanding principal of $1 million and maturity between one and ten years. The index does not reflect the deduction of expenses associated with a mutual fund, such as investment management and fund accounting fees. Investors cannot invest directly in an index, although they can invest in its underlying securities.
Sterling Capital Total Return Bond Fund
Portfolio Managers
Sterling Capital Total Return Bond Fund (the “Fund”) is managed by Portfolio Managers Mark M. Montgomery, CFA, Senior Managing Director, and Peter L. Brown, CFA, Executive Director, for Sterling Capital Management LLC (“Sterling Capital”), advisor to the Fund.
Mark Montgomery, CFA
Mark M. Montgomery, CFA, Senior Managing Director, joined Sterling Capital Management in 1997 and has co-managed the Fund since 2008. He has investment experience since 1990. Mark is a graduate of West Chester University where he received a BS in Marketing and a Minor in Public Administration and a MBA from Drexel University. He holds the Chartered Financial Analyst designation.
Peter L. Brown, CFA
Peter L. Brown, CFA, Executive Director, joined Sterling Capital Management in 2004 and has co-managed the Fund since February 2020. He has investment experience since 2000. Pete received a BS in Statistics with minors in Business Management, Marketing and Communications from Cornell University and a MBA from Wake Forest University. He holds the Chartered Financial Analyst designation.
Investment Considerations
The Fund is subject to the same risks as the underlying bonds in the portfolio such as credit, prepayment, call and interest rate risk. As interest rates rise, the value of bond prices will decline and an investor may lose money. The Fund may invest in foreign securities, which may expose the fund to currency and exchange rate fluctuations; and mortgage-backed securities sensitive to interest rates; and high yield debt (also known as junk bonds), all of which may cause greater volatility and less liquidity. Derivatives may be more sensitive to changes in market conditions and may amplify risks.
Q. How did the Fund perform during the 12-month period between October 1, 2019 and September 30, 2020?
A. The Fund’s Institutional Shares outperformed its current benchmark, the Bloomberg Barclays U.S. Aggregate Bond Index.
Q. What factors affected the Fund’s performance?
A. The Federal Reserve cut the federal funds rate to near zero in March 2020 in anticipation of severe economic disruption due to the COVID-19 outbreak. Lower interest rates boosted prices on fixed-income assets and helped the Fund post strong absolute returns. Additionally, the Federal Reserve announced other emergency measures to restore market function and liquidity, including a new round of asset purchases encompassing Treasuries, mortgage-backed securities, and, for the first time, corporate bonds with maturities less than five years. The Fed’s unprecedented intervention in credit markets sparked a significant rally in many of the asset classes held in the Fund, including corporate bonds, securitized assets and municipals.
The Fund increased its allocation to corporate bonds starting in late March through May, and this positioning boosted relative returns. After poor performance in the first quarter of 2020 due to the COVID-19 crisis, corporate bonds performed historically well over the following six months, as the Federal Reserve’s corporate bond purchase program drove credit spreads on certain bonds nearly back to their pre-COVID levels.
Overall, corporate bonds underperformed duration-matched Treasuries by 1.31 percent over the period. However, by increasing the Fund’s allocation to corporate bonds after their Q1 selloff, the Fund benefited from their subsequent rally. These gains more than offset the poor performance from earlier in the year and helped the Fund outperform the benchmark.
The Fund’s overweight allocation to other non-government asset classes — including securitized assets and taxable municipal bonds —also had a positive effect on relative performance. Likewise, strong security selection in energy companies and commercial mortgage-backed securities helped the Fund’s relative returns.
The Fund’s bulleted yield curve positioning, which included an overweight allocation to bonds maturing in seven to ten years, boosted relative returns as the yield curve steepened in response to the Fed’s emergency rate cuts.
However, the Fund’s slightly short duration positioning during the volatile first quarter of 2020 hurt relative returns as the Federal Reserve cut interest rates.
Portfolio composition is as of September 30, 2020 and is subject to change and risk.
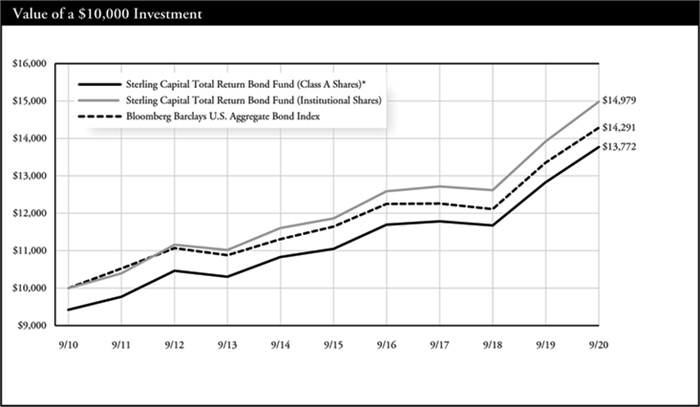
| * | Reflects 5.75% maximum sales charge. |
| ** | Reflects the applicable maximum CDSC of 1.00% (applicable only to redemptions within one year of purchase, and as such, are not reflected in the Average Annual Total Returns table since the periods reflected are for a year or longer). |
| Average Annual Total Returns | |
| As of September 30, 2020 | Inception Date | 1 Year | 5 Years | 10 Years |
| Class A Shares* | 11/30/99 | 1.19% | 3.28% | 3.25% |
| Class C Shares** | 2/01/01 | 6.53% | 3.72% | 3.09% |
| Institutional Shares | 11/30/99 | 7.59% | 4.76% | 4.12% |
| Class R Shares | 01/29/10 | 7.08% | 4.26% | 3.58% |
| Class R6 Shares | 01/31/181 | 7.70% | 4.82% | 4.15% |
| Bloomberg Barclays U.S. Aggregate Bond Index | N/A | 6.98% | 4.18% | 3.64% |
Past performance does not guarantee future results. The performance data quoted represents past performance and current returns may be lower or higher. Total return figures include change in share price, reinvestment of dividends and capital gains, and do not reflect taxes that a shareholder would pay on fund distributions or on the redemption of fund shares. The investment return and principal value will fluctuate so that an investor’s shares, when redeemed, may be worth more or less than the original cost. To obtain performance information current to the most recent month end, please visit www.sterlingcapitalfunds.com. Performance would have been lower without limitations and/or waivers in effect.
The chart above represents a comparison of a hypothetical $10,000 investment in the indicated share class versus a similar investment in the Fund’s benchmark.
| 1 | Class R6 Shares were not in existence prior to 2/1/18. Performance for periods prior to 2/1/18 is based on the performance of Institutional Shares. |
The Fund is measured against the Bloomberg Barclays U.S. Aggregate Bond Index, an unmanaged index, which is a market value-weighted performance benchmark for investment-grade fixed-rate debt issues, including government, corporate, asset-backed, and mortgage-backed securities, with maturities of at least one year. The index is unmanaged and does not reflect the deduction of expenses associated with a mutual fund, such as investment management and fund accounting fees. Investors cannot invest directly in an index, although they can invest in its underlying securities.
Sterling Capital Corporate Fund
Portfolio Managers
Sterling Capital Corporate Fund (the “Fund”) is managed by Portfolio Managers Mark M. Montgomery, CFA, Senior Managing Director, and Peter L. Brown, CFA, Executive Director, for Sterling Capital Management LLC (“Sterling Capital”), advisor to the Fund.
Mark Montgomery, CFA
Mark M. Montgomery, CFA, Senior Managing Director, joined Sterling Capital Management in 1997 and has co-managed the fund since inception. He has investment experience since 1990. Mark is a graduate of West Chester University where he received a BS in Marketing and a Minor in Public Administration and a MBA from Drexel University. He holds the Chartered Financial Analyst designation.
Peter L. Brown, CFA
Peter L. Brown, CFA, Executive Director, joined Sterling Capital Management in 2004 and has co-managed the fund since February 2020. He has investment experience since 2000. Pete received a BS in Statistics with minors in Business Management, Marketing and Communications from Cornell University and a MBA from Wake Forest University. He holds the Chartered Financial Analyst designation.
Investment Considerations
The Fund is subject to the same risks as the underlying bonds in the portfolio such as credit, prepayment, call and interest rate risk. As interest rates rise, the value of bond prices will decline and an investor may lose money. The Fund may invest in more aggressive investments, such as foreign securities, which may expose the fund to currency and exchange rate fluctuations; mortgage-backed securities sensitive to interest rates; and high yield debt (also known as junk bonds), all of which may cause greater volatility and less liquidity. Derivatives may be more sensitive to changes in market conditions and may amplify risks.
Q. How did the Fund perform during the 12-month period between October 1, 2019 and September 30, 2020?
A. The Fund’s Institutional Shares underperformed its current benchmark, the Bloomberg Barclays Corporate Intermediate Bond Index.
Q. What factors affected the Fund’s performance?
A. The Federal Reserve cut the federal funds rate to near zero in March 2020 in anticipation of severe economic disruption due to the COVID-19 outbreak. Lower interest rates boosted prices on fixed-income assets and helped the Fund post strong total returns. Additionally, the Fed announced other emergency measures aimed to restore market function and liquidity, including a new round of asset purchases encompassing Treasuries, mortgage-backed securities, and, for the first time, corporate bonds with maturities less than five years. The Fed’s unprecedented intervention in credit markets sparked a significant rally in corporate bonds and helped total returns rebound strongly following the first quarter of 2020.
The Fund’s exposure to companies hardest hit by the global pandemic — including certain subsectors of the real estate industry as well as aircraft leasing companies — hurt relative returns. Our overweight allocation to the independent energy sector also detracted as oil prices plunged in the first quarter of 2020, as did an underweight allocation to technology.
The Fund’s exposure to below-investment grade securities detracted from relative returns as high-yield bonds underperformed for the period.
The Fund held an overweight allocation to financials and an underweight allocation to industrials for much of the past year, which boosted relative returns. Strong security selection in the financials, industrials, technology and energy sectors also contributed positively. In particular, by avoiding most of the energy companies that saw their bonds downgraded to junk status and adding others that maintained their investment grade ratings, the Fund’s energy holdings significantly outperformed the benchmark’s energy holdings.
Portfolio composition is as of September 30, 2020 and is subject to change and risk.
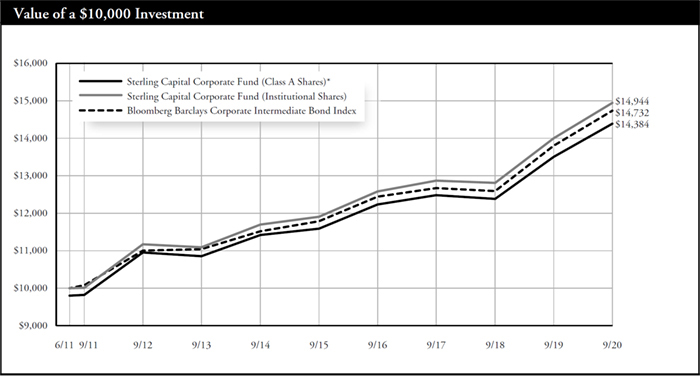
| * | Reflects 2.00% maximum sales charge. |
| ** | Reflects the applicable maximum contingent deferred sales charge (CDSC) of 1.00% (applicable only to redemptions within one year of purchase, and as such, are not reflected in the Annual Total Returns table since the periods reflected are for a year or longer). |
| Average Annual Total Returns | |
| As of September 30, 2020 | Inception
Date | 1 Year | 5 Year | Since
Inception |
| Class A Shares* | 1/31/131 | 4.44% | 3.99% | 4.01% |
| Class C Shares** | 1/31/131 | 5.80% | 3.65% | 3.58% |
| Institutional Shares | 6/30/112 | 6.72% | 4.66% | 4.44% |
| Bloomberg Barclays Corporate Intermediate Bond Index | 6/30/11 | 6.78% | 4.56% | 4.28% |
Past performance does not guarantee future results. The performance data quoted represents past performance and current returns may be lower or higher. Total return figures include change in share price, reinvestment of dividends and capital gains, and do not reflect taxes that a shareholder would pay on fund distributions or on the redemption of fund shares. The investment return and principal value will fluctuate so that an investor’s shares, when redeemed, may be worth more or less than the original cost. To obtain performance information current to the most recent month end, please call 1-888-228-1872.
The chart above represents a comparison of a hypothetical $10,000 investment in the indicated share class versus a similar investment in the Fund’s benchmark.
| 1 | Class A and C Shares were not in existence prior to 2/1/13. Performance for periods prior to 2/1/13 is based on the performance of Institutional Shares and has been adjusted for maximum CDSC to the class applicable but does not include 12b-1 fees, which if reflected, would have caused performance of Class A and C Shares to be lower. |
| 2 | The Fund converted Class S Shares into Institutional Shares effective 2/1/13. |
The Fund is measured against the Bloomberg Barclays Corporate Intermediate Bond Index, an unmanaged index consisting of dollar-denominated debt from U.S. industrial, utility and financial institutions issuers with a duration of 1 to 10 years. The index does not reflect the deduction of expenses associated with a mutual fund, such as investment management and fund accounting fees. Investors cannot invest directly in an index, although they can invest in its underlying securities.
Sterling Capital Quality Income Fund
Portfolio Managers
Sterling Capital Quality Income Fund (the “Fund”) is managed by Executive Directors and portfolio managers Michael Z. Sun, CFA, Jeffrey D. Ormsby, CFA and Byron G. Mims, CFA, for Sterling Capital Management LLC (“Sterling Capital”), advisor to the Fund.
Michael Z. Sun, CFA
Michael Z. Sun, CFA, Executive Director, joined Sterling Capital in 2009 and has been a co-portfolio manager of the Fund since 2014. He has investment experience since 1998. Michael received his MA in Economics from Bowling Green State University, his MS in Urban & Regional Study from Beijing University and his BS in Geography from Nanjing University. He holds the Chartered Financial Analyst designation.
Byron G. Mims, CFA
Byron G. Mims, CFA, Executive Director, joined Sterling Capital in 2012 and has been a co-portfolio manager of the Fund since 2016. He has investment experience since 2006. Byron is a summa cum laude graduate of North Carolina State University where he received his BS in Economics and was recognized as valedictorian. He holds the Chartered Financial Analyst designation.
Jeffrey D. Ormsby, CFA
Jeffrey D. Ormsby, CFA, Executive Director, joined Sterling Capital in 2011 and has been a co-portfolio manager of the Fund since 2016. He has investment experience since 2006. Jeff is a summa cum laude graduate of North Carolina State University where he received his BS in Economics and was recognized as valedictorian. He received his MBA from UNC’s Kenan-Flagler Business School, where he was the Norman Block Valedictorian Award recipient. He holds the Chartered Financial Analyst designation.
Investment Considerations
The Fund is subject to the same risks as the underlying bonds in the portfolio such as credit, prepayment, call and interest rate risk. As interest rates rise, the value of bond prices will decline and an investor may lose money. The Fund may invest in more aggressive investments, such as foreign securities, which may expose the Fund to currency and exchange rate fluctuations; mortgage-backed securities sensitive to interest rates; and high yield debt (also known as junk bonds), all of which may cause greater volatility and less liquidity.
Q. How did the Fund perform during the 12-month period between October 1, 2019 and September 30, 2020?
A. The Fund’s Institutional Shares outperformed its current benchmark, the Bloomberg Barclays U.S. Mortgage Backed Securities Index, gross of fees and expenses. Net of fees and expenses, however, the Fund’s Institutional Shares underperformed the benchmark.
Q. What factors affected the Fund’s performance?
A. Market performance during the period was affected across the board by the COVID-19 pandemic, which generated an economic recession and high volatility between February and April. The Federal Reserve (Fed) took aggressive steps to stabilize the economy by reducing short-term interest rates to the effective lower bound and reinstituting significant open-market purchases of securities. The Fed signaled that it intends to keep interest rates very low for a number of years, even as broader markets staged a steady recovery through the end of the period.
All the major sub-sectors represented in the Fund’s holdings contributed to positive absolute returns during the period. Falling interest rates contributed to positive fixed income returns, as bond prices tend to move in the opposite direction of interest rates. Residential mortgage-backed securities, commercial mortgage-backed securities and consumer asset-backed securities underperformed in the initial volatile period following the onset of the COVID-19 pandemic.
However, the aggressive fiscal and monetary stimulus efforts undertaken in the second and third quarters of 2020 supported a broad recovery in these sectors, leading to strong absolute returns for the 12-month period.
The Fund’s specific pass-through holdings significantly outperformed similar holdings in the benchmark, contributing to relative performance. The Fund maintained a longer duration than the benchmark throughout the period, which benefited relative performance as interest rates fell substantially.
The Fund’s overweight position in longer-term securities compared to the benchmark detracted from relative results as the yield curve steepened, with yields for short-term securities falling more than yields for long-term securities. The Fund’s holdings also include some legacy residential mortgage-backed securities which detracted from relative performance. The short average duration of these holdings meant they did not benefit as much from rising prices caused by falling interest rates in the period.
Portfolio composition is as of September 30, 2020 and is subject to change and risk.
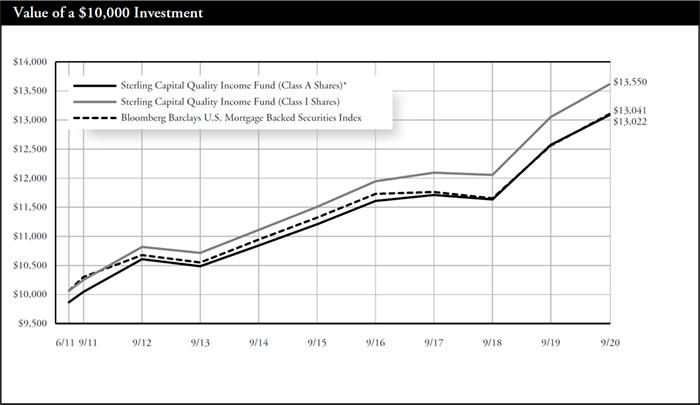
| * | Reflects 2.00% maximum sales charge. |
| ** | Reflects the applicable maximum contingent deferred sales charge (CDSC) of 1.00% (applicable only to redemptions within one year of purchase, and as such, are not reflected in the Annual Total Returns table since the periods reflected are for a year or longer). |
| Average Annual Total Returns | |
| As of September 30, 2020 | Inception
Date | 1 Year | 5 Year | Since
Inception |
| Class A Shares* | 1/31/131 | 1.95% | 2.76% | 2.90% |
| Class C Shares** | 1/31/131 | 3.34% | 2.41% | 2.50% |
| Institutional Shares | 6/30/112 | 4.33% | 3.44% | 3.34% |
| Bloomberg Barclays U.S. Mortgage Backed Securities Index | N/A | 4.36% | 2.98% | 2.91% |
Past performance does not guarantee future results. The performance data quoted represents past performance and current returns may be lower or higher. Total return figures include change in share price, reinvestment of dividends and capital gains, and do not reflect taxes that a shareholder would pay on fund distributions or on the redemption of fund shares. The investment return and principal value will fluctuate so that an investor’s shares, when redeemed, may be worth more or less than the original cost. To obtain performance information current to the most recent month end, please call 1-888-228-1872. Performance would have been lower without limitations and/or waivers in effect.
The chart above represents a comparison of a hypothetical $10,000 investment in the indicated share class versus a similar investment in the Fund’s benchmark.
| 1 | Class A and C Shares were not in existence prior to 2/1/13. Performance for periods prior to 2/1/13 is based on the performance of Institutional Shares and has been adjusted for maximum CDSC to the class applicable but does not include 12b-1 fees, which if reflected, would have caused performance of Class A and C Shares to be lower. |
| 2 | The Fund converted Class S Shares into Institutional Shares effective 2/1/13. |
The Fund is measured against the Bloomberg Barclays U.S. Mortgage Backed Securities Index. The index measures the performance of investment grade fixed-rate mortgage-backed pass-through securities of Ginnie Mae, Fannie Mae, and Freddie Mac. The index is unmanaged and does not reflect the deduction of expenses associated with a mutual fund, such as investment management and fund accounting fees. Investors cannot invest directly in an index, although they can invest in its underlying securities.
Sterling Capital Kentucky Intermediate Tax-Free Fund
Portfolio Manager
Sterling Capital Kentucky Intermediate Tax-Free Fund (the “Fund”) is managed by Robert F. Millikan, CFA, Executive Director and portfolio manager for Sterling Capital Management LLC (“Sterling Capital”), advisor to the Fund.
Robert F. Millikan, CFA
Robert F. Millikan, CFA, Executive Director, joined BB&T Asset Management in 2000 and Sterling Capital Management through merger in October 2010. He has managed the state-specific municipal bond portfolios, including the Fund, since 2000 and has investment experience since 1990. He is a graduate of Wake Forest University where he received a BA in Economics. He holds the Chartered Financial Analyst designation.
Investment Considerations
The Fund is subject to the same risks as the underlying bonds in the portfolios such as credit, prepayment and interest rate risk. As interest rates rise, the value of bond prices will decline and an investor may lose money. The Fund is non-diversified and may invest a greater percentage of its assets in a single issuer than funds that are more diversified. Furthermore, the Fund invests primarily in municipal obligations issued by Kentucky and its political subdivisions and therefore will be affected by economic, political or other events affecting Kentucky.
Q. How did the Fund perform during the 12-month period between October 1, 2019 and September 30, 2020?
A. The Fund’s Institutional Shares outperformed its current benchmark, the ICE BofA Merrill Lynch 2-17 Year Municipal Bond Index, gross of fees and expenses. Net of fees and expenses, however, the Fund’s Institutional Shares matched the performance of the benchmark.
Q. What factors affected the Fund’s performance?
The period’s results were strongly affected by the economic impact of the COVID-19 pandemic in the second quarter of 2020. As economic growth wavered in March, municipal bond markets faced high selling pressure, low levels of liquidity, a spike in yields and wider spreads between higher- and lower-quality bonds. In response to the crisis, the Federal Reserve cut short-term interest rates to near zero and expanded its open-market bond purchases, stabilizing markets and supporting a broad-based economic recovery through the remainder of the period. In this environment, investor demand quickly outpaced the supply of new municipal bond issues. In addition, among the new municipal bonds issued at the time, between 30% and 40% were taxable rather than tax-exempt.
The Fund maintained a longer duration than its benchmark throughout the year. This positioning boosted the Fund’s absolute returns, as rates fell more significantly in shorter-duration issues than longer-duration issues.
The Fund’s relative performance benefitted from its exposure to high-quality municipal bonds. The Fund avoided exposure to municipal bonds issued by lower-rated states such as New Jersey and Illinois. This positioning helped as investors shifted toward higher-quality issues during the pandemic.
The Fund’s relative performance was hurt because its state-specific holdings were generally lower quality than Kentucky bond holdings in the benchmark. In particular, the Fund held an overweight position in A-rated bonds and revenue bonds compared to the benchmark, as well as an underweight position in AAA-rated bonds.
Portfolio composition is as of September 30, 2020 and is subject to change and risk.
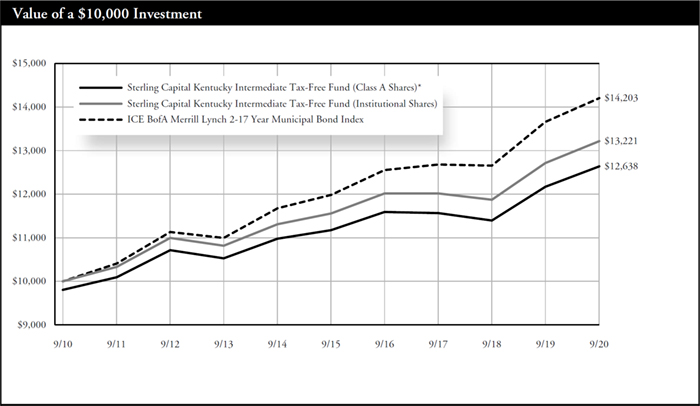
| * | Reflects 2.00% maximum sales charge. |
| ** | Reflects the applicable maximum contingent deferred sales charge of 1.00% (applicable only to redemptions within one year of purchase, and as such, are not reflected in the Average Annual Total Returns table since the periods reflected are for a year or longer). |
| Average Annual Total Returns | |
| As of September 30, 2020 | Inception
Date | 1 Year | 5 Years | 10 Years |
| Class A Shares* | 2/24/03 | 1.74% | 2.07% | 2.37% |
| Class C Shares** | 1/31/121 | 3.22% | 1.91% | 2.02% |
| Institutional Shares | 2/24/03 | 3.97% | 2.73% | 2.83% |
| ICE BofA Merrill Lynch 2-17 Year Municipal Bond Index | N/A | 3.97% | 3.46% | 3.57% |
Past performance does not guarantee future results. The performance data quoted represents past performance and current returns may be lower or higher. Total return figures include change in share price, reinvestment of dividends and capital gains, and do not reflect taxes that a shareholder would pay on fund distributions or on the redemption of fund shares. The investment return and principal value will fluctuate so that an investor’s shares, when redeemed, may be worth more or less than the original cost. To obtain performance information current to the most recent month end, please visit www.sterlingcapitalfunds.com. Performance would have been lower without waivers in effect.
The chart above represents a comparison of a hypothetical $10,000 investment in the indicated share class versus a similar investment in the Fund’s benchmark.
| 1 | Class C Shares were not in existence prior to 2/1/12. Performance for periods prior to 2/1/12 is based on the performance of Class A Shares. Such performance would differ only to the extent that the Classes have different expenses. |
The Fund is measured against the ICE BofA Merrill Lynch 2-17 Year Municipal Bond Index, an unmanaged index that is representative of municipal bonds. The index does not reflect the deduction of expenses associated with a mutual fund, such as investment management and fund accounting fees. Investors cannot invest directly in an index, although they can invest in its underlying securities.
Sterling Capital Maryland Intermediate Tax-Free Fund
Portfolio Manager
Sterling Capital Maryland Intermediate Tax-Free Fund (the “Fund”) is managed by Robert F. Millikan, CFA, Executive Director and portfolio manager for Sterling Capital Management LLC (“Sterling Capital”), advisor to the Fund.
Robert F. Millikan, CFA
Robert F. Millikan, CFA, Executive Director, joined BB&T Asset Management in 2000 and Sterling Capital Management through merger in October 2010. He has managed the state-specific municipal bond portfolios, including the Fund, since 2000 and has investment experience since 1990. He is a graduate of Wake Forest University where he received a BA in Economics. He holds the Chartered Financial Analyst designation.
Investment Considerations
The Fund is subject to the same risks as the underlying bonds in the portfolios such as credit, prepayment and interest rate risk. As interest rates rise, the value of bond prices will decline and an investor may lose money. The Fund is non-diversified and may invest a greater percentage of its assets in a single issuer than funds that are more diversified. Furthermore, the Fund invests primarily in municipal obligations issued by Maryland and its political subdivisions and therefore will be affected by economic, political or other events affecting Maryland.
Q. How did the Fund perform during the 12-month period between October 1, 2019 and September 30, 2020?
A. The Fund’s Institutional Shares underperformed its current benchmark, the ICE BofA Merrill Lynch 2-17 Year Municipal Bond Index.
Q. What factors affected the Fund’s performance?
The period’s results were strongly affected by the economic impact of the COVID-19 pandemic in the second quarter of 2020. As economic growth wavered in March, municipal bond markets faced high selling pressure, low levels of liquidity, a spike in yields and wider spreads between higher- and lower-quality bonds. In response to the crisis, the Federal Reserve cut short-term interest rates to near zero and expanded its open-market bond purchases, stabilizing markets and supporting a broad-based economic recovery through the remainder of the period. In this environment, investor demand quickly outpaced the supply of new municipal bond issues. In addition, among the new municipal bonds issued at the time, between 30% and 40% were taxable rather than tax-exempt.
The Fund maintained a longer duration than its benchmark throughout the year. This positioning boosted the Fund’s absolute returns, as rates fell more significantly in shorter-duration issues than longer-duration issues.
The Fund’s relative performance was hurt due to exposure to Continuing Care Retirement Communities, which performed poorly due to fears about the impact of COVID-19 on their operations. Similarly, the Fund’s relative performance also suffered due to a greater exposure to hospitals than the index.
The Fund’s relative performance benefitted from its exposure to high-quality municipal bonds. The Fund avoided exposure to municipal bonds issued by lower-rated states such as New Jersey and Illinois. This positioning helped as investors shifted toward higher-quality issues during the pandemic. Overweight positions in AAA bonds and underweight positions in A-rated and BBB-rated bonds compared to the index also helped the Fund’s relative performance, as higher-quality issues outperformed lower-quality issues during the period.
Portfolio composition is as of September 30, 2020 and is subject to change and risk.
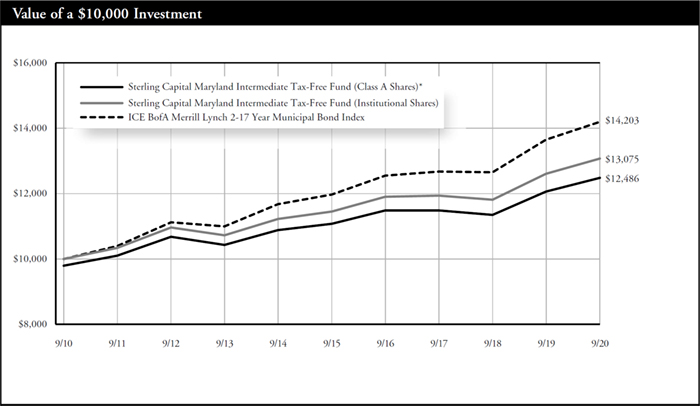
| * | Reflects 2.00% maximum sales charge. |
| ** | Reflects the applicable maximum contingent deferred sales charge of 1.00% (applicable only to redemptions within one year of purchase, and as such, are not reflected in the Average Annual Total Returns table since the periods reflected are for a year or longer). |
| Average Annual Total Returns | |
| As of September 30, 2020 | Inception
Date | 1 Year | 5 Years | 10 Years |
| Class A Shares* | 2/24/03 | 1.39% | 2.00% | 2.25% |
| Class C Shares** | 1/31/121 | 2.56% | 1.64% | 1.79% |
| Institutional Shares | 2/24/03 | 3.68% | 2.67% | 2.72% |
ICE BofA Merrill Lynch 2-17 Year Municipal Bond Index | N/A | 3.97% | 3.46% | 3.57% |
Past performance does not guarantee future results. The performance data quoted represents past performance and current returns may be lower or higher. Total return figures include change in share price, reinvestment of dividends and capital gains, and do not reflect taxes that a shareholder would pay on fund distributions or on the redemption of fund shares. The investment return and principal value will fluctuate so that an investor’s shares, when redeemed, may be worth more or less than the original cost. To obtain performance information current to the most recent month end, please visit www.sterlingcapitalfunds.com.
The chart above represents a comparison of a hypothetical $10,000 investment in the indicated share class versus a similar investment in the Fund’s benchmark.
| 1 | Class C Shares were not in existence prior to 2/1/12. Performance for periods prior to 2/1/12 is based on the performance of Class A Shares. Such performance would differ only to the extent that the Classes have different expenses. |
The Fund is measured against the ICE BofA Merrill Lynch 2-17 Year Municipal Bond Index, an unmanaged index, which is representative of municipal bonds. The index does not reflect the deduction of expenses associated with a mutual fund, such as investment management and fund accounting fees. Investors cannot invest directly in an index, although they can invest in its underlying securities.
Sterling Capital North Carolina Intermediate Tax-Free Fund
Portfolio Manager
Sterling Capital North Carolina Intermediate Tax-Free Fund (the “Fund”) is managed by Robert F. Millikan, CFA, Executive Director and portfolio manager for Sterling Capital Management LLC (“Sterling Capital”), advisor to the Fund.
Robert F. Millikan, CFA
Robert F. Millikan, CFA, Executive Director, joined BB&T Asset Management in 2000 and Sterling Capital Management through merger in October 2010. He has managed the state-specific municipal bond portfolios, including the Fund, since 2000 and has investment experience since 1990. He is a graduate of Wake Forest University where he received a BA in Economics. He holds the Chartered Financial Analyst designation.
Investment Considerations
The Fund is subject to the same risks as the underlying bonds in the portfolios such as credit, prepayment and interest rate risk. As interest rates rise, the value of bond prices will decline and an investor may lose money. The Fund is non-diversified and may invest a greater percentage of its assets in a single issuer than funds that are more diversified. Furthermore, the Fund invests primarily in municipal obligations issued by North Carolina and its political subdivisions and therefore will be affected by economic, political or other events affecting North Carolina.
Q. How did the Fund perform during the 12-month period between October 1, 2019 and September 30, 2020?
A. The Fund’s Institutional Shares underperformed its current benchmark, the ICE BofA Merrill Lynch 2-17 Year Municipal Bond Index.
Q. What factors affected the Fund’s performance?
The period’s results were strongly affected by the economic impact of the COVID-19 pandemic in the second quarter of 2020. As economic growth wavered in March, municipal bond markets faced high selling pressure, low levels of liquidity, a spike in yields and wider spreads between higher- and lower-quality bonds. In response to the crisis, the Federal Reserve cut short-term interest rates to near zero and expanded its open-market bond purchases, stabilizing markets and supporting a broad-based economic recovery through the remainder of the period. In this environment, investor demand quickly outpaced the supply of new municipal bond issues. In addition, among the new municipal bonds issued at the time, between 30% and 40% were taxable rather than tax-exempt.
The Fund maintained a longer duration than its benchmark throughout the year. This positioning boosted the Fund’s absolute returns, as rates fell more significantly in shorter-duration issues than longer-duration issues.
The Fund’s relative performance was hurt due to exposure to Continuing Care Retirement Communities, which performed poorly due to fears about the impact of COVID-19 on their operations.
The Fund’s relative performance benefitted from its exposure to high-quality municipal bonds. The Fund avoided exposure to municipal bonds issued by lower-rated states such as New Jersey and Illinois. This positioning helped as investors shifted toward higher-quality issues during the pandemic. Overweight positions in AAA bonds and underweight positions in A-rated and BBB-rated bonds compared to the index also helped the Fund’s relative performance, as higher-quality issues outperformed lower-quality issues during the period.
Portfolio composition is as of September 30, 2020 and is subject to change and risk.

| * | Reflects 2.00% maximum sales charge. |
| ** | Reflects the applicable maximum contingent deferred sales charge of 1.00% (applicable only to redemptions within one year of purchase, and as such, are not reflected in the Average Annual Total Returns table since the periods reflected are for a year or longer). |
| Average Annual Total Returns | |
| As of September 30, 2020 | Inception
Date | 1 Year | 5 Years | 10 Years |
| Class A Shares* | 10/16/92 | 1.59% | 2.11% | 2.41% |
| Class C Shares** | 1/31/121 | 2.96% | 1.77% | 1.95% |
| Institutional Shares | 10/16/92 | 3.90% | 2.77% | 2.87% |
| ICE BofA Merrill Lynch 2-17 Year Municipal Bond Index | N/A | 3.97% | 3.46% | 3.57% |
Past performance does not guarantee future results. The performance data quoted represents past performance and current returns may be lower or higher. Total return figures include change in share price, reinvestment of dividends and capital gains, and do not reflect taxes that a shareholder would pay on fund distributions or on the redemption of fund shares. The investment return and principal value will fluctuate so that an investor’s shares, when redeemed, may be worth more or less than the original cost. To obtain performance information current to the most recent month end, please visit www.sterlingcapitalfunds.com.
The chart above represents a comparison of a hypothetical $10,000 investment in the indicated share class versus a similar investment in the Fund’s benchmark.
| 1 | Class C Shares were not in existence prior to 2/1/12. Performance for periods prior to 2/1/12 is based on the performance of Class A Shares. Such performance would differ only to the extent that the Classes have different expenses. |
The Fund is measured against the ICE BofA Merrill Lynch 2-17 Year Municipal Bond Index, an unmanaged index, which is representative of municipal bonds. The index does not reflect the deduction of expenses associated with a mutual fund, such as investment management and fund accounting fees. Investors cannot invest directly in an index, although they can invest in its underlying securities.
Sterling Capital South Carolina Intermediate Tax-Free Fund
Portfolio Manager
Sterling Capital South Carolina Intermediate Tax-Free Fund (the “Fund”) is managed by Robert F. Millikan, CFA, Executive Director and portfolio manager for Sterling Capital Management LLC (“Sterling Capital”), advisor to the Fund.
Robert F. Millikan, CFA
Robert F. Millikan, CFA, Executive Director, joined BB&T Asset Management in 2000 and Sterling Capital Management through merger in October 2010. He has managed the state-specific municipal bond portfolios, including the Fund, since 2000 and has investment experience since 1990. He is a graduate of Wake Forest University where he received a BA in Economics. He holds the Chartered Financial Analyst designation.
Investment Considerations
The Fund is subject to the same risks as the underlying bonds in the portfolios such as credit, prepayment and interest rate risk. As interest rates rise, the value of bond prices will decline and an investor may lose money. The Fund is non-diversified and may invest a greater percentage of its assets in a single issuer than funds that are more diversified. Furthermore, the Fund invests primarily in municipal obligations issued by South Carolina and its political subdivisions and therefore will be affected by economic, political or other events affecting South Carolina.
Q. How did the Fund perform during the 12-month period between October 1, 2019 and September 30, 2020?
A. The Fund’s Institutional Shares underperformed its current benchmark, the ICE BofA Merrill Lynch 2-17 Year Municipal Bond Index.
Q. What factors affected the Fund’s performance?
The period’s results were strongly affected by the economic impact of the COVID-19 pandemic in the second quarter of 2020. As economic growth wavered in March, municipal bond markets faced high selling pressure, low levels of liquidity, a spike in yields and wider spreads between higher- and lower-quality bonds. In response to the crisis, the Federal Reserve cut short-term interest rates to near zero and expanded its open-market bond purchases, stabilizing markets and supporting a broad-based economic recovery through the remainder of the period. In this environment, investor demand quickly outpaced the supply of new municipal bond issues. In addition, among the new municipal bonds issued at the time, between 30% and 40% were taxable rather than tax-exempt.
The Fund maintained a longer duration than its benchmark throughout the year. This positioning boosted the Fund’s absolute returns, as rates fell more significantly in shorter-duration issues than longer-duration issues.
The Fund’s relative performance was hurt due to an overweight position in revenue bonds, which underperformed during the period. An overweight position in A-rated bonds also hurt the Fund’s relative performance, as higher-quality bonds outperformed lower-quality bonds.
The Fund’s relative performance benefitted from its exposure to high-quality municipal bonds. The Fund avoided exposure to municipal bonds issued by lower-rated states such as New Jersey and Illinois. This positioning helped as investors shifted toward higher-quality issues during the pandemic.
Portfolio composition is as of September 30, 2020 and is subject to change and risk.
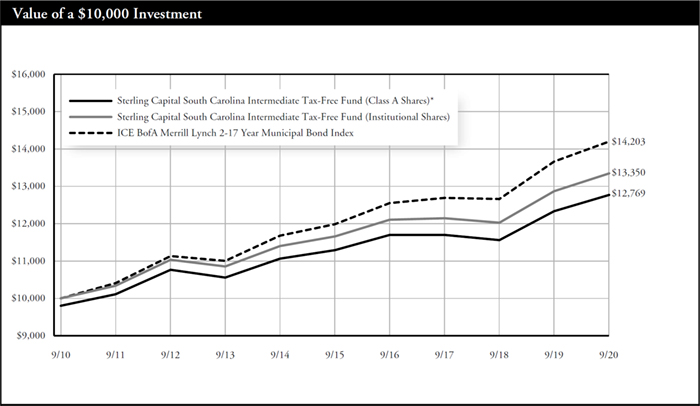
| * | Reflects 2.00% maximum sales charge. |
| ** | Reflects the applicable maximum contingent deferred sales charge of 1.00% (applicable only to redemptions within one year of purchase, and as such, are not reflected in the Average Annual Total Returns table since the periods reflected are for a year or longer). |
| Average Annual Total Returns | |
| As of September 30, 2020 | Inception
Date | 1 Year | 5 Years | 10 Years |
| Class A Shares* | 10/20/97 | 1.51% | 2.08% | 2.48% |
| Class C Shares** | 1/31/121 | 2.72% | 1.71% | 2.01% |
| Institutional Shares | 10/20/97 | 3.76% | 2.75% | 2.93% |
| ICE BofA Merrill Lynch 2-17 Year Municipal Bond Index | N/A | 3.97% | 3.46% | 3.57% |
Past performance does not guarantee future results. The performance data quoted represents past performance and current returns may be lower or higher. Total return figures include change in share price, reinvestment of dividends and capital gains, and do not reflect taxes that a shareholder would pay on fund distributions or on the redemption of fund shares. The investment return and principal value will fluctuate so that an investor’s shares, when redeemed, may be worth more or less than the original cost. To obtain performance information current to the most recent month end, please visit www.sterlingcapitalfunds.com.
The chart above represents a comparison of a hypothetical $10,000 investment in the indicated share class versus a similar investment in the Fund’s benchmark.
| 1 | Class C Shares were not in existence prior to 2/1/12. Performance for periods prior to 2/1/12 is based on the performance of Class A Shares. Such performance would differ only to the extent that the Classes have different expenses. |
The Fund is measured against the ICE BofA Merrill Lynch 2-17 Year Municipal Bond Index, an unmanaged index, which is representative of municipal bonds. The index does not reflect the deduction of expenses associated with a mutual fund, such as investment management and fund accounting fees. Investors cannot invest directly in an index, although they can invest in its underlying securities.
Sterling Capital Virginia Intermediate Tax-Free Fund
Portfolio Manager
Sterling Capital Virginia Intermediate Tax-Free Fund (the “Fund”) is managed by Robert F. Millikan, CFA, Executive Director and portfolio manager for Sterling Capital Management LLC (“Sterling Capital”), advisor to the Fund.
Robert F. Millikan, CFA
Robert F. Millikan, CFA, Executive Director, joined BB&T Asset Management in 2000 and Sterling Capital Management through merger in October 2010. He has managed the state-specific municipal bond portfolios, including the Fund, since 2000 and has investment experience since 1990. He is a graduate of Wake Forest University where he received a BA in Economics. He holds the Chartered Financial Analyst designation.
Investment Considerations
The Fund is subject to the same risks as the underlying bonds in the portfolios such as credit, prepayment and interest rate risk. As interest rates rise, the value of bond prices will decline and an investor may lose money. The Fund is non-diversified and may invest a greater percentage of its assets in a single issuer than funds that are more diversified. Furthermore, the Fund invests primarily in municipal obligations issued by Virginia and its political subdivisions and therefore will be affected by economic, political or other events affecting Virginia.
Q. How did the Fund perform during the 12-month period between October 1, 2019 and September 30, 2020?
A. The Fund’s Institutional Shares outperformed its current benchmark, the ICE BofA Merrill Lynch 2-17 Year Municipal Bond Index.
Q. What factors affected the Fund’s performance?
A. The period’s results were strongly affected by the economic impact of the COVID-19 pandemic in the second quarter of 2020. As economic growth wavered in March, municipal bond markets faced high selling pressure, low levels of liquidity, a spike in yields and wider spreads between higher- and lower-quality bonds. In response to the crisis, the Federal Reserve cut short-term interest rates to near zero and expanded its open-market bond purchases, stabilizing markets and supporting a broad-based economic recovery through the remainder of the period. In this environment, investor demand quickly outpaced the supply of new municipal bond issues. In addition, among the new municipal bonds issued at the time, between 30% and 40% were taxable rather than tax-exempt.
The Fund maintained a longer duration than its benchmark throughout the year. This positioning boosted the Fund’s absolute returns, as rates fell more significantly in shorter-duration issues than longer-duration issues.
The Fund’s relative performance benefitted from its exposure to high-quality municipal bonds. The Fund avoided exposure to municipal bonds issued by lower-rated states such as New Jersey and Illinois. This positioning helped as investors shifted toward higher-quality issues during the pandemic. Overweight positions in AAA bonds and underweight positions in A-rated and BBB-rated bonds compared to the index also helped the Fund’s relative performance, as higher-quality issues outperformed lower-quality issues during the period.
The Fund’s relative performance was hurt due to exposure to Continuing Care Retirement Communities, which performed poorly due to fears about the impact of COVID-19 on their operations. The relatively high quality of the Fund’s portfolio produced lower income compared to the benchmark as yields fell during the period.
Portfolio composition is as of September 30, 2020 and is subject to change and risk.

| * | Reflects 2.00% maximum sales charge. |
| ** | Reflects the applicable maximum contingent deferred sales charge of 1.00% (applicable only to redemptions within one year of purchase, and as such, are not reflected in the Average Annual Total Returns table since the periods reflected are for a year or longer). |
| Average Annual Total Returns | |
| As of September 30, 2020 | Inception
Date | 1 Year | 5 Years | 10 Years |
| Class A Shares* | 5/17/99 | 1.76% | 2.16% | 2.29% |
| Class C Shares** | 1/31/121 | 3.03% | 1.78% | 1.82% |
| Institutional Shares | 5/17/99 | 4.06% | 2.81% | 2.74% |
| ICE BofA Merrill Lynch 2-17 Year Municipal Bond Index | N/A | 3.97% | 3.46% | 3.57% |
Past performance does not guarantee future results. The performance data quoted represents past performance and current returns may be lower or higher. Total return figures include change in share price, reinvestment of dividends and capital gains, and do not reflect taxes that a shareholder would pay on fund distributions or on the redemption of fund shares. The investment return and principal value will fluctuate so that an investor’s shares, when redeemed, may be worth more or less than the original cost. To obtain performance information current to the most recent month end, please visit www.sterlingcapitalfunds.com.
The chart above represents a comparison of a hypothetical $10,000 investment in the indicated share class versus a similar investment in the Fund’s benchmark.
| 1 | Class C Shares were not in existence prior to 2/1/12. Performance for periods prior to 2/1/12 is based on the performance of Class A Shares. Such performance would differ only to the extent that the Classes have different expenses. |
The Fund is measured against the ICE BofA Merrill Lynch 2-17 Year Municipal Bond Index, an unmanaged index, which is representative of municipal bonds. The index does not reflect the deduction of expenses associated with a mutual fund, such as investment management and fund accounting fees. Investors cannot invest directly in an index, although they can invest in its underlying securities.
Sterling Capital West Virginia Intermediate Tax-Free Fund
Portfolio Manager
Sterling Capital West Virginia Intermediate Tax-Free Fund (the “Fund”) is managed by Robert F. Millikan, CFA, Executive Director and portfolio manager for Sterling Capital Management LLC (“Sterling Capital”), advisor to the Fund.
Robert F. Millikan, CFA
Robert F. Millikan, CFA, Executive Director, joined BB&T Asset Management in 2000 and Sterling Capital Management through merger in October 2010. He has managed the state-specific municipal bond portfolios, including the Fund, since 2000 and has investment experience since 1990. He is a graduate of Wake Forest University where he received a BA in Economics. He holds the Chartered Financial Analyst designation.
Investment Considerations
The Fund is subject to the same risks as the underlying bonds in the portfolios such as credit, prepayment and interest rate risk. As interest rates rise, the value of bond prices will decline and an investor may lose money. The Fund is non-diversified and may invest a greater percentage of its assets in a single issuer than funds that are more diversified. Furthermore, the Fund invests primarily in municipal obligations issued by West Virginia and its political subdivisions and therefore will be affected by economic, political or other events affecting West Virginia.
Q. How did the Fund perform during the 12-month period between October 1, 2019 and September 30, 2020?
A. The Fund’s Institutional Shares outperformed its current benchmark, the ICE BofA Merrill Lynch 2-17 Year Municipal Bond Index.
Q. What factors affected the Fund’s performance?
A. The period’s results were strongly affected by the economic impact of the COVID-19 pandemic in the second quarter of 2020. As economic growth wavered in March, municipal bond markets faced high selling pressure, low levels of liquidity, a spike in yields and wider spreads between higher- and lower-quality bonds. In response to the crisis, the Federal Reserve cut short-term interest rates to near zero and expanded its open-market bond purchases, stabilizing markets and supporting a broad-based economic recovery through the remainder of the period. In this environment, investor demand quickly outpaced the supply of new municipal bond issues. In addition, among the new municipal bonds issued at the time, between 30% and 40% were taxable rather than tax-exempt.
The Fund maintained a longer duration than its benchmark throughout the year. This positioning boosted the Fund’s absolute returns, as rates fell more significantly in shorter-duration issues than longer-duration issues.
The Fund’s relative performance benefitted from its exposure to high-quality municipal bonds. The Fund avoided exposure to municipal bonds issued by lower-rated states such as New Jersey and Illinois. This positioning helped as investors shifted toward higher-quality issues during the pandemic. Overweight positions in AAA bonds and underweight positions in A-rated and BBB-rated bonds compared to the index also helped the Fund’s relative performance, as higher-quality issues outperformed lower-quality issues during the period.
Portfolio composition is as of September 30, 2020 and is subject to change and risk.
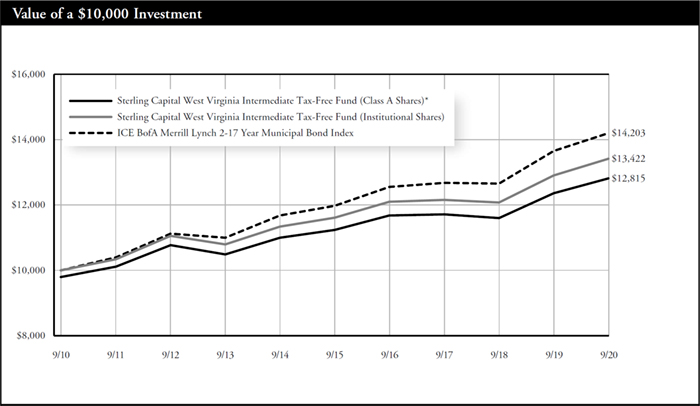
| * | Reflects 2.00% maximum sales charge. |
| ** | Reflects the applicable maximum contingent deferred sales charge of 1.00% (applicable only to redemptions within one year of purchase, and as such, are not reflected in the Average Annual Total Returns table since the periods reflected are for a year or longer). |
| Average Annual Total Returns | |
| As of September 30, 2020 | Inception
Date | 1 Year | 5 Years | 10 Years |
| Class A Shares* | 12/17/93 | 1.55% | 2.24% | 2.51% |
| Class C Shares** | 01/31/12 | 2.89% | 1.91% | 2.07% |
| Institutional Shares | 12/01/93 | 4.01% | 2.93% | 2.99% |
| ICE BofA Merrill Lynch 2-17 Year Municipal Bond Index | N/A | 3.97% | 3.46% | 3.57% |
Past performance does not guarantee future results. The performance data quoted represents past performance and current returns may be lower or higher. Total return figures include change in share price, reinvestment of dividends and capital gains, and do not reflect taxes that a shareholder would pay on fund distributions or on the redemption of fund shares. The investment return and principal value will fluctuate so that an investor’s shares, when redeemed, may be worth more or less than the original cost. To obtain performance information current to the most recent month end, please visit www.sterlingcapitalfunds.com.
The chart above represents a comparison of a hypothetical $10,000 investment in the indicated share class versus a similar investment in the Fund’s benchmark.
| 1 | Class C Shares were not in existence prior to 2/1/12. Performance for periods prior to 2/1/12 is based on the performance of Class A Shares. Such performance would differ only to the extent that the Classes have different expenses. |
The Fund is measured against the ICE BofA Merrill Lynch 2-17 Year Municipal Bond Index, an unmanaged index, which is representative of municipal bonds. The index does not reflect the deduction of expenses associated with a mutual fund, such as investment management and fund accounting fees. Investors cannot invest directly in an index, although they can invest in its underlying securities.
Sterling Capital Diversified Income Fund
Portfolio Managers
Sterling Capital Diversified Income Fund (the “Fund”) is managed by Shane A. Burke, and Brandon W. Carl, CFA, Executive Directors and portfolio managers for Sterling Capital Management LLC (“Sterling Capital”), advisor to the fund, and members of the Sterling Capital Advisory Solutions Team.
Shane A. Burke
Shane A. Burke, Executive Director, joined Sterling Capital Management in 2013. He has investment experience since 2002 and has co-managed the Fund since 2015. Shane received his BS in Finance from the University of North Carolina at Wilmington and his MBA from San Francisco-Golden Gate University.
Brandon W. Carl, CFA
Brandon W. Carl, CFA, Executive Director, joined BB&T Asset Management in 2001 and Sterling Capital Management through merger in October 2010. He has investment experience since 2001 and has co-managed the Fund since 2016. Brandon is a graduate of the University of South Carolina where he received his BS in Finance and Management. He holds the Chartered Financial Analyst designation.
Investment Considerations
The Fund is primarily concentrated in underlying funds and is therefore subject to the same risks as the underlying funds it is invested in and may entail higher expenses. The underlying funds may invest in undervalued securities, which may not appreciate in value as anticipated or may remain undervalued for longer than anticipated. The underlying funds may invest in equity securities including more aggressive investments that engage in long/short equity strategies and in options writing strategies and that invest in derivatives, preferred stocks, exchange-traded funds (ETFs), Master Limited Partnerships (MLPs, the value of which will be affected by the natural resources sector of the economy and regulation) and real estate investment trusts (REITs, the value of which will be affected by conditions of the real estate industry). The Fund’s volatility may be amplified by its use of short sales and derivatives. The Fund is subject to the same risks as the debt securities held by the underlying funds such as credit, prepayment, call and interest rate risk. As interest rates rise, the value of debt securities will decline and an investor may lose money. Investing in high yield debt (also known as junk bonds) involves greater risks and less liquidity than investment grade bonds.
Q. How did the Fund perform during the 12-month period between October 1, 2019 and September 30, 2020?
A. The Fund’s Institutional Shares underperformed its current benchmark, 40% MSCI World Index/60% Bloomberg Barclays U.S. Aggregate Bond Index.
Q. What factors affected the Fund’s performance?
A.The Fund’s equity exposure declined during the fiscal year and was a detractor versus the blended benchmark. Structural biases toward high-dividend yield and value were material headwinds given that lower dividend-yielding, growth-oriented segments of the equity market outperformed during this time frame. The Fund’s exposure to MLPs also made a negative impact on absolute and relative performance as a result of pandemic-induced oil demand destruction and historic levels of oil price volatility. The Fund’s covered call writing allocation made a positive impact on absolute and relative performance, driven by positive stock selection in cyclical sectors such as materials.
The Fund’s fixed income allocation outpaced the Bloomberg Barclays U.S. Aggregate Bond Index for three of the four quarters of the fiscal year. However, the underperformance that occurred in the one negative quarter (Q1 2020) was so severe that it caused the annual return to lag the benchmark. The largest detractor over the year was the Fund’s allocation to emerging market debt. The Fund’s securitized credit allocation also detracted from relative returns. Conversely, the Fund’s government exposure has remained positive and added to returns, particularly allocations to the long end of the Treasury curve. Overall, the largest contributor to fixed income returns over the fiscal year was insurance-linked securities, which have displayed a low correlation to both the equity and fixed income markets.
Portfolio composition is as of September 30, 2020 and is subject to change and risk.

| * | Reflects 5.75% maximum sales charge. |
| ** | Reflects the applicable maximum CDSC of 1.00% (applicable only to redemptions within one year of purchase, and as such, are not reflected in the Average Annual Total Returns table since the periods reflected are for a year or longer). |
| Average Annual Total Returns | |
| As of September 30, 2020 | Inception
Date | 1 Year | 5 Years | 10 Years |
| Class A Shares* | 1/29/98 | -12.16% | 0.82% | 2.84% |
| Class C Shares** | 2/1/01 | -7.46% | 1.27% | 2.68% |
| Institutional Shares | 10/2/97 | -6.55% | 2.28% | 3.71% |
| 40% MSCI World Index/60% Bloomberg Barclays U.S. Aggregate Bond Index | N/A | 8.99% | 6.94% | 6.15% |
| MSCI World Index | N/A | 10.41% | 10.48% | 9.37% |
| Bloomberg Barclays U.S. Aggregate Bond Index | N/A | 6.98% | 4.18% | 3.64% |
Past performance does not guarantee future results. The performance data quoted represents past performance and current returns may be lower or higher. Total return figures include change in share price, reinvestment of dividends and capital gains, and do not reflect taxes that a shareholder would pay on fund distributions or on the redemption of fund shares. The investment return and principal value will fluctuate so that an investor’s shares, when redeemed, may be worth more or less than the original cost. To obtain performance information current to the most recent month end, please visit www.sterlingcapitalfunds.com.
The chart above represents a comparison of a hypothetical $10,000 investment in the indicated share class versus a similar investment in the Fund’s benchmarks.
The Fund is measured against the 40% MSCI World Index/60% Bloomberg Barclays U.S. Aggregate Bond Index. The indices are unmanaged and do not reflect the deduction of expenses associated with a mutual fund, such as investment management and, fund accounting fees. Investors cannot invest directly in an index, although they can invest in its underlying securities.
Sterling Capital Strategic Allocation Funds
Portfolio Managers
Team Managed
Sterling Capital Strategic Allocation Funds (the “Funds”) are managed by the Sterling Capital Advisory Solutions Team, which is led by James C. Willis, CFA, Managing Director & Head of Advisory Solutions, Jeffrey J. Schappe, CFA, Managing Director and Kevin J. Stoll, CFA, Managing Director. Mr. Willis, Mr. Schappe and Mr. Stoll have managed the Funds since 2010, 2005 and 2016, respectively.
James C. Willis, CFA
James C. Willis, CFA, Managing Director, joined BB&T Asset Management in 2003 and Sterling Capital Management through merger in October 2010. He has investment experience since 1996 and has co-managed the Funds since 2010. Jim received his BA in Economics and Political Science from Rice University and his MBA from Georgetown University. He holds the Chartered Financial Analyst designation.
Jeffrey J. Schappe, CFA
Jeffrey J. Schappe, CFA, Managing Director, joined BB&T Asset Management in 2004 and Sterling Capital Management through merger in October 2010. He has investment experience since 1991 and has co-managed the Funds since 2005. Jeff received his BA in Journalism and his MBA in Finance from the University of Wisconsin-Madison. He holds the Chartered Financial Analyst designation.
Kevin J. Stoll, CFA
Kevin J. Stoll, CFA, Managing Director, joined Sterling Capital in 2013. He has investment experience since 1998 and has co-managed the Funds since 2016. He received his BA in Economics and Mathematical Methods in the Social Sciences from Northwestern University and his MBA from Duke University’s Fuqua School of Business. He holds the Chartered Financial Analyst designation.
Investment Considerations
The Funds are primarily concentrated in underlying funds and are therefore subject to the same risks as the underlying funds and bear a portion of the expenses of the underlying funds. The underlying funds may be invested in equity securities and are subject to market risk. Investments in bonds are subject to credit risk, call risk and interest rate risk (as interest rates rise the value of bond prices will decline). The underlying funds may invest in foreign securities, which involve certain risks such as currency volatility, political and social instability and reduced market liquidity; small capitalization companies which are subject to greater volatility and less liquidity due to limited resources or product lines and are more sensitive to economic factors; and high-yield debt securities (also known as junk bonds), which involve greater risks than investment grade bonds. The underlying funds may also be money market funds.
Sterling Capital Strategic Allocation Balanced Fund (the “Balanced Fund”)
Sterling Capital Strategic Allocation Growth Fund (the “Growth Fund”)
(Collectively, “Sterling Capital Strategic Allocation Funds”)
Q. How did the Funds perform during the 12-month period between October 1, 2019 and September 30, 2020?
A. The Growth Fund’s Institutional Shares underperformed its current benchmark, 75% MSCI World Index/25% Bloomberg Barclays U.S. Aggregate Bond Index. For the year, the Growth Fund returned -1.35% versus +10.06% for the benchmark.
A. The Balanced Fund’s Institutional Shares underperformed its current benchmark, 60% MSCI World Index/40% Bloomberg Barclays U.S. Aggregate Bond Index. For the year, the Balanced Fund returned +0.43% versus +9.68% for the benchmark.
Q. What factors affected the Funds’ performance?
A. Both asset allocation and manager selection detracted from benchmark-relative performance over the trailing twelve months.
Overweight allocation to International Developed ex-U.S. Equity detracted – for the year, MSCI EAFE Index returned +0.49% while MSCI World Index posted a +10.41% return. Overweight allocation to U.S. Large Cap Value also detracted – for the year, Russell 1000 Value Index returned -5.03%.
Sterling Capital Behavioral International Equity Fund and Sterling Capital Special Opportunities Fund both materially detracted over the past year, underperforming their respective benchmarks (MSCI EAFE & Russell 3000) by -12.14% and -9.21%.
Portfolio composition is as of September 30, 2020 and is subject to change and risk.
Sterling Capital Strategic Allocation Balanced Fund
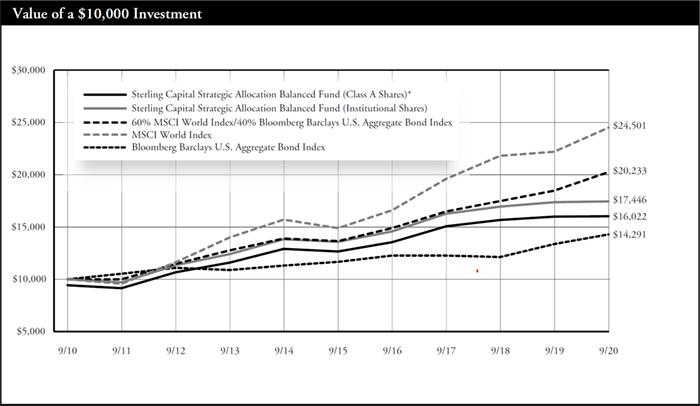
| * | Reflects 5.75% maximum sales charge. |
| ** | Reflects the applicable maximum CDSC of 1.00% (applicable only to redemptions within one year of purchase, and as such, are not reflected in the Annual Average Total Returns table since the periods reflected are for a year or longer). |
| Average Annual Total Returns | |
| As of September 30, 2020 | Inception
Date | 1 Year | 5 Years | 10 Years |
| Class A Shares* | 1/29/98 | -5.62% | 3.63% | 4.83% |
| Class C Shares** | 2/1/01 | -0.63% | 4.07% | 4.66% |
| Institutional Shares | 10/2/97 | 0.43% | 5.13% | 5.72% |
| 60% MSCI World Index/40% Bloomberg Barclays U.S. Aggregate Bond Index | N/A | 9.68% | 8.20% | 7.30% |
| MSCI World Index | N/A | 10.41% | 10.48% | 9.37% |
| Bloomberg Barclays U.S. Aggregate Bond Index | N/A | 6.98% | 4.18% | 3.64% |
Past performance does not guarantee future results. The performance data quoted represents past performance and current returns may be lower or higher. Total return figures include change in share price, reinvestment of dividends and capital gains, and do not reflect taxes that a shareholder would pay on fund distributions or on the redemption of fund shares. The investment return and principal value will fluctuate so that an investor’s shares, when redeemed, may be worth more or less than the original cost. To obtain performance information current to the most recent month end, please visit www.sterlingcapitalfunds.com. Performance would have been lower without limitations and/or waivers in effect.
The chart above represents a comparison of a hypothetical $10,000 investment in the indicated share class versus a similar investment in the Fund’s benchmarks.
The Fund is measured against the 60% MSCI World Index/40% Bloomberg Barclays U.S. Aggregate Bond Index. The index is unmanaged and do not reflect the deduction of expenses associated with a mutual fund, such as investment management and, fund accounting fees. Investors cannot invest directly in an index, although they can invest in its underlying securities.
Sterling Capital Strategic Allocation Growth Fund
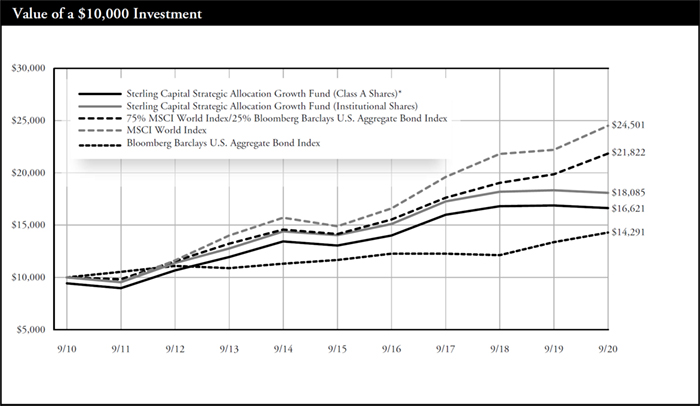
| * | Reflects 5.75% maximum sales charge. |
| ** | Reflects the applicable maximum CDSC of 1.00% (applicable only to redemptions within one year of purchase, and as such, are not reflected in the Annual Average Total Returns table since the periods reflected are for a year or longer). |
| Average Annual Total Returns | |
| As of September 30, 2020 | Inception
Date | 1 Year | 5 Years | 10 Years |
| Class A Shares* | 1/29/98 | -7.21% | 3.74% | 5.21% |
| Class C Shares** | 2/1/01 | -2.29% | 4.19% | 5.05% |
| Institutional Shares | 10/2/97 | -1.35% | 5.23% | 6.10% |
| 75% MSCI World Index/25% Bloomberg Barclays U.S. Aggregate Bond Index | N/A | 10.06% | 9.10% | 8.12% |
| MSCI World Index | N/A | 10.41% | 10.48% | 9.37% |
| Bloomberg Barclays U.S. Aggregate Bond Index | N/A | 6.98% | 4.18% | 3.64% |
Past performance does not guarantee future results. The performance data quoted represents past performance and current returns may be lower or higher. Total return figures include change in share price, reinvestment of dividends and capital gains, and do not reflect taxes that a shareholder would pay on fund distributions or on the redemption of fund shares. The investment return and principal value will fluctuate so that an investor’s shares, when redeemed, may be worth more or less than the original cost. To obtain performance information current to the most recent month end, please visit www.sterlingcapitalfunds.com. Performance would have been lower without limitations and/or waivers in effect.
The chart above represents a comparison of a hypothetical $10,000 investment in the indicated share class versus a similar investment in the Fund’s benchmarks.
The Fund is measured against the 75% MSCI World Index/25% Bloomberg Barclays U.S. Aggregate Bond Index. The index is unmanaged and do not reflect the deduction of expenses associated with a mutual fund, such as investment management and, fund accounting fees. Investors cannot invest directly in an index, although they can invest in its underlying securities.
Summary of Portfolio Holdings (Unaudited)
Sterling Capital Funds invested, as a percentage of net assets, in the following industries, countries, states, funds or security types, as of September 30, 2020:
| Sterling Capital Behavioral Large Cap Value Equity Fund | | Percentage
of net assets |
| Air Freight & Logistics | | | 1.6 | % |
| Auto Components | | | 0.3 | % |
| Automobiles | | | 1.2 | % |
| Banks | | | 5.3 | % |
| Biotechnology | | | 5.3 | % |
| Capital Markets | | | 6.1 | % |
| Chemicals | | | 0.8 | % |
| Commercial Services & Supplies | | | 0.4 | % |
| Construction & Engineering | | | 0.6 | % |
| Consumer Finance | | | 0.5 | % |
| Containers & Packaging | | | 1.7 | % |
| Diversified Consumer Services | | | 0.9 | % |
| Diversified Telecommunication Services | | | 3.0 | % |
| Electric Utilities | | | 2.5 | % |
| Electrical Equipment | | | 3.2 | % |
| Energy Equipment & Services | | | 0.2 | % |
| Entertainment | | | 0.9 | % |
| Equity Real Estate Investment Trusts (REITS) | | | 3.6 | % |
| Food & Staples Retailing | | | 3.0 | % |
| Food Products | | | 2.8 | % |
| Gas Utilities | | | 0.3 | % |
| Health Care Providers & Services | | | 6.9 | % |
| Hotels, Restaurants & Leisure | | | 0.9 | % |
| Household Durables | | | 2.5 | % |
| Independent Power and Renewable Electricity Producers | | | 0.6 | % |
| Industrial Conglomerates | | | 1.3 | % |
| Insurance | | | 2.3 | % |
| Internet & Direct Marketing Retail | | | 1.2 | % |
| IT Services | | | 3.1 | % |
| Machinery | | | 4.8 | % |
| Media | | | 4.3 | % |
| Metals & Mining | | | 3.3 | % |
| Mortgage Real Estate Investment Trusts (REITS) | | | 0.4 | % |
| Multiline Retail | | | 1.8 | % |
| Oil, Gas & Consumable Fuels | | | 2.9 | % |
| Personal Products | | | 1.1 | % |
| Pharmaceuticals | | | 2.5 | % |
| Road & Rail | | | 2.3 | % |
| Semiconductors & Semiconductor Equipment | | | 2.8 | % |
| Software | | | 1.4 | % |
| Specialty Retail | | | 1.0 | % |
| Technology Hardware, Storage & Peripherals | | | 3.8 | % |
| Thrifts & Mortgage Finance | | | 0.4 | % |
| Tobacco | | | 2.1 | % |
| Trading Companies & Distributors | | | 0.6 | % |
| Money Market Fund | | | 1.5 | % |
| | | | 100.0 | % |
| Sterling Capital Mid Value Fund | | Percentage
of net assets |
| Auto Components | | | 3.1 | % |
| Banks | | | 1.7 | % |
| Capital Markets | | | 2.1 | % |
| Chemicals | | | 6.6 | % |
| Construction & Engineering | | | 3.7 | % |
| Consumer Finance | | | 3.6 | % |
| Containers & Packaging | | | 3.8 | % |
| Diversified Financial Services | | | 3.1 | % |
| Diversified Telecommunication Services | | | 6.0 | % |
| Electric Utilities | | | 2.1 | % |
| Electrical Equipment | | | 3.2 | % |
| Energy Equipment & Services | | | 0.9 | % |
| Food Products | | | 2.4 | % |
| Health Care Equipment & Supplies | | | 4.1 | % |
| Health Care Providers & Services | | | 8.8 | % |
| Hotels, Restaurants & Leisure | | | 3.3 | % |
| Household Durables | | | 2.1 | % |
| Household Products | | | 1.5 | % |
| Insurance | | | 5.8 | % |
| Internet & Direct Marketing Retail | | | 2.2 | % |
| IT Services | | | 2.7 | % |
| Machinery | | | 1.9 | % |
| Media | | | 3.4 | % |
| Oil, Gas & Consumable Fuels | | | 1.2 | % |
| Pharmaceuticals | | | 2.1 | % |
| Professional Services | | | 2.6 | % |
| Real Estate Management & Development | | | 3.7 | % |
| Specialty Retail | | | 2.9 | % |
| Technology Hardware, Storage & Peripherals | | | 2.6 | % |
| Trading Companies & Distributors | | | 4.6 | % |
| Money Market Fund | | | 2.5 | % |
| | | | 100.3 | % |
Summary of Portfolio Holdings (Unaudited)
| Sterling Capital Behavioral Small Cap Value Equity Fund | | Percentage
of net assets |
| Air Freight & Logistics | | | 1.4 | % |
| Auto Components | | | 0.5 | % |
| Banks | | | 9.4 | % |
| Building Products | | | 2.9 | % |
| Capital Markets | | | 2.6 | % |
| Chemicals | | | 0.8 | % |
| Commercial Services & Supplies | | | 1.1 | % |
| Communications Equipment | | | 0.8 | % |
| Construction & Engineering | | | 4.7 | % |
| Consumer Finance | | | 3.4 | % |
| Containers & Packaging | | | 0.3 | % |
| Distributors | | | 0.2 | % |
| Diversified Financial Services | | | 1.6 | % |
| Diversified Telecommunication Services | | | 0.3 | % |
| Electric Utilities | | | 1.2 | % |
| Electrical Equipment | | | 0.3 | % |
| Electronic Equipment, Instruments & Components | | | 1.8 | % |
| Energy Equipment & Services | | | 0.4 | % |
| Entertainment | | | 0.9 | % |
| Equity Real Estate Investment Trusts (REITS) | | | 8.2 | % |
| Food & Staples Retailing | | | 2.2 | % |
| Gas Utilities | | | 1.4 | % |
| Health Care Providers & Services | | | 5.2 | % |
| Household Durables | | | 4.1 | % |
| Household Products | | | 0.9 | % |
| Independent Power and Renewable Electricity Producers | | | 0.9 | % |
| Insurance | | | 3.2 | % |
| Internet & Direct Marketing Retail | | | 0.2 | % |
| Leisure Products | | | 1.5 | % |
| Machinery | | | 1.6 | % |
| Marine | | | 0.8 | % |
| Media | | | 0.9 | % |
| Metals & Mining | | | 2.7 | % |
| Mortgage Real Estate Investment Trusts (REITS) | | | 2.1 | % |
| Multiline Retail | | | 0.9 | % |
| Multi-Utilities | | | 1.2 | % |
| Oil, Gas & Consumable Fuels | | | 3.4 | % |
| Paper & Forest Products | | | 1.7 | % |
| Personal Products | | | 0.3 | % |
| Pharmaceuticals | | | 1.7 | % |
| Real Estate Management & Development | | | 1.3 | % |
| Road & Rail | | | 1.4 | % |
| Semiconductors & Semiconductor Equipment | | | 3.6 | % |
| Specialty Retail | | | 5.3 | % |
| Textiles, Apparel & Luxury Goods | | | 0.3 | % |
| Thrifts & Mortgage Finance | | | 3.3 | % |
| Trading Companies & Distributors | | | 2.4 | % |
| Exchange Traded Fund | | | 1.0 | % |
| Money Market Fund | | | 1.7 | % |
| | | | 100.0 | % |
| Sterling Capital Special Opportunities Fund | | Percentage
of net assets |
| Air Freight & Logistics | | | 3.5 | % |
| Auto Components | | | 2.4 | % |
| Biotechnology | | | 1.5 | % |
| Capital Markets | | | 2.2 | % |
| Communications Equipment | | | 5.8 | % |
| Consumer Finance | | | 3.6 | % |
| Containers & Packaging | | | 1.9 | % |
| Electronic Equipment, Instruments & Components | | | 1.4 | % |
| Entertainment | | | 3.2 | % |
| Health Care Equipment & Supplies | | | 13.2 | % |
| Health Care Providers & Services | | | 9.2 | % |
| Health Care Technology | | | 3.3 | % |
| Household Durables | | | 2.9 | % |
| Interactive Media & Services | | | 5.9 | % |
| IT Services | | | 9.7 | % |
| Media | | | 6.7 | % |
| Pharmaceuticals | | | 4.4 | % |
| Professional Services | | | 3.2 | % |
| Real Estate Management & Development | | | 3.1 | % |
| Semiconductors & Semiconductor Equipment | | | 4.8 | % |
| Software | | | 7.0 | % |
| Money Market Fund | | | 0.2 | % |
| | | | 99.1 | % |
| Sterling Capital Equity Income Fund | | Percentage
of net assets |
| Air Freight & Logistics | | | 4.5 | % |
| Banks | | | 1.8 | % |
| Beverages | | | 5.7 | % |
| Biotechnology | | | 3.2 | % |
| Capital Markets | | | 6.6 | % |
| Communications Equipment | | | 3.1 | % |
| Consumer Finance | | | 3.7 | % |
| Diversified Telecommunication Services | | | 3.8 | % |
| Electronic Equipment, Instruments & Components | | | 3.3 | % |
| Equity Real Estate Investment Trusts (REITS) | | | 2.1 | % |
| Food Products | | | 2.6 | % |
| Health Care Equipment & Supplies | | | 8.0 | % |
| Health Care Providers & Services | | | 8.0 | % |
| Hotels, Restaurants & Leisure | | | 5.5 | % |
| Industrial Conglomerates | | | 3.4 | % |
| Insurance | | | 3.6 | % |
| IT Services | | | 5.9 | % |
| Oil, Gas & Consumable Fuels | | | 2.8 | % |
| Pharmaceuticals | | | 7.4 | % |
| Semiconductors & Semiconductor Equipment | | | 5.4 | % |
| Software | | | 4.7 | % |
| Specialty Retail | | | 4.4 | % |
| Money Market Fund | | | 0.5 | % |
| | | | 100.0 | % |
Summary of Portfolio Holdings (Unaudited)
| Sterling Capital Behavioral International Equity Fund | | Percentage
of net assets |
| Australia | | | 6.0 | % |
| Belgium | | | 1.0 | % |
| Denmark | | | 1.0 | % |
| Finland | | | 2.8 | % |
| France | | | 8.9 | % |
| Germany | | | 11.5 | % |
| Hong Kong | | | 1.3 | % |
| Israel | | | 1.7 | % |
| Italy | | | 1.4 | % |
| Japan | | | 28.1 | % |
| Netherlands | | | 3.2 | % |
| Norway | | | 2.0 | % |
| Portugal | | | 0.4 | % |
| Singapore | | | 2.9 | % |
| Spain | | | 1.0 | % |
| Sweden | | | 5.3 | % |
| Switzerland | | | 8.4 | % |
| United Kingdom | | | 11.4 | % |
| Money Market Fund | | | 0.8 | % |
| | | | 99.1 | % |
| Sterling Capital SMID Opportunities Fund | | Percentage
of net assets |
| Airlines | | | 0.5 | % |
| Auto Components | | | 5.0 | % |
| Commercial Services & Supplies | | | 8.6 | % |
| Communications Equipment | | | 3.2 | % |
| Consumer Finance | | | 4.9 | % |
| Containers & Packaging | | | 6.9 | % |
| Entertainment | | | 1.8 | % |
| Equity Real Estate Investment Trusts (REITS) | | | 3.1 | % |
| Health Care Equipment & Supplies | | | 10.7 | % |
| Health Care Providers & Services | | | 9.9 | % |
| Household Durables | | | 1.7 | % |
| Insurance | | | 4.8 | % |
| IT Services | | | 25.4 | % |
| Oil, Gas & Consumable Fuels | | | 0.9 | % |
| Real Estate Management & Development | | | 4.1 | % |
| Software | | | 6.5 | % |
| Specialty Retail | | | 0.8 | % |
| Money Market Fund | | | 1.3 | % |
| | | | 100.1 | % |
| Sterling Capital Stratton Mid Cap Value Fund | | Percentage
of net assets |
| Auto Components | | | 1.4 | % |
| Banks | | | 5.9 | % |
| Capital Markets | | | 2.1 | % |
| Chemicals | | | 1.8 | % |
| Communications Equipment | | | 1.1 | % |
| Construction & Engineering | | | 1.1 | % |
| Containers & Packaging | | | 5.5 | % |
| Electronic Equipment, Instruments & Components | | | 4.1 | % |
| Entertainment | | | 4.8 | % |
| Equity Real Estate Investment Trusts (REITS) | | | 12.2 | % |
| Food & Staples Retailing | | | 3.6 | % |
| Food Products | | | 1.8 | % |
| Gas Utilities | | | 4.4 | % |
| Health Care Equipment & Supplies | | | 4.1 | % |
| Health Care Providers & Services | | | 1.3 | % |
| Household Durables | | | 2.2 | % |
| Industrial Conglomerates | | | 1.9 | % |
| Insurance | | | 6.4 | % |
| IT Services | | | 5.0 | % |
| Life Sciences Tools & Services | | | 11.0 | % |
| Machinery | | | 1.9 | % |
| Oil, Gas & Consumable Fuels | | | 3.1 | % |
| Semiconductors & Semiconductor Equipment | | | 2.9 | % |
| Software | | | 1.6 | % |
| Trading Companies & Distributors | | | 5.0 | % |
| Exchange Traded Fund | | | 2.1 | % |
| Money Market Fund | | | 1.9 | % |
| | | | 100.2 | % |
| Sterling Capital Stratton Real Estate Fund | | Percentage
of net assets |
| Health Care | | | 8.7 | % |
| Hotel & Resort | | | 3.1 | % |
| Industrial | | | 17.3 | % |
| Office | | | 8.4 | % |
| Residential | | | 12.3 | % |
| Retail | | | 8.1 | % |
| Specialized | | | 40.5 | % |
| Money Market Fund | | | 1.4 | % |
| | | | 99.8 | % |
| Sterling Capital Stratton Small Cap Value Fund | | Percentage
of net assets |
| Aerospace & Defense | | | 2.6 | % |
| Banks | | | 16.7 | % |
| Capital Markets | | | 1.2 | % |
| Chemicals | | | 2.8 | % |
| Construction & Engineering | | | 3.2 | % |
| Electric Utilities | | | 2.4 | % |
| Electrical Equipment | | | 3.5 | % |
| Electronic Equipment, Instruments & Components | | | 2.5 | % |
| Entertainment | | | 2.7 | % |
| Equity Real Estate Investment Trusts (REITS) | | | 10.3 | % |
| Food & Staples Retailing | | | 8.3 | % |
| Food Products | | | 1.0 | % |
| Gas Utilities | | | 2.8 | % |
| Health Care Equipment & Supplies | | | 4.9 | % |
| Health Care Providers & Services | | | 2.7 | % |
| Household Durables | | | 2.6 | % |
| Insurance | | | 6.0 | % |
| IT Services | | | 3.8 | % |
| Machinery | | | 6.1 | % |
| Semiconductors & Semiconductor Equipment | | | 7.7 | % |
| Software | | | 2.4 | % |
| Trading Companies & Distributors | | | 2.9 | % |
| Money Market Fund | | | 0.4 | % |
| | | | 99.5 | % |
Summary of Portfolio Holdings (Unaudited)
| Sterling Capital Ultra Short Bond Fund | | Percentage
of net assets |
| Asset Backed Securities | | | 15.1 | % |
| Collateralized Mortgage Obligations | | | 1.4 | % |
| Commercial Mortgage-Backed Securities | | | 8.1 | % |
| Corporate Bonds | | | 72.1 | % |
| Municipal Bonds | | | 2.4 | % |
| Money Market Fund | | | 2.3 | % |
| | | | 101.4 | % |
| Sterling Capital Short Duration Bond Fund | | Percentage
of net assets |
| Asset Backed Securities | | | 18.7 | % |
| Collateralized Mortgage Obligations | | | 1.8 | % |
| Commercial Mortgage-Backed Securities | | | 8.8 | % |
| Corporate Bonds | | | 57.7 | % |
| Municipal Bonds | | | 12.7 | % |
| U.S. Treasury Notes | | | 0.2 | % |
| Money Market Fund | | | 1.1 | % |
| | | | 101.0 | % |
| Sterling Capital Intermediate U.S. Government Fund | | Percentage
of net assets |
| Asset Backed Securities | | | 1.4 | % |
| Collateralized Mortgage Obligations | | | 11.9 | % |
| Commercial Mortgage-Backed Securities | | | 16.7 | % |
| Mortgage-Backed Securities | | | 35.0 | % |
| Municipal Bonds | | | 3.6 | % |
| U.S. Government Agencies | | | 22.5 | % |
| U.S. Treasury Notes | | | 7.7 | % |
| Money Market Fund | | | 4.0 | % |
| | | | 102.8 | % |
| Sterling Capital Total Return Bond Fund | | Percentage
of net assets |
| Asset Backed Securities | | | 9.9 | % |
| Collateralized Mortgage Obligations | | | 5.8 | % |
| Commercial Mortgage-Backed Securities | | | 15.1 | % |
| Corporate Bonds | | | 43.8 | % |
| Mortgage-Backed Securities | | | 20.3 | % |
| Municipal Bonds | | | 4.2 | % |
| U.S. Treasury Bonds | | | 0.4 | % |
| U.S. Treasury Notes | | | 0.1 | % |
| Money Market Fund | | | 0.5 | % |
| | | | 100.1 | % |
| Sterling Capital Corporate Fund | | Percentage
of net assets |
| Corporate Bonds | | | 97.4 | % |
| Preferred Stocks | | | 0.9 | % |
| U.S. Treasury Notes | | | 0.2 | % |
| Money Market Fund | | | 0.8 | % |
| | | | 99.3 | % |
| Sterling Capital Quality Income Fund | | Percentage
of net assets |
| Asset Backed Securities | | | 18.7 | % |
| Collateralized Mortgage Obligations | | | 18.9 | % |
| Commercial Mortgage-Backed Securities | | | 25.1 | % |
| Corporate Bonds | | | 1.8 | % |
| Mortgage-Backed Securities | | | 33.5 | % |
| Money Market Fund | | | 6.2 | % |
| | | | 104.2 | % |
| Sterling Capital Kentucky Intermediate Tax-Free Fund | | Percentage
of net assets |
| Kentucky Municipal Bonds | | | 95.2 | % |
| Money Market Fund | | | 3.8 | % |
| | | | 99.0 | % |
| Sterling Capital Maryland Intermediate Tax-Free Fund | | Percentage
of net assets |
| District of Columbia Municipal Bonds | | | 3.4 | % |
| Maryland Municipal Bonds | | | 91.3 | % |
| Money Market Fund | | | 4.4 | % |
| | | | 99.1 | % |
| Sterling Capital North Carolina Intermediate Tax-Free Fund | | Percentage
of net assets |
| North Carolina Municipal Bonds | | | 95.4 | % |
| Money Market Fund | | | 3.6 | % |
| | | | 99.0 | % |
| Sterling Capital South Carolina Intermediate Tax-Free Fund | | Percentage
of net assets |
| South Carolina Municipal Bonds | | | 98.8 | % |
| Money Market Fund | | | 2.5 | % |
| | | | 101.3 | % |
| Sterling Capital Virginia Intermediate Tax-Free Fund | Percentage
of net assets |
| District of Columbia Municipal Bonds | | | 2.0 | % |
| Virginia Municipal Bonds | | | 94.5 | % |
| Money Market Fund | | | 2.6 | % |
| | | | 99.1 | % |
| Sterling Capital West Virginia Intermediate Tax-Free Fund | | Percentage
of net assets |
| West Virginia Municipal Bonds | | | 94.1 | % |
| Money Market Fund | | | 4.8 | % |
| | | | 98.9 | % |
| Sterling Capital Diversified Income Fund | | Percentage
of net assets |
| Equity Funds | | | 39.8 | % |
| Fixed Income Fund | | | 60.3 | % |
| Money Market Fund | | | 0.4 | % |
| | | | 100.5 | % |
| Sterling Capital Strategic Allocation Balanced Fund | | Percentage
of net assets |
| Equity Funds | | | 60.4 | % |
| Fixed Income Fund | | | 39.0 | % |
| Money Market Fund | | | 0.5 | % |
| | | | 99.9 | % |
| Sterling Capital Strategic Allocation Growth Fund | | Percentage
of net assets |
| Equity Funds | | | 76.4 | % |
| Fixed Income Fund | | | 23.3 | % |
| Money Market Fund | | | 0.3 | % |
| | | | 100.0 | % |
Expense Example (Unaudited)
As a shareholder of the Sterling Capital Funds (each, a “Fund” and collectively, the “Funds”), you incur two types of costs: (1) transaction costs, including sales charges (loads) on purchases and (2) ongoing costs, including management fees; distribution and/or service (12b-1) fees; and other Fund expenses.
These examples are intended to help you understand your ongoing costs (in dollars) of investing in the Funds and to compare these costs with the ongoing costs of investing in other mutual funds. These examples are based on an investment of $1,000 invested at the beginning of the period and held for the entire period from April 1, 2020 through September 30, 2020.
Actual Example
The table below provides information about actual account values and actual expenses. You may use the information below, together with the amount you invested, to estimate the expenses that you paid over the period. Simply divide your account value by $1,000 (for example, an $8,600 account value divided by $1,000 = 8.6), then multiply the result by the number in the table under the heading entitled “Expenses Paid During Period” to estimate the expenses you paid on your account during this period.
| | | Beginning
Account Value
4/1/20 | | Ending
Account Value
9/30/20 | | Expenses Paid
During Period*
4/1/20 - 9/30/20 | | Annualized
Expense Ratio
During Period
4/1/20 - 9/30/20 |
| Sterling Capital Behavioral Large Cap Value Equity Fund | | | | | | | | | | | |
| Class A Shares | | | $1,000.00 | | | | $1,173.08 | | | | $4.89 | | | | 0.90 | % |
| Class C Shares | | | 1,000.00 | | | | 1,169.14 | | | | 8.95 | | | | 1.65 | % |
| Institutional Shares | | | 1,000.00 | | | | 1,174.94 | | | | 3.53 | | | | 0.65 | % |
| Class R6 Shares | | | 1,000.00 | | | | 1,174.98 | | | | 3.21 | | | | 0.59 | % |
| Sterling Capital Mid Value Fund | | | | | | | | | | | | | | | | |
| Class A Shares | | | 1,000.00 | | | | 1,305.04 | | | | 6.17 | | | | 1.07 | % |
| Class C Shares | | | 1,000.00 | | | | 1,299.34 | | | | 10.52 | | | | 1.83 | % |
| Institutional Shares | | | 1,000.00 | | | | 1,306.29 | | | | 4.79 | | | | 0.83 | % |
| Class R Shares | | | 1,000.00 | | | | 1,303.71 | | | | 7.31 | | | | 1.27 | % |
| Class R6 Shares | | | 1,000.00 | | | | 1,306.93 | | | | 4.56 | | | | 0.79 | % |
| Sterling Capital Behavioral Small Cap Value Equity Fund | | | | | | | | | | | |
| Class A Shares | | | 1,000.00 | | | | 1,239.79 | | | | 6.05 | | | | 1.08 | % |
| Class C Shares | | | 1,000.00 | | | | 1,234.13 | | | | 10.22 | | | | 1.83 | % |
| Institutional Shares | | | 1,000.00 | | | | 1,241.95 | | | | 4.65 | | | | 0.83 | % |
| Class R Shares | | | 1,000.00 | | | | 1,237.60 | | | | 7.44 | | | | 1.33 | % |
| Class R6 Shares | | | 1,000.00 | | | | 1,241.70 | | | | 4.15 | | | | 0.74 | % |
| Sterling Capital Special Opportunities Fund | | | | | | | | | | | |
| Class A Shares | | | 1,000.00 | | | | 1,341.48 | | | | 6.56 | | | | 1.12 | % |
| Class C Shares | | | 1,000.00 | | | | 1,336.28 | | | | 10.92 | | | | 1.87 | % |
| Institutional Shares | | | 1,000.00 | | | | 1,342.91 | | | | 5.10 | | | | 0.87 | % |
| Class R Shares | | | 1,000.00 | | | | 1,339.46 | | | | 8.01 | | | | 1.37 | % |
| Class R6 Shares | | | 1,000.00 | | | | 1,343.25 | | | | 4.57 | | | | 0.78 | % |
| Sterling Capital Equity Income Fund | | | | | | | | | | | |
| Class A Shares | | | 1,000.00 | | | | 1,259.05 | | | | 5.87 | | | | 1.04 | % |
| Class C Shares | | | 1,000.00 | | | | 1,254.09 | | | | 10.09 | | | | 1.79 | % |
| Institutional Shares | | | 1,000.00 | | | | 1,260.55 | | | | 4.46 | | | | 0.79 | % |
| Class R Shares | | | 1,000.00 | | | | 1,257.14 | | | | 7.28 | | | | 1.29 | % |
| Class R6 Shares | | | 1,000.00 | | | | 1,260.47 | | | | 3.79 | | | | 0.67 | % |
| Sterling Capital Behavioral International Equity Fund | | | | | | | | | | | |
| Class A Shares | | | 1,000.00 | | | | 1,161.20 | | | | 4.65 | | | | 0.86 | % |
| Class C Shares | | | 1,000.00 | | | | 1,156.38 | | | | 8.68 | | | | 1.61 | % |
| Institutional Shares | | | 1,000.00 | | | | 1,161.20 | | | | 3.30 | | | | 0.61 | % |
| Class R6 Shares | | | 1,000.00 | | | | 1,162.62 | | | | 3.46 | | | | 0.64 | % |
| Sterling Capital SMID Opportunities Fund | | | | | | | | | | | |
| Class A Shares | | | 1,000.00 | | | | 1,273.00 | | | | 5.91 | | | | 1.04 | % |
| Class C Shares | | | 1,000.00 | | | | 1,267.79 | | | | 10.15 | | | | 1.79 | % |
| Institutional Shares | | | 1,000.00 | | | | 1,274.11 | | | | 4.49 | | | | 0.79 | % |
| Sterling Capital Stratton Mid Cap Value Fund | | | | | | | | | | | |
| Class A Shares | | | 1,000.00 | | | | 1,234.36 | | | | 6.48 | | | | 1.16 | % |
| Class C Shares | | | 1,000.00 | | | | 1,230.72 | | | | 11.49 | | | | 2.06 | % |
| Institutional Shares | | | 1,000.00 | | | | 1,235.83 | | | | 5.03 | | | | 0.90 | % |
| Sterling Capital Stratton Real Estate Fund | | | | | | | | | | | |
| Class A Shares | | | 1,000.00 | | | | 1,155.01 | | | | 5.87 | | | | 1.09 | % |
| Class C Shares | | | 1,000.00 | | | | 1,150.46 | | | | 9.89 | | | | 1.84 | % |
| Institutional Shares | | | 1,000.00 | | | | 1,156.40 | | | | 4.53 | | | | 0.84 | % |
| Class R6 Shares | | | 1,000.00 | | | | 1,000.00 | | | | 3.55 | | | | 0.71 | % |
| Sterling Capital Stratton Small Cap Value Fund | | | | | | | | | | | |
| Class A Shares | | | 1,000.00 | | | | 1,194.32 | | | | 6.80 | | | | 1.24 | % |
| Class C Shares | | | 1,000.00 | | | | 1,190.02 | | | | 10.90 | | | | 1.99 | % |
| Institutional Shares | | | 1,000.00 | | | | 1,195.88 | | | | 5.43 | | | | 0.99 | % |
| Class R6 Shares | | | 1,000.00 | | | | 1,000.00 | | | | 4.40 | | | | 0.88 | % |
Expense Example (Unaudited)
| | | Beginning
Account Value
4/1/20 | | Ending
Account Value
9/30/20 | | Expenses Paid
During Period*
4/1/20 - 9/30/20 | | Annualized
Expense Ratio
During Period
4/1/20 - 9/30/20 |
| Sterling Capital Ultra Short Bond Fund | | | | | | | | | | | |
| Class A Shares | | | $1,000.00 | | | | $1,030.50 | | | | $2.99 | | | | 0.59 | % |
| Institutional Shares | | | 1,000.00 | | | | 1,031.77 | | | | 1.73 | | | | 0.34 | % |
| Sterling Capital Short Duration Bond Fund | | | | | | | | | | | |
| Class A Shares | | | 1,000.00 | | | | 1,046.91 | | | | 3.43 | | | | 0.67 | % |
| Class C Shares | | | 1,000.00 | | | | 1,041.84 | | | | 7.25 | | | | 1.42 | % |
| Institutional Shares | | | 1,000.00 | | | | 1,048.22 | | | | 2.15 | | | | 0.42 | % |
| Sterling Capital Intermediate U.S. Government Fund | | | | | | | | | | | |
| Class A Shares | | | 1,000.00 | | | | 1,012.18 | | | | 4.02 | | | | 0.80 | % |
| Class C Shares | | | 1,000.00 | | | | 1,007.38 | | | | 7.78 | | | | 1.55 | % |
| Institutional Shares | | | 1,000.00 | | | | 1,013.45 | | | | 2.77 | | | | 0.55 | % |
| Sterling Capital Total Return Bond Fund | | | | | | | | | | | |
| Class A Shares | | | 1,000.00 | | | | 1,065.90 | | | | 3.67 | | | | 0.71 | % |
| Class C Shares | | | 1,000.00 | | | | 1,061.82 | | | | 7.53 | | | | 1.46 | % |
| Institutional Shares | | | 1,000.00 | | | | 1,067.17 | | | | 2.33 | | | | 0.45 | % |
| Class R Shares | | | 1,000.00 | | | | 1,064.75 | | | | 4.90 | | | | 0.95 | % |
| Class R6 Shares | | | 1,000.00 | | | | 1,067.73 | | | | 1.81 | | | | 0.35 | % |
| Sterling Capital Corporate Fund | | | | | | | | | | | |
| Class A Shares | | | 1,000.00 | | | | 1,117.64 | | | | 4.87 | | | | 0.92 | % |
| Class C Shares | | | 1,000.00 | | | | 1,112.87 | | | | 8.56 | | | | 1.62 | % |
| Institutional Shares | | | 1,000.00 | | | | 1,118.00 | | | | 3.55 | | | | 0.67 | % |
| Sterling Capital Quality Income Fund | | | | | | | | | | | |
| Class A Shares | | | 1,000.00 | | | | 1,028.50 | | | | 4.36 | | | | 0.86 | % |
| Class C Shares | | | 1,000.00 | | | | 1,023.88 | | | | 7.94 | | | | 1.57 | % |
| Institutional Shares | | | 1,000.00 | | | | 1,028.71 | | | | 3.09 | | | | 0.61 | % |
| Sterling Capital Kentucky Intermediate Tax-Free Fund | | | | | | | | | | | |
| Class A Shares | | | 1,000.00 | | | | 1,030.66 | | | | 4.92 | | | | 0.97 | % |
| Class C Shares | | | 1,000.00 | | | | 1,028.62 | | | | 9.84 | | | | 1.94 | % |
| Institutional Shares | | | 1,000.00 | | | | 1,031.99 | | | | 3.66 | | | | 0.72 | % |
| Sterling Capital Maryland Intermediate Tax-Free Fund | | | | | | | | | | | |
| Class A Shares | | | 1,000.00 | | | | 1,026.34 | | | | 4.66 | | | | 0.92 | % |
| Class C Shares | | | 1,000.00 | | | | 1,022.52 | | | | 8.44 | | | | 1.67 | % |
| Institutional Shares | | | 1,000.00 | | | | 1,027.59 | | | | 3.40 | | | | 0.67 | % |
| Sterling Capital North Carolina Intermediate Tax-Free Fund | | | | | | | | | | | |
| Class A Shares | | | 1,000.00 | | | | 1,030.52 | | | | 4.06 | | | | 0.80 | % |
| Class C Shares | | | 1,000.00 | | | | 1,027.60 | | | | 7.86 | | | | 1.55 | % |
| Institutional Shares | | | 1,000.00 | | | | 1,031.78 | | | | 2.79 | | | | 0.55 | % |
| Sterling Capital South Carolina Intermediate Tax-Free Fund | | | | | | | | | | | |
| Class A Shares | | | 1,000.00 | | | | 1,028.31 | | | | 4.16 | | | | 0.82 | % |
| Class C Shares | | | 1,000.00 | | | | 1,024.49 | | | | 7.95 | | | | 1.57 | % |
| Institutional Shares | | | 1,000.00 | | | | 1,029.74 | | | | 2.89 | | | | 0.57 | % |
| Sterling Capital Virginia Intermediate Tax-Free Fund | | | | | | | | | | | |
| Class A Shares | | | 1,000.00 | | | | 1,033.04 | | | | 4.12 | | | | 0.81 | % |
| Class C Shares | | | 1,000.00 | | | | 1,028.37 | | | | 7.91 | | | | 1.56 | % |
| Institutional Shares | | | 1,000.00 | | | | 1,033.48 | | | | 2.85 | | | | 0.56 | % |
| Sterling Capital West Virginia Intermediate Tax-Free Fund | | | | | | | | | | | |
| Class A Shares | | | 1,000.00 | | | | 1,027.62 | | | | 4.16 | | | | 0.82 | % |
| Class C Shares | | | 1,000.00 | | | | 1,023.77 | | | | 7.94 | | | | 1.57 | % |
| Institutional Shares | | | 1,000.00 | | | | 1,029.88 | | | | 2.89 | | | | 0.57 | % |
| Sterling Capital Diversified Income Fund | | | | | | | | | | | |
| Class A Shares | | | 1,000.00 | | | | 1,162.33 | | | | 4.65 | | | | 0.86 | % |
| Class C Shares | | | 1,000.00 | | | | 1,157.98 | | | | 8.69 | | | | 1.61 | % |
| Institutional Shares | | | 1,000.00 | | | | 1,164.09 | | | | 3.30 | | | | 0.61 | % |
| Sterling Capital Strategic Allocation Balanced Fund | | | | | | | | | | | |
| Class A Shares | | | 1,000.00 | | | | 1,158.31 | | | | 2.43 | | | | 0.45 | % |
| Class C Shares | | | 1,000.00 | | | | 1,153.84 | | | | 6.46 | | | | 1.20 | % |
| Institutional Shares | | | 1,000.00 | | | | 1,159.34 | | | | 1.08 | | | | 0.20 | % |
| Sterling Capital Strategic Allocation Growth Fund | | | | | | | | | | | |
| Class A Shares | | | 1,000.00 | | | | 1,185.32 | | | | 2.57 | | | | 0.47 | % |
| Class C Shares | | | 1,000.00 | | | | 1,181.32 | | | | 6.65 | | | | 1.22 | % |
| Institutional Shares | | | 1,000.00 | | | | 1,186.41 | | | | 1.15 | | | | 0.21 | % |
| * | Expenses are equal to the average account value over the period multiplied by the Fund’s annualized expense ratio, multiplied by 183 days divided by 366 (to reflect the six month period). |
Expense Example (Unaudited)
Hypothetical Example for Comparison Purposes
The table below provides information about hypothetical account values and hypothetical expenses based on the Fund’s actual expense ratio and an assumed rate of return of 5% per year before expenses, which is not the Fund’s actual return. The hypothetical account values and expenses may not be used to estimate the actual ending account balance or expenses you paid for the year. You may use this information to compare the ongoing costs of investing in a Fund and other funds. To do so, compare this 5% hypothetical example with the 5% hypothetical examples that appear in the shareholder reports of other funds.
Please note that the expenses shown in the table are meant to highlight your ongoing costs only and do not reflect any transactional costs, such as sales charges (loads), redemption fees, or exchange fees. Therefore, the table is useful in comparing ongoing costs only, and will not help you determine the relative total costs of owning different funds. In addition, if these transactional costs were included, your costs would have been higher.
| | | Beginning
Account Value
4/1/20 | | Ending
Account Value
9/30/20 | | Expenses Paid
During Period*
4/1/20 - 9/30/20 | | Annualized
Expense Ratio
During Period
4/1/20 - 9/30/20 |
| Sterling Capital Behavioral Large Cap Value Equity Fund | | | | | | | | | | | |
| Class A Shares | | | $1,000.00 | | | | $1,020.50 | | | | $4.55 | | | | 0.90 | % |
| Class C Shares | | | 1,000.00 | | | | 1,016.75 | | | | 8.32 | | | | 1.65 | % |
| Institutional Shares | | | 1,000.00 | | | | 1,021.75 | | | | 3.29 | | | | 0.65 | % |
| Class R6 Shares | | | 1,000.00 | | | | 1,022.05 | | | | 2.98 | | | | 0.59 | % |
| Sterling Capital Mid Value Fund | | | | | | | | | | | |
| Class A Shares | | | 1,000.00 | | | | 1,019.65 | | | | 5.40 | | | | 1.07 | % |
| Class C Shares | | | 1,000.00 | | | | 1,015.85 | | | | 9.22 | | | | 1.83 | % |
| Institutional Shares | | | 1,000.00 | | | | 1,020.85 | | | | 4.19 | | | | 0.83 | % |
| Class R Shares | | | 1,000.00 | | | | 1,018.65 | | | | 6.41 | | | | 1.27 | % |
| Class R6 Shares | | | 1,000.00 | | | | 1,021.05 | | | | 3.99 | | | | 0.79 | % |
| Sterling Capital Behavioral Small Cap Value Equity Fund | | | | | | | | | | | |
| Class A Shares | | | 1,000.00 | | | | 1,019.60 | | | | 5.45 | | | | 1.08 | % |
| Class C Shares | | | 1,000.00 | | | | 1,015.85 | | | | 9.22 | | | | 1.83 | % |
| Institutional Shares | | | 1,000.00 | | | | 1,020.85 | | | | 4.19 | | | | 0.83 | % |
| Class R Shares | | | 1,000.00 | | | | 1,018.35 | | | | 6.71 | | | | 1.33 | % |
| Class R6 Shares | | | 1,000.00 | | | | 1,021.30 | | | | 3.74 | | | | 0.74 | % |
| Sterling Capital Special Opportunities Fund | | | | | | | | | | | |
| Class A Shares | | | 1,000.00 | | | | 1,019.40 | | | | 5.65 | | | | 1.12 | % |
| Class C Shares | | | 1,000.00 | | | | 1,015.65 | | | | 9.42 | | | | 1.87 | % |
| Institutional Shares | | | 1,000.00 | | | | 1,020.65 | | | | 4.39 | | | | 0.87 | % |
| Class R Shares | | | 1,000.00 | | | | 1,018.15 | | | | 6.91 | | | | 1.37 | % |
| Class R6 Shares | | | 1,000.00 | | | | 1,021.10 | | | | 3.94 | | | | 0.78 | % |
| Sterling Capital Equity Income Fund | | | | | | | | | | | |
| Class A Shares | | | 1,000.00 | | | | 1,019.80 | | | | 5.25 | | | | 1.04 | % |
| Class C Shares | | | 1,000.00 | | | | 1,016.05 | | | | 9.02 | | | | 1.79 | % |
| Institutional Shares | | | 1,000.00 | | | | 1,021.05 | | | | 3.99 | | | | 0.79 | % |
| Class R Shares | | | 1,000.00 | | | | 1,018.55 | | | | 6.51 | | | | 1.29 | % |
| Class R6 Shares | | | 1,000.00 | | | | 1,021.65 | | | | 3.39 | | | | 0.67 | % |
| Sterling Capital Behavioral International Equity Fund | | | | | | | | | | | |
| Class A Shares | | | 1,000.00 | | | | 1,020.70 | | | | 4.34 | | | | 0.86 | % |
| Class C Shares | | | 1,000.00 | | | | 1,016.95 | | | | 8.12 | | | | 1.61 | % |
| Institutional Shares | | | 1,000.00 | | | | 1,021.95 | | | | 3.08 | | | | 0.61 | % |
| Class R6 Shares | | | 1,000.00 | | | | 1,021.80 | | | | 3.23 | | | | 0.64 | % |
| Sterling Capital SMID Opportunities Fund | | | | | | | | | | | | | | | | |
| Class A Shares | | | 1,000.00 | | | | 1,019.80 | | | | 5.25 | | | | 1.04 | % |
| Class C Shares | | | 1,000.00 | | | | 1,016.05 | | | | 9.02 | | | | 1.79 | % |
| Institutional Shares | | | 1,000.00 | | | | 1,021.05 | | | | 3.99 | | | | 0.79 | % |
| Sterling Capital Stratton Mid Cap Value Fund | | | | | | | | | | | |
| Class A Shares | | | 1,000.00 | | | | 1,019.20 | | | | 5.86 | | | | 1.16 | % |
| Class C Shares | | | 1,000.00 | | | | 1,014.70 | | | | 10.38 | | | | 2.06 | % |
| Institutional Shares | | | 1,000.00 | | | | 1,020.50 | | | | 4.55 | | | | 0.90 | % |
| Sterling Capital Stratton Real Estate Fund | | | | | | | | | | | |
| Class A Shares | | | 1,000.00 | | | | 1,019.55 | | | | 5.50 | | | | 1.09 | % |
| Class C Shares | | | 1,000.00 | | | | 1,015.80 | | | | 9.27 | | | | 1.84 | % |
| Institutional Shares | | | 1,000.00 | | | | 1,020.80 | | | | 4.24 | | | | 0.84 | % |
| Class R6 Shares | | | 1,000.00 | | | | 1,000.00 | | | | 3.55 | | | | 0.71 | % |
| Sterling Capital Stratton Small Cap Value Fund | | | | | | | | | | | |
| Class A Shares | | | 1,000.00 | | | | 1,018.80 | | | | 6.26 | | | | 1.24 | % |
| Class C Shares | | | 1,000.00 | | | | 1,015.05 | | | | 10.02 | | | | 1.99 | % |
| Institutional Shares | | | 1,000.00 | | | | 1,020.05 | | | | 5.00 | | | | 0.99 | % |
| Class R6 Shares | | | 1,000.00 | | | | 1,000.00 | | | | 4.40 | | | | 0.88 | % |
Expense Example (Unaudited)
| | | Beginning
Account Value
4/1/20 | | Ending
Account Value
9/30/20 | | Expenses Paid
During Period*
4/1/20 - 9/30/20 | | Annualized
Expense Ratio
During Period
4/1/20 - 9/30/20 |
| Sterling Capital Ultra Short Bond Fund | | | | | | | | | | | |
| Class A Shares | | | $1,000.00 | | | | $1,022.05 | | | | $2.98 | | | | 0.59 | % |
| Institutional Shares | | | 1,000.00 | | | | 1,023.30 | | | | 1.72 | | | | 0.34 | % |
| Sterling Capital Short Duration Bond Fund | | | | | | | | | | | |
| Class A Shares | | | 1,000.00 | | | | 1,021.65 | | | | 3.39 | | | | 0.67 | % |
| Class C Shares | | | 1,000.00 | | | | 1,017.90 | | | | 7.16 | | | | 1.42 | % |
| Institutional Shares | | | 1,000.00 | | | | 1,022.90 | | | | 2.12 | | | | 0.42 | % |
| Sterling Capital Intermediate U.S. Government Fund | | | | | | | | | | | |
| Class A Shares | | | 1,000.00 | | | | 1,021.00 | | | | 4.04 | | | | 0.80 | % |
| Class C Shares | | | 1,000.00 | | | | 1,017.25 | | | | 7.82 | | | | 1.55 | % |
| Institutional Shares | | | 1,000.00 | | | | 1,022.25 | | | | 2.78 | | | | 0.55 | % |
| Sterling Capital Total Return Bond Fund | | | | | | | | | | | |
| Class A Shares | | | 1,000.00 | | | | 1,021.45 | | | | 3.59 | | | | 0.71 | % |
| Class C Shares | | | 1,000.00 | | | | 1,017.70 | | | | 7.36 | | | | 1.46 | % |
| Institutional Shares | | | 1,000.00 | | | | 1,022.75 | | | | 2.28 | | | | 0.45 | % |
| Class R Shares | | | 1,000.00 | | | | 1,020.25 | | | | 4.80 | | | | 0.95 | % |
| Class R6 Shares | | | 1,000.00 | | | | 1,023.25 | | | | 1.77 | | | | 0.35 | % |
| Sterling Capital Corporate Fund | | | | | | | | | | | |
| Class A Shares | | | 1,000.00 | | | | 1,020.40 | | | | 4.65 | | | | 0.92 | % |
| Class C Shares | | | 1,000.00 | | | | 1,016.90 | | | | 8.17 | | | | 1.62 | % |
| Institutional Shares | | | 1,000.00 | | | | 1,021.65 | | | | 3.39 | | | | 0.67 | % |
| Sterling Capital Quality Income Fund | | | | | | | | | | | |
| Class A Shares | | | 1,000.00 | | | | 1,020.70 | | | | 4.34 | | | | 0.86 | % |
| Class C Shares | | | 1,000.00 | | | | 1,017.15 | | | | 7.92 | | | | 1.57 | % |
| Institutional Shares | | | 1,000.00 | | | | 1,021.95 | | | | 3.08 | | | | 0.61 | % |
| Sterling Capital Kentucky Intermediate Tax-Free Fund | | | | | | | | | | | |
| Class A Shares | | | 1,000.00 | | | | 1,020.15 | | | | 4.90 | | | | 0.97 | % |
| Class C Shares | | | 1,000.00 | | | | 1,015.30 | | | | 9.77 | | | | 1.94 | % |
| Institutional Shares | | | 1,000.00 | | | | 1,021.40 | | | | 3.64 | | | | 0.72 | % |
| Sterling Capital Maryland Intermediate Tax-Free Fund | | | | | | | | | | | |
| Class A Shares | | | 1,000.00 | | | | 1,020.40 | | | | 4.65 | | | | 0.92 | % |
| Class C Shares | | | 1,000.00 | | | | 1,016.65 | | | | 8.42 | | | | 1.67 | % |
| Institutional Shares | | | 1,000.00 | | | | 1,021.65 | | | | 3.39 | | | | 0.67 | % |
| Sterling Capital North Carolina Intermediate Tax-Free Fund | | | | | | | | | | | |
| Class A Shares | | | 1,000.00 | | | | 1,021.00 | | | | 4.04 | | | | 0.80 | % |
| Class C Shares | | | 1,000.00 | | | | 1,017.25 | | | | 7.82 | | | | 1.55 | % |
| Institutional Shares | | | 1,000.00 | | | | 1,022.25 | | | | 2.78 | | | | 0.55 | % |
| Sterling Capital South Carolina Intermediate Tax-Free Fund | | | | | | | | | | | |
| Class A Shares | | | 1,000.00 | | | | 1,020.90 | | | | 4.14 | | | | 0.82 | % |
| Class C Shares | | | 1,000.00 | | | | 1,017.15 | | | | 7.92 | | | | 1.57 | % |
| Institutional Shares | | | 1,000.00 | | | | 1,022.15 | | | | 2.88 | | | | 0.57 | % |
| Sterling Capital Virginia Intermediate Tax-Free Fund | | | | | | | | | | | |
| Class A Shares | | | 1,000.00 | | | | 1,020.95 | | | | 4.09 | | | | 0.81 | % |
| Class C Shares | | | 1,000.00 | | | | 1,017.20 | | | | 7.87 | | | | 1.56 | % |
| Institutional Shares | | | 1,000.00 | | | | 1,022.20 | | | | 2.83 | | | | 0.56 | % |
| Sterling Capital West Virginia Intermediate Tax-Free Fund | | | | | | | | | | | |
| Class A Shares | | | 1,000.00 | | | | 1,020.90 | | | | 4.14 | | | | 0.82 | % |
| Class C Shares | | | 1,000.00 | | | | 1,017.15 | | | | 7.92 | | | | 1.57 | % |
| Institutional Shares | | | 1,000.00 | | | | 1,022.15 | | | | 2.88 | | | | 0.57 | % |
| Sterling Capital Diversified Income Fund | | | | | | | | | | | |
| Class A Shares | | | 1,000.00 | | | | 1,020.70 | | | | 4.34 | | | | 0.86 | % |
| Class C Shares | | | 1,000.00 | | | | 1,016.95 | | | | 8.12 | | | | 1.61 | % |
| Institutional Shares | | | 1,000.00 | | | | 1,021.95 | | | | 3.08 | | | | 0.61 | % |
| Sterling Capital Strategic Allocation Balanced Fund | | | | | | | | | | | |
| Class A Shares | | | 1,000.00 | | | | 1,022.75 | | | | 2.28 | | | | 0.45 | % |
| Class C Shares | | | 1,000.00 | | | | 1,019.00 | | | | 6.06 | | | | 1.20 | % |
| Institutional Shares | | | 1,000.00 | | | | 1,024.00 | | | | 1.01 | | | | 0.20 | % |
| Sterling Capital Strategic Allocation Growth Fund | | | | | | | | | | | |
| Class A Shares | | | 1,000.00 | | | | 1,022.65 | | | | 2.38 | | | | 0.47 | % |
| Class C Shares | | | 1,000.00 | | | | 1,018.90 | | | | 6.16 | | | | 1.22 | % |
| Institutional Shares | | | 1,000.00 | | | | 1,023.95 | | | | 1.06 | | | | 0.21 | % |
| * | Expenses are equal to the average account value over the period multiplied by the Fund’s annualized expense ratio, multiplied by 183 days divided by 366 (to reflect the six month period). |
| Sterling Capital Behavioral Large Cap Value Equity Fund |
Schedule of Portfolio Investments
September 30, 2020
| Shares | | | | | Fair Value | |
| COMMON STOCKS — 98.5% | | | | |
| | | | | Air Freight & Logistics — 1.6% | | | | |
| | 2,650 | | | United Parcel Service, Inc., Class B | | $ | 441,569 | |
| | | | | Auto Components — 0.3% | | | | |
| | 2,001 | | | BorgWarner, Inc. | | | 77,519 | |
| | | | | Automobiles — 1.2% | | | | |
| | 49,750 | | | Ford Motor Co. | | | 331,335 | |
| | | | | Banks — 5.3% | | | | |
| | 6,703 | | | Bank OZK | | | 142,908 | |
| | 6,129 | | | Citigroup, Inc. | | | 264,221 | |
| | 4,809 | | | Citizens Financial Group, Inc. | | | 121,571 | |
| | 3,200 | | | Comerica, Inc. | | | 122,400 | |
| | 9,104 | | | First Horizon National Corp. | | | 85,851 | |
| | 13,350 | | | Huntington Bancshares, Inc. | | | 122,419 | |
| | 3,794 | | | JPMorgan Chase & Co. | | | 365,248 | |
| | 5,950 | | | Synovus Financial Corp. | | | 125,961 | |
| | 8,050 | | | Umpqua Holdings Corp. | | | 85,491 | |
| | | | | | | | 1,436,070 | |
| | | | | Biotechnology — 5.3% | | | | |
| | 3,656 | | | AbbVie, Inc | | | 320,229 | |
| | 1,523 | | | Amgen, Inc. | | | 387,086 | |
| | 1,428 | | | Biogen, Inc.(a) | | | 405,095 | |
| | 574 | | | Regeneron Pharmaceuticals, Inc.(a) | | | 321,314 | |
| | | | | | | | 1,433,724 | |
| | | | | Capital Markets — 6.1% | | | | |
| | 522 | | | BlackRock, Inc. | | | 294,173 | |
| | 10,600 | | | KKR & Co., Inc. | | | 364,004 | |
| | 3,650 | | | Lazard, Ltd., Class A | | | 120,633 | |
| | 8,525 | | | Morgan Stanley | | | 412,184 | |
| | 2,736 | | | T. Rowe Price Group, Inc. | | | 350,810 | |
| | 4,594 | | | Virtu Financial, Inc., Class A | | | 105,708 | |
| | | | | | | | 1,647,512 | |
| | | | | Chemicals — 0.8% | | | | |
| | 1,894 | | | Eastman Chemical Co | | | 147,959 | |
| | 591 | | | PPG Industries, Inc. | | | 72,149 | |
| | | | | | | | 220,108 | |
| | | | | Commercial Services & Supplies — 0.4% | | | | |
| | 13,510 | | | ADT, Inc. | | | 110,377 | |
| | | | | Construction & Engineering — 0.6% | | | | |
| | 2,913 | | | Quanta Services, Inc. | | | 153,981 | |
| | | | | Consumer Finance — 0.5% | | | | |
| | 3,850 | | | OneMain Holdings, Inc. | | | 120,313 | |
| | | | | Containers & Packaging — 1.7% | | | | |
| | 3,316 | | | Berry Global Group, Inc.(a) | | | 160,229 | |
| | 2,043 | | | Crown Holdings, Inc.(a) | | | 157,025 | |
| | 3,549 | | | Silgan Holdings, Inc. | | | 130,497 | |
| | | | | | | | 447,751 | |
| | | | | Diversified Consumer Services — 0.9% | | | | |
| | 300 | | | Graham Holdings Co., Class B | | | 121,233 | |
| | 2,750 | | | Service Corp. International | | | 115,995 | |
| | | | | | | | 237,228 | |
| | | | | Diversified Telecommunication Services — 3.0% | | | | |
| | 13,457 | | | Verizon Communications, Inc. | | | 800,557 | |
| | | | | Electric Utilities — 2.5% | | | | |
| | 1,900 | | | Avangrid, Inc. | | | 95,874 | |
| Shares | | | | | Fair Value | |
| COMMON STOCKS — (continued) | | | | |
| | | | | Electric Utilities — (continued) | | | | |
| | 4,451 | | | Duke Energy Corp. | | $ | 394,180 | |
| | 962 | | | Exelon Corp. | | | 34,401 | |
| | 4,500 | | | PPL Corp. | | | 122,445 | |
| | 700 | | | Southern Co. (The) | | | 37,954 | |
| | | | | | | | 684,854 | |
| | | | | Electrical Equipment — 3.2% | | | | |
| | 4,391 | | | Eaton Corp. PLC | | | 448,014 | |
| | 6,500 | | | Emerson Electric Co. | | | 426,205 | |
| | | | | | | | 874,219 | |
| | | | | Energy Equipment & Services — 0.2% | | | | |
| | 5,249 | | | Halliburton Co. | | | 63,250 | |
| | | | | Entertainment — 0.9% | | | | |
| | 12,550 | | | Lions Gate Entertainment Corp., Class A(a) | | | 118,974 | |
| | 13,500 | | | Lions Gate Entertainment Corp., Class B(a) | | | 117,720 | |
| | | | | | | | 236,694 | |
| | | | | Equity Real Estate Investment Trusts (REITS) — 3.6% | | | | |
| | 1,350 | | | Digital Realty Trust, Inc. | | | 198,126 | |
| | 3,478 | | | Gaming and Leisure Properties, Inc. | | | 128,439 | |
| | 1,650 | | | Public Storage | | | 367,488 | |
| | 5,478 | | | STORE Capital Corp. | | | 150,261 | |
| | 5,843 | | | VICI Properties, Inc. | | | 136,551 | |
| | | | | | | | 980,865 | |
| | | | | Food & Staples Retailing — 3.0% | | | | |
| | 4,780 | | | Kroger Co. (The) | | | 162,090 | |
| | 1,967 | | | Sprouts Farmers Market, Inc.(a) | | | 41,169 | |
| | 4,400 | | | Walmart, Inc. | | | 615,604 | |
| | | | | | | | 818,863 | |
| | | | | Food Products — 2.8% | | | | |
| | 6,386 | | | General Mills, Inc. | | | 393,888 | |
| | 11,864 | | | Kraft Heinz Co. (The) | | | 355,327 | |
| | | | | | | | 749,215 | |
| | | | | Gas Utilities — 0.3% | | | | |
| | 2,000 | | | National Fuel Gas Co. | | | 81,180 | |
| | | | | Health Care Providers & Services — 6.9% | | | | |
| | 1,374 | | | Anthem, Inc. | | | 369,043 | |
| | 1,750 | | | DaVita, Inc.(a) | | | 149,887 | |
| | 2,900 | | | HCA Healthcare, Inc. | | | 361,572 | |
| | 1,010 | | | Humana, Inc. | | | 418,029 | |
| | 974 | | | McKesson Corp. | | | 145,058 | |
| | 1,386 | | | UnitedHealth Group, Inc. | | | 432,113 | |
| | | | | | | | 1,875,702 | |
| | | | | Hotels, Restaurants & Leisure — 0.9% | | | | |
| | 189 | | | Chipotle Mexican Grill, Inc.(a) | | | 235,061 | |
| | | | | Household Durables — 2.5% | | | | |
| | 4,950 | | | DR Horton, Inc. | | | 374,369 | |
| | 1,750 | | | Lennar Corp., Class A | | | 142,940 | |
| | 3,328 | | | PulteGroup, Inc. | | | 154,053 | |
| | | | | | | | 671,362 | |
| | | | | Independent Power and Renewable Electricity Producers — 0.6% | | | | |
| | 8,220 | | | AES Corp. (The) | | | 148,864 | |
See accompanying Notes to the Financial Statements.
| Sterling Capital Behavioral Large Cap Value Equity Fund |
Schedule of Portfolio Investments — (continued)
September 30, 2020
| Shares | | | | | Fair Value | |
| COMMON STOCKS — (continued) | | | | |
| | | | | Industrial Conglomerates — 1.3% | | | | |
| | 2,133 | | | 3M Co. | | $ | 341,664 | |
| | | | | Insurance — 2.3% | | | | |
| | 6,380 | | | MetLife, Inc. | | | 237,144 | |
| | 6,010 | | | Prudential Financial, Inc. | | | 381,755 | |
| | | | | | | | 618,899 | |
| | | | | Internet & Direct Marketing Retail — 1.2% | | | | |
| | 6,350 | | | eBay, Inc. | | | 330,835 | |
| | | | | IT Services — 3.1% | | | | |
| | 1,403 | | | Accenture PLC, Class A | | | 317,064 | |
| | 5,890 | | | Cognizant Technology Solutions Corp., Class A | | | 408,884 | |
| | 48 | | | DXC Technology Co. | | | 857 | |
| | 801 | | | International Business Machines Corp. | | | 97,458 | |
| | | | | | | | 824,263 | |
| | | | | Machinery — 4.8% | | | | |
| | 2,079 | | | Cummins, Inc. | | | 439,002 | |
| | 2,100 | | | Deere & Co. | | | 465,423 | |
| | 1,950 | | | PACCAR, Inc. | | | 166,296 | |
| | 450 | | | Parker-Hannifin Corp. | | | 91,053 | |
| | 2,593 | | | Timken Co. (The) | | | 140,592 | |
| | | | | | | | 1,302,366 | |
| | | | | Media — 4.3% | | | | |
| | 400 | | | Charter Communications, Inc., Class A(a) | | | 249,736 | |
| | 16,687 | | | Comcast Corp., Class A | | | 771,941 | |
| | 1,394 | | | Nexstar Media Group, Inc., Class A | | | 125,362 | |
| | | | | | | | 1,147,039 | |
| | | | | Metals & Mining — 3.3% | | | | |
| | 6,628 | | | Newmont Corp. | | | 420,547 | |
| | 723 | | | Reliance Steel & Aluminum Co. | | | 73,775 | |
| | 8,101 | | | Southern Copper Corp. | | | 366,732 | |
| | 1,249 | | | Steel Dynamics, Inc. | | | 35,759 | |
| | | | | | | | 896,813 | |
| | | | | Mortgage Real Estate Investment Trusts (REITS) — 0.4% | | | | |
| | 8,550 | | | AGNC Investment Corp. | | | 118,931 | |
| | | | | Multiline Retail — 1.8% | | | | |
| | 2,999 | | | Target Corp. | | | 472,102 | |
| | | | | Oil, Gas & Consumable Fuels — 2.9% | | | | |
| | 21,227 | | | Antero Midstream Corp. | | | 113,989 | |
| | 1,016 | | | Cabot Oil & Gas Corp. | | | 17,638 | |
| | 5,500 | | | EQT Corp. | | | 71,115 | |
| | 14,726 | | | Equitrans Midstream Corp. | | | 124,582 | |
| | 24,273 | | | Kinder Morgan, Inc. | | | 299,286 | |
| | 7,730 | | | Williams Cos., Inc. (The) | | | 151,895 | |
| | | | | | | | 778,505 | |
| | | | | Personal Products — 1.1% | | | | |
| | 2,844 | | | Herbalife Nutrition, Ltd.(a) | | | 132,673 | |
| | 3,351 | | | Nu Skin Enterprises, Inc., Class A | | | 167,852 | |
| | | | | | | | 300,525 | |
| | | | | Pharmaceuticals — 2.5% | | | | |
| | 8,388 | | | Bristol-Myers Squibb Co. | | | 505,712 | |
| Shares | | | | | Fair Value | |
| COMMON STOCKS — (continued) | | | |
| | | | | Pharmaceuticals — (continued) | | | | |
| | 1,950 | | | Merck & Co., Inc. | | $ | 161,753 | |
| | | | | | | | 667,465 | |
| | | | | Road & Rail — 2.3% | | | | |
| | 1,285 | | | CSX Corp. | | | 99,806 | |
| | 5,592 | | | Schneider National, Inc., Class B | | | 138,290 | |
| | 2,001 | | | Union Pacific Corp. | | | 393,937 | |
| | | | | | | | 632,033 | |
| | | | | Semiconductors & Semiconductor Equipment — 2.8% | | | | |
| | 1,126 | | | Broadcom, Inc. | | | 410,224 | |
| | 3,000 | | | QUALCOMM, Inc. | | | 353,040 | |
| | | | | | | | 763,264 | |
| | | | | Software — 1.4% | | | | |
| | 6,344 | | | Oracle Corp. | | | 378,737 | |
| | | | | Specialty Retail — 1.0% | | | | |
| | 650 | | | Best Buy Co., Inc. | | | 72,339 | |
| | 1,171 | | | Lowe’s Cos., Inc. | | | 194,222 | |
| | | | | | | | 266,561 | |
| | | | | Technology Hardware, Storage & Peripherals — 3.8% | | | | |
| | 3,368 | | | Apple, Inc. | | | 390,048 | |
| | 5,775 | | | Dell Technologies, Inc., Class C(a) | | | 390,910 | |
| | 13,150 | | | HP, Inc. | | | 249,719 | |
| | | | | | | | 1,030,677 | |
| | | | | Thrifts & Mortgage Finance — 0.4% | | | | |
| | 12,772 | | | New York Community Bancorp, Inc. | | | 105,624 | |
| | | | | Tobacco — 2.1% | | | | |
| | 9,200 | | | Altria Group, Inc. | | | 355,488 | |
| | 2,891 | | | Philip Morris International, Inc. | | | 216,796 | |
| | | | | | | | 572,284 | |
| | | | | Trading Companies & Distributors — 0.6% | | | | |
| | 974 | | | United Rentals, Inc.(a) | | | 169,963 | |
| | | | | Total Common Stocks (Cost $24,660,007) | | | 26,596,723 | |
| | | | | | | | | |
| MONEY MARKET FUND — 1.5% | | | | |
| | 409,551 | | | Federated Treasury Obligations Fund, Institutional Shares, 0.02%(b) | | | 409,551 | |
| | | | | Total Money Market Fund (Cost $409,551) | | | 409,551 | |
Total Investments — 100.0% (Cost $25,069,558) | | | 27,006,274 | |
| Net Other Assets (Liabilities) — 0.0% | | | 7,597 | |
| NET ASSETS — 100.0% | | $ | 27,013,871 | |
| (a) | Represents non-income producing security. |
| (b) | Represents the current yield as of report date. |
Continued
| Sterling Capital Mid Value Fund |
Schedule of Portfolio Investments
September 30, 2020
| Shares | | | | | Fair Value | |
| COMMON STOCKS — 97.8% | | | |
| | | | | Auto Components — 3.1% | | | | |
| | 74,168 | | | Gentex Corp. | | $ | 1,909,826 | |
| | | | | Banks — 1.7% | | | | |
| | 11,425 | | | M&T Bank Corp. | | | 1,052,128 | |
| | | | | Capital Markets — 2.1% | | | | |
| | 18,794 | | | Affiliated Managers Group, Inc. | | | 1,285,134 | |
| | | | | Chemicals — 6.6% | | | | |
| | 85,783 | | | Axalta Coating Systems, Ltd.(a) | | | 1,901,809 | |
| | 72,407 | | | Corteva, Inc. | | | 2,086,046 | |
| | | | | | | | 3,987,855 | |
| | | | | Construction & Engineering — 3.7% | | | | |
| | 24,563 | | | Jacobs Engineering Group, Inc. | | | 2,278,710 | |
| | | | | Consumer Finance — 3.6% | | | | |
| | 145,654 | | | SLM Corp. | | | 1,178,341 | |
| | 37,801 | | | Synchrony Financial | | | 989,252 | |
| | | | | | | | 2,167,593 | |
| | | | | Containers & Packaging — 3.8% | | | | |
| | 30,313 | | | Crown Holdings, Inc.(a) | | | 2,329,857 | |
| | | | | Diversified Financial Services — 3.1% | | | | |
| | 103,916 | | | Jefferies Financial Group, Inc. | | | 1,870,488 | |
| | | | | Diversified Telecommunication Services — 6.0% | | | | |
| | 154,175 | | | CenturyLink, Inc. | | | 1,555,626 | |
| | 25,537 | | | GCI Liberty, Inc., Class A(a) | | | 2,093,013 | |
| | | | | | | | 3,648,639 | |
| | | | | Electric Utilities — 2.1% | | | | |
| | 24,218 | | | ALLETE, Inc. | | | 1,253,039 | |
| | | | | Electrical Equipment — 3.2% | | | | |
| | 44,893 | | | Sensata Technologies Holding PLC(a) | | | 1,936,684 | |
| | | | | Energy Equipment & Services — 0.9% | | | | |
| | 37,070 | | | Core Laboratories NV | | | 565,688 | |
| | | | | Food Products — 2.4% | | | | |
| | 38,261 | | | Cal-Maine Foods, Inc.(a) | | | 1,468,075 | |
| | | | | Health Care Equipment & Supplies — 4.1% | | | | |
| | 18,172 | | | Zimmer Biomet Holdings, Inc. | | | 2,473,936 | |
| | | | | Health Care Providers & Services — 8.8% | | | | |
| | 9,821 | | | HCA Healthcare, Inc. | | | 1,224,482 | |
| | 12,808 | | | Laboratory Corp. of America Holdings(a) | | | 2,411,362 | |
| | 11,445 | | | McKesson Corp. | | | 1,704,504 | |
| | | | | | | | 5,340,348 | |
| | | | | Hotels, Restaurants & Leisure — 3.3% | | | | |
| | 5,967 | | | Cracker Barrel Old Country Store, Inc. | | | 684,176 | |
| | 15,496 | | | Hilton Worldwide Holdings, Inc. | | | 1,322,119 | |
| | | | | | | | 2,006,295 | |
| | | | | Household Durables — 2.1% | | | | |
| | 13,058 | | | Mohawk Industries, Inc.(a) | | | 1,274,330 | |
| | | | | Household Products — 1.5% | | | | |
| | 15,864 | | | Spectrum Brands Holdings, Inc. | | | 906,786 | |
| | | | | Insurance — 5.8% | | | | |
| | 8,769 | | | Enstar Group, Ltd.(a) | | | 1,416,194 | |
| Shares | | | | | Fair Value | |
| COMMON STOCKS — (continued) | | | |
| | | | | Insurance — (continued) | | | | |
| | 14,916 | | | Lincoln National Corp. | | $ | 467,318 | |
| | 1,695 | | | Markel Corp.(a) | | | 1,650,422 | |
| | | | | | | | 3,533,934 | |
| | | | | Internet & Direct Marketing Retail — 2.2% | | | | |
| | 26,022 | | | eBay, Inc. | | | 1,355,746 | |
| | | | | IT Services — 2.7% | | | | |
| | 17,746 | | | Euronet Worldwide, Inc.(a) | | | 1,616,661 | |
| | | | | Machinery — 1.9% | | | | |
| | 60,528 | | | Trinity Industries, Inc. | | | 1,180,296 | |
| | | | | Media — 3.4% | | | | |
| | 24,659 | | | Fox Corp., Class A | | | 686,260 | |
| | 98,833 | | | News Corp., Class B | | | 1,381,685 | |
| | | | | | | | 2,067,945 | |
| | | | | Oil, Gas & Consumable Fuels — 1.2% | | | | |
| | 74,162 | | | CNX Resources Corp.(a) | | | 700,089 | |
| | | | | Pharmaceuticals — 2.1% | | | | |
| | 34,805 | | | Prestige Consumer Healthcare, Inc.(a) | | | 1,267,598 | |
| | | | | Professional Services — 2.6% | | | | |
| | 24,398 | | | ASGN, Inc.(a) | | | 1,550,737 | |
| | | | | Real Estate Management & Development — 3.7% | | | | |
| | 47,638 | | | CBRE Group, Inc., Class A(a) | | | 2,237,557 | |
| | | | | Specialty Retail — 2.9% | | | | |
| | 18,956 | | | CarMax, Inc.(a) | | | 1,742,246 | |
| | | | | Technology Hardware, Storage & Peripherals — 2.6% | | | | |
| | 71,260 | | | NCR Corp.(a) | | | 1,577,696 | |
| | | | | Trading Companies & Distributors — 4.6% | | | | |
| | 31,153 | | | Air Lease Corp. | | | 916,521 | |
| | 45,605 | | | HD Supply Holdings, Inc.(a) | | | 1,880,750 | |
| | | | | | | | 2,797,271 | |
| | | | | Total Common Stocks
(Cost $52,068,276) | | | 59,383,187 | |
| | | | | | | | | |
| MONEY MARKET FUND — 2.5% | | | | |
| | 1,533,445 | | | Federated Treasury Obligations Fund, Institutional Shares, 0.02%(b) | | | 1,533,445 | |
| | | | | Total Money Market Fund
(Cost $1,533,445) | | | 1,533,445 | |
| | | | | | | | | |
Total Investments — 100.3%
(Cost $53,601,721) | | | 60,916,632 | |
| Net Other Assets (Liabilities) — (0.3)% | | | (164,288 | ) |
| NET ASSETS — 100.0% | | $ | 60,752,344 | |
| (a) | Represents non-income producing security. |
| (b) | Represents the current yield as of report date. |
See accompanying Notes to the Financial Statements.
| Sterling Capital Behavioral Small Cap Value Equity Fund |
Schedule of Portfolio Investments
September 30, 2020
| Shares | | | | | Fair Value | |
| COMMON STOCKS — 97.3% | | | |
| | | | | Air Freight & Logistics — 1.4% | | | | |
| | 12,473 | | | Atlas Air Worldwide Holdings, Inc.(a) | | $ | 759,606 | |
| | 7,853 | | | Hub Group, Inc., Class A(a) | | | 394,181 | |
| | | | | | | | 1,153,787 | |
| | | | | Auto Components — 0.5% | | | | |
| | 12,025 | | | Cooper Tire & Rubber Co. | | | 381,193 | |
| | | | | Banks — 9.4% | | | | |
| | 40,176 | | | Bancorp, Inc. (The)(a) | | | 347,121 | |
| | 16,946 | | | Bank OZK | | | 361,289 | |
| | 21,572 | | | BankUnited, Inc. | | | 472,642 | |
| | 29,261 | | | Berkshire Hills Bancorp, Inc. | | | 295,829 | |
| | 16,900 | | | Cathay General Bancorp | | | 366,392 | |
| | 20,891 | | | Central Pacific Financial Corp. | | | 283,491 | |
| | 6,626 | | | Comerica, Inc. | | | 253,445 | |
| | 27,869 | | | Customers Bancorp, Inc.(a) | | | 312,133 | |
| | 10,300 | | | Eagle Bancorp, Inc. | | | 275,937 | |
| | 7,646 | | | East West Bancorp, Inc. | | | 250,330 | |
| | 18,085 | | | First Financial Corp. | | | 567,869 | |
| | 36,851 | | | Hilltop Holdings, Inc. | | | 758,394 | |
| | 86,881 | | | Hope Bancorp, Inc. | | | 658,992 | |
| | 11,982 | | | Independent Bank Group, Inc. | | | 529,365 | |
| | 11,482 | | | National Bank Holdings Corp., Class A | | | 301,403 | |
| | 21,515 | | | People’s United Financial, Inc. | | | 221,820 | |
| | 11,585 | | | Popular, Inc. | | | 420,188 | |
| | 11,713 | | | QCR Holdings, Inc. | | | 321,053 | |
| | 11,486 | | | Synovus Financial Corp. | | | 243,159 | |
| | 70,107 | | | Valley National Bancorp | | | 480,233 | |
| | | | | | | | 7,721,085 | |
| | | | | Building Products — 2.9% | | | | |
| | 13,045 | | | Builders FirstSource, Inc.(a) | | | 425,528 | |
| | 5,059 | | | Masonite International Corp.(a) | | | 497,806 | |
| | 5,029 | | | Owens Corning | | | 346,045 | |
| | 31,895 | | | Quanex Building Products Corp. | | | 588,144 | |
| | 9,978 | | | UFP Industries, Inc. | | | 563,857 | |
| | | | | | | | 2,421,380 | |
| | | | | Capital Markets — 2.6% | | | | |
| | 38,214 | | | Brightsphere Investment Group, Inc. | | | 492,961 | |
| | 34,040 | | | Cowen, Inc., Class A | | | 553,831 | |
| | 13,400 | | | Franklin Resources, Inc. | | | 272,690 | |
| | 21,352 | | | Virtu Financial, Inc., Class A | | | 491,309 | |
| | 24,300 | | | Waddell & Reed Financial, Inc., Class A | | | 360,855 | |
| | | | | | | | 2,171,646 | |
| | | | | Chemicals — 0.8% | | | | |
| | 15,712 | | | Chemours Co. (The) | | | 328,538 | |
| | 13,698 | | | Mosaic Co. (The) | | | 250,262 | |
| | 968 | | | Westlake Chemical Corp. | | | 61,197 | |
| | | | | | | | 639,997 | |
| | | | | Commercial Services & Supplies — 1.1% | | | | |
| | 13,015 | | | ABM Industries, Inc. | | | 477,130 | |
| | 47,817 | | | ADT, Inc. | | | 390,665 | |
| | | | | | | | 867,795 | |
| | | | | Communications Equipment — 0.8% | | | | |
| | 21,285 | | | NETGEAR, Inc.(a) | | | 656,004 | |
| | | | | Construction & Engineering — 4.7% | | | | |
| | 14,326 | | | Arcosa, Inc. | | | 631,633 | |
| | 6,345 | | | Argan, Inc. | | | 265,919 | |
| Shares | | | | | Fair Value | |
| COMMON STOCKS — (continued) | | | |
| | | | | Construction & Engineering — (continued) | | | | |
| | 10,618 | | | Dycom Industries, Inc.(a) | | $ | 560,843 | |
| | 53,533 | | | Great Lakes Dredge & Dock Corp.(a) | | | 509,099 | |
| | 7,089 | | | MYR Group, Inc.(a) | | | 263,569 | |
| | 15,334 | | | Primoris Services Corp. | | | 276,625 | |
| | 9,340 | | | Quanta Services, Inc. | | | 493,712 | |
| | 51,012 | | | Tutor Perini Corp.(a) | | | 567,764 | |
| | 2,182 | | | Valmont Industries, Inc. | | | 270,961 | |
| | | | | | | | 3,840,125 | |
| | | | | Consumer Finance — 3.4% | | | | |
| | 12,361 | | | Ally Financial, Inc. | | | 309,890 | |
| | 10,126 | | | Encore Capital Group, Inc.(a) | | | 390,762 | |
| | 18,278 | | | Enova International, Inc.(a) | | | 299,576 | |
| | 51,950 | | | EZCORP, Inc., Class A(a) | | | 261,309 | |
| | 95,681 | | | Navient Corp. | | | 808,504 | |
| | 8,083 | | | OneMain Holdings, Inc. | | | 252,594 | |
| | 61,882 | | | SLM Corp. | | | 500,625 | |
| | | | | | | | 2,823,260 | |
| | | | | Containers & Packaging — 0.3% | | | | |
| | 5,701 | | | Berry Global Group, Inc.(a) | | | 275,472 | |
| | | | | Distributors — 0.2% | | | | |
| | 6,475 | | | Core-Mark Holding Co., Inc. | | | 187,322 | |
| | | | | Diversified Financial Services — 1.6% | | | | |
| | 29,663 | | | Cannae Holdings, Inc.(a) | | | 1,105,243 | |
| | 13,759 | | | Jefferies Financial Group, Inc. | | | 247,662 | |
| | | | | | | | 1,352,905 | |
| | | | | Diversified Telecommunication Services — 0.3% | | | | |
| | 49,086 | | | Consolidated Communications Holdings,Inc.(a) | | | 279,299 | |
| | | | | Electric Utilities — 1.2% | | | | |
| | 16,585 | | | NRG Energy, Inc. | | | 509,823 | |
| | 52,458 | | | PG&E Corp.(a) | | | 492,581 | |
| | | | | | | | 1,002,404 | |
| | | | | Electrical Equipment — 0.3% | | | | |
| | 2,765 | | | Regal Beloit Corp. | | | 259,551 | |
| | | | | Electronic Equipment, Instruments & Components — 1.8% | | | | |
| | 3,801 | | | Arrow Electronics, Inc.(a) | | | 298,987 | |
| | 3,925 | | | Jabil, Inc. | | | 134,471 | |
| | 12,508 | | | Sanmina Corp.(a) | | | 338,341 | |
| | 1,675 | | | SYNNEX Corp. | | | 234,601 | |
| | 42,380 | | | TTM Technologies, Inc.(a) | | | 483,556 | |
| | | | | | | | 1,489,956 | |
| | | | | Energy Equipment & Services — 0.4% | | | | |
| | 82,673 | | | Patterson-UTI Energy, Inc. | | | 235,618 | |
| | 16,800 | | | ProPetro Holding Corp.(a) | | | 68,208 | |
| | | | | | | | 303,826 | |
| | | | | Entertainment — 0.9% | | | | |
| | 52,626 | | | Lions Gate Entertainment Corp., Class A(a) | | | 498,894 | |
| | 28,572 | | | Lions Gate Entertainment Corp., Class B(a) | | | 249,148 | |
| | | | | | | | 748,042 | |
| | | | | Equity Real Estate Investment Trusts (REITS) — 8.2% | | | | |
| | 63,518 | | | Acadia Realty Trust | | | 666,939 | |
See accompanying Notes to the Financial Statements.
| Sterling Capital Behavioral Small Cap Value Equity Fund |
Schedule of Portfolio Investments — (continued)
September 30, 2020
| Shares | | | | | Fair Value | |
| COMMON STOCKS — (continued) | | | |
| | | | | Equity Real Estate Investment Trusts (REITS) — (continued) | | | | |
| | 27,262 | | | Brixmor Property Group, Inc. | | $ | 318,693 | |
| | 82,600 | | | CoreCivic, Inc. | | | 660,800 | |
| | 6,921 | | | Douglas Emmett, Inc. | | | 173,717 | |
| | 7,872 | | | EPR Properties | | | 216,480 | |
| | — | | | Gaming and Leisure Properties, Inc. | | | 13 | |
| | 34,300 | | | GEO Group, Inc. (The) | | | 388,962 | |
| | 27,400 | | | Industrial Logistics Properties Trust | | | 599,238 | |
| | 22,270 | | | Kimco Realty Corp. | | | 250,760 | |
| | 99,111 | | | Macerich Co. (The) | | | 672,964 | |
| | 23,427 | | | Medical Properties Trust, Inc. | | | 413,018 | |
| | 6,285 | | | National Health Investors, Inc. | | | 378,797 | |
| | 504 | | | Retail Value, Inc. | | | 6,335 | |
| | 40,096 | | | Sabra Health Care REIT, Inc. | | | 552,723 | |
| | 1,043 | | | SL Green Realty Corp. | | | 48,364 | |
| | 14,766 | | | Taubman Centers, Inc. | | | 491,560 | |
| | 76,251 | | | VEREIT, Inc. | | | 495,631 | |
| | 18,722 | | | VICI Properties, Inc. | | | 437,533 | |
| | 642 | | | Weingarten Realty Investors | | | 10,888 | |
| | | | | | | | 6,783,415 | |
| | | | | Food & Staples Retailing — 2.2% | | | | |
| | 2,374 | | | BJ’s Wholesale Club Holdings, Inc.(a) | | | 98,640 | |
| | 36,354 | | | SpartanNash Co. | | | 594,388 | |
| | 23,323 | | | Sprouts Farmers Market, Inc.(a) | | | 488,150 | |
| | 39,303 | | | United Natural Foods, Inc.(a) | | | 584,436 | |
| | | | | | | | 1,765,614 | |
| | | | | Gas Utilities — 1.4% | | | | |
| | 11,970 | | | National Fuel Gas Co. | | | 485,862 | |
| | 23,133 | | | New Jersey Resources Corp. | | | 625,054 | |
| | | | | | | | 1,110,916 | |
| | | | | Health Care Providers & Services — 5.2% | | | | |
| | 5,579 | | | DaVita, Inc.(a) | | | 477,841 | |
| | 4,500 | | | Ensign Group, Inc. (The) | | | 256,770 | |
| | 4,175 | | | Magellan Health, Inc.(a) | | | 316,381 | |
| | 32,113 | | | Owens & Minor, Inc. | | | 806,357 | |
| | 5,491 | | | Providence Service Corp. (The)(a) | | | 510,169 | |
| | 24,099 | | | Select Medical Holdings Corp.(a) | | | 501,741 | |
| | 21,912 | | | Surgery Partners, Inc.(a) | | | 479,873 | |
| | 18,662 | | | Tenet Healthcare Corp.(a) | | | 457,406 | |
| | 17,875 | | | Tivity Health, Inc.(a) | | | 250,607 | |
| | 2,240 | | | Universal Health Services, Inc., Class B | | | 239,725 | |
| | | | | | | | 4,296,870 | |
| | | | | Household Durables — 4.1% | | | | |
| | 9,500 | | | Century Communities, Inc.(a) | | | 402,135 | |
| | 15,300 | | | KB Home | | | 587,367 | |
| | 8,390 | | | Meritage Homes Corp.(a) | | | 926,172 | |
| | 11,127 | | | PulteGroup, Inc. | | | 515,069 | |
| | 52,350 | | | TRI Pointe Group, Inc.(a) | | | 949,629 | |
| | | | | | | | 3,380,372 | |
| | | | | Household Products — 0.9% | | | | |
| | 7,360 | | | Central Garden & Pet Co.(a) | | | 293,885 | |
| | 12,496 | | | Central Garden & Pet Co., Class A(a) | | | 451,605 | |
| | | | | | | | 745,490 | |
| | | | | Independent Power and Renewable Electricity | | | | |
| | | | | Producers — 0.9% | | | | |
| | 27,366 | | | AES Corp. (The) | | | 495,598 | |
| Shares | | | | | Fair Value | |
| COMMON STOCKS — (continued) | | | |
| | | | | Independent Power and Renewable Electricity Producers — (continued) | | | | |
| | 13,291 | | | Vistra Corp. | | $ | 250,668 | |
| | | | | | | | 746,266 | |
| | | | | Insurance — 3.2% | | | | |
| | 11,247 | | | Assured Guaranty, Ltd. | | | 241,586 | |
| | 56,753 | | | CNO Financial Group, Inc. | | | 910,318 | |
| | 15,921 | | | Lincoln National Corp. | | | 498,805 | |
| | 19,179 | | | Old Republic International Corp. | | | 282,698 | |
| | 12,296 | | | Principal Financial Group, Inc. | | | 495,160 | |
| | 13,211 | | | Unum Group | | | 222,341 | |
| | | | | | | | 2,650,908 | |
| | | | | Internet & Direct Marketing Retail — 0.2% | | | | |
| | 26,328 | | | Qurate Retail, Inc., Series A | | | 189,035 | |
| | | | | Leisure Products — 1.5% | | | | |
| | 25,844 | | | Smith & Wesson Brands, Inc. | | | 401,099 | |
| | 3,405 | | | Sturm Ruger & Co., Inc. | | | 208,250 | |
| | 30,752 | | | Vista Outdoor, Inc.(a) | | | 620,575 | |
| | | | | | | | 1,229,924 | |
| | | | | Machinery — 1.6% | | | | |
| | 13,369 | | | Astec Industries, Inc. | | | 725,268 | |
| | 15,278 | | | Terex Corp. | | | 295,782 | |
| | 5,164 | | | Timken Co. (The) | | | 279,992 | |
| | | | | | | | 1,301,042 | |
| | | | | Marine — 0.8% | | | | |
| | 15,468 | | | Matson, Inc. | | | 620,112 | |
| | | | | Media — 0.9% | | | | |
| | 33,593 | | | Gray Television, Inc.(a) | | | 462,576 | |
| | 22,745 | | | Tribune Publishing Co. | | | 265,207 | |
| | | | | | | | 727,783 | |
| | | | | Metals & Mining — 2.7% | | | | |
| | 25,996 | | | Commercial Metals Co. | | | 519,400 | |
| | 4,493 | | | Reliance Steel & Aluminum Co. | | | 458,466 | |
| | 30,053 | | | Schnitzer Steel Industries, Inc., Class A | | | 577,919 | |
| | 9,166 | | | Steel Dynamics, Inc. | | | 262,423 | |
| | 9,379 | | | Worthington Industries, Inc. | | | 382,476 | |
| | | | | | | | 2,200,684 | |
| | | | | Mortgage Real Estate Investment Trusts (REITS) — 2.1% | | | | |
| | 69,183 | | | Annaly Capital Management, Inc. | | | 492,583 | |
| | 43,122 | | | Chimera Investment Corp. | | | 353,600 | |
| | 36,457 | | | Dynex Capital, Inc. | | | 554,511 | |
| | 24,350 | | | Ellington Financial, Inc. | | | 298,531 | |
| | 1,020 | | | Great Ajax Corp. | | | 8,456 | |
| | | | | | | | 1,707,681 | |
| | | | | Multiline Retail — 0.9% | | | | |
| | 16,831 | | | Big Lots, Inc. | | | 750,663 | |
| | | | | Multi-Utilities — 1.2% | | | | |
| | 15,293 | | | Avista Corp. | | | 521,797 | |
| | 11,089 | | | MDU Resources Group, Inc. | | | 249,503 | |
| | 11,215 | | | NiSource, Inc. | | | 246,730 | |
| | | | | | | | 1,018,030 | |
| | | | | Oil, Gas & Consumable Fuels — 3.4% | | | | |
| | 89,833 | | | CNX Resources Corp.(a) | | | 848,023 | |
Continued
| Sterling Capital Behavioral Small Cap Value Equity Fund |
Schedule of Portfolio Investments — (continued)
September 30, 2020
| Shares | | | | | Fair Value | |
| COMMON STOCKS — (continued) | | | | |
| | | | | Oil, Gas & Consumable Fuels — (continued) | | | | |
| | 35,032 | | | Dorian LPG, Ltd.(a) | | $ | 280,606 | |
| | 38,363 | | | EQT Corp. | | | 496,034 | |
| | 43,432 | | | Magnolia Oil & Gas Corp., Class A(a) | | | 224,543 | |
| | 17,250 | | | Renewable Energy Group, Inc.(a) | | | 921,495 | |
| | | | | | | | 2,770,701 | |
| | | | | Paper & Forest Products — 1.7% | | | | |
| | 18,308 | | | Boise Cascade Co. | | | 730,855 | |
| | 16,510 | | | Clearwater Paper Corp.(a) | | | 626,389 | |
| | | | | | | | 1,357,244 | |
| | | | | Personal Products — 0.3% | | | | |
| | 5,036 | | | Nu Skin Enterprises, Inc., Class A | | | 252,253 | |
| | | | | Pharmaceuticals — 1.7% | | | | |
| | 27,989 | | | Corcept Therapeutics, Inc.(a) | | | 487,149 | |
| | 32,483 | | | Innoviva, Inc.(a) | | | 339,447 | |
| | 1,872 | | | Jazz Pharmaceuticals PLC(a) | | | 266,928 | |
| | 18,707 | | | Mylan NV(a) | | | 277,425 | |
| | | | | | | | 1,370,949 | |
| | | | | Real Estate Management & Development — 1.3% | | | | |
| | 29,075 | | | Cushman & Wakefield PLC(a) | | | 305,578 | |
| | 30,220 | | | Forestar Group, Inc.(a) | | | 534,894 | |
| | 2,751 | | | Jones Lang LaSalle, Inc. | | | 263,161 | |
| | | | | | | | 1,103,633 | |
| | | | | Road & Rail — 1.4% | | | | |
| | 19,811 | | | ArcBest Corp. | | | 615,330 | |
| | 11,523 | | | Schneider National, Inc., Class B | | | 284,964 | |
| | 6,113 | | | Werner Enterprises, Inc. | | | 256,685 | |
| | | | | | | | 1,156,979 | |
| | | | | Semiconductors & Semiconductor Equipment — 3.6% | |
| | 47,214 | | | Amkor Technology, Inc.(a) | | | 528,797 | |
| | 34,130 | | | NeoPhotonics Corp.(a) | | | 207,852 | |
| | 25,599 | | | Photronics, Inc.(a) | | | 254,966 | |
| | 48,868 | | | Rambus, Inc.(a) | | | 669,003 | |
| | 14,504 | | | SMART Global Holdings, Inc.(a) | | | 396,539 | |
| | 6,036 | | | Synaptics, Inc.(a) | | | 485,415 | |
| | 21,299 | | | Ultra Clean Holdings, Inc.(a) | | | 457,077 | |
| | | | | | | | 2,999,649 | |
| | | | | Specialty Retail — 5.3% | | | | |
| | 4,525 | | | AutoNation, Inc.(a) | | | 239,508 | |
| | 9,192 | | | Camping World Holdings, Inc., Class A | | | 273,462 | |
| | 8,622 | | | Dick’s Sporting Goods, Inc. | | | 499,041 | |
| | 8,061 | | | Hibbett Sports, Inc.(a) | | | 316,152 | |
| | 2,695 | | | Lithia Motors, Inc., Class A | | | 614,298 | |
| | 11,875 | | | Lumber Liquidators Holdings, Inc.(a) | | | 261,844 | |
| | 11,567 | | | MarineMax, Inc.(a) | | | 296,925 | |
| | 2,105 | | | Murphy USA, Inc.(a) | | | 270,008 | |
| | 16,657 | | | Rent-A-Center, Inc. | | | 497,878 | |
| | 16,583 | | | Sonic Automotive, Inc., Class A | | | 665,973 | |
| Shares | | | | | Fair Value | |
| COMMON STOCKS — (continued) | | | | |
| | | | | Specialty Retail — (continued) | | | | |
| | 30,153 | | | Sportsman’s Warehouse Holdings, Inc.(a) | | $ | 431,489 | |
| | | | | | | | 4,366,578 | |
| | | | | Textiles,Apparel & Luxury Goods — 0.3% | | | | |
| | 13,380 | | | Lakeland Industries, Inc.(a) | | | 264,924 | |
| | | | | Thrifts & Mortgage Finance — 3.3% | | | | |
| | 15,325 | | | Axos Financial, Inc.(a) | | | 357,226 | |
| | 24,351 | | | Flagstar Bancorp, Inc. | | | 721,520 | |
| | 11,450 | | | HomeStreet, Inc. | | | 294,952 | |
| | 55,126 | | | MGIC Investment Corp. | | | 488,416 | |
| | 15,308 | | | PennyMac Financial Services, Inc. | | | 889,701 | |
| | | | | | | | 2,751,815 | |
| | | | | Trading Companies & Distributors — 2.4% | | | | |
| | 15,916 | | | GMS, Inc.(a) | | | 383,576 | |
| | 14,826 | | | Rush Enterprises, Inc., Class A | | | 749,306 | |
| | 21,628 | | | Triton International, Ltd./Bermuda | | | 879,611 | |
| | | | | | | | 2,012,493 | |
| | | | | Total Common Stocks
(Cost $76,330,391) | | | 80,207,072 | |
| | | | | | | | | |
| PREFERRED STOCKS — 0.0% | | | | |
| | | | | Internet & Direct Marketing Retail — 0.0% | | | | |
| | 1 | | | Qurate Retail, Inc. | | | 83 | |
| | | | | Total Preferred Stocks
(Cost $81) | | | 83 | |
| | | | | | | | | |
| EXCHANGE TRADED FUND — 1.0% | | | | |
| | 7,871 | | | iShares Russell 2000 Value ETF | | | 781,826 | |
| | | | | Total Exchange Traded Fund
(Cost $675,763) | | | 781,826 | |
| | | | | | | | | |
| MONEY MARKET FUND — 1.7% | | | | |
| | 1,423,554 | | | Federated Treasury Obligations Fund, Institutional Shares, 0.02%(b) | | | 1,423,554 | |
| | | | | Total Money Market Fund
(Cost $1,423,554) | | | 1,423,554 | |
Total Investments — 100.0%
(Cost $78,429,789) | | | 82,412,535 | |
| Net Other Assets (Liabilities) — 0.0% | | | 3,654 | |
| NET ASSETS — 100.0% | | $ | 82,416,189 | |
| (a) | Represents non-income producing security. |
| (b) | Represents the current yield as of report date. |
ETF — Exchange Traded Fund
Continued
| Sterling Capital Special Opportunities Fund |
Schedule of Portfolio Investments
September 30, 2020
| Shares | | | | | Fair Value | |
| COMMON STOCKS — 98.9% | | | | |
| | | | | Air Freight & Logistics — 3.5% | | | | |
| | 76,503 | | | FedEx Corp. | | $ | 19,242,035 | |
| | | | | Auto Components — 2.4% | | | | |
| | 146,000 | | | Aptiv PLC | | | 13,385,280 | |
| | | | | Biotechnology — 1.5% | | | | |
| | 134,000 | | | Gilead Sciences, Inc. | | | 8,467,460 | |
| | | | | Capital Markets — 2.2% | | | | |
| | 335,187 | | | Charles Schwab Corp. (The) | | | 12,143,825 | |
| | | | | Communications Equipment — 5.8% | | | | |
| | 335,580 | | | Cisco Systems, Inc. | | | 13,218,496 | |
| | 149,500 | | | F5 Networks, Inc.(a) | | | 18,354,115 | |
| | | | | | | | 31,572,611 | |
| | | | | Consumer Finance — 3.6% | | | | |
| | 274,000 | | | Capital One Financial Corp. | | | 19,689,640 | |
| | | | | Containers & Packaging — 1.9% | | | | |
| | 122,872 | | | Ball Corp. | | | 10,213,121 | |
| | | | | Electronic Equipment, Instruments & | | | | |
| | | | | Components — 1.4% | | | | |
| | 211,000 | | | FLIR Systems, Inc. | | | 7,564,350 | |
| | | | | Entertainment — 3.2% | | | | |
| | 217,000 | | | Activision Blizzard, Inc. | | | 17,566,150 | |
| | | | | Health Care Equipment & Supplies — 13.2% | | | | |
| | 386,000 | | | Boston Scientific Corp.(a) | | | 14,749,060 | |
| | 135,000 | | | Danaher Corp. | | | 29,069,550 | |
| | 425,000 | | | Hologic, Inc.(a) | | | 28,249,750 | |
| | | | | | | | 72,068,360 | |
| | | | | Health Care Providers & Services — 9.2% | | | | |
| | 197,500 | | | HCA Healthcare, Inc. | | | 24,624,300 | |
| | 83,500 | | | UnitedHealth Group, Inc. | | | 26,032,795 | |
| | | | | | | | 50,657,095 | |
| | | | | Health Care Technology — 3.3% | | | | |
| | 252,000 | | | Cerner Corp. | | | 18,217,080 | |
| | | | | Household Durables — 2.9% | | | | |
| | 193,494 | | | Lennar Corp., Class A | | | 15,804,590 | |
| | | | | Interactive Media & Services — 5.9% | | | | |
| | 22,000 | | | Alphabet, Inc., Class C(a) | | | 32,331,200 | |
| | | | | IT Services — 9.7% | | | | |
| | 248,500 | | | Akamai Technologies, Inc.(a) | | | 27,469,190 | |
| | 56,000 | | | Broadridge Financial Solutions, Inc. | | | 7,392,000 | |
| Shares | | | | | Fair Value | |
| COMMON STOCKS — (continued) | | | | |
| | | | | IT Services — (continued) | | | | |
| | 174,000 | | | Fiserv, Inc.(a) | | $ | 17,930,700 | |
| | 12,274 | | | Rackspace Technology, Inc.(a) | | | 236,765 | |
| | | | | | | | 53,028,655 | |
| | | | | Media — 6.7% | | | | |
| | 571,055 | | | Comcast Corp., Class A | | | 26,417,004 | |
| | 530,000 | | | Discovery, Inc., Class C(a) | | | 10,388,000 | |
| | | | | | | | 36,805,004 | |
| | | | | Pharmaceuticals — 4.4% | | | | |
| | 399,000 | | | Bristol-Myers Squibb Co. | | | 24,055,710 | |
| | | | | Professional Services — 3.2% | | | | |
| | 94,200 | | | Verisk Analytics, Inc. | | | 17,456,202 | |
| | | | | Real Estate Management & Development — 3.1% | | | | |
| | 362,000 | | | CBRE Group, Inc., Class A(a) | | | 17,003,140 | |
| | | | | Semiconductors & Semiconductor Equipment — 4.8% | | | | |
| | 208,500 | | | NXP Semiconductors NV | | | 26,022,885 | |
| | | | | Software — 7.0% | | | | |
| | 220,000 | | | CDK Global, Inc. | | | 9,589,800 | |
| | 57,000 | | | Intuit, Inc. | | | 18,593,970 | |
| | 125,561 | | | PTC, Inc.(a) | | | 10,386,406 | |
| | | | | | | | 38,570,176 | |
| | | | | Total Common Stocks
(Cost $331,521,062) | | | 541,864,569 | |
| | | | | | | | | |
| MONEY MARKET FUND — 0.2% | | | | |
| | 1,183,389 | | | Federated Treasury Obligations Fund, Institutional Shares, 0.02%(b) | | | 1,183,389 | |
| | | | | Total Money Market Fund
(Cost $1,183,389) | | | 1,183,389 | |
| | | | | | | | | |
Total Investments — 99.1%
(Cost $332,704,451) | | | 543,047,958 | |
| Net Other Assets (Liabilities) — 0.9% | | | 5,196,750 | |
| NET ASSETS — 100.0% | | $ | 548,244,708 | |
| (a) | Represents non-income producing security. |
| (b) | Represents the current yield as of report date. |
See accompanying Notes to the Financial Statements.
| Sterling Capital Equity Income Fund |
Schedule of Portfolio Investments
September 30, 2020
| Shares | | | | | Fair Value | |
| COMMON STOCKS — 99.5% | | | | |
| | | | | Air Freight & Logistics — 4.5% | | | | |
| | 417,500 | | | United Parcel Service, Inc., Class B | | $ | 69,568,025 | |
| | | | | Banks — 1.8% | | | | |
| | 660,000 | | | Citigroup, Inc. | | | 28,452,600 | |
| | | | | Beverages — 5.7% | | | | |
| | 664,000 | | | Coca-Cola Co. (The) | | | 32,781,680 | |
| | 403,434 | | | PepsiCo, Inc. | | | 55,915,952 | |
| | | | | | | | 88,697,632 | |
| | | | | Biotechnology — 3.2% | | | | |
| | 572,500 | | | AbbVie, Inc. | | | 50,145,275 | |
| | | | | Capital Markets — 6.6% | | | | |
| | 193,300 | | | Goldman Sachs Group, Inc. (The) | | | 38,847,501 | |
| | 244,305 | | | Nasdaq, Inc. | | | 29,978,667 | |
| | 438,000 | | | Northern Trust Corp. | | | 34,150,860 | |
| | | | | | | | 102,977,028 | |
| | | | | Communications Equipment — 3.1% | | | | |
| | 697,000 | | | Cisco Systems, Inc. | | | 27,454,830 | |
| | 132,193 | | | Motorola Solutions, Inc. | | | 20,729,184 | |
| | | | | | | | 48,184,014 | |
| | | | | Consumer Finance — 3.7% | | | | |
| | 981,000 | | | Discover Financial Services | | | 56,682,180 | |
| | | | | Diversified Telecommunication Services — 3.8% | | | | |
| | 996,000 | | | Verizon Communications, Inc. | | | 59,252,040 | |
| | | | | Electronic Equipment, Instruments & Components — 3.3% | | | | |
| | 1,602,000 | | | Corning, Inc. | | | 51,920,820 | |
| | | | | Equity Real Estate Investment Trusts (REITS) — 2.1% | | | | |
| | 199,333 | | | Crown Castle International Corp. | | | 33,188,946 | |
| | | | | Food Products — 2.6% | | | | |
| | 686,000 | | | Tyson Foods, Inc., Class A | | | 40,803,280 | |
| | | | | Health Care Equipment & Supplies — 8.0% | | | | |
| | 645,686 | | | Abbott Laboratories | | | 70,270,007 | |
| | 516,471 | | | Medtronic PLC | | | 53,671,666 | |
| | | | | | | | 123,941,673 | |
| | | | | Health Care Providers & Services — 8.0% | | | | |
| | 219,016 | | | Anthem, Inc. | | | 58,825,507 | |
| | 853,091 | | | CVS Health Corp. | | | 49,820,514 | |
| | 248,000 | | | Encompass Health Corp. | | | 16,115,040 | |
| | | | | | | | 124,761,061 | |
| | | | | Hotels, Restaurants & Leisure — 5.5% | | | | |
| | 886,025 | | | Restaurant Brands International, Inc. | | | 50,955,298 | |
| Shares | | | | | Fair Value | |
| COMMON STOCKS — (continued) | | | |
| | | | | Hotels, Restaurants & Leisure — (continued) | | | | |
| | 405,996 | | | Starbucks Corp. | | $ | 34,883,176 | |
| | | | | | | | 85,838,474 | |
| | | | | Industrial Conglomerates — 3.4% | | | | |
| | 315,840 | | | Honeywell International, Inc. | | | 51,990,422 | |
| | | | | Insurance — 3.6% | | | | |
| | 484,500 | | | Chubb, Ltd. | | | 56,260,140 | |
| | | | | IT Services — 5.9% | | | | |
| | 293,000 | | | Accenture PLC, Class A | | | 66,215,070 | |
| | 444,000 | | | Amdocs, Ltd. | | | 25,490,040 | |
| | | | | | | | 91,705,110 | |
| | | | | Oil, Gas & Consumable Fuels — 2.8% | | | | |
| | 563,000 | | | EOG Resources, Inc. | | | 20,234,220 | |
| | 439,392 | | | Phillips 66 | | | 22,778,081 | |
| | | | | | | | 43,012,301 | |
| | | | | Pharmaceuticals — 7.4% | | | | |
| | 374,824 | | | Johnson & Johnson | | | 55,803,797 | |
| | 713,672 | | | Merck & Co., Inc. | | | 59,199,092 | |
| | | | | | | | 115,002,889 | |
| | | | | Semiconductors & Semiconductor Equipment — 5.4% | | | | |
| | 519,567 | | | Analog Devices, Inc. | | | 60,654,252 | |
| | 340,132 | | | Maxim Integrated Products, Inc. | | | 22,996,325 | |
| | | | | | | | 83,650,577 | |
| | | | | Software — 4.7% | | | | |
| | 346,000 | | | Microsoft Corp. | | | 72,774,180 | |
| | | | | Specialty Retail — 4.4% | | | | |
| | 246,784 | | | Home Depot, Inc. (The) | | | 68,534,385 | |
| | | | | Total Common Stocks
(Cost $1,149,422,357) | | | 1,547,343,052 | |
| | | | | | | | | |
| MONEY MARKET FUND — 0.5% | | | | |
| | 7,429,217 | | | Federated Treasury Obligations Fund, Institutional Shares, 0.02%(a) | | | 7,429,217 | |
| | | | | Total Money Market Fund
(Cost $7,429,217) | | | 7,429,217 | |
Total Investments — 100.0%
(Cost $1,156,851,574) | | | 1,554,772,269 | |
| Net Other Assets (Liabilities) — 0.0% | | | 704,719 | |
| NET ASSETS — 100.0% | | $ | 1,555,476,988 | |
| (a) | Represents the current yield as of report date. |
See accompanying Notes to the Financial Statements.
| Sterling Capital Behavioral International Equity Fund |
Schedule of Portfolio Investments
September 30, 2020
| Shares | | | | | Fair Value | |
| COMMON STOCKS — 96.8% | | | | |
| | | | | Australia — 6.0% | | | | |
| | 525,950 | | | AusNet Services | | $ | 709,998 | |
| | 65,700 | | | Coles Group, Ltd. | | | 800,409 | |
| | 76,125 | | | Fortescue Metals Group, Ltd. | | | 894,319 | |
| | 1,175 | | | Lendlease Corp., Ltd. | | | 9,386 | |
| | 13,500 | | | Rio Tinto, Ltd. | | | 922,069 | |
| | 32,100 | | | Sonic Healthcare, Ltd. | | | 762,285 | |
| | 327,600 | | | Stockland, REIT | | | 894,946 | |
| | | | | | | | 4,993,412 | |
| | | | | Belgium — 1.0% | | | | |
| | 7,600 | | | UCB SA | | | 863,165 | |
| | | | | Denmark — 1.0% | | | | |
| | 11,375 | | | Pandora A/S | | | 820,567 | |
| | | | | Finland — 2.8% | | | | |
| | 12,925 | | | Neste Oyj | | | 680,631 | |
| | 185,675 | | | Nokia Oyj(a) | | | 726,710 | |
| | 22,875 | | | Sampo Oyj, Class A | | | 905,921 | |
| | | | | | | | 2,313,262 | |
| | | | | France — 8.9% | | | | |
| | 7,625 | | | Arkema SA | | | 808,439 | |
| | 9,950 | | | Atos SE(a) | | | 799,548 | |
| | 7,125 | | | Capgemini SE | | | 914,110 | |
| | 19,050 | | | Carrefour SA | | | 304,403 | |
| | 22,425 | | | Cie de Saint-Gobain(a) | | | 939,325 | |
| | 7,675 | | | Ipsen SA | | | 802,302 | |
| | 14,000 | | | Sanofi | | | 1,402,974 | |
| | 5,625 | | | Schneider Electric SE | | | 699,185 | |
| | 8,000 | | | Ubisoft Entertainment SA(a) | | | 721,028 | |
| | | | | | | | 7,391,314 | |
| | | | | Germany — 10.0% | | | | |
| | 13,250 | | | Brenntag AG | | | 842,465 | |
| | 3,775 | | | Daimler AG | | | 203,644 | |
| | 23,750 | | | Deutsche Post AG | | | 1,077,676 | |
| | 50,875 | | | Deutsche Telekom AG | | | 847,076 | |
| | 79,425 | | | E.ON SE | | | 875,460 | |
| | 10,125 | | | Fresenius Medical Care AG & Co. KGaA | | | 855,939 | |
| | 9,575 | | | Henkel AG & Co. KGaA | | | 895,537 | |
| | 5,625 | | | LEG Immobilien AG | | | 801,786 | |
| | 5,625 | | | Merck KGaA | | | 820,087 | |
| | 1,600 | | | Muenchener Rueckversicherungs-Gesellschaft AG in Muenchen | | | 406,750 | |
| | 19,025 | | | United Internet AG | | | 727,574 | |
| | | | | | | | 8,353,994 | |
| | | | | Hong Kong — 1.3% | | | | |
| | 302,000 | | | Hang Lung Properties, Ltd. | | | 769,667 | |
| | 64,000 | | | New World Development Co., Ltd. | | | 312,430 | |
| | | | | | | | 1,082,097 | |
| | | | | Israel — 1.7% | | | | |
| | 6,700 | | | Check Point Software Technologies, Ltd.(a) | | | 806,278 | |
| | 71,975 | | | Teva Pharmaceutical Industries, Ltd., ADR(a) | | | 648,495 | |
| | | | | | | | 1,454,773 | |
| | | | | Italy — 1.4% | | | | |
| | 21,075 | | | Enel SpA | | | 182,846 | |
| | 6,825 | | | Prysmian SpA | | | 198,115 | |
| | 154,325 | | | Snam SpA | | | 793,663 | |
| | | | | | | | 1,174,624 | |
| Shares | | | | | Fair Value | |
| COMMON STOCKS — (continued) | | | | |
| | | | | Japan — 28.1% | | | | |
| | 22,100 | | | Calbee, Inc. | | $ | 727,929 | |
| | 122,000 | | | Chiba Bank, Ltd. (The) | | | 673,164 | |
| | 217,400 | | | ENEOS Holdings, Inc. | | | 775,654 | |
| | 7,000 | | | Fujitsu, Ltd. | | | 956,324 | |
| | 43,200 | | | Fukuoka Financial Group, Inc. | | | 726,102 | |
| | 34,600 | | | Iida Group Holdings Co., Ltd. | | | 700,292 | |
| | 38,600 | | | ITOCHU Corp. | | | 988,386 | |
| | 44,200 | | | Japan Post Insurance Co., Ltd. | | | 695,942 | |
| | 700 | | | KDDI Corp. | | | 17,606 | |
| | 24,500 | | | LIXIL Group Corp. | | | 495,201 | |
| | 328,200 | | | Mebuki Financial Group, Inc. | | | 744,750 | |
| | 6,400 | | | Medipal Holdings Corp. | | | 128,335 | |
| | 2,100 | | | MEIJI Holdings Co., Ltd. | | | 160,410 | |
| | 16,500 | | | Mitsubishi Gas Chemical Co., Inc. | | | 306,957 | |
| | 67,580 | | | Mizuho Financial Group, Inc. | | | 843,512 | |
| | 32,800 | | | Nexon Co., Ltd. | | | 818,156 | |
| | 18,000 | | | NH Foods, Ltd. | | | 804,580 | |
| | 77,900 | | | Nomura Holdings, Inc. | | | 355,998 | |
| | 86,000 | | | Obayashi Corp. | | | 785,119 | |
| | 26,700 | | | Ono Pharmaceutical Co., Ltd. | | | 839,818 | |
| | 3,000 | | | Otsuka Holdings Co., Ltd. | | | 127,096 | |
| | 42,600 | | | Persol Holdings Co., Ltd. | | | 695,836 | |
| | 98,000 | | | Renesas Electronics Corp.(a) | | | 719,285 | |
| | 191,900 | | | Resona Holdings, Inc. | | | 653,771 | |
| | 28,400 | | | SBI Holdings, Inc. | | | 735,897 | |
| | 46,000 | | | Sekisui House, Ltd. | | | 815,153 | |
| | 22,500 | | | SoftBank Group Corp. | | | 1,392,178 | |
| | 16,400 | | | Sony Corp. | | | 1,256,929 | |
| | 14,400 | | | Tokyo Century Corp. | | | 784,884 | |
| | 3,900 | | | Tokyo Electron, Ltd. | | | 1,018,893 | |
| | 13,300 | | | Toyo Suisan Kaisha, Ltd. | | | 702,323 | |
| | 11,900 | | | Toyota Industries Corp. | | | 753,530 | |
| | 8,500 | | | Toyota Motor Corp. | | | 564,145 | |
| | 100,700 | | | Z Holdings Corp. | | | 672,618 | |
| | | | | | | | 23,436,773 | |
| | | | | Netherlands — 3.2% | | | | |
| | 33,400 | | | Koninklijke Ahold Delhaize NV | | | 987,241 | |
| | 22,050 | | | NN Group NV | | | 826,521 | |
| | 16,650 | | | Randstad NV(a) | | | 868,227 | |
| | | | | | | | 2,681,989 | |
| | | | | Norway — 2.0% | | | | |
| | 60,375 | | | DNB ASA(a) | | | 841,061 | |
| | 80,700 | | | Orkla ASA | | | 814,463 | |
| | | | | | | | 1,655,524 | |
| | | | | Portugal — 0.4% | | | | |
| | 58,650 | | | EDP - Energias de Portugal SA | | | 288,380 | |
| | | | | Singapore — 2.9% | | | | |
| | 54,000 | | | Venture Corp., Ltd. | | | 766,747 | |
| | 252,800 | | | Wilmar International, Ltd. | | | 820,803 | |
| | 1,093,900 | | | Yangzijiang Shipbuilding Holdings, Ltd. | | | 799,079 | |
| | | | | | | | 2,386,629 | |
| | | | | Spain — 1.0% | | | | |
| | 31,100 | | | Endesa SA | | | 831,868 | |
| | | | | Sweden — 5.3% | | | | |
| | 19,325 | | | Essity AB, Class B(a) | | | 652,438 | |
| | 76,700 | | | Husqvarna AB, Class B | | | 843,407 | |
| | 10,250 | | | Kinnevik AB, Class B | | | 416,031 | |
See accompanying Notes to the Financial Statements.
| Sterling Capital Behavioral International Equity Fund |
Schedule of Portfolio Investments — (continued)
September 30, 2020
| Shares | | | | | Fair Value | |
| COMMON STOCKS — (continued) | | | | |
| | | | | Sweden — (continued) | | | | |
| | 45,350 | | | Sandvik AB(a) | | $ | 886,834 | |
| | 37,325 | | | SKF AB, Class B | | | 770,036 | |
| | 10,850 | | | Swedish Match AB | | | 887,169 | |
| | | | | | | | 4,455,915 | |
| | | | | Switzerland — 8.4% | | | | |
| | 18,475 | | | ABB, Ltd. | | | 469,706 | |
| | 4,650 | | | Adecco Group AG | | | 245,359 | |
| | 4,050 | | | Kuehne + Nagel International AG | | | 786,402 | |
| | 7,800 | | | LafargeHolcim, Ltd. | | | 355,053 | |
| | 11,850 | | | Logitech International SA | | | 917,926 | |
| | 6,425 | | | Roche Holding AG | | | 2,200,823 | |
| | 84,375 | | | UBS Group AG | | | 942,714 | |
| | 3,000 | | | Zurich Insurance Group AG | | | 1,046,146 | |
| | | | | | | | 6,964,129 | |
| | | | | United Kingdom — 11.4% | | | | |
| | 16,250 | | | Admiral Group PLC | | | 548,038 | |
| | 60,825 | | | Antofagasta PLC | | | 802,726 | |
| | 46,325 | | | BHP Group PLC | | | 988,309 | |
| | 27,575 | | | Bunzl PLC | | | 890,302 | |
| | 172,000 | | | Evraz PLC | | | 765,900 | |
| | 9,950 | | | Ferguson PLC | | | 1,001,278 | |
| | 68,650 | | | GVC Holdings PLC(a) | | | 859,793 | |
| | 22,275 | | | Hikma Pharmaceuticals PLC | | | 746,601 | |
| | 76,200 | | | JD Sports Fashion PLC | | | 795,428 | |
| | 251,600 | | | Kingfisher PLC | | | 963,734 | |
| | 19,525 | | | Rio Tinto PLC | | | 1,174,873 | |
| | | | | | | | 9,536,982 | |
| | | | | Total Common Stocks
(Cost $72,505,079) | | | 80,685,397 | |
| | | | | | | | | |
| PREFERRED STOCKS — 1.5% | | | | |
| | | | | Germany — 1.5% | | | | |
| | 14,100 | | | Bayerische Motoren Werke AG | | | 770,603 | |
| | 4,425 | | | Henkel AG & Co. KGaA | | | 462,798 | |
| | | | | Total Preferred Stocks
(Cost $1,130,908) | | | 1,233,401 | |
| | | | | | | | | |
| MONEY MARKET FUND — 0.8% | | | | |
| | | | | United States — 0.8% | | | | |
| | 713,832 | | | Federated Treasury Obligations Fund, Institutional Shares, 0.02%(b) | | | 713,832 | |
| | | | | | | | | |
| | | | | Total Money Market Fund
(Cost $713,832) | | | 713,832 | |
Total Investments — 99.1%
(Cost $74,349,819) | | | 82,632,630 | |
| Net Other Assets (Liabilities) — 0.9% | | | 744,036 | |
| NET ASSETS — 100.0% | | $ | 83,376,666 | |
| (a) | Represents non-income producing security. |
| (b) | Represents the current yield as of report date. |
ADR — American Depository Receipts
| Industry | | Percentage of net assets |
| Air Freight & Logistics | | | 1.3 | % |
| Auto Components | | | 0.9 | % |
| Automobiles | | | 1.8 | % |
| Banks | | | 5.4 | % |
| Building Products | | | 1.7 | % |
| Capital Markets | | | 2.4 | % |
| Chemicals | | | 1.3 | % |
| Communications Equipment | | | 0.9 | % |
| Construction & Engineering | | | 0.9 | % |
| Construction Materials | | | 0.4 | % |
| Diversified Financial Services | | | 1.4 | % |
| Diversified Telecommunication Services | | | 1.9 | % |
| Electric Utilities | | | 2.4 | % |
| Electrical Equipment | | | 1.6 | % |
| Electronic Equipment, Instruments & Components | | | 0.9 | % |
| Entertainment | | | 1.9 | % |
| Equity Real Estate Investment Trusts (REITS) | | | 1.1 | % |
| Food & Staples Retailing | | | 2.5 | % |
| Food Products | | | 4.8 | % |
| Gas Utilities | | | 1.0 | % |
| Health Care Providers & Services | | | 2.1 | % |
| Hotels, Restaurants & Leisure | | | 1.0 | % |
| Household Durables | | | 4.3 | % |
| Household Products | | | 2.4 | % |
| Insurance | | | 5.3 | % |
| Interactive Media & Services | | | 0.8 | % |
| IT Services | | | 3.2 | % |
| Machinery | | | 2.9 | % |
| Marine | | | 0.9 | % |
| Metals & Mining | | | 6.7 | % |
| Money Market Fund | | | 0.9 | % |
| Multi-Utilities | | | 1.1 | % |
| Oil, Gas & Consumable Fuels | | | 1.8 | % |
| Pharmaceuticals | | | 10.1 | % |
| Professional Services | | | 2.2 | % |
| Real Estate Management & Development | | | 2.3 | % |
| Semiconductors & Semiconductor Equipment | | | 2.1 | % |
| Software | | | 1.0 | % |
| Specialty Retail | | | 2.1 | % |
| Technology Hardware, Storage & Peripherals | | | 1.1 | % |
| Textiles, Apparel & Luxury Goods | | | 1.0 | % |
| Tobacco | | | 1.1 | % |
| Trading Companies & Distributors | | | 4.5 | % |
| Wireless Telecommunication Services | | | 1.7 | % |
| | | | 99.1 | % |
Continued
| Sterling Capital SMID Opportunities Fund |
Schedule of Portfolio Investments
September 30, 2020
| Shares | | | | | Fair Value | |
| COMMON STOCKS — 98.8% | | | | |
| | | | | Airlines — 0.5% | | | | |
| | 1,404 | | | Alaska Air Group, Inc. | | $ | 51,428 | |
| | | | | Auto Components — 5.0% | | | | |
| | 4,625 | | | Aptiv PLC. | | | 424,020 | |
| | 4,848 | | | Gentex Corp. | | | 124,836 | |
| | | | | | | | 548,856 | |
| | | | | Commercial Services & Supplies — 8.6% | | | | |
| | 1,666 | | | UniFirst Corp. | | | 315,490 | |
| | 6,110 | | | Waste Connections, Inc. | | | 634,218 | |
| | | | | | | | 949,708 | |
| | | | | Communications Equipment — 3.2% | | | | |
| | 2,880 | | | F5 Networks, Inc.(a) | | | 353,578 | |
| | | | | Consumer Finance — 4.9% | | | | |
| | 67,163 | | | SLM Corp. | | | 543,349 | |
| | | | | Containers & Packaging — 6.9% | | | | |
| | 9,209 | | | Ball Corp. | | | 765,452 | |
| | | | | Entertainment — 1.8% | | | | |
| | 1,200 | | | Take-Two Interactive Software, Inc.(a) | | | 198,264 | |
| | | | | Equity Real Estate Investment Trusts (REITS) — 3.1% | | | | |
| | 11,478 | | | Healthcare Realty Trust, Inc. | | | 345,717 | |
| | | | | Health Care Equipment & Supplies — 10.7% | | | | |
| | 9,119 | | | Hologic, Inc.(a) | | | 606,140 | |
| | 1,683 | | | Teleflex, Inc. | | | 572,927 | |
| | | | | | | | 1,179,067 | |
| | | | | Health Care Providers & Services — 9.9% | | | | |
| | 9,376 | | | Centene Corp.(a) | | | 546,902 | |
| | 1,426 | | | Premier, Inc., Class A(a) | | | 46,816 | |
| | 4,700 | | | Universal Health Services, Inc., Class B | | | 502,994 | |
| | | | | | | | 1,096,712 | |
| | | | | Household Durables — 1.7% | | | | |
| | 46 | | | NVR, Inc.(a) | | | 187,824 | |
| | | | | Insurance — 4.8% | | | | |
| | 4,966 | | | Arthur J Gallagher & Co. | | | 524,310 | |
| | | | | IT Services — 25.4% | | | | |
| | 3,464 | | | Akamai Technologies, Inc.(a) | | | 382,911 | |
| Shares | | | | | Fair Value | |
| COMMON STOCKS — (continued) | | | | |
| | | | | IT Services — (continued) | | | | |
| | 6,435 | | | Amdocs, Ltd. | | $ | 369,433 | |
| | 2,343 | | | Black Knight, Inc.(a) | | | 203,958 | |
| | 900 | | | Broadridge Financial Solutions, Inc. | | | 118,800 | |
| | 6,131 | | | Fiserv, Inc.(a) | | | 631,800 | |
| | 14,000 | | | Genpact, Ltd. | | | 545,300 | |
| | 3,124 | | | Global Payments, Inc. | | | 554,760 | |
| | | | | | | | 2,806,962 | |
| | | | | Oil, Gas & Consumable Fuels — 0.9% | | | | |
| | 9,951 | | | Parsley Energy, Inc., Class A | | | 93,141 | |
| | | | | Real Estate Management & Development — 4.1% | | | | |
| | 3,435 | | | FirstService Corp. | | | 453,042 | |
| | | | | Software — 6.5% | | | | |
| | 8,205 | | | CDK Global, Inc. | | | 357,656 | |
| | 4,334 | | | PTC, Inc.(a) | | | 358,508 | |
| | | | | | | | 716,164 | |
| | | | | Specialty Retail — 0.8% | | | | |
| | 954 | | | CarMax, Inc.(a) | | | 87,682 | |
| | | | | Total Common Stocks (Cost $8,491,521) | | | 10,901,256 | |
| | | | | | | | | |
| MONEY MARKET FUND — 1.3% | | | | |
| | 138,306 | | | Federated Treasury Obligations Fund, Institutional Shares, 0.02%(b) | | | 138,306 | |
| | | | | Total Money Market Fund
(Cost $138,306) | | | 138,306 | |
Total Investments — 100.1%
(Cost $8,629,827) | | | 11,039,562 | |
| Net Other Assets (Liabilities) — (0.1)% | | | (5,631 | ) |
| NET ASSETS — 100.0% | | $ | 11,033,931 | |
| (a) | Represents non-income producing security. |
| (b) | Represents the current yield as of report date. |
See accompanying Notes to the Financial Statements.
| Sterling Capital Stratton Mid Cap Value Fund |
Schedule of Portfolio Investments
September 30, 2020
| Shares | | | | | Fair Value | |
| COMMON STOCKS — 96.2% | | | |
| | | | | Auto Components — 1.4% | | | | |
| | 16,540 | | | Magna International, Inc. | | $ | 756,705 | |
| | | | | Banks — 5.9% | | | | |
| | 18,700 | | | East West Bancorp, Inc. | | | 612,238 | |
| | 8,100 | | | First Republic Bank | | | 883,386 | |
| | 67,700 | | | Huntington Bancshares, Inc. | | | 620,809 | |
| | 47,700 | | | KeyCorp. | | | 569,061 | |
| | 12,100 | | | Wintrust Financial Corp. | | | 484,605 | |
| | | | | | | | 3,170,099 | |
| | | | | Capital Markets — 2.1% | | | | |
| | 7,200 | | | Ameriprise Financial, Inc. | | | 1,109,592 | |
| | | | | Chemicals — 1.8% | | | | |
| | 15,700 | | | Westlake Chemical Corp. | | | 992,554 | |
| | | | | Communications Equipment — 1.1% | | | | |
| | 14,500 | | | Ciena Corp.(a) | | | 575,505 | |
| | | | | Construction & Engineering — 1.1% | | | | |
| | 13,900 | | | MasTec, Inc.(a) | | | 586,580 | |
| | | | | Containers & Packaging — 5.5% | | | | |
| | 12,200 | | | Avery Dennison Corp. | | | 1,559,648 | |
| | 29,100 | | | Berry Global Group, Inc.(a) | | | 1,406,112 | |
| | | | | | | | 2,965,760 | |
| | | | | Electronic Equipment, Instruments & Components — 4.1% | | | | |
| | 10,500 | | | Arrow Electronics, Inc.(a) | | | 825,930 | |
| | 11,600 | | | CDW Corp. | | | 1,386,548 | |
| | | | | | | | 2,212,478 | |
| | | | | Entertainment — 4.8% | | | | |
| | 15,200 | | | Activision Blizzard, Inc. | | | 1,230,440 | |
| | 8,300 | | | Take-Two Interactive Software, Inc.(a) | | | 1,371,326 | |
| | | | | | | | 2,601,766 | |
| | | | | Equity Real Estate Investment Trusts (REITS) — 12.2% | | | | |
| | 19,600 | | | Americold Realty Trust | | | 700,700 | |
| | 13,200 | | | CyrusOne, Inc. | | | 924,396 | |
| | 6,900 | | | Digital Realty Trust, Inc. | | | 1,012,644 | |
| | 9,700 | | | EastGroup Properties, Inc. | | | 1,254,501 | |
| | 21,500 | | | Highwoods Properties, Inc. | | | 721,755 | |
| | 39,000 | | | Hudson Pacific Properties, Inc. | | | 855,270 | |
| | 9,500 | | | Mid-America Apartment Communities, Inc. | | | 1,101,525 | |
| | | | | | | | 6,570,791 | |
| | | | | Food & Staples Retailing — 3.6% | | | | |
| | 6,900 | | | Casey’s General Stores, Inc. | | | 1,225,785 | |
| | 21,300 | | | Performance Food Group Co.(a) | | | 737,406 | |
| | | | | | | | 1,963,191 | |
| | | | | Food Products — 1.8% | | | | |
| | 15,100 | | | Lamb Weston Holdings, Inc. | | | 1,000,677 | |
| | | | | Gas Utilities — 4.4% | | | | |
| | 21,800 | | | Southwest Gas Holdings, Inc. | | | 1,375,580 | |
| | 31,000 | | | UGI Corp. | | | 1,022,380 | |
| | | | | | | | 2,397,960 | |
| | | | | Health Care Equipment & Supplies — 4.1% | | | | |
| | 3,400 | | | Becton Dickinson & Co. | | | 791,112 | |
| Shares | | | | | Fair Value | |
| COMMON STOCKS — (continued) |
| | | | | Health Care Equipment & Supplies — (continued) | | | | |
| | 10,400 | | | Zimmer Biomet Holdings, Inc. | | $ | 1,415,856 | |
| | | | | | | | 2,206,968 | |
| | | | | Health Care Providers & Services — 1.3% | | | | |
| | 15,600 | | | BioTelemetry, Inc.(a) | | | 711,048 | |
| | | | | Household Durables — 2.2% | | | | |
| | 25,700 | | | PulteGroup, Inc. | | | 1,189,653 | |
| | | | | Industrial Conglomerates — 1.9% | | | | |
| | 8,400 | | | Carlisle Cos., Inc. | | | 1,027,908 | |
| | | | | Insurance — 6.4% | | | | |
| | 8,300 | | | American Financial Group, Inc. | | | 555,934 | |
| | 22,300 | | | First American Financial Corp. | | | 1,135,293 | |
| | 12,200 | | | Globe Life, Inc. | | | 974,780 | |
| | 8,300 | | | Hanover Insurance Group, Inc. (The) | | | 773,394 | |
| | | | | | | | 3,439,401 | |
| | | | | IT Services — 5.0% | | | | |
| | 6,800 | | | CACI International, Inc., Class A(a) | | | 1,449,488 | |
| | 12,000 | | | Fiserv, Inc.(a) | | | 1,236,600 | |
| | | | | | | | 2,686,088 | |
| | | | | Life Sciences Tools & Services — 11.0% | | | | |
| | 10,300 | | | ICON PLC(a) | | | 1,968,227 | |
| | 5,710 | | | Medpace Holdings, Inc.(a) | | | 638,093 | |
| | 14,300 | | | PerkinElmer, Inc. | | | 1,794,793 | |
| | 3,500 | | | Thermo Fisher Scientific, Inc. | | | 1,545,320 | |
| | | | | | | | 5,946,433 | |
| | | | | Machinery — 1.9% | | | | |
| | 14,300 | | | Oshkosh Corp. | | | 1,051,050 | |
| | | | | Oil, Gas & Consumable Fuels — 3.1% | | | | |
| | 46,700 | | | Cabot Oil & Gas Corp. | | | 810,712 | |
| | 16,300 | | | Phillips 66 | | | 844,992 | |
| | | | | | | | 1,655,704 | |
| | | | | Semiconductors & Semiconductor Equipment — 2.9% | | | | |
| | 10,900 | | | Skyworks Solutions, Inc. | | | 1,585,950 | |
| | | | | Software — 1.6% | | | | |
| | 10,200 | | | PTC, Inc.(a) | | | 843,744 | |
| | | | | Trading Companies & Distributors — 5.0% | | | | |
| | 35,300 | | | HD Supply Holdings, Inc.(a) | | | 1,455,772 | |
| | 7,100 | | | United Rentals, Inc.(a) | | | 1,238,950 | |
| | | | | | | | 2,694,722 | |
| | | | | Total Common Stocks (Cost $33,000,968) | | | 51,942,327 | |
| | | | | | | | | |
| EXCHANGE TRADED FUND — 2.1% | | | |
| | 14,000 | | | iShares Russell Mid-Cap Value ETF | | | 1,131,760 | |
| | | | | Total Exchange Traded Fund (Cost $949,037) | | | 1,131,760 | |
See accompanying Notes to the Financial Statements.
| Sterling Capital Stratton Mid Cap Value Fund |
Schedule of Portfolio Investments — (continued)
September 30, 2020
| Shares | | | | | Fair Value | |
| MONEY MARKET FUND — 1.9% |
| | 1,007,878 | | | Federated Treasury Obligations Fund, Institutional Shares, 0.02%(b) | | $ | 1,007,878 | |
| | | | | Total Money Market Fund (Cost $1,007,878) | | | 1,007,878 | |
Total Investments — 100.2% (Cost $34,957,883) | | | 54,081,965 | |
| Net Other Assets (Liabilities) — (0.2)% | | | (88,805 | ) |
| NET ASSETS — 100.0% | | $ | 53,993,160 | |
| (a) | Represents non-income producing security. |
| (b) | Represents the current yield as of report date. |
ETF — Exchange Traded Fund
Continued
| Sterling Capital Stratton Real Estate Fund |
Schedule of Portfolio Investments
September 30, 2020
| Shares | | | | | Fair Value | |
| COMMON STOCKS — 98.4% | | | |
| | | | | Health Care — 8.7% | | | | |
| | 109,000 | | | Medical Properties Trust, Inc. | | $ | 1,921,670 | |
| | 59,500 | | | Ventas, Inc. | | | 2,496,620 | |
| | 55,000 | | | Welltower, Inc. | | | 3,029,950 | |
| | | | | | | | 7,448,240 | |
| | | | | Hotel & Resort — 3.1% | | | | |
| | 55,500 | | | MGM Growth Properties, LLC, Class A | | | 1,552,890 | |
| | 31,000 | | | Ryman Hospitality Properties, Inc. | | | 1,140,800 | |
| | | | | | | | 2,693,690 | |
| | | | | Industrial — 17.3% | | | | |
| | 61,000 | | | Americold Realty Trust | | | 2,180,750 | |
| | 62,000 | | | Duke Realty Corp. | | | 2,287,800 | |
| | 16,300 | | | EastGroup Properties, Inc. | | | 2,108,079 | |
| | 57,000 | | | First Industrial Realty Trust, Inc. | | | 2,268,600 | |
| | 12,000 | | | Innovative Industrial Properties, Inc. | | | 1,489,320 | |
| | 45,275 | | | Prologis, Inc. | | | 4,555,570 | |
| | | | | | | | 14,890,119 | |
| | | | | Office — 8.4% | | | | |
| | 19,500 | | | Alexandria Real Estate Equities, Inc. | | | 3,120,000 | |
| | 41,500 | | | Cousins Properties, Inc. | | | 1,186,485 | |
| | 37,000 | | | Highwoods Properties, Inc. | | | 1,242,090 | |
| | 75,000 | | | Hudson Pacific Properties, Inc. | | | 1,644,750 | |
| | | | | | | | 7,193,325 | |
| | | | | Residential — 12.3% | | | | |
| | 46,000 | | | American Campus Communities, Inc. | | | 1,606,320 | |
| | 10,800 | | | Essex Property Trust, Inc. | | | 2,168,532 | |
| | 99,000 | | | Invitation Homes, Inc. | | | 2,771,010 | |
| | 18,700 | | | Mid-America Apartment Communities, Inc. | | | 2,168,265 | |
| | 56,000 | | | UDR, Inc. | | | 1,826,160 | |
| | | | | | | | 10,540,287 | |
| | | | | Retail — 8.1% | | | | |
| | 48,000 | | | Getty Realty Corp. | | | 1,248,480 | |
| Shares | | | | | Fair Value | |
| COMMON STOCKS — (continued) | | | |
| | | | | Retail — (continued) | | | | |
| | 150,000 | | | Kite Realty Group Trust | | $ | 1,737,000 | |
| | 48,400 | | | National Retail Properties, Inc. | | | 1,670,284 | |
| | 132,000 | | | Retail Opportunity Investments Corp. | | | 1,374,780 | |
| | 159,000 | | | Retail Properties of America, Inc., Class A | | | 923,790 | |
| | | | | | | | 6,954,334 | |
| | | | | Specialized — 40.5% | | | | |
| | 33,000 | | | American Tower Corp. | | | 7,977,090 | |
| | 32,300 | | | Crown Castle International Corp. | | | 5,377,950 | |
| | 68,000 | | | CubeSmart | | | 2,197,080 | |
| | 24,200 | | | CyrusOne, Inc. | | | 1,694,726 | |
| | 27,900 | | | Digital Realty Trust, Inc. | | | 4,094,604 | |
| | 9,200 | | | Equinix, Inc. | | | 6,993,196 | |
| | 19,500 | | | Life Storage, Inc. | | | 2,052,765 | |
| | 43,000 | | | PotlatchDeltic Corp. | | | 1,810,300 | |
| | 8,100 | | | SBA Communications Corp. | | | 2,579,688 | |
| | | | | | | | 34,777,399 | |
| | | | | Total Common Stocks (Cost $54,915,293) | | | 84,497,394 | |
| | | | | | | | | |
| MONEY MARKET FUND — 1.4% |
| | 1,184,057 | | | Federated Treasury Obligations Fund, Institutional Shares, 0.02%(a) | | | 1,184,057 | |
| | | | | Total Money Market Fund (Cost $1,184,057) | | | 1,184,057 | |
Total Investments — 99.8% (Cost $56,099,350) | | | 85,681,451 | |
| Net Other Assets (Liabilities) — 0.2% | | | 191,152 | |
| NET ASSETS — 100.0% | | $ | 85,872,603 | |
| (a) | Represents the current yield as of report date. |
See accompanying Notes to the Financial Statements.
| Sterling Capital Stratton Small Cap Value Fund |
Schedule of Portfolio Investments
September 30, 2020
| Shares | | | | | Fair Value | |
| COMMON STOCKS — 99.1% | | | |
| | | | | Aerospace & Defense — 2.6% | | | | |
| | 194,765 | | | Moog, Inc., Class A | | $ | 12,373,420 | |
| | | | | Banks — 16.7% | | | | |
| | 286,350 | | | Community Bank System, Inc. | | | 15,594,621 | |
| | 227,343 | | | First Horizon National Corp. | | | 2,143,844 | |
| | 380,350 | | | First Midwest Bancorp, Inc. | | | 4,100,173 | |
| | 355,260 | | | Glacier Bancorp, Inc. | | | 11,386,083 | |
| | 111,100 | | | Signature Bank | | | 9,220,189 | |
| | 30,680 | | | SVB Financial Group(a) | | | 7,382,222 | |
| | 169,520 | | | TCF Financial Corp. | | | 3,959,987 | |
| | 448,651 | | | Umpqua Holdings Corp. | | | 4,764,674 | |
| | 181,310 | | | United Bankshares, Inc. | | | 3,892,726 | |
| | 308,130 | | | Webster Financial Corp. | | | 8,137,713 | |
| | 240,880 | | | Wintrust Financial Corp. | | | 9,647,244 | |
| | | | | | | | 80,229,476 | |
| | | | | Capital Markets — 1.2% | | | | |
| | 86,320 | | | Affiliated Managers Group, Inc. | | | 5,902,562 | |
| | | | | Chemicals — 2.8% | | | | |
| | 500,467 | | | Avient Corp. | | | 13,242,357 | |
| | | | | Construction & Engineering — 3.2% | | | | |
| | 363,870 | | | MasTec, Inc.(a) | | | 15,355,314 | |
| | | | | Electric Utilities — 2.4% | | | | |
| | 325,290 | | | Portland General Electric Co. | | | 11,547,795 | |
| | | | | Electrical Equipment — 3.5% | | | | |
| | 250,400 | | | EnerSys | | | 16,806,848 | |
| | | | | Electronic Equipment, Instruments & Components — 2.5% | | | | |
| | 257,368 | | | Belden, Inc. | | | 8,009,292 | |
| | 58,200 | | | ePlus, Inc.(a) | | | 4,260,240 | |
| | | | | | | | 12,269,532 | |
| | | | | Entertainment — 2.7% | | | | |
| | 80,090 | | | Take-Two Interactive Software, Inc.(a) | | | 13,232,470 | |
| | | | | Equity Real Estate Investment Trusts (REITS) — 10.3% | | | | |
| | 210,000 | | | American Campus Communities, Inc. | | | 7,333,200 | |
| | 464,943 | | | First Industrial Realty Trust, Inc. | | | 18,504,731 | |
| | 304,634 | | | Highwoods Properties, Inc. | | | 10,226,563 | |
| | 569,890 | | | Medical Properties Trust, Inc. | | | 10,047,161 | |
| | 76,960 | | | SL Green Realty Corp. | | | 3,568,635 | |
| | | | | | | | 49,680,290 | |
| | | | | Food & Staples Retailing — 8.3% | | | | |
| | 334,030 | | | BJ’s Wholesale Club Holdings, Inc.(a) | | | 13,878,947 | |
| | 103,620 | | | Casey’s General Stores, Inc. | | | 18,408,093 | |
| | 213,890 | | | Performance Food Group Co.(a) | | | 7,404,872 | |
| | | | | | | | 39,691,912 | |
| | | | | Food Products — 1.0% | | | | |
| | 119,160 | | | TreeHouse Foods, Inc.(a) | | | 4,829,555 | |
| Shares | | | | | Fair Value | |
| COMMON STOCKS — (continued) | | | |
| | | | | Gas Utilities — 2.8% | | | | |
| | 213,490 | | | Southwest Gas Holdings, Inc. | | $ | 13,471,219 | |
| | | | | Health Care Equipment & Supplies — 4.9% | | | | |
| | 85,273 | | | West Pharmaceutical Services, Inc. | | | 23,441,548 | |
| | | | | Health Care Providers & Services — 2.7% | | | | |
| | 281,418 | | | BioTelemetry, Inc.(a) | | | 12,827,032 | |
| | | | | Household Durables — 2.6% | | | | |
| | 111,840 | | | Meritage Homes Corp.(a) | | | 12,346,018 | |
| | | | | Insurance — 6.0% | | | | |
| | 155,980 | | | Hanover Insurance Group, Inc. (The) | | | 14,534,216 | |
| | 277,180 | | | Selective Insurance Group, Inc. | | | 14,271,998 | |
| | | | | | | | 28,806,214 | |
| | | | | IT Services — 3.8% | | | | |
| | 85,700 | | | CACI International, Inc., Class A(a) | | | 18,267,812 | |
| | | | | Machinery — 6.1% | | | | |
| | 242,570 | | | Crane Co. | | | 12,160,034 | |
| | 234,010 | | | Oshkosh Corp. | | | 17,199,735 | |
| | | | | | | | 29,359,769 | |
| | | | | Semiconductors & Semiconductor Equipment — 7.7% | | | | |
| | 806,187 | | | ON Semiconductor Corp.(a) | | | 17,486,196 | |
| | 153,144 | | | Qorvo, Inc.(a) | | | 19,757,107 | |
| | | | | | | | 37,243,303 | |
| | | | | Software — 2.4% | | | | |
| | 138,057 | | | PTC, Inc.(a) | | | 11,420,075 | |
| | | | | Trading Companies & Distributors — 2.9% | | | | |
| | 79,611 | | | United Rentals, Inc.(a) | | | 13,892,120 | |
| | | | | Total Common Stocks (Cost $208,244,372) | | | 476,236,641 | |
| | | | | | | | | |
| MONEY MARKET FUND — 0.4% | | | |
| | 2,132,880 | | | Federated Treasury Obligations Fund, Institutional Shares, 0.02%(b) | | | 2,132,880 | |
| | | | | Total Money Market Fund (Cost $2,132,880) | | | 2,132,880 | |
Total Investments — 99.5% (Cost $210,377,252) | | | 478,369,521 | |
| Net Other Assets (Liabilities) — 0.5% | | | 2,420,491 | |
| NET ASSETS — 100.0% | | $ | 480,790,012 | |
| (a) | Represents non-income producing security. |
| (b) | Represents the current yield as of report date. |
See accompanying Notes to the Financial Statements.
| Sterling Capital Ultra Short Bond Fund |
Schedule of Portfolio Investments
September 30, 2020
Principal
Amount | | | | | Fair Value | |
| ASSET BACKED SECURITIES — 15.1% | | | |
| $ | 170,000 | | | AmeriCredit Automobile Receivables Trust, Series 2017-4, Class B, 2.360%, 12/19/22 | | $ | 171,249 | |
| | 135,705 | | | AmeriCredit Automobile Receivables Trust, Series 2017-3, Class B, 2.240%, 6/19/23 | | | 136,228 | |
| | 100,000 | | | AmeriCredit Automobile Receivables Trust, Series 2018-1, Class B, 3.260%, 1/18/24 | | | 102,330 | |
| | 150,000 | | | AmeriCredit Automobile Receivables Trust, Series 2019-1, Class B, 3.130%, 2/18/25 | | | 155,708 | |
| | 313,471 | | | ARI Fleet Lease Trust, Series 2018-A, Class A2, 2.550%, 10/15/26(a) | | | 314,442 | |
| | 166,747 | | | ARI Fleet Lease Trust, Series 2019-A, Class A2A, 2.410%, 11/15/27(a) | | | 169,151 | |
| | 350,000 | | | Avis Budget Rental Car Funding AESOP, LLC, Series 2016-2A, Class A, 2.720%, 11/20/22(a) | | | 355,221 | |
| | 200,000 | | | Avis Budget Rental Car Funding AESOP, LLC, Series 2019-1A, Class A, 3.450%, 3/20/23(a) | | | 204,661 | |
| | 32,968 | | | Chesapeake Funding II, LLC, Series 2017-2A, Class A1, 1.990%, 5/15/29(a) | | | 33,049 | |
| | 189,587 | | | Chesapeake Funding II, LLC, Series 2017-3A, Class A1, 1.910%, 8/15/29(a) | | | 190,040 | |
| | 197,748 | | | Chesapeake Funding II, LLC, Series 2018-2A, Class A1, 3.230%, 8/15/30(a) | | | 200,617 | |
| | 13,142 | | | Citicorp Residential Mortgage Trust, STEP, Series 2007-2, Class A6, 5.016%, 6/25/37 | | | 13,408 | |
| | 33,741 | | | Countrywide Asset-Backed Certificates, Series 2004-12, Class MV4, 1.573%, (LIBOR USD 1-Month plus 1.43%), 3/25/35(b) | | | 33,718 | |
| | 56,464 | | | Countrywide Asset-Backed Certificates, Series 2006-3, Class 2A3, 0.438%, (LIBOR USD 1-Month plus 0.29%), 6/25/36(b) | | | 56,414 | |
| | 10,208 | | | Enterprise Fleet Financing, LLC, Series 2017-3, Class A2, 2.130%, 5/22/23(a) | | | 10,217 | |
| | 257,984 | | | Enterprise Fleet Financing, LLC, Series 2018-1, Class A2, 2.870%, 10/20/23(a) | | | 259,358 | |
| | 168,248 | | | Enterprise Fleet Financing, LLC, Series 2019-3, Class A2, 2.060%, 5/20/25(a) | | | 171,201 | |
| | 9,540 | | | Ford Credit Auto Owner Trust, Series 2017-B, Class A3, 1.690%, 11/15/21 | | | 9,547 | |
| | 475,000 | | | Ford Credit Auto Owner Trust, Series 2016-1, Class A, 2.310%, 8/15/27(a) | | | 478,374 | |
| | 250,000 | | | GreatAmerica Leasing Receivables Funding, LLC, Series 2020-1, Class A2, 1.760%, 6/15/22(a) | | | 252,131 | |
| | 77,581 | | | GreatAmerica Leasing Receivables Funding, LLC, Series 2017-1, Class A4, 2.360%, 1/20/23(a) | | | 77,745 | |
| | 250,000 | | | GreatAmerica Leasing Receivables Funding, LLC, Series 2018-1, Class A4, 2.830%, 6/17/24(a) | | | 254,284 | |
| | 38,665 | | | Hyundai Auto Receivables Trust, Series 2018-A, Class A3, 2.790%, 7/15/22 | | | 39,030 | |
| | 100,000 | | | Hyundai Auto Receivables Trust, Series 2016-B, Class C, 2.190%, 11/15/22 | | | 100,667 | |
| | 116,587 | | | New Century Home Equity Loan Trust, Series 2005-3, Class M3, 0.913%, (LIBOR USD 1-Month plus 0.77%), 7/25/35(b) | | | 116,432 | |
| | 224,087 | | | Santander Drive Auto Receivables Trust, Series 2019-1, Class B, 3.210%, 9/15/23 | | | 225,606 | |
| | 71,074 | | | Santander Drive Auto Receivables Trust, Series 2018-1, Class C, 2.960%, 3/15/24 | | | 71,601 | |
Principal
Amount | | | | | Fair Value | |
| ASSET BACKED SECURITIES — (continued) | | | |
| $ | 400,000 | | | Santander Drive Auto Receivables Trust, Series 2020-3, Class B, 0.690%, 3/17/25 | | $ | 400,171 | |
| | 64,364 | | | Saxon Asset Securities Trust, Series 2006-2, Class A3C, 0.298%, (LIBOR USD 1-Month plus 0.15%), 9/25/36(b) | | | 64,104 | |
| | 120,795 | | | SoFi Professional Loan Program Trust, Series 2020-A, Class A1FX, 2.060%, 5/15/46(a) | | | 121,859 | |
| | 30,056 | | | Sofi Professional Loan Program, LLC, Series 2016-E, Class A1, 0.998%, (LIBOR USD 1-Month plus 0.85%), 7/25/39(a)(b) | | | 29,993 | |
| | 291,000 | | | Wheels SPV 2, LLC, Series 2018-1A, Class A3, 3.240%, 4/20/27(a) | | | 296,904 | |
| | 152,611 | | | Wheels SPV 2, LLC, Series 2019-1A, Class A2, 2.300%, 5/22/28(a) | | | 154,309 | |
| | 200,000 | | | World Omni Auto Receivables Trust, Series 2018-B, Class A4, 3.030%, 6/17/24 | | | 208,151 | |
| | | | | Total Asset Backed Securities (Cost $5,452,959) | | | 5,477,920 | |
| | | | | | | | | |
| COLLATERALIZED MORTGAGE OBLIGATIONS — 1.4% | | | |
| | 126,737 | | | Freddie Mac, Series 3959, Class PN, 2.000%, 1/15/26 | | | 127,419 | |
| | 963 | | | Freddie Mac, Series 3805, Class EK, 4.000%, 6/15/40 | | | 962 | |
| | 159,156 | | | Freddie Mac, Series 4172, Class PB, 1.500%, 7/15/40 | | | 159,652 | |
| | 84,120 | | | Galton Funding Mortgage Trust, Series 2018-2, Class A41, 4.500%, 10/25/58(a)(c) | | | 85,971 | |
| | 128,306 | | | Galton Funding Mortgage Trust, Series 2019-1, Class A41, 4.500%, 2/25/59(a)(c) | | | 130,635 | |
| | | | | Total Collateralized Mortgage Obligations (Cost $501,011) | | | 504,639 | |
| | | | | | | | | |
| COMMERCIAL MORTGAGE-BACKED SECURITIES — 8.1% | | | |
| | 89,055 | | | COMM 2012-CCRE1 Mortgage Trust, Series 2012-CR1, Class A3, 3.391%, 5/15/45 | | | 90,919 | |
| | 250,000 | | | COMM 2012-CCRE2 Mortgage Trust, Series 2012-CR2, Class A4, 3.147%, 8/15/45 | | | 258,241 | |
| | 253,708 | | | COMM 2014-CCRE15 Mortgage Trust, Series 2014-CR15, Class A2, 2.928%, 2/10/47 | | | 256,942 | |
| | 41,503 | | | COMM 2015-CCRE22 Mortgage Trust, Series 2015-CR22, Class A2, 2.856%, 3/10/48 | | | 41,492 | |
| | 47,543 | | | COMM 2015-CCRE23 Mortgage Trust, Series 2015-CR23, Class A2, 2.852%, 5/10/48 | | | 47,534 | |
| | 363,254 | | | DBUBS 2011-LC2 Mortgage Trust, Series 2011-LC2A, Class A4, 4.537%, 7/10/44(a) | | | 367,519 | |
| | 96,516 | | | JP Morgan Chase Commercial Mortgage Securities Trust, Series 2011-C3, Class A4, 4.717%, 2/15/46(a) | | | 96,818 | |
| | 209,444 | | | Morgan Stanley Capital I Trust, Series 2011-C2, Class A4, 4.661%, 6/15/44(a) | | | 214,573 | |
| | 300,000 | | | UBS-Barclays Commercial Mortgage Trust, Series 2012-C4, Class A5, 2.850%, 12/10/45 | | | 310,999 | |
| | 198,003 | | | UBS-Barclays Commercial Mortgage Trust, Series 2012-C3, Class A4, 3.091%, 8/10/49 | | | 205,046 | |
| | 103,000 | | | WFRBS Commercial Mortgage Trust, Series 2011-C2, Class C, 5.392%, 2/15/44(a)(c) | | | 102,702 | |
| | 184,350 | | | WFRBS Commercial Mortgage Trust, Series 2011-C3, Class A4, 4.375%, 3/15/44(a) | | | 185,611 | |
See accompanying Notes to the Financial Statements.
| Sterling Capital Ultra Short Bond Fund |
Schedule of Portfolio Investments — (continued)
September 30, 2020
Principal
Amount | | | | | Fair Value | |
| COMMERCIAL MORTGAGE-BACKED SECURITIES — (continued) | | | |
| $ | 220,000 | | | WFRBS Commercial Mortgage Trust, Series 2011-C4, Class A4, 4.902%, 6/15/44(a)(c) | | $ | 222,888 | |
| | 320,736 | | | WFRBS Commercial Mortgage Trust, Series 2011-C5, Class A4, 3.667%, 11/15/44 | | | 326,253 | |
| | 70,000 | | | WFRBS Commercial Mortgage Trust, Series 2012-C7, Class A2, 3.431%, 6/15/45 | | | 72,191 | |
| | 144,644 | | | WFRBS Commercial Mortgage Trust, Series 2014-C19, Class A3, 3.660%, 3/15/47 | | | 145,351 | |
| | | | | Total Commercial Mortgage-Backed Securities (Cost $2,960,464) | | | 2,945,079 | |
| | | | | | | | | |
| CORPORATE BONDS — 72.1% | | | |
| | | | | Aerospace & Defense — 0.4% | | | | |
| | 149,000 | | | L3Harris Technologies, Inc., 4.950%, 2/15/21 | | | 149,812 | |
| | | | | Automobiles — 3.2% | | | | |
| | 100,000 | | | BMW U.S. Capital, LLC, 0.676%, (LIBOR USD 3-Month plus 0.41%), 4/12/21(a)(b) | | | 100,139 | |
| | 300,000 | | | Daimler Finance North America, LLC, 2.000%, 7/6/21(a) | | | 303,124 | |
| | 280,000 | | | Ford Motor Credit Co., LLC, 3.200%, 1/15/21 | | | 279,409 | |
| | 150,000 | | | General Motors Financial Co., Inc., 3.200%, 7/6/21 | | | 152,270 | |
| | 150,000 | | | General Motors Financial Co., Inc., 1.818%, (LIBOR USD 3-Month plus 1.55%), 1/14/22(b) | | | 150,745 | |
| | 189,000 | | | Hyundai Capital America, 1.217%, (LIBOR USD 3-Month plus 0.94%), 7/8/21(a)(b) | | | 189,137 | |
| | | | | | | | 1,174,824 | |
| | | | | Banks — 19.7% | | | | |
| | 200,000 | | | American Express Co., 0.849%, (LIBOR USD 3-Month plus 0.60%), 11/5/21(b) | | | 200,834 | |
| | 250,000 | | | Bank of America Corp., MTN, 2.625%, 10/19/20 | | | 250,272 | |
| | 155,000 | | | Bank of Nova Scotia (The), BKNT, 2.500%, 1/8/21 | | | 155,943 | |
| | 350,000 | | | Barclays Bank PLC, 0.726%, (LIBOR USD 3-Month plus 0.46%), 1/11/21(b) | | | 350,236 | |
| | 200,000 | | | BNP Paribas SA, 2.950%, 5/23/22(a) | | | 207,232 | |
| | 250,000 | | | BNZ International Funding, Ltd./London, 2.100%, 9/14/21(a) | | | 254,016 | |
| | 250,000 | | | BPCE SA, 1.476%, (LIBOR USD 3-Month plus 1.22%), 5/22/22(a)(b) | | | 252,752 | |
| | 250,000 | | | Capital One Financial Corp., 4.750%, 7/15/21 | | | 258,669 | |
| | 154,000 | | | Citigroup, Inc., 1.600%, (LIBOR USD 3-Month plus 1.38%), 3/30/21(b) | | | 154,960 | |
| | 250,000 | | | Citizens Bank N.A./Providence RI, BKNT, 2.250%, 10/30/20 | | | 250,107 | |
| | 100,000 | | | Cooperatieve Rabobank UA, 4.500%, 1/11/21 | | | 101,157 | |
| | 250,000 | | | Credit Agricole SA/London, 1.703%, (LIBOR USD 3-Month plus 1.43%), 1/10/22(a)(b) | | | 253,050 | |
| | 250,000 | | | Credit Suisse Group Funding Guernsey, Ltd., 3.125%, 12/10/20 | | | 251,300 | |
| | 250,000 | | | DNB Bank ASA, 0.672%, (LIBOR USD 3-Month plus 0.37%), 10/2/20(b) | | | 250,000 | |
| | 200,000 | | | Fifth Third Bank N.A., BKNT, 0.891%, (LIBOR USD 3-Month plus 0.64%), 2/1/22(b) | | | 201,237 | |
Principal
Amount | | | | | Fair Value | |
| CORPORATE BONDS — (continued) | | | |
| | | | | Banks — (continued) | | | | |
| $ | 250,000 | | | Goldman Sachs Group, Inc. (The), 1.605%, (LIBOR USD 3-Month plus 1.36%), 4/23/21(b) | | $ | 251,441 | |
| | 250,000 | | | Goldman Sachs Group, Inc. (The), 1.355%, (LIBOR USD 3-Month plus 1.11%), 4/26/22(b) | | | 251,034 | |
| | 250,000 | | | Huntington National Bank (The), 3.250%, 5/14/21 | | | 253,944 | |
| | 270,000 | | | Lloyds Banking Group PLC, 1.027%, (LIBOR USD 3-Month plus 0.80%), 6/21/21(b) | | | 271,082 | |
| | 150,000 | | | Macquarie Bank, Ltd., 6.625%, 4/7/21(a) | | | 154,578 | |
| | 200,000 | | | Mitsubishi UFJ Financial Group, Inc., 0.895%, (LIBOR USD 3-Month plus 0.65%), 7/26/21(b) | | | 200,773 | |
| | 250,000 | | | Morgan Stanley, MTN, 2.625%, 11/17/21 | | | 256,245 | |
| | 250,000 | | | NatWest Markets PLC, 1.618%, (LIBOR USD 3-Month plus 1.40%), 9/29/22(a)(b) | | | 251,996 | |
| | 350,000 | | | Nordea Bank Abp, 2.250%, 5/27/21(a) | | | 354,458 | |
| | 250,000 | | | PNC Bank N.A., BKNT, 0.745%, (LIBOR USD 3-Month plus 0.50%), 7/27/22(b) | | | 251,333 | |
| | 200,000 | | | Royal Bank of Canada, GMTN, 0.979%, (LIBOR USD 3-Month plus 0.73%), 2/1/22(b) | | | 201,827 | |
| | 90,000 | | | Santander UK Group Holdings PLC, 2.875%, 10/16/20 | | | 90,086 | |
| | 90,000 | | | Santander UK Group Holdings PLC, 3.125%, 1/8/21 | | | 90,639 | |
| | 250,000 | | | Standard Chartered PLC, 2.744%, (LIBOR USD 3-Month plus 1.20%), 9/10/22(a)(d) | | | 253,949 | |
| | 150,000 | | | Sumitomo Mitsui Financial Group, Inc., 2.934%, 3/9/21 | | | 151,683 | |
| | 100,000 | | | U.S. Bancorp, MTN, 2.350%, 1/29/21 | | | 100,510 | |
| | 200,000 | | | UBS Group AG, 2.048%, (LIBOR USD 3-Month plus 1.78%), 4/14/21(a)(b) | | | 201,739 | |
| | 200,000 | | | Wells Fargo & Co., MTN, 2.550%, 12/7/20 | | | 200,808 | |
| | | | | | | | 7,179,890 | |
| | | | | Beverages — 0.8% | | | | |
| | 300,000 | | | Constellation Brands, Inc., 0.980%, (LIBOR USD 3-Month plus 0.70%), 11/15/21(b) | | | 300,021 | |
| | | | | Biotechnology — 0.8% | | | | |
| | 296,000 | | | AbbVie, Inc., 2.300%, 5/14/21 | | | 298,755 | |
| | | | | Chemicals — 2.8% | | | | |
| | 350,000 | | | Albemarle Corp., 1.330%, (LIBOR USD 3-Month plus 1.05%), 11/15/22(b) | | | 348,736 | |
| | 150,000 | | | DuPont de Nemours, Inc., 0.990%, (LIBOR USD 3-Month plus 0.71%), 11/15/20(b) | | | 150,103 | |
| | 160,000 | | | FMC Corp., 3.950%, 2/1/22 | | | 165,362 | |
| | 350,000 | | | Nutrition & Biosciences, Inc., 0.697%, 9/15/22(a) | | | 350,577 | |
| | | | | | | | 1,014,778 | |
| | | | | Commercial Services — 0.6% | | | | |
| | 100,000 | | | ERAC USA Finance, LLC, 4.500%, 8/16/21(a) | | | 103,355 | |
| | 100,000 | | | ERAC USA Finance, LLC, 2.600%, 12/1/21(a) | | | 101,740 | |
| | | | | | | | 205,095 | |
| | | | | Construction Materials — 0.7% | | | | |
| | 240,000 | | | Vulcan Materials Co., 0.896%, (LIBOR USD 3-Month plus 0.65%), 3/1/21(b) | | | 240,091 | |
Continued
| Sterling Capital Ultra Short Bond Fund |
Schedule of Portfolio Investments — (continued)
September 30, 2020
Principal
Amount | | | | | Fair Value | |
| CORPORATE BONDS — (continued) | | | | |
| | | | | Diversified Financial Services — 5.1% | | | | |
| $ | 150,000 | | | AerCap Ireland Capital DAC/AerCap Global Aviation Trust, 4.500%, 5/15/21 | | $ | 152,858 | |
| | 150,000 | | | AerCap Ireland Capital DAC/AerCap Global Aviation Trust, 3.950%, 2/1/22 | | | 151,864 | |
| | 150,000 | | | Ally Financial, Inc., 4.250%, 4/15/21 | | | 152,558 | |
| | 400,000 | | | GE Capital International Funding Co. Unlimited Co., 2.342%, 11/15/20(a) | | | 400,895 | |
| | 340,000 | | | Intercontinental Exchange, Inc., 0.903%, (LIBOR USD 3-Month plus 0.65%), 6/15/23(b) | | | 340,922 | |
| | 325,000 | | | Park Aerospace Holdings, Ltd., 3.625%, 3/15/21(a) | | | 323,598 | |
| | 200,000 | | | Siemens Financieringsmaatschappij NV, 0.847%, (LIBOR USD 3-Month plus 0.61%), 3/16/22(a)(b) | | | 201,066 | |
| | 130,000 | | | TD Ameritrade Holding Corp., 0.681%, (LIBOR USD 3-Month plus 0.43%), 11/1/21(b) | | | 130,443 | |
| | | | | | | | 1,854,204 | |
| | | | | Diversified Telecommunication Services — 1.8% | | | | |
| | 350,000 | | | America Movil SAB de CV, 3.125%, 7/16/22 | | | 363,325 | |
| | 281,500 | | | Sprint Spectrum Co., LLC/Sprint Spectrum Co. II, LLC/Sprint Spectrum Co. III, LLC, 3.360%, 9/20/21(a) | | | 284,653 | |
| | | | | | | | 647,978 | |
| | | | | Electric Utilities — 5.7% | | | | |
| | 250,000 | | | Alabama Power Co., 3.950%, 6/1/21 | | | 256,077 | |
| | 319,000 | | | American Electric Power Co., Inc., 2.150%, 11/13/20 | | | 319,597 | |
| | 310,000 | | | CenterPoint Energy, Inc., 3.600%, 11/1/21 | | | 320,206 | |
| | 350,000 | | | Dominion Energy, Inc., STEP, 4.104%, 4/1/21 | | | 356,078 | |
| | 100,000 | | | Duke Energy Florida, LLC, 3.100%, 8/15/21 | | | 101,718 | |
| | 350,000 | | | Duke Energy Progress, LLC, Series A, 0.433%, (LIBOR USD 3-Month plus 0.18%), 2/18/22(b) | | | 349,892 | |
| | 200,000 | | | Exelon Corp., 3.497%, 6/1/22 | | | 209,097 | |
| | 150,000 | | | San Diego Gas & Electric Co., 3.000%, 8/15/21 | | | 153,544 | |
| | | | | | | | 2,066,209 | |
| | | | | Electrical Equipment — 2.8% | | | | |
| | 245,000 | | | Fortive Corp., 2.350%, 6/15/21 | | | 247,836 | |
| | 315,000 | | | Honeywell International, Inc., 0.483%, 8/19/22 | | | 315,518 | |
| | 300,000 | | | Roper Technologies, Inc., 0.450%, 8/15/22 | | | 299,833 | |
| | 150,000 | | | Textron, Inc., 0.793%, (LIBOR USD 3-Month plus 0.55%), 11/10/20(b) | | | 150,004 | |
| | | | | | | | 1,013,191 | |
| | | | | Energy Equipment & Services — 4.1% | | | | |
| | 150,000 | | | BP Capital Markets America, Inc., 4.742%, 3/11/21 | | | 152,859 | |
| | 200,000 | | | Enbridge, Inc., 0.770%, (LIBOR USD 3-Month plus 0.50%), 2/18/22(b) | | | 199,892 | |
| | 190,000 | | | Kinder Morgan Energy Partners L.P., 3.500%, 3/1/21 | | | 191,358 | |
| | 200,000 | | | ONEOK, Inc., 4.250%, 2/1/22 | | | 207,017 | |
| | 150,000 | | | Plains All American Pipeline L.P./PAA Finance Corp., 5.000%, 2/1/21 | | | 150,548 | |
| | 437,000 | | | Sunoco Logistics Partners Operations L.P., 4.400%, 4/1/21 | | | 443,413 | |
Principal
Amount | | | | | Fair Value | |
| CORPORATE BONDS — (continued) | | | |
| | | | | Energy Equipment & Services — (continued) | | | | |
| $ | 150,000 | | | TransCanada PipeLines, Ltd., 3.800%, 10/1/20 | | $ | 150,000 | |
| | | | | | | | 1,495,087 | |
| | | | | Equity Real Estate Investment Trusts (REITS) — 4.5% | | | | |
| | 265,000 | | | American Tower Corp., 4.700%, 3/15/22 | | | 280,847 | |
| | 200,000 | | | Brixmor Operating Partnership L.P., 3.875%, 8/15/22 | | | 207,360 | |
| | 181,000 | | | Federal Realty Investment Trust, 3.000%, 8/1/22 | | | 186,325 | |
| | 200,000 | | | Scentre Group Trust 1/Scentre Group Trust 2, 2.375%, 4/28/21(a) | | | 201,293 | |
| | 228,000 | | | SL Green Operating Partnership L.P., 1.260%, (LIBOR USD 3-Month plus 0.98%), 8/16/21(b) | | | 226,382 | |
| | 184,000 | | | Starwood Property Trust, Inc., 3.625%, 2/1/21 | | | 183,871 | |
| | 125,000 | | | Ventas Realty L.P./Ventas Capital Corp., 3.250%, 8/15/22 | | | 129,963 | |
| | 200,000 | | | WEA Finance, LLC, 3.150%, 4/5/22(a) | | | 203,218 | |
| | | | | | | | 1,619,259 | |
| | | | | Food & Staples Retailing — 1.8% | | | | |
| | 125,000 | | �� | Cargill, Inc., 3.250%, 11/15/21(a) | | | 129,044 | |
| | 152,000 | | | Conagra Brands, Inc., 3.800%, 10/22/21 | | | 157,173 | |
| | 156,000 | | | CVS Health Corp., 0.962%, (LIBOR USD 3-Month plus 0.72%), 3/9/21(b) | | | 156,390 | |
| | 115,000 | | | Macy’s Retail Holdings, LLC, 3.450%, 1/15/21 | | | 113,563 | |
| | 90,000 | | | Smithfield Foods, Inc., 2.650%, 10/3/21(a) | | | 90,558 | |
| | | | | | | | 646,728 | |
| | | | | Food Products — 0.5% | | | | |
| | 175,000 | | | Tyson Foods, Inc., 2.250%, 8/23/21 | | | 177,775 | |
| | | | | Household Durables — 0.3% | | | | |
| | 100,000 | | | DR Horton, Inc., 2.550%, 12/1/20 | | | 100,338 | |
| | | | | Insurance — 4.2% | | | | |
| | 19,000 | | | Assurant, Inc., 1.483%, (LIBOR USD 3-Month plus 1.25%), 3/26/21(b) | | | 18,993 | |
| | 350,000 | | | Athene Global Funding, 3.000%, 7/1/22(a) | | | 361,438 | |
| | 125,000 | | | Fidelity National Financial, Inc., 5.500%, 9/1/22 | | | 135,668 | |
| | 165,000 | | | Guardian Life Global Funding, 1.950%, 10/27/21(a) | | | 167,904 | |
| | 150,000 | | | Jackson National Life Global Funding, 0.575%, (LIBOR USD 3-Month plus 0.30%), 10/15/20(a)(b) | | | 150,016 | |
| | 153,000 | | | Marsh & McLennan Cos., Inc., 3.500%, 12/29/20 | | | 154,168 | |
| | 150,000 | | | Nationwide Financial Services, Inc., 5.375%, 3/25/21(a) | | | 153,324 | |
| | 175,000 | | | Principal Life Global Funding II, 2.375%, 11/21/21(a) | | | 178,738 | |
| | 150,000 | | | Protective Life Global Funding, 0.753%, (LIBOR USD 3-Month plus 0.52%), 6/28/21(a)(b) | | | 150,458 | |
| | 58,000 | | | Reliance Standard Life Global Funding II, 3.050%, 1/20/21(a) | | | 58,428 | |
| | | | | | | | 1,529,135 | |
Continued
| Sterling Capital Ultra Short Bond Fund |
Schedule of Portfolio Investments — (continued)
September 30, 2020
Principal
Amount | | | | | Fair Value | |
| CORPORATE BONDS — (continued) | | | | |
| | | | | Media — 3.0% | | | | |
| $ | 300,000 | | | Charter Communications Operating, LLC/Charter Communications Operating Capital, 4.464%, 7/23/22 | | $ | 317,621 | |
| | 344,000 | | | Interpublic Group of Cos., Inc. (The), 3.500%, 10/1/20 | | | 344,000 | |
| | 280,000 | | | Interpublic Group of Cos., Inc. (The), 3.750%, 10/1/21 | | | 288,842 | |
| | 150,000 | | | Omnicom Group, Inc./Omnicom Capital, Inc., 3.625%, 5/1/22 | | | 157,098 | |
| | | | | | | | 1,107,561 | |
| | | | | Metals & Mining — 1.1% | | | | |
| | 200,000 | | | Anglo American Capital PLC, 4.125%, 4/15/21(a) | | | 203,114 | |
| | 200,000 | | | Nucor Corp., 4.125%, 9/15/22 | | | 212,141 | |
| | | | | | | | 415,255 | |
| | | | | Multiline Retail — 0.9% | | | | |
| | 315,000 | | | Family Dollar Stores, Inc., 5.000%, 2/1/21 | | | 319,362 | |
| | | | | Oil, Gas & Consumable Fuels — 1.9% | | | | |
| | 250,000 | | | Newfield Exploration Co., 5.750%, 1/30/22 | | | 249,892 | |
| | 155,000 | | | Occidental Petroleum Corp., 2.600%, 8/13/21 | | | 152,094 | |
| | 51,000 | | | Ovintiv, Inc., 3.900%, 11/15/21 | | | 50,983 | |
| | 250,000 | | | Southern California Gas Co., 0.570%, (LIBOR USD 3-Month plus 0.35%), 9/14/23(b) | | | 249,900 | |
| | | | | | | | 702,869 | |
| | | | | Pharmaceuticals — 1.6% | | | | |
| | 218,000 | | | EMD Finance, LLC, 2.950%, 3/19/22(a) | | | 224,465 | |
| | 332,000 | | | Shire Acquisitions Investments Ireland DAC, 2.400%, 9/23/21 | | | 337,998 | |
| | | | | | | | 562,463 | |
| | | | | Road & Rail — 1.1% | | | | |
| | 275,000 | | | Penske Truck Leasing Co. L.P./PTL Finance Corp., 3.375%, 2/1/22(a) | | | 283,958 | |
| | 125,000 | | | Ryder System, Inc., MTN, 2.800%, 3/1/22 | | | 128,738 | |
| | | | | | | | 412,696 | |
| | | | | Semiconductors & Semiconductor Equipment — 1.3% | | | | |
| | 200,000 | | | Broadcom Corp./Broadcom Cayman Finance, Ltd., 3.000%, 1/15/22 | | | 205,739 | |
| | 150,000 | | | Lam Research Corp., 2.800%, 6/15/21 | | | 152,320 | |
| | 125,000 | | | Microchip Technology, Inc., 3.922%, 6/1/21 | | | 127,767 | |
| | | | | | | | 485,826 | |
| | | | | Telecommunication Services — 0.4% | | | | |
| | 160,000 | | | Verizon Communications, Inc., 1.237%, (LIBOR USD 3-Month plus 1.00%), 3/16/22(b) | | | 161,836 | |
| | | | | Tobacco — 1.0% | | | | |
| | 150,000 | | | BAT Capital Corp., 1.160%, (LIBOR USD 3-Month plus 0.88%), 8/15/22(b) | | | 150,857 | |
| | 200,000 | | | BAT International Finance PLC, 3.250%, 6/7/22(a) | | | 208,443 | |
| | �� | | | | | | 359,300 | |
| | | | | Total Corporate Bonds (Cost $26,170,716) | | | 26,240,338 | |
Principal
Amount | | | | | Fair Value | |
| MUNICIPAL BONDS — 2.4% | | | | |
| | | | | Connecticut — 0.6% | | | | |
| $ | 200,000 | | | State Of Connecticut, CT, Public Improvements, Taxable Revenue Bonds, G.O., Series A, 3.000%, 7/1/21 | | $ | 203,884 | |
| | | | | Illinois — 0.7% | | | | |
| | 275,000 | | | Chicago O’Hare International Airport, IL, Refunding, Taxable Revenue Bonds, Series D, 0.959%, 1/1/23 | | | 275,201 | |
| | | | | Kansas — 0.4% | | | | |
| | 150,000 | | | Wyandotte County, KS, Advance Refunding, Taxable Revenue Bonds, Series B, 0.689%, 9/1/21 | | | 150,062 | |
| | | | | Pennsylvania — 0.7% | | | | |
| | 250,000 | | | Allegheny County, PA, Advance Refunding, Taxable Revenue Bonds, G.O., Series C79, 0.573%, 11/1/22 | | | 249,488 | |
| | | | | Total Municipal Bonds (Cost $877,131) | | | 878,635 | |
| Shares | | | | | Fair Value | |
| MONEY MARKET FUND — 2.3% | | | |
| | 845,516 | | | Federated Treasury Obligations Fund, Institutional Shares, 0.02%(e) | | | 845,516 | |
| | | | | Total Money Market Fund (Cost $845,516) | | | 845,516 | |
| | | | | | | | | |
Total Investments — 101.4% (Cost $36,807,797) | | | 36,892,127 | |
| Net Other Assets (Liabilities) — (1.4)% | | | (517,494 | ) |
| NET ASSETS — 100.0% | | $ | 36,374,633 | |
| (a) | Rule 144A, Section 4(2) or other security that is restricted as to resale to qualified institutional investors. The Advisor, using Board approved procedures, has deemed these securities or a portion of these securities to be liquid. |
| (b) | The interest rate for this floating rate note, which will change periodically, is based either on the prime rate or an index of market rates. The reflected rate is in effect as of September 30, 2020. The maturity date reflected is the final maturity date. |
| (c) | The interest rate for this variable rate note, which will change periodically, is based either on the prime rate or an index of market rates. The reflected rate is in effect as of September 30, 2020. The maturity date reflected is the final maturity date. |
| (d) | Security is a fix-to-float security, which carries a fixed coupon until a certain date, upon which it switches to a floating rate. Rate shown is the fixed rate. |
| (e) | Represents the current yield as of report date. |
BKNT — Bank Note
GMTN — Global Medium Term Note
MTN — Medium Term Note
STEP — Step Coupon Bond
Continued
| Sterling Capital Short Duration Bond Fund |
Schedule of Portfolio Investments
September 30, 2020
Principal
Amount | | | | | Fair Value | |
| ASSET BACKED SECURITIES — 18.7% | | | | |
| $ | 1,500,000 | | | AmeriCredit Automobile Receivables Trust, Series 2017-4, Class C, 2.600%, 9/18/23 | | $ | 1,533,140 | |
| | 1,290,000 | | | AmeriCredit Automobile Receivables Trust, Series 2018-3, Class C, 3.740%, 10/18/24 | | | 1,364,750 | |
| | 815,000 | | | AmeriCredit Automobile Receivables Trust, Series 2019-1, Class B, 3.130%, 2/18/25 | | | 846,013 | |
| | 10,881 | | | Ameriquest Mortgage Securities, Inc. Asset-Backed Pass Through Certificates, Series 2004-R6, Class M1, 2.248%, (LIBOR USD 1-Month plus 2.10%), 7/25/34(a) | | | 10,883 | |
| | 1,537,781 | | | ARI Fleet Lease Trust, Series 2019-A, Class A2A, 2.410%, 11/15/27(b) | | | 1,559,946 | |
| | 1,800,000 | | | Avis Budget Rental Car Funding AESOP, LLC, Series 2019-1A, Class A, 3.450%, 3/20/23(b) | | | 1,841,953 | |
| | 1,000,000 | | | Avis Budget Rental Car Funding AESOP, LLC, Series 2017-2A, Class A, 2.970%, 3/20/24(b) | | | 1,032,020 | |
| | 795,000 | | | Capital Auto Receivables Asset Trust, Series 2017-1, Class B, 2.430%, 5/20/22(b) | | | 802,212 | |
| | 890,000 | | | Capital Auto Receivables Asset Trust, Series 2017-1, Class C, 2.700%, 9/20/22(b) | | | 903,882 | |
| | 1,250,000 | | | Capital One Prime Auto Receivables Trust, Series 2019-2, Class A4, 1.960%, 2/18/25 | | | 1,293,254 | |
| | 300,000 | | | CarMax Auto Owner Trust, Series 2017-3, Class B, 2.440%, 2/15/23 | | | 305,169 | |
| | 1,151,000 | | | CarMax Auto Owner Trust, Series 2018-3, Class A4, 3.270%, 3/15/24 | | | 1,207,523 | |
| | 1,110,000 | | | CarMax Auto Owner Trust, Series 2020-3, Class A4, 0.770%, 3/16/26 | | | 1,121,326 | |
| | 55,793 | | | Chesapeake Funding II, LLC, Series 2017-2A, Class A1, 1.990%, 5/15/29(b) | | | 55,929 | |
| | 409,230 | | | Chesapeake Funding II, LLC, Series 2018-1A, Class A1, 3.040%, 4/15/30(b) | | | 418,187 | |
| | 222,467 | | | Chesapeake Funding II, LLC, Series 2018-2A, Class A1, 3.230%, 8/15/30(b) | | | 225,694 | |
| | 763,339 | | | Chesapeake Funding II, LLC, Series 2018-3A, Class A1, 3.390%, 1/15/31(b) | | | 787,135 | |
| | 610,679 | | | Chesapeake Funding II, LLC, Series 2019-1A, Class A1, 2.940%, 4/15/31(b) | | | 626,573 | |
| | 22,427 | | | Citicorp Residential Mortgage Trust, STEP, Series 2007-2, Class A6, 5.016%, 6/25/37 | | | 22,883 | |
| | 782,233 | | | Citigroup Mortgage Loan Trust, Inc., Series 2005-HE1, Class M3, 1.123%, (LIBOR USD 1-Month plus 0.98%), 5/25/35(a) | | | 779,793 | |
| | 53,373 | | | Countrywide Asset-Backed Certificates, Series 2004-12, Class MV4, 1.573%, (LIBOR USD 1-Month plus 1.43%), 3/25/35(a) | | | 53,336 | |
| | 1,475,000 | | | Discover Card Execution Note Trust, Series 2019-A3, Class A, 1.890%, 10/15/24 | | | 1,524,204 | |
| | 2,966,000 | | | Enterprise Fleet Financing, LLC, Series 2019-1, Class A3, 3.070%, 10/20/24(b) | | | 3,083,110 | |
| | 518,000 | | | Ford Credit Auto Owner Trust, Series 2017-B, Class B, 2.150%, 10/15/22 | | | 521,782 | |
| | 2,100,000 | | | Ford Credit Auto Owner Trust, Series 2017-1, Class A, 2.620%, 8/15/28(b) | | | 2,164,034 | |
| | 1,146,000 | | | Ford Credit Auto Owner Trust, Series 2017-2, Class A, 2.360%, 3/15/29(b) | | | 1,187,071 | |
| | 525,000 | | | GreatAmerica Leasing Receivables Funding, LLC, Series 2020-1, Class A3, 1.760%, 8/15/23(b) | | | 535,863 | |
| | 1,195,351 | | | Hertz Fleet Lease Funding L.P., Series 2019-1, Class A2, 2.700%, 1/10/33(b) | | | 1,212,540 | |
Principal
Amount | | | | | Fair Value | |
| ASSET BACKED SECURITIES — (continued) | | | | |
| $ | 2,000,000 | | | Santander Drive Auto Receivables Trust, Series 2020-2, Class B, 0.960%, 11/15/24 | | $ | 2,006,576 | |
| | 2,000,000 | | | Santander Drive Auto Receivables Trust, Series 2020-3, Class B, 0.690%, 3/17/25 | | | 2,000,854 | |
| | 914,589 | | | SoFi Professional Loan Program Trust, Series 2020-A, Class A1FX, 2.060%, 5/15/46(b) | | | 922,648 | |
| | 168,139 | | | Sofi Professional Loan Program, LLC, Series 2016-B, Class A1, 1.348%, (LIBOR USD 1-Month plus 1.20%), 6/25/33(a)(b) | | | 168,504 | |
| | 47,736 | | | Sofi Professional Loan Program, LLC, Series 2016-E, Class A1, 0.998%, (LIBOR USD 1-Month plus 0.85%), 7/25/39(a)(b) | | | 47,636 | |
| | 305,000 | | | Wheels SPV 2, LLC, Series 2017-1A, Class A4, 2.400%, 4/20/26(b) | | | 305,698 | |
| | 1,250,000 | | | Wheels SPV 2, LLC, Series 2019-1A, Class A3, 2.350%, 5/22/28(b) | | | 1,287,601 | |
| | 2,292 | | | World Omni Auto Receivables Trust, Series 2016-B, Class A3, 1.300%, 2/15/22 | | | 2,292 | |
| | | | | Total Asset Backed Securities (Cost $33,074,111) | | | 33,762,014 | |
| | | | | | | | | |
| COLLATERALIZED MORTGAGE OBLIGATIONS — 1.8% | | | | |
| | 58,964 | | | Alternative Loan Trust, Series 2004-22CB, Class 1A1, 6.000%, 10/25/34 | | | 61,209 | |
| | 193,758 | | | Banc of America Funding Trust, Series 2004-C, Class 4A3, 1.056%, (LIBOR USD 1-Month plus 0.90%), 12/20/34(a) | | | 193,015 | |
| | 124,157 | | | Fannie Mae, Series 2014-76, Class BC, 3.000%, 5/25/37 | | | 124,193 | |
| | 363,105 | | | Fannie Mae, Series 2012-152, Class PC, 1.750%, 8/25/42 | | | 364,321 | |
| | 99,366 | | | Fannie Mae, Series 2013-72, Class NA, 2.500%, 8/25/42 | | | 103,254 | |
| | 1,065,662 | | | Fannie Mae, Series 2013-35, Class CB, 2.000%, 2/25/43 | | | 1,104,565 | |
| | 166,410 | | | Freddie Mac, Series 4030, Class PD, 3.000%, 6/15/40 | | | 168,295 | |
| | 70,856 | | | Galton Funding Mortgage Trust, Series 2018-1, Class A43, 3.500%, 11/25/57(b)(c) | | | 71,502 | |
| | 540,312 | | | Galton Funding Mortgage Trust, Series 2018-2, Class A41, 4.500%, 10/25/58(b)(c) | | | 552,197 | |
| | 482,161 | | | Galton Funding Mortgage Trust, Series 2019-1, Class A41, 4.500%, 2/25/59(b)(c) | | | 490,911 | |
| | | | | Total Collateralized Mortgage Obligations (Cost $3,167,018) | | | 3,233,462 | |
| | | | | | | | | |
| COMMERCIAL MORTGAGE-BACKED SECURITIES — 8.8% | | | | |
| | 1,743,610 | | | COMM 2012-CCRE1 Mortgage Trust, Series 2012-CR1, Class A3, 3.391%, 5/15/45 | | | 1,780,096 | |
| | 1,623,000 | | | COMM 2012-CCRE2 Mortgage Trust, Series 2012-CR2, Class A4, 3.147%, 8/15/45 | | | 1,676,500 | |
| | 454,000 | | | COMM 2013-CCRE11 Mortgage Trust, Series 2013-CR11, Class A4, 4.258%, 8/10/50 | | | 494,359 | |
| | 458,739 | | | COMM 2014-CCRE15 Mortgage Trust, Series 2014-CR15, Class A2, 2.928%, 2/10/47 | | | 464,587 | |
| | 750,000 | | | DBUBS 2011-LC1 Mortgage Trust, Series 2011-LC1A, Class B, 5.471%, 11/10/46(b)(c) | | | 751,578 | |
See accompanying Notes to the Financial Statements.
| Sterling Capital Short Duration Bond Fund |
Schedule of Portfolio Investments — (continued)
September 30, 2020
Principal
Amount | | | | | Fair Value | |
| COMMERCIAL MORTGAGE-BACKED SECURITIES — (continued) | | | |
| $ | 95,354 | | | DBUBS 2011-LC2 Mortgage Trust, Series 2011-LC2A, Class A4, 4.537%, 7/10/44(b) | | $ | 96,474 | |
| | 114,831 | | | GS Mortgage Securities Trust, Series 2010-C1, Class A2, 4.592%, 8/10/43(b) | | | 114,834 | |
| | 300,000 | | | GS Mortgage Securities Trust, Series 2010-C1, Class B, 5.148%, 8/10/43(b) | | | 272,330 | |
| | 553,283 | | | GS Mortgage Securities Trust, Series 2014-GC24, Class AAB, 3.650%, 9/10/47 | | | 579,405 | |
| | 937,651 | | | JP Morgan Chase Commercial Mortgage Securities Trust, Series 2011-C3, Class A4, 4.717%, 2/15/46(b) | | | 940,590 | |
| | 1,100,000 | | | JP Morgan Chase Commercial Mortgage Securities Trust, Series 2014-C20, Class A5, 3.805%, 7/15/47 | | | 1,200,445 | |
| | 5,205 | | | JPMBB Commercial Mortgage Securities Trust, Series 2014-C19, Class A2, 3.046%, 4/15/47 | | | 5,223 | |
| | 1,500,000 | | | Morgan Stanley Capital I Trust, Series 2016-BNK2, Class A2, 2.454%, 11/15/49 | | | 1,518,563 | |
| | 1,383,094 | | | UBS-Barclays Commercial Mortgage Trust, Series 2012-C3, Class A4, 3.091%, 8/10/49 | | | 1,432,289 | |
| | 1,106,100 | | | WFRBS Commercial Mortgage Trust, Series 2011-C3, Class A4, 4.375%, 3/15/44(b) | | | 1,113,668 | |
| | 250,000 | | | WFRBS Commercial Mortgage Trust, Series 2011-C4, Class A4, 4.902%, 6/15/44(b)(c) | | | 253,282 | |
| | 612,315 | | | WFRBS Commercial Mortgage Trust, Series 2011-C5, Class A4, 3.667%, 11/15/44 | | | 622,846 | |
| | 1,700,000 | | | WFRBS Commercial Mortgage Trust, Series 2012-C7, Class A2, 3.431%, 6/15/45 | | | 1,753,202 | |
| | 766,788 | | | WF-RBS Commercial Mortgage Trust, Series 2011-C2, Class A4, 4.869%, 2/15/44(b)(c) | | | 771,299 | |
| | | | | Total Commercial Mortgage-Backed Securities (Cost $15,914,432) | | | 15,841,570 | |
| | | | | | | | | |
| CORPORATE BONDS — 57.7% | | | | |
| | | | | Automobiles — 3.6% | | | | |
| | 1,000,000 | | | American Honda Finance Corp., MTN, 0.875%, 7/7/23 | | | 1,008,227 | |
| | 1,250,000 | | | BMW U.S. Capital, LLC, 3.150%, 4/18/24(b) | | | 1,340,585 | |
| | 900,000 | | | Ford Motor Credit Co., LLC, 3.350%, 11/1/22 | | | 886,500 | |
| | 1,100,000 | | | General Motors Financial Co., Inc., 1.700%, 8/18/23 | | | 1,102,749 | |
| | 1,200,000 | | | Toyota Industries Corp., 3.110%, 3/12/22(b) | | | 1,238,340 | |
| | 840,000 | | | Toyota Motor Credit Corp., MTN, 2.900%, 3/30/23 | | | 890,606 | |
| | | | | | | | 6,467,007 | |
| | | | | Banks — 17.7% | | | | |
| | 2,750,000 | | | Bank of America Corp., MTN, 0.981%, (SOFR plus 0.91%), 9/25/25(d) | | | 2,749,367 | |
| | 800,000 | | | Bank of Nova Scotia (The), 2.000%, 11/15/22 | | | 826,126 | |
| | 825,000 | | | Barclays PLC, 4.610%, (LIBOR USD 3-Month plus 1.40%), 2/15/23(d) | | | 863,352 | |
| | 1,250,000 | | | BNP Paribas SA, 3.800%, 1/10/24(b) | | | 1,352,511 | |
| | 950,000 | | | BPCE SA, 4.000%, 4/15/24 | | | 1,052,184 | |
| | 800,000 | | | Citigroup, Inc., 1.676%, (LIBOR USD 3-Month plus 1.43%), 9/1/23(a) | | | 813,320 | |
| | 1,000,000 | | | Citigroup, Inc., 3.352%, (LIBOR USD 3-Month plus 0.90%), 4/24/25(d) | | | 1,081,924 | |
Principal
Amount | | | | | Fair Value | |
| CORPORATE BONDS — (continued) | | | | |
| | | | | Banks — (continued) | | | | |
| $ | 1,075,000 | | | Citizens Bank NA/Providence RI, BKNT, 1.044%, (LIBOR USD 3-Month plus 0.81%), 5/26/22(a) | | $ | 1,083,258 | |
| | 800,000 | | | Cooperatieve Rabobank UA, 2.750%, 1/10/23 | | | 841,512 | |
| | 650,000 | | | Credit Suisse AG, 2.800%, 4/8/22 | | | 673,094 | |
| | 625,000 | | | DBS Group Holdings, Ltd., 2.850%, 4/16/22(b) | | | 644,779 | |
| | 450,000 | | | Fifth Third Bank N.A., BKNT, 1.800%, 1/30/23 | | | 462,463 | |
| | 1,000,000 | | | Huntington National Bank (The), BKNT, 3.550%, 10/6/23 | | | 1,088,083 | |
| | 900,000 | | | JPMorgan Chase & Co., 3.559%, (LIBOR USD 3-Month plus 0.73%), 4/23/24(d) | | | 965,070 | |
| | 491,000 | | | JPMorgan Chase & Co., Series I, 3.738%, (LIBOR USD 3-Month plus 3.47%),(c)(e) | | | 470,804 | |
| | 1,200,000 | | | KeyBank NA/Cleveland OH, BKNT, 1.250%, 3/10/23 | | | 1,222,164 | |
| | 1,000,000 | | | Lloyds Banking Group PLC, 2.907%, (LIBOR USD 3-Month plus 0.81%), 11/7/23(d) | | | 1,038,551 | |
| | 1,000,000 | | | Macquarie Bank, Ltd., 6.625%, 4/7/21(b) | | | 1,030,521 | |
| | 1,450,000 | | | Mitsubishi UFJ Financial Group, Inc., 0.848%, (1-Year Treasury Constant Maturity plus 0.68%), 9/15/24(c) | | | 1,450,905 | |
| | 1,150,000 | | | Morgan Stanley, Series F, 3.875%, 4/29/24 | | | 1,269,070 | |
| | 625,000 | | | National Securities Clearing Corp., 1.200%, 4/23/23(b) | | | 636,037 | |
| | 1,000,000 | | | Nationwide Building Society, 2.000%, 1/27/23(b) | | | 1,029,001 | |
| | 1,000,000 | | | NatWest Markets PLC, 2.375%, 5/21/23(b) | | | 1,029,570 | |
| | 400,000 | | | Nordea Bank Abp, 1.000%, 6/9/23(b) | | | 405,356 | |
| | 842,000 | | | PNC Financial Services Group, Inc. (The), Series O, 6.750%, (LIBOR USD 3-Month plus 3.68%), 2/1/69(d)(e) | | | 863,302 | |
| | 1,000,000 | | | Skandinaviska Enskilda Banken AB, 0.550%, 9/1/23(b) | | | 1,000,520 | |
| | 825,000 | | | Standard Chartered PLC, 4.247%, (LIBOR USD 3-Month plus 1.15%), 1/20/23(b)(d) | | | 855,933 | |
| | 1,000,000 | | | Sumitomo Mitsui Financial Group, Inc., 2.696%, 7/16/24 | | | 1,063,984 | |
| | 500,000 | | | Sumitomo Mitsui Trust Bank, Ltd., 0.800%, 9/12/23(b) | | | 500,742 | |
| | 1,250,000 | | | Svenska Handelsbanken AB, 0.625%, 6/30/23(b) | | | 1,254,308 | |
| | 1,500,000 | | | Toronto-Dominion Bank (The), MTN, 1.900%, 12/1/22 | | | 1,548,427 | |
| | 750,000 | | | Zions Bancorp NA, 3.500%, 8/27/21 | | | 765,595 | |
| | | | | | | | 31,931,833 | |
| | | | | Beverages — 0.7% | | | | |
| | 1,200,000 | | | Constellation Brands, Inc., 2.650%, 11/7/22 | | | 1,242,891 | |
| | | | | | | | | |
| | | | | Capital Goods — 0.5% | | | | |
| | 550,000 | | | Caterpillar Financial Services Corp., 0.650%, 7/7/23 | | | 552,620 | |
| | 285,000 | | | Caterpillar Financial Services Corp., MTN, 0.450%, 9/14/23 | | | 284,892 | |
| | | | | | | | 837,512 | |
| | | | | Chemicals — 1.2% | | | | |
| | 1,199,000 | | | Albemarle Corp., 1.330%, (LIBOR USD 3-Month plus 1.05%), 11/15/22(a) | | | 1,194,670 | |
| | 1,000,000 | | | FMC Corp., 3.950%, 2/1/22 | | | 1,033,512 | |
| | | | | | | | 2,228,182 | |
Continued
| Sterling Capital Short Duration Bond Fund |
Schedule of Portfolio Investments — (continued)
September 30, 2020
Principal
Amount | | | | | Fair Value | |
| CORPORATE BONDS — (continued) | | | | |
| | | | | Diversified Financial Services — 6.4% | | | | |
| $ | 450,000 | | | AerCap Ireland Capital DAC/AerCap Global Aviation Trust, 4.450%, 12/16/21 | | $ | 459,794 | |
| | 600,000 | | | AerCap Ireland Capital DAC/AerCap Global Aviation Trust, 3.150%, 2/15/24 | | | 594,098 | |
| | 650,000 | | | AIG Global Funding, 0.800%, 7/7/23(b) | | | 653,408 | |
| | 335,000 | | | Ally Financial, Inc., 1.450%, 10/2/23 | | | 334,629 | |
| | 875,000 | | | Avolon Holdings Funding, Ltd., 3.625%, 5/1/22(b) | | | 859,817 | |
| | 590,000 | | | Carlyle Holdings Finance, LLC, 3.875%, 2/1/23(b) | | | 632,453 | |
| | 1,200,000 | | | ERAC USA Finance, LLC, 3.300%, 10/15/22(b) | | | 1,257,724 | |
| | 750,000 | | | Goldman Sachs Group, Inc. (The), 3.000%, 4/26/22 | | | 760,832 | |
| | 1,200,000 | | | Goldman Sachs Group, Inc. (The), 2.908%, (LIBOR USD 3-Month plus 1.05%), 6/5/23(d) | | | 1,242,904 | |
| | 640,000 | | | Intercontinental Exchange, Inc., 0.700%, 6/15/23 | | | 641,645 | |
| | 1,200,000 | | | Jefferies Group, LLC, 5.125%, 1/20/23 | | | 1,308,026 | |
| | 466,000 | | | Nationwide Financial Services, Inc., 5.375%, 3/25/21(b) | | | 476,328 | |
| | 1,000,000 | | | PayPal Holdings, Inc., 2.200%, 9/26/22 | | | 1,033,612 | |
| | 1,275,000 | | | Penske Truck Leasing Co. L.P./PTL Finance Corp., 2.700%, 3/14/23(b) | | | 1,327,275 | |
| | | | | | | | 11,582,545 | |
| | | | | Diversified Telecommunication Services — 1.6% | | | | |
| | 2,000,000 | | | AT&T, Inc., 4.450%, 4/1/24 | | | 2,233,958 | |
| | 564,000 | | | Sprint Spectrum Co., LLC/Sprint Spectrum Co. II, LLC/Sprint Spectrum Co. III, LLC, 4.738%, 3/20/25(b) | | | 609,825 | |
| | | | | | | | 2,843,783 | |
| | | | | Electric Utilities — 3.7% | | | | |
| | 1,000,000 | | | American Electric Power Co., Inc., Series I, 3.650%, 12/1/21 | | | 1,035,487 | |
| | 1,000,000 | | | Baltimore Gas and Electric Co., 2.800%, 8/15/22 | | | 1,038,331 | |
| | 1,000,000 | | | CenterPoint Energy, Inc., 3.850%, 2/1/24 | | | 1,095,572 | |
| | 1,250,000 | | | Dominion Energy, Inc., 2.450%, 1/15/23(b) | | | 1,302,137 | |
| | 1,200,000 | | | Duke Energy Corp., 3.050%, 8/15/22 | | | 1,248,031 | |
| | 960,000 | | | Korea East-West Power Co., Ltd., 2.625%, 6/19/22(b) | | | 991,513 | |
| | | | | | | | 6,711,071 | |
| | | | | Energy Equipment & Services — 2.7% | | | | |
| | 900,000 | | | Energy Transfer Operating L.P., 4.250%, 3/15/23 | | | 935,767 | |
| | 1,100,000 | | | Midwest Connector Capital Co., LLC, 3.625%, 4/1/22(b) | | | 1,108,201 | |
| | 500,000 | | | Sabine Pass Liquefaction, LLC, 6.250%, 3/15/22 | | | 530,603 | |
| | 1,050,000 | | | Saudi Arabian Oil Co., 2.750%, 4/16/22(b) | | | 1,075,842 | |
| | 1,155,000 | | | Williams Cos., Inc. (The), 4.500%, 11/15/23 | | | 1,264,196 | |
| | | | | | | | 4,914,609 | |
| | | | | Equity Real Estate Investment Trusts (REITS) — 4.9% | | | | |
| | 780,000 | | | Alexandria Real Estate Equities, Inc., 4.000%, 1/15/24 | | | 858,895 | |
| | 790,000 | | | American Tower Corp., 5.000%, 2/15/24 | | | 893,306 | |
Principal
Amount | | | | | Fair Value | |
| CORPORATE BONDS — (continued) | | | | |
| | | | | Equity Real Estate Investment Trusts (REITS) — (continued) | | | | |
| $ | 700,000 | | | Crown Castle International Corp., 3.150%, 7/15/23 | | $ | 744,400 | |
| | 1,205,000 | | | Jones Lang LaSalle, Inc., 4.400%, 11/15/22 | | | 1,274,478 | |
| | 1,000,000 | | | Kimco Realty Corp., 2.700%, 3/1/24 | | | 1,045,051 | |
| | 1,075,000 | | | Ontario Teachers’ Cadillac Fairview Properties Trust, 3.125%, 3/20/22(b) | | | 1,100,487 | |
| | 1,000,000 | | | Retail Opportunity Investments Partnership L.P., 5.000%, 12/15/23 | | | 1,043,364 | |
| | 915,000 | | | Starwood Property Trust, Inc., 3.625%, 2/1/21 | | | 914,359 | |
| | 1,000,000 | | | WEA Finance, LLC, 3.150%, 4/5/22(b) | | | 1,016,091 | |
| | | | | | | | 8,890,431 | |
| | | | | Food & Staples Retailing — 1.1% | | | | |
| | 330,000 | | | Albertsons Cos., Inc./Safeway, Inc./New Albertsons L.P./Albertsons, LLC, 3.500%, 2/15/23(b) | | | 335,527 | |
| | 1,607,000 | | | Seven & i Holdings Co., Ltd., 3.350%, 9/17/21(b) | | | 1,646,738 | |
| | | | | | | | 1,982,265 | |
| | | | | Food Products — 0.8% | | | | |
| | 1,250,000 | | | Conagra Brands, Inc., 4.300%, 5/1/24 | | | 1,394,613 | |
| | | | | Health Care Providers & Services — 2.0% | | | | |
| | 732,000 | | | Cigna Corp., 3.750%, 7/15/23 | | | 793,248 | |
| | 496,000 | | | CVS Health Corp., 3.700%, 3/9/23 | | | 531,508 | |
| | 1,000,000 | | | DH Europe Finance II Sarl, 2.050%, 11/15/22 | | | 1,030,895 | |
| | 1,085,000 | | | Shire Acquisitions Investments Ireland DAC, 2.875%, 9/23/23 | | | 1,150,046 | |
| | | | | | | | 3,505,697 | |
| | | | | Insurance — 3.3% | | | | |
| | 142,000 | | | Assurant, Inc., 1.483%, (LIBOR USD 3-Month plus 1.25%), 3/26/21(a) | | | 141,950 | |
| | 750,000 | | | Athene Global Funding, 3.000%, 7/1/22(b) | | | 774,511 | |
| | 800,000 | | | Fidelity National Financial, Inc., 5.500%, 9/1/22 | | | 868,277 | |
| | 350,000 | | | Guardian Life Global Funding, 2.900%, 5/6/24(b) | | | 376,835 | |
| | 1,175,000 | | | Jackson National Life Global Funding, 3.300%, 2/1/22(b) | | | 1,219,421 | |
| | 200,000 | | | New York Life Global Funding, 1.100%, 5/5/23(b) | | | 203,370 | |
| | 400,000 | | | New York Life Global Funding, 2.900%, 1/17/24(b) | | | 428,638 | |
| | 600,000 | | | Pacific Life Global Funding II, 0.500%, 9/23/23(b) | | | 599,484 | |
| | 1,275,000 | | | Reliance Standard Life Global Funding II, 2.625%, 7/22/22(b) | | | 1,312,522 | |
| | | | | | | | 5,925,008 | |
| | | | | Media — 2.1% | | | | |
| | 1,104,000 | | | Charter Communications Operating, LLC/Charter Communications Operating Capital, 4.464%, 7/23/22 | | | 1,168,846 | |
| | 1,175,000 | | | Comcast Corp., 3.600%, 3/1/24 | | | 1,292,899 | |
| | 1,250,000 | | | ViacomCBS, Inc., 4.250%, 9/1/23 | | | 1,361,725 | |
| | | | | | | | 3,823,470 | |
| | | | | Multiline Retail — 0.5% | | | | |
| | 750,000 | | | Dollar Tree, Inc., 3.700%, 5/15/23 | | | 806,540 | |
Continued
| Sterling Capital Short Duration Bond Fund |
Schedule of Portfolio Investments — (continued)
September 30, 2020
Principal
Amount | | | | | Fair Value | |
| CORPORATE BONDS — (continued) | | | | |
| | | | | Oil, Gas & Consumable Fuels — 2.2% | | | | |
| $ | 800,000 | | | Aker BP ASA, 4.750%, 6/15/24(b) | | $ | 821,521 | |
| | 972,000 | | | Diamondback Energy, Inc., 5.375%, 5/31/25 | | | 1,009,271 | |
| | 831,000 | | | HollyFrontier Corp., 2.625%, 10/1/23 | | | 831,233 | |
| | 515,000 | | | Marathon Petroleum Corp., 5.375%, 10/1/22 | | | 515,000 | |
| | 825,000 | | | Newfield Exploration Co., 5.750%, 1/30/22 | | | 824,643 | |
| | | | | | | | 4,001,668 | |
| | | | | Pharmaceuticals — 0.7% | | | | |
| | 1,100,000 | | | AbbVie, Inc., 3.750%, 11/14/23 | | | 1,200,330 | |
| | | | | Road & Rail — 0.4% | | | | |
| | 202,000 | | | Ryder System, Inc., MTN, 2.875%, 6/1/22 | | | 209,304 | |
| | 425,000 | | | Ryder System, Inc., MTN, 2.500%, 9/1/22 | | | 438,736 | |
| | | | | | | | 648,040 | |
| | | | | Semiconductors & Semiconductor Equipment — 0.9% | | | | |
| | 825,000 | | | Broadcom Corp./Broadcom Cayman Finance, Ltd., 3.625%, 1/15/24 | | | 887,321 | |
| | 800,000 | | | TSMC Global, Ltd., 0.750%, 9/28/25(b) | | | 792,882 | |
| | | | | | | | 1,680,203 | |
| | | | | Tobacco — 0.7% | | | | |
| | 1,200,000 | | | BAT Capital Corp., 2.764%, 8/15/22 | | | 1,243,636 | |
| | | | | Total Corporate Bonds
(Cost $102,063,465) | | | 103,861,334 | |
| | | | | | | | | |
| MUNICIPAL BONDS — 12.7% | | | | |
| | | | | California — 1.5% | | | | |
| | 650,000 | | | Beverly Hills Public Financing Authority, CA, Advance Refunding, Taxable Revenue Bonds, Series B, 0.730%, 6/1/24 | | | 649,818 | |
| | 2,000,000 | | | State of California, Taxable Revenue, Group B, Current Refunding G.O., 2.500%, 10/1/22 | | | 2,082,200 | |
| | | | | | | | 2,732,018 | |
| | | | | Florida — 1.1% | | | | |
| | 2,000,000 | | | Florida Water Pollution Control Financing Corp. Taxable Revenue, Series A, Advance Refunding Revenue Bonds, 2.000%, 1/15/23 | | | 2,070,100 | |
| | | | | Illinois — 1.4% | | | | |
| | 1,315,000 | | | Chicago O’Hare International Airport, IL, Refunding, Taxable Revenue Bonds, Series D, 1.168%, 1/1/24 | | | 1,315,802 | |
| | 1,200,000 | | | Chicago Transit Authority Sales Tax Receipts Fund, IL, Advance Refunding, Taxable Revenue Bonds, Series B, 1.708%, 12/1/22 | | | 1,213,644 | |
| | | | | | | | 2,529,446 | |
| | | | | Massachusetts — 1.1% | | | | |
| | 1,000,000 | | | Massachusetts School Building Authority, MA, Advance Refunding, Taxable Revenue Bonds, Series -S, 0.618%, 8/15/23 | | | 1,004,960 | |
| | 1,000,000 | | | Massachusetts Water Resources Authority, Taxable Revenue, Green Bond-Series F, Advance Refunding Revenue Bonds, 1.772%, 8/1/23 | | | 1,034,780 | |
| | | | | | | | 2,039,740 | |
Principal
Amount | | | | | Fair Value | |
| MUNICIPAL BONDS — (continued) | | | | |
| | | | | New Jersey — 0.2% | | | |
| $ | 325,000 | | | New Jersey Economic Development Authority, School Facilities Construction Refunding Revenue, Taxable, Series C, 4.521%, 6/15/21 | | $ | 331,409 | |
| | | | | New York — 0.6% | | | | |
| | 1,000,000 | | | New York State Urban Development Corp. Taxable Revenue, Series B, Economic Improvements Revenue Bonds, 1.910%, 3/15/23 | | | 1,028,370 | |
| | | | | North Carolina — 0.3% | | | | |
| | 500,000 | | | North Carolina Eastern Municipal Power Agency, Refunding Revenue (AGM), 3.558%, 7/1/22 | | | 523,450 | |
| | | | | Pennsylvania — 1.4% | | | | |
| | 1,000,000 | | | Allegheny County, PA, Advance Refunding, Taxable Revenue Bonds, G.O., Series C79, 0.694%, 11/1/23 | | | 997,030 | |
| | 985,000 | | | Bucks County, PA, Advance Refunding, Taxable Revenue Bonds, G.O., 0.979%, 6/1/24 | | | 986,458 | |
| | 515,000 | | | Pennsylvania State University (The), PA, Refunding Notes, Taxable Revenue Bonds, Series D, 1.353%, 9/1/23 | | | 526,557 | |
| | | | | | | | 2,510,045 | |
| | | | | South Carolina — 0.9% | | | | |
| | 1,500,000 | | | City of Columbia, SC, Waterworks & Sewer System Revenue, Taxable Revenue-Series B, Advance Refunding Revenue Bonds, 1.932%, 2/1/23 | | | 1,532,190 | |
| | | | | Texas — 2.8% | | | | |
| | 970,000 | | | City of Houston, TX, Airport System Revenue, Refunding, Taxable Revenue Bonds, Series C, 1.054%, 7/1/23 | | | 971,145 | |
| | 1,250,000 | | | City of Houston, TX, Combined Utility System Revenue, Taxable Revenue, First Lien-Series C, Advance Refunding Revenue Bonds, 1.746%, 11/15/23 | | | 1,301,575 | |
| | 1,250,000 | | | City of Houston, TX, Combined Utility System Revenue, Taxable Revenue, Series B, Advance Refunding G.O., 1.820%, 3/1/23 | | | 1,278,913 | |
| | 1,475,000 | | | Texas State University System, Taxable Revenue, Series B, Advance Refunding Revenue Bonds, 2.043%, 3/15/23 | | | 1,520,873 | |
| | | | | | | | 5,072,506 | |
| | | | | Virginia — 1.4% | | | | |
| | 1,000,000 | | | Hampton Roads Sanitation District, Taxable Revenue, Sub-Series A, Advance Refunding Revenue Bonds, 1.762%, 2/1/23 | | | 1,019,650 | |
| | 1,500,000 | | | Montgomery County Economic Development Authority, Taxable Revenue, Virginia Tech Foundation Economic Improvements Revenue Bonds, 1.941%, 6/1/22 | | | 1,528,560 | |
| | | | | | | | 2,548,210 | |
| | | | | Total Municipal Bonds
(Cost $22,474,175) | | | 22,917,484 | |
Continued
| Sterling Capital Short Duration Bond Fund |
Schedule of Portfolio Investments — (continued)
September 30, 2020
Principal
Amount | | | | | Fair Value | |
| U.S. TREASURY NOTES — 0.2% | | | | |
| $ | 300,000 | | | 1.500%, 1/15/23 | | $ | 309,305 | |
| | | | | Total U.S. Treasury Notes
(Cost $303,956) | | | 309,305 | |
| Shares | | | | | | | |
| MONEY MARKET FUND — 1.1% | | | |
| | 1,933,288 | | | Federated Treasury Obligations Fund, Institutional Shares, 0.02%(f) | | | 1,933,288 | |
| | | | | Total Money Market Fund
(Cost $1,933,288) | | | 1,933,288 | |
Total Investments — 101.0% (Cost $178,930,445) | | | 181,858,457 | |
| Net Other Assets (Liabilities) — (1.0)% | | | (1,814,370 | ) |
| NET ASSETS — 100.0% | | $ | 180,044,087 | |
| (a) | The interest rate for this floating rate note, which will change periodically, is based either on the prime rate or an index of market rates. The reflected rate is in effect as of September 30, 2020. The maturity date reflected is the final maturity date. |
| (b) | Rule 144A, Section 4(2) or other security that is restricted as to resale to qualified institutional investors. The Advisor, using Board approved procedures, has deemed these securities or a portion of these securities to be liquid. |
| (c) | The interest rate for this variable rate note, which will change periodically, is based either on the prime rate or an index of market rates. The reflected rate is in effect as of September 30, 2020. The maturity date reflected is the final maturity date. |
| (d) | Security is a fix-to-float security, which carries a fixed coupon until a certain date, upon which it switches to a floating rate. Rate shown is the fixed rate. |
| (e) | Security is perpetual in nature and has no stated maturity date. |
| (f) | Represents the current yield as of report date. |
AGM — Assured Guaranty Municipal Corp.
BKNT — Bank Note
MTN — Medium Term Note
STEP — Step Coupon Bond
Continued
| Sterling Capital Intermediate U.S. Government Fund |
Schedule of Portfolio Investments
September 30, 2020
Principal
Amount | | | | | Fair Value | |
| ASSET BACKED SECURITIES — 1.4% | | | | |
| | | | | Asset Backed Securities — 1.4% | | | | |
| $ | 153,739 | | | United States Small Business Administration, Series 2015-20G, Class 1, 2.880%, 7/1/35 | | $ | 167,098 | |
| | | | | Total Asset Backed Securities
(Cost $153,739) | | | 167,098 | |
| COLLATERALIZED MORTGAGE OBLIGATIONS — 11.9% | | | | |
| | 51,653 | | | Fannie Mae, Series 2010-129, Class NA, 3.500%, 3/25/25 | | | 51,928 | |
| | 76,006 | | | Fannie Mae, Series 2003-44, Class Q, 3.500%, 6/25/33 | | | 81,911 | |
| | 273,826 | | | Fannie Mae, Series 2016-49, Class DA, 3.500%, 10/25/42 | | | 283,690 | |
| | 407,660 | | | Fannie Mae, Series 2016-49, Class PA, 3.000%, 9/25/45 | | | 430,963 | |
| | 123,753 | | | Freddie Mac, Series 4281, Class GA, 3.000%, 2/15/39 | | | 125,779 | |
| | 81,043 | | | Freddie Mac, Series 4648, Class E, 3.500%, 8/15/43 | | | 82,783 | |
| | 305,547 | | | Freddie Mac, Series 4656, Class PA, 3.500%, 10/15/45 | | | 324,798 | |
| | 71,104 | | | Ginnie Mae, Series 2011-71, Class QE, 3.500%, 9/16/40 | | | 73,720 | |
| | | | | Total Collateralized Mortgage Obligations
(Cost $1,387,156) | | | 1,455,572 | |
| COMMERCIAL MORTGAGE-BACKED SECURITIES — 16.7% | | | | |
| | 145,000 | | | Citigroup Commercial Mortgage Trust, Series 2015-GC29, Class A3, 2.935%, 4/10/48 | | | 153,221 | |
| | 102,677 | | | COMM Mortgage Trust, Series 2012-CR3, Class A3, 2.822%, 10/15/45 | | | 104,636 | |
| | 60,000 | | | COMM Mortgage Trust, Series 2013-CR11, Class A4, 4.258%, 8/10/50 | | | 65,334 | |
| | 300,000 | | | Freddie Mac Multifamily Structured Pass Through Certificates, Series K033, Class A2, 3.060%, 7/25/23(a) | | | 319,043 | |
| | 140,000 | | | Freddie Mac Multifamily Structured Pass Through Certificates, Series K049, Class A2, 3.010%, 7/25/25 | | | 154,337 | |
| | 210,000 | | | Freddie Mac Multifamily Structured Pass Through Certificates, Series K060, Class A2, 3.300%, 10/25/26 | | | 238,814 | |
| | 210,000 | | | Freddie Mac Multifamily Structured Pass Through Certificates, Series K061, Class A2, 3.347%, 11/25/26(a) | | | 240,562 | |
| | 160,000 | | | Freddie Mac Multifamily Structured Pass Through Certificates, Series K069, Class A2, 3.187%, 9/25/27(a) | | | 183,737 | |
| | 275,000 | | | Freddie Mac Multifamily Structured Pass Through Certificates, Series K079, Class A2, 3.926%, 6/25/28 | | | 330,233 | |
| | 106,912 | | | WFRBS Commercial Mortgage Trust, Series 2011-C5, Class A4, 3.667%, 11/15/44 | | | 108,751 | |
| | 35,000 | | | WFRBS Commercial Mortgage Trust, Series 2012-C8, Class A3, 3.001%, 8/15/45 | | | 36,059 | |
Principal
Amount | | | | | Fair Value | |
| COMMERCIAL MORTGAGE-BACKED SECURITIES — (continued) | | | |
| $ | 119,113 | | | WF-RBS Commercial Mortgage Trust, Series 2011-C2, Class A4, 4.869%, 2/15/44(a)(b) | | $ | 119,814 | |
| | | | | Total Commercial Mortgage-Backed Securities
(Cost $1,920,570) | | | 2,054,541 | |
| MORTGAGE-BACKED SECURITIES — 35.0% | | | | |
| | | | | Fannie Mae — 24.7% | | | | |
| | 357,252 | | | 4.000%, 12/1/33, Pool #MA1689 | | | 391,836 | |
| | 109,064 | | | 4.000%, 12/1/36, Pool #MA2856 | | | 118,142 | |
| | 100,727 | | | 4.000%, 2/1/37, Pool #MA2914 | | | 108,742 | |
| | 112,559 | | | 4.000%, 5/1/47, Pool #BE9598 | | | 121,028 | |
| | 275,104 | | | 3.500%, 12/1/47, Pool #CA0833 | | | 291,217 | |
| | 189,891 | | | 5.000%, 8/1/48, Pool #CA2219 | | | 208,451 | |
| | 190,926 | | | 3.500%, 9/1/49, Pool #BJ9608 | | | 201,188 | |
| | 227,914 | | | 3.500%, 10/1/49, Pool #CA4431 | | | 240,180 | |
| | 256,627 | | | 3.000%, 12/1/49, Pool #BO6225 | | | 268,712 | |
| | 216,094 | | | 3.000%, 3/1/50, Pool #FM2714 | | | 226,729 | |
| | 249,132 | | | 2.000%, 8/1/50, Pool #CA6799 | | | 258,778 | |
| | 374,556 | | | 2.000%, 9/1/50, Pool #CA7019 | | | 387,330 | |
| | 205,000 | | | 2.500%, 9/1/50, Pool #BQ0538 | | | 215,204 | |
| | | | | | | | 3,037,537 | |
| | | | | Freddie Mac — 10.0% | | | | |
| | 220,459 | | | 4.000%, 12/1/35, Pool #ZA2401 | | | 240,151 | |
| | 216,314 | | | 3.500%, 6/1/36, Pool #ZA2414 | | | 233,796 | |
| | 187,154 | | | 4.000%, 3/1/39, Pool #ZA6403 | | | 199,510 | |
| | 243,800 | | | 3.000%, 11/1/39, Pool #RB5022 | | | 255,378 | |
| | 285,911 | | | 3.500%, 1/1/47, Pool #U69037 | | | 305,030 | |
| | | | | | | | 1,233,865 | |
| | | | | Ginnie Mae — 0.3% | | | | |
| | 29,709 | | | 5.000%, 11/20/38, Pool #4283 | | | 31,415 | |
| | | | | Total Mortgage-Backed Securities
(Cost $4,193,597) | | | 4,302,817 | |
| MUNICIPAL BONDS — 3.6% | | | | |
| | | | | North Carolina — 2.0% | | | | |
| | 250,000 | | | Durham County, NC, Build America Bonds, Public Improvements G.O., Taxable, Series B, Callable 10/1/20 @ 100, 4.845%, 10/1/29 | | | 250,000 | |
| | | | | Wisconsin — 1.6% | | | | |
| | 165,000 | | | State of Wisconsin, TXB, Revenue Bonds, Pension Funding, Series A, (AGM), 5.700%, 5/1/26 | | | 195,150 | |
| | | | | Total Municipal Bonds
(Cost $442,316) | | | 445,150 | |
| U.S. GOVERNMENT AGENCIES — 22.5% | | | | |
| | | | | Fannie Mae — 22.5% | | | | |
| | 500,000 | | | 1.875%, 9/24/26 | | | 541,920 | |
| | 1,000,000 | | | 6.250%, 5/15/29 | | | 1,447,251 | |
| | 500,000 | | | 7.125%, 1/15/30 | | | 774,020 | |
| | | | | | | | 2,763,191 | |
| | | | | Total U.S. Government Agencies
(Cost $2,350,537) | | | 2,763,191 | |
See accompanying Notes to the Financial Statements.
| Sterling Capital Intermediate U.S. Government Fund |
Schedule of Portfolio Investments — (continued)
September 30, 2020
Principal
Amount | | | | | Fair Value | |
| U.S. TREASURY NOTES — 7.7% | | | | |
| $ | 600,000 | | | 2.500%, 1/31/24 | | $ | 646,336 | |
| | 287,652 | | | 0.500%, 4/15/24(c) | | | 305,425 | |
| | | | | Total U.S. Treasury Notes
(Cost $903,743) | | | 951,761 | |
| Shares | | | | | | | |
| MONEY MARKET FUND — 4.0% | | | |
| | 491,059 | | | Federated Treasury Obligations Fund, Institutional Shares, 0.02%(d) | | | 491,059 | |
| | | | | Total Money Market Fund
(Cost $491,059) | | | 491,059 | |
| | | | | | | | | |
Total Investments — 102.8%
(Cost $11,842,717) | | | 12,631,189 | |
| Net Other Assets (Liabilities) — (2.8)% | | | (343,643 | ) |
| NET ASSETS — 100.0% | | $ | 12,287,546 | |
| (a) | The interest rate for this variable rate note, which will change periodically, is based either on the prime rate or an index of market rates. The reflected rate is in effect as of September 30, 2020. The maturity date reflected is the final maturity date. |
| (b) | Rule 144A, Section 4(2) or other security that is restricted as to resale to qualified institutional investors. The Advisor, using Board approved procedures, has deemed these securities or a portion of these securities to be liquid. |
| (c) | Inflation protection security. Principal amount periodically adjusted for inflation. |
| (d) | Represents the current yield as of report date. |
AGM — Assured Guaranty Municipal Corp.
G.O. — General Obligation
Continued
| Sterling Capital Total Return Bond Fund |
Schedule of Portfolio Investments
September 30, 2020
Principal
Amount | | | | | Fair Value | |
| ASSET BACKED SECURITIES — 9.9% | | | | |
| $ | 1,125,752 | | | Aegis Asset Backed Securities Trust, Series 2005-5, Class 1A4, 0.498%, (LIBOR USD 1-Month plus 0.35%), 12/25/35(a) | | $ | 1,114,366 | |
| | 165,503 | | | Argent Securities, Inc. Asset-Backed Pass Through Certificates, Series 2005-W3, Class A2D, 0.488%, (LIBOR USD 1-Month plus 0.34%), 11/25/35(a) | | | 165,004 | |
| | 11,465,000 | | | ARI Fleet Lease Trust, Series 2019-A, Class A3, 2.530%, 11/15/27(b) | | | 11,706,801 | |
| | 4,000,000 | | | Avis Budget Rental Car Funding AESOP, LLC, Series 2016-1A, Class A, 2.990%, 6/20/22(b) | | | 4,032,213 | |
| | 7,060,000 | | | Avis Budget Rental Car Funding AESOP, LLC, Series 2017-1A, Class A, 3.070%, 9/20/23(b) | | | 7,227,102 | |
| | 2,405,000 | | | Avis Budget Rental Car Funding AESOP, LLC, Series 2017-2A, Class A, 2.970%, 3/20/24(b) | | | 2,482,008 | |
| | 8,000,000 | | | Avis Budget Rental Car Funding AESOP, LLC, Series 2019-2A, Class A, 3.350%, 9/22/25(b) | | | 8,448,566 | |
| | 3,000,000 | | | Avis Budget Rental Car Funding AESOP, LLC, Series 2020-2A, Class A, 2.020%, 2/20/27(b) | | | 3,026,608 | |
| | 3,195,000 | | | Capital Auto Receivables Asset Trust, Series 2017-1, Class C, 2.700%, 9/20/22(b) | | | 3,244,835 | |
| | 12,034,000 | | | Capital One Multi-Asset Execution Trust, Series 2019-A3, Class A3, 2.060%, 8/15/28 | | | 12,933,936 | |
| | 2,067,367 | | | Chesapeake Funding II, LLC, Series 2017-2A, Class A1, 1.990%, 5/15/29(b) | | | 2,072,420 | |
| | 1,851,637 | | | Chesapeake Funding II, LLC, Series 2020-1A, Class A1, 0.870%, 8/16/32(b) | | | 1,856,860 | |
| | 2,495,000 | | | Citibank Credit Card Issuance Trust, Series 2007-A3, Class A3, 6.150%, 6/15/39 | | | 3,659,479 | |
| | 141,527 | | | Citicorp Residential Mortgage Trust, STEP, Series 2007-2, Class A6, 5.016%, 6/25/37 | | | 144,401 | |
| | 247,846 | | | Countrywide Asset-Backed Certificates, Series 2004-12, Class MV4, 1.573%, (LIBOR USD 1-Month plus 1.43%), 3/25/35(a) | | | 247,677 | |
| | 1,692,923 | | | Encore Credit Receivables Trust, Series 2005-4, Class M2, 0.808%, (LIBOR USD 1-Month plus 0.66%), 1/25/36(a) | | | 1,690,991 | |
| | 204,038 | | | Enterprise Fleet Financing, LLC, Series 2017-3, Class A2, 2.130%, 5/22/23(b) | | | 204,225 | |
| | 9,010,000 | | | Enterprise Fleet Financing, LLC, Series 2018-1, Class A3, 3.100%, 10/20/23(b) | | | 9,169,224 | |
| | 12,838,000 | | | Enterprise Fleet Financing, LLC, Series 2018-2, Class A3, 3.340%, 2/20/24(b) | | | 13,280,589 | |
| | 6,780,000 | | | Enterprise Fleet Financing, LLC, Series 2020-1, Class A3, 1.860%, 12/22/25(b) | | | 6,960,787 | |
| | 1,822,000 | | | Ford Credit Auto Owner Trust, Series 2017-2, Class A, 2.360%, 3/15/29(b) | | | 1,887,298 | |
| | 17,015,000 | | | Ford Credit Auto Owner Trust, Series 2018-1, Class A, 3.190%, 7/15/31(b) | | | 18,745,737 | |
| | 292,972 | | | GSAMP Trust, Series 2006-SEA1, Class M1, 0.648%, (LIBOR USD 1-Month plus 0.50%), 5/25/36(a)(b) | | | 291,966 | |
| | 8,892,085 | | | Hertz Fleet Lease Funding L.P., Series 2019-1, Class A2, 2.700%, 1/10/33(b) | | | 9,019,947 | |
| | 650,311 | | | Home Equity Mortgage Loan Asset-Backed Trust, Series 2005-B, Class M3, 0.883%, (LIBOR USD 1-Month plus 0.74%), 8/25/35(a) | | | 651,669 | |
| | 1,014,666 | | | JP Morgan Mortgage Acquisition Corp., Series 2005-OPT1, Class M2, 0.853%, (LIBOR USD 1-Month plus 0.71%), 6/25/35(a) | | | 1,013,614 | |
Principal
Amount | | | | | Fair Value | |
| ASSET BACKED SECURITIES — (continued) | | | | |
| $ | 651,484 | | | New Century Home Equity Loan Trust, Series 2003-4, Class M1, 1.273%, (LIBOR USD 1-Month plus 1.13%), 10/25/33(a) | | $ | 644,021 | |
| | 1,419,581 | | | Park Place Securities, Inc. Asset-Backed Pass Through Certificates, Series 2005-WHQ2, Class M2, 0.838%, (LIBOR USD 1-Month plus 0.69%), 5/25/35(a) | | | 1,414,171 | |
| | 329,449 | | | RAMP Trust, Series 2005-RZ4, Class M2, 0.648%, (LIBOR USD 1-Month plus 0.50%), 11/25/35(a) | | | 329,245 | |
| | 15,800,000 | | | Santander Drive Auto Receivables Trust, Series 2020-3, Class B, 0.690%, 3/17/25 | | | 15,806,743 | |
| | 3,582,922 | | | Saxon Asset Securities Trust, Series 2004-3, Class M1, 1.048%, (LIBOR USD 1-Month plus 0.90%), 12/26/34(a) | | | 3,490,361 | |
| | 204,648 | | | Sofi Professional Loan Program, LLC, Series 2016-E, Class A1, 0.998%, (LIBOR USD 1-Month plus 0.85%), 7/25/39(a)(b) | | | 204,217 | |
| | 8,405,000 | | | Toyota Auto Loan Extended Note Trust, Series 2019-1A, Class A, 2.560%, 11/25/31(b) | | | 8,969,526 | |
| | 5,150,000 | | | Toyota Auto Loan Extended Note Trust, Series 2020-1A, Class A, 1.350%, 5/25/33(b) | | | 5,285,987 | |
| | 3,580,000 | | | Wheels SPV 2, LLC, Series 2018-1A, Class A4, 3.410%, 4/20/27(b) | | | 3,649,932 | |
| | 9,250,000 | | | Wheels SPV 2, LLC, Series 2019-1A, Class A3, 2.350%, 5/22/28(b) | | | 9,528,247 | |
| | | | | Total Asset Backed Securities
(Cost $168,175,655) | | | 174,600,773 | |
| | | | | | | | | |
| COLLATERALIZED MORTGAGE OBLIGATIONS — 5.8% | | | | |
| | 166,661 | | | Adjustable Rate Mortgage Trust, Series 2004-5, Class 4A1, 3.765%, 4/25/35(c) | | | 167,215 | |
| | 336,092 | | | Alternative Loan Trust, Series 2004-22CB, Class 1A1, 6.000%, 10/25/34 | | | 348,893 | |
| | 1,009,706 | | | Banc of America Funding Trust, Series 2004-C, Class 4A1, 0.816%, (LIBOR USD 1-Month plus 0.66%), 12/20/34(a) | | | 997,053 | |
| | 407,315 | | | Banc of America Funding Trust, Series 2006-2, Class 3A1, 6.000%, 3/25/36 | | | 408,635 | |
| | 64,107 | | | Banc of America Mortgage Trust, Series 2005-3, Class 1A24, 5.500%, 4/25/35 | | | 66,072 | |
| | 10,025 | | | Citigroup Mortgage Loan Trust, Inc., Series 2004-NCM2, Class 3CB2, 6.500%, 8/25/20 | | | 9,983 | |
| | 90,248 | | | Countrywide Home Loan Mortgage Pass Through Trust, Series 2004-3, Class A4, 5.750%, 4/25/34 | | | 92,209 | |
| | 252,412 | | | Credit Suisse First Boston Mortgage Securities Corp., Series 2004-1, Class 2A1, 6.500%, 2/25/34 | | | 261,656 | |
| | 669,638 | | | Fannie Mae, Series 2013-133, Class AV, 4.000%, 12/25/26 | | | 691,808 | |
| | 1,332,104 | | | Fannie Mae, Series 2014-39, Class VP, 3.000%, 8/25/27 | | | 1,394,032 | |
| | 10,325,977 | | | Fannie Mae, Series 2013-16, Class A, 1.750%, 1/25/40 | | | 10,448,722 | |
| | 1,319,616 | | | Fannie Mae, Series 2011-38, Class D, 4.500%, 5/25/41 | | | 1,501,808 | |
| | 1,000,000 | | | Fannie Mae, Series 2013-70, Class CY, 3.500%, 7/25/43 | | | 1,120,687 | |
| | 539,210 | | | Fannie Mae, Series 2017-64, Class PD, 2.500%, 7/25/47 | | | 554,743 | |
See accompanying Notes to the Financial Statements.
| Sterling Capital Total Return Bond Fund |
Schedule of Portfolio Investments — (continued)
September 30, 2020
Principal
Amount | | | | | Fair Value | |
| COLLATERALIZED MORTGAGE OBLIGATIONS — (continued) | | | |
| $ | 1,167,657 | | | FirstKey Mortgage Trust, Series 2014-1, Class A12, 3.500%, 11/25/44(b)(c) | | $ | 1,204,682 | |
| | 691,723 | | | Freddie Mac, Series 3768, Class V, 4.000%, 11/15/23 | | | 719,867 | |
| | 1,704,683 | | | Freddie Mac, Series 4387, Class VM, 4.000%, 11/15/25 | | | 1,743,269 | |
| | 1,269,756 | | | Freddie Mac, Series 4287, Class V, 4.500%, 10/15/26 | | | 1,357,215 | |
| | 434,187 | | | Freddie Mac, Series 4136, Class HZ, 3.500%, 11/15/27 | | | 486,132 | |
| | 2,057,352 | | | Freddie Mac, Series 4331, Class V, 4.000%, 11/15/28 | | | 2,148,275 | |
| | 569,000 | | | Freddie Mac, Series 4120, Class YK, 2.000%, 10/15/32 | | | 601,427 | |
| | 1,238,000 | | | Freddie Mac, Series 4160, Class HH, 2.500%, 12/15/32 | | | 1,258,124 | |
| | 10,000,000 | | | Freddie Mac, Series 4655, Class GV, 3.500%, 12/15/36 | | | 10,591,008 | |
| | 5,500,000 | | | Freddie Mac, Series 4657, Class VT, 3.500%, 6/15/37 | | | 5,800,589 | |
| | 782,851 | | | Freddie Mac, Series 3632, Class PK, 5.000%, 2/15/40 | | | 877,138 | |
| | 1,263,481 | | | Freddie Mac, Series 4077, Class PJ, 3.500%, 11/15/40 | | | 1,329,405 | |
| | 819,000 | | | Freddie Mac, Series 3762, Class LN, 4.000%, 11/15/40 | | | 990,192 | |
| | 2,892,087 | | | Freddie Mac, Series 4100, Class PA, 3.000%, 1/15/42 | | | 3,080,032 | |
| | 1,352,586 | | | Freddie Mac, Series 4508, Class UZ, 3.000%, 7/15/43 | | | 1,358,294 | |
| | 981,181 | | | Freddie Mac, Series 4328, Class KD, 3.000%, 8/15/43 | | | 1,043,397 | |
| | 3,828,480 | | | Freddie Mac, Series 4648, Class E, 3.500%, 8/15/43 | | | 3,910,647 | |
| | 4,837,000 | | | Freddie Mac, Series 4801, Class LT, 4.000%, 12/15/43 | | | 4,905,752 | |
| | 2,571,897 | | | Freddie Mac, Series 4710, Class GA, 3.000%, 3/15/44 | | | 2,658,077 | |
| | 8,000,000 | | | Freddie Mac, Series 4752, Class HB, 3.500%, 4/15/44 | | | 8,243,581 | |
| | 5,052,749 | | | Freddie Mac, Series 4427, Class KA, 2.250%, 7/15/44 | | | 5,211,448 | |
| | 10,000,000 | | | Freddie Mac, Series 4776, Class DW, 4.000%, 9/15/44 | | | 10,228,167 | |
| | 3,263,793 | | | Freddie Mac, Series 4654, Class KA, 3.000%, 6/15/45 | | | 3,424,831 | |
| | 1,138,131 | | | Galton Funding Mortgage Trust, Series 2018-1, Class A43, 3.500%, 11/25/57(b)(c) | | | 1,148,499 | |
| | 3,953,663 | | | Galton Funding Mortgage Trust, Series 2018-2, Class A41, 4.500%, 10/25/58(b)(c) | | | 4,040,625 | |
| | 3,392,684 | | | Galton Funding Mortgage Trust, Series 2019-1, Class A41, 4.500%, 2/25/59(b)(c) | | | 3,454,254 | |
| | 317,886 | | | Ginnie Mae, Series 2008-51, Class PG, 5.000%, 6/20/38 | | | 357,267 | |
| | 597,293 | | | MASTR Alternative Loan Trust, Series 2003-5, Class 8A1, 5.500%, 6/25/33 | | | 617,874 | |
| | 414,446 | | | MASTR Alternative Loan Trust, Series 2004-13, Class 3A1, 6.500%, 1/25/35 | | | 407,291 | |
| | 380 | | | RAAC Trust, Series 2004-SP3, Class AI5, 4.890%, 12/25/32(c) | | | 386 | |
Principal
Amount | | | | | Fair Value | |
| COLLATERALIZED MORTGAGE OBLIGATIONS — (continued) | | | | |
| $ | 298,514 | | | RAAC Trust, STEP, Series 2004-SP1, Class AI3, 6.118%, 3/25/34 | | $ | 303,169 | |
| | 152,633 | | | Residential Asset Securitization Trust, Series 2004-IP2, Class 4A, 3.814%, 12/25/34(c) | | | 148,304 | |
| | | | | Total Collateralized Mortgage Obligations
(Cost $99,162,341) | | | 101,712,734 | |
| | | | | | | | | |
| COMMERCIAL MORTGAGE-BACKED SECURITIES — 15.1% | | | | |
| | 16,239,000 | | | BANK, Series 2020-BN27, Class A5, 2.144%, 4/15/63 | | | 17,052,410 | |
| | 2,110,000 | | | BANK 2020-BNK28, Series 2020-BN28, Class A4, 1.844%, 3/15/63 | | | 2,166,810 | |
| | 3,576,000 | | | BBCMS Mortgage Trust, Series 2020-C7, Class A5, 2.037%, 4/15/53 | | | 3,731,492 | |
| | 6,048,000 | | | Benchmark Mortgage Trust, Series 2020-B18, Class A5, 1.925%, 7/15/53 | | | 6,260,127 | |
| | 4,043,000 | | | Benchmark Mortgage Trust, Series 2020-B19, Class A5, 1.850%, 9/15/53 | | | 4,155,109 | |
| | 4,842,000 | | | CD Mortgage Trust, Series 2016-CD2, Class A4, 3.526%, 11/10/49(c) | | | 5,448,439 | |
| | 3,868,000 | | | CFCRE Commercial Mortgage Trust, Series 2016-C7, Class A3, 3.839%, 12/10/54 | | | 4,345,696 | |
| | 1,540,000 | | | CFCRE Commercial Mortgage Trust, Series 2016-C4, Class A2, 2.707%, 5/10/58 | | | 1,548,332 | |
| | 1,500,000 | | | Citigroup Commercial Mortgage Trust, Series 2017-P7, Class A4, 3.712%, 4/14/50 | | | 1,710,933 | |
| | 5,730,000 | | | Citigroup Commercial Mortgage Trust, Series 2018-B2, Class A4, 4.009%, 3/10/51 | | | 6,672,637 | |
| | 1,000,000 | | | COMM Mortgage Trust, Series 2012-CR1, Class AM, 3.912%, 5/15/45 | | | 1,035,338 | |
| | 3,545,000 | | | COMM Mortgage Trust, Series 2013-CR12, Class A4, 4.046%, 10/10/46 | | | 3,856,678 | |
| | 892,000 | | | COMM Mortgage Trust, Series 2014-CR16, Class A4, 4.051%, 4/10/47 | | | 978,535 | |
| | 1,208,000 | | | COMM Mortgage Trust, Series 2014-LC17, Class A5, 3.917%, 10/10/47 | | | 1,325,053 | |
| | 1,844,000 | | | COMM Mortgage Trust, Series 2014-CR20, Class A4, 3.590%, 11/10/47 | | | 2,011,087 | |
| | 8,030,000 | | | COMM Mortgage Trust, Series 2017-COR2, Class A3, 3.510%, 9/10/50 | | | 8,982,984 | |
| | 1,500,000 | | | CSAIL Commercial Mortgage Trust, Series 2015-C4, Class A4, 3.808%, 11/15/48 | | | 1,668,239 | |
| | 4,084,000 | | | DBJPM 20-C9 Mortgage Trust, Series 2020-C9, Class A5, 1.926%, 9/15/53 | | | 4,233,053 | |
| | 3,450,000 | | | DBUBS Mortgage Trust, Series 2011-LC1A, Class C, 5.790%, 11/10/46(b)(c) | | | 3,456,219 | |
| | 3,350,000 | | | Freddie Mac Multifamily Structured Pass Through Certificates, Series K068, Class A2, 3.244%, 8/25/27 | | | 3,853,236 | |
| | 3,920,000 | | | Freddie Mac Multifamily Structured Pass Through Certificates, Series K069, Class A2, 3.187%, 9/25/27(c) | | | 4,501,562 | |
| | 8,495,000 | | | Freddie Mac Multifamily Structured Pass Through Certificates, Series K099, Class A2, 2.595%, 9/25/29 | | | 9,554,087 | |
| | 3,800,000 | | | Freddie Mac Multifamily Structured Pass Through Certificates, Series K153, Class A3, 3.117%, 10/25/31(c) | | | 4,426,301 | |
Continued
| Sterling Capital Total Return Bond Fund |
Schedule of Portfolio Investments — (continued)
September 30, 2020
Principal
Amount | | | | | Fair Value | |
| COMMERCIAL MORTGAGE-BACKED SECURITIES — (continued) | | | |
| $ | 9,580,000 | | | Freddie Mac Multifamily Structured Pass Through Certificates, Series K155, Class A3, 3.750%, 4/25/33 | | $ | 11,727,788 | |
| | 7,296,925 | | | FRESB Mortgage Trust, Series 2018-SB52, Class A10F, 3.480%, 6/25/28(c) | | | 7,814,221 | |
| | 336,645 | | | GS Mortgage Securities Trust, Series 2010-C1, Class A2, 4.592%, 8/10/43(b) | | | 336,655 | |
| | 3,000,000 | | | GS Mortgage Securities Trust, Series 2010-C1, Class B, 5.148%, 8/10/43(b) | | | 2,723,304 | |
| | 720,000 | | | GS Mortgage Securities Trust, Series 2012-GCJ7, Class AS, 4.085%, 5/10/45 | | | 744,396 | |
| | 2,524,000 | | | GS Mortgage Securities Trust, Series 2014-GC24, Class A5, 3.931%, 9/10/47 | | | 2,772,154 | |
| | 2,044,000 | | | GS Mortgage Securities Trust, Series 2016-GS4, Class A4, 3.442%, 11/10/49(c) | | | 2,277,066 | |
| | 7,126,000 | | | GS Mortgage Securities Trust, Series 2020-GC47, Class A5, 2.377%, 5/12/53 | | | 7,622,467 | |
| | 4,000,000 | | | JP Morgan Chase Commercial Mortgage Securities Trust, Series 2011-C3, Class B, 5.013%, 2/15/46(b)(c) | | | 3,776,021 | |
| | 1,680,000 | | | JP Morgan Chase Commercial Mortgage Securities Trust, Series 2013-C10, Class AS, 3.372%, 12/15/47 | | | 1,753,323 | |
| | 1,702,000 | | | JP Morgan Chase Commercial Mortgage Securities Trust, Series 2016-JP4, Class A4, 3.648%, 12/15/49(c) | | | 1,934,015 | |
| | 1,397,000 | | | JPMBB Commercial Mortgage Securities Trust, Series 2014-C23, Class A5, 3.934%, 9/15/47 | | | 1,545,856 | |
| | 4,200,000 | | | JPMCC Commercial Mortgage Securities Trust, Series 2017-JP5, Class A5, 3.723%, 3/15/50 | | | 4,801,695 | |
| | 3,364,000 | | | JPMDB Commercial Mortgage Securities Trust, Series 2020-COR7, Class A5, 2.180%, 5/13/53 | | | 3,534,440 | |
| | 660,000 | | | Morgan Stanley Bank of America Merrill Lynch Trust, Series 2014-C18, Class A4, 3.923%, 10/15/47 | | | 728,996 | |
| | 5,834,000 | | | Morgan Stanley Bank of America Merrill Lynch Trust, Series 2016-C32, Class A4, 3.720%, 12/15/49 | | | 6,640,466 | |
| | 4,000,000 | | | Morgan Stanley Capital I Trust, Series 2011-C1, Class B, 5.675%, 9/15/47(b)(c) | | | 4,016,319 | |
| | 640,000 | | | Morgan Stanley Capital I Trust, Series 2011-C1, Class C, 5.675%, 9/15/47(b)(c) | | | 643,601 | |
| | 2,562,000 | | | Morgan Stanley Capital I Trust, Series 2016-BNK2, Class A4, 3.049%, 11/15/49 | | | 2,811,696 | |
| | 8,021,000 | | | Morgan Stanley Capital I Trust, Series 2020-HR8, Class A4, 2.041%, 7/15/53 | | | 8,327,284 | |
| | 10,000,000 | | | Morgan Stanley Capital I, Inc., Series 2017-HR2, Class A4, 3.587%, 12/15/50 | | | 11,333,927 | |
| | 11,055,000 | | | Morgan Stanley Capital I, Inc., Series 2018-H3, Class A5, 4.177%, 7/15/51 | | | 13,122,828 | |
| | 3,156,000 | | | Wells Fargo Commercial Mortgage Trust, Series 2015-P2, Class A4, 3.809%, 12/15/48 | | | 3,545,657 | |
| | 9,642,000 | | | Wells Fargo Commercial Mortgage Trust, Series 2017-C40, Class A4, 3.581%, 10/15/50 | | | 10,990,013 | |
| | 5,302,000 | | | Wells Fargo Commercial Mortgage Trust, Series 2020-C56, Class A5, 2.448%, 6/15/53 | | | 5,702,783 | |
| | 12,734,000 | | | Wells Fargo Commercial Mortgage Trust, Series 2020-C57, Class A4, 2.118%, 8/15/53 | | | 13,226,610 | |
| | 7,747,309 | | | WFRBS Commercial Mortgage Trust, Series 2011-C3, Class A4, 4.375%, 3/15/44(b) | | | 7,800,316 | |
Principal
Amount | | | | | Fair Value | |
| COMMERCIAL MORTGAGE-BACKED SECURITIES — (continued) | | | | |
| $ | 9,640,020 | | | WFRBS Commercial Mortgage Trust, Series 2012-C7, Class A2, 3.431%, 6/15/45 | | $ | 9,941,706 | |
| | 1,500,000 | | | WFRBS Commercial Mortgage Trust, Series 2012-C8, Class AS, 3.660%, 8/15/45 | | | 1,556,893 | |
| | 3,716,000 | | | WFRBS Commercial Mortgage Trust, Series 2014-C22, Class A5, 3.752%, 9/15/57 | | | 4,084,563 | |
| | 1,008,000 | | | WFRBS Commercial Mortgage Trust, Series 2014-C23, Class A5, 3.917%, 10/15/57 | | | 1,114,470 | |
| | 1,320,662 | | | WF-RBS Commercial Mortgage Trust, Series 2011-C2, Class A4, 4.869%, 2/15/44(b)(c) | | | 1,328,432 | |
| | 2,000,000 | | | WF-RBS Commercial Mortgage Trust, Series 2011-C2, Class B, 5.174%, 2/15/44(b)(c) | | | 2,003,567 | |
| | | | | Total Commercial Mortgage-Backed Securities
(Cost $251,798,139) | | | 265,257,885 | |
| | | | | | | | | |
| CORPORATE BONDS — 43.8% | | | | |
| | | | | Aerospace & Defense — 0.6% | | | | |
| | 3,158,000 | | | L3Harris Technologies, Inc., 3.832%, 4/27/25 | | | 3,529,291 | |
| | 5,297,000 | | | Raytheon Technologies Corp., 4.125%, 11/16/28 | | | 6,272,310 | |
| | | | | | | | 9,801,601 | |
| | | | | Automobiles — 0.5% | | | | |
| | 3,549,000 | | | General Motors Financial Co., Inc., 4.200%, 11/6/21 | | | 3,663,082 | |
| | 2,073,000 | | | General Motors Financial Co., Inc., 4.350%, 4/9/25 | | | 2,248,840 | |
| | 2,934,000 | | | Toyota Motor Credit Corp., MTN, 3.375%, 4/1/30 | | | 3,382,094 | |
| | | | | | | | 9,294,016 | |
| | | | | Banks — 7.9% | | | | |
| | 2,998,000 | | | Australia & New Zealand Banking Group, Ltd., 2.950%, (5-Year Treasury Constant Maturity plus 1.29%), 7/22/30(b)(c) | | | 3,107,275 | |
| | 10,304,000 | | | Bank of America Corp., 3.419%, (LIBOR USD 3-Month plus 1.04%), 12/20/28(d) | | | 11,466,040 | |
| | 10,020,000 | | | Bank of America Corp., MTN, 1.898%, (SOFR plus 1.53%), 7/23/31(d) | | | 9,959,963 | |
| | 5,225,000 | | | Bank of Montreal, Series E, 3.300%, 2/5/24 | | | 5,660,516 | |
| | 3,446,000 | | | Barclays PLC, 4.338%, (LIBOR USD 3-Month plus 1.36%), 5/16/24(d) | | | 3,699,441 | |
| | 4,434,000 | | | BPCE SA, 2.375%, 1/14/25(b) | | | 4,610,815 | |
| | 3,586,000 | | | Capital One Financial Corp., 3.300%, 10/30/24 | | | 3,886,752 | |
| | 2,900,000 | | | CIT Bank NA, BKNT, 2.969%, (SOFR plus 1.72%), 9/27/25(d) | | | 2,877,322 | |
| | 3,449,000 | | | Citigroup, Inc., 3.106%, (SOFR plus 2.75%), 4/8/26(d) | | | 3,732,978 | |
| | 2,804,000 | | | Citigroup, Inc., 3.200%, 10/21/26 | | | 3,093,092 | |
| | 4,000,000 | | | Citigroup, Inc., 4.412%, (SOFR plus 3.91%), 3/31/31(d) | | | 4,794,905 | |
| | 3,908,000 | | | Citizens Bank NA/Providence RI, BKNT, 1.044%, (LIBOR USD 3-Month plus 0.81%), 5/26/22(a) | | | 3,938,019 | |
| | 3,560,000 | | | Cooperatieve Rabobank UA, 3.950%, 11/9/22 | | | 3,782,812 | |
| | 3,744,000 | | | First Citizens BancShares, Inc., 3.375%, (SOFR plus 2.47%), 3/15/30(d) | | | 3,707,358 | |
| | 3,993,000 | | | Huntington Bancshares, Inc., 2.625%, 8/6/24 | | | 4,252,956 | |
| | 4,945,000 | | | ING Groep NV, 3.150%, 3/29/22 | | | 5,130,903 | |
Continued
| Sterling Capital Total Return Bond Fund |
Schedule of Portfolio Investments — (continued)
September 30, 2020
Principal
Amount | | | | | Fair Value | |
| CORPORATE BONDS — (continued) | | | | |
| | | | | Banks — (continued) | | | | |
| $ | 5,686,000 | | | JPMorgan Chase & Co., 2.083%, (SOFR plus 1.85%), 4/22/26(d) | | $ | 5,946,304 | |
| | 10,422,000 | | | JPMorgan Chase & Co., 4.452%, (LIBOR USD 3-Month plus 1.33%), 12/5/29(d) | | | 12,530,313 | |
| | 2,000,000 | | | KeyBank NA/Cleveland OH, BKNT, 2.300%, 9/14/22 | | | 2,074,742 | |
| | 3,378,000 | | | Lloyds Banking Group PLC, 4.582%, 12/10/25 | | | 3,712,893 | |
| | 2,921,000 | | | Macquarie Bank, Ltd., 6.625%, 4/7/21(b) | | | 3,010,151 | |
| | 4,831,000 | | | Mitsubishi UFJ Financial Group, Inc., 3.761%, 7/26/23 | | | 5,229,775 | |
| | 3,411,000 | | | PNC Financial Services Group, Inc. (The), 2.550%, 1/22/30 | | | 3,694,672 | |
| | 4,218,000 | | | PNC Financial Services Group, Inc. (The), Series O, 6.750%, (LIBOR USD 3-Month plus 3.68%), 2/1/69(d) | | | 4,324,714 | |
| | 5,440,000 | | | Sumitomo Mitsui Financial Group, Inc., 2.130%, 7/8/30 | | | 5,520,055 | |
| | 3,360,000 | | | Toronto-Dominion Bank (The), 3.625%, (5 yr. Swap Semi 30/360 USD plus 2.21%), 9/15/31(c) | | | 3,776,375 | |
| | 2,813,000 | | | U.S. Bancorp, 3.150%, 4/27/27 | | | 3,173,410 | |
| | 1,340,000 | | | Visa, Inc., 2.700%, 4/15/40 | | | 1,449,457 | |
| | 4,422,000 | | | Wells Fargo & Co., MTN, 2.879%, (LIBOR USD 3-Month plus 1.17%), 10/30/30(d) | | | 4,748,775 | |
| | 2,112,000 | | | Westpac Banking Corp., GMTN, 4.322%, (USD Swap Rate 11:00 am NY 1 plus 2.24%), 11/23/31(c) | | | 2,389,603 | |
| | | | | | | | 139,282,386 | |
| | | | | Beverages — 1.4% | | | | |
| | 3,338,000 | | | Anheuser-Busch InBev Worldwide, Inc., 4.750%, 1/23/29 | | | 4,073,758 | |
| | 2,579,000 | | | Anheuser-Busch InBev Worldwide, Inc., 5.800%, 1/23/59 | | | 3,686,497 | |
| | 3,163,000 | | | Bacardi, Ltd., 4.450%, 5/15/25(b) | | | 3,532,918 | |
| | 3,913,000 | | | Coca-Cola Co. (The), 2.125%, 9/6/29 | | | 4,187,902 | |
| | 3,580,000 | | | Constellation Brands, Inc., 4.400%, 11/15/25 | | | 4,162,034 | |
| | 2,243,000 | | | Constellation Brands, Inc., 3.150%, 8/1/29 | | | 2,448,461 | |
| | 1,970,000 | | | PepsiCo, Inc., 3.450%, 10/6/46 | | | 2,283,596 | |
| | | | | | | | 24,375,166 | |
| | | | | Biotechnology — 0.2% | | | | |
| | 3,835,000 | | | Biogen, Inc., 2.250%, 5/1/30 | | | 3,927,339 | |
| | | | | Capital Goods — 0.4% | | | | |
| | 3,554,000 | | | Caterpillar Financial Services Corp., MTN, 1.450%, 5/15/25 | | | 3,671,389 | |
| | 3,457,000 | | | Keysight Technologies, Inc., 4.550%, 10/30/24 | | | 3,905,096 | |
| | | | | | | | 7,576,485 | |
| | | | | Capital Markets — 0.6% | | | | |
| | 4,285,000 | | | Morgan Stanley, 2.188%, (SOFR plus 1.99%), 4/28/26(d) | | | 4,487,615 | |
| | 3,268,000 | | | Morgan Stanley, 3.971%, (LIBOR USD 3-Month plus 1.46%), 7/22/38(d) | | | 3,872,594 | |
| | 2,646,000 | | | Morgan Stanley, GMTN, 3.700%, 10/23/24 | | | 2,935,622 | |
| | | | | | | | 11,295,831 | |
| | | | | Chemicals — 0.9% | | | | |
| | 3,576,000 | | | Albemarle Corp., 5.450%, 12/1/44 | | | 3,926,105 | |
| | 3,414,000 | | | Dow Chemical Co. (The), 4.375%, 11/15/42 | | | 3,863,749 | |
| | 4,106,000 | | | FMC Corp., 3.450%, 10/1/29 | | | 4,572,845 | |
Principal
Amount | | | | | Fair Value | |
| CORPORATE BONDS — (continued) | | | | |
| | | | | Chemicals — (continued) | | | | |
| $ | 3,138,000 | | | Westlake Chemical Corp., 3.375%, 6/15/30 | | $ | 3,365,596 | |
| | | | | | | | 15,728,295 | |
| | | | | Commercial Services & Supplies — 0.7% | | | | |
| | 2,073,000 | | | CoStar Group, Inc., 2.800%, 7/15/30(b) | | | 2,148,005 | |
| | 1,400,000 | | | Republic Services, Inc., 3.550%, 6/1/22 | | | 1,460,553 | |
| | 3,365,000 | | | Waste Connections, Inc., 3.500%, 5/1/29 | | | 3,831,239 | |
| | 500,000 | | | Waste Management, Inc., 3.900%, 3/1/35 | | | 605,577 | |
| | 2,692,000 | | | Waste Management, Inc., 4.100%, 3/1/45 | | | 3,290,617 | |
| | | | | | | | 11,335,991 | |
| | | | | Construction Materials — 0.2% | | | | |
| | 3,801,000 | | | Vulcan Materials Co., 3.500%, 6/1/30 | | | 4,256,821 | |
| | | | | Diversified Financial Services — 2.3% | | | | |
| | 520,000 | | | AerCap Ireland Capital DAC/AerCap Global | | | | |
| | | | | Aviation Trust, 4.500%, 9/15/23 | | | 535,886 | |
| | 3,650,000 | | | AerCap Ireland Capital DAC/AerCap Global Aviation Trust, 4.875%, 1/16/24 | | | 3,780,491 | |
| | 3,155,000 | | | Charles Schwab Corp. (The), 3.250%, 5/22/29 | | | 3,628,008 | |
| | | | | | | | | |
| | 4,741,000 | | | Credit Suisse Group Funding Guernsey, Ltd., 3.800%, 9/15/22 | | | 5,016,671 | |
| | 4,329,000 | | | Goldman Sachs Group, Inc. (The), 2.908%, (LIBOR USD 3-Month plus 1.05%), 6/5/23(d) | | | 4,483,777 | |
| | 7,094,000 | | | Goldman Sachs Group, Inc. (The), 3.500%, 4/1/25 | | | 7,829,434 | |
| | 2,560,000 | | | Goldman Sachs Group, Inc. (The), 6.250%, 2/1/41 | | | 3,824,384 | |
| | 2,343,000 | | | Jefferies Group, LLC/Jefferies Group Capital Finance, Inc., 4.150%, 1/23/30 | | | 2,640,572 | |
| | 3,414,000 | | | PayPal Holdings, Inc., 2.300%, 6/1/30 | | | 3,610,455 | |
| | 4,045,000 | | | Stifel Financial Corp., 4.000%, 5/15/30 | | | 4,479,135 | |
| | | | | | | | 39,828,813 | |
| | | | | Diversified Telecommunication Services — 0.9% | | | | |
| | 2,500,000 | | | CommScope, Inc., 5.500%, 3/1/24(b) | | | 2,568,925 | |
| | 2,975,000 | | | Sprint Spectrum Co., LLC/Sprint Spectrum Co. II, LLC/Sprint Spectrum Co. III, LLC, 4.738%, 3/20/25(b) | | | 3,216,719 | |
| | 3,032,000 | | | T.-Mobile USA, Inc., 3.500%, 4/15/25(b) | | | 3,327,014 | |
| | 3,148,000 | | | Verizon Communications, Inc., 4.812%, 3/15/39 | | | 4,122,359 | |
| | 2,134,000 | | | Verizon Communications, Inc., 5.012%, 4/15/49 | | | 3,071,602 | |
| | | | | | | | 16,306,619 | |
| | | | | Electric Utilities — 2.3% | | | | |
| | 2,838,000 | | | Berkshire Hathaway Energy Co., 3.700%, 7/15/30(b) | | | 3,335,999 | |
| | 3,078,000 | | | Berkshire Hathaway Energy Co., 4.250%, 10/15/50(b) | | | 3,832,157 | |
| | 1,679,000 | | | CenterPoint Energy, Inc., 2.950%, 3/1/30 | | | 1,839,644 | |
| | 3,432,000 | | | Dominion Energy, Inc., STEP, 3.071%, 8/15/24 | | | 3,694,187 | |
| | 4,329,000 | | | Duke Energy Progress, LLC, 3.600%, 9/15/47 | | | 5,028,948 | |
| | 2,198,000 | | | Entergy Louisiana, LLC, 4.200%, 9/1/48 | | | 2,785,440 | |
| | 3,180,000 | | | Entergy Mississippi, LLC, 3.100%, 7/1/23 | | | 3,368,449 | |
| | 3,475,000 | | | Exelon Generation Co., LLC, 5.600%, 6/15/42 | | | 4,095,533 | |
| | 2,965,000 | | | Florida Power & Light Co., 3.990%, 3/1/49 | | | 3,796,440 | |
| | 3,200,000 | | | Indiana Michigan Power Co., Series K, 4.550%, 3/15/46 | | | 4,089,910 | |
Continued
| Sterling Capital Total Return Bond Fund |
Schedule of Portfolio Investments — (continued)
September 30, 2020
Principal
Amount | | | | | Fair Value | |
| CORPORATE BONDS — (continued) | | | |
| | | | | Electric Utilities — (continued) | | | | |
| $ | 1,000,000 | | | Korea East-West Power Co., Ltd., 1.750%, 5/6/25(b) | | $ | 1,033,282 | |
| | 2,530,000 | | | Ohio Edison Co., 6.875%, 7/15/36 | | | 3,569,470 | |
| | | | | | | | 40,469,459 | |
| | | | | Electrical Equipment — 0.5% | | | | |
| | 2,276,000 | | | Fortive Corp., 4.300%, 6/15/46 | | | 2,710,507 | |
| | 1,204,000 | | | General Electric Co., 3.450%, 5/1/27 | | | 1,274,779 | |
| | 1,415,000 | | | Roper Technologies, Inc., 1.000%, 9/15/25 | | | 1,418,054 | |
| | 3,128,000 | | | Textron, Inc., 3.650%, 3/1/21 | | | 3,165,368 | |
| | | | | | | | 8,568,708 | |
| | | | | Energy Equipment & Services — 1.4% | | | | |
| | 1,693,000 | | | Cheniere Corpus Christi Holdings, LLC, 3.700%, 11/15/29(b) | | | 1,759,676 | |
| | 2,153,000 | | | Enterprise Products Operating, LLC, 5.950%, 2/1/41 | | | 2,716,753 | |
| | 1,565,000 | | | Hess Corp., 7.875%, 10/1/29 | | | 1,959,111 | |
| | 3,355,000 | | | Kinder Morgan, Inc., 4.300%, 6/1/25 | | | 3,778,880 | |
| | 3,326,000 | | | Midwest Connector Capital Co., LLC, 3.900%, 4/1/24(b) | | | 3,355,452 | |
| | 3,173,000 | | | MPLX L.P., 4.125%, 3/1/27 | | | 3,487,900 | |
| | 255,000 | | | NuStar Logistics L.P., 6.000%, 6/1/26 | | | 255,719 | |
| | 3,383,000 | | | Plains All American Pipeline L.P./PAA Finance Corp., 4.900%, 2/15/45 | | | 3,087,477 | |
| | 3,447,000 | | | Sabine Pass Liquefaction, LLC, 5.625%, 3/1/25 | | | 3,942,818 | |
| | | | | | | | 24,343,786 | |
| | | | | Equity Real Estate Investment Trusts (REITS) — 4.5% | | | | |
| | 2,895,000 | | | Alexandria Real Estate Equities, Inc., 4.000%, 1/15/24 | | | 3,187,821 | |
| | 1,820,000 | | | American Homes 4 Rent L.P., 4.900%, 2/15/29 | | | 2,170,521 | |
| | 3,680,000 | | | American Tower Trust, 3.652%, 3/23/28(b) | | | 3,992,345 | |
| | 4,178,000 | | | Brixmor Operating Partnership L.P., 4.125%, 5/15/29 | | | 4,525,961 | |
| | 1,754,000 | | | Brixmor Operating Partnership L.P., 4.050%, 7/1/30 | | | 1,876,060 | |
| | 3,574,000 | | | Crown Castle International Corp., 5.250%, 1/15/23 | | | 3,934,395 | |
| | 4,000,000 | | | Federal Realty Investment Trust, 3.500%, 6/1/30 | | | 4,327,799 | |
| | 2,656,000 | | | Healthcare Trust of America Holdings L.P., 3.100%, 2/15/30 | | | 2,858,062 | |
| | 3,624,000 | | | Hudson Pacific Properties L.P., 3.250%, 1/15/30 | | | 3,753,488 | |
| | 2,853,000 | | | Jones Lang LaSalle, Inc., 4.400%, 11/15/22 | | | 3,017,500 | |
| | 4,100,000 | | | Kimco Realty Corp., 2.800%, 10/1/26 | | | 4,379,949 | |
| | 2,417,000 | | | Lexington Realty Trust, 2.700%, 9/15/30 | | | 2,464,128 | |
| | 1,420,000 | | | Life Storage L.P., 2.200%, 10/15/30 | | | 1,416,376 | |
| | 3,350,000 | | | Ontario Teachers’ Cadillac Fairview Properties Trust, 3.875%, 3/20/27(b) | | | 3,658,652 | |
| | 3,974,000 | | | Physicians Realty L.P., 4.300%, 3/15/27 | | | 4,168,309 | |
| | 3,000,000 | | | Prologis L.P., 2.125%, 10/15/50 | | | 2,701,338 | |
| | 3,361,000 | | | Public Storage, 3.385%, 5/1/29 | | | 3,874,963 | |
| | 2,664,000 | | | Sabra Health Care L.P., 4.800%, 6/1/24 | | | 2,799,240 | |
| | 3,660,000 | | | Scentre Group Trust 1/Scentre Group Trust 2, 4.375%, 5/28/30(b) | | | 4,112,562 | |
| | 3,708,000 | | | Spirit Realty L.P., 3.400%, 1/15/30 | | | 3,686,669 | |
| | 429,000 | | | Starwood Property Trust, Inc., 3.625%, 2/1/21 | | | 428,700 | |
| | 578,000 | | | Starwood Property Trust, Inc., 5.000%, 12/15/21 | | | 572,220 | |
Principal
Amount | | | | | Fair Value | |
| CORPORATE BONDS — (continued) | | | |
| | | | | Equity Real Estate Investment Trusts (REITS) — (continued) | | | | |
| $ | 3,689,000 | | | VEREIT Operating Partnership L.P., 3.950%, 8/15/27 | | $ | 3,935,120 | |
| | 869,000 | | | WEA Finance, LLC, 2.875%, 1/15/27(b) | | | 857,216 | |
| | 2,500,000 | | | WEA Finance, LLC/Westfield UK & Europe Finance PLC, 4.750%, 9/17/44(b) | | | 2,526,213 | |
| | 4,019,000 | | | Welltower, Inc., 2.750%, 1/15/31 | | | 4,141,452 | |
| | | | | | | | 79,367,059 | |
| | | | | Food & Staples Retailing — 2.0% | | | | |
| | 3,873,000 | | | AbbVie, Inc., 2.950%, 11/21/26(b) | | | 4,218,577 | |
| | 3,847,000 | | | AbbVie, Inc., 4.875%, 11/14/48 | | | 4,885,141 | |
| | 4,116,000 | | | Bristol Myers Squibb Co., 5.000%, 8/15/45 | | | 5,788,190 | |
| | 2,210,000 | | | Conagra Brands, Inc., 5.300%, 11/1/38 | | | 2,849,111 | |
| | 1,719,000 | | | CVS Health Corp., 3.700%, 3/9/23 | | | 1,842,062 | |
| | 5,982,000 | | | CVS Health Corp., 4.300%, 3/25/28 | | | 7,001,761 | |
| | 4,673,000 | | | CVS Health Corp., 2.700%, 8/21/40 | | | 4,453,758 | |
| | 825,000 | | | Hershey Co. (The), 1.700%, 6/1/30 | | | 848,564 | |
| | 3,244,000 | | | Smithfield Foods, Inc., 5.200%, 4/1/29(b) | | | 3,794,915 | |
| | | | | | | | 35,682,079 | |
| | | | | Food, Beverage & Tobacco — 0.1% | | | | |
| | 1,300,000 | | | PepsiCo, Inc., 4.450%, 4/14/46 | | | 1,730,359 | |
| | | | | Gas Utilities — 0.3% | | | | |
| | 4,624,000 | | | Sempra Energy, 3.800%, 2/1/38 | | | 5,176,757 | |
| | | | | Health Care Equipment & Services — 0.4% | | | | |
| | 3,717,000 | | | DH Europe Finance II Sarl, 3.250%, 11/15/39 | | | 4,157,671 | |
| | 3,065,000 | | | HCA, Inc., 5.000%, 3/15/24 | | | 3,433,777 | |
| | | | | | | | 7,591,448 | |
| | | | | Health Care Providers & Services — 0.2% | | | | |
| | 3,373,000 | | | Anthem, Inc., 4.101%, 3/1/28 | | | 3,922,483 | |
| | | | | Household Products — 0.1% | | | | |
| | 1,688,000 | | | Procter & Gamble Co. (The), 2.450%, 3/25/25 | | | 1,828,120 | |
| | | | | Insurance — 2.5% | | | | |
| | 575,000 | | | Alleghany Corp., 4.900%, 9/15/44 | | | 718,354 | |
| | 2,424,000 | | | Aspen Insurance Holdings, Ltd., 4.650%, 11/15/23 | | | 2,624,608 | |
| | 438,000 | | | Assurant, Inc., 1.483%, (LIBOR USD 3-Month plus 1.25%), 3/26/21(a) | | | 437,845 | |
| | 1,417,000 | | | Athene Holding, Ltd., 6.150%, 4/3/30 | | | 1,682,721 | |
| | 4,000,000 | | | AXIS Specialty Finance, LLC, 3.900%, 7/15/29 | | | 4,371,828 | |
| | 2,915,000 | | | Carlyle Finance, LLC, 5.650%, 9/15/48(b) | | | 3,768,140 | |
| | 3,891,000 | | | CBRE Services, Inc., 5.250%, 3/15/25 | | | 4,461,666 | |
| | 3,675,000 | | | Fidelity National Financial, Inc., 3.400%, 6/15/30 | | | 3,974,800 | |
| | 2,680,000 | | | KKR Group Finance Co. III, LLC, 5.125%, 6/1/44(b) | | | 3,346,742 | |
| | 1,510,000 | | | Loews Corp., 3.200%, 5/15/30 | | | 1,687,919 | |
| | 2,000,000 | | | Meiji Yasuda Life Insurance Co., 5.200%, (5 yr. Swap Semi 30/360 USD plus 4.23%), 10/20/45(b)(c) | | | 2,285,000 | |
| | 3,635,000 | | | Nationwide Mutual Insurance Co., 4.350%, 4/30/50(b) | | | 3,894,142 | |
| | 3,765,000 | | | Reinsurance Group of America, Inc., 3.900%, 5/15/29 | | | 4,298,070 | |
| | 2,049,000 | | | Symetra Financial Corp., 4.250%, 7/15/24 | | | 2,255,445 | |
| | 2,117,000 | | | Transatlantic Holdings, Inc., 8.000%, 11/30/39 | | | 3,316,973 | |
| | | | | | | | 43,124,253 | |
Continued
| Sterling Capital Total Return Bond Fund |
Schedule of Portfolio Investments — (continued)
September 30, 2020
Principal
Amount | | | | | Fair Value | |
| CORPORATE BONDS — (continued) | | | |
| | | | | IT Services — 0.2% | | | | |
| $ | 3,472,000 | | | Fiserv, Inc., 3.200%, 7/1/26 | | $ | 3,857,543 | |
| | | | | Machinery — 0.3% | | | | |
| | 230,000 | | | Colfax Corp., 6.000%, 2/15/24(b) | | | 238,338 | |
| | 3,514,000 | | | Deere & Co., 3.750%, 4/15/50 | | | 4,403,849 | |
| | | | | | | | 4,642,187 | |
| | | | | Media — 2.2% | | | | |
| | 3,803,000 | | | Comcast Corp., 3.700%, 4/15/24 | | | 4,199,634 | |
| | 2,372,000 | | | Comcast Corp., 3.100%, 4/1/25 | | | 2,613,522 | |
| | 4,139,000 | | | Comcast Corp., 4.600%, 10/15/38 | | | 5,290,252 | |
| | 2,882,000 | | | Discovery Communications, LLC, 3.625%, 5/15/30 | | | 3,202,162 | |
| | 3,144,000 | | | Discovery Communications, LLC, 5.200%, 9/20/47 | | | 3,808,505 | |
| | 3,622,000 | | | Interpublic Group of Cos., Inc. (The), 4.750%, 3/30/30 | | | 4,348,949 | |
| | 5,541,000 | | | Time Warner Cable, LLC, 6.550%, 5/1/37 | | | 7,366,553 | |
| | 3,636,000 | | | ViacomCBS, Inc., 4.200%, 5/19/32 | | | 4,160,876 | |
| | 3,926,000 | | | ViacomCBS, Inc., 4.375%, 3/15/43 | | | 4,173,426 | |
| | | | | | | | 39,163,879 | |
| | | | | Metals & Mining — 0.7% | | | | |
| | 3,676,000 | | | Nucor Corp., 4.400%, 5/1/48 | | | 4,775,682 | |
| | 2,261,000 | | | Southern Copper Corp., 3.500%, 11/8/22 | | | 2,373,861 | |
| | 1,207,000 | | | Steel Dynamics, Inc., 2.400%, 6/15/25 | | | 1,259,351 | |
| | 3,500,000 | | | Teck Resources, Ltd., 6.000%, 8/15/40 | | | 3,963,309 | |
| | | | | | | | 12,372,203 | |
| | | | | Multi-Utilities — 0.5% | | | | |
| | 2,275,000 | | | CMS Energy Corp., 4.700%, 3/31/43 | | | 2,841,949 | |
| | 1,903,000 | | | Progress Energy, Inc., 3.150%, 4/1/22 | | | 1,965,078 | |
| | 3,429,000 | | | Puget Sound Energy, Inc., 4.223%, 6/15/48 | | | 4,282,435 | |
| | | | | | | | 9,089,462 | |
| | | | | Oil, Gas & Consumable Fuels — 2.4% | | | | |
| | 4,145,000 | | | Aker BP ASA, 4.750%, 6/15/24(b) | | | 4,256,506 | |
| | 2,465,000 | | | Aker BP ASA, 5.875%, 3/31/25(b) | | | 2,563,155 | |
| | 4,697,000 | | | Devon Energy Corp., 5.600%, 7/15/41 | | | 4,751,828 | |
| | 5,207,000 | | | Diamondback Energy, Inc., 5.375%, 5/31/25 | | | 5,406,659 | |
| | 4,653,000 | | | HollyFrontier Corp., 5.875%, 4/1/26 | | | 5,098,013 | |
| | 2,071,000 | | | Marathon Petroleum Corp., 5.375%, 10/1/22 | | | 2,071,000 | |
| | 4,440,000 | | | Newfield Exploration Co., 5.750%, 1/30/22 | | | 4,438,081 | |
| | 3,260,000 | | | Newfield Exploration Co., 5.625%, 7/1/24 | | | 3,162,365 | |
| | 5,271,000 | | | Noble Energy, Inc., 5.050%, 11/15/44 | | | 6,840,043 | |
| | 2,356,000 | | | Saudi Arabian Oil Co., 4.375%, 4/16/49(b) | | | 2,838,724 | |
| | | | | | | | 41,426,374 | |
| | | | | Pharmaceuticals — 0.7% | | | | |
| | 2,094,000 | | | Merck & Co., Inc., 3.900%, 3/7/39 | | | 2,598,259 | |
| | 2,872,000 | | | SC Johnson & Son, Inc., 4.750%, 10/15/46(b) | | | 3,840,751 | |
| | 2,530,000 | | | Takeda Pharmaceutical Co., Ltd., 3.375%, 7/9/60 | | | 2,665,203 | |
| | 3,636,000 | | | Upjohn, Inc., 2.700%, 6/22/30(b) | | | 3,764,573 | |
| | | | | | | | 12,868,786 | |
| | | | | Road & Rail — 0.2% | | | | |
| | 2,619,000 | | | Burlington Northern Santa Fe, LLC, 4.950%, 9/15/41 | | | 3,509,761 | |
| | | | | Semiconductors & Semiconductor Equipment — 1.2% | | | | |
| | 5,605,000 | | | Broadcom, Inc., 4.150%, 11/15/30 | | | 6,296,342 | |
Principal
Amount | | | | | Fair Value | |
| CORPORATE BONDS — (continued) | | | |
| | | | | Semiconductors & Semiconductor Equipment — (continued) | | | | |
| $ | 2,664,000 | | | Intel Corp., 4.750%, 3/25/50 | | $ | 3,668,648 | |
| | 4,203,000 | | | Lam Research Corp., 3.125%, 6/15/60 | | | 4,501,238 | |
| | 2,210,000 | | | Microchip Technology, Inc., 3.922%, 6/1/21 | | | 2,258,914 | |
| | 1,361,000 | | | NVIDIA Corp., 3.500%, 4/1/50 | | | 1,592,750 | |
| | 2,950,000 | | | TSMC Global, Ltd., 1.375%, 9/28/30(b) | | | 2,891,013 | |
| | | | | | | | 21,208,905 | |
| | | | | Software — 0.8% | | | | |
| | 2,809,000 | | | Apple, Inc., 2.650%, 5/11/50 | | | 2,943,503 | |
| | 1,307,000 | | | Dell International, LLC/EMC Corp., 5.875%, 6/15/21(b) | | | 1,308,634 | |
| | 3,843,000 | | | International Business Machines Corp., 2.950%, 5/15/50 | | | 3,970,700 | |
| | 3,040,000 | | | Microsoft Corp., 2.675%, 6/1/60 | | | 3,206,821 | |
| | 2,138,000 | | | salesforce.com, Inc., 3.700%, 4/11/28 | | | 2,524,270 | |
| | | | | | | | 13,953,928 | |
| | | | | Specialty Retail — 2.2% | | | | |
| | 3,783,000 | | | Advance Auto Parts, Inc., 1.750%, 10/1/27 | | | 3,771,768 | |
| | 4,492,000 | | | Alimentation Couche-Tard, Inc., 3.550%, 7/26/27(b) | | | 5,027,691 | |
| | 1,065,000 | | | Costco Wholesale Corp., 1.375%, 6/20/27 | | | 1,090,888 | |
| | 4,063,000 | | | Dollar Tree, Inc., 4.000%, 5/15/25 | | | 4,583,741 | |
| | 4,653,000 | | | ERAC USA Finance, LLC, 4.200%, 11/1/46(b) | | | 5,349,916 | |
| | 3,267,000 | | | Home Depot, Inc. (The), 2.700%, 4/15/30 | | | 3,635,756 | |
| | 6,030,000 | | | Lowe’s Cos., Inc., 4.500%, 4/15/30 | | | 7,480,562 | |
| | 3,339,000 | | | McDonald’s Corp., MTN, 2.125%, 3/1/30 | | | 3,474,372 | |
| | 3,345,000 | | | Target Corp., 3.375%, 4/15/29 | | | 3,889,229 | |
| | | | | | | | 38,303,923 | |
| | | | | Telecommunication Services — 0.7% | | | | |
| | 1,901,000 | | | AT&T, Inc., 1.650%, 2/1/28 | | | 1,904,594 | |
| | 4,687,000 | | | AT&T, Inc., 3.550%, 9/15/55(b) | | | 4,542,512 | |
| | 4,818,000 | | | AT&T, Inc., 3.850%, 6/1/60 | | | 4,902,276 | |
| | | | | | | | 11,349,382 | |
| | | | | Textiles, Apparel & Luxury Goods — 0.1% | | | | |
| | 2,447,000 | | | Ralph Lauren Corp., 1.700%, 6/15/22 | | | 2,491,037 | |
| | | | | Tobacco — 0.7% | | | | |
| | 2,965,000 | | | BAT Capital Corp., 4.700%, 4/2/27 | | | 3,401,537 | |
| | 3,567,000 | | | BAT Capital Corp., 4.540%, 8/15/47 | | | 3,819,808 | |
| | 4,120,000 | | | Philip Morris International, Inc., 3.375%, 8/11/25 | | | 4,585,227 | |
| | | | | | | | 11,806,572 | |
| | | | | Total Corporate Bonds
(Cost $711,820,562) | | | 770,857,816 | |
| | | | | | | | | |
| MORTGAGE-BACKED SECURITIES — 20.3% | | | |
| | | | | Fannie Mae — 11.9% | | | | |
| | 35,102 | | | 5.000%, 9/1/25, Pool #255892 | | | 38,412 | |
| | 2,201,001 | | | 4.000%, 12/1/33, Pool #MA1689 | | | 2,414,071 | |
| | 1,358,280 | | | 4.000%, 6/1/34, Pool #MA1922 | | | 1,481,266 | |
| | 76,668 | | | 6.500%, 1/1/35, Pool #809198 | | | 91,367 | |
| | 1,222,859 | | | 4.000%, 3/1/35, Pool #MA2211 | | | 1,331,352 | |
| | 19,065 | | | 7.000%, 6/1/35, Pool #255820 | | | 22,728 | |
| | 50,610 | | | 6.500%, 3/1/36, Pool #866062 | | | 59,284 | |
| | 31,664 | | | 6.500%, 7/1/36, Pool #885493 | | | 35,414 | |
| | 520,802 | | | 5.500%, 8/1/37, Pool #995082 | | | 612,822 | |
| | 8,142,332 | | | 3.500%, 8/1/38, Pool #FM2472 | | | 8,631,397 | |
Continued
| Sterling Capital Total Return Bond Fund |
Schedule of Portfolio Investments — (continued)
September 30, 2020
Principal
Amount | | | | | Fair Value | |
| MORTGAGE-BACKED SECURITIES — (continued) | | | |
| | | | | Fannie Mae — (continued) | | | | |
| $ | 282,439 | | | 4.500%, 10/1/39, Pool #AC2645 | | $ | 313,591 | |
| | 225,910 | | | 5.000%, 6/1/40, Pool #AD4927 | | | 260,165 | |
| | 202,182 | | | 5.000%, 6/1/40, Pool #AD8718 | | | 232,864 | |
| | 631,458 | | | 4.500%, 12/1/40, Pool #AH1100 | | | 706,540 | |
| | 245,635 | | | 4.500%, 3/1/41, Pool #AB2467 | | | 278,357 | |
| | 544,402 | | | 4.500%, 5/1/41, Pool #AI1023 | | | 612,601 | |
| | 342,145 | | | 4.500%, 11/1/41, Pool #AJ4994 | | | 385,177 | |
| | 480,818 | | | 4.500%, 12/1/41, Pool #AJ7696 | | | 540,751 | |
| | 1,152,729 | | | 3.500%, 6/1/42, Pool #AB5373 | | | 1,249,797 | |
| | 1,313,440 | | | 3.500%, 5/1/43, Pool #AB9368 | | | 1,408,997 | |
| | 1,478,492 | | | 3.500%, 5/1/43, Pool #AL3605 | | | 1,645,703 | |
| | 17,306,607 | | | 3.000%, 8/1/43, Pool #AL9500 | | | 18,971,902 | |
| | 1,786,368 | | | 3.500%, 8/1/43, Pool #AU0613 | | | 1,975,337 | |
| | 548,096 | | | 4.500%, 11/1/44, Pool #MA2100 | | | 608,592 | |
| | 1,482,020 | | | 4.500%, 1/1/45, Pool #MA2158 | | | 1,630,597 | |
| | 2,055,685 | | | 4.000%, 3/1/45, Pool #MA2217 | | | 2,235,670 | |
| | 1,878,738 | | | 4.000%, 6/1/46, Pool #MA2653 | | | 2,042,786 | |
| | 2,020,060 | | | 4.500%, 7/1/46, Pool #AS7568 | | | 2,210,733 | |
| | 2,277,707 | | | 4.000%, 11/1/46, Pool #MA2808 | | | 2,466,710 | |
| | 3,495,264 | | | 4.000%, 5/1/47, Pool #BE9598 | | | 3,758,227 | |
| | 3,292,477 | | | 4.000%, 8/1/47, Pool #BH5117 | | | 3,522,262 | |
| | 8,987,770 | | | 4.000%, 4/1/48, Pool #BM3900 | | | 9,637,634 | |
| | 5,217,266 | | | 5.000%, 8/1/48, Pool #CA2219 | | | 5,727,202 | |
| | 8,328,624 | | | 3.000%, 11/1/48, Pool #BM5822 | | | 8,765,099 | |
| | 16,869,409 | | | 3.500%, 10/1/49, Pool #CA4431 | | | 17,777,318 | |
| | 6,750,767 | | | 3.000%, 12/1/49, Pool #BO6222 | | | 7,068,690 | |
| | 13,216,278 | | | 3.000%, 12/1/49, Pool #BO6225 | | | 13,838,690 | |
| | 8,652,996 | | | 3.000%, 1/1/50, Pool #BO7242 | | | 9,060,503 | |
| | 16,485,588 | | | 3.000%, 3/1/50, Pool #FM2714 | | | 17,296,915 | |
| | 6,667,124 | | | 2.500%, 5/1/50, Pool #FM3287 | | | 6,998,987 | |
| | 11,553,850 | | | 2.000%, 7/1/50, Pool #CA6301 | | | 12,001,206 | |
| | 10,993,585 | | | 2.500%, 7/1/50, Pool #CA6307 | | | 11,583,302 | |
| | 12,710,697 | | | 2.000%, 8/1/50, Pool #CA6799 | | | 13,202,848 | |
| | 14,490,143 | | | 2.500%, 9/1/50, Pool #BQ0538 | | | 15,211,405 | |
| | | | | | | | 209,945,271 | |
| | | | | Freddie Mac — 8.4% | | | | |
| | 9,009 | | | 5.500%, 10/1/21, Pool #ZS5201 | | | 9,163 | |
| | 14,561 | | | 5.000%, 12/1/21, Pool #ZK0490 | | | 15,332 | |
| | 50,288 | | | 5.000%, 7/1/25, Pool #ZA1892 | | | 54,979 | |
| | 195,644 | | | 2.500%, 1/1/28, Pool #J22069 | | | 206,796 | |
| | 646,472 | | | 3.500%, 7/1/30, Pool #ZS8575 | | | 686,698 | |
| | 63,930 | | | 5.000%, 3/1/36, Pool #ZS4230 | | | 73,490 | |
| | 2,240,711 | | | 4.000%, 4/1/36, Pool #ZA2413 | | | 2,443,543 | |
| | 3,126,978 | | | 3.500%, 6/1/36, Pool #ZA2414 | | | 3,379,698 | |
| | 18,021 | | | 5.000%, 7/1/36, Pool #ZS1139 | | | 20,718 | |
| | 1,733,290 | | | 3.500%, 8/1/36, Pool #ZA2425 | | | 1,873,389 | |
| | 200,782 | | | 6.500%, 9/1/36, Pool #ZS4257 | | | 231,474 | |
| | 4,421,362 | | | 3.500%, 11/1/36, Pool #ZA2439 | | | 4,703,520 | |
| | 64,369 | | | 5.000%, 2/1/37, Pool #ZI5759 | | | 74,007 | |
| | 3,411,373 | | | 4.000%, 5/1/37, Pool #C91938 | | | 3,687,763 | |
| | 86,448 | | | 4.500%, 10/1/39, Pool #A89346 | | | 97,274 | |
| | 3,653,951 | | | 3.000%, 11/1/39, Pool #RB5022 | | | 3,827,490 | |
| | 22,385,779 | | | 2.500%, 6/1/40, Pool #RB5054 | | | 23,500,054 | |
| | 243,456 | | | 5.000%, 6/1/40, Pool #C03479 | | | 280,568 | |
| | 689,939 | | | 5.000%, 7/1/40, Pool #A93070 | | | 795,148 | |
| | 79,419 | | | 5.000%, 9/1/40, Pool #C03518 | | | 91,085 | |
| | 882,617 | | | 4.000%, 12/1/42, Pool #ZS3671 | | | 973,556 | |
| | 712,042 | | | 3.500%, 5/1/43, Pool #Q18305 | | | 772,789 | |
| | 432,262 | | | 4.000%, 5/1/44, Pool #V81186 | | | 472,040 | |
| | 229,213 | | | 4.000%, 7/1/44, Pool #ZS4573 | | | 250,212 | |
Principal
Amount | | | | | Fair Value | |
| MORTGAGE-BACKED SECURITIES — (continued) | | | |
| | | | | Freddie Mac — (continued) | | | | |
| $ | 240,295 | | | 4.000%, 9/1/44, Pool #Q28299 | | $ | 260,912 | |
| | 4,471,769 | | | 3.500%, 1/1/45, Pool #Q30876 | | | 4,880,219 | |
| | 5,126,630 | | | 3.500%, 5/1/46, Pool #ZS4663 | | | 5,498,794 | |
| | 1,214,170 | | | 4.000%, 8/1/46, Pool #ZS4673 | | | 1,311,503 | |
| | 3,276,956 | | | 3.500%, 9/1/46, Pool #ZS4678 | | | 3,497,568 | |
| | 6,340,339 | | | 3.500%, 9/1/47, Pool #Q50962 | | | 6,712,057 | |
| | 1,571,391 | | | 3.500%, 1/1/48, Pool #Q53640 | | | 1,667,644 | |
| | 1,958,411 | | | 4.000%, 2/1/48, Pool #ZT1639 | | | 2,101,690 | |
| | 1,496,898 | | | 4.000%, 6/1/48, Pool #G67713 | | | 1,638,437 | |
| | 9,554,076 | | | 3.000%, 10/1/49, Pool #QA3329 | | | 10,036,899 | |
| | 13,021,926 | | | 2.500%, 11/1/49, Pool #QA4396 | | | 13,670,106 | |
| | 9,314,552 | | | 3.000%, 11/1/49, Pool #QA4336 | | | 9,825,137 | |
| | 7,901,217 | | | 3.500%, 6/1/50, Pool #RA2794 | | | 8,386,424 | |
| | 18,997,637 | | | 2.500%, 7/1/50, Pool #RA2970 | | | 19,989,902 | |
| | 9,485,925 | | | 2.000%, 8/1/50, Pool #RA3328 | | | 9,809,442 | |
| | | | | | | | 147,807,520 | |
| | | | | Ginnie Mae — 0.0% | | | | |
| | 121,215 | | | 5.000%, 2/15/40, Pool #737037 | | | 136,037 | |
| | | | | Total Mortgage-Backed Securities
(Cost $350,569,541) | | | 357,888,828 | |
| | | | | | | | | |
| MUNICIPAL BONDS — 4.2% | | | |
| | | | | Alabama — 0.2% | | | | |
| | 3,000,000 | | | Alabama Economic Settlement Authority, Economic Imports, Taxable BP - Settlement Revenue, Series B, 4.263%, 9/15/32 | | | 3,579,810 | |
| | | | | California — 0.6% | | | | |
| | 1,285,000 | | | State of California, Build America Bonds, School Improvements G.O., 7.625%, 3/1/40 | | | 2,224,438 | |
| | 8,000,000 | | | State of California, Refunding, Taxable-Various Purpose-Bid Group, Transit Improvements G.O., 2.650%,4/1/26 | | | 8,748,320 | |
| | | | | | | | 10,972,758 | |
| | | | | Connecticut — 0.2% | | | | |
| | 3,000,000 | | | State of Connecticut Special Tax Revenue, Build America Bonds, Transition Infrastructure, Series B, 4.126%, 11/1/20 | | | 3,007,740 | |
| | | | | Florida — 0.2% | | | | |
| | 2,135,000 | | | Reedy Creek Improvement District, Advance Refunding, Taxable Revenue Bonds, G.O., Series A, 2.147%, 6/1/29 | | | 2,201,954 | |
| | 2,030,000 | | | Reedy Creek Improvement District, Advance Refunding, Taxable Revenue Bonds, G.O., Series A, 2.197%, 6/1/30 | | | 2,091,631 | |
| | | | | | | | 4,293,585 | |
| | | | | Illinois — 0.8% | | | | |
| | 8,030,000 | | | Sales Tax Securitization Corp., Second Lien, Current Refunding, Taxable Revenue Bonds, Series B, 3.057%, 1/1/34 | | | 8,468,759 | |
| | 1,800,000 | | | State of Illinois, Public Improvements, Taxable Building Revenue, 3.481%, 6/15/26 | | | 1,783,278 | |
| | 3,130,000 | | | State of Illinois, Public Improvements, Taxable Revenue, Series B, 2.620%, 6/15/26 | | | 2,963,359 | |
| | | | | | | | 13,215,396 | |
Continued
| Sterling Capital Total Return Bond Fund |
Schedule of Portfolio Investments — (continued)
September 30, 2020
Principal
Amount | | | | | Fair Value | |
| MUNICIPAL BONDS — (continued) | | | |
| | | | | New Jersey — 0.1% | | | | |
| $ | 2,375,000 | | | New Jersey Economic Development Authority, School Facilities Construction Refunding Revenue, Taxable, Series C, 4.521%, 6/15/21 | | $ | 2,421,835 | |
| | | | | New York — 0.8% | | | | |
| | 8,000,000 | | | New York City Transitional Finance Authority Future Tax Secured Revenue Bonds, Public Improvements, Taxable Revenue, Sub Series B3, Callable 11/1/29 @ 100, 3.000%, 11/1/33 | | | 8,580,320 | |
| | 3,020,000 | | | New York City Transitional Finance Authority Future Tax Secured Revenue, Public Improvements, Taxable Revenue, Callable 2/1/27 @ 100, 3.330%, 2/1/28 | | | 3,369,716 | |
| | 1,640,000 | | | New York, NY, Build America Bonds, Public Improvements G.O., 4.874%, 3/1/21 | | | 1,670,127 | |
| | | | | | | | 13,620,163 | |
| | | | | North Carolina — 0.2% | | | | |
| | 2,600,000 | | | Duke University, 3.299%, 10/1/46 | | | 2,932,861 | |
| | | | | Ohio — 0.3% | | | | |
| | 5,658,000 | | | Premier Health Partners, Series G, Callable 5/15/26 @ 100, 2.911%, 11/15/26 | | | 5,462,963 | |
| | | | | Pennsylvania — 0.6% | | | | |
| | 2,600,000 | | | City of Pittsburgh, PA, Refunding, Taxable Revenue Bonds, G.O., Series B, 1.189%, 9/1/26 | | | 2,599,350 | |
| | 1,005,000 | | | Commonwealth Financing Authority, School Improvements, Taxable Revenue, Series A, 4.014%, 6/1/33 | | | 1,177,810 | |
| | 4,375,000 | | | Lehigh University, 3.479%, 11/15/46 | | | 4,815,363 | |
| | 2,260,000 | | | Philadelphia Authority for Industrial Development, Refunding Revenue, Taxable, 3.664%, 4/15/22 | | | 2,310,918 | |
| | | | | | | | 10,903,441 | |
| | | | | Texas — 0.1% | | | | |
| | 1,770,000 | | | Dallas Area Rapid Transit, Advance Refunding, Taxable Revenue Bonds, Series C, Callable 12/1/29 @ 100, 1.846%, 12/1/30 | | | 1,798,656 | |
| | | | | Wisconsin — 0.1% | �� | | | |
| | 2,140,000 | | | State of Wisconsin, Current Refunding, Taxable Revenue Bonds, Series A, 2.196%, 5/1/27 | | | 2,274,456 | |
| | | | | | | | | |
| | | | | Total Municipal Bonds
(Cost $70,081,118) | | | 74,483,664 | |
Principal
Amount | | | | | Fair Value | |
| U.S. TREASURY BONDS — 0.4% | | | |
| $ | 6,220,000 | | | 2.500%, 2/15/45 | | $ | 7,671,984 | |
| | | | | Total U.S. Treasury Bonds
(Cost $7,646,495) | | | 7,671,984 | |
| | | | | | | | | |
| U.S. TREASURY NOTES — 0.1% | | | |
| | 824,100 | | | 0.625%, 5/15/30. | | | 821,653 | |
| | | | | Total U.S. Treasury Notes
(Cost $824,361) | | | 821,653 | |
| | | | | | | | | |
| Shares | | | | | Principal Amount | |
| MONEY MARKET FUND — 0.5% | | | |
| | 7,970,369 | | | Federated Treasury Obligations Fund, Institutional Shares, 0.02%(e) | | | 7,970,369 | |
| | | | | Total Money Market Fund
(Cost $7,970,369) | | | 7,970,369 | |
| | | | | | | | | |
Total Investments — 100.1%
(Cost $1,668,048,581) | | | 1,761,265,706 | |
| Net Other Assets (Liabilities) — (0.1)% | | | (1,466,142 | ) |
| NET ASSETS — 100.0% | | $ | 1,759,799,564 | |
| (a) | The interest rate for this floating rate note, which will change periodically, is based either on the prime rate or an index of market rates. The reflected rate is in effect as of September 30, 2020. The maturity date reflected is the final maturity date. |
| (b) | Rule 144A, Section 4(2) or other security that is restricted as to resale to qualified institutional investors. The Advisor, using Board approved procedures, has deemed these securities or a portion of these securities to be liquid. |
| (c) | The interest rate for this variable rate note, which will change periodically, is based either on the prime rate or an index of market rates. The reflected rate is in effect as of September 30, 2020. The maturity date reflected is the final maturity date. |
| (d) | Security is a fix-to-float security, which carries a fixed coupon until a certain date, upon which it switches to a floating rate. Rate shown is the fixed rate. |
| (e) | Represents the current yield as of report date. |
BKNT — Bank Note
G.O. — General Obligation
GMTN — Global Medium Term Note
MTN — Medium Term Note
STEP — Step Coupon Bond
Continued
| Sterling Capital Corporate Fund |
Schedule of Portfolio Investments
September 30, 2020
Principal
Amount | | | | | Fair Value | |
| CORPORATE BONDS — 97.4% | | | |
| | | | | Aerospace & Defense — 1.0% | | | | |
| $ | 165,000 | | | Raytheon Technologies Corp., 4.125%, 11/16/28 | | $ | 195,381 | |
| | | | | Automobiles — 2.8% | | | | |
| | 139,000 | | | Advance Auto Parts, Inc., 1.750%, 10/1/27 | | | 138,587 | |
| | 42,000 | | | Ford Motor Co., 8.500%, 4/21/23 | | | 45,780 | |
| | 200,000 | | | Ford Motor Credit Co., LLC, 5.085%, 1/7/21 | | | 200,250 | |
| | 140,000 | | | General Motors Financial Co., Inc., 3.550%, 7/8/22 | | | 144,651 | |
| | | | | | | | 529,268 | |
| | | | | Banks — 17.4% | | | | |
| | 200,000 | | | Australia & New Zealand Banking Group, Ltd., 2.950%, (5-Year Treasury Constant Maturity plus 1.29%), 7/22/30(a)(b) | | | 207,290 | |
| | 400,000 | | | Bank of America Corp., 3.419%, (LIBOR USD 3-Month plus 1.04%), 12/20/28(c) | | | 445,110 | |
| | 200,000 | | | Barclays PLC, 4.338%, (LIBOR USD 3-Month plus 1.36%), 5/16/24(c) | | | 214,709 | |
| | 185,000 | | | Capital One Financial Corp., 3.200%, 2/5/25 | | | 199,861 | |
| | 280,000 | | | Citigroup, Inc., 4.412%, (SOFR plus 3.91%), 3/31/31(c) | | | 335,643 | |
| | 250,000 | | | Cooperatieve Rabobank UA, 3.950%, 11/9/22 | | | 265,647 | |
| | 250,000 | | | JPMorgan Chase & Co., 4.452%, (LIBOR USD 3-Month plus 1.33%), 12/5/29(c) | | | 300,574 | |
| | 200,000 | | | Lloyds Banking Group PLC, 4.582%, 12/10/25 | | | 219,828 | |
| | 375,000 | | | Morgan Stanley, MTN, 3.622%, (SOFR plus 3.12%), 4/1/31(c) | | | 430,867 | |
| | 135,000 | | | PNC Financial Services Group, Inc. (The), Series O, 6.750%, (LIBOR USD 3-Month plus 3.68%),(c)(d) | | | 138,415 | |
| | 135,000 | | | Toronto-Dominion Bank (The), 3.625%, (5 yr. Swap Semi 30/360 USD plus 2.21%), 9/15/31(b) | | | 151,729 | |
| | 130,000 | | | Wells Fargo & Co., MTN, 3.550%, 9/29/25 | | | 144,728 | |
| | 250,000 | | | Zions Bancorp NA, 3.500%, 8/27/21 | | | 255,198 | |
| | | | | | | | 3,309,599 | |
| | | | | Beverages — 2.8% | | | | |
| | 100,000 | | | Anheuser-Busch Cos., LLC/Anheuser-Busch InBev Worldwide, Inc., 3.650%, 2/1/26 | | | 112,100 | |
| | 155,000 | | | Bacardi, Ltd., 4.450%, 5/15/25(a) | | | 173,127 | |
| | 115,000 | | | Coca-Cola Co. (The), 2.250%, 9/1/26 | | | 124,372 | |
| | 120,000 | | | Constellation Brands, Inc., 3.150%, 8/1/29 | | | 130,992 | |
| | | | | | | | 540,591 | |
| | | | | Capital Goods — 0.8% | | | | |
| | 135,000 | | | Keysight Technologies, Inc., 4.550%, 10/30/24 | | | 152,499 | |
| | | | | Chemicals — 1.8% | | | | |
| | 115,000 | | | Albemarle Corp., 1.330%, (LIBOR USD 3-Month plus 1.05%), 11/15/22(e) | | | 114,585 | |
| | 87,000 | | | FMC Corp., 3.450%, 10/1/29 | | | 96,892 | |
| | 110,000 | | | Westlake Chemical Corp., 3.600%, 8/15/26 | | | 120,834 | |
| | | | | | | | 332,311 | |
| | | | | Commercial Services & Supplies — 2.3% | | | | |
| | 106,000 | | | H&E Equipment Services, Inc., 5.625%, 9/1/25 | | | 110,505 | |
| | 59,000 | | | Service Corp. International, 3.375%, 8/15/30 | | | 59,074 | |
| | 141,000 | | | Waste Connections, Inc., 3.500%, 5/1/29 | | | 160,536 | |
| | 110,000 | | | WPP Finance 2010, 3.625%, 9/7/22 | | | 115,448 | |
| | | | | | | | 445,563 | |
Principal
Amount | | | | | Fair Value | |
| CORPORATE BONDS — (continued) | | | |
| | | | | Diversified Financial Services — 6.8% | | | | |
| $ | 150,000 | | | AerCap Ireland Capital DAC/AerCap Global Aviation Trust, 4.500%, 9/15/23 | | $ | 154,583 | |
| | 190,000 | | | Ares Finance Co., LLC, 4.000%, 10/8/24(a) | | | 203,106 | |
| | 120,000 | | | Avolon Holdings Funding, Ltd., 3.625%, 5/1/22(a) | | | 117,918 | |
| | 250,000 | | | Credit Suisse Group AG, 2.593%, (SOFR plus 1.56%), 9/11/25(a)(c) | | | 261,062 | |
| | 253,000 | | | Goldman Sachs Group, Inc. (The), 4.250%, 10/21/25 | | | 287,838 | |
| | 60,000 | | | Jefferies Group, LLC/Jefferies Group Capital Finance, Inc., 4.850%, 1/15/27 | | | 67,765 | |
| | 168,000 | | | KKR Group Finance Co. VI, LLC, 3.750%, 7/1/29(a) | | | 193,275 | |
| | | | | | | | 1,285,547 | |
| | | | | Diversified Telecommunication Services — 3.7% | | | | |
| | 129,000 | | | AT&T, Inc., 4.100%, 2/15/28 | | | 149,343 | |
| | 200,000 | | | Sprint Spectrum Co., LLC/Sprint Spectrum Co. II, LLC/Sprint Spectrum Co. III, LLC, 4.738%, 3/20/25(a) | | | 216,250 | |
| | 150,000 | | | Telefonica Emisiones SA, 4.103%, 3/8/27 | | | 170,617 | |
| | 139,000 | | | Verizon Communications, Inc., 4.016%, 12/3/29 | | | 166,447 | |
| | | | | | | | 702,657 | |
| | | | | Electric Utilities — 2.8% | | | | |
| | 200,000 | | | Appalachian Power Co., 4.600%, 3/30/21 | | | 202,020 | |
| | 82,000 | | | Energizer Holdings, Inc., 4.750%, 6/15/28(a) | | | 84,862 | |
| | 170,000 | | | Exelon Generation Co., LLC, 3.250%, 6/1/25 | | | 185,851 | |
| | 55,000 | | | Pattern Energy Operations L.P./Pattern Energy Operations, Inc., 4.500%, 8/15/28(a) | | | 57,063 | |
| | | | | | | | 529,796 | |
| | | | | Energy Equipment & Services — 5.3% | | | | |
| | 5,000 | | | Cheniere Energy, Inc., 4.625%, 10/15/28(a) | | | 5,131 | |
| | 105,000 | | | Energy Transfer Operating L.P., 4.050%, 3/15/25 | | | 110,364 | |
| | 100,000 | | | EQM Midstream Partners L.P., 6.000%, 7/1/25(a) | | | 103,125 | |
| | 89,000 | | | Hess Corp., 7.875%, 10/1/29 | | | 111,413 | |
| | 86,000 | | | Kinder Morgan, Inc., 4.300%, 6/1/25 | | | 96,865 | |
| | 165,000 | | | Midwest Connector Capital Co., LLC, 3.900%, 4/1/24(a) | | | 166,461 | |
| | 105,000 | | | MPLX L.P., 5.250%, 1/15/25 | | | 108,599 | |
| | 10,000 | | | NuStar Logistics L.P., 5.750%, 10/1/25 | | | 10,328 | |
| | 187,000 | | | Penske Truck Leasing Co. L.P./PTL Finance Corp., 3.400%, 11/15/26(a) | | | 204,649 | |
| | 82,000 | | | Sabine Pass Liquefaction, LLC, 5.625%, 3/1/25 | | | 93,795 | |
| | | | | | | | 1,010,730 | |
| | | | | Entertainment — 0.1% | | | | |
| | 15,000 | | | Live Nation Entertainment, Inc., 4.750%, 10/15/27(a) | | | 14,048 | |
| | | | | Equity Real Estate Investment Trusts (REITS) — 13.3% | | | | |
| | 157,000 | | | American Tower Trust, 3.652%, 3/23/28(a) | | | 170,326 | |
| | 135,000 | | | Crown Castle International Corp., 3.300%, 7/1/30 | | | 147,632 | |
| | 115,000 | | | Duke Realty L.P., 3.250%, 6/30/26 | | | 127,516 | |
| | 111,000 | | | ESH Hospitality, Inc., 5.250%, 5/1/25(a) | | | 112,110 | |
See accompanying Notes to the Financial Statements.
| Sterling Capital Corporate Fund |
Schedule of Portfolio Investments — (continued)
September 30, 2020
Principal
Amount | | | | | Fair Value | |
| CORPORATE BONDS — (continued) | | | |
| | | | | Equity Real Estate Investment Trusts (REITS) — (continued) | | | | |
| $ | 117,000 | | | Federal Realty Investment Trust, 3.500%, 6/1/30 | | $ | 126,588 | |
| | 186,000 | | | Healthcare Realty Trust, Inc., 3.625%, 1/15/28 | | | 203,858 | |
| | 123,000 | | | Healthcare Trust of America Holdings L.P., 3.100%, 2/15/30 | | | 132,358 | |
| | 100,000 | | | Iron Mountain, Inc., 5.250%, 7/15/30(a) | | | 104,250 | |
| | 56,000 | | | iStar, Inc., 4.750%, 10/1/24 | | | 54,180 | |
| | 233,000 | | | Jones Lang LaSalle, Inc., 4.400%, 11/15/22 | | | 246,434 | |
| | 208,000 | | | Kimco Realty Corp., 2.800%, 10/1/26 | | | 222,202 | |
| | 50,000 | | | Life Storage L.P., 2.200%, 10/15/30 | | | 49,872 | |
| | 189,000 | | | Physicians Realty L.P., 4.300%, 3/15/27 | | | 198,241 | |
| | 128,000 | | | Sabra Health Care L.P., 4.800%, 6/1/24 | | | 134,498 | |
| | 165,000 | | | Spirit Realty L.P., 3.400%, 1/15/30 | | | 164,051 | |
| | 121,000 | | | Starwood Property Trust, Inc., 3.625%, 2/1/21 | | | 120,915 | |
| | 19,000 | | | Starwood Property Trust, Inc., 5.000%, 12/15/21 | | | 18,810 | |
| | 200,000 | | | WEA Finance, LLC, 2.875%, 1/15/27(a) | | | 197,288 | |
| | | | | | | | 2,531,129 | |
| | | | | Food Products — 2.6% | | | | |
| | 45,000 | | | Albertsons Cos., Inc./Safeway, Inc./New Albertsons L.P./Albertsons, LLC, 3.500%, 2/15/23(a) | | | 45,754 | |
| | 160,000 | | | Conagra Brands, Inc., 4.300%, 5/1/24 | | | 178,510 | |
| | 70,000 | | | Kraft Heinz Foods Co., 3.875%, 5/15/27(a) | | | 74,145 | |
| | 161,000 | | | Smithfield Foods, Inc., 5.200%, 4/1/29(a) | | | 188,342 | |
| | | | | | | | 486,751 | |
| | | | | Food, Beverage & Tobacco — 0.3% | | | | |
| | 61,000 | | | CVS Health Corp., 3.700%, 3/9/23 | | | 65,367 | |
| | | | | Health Care Providers & Services — 0.6% | | | | |
| | 105,000 | | | HCA, Inc., 5.000%, 3/15/24 | | | 117,633 | |
| | | | | Hotels, Restaurants & Leisure — 0.5% | | | | |
| | 60,000 | | | Prime Security Services Borrower, LLC/Prime Finance, Inc., 3.375%, 8/31/27(a) | | | 57,555 | |
| | 45,000 | | | Prime Security Services Borrower, LLC/Prime Finance, Inc., 6.250%, 1/15/28(a) | | | 45,563 | |
| | | | | | | | 103,118 | |
| | | | | Industrial Conglomerates — 1.2% | | | | |
| | 214,000 | | | Carlisle Cos., Inc., 3.500%, 12/1/24 | | | 234,589 | |
| | | | | Insurance — 8.0% | | | | |
| | 155,000 | | | Alleghany Corp., 4.950%, 6/27/22 | | | 164,769 | |
| | 160,000 | | | Aspen Insurance Holdings, Ltd., 4.650%, 11/15/23 | | | 173,241 | |
| | 180,000 | | | CBRE Services, Inc., 5.250%, 3/15/25 | | | 206,399 | |
| | 110,000 | | | Jackson National Life Global Funding, 3.250%, 1/30/24(a) | | | 117,998 | |
| | 55,000 | | | Liberty Mutual Group, Inc., 4.250%, 6/15/23(a) | | | 60,293 | |
| | 125,000 | | | Liberty Mutual Group, Inc., 4.569%, 2/1/29(a) | | | 150,805 | |
| | 164,000 | | | Radian Group, Inc., 4.875%, 3/15/27 | | | 164,000 | |
| | 165,000 | | | RenaissanceRe Finance, Inc., 3.450%, 7/1/27 | | | 180,200 | |
| | 270,000 | | | Symetra Financial Corp., 4.250%, 7/15/24 | | | 297,204 | |
| | | | | | | | 1,514,909 | |
| | | | | IT Services — 1.0% | | | | |
| | 175,000 | | | Fiserv, Inc., 2.750%, 7/1/24 | | | 186,949 | |
Principal
Amount | | | | | Fair Value | |
| CORPORATE BONDS — (continued) | | | |
| | | | | Media — 5.0% | | | | |
| $ | 165,000 | | | Charter Communications Operating,LLC/Charter Communications Operating Capital, 4.200%, 3/15/28 | | $ | 187,262 | |
| | 158,000 | | | Comcast Corp., 4.150%, 10/15/28 | | | 190,393 | |
| | 110,000 | | | Diamond Sports Group, LLC/Diamond Sports Finance Co., 6.625%, 8/15/27(a) | | | 57,269 | |
| | 143,000 | | | Discovery Communications, LLC, 3.950%, 3/20/28 | | | 162,677 | |
| | 95,000 | | | Nexstar Broadcasting, Inc., 4.750%, 11/1/28(a) | | | 96,762 | |
| | 69,000 | | | Outfront Media Capital, LLC/Outfront Media Capital Corp., 6.250%, 6/15/25(a) | | | 71,070 | |
| | 165,000 | | | ViacomCBS, Inc., 3.875%, 4/1/24 | | | 179,795 | |
| | | | | | | | 945,228 | |
| | | | | Metals & Mining — 2.3% | | | | |
| | 44,000 | | | Freeport-McMoRan, Inc., 4.125%, 3/1/28 | | | 44,550 | |
| | 115,000 | | | Glencore Funding, LLC, 4.125%, 5/30/23(a) | | | 123,290 | |
| | 124,000 | | | Nucor Corp., 3.950%, 5/1/28 | | | 144,524 | |
| | 125,000 | | | Southern Copper Corp., 3.500%, 11/8/22 | | | 131,240 | |
| | | | | | | | 443,604 | |
| | | | | Multi-Utilities — 3.1% | | | | |
| | 200,000 | | | Entergy Louisiana, LLC, 4.440%, 1/15/26 | | | 230,863 | |
| | 165,000 | | | Progress Energy, Inc., 3.150%, 4/1/22 | | | 170,383 | |
| | 165,000 | | | Sempra Energy, 3.550%, 6/15/24 | | | 178,617 | |
| | | | | | | | 579,863 | |
| | | | | Oil, Gas & Consumable Fuels — 2.9% | | | | |
| | 107,000 | | | Diamondback Energy, Inc., 5.375%, 5/31/25 | | | 111,103 | |
| | 84,000 | | | HollyFrontier Corp., 5.875%, 4/1/26 | | | 92,034 | |
| | 146,000 | | | Marathon Petroleum Corp., 5.375%, 10/1/22 | | | 146,000 | |
| | 100,000 | | | Newfield Exploration Co., 5.625%, 7/1/24 | | | 97,005 | |
| | 91,000 | | | WPX Energy, Inc., 5.875%, 6/15/28 | | | 95,095 | |
| | | | | | | | 541,237 | |
| | | | | Pharmaceuticals — 0.7% | | | | |
| | 125,000 | | | AbbVie, Inc., 3.600%, 5/14/25 | | | 138,550 | |
| | | | | Semiconductors & Semiconductor Equipment — 2.2% | | | | |
| | 164,000 | | | Broadcom, Inc., 4.150%, 11/15/30 | | | 184,228 | |
| | 130,000 | | | Microchip Technology, Inc., 3.922%, 6/1/21 | | | 132,877 | |
| | 100,000 | | | ON Semiconductor Corp., 3.875%, 9/1/28(a) | | | 101,407 | |
| | | | | | | | 418,512 | |
| | | | | Software — 1.9% | | | | |
| | 145,000 | | | Apple, Inc., 1.650%, 5/11/30 | | | 150,200 | |
| | 207,000 | | | International Business Machines Corp., 1.950%, 5/15/30 | | | 213,557 | |
| | | | | | | | 363,757 | |
| | | | | Specialty Retail — 2.7% | | | | |
| | 103,000 | | | Alimentation Couche-Tard, Inc., 3.550%, 7/26/27(a) | | | 115,283 | |
| | 135,000 | | | ERAC USA Finance, LLC, 3.800%, 11/1/25(a) | | | 150,284 | |
| | 125,000 | | | Lowe’s Cos., Inc., 2.500%, 4/15/26 | | | 135,511 | |
| | 106,000 | | | Match Group Holdings II, LLC, 4.125%, 8/1/30(a) | | | 107,225 | |
| | | | | | | | 508,303 | |
| | | | | Textiles, Apparel & Luxury Goods — 0.5% | | | | |
| | 91,000 | | | CoStar Group, Inc., 2.800%, 7/15/30(a) | | | 94,293 | |
Continued
| Sterling Capital Corporate Fund |
Schedule of Portfolio Investments — (continued)
September 30, 2020
Principal
Amount | | | | | Fair Value | |
| CORPORATE BONDS — (continued) | | | |
| | | | | Tobacco — 1.0% | | | | |
| $ | 180,000 | | | BAT Capital Corp., 3.557%, 8/15/27 | | $ | 194,402 | |
| | | | | Total Corporate Bonds
(Cost $17,478,071) | | | 18,516,184 | |
| | | | | | | | | |
| U.S. TREASURY NOTES — 0.2% | | | | |
| | 38,100 | | | 0.625%, 5/15/30 | | | 37,987 | |
| | | | | Total U.S. Treasury Notes
(Cost $38,112) | | | 37,987 | |
| Shares | | | | | | | |
| PREFERRED STOCKS — 0.9% | | | | |
| | | | | Equity Real Estate Investment Trusts (REITS) — 0.3% | | | | |
| | 2,189 | | | Public Storage | | | 56,695 | |
| | | | | Trading Companies & Distributors — 0.6% | | | | |
| | 3,900 | | | WESCO International, Inc. | | | 109,200 | |
| | | | | Total Preferred Stocks
(Cost $158,441) | | | 165,895 | |
| | | | | | | | | |
| MONEY MARKET FUND — 0.8% | | | | |
| | 157,320 | | | Federated Treasury Obligations Fund, Institutional Shares, 0.02%(f) | | | 157,320 | |
| | | | | Total Money Market Fund
(Cost $157,320) | | | 157,320 | |
| | | Fair Value | |
Total Investments — 99.3%
(Cost $17,831,944) | | $ | 18,877,386 | |
| Net Other Assets (Liabilities) — 0.7% | | | 134,578 | |
| NET ASSETS — 100.0% | | $ | 19,011,964 | |
| (a) | Rule 144A, Section 4(2) or other security that is restricted as to resale to qualified institutional investors. The Advisor, using Board approved procedures, has deemed these securities or a portion of these securities to be liquid. |
| (b) | The interest rate for this variable rate note, which will change periodically, is based either on the prime rate or an index of market rates. The reflected rate is in effect as of September 30, 2020. The maturity date reflected is the final maturity date. |
| (c) | Security is a fix-to-float security, which carries a fixed coupon until a certain date, upon which it switches to a floating rate. Rate shown is the fixed rate. |
| (d) | Security is perpetual in nature and has no stated maturity date. |
| (e) | The interest rate for this floating rate note, which will change periodically, is based either on the prime rate or an index of market rates. The reflected rate is in effect as of September 30, 2020. The maturity date reflected is the final maturity date. |
| (f) | Represents the current yield as of report date. |
MTN — Medium Term Note
Continued
| Sterling Capital Quality Income Fund |
Schedule of Portfolio Investments
September 30, 2020
Principal
Amount | | | | | Fair Value | |
| ASSET BACKED SECURITIES — 18.7% | | | |
| $ | 346,621 | | | Aegis Asset Backed Securities Trust, Series 2005-5, Class 1A4, 0.498%, (LIBOR USD 1-Month plus 0.35%), 12/25/35(a) | | $ | 343,116 | |
| | 230,000 | | | AmeriCredit Automobile Receivables Trust, Series 2019-2, Class B, 2.540%, 7/18/24 | | | 236,897 | |
| | 168,000 | | | AmeriCredit Automobile Receivables Trust, Series 2019-1, Class B, 3.130%, 2/18/25 | | | 174,393 | |
| | 52,015 | | | Argent Securities, Inc. Asset-Backed Pass Through Certificates, Series 2005-W3, Class A2D, 0.488%, (LIBOR USD 1-Month plus 0.34%), 11/25/35(a) | | | 51,858 | |
| | 350,000 | | | ARI Fleet Lease Trust, Series 2018-A, Class A3, 2.840%, 10/15/26(b) | | | 355,600 | |
| | 500,000 | | | Avis Budget Rental Car Funding AESOP, LLC, Series 2017-1A, Class A, 3.070%, 9/20/23(b) | | | 511,834 | |
| | 300,000 | | | Avis Budget Rental Car Funding AESOP, LLC, Series 2017-2A, Class A, 2.970%, 3/20/24(b) | | | 309,606 | |
| | 53,990 | | | Bear Stearns Asset Backed Securities I Trust, Series 2004-HE11, Class M2, 1.723%, (LIBOR USD 1-Month plus 1.58%), 12/25/34(a) | | | 54,100 | |
| | 355,000 | | | Capital Auto Receivables Asset Trust, Series 2018-1, Class B, 3.090%, 8/22/22(b) | | | 361,869 | |
| | 61,067 | | | Chesapeake Funding II, LLC, Series 2018-3A, Class A1, 3.390%, 1/15/31(b) | | | 62,971 | |
| | 450,000 | | | Citibank Credit Card Issuance Trust, Series 2007-A3, Class A3, 6.150%, 6/15/39 | | | 660,026 | |
| | 13,732 | | | Citicorp Residential Mortgage Trust, STEP, Series 2007-2, Class A6, 5.016%, 6/25/37 | | | 14,011 | |
| | 170,357 | | | Encore Credit Receivables Trust, Series 2005-4, Class M2, 0.808%, (LIBOR USD 1-Month plus 0.66%), 1/25/36(a) | | | 170,163 | |
| | 401,403 | | | Enterprise Fleet Financing, LLC, Series 2019-2, Class A2, 2.290%, 2/20/25(b) | | | 408,472 | |
| | 450,000 | | | Ford Credit Auto Owner Trust, Series 2018-1, Class A, 3.190%, 7/15/31(b) | | | 495,773 | |
| | 250,000 | | | Ford Credit Auto Owner Trust, Series 2020-1, Class A, 2.040%, 8/15/31(b) | | | 261,958 | |
| | 91,554 | | | GSAMP Trust, Series 2006-SEA1, Class M1, 0.648%, (LIBOR USD 1-Month plus 0.50%), 5/25/36(a)(b) | | | 91,240 | |
| | 176,372 | | | Home Equity Asset Trust, Series 2005-7, Class M1, 0.598%, (LIBOR USD 1-Month plus 0.45%), 1/25/36(a) | | | 175,724 | |
| | 67,425 | | | Home Equity Asset Trust, Series 2005-8, Class M1, 0.578%, (LIBOR USD 1-Month plus 0.43%), 2/25/36(a) | | | 67,214 | |
| | 169,111 | | | JP Morgan Mortgage Acquisition Corp., Series 2005-OPT1, Class M2, 0.853%, (LIBOR USD 1-Month plus 0.71%), 6/25/35(a) | | | 168,936 | |
| | 85,491 | | | New Century Home Equity Loan Trust, Series 2005-4, Class M2, 0.658%, (LIBOR USD 1-Month plus 0.51%), 9/25/35(a) | | | 85,582 | |
| | 179,947 | | | Park Place Securities, Inc. Asset-Backed Pass Through Certificates, Series 2005-WHQ2, Class M2, 0.838%, (LIBOR USD 1-Month plus 0.69%), 5/25/35(a) | | | 179,261 | |
| | 151,749 | | | Park Place Securities, Inc. Asset-Backed Pass Through Certificates, Series 2005-WCW3, Class M1, 0.628%, (LIBOR USD 1-Month plus 0.48%), 8/25/35(a) | | | 151,668 | |
Principal
Amount | | | | | Fair Value | |
| ASSET BACKED SECURITIES — (continued) | | | |
| $ | 39,337 | | | RAMP Trust, Series 2005-RZ4, Class M2, 0.648%, (LIBOR USD 1-Month plus 0.50%), 11/25/35(a) | | $ | 39,313 | |
| | 400,000 | | | Santander Drive Auto Receivables Trust, Series 2020-3, Class B, 0.690%, 3/17/25 | | | 400,171 | |
| | 221,111 | | | Saxon Asset Securities Trust, Series 2004-3, Class M1, 1.048%, (LIBOR USD 1-Month plus 0.90%), 12/26/34(a) | | | 215,399 | |
| | 500,000 | | | SoFi Professional Loan Program Trust, Series 2020-A, Class A2FX, 2.540%, 5/15/46(b) | | | 519,164 | |
| | 108,410 | | | United States Small Business Administration, Series 2010-20D, Class 1, 4.360%, 4/1/30 | | | 118,467 | |
| | | | | Total Asset Backed Securities | | | | |
| | | | | (Cost $6,383,207) | | | 6,684,786 | |
| | | | | | | | | |
| COLLATERALIZED MORTGAGE OBLIGATIONS — 18.9% | | | |
| | 88,445 | | | Alternative Loan Trust, Series 2004-22CB, Class 1A1, 6.000%, 10/25/34 | | | 91,814 | |
| | 42,738 | | | Banc of America Mortgage Trust, Series 2005-3, Class 1A24, 5.500%, 4/25/35 | | | 44,048 | |
| | 52,884 | | | Citicorp Mortgage Securities, Inc., Series 2005-1, Class 1A4, 5.500%, 2/25/35 | | | 54,425 | |
| | 10,000 | | | Citigroup Mortgage Loan Trust, Inc., Series 2004-NCM2, Class 3CB2, 6.500%, 8/25/20 | | | 9,958 | |
| | 54,149 | | | Countrywide Home Loan Mortgage Pass Through Trust, Series 2004-3, Class A4, 5.750%, 4/25/34 | | | 55,325 | |
| | 97,645 | | | Credit Suisse First Boston Mortgage Securities Corp., Series 2004-1, Class 2A1, 6.500%, 2/25/34 | | | 101,221 | |
| | 192,600 | | | Fannie Mae, Series 2003-21, Class OW, 4.000%, 3/25/33 | | | 218,127 | |
| | 57,101 | | | Fannie Mae, Series 2003-19, Class AR, 5.500%, 3/25/33 | | | 65,072 | |
| | 380,000 | | | Fannie Mae, Series 2011-131, Class PB, 4.500%, 12/25/41 | | | 453,523 | |
| | 585,000 | | | Fannie Mae, Series 2013-30, Class PY, 3.000%, 4/25/43 | | | 634,711 | |
| | 68,894 | | | FirstKey Mortgage Trust, Series 2014-1, Class A12, 3.500%, 11/25/44(b)(c) | | | 71,078 | |
| | 22,700 | | | Freddie Mac, Series 4079, Class WV, 3.500%, 3/15/27 | | | 23,639 | |
| | 195,000 | | | Freddie Mac, Series 4097, Class CU, 1.500%, 8/15/27 | | | 200,574 | |
| | 373,434 | | | Freddie Mac, Series 4136, Class HZ, 3.500%, 11/15/27 | | | 418,111 | |
| | 180,000 | | | Freddie Mac, Series 4230, Class VB, 2.500%, 12/15/31 | | | 183,997 | |
| | 120,033 | | | Freddie Mac, Series 2485, Class WG, 6.000%, 8/15/32 | | | 140,603 | |
| | 400,000 | | | Freddie Mac, Series 4160, Class HH, 2.500%, 12/15/32 | | | 406,502 | |
| | 180,167 | | | Freddie Mac, Series 3440, Class EM, 5.000%, 4/15/38 | | | 205,010 | |
| | 310,683 | | | Freddie Mac, Series 3816, Class HM, 4.500%, 5/15/40 | | | 343,309 | |
| | 500,000 | | | Freddie Mac, Series 3714, Class PB, 4.750%, 8/15/40 | | | 624,334 | |
| | 45,214 | | | Freddie Mac, Series 3803, Class PJ, 4.250%, 1/15/41 | | | 47,239 | |
See accompanying Notes to the Financial Statements.
| Sterling Capital Quality Income Fund |
Schedule of Portfolio Investments — (continued)
September 30, 2020
Principal
Amount | | | | | Fair Value | |
| COLLATERALIZED MORTGAGE OBLIGATIONS — (continued) | | | |
| $ | 200,000 | | | Freddie Mac, Series 3815, Class TB, 4.500%, 2/15/41 | | $ | 240,932 | |
| | 96,279 | | | Freddie Mac, Series 4293, Class MH, 3.000%, 12/15/41 | | | 103,269 | |
| | 400,000 | | | Freddie Mac, Series 3989, Class JW, 3.500%, 1/15/42 | | | 449,783 | |
| | 500,000 | | | Freddie Mac, Series 4650, Class BC, 3.500%, 5/15/43 | | | 532,318 | |
| | 449,665 | | | Freddie Mac, Series 4508, Class UZ, 3.000%, 7/15/43 | | | 451,563 | |
| | 55,357 | | | Galton Funding Mortgage Trust, Series 2018-1, Class A43, 3.500%, 11/25/57(b)(c) | | | 55,861 | |
| | 122,945 | | | Galton Funding Mortgage Trust, Series 2018-2, Class A41, 4.500%, 10/25/58(b)(c) | | | 125,650 | |
| | 90,475 | | | Ginnie Mae, Series 2004-69, Class GC, 5.500%, 4/20/34 | | | 104,405 | |
| | 31,081 | | | Ginnie Mae, Series 2010-85, Class DQ, 3.000%, 12/20/39 | | | 31,959 | |
| | 212,288 | | | MASTR Alternative Loan Trust, Series 2003-5, Class 8A1, 5.500%, 6/25/33 | | | 219,603 | |
| | 39,591 | | | MASTR Alternative Loan Trust, Series 2004-13, Class 3A1, 6.500%, 1/25/35 | | | 38,907 | |
| | 37,056 | | | RBSGC Mortgage Loan Trust, Series 2007-B, Class 3A1, 4.441%, 7/25/35(c) | | | 37,754 | |
| | | | | Total Collateralized Mortgage Obligations | | | | |
| | | | | (Cost $6,286,134) | | | 6,784,624 | |
| | | | | | | | | |
| COMMERCIAL MORTGAGE-BACKED SECURITIES — 25.1% | | | |
| | 500,000 | | | CD Mortgage Trust, Series 2016-CD2, Class A4, 3.526%, 11/10/49(c) | | | 562,623 | |
| | 300,000 | | | Citigroup Commercial Mortgage Trust, Series 2013-GC17, Class AS, 4.544%, 11/10/46 | | | 326,340 | |
| | 492,148 | | | COMM 2012-CCRE1 Mortgage Trust, Series 2012-CR1, Class A3, 3.391%, 5/15/45 | | | 502,446 | |
| | 75,000 | | | COMM 2013-CCRE11 Mortgage Trust, Series 2013-CR11, Class A4, 4.258%, 8/10/50 | | | 81,667 | |
| | 75,000 | | | COMM Mortgage Trust, Series 2012-CR1, Class AM, 3.912%, 5/15/45 | | | 77,650 | |
| | 250,000 | | | COMM Mortgage Trust, Series 2017-COR2, Class A3, 3.510%, 9/10/50 | | | 279,670 | |
| | 500,000 | | | CSAIL Commercial Mortgage Trust, Series 2015-C3, Class A4, 3.718%, 8/15/48 | | | 551,206 | |
| | 200,000 | | | DBUBS Mortgage Trust, Series 2011-LC1A, Class C, 5.790%, 11/10/46(b)(c) | | | 200,362 | |
| | 472,616 | | | FRESB Mortgage Trust, Series 2017-SB36, Class A10F, 2.880%, 7/25/27(c) | | | 496,673 | |
| | 175,000 | | | GS Mortgage Securities Trust, Series 2010-C1, Class B, 5.148%, 8/10/43(b) | | | 158,859 | |
| | 550,000 | | | GS Mortgage Securities Trust, Series 2012-GCJ7, Class AS, 4.085%, 5/10/45 | | | 568,636 | |
| | 85,000 | | | GS Mortgage Securities Trust, Series 2014-GC24, Class A5, 3.931%, 9/10/47 | | | 93,357 | |
| | 500,000 | | | GS Mortgage Securities Trust, Series 2016-GS4, Class A4, 3.442%, 11/10/49(c) | | | 557,012 | |
| | 272,000 | | | GS Mortgage Securities Trust, Series 2020-GC47, Class A5, 2.377%, 5/12/53 | | | 290,950 | |
| | 250,000 | | | JP Morgan Chase Commercial Mortgage Securities Trust, Series 2011-C3, Class B, 5.013%, 2/15/46(b)(c) | | | 236,001 | |
Principal
Amount | | | | | Fair Value | |
| COMMERCIAL MORTGAGE-BACKED SECURITIES — (continued) | | | |
| $ | 100,000 | | | Morgan Stanley Bank of America Merrill Lynch Trust, Series 2014-C18, Class A4, 3.923%, 10/15/47 | | $ | 110,454 | |
| | 500,000 | | | Morgan Stanley Bank of America Merrill Lynch Trust, Series 2016-C32, Class A4, 3.720%, 12/15/49 | | | 569,118 | |
| | 91,861 | | | Morgan Stanley Capital I Trust, Series 2011-C2, Class A4, 4.661%, 6/15/44(b) | | | 94,111 | |
| | 300,000 | | | Wells Fargo Commercial Mortgage Trust, Series 2015-P2, Class A4, 3.809%, 12/15/48 | | | 337,040 | |
| | 100,000 | | | WFRBS Commercial Mortgage Trust, Series 2011-C2, Class C, 5.392%, 2/15/44(b)(c) | | | 99,711 | |
| | 553,050 | | | WFRBS Commercial Mortgage Trust, Series 2011-C3, Class A4, 4.375%, 3/15/44(b) | | | 556,834 | |
| | 536,000 | | | WFRBS Commercial Mortgage Trust, Series 2011-C4, Class A4, 4.902%, 6/15/44(b)(c) | | | 543,036 | |
| | 177,863 | | | WFRBS Commercial Mortgage Trust, Series 2011-C5, Class A4, 3.667%, 11/15/44 | | | 180,922 | |
| | 350,000 | | | WFRBS Commercial Mortgage Trust, Series 2012-C7, Class A2, 3.431%, 6/15/45 | | | 360,953 | |
| | 200,000 | | | WFRBS Commercial Mortgage Trust, Series 2012-C8, Class AS, 3.660%, 8/15/45 | | | 207,586 | |
| | 85,000 | | | WFRBS Commercial Mortgage Trust, Series 2013-UBS1, Class A4, 4.079%, 3/15/46(c) | | | 92,309 | |
| | 164,000 | | | WFRBS Commercial Mortgage Trust, Series 2014-C23, Class A5, 3.917%, 10/15/57 | | | 181,322 | |
| | 107,946 | | | WF-RBS Commercial Mortgage Trust, Series 2011-C2, Class A4, 4.869%, 2/15/44(b)(c) | | | 108,581 | |
| | 575,000 | | | WF-RBS Commercial Mortgage Trust, Series 2011-C2, Class B, 5.174%, 2/15/44(b)(c) | | | 576,025 | |
| | | | | Total Commercial Mortgage-Backed Securities | | | | |
| | | | | (Cost $8,843,369) | | | 9,001,454 | |
| | | | | | | | | |
| CORPORATE BONDS — 1.8% | | | |
| | | | | Diversified Telecommunication Services — 1.0% | | | | |
| | 350,000 | | | Sprint Spectrum Co., LLC/Sprint Spectrum Co. II, LLC/Sprint Spectrum Co. III, LLC, 4.738%, 3/20/25(b) | | | 378,438 | |
| | | | | Equity Real Estate Investment Trusts (REITS) — 0.8% | | | | |
| | 250,000 | | | American Tower Trust, 3.652%, 3/23/28(b) | | | 271,219 | |
| | | | | Total Corporate Bonds | | | | |
| | | | | (Cost $619,522) | | | 649,657 | |
| | | | | | | | | |
| MORTGAGE-BACKED SECURITIES — 33.5% | | | |
| | | | | Fannie Mae — 16.7% | | | | |
| | 264,586 | | | 3.000%, 1/1/31, Pool #BA6574 | | | 278,133 | |
| | 100,439 | | | 5.500%, 6/1/38, Pool #984277 | | | 116,536 | |
| | 56,901 | | | 5.500%, 8/1/38, Pool #995072 | | | 65,981 | |
| | 80,611 | | | 4.500%, 9/1/39, Pool #AC1830 | | | 90,565 | |
| | 66,589 | | | 4.500%, 10/1/40, Pool #AE4855 | | | 74,493 | |
| | 129,672 | | | 3.500%, 2/1/41, Pool #AH5646 | | | 144,337 | |
| | 225,766 | | | 4.000%, 3/1/41, Pool #AH4008 | | | 248,601 | |
| | 59,739 | | | 4.500%, 6/1/41, Pool #AC9298 | | | 66,455 | |
| | 176,452 | | | 5.000%, 7/1/41, Pool #AI5595 | | | 201,789 | |
| | 237,323 | | | 4.000%, 9/1/41, Pool #AJ1717 | | | 262,297 | |
| | 265,497 | | | 3.500%, 6/1/42, Pool #AB5373 | | | 287,854 | |
| | 72,226 | | | 4.500%, 10/1/44, Pool #MA2066 | | | 79,880 | |
Continued
| Sterling Capital Quality Income Fund |
Schedule of Portfolio Investments — (continued)
September 30, 2020
Principal
Amount | | | | | Fair Value | |
| MORTGAGE-BACKED SECURITIES — (continued) | | | |
| | | | | Fannie Mae — (continued) | | | | |
| $ | 239,276 | | | 4.000%, 12/1/44, Pool #MA2127 | | $ | 262,555 | |
| | 245,085 | | | 4.500%, 1/1/45, Pool #MA2158 | | | 269,655 | |
| | 271,579 | | | 3.500%, 3/1/45, Pool #AS4552 | | | 296,401 | |
| | 359,960 | | | 4.000%, 10/1/45, Pool #AL7487 | | | 390,425 | |
| | 207,206 | | | 4.000%, 11/1/46, Pool #MA2808 | | | 224,400 | |
| | 208,697 | | | 3.000%, 2/1/47, Pool #BE2329 | | | 219,575 | |
| | 174,763 | | | 4.000%, 5/1/47, Pool #BE9598 | | | 187,911 | |
| | 164,342 | | | 4.500%, 11/1/47, Pool #BM3286 | | | 178,620 | |
| | 351,877 | | | 3.500%, 12/1/47, Pool #CA0833 | | | 372,487 | |
| | 206,886 | | | 4.500%, 5/1/48, Pool #CA1711 | | | 224,051 | |
| | 318,210 | | | 3.500%, 9/1/49, Pool #BJ9608 | | | 335,313 | |
| | 516,033 | | | 3.500%, 6/1/50, Pool #CA6097 | | | 547,721 | |
| | 518,381 | | | 2.500%, 7/1/50, Pool #CA6307 | | | 546,188 | |
| | | | | | | | 5,972,223 | |
| | | | | Freddie Mac — 12.5% | | | | |
| | 87,902 | | | 4.000%, 11/1/32, Pool #ZS8993 | | | 95,885 | |
| | 398,962 | | | 3.500%, 5/1/35, Pool #C91829 | | | 431,301 | |
| | 284,719 | | | 4.000%, 5/1/37, Pool #ZA2461 | | | 307,721 | |
| | 35,747 | | | 5.500%, 10/1/39, Pool #A89387 | | | 41,198 | |
| | 61,282 | | | 5.000%, 4/1/40, Pool #A91812 | | | 70,099 | |
| | 109,722 | | | 5.500%, 4/1/40, Pool #C03467 | | | 124,959 | |
| | 53,632 | | | 5.000%, 8/1/40, Pool #C03491 | | | 61,658 | |
| | 125,687 | | | 4.000%, 11/1/40, Pool #A94742 | | | 139,698 | |
| | 151,001 | | | 4.000%, 12/1/40, Pool #A95447 | | | 167,620 | |
| | 308,642 | | | 3.500%, 8/1/42, Pool #Q10324 | | | 335,359 | |
| | 411,839 | | | 3.500%, 3/1/43, Pool #U99045 | | | 447,673 | |
| | 331,666 | | | 3.500%, 1/1/45, Pool #Q30876 | | | 361,960 | |
| | 262,996 | | | 3.500%, 3/1/45, Pool #U99124 | | | 285,797 | |
| | 231,946 | | | 3.000%, 1/1/46, Pool #G08686 | | | 244,153 | |
| | 267,408 | | | 4.000%, 4/1/46, Pool #Q40048 | | | 289,878 | |
| | 235,886 | | | 3.500%, 12/1/47, Pool #Q52955 | | | 250,068 | |
| | 463,605 | | | 2.500%, 11/1/49, Pool #QA4396 | | | 486,681 | |
| | 323,164 | | | 3.000%, 1/1/50, Pool #QA6230 | | | 338,871 | |
| | | | | | | | 4,480,579 | |
| | | | | Ginnie Mae — 0.0% | | | | |
| | 13,824 | | | 4.000%, 12/20/40, Pool #755678 | | | 15,172 | |
| | | | | UMBS (TBA) — 4.3% | | | | |
| | 1,500,000 | | | 2.000%, 10/1/50 | | | 1,550,859 | |
| | | | | Total Mortgage-Backed Securities | | | | |
| | | | | (Cost $11,568,610) | | | 12,018,833 | |
| Shares | | | | | Fair Value | |
| MONEY MARKET FUND — 6.2% |
| | 2,203,499 | | | Federated Treasury Obligations Fund, Institutional Shares, 0.02%(d) | | $ | 2,203,499 | |
| | | | | Total Money Market Fund | | | | |
| | | | | (Cost $2,203,499) | | | 2,203,499 | |
| | | | | | | | | |
| Total Investments — 104.2% | | | | |
| (Cost $35,904,341) | | | 37,342,853 | |
| Net Other Assets (Liabilities) — (4.2)% | | | (1,506,300 | ) |
| NET ASSETS — 100.0% | | $ | 35,836,553 | |
| (a) | The interest rate for this floating rate note, which will change periodically, is based either on the prime rate or an index of market rates. The reflected rate is in effect as of September 30, 2020. The maturity date reflected is the final maturity date. |
| (b) | Rule 144A, Section 4(2) or other security that is restricted as to resale to qualified institutional investors. The Advisor, using Board approved procedures, has deemed these securities or a portion of these securities to be liquid. |
| (c) | The interest rate for this variable rate note, which will change periodically, is based either on the prime rate or an index of market rates. The reflected rate is in effect as of September 30, 2020. The maturity date reflected is the final maturity date. |
| (d) | Represents the current yield as of report date. |
STEP — Step Coupon Bond
TBA — To-Be-Announced
Continued
| Sterling Capital Kentucky Intermediate Tax-Free Fund |
Schedule of Portfolio Investments
September 30, 2020
Principal
Amount | | | | | Fair Value | |
| MUNICIPAL BONDS — 95.2% | | | | |
| | | | | Kentucky — 95.2% | | | | |
| $ | 210,000 | | | Bowling Green, KY, Advance Refunding G.O., Series C, Callable 6/1/26 @ 102, 4.000%, 6/1/27 | | $ | 254,304 | |
| | 300,000 | | | Bowling Green, KY, Independent School District Finance Corp., School Improvements Revenue, (State Intercept), 5.000%, 8/1/24 | | | 350,592 | |
| | 115,000 | | | Boyle County School District Finance Corp., School Improvements Revenue Bonds, (State Intercept), 3.000%, 2/1/22 | | | 119,073 | |
| | 250,000 | | | Campbell Kenton & Boone Counties Sanitation District No. 1, Advance Refunding Revenue, Callable 8/1/26 @ 100, 5.000%, 8/1/29 | | | 310,685 | |
| | 195,000 | | | Commonwealth of Kentucky, Certificate of Participation, Public Facilities, State Office Building Project, Callable 4/15/28 @ 100, OID, 4.000%, 4/15/48 | | | 216,641 | |
| | 300,000 | | | Commonwealth of Kentucky, Certificate of Participation, Public Improvements, Callable 6/15/25 @ 100, 5.000%, 6/15/34 | | | 347,376 | |
| | 300,000 | | | Eastern Kentucky University, Refunding Revenue, Series A, (State Intercept), 5.000%, 4/1/24 | | | 337,113 | |
| | 300,000 | | | Eastern Kentucky University, University & College Improvements Revenue, Series A (State Intercept), 5.000%, 4/1/25 | | | 346,470 | |
| | 165,000 | | | Fayette County School District Finance Corp., KY, School Improvements Revenue Bonds, Series A, Callable 8/1/28 @ 100, (State Intercept), 4.000%, 8/1/31 | | | 198,005 | |
| | 250,000 | | | Fayette County School District Finance Corp., School Improvements Revenue, Series A, Callable 5/1/26 @ 100, (State Intercept), 4.000%, 5/1/38 | | | 279,563 | |
| | 150,000 | | | Franklin County, KY, Public Properties Corp., Justice Center Project, Advance Refunding Revenue, 4.000%, 4/1/28 | | | 178,505 | |
| | 200,000 | | | Hopkinsville, KY, Refunding G.O., Series A, 4.000%, 10/1/24 | | | 228,224 | |
| | 300,000 | | | Jefferson County, KY, School District Finance Corp., School Improvements Revenue Bonds, Series C, Callable 12/1/25 @ 100, (State Intercept), 4.000%, 12/1/28 | | | 344,877 | |
| | 255,000 | | | Jefferson County, KY, School District Finance Corp., School Improvements Revenue, Series A, Callable 4/1/25 @ 100, 5.000%, 4/1/27 | | | 302,570 | |
| | 125,000 | | | Kenton County Airport Board, Airport & Marina Improvements Revenue, Callable 1/1/29 @ 100, 5.000%, 1/1/31 | | | 158,385 | |
| | 135,000 | | | Kenton County, KY, Refunding Revenue, G.O., Series A, 5.000%, 4/1/27 | | | 170,618 | |
| | 250,000 | | | Kentucky Asset/Liability Commission, Project Notes, Federal Highway Trust Transit Improvements Revenue, First Series, Callable 9/1/23 @ 100, 5.250%, 9/1/25 | | | 279,180 | |
| | 400,000 | | | Kentucky Association of Counties Finance Corp., Public Improvements Revenue, First Series B, 4.000%, 2/1/25 | | | 456,220 | |
| | 200,000 | | | Kentucky Association of Counties Finance Corp., Water Utility Improvements Revenue, Series B, 5.000%, 2/1/26 | | | 243,728 | |
Principal
Amount | | | | | Fair Value | |
| MUNICIPAL BONDS — (continued) | | | | |
| | | | | Kentucky — (continued) | | | | |
| $ | 210,000 | | | Kentucky Bond Development Corp., Recreational Facility Improvements Revenue, Callable 9/1/28 @ 100, 5.000%, 9/1/35 | | $ | 240,777 | |
| | 295,000 | | | Kentucky Economic Development Finance Authority, KY, Health, Hospital, Nursing Home Improvements Revenue Bonds, Series B, Callable 8/15/27 @ 100, 5.000%, 8/15/28 | | | 360,053 | |
| | 120,000 | | | Kentucky Infrastructure Authority, Wastewater & Drinking Water Revolving, Advance Refunding Revenue, Callable 2/1/26 @ 100, 5.000%, 2/1/27 | | | 146,709 | |
| | 250,000 | | | Kentucky Rural Water Finance Corp., Flexible Term Program, Refunding & Improvements Revenue, Series B, Callable 11/2/20 @ 100, 4.000%, 2/1/21 | | | 250,615 | |
| | 130,000 | | | Kentucky State Property & Building Commission, Project No. 112, Series A, Public Improvements Revenue, Callable 2/1/26 @ 100, 5.000%, 2/1/27 | | | 156,519 | |
| | 200,000 | | | Kentucky State Property & Building Commission, Project No. 114, University & College Improvements Revenue, Callable 10/1/26 @ 100, 5.000%, 10/1/28 | | | 245,752 | |
| | 250,000 | | | Kentucky State Property & Building Commission, Project No. 116, University & College Improvements Revenue, (AGM-State Intercept), 5.000%, 10/1/26 | | | 310,373 | |
| | 200,000 | | | Kentucky State Property & Building Commission, Project No. 117, Series B, Public Improvements Revenue, Callable 5/1/27 @ 100, 5.000%, 5/1/28 | | | 247,244 | |
| | 270,000 | | | Kentucky State Property & Building Commission, Project No. 119, Public Improvements Revenue, Callable 5/1/28 @ 100, 5.000%, 5/1/37 | | | 325,201 | |
| | 280,000 | | | Kentucky State Property & Building Commission, Refunding Revenue, Callable 8/1/25 @ 100, 5.000%, 8/1/31 | | | 323,593 | |
| | 200,000 | | | Kentucky Turnpike Authority, Revitalization Project, Advance Refunding Revenue, Series B, 5.000%, 7/1/25 | | | 237,720 | |
| | 250,000 | | | Laurel County, KY, Correctional Facilities Improvements G.O., Series A, Callable 5/1/27 @ 100, (BAM), 5.000%, 5/1/28 | | | 315,175 | |
| | 300,000 | | | Laurel County, KY, School District Finance Corp., Refunding Revenue, Callable 3/1/25 @ 100 (State Intercept), 4.000%, 6/1/25 | | | 343,470 | |
| | 250,000 | | | Lexington-Fayette, KY, Urban County Government Public Facilities Corp., Court Facilities Project, Current Refunding Revenue Bonds, Callable 10/1/26 @ 100, 5.000%, 10/1/27 | | | 308,180 | |
| | 325,000 | | | Louisville & Jefferson County, KY, Metropolitan Government, Center City Project, Refunding Notes, G.O., Callable 12/1/25 @ 100, 5.000%, 12/1/28 | | | 397,069 | |
| | 250,000 | | | Louisville & Jefferson County, KY, Metropolitan Government, Refunding G.O., Series F, Callable 11/1/24 @ 100, 4.000%, 11/1/26 | | | 285,643 | |
See accompanying Notes to the Financial Statements.
| Sterling Capital Kentucky Intermediate Tax-Free Fund |
Schedule of Portfolio Investments — (continued)
September 30, 2020
Principal
Amount | | | | | Fair Value | |
| MUNICIPAL BONDS — (continued) | | | | |
| | | | | Kentucky — (continued) | | | | |
| $ | 200,000 | | | Louisville & Jefferson County, KY, Metropolitan Sewer District, Sewer Improvements Revenue, Series A, 5.000%, 5/15/25 | | $ | 242,576 | |
| | 250,000 | | | Louisville & Jefferson County, KY, Metropolitan Sewer District, Sewer Refunding Revenue, Series A, Callable 11/15/21 @ 100, 5.000%, 5/15/30 | | | 262,423 | |
| | 250,000 | | | Louisville & Jefferson County, KY, Metropolitan Sewer District, Sewer Refunding Revenue, Series A, Callable 5/15/28 @ 100, 4.000%, 5/15/32 | | | 299,477 | |
| | 160,000 | | | Louisville Water Co., Metro Government Waterworks Board, Water Utility Improvements Revenue, 5.000%, 11/15/24 | | | 190,952 | |
| | 170,000 | | | McCracken County School District Finance Corp., School Building Revenue Bonds, School Improvements Revenue, (State Intercept), 5.000%, 6/1/22 | | | 183,133 | |
| | 300,000 | | | Murray, KY, School District Finance Corp., School Improvements Revenue, (State Intercept), 5.000%, 3/1/27 | | | 376,638 | |
| | 200,000 | | | Northern Kentucky University, University & College Improvements Revenue, Series A, Callable 9/1/26 @ 100, (AGM-State Intercept), 4.000%, 9/1/29 | | | 226,666 | |
| | 105,000 | | | Northern Kentucky Water District, Refunding Revenue, Series B, Callable 8/1/23 @ 100, 4.000%, 2/1/24 | | | 116,080 | |
Principal
Amount | | | | | Fair Value | |
| MUNICIPAL BONDS — (continued) | | | | |
| | | | | Kentucky — (continued) | | | | |
| $ | 250,000 | | | Taylor County, KY, Public Courthouse Corp., Justice Center Project, Refunding Revenue, Callable 9/1/26 @ 100, 4.000%, 9/1/27 | | $ | 287,463 | |
| | | | | Total Municipal Bonds
(Cost $11,103,902) | | | 11,801,630 | |
| Shares | | | | | | | |
| MONEY MARKET FUND — 3.8% | | | | |
| | 465,816 | | | Federated Treasury Obligations Fund, Institutional Shares, 0.02%(a) | | | 465,816 | |
| | | | | Total Money Market Fund
(Cost $465,816) | | | 465,816 | |
Total Investments — 99.0%
(Cost $11,569,718) | | | 12,267,446 | |
| Net Other Assets (Liabilities) — 1.0% | | | 126,280 | |
| NET ASSETS — 100.0% | | $ | 12,393,726 | |
| (a) | Represents the current yield as of report date. |
AGM — Assured Guaranty Municipal Corp.
BAM — Build America Mutual
G.O. — General Obligation
OID — Original Issue Discount
Continued
| Sterling Capital Maryland Intermediate Tax-Free Fund |
Schedule of Portfolio Investments
September 30, 2020
Principal
Amount | | | | | Fair Value | |
| MUNICIPAL BONDS — 94.7% | | | | |
| | | | | District of Columbia — 3.4% | | | | |
| $ | 350,000 | | | Washington Metropolitan Area Transit Authority, Series A-1, Advance Refunding Revenue Bonds, 5.000%, 7/1/26 | | $ | 435,817 | |
| | | | | Maryland — 91.3% | | | | |
| | 415,000 | | | Anne Arundel County, MD, Consolidated Water & Sewer Improvements, G.O., Callable 10/1/29 @ 100, 5.000%, 10/1/31 | | | 558,872 | |
| | 250,000 | | | Baltimore City, MD, Senior Refunding Revenue Bonds, Series D, Callable 1/1/25 @ 100, 5.000%, 7/1/30 | | | 292,980 | |
| | 190,000 | | | Baltimore County, MD, Consolidated Public Improvements, Refunding Notes, G.O., Callable 3/1/29 @ 100, 4.000%, 3/1/39 | | | 226,750 | |
| | 400,000 | | | Calvert County, MD, County Commissioners Public Improvements, School Improvements G.O., Callable 7/1/29 @ 100, 4.000%, 7/1/31 | | | 498,448 | |
| | 200,000 | | | Cecil County, MD, Consolidated Public School Improvements, Advance Refunding G.O., 4.000%, 2/1/24 | | | 224,890 | |
| | 250,000 | | | Charles County, MD, Consolidated Public School Improvements G.O., Callable 7/15/23 @ 100, 5.000%, 7/15/25 | | | 283,473 | |
| | 400,000 | | | Dorchester County, MD, Telecommunications Improvements, G.O., Callable 1/1/28 @ 100, 5.000%, 1/1/31 | | | 511,288 | |
| | 200,000 | | | Harford County, MD, Public Improvements, G.O., Series A, Callable 10/1/29 @ 100, 5.000%, 10/1/31 | | | 269,336 | |
| | 275,000 | | | Howard County, MD, Housing Commission, General Capital Improvement Program, Local Multifamily Housing Revenue, 4.000%, 6/1/22 | | | 289,432 | |
| | 420,000 | | | Maryland Economic Development Corp., Public Health Laboratory Public Improvements Revenue, Callable 6/1/21 @ 100, 5.000%, 6/1/26 | | | 433,339 | |
| | 250,000 | | | Maryland Health & Higher Educational Facilities Authority, Anne Arundel Health System, Advance Refunding Revenue Bonds, Callable 7/1/27 @ 100, 5.000%, 7/1/28 | | | 305,923 | |
| | 300,000 | | | Maryland Health & Higher Educational Facilities Authority, Broadmead Issue, Hospital, Nursing Home Improvements, Refunding Revenue, Series A, Callable 7/1/25 @ 103, 5.000%, 7/1/43 | | | 327,699 | |
| | 250,000 | | | Maryland Health & Higher Educational Facilities Authority, Calvert Health System, Health, Hospital, Nursing Home Improvements, Refunding Revenue, Callable 7/1/23 @ 100, OID, 5.000%, 7/1/38 | | | 267,637 | |
| | 250,000 | | | Maryland Health & Higher Educational Facilities Authority, Greater Baltimore Medical Center, Refunding Revenue, Series A, Callable 7/1/22 @ 100, 5.000%, 7/1/26 | | | 270,140 | |
| | 250,000 | | | Maryland Health & Higher Educational Facilities Authority, Johns Hopkins Health System, Health, Hospital, Nursing Home Improvements Revenue, Callable 7/1/22 @ 100, 5.000%, 7/1/25 | | | 271,057 | |
Principal
Amount | | | | | Fair Value | |
| MUNICIPAL BONDS — (continued) | | | | |
| | | | | Maryland — (continued) | | | | |
| $ | 470,000 | | | Maryland Health & Higher Educational Facilities Authority, Lifebridge Health, Current Refunding Revenue Bonds, Callable 7/1/27 @ 100, 5.000%, 7/1/32 | | $ | 568,832 | |
| | 250,000 | | | Maryland Health & Higher Educational Facilities Authority, Maryland Institute College of Art, Refunding Revenue, Callable 6/1/22 @ 100, 5.000%, 6/1/23 | | | 265,395 | |
| | 400,000 | | | Maryland Health & Higher Educational Facilities Authority, Meritus Medical Center Issue, Refunding Revenue, 5.000%, 7/1/22 | | | 428,432 | |
| | 100,000 | | | Maryland Health & Higher Educational Facilities Authority, Variable Refunding University of Maryland, Health, Hospital, Nursing Home Improvements, Advance Refunding Revenue Bonds, Callable 1/1/27 @ 100, 5.000%, 7/1/45 | | | 124,125 | |
| | 250,000 | | | Maryland Stadium Authority, Construction & Revitalization, School Improvements Revenue, Callable 5/1/28 @ 100, 5.000%, 5/1/35 | | | 306,387 | |
| | 400,000 | | | Maryland Stadium Authority, Refunding Revenue, 5.000%, 6/15/23 | | | 451,276 | |
| | 250,000 | | | Montgomery County, MD, Consolidated Public Improvements, Refunding G.O., Series A, Callable 11/1/28 @ 100, 5.000%, 11/1/32 | | | 327,020 | |
| | 250,000 | | | Montgomery County, MD, Department Liquor Control Public Improvements Revenue, Series A, Callable 4/1/21 @ 100, OID, 4.500%, 4/1/26 | | | 255,315 | |
| | 250,000 | | | Montgomery County, MD, West Germantown Development District, Refunding, Special Tax, 4.000%, 7/1/23 | | | 274,205 | |
| | 400,000 | | | Prince George’s County, MD, Consolidated Public School Improvements, G.O., Series A, Callable 9/1/24 @ 100, 4.000%, 9/1/25 | | | 458,024 | |
| | 250,000 | | | St. Mary’s College of Maryland, Academic Fees & Auxiliary, Refunding Revenue, (BAM), 4.000%, 9/1/25 | | | 282,265 | |
| | 250,000 | | | State of Maryland, State and Local Facilities Loan First Series, Public Improvements, G.O., Callable 3/15/29 @ 100, 5.000%, 3/15/32 | | | 330,125 | |
| | 250,000 | | | State Of Maryland, State and Local Facilities Loan Second Series, School Improvements, G.O., Callable 8/1/28 @ 100, 5.000%, 8/1/31 | | | 325,695 | |
| | 175,000 | | | Washington County, MD, Current Refunding, G.O., 5.000%, 7/1/29 | | | 236,953 | |
| | 400,000 | | | Washington Suburban Sanitary Commission, Consolidated Public Water Utility Improvements, G.O., (County Guaranteed), 4.000%, 6/1/24 | | | 455,532 | |
| | 400,000 | | | Washington Suburban Sanitary Commission, Consolidated Public Water Utility Improvements, G.O., Callable 6/1/26 @ 100, (County Guaranteed), 5.000%, 6/1/27 | | | 500,172 | |
| | 500,000 | | | Washington Suburban Sanitary Commission, Consolidated Public Water Utility Improvements, G.O., Callable 6/1/26 @ 100, (County Guaranteed), 5.000%, 6/1/38 | | | 604,065 | |
See accompanying Notes to the Financial Statements.
| Sterling Capital Maryland Intermediate Tax-Free Fund |
Schedule of Portfolio Investments — (continued)
September 30, 2020
Principal
Amount | | | | | Fair Value | |
| MUNICIPAL BONDS — (continued) | | | | |
| | | | | Maryland — (continued) | | | | |
| $ | 400,000 | | | Worcester County, MD, Consolidated Public Improvements, School Improvements G.O., Callable 8/1/29 @ 100, 4.000%, 8/1/32 | | $ | 493,688 | |
| | | | | | | | 11,718,770 | |
| | | | | Total Municipal Bonds
(Cost $11,423,115) | | | 12,154,587 | |
| Shares | | | | | | |
| MONEY MARKET FUND — 4.4% | | | |
| | 560,695 | | | Federated Treasury Obligations Fund,
Institutional Shares, 0.02%(a) | | | 560,695 | |
| | | | | Total Money Market Fund
(Cost $560,695) | | | 560,695 | |
Total Investments — 99.1%
(Cost $11,983,810) | | | 12,715,282 | |
| Net Other Assets (Liabilities) — 0.9% | | | 114,952 | |
| NET ASSETS — 100.0% | | $ | 12,830,234 | |
| (a) | Represents the current yield as of report date. |
BAM — Build America Mutual
G.O. — General Obligation
OID — Original Issue Discount
Continued
| Sterling Capital North Carolina Intermediate Tax-Free Fund |
Schedule of Portfolio Investments
September 30, 2020
Principal
Amount | | | | | Fair Value | |
| MUNICIPAL BONDS — 95.4% | | | | |
| | | | | North Carolina — 95.4% | | | | |
| $ | 1,000,000 | | | Beaufort County, NC, Refunding Revenue Limited Obligation, Callable 6/1/22 @ 100, 5.000%, 6/1/24 | | $ | 1,077,990 | |
| | 1,000,000 | | | Beaufort County, NC, Refunding Revenue Limited Obligation, Callable 6/1/22 @ 100, 5.000%, 6/1/26 | | | 1,076,770 | |
| | 1,000,000 | | | Broad River Water Authority, Water System Refunding Revenue, 5.000%, 6/1/24 | | | 1,160,180 | |
| | 1,025,000 | | | Buncombe County Metropolitan Sewerage District, Sewer Improvements Revenue, Callable 7/1/24 @ 100, 5.000%, 7/1/39 | | | 1,177,848 | |
| | 1,475,000 | | | Buncombe County, NC, Advance Refunding Revenue Limited Obligation, Callable 6/1/25 @ 100, 5.000%, 6/1/28 | | | 1,761,740 | |
| | 1,175,000 | | | Buncombe County, NC, School Improvements, Refunding Revenue, Series A, Callable 6/1/24 @ 100, 5.000%, 6/1/29 | | | 1,370,203 | |
| | 1,010,000 | | | Cape Fear Public Utility Authority, Advance Refunding Revenue Bonds, 5.000%, 8/1/25 | | | 1,234,473 | |
| | 1,895,000 | | | Cape Fear Public Utility Authority, Refunding Revenue Bonds, Series A, Callable 8/1/29 @ 100, 4.000%, 8/1/38 | | | 2,251,620 | |
| | 1,475,000 | | | Cape Fear Public Utility Authority, Water & Sewer System, Improvements Refunding Revenue, Callable 8/1/21 @ 100, 5.000%, 8/1/26 | | | 1,533,218 | |
| | 1,000,000 | | | Charlotte, NC, Charlotte Douglas International Airport Refunding Revenue, Callable 7/1/24 @ 100, 5.000%, 7/1/31 | | | 1,143,950 | |
| | 1,000,000 | | | Charlotte, NC, Convention Facility, Refunding Revenue, Certification of Participation, Callable 6/1/29 @ 100, 5.000%, 6/1/30 | | | 1,323,290 | |
| | 1,000,000 | | | Charlotte, NC, Convention Facility, Refunding Revenue, Certification of Participation, Callable 6/1/29 @ 100, 5.000%, 6/1/31 | | | 1,315,500 | |
| | 1,000,000 | | | Charlotte, NC, Convention Facility, Refunding Revenue, Certification of Participation, Callable 6/1/29 @ 100, 5.000%, 6/1/32 | | | 1,306,910 | |
| | 2,275,000 | | | Charlotte, NC, Recreational Facilities Improvements Revenue, Callable 12/1/28 @ 100, 5.000%, 12/1/33 | | | 2,937,435 | |
| | 1,520,000 | | | Charlotte, NC, Recreational Facilities Improvements Revenue, Callable 12/1/28 @ 100, 5.000%, 12/1/34 | | | 1,957,152 | |
| | 2,180,000 | | | Charlotte, NC, Refunding G.O., Series A, Callable 6/1/29 @ 100, 5.000%, 6/1/30 | | | 2,931,751 | |
| | 1,875,000 | | | Charlotte, NC, Refunding Revenue G.O., Series A, 5.000%, 7/1/25 | | | 2,294,100 | |
| | 2,295,000 | | | Charlotte, NC, Water & Sewer System Revenue, Refunding Revenue, 5.000%, 7/1/27 | | | 2,979,805 | |
| | 3,000,000 | | | Charlotte, NC, Water & Sewer System Revenue, Refunding Revenue, Callable 7/1/28 @ 100, 5.000%, 7/1/36 | | | 3,827,970 | |
| | 3,100,000 | | | Charlotte-Mecklenburg Hospital Authority(The), NC, Current Refunding Revenue, Series A, Callable 1/15/22 @ 100, 5.000%, 1/15/30 | | | 3,253,171 | |
| | 3,000,000 | | | Charlotte-Mecklenburg Hospital Authority(The), NC, Refunding Revenue Bonds, Series-C, Callable 10/5/20 @ 100, 0.050%, 1/15/37 | | | 3,000,000 | |
Principal
Amount | | | | | Fair Value | |
| MUNICIPAL BONDS — (continued) | | | | |
| | | | | North Carolina — (continued) | | | | |
| $ | 2,035,000 | | | Chatham County, NC, Refunding Revenue (County Guaranteed), 5.000%, 12/1/28 | | $ | 2,521,874 | |
| | 2,500,000 | | | Durham Capital Financing Corp., Refunding Revenue Limited Obligation, Callable 6/1/23 @ 100, 5.000%, 6/1/38 | | | 2,820,075 | |
| | 1,225,000 | | | East Carolina University, University & College Improvements Revenue, Series A, Callable 4/1/26 @ 100, 5.000%, 10/1/27 | | | 1,500,931 | |
| | 1,000,000 | | | Elizabeth City State University, Board of Governors of NC, Advance Refunding Revenue Bonds (AGM), Callable 4/1/29 @ 100, 5.000%, 4/1/40 | | | 1,188,390 | |
| | 1,750,000 | | | Fayetteville, NC, Public Works Commission, Electric Light & Power Improvements Revenue, Callable 3/1/24 @ 100, 4.000%, 3/1/27 | | | 1,949,307 | |
| | 1,690,000 | | | Fayetteville, NC, Public Works Commission, Multi-Utility Improvements Revenue, Callable 3/1/28 @ 100, 5.000%, 3/1/29 | | | 2,185,694 | |
| | 3,000,000 | | | Forsyth County NC, Public Improvements, G.O., Series B, Callable 3/1/29 @ 100, 5.000%, 3/1/31 | | | 4,002,570 | |
| | 2,200,000 | | | Forsyth County NC, Refunding Revenue, G.O., 5.000%, 7/1/26 | | | 2,774,838 | |
| | 1,675,000 | | | Guilford County, NC, Advance Refunding, G.O., Series A, Callable 2/1/26 @ 100, 5.000%, 2/1/28 | | | 2,064,354 | |
| | 2,075,000 | | | High Point, NC, Combined Water & Sewer System, Advance Refunding Revenue Bonds, 5.000%, 11/1/26 | | | 2,635,167 | |
| | 1,010,000 | | | Holly Springs, NC, Public Improvements Revenue, Callable 10/1/24 @ 100, 5.000%, 10/1/27 | | | 1,195,153 | |
| | 3,000,000 | | | Johnston County, NC, Correctional Facilities Improvements, Current Refunding Revenue, Series A, 5.000%, 4/1/26 | | | 3,728,580 | |
| | 4,000,000 | | | Mecklenburg County, NC, Public Improvements, School Improvements, G.O., Series B, 5.000%, 12/1/26 | | | 5,105,960 | |
| | 1,195,000 | | | Monroe, NC, Advance Refunding Revenue Bonds, Callable 3/1/26 @ 100, 5.000%, 3/1/29 | | | 1,453,239 | |
| | 1,465,000 | | | Moore County, Advance Refunding Revenue, G.O., 5.000%, 6/1/28 | | | 1,925,274 | |
| | 1,250,000 | | | New Hanover County, NC, Public Facilities Revenue Bonds, Series A, 5.000%, 2/1/26 | | | 1,546,125 | |
| | 1,000,000 | | | North Carolina Agricultural & Technical State University, Series A, Refunding Revenue, Callable 10/1/25 @ 100, 5.000%, 10/1/32 | | | 1,146,470 | |
| | 1,215,000 | | | North Carolina Agricultural & Technical State University, Series A, Refunding Revenue, Callable 10/1/25 @ 100, 5.000%, 10/1/34 | | | 1,386,351 | |
| | 1,305,000 | | | North Carolina Capital Facilities Finance Agency, Johnson & Wales University Project, Refunding Revenue, 5.000%, 4/1/21 | | | 1,327,342 | |
| | 1,000,000 | | | North Carolina Capital Facilities Finance Agency, Johnson & Wales University Project, Refunding Revenue, Callable 4/1/23 @ 100, 5.000%, 4/1/25 | | | 1,079,550 | |
See accompanying Notes to the Financial Statements.
| Sterling Capital North Carolina Intermediate Tax-Free Fund |
Schedule of Portfolio Investments — (continued)
September 30, 2020
Principal
Amount | | | | | Fair Value | |
| MUNICIPAL BONDS — (continued) | | | | |
| | | | | North Carolina — (continued) | | | | |
| $ | 840,000 | | | North Carolina Capital Facilities Finance Agency, Meredith College Project, Refunding Revenue, 5.000%, 6/1/24 | | $ | 933,442 | |
| | 750,000 | | | North Carolina Capital Facilities Finance Agency, Meredith College Project, Refunding Revenue, 5.000%, 6/1/25 | | | 849,225 | |
| | 1,045,000 | | | North Carolina Capital Facilities Finance Agency, The Arc of North Carolina Project, Refunding Revenue, (Housing and Urban Development, Section 8), 5.000%, 10/1/25 | | | 1,195,020 | |
| | 1,750,000 | | | North Carolina Capital Facilities Finance Agency, The Arc of North Carolina Project, Refunding Revenue, Callable 10/1/27 @ 100 (Housing and Urban Development, Section 8), 5.000%, 10/1/34 | | | 2,001,475 | |
| | 1,205,000 | | | North Carolina Central University, University & College Improvements, Revenue Bonds, Callable 4/1/29 @ 100, 5.000%, 4/1/33 | | | 1,475,884 | |
| | 1,000,000 | | | North Carolina Central University, University & College Improvements, Revenue Bonds, Callable 4/1/29 @ 100, 5.000%, 4/1/37 | | | 1,206,650 | |
| | 370,000 | | | North Carolina Eastern Municipal Power Agency, Electric, Lights & Power Improvements Revenue, Series A, OID, 6.400%, 1/1/21 | | | 375,646 | |
| | 800,000 | | | North Carolina Medical Care Commission, Health Care Facilities, Nursing home Improvement Revenue Bonds, Series A, Callable 1/1/30 @ 100, 5.000%, 7/1/32 | | | 1,018,024 | |
| | 2,780,000 | | | North Carolina Medical Care Commission, Vidant Health Care Facilities, Refunding Revenue, Series A, Callable 6/1/22 @ 100, 5.000%, 6/1/24 | | | 3,000,565 | |
| | 2,000,000 | | | North Carolina State University at Raleigh, Refunding Revenue, Series A, Callable 10/1/23 @ 100, 5.000%, 10/1/28 | | | 2,283,500 | |
| | 1,960,000 | | | North Carolina State, Advance Refunding G.O., Series A, Callable 6/1/26 @ 100, 5.000%, 6/1/27 | | | 2,457,076 | |
| | 3,000,000 | | | North Carolina State, Advance Refunding Revenue Bonds, Series B, Callable 5/1/27 @ 100, 5.000%, 5/1/28 | | | 3,828,330 | |
| | 4,385,000 | | | North Carolina State, Advance Refunding, Revenue, Series B, Callable 5/1/27 @ 100, 5.000%, 5/1/30 | | | 5,533,212 | |
| | 2,645,000 | | | North Carolina State, Refunding Revenue G.O., Series B, 5.000%, 6/1/25 | | | 3,225,366 | |
| | 1,250,000 | | | North Carolina Turnpike Authority, Senior Lien, Advance Refunding Revenue (AGM), 5.000%, 1/1/26 | | | 1,509,887 | |
| | 1,500,000 | | | North Carolina Turnpike Authority, Senior Lien, Advance Refunding Revenue (AGM), 5.000%, 1/1/27 | | | 1,856,745 | |
| | 2,100,000 | | | North Carolina Turnpike Authority, Senior Lien, Advance Refunding Revenue (AGM), Callable 1/1/27 @ 100, 5.000%, 1/1/28 | | | 2,582,307 | |
| | 1,210,000 | | | Pender County, NC, Limited Obligation Refunding Revenue, Callable 6/1/22 @ 100, 5.000%, 6/1/26 | | | 1,302,892 | |
Principal
Amount | | | | | Fair Value | |
| MUNICIPAL BONDS — (continued) | | | | |
| | | | | North Carolina — (continued) | | | | |
| $ | 1,060,000 | | | Pitt County, NC, Advance Refunding Revenue Bonds, Series B, Callable 10/1/26 @ 100, 5.000%, 4/1/30 | | $ | 1,306,450 | |
| | 1,395,000 | | | Pitt County, NC, Certificate of Participation, Refunding, Callable 4/1/22 @ 100, 5.000%, 4/1/25 | | | 1,495,370 | |
| | 1,500,000 | | | Raleigh, NC, Combined Enterprise System, Refunding Revenue, Series A, Callable 3/1/23 @ 100, 5.000%, 3/1/27 | | | 1,672,140 | |
| | 1,615,000 | | | Raleigh, NC, Combined Enterprise System, Refunding Revenue, Series A, Callable 3/1/23 @ 100, 5.000%, 3/1/28 | | | 1,800,337 | |
| | 1,000,000 | | | Raleigh, NC, Refunding Revenue, Callable 2/1/26 @ 100, 5.000%, 2/1/27 | | | 1,229,640 | |
| | 1,790,000 | | | Salisbury, NC, Combined Enterprise System Revenue, Water Utility Improvements, Refunding Revenue, 5.000%, 2/1/25 | | | 2,138,961 | |
| | 1,985,000 | | | Sampson County, NC, Refunding Revenue, Callable 12/1/25 @ 100, 5.000%, 12/1/26 | | | 2,411,835 | |
| | 720,000 | | | Surry County, NC, School Improvements, Revenue Bonds, Callable 6/1/29 @ 100, 5.000%, 6/1/30 | | | 956,966 | |
| | 1,025,000 | | | Surry County, NC, School Improvements, Revenue Bonds, Callable 6/1/29 @ 100, 4.000%, 6/1/35 | | | 1,227,109 | |
| | 870,000 | | | Town of Oak Island, NC, Combined Enterprise System, Advance Refunding Revenue (AGM), 5.000%, 6/1/25 | | | 1,045,201 | |
| | 1,000,000 | | | Union County, NC, Enterprise Systems, Refunding Revenue, Series A, Callable 12/1/21 @ 100, 4.000%, 12/1/22 | | | 1,044,030 | |
| | 2,235,000 | | | Union County, NC, Enterprise Systems, Water Utility Improvements, Refunding Revenue, Series A, Callable 6/1/29 @ 100, 4.000%, 6/1/38 | | | 2,649,637 | |
| | 2,205,000 | | | Union County, NC, Refunding G.O., Series A, 5.000%, 3/1/22 | | | 2,357,299 | |
| | 1,000,000 | | | Union County, NC, Refunding Revenue, 5.000%, 12/1/23 | | | 1,149,730 | |
| | 1,695,000 | | | University of North Carolina at Greensboro, University & College Improvements Revenue, Callable 4/1/24 @ 100, 5.000%, 4/1/28 | | | 1,930,673 | |
| | 410,000 | | | University of North Carolina System, Asheville/Wilmington, Refunding Revenue, Series C, Callable 11/5/20 @ 100 (Assured Guaranty), 5.250%, 10/1/24 | | | 411,644 | |
| | 1,985,000 | | | Wake County, NC, Advance Refunding Revenue Bonds, Series A, Callable 12/1/26 @ 100, 5.000%, 12/1/28 | | | 2,486,947 | |
| | 1,585,000 | | | Wake County, NC, Public Improvements, G.O., Series A, Callable 3/1/28 @ 100, 5.000%, 3/1/30 | | | 2,064,669 | |
| | 2,025,000 | | | Wake County, NC, Public Improvements, G.O., Series A, Callable 3/1/29 @ 100, 5.000%, 3/1/30 | | | 2,717,773 | |
| | 1,000,000 | | | Wake County, NC, Public Improvements, Refunding Notes, G.O., Series A, 5.000%, 3/1/28 | | | 1,319,640 | |
| | 2,000,000 | | | Wake County, NC, School Improvements, Revenue Bonds, Callable 9/1/29 @ 100, 5.000%, 9/1/30 | | | 2,692,260 | |
Continued
| Sterling Capital North Carolina Intermediate Tax-Free Fund |
Schedule of Portfolio Investments — (continued)
September 30, 2020
Principal
Amount | | | | | Fair Value | |
| MUNICIPAL BONDS — (continued) | | | | |
| | | | | North Carolina — (continued) | | | | |
| $ | 1,270,000 | | | Wake County, NC, School Improvements, Revenue Bonds, Series A, 5.000%, 9/1/29 | | $ | 1,720,736 | |
| | 2,125,000 | | | Watauga Public Facilities Corp., Revenue, Series A, Callable 6/1/22 @ 100, 5.000%, 6/1/24 | | | 2,295,467 | |
| | 1,000,000 | | | Watauga Public Facilities Corp., Revenue, Series A, Callable 6/1/22 @ 100, 5.000%, 6/1/26 | | | 1,080,220 | |
| | 1,000,000 | | | Winston-Salem State University Foundation LLC, Refunding Revenue, Callable 4/1/22 @ 100, 5.000%, 4/1/25 | | | 1,051,610 | |
| | 1,000,000 | | | Winston-Salem, NC, Transit Improvements, Refunding Revenue, Series C, Callable 6/1/24 @ 100, 5.000%, 6/1/30 | | | 1,163,350 | |
| | 1,165,000 | | | Winston-Salem, NC, Water & Sewer System, Refunding Revenue, Series A, 5.000%, 6/1/24 | | | 1,368,782 | |
| | 1,875,000 | | | Winston-Salem, NC, Water & Sewer System, Refunding Revenue, Series A, Callable 6/1/24 @ 100, 5.000%, 6/1/25 | | | 2,199,375 | |
| | 1,000,000 | | | Winston-Salem, NC, Water & Sewer System, Refunding Revenue, Series A, Callable 6/1/24 @ 100, 5.000%, 6/1/28 | | | 1,174,730 | |
| | | | | Total Municipal Bonds
(Cost $158,087,010) | | | 169,250,147 | |
| Shares | | | | | Fair Value | |
| MONEY MARKET FUND — 3.6% | | | |
| | 6,286,694 | | | Federated Treasury Obligations Fund, Institutional Shares, 0.02%(a) | | $ | 6,286,694 | |
| | | | | Total Money Market Fund
(Cost $6,286,694) | | | 6,286,694 | |
Total Investments — 99.0%
(Cost $164,373,704) | | | 175,536,841 | |
| Net Other Assets (Liabilities) — 1.0% | | | 1,862,554 | |
| NET ASSETS — 100.0% | | $ | 177,399,395 | |
| (a) | Represents the current yield as of report date. |
AGM — Assured Guaranty Municipal Corp.
G.O. — General Obligation
OID — Original Issue Discount
Continued
| Sterling Capital South Carolina Intermediate Tax-Free Fund |
Schedule of Portfolio Investments
September 30, 2020
Principal
Amount | | | | | Fair Value | |
| MUNICIPAL BONDS — 98.8% | | | | |
| | | | | South Carolina — 98.8% | | | | |
| $ | 1,000,000 | | | Aiken County, SC, Consolidated School District, School Improvements G.O., Series A, Callable 4/1/29 @ 100, (SCSDE), 4.000%, 4/1/34 | | $ | 1,212,890 | |
| | 1,000,000 | | | Aiken County, SC, Consolidated School District, Special Obligation Bonds, School Improvements Revenue, Callable 6/1/29 @ 100, 4.000%, 6/1/31 | | | 1,221,330 | |
| | 850,000 | | | Aiken County, SC, Consolidated School District, Special Obligation Bonds, School Improvements Revenue, Callable 6/1/29 @ 100, 4.000%, 6/1/33 | | | 1,025,134 | |
| | 1,770,000 | | | Anderson County, SC, School District No. 2, Refunding, G.O., (SCSDE), 5.000%, 3/1/24 | | | 2,056,227 | |
| | 1,515,000 | | | Anderson County, SC, School District No. 4, Refunding, G.O., Series A, Callable 3/1/25 @ 100, (SCSDE), 5.000%, 3/1/28 | | | 1,820,697 | |
| | 1,000,000 | | | Anderson Regional Joint Water System, Refunding Revenue, Series A, Callable 7/15/21 @ 100, 5.000%, 7/15/25 | | | 1,038,250 | |
| | 1,000,000 | | | Beaufort-Jasper Water & Sewer Authority, Advance Refunding Revenue, Series B, 5.000%, 3/1/24 | | | 1,161,710 | |
| | 1,000,000 | | | Beaufort-Jasper Water & Sewer Authority, Advance Refunding Revenue, Series B, 5.000%, 3/1/25 | | | 1,204,700 | |
| | 1,000,000 | | | Camden, SC, Combined Public Utility System Revenue, Current Refunding Revenue Bonds, (AGM), 4.000%, 3/1/30 | | | 1,252,640 | |
| | 450,000 | | | Charleston County, Airport District Port, Airport & Marina Improvements Revenue, Callable 7/1/29 @ 100, 5.000%, 7/1/30 | | | 573,655 | |
| | 1,000,000 | | | Charleston County, SC, Port, Airport & Marina Improvements Revenue, 5.000%, 12/1/22 | | | 1,104,840 | |
| | 1,500,000 | | | Charleston Educational Excellence Finance Corp., Charleston County School Refunding Revenue, 5.000%, 12/1/21(a) | | | 1,584,570 | |
| | 1,000,000 | | | Charleston Public Facilities Corp., Charleston City Project Series, Parking Facilities Improvement Revenue, Callable 9/1/27 @ 100, 5.000%, 9/1/29 | | | 1,274,530 | |
| | 1,215,000 | | | Charleston, SC, Waterworks & Sewer System Revenue, Advance Refunding Revenue, Series A, Callable 7/1/26 @ 100, 4.000%, 1/1/41 | | | 1,377,057 | |
| | 1,355,000 | | | Coastal Carolina University, University & College Improvements Revenue, Callable 6/1/24 @ 100, 5.000%, 6/1/34 | | | 1,557,667 | |
| | 1,295,000 | | | College of Charleston, University & College Improvements Refunding Revenue, Series A, Callable 4/1/21 @ 100, 5.000%, 4/1/25(a) | | | 1,322,389 | |
| | 1,000,000 | | | College of Charleston, University & College Improvements Revenue, Series A, Callable 4/1/24 @ 100, 5.000%, 4/1/25 | | | 1,133,770 | |
| | 1,000,000 | | | College of Charleston, University & College Improvements Revenue, Series B, 5.000%, 4/1/27 | | | 1,225,510 | |
| | 1,650,000 | | | Columbia, SC, Waterworks & Sewer System Revenue, Water & Sewer Utility Improvements Revenue, Callable 2/1/28 @ 100, 5.000%, 2/1/48 | | | 2,023,758 | |
Principal
Amount | | | | | Fair Value | |
| MUNICIPAL BONDS — (continued) | | | | |
| | | | | South Carolina — (continued) | | | | |
| $ | 1,135,000 | | | East Richland County Public Service District, Refunding Revenue, 4.000%, 1/1/22 | | $ | 1,189,276 | |
| | 1,000,000 | | | Florence County, SC, McLeod Regional Medical Center Project, Refunding Revenue, Callable 11/1/24 @ 100, 5.000%, 11/1/28 | | | 1,152,120 | |
| | 1,100,000 | | | Florence County, SC, McLeod Regional Medical Center Project, Refunding Revenue, Callable 11/1/24 @ 100, 5.000%, 11/1/33(a) | | | 1,247,818 | |
| | 1,000,000 | | | Georgetown County, SC, School District, School Improvements, G.O., Callable 3/1/28 @ 100 (SCSDE), 4.000%, 3/1/30 | | | 1,211,520 | |
| | 1,000,000 | | | Georgetown County, SC, School District, School Improvements, Refunding Notes, G.O., Callable 3/1/28 @ 100, (SCSDE), 4.000%, 3/1/31 | | | 1,204,980 | |
| | 1,000,000 | | | Greenville County, SC, School District Building Refunding Revenue, 5.000%, 12/1/22 | | | 1,101,400 | |
| | 1,000,000 | | | Greenville Health System, Hospital System Board, Refunding Revenue, Callable 5/1/22 @ 100, 5.000%, 5/1/31 | | | 1,047,950 | |
| | 1,415,000 | | | Greenville Health System, Hospital System Board, Series B, Callable 5/1/24 @ 100, 5.000%, 5/1/31 | | | 1,562,245 | |
| | 1,000,000 | | | Greenwood County, SC, Self Regional Healthcare Refunding Revenue, Series B, Callable 4/1/22 @ 100, 5.000%, 10/1/24 | | | 1,063,550 | |
| | 2,025,000 | | | Horry County, SC, School District, Refunding, G.O., Series B (SCSDE), 5.000%, 3/1/23(a) | | | 2,259,394 | |
| | 1,000,000 | | | Kershaw County, SC, Kershaw County School District Project, Refunding Revenue, 5.000%, 12/1/23 | | | 1,135,120 | |
| | 1,855,000 | | | Lancaster County SC, Lancaster School District, School Improvements, G.O. (SCSDE), Callable 3/1/27 @ 100, 4.000%, 3/1/28 | | | 2,233,420 | |
| | 1,600,000 | | | Lancaster Educational Assistance Program, Inc., SC, Lancaster County School District Refunding Revenue, Callable 12/1/23 @ 100, 5.000%, 12/1/24 | | | 1,837,936 | |
| | 1,000,000 | | | Lexington County, School District No. 1, G.O., Series B, Callable 2/1/29 @ 100, (SCSDE), 5.000%, 2/1/32 | | | 1,309,700 | |
| | 1,500,000 | | | Lexington County, School District No. 2, G.O., Series C, Callable 3/1/27 @ 100, (SCSDE), 5.000%, 3/1/29 | | | 1,887,645 | |
| | 1,345,000 | | | Lexington County, School District No. 2, G.O., Series C, Callable 3/1/27 @ 100, (SCSDE), 5.000%, 3/1/30 | | | 1,680,375 | |
| | 1,000,000 | | | Lugoff-Elgin Water Authority, Refunding Revenue, Series B, Callable 7/1/26 @ 100, 5.000%, 7/1/30 | | | 1,208,050 | |
| | 1,460,000 | | | Newberry, SC, Refunding Revenue (AGM), 5.000%, 4/1/24. | | | 1,682,241 | |
| | 465,000 | | | North Charleston, SC, Tax Increment Pledge, Public Improvements, Tax Allocation, 5.000%, 10/1/28(b) | | | 594,317 | |
| | 1,485,000 | | | Orangeburg County, SC, Correctional Facilities Improvements, Installment Purchase Revenue Bonds, Callable 12/1/27 @ 100, 5.000%, 12/1/29(a) | | | 1,856,458 | |
See accompanying Notes to the Financial Statements.
| Sterling Capital South Carolina Intermediate Tax-Free Fund |
Schedule of Portfolio Investments — (continued)
September 30, 2020
Principal
Amount | | | | | Fair Value | |
| MUNICIPAL BONDS — (continued) | | | | |
| | | | | South Carolina — (continued) | | | | |
| $ | 1,570,000 | | | Orangeburg County, SC, School District No. 4, School Improvements Refunding, G.O., Series A (SCSDE), 5.000%, 3/1/24 | | $ | 1,823,885 | |
| | 1,000,000 | | | Piedmont Municipal Power Agency, Power System Refunding Revenue, Series B, Callable 1/1/22 @ 100, 4.000%, 1/1/23 | | | 1,042,340 | |
| | 1,000,000 | | | Richland County, SC, School District No. 1, Refunding Bonds, G.O., Series A, (SCSDE), 5.000%, 3/1/26 | | | 1,242,910 | |
| | 1,640,000 | | | Richland County, SC, School District No. 2, Refunding Bonds, G.O., Series B, Callable 3/1/27 @ 100, (SCSDE), 4.000%, 3/1/29 | | | 1,961,669 | |
| | 1,000,000 | | | Richland County, SC, School District No. 2, School Improvements, G.O., Series A, Callable 3/1/29 @ 100, (SCSDE), 4.000%, 3/1/30 | | | 1,237,020 | |
| | 1,000,000 | | | Rock Hill, SC, Combined Utility System, Refunding Revenue, Series A, Callable 1/1/22 @ 100 (AGM), 5.000%, 1/1/23 | | | 1,059,330 | |
| | 1,000,000 | | | Rock Hill, SC, Hospital Fee Pledge, Refunding Revenue, Callable 4/1/23 @ 100, 5.000%, 4/1/33 | | | 1,107,480 | |
| | 1,500,000 | | | SCAGO Educational Facilities Corp. for Cherokee School District No. 1, Refunding Revenue, 5.000%, 12/1/24 | | | 1,754,985 | |
| | 585,000 | | | SCAGO Educational Facilities Corp. for Spartanburg School District No. 1, Refunding Revenue, Series B, 5.000%, 6/1/22 | | | 612,284 | |
| | 470,000 | | | SCAGO Educational Facilities Corp. for Spartanburg School District No. 1, Refunding Revenue, Series B, 4.000%, 6/1/24 | | | 499,521 | |
| | 625,000 | | | SCAGO Educational Facilities Corp. for Spartanburg School District No. 1, Refunding Revenue, Series B, 5.000%, 6/1/25 | | | 699,994 | |
| | 600,000 | | | SCAGO Educational Facilities Corp. for Sumter County School 17, Refunding Revenue, 5.000%, 12/1/24 | | | 675,726 | |
| | 490,000 | | | SCAGO Educational Facilities Corp. for Sumter County School 17, Refunding Revenue, 5.000%, 12/1/25 | | | 563,853 | |
| | 790,000 | | | SCAGO Educational Facilities Corp. for Union School District, Refunding Revenue, 5.000%, 12/1/21 | | | 830,535 | |
| | 850,000 | | | South Carolina Jobs-Economic Development Authority, AnMed Health Project, Advance Refunding Revenue Bonds, Callable 2/1/26 @ 100, 5.000%, 2/1/29 | | | 1,009,341 | |
| | 1,540,000 | | | South Carolina Jobs-Economic Development Authority, Wofford College Project, University & College Improvements Revenue, Callable 4/1/29 @ 100, 5.000%, 4/1/44 | | | 1,769,768 | |
| | 1,000,000 | | | South Carolina Jobs-Economic Development Authority, Wofford College Project, University & College Improvements Revenue, Callable 4/1/29 @ 100, 5.000%, 4/1/49 | | | 1,141,090 | |
Principal
Amount | | | | | Fair Value | |
| MUNICIPAL BONDS — (continued) | | | | |
| | | | | South Carolina — (continued) | | | | |
| $ | 1,400,000 | | | South Carolina State Fiscal Accountability Authority, Department of Mental Health Project, Callable 4/1/27 @ 100, 5.000%, 10/1/37 | | $ | 1,703,198 | |
| | 1,250,000 | | | South Carolina Transportation Infrastructure Bank, Advance Refunding Revenue, Series A, 5.000%, 10/1/23 | | | 1,416,487 | |
| | 1,000,000 | | | South Carolina Transportation Infrastructure Bank, Advance Refunding Revenue, Series A, Callable 10/1/27 @ 100 (AGM-CR), 5.000%, 10/1/38 | | | 1,229,940 | |
| | 1,740,000 | | | Spartanburg, SC, Water System Revenue, Water Utility Improvements Refunding Revenue, Series B, Callable 6/1/27 @ 100, 5.000%, 6/1/39 | | | 2,112,482 | |
| | 1,235,000 | | | State of South Carolina, Refunding Revenue, G.O., Series D, Callable 4/1/26 @ 100 (State Aid Withholding), 5.000%, 4/1/28 | | | 1,521,001 | |
| | 1,195,000 | | | State of South Carolina, University & College Improvements, G.O., Series B, Callable 10/1/27 @ 100 (State Aid Withholding), 5.000%, 4/1/30 | | | 1,536,208 | |
| | 1,150,000 | | | Town of Mount Pleasant, SC, Public Facilities, G.O., Callable 6/1/28 @ 100, 5.000%, 6/1/30 | | | 1,505,258 | |
| | | | | Total Municipal Bonds
(Cost $78,752,616) | | | 83,693,144 | |
| Shares | | | | | | |
| MONEY MARKET FUND — 2.5% | | | |
| | 2,163,552 | | | Federated Treasury Obligations Fund, Institutional Shares, 0.02%(c) | | | 2,163,552 | |
| | | | | Total Money Market Fund
(Cost $2,163,552) | | | 2,163,552 | |
Total Investments — 101.3%
(Cost $80,916,168) | | | 85,856,696 | |
| Net Other Assets (Liabilities) — (1.3)% | | | (1,111,425 | ) |
| NET ASSETS — 100.0% | | $ | 84,745,271 | |
| (a) | Represents that all or a portion of the security was pledged as collateral for securities purchased on a when-issued basis. |
| (b) | Represents securities purchased on a when-issued basis. At September 30, 2020, total cost of investments purchased on a when-issued basis was $595,321. |
| (c) | Represents the current yield as of report date. |
AGM — Assured Guaranty Municipal Corp.
G.O. — General Obligation
SCAGO — South Carolina Association of Governmental Organizations
SCSDE — South Carolina School District Enhancement
Continued
| Sterling Capital Virginia Intermediate Tax-Free Fund |
Schedule of Portfolio Investments
September 30, 2020
Principal
Amount | | | | | Fair Value | |
| MUNICIPAL BONDS — 96.5% | | | | |
| | | | | District of Columbia — 2.0% | | | | |
| $ | 1,325,000 | | | Washington Metropolitan Area Transit Authority, DC, Transit Improvements Revenue, Callable 7/1/27 @ 100, 5.000%, 7/1/36 | | $ | 1,615,732 | |
| | | | | Virginia — 94.5% | | | | |
| | 1,730,000 | | | Albemarle County, VA, Economic Development Authority, Albemarle County Project, Public Improvements Revenue, Callable 6/1/22 @ 100, 5.000%, 6/1/23 | | | 1,865,822 | |
| | 1,240,000 | | | Albemarle County, VA, Economic Development Authority, Public Improvements Revenue, 5.000%, 6/1/27 | | | 1,589,457 | |
| | 1,365,000 | | | Albemarle County, VA, School Improvements G.O., (State Aid Withholding), 5.000%, 6/1/26 | | | 1,718,385 | |
| | 1,000,000 | | | Alexandria, VA, Refunding G.O. (State Aid Withholding), 5.000%, 6/15/21 | | | 1,034,200 | |
| | 1,450,000 | | | Arlington County, VA, Public Improvements G.O., Callable 8/15/27 @ 100, 5.000%, 8/15/30 | | | 1,867,600 | |
| | 1,500,000 | | | Arlington County, VA, Public Improvements G.O., Series A, Callable 8/15/27 @ 100, 5.000%, 8/15/29 | | | 1,938,585 | |
| | 1,000,000 | | | Campbell County Industrial Development Authority, Public Facilities, School Improvements Revenue, Callable 6/1/30 @ 100, 5.000%, 6/1/32 | | | 1,319,980 | |
| | 1,085,000 | | | Chesapeake Bay Bridge & Tunnel District, First Tier General Resolution, Highway Improvements, Revenue Bonds, Callable 7/1/26 @ 100 (AGM), 5.000%, 7/1/41 | | | 1,283,034 | |
| | 1,085,000 | | | Chesapeake Hospital Authority, VA, Health, Hospital, Nursing Home Improvements Revenue Bonds, 5.000%, 7/1/29 | | | 1,403,317 | |
| | 1,770,000 | | | Chesapeake, VA, Public Improvements, Refunding G.O., Series A, Callable 8/1/27 @ 100, 5.000%, 8/1/30 | | | 2,278,769 | |
| | 1,000,000 | | | Chesterfield County, VA, School District, School Public Improvement, G.O., Series A, Callable 1/1/28 @ 100 (State Aid Withholding), 4.000%, 1/1/31 | | | 1,210,840 | |
| | 1,000,000 | | | Chesterfield County, VA, School Public Improvement, Advance Refunding, G.O., Callable 1/1/26 @ 100, 5.000%, 1/1/28 | | | 1,232,720 | |
| | 1,145,000 | | | Culpeper County, VA, Economic Development Authority, VA Capital Projects, Refunding Revenue, Callable 6/1/24 @ 100, 4.000%, 6/1/26 | | | 1,285,159 | |
| | 1,500,000 | | | Fairfax County, VA, Economic Development Authority, Laurel Hill Public Facilities Project, Refunding Revenue, Series A, 5.000%, 6/1/22 | | | 1,621,110 | |
| | 1,500,000 | | | Fairfax County, VA, Public Improvement, Refunding G.O., Series A, Callable 4/1/26 @ 100, (State Aid Withholding), 4.000%, 10/1/26 | | | 1,791,525 | |
| | 2,000,000 | | | Fairfax County, VA, School District, School Public Improvements G.O., Series A, Callable 4/1/29 @ 100 (State Aid Withholding), 5.000%, 10/1/31 | | | 2,666,000 | |
Principal
Amount | | | | | Fair Value | |
| MUNICIPAL BONDS — (continued) | | | | |
| | | | | Virginia — (continued) | | | | |
| $ | 1,000,000 | | | Fredericksburg Economic Development Authority, Mary Washington Healthcare Obligation Group, Refunding Revenue, Callable 6/15/24 @ 100, 5.000%, 6/15/26 | | $ | 1,133,650 | |
| | 840,000 | | | Fredericksburg Economic Development Authority, VA, Medicorp Health Systems Obligation, Refunding Revenue Bonds, 5.250%, 6/15/22 | | | 903,235 | |
| | 1,700,000 | | | Leesburg, VA, Refunding G.O., Callable 1/15/24 @ 100, (State Aid Withholding), 4.000%, 1/15/27 | | | 1,901,960 | |
| | 1,000,000 | | | Leesburg, VA, Refunding G.O., Callable 1/15/25 @ 100, (State Aid Withholding), 5.000%, 1/15/27 | | | 1,196,880 | |
| | 1,000,000 | | | Loudoun County, VA, Economic Development Authority, Public Improvements Revenue, Callable 12/1/24 @ 100, 5.000%, 12/1/27 | | | 1,184,430 | |
| | 1,365,000 | | | Loudoun County, VA, Industrial Development Authority, Refunding Revenue, 4.000%, 12/15/22 | | | 1,478,745 | |
| | 1,250,000 | | | Loudoun County, VA, Public Improvements, Advance Refunding G.O., Series A, Callable 12/1/25 @ 100, 5.000%, 12/1/26 | | | 1,555,188 | |
| | 1,810,000 | | | Manassas, VA, Public Improvements, Public Facilities G.O., Callable 7/1/29 @ 100 (State Aid Withholding), 4.000%, 7/1/33 | | | 2,220,309 | |
| | 1,000,000 | | | Newport News, VA, General Water Improvements, Refunding G.O., Series B, 5.250%, 7/1/21 | | | 1,038,220 | |
| | 1,500,000 | | | Newport News, VA, Public Improvements, G.O., Series A (State Aid Withholding), 5.000%, 2/1/29 | | | 2,017,650 | |
| | 1,000,000 | | | Norfolk, VA, Economic Development Authority, Bon Secours Health System, Inc., Refunding Revenue, Callable 11/1/22 @ 100, 5.000%, 11/1/29 | | | 1,096,750 | |
| | 1,000,000 | | | Norfolk, VA, Economic Development Authority, Sentara Healthcare Facilities, Inc., Current Refunding Revenue Bonds, Series B, Callable 11/1/28 @ 100, 4.000%, 11/1/48 | | | 1,124,730 | |
| | 1,000,000 | | | Norfolk, VA, Economic Development Authority, Sentara Healthcare Facilities, Refunding Revenue, Series B, Callable 11/1/22 @ 100, 5.000%, 11/1/25 | | | 1,088,470 | |
| | 1,465,000 | | | Norfolk, VA, Economic Development Authority, Sentara Healthcare, Refunding Revenue, Series B, Callable 11/1/22 @ 100, 5.000%, 11/1/36 | | | 1,562,803 | |
| | 1,445,000 | | | Norfolk, VA, Public Improvements, G.O., Callable 8/1/28 @ 100 (State Aid Withholding), 5.000%, 8/1/47 | | | 1,956,920 | |
| | 2,000,000 | | | Norfolk, VA, Public Improvements, G.O., Series A, Callable 10/1/26 @ 100, 5.000%, 10/1/30 | | | 2,555,540 | |
| | 1,245,000 | | | Rappahannock Regional Jail Authority, Refunding Revenue, Callable 10/1/25 @ 100, 5.000%, 10/1/26 | | | 1,517,879 | |
| | 2,000,000 | | | Richmond, VA, Public Improvements, Refunding G.O., Series A, Callable 3/1/24 @ 100 (State Aid Withholding), 5.000%, 3/1/28 | | | 2,326,460 | |
See accompanying Notes to the Financial Statements.
| Sterling Capital Virginia Intermediate Tax-Free Fund |
Schedule of Portfolio Investments — (continued)
September 30, 2020
Principal
Amount | | | | | Fair Value | |
| MUNICIPAL BONDS — (continued) | | | | |
| | | | | Virginia — (continued) | | | | |
| $ | 1,250,000 | | | Richmond, VA, Public Utility Advance Refunding Revenue Bonds, Callable 1/15/26 @ 100, 5.000%, 1/15/27 | | $ | 1,541,900 | |
| | 1,530,000 | | | Smyth County, VA, Public Improvement, Refunding G.O., Series A, Callable 11/1/21 @ 100 (State Aid Withholding), 5.000%, 11/1/25 | | | 1,609,055 | |
| | 1,265,000 | | | Virginia Beach, VA, Advance Refunding, G.O., Series B, Callable 9/15/25 @ 100, (State Aid Withholding), 5.000%, 9/15/26 | | | 1,556,051 | |
| | 1,850,000 | | | Virginia College Building Authority, 21st Century College Programs, University & College Improvements Revenue, Callable 2/1/27 @ 100, 5.000%, 2/1/31 | | | 2,307,266 | |
| | 1,500,000 | | | Virginia College Building Authority, 21st Century College & Equipment, University & College Improvements Revenue, Series A, 5.000%, 2/1/22 | | | 1,597,080 | |
| | 1,500,000 | | | Virginia Commonwealth Transportation Board, Capital Projects, Highway Improvements, Revenue Bonds, Callable 5/15/29 @ 100, 5.000%, 5/15/30 | | | 2,000,550 | |
| | 1,215,000 | | | Virginia Commonwealth Transportation Board, Federal Highway Transportation Grant, Callable 9/15/26 @ 100, 5.000%, 9/15/30 | | | 1,511,509 | |
| | 2,000,000 | | | Virginia Commonwealth Transportation Board, Federal Transportation Grant, Anticipation Advance Refunding Revenue, Callable 9/15/27 @ 100, 5.000%, 9/15/31 | | | 2,538,480 | |
| | 1,515,000 | | | Virginia Public School Authority, Advance Refunding Revenue, Callable 8/1/25 @ 100 (State Aid Withholding), 5.000%, 8/1/26 | | | 1,849,270 | |
| | 1,000,000 | | | Virginia Public School Authority, School Improvements, Revenue Bonds, Series A, Callable 8/1/29 @ 100, 4.000%, 8/1/32 | | | 1,225,770 | |
| | 2,000,000 | | | Virginia Small Business Financing Authority, VA, Health, Hospital, Nursing Home Improvements Revenue Bonds, Callable 10/5/20 @ 100, 0.100%, 7/1/42 | | | 2,000,000 | |
Principal
Amount | | | | | Fair Value | |
| MUNICIPAL BONDS — (continued) | | | | |
| | | | | Virginia — (continued) | | | | |
| $ | 765,000 | | | Western Regional Jail Authority, Prerefunded Revenue, Callable 12/1/25 @ 100, 5.000%, 12/1/26 | | $ | 945,555 | |
| | 760,000 | | | Western Regional Jail Authority, Unrefunded Revenue, Callable 12/1/25 @ 100, 5.000%, 12/1/26 | | | 935,446 | |
| | 920,000 | | | Winchester, VA, Economic Development Authority, Valley Health System Obligated Group, Hospital Refunding Revenue, Series A, Callable 1/1/24 @ 100, 5.000%, 1/1/26 | | | 1,059,619 | |
| | | | | | | | 76,643,873 | |
| | | | | Total Municipal Bonds
(Cost $72,707,126) | | | 78,259,605 | |
| Shares | | | | | | |
| MONEY MARKET FUND — 2.6% | | | |
| | 2,092,909 | | | Federated Treasury Obligations Fund, Institutional Shares, 0.02%(a) | | | 2,092,909 | |
| | | | | Total Money Market Fund
(Cost $2,092,909) | | | 2,092,909 | |
Total Investments — 99.1%
(Cost $74,800,035) | | | 80,352,514 | |
| Net Other Assets (Liabilities) — 0.9% | | | 700,790 | |
| NET ASSETS — 100.0% | | $ | 81,053,304 | |
| (a) | Represents the current yield as of report date. |
AGM — Assured Guaranty Municipal Corp.
G.O. — General Obligation
Continued
| Sterling Capital West Virginia Intermediate Tax-Free Fund |
Schedule of Portfolio Investments
September 30, 2020
Principal
Amount | | | | | Fair Value | |
| MUNICIPAL BONDS — 94.1% | | | | |
| | | | | West Virginia — 94.1% | | | | |
| $ | 550,000 | | | Berkeley County, WV, Board of Education, Current Refunding G.O., 5.000%, 5/1/25 | | $ | 658,702 | |
| | 1,060,000 | | | Berkeley County, WV, Building Commission, Judicial Center Project, Refunding Revenue, Callable 9/1/21 @ 100, 4.500%, 9/1/23 | | | 1,099,665 | |
| | 1,085,000 | | | Berkeley County, WV, Building Commission, Lease Refunding Revenue, Callable 12/1/22 @ 100, 4.000%, 12/1/26 | | | 1,160,125 | |
| | 1,500,000 | | | Berkeley County, WV, Public Service Sewer District, Miscellaneous Purposes Revenue, Series C, Callable 10/1/23 @ 100, (BAM), 4.500%, 10/1/32 | | | 1,652,640 | |
| | 280,000 | | | Berkeley County, WV, Public Service Sewer District, Sewer Improvements Revenue, Series A, Callable 11/5/20 @ 100, 5.000%, 3/1/22 | | | 281,257 | |
| | 1,080,000 | | | Braxton County, WV, Board of Education, Public School, Advance Refunding G.O., Callable 5/1/26 @ 100, (West Virginia Board Commission), 5.000%, 5/1/28 | | | 1,328,746 | |
| | 1,005,000 | | | Fairmont State University, WV, University & College Improvements, Refunding Revenue, Series A, Callable 6/1/21 @ 100, 5.000%, 6/1/23 | | | 1,028,758 | |
| | 1,500,000 | | | Marshall University, WV, University & College Improvements Revenue Bonds, Series A, (AGM), 5.000%, 5/1/30 | | | 1,953,840 | |
| | 1,390,000 | | | Marshall University, WV, University & College Improvements Revenue, Callable 5/1/21 @ 100, 5.000%, 5/1/26 | | | 1,429,893 | |
| | 1,000,000 | | | Monongalia County, WV, Board of Education, Public School Refunding G.O., Callable 5/1/22 @ 100, (West Virginia Board Commission), 5.000%, 5/1/23 | | | 1,075,540 | |
| | 675,000 | | | Monongalia County, WV, Board of Education, Public School Refunding G.O., Callable 5/1/22 @ 100, (West Virginia Board Commission), 5.000%, 5/1/31 | | | 725,989 | |
| | 965,000 | | | Monongalia County, WV, Board of Education, Public School Refunding G.O., Callable 5/1/22 @ 100, (West Virginia Board Commission), 5.000%, 5/1/33 | | | 1,037,896 | |
| | 915,000 | | | Monongalia County, WV, Building Commission, Health System Obligated Group Refunding Revenue, Callable 7/1/21 @ 100, OID, 6.250%, 7/1/31 | | | 943,539 | |
| | 2,000,000 | | | Monongalia County, WV, Building Commission, Monongalia Health System Group Refunding Revenue, Callable 7/1/25 @ 100, 5.000%, 7/1/26 | | | 2,253,280 | |
| | 550,000 | | | Morgantown Utility Board, WV, Combined Water Utility Improvements Revenue, Series B, Callable 6/1/28 @ 100, 5.000%, 12/1/34 | | | 694,831 | |
| | 1,810,000 | | | Ohio County, WV, Board of Education, School Improvements G.O., (West Virginia Board Commission), 4.000%, 6/1/29 | | | 2,272,600 | |
| | 2,275,000 | | | Ohio County, WV, Board of Education, School Improvements G.O., Callable 6/1/29 @ 100, (West Virginia Board Commission), 3.000%, 6/1/30 | | | 2,558,943 | |
Principal
Amount | | | | | Fair Value | |
| MUNICIPAL BONDS — (continued) | | | | |
| | | | | West Virginia — (continued) | | | | |
| $ | 1,845,000 | | | Ohio County, WV, Board of Education, School Improvements G.O., Callable 6/1/29 @ 100, (West Virginia Board Commission), 3.000%, 6/1/31 | | $ | 2,062,452 | |
| | 1,000,000 | | | Ohio County, WV, Country Commission, Fort Henry Centre Financing District, Public Improvement, Tax Allocation, Callable 6/1/22 @ 100, 4.750%, 6/1/31 | | | 1,018,690 | |
| | 1,165,000 | | | Pleasants County, WV, Board of Education, Public School Improvements G.O., Callable 5/1/21 @ 100, 4.000%, 5/1/24 | | | 1,188,743 | |
| | 960,000 | | | Putnam Public Service District, WV, Current Refunding Revenue Bonds, Callable 11/1/30 @ 100, (BAM), 3.000%, 11/1/31 | | | 1,061,741 | |
| | 695,000 | | | School Building Authority of West Virginia, Lottery Capital Improvements Revenue, Callable 7/1/24 @ 100, Series A, 5.000%, 7/1/27 | | | 810,384 | |
| | 1,265,000 | | | School Building Authority of West Virginia, Lottery Capital Improvements Revenue, Callable 7/1/24 @ 100, Series A, 5.000%, 7/1/28 | | | 1,472,447 | |
| | 1,775,000 | | | State of West Virginia, Current Refunding G.O., Series A, 5.000%, 6/1/24 | | | 2,081,223 | |
| | 2,000,000 | | | State of West Virginia, Fuel Sales Tax Revenue, Group 1 Highway Improvements, G.O., Series S, Callable 6/1/29 @ 100, 5.000%, 12/1/33 | | | 2,619,980 | |
| | 705,000 | | | State Of West Virginia, Fuel Sales Tax Revenue, Group 1 Highway Improvements, G.O., Series -S, Callable 6/1/29 @ 100, 5.000%, 6/1/32 | | | 932,912 | |
| | 1,000,000 | | | State Of West Virginia, Fuel Sales Tax Revenue, Group 1 Highway Improvements, G.O., Series -S, Callable 6/1/29 @ 100, 5.000%, 12/1/35 | | | 1,296,800 | |
| | 2,000,000 | | | State of West Virginia, Fuel Sales Tax Revenue, Group 2 Highway Improvements, G.O., Series B, Callable 6/1/28 @ 100, 5.000%, 12/1/39 | | | 2,514,840 | |
| | 1,765,000 | | | State of West Virginia, Fuel Sales Tax Revenue, Group 2 Highway Improvements, G.O., Series B, Callable 6/1/28 @ 100, 4.000%, 6/1/43 | | | 2,034,674 | |
| | 1,000,000 | | | State of West Virginia, General Fund, Highway Improvements G.O., Series B, Callable 6/1/28 @ 100, 5.000%, 6/1/36 | | | 1,270,220 | |
| | 2,000,000 | | | West Virginia Economic Development Authority, Correctional Juvenile Public Safety Facilities Lease, Refunding Revenue, Callable 6/1/22 @ 100, 5.000%, 6/1/25 | | | 2,153,200 | |
| | 3,185,000 | | | West Virginia Economic Development Authority, Correctional Juvenile Public Safety Facilities Lease, Refunding Revenue, Callable 6/1/22 @ 100, 5.000%, 6/1/26 | | | 3,426,742 | |
| | 1,145,000 | | | West Virginia Economic Development Authority, Lottery Recreational Facilities Improvements Revenue, Series A, Callable 7/1/27 @ 100, 5.000%, 7/1/28 | | | 1,458,421 | |
| | 1,500,000 | | | West Virginia Economic Development Authority, Lottery Recreational Facilities Improvements Revenue, Series A, Callable 7/1/28 @ 100, 5.000%, 7/1/35 | | | 1,888,485 | |
See accompanying Notes to the Financial Statements.
| Sterling Capital West Virginia Intermediate Tax-Free Fund |
Schedule of Portfolio Investments — (continued)
September 30, 2020
Principal
Amount | | | | | Fair Value | |
| MUNICIPAL BONDS — (continued) | | | | |
| | | | | West Virginia — (continued) | | | | |
| $ | 1,015,000 | | | West Virginia Economic Development Authority, State Office Building 3, Public Improvements Revenue, Series D, Callable 6/1/25 @ 100, 5.000%, 6/1/26 | | $ | 1,215,260 | |
| | 1,000,000 | | | West Virginia Higher Education Policy, Community & Technical College Capital, University & College Improvements Refunding Revenue, Callable 7/1/27 @ 100, 5.000%, 7/1/30 | | | 1,236,940 | |
| | 750,000 | | | West Virginia Higher Education Policy, Community & Technical College Capital, University & College Improvements Refunding Revenue, Callable 7/1/27 @ 100, 5.000%, 7/1/36 | | | 903,367 | |
| | 775,000 | | | West Virginia Hospital Finance Authority, Cabell Huntington Hospital Obligated Group, Refunding Revenue, Callable 1/1/29 @ 100, 5.000%, 1/1/31 | | | 960,310 | |
| | 945,000 | | | West Virginia Hospital Finance Authority, Charleston Area Medical Center Inc., Health, Hospital, Nursing Home Improvements, Refunding Revenue, Callable 9/1/24 @ 100, 5.000%, 9/1/25 | | | 1,072,518 | |
| | 1,250,000 | | | West Virginia Hospital Finance Authority, Charleston Area Medical Center Inc., Health, Hospital, Nursing Home Improvements, Refunding Revenue, Callable 9/1/29 @ 100, 5.000%, 9/1/39 | | | 1,464,475 | |
| | 1,315,000 | | | West Virginia Hospital Finance Authority, United Health System Obligation, Health, Hospital, Nursing Home Improvements Refunding Revenue Bonds, 5.000%, 6/1/26 | | | 1,604,261 | |
| | 2,000,000 | | | West Virginia Hospital Finance Authority, United Health System Obligation, Health, Hospital, Nursing Home Improvements Refunding Revenue, Series A, Callable 6/1/23 @ 100, OID, 5.375%, 6/1/38 | | | 2,175,340 | |
| | 515,000 | | | West Virginia Hospital Finance Authority, Valley Health System Obligated Group, Refunding Revenue, 5.000%, 1/1/24 | | | 586,312 | |
| | 630,000 | | | West Virginia Hospital Finance Authority, Valley Health System Obligated Group, Refunding Revenue, Callable 1/1/24 @ 100, 5.000%, 1/1/26 | | | 726,718 | |
| | 1,690,000 | | | West Virginia Parkways Authority, Senior Turnpike Toll Revenue, Highway Improvements, 5.000%, 6/1/26 | | | 2,111,385 | |
| | 1,000,000 | | | West Virginia Parkways Authority, Senior Turnpike Toll Revenue, Highway Improvements Revenue Bonds, Callable 6/1/28 @ 100, 5.000%, 6/1/35 | | | 1,265,880 | |
| | 2,065,000 | | | West Virginia Parkways Authority, Senior Turnpike Toll Revenue, Highway Improvements, Callable 6/1/28 @ 100, 5.000%, 6/1/39 | | | 2,581,250 | |
| | 1,720,000 | | | West Virginia Parkways Authority, Senior Turnpike Toll Revenue, Highway Improvements, Callable 6/1/28 @ 100, 5.000%, 6/1/43 | | | 2,125,920 | |
Principal
Amount | | | | | Fair Value | |
| MUNICIPAL BONDS — (continued) | | | | |
| | | | | West Virginia — (continued) | | | | |
| $ | 665,000 | | | West Virginia State Building Commission, Regional Jail Refunding Revenue, Series A, (AMBAC), 5.375%, 7/1/21 | | $ | 673,093 | |
| | 1,500,000 | | | West Virginia State School Building Authority Lottery Revenue, School Improvements Revenue, Series A, Callable 7/1/28 @ 100, 5.000%, 7/1/29 | | | 1,952,550 | |
| | 1,050,000 | | | West Virginia State Water Development Authority, Loan Program II, Refunding Revenue, Series A-II, Callable 11/1/23 @ 100, 5.000%, 11/1/26 | | | 1,195,257 | |
| | 2,525,000 | | | West Virginia State Water Development Authority, Loan Program II, Refunding Revenue, Series A-II, Callable 11/1/23 @ 100, 5.000%, 11/1/27 | | | 2,869,309 | |
| | 1,000,000 | | | West Virginia University, University Projects, University & College Improvements Revenue, Callable 10/1/29 @ 100, 5.000%, 10/1/32 | | | 1,298,170 | |
| | 2,000,000 | | | West Virginia University, University Projects, University & College Improvements Revenue, Callable 10/1/29 @ 100, 5.000%, 10/1/33 | | | 2,582,680 | |
| | 1,750,000 | | | West Virginia University, University Projects, University & College Improvements Revenue, Series B, Callable 10/1/21 @ 100, 5.000%, 10/1/30 | | | 1,834,368 | |
| | 1,530,000 | | | West Virginia University, University Projects, University & College Improvements, Refunding Revenue, Series A, Callable 10/1/22 @ 100, 5.000%, 10/1/35 | | | 1,676,957 | |
| | 515,000 | | | West Virginia Water Development Authority, Chesapeake Bay/Greenbrier River, Water Utility Improvements Revenue, Callable 7/1/24 @ 100, 5.000%, 7/1/25 | | | 604,909 | |
| | 1,170,000 | | | West Virginia Water Development Authority, Loan Program II, Refunding Revenue, Series A-II, 5.000%, 11/1/24 | | | 1,386,520 | |
| | 1,000,000 | | | West Virginia Water Development Authority, Loan Program II, Refunding Revenue, Series A-II, 5.000%, 11/1/25 | | | 1,225,540 | |
| | 1,205,000 | | | Wood County, WV, Board of Education, Public School Improvements, G.O., (West Virginia Board Commission), 4.000%, 6/1/25 | | | 1,398,378 | |
| | | | | Total Municipal Bonds
(Cost $85,340,075) | | | 90,175,865 | |
| | | | | | | | | |
| Shares | | | | | | |
| MONEY MARKET FUND — 4.8% | | | | |
| | 4,575,339 | | | Federated Treasury Obligations Fund, Institutional Shares, 0.02%(a) | | | 4,575,339 | |
| | | | | Total Money Market Fund
(Cost $4,575,339) | | | 4,575,339 | |
| Total Investments — 98.9% | | | | |
| (Cost $89,915,414) | | | 94,751,204 | |
| Net Other Assets (Liabilities) — 1.1% | | | 1,045,748 | |
| NET ASSETS — 100.0% | | $ | 95,796,952 | |
| (a) | Represents the current yield as of report date. |
Continued
| Sterling Capital West Virginia Intermediate Tax-Free Fund |
Schedule of Portfolio Investments — (continued)
September 30, 2020
AGM — Assured Guaranty Municipal Corp.
AMBAC — American Municipal Bond Assurance Corp.
BAM — Build America Mutual
G.O. — General Obligation
OID — Original Issue Discount
Continued
| Sterling Capital Diversified Income Fund |
Schedule of Portfolio Investments
September 30, 2020
| Shares | | | | | Fair Value | |
| EQUITY FUNDS — 39.8% | | | |
| | 51,712 | | | First Trust DJ Global Select Dividend Index Fund | | $ | 922,025 | |
| | 48,759 | | | Global SuperDividend U.S. ETF | | | 737,236 | |
| | 213,724 | | | Invesco SteelPath MLP Select 40 Fund | | | 780,092 | |
| | 160,794 | | | Madison Covered Call & Equity Income Fund | | | 1,305,650 | |
| | 17,404 | | | SPDR S&P Global Dividend ETF | | | 925,075 | |
| | 13,200 | | | Vanguard High Dividend Yield ETF | | | 1,068,276 | |
| | | | | Total Equity Funds
(Cost $6,278,490) | | | 5,738,354 | |
| | | | | | | | | |
| | | | | | | | | |
| FIXED INCOME FUNDS — 60.3% | | | | |
| | 176,453 | | | Ashmore Emerging Markets Short Duration Fund | | | 1,319,872 | |
| | 28,347 | | | Fidelity Long-Term Treasury Bond Index Fund | | | 478,208 | |
| | 27,313 | | | Fidelity Short Term Treasury Bond Index Fund | | | 296,888 | |
| | 269,602 | | | PGIM High Yield Fund | | | 1,428,892 | |
| | 51,854 | | | Principal Spectrum Preferred and Capital Securities Income Fund | | | 526,319 | |
| | 106,530 | | | Shenkman Capital Floating Rate High Income Fund, Institutional Shares | | | 982,206 | |
| | 126,190 | | | Stone Ridge High Yield Reinsurance Risk Premium Fund | | | 1,167,257 | |
| | 20,947 | | | VanEck Vectors Fallen Angel High Yield Bond ETF | | | 622,964 | |
| Shares | | | | | Fair Value | |
| FIXED INCOME FUNDS — (continued) | | | |
| | 197,123 | | | Voya Securitized Credit Fund | | $ | 1,868,724 | |
| | | | | Total Fixed Income Funds
(Cost $9,056,843) | | | 8,691,330 | |
| | | | | | | | | |
| MONEY MARKET FUND — 0.4% | | | | |
| | 61,155 | | | Federated Treasury Obligations Fund, Institutional Shares, 0.02%(a) | | | 61,155 | |
| | | | | Total Money Market Fund
(Cost $61,155) | | | 61,155 | |
Total Investments — 100.5%
(Cost $15,396,488) | | | 14,490,839 | |
| Net Other Assets (Liabilities) — (0.5)% | | | (75,089 | ) |
| NET ASSETS — 100.0% | | $ | 14,415,750 | |
| (a) | Represents the current yield as of report date. |
ETF — Exchange Traded Fund
MLP — Master Limited Partnership
See accompanying Notes to the Financial Statements.
| Sterling Capital Strategic Allocation Balanced Fund |
Schedule of Portfolio Investments
September 30, 2020
| Shares | | | | | Fair Value | |
| EQUITY FUNDS — 60.4% | | | |
| | 801,107 | | | Sterling Capital Behavioral International Equity Fund, Institutional Shares(a) | | $ | 6,521,008 | |
| | 165,954 | | | Sterling Capital Equity Income Fund, Institutional Shares(a) | | | 3,335,675 | |
| | 130,127 | | | Sterling Capital Special Opportunities Fund, Institutional Shares(a) | | | 3,409,339 | |
| | | | | Total Equity Funds
(Cost $13,022,493) | | | 13,266,022 | |
| | | | | | | | | |
| FIXED INCOME FUND — 39.0% | | | | |
| | 753,111 | | | Sterling Capital Total Return Bond Fund, Institutional Shares(a) | | | 8,577,934 | |
| | | | | Total Fixed Income Fund
(Cost $7,677,800) | | | 8,577,934 | |
| | | | | | | | | |
| MONEY MARKET FUND — 0.5% | | | | |
| | 117,537 | | | Federated Treasury Obligations Fund, Institutional Shares, 0.02%(b) | | | 117,537 | |
| | | | | Total Money Market Fund
(Cost $117,537) | | | 117,537 | |
Total Investments — 99.9%
(Cost $20,817,830) | | | 21,961,493 | |
| Net Other Assets (Liabilities) — 0.1% | | | 12,874 | |
| NET ASSETS — 100.0% | | $ | 21,974,367 | |
| (a) | Investments in issuers considered to be an affiliate of the Fund for purposes of Section 2(a)(3) of the Investment Company Act of 1940 |
| (b) | Represents the current yield as of report date. |
See accompanying Notes to the Financial Statements.
| Sterling Capital Strategic Allocation Growth Fund |
Schedule of Portfolio Investments
September 30, 2020
| Shares | | | | | Fair Value | |
| EQUITY FUNDS — 76.4% | | | |
| | 802,045 | | | Sterling Capital Behavioral International Equity Fund, Institutional Shares(a) | | $ | 6,528,647 | |
| | 173,011 | | | Sterling Capital Equity Income Fund, Institutional Shares(a) | | | 3,477,515 | |
| | 135,611 | | | Sterling Capital Special Opportunities Fund, Institutional Shares(a) | | | 3,553,004 | |
| | | | | Total Equity Funds
(Cost $13,184,340) | | | 13,559,166 | |
| | | | | | | | | |
| FIXED INCOME FUND — 23.3% | | | | |
| | 362,067 | | | Sterling Capital Total Return Bond Fund, Institutional Shares(a) | | | 4,123,948 | |
| | | | | Total Fixed Income Fund
(Cost $3,787,835) | | | 4,123,948 | |
| | | | | | | | | |
| MONEY MARKET FUND — 0.3% | | | | |
| | 49,446 | | | Federated Treasury Obligations Fund, Institutional Shares, 0.02%(b) | | | 49,446 | |
| | | | | Total Money Market Fund
(Cost $49,446) | | | 49,446 | |
Total Investments — 100.0%
(Cost $17,021,621) | | | 17,732,560 | |
| Net Other Assets (Liabilities) — 0.0% | | | 6,082 | |
| NET ASSETS — 100.0% | | $ | 17,738,642 | |
| (a) | Investments in issuers considered to be an affiliate of the Fund for purposes of Section 2(a)(3) of the Investment Company Act of 1940. |
| (b) | Represents the current yield as of report date. |
See accompanying Notes to the Financial Statements.
Statements of Assets and Liabilities
September 30, 2020
| | Sterling Capital
Behavioral Large Cap
Value Equity Fund | | | Sterling Capital
Mid
Value Fund | |
| Assets: | | | | | | |
| Investments at fair value (a) | | $ | 27,006,274 | | | $ | 60,916,632 | |
| Foreign currency, at value (cost $— , $— , $— , $— , $— , $129,031, $— , and $— , respectively) | | | — | | | | — | |
| Dividends receivable | | | 36,749 | | | | 28,696 | |
| Receivable for investments sold | | | — | | | | — | |
| Receivable for capital shares issued | | | 249 | | | | 95,956 | |
| Prepaid and other expenses | | | 10,156 | | | | 11,567 | |
| Total Assets | | | 27,053,428 | | | | 61,052,851 | |
| Liabilities: | | | | | | | | |
| Payable for investments purchased | | | — | | | | — | |
| Payable for capital shares redeemed | | | 2,498 | | | | 241,650 | |
| Accrued expenses and other payables: | | | | | | | | |
| Investment advisory fees | | | 3,936 | | | | 31,177 | |
| Accounting out-of-pocket fees | | | 710 | | | | 287 | |
| Administration fees | | | 1,937 | | | | 4,795 | |
| Audit fees | | | 14,885 | | | | 5,485 | |
| Compliance service fees | | | 61 | | | | 100 | |
| Distribution (12b-1) fees | | | 5,558 | | | | 5,303 | |
| Custodian fees | | | 1,139 | | | | 737 | |
| Printing fees | | | 4,637 | | | | 1,744 | |
| Transfer agent fees | | | 2,842 | | | | 7,662 | |
| Other fees and liabilities | | | 1,354 | | | | 1,567 | |
| Total Liabilities | | | 39,557 | | | | 300,507 | |
| Net Assets | | $ | 27,013,871 | | | $ | 60,752,344 | |
| Net Assets Consist of: | | | | | | | | |
| Capital | | $ | 50,527,679 | | | $ | 56,537,311 | |
| Total distributable earnings | | | (23,513,808 | ) | | | 4,215,033 | |
| Net Assets | | $ | 27,013,871 | | | $ | 60,752,344 | |
| Net Assets | | | | | | | | |
| Class A Shares | | $ | 24,497,040 | | | $ | 18,851,224 | |
| Class C Shares | | | 567,446 | | | | 1,584,382 | |
| Institutional Shares | | | 1,948,942 | | | | 36,834,994 | |
| Class R Shares | | | — | | | | 5,004 | |
| Class R6 Shares | | | 443 | | | | 3,476,740 | |
| Total | | $ | 27,013,871 | | | $ | 60,752,344 | |
| Shares of Beneficial Interest Outstanding (Unlimited number of shares authorized, no par value) | | | | | | | | |
| Class A Shares | | | 1,464,818 | | | | 1,347,199 | |
| Class C Shares | | | 35,099 | | | | 133,653 | |
| Institutional Shares | | | 115,797 | | | | 2,570,226 | |
| Class R Shares | | | — | | | | 375 | |
| Class R6 Shares | | | 26 | | | | 242,206 | |
| Total | | | 1,615,740 | | | | 4,293,659 | |
| Net Asset Value | | | | | | | | |
| Class A Shares - redemption price per share | | $ | 16.72 | | | $ | 13.99 | |
| Class C Shares - offering price per share* | | $ | 16.17 | | | $ | 11.85 | |
| Institutional Shares | | $ | 16.83 | | | $ | 14.33 | |
| Class R Shares | | $ | — | | | $ | 13.35 | ** |
| Class R6 Shares | | $ | 16.85 | ** | | $ | 14.35 | |
| Maximum Sales Charge - Class A Shares | | | 5.75 | % | | | 5.75 | % |
| Maximum Offering Price (100%/(100% - Maximum Sales Charge)) of net asset value adjusted to the nearest cent per share - Class A Shares | | $ | 17.74 | | | $ | 14.84 | |
| (a) Investments at cost | | $ | 25,069,558 | | | $ | 53,601,721 | |
| * | Redemption price per share varies by length of time shares are held. |
| ** | The Sterling Capital Behavioral Large Cap Value Equity Fund net asset value for Class R6 Shares, Sterling Capital Mid Value Fund net asset value for Class R Shares and Sterling Capital Stratton Mid Cap Value Fund net asset value for Class C Shares is calculated using unrounded net assets of $443.28, 5,004.23 and $1,308.29 divided by the unrounded shares of 26.311, 374.774 and 22.857, respectively. |
See accompanying Notes to the Financial Statements.
Sterling Capital
Behavioral Small Cap
Value Equity Fund | | | Sterling Capital
Special
Opportunities Fund | | | Sterling Capital
Equity
Income Fund | | | Sterling Capital
Behavioral International
Equity Fund | | | Sterling Capital
SMID
Opportunities Fund | | | Sterling Capital
Stratton Mid Cap
Value Fund | |
| $ | 82,412,535 | | | $ | 543,047,958 | | | $ | 1,554,772,269 | | | $ | 82,632,630 | | | $ | 11,039,562 | | | $ | 54,081,965 | |
| | | | | | | | | | | | | | | | | | | | | | | |
| | — | | | | — | | | | — | | | | 129,915 | | | | — | | | | — | |
| | 134,536 | | | | 222,113 | | | | 2,379,966 | | | | 698,566 | | | | 3,113 | | | | 48,354 | |
| | 20,054,738 | | | | 7,104,906 | | | | — | | | | — | | | | — | | | | — | |
| | 603 | | | | 156,496 | | | | 2,195,915 | | | | 6,577 | | | | — | | | | 600 | |
| | 6,710 | | | | 27,042 | | | | 43,102 | | | | 1,906 | | | | 4,066 | | | | 9,453 | |
| | 102,609,122 | | | | 550,558,515 | | | | 1,559,391,252 | | | | 83,469,594 | | | | 11,046,741 | | | | 54,140,372 | |
| | | | | | | | | | | | | | | | | | | | | | | |
| | 20,110,419 | | | | 232,478 | | | | 108,733 | | | | — | | | | — | | | | — | |
| | 18,935 | | | | 1,483,592 | | | | 2,481,210 | | | | 15,000 | | | | — | | | | 103,213 | |
| | | | | | | | | | | | | | | | | | | | | | | |
| | 41,246 | | | | 287,067 | | | | 656,037 | | | | 27,751 | | | | 6,430 | | | | 29,350 | |
| | 1,406 | | | | 345 | | | | 482 | | | | 5,097 | | | | 237 | | | | 362 | |
| | 3,793 | | | | 38,285 | | | | 111,107 | | | | 25,810 | | | | 832 | | | | 4,110 | |
| | 6,926 | | | | 62,405 | | | | 127,214 | | | | 6,180 | | | | 773 | | | | 3,965 | |
| | 123 | | | | 617 | | | | 1,650 | | | | 121 | | | | 44 | | | | 90 | |
| | 1,185 | | | | 106,758 | | | | 166,315 | | | | 128 | | | | 1,926 | | | | 31 | |
| | 993 | | | | 7,758 | | | | 18,764 | | | | 6,397 | | | | 133 | | | | 629 | |
| | 2,149 | | | | 19,336 | | | | 41,069 | | | | 1,904 | | | | 238 | | | | 1,224 | |
| | 4,107 | | | | 66,418 | | | | 179,634 | | | | 3,061 | | | | 1,784 | | | | 3,142 | |
| | 1,651 | | | | 8,748 | | | | 22,049 | | | | 1,479 | | | | 413 | | | | 1,096 | |
| | 20,192,933 | | | | 2,313,807 | | | | 3,914,264 | | | | 92,928 | | | | 12,810 | | | | 147,212 | |
| $ | 82,416,189 | | | $ | 548,244,708 | | | $ | 1,555,476,988 | | | $ | 83,376,666 | | | $ | 11,033,931 | | | $ | 53,993,160 | |
| | | | | | | | | | | | | | | | | | | | | | | |
| $ | 108,935,908 | | | $ | 337,996,630 | | | $ | 1,220,593,977 | | | $ | 97,530,909 | | | $ | 9,872,008 | | | $ | 35,117,125 | |
| | (26,519,719 | ) | | | 210,248,078 | | | | 334,883,011 | | | | (14,154,243 | ) | | | 1,161,923 | | | | 18,876,035 | |
| $ | 82,416,189 | | | $ | 548,244,708 | | | $ | 1,555,476,988 | | | $ | 83,376,666 | | | $ | 11,033,931 | | | $ | 53,993,160 | |
| | | | | | | | | | | | | | | | | | | | | | | |
| $ | 4,948,284 | | | $ | 276,975,186 | | | $ | 320,254,853 | | | $ | 426,342 | | | $ | 4,424,920 | | | $ | 145,203 | |
| | 100,213 | | | | 60,776,555 | | | | 119,474,665 | | | | 44,272 | | | | 1,250,061 | | | | 1,308 | |
| | 6,820,080 | | | | 170,323,173 | | | | 1,057,721,575 | | | | 13,669,576 | | | | 5,358,950 | | | | 53,846,649 | |
| | 175,307 | | | | 112,520 | | | | 1,748,705 | | | | — | | | | — | | | | — | |
| | 70,372,305 | | | | 40,057,274 | | | | 56,277,190 | | | | 69,236,476 | | | | — | | | | — | |
| $ | 82,416,189 | | | $ | 548,244,708 | | | $ | 1,555,476,988 | | | $ | 83,376,666 | | | $ | 11,033,931 | | | $ | 53,993,160 | |
| | | | | | | | | | | | | | | | | | | | | | | |
| | 418,231 | | | | 11,227,792 | | | | 15,982,307 | | | | 52,407 | | | | 355,392 | | | | 2,475 | |
| | 8,886 | | | | 3,089,169 | | | | 6,024,811 | | | | 5,495 | | | | 103,151 | | | | 23 | |
| | 570,615 | | | | 6,501,202 | | | | 52,626,001 | | | | 1,678,886 | | | | 426,895 | | | | 913,428 | |
| | 14,965 | | | | 4,534 | | | | 87,999 | | | | — | | | | — | | | | — | |
| | 5,879,905 | | | | 1,527,671 | | | | 2,800,814 | | | | 8,502,623 | | | | — | | | | — | |
| | 6,892,602 | | | | 22,350,368 | | | | 77,521,932 | | | | 10,239,411 | | | | 885,438 | | | | 915,926 | |
| | | | | | | | | | | | | | | | | | | | | | | |
| $ | 11.83 | | | $ | 24.67 | | | $ | 20.04 | | | $ | 8.14 | | | $ | 12.45 | | | $ | 58.67 | |
| $ | 11.28 | | | $ | 19.67 | | | $ | 19.83 | | | $ | 8.06 | | | $ | 12.12 | | | $ | 57.24 | ** |
| $ | 11.95 | | | $ | 26.20 | | | $ | 20.10 | | | $ | 8.14 | | | $ | 12.55 | | | $ | 58.95 | |
| $ | 11.71 | | | $ | 24.82 | | | $ | 19.87 | | | $ | — | | | $ | — | | | $ | — | |
| $ | 11.97 | | | $ | 26.22 | | | $ | 20.09 | | | $ | 8.14 | | | $ | — | | | $ | — | |
| | 5.75 | % | | | 5.75 | % | | | 5.75 | % | | | 5.75 | % | | | 5.75 | % | | | 5.75 | % |
| | | | | | | | | | | | | | | | | | | | | | | |
| $ | 12.56 | | | $ | 26.18 | | | $ | 21.26 | | | $ | 8.64 | | | $ | 13.21 | | | $ | 62.25 | |
| $ | 78,429,789 | | | $ | 332,704,451 | | | $ | 1,156,851,574 | | | $ | 74,349,819 | | | $ | 8,629,827 | | | $ | 34,957,883 | |
Statements of Assets and Liabilities
September 30, 2020
| | | Sterling Capital
Stratton
Real Estate
Fund | | | Sterling Capital
Stratton
Small Cap
Value Fund | |
| Assets: | | | | | | |
| Investments at fair value (a) | | $ | 85,681,451 | | | $ | 478,369,521 | |
| Interest and dividends receivable | | | 279,930 | | | | 817,390 | |
| Receivable for investments sold | | | — | | | | 2,228,829 | |
| Receivable for capital shares issued | | | 26,844 | | | | 675,335 | |
| Prepaid and other expenses | | | 10,708 | | | | 22,487 | |
| Total Assets | | | 85,998,933 | | | | 482,113,562 | |
| Liabilities: | | | | | | | | |
| Distributions payable | | | — | | | | — | |
| Payable for investments purchased | | | — | | | | — | |
| Payable for capital shares redeemed | | | 59,098 | | | | 837,790 | |
| Accrued expenses and other payables: | | | | | | | | |
| Investment advisory fees | | | 41,065 | | | | 302,446 | |
| Administration fees | | | 6,601 | | | | 37,156 | |
| Audit fees | | | 6,670 | | | | 51,220 | |
| Compliance service fees | | | 126 | | | | 572 | |
| Distribution (12b-1) fees | | | 276 | | | | 636 | |
| Transfer agent fees | | | 7,463 | | | | 63,390 | |
| Other fees | | | 5,031 | | | | 30,340 | |
| Total Liabilities | | | 126,330 | | | | 1,323,550 | |
| Net Assets | | $ | 85,872,603 | | | $ | 480,790,012 | |
| Net Assets Consist of: | | | | | | | | |
| Capital | | $ | 54,099,547 | | | $ | 143,617,406 | |
| Total distributable earnings | | | 31,773,056 | | | | 337,172,606 | |
| Net Assets | | $ | 85,872,603 | | | $ | 480,790,012 | |
| Net Assets | | | | | | | | |
| Class A Shares | | $ | 536,885 | | | $ | 2,047,535 | |
| Class C Shares | | | 191,549 | | | | 245,118 | |
| Institutional Shares | | | 85,143,716 | | | | 475,615,427 | |
| Class R Shares | | | — | | | | — | |
| Class R6 Shares | | | 453 | | | | 2,881,932 | |
| Total | | $ | 85,872,603 | | | $ | 480,790,012 | |
| Shares of Beneficial Interest Outstanding (Unlimited number of shares authorized, no par value) | | | | | | | | |
| Class A Shares | | | 14,667 | | | | 32,159 | |
| Class C Shares | | | 5,272 | | | | 3,982 | |
| Institutional Shares | | | 2,322,554 | | | | 7,427,246 | |
| Class R Shares | | | — | | | | — | |
| Class R6 Shares | | | 12 | | | | 44,970 | |
| Total | | | 2,342,505 | | | | 7,508,357 | |
| Net Asset Value | | | | | | | | |
| Class A Shares - redemption price per share | | $ | 36.61 | ** | | $ | 63.67 | |
| Class C Shares - offering price per share* | | $ | 36.33 | | | $ | 61.56 | |
| Institutional Shares | | $ | 36.66 | | | $ | 64.04 | |
| Class R Shares | | $ | — | | | $ | — | |
| Class R6 Shares | | $ | 36.69 | ** | | $ | 64.09 | |
| Maximum Sales Charge - Class A Shares | | | 5.75 | % | | | 5.75 | % |
| Maximum Offering Price (100%/(100% - Maximum Sales Charge)) of net asset value adjusted to the nearest cent per share - Class A Shares | | $ | 38.84 | | | $ | 67.55 | |
| (a) Investments at cost | | $ | 56,099,350 | | | $ | 210,377,252 | |
| * | Redemption price per share varies by length of time shares are held. |
| ** | The Sterling Capital Stratton Real Estate Fund net asset value of Class A Shares and Class R6 shares, Sterling Capital Total Return Bond Fund net asset value of Class R Shares, Sterling Capital Quality Income Fund net asset value of Class C Shares, and Sterling Capital Kentucky Intermediate Tax-Free Fund net asset value of Class C Shares is calculated using unrounded net assets of $536,884.78, $453.55, $31,825.70, $3,150.00 and $1,682.38 divided by the unrounded shares of 14,666.548, 12.361, 2,805.339, 307.547 and 159.674, respectively. |
See accompanying Notes to the Financial Statements.
Sterling Capital
Ultra Short
Bond Fund | | | Sterling Capital
Short Duration
Bond Fund | | | Sterling Capital
Intermediate U.S.
Government Fund | | | Sterling Capital
Total Return
Bond Fund | | | Sterling Capital
Corporate
Fund | | | Sterling Capital
Quality Income
Fund | | | Sterling Capital
Kentucky Intermediate
Tax-Free Fund | |
| $ | 36,892,127 | | | $ | 181,858,457 | | | $ | 12,631,189 | | | $ | 1,761,265,706 | | | $ | 18,877,386 | | | $ | 37,342,853 | | | $ | 12,267,446 | |
| | 182,449 | | | | 932,470 | | | | 65,683 | | | | 10,090,384 | | | | 178,949 | | | | 94,412 | | | | 140,802 | |
| | — | | | | 1,214,774 | | | | — | | | | 994,012 | | | | 45,529 | | | | — | | | | — | |
| | 49,151 | | | | 233,975 | | | | 101 | | | | 1,383,907 | | | | — | | | | — | | | | — | |
| | 5,851 | | | | 11,164 | | | | 4,703 | | | | 39,951 | | | | 4,429 | | | | 6,216 | | | | 4,952 | |
| | 37,129,578 | | | | 184,250,840 | | | | 12,701,676 | | | | 1,773,773,960 | | | | 19,106,293 | | | | 37,443,481 | | | | 12,413,200 | |
| | | | | | | | | | | | | | | | | | | | | | | | | | | |
| | 13,498 | | | | 69,741 | | | | 15,983 | | | | 1,129,813 | | | | 255 | | | | 4,846 | | | | 10,528 | |
| | 679,305 | | | | 4,005,891 | | | | 389,341 | | | | 8,493,084 | | | | 38,202 | | | | 1,547,021 | | | | — | |
| | 49,989 | | | | 50,648 | | | | 923 | | | | 3,576,509 | | | | 43,070 | | | | 33,951 | | | | 786 | |
| | | | | | | | | | | | | | | | | | | | | | | | | | | |
| | 601 | | | | 29,681 | | | | 1,626 | | | | 348,068 | | | | 4,858 | | | | 9,108 | | | | 3,504 | |
| | 2,782 | | | | 13,729 | | | | 939 | | | | 69,599 | | | | 1,449 | | | | 2,717 | | | | 926 | |
| | 1,683 | | | | 12,327 | | | | 967 | | | | 114,425 | | | | 1,487 | | | | 2,567 | | | | 809 | |
| | 65 | | | | 220 | | | | 46 | | | | 1,869 | | | | 53 | | | | 69 | | | | 45 | |
| | 539 | | | | 1,582 | | | | 1,076 | | | | 18,739 | | | | 102 | | | | 7 | | | | 699 | |
| | 1,124 | | | | 8,582 | | | | 896 | | | | 132,955 | | | | 829 | | | | 1,300 | | | | 569 | |
| | 5,359 | | | | 14,352 | | | | 2,333 | | | | 89,335 | | | | 4,024 | | | | 5,342 | | | | 1,608 | |
| | 754,945 | | | | 4,206,753 | | | | 414,130 | | | | 13,974,396 | | | | 94,329 | | | | 1,606,928 | | | | 19,474 | |
| $ | 36,374,633 | | | $ | 180,044,087 | | | $ | 12,287,546 | | | $ | 1,759,799,564 | | | $ | 19,011,964 | | | $ | 35,836,553 | | | $ | 12,393,726 | |
| | | | | | | | | | | | | | | | | | | | | | | | | | | |
| $ | 37,288,097 | | | $ | 184,254,942 | | | $ | 12,453,003 | | | $ | 1,651,675,964 | | | $ | 17,608,847 | | | $ | 36,159,273 | | | $ | 11,642,514 | |
| | (913,464 | ) | | | (4,210,855 | ) | | | (165,457 | ) | | | 108,123,600 | | | | 1,403,117 | | | | (322,720 | ) | | | 751,212 | |
| $ | 36,374,633 | | | $ | 180,044,087 | | | $ | 12,287,546 | | | $ | 1,759,799,564 | | | $ | 19,011,964 | | | $ | 35,836,553 | | | $ | 12,393,726 | |
| | | | | | | | | | | | | | | | | | | | | | | | | | | |
| $ | 2,675,452 | | | $ | 4,260,491 | | | $ | 3,929,860 | | | $ | 57,201,591 | | | $ | 489,670 | | | $ | 25,250 | | | $ | 3,413,956 | |
| | — | | | | 892,965 | | | | 308,529 | | | | 8,331,568 | | | | 3,314 | | | | 3,150 | | | | 1,682 | |
| | 33,699,181 | | | | 174,890,631 | | | | 8,049,157 | | | | 1,051,890,786 | | | | 18,518,980 | | | | 35,808,153 | | | | 8,978,088 | |
| | — | | | | — | | | | — | | | | 31,826 | | | | — | | | | — | | | | — | |
| | — | | | | — | | | | — | | | | 642,343,793 | | | | — | | | | — | | | | — | |
| $ | 36,374,633 | | | $ | 180,044,087 | | | $ | 12,287,546 | | | $ | 1,759,799,564 | | | $ | 19,011,964 | | | $ | 35,836,553 | | | $ | 12,393,726 | |
| | | | | | | | | | | | | | | | | | | | | | | | | | | |
| | 272,410 | | | | 485,320 | | | | 387,982 | | | | 5,024,554 | | | | 45,431 | | | | 2,464 | | | | 324,291 | |
| | — | | | | 101,789 | | | | 30,513 | | | | 730,749 | | | | 308 | | | | 308 | | | | 160 | |
| | 3,429,722 | | | | 19,925,539 | | | | 793,910 | | | | 92,356,770 | | | | 1,718,702 | | | | 3,490,933 | | | | 854,125 | |
| | — | | | | — | | | | — | | | | 2,805 | | | | — | | | | — | | | | — | |
| | — | | | | — | | | | — | | | | 56,407,788 | | | | — | | | | — | | | | — | |
| | 3,702,132 | | | | 20,512,648 | | | | 1,212,405 | | | | 154,522,666 | | | | 1,764,441 | | | | 3,493,705 | | | | 1,178,576 | |
| | | | | | | | | | | | | | | | | | | | | | | | | | | |
| $ | 9.82 | | | $ | 8.78 | | | $ | 10.13 | | | $ | 11.38 | | | $ | 10.78 | | | $ | 10.25 | | | $ | 10.53 | |
| $ | — | | | $ | 8.77 | | | $ | 10.11 | | | $ | 11.40 | | | $ | 10.76 | | | $ | 10.24 | ** | | $ | 10.54 | ** |
| $ | 9.83 | | | $ | 8.78 | | | $ | 10.14 | | | $ | 11.39 | | | $ | 10.77 | | | $ | 10.26 | | | $ | 10.51 | |
| $ | — | | | $ | — | | | $ | — | | | $ | 11.34 | ** | | $ | — | | | $ | — | | | $ | — | |
| $ | — | | | $ | — | | | $ | — | | | $ | 11.39 | | | $ | — | | | $ | — | | | $ | — | |
| | 0.50 | % | | | 2.00 | % | | | 2.00 | % | | | 5.75 | % | | | 2.00 | % | | | 2.00 | % | | | 2.00 | % |
| | | | | | | | | | | | | | | | | | | | | | | | | | | |
| $ | 9.87 | | | $ | 8.96 | | | $ | 10.34 | | | $ | 12.07 | | | $ | 11.00 | | | $ | 10.46 | | | $ | 10.74 | |
| $ | 36,807,797 | | | $ | 178,930,445 | | | $ | 11,842,717 | | | $ | 1,668,048,581 | | | $ | 17,831,944 | | | $ | 35,904,341 | | | $ | 11,569,718 | |
Statements of Assets and Liabilities
September 30, 2020
| | | Sterling Capital
Maryland
Intermediate
Tax-Free Fund | | | Sterling Capital
North Carolina
Intermediate
Tax-Free Fund | |
| Assets: | | | | | | |
| Investments at fair value - unaffiliated (a) | | $ | 12,715,282 | | | $ | 175,536,841 | |
| Investments at fair value - affiliated (b) | | | — | | | | — | |
| Interest and dividends receivable - unaffiliated | | | 132,839 | | | | 2,039,674 | |
| Dividends receivable - affiliated | | | — | | | | — | |
| Receivable for capital shares issued | | | 200 | | | | 107,349 | |
| Prepaid and other expenses | | | 4,410 | | | | 7,177 | |
| Total Assets | | | 12,852,731 | | | | 177,691,041 | |
| Liabilities: | | | | | | | | |
| Distributions payable | | | 12,197 | | | | 117,974 | |
| Payable for investments purchased | | | — | | | | — | |
| Payable for capital shares redeemed | | | 1,402 | | | | 68,784 | |
| Accrued expenses and other payables: | | | | | | | | |
| Investment advisory fees | | | 3,671 | | | | 50,900 | |
| Administration fees | | | 970 | | | | 13,452 | |
| Audit fees | | | 918 | | | | 12,403 | |
| Compliance service fees | | | 46 | | | | 216 | |
| Distribution (12b-1) fees | | | 1,139 | | | | 9,294 | |
| Transfer agent fees | | | 618 | | | | 7,762 | |
| Other fees | | | 1,536 | | | | 10,861 | |
| Total Liabilities | | | 22,497 | | | | 291,646 | |
| Net Assets | | $ | 12,830,234 | | | $ | 177,399,395 | |
| Net Assets Consist of: | | | | | | | | |
| Capital | | $ | 11,912,808 | | | $ | 166,648,850 | |
| Total distributable earnings | | | 917,426 | | | | 10,750,545 | |
| Net Assets | | $ | 12,830,234 | | | $ | 177,399,395 | |
| Net Assets | | | | | | | | |
| Class A Shares | | $ | 3,492,931 | | | $ | 33,647,795 | |
| Class C Shares | | | 510,189 | | | | 2,793,183 | |
| Institutional Shares | | | 8,827,114 | | | | 140,958,417 | |
| Total | | $ | 12,830,234 | | | $ | 177,399,395 | |
| Shares of Beneficial Interest Outstanding (Unlimited number of shares authorized, no par value) | | | | | | | | |
| Class A Shares | | | 315,358 | | | | 3,024,594 | |
| Class C Shares | | | 46,049 | | | | 251,258 | |
| Institutional Shares | | | 795,568 | | | | 12,670,976 | |
| Total | | | 1,156,975 | | | | 15,946,828 | |
| Net Asset Value | | | | | | | | |
| Class A Shares - redemption price per share | | $ | 11.08 | | | $ | 11.12 | |
| Class C Shares - offering price per share* | | $ | 11.08 | | | $ | 11.12 | |
| Institutional Shares | | $ | 11.10 | | | $ | 11.12 | |
| Maximum Sales Charge - Class A Shares | | | 2.00 | % | | | 2.00 | % |
| Maximum Offering Price (100%/(100% - Maximum Sales Charge)) of net asset value adjusted to the nearest cent per share - Class A Shares | | $ | 11.31 | | | $ | 11.35 | |
| Investments at cost: | | | | | | | | |
| (a) Investments at cost - unaffiliated | | $ | 11,983,810 | | | $ | 164,373,704 | |
| (b) Investments at cost - affiliated | | $ | — | | | $ | — | |
| * | Redemption price per share varies by length of time shares are held. |
See accompanying Notes to the Financial Statements.
Sterling Capital
South Carolina
Intermediate
Tax-Free Fund | | | Sterling Capital
Virginia
Intermediate
Tax-Free Fund | | | Sterling Capital
West Virginia
Intermediate
Tax-Free Fund | | | Sterling Capital
Diversified
Income Fund | | | Sterling Capital
Strategic Allocation
Balanced Fund | | | Sterling Capital
Strategic Allocation
Growth Fund | |
| | | | | | | | | | | | | | | | | |
| $ | 85,856,696 | | | $ | 80,352,514 | | | $ | 94,751,204 | | | $ | 14,490,839 | | | $ | 117,537 | | | $ | 49,446 | |
| | — | | | | — | | | | — | | | | — | | | | 21,843,956 | | | | 17,683,114 | |
| | 983,428 | | | | 824,301 | | | | 1,248,845 | | | | 35,358 | | | | — | | | | — | |
| | — | | | | — | | | | — | | | | — | | | | 19,064 | | | | 9,065 | |
| | 193,426 | | | | 17 | | | | 125,172 | | | | — | | | | 337 | | | | 268 | |
| | 6,074 | | | | 6,565 | | | | 8,328 | | | | 5,274 | | | | 4,266 | | | | 5,561 | |
| | 87,039,624 | | | | 81,183,397 | | | | 96,133,549 | | | | 14,531,471 | | | | 21,985,160 | | | | 17,747,454 | |
| | | | | | | | | | | | | | | | | | | | | | | |
| | 81,584 | | | | 75,421 | | | | 95,897 | | | | 16,839 | | | | 88 | | | | 644 | |
| | 1,835,901 | | | | — | | | | — | | | | 18,744 | | | | — | | | | — | |
| | 327,625 | | | | 6,903 | | | | 184,502 | | | | 70,715 | | | | 1,393 | | | | 519 | |
| | | | | | | | | | | | | | | | | | | | | | | |
| | 24,277 | | | | 23,063 | | | | 27,459 | | | | 3,020 | | | | — | | | | — | |
| | 6,416 | | | | 6,096 | | | | 7,259 | | | | 1,117 | | | | — | | | | — | |
| | 5,787 | | | | 5,486 | | | | 5,997 | | | | 1,217 | | | | 1,629 | | | | 1,317 | |
| | 119 | | | | 115 | | | | 129 | | | | 48 | | | | 56 | | | | 51 | |
| | 3,338 | | | | 4,213 | | | | 5,949 | | | | 1,638 | | | | 4,659 | | | | 3,884 | |
| | 3,747 | | | | 3,584 | | | | 3,753 | | | | 1,162 | | | | 1,640 | | | | 1,254 | |
| | 5,559 | | | | 5,212 | | | | 5,652 | | | | 1,221 | | | | 1,328 | | | | 1,143 | |
| | 2,294,353 | | | | 130,093 | | | | 336,597 | | | | 115,721 | | | | 10,793 | | | | 8,812 | |
| $ | 84,745,271 | | | $ | 81,053,304 | | | $ | 95,796,952 | | | $ | 14,415,750 | | | $ | 21,974,367 | | | $ | 17,738,642 | |
| | | | | | | | | | | | | | | | | | | | | | | |
| $ | 80,114,409 | | | $ | 75,239,915 | | | $ | 90,819,254 | | | $ | 17,853,964 | | | $ | 20,912,871 | | | $ | 17,173,441 | |
| | 4,630,862 | | | | 5,813,389 | | | | 4,977,698 | | | | (3,438,214 | ) | | | 1,061,496 | | | | 565,201 | |
| $ | 84,745,271 | | | $ | 81,053,304 | | | $ | 95,796,952 | | | $ | 14,415,750 | | | $ | 21,974,367 | | | $ | 17,738,642 | |
| | | | | | | | | | | | | | | | | | | | | | | |
| $ | 11,925,501 | | | $ | 17,445,842 | | | $ | 27,866,241 | | | $ | 6,072,279 | | | $ | 21,557,446 | | | $ | 17,296,340 | |
| | 954,681 | | | | 779,743 | | | | 303,624 | | | | 415,929 | | | | 258,017 | | | | 359,546 | |
| | 71,865,089 | | | | 62,827,719 | | | | 67,627,087 | | | | 7,927,542 | | | | 158,904 | | | | 82,756 | |
| $ | 84,745,271 | | | $ | 81,053,304 | | | $ | 95,796,952 | | | $ | 14,415,750 | | | $ | 21,974,367 | | | $ | 17,738,642 | |
| | | | | | | | | | | | | | | | | | | | | | | |
| | 1,040,123 | | | | 1,427,049 | | | | 2,707,157 | | | | 662,333 | | | | 1,880,891 | | | | 1,540,726 | |
| | 83,305 | | | | 63,795 | | | | 29,486 | | | | 45,779 | | | | 22,971 | | | | 33,460 | |
| | 6,311,069 | | | | 5,140,757 | | | | 6,562,382 | | | | 852,625 | | | | 13,748 | | | | 7,354 | |
| | 7,434,497 | | | | 6,631,601 | | | | 9,299,025 | | | | 1,560,737 | | | | 1,917,610 | | | | 1,581,540 | |
| | | | | | | | | | | | | | | | | | | | | | | |
| $ | 11.47 | | | $ | 12.23 | | | $ | 10.29 | | | $ | 9.17 | | | $ | 11.46 | | | $ | 11.23 | |
| $ | 11.46 | | | $ | 12.22 | | | $ | 10.30 | | | $ | 9.09 | | | $ | 11.23 | | | $ | 10.75 | |
| $ | 11.39 | | | $ | 12.22 | | | $ | 10.31 | | | $ | 9.30 | | | $ | 11.56 | | | $ | 11.25 | |
| | 2.00 | % | | | 2.00 | % | | | 2.00 | % | | | 5.75 | % | | | 5.75 | % | | | 5.75 | % |
| $ | 11.70 | | | $ | 12.48 | | | $ | 10.50 | | | $ | 9.73 | | | $ | 12.16 | | | $ | 11.92 | |
| | | | | | | | | | | | | | | | | | | | | | | |
| $ | 80,916,168 | | | $ | 74,800,035 | | | $ | 89,915,414 | | | $ | 15,396,488 | | | $ | 117,537 | | | $ | 49,446 | |
| $ | — | | | $ | — | | | $ | — | | | $ | — | | | $ | 20,700,293 | | | $ | 16,972,175 | |
Statements of Operations
For the year Ended September 30, 2020
| | | Sterling Capital
Behavioral
Large Cap Value
Equity Fund | | | Sterling Capital
Mid
Value Fund | |
| Investment Income: | | | | | | | | |
| Dividend income | | $ | 5,931,412 | | | $ | 955,667 | |
| Foreign tax withholding | | | (7,091 | ) | | | (4,755 | ) |
| Total investment income | | | 5,924,321 | | | | 950,912 | |
| Expenses: | | | | | | | | |
| Investment advisory fees (See Note 5) | | | 953,893 | | | | 545,528 | |
| Administration fees (See Note 5) | | | 181,135 | | | | 67,055 | |
| Distribution fees - Class A Shares (See Note 5) | | | 65,556 | | | | 50,564 | |
| Distribution fees - Class C Shares (See Note 5) | | | 6,099 | | | | 22,524 | |
| Distribution fees - Class R Shares (See Note 5) | | | — | | | | 25 | |
| Compliance service fees (See Note 5) | | | 2,717 | | | | 1,270 | |
| Trustee fees | | | 26,119 | | | | 15,641 | |
| Accounting and out-of-pocket fees | | | 8,401 | | | | 4,298 | |
| Audit fees | | | 15,062 | | | | 6,157 | |
| Custodian fees | | | 10,209 | | | | 3,206 | |
| Fund accounting fees (See Note 5) | | | 15,898 | | | | 5,845 | |
| Interest expense (See Note 7) | | | — | | | | 167 | |
| Legal fees | | | 26,582 | | | | 9,593 | |
| Printing fees | | | 24,726 | | | | 7,538 | |
| Registration fees | | | 44,599 | | | | 46,503 | |
| Transfer agent fees (See Note 5) | | | 41,055 | | | | 50,145 | |
| Other fees | | | 25,766 | | | | 18,163 | |
| Total expenses before waivers | | | 1,447,817 | | | | 854,222 | |
| Less expenses waived by the Investment Advisor (See Note 5) | | | (18,189 | ) | | | (109,151 | ) |
| Less expenses waived by the Administrator (See Note 5) | | | (99,365 | ) | | | — | |
| Net expenses | | | 1,330,263 | | | | 745,071 | |
| Net investment income (loss) | | | 4,594,058 | | | | 205,841 | |
| Realized and Unrealized Gain (Loss): | | | | | | | | |
| Net realized gain (loss) from: | | | | | | | | |
| Investments | | | (25,595,977 | ) | | | 4,604,107 | |
| In-kind redemptions | | | 17,976,513 | | | | 42,135,576 | |
| Written options | | | — | | | | — | |
| Foreign currency transactions | | | — | | | | — | |
| Change in unrealized appreciation/depreciation on: | | | | | | | | |
| Investments | | | (23,882,038 | ) | | | (64,433,692 | ) |
| Written options | | | — | | | | — | |
| Foreign currency transactions | | | — | | | | — | |
| Total realized and unrealized gain (loss) | | | (31,501,502 | ) | | | (17,694,009 | ) |
| Change in net assets from operations | | $ | (26,907,444 | ) | | $ | (17,488,168 | ) |
See accompanying Notes to the Financial Statements.
Sterling Capital
Behavioral Small
Cap Value
Equity Fund | | | Sterling Capital
Special
Opportunities Fund | | | Sterling Capital
Equity
Income Fund | | | Sterling Capital
Behavioral
International
Equity Fund | | | Sterling Capital
SMID
Opportunities Fund | | | Sterling Capital
Stratton Mid Cap
Value Fund | |
| | | | | | | | | | | | | | | | | | | | | | | |
| $ | 1,820,939 | | | $ | 9,826,725 | | | $ | 51,882,927 | | | $ | 3,570,941 | | | $ | 90,639 | | | $ | 896,529 | |
| | (6,165 | ) | | | (72,248 | ) | | | (542,007 | ) | | | (291,924 | ) | | | (986 | ) | | | (3,883 | ) |
| | 1,814,774 | | | | 9,754,477 | | | | 51,340,920 | | | | 3,279,017 | | | | 89,653 | | | | 892,646 | |
| | | | | | | | | | | | | | | | | | | | | | | |
| | 591,958 | | | | 5,779,059 | | | | 9,967,294 | | | | 527,952 | | | | 77,149 | | | | 395,310 | |
| | 84,926 | | | | 765,253 | | | | 1,566,815 | | | | 76,145 | | | | 9,576 | | | | 48,880 | |
| | 14,010 | | | | 733,792 | | | | 804,862 | | | | 1,206 | | | | 9,957 | | | | 346 | |
| | 1,241 | | | | 715,183 | | | | 1,373,429 | | | | 488 | | | | 12,265 | | | | 13 | |
| | 803 | | | | 639 | | | | 10,024 | | | | — | | | | — | | | | — | |
| | 1,516 | | | | 10,251 | | | | 20,655 | | | | 1,393 | | | | 525 | | | | 1,034 | |
| | 13,305 | | | | 100,947 | | | | 193,861 | | | | 9,461 | | | | 1,134 | | | | 6,049 | |
| | 7,354 | | | | 21,785 | | | | 40,908 | | | | 20,813 | | | | 2,278 | | | | 3,633 | |
| | 6,860 | | | | 63,141 | | | | 127,590 | | | | 6,139 | | | | 775 | | | | 4,000 | |
| | 4,876 | | | | 42,304 | | | | 86,691 | | | | 13,336 | | | | 532 | | | | 2,696 | |
| | 7,400 | | | | 66,681 | | | | 135,918 | | | | 6,600 | | | | 827 | | | | 4,236 | |
| | 605 | | | | 1,000 | | | | 3,132 | | | | 17 | | | | 63 | | | | — | |
| | 11,684 | | | | 109,690 | | | | 218,684 | | | | 10,491 | | | | 1,324 | | | | 6,825 | |
| | 11,136 | | | | 100,978 | | | | 210,673 | | | | 9,646 | | | | 1,192 | | | | 6,072 | |
| | 29,675 | | | | 57,050 | | | | 106,612 | | | | 9,571 | | | | 12,129 | | | | 20,945 | |
| | 26,453 | | | | 453,237 | | | | 1,322,508 | | | | 15,713 | | | | 8,079 | | | | 21,750 | |
| | 16,899 | | | | 76,557 | | | | 132,694 | | | | 21,075 | | | | 4,552 | | | | 8,737 | |
| | 830,701 | | | | 9,097,547 | | | | 16,322,350 | | | | 730,046 | | | | 142,357 | | | | 530,526 | |
| | (7,126 | ) | | | (25,394 | ) | | | (90,793 | ) | | | (175,983 | ) | | | (33,006 | ) | | | (14,044 | ) |
| | (67,586 | ) | | | (235,311 | ) | | | (320,492 | ) | | | (1,345 | ) | | | — | | | | — | |
| | 755,989 | | | | 8,836,842 | | | | 15,911,065 | | | | 552,718 | | | | 109,351 | | | | 516,482 | |
| | 1,058,785 | | | | 917,635 | | | | 35,429,855 | | | | 2,726,299 | | | | (19,698 | ) | | | 376,164 | |
| | | | | | | | | | | | | | | | | | | | | | | |
| | | | | | | | | | | | | | | | | | | | | | | |
| | (23,590,860 | ) | | | 32,121,148 | | | | (64,838,008 | ) | | | (18,410,915 | ) | | | (1,227,190 | ) | | | (210,347 | ) |
| | 7,864,057 | | | | 139,676,823 | | | | 105,383,070 | | | | — | | | | — | | | | — | |
| | — | | | | — | | | | 295,756 | | | | — | | | | — | | | | — | |
| | — | | | | — | | | | — | | | | (82,422 | ) | | | — | | | | — | |
| | | | | | | | | | | | | | | | | | | | | | | |
| | (10,642,628 | ) | | | (150,860,810 | ) | | | (138,576,160 | ) | | | 4,909,642 | | | | 567,884 | | | | (3,504,691 | ) |
| | — | | | | — | | | | (107,368 | ) | | | — | | | | — | | | | — | |
| | — | | | | — | | | | — | | | | 30,808 | | | | — | | | | — | |
| | (26,369,431 | ) | | | 20,937,161 | | | | (97,842,710 | ) | | | (13,552,887 | ) | | | (659,306 | ) | | | (3,715,038 | ) |
| $ | (25,310,646 | ) | | $ | 21,854,796 | | | $ | (62,412,855 | ) | | $ | (10,826,588 | ) | | $ | (679,004 | ) | | $ | (3,338,874 | ) |
Statements of Operations
For the year Ended September 30, 2020
| | | Sterling Capital
Stratton Real
Estate Fund | | | Sterling Capital
Stratton Small Cap
Value Fund | | | Sterling Capital
Ultra Short
Bond Fund | | | Sterling Capital
Short Duration
Bond Fund | |
| Investment Income: | | | | | | | | | | | | |
| Interest income | | $ | — | | | $ | — | | | $ | 542,493 | | | $ | 4,563,099 | |
| Dividend income | | | 2,250,988 | | | | 11,626,891 | | | | 3,955 | | | | 18,882 | |
| Total investment income | | | 2,250,988 | | | | 11,626,891 | | | | 546,448 | | | | 4,581,981 | |
| Expenses: | | | | | | | | | | | | | | | | |
| Investment advisory fees (See Note 5) | | | 545,947 | | | | 6,214,094 | | | | 47,802 | | | | 525,750 | |
| Administration fees (See Note 5) | | | 82,184 | | | | 627,408 | | | | 20,970 | | | | 152,411 | |
| Distribution fees - Class A Shares (See Note 5) | | | 2,513 | | | | 6,156 | | | | 5,869 | | | | 8,031 | |
| Distribution fees - Class C Shares (See Note 5) | | | 1,981 | | | | 2,935 | | | | — | | | | 9,386 | |
| Distribution fees - Class R Shares (See Note 5) | | | — | | | | — | | | | — | | | | — | |
| Compliance service fees (See Note 5) | | | 1,468 | | | | 8,478 | | | | 646 | | | | 2,373 | |
| Trustee fees | | | 10,227 | | | | 82,112 | | | | 2,368 | | | | 18,876 | |
| Accounting and out-of-pocket fees | | | 5,760 | | | | 16,552 | | | | 21,816 | | | | 34,265 | |
| Audit fees | | | 6,518 | | | | 54,625 | | | | 1,785 | | | | 12,379 | |
| Custodian fees | | | 4,606 | | | | 34,631 | | | | 1,086 | | | | 8,373 | |
| Fund accounting fees (See Note 5) | | | 7,121 | | | | 54,830 | | | | 1,793 | | | | 13,144 | |
| Interest expense (See Note 7) | | | 29 | | | | 951 | | | | — | | | | — | |
| Legal fees | | | 11,413 | | | | 92,374 | | | | 2,732 | | | | 20,710 | |
| Printing fees | | | 10,679 | | | | 83,192 | | | | 1,992 | | | | 18,881 | |
| Registration fees | | | 27,850 | | | | 38,491 | | | | 19,651 | | | | 31,919 | |
| Transfer agent fees (See Note 5) | | | 56,206 | | | | 547,839 | | | | 4,861 | | | | 54,972 | |
| Other fees | | | 12,561 | | | | 67,600 | | | | 4,838 | | | | 16,727 | |
| Total expenses before waivers. | | | 787,063 | | | | 7,932,268 | | | | 138,209 | | | | 928,197 | |
| Less expenses waived by the Investment Advisor (See Note 5) | | | — | | | | (567,947 | ) | | | (42,563 | ) | | | (175,250 | ) |
| Less expenses waived by the Administrator (See Note 5) | | | — | | | | (1,086 | ) | | | — | | | | — | |
| Net expenses | | | 787,063 | | | | 7,363,235 | | | | 95,646 | | | | 752,947 | |
| Net investment income | | | 1,463,925 | | | | 4,263,656 | | | | 450,802 | | | | 3,829,034 | |
| Realized and Unrealized Gain (Loss): | | | | | | | | | | | | | | | | |
| Net realized gain from: | | | | | | | | | | | | | | | | |
| Investments | | | 2,508,959 | | | | 88,415,592 | | | | 36,747 | | | | 1,927,039 | |
| Change in unrealized appreciation/depreciation on investments | | | (13,233,054 | ) | | | (231,075,150 | ) | | | 40,335 | | | | 1,039,743 | |
| Total realized and unrealized gain (loss) | | | (10,724,095 | ) | | | (142,659,558 | ) | | | 77,082 | | | | 2,966,782 | |
| Change in net assets from operations | | $ | (9,260,170 | ) | | $ | (138,395,902 | ) | | $ | 527,884 | | | $ | 6,795,816 | |
See accompanying Notes to the Financial Statements.
Sterling Capital
Intermediate U.S.
Government Fund | | | Sterling Capital
Total Return
Bond Fund | | | Sterling Capital
Corporate
Fund | | | Sterling Capital
Quality
Income Fund | | | Sterling Capital
Kentucky Intermediate
Tax-Free Fund | |
| | | | | | | | | | | | | | | | | | | |
| $ | 339,626 | | | $ | 46,844,248 | | | $ | 733,752 | | | $ | 1,073,477 | | | $ | 281,472 | |
| | 2,178 | | | | 217,892 | | | | 6,312 | | | | 4,851 | | | | 3,148 | |
| | 341,804 | | | | 47,062,140 | | | | 740,064 | | | | 1,078,328 | | | | 284,620 | |
| | | | | | | | | | | | | | | | | | | |
| | 44,034 | | | | 6,026,362 | | | | 74,069 | | | | 127,827 | | | | 40,332 | |
| | 11,940 | | | | 1,419,626 | | | | 18,345 | | | | 31,755 | | | | 10,028 | |
| | | | | | | | | | | | | | | | | | | |
| | 9,186 | | | | 138,760 | | | | 1,193 | | | | 53 | | | | 8,636 | |
| | | | | | | | | | | | | | | | | | | |
| | 3,517 | | | | 81,863 | | | | 32 | | | | 128 | | | | 17 | |
| | | | | | | | | | | | | | | | | | | |
| | — | | | | 184 | | | | — | | | | — | | | | — | |
| | 555 | | | | 18,856 | | | | 638 | | | | 811 | | | | 530 | |
| | 1,517 | | | | 171,525 | | | | 2,318 | | | | 3,949 | | | | 1,225 | |
| | 9,589 | | | | 94,693 | | | | 19,381 | | | | 23,310 | | | | 8,075 | |
| | 984 | | | | 114,300 | | | | 1,505 | | | | 2,579 | | | | 813 | |
| | 663 | | | | 78,906 | | | | 1,021 | | | | 1,774 | | | | 553 | |
| | 1,032 | | | | 122,156 | | | | 1,587 | | | | 2,740 | | | | 864 | |
| | — | | | | — | | | | — | | | | — | | | | — | |
| | 1,655 | | | | 207,925 | | | | 2,791 | | | | 4,741 | | | | 1,354 | |
| | 2,688 | | | | 181,671 | | | | 2,217 | | | | 4,938 | | | | 1,209 | |
| | 11,899 | | | | 71,690 | | | | 13,764 | | | | 14,619 | | | | 8,804 | |
| | 4,638 | | | | 755,182 | | | | 4,243 | | | | 6,427 | | | | 2,708 | |
| | 4,955 | | | | 106,724 | | | | 5,344 | | | | 6,232 | | | | 3,681 | |
| | 108,852 | | | | 9,590,423 | | | | 148,448 | | | | 231,883 | | | | 88,829 | |
| | | | | | | | | | | | | | | | | | | |
| | (22,017 | ) | | | (2,066,337 | ) | | | (5,369 | ) | | | (14,609 | ) | | | — | |
| | | | | | | | | | | | | | | | | | | |
| | — | | | | (490,528 | ) | | | — | | | | — | | | | — | |
| | 86,835 | | | | 7,033,558 | | | | 143,079 | | | | 217,274 | | | | 88,829 | |
| | 254,969 | | | | 40,028,582 | | | | 596,985 | | | | 861,054 | | | | 195,791 | |
| | | | | | | | | | | | | | | | | | | |
| | 85,001 | | | | 39,186,823 | | | | 554,955 | | | | 335,207 | | | | 40,679 | |
| | | | | | | | | | | | | | | | | | | |
| | 307,636 | | | | 39,961,602 | | | | 168,387 | | | | 352,430 | | | | 216,146 | |
| | 392,637 | | | | 79,148,425 | | | | 723,342 | | | | 687,637 | | | | 256,825 | |
| $ | 647,606 | | | $ | 119,177,007 | | | $ | 1,320,327 | | | $ | 1,548,691 | | | $ | 452,616 | |
Statements of Operations
For the year Ended September 30, 2020
| | | Sterling Capital
Maryland
Intermediate
Tax-Free Fund | | | Sterling Capital
North Carolina
Intermediate
Tax-Free Fund | |
| Investment Income: | | | | | | |
| Interest income | | $ | 331,067 | | | $ | 4,307,169 | |
| Dividend income - unaffiliated | | | 2,630 | | | | 44,678 | |
| Dividend income - affiliated* | | | — | | | | — | |
| Total investment income | | | 333,697 | | | | 4,351,847 | |
| Expenses: | | | | | | | | |
| Investment advisory fees (See Note 5) | | | 45,706 | | | | 617,788 | |
| Administration fees (See Note 5) | | | 11,342 | | | | 153,346 | |
| Distribution fees - Class A Shares (See Note 5) | | | 9,017 | | | | 92,153 | |
| Distribution fees - Class C Shares (See Note 5) | | | 5,023 | | | | 28,540 | |
| Compliance service fees (See Note 5) | | | 547 | | | | 2,387 | |
| Trustee fees | | | 1,425 | | | | 18,938 | |
| Accounting and out-of-pocket fees | | | 6,388 | | | | 19,259 | |
| Audit fees | | | 931 | | | | 12,419 | |
| Custodian fees | | | 620 | | | | 8,428 | |
| Fund accounting fees (See Note 5) | | | 980 | | | | 13,238 | |
| Interest expense (See Note 7) | | | — | | | | 334 | |
| Legal fees | | | 1,555 | | | | 17,974 | |
| Printing fees | | | 1,329 | | | | 18,821 | |
| Registration fees | | | 11,098 | | | | 13,758 | |
| Transfer agent fees (See Note 5) | | | 3,386 | | | | 43,512 | |
| Other fees | | | 4,240 | | | | 15,239 | |
| Total expenses before waivers | | | 103,587 | | | | 1,076,134 | |
| Less expenses waived by the Investment Advisor (See Note 5) | | | (490 | ) | | | — | |
| Net expenses | | | 103,097 | | | | 1,076,134 | |
| Net investment income | | | 230,600 | | | | 3,275,713 | |
| Realized and Unrealized Gain (Loss): | | | | | | | | |
| Net realized gain (loss) from: | | | | | | | | |
| Investments - unaffiliated | | | 179,716 | | | | 351,826 | |
| Investments - affiliated | | | — | | | | — | |
| Distributions from unaffiliated funds | | | — | | | | — | |
| Distributions from affiliated funds | | | — | | | | — | |
| Change in unrealized appreciation/depreciation on investments. | | | 22,110 | | | | 2,159,557 | |
| Total realized and unrealized gain (loss) | | | 201,826 | | | | 2,511,383 | |
| Change in net assets from operations | | $ | 432,426 | | | $ | 5,787,096 | |
| * | This dividend income is derived from affiliates other than controlled companies. |
See accompanying Notes to the Financial Statements.
Sterling Capital
South Carolina
Intermediate
Tax-Free Fund | | | Sterling Capital
Virginia
Intermediate
Tax-Free Fund | | | Sterling Capital
West Virginia
Intermediate
Tax-Free Fund | | | Sterling Capital
Diversified
Income Fund | | | Sterling Capital
Strategic
Allocation
Balanced Fund | | | Sterling Capital
Strategic Allocation
Growth Fund | |
| | | | | | | | | | | | | | | | | | | | | | | |
| $ | 2,098,760 | | | $ | 1,919,934 | | | $ | 2,234,344 | | | $ | — | | | $ | — | | | $ | — | |
| | 15,549 | | | | 8,966 | | | | 23,283 | | | | 903,380 | | | | 3,190 | | | | 2,187 | |
| | — | | | | — | | | | — | | | | — | | | | 562,146 | | | | 436,126 | |
| | 2,114,309 | | | | 1,928,900 | | | | 2,257,627 | | | | 903,380 | | | | 565,336 | | | | 438,313 | |
| | | | | | | | | | | | | | | | | | | | | | | |
| | 288,161 | | | | 273,210 | | | | 298,771 | | | | 43,311 | | | | 57,980 | | | | 46,879 | |
| | 71,639 | | | | 67,902 | | | | 74,400 | | | | 14,969 | | | | — | | | | — | |
| | 30,913 | | | | 43,242 | | | | 68,053 | | | | 20,609 | | | | 56,484 | | | | 45,366 | |
| | 9,600 | | | | 8,117 | | | | 3,295 | | | | 5,379 | | | | 3,236 | | | | 3,322 | |
| | 1,327 | | | | 1,278 | | | | 1,363 | | | | 594 | | | | 660 | | | | 610 | |
| | 8,844 | | | | 8,397 | | | | 9,044 | | | | 1,896 | | | | 2,520 | | | | 2,041 | |
| | 12,066 | | | | 10,303 | | | | 11,377 | | | | 2,302 | | | | 1,969 | | | | 1,969 | |
| | 5,810 | | | | 5,516 | | | | 6,015 | | | | 1,217 | | | | 1,648 | | | | 1,329 | |
| | 3,945 | | | | 3,730 | | | | 4,071 | | | | 823 | | | | 1,085 | | | | 875 | |
| | 6,175 | | | | 5,854 | | | | 6,403 | | | | 1,299 | | | | 1,739 | | | | 1,406 | |
| | — | | | | 1 | | | | — | | | | — | | | | 89 | | | | 64 | |
| | 9,697 | | | | 9,219 | | | | 9,944 | | | | 2,102 | | | | 2,809 | | | | 2,275 | |
| | 8,702 | | | | 8,259 | | | | 9,028 | | | | 1,971 | | | | 2,425 | | | | 1,978 | |
| | 13,292 | | | | 14,912 | | | | 20,107 | | | | 14,688 | | | | 12,996 | | | | 11,673 | |
| | 19,544 | | | | 17,684 | | | | 17,587 | | | | 6,777 | | | | 8,170 | | | | 6,039 | |
| | 8,563 | | | | 8,710 | | | | 8,667 | | | | 5,451 | | | | 5,157 | | | | 4,991 | |
| | 498,278 | | | | 486,334 | | | | 548,125 | | | | 123,388 | | | | 158,967 | | | | 130,817 | |
| | — | | | | — | | | | — | | | | — | | | | (57,980 | ) | | | (46,879 | ) |
| | 498,278 | | | | 486,334 | | | | 548,125 | | | | 123,388 | | | | 100,987 | | | | 83,938 | |
| | 1,616,031 | | | | 1,442,566 | | | | 1,709,502 | | | | 779,992 | | | | 464,349 | | | | 354,375 | |
| | | | | | | | | | | | | | | | | | | | | | | |
| | 163,968 | | | | 264,207 | | | | 88,771 | | | | (1,471,629 | ) | | | 1,200 | | | | 593 | |
| | — | | | | — | | | | — | | | | — | | | | 178,617 | | | | 129,717 | |
| | — | | | | — | | | | — | | | | 34,648 | | | | — | | | | — | |
| | — | | | | — | | | | — | | | | — | | | | 348,771 | | | | 347,695 | |
| | 1,193,350 | | | | 1,281,687 | | | | 1,420,110 | | | | (850,418 | ) | | | (1,049,153 | ) | | | (1,194,109 | ) |
| | 1,357,318 | | | | 1,545,894 | | | | 1,508,881 | | | | (2,287,399 | ) | | | (520,565 | ) | | | (716,104 | ) |
| $ | 2,973,349 | | | $ | 2,988,460 | | | $ | 3,218,383 | | | $ | (1,507,407 | ) | | $ | (56,216 | ) | | $ | (361,729 | ) |
Statements of Changes in Net Assets
| | | Sterling Capital
Behavioral Large Cap
Value Equity Fund | |
| | | For the
Year Ended
September 30,
2020 | | | For the
Year Ended
September 30,
2019 | |
| From Investment Activities: | | | | | | | | |
| Operations: | | | | | | | | |
| Net investment income | | $ | 4,594,058 | | | $ | 6,455,876 | |
| Net realized gain (loss) | | | (7,619,464 | ) | | | 8,586,607 | |
| Change in unrealized appreciation/depreciation | | | (23,882,038 | ) | | | (22,687,741 | ) |
| Change in net assets from operations | | | (26,907,444 | ) | | | (7,645,258 | ) |
| Distributions to Shareholders: | | | | | | | | |
| Net investment income and net realized gains from investments: | | | | | | | | |
| Class A | | | (1,529,996 | ) | | | (3,138,063 | ) |
| Class C | | | (31,751 | ) | | | (80,167 | ) |
| Institutional Class | | | (319,890 | ) | | | (858,373 | ) |
| Class R | | | — | | | | — | |
| Class R6 | | | (10,771,551 | ) | | | (26,185,374 | ) |
| Change in net assets from shareholder distributions | | | (12,653,188 | ) | | | (30,261,977 | ) |
| Capital Transactions: | | | | | | | | |
| Change in net assets from capital transactions | | | (209,921,189 | ) | | | 1,423,452 | |
| Change in net assets | | | (249,481,821 | ) | | | (36,483,783 | ) |
| Net Assets: | | | | | | | | |
| Beginning of year | | | 276,495,692 | | | | 312,979,475 | |
| End of year | | $ | 27,013,871 | | | $ | 276,495,692 | |
See accompanying Notes to the Financial Statements.
Sterling Capital
Mid Value
Fund | | | Sterling Capital
Behavioral Small Cap
Value Equity Fund | | | Sterling Capital
Special Opportunities
Fund | |
For the
Year Ended
September 30,
2020 | | | For the
Year Ended
September 30,
2019 | | | For the
Year Ended
September 30,
2020 | | | For the
Year Ended
September 30,
2019 | | | For the
Year Ended
September 30,
2020 | | | For the
Year Ended
September 30,
2019 | |
| | | | | | | | | | | | | | | | | |
| $ | 205,841 | | | $ | 2,760,350 | | | $ | 1,058,785 | | | $ | 3,197,783 | | | $ | 917,635 | | | $ | 1,746,357 | |
| | 46,739,683 | | | | 24,707,781 | | | | (15,726,803 | ) | | | (7,053,333 | ) | | | 171,797,971 | | | | 63,257,242 | |
| | (64,433,692 | ) | | | (59,094,578 | ) | | | (10,642,628 | ) | | | (17,208,260 | ) | | | (150,860,810 | ) | | | (61,106,426 | ) |
| | (17,488,168 | ) | | | (31,626,447 | ) | | | (25,310,646 | ) | | | (21,063,810 | ) | | | 21,854,796 | | | | 3,897,173 | |
| | | | | | | | | | | | | | | | | | | | | | | |
| | (1,879,928 | ) | | | (3,408,094 | ) | | | (61,349 | ) | | | (1,025,701 | ) | | | (16,884,047 | ) | | | (23,254,518 | ) |
| | (242,428 | ) | | | (477,465 | ) | | | (1,205 | ) | | | (20,475 | ) | | | (5,356,907 | ) | | | (11,770,076 | ) |
| | (4,770,709 | ) | | | (30,649,387 | ) | | | (215,820 | ) | | | (4,266,355 | ) | | | (14,778,572 | ) | | | (23,120,615 | ) |
| | (455 | ) | | | (513 | ) | | | (1,536 | ) | | | (8,674 | ) | | | (4,838 | ) | | | (18,880 | ) |
| | (39 | ) | | | (33,160,969 | ) | | | (872,270 | ) | | | (23,767,086 | ) | | | (18,960,053 | ) | | | (24,985,390 | ) |
| | (6,893,559 | ) | | | (67,696,428 | ) | | | (1,152,180 | ) | | | (29,088,291 | ) | | | (55,984,417 | ) | | | (83,149,479 | ) |
| | | | | | | | | | | | | | | | | | | | | | | |
| | (342,919,127 | ) | | | (116,439,231 | ) | | | (136,635,943 | ) | | | 56,614,739 | | | | (460,138,495 | ) | | | (80,171,646 | ) |
| | (367,300,854 | ) | | | (215,762,106 | ) | | | (163,098,769 | ) | | | 6,462,638 | | | | (494,268,116 | ) | | | (159,423,952 | ) |
| | | | | | | | | | | | | | | | | | | | | | | |
| | 428,053,198 | | | | 643,815,304 | | | | 245,514,958 | | | | 239,052,320 | | | | 1,042,512,824 | | | | 1,201,936,776 | |
| $ | 60,752,344 | | | $ | 428,053,198 | | | $ | 82,416,189 | | | $ | 245,514,958 | | | $ | 548,244,708 | | | $ | 1,042,512,824 | |
Statements of Changes in Net Assets
| | | Sterling Capital
Equity Income
Fund | |
| | | For the
Year Ended
September 30,
2020 | | | For the
Year Ended
September 30,
2019 | |
| From Investment Activities: | | | | | | | | |
| Operations: | | | | | | | | |
| Net investment income (loss) | | $ | 35,429,855 | | | $ | 34,490,511 | |
| Net realized gain (loss) | | | 40,840,818 | | | | 81,979,112 | |
| Change in unrealized appreciation/depreciation | | | (138,683,528 | ) | | | 28,039,403 | |
| Change in net assets from operations | | | (62,412,855 | ) | | | 144,509,026 | |
| Distributions to Shareholders: | | | | | | | | |
| Net investment income and net realized gains from investments: | | | | | | | | |
| Class A | | | (19,225,030 | ) | | | (27,902,929 | ) |
| Class C | | | (7,565,163 | ) | | | (15,778,727 | ) |
| Institutional Class | | | (64,305,155 | ) | | | (77,612,408 | ) |
| Class R | | | (129,017 | ) | | | (248,333 | ) |
| Class R6 | | | (19,852,052 | ) | | | (29,401,719 | ) |
| Change in net assets from shareholder distributions | | | (111,076,417 | ) | | | (150,944,116 | ) |
| Capital Transactions: | | | | | | | | |
| Change in net assets from capital transactions. | | | (109,274,630 | ) | | | 171,789,600 | |
| Change in net assets | | | (282,763,902 | ) | | | 165,354,510 | |
| Net Assets: | | | | | | | | |
| Beginning of year | | | 1,838,240,890 | | | | 1,672,886,380 | |
| End of year | | $ | 1,555,476,988 | | | $ | 1,838,240,890 | |
See accompanying Notes to the Financial Statements.
Sterling Capital
Behavioral International
Equity Fund | | | Sterling Capital
SMID
Opportunities Fund | | | Sterling Capital
Stratton Mid Cap
Value Fund | |
For the
Year Ended
September 30,
2020 | | | For the
Year Ended
September 30,
2019 | | | For the
Year Ended
September 30,
2020 | | | For the
Year Ended
September 30,
2019 | | | For the
Year Ended
September 30,
2020 | | | For the
Year Ended
September 30,
2019 | |
| | | | | | | | | | | | | | | | | |
| $ | 2,726,299 | | | $ | 2,909,724 | | | $ | (19,698 | ) | | $ | (13,781 | ) | | $ | 376,164 | | | $ | 440,747 | |
| | (18,493,337 | ) | | | (6,321,497 | ) | | | (1,227,190 | ) | | | 492,439 | | | | (210,347 | ) | | | 2,230,489 | |
| | 4,940,450 | | | | (2,783,452 | ) | | | 567,884 | | | | 77,300 | | | | (3,504,691 | ) | | | (1,902,285 | ) |
| | (10,826,588 | ) | | | (6,195,225 | ) | | | (679,004 | ) | | | 555,958 | | | | (3,338,874 | ) | | | 768,951 | |
| | | | | | | | | | | | | | | | | | | | | | | |
| | (15,272 | ) | | | (45,602 | ) | | | (158,917 | ) | | | — | | | | (3,930 | ) | | | (8,075 | ) |
| | (986 | ) | | | (4,299 | ) | | | (58,816 | ) | | | — | | | | (34 | ) | | | (103 | ) |
| | (484,264 | ) | | | (1,243,697 | ) | | | (253,402 | ) | | | — | | | | (2,009,020 | ) | | | (5,084,526 | ) |
| | — | | | | — | | | | — | | | | — | | | | — | | | | — | |
| | (2,512,099 | ) | | | (4,081,173 | ) | | | — | | | | — | | | | — | | | | — | |
| | (3,012,621 | ) | | | (5,374,771 | ) | | | (471,135 | ) | | | — | | | | (2,012,984 | ) | | | (5,092,704 | ) |
| | | | | | | | | | | | | | | | | | | | | | | |
| | 1,587,180 | | | | 24,240,078 | | | | 2,513,789 | | | | (116,917 | ) | | | (2,690,807 | ) | | | (302,087 | ) |
| | (12,252,029 | ) | | | 12,670,082 | | | | 1,363,650 | | | | 439,041 | | | | (8,042,665 | ) | | | (4,625,840 | ) |
| | | | | | | | | | | | | | | | | | | | | | | |
| | 95,628,695 | | | | 82,958,613 | | | | 9,670,281 | | | | 9,231,240 | | | | 62,035,825 | | | | 66,661,665 | |
| $ | 83,376,666 | | | $ | 95,628,695 | | | $ | 11,033,931 | | | $ | 9,670,281 | | | $ | 53,993,160 | | | $ | 62,035,825 | |
Statements of Changes in Net Assets
| | | Sterling Capital
Stratton Real
Estate Fund | |
| | | For the
Year Ended
September 30,
2020 | | | For the
Year Ended
September 30,
2019 | |
| From Investment Activities: | | | | | | | | |
| Operations: | | | | | | | | |
| Net investment income | | $ | 1,463,925 | | | $ | 1,945,131 | |
| Net realized gain | | | 2,508,959 | | | | 4,052,238 | |
| Change in unrealized appreciation/depreciation | | | (13,233,054 | ) | | | 11,153,699 | |
| Change in net assets from operations | | | (9,260,170 | ) | | | 17,151,068 | |
| Distributions to Shareholders: | | | | | | | | |
| Net investment income and net realized gains from investments: | | | | | | | | |
| Class A | | | (56,366 | ) | | | (27,282 | ) |
| Class C | | | (10,328 | ) | | | (6,293 | ) |
| Institutional Class | | | (5,651,172 | ) | | | (5,133,185 | ) |
| Class R6 | | | (9 | ) | | | — | |
| Change in net assets from shareholder distributions | | | (5,717,875 | ) | | | (5,166,760 | ) |
| Capital Transactions: | | | | | | | | |
| Change in net assets from capital transactions | | | (5,370,588 | ) | | | 2,115,839 | |
| Change in net assets | | | (20,348,633 | ) | | | 14,100,147 | |
| Net Assets: | | | | | | | | |
| Beginning of year | | | 106,221,236 | | | | 92,121,089 | |
| End of year | | $ | 85,872,603 | | | $ | 106,221,236 | |
See accompanying Notes to the Financial Statements.
Sterling Capital
Stratton Small Cap
Value Fund | | | Sterling Capital
Ultra Short
Bond Fund | |
| | For the
Year Ended
September 30,
2020 | | | For the
Year Ended
September 30,
2019 | | | For the
Year Ended
September 30,
2020 | | | For the
Year Ended
September 30,
2019 | |
| | | | | | | | | | | | | | | |
| $ | 4,263,656 | | | $ | 6,647,729 | | | $ | 450,802 | | | $ | 928,786 | |
| | 88,415,592 | | | | 80,480,253 | | | | 36,747 | | | | 90,770 | |
| | (231,075,150 | ) | | | (160,890,027 | ) | | | 40,335 | | | | 116,592 | |
| | (138,395,902 | ) | | | (73,762,045 | ) | | | 527,884 | | | | 1,136,148 | |
| | | | | | | | | | | | | | | |
| | (176,450 | ) | | | (133,162 | ) | | | (40,911 | ) | | | (94,793 | ) |
| | (24,177 | ) | | | (7,554 | ) | | | — | | | | — | |
| | (64,382,924 | ) | | | (87,347,809 | ) | | | (414,182 | ) | | | (820,309 | ) |
| | — | | | | — | | | | — | | | | — | |
| | (64,583,551 | ) | | | (87,488,525 | ) | | | (455,093 | ) | | | (915,102 | ) |
| | | | | | | | | | | | | | | |
| | (279,158,884 | ) | | | (174,989,690 | ) | | | 18,740,067 | | | | (9,659,452 | ) |
| | (482,138,337 | ) | | | (336,240,260 | ) | | | 18,812,858 | | | | (9,438,406 | ) |
| | | | | | | | | | | | | | | |
| | 962,928,349 | | | | 1,299,168,609 | | | | 17,561,775 | | | | 27,000,181 | |
| $ | 480,790,012 | | | $ | 962,928,349 | | | $ | 36,374,633 | | | $ | 17,561,775 | |
Statements of Changes in Net Assets
| | | Sterling Capital
Short Duration
Bond Fund | |
| | | For the
Year Ended
September 30,
2020 | | | For the
Year Ended
September 30,
2019 | |
| From Investment Activities: | | | | | | | | |
| Operations: | | | | | | | | |
| Net investment income | | $ | 3,829,034 | | | $ | 4,650,289 | |
| Net realized gain (loss) | | | 1,927,039 | | | | 304,183 | |
| Change in unrealized appreciation/depreciation | | | 1,039,743 | | | | 2,918,772 | |
| Change in net assets from operations | | | 6,795,816 | | | | 7,873,244 | |
| Distributions to Shareholders: | | | | | | | | |
| Net investment income and net realized gains from investments: | | | | | | | | |
| Class A | | | (73,507 | ) | | | (101,425 | ) |
| Class C | | | (14,615 | ) | | | (20,881 | ) |
| Institutional Class | | | (4,361,183 | ) | | | (4,979,836 | ) |
| Class R | | | — | | | | — | |
| Class R6 | | | — | | | | — | |
| Change in net assets from shareholder distributions | | | (4,449,305 | ) | | | (5,102,142 | ) |
| Capital Transactions: | | | | | | | | |
| Change in net assets from capital transactions | | | 1,459,121 | | | | 41,105,586 | |
| Change in net assets | | | 3,805,632 | | | | 43,876,688 | |
| Net Assets: | | | | | | | | |
| Beginning of year | | | 176,238,455 | | | | 132,361,767 | |
| End of year . | | $ | 180,044,087 | | | $ | 176,238,455 | |
See accompanying Notes to the Financial Statements.
Sterling Capital
Intermediate U.S.
Government Fund | | | Sterling Capital
Total Return
Bond Fund | | | Sterling Capital
Corporate
Fund | |
For the
Year Ended
September 30,
2020 | | | For the
Year Ended
September 30,
2019 | | | For the
Year Ended
September 30,
2020 | | | For the
Year Ended
September 30,
2019 | | | For the
Year Ended
September 30,
2020 | | | For the
Year Ended
September 30,
2019 | |
| | | | | | | | | | | | | | | | | | | | | | | |
| $ | 254,969 | | | $ | 385,137 | | | $ | 40,028,582 | | | $ | 40,036,049 | | | $ | 596,985 | | | $ | 802,792 | |
| | 85,001 | | | | (135,818 | ) | | | 39,186,823 | | | | 9,093,529 | | | | 554,955 | | | | 1,362 | |
| | 307,636 | | | | 941,605 | | | | 39,961,602 | | | | 78,052,011 | | | | 168,387 | | | | 1,229,006 | |
| | 647,606 | | | | 1,190,924 | | | | 119,177,007 | | | | 127,181,589 | | | | 1,320,327 | | | | 2,033,160 | |
| | | | | | | | | | | | | | | | | | | | | | | |
| | (90,704 | ) | | | (100,924 | ) | | | (1,439,572 | ) | | | (1,758,079 | ) | | | (12,277 | ) | | | (13,849 | ) |
| | (6,038 | ) | | | (7,749 | ) | | | (150,558 | ) | | | (172,524 | ) | | | (59 | ) | | | (111 | ) |
| | (264,844 | ) | | | (337,311 | ) | | | (30,684,940 | ) | | | (29,747,187 | ) | | | (584,519 | ) | | | (788,778 | ) |
| | — | | | | — | | | | (867 | ) | | | (829 | ) | | | — | | | | — | |
| | — | | | | — | | | | (14,238,201 | ) | | | (10,125,629 | ) | | | — | | | | — | |
| | (361,586 | ) | | | (445,984 | ) | | | (46,514,138 | ) | | | (41,804,248 | ) | | | (596,855 | ) | | | (802,738 | ) |
| | | | | | | | | | | | | | | | | | | | | | | |
| | (2,958,620 | ) | | | (8,583,621 | ) | | | 207,853,743 | | | | 175,350,460 | | | | (4,864,338 | ) | | | (9,365,172 | ) |
| | (2,672,600 | ) | | | (7,838,681 | ) | | | 280,516,612 | | | | 260,727,801 | | | | (4,140,866 | ) | | | (8,134,750 | ) |
| | | | | | | | | | | | | | | | | | | | | | | |
| | 14,960,146 | | | | 22,798,827 | | | | 1,479,282,952 | | | | 1,218,555,151 | | | | 23,152,830 | | | | 31,287,580 | |
| $ | 12,287,546 | | | $ | 14,960,146 | | | $ | 1,759,799,564 | | | $ | 1,479,282,952 | | | $ | 19,011,964 | | | $ | 23,152,830 | |
Statements of Changes in Net Assets
| | | Sterling Capital
Quality Income
Fund | |
| | | For the
Year Ended
September 30,
2020 | | | For the
Year Ended
September 30,
2019 | |
| From Investment Activities: | | | | | | | | |
| Operations: | | | | | | | | |
| Net investment income | | $ | 861,054 | | | $ | 1,127,298 | |
| Net realized gain (loss) | | | 335,207 | | | | (2,517 | ) |
| Change in unrealized appreciation/depreciation | | | 352,430 | | | | 1,730,730 | |
| Change in net assets from operations | | | 1,548,691 | | | | 2,855,511 | |
| Distributions to Shareholders: | | | | | | | | |
| Net investment income and net realized gains from investments: | | | | | | | | |
| Class A | | | (498 | ) | | | (543 | ) |
| Class C | | | (233 | ) | | | (701 | ) |
| Institutional Class | | | (975,676 | ) | | | (1,106,026 | ) |
| Change in net assets from shareholder distributions | | | (976,407 | ) | | | (1,107,270 | ) |
| Capital Transactions: | | | | | | | | |
| Change in net assets from capital transactions | | | (1,150,794 | ) | | | (2,472,234 | ) |
| Change in net assets | | | (578,510 | ) | | | (723,993 | ) |
| Net Assets: | | | | | | | | |
| Beginning of year | | | 36,415,063 | | | | 37,139,056 | |
| End of year | | $ | 35,836,553 | | | $ | 36,415,063 | |
See accompanying Notes to the Financial Statements.
Sterling Capital
Kentucky
Intermediate
Tax-Free Fund | | | Sterling Capital
Maryland
Intermediate
Tax-Free Fund | | | Sterling Capital
North Carolina
Intermediate
Tax-Free Fund | |
For the
Year Ended
September 30,
2020 | | | For the
Year Ended
September 30,
2019 | | | For the
Year Ended
September 30,
2020 | | | For the
Year Ended
September 30,
2019 | | | For the
Year Ended
September 30,
2020 | | | For the
Year Ended
September 30,
2019 | |
| | | | | | | | | | | | | | | | | |
| | | | | | | | | | | | | | | | | |
| $ | 195,791 | | | $ | 208,253 | | | $ | 230,600 | | | $ | 317,751 | | | $ | 3,275,713 | | | $ | 3,913,470 | |
| | 40,679 | | | | 23,293 | | | | 179,716 | | | | 65,387 | | | | 351,826 | | | | 432,735 | |
| | 216,146 | | | | 473,487 | | | | 22,110 | | | | 628,011 | | | | 2,159,557 | | | | 7,032,082 | |
| | 452,616 | | | | 705,033 | | | | 432,426 | | | | 1,011,149 | | | | 5,787,096 | | | | 11,378,287 | |
| | | | | | | | | | | | | | | | | | | | | | | |
| | | | | | | | | | | | | | | | | | | | | | | |
| | (59,838 | ) | | | (78,236 | ) | | | (78,577 | ) | | | (127,247 | ) | | | (618,328 | ) | | | (807,558 | ) |
| | (20 | ) | | | (31 | ) | | | (7,350 | ) | | | (13,595 | ) | | | (26,263 | ) | | | (40,835 | ) |
| | (158,989 | ) | | | (195,012 | ) | | | (220,232 | ) | | | (399,198 | ) | | | (2,630,444 | ) | | | (3,064,006 | ) |
| | (218,847 | ) | | | (273,279 | ) | | | (306,159 | ) | | | (540,040 | ) | | | (3,275,035 | ) | | | (3,912,399 | ) |
| | | | | | | | | | | | | | | | | | | | | | | |
| | 1,491,512 | | | | (1,117,426 | ) | | | (1,736,999 | ) | | | (4,847,604 | ) | | | (6,598,839 | ) | | | (8,430 | ) |
| | 1,725,281 | | | | (685,672 | ) | | | (1,610,732 | ) | | | (4,376,495 | ) | | | (4,086,778 | ) | | | 7,457,458 | |
| | | | | | | | | | | | | | | | | | | | | | | |
| | 10,668,445 | | | | 11,354,117 | | | | 14,440,966 | | | | 18,817,461 | | | | 181,486,173 | | | | 174,028,715 | |
| $ | 12,393,726 | | | $ | 10,668,445 | | | $ | 12,830,234 | | | $ | 14,440,966 | | | $ | 177,399,395 | | | $ | 181,486,173 | |
Statements of Changes in Net Assets
| | | Sterling Capital
South Carolina
Intermediate
Tax-Free Fund | |
| | | For the
Year Ended
September 30,
2020 | | | For the
Year Ended
September 30,
2019 | |
| From Investment Activities: | | | | | | | | |
| Operations: | | | | | | | | |
| Net investment income | | $ | 1,616,031 | | | $ | 1,611,928 | |
| Net realized gain | | | 163,968 | | | | 97,934 | |
| Change in unrealized appreciation/depreciation | | | 1,193,350 | | | | 3,429,312 | |
| Change in net assets from operations | | | 2,973,349 | | | | 5,139,174 | |
| Distributions to Shareholders: | | | | | | | | |
| Net investment income and net realized gains from investments: | | | | | | | | |
| Class A | | | (217,872 | ) | | | (245,867 | ) |
| Class C | | | (9,723 | ) | | | (11,011 | ) |
| Institutional Class | | | (1,388,129 | ) | | | (1,355,050 | ) |
| Change in net assets from shareholder distributions | | | (1,615,724 | ) | | | (1,611,928 | ) |
| Capital Transactions: | | | | | | | | |
| Change in net assets from capital transactions | | | 3,601,217 | | | | (1,686,203 | ) |
| Change in net assets | | | 4,958,842 | | | | 1,841,043 | |
| Net Assets: | | | | | | | | |
| Beginning of year | | | 79,786,429 | | | | 77,945,386 | |
| End of year | | $ | 84,745,271 | | | $ | 79,786,429 | |
See accompanying Notes to the Financial Statements.
Sterling Capital
Virginia
Intermediate
Tax-Free Fund | | | Sterling Capital
West Virginia
Intermediate
Tax-Free Fund | |
For the
Year Ended
September 30,
2020 | | | For the
Year Ended
September 30,
2019 | | | For the
Year Ended
September 30,
2020 | | | For the
Year Ended
September 30,
2019 | |
| | | | | | | | | | | |
| | | | | | | | | | | |
| $ | 1,442,566 | | | $ | 1,659,728 | | | $ | 1,709,502 | | | $ | 1,705,529 | |
| | 264,207 | | | | 333,963 | | | | 88,771 | | | | 51,276 | |
| | 1,281,687 | | | | 3,500,332 | | | | 1,420,110 | | | | 2,940,544 | |
| | 2,988,460 | | | | 5,494,023 | | | | 3,218,383 | | | | 4,697,349 | |
| | | | | | | | | | | | | | | |
| | | | | | | | | | | | | | | |
| | (288,025 | ) | | | (357,345 | ) | | | (526,269 | ) | | | (506,838 | ) |
| | (7,450 | ) | | | (9,779 | ) | | | (3,932 | ) | | | (10,261 | ) |
| | (1,147,072 | ) | | | (1,292,604 | ) | | | (1,253,906 | ) | | | (1,305,041 | ) |
| | (1,442,547 | ) | | | (1,659,728 | ) | | | (1,784,107 | ) | | | (1,822,140 | ) |
| | | | | | | | | | | | | | | |
| | 1,578,521 | | | | (9,011,256 | ) | | | 18,286,559 | | | | (6,345,674 | ) |
| | 3,124,434 | | | | (5,176,961 | ) | | | 19,720,835 | | | | (3,470,465 | ) |
| | | | | | | | | | | | | | | |
| | 77,928,870 | | | | 83,105,831 | | | | 76,076,117 | | | | 79,546,582 | |
| $ | 81,053,304 | | | $ | 77,928,870 | | | $ | 95,796,952 | | | $ | 76,076,117 | |
Statements of Changes in Net Assets
| | | Sterling Capital
Diversified
Income Fund | |
| | | For the
Year Ended
September 30,
2020 | | | For the
Year Ended
September 30,
2019 | |
| From Investment Activities: | | | | | | | | |
| Operations: | | | | | | | | |
| Net investment income | | $ | 779,992 | | | $ | 843,831 | |
| Net realized gain (loss) | | | (1,436,981 | ) | | | 17,364 | |
| Change in unrealized appreciation/depreciation | | | (850,418 | ) | | | (598,172 | ) |
| Change in net assets from operations | | | (1,507,407 | ) | | | 263,023 | |
| Distributions to Shareholders: | | | | | | | | |
| Net investment income and net realized gains from investments: | | | | | | | | |
| Class A | | | (370,223 | ) | | | (555,310 | ) |
| Class C | | | (20,303 | ) | | | (35,414 | ) |
| Institutional Class | | | (399,639 | ) | | | (331,903 | ) |
| Return of Capital: | | | | | | | | |
| Class A | | | — | | | | — | |
| Class C | | | — | | | | — | |
| Institutional Class | | | — | | | | — | |
| Change in net assets from shareholder distributions | | | (790,165 | ) | | | (922,627 | ) |
| Capital Transactions: | | | | | | | | |
| Change in net assets from capital transactions | | | (3,454,541 | ) | | | 501,805 | |
| Change in net assets | | | (5,752,113 | ) | | | (157,799 | ) |
| Net Assets: | | | | | | | | |
| Beginning of year | | | 20,167,863 | | | | 20,325,662 | |
| End of year | | $ | 14,415,750 | | | $ | 20,167,863 | |
See accompanying Notes to the Financial Statements.
Sterling Capital
Strategic Allocation
Balanced Fund | | | Sterling Capital
Strategic Allocation
Growth Fund | |
For the
Year Ended
September 30,
2020 | | | For the
Year Ended
September 30,
2019 | | | For the
Year Ended
September 30,
2020 | | | For the
Year Ended
September 30,
2019 | |
| $ | 464,349 | | | $ | 576,614 | | | $ | 354,375 | | | $ | 415,882 | |
| | 528,588 | | | | 824,498 | | | | 478,005 | | | | 788,971 | |
| | (1,049,153 | ) | | | (890,437 | ) | | | (1,194,109 | ) | | | (1,127,573 | ) |
| | (56,216 | ) | | | 510,675 | | | | (361,729 | ) | | | 77,280 | |
| | | | | | | | | | | | | | | |
| | (966,957 | ) | | | (573,911 | ) | | | (798,185 | ) | | | (403,342 | ) |
| | (13,688 | ) | | | (7,432 | ) | | | (13,108 | ) | | | (5,356 | ) |
| | (12,998 | ) | | | (5,227 | ) | | | (22,348 | ) | | | (15,673 | ) |
| | | | | | | | | | | | | | | |
| | (316,736 | ) | | | — | | | | (320,645 | ) | | | — | |
| | (4,484 | ) | | | — | | | | (5,266 | ) | | | — | |
| | (4,257 | ) | | | — | | | | (8,978 | ) | | | — | |
| | (1,319,120 | ) | | | (586,570 | ) | | | (1,168,530 | ) | | | (424,371 | ) |
| | | | | | | | | | | | | | | |
| | (2,236,687 | ) | | | (3,606,279 | ) | | | (1,538,772 | ) | | | (1,735,975 | ) |
| | (3,612,023 | ) | | | (3,682,174 | ) | | | (3,069,031 | ) | | | (2,083,066 | ) |
| | | | | | | | | | | | | | | |
| | 25,586,390 | | | | 29,268,564 | | | | 20,807,673 | | | | 22,890,739 | |
| $ | 21,974,367 | | | $ | 25,586,390 | | | $ | 17,738,642 | | | $ | 20,807,673 | |
Statements of Changes in Net Assets
| | | Sterling Capital
Behavioral Large Cap
Value Equity Fund | |
| | | For the
Year Ended
September 30,
2020 | | | For the
Year Ended
September 30,
2019 | |
| Capital Transactions: | | | | | | | | |
| Class A Shares: | | | | | | | | |
| Proceeds from shares issued | | $ | 2,524,986 | | | $ | 935,934 | |
| Distributions reinvested | | | 1,486,105 | | | | 3,024,043 | |
| Value of shares redeemed | | | (4,171,306 | ) | | | (4,522,058 | ) |
| Change in net assets from Class A Share transactions | | | (160,215 | ) | | | (562,081 | ) |
| Class C Shares: | | | | | | | | |
| Proceeds from shares issued | | | 133,361 | | | | 34,072 | |
| Distributions reinvested | | | 30,756 | | | | 76,180 | |
| Value of shares redeemed | | | (167,857 | ) | | | (244,255 | ) |
| Change in net assets from Class C Share transactions | | | (3,740 | ) | | | (134,003 | ) |
| Institutional Shares: | | | | | | | | |
| Proceeds from shares issued | | | 149,451 | | | | 348,169 | |
| Distributions reinvested | | | 288,365 | | | | 813,806 | |
| Value of shares redeemed | | | (4,315,079 | ) | | | (1,379,019 | ) |
| Change in net assets from Institutional Share transactions | | | (3,877,263 | ) | | | (217,044 | ) |
| Class R Shares: | | | | | | | | |
| Proceeds from shares issued | | | — | | | | — | |
| Distributions reinvested | | | — | | | | — | |
| Value of shares redeemed | | | — | | | | — | |
| Change in net assets from Class R Share transactions | | | — | | | | — | |
| Class R6 Shares: | | | | | | | | |
| Proceeds from shares issued | | | 8,106,412 | | | | 8,476,640 | |
| Distributions reinvested | | | 10,771,551 | | | | 26,185,374 | |
| Value of shares redeemed | | | (224,757,934 | ) | | | (32,325,434 | ) |
| Change in net assets from Class R6 Share transactions | | | (205,879,971 | ) | | | 2,336,580 | |
| Change in net assets from capital transactions | | $ | (209,921,189 | ) | | $ | 1,423,452 | |
| Share Transactions: | | | | | | | | |
| Class A Shares: | | | | | | | | |
| Issued | | | 153,400 | | | | 51,282 | |
| Reinvested | | | 81,556 | | | | 163,604 | |
| Redeemed | | | (234,670 | ) | | | (235,640 | ) |
| Change in Class A Shares | | | 286 | | | | (20,754 | ) |
| Class C Shares: | | | | | | | | |
| Issued | | | 10,269 | | | | 1,858 | |
| Reinvested | | | 1,736 | | | | 4,266 | |
| Redeemed | | | (10,492 | ) | | | (13,480 | ) |
| Change in Class C Shares | | | 1,513 | | | | (7,356 | ) |
| Institutional Shares: | | | | | | | | |
| Issued | | | 8,460 | | | | 17,721 | |
| Reinvested | | | 15,145 | | | | 43,752 | |
| Redeemed | | | (292,703 | ) | | | (71,669 | ) |
| Change in Institutional Shares | | | (269,098 | ) | | | (10,196 | ) |
| Class R Shares: | | | | | | | | |
| Issued | | | — | | | | — | |
| Reinvested | | | — | | | | — | |
| Redeemed | | | — | | | | — | |
| Change in Class R Shares | | | — | | | | — | |
| Class R6 Shares: | | | | | | | | |
| Issued | | | 463,022 | | | | 441,965 | |
| Reinvested | | | 574,922 | | | | 1,406,557 | |
| Redeemed | | | (13,259,237 | ) | | | (1,668,727 | ) |
| Change in Class R6 Shares | | | (12,221,293 | ) | | | 179,795 | |
| Change in Shares | | | (12,488,592 | ) | | | 141,489 | |
See accompanying Notes to the Financial Statements.
Sterling Capital
Mid Value
Fund | | | Sterling Capital
Behavioral Small Cap
Value Equity Fund | | | Sterling Capital
Special Opportunities
Fund | |
For the
Year Ended
September 30,
2020 | | | For the
Year Ended
September 30,
2019 | | | For the
Year Ended
September 30,
2020 | | | For the
Year Ended
September 30,
2019 | | | For the
Year Ended
September 30,
2020 | | | For the
Year Ended
September 30,
2019 | |
| $ | 609,680 | | | $ | 694,889 | | | $ | 288,173 | | | $ | 147,039 | | | $ | 19,038,037 | | | $ | 50,507,639 | |
| | 1,809,392 | | | | 3,287,181 | | | | 60,376 | | | | 986,210 | | | | 16,465,521 | | | | 22,655,125 | |
| | (3,436,452 | ) | | | (7,119,018 | ) | | | (833,998 | ) | | | (1,370,407 | ) | | | (74,966,780 | ) | | | (64,745,949 | ) |
| | (1,017,380 | ) | | | (3,136,948 | ) | | | (485,449 | ) | | | (237,158 | ) | | | (39,463,222 | ) | | | 8,416,815 | |
| | | | | | | | | | | | | | | | | | | | | | | |
| | 46,636 | | | | 85,785 | | | | 8,445 | | | | 1,704 | | | | 3,525,009 | | | | 7,033,672 | |
| | 231,932 | | | | 452,191 | | | | 1,166 | | | | 20,117 | | | | 5,097,950 | | | | 11,253,584 | |
| | (1,074,073 | ) | | | (1,116,509 | ) | | | (29,287 | ) | | | (13,228 | ) | | | (28,053,096 | ) | | | (64,942,936 | ) |
| | (795,505 | ) | | | (578,533 | ) | | | (19,676 | ) | | | 8,593 | | | | (19,430,137 | ) | | | (46,655,680 | ) |
| | | | | | | | | | | | | | | | | | | | | | | |
| | 8,007,600 | | | | 65,563,253 | | | | 1,201,562 | | | | 3,001,531 | | | | 52,543,075 | | | | 64,929,181 | |
| | 3,922,615 | | | | 27,818,006 | | | | 155,825 | | | | 3,836,811 | | | | 10,359,812 | | | | 15,827,150 | |
| | (117,763,003 | ) | | | (209,396,363 | ) | | | (16,809,476 | ) | | | (9,417,780 | ) | | | (161,840,614 | ) | | | (125,765,263 | ) |
| | (105,832,788 | ) | | | (116,015,104 | ) | | | (15,452,089 | ) | | | (2,579,438 | ) | | | (98,937,727 | ) | | | (45,008,932 | ) |
| | | | | | | | | | | | | | | | | | | | | | | |
| | 15 | | | | 2,348 | | | | 109,023 | | | | 55,513 | | | | 18,817 | | | | 117,708 | |
| | 455 | | | | 513 | | | | 1,536 | | | | 8,673 | | | | 4,837 | | | | 18,879 | |
| | (18 | ) | | | — | | | | (7,952 | ) | | | (6,067 | ) | | | (209,835 | ) | | | (14,718 | ) |
| | 452 | | | | 2,861 | | | | 102,607 | | | | 58,119 | | | | (186,181 | ) | | | 121,869 | |
| | | | | | | | | | | | | | | | | | | | | | | |
| | 4,401,107 | | | | 13,151,563 | | | | 1,214,580 | | | | 57,985,597 | | | | 58,697,590 | | | | 22,632,332 | |
| | 39 | | | | 33,160,969 | | | | 872,270 | | | | 23,767,086 | | | | 18,960,051 | | | | 24,985,390 | |
| | (239,675,052 | ) | | | (43,024,039 | ) | | | (122,868,186 | ) | | | (22,388,060 | ) | | | (379,778,869 | ) | | | (44,663,440 | ) |
| | (235,273,906 | ) | | | 3,288,493 | | | | (120,781,336 | ) | | | 59,364,623 | | | | (302,121,228 | ) | | | 2,954,282 | |
| $ | (342,919,127 | ) | | $ | (116,439,231 | ) | | $ | (136,635,943 | ) | | $ | 56,614,739 | | | $ | (460,138,495 | ) | | $ | (80,171,646 | ) |
| | | | | | | | | | | | | | | | | | | | | | | |
| | | | | | | | | | | | | | | | | | | | | | | |
| | 44,410 | | | | 42,603 | | | | 25,993 | | | | 9,619 | | | | 821,061 | | | | 2,122,752 | |
| | 113,825 | | | | 213,849 | | | | 3,875 | | | | 70,278 | | | | 667,153 | | | | 1,019,586 | |
| | (240,368 | ) | | | (444,018 | ) | | | (65,574 | ) | | | (93,083 | ) | | | (3,334,855 | ) | | | (2,761,560 | ) |
| | (82,133 | ) | | | (187,566 | ) | | | (35,706 | ) | | | (13,186 | ) | | | (1,846,641 | ) | | | 380,778 | |
| | | | | | | | | | | | | | | | | | | | | | | |
| | 4,461 | | | | 6,192 | | | | 687 | | | | 123 | | | | 193,408 | | | | 365,472 | |
| | 17,217 | | | | 33,914 | | | | 78 | | | | 1,500 | | | | 257,473 | | | | 618,729 | |
| | (92,335 | ) | | | (78,751 | ) | | | (2,636 | ) | | | (946 | ) | | | (1,526,477 | ) | | | (3,374,253 | ) |
| | (70,657 | ) | | | (38,645 | ) | | | (1,871 | ) | | | 677 | | | | (1,075,596 | ) | | | (2,390,052 | ) |
| | | | | | | | | | | | | | | | | | | | | | | |
| | 557,945 | | | | 3,972,320 | | | | 98,215 | | | | 206,914 | | | | 2,245,496 | | | | 2,632,339 | |
| | 241,018 | | | | 1,790,222 | | | | 9,919 | | | | 270,694 | | | | 394,968 | | | | 674,880 | |
| | (7,601,067 | ) | | | (13,022,482 | ) | | | (1,463,078 | ) | | | (626,557 | ) | | | (6,923,672 | ) | | | (5,146,852 | ) |
| | (6,802,104 | ) | | | (7,259,940 | ) | | | (1,354,944 | ) | | | (148,949 | ) | | | (4,283,208 | ) | | | (1,839,633 | ) |
| | | | | | | | | | | | | | | | | | | | | | | |
| | 1 | | | | 153 | | | | 8,238 | | | | 3,815 | | | | 817 | | | | 4,875 | |
| | 30 | | | | 34 | | | | 99 | | | | 622 | | | | 194 | | | | 841 | |
| | (1 | ) | | | — | | | | (776 | ) | | | (430 | ) | | | (8,059 | ) | | | (620 | ) |
| | 30 | | | | 187 | | | | 7,561 | | | | 4,007 | | | | (7,048 | ) | | | 5,096 | |
| | | | | | | | | | | | | | | | | | | | | | | |
| | 320,533 | | | | 787,365 | | | | 92,534 | | | | 4,022,893 | | | | 2,425,430 | | | | 897,401 | |
| | 2 | | | | 2,109,457 | | | | 55,488 | | | | 1,674,722 | | | | 721,782 | | | | 1,064,068 | |
| | (15,125,634 | ) | | | (2,556,762 | ) | | | (8,615,520 | ) | | | (1,492,555 | ) | | | (15,250,967 | ) | | | (1,771,703 | ) |
| | (14,805,099 | ) | | | 340,060 | | | | (8,467,498 | ) | | | 4,205,060 | | | | (12,103,755 | ) | | | 189,766 | |
| | (21,759,963 | ) | | | (7,145,904 | ) | | | (9,852,458 | ) | | | 4,047,609 | | | | (19,316,248 | ) | | | (3,654,045 | ) |
Statements of Changes in Net Assets
| | | Sterling Capital
Equity Income
Fund | |
| | | For the
Year Ended
September 30,
2020 | | | For the
Year Ended
September 30,
2019 | |
| Capital Transactions: | | | | | | | | |
| Class A Shares: | | | | | | | | |
| Proceeds from shares issued | | $ | 61,979,645 | | | $ | 55,127,466 | |
| Distributions reinvested | | | 18,130,587 | | | | 26,666,056 | |
| Value of shares redeemed | | | (75,667,035 | ) | | | (58,116,549 | ) |
| Change in net assets from Class A Share transactions | | | 4,443,197 | | | | 23,676,973 | |
| Class C Shares: | | | | | | | | |
| Proceeds from shares issued | | | 11,942,453 | | | | 13,893,581 | |
| Distributions reinvested | | | 7,273,756 | | | | 15,208,917 | |
| Value of shares redeemed | | | (47,264,406 | ) | | | (73,739,039 | ) |
| Change in net assets from Class C Share transactions | | | (28,048,197 | ) | | | (44,636,541 | ) |
| Institutional Shares: | | | | | | | | |
| Proceeds from shares issued | | | 657,438,047 | | | | 277,543,621 | |
| Distributions reinvested | | | 50,554,803 | | | | 59,774,878 | |
| Value of shares redeemed | | | (538,369,044 | ) | | | (173,731,332 | ) |
| Change in net assets from Institutional Share transactions | | | 169,623,806 | | | | 163,587,167 | |
| Class R Shares: | | | | | | | | |
| Proceeds from shares issued | | | 275,755 | | | | 743,404 | |
| Distributions reinvested | | | 128,228 | | | | 248,332 | |
| Value of shares redeemed | | | (1,341,545 | ) | | | (709,460 | ) |
| Change in net assets from Class R Share transactions | | | (937,562 | ) | | | 282,276 | |
| Class R6 Shares: | | | | | | | | |
| Proceeds from shares issued | | | 144,728,495 | | | | 31,522,334 | |
| Distributions reinvested | | | 19,454,375 | | | | 29,401,719 | |
| Value of shares redeemed | | | (418,538,744 | ) | | | (32,044,328 | ) |
| Change in net assets from Class R6 Share transactions | | | (254,355,874 | ) | | | 28,879,725 | |
| Change in net assets from capital transactions | | $ | (109,274,630 | ) | | $ | 171,789,600 | |
| Share Transactions: | | | | | | | | |
| Class A Shares: | | | | | | | | |
| Issued | | | 3,135,753 | | | | 2,746,680 | |
| Reinvested | | | 894,160 | | | | 1,367,419 | |
| Redeemed | | | (3,952,671 | ) | | | (2,883,769 | ) |
| Change in Class A Shares | | | 77,242 | | | | 1,230,330 | |
| Class C Shares: | | | | | | | | |
| Issued | | | 601,400 | | | | 701,973 | |
| Reinvested | | | 359,269 | | | | 792,747 | |
| Redeemed | | | (2,458,114 | ) | | | (3,702,614 | ) |
| Change in Class C Shares | | | (1,497,445 | ) | | | (2,207,894 | ) |
| Institutional Shares: | | | | | | | | |
| Issued | | | 32,659,085 | | | | 13,723,097 | |
| Reinvested | | | 2,486,728 | | | | 3,051,663 | |
| Redeemed | | | (29,067,017 | ) | | | (8,576,271 | ) |
| Change in Institutional Shares | | | 6,078,796 | | | | 8,198,489 | |
| Class R Shares: | | | | | | | | |
| Issued | | | 13,967 | | | | 37,398 | |
| Reinvested | | | 6,290 | | | | 12,867 | |
| Redeemed. | | | (66,172 | ) | | | (35,480 | ) |
| Change in Class R Shares | | | (45,915 | ) | | | 14,785 | |
| Class R6 Shares: | | | | | | | | |
| Issued | | | 7,276,798 | | | | 1,562,417 | |
| Reinvested | | | 958,953 | | | | 1,500,794 | |
| Redeemed | | | (21,642,399 | ) | | | (1,563,071 | ) |
| Change in Class R6 Shares | | | (13,406,648 | ) | | | 1,500,140 | |
| Change in Shares | | | (8,793,970 | ) | | | 8,735,850 | |
See accompanying Notes to the Financial Statements.
Sterling Capital
Behavioral International
Equity Fund | | | Sterling Capital
SMID
Opportunities Fund | | | Sterling Capital
Stratton Mid Cap
Value Fund | |
For the
Year Ended
September 30,
2020 | | | For the
Year Ended
September 30,
2019 | | | For the
Year Ended
September 30,
2020 | | | For the
Year Ended
September 30,
2019 | | | For the
Year Ended
September 30,
2020 | | | For the
Year Ended
September 30,
2019 | |
| | | | | | | | | | | | | | | | | | | | | | | |
| | | | | | | | | | | | | | | | | | | | | | | |
| $ | 48,933 | | | $ | 123,265 | | | $ | 1,803,928 | | | $ | 366,941 | | | $ | 42,699 | | | $ | 21,905 | |
| | 15,210 | | | | 45,511 | | | | 158,917 | | | | — | | | | 3,928 | | | | 8,075 | |
| | (92,152 | ) | | | (345,274 | ) | | | (304,881 | ) | | | (309,895 | ) | | | (10,801 | ) | | | (5,899 | ) |
| | (28,009 | ) | | | (176,498 | ) | | | 1,657,964 | | | | 57,046 | | | | 35,826 | | | | 24,081 | |
| | | | | | | | | | | | | | | | | | | | | | | |
| | — | | | | 14,205 | | | | 218,546 | | | | 84,270 | | | | — | | | | — | |
| | 987 | | | | 4,299 | | | | 58,816 | | | | — | | | | 34 | | | | 103 | |
| | (13,296 | ) | | | (5,850 | ) | | | (106,746 | ) | | | (423,647 | ) | | | — | | | | — | |
| | (12,309 | ) | | | 12,654 | | | | 170,616 | | | | (339,377 | ) | | | 34 | | | | 103 | |
| | | | | | | | | | | | | | | | | | | | | | | |
| | 588,489 | | | | 1,837,673 | | | | 3,976,210 | | | | 690,359 | | | | 1,843,863 | | | | 725,039 | |
| | 23,254 | | | | 710,669 | | | | 253,402 | | | | — | | | | 1,862,795 | | | | 4,783,434 | |
| | (1,496,343 | ) | | | (2,231,436 | ) | | | (3,544,403 | ) | | | (524,945 | ) | | | (6,433,325 | ) | | | (5,834,744 | ) |
| | (884,600 | ) | | | 316,906 | | | | 685,209 | | | | 165,414 | | | | (2,726,667 | ) | | | (326,271 | ) |
| | | | | | | | | | | | | | | | | | | | | | | |
| | — | | | | — | | | | — | | | | — | | | | — | | | | — | |
| | — | | | | — | | | | — | | | | — | | | | — | | | | — | |
| | — | | | | — | | | | — | | | | — | | | | — | | | | — | |
| | — | | | | — | | | | — | | | | — | | | | — | | | | — | |
| | | | | | | | | | | | | | | | | | | | | | | |
| | — | | | | 20,005,843 | | | | — | | | | — | | | | — | | | | — | |
| | 2,512,098 | | | | 4,081,173 | | | | — | | | | — | | | | — | | | | — | |
| | — | | | | — | | | | — | | | | — | | | | — | | | | — | |
| | 2,512,098 | | | | 24,087,016 | | | | — | | | | — | | | | — | | | | — | |
| $ | 1,587,180 | | | $ | 24,240,078 | | | $ | 2,513,789 | | | $ | (116,917 | ) | | $ | (2,690,807 | ) | | $ | (302,087 | ) |
| | | | | | | | | | | | | | | | | | | | | | | |
| | | | | | | | | | | | | | | | | | | | | | | |
| | 5,175 | | | | 13,137 | | | | 135,999 | | | | 29,734 | | | | 673 | | | | 372 | |
| | 1,530 | | | | 4,942 | | | | 11,940 | | | | — | | | | 60 | | | | 144 | |
| | (10,924 | ) | | | (35,540 | ) | | | (26,499 | ) | | | (26,444 | ) | | | (229 | ) | | | (97 | ) |
| | (4,219 | ) | | | (17,461 | ) | | | 121,440 | | | | 3,290 | | | | 504 | | | | 419 | |
| | | | | | | | | | | | | | | | | | | | | | | |
| | - | | | | 1,381 | | | | 16,823 | | | | 7,505 | | | | — | | | | — | |
| | 100 | | | | 470 | | | | 4,510 | | | | — | | | | 1 | | | | 2 | |
| | (1,362 | ) | | | (616 | ) | | | (9,579 | ) | | | (36,049 | ) | | | — | | | | — | |
| | (1,262 | ) | | | 1,235 | | | | 11,754 | | | | (28,544 | ) | | | 1 | | | | 2 | |
| | | | | | | | | | | | | | | | | | | | | | | |
| | 64,545 | | | | 197,397 | | | | 332,630 | | | | 60,406 | | | | 33,549 | | | | 12,066 | |
| | 2,342 | | | | 75,256 | | | | 18,925 | | | | — | | | | 28,066 | | | | 84,617 | |
| | (150,716 | ) | | | (232,741 | ) | | | (329,334 | ) | | | (47,246 | ) | | | (110,782 | ) | | | (98,396 | ) |
| | (83,829 | ) | | | 39,912 | | | | 22,221 | | | | 13,160 | | | | (49,167 | ) | | | (1,713 | ) |
| | | | | | | | | | | | | | | | | | | | | | | |
| | — | | | | — | | | | — | | | | — | | | | — | | | | — | |
| | — | | | | — | | | | — | | | | — | | | | — | | | | — | |
| | — | | | | — | | | | — | | | | — | | | | — | | | | — | |
| | — | | | | — | | | | — | | | | — | | | | — | | | | — | |
| | | | | | | | | | | | | | | | | | | | | | | |
| | — | | | | 2,190,581 | | | | — | | | | — | | | | — | | | | — | |
| | 252,981 | | | | 444,173 | | | | — | | | | — | | | | — | | | | — | |
| | — | | | | — | | | | — | | | | — | | | | — | | | | — | |
| | 252,981 | | | | 2,634,754 | | | | — | | | | — | | | | — | | | | — | |
| | 163,671 | | | | 2,658,440 | | | | 155,415 | | | | (12,094 | ) | | | (48,662 | ) | | | (1,292 | ) |
Statements of Changes in Net Assets
| | | Sterling Capital
Stratton Real
Estate Fund | |
| | | For the
Year Ended
September 30,
2020 | | | For the
Year Ended
September 30,
2019 | |
| Capital Transactions: | | | | | | | | |
| Class A Shares: | | | | | | | | |
| Proceeds from shares issued | | $ | 1,481,184 | | | $ | 402,433 | |
| Distributions reinvested | | | 53,827 | | | | 25,560 | |
| Value of shares redeemed | | | (1,569,461 | ) | | | (100,521 | ) |
| Change in net assets from Class A Share transactions | | | (34,450 | ) | | | 327,472 | |
| Class C Shares: | | | | | | | | |
| Proceeds from shares issued | | | 12,001 | | | | 80,202 | |
| Distributions reinvested | | | 10,328 | | | | 6,292 | |
| Value of shares redeemed | | | (5,223 | ) | | | (1,561 | ) |
| Change in net assets from Class C Share transactions | | | 17,106 | | | | 84,933 | |
| Institutional Shares: | | | | | | | | |
| Proceeds from shares issued | | | 9,677,466 | | | | 17,505,972 | |
| Distributions reinvested | | | 5,099,447 | | | | 4,554,669 | |
| Value of shares redeemed | | | (20,130,666 | ) | | | (20,357,207 | ) |
| Change in net assets from Institutional Share transactions | | | (5,353,753 | ) | | | 1,703,434 | |
| Class R6 Shares: | | | | | | | | |
| Proceeds from shares issued | | | 500 | | | | — | |
| Distributions reinvested | | | 9 | | | | — | |
| Change in net assets from Class R6 Share transactions | | | 509 | | | | — | |
| Change in net assets from capital transactions | | $ | (5,370,588 | ) | | $ | 2,115,839 | |
| Share Transactions: | | | | | | | | |
| Class A Shares: | | | | | | | | |
| Issued | | | 36,748 | | | | 10,283 | |
| Reinvested | | | 1,452 | | | | 682 | |
| Redeemed | | | (42,464 | ) | | | (2,618 | ) |
| Change in Class A Shares | | | (4,264 | ) | | | 8,347 | |
| Class C Shares: | | | | | | | | |
| Issued | | | 284 | | | | 2,115 | |
| Reinvested | | | 272 | | | | 170 | |
| Redeemed | | | (147 | ) | | | (41 | ) |
| Change in Class C Shares | | | 409 | | | | 2,244 | |
| Institutional Shares: | | | | | | | | |
| Issued | | | 247,551 | | | | 451,964 | |
| Reinvested | | | 133,980 | | | | 121,837 | |
| Redeemed | | | (542,622 | ) | | | (524,867 | ) |
| Change in Institutional Shares | | | (161,091 | ) | | | 48,934 | |
| Class R6 Shares: | | | | | | | | |
| Issued | | | 12 | | | | — | |
| Change in Class R6 Shares | | | 12 | | | | — | |
| Change in Shares | | | (164,934 | ) | | | 59,525 | |
See accompanying Notes to the Financial Statements.
Sterling Capital
Stratton Small Cap
Value Fund | | | Sterling Capital
Ultra Short
Bond Fund | |
For the
Year Ended
September 30,
2020 | | | For the
Year Ended
September 30,
2019 | | | For the
Year Ended
September 30,
2020 | | | For the
Year Ended
September 30,
2019 | |
| | | | | | | | | | | |
| | | | | | | | | | | |
| $ | 553,247 | | | $ | 1,407,442 | | | $ | 768,600 | | | $ | 875,745 | |
| | 174,082 | | | | 130,424 | | | | 39,025 | | | | 68,193 | |
| | (944,522 | ) | | | (678,947 | ) | | | (363,294 | ) | | | (3,815,644 | ) |
| | (217,193 | ) | | | 858,919 | | | | 444,331 | | | | (2,871,706 | ) |
| | | | | | | | | | | | | | | |
| | 119,709 | | | | 168,061 | | | | — | | | | — | |
| | 23,281 | | | | 7,554 | | | | — | | | | — | |
| | (80,726 | ) | | | (2,000 | ) | | | — | | | | — | |
| | 62,264 | | | | 173,615 | | | | — | | | | — | |
| | | | | | | | | | | | | | | |
| | 110,101,534 | | | | 129,863,570 | | | | 24,826,301 | | | | 21,239,320 | |
| | 45,739,757 | | | | 59,385,321 | | | | 280,149 | | | | 679,867 | |
| | (437,842,996 | ) | | | (365,271,115 | ) | | | (6,810,714 | ) | | | (28,706,933 | ) |
| | (282,001,705 | ) | | | (176,022,224 | ) | | | 18,295,736 | | | | (6,787,746 | ) |
| | | | | | | | | | | | | | | |
| | 2,997,750 | | | | — | | | | — | | | | — | |
| | — | | | | — | | | | — | | | | — | |
| | 2,997,750 | | | | — | | | | — | | | | — | |
| $ | (279,158,884 | ) | | $ | (174,989,690 | ) | | $ | 18,740,067 | | | $ | (9,659,452 | ) |
| | | | | | | | | | | | | | | |
| | | | | | | | | | | | | | | |
| | | | | | | | | | | | | | | |
| | 7,926 | | | | 18,224 | | | | 78,800 | | | | 89,884 | |
| | 2,260 | | | | 1,791 | | | | 3,993 | | | | 6,986 | |
| | (13,600 | ) | | | (8,785 | ) | | | (37,182 | ) | | | (390,630 | ) |
| | (3,414 | ) | | | 11,230 | | | | 45,611 | | | | (293,760 | ) |
| | | | | | | | | | | | | | | |
| | 1,598 | | | | 2,303 | | | | — | | | | — | |
| | 312 | | | | 106 | | | | — | | | | — | |
| | (1,601 | ) | | | (25 | ) | | | — | | | | — | |
| | 309 | | | | 2,384 | | | | — | | | | — | |
| | | | | | | | | | | | | | | |
| | 1,728,136 | | | | 1,700,927 | | | | 2,531,059 | | | | 2,182,523 | |
| | 590,269 | | | | 813,078 | | | | 28,634 | | | | 69,593 | |
| | (7,138,073 | ) | | | (4,821,192 | ) | | | (697,381 | ) | | | (2,933,540 | ) |
| | (4,819,668 | ) | | | (2,307,187 | ) | | | 1,862,312 | | | | (681,424 | ) |
| | | | | | | | | | | | | | | |
| | 44,970 | | | | — | | | | — | | | | — | |
| | 44,970 | | | | — | | | | — | | | | — | |
| | (4,777,803 | ) | | | (2,293,573 | ) | | | 1,907,923 | | | | (975,184 | ) |
Statements of Changes in Net Assets
| | | Sterling Capital
Short Duration
Bond Fund | |
| | | | | | | | | |
| | | | For the
Year Ended
September 30,
2020 | | | | For the
Year Ended
September 30,
2019 | |
| Capital Transactions: | | | | | | | | |
| Class A Shares: | | | | | | | | |
| Proceeds from shares issued | | $ | 1,540,121 | | | $ | 132,602 | |
| Distributions reinvested | | | 64,820 | | | | 91,963 | |
| Value of shares redeemed | | | (585,882 | ) | | | (1,475,687 | ) |
| Change in net assets from Class A Share transactions | | | 1,019,059 | | | | (1,251,122 | ) |
| Class C Shares: | | | | | | | | |
| Proceeds from shares issued | | | 142,762 | | | | 122,296 | |
| Distributions reinvested | | | 14,118 | | | | 19,926 | |
| Value of shares redeemed | | | (329,079 | ) | | | (197,504 | ) |
| Change in net assets from Class C Share transactions | | | (172,199 | ) | | | (55,282 | ) |
| Institutional Shares: | | | | | | | | |
| Proceeds from shares issued | | | 36,219,458 | | | | 76,584,610 | |
| Distributions reinvested | | | 3,435,852 | | | | 3,897,901 | |
| Value of shares redeemed | | | (39,043,049 | ) | | | (38,070,521 | ) |
| Change in net assets from Institutional Share transactions | | | 612,261 | | | | 42,411,990 | |
| Class R Shares: | | | | | | | | |
| Proceeds from shares issued | | | — | | | | — | |
| Distributions reinvested | | | — | | | | — | |
| Value of shares redeemed | | | — | | | | — | |
| Change in net assets from Class R Share transactions | | | — | | | | — | |
| Class R6 Shares: | | | | | | | | |
| Proceeds from shares issued | | | — | | | | — | |
| Distributions reinvested | | | — | | | | — | |
| Value of shares redeemed | | | — | | | | — | |
| Change in net assets from Class R6 Share transactions | | | — | | | | — | |
| Change in net assets from capital transactions | | $ | 1,459,121 | | | $ | 41,105,586 | |
| Share Transactions: | | | | | | | | |
| Class A Shares: | | | | | | | | |
| Issued | | | 175,935 | | | | 15,539 | |
| Reinvested | | | 7,457 | | | | 10,734 | |
| Redeemed | | | (67,674 | ) | | | (172,452 | ) |
| Change in Class A Shares | | | 115,718 | | | | (146,179 | ) |
| Class C Shares: | | | | | | | | |
| Issued | | | 16,474 | | | | 14,418 | |
| Reinvested | | | 1,626 | | | | 2,326 | |
| Redeemed | | | (38,057 | ) | | | (23,125 | ) |
| Change in Class C Shares | | | (19,957 | ) | | | (6,381 | ) |
| Institutional Shares: | | | | | | | | |
| Issued | | | 4,175,301 | | | | 8,975,919 | |
| Reinvested | | | 395,450 | | | | 454,557 | |
| Redeemed | | | (4,531,536 | ) | | | (4,440,972 | ) |
| Change in Institutional Shares | | | 39,215 | | | | 4,989,504 | |
| Class R Shares: | | | | | | | | |
| Issued | | | — | | | | — | |
| Reinvested | | | — | | | | — | |
| Redeemed | | | — | | | | — | |
| Change in Class R Shares | | | — | | | | — | |
| Class R6 Shares: | | | | | | | | |
| Issued | | | — | | | | — | |
| Reinvested | | | — | | | | — | |
| Redeemed | | | — | | | | — | |
| Change in Class R6 Shares | | | — | | | | — | |
| Change in Shares | | | 134,976 | | | | 4,836,944 | |
See accompanying Notes to the Financial Statements.
Sterling Capital
Intermediate U.S.
Government Fund | | | Sterling Capital
Total Return
Bond Fund | | | Sterling Capital
Corporate Fund | |
| | | | | | | | | | | | | | | | | | | | | | | |
For the
Year Ended
September 30,
2020 | | | For the
Year Ended
September 30,
2019 | | | For the
Year Ended
September 30,
2020 | | | For the
Year Ended
September 30,
2019 | | | For the
Year Ended
September 30,
2020 | | | For the
Year Ended
September 30,
2019 | |
| | | | | | | | | | | | | | | | | | | | | | | |
| $ | 554,319 | | | $ | 100,741 | | | $ | 10,424,297 | | | $ | 10,027,413 | | | $ | 156,446 | | | $ | 62,259 | |
| | 85,392 | | | | 94,743 | | | | 1,378,467 | | | | 1,697,366 | | | | 12,278 | | | | 13,850 | |
| | (315,048 | ) | | | (1,199,621 | ) | | | (12,578,428 | ) | | | (28,820,527 | ) | | | (193,295 | ) | | | (44,374 | ) |
| | 324,663 | | | | (1,004,137 | ) | | | (775,664 | ) | | | (17,095,748 | ) | | | (24,571 | ) | | | 31,735 | |
| | | | | | | | | | | | | | | | | | | | | | | |
| | 112,211 | | | | 3,772 | | | | 2,084,221 | | | | 2,597,620 | | | | — | | | | — | |
| | 6,005 | | | | 7,680 | | | | 133,900 | | | | 145,756 | | | | 59 | | | | 69 | |
| | (194,695 | ) | | | (141,933 | ) | | | (2,514,880 | ) | | | (2,446,047 | ) | | | — | | | | (39,205 | ) |
| | (76,479 | ) | | | (130,481 | ) | | | (296,759 | ) | | | 297,329 | | | | 59 | | | | (39,136 | ) |
| | | | | | | | | | | | | | | | | | | | | | | |
| | 1,266,215 | | | | 2,174,624 | | | | 500,763,875 | | | | 377,140,069 | | | | 1,891,535 | | | | 3,831,591 | |
| | 41,332 | | | | 57,117 | | | | 17,896,942 | | | | 15,017,587 | | | | 581,655 | | | | 787,886 | |
| | (4,514,351 | ) | | | (9,680,744 | ) | | | (578,148,682 | ) | | | (248,196,183 | ) | | | (7,313,016 | ) | | | (13,977,248 | ) |
| | (3,206,804 | ) | | | (7,449,003 | ) | | | (59,487,865 | ) | | | 143,961,473 | | | | (4,839,826 | ) | | | (9,357,771 | ) |
| | | | | | | | | | | | | | | | | | | | | | | |
| | — | | | | — | | | | 23,288 | | | | — | | | | — | | | | — | |
| | — | | | | — | | | | 856 | | | | 829 | | | | — | | | | — | |
| | — | | | | — | | | | (24,910 | ) | | | (8,975 | ) | | | — | | | | — | |
| | — | | | | — | | | | (766 | ) | | | (8,146 | ) | | | — | | | | — | |
| | | | | | | | | | | | | | | | | | | | | | | |
| | — | | | | — | | | | 428,138,587 | | | | 78,280,930 | | | | — | | | | — | |
| | — | | | | — | | | | 13,099,276 | | | | 10,121,716 | | | | — | | | | — | |
| | — | | | | — | | | | (172,823,066 | ) | | | (40,207,094 | ) | | | — | | | | — | |
| | — | | | | — | | | | 268,414,797 | | | | 48,195,552 | | | | — | | | | — | |
| $ | (2,958,620 | ) | | $ | (8,583,621 | ) | | $ | 207,853,743 | | | $ | 175,350,460 | | | $ | (4,864,338 | ) | | $ | (9,365,172 | ) |
| | | | | | | | | | | | | | | | | | | | | | | |
| | 55,087 | | | | 10,380 | | | | 936,247 | | | | 949,954 | | | | 15,085 | | | | 6,118 | |
| | 8,487 | | | | 9,748 | | | | 124,243 | | | | 162,462 | | | | 1,171 | | | | 1,380 | |
| | (31,430 | ) | | | (122,964 | ) | | | (1,135,926 | ) | | | (2,778,531 | ) | | | (18,827 | ) | | | (4,324 | ) |
| | 32,144 | | | | (102,836 | ) | | | (75,436 | ) | | | (1,666,115 | ) | | | (2,571 | ) | | | 3,174 | |
| | | | | | | | | | | | | | | | | | | | | | | |
| | 11,185 | | | | 391 | | | | 187,152 | | | | 247,292 | | | | — | | | | — | |
| | 598 | | | | 791 | | | | 12,051 | | | | 13,896 | | | | 6 | | | | 7 | |
| | (19,381 | ) | | | (14,594 | ) | | | (226,735 | ) | | | (233,935 | ) | | | — | | | | (4,021 | ) |
| | (7,598 | ) | | | (13,412 | ) | | | (27,532 | ) | | | 27,253 | | | | 6 | | | | (4,014 | ) |
| | | | | | | | | | | | | | | | | | | | | | | |
| | 126,341 | | | | 224,428 | | | | 45,022,046 | | | | 35,941,744 | | | | 180,117 | | | | 383,753 | |
| | 4,106 | | | | 5,876 | | | | 1,611,907 | | | | 1,430,579 | | | | 55,573 | | | | 78,805 | |
| | (449,326 | ) | | | (1,009,532 | ) | | | (52,101,509 | ) | | | (23,901,584 | ) | | | (699,692 | ) | | | (1,420,672 | ) |
| | (318,879 | ) | | | (779,228 | ) | | | (5,467,556 | ) | | | 13,470,739 | | | | (464,002 | ) | | | (958,114 | ) |
| | | | | | | | | | | | | | | | | | | | | | | |
| | — | | | | — | | | | 2,233 | | | | — | | | | — | | | | — | |
| | — | | | | — | | | | 77 | | | | 80 | | | | — | | | | — | |
| | — | | | | — | | | | (2,208 | ) | | | (881 | ) | | | — | | | | — | |
| | — | | | | — | | | | 102 | | | | (801 | ) | | | — | | | | — | |
| | | | | | | | | | | | | | | | | | | | | | | |
| | — | | | | — | | | | 38,524,008 | | | | 7,416,251 | | | | — | | | | — | |
| | — | | | | — | | | | 1,177,261 | | | | 964,467 | | | | — | | | | — | |
| | — | | | | — | | | | (15,446,477 | ) | | | (3,840,531 | ) | | | — | | | | — | |
| | — | | | | — | | | | 24,254,792 | | | | 4,540,187 | | | | — | | | | — | |
| | (294,333 | ) | | | (895,476 | ) | | | 18,684,370 | | | | 16,371,263 | | | | (466,567 | ) | | | (958,954 | ) |
Statements of Changes in Net Assets
| | | Sterling Capital
Quality Income
Fund | |
| | | | | | | | | |
| | | For the
Year Ended
September 30,
2020 | | | For the
Year Ended
September 30,
2019 | |
| | | | | | | | | |
| Capital Transactions: | | | | | | | | |
| Class A Shares: | | | | | | | | |
| Proceeds from shares issued | | $ | 4,530 | | | $ | — | |
| Distributions reinvested | | | 503 | | | | 543 | |
| Value of shares redeemed | | | — | | | | (9 | ) |
| Change in net assets from Class A Share transactions | | | 5,033 | | | | 534 | |
| Class C Shares: | | | | | | | | |
| Proceeds from shares issued | | | — | | | | — | |
| Distributions reinvested | | | 193 | | | | 701 | |
| Value of shares redeemed | | | (31,480 | ) | | | (639 | ) |
| Change in net assets from Class C Share transactions | | | (31,287 | ) | | | 62 | |
| Institutional Shares: | | | | | | | | |
| Proceeds from shares issued | | | 2,105,011 | | | | 1,743,197 | |
| Distributions reinvested | | | 920,397 | | | | 1,062,163 | |
| Value of shares redeemed | | | (4,149,948 | ) | | | (5,278,190 | ) |
| Change in net assets from Institutional Share transactions | | | (1,124,540 | ) | | | (2,472,830 | ) |
| Change in net assets from capital transactions | | $ | (1,150,794 | ) | | $ | (2,472,234 | ) |
| Share Transactions: | | | | | | | | |
| Class A Shares: | | | | | | | | |
| Issued | | | 442 | | | | — | |
| Reinvested | | | 49 | | | | 55 | |
| Redeemed | | | — | | | | (1 | ) |
| Change in Class A Shares | | | 491 | | | | 54 | |
| Class C Shares: | | | | | | | | |
| Issued | | | — | | | | — | |
| Reinvested | | | 20 | | | | 72 | |
| Redeemed | | | (3,131 | ) | | | (65 | ) |
| Change in Class C Shares | | | (3,111 | ) | | | 7 | |
| Institutional Shares: | | | | | | | | |
| Issued | | | 208,010 | | | | 174,842 | |
| Reinvested | | | 90,503 | | | | 107,799 | |
| Redeemed | | | (407,950 | ) | | | (539,555 | ) |
| Change in Institutional Shares | | | (109,437 | ) | | | (256,914 | ) |
| Change in Shares | | | (112,057 | ) | | | (256,853 | ) |
See accompanying Notes to the Financial Statements.
Sterling Capital
Kentucky
Intermediate
Tax-Free Fund | | | Sterling Capital
Maryland
Intermediate
Tax-Free Fund | | | Sterling Capital
North Carolina
Intermediate
Tax-Free Fund | |
| | | | | | | | | | | | | | | | | | | | | | | |
For the
Year Ended
September 30,
2020 | | | For the
Year Ended
September 30,
2019 | | | For the
Year Ended
September 30,
2020 | | | For the
Year Ended
September 30,
2019 | | | For the
Year Ended
September 30,
2020 | | | For the
Year Ended
September 30,
2019 | |
| | | | | | | | | | | | | | | | | | | | | | | |
| $ | 58,458 | | | $ | 486,125 | | | $ | 22,008 | | | $ | 37,386 | | | $ | 1,667,914 | | | $ | 3,836,676 | |
| | 57,533 | | | | 75,439 | | | | 64,629 | | | | 101,927 | | | | 530,626 | | | | 687,412 | |
| | (401,664 | ) | | | (708,577 | ) | | | (579,086 | ) | | | (1,307,983 | ) | | | (7,727,144 | ) | | | (4,498,190 | ) |
| | (285,673 | ) | | | (147,013 | ) | | | (492,449 | ) | | | (1,168,670 | ) | | | (5,528,604 | ) | | | 25,898 | |
| | | | | | | | | | | | | | | | | | | | | | | |
| | — | | | | — | | | | 107,279 | | | | 20,750 | | | | 308,701 | | | | 202,741 | |
| | 19 | | | | 31 | | | | 7,350 | | | | 13,595 | | | | 26,154 | | | | 40,518 | |
| | — | | | | — | | | | (135,435 | ) | | | (114,271 | ) | | | (470,613 | ) | | | (853,777 | ) |
| | 19 | | | | 31 | | | | (20,806 | ) | | | (79,926 | ) | | | (135,758 | ) | | | (610,518 | ) |
| | | | | | | | | | | | | | | | | | | | | | | |
| | 3,159,152 | | | | 569,087 | | | | 1,023,962 | | | | 877,547 | | | | 26,185,547 | | | | 28,191,390 | |
| | 13,087 | | | | 16,476 | | | | 38,892 | | | | 67,911 | | | | 977,398 | | | | 1,018,133 | |
| | (1,395,073 | ) | | | (1,556,007 | ) | | | (2,286,598 | ) | | | (4,544,466 | ) | | | (28,097,422 | ) | | | (28,633,333 | ) |
| | 1,777,166 | | | | (970,444 | ) | | | (1,223,744 | ) | | | (3,599,008 | ) | | | (934,477 | ) | | | 576,190 | |
| $ | 1,491,512 | | | $ | (1,117,426 | ) | | $ | (1,736,999 | ) | | $ | (4,847,604 | ) | | $ | (6,598,839 | ) | | $ | (8,430 | ) |
| | | | | | | | | | | | | | | | | | | | | | | |
| | 5,655 | | | | 47,623 | | | | 2,014 | | | | 3,439 | | | | 152,013 | | | | 360,881 | |
| | 5,536 | | | | 7,490 | | | | 5,891 | | | | 9,561 | | | | 48,264 | | | | 64,342 | |
| | (38,629 | ) | | | (71,671 | ) | | | (52,859 | ) | | | (122,794 | ) | | | (713,982 | ) | | | (420,823 | ) |
| | (27,438 | ) | | | (16,558 | ) | | | (44,954 | ) | | | (109,794 | ) | | | (513,705 | ) | | | 4,400 | |
| | | | | | | | | | | | | | | | | | | | | | | |
| | — | | | | — | | | | 9,728 | | | | 1,950 | | | | 27,857 | | | | 19,020 | |
| | 2 | | | | 3 | | | | 670 | | | | 1,278 | | | | 2,382 | | | | 3,800 | |
| | — | | | | — | | | | (12,526 | ) | | | (10,654 | ) | | | (43,040 | ) | | | (81,063 | ) |
| | 2 | | | | 3 | | | | (2,128 | ) | | | (7,426 | ) | | | (12,801 | ) | | | (58,243 | ) |
| | | | | | | | | | | | | | | | | | | | | | | |
| | 304,097 | | | | 57,224 | | | | 92,921 | | | | 81,375 | | | | 2,377,741 | | | | 2,626,439 | |
| | 1,261 | | | | 1,637 | | | | 3,539 | | | | 6,361 | | | | 88,821 | | | | 95,238 | |
| | (133,791 | ) | | | (155,416 | ) | | | (209,033 | ) | | | (424,138 | ) | | | (2,635,408 | ) | | | (2,712,318 | ) |
| | 171,567 | | | | (96,555 | ) | | | (112,573 | ) | | | (336,402 | ) | | | (168,846 | ) | | | 9,359 | |
| | 144,131 | | | | (113,110 | ) | | | (159,655 | ) | | | (453,622 | ) | | | (695,352 | ) | | | (44,484 | ) |
Statements of Changes in Net Assets
| | | Sterling Capital
South Carolina
Intermediate
Tax-Free Fund | |
| | | For the
Year Ended
September 30,
2020 | | | For the
Year Ended
September 30,
2019 | |
| Capital Transactions: | | | | | | | | |
| Class A Shares: | | | | | | | | |
| Proceeds from shares issued | | $ | 2,110,914 | | | $ | 382,162 | |
| Distributions reinvested | | | 214,543 | | | | 238,267 | |
| Value of shares redeemed | | | (3,071,326 | ) | | | (2,603,553 | ) |
| Change in net assets from Class A Share transactions | | | (745,869 | ) | | | (1,983,124 | ) |
| Class C Shares: | | | | | | | | |
| Proceeds from shares issued | | | 13,353 | | | | 79,002 | |
| Distributions reinvested | | | 9,725 | | | | 10,990 | |
| Value of shares redeemed | | | (62,283 | ) | | | (147,972 | ) |
| Change in net assets from Class C Share transactions | | | (39,205 | ) | | | (57,980 | ) |
| Institutional Shares: | | | | | | | | |
| Proceeds from shares issued | | | 14,320,358 | | | | 12,432,193 | |
| Distributions reinvested | | | 351,267 | | | | 311,034 | |
| Value of shares redeemed | | | (10,285,334 | ) | | | (12,388,326 | ) |
| Change in net assets from Institutional Share transactions | | | 4,386,291 | | | | 354,901 | |
| Change in net assets from capital transactions | | $ | 3,601,217 | | | $ | (1,686,203 | ) |
| Share Transactions: | | | | | | | | |
| Class A Shares: | | | | | | | | |
| Issued | | | 184,616 | | | | 35,168 | |
| Reinvested | | | 18,872 | | | | 21,560 | |
| Redeemed | | | (270,196 | ) | | | (237,374 | ) |
| Change in Class A Shares | | | (66,708 | ) | | | (180,646 | ) |
| Class C Shares: | | | | | | | | |
| Issued | | | 1,185 | | | | 7,134 | |
| Reinvested | | | 856 | | | | 994 | |
| Redeemed | | | (5,511 | ) | | | (13,459 | ) |
| Change in Class C Shares | | | (3,470 | ) | | | (5,331 | ) |
| Institutional Shares: | | | | | | | | |
| Issued | | | 1,270,610 | | | | 1,133,723 | |
| Reinvested | | | 31,100 | | | | 28,322 | |
| Redeemed | | | (915,223 | ) | | | (1,136,914 | ) |
| Change in Institutional Shares | | | 386,487 | | | | 25,131 | |
| Change in Shares | | | 316,309 | | | | (160,846 | ) |
See accompanying Notes to the Financial Statements.
Sterling Capital
Virginia
Intermediate
Tax-Free Fund | | | Sterling Capital
West Virginia
Intermediate
Tax-Free Fund | |
For the
Year Ended
September 30,
2020 | | | For the
Year Ended
September 30,
2019 | | | For the
Year Ended
September 30,
2020 | | | For the
Year Ended
September 30,
2019 | |
| | | | | | | | | | | | | | | |
| $ | 324,486 | | | $ | 330,984 | | | $ | 6,396,778 | | | $ | 2,471,962 | |
| | 247,942 | | | | 303,035 | | | | 480,527 | | | | 451,194 | |
| | (1,266,893 | ) | | | (4,580,565 | ) | | | (1,879,261 | ) | | | (5,229,839 | ) |
| | (694,465 | ) | | | (3,946,546 | ) | | | 4,998,044 | | | | (2,306,683 | ) |
| | | | | | | | | | | | | | | |
| | 104 | | | | 5,161 | | | | 15,630 | | | | 199,557 | |
| | 7,181 | | | | 9,346 | | | | 3,931 | | | | 10,210 | |
| | (66,023 | ) | | | (76,755 | ) | | | (56,942 | ) | | | (627,510 | ) |
| | (58,738 | ) | | | (62,248 | ) | | | (37,381 | ) | | | (417,743 | ) |
| | | | | | | | | | | | | | | |
| | 8,258,693 | | | | 7,716,491 | | | | 20,938,668 | | | | 9,176,083 | |
| | 161,997 | | | | 181,453 | | | | 115,735 | | | | 115,667 | |
| | (6,088,966 | ) | | | (12,900,406 | ) | | | (7,728,507 | ) | | | (12,912,998 | ) |
| | 2,331,724 | | | | (5,002,462 | ) | | | 13,325,896 | | | | (3,621,248 | ) |
| $ | 1,578,521 | | | $ | (9,011,256 | ) | | $ | 18,286,559 | | | $ | (6,345,674 | ) |
| | | | | | | | | | | | | | | |
| | 26,491 | | | | 28,227 | | | | 634,144 | | | | 247,431 | |
| | 20,505 | | | | 25,903 | | | | 47,135 | | | | 45,459 | |
| | (105,821 | ) | | | (396,731 | ) | | | (185,534 | ) | | | (533,392 | ) |
| | (58,825 | ) | | | (342,601 | ) | | | 495,745 | | | | (240,502 | ) |
| | | | | | | | | | | | | | | |
| | 9 | | | | 437 | | | | 1,517 | | | | 19,844 | |
| | 594 | | | | 799 | | | | 386 | | | | 1,032 | |
| | (5,468 | ) | | | (6,628 | ) | | | (5,507 | ) | | | (62,409 | ) |
| | (4,865 | ) | | | (5,392 | ) | | | (3,604 | ) | | | (41,533 | ) |
| | | | | | | | | | | | | | | |
| | 681,495 | | | | 660,524 | | | | 2,043,897 | | | | 918,268 | |
| | 13,400 | | | | 15,497 | | | | 11,342 | | | | 11,662 | |
| | (508,256 | ) | | | (1,111,688 | ) | | | (757,217 | ) | | | (1,316,333 | ) |
| | 186,639 | | | | (435,667 | ) | | | 1,298,022 | | | | (386,403 | ) |
| | 122,949 | | | | (783,660 | ) | | | 1,790,163 | | | | (668,438 | ) |
Statements of Changes in Net Assets
| | | Sterling Capital
Diversified
Income Fund | |
| | | For the
Year Ended
September 30,
2020 | | | For the
Year Ended
September 30,
2019 | |
| Capital Transactions: | | | | | | | | |
| Class A Shares: | | | | | | | | |
| Proceeds from shares issued | | $ | 294,478 | | | $ | 389,953 | |
| Distributions reinvested | | | 369,363 | | | | 550,891 | |
| Value of shares redeemed | | | (4,155,085 | ) | | | (2,331,497 | ) |
| Change in net assets from Class A Share transactions | | | (3,491,244 | ) | | | (1,390,653 | ) |
| Class C Shares: | | | | | | | | |
| Proceeds from shares issued | | | 45,393 | | | | 416 | |
| Distributions reinvested | | | 20,302 | | | | 35,414 | |
| Value of shares redeemed | | | (262,747 | ) | | | (374,439 | ) |
| Change in net assets from Class C Share transactions | | | (197,052 | ) | | | (338,609 | ) |
| Institutional Shares: | | | | | | | | |
| Proceeds from shares issued | | | 1,769,602 | | | | 3,888,968 | |
| Distributions reinvested | | | 213,539 | | | | 277,718 | |
| Value of shares redeemed | | | (1,749,386 | ) | | | (1,935,619 | ) |
| Change in net assets from Institutional Share transactions | | | 233,755 | | | | 2,231,067 | |
| Change in net assets from capital transactions | | $ | (3,454,541 | ) | | $ | 501,805 | |
| Share Transactions: | | | | | | | | |
| Class A Shares: | | | | | | | | |
| Issued | | | 34,590 | | | | 37,763 | |
| Reinvested | | | 38,765 | | | | 53,728 | |
| Redeemed | | | (449,845 | ) | | | (225,790 | ) |
| Change in Class A Shares | | | (376,490 | ) | | | (134,299 | ) |
| Class C Shares: | | | | | | | | |
| Issued | | | 5,239 | | | | 41 | |
| Reinvested | | | 2,149 | | | | 3,487 | |
| Redeemed | | | (28,308 | ) | | | (36,602 | ) |
| Change in Class C Shares | | | (20,920 | ) | | | (33,074 | ) |
| Institutional Shares: | | | | | | | | |
| Issued | | | 181,178 | | | | 369,829 | |
| Reinvested | | | 22,164 | | | | 26,739 | |
| Redeemed | | | (194,522 | ) | | | (185,095 | ) |
| Change in Institutional Shares | | | 8,820 | | | | 211,473 | |
| Change in Shares | | | (388,590 | ) | | | 44,100 | |
See accompanying Notes to the Financial Statements.
Sterling Capital
Strategic Allocation
Balanced Fund | | | Sterling Capital
Strategic Allocation
Growth Fund | |
For the
Year Ended
September 30,
2020 | | | For the
Year Ended
September 30,
2019 | | | For the
Year Ended
September 30,
2020 | | | For the
Year Ended
September 30,
2019 | |
| | | | | | | | | | | |
| $ | 310,764 | | | $ | 649,698 | | | $ | 248,682 | | | $ | 398,273 | |
| | 1,280,133 | | | | 572,661 | | | | 1,087,898 | | | | 401,982 | |
| | (3,558,366 | ) | | | (4,773,194 | ) | | | (2,296,365 | ) | | | (2,428,833 | ) |
| | (1,967,469 | ) | | | (3,550,835 | ) | | | (959,785 | ) | | | (1,628,578 | ) |
| | | | | | | | | | | | | | | |
| | 19,398 | | | | 4,500 | | | | 51,295 | | | | 19,434 | |
| | 18,176 | | | | 7,432 | | | | 18,375 | | | | 5,049 | |
| | (163,396 | ) | | | (178,051 | ) | | | (34,418 | ) | | | (93,678 | ) |
| | (125,822 | ) | | | (166,119 | ) | | | 35,252 | | | | (69,195 | ) |
| | | | | | | | | | | | | | | |
| | 20,137 | | | | 160,939 | | | | 34,596 | | | | 36,945 | |
| | 17,255 | | | | 5,227 | | | | 31,328 | | | | 15,673 | |
| | (180,788 | ) | | | (55,491 | ) | | | (680,163 | ) | | | (90,820 | ) |
| | (143,396 | ) | | | 110,675 | | | | (614,239 | ) | | | (38,202 | ) |
| $ | (2,236,687 | ) | | $ | (3,606,279 | ) | | $ | (1,538,772 | ) | | $ | (1,735,975 | ) |
| | | | | | | | | | | | | | | |
| | | | | | | | | | | | | | | |
| | 27,102 | | | | 56,037 | | | | 21,881 | | | | 34,197 | |
| | 107,684 | | | | 50,445 | | | | 90,665 | | | | 35,868 | |
| | (312,269 | ) | | | (404,802 | ) | | | (208,114 | ) | | | (206,022 | ) |
| | (177,483 | ) | | | (298,320 | ) | | | (95,568 | ) | | | (135,957 | ) |
| | | | | | | | | | | | | | | |
| | 1,769 | | | | 394 | | | | 4,695 | | | | 1,721 | |
| | 1,545 | | | | 680 | | | | 1,586 | | | | 478 | |
| | (14,624 | ) | | | (15,416 | ) | | | (3,005 | ) | | | (8,249 | ) |
| | (11,310 | ) | | | (14,342 | ) | | | 3,276 | | | | (6,050 | ) |
| | | | | | | | | | | | | | | |
| | 2,055 | | | | 13,119 | | | | 3,246 | | | | 3,127 | |
| | 1,439 | | | | 454 | | | | 2,596 | | | | 1,389 | |
| | (16,940 | ) | | | (4,672 | ) | | | (56,296 | ) | | | (7,676 | ) |
| | (13,446 | ) | | | 8,901 | | | | (50,454 | ) | | | (3,160 | ) |
| | (202,239 | ) | | | (303,761 | ) | | | (142,746 | ) | | | (145,167 | ) |
Financial Highlights, Class A Shares
The financial highlights table is intended to help you understand the Funds’ financial performance for the past 5 years or, if shorter, the period of the Funds’ operations. Certain information reflects financial results for a single Fund share. The total returns in the table represent the rate that an investor would have earned (or lost) on an investment in the Fund (assuming reinvestment of all dividends and distributions).
| | | | | Investment Activities | | | Distributions | |
| | | Net Asset
Value,
Beginning
of Year | | | Net
investment
income
(loss)(a) | | | Net realized/
unrealized
gains (losses) on investments | | | Total from
Investment
Activities | | | Net
investment
income | | | Net realized
gains on
investments | | | Total
Distributions | |
| Sterling Capital Behavioral Large Cap Value Equity Fund | | | | | | | | | | | | | | | | | | | |
| Year Ended September 30, 2020 | | $ | 19.49 | | | | 0.36 | | | | (2.07 | ) | | | (1.71 | ) | | | (0.48 | ) | | | (0.58 | ) | | | (1.06 | ) |
| Year Ended September 30, 2019 | | $ | 22.30 | | | | 0.39 | | | | (1.07 | ) | | | (0.68 | ) | | | (0.38 | ) | | | (1.75 | ) | | | (2.13 | ) |
| Year Ended September 30, 2018 | | $ | 20.71 | | | | 0.31 | | | | 1.91 | | | | 2.22 | | | | (0.44 | ) | | | (0.19 | ) | | | (0.63 | ) |
| Year Ended September 30, 2017 | | $ | 17.68 | | | | 0.36 | | | | 2.97 | | | | 3.33 | | | | (0.30 | ) | | | — | | | | (0.30 | ) |
| Year Ended September 30, 2016 | | $ | 16.53 | | | | 0.27 | | | | 1.15 | | | | 1.42 | | | | (0.27 | ) | | | — | | | | (0.27 | ) |
| Sterling Capital Mid Value Fund | | | | | | | | | | | | | | | | | | | | | | |
| Year Ended September 30, 2020 | | $ | 16.10 | | | | 0.02 | | | | (0.80 | ) | | | (0.78 | ) | | | (0.20 | ) | | | (1.13 | ) | | | (1.33 | ) |
| Year Ended September 30, 2019 | | $ | 19.08 | | | | 0.05 | | | | (0.77 | ) | | | (0.72 | ) | | | — | | | | (2.26 | ) | | | (2.26 | ) |
| Year Ended September 30, 2018 | | $ | 18.72 | | | | (0.03 | ) | | | 1.23 | | | | 1.20 | | | | — | | | | (0.84 | ) | | | (0.84 | ) |
| Year Ended September 30, 2017 | | $ | 16.71 | | | | (0.02 | ) | | | 2.56 | | | | 2.54 | | | | — | | | | (0.53 | ) | | | (0.53 | ) |
| Year Ended September 30, 2016 | | $ | 17.97 | | | | 0.02 | | | | 2.06 | | | | 2.08 | | | | — | | | | (3.34 | ) | | | (3.34 | ) |
| Sterling Capital Behavioral Small Cap Value Equity Fund | | | | | | | | | | | | | | | | | | | |
| Year Ended September 30, 2020 | | $ | 14.54 | | | | 0.10 | | | | (2.67 | ) | | | (2.57 | ) | | | (0.14 | ) | | | — | | | | (0.14 | ) |
| Year Ended September 30, 2019 | | $ | 18.65 | | | | 0.17 | | | | (2.07 | ) | | | (1.90 | ) | | | (0.23 | ) | | | (1.98 | ) | | | (2.21 | ) |
| Year Ended September 30, 2018 | | $ | 18.39 | | | | 0.17 | | | | 0.86 | | | | 1.03 | | | | (0.12 | ) | | | (0.65 | ) | | | (0.77 | ) |
| Year Ended September 30, 2017 | | $ | 15.19 | | | | 0.12 | | | | 3.17 | | | | 3.29 | | | | (0.09 | ) | | | — | | | | (0.09 | ) |
| Year Ended September 30, 2016 | | $ | 14.04 | | | | 0.18 | | | | 1.15 | | | | 1.33 | | | | (0.17 | ) | | | (0.01 | ) | | | (0.18 | ) |
| Sterling Capital Special Opportunities Fund | | | | | | | | | | | | | | | | | | | |
| Year Ended September 30, 2020 | | $ | 24.63 | | | | (0.01 | ) | | | 1.38 | | | | 1.37 | | | | — | | | | (1.33 | ) | | | (1.33 | ) |
| Year Ended September 30, 2019 | | $ | 26.37 | | | | 0.02 | | | | 0.10 | | | | 0.12 | | | | — | | | | (1.86 | ) | | | (1.86 | ) |
| Year Ended September 30, 2018 | | $ | 24.51 | | | | 0.01 | | | | 3.93 | | | | 3.94 | | | | (0.14 | ) | | | (1.94 | ) | | | (2.08 | ) |
| Year Ended September 30, 2017 | | $ | 21.53 | | | | 0.02 | | | | 3.37 | | | | 3.39 | | | | — | | | | (0.41 | ) | | | (0.41 | ) |
| Year Ended September 30, 2016 | | $ | 22.96 | | | | — | | | | 1.88 | | | | 1.88 | | | | — | | | | (3.31 | ) | | | (3.31 | ) |
| Sterling Capital Equity Income Fund | | | | | | | | | | | | | | | | | | | | | | |
| Year Ended September 30, 2020 | | $ | 21.27 | | | | 0.36 | | | | (0.39 | ) | | | (0.03 | ) | | | (0.36 | ) | | | (0.84 | ) | | | (1.20 | ) |
| Year Ended September 30, 2019 | | $ | 21.55 | | | | 0.39 | | | | 1.23 | | | | 1.62 | | | | (0.38 | ) | | | (1.52 | ) | | | (1.90 | ) |
| Year Ended September 30, 2018 | | $ | 20.84 | | | | 0.34 | | | | 2.66 | | | | 3.00 | | | | (0.34 | ) | | | (1.95 | ) | | | (2.29 | ) |
| Year Ended September 30, 2017 | | $ | 18.30 | | | | 0.34 | | | | 2.59 | | | | 2.93 | | | | (0.37 | ) | | | (0.02 | ) | | | (0.39 | ) |
| Year Ended September 30, 2016 | | $ | 17.35 | | | | 0.31 | | | | 2.05 | | | | 2.36 | | | | (0.31 | ) | | | (1.10 | ) | | | (1.41 | ) |
| * | During the periods certain fees were waived (See Note 5 in the Notes to the Financial Statements). If such reductions had not occurred, the ratios would have been as indicated. |
| ** | Portfolio turnover rate is calculated on the basis of the Fund as a whole without distinguishing between classes of shares issued. |
| (a) | Per share net investment income (loss) has been calculated using the average daily shares method. |
See accompanying Notes to the Financial Statements.
| | | | | | | | | Ratios/Supplementary Data | |
Net Asset
Value,
End of
Year | | | Total
Return
(excludes
sales charge) | | | Net Assets,
End of
Year
(000) | | | Ratio of
net expenses
to average
net assets | | | Ratio of net
investment
income
(loss) to
average net
assets | | | Ratio of
expenses to
average
net assets* | | Portfolio
turnover rate** | |
| | | | | | | | | | | | | | | | | | | | | | | | | | | |
| $ | 16.72 | | | | (9.15 | )% | | $ | 24,497 | | | | 0.89 | % | | | 2.00 | % | | | 0.96 | % | | | 167.34 | % |
| $ | 19.49 | | | | (2.34 | )% | | $ | 28,548 | | | | 0.89 | % | | | 2.04 | % | | | 0.89 | % | | | 142.59 | % |
| $ | 22.30 | | | | 10.87 | % | | $ | 33,126 | | | | 0.87 | % | | | 1.44 | % | | | 0.87 | % | | | 127.89 | % |
| $ | 20.71 | | | | 18.94 | % | | $ | 33,358 | | | | 0.89 | % | | | 1.87 | % | | | 0.89 | % | | | 144.85 | % |
| $ | 17.68 | | | | 8.66 | % | | $ | 30,159 | | | | 1.01 | % | | | 1.58 | % | | | 1.15 | % | | | 145.53 | % |
| | | | | | | | | | | | | | | | | | | | | | | | | | | |
| $ | 13.99 | | | | (5.76 | )% | | $ | 18,851 | | | | 1.13 | % | | | 0.13 | % | | | 1.26 | % | | | 28.77 | % |
| $ | 16.10 | | | | (2.80 | )% | | $ | 23,013 | | | | 1.18 | % | | | 0.29 | % | | | 1.18 | % | | | 26.62 | % |
| $ | 19.08 | | | | 6.54 | % | | $ | 30,857 | | | | 1.17 | % | | | (0.16 | )% | | | 1.17 | % | | | 34.62 | % |
| $ | 18.72 | | | | 15.42 | % | | $ | 33,503 | | | | 1.15 | % | | | (0.09 | )% | | | 1.15 | % | | | 24.83 | % |
| $ | 16.71 | | | | 13.07 | % | | $ | 31,625 | | | | 1.18 | % | | | 0.15 | % | | | 1.18 | % | | | 25.45 | % |
| | | | | | | | | | | | | | | | | | | | | | | | | | | |
| $ | 11.83 | | | | (17.84 | )% | | $ | 4,948 | | | | 1.06 | % | | | 0.81 | % | | | 1.08 | % | | | 119.76 | % |
| $ | 14.54 | | | | (9.57 | )% | | $ | 6,599 | | | | 1.05 | % | | | 1.17 | % | | | 1.05 | % | | | 124.82 | % |
| $ | 18.65 | | | | 5.69 | % | | $ | 8,711 | | | | 1.03 | % | | | 0.91 | % | | | 1.03 | % | | | 89.85 | % |
| $ | 18.39 | | | | 21.65 | % | | $ | 9,281 | | | | 1.05 | % | | | 0.72 | % | | | 1.10 | % | | | 109.05 | % |
| $ | 15.19 | | | | 9.52 | % | | $ | 8,714 | | | | 1.13 | % | | | 1.29 | % | | | 1.21 | % | | | 120.42 | % |
| | | | | | | | | | | | | | | | | | | | | | | | | | | |
| $ | 24.67 | | | | 5.55 | % | | $ | 276,975 | | | | 1.11 | % | | | (0.04 | )% | | | 1.11 | % | | | 17.50 | % |
| $ | 24.63 | | | | 1.21 | % | | $ | 322,003 | | | | 1.11 | % | | | 0.06 | % | | | 1.11 | % | | | 17.31 | % |
| $ | 26.37 | | | | 17.16 | % | | $ | 334,687 | | | | 1.11 | % | | | 0.05 | % | | | 1.11 | % | | | 22.78 | % |
| $ | 24.51 | | | | 15.97 | % | | $ | 343,873 | | | | 1.12 | % | | | 0.07 | % | | | 1.12 | % | | | 18.92 | % |
| $ | 21.53 | | | | 8.57 | % | | $ | 351,467 | | | | 1.17 | % | | | 0.02 | % | | | 1.22 | % | | | 27.32 | % |
| | | | | | | | | | | | | | | | | | | | | | | | | | | |
| $ | 20.04 | | | | (0.10 | )% | | $ | 320,255 | | | | 1.03 | % | | | 1.79 | % | | | 1.03 | % | | | 33.60 | % |
| $ | 21.27 | | | | 8.48 | % | | $ | 338,293 | | | | 1.02 | % | | | 1.92 | % | | | 1.02 | % | | | 23.20 | % |
| $ | 21.55 | | | | 15.28 | % | | $ | 316,245 | | | | 1.02 | % | | | 1.66 | % | | | 1.02 | % | | | 19.49 | % |
| $ | 20.84 | | | | 16.19 | % | | $ | 348,427 | | | | 1.03 | % | | | 1.78 | % | | | 1.03 | % | | | 16.93 | % |
| $ | 18.30 | | | | 14.50 | % | | $ | 467,470 | | | | 1.21 | % | | | 1.78 | % | | | 1.21 | % | | | 20.64 | % |
Financial Highlights, Class A Shares
The financial highlights table is intended to help you understand the Funds’ financial performance for the past 5 years or, if shorter, the period of the Funds’ operations. Certain information reflects financial results for a single Fund share. The total returns in the table represent the rate that an investor would have earned (or lost) on an investment in the Fund (assuming reinvestment of all dividends and distributions).
| | | | | Investment Activities | | | Distributions | |
| | | Net Asset
Value,
Beginning
of Year | | | Net
investment
income
(loss)(a) | | | Net realized/
unrealized
gains (losses) on investments | | | Total from
Investment
Activities | | | Net
investment
income | | | Net realized
gains on
investments | | | Total
Distributions | |
| Sterling Capital Behavioral International Equity Fund | | | | | | | | | | | | | | | | | | | |
| Year Ended September 30, 2020 | | $ | 9.48 | | | | 0.24 | | | | (1.30 | ) | | | (1.06 | ) | | | (0.28 | ) | | | — | | | | (0.28 | ) |
| Year Ended September 30, 2019 | | $ | 11.17 | | | | 0.31 | | | | (1.31 | ) | | | (1.00 | ) | | | (0.29 | ) | | | (0.40 | ) | | | (0.69 | ) |
| Year Ended September 30, 2018 | | $ | 11.75 | | | | 0.37 | | | | (0.52 | ) | | | (0.15 | ) | | | (0.32 | ) | | | (0.11 | ) | | | (0.43 | ) |
| Year Ended September 30, 2017 | | $ | 9.68 | | | | 0.25 | | | | 1.96 | | | | 2.21 | | | | (0.14 | ) | | | — | | | | (0.14 | ) |
| Year Ended September 30, 2016 | | $ | 9.22 | | | | 0.21 | | | | 0.46 | | | | 0.67 | | | | (0.21 | ) | | | — | | | | (0.21 | ) |
| Sterling Capital SMID Opportunities Fund | | | | | | | | | | | | | | | | | | | |
| Year Ended September 30, 2020 | | $ | 13.24 | | | | (0.03 | ) | | | (0.13 | ) | | | (0.16 | ) | | | — | | | | (0.63 | ) | | | (0.63 | ) |
| Year Ended September 30, 2019 | | $ | 12.44 | | | | (0.02 | ) | | | 0.82 | | | | 0.80 | | | | — | | | | — | | | | — | |
| Year Ended September 30, 2018 | | $ | 11.75 | | | | (0.05 | ) | | | 0.98 | | | | 0.93 | | | | (0.06 | ) | | | (0.18 | ) | | | (0.24 | ) |
| October 3, 2016 to September 30, 2017(d) | | $ | 10.00 | | | | — | (e) | | | 1.76 | | | | 1.76 | | | | (0.01 | ) | | | — | | | | (0.01 | ) |
| Sterling Capital Stratton Mid Cap Value Fund | | | | | | | | | | | | | | | | | | | |
| Year Ended September 30, 2020 | | $ | 64.04 | | | | 0.25 | | | | (3.65 | ) | | | (3.40 | ) | | | (0.46 | ) | | | (1.51 | ) | | | (1.97 | ) |
| Year Ended September 30, 2019 | | $ | 68.74 | | | | 0.30 | | | | 0.17 | | | | 0.47 | | | | (0.15 | ) | | | (5.02 | ) | | | (5.17 | ) |
| Year Ended September 30, 2018 | | $ | 66.23 | | | | 0.10 | | | | 4.85 | | | | 4.95 | | | | (0.15 | ) | | | (2.29 | ) | | | (2.44 | ) |
| Year Ended September 30, 2017 | | $ | 55.87 | | | | 0.02 | | | | 10.65 | | | | 10.67 | | | | (0.04 | ) | | | (0.27 | ) | | | (0.31 | ) |
| Period Ended September 30, 2016 | | $ | 52.55 | | | | (0.02 | ) | | | 3.34 | | | | 3.32 | | | | — | | | | — | | | | — | |
| Sterling Capital Stratton Real Estate Fund | | | | | | | | | | | | | | | | | | | |
| Year Ended September 30, 2020 | | $ | 42.28 | | | | 0.25 | | | | (3.72 | ) | | | (3.47 | ) | | | (0.68 | ) | | | (1.52 | ) | | | (2.20 | ) |
| Year Ended September 30, 2019 | | $ | 37.57 | | | | 0.75 | | | | 5.98 | | | | 6.73 | | | | (0.78 | ) | | | (1.24 | ) | | | (2.02 | ) |
| Year Ended September 30, 2018 | | $ | 37.04 | | | | 0.74 | | | | 1.50 | | | | 2.24 | | | | (0.49 | ) | | | (1.22 | ) | | | (1.71 | ) |
| Year Ended September 30, 2017 | | $ | 39.67 | | | | 0.75 | | | | (0.54 | ) | | | 0.21 | | | | (1.09 | ) | | | (1.75 | ) | | | (2.84 | ) |
| Period Ended September 30, 2016 | | $ | 36.00 | | | | 0.57 | | | | 3.58 | | | | 4.15 | | | | (0.48 | ) | | | — | | | | (0.48 | ) |
| Sterling Capital Stratton Small Cap Value Fund | | | | | | | | | | | | | | | | | | | |
| Year Ended September 30, 2020 | | $ | 78.00 | | | | 0.25 | | | | (9.36 | ) | | | (9.11 | ) | | | (0.29 | ) | | | (4.93 | ) | | | (5.22 | ) |
| Year Ended September 30, 2019 | | $ | 88.73 | | | | 0.32 | | | | (5.00 | ) | | | (4.68 | ) | | | (0.15 | ) | | | (5.90 | ) | | | (6.05 | ) |
| Year Ended September 30, 2018 | | $ | 89.91 | | | | 0.12 | | | | 6.49 | | | | 6.61 | | | | (0.10 | ) | | | (7.69 | ) | | | (7.79 | ) |
| Year Ended September 30, 2017 | | $ | 78.34 | | | | — | (e) | | | 15.72 | | | | 15.72 | | | | (0.05 | ) | | | (4.10 | ) | | | (4.15 | ) |
| Period Ended September 30, 2016 | | $ | 69.90 | | | | (0.02 | ) | | | 8.46 | | | | 8.44 | | | | — | | | | — | | | | — | |
| Sterling Capital Ultra Short Bond Fund | | | | | | | | | | | | | | | | | | | |
| Year Ended September 30, 2020 | | $ | 9.78 | | | | 0.17 | | | | 0.04 | | | | 0.21 | | | | (0.17 | ) | | | — | | | | (0.17 | ) |
| Year Ended September 30, 2019 | | $ | 9.75 | | | | 0.23 | | | | 0.03 | | | | 0.26 | | | | (0.23 | ) | | | — | | | | (0.23 | ) |
| Year Ended September 30, 2018 | | $ | 9.79 | | | | 0.14 | | | | (0.02 | ) | | | 0.12 | | | | (0.16 | ) | | | — | | | | (0.16 | ) |
| Year Ended September 30, 2017 | | $ | 9.82 | | | | 0.07 | | | | 0.03 | | | | 0.10 | | | | (0.13 | ) | | | — | | | | (0.13 | ) |
| Year Ended September 30, 2016 | | $ | 9.87 | | | | 0.07 | | | | 0.03 | | | | 0.10 | | | | (0.15 | ) | | | — | | | | (0.15 | ) |
| * | During the periods certain fees were waived (See Note 5 in the Notes to the Financial Statements). If such reductions had not occurred, the ratios would have been as indicated. |
| ** | Portfolio turnover rate is calculated on the basis of the Fund as a whole without distinguishing between classes of shares issued. |
| (a) | Per share net investment income (loss) has been calculated using the average daily shares method. |
| (b) | Not annualized for periods less than one year. |
| (c) | Annualized for periods less than one year. |
| (d) | Period from commencement of operations. |
| (e) | Amount is less than $0.005. |
See accompanying Notes to the Financial Statements.
| | | | | | | Ratios/Supplementary Data | |
Net Asset
Value,
End of
Period | | | Total
Return
(excludes
sales charge) (b) | | | Net Assets,
End of
Period
(000) | | | Ratio of
net expenses
to average
net assets (c) | | | Ratio of net
investment
income
(loss) to
average net
assets (c) | | | Ratio of
expenses to
average
net assets*(c) | | | Portfolio
turnover rate**(b) | |
| | | | | | | | | | | | | | | | | | | | |
| $ | 8.14 | | | | (11.76 | )% | | $ | 426 | | | | 0.88 | % | | | 2.81 | % | | | 1.08 | % | | | 164.02 | % |
| $ | 9.48 | | | | (8.72 | )% | | $ | 537 | | | | 0.94 | % | | | 3.16 | % | | | 1.14 | % | | | 97.74 | % |
| $ | 11.17 | | | | (1.47 | )% | | $ | 828 | | | | 0.90 | % | | | 3.17 | % | | | 1.10 | % | | | 96.65 | % |
| $ | 11.75 | | | | 23.19 | % | | $ | 510 | | | | 0.93 | % | | | 2.38 | % | | | 1.19 | % | | | 91.65 | % |
| $ | 9.68 | | | | 7.24 | % | | $ | 354 | | | | 1.05 | % | | | 2.26 | % | | | 1.36 | % | | | 125.35 | % |
| | | | | | | | | | | | | | | | | | | | | | | | | | | |
| $ | 12.45 | | | | (1.54 | )% | | $ | 4,425 | | | | 1.04 | % | | | (0.22 | )% | | | 1.34 | % | | | 60.03 | % |
| $ | 13.24 | | | | 6.43 | % | | $ | 3,097 | | | | 1.04 | % | | | (0.18 | )% | | | 1.45 | % | | | 45.11 | % |
| $ | 12.44 | | | | 8.07 | % | | $ | 2,870 | | | | 1.04 | % | | | (0.39 | )% | | | 1.29 | % | | | 45.64 | % |
| $ | 11.75 | | | | 17.59 | % | | $ | 4,038 | | | | 1.04 | % | | | (0.03 | )% | | | 1.66 | % | | | 37.97 | % |
| | | | | | | | | | | | | | | | | | | | | | | | | | | |
| $ | 58.67 | | | | (5.63 | )% | | $ | 145 | | | | 1.16 | % | | | 0.42 | % | | | 1.19 | % | | | 9.21 | % |
| $ | 64.04 | | | | 1.72 | % | | $ | 126 | | | | 1.20 | % | | | 0.50 | % | | | 1.20 | % | | | 6.75 | % |
| $ | 68.74 | | | | 7.54 | % | | $ | 107 | | | | 1.20 | % | | | 0.15 | % | | | 1.20 | % | | | 14.47 | % |
| $ | 66.23 | | | | 19.16 | % | | $ | 108 | | | | 1.16 | % | | | 0.03 | % | | | 1.16 | % | | | 12.19 | % |
| $ | 55.87 | | | | 6.32 | % | | $ | 19 | | | | 1.20 | % | | | (0.04 | )% | | | 1.22 | % | | | 11.16 | % |
| | | | | | | | | | | | | | | | | | | | | | | | | | | |
| $ | 36.61 | | | | (8.33 | )% | | $ | 537 | | | | 1.08 | % | | | 0.67 | % | | | 1.08 | % | | | 19.58 | % |
| $ | 42.28 | | | | 18.76 | % | | $ | 800 | | | | 1.07 | % | | | 1.92 | % | | | 1.07 | % | | | 14.56 | % |
| $ | 37.57 | | | | 6.17 | % | | $ | 398 | | | | 1.07 | % | | | 2.04 | % | | | 1.07 | % | | | 8.34 | % |
| $ | 37.04 | | | | 0.90 | % | | $ | 302 | | | | 1.04 | % | | | 2.03 | % | | | 1.05 | % | | | 13.52 | % |
| $ | 39.67 | | | | 11.50 | % | | $ | 115 | | | | 1.08 | % | | | 1.93 | % | | | 1.11 | % | | | 18.43 | % |
| | | | | | | | | | | | | | | | | | | | | | | | | | | |
| $ | 63.67 | | | | (12.81 | )% | | $ | 2,048 | | | | 1.25 | % | | | 0.37 | % | | | 1.33 | % | | | 8.33 | % |
| $ | 78.00 | | | | (4.79 | )% | | $ | 2,775 | | | | 1.28 | % | | | 0.42 | % | | | 1.33 | % | | | 8.60 | % |
| $ | 88.73 | | | | 7.71 | % | | $ | 2,160 | | | | 1.28 | % | | | 0.14 | % | | | 1.32 | % | | | 15.51 | % |
| $ | 89.91 | | | | 20.43 | % | | $ | 529 | | | | 1.31 | % | | | 0.01 | % | | | 1.31 | % | | | 7.04 | % |
| $ | 78.34 | | | | 12.07 | % | | $ | 87 | | | | 1.33 | % | | | (0.04 | )% | | | 1.33 | % | | | 3.42 | % |
| | | | | | | | | | | | | | | | | | | | | | | | | | | |
| $ | 9.82 | | | | 2.20 | % | | $ | 2,675 | | | | 0.63 | % | | | 1.73 | % | | | 0.81 | % | | | 43.45 | % |
| $ | 9.78 | | | | 2.70 | % | | $ | 2,219 | | | | 0.68 | % | | | 2.39 | % | | | 0.79 | % | | | 103.69 | % |
| $ | 9.75 | | | | 1.20 | % | | $ | 5,074 | | | | 0.66 | % | | | 1.39 | % | | | 0.76 | % | | | 74.56 | % |
| $ | 9.79 | | | | 1.00 | % | | $ | 4,663 | | | | 0.68 | % | | | 0.71 | % | | | 0.78 | % | | | 59.57 | % |
| $ | 9.82 | | | | 0.99 | % | | $ | 6,250 | | | | 0.71 | % | | | 0.72 | % | | | 0.80 | % | | | 43.02 | % |
Financial Highlights, Class A Shares
The financial highlights table is intended to help you understand the Funds’ financial performance for the past 5 years or, if shorter, the period of the Funds’ operations. Certain information reflects financial results for a single Fund share. The total returns in the table represent the rate that an investor would have earned (or lost) on an investment in the Fund (assuming reinvestment of all dividends and distributions).
| | | | | | Investment Activities | | | Distributions | |
| | | Net Asset
Value,
Beginning
of Year | | | Net
investment
income(a) | | | Net realized/
unrealized
gains
(losses) on investments | | | Total from
Investment
Activities | | | Net
investment
income | | | Net realized
gains on
investments | | | Return
of
capital | | | Total
Distributions | |
| Sterling Capital Short Duration Bond Fund |
| Year Ended September 30, 2020 | | $ | 8.65 | | | | 0.17 | | | | 0.16 | | | | 0.33 | | | | (0.20 | ) | | | — | | | | — | | | | (0.20 | ) |
| Year Ended September 30, 2019 | | $ | 8.52 | | | | 0.21 | | | | 0.15 | | | | 0.36 | | | | (0.23 | ) | | | — | | | | — | | | | (0.23 | ) |
| Year Ended September 30, 2018 | | $ | 8.69 | | | | 0.16 | | | | (0.11 | ) | | | 0.05 | | | | (0.22 | ) | | | — | | | | — | | | | (0.22 | ) |
| Year Ended September 30, 2017 | | $ | 8.81 | | | | 0.10 | | | | (0.01 | ) | | | 0.09 | | | | (0.21 | ) | | | — | | | | — | | | | (0.21 | ) |
| Year Ended September 30, 2016 | | $ | 8.86 | | | | 0.10 | | | | 0.07 | | | | 0.17 | | | | (0.22 | ) | | | — | | | | — | | | | (0.22 | ) |
| Sterling Capital Intermediate U.S. Government Fund | | | | | |
| Year Ended September 30, 2020 | | $ | 9.92 | | | | 0.17 | | | | 0.29 | | | | 0.46 | | | | (0.25 | ) | | | — | | | | — | | | | (0.25 | ) |
| Year Ended September 30, 2019 | | $ | 9.48 | | | | 0.21 | | | | 0.47 | | | | 0.68 | | | | (0.24 | ) | | | — | | | | — | | | | (0.24 | ) |
| Year Ended September 30, 2018 | | $ | 9.91 | | | | 0.17 | | | | (0.34 | ) | | | (0.17 | ) | | | (0.26 | ) | | | — | | | | — | | | | (0.26 | ) |
| Year Ended September 30, 2017 | | $ | 10.24 | | | | 0.15 | | | | (0.27 | ) | | | (0.12 | ) | | | (0.21 | ) | | | — | | | | — | | | | (0.21 | ) |
| Year Ended September 30, 2016 | | $ | 10.18 | | | | 0.13 | | | | 0.11 | | | | 0.24 | | | | (0.18 | ) | | | — | | | | — | | | | (0.18 | ) |
| Sterling Capital Total Return Bond Fund | | | | | |
| Year Ended September 30, 2020 | | $ | 10.88 | | | | 0.24 | | | | 0.55 | | | | 0.79 | | | | (0.29 | ) | | | — | (b) | | | — | | | | (0.29 | ) |
| Year Ended September 30, 2019 | | $ | 10.20 | | | | 0.30 | | | | 0.69 | | | | 0.99 | | | | (0.31 | ) | | | — | | | | — | | | | (0.31 | ) |
| Year Ended September 30, 2018 | | $ | 10.59 | | | | 0.27 | | | | (0.36 | ) | | | (0.09 | ) | | | (0.30 | ) | | | — | | | | — | | | | (0.30 | ) |
| Year Ended September 30, 2017 | | $ | 10.81 | | | | 0.23 | | | | (0.15 | ) | | | 0.08 | | | | (0.30 | ) | | | — | | | | — | | | | (0.30 | ) |
| Year Ended September 30, 2016 | | $ | 10.53 | | | | 0.26 | | | | 0.34 | | | | 0.60 | | | | (0.32 | ) | | | — | | | | — | | | | (0.32 | ) |
| Sterling Capital Corporate Fund | | | | | |
| Year Ended September 30, 2020 | | $ | 10.38 | | | | 0.27 | | | | 0.40 | | | | 0.67 | | | | (0.27 | ) | | | — | | | | — | | | | (0.27 | ) |
| Year Ended September 30, 2019 | | $ | 9.81 | | | | 0.30 | | | | 0.57 | | | | 0.87 | | | | (0.30 | ) | | | — | | | | — | | | | (0.30 | ) |
| Year Ended September 30, 2018 | | $ | 10.25 | | | | 0.29 | | | | (0.37 | ) | | | (0.08 | ) | | | (0.29 | ) | | | (0.07 | ) | | | — | | | | (0.36 | ) |
| Year Ended September 30, 2017 | | $ | 10.37 | | | | 0.29 | | | | (0.08 | ) | | | 0.21 | | | | (0.29 | ) | | | (0.04 | ) | | | — | | | | (0.33 | ) |
| Year Ended September 30, 2016 | | $ | 10.10 | | | | 0.28 | | | | 0.27 | | | | 0.55 | | | | (0.28 | ) | | | — | | | | — | | | | (0.28 | ) |
| Sterling Capital Quality Income Fund | | | | | |
| Year Ended September 30, 2020 | | $ | 10.09 | | | | 0.21 | | | | 0.20 | | | | 0.41 | | | | (0.25 | ) | | | — | | | | — | | | | (0.25 | ) |
| Year Ended September 30, 2019 | | $ | 9.60 | | | | 0.28 | | | | 0.49 | | | | 0.77 | | | | (0.28 | ) | | | — | | | | — | | | | (0.28 | ) |
| Year Ended September 30, 2018 | | $ | 9.94 | | | | 0.25 | | | | (0.31 | ) | | | (0.06 | ) | | | (0.28 | ) | | | — | | | | — | | | | (0.28 | ) |
| Year Ended September 30, 2017 | | $ | 10.10 | | | | 0.21 | | | | (0.12 | ) | | | 0.09 | | | | (0.25 | ) | | | — | | | | — | | | | (0.25 | ) |
| Year Ended September 30, 2016 | | $ | 9.98 | | | | 0.19 | | | | 0.16 | | | | 0.35 | | | | (0.23 | ) | | | — | | | | — | | | | (0.23 | ) |
| Sterling Capital Kentucky Intermediate Tax-Free Fund | | | | | |
| Year Ended September 30, 2020 | | $ | 10.32 | | | | 0.16 | | | | 0.23 | | | | 0.39 | | | | (0.16 | ) | | | (0.02 | ) | | | — | | | | (0.18 | ) |
| Year Ended September 30, 2019 | | $ | 9.90 | | | | 0.18 | | | | 0.48 | | | | 0.66 | | | | (0.18 | ) | | | (0.06 | ) | | | — | | | | (0.24 | ) |
| Year Ended September 30, 2018 | | $ | 10.27 | | | | 0.20 | | | | (0.34 | ) | | | (0.14 | ) | | | (0.20 | ) | | | (0.03 | ) | | | — | | | | (0.23 | ) |
| Year Ended September 30, 2017 | | $ | 10.64 | | | | 0.21 | | | | (0.23 | ) | | | (0.02 | ) | | | (0.21 | ) | | | (0.14 | ) | | | — | | | | (0.35 | ) |
| Year Ended September 30, 2016 | | $ | 10.62 | | | | 0.24 | | | | 0.15 | | | | 0.39 | | | | (0.24 | ) | | | (0.13 | ) | | | — | | | | (0.37 | ) |
| Sterling Capital Maryland Intermediate Tax-Free Fund | | | | | |
| Year Ended September 30, 2020 | | $ | 10.95 | | | | 0.18 | | | | 0.19 | | | | 0.37 | | | | (0.18 | ) | | | (0.06 | ) | | | — | | | | (0.24 | ) |
| Year Ended September 30, 2019 | | $ | 10.62 | | | | 0.20 | | | | 0.46 | | | | 0.66 | | | | (0.20 | ) | | | (0.13 | ) | | | — | | | | (0.33 | ) |
| Year Ended September 30, 2018 | | $ | 11.02 | | | | 0.20 | | | | (0.34 | ) | | | (0.14 | ) | | | (0.20 | ) | | | (0.06 | ) | | | — | | | | (0.26 | ) |
| Year Ended September 30, 2017 | | $ | 11.31 | | | | 0.21 | | | | (0.21 | ) | | | — | | | | (0.21 | ) | | | (0.08 | ) | | | — | | | | (0.29 | ) |
| Year Ended September 30, 2016 | | $ | 11.17 | | | | 0.20 | | | | 0.21 | | | | 0.41 | | | | (0.20 | ) | | | (0.07 | ) | | | — | | | | (0.27 | ) |
| * | During the periods certain fees were waived (See Note 5 in the Notes to the Financial Statements). If such reductions had not occurred, the ratios would have been as indicated. |
| ** | Portfolio turnover rate is calculated on the basis of the Fund as a whole without distinguishing between classes of shares issued. |
| (a) | Per share net investment income has been calculated using the average daily shares method. |
| (b) | Amount is less than $0.005. |
See accompanying Notes to the Financial Statements.
| | | | | | | | | Ratios/Supplementary Data | |
| | | | | | | | | | | | | | | | | | | | | | | | | | | |
Net Asset
Value,
End of
Year | | | Total
Return
(excludes
sales charge) | | | Net Assets,
End of
Year
(000) | | | Ratio of
net expenses
to average
net assets | | | Ratio of net
investment
income to
average net
assets | | | Ratio of
expenses to
average
net assets* | | | Portfolio
turnover rate** | |
| | | | | | | | | | | | | | | | | | | | | | | | | | | |
| $ | 8.78 | | | | 3.86 | % | | $ | 4,260 | | | | 0.67 | % | | | 1.93 | % | | | 0.77 | % | | | 64.69 | % |
| $ | 8.65 | | | | 4.29 | % | | $ | 3,197 | | | | 0.68 | % | | | 2.44 | % | | | 0.78 | % | | | 78.58 | % |
| $ | 8.52 | | | | 0.55 | % | | $ | 4,393 | | | | 0.68 | % | | | 1.84 | % | | | 0.78 | % | | | 62.02 | % |
| $ | 8.69 | | | | 1.02 | % | | $ | 5,746 | | | | 0.70 | % | | | 1.11 | % | | | 0.80 | % | | | 78.77 | % |
| $ | 8.81 | | | | 1.98 | % | | $ | 7,332 | | | | 0.74 | % | | | 1.09 | % | | | 0.81 | % | | | 54.68 | % |
| | | | | | | | | | | | | | | | | | | | | | | | | | | |
| $ | 10.13 | | | | 4.66 | % | | $ | 3,930 | | | | 0.79 | % | | | 1.68 | % | | | 0.95 | % | | | 47.36 | % |
| $ | 9.92 | | | | 7.27 | % | | $ | 3,531 | | | | 0.81 | % | | | 2.12 | % | | | 0.91 | % | | | 40.13 | % |
| $ | 9.48 | | | | (1.73 | )% | | $ | 4,350 | | | | 0.91 | % | | | 1.73 | % | | | 0.92 | % | | | 40.85 | % |
| $ | 9.91 | | | | (1.20 | )% | | $ | 5,418 | | | | 0.87 | % | | | 1.54 | % | | | 0.91 | % | | | 32.44 | % |
| $ | 10.24 | | | | 2.37 | % | | $ | 7,066 | | | | 0.85 | % | | | 1.24 | % | | | 0.97 | % | | | 49.39 | % |
| | | | | | | | | | | | | | | | | | | | | | | | | | | |
| $ | 11.38 | | | | 7.33 | % | | $ | 57,202 | | | | 0.70 | % | | | 2.20 | % | | | 0.82 | % | | | 59.59 | % |
| $ | 10.88 | | | | 9.90 | % | | $ | 55,513 | | | | 0.70 | % | | | 2.87 | % | | | 0.83 | % | | | 79.40 | % |
| $ | 10.20 | | | | (0.90 | )% | | $ | 68,982 | | | | 0.70 | % | | | 2.56 | % | | | 0.82 | % | | | 62.28 | % |
| $ | 10.59 | | | | 0.75 | % | | $ | 72,030 | | | | 0.72 | % | | | 2.13 | % | | | 0.82 | % | | | 64.07 | % |
| $ | 10.81 | | | | 5.84 | % | | $ | 70,257 | | | | 0.74 | % | | | 2.42 | % | | | 0.84 | % | | | 65.47 | % |
| | | | | | | | | | | | | | | | | | | | | | | | | | | |
| $ | 10.78 | | | | 6.56 | % | | $ | 490 | | | | 0.92 | % | | | 2.57 | % | | | 0.94 | % | | | 52.28 | % |
| $ | 10.38 | | | | 9.01 | % | | $ | 498 | | | | 0.93 | % | | | 2.98 | % | | | 0.95 | % | | | 82.23 | % |
| $ | 9.81 | | | | (0.80 | )% | | $ | 440 | | | | 0.89 | % | | | 2.94 | % | | | 0.89 | % | | | 66.82 | % |
| $ | 10.25 | | | | 2.07 | % | | $ | 372 | | | | 0.88 | % | | | 2.84 | % | | | 0.88 | % | | | 78.79 | % |
| $ | 10.37 | | | | 5.55 | % | | $ | 441 | | | | 0.89 | % | | | 2.77 | % | | | 0.89 | % | | | 83.88 | % |
| | | | | | | | | | | | | | | | | | | | | | | | | | | |
| $ | 10.25 | | | | 4.07 | % | | $ | 25 | | | | 0.84 | % | | | 2.06 | % | | | 0.88 | % | | | 35.96 | % |
| $ | 10.09 | | | | 8.13 | % | | $ | 20 | | | | 0.85 | % | | | 2.90 | % | | | 0.89 | % | | | 17.58 | % |
| $ | 9.60 | | | | (0.63 | )% | | $ | 18 | | | | 0.83 | % | | | 2.54 | % | | | 0.87 | % | | | 19.17 | % |
| $ | 9.94 | | | | 0.89 | % | | $ | 94 | | | | 0.85 | % | | | 2.06 | % | | | 0.89 | % | | | 34.72 | % |
| $ | 10.10 | | | | 3.60 | % | | $ | 377 | | | | 0.84 | % | | | 1.89 | % | | | 0.88 | % | | | 43.63 | % |
| | | | | | | | | | | | | | | | | | | | | | | | | | | |
| $ | 10.53 | | | | 3.81 | % | | $ | 3,414 | | | | 0.94 | % | | | 1.53 | % | | | 0.94 | % | | | 7.76 | % |
| $ | 10.32 | | | | 6.79 | % | | $ | 3,631 | | | | 0.95 | % | | | 1.79 | % | | | 0.95 | % | | | 32.58 | % |
| $ | 9.90 | | | | (1.44 | )% | | $ | 3,647 | | | | 0.93 | % | | | 1.95 | % | | | 0.93 | % | | | 20.37 | % |
| $ | 10.27 | | | | (0.19 | )% | | $ | 4,072 | | | | 0.93 | % | | | 2.01 | % | | | 0.96 | % | | | 17.93 | % |
| $ | 10.64 | | | | 3.69 | % | | $ | 4,358 | | | | 0.91 | % | | | 2.25 | % | | | 1.02 | % | | | 16.44 | % |
| | | | | | | | | | | | | | | | | | | | | | | | | | | |
| $ | 11.08 | | | | 3.43 | % | | $ | 3,493 | | | | 0.93 | % | | | 1.62 | % | | | 0.94 | % | | | 9.44 | % |
| $ | 10.95 | | | | 6.35 | % | | $ | 3,947 | | | | 0.92 | % | | | 1.83 | % | | | 0.94 | % | | | 20.76 | % |
| $ | 10.62 | | | | (1.23 | )% | | $ | 4,991 | | | | 0.88 | % | | | 1.89 | % | | | 0.88 | % | | | 31.12 | % |
| $ | 11.02 | | | | 0.00 | % | | $ | 5,818 | | | | 0.86 | % | | | 1.88 | % | | | 0.90 | % | | | 5.89 | % |
| $ | 11.31 | | | | 3.71 | % | | $ | 6,537 | | | | 0.86 | % | | | 1.75 | % | | | 0.96 | % | | | 14.36 | % |
Financial Highlights, Class A Shares
The financial highlights table is intended to help you understand the Funds’ financial performance for the past 5 years or, if shorter, the period of the Funds’ operations. Certain information reflects financial results for a single Fund share. The total returns in the table represent the rate that an investor would have earned (or lost) on an investment in the Fund (assuming reinvestment of all dividends and distributions).
| | | | | | Investment Activities | | | Distributions | |
| | | Net Asset
Value,
Beginning
of Year | | | Net
investment
income(a) | | | Net realized/
unrealized
gains
(losses) on investments | | | Total from
Investment
Activities | | | Net
investment
income | | | Return
of Capital | | | Net realized
gains on
investments | | | Total
Distributions | |
| Sterling Capital North Carolina Intermediate Tax-Free Fund | | | | | |
| Year Ended September 30, 2020 | | $ | 10.91 | | | | 0.18 | | | | 0.21 | | | | 0.39 | | | | (0.18 | ) | | | — | | | | — | | | | (0.18 | ) |
| Year Ended September 30, 2019 | | $ | 10.43 | | | | 0.23 | | | | 0.48 | | | | 0.71 | | | | (0.23 | ) | | | — | | | | — | | | | (0.23 | ) |
| Year Ended September 30, 2018 | | $ | 10.78 | | | | 0.24 | | | | (0.35 | ) | | | (0.11 | ) | | | (0.24 | ) | | | — | | | | — | | | | (0.24 | ) |
| Year Ended September 30, 2017 | | $ | 11.08 | | | | 0.23 | | | | (0.27 | ) | | | (0.04 | ) | | | (0.22 | ) | | | — | | | | (0.04 | ) | | | (0.26 | ) |
| Year Ended September 30, 2016 | | $ | 10.97 | | | | 0.23 | | | | 0.17 | | | | 0.40 | | | | (0.23 | ) | | | — | | | | (0.06 | ) | | | (0.29 | ) |
| Sterling Capital South Carolina Intermediate Tax-Free Fund | | | | | |
| Year Ended September 30, 2020 | | $ | 11.27 | | | | 0.20 | | | | 0.20 | | | | 0.40 | | | | (0.20 | ) | | | — | | | | — | | | | (0.20 | ) |
| Year Ended September 30, 2019 | | $ | 10.77 | | | | 0.21 | | | | 0.50 | | | | 0.71 | | | | (0.21 | ) | | | — | | | | — | | | | (0.21 | ) |
| Year Ended September 30, 2018 | | $ | 11.10 | | | | 0.20 | | | | (0.33 | ) | | | (0.13 | ) | | | (0.20 | ) | | | — | | | | — | | | | (0.20 | ) |
| Year Ended September 30, 2017 | | $ | 11.30 | | | | 0.20 | | | | (0.20 | ) | | | — | | | | (0.20 | ) | | | — | | | | — | | | | (0.20 | ) |
| Year Ended September 30, 2016 | | $ | 11.14 | | | | 0.20 | | | | 0.20 | | | | 0.40 | | | | (0.20 | ) | | | — | | | | (0.04 | ) | | | (0.24 | ) |
| Sterling Capital Virginia Intermediate Tax-Free Fund | | | | | |
| Year Ended September 30, 2020 | | $ | 11.98 | | | | 0.20 | | | | 0.25 | | | | 0.45 | | | | (0.20 | ) | | | — | | | | (0.20 | ) | | | | |
| Year Ended September 30, 2019 | | $ | 11.40 | | | | 0.23 | | | | 0.58 | | | | 0.81 | | | | (0.23 | ) | | | — | | | | — | | | | (0.23 | ) |
| Year Ended September 30, 2018 | | $ | 11.76 | | | | 0.23 | | | | (0.36 | ) | | | (0.13 | ) | | | (0.23 | ) | | | — | | | | — | | | | (0.23 | ) |
| Year Ended September 30, 2017 | | $ | 12.13 | | | | 0.23 | | | | (0.28 | ) | | | (0.05 | ) | | | (0.23 | ) | | | — | | | | (0.09 | ) | | | (0.32 | ) |
| Year Ended September 30, 2016 | | $ | 11.98 | | | | 0.24 | | | | 0.19 | | | | 0.43 | | | | (0.24 | ) | | | — | | | | (0.04 | ) | | | (0.28 | ) |
| Sterling Capital West Virginia Intermediate Tax-Free Fund | | | | | |
| Year Ended September 30, 2020 | | $ | 10.12 | | | | 0.19 | | | | 0.18 | | | | 0.37 | | | | (0.19 | ) | | | — | | | | (0.01 | ) | | | (0.20 | ) |
| Year Ended September 30, 2019 | | $ | 9.72 | | | | 0.22 | | | | 0.42 | | | | 0.64 | | | | (0.22 | ) | | | — | | | | (0.02 | ) | | | (0.24 | ) |
| Year Ended September 30, 2018 | | $ | 10.04 | | | | 0.21 | | | | (0.31 | ) | | | (0.10 | ) | | | (0.21 | ) | | | — | | | | (0.01 | ) | | | (0.22 | ) |
| Year Ended September 30, 2017 | | $ | 10.27 | | | | 0.21 | | | | (0.18 | ) | | | 0.03 | | | | (0.21 | ) | | | — | | | | (0.05 | ) | | | (0.26 | ) |
| Year Ended September 30, 2016 | | $ | 10.14 | | | | 0.21 | | | | 0.18 | | | | 0.39 | | | | (0.21 | ) | | | — | | | | (0.05 | ) | | | (0.26 | ) |
| Sterling Capital Diversified Income Fund(b) | | | | | |
| Year Ended September 30, 2020 | | $ | 10.29 | | | | 0.42 | | | | (1.11 | ) | | | (0.69 | ) | | | (0.43 | ) | | | — | | | | — | | | | (0.43 | ) |
| Year Ended September 30, 2019 | | $ | 10.63 | | | | 0.46 | | | | (0.29 | ) | | | 0.17 | | | | (0.51 | ) | | | — | | | | — | | | | (0.51 | ) |
| Year Ended September 30, 2018 | | $ | 10.79 | | | | 0.35 | | | | (0.10 | ) | | | 0.25 | | | | (0.41 | ) | | | — | | | | — | | | | (0.41 | ) |
| Year Ended September 30, 2017 | | $ | 10.82 | | | | 0.41 | | | | (0.03 | ) | | | 0.38 | | | | (0.41 | ) | | | — | | | | — | | | | (0.41 | ) |
| Year Ended September 30, 2016 | | $ | 10.21 | | | | 0.33 | | | | 0.65 | | | | 0.98 | | | | (0.37 | ) | | | — | | | | — | | | | (0.37 | ) |
| Sterling Capital Strategic Allocation Balanced Fund(b) | | | | | |
| Year Ended September 30, 2020 | | $ | 12.07 | | | | 0.23 | | | | (0.19 | ) | | | 0.04 | | | | (0.17 | ) | | | (0.06 | ) | | | (0.42 | ) | | | (0.65 | ) |
| Year Ended September 30, 2019 | | $ | 12.08 | | | | 0.25 | | | | — | | | | 0.25 | | | | (0.26 | ) | | | — | | | | — | | | | (0.26 | ) |
| Year Ended September 30, 2018 | | $ | 11.89 | | | | 0.23 | | | | 0.23 | | | | 0.46 | | | | (0.27 | ) | | | — | | | | — | | | | (0.27 | ) |
| Year Ended September 30, 2017 | | $ | 10.82 | | | | 0.15 | | | | 1.08 | | | | 1.23 | | | | (0.16 | ) | | | — | | | | — | | | | (0.16 | ) |
| Year Ended September 30, 2016 | | $ | 10.31 | | | | 0.17 | | | | 0.55 | | | | 0.72 | | | | (0.21 | ) | | | — | | | | — | | | | (0.21 | ) |
| Sterling Capital Strategic Allocation Growth Fund(b) | | | | | |
| Year Ended September 30, 2020 | | $ | 12.07 | | | | 0.22 | | | | (0.37 | ) | | | (0.15 | ) | | | (0.15 | ) | | | (0.06 | ) | | | (0.48 | ) | | | (0.69 | ) |
| Year Ended September 30, 2019 | | $ | 12.25 | | | | 0.23 | | | | (0.18 | ) | | | 0.05 | | | | (0.23 | ) | | | — | | | | — | | | | (0.23 | ) |
| Year Ended September 30, 2018 | | $ | 11.90 | | | | 0.21 | | | | 0.39 | | | | 0.60 | | | | (0.25 | ) | | | — | | | | — | | | | (0.25 | ) |
| Year Ended September 30, 2017 | | $ | 10.53 | | | | 0.11 | | | | 1.38 | | | | 1.49 | | | | (0.12 | ) | | | — | | | | — | | | | (0.12 | ) |
| Year Ended September 30, 2016 | | $ | 9.99 | | | | 0.14 | | | | 0.57 | | | | 0.71 | | | | (0.17 | ) | | | — | | | | — | | | | (0.17 | ) |
| * | During the periods certain fees were waived (See Note 5 in the Notes to the Financial Statements). If such reductions had not occurred, the ratios would have been as indicated. |
| ** | Portfolio turnover rate is calculated on the basis of the Fund as a whole without distinguishing between classes of shares issued. |
| (a) | Per share net investment income has been calculated using the average daily shares method. |
| (b) | The expense ratios exclude the impact of fees/expenses paid by each underlying fund. |
See accompanying Notes to the Financial Statements.
| | | | | | | | | Ratios/Supplementary Data | |
| | | | | | | | | | | | | | | | | | | | | | | | | | | |
Net Asset
Value,
End of
Year | | | Total
Return
(excludes
sales charge) | | | Net Assets,
End of
Year
(000) | | | Ratio of
net expenses
to average
net assets | | | Ratio of net
investment
income to
average net
assets | | | Ratio of
expenses to
average
net assets* | | | Portfolio
turnover rate** | |
| | | | | | | | | | | | | | | | | | | | | | | | | | | |
| $ | 11.12 | | | | 3.64 | % | | $ | 33,648 | | | | 0.79 | % | | | 1.68 | % | | | 0.79 | % | | | 17.06 | % |
| $ | 10.91 | | | | 6.84 | % | | $ | 38,587 | | | | 0.80 | % | | | 2.12 | % | | | 0.80 | % | | | 33.12 | % |
| $ | 10.43 | | | | (1.06 | )% | | $ | 36,857 | | | | 0.79 | % | | | 2.23 | % | | | 0.79 | % | | | 22.06 | % |
| $ | 10.78 | | | | (0.31 | )% | | $ | 45,357 | | | | 0.79 | % | | | 2.09 | % | | | 0.83 | % | | | 25.92 | % |
| $ | 11.08 | | | | 3.69 | % | | $ | 52,130 | | | | 0.80 | % | | | 2.08 | % | | | 0.90 | % | | | 10.05 | % |
| | | | | | | | | | | | | | | | | | | | | | | | | | | |
| $ | 11.47 | | | | 3.58 | % | | $ | 11,926 | | | | 0.81 | % | | | 1.76 | % | | | 0.81 | % | | | 4.84 | % |
| $ | 11.27 | | | | 6.62 | % | | $ | 12,478 | | | | 0.81 | % | | | 1.88 | % | | | 0.81 | % | | | 23.84 | % |
| $ | 10.77 | | | | (1.15 | )% | | $ | 13,864 | | | | 0.80 | % | | | 1.85 | % | | | 0.80 | % | | | 27.71 | % |
| $ | 11.10 | | | | 0.01 | % | | $ | 15,832 | | | | 0.81 | % | | | 1.78 | % | | | 0.84 | % | | | 31.17 | % |
| $ | 11.30 | | | | 3.59 | % | | $ | 18,683 | | | | 0.82 | % | | | 1.78 | % | | | 0.92 | % | | | 2.69 | % |
| | | | | | | | | | | | | | | | | | | | | | | | | | | |
| $ | 12.23 | | | | 3.80 | % | | $ | 17,446 | | | | 0.81 | % | | | 1.67 | % | | | 0.81 | % | | | 15.44 | % |
| $ | 11.98 | | | | 7.13 | % | | $ | 17,795 | | | | 0.81 | % | | | 1.94 | % | | | 0.81 | % | | | 24.57 | % |
| $ | 11.40 | | | | (1.14 | )% | | $ | 20,842 | | | | 0.80 | % | | | 1.96 | % | | | 0.80 | % | | | 21.08 | % |
| $ | 11.76 | | | | (0.39 | )% | | $ | 27,481 | | | | 0.80 | % | | | 1.93 | % | | | 0.84 | % | | | 23.25 | % |
| $ | 12.13 | | | | 3.65 | % | | $ | 34,691 | | | | 0.81 | % | | | 1.99 | % | | | 0.91 | % | | | 16.18 | % |
| | | | | | | | | | | | | | | | | | | | | | | | | | | |
| $ | 10.29 | | | | 3.66 | % | | $ | 27,866 | | | | 0.81 | % | | | 1.84 | % | | | 0.81 | % | | | 3.28 | % |
| $ | 10.12 | | | | 6.59 | % | | $ | 22,389 | | | | 0.81 | % | | | 2.18 | % | | | 0.81 | % | | | 33.73 | % |
| $ | 9.72 | | | | (0.98 | )% | | $ | 23,833 | | | | 0.80 | % | | | 2.14 | % | | | 0.80 | % | | | 17.53 | % |
| $ | 10.04 | | | | 0.28 | % | | $ | 30,134 | | | | 0.81 | % | | | 2.08 | % | | | 0.85 | % | | | 21.00 | % |
| $ | 10.27 | | | | 3.92 | % | | $ | 37,720 | | | | 0.82 | % | | | 2.05 | % | | | 0.92 | % | | | 11.31 | % |
| | | | | | | | | | | | | | | | | | | | | | | | | | | |
| $ | 9.17 | | | | (6.78 | )% | | $ | 6,072 | | | | 0.81 | % | | | 4.38 | % | | | 0.81 | % | | | 38.04 | % |
| $ | 10.29 | | | | 1.73 | % | | $ | 10,688 | | | | 0.79 | % | | | 4.46 | % | | | 0.80 | % | | | 26.68 | % |
| $ | 10.63 | | | | 2.38 | % | | $ | 12,468 | | | | 0.79 | % | | | 3.25 | % | | | 0.80 | % | | | 48.19 | % |
| $ | 10.79 | | | | 3.57 | % | | $ | 14,754 | | | | 0.77 | % | | | 3.84 | % | | | 0.77 | % | | | 43.86 | % |
| $ | 10.82 | | | | 9.87 | % | | $ | 15,126 | | | | 0.64 | % | | | 3.17 | % | | | 0.72 | % | | | 67.18 | % |
| | | | | | | | | | | | | | | | | | | | | | | | | | | |
| $ | 11.46 | | | | 0.17 | % | | $ | 21,557 | | | | 0.43 | % | | | 2.01 | % | | | 0.68 | % | | | 3.91 | % |
| $ | 12.07 | | | | 2.18 | % | | $ | 24,850 | | | | 0.41 | % | | | 2.14 | % | | | 0.66 | % | | | 9.41 | % |
| $ | 12.08 | | | | 3.88 | % | | $ | 28,470 | | | | 0.41 | % | | | 1.93 | % | | | 0.66 | % | | | 14.41 | % |
| $ | 11.89 | | | | 11.46 | % | | $ | 30,181 | | | | 0.42 | % | | | 1.37 | % | | | 0.67 | % | | | 0.80 | % |
| $ | 10.82 | | | | 7.02 | % | | $ | 31,951 | | | | 0.40 | % | | | 1.65 | % | | | 0.65 | % | | | 5.19 | % |
| | | | | | | | | | | | | | | | | | | | | | | | | | | |
| $ | 11.23 | | | | (1.52 | )% | | $ | 17,296 | | | | 0.44 | % | | | 1.91 | % | | | 0.69 | % | | | 3.50 | % |
| $ | 12.07 | | | | 0.59 | % | | $ | 19,758 | | | | 0.41 | % | | | 1.95 | % | | | 0.66 | % | | | 10.69 | % |
| $ | 12.25 | | | | 5.08 | % | | $ | 21,715 | | | | 0.44 | % | | | 1.73 | % | | | 0.69 | % | | | 17.81 | % |
| $ | 11.90 | | | | 14.24 | % | | $ | 22,836 | | | | 0.44 | % | | | 1.04 | % | | | 0.69 | % | | | 1.92 | % |
| $ | 10.53 | | | | 7.22 | % | | $ | 21,912 | | | | 0.43 | % | | | 1.34 | % | | | 0.68 | % | | | 5.95 | % |
Financial Highlights, Class C Shares
The financial highlights table is intended to help you understand the Funds’ financial performance for the past 5 years or, if shorter, the period of the Funds’ operations. Certain information reflects financial results for a single Fund share. The total returns in the table represent the rate that an investor would have earned (or lost) on an investment in the Fund (assuming reinvestment of all dividends and distributions).
| | | | | | Investment Activities | | | Distributions | |
| | | Net Asset Value, Beginning of Year | | | Net investment income (loss)(a) | | | Net realized/ unrealized gains (losses) on investments | | | Total from Investment Activities | | | Net investment income | | | Net realized gains on investments | | | Total Distributions | |
| Sterling Capital Behavioral Large Cap Value Equity Fund |
| Year Ended September 30, 2020 | | $ | 18.88 | | | | 0.21 | | | | (1.99 | ) | | | (1.78 | ) | | | (0.35 | ) | | | (0.58 | ) | | | (0.93 | ) |
| Year Ended September 30, 2019 | | $ | 21.67 | | | | 0.24 | | | | (1.04 | ) | | | (0.80 | ) | | | (0.24 | ) | | | (1.75 | ) | | | (1.99 | ) |
| Year Ended September 30, 2018 | | $ | 20.13 | | | | 0.15 | | | | 1.86 | | | | 2.01 | | | | (0.28 | ) | | | (0.19 | ) | | | (0.47 | ) |
| Year Ended September 30, 2017 | | $ | 17.20 | | | | 0.21 | | | | 2.87 | | | | 3.08 | | | | (0.15 | ) | | | — | | | | (0.15 | ) |
| Year Ended September 30, 2016 | | $ | 16.09 | | | | 0.14 | | | | 1.12 | | | | 1.26 | | | | (0.15 | ) | | | — | | | | (0.15 | ) |
| Sterling Capital Mid Value Fund | | | | | | | | | | | | | | | | | | | | | | | |
| Year Ended September 30, 2020 | | $ | 13.83 | | | | (0.07 | ) | | | (0.68 | ) | | | (0.75 | ) | | | (0.10 | ) | | | (1.13 | ) | | | (1.23 | ) |
| Year Ended September 30, 2019 | | $ | 16.86 | | | | (0.07 | ) | | | (0.70 | ) | | | (0.77 | ) | | | — | | | | (2.26 | ) | | | (2.26 | ) |
| Year Ended September 30, 2018 | | $ | 16.76 | | | | (0.15 | ) | | | 1.09 | | | | 0.94 | | | | — | | | | (0.84 | ) | | | (0.84 | ) |
| Year Ended September 30, 2017 | | $ | 15.12 | | | | (0.14 | ) | | | 2.31 | | | | 2.17 | | | | — | | | | (0.53 | ) | | | (0.53 | ) |
| Year Ended September 30, 2016 | | $ | 16.67 | | | | (0.09 | ) | | | 1.88 | | | | 1.79 | | | | — | | | | (3.34 | ) | | | (3.34 | ) |
| Sterling Capital Behavioral Small Cap Value Equity Fund |
| Year Ended September 30, 2020 | | $ | 13.94 | | | | 0.01 | | | | (2.56 | ) | | | (2.55 | ) | | | (0.11 | ) | | | — | | | | (0.11 | ) |
| Year Ended September 30, 2019 | | $ | 17.89 | | | | 0.06 | | | | (1.98 | ) | | | (1.92 | ) | | | (0.05 | ) | | | (1.98 | ) | | | (2.03 | ) |
| Year Ended September 30, 2018 | | $ | 17.69 | | | | 0.03 | | | | 0.82 | | | | 0.85 | | | | — | | | | (0.65 | ) | | | (0.65 | ) |
| Year Ended September 30, 2017 | | $ | 14.70 | | | | (0.02 | ) | | | 3.07 | | | | 3.05 | | | | (0.06 | ) | | | — | | | | (0.06 | ) |
| Year Ended September 30, 2016 | | $ | 13.60 | | | | 0.07 | | | | 1.11 | | | | 1.18 | | | | (0.07 | ) | | | (0.01 | ) | | | (0.08 | ) |
| Sterling Capital Special Opportunities Fund | | | | | | | | | | | | | | | | | | | | | | | |
| Year Ended September 30, 2020 | | $ | 20.04 | | | | (0.15 | ) | | | 1.11 | | | | 0.96 | | | | — | | | | (1.33 | ) | | | (1.33 | ) |
| Year Ended September 30, 2019 | | $ | 21.98 | | | | (0.14 | ) | | | 0.06 | | | | (0.08 | ) | | | — | | | | (1.86 | ) | | | (1.86 | ) |
| Year Ended September 30, 2018 | | $ | 20.88 | | | | (0.14 | ) | | | 3.29 | | | | 3.15 | | | | (0.11 | ) | | | (1.94 | ) | | | (2.05 | ) |
| Year Ended September 30, 2017 | | $ | 18.54 | | | | (0.13 | ) | | | 2.88 | | | | 2.75 | | | | — | | | | (0.41 | ) | | | (0.41 | ) |
| Year Ended September 30, 2016 | | $ | 20.34 | | | | (0.14 | ) | | | 1.65 | | | | 1.51 | | | | — | | | | (3.31 | ) | | | (3.31 | ) |
| Sterling Capital Equity Income Fund | | | | | | | | | | | | | | | | | | | | | | | |
| Year Ended September 30, 2020 | | $ | 21.05 | | | | 0.21 | | | | (0.38 | ) | | | (0.17 | ) | | | (0.21 | ) | | | (0.84 | ) | | | (1.05 | ) |
| Year Ended September 30, 2019 | | $ | 21.34 | | | | 0.24 | | | | 1.21 | | | | 1.45 | | | | (0.22 | ) | | | (1.52 | ) | | | (1.74 | ) |
| Year Ended September 30, 2018 | | $ | 20.66 | | | | 0.19 | | | | 2.62 | | | | 2.81 | | | | (0.18 | ) | | | (1.95 | ) | | | (2.13 | ) |
| Year Ended September 30, 2017 | | $ | 18.14 | | | | 0.20 | | | | 2.56 | | | | 2.76 | | | | (0.22 | ) | | | (0.02 | ) | | | (0.24 | ) |
| Year Ended September 30, 2016 | | $ | 17.21 | | | | 0.18 | | | | 2.03 | | | | 2.21 | | | | (0.18 | ) | | | (1.10 | ) | | | (1.28 | ) |
| Sterling Capital Behavioral International Equity Fund |
| Year Ended September 30, 2020 | | $ | 9.37 | | | | 0.18 | | | | (1.31 | ) | | | (1.13 | ) | | | (0.18 | ) | | | — | | | | (0.18 | ) |
| Year Ended September 30, 2019 | | $ | 11.06 | | | | 0.26 | | | | (1.33 | ) | | | (1.07 | ) | | | (0.22 | ) | | | (0.40 | ) | | | (0.62 | ) |
| Year Ended September 30, 2018 | | $ | 11.64 | | | | 0.25 | | | | (0.48 | ) | | | (0.23 | ) | | | (0.24 | ) | | | (0.11 | ) | | | (0.35 | ) |
| Year Ended September 30, 2017 | | $ | 9.62 | | | | 0.15 | | | | 1.96 | | | | 2.11 | | | | (0.09 | ) | | | — | | | | (0.09 | ) |
| Year Ended September 30, 2016 | | $ | 9.18 | | | | 0.17 | | | | 0.42 | | | | 0.59 | | | | (0.15 | ) | | | — | | | | (0.15 | ) |
| * | During the periods certain fees were waived (See Note 5 in the Notes to the Financial Statements). If such reductions had not occurred, the ratios would have been as indicated. |
| ** | Portfolio turnover rate is calculated on the basis of the Fund as a whole without distinguishing between classes of shares issued. |
| (a) | Per share net investment income (loss) has been calculated using the average daily shares method. |
See accompanying Notes to the Financial Statements.
| | | | | | | | | Ratios/Supplementary Data | |
| Net Asset Value, End of Year | | | Total Return (excludes sales charge) | | | Net Assets, End of Year (000) | | | Ratio of net expenses to average net assets | | | Ratio of net investment income (loss) to average net assets | | | Ratio of expenses to average net assets* | | | Portfolio turnover rate** | |
| | | | | | | | | | | | | | | | | | | | | | | | | | | |
| $ | 16.17 | | | | (9.81 | )% | | $ | 567 | | | | 1.64 | % | | | 1.26 | % | | | 1.71 | % | | | 167.34 | % |
| $ | 18.88 | | | | (3.08 | )% | | $ | 634 | | | | 1.64 | % | | | 1.29 | % | | | 1.64 | % | | | 142.59 | % |
| $ | 21.67 | | | | 10.11 | % | | $ | 887 | | | | 1.62 | % | | | 0.69 | % | | | 1.62 | % | | | 127.89 | % |
| $ | 20.13 | | | | 18.00 | % | | $ | 966 | | | | 1.64 | % | | | 1.12 | % | | | 1.64 | % | | | 144.85 | % |
| $ | 17.20 | | | | 7.87 | % | | $ | 919 | | | | 1.76 | % | | | 0.81 | % | | | 1.90 | % | | | 145.53 | % |
| | | | | | | | | | | | | | | | | | | | | | | | | | | |
| $ | 11.85 | | | | (6.46 | )% | | $ | 1,584 | | | | 1.88 | % | | | (0.61 | )% | | | 2.02 | % | | | 28.77 | % |
| $ | 13.83 | | | | (3.52 | )% | | $ | 2,826 | | | | 1.93 | % | | | (0.46 | )% | | | 1.93 | % | | | 26.62 | % |
| $ | 16.86 | | | | 5.72 | % | | $ | 4,097 | | | | 1.92 | % | | | (0.91 | )% | | | 1.92 | % | | | 34.62 | % |
| $ | 16.76 | | | | 14.58 | % | | $ | 4,363 | | | | 1.90 | % | | | (0.87 | )% | | | 1.90 | % | | | 24.83 | % |
| $ | 15.12 | | | | 12.22 | % | | $ | 5,282 | | | | 1.93 | % | | | (0.61 | )% | | | 1.93 | % | | | 25.45 | % |
| | | | | | | | | | | | | | | | | | | | | | | | | | | |
| $ | 11.28 | | | | (18.47 | )% | | $ | 100 | | | | 1.81 | % | | | 0.05 | % | | | 1.83 | % | | | 119.76 | % |
| $ | 13.94 | | | | (10.28 | )% | | $ | 150 | | | | 1.80 | % | | | 0.43 | % | | | 1.80 | % | | | 124.82 | % |
| $ | 17.89 | | | | 4.88 | % | | $ | 180 | | | | 1.78 | % | | | 0.17 | % | | | 1.78 | % | | | 89.85 | % |
| $ | 17.69 | | | | 20.73 | % | | $ | 191 | | | | 1.80 | % | | | (0.10 | )% | | | 1.85 | % | | | 109.05 | % |
| $ | 14.70 | | | | 8.68 | % | | $ | 364 | | | | 1.88 | % | | | 0.52 | % | | | 1.98 | % | | | 120.42 | % |
| | | | | | | | | | | | | | | | | | | | | | | | | | | |
| $ | 19.67 | | | | 4.73 | % | | $ | 60,777 | | | | 1.86 | % | | | (0.79 | )% | | | 1.86 | % | | | 17.50 | % |
| $ | 20.04 | | | | 0.48 | % | | $ | 83,451 | | | | 1.86 | % | | | (0.71 | )% | | | 1.86 | % | | | 17.31 | % |
| $ | 21.98 | | | | 16.27 | % | | $ | 144,100 | | | | 1.86 | % | | | (0.70 | )% | | | 1.86 | % | | | 22.78 | % |
| $ | 20.88 | | | | 15.08 | % | | $ | 149,892 | | | | 1.87 | % | | | (0.68 | )% | | | 1.87 | % | | | 18.92 | % |
| $ | 18.54 | | | | 7.76 | % | | $ | 181,061 | | | | 1.92 | % | | | (0.73 | )% | | | 1.97 | % | | | 27.32 | % |
| | | | | | | | | | | | | | | | | | | | | | | | | | | |
| $ | 19.83 | | | | (0.85 | )% | | $ | 119,475 | | | | 1.77 | % | | | 1.04 | % | | | 1.78 | % | | | 33.60 | % |
| $ | 21.05 | | | | 7.66 | % | | $ | 158,353 | | | | 1.77 | % | | | 1.17 | % | | | 1.77 | % | | | 23.20 | % |
| $ | 21.34 | | | | 14.41 | % | | $ | 207,659 | | | | 1.77 | % | | | 0.91 | % | | | 1.77 | % | | | 19.49 | % |
| $ | 20.66 | | | | 15.36 | % | | $ | 234,108 | | | | 1.78 | % | | | 1.03 | % | | | 1.78 | % | | | 16.93 | % |
| $ | 18.14 | | | | 13.66 | % | | $ | 271,598 | | | | 1.96 | % | | | 1.03 | % | | | 1.96 | % | | | 20.64 | % |
| | | | | | | | | | | | | | | | | | | | | | | | | | | |
| $ | 8.06 | | | | (12.41 | )% | | $ | 44 | | | | 1.63 | % | | | 2.03 | % | | | 1.83 | % | | | 164.02 | % |
| $ | 9.37 | | | | (9.44 | )% | | $ | 63 | | | | 1.69 | % | | | 2.68 | % | | | 1.89 | % | | | 97.74 | % |
| $ | 11.06 | | | | (2.18 | )% | | $ | 61 | | | | 1.65 | % | | | 2.15 | % | | | 1.85 | % | | | 96.65 | % |
| $ | 11.64 | | | | 22.19 | % | | $ | 59 | | | | 1.68 | % | | | 1.44 | % | | | 1.94 | % | | | 91.65 | % |
| $ | 9.62 | | | | 6.38 | % | | $ | 47 | | | | 1.80 | % | | | 1.83 | % | | | 2.13 | % | | | 125.35 | % |
Financial Highlights, Class C Shares
The financial highlights table is intended to help you understand the Funds’ financial performance for the past 5 years or, if shorter, the period of the Funds’ operations. Certain information reflects financial results for a single Fund share. The total returns in the table represent the rate that an investor would have earned (or lost) on an investment in the Fund (assuming reinvestment of all dividends and distributions).
| | | | | | Investment Activities | | | Distributions | |
| | | Net Asset Value, Beginning of Period | | | Net investment income (loss)(a) | | | Net realized/ unrealized gains (losses) on investments | | | Total from Investment Activities | | | Net investment income | | | Net realized gains on investments | | | Total Distributions | |
| Sterling Capital SMID Opportunities Fund | | | | | | | | | | | | | | | | | | | | | | |
| Year Ended September 30, 2020 | | $ | 12.99 | | | | (0.11 | ) | | | (0.13 | ) | | | (0.24 | ) | | | — | | | | (0.63 | ) | | | (0.63 | ) |
| Year Ended September 30, 2019 | | $ | 12.30 | | | | (0.11 | ) | | | 0.80 | | | | 0.69 | | | | — | | | | — | | | | — | |
| Year Ended September 30, 2018 | | $ | 11.67 | | | | (0.13 | ) | | | 0.96 | | | | 0.83 | | | | (0.02 | ) | | | (0.18 | ) | | | (0.20 | ) |
| October 3, 2016 to September 30, 2017(d) | | $ | 10.00 | | | | (0.09 | ) | | | 1.76 | | | | 1.67 | | | | — | | | | — | | | | — | |
| Sterling Capital Stratton Mid Cap Value Fund |
| Year Ended September 30, 2020 | | $ | 62.48 | | | | (0.12 | ) | | | (3.60 | ) | | | (3.72 | ) | | | (0.01 | ) | | | (1.51 | ) | | | (1.52 | ) |
| Year Ended September 30, 2019 | | $ | 67.46 | | | | (0.12 | ) | | | 0.16 | | | | 0.04 | | | | — | | | | (5.02 | ) | | | (5.02 | ) |
| Year Ended September 30, 2018 | | $ | 65.40 | | | | (0.42 | ) | | | 4.77 | | | | 4.35 | | | | — | | | | (2.29 | ) | | | (2.29 | ) |
| Year Ended September 30, 2017 | | $ | 55.55 | | | | (0.41 | ) | | | 10.53 | | | | 10.12 | | | | — | | | | (0.27 | ) | | | (0.27 | ) |
| Period Ended September 30, 2016 | | $ | 52.54 | | | | (0.32 | ) | | | 3.33 | | | | 3.01 | | | | — | | | | — | | | | — | |
| Sterling Capital Stratton Real Estate Fund | | | | | | | | | | | | | | | | | | | | | | | | |
| Year Ended September 30, 2020 | | $ | 42.06 | | | | 0.22 | | | | (3.94 | ) | | | (3.72 | ) | | | (0.49 | ) | | | (1.52 | ) | | | (2.01 | ) |
| Year Ended September 30, 2019 | | $ | 37.40 | | | | 0.42 | | | | 5.99 | | | | 6.41 | | | | (0.51 | ) | | | (1.24 | ) | | | (1.75 | ) |
| Year Ended September 30, 2018 | | $ | 36.91 | | | | 0.51 | | | | 1.45 | | | | 1.96 | | | | (0.25 | ) | | | (1.22 | ) | | | (1.47 | ) |
| Year Ended September 30, 2017 | | $ | 39.50 | | | | 0.43 | | | | (0.49 | ) | | | (0.06 | ) | | | (0.78 | ) | | | (1.75 | ) | | | (2.53 | ) |
| Period Ended September 30, 2016 | | $ | 35.97 | | | | 0.34 | | | | 3.58 | | | | 3.92 | | | | (0.39 | ) | | | — | | | | (0.39 | ) |
| Sterling Capital Stratton Small Cap Value Fund |
| Year Ended September 30, 2020 | | $ | 75.87 | | | | (0.24 | ) | | | (9.11 | ) | | | (9.35 | ) | | | (0.03 | ) | | | (4.93 | ) | | | (4.96 | ) |
| Year Ended September 30, 2019 | | $ | 86.92 | | | | (0.19 | ) | | | (4.96 | ) | | | (5.15 | ) | | | — | | | | (5.90 | ) | | | (5.90 | ) |
| Year Ended September 30, 2018 | | $ | 88.75 | | | | (0.62 | ) | | | 6.48 | | | | 5.86 | | | | — | | | | (7.69 | ) | | | (7.69 | ) |
| Year Ended September 30, 2017 | | $ | 77.88 | | | | (0.64 | ) | | | 15.61 | | | | 14.97 | | | | — | | | | (4.10 | ) | | | (4.10 | ) |
| Period Ended September 30, 2016 | | $ | 69.88 | | | | (0.41 | ) | | | 8.41 | | | | 8.00 | | | | — | | | | — | | | | — | |
| Sterling Capital Short Duration Bond Fund | | | | | | | | | | | | | | | | | | | | | | | |
| Year Ended September 30, 2020 | | $ | 8.64 | | | | 0.11 | | | | 0.15 | | | | 0.26 | | | | (0.13 | ) | | | — | | | | (0.13 | ) |
| Year Ended September 30, 2019 | | $ | 8.51 | | | | 0.14 | | | | 0.16 | | | | 0.30 | | | | (0.17 | ) | | | — | | | | (0.17 | ) |
| Year Ended September 30, 2018 | | $ | 8.69 | | | | 0.09 | | | | (0.12 | ) | | | (0.03 | ) | | | (0.15 | ) | | | — | | | | (0.15 | ) |
| Year Ended September 30, 2017 | | $ | 8.80 | | | | 0.03 | | | | — | | | | 0.03 | | | | (0.14 | ) | | | — | | | | (0.14 | ) |
| Year Ended September 30, 2016 | | $ | 8.85 | | | | 0.03 | | | | 0.07 | | | | 0.10 | | | | (0.16 | ) | | | — | | | | (0.16 | ) |
| * | During the periods certain fees were waived (See Note 5 in the Notes to the Financial Statements). If such reductions had not occurred, the ratios would have been as indicated. |
| ** | Portfolio turnover rate is calculated on the basis of the Fund as a whole without distinguishing between classes of shares issued. |
| (a) | Per share net investment income (loss) has been calculated using the average daily shares method. |
| (b) | Not annualized for periods less than one year. |
| (c) | Annualized for periods less than one year. |
| (d) | Period from commencement of operations. |
See accompanying Notes to the Financial Statements.
| | | | | | | | | Ratios/Supplementary Data | |
| Net Asset Value, End of Period | | | Total Return (excludes sales charge) (b) | | | Net Assets, End of Period (000) | | | Ratio of net expenses to average net assets (c) | | | Ratio of net investment income (loss) to average net assets (c) | | | Ratio of expenses to average net assets*(c) | | | Portfolio turnover rate**(b) | |
| | | | | | | | | | | | | | | | | | | | | | | | | | | |
| $ | 12.12 | | | | (2.22 | )% | | $ | 1,250 | | | | 1.79 | % | | | (0.97 | )% | | | 2.09 | % | | | 60.03 | % |
| $ | 12.99 | | | | 5.61 | % | | $ | 1,188 | | | | 1.79 | % | | | (0.95 | )% | | | 2.19 | % | | | 45.11 | % |
| $ | 12.30 | | | | 7.25 | % | | $ | 1,476 | | | | 1.79 | % | | | (1.13 | )% | | | 2.04 | % | | | 45.64 | % |
| $ | 11.67 | | | | 16.70 | % | | $ | 1,414 | | | | 1.79 | % | | | (0.80 | )% | | | 2.38 | % | | | 37.97 | % |
| | | | | | | | | | | | | | | | | | | | | | | | | | | |
| $ | 57.24 | | | | (6.21 | )% | | $ | 1 | | | | 1.92 | % | | | (0.20 | )% | | | 1.92 | % | | | 9.21 | % |
| $ | 62.48 | | | | 1.03 | % | | $ | 1 | | | | 1.95 | % | | | (0.21 | )% | | | 1.95 | % | | | 6.75 | % |
| $ | 67.46 | | | | 6.70 | % | | $ | 1 | | | | 1.95 | % | | | (0.63 | )% | | | 1.95 | % | | | 14.47 | % |
| $ | 65.40 | | | | 18.27 | % | | $ | 1 | | | | 1.89 | % | | | (0.68 | )% | | | 1.89 | % | | | 12.19 | % |
| $ | 55.55 | | | | 5.73 | % | | $ | 1 | | | | 1.95 | % | | | (0.82 | )% | | | 1.95 | % | | | 11.16 | % |
| | | | | | | | | | | | | | | | | | | | | | | | | | | |
| $ | 36.33 | | | | (9.02 | )% | | $ | 192 | | | | 1.83 | % | | | 0.58 | % | | | 1.83 | % | | | 19.58 | % |
| $ | 42.06 | | | | 17.88 | % | | $ | 205 | | | | 1.82 | % | | | 1.08 | % | | | 1.82 | % | | | 14.56 | % |
| $ | 37.40 | | | | 5.38 | % | | $ | 98 | | | | 1.82 | % | | | 1.41 | % | | | 1.82 | % | | | 8.34 | % |
| $ | 36.91 | | | | 0.16 | % | | $ | 64 | | | | 1.79 | % | | | 1.18 | % | | | 1.80 | % | | | 13.52 | % |
| $ | 39.50 | | | | 10.90 | % | | $ | 20 | | | | 1.83 | % | | | 1.21 | % | | | 1.85 | % | | | 18.43 | % |
| | | | | | | | | | | | | | | | | | | | | | | | | | | |
| $ | 61.56 | | | | (13.46 | )% | | $ | 245 | | | | 2.00 | % | | | (0.35 | )% | | | 2.08 | % | | | 8.33 | % |
| $ | 75.87 | | | | (5.49 | )% | | $ | 279 | | | | 2.03 | % | | | (0.25 | )% | | | 2.08 | % | | | 8.60 | % |
| $ | 86.92 | | | | 6.90 | % | | $ | 112 | | | | 2.03 | % | | | (0.71 | )% | | | 2.06 | % | | | 15.51 | % |
| $ | 88.75 | | | | 19.55 | % | | $ | 107 | | | | 2.06 | % | | | 0.78 | % | | | 2.06 | % | | | 7.04 | % |
| $ | 77.88 | | | | 11.45 | % | | $ | 65 | | | | 2.08 | % | | | (0.74 | )% | | | 2.08 | % | | | 3.42 | % |
| | | | | | | | | | | | | | | | | | | | | | | | | | | |
| $ | 8.77 | | | | 3.09 | % | | $ | 893 | | | | 1.42 | % | | | 1.21 | % | | | 1.52 | % | | | 64.69 | % |
| $ | 8.64 | | | | 3.52 | % | | $ | 1,052 | | | | 1.43 | % | | | 1.68 | % | | | 1.53 | % | | | 78.58 | % |
| $ | 8.51 | | | | (0.32 | )% | | $ | 1,091 | | | | 1.43 | % | | | 1.07 | % | | | 1.53 | % | | | 62.02 | % |
| $ | 8.69 | | | | 0.38 | % | | $ | 1,546 | | | | 1.45 | % | | | 0.37 | % | | | 1.55 | % | | | 78.77 | % |
| $ | 8.80 | | | | 1.22 | % | | $ | 1,886 | | | | 1.49 | % | | | 0.35 | % | | | 1.56 | % | | | 54.68 | % |
Financial Highlights, Class C Shares
The financial highlights table is intended to help you understand the Funds’ financial performance for the past 5 years or, if shorter, the period of the Funds’ operations. Certain information reflects financial results for a single Fund share. The total returns in the table represent the rate that an investor would have earned (or lost) on an investment in the Fund (assuming reinvestment of all dividends and distributions).
| | | | | | Investment Activities | | | Distributions | |
| | | Net Asset Value, Beginning of Year | | | Net investment income(a) | | | Net realized/ unrealized gains (losses) on investments | | | Total from Investment Activities | | | Net investment income | | | Net realized gains on investments | | | Return of capital | | | Total Distributions | |
| Sterling Capital Intermediate U.S. Government Fund | | | | | | | | | | | | | | | | | | | | |
| Year Ended September 30, 2020 | | $ | 9.91 | | | | 0.09 | | | | 0.28 | | | | 0.37 | | | | (0.17 | ) | | | — | | | | — | | | | (0.17 | ) |
| Year Ended September 30, 2019 | | $ | 9.47 | | | | 0.13 | | | | 0.48 | | | | 0.61 | | | | (0.17 | ) | | | — | | | | — | | | | (0.17 | ) |
| Year Ended September 30, 2018 | | $ | 9.89 | | | | 0.09 | | | | (0.32 | ) | | | (0.23 | ) | | | (0.19 | ) | | | — | | | | — | | | | (0.19 | ) |
| Year Ended September 30, 2017 | | $ | 10.22 | | | | 0.08 | | | | (0.28 | ) | | | (0.20 | ) | | | (0.13 | ) | | | — | | | | — | | | | (0.13 | ) |
| Year Ended September 30, 2016 | | $ | 10.17 | | | | 0.05 | | | | 0.10 | | | | 0.15 | | | | (0.10 | ) | | | — | | | | — | | | | (0.10 | ) |
| Sterling Capital Total Return Bond Fund | | | | | | | | | | | | | | | | | | | | |
| Year Ended September 30, 2020 | | $ | 10.90 | | | | 0.16 | | | | 0.54 | | | | 0.70 | | | | (0.20 | ) | | | — | (b) | | | — | | | | (0.20 | ) |
| Year Ended September 30, 2019 | | $ | 10.21 | | | | 0.22 | | | | 0.70 | | | | 0.92 | | | | (0.23 | ) | | | — | | | | — | | | | (0.23 | ) |
| Year Ended September 30, 2018 | | $ | 10.61 | | | | 0.19 | | | | (0.37 | ) | | | (0.18 | ) | | | (0.22 | ) | | | — | | | | — | | | | (0.22 | ) |
| Year Ended September 30, 2017 | | $ | 10.83 | | | | 0.15 | | | | (0.15 | ) | | | — | | | | (0.22 | ) | | | — | | | | — | | | | (0.22 | ) |
| Year Ended September 30, 2016 | | $ | 10.55 | | | | 0.18 | | | | 0.35 | | | | 0.53 | | | | (0.25 | ) | | | — | | | | — | | | | (0.25 | ) |
| Sterling Capital Corporate Fund | | | | | | | | | | | | | | | | | | | | |
| Year Ended September 30, 2020 | | $ | 10.36 | | | | 0.19 | | | | 0.40 | | | | 0.59 | | | | (0.19 | ) | | | — | | | | — | | | | (0.19 | ) |
| Year Ended September 30, 2019 | | $ | 9.80 | | | | 0.24 | | | | 0.55 | | | | 0.79 | | | | (0.23 | ) | | | — | | | | — | | | | (0.23 | ) |
| Year Ended September 30, 2018 | | $ | 10.23 | | | | 0.22 | | | | (0.36 | ) | | | (0.14 | ) | | | (0.22 | ) | | | (0.07 | ) | | | — | | | | (0.29 | ) |
| Year Ended September 30, 2017 | | $ | 10.35 | | | | 0.21 | | | | (0.08 | ) | | | 0.13 | | | | (0.21 | ) | | | (0.04 | ) | | | — | | | | (0.25 | ) |
| Year Ended September 30, 2016 | | $ | 10.09 | | | | 0.21 | | | | 0.26 | | | | 0.47 | | | | (0.21 | ) | | | — | | | | — | | | | (0.21 | ) |
| Sterling Capital Quality Income Fund | | | | | | | | | | | | | | | | | | | | |
| Year Ended September 30, 2020 | | $ | 10.08 | | | | 0.17 | | | | 0.16 | | | | 0.33 | | | | (0.17 | ) | | | — | | | | — | | | | (0.17 | ) |
| Year Ended September 30, 2019 | | $ | 9.60 | | | | 0.21 | | | | 0.48 | | | | 0.69 | | | | (0.21 | ) | | | — | | | | — | | | | (0.21 | ) |
| Year Ended September 30, 2018 | | $ | 9.93 | | | | 0.19 | | | | (0.32 | ) | | | (0.13 | ) | | | (0.20 | ) | | | — | | | | — | | | | (0.20 | ) |
| Year Ended September 30, 2017 | | $ | 10.09 | | | | 0.13 | | | | (0.12 | ) | | | 0.01 | | | | (0.17 | ) | | | — | | | | — | | | | (0.17 | ) |
| Year Ended September 30, 2016 | | $ | 9.97 | | | | 0.12 | | | | 0.16 | | | | 0.28 | | | | (0.16 | ) | | | — | | | | — | | | | (0.16 | ) |
| Sterling Capital Kentucky Intermediate Tax-Free Fund | | | | | | | | | | | | | | | | | | | | |
| Year Ended September 30, 2020 | | $ | 10.33 | | | | 0.10 | | | | 0.23 | | | | 0.33 | | | | (0.10 | ) | | | (0.02 | ) | | | — | | | | (0.12 | ) |
| Year Ended September 30, 2019 | | $ | 9.91 | | | | 0.13 | | | | 0.48 | | | | 0.61 | | | | (0.13 | ) | | | (0.06 | ) | | | — | | | | (0.19 | ) |
| Year Ended September 30, 2018 | | $ | 10.28 | | | | 0.15 | | | | (0.34 | ) | | | (0.19 | ) | | | (0.15 | ) | | | (0.03 | ) | | | — | | | | (0.18 | ) |
| Year Ended September 30, 2017 | | $ | 10.65 | | | | 0.14 | | | | (0.22 | ) | | | (0.08 | ) | | | (0.15 | ) | | | (0.14 | ) | | | — | | | | (0.29 | ) |
| Year Ended September 30, 2016 | | $ | 10.63 | | | | 0.16 | | | | 0.15 | | | | 0.31 | | | | (0.16 | ) | | | (0.13 | ) | | | — | | | | (0.29 | ) |
| Sterling Capital Maryland Intermediate Tax-Free Fund | | | | | | | | | | | | | | | | | | | | |
| Year Ended September 30, 2020 | | $ | 10.96 | | | | 0.10 | | | | 0.18 | | | | 0.28 | | | | (0.10 | ) | | | (0.06 | ) | | | — | | | | (0.16 | ) |
| Year Ended September 30, 2019 | | $ | 10.62 | | | | 0.12 | | | | 0.47 | | | | 0.59 | | | | (0.12 | ) | | | (0.13 | ) | | | — | | | | (0.25 | ) |
| Year Ended September 30, 2018 | | $ | 11.02 | | | | 0.12 | | | | (0.34 | ) | | | (0.22 | ) | | | (0.12 | ) | | | (0.06 | ) | | | — | | | | (0.18 | ) |
| Year Ended September 30, 2017 | | $ | 11.31 | | | | 0.12 | | | | (0.21 | ) | | | (0.09 | ) | | | (0.12 | ) | | | (0.08 | ) | | | — | | | | (0.20 | ) |
| Year Ended September 30, 2016 | | $ | 11.18 | | | | 0.11 | | | | 0.20 | | | | 0.31 | | | | (0.11 | ) | | | (0.07 | ) | | | — | | | | (0.18 | ) |
| Sterling Capital North Carolina Intermediate Tax-Free Fund | | | | | | | | | | | | | | | | | | | | |
| Year Ended September 30, 2020 | | $ | 10.90 | | | | 0.10 | | | | 0.22 | | | | 0.32 | | | | (0.10 | ) | | | — | | | | — | | | | (0.10 | ) |
| Year Ended September 30, 2019 | | $ | 10.42 | | | | 0.15 | | | | 0.48 | | | | 0.63 | | | | (0.15 | ) | | | — | | | | — | | | | (0.15 | ) |
| Year Ended September 30, 2018 | | $ | 10.77 | | | | 0.16 | | | | (0.35 | ) | | | (0.19 | ) | | | (0.16 | ) | | | — | | | | — | | | | (0.16 | ) |
| Year Ended September 30, 2017 | | $ | 11.07 | | | | 0.14 | | | | (0.26 | ) | | | (0.12 | ) | | | (0.14 | ) | | | (0.04 | ) | | | — | | | | (0.18 | ) |
| Year Ended September 30, 2016 | | $ | 10.96 | | | | 0.15 | | | | 0.17 | | | | 0.32 | | | | (0.15 | ) | | | (0.06 | ) | | | — | | | | (0.21 | ) |
| * | During the periods certain fees were waived (See Note 5 in the Notes to the Financial Statements). If such reductions had not occurred, the ratios would have been as indicated. |
| ** | Portfolio turnover rate is calculated on the basis of the Fund as a whole without distinguishing between classes of shares issued. |
| (a) | Per share net investment income has been calculated using the average daily shares method. |
| (b) | Amount is less than $0.005. |
See accompanying Notes to the Financial Statements.
| | | | | | | | | Ratios/Supplementary Data | |
| Net Asset Value, End of Year | | | Total Return (excludes sales charge) | | | Net Assets, End of Year (000) | | | Ratio of net expenses to average net assets | | | Ratio of net investment income to average net assets | | | Ratio of expenses to average net assets* | | | Portfolio turnover rate** | |
| | | | | | | | | | | | | | | | | | | | | | | | | | | |
| $ | 10.11 | | | | 3.78 | % | | $ | 309 | | | | 1.54 | % | | | 0.93 | % | | | 1.70 | % | | | 47.36 | % |
| $ | 9.91 | | | | 6.48 | % | | $ | 378 | | | | 1.56 | % | | | 1.37 | % | | | 1.66 | % | | | 40.13 | % |
| $ | 9.47 | | | | (2.37 | )% | | $ | 488 | | | | 1.66 | % | | | 0.98 | % | | | 1.67 | % | | | 40.85 | % |
| $ | 9.89 | | | | (1.94 | )% | | $ | 577 | | | | 1.62 | % | | | 0.80 | % | | | 1.66 | % | | | 32.44 | % |
| $ | 10.22 | | | | 1.51 | % | | $ | 706 | | | | 1.60 | % | | | 0.48 | % | | | 1.72 | % | | | 49.39 | % |
| | | | | | | | | | | | | | | | | | | | | | | | | | | |
| $ | 11.40 | | | | 6.53 | % | | $ | 8,332 | | | | 1.45 | % | | | 1.44 | % | | | 1.57 | % | | | 59.59 | % |
| $ | 10.90 | | | | 9.17 | % | | $ | 8,266 | | | | 1.45 | % | | | 2.11 | % | | | 1.58 | % | | | 79.40 | % |
| $ | 10.21 | | | | (1.73 | )% | | $ | 7,464 | | | | 1.45 | % | | | 1.81 | % | | | 1.57 | % | | | 62.28 | % |
| $ | 10.61 | | | | 0.00 | % | | $ | 7,582 | | | | 1.47 | % | | | 1.38 | % | | | 1.57 | % | | | 64.07 | % |
| $ | 10.83 | | | | 5.05 | % | | $ | 7,933 | | | | 1.49 | % | | | 1.66 | % | | | 1.59 | % | | | 65.47 | % |
| | | | | | | | | | | | | | | | | | | | | | | | | | | |
| $ | 10.76 | | | | 5.80 | % | | $ | 3 | | | | 1.64 | % | | | 1.86 | % | | | 1.65 | % | | | 52.28 | % |
| $ | 10.36 | | | | 8.18 | % | | $ | 3 | | | | 1.68 | % | | | 2.36 | % | | | 1.68 | % | | | 82.23 | % |
| $ | 9.80 | | | | (1.44 | )% | | $ | 42 | | | | 1.63 | % | | | 2.19 | % | | | 1.63 | % | | | 66.82 | % |
| $ | 10.23 | | | | 1.30 | % | | $ | 43 | | | | 1.64 | % | | | 2.09 | % | | | 1.64 | % | | | 78.79 | % |
| $ | 10.35 | | | | 4.69 | % | | $ | 58 | | | | 1.64 | % | | | 2.03 | % | | | 1.64 | % | | | 83.88 | % |
| | | | | | | | | | | | | | | | | | | | | | | | | | | |
| $ | 10.24 | | | | 3.34 | % | | $ | 3 | | | | 1.57 | % | | | 1.63 | % | | | 1.61 | % | | | 35.96 | % |
| $ | 10.08 | | | | 7.21 | % | | $ | 34 | | | | 1.60 | % | | | 2.15 | % | | | 1.64 | % | | | 17.58 | % |
| $ | 9.60 | | | | (1.27 | )% | | $ | 33 | | | | 1.58 | % | | | 1.97 | % | | | 1.62 | % | | | 19.17 | % |
| $ | 9.93 | | | | 0.12 | % | | $ | 34 | | | | 1.60 | % | | | 1.31 | % | | | 1.64 | % | | | 34.72 | % |
| $ | 10.09 | | | | 2.83 | % | | $ | 40 | | | | 1.61 | % | | | 1.16 | % | | | 1.65 | % | | | 43.63 | % |
| | | | | | | | | | | | | | | | | | | | | | | | | | | |
| $ | 10.54 | | | | 3.22 | % | | $ | 2 | | | | 1.71 | % | | | 0.96 | % | | | 1.71 | % | | | 7.76 | % |
| $ | 10.33 | | | | 6.28 | % | | $ | 2 | | | | 1.70 | % | | | 1.31 | % | | | 1.70 | % | | | 32.58 | % |
| $ | 9.91 | | | | (1.93 | )% | | $ | 2 | | | | 1.68 | % | | | 1.45 | % | | | 1.68 | % | | | 20.37 | % |
| $ | 10.28 | | | | (0.74 | )% | | $ | 2 | | | | 1.58 | % | | | 1.32 | % | | | 1.65 | % | | | 17.93 | % |
| $ | 10.65 | | | | 2.93 | % | | $ | 20 | | | | 1.65 | % | | | 1.50 | % | | | 1.76 | % | | | 16.44 | % |
| | | | | | | | | | | | | | | | | | | | | | | | | | | |
| $ | 11.08 | | | | 2.56 | % | | $ | 510 | | | | 1.68 | % | | | 0.87 | % | | | 1.69 | % | | | 9.44 | % |
| $ | 10.96 | | | | 5.65 | % | | $ | 528 | | | | 1.67 | % | | | 1.09 | % | | | 1.69 | % | | | 20.76 | % |
| $ | 10.62 | | | | (1.97 | )% | | $ | 591 | | | | 1.63 | % | | | 1.14 | % | | | 1.63 | % | | | 31.12 | % |
| $ | 11.02 | | | | (0.74 | )% | | $ | 627 | | | | 1.61 | % | | | 1.13 | % | | | 1.65 | % | | | 5.89 | % |
| $ | 11.31 | | | | 2.85 | % | | $ | 802 | | | | 1.61 | % | | | 1.01 | % | | | 1.71 | % | | | 14.36 | % |
| | | | | | | | | | | | | | | | | | | | | | | | | | | |
| $ | 11.12 | | | | 2.96 | % | | $ | 2,793 | | | | 1.54 | % | | | 0.92 | % | | | 1.54 | % | | | 17.06 | % |
| $ | 10.90 | | | | 6.05 | % | | $ | 2,878 | | | | 1.55 | % | | | 1.38 | % | | | 1.55 | % | | | 33.12 | % |
| $ | 10.42 | | | | (1.80 | )% | | $ | 3,359 | | | | 1.54 | % | | | 1.48 | % | | | 1.54 | % | | | 22.06 | % |
| $ | 10.77 | | | | (1.06 | )% | | $ | 4,591 | | | | 1.54 | % | | | 1.34 | % | | | 1.58 | % | | | 25.92 | % |
| $ | 11.07 | | | | 2.91 | % | | $ | 6,108 | | | | 1.55 | % | | | 1.31 | % | | | 1.65 | % | | | 10.05 | % |
Financial Highlights, Class C Shares
The financial highlights table is intended to help you understand the Funds’ financial performance for the past 5 years or, if shorter, the period of the Funds’ operations. Certain information reflects financial results for a single Fund share. The total returns in the table represent the rate that an investor would have earned (or lost) on an investment in the Fund (assuming reinvestment of all dividends and distributions).
| | | | | | Investment Activities | | | Distributions | |
| | | Net Asset Value, Beginning of Year | | | Net investment income(a) | | | Net realized/ unrealized gains (losses) on investments | | | Total from Investment Activities | | | Net investment income | | | Return of Capital | | | Net realized gains on investments | | | Total Distributions | |
| Sterling Capital South Carolina Intermediate Tax-Free Fund | | | | | | | | | | | | | | | | | | | | |
| Year Ended September 30, 2020 | | $ | 11.27 | | | | 0.11 | | | | 0.19 | | | | 0.30 | | | | (0.11 | ) | | | — | | | | — | | | | (0.11 | ) |
| Year Ended September 30, 2019 | | $ | 10.76 | | | | 0.12 | | | | 0.51 | | | | 0.63 | | | | (0.12 | ) | | | — | | | | — | | | | (0.12 | ) |
| Year Ended September 30, 2018 | | $ | 11.10 | | | | 0.12 | | | | (0.34 | ) | | | (0.22 | ) | | | (0.12 | ) | | | — | | | | — | | | | (0.12 | ) |
| Year Ended September 30, 2017 | | $ | 11.30 | | | | 0.11 | | | | (0.20 | ) | | | (0.09 | ) | | | (0.11 | ) | | | — | | | | — | | | | (0.11 | ) |
| Year Ended September 30, 2016 | | $ | 11.14 | | | | 0.12 | | | | 0.20 | | | | 0.32 | | | | (0.12 | ) | | | — | | | | (0.04 | ) | | | (0.16 | ) |
| Sterling Capital Virginia Intermediate Tax-Free Fund | | | | | | | | | | | | | | | | | | | | |
| Year Ended September 30, 2020 | | $ | 11.97 | | | | 0.11 | | | | 0.25 | | | | 0.36 | | | | (0.11 | ) | | | — | | | | — | | | | (0.11 | ) |
| Year Ended September 30, 2019 | | $ | 11.40 | | | | 0.14 | | | | 0.57 | | | | 0.71 | | | | (0.14 | ) | | | — | | | | — | | | | (0.14 | ) |
| Year Ended September 30, 2018 | | $ | 11.76 | | | | 0.14 | | | | (0.36 | ) | | | (0.22 | ) | | | (0.14 | ) | | | — | | | | — | | | | (0.14 | ) |
| Year Ended September 30, 2017 | | $ | 12.13 | | | | 0.14 | | | | (0.28 | ) | | | (0.14 | ) | | | (0.14 | ) | | | — | | | | (0.09 | ) | | | (0.23 | ) |
| Year Ended September 30, 2016 | | $ | 11.98 | | | | 0.15 | | | | 0.19 | | | | 0.34 | | | | (0.15 | ) | | | — | | | | (0.04 | ) | | | (0.19 | ) |
| Sterling Capital West Virginia Intermediate Tax-Free Fund | | | | | | | | | | | | | | | | | | | | |
| Year Ended September 30, 2020 | | $ | 10.13 | | | | 0.11 | | | | 0.18 | | | | 0.29 | | | | (0.11 | ) | | | — | | | | (0.01 | ) | | | (0.12 | ) |
| Year Ended September 30, 2019 | | $ | 9.72 | | | | 0.14 | | | | 0.43 | | | | 0.57 | | | | (0.14 | ) | | | — | | | | (0.02 | ) | | | (0.16 | ) |
| Year Ended September 30, 2018 | | $ | 10.05 | | | | 0.14 | | | | (0.32 | ) | | | (0.18 | ) | | | (0.14 | ) | | | — | | | | (0.01 | ) | | | (0.15 | ) |
| Year Ended September 30, 2017 | | $ | 10.27 | | | | 0.13 | | | | (0.17 | ) | | | (0.04 | ) | | | (0.13 | ) | | | — | | | | (0.05 | ) | | | (0.18 | ) |
| Year Ended September 30, 2016 | | $ | 10.14 | | | | 0.13 | | | | 0.18 | | | | 0.31 | | | | (0.13 | ) | | | — | | | | (0.05 | ) | | | (0.18 | ) |
| Sterling Capital Diversified Income Fund(b) | | | | | | | | | | | | | | | | | | | | |
| Year Ended September 30, 2020 | | $ | 10.20 | | | | 0.35 | | | | (1.10 | ) | | | (0.75 | ) | | | (0.36 | ) | | | — | | | | — | | | | (0.36 | ) |
| Year Ended September 30, 2019 | | $ | 10.54 | | | | 0.38 | | | | (0.29 | ) | | | 0.09 | | | | (0.43 | ) | | | — | | | | — | | | | (0.43 | ) |
| Year Ended September 30, 2018 | | $ | 10.70 | | | | 0.27 | | | | (0.10 | ) | | | 0.17 | | | | (0.33 | ) | | | — | | | | — | | | | (0.33 | ) |
| Year Ended September 30, 2017 | | $ | 10.73 | | | | 0.33 | | | | (0.03 | ) | | | 0.30 | | | | (0.33 | ) | | | — | | | | — | | | | (0.33 | ) |
| Year Ended September 30, 2016 | | $ | 10.13 | | | | 0.24 | | | | 0.66 | | | | 0.90 | | | | (0.30 | ) | | | — | | | | — | | | | (0.30 | ) |
| Sterling Capital Strategic Allocation Balanced Fund(b) | | | | | | | | | | | | | | | | | | | | |
| Year Ended September 30, 2020 | | $ | 11.84 | | | | 0.15 | | | | (0.20 | ) | | | (0.05 | ) | | | (0.11 | ) | | | (0.03 | ) | | | (0.42 | ) | | | (0.56 | ) |
| Year Ended September 30, 2019 | | $ | 11.85 | | | | 0.17 | | | | (0.02 | ) | | | 0.15 | | | | (0.16 | ) | | | — | | | | — | | | | (0.16 | ) |
| Year Ended September 30, 2018 | | $ | 11.67 | | | | 0.15 | | | | 0.21 | | | | 0.36 | | | | (0.18 | ) | | | — | | | | — | | | | (0.18 | ) |
| Year Ended September 30, 2017 | | $ | 10.62 | | | | 0.07 | | | | 1.06 | | | | 1.13 | | | | (0.08 | ) | | | — | | | | — | | | | (0.08 | ) |
| Year Ended September 30, 2016 | | $ | 10.13 | | | | 0.09 | | | | 0.53 | | | | 0.62 | | | | (0.13 | ) | | | — | | | | — | | | | (0.13 | ) |
| Sterling Capital Strategic Allocation Growth Fund(b) | | | | | | | | | | | | | | | | | | | | |
| Year Ended September 30, 2020 | | $ | 11.61 | | | | 0.12 | | | | (0.35 | ) | | | (0.23 | ) | | | (0.11 | ) | | | (0.04 | ) | | | (0.48 | ) | | | (0.63 | ) |
| Year Ended September 30, 2019 | | $ | 11.79 | | | | 0.14 | | | | (0.17 | ) | | | (0.03 | ) | | | (0.15 | ) | | | — | | | | — | | | | (0.15 | ) |
| Year Ended September 30, 2018 | | $ | 11.47 | | | | 0.11 | | | | 0.38 | | | | 0.49 | | | | (0.17 | ) | | | — | | | | — | | | | (0.17 | ) |
| Year Ended September 30, 2017 | | $ | 10.18 | | | | 0.03 | | | | 1.32 | | | | 1.35 | | | | (0.06 | ) | | | — | | | | — | | | | (0.06 | ) |
| Year Ended September 30, 2016 | | $ | 9.68 | | | | 0.05 | | | | 0.57 | | | | 0.62 | | | | (0.12 | ) | | | — | | | | — | | | | (0.12 | ) |
| * | During the periods certain fees were waived (See Note 5 in the Notes to the Financial Statements). If such reductions had not occurred, the ratios would have been as indicated. |
| ** | Portfolio turnover rate is calculated on the basis of the Fund as a whole without distinguishing between classes of shares issued. |
| (a) | Per share net investment income (loss) has been calculated using the average daily shares method. |
| (b) | The expense ratios exclude the impact of fees/expenses paid by each underlying fund. |
See accompanying Notes to the Financial Statements.
| | | | | | | | | Ratios/Supplementary Data | |
| Net Asset Value, End of Year | | | Total Return (excludes sales charge) | | | Net Assets, End of Year (000) | | | Ratio of net expenses to average net assets | | | Ratio of net investment income to average net assets | | | Ratio of expenses to average net assets* | | | Portfolio turnover rate** | |
| | | | | | | | | | | | | | | | | | | | | | | | | | | |
| $ | 11.46 | | | | 2.72 | % | | $ | 955 | | | | 1.56 | % | | | 1.01 | % | | | 1.56 | % | | | 4.84 | % |
| $ | 11.27 | | | | 5.93 | % | | $ | 978 | | | | 1.56 | % | | | 1.13 | % | | | 1.56 | % | | | 23.84 | % |
| $ | 10.76 | | | | (1.98 | )% | | $ | 991 | | | | 1.55 | % | | | 1.11 | % | | | 1.55 | % | | | 27.71 | % |
| $ | 11.10 | | | | (0.74 | )% | | $ | 1,440 | | | | 1.56 | % | | | 1.04 | % | | | 1.59 | % | | | 31.17 | % |
| $ | 11.30 | | | | 2.82 | % | | $ | 1,806 | | | | 1.56 | % | | | 1.02 | % | | | 1.66 | % | | | 2.69 | % |
| | | | | | | | | | | | | | | | | | | | | | | | | | | |
| $ | 12.22 | | | | 3.03 | % | | $ | 780 | | | | 1.56 | % | | | 0.92 | % | | | 1.56 | % | | | 15.44 | % |
| $ | 11.97 | | | | 6.25 | % | | $ | 822 | | | | 1.56 | % | | | 1.19 | % | | | 1.56 | % | | | 24.57 | % |
| $ | 11.40 | | | | (1.87 | )% | | $ | 844 | | | | 1.55 | % | | | 1.22 | % | | | 1.55 | % | | | 21.08 | % |
| $ | 11.76 | | | | (1.14 | )% | | $ | 935 | | | | 1.55 | % | | | 1.18 | % | | | 1.59 | % | | | 23.25 | % |
| $ | 12.13 | | | | 2.88 | % | | $ | 1,170 | | | | 1.56 | % | | | 1.24 | % | | | 1.66 | % | | | 16.18 | % |
| | | | | | | | | | | | | | | | | | | | | | | | | | | |
| $ | 10.30 | | | | 2.89 | % | | $ | 304 | | | | 1.56 | % | | | 1.10 | % | | | 1.56 | % | | | 3.28 | % |
| $ | 10.13 | | | | 5.90 | % | | $ | 335 | | | | 1.56 | % | | | 1.45 | % | | | 1.56 | % | | | 33.73 | % |
| $ | 9.72 | | | | (1.82 | )% | | $ | 726 | | | | 1.55 | % | | | 1.39 | % | | | 1.55 | % | | | 17.53 | % |
| $ | 10.05 | | | | (0.38 | )% | | $ | 739 | | | | 1.56 | % | | | 1.34 | % | | | 1.59 | % | | | 21.00 | % |
| $ | 10.27 | | | | 3.14 | % | | $ | 817 | | | | 1.57 | % | | | 1.29 | % | | | 1.67 | % | | | 11.31 | % |
| | | | | | | | | | | | | | | | | | | | | | | | | | | |
| $ | 9.09 | | | | (7.46 | )% | | $ | 416 | | | | 1.56 | % | | | 3.66 | % | | | 1.56 | % | | | 38.04 | % |
| $ | 10.20 | | | | 0.96 | % | | $ | 680 | | | | 1.54 | % | | | 3.68 | % | | | 1.55 | % | | | 26.68 | % |
| $ | 10.54 | | | | 1.64 | % | | $ | 1,051 | | | | 1.54 | % | | | 2.52 | % | | | 1.55 | % | | | 48.19 | % |
| $ | 10.70 | | | | 2.84 | % | | $ | 1,155 | | | | 1.52 | % | | | 3.08 | % | | | 1.52 | % | | | 43.86 | % |
| $ | 10.73 | | | | 9.07 | % | | $ | 1,157 | | | | 1.39 | % | | | 2.43 | % | | | 1.47 | % | | | 67.18 | % |
| | | | | | | | | | | | | | | | | | | | | | | | | | | |
| $ | 11.23 | | | | (0.63 | )% | | $ | 258 | | | | 1.18 | % | | | 1.35 | % | | | 1.43 | % | | | 3.91 | % |
| $ | 11.84 | | | | 1.41 | % | | $ | 406 | | | | 1.16 | % | | | 1.47 | % | | | 1.41 | % | | | 9.41 | % |
| $ | 11.85 | | | | 3.09 | % | | $ | 576 | | | | 1.16 | % | | | 1.23 | % | | | 1.41 | % | | | 14.41 | % |
| $ | 11.67 | | | | 10.68 | % | | $ | 785 | | | | 1.17 | % | | | 0.62 | % | | | 1.42 | % | | | 0.80 | % |
| $ | 10.62 | | | | 6.18 | % | | $ | 741 | | | | 1.15 | % | | | 0.89 | % | | | 1.40 | % | | | 5.19 | % |
| | | | | | | | | | | | | | | | | | | | | | | | | | | |
| $ | 10.75 | | | | (2.29 | )% | | $ | 360 | | | | 1.19 | % | | | 1.09 | % | | | 1.44 | % | | | 3.50 | % |
| $ | 11.61 | | | | (0.12 | )% | | $ | 350 | | | | 1.16 | % | | | 1.25 | % | | | 1.41 | % | | | 10.69 | % |
| $ | 11.79 | | | | 4.27 | % | | $ | 427 | | | | 1.19 | % | | | 0.95 | % | | | 1.44 | % | | | 17.81 | % |
| $ | 11.47 | | | | 13.36 | % | | $ | 407 | | | | 1.19 | % | | | 0.31 | % | | | 1.44 | % | | | 1.92 | % |
| $ | 10.18 | | | | 6.46 | % | | $ | 436 | | | | 1.18 | % | | | 0.56 | % | | | 1.43 | % | | | 5.95 | % |
Financial Highlights, Institutional Shares
The financial highlights table is intended to help you understand the Funds’ financial performance for the past 5 years or, if shorter, the period of the Funds’ operations. Certain information reflects financial results for a single Fund share. The total returns in the table represent the rate that an investor would have earned (or lost) on an investment in the Fund (assuming reinvestment of all dividends and distributions).
| | | | | | Investment Activities | | Distributions | |
| | | Net Asset Value, Beginning of Year | | | Net investment income (loss)(a) | | | Net realized/ unrealized gains (losses) on investments | | | Total from Investment Activities | | | Net investment income | | | Net realized gains on investments | | | Total Distributions | |
| Sterling Capital Behavioral Large Cap Value Equity Fund | | | | | | | | | | | | | | | | |
| Year Ended September 30, 2020 | | $ | 19.62 | | | | 0.41 | | | | (2.10 | ) | | | (1.69 | ) | | | (0.52 | ) | | | (0.58 | ) | | | (1.10 | ) |
| Year Ended September 30, 2019 | | $ | 22.43 | | | | 0.44 | | | | (1.07 | ) | | | (0.63 | ) | | | (0.43 | ) | | | (1.75 | ) | | | (2.18 | ) |
| Year Ended September 30, 2018 | | $ | 20.82 | | | | 0.33 | | | | 1.97 | | | | 2.30 | | | | (0.50 | ) | | | (0.19 | ) | | | (0.69 | ) |
| Year Ended September 30, 2017 | | $ | 17.78 | | | | 0.41 | | | | 2.98 | | | | 3.39 | | | | (0.35 | ) | | | — | | | | (0.35 | ) |
| Year Ended September 30, 2016 | | $ | 16.62 | | | | 0.32 | | | | 1.16 | | | | 1.48 | | | | (0.32 | ) | | | — | | | | (0.32 | ) |
| Sterling Capital Mid Value Fund | | | | | | | | | | | | | | | | |
| Year Ended September 30, 2020 | | $ | 16.46 | | | | 0.06 | | | | (0.81 | ) | | | (0.75 | ) | | | (0.25 | ) | | �� | (1.13 | ) | | | (1.38 | ) |
| Year Ended September 30, 2019 | | $ | 19.42 | | | | 0.08 | | | | (0.77 | ) | | | (0.69 | ) | | | (0.01 | ) | | | (2.26 | ) | | | (2.27 | ) |
| Year Ended September 30, 2018 | | $ | 19.00 | | | | 0.01 | | | | 1.26 | | | | 1.27 | | | | (0.01 | ) | | | (0.84 | ) | | | (0.85 | ) |
| Year Ended September 30, 2017 | | $ | 16.92 | | | | 0.03 | | | | 2.59 | | | | 2.62 | | | | (0.01 | ) | | | (0.53 | ) | | | (0.54 | ) |
| Year Ended September 30, 2016 | | $ | 18.14 | | | | 0.07 | | | | 2.07 | | | | 2.14 | | | | (0.02 | ) | | | (3.34 | ) | | | (3.36 | ) |
| Sterling Capital Behavioral Small Cap Value Equity Fund | | | | | | | | | | | | | | | | |
| Year Ended September 30, 2020 | | $ | 14.66 | | | | 0.13 | | | | (2.69 | ) | | | (2.56 | ) | | | (0.15 | ) | | | — | | | | (0.15 | ) |
| Year Ended September 30, 2019 | | $ | 18.82 | | | | 0.21 | | | | (2.09 | ) | | | (1.88 | ) | | | (0.30 | ) | | | (1.98 | ) | | | (2.28 | ) |
| Year Ended September 30, 2018 | | $ | 18.55 | | | | 0.19 | | | | 0.89 | | | | 1.08 | | | | (0.16 | ) | | | (0.65 | ) | | | (0.81 | ) |
| Year Ended September 30, 2017 | | $ | 15.30 | | | | 0.17 | | | | 3.18 | | | | 3.35 | | | | (0.10 | ) | | | — | | | | (0.10 | ) |
| Year Ended September 30, 2016 | | $ | 14.14 | | | | 0.22 | | | | 1.16 | | | | 1.38 | | | | (0.21 | ) | | | (0.01 | ) | | | (0.22 | ) |
| Sterling Capital Special Opportunities Fund | | | | | | | | | | | | | | | | |
| Year Ended September 30, 2020 | | $ | 26.07 | | | | 0.06 | | | | 1.45 | | | | 1.51 | | | | (0.05 | ) | | | (1.33 | ) | | | (1.38 | ) |
| Year Ended September 30, 2019 | | $ | 27.73 | | | | 0.08 | | | | 0.12 | | | | 0.20 | | | | — | (b) | | | (1.86 | ) | | | (1.86 | ) |
| Year Ended September 30, 2018 | | $ | 25.65 | | | | 0.09 | | | | 4.11 | | | | 4.20 | | | | (0.18 | ) | | | (1.94 | ) | | | (2.12 | ) |
| Year Ended September 30, 2017 | | $ | 22.48 | | | | 0.08 | | | | 3.51 | | | | 3.59 | | | | (0.01 | ) | | | (0.41 | ) | | | (0.42 | ) |
| Year Ended September 30, 2016 | | $ | 23.78 | | | | 0.06 | | | | 1.95 | | | | 2.01 | | | | — | | | | (3.31 | ) | | | (3.31 | ) |
| Sterling Capital Equity Income Fund | | | | | | | | | | | | | | | | |
| Year Ended September 30, 2020 | | $ | 21.33 | | | | 0.41 | | | | (0.39 | ) | | | 0.02 | | | | (0.41 | ) | | | (0.84 | ) | | | (1.25 | ) |
| Year Ended September 30, 2019 | | $ | 21.61 | | | | 0.44 | | | | 1.23 | | | | 1.67 | | | | (0.43 | ) | | | (1.52 | ) | | | (1.95 | ) |
| Year Ended September 30, 2018 | | $ | 20.89 | | | | 0.40 | | | | 2.66 | | | | 3.06 | | | | (0.39 | ) | | | (1.95 | ) | | | (2.34 | ) |
| Year Ended September 30, 2017 | | $ | 18.34 | | | | 0.39 | | | | 2.60 | | | | 2.99 | | | | (0.42 | ) | | | (0.02 | ) | | | (0.44 | ) |
| Year Ended September 30, 2016 | | $ | 17.39 | | | | 0.35 | | | | 2.06 | | | | 2.41 | | | | (0.36 | ) | | | (1.10 | ) | | | (1.46 | ) |
| * | During the periods certain fees were waived (See Note 5 in the Notes to the Financial Statements). If such reductions had not occurred, the ratios would have been as indicated. |
| ** | Portfolio turnover rate is calculated on the basis of the Fund as a whole without distinguishing between classes of shares issued. |
| (a) | Per share net investment income (loss) has been calculated using the average daily shares method. |
| (b) | Amount is less than $0.005. |
See accompanying Notes to the Financial Statements.
| | | | | | | Ratios/Supplementary Data | |
| Net Asset Value, End of Year | | | Total Return | | | Net Assets, End of Year (000) | | | Ratio of net expenses to average net assets | | | Ratio of net investment income (loss) to average net assets | | | Ratio of expenses to average net assets* | | | Portfolio turnover rate** | |
| | | | | | | | | | | | | | | | | | | | | | | | | | | |
| $ | 16.83 | | | | (8.96 | )% | | $ | 1,949 | | | | 0.64 | % | | | 2.18 | % | | | 0.66 | % | | | 167.34 | % |
| $ | 19.62 | | | | (2.08 | )% | | $ | 7,550 | | | | 0.64 | % | | | 2.28 | % | | | 0.64 | % | | | 142.59 | % |
| $ | 22.43 | | | | 11.19 | % | | $ | 8,862 | | | | 0.63 | % | | | 1.51 | % | | | 0.63 | % | | | 127.89 | % |
| $ | 20.82 | | | | 19.18 | % | | $ | 272,504 | | | | 0.64 | % | | | 2.12 | % | | | 0.64 | % | | | 144.85 | % |
| $ | 17.78 | | | | 8.94 | % | | $ | 240,971 | | | | 0.76 | % | | | 1.83 | % | | | 0.90 | % | | | 145.53 | % |
| | | | | | | | | | | | | | | | | | | | | | | | | | | |
| $ | 14.33 | | | | (5.50 | )% | | $ | 36,835 | | | | 0.89 | % | | | 0.39 | % | | | 1.04 | % | | | 28.77 | % |
| $ | 16.46 | | | | (2.54 | )% | | $ | 154,259 | | | | 0.93 | % | | | 0.49 | % | | | 0.93 | % | | | 26.62 | % |
| $ | 19.42 | | | | 6.82 | % | | $ | 323,012 | | | | 0.92 | % | | | 0.08 | % | | | 0.92 | % | | | 34.62 | % |
| $ | 19.00 | | | | 15.73 | % | | $ | 632,867 | | | | 0.90 | % | | | 0.15 | % | | | 0.90 | % | | | 24.83 | % |
| $ | 16.92 | | | | 13.32 | % | | $ | 550,697 | | | | 0.93 | % | | | 0.41 | % | | | 0.93 | % | | | 25.45 | % |
| | | | | | | | | | | | | | | | | | | | | | | | | | | |
| $ | 11.95 | | | | (17.64 | )% | | $ | 6,820 | | | | 0.80 | % | | | 0.97 | % | | | 0.84 | % | | | 119.76 | % |
| $ | 14.66 | | | | (9.32 | )% | | $ | 28,223 | | | | 0.80 | % | | | 1.42 | % | | | 0.80 | % | | | 124.82 | % |
| $ | 18.82 | | | | 5.96 | % | | $ | 39,047 | | | | 0.78 | % | | | 1.04 | % | | | 0.78 | % | | | 89.85 | % |
| $ | 18.55 | | | | 21.89 | % | | $ | 208,404 | | | | 0.80 | % | | | 0.99 | % | | | 0.85 | % | | | 109.05 | % |
| $ | 15.30 | | | | 9.80 | % | | $ | 157,413 | | | | 0.88 | % | | | 1.54 | % | | | 0.98 | % | | | 120.42 | % |
| | | | | | | | | | | | | | | | | | | | | | | | | | | |
| $ | 26.20 | | | | 5.79 | % | | $ | 170,323 | | | | 0.86 | % | | | 0.22 | % | | | 0.86 | % | | | 17.50 | % |
| $ | 26.07 | | | | 1.47 | % | | $ | 281,099 | | | | 0.86 | % | | | 0.30 | % | | | 0.86 | % | | | 17.31 | % |
| $ | 27.73 | | | | 17.46 | % | | $ | 350,030 | | | | 0.86 | % | | | 0.35 | % | | | 0.86 | % | | | 22.78 | % |
| $ | 25.65 | | | | 16.22 | % | | $ | 652,211 | | | | 0.87 | % | | | 0.32 | % | | | 0.87 | % | | | 18.92 | % |
| $ | 22.48 | | | | 8.86 | % | | $ | 587,320 | | | | 0.92 | % | | | 0.27 | % | | | 0.97 | % | | | 27.32 | % |
| | | | | | | | | | | | | | | | | | | | | | | | | | | |
| $ | 20.10 | | | | 0.15 | % | | $ | 1,057,722 | | | | 0.77 | % | | | 2.06 | % | | | 0.78 | % | | | 33.60 | % |
| $ | 21.33 | | | | 8.72 | % | | $ | 992,964 | | | | 0.77 | % | | | 2.17 | % | | | 0.77 | % | | | 23.20 | % |
| $ | 21.61 | | | | 15.58 | % | | $ | 828,607 | | | | 0.77 | % | | | 1.91 | % | | | 0.77 | % | | | 19.49 | % |
| $ | 20.89 | | | | 16.51 | % | | $ | 980,982 | | | | 0.78 | % | | | 2.04 | % | | | 0.78 | % | | | 16.93 | % |
| $ | 18.34 | | | | 14.75 | % | | $ | 943,101 | | | | 0.96 | % | | | 2.04 | % | | | 0.96 | % | | | 20.64 | % |
Financial Highlights, Institutional Shares
The financial highlights table is intended to help you understand the Funds’ financial performance for the past 5 years or, if shorter, the period of the Funds’ operations. Certain information reflects financial results for a single Fund share. The total returns in the table represent the rate that an investor would have earned (or lost) on an investment in the Fund (assuming reinvestment of all dividends and distributions).
| | | | | | Investment Activities | | | Distributions | | | |
| | | Net Asset Value, Beginning of Period | | | Net investment income (loss)(a) | | | Net realized/ unrealized gains (losses) on investments | | | Total from Investment Activities | | | Net investment income | | | Net realized gains on investments | | | Total Distributions | | | Redemption Fees | |
| Sterling Capital Behavioral International Equity Fund | | | | | | | | | | | | | | | | | | | | |
| Year Ended September 30, 2020 | | $ | 9.49 | | | | 0.27 | | | | (1.32 | ) | | | (1.05 | ) | | | (0.30 | ) | | | — | | | | (0.30 | ) | | | — | |
| Year Ended September 30, 2019 | | $ | 11.18 | | | | 0.35 | | | | (1.33 | ) | | | (0.98 | ) | | | (0.31 | ) | | | (0.40 | ) | | | (0.71 | ) | | | — | |
| Year Ended September 30, 2018 | | $ | 11.76 | | | | 0.28 | | | | (0.40 | ) | | | (0.12 | ) | | | (0.35 | ) | | | (0.11 | ) | | | (0.46 | ) | | | — | |
| Year Ended September 30, 2017 | | $ | 9.69 | | | | 0.27 | | | | 1.97 | | | | 2.24 | | | | (0.17 | ) | | | — | | | | (0.17 | ) | | | — | |
| Year Ended September 30, 2016 | | $ | 9.24 | | | | 0.23 | | | | 0.44 | | | | 0.67 | | | | (0.22 | ) | | | — | | | | (0.22 | ) | | | — | |
| Sterling Capital SMID Opportunities Fund | | | | | | | | | | | | | | | | | | | | |
| Year Ended September 30, 2020 | | $ | 13.31 | | | | — | (d) | | | (0.13 | ) | | | (0.13 | ) | | | — | | | | (0.63 | ) | | | (0.63 | ) | | | — | |
| Year Ended September 30, 2019 | | $ | 12.48 | | | | 0.01 | | | | 0.82 | | | | 0.83 | | | | — | | | | — | | | | — | | | | — | |
| Year Ended September 30, 2018 | | $ | 11.77 | | | | (0.02 | ) | | | 0.99 | | | | 0.97 | | | | (0.08 | ) | | | (0.18 | ) | | | (0.26 | ) | | | — | |
| October 3, 2016 to September 30, 2017(e) | | $ | 10.00 | | | | 0.02 | | | | 1.76 | | | | 1.78 | | | | (0.01 | ) | | | — | | | | (0.01 | ) | | | — | |
| Sterling Capital Stratton Mid Cap Value Fund | | | | | | | | | | | | | | | | | | | | |
| Year Ended September 30, 2020 | | $ | 64.31 | | | | 0.40 | | | | (3.64 | ) | | | (3.24 | ) | | | (0.61 | ) | | | (1.51 | ) | | | (2.12 | ) | | | — | |
| Year Ended September 30, 2019 | | $ | 69.02 | | | | 0.45 | | | | 0.15 | | | | 0.60 | | | | (0.29 | ) | | | (5.02 | ) | | | (5.31 | ) | | | — | |
| Year Ended September 30, 2018 | | $ | 66.47 | | | | 0.27 | | | | 4.87 | | | | 5.14 | | | | (0.30 | ) | | | (2.29 | ) | | | (2.59 | ) | | | — | |
| Year Ended September 30, 2017 | | $ | 55.97 | | | | 0.19 | | | | 10.66 | | | | 10.85 | | | | (0.08 | ) | | | (0.27 | ) | | | (0.35 | ) | | | — | |
| Period Ended September 30, 2016 | | $ | 52.55 | | | | 0.07 | | | | 3.35 | | | | 3.42 | | | | — | | | | — | | | | — | | | | — | |
| Sterling Capital Stratton Real Estate Fund | | | | | | | | | | | | | | | | | | | | |
| Year Ended September 30, 2020 | | $ | 42.36 | | | | 0.59 | | | | (3.97 | ) | | | (3.38 | ) | | | (0.80 | ) | | | (1.52 | ) | | | (2.32 | ) | | | — | |
| Year Ended September 30, 2019 | | $ | 37.63 | | | | 0.79 | | | | 6.05 | | | | 6.84 | | | | (0.87 | ) | | | (1.24 | ) | | | (2.11 | ) | | | — | |
| Year Ended September 30, 2018 | | $ | 37.10 | | | | 0.81 | | | | 1.52 | | | | 2.33 | | | | (0.58 | ) | | | (1.22 | ) | | | (1.80 | ) | | | — | |
| Year Ended September 30, 2017 | | $ | 39.74 | | | | 0.83 | | | | (0.53 | ) | | | 0.30 | | | | (1.19 | ) | | | (1.75 | ) | | | (2.94 | ) | | | — | |
| Period Ended September 30, 2016 | | $ | 36.01 | | | | 0.61 | | | | 3.62 | | | | 4.23 | | | | (0.50 | ) | | | — | | | | (0.50 | ) | | | — | |
| Sterling Capital Stratton Small Cap Value Fund | | | | | | | | | | | | | | | | | | | | |
| Year Ended September 30, 2020 | | $ | 78.38 | | | | 0.41 | | | | (9.36 | ) | | | (8.95 | ) | | | (0.46 | ) | | | (4.93 | ) | | | (5.39 | ) | | | — | |
| Year Ended September 30, 2019 | | $ | 89.11 | | | | 0.49 | | | | (5.02 | ) | | | (4.53 | ) | | | (0.30 | ) | | | (5.90 | ) | | | (6.20 | ) | | | — | |
| Year Ended September 30, 2018 | | $ | 90.19 | | | | 0.26 | | | | 6.60 | | | | 6.86 | | | | (0.25 | ) | | | (7.69 | ) | | | (7.94 | ) | | | — | |
| Year Ended September 30, 2017 | | $ | 78.46 | | | | 0.16 | | | | 15.81 | | | | 15.97 | | | | (0.14 | ) | | | (4.10 | ) | | | (4.24 | ) | | | — | (d) |
| Period Ended September 30, 2016 | | $ | 69.89 | | | | 0.10 | | | | 8.47 | | | | 8.57 | | | | — | | | | — | | | | — | | | | — | (d) |
| Sterling Capital Ultra Short Bond Fund | | | | | | | | | | | | | | | | | | | | |
| Year Ended September 30, 2020 | | $ | 9.79 | | | | 0.19 | | | | 0.05 | | | | 0.24 | | | | (0.20 | ) | | | — | | | | (0.20 | ) | | | — | |
| Year Ended September 30, 2019 | | $ | 9.75 | | | | 0.26 | | | | 0.03 | | | | 0.29 | | | | (0.25 | ) | | | — | | | | (0.25 | ) | | | — | |
| Year Ended September 30, 2018 | | $ | 9.79 | | | | 0.16 | | | | (0.02 | ) | | | 0.14 | | | | (0.18 | ) | | | — | | | | (0.18 | ) | | | — | |
| Year Ended September 30, 2017 | | $ | 9.81 | | | | 0.09 | | | | 0.04 | | | | 0.13 | | | | (0.15 | ) | | | — | | | | (0.15 | ) | | | — | |
| Year Ended September 30, 2016 | | $ | 9.86 | | | | 0.09 | | | | 0.03 | | | | 0.12 | | | | (0.17 | ) | | | — | | | | (0.17 | ) | | | — | |
| * | During the periods certain fees were waived (See Note 5 in the Notes to the Financial Statements). If such reductions had not occurred, the ratios would have been as indicated. |
| ** | Portfolio turnover rate is calculated on the basis of the Fund as a whole without distinguishing between classes of shares issued. |
| (a) | Per share net investment income (loss) has been calculated using the average daily shares method. |
| (b) | Not annualized for periods less than one year. |
| (c) | Annualized for periods less than one year. |
| (d) | Amount is less than $0.005. |
| (e) | Period from commencement of operations. |
See accompanying Notes to the Financial Statements.
| | | | | | | Ratios/Supplementary Data | |
| Net Asset Value, End of Period | | | Total Return (b) | | | Net Assets, End of Period (000) | | | Ratio of net expenses to average net assets (c) | | | Ratio of net investment income (loss) to average net assets (c) | | | Ratio of expenses to average net assets*(c) | | | Portfolio turnover rate**(b) | |
| | | | | | | | | | | | | | | | | | | | | | | | | | | |
| $ | 8.14 | | | | (11.65 | )% | | $ | 13,670 | | | | 0.63 | % | | | 3.09 | % | | | 0.83 | % | | | 164.02 | % |
| $ | 9.49 | | | | (8.44 | )% | | $ | 16,721 | | | | 0.69 | % | | | 3.62 | % | | | 0.89 | % | | | 97.74 | % |
| $ | 11.18 | | | | (1.25 | )% | | $ | 19,266 | | | | 0.65 | % | | | 2.33 | % | | | 0.85 | % | | | 96.65 | % |
| $ | 11.76 | | | | 23.46 | % | | $ | 81,876 | | | | 0.68 | % | | | 2.59 | % | | | 0.95 | % | | | 91.65 | % |
| $ | 9.69 | | | | 7.30 | % | | $ | 69,954 | | | | 0.80 | % | | | 2.48 | % | | | 1.16 | % | | | 125.35 | % |
| | | | | | | | | | | | | | | | | | | | | | | | | | | |
| $ | 12.55 | | | | (1.30 | )% | | $ | 5,359 | | | | 0.79 | % | | | 0.02 | % | | | 1.09 | % | | | 60.03 | % |
| $ | 13.31 | | | | 6.65 | % | | $ | 5,386 | | | | 0.79 | % | | | 0.07 | % | | | 1.20 | % | | | 45.11 | % |
| $ | 12.48 | | | | 8.39 | % | | $ | 4,886 | | | | 0.79 | % | | | (0.13 | )% | | | 1.04 | % | | | 45.64 | % |
| $ | 11.77 | | | | 17.84 | % | | $ | 4,460 | | | | 0.79 | % | | | 0.19 | % | | | 1.35 | % | | | 37.97 | % |
| | | | | | | | | | | | | | | | | | | | | | | | | | | |
| $ | 58.95 | | | | (5.39 | )% | | $ | 53,847 | | | | 0.91 | % | | | 0.67 | % | | | 0.94 | % | | | 9.21 | % |
| $ | 64.31 | | | | 1.97 | % | | $ | 61,908 | | | | 0.95 | % | | | 0.73 | % | | | 0.95 | % | | | 6.75 | % |
| $ | 69.02 | | | | 7.81 | % | | $ | 66,554 | | | | 0.95 | % | | | 0.40 | % | | | 0.95 | % | | | 14.47 | % |
| $ | 66.47 | | | | 19.47 | % | | $ | 66,030 | | | | 0.91 | % | | | 0.32 | % | | | 0.92 | % | | | 12.19 | % |
| $ | 55.97 | | | | 6.51 | % | | $ | 63,513 | | | | 0.95 | % | | | 0.18 | % | | | 0.97 | % | | | 11.16 | % |
| | | | | | | | | | | | | | | | | | | | | | | | | | | |
| $ | 36.66 | | | | (8.09 | )% | | $ | 85,144 | | | | 0.82 | % | | | 1.55 | % | | | 0.82 | % | | | 19.58 | % |
| $ | 42.36 | | | | 19.06 | % | | $ | 105,216 | | | | 0.82 | % | | | 2.03 | % | | | 0.82 | % | | | 14.56 | % |
| $ | 37.63 | | | | 6.42 | % | | $ | 91,626 | | | | 0.82 | % | | | 2.21 | % | | | 0.82 | % | | | 8.34 | % |
| $ | 37.10 | | | | 1.16 | % | | $ | 96,199 | | | | 0.79 | % | | | 2.23 | % | | | 0.81 | % | | | 13.52 | % |
| $ | 39.74 | | | | 11.73 | % | | $ | 104,688 | | | | 0.83 | % | | | 2.13 | % | | | 0.85 | % | | | 18.43 | % |
| | | | | | | | | | | | | | | | | | | | | | | | | | | |
| $ | 64.04 | | | | (12.59 | )% | | $ | 475,615 | | | | 1.01 | % | | | 0.58 | % | | | 1.08 | % | | | 8.33 | % |
| $ | 78.38 | | | | (4.55 | )% | | $ | 959,875 | | | | 1.03 | % | | | 0.64 | % | | | 1.08 | % | | | 8.60 | % |
| $ | 89.11 | | | | 7.98 | % | | $ | 1,296,897 | | | | 1.03 | % | | | 0.29 | % | | | 1.06 | % | | | 15.51 | % |
| $ | 90.19 | | | | 20.73 | % | | $ | 1,183,974 | | | | 1.06 | % | | | 0.19 | % | | | 1.06 | % | | | 7.04 | % |
| $ | 78.46 | | | | 12.26 | % | | $ | 1,213,344 | | | | 1.08 | % | | | 0.20 | % | | | 1.08 | % | | | 3.42 | % |
| | | | | | | | | | | | | | | | | | | | | | | | | | | |
| $ | 9.83 | | | | 2.44 | % | | $ | 33,699 | | | | 0.38 | % | | | 1.90 | % | | | 0.55 | % | | | 43.45 | % |
| $ | 9.79 | | | | 3.06 | % | | $ | 15,343 | | | | 0.42 | % | | | 2.70 | % | | | 0.52 | % | | | 103.69 | % |
| $ | 9.75 | | | | 1.46 | % | | $ | 21,926 | | | | 0.41 | % | | | 1.65 | % | | | 0.51 | % | | | 74.56 | % |
| $ | 9.79 | | | | 1.36 | % | | $ | 33,879 | | | | 0.43 | % | | | 0.95 | % | | | 0.53 | % | | | 59.57 | % |
| $ | 9.81 | | | | 1.24 | % | | $ | 54,183 | | | | 0.45 | % | | | 0.90 | % | | | 0.54 | % | | | 43.02 | % |
Financial Highlights, Institutional Shares
The financial highlights table is intended to help you understand the Funds’ financial performance for the past 5 years or, if shorter, the period of the Funds’ operations. Certain information reflects financial results for a single Fund share. The total returns in the table represent the rate that an investor would have earned (or lost) on an investment in the Fund (assuming reinvestment of all dividends and distributions).
| | | | | | Investment Activities | | | Distributions | |
| | | Net Asset
Value,
Beginning
of Year | | | Net
investment
income(a) | | | Net realized/
unrealized
gains (losses)
on investments | | | Total from
Investment
Activities | | | Net
investment
income | | | Net realized
gains on
investments | | | Return
of
capital | | | Total
Distributions | |
| Sterling Capital Short Duration Bond Fund | | | | | | | | | | | | | | | | | |
| Year Ended September 30, 2020 | | $ | 8.65 | | | | 0.19 | | | | 0.16 | | | | 0.35 | | | | (0.22 | ) | | | — | | | | — | | | | (0.22 | ) |
| Year Ended September 30, 2019 | | $ | 8.52 | | | | 0.23 | | | | 0.15 | | | | 0.38 | | | | (0.25 | ) | | | — | | | | — | | | | (0.25 | ) |
| Year Ended September 30, 2018 | | $ | 8.69 | | | | 0.19 | | | | (0.12 | ) | | | 0.07 | | | | (0.24 | ) | | | — | | | | — | | | | (0.24 | ) |
| Year Ended September 30, 2017 | | $ | 8.81 | | | | 0.12 | | | | (0.01 | ) | | | 0.11 | | | | (0.23 | ) | | | — | | | | — | | | | (0.23 | ) |
| Year Ended September 30, 2016 | | $ | 8.86 | | | | 0.12 | | | | 0.07 | | | | 0.19 | | | | (0.24 | ) | | | — | | | | — | | | | (0.24 | ) |
| Sterling Capital Intermediate U.S. Government Fund | | | | | | | | | | | | | | | | | |
| Year Ended September 30, 2020 | | $ | 9.93 | | | | 0.20 | | | | 0.28 | | | | 0.48 | | | | (0.27 | ) | | | — | | | | — | | | | (0.27 | ) |
| Year Ended September 30, 2019 | | $ | 9.49 | | | | 0.23 | | | | 0.48 | | | | 0.71 | | | | (0.27 | ) | | | — | | | | — | | | | (0.27 | ) |
| Year Ended September 30, 2018 | | $ | 9.92 | | | | 0.19 | | | | (0.34 | ) | | | (0.15 | ) | | | (0.28 | ) | | | — | | | | — | | | | (0.28 | ) |
| Year Ended September 30, 2017 | | $ | 10.25 | | | | 0.18 | | | | (0.28 | ) | | | (0.10 | ) | | | (0.23 | ) | | | — | | | | — | | | | (0.23 | ) |
| Year Ended September 30, 2016 | | $ | 10.19 | | | | 0.15 | | | | 0.12 | | | | 0.27 | | | | (0.21 | ) | | | — | | | | — | | | | (0.21 | ) |
| Sterling Capital Total Return Bond Fund | | | | | | | | | | | | | | | | | |
| Year Ended September 30, 2020 | | $ | 10.89 | | | | 0.27 | | | | 0.54 | | | | 0.81 | | | | (0.31 | ) | | | — | (b) | | | — | | | | (0.31 | ) |
| Year Ended September 30, 2019 | | $ | 10.20 | | | | 0.32 | | | | 0.71 | | | | 1.03 | | | | (0.34 | ) | | | — | | | | — | | | | (0.34 | ) |
| Year Ended September 30, 2018 | | $ | 10.60 | | | | 0.29 | | | | (0.37 | ) | | | (0.08 | ) | | | (0.32 | ) | | | — | | | | — | | | | (0.32 | ) |
| Year Ended September 30, 2017 | | $ | 10.82 | | | | 0.25 | | | | (0.15 | ) | | | 0.10 | | | | (0.32 | ) | | | — | | | | — | | | | (0.32 | ) |
| Year Ended September 30, 2016 | | $ | 10.54 | | | | 0.28 | | | | 0.35 | | | | 0.63 | | | | (0.35 | ) | | | — | | | | — | | | | (0.35 | ) |
| Sterling Capital Corporate Fund | | | | | | | | | | | | | | | | | |
| Year Ended September 30, 2020 | | $ | 10.38 | | | | 0.30 | | | | 0.39 | | | | 0.69 | | | | (0.30 | ) | | | — | | | | — | | | | (0.30 | ) |
| Year Ended September 30, 2019 | | $ | 9.81 | | | | 0.33 | | | | 0.56 | | | | 0.89 | | | | (0.32 | ) | | | — | | | | — | | | | (0.32 | ) |
| Year Ended September 30, 2018 | | $ | 10.24 | | | | 0.32 | | | | (0.36 | ) | | | (0.04 | ) | | | (0.32 | ) | | | (0.07 | ) | | | — | | | | (0.39 | ) |
| Year Ended September 30, 2017 | | $ | 10.36 | | | | 0.32 | | | | (0.09 | ) | | | 0.23 | | | | (0.31 | ) | | | (0.04 | ) | | | — | | | | (0.35 | ) |
| Year Ended September 30, 2016 | | $ | 10.10 | | | | 0.31 | | | | 0.26 | | | | 0.57 | | | | (0.31 | ) | | | — | | | | — | | | | (0.31 | ) |
| Sterling Capital Quality Income Fund | | | | | | | | | | | | | | | | | |
| Year Ended September 30, 2020 | | $ | 10.10 | | | | 0.24 | | | | 0.19 | | | | 0.43 | | | | (0.27 | ) | | | — | | | | — | | | | (0.27 | ) |
| Year Ended September 30, 2019 | | $ | 9.62 | | | | 0.31 | | | | 0.47 | | | | 0.78 | | | | (0.30 | ) | | | — | | | | — | | | | (0.30 | ) |
| Year Ended September 30, 2018 | | $ | 9.95 | | | | 0.29 | | | | (0.32 | ) | | | (0.03 | ) | | | (0.30 | ) | | | — | | | | — | | | | (0.30 | ) |
| Year Ended September 30, 2017 | | $ | 10.10 | | | | 0.23 | | | | (0.11 | ) | | | 0.12 | | | | (0.27 | ) | | | — | | | | — | | | | (0.27 | ) |
| Year Ended September 30, 2016 | | $ | 9.98 | | | | 0.22 | | | | 0.16 | | | | 0.38 | | | | (0.26 | ) | | | — | | | | — | | | | (0.26 | ) |
| Sterling Capital Kentucky Intermediate Tax-Free Fund | | | | | | | | | | | | | | | | | |
| Year Ended September 30, 2020 | | $ | 10.31 | | | | 0.18 | | | | 0.22 | | | | 0.40 | | | | (0.18 | ) | | | (0.02 | ) | | | — | | | | (0.20 | ) |
| Year Ended September 30, 2019 | | $ | 9.89 | | | | 0.21 | | | | 0.48 | | | | 0.69 | | | | (0.21 | ) | | | (0.06 | ) | | | — | | | | (0.27 | ) |
| Year Ended September 30, 2018 | | $ | 10.26 | | | | 0.22 | | | | (0.34 | ) | | | (0.12 | ) | | | (0.22 | ) | | | (0.03 | ) | | | — | | | | (0.25 | ) |
| Year Ended September 30, 2017 | | $ | 10.63 | | | | 0.23 | | | | (0.23 | ) | | | — | | | | (0.23 | ) | | | (0.14 | ) | | | — | | | | (0.37 | ) |
| Year Ended September 30, 2016 | | $ | 10.61 | | | | 0.27 | | | | 0.14 | | | | 0.41 | | | | (0.26 | ) | | | (0.13 | ) | | | — | | | | (0.39 | ) |
| Sterling Capital Maryland Intermediate Tax-Free Fund | | | | | | | | | | | | | | | | | |
| Year Ended September 30, 2020 | | $ | 10.97 | | | | 0.21 | | | | 0.19 | | | | 0.40 | | | | (0.21 | ) | | | (0.06 | ) | | | — | | | | (0.27 | ) |
| Year Ended September 30, 2019 | | $ | 10.63 | | | | 0.22 | | | | 0.47 | | | | 0.69 | | | | (0.22 | ) | | | (0.13 | ) | | | — | | | | (0.35 | ) |
| Year Ended September 30, 2018 | | $ | 11.04 | | | | 0.23 | �� | | | (0.35 | ) | | | (0.12 | ) | | | (0.23 | ) | | | (0.06 | ) | | | — | | | | (0.29 | ) |
| Year Ended September 30, 2017 | | $ | 11.33 | | | | 0.23 | | | | (0.21 | ) | | | 0.02 | | | | (0.23 | ) | | | (0.08 | ) | | | — | | | | (0.31 | ) |
| Year Ended September 30, 2016 | | $ | 11.19 | | | | 0.23 | | | | 0.21 | | | | 0.44 | | | | (0.23 | ) | | | (0.07 | ) | | | — | | | | (0.30 | ) |
| * | During the periods certain fees were waived (See Note 5 in the Notes to the Financial Statements). If such reductions had not occurred, the ratios would have been as indicated. |
| ** | Portfolio turnover rate is calculated on the basis of the Fund as a whole without distinguishing between classes of shares issued. |
| (a) | Per share net investment income (loss) has been calculated using the average daily shares method. |
| (b) | Amount is less than $0.005. |
See accompanying Notes to the Financial Statements.
| | | | | | | | | Ratios/Supplementary Data | |
| | Net Asset
Value,
End of
Year | | | | Total
Return | | | | Net Assets,
End of
Year
(000) | | | | Ratio of
net expenses
to average
net assets | | | | Ratio of net
investment
income to
average net
assets | | | | Ratio of
expenses to
average
net assets* | | | | Portfolio
turnover rate** | |
| | | | | | | | | | | | | | | | | | | | | | | | | | | |
| $ | 8.78 | | | | 4.12 | % | | $ | 174,891 | | | | 0.42 | % | | | 2.20 | % | | | 0.52 | % | | | 64.69 | % |
| $ | 8.65 | | | | 4.55 | % | | $ | 171,989 | | | | 0.43 | % | | | 2.68 | % | | | 0.53 | % | | | 78.58 | % |
| $ | 8.52 | | | | 0.80 | % | | $ | 126,878 | | | | 0.43 | % | | | 2.20 | % | | | 0.53 | % | | | 62.02 | % |
| $ | 8.69 | | | | 1.28 | % | | $ | 67,467 | | | | 0.45 | % | | | 1.37 | % | | | 0.55 | % | | | 78.77 | % |
| $ | 8.81 | | | | 2.24 | % | | $ | 77,374 | | | | 0.49 | % | | | 1.34 | % | | | 0.56 | % | | | 54.68 | % |
| | | | | | | | | | | | | | | | | | | | | | | | | | | |
| $ | 10.14 | | | | 4.92 | % | | $ | 8,049 | | | | 0.54 | % | | | 1.95 | % | | | 0.70 | % | | | 47.36 | % |
| $ | 9.93 | | | | 7.54 | % | | $ | 11,052 | | | | 0.57 | % | | | 2.35 | % | | | 0.66 | % | | | 40.13 | % |
| $ | 9.49 | | | | (1.48 | )% | | $ | 17,961 | | | | 0.65 | % | | | 1.99 | % | | | 0.66 | % | | | 40.85 | % |
| $ | 9.92 | | | | (0.95 | )% | | $ | 16,412 | | | | 0.62 | % | | | 1.80 | % | | | 0.66 | % | | | 32.44 | % |
| $ | 10.25 | | | | 2.63 | % | | $ | 18,871 | | | | 0.61 | % | | | 1.48 | % | | | 0.72 | % | | | 49.39 | % |
| | | | | | | | | | | | | | | | | | | | | | | | | | | |
| $ | 11.39 | | | | 7.59 | % | | $ | 1,051,891 | | | | 0.45 | % | | | 2.45 | % | | | 0.57 | % | | | 59.59 | % |
| $ | 10.89 | | | | 10.27 | % | | $ | 1,065,346 | | | | 0.45 | % | | | 3.10 | % | | | 0.58 | % | | | 79.40 | % |
| $ | 10.20 | | | | (0.74 | )% | | $ | 860,437 | | | | 0.45 | % | | | 2.79 | % | | | 0.57 | % | | | 62.28 | % |
| $ | 10.60 | | | | 1.00 | % | | $ | 997,074 | | | | 0.47 | % | | | 2.38 | % | | | 0.57 | % | | | 64.07 | % |
| $ | 10.82 | | | | 6.10 | % | | $ | 709,103 | | | | 0.49 | % | | | 2.67 | % | | | 0.59 | % | | | 65.47 | % |
| | | | | | | | | | | | | | | | | | | | | | | | | | | |
| $ | 10.77 | | | | 6.72 | % | | $ | 18,519 | | | | 0.67 | % | | | 2.83 | % | | | 0.70 | % | | | 52.28 | % |
| $ | 10.38 | | | | 9.28 | % | | $ | 22,651 | | | | 0.68 | % | | | 3.25 | % | | | 0.69 | % | | | 82.23 | % |
| $ | 9.81 | | | | (0.45 | )% | | $ | 30,805 | | | | 0.63 | % | | | 3.18 | % | | | 0.63 | % | | | 66.82 | % |
| $ | 10.24 | | | | 2.32 | % | | $ | 29,471 | | | | 0.63 | % | | | 3.09 | % | | | 0.63 | % | | | 78.79 | % |
| $ | 10.36 | | | | 5.70 | % | | $ | 31,755 | | | | 0.64 | % | | | 3.02 | % | | | 0.64 | % | | | 83.88 | % |
| | | | | | | | | | | | | | | | | | | | | | | | | | | |
| $ | 10.26 | | | | 4.33 | % | | $ | 35,808 | | | | 0.59 | % | | | 2.36 | % | | | 0.63 | % | | | 35.96 | % |
| $ | 10.10 | | | | 8.27 | % | | $ | 36,361 | | | | 0.60 | % | | | 3.15 | % | | | 0.64 | % | | | 17.58 | % |
| $ | 9.62 | | | | (0.28 | )% | | $ | 37,088 | | | | 0.58 | % | | | 2.97 | % | | | 0.62 | % | | | 19.17 | % |
| $ | 9.95 | | | | 1.23 | % | | $ | 39,533 | | | | 0.60 | % | | | 2.31 | % | | | 0.64 | % | | | 34.72 | % |
| $ | 10.10 | | | | 3.86 | % | | $ | 46,364 | | | | 0.61 | % | | | 2.16 | % | | | 0.65 | % | | | 43.63 | % |
| | | | | | | | | | | | | | | | | | | | | | | | | | | |
| $ | 10.51 | | | | 3.97 | % | | $ | 8,978 | | | | 0.70 | % | | | 1.77 | % | | | 0.70 | % | | | 7.76 | % |
| $ | 10.31 | | | | 7.06 | % | | $ | 7,036 | | | | 0.70 | % | | | 2.05 | % | | | 0.70 | % | | | 32.58 | % |
| $ | 9.89 | | | | (1.19 | )% | | $ | 7,705 | | | | 0.68 | % | | | 2.20 | % | | | 0.68 | % | | | 20.37 | % |
| $ | 10.26 | | | | 0.05 | % | | $ | 8,026 | | | | 0.68 | % | | | 2.26 | % | | | 0.71 | % | | | 17.93 | % |
| $ | 10.63 | | | | 3.95 | % | | $ | 8,580 | | | | 0.66 | % | | | 2.50 | % | | | 0.77 | % | | | 16.44 | % |
| | | | | | | | | | | | | | | | | | | | | | | | | | | |
| $ | 11.10 | | | | 3.68 | % | | $ | 8,827 | | | | 0.68 | % | | | 1.87 | % | | | 0.69 | % | | | 9.44 | % |
| $ | 10.97 | | | | 6.70 | % | | $ | 9,966 | | | | 0.67 | % | | | 2.09 | % | | | 0.69 | % | | | 20.76 | % |
| $ | 10.63 | | | | (1.07 | )% | | $ | 13,236 | | | | 0.63 | % | | | 2.14 | % | | | 0.63 | % | | | 31.12 | % |
| $ | 11.04 | | | | 0.26 | % | | $ | 16,991 | | | | 0.61 | % | | | 2.13 | % | | | 0.65 | % | | | 5.89 | % |
| $ | 11.33 | | | | 3.97 | % | | $ | 24,621 | | | | 0.61 | % | | | 2.00 | % | | | 0.71 | % | | | 14.36 | % |
Financial Highlights, Institutional Shares
The financial highlights table is intended to help you understand the Funds’ financial performance for the past 5 years or, if shorter, the period of the Funds’ operations. Certain information reflects financial results for a single Fund share. The total returns in the table represent the rate that an investor would have earned (or lost) on an investment in the Fund (assuming reinvestment of all dividends and distributions).
| | | | | | Investment Activities | | | Distributions | |
| | | | | | | | | | | | | | | | | | | | | | | | | |
| | | Net Asset Value,
Beginning
of Year | | | Net
investment
income(a) | | | Net realized/
unrealized
gains (losses)
on investments | | | Total from
Investment
Activities | | | Net
investment
income | | | Return
of Capital | | | Net realized
gains on
investments | | | Total
Distributions | |
| Sterling Capital North Carolina Intermediate Tax-Free Fund | | | | | | | | | | | | | | | | | |
| Year Ended September 30, 2020 | | $ | 10.91 | | | | 0.21 | | | | 0.21 | | | | 0.42 | | | | (0.21 | ) | | | — | | | | — | | | | (0.21 | ) |
| Year Ended September 30, 2019 | | $ | 10.43 | | | | 0.25 | | | | 0.48 | | | | 0.73 | | | | (0.25 | ) | | | — | | | | — | | | | (0.25 | ) |
| Year Ended September 30, 2018 | | $ | 10.78 | | | | 0.26 | | | | (0.35 | ) | | | (0.09 | ) | | | (0.26 | ) | | | — | | | | — | | | | (0.26 | ) |
| Year Ended September 30, 2017 | | $ | 11.08 | | | | 0.25 | | | | (0.26 | ) | | | (0.01 | ) | | | (0.25 | ) | | | — | | | | (0.04 | ) | | | (0.29 | ) |
| Year Ended September 30, 2016 | | $ | 10.97 | | | | 0.26 | | | | 0.17 | | | | 0.43 | | | | (0.26 | ) | | | — | | | | (0.06 | ) | | | (0.32 | ) |
| Sterling Capital South Carolina Intermediate Tax-Free Fund | | | | | | | | | | | | | | | | | |
| Year Ended September 30, 2020 | | $ | 11.20 | | | | 0.23 | | | | 0.19 | | | | 0.42 | | | | (0.23 | ) | | | — | | | | — | | | | (0.23 | ) |
| Year Ended September 30, 2019 | | $ | 10.69 | | | | 0.23 | | | | 0.51 | | | | 0.74 | | | | (0.23 | ) | | | — | | | | — | | | | (0.23 | ) |
| Year Ended September 30, 2018 | | $ | 11.03 | | | | 0.23 | | | | (0.34 | ) | | | (0.11 | ) | | | (0.23 | ) | | | — | | | | — | | | | (0.23 | ) |
| Year Ended September 30, 2017 | | $ | 11.22 | | | | 0.22 | | | | (0.19 | ) | | | 0.03 | | | | (0.22 | ) | | | — | | | | — | | | | (0.22 | ) |
| Year Ended September 30, 2016 | | $ | 11.06 | | | | 0.23 | | | | 0.20 | | | | 0.43 | | | | (0.23 | ) | | | — | | | | (0.04 | ) | | | (0.27 | ) |
| Sterling Capital Virginia Intermediate Tax-Free Fund | | | | | | | | | | | | | | | | | |
| Year Ended September 30, 2020 | | $ | 11.97 | | | | 0.23 | | | | 0.25 | | | | 0.48 | | | | (0.23 | ) | | | — | | | | — | | | | (0.23 | ) |
| Year Ended September 30, 2019 | | $ | 11.40 | | | | 0.26 | | | | 0.57 | | | | 0.83 | | | | (0.26 | ) | | | — | | | | — | | | | (0.26 | ) |
| Year Ended September 30, 2018 | | $ | 11.76 | | | | 0.26 | | | | (0.36 | ) | | | (0.10 | ) | | | (0.26 | ) | | | — | | | | — | | | | (0.26 | ) |
| Year Ended September 30, 2017 | | $ | 12.13 | | | | 0.26 | | | | (0.28 | ) | | | (0.02 | ) | | | (0.26 | ) | | | — | | | | (0.09 | ) | | | (0.35 | ) |
| Year Ended September 30, 2016 | | $ | 11.98 | | | | 0.27 | | | | 0.19 | | | | 0.46 | | | | (0.27 | ) | | | — | | | | (0.04 | ) | | | (0.31 | ) |
| Sterling Capital West Virginia Intermediate Tax-Free Fund | | | | | | | | | | | | | | | | | |
| Year Ended September 30, 2020 | | $ | 10.13 | | | | 0.21 | | | | 0.19 | | | | 0.40 | | | | (0.21 | ) | | | — | | | | (0.01 | ) | | | (0.22 | ) |
| Year Ended September 30, 2019 | | $ | 9.73 | | | | 0.24 | | | | 0.42 | | | | 0.66 | | | | (0.24 | ) | | | — | | | | (0.02 | ) | | | (0.26 | ) |
| Year Ended September 30, 2018 | | $ | 10.05 | | | | 0.24 | | | | (0.31 | ) | | | (0.07 | ) | | | (0.24 | ) | | | — | | | | (0.01 | ) | | | (0.25 | ) |
| Year Ended September 30, 2017 | | $ | 10.28 | | | | 0.23 | | | | (0.18 | ) | | | 0.05 | | | | (0.23 | ) | | | — | | | | (0.05 | ) | | | (0.28 | ) |
| Year Ended September 30, 2016 | | $ | 10.15 | | | | 0.24 | | | | 0.17 | | | | 0.41 | | | | (0.23 | ) | | | — | | | | (0.05 | ) | | | (0.28 | ) |
| Sterling Capital Diversified Income Fund(b) | | | | | | | | | | | | | | | | | |
| Year Ended September 30, 2020 | | $ | 10.43 | | | | 0.45 | | | | (1.13 | ) | | | (0.68 | ) | | | (0.45 | ) | | | — | | | | — | | | | (0.45 | ) |
| Year Ended September 30, 2019 | | $ | 10.76 | | | | 0.50 | | | | (0.29 | ) | | | 0.21 | | | | (0.54 | ) | | | — | | | | — | | | | (0.54 | ) |
| Year Ended September 30, 2018 | | $ | 10.92 | | | | 0.37 | | | | (0.09 | ) | | | 0.28 | | | | (0.44 | ) | | | — | | | | — | | | | (0.44 | ) |
| Year Ended September 30, 2017 | | $ | 10.94 | | | | 0.45 | | | | (0.04 | ) | | | 0.41 | | | | (0.43 | ) | | | — | | | | — | | | | (0.43 | ) |
| Year Ended September 30, 2016 | | $ | 10.32 | | | | 0.36 | | | | 0.66 | | | | 1.02 | | | | (0.40 | ) | | | — | | | | — | | | | (0.40 | ) |
| Sterling Capital Strategic Allocation Balanced Fund(b) | | | | | | | | | | | | | | | | | |
| Year Ended September 30, 2020 | | $ | 12.17 | | | | 0.27 | | | | (0.20 | ) | | | 0.07 | | | | (0.20 | ) | | | (0.06 | ) | | | (0.42 | ) | | | (0.68 | ) |
| Year Ended September 30, 2019 | | $ | 12.17 | | | | 0.29 | | | | — | (c) | | | 0.29 | | | | (0.29 | ) | | | — | | | | — | | | | (0.29 | ) |
| Year Ended September 30, 2018 | | $ | 11.98 | | | | 0.25 | | | | 0.24 | | | | 0.49 | | | | (0.30 | ) | | | — | | | | — | | | | (0.30 | ) |
| Year Ended September 30, 2017 | | $ | 10.90 | | | | 0.19 | | | | 1.08 | | | | 1.27 | | | | (0.19 | ) | | | — | | | | — | | | | (0.19 | ) |
| Year Ended September 30, 2016 | | $ | 10.39 | | | | 0.20 | | | | 0.54 | | | | 0.74 | | | | (0.23 | ) | | | — | | | | — | | | | (0.23 | ) |
| Sterling Capital Strategic Allocation Growth Fund(b) | | | | | | | | | | | | | | | | | |
| Year Ended September 30, 2020 | | $ | 12.10 | | | | 0.17 | | | | (0.30 | ) | | | (0.13 | ) | | | (0.17 | ) | | | (0.07 | ) | | | (0.48 | ) | | | (0.72 | ) |
| Year Ended September 30, 2019 | | $ | 12.28 | | | | 0.26 | | | | (0.18 | ) | | | 0.08 | | | | (0.26 | ) | | | — | | | | — | | | | (0.26 | ) |
| Year Ended September 30, 2018 | | $ | 11.93 | | | | 0.24 | | | | 0.39 | | | | 0.63 | | | | (0.28 | ) | | | — | | | | — | | | | (0.28 | ) |
| Year Ended September 30, 2017 | | $ | 10.56 | | | | 0.15 | | | | 1.36 | | | | 1.51 | | | | (0.14 | ) | | | — | | | | — | | | | (0.14 | ) |
| Year Ended September 30, 2016 | | $ | 10.01 | | | | 0.14 | | | | 0.61 | | | | 0.75 | | | | (0.20 | ) | | | — | | | | — | | | | (0.20 | ) |
| * | During the periods certain fees were waived (See Note 5 in the Notes to the Financial Statements). If such reductions had not occurred, the ratios would have been as indicated. |
| ** | Portfolio turnover rate is calculated on the basis of the Fund as a whole without distinguishing between classes of shares issued. |
| (a) | Per share net investment income has been calculated using the average daily shares method. |
| (b) | The expense ratios exclude the impact of fees/expenses paid by each underlying fund. |
| (c) | Amount is less than $0.005. |
See accompanying Notes to the Financial Statements.
| | | | | | | | | Ratios/Supplementary Data | |
| | Net Asset
Value,
End of
Year | | | | Total
Return | | | | Net Assets,
End of
Year
(000) | | | | Ratio of
net expenses
to average
net assets | | | | Ratio of net
investment
income to
average net
assets | | | | Ratio of
expenses to
average
net assets* | | | | Portfolio
turnover rate** | |
| | | | | | | | | | | | | | | | | | | | | | | | | | | |
| $ | 11.12 | | | | 3.90 | % | | $ | 140,958 | | | | 0.54 | % | | | 1.92 | % | | | 0.54 | % | | | 17.06 | % |
| $ | 10.91 | | | | 7.10 | % | | $ | 140,022 | | | | 0.55 | % | | | 2.37 | % | | | 0.55 | % | | | 33.12 | % |
| $ | 10.43 | | | | (0.81 | )% | | $ | 133,812 | | | | 0.54 | % | | | 2.49 | % | | | 0.54 | % | | | 22.06 | % |
| $ | 10.78 | | | | (0.06 | )% | | $ | 140,484 | | | | 0.54 | % | | | 2.34 | % | | | 0.58 | % | | | 25.92 | % |
| $ | 11.08 | | | | 3.94 | % | | $ | 157,284 | | | | 0.55 | % | | | 2.33 | % | | | 0.65 | % | | | 10.05 | % |
| | | | | | | | | | | | | | | | | | | | | | | | | | | |
| $ | 11.39 | | | | 3.76 | % | | $ | 71,865 | | | | 0.56 | % | | | 2.01 | % | | | 0.56 | % | | | 4.84 | % |
| $ | 11.20 | | | | 7.02 | % | | $ | 66,331 | | | | 0.56 | % | | | 2.13 | % | | | 0.56 | % | | | 23.84 | % |
| $ | 10.69 | | | | (1.02 | )% | | $ | 63,090 | | | | 0.55 | % | | | 2.10 | % | | | 0.55 | % | | | 27.71 | % |
| $ | 11.03 | | | | 0.34 | % | | $ | 69,746 | | | | 0.56 | % | | | 2.03 | % | | | 0.59 | % | | | 31.17 | % |
| $ | 11.22 | | | | 3.87 | % | | $ | 72,722 | | | | 0.57 | % | | | 2.03 | % | | | 0.67 | % | | | 2.69 | % |
| | | | | | | | | | | | | | | | | | | | | | | | | | | |
| $ | 12.22 | | | | 4.06 | % | | $ | 62,828 | | | | 0.56 | % | | | 1.91 | % | | | 0.56 | % | | | 15.44 | % |
| $ | 11.97 | | | | 7.31 | % | | $ | 59,312 | | | | 0.56 | % | | | 2.18 | % | | | 0.56 | % | | | 24.57 | % |
| $ | 11.40 | | | | (0.88 | )% | | $ | 61,420 | | | | 0.55 | % | | | 2.22 | % | | | 0.55 | % | | | 21.08 | % |
| $ | 11.76 | | | | (0.14 | )% | | $ | 70,780 | | | | 0.55 | % | | | 2.18 | % | | | 0.59 | % | | | 23.25 | % |
| $ | 12.13 | | | | 3.91 | % | | $ | 83,965 | | | | 0.56 | % | | | 2.23 | % | | | 0.66 | % | | | 16.18 | % |
| | | | | | | | | | | | | | | | | | | | | | | | | | | |
| $ | 10.31 | | | | 4.01 | % | | $ | 67,627 | | | | 0.56 | % | | | 2.08 | % | | | 0.56 | % | | | 3.28 | % |
| $ | 10.13 | | | | 6.85 | % | | $ | 53,352 | | | | 0.56 | % | | | 2.43 | % | | | 0.56 | % | | | 33.73 | % |
| $ | 9.73 | | | | (0.73 | )% | | $ | 54,988 | | | | 0.55 | % | | | 2.39 | % | | | 0.55 | % | | | 17.53 | % |
| $ | 10.05 | | | | 0.52 | % | | $ | 59,567 | | | | 0.56 | % | | | 2.34 | % | | | 0.59 | % | | | 21.00 | % |
| $ | 10.28 | | | | 4.18 | % | | $ | 64,199 | | | | 0.57 | % | | | 2.30 | % | | | 0.67 | % | | | 11.31 | % |
| | | | | | | | | | | | | | | | | | | | | | | | | | | |
| $ | 9.30 | | | | (6.55 | )% | | $ | 7,928 | | | | 0.57 | % | | | 4.67 | % | | | 0.57 | % | | | 38.04 | % |
| $ | 10.43 | | | | 2.05 | % | | $ | 8,799 | | | | 0.54 | % | | | 4.79 | % | | | 0.54 | % | | | 26.68 | % |
| $ | 10.76 | | | | 2.61 | % | | $ | 6,807 | | | | 0.55 | % | | | 3.39 | % | | | 0.55 | % | | | 48.19 | % |
| $ | 10.92 | | | | 3.88 | % | | $ | 7,962 | | | | 0.50 | % | | | 4.11 | % | | | 0.50 | % | | | 43.86 | % |
| $ | 10.94 | | | | 10.13 | % | | $ | 26,328 | | | | 0.39 | % | | | 3.43 | % | | | 0.47 | % | | | 67.18 | % |
| | | | | | | | | | | | | | | | | | | | | | | | | | | |
| $ | 11.56 | | | | 0.43 | % | | $ | 159 | | | | 0.18 | % | | | 2.35 | % | | | 0.43 | % | | | 3.91 | % |
| $ | 12.17 | | | | 2.50 | % | | $ | 331 | | | | 0.16 | % | | | 2.48 | % | | | 0.41 | % | | | 9.41 | % |
| $ | 12.17 | | | | 4.11 | % | | $ | 223 | | | | 0.16 | % | | | 2.06 | % | | | 0.41 | % | | | 14.41 | % |
| $ | 11.98 | | | | 11.75 | % | | $ | 111 | | | | 0.17 | % | | | 1.67 | % | | | 0.42 | % | | | 0.80 | % |
| $ | 10.90 | | | | 7.24 | % | | $ | 80 | | | | 0.16 | % | | | 1.89 | % | | | 0.40 | % | | | 5.19 | % |
| | | | | | | | | | | | | | | | | | | | | | | | | | | |
| $ | 11.25 | | | | (1.35 | )% | | $ | 83 | | | | 0.17 | % | | | 1.44 | % | | | 0.42 | % | | | 3.50 | % |
| $ | 12.10 | | | | 0.84 | % | | $ | 700 | | | | 0.16 | % | | | 2.23 | % | | | 0.41 | % | | | 10.69 | % |
| $ | 12.28 | | | | 5.33 | % | | $ | 749 | | | | 0.19 | % | | | 1.95 | % | | | 0.44 | % | | | 17.81 | % |
| $ | 11.93 | | | | 14.48 | % | | $ | 692 | | | | 0.19 | % | | | 1.34 | % | | | 0.44 | % | | | 1.92 | % |
| $ | 10.56 | | | | 7.58 | % | | $ | 725 | | | | 0.18 | % | | | 1.35 | % | | | 0.43 | % | | | 5.95 | % |
Financial Highlights, Class R Shares
The financial highlights table is intended to help you understand the Funds’ financial performance for the past 5 years or, if shorter, the period of the Funds’ operations. Certain information reflects financial results for a single Fund share. The total returns in the table represent the rate that an investor would have earned (or lost) on an investment in the Fund (assuming reinvestment of all dividends and distributions).
| | | | | | Investment Activities | | | Distributions | |
| | | Net Asset Value, Beginning of Year | | | Net investment income (loss)(a) | | | Net realized/ unrealized gains (loss) on investments | | | Total from Investment Activities | | | Net investment income | | | Net realized gains on investments | | | Total Distributions | |
| Sterling Capital Mid Value Fund |
| Year Ended September 30, 2020 | | $ | 15.43 | | | | (0.01 | ) | | | (0.76 | ) | | | (0.77 | ) | | | (0.18 | ) | | | (1.13 | ) | | | (1.31 | ) |
| Year Ended September 30, 2019 | | $ | 18.43 | | | | 0.03 | | | | (0.77 | ) | | | (0.74 | ) | | | — | | | | (2.26 | ) | | | (2.26 | ) |
| Year Ended September 30, 2018 | | $ | 18.15 | | | | (0.07 | ) | | | 1.19 | | | | 1.12 | | | | — | | | | (0.84 | ) | | | (0.84 | ) |
| Year Ended September 30, 2017 | | $ | 16.25 | | | | — | (b) | | | 2.43 | | | | 2.43 | | | | — | | | | (0.53 | ) | | | (0.53 | ) |
| Year Ended September 30, 2016 | | $ | 17.59 | | | | (0.02 | ) | | | 2.02 | | | | 2.00 | | | | — | | | | (3.34 | ) | | | (3.34 | ) |
| Sterling Capital Behavioral Small Cap Value Equity Fund |
| Year Ended September 30, 2020 | | $ | 14.42 | | | | 0.07 | | | | (2.65 | ) | | | (2.58 | ) | | | (0.13 | ) | | | — | | | | (0.13 | ) |
| Year Ended September 30, 2019 | | $ | 18.52 | | | | 0.14 | | | | (2.07 | ) | | | (1.93 | ) | | | (0.19 | ) | | | (1.98 | ) | | | (2.17 | ) |
| Year Ended September 30, 2018 | | $ | 18.32 | | | | 0.13 | | | | 0.85 | | | | 0.98 | | | | (0.13 | ) | | | (0.65 | ) | | | (0.78 | ) |
| Year Ended September 30, 2017 | | $ | 15.14 | | | | 0.18 | | | | 3.08 | | | | 3.26 | | | | (0.08 | ) | | | — | | | | (0.08 | ) |
| Year Ended September 30, 2016 | | $ | 14.00 | | | | 0.14 | | | | 1.15 | | | | 1.29 | | | | (0.14 | ) | | | (0.01 | ) | | | (0.15 | ) |
| Sterling Capital Special Opportunities Fund |
| Year Ended September 30, 2020 | | $ | 24.83 | | | | (0.07 | ) | | | 1.39 | | | | 1.32 | | | | — | | | | (1.33 | ) | | | (1.33 | ) |
| Year Ended September 30, 2019 | | $ | 26.63 | | | | (0.04 | ) | | | 0.10 | | | | 0.06 | | | | — | | | | (1.86 | ) | | | (1.86 | ) |
| Year Ended September 30, 2018 | | $ | 24.79 | | | | (0.04 | ) | | | 3.94 | | | | 3.90 | | | | (0.12 | ) | | | (1.94 | ) | | | (2.06 | ) |
| Year Ended September 30, 2017 | | $ | 21.83 | | | | (0.04 | ) | | | 3.41 | | | | 3.37 | | | | — | | | | (0.41 | ) | | | (0.41 | ) |
| Year Ended September 30, 2016 | | $ | 23.28 | | | | (0.05 | ) | | | 1.91 | | | | 1.86 | | | | — | | | | (3.31 | ) | | | (3.31 | ) |
| Sterling Capital Equity Income Fund |
| Year Ended September 30, 2020 | | $ | 21.10 | | | | 0.30 | | | | (0.38 | ) | | | (0.08 | ) | | | (0.31 | ) | | | (0.84 | ) | | | (1.15 | ) |
| Year Ended September 30, 2019 | | $ | 21.39 | | | | 0.34 | | | | 1.22 | | | | 1.56 | | | | (0.33 | ) | | | (1.52 | ) | | | (1.85 | ) |
| Year Ended September 30, 2018 | | $ | 20.70 | | | | 0.29 | | | | 2.63 | | | | 2.92 | | | | (0.28 | ) | | | (1.95 | ) | | | (2.23 | ) |
| Year Ended September 30, 2017 | | $ | 18.18 | | | | 0.29 | | | | 2.58 | | | | 2.87 | | | | (0.33 | ) | | | (0.02 | ) | | | (0.35 | ) |
| Year Ended September 30, 2016 | | $ | 17.25 | | | | 0.26 | | | | 2.04 | | | | 2.30 | | | | (0.27 | ) | | | (1.10 | ) | | | (1.37 | ) |
| Sterling Capital Total Return Bond Fund |
| Year Ended September 30, 2020 | | $ | 10.84 | | | | 0.21 | | | | 0.55 | | | | 0.76 | | | | (0.26 | ) | | | — | (b) | | | (0.26 | ) |
| Year Ended September 30, 2019 | | $ | 10.16 | | | | 0.27 | | | | 0.70 | | | | 0.97 | | | | (0.29 | ) | | | — | | | | (0.29 | ) |
| Year Ended September 30, 2018 | | $ | 10.55 | | | | 0.25 | | | | (0.37 | ) | | | (0.12 | ) | | | (0.27 | ) | | | — | | | | (0.27 | ) |
| Year Ended September 30, 2017 | | $ | 10.77 | | | | 0.20 | | | | (0.15 | ) | | | 0.05 | | | | (0.27 | ) | | | — | | | | (0.27 | ) |
| Year Ended September 30, 2016 | | $ | 10.49 | | | | 0.23 | | | | 0.35 | | | | 0.58 | | | | (0.30 | ) | | | — | | | | (0.30 | ) |
| * | During the periods certain fees were waived (See Note 5 in the Notes to the Financial Statements). If such reductions had not occurred, the ratios would have been as indicated. |
| ** | Portfolio turnover rate is calculated on the basis of the Fund as a whole without distinguishing between classes of shares issued. |
| (a) | Per share net investment income (loss) has been calculated using the average daily shares method. |
| (b) | Amount is less than $0.005. |
| (c) | Net Assets are below $1,000. |
See accompanying Notes to the Financial Statements.
| | | | | | | Ratios/Supplementary Data | |
| Net Asset Value, End of Year | | | Total Return (excludes sales charge) | | | Net Assets, End of Year (000) | | | Ratio of net expenses to average net assets | | | Ratio of net investment income (loss) to average net assets | | | Ratio of expenses to average net assets* | | | Portfolio turnover rate** | |
| | | | | | | | | | | | | | | | | | | | |
| $ | 13.35 | | | | (5.97 | )% | | $ | 5 | | | | 1.34 | % | | | (0.08 | )% | | | 1.45 | % | | | 28.77 | % |
| $ | 15.43 | | | | (3.02 | )% | | $ | 5 | | | | 1.42 | % | | | 0.19 | % | | | 1.42 | % | | | 26.62 | % |
| $ | 18.43 | | | | 6.29 | % | | $ | 3 | | | | 1.42 | % | | | (0.39 | )% | | | 1.42 | % | | | 34.62 | % |
| $ | 18.15 | | | | 15.18 | % | | $ | 2 | | | | 1.39 | % | | | (0.01 | )% | | | 1.39 | % | | | 24.83 | % |
| $ | 16.25 | | | | 12.82 | % | | $ | — | (c) | | | 1.43 | % | | | (0.12 | )% | | | 1.43 | % | | | 25.45 | % |
| | | | | | | | | | | | | | | | | | | | | | | | | | | |
| $ | 11.71 | | | | (18.04 | )% | | $ | 175 | | | | 1.31 | % | | | 0.59 | % | | | 1.33 | % | | | 119.76 | % |
| $ | 14.42 | | | | (9.84 | )% | | $ | 107 | | | | 1.30 | % | | | 0.97 | % | | | 1.30 | % | | | 124.82 | % |
| $ | 18.52 | | | | 5.44 | % | | $ | 63 | | | | 1.28 | % | | | 0.69 | % | | | 1.28 | % | | | 89.85 | % |
| $ | 18.32 | | | | 21.52 | % | | $ | 33 | | | | 1.29 | % | | | 1.09 | % | | | 1.29 | % | | | 109.05 | % |
| $ | 15.14 | | | | 9.22 | % | | $ | — | (c) | | | 1.38 | % | | | 0.99 | % | | | 1.38 | % | | | 120.42 | % |
| | | | | | | | | | | | | | | | | | | | | | | | | | | |
| $ | 24.82 | | | | 5.29 | % | | $ | 113 | | | | 1.35 | % | | | (0.32 | )% | | | 1.36 | % | | | 17.50 | % |
| $ | 24.83 | | | | 0.95 | % | | $ | 288 | | | | 1.36 | % | | | (0.18 | )% | | | 1.36 | % | | | 17.31 | % |
| $ | 26.63 | | | | 16.80 | % | | $ | 173 | | | | 1.36 | % | | | (0.18 | )% | | | 1.36 | % | | | 22.78 | % |
| $ | 24.79 | | | | 15.66 | % | | $ | 266 | | | | 1.36 | % | | | (0.16 | )% | | | 1.36 | % | | | 18.92 | % |
| $ | 21.83 | | | | 8.34 | % | | $ | 191 | | | | 1.42 | % | | | (0.25 | )% | | | 1.48 | % | | | 27.32 | % |
| | | | | | | | | | | | | | | | | | | | | | | | | | | |
| $ | 19.87 | | | | (0.40 | )% | | $ | 1,749 | | | | 1.27 | % | | | 1.52 | % | | | 1.28 | % | | | 33.60 | % |
| $ | 21.10 | | | | 8.24 | % | | $ | 2,825 | | | | 1.28 | % | | | 1.67 | % | | | 1.28 | % | | | 23.20 | % |
| $ | 21.39 | | | | 14.97 | % | | $ | 2,548 | | | | 1.27 | % | | | 1.41 | % | | | 1.27 | % | | | 19.49 | % |
| $ | 20.70 | | | | 15.96 | % | | $ | 3,694 | | | | 1.28 | % | | | 1.52 | % | | | 1.28 | % | | | 16.93 | % |
| $ | 18.18 | | | | 14.18 | % | | $ | 1,921 | | | | 1.46 | % | | | 1.54 | % | | | 1.46 | % | | | 20.64 | % |
| | | | | | | | | | | | | | | | | | | | | | | | | | | |
| $ | 11.34 | | | | 7.08 | % | | $ | 32 | | | | 0.95 | % | | | 1.95 | % | | | 1.08 | % | | | 59.59 | % |
| $ | 10.84 | | | | 9.65 | % | | $ | 29 | | | | 0.95 | % | | | 2.62 | % | | | 1.08 | % | | | 79.40 | % |
| $ | 10.16 | | | | (1.13 | )% | | $ | 36 | | | | 0.93 | % | | | 2.45 | % | | | 1.08 | % | | | 62.28 | % |
| $ | 10.55 | | | | 0.50 | % | | $ | 5 | | | | 0.96 | % | | | 1.90 | % | | | 1.04 | % | | | 64.07 | % |
| $ | 10.77 | | | | 5.59 | % | | $ | 5 | | | | 0.99 | % | | | 2.20 | % | | | 1.07 | % | | | 65.47 | % |
Financial Highlights, Class R6 Shares
The financial highlights table is intended to help you understand the Funds’ financial performance for the past 5 years or, if shorter, the period of the Funds’ operations. Certain information reflects financial results for a single Fund share. The total returns in the table represent the rate that an investor would have earned (or lost) on an investment in the Fund (assuming reinvestment of all dividends and distributions).
| | | | | | Investment Activities | | | Distributions | |
| | | Net Asset Value, Beginning of Period | | | Net investment income(a) | | | Net realized/unrealized gains on investments | | | Total from Investment Activities | | | Net investment income | | | Net realized gains on investments | | | Total Distributions | |
| Sterling Capital Behavioral Large Cap Value Equity Fund |
| Year Ended September 30, 2020 | | $ | 19.62 | | | | 0.40 | | | | (2.07 | ) | | | (1.67 | ) | | | (0.52 | ) | | | (0.58 | ) | | | (1.10 | ) |
| Year Ended September 30, 2019 | | $ | 22.43 | | | | 0.46 | | | | (1.08 | ) | | | (0.62 | ) | | | (0.44 | ) | | | (1.75 | ) | | | (2.19 | ) |
| February 1, 2018 to September 30, 2018(e) | | $ | 22.89 | | | | 0.28 | | | | (0.45 | ) | | | (0.17 | ) | | | (0.29 | ) | | | — | | | | (0.29 | ) |
| | | | | | | | | | | | | | | | | | | | | | | | | | | | | |
| Sterling Capital Mid Value Fund |
| Year Ended September 30, 2020 | | $ | 16.48 | | | | (0.02 | ) | | | (0.75 | ) | | | (0.77 | ) | | | (0.23 | ) | | | (1.13 | ) | | | (1.36 | ) |
| Year Ended September 30, 2019 | | $ | 19.44 | | | | 0.11 | | | | (0.78 | ) | | | (0.67 | ) | | | (0.03 | ) | | | (2.26 | ) | | | (2.29 | ) |
| February 1, 2018 to September 30, 2018(e) | | $ | 20.22 | | | | 0.03 | | | | (0.81 | ) | | | (0.78 | ) | | | — | | | | — | | | | — | |
| | | | | | | | | | | | | | | | | | | | | | | | | | | | | |
| Sterling Capital Behavioral Small Cap Value Equity Fund |
| Year Ended September 30, 2020 | | $ | 14.67 | | | | 0.15 | | | | (2.70 | ) | | | (2.55 | ) | | | (0.15 | ) | | | — | | | | (0.15 | ) |
| Year Ended September 30, 2019 | | $ | 18.84 | | | | 0.23 | | | | (2.10 | ) | | | (1.87 | ) | | | (0.32 | ) | | | (1.98 | ) | | | (2.30 | ) |
| February 1, 2018 to September 30, 2018(e) | | $ | 18.59 | | | | 0.17 | | | | 0.08 | | | | 0.25 | | | | — | | | | — | | | | — | |
| | | | | | | | | | | | | | | | | | | | | | | | | | | | | |
| Sterling Capital Special Opportunities Fund |
| Year Ended September 30, 2020 | | $ | 26.09 | | | | 0.09 | | | | 1.44 | | | | 1.53 | | | | (0.07 | ) | | | (1.33 | ) | | | (1.40 | ) |
| Year Ended September 30, 2019 | | $ | 27.75 | | | | 0.10 | | | | 0.12 | | | | 0.22 | | | | (0.02 | ) | | | (1.86 | ) | | | (1.88 | ) |
| February 1, 2018 to September 30, 2018(e) | | $ | 26.44 | | | | 0.04 | | | | 1.42 | | | | 1.46 | | | | (0.15 | ) | | | — | | | | (0.15 | ) |
| | | | | | | | | | | | | | | | | | | | | | | | | | | | | |
| Sterling Capital Equity Income Fund |
| Year Ended September 30, 2020 | | $ | 21.34 | | | | 0.43 | | | | (0.40 | ) | | | 0.03 | | | | (0.44 | ) | | | (0.84 | ) | | | (1.28 | ) |
| Year Ended September 30, 2019 | | $ | 21.61 | | | | 0.47 | | | | 1.23 | | | | 1.70 | | | | (0.45 | ) | | | (1.52 | ) | | | (1.97 | ) |
| February 1, 2018 to September 30, 2018(e) | | $ | 21.49 | | | | 0.30 | | | | 0.12 | | | | 0.42 | | | | (0.30 | ) | | | — | | | | (0.30 | ) |
| | | | | | | | | | | | | | | | | | | | | | | | | | | | | |
| Sterling Capital Behavioral International Equity Fund |
| Year Ended September 30, 2020 | | $ | 9.49 | | | | 0.27 | | | | (1.32 | ) | | | (1.05 | ) | | | (0.30 | ) | | | — | | | | (0.30 | ) |
| Year Ended September 30, 2019 | | $ | 11.19 | | | | 0.36 | | | | (1.34 | ) | | | (0.98 | ) | | | (0.32 | ) | | | (0.40 | ) | | | (0.72 | ) |
| February 1, 2018 to September 30, 2018(e) | | $ | 12.35 | | | | 0.35 | | | | (1.51 | ) | | | (1.16 | ) | | | — | | | | — | | | | — | |
| | | | | | | | | | | | | | | | | | | | | | | | | | | | | |
| Sterling Capital Stratton Real Estate Fund |
| January 31, 2020 to September 30, 2020(e) | | $ | 41.35 | | | | 0.36 | | | | (4.26 | ) | | | (3.90 | ) | | | (0.76 | ) | | | — | | | | (0.76 | ) |
| | | | | | | | | | | | | | | | | | | | | | | | | | | | | |
| Sterling Capital Stratton Small Cap Value Fund |
| January 31, 2020 to September 30, 2020(e) | | $ | 77.13 | | | | 0.49 | | | | (13.53 | ) | | | (13.04 | ) | | | — | | | | — | | | | — | |
| | | | | | | | | | | | | | | | | | | | | | | | | | | | | |
| Sterling Capital Total Return Bond Fund |
| Year Ended September 30, 2020 | | $ | 10.89 | | | | 0.28 | | | | 0.54 | | | | 0.82 | | | | (0.32 | ) | | | — | (f) | | | (0.32 | ) |
| Year Ended September 30, 2019 | | $ | 10.20 | | | | 0.33 | | | | 0.71 | | | | 1.04 | | | | (0.35 | ) | | | — | | | | (0.35 | ) |
| February 1, 2018 to September 30, 2018(e) | | $ | 10.48 | | | | 0.21 | | | | (0.27 | ) | | | (0.06 | ) | | | (0.22 | ) | | | — | | | | (0.22 | ) |
| * | During the periods certain fees were waived (See Note 5 in the Notes to the Financial Statements). If such reductions had not occurred, the ratios would have been as indicated. |
| ** | Portfolio turnover rate is calculated on the basis of the Fund as a whole without distinguishing between classes of shares issued. |
| (a) | Per share net investment income (loss) has been calculated using the average daily shares method. |
| (b) | Not annualized for periods less than one year. |
| (c) | Annualized for periods less than one year. |
| (d) | Net Assets are below $1,000. |
| (e) | Period from commencement of operations. |
| (f) | Amount is less than $0.005. |
See accompanying Notes to the Financial Statements.
| | | | | | | Ratios/Supplementary Data | |
| Net Asset Value, End of Period | | | Total Return (excludes sales charge) (b) | | | Net Assets, End of Period (000) | | | Ratio of net expenses to average net assets (c) | | | Ratio of net investment income to average net assets (c) | | | Ratio of expenses to average net assets*(c) | | | Portfolio turnover rate**(b) | |
| | | | | | | | | | | | | | | | | | | | |
| $ | 16.85 | | | | (8.88 | )% | | $ | — | (d) | | | 0.59 | % | | | 2.19 | % | | | 0.64 | % | | | 167.34 | % |
| $ | 19.62 | | | | (2.02 | )% | | $ | 239,763 | | | | 0.58 | % | | | 2.35 | % | | | 0.64 | % | | | 142.59 | % |
| $ | 22.43 | | | | (0.69 | )% | | $ | 270,105 | | | | 0.58 | % | | | 1.94 | % | | | 0.63 | % | | | 127.89 | % |
| | | | | | | | | | | | | | | | | | | | | | | | | | | |
| $ | 14.35 | | | | (5.56 | )% | | $ | 3,477 | | | | 0.54 | % | | | (0.06 | )% | | | 0.56 | % | | | 28.77 | % |
| $ | 16.48 | | | | (2.45 | )% | | $ | 247,949 | | | | 0.82 | % | | | 0.68 | % | | | 0.93 | % | | | 26.62 | % |
| $ | 19.44 | | | | (3.86 | )% | | $ | 285,847 | | | | 0.83 | % | | | 0.26 | % | | | 0.93 | % | | | 34.62 | % |
| | | | | | | | | | | | | | | | | | | | | | | | | | | |
| $ | 11.97 | | | | (17.63 | )% | | $ | 70,372 | | | | 0.74 | % | | | 1.11 | % | | | 0.82 | % | | | 119.76 | % |
| $ | 14.67 | | | | (9.29 | )% | | $ | 210,436 | | | | 0.73 | % | | | 1.53 | % | | | 0.80 | % | | | 124.82 | % |
| $ | 18.84 | | | | 1.34 | % | | $ | 191,051 | | | | 0.73 | % | | | 1.38 | % | | | 0.79 | % | | | 89.85 | % |
| | | | | | | | | | | | | | | | | | | | | | | | | | | |
| $ | 26.22 | | | | 5.87 | % | | $ | 40,057 | | | | 0.78 | % | | | 0.38 | % | | | 0.86 | % | | | 17.50 | % |
| $ | 26.09 | | | | 1.53 | % | | $ | 355,672 | | | | 0.77 | % | | | 0.40 | % | | | 0.86 | % | | | 17.31 | % |
| $ | 27.75 | | | | 5.60 | % | | $ | 372,948 | | | | 0.78 | % | | | 0.21 | % | | | 0.85 | % | | | 22.78 | % |
| | | | | | | | | | | | | | | | | | | | | | | | | | | |
| $ | 20.09 | | | | 0.21 | % | | $ | 56,277 | | | | 0.67 | % | | | 2.18 | % | | | 0.78 | % | | | 33.60 | % |
| $ | 21.34 | | | | 8.89 | % | | $ | 345,806 | | | | 0.66 | % | | | 2.28 | % | | | 0.77 | % | | | 23.20 | % |
| $ | 21.61 | | | | 2.03 | % | | $ | 317,827 | | | | 0.66 | % | | | 2.16 | % | | | 0.77 | % | | | 19.49 | % |
| | | | | | | | | | | | | | | | | | | | | | | | | | | |
| $ | 8.14 | | | | (11.49 | )% | | $ | 69,236 | | | | 0.63 | % | | | 3.10 | % | | | 0.83 | % | | | 164.02 | % |
| $ | 9.49 | | | | (8.48 | )% | | $ | 78,307 | | | | 0.61 | % | | | 3.77 | % | | | 0.89 | % | | | 97.74 | % |
| $ | 11.19 | | | | (9.39 | )% | | $ | 62,804 | | | | 0.62 | % | | | 4.63 | % | | | 0.87 | % | | | 96.65 | % |
| | | | | | | | | | | | | | | | | | | | | | | | | | | |
| $ | 36.69 | | | | (9.30 | )% | | $ | — | (d) | | | 0.70 | % | | | 1.47 | % | | | 0.70 | % | | | 19.58 | % |
| | | | | | | | | | | | | | | | | | | | | | | | | | | |
| $ | 64.09 | | | | (16.91 | )% | | $ | 2,882 | | | | 0.87 | % | | | 1.17 | % | | | 1.09 | % | | | 8.33 | % |
| | | | | | | | | | | | | | | | | | | | | | | | | | | |
| $ | 11.39 | | | | 7.70 | % | | $ | 642,344 | | | | 0.35 | % | | | 2.52 | % | | | 0.58 | % | | | 59.59 | % |
| $ | 10.89 | | | | 10.38 | % | | $ | 350,129 | | | | 0.35 | % | | | 3.20 | % | | | 0.58 | % | | | 79.40 | % |
| $ | 10.20 | | | | (0.52 | )% | | $ | 281,637 | | | | 0.35 | % | | | 3.16 | % | | | 0.59 | % | | | 62.28 | % |
Notes to Financial Statements
September 30, 2020
Sterling Capital Funds (the “Trust”) commenced operations on October 5, 1992 and is registered under the Investment Company Act of 1940, as amended (the “1940 Act”), as an open-end investment company established as a Massachusetts business trust.
The Trust offers shares of Sterling Capital Behavioral Large Cap Value Equity Fund, Sterling Capital Mid Value Fund, Sterling Capital Behavioral Small Cap Value Equity Fund, Sterling Capital Special Opportunities Fund, Sterling Capital Equity Income Fund, Sterling Capital Behavioral International Equity Fund, Sterling Capital SMID Opportunities Fund, Sterling Capital Stratton Mid Cap Value Fund, Sterling Capital Stratton Real Estate Fund, Sterling Capital Stratton Small Cap Value Fund, Sterling Capital Ultra Short Bond Fund, Sterling Capital Short Duration Bond Fund, Sterling Capital Intermediate U.S. Government Fund, Sterling Capital Total Return Bond Fund, Sterling Capital Corporate Fund, Sterling Capital Quality Income Fund, Sterling Capital Kentucky Intermediate Tax-Free Fund, Sterling Capital Maryland Intermediate Tax-Free Fund, Sterling Capital North Carolina Intermediate Tax-Free Fund, Sterling Capital South Carolina Intermediate Tax-Free Fund, Sterling Capital Virginia Intermediate Tax-Free Fund, Sterling Capital West Virginia Intermediate Tax-Free Fund, Sterling Capital Diversified Income Fund, Sterling Capital Strategic Allocation Balanced Fund and Sterling Capital Strategic Allocation Growth Fund (referred to individually as a “Fund” and collectively as the “Funds”). Sterling Capital Kentucky Intermediate Tax-Free Fund, Sterling Capital Maryland Intermediate Tax-Free Fund, Sterling Capital North Carolina Intermediate Tax-Free Fund, Sterling Capital South Carolina Intermediate Tax-Free Fund, Sterling Capital Virginia Intermediate Tax-Free Fund and Sterling Capital West Virginia Intermediate Tax-Free Fund are referred to as the “Tax-Free Funds.” Sterling Capital Diversified Income Fund, Sterling Capital Strategic Allocation Balanced Fund and Sterling Capital Strategic Allocation Growth Fund are referred to as the “Funds of Funds.” The Funds, excluding the Funds of Funds, are referred to as the “Variable Net Asset Value Funds.” The Funds of Funds invest in underlying mutual funds as opposed to individual securities.
All Funds, other than the Tax-Free Funds, are “diversified” funds, as defined in the 1940 Act. The Tax-Free Funds are non-diversified funds, which means they may invest in the securities of a limited number of issuers.
By owning shares of underlying investment companies, each of the Funds of Funds invests, to varying degrees, in securities of U.S. and non-U.S. companies, including small and medium sized companies, and in debt securities. Funds of Funds with exposure to underlying equity funds may include funds that invest in real estate related securities. In addition, underlying investment companies may invest in derivatives and may engage in long/short equity strategies and in option writing strategies. The Funds of Funds except for Sterling Capital Diversified Income Fund currently invest only in other Funds that are part of the Sterling Capital Funds group of investment companies (not including cash sweep vehicles). Financial information for those Sterling Capital Funds is included in this report and also is available at www.sec.gov. Financial information for the other underlying Funds is available at www.sec.gov.
The Funds are authorized to issue an unlimited amount of shares. As of September 30, 2020, the Funds discussed herein offered up to five classes of shares: Class A Shares, Class C Shares, Class R Shares, Class R6 Shares and Institutional Shares. Class A Shares of Sterling Capital Behavioral Large Cap Value Equity Fund, Sterling Capital Mid Value Fund, Sterling Capital Behavioral Small Cap Value Equity Fund, Sterling Capital Special Opportunities Fund, Sterling Capital Equity Income Fund, Sterling Capital Behavioral International Equity Fund, Sterling Capital Stratton Mid Cap Value Fund, Sterling Capital Stratton Real Estate Fund, Sterling Capital Stratton Small Cap Value Fund, Sterling Capital SMID Opportunities Fund, and the Funds of Funds have a maximum sales charge of 5.75% as a percentage of original purchase price. Class A Shares of Sterling Capital Ultra Short Bond Fund have a maximum sales charge of 0.50%. Class A Shares of Sterling Capital Short Duration Bond Fund, Sterling Capital Intermediate U.S. Government Fund, Sterling Capital Corporate Fund, Sterling Capital Total Return Fund, Sterling Capital Quality Income Fund, and the Tax-Free Funds have a maximum sales charge of 2.00% as a percentage of the original purchase price. Purchases of $1 million or more of Class A Shares are not subject to a front-end sales charge but will be subject to a Contingent Deferred Sales Charge (“CDSC”) of up to 1.00% of the purchase price if redeemed within two years after purchase for all Funds except the Tax-Free Funds, Sterling Capital Short Duration Bond Fund, Sterling Capital Intermediate U.S. Government Fund, Sterling Capital Corporate Fund, Sterling CapitalTotal Return Bond Fund, Sterling Capital Quality Income Fund, and Sterling Capital Ultra Short Bond Fund. With respect to the Tax-Free Funds, Sterling Capital Short Duration Bond Fund, Sterling Capital Intermediate U.S. Government Fund, Sterling Capital Corporate Fund, Sterling Capital Total Return Bond Fund, and Sterling Capital Quality Income Fund, sales of Class A shares of $250,000 or more are not subject to a sales load but will be subject to a CDSC of up to 0.50% of the purchase price if redeemed within 18 months of purchase. With respect to Sterling Capital Ultra Short Bond Fund, sales of Class A shares of $100,000 or more are not subject
Notes to Financial Statements — (continued)
September 30, 2020
to a sales load.This charge is based on the lower of the price paid for the shares or their net asset value at the time of redemption. Class C Shares of the Funds are offered without any front-end sales charge but will be subject to a maximum CDSC of 1.00% if redeemed less than one year after purchase.
Each class of shares has identical rights and privileges except with respect to the fees paid under the distribution plan, voting rights on matters affecting a single class of shares and the exchange privilege of each class of shares.
Under the Trust’s organizational documents, its Officers and Trustees are indemnified against certain liabilities arising out of the performance of their duties to the Trust. In addition, in the normal course of business, the Funds may enter into contracts with their vendors and others that provide for general indemnifications.The Funds’maximum exposure under these arrangements is unknown, as this would involve future claims that may be made against the Funds. However, based on experience, the Funds expect that risk of loss to be remote.
| 2. | Significant Accounting Policies: |
The Funds are investment companies and accordingly follow the investment company accounting and reporting guidance of the FinancialAccounting Standards Board (“FASB”)Accounting Standards CodificationTopic 946, Financial Services-Investment Companies. The following is a summary of significant accounting policies followed by the Funds. The policies are in conformity with United States generally accepted accounting principles (“U.S. GAAP”). The preparation of these financial statements requires management to make estimates and assumptions that affect the reported amounts of assets and liabilities and disclosure of contingent assets and liabilities at the date of the financial statements and the reported amounts of income and expenses for the reporting period. Actual results could differ from those estimates.
Securities Valuation — Investments of the Variable Net Asset Value Funds in securities traded on a national securities exchange or in the over-the-counter market are valued at the closing price on the principal exchange or market (including the NASDAQ Closing Price for securities traded on NASDAQ), typically 4:00 PM ET or, absent such a price, by reference to the latest available bid prices in the principal market in which such securities are normally traded. The Variable Net Asset Value Funds may also use an independent pricing service approved by the Board of Trustees (the “Board”) to value certain securities, including the use of electronic and matrix techniques. Investments in open-end investment companies, including underlying funds invested in by the Funds of Funds, are valued at their respective net asset values as reported by such companies. Investments in closed-end investment companies and exchange-traded funds are valued at their market values based upon the latest available sale price or, absent such a price, by reference to the latest available bid prices in the principal market in which such securities are normally traded. The differences between cost and fair value of investments are reflected as either unrealized appreciation or depreciation. Securities for which market quotations are not readily available or deemed unreliable (e.g., an approved pricing service does not provide a price, a furnished price is in error, certain stale prices, or an event occurs that materially affects the furnished price) will be fair valued in accordance with procedures established in good faith under the general supervision of the Board.
Fair value pricing may be used if events materially affecting the value of foreign securities occur between the time when the exchange on which they are traded closes and the time when the Sterling Capital Behavioral International Equity Fund’s net asset value is calculated; such securities may be valued at fair value in accordance with procedures adopted by the Board.
Fair Value Measurements — The objective of a fair value measurement is to determine the price that would be received to sell an asset or paid to transfer a liability in an orderly transaction between market participants at the measurement date (an exit price). Accordingly, the fair value hierarchy gives the highest priority to quoted prices (unadjusted) in active markets for identical assets or liabilities (Level 1) and the lowest priority to unobservable inputs (Level 3). The three levels of the fair value hierarchy are described as follows:
● Level 1 – quoted prices in active markets for identical securities
● Level 2 – based on other significant observable inputs (including quoted prices for similar securities, interest rates, prepayment speeds, credit risk, etc.)
● Level 3 – based on significant unobservable inputs (including a Fund’s own assumptions in determining the fair value of investments)
Notes to Financial Statements — (continued)
September 30, 2020
The inputs or methodology used for valuing securities are not necessarily an indication of the risk associated with investing in those securities. During the fiscal year ended September 30, 2020, there were no significant changes to the valuation policies and procedures.
The summary of inputs used to determine the fair value of each Fund’s investments as of September 30, 2020 is as follows:
| | | Level 1– Quoted Prices | | | Level 2– Other Significant Observable Inputs | | | Level 3– Significant Unobservable Inputs | | | Total | |
| Assets: | | | | | | | | | | | | |
| Investments in Securities | | | | | | | | | | | | | | | | |
| Sterling Capital Behavioral Large Cap Value Equity Fund | | $ | 27,006,274 | (a) | | $ | — | | | $ | — | | | $ | 27,006,274 | |
| Sterling Capital Mid Value Fund | | | 60,916,632 | (a) | | | — | | | | — | | | | 60,916,632 | |
| Sterling Capital Behavioral Small Cap Value Equity Fund | | | 82,412,535 | (a) | | | — | | | | — | | | | 82,412,535 | |
| Sterling Capital Special Opportunities Fund | | | 543,047,958 | (a) | | | — | | | | — | | | | 543,047,958 | |
| Sterling Capital Equity Income Fund | | | 1,554,772,269 | (a) | | | — | | | | — | | | | 1,554,772,269 | |
| Sterling Capital Behavioral International Equity Fund | | | 2,168,605 | (a) | | | 80,464,025(a) | | | | — | | | | 82,632,630 | |
| Sterling Capital SMID Opportunities Fund | | | 11,039,562 | (a) | | | — | | | | — | | | | 11,039,562 | |
| Sterling Capital Stratton Mid Cap Value Fund | | | 54,081,965 | (a) | | | — | | | | — | | | | 54,081,965 | |
| Sterling Capital Stratton Real Estate Fund | | | 85,681,451 | (a) | | | — | | | | — | | | | 85,681,451 | |
| Sterling Capital Stratton Small Cap Value Fund | | | 478,369,521 | (a) | | | — | | | | — | | | | 478,369,521 | |
| Sterling Capital Ultra Short Bond Fund | | | 845,516 | (b) | | | 36,046,611(a) | | | | — | | | | 36,892,127 | |
| Sterling Capital Short Duration Bond Fund | | | 1,933,288 | (b) | | | 179,925,169(a) | | | | — | | | | 181,858,457 | |
| Sterling Capital Intermediate U.S. Government Fund | | | 491,059 | (b) | | | 12,140,130(a) | | | | — | | | | 12,631,189 | |
| Sterling Capital Total Return Bond Fund | | | 7,970,369 | (b) | | | 1,753,295,337(a) | | | | — | | | | 1,761,265,706 | |
| Sterling Capital Corporate Fund | | | 323,215 | (b) | | | 18,554,171(a) | | | | — | | | | 18,877,386 | |
| Sterling Capital Quality Income Fund | | | 2,203,499 | (b) | | | 35,139,354(a) | | | | — | | | | 37,342,853 | |
| Sterling Capital Kentucky Intermediate Tax-Free Fund | | | 465,816 | (b) | | | 11,801,630(a) | | | | — | | | | 12,267,446 | |
| Sterling Capital Maryland Intermediate Tax-Free Fund | | | 560,695 | (b) | | | 12,154,587(a) | | | | — | | | | 12,715,282 | |
| Sterling Capital North Carolina Intermediate Tax-Free Fund | | | 6,286,694 | (b) | | | 169,250,147(a) | | | | — | | | | 175,536,841 | |
| Sterling Capital South Carolina Intermediate Tax-Free Fund | | | 2,163,552 | (b) | | | 83,693,144(a) | | | | — | | | | 85,856,696 | |
| Sterling Capital Virginia Intermediate Tax-Free Fund | | | 2,092,909 | (b) | | | 78,259,605(a) | | | | — | | | | 80,352,514 | |
| Sterling Capital West Virginia Intermediate Tax-Free Fund | | | 4,575,339 | (b) | | | 90,175,865(a) | | | | — | | | | 94,751,204 | |
| Sterling Capital Diversified Income Fund | | | 14,490,839 | (a) | | | — | | | | — | | | | 14,490,839 | |
| Sterling Capital Strategic Allocation Balanced Fund | | | 21,961,493 | (a) | | | — | | | | — | | | | 21,961,493 | |
| Sterling Capital Strategic Allocation Growth Fund | | | 17,732,560 | (a) | | | — | | | | — | | | | 17,732,560 | |
| (a) | Industries, countries or security types are disclosed in the Schedules of Portfolio Investments. |
| (b) | Represents money market funds and/or certain preferred stocks. |
Cash and Cash Equivalents — The Funds consider liquid assets deposited with a bank, and certain short term debt instruments with original maturities of three months or less to be cash equivalents. These investments represent amounts held with financial institutions that are readily accessible to pay Fund expenses or investments. The Funds may invest their excess cash in the Federated Treasury Obligations Fund or a similar money market fund or other short-term investment.
Credit Enhancements — Certain obligations held in the Funds have credit enhancement or liquidity features that may, under certain circumstances, provide for repayment of principal and interest on the obligation upon demand date, interest rate reset date or final maturity. These enhancements may include: letters of credit; liquidity guarantees; security purchase agreements; tender option purchase agreements; and third party insurance (i.e., AMBAC).
Derivative Instruments Categorized by Risk Exposure — The Funds’ derivative contracts for the year ended September 30, 2020 are not accounted for as hedging instruments under U.S. GAAP. The following is a summary of the location of the derivative instruments held by the Funds on the Statements of Operations and the category of primary risk exposure as of September 30, 2020:
Notes to Financial Statements — (continued)
September 30, 2020
The effect of derivative financial instruments on the Statements of Operations for the year ended September 30, 2020:
| Net Realized Gain (Loss) | Sterling Capital
Equity
Income Fund |
| Written options (equity contracts) | $295,756 |
| Net Change in Unrealized Appreciation (Depreciation) | Sterling Capital
Equity
Income Fund |
| Written options (equity contracts) | $(107,368) |
During the year ended September 30, 2020, the Equity Income Fund held a daily number of contracts and a daily notional amount of equity written options of 1,300 and $11,494,600, respectively, while outstanding.
Distributions to Shareholders — Dividends from net investment income are declared daily and paid monthly for Sterling Capital Ultra Short Bond Fund, Sterling Capital Short Duration Bond Fund, Sterling Capital Intermediate U.S. Government Fund, Sterling Capital Total Return Bond Fund, Sterling Capital Corporate Fund, Sterling Capital Quality Income Fund, and the Tax-Free Funds. Dividends from net investment income are declared and paid monthly for Sterling Capital Diversified Income Fund. Dividends from net investment income are declared and paid quarterly for Sterling Capital Stratton Mid Cap Value Fund, Sterling Capital Stratton Real Estate Fund, Sterling Capital Stratton Small Cap Value Fund, Sterling Capital Behavioral Large Cap Value Equity Fund, Sterling Capital Mid Value Fund, Sterling Capital Behavioral Small Cap Value Equity Fund, Sterling Capital Special Opportunities Fund, Sterling Capital Equity Income Fund, Sterling Capital SMID Opportunities Fund, Sterling Capital Strategic Allocation Balanced Fund, and Sterling Capital Strategic Allocation Growth Fund if the annualized yield of the distribution exceeds an amount determined annually by the Board. Dividends from net investment income for Sterling Capital Behavioral International Equity Fund is declared and paid annually. Distributable net realized gains, if any, are declared and distributed at least annually. Distributions to shareholders that exceed net investment income and net realized gains for tax purposes are reported as distributions of capital. Distributions to shareholders are recorded on the ex-dividend date.
Expenses and Allocation Methodology — Expenses directly attributable to a Fund are charged to that Fund. Expenses not directly attributable to a Fund are allocated proportionately among all Funds daily in relation to the net assets of each Fund or on another reasonable basis. Each class of shares bears its pro-rata portion of expenses attributable to its series, except that each class separately bears expenses related specifically to that class, such as distribution fees. Income and realized and unrealized gains or losses on investments are allocated to each class of shares based on its relative net assets or another appropriate basis.
Foreign Currency Translation — The accounting records of the Sterling Capital Behavioral International Equity Fund are maintained in U.S. dollars. Foreign currency amounts are translated into U.S. dollars at the latest foreign exchange bid quotation (from an approved pricing vendor) to determine the fair value of investments, assets and liabilities. Purchases and sales of securities, income and expenses are translated at the prevailing rate of exchange, on the respective dates of such transactions. The Sterling Capital Behavioral International Equity Fund does not isolate that portion of the results of operations resulting from changes in foreign exchange rates on investments from fluctuations arising from changes in market prices of securities held. Such fluctuations are included with the net realized and unrealized gain or loss from investments and foreign currencies.
Forward Foreign Currency Exchange Contracts — The Sterling Capital Behavioral International Equity Fund, Sterling Capital Ultra Short Bond Fund, Sterling Capital Short Duration Bond Fund, Sterling Capital Total Return Bond Fund and Sterling Capital Corporate Fund may enter into forward foreign currency exchange contracts (foreign currency exchange risk) in connection with planned purchases or sales of securities or to hedge the U.S. dollar value of Funds securities denominated in a particular currency. A foreign currency exchange contract is an agreement between two parties to buy and sell a currency at a set exchange rate on a future date. The Funds can be exposed to risks if the counterparties to the contracts are unable to meet the terms of their contracts and from unanticipated movements in the value of a foreign currency relative to the U.S. dollar. In the event of default by the counterparty to the transaction, the Funds’ maximum amount of loss, as either the buyer or seller, is the unrealized gain of the contract. The forward foreign currency exchange
Notes to Financial Statements — (continued)
September 30, 2020
contracts are adjusted by the daily exchange rate of the underlying currency and any gains or losses are recorded for financial statement purposes as unrealized gains or losses until the contract settlement date. When the contract is closed, the Funds record a realized gain (loss) equal to the difference between the value at the time it was opened and the value at the time it was closed.
Mortgage Dollar Rolls — The Variable Net Asset Value Funds may sell mortgage-backed securities for delivery in the current month and simultaneously contract to repurchase substantially similar (same type, coupon and maturity) securities on a specific future date at an agreed-upon price. The market value of the securities that a Fund is required to purchase may decline below the agreed upon repurchase price of those securities. Pools of mortgages collateralizing those securities may have different prepayment histories than those sold. During the period between the sale and repurchase, a Fund will not be entitled to receive interest and principal payments on the securities sold. Proceeds of the sale will be invested in additional instruments for a Fund, and the income from these investments will generate income for a Fund. If such income does not exceed the income, capital appreciation and gain or loss that would have been realized on the securities sold as part of the dollar roll, the use of this technique will diminish the investment performance of a Fund compared with what the performance would have been without the use of dollar rolls. The Funds account for mortgage dollar roll transactions as purchases and sales. The Funds did not hold any mortgage dollar rolls during the year.
Options Contracts — Sterling Capital Special Opportunities Fund and Sterling Capital Equity Income Fund write (sell) “covered” call options on securities and purchase options on securities to close out options previously written by them. Sterling Capital Diversified Income Fund may invest in underlying funds that engage in options writing strategies (including cash-secured put writing and covered call writing).
In writing an option, a Fund contracts with a specified counterparty to purchase (put option written) or sell (call option written) a specified quantity (notional amount) of an underlying asset at a specified price during a specified period upon demand of the counterparty. The risk associated with writing an option is that the Funds bear the market risk of an unfavorable change in the price of an underlying asset and are required to buy or sell an underlying asset under the contractual terms of the option at a price different from the current value. The Funds execute transactions in both listed and over-the-counter options. When purchasing over-the-counter options, a Fund bears the risk of economic loss from counterparty default, equal to the market value of the option. Listed options involve minimal counterparty risk since the listed options are guaranteed against default by the exchange on which they trade. Transactions in over-the-counter options expose the Funds to the risk of default by the counterparty to the transaction. In the event of default by the counterparty to the over-the-counter transaction, the Funds’ maximum amount of loss is the premium paid (as the purchaser) or the unrealized depreciation of the contract (as the writer).
Sterling Capital Special Opportunities Fund and Sterling Capital Equity Income Fund may invest in written options to economically hedge the downside exposure by collecting a premium when sold against the equity holding.
Risks Associated with Foreign Securities and Currencies — Investments in securities of foreign issuers carry certain risks not ordinarily associated with investments in securities of domestic issuers. Such risks include future political and economic developments and the possible imposition of exchange controls or other foreign governmental laws and restrictions. In addition, with respect to certain countries, there is the possibility of expropriation of assets, confiscatory taxation, political or social instability or diplomatic developments which could adversely affect investments in those countries. Certain foreign investments may also be subject to foreign withholding taxes.
Securities Transactions and Related Income — During the period, security transactions are accounted for no later than one business day after the trade date. For financial reporting purposes, however, security transactions as of the last business day of the reporting period are accounted for on the trade date. Interest income is recognized on the accrual basis and includes, where applicable, the amortization/accretion of premium or discount. Discounts and premiums on securities purchased are accreted and amortized over the lives of the respective securities. Dividend income is recorded on the ex-dividend date. Gains or losses realized from sales of securities are determined by comparing the identified cost of the security lot sold with the net sales proceeds.
When-Issued and Forward Commitments — The Funds may purchase securities on a “when-issued” basis. Sterling Capital Behavioral Large Cap Value Equity Fund, Sterling Capital Mid Value Fund, Sterling Capital Behavioral Small Cap Value Equity Fund, Sterling Capital Special Opportunities Fund and Sterling Capital Equity Income Fund may also purchase or sell securities on a forward commitment basis. The Funds record when-issued securities on the trade date and pledge assets
Notes to Financial Statements — (continued)
September 30, 2020
with a value at least equal to the purchase commitment for payment of the securities purchased. The value of the securities underlying when-issued or forward commitments to purchase securities, and any subsequent fluctuation in their value, is taken into account when determining the net asset value of the Funds commencing with the date the Funds agree to purchase the securities. The Funds do not accrue interest or dividends on when-issued securities until the underlying securities are received.
Accounting Standards — The Funds adopted FASB Accounting Standards Update (“ASU”) 2017-08, Receivables – Nonrefundable Fees and Other Costs (Subtopic 310-20): Premium Amortization on Purchased Callable Debt Securities to amend the amortization period for certain callable debt securities purchased at a premium. Under the new standard, the Funds changed the amortization period for the premium on certain purchased callable debt securities with non-contingent call features to the earliest call date. In accordance with the transition provisions of the standard, the Funds applied the amendments on a modified retrospective basis beginning after the fiscal year ended September 30, 2019. This change in accounting policy has been made to comply with the newly issued accounting standard and had no impact on total accumulated earnings (deficit) or the net asset value of the Funds.
In March 2020, the FASB issued ASU 2020-04, Reference Rate Reform (Topic 848) — Facilitation of the Effects of Reference Rate Reform on Financial Reporting, which provides optional, temporary relief with respect to the financial reporting of contracts subject to certain types of modifications due to the planned discontinuation of the London Interbank Offered Rate (LIBOR) and other interbank-offered based reference rates as of the end of 2021. The guidance is effective for certain reference rate-related contract modifications that occur during the period March 12, 2020 through December 31, 2022. Management is currently evaluating the impact, if any, of the ASU on the Funds’ financial statements.
| 3. | Purchases and Sales of Securities: |
Purchases and sales of securities (excluding in-kind transactions, U.S. government securities and securities maturing less than one year from acquisition) for the fiscal year ended September 30, 2020 were as follows:
| | | Purchases | | | Sales | |
| Sterling Capital Behavioral Large Cap Value Equity Fund | | $ | 331,431,576 | | | $ | 347,418,687 | |
| Sterling Capital Mid Value Fund | | | 27,459,024 | | | | 140,785,290 | |
| Sterling Capital Behavioral Small Cap Value Equity Fund | | | 125,470,107 | | | | 137,395,513 | |
| Sterling Capital Special Opportunities Fund | | | 150,920,280 | | | | 353,946,088 | |
| Sterling Capital Equity Income Fund | | | 745,655,169 | | | | 582,425,800 | |
| Sterling Capital Behavioral International Equity Fund | | | 143,230,770 | | | | 142,078,386 | |
| Sterling Capital SMID Opportunities Fund | | | 8,480,170 | | | | 6,241,285 | |
| Sterling Capital Stratton Mid Cap Value Fund | | | 5,052,869 | | | | 8,174,141 | |
| Sterling Capital Stratton Real Estate Fund | | | 18,408,978 | | | | 25,216,267 | |
| Sterling Capital Stratton Small Cap Value Fund | | | 60,225,286 | | | | 379,916,952 | |
| Sterling Capital Ultra Short Bond Fund | | | 28,048,818 | | | | 8,676,277 | |
| Sterling Capital Short Duration Bond Fund | | | 111,759,879 | | | | 77,056,217 | |
| Sterling Capital Intermediate U.S. Government Fund | | | 64,163 | | | | 220,466 | |
| Sterling Capital Total Return Bond Fund | | | 695,541,081 | | | | 374,919,281 | |
| Sterling Capital Corporate Fund | | | 9,464,891 | | | | 13,916,619 | |
| Sterling Capital Quality Income Fund | | | 7,082,390 | | | | 3,487,811 | |
| Sterling Capital Kentucky Intermediate Tax-Free Fund | | | 2,373,188 | | | | 859,845 | |
| Sterling Capital Maryland Intermediate Tax-Free Fund | | | 1,189,689 | | | | 3,042,852 | |
| Sterling Capital North Carolina Intermediate Tax-Free Fund | | | 28,865,014 | | | | 32,461,527 | |
| Sterling Capital South Carolina Intermediate Tax-Free Fund | | | 9,821,303 | | | | 3,890,570 | |
| Sterling Capital Virginia Intermediate Tax-Free Fund | | | 12,839,556 | | | | 11,763,972 | |
| Sterling Capital West Virginia Intermediate Tax-Free Fund | | | 18,032,378 | | | | 2,683,709 | |
| Sterling Capital Diversified Income Fund | | | 6,518,810 | | | | 9,719,764 | |
| Sterling Capital Strategic Allocation Balanced Fund | | | 898,970 | | | | 3,508,000 | |
| Sterling Capital Strategic Allocation Growth Fund | | | 649,800 | | | | 2,325,972 | |
Notes to Financial Statements — (continued)
September 30, 2020
Purchases and sales of U.S. government securities (excluding securities maturing less than one year from acquisition) for the fiscal year ended September 30, 2020 were as follows:
| | | Purchases | | | Sales | |
| Sterling Capital Ultra Short Bond Fund | | $ | 536,342 | | | $ | — | |
| Sterling Capital Short Duration Bond Fund | | | 20,340,657 | | | | 34,835,132 | |
| Sterling Capital Intermediate U.S. Government Fund | | | 6,348,065 | | | | 6,787,555 | |
| Sterling Capital Total Return Bond Fund | | | 663,174,086 | | | | 582,978,956 | |
| Sterling Capital Corporate Fund | | | 1,350,376 | | | | 1,331,257 | |
| Sterling Capital Quality Income Fund | | | 11,407,232 | | | | 9,541,131 | |
During the fiscal year ended September 30, 2020, the Sterling Capital Behavioral Small Cap Value Equity Fund permitted an in-kind redemption of its shares, accepting redemption for such shares in the form of securities that are permissible investments of the Fund. The redemption in-kind occurred on October 3, 2019 and totaled $121,593,889.
During the fiscal year ended September 30, 2020, the Sterling Capital Mid Value Fund permitted an in-kind redemption of its shares, accepting redemption for such shares in the form of securities that are permissible investments of the Fund. The redemption in-kind occurred on October 3, 2019 and totaled $237,873,708.
During the fiscal year ended September 30, 2020, the Sterling Capital Equity Income Fund permitted an in-kind redemption of its shares, accepting redemption for such shares in the form of securities that are permissible investments of the Fund. The redemption in-kind occurred on July 24, 2020 and totaled $294,342,251.
During the fiscal year ended September 30, 2020, the Sterling Capital Behavioral Large Cap Value Equity Fund permitted an in-kind redemption of its shares, accepting redemption for such shares in the form of securities that are permissible investments of the Fund. The redemption in-kind occurred on July 24, 2020 and totaled $200,223,088.
During the fiscal year ended September 30, 2020, the Sterling Capital Special Opportunities Fund permitted an in-kind redemption of its shares, accepting redemption for such shares in the form of securities that are permissible investments of the Fund. The redemption in-kind occurred on July 24, 2020 and totaled $315,058,348.
| 4. | Investments in Affiliated Issuers: |
A summary of the Funds’ transactions in the shares of affiliated issuers during the fiscal year ended September 30, 2020 is as follows:
| | | Shares Held at September 30, 2019 | | | Shares Purchased | | | Shares Sold | | | Shares Held at September 30, 2020 | | | Value at September 30, 2020 | | | Dividend Income October 1, 2019- September 30, 2020 | | | Distributions and Net Realized Gain (Loss) October 1, 2019- September 30, 2020 | | | Change in Unrealized Appreciation/ Depreciation October 1, 2019- September 30, 2020 | |
| Sterling Capital Strategic Allocation Balanced Fund | | | | | | | | | | | | | | | | | | | | | | | | | | | | | | | | |
| Sterling Capital Behavioral International Equity Fund, Institutional Shares | | | 853,789 | | | | 32,489 | | | | 85,171 | | | | 801,107 | | | $ | 6,521,008 | | | $ | 229,625 | | | $ | (26,211 | ) | | $ | (1,000,235 | ) |
| Sterling Capital Equity Income Fund, Institutional Shares | | | 184,926 | | | | 8,193 | | | | 27,165 | | | | 165,954 | | | | 3,335,675 | | | | 72,654 | | | | 202,316 | | | | (282,118 | ) |
| Sterling Capital Special Opportunities Fund, Institutional Shares | | | 153,736 | | | | 7,471 | | | | 31,080 | | | | 130,127 | | | | 3,409,339 | | | | 7,870 | | | | 310,442 | | | | (115,013 | ) |
| Sterling Capital Total Return Bond Fund, Institutional Shares | | | 851,119 | | | | 21,749 | | | | 119,757 | | | | 753,111 | | | | 8,577,934 | | | | 251,997 | | | | 40,841 | | | | 348,213 | |
| Total Affiliates | | | 2,043,570 | | | | 69,902 | | | | 263,173 | | | | 1,850,299 | | | $ | 21,843,956 | | | $ | 562,146 | | | $ | 527,388 | | | $ | (1,049,153 | ) |
Notes to Financial Statements — (continued)
September 30, 2020
| | | Shares Held at September 30, 2019 | | | Shares Purchased | | | Shares Sold | | | Shares Held at September 30, 2020 | | | Value at September 30, 2020 | | | Dividend Income October 1, 2019- September 30, 2020 | | | Distributions and Net Realized Gain (Loss) October 1, 2019- September 30, 2020 | | | Change in Unrealized Appreciation/ Depreciation October 1, 2019- September 30, 2020 | |
| Sterling Capital Strategic Allocation Growth Fund | | | | | | | | | | | | | | | | | | | | | | | | | | | | | | | | |
| Sterling Capital Behavioral International Equity Fund, Institutional Shares | | | 831,465 | | | | 27,533 | | | | 56,953 | | | | 802,045 | | | $ | 6,528,647 | | | $ | 231,385 | | | $ | (7,772 | ) | | $ | (1,027,176 | ) |
| Sterling Capital Equity Income Fund, Institutional Shares | | | 184,839 | | | | 7,222 | | | | 19,050 | | | | 173,011 | | | | 3,477,515 | | | | 73,943 | | | | 191,533 | | | | (264,165 | ) |
| Sterling Capital Special Opportunities Fund, Institutional Shares | | | 151,758 | | | | 7,413 | | | | 23,560 | | | | 135,611 | | | | 3,553,004 | | | | 7,956 | | | | 286,791 | | | | (77,613 | ) |
| Sterling Capital Total Return Bond | | | | | | | | | | | | | | | | | | | | | | | | | | | | | | | | |
| Fund, Institutional Shares | | | 425,541 | | | | 4,802 | | | | 68,276 | | | | 362,067 | | | | 4,123,948 | | | | 122,842 | | | | 6,860 | | | | 174,845 | |
| Total Affiliates | | | 1,593,603 | | | | 46,970 | | | | 167,839 | | | | 1,472,734 | | | $ | 17,683,114 | | | $ | 436,126 | | | $ | 477,412 | | | $ | (1,194,109 | ) |
| 5. | Related Party Transactions: |
Under the terms of the investment advisory agreement, Sterling Capital Management LLC (“Sterling Capital” or the “Advisor”) is entitled to receive fees based on a percentage of the average daily net assets of the Funds. These fees are accrued daily and payable on a monthly basis and are reflected on the Statements of Operations as “Investment advisory fees.” Sterling Capital’s waived investment advisory fees are included on the Statements of Operations as “Less expenses waived by the Investment Advisor.” Information regarding these transactions is as follows for the fiscal year ended September 30, 2020:
| | Prior to February 1, 2020 | Effective February 1, 2020 |
| | Contractual Fee Rate | Fee Rate after Contractual Waivers | Contractual Fee Rate | Fee Rate after Contractual Waivers |
| Sterling Capital Behavioral Large Cap Value Equity Fund | 0.45% | 0.45% | 0.45% | 0.45%(3) |
| Sterling Capital Mid Value Fund | 0.70% | 0.70%(3) | 0.70% | 0.61%(2) |
| Sterling Capital Behavioral Small Cap Value Equity Fund | 0.60% | 0.60%(3) | 0.60% | 0.60% |
| Sterling Capital Special Opportunities Fund | 0.65% | 0.65% | 0.65% | 0.65%(3) |
| Sterling Capital Equity Income Fund | 0.55% | 0.55% | 0.55% | 0.55%(3) |
| Sterling Capital Behavioral International Equity Fund | 0.60% | 0.40%(1) | 0.60% | 0.40%(2) |
| Sterling Capital SMID Opportunities Fund | 0.70% | 0.54%(1) | 0.70% | 0.70% |
| Sterling Capital Stratton Mid Cap Value Fund | 0.70% | 0.70% | 0.70% | 0.66%(2) |
| Sterling Capital Stratton Real Estate Fund | 0.58% | 0.58% | 0.58% | 0.58% |
| Sterling Capital Stratton Small Cap Value Fund | 0.85% | 0.80%(1) | 0.85% | 0.75%(2) |
| Sterling Capital Ultra Short Bond Fund | 0.20% | 0.10%(1)(3) | 0.20% | 0.02%(2) |
| Sterling Capital Short Duration Bond Fund | 0.30% | 0.20%(1) | 0.30% | 0.20%(2) |
| Sterling Capital Intermediate U.S. Government Fund | 0.32% | 0.16%(1) | 0.32% | 0.16%(2) |
| Sterling Capital Total Return Bond Fund | 0.37% | 0.25%(1) | 0.37% | 0.24%(2) |
| Sterling Capital Corporate Fund | 0.35% | 0.35% | 0.35% | 0.31%(2) |
| Sterling Capital Quality Income Fund | 0.35% | 0.31%(1) | 0.35% | 0.31%(2) |
| Sterling Capital Kentucky Intermediate Tax-Free Fund | 0.35% | 0.35% | 0.35% | 0.35% |
| Sterling Capital Maryland Intermediate Tax-Free Fund | 0.35% | 0.35%(3) | 0.35% | 0.35% |
| Sterling Capital North Carolina Intermediate Tax-Free Fund | 0.35% | 0.35% | 0.35% | 0.35% |
| Sterling Capital South Carolina Intermediate Tax-Free Fund | 0.35% | 0.35% | 0.35% | 0.35% |
| Sterling Capital Virginia Intermediate Tax-Free Fund | 0.35% | 0.35% | 0.35% | 0.35% |
| Sterling Capital West Virginia Intermediate Tax-Free Fund | 0.35% | 0.35% | 0.35% | 0.35% |
| Sterling Capital Diversified Income Fund | 0.25% | 0.25% | 0.25% | 0.25% |
| Sterling Capital Strategic Allocation Balanced Fund | 0.25% | 0.00%(1) | 0.25% | 0.00%(2) |
| Sterling Capital Strategic Allocation Growth Fund | 0.25% | 0.00%(1) | 0.25% | 0.00%(2) |
| (1) | Sterling Capital contractually agreed to limit the advisory fees paid by the Fund from February 1, 2019 through January 31, 2020. |
| (2) | Sterling Capital contractually agreed to limit the advisory fees paid by the Fund from February 1, 2020 through January 31, 2021. |
| (3) | For all or a portion of the fiscal year ended September 30, 2020, Sterling Capital voluntarily waived and/or reimbursed certain expenses of the Funds. Voluntary waivers and reimbursements of expenses may be discontinued at any time. |
Notes to Financial Statements — (continued)
September 30, 2020
For the following Funds, Sterling Capital has contractually agreed to waive its investment advisory fees, pay Fund operating expenses, and/or reimburse fees or expenses, in order to limit expenses of the shares based on average daily net assets, excluding interest, taxes, acquired funds fees and extraordinary expenses. The expense limitations in place through January 31, 2021 are as follows:
| | Class A | Class C | Institutional | Class R |
| Sterling Capital Behavioral International Equity Fund | 100% | 175% | 075% | — |
| Sterling Capital SMID Opportunities Fund | 104% | 179% | 079% | — |
| Sterling Capital Stratton Small Cap Value Fund | 130% | 205% | 105% | — |
| Sterling Capital Total Return Bond Fund | 070% | 145% | 045% | 095% |
For the following Funds, Sterling Capital has contractually agreed to waive its administration fees, pay Fund operating expenses of Class R6 Shares, and/or reimburse fees or expenses, in order to limit expenses of the shares based on average daily net assets, excluding interest, taxes, acquired funds fees and extraordinary expenses. The expense limitations effective for the periods February 1, 2019 through January 31, 2020 and February 1, 2020 through January 31, 2021 are as follows:
| | Prior to
February 1, 2020 | Effective
February 1, 2020 |
| Sterling Capital Behavioral Large Cap Value Equity Fund | 0.58% | 0.59% |
| Sterling Capital Mid Value Fund | 0.81% | 0.81% |
| Sterling Capital Behavioral Small Cap Value Equity Fund | 0.73% | 0.74% |
| Sterling Capital Special Opportunities Fund | 0.77% | 0.78% |
| Sterling Capital Equity Income Fund | 0.66% | 0.67% |
| Sterling Capital Behavioral International Equity Fund | 0.60% | 0.64% |
| Sterling Capital Stratton Real Estate Fund | — | 0.73% |
| Sterling Capital Stratton Small Cap Value Fund | — | 0.87% |
| Sterling Capital Total Return Bond Fund | 0.35% | 0.35% |
Sterling Capital serves as the administrator to the Funds pursuant to an administration agreement. The Funds (except the Sterling Capital Strategic Allocation Balanced Fund and Sterling Capital Strategic Allocation Growth Fund) pay their portion of a fee to Sterling Capital for providing administration services based on the aggregate assets of the Funds, excluding the assets of the Funds of Funds, at a rate of 0.1075% on the first $3.5 billion of average net assets, 0.075% on the next $1 billion of average net assets; 0.06% on the next $1.5 billion of average net assets; and 0.04% of average net assets over $6 billion. Expenses incurred are reflected on the Statements of Operations as “Administration fees.” Pursuant to a sub-administration agreement with Sterling Capital, The Bank of New York Mellon (“the “Sub-Administrator”), serves as the sub-administrator to the Funds subject to the general supervision of the Board and Sterling Capital. For these services, The Bank of New York Mellon is entitled to a fee payable by Sterling Capital. The Bank of New York Mellon also serves as the Funds’ fund accountant and receives compensation by the Funds for these services. Expenses incurred are reflected on the Statements of Operations as “Fund accounting fees.”
BNY Mellon Investment Servicing (US) Inc. serves as the Funds’ transfer agent and receives compensation by the Funds for these services. Expenses incurred are reflected on the Statements of Operations as “Transfer agent fees.”
Sterling Capital’s Chief Compliance Officer (“CCO”) serves as the Funds’ CCO. The CCO’s compensation is reviewed and approved by the Funds’ Board and paid by Sterling Capital. However, the Funds reimburse Sterling Capital for their allocable portion of the CCO’s base salary and incentive pay. As a result, the CCO fee paid by the Funds is only part of the total compensation received by the CCO. Expenses incurred are reflected on the Statements of Operations as “Compliance Service Fees.”
For the fiscal year ended September 30, 2020, the Funds paid $5,426 in brokerage fees to BB&T Securities LLC on the execution of purchases and sales of the Funds’ portfolio investments.
The Funds have adopted a Distribution and Shareholder Services Plan (the “Plan”) in accordance with Rule 12b-1 under the 1940 Act. Sterling Capital Distributors, LLC (the “Distributor”) serves as distributor to the Funds pursuant to an underwriting agreement. The Plan provides for payments to the Distributor of up to 0.25%, 1.00% and 0.50% of the average daily net assets of the Class A Shares, Class C Shares, and Class R Shares, respectively. In addition, the Distributor is entitled to receive commissions on sales of shares of the Variable Net Asset Value Funds. For the fiscal year ended September 30, 2020, the Distributor received $351,142 from commissions earned on sales of shares of the Variable Net Asset Value Funds. The Distributor does not retain
Notes to Financial Statements — (continued)
September 30, 2020
commissions for profit. These commissions and fees may be used by the Distributor to pay banks, broker dealers and other institutions, including affiliates of the Advisor.
The Advisor and/or its affiliates may pay out of their own assets (and not as an additional charge to a fund) compensation to selected affiliated and unaffiliated brokers, dealers and other financial intermediaries in connection with the sale and distribution of the shares and/or the retention and/or servicing of Fund investors and Fund shares. These payments, sometimes referred to as “revenue sharing” payments are payments over and above any sales charges (including Rule 12b-1 fees) and service fees paid by the Funds. The amount of these payments is determined at the discretion of the Advisor and/or its affiliates from time to time, may be substantial, and may be different for different financial advisors. Receipt of, or the prospect of receiving, this additional compensation may influence your financial intermediary’s recommendation of a Fund or of a particular share class of a Fund. Commissions and finder’s fees financed by the Advisor and paid by the Distributor to affiliated broker-dealers during the fiscal year ended September 30, 2020 were $1,939.
Certain Officers and a Trustee of the Funds are affiliated with Sterling Capital or the Sub-Administrator. Such Officers and Trustee receive no compensation from the Funds for serving in their respective roles. Each of the Trustees who are not interested persons (as defined in the 1940 Act) of the Trust who serve on the Board are compensated at the annual rate of $100,000 plus $7,500 for each regularly scheduled quarterly meeting attended, $4,000 for each special meeting attended in person and $1,500 for each special meeting attended by telephone, plus reimbursement for certain out of pocket expenses. Each Trustee serving on a Committee of the Board receives a fee of $4,000 for each Committee meeting attended in person and $1,500 for each Committee meeting attended by telephone, plus reimbursement for certain out of pocket expenses. Committee meeting fees are only paid when such Committee meetings are not held in conjunction with a regular board meeting. Additionally, the Chairman of the Board receives additional compensation at the annual rate of $24,000, the Audit Committee Chairman receives additional compensation at the annual rate of $18,000, and the Chairman of the Nominations Committee receives additional compensation at the annual rate of $7,500. The fees are allocated across the Trust based upon relative net assets.
| 6. | Concentration of Credit Risk: |
The Tax-Free Funds invest primarily in debt instruments of municipal issuers in their respective states. The issuers’ abilities to meet their obligations may be affected by economic developments in a specific state or region.
U.S. Bank, N.A. has made available a credit facility to the Trust, pursuant to an umbrella credit agreement (the “Agreement”). The primary purpose of the Agreement is to allow the Trust to avoid security liquidations that Sterling Capital believes are unfavorable to shareholders. Under theAgreement, an aggregate uncommitted amount of $100,000,000 has been made available for use by all Funds of the Trust. Outstanding principal amounts under the Agreement bear interest at a rate per annum equal to the Prime Rate minus two percent (2%), but never at a rate of less than one percent (1%) per annum. The Agreement will expire on March 24, 2021. During the fiscal year ended September 30, 2020, each of the following Funds utilized its line of credit:
| | | Average Interest Rate | | | Average Loan Balance | | | Number of Days Outstanding | | | Interest Expense Incurred | | | Maximum Amount Borrowed | |
| Sterling Capital Mid Value Fund | | 2.15% | | | $ | 449,200 | | | 5 | | | $ | 167 | | | $ | 715,000 | |
| Sterling Capital Behavioral Small Cap Value Equity Fund | | 1.25% | | | | 2,487,857 | | | 7 | | | | 605 | | | | 2,973,000 | |
| Sterling Capital Special Opportunities Fund | | 1.25% | | | | 1,800,063 | | | 16 | | | | 1,000 | | | | 6,791,000 | |
| Sterling Capital Equity Income Fund | | 1.25% | | | | 10,021,889 | | | 9 | | | | 3,132 | | | | 35,708,000 | |
| Sterling Capital Behavioral International Equity Fund | | 2.75% | | | | 73,000 | | | 3 | | | | 17 | | | | 73,000 | |
| Sterling Capital Stratton Real Estate | | 2.00% | | | | 327,500 | | | 2 | | | | 29 | | | | 509,000 | |
| Sterling Capital Stratton Small-Cap Value. | | 1.37% | | | | 1,595,462 | | | 13 | | | | 951 | | | | 5,702,000 | |
| Sterling Capital North Carolina Intermediate Tax-Free Fund | | 1.25% | | | | 9,619,000 | | | 1 | | | | 334 | | | | 9,619,000 | |
| Sterling Capital Virginia Intermediate Tax-Free Fund Fund | | 1.25% | | | | 19,000 | | | 1 | | | | 1 | | | | 19,000 | |
| Sterling Capital SMID Opportunities Fund. | | 1.25% | | | | 603,667 | | | 3 | | | | 63 | | | | 945,000 | |
| 8. | Federal Tax Information: |
It is the policy of each Fund to continue to qualify as a regulated investment company as defined in the Internal Revenue Code of 1986, as amended (the “Code”), by complying with the applicable provisions of the Code and to make distributions of net investment income and net realized capital gains sufficient to relieve it from all, or substantially all, federal income taxes. Accordingly, no provision for federal income tax was required in the Funds’ financial statements.
Notes to Financial Statements — (continued)
September 30, 2020
Management evaluates its tax positions to determine if the tax positions taken meet the minimum recognition threshold in connection with accounting for uncertainties in income tax positions taken or expected to be taken for the purposes of measuring and recognizing tax liabilities in the financial statements. Recognition of tax benefits of an uncertain tax position is required only when the position is “more likely than not” to be sustained assuming examination by taxing authorities.The Funds recognize interest and penalties, if any, related to unrecognized tax benefits as income tax expense. During the year, the Funds did not incur any interest or penalties.
Management has analyzed the Funds’ tax positions taken on federal income tax returns for all open tax years (current and prior three tax years), and has concluded that no provision for federal income tax was required in the Funds’financial statements. The Funds’ federal income and excise tax returns for tax years for which the applicable statutes of limitations have not expired are subject to examination by the Internal Revenue Service and state departments of revenue.
Capital losses are permitted to be carried forward without expiration. Such capital losses will retain their character as either short-term or long-term capital losses.
At September 30, 2020, the following Funds had net capital loss carryforwards available to offset future net capital gains, if any, to the extent provided by the Code and the Treasury regulations:
| | | Amount With No Expiration | |
| | | Short-term | | | Long-term | |
| | | Losses | | | Losses | |
| Sterling Capital Behavioral Large Cap Value Equity Fund | | $ | (25,351,797 | ) | | $ | — | |
| Sterling Capital Behavioral Small Cap Value Equity Fund | | | (23,661,059 | ) | | | (6,840,817 | ) |
| Sterling Capital Equity Income Fund | | | (62,718,536 | ) | | | — | |
| Sterling Capital Behavioral International Equity Fund | | | (21,129,218 | ) | | | (3,526,051 | ) |
| Sterling Capital SMID Opportunities Fund. | | | (5,413 | ) | | | (41,673 | ) |
| Sterling Capital Ultra Short Bond Fund | | | (74,448 | ) | | | (921,894 | ) |
| Sterling Capital Short Duration Bond Fund | | | (777,978 | ) | | | (6,185,252 | ) |
| Sterling Capital Intermediate U.S. Government Fund | | | (254,289 | ) | | | (737,201 | ) |
| Sterling Capital Quality Income Fund | | | (1,267,771 | ) | | | (486,012 | ) |
| Sterling Capital North Carolina Intermediate Tax-Free Fund | | | (525,153 | ) | | | — | |
| Sterling Capital South Carolina Intermediate Tax-Free Fund | | | (338,132 | ) | | | — | |
| Sterling Capital Diversified Income Fund. | | | (1,628,470 | ) | | | (797,448 | ) |
Notes to Financial Statements — (continued)
September 30, 2020
Capital loss carryforwards utilized in the current year were as follows:
| | | Utilized | |
| | | Capital Loss | |
| | | Carryforwards | |
| Sterling Capital Ultra Short Bond Fund | | $ | 31,908 | |
| Sterling Capital Short Duration Bond Fund | | | 1,308,256 | |
| Sterling Capital Intermediate U.S. Government Fund | | | 22,678 | |
| Sterling Capital Total Return Bond Fund | | | 14,781,962 | |
| Sterling Capital Corporate Fund | | | 168,631 | |
| Sterling Capital Quality Income Fund | | | 217,089 | |
| Sterling Capital North Carolina Intermediate Tax-Free Fund | | | 351,826 | |
| Sterling Capital South Carolina Intermediate Tax-Free Fund | | | 163,968 | |
| Sterling Capital Virginia Intermediate Tax-Free Fund. | | | 66,521 | |
The character of income and gains distributed is determined in accordance with the Code and the Treasury regulations, which may differ from U.S. GAAP. These “book/tax” differences are either considered temporary or permanent in nature. To the extent these differences are permanent in nature (e.g., redemptions in-kind, non-deductible partnership income, net operating loss write-off, and equalization utilized), such amounts are reclassified within the composition of net assets based on their federal tax-basis treatment; temporary differences do not require reclassification. These reclassifications have no impact on net assets or net asset values per share.
As of September 30, 2020, these reclassifications were as follows:
| | | | | | Increase/ | |
| | | Increase/ | | | (Decrease) | |
| | | (Decrease) | | | Distributable | |
| | | Paid-in-Capital | | | Earnings | |
| Sterling Capital Behavioral Large Cap Value Equity Fund | | $ | 17,842,912 | | | $ | (17,842,912 | ) |
| Sterling Capital Behavioral Small Cap Value Equity Fund | | | 7,900,458 | | | | (7,900,458 | ) |
| Sterling Capital Mid Value Fund | | | 34,168,097 | | | | (34,168,097 | ) |
| Sterling Capital Special Opportunities Fund | | | 168,314,326 | | | | (168,314,326 | ) |
| Sterling Capital Equity Income Fund | | | 103,812,619 | | | | (103,812,619 | ) |
| Sterling Capital SMID Opportunities Fund. | | | (10,902 | ) | | | 10,902 | |
| Sterling Capital Stratton Real Estate Fund | | | 290,738 | | | | (290,738 | ) |
| Sterling Capital Stratton Small Cap Value Fund | | | 19,385,174 | | | | (19,385,174 | ) |
| Sterling Capital Corporate Fund | | | 33,824 | | | | (33,824 | ) |
| Sterling Capital Maryland Intermediate Tax-Free Fund | | | 1,325 | | | | (1,325 | ) |
| Sterling Capital West Virginia Intermediate Tax-Free Fund | | | 3,848 | | | | (3,848 | ) |
The tax character of distributions paid to shareholders during the fiscal year ended September 30, 2020 was as follows:
| | | Distributions paid from | | | | | | | | | | | | | | | | | |
| | | Ordinary Income | | | Net Long-Term Gains | | | Total Taxable Distributions | | | Return Of Capital | | | Tax Exempt Distributions | | | Total Distributions Paid* | |
| Sterling Capital Behavioral Large Cap Value Equity Fund | | $ | 4,582,204 | | | $ | 8,070,984 | | | $ | 12,653,188 | | | $ | — | | | $ | — | | | $ | 12,653,188 | |
| Sterling Capital Mid Value Fund | | | 1,432,311 | | | | 5,461,248 | | | | 6,893,559 | | | | — | | | | — | | | | 6,893,559 | |
| Sterling Capital Behavioral Small Cap Value Equity Fund | | | 1,152,180 | | | | — | | | | 1,152,180 | | | | — | | | | — | | | | 1,152,180 | |
| Sterling Capital Special Opportunities Fund | | | 1,733,137 | | | | 83,258,457 | | | | 84,991,594 | | | | — | | | | — | | | | 84,991,594 | |
| Sterling Capital Equity Income Fund | | | 34,913,648 | | | | 76,162,769 | | | | 111,076,417 | | | | — | | | | — | | | | 111,076,417 | |
| Sterling Capital Behavioral International Equity Fund | | | 3,012,621 | | | | — | | | | 3,012,621 | | | | — | | | | — | | | | 3,012,621 | |
| Sterling Capital SMID Opportunities Fund. | | | — | | | | 471,135 | | | | 471,135 | | | | — | | | | — | | | | 471,135 | |
| Sterling Capital Stratton Mid Cap Value Fund | | | 579,842 | | | | 1,433,142 | | | | 2,012,984 | | | | — | | | | — | | | | 2,012,984 | |
| Sterling Capital Stratton Real Estate Fund | | | 1,738,242 | | | | 4,272,613 | | | | 6,010,855 | | | | — | | | | — | | | | 6,010,855 | |
| Sterling Capital Stratton Small Cap Value Fund | | | 6,024,521 | | | | 77,944,204 | | | | 83,968,725 | | | | — | | | | — | | | | 83,968,725 | |
| Sterling Capital Ultra Short Bond Fund | | | 444,854 | | | | — | | | | 444,854 | | | | — | | | | — | | | | 444,854 | |
| Sterling Capital Short Duration Bond Fund | | | | | | | — | | | | — | | | | — | | | | — | | | | — | |
| Sterling Capital Intermediate U.S. Government Fund | | | 367,820 | | | | — | | | | 367,820 | | | | — | | | | — | | | | 367,820 | |
| Sterling Capital Total Return Bond Fund | | | 46,351,977 | | | | 193,428 | | | | 46,545,405 | | | | — | | | | — | | | | 46,545,405 | |
Notes to Financial Statements — (continued)
September 30, 2020
| | | Distributions paid from | | | | | | | | | | | | | | | | | |
| | | Ordinary Income | | | Net Long-Term Gains | | | Total Taxable Distributions | | | Return Of Capital | | | Tax Exempt Distributions | | | Total Distributions Paid* | |
| Sterling Capital Corporate Fund | | $ | 609,261 | | | $ | 21,250 | | | $ | 630,511 | | | $ | — | | | $ | — | | | $ | 630,511 | |
| Sterling Capital Quality Income Fund | | | 975,082 | | | | — | | | | 975,082 | | | | — | | | | — | | | | 975,082 | |
| Sterling Capital Kentucky Intermediate Tax-Free Fund | | | 2,528 | | | | 23,055 | | | | 25,583 | | | | — | | | | 192,601 | | | | 218,184 | |
| Sterling Capital Maryland Intermediate Tax-Free Fund | | | 2,097 | | | | 77,065 | | | | 79,162 | | | | — | | | | 230,780 | | | | 309,942 | |
| Sterling Capital North Carolina Intermediate Tax-Free Fund | | | 143,649 | | | | — | | | | 143,649 | | | | — | | | | 3,188,284 | | | | 3,331,933 | |
| Sterling Capital South Carolina Intermediate Tax-Free Fund | | | 13,257 | | | | — | | | | 13,257 | | | | — | | | | 1,608,335 | | | | 1,621,592 | |
| Sterling Capital Virginia Intermediate Tax-Free Fund | | | 72,152 | | | | — | | | | 72,152 | | | | — | | | | 1,384,524 | | | | 1,456,676 | |
| Sterling Capital West Virginia Intermediate Tax-Free Fund | | | 19,612 | | | | 78,475 | | | | 98,087 | | | | — | | | | 1,691,414 | | | | 1,789,501 | |
| Sterling Capital Diversified Income Fund | | | 792,656 | | | | — | | | | 792,656 | | | | — | | | | — | | | | 792,656 | |
| Sterling Capital Strategic Allocation Balanced Fund | | | 468,238 | | | | 525,507 | | | | 993,745 | | | | 325,477 | | | | — | | | | 1,319,222 | |
| Sterling Capital Strategic Allocation Growth Fund | | | 382,200 | | | | 450,905 | | | | 833,105 | | | | 334,888 | | | | — | | | | 1,167,993 | |
| * | Total distributions paid may differ from the Statements of Changes in Net Assets because distributions are recognized when actually paid for tax purposes. The Funds may also utilize equalization accounting for tax purposes and designate earnings and profits, including net realized gains distributed to shareholders on redemption of shares, as part of the dividends. |
The tax character of distributions paid to shareholders during the fiscal year ended September 30, 2019 was as follows:
| | | Distributions paid from | | | | | | | | | | | | | | | | | |
| | | Ordinary Income | | | Net Long-Term Gains | | | Total Taxable Distributions | | | Return Of Capital | | | Tax Exempt Distributions | | | Total Distributions Paid* | |
| Sterling Capital Behavioral Large Cap Value Equity Fund | | $ | 6,455,876 | | | $ | 24,460,861 | | | $ | 30,916,737 | | | $ | — | | | $ | — | | | $ | 30,916,737 | |
| Sterling Capital Mid Value Fund | | | 17,006,752 | | | | 55,931,502 | | | | 72,938,254 | | | | — | | | | — | | | | 72,938,254 | |
| Sterling Capital Behavioral Small Cap Value Equity Fund | | | 5,313,627 | | | | 23,774,664 | | | | 29,088,291 | | | | — | | | | — | | | | 29,088,291 | |
| Sterling Capital Special Opportunities Fund | | | 468,140 | | | | 88,479,342 | | | | 88,947,482 | | | | — | | | | — | | | | 88,947,482 | |
| Sterling Capital Equity Income Fund | | | 37,402,332 | | | | 120,138,987 | | | | 157,541,319 | | | | — | | | | — | | | | 157,541,319 | |
| Sterling Capital Behavioral International Equity Fund | | | 2,426,684 | | | | 2,948,087 | | | | 5,374,771 | | | | — | | | | — | | | | 5,374,771 | |
| Sterling Capital SMID Opportunities Fund | | | — | | | | 3,816 | | | | 3,816 | | | | — | | | | — | | | | 3,816 | |
| Sterling Capital Stratton Mid Cap Value Fund | | | 301,242 | | | | 4,854,806 | | | | 5,156,048 | | | | — | | | | — | | | | 5,156,048 | |
| Sterling Capital Stratton Real Estate Fund | | | 2,272,875 | | | | 3,198,589 | | | | 5,471,464 | | | | — | | | | — | | | | 5,471,464 | |
| Sterling Capital Stratton Small Cap Value Fund | | | 4,935,667 | | | | 93,660,196 | | | | 98,595,863 | | | | — | | | | — | | | | 98,595,863 | |
| Sterling Capital Ultra Short Bond Fund | | | 926,768 | | | | — | | | | 926,768 | | | | — | | | | — | | | | 926,768 | |
| Sterling Capital Short Duration Bond Fund | | | 5,076,518 | | | | — | | | | 5,076,518 | | | | — | | | | — | | | | 5,076,518 | |
| Sterling Capital Intermediate U.S. Government Fund | | | 454,636 | | | | — | | | | 454,636 | | | | — | | | | — | | | | 454,636 | |
| Sterling Capital Total Return Bond Fund | | | 41,816,024 | | | | — | | | | 41,816,024 | | | | — | | | | — | | | | 41,816,024 | |
| Sterling Capital Corporate Fund | | | 797,562 | | | | — | | | | 797,562 | | | | 5,172 | | | | — | | | | 802,734 | |
| Sterling Capital Quality Income Fund | | | 1,109,229 | | | | — | | | | 1,109,229 | | | | — | | | | — | | | | 1,109,229 | |
| Sterling Capital Kentucky Intermediate Tax-Free Fund | | | 7,051 | | | | 65,026 | | | | 72,077 | | | | — | | | | 204,720 | | | | 276,797 | |
| Sterling Capital Maryland Intermediate Tax-Free Fund | | | 7,398 | | | | 222,289 | | | | 229,687 | | | | — | | | | 316,320 | | | | 546,007 | |
| Sterling Capital North Carolina Intermediate Tax-Free Fund | | | 88,327 | | | | — | | | | 88,327 | | | | — | | | | 3,850,776 | | | | 3,939,103 | |
| Sterling Capital South Carolina Intermediate Tax-Free Fund | | | 35,736 | | | | — | | | | 35,736 | | | | — | | | | 1,574,817 | | | | 1,610,553 | |
| Sterling Capital Virginia Intermediate Tax-Free Fund | | | 58,115 | | | | — | | | | 58,115 | | | | — | | | | 1,619,978 | | | | 1,678,093 | |
| Sterling Capital West Virginia Intermediate Tax-Free Fund | | | 33,006 | | | | 117,382 | | | | 150,388 | | | | — | | | | 1,682,156 | | | | 1,832,544 | |
| Sterling Capital Diversified Income Fund | | | 905,870 | | | | — | | | | 905,870 | | | | — | | | | — | | | | 905,870 | |
| Sterling Capital Strategic Allocation Balanced Fund | | | 586,478 | | | | — | | | | 586,478 | | | | — | | | | — | | | | 586,478 | |
| Sterling Capital Strategic Allocation Growth Fund | | | 424,367 | | | | — | | | | 424,367 | | | | — | | | | — | | | | 424,367 | |
| * | Total distributions paid may differ from the Statements of Changes in NetAssets because distributions are recognized when actually paid for tax purposes. The Funds may also utilize equalization accounting for tax purposes and designate earnings and profits, including net realized gains distributed to shareholders on redemption of shares, as part of the dividends. |
Notes to Financial Statements — (continued)
September 30, 2020
As of September 30, 2020, the components of distributable earnings (accumulated deficit) on a tax basis were as follows:
| | | Undistributed Ordinary Income/Tax Exempt Income | | | Undistributed Long Term Capital Gains | | | Distributable Earnings | | | Distributions Payable | | | Accumulated Capital and Other Losses | | | Unrealized Appreciation (Depreciation)* | | | Total Distributable Earnings (Accumulated Deficit) | |
| Sterling Capital Behavioral Large Cap Value Equity Fund | | $ | 11,854 | | | $ | — | | | $ | 11,854 | | | $ | — | | | $ | (25,351,797 | ) | | $ | 1,826,135 | | | $ | (23,513,808 | ) |
| Sterling Capital Mid Value Fund | | | — | | | | — | | | | — | | | | — | | | | (2,583,299 | ) | | | 6,798,332 | | | | 4,215,033 | |
| Sterling Capital Behavioral Small Cap Value Equity Fund | | | 287,636 | | | | — | | | | 287,636 | | | | — | | | | (30,501,876 | ) | | | 3,694,521 | | | | (26,519,719 | ) |
| Sterling Capital Special Opportunities Fund | | | 462,715 | | | | — | | | | 462,715 | | | | — | | | | — | | | | 209,785,363 | | | | 210,248,078 | |
| Sterling Capital Equity Income Fund | | | 516,207 | | | | — | | | | 516,207 | | | | — | | | | (62,718,536 | ) | | | 397,085,340 | | | | 334,883,011 | |
| Sterling Capital Behavioral International Equity Fund | | | 2,314,425 | | | | — | | | | 2,314,425 | | | | — | | | | (24,655,269 | ) | | | 8,186,601 | | | | (14,154,243 | ) |
| Sterling Capital SMID Opportunities Fund | | | — | | | | — | | | | — | | | | — | | | | (1,095,725 | ) | | | 2,257,648 | | | | 1,161,923 | |
| Sterling Capital Stratton Mid Cap Value Fund | | | 187,816 | | | | — | | | | 187,816 | | | | — | | | | (431,831 | ) | | | 19,120,050 | | | | 18,876,035 | |
| Sterling Capital Stratton Real Estate Fund | | | — | | | | 1,894,143 | | | | 1,894,143 | | | | — | | | | — | | | | 29,878,913 | | | | 31,773,056 | |
| Sterling Capital Stratton Small Cap Value Fund | | | 1,661,767 | | | | 67,518,570 | | | | 69,180,337 | | | | — | | | | — | | | | 267,992,269 | | | | 337,172,606 | |
| Sterling Capital Ultra Short Bond Fund | | | 12,046 | | | | — | | | | 12,046 | | | | (13,498 | ) | | | (996,342 | ) | | | 84,330 | | | | (913,464 | ) |
| Sterling Capital Short Duration Bond Fund | | | 360,758 | | | | — | | | | 360,758 | | | | (69,741 | ) | | | (6,963,230 | ) | | | 2,461,358 | | | | (4,210,855 | ) |
| Sterling Capital Intermediate U.S. Government Fund | | | 193,000 | | | | — | | | | 193,000 | | | | (15,983 | ) | | | (991,490 | ) | | | 649,016 | | | | (165,457 | ) |
| Sterling Capital Total Return Bond Fund | | | 20,796,444 | | | | 808,164 | | | | 21,604,608 | | | | (1,129,813 | ) | | | — | | | | 87,648,805 | | | | 108,123,600 | |
| Sterling Capital Corporate Fund | | | 31,238 | | | | 326,716 | | | | 357,954 | | | | (255 | ) | | | — | | | | 1,045,418 | | | | 1,403,117 | |
| Sterling Capital Quality Income Fund | | | 4,935 | | | | — | | | | 4,935 | | | | (4,846 | ) | | | (1,753,783 | ) | | | 1,430,974 | | | | (322,720 | ) |
| Sterling Capital Kentucky Intermediate Tax-Free Fund | | | 23,337 | | | | 40,676 | | | | 64,013 | | | | (10,528 | ) | | | — | | | | 697,727 | | | | 751,212 | |
| Sterling Capital Maryland Intermediate Tax-Free Fund | | | 30,113 | | | | 168,038 | | | | 198,151 | | | | (12,197 | ) | | | — | | | | 731,472 | | | | 917,426 | |
| Sterling Capital North Carolina Intermediate Tax-Free Fund | | | 230,535 | | | | — | | | | 230,535 | | | | (117,974 | ) | | | (525,153 | ) | | | 11,163,137 | | | | 10,750,545 | |
| Sterling Capital South Carolina Intermediate Tax-Free Fund | | | 110,050 | | | | — | | | | 110,050 | | | | (81,584 | ) | | | (338,132 | ) | | | 4,940,528 | | | | 4,630,862 | |
| Sterling Capital Virginia Intermediate Tax-Free Fund | | | 138,643 | | | | 197,686 | | | | 336,329 | | | | (75,421 | ) | | | — | | | | 5,552,481 | | | | 5,813,389 | |
| Sterling Capital West Virginia Intermediate Tax-Free Fund | | | 177,046 | | | | 60,757 | | | | 237,803 | | | | (95,897 | ) | | | — | | | | 4,835,792 | | | | 4,977,698 | |
| Sterling Capital Diversified Income Fund | | | 54,907 | | | | — | | | | 54,907 | | | | (16,839 | ) | | | (2,425,918 | ) | | | (1,050,364 | ) | | | (3,438,214 | ) |
| Sterling Capital Strategic Allocation Balanced Fund | | | — | | | | — | | | | — | | | | (88 | ) | | | — | | | | 1,061,584 | | | | 1,061,496 | |
| Sterling Capital Strategic Allocation Growth Fund | | | — | | | | — | | | | — | | | | (644 | ) | | | — | | | | 565,845 | | | | 565,201 | |
| * | The primary differences between book basis and tax basis unrealized appreciation (depreciation) were due to the deferral of losses on wash sales, basis adjustments on partnership interests, Passive Foreign Investment Companies and the deferral of market discount and premium until point of sale and real estate investment trust adjustments. |
Notes to Financial Statements — (continued)
September 30, 2020
Under current tax law, net capital losses or, if there are no such losses, net long-term capital losses or net short-term capital losses realized after October 31, net ordinary losses from the sale, exchange or other taxable disposition of property realized after October 31 and other net ordinary losses realized after December 31 of a Fund’s taxable year may be deferred and treated as occurring on the first business day of the following taxable year for tax purposes.The following Funds had deferred qualified late-year losses during the fiscal year ended September 30, 2020:
| | | Qualified | | | Qualified | | | Qualified | |
| | | Late-Year | | | LateYear | | | LateYear | |
| | | Ordinary | | | Short-term | | | Long-term | |
| | | Losses | | | Capital Losses | | | Capital Losses | |
| Sterling Capital Mid Value Fund | | $ | — | | | $ | (1,381,273 | ) | | $ | 3,964,572 | |
| Sterling Capital Stratton Mid Cap Value Fund | | | — | | | | 139,379 | | | | 292,452 | |
| Sterling Capital SMID Opportunities Fund. | | | 18,568 | | | | 754,371 | | | | 275,700 | |
As of September 30, 2020, federal income tax cost, gross unrealized appreciation and gross unrealized depreciation on securities were as follows:
| | | | | | | | | | | | Net Tax | |
| | | | | | Gross Tax | | | Gross Tax | | | Unrealized | |
| | | | | | Unrealized | | | Unrealized | | | Appreciation | |
| | | Tax Cost | | | Appreciation | | | Depreciation | | | (Depreciation) | |
| Sterling Capital Behavioral Large Cap Value Equity Fund | | $ | 25,180,139 | | | $ | 2,566,131 | | | $ | (739,996 | ) | | $ | 1,826,135 | |
| Sterling Capital Mid Value Fund | | | 54,118,300 | | | | 12,245,680 | | | | (5,447,348 | ) | | | 6,798,332 | |
| Sterling Capital Behavioral Small Cap Value Equity Fund | | | 78,718,014 | | | | 8,948,118 | | | | (5,253,597 | ) | | | 3,694,521 | |
| Sterling Capital Special Opportunities Fund | | | 333,262,595 | | | | 222,394,211 | | | | (12,608,848 | ) | | | 209,785,363 | |
| Sterling Capital Equity Income Fund | | | 1,157,686,929 | | | | 464,904,302 | | | | (67,818,962 | ) | | | 397,085,340 | |
| Sterling Capital Behavioral International Equity Fund | | | 74,461,506 | | | | 10,134,072 | | | | (1,947,471 | ) | | | 8,186,601 | |
| Sterling Capital SMID Opportunities Fund | | | 8,781,914 | | | | 2,612,900 | | | | (355,252 | ) | | | 2,257,648 | |
| Sterling Capital Stratton Mid Cap Value Fund | | | 34,961,915 | | | | 21,435,646 | | | | (2,315,596 | ) | | | 19,120,050 | |
| Sterling Capital Stratton Real Estate Fund | | | 55,802,538 | | | | 30,768,469 | | | | (889,556 | ) | | | 29,878,913 | |
| Sterling Capital Stratton Small Cap Value Fund | | | 210,377,252 | | | | 272,823,978 | | | | (4,831,709 | ) | | | 267,992,269 | |
| Sterling Capital Ultra Short Bond Fund | | | 36,807,797 | | | | 130,152 | | | | (45,822 | ) | | | 84,330 | |
| Sterling Capital Short Duration Bond Fund | | | 179,397,099 | | | | 3,343,204 | | | | (881,846 | ) | | | 2,461,358 | |
| Sterling Capital Intermediate U.S. Government Fund | | | 11,982,173 | | | | 828,478 | | | | (179,462 | ) | | | 649,016 | |
| Sterling Capital Total Return Bond Fund | | | 1,673,616,901 | | | | 98,962,442 | | | | (11,313,637 | ) | | | 87,648,805 | |
| Sterling Capital Corporate Fund | | | 17,831,967 | | | | 1,116,322 | | | | (70,904 | ) | | | 1,045,418 | |
| Sterling Capital Quality Income Fund | | | 35,911,879 | | | | 1,600,275 | | | | (169,301 | ) | | | 1,430,974 | |
| Sterling Capital Kentucky Intermediate Tax-Free Fund | | | 11,569,719 | | | | 698,069 | | | | (342 | ) | | | 697,727 | |
| Sterling Capital Maryland Intermediate Tax-Free Fund | | | 11,983,810 | | | | 734,550 | | | | (3,078 | ) | | | 731,472 | |
| Sterling Capital North Carolina Intermediate Tax-Free Fund | | | 164,373,704 | | | | 11,175,720 | | | | (12,583 | ) | | | 11,163,137 | |
| Sterling Capital South Carolina Intermediate Tax-Free Fund | | | 80,916,168 | | | | 5,016,021 | | | | (75,493 | ) | | | 4,940,528 | |
| Sterling Capital Virginia Intermediate Tax-Free Fund | | | 74,800,033 | | | | 5,555,477 | | | | (2,996 | ) | | | 5,552,481 | |
| Sterling Capital West Virginia Intermediate Tax-Free Fund | | | 89,915,412 | | | | 4,896,224 | | | | (60,432 | ) | | | 4,835,792 | |
| Sterling Capital Diversified Income Fund | | | 15,541,203 | | | | 417,472 | | | | (1,467,836 | ) | | | (1,050,364 | ) |
| Sterling Capital Strategic Allocation Balanced Fund | | | 20,899,909 | | | | 2,493,768 | | | | (1,432,184 | ) | | | 1,061,584 | |
| Sterling Capital Strategic Allocation Growth Fund | | | 17,166,715 | | | | 2,053,629 | | | | (1,487,784 | ) | | | 565,845 | |
Management has evaluated the need for the disclosure and/or adjustments resulting from subsequent events through the date the financial statements were issued, and has noted the following item:
On November 18, 2020, the Board of Trustees of Sterling Capital Funds approved the liquidation of each of Sterling Capital Kentucky Intermediate Tax-Free Fund, Sterling Capital Maryland Intermediate Tax-Free Fund, Sterling Capital Diversified Income Fund, Sterling Capital Strategic Allocation Balanced Fund and Sterling Capital Strategic Allocation Growth Fund. Each of the liquidations is expected to occur on or about January 26, 2021.

REPORT OF INDEPENDENT REGISTERED PUBLIC ACCOUNTING FIRM
To the Shareholders and Board of Trustees of
Sterling Capital Funds
Opinion on the Financial Statements
We have audited the accompanying statements of assets and liabilities, including the schedules of portfolio investments, of Sterling Capital Funds, comprising Sterling Capital Behavioral Large Cap Value Equity Fund, Sterling Capital Mid Value Fund, Sterling Capital Behavioral Small Cap Value Equity Fund, Sterling Capital Special Opportunities Fund, Sterling Capital Equity Income Fund, Sterling Capital Behavioral International Equity Fund, Sterling Capital SMID Opportunities Fund, Sterling Capital Stratton Mid Cap Value Fund, Sterling Capital Stratton Real Estate Fund, Sterling Capital Stratton Small Cap Value Fund, Sterling Capital Ultra Short Bond Fund, Sterling Capital Short Duration Bond Fund, Sterling Capital Intermediate U.S. Government Fund, Sterling Capital Total Return Bond Fund, Sterling Capital Corporate Fund, Sterling Capital Quality Income Fund (formerly, Sterling Capital Securitized Opportunities Fund), Sterling Capital Kentucky Intermediate Tax-Free Fund, Sterling Capital Maryland Intermediate Tax-Free Fund, Sterling Capital North Carolina Intermediate Tax-Free Fund, Sterling Capital South Carolina Intermediate Tax-Free Fund, Sterling Capital Virginia Intermediate Tax-Free Fund, Sterling Capital West Virginia Intermediate Tax-Free Fund, Sterling Capital Diversified Income Fund, Sterling Capital Strategic Allocation Balanced Fund, and Sterling Capital Strategic Allocation Growth Fund (the “Funds”) as of September 30, 2020, the related statements of operations for the year then ended, and the statements of changes in net assets and the financial highlights for each of the two years in the period then ended, including the related notes (collectively referred to as the “financial statements”). In our opinion, the financial statements present fairly, in all material respects, the financial position of each of the Funds as of September 30, 2020, the results of their operations for the year then ended, the changes in their net assets and the financial highlights for each of the two years in the period then ended, in conformity with accounting principles generally accepted in the United States of America.
The Funds’ financial highlights for the years ended September 30, 2018, and prior, were audited by other auditors, whose report dated November 21, 2018, expressed an unqualified opinion on those financial statements and financial highlights.
Basis for Opinion
These financial statements are the responsibility of the Funds’ management. Our responsibility is to express an opinion on the Funds’ financial statements based on our audits. We are a public accounting firm registered with the Public Company Accounting Oversight Board (United States) (“PCAOB”) and are required to be independent with respect to the Funds in accordance with the U.S. federal securities laws and the applicable rules and regulations of the Securities and Exchange Commission and the PCAOB.
We conducted our audits in accordance with the standards of the PCAOB. Those standards require that we plan and perform the audit to obtain reasonable assurance about whether the financial statements are free of material misstatement whether due to error or fraud.
C O H E N & C O M P A N Y , L T D.
800.229.1099 | 866.818.4535 fax | cohencpa.com
Registered with the Public Company Accounting Oversight Board
Our audits included performing procedures to assess the risks of material misstatement of the financial statements, whether due to error or fraud, and performing procedures that respond to those risks. Such procedures included examining, on a test basis, evidence regarding the amounts and disclosures in the financial statements. Our procedures included confirmation of securities owned as of September 30, 2020, by correspondence with the custodian and brokers or by other appropriate auditing procedures where replies from brokers or counterparties were not received. Our audits also included evaluating the accounting principles used and significant estimates made by management, as well as evaluating the overall presentation of the financial statements. We believe that our audits provide a reasonable basis for our opinion.
We have served as the Funds’ auditor since 2019.
 | |
| | |
| COHEN & COMPANY, LTD. | |
| Milwaukee, Wisconsin | |
| November 23, 2020 | |
September 30, 2020
Notice to Shareholders (Unaudited)
All amounts and percentages below are based on financial information available as of the date of this annual report and, accordingly are subject to change. For each item it is the intention of the Funds to report the maximum amount permitted under the Internal Revenue Code and the regulations thereunder.
For the fiscal year ended September 30, 2020, each Fund is reporting the following items with regard to distributions paid during the year.
| | | Long-Term
Capital Gain | | | Qualified
Dividend Income % | | | (for corporate
shareholders)
Dividends
Received
Deduction % | | | Exempt-
Interest
Dividend | | | U.S.
Government
Income | | | Foreign
Taxes
Paid | | | Foreign
Source
Income | |
| Sterling Capital Behavioral Large Cap Value Equity Fund | | $ | 8,070,984 | | | | 100.00 | % | | | 100.00 | % | | $ | — | | | | — | | | $ | — | | | $ | — | |
| Sterling Capital Mid Value Fund | | | 5,461,248 | | | | 100.00 | % | | | 100.00 | % | | | — | | | | — | | | | — | | | | — | |
| Sterling Capital Behavioral Small Cap Value Equity Fund | | | — | | | | 90.14 | % | | | 89.83 | % | | | — | | | | — | | | | — | | | | — | |
| Sterling Capital Special Opportunities Fund | | | 83,258,457 | | | | 100.00 | % | | | 100.00 | % | | | — | | | | — | | | | — | | | | — | |
| Sterling Capital Equity Income Fund | | | 76,162,769 | | | | 100.00 | % | | | 100.00 | % | | | — | | | | — | | | | — | | | | — | |
| Sterling Capital Behavioral International Equity Fund | | | — | | | | 100.00 | % | | | 0.39 | % | | | — | | | | — | | | | 162,587 | | | | 3,564,307 | |
| Sterling Capital SMID Opportunities Fund. | | | 471,135 | | | | — | | | | — | | | | — | | | | — | | | | — | | | | — | |
| Sterling Capital Stratton Mid Cap Value Fund | | | 1,433,142 | | | | 100.00 | % | | | 100.00 | % | | | — | | | | — | | | | — | | | | — | |
| Sterling Capital Stratton Real Estate Fund | | | 4,272,613 | | | | 0.62 | % | | | 0.62 | % | | | — | | | | — | | | | — | | | | — | |
| Sterling Capital Stratton Small Cap Value Fund | | | 77,944,204 | | | | 96.91 | % | | | 100.00 | % | | | — | | | | — | | | | — | | | | — | |
| Sterling Capital Ultra Short Bond Fund | | | — | | | | — | | | | — | | | | — | | | | 0.24 | % | | | — | | | | — | |
| Sterling Capital Short Duration Bond Fund | | | — | | | | — | | | | — | | | | — | | | | 1.65 | % | | | — | | | | — | |
| Sterling Capital Intermediate U.S. Government Fund | | | — | | | | — | | | | — | | | | — | | | | 12.96 | % | | | — | | | | — | |
| Sterling Capital Total Return Bond Fund | | | 193,428 | | | | 0.10 | % | | | 0.10 | % | | | — | | | | 3.10 | % | | | — | | | | — | |
| Sterling Capital Corporate Fund | | | 21,250 | | | | 0.44 | % | | | 0.44 | % | | | — | | | | 0.20 | % | | | — | | | | — | |
| Sterling Capital Kentucky Intermediate Tax-Free Fund | | | 23,055 | | | | — | | | | — | | | | — | | | | — | | | | — | | | | — | |
| Sterling Capital Maryland Intermediate Tax-Free Fund | | | 77,065 | | | | — | | | | — | | | | — | | | | — | | | | — | | | | — | |
| Sterling Capital West Virginia Intermediate Tax-Free Fund | | | 78,475 | | | | — | | | | — | | | | — | | | | — | | | | — | | | | — | |
| Sterling Capital Diversified Income Fund. | | | — | | | | 9.36 | % | | | 4.55 | % | | | — | | | | — | | | | 24,960 | | | | 108,246 | |
| Sterling Capital Strategic Allocation Balanced Fund | | | 850,984 | | | | 65.03 | % | | | 17.11 | % | | | — | | | | 0.63 | % | | | 12,297 | | | | 229,625 | |
| Sterling Capital Strategic Allocation Growth Fund | | | 785,793 | | | | 79.80 | % | | | 21.11 | % | | | — | | | | 0.37 | % | | | 12,391 | | | | 231,385 | |
Other Information (Unaudited)
A description of the policies and procedures that the Funds use to determine how to vote proxies relating to portfolio securities is available (i) without charge, upon request, by calling 1-800-228-1872; and (ii) on the Securities and Exchange Commission’s (the “Commission”) website at www.sec.gov.
Information regarding how the Funds voted proxies relating to portfolio securities during the most recent 12-month period ended June 30th is available (i) without charge, upon request, by calling 1-800-228-1872 and (ii) on the Commission’s website at www.sec.gov.
The Funds file complete Schedules of Portfolio Holdings with the Commission for the first and third quarters of each fiscal year as an exhibit to its reports on Form N-PORT. The Funds’ Forms N-PORT reports, once filed, will be available without charge on the Commission’s website at www.sec.gov.
Information about Trustees and Officers (Unaudited)
Overall responsibility for the management of the Funds rests with its Board of Trustees (“Trustees”), who are elected by the shareholders of the Funds. The Trustees elect the officers of the Funds to supervise actively its day-to-day operations. The names of the Trustees, birthdates, term of office and length of time served, principal occupations during the past five years, number of portfolios overseen and directorships held outside of the Funds are listed in the two tables immediately following. The business address of the persons listed below is 3605 Glenwood Avenue, Suite 100, Raleigh, North Carolina 27612.
INDEPENDENT TRUSTEES
| Name and Birthdate | Position(s) Held
With the Funds | Term of Office/ Length of Time Served | Principal Occupation
During the Past 5 Years | Number of Portfolios in Fund Complex Overseen by Trustee | Other Directorships Held by Trustee |
Drew T. Kagan
Birthdate: 02/48 | Trustee, Chairman of the Board of Trustees | Indefinite,
08/00 — Present | Retired; from September 2010 to March 2013, Chairman, Montecito Advisors, Inc.; from December 2003 to September 2010, CEO, Montecito Advisors, Inc.; from March 1996 to December 2003, President, Investment Affiliate, Inc. | 25 | None |
Laura C. Bingham
Birthdate: 11/56 | Trustee | Indefinite,
02/01 — Present | From March 2013 to December 2019, Partner, Newport LLC; from July 2010 to March 2013, governance and leadership consultant; from June 1998 to July 2010, President and CEO of Peace College | 25 | None |
Douglas R. Van Scoy
Birthdate: 11/43 | Trustee | Indefinite,
05/04 — Present | Retired; from 2010 to present, Partner, The Fresh Capital Group; from November 1974 to July 2001, employee of Smith Barney (investment banking), most recently as Director of Private Client Group and Senior Executive Vice President | 25 | None |
James L. Roberts
Birthdate: 11/42 | Trustee | Indefinite,
11/04 — Present | Retired; from December 2009 to present, Consultant, Asphalt Systems, Inc.; from December 2007 to present, Consultant, Grand Mountain Bank | 25 | None |
Alan G. Priest
Birthdate: 05/52 | Trustee | Indefinite,
07/12 — Present | Retired; from April 1993 to April 2012, Partner, Ropes & Gray LLP | 25 | None |
The following table shows information for the trustee who is an “interested person” of the Funds as defined in the 1940 Act:
INTERESTED TRUSTEES
| Name and Birthdate | Position(s) Held
With the Funds | Term of Office/
Length of
Time Served | Principal Occupation
During the Past 5 Years | Number of
Portfolios
in Fund
Complex
Overseen
by Trustee | Other
Directorships
Held
by Trustee |
Alexander W. McAlister*
Birthdate: 03/60 | Trustee | Indefinite, 11/10 — Present | From August 1981 to present, President, Sterling Capital Management LLC | 25 | Director, Sterling Capital Management LLC |
| * | Mr. McAlister is treated by the Funds as an “interested person” (as defined in Section 2(a)(19) of the 1940 Act) of the Funds because he is an officer of the Advisor. |
The following table shows information for officers of Funds:
| Name and Birthdate | Position(s) Held
With the Funds | Term of Office/
Length of
Time Served | Principal Occupation
During the Past 5 Years |
James T. Gillespie
Birthdate: 11/66 | President | Indefinite, 12/12 — Present | From August 2020 to present, Managing Director, Sterling Capital Management LLC; From March 2012 to present, Executive Director, Sterling Capital Management LLC; From June 2010 to March 2012, Director, Sterling Capital Management LLC and its predecessors |
Todd M. Miller
Birthdate: 09/71 | Treasurer and Secretary | Indefinite, Treasurer, 01/15 — Present; Secretary, 08/10 — Present | From June 2009 to present, Director, Sterling Capital Management LLC and its predecessors |
Michelle A. Whalen
Birthdate: 04/69 | Vice President | Indefinite, 11/15 — Present | From August 2015 to present, Associate Director & Senior Mutual Fund Administrator, Sterling Capital; from September 2000 to July 2015, Supervisor Mutual Fund Administration, Stratton Management Co. |
Charles A. Durham
Birthdate: 06/79 | Chief Compliance and Anti-Money Laundering Officer | Indefinite, 06/18 — Present | From June 2018 to present, Chief Compliance Officer and Executive Director, Sterling Capital; from September 2010 to June 2018, Vice President, Senior Compliance Manager, Brown Brothers Harriman & Co. |
John A. Bruggeman
Birthdate: 12/71 | Assistant Treasurer | Indefinite, Assistant Treasurer, 08/16 — Present | From January 2010 to present, Vice President and Senior Director, Fund Accounting and Administration Department, The Bank of New York Mellon |
Julie M. Powers
Birthdate: 10/69 | Assistant Secretary | Indefinite, 11/11 — Present | From November 2011 to present, Vice President, Regulatory Administration Department, The Bank of New York Mellon |
The Funds’ Statement of Additional Information includes additional information about the Funds’ Trustees and Officers. To receive your free copy of the Statement of Additional Information, call toll free: 1-800-228-1872.
Liquidity Risk Management Program
The Funds have adopted a liquidity risk management program pursuant to Rule 22e-4 under the Investment Company Act of 1940, as amended (the “Program”). The Funds’ board has designated Sterling Capital Management LLC (“Sterling Capital”) as the administrator of the Program. The Program’s principal objectives are to support the Funds’ compliance with limits on investments in illiquid assets and to mitigate the risk that a Fund is unable to meet its redemption obligations timely. In this regard, the Program includes a number of elements that support the management or assessment of liquidity risk, including an assessment of factors that influence a Fund’s liquidity and the periodic classification and, as determined necessary, re-classification of a Fund’s investments into buckets that reflect their relative liquidity under current market conditions.
The Funds’ Board reviewed a written report from Sterling Capital on May 19, 2020 addressing the Program’s operation, adequacy, and effectiveness (the “Report”). From December 1, 2018 through December 31, 2019, the period covered by the Report, the Program supported each Fund’s ability to honor redemption requests timely and Sterling Capital’s management of each Fund’s liquidity risk profile, including during any periods of market volatility and net redemptions.
There can be no assurance that the Program will achieve its objectives under all circumstances in the future. Please refer to your Fund’s prospectus for more information regarding the Fund’s exposure to liquidity risk and other risks to which it may be subject.
Notice of Privacy Policy & Practices
Sterling Capital Funds provide this notice to you so that you will know what kinds of information we collect about shareholders1, prospective investors, and individuals (such as beneficiaries), and the circumstances in which that information may be disclosed to third parties who are not affiliated with Sterling Capital Funds.
Collection of Personal Information
We collect nonpublic personal information about you from the following sources:
| • | Account Applications and other forms, which may include your name, address, social security number, and information about your investment goals and risk tolerance; |
| • | Account History, including information about the transactions and balances in your account(s); |
| • | Correspondence, written, telephonic or electronic between you and Sterling Capital Funds or service providers working on behalf of Sterling Capital Funds; |
| • | Online, your name and e-mail address if you provide them; and |
| • | Third Parties, such as your financial intermediary in connection with your transactions, or third-party data services used to verify or update personal information that you provide. |
To comply with federal regulations, information we receive from you or a third party will be used to verify your identity.
Disclosure of Personal Information
We may disclose your personal information as permitted by law to third parties who are not affiliated with the Sterling Capital Funds, including:
| • | in connection with legal proceedings, such as responding to a subpoena; |
| • | to service providers who maintain or service shareholder accounts for Sterling Capital Funds or to a shareholder’s broker or agent; or to companies that mail account-related materials, such as shareholder reports; and |
| • | to perform marketing services on our behalf, or pursuant to a joint marketing agreement with another financial institution. |
Safeguarding of Personal Information
Sterling Capital Funds employs policies, practices and procedures for safeguarding your personal information that we believe comply with applicable law, however no security measures are perfect or impenetrable.
We request that all service providers to Sterling Capital Funds:
| • | maintain policies and procedures designed to assure only appropriate access to, and use of your personal information; and |
| • | maintain physical, electronic and procedural safeguards that comply with applicable legal standards to guard your nonpublic personal information. |
When information is shared with third parties, they are not permitted to use the information for any purpose other than to assist our servicing of your account(s), including helping us improve the services we offer.
| 1 | For purposes of this notice, the terms “shareholder” or “shareholders” includes both individual shareholders (both current and former) of the Sterling Capital Funds and individuals (such as beneficiaries, for example) whose nonpublic personal information is provided to the Sterling Capital Funds, even though they do not invest in Sterling Capital Funds shares. |
INVESTMENT ADVISOR
Sterling Capital Management LLC
4350 Congress Street, Suite 1000
Charlotte, NC 28209
DISTRIBUTOR
Sterling Capital Distributors, LLC
400 Berwyn Park
899 Cassatt Road
Berwyn, PA 19312
LEGAL COUNSEL
Ropes & Gray LLP
Prudential Tower
800 Boylston Street
Boston, MA 02199
TRANSFER AGENT
BNY Mellon Investment Servicing (US) Inc.
301 Bellevue Parkway
Wilmington, DE 19809
INDEPENDENT REGISTERED PUBLIC ACCOUNTING FIRM
Cohen & Company, Ltd.
342 North Water Street, Suite 830
Milwaukee, WI 53202
(This page has been left blank intentionally.)

Item 2. Code of Ethics.
| (a) | The registrant, as of the end of the period covered by this report, has adopted a code of ethics that applies to the registrant’s principal executive officer, principal financial officer, principal accounting officer or controller, or persons performing similar functions, regardless of whether these individuals are employed by the registrant or a third party (the “Code of Ethics”). |
| (c) | There have been no amendments, during the period covered by this report, to a provision of the Code of Ethics that applies to the registrant’s principal executive officer, principal financial officer, principal accounting officer or controller, or persons performing similar functions, regardless of whether these individuals are employed by the registrant or a third party, and that relates to any element of the code of ethics definition enumerated in Item 2(b) of Form N-CSR. |
| (d) | The registrant has not granted any waivers, including an implicit waiver, from a provision of the code of ethics that applies to the registrant’s principal executive officer, principal financial officer, principal accounting officer or controller, or persons performing similar functions, regardless of whether these individuals are employed by the registrant or a third party, that relates to one or more of the items set forth in Item 2(b) of Form N-CSR. |
Item 3. Audit Committee Financial Expert.
As of the end of the period covered by the report, the registrant’s board of trustees has determined that Drew Kagan is qualified to serve as an audit committee financial expert serving on its audit committee and that he is “independent,” as defined by Item 3 of Form N-CSR.
Item 4. Principal Accountant Fees and Services.
Audit Fees
| (a) | The aggregate fees billed for each of the last two fiscal years for professional services rendered by the principal accountant for the audit of the registrant's annual financial statements or services that are normally provided by the accountant in connection with statutory and regulatory filings or engagements for those fiscal years are $365,500 for 2020 and $365,500 for 2019. |
Audit-Related Fees
| (b) | The aggregate fees billed in each of the last two fiscal years for assurance and related services by the principal accountant that are reasonably related to the performance of the audit of the registrant's financial statements and are not reported under paragraph (a) of this Item are $0 for 2020 and $0 for 2019. These audit-related services include issuance of consents to use the name of the auditor in new Fund filings. |
Tax Fees
| (c) | The aggregate fees billed in each of the last two fiscal years for professional services rendered by the principal accountant for tax compliance, tax advice, and tax planning are $95,500 for 2020 and $95,500 for 2019. Fees for both 2020 and 2019 relate to the preparation of the registrant’s federal income and excise tax returns and review of the registrant’s capital gains distribution calculations. |
All Other Fees
| (d) | The aggregate fees billed in each of the last two fiscal years for products and services provided by the principal accountant, other than the services reported in paragraphs (a) through (c) of this Item are $0 for 2020 and $0 for 2019. |
| (e)(1) | Except as permitted by Rule 2-01(c)(7)(i)(C) of Regulation S-X, the Trust’s Audit Committee must pre-approve all audit and non-audit services provided by the independent accountants relating to the operations or financial reporting of the funds. Prior to the commencement of any audit or non-audit services to a fund, the Audit Committee reviews the services to determine whether they are appropriate and permissible under applicable law. |
| (e)(2) | The percentage of services described in each of paragraphs (b) through (d) of this Item that were approved by the audit committee pursuant to paragraph (c)(7)(i)(C) of Rule 2-01 of Regulation S-X are as follows: |
(b) N/A
(c) 100%
(d) N/A
| (f) | The percentage of hours expended on the principal accountant's engagement to audit the registrant's financial statements for the most recent fiscal year that were attributed to work performed by persons other than the principal accountant's full-time, permanent employees was less than fifty percent. |
| (g) | The aggregate non-audit fees billed by the registrant's accountant for services rendered to the registrant, and rendered to the registrant's investment adviser (not including any sub-adviser whose role is primarily portfolio management and is subcontracted with or overseen by another investment adviser), and any entity controlling, controlled by, or under common control with the adviser that provides ongoing services to the registrant for each of the last two fiscal years of the registrant was $0 for 2020 and $0 for 2019. |
| (h) | The audit committee of the registrant’s board of trustees has considered whether the provision of non-audit services that were rendered to the registrant's investment adviser (not including any sub-adviser whose role is primarily portfolio management and is subcontracted with or overseen by another investment adviser), and any entity controlling, controlled by, or under common control with the investment adviser that provides ongoing services to the registrant that were not pre-approved pursuant to paragraph (c)(7)(ii) of Rule 2-01 of Regulation S-X is compatible with maintaining the principal accountant's independence. |
Item 5. Audit Committee of Listed Registrants.
Not applicable.
Item 6. Investments.
| (a) | Schedule of Investments in securities of unaffiliated issuers as of the close of the reporting period is included as part of the report to shareholders filed under Item 1 of this form. |
Item 7. Disclosure of Proxy Voting Policies and Procedures for Closed-End Management Investment Companies.
Not applicable.
Item 8. Portfolio Managers of Closed-End Management Investment Companies.
Not applicable.
Item 9. Purchases of Equity Securities by Closed-End Management Investment Company and Affiliated Purchasers.
Not applicable.
Item 10. Submission of Matters to a Vote of Security Holders.
There have been no material changes to the procedures by which shareholders may recommend nominees to the registrant’s board of trustees, where those changes were implemented after the registrant last provided disclosure in response to the requirements of Item 407(c)(2)(iv) of Regulation S----K (17 CFR 229.407) (as required by Item 22(b)(15) of Schedule 14A (17 CFR 240.14a-101)), or this Item.
Item 11. Controls and Procedures.
| (a) | The registrant’s principal executive officer and principal financial officer have concluded, based on their evaluation of the effectiveness of the design and operation of the registrant’s disclosure controls and procedures (as defined in Rule 30a-3(c) under the Investment Company Act of 1940 (17 CFR 270.30a-3(c))) as of a date within 90 days of the filing date of this report, that the design and operation of such procedures are effective to provide reasonable assurance that information required to be disclosed by the registrant on Form N-CSR is recorded, processed, summarized and reported within the time periods specified in the Securities and Exchange Commission’s rules and forms, and that information required to be disclosed by the registrant in the reports that it files or submits on Form N-CSR is accumulated and communicated to the registrant’s management, including its principal executive and principal financial officers, as appropriate to allow timely decisions regarding required disclosure. |
| (b) | There were no changes in the registrant’s internal control over financial reporting (as defined in Rule 30a-3(d) under the 1940 Act (17 CFR 270.30a-3(d))) that occurred during the period covered by this report that have materially affected, or are reasonably likely to materially affect, the registrant’s internal control over financial reporting. |
Item 12. Disclosure of Securities Lending Activities for Closed-End Management Investment Companies.
Not applicable.
Item 13. Exhibits.
SIGNATURES
Pursuant to the requirements of the Securities Exchange Act of 1934 and the Investment Company Act of 1940, the registrant has duly caused this report to be signed on its behalf by the undersigned, thereunto duly authorized.
| (Registrant) | Sterling Capital Funds | |
| | | |
| By (Signature and Title) | /s/ James T. Gillespie | |
| | | |
| | James T. Gillespie, President | |
| | (principal executive officer) | |
| | | |
| Date | 11/23/20 | |
Pursuant to the requirements of the Securities Exchange Act of 1934 and the Investment Company Act of 1940, this report has been signed below by the following persons on behalf of the registrant and in the capacities and on the dates indicated.
| By (Signature and Title) | /s/ James T. Gillespie | |
| | | |
| | James T. Gillespie, President | |
| | (principal executive officer) | |
| | | |
| Date | 11/23/20 | |
| | | |
| By (Signature and Title) | /s/ Todd M. Miller | |
| | | |
| | Todd M. Miller, Treasurer | |
| | (principal financial officer) | |
| | | |
| Date | 11/23/20 | |