UNITED STATES
SECURITIES AND EXCHANGE COMMISSION
Washington, D.C. 20549
FORM N-CSR
CERTIFIED SHAREHOLDER REPORT OF REGISTERED MANAGEMENT INVESTMENT COMPANIES
Investment Company Act file number 811-06719
Sterling Capital Funds
(Exact name of registrant as specified in charter)
434 Fayetteville St., Suite 500
Raleigh, NC 27601
(Address of principal executive offices) (Zip code)
James T. Gillespie, President
Sterling Capital Funds
434 Fayetteville St., Suite 500
Raleigh, NC 27601
(Name and address of agent for service)
Registrant’s telephone number, including area code: (800) 228-1872
Date of fiscal year end: September 30
Date of reporting period: September 30, 2023
Form N-CSR is to be used by management investment companies to file reports with the Commission not later than 10 days after the transmission to stockholders of any report that is required to be transmitted to stockholders under Rule 30e-1 under the Investment Company Act of 1940 (17 CFR 270.30e-1). The Commission may use the information provided on Form N-CSR in its regulatory, disclosure review, inspection, and policymaking roles.
A registrant is required to disclose the information specified by Form N-CSR, and the Commission will make this information public. A registrant is not required to respond to the collection of information contained in Form N-CSR unless the Form displays a currently valid Office of Management and Budget (“OMB”) control number. Please direct comments concerning the accuracy of the information collection burden estimate and any suggestions for reducing the burden to Secretary, Securities and Exchange Commission, 450 Fifth Street, NW, Washington, DC 20549-0609. The OMB has reviewed this collection of information under the clearance requirements of 44 U.S.C. § 3507.
Item 1. Reports to Stockholders.
| (a) | The Report to Shareholders is attached herewith. |

(This page is intentionally left blank.)
Letter from the President and the Investment Advisor
Dear Shareholders:
We are pleased to present this Sterling Capital Funds Annual Report covering the 12 months from October 1, 2022, to September 30, 2023.
Equity markets posted double-digit returns over the 12-month period under review. Share prices rebounded strongly in October 2022 after relatively weak performance for much of the calendar year. Stock prices peaked early in the third quarter of 2023 before declining modestly through the end of the period.
Inflation and the Federal Reserve’s (Fed’s) monetary policy decisions were major themes influencing domestic equity performance during the 12-month period under review. Investors began the period concerned that the Fed’s rate hikes would drive the U.S. economy into a recession. Those fears faded with the New Year as inflation showed signs of cooling and economic fundamentals remained strong, but they were renewed after the Fed raised interest rates in July and again in September after Fed Chair Jerome Powell adopted a more hawkish tone about potential interest rate moves in 2024.
Although U.S. and developed international equities ended the 12-month period largely in line with one another, the pace of those gains and the nature of the trends differed. For instance, domestic equities underperformed international equities for the fourth quarter of 2022, while that pattern reversed across the latter half of the period. In fact, most of the gains for international stocks took place during the fourth quarter of 2022, when large-cap international stocks, as measured by the MSCI1 EAFE Large Cap (LC) Index, gained 17.3% and the S&P 500®2 Index, a measure of large-cap U.S. stocks, posted a 7.5% gain. Value stocks also generally outperformed growth names during this final quarter of 2022, as they did for most of 2022.
In early 2023, U.S. Investors appeared to regain some of their appetite for risk. Fears of a financial crisis, triggered by the well-publicized failure of a few regional banks in March, kept share prices mostly in check across the first quarter of 2023. However, U.S. equities rebounded strongly through the second quarter of 2023. Despite mixed economic data, investors’ appetite for risk increased, leading to a shift toward growth stocks and away from value names. In fact, across the first three quarters of 2023, U.S. large-cap growth stocks, as measured by the Russell3 1000® Growth Index, returned 25.0%, outperforming the 1.8% return by U.S. large-cap value stocks, as measured by the Russell 1000® Value Index. By comparison, value stocks continued to outperform growth names in international markets across the same final three quarters of the period, even as the difference was more muted. The MSCI ACWI ex USA Value Index, a measure of large- and mid-cap international value stocks, returned 8.8% during the first nine months of 2023. That compared to a 2.9% gain for the MSCI ACWI ex USA Growth Index. It was only in the final quarter of the period that investor enthusiasm for growth stocks waned. During that period, investors worried about the potential for additional interest rate hikes, a more hawkish stance by the Fed, the risk of a government shutdown, and the economic impact of a prolonged autoworkers strike. U.S. large-cap growth and value stocks both declined equally across the final quarter of the period.
Domestic investors’ pivot to growth during the period was visible in the performance of individual sectors of the S&P 500. In the fourth quarter of 2022, the energy, industrials, and materials sectors posted the strongest gains, while consumer discretionary and communication services were the only sectors of the index to post a loss for the quarter. When considering the first three quarters of 2023, however, the three top-performing sectors were communications services, information technology, and consumer discretionary. Meanwhile, more-defensive areas such as health care, consumer staples, real estate, and utilities all lagged their peers.
Over the course of the 12-month period, the Fed raised the fed funds rate4 – a key short-term interest rate – six times for a total increase of 225 basis points5 (bps), or 2.25%. The two rate hikes in the fourth quarter of 2022 accounted for 125bps, while the four rate hikes in February, March, May, and July were each 25bp increases. The rapid rise in interest rates had the expected effect on bonds of pushing down prices. However, those effects were mixed along the length of the yield curve6 as investors worked to process the monthly changes in inflation data and the shifting tone of the Fed.
In the fourth quarter of 2022, short-term yields skyrocketed, with the yield on 6-month Treasuries up 100bps for the quarter. Meanwhile, the yield on 10-year Treasuries remained relatively flat. In the first quarter of 2023, a banking crisis among regional banks in March 2023 led to a flight to safety which saw Treasury yields decline despite the single Fed interest rate increase that took place in February. The inversion between two- and 10-year Treasuries declined to -56bps by the end of the quarter. Meanwhile, the spread on corporate yields narrowed as the Fed and FDIC aggressively intervened in the regional banking crisis, and confidence in the resilience of the banking system returned.
In the second quarter, yields rose once again as investors regained confidence in the economy, but the increases were uneven across the length of the yield curve. The inversion between 2- and 10-year Treasuries grew -106bps by the end of the quarter. The spread on corporate yields tightened even further. In the third quarter, yields increased sharply across the curve as the economy demonstrated its resilience to the aggressive Fed rate hikes as it added more jobs than expected, and markets began to weigh future rate increases. The yield curve began to normalize near the end of the period, and the inversion between two- and 10-year Treasuries was reduced to just -50bps by the end of the quarter. Yields on 2-year Treasuries ended the period at 5.0% (up from 4.2% at the start of the period) and yields on 10-year Treasuries ended the period at 4.6% (up from 3.8% at the start of the period) – levels not seen since before the 2008 Financial Crisis. The rise in interest rates across the period negatively affected bond returns, and the Bloomberg7 U.S. Aggregate Bond Index was down 1.21% YTD through September 30.
The Fed’s aggressive rate hikes proved effective in cooling inflation over the 12-month period, although not quite down to the Fed’s target of 2.0%. The Consumer Price Index8 (CPI) began the period at 7.7% and finished the period at 3.7%, with its lowest point at 3.0% in June. Despite the aggressive rate hikes, the economy remained resilient, with gross domestic product9 (GDP) increasing at an annualized rate of 2.6% in the fourth quarter of 2022 and increases of 2.2% and 2.1% across the first and second quarters of 2023, respectively. The advance estimate for GDP growth in the third quarter of 2023 is a robust 4.9%. Employment data was one of the key metrics investors turned to for confirmation of the U.S. economy’s strength in the face of rising interest rates. The monthly unemployment rate started the 12-month period at 3.7% and ended the period at 3.8%.
The S&P 500 gained 21.6% (total return) during the 12 months under review. Small-cap stocks underperformed their large-cap counterparts over the same period, with the Russell 2000® Index gaining 8.9% (total return). International markets also posted strong returns, with the MSCI EAFE Index up 22.3% (price return), while the MSCI Emerging Markets Index posted a more modest gain of 11.7% (net return) for the period.
We will continue to monitor the evolving economic and market climate and will manage the Sterling Capital Funds accordingly. Thank you for your confidence in Sterling Capital Management. We look forward to serving your investment needs during the months and years ahead.
Past performance is not indicative of future results. Any type of investing involves risk and there are no guarantees that these methods will be successful.
Specific securities identified and described do not represent all of the securities purchased, sold or recommended to clients. There are no assurances that securities identified will be profitable investments. The securities described are neither a recommendation nor a solicitation. Security information is being obtained from resources the firm believes to be accurate, but no warrant is made as to the accuracy or completeness of the information.
The volatility of an index varies greatly. All indices are unmanaged and investments cannot be made directly in an index.
Sincerely,

James T. Gillespie
President
Sterling Capital Funds

Jeffrey J. Schappe, CFA®
Managing Director
Sterling Capital Management LLC
| 1 | “MSCI Inc. is an American finance company headquartered in New York, NY. MSCI is a global provider of equity, fixed income, real estate indexes, multi-asset portfolio analysis tools, ESG and climate products. It operates the MSCI Europe/Australasia/Far East (EAFE) Indices (EAFE), the MSCI All Country World Indices (ACWI), and the MSCI Emerging Markets Indices referenced herein, among others. |
| 2 | “S&P 500®” is a registered service mark of Standard & Poor’s Corporation, which does not sponsor and is in no way affiliated with the Sterling Capital Funds. The S&P 500® Index is generally considered to be representative of the performance of the stock market as a whole. |
| 3 | LSEG Group, the parent company of FTSE Russell, is a global finance company headquartered in London, UK and is a provider of investment data, indices, and analytics across multiple asset classes. FTSE Russell operates the Russell 1000® and Russell 2000® U.S. equity indices referenced herein, among others. |
Letter from the President and the Investment Advisor
| 4 | The Fed Funds Rate refers to the interest rate that depository institutions (such as banks and credit unions) charge other depository institutions for overnight lending of capital from their reserve balances on an uncollateralized basis. |
| 5 | Basis points (bps) are a measure equal to 1/100 of one percent, typically used to express differences in interest rates. |
| 6 | A yield curve is a line that plots the yields of bonds of similar credit quality but different maturity dates. |
| 7 | “Bloomberg®” and the Bloomberg indices are service marks of Bloomberg Finance L.P. and its affiliates, including Bloomberg Index Services Limited (“BISL”), the administrator of the index (collectively, “Bloomberg”) and have been licensed for use for certain purposes by Sterling Capital Management LLC and its affiliates. Bloomberg is not affiliated with Sterling Capital Management LLC or its affiliates, and Bloomberg does not approve, endorse, review, or recommend the product(s) presented herein. Bloomberg does not guarantee the timeliness, accurateness, or completeness of any data or information relating to the product(s) presented herein. It operates the Bloomberg U.S. Aggregate Bond Index referenced herein, among others. |
| 8 | The Consumer Price Index (CPI) is a measure of the average change over time in the prices paid by urban consumers for a market basket of consumer goods and services. Indexes are available for the U.S. and various geographic areas. Average price data for select utility, automotive fuel, and food items are also available. |
| 9 | Real gross domestic product (GDP) is an inflation-adjusted measure that reflects the value of all goods and services produced by an economy in a given year, expressed in base-year prices. |
Past performance does not guarantee future results. Mutual fund investing involves risk including the possible loss of principal.
This report is authorized for distribution only when preceded or accompanied by a prospectus. Please read the prospectus carefully before investing or sending money. Sterling Capital Management LLC (“Sterling Capital”) serves as investment advisor to the Sterling Capital Funds (each a “Fund” and collectively, the “Funds”) and is paid a fee for its services. Shares of the Funds are not deposits or obligations of, or guaranteed or endorsed by, Truist Financial Corporation (“Truist”) or its affiliates. The Funds are not insured by the FDIC or any other government agency. The Funds currently are distributed by Sterling Capital Distributors, LLC. The distributor is not affiliated with Truist Financial Corporation or its affiliates.
The foregoing information and opinions are for general information only. Sterling Capital does not guarantee their accuracy or completeness, nor assume liability for any loss, which may result from the reliance by any person upon any such information or opinions. Such information and opinions are subject to change without notice, are for general information only and are not intended as an offer or solicitation with respect to the purchase or sale of any security or as offering individual or personalized investment advice.
Sterling Capital Behavioral Large Cap Value Equity Fund
Portfolio Managers
Sterling Capital Behavioral Large Cap Value Equity Fund (the “Fund”) is managed by Portfolio Managers Robert W. Bridges, CFA®, Senior Managing Director, and Robert O. Weller, CFA®, Executive Director, for Sterling Capital Management LLC (“Sterling Capital”), advisor to the Fund.
Robert W. Bridges, CFA®
Robert W. Bridges, CFA, Senior Managing Director, CIO and Head of Equity, joined Sterling Capital in 1996 and has investment experience since 1991. He has been co-portfolio manager of the Behavioral Large Cap Value Equity Fund since August 2013. Bob is a graduate of Wake Forest University, where he received a B.S. in Business. He holds the Chartered Financial Analyst designation.
Robert O. Weller, CFA®
Robert O. Weller, CFA, Executive Director, joined Sterling Capital in 2012 and has investment experience since 1996. He has been co-portfolio manager of the Behavioral Large Cap Value Equity Fund since August 2013. Rob is a graduate of Loyola University Maryland, where he received a B.B.A. in Finance. He holds the Chartered Financial Analyst designation.
Investment Considerations
The overall results of the Fund will be dependent on the process and ability of the Adviser to apply “behavioral finance” principles to recognize a company’s value, earnings revisions and price momentum. The Fund may invest in undervalued securities which may not appreciate in value as anticipated or remain undervalued for longer than anticipated. The overall results of the Fund will be dependent on the process and ability of the Adviser to recognize a company’s value. The Fund may invest in REITs (Real Estate Investment Trusts), the value of which will be affected by conditions of the real estate industry. The Fund may also invest in exchange-traded funds (ETFs); thus shareholders may bear additional costs and the ETF may not exactly replicate the performance it seeks to track.
Q. How did the Fund perform during the 12-month period between October 1, 2022 and September 30, 2023?
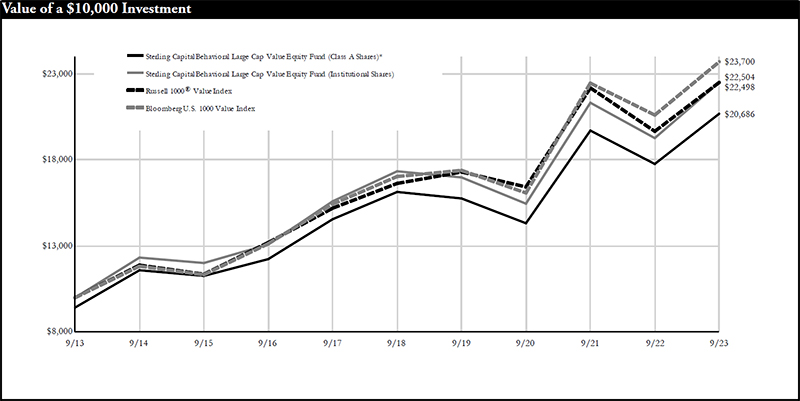
A. The Fund’s Institutional Shares outperformed its current benchmark, the Russell 1000® Value Index.
Q. What factors affected the Fund’s performance?
A. The Russell 1000® Index as a whole posted double-digit gains during the 12-month period amid strong domestic equity returns. A large portion of those gains were driven by large-cap, high-growth technology companies that make up a large portion of the Index. These companies benefited from investor enthusiasm about artificial intelligence (AI) and a general increase in investor optimism in the resilience of the economy despite the rapid rise in interest rates. This shift in attitude helped drive investors to pivot in early 2023 toward growth-oriented names and away from value-oriented stocks. This trend negatively affected the absolute performance of both the Fund and its value-oriented benchmark as it drove value to underperform growth for the period under review. Investor enthusiasm waned briefly in March after the well-publicized failures of a few regional financial institutions fanned fears about liquidity and potential bank runs. However, markets quickly rebounded in the second quarter of 2023 and continued to post steady gains throughout most of the rest of the period.
The Fund applies principles of behavioral finance to its investment strategy. This process is designed to capitalize on known investor biases and heuristics (mental shortcuts) by accounting for the impact on markets of behavioral factors such as greed, fear, and ego. One element of the Fund’s strategy is a focus on how investor fears result in cheaper stocks. Shares held at discounts provided most of the relative outperformance over the year as such holdings posted positive returns, while expensive stocks underperformed.
The Fund’s relative performance suffered from investors’ pivot toward riskier investments in January. This shift led momentum stocks to underperform, and targeting momentum is one of the Fund’s priorities. The shift caused the Fund to underperform significantly in January, but some of those losses were recouped later in the quarter when the regional bank failures triggered investor concerns around liquidity and caused the markets to pull back.
A Note on Indices: The volatility of an index varies greatly. All indices are unmanaged and investments cannot be made directly in an index.
The Russell 1000® Index measures the performance of the large-cap segment of the U.S. equity universe.
The Russell 1000® Value Index measures the performance of value-style investing in large-cap U.S. stocks.
Portfolio composition is as of September 30, 2023 and is subject to change and risk.
| Average Annual Total Returns |
| As of September 30, 2023 | Inception Date | 1 Year | 5 Years | 10 Years |
| Class A Shares* | 10/9/92 | 9.74% | 3.85% | 7.54% |
| Class C Shares** | 2/1/01 | 15.57% | 4.31% | 7.38% |
| Institutional Shares | 10/9/92 | 16.74% | 5.34% | 8.45% |
| Class R6 Shares | 2/1/181 | 16.84% | 5.43% | 8.49% |
| Russell 1000® Value Index | N/A | 14.44% | 6.23% | 8.45% |
| Bloomberg U.S. 1000 Value Index | N/A | 14.99% | 6.81% | 9.01% |
Past performance does not guarantee future results. The performance data quoted represents past performance and current returns may be lower or higher. Total return figures include change in share price, reinvestment of dividends and capital gains, and do not reflect taxes that a shareholder would pay on fund distributions or on the redemption of fund shares. The investment return and principal value will fluctuate so that an investor’s shares, when redeemed, may be worth more or less than the original cost. To obtain performance information current to the most recent month end, please visit www.sterlingcapitalfunds.com.
The chart above represents a comparison of a hypothetical $10,000 investment in the indicated share class versus a similar investment in the Fund’s benchmark.
| * | Reflects 5.75% maximum sales charge. |
| ** | Reflects the applicable maximum CDSC of 1.00% (applicable only to redemptions within one year of purchase, and as such, are not reflected in the Average Annual Total Returns table since the periods reflected are for a year or longer). |
| 1 | Class R6 Shares were not in existence prior to 2/1/18. Performance for periods prior to 2/1/18 is based on the performance of Institutional Shares. |
The Russell 1000® Value Index is a widely recognized index of common stocks that measures the performance of the large-cap value sector of the U.S. equity market. The index is unmanaged and does not reflect the deduction of expenses associated with a mutual fund, such as investment management and fund accounting fees. Investors cannot invest directly in an index, although they can invest in its underlying securities.
The Bloomberg U.S. 1000 Value Index provides exposure to companies with superior value factor scores based on their earnings yield, valuation, dividend yield, and growth.
Sterling Capital Mid Value Fund
Portfolio Managers
Sterling Capital Mid Value Fund (the “Fund”) is managed by Portfolio Managers Patrick W. Rau, CFA®, Managing Director, William C. Smith, CFA®, Executive Director and Lee D. Houser, CFA®, Executive Director for Sterling Capital Management LLC (“Sterling Capital”), advisor to the Fund.
Patrick W. Rau, CFA®
Patrick W. Rau, CFA®, Managing Director, joined Sterling Capital Management in 2001 and has investment experience since 1993. Patrick has been co-portfolio manager of Mid Value Fund since August 2021. Patrick received his A.B. in Political Science from Duke University and his MBA from Vanderbilt University. He holds the Chartered Financial Analyst designation.
William C. Smith, CFA®
William C. Smith, CFA®, Executive Director, joined Sterling Capital Management in 2015 and has investment experience since 2002. Will has been co-portfolio manager of the Mid Value Fund since August 2021 and served as associate portfolio manager of the Fund from February 2021 to August 2021. Will received his B.E. in Structural Engineering from Vanderbilt University and his MBA from the London Business School. He holds the Chartered Financial Analyst® designation.
Lee D. Houser, CFA®
Lee D. Houser, CFA®, Executive Director, joined Sterling Capital Management in 2006 and has investment experience since 1999. Lee has been associate portfolio manager of the Mid Value Fund since February 2021. Lee received his B.S. in Mathematics and Economics from James Madison University, where he was a summa cum laude graduate, and his MBA from Duke University. He holds the Chartered Financial Analyst® designation.
Investment Considerations
The Fund may invest in undervalued securities that may not appreciate in value as anticipated or remain undervalued for longer than anticipated. Investments made in small to mid-capitalization companies are subject to greater risks than large company stocks due to limited resources and inventory and are more sensitive to adverse conditions. The Fund may invest in foreign securities, which may be more volatile and less liquid due to currency fluctuation, political instability, and social and economic risks.
Q. How did the Fund perform during the 12-month period between October 1, 2022 and September 30, 2023?
A. The Fund’s Institutional Shares outperformed its benchmark, the Russell Midcap® Value Index.
Q. What factors affected the Fund’s performance?
A. Despite an aggressive series of interest rate hikes by the Federal Reserve (the Fed) throughout the period under review, the economy remained resilient. As the period progressed, investors grew increasingly optimistic about the Fed’s ability to rein in inflation without triggering a recession. The stubbornly high inflation rate eased throughout the 12-month period, even as the unemployment rate remained near historic lows. In this environment, domestic equities generally performed well as investors, encouraged by healthy corporate profits, shifted significant assets into equities, which helped boost the Fund’s absolute returns. Amid this shift to a more risk-on attitude, the Fund’s holdings within the consumer discretionary, real estate, and utilities sectors added to absolute
performance, while investments in industrials, materials, and consumer staples generally lagged on an absolute basis.
The Fund’s relative performance benefited from stock selection in the consumer discretionary, health care, and communications services sectors. Leading contributors included a video game company that announced a major product upgrade and an outpatient services company that benefitted from lower labor costs.
Stock selection within industrials and materials dragged on the Fund’s performance relative to its benchmark. Detractors included a staffing company experiencing a slowdown in demand and an agricultural products company facing a destocking cycle.
A Note on Indices: The volatility of an index varies greatly. All indices are unmanaged and investments cannot be made directly in an index.
The Russell Midcap® Value Index measures the performance of value-style investing in mid-cap U.S. stocks.
Portfolio composition is as of September 30, 2023 and is subject to change and risk.

| Average Annual Total Returns | | | | |
| As of September 30, 2023 | Inception Date | 1 Year | 5 Years | 10 Years |
| Class A Shares* | 8/1/96 | 6.92% | 2.99% | 5.80% |
| Class C Shares** | 7/25/01 | 12.57% | 3.44% | 5.64% |
| Institutional Shares | 8/1/96 | 13.77% | 4.49% | 6.70% |
| Class R6 Shares | 2/1/181 | 13.86% | 4.56% | 6.75% |
| Russell Midcap® Value Index | N/A | 11.05% | 5.18% | 7.92% |
| Bloomberg U.S. Mid Cap Value Index | N/A | 11.50% | 6.24% | 8.84% |
Past performance does not guarantee future results. The performance data quoted represents past performance and current returns may be lower or higher. Total return figures include change in share price, reinvestment of dividends and capital gains, and do not reflect taxes that a shareholder would pay on fund distributions or on the redemption of fund shares. The investment return and principal value will fluctuate so that an investor’s shares, when redeemed, may be worth more or less than the original cost. To obtain performance information current to the most recent month end, please visit www.sterlingcapitalfunds.com.
The chart above represents a comparison of a hypothetical $10,000 investment in the indicated share class versus a similar investment in the Fund’s benchmark.
| * | Reflects 5.75% maximum sales charge. |
| ** | Reflects the applicable maximum CDSC of 1.00% (applicable only to redemptions within one year of purchase, and as such, are not reflected in the Average Annual Total Returns table since the periods reflected are for a year or longer). |
| 1 | Class R6 Shares were not in existence prior to 2/1/18. Performance for periods prior to 2/1/18 is based on the performance of Institutional Shares. |
The Fund is measured against the Russell Midcap® Value Index, an unmanaged index, which measures the performance of the mid-cap value segment of the U.S. equity universe. It includes those Russell Midcap® Index companies with lower price-to-book ratios and lower forecasted growth values. The index is unmanaged and does not reflect the deduction of expenses associated with a mutual fund, such as investment management and fund accounting fees. Investors cannot invest directly in an index, although they can invest in its underlying securities.
The Bloomberg U.S. Mid Cap Value Index is a float market-cap-weighted index based on an equal-weighted combination of four factors:
earnings yield, valuation, dividend yield, and growth.
Sterling Capital Behavioral Small Cap Value Equity Fund
Portfolio Managers
Sterling Capital Behavioral Small Cap Value Equity Fund (the “Fund”) is managed by Portfolio Managers Robert W. Bridges, CFA®, Senior Managing Director, and Robert O. Weller, CFA®, Executive Director, for Sterling Capital Management LLC (“Sterling Capital”), advisor to the Fund.
Robert W. Bridges, CFA®
Robert W. Bridges, CFA®, Senior Managing Director, CIO and Head of Equity, joined Sterling Capital in 1996 and has investment experience since 1991. He has been co-portfolio manager of the Behavioral Small Cap Value Equity Fund since June 2013. Bob is a graduate of Wake Forest University, where he received a B.S. in Business. He holds the Chartered Financial Analyst® designation.
Robert O. Weller, CFA®
Robert O. Weller, CFA®, Executive Director, joined Sterling Capital in 2012 and has investment experience since 1996. He has been co-portfolio manager of the Behavioral Small Cap Value Equity Fund since June 2013. Rob is a graduate of Loyola University Maryland, where he received a B.B.A. in Finance. He holds the Chartered Financial Analyst® designation.
Investment Considerations
The overall results of the Fund will be dependent on the process and ability of the Adviser to apply “behavioral finance” principles to recognize a company’s value, earnings revisions and price momentum. The Fund may invest in undervalued securities which may not appreciate in value as anticipated or remain undervalued for longer than anticipated. Investments made in small to mid-capitalization companies are subject to greater risks than large company stocks due to limited resources and inventory as well as more sensitive to adverse conditions.
Q. How did the Fund perform during the 12-month period between October 1, 2022 and September 30, 2023?
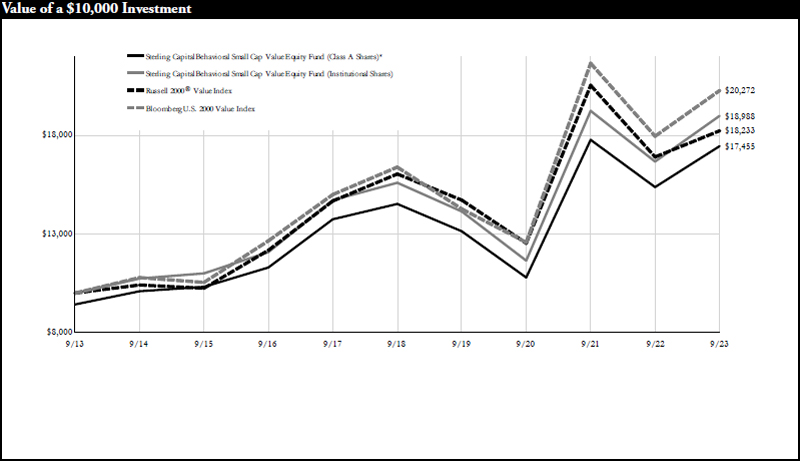
A. The Fund’s Institutional Shares outperformed its current benchmark, the Russell 2000® Value Index.
Q. What factors affected the Fund’s performance?
A. The Russell 2000 posted single-digit gains during the 12-month period amid strong domestic equity returns. Small-cap stocks generally underperformed their large-cap counterparts in large part due to robust gains by the equity market’s biggest, highest-growth technology companies who benefited from investor enthusiasm about artificial intelligence (AI). Investors regained their appetite for risk in early 2023 as inflation showed signs of easing without slowing the economy enough to tip it into a recession. However, rates continued to increase throughout most of the period, causing markets to rise and fall as investors attempted to predict the Federal Reserve’s strategy and to interpret the future effects of higher rates on the economy.
The Fund applies principles of behavioral finance to its investment strategy. This process is designed to capitalize on known investor biases and heuristics (mental shortcuts) by accounting for the impact on markets of behavioral factors such as greed, fear, and ego. One
element of the Fund’s strategy is a focus on how investor fears result in cheaper stocks. Shares held at discounts provided most of the relative outperformance over the year as such holdings posted positive returns, while expensive stocks underperformed.
The shift by investors toward a risk on attitude in January detracted from the Fund’s performance relative to its benchmark due to the Fund’s strategy of targeting momentum stocks. The shift led investors to pivot to growth-oriented stocks and away from value-oriented stocks that had previously experienced increased momentum, which caused the momentum strategy to significantly detract from relative returns early in the period. The Fund was able to recapture some of those lost returns after the well-publicized failures of a few regional banks caused markets to pull back in March. However, the strategy remained largely neutral to relative results throughout the rest of the period.
A Note on Indices: The volatility of an index varies greatly. All indices are unmanaged and investments cannot be made directly in an index.
The Russell 2000® Index measures the performance of the small-cap segment of the U.S. equity universe.
The Russell 2000® Value Index measures the performance of value-style investing in small cap U.S. stocks.
Portfolio composition is as of September 30, 2023 and is subject to change and risk.
| Average Annual Total Returns | | | | |
| As of September 30, 2023 | Inception Date | 1 Year | 5 Years | 10 Years |
| Class A Shares* | 1/29/10 | 6.99% | 2.52% | 5.73% |
| Class C Shares** | 1/29/10 | 12.70% | 2.97% | 5.56% |
| Institutional Shares | 1/2/97 | 13.86% | 4.01% | 6.62% |
| Class R6 Shares | 2/1/181 | 13.94% | 4.07% | 6.66% |
| Russell 2000® Value Index | N/A | 7.84% | 2.59% | 6.19% |
| Bloomberg U.S. 2000 Value Index | N/A | 12.88% | 4.34% | 7.32% |
Past performance does not guarantee future results. The performance data quoted represents past performance and current returns may be lower or higher. Total return figures include change in share price, reinvestment of dividends and capital gains, and do not reflect taxes that a shareholder would pay on fund distributions or on the redemption of fund shares. The investment return and principal value will fluctuate so that an investor’s shares, when redeemed, may be worth more or less than the original cost. To obtain performance information current to the most recent month end, please visit www.sterlingcapitalfunds.com. Performance would have been lower without waivers in effect.
The chart above represents a comparison of a hypothetical $10,000 investment in the indicated share class versus a similar investment in the Fund’s benchmark.
| * | Reflects 5.75% maximum sales charge. |
| ** | Reflects the applicable maximum CDSC of 1.00% (applicable only to redemptions within one year of purchase, and as such, are not reflected in the Average Annual Total Returns table since the periods reflected are for a year or longer). |
| 1 | Class R6 Shares were not in existence prior to 2/1/18. Performance for periods prior to 2/1/18 is based on the performance of Institutional Shares. |
The Russell 2000® Value Index is a widely recognized index of common stocks that measures the performance of the small-cap value sector of the U.S. equity market. The index is unmanaged and does not reflect the deduction of expenses associated with a mutual fund, such as investment management and fund accounting fees. Investors cannot invest directly in an index, although they can invest in its underlying securities.
The Bloomberg U.S. 2000 Value Index is a float market-cap-weighted benchmark of the lower 2000 in capitalization of the Bloomberg U.S. 3000 Index that provides exposure to companies with superior value factor scores based on their earnings yield, valuation, dividend yield, and growth.
Sterling Capital Special Opportunities Fund
Portfolio Managers
Sterling Capital Special Opportunities Fund (the “Fund”) is managed by Portfolio Managers James L. Curtis, CFA®, Executive Director and Daniel A. Morrall, Executive Director for Sterling Capital Management LLC (“Sterling Capital”), advisor to the Fund.
James L. Curtis, CFA®
James L. Curtis, CFA®, Executive Director, first worked at Sterling Capital Management from 1999 to 2001 and rejoined the firm in 2020. He has investment experience since 1996 and has served as Co-Portfolio Manager of the Special Opportunities Fund since April 2023. Jim received his B.S.B.A. in Finance from the University of North Carolina at Chapel Hill’s Kenan-Flagler Business School and his M.B.A. in Finance from Emory University’s Goizueta Business School. He holds the Chartered Financial Analyst® designation.
Daniel A. Morrall
Daniel A. Morrall, Executive Director, joined Sterling Capital Management in 2014 and has investment experience since 2001. Dan has been co-portfolio manager of the Special Opportunities Fund since December 2021 and was associate portfolio manager of the Fund from July 2021 to December 2021. Dan received his B.S. in Business and Economics from Washington and Lee University, his MBA from Columbia Business School, and his M.S.I.T. from Capella University.
Investment Considerations
The Fund is subject to investment style risk, which depends on the market segment in which the Fund is primarily invested. An investment in growth stocks may be particularly sensitive to market conditions while value stocks may be undervalued for longer than anticipated. The Fund may invest in foreign securities subject to risks such as currency volatility and political and social instability or small capitalization companies subject to greater volatility and less liquidity due to limited resources or product lines.
Q. How did the Fund perform during the 12-month period between October 1, 2022 and September 30, 2023?
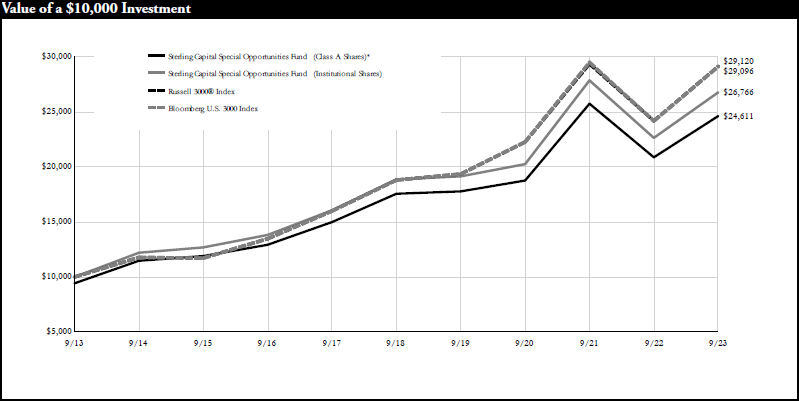
A. The Fund’s Institutional Shares underperformed its current benchmark, the Russell 3000® Index.
Q. What factors affected the Fund’s performance?
A. The Russell 3000® posted double-digit gains during the 12-month period despite continued hikes in the federal funds interest rate by the Federal Reserve. Rising corporate earnings helped boost investor optimism about growth prospects in 2023 and dampen any concerns about the potential for a recession. As a result, counter-cyclical sectors such as utilities, consumer staples, real estate, and health care did poorly, while investor appetite for high-growth technology areas such as artificial intelligence (AI), cloud-based services, video streaming, and electric vehicles all increased. These economic conditions similarly drove the Fund to post double-digit returns for the period, although those gains mostly came across the first three quarters of the period. The Fund declined on an absolute basis in the third quarter 2023 due to concerns about the effects of higher costs of capital.
The Fund’s performance relative to its benchmark suffered mostly from allocation decisions. For example, an above-benchmark exposure to the health care sector lagged as investors sought growth opportunities elsewhere. Similarly, the Fund’s overweight exposure to the financials sector detracted due to investor concerns
about liquidity and potential bank runs after the well-publicized failures of a few regional banks in March. Meanwhile, the Fund’s below-benchmark exposure to the energy sector (a result of its strategy of focusing on enterprises with strong secular growth and balance sheets) also weighed on relative results as oil prices rose during the period, boosting share prices in that sector. Lastly, the Fund’s lack of ownership of four large technology companies, which comprise 12% of the benchmark, was a detractor from relative performance as those companies outperformed during the period. The Fund management team regarded those names as either too pricey or had issues with their underlying fundamentals.
The Fund’s relative returns benefitted from an above-benchmark exposure to the technology and communications services sectors as well as stock selection within the sectors that benefited from developments in generative AI and other digital transformations. Those investments included holdings of a leading Internet company, as well as two semiconductor providers and a major software business. The Fund’s below-benchmark exposure to the struggling sectors of utilities, real estate, and consumer staples also added on a relative basis.
A Note on Indices: The volatility of an index varies greatly. All indices are unmanaged and investments cannot be made directly in an index.
The Russell 3000® Index measures the performance of the largest 3,000 U.S. companies representing approximately 98% of the investable U.S. equity market.
Portfolio composition is as of September 30, 2023 and is subject to change and risk.
| Average Annual Total Returns | | | | |
| As of September 30, 2023 | Inception Date | 1 Year | 5 Years | 10 Years |
| Class A Shares* | 6/2/03 | 11.18% | 5.73% | 9.42% |
| Class C Shares** | 6/2/03 | 17.07% | 6.19% | 9.25% |
| Institutional Shares | 6/2/03 | 18.28% | 7.25% | 10.35% |
| Class R6 Shares | 2/1/181 | 18.39% | 7.34% | 10.40% |
| Russell 3000® Index | N/A | 20.46% | 9.14% | 11.28% |
| Bloomberg U.S. 3000 Index | N/A | 20.41% | 9.12% | 11.27% |
Past performance does not guarantee future results. The performance data quoted represents past performance and current returns may be lower or higher. Total return figures include change in share price, reinvestment of dividends and capital gains, and do not reflect taxes that a shareholder would pay on fund distributions or on the redemption of fund shares. The investment return and principal value will fluctuate so that an investor’s shares, when redeemed, may be worth more or less than the original cost. To obtain performance information current to the most recent month end, please visit www.sterlingcapitalfunds.com.
The chart above represents a comparison of a hypothetical $10,000 investment in the indicated share class versus a similar investment in the Fund’s benchmark.
| * | Reflects 5.75% maximum sales charge. |
| ** | Reflects the applicable maximum CDSC of 1.00% (applicable only to redemptions within one year of purchase, and as such, are not reflected in the Average Annual Total Returns table since the periods reflected are for a year or longer). |
| 1 | Class R6 Shares were not in existence prior to 2/1/18. Performance for periods prior to 2/1/18 is based on the performance of Institutional Shares. |
The Fund is measured against the Russell 3000® Index, an unmanaged index that is generally considered to be representative of the performance of the stock market as a whole. The index does not reflect the deduction of expenses associated with a mutual fund, such as investment management and fund accounting fees. Investors cannot invest directly in an index, although they can invest in its underlying securities.
The Bloomberg U.S. 3000 Index is a float market-cap-weighted benchmark of the 3000 most highly capitalized U.S. companies.
Sterling Capital Equity Income Fund
Portfolio Managers
Sterling Capital Equity Income Fund (the “Fund”) is managed by Portfolio Managers Jeremy M. Lopez, CFA®, Executive Director and Charles J. Wittmann, CFA®, Executive Director for Sterling Capital Management LLC (“Sterling Capital”), advisor to the Fund.
Jeremy M. Lopez, CFA®
Jeremy M. Lopez, CFA®, Executive Director, joined Sterling Capital Management in 2016 and has investment experience since 1997. Jeremy has been co-manager of the Equity Income Fund since November 2022. Jeremy received his B.A. in Economics from Wheaton College and his M.B.A. from the University of Chicago's Booth School of Business. He holds the Chartered Financial Analyst® designation.
Charles J. Wittmann, CFA®
Charles J. Wittmann, CFA®, Executive Director, joined Sterling Capital Management in 2014 and has investment experience since 1995. He has been co-portfolio manager of the Equity Income Fund since December 2021 and was associate portfolio manager of the Fund from July 2021 to December 2021. Chip received his B.A. in Economics from Davidson College and his MBA from Duke University's Fuqua School of Business. He earned the Certificate in ESG Investing, which is developed, administered and awarded by the CFA® Society of the United Kingdom. He holds the Chartered Financial Analyst® designation.
Investment Considerations
The Fund invests primarily in dividend-paying securities. These securities may be undervalued and their value could be negatively affected by a rise in interest rates. The Fund may engage in writing covered call options on securities. By writing covered call options, the Fund limits its opportunity to profit from an increase in the price of the underlying stock above the premium and the strike price, but continues to bear the risk of a decline in the stock price. While the Fund receives premiums for writing covered call options, the price it realizes from the exercise of an option could be substantially below a stock’s current market price.
Q. How did the Fund perform during the 12-month period between October 1, 2022 and September 30, 2023?
A. The Fund’s Institutional Shares underperformed its benchmark, the Russell 1000 Value® Index.
Q. What factors affected the Fund’s performance?
A. Equity markets experienced strong gains for the 12-month period under review, including the Fund’s benchmark, which posted double-digit gains. Share prices rose as investors grew less concerned that the economy was headed for a recession and more optimistic about corporate earnings estimates for 2024. The optimism persisted, despite continued interest rate hikes by the Federal Reserve (the Fed). In total, the Fed raised interest rates six times throughout the period, bringing the federal funds rate from 3.25% at the start of the period up to 5.50% by the end. In this environment, the investment pillars that underlie the Fund’s strategy had mixed performance for the period under review, with dividend growth and yield falling out of favor. From a sector perspective, consumer discretionary, energy, industrials, information technology, and materials all posted gains of more than 20% on an absolute basis.
The Fund’s lack of exposure to a major social media platform company was the largest single detractor from relative performance for the period. That company, which does not pay a dividend, made up a large portion of the Russell 1000
Value Index for the first three quarters of the period, posting strong gains over that timeframe. The Fund’s exposure to the underperforming health care sector also weighed on relative results, along with a below-benchmark exposure to the outperforming energy sector. The latter sector did well, as oil prices rose during the final quarter of the period under review.
The Fund’s relative results benefited from its investments within the information technology sector. In particular, the Fund benefited from stock selection related to generative artificial intelligence (AI) and semiconductor companies (as well as its above-benchmark exposure to the sector in general) which outperformed. The Fund’s investments in a variety of insurance companies within the financials sector also added to relative results, as did stock selection within industrials. The Fund’s new investments in a plumbing and HVAC company as well as a human resources management provider both added to relative results as those companies outperformed. The Fund’s lack of exposure to the struggling utilities sector also added to performance on a relative basis.
A Note on Indices: The volatility of an index varies greatly. All indices are unmanaged and investments cannot be made directly in an index.
The Russell 1000® Value Index measures the performance of the large-cap value segment of the U.S. equity universe.
Portfolio composition is as of September 30, 2023 and is subject to change and risk.

| Average Annual Total Returns | | | | |
| As of September 30, 2023 | Inception Date | 1 Year | 5 Years | 10 Years |
| Class A Shares* | 6/30/04 | 6.08% | 7.74% | 8.88% |
| Class C Shares** | 6/30/04 | 11.71% | 8.21% | 8.71% |
| Institutional Shares | 6/30/04 | 12.83% | 9.29% | 9.80% |
| Class R6 Shares | 2/1/181 | 12.94% | 9.40% | 9.86% |
| Russell 1000® Value Index | N/A | 14.44% | 6.23% | 8.45% |
| Bloomberg U.S. 1000 Value Index | N/A | 14.99% | 6.81% | 9.01% |
Past performance does not guarantee future results. The performance data quoted represents past performance and current returns may be lower or higher. Total return figures include change in share price, reinvestment of dividends and capital gains, and do not reflect taxes that a shareholder would pay on fund distributions or on the redemption of fund shares. The investment return and principal value will fluctuate so that an investor’s shares, when redeemed, may be worth more or less than the original cost. To obtain performance information current to the most recent month end, please visit www.sterlingcapitalfunds.com.
The chart above represents a comparison of a hypothetical $10,000 investment in the indicated share class versus a similar investment in the Fund’s benchmark.
| * | Reflects 5.75% maximum sales charge. |
| ** | Reflects the applicable maximum CDSC of 1.00% (applicable only to redemptions within one year of purchase, and as such, are not reflected in the Average Annual Total Returns table since the periods reflected are for a year or longer). |
| 1 | Class R6 Shares were not in existence prior to 2/1/18. Performance for periods prior to 2/1/18 is based on the performance of Institutional Shares. |
The Fund is measured against the Russell 1000® Value Index, an unmanaged index that is generally considered to be representative of the performance of the stock market as a whole. The index does not reflect the deduction of expenses associated with a mutual fund, such as investment management and fund accounting fees. Investors cannot invest directly in an index, although they can invest in its underlying securities.
The Bloomberg U.S. 1000 Value Index provides exposure to companies with superior value factor scores based on their earnings yield, valuation, dividend yield, and growth.
Sterling Capital Behavioral International Equity Fund
Portfolio Managers
Sterling Capital Behavioral International Equity Fund (the “Fund”) is managed by Portfolio Managers Robert W. Bridges, CFA®, Senior Managing Director, and Robert O. Weller, CFA®, Executive Director, for Sterling Capital Management LLC (“Sterling Capital”), advisor to the Fund.
Robert W. Bridges, CFA®
Robert W. Bridges, CFA®, Senior Managing Director, CIO and Head of Equity, joined Sterling Capital in 1996 and has investment experience since 1991. He has been co-portfolio manager of the Behavioral International Equity Fund since inception. Bob is a graduate of Wake Forest University, where he received a B.S. in Business. He holds the Chartered Financial Analyst® designation.
Robert O. Weller, CFA®
Robert O. Weller, CFA®, Executive Director, joined Sterling Capital in 2012 and has investment experience since 1996. He has been co-portfolio manager of the Behavioral International Equity Fund since inception. Rob is a graduate of Loyola University Maryland, where he received a B.B.A. in Finance. He holds the Chartered Financial Analyst® designation.
Investment Considerations
The overall results of the Fund will be dependent on the process and ability of the Adviser to apply “behavioral finance” principles to recognize a company’s value, earnings revisions and market momentum. The Fund will invest in foreign securities which may be more volatile and less liquid due to currency fluctuation, political instability, and social and economic risks. The Fund may invest in REITs (Real Estate Investment Trusts), the value of which will be affected by conditions of the real estate industry, and exchange-traded funds (ETFs). Investing in ETFs may cause shareholders to bear additional costs, and an ETF may not exactly replicate the performance it seeks to track.
Q. How did the Fund perform during the 12-month period between October 1, 2022 and September 30, 2023?
A. The Fund’s Institutional Shares outperformed its current benchmark, the Bloomberg Developed Markets ex.-North America Large and Mid-Cap Index.
Q. What factors affected the Fund’s performance?
A. International large- and mid-cap stocks posted double-digit returns during the 12-month period under review. Most of these gains occurred in late 2022 and January 2023 as investors saw that Europe would avoid a worst-case scenario energy shortage caused by the war in Ukraine. The international financials sector also benefitted from the relative strength of European Union banks compared to their American counterparts, where mid-cap financial institutions have suffered from higher costs and the fallout from the failure of a few regional banks in March 2023.
The Fund applies principles of behavioral finance to its investment strategy. This process is designed to capitalize on known investor biases and heuristics (mental shortcuts) by accounting for the impact on markets of behavioral factors such as greed, fear, and ego.
The Fund’s relative performance benefited from its strategy by targeting momentum stocks. Unlike the shift toward high-growth technology names that occurred in domestic markets as investors adopted a risk-on attitude in January 2023, international investors remained more cautious and continued with their strategies from 2022, which allowed momentum stocks and the Fund’s momentum strategy to outperform. Value-oriented stocks remained more in favor in international markets
than they did domestically, which also added to the Fund’s relative results through its behavioral strategy, as stocks held at discounts generally outperformed.
The two biggest detractors from the Fund’s performance relative to its benchmark were sector allocations that resulted from its strategies targeting favorable valuations, momentum, and earnings revisions. An above-benchmark exposure to the industrials sector and an underweight position in information technology both weighed on relative results as the former underperformed and the latter outperformed.
A Note on Indices: The volatility of an index varies greatly. All indices are unmanaged and investments cannot be made directly in an index.
The Bloomberg Developed Markets ex.-North America Large & Mid Cap Index is a float market-cap-weighted equity benchmark that covers 85% market cap of the measured market.
“Bloomberg®” and the Bloomberg indices are service marks of Bloomberg Finance L.P. and its affiliates, including Bloomberg Index Services Limited (“BISL”), the administrator of the index (collectively, “Bloomberg”) and have been licensed for use for certain purposes by Sterling Capital Management LLC and its affiliates. Bloomberg is not affiliated with Sterling Capital Management LLC or its affiliates, and Bloomberg does not approve, endorse, review, or recommend the product(s) presented herein. Bloomberg does not guarantee the timeliness, accurateness, or completeness of any data or information relating to the product(s) presented herein.
Portfolio composition is as of September 30, 2023 and is subject to change and risk.

| Average Annual Total Returns | | | | |
| As of September 30, 2023 | Inception Date | 1 Year | 5 Years | Since Inception |
| Class A Shares* | 11/28/14 | 24.95% | -1.25% | 1.39% |
| Class C Shares** | 11/28/14 | 31.56% | -0.83% | 1.31% |
| Institutional Shares | 11/28/14 | 33.01% | 0.19% | 2.31% |
| Class R6 Shares | 2/1/181 | 32.87% | 0.20% | 2.33% |
| Bloomberg Developed Markets ex North America Large and Mid Cap Index (Net) | N/A | 25.72% | 3.32% | 3.82% |
| MSCI EAFE® Net Index | 11/30/14 | 25.65% | 3.24% | 3.86% |
Past performance does not guarantee future results. The performance data quoted represents past performance and current returns may be lower or higher. Total return figures include change in share price, reinvestment of dividends and capital gains, and do not reflect taxes that a shareholder would pay on fund distributions or on the redemption of fund shares. The investment return and principal value will fluctuate so that an investor’s shares, when redeemed, may be worth more or less than the original cost. To obtain performance information current to the most recent month end, please visit ww.sterlingcapitalfunds.com. Performance would have been lower without limitations and/or waivers in effect.
The chart above represents a comparison of a hypothetical $10,000 investment in the indicated share class versus a similar investment in the Fund’s benchmark.
| * | Reflects 5.75% maximum sales charge. |
| ** | Reflects the applicable maximum CDSC of 1.00% (applicable only to redemptions within one year of purchase, and as such, are not reflected in the Average Annual Total Returns table since the periods reflected are for a year or longer). |
| 1 | Class R6 Shares were not in existence prior to 2/1/18. Performance for periods prior to 2/1/18 is based on the performance of Institutional Shares. |
The Fund is measured against the MSCI EAFE® Net Index, an unmanaged index which is generally representative of large- and mid-cap equity across developed markets countries around the world, excluding the U.S. and Canada. The index does not reflect the deduction of expenses associated with a mutual fund, such as investment management and fund accounting fees. Investors cannot invest directly in an index, although they can invest in its underlying securities. Effective February 1, 2023, the primary benchmark for the Fund changed from the MSCI EAFE Net Index to the Bloomberg Developed Markets ex North America Large and Mid Cap Index (Net).
Sterling Capital SMID Opportunities Fund
Portfolio Manager
Sterling Capital SMID Opportunities Fund (the “Fund”) is managed by Portfolio Manager Lee D. Houser, CFA®, Executive Director.
Lee D. Houser, CFA®
Lee D. Houser, CFA®, Executive Director, joined Sterling Capital Management in 2006 and has investment experience since 1999. Lee has been portfolio manager of the SMID Opportunities Fund since August 2021. Lee received his B.S. in Mathematics and Economics from James Madison University, where he was a summa cum laude graduate, and his MBA from Duke University. He holds the Chartered Financial Analyst® designation.
Investment Considerations
The Fund uses a multi-style approach and invests in both growth and value-oriented companies. A growth investment style may be particularly sensitive to market conditions. Value investing involves the risk that an investment made in undervalued securities may not appreciate in value as anticipated or remain undervalued for long periods of time. The Fund invests in small and middle capitalization companies which may be riskier, more volatile and vulnerable to economic, market and industry changes than investments in larger more established companies. As a result, share price changes may be more erratic or trade less frequently in lesser quantities.
Q. How did the Fund perform during the period from its inception on October 1, 2022 to September 30, 2023?
A. The Fund’s Institutional Shares outperformed its benchmark, the Russell 2500® Index.
Q. What factors affected the Fund’s performance?
A. Despite an aggressive series of interest rate hikes by the Federal Reserve (the Fed) throughout the period under review, the economy remained resilient. As the period progressed, investors grew increasingly optimistic about the Fed’s ability to rein in inflation without triggering a recession. The stubbornly high inflation rate eased throughout the 12-month period, even as the unemployment rate remained near historic lows. In this environment, domestic equities generally performed well as investors, encouraged by healthy corporate profits, shifted significant assets into equities, which helped boost the Fund’s absolute returns. Amid this shift to a more risk-on attitude, the Fund’s holdings within the healthcare, consumer discretionary, and materials sectors added to absolute performance, while investments in industrials, information technology, and financials lagged on an absolute basis.
The Fund held an above-benchmark exposure to mid-cap firms during the period. This relative positioning contributed to the Fund’s outperformance relative to its benchmark as stocks of medium-sized companies generally outperformed those of smaller companies.
Stock selection in the industrials sector weighed most heavily on the Fund’s relative performance during the period. A manufacturer of sensors used in automobiles performed poorly as supply chain disruptions negatively impacted global automobile production, thus generating a headwind that negatively affected the company’s profit margin. A below-benchmark exposure to the information technology sector also dragged on relative results, as the sector outperformed partly due to the excitement surrounding advancements in artificial intelligence.
A Note on Indices: The volatility of an index varies greatly. All indices are unmanaged and investments cannot be made directly in an index.
The Russell 2500® Index is a market cap-weighted index that includes the smallest 2,500 companies covered in the Russell 3000 universe of U.S.-based listed equities.
Portfolio composition is as of September 30, 2023 and is subject to change and risk.

| Average Annual Total Returns | | | | |
| As of September 30, 2023 | Inception Date | 1 Year | 5 Years | Since Inception |
| Class A Shares* | 9/30/16 | 5.05% | 3.08% | 5.75% |
| Class C Shares** | 9/30/16 | 10.74% | 3.54% | 5.86% |
| Institutional Shares | 9/30/16 | 11.84% | 4.58% | 6.92% |
| Russell 2500® Index | 9/30/16 | 11.28% | 4.55% | 7.96% |
| Bloomberg U.S. 2500 Index | N/A | 11.61% | 4.28% | 7.79% |
Past performance does not guarantee future results. The performance data quoted represents past performance and current returns may be lower or higher. Total return figures include change in share price, reinvestment of dividends and capital gains, and do not reflect taxes that a shareholder would pay on fund distributions or on the redemption of fund shares. The investment return and principal value will fluctuate so that an investor’s shares, when redeemed, may be worth more or less than the original cost. To obtain performance information current to the most recent month end, please visit www.sterlingcapitalfunds.com. Performance would have been lower without limitations and/ or waivers in effect.
The chart above represents a comparison of a hypothetical $10,000 investment in the indicated share class versus a similar investment in the Fund’s benchmark.
| * | Reflects 5.75% maximum sales charge. |
| ** | Reflects the applicable maximum CDSC of 1.00% (applicable only to redemptions within one year of purchase, and as such, are not reflected in the Average Annual Total Returns table since the periods reflected are for a year or longer). |
The Russell 2500® Index is a widely recognized index of common stocks that measures the performance of the small and mid cap sector of the U.S. equity market. The index is unmanaged and does not reflect the deduction of expenses associated with a mutual fund, such as investment management and fund accounting fees. Investors cannot invest directly in an index, although they can invest in its underlying securities.
The Bloomberg U.S. 2500 Index is a float market-cap-weighted benchmark of the lower 2500 in capitalization of the Bloomberg U.S. 3000 Index.
Sterling Capital Mid Cap Relative Value Fund
Portfolio Managers
Sterling Capital Mid Cap Relative Value Fund (the “Fund”) is managed by Portfolio Managers Shawn M. Gallagher, CFA®, Executive Director and Andrew T. DiZio, CFA, Executive Director for Sterling Capital Management LLC (“Sterling Capital”), advisor to the Fund.
Shawn M. Gallagher, CFA®
Shawn M. Gallagher, CFA®, Executive Director, joined Stratton Management Company in 2005 and Sterling Capital Management as part of a business acquisition in 2015. He has investment experience since 2003 and has been co-portfolio manager of the Stratton Mid Cap Value Fund since November 2015. Shawn received his B.S. in Finance from Pennsylvania State University. He holds the Chartered Financial Analyst designation and is a member of the CFA Society of Philadelphia and the CFA Institute.
Andrew T. DiZio, CFA®
Andrew T. DiZio, CFA®, Executive Director, joined Stratton Management Company in 2012 and Sterling Capital Management as part of a business acquisition in 2015. He has investment experience since 2003. Andy has been co-portfolio manager of the Mid Cap Value Fund since August 2021 and was associate portfolio manager of the Fund from November 2015 to August 2021. Andy received his B.S. in Finance with a minor in Economics from Pennsylvania State University. He holds the Chartered Financial Analyst® designation and is a member of the CFA Society of Philadelphia and the CFA Institute.
Investment Considerations
Mid-capitalization companies are generally riskier than large company stocks due to greater volatility and less liquidity. Value stocks can perform differently than other types of stocks and can continue to be undervalued by the market for long periods of time.
Q. How did the Fund perform during the 12-month period between October 1, 2022 and September 30, 2023?
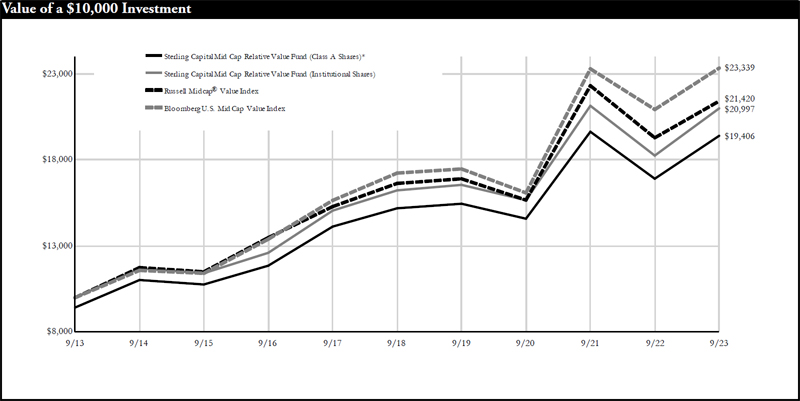
A. The Fund’s Institutional Shares outperformed its benchmark, the Russell Midcap® Value Index.
| Q. | What factors affected the Fund’s performance? |
A. Equity markets posted strong returns for the 12-month period under review, due in part to a resilient domestic economy. Share prices rose as investors maintained their risk-on attitude in the face of a historically aggressive tightening campaign by the Federal Reserve (the Fed) and fading pandemic-era stimuli. Low unemployment and easing inflation helped drive increased investor optimism that the Fed would manage a soft landing for the economy and avoid a recession. The Fund’s holdings within the consumer discretionary, energy, and consumer staples sectors added to absolute performance, while investments in utilities, financials, and real estate weighed on the Fund’s overall return on an absolute basis.
Stock selection within the consumer staples sector added the most to the Fund’s relative returns. The Fund’s three investments in that sector (a convenience store operator, a restaurant supply distributor, and a producer of frozen potato products) all outperformed based on strong earnings and resilient fundamentals. The Fund also benefited from stock selection within the technology and communications services sectors, which added to relative performance.
Stock selection within the financials sector was the largest drag on relative results for the period under review. The Fund’s investments in several banks underperformed as they were caught in the broader sell-off triggered by a few notable regional banks in the middle of March. Stock selection within the utilities sector also weighed on relative results, as did the Fund’s below-benchmark exposure to the outperforming consumer discretionary sector.
A Note on Indices: The volatility of an index varies greatly. All indices are unmanaged and investments cannot be made directly in an index.
The Russell Midcap® Value Index measures the performance of value-style investing in mid-cap U.S. stocks.
Portfolio composition is as of September 30, 2023 and is subject to change and risk.
| Average Annual Total Returns | | | | |
| As of September 30, 2023 | Inception Date | 1 Year | 5 Years | 10 Years |
| Class A Shares* | 11/13/15 | 8.15% | 3.78% | 6.85% |
| Class C Shares** | 11/13/15 | 14.00% | 4.34% | 6.91% |
| Institutional Shares | 9/30/72 | 15.03% | 5.28% | 7.70% |
| Russell Midcap® | | | | |
| Value Index | N/A | 11.05% | 5.18% | 7.92% |
| Bloomberg U.S. Mid | | | | |
| Cap Value Index | N/A | 11.50% | 6.24% | 8.84% |
Past performance does not guarantee future results. The performance data quoted represents past performance and current returns may be lower or higher. Total return figures include change in share price, reinvestment of dividends and capital gains, and do not reflect taxes that a shareholder would pay on fund distributions or on the redemption of fund shares. The investment return and principal value will fluctuate so that an investor’s shares, when redeemed, may be worth more or less than the original cost. The performance shown here (for periods prior to the date of commencement of operations on November 16, 2015) is that of Mid Cap Value Fund (the “Predecessor Fund”), whose shares were reorganized into Institutional Shares of the Fund at the close of business on November 13, 2015. Because the Fund had no investment operations prior to the closing of the reorganization, and based on the similarity of the Fund to the Predecessor Fund, the Predecessor Fund is treated as the survivor of the reorganization for accounting and performance reporting purposes. Accordingly, all performance and other information shown for the Fund for periods prior to November 16, 2015 is that of the Predecessor Fund. Performance for Class A Shares and Class C Shares, prior to the date of commencement of operations on November 16, 2015, is based on the performance of the shares of the Predecessor Fund. To obtain performance information current to the most recent month end, please visit www.sterlingcapitalfunds.com. Performance would have been lower without waivers in effect.
The chart above represents a comparison of a hypothetical $10,000 investment in the indicated share class versus a similar investment in the Fund’s benchmark.
| * | Reflects 5.75% maximum sales charge. |
| ** | Reflects the applicable maximum CDSC of 1.00% (applicable only to redemptions within one year of purchase, and as such, are not reflected in the Average Annual Total Returns table since the periods reflected are for a year or longer). |
The Fund is measured against the Russell Midcap® Value Index, an unmanaged index, which measures the performance of the mid-cap value segment of the U.S. equity universe. It includes those Russell Midcap® Index companies with lower price-to-book ratios and lower forecasted growth values. The index is unmanaged and does not reflect the deduction of expenses associated with a mutual fund, such as investment management and fund accounting fees. Investors cannot invest directly in an index, although they can invest in its underlying securities.
The Bloomberg U.S. Mid Cap Value Index is a float market-cap-weighted index based on an equal-weighted combination of four factors: earnings yield, valuation, dividend yield, and growth.
Sterling Capital Real Estate Fund
Portfolio Managers
Sterling Capital Real Estate Fund (the “Fund”) is managed by Portfolio Managers Andrew T. DiZio, CFA®, Executive Director and Shawn M. Gallagher, CFA®, Executive Director for Sterling Capital Management LLC (“Sterling Capital”), advisor to the Fund.
Andrew T. DiZio, CFA®
Andrew T. DiZio, CFA®, Executive Director, joined Stratton Management Company in 2012 and Sterling Capital Management as part of a business acquisition in 2015. He has investment experience since 2003. Andy is co-portfolio manager of the Real Estate Fund and has managed the Fund since November 2015. Andy received his B.S. in Finance with a minor in Economics from Pennsylvania State University. He holds the Chartered Financial Analyst® designation and is a member of the CFA Society of Philadelphia and the CFA Institute.
Shawn M. Gallagher, CFA®
Shawn M. Gallagher, CFA®, Executive Director, joined Stratton Management Company in 2005 and Sterling Capital Management as part of a business acquisition in 2015. He has investment experience since 2003. Shawn has been co-portfolio manager of the Real Estate Fund since August 2021 and was associate portfolio manager of the Fund from November 2015 to August 2021. Shawn received his B.S. in Finance from Pennsylvania State University. He holds the Chartered Financial Analyst® designation and is a member of the CFA Society of Philadelphia and the CFA Institute.
Investment Considerations
Real Estate Funds may be subject to a higher degree of market risk because of concentration in a specific industry or geographic sector. Risks include declines in value of real estate, general and economic conditions, changes in the value of the underlying property and defaults by borrowers.
Q. How did the Fund perform during the 12-month period between October 1, 2022 and September 30, 2023?
A. The Fund’s Institutional Shares outperformed its benchmark, the Bloomberg U.S. 3000 REIT Index.
| Q. | What factors affected the Fund’s performance? |
A.The rise in interest rates was the largest single factor influencing REIT share prices throughout the 12-month period under review. Higher interest rates typically have a negative effect on real estate values as financing becomes more expensive, and that relationship held true over the past 12 months. The Federal Reserve (the Fed) chose to hike interest rates six times during the period, leading to a total increase of 2.25 percentage points, or 225 basis points. The successive rate hikes dragged on share prices of REITs as the values of the underlying property declined. In this challenging environment, leasing demand for several property types remained strong, including data centers, shopping centers, hotels, warehouses, and senior living. REITs with exposure to those sectors generally increased their cash flows and experienced gains in their share price despite the higher interest rates.
The Fund’s stock selection within the retail and self-storage subsectors were the largest positive contributors to relative performance. Within the retail space, the Fund benefited from an above-benchmark exposure to an outlet-based REIT that outperformed as the company’s new management team did a better-than-expected job of growing leasing and accelerating its cash flow. Within the self-storage subsector, the Fund benefited from an above-benchmark investment in a smaller operator whose share price gained strongly when it was acquired by a larger public competitor.
Stock selection within the residential subsector dragged on the Fund’s relative results, as did an above-benchmark exposure to the infrastructure subsector. Together, these two factors were the largest negative contributors to relative performance. Within the residential space, the Fund’s above-benchmark exposure to landlords with concentrated assets
across the southeastern United States weighed on results, as the leasing fundamentals in that region weakened as new supply became available. The Fund’s investments in the infrastructure subsector dragged on results as rising interest rates, along with slower leasing as deployment of 5G decelerated, combined to generate headwinds for REITs with cell tower exposure.
A Note on Indices: The volatility of an index varies greatly. All indices are unmanaged and investments cannot be made directly in an index.
FTSE NAREIT All Equity REITs Index contains all tax-qualified REITs with more than 50 percent of total assets in qualifying real estate assets other than mortgages secured by real properly that also meet minimum size and liquidity criteria. The FTSE NAREIT All Equity REITs Index is designed to present investors with a comprehensive family of REIT performance indexes that spans the commercial real estate space across the U.S. economy. The index series provides investors with exposure to all investment and property sectors. In addition, the more narrowly focused property sector and sub-sector indexes provide the facility to concentrate commercial real estate exposure in more selected markets.
The Bloomberg U.S. 3000 REIT Index is a float market-capitalization-weighted index that provides exposure to companies classified as per the Bloomberg Industry Classification System (BICS) with a level 3 sub-industry of REIT.
“Bloomberg®” and the Bloomberg indices are service marks of Bloomberg Finance L.P. and its affiliates, including Bloomberg Index Services Limited (“BISL”), the administrator of the index (collectively, “Bloomberg”) and have been licensed for use for certain purposes by Sterling Capital Management LLC and its affiliates. Bloomberg is not affiliated with Sterling Capital Management LLC or its affiliates, and Bloomberg does not approve, endorse, review, or recommend the product(s) presented herein. Bloomberg does not guarantee the timeliness, accurateness, or completeness of any data or information relating to the product(s) presented herein.
Portfolio composition is as of September 30, 2023 and is subject to change and risk.

| Average Annual Total Returns | | | | |
| As of September 30, 2023 | Inception Date | 1 Year | 5 Years | 10 Years |
| Class A Shares* | 11/13/15 | -5.10% | 1.82% | 5.65% |
| Class C Shares** | 11/13/15 | -0.06% | 2.27% | 5.66% |
| Institutional Shares | 5/31/08 | 0.95% | 3.29% | 6.49% |
| Class R6 Shares | 1/31/201 | 1.01% | 3.38% | 6.53% |
| S&P 500® Index | N/A | 21.62% | 9.92% | 11.91% |
| Bloomberg U.S. 3000 REIT Index | N/A | -1.68% | 2.83% | 6.22% |
| FTSE NAREIT All Equity REITs Index | N/A | -1.71% | 2.80% | 6.17% |
Past performance does not guarantee future results. The performance data quoted represents past performance and current returns may be lower or higher. Total return figures include change in share price, reinvestment of dividends and capital gains, and do not reflect taxes that a shareholder would pay on fund distributions or on the redemption of fund shares. The investment return and principal value will fluctuate so that an investor’s shares, when redeemed, may be worth more or less than the original cost. The performance shown here (for periods prior to the date of commencement of operations on November 16, 2015) is that of Real Estate Fund (the “Predecessor Fund”), whose shares were reorganized into Institutional Shares of the Fund at the close of business on November 13, 2015. Because the Fund had no investment operations prior to the closing of the reorganization, and based on the similarity of the Fund to the Predecessor Fund, the Predecessor Fund is treated as the survivor of the reorganization for accounting and performance reporting purposes. Accordingly, all performance and other information shown for the Fund for periods prior to November 16, 2015 is that of the Predecessor Fund. Performance for Class A Shares and Class C Shares, prior to the date of commencement of operations on November 16, 2015, is based on the performance of the shares of the Predecessor Fund. To obtain performance information current to the most recent month end, please visit www.sterlingcapitalfunds.com. Performance would have been lower without waivers in effect.
The chart above represents a comparison of a hypothetical $10,000 investment in the indicated share class versus a similar investment in the Fund’s benchmarks.
| * | Reflects 5.75% maximum sales charge. |
| ** | Reflects the applicable maximum CDSC of 1.00% (applicable only to redemptions within one year of purchase, and as such, are not reflected in the Average Annual Total Returns table since the periods reflected are for a year or longer). |
| 1 | Class R6 Shares were not in existence prior to 2/1/18. Performance for periods prior to 2/1/18 is based on the performance of Institutional Shares. |
The Fund is measured against the Bloomberg U.S. 3000 REIT Index, a float market-capitalization-weighted index that provides exposure to companies classified as per the Bloomberg Industry Classification System (BICS) with a level 3 sub-industry of REIT. The Fund is also measured against the FTSE NAREIT All Equity REITs Index, an unmanaged index, which contains all tax-qualified REITs with more than 50 percent of total assets in qualifying real estate assets other than mortgages secured by real property that also meet minimum size and liquidity criteria. The S&P 500® Index is an unmanaged index, which is generally considered to be representative of the performance of the stock market as a whole. The indices do not reflect the deduction of expenses associated with a mutual fund, such as investment management and fund accounting fees. Investors cannot invest directly in an index, although they can invest in its underlying securities. Effective March 31, 2023, the primary benchmark for the Fund changed from FTSE NAREIT All Equity REITs Index to the Bloomberg U.S. 3000 REIT Index.
Sterling Capital Small Cap Value Fund
Portfolio Managers
Sterling Capital Small Cap Value Fund (the “Fund”) is managed by Portfolio Managers Gerald M. Van Horn, CFA®, Executive Director, Shawn M. Gallagher, CFA®, Executive Director and Andrew T. DiZio, CFA, Executive Director for Sterling Capital Management LLC (“Sterling Capital”), advisor to the Fund.
Gerald M. Van Horn, CFA®
Gerald M. Van Horn, CFA®, Executive Director, joined Stratton Management Company in 1998 and Sterling Capital as part of a business acquisition in August 2015. He has investment experience since 1996. Jerry has been lead portfolio manager for the Sterling Capital Small Cap Value Fund since inception on November 2015 and the predecessor fund since 2000. He received his B.A. in Economics from The College of New Jersey and holds the Chartered Financial Analyst® designation.
Shawn M. Gallagher, CFA®
Shawn M. Gallagher, CFA®, Executive Director, joined Stratton Management Company in 2005 and Sterling Capital Management as part of a business acquisition in 2015. He has investment experience since 2003 and is associate portfolio manager of the Sterling Capital Small Cap Value Fund. Shawn received his B.S. in Finance from Pennsylvania State University. He holds the Chartered Financial Analyst® designation and is a member of the CFA Society of Philadelphia and the CFA Institute.
Andrew T. DiZio, CFA®
Andrew T. DiZio, CFA®, Executive Director, joined Stratton Management Company in 2012 and Sterling Capital Management as part of a business acquisition in 2015. He has investment experience since 2003 and is associate portfolio manager of the Sterling Capital Small Cap Value Fund. Andy received his B.S. in Finance with a minor in Economics from Pennsylvania State University. He holds the Chartered Financial Analyst® designation and is a member of the CFA Society of Philadelphia and the CFA Institute.
Investment Considerations
Small cap company stocks are generally riskier than large company stocks due to greater volatility and less liquidity. Value stocks can perform differently than other types of stocks and can continue to be undervalued by the market for long periods of time.
Q. How did the Fund perform during the 12-month period between October 1, 2022 and September 30, 2023?
A. The Fund’s Institutional Shares outperformed its benchmark, the Russell 2000® Value Index.
Q. What factors affected the Fund’s performance?
A. Equity markets experienced strong gains for the 12-month period under review. Fears of an impending recession driven by the Federal Reserve’s historically aggressive tightening campaign (including the lagged impact of restrictive monetary policy) took a back seat to investor optimism about falling inflation and resilient corporate earnings. The economy’s strong fundamentals persisted, despite rising interest rates and tightening financial conditions, which helped investors maintain a risk-on attitude for the period under review. The Fund’s absolute returns benefited from its investments in the industrials, information technology, and consumer staples sectors. Meanwhile, its holdings in the financials and utilities sectors dragged on an absolute basis during the period.
Stock selection within the information technology sector added to relative results. In particular, the Fund’s investments in a manufacturer of networking and cable products, an industrials technology company, a semiconductor manufacturer, and a global software company
outperformed due to strong demand in industrial-related end markets. These companies benefited from the economic tailwinds of ongoing infrastructure spending and the return of manufacturing capacity to the United States. The Fund’s relative performance also benefited from its below-benchmark exposure to the health care sector, which underperformed the broader benchmark by a wide margin during the period.
The Fund’s stock selection within the financials sector weighed on relative results, particularly its investments in four regional banks that underperformed amidst the bank failures and resulting FDIC takeovers that occurred in March. The Fund’s relative results were also negatively affected by its below-benchmark exposure to the consumer discretionary sector, although positive stock selection helped offset the negative effects as the Fund’s investments in a homebuilder and home furnishings manufacturer outperformed during the period. A below-benchmark exposure to the energy sector also weighed on results, as did stock selection in the real estate sector due to the underperformance of a health care REIT.
A Note on Indices: The volatility of an index varies greatly. All indices are unmanaged and investments cannot be made directly in an index.
The Russell 2000® Value Index measures the performance of value-style investing in small cap U.S. stocks.
Portfolio composition is as of September 30, 2023 and is subject to change and risk.

| Average Annual Total Returns | | | | |
| As of September 30, 2023 | Inception Date | 1 Year | 5 Years | 10 Years |
| Class A Shares* | 11/13/15 | 8.43% | 3.33% | 6.45% |
| Class C Shares** | 11/13/15 | 14.18% | 3.78% | 6.46% |
| Institutional Shares | 4/12/93 | 15.31% | 4.82% | 7.29% |
| Class R6 Shares | 1/31/201 | 15.45% | 4.90% | 7.33% |
| Russell 2000® Value Index | N/A | 7.84% | 2.59% | 6.19% |
| Bloomberg U.S. 2000 Value Index | N/A | 12.88% | 4.34% | 7.32% |
Past performance does not guarantee future results. The performance data quoted represents past performance and current returns may be lower or higher. Total return figures include change in share price, reinvestment of dividends and capital gains, and do not reflect taxes that a shareholder would pay on fund distributions or on the redemption of fund shares. The investment return and principal value will fluctuate so that an investor’s shares, when redeemed, may be worth more or less than the original cost. The performance shown here (for periods prior to the date of commencement of operations on November 16, 2015) is that of Sterling Capital Small Cap Value Fund (the “Predecessor Fund”), whose shares were reorganized into Institutional Shares of the Fund at the close of business on November 13, 2015. Because the Fund had no investment operations prior to the closing of the reorganization, and based on the similarity of the Fund to the Predecessor Fund, the Predecessor Fund is treated as the survivor of the reorganization for accounting and performance reporting purposes. Accordingly, all performance and other information shown for the Fund for periods prior to November 16, 2015 is that of the Predecessor Fund. Performance for Class A Shares and Class C Shares, prior to the date of commencement of operations on November 16, 2015, is based on the performance of the shares of the Predecessor Fund. To obtain performance information current to the most recent month end, please visit www.sterlingcapitalfunds.com.
The chart above represents a comparison of a hypothetical $10,000 investment in the indicated share class versus a similar investment in the Fund’s benchmark.
| * | Reflects 5.75% maximum sales charge. |
| ** | Reflects the applicable maximum CDSC of 1.00% (applicable only to redemptions within one year of purchase, and as such, are not reflected in the Average Annual Total Returns table since the periods reflected are for a year or longer). |
| 1 | Class R6 Shares were not in existence prior to 2/1/18. Performance for periods prior to 2/1/18 is based on the performance of Institutional Shares. |
The Russell 2000® Value Index is a widely recognized index of common stocks that measures the performance of the small-cap value sector of the U.S. equity market. The index is unmanaged and does not reflect the deduction of expenses associated with a mutual fund, such as investment management and fund accounting fees. Investors cannot invest directly in an index, although they can invest in its underlying securities.
The Bloomberg U.S. 2000 Value Index is a float market-cap-weighted benchmark of the lower 2000 in capitalization of the Bloomberg U.S. 3000 Index that provides exposure to companies with superior value factor scores based on their earnings yield, valuation, dividend yield, and growth.
Sterling Capital Ultra Short Bond Fund
Portfolio Managers
Sterling Capital Ultra Short Bond Fund (the “Fund”) is managed by Portfolio Managers Mark M. Montgomery, CFA®, Senior Managing Director, Byron G. Mims, CFA®, Executive Director, and Jeffrey D. Ormsby, CFA®, Executive Director, for Sterling Capital Management LLC (“Sterling Capital”), advisor to the Fund.
Mark M. Montgomery, CFA®
Mark M. Montgomery, CFA®, Senior Managing Director, CIO and Head of Fixed Income, joined Sterling Capital in 1997 and has investment experience since 1990. He has been co-portfolio manager of the Ultra Short Bond Fund since its inception. Mark received his B.S. in Marketing with a minor in Public Administration and his MBA from Drexel University. He holds the Chartered Financial Analyst designation.
Byron G. Mims, CFA®
Byron G. Mims, CFA®, Executive Director, joined Sterling Capital in 2012 and has investment experience since 2006. He has been co-portfolio manager of the Ultra Short Bond Fund since February 2020. Byron received his B.S. in Economics from North Carolina State University. He holds the Chartered Financial Analyst designation.
Jeffrey D. Ormsby, CFA®
Jeffrey D. Ormsby, CFA®, Executive Director, joined Sterling Capital in 2011 and has investment experience since 2006. He has been co-portfolio manager of the Ultra Short Bond Fund since February 2020. Jeff received his B.S. in Economics from North Carolina State University and his MBA from UNC’s Kenan-Flagler Business School. He holds the Chartered Financial Analyst designation.
Investment Considerations
The Fund is subject to the same risks as the underlying bonds in the portfolio such as credit, prepayment, call and interest rate risk. As interest rates rise, the value of bond prices will decline and an investor may lose money. The Fund may invest in more aggressive investments, such as foreign securities, which may expose the Fund to currency and exchange rate fluctuations; mortgage-backed securities sensitive to interest rates; and high yield debt (also known as junk bonds), all of which may cause greater volatility and less liquidity.
Q. How did the Fund perform during the 12-month period between October 1, 2022 and September 30, 2023?
A. The Fund’s Institutional Shares outperformed its current benchmark, the FTSE U.S. Six-Month Treasury Bill Index.
Q. What factors affected the Fund’s performance?
A. Risk assets performed well over the 12-month period under review as the economy proved stronger-than-expected despite the Federal Reserve’s aggressive strategy of interest rate increases. Investors grew increasingly optimistic that the Fed’s efforts would not push the economy into a recession, which led them to adopt a “risk-on” attitude as the period progressed. Amid this environment, floating rate commercial mortgage-backed securities (CMBS) performed best in absolute terms over the period, as interest rates rose throughout the period. Corporate bonds and off-the-run asset-backed securities (ABS) also performed well, which added to the Fund’s returns on an absolute basis. However, the portfolio's exposure to commercial paper, Treasuries, and cash weighed on its absolute returns.
Given the higher starting yields and tightening spreads for risk assets during the second and third quarters of 2023, the Fund’s off-benchmark exposure to corporate bonds and CMBS added to its performance relative to the benchmark. The Fund’s relative returns also benefited from the changing shape of the yield curve. Given the Fed’s more hawkish tone, shorter rates rose more than longer rates, and the Fund held an above-benchmark exposure to key longer rates, which aided its performance on a relative basis.
The Fund’s relative performance suffered from its Treasury holdings. The Fund's Treasury assets are concentrated in the short term and are mostly used to fund redemptions. These short Treasuries underperformed the benchmark due to the shortest rates rising more than longer rates. The Fund’s exposure to auto loan ABS and commercial paper also dragged on relative returns, as these sectors underperformed the benchmark.
A Note on Indices: The volatility of an index varies greatly. All indices are unmanaged and investments cannot be made directly in an index.
The FTSE U.S. Six-Month Treasury Bill Index is an average of the last six 6-month Treasury bill month-end rates. This family of indices measures return equivalents of yield averages and the instruments are not marked to market.
Portfolio composition is as of September 30, 2023 and is subject to change and risk.
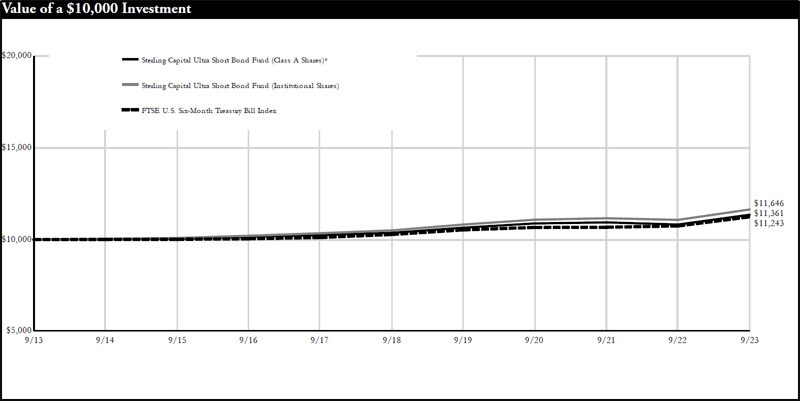
| Average Annual Total Returns | | | | |
| As of September 30, 2023 | Inception Date | 1 Year | 5 Years | 10 Years |
| Class A Shares* | 11/30/12 | 4.97% | 1.84% | 1.28% |
| Institutional Shares | 11/30/12 | 5.12% | 2.09% | 1.53% |
| FTSE U.S. Six-Month Treasury Bill Index | N/A | 4.63% | 1.81% | 1.18% |
Past performance does not guarantee future results. The performance data quoted represents past performance and current returns may be lower or higher. Total return figures include change in share price, reinvestment of dividends and capital gains, and do not reflect taxes that a shareholder would pay on fund distributions or on the redemption of fund shares. The investment return and principal value will fluctuate so that an investor’s shares, when redeemed, may be worth more or less than the original cost. To obtain performance information current to the most recent month end, please visit www.sterlingcapitalfunds.com. Performance would have been lower without limitations and/or waivers in effect.
The chart above represents a comparison of a hypothetical $10,000 investment in the indicated share class versus a similar investment in the Fund’s benchmark.
| * | Reflects 0.00% maximum sales charge. |
The Fund is measured against the FTSE U.S. Six-Month Treasury Bill Index, which measures the performance of Treasury bills with a maturity of six months or less. The index does not reflect the deduction of expenses associated with a mutual fund, such as investment management and fund accounting fees. Investors cannot invest directly in an index, although they can invest in its underlying securities.
Sterling Capital Short Duration Bond Fund
Portfolio Managers
Sterling Capital Short Duration Bond Fund (the “Fund”) is managed by Portfolio Managers Mark M. Montgomery, CFA®, Senior Managing Director, and Peter L. Brown, CFA®, Managing Director, for Sterling Capital Management LLC (“Sterling Capital”), advisor to the Fund.
Mark M. Montgomery, CFA®
Mark M. Montgomery, CFA®, Senior Managing Director, CIO and Head of Fixed Income, joined Sterling Capital in 1997 and has investment experience since 1990. He has been co-portfolio manager of the Short Duration Bond Fund since February 2011. Mark received his B.S. in Marketing with a minor in Public Administration and his MBA from Drexel University. He holds the Chartered Financial Analyst® designation.
Peter L. Brown, CFA®
Peter L. Brown, CFA®, Executive Director, joined Sterling Capital in 2004 and has investment experience since 2000. He has been co-portfolio manager of the Short Duration Bond Fund since February 2020. Pete received a B.S. in Statistics with minors in Business Management, Marketing and Communications from Cornell University, and a MBA from Wake Forest University. He holds the Chartered Financial Analyst® designation.
Investment Considerations
The Fund is subject to the same risks as the underlying bonds in the portfolio such as credit, prepayment, call and interest rate risk. As interest rates rise, the value of bond prices will decline and an investor may lose money. The Fund may invest in more aggressive investments, such as foreign securities, which may expose the Fund to currency and exchange rate fluctuations; mortgage-backed securities sensitive to interest rates; and high yield debt (also known as junk bonds), all of which may cause greater volatility and less liquidity.
Q. How did the Fund perform during the 12-month period between October 1, 2022 and September 30, 2023?
A. The Fund’s Institutional Shares outperformed its current benchmark, the ICE BofA 1-3 Year U.S. Corporate Government Bond Index.
Q. What factors affected the Fund’s performance?
A. Bond yields rose considerably during the final quarter of 2022 and the first three quarters of 2023 as stubbornly high inflation led the Federal Reserve (the Fed) to continue raising interest rates. A higher-than-expected U.S. government budget deficit caused the Treasury to issue more long-term debt, further driving up yields. The rise in rates caused existing bond prices to fall, which dragged on total returns on an absolute basis. However, the Fund began the period with a higher yield-to-maturity than it held in previous years, which helped absorb some of the losses generated by falling prices.
The U.S. economy performed better than expected, which meant that risk premia on non-government assets such as corporate bonds, asset-backed securities (ABS) and commercial mortgage-backed securities (CMBS) narrowed versus Treasuries, which added to the Fund’s returns on an absolute basis.
The Fund’s relative performance benefited from its duration positioning. In anticipation of a rise in short-term interest rates, the Fund maintained a short duration position relative to its benchmark throughout the period, which boosted relative returns. The Fund’s relative returns also benefitted from an overweight position to corporate bonds in general, and an off-benchmark exposure to below-investment-grade securities, in particular. Short duration investment grade corporate bonds benefitted from a strong U.S. economy, solid earnings, and modest issuance during
the period, while riskier corporate bonds fared even better in the strong economy. Security selection within the Fund’s corporate bond allocation also helped relative performance, particularly due to a lower quality bias in the industrial sector. In addition, the Fund’s choice of investment grade securities in the energy, consumer, and technology sectors helped the Fund’s allocation to corporate bonds outperform its benchmark.
The Fund’s overweight exposure to taxable municipal bonds and short duration securitized assets also boosted returns on a relative basis. Taxable municipal bonds outperformed Treasuries and securitized assets due to a strong fundamental position for U.S. municipalities driven by pandemic-related stimulus. An overweight position to ABS and non-agency CMBS also boosted the Fund’s relative performance. Although delinquencies in both consumer loans and the commercial real estate market rose during the period, high-quality securities in these sectors remained in demand and thus outperformed Treasuries.
The Fund’s exposure to mid-sized regional banks in the financial sector weighed on its relative performance, as investors grew concerned about profitability and unrealized losses on the balance sheets of these institutions. An overweight allocation to the insurance sector, which generated positive excess returns but underperformed other financial sub-sectors, also dragged on relative results.
A Note on Indices: The volatility of an index varies greatly. All indices are unmanaged and investments cannot be made directly in an index.
The ICE BofA 1-3 Year U.S. Corporate Government Bond Index includes fixed rate debt issues rated investment grade or higher by Moody’s and S&P. All issues have at least one year to three years to maturity and an outstanding par value of at least $300 million.
Portfolio composition is as of September 30, 2023 and is subject to change and risk.
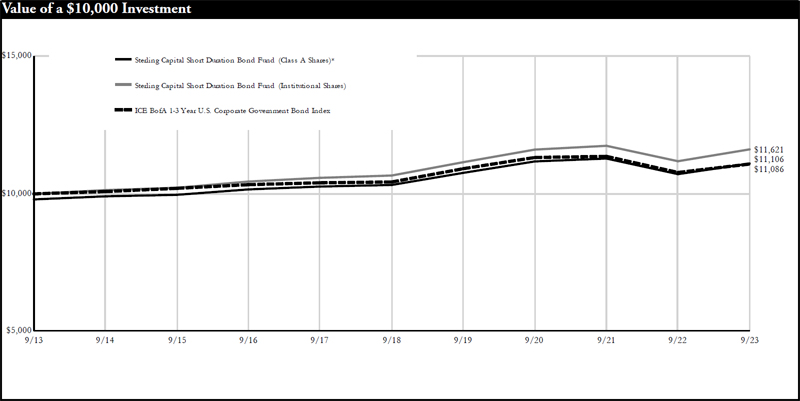
| Average Annual Total Returns | | | | |
| As of September 30, 2023 | Inception Date | 1 Year | 5 Years | 10 Years |
| Class A Shares* | 11/30/92 | 1.60% | 1.07% | 1.05% |
| Class C Shares** | 1/31/12 | 2.84% | 0.74% | 0.51% |
| Institutional Shares | 11/30/92 | 3.87% | 1.73% | 1.51% |
| Class R6 Shares | 2/1/211 | 4.09% | 1.69% | 1.37% |
| ICE BofA 1-3 Year U.S. Corporate Government Bond Index | N/A | 2.85% | 1.22% | 1.04% |
Past performance does not guarantee future results. The performance data quoted represents past performance and current returns may be lower or higher. Total return figures include change in share price, reinvestment of dividends and capital gains, and do not reflect taxes that a shareholder would pay on fund distributions or on the redemption of fund shares. The investment return and principal value will fluctuate so that an investor’s shares, when redeemed, may be worth more or less than the original cost. To obtain performance information current to the most recent month end, please visit www.sterlingcapitalfunds.com. Performance would have been lower without limitations and/or waivers in effect.
The chart above represents a comparison of a hypothetical $10,000 investment in the indicated share class versus a similar investment in the Fund’s benchmark.
| * | Reflects 2% maximum sales charge. |
| ** | Reflects the applicable maximum CDSC of 1.00% (applicable only to redemptions within one year of purchase, and as such, are not reflected in the Average Annual Total Returns table since the periods reflected are for a year or longer). |
| 1 | Class R6 Shares were not in existence prior to 2/1/18. Performance for periods prior to 2/1/18 is based on the performance of Institutional Shares. |
The Fund is measured against the ICE BofA 1-3 Year U.S. Corporate Government Bond Index, which consists of securities with a maturity from one to three years. The index does not reflect the deduction of expenses associated with a mutual fund, such as investment management and fund accounting fees. Investors cannot invest directly in an index, although they can invest in its underlying securities.
Sterling Capital Intermediate U.S. Government Fund
Portfolio Managers
Sterling Capital Intermediate U.S. Government Fund (the “Fund”) is managed by Executive Directors and Portfolio Managers Michael Sun and Jeffrey D. Ormsby, CFA® for Sterling Capital Management LLC (“Sterling Capital”), advisor to the Fund.
Michael Z. Sun, CFA®
Michael Z. Sun, CFA®, Executive Director, joined Sterling Capital in 2009 and has investment experience since 1998. He has been co-portfolio manager of the Intermediate U.S. Government Fund since February 2019. Michael received his M.A. in Economics from Bowling Green State University, his M.S. in Urban & Regional Study from Beijing University and his B.S. in Geography from Nanjing University. He holds the Chartered Financial Analyst designation.
Jeffrey D. Ormsby, CFA®
Jeffrey D. Ormsby, CFA®, Executive Director, joined Sterling Capital in 2011 and has investment experience since 2006. He has been co-portfolio manager of the Ultra Short Bond Fund since February 2020. Jeff received his B.S. in Economics from North Carolina State University and his MBA from UNC’s Kenan-Flagler Business School. He holds the Chartered Financial Analyst designation.
Investment Considerations
The Fund is subject to the same risks as the underlying bonds in the portfolio such as credit, prepayment, call and interest rate risk. As interest rates rise, the value of bond prices will decline and an investor may lose money. The Fund may invest in mortgage-backed securities, which tend to be more sensitive to changes in interest rates. The Fund invests in securities issued or guaranteed by the U.S. government or its agencies (such as Fannie Mae or Freddie Mac). Although U.S. government securities issued directly by the U.S. government are guaranteed by the U.S. Treasury, other U.S. government securities issued by an agency or instrumentality of the U.S. government may not be. No assurance can be given that the U.S. government would provide financial support to its agencies and instrumentalities if not required to do so by law.
Q. How did the Fund perform during the 12-month period between October 1, 2022 and September 30, 2023?
A. The Fund’s Institutional Shares underperformed its current benchmark, the Bloomberg U.S. Intermediate Government Bond Index.
Q. What factors affected the Fund’s performance?
A. The Federal Reserve (the Fed) repeatedly raised the federal funds rate during the 12-month period, for a total increase of 225 basis points or 2.25%. Since bond prices generally move in the opposite direction of interest rates, these rate hikes hurt the Fund’s performance on an absolute basis. The economy’s unexpected resilience to the aggressive rate hikes helped reduce risk premiums—the additional yield other debt securities pay over Treasuries to compensate investors for taking on greater risk. The lower risk premiums helped offset some of the negative effects of higher Treasury yields because it meant that the yields of other securities held by the Fund did not rise as much, and therefore their prices did not fall as much.
The largest detractor to the Fund’s relative performance was its longer average duration relative to that of its benchmark. Also dragging on performance was the Fund’s overweight exposure to collateralized mortgage obligations (CMO). A rising-rate environment made prepayment on this debt less likely, which led to extending the duration of CMOs and consequently hurt returns.
The Fund’s bias toward asset-backed securities (ABS), commercial mortgage-backed securities (CMBS), taxable municipal bonds
and corporate bonds contributed positively to the Fund’s relative performance, as each of these categories outperformed duration-matched Treasuries in the benchmark due to the lower risk premiums. The Fund’s overweight position in five- to 10-year securities also added to relative results. The interest rates for this part of the yield curve did not rise as high as they did for the shorter and longer ends of the yield curve.
A Note on Indices: The volatility of an index varies greatly. All indices are unmanaged and investments cannot be made directly in an index.
The Bloomberg U.S. Intermediate Government Bond Index measures the performance of U.S. dollar-denominated U.S. Treasuries, government-related and investment grade U.S. corporate securities that have a remaining maturity of greater than one year and less than ten years.
“Bloomberg®” and the Bloomberg indices are service marks of Bloomberg Finance L.P. and its affiliates, including Bloomberg Index Services Limited (“BISL”), the administrator of the index (collectively, “Bloomberg”) and have been licensed for use for certain purposes by Sterling Capital Management LLC and its affiliates. Bloomberg is not affiliated with Sterling Capital Management LLC or its affiliates, and Bloomberg does not approve, endorse, review, or recommend the product(s) presented herein. Bloomberg does not guarantee the timeliness, accurateness, or completeness of any data or information relating to the product(s) presented herein.
Portfolio composition is as of September 30, 2023 and is subject to change and risk.

| Average Annual Total Returns | | | | |
| As of September 30, 2023 | Inception Date | 1 Year | 5 Years | 10 Years |
| Class A Shares* | 10/9/92 | -1.54% | -0.60% | 0.04% |
| Class C Shares** | 2/1/01 | -0.32% | -0.97% | -0.51% |
| Institutional Shares | 10/9/92 | 0.80% | 0.05% | 0.49% |
| Bloomberg U.S. Intermediate Government Bond Index | N/A | 1.33% | 0.68% | 0.81% |
Past performance does not guarantee future results. The performance data quoted represents past performance and current returns may be lower or higher. Total return figures include change in share price, reinvestment of dividends and capital gains, and do not reflect taxes that a shareholder would pay on fund distributions or on the redemption of fund shares. The investment return and principal value will fluctuate so that an investor’s shares, when redeemed, may be worth more or less than the original cost. To obtain performance information current to the most recent month end, please visit www.sterlingcapitalfunds.com. Performance would have been lower without limitations and/or waivers in effect.
The chart above represents a comparison of a hypothetical $10,000 investment in the indicated share class versus a similar investment in the Fund’s benchmark.
| * | Reflects 2% maximum sales charge. |
| ** | Reflects the applicable maximum CDSC of 1.00% (applicable only to redemptions within one year of purchase, and as such, are not reflected in the Average Annual Total Returns table since the periods reflected are for a year or longer). |
The Fund is measured against the Bloomberg U.S. Government Bond Intermediate Index, an unmanaged index comprised of all publicly issued non-convertible domestic debt of the U.S. government or any agency there of, or corporate debt guaranteed by the U.S. government all with outstanding principal of $1 million and maturity between one and ten years. The index does not reflect the deduction of expenses associated with a mutual fund, such as investment management and fund accounting fees. Investors cannot invest directly in an index, although they can invest in its underlying securities.
Sterling Capital Total Return Bond Fund
Portfolio Managers
Sterling Capital Total Return Bond Fund (the “Fund”) is managed by Portfolio Managers Mark M. Montgomery, CFA®, Senior Managing Director, and Peter L. Brown, CFA®, Managing Director, for Sterling Capital Management LLC (“Sterling Capital”), advisor to the Fund.
Mark M. Montgomery, CFA®
Mark M. Montgomery, CFA®, Senior Managing Director, CIO and Head of Fixed Income, joined Sterling Capital in 1997 and has investment experience since 1990. He has been co-portfolio manager of the Total Return Bond Fund since January 2008. Mark received his B.S. in Marketing with a minor in Public Administration and his MBA from Drexel University. He holds the Chartered Financial Analyst designation.
Peter L. Brown, CFA®
Peter L. Brown, CFA®, Managing Director, joined Sterling Capital in 2004 and has investment experience since 2000. He has been co-portfolio manager of the Total Return Bond Fund since February 2020. Pete received a B.S. in Statistics with minors in Business Management, Marketing and Communications from Cornell University, and a MBA from Wake Forest University. He holds the Chartered Financial Analyst® designation.
Investment Considerations
The Fund is subject to the same risks as the underlying bonds in the portfolio such as credit, prepayment, call and interest rate risk. As interest rates rise, the value of bond prices will decline and an investor may lose money. The Fund may invest in foreign securities, which may expose the fund to currency and exchange rate fluctuations; and mortgage-backed securities sensitive to interest rates; and high yield debt (also known as junk bonds), all of which may cause greater volatility and less liquidity. Derivatives may be more sensitive to changes in market conditions and may amplify risks.
Q. How did the Fund perform during the 12-month period between October 1, 2022 and September 30, 2023?
A. The Fund’s Institutional Shares outperformed its current benchmark, the Bloomberg U.S. Aggregate Bond Index.
Q. What factors affected the Fund’s performance?
A. Bond yields rose considerably during the final quarter of 2022 and the first three quarters of 2023 as stubbornly high inflation forced the Federal Reserve to continue raising interest rates. A higher-than-expected U.S. government budget deficit forced the Treasury to issue increasing amounts of longer-term debt, further driving up yields. The rise in rates caused existing bond prices to fall, which dragged on total returns on an absolute basis. However, the Fund began the period with a higher yield-to-maturity than it held in previous years, which helped absorb some of the losses generated by falling prices.
The U.S. economy performed better than expected, which meant that risk premia on non-government assets such as corporate bonds, asset-backed securities (ABS), and commercial mortgage-backed securities (CMBS) narrowed versus Treasuries, which further added to the Fund’s returns on an absolute basis.
The Fund’s overweight position in corporate bonds boosted its performance on a relative basis. Corporate bonds benefitted from a strong U.S. economy, solid earnings, and modest issuance, and they significantly outperformed duration-matched Treasuries during the period under review. Additionally, well-timed decisions to increase and decrease corporate bond exposure added to the Fund’s relative results, as did security selection, particularly in the form of long duration exposure to companies with improving credit. The Fund’s overweight exposure to taxable municipals also benefited relative returns as these securities generally outperformed Treasuries and securitized assets during the
period due to a very strong fundamental position for U.S. municipalities driven by pandemic-related stimulus. With many municipal issuers in a strong budgetary position, there was little need for issuance, which drove risk premia tighter and lifted municipal bond prices.
The Fund’s positioning and selection within securitized assets also benefited relative returns. The Fund carried an overweight position to ABS and non-agency CMBS versus agency mortgage-backed securities (MBS), which struggled for much of the period due to elevated interest rate volatility. And though delinquencies in both consumer loans and the commercial real estate market rose during the period, high-quality securities in these sectors remained in demand. Within CMBS, investors’ concerns about falling asset prices hurt performance, but the Fund’s concentration in shorter duration, floating rate securities and higher quality securities added to relative results. Investor preference for higher coupon agency MBS was likewise additive to relative returns.
The Fund shifted from a short-to-neutral position on duration relative to its benchmark to a longer position in mid-2023. This proved to be premature as interest rates continued to rise, hurting relative performance. Likewise, the Fund’s overweight allocation to securitized assets hurt relative performance as they underperformed other risk assets, including corporate bonds and government-related sectors, namely local-authority and sovereign bonds.
A Note on Indices: The volatility of an index varies greatly. All indices are unmanaged and investments cannot be made directly in an index.
The Bloomberg U.S. Aggregate Bond Index is an unmanaged index composed of securities that are SEC-registered, taxable, and dollar denominated. The index covers the U.S. investment grade fixed rate bond market, with index components for government and corporate securities, mortgage pass-through securities, and asset-backed securities.
Portfolio composition is as of September 30, 2023 and is subject to change and risk.

| Average Annual Total Returns | | | | |
| As of September 30, 2023 | Inception Date | 1 Year | 5 Years | 10 Years |
| Class A Shares* | 11/30/99 | -1.64% | -0.17% | 1.17% |
| Class C Shares** | 2/1/01 | -0.22% | -0.49% | 0.62% |
| Institutional Shares | 11/30/99 | 0.78% | 0.51% | 1.62% |
| Class R6 Shares | 1/31/181 | 0.88% | 0.61% | 1.68% |
| Bloomberg U.S. Aggregate Bond Index | N/A | 0.64% | 0.10% | 1.13% |
Past performance does not guarantee future results. The performance data quoted represents past performance and current returns may be lower or higher. Total return figures include change in share price, reinvestment of dividends and capital gains, and do not reflect taxes that a shareholder would pay on fund distributions or on the redemption of fund shares. The investment return and principal value will fluctuate so that an investor’s shares, when redeemed, may be worth more or less than the original cost. To obtain performance information current to the most recent month end, please visit www.sterlingcapitalfunds.com. Performance would have been lower without limitations and/ or waivers in effect.
The chart above represents a comparison of a hypothetical $10,000 investment in the indicated share class versus a similar investment in the Fund’s benchmark.
| * | Reflects 2% maximum sales charge. |
| ** | Reflects the applicable maximum CDSC of 1.00% (applicable only to redemptions within one year of purchase, and as such, are not reflected in the Average Annual Total Returns table since the periods reflected are for a year or longer). |
| 1 | Class R6 Shares were not in existence prior to 2/1/18. Performance for periods prior to 2/1/18 is based on the performance of Institutional Shares. |
The Fund is measured against the Bloomberg U.S. Aggregate Bond Index, an unmanaged index, which is a market value-weighted performance benchmark for investment-grade fixed-rate debt issues, including government, corporate, asset-backed, and mortgage-backed securities, with maturities of at least one year. The index is unmanaged and does not reflect the deduction of expenses associated with a mutual fund, such as investment management and fund accounting fees. Investors cannot invest directly in an index, although they can invest in its underlying securities.
Sterling Capital Long Duration Corporate Bond Fund
Portfolio Managers
Sterling Capital Long Duration Corporate Bond Fund (the “Fund”) is managed by Portfolio Managers Mark M. Montgomery, CFA®, Senior Managing Director, Peter L. Brown, CFA®, Managing Director, and Robert A. Brown, CFA®, Managing Director for Sterling Capital Management LLC (“Sterling Capital”), advisor to the Fund.
Mark M. Montgomery, CFA®
Mark M. Montgomery, CFA®, Senior Managing Director, CIO and Head of Fixed Income, joined Sterling Capital in 1997 and has investment experience since 1990. He has been co-portfolio manager of the Corporate Fund since inception. Mark received his B.S. in Marketing with a minor in Public Administration and his MBA from Drexel University. He holds the Chartered Financial Analyst® designation.
Peter L. Brown, CFA®
Peter L. Brown, CFA®, Managing Director, joined Sterling Capital in 2004 and has investment experience since 2000. He has been co-portfolio manager of the Corporate Fund since February 2020. Pete received a B.S. in Statistics with minors in Business Management, Marketing and Communications from Cornell University, and a MBA from Wake Forest University. He holds the Chartered Financial Analyst® designation.
Robert A. Brown, CFA®
Robert A. Brown, CFA®, Managing Director, joined Sterling Capital Management in 2016 and has investment experience since 1986. He has co-managed the Fund since February 2022. Robert received his B.A. in Geography with Economics from the University of Exeter. He holds the Chartered Financial Analyst® designation.
Investment Considerations
The Fund is subject to the same risks as the underlying bonds in the portfolio such as credit, prepayment, call and interest rate risk. As interest rates rise, the value of bond prices will decline and an investor may lose money. The Fund may invest in more aggressive investments, such as foreign securities, which may expose the fund to currency and exchange rate fluctuations; mortgage-backed securities sensitive to interest rates; and high yield debt (also known as junk bonds), all of which may cause greater volatility and less liquidity. Derivatives may be more sensitive to changes in market conditions and may amplify risks.
Q. How did the Fund perform during the 12-month period between October 1, 2022 and September 30, 2023?
A. The Fund’s Institutional Shares underperformed its current benchmark, the Bloomberg Long U.S. Corporate Bond Index.
Q. What factors affected the Fund’s performance?
A. Bond yields rose considerably during the end of 2022 and throughout the first three quarters of 2023 as the Federal Reserve continued raising interest rates to combat stubbornly high inflation. A higher-than-expected U.S. government budget deficit caused the Treasury to issue increasing amounts of longer-term debt, which put additional upward pressure on yields. Rising rates caused existing bond prices to fall, which hurt the Fund’s total returns on an absolute basis.
The Fund’s performance relative to its benchmark suffered from its decision to shift from a short-to-neutral position on duration relative to its benchmark to a longer position in mid-2023. This proved to be premature, however, as interest rates continued to rise, thus weighing on relative results. The Fund’s above-benchmark exposure to Treasuries also detracted from relative performance, as Treasuries underperformed corporate bonds.
Likewise, the Fund’s overweight exposure to the financials and utilities sectors and underweight exposure to the industrials sector weighed on results, as financials underperformed and utilities were dragged down by an increase in securities issued. Security selection within the utilities sector also dragged on performance during the period. Investor preference for lower quality, wider-trading names coupled with a relatively benign California wildfire season helped two of the largest companies in the benchmark outperform other utilities names. The
Fund’s underweight exposure to the California utility companies hurt relative performance.
The Fund benefited from its overweight exposure to the aircraft leasing industry as well as its exposure to REITs. The Fund’s decision to avoid exposure to traditional office real estate boosted relative results, as commercial real estate prices declined during the period. The Fund’s relative returns also benefited from security selection in the communications sector, as a handful of major communications companies were among the top-performing issuers during this period.
A Note on Indices: The volatility of an index varies greatly. All indices are unmanaged and investments cannot be made directly in an index.
The Bloomberg Long U.S. Corporate Bond Index measures the investment grade, fixed-rate, taxable corporate bond market. It includes USD-denominated securities publicly issued by U.S. and non-U.S. industrial, utility and financial issuers that have a remaining maturity of ten years or more.
“Bloomberg®” and the Bloomberg indices are service marks of Bloomberg Finance L.P. and its affiliates, including Bloomberg Index Services Limited (“BISL”), the administrator of the index (collectively, “Bloomberg”) and have been licensed for use for certain purposes by Sterling Capital Management LLC and its affiliates. Bloomberg is not affiliated with Sterling Capital Management LLC or its affiliates, and Bloomberg does not approve, endorse, review, or recommend the product(s) presented herein. Bloomberg does not guarantee the timeliness, accurateness, or completeness of any data or information relating to the product(s) presented herein.
Portfolio composition is as of September 30, 2023 and is subject to change and risk.
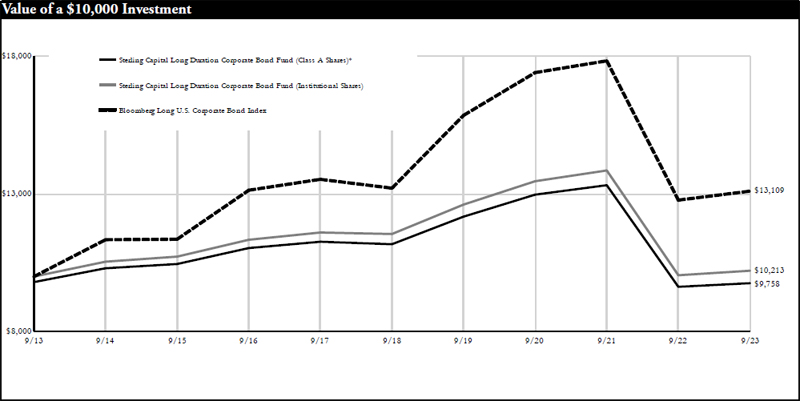
| Average Annual Total Returns | | | | |
| As of September 30, 2023 | Inception Date | 1 Year | 5 Years | 10 Years |
| Class A Shares* | 1/31/131 | -0.72% | -3.07% | -0.24% |
| Class C Shares** | 1/31/131 | 0.78% | -3.37% | -0.78% |
| Institutional Shares | 6/30/112 | 1.64% | -2.43% | 0.21% |
| Class R6 Shares | 1/31/223 | 1.72% | -2.40% | 0.23% |
| Bloomberg Long U.S. Corporate Bond Index | N/A | 2.55% | -0.16% | 2.74% |
Past performance does not guarantee future results. The performance data quoted represents past performance and current returns may be lower or higher. Total return figures include change in share price, reinvestment of dividends and capital gains, and do not reflect taxes that a shareholder would pay on fund distributions or on the redemption of fund shares. The investment return and principal value will fluctuate so that an investor’s shares, when redeemed, may be worth more or less than the original cost. To obtain performance information current to the most recent month end, please visit www.sterlingcapitalfunds.com.
The chart above represents a comparison of a hypothetical $10,000 investment in the indicated share class versus a similar investment in the Fund’s benchmark.
| * | Reflects 2% maximum sales charge. |
| ** | Reflects the applicable maximum CDSC of 1.00% (applicable only to redemptions within one year of purchase, and as such, are not reflected in the Average Annual Total Returns table since the periods reflected are for a year or longer). |
| 1 | The Fund converted Class S Shares into Institutional Shares effective 2/1/13. |
| 2 | Class R6 Shares were not in existence prior to 1/31/22. Performance for periods prior to 1/31/22 is based on the performance of Institutional Shares. |
The Fund is measured against the Bloomberg Long U.S. Corporate Bond Index, which measures the investment grade, fixed-rate, taxable corporate bond market. It includes USD-denominated securities publicly issued by U.S. and non-U.S. industrial, utility and financial issuers that have a remaining maturity of ten years or more. The index does not reflect the deduction of expenses associated with a mutual fund, such as investment management and fund accounting fees. Investors cannot invest directly in an index, although they can invest in its underlying securities.
The Bloomberg Long U.S. Corporate Bond Index measures the investment grade, fixed-rate, taxable corporate bond market. It includes USD-denominated securities publicly issued by U.S. and non-U.S. industrial, utility and financial issuers that have a remaining maturity of ten years or more.
Sterling Capital Quality Income Fund
Portfolio Managers
Sterling Capital Quality Income Fund (the “Fund”) is managed by Executive Directors and portfolio managers Michael Z. Sun, CFA®, Jeffrey D. Ormsby, CFA® and Byron G. Mims, CFA®, for Sterling Capital Management LLC (“Sterling Capital”), advisor to the Fund.
Michael Z. Sun, CFA®
Michael Z. Sun, CFA®, Executive Director, joined Sterling Capital in 2009 and has investment experience since 1998. He has been co-portfolio manager of the Quality Income Fund since February 2014. Michael received his M.A. in Economics from Bowling Green State University, his M.S. in Urban & Regional Study from Beijing University and his B.S. in Geography from Nanjing University. He holds the Chartered Financial Analyst® designation.
Jeffrey D. Ormsby, CFA®
Jeffrey D. Ormsby, CFA®, Executive Director, joined Sterling Capital in 2011 and has investment experience since 2006. He has been co-portfolio manager of the Quality Income Fund since February 2016. Jeff received his B.S. in Economics from North Carolina State University and his MBA from UNC’s Kenan-Flagler Business School. He holds the Chartered Financial Analyst® designation.
Byron G. Mims, CFA®
Byron G. Mims, CFA®, Executive Director, joined Sterling Capital in 2012 and has investment experience since 2006. He has been co-portfolio manager of the Quality Income Fund since February 2016. Byron received his B.S. in Economics from North Carolina State University. He holds the Chartered Financial Analyst® designation.
Investment Considerations
The Fund is subject to the same risks as the underlying bonds in the portfolio such as credit, prepayment, call and interest rate risk. As interest rates rise, the value of bond prices will decline and an investor may lose money. The Fund may invest in more aggressive investments, such as foreign securities, which may expose the Fund to currency and exchange rate fluctuations; mortgage-backed securities sensitive to interest rates; and high yield debt (also known as junk bonds), all of which may cause greater volatility and less liquidity.
Q. How did the Fund perform during the 12-month period between October 1, 2022 and September 30, 2023?
A. The Fund’s Institutional Shares outperformed its current benchmark, the Bloomberg U.S. MBS Index.
Q. What factors affected the Fund’s performance?
A. The Federal Reserve (the Fed) raised the federal funds rate six times during the 12-month period, for a total increase of 225 basis points or 2.25%. Amid rising rates, the Fund’s exposure to shorter-duration securities contributed the most to absolute returns, as those securities can take advantage of higher rates earlier than others. Single-asset or single-borrower (SASB) commercial mortgage-backed securities (CMBS) were the Fund’s top-performing subsector on an absolute basis, benefiting from higher rates due to their floating-rate coupons. The Fund’s exposure to short-duration asset-backed securities (ABS) also contributed to absolute returns. By comparison, the portfolio’s holdings in longer-duration agency debentures, fixed-rate Treasury securities and longer-duration fixed-rate collateralized mortgage securities all dragged on absolute returns, as these securities saw negative returns for the period under review.
The Fund’s bias toward non-agency CMBS and consumer ABS boosted performance relative to the benchmark, as both sectors outperformed agency MBS during the period. Within agency mortgage-backed securities (MBS), the Fund also benefited from its below-benchmark exposure to lower-coupon 30-year securities, as those underperformed within the sector. A third contributing factor to the Fund’s outperformance was its average duration, which was shorter than that of the benchmark and therefore better positioned to weather rising interest rates.
The Fund’s yield curve positioning detracted from relative performance. The Fund had a below-benchmark exposure to bonds in the five- and 10-year range, which saw smaller interest rate increases than both shorter-and longer-term bonds, and therefore saw smaller price drops. The Fund’s off-benchmark allocation to Treasuries also weighed on relative results, as each of the major securitized subsectors posted positive excess returns compared to duration-matched Treasuries during the period.
A Note on Indices: The volatility of an index varies greatly. All indices are unmanaged and investments cannot be made directly in an index.
The Bloomberg U.S. MBS Index covers the mortgage-backed pass-through securities of Ginnie Mae (GNMA), Fannie Mae (FNMA), and Freddie Mac (FHLMC). It is formed by grouping the universe of individual fixed rate MBS pools into generic aggregates.
“Bloomberg®” and the Bloomberg indices are service marks of Bloomberg Finance L.P. and its affiliates, including Bloomberg Index Services Limited (“BISL”), the administrator of the index (collectively, “Bloomberg”) and have been licensed for use for certain purposes by Sterling Capital Management LLC and its affiliates. Bloomberg is not affiliated with Sterling Capital Management LLC or its affiliates, and Bloomberg does not approve, endorse, review, or recommend the product(s) presented herein. Bloomberg does not guarantee the timeliness, accurateness, or completeness of any data or information relating to the product(s) presented herein.
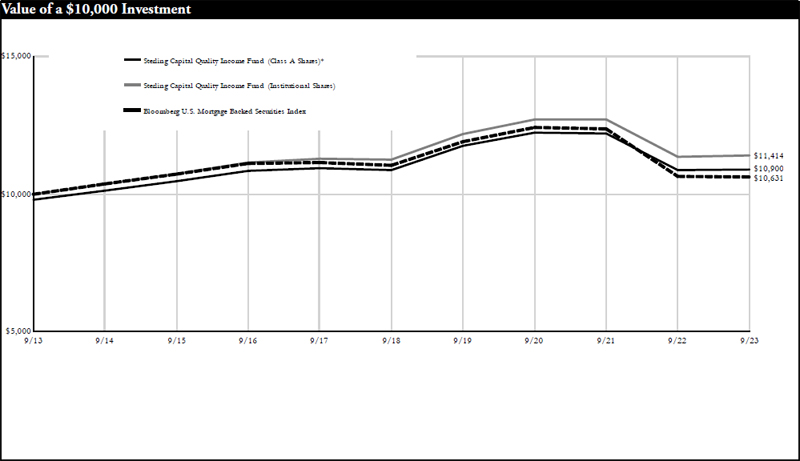
| Average Annual Total Returns | | | | |
| As of September 30, 2023 | Inception Date | 1 Year | 5 Years | 10 Years |
| Class A Shares* | 1/31/13 | -1.83% | -0.37% | 0.87% |
| Class C Shares** | 1/31/13 | -0.52% | -0.67% | 0.35% |
| Institutional Shares | 6/30/11 | 0.44% | 0.27% | 1.33% |
| Bloomberg U.S. Mortgage Backed Securities Index | N/A | -0.17% | -0.78% | 0.61% |
Past performance does not guarantee future results. The performance data quoted represents past performance and current returns may be lower or higher. Total return figures include change in share price, reinvestment of dividends and capital gains, and do not reflect taxes that a shareholder would pay on fund distributions or on the redemption of fund shares. The investment return and principal value will fluctuate so that an investor’s shares, when redeemed, may be worth more or less than the original cost. To obtain performance information current to the most recent month end, please visit www.sterlingcapitalfunds.com.
The chart above represents a comparison of a hypothetical $10,000 investment in the indicated share class versus a similar investment in the Fund’s benchmark.
| * | Reflects 2% maximum sales charge. |
| ** | Reflects the applicable maximum CDSC of 1.00% (applicable only to redemptions within one year of purchase, and as such, are not reflected in the Average Annual Total Returns table since the periods reflected are for a year or longer). |
The Fund is measured against the Bloomberg U.S. Mortgage Backed Securities Index. The index measures the performance of investment grade fixed-rate mortgage-backed pass-through securities of Ginnie Mae, Fannie Mae, and Freddie Mac. The index is unmanaged and does not reflect the deduction of expenses associated with a mutual fund, such as investment management and fund accounting fees. Investors cannot invest directly in an index, although they can invest in its underlying securities.
Sterling Capital North Carolina Intermediate Tax-Free Fund
Portfolio Managers
Sterling Capital North Carolina Intermediate Tax-Free Fund (the “Fund”) is managed by Portfolio Managers Robert F. Millikan, CFA®, Executive Director and Michael P. McVicker, Executive Director for Sterling Capital Management LLC (“Sterling Capital”), advisor to the Fund.
Robert F. Millikan, CFA®
Robert F. Millikan, CFA®, Executive Director, joined BB&T Asset Management in 2000 and Sterling Capital through merger in October 2010. He has investment experience since 1990 and joined the team that manages each of the Tax-Free Bond Funds in February 2000. He is a graduate of Wake Forest University where he received his B.A. in Economics. He holds the Chartered Financial Analyst designation.
Michael P. McVicker
Michael P. McVicker, Executive Director, joined Sterling Capital in 1992 and has investment experience since 1992. He has been associate portfolio manager for each of the Tax-Free Bond Funds since February 2016. Michael is a graduate of the University of North Carolina – Charlotte where he received his B.S.B.A. in Finance with a minor in Psychology.
Investment Considerations
The Fund is subject to the same risks as the underlying bonds in the portfolios such as credit, prepayment and interest rate risk. As interest rates rise, the value of bond prices will decline and an investor may lose money. The Fund is non-diversified and may invest a greater percentage of its assets in a single issuer than funds that are more diversified. Furthermore, the Fund invests primarily in municipal obligations issued by North Carolina and its political subdivisions and therefore will be affected by economic, political or other events affecting North Carolina.
Q. How did the Fund perform during the 12-month period between October 1, 2022 and September 30, 2023?
A. The Fund’s Institutional Shares underperformed its current benchmark, the ICE BofA 2-17 Year U.S. Municipal Bond Index.
| Q. | What factors affected the Fund’s performance? |
A. The Federal Reserve (the Fed) raised the federal funds rate six times during the 12-month period, for a total increase of 225 basis points or 2.25%. When interest rates rise, bond prices tend to fall, which weighs on returns. Interest rate increases were not uniform across the yield curve, however. For instance, one-year rates rose 64 basis points, five-year rates rose 31 basis points, 10-year rates rose 15 basis points, and 20-year rates rose 42 basis points. This distribution of interest rate increases inverted the yield curve. Amid this inversion, and rising rates generally, the Fund’s position in one- to three-year bonds contributed to returns on an absolute basis.
Lower-quality bonds outperformed higher quality bonds during the period, as investors were willing to take on risk to seek higher income in
a better-than-expected economic environment. Therefore, the Fund’s bias toward AAA- and AA-rated securities dragged on its performance relative to the benchmark.
The Fund’s selective overweight position in five-year and 10-year bonds boosted relative performance, as rates rose less among those assets than among one- and 20-year bonds, which caused a smaller decline in their prices. The Fund’s below-benchmark exposure to durations longer than 10 years also added to relative performance, as rates rose higher and prices dropped further among those bonds.
A Note on Indices: The volatility of an index varies greatly. All indices are unmanaged and investments cannot be made directly in an index.
The ICE BofA 2-17 U.S. Year Municipal Bond Index is an unmanaged index composed of securities that are SEC-registered, tax-exempt, and dollar denominated. The index covers the intermediate U.S. investment grade fixed rate municipal bond market, with index components for municipal securities.
Portfolio composition is as of September 30, 2023 and is subject to change and risk.
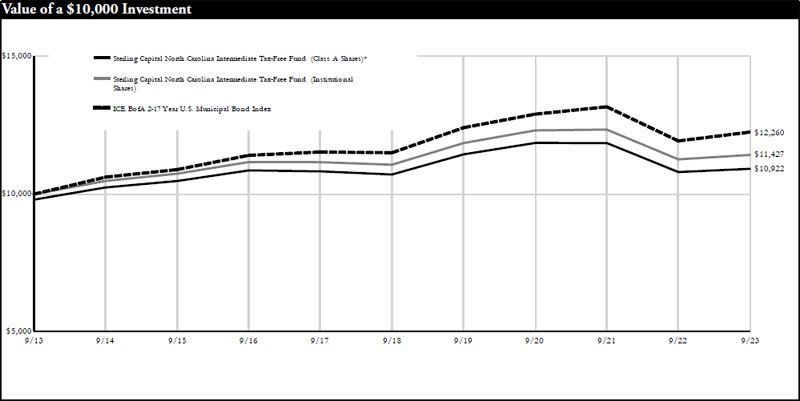
| Average Annual Total Returns | | | | |
| As of September 30, 2023 | Inception Date | 1 Year | 5 Years | 10 Years |
| Class A Shares* | 10/16/92 | -0.93% | -0.02% | 0.89% |
| Class C Shares** | 1/31/12 | 0.32% | -0.37% | 0.33% |
| Institutional Shares | 10/16/92 | 1.44% | 0.63% | 1.34% |
| ICE BofA 2-17 Year U.S. Municipal Bond Index | N/A | 2.71% | 1.27% | 2.06% |
Past performance does not guarantee future results. The performance data quoted represents past performance and current returns may be lower or higher. Total return figures include change in share price, reinvestment of dividends and capital gains, and do not reflect taxes that a shareholder would pay on fund distributions or on the redemption of fund shares. The investment return and principal value will fluctuate so that an investor’s shares, when redeemed, may be worth more or less than the original cost. To obtain performance information current to the most recent month end, please visit www.sterlingcapitalfunds.com.
The chart above represents a comparison of a hypothetical $10,000 investment in the indicated share class versus a similar investment in the Fund’s benchmark.
| * | Reflects 2% maximum sales charge. |
| ** | Reflects the applicable maximum CDSC of 1.00% (applicable only to redemptions within one year of purchase, and as such, are not reflected in the Average Annual Total Returns table since the periods reflected are for a year or longer). |
The Fund is measured against the ICE BofA 2-17 Year U.S. Municipal Bond Index, an unmanaged index, which is representative of municipal bonds. The index does not reflect the deduction of expenses associated with a mutual fund, such as investment management and fund accounting fees. Investors cannot invest directly in an index, although they can invest in its underlying securities.
Sterling Capital South Carolina Intermediate Tax-Free
Portfolio Managers
Sterling Capital South Carolina Intermediate Tax-Free Fund (the “Fund”) is managed by Portfolio Managers Robert F. Millikan, CFA®, Executive Director and Michael P. McVicker, Executive Director for Sterling Capital Management LLC (“Sterling Capital”), advisor to the Fund.
Robert F. Millikan, CFA®
Robert F. Millikan, CFA®, Executive Director, joined BB&T Asset Management in 2000 and Sterling Capital through merger in October 2010. He has investment experience since 1990 and joined the team that manages each of the Tax-Free Bond Funds in February 2000. He is a graduate of Wake Forest University where he received his B.A. in Economics. He holds the Chartered Financial Analyst® designation.
Michael P. McVicker
Michael P. McVicker, Executive Director, joined Sterling Capital in 1992 and has investment experience since 1992. He has been associate portfolio manager for each of the Tax-Free Bond Funds since February 2016. Michael is a graduate of the University of North Carolina – Charlotte where he received his B.S.B.A. in Finance with a minor in Psychology.
Investment Considerations
The Fund is subject to the same risks as the underlying bonds in the portfolios such as credit, prepayment and interest rate risk. As interest rates rise, the value of bond prices will decline and an investor may lose money. The Fund is non-diversified and may invest a greater percentage of its assets in a single issuer than funds that are more diversified. Furthermore, the Fund invests primarily in municipal obligations issued by South Carolina and its political subdivisions and therefore will be affected by economic, political or other events affecting South Carolina.
Q. How did the Fund perform during the 12-month period between October 1, 2022 and September 30, 2023?
A. The Fund’s Institutional Shares underperformed its current benchmark, the ICE BofA 2-17 Year U.S. Municipal Bond Index.
| Q. | What factors affected the Fund’s performance? |
A. The Federal Reserve (the Fed) raised the federal funds rate six times during the 12-month period, for a total increase of 225 basis points or 2.25%. When interest rates rise, bond prices tend to fall, which weighs on returns. Interest rate increases were not uniform across the yield curve, however. For instance, one-year rates rose 64 basis points, five-year rates rose 31 basis points, 10-year rates rose 15 basis points, and 20-year rates rose 42 basis points. This distribution of interest rate increases inverted the yield curve. Amid this inversion, and rising rates generally, the Fund’s position in one- to three-year bonds contributed to returns on an absolute basis. The Fund’s exposure to lower quality A-rated bonds also added on an absolute basis, as lower-quality bonds outperformed higher quality bonds during the period. Investors were willing to take on risk to seek higher income in a better-than-expected economic environment.
On a relative basis, however, the Fund’s above-benchmark exposure to AAA- and AA-rated securities dragged on its returns. This bias toward higher-quality bonds relative to the benchmark was the primary driver of relative underperformance.
The Fund’s selective overweight position in five-year and 10-year bonds boosted relative performance, as rates rose less among those assets than among one- and 20-year bonds, which caused a smaller decline in their prices. The Fund’s below-benchmark exposure to durations longer than 10 years also added to relative performance, as rates rose higher and prices dropped further among those bonds.
A Note on Indices: The volatility of an index varies greatly. All indices are unmanaged and investments cannot be made directly in an index.
ICE BofA 2-17 Year U.S. Municipal Bond Index is an unmanaged index composed of securities that are SEC-registered, tax-exempt, and dollar denominated. The index covers the intermediate U.S. investment grade fixed rate municipal bond market, with index components for municipal securities.
Portfolio composition is as of September 30, 2023 and is subject to change and risk.

| Average Annual Total Returns | | | | |
| As of September 30, 2023 | Inception Date | 1 Year | 5 Years | 10 Years |
| Class A Shares* | 10/20/97 | -0.88% | 0.17% | 1.00% |
| Class C Shares** | 1/31/12 | 0.30% | -0.18% | 0.44% |
| Institutional Shares | 10/20/97 | 1.40% | 0.84% | 1.45% |
| ICE BofA 2-17 Year U.S. Municipal Bond Index | N/A | 2.71% | 1.27% | 2.06% |
Past performance does not guarantee future results. The performance data quoted represents past performance and current returns may be lower or higher. Total return figures include change in share price, reinvestment of dividends and capital gains, and do not reflect taxes that a shareholder would pay on fund distributions or on the redemption of fund shares. The investment return and principal value will fluctuate so that an investor’s shares, when redeemed, may be worth more or less than the original cost. To obtain performance information current to the most recent month end, please visit www.sterlingcapitalfunds.com.
The chart above represents a comparison of a hypothetical $10,000 investment in the indicated share class versus a similar investment in the Fund’s benchmark.
| * | Reflects 2% maximum sales charge. |
| ** | Reflects the applicable maximum CDSC of 1.00% (applicable only to redemptions within one year of purchase, and as such, are not reflected in the Average Annual Total Returns table since the periods reflected are for a year or longer). |
The Fund is measured against the ICE BofA 2-17 Year U.S. Municipal Bond Index, an unmanaged index, which is representative of municipal bonds. The index does not reflect the deduction of expenses associated with a mutual fund, such as investment management and fund accounting fees. Investors cannot invest directly in an index, although they can invest in its underlying securities.
Sterling Capital Virginia Intermediate Tax-Free Fund
Portfolio Managers
Sterling Capital Virginia Intermediate Tax-Free Fund (the “Fund”) is managed by Portfolio Managers Robert F. Millikan, CFA®, Executive Director and Michael P. McVicker, Executive Director for Sterling Capital Management LLC (“Sterling Capital”), advisor to the Fund.
Robert F. Millikan, CFA
Robert F. Millikan, CFA, Executive Director, joined BB&T Asset Management in 2000 and Sterling Capital through merger in October 2010. He has investment experience since 1990 and joined the team that manages each of the Tax-Free Bond Funds in February 2000. He is a graduate of Wake Forest University where he received his B.A. in Economics. He holds the Chartered Financial Analyst designation.
Michael P. McVicker
Michael P. McVicker, Executive Director, joined Sterling Capital in 1992 and has investment experience since 1992. He has been associate portfolio manager for each of the Tax-Free Bond Funds since February 2016. Michael is a graduate of the University of North Carolina – Charlotte where he received his B.S.B.A. in Finance with a minor in Psychology.
Investment Considerations
The Fund is subject to the same risks as the underlying bonds in the portfolios such as credit, prepayment and interest rate risk. As interest rates rise, the value of bond prices will decline and an investor may lose money. The Fund is non-diversified and may invest a greater percentage of its assets in a single issuer than funds that are more diversified. Furthermore, the Fund invests primarily in municipal obligations issued by Virginia and its political subdivisions and therefore will be affected by economic, political or other events affecting Virginia.
Q. How did the Fund perform during the 12-month period between October 1, 2022 and September 30, 2023?
A. The Fund’s Institutional Shares underperformed its current benchmark, the ICE BofA 2-17 Year U.S. Municipal Bond Index.
| Q. | What factors affected the Fund’s performance? |
A. The Federal Reserve (the Fed) raised the federal funds rate six times during the 12-month period, for a total increase of 225 basis points or 2.25%. When interest rates rise, bond prices tend to fall, which weighs on returns. Interest rate increases were not uniform across the yield curve, however. For instance, one-year rates rose 64 basis points, five-year rates rose 31 basis points, 10-year rates rose 15 basis points, and 20-year rates rose 42 basis points. This distribution of interest rate increases inverted the yield curve. Amid this inversion, and rising rates generally, the Fund’s position in pre-refunded bonds contributed to returns on an absolute basis.
Lower-quality bonds outperformed higher quality bonds during the period, as investors were willing to take on risk to seek higher income in
a better-than-expected economic environment. Therefore, the Fund’s bias toward AAA- and AA-rated securities dragged on its performance relative to the benchmark.
The Fund’s selective overweight position in five-year and 10-year bonds boosted relative performance, as rates rose less among those assets than among one- and 20-year bonds, which caused a smaller decline in their prices. The Fund’s below-benchmark exposure to durations longer than 10 years also added to relative performance, as rates rose higher and prices dropped further among those bonds.
A Note on Indices: The volatility of an index varies greatly. All indices are unmanaged and investments cannot be made directly in an index.
The ICE BofA 2-17 Year U.S. Municipal Bond Index is an unmanaged index composed of securities that are SEC-registered, tax-exempt, and dollar denominated. The index covers the intermediate U.S. investment grade fixed rate municipal bond market, with index components for municipal securities.
Portfolio composition is as of September 30, 2023 and is subject to change and risk.
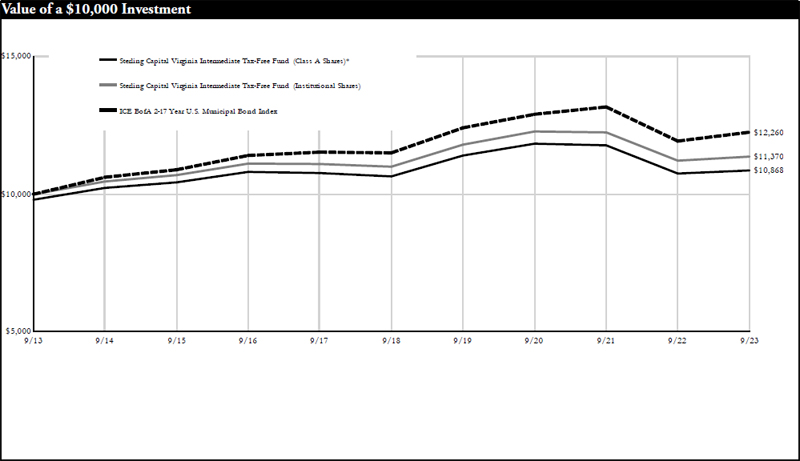
| Average Annual Total Returns | | | | |
| As of September 30, 2023 | Inception Date | 1 Year | 5 Years | 10 Years |
| Class A Shares* | 5/17/99 | -0.97% | 0.01% | 0.84% |
| Class C Shares** | 1/31/12 | 0.13% | -0.38% | 0.27% |
| Institutional Shares | 5/17/99 | 1.30% | 0.66% | 1.29% |
| ICE BofA 2-17 Year U.S. Municipal Bond Index | N/A | 2.71% | 1.27% | 2.06% |
Past performance does not guarantee future results. The performance data quoted represents past performance and current returns may be lower or higher. Total return figures include change in share price, reinvestment of dividends and capital gains, and do not reflect taxes that a shareholder would pay on fund distributions or on the redemption of fund shares. The investment return and principal value will fluctuate so that an investor’s shares, when redeemed, may be worth more or less than the original cost. To obtain performance information current to the most recent month end, please visit www.sterlingcapitalfunds.com.
The chart above represents a comparison of a hypothetical $10,000 investment in the indicated share class versus a similar investment in the Fund’s benchmark.
| * | Reflects 2% maximum sales charge. |
| ** | Reflects the applicable maximum CDSC of 1.00% (applicable only to redemptions within one year of purchase, and as such, are not reflected in the Average Annual Total Returns table since the periods reflected are for a year or longer). |
The Fund is measured against the ICE BofA 2-17 Year U.S. Municipal Bond Index, an unmanaged index, which is representative of municipal bonds. The index does not reflect the deduction of expenses associated with a mutual fund, such as investment management and fund accounting fees. Investors cannot invest directly in an index, although they can invest in its underlying securities.
Sterling Capital West Virginia Intermediate Tax-Free Fund
Portfolio Managers
Sterling Capital West Virginia Intermediate Tax-Free Fund (the “Fund”) is managed by Portfolio Managers Robert F. Millikan, CFA®, Executive Director and Michael P. McVicker, Executive Director for Sterling Capital Management LLC (“Sterling Capital”), advisor to the Fund.
Robert F. Millikan, CFA®
Robert F. Millikan, CFA®, Executive Director, joined BB&T Asset Management in 2000 and Sterling Capital through merger in October 2010. He has investment experience since 1990 and joined the team that manages each of the Tax-Free Bond Funds in February 2000. He is a graduate of Wake Forest University where he received his B.A. in Economics. He holds the Chartered Financial Analyst designation.
Michael P. McVicker
Michael P. McVicker, Executive Director, joined Sterling Capital in 1992 and has investment experience since 1992. He has been associate portfolio manager for each of the Tax-Free Bond Funds since February 2016. Michael is a graduate of the University of North Carolina – Charlotte where he received his B.S.B.A. in Finance with a minor in Psychology.
Investment Considerations
The Fund is subject to the same risks as the underlying bonds in the portfolios such as credit, prepayment and interest rate risk. As interest rates rise, the value of bond prices will decline and an investor may lose money. The Fund is non-diversified and may invest a greater percentage of its assets in a single issuer than funds that are more diversified. Furthermore, the Fund invests primarily in municipal obligations issued by West Virginia and its political subdivisions and therefore will be affected by economic, political or other events affecting West Virginia.
Q. How did the Fund perform during the 12-month period between October 1, 2022 and September 30, 2023?
A. The Fund’s Institutional Shares underperformed its current benchmark, the ICE BofA 2-17 Year U.S. Municipal Bond Index.
| Q. | What factors affected the Fund’s performance? |
A. The Federal Reserve (the Fed) raised the federal funds rate six times during the 12-month period, for a total increase of 225 basis points or 2.25%. When interest rates rise, bond prices tend to fall, which weighs on returns. Interest rate increases were not uniform across the yield curve, however. For instance, one-year rates rose 64 basis points, five-year rates rose 31 basis points, 10-year rates rose 15 basis points, and 20-year rates rose 42 basis points. This distribution of interest rate increases inverted the yield curve. Amid this inversion, and rising rates generally, the Fund’s position in one- to three-year bonds along with its exposure to higher-income bonds lower-quality bonds that offer higher yields contributed to returns on an absolute basis.
Lower-quality bonds outperformed higher quality bonds during the period, as investors were willing to take on risk to seek higher income in a better-than-expected economic environment. Therefore, the Fund’s bias toward AAA- and AA-rated securities dragged on its performance relative to the benchmark.
The Fund’s selective overweight position in five-year and 10-year bonds boosted relative performance, as rates rose less among those assets than among one- and 20-year bonds, which caused a smaller decline in their prices. The Fund’s below-benchmark exposure to durations longer than 10 years also added to relative performance, as rates rose higher and prices dropped further among those bonds.
A Note on Indices: The volatility of an index varies greatly. All indices are unmanaged and investments cannot be made directly in an index.
The ICE BofA 2-17 Year U.S. Municipal Bond Index is an unmanaged index composed of securities that are SEC-registered, tax-exempt, and dollar denominated. The index covers the intermediate U.S. investment grade fixed rate municipal bond market, with index components for municipal securities.
Portfolio composition is as of September 30, 2023 and is subject to change and risk.
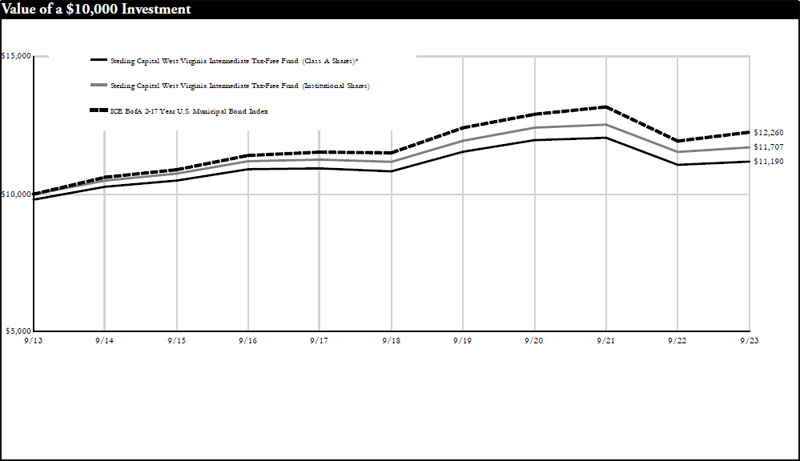
| Average Annual Total Returns | | | | |
| As of September 30, 2023 | Inception Date | 1 Year | 5 Years | 10 Years |
| Class A Shares* | 12/17/93 | -0.97% | 0.24% | 1.13% |
| Class C Shares** | 1/31/12 | 0.62% | -0.04% | 0.60% |
| Institutional Shares | 12/1/93 | 1.43% | 0.92% | 1.59% |
| ICE BofA 2-17 Year U.S. Municipal Bond Index | N/A | 2.71% | 1.27% | 2.06% |
Past performance does not guarantee future results. The performance data quoted represents past performance and current returns may be lower or higher. Total return figures include change in share price, reinvestment of dividends and capital gains, and do not reflect taxes that a shareholder would pay on fund distributions or on the redemption of fund shares. The investment return and principal value will fluctuate so that an investor’s shares, when redeemed, may be worth more or less than the original cost. To obtain performance information current to the most recent month end, please visit www.sterlingcapitalfunds.com.
The chart above represents a comparison of a hypothetical $10,000 investment in the indicated share class versus a similar investment in the Fund’s benchmark.
| * | Reflects 2% maximum sales charge. |
| ** | Reflects the applicable maximum CDSC of 1.00% (applicable only to redemptions within one year of purchase, and as such, are not reflected in the Average Annual Total Returns table since the periods reflected are for a year or longer). |
The Fund is measured against the ICE BofA 2-17 Year U.S. Municipal Bond Index, an unmanaged index, which is representative of municipal bonds. The index does not reflect the deduction of expenses associated with a mutual fund, such as investment management and fund accounting fees. Investors cannot invest directly in an index, although they can invest in its underlying securities.
Summary of Portfolio Holdings (Unaudited)
Sterling Capital Funds invested, as a percentage of net assets, in the following industries, countries, states, funds or security types, as of September 30, 2023:
| Sterling Capital Behavioral Large Cap Value Equity Fund | Percentage of net assets |
| Air Freight & Logistics | 1.7% |
| Automobiles | 1.9% |
| Banks | 5.3% |
| Beverages | 0.5% |
| Biotechnology | 4.9% |
| Building Products | 2.4% |
| Capital Markets | 3.2% |
| Communications Equipment | 2.4% |
| Construction Materials | 0.5% |
| Consumer Finance | 0.4% |
| Consumer Staples Distribution & Retail | 0.7% |
| Diversified Consumer Services | 0.2% |
| Diversified Telecommunication Services | 1.8% |
| Electric Utilities | 3.4% |
| Electronic Equipment, Instruments & Components | 1.1% |
| Energy Equipment & Services | 1.5% |
| Financial Services | 4.8% |
| Food Products | 1.3% |
| Gas Utilities | 0.3% |
| Health Care Providers & Services | 6.8% |
| Hotels, Restaurants & Leisure | 2.3% |
| Household Durables | 2.4% |
| Household Products | 0.9% |
| Insurance | 5.0% |
| Interactive Media & Services | 1.6% |
| IT Services | 1.7% |
| Machinery | 6.9% |
| Media | 2.7% |
| Metals & Mining | 3.3% |
| Mortgage Real Estate Investment Trusts (REITs) | 0.9% |
| Multi-Utilities | 0.3% |
| Office REITs | 0.3% |
| Oil, Gas & Consumable Fuels | 8.3% |
| Passenger Airlines | 0.9% |
| Personal Care Products | 0.2% |
| Pharmaceuticals | 2.8% |
| Professional Services | 0.1% |
| Retail REITs | 1.7% |
| Semiconductors & Semiconductor Equipment | 4.7% |
| Software | 2.1% |
| Specialized REITs | 1.3% |
| Specialty Retail | 2.2% |
| Technology Hardware, Storage & Peripherals | 0.1% |
| Tobacco | 1.6% |
| Trading Companies & Distributors | 0.1% |
| Money Market Fund | 0.4% |
| | 99.9% |
| Sterling Capital Mid Value Fund | Percentage of net assets |
| Automobile Components | 3.1% |
| Banks | 6.1% |
| Broadline Retail | 1.4% |
| Chemicals | 3.2% |
| Consumer Finance | 3.3% |
| Consumer Staples Distribution & Retail | 4.6% |
| Containers & Packaging | 3.1% |
| Electric Utilities | 3.1% |
| Electrical Equipment | 2.6% |
| Entertainment | 2.9% |
| Financial Services | 7.3% |
| Health Care Providers & Services | 14.8% |
| Hotels, Restaurants & Leisure | 2.2% |
| Household Durables | 2.2% |
| Household Products | 2.5% |
| Insurance | 5.9% |
| Interactive Media & Services | 1.5% |
| Life Sciences Tools & Services | 0.5% |
| Machinery | 3.5% |
| Media | 2.9% |
| Multi-Utilities | 0.5% |
| Oil, Gas & Consumable Fuels | 6.0% |
| Professional Services | 7.4% |
| Real Estate Management & Development | 2.6% |
| Software | 1.6% |
| Trading Companies & Distributors | 3.2% |
| Money Market Fund | 2.2% |
| | 100.2% |
Summary of Portfolio Holdings (Unaudited)
| Sterling Capital Behavioral Small Cap Value Equity Fund | Percentage of net assets |
| Banks | 10.8% |
| Beverages | 0.2% |
| Broadline Retail | 0.6% |
| Building Products | 3.4% |
| Capital Markets | 0.7% |
| Chemicals | 0.2% |
| Commercial Services & Supplies | 0.7% |
| Construction & Engineering | 0.7% |
| Construction Materials | 0.4% |
| Consumer Finance | 2.2% |
| Consumer Staples Distribution & Retail | 1.5% |
| Diversified Consumer Services | 0.6% |
| Diversified REITs | 1.0% |
| Diversified Telecommunication Services | 0.4% |
| Electric Utilities | 3.1% |
| Electrical Equipment | 2.2% |
| Electronic Equipment, Instruments & Components | 2.5% |
| Energy Equipment & Services | 0.9% |
| Entertainment | 0.7% |
| Financial Services | 4.6% |
| Food Products | 0.3% |
| Gas Utilities | 0.3% |
| Ground Transportation | 0.0%* |
| Health Care Equipment & Supplies | 2.0% |
| Health Care Providers & Services | 4.2% |
| Health Care REITs | 0.3% |
| Health Care Technology | 0.8% |
| Hotel & Resort REITs | 2.9% |
| Household Durables | 6.0% |
| Household Products | 0.7% |
| Independent Power and Renewable Electricity Producers | 0.2% |
| Industrial REITs | 0.5% |
| Insurance | 3.8% |
| Interactive Media & Services | 0.6% |
| Machinery | 3.1% |
| Marine Transportation | 0.6% |
| Media | 0.7% |
| Metals & Mining | 4.7% |
| Mortgage Real Estate Investment Trusts (REITs) | 2.4% |
| Office REITs | 1.5% |
| Oil, Gas & Consumable Fuels | 9.8% |
| Passenger Airlines | 0.9% |
| Pharmaceuticals | 1.3% |
| Real Estate Management & Development | 1.1% |
| Retail REITs | 1.3% |
| Semiconductors & Semiconductor Equipment | 2.4% |
| Software | 0.9% |
| Specialized REITs | 1.4% |
| Specialty Retail | 2.7% |
| Technology Hardware, Storage & Peripherals | 0.3% |
| Textiles, Apparel & Luxury Goods | 0.4% |
| Trading Companies & Distributors | 3.3% |
| Exchange Traded Fund | 0.5% |
| Money Market Fund | 1.1% |
| | 100.4% |
| * | Amount represents less than 0.05%. |
| Sterling Capital Special Opportunities Fund | Percentage of net assets |
| Automobile Components | 3.6% |
| Broadline Retail | 5.3% |
| Capital Markets | 6.9% |
| Communications Equipment | 3.6% |
| Consumer Finance | 1.9% |
| Consumer Staples Distribution & Retail | 0.8% |
| Containers & Packaging | 3.7% |
| Electronic Equipment, Instruments & Components | 3.8% |
| Entertainment | 4.0% |
| Financial Services | 9.8% |
| Health Care Providers & Services | 8.1% |
| Interactive Media & Services | 5.5% |
| IT Services | 3.0% |
| Life Sciences Tools & Services | 8.2% |
| Media | 3.9% |
| Pharmaceuticals | 1.8% |
| Professional Services | 3.3% |
| Real Estate Management & Development | 2.4% |
| Semiconductors & Semiconductor Equipment | 6.9% |
| Software | 7.3% |
| Wireless Telecommunication Services | 3.8% |
| Money Market Fund | 2.9% |
| | 100.5% |
| | |
| Sterling Capital Equity Income Fund | Percentage of net assets |
| Air Freight & Logistics | 2.1% |
| Beverages | 2.9% |
| Biotechnology | 3.8% |
| Broadline Retail | 1.9% |
| Capital Markets | 16.4% |
| Chemicals | 2.3% |
| Communications Equipment | 1.6% |
| Consumer Finance | 0.6% |
| Containers & Packaging | 4.0% |
| Health Care Equipment & Supplies | 3.6% |
| Health Care Providers & Services | 6.9% |
| Insurance | 11.9% |
| IT Services | 4.0% |
| Pharmaceuticals | 4.6% |
| Professional Services | 7.3% |
| Semiconductors & Semiconductor Equipment | 4.7% |
| Software | 4.5% |
| Specialized REITs | 2.7% |
| Specialty Retail | 3.8% |
| Tobacco | 3.4% |
| Trading Companies & Distributors | 4.6% |
| Money Market Fund | 2.3% |
| | 99.9% |
Summary of Portfolio Holdings (Unaudited)
| Sterling Capital Behavioral International Equity Fund | Percentage of net assets |
| Australia | 5.2% |
| Austria | 1.2% |
| Belgium | 0.9% |
| Bermuda | 0.3% |
| Denmark | 1.8% |
| Finland | 1.1% |
| France | 13.1% |
| Germany | 9.9% |
| Ireland | 1.2% |
| Israel | 2.0% |
| Italy | 3.4% |
| Japan | 20.7% |
| Luxembourg | 0.1% |
| Netherlands | 5.3% |
| Norway | 0.8% |
| Singapore | 1.8% |
| Spain | 4.7% |
| Sweden | 2.8% |
| Switzerland | 8.6% |
| United Kingdom | 12.8% |
| Money Market Fund | 1.3% |
| | 99.0% |
| Sterling Capital SMID Opportunities Fund | Percentage of net assets |
| Aerospace & Defense | 2.1% |
| Automobile Components | 4.1% |
| Banks | 2.6% |
| Building Products | 3.6% |
| Chemicals | 2.4% |
| Commercial Services & Supplies | 8.1% |
| Consumer Finance | 3.0% |
| Containers & Packaging | 2.5% |
| Electrical Equipment | 2.0% |
| Entertainment | 3.7% |
| Financial Services | 11.3% |
| Health Care Providers & Services | 9.9% |
| Hotels, Restaurants & Leisure | 2.7% |
| Household Durables | 5.3% |
| Insurance | 2.6% |
| Leisure Products | 2.1% |
| Media | 3.6% |
| Metals & Mining | 3.9% |
| Oil, Gas & Consumable Fuels | 7.3% |
| Professional Services | 6.9% |
| Real Estate Management & Development | 2.3% |
| Trading Companies & Distributors | 2.7% |
| Money Market Fund | 5.2% |
| | 99.9% |
| Sterling Capital Mid Cap Relative Value Fund | Percentage of net assets |
| Automobile Components | 1.9% |
| Banks | 3.1% |
| Building Products | 2.8% |
| Capital Markets | 3.1% |
| Chemicals | 3.4% |
| Communications Equipment | 1.1% |
| Construction & Engineering | 1.8% |
| Consumer Staples Distribution & Retail | 6.0% |
| Containers & Packaging | 5.2% |
| Electronic Equipment, Instruments & Components | 7.6% |
| Entertainment | 4.0% |
| Financial Services | 2.7% |
| Food Products | 2.1% |
| Gas Utilities | 2.3% |
| Health Care Equipment & Supplies | 3.7% |
| Household Durables | 1.1% |
| Industrial REITs | 2.4% |
| Insurance | 7.4% |
| Leisure Products | 1.2% |
| Life Sciences Tools & Services | 7.0% |
| Machinery | 2.1% |
| Multi-Utilities | 1.7% |
| Office REITs | 1.0% |
| Oil, Gas & Consumable Fuels | 5.7% |
| Professional Services | 3.5% |
| Real Estate Management & Development | 1.6% |
| Residential REITs | 1.8% |
| Semiconductors & Semiconductor Equipment | 1.4% |
| Software | 3.8% |
| Specialized REITs | 1.5% |
| Trading Companies & Distributors | 2.3% |
| Money Market Fund | 3.7% |
| | 100.0% |
| Sterling Capital Real Estate Fund | Percentage of net assets |
| Data Center | 11.9% |
| Diversified | 1.7% |
| Health Care | 7.6% |
| Hotel & Resort | 3.4% |
| Industrial | 14.8% |
| Multi-Family Residential | 13.2% |
| Office | 4.3% |
| Other Specialized | 4.0% |
| Real Estate Development | 1.6% |
| Retail | 13.8% |
| Self-Storage | 6.2% |
| Single-Family Residential | 4.0% |
| Telecom Tower | 11.7% |
| Money Market Fund | 1.7% |
| | 99.9% |
Summary of Portfolio Holdings (Unaudited)
| Sterling Capital Small Cap Value Fund | Percentage of net assets |
| Aerospace & Defense | 3.6% |
| Automobile Components | 1.3% |
| Banks | 11.4% |
| Capital Markets | 2.0% |
| Chemicals | 3.2% |
| Construction & Engineering | 2.6% |
| Consumer Staples Distribution & Retail | 9.9% |
| Electric Utilities | 2.3% |
| Electrical Equipment | 3.1% |
| Electronic Equipment, Instruments & Components | 5.9% |
| Entertainment | 1.9% |
| Gas Utilities | 2.3% |
| Household Durables | 4.1% |
| Industrial REITs | 3.5% |
| Insurance | 7.1% |
| Life Sciences Tools & Services | 3.7% |
| Machinery | 7.9% |
| Office REITs | 1.1% |
| Oil, Gas & Consumable Fuels | 3.8% |
| Professional Services | 3.7% |
| Retail REITs | 1.0% |
| Semiconductors & Semiconductor Equipment | 5.5% |
| Software | 3.2% |
| Trading Companies & Distributors | 4.3% |
| Money Market Fund | 0.5% |
| | 98.9% |
| Sterling Capital Ultra Short Bond Fund | Percentage of net assets |
| Asset Backed Securities | 13.9% |
| Collateralized Mortgage Obligations | 3.7% |
| Commercial Mortgage-Backed Securities | 9.5% |
| Commercial Paper | 2.9% |
| Corporate Bonds | 63.4% |
| U.S. Government Agencies | 2.7% |
| U.S. Treasury Bills | 1.7% |
| Money Market Fund | 3.6% |
| | 101.4% |
| Sterling Capital Short Duration Bond Fund | Percentage of net assets |
| Asset Backed Securities | 20.1% |
| Collateralized Mortgage Obligations | 2.0% |
| Commercial Mortgage-Backed Securities | 6.5% |
| Corporate Bonds | 60.7% |
| Municipal Bonds | 3.3% |
| U.S. Government Agencies | 0.8% |
| U.S. Treasury Notes | 4.5% |
| Money Market Fund | 3.0% |
| | 100.9% |
| Sterling Capital Intermediate U.S. Government Fund | Percentage of net assets |
| Asset Backed Securities | 1.9% |
| Collateralized Mortgage Obligations | 20.1% |
| Commercial Mortgage-Backed Securities | 20.2% |
| Corporate Bonds | 2.2% |
| Mortgage-Backed Securities | 31.0% |
| Municipal Bonds | 0.7% |
| U.S. Government Agencies | 13.5% |
| U.S. Treasury Notes | 9.6% |
| Money Market Fund | 0.4% |
| | 99.6% |
| Sterling Capital Total Return Bond Fund | Percentage of net assets |
| Asset Backed Securities | 10.7% |
| Collateralized Mortgage Obligations | 2.3% |
| Commercial Mortgage-Backed Securities | 11.1% |
| Corporate Bonds | 25.2% |
| Mortgage-Backed Securities | 27.5% |
| Municipal Bonds | 4.9% |
| U.S. Government Agencies | 0.8% |
| U.S. Treasury Bonds | 6.5% |
| U.S. Treasury Notes | 9.9% |
| Money Market Fund | 0.6% |
| | 99.5% |
| Sterling Capital Long Duration Corporate Bond Fund | Percentage of net assets |
| Corporate Bonds | 92.9% |
| U.S. Government Agencies | 0.2% |
| U.S. Treasury Bonds | 5.1% |
| Money Market Fund | 0.5% |
| | 98.7% |
| Sterling Capital Quality Income Fund | Percentage of net assets |
| Asset Backed Securities | 16.1% |
| Collateralized Mortgage Obligations | 20.7% |
| Commercial Mortgage-Backed Securities | 18.7% |
| Corporate Bonds | 0.3% |
| Mortgage-Backed Securities | 38.7% |
| U.S. Government Agencies | 0.5% |
| U.S. Treasury Bonds | 2.4% |
| U.S. Treasury Notes | 1.1% |
| Money Market Fund | 1.4% |
| | 99.9% |
| Sterling Capital North Carolina Intermediate Tax-Free Fund | Percentage of net assets |
| North Carolina Municipal Bonds | 96.8% |
| Money Market Fund | 2.2% |
| | 99.0% |
| | |
| Sterling Capital South Carolina Intermediate Tax-Free Fund | Percentage of net assets |
| South Carolina Municipal Bonds | 97.8% |
| Money Market Fund | 1.2% |
| | 99.0% |
Summary of Portfolio Holdings (Unaudited)
| Sterling Capital Virginia Intermediate Tax-Free Fund | Percentage of net assets |
| Virginia Municipal Bonds | 98.7% |
| Money Market Fund | 0.8% |
| | 99.5% |
| Sterling Capital West Virginia Intermediate Tax-Free Fund | Percentage of net assets |
| West Virginia Municipal Bonds | 96.8% |
| Money Market Fund | 1.9% |
| | 98.7% |
Expense Example (Unaudited)
As a shareholder of the Sterling Capital Funds (each, a “Fund” and collectively, the “Funds”), you incur two types of costs: (1) transaction costs, including sales charges (loads) on purchases and (2) ongoing costs, including management fees; distribution and/or service (12b-1) fees; and other Fund expenses.
These examples are intended to help you understand your ongoing costs (in dollars) of investing in the Funds and to compare these costs with the ongoing costs of investing in other mutual funds. These examples are based on an investment of $1,000 invested at the beginning of the period and held for the entire period from April 1, 2023 through September 30, 2023.
Actual Example
The table below provides information about actual account values and actual expenses. You may use the information below, together with the amount you invested, to estimate the expenses that you paid over the period. Simply divide your account value by $1,000 (for example, an $8,600 account value divided by $1,000 = 8.6), then multiply the result by the number in the table under the heading entitled “Expenses Paid During Period” to estimate the expenses you paid on your account during this period.
| | | Beginning Account Value 4/1/23 | | Ending Account Value 9/30/23 | | Expenses Paid During Period* 4/1/23 - 9/30/23 | Annualized Expense Ratio During Period 4/1/23 - 9/30/23 |
| Sterling Capital Behavioral Large Cap Value Equity Fund | | | | | | | |
| Class A Shares | $ | 1,000.00 | $ | 1,027.81 | $ | 5.80 | 1.14% |
| Class C Shares | | 1,000.00 | | 1,024.31 | | 9.59 | 1.89% |
| Institutional Shares | | 1,000.00 | | 1,029.28 | | 4.53 | 0.89% |
| Class R6 Shares | | 1,000.00 | | 1,029.64 | | 4.17 | 0.82% |
| Sterling Capital Mid Value Fund | | | | | | | |
| Class A Shares | | 1,000.00 | | 1,020.45 | | 5.72 | 1.13% |
| Class C Shares | | 1,000.00 | | 1,016.10 | | 9.50 | 1.88% |
| Institutional Shares | | 1,000.00 | | 1,021.84 | | 4.46 | 0.88% |
| Class R6 Shares | | 1,000.00 | | 1,022.48 | | 4.06 | 0.80% |
| Sterling Capital Behavioral Small Cap Value Equity Fund | | | | | | | |
| Class A Shares | | 1,000.00 | | 1,041.91 | | 5.89 | 1.15% |
| Class C Shares | | 1,000.00 | | 1,037.69 | | 9.71 | 1.90% |
| Institutional Shares | | 1,000.00 | | 1,043.39 | | 4.56 | 0.89% |
| Class R6 Shares | | 1,000.00 | | 1,043.66 | | 4.25 | 0.83% |
| Sterling Capital Special Opportunities Fund | | | | | | | |
| Class A Shares | | 1,000.00 | | 1,064.06 | | 5.95 | 1.15% |
| Class C Shares | | 1,000.00 | | 1,059.60 | | 9.81 | 1.90% |
| Institutional Shares | | 1,000.00 | | 1,065.17 | | 4.66 | 0.90% |
| Class R6 Shares | | 1,000.00 | | 1,066.02 | | 4.20 | 0.81% |
| Sterling Capital Equity Income Fund | | | | | | | |
| Class A Shares | | 1,000.00 | | 1,002.77 | | 5.42 | 1.08% |
| Class C Shares | | 1,000.00 | | 998.98 | | 9.17 | 1.83% |
| Institutional Shares | | 1,000.00 | | 1,004.01 | | 4.17 | 0.83% |
| Class R6 Shares | | 1,000.00 | | 1,004.13 | | 3.67 | 0.73% |
| Sterling Capital Behavioral International Equity Fund | | | | | | | |
| Class A Shares | | 1,000.00 | | 1,017.84 | | 4.86 | 0.96% |
| Class C Shares | | 1,000.00 | | 1,013.32 | | 8.53 | 1.69% |
| Institutional Shares | | 1,000.00 | | 1,018.95 | | 3.59 | 0.71% |
| Class R6 Shares | | 1,000.00 | | 1,018.95 | | 3.34 | 0.66% |
| Sterling Capital SMID Opportunities Fund | | | | | | | |
| Class A Shares | | 1,000.00 | | 1,043.07 | | 5.33 | 1.04% |
| Class C Shares | | 1,000.00 | | 1,040.04 | | 9.15 | 1.79% |
| Institutional Shares | | 1,000.00 | | 1,044.88 | | 4.05 | 0.79% |
| Sterling Capital Mid Cap Relative Value Fund | | | | | | | |
| Class A Shares | | 1,000.00 | | 1,014.29 | | 5.66 | 1.12% |
| Class C Shares | | 1,000.00 | | 1,010.88 | | 8.92 | 1.77% |
| Institutional Shares | | 1,000.00 | | 1,015.56 | | 4.40 | 0.87% |
Expense Example (Unaudited)
| | | Beginning Account Value 4/1/23 | | Ending Account Value 9/30/23 | | Expenses Paid During Period* 4/1/23 - 9/30/23 | Annualized Expense Ratio During Period 4/1/23 - 9/30/23 |
| Sterling Capital Real Estate Fund | | | | | | | |
| Class A Shares | $ | 1,000.00 | $ | 933.30 | $ | 5.43 | 1.12% |
| Class C Shares | | 1,000.00 | | 929.79 | | 9.05 | 1.87% |
| Institutional Shares | | 1,000.00 | | 934.40 | | 4.22 | 0.87% |
| Class R6 Shares | | 1,000.00 | | 934.72 | | 3.93 | 0.81% |
| Sterling Capital Small Cap Value Fund | | | | | | | |
| Class A Shares | | 1,000.00 | | 1,027.80 | | 6.46 | 1.27% |
| Class C Shares | | 1,000.00 | | 1,023.74 | | 10.25 | 2.02% |
| Institutional Shares | | 1,000.00 | | 1,028.82 | | 5.19 | 1.02% |
| Class R6 Shares | | 1,000.00 | | 1,029.56 | | 4.68 | 0.92% |
| Sterling Capital Ultra Short Bond Fund | | | | | | | |
| Class A Shares | | 1,000.00 | | 1,025.91 | | 2.64 | 0.52% |
| Institutional Shares | | 1,000.00 | | 1,026.14 | | 1.37 | 0.27% |
| Sterling Capital Short Duration Bond Fund | | | | | | | |
| Class A Shares | | 1,000.00 | | 1,010.98 | | 3.43 | 0.68% |
| Class C Shares | | 1,000.00 | | 1,007.19 | | 7.20 | 1.43% |
| Institutional Shares | | 1,000.00 | | 1,012.23 | | 2.17 | 0.43% |
| Class R6 Shares | | 1,000.00 | | 1,013.93 | | 1.72 | 0.34% |
| Sterling Capital Intermediate U.S. Government Fund | | | | | | | |
| Class A Shares | | 1,000.00 | | 974.01 | | 3.71 | 0.75% |
| Class C Shares | | 1,000.00 | | 970.27 | | 7.41 | 1.50% |
| Institutional Shares | | 1,000.00 | | 976.38 | | 2.48 | 0.50% |
| Sterling Capital Total Return Bond Fund | | | | | | | |
| Class A Shares | | 1,000.00 | | 962.39 | | 3.44 | 0.70% |
| Class C Shares | | 1,000.00 | | 958.88 | | 7.12 | 1.45% |
| Institutional Shares | | 1,000.00 | | 963.64 | | 2.22 | 0.45% |
| Class R6 Shares | | 1,000.00 | | 964.12 | | 1.72 | 0.35% |
| Sterling Capital Long Duration Corporate Bond Fund | | | | | | | |
| Class A Shares | | 1,000.00 | | 918.71 | | 3.37 | 0.70% |
| Class C Shares | | 1,000.00 | | 916.51 | | 6.92 | 1.44% |
| Institutional Shares | | 1,000.00 | | 921.16 | | 2.17 | 0.45% |
| Class R6 Shares | | 1,000.00 | | 920.27 | | 1.73 | 0.36% |
| Sterling Capital Quality Income Fund | | | | | | | |
| Class A Shares | | 1,000.00 | | 969.36 | | 4.20 | 0.85% |
| Class C Shares | | 1,000.00 | | 966.92 | | 7.79 | 1.58% |
| Institutional Shares | | 1,000.00 | | 971.70 | | 2.97 | 0.60% |
| Sterling Capital North Carolina Intermediate Tax-Free Fund | | | | | | | |
| Class A Shares | | 1,000.00 | | 959.27 | | 4.17 | 0.85% |
| Class C Shares | | 1,000.00 | | 955.61 | | 7.89 | 1.61% |
| Institutional Shares | | 1,000.00 | | 961.44 | | 2.95 | 0.60% |
| Sterling Capital South Carolina Intermediate Tax-Free Fund | | | | | | | |
| Class A Shares | | 1,000.00 | | 965.65 | | 3.99 | 0.81% |
| Class C Shares | | 1,000.00 | | 961.05 | | 7.67 | 1.56% |
| Institutional Shares | | 1,000.00 | | 966.57 | | 2.76 | 0.56% |
| Sterling Capital Virginia Intermediate Tax-Free Fund | | | | | | | |
| Class A Shares | | 1,000.00 | | 959.96 | | 4.32 | 0.88% |
| Class C Shares | | 1,000.00 | | 954.77 | | 7.79 | 1.59% |
| Institutional Shares | | 1,000.00 | | 961.17 | | 3.10 | 0.63% |
Expense Example (Unaudited)
| | | Beginning Account Value 4/1/23 | | Ending Account Value 9/30/23 | | Expenses Paid During Period* 4/1/23 - 9/30/23 | Annualized Expense Ratio During Period 4/1/23 - 9/30/23 |
| Sterling Capital West Virginia Intermediate Tax-Free Fund | | | | | | | |
| Class A Shares | $ | 1,000.00 | $ | 968.95 | $ | 4.34 | 0.88% |
| Class C Shares | | 1,000.00 | | 967.12 | | 7.35 | 1.49% |
| Institutional Shares | | 1,000.00 | | 971.29 | | 3.16 | 0.64% |
| * | Expenses are equal to the average account value over the period multiplied by the Fund’s annualized expense ratio, multiplied by 182 days divided by 365 (to reflect the six month period). |
Expense Example (Unaudited)
Hypothetical Example for Comparison Purposes
The table below provides information about hypothetical account values and hypothetical expenses based on the Fund’s actual expense ratio and an assumed rate of return of 5% per year before expenses, which is not the Fund’s actual return. The hypothetical account values and expenses may not be used to estimate the actual ending account balance or expenses you paid for the year. You may use this information to compare the ongoing costs of investing in a Fund and other funds. To do so, compare this 5% hypothetical example with the 5% hypothetical examples that appear in the shareholder reports of other funds.
Please note that the expenses shown in the table are meant to highlight your ongoing costs only and do not reflect any transactional costs, such as sales charges (loads), redemption fees, or exchange fees. Therefore, the table is useful in comparing ongoing costs only, and will not help you determine the relative total costs of owning different funds. In addition, if these transactional costs were included, your costs would have been higher.
| | | Beginning Account Value 4/1/23 | | Ending Account Value 9/30/23 | | Expenses Paid During Period* 4/1/23 - 9/30/23 | Annualized Expense Ratio During Period 4/1/23 - 9/30/23 |
| Sterling Capital Behavioral Large Cap Value Equity Fund | | | | | | | |
| Class A Shares | $ | 1,000.00 | $ | 1,019.35 | $ | 5.77 | 1.14% |
| Class C Shares | | 1,000.00 | | 1,015.59 | | 9.55 | 1.89% |
| Institutional Shares | | 1,000.00 | | 1,020.61 | | 4.51 | 0.89% |
| Class R6 Shares | | 1,000.00 | | 1,020.96 | | 4.15 | 0.82% |
| Sterling Capital Mid Value Fund | | | | | | | |
| Class A Shares | | 1,000.00 | | 1,019.40 | | 5.72 | 1.13% |
| Class C Shares | | 1,000.00 | | 1,015.64 | | 9.50 | 1.88% |
| Institutional Shares | | 1,000.00 | | 1,020.66 | | 4.46 | 0.88% |
| Class R6 Shares | | 1,000.00 | | 1,021.06 | | 4.05 | 0.80% |
| Sterling Capital Behavioral Small Cap Value Equity Fund | | | | | | | |
| Class A Shares | | 1,000.00 | | 1,019.30 | | 5.82 | 1.15% |
| Class C Shares | | 1,000.00 | | 1,015.54 | | 9.60 | 1.90% |
| Institutional Shares | | 1,000.00 | | 1,020.61 | | 4.51 | 0.89% |
| Class R6 Shares | | 1,000.00 | | 1,020.91 | | 4.20 | 0.83% |
| Sterling Capital Special Opportunities Fund | | | | | | | |
| Class A Shares | | 1,000.00 | | 1,019.30 | | 5.82 | 1.15% |
| Class C Shares | | 1,000.00 | | 1,015.54 | | 9.60 | 1.90% |
| Institutional Shares | | 1,000.00 | | 1,020.56 | | 4.56 | 0.90% |
| Class R6 Shares | | 1,000.00 | | 1,021.01 | | 4.10 | 0.81% |
| Sterling Capital Equity Income Fund | | | | | | | |
| Class A Shares | | 1,000.00 | | 1,019.65 | | 5.47 | 1.08% |
| Class C Shares | | 1,000.00 | | 1,015.89 | | 9.25 | 1.83% |
| Institutional Shares | | 1,000.00 | | 1,020.91 | | 4.20 | 0.83% |
| Class R6 Shares | | 1,000.00 | | 1,021.41 | | 3.70 | 0.73% |
| Sterling Capital Behavioral International Equity Fund | | | | | | | |
| Class A Shares | | 1,000.00 | | 1,020.26 | | 4.86 | 0.96% |
| Class C Shares | | 1,000.00 | | 1,016.60 | | 8.54 | 1.69% |
| Institutional Shares | | 1,000.00 | | 1,021.51 | | 3.60 | 0.71% |
| Class R6 Shares | | 1,000.00 | | 1,021.76 | | 3.35 | 0.66% |
| Sterling Capital SMID Opportunities Fund | | | | | | | |
| Class A Shares | | 1,000.00 | | 1,019.85 | | 5.27 | 1.04% |
| Class C Shares | | 1,000.00 | | 1,016.09 | | 9.05 | 1.79% |
| Institutional Shares | | 1,000.00 | | 1,021.11 | | 4.00 | 0.79% |
| Sterling Capital Mid Cap Relative Value Fund | | | | | | | |
| Class A Shares | | 1,000.00 | | 1,019.45 | | 5.67 | 1.12% |
| Class C Shares | | 1,000.00 | | 1,016.19 | | 8.95 | 1.77% |
| Institutional Shares | | 1,000.00 | | 1,020.71 | | 4.41 | 0.87% |
Expense Example (Unaudited)
| | | Beginning Account Value 4/1/23 | | Ending Account Value 9/30/23 | | Expenses Paid During Period* 4/1/23 - 9/30/23 | Annualized Expense Ratio During Period 4/1/23 - 9/30/23 |
| Sterling Capital Real Estate Fund | | | | | | | |
| Class A Shares | $ | 1,000.00 | $ | 1,019.45 | $ | 5.67 | 1.12% |
| Class C Shares | | 1,000.00 | | 1,015.69 | | 9.45 | 1.87% |
| Institutional Shares | | 1,000.00 | | 1,020.71 | | 4.41 | 0.87% |
| Class R6 Shares | | 1,000.00 | | 1,021.01 | | 4.10 | 0.81% |
| Sterling Capital Small Cap Value Fund | | | | | | | |
| Class A Shares | | 1,000.00 | | 1,018.70 | | 6.43 | 1.27% |
| Class C Shares | | 1,000.00 | | 1,014.94 | | 10.20 | 2.02% |
| Institutional Shares | | 1,000.00 | | 1,019.95 | | 5.16 | 1.02% |
| Class R6 Shares | | 1,000.00 | | 1,020.46 | | 4.66 | 0.92% |
| Sterling Capital Ultra Short Bond Fund | | | | | | | |
| Class A Shares | | 1,000.00 | | 1,022.46 | | 2.64 | 0.52% |
| Institutional Shares | | 1,000.00 | | 1,023.71 | | 1.37 | 0.27% |
| Sterling Capital Short Duration Bond Fund | | | | | | | |
| Class A Shares | | 1,000.00 | | 1,021.66 | | 3.45 | 0.68% |
| Class C Shares | | 1,000.00 | | 1,017.90 | | 7.23 | 1.43% |
| Institutional Shares | | 1,000.00 | | 1,022.91 | | 2.18 | 0.43% |
| Class R6 Shares | | 1,000.00 | | 1,023.36 | | 1.72 | 0.34% |
| Sterling Capital Intermediate U.S. Government Fund | | | | | | | |
| Class A Shares | | 1,000.00 | | 1,021.31 | | 3.80 | 0.75% |
| Class C Shares | | 1,000.00 | | 1,017.55 | | 7.59 | 1.50% |
| Institutional Shares | | 1,000.00 | | 1,022.56 | | 2.54 | 0.50% |
| Sterling Capital Total Return Bond Fund | | | | | | | |
| Class A Shares | | 1,000.00 | | 1,021.56 | | 3.55 | 0.70% |
| Class C Shares | | 1,000.00 | | 1,017.80 | | 7.33 | 1.45% |
| Institutional Shares | | 1,000.00 | | 1,022.81 | | 2.28 | 0.45% |
| Class R6 Shares | | 1,000.00 | | 1,023.31 | | 1.78 | 0.35% |
| Sterling Capital Long Duration Corporate Bond Fund | | | | | | | |
| Class A Shares | | 1,000.00 | | 1,021.56 | | 3.55 | 0.70% |
| Class C Shares | | 1,000.00 | | 1,017.85 | | 7.28 | 1.44% |
| Institutional Shares | | 1,000.00 | | 1,022.81 | | 2.28 | 0.45% |
| Class R6 Shares | | 1,000.00 | | 1,023.26 | | 1.83 | 0.36% |
| Sterling Capital Quality Income Fund | | | | | | | |
| Class A Shares | | 1,000.00 | | 1,020.81 | | 4.31 | 0.85% |
| Class C Shares | | 1,000.00 | | 1,017.15 | | 7.99 | 1.58% |
| Institutional Shares | | 1,000.00 | | 1,022.06 | | 3.04 | 0.60% |
| Sterling Capital North Carolina Intermediate Tax-Free Fund | | | | | | | |
| Class A Shares | | 1,000.00 | | 1,020.81 | | 4.31 | 0.85% |
| Class C Shares | | 1,000.00 | | 1,017.00 | | 8.14 | 1.61% |
| Institutional Shares | | 1,000.00 | | 1,022.06 | | 3.04 | 0.60% |
| Sterling Capital South Carolina Intermediate Tax-Free Fund | | | | | | | |
| Class A Shares | | 1,000.00 | | 1,021.01 | | 4.10 | 0.81% |
| Class C Shares | | 1,000.00 | | 1,017.25 | | 7.89 | 1.56% |
| Institutional Shares | | 1,000.00 | | 1,022.26 | | 2.84 | 0.56% |
| Sterling Capital Virginia Intermediate Tax-Free Fund | | | | | | | |
| Class A Shares | | 1,000.00 | | 1,020.66 | | 4.46 | 0.88% |
| Class C Shares | | 1,000.00 | | 1,017.10 | | 8.04 | 1.59% |
| Institutional Shares | | 1,000.00 | | 1,021.91 | | 3.19 | 0.63% |
Expense Example (Unaudited)
| | | Beginning Account Value 4/1/23 | | Ending Account Value 9/30/23 | | Expenses Paid During Period* 4/1/23 - 9/30/23 | Annualized Expense Ratio During Period 4/1/23 - 9/30/23 |
| Sterling Capital West Virginia Intermediate Tax-Free Fund | | | | | | | |
| Class A Shares | $ | 1,000.00 | $ | 1,020.66 | $ | 4.46 | 0.88% |
| Class C Shares | | 1,000.00 | | 1,017.60 | | 7.54 | 1.49% |
| Institutional Shares | | 1,000.00 | | 1,021.86 | | 3.24 | 0.64% |
| * | Expenses are equal to the average account value over the period multiplied by the Fund’s annualized expense ratio, multiplied by 182 days divided by 365 (to reflect the six month period). |
| Sterling Capital Behavioral Large Cap Value Equity Fund |
Schedule of Portfolio Investments
September 30, 2023
| Shares | | | | | Fair Value | |
| COMMON STOCKS — 99.5% | | | | |
| | | | | | | | | |
| | | | | Air Freight & Logistics — 1.7% |
| | 2,000 | | | FedEx Corp. | | $ | 529,840 | |
| | | | | | | | | |
| | | | | Automobiles — 1.9% |
| | 10,625 | | | Ford Motor Co. | | | 131,962 | |
| | 13,275 | | | General Motors Co. | | | 437,677 | |
| | | | | | | | 569,639 | |
| | | | | | | | | |
| | | | | Banks — 5.3% |
| | 7,575 | | | JPMorgan Chase & Co. | | | 1,098,526 | |
| | 13,200 | | | New York Community Bancorp, Inc. | | | 149,688 | |
| | 9,300 | | | Wells Fargo & Co. | | | 379,998 | |
| | | | | | | | 1,628,212 | |
| | | | | | | | | |
| | | | | Beverages — 0.5% |
| | 2,250 | | | Molson Coors Beverage Co., Class B | | | 143,078 | |
| | | | | | | | | |
| | | | | Biotechnology — 4.9% |
| | 2,800 | | | AbbVie, Inc. | | | 417,368 | |
| | 1,200 | | | Amgen, Inc. | | | 322,512 | |
| | 7,050 | | | Gilead Sciences, Inc. | | | 528,327 | |
| | 150 | | | Regeneron Pharmaceuticals, Inc.(a) | | | 123,444 | |
| | 200 | | | United Therapeutics Corp.(a) | | | 45,174 | |
| | 200 | | | Vertex Pharmaceuticals, Inc.(a) | | | 69,548 | |
| | | | | | | | 1,506,373 | |
| | | | | | | | | |
| | | | | Building Products — 2.4% |
| | 950 | | | Builders FirstSource, Inc.(a) | | | 118,266 | |
| | 8,525 | | | Carrier Global Corp. | | | 470,580 | |
| | 1,000 | | | Owens Corning | | | 136,410 | |
| | | | | | | | 725,256 | |
| | | | | | | | | |
| | | | | Capital Markets — 3.2% |
| | 525 | | | Ameriprise Financial, Inc. | | | 173,082 | |
| | 4,050 | | | Bank of New York Mellon Corp. (The) | | | 172,733 | |
| | 3,450 | | | Interactive Brokers Group, Inc., Class A | | | 298,632 | |
| | 5,175 | | | Janus Henderson Group PLC | | | 133,618 | |
| | 475 | | | T. Rowe Price Group, Inc. | | | 49,813 | |
| | 6,275 | | | XP, Inc., Class A | | | 144,639 | |
| | | | | | | | 972,517 | |
| | | | | | | | | |
| | | | | Communications Equipment — 2.4% |
| | 13,650 | | | Cisco Systems, Inc. | | | 733,824 | |
| | | | | | | | | |
| | | | | Construction Materials — 0.5% |
| | 925 | | | Eagle Materials, Inc. | | | 154,031 | |
| | | | | | | | | |
| | | | | Consumer Finance — 0.4% |
| | 3,100 | | | OneMain Holdings, Inc. | | | 124,279 | |
| | | | | | | | | |
| | | | | Consumer Staples Distribution & Retail — 0.7% |
| | 3,700 | | | Kroger Co. (The) | | | 165,575 | |
| | 1,600 | | | U.S. Foods Holding Corp.(a) | | | 63,520 | |
| | | | | | | | 229,095 | |
| | | | | |
| | | | | Diversified Consumer Services — 0.2% |
| | 400 | | | Grand Canyon Education, Inc.(a) | | | 46,752 | |
| Shares | | | | | Fair Value | |
| COMMON STOCKS — (continued) | | | | |
| | | | | | | | | |
| | | | | Diversified Telecommunication Services — 1.8% |
| | 35,675 | | | AT&T, Inc. | | $ | 535,838 | |
| | | | | | | | | |
| | | | | Electric Utilities — 3.4% |
| | 3,925 | | | Duke Energy Corp. | | | 346,420 | |
| | 2,125 | | | Edison International | | | 134,491 | |
| | 2,600 | | | Evergy, Inc. | | | 131,820 | |
| | 3,925 | | | NRG Energy, Inc. | | | 151,191 | |
| | 4,275 | | | OGE Energy Corp. | | | 142,486 | |
| | 1,750 | | | Pinnacle West Capital Corp. | | | 128,940 | |
| | | | | | | | 1,035,348 | |
| | | | | | | | | |
| | | | | Electronic Equipment, Instruments & Components — 1.1% |
| | 1,625 | | | Jabil, Inc. | | | 206,196 | |
| | 4,450 | | | Vontier Corp. | | | 137,594 | |
| | | | | | | | 343,790 | |
| | | | | | | | | |
| | | | | Energy Equipment & Services — 1.5% |
| | 12,900 | | | Baker Hughes Co. | | | 455,628 | |
| | | | | | | | | |
| | | | | Financial Services — 4.8% |
| | 4,600 | | | Apollo Global Management, Inc. | | | 412,896 | |
| | 7,800 | | | Corebridge Financial, Inc. | | | 154,050 | |
| | 4,200 | | | Fiserv, Inc.(a) | | | 474,432 | |
| | 8,050 | | | MGIC Investment Corp. | | | 134,355 | |
| | 27,075 | | | UWM Holdings Corp. | | | 131,314 | |
| | 12,275 | | | Western Union Co. (The) | | | 161,784 | |
| | | | | | | | 1,468,831 | |
| | | | | | | | | |
| | | | | Food Products — 1.3% |
| | 5,400 | | | Archer-Daniels-Midland Co. | | | 407,268 | |
| | | | | | | | | |
| | | | | Gas Utilities — 0.3% |
| | 1,475 | | | National Fuel Gas Co. | | | 76,567 | |
| | | | | | | | | |
| | | | | Health Care Providers & Services — 6.8% |
| | 2,075 | | | Cencora, Inc. | | | 373,438 | |
| | 5,400 | | | Centene Corp.(a) | | | 371,952 | |
| | 600 | | | Cigna Group (The) | | | 171,642 | |
| | 524 | | | Elevance Health, Inc. | | | 228,160 | |
| | 1,775 | | | HCA Healthcare, Inc. | | | 436,615 | |
| | 1,124 | | | McKesson Corp. | | | 488,771 | |
| | | | | | | | 2,070,578 | |
| | | | | | | | | |
| | | | | Hotels, Restaurants & Leisure — 2.3% |
| | 125 | | | Booking Holdings, Inc.(a) | | | 385,494 | |
| | 2,375 | | | Boyd Gaming Corp. | | | 144,471 | |
| | 425 | | | Marriott International, Inc., Class A | | | 83,538 | |
| | 850 | | | Royal Caribbean Cruises, Ltd.(a) | | | 78,319 | |
| | | | | | | | 691,822 | |
| | | | | | | | | |
| | | | | Household Durables — 2.4% |
| | 3,975 | | | DR Horton, Inc. | | | 427,193 | |
| | 1,250 | | | Lennar Corp., Class A | | | 140,288 | |
| | 2,300 | | | Toll Brothers, Inc. | | | 170,108 | |
| | | | | | | | 737,589 | |
See accompanying Notes to the Financial Statements.
| Sterling Capital Behavioral Large Cap Value Equity Fund |
Schedule of Portfolio Investments — (continued)
September 30, 2023
| Shares | | | | | Fair Value | |
| COMMON STOCKS — (continued) | | | | |
| | | | | | | | | |
| | | | | Household Products — 0.9% |
| | 1,125 | | | Kimberly-Clark Corp. | | $ | 135,956 | |
| | 1,775 | | | Spectrum Brands Holdings, Inc. | | | 139,071 | |
| | | | | | | | 275,027 | |
| | | | | | | | | |
| | | | | Insurance — 5.0% |
| | 6,600 | | | Aflac, Inc. | | | 506,550 | |
| | 8,125 | | | American International Group, Inc. | | | 492,375 | |
| | 2,750 | | | Prudential Financial, Inc. | | | 260,947 | |
| | 700 | | | Reinsurance Group of America, Inc. | | | 101,633 | |
| | 3,550 | | | Unum Group | | | 174,625 | |
| | | | | | | | 1,536,130 | |
| | | | | | | | | |
| | | | | Interactive Media & Services — 1.6% |
| | 600 | | | Alphabet, Inc., Class C(a) | | | 79,110 | |
| | 1,400 | | | Meta Platforms, Inc., Class A(a) | | | 420,294 | |
| | | | | | | | 499,404 | |
| | | | | | | | | |
| | | | | IT Services — 1.7% |
| | 6,375 | | | Cognizant Technology Solutions Corp., Class A | | | 431,843 | |
| | 600 | | | International Business Machines Corp. | | | 84,180 | |
| | | | | | | | 516,023 | |
| | | | | | | | | |
| | | | | Machinery — 6.9% |
| | 2,300 | | | Allison Transmission Holdings, Inc. | | | 135,838 | |
| | 1,775 | | | Caterpillar, Inc. | | | 484,575 | |
| | 950 | | | Deere & Co. | | | 358,511 | |
| | 5,850 | | | PACCAR, Inc. | | | 497,367 | |
| | 1,250 | | | Parker-Hannifin Corp. | | | 486,900 | |
| | 550 | | | Snap-on, Inc. | | | 140,283 | |
| | | | | | | | 2,103,474 | |
| | | | | | | | | |
| | | | | Media — 2.7% |
| | 225 | | | Charter Communications, Inc., Class A(a) | | | 98,960 | |
| | 16,050 | | | Comcast Corp., Class A | | | 711,657 | |
| | | | | | | | 810,617 | |
| | | | | | | | | |
| | | | | Metals & Mining — 3.3% |
| | 3,000 | | | Nucor Corp. | | | 469,050 | |
| | 625 | | | Reliance Steel & Aluminum Co. | | | 163,894 | |
| | 3,200 | | | Southern Copper Corp. | | | 240,928 | |
| | 1,400 | | | Steel Dynamics, Inc. | | | 150,108 | |
| | | | | | | | 1,023,980 | |
| | | | | | | | | |
| | | | | Mortgage Real Estate Investment Trusts (REITs) — 0.9% |
| | 13,375 | | | Rithm Capital Corp. | | | 124,254 | |
| | 7,150 | | | Starwood Property Trust, Inc. | | | 138,352 | |
| | | | | | | | 262,606 | |
| | | | | | | | | |
| | | | | Multi-Utilities — 0.3% |
| | 1,575 | | | Public Service Enterprise Group, Inc. | | | 89,633 | |
| | | | | | | | | |
| | | | | Office REITs — 0.3% |
| | 1,800 | | | Boston Properties, Inc. | | | 107,064 | |
| Shares | | | | | Fair Value | |
| COMMON STOCKS — (continued) |
| | | | | | | |
| | | | | Oil, Gas & Consumable Fuels — 8.3% |
| | 3,425 | | | Exxon Mobil Corp. | | $ | 402,711 | |
| | 2,375 | | | HF Sinclair Corp. | | | 135,209 | |
| | 3,450 | | | Marathon Petroleum Corp. | | | 522,123 | |
| | 4,250 | | | Phillips 66 | | | 510,637 | |
| | 2,050 | | | Pioneer Natural Resources Co. | | | 470,578 | |
| | 3,500 | | | Valero Energy Corp. | | | 495,985 | |
| | | | | | | | 2,537,243 | |
| | | | | | | | | |
| | | | | Passenger Airlines — 0.9% |
| | 1,550 | | | Copa Holdings SA, Class A | | | 138,136 | |
| | 3,300 | | | United Airlines Holdings, Inc.(a) | | | 139,590 | |
| | | | | | | | 277,726 | |
| | | | | | | | | |
| | | | | Personal Care Products — 0.2% |
| | 6,625 | | | Coty, Inc., Class A(a) | | | 72,676 | |
| | | | | | | | | |
| | | | | Pharmaceuticals — 2.8% |
| | 1,025 | | | Jazz Pharmaceuticals PLC(a) | | | 132,676 | |
| | 7,025 | | | Merck & Co., Inc. | | | 723,224 | |
| | | | | | | | 855,900 | |
| | | | | | | | | |
| | | | | Professional Services — 0.1% |
| | 275 | | | Science Applications International Corp. | | | 29,024 | |
| | | | | | | | | |
| | | | | Retail REITs — 1.7% |
| | 3,875 | | | Simon Property Group, Inc. | | | 418,616 | |
| | 3,000 | | | Spirit Realty Capital, Inc. | | | 100,590 | |
| | | | | | | | 519,206 | |
| | | | | | | | | |
| | | | | Semiconductors & Semiconductor Equipment — 4.7% |
| | 2,900 | | | Applied Materials, Inc. | | | 401,505 | |
| | 476 | | | Broadcom, Inc. | | | 395,356 | |
| | 600 | | | KLA Corp. | | | 275,196 | |
| | 4,550 | | | Microchip Technology, Inc. | | | 355,128 | |
| | | | | | | | 1,427,185 | |
| | | | | | | | | |
| | | | | Software — 2.1% |
| | 4,925 | | | NCR Corp.(a) | | | 132,827 | |
| | 4,800 | | | Oracle Corp. | | | 508,416 | |
| | | | | | | | 641,243 | |
| | | | | | | | | |
| | | | | Specialized REITs — 1.3% |
| | 3,150 | | | EPR Properties | | | 130,851 | |
| | 2,450 | | | Gaming & Leisure Properties, Inc. | | | 111,598 | |
| | 5,175 | | | VICI Properties, Inc. | | | 150,592 | |
| | | | | | | | 393,041 | |
| | | | | | | | | |
| | | | | Specialty Retail — 2.2% |
| | 775 | | | AutoNation, Inc.(a) | | | 117,335 | |
| | 150 | | | AutoZone, Inc.(a) | | | 380,998 | |
| | 1,000 | | | Penske Automotive Group, Inc. | | | 167,060 | |
| | | | | | | | 665,393 | |
| | | | | | | | | |
| | | | | Technology Hardware, Storage & Peripherals — 0.1% |
| | 1,375 | | | HP, Inc. | | | 35,338 | |
Continued
| Sterling Capital Behavioral Large Cap Value Equity Fund |
Schedule of Portfolio Investments — (continued)
September 30, 2023
| Shares | | | | Fair Value | |
| COMMON STOCKS — (continued) | | | |
| | | | | | | | | |
| | | | | Tobacco — 1.6% | | | | |
| | 11,500 | | | Altria Group, Inc. | | $ | 483,575 | |
| | | | | | | | | |
| | | | | Trading Companies & Distributors — 0.1% | | | | |
| | 1,575 | | | Core & Main, Inc., Class A(a) | | | 45,439 | |
| | | | | | | | | |
| | | | | Total Common Stocks | | | | |
| | | | | (Cost $27,584,562) | | | 30,393,102 | |
| | | | | | | | | |
| MONEY MARKET FUND — 0.4% | | | | |
| | 132,774 | | | Federated Treasury Obligations Fund, Institutional Shares, 5.21%(b) | | | 132,774 | |
| | | | | | | | | |
| | | | | Total Money Market Fund | | | | |
| | | | | (Cost $132,774) | | | 132,774 | |
| | | | | | | | | |
| Total Investments — 99.9% | | | | |
| (Cost $27,717,336) | | | 30,525,876 | |
| Net Other Assets (Liabilities) — 0.1% | | | 36,929 | |
| NET ASSETS — 100.0% | | $ | 30,562,805 | |
| (a) | Represents non-income producing security. |
| (b) | Represents the current yield as of report date. |
Continued
| Sterling Capital Mid Value Fund |
Schedule of Portfolio Investments
September 30, 2023
| Shares | | | | | Fair Value | |
| COMMON STOCKS — 98.0% | | | | |
| | | | | | | | | |
| | | | | Automobile Components — 3.1% |
| | 43,035 | | | Gentex Corp. | | $ | 1,400,359 | |
| | | | | | | | | |
| | | | | Banks — 6.1% |
| | 8,685 | | | M&T Bank Corp. | | | 1,098,218 | |
| | 12,821 | | | Pinnacle Financial Partners, Inc. | | | 859,520 | |
| | 12,137 | | | SouthState Corp. | | | 817,548 | |
| | | | | | | | 2,775,286 | |
| | | | | | | | | |
| | | | | Broadline Retail — 1.4% |
| | 14,942 | | | eBay, Inc. | | | 658,793 | |
| | | | | | | | | |
| | | | | Chemicals — 3.2% |
| | 28,825 | | | Corteva, Inc. | | | 1,474,687 | |
| | | | | | | | | |
| | | | | Consumer Finance — 3.3% |
| | 2,568 | | | Discover Financial Services | | | 222,466 | |
| | 92,671 | | | SLM Corp. | | | 1,262,179 | |
| | | | | | | | 1,484,645 | |
| | | | | | | | | |
| | | | | Consumer Staples Distribution & Retail — 4.6% |
| | 7,837 | | | Dollar General Corp. | | | 829,155 | |
| | 11,404 | | | Target Corp. | | | 1,260,940 | |
| | | | | | | | 2,090,095 | |
| | | | | | | | | |
| | | | | Containers & Packaging — 3.1% |
| | 16,180 | | | Crown Holdings, Inc. | | | 1,431,606 | |
| | | | | | | | | |
| | | | | Electric Utilities — 3.1% |
| | 26,472 | | | ALLETE, Inc. | | | 1,397,722 | |
| | | | | | | | | |
| | | | | Electrical Equipment — 2.6% |
| | 31,105 | | | Sensata Technologies Holding PLC | | | 1,176,391 | |
| | | | | | | | | |
| | | | | Entertainment — 2.9% |
| | 9,445 | | | Take-Two Interactive Software, Inc.(a) | | | 1,325,984 | |
| | | | | | | | | |
| | | | | Financial Services — 7.3% |
| | 13,646 | | | Euronet Worldwide, Inc.(a) | | | 1,083,219 | |
| | 13,320 | | | Global Payments, Inc. | | | 1,536,995 | |
| | 28,394 | | | Radian Group, Inc. | | | 712,973 | |
| | | | | | | | 3,333,187 | |
| | | | | | | | | |
| | | | | Health Care Providers & Services — 14.8% |
| | 25,321 | | | Centene Corp.(a) | | | 1,744,110 | |
| | 3,874 | | | Cigna Group (The) | | | 1,108,235 | |
| | 16,929 | | | Encompass Health Corp. | | | 1,136,952 | |
| | 7,386 | | | Laboratory Corp. of America Holdings | | | 1,484,955 | |
| | 2,915 | | | McKesson Corp. | | | 1,267,588 | |
| | | | | | | | 6,741,840 | |
| | | | | | | | | |
| | | | | Hotels, Restaurants & Leisure — 2.2% |
| | 6,740 | | | Hilton Worldwide Holdings, Inc. | | | 1,012,213 | |
| | | | | | | | | |
| | | | | Household Durables — 2.2% |
| | 11,456 | | | Mohawk Industries, Inc.(a) | | | 983,039 | |
| | | | | | | | | |
| | | | | Household Products — 2.5% |
| | 24,177 | | | GCI Liberty Escrow Shares(a)(b) | | | - | |
| Shares | | | | | Fair Value | |
| COMMON STOCKS — (continued) | | | | |
| | | | | | | | | |
| | | | | Household Products — (continued) |
| | 14,776 | | | Spectrum Brands Holdings, Inc. | | $ | 1,157,700 | |
| | | | | | | | | |
| | | | | Insurance — 5.9% |
| | 11,475 | | | Globe Life, Inc. | | | 1,247,677 | |
| | 978 | | | Markel Group, Inc.(a) | | | 1,440,095 | |
| | | | | | | | 2,687,772 | |
| | | | | |
| | | | | Interactive Media & Services — 1.5% |
| | 13,966 | | | IAC, Inc.(a) | | | 703,747 | |
| | | | | | | | | |
| | | | | Life Sciences Tools & Services — 0.5% |
| | 7,386 | | | Fortrea Holdings, Inc.(a) | | | 211,166 | |
| | | | | | | | | |
| | | | | Machinery — 3.5% |
| | 65,617 | | | Trinity Industries, Inc. | | | 1,597,774 | |
| | | | | | | | | |
| | | | | Media — 2.9% |
| | 14,737 | | | Liberty Broadband Corp., Class C(a) | | | 1,345,783 | |
| | | | | | | | | |
| | | | | Multi-Utilities — 0.5% |
| | 9,045 | | | NiSource, Inc. | | | 223,231 | |
| | | | | | | | | |
| | | | | Oil, Gas & Consumable Fuels — 6.0% |
| | 48,995 | | | CNX Resources Corp.(a) | | | 1,106,307 | |
| | 7,051 | | | Pioneer Natural Resources Co. | | | 1,618,557 | |
| | | | | | | | 2,724,864 | |
| | | | | | | | | |
| | | | | Professional Services — 7.4% |
| | 14,736 | | | ASGN, Inc.(a) | | | 1,203,636 | |
| | 10,393 | | | Jacobs Solutions, Inc. | | | 1,418,645 | |
| | 14,447 | | | SS&C Technologies Holdings, Inc. | | | 759,045 | |
| | | | | | | | 3,381,326 | |
| | | | | | | | | |
| | | | | Real Estate Management & Development — 2.6% |
| | 15,815 | | | CBRE Group, Inc., Class A(a) | | | 1,168,096 | |
| | | | | | | | | |
| | | | | Software 1.6% |
| | 26,377 | | | NCR Corp.(a) | | | 711,388 | |
| | | | | | | | | |
| | | | | Trading Companies & Distributors — 3.2% |
| | 37,130 | | | Air Lease Corp. | | | 1,463,293 | |
| | | | | | | | | |
| | | | | Total Common Stocks | | | | |
| | | | | (Cost $36,290,209) | | | 44,661,987 | |
| | | | | | | | | |
| MONEY MARKET FUND — 2.2% |
| | 991,488 | | | Federated Treasury Obligations Fund, Institutional Shares, 5.21%(c) | | | 991,488 | |
| | | | | Total Money Market Fund | | | | |
| | | | | (Cost $991,488) | | | 991,488 | |
| Total Investments 100.2% | | | | |
| (Cost $37,281,697) | | | 45,653,475 | |
| Net Other Assets (Liabilities) (0.2)% | | | (109,403 | ) |
| NET ASSETS 100.0% | | $ | 45,544,072 | |
See accompanying Notes to the Financial Statements.
| Sterling Capital Mid Value Fund |
Schedule of Portfolio Investments — (continued)
September 30, 2023
| (a) | Represents non-income producing security. |
| (b) | The value of this security has been determined in good faith under policies of the Board of Trustees. |
| (c) | Represents the current yield as of report date. |
Continued
| Sterling Capital Behavioral Small Cap Value Equity Fund |
Schedule of Portfolio Investments
September 30, 2023
| Shares | | | | | Fair Value | |
| COMMON STOCKS — 98.8% | | | | |
| | | | | | | | | |
| | | | | Banks — 10.8% |
| | 10,709 | | | Axos Financial, Inc.(a) | | $ | 405,443 | |
| | 13,320 | | | Bank of NT Butterfield & Son, Ltd. (The) | | | 360,706 | |
| | 7,410 | | | Bank OZK | | | 274,689 | |
| | 17,612 | | | BankUnited, Inc. | | | 399,792 | |
| | 16,840 | | | Business First Bancshares, Inc. | | | 315,918 | |
| | 15,340 | | | Byline Bancorp, Inc. | | | 302,351 | |
| | 12,877 | | | Cathay General Bancorp | | | 447,605 | |
| | 15,488 | | | Central Pacific Financial Corp. | | | 258,340 | |
| | 11,517 | | | Customers Bancorp, Inc.(a) | | | 396,761 | |
| | 9,665 | | | Eagle Bancorp, Inc. | | | 207,314 | |
| | 33,290 | | | First BanCorp. | | | 448,083 | |
| | 6,826 | | | First Financial Corp. | | | 230,787 | |
| | 18,488 | | | Hanmi Financial Corp. | | | 300,060 | |
| | 40,045 | | | Hope Bancorp, Inc. | | | 354,398 | |
| | 13,401 | | | Independent Bank Corp. | | | 245,774 | |
| | 5,378 | | | Mercantile Bank Corp. | | | 166,234 | |
| | 12,223 | | | Midland States Bancorp, Inc. | | | 251,060 | |
| | 25,281 | | | New York Community Bancorp, Inc. | | | 286,687 | |
| | 6,630 | | | Northeast Bank | | | 292,383 | |
| | 19,972 | | | Northeast Community Bancorp, Inc. | | | 294,787 | |
| | 17,693 | | | OceanFirst Financial Corp. | | | 256,018 | |
| | 17,212 | | | OFG Bancorp | | | 513,950 | |
| | 23,060 | | | Old Second Bancorp, Inc. | | | 313,847 | |
| | 4,350 | | | Popular, Inc. | | | 274,093 | |
| | 4,978 | | | Preferred Bank | | | 309,880 | |
| | 12,993 | | | RBB Bancorp | | | 166,051 | |
| | 10,306 | | | South Plains Financial, Inc. | | | 272,491 | |
| | 10,470 | | | TrustCo Bank Corp. NY | | | 285,726 | |
| | 17,530 | | | Trustmark Corp. | | | 380,927 | |
| | 12,518 | | | Univest Financial Corp. | | | 217,563 | |
| | 13,385 | | | Washington Federal, Inc. | | | 342,924 | |
| | 3,580 | | | Wintrust Financial Corp. | | | 270,290 | |
| | | | | | | | 9,842,932 | |
| | | | | | | | | |
| | | | | Beverages — 0.2% |
| | 2,690 | | | Molson Coors Beverage Co., Class B | | | 171,057 | |
| | | | | | | | | |
| | | | | Broadline Retail — 0.6% |
| | 1,564 | | | Dillard's, Inc., Class A | | | 517,387 | |
| | | | | | | | | |
| | | | | Building Products — 3.4% |
| | 4,884 | | | American Woodmark Corp.(a) | | | 369,279 | |
| | 6,710 | | | Apogee Enterprises, Inc. | | | 315,907 | |
| | 3,196 | | | Builders FirstSource, Inc.(a) | | | 397,870 | |
| | 27,035 | | | JELD-WEN Holding, Inc.(a) | | | 361,188 | |
| | 3,989 | | | Owens Corning | | | 544,139 | |
| | 12,370 | | | Quanex Building Products Corp. | | | 348,463 | |
| | 6,842 | | | UFP Industries, Inc. | | | 700,621 | |
| | | | | | | | 3,037,467 | |
| | | | | | | | | |
| | | | | Capital Markets — 0.7% |
| | 4,025 | | | StoneX Group, Inc.(a) | | | 390,103 | |
| | 11,009 | | | XP, Inc., Class A | | | 253,757 | |
| | | | | | | | 643,860 | |
| Shares | | | | | Fair Value | |
| COMMON STOCKS — (continued) | | | | |
| | | | | | | | | |
| | | | | Chemicals — 0.2% |
| | 1,391 | | | Westlake Corp. | | $ | 173,416 | |
| | | | | | | | | |
| | | | | Commercial Services & Supplies — 0.7% |
| | 31,390 | | | Interface, Inc. | | | 307,936 | |
| | 32,540 | | | Steelcase, Inc., Class A | | | 363,472 | |
| | | | | | | | 671,408 | |
| | | | | Construction & Engineering — 0.7% |
| | 8,100 | | | Sterling Infrastructure, Inc.(a) | | | 595,188 | |
| | | | | | | | | |
| | | | | Construction Materials— 0.4% |
| | 2,013 | | | Eagle Materials, Inc. | | | 335,205 | |
| | | | | | | | | |
| | | | | Consumer Finance — 2.2% |
| | 9,836 | | | Ally Financial, Inc. | | | 262,424 | |
| | 12,840 | | | Bread Financial Holdings, Inc. | | | 439,128 | |
| | 11,749 | | | Enova International, Inc.(a) | | | 597,672 | |
| | 25,614 | | | Navient Corp. | | | 441,073 | |
| | 9,022 | | | Synchrony Financial | | | 275,803 | |
| | | | | | | | 2,016,100 | |
| | | | | | | | | |
| | | | | Consumer Staples Distribution & Retail — 1.5% |
| | 9,280 | | | Andersons, Inc. (The) | | | 478,013 | |
| | 4,170 | | | PriceSmart, Inc. | | | 310,373 | |
| | 13,093 | | | Sprouts Farmers Market, Inc.(a) | | | 560,380 | |
| | | | | | | | 1,348,766 | |
| | | | | | | | | |
| | | | | Diversified Consumer Services — 0.6% |
| | 30,835 | | | Perdoceo Education Corp. | | | 527,279 | |
| | | | | | | | | |
| | | | | Diversified REITs — 1.0% |
| | 31,631 | | | Broadstone Net Lease, Inc. | | | 452,323 | |
| | 22,355 | | | Essential Properties Realty Trust, Inc. | | | 483,539 | |
| | | | | | | | 935,862 | |
| | | | | | | | | |
| | | | | Diversified Telecommunication Services — 0.4% |
| | 44,064 | | | Liberty Latin America, Ltd., Class C(a) | | | 359,562 | |
| | | | | | | | | |
| | | | | Electric Utilities — 3.1% |
| | 9,569 | | | ALLETE, Inc. | | | 505,243 | |
| | 8,050 | | | Avangrid, Inc. | | | 242,868 | |
| | 21,070 | | | Hawaiian Electric Industries, Inc. | | | 259,372 | |
| | 7,100 | | | NRG Energy, Inc. | | | 273,492 | |
| | 9,175 | | | Otter Tail Corp. | | | 696,566 | |
| | 4,293 | | | Pinnacle West Capital Corp. | | | 316,308 | |
| | 12,570 | | | Portland General Electric Co. | | | 508,834 | |
| | | | | | | | 2,802,683 | |
| | | | | | | | | |
| | | | | Electrical Equipment — 2.2% |
| | 3,011 | | | Atkore, Inc.(a) | | | 449,211 | |
| | 4,037 | | | Encore Wire Corp. | | | 736,591 | |
| | 22,161 | | | LSI Industries, Inc. | | | 351,917 | |
| | 5,209 | | | Powell Industries, Inc. | | | 431,826 | |
| | | | | | | | 1,969,545 | |
| | | | | | | | | |
| | | | | Electronic Equipment, Instruments & Components — 2.5% |
| | 6,772 | | | Bel Fuse, Inc., Class B | | | 323,160 | |
See accompanying Notes to the Financial Statements.
| Sterling Capital Behavioral Small Cap Value Equity Fund |
Schedule of Portfolio Investments — (continued)
September 30, 2023
| Shares | | | | | Fair Value | |
| COMMON STOCKS — (continued) | | | | |
| | | | | | | | | |
| | | | | Electronic Equipment, Instruments & Components — (continued) |
| | 1,882 | | | Insight Enterprises, Inc.(a) | | $ | 273,831 | |
| | 4,229 | | | Jabil, Inc. | | | 536,618 | |
| | 2,620 | | | PC Connection, Inc. | | | 139,856 | |
| | 29,179 | | | TTM Technologies, Inc.(a) | | | 375,825 | |
| | 25,614 | | | Vishay Intertechnology, Inc. | | | 633,178 | |
| | | | | | | | 2,282,468 | |
| | | | | | | | | |
| | | | | Energy Equipment & Services — 0.9% |
| | 14,904 | | | Oceaneering International, Inc.(a) | | | 383,331 | |
| | 4,385 | | | Weatherford International PLC(a) | | | 396,097 | |
| | | | | | | | 779,428 | |
| | | | | | | | | |
| | | | | Entertainment — 0.7% |
| | 18,083 | | | Cinemark Holdings, Inc.(a) | | | 331,823 | |
| | 20,054 | | | Marcus Corp. (The) | | | 310,837 | |
| | | | | | | | 642,660 | |
| | | | | | | | | |
| | | | | Financial Services — 4.6% |
| | 8,530 | | | A-Mark Precious Metals, Inc. | | | 250,185 | |
| | 14,060 | | | Banco Latinoamericano de Comercio Exterior SA, Class E | | | 298,072 | |
| | 16,452 | | | Corebridge Financial, Inc. | | | 324,927 | |
| | 13,238 | | | Enact Holdings, Inc. | | | 360,471 | |
| | 13,688 | | | Jackson Financial, Inc., Class A | | | 523,155 | |
| | 14,470 | | | MGIC Investment Corp. | | | 241,504 | |
| | 11,902 | | | Mr Cooper Group, Inc.(a) | | | 637,471 | |
| | 39,042 | | | Pagseguro Digital, Ltd., Class A(a) | | | 336,151 | |
| | 27,281 | | | Radian Group, Inc. | | | 685,026 | |
| | 38,213 | | | StoneCo, Ltd., Class A(a) | | | 407,733 | |
| | | | | | | | 4,064,695 | |
| | | | | | | | | |
| | | | | Food Products — 0.3% |
| | 22,685 | | | Dole PLC. | | | 262,692 | |
| | | | | | | | | |
| | | | | Gas Utilities — 0.3% |
| | 5,693 | | | National Fuel Gas Co. | | | 295,524 | |
| | | | | | | | | |
| | | | | Ground Transportation — 0.0% |
| | 433 | | | ArcBest Corp. | | | 44,014 | |
| | | | | | | | | |
| | | | | Health Care Equipment & Supplies — 2.0% |
| | 3,381 | | | Haemonetics Corp.(a) | | | 302,870 | |
| | 7,431 | | | Inmode, Ltd.(a) | | | 226,348 | |
| | 5,040 | | | Lantheus Holdings, Inc.(a) | | | 350,179 | |
| | 7,030 | | | Omnicell, Inc.(a) | | | 316,631 | |
| | 52,750 | | | OraSure Technologies, Inc.(a) | | | 312,808 | |
| | 17,410 | | | Varex Imaging Corp.(a) | | | 327,134 | |
| | | | | | | | 1,835,970 | |
| | | | | | | | | |
| | | | | Health Care Providers & Services — 4.2% |
| | 3,428 | | | Addus HomeCare Corp.(a) | | | 292,031 | |
| | 3,204 | | | AMN Healthcare Services, Inc.(a) | | | 272,917 | |
| | 12,069 | | | Cross Country Healthcare, Inc.(a) | | | 299,190 | |
| | 2,764 | | | DaVita, Inc.(a) | | | 261,281 | |
| | 4,966 | | | Encompass Health Corp. | | | 333,517 | |
| | 3,689 | | | Ensign Group, Inc. (The) | | | 342,819 | |
| Shares | | | | | Fair Value | |
| COMMON STOCKS — (continued) |
| | | | | | | |
| | | | | Health Care Providers & Services — (continued) |
| | 11,346 | | | Fulgent Genetics, Inc.(a) | | $ | 303,392 | |
| | 2,870 | | | Option Care Health, Inc.(a) | | | 92,844 | |
| | 22,846 | | | Owens & Minor, Inc.(a) | | | 369,191 | |
| | 14,750 | | | PetIQ, Inc.(a) | | | 290,575 | |
| | 7,628 | | | Premier, Inc., Class A | | | 164,002 | |
| | 10,460 | | | Select Medical Holdings Corp. | | | 264,324 | |
| | 3,420 | | | Tenet Healthcare Corp.(a) | | | 225,344 | |
| | 2,587 | | | Universal Health Services, Inc., Class B | | | 325,264 | |
| | | | | | | | 3,836,691 | |
| | | | | | | | | |
| | | | | Health Care REITs — 0.3% |
| | 50,666 | | | Medical Properties Trust, Inc. | | | 276,130 | |
| | | | | | | | | |
| | | | | Health Care Technology — 0.8% |
| | 15,784 | | | HealthStream, Inc. | | | 340,619 | |
| | 29,968 | | | Veradigm, Inc.(a) | | | 393,779 | |
| | | | | | | | 734,398 | |
| | | | | | | | | |
| | | | | Hotel & Resort REITs — 2.9% |
| | 35,231 | | | Apple Hospitality REIT, Inc. | | | 540,444 | |
| | 49,039 | | | DiamondRock Hospitality Co. | | | 393,783 | |
| | 16,227 | | | Host Hotels & Resorts, Inc. | | | 260,768 | |
| | 21,497 | | | Park Hotels & Resorts, Inc. | | | 264,843 | |
| | 38,813 | | | RLJ Lodging Trust | | | 379,979 | |
| | 44,718 | | | Sunstone Hotel Investors, Inc. | | | 418,113 | |
| | 31,560 | | | Xenia Hotels & Resorts, Inc. | | | 371,777 | |
| | | | | | | | 2,629,707 | |
| | | | | | | | | |
| | | | | Household Durables — 6.0% |
| | 13,980 | | | Beazer Homes USA, Inc.(a) | | | 348,242 | |
| | 6,210 | | | Century Communities, Inc. | | | 414,704 | |
| | 13,781 | | | Ethan Allen Interiors, Inc. | | | 412,052 | |
| | 9,633 | | | Green Brick Partners, Inc.(a) | | | 399,866 | |
| | 10,726 | | | KB Home | | | 496,399 | |
| | 12,249 | | | La-Z-Boy, Inc. | | | 378,249 | |
| | 6,253 | | | M/I Homes, Inc.(a) | | | 525,502 | |
| | 10,435 | | | MDC Holdings, Inc. | | | 430,235 | |
| | 5,034 | | | Meritage Homes Corp. | | | 616,111 | |
| | 14,537 | | | Taylor Morrison Home Corp.(a) | | | 619,422 | |
| | 4,473 | | | Toll Brothers, Inc. | | | 330,823 | |
| | 15,902 | | | TRI Pointe Homes, Inc.(a) | | | 434,920 | |
| | | | | | | | 5,406,525 | |
| | | | | | | | | |
| | | | | Household Products — 0.7% |
| | 6,480 | | | Central Garden & Pet Co.(a) | | | 286,027 | |
| | 9,490 | | | Central Garden & Pet Co., Class A(a) | | | 380,454 | |
| | | | | | | | 666,481 | |
| | | | | | | | | |
| | | | | Independent Power and Renewable Electricity Producers — 0.2% |
| | 8,528 | | | Brookfield Renewable Corp., Class A | | | 204,160 | |
| | | | | | | | | |
| | | | | Industrial REITs — 0.5% |
| | 5,710 | | | Innovative Industrial Properties, Inc. | | | 432,019 | |
| | | | | | | | | |
| | | | | Insurance — 3.8% |
| | 25,110 | | | Ambac Financial Group, Inc.(a) | | | 302,827 | |
Continued
| Sterling Capital Behavioral Small Cap Value Equity Fund |
Schedule of Portfolio Investments — (continued)
September 30, 2023
| Shares | | | | | Fair Value | |
| COMMON STOCKS — (continued) | | | | |
| | | | | | | | | |
| | | | | Insurance — (continued) |
| | 12,413 | | | American Equity Investment Life Holding Co.(a) | | $ | 665,833 | |
| | 5,921 | | | Axis Capital Holdings, Ltd. | | | 333,767 | |
| | 6,028 | | | Brighthouse Financial, Inc.(a) | | | 295,010 | |
| | 9,129 | | | Employers Holdings, Inc. | | | 364,703 | |
| | 12,955 | | | Old Republic International Corp. | | | 349,008 | |
| | 1,890 | | | Reinsurance Group of America, Inc. | | | 274,409 | |
| | 2,152 | | | RenaissanceRe Holdings, Ltd. | | | 425,924 | |
| | 8,235 | | | Unum Group | | | 405,080 | |
| | | | | | | | 3,416,561 | |
| | | | | | | | | |
| | | | | Interactive Media & Services — 0.6% |
| | 14,774 | | | Cargurus, Inc.(a) | | | 258,840 | |
| | 6,440 | | | Yelp, Inc.(a) | | | 267,840 | |
| | | | | | | | 526,680 | |
| | | | | | | | | |
| | | | | Machinery — 3.1% |
| | 2,154 | | | AGCO Corp. | | | 254,775 | |
| | 6,034 | | | Allison Transmission Holdings, Inc. | | | 356,368 | |
| | 15,460 | | | Blue Bird Corp.(a) | | | 330,071 | |
| | 17,692 | | | Manitowoc Co., Inc. (The)(a) | | | 266,264 | |
| | 7,204 | | | Mueller Industries, Inc. | | | 541,453 | |
| | 19,420 | | | REV Group, Inc. | | | 310,720 | |
| | 7,943 | | | Terex Corp. | | | 457,676 | |
| | 11,703 | | | Wabash National Corp. | | | 247,167 | |
| | | | | | | | 2,764,494 | |
| | | | | | | | | |
| | | | | Marine Transportation — 0.6% |
| | 5,910 | | | Matson, Inc. | | | 524,335 | |
| | | | | | | | | |
| | | | | Media — 0.7% |
| | 8,370 | | | Fox Corp., Class A | | | 261,144 | |
| | 8,980 | | | Scholastic Corp. | | | 342,497 | |
| | | | | | | | 603,641 | |
| | | | | | | | | |
| | | | | Metals & Mining — 4.7% |
| | 2,515 | | | Alpha Metallurgical Resources, Inc. | | | 653,221 | |
| | 14,551 | | | Commercial Metals Co. | | | 718,965 | |
| | 5,890 | | | Olympic Steel, Inc. | | | 331,077 | |
| | 1,026 | | | Reliance Steel & Aluminum Co. | | | 269,048 | |
| | 9,164 | | | Ryerson Holding Corp. | | | 266,581 | |
| | 45,476 | | | SunCoke Energy, Inc. | | | 461,582 | |
| | 16,570 | | | TimkenSteel Corp.(a) | | | 359,900 | |
| | 15,854 | | | Warrior Met Coal, Inc. | | | 809,822 | |
| | 6,394 | | | Worthington Industries, Inc. | | | 395,277 | |
| | | | | | | | 4,265,473 | |
| | | | | | | | | |
| | | | | Mortgage Real Estate Investment Trusts (REITs) — 2.4% |
| | 35,842 | | | Arbor Realty Trust, Inc. | | | 544,082 | |
| | 26,626 | | | Invesco Mortgage Capital, Inc. | | | 266,526 | |
| | 37,924 | | | Ladder Capital Corp. | | | 389,100 | |
| | 38,254 | | | Ready Capital Corp. | | | 386,748 | |
| | 32,810 | | | Rithm Capital Corp. | | | 304,805 | |
| | 13,510 | | | Starwood Property Trust, Inc. | | | 261,419 | |
| | | | | | | | 2,152,680 | |
| Shares | | | | | Fair Value | |
| COMMON STOCKS — (continued) | | | | |
| | | | | |
| | | | | Office REITs — 1.5% |
| | 12,840 | | | Cousins Properties, Inc. | | $ | 261,551 | |
| | 12,113 | | | Highwoods Properties, Inc. | | | 249,649 | |
| | 8,990 | | | Kilroy Realty Corp. | | | 284,174 | |
| | 54,980 | | | Office Properties Income Trust | | | 225,418 | |
| | 11,730 | | | Vornado Realty Trust. | | | 266,036 | |
| | | | | | | | 1,286,828 | |
| | | | | | | | | |
| | | | | Oil, Gas & Consumable Fuels — 9.8% |
| | 38,890 | | | Berry Corp. | | | 318,898 | |
| | 10,520 | | | California Resources Corp. | | | 589,225 | |
| | 6,170 | | | Centrus Energy Corp., Class A(a) | | | 350,209 | |
| | 4,820 | | | Chord Energy Corp. | | | 781,178 | |
| | 9,328 | | | Civitas Resources, Inc. | | | 754,355 | |
| | 24,840 | | | CNX Resources Corp.(a) | | | 560,887 | |
| | 8,160 | | | CVR Energy, Inc. | | | 277,685 | |
| | 20,958 | | | Dorian LPG, Ltd. | | | 602,123 | |
| | 52,870 | | | Equitrans Midstream Corp. | | | 495,392 | |
| | 3,310 | | | Gulfport Energy Corp.(a) | | | 392,765 | |
| | 4,540 | | | HF Sinclair Corp. | | | 258,462 | |
| | 10,192 | | | International Seaways, Inc. | | | 458,640 | |
| | 12,763 | | | Par Pacific Holdings, Inc.(a) | | | 458,702 | |
| | 15,579 | | | PBF Energy, Inc., Class A | | | 833,944 | |
| | 8,970 | | | Range Resources Corp. | | | 290,718 | |
| | 7,740 | | | REX American Resources Corp.(a) | | | 315,173 | |
| | 16,450 | | | SM Energy Co. | | | 652,243 | |
| | 10,102 | | | Teekay Tankers, Ltd., Class A | | | 420,546 | |
| | | | | | | | 8,811,145 | |
| | | | | | | | | |
| | | | | Passenger Airlines — 0.9% |
| | 1,376 | | | Copa Holdings SA, Class A | | | 122,629 | |
| | 9,780 | | | SkyWest, Inc.(a) | | | 410,173 | |
| | 6,953 | | | United Airlines Holdings, Inc.(a) | | | 294,112 | |
| | | | | | | | 826,914 | |
| | | | | | | | | |
| | | | | Pharmaceuticals — 1.3% |
| | 9,579 | | | Amphastar Pharmaceuticals, Inc.(a) | | | 440,538 | |
| | 8,430 | | | Corcept Therapeutics, Inc.(a) | | | 229,675 | |
| | 1,936 | | | Jazz Pharmaceuticals PLC(a) | | | 250,596 | |
| | 25,623 | | | Viatris, Inc. | | | 252,643 | |
| | | | | | | | 1,173,452 | |
| | | | | | | | | |
| | | | | Real Estate Management & Development — 1.1% |
| | 15,619 | | | Forestar Group, Inc.(a) | | | 420,776 | |
| | 4,331 | | | Howard Hughes Holdings, Inc.(a) | | | 321,057 | |
| | 11,933 | | | RMR Group, Inc. (The), Class A | | | 292,597 | |
| | | | | | | | 1,034,430 | |
| | | | | | | | | |
| | | | | Retail REITs — 1.3% |
| | 25,210 | | | Acadia Realty Trust. | | | 361,763 | |
| | 27,952 | | | Kimco Realty Corp. | | | 491,676 | |
| | 33,850 | | | Whitestone REIT | | | 325,975 | |
| | | | | | | | 1,179,414 | |
Continued
| Sterling Capital Behavioral Small Cap Value Equity Fund |
Schedule of Portfolio Investments — (continued)
September 30, 2023
| Shares | | | | | Fair Value | |
| COMMON STOCKS — (continued) | | | | |
| | | | | | | | | |
| | | | | Semiconductors & Semiconductor Equipment — 2.4% |
| | 32,533 | | | Amkor Technology, Inc. | | $ | 735,246 | |
| | 3,259 | | | Axcelis Technologies, Inc.(a) | | | 531,380 | |
| | 22,628 | | | Photronics, Inc.(a) | | | 457,312 | |
| | 14,340 | | | Veeco Instruments, Inc.(a) | | | 403,097 | |
| | | | | | | | 2,127,035 | |
| | | | | | | | | |
| | | | | Software — 0.9% |
| | 26,048 | | | Adeia, Inc. | | | 278,193 | |
| | 2,938 | | | InterDigital, Inc. | | | 235,745 | |
| | 10,934 | | | NCR Corp.(a) | | | 294,890 | |
| | | | | | | | 808,828 | |
| | | | | | | | | |
| | | | | Specialized REITs — 1.4% |
| | 7,077 | | | EPR Properties | | | 293,979 | |
| | 88,878 | | | Uniti Group, Inc. | | | 419,504 | |
| | 17,487 | | | VICI Properties, Inc. | | | 508,872 | |
| | | | | | | | 1,222,355 | |
| | | | | | | | | |
| | | | | Specialty Retail — 2.7% |
| | 23,010 | | | Aaron's Co., Inc. (The) | | | 240,915 | |
| | 1,983 | | | AutoNation, Inc.(a) | | | 300,226 | |
| | 13,706 | | | Build-A-Bear Workshop, Inc. | | | 403,093 | |
| | 2,919 | | | Group 1 Automotive, Inc. | | | 784,365 | |
| | 10,699 | | | ODP Corp. (The)(a) | | | 493,759 | |
| | 1,482 | | | Penske Automotive Group, Inc. | | | 247,583 | |
| | | | | | | | 2,469,941 | |
| | | | | | | | | |
| | | | | Technology Hardware, Storage & Peripherals — 0.3% |
| | 40,395 | | | Immersion Corp. | | | 267,011 | |
| | | | | | | | | |
| | | | | Textiles, Apparel & Luxury Goods — 0.4% |
| | 14,320 | | | G-III Apparel Group, Ltd.(a) | | | 356,854 | |
| | | | | | | | | |
| | | | | Trading Companies & Distributors — 3.3% |
| | 7,380 | | | Beacon Roofing Supply, Inc.(a) | | | 569,515 | |
| | 5,468 | | | BlueLinx Holdings, Inc.(a) | | | 448,868 | |
| | 11,483 | | | Boise Cascade Co. | | | 1,183,208 | |
| | 6,123 | | | GMS, Inc.(a) | | | 391,688 | |
| | 10,119 | | | Textainer Group Holdings, Ltd. | | | 376,933 | |
| | | | | | | | 2,970,212 | |
| | | | | Total Common Stocks | | | | |
| | | | | (Cost $81,059,357) | | | 89,129,562 | |
| | | | | | | | | |
| WARRANTS — 0.0% | | | | |
| | | | | | | | | |
| | | | | Energy Equipment & Services — 0.0% |
| | 689 | | | Nabors Industries, Ltd., 06/11/2026(a) | | | 10,129 | |
| | | | | | | | | |
| | | | | Total Warrants | | | | |
| | | | | (Cost $ ) | | | 10,129 | |
| Shares | | | | | Fair Value | |
| EXCHANGE TRADED FUND — 0.5% |
| | 3,000 | | | iShares Russell 2000 Value ETF | | $ | 406,650 | |
| | | | | Total Exchange Traded Fund | | | | |
| | | | | (Cost $410,769) | | | 406,650 | |
| | | | | | | | | |
| MONEY MARKET FUND — 1.1% | | | | |
| | 1,036,511 | | | Federated Treasury Obligations Fund, Institutional Shares, 5.21%(b) | | | 1,036,511 | |
| | | | | Total Money Market Fund | | | | |
| | | | | (Cost $1,036,511) | | | 1,036,511 | |
| Total Investments 100.4% | | | | |
| (Cost $82,506,637) | | | 90,582,852 | |
| Net Other Assets (Liabilities) (0.4)%. | | | (328,744 | ) |
| NET ASSETS — 100.0% | | $ | 90,254,108 | |
| (a) | Represents non-income producing security. |
| (b) | Represents the current yield as of report date. |
Continued
| Sterling Capital Special Opportunities Fund |
Schedule of Portfolio Investments
September 30, 2023
| Shares | | | | | Fair Value | |
| COMMON STOCKS — 97.6% | | | | |
| | | | | |
| | | | | Automobile Components — 3.6% |
| | 170,292 | | | Aptiv PLC(a) | | $ | 16,789,088 | |
| | | | | | | | | |
| | | | | Broadline Retail — 5.3% |
| | 192,238 | | | Amazon.com, Inc.(a) | | | 24,437,295 | |
| | | | | | | | | |
| | | | | Capital Markets — 6.9% |
| | 375,568 | | | Charles Schwab Corp. (The) | | | 20,618,683 | |
| | 31,557 | | | S&P Global, Inc. | | | 11,531,244 | |
| | | | | | | | 32,149,927 | |
| | | | | | | | | |
| | | | | Communications Equipment — 3.6% |
| | 104,192 | | | F5, Inc.(a) | | | 16,789,499 | |
| | | | | | | | | |
| | | | | Consumer Finance — 1.9% |
| | 93,231 | | | Capital One Financial Corp. | | | 9,048,069 | |
| | | | | | | | | |
| | | | | Consumer Staples Distribution & Retail — 0.8% |
| | 36,569 | | | Dollar General Corp. | | | 3,869,000 | |
| | | | | | | | | |
| | | | | Containers & Packaging — 3.7% |
| | 192,529 | | | Crown Holdings, Inc. | | | 17,034,966 | |
| | | | | | | | | |
| | | | | Electronic Equipment, Instruments & Components — 3.8% |
| | 540,697 | | | Coherent Corp.(a) | | | 17,648,350 | |
| | | | | | | | | |
| | | | | Entertainment — 4.0% |
| | 131,361 | | | Take-Two Interactive Software, Inc.(a) | | | 18,441,771 | |
| | | | | | | | | |
| | | | | Financial Services — 9.8% |
| | 168,249 | | | Global Payments, Inc. | | | 19,414,252 | |
| | 142,966 | | | PayPal Holdings, Inc.(a) | | | 8,357,793 | |
| | 77,392 | | | Visa, Inc., Class A | | | 17,800,934 | |
| | | | | | | | 45,572,979 | |
| | | | | | | | | |
| | | | | Health Care Providers & Services — 8.1% |
| | 64,984 | | | HCA Healthcare, Inc. | | | 15,984,764 | |
| | 42,926 | | | UnitedHealth Group, Inc. | | | 21,642,860 | |
| | | | | | | | 37,627,624 | |
| | | | | | | | | |
| | | | | Interactive Media & Services — 5.5% |
| | 192,373 | | | Alphabet, Inc., Class C(a) | | | 25,364,380 | |
| | | | | | | | | |
| | | | | IT Services — 3.0% |
| | 131,174 | | | Akamai Technologies, Inc.(a) | | | 13,975,278 | |
| | | | | | | | | |
| | | | | Life Sciences Tools & Services — 8.2% |
| | 78,626 | | | Danaher Corp. | | | 19,507,111 | |
| | 94,110 | | | IQVIA Holdings, Inc.(a) | | | 18,516,142 | |
| | | | | | | | 38,023,253 | |
| | | | | | | | | |
| | | | | Media — 3.9% |
| | 403,892 | | | Comcast Corp., Class A | | | 17,908,571 | |
| | | | | | | | | |
| | | | | Pharmaceuticals — 1.8% |
| | 143,055 | | | Bristol-Myers Squibb Co. | | | 8,302,912 | |
| | | | | | | | | |
| | | | | Professional Services — 3.3% |
| | 131,021 | | | Genpact, Ltd. | | | 4,742,960 | |
| Shares | | | | | Fair Value | |
| COMMON STOCKS — (continued) | | | | |
| | | | | | | | | |
| | | | | Professional Services — (continued) |
| | 45,977 | | | Verisk Analytics, Inc. | | $ | 10,861,606 | |
| | | | | | | | 15,604,566 | |
| | | | | | | | | |
| | | | | Real Estate Management & Development — 2.4% |
| | 153,467 | | | CBRE Group, Inc., Class A(a) | | | 11,335,073 | |
| | | | | | | | | |
| | | | | Semiconductors & Semiconductor Equipment — 6.9% |
| | 238,665 | | | Marvell Technology, Inc. | | | 12,918,936 | |
| | 94,478 | | | NXP Semiconductors NV | | | 18,888,042 | |
| | | | | | | | 31,806,978 | |
| | | | | | | | | |
| | | | | Software — 7.3% |
| | 37,004 | | | Intuit, Inc. | | | 18,906,824 | |
| | 46,982 | | | Microsoft Corp. | | | 14,834,566 | |
| | | | | | | | 33,741,390 | |
| | | | | | | | | |
| | | | | Wireless Telecommunication Services — 3.8% |
| | 126,065 | | | T-Mobile U.S. Inc(a) | | | 17,655,403 | |
| | | | | Total Common Stocks | | | | |
| | | | | (Cost $292,038,469) | | | 453,126,372 | |
| | | | | |
| MONEY MARKET FUND — 2.9% | | | | |
| | 13,253,066 | | | Federated Treasury Obligations Fund, Institutional Shares, 5.21%(b) | | | 13,253,066 | |
| | | | | | | | | |
| | | | | Total Money Market Fund | | | | |
| | | | | (Cost $13,253,066) | | | 13,253,066 | |
| | | | | | | | | |
| Total Investments — 100.5% | | | | |
| (Cost $305,291,535) | | | 466,379,438 | |
| Net Other Assets (Liabilities) — (0.5)% | | | (2,157,637 | ) |
| NET ASSETS — 100.0% | | $ | 464,221,801 | |
| (a) | Represents non-income producing security. |
| (b) | Represents the current yield as of report date. |
See accompanying Notes to the Financial Statements.
| Sterling Capital Equity Income Fund |
Schedule of Portfolio Investments
September 30, 2023
| Shares | | | | | Fair Value | |
| COMMON STOCKS — 97.6% | | | | |
| | | | | |
| | | | | Air Freight & Logistics — 2.1% | | | | |
| | 248,488 | | | United Parcel Service, Inc., Class B | | $ | 38,731,825 | |
| | | | | | | | | |
| | | | | Beverages — 2.9% | | | | |
| | 318,985 | | | PepsiCo, Inc. | | | 54,048,818 | |
| | | | | | | | | |
| | | | | Biotechnology — 3.8% | | | | |
| | 480,505 | | | AbbVie, Inc. | | | 71,624,075 | |
| | | | | | | | | |
| | | | | Broadline Retail — 1.9% | | | | |
| | 827,698 | | | eBay, Inc. | | | 36,493,205 | |
| | | | | | | | | |
| | | | | Capital Markets — 16.4% | | | | |
| | 221,642 | | | Ameriprise Financial, Inc. | | | 73,070,934 | |
| | 81,604 | | | BlackRock, Inc. | | | 52,756,170 | |
| | 1,128,904 | | | Charles Schwab Corp. (The) | | | 61,976,830 | |
| | 196,077 | | | Goldman Sachs Group, Inc. (The) | | | 63,444,635 | |
| | 1,178,686 | | | Nasdaq, Inc. | | | 57,272,353 | |
| | | | | | | | 308,520,922 | |
| | | | | | | | | |
| | | | | Chemicals — 2.3% | | | | |
| | 150,721 | | | Air Products & Chemicals, Inc. | | | 42,714,331 | |
| | | | | | | | | |
| | | | | Communications Equipment — 1.6% | | | | |
| | 111,137 | | | Motorola Solutions, Inc. | | | 30,255,937 | |
| | | | | | | | | |
| | | | | Consumer Finance — 0.6% | | | | |
| | 124,106 | | | Discover Financial Services | | | 10,751,303 | |
| | | | | | | | | |
| | | | | Containers & Packaging — 4.0% | | | | |
| | 414,563 | | | Avery Dennison Corp. | | | 75,728,223 | |
| | | | | | | | | |
| | | | | Health Care Equipment & Supplies — 3.6% | | | | |
| | 690,512 | | | Abbott Laboratories | | | 66,876,087 | |
| | | | | | | | | |
| | | | | Health Care Providers & Services — 6.9% | | | | |
| | 719,293 | | | CVS Health Corp. | | | 50,221,037 | |
| | 184,335 | | | Elevance Health, Inc. | | | 80,263,146 | |
| | | | | | | | 130,484,183 | |
| | | | | | | | | |
| | | | | Insurance — 11.9% | | | | |
| | 813,875 | | | Aflac, Inc. | | | 62,464,906 | |
| | 216,436 | | | Chubb, Ltd. | | | 45,057,646 | |
| | 404,033 | | | Marsh & McLennan Cos., Inc. | | | 76,887,480 | |
| | 616,282 | | | MetLife, Inc. | | | 38,770,301 | |
| | | | | | | | 223,180,333 | |
| | | | | | | | | |
| | | | | IT Services — 4.0% | | | | |
| | 246,237 | | | Accenture PLC, Class A | | | 75,621,845 | |
| | | | | | | | | |
| | | | | Pharmaceuticals — 4.6% | | | | |
| | 371,110 | | | Johnson & Johnson | | | 57,800,382 | |
| | 286,007 | | | Merck & Co., Inc. | | | 29,444,421 | |
| | | | | | | | 87,244,803 | |
| | | | | | | | | |
| | | | | Professional Services — 7.3% | | | | |
| | 321,511 | | | Automatic Data Processing, Inc. | | | 77,349,116 | |
| | 550,394 | | | Booz Allen Hamilton Holding Corp. | | | 60,141,553 | |
| | | | | | | | 137,490,669 | |
| Shares | | | | | Fair Value | |
| | | | |
| COMMON STOCKS — (continued) | | | |
| | | | |
| | | | | Semiconductors & Semiconductor Equipment — 4.7% | | | | |
| | 384,916 | | | Analog Devices, Inc. | | $ | 67,394,942 | |
| | 220,605 | | | Skyworks Solutions, Inc. | | | 21,749,447 | |
| | | | | | | | 89,144,389 | |
| | | | | | | | | |
| | | | | Software — 4.5% | | | | |
| | 270,351 | | | Microsoft Corp. | | | 85,363,328 | |
| | | | | | | | | |
| | | | | Specialized REITs — 2.7% | | | | |
| | 1,307,575 | | | CubeSmart | | | 49,857,835 | |
| | | | | | | | | |
| | | | | Specialty Retail — 3.8% | | | | |
| | 236,926 | | | Home Depot, Inc. (The) | | | 71,589,560 | |
| | | | | | | | | |
| | | | | Tobacco — 3.4% | | | | |
| | 1,535,430 | | | Altria Group, Inc. | | | 64,564,832 | |
| | | | | | | | | |
| | | | | Trading Companies & Distributors — 4.6% |
| | 523,957 | | | Ferguson PLC | | | 86,175,208 | |
| | | | | | | | | |
| | | | | Total Common Stocks | | | | |
| | | | | (Cost $1,269,882,585) | | | 1,836,461,711 | |
| | | | | | | | | |
| MONEY MARKET FUND — 2.3% | | | | |
| | | | | | | | | |
| | 43,200,889 | | | Federated Treasury Obligations Fund, Institutional Shares, 5.21%(a) | | | 43,200,889 | |
| | | | | | | | | |
| | | | | Total Money Market Fund | | | | |
| | | | | (Cost $43,200,889) | | | 43,200,889 | |
| | | | | | | | | |
| Total Investments — 99.9% | | | | |
| (Cost $1,313,083,474) | | | 1,879,662,600 | |
| Net Other Assets (Liabilities) — 0.1% | | | 1,376,447 | |
| NET ASSETS — 100.0% | | $ | 1,881,039,047 | |
| (a) | Represents the current yield as of report date. |
See accompanying Notes to the Financial Statements.
| Sterling Capital Behavioral International Equity Fund |
Schedule of Portfolio Investments
September 30, 2023
| Shares | | | | | Fair Value | |
| COMMON STOCKS — 96.0% | | | | |
| | | | | | | | | |
| | | | | Australia — 5.2% | | | | |
| | 85,525 | | | ANZ Group Holdings, Ltd. | | $ | 1,411,000 | |
| | 1,580 | | | BHP Group, Ltd. | | | 44,952 | |
| | 87,522 | | | BlueScope Steel, Ltd. | | | 1,093,933 | |
| | 349,236 | | | Pilbara Minerals, Ltd. | | | 965,527 | |
| | 233,536 | | | Qantas Airways, Ltd.(a) | | | 777,787 | |
| | 84,407 | | | Santos, Ltd. | | | 428,729 | |
| | 121,920 | | | Suncorp Group, Ltd. | | | 1,095,087 | |
| | 256,594 | | | Vicinity Centres | | | 279,636 | |
| | | | | | | | 6,096,651 | |
| | | | | | | | | |
| | | | | Austria — 1.2% | | | | |
| | 30,671 | | | Erste Group Bank AG | | | 1,064,251 | |
| | 8,052 | | | OMV AG | | | 385,808 | |
| | | | | | | | 1,450,059 | |
| | | | | | | | | |
| | | | | Belgium — 0.9% | | | | |
| | 9,364 | | | Solvay SA | | | 1,038,024 | |
| | | | | | | | | |
| | | | | Bermuda — 0.3% | | | | |
| | 6,400 | | | Jardine Matheson Holdings, Ltd. | | | 297,088 | |
| | | | | | | | | |
| | | | | Denmark — 1.8% | | | | |
| | 8,118 | | | Carlsberg AS, Class B | | | 1,025,790 | |
| | 10,623 | | | Pandora A/S | | | 1,101,686 | |
| | | | | | | | 2,127,476 | |
| | | | | | | | | |
| | | | | Finland — 1.1% | | | | |
| | 110,896 | | | Nordea Bank Abp | | | 1,220,753 | |
| | | | | | | | | |
| | | | | France — 13.1% | | | | |
| | 17,850 | | | Amundi SA(b) | | | 1,006,816 | |
| | 31,094 | | | AXA SA | | | 926,393 | |
| | 4,226 | | | BNP Paribas SA | | | 269,997 | |
| | 2,981 | | | Capgemini SE | | | 522,546 | |
| | 19,909 | | | Cie de Saint-Gobain SA | | | 1,197,255 | |
| | 44,627 | | | Credit Agricole SA | | | 551,651 | |
| | 3,716 | | | Dassault Aviation SA | | | 700,887 | |
| | 9,942 | | | Eiffage SA | | | 946,427 | |
| | 77,223 | | | Engie SA | | | 1,186,288 | |
| | 8,278 | | | Ipsen SA | | | 1,086,988 | |
| | 2,024 | | | LVMH Moet Hennessy Louis Vuitton SE | | | 1,533,006 | |
| | 96,284 | | | Orange SA | | | 1,105,507 | |
| | 15,147 | | | Publicis Groupe SA | | | 1,149,176 | |
| | 26,757 | | | Renault SA | | | 1,099,729 | |
| | 18,061 | | | Sanofi | | | 1,937,760 | |
| | | | | | | | 15,220,426 | |
| | | | | | | | | |
| | | | | Germany — 8.2% | | | | |
| | 12,478 | | | Bayerische Motoren Werke AG | | | 1,271,480 | |
| | 1,925 | | | Brenntag SE | | | 149,547 | |
| | 83,339 | | | Deutsche Lufthansa AG(a) | | | 661,355 | |
| | 72,485 | | | Deutsche Telekom AG | | | 1,522,580 | |
| | 96,951 | | | E.ON SE | | | 1,148,016 | |
| | 9,825 | | | Fresenius Medical Care AG & Co. KGaA | | | 424,225 | |
| | 36,610 | | | Fresenius SE & Co. KGaA | | | 1,140,276 | |
| | 16,370 | | | Heidelberg Materials AG | | | 1,272,424 | |
| | 12,395 | | | Henkel AG & Co. KGaA | | | 782,608 | |
| Shares | | | | | Fair Value | |
| COMMON STOCKS — (continued) | | | | |
| | | | | |
| | | | | Germany — (continued) | | | | |
| | 5,924 | | | Infineon Technologies AG | | $ | 196,381 | |
| | 13,212 | | | Mercedes-Benz Group AG | | | 920,377 | |
| | | | | | | | 9,489,269 | |
| | | | | | | | | |
| | | | | Ireland — 1.2% | | | | |
| | 24,800 | | | CRH PLC | | | 1,357,304 | |
| | | | | | | | | |
| | | | | Israel — 2.0% | | | | |
| | 8,452 | | | Check Point Software Technologies, Ltd.(a) | | | 1,126,483 | |
| | 115,922 | | | Teva Pharmaceutical Industries, Ltd., ADR(a) | | | 1,182,404 | |
| | | | | | | | 2,308,887 | |
| | | | | | | | | |
| | | | | Italy — 3.4% | | | | |
| | 32,350 | | | Enel SpA | | | 199,056 | |
| | 499,493 | | | Intesa Sanpaolo SpA | | | 1,288,537 | |
| | 21,000 | | | Recordati Industria Chimica e Farmaceutica SpA | | | 992,663 | |
| | 63,346 | | | UniCredit SpA | | | 1,522,286 | |
| | | | | | | | 4,002,542 | |
| | | | | | | | | |
| | | | | Japan — 20.7% | | | | |
| | 37,400 | | | Astellas Pharma, Inc. | | | 519,055 | |
| | 85,300 | | | Chubu Electric Power Co., Inc. | | | 1,088,511 | |
| | 28,900 | | | Daiwa House Industry Co., Ltd. | | | 776,455 | |
| | 51,000 | | | Honda Motor Co., Ltd. | | | 574,023 | |
| | 8,300 | | | Inpex Corp. | | | 125,300 | |
| | 40,747 | | | ITOCHU Corp. | | | 1,474,025 | |
| | 58,718 | | | Japan Tobacco, Inc. | | | 1,351,646 | |
| | 70,600 | | | JFE Holdings, Inc. | | | 1,035,095 | |
| | 77,000 | | | Kansai Electric Power Co., Inc. (The) | | | 1,070,446 | |
| | 74,465 | | | Marubeni Corp. | | | 1,162,021 | |
| | 42,100 | | | Mitsubishi Chemical Holdings Corp. | | | 265,576 | |
| | 32,028 | | | Mitsubishi Corp. | | | 1,527,674 | |
| | 166,553 | | | Mitsubishi HC Capital, Inc. | | | 1,110,056 | |
| | 38,523 | | | Mitsui & Co., Ltd. | | | 1,397,954 | |
| | 34,786 | | | Mitsui OSK Lines, Ltd. | | | 956,708 | |
| | 22,700 | | | MS&AD Insurance Group Holdings, Inc. | | | 834,693 | |
| | 16,000 | | | Nitto Denko Corp. | | | 1,050,107 | |
| | 53,930 | | | Ono Pharmaceutical Co., Ltd. | | | 1,035,006 | |
| | 28,200 | | | Otsuka Holdings Co., Ltd. | | | 1,002,587 | |
| | 101,000 | | | Panasonic Holdings Corp. | | | 1,136,791 | |
| | 67,614 | | | Renesas Electronics Corp.(a) | | | 1,034,072 | |
| | 24,900 | | | Shionogi & Co., Ltd. | | | 1,114,035 | |
| | 59,785 | | | Sumitomo Corp. | | | 1,193,780 | |
| | 21,400 | | | Toyota Tsusho Corp. | | | 1,259,455 | |
| | | | | | | | 24,095,071 | |
| | | | | | | | | |
| | | | | Luxembourg — 0.1% | | | | |
| | 5,427 | | | ArcelorMittal SA | | | 136,414 | |
| | | | | | | | | |
| | | | | Netherlands — 5.3% | | | | |
| | 65,902 | | | ABN AMRO Bank NV(b) | | | 936,430 | |
| | 13,968 | | | Koninklijke Ahold Delhaize NV | | | 421,174 | |
| | 30,471 | | | NN Group NV | | | 980,639 | |
| | 19,907 | | | Randstad NV | | | 1,102,425 | |
| | 75,177 | | | Stellantis NV | | | 1,447,347 | |
See accompanying Notes to the Financial Statements.
| Sterling Capital Behavioral International Equity Fund |
Schedule of Portfolio Investments — (continued)
September 30, 2023
| Shares | | | | | Fair Value | |
| COMMON STOCKS — (continued) | | | | |
| | | | | |
| | | | | Netherlands — (continued) | | | | |
| | 28,096 | | | STMicroelectronics NV | | $ | 1,217,439 | |
| | | | | | | | 6,105,454 | |
| | | | | | | | | |
| | | | | Norway — 0.8% | | | | |
| | 45,707 | | | DNB Bank ASA | | | 921,263 | |
| | | | | | | | | |
| | | | | Singapore — 1.8% | | | | |
| | 43,900 | | | Jardine Cycle & Carriage, Ltd. | | | 1,025,404 | |
| | 223,600 | | | Singapore Airlines, Ltd. | | | 1,056,661 | |
| | | | | | | | 2,082,065 | |
| | | | | | | | | |
| | | | | Spain — 4.7% | | | | |
| | 194,457 | | | Banco Bilbao Vizcaya Argentaria SA | | | 1,585,096 | |
| | 275,149 | | | CaixaBank SA | | | 1,101,352 | |
| | 16,593 | | | Industria de Diseno Textil SA | | | 619,091 | |
| | 70,751 | | | Repsol SA | | | 1,164,659 | |
| | 243,100 | | | Telefonica SA | | | 994,144 | |
| | | | | | | | 5,464,342 | |
| | | | | | | | | |
| | | | | Sweden — 2.8% | | | | |
| | 52,750 | | | H & M Hennes & Mauritz AB, Class B | | | 750,582 | |
| | 130,976 | | | Securitas AB, Class B | | | 1,038,884 | |
| | 32,461 | | | Svenska Handelsbanken AB, Class A | | | 289,861 | |
| | 62,632 | | | Swedbank AB, Class A | | | 1,153,976 | |
| | | | | | | | 3,233,303 | |
| | | | | | | | | |
| | | | | Switzerland — 8.6% | | | | |
| | 34,986 | | | Coca-Cola HBC AG | | | 960,018 | |
| | 20,752 | | | Holcim AG | | | 1,332,608 | |
| | 16,675 | | | Julius Baer Group, Ltd. | | | 1,072,257 | |
| | 500 | | | Kuehne + Nagel International AG | | | 142,568 | |
| | 15,417 | | | Logitech International SA | | | 1,065,808 | |
| | 27,090 | | | Novartis AG | | | 2,778,105 | |
| | 668 | | | Roche Holding AG | | | 182,772 | |
| | 12,478 | | | Swiss Re AG | | | 1,285,765 | |
| | 2,675 | | | Zurich Insurance Group AG | | | 1,227,692 | |
| | | | | | | | 10,047,593 | |
| | | | | | | | | |
| | | | | United Kingdom — 12.8% | | | | |
| | 100,450 | | | BAE Systems PLC | | | 1,222,894 | |
| | 293,365 | | | BP PLC | | | 1,902,065 | |
| | 28,514 | | | Burberry Group PLC | | | 663,966 | |
| | 18,327 | | | Coca-Cola Europacific Partners PLC | | | 1,145,071 | |
| | 5,565 | | | GSK PLC | | | 101,305 | |
| | 50,700 | | | Imperial Brands PLC | | | 1,031,191 | |
| | 12,635 | | | InterContinental Hotels Group PLC | | | 936,365 | |
| | 309,290 | | | J Sainsbury PLC | | | 953,978 | |
| | 548,719 | | | JD Sports Fashion PLC | | | 1,002,229 | |
| | 123,062 | | | Phoenix Group Holdings PLC | | | 724,013 | |
| | 469,169 | | | Rolls-Royce Holdings PLC(a) | | | 1,264,505 | |
| | 83,917 | | | Shell PLC | | | 2,668,209 | |
| | 358,577 | | | Tesco PLC | | | 1,155,874 | |
| | 172,083 | | | Vodafone Group PLC | | | 161,290 | |
| | | | | | | | 14,932,955 | |
| | | | | | | | | |
| | | | | Total Common Stocks | | | | |
| | | | | (Cost $101,061,881) | | | 111,626,939 | |
| Shares | | | | | Fair Value | |
| PREFERRED STOCKS — 1.7% | | | | |
| | | | | | | | | |
| | | | | Germany — 1.7% | | | | |
| | 11,077 | | | Bayerische Motoren Werke AG | | $ | 1,034,095 | |
| | 14,075 | | | Henkel AG & Co. KGaA | | | 1,003,859 | |
| | | | | | | | | |
| | | | | Total Preferred Stocks | | | | |
| | | | | (Cost $1,885,171) | | | 2,037,954 | |
| | | | | | | | | |
| MONEY MARKET FUND — 1.3% | | | | |
| | | | | |
| | | | | United States — 1.3% | | | | |
| | 1,527,600 | | | Federated Treasury Obligations Fund, Institutional Shares, 5.21%(c) | | | 1,527,600 | |
| | | | | | | | | |
| | | | | Total Money Market Fund | | | | |
| | | | | (Cost $1,527,600) | | | 1,527,600 | |
| | | | | | | | | |
| Total Investments — 99.0% | | | | |
| (Cost $104,474,652) | | | 115,192,493 | |
| Net Other Assets (Liabilities) — 1.0% | | | 1,123,706 | |
| NET ASSETS - 100.0% | | $ | 116,316,199 | |
| (a) | Represents non-income producing security. |
| (b) | Rule 144A, Section 4(a)(2) or other security that is restricted as to resale to qualified institutional investors. Sterling Capital Management LLC (the “Advisor”), using Board approved procedures, has deemed these securities or a portion of these securities to be liquid. |
| (c) | Represents the current yield as of report date. |
| ADR | American Depositary Receipt |
Continued
| Sterling Capital Behavioral International Equity Fund |
Schedule of Portfolio Investments — (continued)
September 30, 2023
| Industry | Percentage of net assets |
| Aerospace & Defense | 2.7% |
| Automobiles | 5.4% |
| Banks | 11.5% |
| Beverages | 2.7% |
| Building Products | 1.0% |
| Capital Markets | 1.8% |
| Chemicals | 2.0% |
| Commercial Services & Supplies | 0.9% |
| Construction & Engineering | 0.8% |
| Construction Materials | 3.4% |
| Consumer Staples Distribution & Retail | 2.2% |
| Diversified Telecommunication Services | 3.2% |
| Electric Utilities | 2.0% |
| Financial Services | 0.9% |
| Health Care Providers & Services | 1.3% |
| Hotels, Restaurants & Leisure | 0.8% |
| Household Durables | 1.0% |
| Household Products | 1.5% |
| Industrial Conglomerates | 1.2% |
| Insurance | 6.1% |
| IT Services | 0.5% |
| Marine Transportation | 0.9% |
| Media | 1.0% |
| Metals & Mining | 2.7% |
| Money Market Fund | 1.3% |
| Multi-Utilities | 2.0% |
| Oil, Gas & Consumable Fuels | 5.7% |
| Passenger Airlines | 2.2% |
| Pharmaceuticals | 10.3% |
| Professional Services | 1.0% |
| Real Estate Management & Development | 0.7% |
| Retail REITs | 0.2% |
| Semiconductors & Semiconductor Equipment | 2.2% |
| Software | 1.0% |
| Specialty Retail | 2.0% |
| Technology Hardware, Storage & Peripherals | 0.9% |
| Textiles, Apparel & Luxury Goods | 2.8% |
| Tobacco | 2.1% |
| Trading Companies & Distributors | 7.0% |
| Wireless Telecommunication Services | 0.1% |
| | 99.0% |
Continued
| Sterling Capital SMID Opportunities Fund |
Schedule of Portfolio Investments
September 30, 2023
| Shares | | | | | Fair Value | |
| COMMON STOCKS — 94.7% | | | | |
| | | | | | | | | |
| | | | | Aerospace & Defense — 2.1% | | | | |
| | 2,170 | | | Ducommun, Inc.(a) | | $ | 94,417 | |
| | | | | | | | | |
| | | | | Automobile Components — 4.1% | | | | |
| | 5,592 | | | Gentex Corp. | | | 181,964 | |
| | | | | | | | | |
| | | | | Banks — 2.6% | | | | |
| | 1,703 | | | SouthState Corp. | | | 114,714 | |
| | | | | | | | | |
| | | | | Building Products — 3.6% | | | | |
| | 3,481 | | | AZZ, Inc. | | | 158,664 | |
| | | | | | | | | |
| | | | | Chemicals — 2.4% | | | | |
| | 1,264 | | | CF Industries Holdings, Inc. | | | 108,375 | |
| | | | | | | | | |
| | | | | Commercial Services & Supplies — 8.1% | | | | |
| | 8,900 | | | Civeo Corp. | | | 184,497 | |
| | 1,322 | | | Waste Connections, Inc. | | | 177,545 | |
| | | | | | | | 362,042 | |
| | | | | | | | | |
| | | | | Consumer Finance — 3.0% | | | | |
| | 9,878 | | | SLM Corp. | | | 134,538 | |
| | | | | | | | | |
| | | | | Containers & Packaging — 2.5% | | | | |
| | 1,238 | | | Crown Holdings, Inc. | | | 109,538 | |
| | | | | | | | | |
| | | | | Electrical Equipment — 2.0% | | | | |
| | 2,399 | | | Sensata Technologies Holding PLC | | | 90,730 | |
| | | | | | | | | |
| | | | | Entertainment — 3.7% | | | | |
| | 1,170 | | | Take-Two Interactive Software, Inc.(a) | | | 164,256 | |
| | | | | | | | | |
| | | | | Financial Services — 11.3% | | | | |
| | 9,468 | | | Cannae Holdings, Inc.(a) | | | 176,484 | |
| | 1,220 | | | Euronet Worldwide, Inc.(a) | | | 96,843 | |
| | 2,017 | | | Global Payments, Inc. | | | 232,742 | |
| | | | | | | | 506,069 | |
| | | | | | | | | |
| | | | | Health Care Providers & Services — 9.9% | | | | |
| | 2,695 | | | Centene Corp.(a) | | | 185,631 | |
| | 2,379 | | | Encompass Health Corp. | | | 159,774 | |
| | 493 | | | Laboratory Corp. of America Holdings | | | 99,118 | |
| | | | | | | | 444,523 | |
| | | | | | | | | |
| | | | | Hotels, Restaurants & Leisure — 2.7% | | | | |
| | 811 | | | Hilton Worldwide Holdings, Inc. | | | 121,796 | |
| | | | | | | | | |
| | | | | Household Durables — 5.3% | | | | |
| | 6,932 | | | Legacy Housing Corp.(a) | | | 134,550 | |
| | 1,172 | | | Mohawk Industries, Inc.(a) | | | 100,570 | |
| | | | | | | | 235,120 | |
| | | | | | | | | |
| | | | | Insurance — 2.6% | | | | |
| | 1,082 | | | Globe Life, Inc. | | | 117,646 | |
| | | | | | | | | |
| | | | | Leisure Products — 2.1% | | | | |
| | 4,282 | | | MasterCraft Boat Holdings, Inc.(a) | | | 95,146 | |
| | | | | | | | | |
| | | | | Media — 3.6% | | | | |
| | 263 | | | Cable One, Inc. | | | 161,913 | |
| Shares | | | | | Fair Value | |
| COMMON STOCKS — (continued) |
| | | | | | | | | |
| | | | | Metals & Mining — 3.9% | | | | |
| | 1,029 | | | Arch Resources, Inc. | | $ | 175,609 | |
| | | | | | | | | |
| | | | | Oil, Gas & Consumable Fuels — 7.3% |
| | 5,503 | | | Callon Petroleum Co.(a) | | | 215,278 | |
| | 473 | | | Pioneer Natural Resources Co. | | | 108,577 | |
| | | | | | | | 323,855 | |
| | | | | | | | | |
| | | | | Professional Services — 6.9% |
| | 1,069 | | | ASGN, Inc.(a) | | | 87,316 | |
| | 1,006 | | | Jacobs Solutions, Inc. | | | 137,319 | |
| | 1,605 | | | SS&C Technologies Holdings, Inc. | | | 84,327 | |
| | | | | | | | 308,962 | |
| | | | | | | | | |
| | | | | Real Estate Management & Development — 2.3% |
| | 1,398 | | | CBRE Group, Inc., Class A(a) | | | 103,256 | |
| | | | | | | | | |
| | | | | Trading Companies & Distributors — 2.7% |
| | 3,040 | | | Air Lease Corp. | | | 119,806 | |
| | | | | | | | | |
| | | | | Total Common Stocks | | | | |
| | | | | (Cost $3,756,125) | | | 4,232,939 | |
| | | | | | | | | |
| MONEY MARKET FUND — 5.2% |
| | | | | | | | | |
| | 232,639 | | | Federated Treasury Obligations Fund, Institutional Shares, 5.21%(b) | | | 232,639 | |
| | | | | | | | | |
| | | | | Total Money Market Fund | | | | |
| | | | | (Cost $232,639) | | | 232,639 | |
| | | | | | | | | |
| Total Investments — 99.9% | | | | |
| (Cost $3,988,764) | | | 4,465,578 | |
| Net Other Assets (Liabilities) — 0.1% | | | 4,268 | |
| NET ASSETS — 100.0% | | $ | 4,469,846 | |
| (a) | Represents non-income producing security. |
| (b) | Represents the current yield as of report date. |
See accompanying Notes to the Financial Statements.
| Sterling Capital Mid Cap Relative Value Fund |
Schedule of Portfolio Investments
September 30, 2023
| Shares | | | | | Fair Value | |
| COMMON STOCKS — 96.3% | | | | |
| | | | | |
| | | | | Automobile Components — 1.9% | | | | |
| | 15,200 | | | Magna International, Inc. | | $ | 814,872 | |
| | | | | | | | | |
| | | | | Banks — 3.1% | | | | |
| | 7,861 | | | East West Bancorp, Inc. | | | 414,353 | |
| | 34,589 | | | Huntington Bancshares, Inc. | | | 359,726 | |
| | 7,796 | | | Wintrust Financial Corp. | | | 588,598 | |
| | | | | | | | 1,362,677 | |
| | | | | | | | | |
| | | | | Building Products — 2.8% | | | | |
| | 4,623 | | | Carlisle Cos., Inc. | | | 1,198,559 | |
| | | | | | | | | |
| | | | | Capital Markets — 3.1% | | | | |
| | 4,157 | | | Ameriprise Financial, Inc. | | | 1,370,480 | |
| | | | | | | | | |
| | | | | Chemicals — 3.4% | | | | |
| | 13,915 | | | Avient Corp. | | | 491,478 | |
| | 7,867 | | | Westlake Corp. | | | 980,779 | |
| | | | | | | | 1,472,257 | |
| | | | | | | | | |
| | | | | Communications Equipment — 1.1% | | | | |
| | 10,367 | | | Ciena Corp.(a) | | | 489,944 | |
| | | | | | | | | |
| | | | | Construction & Engineering — 1.8% | | | | |
| | 10,805 | | | MasTec, Inc.(a) | | | 777,636 | |
| | | | | | | | | |
| | | | | Consumer Staples Distribution & Retail — 6.0% | | | | |
| | 5,366 | | | Casey's General Stores, Inc. | | | 1,456,976 | |
| | 19,688 | | | Performance Food Group Co.(a) | | | 1,158,836 | |
| | | | | | | | 2,615,812 | |
| | | | | | | | | |
| | | | | Containers & Packaging — 5.2% | | | | |
| | 6,317 | | | Avery Dennison Corp. | | | 1,153,926 | |
| | 17,748 | | | Berry Global Group, Inc. | | | 1,098,779 | |
| | | | | | | | 2,252,705 | |
| | | | | | | | | |
| | | | | Electronic Equipment, Instruments & Components — 7.6% | | | | |
| | 6,641 | | | Arrow Electronics, Inc.(a) | | | 831,719 | |
| | 7,253 | | | CDW Corp. | | | 1,463,365 | |
| | 18,790 | | | nVent Electric PLC | | | 995,682 | |
| | | | | | | | 3,290,766 | |
| | | | | | | | | |
| | | | | Entertainment — 4.0% | | | | |
| | 8,353 | | | Activision Blizzard, Inc. | | | 782,091 | |
| | 6,905 | | | Take-Two Interactive Software, Inc.(a) | | | 969,393 | |
| | | | | | | | 1,751,484 | |
| | | | | | | | | |
| | | | | Financial Services — 2.7% | | | | |
| | 10,404 | | | Fiserv, Inc.(a) | | | 1,175,236 | |
| | | | | | | | | |
| | | | | Food Products — 2.1% | | | | |
| | 9,921 | | | Lamb Weston Holdings, Inc. | | | 917,296 | |
| | | | | | | | | |
| | | | | Gas Utilities — 2.3% | | | | |
| | 16,534 | | | Southwest Gas Holdings, Inc. | | | 998,819 | |
| | | | | | | | | |
| | | | | Health Care Equipment & Supplies — 3.7% | | | | |
| | 2,670 | | | Becton Dickinson & Co. | | | 690,275 | |
| Shares | | | | | Fair Value | |
| COMMON STOCKS — (continued) | | | | |
| | | | | | | | | |
| | | | | Health Care Equipment & Supplies — (continued) |
| | 8,080 | | | Zimmer Biomet Holdings, Inc. | | $ | 906,738 | |
| | | | | | | | 1,597,013 | |
| | | | | | | | | |
| | | | | Household Durables — 1.1% | | | | |
| | 6,565 | | | PulteGroup, Inc. | | | 486,138 | |
| | | | | | | | | |
| | | | | Industrial REITs — 2.4% | | | | |
| | 6,188 | | | EastGroup Properties, Inc. | | | 1,030,488 | |
| | | | | | | | | |
| | | | | Insurance — 7.4% | | | | |
| | 6,445 | | | American Financial Group, Inc. | | | 719,713 | |
| | 13,245 | | | First American Financial Corp. | | | 748,210 | |
| | 9,474 | | | Globe Life, Inc. | | | 1,030,108 | |
| | 6,445 | | | Hanover Insurance Group, Inc. (The) | | | 715,266 | |
| | | | | | | | 3,213,297 | |
| | | | | | | | | |
| | | | | Leisure Products — 1.2% | | | | |
| | 4,839 | | | Polaris, Inc. | | | 503,933 | |
| | | | | | | | | |
| | | | | Life Sciences Tools & Services — 7.0% |
| | 5,056 | | | ICON PLC(a) | | | 1,245,040 | |
| | 7,867 | | | Revvity, Inc. | | | 870,877 | |
| | 1,829 | | | Thermo Fisher Scientific, Inc. | | | 925,785 | |
| | | | | | | | 3,041,702 | |
| | | | | | | | | |
| | | | | Machinery — 2.1% | | | | |
| | 9,545 | | | Oshkosh Corp. | | | 910,879 | |
| | | | | | | | | |
| | | | | Multi-Utilities — 1.7% | | | | |
| | 29,245 | | | NiSource, Inc. | | | 721,766 | |
| | | | | | | | | |
| | | | | Office REITs — 1.0% | | | | |
| | 4,567 | | | Alexandria Real Estate Equities, Inc. | | | 457,157 | |
| | | | | | | | | |
| | | | | Oil, Gas & Consumable Fuels — 5.7% |
| | 32,707 | | | Coterra Energy, Inc. | | | 884,724 | |
| | 4,555 | | | Diamondback Energy, Inc. | | | 705,479 | |
| | 7,366 | | | Phillips 66 | | | 885,025 | |
| | | | | | | | 2,475,228 | |
| | | | | | | | | |
| | | | | Professional Services — 3.5% | | | | |
| | 4,859 | | | CACI International, Inc., Class A(a) | | | 1,525,386 | |
| | | | | | | | | |
| | | | | Real Estate Management & Development — 1.6% |
| | 9,603 | | | Howard Hughes Holdings, Inc.(a) | | | 711,870 | |
| | | | | | | | | |
| | | | | Residential REITs — 1.8% | | | | |
| | 6,094 | | | Mid-America Apartment Communities, Inc. | | | 783,993 | |
| | | | | | | | | |
| | | | | Semiconductors & Semiconductor Equipment — 1.4% |
| | 6,132 | | | Skyworks Solutions, Inc. | | | 604,554 | |
| | | | | | | | | |
| | | | | Software — 3.8% | | | | |
| | 23,696 | | | Dropbox, Inc., Class A(a) | | | 645,242 | |
See accompanying Notes to the Financial Statements.
| Sterling Capital Mid Cap Relative Value Fund |
Schedule of Portfolio Investments — (continued)
September 30, 2023
| Shares | | | | | Fair Value | |
| COMMON STOCKS — (continued) | | | | |
| | | | | |
| | | | | Software — (continued) | | | | |
| | 7,156 | | | PTC, Inc.(a) | | $ | 1,013,862 | |
| | | | | | | | 1,659,104 | |
| | | | | | | | | |
| | | | | Specialized REITs — 1.5% | | | | |
| | 5,346 | | | Digital Realty Trust, Inc. | | | 646,973 | |
| | | | | | | | | |
| | | | | Trading Companies & Distributors — 2.3% | | | | |
| | 2,218 | | | United Rentals, Inc. | | | 986,056 | |
| | | | | | | | | |
| | | | | Total Common Stocks | | | | |
| | | | | (Cost $22,166,986) | | | 41,844,080 | |
| | | | | | | | | |
| MONEY MARKET FUND — 3.7% | | | | |
| | | | | | | | | |
| | 1,629,056 | | | Federated Treasury Obligations Fund, Institutional Shares, 5.21%(b) | | | 1,629,056 | |
| | | | | | | | | |
| | | | | Total Money Market Fund | | | | |
| | | | | (Cost $1,629,056) | | | 1,629,056 | |
| | | | | | | | | |
| Total Investments — 100.0% | | | | |
| (Cost $23,796,042) | | | 43,473,136 | |
| Net Other Assets (Liabilities) — 0.0% | | | 6,356 | |
| NET ASSETS — 100.0% | | $ | 43,479,492 | |
| (a) | Represents non-income producing security. |
| (b) | Represents the current yield as of report date. |
Continued
| Sterling Capital Real Estate Fund |
Schedule of Portfolio Investments
September 30, 2023
| Shares | | | | | Fair Value | |
| COMMON STOCKS — 98.2% | | | | |
| | | | | |
| | | | | Data Center — 11.9% | | | | |
| | 23,682 | | | Digital Realty Trust, Inc. | | $ | 2,865,996 | |
| | 6,584 | | | Equinix, Inc. | | | 4,781,696 | |
| | | | | | | | 7,647,692 | |
| | | | | | | | | |
| | | | | Diversified — 1.7% | | | | |
| | 51,838 | | | Essential Properties Realty Trust, Inc. | | | 1,121,256 | |
| | | | | | | | | |
| | | | | Health Care — 7.6% | | | | |
| | 42,841 | | | Ventas, Inc. | | | 1,804,891 | |
| | 38,095 | | | Welltower, Inc. | | | 3,120,743 | |
| | | | | | | | 4,925,634 | |
| | | | | | | | | |
| | | | | Hotel & Resort — 3.4% | | | | |
| | 36,204 | | | Apple Hospitality REIT, Inc. | | | 555,369 | |
| | 19,483 | | | Ryman Hospitality Properties, Inc. | | | 1,622,544 | |
| | | | | | | | 2,177,913 | |
| | | | | | | | | |
| | | | | Industrial — 14.8% | | | | |
| | 12,491 | | | EastGroup Properties, Inc. | | | 2,080,126 | |
| | 36,269 | | | First Industrial Realty Trust, Inc. | | | 1,726,042 | |
| | 51,115 | | | Prologis, Inc. | | | 5,735,614 | |
| | | | | | | | 9,541,782 | |
| | | | | | | | | |
| | | | | Multi-Family Residential — 13.2% | | | | |
| | 14,774 | | | Camden Property Trust | | | 1,397,325 | |
| | 9,510 | | | Essex Property Trust, Inc. | | | 2,016,976 | |
| | 15,940 | | | Mid-America Apartment Communities, Inc. | | | 2,050,681 | |
| | 23,510 | | | NexPoint Residential Trust, Inc. | | | 756,552 | |
| | 62,080 | | | UDR, Inc. | | | 2,214,393 | |
| | | | | | | | 8,435,927 | |
| | | | | | | | | |
| | | | | Office — 4.3% | | | | |
| | 16,600 | | | Alexandria Real Estate Equities, Inc. | | | 1,661,660 | |
| | 30,555 | | | Highwoods Properties, Inc. | | | 629,739 | |
| | 73,859 | | | Hudson Pacific Properties, Inc. | | | 491,162 | |
| | | | | | | | 2,782,561 | |
| | | | | | | | | |
| | | | | Other Specialized — 4.0% | | | | |
| | 88,262 | | | VICI Properties, Inc. | | | 2,568,424 | |
| | | | | | | | | |
| | | | | Real Estate Development — 1.6% | | | | |
| | 13,664 | | | Howard Hughes Holdings, Inc.(a) | | | 1,012,912 | |
| | | | | | | | | |
| | | | | Retail — 13.8% | | | | |
| | 83,765 | | | Brixmor Property Group, Inc. | | | 1,740,637 | |
| | 43,153 | | | InvenTrust Properties Corp. | | | 1,027,473 | |
| | 104,210 | | | Kite Realty Group Trust | | | 2,232,178 | |
| | 62,040 | | | NETSTREIT Corp. | | | 966,583 | |
| | 79,188 | | | Retail Opportunity Investments Corp. | | | 980,348 | |
| | 85,790 | | | Tanger Factory Outlet Centers, Inc. | | | 1,938,854 | |
| | | | | | | | 8,886,073 | |
| | | | | | | | | |
| | | | | Self-Storage — 6.2% | | | | |
| | 50,857 | | | CubeSmart | | | 1,939,177 | |
| Shares | | | | | Fair Value | |
| COMMON STOCKS — (continued) | | | | |
| | | | | | | | | |
| | | | | Self-Storage — (continued) | | | | |
| | 16,973 | | | Extra Space Storage, Inc. | | $ | 2,063,577 | |
| | | | | | | | 4,002,754 | |
| | | | | | | | | |
| | | | | Single-Family Residential — 4.0% | | | | |
| | 80,959 | | | Invitation Homes, Inc. | | | 2,565,591 | |
| | | | | | | | | |
| | | | | Telecom Tower — 11.7% | | | | |
| | 32,209 | | | American Tower Corp. | | | 5,296,770 | |
| | 10,969 | | | SBA Communications Corp. | | | 2,195,665 | |
| | | | | | | | 7,492,435 | |
| | | | | | | | | |
| | | | | Total Common Stocks | | | | |
| | | | | (Cost $42,869,758) | | | 63,160,954 | |
| | | | | | | | | |
| MONEY MARKET FUND — 1.7% | | | | |
| | | | | | | | | |
| | 1,075,168 | | | Federated Treasury Obligations Fund, Institutional Shares, 5.21%(b) | | | 1,075,168 | |
| | | | | | | | | |
| | | | | Total Money Market Fund | | | | |
| | | | | (Cost $1,075,168) | | | 1,075,168 | |
| | | | | | | | | |
| Total Investments — 99.9% | | | | |
| (Cost $43,944,926) | | | 64,236,122 | |
| Net Other Assets (Liabilities) — 0.1% | | | 45,154 | |
| NET ASSETS — 100.0% | | $ | 64,281,276 | |
| (a) | Represents non-income producing security. |
| (b) | Represents the current yield as of report date. |
See accompanying Notes to the Financial Statements.
| Sterling Capital Small Cap Value Fund |
Schedule of Portfolio Investments
September 30, 2023
| Shares | | | | | Fair Value | |
| COMMON STOCKS — 98.4% | | | | |
| | | | | | | | | |
| | | | | Aerospace & Defense — 3.6% |
| | 86,007 | | | Moog, Inc., Class A | | $ | 9,715,351 | |
| | | | | | | | | |
| | | | | Automobile Components — 1.3% |
| | 46,559 | | | Dorman Products, Inc.(a) | | | 3,527,310 | |
| | | | | | | | | |
| | | | | Banks — 11.4% | | | | |
| | 125,611 | | | Columbia Banking System, Inc. | | | 2,549,903 | |
| | 125,828 | | | Community Bank System, Inc. | | | 5,311,200 | |
| | 155,520 | | | Glacier Bancorp, Inc. | | | 4,432,320 | |
| | 203,110 | | | Old National Bancorp. | | | 2,953,219 | |
| | 89,848 | | | United Bankshares, Inc. | | | 2,478,906 | |
| | 133,597 | | | Webster Financial Corp. | | | 5,385,295 | |
| | 104,095 | | | Wintrust Financial Corp. | | | 7,859,173 | |
| | | | | | | | 30,970,016 | |
| | | | | | | | | |
| | | | | Capital Markets — 2.0% | | | | |
| | 41,183 | | | Affiliated Managers Group, Inc. | | | 5,367,792 | |
| | | | | | | | | |
| | | | | Chemicals — 3.2% | | | | |
| | 243,016 | | | Avient Corp. | | | 8,583,325 | |
| | | | | | | | | |
| | | | | Construction & Engineering — 2.6% | | | | |
| | 96,160 | | | MasTec, Inc.(a) | | | 6,920,635 | |
| | | | | | | | | |
| | | | | Consumer Staples Distribution & Retail — 9.9% |
| | 137,477 | | | BJ's Wholesale Club Holdings, Inc.(a) | | | 9,811,734 | |
| | 39,564 | | | Casey's General Stores, Inc. | | | 10,742,417 | |
| | 106,240 | | | Performance Food Group Co.(a) | | | 6,253,286 | |
| | | | | | | | 26,807,437 | |
| | | | | | | | | |
| | | | | Electric Utilities — 2.3% | | | | |
| | 156,774 | | | Portland General Electric Co. | | | 6,346,211 | |
| | | | | | | | | |
| | | | | Electrical Equipment — 3.1% | | | | |
| | 90,208 | | | EnerSys | | | 8,539,991 | |
| | | | | | | | | |
| | | | | Electronic Equipment, Instruments & Components — 5.9% |
| | 109,417 | | | Belden, Inc. | | | 10,564,212 | |
| | 86,612 | | | ePlus, Inc.(a) | | | 5,501,594 | |
| | | | | | | | 16,065,806 | |
| | | | | | | | | |
| | | | | Entertainment — 1.9% |
| | 36,257 | | | Take-Two Interactive Software, Inc.(a) | | | 5,090,120 | |
| | | | | | | | | |
| | | | | Gas Utilities — 2.3% | | | | |
| | 103,637 | | | Southwest Gas Holdings, Inc. | | | 6,260,711 | |
| | | | | | | | | |
| | | | | Household Durables — 4.1% | | | | |
| | 129,955 | | | Ethan Allen Interiors, Inc. | | | 3,885,654 | |
| | 58,415 | | | Meritage Homes Corp. | | | 7,149,412 | |
| | | | | | | | 11,035,066 | |
| | | | | | | | | |
| | | | | Industrial REITs — 3.5% |
| | 201,266 | | | First Industrial Realty Trust, Inc. | | | 9,578,249 | |
| | | | | | | | | |
| | | | | Insurance — 7.1% | | | | |
| | 76,342 | | | Hanover Insurance Group, Inc. (The) | | | 8,472,435 | |
| Shares | | | | | Fair Value | |
| | | | | | | |
| COMMON STOCKS — (continued) | | | | |
| | | | | Insurance — (continued) | | | | |
| | 103,417 | | | Selective Insurance Group, Inc. | | $ | 10,669,532 | |
| | | | | | | | 19,141,967 | |
| | | | | | | | | |
| | | | | Life Sciences Tools & Services — 3.7% |
| | 27,095 | | | West Pharmaceutical Services, Inc. | | | 10,166,315 | |
| | | | | | | | | |
| | | | | Machinery — 7.9% | | | | |
| | 88,122 | | | Crane Co. | | | 7,828,758 | |
| | 87,168 | | | Crane NXT Co. | | | 4,843,926 | |
| | 90,605 | | | Oshkosh Corp. | | | 8,646,435 | |
| | | | | | | | 21,319,119 | |
| | | | | | | | | |
| | | | | Office REITs — 1.1% |
| | 151,377 | | | Highwoods Properties, Inc. | | | 3,119,880 | |
| | | | | | | | | |
| | | | | Oil, Gas & Consumable Fuels — 3.8% |
| | 20,900 | | | Chord Energy Corp. | | | 3,387,263 | |
| | 50,903 | | | Matador Resources Co. | | | 3,027,711 | |
| | 96,384 | | | Northern Oil & Gas, Inc. | | | 3,877,528 | |
| | | | | | | | 10,292,502 | |
| | | | | | | | | |
| | | | | Professional Services — 3.7% | | | | |
| | 31,559 | | | CACI International, Inc., Class A(a) | | | 9,907,317 | |
| | | | | | | | | |
| | | | | Retail REITs — 1.0% | | | | |
| | 125,471 | | | Tanger Factory Outlet Centers, Inc. | | | 2,835,645 | |
| | | | | | | | | |
| | | | | Semiconductors & Semiconductor Equipment — 5.5% |
| | | | | | | | | |
| | 108,964 | | | ON Semiconductor Corp.(a) | | | 10,128,204 | |
| | 50,825 | | | Qorvo, Inc.(a) | | | 4,852,263 | |
| | | | | | | | 14,980,467 | |
| | | | | | | | | |
| | | | | Software — 3.2% | | | | |
| | 60,907 | | | PTC, Inc.(a) | | | 8,629,304 | |
| | | | | | | | | |
| | | | | Trading Companies & Distributors — 4.3% |
| | 8,678 | | | Herc Holdings, Inc. | | | 1,032,161 | |
| | 23,685 | | | United Rentals, Inc. | | | 10,529,641 | |
| | | | | | | | 11,561,802 | |
| | | | | | | | | |
| | | | | Total Common Stocks | | | | |
| | | | | (Cost $87,758,025) | | | 266,762,338 | |
| | | | | | | | | |
| MONEY MARKET FUND — 0.5% |
| | | | | | | | | |
| | 1,313,608 | | | Federated Treasury Obligations Fund, Institutional Shares, 5.21%(b) | | | 1,313,608 | |
| | | | | | | | | |
| | | | | Total Money Market Fund | | | | |
| | | | | (Cost $1,313,608) | | | 1,313,608 | |
| | | | | | | | | |
| Total Investments — 98.9% | | | | |
| (Cost $89,071,633) | | | 268,075,946 | |
| Net Other Assets (Liabilities) — 1.1% | | | 3,104,478 | |
| NET ASSETS — 100.0% | | $ | 271,180,424 | |
See accompanying Notes to the Financial Statements.
| Sterling Capital Small Cap Value Fund |
Schedule of Portfolio Investments — (continued)
September 30, 2023
| (a) | Represents non-income producing security. |
| (b) | Represents the current yield as of report date. |
Continued
| Sterling Capital Ultra Short Bond Fund |
Schedule of Portfolio Investments
September 30, 2023
Principal
Amount | | | | | Fair Value | |
| ASSET BACKED SECURITIES — 13.9% | | | | |
| $ | 63,455 | | | Ally Auto Receivables Trust, Series 2022-3, Class A2, 5.290%, 6/16/25 | | $ | 63,364 | |
| | 96,252 | | | AmeriCredit Automobile Receivables Trust, Series 2019-3, Class C, 2.320%, 7/18/25 | | | 95,759 | |
| | 350,000 | | | AmeriCredit Automobile Receivables Trust, Series 2021-2, Class B, 0.690%, 1/19/27 | | | 332,843 | |
| | 16,796 | | | AmeriCredit Automobile Receivables Trust, Series 2022-1, Class A2, 2.050%, 1/20/26 | | | 16,764 | |
| | 55,282 | | | ARI Fleet Lease Trust, Series 2021-A, Class A2,
0.370%, 3/15/30(a) | | | 54,951 | |
| | 174,376 | | | Carmax Auto Owner Trust, Series 2022-4, Class A2A, 5.340%, 12/15/25 | | | 174,006 | |
| | 230,000 | | | CarMax Auto Owner Trust, Series 2020-4, Class A4, 0.630%, 6/15/26 | | | 217,946 | |
| | 42,709 | | | Carvana Auto Receivables Trust, Series 2021-P2, Class A3, 0.490%, 3/10/26 | | | 41,776 | |
| | 182,780 | | | Chesapeake Funding II, LLC, Series 2020- 1A, Class A1, 0.870%, 8/15/32(a) | | | 180,734 | |
| | 234,545 | | | Chesapeake Funding II, LLC, Series 2021- 1A, Class A1, 0.470%, 4/15/33(a) | | | 228,280 | |
| | 253 | | | Citicorp Residential Mortgage Trust, STEP, Series 2007-2, Class A6, 4.622%, 6/25/37 | | | 250 | |
| | 51,374 | | | Enterprise Fleet Financing, LLC, Series 2020-2, Class A2, 0.610%, 7/20/26(a) | | | 50,851 | |
| | 136,432 | | | Enterprise Fleet Financing, LLC, Series 2021-2, Class A2, 0.480%, 5/20/27(a) | | | 132,282 | |
| | 325,000 | | | GreatAmerica Leasing Receivables, Series 2023-1, Class A2, 5.350%, 2/16/26(a) | | | 322,320 | |
| | 94,413 | | | GreatAmerica Leasing Receivables Funding, LLC, Series 2021-1, Class A3, 0.340%, 8/15/24(a) | | | 93,414 | |
| | 450,000 | | | Hertz Vehicle Financing, LLC, Series 2021-1A, Class A, 1.210%, 12/26/25(a) | | | 427,073 | |
| | 300,000 | | | OneMain Direct Auto Receivables Trust 2021-1, Series 2021-1A, Class A, 0.870%, 7/14/28(a) | | | 285,734 | |
| | 186,305 | | | OneMain Financial Issuance Trust, Series 2018-2A,
Class A, 3.570%, 3/14/33(a) | | | 184,109 | |
| | 17,759 | | | OneMain Financial Issuance Trust, Series 2020-1A,
Class A, 3.840%, 5/14/32(a) | | | 17,726 | |
| | 60,463 | | | Santander Consumer Auto Receivables Trust 2021-A, Series 2021-AA, Class A3, 0.330%, 10/15/25(a) | | | 60,139 | |
| | 10,761 | | | Santander Drive Auto Receivables Trust, Series 2021-1, Class C, 0.750%, 2/17/26 | | | 10,737 | |
| | 300,000 | | | Santander Drive Auto Receivables Trust, Series 2022-5, Class B, 4.430%, 3/15/27 | | | 294,217 | |
| | 313,955 | | | Wheels SPV 2, LLC, Series 2020-1A, Class A3, 0.620%, 8/20/29(a) | | | 308,754 | |
| | 191,060 | | | World Omni Auto Receivables Trust, Series 2021-B, Class A3, 0.420%, 6/15/26 | | | 184,909 | |
Principal
Amount | | | | | Fair Value | |
| ASSET BACKED SECURITIES — (continued) | | | | |
| $ | 284,595 | | | World Omni Select Auto Trust, Series 2023-A, Class A2A, 5.920%, 3/15/27 | | $ | 284,143 | |
| | | | | | | | | |
| | | | | Total Asset Backed Securities | | | | |
| | | | | (Cost $4,080,439) | | | 4,063,081 | |
| | | | | | | | | |
| COLLATERALIZED MORTGAGE OBLIGATIONS — 3.7% |
| | 227,013 | | | Fannie Mae, Series 2011-140, Class BH, 2.500%, 1/25/27 | | | 219,513 | |
| | 268,002 | | | Freddie Mac, Series 4213, Class GV, 3.500%, 6/15/26 | | | 260,853 | |
| | 366,700 | | | Freddie Mac, Series 4841, Class PV, 4.500%, 11/15/29 | | | 361,747 | |
| | 254,558 | | | Ginnie Mae, Series 2013-144, Class GA, 2.500%, 12/20/40 | | | 245,633 | |
| | | | | | | | | |
| | | | | Total Collateralized Mortgage Obligations | | | | |
| | | | | (Cost $1,092,927) | | | 1,087,746 | |
| | | | | | | | | |
| COMMERCIAL MORTGAGE-BACKED SECURITIES — 9.5% |
| | 172,000 | | | BX Commercial Mortgage Trust, Series 2021-ACNT, Class C, 6.946%, (TSFR1M plus 1.61%), 11/15/38(a)(b) | | | 167,683 | |
| | 202,000 | | | BX Commercial Mortgage Trust, Series 2021-CIP, Class B, 6.717%, (TSFR1M plus 1.39%), 12/15/38(a)(b) | | | 196,931 | |
| | 12,305 | | | Citigroup Commercial Mortgage Trust, Series 2013-GC17, Class A4, 4.131%, 11/10/46 | | | 12,274 | |
| | 100,000 | | | Citigroup Commercial Mortgage Trust, Series 2015-GC33, Class A4, 3.778%, 9/10/58 | | | 93,787 | |
| | 86,066 | | | COMM 2013-CCRE12 Mortgage Trust, Series 2013-CR12, Class A4, 4.046%, 10/10/46 | | | 85,822 | |
| | 206,924 | | | COMM 2013-CCRE13 Mortgage Trust, Series 2013-CR13, Class A4, 4.194%, 11/10/46(c) | | | 206,244 | |
| | 290,000 | | | COMM Mortgage Trust, Series 2014- UBS2, Class A5, 3.961%, 3/10/47 | | | 287,806 | |
| | 155,000 | | | ELP Commercial Mortgage Trust, Series 2021-ELP, Class C, 6.767%, (TSFR1M plus 1.43%), 11/15/38(a)(b) | | | 151,110 | |
| | 300,000 | | | JP Morgan Chase Commercial Mortgage Securities Trust, Series 2014-C20, Class A5, 3.805%, 7/15/47 | | | 295,686 | |
| | 125,178 | | | OPG Trust, Series 2021-PORT, Class C, 6.279%, (TSFR1M plus 0.95%), 10/15/36(a)(b) | | | 120,780 | |
| | 226,000 | | | Wells Fargo Commercial Mortgage Trust, Series 2014-LC18, Class A5, 3.405%, 12/15/47 | | | 217,008 | |
See accompanying Notes to the Financial Statements.
| Sterling Capital Ultra Short Bond Fund |
Schedule of Portfolio Investments — (continued)
September 30, 2023
Principal
Amount | | | | | Fair Value | |
| COMMERCIAL MORTGAGE-BACKED SECURITIES — (continued) |
| $ | 325,000 | | | WFRBS Commercial Mortgage Trust, Series 2014-C22, Class A5, 3.752%, 9/15/57 | | $ | 314,928 | |
| | 300,000 | | | WFRBS Commercial Mortgage Trust, Series 2014-C23, Class A5, 3.917%, 10/15/57 | | | 289,569 | |
| | 350,000 | | | WFRBS Commercial Mortgage Trust, Series 2014-LC14, Class A5, 4.045%, 3/15/47 | | | 347,925 | |
| | | | | | | | | |
| | | | | Total Commercial Mortgage-Backed Securities | | | | |
| | | | | (Cost $2,841,612) | | | 2,787,553 | |
| | | | | | | | | |
| CORPORATE BONDS — 63.4% | | | | |
| | | | | |
| | | | | Automobiles — 3.0% | | | | |
| | 250,000 | | | American Honda Finance Corp., MTN, 0.550%, 7/12/24 | | | 240,383 | |
| | 200,000 | | | Ford Motor Credit Co., LLC, 3.810%, 1/9/24 | | | 197,677 | |
| | 250,000 | | | General Motors Financial Co., Inc., 5.920%, (SOFR plus 0.62%), 10/15/24(b) | | | 249,240 | |
| | 203,000 | | | Mercedes-Benz Finance North America, LLC, 3.650%, 2/22/24(a) | | | 201,218 | |
| | | | | | | | 888,518 | |
| | | | | | | | | |
| | | | | Banks — 13.7% | | | | |
| | 350,000 | | | Bank of America Corp., MTN, 6.062%, (SOFR plus 0.73%), 10/24/24(b) | | | 350,084 | |
| | 250,000 | | | Bank of New Zealand, 3.500%, 2/20/24(a) | | | 247,645 | |
| | 250,000 | | | BPCE SA, 4.625%, 7/11/24(a) | | | 245,218 | |
| | 325,000 | | | Citigroup, Inc., 0.776%, (SOFR plus 0.69%), 10/30/24(d) | | | 323,483 | |
| | 250,000 | | | Citizens Bank NA, BKNT, 4.119%, (SOFR plus 1.40%), 5/23/25(d) | | | 241,722 | |
| | 250,000 | | | Credit Suisse AG, 0.495%, 2/2/24 | | | 245,139 | |
| | 200,000 | | | Federation des Caisses Desjardins du Quebec, 5.772%, (SOFR plus 0.43%), 5/21/24(a)(b) | | | 199,765 | |
| | 250,000 | | | Fifth Third Bancorp, 4.300%, 1/16/24 | | | 248,456 | |
| | 250,000 | | | Huntington National Bank (The), BKNT, 3.550%, 10/6/23 | | | 249,935 | |
| | 300,000 | | | JPMorgan Chase & Co., 0.563%, (SOFR plus 0.42%), 2/16/25(d) | | | 293,296 | |
| | 250,000 | | | KeyBank NA, BKNT, 5.664%, (SOFRINDX plus 0.32%), 6/14/24(c) | | | 245,989 | |
| | 150,000 | | | Macquarie Group, Ltd., 6.008%, (SOFR plus 0.71%), 10/14/25(a)(b) | | | 149,163 | |
| | 325,000 | | | Morgan Stanley, MTN, 5.790%, (SOFR plus 0.46%), 1/25/24(c) | | | 324,932 | |
| | 250,000 | | | Standard Chartered PLC, 0.991%, (1-Year Treasury Constant Maturity plus 0.78%), 1/12/25(a)(c) | | | 245,862 | |
Principal
Amount | | | | | Fair Value | |
| CORPORATE BONDS — (continued) | | | | |
| | | | | |
| | | | | Banks — (continued) | | | | |
| $ | 400,000 | | | Wells Fargo & Co., MTN, 0.805%, (SOFR plus 0.51%), 5/19/25(d) | | $ | 385,763 | |
| | | | | | | | 3,996,452 | |
| | | | | | | | | |
| | | | | Communications Equipment — 1.2% |
| | 350,000 | | | Cisco Systems, Inc., 3.625%, 3/4/24 | | | 346,863 | |
| | | | | | | | | |
| | | | | Diversified REITs — 1.4% | | | | |
| | 225,000 | | | SBA Tower Trust, STEP, Series 2014-2A, Class C, 3.869%, 10/15/49(a) | | | 218,999 | |
| | 179,000 | | | Starwood Property Trust, Inc., 5.500%, 11/1/23(a) | | | 178,635 | |
| | | | | | | | 397,634 | |
| | | | | | | | | |
| | | | | Diversified Telecommunication Services — 0.8% |
| | 225,000 | | | Sprint, LLC, 7.125%, 6/15/24 | | | 226,435 | |
| | | | | | | | | |
| | | | | Electric Utilities — 9.8% |
| | 545,000 | | | American Electric Power Co., Inc., 2.031%, 3/15/24(e) | | | 534,795 | |
| | 325,000 | | | CMS Energy Corp., 3.875%, 3/1/24 | | | 322,069 | |
| | 250,000 | | | Dominion Energy, Inc., STEP, 3.071%, 8/15/24 | | | 243,372 | |
| | 303,000 | | | DTE Energy Co., STEP, Series C, 2.529%, 10/1/24 | | | 292,301 | |
| | 300,000 | | | Entergy Louisiana, LLC, 0.950%, 10/1/24 | | | 286,007 | |
| | 280,000 | | | Georgia Power Co., Series A, 2.200%, 9/15/24 | | | 270,021 | |
| | 85,000 | | | NextEra Energy Capital Holdings, Inc., 6.051%, 3/1/25 | | | 85,134 | |
| | 300,000 | | | Oncor Electric Delivery Co., LLC, 2.750%, 6/1/24 | | | 293,803 | |
| | 250,000 | | | Southern California Edison Co., 6.175%, (SOFRINDX plus 0.83%), 4/1/24(b) | | | 250,017 | |
| | 300,000 | | | Vistra Operations Co., LLC, 4.875%, 5/13/24(a) | | | 296,568 | |
| | | | | | | | 2,874,087 | |
| | | | | | | | | |
| | | | | Energy Equipment & Services — 6.0% |
| | 220,000 | | | Crestwood Midstream Partners L.P./Crestwood Midstream Finance Corp., 5.750%, 4/1/25 | | | 216,423 | |
| | 300,000 | | | Enbridge, Inc., 2.150%, 2/16/24 | | | 295,705 | |
| | 250,000 | | | Energy Transfer L.P., 5.875%, 1/15/24 | | | 249,844 | |
| | 200,000 | | | Kinder Morgan Energy Partners L.P., 4.150%, 2/1/24 | | | 198,703 | |
| | 175,000 | | | NuStar Logistics L.P., 5.750%, 10/1/25 | | | 170,188 | |
| | 341,000 | | | Penske Truck Leasing Co. L.P./PTL Finance Corp., 3.450%, 7/1/24(a) | | | 334,454 | |
| | 250,000 | | | Plains All American Pipeline L.P./PAA Finance Corp., 3.850%, 10/15/23 | | | 249,772 | |
| | 55,000 | | | Sabine Pass Liquefaction, LLC, 5.750%, 5/15/24 | | | 54,883 | |
| | | | | | | | 1,769,972 | |
Continued
| Sterling Capital Ultra Short Bond Fund |
Schedule of Portfolio Investments — (continued)
September 30, 2023
Principal
Amount | | | | | Fair Value | |
| CORPORATE BONDS — (continued) | | | | |
| | | | | |
| | | | | Financial Services — 7.0% | | | | |
| $ | 300,000 | | | AerCap Ireland Capital DAC/AerCap Global Aviation Trust, 1.650%, 10/29/24 | | $ | 285,429 | |
| | 250,000 | | | Air Lease Corp., MTN, 2.300%, 2/1/25 | | | 236,823 | |
| | 300,000 | | | Ally Financial, Inc., 1.450%, 10/2/23 | | | 300,000 | |
| | 335,000 | | | Avolon Holdings Funding, Ltd., 5.125%, 10/1/23(a) | | | 335,000 | |
| | 290,000 | | | Blue Owl Capital Corp., 5.250%, 4/15/24 | | | 288,010 | |
| | 270,000 | | | BNP Paribas SA, 3.375%, 1/9/25(a) | | | 260,580 | |
| | 87,000 | | | OneMain Finance Corp., 6.125%, 3/15/24 | | | 86,722 | |
| | 250,000 | | | Sumitomo Mitsui Financial Group, Inc., 4.436%, 4/2/24(a) | | | 247,745 | |
| | | | | | | | 2,040,309 | |
| | | | | | | | | |
| | | | | Gas Utilities — 0.9% | | | | |
| | 271,000 | | | Sempra, 3.300%, 4/1/25 | | | 260,515 | |
| | | | | | | | | |
| | | | | Health Care Providers & Services — 3.4% |
| | 250,000 | | | Amgen, Inc., 3.625%, 5/22/24 | | | 246,509 | |
| | 500,000 | | | Bristol-Myers Squibb Co., 3.250%, 11/1/23 | | | 498,872 | |
| | 250,000 | | | Pfizer Investment Enterprises Pte, Ltd., 4.650%, 5/19/25 | | | 246,569 | |
| | | | | | | | 991,950 | |
| | | | | | | | | |
| | | | | Industrial REITs — 0.7% | | | | |
| | 205,000 | | | Public Storage Operating Co., 5.790%, (SOFR plus 0.47%), 4/23/24(b) | | | 204,912 | |
| | | | | | | | | |
| | | | | Insurance — 7.4% | | | | |
| | 300,000 | | | Athene Global Funding, 2.750%, 6/25/24(a) | | | 291,953 | |
| | 75,000 | | | Brighthouse Financial Global Funding, 6.053%, (SOFR plus 0.76%), 4/12/24(a)(b) | | | 74,646 | |
| | 300,000 | | | Corebridge Global Funding, 0.450%, 12/8/23(a) | | | 296,491 | |
| | 260,000 | | | Five Corners Funding Trust, 4.419%, 11/15/23(a) | | | 259,319 | |
| | 200,000 | | | GA Global Funding Trust, 0.800%, 9/13/24(a) | | | 188,811 | |
| | 272,000 | | | John Hancock Life Insurance Co., 7.375%, 2/15/24(a) | | | 272,821 | |
| | 300,000 | | | Nationwide Mutual Insurance Co., 7.961%, (LIBOR USD 3-Month plus 2.29%), 12/15/24(a)(c) | | | 299,990 | |
| | 250,000 | | | Protective Life Global Funding, 0.473%, 1/12/24(a) | | | 246,286 | |
| | 250,000 | | | Symetra Financial Corp., 4.250%, 7/15/24 | | | 243,910 | |
| | | | | | | | 2,174,227 | |
| | | | | | | | | |
| | | | | Oil, Gas & Consumable Fuels — 1.9% |
| | 200,000 | | | Baker Hughes Holdings, LLC/Baker Hughes Co-Obligor, Inc., 1.231%, 12/15/23 | | | 198,023 | |
| | 350,000 | | | HF Sinclair Corp., 2.625%, 10/1/23 | | | 350,000 | |
| | | | | | | | 548,023 | |
Principal
Amount | | | | | Fair Value | |
| CORPORATE BONDS — (continued) | | |
| | | |
| | | | | Semiconductors & Semiconductor Equipment — 0.8% |
| $ | 250,000 | | | Xilinx, Inc., 2.950%, 6/1/24 | | $ | 244,936 | |
| | | | | | | | | |
| | | | | Software — 3.0% | | | | |
| | 300,000 | | | Hewlett Packard Enterprise Co., 5.900%, 10/1/24 | | | 299,762 | |
| | 305,000 | | | Take-Two Interactive Software, Inc., 3.300%, 3/28/24 | | | 300,851 | |
| | 275,000 | | | VMware, Inc., 1.000%, 8/15/24 | | | 263,415 | |
| | | | | | | | 864,028 | |
| | | | | | | | | |
| | | | | Specialty Retail — 0.5% | | | | |
| | 161,000 | | | Nordstrom, Inc., 2.300%, 4/8/24 | | | 157,627 | |
| | | | | | | | | |
| | | | | Telecommunication Services — 0.6% |
| | 187,501 | | | Sprint Spectrum Co., LLC/Sprint Spectrum Co. II, LLC/Sprint Spectrum Co. III, LLC, 4.738%, 3/20/25(a) | | | 185,519 | |
| | | | | | | | | |
| | | | | Tobacco — 1.3% | | | | |
| | 145,000 | | | BAT Capital Corp., 3.222%, 8/15/24 | | | 141,381 | |
| | 250,000 | | | Philip Morris International, Inc., 2.875%, 5/1/24 | | | 245,795 | |
| | | | | | | | 387,176 | |
| | | | | | | | | |
| | | | | Total Corporate Bonds | | | | |
| | | | | (Cost $18,608,891) | | | 18,559,183 | |
| | | | | | | | | |
| U.S. GOVERNMENT AGENCIES — 2.7% | | | | |
| | | | | |
| | | | | Federal Home Loan Banks — 2.7% |
| | 810,000 | | | 0.440%, 9/23/24 | | | 770,571 | |
| | | | | | | | | |
| | | | | Total U.S. Government Agencies | | | | |
| | | | | (Cost $778,452) | | | 770,571 | |
| | | | | | | | | |
| COMMERCIAL PAPER — 2.9% | | | | |
| | | | | |
| | | | | Banks — 2.9% | | | | |
| | 600,000 | | | DNB Bank ASA, 5.105%, 10/10/23 | | | 599,036 | |
| | 250,000 | | | Westpac Banking Corp., 5.246%, 11/15/23 | | | 248,283 | |
| | | | | | | | 847,319 | |
| | | | | | | | | |
| | | | | Total Commercial Paper | | | | |
| | | | | (Cost $847,684) | | | 847,319 | |
| | | | | | | | | |
| U.S. TREASURY BILLS — 1.7% |
| | | | | |
| | 500,000 | | | 5.316%, 10/10/23(f) | | | 499,415 | |
| | | | | | | | | |
| | | | | Total U.S. Treasury Bills | | | | |
| | | | | (Cost $499,343) | | | 499,415 | |
Continued
| Sterling Capital Ultra Short Bond Fund |
Schedule of Portfolio Investments — (continued)
September 30, 2023
| Shares | | | | | Fair Value | |
| MONEY MARKET FUND — 3.6% | | | |
| | 1,067,441 | | | Federated Treasury Obligations Fund, Institutional Shares, 5.21%(g) | | $ | 1,067,441 | |
| | | | | | | | |
| | | | Total Money Market Fund | | | | |
| | | | (Cost $1,067,441) | | | 1,067,441 | |
| | | | | | | | |
| Total Investments — 101.4% | | | | |
| (Cost $29,816,789) | | | 29,682,309 | |
| Net Other Assets (Liabilities) — (1.4)% | | | (404,275 | ) |
| NET ASSETS — 100.0% | | $ | 29,278,034 | |
| (a) | Rule 144A, Section 4(a)(2) or other security that is restricted as to resale to qualified institutional investors. The Advisor, using Board approved procedures, has deemed these securities or a portion of these securities to be liquid. |
| (b) | The interest rate for this floating rate note, which will change periodically, is based either on the prime rate or an index of market rates. The reflected rate is in effect as of September 30, 2023. The maturity date reflected is the final maturity date. |
| (c) | The interest rate for this variable rate note, which will change periodically, is based either on the prime rate or an index of market rates. The reflected rate is in effect as of September 30, 2023. The maturity date reflected is the final maturity date. |
| (d) | Security is a fix-to-float security, which carries a fixed coupon until a certain date, upon which it switches to a floating rate. Rate shown is the fixed rate. |
| (e) | All or a portion of the securities are held in a separate collateral account at US Bank. |
| (f) | Yield to maturity at time of purchase. |
| (g) | Represents the current yield as of report date. |
Continued
| Sterling Capital Short Duration Bond Fund |
Schedule of Portfolio Investments
September 30, 2023
Principal
Amount | | | | | Fair Value | |
| ASSET BACKED SECURITIES — 20.1% | | | | |
| $ | 205,000 | | | Ally Auto Receivables Trust, Series 2022-3, Class A4, 5.070%, 6/15/31. | | $ | 203,098 | |
| | 1,009,000 | | | AmeriCredit Automobile Receivables Trust, Series 2021-1, Class B, 0.680%, 10/19/26 | | | 986,295 | |
| | 975,000 | | | Avis Budget Rental Car Funding AESOP, LLC, Series 2020-2A, Class A, 2.020%, 2/20/27(a) | | | 889,814 | |
| | 590,000 | | | Avis Budget Rental Car Funding AESOP, LLC, Series 2023-3A, Class A, 5.440%, 2/22/28(a) | | | 579,382 | |
| | 753,000 | | | BA Credit Card Trust, Series 2022-A2, Class A2,
5.000%, 4/15/28 | | | 745,235 | |
| | 1,000,000 | | | CarMax Auto Owner Trust, Series 2022-1, Class A4, 1.700%, 8/16/27 | | | 918,919 | |
| | 1,159,000 | | | CarMax Auto Owner Trust, Series 2022-4, Class A3, 5.340%, 8/16/27 | | | 1,148,308 | |
| | 348,075 | | | Carvana Auto Receivables Trust, Series 2021-P2, Class A3, 0.490%, 3/10/26 | | | 340,478 | |
| | 496,916 | | | Chesapeake Funding II, LLC, Series 2021- 1A, Class A1, 0.470%, 4/15/33(a) | | | 483,644 | |
| | 199 | | | Citicorp Residential Mortgage Trust, STEP, Series 2007-2, Class A6, 4.622%, 6/25/37 | | | 196 | |
| | 975,000 | | | Discover Card Execution Note Trust, Series 2023-A2, Class A, 4.930%, 6/15/28 | | | 963,168 | |
| | 1,183,000 | | | Enterprise Fleet Financing, LLC, Series 2023-1, Class A3, 5.420%, 10/22/29(a) | | | 1,165,590 | |
| | 1,500,000 | | | Enterprise Fleet Funding, LLC, Series 2021-1, Class A3, 0.700%, 12/21/26(a) | | | 1,430,291 | |
| | 1,500,000 | | | Ford Credit Auto Owner Trust 2020- REV2, Series 2020-2, Class A, 1.060%, 4/15/33(a) | | | 1,363,156 | |
| | 971,375 | | | GreatAmerica Leasing Receivables Funding, LLC, Series 2021-2, Class A3, 0.670%, 7/15/25(a) | | | 940,912 | |
| | 1,288,000 | | | Hertz Vehicle Financing III L.P., Series 2021-2A, Class A, 1.680%, 12/27/27(a) | | | 1,130,119 | |
| | 490,000 | | | Hertz Vehicle Financing, LLC, Series 2021-1A, Class A, 1.210%, 12/26/25(a) | | | 465,035 | |
| | 1,078,000 | | | OneMain Direct Auto Receivables Trust 2019-1, Series 2019-1A, Class A, 3.630%, 9/14/27(a) | | | 1,046,358 | |
| | 890,000 | | | OneMain Direct Auto Receivables Trust 2023-1, Series 2023-1A, Class A, 5.410%, 11/14/29(a) | | | 876,309 | |
| | 59,195 | | | OneMain Financial Issuance Trust, Series 2020-1A,
Class A, 3.840%, 5/14/32(a) | | | 59,085 | |
| | 775,000 | | | OneMain Financial Issuance Trust 2022- 2, Series 2022-2A, Class A, 4.890%, 10/14/34(a) | | | 758,722 | |
| | 700,000 | | | OneMain Financial Issuance Trust 2022- 3, Series 2022-3A, Class A, 5.940%, 5/15/34(a) | | | 695,432 | |
Principal
Amount | | | | | Fair Value | |
| ASSET BACKED SECURITIES — (continued) |
| $ | 600,000 | | | Santander Drive Auto Receivables Trust, Series 2022-7, Class A3, 5.750%, 4/15/27 | | $ | 597,732 | |
| | 810,000 | | | Synchrony Card Funding, LLC, Series 2023-A1, Class A, 5.540%, 7/15/29 | | | 809,148 | |
| | 941,865 | | | Wheels SPV 2, LLC, Series 2020-1A, Class A3, 0.620%, 8/20/29(a). | | | 926,263 | |
| | 1,400,000 | | | World Omni Select Auto Trust, Series 2023-A, Class A3, 5.650%, 7/17/28 | | | 1,395,033 | |
| | | | | | | | | |
| | | | | Total Asset Backed Securities | | | | |
| | | | | (Cost $21,147,619) | | | 20,917,722 | |
| | | | | | | | | |
| COLLATERALIZED MORTGAGE OBLIGATIONS — 2.0% |
| | 695,625 | | | Chase Home Lending Mortgage Trust, Series 2019-ATR2, Class A3, 3.500%, 7/25/49(a)(b) | | | 596,188 | |
| | 43,023 | | | Fannie Mae, Series 2012-152, Class PC, 1.750%, 8/25/42 | | | 41,779 | |
| | 484,598 | | | Fannie Mae, Series 2013-35, Class CB, 2.000%, 2/25/43 | | | 448,744 | |
| | 31,480 | | | Fannie Mae, Series 2013-72, Class NA, 2.500%, 8/25/42 | | | 29,989 | |
| | 351,735 | | | Fannie Mae, Series 2015-71, Class PD, 2.500%, 3/25/43 | | | 336,477 | |
| | 261,576 | | | Fannie Mae, Series 2016-100, Class DA, 3.000%, 2/25/43 | | | 245,968 | |
| | 364,558 | | | Freddie Mac, Series 4828, Class QA, 3.500%, 3/15/47 | | | 345,380 | |
| | | | | Total Collateralized Mortgage Obligations | | | | |
| | | | | (Cost $2,254,839) | | | 2,044,525 | |
| | | | | | | | | |
| COMMERCIAL MORTGAGE-BACKED SECURITIES — 6.5% |
| | 434,500 | | | BX Commercial Mortgage Trust, Series 2021-ACNT, Class C, 6.946%, (TSFR1M plus 1.61%),
11/15/38(a)(c) | | | 423,595 | |
| | 653,000 | | | BX Commercial Mortgage Trust, Series 2021-CIP, Class B, 6.717%, (TSFR1M plus 1.39%), 12/15/38(a)(c) | | | 636,614 | |
| | 395,241 | | | BX Trust, Series 2021-RISE, Class C, 6.896%, (TSFR1M plus 1.56%), 11/15/36(a)(c) | | | 386,562 | |
| | 1,100,000 | | | COMM Mortgage Trust, Series 2014- LC15, Class A4, 4.006%, 4/10/47 | | | 1,089,933 | |
| | 394,500 | | | ELP Commercial Mortgage Trust, Series 2021-ELP, Class C, 6.767%, (TSFR1M plus 1.43%), 11/15/38(a)(c) | | | 384,599 | |
| | 30,196 | | | GS Mortgage Securities Trust, Series 2010- C1, Class B, 5.148%, 8/10/43(a) | | | 29,924 | |
| | 107,268 | | | GS Mortgage Securities Trust, Series 2014- GC24, Class AAB, 3.650%, 9/10/47 | | | 105,750 | |
See accompanying Notes to the Financial Statements.
| Sterling Capital Short Duration Bond Fund |
Schedule of Portfolio Investments — (continued)
September 30, 2023
Principal
Amount | | | | | Fair Value | |
| COMMERCIAL MORTGAGE-BACKED SECURITIES — (continued) |
| $ | 1,000,000 | | | JP Morgan Chase Commercial Mortgage Securities Trust, Series 2014-C20, Class A5, 3.805%, 7/15/47 | | $ | 985,619 | |
| | 300,000 | | | JPMBB Commercial Mortgage Securities Trust, Series 2014-C23, Class A5, 3.934%, 9/15/47 | | | 292,022 | |
| | 1,121,000 | | | Morgan Stanley Bank of America Merrill Lynch Trust, Series 2014-C18, Class A4, 3.923%, 10/15/47 | | | 1,088,601 | |
| | 623,229 | | | OPG Trust, Series 2021-PORT, Class C, 6.279%, (TSFR1M plus 0.95%), 10/15/36(a)(c) | | | 601,329 | |
| | 265,329 | | | SMR Mortgage Trust, Series 2022-IND, Class A, 6.982%, (TSFR1M plus 1.65%), 2/15/39(a)(c) | | | 253,645 | |
| | 500,000 | | | WFRBS Commercial Mortgage Trust, Series 2014-C21, Class A5, 3.678%, 8/15/47 | | | 486,884 | |
| | | | | Total Commercial Mortgage-Backed Securities | | | | |
| | | | | (Cost $6,852,947) | | | 6,765,077 | |
| | | | | | | | | |
| CORPORATE BONDS — 60.7% | | | | |
| | | | | |
| | | | | Aerospace & Defense — 0.3% | | | | |
| | 280,000 | | | RTX Corp., 5.000%, 2/27/26 | | | 276,636 | |
| | | | | | | | | |
| | | | | Automobiles — 3.4% | | | | |
| | 825,000 | | | Daimler Truck Finance North America, LLC, 3.500%,
4/7/25(a) | | | 796,445 | |
| | 540,000 | | | Ford Motor Credit Co., LLC, 2.300%, 2/10/25(d) | | | 505,739 | |
| | 765,000 | | | General Motors Financial Co., Inc., 5.400%, 4/6/26 | | | 749,257 | |
| | 760,000 | | | Mercedes-Benz Finance North America, LLC, 4.800%,
3/30/26(a) | | | 746,805 | |
| | 750,000 | | | Toyota Motor Credit Corp., 4.450%, 5/18/26 | | | 733,483 | |
| | | | | | | | 3,531,729 | |
| | | | | Banks — 15.6% | | | | |
| | 1,075,000 | | | Bank of America Corp., MTN, 0.981%, (SOFR plus 0.91%), 9/25/25(e) | | | 1,018,215 | |
| | 776,000 | | | Bank of New York Mellon Corp. (The), 4.947%, (SOFR plus 1.03%), 4/26/27(e) | | | 757,546 | |
| | 800,000 | | | Canadian Imperial Bank of Commerce, 5.926%, 10/2/26 | | | 799,808 | |
| | 825,000 | | | Citigroup, Inc., 3.352%, (TSFR3M plus 1.16%), 4/24/25(e) | | | 810,311 | |
| | 750,000 | | | Citizens Bank NA, BKNT, 4.119%, (SOFR plus 1.40%),
5/23/25(e) | | | 725,166 | |
| | 800,000 | | | Cooperatieve Rabobank UA, 5.500%, 10/5/26 | | | 797,628 | |
| | 535,000 | | | Fifth Third Bank NA, 5.852%, (SOFRINDX plus 1.23%), 10/27/25(e) | | | 526,338 | |
Principal
Amount | | | | | Fair Value | |
| CORPORATE BONDS — (continued) | | | | |
| | | | | |
| | | | | Banks — (continued) | | | | |
| $ | 625,000 | | | HSBC Holdings PLC, 2.999%, (SOFR plus 1.43%),
3/10/26(e) | | $ | 595,636 | |
| | 650,000 | | | Huntington National Bank (The), 4.008%, (SOFR plus 1.21%), 5/16/25(e) | | | 633,622 | |
| | 950,000 | | | ING Groep NV, 6.083%, (SOFR plus 1.56%), 9/11/27(e) | | | 946,345 | |
| | 775,000 | | | KeyBank NA, 4.700%, 1/26/26 | | | 735,052 | |
| | 1,045,000 | | | Morgan Stanley, MTN, 1.164%, (SOFR plus 0.56%),
10/21/25(e) | | | 986,492 | |
| | 855,000 | | | National Securities Clearing Corp., 0.750%, 12/7/25(a) | | | 771,464 | |
| | 850,000 | | | NatWest Markets PLC, 6.105%, (SOFR plus 0.76%),
9/29/26(a)(c) | | | 835,993 | |
| | 1,025,000 | | | PNC Financial Services Group, Inc. (The), 4.758%, (SOFR plus 1.09%), 1/26/27(e) | | | 996,528 | |
| | 842,000 | | | PNC Financial Services Group, Inc. (The), Series O, 9.312%, (TSFR3M plus 3.94%)(b)(f) | | | 842,745 | |
| | 125,000 | | | Royal Bank of Canada, GMTN, 4.875%, 1/12/26(d) | | | 122,691 | |
| | 755,000 | | | State Street Corp., 5.751%, (SOFR plus 1.35%),
11/4/26(e) | | | 752,447 | |
| | 750,000 | | | Sumitomo Mitsui Trust Bank, Ltd., 5.650%, 3/9/26(a) | | | 747,982 | |
| | 750,000 | | | Svenska Handelsbanken AB, 5.250%, 6/15/26(a) | | | 739,773 | |
| | 1,160,000 | | | Toronto-Dominion Bank (The), MTN, 1.200%, 6/3/26 | | | 1,028,773 | |
| | | | | | | | 16,170,555 | |
| | | | | | | | | |
| | | | | Chemicals — 0.7% | | | | |
| | 696,000 | | | NOVA Chemicals Corp., 4.875%, 6/1/24(a) | | | 683,687 | |
| | | | | | | | | |
| | | | | Commercial Services & Supplies — 0.5% |
| | 554,000 | | | GFL Environmental, Inc., 4.250%, 6/1/25(a) | | | 532,455 | |
| | | | | | | | | |
| | | | | Construction Materials — 0.6% | | | | |
| | 575,000 | | | Martin Marietta Materials, Inc., 4.250%, 7/2/24 | | | 568,462 | |
| | | | | | | | | |
| | | | | Consumer Staples Distribution & Retail — 1.4% | | | | |
| | 750,000 | | | Cargill, Inc., 3.500%, 4/22/25(a) | | | 727,486 | |
| | 779,000 | | | Cargill, Inc., 4.500%, 6/24/26(a) | | | 761,977 | |
| | | | | | | | 1,489,463 | |
| | | | | | | | | |
| | | | | Diversified REITs — 0.9% | | | | |
| | 502,000 | | | Ladder Capital Finance Holdings LLLP/Ladder Capital Finance Corp., 5.250%, 10/1/25(a) | | | 483,267 | |
| | 518,000 | | | Starwood Property Trust, Inc., 3.750%, 12/31/24(a) | | | 493,166 | |
| | | | | | | | 976,433 | |
Continued
| Sterling Capital Short Duration Bond Fund |
Schedule of Portfolio Investments — (continued)
September 30, 2023
Principal
Amount | | | | | Fair Value | |
| CORPORATE BONDS — (continued) | | | |
| | | | |
| | | | | Diversified Telecommunication Services — 1.0% |
| $ | 367,125 | | | Sprint Spectrum Co., LLC/Sprint Spectrum Co. II, LLC/Sprint Spectrum Co. III, LLC, 4.738%, 3/20/25(a) | | $ | 363,244 | |
| | 650,000 | | | Sprint, LLC, 7.625%, 3/1/26 | | | 668,291 | |
| | | | | | | | 1,031,535 | |
| | | | | | | | | |
| | | | | Electric Utilities — 5.1% | | | | |
| | 770,000 | | | CenterPoint Energy, Inc., 5.250%, 8/10/26 | | | 760,277 | |
| | 750,000 | | | Duke Energy Progress, LLC, 3.250%, 8/15/25 | | | 720,344 | |
| | 300,000 | | | Korea East-West Power Co., Ltd., 3.600%, 5/6/25(a) | | | 289,706 | |
| | 650,000 | | | NextEra Energy Capital Holdings, Inc., 5.749%, 9/1/25 | | | 648,362 | |
| | 390,000 | | | NextEra Energy Capital Holdings, Inc., 6.051%, 3/1/25 | | | 390,613 | |
| | 275,000 | | | Public Service Electric & Gas Co., MTN, 2.250%, 9/15/26 | | | 252,651 | |
| | 795,000 | | | Puget Energy, Inc., 3.650%, 5/15/25 | | | 762,111 | |
| | 825,000 | | | Sempra, 3.300%, 4/1/25 | | | 793,080 | |
| | 690,000 | | | Southern California Edison Co., 4.900%, 6/1/26 | | | 677,805 | |
| | | | | | | | 5,294,949 | |
| | | | | | | | | |
| | | | | Energy Equipment & Services — 3.0% |
| | 750,000 | | | Crestwood Midstream Partners L.P./Crestwood Midstream Finance Corp., 5.750%, 4/1/25 | | | 737,805 | |
| | 586,000 | | | Holly Energy Partners L.P./Holly Energy Finance Corp., 6.375%, 4/15/27(a) | | | 573,547 | |
| | 800,000 | | | NuStar Logistics L.P., 5.750%, 10/1/25 | | | 778,000 | |
| | 996,000 | | | Williams Cos., Inc. (The), 5.400%, 3/2/26 | | | 988,334 | |
| | | | | | | | 3,077,686 | |
| | | | | | | | | |
| | | | | Entertainment — 0.5% | | | | |
| | 525,000 | | | Mattel, Inc., 3.375%, 4/1/26(a) | | | 487,243 | |
| | | | | | | | | |
| | | | | Financial Services — 5.9% | | | | |
| | 600,000 | | | AerCap Ireland Capital DAC/AerCap Global Aviation Trust, 6.100%, 1/15/27 | | | 597,126 | |
| | 800,000 | | | Ally Financial, Inc., 5.750%, 11/20/25 | | | 777,365 | |
| | 775,000 | | | American Express Co., 2.250%, 3/4/25(d) | | | 736,535 | |
| | 776,000 | | | American Express Co., 4.900%, 2/13/26 | | | 761,411 | |
| | 825,000 | | | Blackstone Private Credit Fund, 1.750%, 9/15/24 | | | 787,253 | |
| | 768,000 | | | Charles Schwab Corp. (The), 5.875%, 8/24/26 | | | 765,527 | |
| | 753,000 | | | ERAC USA Finance, LLC, 3.850%, 11/15/24(a) | | | 735,446 | |
| | 770,000 | | | Lloyds Banking Group PLC, 5.985%, (1-Year Treasury Constant Maturity plus 1.48%), 8/7/27(b) | | | 763,524 | |
| | 241,000 | | | OneMain Finance Corp., 6.125%, 3/15/24 | | | 240,231 | |
| | | | | | | | 6,164,418 | |
Principal
Amount | | | | | Fair Value | |
| CORPORATE BONDS — (continued) | | | | |
| | | | | |
| | | | | Gas Utilities — 0.3% | | | | |
| $ | 334,000 | | | National Rural Utilities Cooperative Finance Corp., 4.450%, 3/13/26 | | $ | 326,295 | |
| | | | | | | | | |
| | | | | Ground Transportation — 0.9% | | | | |
| | 525,000 | | | Union Pacific Corp., 2.750%, 3/1/26 | | | 493,360 | |
| | 455,000 | | | Union Pacific Corp., 4.750%, 2/21/26 | | | 449,352 | |
| | | | | | | | 942,712 | |
| | | | | | | | | |
| | | | | Health Care Providers & Services — 1.5% |
| | 800,000 | | | Novartis Capital Corp., 3.000%, 11/20/25 | | | 762,505 | |
| | 780,000 | | | Pfizer Investment Enterprises Pte, Ltd., 4.450%, 5/19/26 | | | 762,335 | |
| | | | | | | | 1,524,840 | |
| | | | | | | | | |
| | | | | Hotels, Restaurants & Leisure — 0.5% |
| | 534,000 | | | Prime Security Services Borrower, LLC/Prime Finance, Inc., 5.250%, 4/15/24(a) | | | 530,343 | |
| | | | | | | | | |
| | | | | Household Products — 1.4% | | | | |
| | 750,000 | | | Haleon UK Capital PLC, 3.125%, 3/24/25 | | | 720,447 | |
| | 755,000 | | | Kenvue, Inc., 5.350%, 3/22/26(a) | | | 753,327 | |
| | | | | | | | 1,473,774 | |
| | | | | | | | | |
| | | | | Insurance — 7.1% | | | | |
| | 825,000 | | | Apollo Management Holdings L.P., 4.000%, 5/30/24(a) | | | 812,806 | |
| | 770,000 | | | Corebridge Global Funding, 5.750%, 7/2/26(a) | | | 760,792 | |
| | 825,000 | | | F&G Global Funding, 0.900%, 9/20/24(a) | | | 778,911 | |
| | 880,000 | | | GA Global Funding Trust, 0.800%, 9/13/24(a) | | | 830,769 | |
| | 625,000 | | | Jackson National Life Global Funding, 3.875%, 6/11/25(a) | | | 595,124 | |
| | 770,000 | | | Metropolitan Life Global Funding I, 5.000%, 1/6/26(a) | | | 760,953 | |
| | 900,000 | | | New York Life Global Funding, 5.450%, 9/18/26(a) | | | 897,791 | |
| | 1,135,000 | | | Reliance Standard Life Global Funding II, 5.243%,
2/2/26(a) | | | 1,104,022 | |
| | 815,000 | | | Security Benefit Global Funding, 1.250%, 5/17/24(a) | | | 786,542 | |
| | | | | | | | 7,327,710 | |
| | | | | | | | | |
| | | | | Internet & Direct Marketing Retail — 0.7% |
| | 850,000 | | | Amazon.com, Inc., 1.000%, 5/12/26 | | | 764,339 | |
| | | | | | | | | |
| | | | | Machinery — 0.7% | | | | |
| | 770,000 | | | John Deere Capital Corp., MTN, 4.800%, 1/9/26 | | | 761,169 | |
| | | | | | | | | |
| | | | | Media — 0.7% | | | | |
| | 800,000 | | | Gray Television, Inc., 5.875%, 7/15/26(a) | | | 718,697 | |
| | | | | | | | | |
| | | | | Oil, Gas & Consumable Fuels — 2.6% |
| | 700,000 | | | Occidental Petroleum Corp., 5.550%, 3/15/26 | | | 690,774 | |
Continued
| Sterling Capital Short Duration Bond Fund |
Schedule of Portfolio Investments — (continued)
September 30, 2023
Principal
Amount | | | | | Fair Value | |
| CORPORATE BONDS — (continued) | | | |
| | | | |
| | | | | Oil, Gas & Consumable Fuels — (continued) |
| $ | 1,060,000 | | | Pioneer Natural Resources Co., 5.100%, 3/29/26 | | $ | 1,046,814 | |
| | 1,060,000 | | | Shell International Finance BV, 2.875%, 5/10/26 | | | 1,000,037 | |
| | | | | | | | 2,737,625 | |
| | | | | | | | | |
| | | | | Semiconductors & Semiconductor Equipment — 1.5% |
| | 803,000 | | | Microchip Technology, Inc., 4.250%, 9/1/25 | | | 776,899 | |
| | 780,000 | | | NXP BV/NXP Funding, LLC, 5.350%, 3/1/26 | | | 768,573 | |
| | | | | | | | 1,545,472 | |
| | | | | | | | | |
| | | | | Software — 1.8% | | | | |
| | 790,000 | | | Microsoft Corp., 3.125%, 11/3/25 | | | 756,949 | |
| | 375,000 | | | Oracle Corp., 5.800%, 11/10/25 | | | 376,436 | |
| | 770,000 | | | Take-Two Interactive Software, Inc., 5.000%, 3/28/26 | | | 755,699 | |
| | | | | | | | 1,889,084 | |
| | | | | | | | | |
| | | | | Specialty Retail — 1.4% | | | | |
| | 765,000 | | | Lowe's Cos., Inc., 4.800%, 4/1/26 | | | 750,725 | |
| | 717,000 | | | Nordstrom, Inc., 2.300%, 4/8/24 | | | 701,979 | |
| | | | | | | | 1,452,704 | |
| | | | | | | | | |
| | | | | Tobacco — 0.7% | | | | |
| | 781,000 | | | Philip Morris International, Inc., 4.875%, 2/13/26 | | | 768,274 | |
| | | | | | | | | |
| | | | | Total Corporate Bonds | | | | |
| | | | | (Cost $64,619,092) | | | 63,048,289 | |
| | | | | | | | | |
| MUNICIPAL BONDS — 3.3% | | | | |
| | | | | |
| | | | | California — 0.7% | | | | |
| | 750,000 | | | University of California, Current Refunding, Taxable Revenue Bonds, Series AX, Callable 4/1/25 @ 100, 3.063%, 7/1/25 | | | 722,737 | |
| | | | | | | | | |
| | | | | Connecticut — 0.5% | | | | |
| | 525,000 | | | State of Connecticut, Miscellaneous Purposes Revenue, Taxable Revenue G.O., Series A, 5.050%, 5/15/26 | | | 523,079 | |
| | | | | | | | | |
| | | | | Hawaii — 0.2% | | | | |
| | 240,000 | | | State of Hawaii, HI, Public Improvements, Cash Flow Management G.O., 0.802%, 10/1/24 | | | 229,102 | |
| | | | | | | | | |
| | | | | Illinois — 0.8% | | | | |
| | 805,000 | | | Sales Tax Securitization Corp., Current Refunding, Taxable Revenue Bonds, Series B, 4.558%, 1/1/26 | | | 788,328 | |
Principal
Amount | | | | | Fair Value | |
| MUNICIPAL BONDS — (continued) | | | | |
| | | | | |
| | | | | Massachusetts — 1.0% | | | | |
| $ | 1,085,000 | | | Commonwealth of Massachusetts, Cash Flow Management, Taxable Revenue Bonds, Series A, 3.670%, 1/15/26 | | $ | 1,048,696 | |
| | | | | | | | | |
| | | | | Texas — 0.1% | | | | |
| | 140,000 | | | Dallas Fort Worth International Airport, Current Refunding, Taxable Revenue Bonds, Series A, 4.738%, 11/1/26(d) | | | 138,251 | |
| | | | | | | | | |
| | | | | Total Municipal Bonds | | | | |
| | | | | (Cost $3,518,707) | | | 3,450,193 | |
| | | | | | | | | |
| U.S. GOVERNMENT AGENCIES — 0.8% | | | | |
| | | | | |
| | | | | Federal Home Loan Banks — 0.8% |
| | 900,000 | | | 0.500%, 9/22/25 | | | 820,551 | |
| | | | | | | | | |
| | | | | Total U.S. Government Agencies | | | | |
| | | | | (Cost $827,600) | | | 820,551 | |
| | | | | | | | | |
| U.S. TREASURY NOTES — 4.5% | | | | |
| | | | | |
| | 2,040,000 | | | 3.000%, 7/15/25 | | | 1,965,970 | |
| | 1,750,000 | | | 3.625%, 5/15/26 | | | 1,696,406 | |
| | 1,000,000 | | | 4.625%, 9/15/26 | | | 995,235 | |
| | | | | | | | | |
| | | | | Total U.S. Treasury Notes | | | | |
| | | | | (Cost $4,716,304) | | | 4,657,611 | |
| Shares | | | | | | |
| MONEY MARKET FUND — 3.0% | | | |
| | 3,151,037 | | | Federated Treasury Obligations Fund, Institutional Shares, 5.21%(g) | | | 3,151,037 | |
| | | | | | | | |
| | | | Total Money Market Fund | | | | |
| | | | (Cost $3,151,037) | | | 3,151,037 | |
| | | | | | | | |
| Total Investments — 100.9% | | | | |
| (Cost $107,088,145) | | | 104,855,005 | |
| Net Other Assets (Liabilities) — (0.9)% | | | (903,883 | ) |
| NET ASSETS — 100.0% | | $ | 103,951,122 | |
| (a) | Rule 144A, Section 4(a)(2) or other security that is restricted as to resale to qualified institutional investors. The Advisor, using Board approved procedures, has deemed these securities or a portion of these securities to be liquid. |
| (b) | The interest rate for this variable rate note, which will change periodically, is based either on the prime rate or an index of market rates. The reflected rate is in effect as of September 30, 2023. The maturity date reflected is the final maturity date. |
| (c) | The interest rate for this floating rate note, which will change periodically, is based either on the prime rate or an index of market rates. The reflected rate is in effect as of September 30, 2023. The maturity date reflected is the final maturity date. |
| (d) | All or a portion of the securities are held in a separate collateral account at US Bank. |
Continued
| Sterling Capital Short Duration Bond Fund |
Schedule of Portfolio Investments — (continued)
September 30, 2023
| (e) | Security is a fix-to-float security, which carries a fixed coupon until a certain date, upon which it switches to a floating rate. Rate shown is the fixed rate. |
| (f) | Security is perpetual in nature and has no stated maturity date. |
| (g) | Represents the current yield as of report date. |
| BKNT | Bank Note |
| GMTN | Global Medium Term Note |
| G.O. | General Obligation |
| MTN | Medium Term Note |
| STEP | Step Coupon Bond |
Continued
| Sterling Capital Intermediate U.S. Government Fund |
Schedule of Portfolio Investments
September 30, 2023
Principal
Amount | | | | | Fair Value | |
| ASSET BACKED SECURITIES — 1.9% | | | | |
| $ | 265,000 | | | Avis Budget Rental Car Funding AESOP, LLC, Series 2019-3A, Class A, 2.360%, 3/20/26(a) | | $ | 252,267 | |
| | 77,835 | | | United States Small Business Administration, Series 2015-20G, Class 1, 2.880%, 7/1/35(b) | | | 70,214 | |
| | | | | | | | | |
| | | | | Total Asset Backed Securities | | | | |
| | | | | (Cost $344,259) | | | 322,481 | |
| | | | | | | | | |
| COLLATERALIZED MORTGAGE OBLIGATIONS — 20.1% |
| |
| | 36,282 | | | Fannie Mae, Series 2003-44, Class Q, 3.500%, 6/25/33 | | | 33,764 | |
| | 142,085 | | | Fannie Mae, Series 2005-31, Class PB, 5.500%, 4/25/35 | | | 141,275 | |
| | 141,258 | | | Fannie Mae, Series 2012-150, Class KA, 1.750%, 1/25/43 | | | 109,634 | |
| | 222,606 | | | Fannie Mae, Series 2012-87, Class MB, 2.000%, 5/25/42 | | | 197,676 | |
| | 84,562 | | | Fannie Mae, Series 2013-44, Class DJ, 1.850%, 5/25/33 | | | 74,582 | |
| | 139,718 | | | Fannie Mae, Series 2016-24, Class CD, 1.750%, 2/25/46 | | | 112,687 | |
| | 47,402 | | | Fannie Mae, Series 2016-49, Class DA, 3.500%, 10/25/42 | | | 45,697 | |
| | 192,225 | | | Fannie Mae, Series 2016-49, Class PA, 3.000%, 9/25/45 | | | 171,885 | |
| | 245,526 | | | Fannie Mae, Series 2016-88, Class PK, 2.500%, 3/25/46 | | | 212,861 | |
| | 206,536 | | | Fannie Mae, Series 2019-25, Class PD, 2.500%, 5/25/48 | | | 175,810 | |
| | 171,675 | | | Freddie Mac, Series 3787, Class LM, 4.000%, 1/15/31 | | | 165,277 | |
| | 65,106 | | | Freddie Mac, Series 4122, Class BC, 3.000%, 5/15/40 | | | 58,486 | |
| | 94,557 | | | Freddie Mac, Series 4151, Class PA, 2.000%, 1/15/33 | | | 86,809 | |
| | 175,041 | | | Freddie Mac, Series 4173, Class NB, 3.000%, 3/15/43 | | | 151,561 | |
| | 410,079 | | | Freddie Mac, Series 4601, Class NJ, 1.900%, 9/15/45 | | | 345,920 | |
| | 118,008 | | | Freddie Mac, Series 4656, Class PA, 3.500%, 10/15/45 | | | 109,343 | |
| | 315,000 | | | Freddie Mac, Series 4669, Class QY, 3.500%, 9/15/44 | | | 289,146 | |
| | 191,212 | | | Freddie Mac, Series 4863, Class AJ, 3.500%, 7/15/38 | | | 175,169 | |
| | 222,100 | | | Freddie Mac, Series 4942, Class NC, 2.500%, 10/25/49 | | | 185,479 | |
| | 63,004 | | | Ginnie Mae, Series 2013-133, Class PL, 3.500%, 2/16/37 | | | 59,889 | |
| | 50,210 | | | Ginnie Mae, Series 2015-162, Class EB, 2.500%, 9/20/44 | | | 46,059 | |
| | 222,799 | | | Ginnie Mae, Series 2022-137, Class PA, 4.000%, 5/20/52 | | | 205,813 | |
Principal
Amount | | | | | Fair Value | |
| COLLATERALIZED MORTGAGE OBLIGATIONS — (continued) |
| $ | 172,039 | | | Ginnie Mae, Series 2023-79, Class DV, 5.500%, 5/20/34 | | $ | 166,849 | |
| | | | | | | | | |
| | | | | Total Collateralized Mortgage Obligations | | | | |
| | | | | (Cost $3,672,026) | | | 3,321,671 | |
| | | | | | | | | |
| COMMERCIAL MORTGAGE-BACKED SECURITIES — 20.2% |
| |
| | 136,114 | | | Citigroup Commercial Mortgage Trust, Series 2015-GC29, Class A3, 2.935%, 4/10/48 | | | 131,959 | |
| | 409,363 | | | Fannie Mae-Aces, Series 2015-M17, Class A2, 3.003%,
11/25/25(c) | | | 390,276 | |
| | 392,246 | | | Fannie Mae-Aces, Series 2017-M7, Class A2, 2.961%,
2/25/27(c) | | | 366,631 | |
| | 218,455 | | | Fannie Mae-Aces, Series 2017-M8, Class A2, 3.061%,
5/25/27(c) | | | 203,113 | |
| | 390,000 | | | Fannie Mae-Aces, Series 2018-M10, Class A2, 3.469%,
7/25/28(c) | | | 363,037 | |
| | 140,000 | | | Freddie Mac Multifamily Structured Pass Through Certificates, Series K049, Class A2, 3.010%, 7/25/25 | | | 134,162 | |
| | 210,000 | | | Freddie Mac Multifamily Structured Pass Through Certificates, Series K060, Class A2, 3.300%, 10/25/26 | | | 198,469 | |
| | 500,000 | | | Freddie Mac Multifamily Structured Pass Through Certificates, Series K061, Class A2, 3.347%, 11/25/26(c) | | | 471,860 | |
| | 125,000 | | | Freddie Mac Multifamily Structured Pass Through Certificates, Series K066, Class A2, 3.117%, 6/25/27 | | | 116,351 | |
| | 160,000 | | | Freddie Mac Multifamily Structured Pass Through Certificates, Series K069, Class A2, 3.187%, 9/25/27(c) | | | 148,679 | |
| | 275,000 | | | Freddie Mac Multifamily Structured Pass Through Certificates, Series K079, Class A2, 3.926%, 6/25/28 | | | 260,901 | |
| | 250,000 | | | JPMBB Commercial Mortgage Securities Trust, Series 2014-C23, Class A5, 3.934%, 9/15/47 | | | 243,352 | |
| | 71,000 | | | Morgan Stanley Bank of America Merrill Lynch Trust, Series 2014-C18, Class A4, 3.923%, 10/15/47 | | | 68,948 | |
| | 250,000 | | | Morgan Stanley Bank of America Merrill Lynch Trust, Series 2014-C19, Class A4, 3.526%, 12/15/47 | | | 240,964 | |
| | | | | | | | | |
| | | | | Total Commercial Mortgage-Backed Securities | | | | |
| | | | | (Cost $3,613,646) | | | 3,338,702 | |
See accompanying Notes to the Financial Statements.
| Sterling Capital Intermediate U.S. Government Fund |
Schedule of Portfolio Investments — (continued)
September 30, 2023
Principal
Amount | | | | | Fair Value | |
| CORPORATE BONDS — 2.2% | | | | |
| | | | | |
| | | | | Banks — 0.4% | | | | |
| $ | 70,000 | | | Bank of America Corp., GMTN, 3.500%, 4/19/26 | | $ | 66,098 | |
| | | | | | | | | |
| | | | | Electric Utilities — 0.4% | | | | |
| | 75,000 | | | Public Service Electric & Gas Co., MTN, 2.250%,
9/15/26(b) | | | 68,905 | |
| | | | | | | | | |
| | | | | Retail REITs — 1.4% | | | | |
| | 250,000 | | | Federal Realty OP L.P., 1.250%, 2/15/26(b) | | | 224,630 | |
| | | | | | | | | |
| | | | | Total Corporate Bonds | | | | |
| | | | | (Cost $401,115) | | | 359,633 | |
| | | | | | | | | |
| MORTGAGE-BACKED SECURITIES — 31.0% |
| | | | | |
| | | | | Fannie Mae — 19.3% | | | | |
| | 177,197 | | | 4.000%, 12/1/33, Pool #MA1689 | | | 164,851 | |
| | 241,833 | | | 4.500%, 3/1/34, Pool #CA3294 | | | 234,134 | |
| | 42,807 | | | 4.000%, 12/1/36, Pool #MA2856 | | | 39,246 | |
| | 42,551 | | | 4.000%, 2/1/37, Pool #MA2914 | | | 39,012 | |
| | 379,756 | | | 1.500%, 12/1/40, Pool #MA4202 | | | 294,757 | |
| | 157,223 | | | 6.000%, 9/1/43, Pool #MA5158 | | | 156,487 | |
| | 39,507 | | | 4.000%, 5/1/47, Pool #BE9598 | | | 35,763 | |
| | 109,192 | | | 3.500%, 12/1/47, Pool #CA0833 | | | 95,722 | |
| | 52,460 | | | 5.000%, 8/1/48, Pool #CA2219 | | | 50,390 | |
| | 53,422 | | | 3.500%, 9/1/49, Pool #BJ9608 | | | 46,733 | |
| | 59,775 | | | 3.500%, 10/1/49, Pool #CA4431 | | | 52,260 | |
| | 91,979 | | | 3.000%, 3/1/50, Pool #FM2714 | | | 77,155 | |
| | 204,824 | | | 3.000%, 7/1/50, Pool #CA6422 | | | 170,734 | |
| | 204,336 | | | 3.000%, 7/1/50, Pool #CA6421 | | | 170,390 | |
| | 170,286 | | | 2.000%, 8/1/50, Pool #CA6799 | | | 131,091 | |
| | 258,858 | | | 2.000%, 9/1/50, Pool #CA7019 | | | 198,381 | |
| | 298,188 | | | 2.500%, 9/1/50, Pool #BQ2883 | | | 238,802 | |
| | 140,827 | | | 2.500%, 9/1/50, Pool #BQ0538 | | | 112,778 | |
| | 366,815 | | | 2.000%, 10/1/50, Pool #CA7224 | | | 281,542 | |
| | 295,118 | | | 2.500%, 10/1/50, Pool #FM4638 | | | 236,415 | |
| | 277,938 | | | 2.500%, 10/1/50, Pool #FM4530 | | | 222,421 | |
| | 146,094 | | | 5.000%, 11/1/52, Pool #CB5278 | | | 138,061 | |
| | | | | | | | 3,187,125 | |
| | | | | | | | | |
| | | | | Freddie Mac — 10.9% | | | | |
| | 103,248 | | | 4.000%, 12/1/35, Pool #ZA2401 | | | 95,008 | |
| | 93,144 | | | 3.500%, 6/1/36, Pool #ZA2414 | | | 85,532 | |
| | 59,986 | | | 4.000%, 3/1/39, Pool #ZA6403 | | | 54,734 | |
| | 196,110 | | | 2.000%, 12/1/40, Pool #RB5090 | | | 159,022 | |
| | 130,586 | | | 3.500%, 1/1/47, Pool #ZT0941 | | | 115,157 | |
| | 97,963 | | | 3.000%, 12/1/51, Pool #SD8184 | | | 81,617 | |
| | 184,870 | | | 4.500%, 6/1/52, Pool #SD1265 | | | 170,542 | |
| | 183,844 | | | 4.500%, 8/1/52, Pool #SD1515 | | | 169,068 | |
| | 275,354 | | | 5.000%, 9/1/52, Pool #RA7936 | | | 260,029 | |
| | 164,661 | | | 5.500%, 2/1/53, Pool #QF8052 | | | 159,414 | |
| | 197,944 | | | 5.000%, 3/1/53, Pool #SD2390 | | | 186,932 | |
| | 98,494 | | | 6.000%, 5/1/53, Pool #SD3072 | | | 97,326 | |
| | 167,973 | | | 6.000%, 7/1/53, Pool #SD3223 | | | 166,564 | |
| | | | | | | | 1,800,945 | |
Principal
Amount | | | | | Fair Value | |
| MORTGAGE-BACKED SECURITIES — (continued) |
| |
| | | | | Ginnie Mae — 0.6% | | | | |
| $ | 107,195 | | | 4.000%, 7/20/52, Pool #786280 | | $ | 96,929 | |
| | | | | | | | | |
| | | | | Ginnie Mae II — 0.2% | | | | |
| | 26,565 | | | 5.000%, 11/20/38, Pool #4283 | | | 24,832 | |
| | | | | | | | | |
| | | | | Total Mortgage-Backed Securities | | | | |
| | | | | (Cost $6,042,048) | | | 5,109,831 | |
| | | | | | | | | |
| MUNICIPAL BONDS — 0.7% | | | | |
| | | | | |
| | | | | Wisconsin — 0.7% | | | | |
| | 115,000 | | | State of Wisconsin, TXB, Revenue Bonds, Pension Funding, Series A, (AGM), 5.700%, 5/1/26(b) | | | 115,872 | |
| | | | | | | | | |
| | | | | Total Municipal Bonds | | | | |
| | | | | (Cost $118,848) | | | 115,872 | |
| | | | | | | | | |
| U.S. GOVERNMENT AGENCIES — 13.5% | | | | |
| | | | | | | | | |
| | | | | Fannie Mae — 9.9% | | | | |
| | 1,000,000 | | | 6.250%, 5/15/29 | | | 1,074,193 | |
| | 500,000 | | | 7.125%, 1/15/30 | | | 562,523 | |
| | | | | | | | 1,636,716 | |
| | | | | | | | | |
| | | | | Federal Farm Credit Banks Funding Corp. — 0.4% |
| | 86,000 | | | 2.400%, 3/24/36 | | | 62,244 | |
| | | | | | | | | |
| | | | | Federal Home Loan Banks — 3.2% |
| | 500,000 | | | 1.200%, 12/30/24 | | | 474,244 | |
| | 60,000 | | | 1.900%, 10/7/31 | | | 46,890 | |
| | | | | | | | 521,134 | |
| | | | | | | | | |
| | | | | Total U.S. Government Agencies | | | | |
| | | | | (Cost $2,377,224) | | | 2,220,094 | |
| | | | | | | | | |
| U.S. TREASURY NOTES — 9.6% | | | | |
| | | | | |
| | 595,000 | | | 0.250%, 9/30/25 | | | 541,473 | |
| | 1,150,200 | | | 1.125%, 2/15/31 | | | 907,355 | |
| | 150,000 | | | 2.750%, 8/15/32 | | | 129,897 | |
| | | | | | | | | |
| | | | | Total U.S. Treasury Notes | | | | |
| | | | | (Cost $1,727,510) | | | 1,578,725 | |
| Shares | | | | | | |
| MONEY MARKET FUND — 0.4% | | | |
| | | | |
| | 62,540 | | | Federated Treasury Obligations Fund, Institutional Shares, 5.21%(d) | | | 62,540 | |
| | | | | | | | |
| | | | Total Money Market Fund | | | | |
| | | | (Cost $62,540) | | | 62,540 | |
| | | | | | | | |
| Total Investments — 99.6% | | | | |
| (Cost $18,359,216) | | 16,429,549 | |
| Net Other Assets (Liabilities) — 0.4% | | 66,298 | |
| NET ASSETS — 100.0% | $ | 16,495,847 | |
Continued
| Sterling Capital Intermediate U.S. Government Fund |
Schedule of Portfolio Investments — (continued)
September 30, 2023
| (a) | Rule 144A, Section 4(a)(2) or other security that is restricted as to resale to qualified institutional investors. The Advisor, using Board approved procedures, has deemed these securities or a portion of these securities to be liquid. |
| (b) | All or a portion of the securities are held in a separate collateral account at US Bank. |
| (c) | The interest rate for this variable rate note, which will change periodically, is based either on the prime rate or an index of market rates. The reflected rate is in effect as of September 30, 2023. The maturity date reflected is the final maturity date. |
| (d) | Represents the current yield as of report date. |
| AGM | Assured Guaranty Municipal Corp. |
| GMTN | Global Medium Term Note |
| MTN | Medium Term Note |
| TXB | Taxable Bond |
Continued
| Sterling Capital Total Return Bond Fund |
Schedule of Portfolio Investments
September 30, 2023
Principal
Amount | | | | | Fair Value | |
| ASSET BACKED SECURITIES — 10.7% | | | | |
| $ | 2,030,000 | | | Avis Budget Rental Car Funding AESOP, LLC, Series 2019-3A, Class A, 2.360%, 3/20/26(a) | | $ | 1,932,461 | |
| | 2,500,000 | | | Avis Budget Rental Car Funding AESOP, LLC, Series 2020-2A, Class A, 2.020%, 2/20/27(a) | | | 2,281,575 | |
| | 6,250,000 | | | Avis Budget Rental Car Funding AESOP, LLC, Series 2021-1A, Class A, 1.380%, 8/20/27(a) | | | 5,515,334 | |
| | 8,720,000 | | | Carvana Auto Receivables Trust, Series 2021-P2, Class B, 1.270%, 3/10/27 | | | 7,791,290 | |
| | 4,791,000 | | | Citibank Credit Card Issuance Trust, Series 2007-A3, Class A3, 6.150%, 6/15/39 | | | 4,922,771 | |
| | 1,116 | | | Citicorp Residential Mortgage Trust, STEP, Series 2007-2, Class A6, 4.622%, 6/25/37 | | | 1,103 | |
| | 7,000,000 | | | Enterprise Fleet Financing, LLC, Series 2022-1, Class A3, 3.270%, 1/20/28(a) | | | 6,632,453 | |
| | 7,101,000 | | | Enterprise Fleet Financing, LLC, Series 2023-1, Class A3, 5.420%, 10/22/29(a) | | | 6,996,495 | |
| | 10,559,000 | | | Ford Credit Auto Owner Trust 2021- REV2, Series 2021-2, Class A, 1.530%, 5/15/34(a) | | | 9,320,431 | |
| | 6,000,000 | | | GM Financial Revolving Receivables Trust, Series 2021-1, Class A, 1.170%, 6/12/34(a) | | | 5,281,717 | |
| | 15,735,000 | | | Hertz Vehicle Financing III L.P., Series 2021-2A, Class A, 1.680%, 12/27/27(a) | | | 13,806,222 | |
| | 7,000,000 | | | Hertz Vehicle Financing, LLC, Series 2022-2A, Class A, 2.330%, 6/26/28(a) | | | 6,183,397 | |
| | 382,771 | | | New Century Home Equity Loan Trust, Series 2003-4, Class M1, 6.559%, (TSFR1M plus 1.24%),
10/25/33(b)(c) | | | 374,512 | |
| | 13,050,000 | | | OneMain Direct Auto Receivables Trust 2023-1, Series 2023-1A, Class A, 5.410%, 11/14/29(a) | | | 12,849,244 | |
| | 3,950,000 | | | OneMain Financial Issuance Trust, Series 2022-S1, Class A, 4.130%, 5/14/35(a) | | | 3,790,322 | |
| | 20,805,000 | | | OneMain Financial Issuance Trust 2021-1, Series 2021-1A, Class A1, 1.550%, 6/16/36(a) | | | 18,074,868 | |
| | 1,870,614 | | | Saxon Asset Securities Trust, Series 2004-3, Class M1, 6.334%, (TSFR1M plus 1.01%), 12/26/34(b) | | | 1,754,146 | |
| | | | | Total Asset Backed Securities | | | | |
| | | | | (Cost $118,347,042) | | | 107,508,341 | |
| | | | | | | | | |
COLLATERALIZED MORTGAGE OBLIGATIONS — 2.3% |
| | 16,505 | | | Adjustable Rate Mortgage Trust, Series 2004-5, Class 4A1, 4.040%, 4/25/35(d) | | | 16,370 | |
| | 9,160 | | | Citigroup Mortgage Loan Trust, Inc., Series 2004-NCM2, Class 3CB2, 6.500%, 8/25/19(c) | | | 8,920 | |
Principal
Amount | | | | | Fair Value | |
| COLLATERALIZED MORTGAGE OBLIGATIONS — (continued) |
| $ | 45,850 | | | Countrywide Home Loan Mortgage Pass- Through Trust, Series 2004-3, Class A4, 5.750%, 4/25/34 | | $ | 42,935 | |
| | 120,545 | | | Credit Suisse First Boston Mortgage- Backed Pass-Through Certificates, Series 2004-1, Class 2A1, 6.500%, 2/25/34 | | | 117,885 | |
| | 658,918 | | | Fannie Mae, Series 2011-38, Class D, 4.500%, 5/25/41(c) | | | 631,053 | |
| | 1,432,444 | | | Fannie Mae, Series 2013-16, Class A, 1.750%, 1/25/40 | | | 1,375,353 | |
| | 891,000 | | | Fannie Mae, Series 2013-70, Class CY, 3.500%, 7/25/43 | | | 703,686 | |
| | 779,782 | | | Fannie Mae, Series 2014-39, Class VP, 3.000%, 8/25/27 | | | 761,817 | |
| | 134,352 | | | Fannie Mae, Series 2017-64, Class PD, 2.500%, 7/25/47 | | | 112,798 | |
| | 258,709 | | | Freddie Mac, Series 3632, Class PK, 5.000%, 2/15/40 | | | 251,727 | |
| | 730,000 | | | Freddie Mac, Series 3762, Class LN, 4.000%, 11/15/40 | | | 659,456 | |
| | 331,083 | | | Freddie Mac, Series 4077, Class PJ, 3.500%, 11/15/40 | | | 320,916 | |
| | 1,128,041 | | | Freddie Mac, Series 4100, Class PA, 3.000%, 1/15/42 | | | 1,030,586 | |
| | 507,000 | | | Freddie Mac, Series 4120, Class YK, 2.000%, 10/15/32 | | | 394,486 | |
| | 429,613 | | | Freddie Mac, Series 4136, Class HZ, 3.500%, 11/15/27 | | | 397,105 | |
| | 324,000 | | | Freddie Mac, Series 4160, Class HH, 2.500%, 12/15/32 | | | 281,338 | |
| | 99,978 | | | Freddie Mac, Series 4287, Class V, 4.500%, 10/15/26 | | | 99,692 | |
| | 336,341 | | | Freddie Mac, Series 4328, Class KD, 3.000%, 8/15/43 | | | 309,685 | |
| | 1,465,504 | | | Freddie Mac, Series 4427, Class KA, 2.250%, 7/15/44 | | | 1,305,467 | |
| | 1,075,046 | | | Freddie Mac, Series 4654, Class KA, 3.000%, 6/15/45 | | | 983,744 | |
| | 222,114 | | | Freddie Mac, Series 4710, Class GA, 3.000%, 3/15/44 | | | 215,692 | |
| | 10,541,017 | | | Freddie Mac, Series 5300, Class AB, 5.500%, 1/25/49 | | | 10,303,836 | |
| | 137,277 | | | Ginnie Mae, Series 2008-51, Class PG, 5.000%, 6/20/38 | | | 133,159 | |
| | 2,852,078 | | | Ginnie Mae, Series 2014-2, Class AG, 2.307%,
3/20/40(d) | | | 2,453,681 | |
| | 345,899 | | | MASTR Alternative Loan Trust, Series 2003-5, Class 8A1, 5.500%, 6/25/33 | | | 309,015 | |
| | 2 | | | RAAC Trust, Series 2004-SP3, Class AI5, 4.890%, 12/25/32(d) | | | 2 | |
| | 46,685 | | | RAAC Trust, STEP, Series 2004-SP1, Class AI3, 6.118%, 3/25/34 | | | 45,148 | |
| | | | | Total Collateralized Mortgage Obligations | | | | |
| | | | | (Cost $24,814,472) | | | 23,265,552 | |
See accompanying Notes to the Financial Statements.
| Sterling Capital Total Return Bond Fund |
Schedule of Portfolio Investments — (continued)
September 30, 2023
Principal
Amount | | | | | Fair Value | |
| COMMERCIAL MORTGAGE-BACKED SECURITIES — 11.1% |
| $ | 3,417,000 | | | BX Commercial Mortgage Trust, Series 2021-ACNT, Class C, 6.946%, (TSFR1M plus 1.61%), 11/15/38(a)(b) | | $ | 3,331,245 | |
| | 2,972,000 | | | BX Commercial Mortgage Trust, Series 2021-CIP, Class B, 6.717%, (TSFR1M plus 1.39%), 12/15/38(a)(b) | | | 2,897,421 | |
| | 3,106,909 | | | BX Trust, Series 2021-RISE, Class C, 6.896%, (TSFR1M plus 1.56%), 11/15/36(a)(b) | | | 3,038,682 | |
| | 4,314,000 | | | CD Mortgage Trust, Series 2016-CD2, Class A4, 3.526%, 11/10/49(d) | | | 3,921,500 | |
| | 530,000 | | | CD Mortgage Trust, Series 2017-CD3, Class A4, 3.631%, 2/10/50 | | | 476,173 | |
| | 3,447,000 | | | CFCRE Commercial Mortgage Trust, Series 2016-C7, Class A3, 3.839%, 12/10/54 | | | 3,232,733 | |
| | 1,337,000 | | | Citigroup Commercial Mortgage Trust, Series 2017-P7, Class A4, 3.712%, 4/14/50 | | | 1,217,538 | |
| | 1,394,263 | | | COMM 2013-CCRE12 Mortgage Trust, Series 2013-CR12, Class A4, 4.046%, 10/10/46 | | | 1,390,319 | |
| | 795,000 | | | COMM Mortgage Trust, Series 2014-CR16, Class A4, 4.051%, 4/10/47 | | | 782,707 | |
| | 1,643,000 | | | COMM Mortgage Trust, Series 2014-CR20, Class A4, 3.590%, 11/10/47 | | | 1,591,194 | |
| | 1,070,000 | | | COMM Mortgage Trust, Series 2014-UBS4, Class A5, 3.694%, 8/10/47 | | | 1,040,153 | |
| | 7,155,000 | | | COMM Mortgage Trust, Series 2017-COR2, Class A3, 3.510%, 9/10/50 | | | 6,495,116 | |
| | 1,337,000 | | | CSAIL Commercial Mortgage Trust, Series 2015-C4, Class A4, 3.808%, 11/15/48 | | | 1,262,866 | |
| | 3,084,000 | | | ELP Commercial Mortgage Trust, Series 2021-ELP, Class C, 6.767%, (TSFR1M plus 1.43%), 11/15/38(a)(b) | | | 3,006,601 | |
| | 2,998,787 | | | Fannie Mae-Aces, Series 2017-M8, Class A2, 3.061%,
5/25/27(d) | | | 2,788,184 | |
| | 1,898,104 | | | Fannie Mae-Aces, Series 2019-M9, Class A2, 2.937%,
6/25/29 | | | 1,709,848 | |
| | 3,386,000 | | | Freddie Mac Multifamily Structured Pass Through Certificates, Series K153, Class A3, 3.117%,
10/25/31(d) | | | 2,922,340 | |
| | 8,536,000 | | | Freddie Mac Multifamily Structured Pass Through Certificates, Series K155, Class A3, 3.750%, 4/25/33 | | | 7,582,694 | |
| | 4,880,322 | | | FRESB Mortgage Trust, Series 2018-SB52, Class A10F, 3.480%, 6/25/28(d) | | | 4,549,138 | |
| | 269,046 | | | GS Mortgage Securities Trust, Series 2010- C1, Class B, 5.148%, 8/10/43(a) | | | 266,617 | |
| | 2,249,000 | | | GS Mortgage Securities Trust, Series 2014- GC24, Class A5, 3.931%, 9/10/47 | | | 2,179,877 | |
| | 2,209,000 | | | GS Mortgage Securities Trust, Series 2016-GS4, Class A4, 3.442%, 11/10/49(d) | | | 2,038,019 | |
Principal
Amount | | | | | Fair Value | |
| COMMERCIAL MORTGAGE-BACKED SECURITIES — (continued) |
| $ | 2,029,616 | | | JP Morgan Chase Commercial Mortgage Securities Trust, Series 2011-C3, Class B, 5.013%, 2/15/46(a)(d) | | $ | 1,886,469 | |
| | 1,517,000 | | | J P Morgan Chase Commercial Mortgage Securities Trust, Series 2016-JP4, Class A4, 3.648%, 12/15/49(d) | | | 1,402,704 | |
| | 3,742,000 | | | JPMCC Commercial Mortgage Securities Trust, Series 2017-JP5, Class A5, 3.723%, 3/15/50 | | | 3,425,489 | |
| | 3,343,454 | | | Med Trust, Series 2021-MDLN, Class C, 7.246%, (TSFR1M plus 1.91%), 11/15/38(a)(b) | | | 3,246,337 | |
| | 589,000 | | | Morgan Stanley Bank of America Merrill Lynch Trust, Series 2014-C18, Class A4, 3.923%, 10/15/47 | | | 571,977 | |
| | 5,198,000 | | | Morgan Stanley Bank of America Merrill Lynch Trust, Series 2016-C32, Class A4, 3.720%, 12/15/49 | | | 4,796,282 | |
| | 2,562,000 | | | Morgan Stanley Capital I Trust, Series 2016-BNK2, Class A4, 3.049%, 11/15/49 | | | 2,318,197 | |
| | 9,850,000 | | | Morgan Stanley Capital I Trust, Series 2018-H3, Class A5, 4.177%, 7/15/51 | | | 9,105,480 | |
| | 8,910,000 | | | Morgan Stanley Capital I, Inc., Series 2017-HR2, Class A4, 3.587%, 12/15/50 | | | 8,051,454 | |
| | 4,947,877 | | | OPG Trust, Series 2021-PORT, Class C, 6.279%, (TSFR1M plus 0.95%), 10/15/36(a)(b) | | | 4,774,010 | |
| | 2,631,955 | | | SMR Mortgage Trust, Series 2022-IND, Class A, 6.982%, (TSFR1M plus 1.65%), 2/15/39(a)(b) | | | 2,516,053 | |
| | 2,812,000 | | | Wells Fargo Commercial Mortgage Trust, Series 2015-P2, Class A4, 3.809%, 12/15/48 | | | 2,662,450 | |
| | 723,000 | | | Wells Fargo Commercial Mortgage Trust, Series 2016-C37, Class A5, 3.794%, 12/15/49 | | | 672,964 | |
| | 8,591,000 | | | Wells Fargo Commercial Mortgage Trust, Series 2017-C40, Class A4, 3.581%, 10/15/50 | | | 7,827,621 | |
| | 899,000 | | | WFRBS Commercial Mortgage Trust, Series 2014-C23, Class A5, 3.917%, 10/15/57 | | | 867,743 | |
| | | | | Total Commercial Mortgage-Backed Securities | | | | |
| | | | | (Cost $122,805,682) | | | 111,846,195 | |
| | | | | |
| CORPORATE BONDS — 25.2% | | | | |
| | | | | |
| | | | | Aerospace & Defense — 0.7% | | | | |
| | 4,410,000 | | | Boeing Co. (The), 5.705%, 5/1/40 | | | 4,065,716 | |
| | 1,593,000 | | | Lockheed Martin Corp., 4.450%, 5/15/28 | | | 1,541,965 | |
| | 1,670,000 | | | RTX Corp., 4.500%, 6/1/42 | | | 1,369,574 | |
| | | | | | | | 6,977,255 | |
Continued
| Sterling Capital Total Return Bond Fund |
Schedule of Portfolio Investments — (continued)
September 30, 2023
Principal
Amount | | | | | Fair Value | |
| CORPORATE BONDS — (continued) | | | | |
| | | | | |
| | | | | Automobiles — 0.7% | | | | |
| $ | 2,945,000 | | | Daimler Truck Finance North America, LLC, 2.000%,
12/14/26(a) | | $ | 2,631,585 | |
| | 1,850,000 | | | General Motors Financial Co., Inc., 5.850%, 4/6/30 | | | 1,772,080 | |
| | 3,286,000 | | | Mercedes-Benz Finance North America, LLC, 5.050%,
8/3/33(a) | | | 3,113,886 | |
| | | | | | | | 7,517,551 | |
| | | | | | | | | |
| | | | | Banks — 4.8% | | | | |
| | 3,101,000 | | | Bank of America Corp., 3.419%, (TSFR3M plus 1.30%), 12/20/28(e) | | | 2,791,289 | |
| | 1,853,000 | | | Bank of America Corp., 5.288%, (SOFR plus 1.91%),
4/25/34(e) | | | 1,724,265 | |
| | 2,441,000 | | | BPCE SA, 2.375%, 1/14/25(a) | | | 2,313,054 | |
| | 2,154,000 | | | Fifth Third Bancorp, 4.055%, (SOFR plus 1.36%),
4/25/28(e) | | | 1,982,392 | |
| | 910,000 | | | Fifth Third Bancorp, 4.337%, (SOFR plus 1.66%),
4/25/33(e) | | | 769,853 | |
| | 3,216,000 | | | First Citizens BancShares, Inc., 3.375%, (TSFR3M plus 2.47%), 3/15/30(e) | | | 2,999,997 | |
| | 4,025,000 | | | JPMorgan Chase & Co., 2.083%, (SOFR plus 1.85%),
4/22/26(e) | | | 3,778,154 | |
| | 3,537,000 | | | JPMorgan Chase & Co., 6.205%, (SOFR plus 0.89%),
4/22/27(b) | | | 3,512,064 | |
| | 1,755,000 | | | KeyCorp, MTN, 2.550%, 10/1/29 | | | 1,369,570 | |
| | 2,810,000 | | | Lloyds Banking Group PLC, 4.582%, 12/10/25 | | | 2,687,492 | |
| | 2,749,000 | | | Macquarie Group, Ltd., 1.340%, (SOFR plus 1.07%),
1/12/27(a)(e) | | | 2,459,613 | |
| | 2,012,000 | | | Morgan Stanley, MTN, 5.250%, (SOFR plus 1.87%),
4/21/34(e) | | | 1,868,999 | |
| | 2,569,000 | | | PNC Financial Services Group, Inc. (The), 5.068%, (SOFR plus 1.93%), 1/24/34(e) | | | 2,329,995 | |
| | 2,748,000 | | | PNC Financial Services Group, Inc. (The), Series O, 9.312%, (TSFR3M plus 3.94%)(d)(f) | | | 2,750,430 | |
| | 3,152,000 | | | Sumitomo Mitsui Financial Group, Inc., 2.130%, 7/8/30 | | | 2,467,425 | |
| | 3,054,000 | | | Toronto-Dominion Bank (The), 3.625%, (5 yr. Swap Semi 30/360 USD plus 2.21%), 9/15/31(d) | | | 2,825,974 | |
| | 1,330,000 | | | U.S. Bancorp, 5.850%, (SOFR plus 2.09%), 10/21/33(e) | | | 1,259,431 | |
| | 1,904,000 | | | Visa, Inc., 2.700%, 4/15/40 | | | 1,339,915 | |
| | 3,524,000 | | | Wells Fargo & Co., 3.068%, (SOFR plus 2.53%),
4/30/41(e) | | | 2,367,243 | |
| | 1,890,000 | | | Wells Fargo & Co., 5.389%, (SOFR plus 2.02%),
4/24/34(e) | | | 1,767,448 | |
| | 1,378,000 | | | Wells Fargo & Co., MTN, 4.808%, (SOFR plus 1.98%),
7/25/28(e) | | | 1,315,606 | |
| | 1,922,000 | | | Westpac Banking Corp., GMTN, 4.322%, (USISOA05 plus 2.24%), 11/23/31(d) | | | 1,779,871 | |
| | | | | | | | 48,460,080 | |
Principal
Amount | | | | | Fair Value | |
| CORPORATE BONDS — (continued) | | | | |
| | | | | |
| | | | | Beverages — 0.3% | | | | |
| $ | 1,419,000 | | | Anheuser-Busch InBev Worldwide, Inc., 5.800%, 1/23/59 | | $ | 1,387,898 | |
| | 1,461,000 | | | Bacardi, Ltd./Bacardi-Martini BV, 5.400%, 6/15/33(a) | | | 1,369,408 | |
| | | | | | | | 2,757,306 | |
| | | | | | | | | |
| | | | | Broadline Retail — 0.1% | | | | |
| | 1,526,000 | | | Dollar General Corp., 5.450%, 7/5/33 | | | 1,410,170 | |
| | | | | | | | | |
| | | | | Capital Markets — 0.3% |
| | 2,958,000 | | | Morgan Stanley, 2.188%, (SOFR plus 1.99%), 4/28/26(e) | | | 2,778,917 | |
| | | | | | | | | |
| | | | | Chemicals — 0.4% |
| | 2,856,000 | | | Albemarle Corp., 5.450%, 12/1/44(c) | | | 2,455,729 | |
| | 1,267,000 | | | FMC Corp., 3.450%, 10/1/29 | | | 1,067,069 | |
| | | | | | | | 3,522,798 | |
| | | | | |
| | | | | Commercial Services & Supplies — 0.2% |
| | 2,695,000 | | | Waste Connections, Inc., 2.950%, 1/15/52 | | | 1,633,472 | |
| | | | | | | | | |
| | | | | Construction Materials — 0.1% | | | | |
| | 1,741,000 | | | Vulcan Materials Co., 4.500%, 6/15/47 | | | 1,395,073 | |
| | | | | | | | | |
| | | | | Consumer Discretionary Distribution & Retail — 0.4% |
| | 3,517,000 | | | Amazon.com, Inc., 2.700%, 6/3/60(c) | | | 1,986,493 | |
| | 2,436,000 | | | Meta Platforms, Inc., 4.600%, 5/15/28 | | | 2,382,981 | |
| | | | | | | | 4,369,474 | |
| | | | | | | | | |
| | | | | Consumer Staples Distribution & Retail — 0.6% |
| | 3,008,000 | | | AbbVie, Inc., 4.875%, 11/14/48 | | | 2,626,281 | |
| | 1,596,000 | | | Cargill, Inc., 4.750%, 4/24/33(a) | | | 1,505,971 | |
| | 2,097,000 | | | General Mills, Inc., 4.950%, 3/29/33 | | | 1,965,475 | |
| | | | | | | | 6,097,727 | |
| | | | | | | | | |
| | | | | Diversified REITs — 0.9% |
| | 3,279,000 | | | American Tower Trust, 3.652%, 3/23/28(a)(c) | | | 2,999,484 | |
| | 2,074,000 | | | LXP Industrial Trust, 2.700%, 9/15/30 | | | 1,606,665 | |
| | 5,037,000 | | | SBA Tower Trust, Series 2014-2A, Class C, 3.869%,
10/15/49(a) | | | 4,902,669 | |
| | | | | | | | 9,508,818 | |
| | | | | | | | | |
| | | | | Diversified Telecommunication Services — 0.8% |
| | 58,125 | | | Sprint Spectrum Co., LLC/Sprint Spectrum Co. II, LLC/Sprint Spectrum Co. III, LLC, 4.738%, 3/20/25(a) | | | 57,510 | |
| | 2,550,000 | | | Sprint, LLC, 7.625%, 3/1/26 | | | 2,621,758 | |
| | 870,000 | | | T-Mobile USA, Inc., 6.000%, 6/15/54 | | | 828,434 | |
| | 2,671,000 | | | Verizon Communications, Inc., 1.450%, 3/20/26 | | | 2,412,007 | |
| | 1,933,000 | | | Warnermedia Holdings, Inc., 4.054%, 3/15/29 | | | 1,726,132 | |
| | | | | | | | 7,645,841 | |
Continued
| Sterling Capital Total Return Bond Fund |
Schedule of Portfolio Investments — (continued)
September 30, 2023
Principal
Amount | | | | | Fair Value | |
| CORPORATE BONDS — (continued) | | | | |
| | | | | | | | | |
| | | | | Electric Utilities — 1.8% | | | | |
| $ | 1,537,000 | | | American Electric Power Co., Inc., 5.750%, 11/1/27 | | $ | 1,546,121 | |
| | 2,819,000 | | | CenterPoint Energy, Inc., 2.950%, 3/1/30 | | | 2,363,061 | |
| | 2,023,000 | | | DTE Electric Co., 5.200%, 4/1/33 | | | 1,962,255 | |
| | 3,707,000 | | | Duke Energy Progress, LLC, 3.600%, 9/15/47 | | | 2,578,649 | |
| | 2,028,000 | | | Georgia Power Co., 4.950%, 5/17/33 | | | 1,901,306 | |
| | 3,256,000 | | | Indiana Michigan Power Co., Series K, 4.550%, 3/15/46 | | | 2,647,136 | |
| | 1,000,000 | | | Korea East-West Power Co., Ltd., 1.750%, 5/6/25(a) | | | 938,165 | |
| | 2,641,000 | | | NextEra Energy Capital Holdings, Inc., 2.440%, 1/15/32 | | | 2,043,745 | |
| | 1,986,000 | | | Southern California Edison Co., 5.950%, 11/1/32 | | | 1,981,058 | |
| | | | | | | | 17,961,496 | |
| | | | | | | | | |
| | | | | Energy Equipment & Services — 1.0% | | | | |
| | 2,678,000 | | | Aker BP ASA, 3.750%, 1/15/30(a) | | | 2,300,010 | |
| | 1,398,000 | | | Cheniere Corpus Christi Holdings, LLC, 3.700%, 11/15/29 | | | 1,240,421 | |
| | 1,637,000 | | | Cheniere Energy, Inc., 4.625%, 10/15/28 | | | 1,509,906 | |
| | 1,849,000 | | | Enterprise Products Operating, LLC, 5.950%, 2/1/41 | | | 1,819,577 | |
| | 1,537,000 | | | Hess Corp., 7.875%, 10/1/29(c) | | | 1,666,869 | |
| | 1,796,000 | | | Sempra Global, 3.250%, 1/15/32(a) | | | 1,406,925 | |
| | | | | | | | 9,943,708 | |
| | | | | | | | | |
| | | | | Financial Services — 2.3% | | | | |
| | 2,750,000 | | | AerCap Ireland Capital DAC/AerCap Global Aviation Trust, 6.150%, 9/30/30 | | | 2,709,053 | |
| | 2,843,000 | | | Avolon Holdings Funding, Ltd., 2.875%, 2/15/25(a) | | | 2,684,241 | |
| | 1,770,000 | | | Barings BDC, Inc., 3.300%, 11/23/26 | | | 1,553,290 | |
| | 3,509,000 | | | BlackRock, Inc., 1.900%, 1/28/31(c) | | | 2,772,887 | |
| | 1,595,000 | | | Blue Owl Capital Corp., 3.400%, 7/15/26 | | | 1,430,687 | |
| | 2,920,000 | | | Blue Owl Finance, LLC, 4.125%, 10/7/51(a) | | | 1,701,972 | |
| | 2,427,000 | | | Charles Schwab Corp. (The), 5.643%, (SOFR plus 2.21%), 5/19/29(e) | | | 2,377,416 | |
| | 1,023,000 | | | Citigroup, Inc., 6.174%, (SOFR plus 2.66%), 5/25/34(e) | | | 978,821 | |
| | 2,272,000 | | | Citigroup, Inc., 6.270%, (SOFR plus 2.34%), 11/17/33(e) | | | 2,267,612 | |
| | 1,355,000 | | | Jefferies Financial Group, Inc., 4.150%, 1/23/30 | | | 1,196,715 | |
| | 1,373,000 | | | Mitsubishi UFJ Financial Group, Inc., 5.422%, (1-Year Treasury Constant Maturity plus 1.38%), 2/22/29(d) | | | 1,343,995 | |
| | 2,024,000 | | | S&P Global, Inc., 5.250%, 9/15/33(a) | | | 1,973,735 | |
| | | | | | | | 22,990,424 | |
| | | | | | | | | |
| | | | | Gas Utilities — 0.7% | | | | |
| | 2,231,000 | | | Entergy Louisiana, LLC, 2.350%, 6/15/32 | | | 1,716,801 | |
| | 2,078,000 | | | National Grid PLC, 5.809%, 6/12/33 | | | 2,019,038 | |
Principal
Amount | | | | | Fair Value | |
| CORPORATE BONDS — (continued) | | | | |
| | | | | |
| | | | | Gas Utilities — (continued) | | | | |
| $ | 4,380,000 | | | Sempra, 3.800%, 2/1/38 | | $ | 3,405,334 | |
| | | | | | | | 7,141,173 | |
| | | | | Ground Transportation — 0.5% |
| | 2,484,000 | | | Burlington Northern Santa Fe, LLC, 4.950%, 9/15/41 | | | 2,240,915 | |
| | 3,434,000 | | | Canadian Pacific Railway Co., 4.200%, 11/15/69 | | | 2,440,983 | |
| | | | | | | | 4,681,898 | |
| | | | | | | | | |
| | | | | Health Care Equipment & Services — 0.3% |
| | 1,711,000 | | | GE HealthCare Technologies, Inc., 5.857%, 3/15/30 | | | 1,696,989 | |
| | 974,000 | | | HCA, Inc., 3.125%, 3/15/27 | | | 884,808 | |
| | | | | | | | 2,581,797 | |
| | | | | | | | | |
| | | | | Health Care Providers & Services — 1.1% |
| | 2,169,000 | | | Amgen, Inc., 5.250%, 3/2/30 | | | 2,119,366 | |
| | 3,750,000 | | | Bristol-Myers Squibb Co., 2.550%, 11/13/50 | | | 2,139,194 | |
| | 2,101,000 | | | CSL Finance PLC, 4.250%, 4/27/32(a) | | | 1,901,972 | |
| | 2,984,000 | | | CVS Health Corp., 2.700%, 8/21/40 | | | 1,878,475 | |
| | 2,031,000 | | | Elevance Health, Inc., 3.600%, 3/15/51(c) | | | 1,392,549 | |
| | 2,211,000 | | | Pfizer Investment Enterprises Pte, Ltd., 4.750%, 5/19/33 | | | 2,094,659 | |
| | | | | | | | 11,526,215 | |
| | | | | Household Products — 0.3% |
| | 2,695,000 | | | Kenvue, Inc., 5.000%, 3/22/30(a) | | | 2,626,117 | |
| | | | | | | | | |
| | | | | Insurance — 1.7% | | | | |
| | 2,769,000 | | | Athene Global Funding, 2.500%, 1/14/25(a) | | | 2,617,105 | |
| | 1,664,000 | | | AXIS Specialty Finance, LLC, 3.900%, 7/15/29 | | | 1,484,232 | |
| | 1,658,000 | | | Corebridge Financial, Inc., 3.900%, 4/5/32 | | | 1,396,552 | |
| | 2,002,000 | | | Enstar Group, Ltd., 3.100%, 9/1/31 | | | 1,508,342 | |
| | 1,554,000 | | | KKR Group Finance Co. III, LLC, 5.125%, 6/1/44(a) | | | 1,285,566 | |
| | 3,064,000 | | | Meiji Yasuda Life Insurance Co., 5.200%, (5 yr. Swap Semi 30/360 USD plus 4.23%), 10/20/45(a)(d) | | | 2,982,138 | |
| | 1,689,000 | | | Prudential Financial, Inc., 3.935%, 12/7/49 | | | 1,212,708 | |
| | 609,000 | | | Reinsurance Group of America, Inc., 3.150%, 6/15/30 | | | 504,613 | |
| | 1,343,000 | | | Sammons Financial Group, Inc., 3.350%, 4/16/31(a) | | | 1,014,530 | |
| | 1,292,000 | | | SBL Holdings, Inc., 5.000%, 2/18/31(a) | | | 1,005,418 | |
| | 1,870,000 | | | Transatlantic Holdings, Inc., 8.000%, 11/30/39 | | | 2,176,998 | |
| | | | | | | | 17,188,202 | |
| | | | | Machinery — 0.1% | | | | |
| | 1,754,000 | | | Deere & Co., 3.750%, 4/15/50 | | | 1,384,295 | |
Continued
| Sterling Capital Total Return Bond Fund |
Schedule of Portfolio Investments — (continued)
September 30, 2023
Principal
Amount | | | | | Fair Value | |
| CORPORATE BONDS — (continued) | | | | |
| | | | | | | | | |
| | | | | Media — 0.5% | | | | |
| $ | 1,739,000 | | | Discovery Communications, LLC, 5.200%, 9/20/47 | | $ | 1,317,400 | |
| | 1,303,000 | | | FactSet Research Systems, Inc., 2.900%, 3/1/27 | | | 1,188,409 | |
| | 1,831,000 | | | FactSet Research Systems, Inc., 3.450%, 3/1/32 | | | 1,517,687 | |
| | 1,602,000 | | | Time Warner Cable, LLC, 6.550%, 5/1/37 | | | 1,453,751 | |
| | | | | | | | 5,477,247 | |
| | | | | Multi-Utilities — 0.6% | | | | |
| | 2,310,000 | | | CMS Energy Corp., 4.700%, 3/31/43 | | | 1,873,854 | |
| | 2,933,000 | | | Newmont Corp., 2.250%, 10/1/30 | | | 2,335,770 | |
| | 2,946,000 | | | Puget Sound Energy, Inc., 4.223%, 6/15/48 | | | 2,230,589 | |
| | | | | | | | 6,440,213 | |
| | | | | | | | | |
| | | | | Oil, Gas & Consumable Fuels — 0.7% |
| | 1,917,000 | | | EQT Corp., 7.000%, 2/1/30 | | | 1,973,820 | |
| | 1,518,000 | | | Halliburton Co., 4.850%, 11/15/35 | | | 1,365,688 | |
| | 1,829,000 | | | HF Sinclair Corp., 5.875%, 4/1/26 | | | 1,823,856 | |
| | 1,778,000 | | | Schlumberger Investment SA, 2.650%, 6/26/30 | | | 1,505,550 | |
| | | | | | | | 6,668,914 | |
| | | | | | | | | |
| | | | | Pharmaceuticals — 0.1% |
| | 1,705,000 | | | SC Johnson & Son, Inc., 4.750%, 10/15/46(a) | | | 1,433,607 | |
| | | | | | | | | |
| | | | | Residential REITs — 0.2% |
| | 1,400,000 | | | Invitation Homes Operating Partnership L.P., 4.150%,
4/15/32 | | | 1,204,797 | |
| | 1,694,000 | | | Tanger Properties L.P., 2.750%, 9/1/31 | | | 1,222,116 | |
| | | | | | | | 2,426,913 | |
| | | | | | | | | |
| | | | | Retail REITs — 0.2% |
| | 1,870,000 | | | Retail Opportunity Investments Partnership L.P., 6.750%, 10/15/28 | | | 1,846,045 | |
| | | | | | | | | |
| | | | | Semiconductors & Semiconductor Equipment — 1.0% |
| | 2,323,000 | | | Broadcom, Inc., 4.926%, 5/15/37(a) | | | 2,002,810 | |
| | 2,280,000 | | | Lam Research Corp., 2.875%, 6/15/50 | | | 1,413,298 | |
| | 2,240,000 | | | Marvell Technology, Inc., 2.950%, 4/15/31 | | | 1,812,799 | |
| | 589,000 | | | Marvell Technology, Inc., 5.950%, 9/15/33 | | | 578,362 | |
| | 2,363,000 | | | NVIDIA Corp., 2.850%, 4/1/30 | | | 2,062,080 | |
| | 2,251,000 | | | NXP BV / NXP Funding, LLC/NXP USA, Inc., 5.000%,
1/15/33 | | | 2,071,601 | |
| | | | | | | | 9,940,950 | |
| | | | | | | | | |
| | | | | Software — 0.6% |
| | 3,958,000 | | | Oracle Corp., 4.900%, 2/6/33 | | | 3,652,116 | |
| | 2,653,000 | | | Take-Two Interactive Software, Inc., 5.000%, 3/28/26 | | | 2,603,725 | |
| | | | | | | | 6,255,841 | |
| | | | | | | | | |
| | | | | Specialty Retail — 0.3% |
| | 1,718,000 | | | ERAC USA Finance, LLC, 4.200%, 11/1/46(a) | | | 1,320,412 | |
Principal
Amount | | | | | Fair Value | |
| CORPORATE BONDS — (continued) | | | | |
| | | | | | | | | |
| | | | | Specialty Retail — (continued) | | | | |
| $ | 1,775,000 | | | Lowe's Cos., Inc., 5.150%, 7/1/33 | | $ | 1,686,589 | |
| | | | | | | | 3,007,001 | |
| | | | | | | | | |
| | | | | Telecommunication Services — 0.4% | | | | |
| | 3,783,000 | | | AT&T, Inc., 3.550%, 9/15/55(c) | | | 2,307,733 | |
| | 2,900,000 | | | AT&T, Inc., 3.850%, 6/1/60(c) | | | 1,846,985 | |
| | | | | | | | 4,154,718 | |
| | | | | | | | | |
| | | | | Tobacco — 0.5% | | | | |
| | 2,883,000 | | | BAT Capital Corp., 6.421%, 8/2/33 | | | 2,803,075 | |
| | 2,224,000 | | | Philip Morris International, Inc., 5.625%, 9/7/33 | | | 2,139,318 | |
| | | | | | | | 4,942,393 | |
| | | | | Total Corporate Bonds | | | | |
| | | | | (Cost $290,995,796) | | | 254,693,649 | |
| | | | |
| MORTGAGE-BACKED SECURITIES — 27.5% | | | |
| | | | | | | | | |
| | | | | Fannie Mae — 15.9% | | | | |
| | 6,946 | | | 5.000%, 9/1/25, Pool #255892 | | | 6,642 | |
| | 972,764 | | | 4.000%, 12/1/33, Pool #MA1689 | | | 904,989 | |
| | 571,209 | | | 4.000%, 6/1/34, Pool #MA1922 | | | 537,858 | |
| | 553,669 | | | 4.000%, 3/1/35, Pool #MA2211 | | | 510,056 | |
| | 233,805 | | | 5.500%, 8/1/37, Pool #995082 | | | 232,911 | |
| | 2,495,036 | | | 3.500%, 8/1/38, Pool #FM2472 | | | 2,246,330 | |
| | 93,133 | | | 4.500%, 10/1/39, Pool #AC2645 | | | 87,543 | |
| | 94,721 | | | 5.000%, 6/1/40, Pool #AD4927 | | | 92,573 | |
| | 90,823 | | | 5.000%, 6/1/40, Pool #AD8718 | | | 88,762 | |
| | 6,006,894 | | | 4.000%, 8/1/40, Pool #FM4673 | | | 5,540,946 | |
| | 11,980,424 | | | 1.500%, 12/1/40, Pool #MA4202 | | | 9,298,899 | |
| | 189,622 | | | 4.500%, 12/1/40, Pool #AH1100 | | | 179,230 | |
| | 122,384 | | | 4.500%, 3/1/41, Pool #AB2467 | | | 115,675 | |
| | 189,451 | | | 4.500%, 5/1/41, Pool #AI1023 | | | 178,077 | |
| | 142,974 | | | 4.500%, 11/1/41, Pool #AJ4994 | | | 135,137 | |
| | 169,808 | | | 4.500%, 12/1/41, Pool #AJ7696 | | | 160,280 | |
| | 416,168 | | | 3.500%, 6/1/42, Pool #AB5373 | | | 369,440 | |
| | 755,951 | | | 3.500%, 5/1/43, Pool #AL3605 | | | 663,463 | |
| | 378,947 | | | 3.500%, 5/1/43, Pool #AB9368 | | | 336,100 | |
| | 9,072,242 | | | 3.000%, 8/1/43, Pool #AL9500 | | | 7,764,964 | |
| | 1,027,110 | | | 3.500%, 8/1/43, Pool #AU0613 | | | 907,555 | |
| | 229,195 | | | 4.500%, 11/1/44, Pool #MA2100 | | | 215,203 | |
| | 570,418 | | | 4.500%, 1/1/45, Pool #MA2158 | | | 535,607 | |
| | 701,472 | | | 4.000%, 3/1/45, Pool #MA2217(c) | | | 641,246 | |
| | 633,419 | | | 4.000%, 6/1/46, Pool #MA2653 | | | 576,504 | |
| | 595,431 | | | 4.500%, 7/1/46, Pool #AS7568 | | | 559,112 | |
| | 792,741 | | | 4.000%, 11/1/46, Pool #MA2808 | | | 721,164 | |
| | 1,093,091 | | | 4.000%, 5/1/47, Pool #BE9598 | | | 989,507 | |
| | 1,235,856 | | | 4.000%, 8/1/47, Pool #BH5117 | | | 1,122,670 | |
| | 3,173,540 | | | 4.000%, 4/1/48, Pool #BM3900 | | | 2,878,149 | |
| | 1,284,232 | | | 5.000%, 8/1/48, Pool #CA2219 | | | 1,233,535 | |
| | 3,073,820 | | | 3.000%, 11/1/48, Pool #BM5822 | | | 2,599,310 | |
| | 3,941,939 | | | 3.500%, 10/1/49, Pool #CA4431 | | | 3,446,348 | |
| | 10,789,379 | | | 3.000%, 3/1/50, Pool #FM2870 | | | 9,075,563 | |
| | 6,251,738 | | | 3.000%, 3/1/50, Pool #FM2714 | | | 5,244,135 | |
| | 2,934,006 | | | 2.500%, 5/1/50, Pool #FM3287 | | | 2,350,132 | |
Continued
| Sterling Capital Total Return Bond Fund |
Schedule of Portfolio Investments — (continued)
September 30, 2023
Principal
Amount | | | | | Fair Value | |
| MORTGAGE-BACKED SECURITIES — (continued) |
| | | | | | | | | |
| | | | | Fannie Mae — (continued) | | | | |
| $ | 7,103,674 | | | 2.000%, 7/1/50, Pool #CA6301 | | $ | 5,466,918 | |
| | 8,868,741 | | | 2.500%, 9/1/50, Pool #BQ0538 | | | 7,102,368 | |
| | 3,521,124 | | | 2.500%, 9/1/50, Pool #BQ2883 | | | 2,819,871 | |
| | 3,692,477 | | | 3.000%, 10/1/50, Pool #CA7381 | | | 3,079,051 | |
| | 4,544,984 | | | 3.000%, 11/1/51, Pool #CB2170 | | | 3,771,438 | |
| | 14,948,830 | | | 3.500%, 4/1/52, Pool #FS1475 | | | 13,035,043 | |
| | 11,846,039 | | | 3.500%, 4/1/52, Pool #FS1185 | | | 10,224,776 | |
| | 9,351,586 | | | 4.500%, 6/1/52, Pool #FS2157 | | | 8,652,807 | |
| | 6,772,748 | | | 4.500%, 11/1/52, Pool #FS3809 | | | 6,228,127 | |
| | 6,910,263 | | | 5.000%, 11/1/52, Pool #CB5278 | | | 6,530,304 | |
| | 7,612,074 | | | 5.500%, 3/1/53, Pool #FS3925 | | | 7,395,947 | |
| | 7,792,489 | | | 4.500%, 5/1/53, Pool #CB6304 | | | 7,166,554 | |
| | 9,550,482 | | | 5.500%, 5/1/53, Pool #FS4571 | | | 9,250,891 | |
| | 7,087,584 | | | 6.000%, 7/1/53, Pool #FS5233 | | | 7,013,945 | |
| | | | | | | | 160,283,655 | |
| | | | | | | | | |
| | | | | Freddie Mac — 11.0% | | | | |
| | 9,181 | | | 5.000%, 7/1/25, Pool #ZA1892 | | | 8,780 | |
| | 66,473 | | | 2.500%, 1/1/28, Pool #ZK4918 | | | 63,194 | |
| | 217,596 | | | 3.500%, 7/1/30, Pool #ZS8575 | | | 204,641 | |
| | 31,545 | | | 5.000%, 3/1/36, Pool #ZS4230 | | | 30,915 | |
| | 936,192 | | | 4.000%, 4/1/36, Pool #ZA2413 | | | 858,720 | |
| | 1,199,796 | | | 3.500%, 6/1/36, Pool #ZA2414(c) | | | 1,101,740 | |
| | 8,666 | | | 5.000%, 7/1/36, Pool #ZS1139 | | | 8,489 | |
| | 707,147 | | | 3.500%, 8/1/36, Pool #ZA2425 | | | 646,800 | |
| | 91,868 | | | 6.500%, 9/1/36, Pool #ZS4257 | | | 94,378 | |
| | 1,828,804 | | | 3.500%, 11/1/36, Pool #ZA2439 | | | 1,659,547 | |
| | 37,222 | | | 5.000%, 2/1/37, Pool #ZI5759 | | | 36,443 | |
| | 1,372,534 | | | 4.000%, 5/1/37, Pool #ZA2461 | | | 1,258,348 | |
| | 34,016 | | | 4.500%, 10/1/39, Pool #ZI9349 | | | 31,975 | |
| | 4,573,637 | | | 3.000%, 5/1/40, Pool #RB5049 | | | 3,957,040 | |
| | 100,826 | | | 5.000%, 6/1/40, Pool #ZA1049 | | | 98,610 | |
| | 240,288 | | | 5.000%, 7/1/40, Pool #ZJ0194 | | | 234,464 | |
| | 28,495 | | | 5.000%, 9/1/40, Pool #ZA1066 | | | 27,775 | |
| | 6,102,955 | | | 2.000%, 12/1/40, Pool #RB5090 | | | 4,948,779 | |
| | 376,024 | | | 4.000%, 12/1/42, Pool #ZS3671 | | | 343,252 | |
| | 282,900 | | | 3.500%, 5/1/43, Pool #ZL5915 | | | 250,881 | |
| | 157,854 | | | 4.000%, 5/1/44, Pool #ZA4468 | | | 144,301 | |
| | 75,078 | | | 4.000%, 7/1/44, Pool #ZS4573 | | | 68,663 | |
| | 136,536 | | | 4.000%, 9/1/44, Pool #ZL8439 | | | 124,203 | |
| | 1,647,767 | | | 3.500%, 1/1/45, Pool #ZL8964 | | | 1,455,272 | |
| | 1,492,027 | | | 3.500%, 5/1/46, Pool #ZS4663 | | | 1,321,517 | |
| | 417,750 | | | 4.000%, 8/1/46, Pool #ZS4673 | | | 380,060 | |
| | 1,018,894 | | | 3.500%, 9/1/46, Pool #ZS4678 | | | 897,735 | |
| | 2,306,017 | | | 3.500%, 9/1/47, Pool #ZM4305 | | | 2,021,332 | |
| | 610,020 | | | 3.500%, 1/1/48, Pool #ZM5375 | | | 534,707 | |
| | 568,181 | | | 4.000%, 2/1/48, Pool #ZT1639 | | | 516,142 | |
| | 518,552 | | | 4.000%, 6/1/48, Pool #ZT0541 | | | 472,120 | |
| | 5,968,432 | | | 2.500%, 11/1/49, Pool #QA4396 | | | 4,783,736 | |
| | 2,530,003 | | | 3.000%, 11/1/49, Pool #QA4336 | | | 2,127,982 | |
| | 2,346,086 | | | 3.500%, 6/1/50, Pool #RA2794 | | | 2,042,399 | |
| | 9,457,492 | | | 2.500%, 7/1/50, Pool #RA2970 | | | 7,565,881 | |
| | 235,276 | | | 3.000%, 1/1/51, Pool #SD8123 | | | 195,183 | |
| | 1,307,599 | | | 3.000%, 12/1/51, Pool #SD8184 | | | 1,089,404 | |
| | 5,179,233 | | | 3.500%, 4/1/52, Pool #RA7191 | | | 4,466,024 | |
Principal
Amount | | | | | Fair Value | |
| MORTGAGE-BACKED SECURITIES — (continued) |
| | | | | | | | | |
| | | | | Freddie Mac — (continued) | | | | |
| $ | 10,030,392 | | | 4.000%, 5/1/52, Pool #RA7306 | | $ | 8,970,035 | |
| | 9,913,784 | | | 4.500%, 8/1/52, Pool #SD1515 | | | 9,116,982 | |
| | 10,123,842 | | | 5.000%, 9/1/52, Pool #RA7936 | | | 9,560,382 | |
| | 8,650,167 | | | 5.000%, 10/1/52, Pool #SD1710 | | | 8,183,552 | |
| | 9,479,777 | | | 5.500%, 2/1/53, Pool #QF8052 | | | 9,177,721 | |
| | 12,150,437 | | | 4.000%, 3/1/53, Pool #SD3107 | | | 10,865,562 | |
| | 3,214,204 | | | 5.000%, 3/1/53, Pool #SD2390 | | | 3,035,395 | |
| | 5,958,883 | | | 6.000%, 5/1/53, Pool #SD3072 | | | 5,888,233 | |
| | | | | | | | 110,869,294 | |
| | | | | | | | | |
| | | | | Ginnie Mae — 0.6% | | | | |
| | 49,152 | | | 5.000%, 2/15/40, Pool #737037 | | | 47,768 | |
| | 6,613,436 | | | 4.000%, 7/20/52, Pool #786280 | | | 5,980,123 | |
| | | | | | | | 6,027,891 | |
| | | | | Total Mortgage-Backed Securities | | | | |
| | | | | (Cost $315,024,045) | | | 277,180,840 | |
| | | | | |
| MUNICIPAL BONDS — 4.9% | | | | |
| | | | | |
| | | | | Alabama — 0.2% | | | | |
| | 2,675,000 | | | Alabama Economic Settlement Authority, Economic Imports, Taxable BP - Settlement Revenue, Series B, 4.263%, 9/15/32(c) | | | 2,469,212 | |
| | | | | | | | | |
| | | | | California — 0.7% | | | | |
| | 2,675,000 | | | Municipal Improvement Corp. of Los Angeles, Advance Refunding Revenue Bonds, Series A, 1.448%,
11/1/27 | | | 2,297,023 | |
| | 2,230,000 | | | Municipal Improvement Corp. of Los Angeles, Advance Refunding Revenue Bonds, Series A, 1.648%,
11/1/28 | | | 1,864,904 | |
| | 2,370,000 | | | San Diego County Water Authority, Taxable Green Bonds, Advance Refunding Revenue Bonds, Series A, 1.531%, 5/1/30 | | | 1,898,915 | |
| | 1,145,000 | | | State of California, Build America Bonds, School Improvements G.O., 7.625%, 3/1/40(c) | | | 1,342,169 | |
| | | | | | | | 7,403,011 | |
| | | | | Connecticut — 0.3% | | | | |
| | 2,760,000 | | | State of Connecticut, Miscellaneous Purposes Revenue, Taxable Revenue G.O., Series A, 4.607%, 5/15/29 | | | 2,691,331 | |
| | | | | | | | | |
| | | | | Florida — 0.3% | | | | |
| | 1,905,000 | | | Central Florida Tourism Oversight District, Advance Refunding, Taxable Revenue Bonds, G.O., Series A, 2.147%, 6/1/29 | | | 1,610,697 | |
| | 1,810,000 | | | Central Florida Tourism Oversight District, Advance Refunding, Taxable Revenue Bonds, G.O., Series A, 2.197%, 6/1/30 | | | 1,486,462 | |
| | | | | | | | 3,097,159 | |
Continued
| Sterling Capital Total Return Bond Fund |
Schedule of Portfolio Investments — (continued)
September 30, 2023
Principal
Amount | | | | | Fair Value | |
| MUNICIPAL BONDS — (continued) |
| | | | | | | | | |
| | | | | Illinois — 1.0% | | | | |
| $ | 7,155,000 | | | Sales Tax Securitization Corp., Second Lien, Current Refunding, Taxable Revenue Bonds, Series B, 3.057%, 1/1/34 | | $ | 5,716,773 | |
| | 1,605,000 | | | State of Illinois Sales Tax Revenue, Public Improvements, Taxable Building Revenue, 3.481%, 6/15/26 | | | 1,511,461 | |
| | 2,790,000 | | | State of Illinois Sales Tax Revenue, Public Improvements, Taxable Revenue, Series B, 2.620%, 6/15/26 | | | 2,568,223 | |
| | | | | | | | 9,796,457 | |
| | | | | | | | | |
| | | | | New York — 1.2% | | | | |
| | 4,630,000 | | | Metropolitan Transportation Authority, Taxable Green Bonds, Green Purpose Revenue Bonds, Series C2, 5.175%, 11/15/49 | | | 3,979,300 | |
| | 2,695,000 | | | New York City Transitional Finance Authority Future Tax Secured Revenue, Public Improvements, Taxable Revenue, Callable 2/1/27 @ 100, 3.330%, 2/1/28 | | | 2,498,588 | |
| | 7,130,000 | | | New York City Transitional Finance Authority Future Tax Secured Revenue Bonds, Public Improvements, Taxable Revenue, Sub Series B3, Callable 11/1/29 @ 100, 3.000%, 11/1/33 | | | 5,724,748 | |
| | | | | | | | 12,202,636 | |
| | | | | | | | | |
| | | | | North Carolina — 0.2% | | | | |
| | 2,317,000 | | | Duke University, 3.299%, 10/1/46 | | | 1,611,344 | |
| | | | | | | | | |
| | | | | Pennsylvania — 0.5% | | | | |
| | 2,320,000 | | | City of Pittsburgh, PA, Refunding, Taxable Revenue Bonds, G.O., Series B, 1.189%, 9/1/26 | | | 2,074,799 | |
| | 3,898,000 | | | Lehigh University, 3.479%, 11/15/46 | | | 2,646,549 | |
| | | | | | | | 4,721,348 | |
| | | | | | | | | |
| | | | | Texas — 0.5% | | | | |
| | 1,580,000 | | | Dallas Area Rapid Transit, Advance Refunding, Taxable Revenue Bonds, Series C, Callable 12/1/29 @ 100, 1.846%, 12/1/30 | | | 1,269,040 | |
| | 4,605,000 | | | Tarrant Regional Water District, Advance Refunding Revenue Bonds, Series S, 1.450%, 9/1/29 | | | 3,773,706 | |
| | | | | | | | 5,042,746 | |
| | | | | | | | | |
| | | | | Total Municipal Bonds | | | | |
| | | | | (Cost $59,829,762) | | | 49,035,244 | |
| | | | |
| U.S. GOVERNMENT AGENCIES — 0.8% | | | |
| | | | | | | | | |
| | | | | Federal Farm Credit Banks Funding Corp. — 0.8% |
| | 4,769,000 | | | 4.125%, 12/15/32 | | | 4,442,679 | |
Principal
Amount | | | | | Fair Value | |
| U.S. GOVERNMENT AGENCIES — (continued) |
| | | | | | | | |
| | | | Federal Farm Credit Banks Funding Corp. — (continued) |
| $ | 5,325,000 | | | 2.400%, 3/24/36 | | $ | 3,854,069 | |
| | | | | | | 8,296,748 | |
| | | | | | | | |
| | | | Total U.S. Government Agencies | | | | |
| | | | (Cost $8,997,109) | | | 8,296,748 | |
| | | | | |
| U.S. TREASURY BONDS — 6.5% | | | | |
| | | | | |
| 68,474,300 | | | 2.500%, 2/15/45 | | | 46,458,208 | |
| 39,349,200 | | | 1.375%, 8/15/50 | | | 19,171,975 | |
| | | | | | | | |
| | | | Total U.S. Treasury Bonds | | | | |
| | | | (Cost $79,761,419) | | | 65,630,183 | |
| | | | | |
| U.S. TREASURY NOTES — 9.9% |
| | | | | |
| 11,240,500 | | | 2.625%, 2/15/29 | | | 10,170,018 | |
| 93,010,200 | | | 4.125%, 11/15/32 | | | 89,718,511 | |
| | | | | | | | |
| | | | Total U.S. Treasury Notes | | | | |
| | | | (Cost $104,981,090) | | | 99,888,529 | |
| Shares | | | | | | | |
| MONEY MARKET FUND — 0.6% | | | | |
| | 5,905,651 | | | Federated Treasury Obligations Fund, Institutional Shares, 5.21% (g) | | | 5,905,651 | |
| | | | | | | | |
| | | | Total Money Market Fund | | | | |
| | | | (Cost $5,905,651) | | | 5,905,651 | |
| | | | | |
| Total Investments — 99.5% | | | | |
| (Cost $1,131,462,068) | | | 1,003,250,932 | |
| Net Other Assets (Liabilities) — 0.5%. | | | 5,265,077 | |
| NET ASSETS — 100.0% | | $ | 1,008,516,009 | |
| (a) | Rule 144A, Section 4(a)(2) or other security that is restricted as to resale to qualified institutional investors. The Advisor, using Board approved procedures, has deemed these securities or a portion of these securities to be liquid. |
| (b) | The interest rate for this floating rate note, which will change periodically, is based either on the prime rate or an index of market rates. The reflected rate is in effect as of September 30, 2023. The maturity date reflected is the final maturity date. |
| (c) | All or a portion of the securities are held in a separate collateral account at US Bank. |
| (d) | The interest rate for this variable rate note, which will change periodically, is based either on the prime rate or an index of market rates. The reflected rate is in effect as of September 30, 2023. The maturity date reflected is the final maturity date. |
| (e) | Security is a fix-to-float security, which carries a fixed coupon until a certain date, upon which it switches to a floating rate. Rate shown is the fixed rate. |
| (f) | Security is perpetual in nature and has no stated maturity date. |
| (g) | Represents the current yield as of report date. |
Continued
| Sterling Capital Total Return Bond Fund |
Schedule of Portfolio Investments — (continued)
September 30, 2023
| GMTN | Global Medium Term Note |
Continued
| Sterling Capital Long Duration Corporate Bond Fund |
Schedule of Portfolio Investments
September 30, 2023
Principal
Amount | | | | | Fair Value | |
| CORPORATE BONDS — 92.9% | | | | |
| | | | | | | | | |
| | | | | Aerospace & Defense — 3.3% |
| $ | 90,000 | | | Boeing Co. (The), 3.825%, 3/1/59 | | $ | 57,483 | |
| | 180,000 | | | Boeing Co. (The), 3.900%, 5/1/49 | | | 125,392 | |
| | 285,000 | | | Boeing Co. (The), 5.705%, 5/1/40 | | | 262,750 | |
| | 70,000 | | | L3Harris Technologies, Inc., 4.854%, 4/27/35 | | | 63,691 | |
| | 237,000 | | | Lockheed Martin Corp., 4.150%, 6/15/53 | | | 186,721 | |
| | 160,000 | | | RTX Corp., 2.820%, 9/1/51 | | | 91,630 | |
| | 70,000 | | | RTX Corp., 3.030%, 3/15/52 | | | 42,060 | |
| | 185,000 | | | RTX Corp., 4.450%, 11/16/38 | | | 155,745 | |
| | 35,000 | | | RTX Corp., 5.375%, 2/27/53 | | | 31,650 | |
| | | | | | | | 1,017,122 | |
| | | | | | | | | |
| | | | | Apparel — 0.3% |
| | 110,000 | | | NIKE, Inc., 3.375%, 3/27/50 | | | 78,349 | |
| | | | | | | | | |
| | | | | Automobiles — 0.6% |
| | 90,000 | | | Ford Motor Co., 5.291%, 12/8/46 | | | 68,426 | |
| | 135,000 | | | General Motors Co., 5.150%, 4/1/38 | | | 112,748 | |
| | | | | | | | 181,174 | |
| | | | | | | | | |
| | | | | Banks — 8.3% |
| | 90,000 | | | Bank of America Corp., 2.482%, (5-Year Treasury Constant Maturity plus 1.20%), 9/21/36(a) | | | 65,508 | |
| | 70,000 | | | Bank of America Corp., 4.244%, (TSFR3M plus 2.08%),
4/24/38(b) | | | 57,818 | |
| | 110,000 | | | Bank of America Corp., 6.110%, 1/29/37 | | | 108,550 | |
| | 340,000 | | | Bank of America Corp., MTN, 2.676%, (SOFR plus 1.93%), 6/19/41(b) | | | 219,105 | |
| | 155,000 | | | Bank of America Corp., MTN, 4.330%, (TSFR3M plus 1.78%), 3/15/50(b) | | | 120,460 | |
| | 70,000 | | | Citigroup, Inc., 3.878%, (TSFR3M plus 1.43%), 1/24/39(b) | | | 54,422 | |
| | 85,000 | | | Citigroup, Inc., 5.316%, (SOFR plus 4.55%), 3/26/41(b) | | | 76,727 | |
| | 100,000 | | | Citigroup, Inc., 5.875%, 1/30/42 | | | 96,001 | |
| | 21,000 | | | Citigroup, Inc., Series U, 5.000%, (SOFR plus 3.81%)(b)(c) | | | 19,969 | |
| | 50,000 | | | Fifth Third Bancorp, 8.250%, 3/1/38 | | | 53,310 | |
| | 130,000 | | | Goldman Sachs Group, Inc. (The), 2.908%, (SOFR plus 1.47%), 7/21/42(b) | | | 83,913 | |
| | 140,000 | | | Goldman Sachs Group, Inc. (The), 6.750%, 10/1/37 | | | 141,821 | |
| | 400,000 | | | JPMorgan Chase & Co., 3.109%, (TSFR3M plus 2.46%),
4/22/41(b) | | | 277,851 | |
| | 165,000 | | | JPMorgan Chase & Co., 3.882%, (TSFR3M plus 1.62%),
7/24/38(b) | | | 131,807 | |
| | 120,000 | | | JPMorgan Chase & Co., 4.260%, (TSFR3M plus 1.84%),
2/22/48(b) | | | 93,369 | |
| | 100,000 | | | Morgan Stanley, 2.484%, (SOFR plus 1.36%), 9/16/36(b) | | | 72,649 | |
| | 120,000 | | | Morgan Stanley, 3.217%, (SOFR plus 1.49%), 4/22/42(b) | | | 82,612 | |
| | 195,000 | | | Morgan Stanley, 3.971%, 7/22/38(a) | | | 154,751 | |
Principal
Amount | | | | | Fair Value | |
| CORPORATE BONDS — (continued) | | | | |
| | | | | | | | | |
| | | | | Banks — (continued) |
| $ | 135,000 | | | PNC Financial Services Group, Inc. (The), Series O, 9.312%, (TSFR3M plus 3.94%)(a)(c) | | $ | 135,119 | |
| | 195,000 | | | Wells Fargo & Co., 3.068%, (SOFR plus 2.53%), 4/30/41(b) | | | 130,991 | |
| | 290,000 | | | Wells Fargo & Co., 5.375%, 11/2/43 | | | 251,264 | |
| | 110,000 | | | Wells Fargo & Co., MTN, 5.013%, (TSFR3M plus 4.50%), 4/4/51(b) | | | 92,335 | |
| | 90,000 | | | Westpac Banking Corp., 2.963%, 11/16/40 | | | 54,712 | |
| | | | | | | | 2,575,064 | |
| | | | | | | | | |
| | | | | Beverages — 3.5% |
| | 160,000 | | | Anheuser-Busch Cos., LLC/Anheuser-Busch InBev Worldwide, Inc., 4.700%, 2/1/36 | | | 146,691 | |
| | 265,000 | | | Anheuser-Busch Cos., LLC/Anheuser-Busch InBev Worldwide, Inc., 4.900%, 2/1/46 | | | 233,492 | |
| | 200,000 | | | Anheuser-Busch InBev Worldwide, Inc., 4.600%, 6/1/60 | | | 164,537 | |
| | 50,000 | | | Anheuser-Busch InBev Worldwide, Inc., 5.800%, 1/23/59 | | | 48,904 | |
| | 100,000 | | | Bacardi, Ltd., 5.300%, 5/15/48(d) | | | 86,115 | |
| | 170,000 | | | Constellation Brands, Inc., 3.750%, 5/1/50 | | | 120,795 | |
| | 100,000 | | | Diageo Capital PLC, 3.875%, 4/29/43 | | | 77,291 | |
| | 90,000 | | | PepsiCo, Inc., 2.750%, 10/21/51 | | | 56,224 | |
| | 185,000 | | | PepsiCo, Inc., 4.650%, 2/15/53 | | | 164,083 | |
| | | | | | | | 1,098,132 | |
| | | | | | | | | |
| | | | | Broadline Retail — 0.2% |
| | 115,000 | | | Walmart, Inc., 2.500%, 9/22/41 | | | 76,993 | |
| | | | | | | | | |
| | | | | Capital Goods — 0.5% |
| | 90,000 | | | Caterpillar, Inc., 3.803%, 8/15/42 | | | 71,997 | |
| | 130,000 | | | Packaging Corp. of America, 3.050%, 10/1/51 | | | 77,395 | |
| | | | | | | | 149,392 | |
| | | | | | | | | |
| | | | | Chemicals — 1.2% |
| | 110,000 | | | Air Products & Chemicals, Inc., 2.700%, 5/15/40 | | | 75,350 | |
| | 55,000 | | | Albemarle Corp., 5.450%, 12/1/44 | | | 47,292 | |
| | 42,000 | | | Dow Chemical Co. (The), 4.375%, 11/15/42 | | | 32,732 | |
| | 90,000 | | | DuPont de Nemours, Inc., 5.319%, 11/15/38 | | | 84,220 | |
| | 170,000 | | | Ecolab, Inc., 2.750%, 8/18/55 | | | 95,895 | |
| | 50,000 | | | LYB International Finance III, LLC, 4.200%, 5/1/50 | | | 35,165 | |
| | | | | | | | 370,654 | |
| | | | | |
| | | | | Commercial Services & Supplies — 0.8% |
| | 62,216 | | | Polar Tankers, Inc., 5.951%, 5/10/37(d) | | | 61,557 | |
| | 130,000 | | | Republic Services, Inc., 2.375%, 3/15/33 | | | 99,936 | |
See accompanying Notes to the Financial Statements.
| Sterling Capital Long Duration Corporate Bond Fund |
Schedule of Portfolio Investments — (continued)
September 30, 2023
Principal
Amount | | | | | Fair Value | |
| CORPORATE BONDS — (continued) |
| | | | | Commercial Services & Supplies — (continued) |
| $ | 150,000 | | | Waste Connections, Inc., 2.950%, 1/15/52 | | $ | 90,917 | |
| | | | | | | | 252,410 | |
| | | | | | | | | |
| | | | | Construction Materials — 0.4% |
| | 80,000 | | | Martin Marietta Materials, Inc., 4.250%, 12/15/47 | | | 60,587 | |
| | 80,000 | | | Vulcan Materials Co., 4.500%, 6/15/47 | | | 64,104 | |
| | | | | | | | 124,691 | |
| | | | | | | | | |
| | | | | Consumer Discretionary Distribution & Retail — 1.0% |
| | 225,000 | | | Amazon.com, Inc., 2.500%, 6/3/50 | | | 132,160 | |
| | 300,000 | | | Amazon.com, Inc., 2.700%, 6/3/60 | | | 169,448 | |
| | | | | | | | 301,608 | |
| | | | | | | | | |
| | | | | Consumer Staples Distribution & Retail — 1.3% |
| | 115,000 | | | Hershey Co. (The), 3.125%, 11/15/49 | | | 75,934 | |
| | 60,000 | | | Hormel Foods Corp., 3.050%, 6/3/51 | | | 38,442 | |
| | 66,000 | | | Kraft Heinz Foods Co., 4.875%, 10/1/49 | | | 55,048 | |
| | 145,000 | | | Kraft Heinz Foods Co., 6.875%, 1/26/39 | | | 151,955 | |
| | 150,000 | | | Nestle Holdings, Inc., 2.500%, 9/14/41(d) | | | 98,867 | |
| | | | | | | | 420,246 | |
| | | | | | | | | |
| | | | | Diversified REITs — 0.5% |
| | 157,000 | | | American Tower Trust, 3.652%, 3/23/28(d) | | | 143,617 | |
| | | | | | | | | |
| | | | | Diversified Telecommunication Services — 2.5% |
| | 100,000 | | | America Movil SAB de CV, 6.125%, 3/30/40 | | | 98,937 | |
| | 100,000 | | | T-Mobile USA, Inc., 3.600%, 11/15/60 | | | 61,912 | |
| | 210,000 | | | T-Mobile USA, Inc., 4.375%, 4/15/40 | | | 168,770 | |
| | 95,000 | | | T-Mobile USA, Inc., 5.650%, 1/15/53 | | | 86,750 | |
| | 180,000 | | | T-Mobile USA, Inc., 5.800%, 9/15/62 | | | 164,017 | |
| | 80,000 | | | Vodafone Group PLC, 4.250%, 9/17/50 | | | 57,957 | |
| | 135,000 | | | Warnermedia Holdings, Inc., 5.050%, 3/15/42 | | | 104,518 | |
| | 50,000 | | | Warnermedia Holdings, Inc., 5.141%, 3/15/52 | | | 37,085 | |
| | | | | | | | 779,946 | |
| | | | | | | | | |
| | | | | Electric Utilities — 13.9% |
| | 110,000 | | | AEP Transmission Co., LLC, Series M, 3.650%, 4/1/50(e) | | | 77,883 | |
| | 90,000 | | | Appalachian Power Co., Series L, 5.800%, 10/1/35 | | | 85,445 | |
| | 40,000 | | | Avista Corp., 4.000%, 4/1/52 | | | 28,475 | |
| | 150,000 | | | Baltimore Gas & Electric Co., 2.900%, 6/15/50 | | | 89,268 | |
| | 80,000 | | | Berkshire Hathaway Energy Co., 4.250%, 10/15/50 | | | 59,189 | |
| | 75,000 | | | Berkshire Hathaway Energy Co., 4.600%, 5/1/53 | | | 58,523 | |
| | 70,000 | | | CenterPoint Energy Houston Electric, LLC, Series AC, 4.250%, 2/1/49 | | | 55,226 | |
| | 200,000 | | | CenterPoint Energy Houston Electric, LLC, Series AD, 2.900%, 7/1/50(e) | | | 121,705 | |
Principal
Amount | | | | | Fair Value | |
| CORPORATE BONDS — (continued) | | | | |
| | | | | | | | | |
| | | | | Electric Utilities — (continued) | | | | |
| $ | 110,000 | | | CMS Energy Corp., 3.750%, (5-Year Treasury Constant Maturity plus 2.90%), 12/1/50(a) | | $ | 82,616 | |
| | 70,000 | | | CMS Energy Corp., 4.700%, 3/31/43 | | | 56,783 | |
| | 60,000 | | | Commonwealth Edison Co., 5.900%, 3/15/36 | | | 60,039 | |
| | 80,000 | | | Connecticut Light & Power Co. (The), 4.000%, 4/1/48 | | | 60,982 | |
| | 135,000 | | | Consolidated Edison Co. of New York, Inc., 4.450%, 3/15/44 | | | 107,917 | |
| | 70,000 | | | Consolidated Edison Co. of New York, Inc., Series E, 4.650%, 12/1/48 | | | 56,641 | |
| | 60,000 | | | Dominion Energy South Carolina, Inc., 5.100%, 6/1/65 | | | 51,688 | |
| | 40,000 | | | Dominion Energy, Inc., Series B, 3.300%, 4/15/41 | | | 27,293 | |
| | 80,000 | | | DTE Electric Co., 3.750%, 8/15/47 | | | 57,735 | |
| | 130,000 | | | DTE Electric Co., Series B, 3.650%, 3/1/52 | | | 90,936 | |
| | 68,000 | | | Duke Energy Carolinas, LLC, 5.350%, 1/15/53 | | | 62,089 | |
| | 43,000 | | | Duke Energy Carolinas, LLC, 5.400%, 1/15/54 | | | 39,684 | |
| | 80,000 | | | Duke Energy Carolinas, LLC, 6.100%, 6/1/37 | | | 79,429 | |
| | 130,000 | | | Duke Energy Corp., 5.000%, 8/15/52 | | | 108,093 | |
| | 70,000 | | | Duke Energy Corp., 6.100%, 9/15/53 | | | 67,819 | |
| | 60,000 | | | Duke Energy Florida, LLC, 6.350%, 9/15/37 | | | 61,347 | |
| | 200,000 | | | Duke Energy Indiana, LLC, 3.750%, 5/15/46 | | | 141,050 | |
| | 80,000 | | | Duke Energy Ohio, Inc., 3.700%, 6/15/46 | | | 55,422 | |
| | 130,000 | | | Duke Energy Progress, LLC, 2.900%, 8/15/51 | | | 76,580 | |
| | 205,000 | | | Entergy Texas, Inc., 3.550%, 9/30/49 | | | 138,154 | |
| | 50,000 | | | Entergy Texas, Inc., 5.800%, 9/1/53 | | | 47,800 | |
| | 70,000 | | | Exelon Corp., 4.450%, 4/15/46 | | | 54,556 | |
| | 70,000 | | | Exelon Corp., 5.100%, 6/15/45 | | | 59,812 | |
| | 120,000 | | | FirstEnergy Corp., Series C, 5.100%, 7/15/47 | | | 101,839 | |
| | 40,000 | | | FirstEnergy Transmission, LLC, 4.550%, 4/1/49(d) | | | 31,287 | |
| | 120,000 | | | Florida Power & Light Co., 4.125%, 2/1/42 | | | 96,672 | |
| | 45,000 | | | Florida Power & Light Co., 5.850%, 5/1/37 | | | 43,119 | |
| | 259,000 | | | Georgia Power Co., Series B, 3.700%, 1/30/50 | | | 181,336 | |
| | 110,000 | | | Indiana Michigan Power Co., 5.625%, 4/1/53 | | | 103,692 | |
| | 80,000 | | | Massachusetts Electric Co., 5.900%, 11/15/39(d) | | | 74,897 | |
| | 90,000 | | | MidAmerican Energy Co., 2.700%, 8/1/52 | | | 50,961 | |
| | 70,000 | | | MidAmerican Energy Co., 4.800%, 9/15/43 | | | 59,674 | |
| | 80,000 | | | NextEra Energy Capital Holdings, Inc., 2.440%, 1/15/32 | | | 61,908 | |
| | 90,000 | | | Northern States Power Co., 3.200%, 4/1/52 | | | 57,496 | |
Continued
| Sterling Capital Long Duration Corporate Bond Fund |
Schedule of Portfolio Investments — (continued)
September 30, 2023
Principal
Amount | | | | | Fair Value | |
| CORPORATE BONDS — (continued) | | | | |
| | | | | | | | | |
| | | | | Electric Utilities — (continued) |
| $ | 40,000 | | | Northern States Power Co., 4.500%, 6/1/52 | | $ | 32,472 | |
| | 80,000 | | | Oncor Electric Delivery Co., LLC, 4.950%, 9/15/52 | | | 69,627 | |
| | 240,000 | | | PECO Energy Co., 2.850%, 9/15/51 | | | 141,900 | |
| | 50,000 | | | Public Service Electric & Gas Co., 5.450%, 8/1/53 | | | 47,596 | |
| | 110,000 | | | Public Service Electric & Gas Co., MTN, 5.375%, 11/1/39 | | | 101,756 | |
| | 110,000 | | | Puget Sound Energy, Inc., 2.893%, 9/15/51 | | | 64,100 | |
| | 60,000 | | | Puget Sound Energy, Inc., 5.638%, 4/15/41 | | | 55,502 | |
| | 115,000 | | | San Diego Gas & Electric Co., Series TTT, 4.100%, 6/15/49 | | | 85,152 | |
| | 105,000 | | | San Diego Gas & Electric Co., Series UUU, 3.320%, 4/15/50 | | | 66,930 | |
| | 155,000 | | | Sempra, 3.800%, 2/1/38 | | | 120,508 | |
| | 159,000 | | | Southern California Edison Co., 5.700%, 3/1/53 | | | 145,949 | |
| | 50,000 | | | Southern California Edison Co., 5.875%, 12/1/53 | | | 46,919 | |
| | 90,000 | | | Union Electric Co., 3.250%, 10/1/49 | | | 56,876 | |
| | 55,000 | | | Union Electric Co., 5.450%, 3/15/53 | | | 50,698 | |
| | 110,000 | | | Virginia Electric & Power Co., 4.000%, 1/15/43 | | | 83,971 | |
| | 110,000 | | | Xcel Energy, Inc., 3.500%, 12/1/49 | | | 71,696 | |
| | | | | | | | 4,324,712 | |
| | | | | | | | | |
| | | | | Energy Equipment & Services — 5.6% |
| | 100,000 | | | Cheniere Corpus Christi Holdings, LLC, 2.742%,12/31/39 | | | 74,805 | |
| | 95,000 | | | DCP Midstream Operating L.P., 5.600%, 4/1/44 | | | 83,840 | |
| | 75,000 | | | Eastern Gas Transmission & Storage, Inc., 4.800%,11/1/43 | | | 60,959 | |
| | 155,000 | | | Energy Transfer L.P., 5.000%, 5/15/44 | | | 121,118 | |
| | 40,000 | | | Energy Transfer L.P., 5.000%, 5/15/50 | | | 31,313 | |
| | 105,000 | | | Energy Transfer L.P., 5.350%, 5/15/45 | | | 86,045 | |
| | 80,000 | | | Energy Transfer L.P., 7.500%, 7/1/38 | | | 83,957 | |
| | 210,000 | | | Enterprise Products Operating, LLC, 3.300%, 2/15/53 | | | 136,513 | |
| | 140,000 | | | Enterprise Products Operating, LLC, 5.950%, 2/1/41 | | | 137,772 | |
| | 80,000 | | | Enterprise Products Operating, LLC, 6.125%, 10/15/39 | | | 79,814 | |
| | 90,000 | | | Kinder Morgan Energy Partners L.P., 5.625%, 9/1/41 | | | 77,719 | |
| | 145,000 | | | Kinder Morgan, Inc., 3.600%, 2/15/51 | | | 92,043 | |
| | 50,000 | | | Kinder Morgan, Inc., 5.450%, 8/1/52 | | | 42,543 | |
| | 70,000 | | | Kinder Morgan, Inc., 5.550%, 6/1/45 | | | 60,312 | |
| | 51,000 | | | MPLX L.P., 4.950%, 3/14/52 | | | 39,915 | |
| | 90,000 | | | MPLX L.P., 5.200%, 12/1/47 | | | 72,642 | |
| | 60,000 | | | MPLX L.P., 5.650%, 3/1/53 | | | 51,517 | |
| | 65,000 | | | ONEOK, Inc., 6.625%, 9/1/53 | | | 63,638 | |
| | 100,000 | | | Plains All American Pipeline L.P./PAA Finance Corp., 4.700%, 6/15/44 | | | 73,807 | |
Principal
Amount | | | | | Fair Value | |
| CORPORATE BONDS — (continued) |
| | | | |
| | | | | Energy Equipment & Services — (continued) |
| $ | 80,000 | | | Spectra Energy Partners L.P., 4.500%, 3/15/45 | | $ | 60,719 | |
| | 85,000 | | | Targa Resources Corp., 6.250%, 7/1/52 | | | 77,984 | |
| | 94,000 | | | TransCanada PipeLines, Ltd., 4.625%, 3/1/34 | | | 81,913 | |
| | 70,000 | | | Williams Cos., Inc. (The), 6.300%, 4/15/40 | | | 68,516 | |
| | | | | | | | 1,759,404 | |
| | | | | | | | | |
| | | | | Entertainment — 0.5% |
| | 185,000 | | | Activision Blizzard, Inc., 2.500%, 9/15/50 | | | 110,047 | |
| | 37,000 | | | Mattel, Inc., 5.450%, 11/1/41 | | | 30,531 | |
| | | | | | | | 140,578 | |
| | | | | | | | | |
| | | | | Financial Services — 2.6% |
| | 150,000 | | | AerCap Ireland Capital DAC/AerCap Global Aviation Trust, 3.850%, 10/29/41 | | | 106,360 | |
| | 100,000 | | | American Express Co., 4.050%, 12/3/42 | | | 79,498 | |
| | 60,000 | | | Blackstone Holdings Finance Co., LLC, 6.250%, 8/15/42(d) | | | 55,594 | |
| | 70,000 | | | Blue Owl Finance, LLC, 4.125%, 10/7/51(d) | | | 40,801 | |
| | 100,000 | | | Charles Schwab Corp. (The), Series H, 4.000%, (10-Year Treasury Constant Maturity plus 3.08%)(a)(c) | | | 70,521 | |
| | 180,000 | | | CSL Finance PLC, 4.750%, 4/27/52(d) | | | 152,182 | |
| | 130,000 | | | Intercontinental Exchange, Inc., 4.250%, 9/21/48 | | | 102,468 | |
| | 40,000 | | | Jefferies Financial Group, Inc., 6.500%, 1/20/43 | | | 38,654 | |
| | 105,000 | | | S&P Global, Inc., 3.700%, 3/1/52 | | | 75,800 | |
| | 90,000 | | | Visa, Inc., 4.300%, 12/14/45 | | | 76,095 | |
| | | | | | | | 797,973 | |
| | | | | | | | | |
| | | | | Ground Transportation — 3.2% |
| | 140,000 | | | Burlington Northern Santa Fe, LLC, 4.900%, 4/1/44 | | | 123,807 | |
| | 85,000 | | | Burlington Northern Santa Fe, LLC, 4.950%, 9/15/41 | | | 76,682 | |
| | 75,000 | | | Burlington Northern Santa Fe, LLC, 5.200%, 4/15/54 | | | 68,633 | |
| | 165,000 | | | Canadian Pacific Railway Co., 3.500%, 5/1/50 | | | 112,875 | |
| | 100,000 | | | CSX Corp., 4.500%, 11/15/52 | | | 81,350 | |
| | 70,000 | | | CSX Corp., 6.000%, 10/1/36 | | | 71,046 | |
| | 120,000 | | | FedEx Corp., 4.550%, 4/1/46 | | | 94,948 | |
| | 50,000 | | | Norfolk Southern Corp., 3.400%, 11/1/49 | | | 32,984 | |
| | 70,000 | | | Norfolk Southern Corp., 3.950%, 10/1/42 | | | 53,642 | |
| | 210,000 | | | Union Pacific Corp., 2.950%, 3/10/52 | | | 129,296 | |
| | 30,000 | | | Union Pacific Corp., 3.375%, 2/14/42 | | | 22,012 | |
| | 95,000 | | | Union Pacific Corp., 3.600%, 9/15/37 | | | 76,375 | |
| | 70,000 | | | United Parcel Service, Inc., 5.300%, 4/1/50 | | | 66,615 | |
| | | | | | | | 1,010,265 | |
| | | | | | | | | |
| | | | | Health Care Providers & Services — 11.0% |
| | 70,000 | | | Abbott Laboratories, 4.900%, 11/30/46 | | | 63,926 | |
| | 60,000 | | | AbbVie, Inc., 4.050%, 11/21/39 | | | 49,065 | |
Continued
| Sterling Capital Long Duration Corporate Bond Fund |
Schedule of Portfolio Investments — (continued)
September 30, 2023
Principal Amount | | | | | Fair Value | |
| CORPORATE BONDS — (continued) | | | |
| | | | | | | | | |
| | | | | Health Care Providers & Services — (continued) | |
| $ | 150,000 | | | AbbVie, Inc., 4.250%, 11/21/49 | | $ | 118,621 | |
| | 95,000 | | | AbbVie, Inc., 4.400%, 11/6/42 | | | 78,944 | |
| | 140,000 | | | AbbVie, Inc., 4.450%, 5/14/46 | | | 114,327 | |
| | 70,000 | | | Aetna, Inc., 4.500%, 5/15/42 | | | 55,275 | |
| | 70,000 | | | Amgen, Inc., 2.770%, 9/1/53 | | | 38,972 | |
| | 165,000 | | | Amgen, Inc., 2.800%, 8/15/41 | | | 106,976 | |
| | 100,000 | | | Amgen, Inc., 4.400%, 2/22/62 | | | 74,010 | |
| | 55,000 | | | Amgen, Inc., 5.150%, 11/15/41 | | | 48,525 | |
| | 120,000 | | | Amgen, Inc., 5.600%, 3/2/43 | | | 111,633 | |
| | 110,000 | | | Baxalta, Inc., 5.250%, 6/23/45 | | | 97,912 | |
| | 100,000 | | | Baxter International, Inc., 3.132%, 12/1/51 | | | 59,420 | |
| | 80,000 | | | Becton Dickinson & Co., 4.875%, 5/15/44 | | | 63,915 | |
| | 145,000 | | | Bristol-Myers Squibb Co., 2.350%, 11/13/40 | | | 91,684 | |
| | 185,000 | | | Bristol-Myers Squibb Co., 2.550%, 11/13/50 | | | 105,534 | |
| | 130,000 | | | Bristol-Myers Squibb Co., 3.700%, 3/15/52 | | | 93,274 | |
| | 110,000 | | | Bristol-Myers Squibb Co., 4.250%, 10/26/49 | | | 87,063 | |
| | 70,000 | | | Bristol-Myers Squibb Co., 4.625%, 5/15/44 | | | 59,851 | |
| | 70,000 | | | Cigna Group (The), 4.800%, 8/15/38 | | | 61,657 | |
| | 95,000 | | | CVS Health Corp., 2.700%, 8/21/40 | | | 59,804 | |
| | 65,000 | | | CVS Health Corp., 4.780%, 3/25/38 | | | 55,977 | |
| | 40,000 | | | CVS Health Corp., 5.050%, 3/25/48 | | | 33,317 | |
| | 130,000 | | | CVS Health Corp., 5.125%, 7/20/45 | | | 109,990 | |
| | 105,000 | | | CVS Health Corp., 5.875%, 6/1/53 | | | 97,051 | |
| | 125,000 | | | Danaher Corp., 2.800%, 12/10/51 | | | 76,101 | |
| | 180,000 | | | Elevance Health, Inc., 4.375%, 12/1/47 | | | 143,100 | |
| | 90,000 | | | Elevance Health, Inc., 5.125%, 2/15/53 | | | 79,375 | |
| | 90,000 | | | Gilead Sciences, Inc., 2.600%, 10/1/40 | | | 59,369 | |
| | 40,000 | | | Gilead Sciences, Inc., 5.550%, 10/15/53 | | | 38,416 | |
| | 150,000 | | | HCA, Inc., 3.500%, 7/15/51 | | | 93,516 | |
| | 125,000 | | | HCA, Inc., 5.500%, 6/15/47 | | | 107,189 | |
| | 75,000 | | | Novartis Capital Corp., 2.750%, 8/14/50 | | | 47,829 | |
| | 100,000 | | | Pfizer Investment Enterprises Pte, Ltd., 5.110%, 5/19/43 | | | 91,909 | |
| | 200,000 | | | Roche Holdings, Inc., 2.607%, 12/13/51(d) | | | 119,524 | |
| | 80,000 | | | Stryker Corp., 4.625%, 3/15/46 | | | 67,349 | |
| | 300,000 | | | UnitedHealth Group, Inc., 3.500%, 8/15/39 | | | 230,818 | |
| | 140,000 | | | UnitedHealth Group, Inc., 3.750%, 10/15/47 | | | 102,874 | |
| | 155,000 | | | Wyeth, LLC, 5.950%, 4/1/37 | | | 159,332 | |
| | 90,000 | | | Zoetis, Inc., 4.700%, 2/1/43 | | | 77,525 | |
| | | | | | | | 3,430,949 | |
| | | | | | | | | |
| | | | | Household Products — 0.6% | | | | |
| | 135,000 | | | Kenvue, Inc., 5.050%, 3/22/53(d) | | | 122,519 | |
| | 60,000 | | | Procter & Gamble Co. (The), 5.550%, 3/5/37 | | | 61,872 | |
| | | | | | | | 184,391 | |
| | | | | | | | | |
| | | | | Industrial REITs — 0.2% | | | | |
| | 55,000 | | | Prologis L.P., 5.250%, 6/15/53 | | | 49,380 | |
Principal Amount | | | | | Fair Value | |
| CORPORATE BONDS — (continued) | | | | |
| | | | | |
| | | | | Insurance — 3.9% | | | | |
| $ | 103,000 | | | Athene Holding, Ltd., 3.950%, 5/25/51 | | $ | 67,510 | |
| | 55,000 | | | Berkshire Hathaway Finance Corp., 3.850%, 3/15/52 | | | 40,983 | |
| | 70,000 | | | Berkshire Hathaway Finance Corp., 4.200%, 8/15/48 | | | 57,084 | |
| | 40,000 | | | Carlyle Holdings II Finance, LLC, 5.625%, 3/30/43(d) | | | 33,227 | |
| | 84,000 | | | Corebridge Financial, Inc., 4.400%, 4/5/52 | | | 61,364 | |
| | 80,000 | | | Enstar Finance, LLC, 5.500%, (5-Year Treasury Constant Maturity plus 4.01%), 1/15/42(a) | | | 63,723 | |
| | 37,000 | | | Enstar Group, Ltd., 3.100%, 9/1/31 | | | 27,876 | |
| | 90,000 | | | Fidelity National Financial, Inc., 3.200%, 9/17/51 | | | 49,492 | |
| | 80,000 | | | Global Atlantic Fin Co., 4.700%, (5-Year Treasury Constant Maturity plus 3.80%), 10/15/51(a)(d) | | | 57,866 | |
| | 70,000 | | | Guardian Life Insurance Co. of America (The), 4.875%,
6/19/64(d) | | | 55,076 | |
| | 70,000 | | | KKR Group Finance Co. III, LLC, 5.125%, 6/1/44(d) | | | 57,908 | |
| | 100,000 | | | Nationwide Mutual Insurance Co., 4.350%, 4/30/50(d) | | | 71,351 | |
| | 103,000 | | | New York Life Insurance Co., 3.750%, 5/15/50(d) | | | 71,030 | |
| | 80,000 | | | New York Life Insurance Co., 4.450%, 5/15/69(d) | | | 58,682 | |
| | 100,000 | | | New York Life Insurance Co., 6.750%, 11/15/39(d) | | | 104,559 | |
| | 90,000 | | | Northwestern Mutual Life Insurance Co. (The), 3.450%,
3/30/51(d) | | | 57,526 | |
| | 80,000 | | | Pacific LifeCorp, 3.350%, 9/15/50(d) | | | 51,009 | |
| | 100,000 | | | Prudential Financial, Inc., 3.700%, (5-Year Treasury Constant Maturity plus 3.04%), 10/1/50(a) | | | 81,348 | |
| | 70,000 | | | Securian Financial Group, Inc., 4.800%, 4/15/48(d) | | | 50,629 | |
| | 70,000 | | | Voya Financial, Inc., 4.800%, 6/15/46 | | | 53,242 | |
| | 90,000 | | | W R Berkley Corp., 3.150%, 9/30/61 | | | 49,581 | |
| | | | | | | | 1,221,066 | |
| | | | | | | | | |
| | | | | Internet & Direct Marketing Retail — 0.3% | |
| | 120,000 | | | Meta Platforms, Inc., 4.450%, 8/15/52 | | | 95,360 | |
| | | | | | | | | |
| | | | | IT Services — 0.2% | | | | |
| | 100,000 | | | Fiserv, Inc., 4.400%, 7/1/49 | | | 76,593 | |
| | | | | | | | | |
| | | | | Machinery — 0.2% | | | | |
| | 80,000 | | | Deere & Co., 3.900%, 6/9/42 | | | 66,033 | |
| | | | | | | | | |
| | | | | Media — 4.2% | | | | |
| | 190,000 | | | Charter Communications Operating, LLC/ Charter Communications Operating Capital, 4.400%, 12/1/61 | | | 116,986 | |
Continued
| Sterling Capital Long Duration Corporate Bond Fund |
Schedule of Portfolio Investments — (continued)
September 30, 2023
Principal Amount | | | | | Fair Value | |
| CORPORATE BONDS — (continued) | | | | |
| | | | | |
| | | | | Media — (continued) | | | | |
| $ | 110,000 | | | Charter Communications Operating, LLC/ Charter Communications Operating Capital, 6.484%, 10/23/45 | | $ | 96,043 | |
| | 130,000 | | | Comcast Corp., 2.800%, 1/15/51 | | | 76,043 | |
| | 170,000 | | | Comcast Corp., 2.987%, 11/1/63 | | | 93,668 | |
| | 130,000 | | | Comcast Corp., 3.250%, 11/1/39 | | | 94,936 | |
| | 100,000 | | | Comcast Corp., 3.400%, 7/15/46 | | | 68,199 | |
| | 150,000 | | | Comcast Corp., 5.500%, 5/15/64 | | | 136,143 | |
| | 90,000 | | | Discovery Communications, LLC, 4.000%, 9/15/55 | | | 53,946 | |
| | 100,000 | | | Discovery Communications, LLC, 5.200%, 9/20/47 | | | 75,756 | |
| | 90,000 | | | Interpublic Group of Cos., Inc. (The), 3.375%, 3/1/41 | | | 59,486 | |
| | 70,000 | | | Time Warner Cable, LLC, 5.875%, 11/15/40 | | | 58,035 | |
| | 155,000 | | | Time Warner Cable, LLC, 6.550%, 5/1/37 | | | 140,656 | |
| | 100,000 | | | Walt Disney Co. (The), 2.750%, 9/1/49 | | | 59,359 | |
| | 130,000 | | | Walt Disney Co. (The), 3.500%, 5/13/40 | | | 97,653 | |
| | 70,000 | | | Walt Disney Co. (The), 6.200%, 12/15/34 | | | 72,766 | |
| | | | | | | | 1,299,675 | |
| | | | | | | | | |
| | | | | Metals & Mining — 0.9% | |
| | 100,000 | | | Nucor Corp., 2.979%, 12/15/55 | | | 56,822 | |
| | 100,000 | | | Southern Copper Corp., 7.500%, 7/27/35 | | | 110,005 | |
| | 80,000 | | | Steel Dynamics, Inc., 3.250%, 10/15/50 | | | 48,536 | |
| | 62,000 | | | Teck Resources, Ltd., 6.000%, 8/15/40 | | | 55,400 | |
| | | | | | | | 270,763 | |
| | | | | | | | | |
| | | | | Office REITs — 0.1% | |
| | 50,000 | | | Alexandria Real Estate Equities, Inc., 3.000%, 5/18/51 | | | 28,193 | |
| | | | | | |
| | | | | Oil, Gas & Consumable Fuels — 4.6% | |
| | 77,000 | | | Apache Corp., 5.250%, 2/1/42 | | | 60,361 | |
| | 80,000 | | | Atmos Energy Corp., 4.125%, 10/15/44 | | | 62,588 | |
| | 90,000 | | | BP Capital Markets America, Inc., 2.939%, 6/4/51 | | | 54,984 | |
| | 95,000 | | | BP Capital Markets America, Inc., 3.060%, 6/17/41 | | | 65,533 | |
| | 75,000 | | | ConocoPhillips Co., 4.025%, 3/15/62 | | | 53,821 | |
| | 61,000 | | | Devon Energy Corp., 5.600%, 7/15/41 | | | 53,934 | |
| | 113,000 | | | Diamondback Energy, Inc., 4.250%, 3/15/52 | | | 80,075 | |
| | 80,000 | | | Equinor ASA, 5.100%, 8/17/40 | | | 74,905 | |
| | 70,000 | | | Exxon Mobil Corp., 4.114%, 3/1/46 | | | 56,190 | |
| | 202,000 | | | Exxon Mobil Corp., 4.227%, 3/19/40 | | | 171,972 | |
| | 80,000 | | | Halliburton Co., 4.850%, 11/15/35 | | | 71,973 | |
| | 85,000 | | | Halliburton Co., 5.000%, 11/15/45 | | | 72,016 | |
| | 35,000 | | | Hess Corp., 5.600%, 2/15/41 | | | 31,574 | |
| | 80,000 | | | Marathon Petroleum Corp., 6.500%, 3/1/41 | | | 79,093 | |
| | 85,000 | | | NiSource, Inc., 4.800%, 2/15/44 | | | 69,934 | |
| | 100,000 | | | Shell International Finance BV, 4.550%, 8/12/43 | | | 84,815 | |
Principal Amount | | | | | Fair Value | |
| CORPORATE BONDS — (continued) | | | |
| | | | |
| | | | | Oil, Gas & Consumable Fuels — (continued) | |
| $ | 145,000 | | | Shell International Finance BV, 6.375%, 12/15/38 | | $ | 154,698 | |
| | 225,000 | | | Southern Co. Gas Capital Corp., Series 21A, 3.150%,
9/30/51 | | | 133,240 | |
| | | | | | | | 1,431,706 | |
| | | | | | | | | |
| | | | | Residential REITs — 0.7% | | | | |
| | 110,000 | | | American Homes 4 Rent L.P., 4.300%, 4/15/52 | | | 79,477 | |
| | 30,000 | | | Mid-America Apartments L.P., 2.875%, 9/15/51 | | | 17,251 | |
| | 120,000 | | | NNN REIT, Inc., 3.500%, 4/15/51 | | | 75,362 | |
| | 80,000 | | | UDR, Inc., 3.100%, 11/1/34 | | | 60,333 | |
| | | | | | | | 232,423 | |
| | | | | | | | | |
| | | | | Retail REITs — 0.4% | | | | |
| | 110,000 | | | Kimco Realty OP, LLC, 4.250%, 4/1/45 | | | 79,381 | |
| | 80,000 | | | Simon Property Group L.P., 3.250%, 9/13/49 | | | 49,487 | |
| | | | | | | | 128,868 | |
| | | | | | | | | |
| | | | | Semiconductors & Semiconductor Equipment — 2.6% |
| | 55,000 | | | Broadcom, Inc., 3.469%, 4/15/34(d) | | | 43,211 | |
| | 80,000 | | | Broadcom, Inc., 3.500%, 2/15/41(d) | | | 55,566 | |
| | 90,000 | | | Broadcom, Inc., 3.750%, 2/15/51(d) | | | 60,301 | |
| | 155,000 | | | Lam Research Corp., 2.875%, 6/15/50 | | | 96,079 | |
| | 125,000 | | | NVIDIA Corp., 3.500%, 4/1/50 | | | 91,009 | |
| | 50,000 | | | NXP BV / NXP Funding, LLC/NXP USA, Inc., 3.250%, 11/30/51 | | | 30,377 | |
| | 120,000 | | | NXP BV/NXP Funding, LLC/NXP USA, Inc., 5.000%,
1/15/33 | | | 110,436 | |
| | 70,000 | | | QUALCOMM, Inc., 4.300%, 5/20/47 | | | 56,591 | |
| | 200,000 | | | QUALCOMM, Inc., 4.500%, 5/20/52 | | | 163,878 | |
| | 90,000 | | | Texas Instruments, Inc., 5.000%, 3/14/53 | | | 81,414 | |
| | 41,000 | | | Texas Instruments, Inc., 5.050%, 5/18/63 | | | 36,305 | |
| | | | | | | | 825,167 | |
| | | | | | | | | |
| | | | | Software — 4.3% | | | | |
| | 130,000 | | | Apple, Inc., 2.650%, 5/11/50 | | | 79,524 | |
| | 180,000 | | | Apple, Inc., 2.800%, 2/8/61 | | | 105,557 | |
| | 150,000 | | | Apple, Inc., 3.850%, 5/4/43 | | | 121,252 | |
| | 80,000 | | | Apple, Inc., 3.850%, 8/4/46 | | | 63,293 | |
| | 170,000 | | | Apple, Inc., 3.950%, 8/8/52 | | | 133,193 | |
| | 90,000 | | | Microsoft Corp., 2.525%, 6/1/50 | | | 54,851 | |
| | 305,000 | | | Microsoft Corp., 2.675%, 6/1/60 | | | 178,818 | |
| | 220,000 | | | Oracle Corp., 3.650%, 3/25/41 | | | 156,895 | |
| | 100,000 | | | Oracle Corp., 3.800%, 11/15/37 | | | 76,405 | |
| | 90,000 | | | Oracle Corp., 3.850%, 4/1/60 | | | 57,364 | |
| | 90,000 | | | Oracle Corp., 3.950%, 3/25/51 | | | 61,625 | |
| | 110,000 | | | Oracle Corp., 4.000%, 7/15/46 | | | 77,860 | |
| | 115,000 | | | Oracle Corp., 5.550%, 2/6/53 | | | 100,900 | |
| | 75,000 | | | Oracle Corp., 6.900%, 11/9/52 | | | 77,311 | |
| | | | | | | | 1,344,848 | |
Continued
| Sterling Capital Long Duration Corporate Bond Fund |
Schedule of Portfolio Investments — (continued)
September 30, 2023
Principal Amount | | | | | Fair Value | |
| CORPORATE BONDS — (continued) | | | | |
| �� | | | | |
| | | | | Specialty Retail — 2.7% | | | | |
| $ | 90,000 | | | ERAC USA Finance, LLC, 5.625%, 3/15/42(d) | | $ | 83,945 | |
| | 225,000 | | | Home Depot, Inc. (The), 2.750%, 9/15/51 | | | 133,832 | |
| | 130,000 | | | Home Depot, Inc. (The), 3.125%, 12/15/49 | | | 85,120 | |
| | 110,000 | | | Lowe's Cos., Inc., 5.000%, 4/15/40 | | | 96,536 | |
| | 150,000 | | | Lowe's Cos., Inc., 5.625%, 4/15/53 | | | 137,055 | |
| | 135,000 | | | McDonald's Corp., MTN, 3.625%, 9/1/49 | | | 94,951 | |
| | 140,000 | | | McDonald's Corp., MTN, 4.875%, 12/9/45 | | | 121,117 | |
| | 135,000 | | | Starbucks Corp., 3.500%, 11/15/50 | | | 91,085 | |
| | | | | | | | 843,641 | |
| | | | | | | | | |
| | | | | Telecommunication Services — 4.1% | | | | |
| | 170,000 | | | AT&T, Inc., 3.500%, 6/1/41 | | | 118,017 | |
| | 240,000 | | | AT&T, Inc., 3.650%, 9/15/59 | | | 146,008 | |
| | 245,000 | | | AT&T, Inc., 3.850%, 6/1/60 | | | 156,038 | |
| | 240,000 | | | AT&T, Inc., 4.500%, 5/15/35 | | | 205,613 | |
| | 150,000 | | | Deutsche Telekom AG, 3.625%, 1/21/50(d) | | | 102,414 | |
| | 60,000 | | | Telefonica Emisiones SA, 5.213%, 3/8/47 | | | 47,814 | |
| | 150,000 | | | Verizon Communications, Inc., 2.650%, 11/20/40 | | | 94,889 | |
| | 250,000 | | | Verizon Communications, Inc., 3.400%, 3/22/41 | | | 177,172 | |
| | 80,000 | | | Verizon Communications, Inc., 3.700%, 3/22/61 | | | 50,949 | |
| | 60,000 | | | Verizon Communications, Inc., 4.400%, 11/1/34 | | | 52,225 | |
| | 150,000 | | | Verizon Communications, Inc., 5.250%, 3/16/37 | | | 140,170 | |
| | | | | | | | 1,291,309 | |
| | | | | Tobacco — 1.7% | | | | |
| | 80,000 | | | Altria Group, Inc., 3.875%, 9/16/46 | | | 52,463 | |
| | 190,000 | | | BAT Capital Corp., 4.390%, 8/15/37 | | | 145,448 | |
| | 90,000 | | | BAT Capital Corp., 4.540%, 8/15/47 | | | 62,031 | |
| | 70,000 | | | Cargill, Inc., 4.375%, 4/22/52(d) | | | 56,816 | |
| | 90,000 | | | Cargill, Inc., 4.760%, 11/23/45(d) | | | 76,298 | |
| | 180,000 | | | Philip Morris International, Inc., 4.375%, 11/15/41 | | | 140,833 | |
| | | | | | | | 533,889 | |
| | | | | Total Corporate Bonds | | | | |
| | | | | (Cost $36,942,518) | | | 28,956,584 | |
| | | | | | | | | |
U.S. GOVERNMENT AGENCIES — 0.2% | | | | |
| | | | | | | | | |
| | | | | Tennessee Valley Authority — 0.2% | | | | |
| | 70,000 | | | 4.250%, 9/15/52 | | | 57,312 | |
| | | | | | | | | |
| | | | | Total U.S. Government Agencies | | | | |
| | | | | (Cost $67,789) | | | 57,312 | |
| | | | | | | | | |
| U.S. TREASURY BONDS — 5.1% | | | | |
| | 1,937,000 | | | 2.000%, 11/15/41 | | | 1,255,948 | |
Principal Amount | | | | | Fair Value | |
| U.S. TREASURY BONDS — (continued) | | | |
| | | | |
| $ | 567,900 | | | 2.000%, 8/15/51 | | $ | 327,252 | |
| | | | | | | | |
| | | | Total U.S. Treasury Bonds | | | | |
| | | | (Cost $1,801,312) | | | 1,583,200 | |
| Shares | | | | | | |
| MONEY MARKET FUND — 0.5% | | | |
| | 162,187 | | | Federated Treasury Obligations Fund, Institutional Shares, 5.21%(f) | | | 162,187 | |
| | | | | | | | |
| | | | Total Money Market Fund | | | | |
| | | | (Cost $162,187) | | | 162,187 | |
| | | | | | | | |
| Total Investments — 98.7% | | | | |
| (Cost $38,973,806) | | | 30,759,283 | |
| Net Other Assets (Liabilities) — 1.3% | | | 418,530 | |
| NET ASSETS — 100.0% | | $ | 31,177,813 | |
| (a) | The interest rate for this variable rate note, which will change periodically, is based either on the prime rate or an index of market rates. The reflected rate is in effect as of September 30, 2023. The maturity date reflected is the final maturity date. |
| (b) | Security is a fix-to-float security, which carries a fixed coupon until a certain date, upon which it switches to a floating rate. Rate shown is the fixed rate. |
| (c) | Security is perpetual in nature and has no stated maturity date. |
| (d) | Rule 144A, Section 4(a)(2) or other security that is restricted as to resale to qualified institutional investors. The Advisor, using Board approved procedures, has deemed these securities or a portion of these securities to be liquid. |
| (e) | All or a portion of the securities are held in a separate collateral account at US Bank. |
| (f) | Represents the current yield as of report date. |
Continued
| Sterling Capital Quality Income Fund |
Schedule of Portfolio Investments
September 30, 2023
Principal Amount | | | | | Fair Value | |
| ASSET BACKED SECURITIES — 16.1% | | | | |
| | | | | | | | | |
| $ | 22,069 | | | AmeriCredit Automobile Receivables Trust, Series 2019-2, Class C, 2.740%, 4/18/25 | | $ | 22,036 | |
| | 555,000 | | | AmeriCredit Automobile Receivables Trust, Series 2021-2, Class B, 0.690%, 1/19/27 | | | 527,795 | |
| | 170,000 | | | ARI Fleet Lease Trust, Series 2021-A, Class A3, 0.680%, 3/15/30(a) | | | 165,704 | |
| | 470,000 | | | ARI Fleet Lease Trust, Series 2022-A, Class A3, 3.430%, 1/15/31(a) | | | 452,391 | |
| | 1,250,000 | | | Avis Budget Rental Car Funding AESOP, LLC, Series 2023-4A, Class A, 5.490%, 6/20/29(a) | | | 1,216,552 | |
| | 550,000 | | | Carvana Auto Receivables Trust, Series 2021-P1, Class A4, 0.860%, 1/11/27 | | | 516,659 | |
| | 509,000 | | | Carvana Auto Receivables Trust, Series 2021-P2, Class B, 1.270%, 3/10/27 | | | 454,790 | |
| | 600,000 | | | Carvana Auto Receivables Trust, Series 2021-P3, Class B, 1.420%, 8/10/27 | | | 519,872 | |
| | 620,000 | | | Citibank Credit Card Issuance Trust, Series 2007-A3,
Class A3, 6.150%, 6/15/39(b) | | | 637,052 | |
| | 122 | | | Citicorp Residential Mortgage Trust, STEP, Series 2007-2, Class A6, 4.622%, 6/25/37 | | | 120 | |
| | 300,000 | | | Enterprise Fleet Financing, LLC, Series 2021-2, Class A3, 0.740%, 5/20/27(a) | | | 278,325 | |
| | 410,000 | | | Enterprise Fleet Financing, LLC, Series 2021-3, Class A3, 1.220%, 8/20/27(a) | | | 378,103 | |
| | 544,000 | | | Enterprise Fleet Financing, LLC, Series 2023-1, Class A3, 5.420%, 10/22/29(a) | | | 535,994 | |
| | 375,000 | | | Enterprise Fleet Funding, LLC, Series 2021-1, Class A3, 0.700%, 12/21/26(a) | | | 357,573 | |
| | 642,000 | | | Ford Credit Auto Owner Trust 2020- REV2, Series 2020-2, Class A, 1.060%, 4/15/33(a)(b) | | | 583,431 | |
| | 415,000 | | | Ford Credit Auto Owner Trust 2021- REV2, Series 2021-2, Class A, 1.530%, 5/15/34(a) | | | 366,320 | |
| | 205,000 | | | GreatAmerica Leasing Receivables Funding, LLC, Series 2021-1, Class A4, 0.550%, 12/15/26(a) | | | 195,358 | |
| | 1,295,000 | | | Hertz Vehicle Financing III L.P., Series 2021-2A, Class A, 1.680%, 12/27/27(a) | | | 1,136,260 | |
| | 1,315,000 | | | OneMain Direct Auto Receivables Trust 2023-1, Series 2023-1A, Class A, 5.410%, 11/14/29(a) | | | 1,294,771 | |
| | 29,598 | | | OneMain Financial Issuance Trust, Series 2020-1A, Class A, 3.840%, 5/14/32(a) | | | 29,542 | |
| | 630,000 | | | OneMain Financial Issuance Trust 2019- 2, Series 2019-2A, Class A, 3.140%, 10/14/36(a)(b) | | | 570,255 | |
| | 480,000 | | | OneMain Financial Issuance Trust 2021-1, Series 2021-1A, Class A1, 1.550%, 6/16/36(a)(b) | | | 417,012 | |
| | 750,000 | | | Santander Drive Auto Receivables Trust, Series 2023-3, Class B, 5.610%, 7/17/28 | | | 743,138 | |
| Principal Amount | | | | | Fair Value | |
| ASSET BACKED SECURITIES — (continued) | | | | |
| $ | 129,557 | | | Saxon Asset Securities Trust, Series 2004-3, Class M1, 6.334%, (TSFR1M plus 1.01%), 12/26/34(c) | | $ | 121,491 | |
| | 280,721 | | | SoFi Professional Loan Program Trust, Series 2020-A, Class A2FX, 2.540%, 5/15/46(a)(b) | | | 256,974 | |
| | 561,000 | | | Synchrony Card Funding, LLC, Series 2023-A1, Class A, 5.540%, 7/15/29 | | | 560,410 | |
| | 750,000 | | | Toyota Auto Loan Extended Note Trust 2021-1, Series 2021-1A, Class A, 1.070%, 2/27/34(a)(b) | | | 671,557 | |
| | 1,000,000 | | | Toyota Auto Loan Extended Note Trust 2022-1, Series 2022-1A, Class A, 3.820%, 4/25/35(a) | | | 940,796 | |
| | 45,340 | | | U.S. Small Business Administration, Series 2010-20D, Class 1, 4.360%, 4/1/30(b) | | | 43,306 | |
| | 150,001 | | | Wheels SPV 2, LLC, Series 2020-1A, Class A3, 0.620%, 8/20/29(a) | | | 147,516 | |
| | | | | | | | | |
| | | | | Total Asset Backed Securities | | | | |
| | | | | (Cost $15,128,735) | | | 14,141,103 | |
| | | | | | | | | |
| COLLATERALIZED MORTGAGE OBLIGATIONS — 20.7% |
| | 348,451 | | | Chase Home Lending Mortgage Trust, Series 2019-ATR2, Class A3, 3.500%, 7/25/49(a)(d) | | | 298,641 | |
| | 9,137 | | | Citigroup Mortgage Loan Trust, Inc., Series 2004-NCM2, Class 3CB2, 6.500%, 8/25/19 | | | 8,898 | |
| | 27,510 | | | Countrywide Home Loan Mortgage Pass- Through Trust, Series 2004-3, Class A4, 5.750%, 4/25/34 | | | 25,761 | |
| | 52,339 | | | Credit Suisse First Boston Mortgage- Backed Pass-Through Certificates, Series 2004-1, Class 2A1, 6.500%, 2/25/34 | | | 51,184 | |
| | 38,956 | | | Fannie Mae, Series 2003-19, Class AR, 5.500%, 3/25/33 | | | 38,524 | |
| | 176,655 | | | Fannie Mae, Series 2003-21, Class OW, 4.000%, 3/25/33 | | | 165,117 | |
| | 682,000 | | | Fannie Mae, Series 2008-2, Class PH, 5.500%, 2/25/38 | | | 669,207 | |
| | 527,000 | | | Fannie Mae, Series 2009-28, Class HX, 5.000%, 5/25/39 | | | 509,349 | |
| | 825,833 | | | Fannie Mae, Series 2010-150, Class YL, 4.000%, 1/25/41 | | | 711,006 | |
| | 869,075 | | | Fannie Mae, Series 2011-131, Class PB, 4.500%, 12/25/41 | | | 825,809 | |
| | 112,068 | | | Fannie Mae, Series 2011-74, Class QM, 4.500%, 11/25/40 | | | 109,936 | |
| | 1,050,281 | | | Fannie Mae, Series 2013-30, Class PY, 3.000%, 4/25/43 | | | 978,047 | |
| | 356,921 | | | Fannie Mae, Series 2013-91, Class DV, 3.000%, 10/25/26 | | | 344,201 | |
| | 928,514 | | | Fannie Mae, Series 2015-65, Class CZ, 3.500%, 9/25/45 | | | 727,567 | |
See accompanying Notes to the Financial Statements.
| Sterling Capital Quality Income Fund |
Schedule of Portfolio Investments — (continued)
September 30, 2023
Principal Amount | | | | | Fair Value | |
| COLLATERALIZED MORTGAGE OBLIGATIONS — (continued) | | | | |
| $ | 496,931 | | | Fannie Mae, Series 2016-11, Class GA, 2.500%, 3/25/46 | | $ | 442,544 | |
| | 127,197 | | | Fannie Mae, Series 2016-85, Class GA, 2.500%, 10/25/45 | | | 111,632 | |
| | 1,495,000 | | | Fannie Mae, Series 2017-42, Class HL, 3.000%, 6/25/47 | | | 1,268,102 | |
| | 337,555 | | | Fannie Mae, Series 2020-10, Class Q, 3.000%, 3/25/50 | | | 279,114 | |
| | 64,387 | | | Freddie Mac, Series 2485, Class WG, 6.000%, 8/15/32 | | | 64,681 | |
| | 134,468 | | | Freddie Mac, Series 2768, Class PC, 4.000%, 3/15/34 | | | 127,620 | |
| | 115,134 | | | Freddie Mac, Series 3042, Class PZ, 5.750%, 9/15/35 | | | 114,909 | |
| | 87,504 | | | Freddie Mac, Series 3440, Class EM, 5.000%, 4/15/38 | | | 85,601 | |
| | 500,000 | | | Freddie Mac, Series 3714, Class PB, 4.750%, 8/15/40(b) | | | 475,234 | |
| | 7,332 | | | Freddie Mac, Series 3803, Class PJ, 4.250%, 1/15/41 | | | 7,208 | |
| | 200,000 | | | Freddie Mac, Series 3815, Class TB, 4.500%, 2/15/41 | | | 183,264 | |
| | 117,826 | | | Freddie Mac, Series 3816, Class HM, 4.500%, 5/15/40 | | | 112,379 | |
| | 990,000 | | | Freddie Mac, Series 3895, Class PW, 4.500%, 7/15/41 | | | 942,763 | |
| | 296,893 | | | Freddie Mac, Series 3989, Class JW, 3.500%, 1/15/42(b) | | | 266,017 | |
| | 338,000 | | | Freddie Mac, Series 4088, Class CD, 3.000%, 8/15/42 | | | 251,890 | |
| | 300,000 | | | Freddie Mac, Series 4094, Class ME, 2.500%, 8/15/42 | | | 246,060 | |
| | 215,000 | | | Freddie Mac, Series 4097, Class CU, 1.500%, 8/15/27 | | | 190,277 | |
| | 724,000 | | | Freddie Mac, Series 4125, Class JC, 2.500%, 11/15/42 | | | 496,207 | |
| | 628,000 | | | Freddie Mac, Series 4135, Class AY, 2.000%, 11/15/42 | | | 455,604 | |
| | 467,283 | | | Freddie Mac, Series 4136, Class HZ, 3.500%, 11/15/27 | | | 431,925 | |
| | 119,000 | | | Freddie Mac, Series 4160, Class HH, 2.500%, 12/15/32(b) | | | 103,331 | |
| | 122,529 | | | Freddie Mac, Series 4173, Class NB, 3.000%, 3/15/43 | | | 106,092 | |
| | 81,669 | | | Freddie Mac, Series 4215, Class LD, 2.000%, 7/15/41 | | | 75,924 | |
| | 34,269 | | | Freddie Mac, Series 4293, Class MH, 3.000%, 12/15/41 | | | 31,461 | |
| | 93,275 | | | Freddie Mac, Series 4352, Class ZX, 4.000%, 4/15/44 | | | 85,752 | |
| | 1,000,000 | | | Freddie Mac, Series 4507, Class GB, 3.000%, 9/15/45 | | | 800,333 | |
| | 475,000 | | | Freddie Mac, Series 4650, Class JE, 3.000%, 7/15/46 | | | 374,610 | |
Principal Amount | | | | | Fair Value | |
| COLLATERALIZED MORTGAGE OBLIGATIONS — (continued) |
| $ | 898,398 | | | Freddie Mac, Series 4941, Class MB, 3.000%, 7/25/49 | | $ | 763,006 | |
| | 391,438 | | | Freddie Mac, Series 5115, Class G, 2.500%, 9/25/50 | | | 310,714 | |
| | 215,951 | | | Freddie Mac Strips, Series 219, Class PO, 3/1/32 | | | 185,196 | |
| | 995,345 | | | Freddie Mac Strips, Series 236, Class PO, 4/1/36 | | | 794,762 | |
| | 51,632 | | | Ginnie Mae, Series 2004-69, Class GC, 5.500%, 4/20/34 | | | 51,213 | |
| | 426,916 | | | Ginnie Mae, Series 2005-60, Class WZ, 5.500%, 9/20/35 | | | 420,125 | |
| | 183,452 | | | Ginnie Mae, Series 2007-57, Class ZA, 5.750%, 10/20/37 | | | 183,577 | |
| | 750,000 | | | Ginnie Mae, Series 2011-135, Class PG, 3.000%, 10/16/41 | | | 620,643 | |
| | 612,000 | | | Ginnie Mae, Series 2017-75, Class DL, 3.000%, 3/20/47 | | | 475,072 | |
| | 800,000 | | | Ginnie Mae, Series 2019-6, Class JK, 3.500%, 1/20/49 | | | 680,131 | |
| | 137,978 | | | MASTR Alternative Loan Trust, Series 2003-5, Class 8A1, 5.500%, 6/25/33(b) | | | 123,265 | |
| | | | | | | | | |
| | | | | Total Collateralized Mortgage Obligations | | | | |
| | | | | (Cost $20,437,224) | | | 18,201,485 | |
| | | | | | | | | |
| COMMERCIAL MORTGAGE-BACKED SECURITIES — 18.7% |
| | 250,000 | | | BANK 2020-BNK29, Series 2020-BN29, Class A4, 1.997%, 11/15/53 | | | 185,437 | |
| | 325,000 | | | BBCMS Mortgage Trust, Series 2020-C7, Class A5, 2.037%, 4/15/53 | | | 257,357 | |
| | 589,492 | | | Benchmark Mortgage Trust, Series 2020- B18, Class A5, 1.925%, 7/15/53 | | | 450,037 | |
| | 1,250,000 | | | Benchmark Mortgage Trust, Series 2020- B21, Class A5, 1.978%, 12/17/53(b) | | | 954,690 | |
| | 277,000 | | | BX Commercial Mortgage Trust, Series 2021-ACNT, Class C, 6.946%, (TSFR1M plus 1.61%),
11/15/38(a)(c) | | | 270,048 | |
| | 252,184 | | | BX Trust, Series 2021-RISE, Class C, 6.896%, (TSFR1M plus 1.56%), 11/15/36(a)(c) | | | 246,647 | |
| | 589,000 | | | CD Mortgage Trust, Series 2016-CD2, Class A4, 3.526%, 11/10/49(b)(d) | | | 535,411 | |
| | 700,000 | | | CD Mortgage Trust, Series 2017-CD3, Class A4, 3.631%, 2/10/50 | | | 628,908 | |
| | 100,000 | | | CFCRE Commercial Mortgage Trust, Series 2016-C7, Class A3, 3.839%, 12/10/54 | | | 93,784 | |
| | 405,000 | | | Citigroup Commercial Mortgage Trust, Series 2013-GC17, Class AS, 4.544%, 11/10/46(b) | | | 402,948 | |
Continued
| Sterling Capital Quality Income Fund |
Schedule of Portfolio Investments — (continued)
September 30, 2023
Principal
Amount | | | | | Fair Value | |
| COMMERCIAL MORTGAGE-BACKED SECURITIES — (continued) |
| $ | 500,000 | | | Citigroup Commercial Mortgage Trust, Series 2015-GC33, Class A4, 3.778%, 9/10/58 | | $ | 468,936 | |
| | 44,341 | | | COMM 2013-CCRE13 Mortgage Trust, Series 2013-CR13, Class A4, 4.194%, 11/10/46(d) | | | 44,195 | |
| | 350,000 | | | COMM 2014-CCRE15 Mortgage Trust, Series 2014-CR15, Class A4, 4.074%, 2/10/47(d) | | | 347,534 | |
| | 500,000 | | | COMM 2014-CCRE18 Mortgage Trust, Series 2014-CR18, Class A5, 3.828%, 7/15/47(b) | | | 490,922 | |
| | 266,000 | | | COMM Mortgage Trust, Series 2014- CR20, Class A4, 3.590%, 11/10/47 | | | 257,613 | |
| | 153,000 | | | COMM Mortgage Trust, Series 2014- UBS2, Class A5, 3.961%, 3/10/47 | | | 151,842 | |
| | 455,000 | | | COMM Mortgage Trust, Series 2014- UBS4, Class A5, 3.694%, 8/10/47 | | | 442,308 | |
| | 250,000 | | | COMM Mortgage Trust, Series 2017- COR2, Class A3, 3.510%, 9/10/50(b) | | | 226,943 | |
| | 500,000 | | | CSAIL Commercial Mortgage Trust, Series 2015-C3, Class A4, 3.718%, 8/15/48(b) | | | 473,318 | |
| | 251,000 | | | ELP Commercial Mortgage Trust, Series 2021-ELP, Class C, 6.767%, (TSFR1M plus 1.43%), 11/15/38(a)(c) | | | 244,701 | |
| | 1,000,000 | | | Freddie Mac Multifamily Structured Pass Through Certificates, Series K1522, Class A2, 2.361%, 10/25/36 | | | 711,304 | |
| | 140,000 | | | Freddie Mac Multifamily Structured Pass Through Certificates, Series K159, Class A2, 3.950%,
11/25/30(d) | | | 129,230 | |
| | 363,690 | | | FRESB Mortgage Trust, Series 2017-SB36, Class A10F, 2.880%, 7/25/27(b)(d) | | | 335,103 | |
| | 573,183 | | | Ginnie Mae, Series 2014-126, Class A, 2.500%, 11/16/46 | | | 529,458 | |
| | 352,763 | | | Ginnie Mae, Series 2019-79, Class V, 2.800%, 3/16/29 | | | 323,199 | |
| | 17,614 | | | GS Mortgage Securities Trust, Series 2010- C1, Class B, 5.148%, 8/10/43(a) | | | 17,455 | |
| | 85,000 | | | GS Mortgage Securities Trust, Series 2014- GC24, Class A5, 3.931%, 9/10/47 | | | 82,388 | |
| | 500,000 | | | GS Mortgage Securities Trust, Series 2016- GS4, Class A4, 3.442%, 11/10/49(b)(d) | | | 461,299 | |
| | 64,000 | | | GS Mortgage Securities Trust, Series 2020- GC47, Class A5, 2.377%, 5/12/53 | | | 51,395 | |
| | 500,000 | | | GS Mortgage Securities Trust, Series 2020- GSA2, Class A5, 2.012%, 12/12/53(b) | | | 380,070 | |
| | 142,369 | | | JP Morgan Chase Commercial Mortgage Securities Trust, Series 2011-C3, Class B, 5.013%, 2/15/46(a)(d) | | | 132,328 | |
| | 500,000 | | | JP Morgan Chase Commercial Mortgage Securities Trust, Series 2014-C20, Class A5, 3.805%, 7/15/47(b) | | | 492,810 | |
Principal Amount | | | | | Fair Value | |
| COMMERCIAL MORTGAGE-BACKED SECURITIES — (continued) | |
| $ | 185,000 | | | JP Morgan Chase Commercial Mortgage Securities Trust, Series 2016-JP4, Class A4, 3.648%, 12/15/49(d) | | $ | 171,061 | |
| | 272,691 | | | Med Trust, Series 2021-MDLN, Class C, 7.246%, (TSFR1M plus 1.91%), 11/15/38(a)(c) | | | 264,770 | |
| | 100,000 | | | Morgan Stanley Bank of America Merrill Lynch Trust, Series 2014-C18, Class A4, 3.923%, 10/15/47(b) | | | 97,110 | |
| | 300,167 | | | Morgan Stanley Bank of America Merrill Lynch Trust, Series 2014-C19, Class A4, 3.526%, 12/15/47 | | | 289,317 | |
| | 500,000 | | | Morgan Stanley Bank of America Merrill Lynch Trust, Series 2016-C32, Class A4, 3.720%, 12/15/49(b) | | | 461,359 | |
| | 435,000 | | | Morgan Stanley Capital I Trust, Series 2018-H3, Class A5, 4.177%, 7/15/51 | | | 402,120 | |
| | 659,333 | | | Morgan Stanley Capital I Trust, Series 2020-HR8, Class A4, 2.041%, 7/15/53 | | | 513,879 | |
| | 199,753 | | | OPG Trust, Series 2021-PORT, Class C, 6.279%, (TSFR1M plus 0.95%), 10/15/36(a)(c) | | | 192,734 | |
| | 235,642 | | | SMR Mortgage Trust, Series 2022-IND, Class A, 6.982%, (TSFR1M plus 1.65%), 2/15/39(a)(c) | | | 225,265 | |
| | 600,000 | | | Wells Fargo Commercial Mortgage Trust, Series 2014-LC18, Class A5, 3.405%, 12/15/47 | | | 576,127 | |
| | 644,000 | | | Wells Fargo Commercial Mortgage Trust, Series 2015-P2, Class A4, 3.809%, 12/15/48 | | | 609,750 | |
| | 50,000 | | | Wells Fargo Commercial Mortgage Trust, Series 2016-C37, Class A5, 3.794%, 12/15/49 | | | 46,540 | |
| | 300,000 | | | Wells Fargo Commercial Mortgage Trust, Series 2017-C40, Class A4, 3.581%, 10/15/50 | | | 273,343 | |
| | 220,800 | | | Wells Fargo Commercial Mortgage Trust, Series 2020-C56, Class A5, 2.448%, 6/15/53 | | | 177,832 | |
| | 500,000 | | | Wells Fargo Commercial Mortgage Trust, Series 2020-C57, Class A4, 2.118%, 8/15/53 | | | 392,933 | |
| | 300,000 | | | Wells Fargo Commercial Mortgage Trust, Series 2020-C58, Class A4, 2.092%, 7/15/53 | | | 230,777 | |
| | 475,000 | | | WFRBS Commercial Mortgage Trust, Series 2014-C20, Class AS, 4.176%, 5/15/47 | | | 444,823 | |
Continued
| Sterling Capital Quality Income Fund |
Schedule of Portfolio Investments — (continued)
September 30, 2023
Principal Amount | | | | | Fair Value | |
| COMMERCIAL MORTGAGE-BACKED SECURITIES — (continued) | |
| $ | 302,000 | | | WFRBS Commercial Mortgage Trust, Series 2014-C23, Class A5, 3.917%, 10/15/57 | | $ | 291,500 | |
| | | | | | | | | |
| | | | | Total Commercial Mortgage-Backed Securities | | | | |
| | | | | (Cost $18,873,908) | | | 16,480,858 | |
| | | | | | | | | |
| CORPORATE BONDS — 0.3% | | | | |
| | | | | | | | | |
| | | | | Diversified REITs — 0.3% | | | | |
| | 250,000 | | | American Tower Trust, 3.652%, 3/23/28(a)(b) | | | 228,689 | |
| | | | | | | | | |
| | | | | Total Corporate Bonds | | | | |
| | | | | (Cost $250,000) | | | 228,689 | |
| | | | | | | | | |
| MORTGAGE-BACKED SECURITIES — 38.7% | | | | |
| | | | | |
| | | | | Fannie Mae — 15.3% | | | | |
| | 99,762 | | | 3.000%, 1/1/31, Pool #BA6574 | | | 93,076 | |
| | 302,291 | | | 4.500%, 3/1/34, Pool #CA3294 | | | 292,667 | |
| | 270,375 | | | 2.500%, 11/1/35, Pool #CA7939 | | | 238,527 | |
| | 54,293 | | | 5.500%, 6/1/38, Pool #984277(b) | | | 54,064 | |
| | 29,732 | | | 5.500%, 8/1/38, Pool #995072 | | | 29,657 | |
| | 38,817 | | | 4.500%, 9/1/39, Pool #AC1830 | | | 36,690 | |
| | 36,572 | | | 4.500%, 10/1/40, Pool #AE4855 | | | 34,568 | |
| | 70,229 | | | 3.500%, 2/1/41, Pool #AH5646 | | | 62,417 | |
| | 111,749 | | | 4.000%, 3/1/41, Pool #AH4008 | | | 102,451 | |
| | 327,078 | | | 2.500%, 5/1/41, Pool #MA4334 | | | 267,584 | |
| | 28,310 | | | 4.500%, 6/1/41, Pool #AC9298 | | | 26,758 | |
| | 80,313 | | | 5.000%, 7/1/41, Pool #AI5595 | | | 78,027 | |
| | 132,988 | | | 4.000%, 9/1/41, Pool #AJ1717 | | | 121,906 | |
| | 107,583 | | | 3.500%, 6/1/42, Pool #AB5373 | | | 95,503 | |
| | 681,668 | | | 6.000%, 8/1/43, Pool #MA5129 | | | 677,534 | |
| | 36,695 | | | 4.500%, 10/1/44, Pool #MA2066 | | | 34,455 | |
| | 113,080 | | | 4.000%, 12/1/44, Pool #MA2127 | | | 103,374 | |
| | 105,864 | | | 4.500%, 1/1/45, Pool #MA2158 | | | 99,403 | |
| | 135,635 | | | 3.500%, 3/1/45, Pool #AS4552 | | | 119,396 | |
| | 119,369 | | | 4.000%, 10/1/45, Pool #AL7487 | | | 108,980 | |
| | 835,306 | | | 3.000%, 10/1/46, Pool #BC4764 | | | 706,220 | |
| | 80,937 | | | 4.000%, 11/1/46, Pool #MA2808 | | | 73,630 | |
| | 109,152 | | | 3.000%, 2/1/47, Pool #BE2329 | | | 92,234 | |
| | 61,340 | | | 4.000%, 5/1/47, Pool #BE9598 | | | 55,527 | |
| | 52,737 | | | 4.500%, 11/1/47, Pool #BM3286 | | | 50,259 | |
| | 196,800 | | | 3.500%, 12/1/47, Pool #CA0833 | | | 172,522 | |
| | 62,292 | | | 4.500%, 5/1/48, Pool #CA1711 | | | 58,170 | |
| | 89,036 | | | 3.500%, 9/1/49, Pool #BJ9608 | | | 77,888 | |
| | 206,030 | | | 3.500%, 6/1/50, Pool #CA6097 | | | 179,212 | |
| | 204,824 | | | 3.000%, 7/1/50, Pool #CA6422 | | | 170,734 | |
| | 204,336 | | | 3.000%, 7/1/50, Pool #CA6421 | | | 170,390 | |
| | 518,206 | | | 2.500%, 8/1/50, Pool #FM4053 | | | 417,704 | |
| | 330,498 | | | 2.500%, 8/1/50, Pool #FM4055 | | | 264,675 | |
| | 787,593 | | | 3.000%, 8/1/50, Pool #FS0973 | | | 663,414 | |
| | 388,347 | | | 2.500%, 10/1/50, Pool #FM4702 | | | 311,001 | |
| | 480,023 | | | 2.500%, 3/1/51, Pool #FM6523 | | | 384,318 | |
Principal Amount | | | | | Fair Value | |
| MORTGAGE-BACKED SECURITIES — (continued) | |
| | |
| | | | | Fannie Mae — (continued) | | | | |
| $ | 329,303 | | | 3.000%, 5/1/51, Pool #FM7346 | | $ | 274,492 | |
| | 1,050,662 | | | 2.500%, 8/1/51, Pool #FM8438 | | | 843,838 | |
| | 1,257,049 | | | 4.000%, 8/1/51, Pool #FS1976 | | | 1,138,298 | |
| | 311,064 | | | 3.000%, 11/1/51, Pool #CB2170 | | | 258,121 | |
| | 835,173 | | | 3.500%, 2/1/52, Pool #MA4550 | | | 720,539 | |
| | 960,388 | | | 3.000%, 3/1/52, Pool #BV4143 | | | 807,193 | |
| | 734,069 | | | 3.500%, 4/1/52, Pool #FS1185 | | | 633,604 | |
| | 681,286 | | | 3.500%, 4/1/52, Pool #FS1260 | | | 591,266 | |
| | 663,461 | | | 4.500%, 6/1/52, Pool #FS2157 | | | 613,885 | |
| | 506,460 | | | 5.000%, 11/1/52, Pool #CB5278 | | | 478,613 | |
| | 567,481 | | | 5.500%, 3/1/53, Pool #FS3925 | | | 551,369 | |
| | | | | | | | 13,436,153 | |
| | | | | | | | | |
| | | | | Freddie Mac — 22.9% | | | | |
| | 37,856 | | | 4.000%, 11/1/32, Pool #ZS8993 | | | 35,185 | |
| | 174,992 | | | 3.500%, 5/1/35, Pool #ZA2378 | | | 160,786 | |
| | 128,562 | | | 4.000%, 5/1/37, Pool #ZA2461 | | | 117,866 | |
| | 18,441 | | | 5.500%, 10/1/39, Pool #ZI9359 | | | 18,359 | |
| | 33,328 | | | 5.000%, 4/1/40, Pool #ZI9910 | | | 32,537 | |
| | 54,574 | | | 5.500%, 4/1/40, Pool #ZA1042 | | | 54,524 | |
| | 427,526 | | | 2.000%, 8/1/40, Pool #RB5076 | | | 347,472 | |
| | 22,441 | | | 5.000%, 8/1/40, Pool #ZA1056 | | | 21,909 | |
| | 58,511 | | | 4.000%, 11/1/40, Pool #ZJ0654 | | | 53,493 | |
| | 63,217 | | | 4.000%, 12/1/40, Pool #ZJ0811 | | | 57,954 | |
| | 149,841 | | | 3.500%, 8/1/42, Pool #ZL3508 | | | 133,202 | |
| | 575,364 | | | 3.000%, 12/1/42, Pool #Q14108 | | | 494,737 | |
| | 651,042 | | | 6.000%, 2/1/43, Pool #RB5221 | | | 645,890 | |
| | 193,335 | | | 3.500%, 3/1/43, Pool #ZT1107 | | | 170,512 | |
| | 809,056 | | | 3.500%, 1/1/45, Pool #SD1309 | | | 716,699 | |
| | 137,172 | | | 3.500%, 1/1/45, Pool #ZL8964 | | | 121,148 | |
| | 112,675 | | | 3.500%, 3/1/45, Pool #ZT1164 | | | 99,274 | |
| | 88,982 | | | 3.000%, 1/1/46, Pool #ZS4646 | | | 75,325 | |
| | 91,802 | | | 4.000%, 4/1/46, Pool #ZM1015 | | | 83,605 | |
| | 94,030 | | | 3.500%, 12/1/47, Pool #ZM5123 | | | 82,421 | |
| | 238,485 | | | 2.500%, 11/1/49, Pool #QA4396 | | | 191,147 | |
| | 115,833 | | | 3.000%, 1/1/50, Pool #QA6230 | | | 96,888 | |
| | 505,144 | | | 3.000%, 6/1/51, Pool #SD8152 | | | 419,803 | |
| | 646,904 | | | 2.500%, 7/1/51, Pool #QC4230 | | | 521,523 | |
| | 369,942 | | | 3.000%, 7/1/51, Pool #RA5552 | | | 308,326 | |
| | 285,991 | | | 3.500%, 7/1/51, Pool #RA5549 | | | 247,276 | |
| | 1,002,126 | | | 3.000%, 8/1/51, Pool #SD8162 | | | 832,437 | |
| | 984,764 | | | 2.500%, 9/1/51, Pool #RA5921 | | | 784,225 | |
| | 552,787 | | | 3.500%, 1/1/52, Pool #RA6531 | | | 476,873 | |
| | 441,776 | | | 3.000%, 2/1/52, Pool #SD8195 | | | 366,367 | |
| | 950,891 | | | 3.500%, 4/1/52, Pool #RA7191 | | | 819,948 | |
| | 879,069 | | | 3.500%, 4/1/52, Pool #SD0957 | | | 757,448 | |
| | 739,482 | | | 4.500%, 6/1/52, Pool #SD1265 | | | 682,166 | |
| | 1,149,025 | | | 4.500%, 8/1/52, Pool #SD1515 | | | 1,056,674 | |
| | 762,549 | | | 5.000%, 10/1/52, Pool #SD1710 | | | 721,415 | |
| | 968,072 | | | 5.000%, 11/1/52, Pool #SD1727 | | | 917,039 | |
| | 716,150 | | | 5.000%, 1/1/53, Pool #RA8382 | | | 676,772 | |
| | 940,921 | | | 5.500%, 2/1/53, Pool #QF8052 | | | 910,940 | |
| | 989,720 | | | 5.000%, 3/1/53, Pool #SD2390 | | | 934,660 | |
| | 1,318,061 | | | 4.500%, 5/1/53, Pool #SD2952 | | | 1,219,160 | |
| | 467,846 | | | 6.000%, 5/1/53, Pool #SD3072 | | | 462,299 | |
Continued
| Sterling Capital Quality Income Fund |
Schedule of Portfolio Investments — (continued)
September 30, 2023
Principal Amount | | | | | Fair Value | |
| MORTGAGE-BACKED SECURITIES — (continued) | |
| | | | | | | | | |
| | | | | Freddie Mac — (continued) | | | | |
| $ | 995,619 | | | 5.000%, 6/1/53, Pool #SD3128 | | $ | 940,529 | |
| | 994,607 | | | 5.500%, 6/1/53, Pool #SD3136 | | | 963,138 | |
| | 1,333,907 | | | 6.000%, 7/1/53, Pool #SD3223 | | | 1,322,716 | |
| | | | | | | | 20,152,667 | |
| | | | | Ginnie Mae — 0.5% | | | | |
| | 7,142 | | | 4.000%, 12/20/40, Pool #755678 | | | 6,618 | |
| | 517,330 | | | 4.000%, 7/20/52, Pool #786280 | | | 467,790 | |
| | | | | | | | 474,408 | |
| | | | | Total Mortgage-Backed Securities | | | | |
| | | | | (Cost $38,365,664) | | | 34,063,228 | |
| | | | | | | | | |
| U.S. GOVERNMENT AGENCIES — 0.5% | | | | |
| | | | | | | | | |
| | | | | Federal Home Loan Banks — 0.5% | | | | |
| | 550,000 | | | 1.900%, 10/7/31 | | | 429,827 | |
| | | | | | | | | |
| | | | | Total U.S. Government Agencies | | | | |
| | | | | (Cost $462,746) | | | 429,827 | |
| | | | | | | | | |
| U.S. TREASURY BONDS — 2.4% | | | | |
| | 2,250,000 | | | 2.375%, 2/15/42 | | | 1,553,994 | |
| | 1,065,000 | | | 1.875%, 11/15/51(b) | | | 592,697 | |
| | | | | | | | | |
| | | | | Total U.S. Treasury Bonds | | | | |
| | | | | (Cost $2,723,278) | | | 2,146,691 | |
| | | | | | | | | |
| U.S. TREASURY NOTES — 1.1% | | | | |
| | 200,000 | | | 1.375%, 11/15/31 | | | 156,750 | |
| | 1,000,000 | | | 1.875%, 2/15/32 | | | 812,422 | |
| | | | | | | | | |
| | | | | Total U.S. Treasury Notes | | | | |
| | | | | (Cost $1,166,304) | | | 969,172 | |
| Shares | | | | | | |
| MONEY MARKET FUND —1.4% | | | |
| 1,258,182 | | | Federated Treasury Obligations Fund, Institutional Shares, 5.21%(e) | | | 1,258,182 | |
| | | | | | | | |
| | | | Total Money Market Fund | | | | |
| | | | (Cost $1,258,182) | | | 1,258,182 | |
| | | | | | | | |
| Total Investments — 99.9% | | | | |
| (Cost $98,666,041) | | | 87,919,235 | |
| Net Other Assets (Liabilities) — 0.1% | | | 120,731 | |
| NET ASSETS — 100.0% | | $ | 88,039,966 | |
| (a) | Rule 144A, Section 4(a)(2) or other security that is restricted as to resale to qualified institutional investors. The Advisor, using Board approved procedures, has deemed these securities or a portion of these securities to be liquid. |
| (b) | All or a portion of the securities are held in a separate collateral account at US Bank. |
| (c) | The interest rate for this floating rate note, which will change periodically, is based either on the prime rate or an index of market rates. The reflected rate is in effect as of September 30, 2023. The maturity date reflected is the final maturity date. |
| (d) | The interest rate for this variable rate note, which will change periodically, is based either on the prime rate or an index of market rates. The reflected rate is in effect as of September 30, 2023. The maturity date reflected is the final maturity date. |
| (e) | Represents the current yield as of report date. |
Continued
| Sterling Capital North Carolina Intermediate Tax-Free Fund |
Schedule of Portfolio Investments
September 30, 2023
Principal Amount | | | | | Fair Value | |
| MUNICIPAL BONDS — 96.8% | | | | |
| | | | | |
| | | | | North Carolina — 96.8% | | | | |
| $ | 1,000,000 | | | Broad River Water Authority, Water System Refunding Revenue, 5.000%, 6/1/24 | | $ | 1,006,120 | |
| | 1,390,000 | | | Brunswick County, NC, School Improvements G.O., 5.000%, 8/1/28 | | | 1,489,246 | |
| | 1,025,000 | | | Buncombe County Metropolitan Sewerage District, Sewer Improvements Revenue, Callable 7/1/24 @ 100, 5.000%, 7/1/39 | | | 1,027,593 | |
| | 1,475,000 | | | Buncombe County, NC, Advance Refunding Revenue Limited Obligation, Callable 6/1/25 @ 100, 5.000%,
6/1/28 | | | 1,500,945 | |
| | 1,100,000 | | | Cabarrus County, NC, Refunding Revenue Bonds, Series A, 5.000%, 6/1/31 | | | 1,205,457 | |
| | 1,010,000 | | | Cape Fear Public Utility Authority, Advance Refunding Revenue Bonds, 5.000%, 8/1/25 | | | 1,032,664 | |
| | 1,000,000 | | | Charlotte, NC, Charlotte Douglas International Airport Refunding Revenue, Callable 7/1/24 @ 100, 5.000%,
7/1/31 | | | 997,460 | |
| | 3,195,000 | | | Charlotte, NC, Current Refunding G.O., Series A, 5.000%, 6/1/29 | | | 3,454,242 | |
| | 2,000,000 | | | Charlotte, NC, Current Refunding G.O., Series A, Callable 6/1/29 @ 100, 5.000%, 6/1/34 | | | 2,149,060 | |
| | 2,000,000 | | | Charlotte, NC, Public Facilities, Certificate of Participation, Series B, Callable 12/1/31 @ 100, 5.000%, 12/1/32 | | | 2,205,120 | |
| | 2,275,000 | | | Charlotte, NC, Recreational Facilities Improvements Revenue, Callable 12/1/28 @ 100, 5.000%, 12/1/33 | | | 2,419,372 | |
| | 1,520,000 | | | Charlotte, NC, Recreational Facilities Improvements Revenue, Callable 12/1/28 @ 100, 5.000%, 12/1/34 | | | 1,613,374 | |
| | 2,650,000 | | | Charlotte, NC, Water & Sewer System Revenue, Refunding Revenue Bonds, Series A, Callable 7/1/32 @ 100, 5.000%, 7/1/39 | | | 2,835,845 | |
| | 2,035,000 | | | Chatham County, NC, Refunding Revenue (County Guaranteed), 5.000%, 12/1/28 | | | 2,105,228 | |
| | 2,100,000 | | | Concord, NC, Recreational Facility Improvements G.O., Callable 9/1/33 @ 100, 5.000%, 9/1/34 | | | 2,352,000 | |
| | 1,890,000 | | | Durham County, NC, Current Refunding G.O., 5.000%,
6/1/29 | | | 2,044,375 | |
| | 1,225,000 | | | East Carolina University, University & College Improvements Revenue, Series A, Callable 4/1/26 @ 100, 5.000%, 10/1/27 | | | 1,252,673 | |
| | 1,000,000 | | | Elizabeth City State University, Board of Governors of NC, Advance Refunding Revenue Bonds, Callable 4/1/29 @ 100 (AGM), 5.000%, 4/1/40 | | | 1,009,500 | |
Principal Amount | | | | | Fair Value | |
| MUNICIPAL BONDS — (continued) | | | | |
| | | | | |
| | | | | North Carolina — (continued) | | | | |
| $ | 1,750,000 | | | Fayetteville, NC, Public Works Commission, Electric Light & Power Improvements Revenue, Callable 3/1/24 @ 100, 4.000%, 3/1/27 | | $ | 1,718,570 | |
| | 1,690,000 | | | Fayetteville, NC, Public Works Commission, Multi-Utility Improvements Revenue, Callable 3/1/28 @ 100, 5.000%, 3/1/29 | | | 1,787,175 | |
| | 3,000,000 | | | Forsyth County NC, Public Improvements, G.O., Series B, Callable 3/1/29 @ 100, 5.000%, 3/1/31 | | | 3,221,820 | |
| | 1,500,000 | | | Gaston County, NC, Current Refunding G.O., 5.000%,
2/1/29 | | | 1,613,895 | |
| | 2,000,000 | | | Greensboro, NC, Recreational Facility Improvements G.O., Series B, Callable 4/1/32 @ 100, 5.000%, 4/1/40 | | | 2,129,120 | |
| | 1,675,000 | | | Guilford County, NC, Advance Refunding, G.O., Series A, Callable 2/1/26 @ 100, 5.000%, 2/1/28 | | | 1,726,389 | |
| | 2,075,000 | | | High Point, NC, Combined Water & Sewer System, Advance Refunding Revenue Bonds, 5.000%, 11/1/26 | | | 2,162,337 | |
| | 880,000 | | | Johnston County, NC, Water Utility Improvements Revenue Bonds, Callable 4/1/33 @ 100, 5.000%, 4/1/39 | | | 936,126 | |
| | 430,000 | | | Johnston County, NC, Water Utility Improvements Revenue Bonds, Callable 4/1/33 @ 100, 5.000%, 4/1/40 | | | 455,585 | |
| | 3,640,000 | | | Mecklenburg County, Recreational Facility Improvements, Public Improvements G.O., 5.000%, 3/1/24 | | | 3,655,179 | |
| | 1,195,000 | | | Monroe, NC, Advance Refunding Revenue Bonds, Callable 3/1/26 @ 100, 5.000%, 3/1/29 | | | 1,226,906 | |
| | 1,000,000 | | | North Carolina Agricultural & Technical State University, Series A, Refunding Revenue, Callable 10/1/25 @ 100, 5.000%, 10/1/32 | | | 1,010,890 | |
| | 1,215,000 | | | North Carolina Agricultural & Technical State University, Series A, Refunding Revenue, Callable 10/1/25 @ 100, 5.000%, 10/1/34 | | | 1,226,846 | |
| | 840,000 | | | North Carolina Capital Facilities Finance Agency, Meredith College Project, Refunding Revenue, 5.000%, 6/1/24 | | | 843,830 | |
| | 750,000 | | | North Carolina Capital Facilities Finance Agency, Meredith College Project, Refunding Revenue, 5.000%, 6/1/25 | | | 757,710 | |
| | 1,045,000 | | | North Carolina Capital Facilities Finance Agency, The Arc of North Carolina Project, Refunding Revenue (Housing and Urban Development, Section 8), 5.000%, 10/1/25 | | | 1,040,695 | |
See accompanying Notes to the Financial Statements.
| Sterling Capital North Carolina Intermediate Tax-Free Fund |
Schedule of Portfolio Investments — (continued)
September 30, 2023
Principal Amount | | | | Fair Value | |
| MUNICIPAL BONDS — (continued) | | | |
| | | | | |
| | | | | North Carolina — (continued) | | | | |
| $ | 1,750,000 | | | North Carolina Capital Facilities Finance Agency, The Arc of North Carolina Project, Refunding Revenue, Callable 10/1/27 @ 100 (Housing and Urban Development, Section 8), 5.000%, 10/1/34 | | $ | 1,668,782 | |
| | 1,205,000 | | | North Carolina Central University, University & College Improvements, Revenue Bonds, Callable 4/1/29 @ 100, 5.000%, 4/1/33 | | | 1,252,622 | |
| | 1,000,000 | | | North Carolina Central University, University & College Improvements, Revenue Bonds, Callable 4/1/29 @ 100, 5.000%, 4/1/37 | | | 1,018,090 | |
| | 2,000,000 | | | North Carolina Medical Care Commission, Advance Refunding Revenue Bonds, Vidant Health, Callable
6/1/25 @ 100, 5.000%, 6/1/40 | | | 1,960,360 | |
| | 1,500,000 | | | North Carolina Medical Care Commission, Health, Hospital and Nursinghome Improvements, Revenue Bonds, Series A, Callable 1/1/30 @ 100, 5.000%, 7/1/32 | | | 1,568,955 | |
| | 1,000,000 | | | North Carolina Municipal Power Agency No. 1, Advance Refunding Revenue Bonds, Series A, Callable 7/1/26 @ 100, 5.000%, 1/1/29 | | | 1,022,370 | |
| | 3,100,000 | | | North Carolina State, Advance Refunding Revenue Bonds, Series B, Callable 5/1/27 @ 100, 5.000%, 5/1/28 | | | 3,247,808 | |
| | 4,385,000 | | | North Carolina State, Advance Refunding Revenue Bonds, Series B, Callable 5/1/27 @ 100, 5.000%, 5/1/30(a) | | | 4,576,361 | |
| | 2,500,000 | | | North Carolina State, Build North Carolina Bonds, Highway Improvements Revenue Bonds, Series A, Callable 5/1/29 @ 100, 5.000%, 5/1/31 | | | 2,680,800 | |
| | 5,000,000 | | | North Carolina State, Highway Improvements Revenue Bonds, Series N, Callable 3/1/31 @ 100, 4.000%, 3/1/34 | | | 5,029,550 | |
| | 1,250,000 | | | North Carolina Turnpike Authority, Senior Lien, Advance Refunding Revenue (AGM), 5.000%, 1/1/26 | | | 1,273,387 | |
| | 1,500,000 | | | North Carolina Turnpike Authority, Senior Lien, Advance Refunding Revenue (AGM), 5.000%, 1/1/27 | | | 1,544,985 | |
| | 2,100,000 | | | North Carolina Turnpike Authority, Senior Lien, Advance Refunding Revenue, Callable 1/1/27 @ 100 (AGM), 5.000%, 1/1/28 | | | 2,168,565 | |
| | 1,060,000 | | | Pitt County, NC, Advance Refunding Revenue Bonds, Series B, Callable 10/1/26 @ 100, 5.000%, 4/1/30 | | | 1,094,598 | |
Principal Amount | | | | | Fair Value | |
| MUNICIPAL BONDS — (continued) | | | | |
| | | | | |
| | | | | North Carolina — (continued) | | | | |
| $ | 2,000,000 | | | Raleigh, NC, Refunding Notes G.O., Series A, Callable
4/1/33 @ 100, 5.000%, 4/1/35 | | $ | 2,226,460 | |
| | 1,025,000 | | | Raleigh, NC, Refunding Notes G.O., Series A, Callable
4/1/33 @ 100, 5.000%, 4/1/36 | | | 1,130,893 | |
| | 2,200,000 | | | Raleigh, NC, Refunding Notes G.O., Series A, Callable
4/1/33 @ 100, 5.000%, 4/1/40 | | | 2,355,782 | |
| | 3,000,000 | | | Raleigh, NC, Combined Enterprise System Revenue, Current Refunding Revenue Bonds, Callable 9/1/33 @ 100, 5.000%, 9/1/48 | | | 3,140,070 | |
| | 1,985,000 | | | Sampson County, NC, Refunding Revenue, Callable
12/1/25 @ 100, 5.000%, 12/1/26(a) | | | 2,026,288 | |
| | 1,025,000 | | | Surry County, NC, School Improvements, Revenue Bonds, Callable 6/1/29 @ 100, 4.000%, 6/1/35 | | | 1,011,962 | |
| | 720,000 | | | Surry County, NC, School Improvements, Revenue Bonds, Callable 6/1/29 @ 100, 5.000%, 6/1/30 | | | 769,802 | |
| | 1,195,000 | | | Town of Fuquay-Varina NC, Multi-Utility Improvements G.O., 5.000%, 8/1/31 | | | 1,322,017 | |
| | 1,425,000 | | | Town of Fuquay-Varina NC, Multi-Utility Improvements G.O., Callable 8/1/33 @ 100, 5.000%, 8/1/37 | | | 1,553,806 | |
| | 1,080,000 | | | Town of Garner NC, Public Improvements G.O., 5.000%, 2/1/31 | | | 1,190,624 | |
| | 1,080,000 | | | Town of Garner NC, Public Improvements G.O., Callable 2/1/33 @ 100, 5.000%, 2/1/34 | | | 1,208,444 | |
| | 1,010,000 | | | Town of Holly Springs, NC, Public Improvements Revenue, Callable 10/1/24 @ 100, 5.000%, 10/1/27 | | | 1,021,908 | |
| | 870,000 | | | Town of Oak Island, NC, Combined Enterprise System, Advance Refunding Revenue (AGM), 5.000%, 6/1/25 | | | 884,668 | |
| | 1,030,000 | | | Union County, NC, Public Improvements Bonds G.O., Callable 3/1/32 @ 100, 5.000%, 3/1/34 | | | 1,141,147 | |
| | 1,720,000 | | | Union County, School Improvements G.O., Callable 9/1/33 @ 100, 5.000%, 9/1/42 | | | 1,828,601 | |
| | 1,500,000 | | | University of North Carolina at Chapel Hill, Current Refunding Revenue Bonds, Series B, Callable 12/1/31 @ 100, 5.000%, 12/1/36 | | | 1,627,125 | |
| | 1,695,000 | | | University of North Carolina at Greensboro, University & College Improvements Revenue, Callable 4/1/24 @ 100, 5.000%, 4/1/28 | | | 1,701,441 | |
Continued
| Sterling Capital North Carolina Intermediate Tax-Free Fund |
Schedule of Portfolio Investments — (continued)
September 30, 2023
Principal Amount | | | | | Fair Value | |
| MUNICIPAL BONDS — (continued) | | | |
| | | | | |
| | | | | North Carolina — (continued) | | | | |
| $ | 1,000,000 | | | University of North Carolina at Wilmington, Current Refunding Revenue Bonds, Series B, Callable 10/1/29 @ 100, 5.000%, 10/1/34 | | $ | 1,063,480 | |
| | 410,000 | | | University of North Carolina System, Asheville/Wilmington, Refunding Revenue, Series C, Callable 10/30/23 @ 100 (Assured Guaranty), 5.250%, 10/1/24 | | | 410,242 | |
| | 1,985,000 | | | Wake County, NC, Advance Refunding Revenue Bonds, Series A, Callable 12/1/26 @ 100, 5.000%, 12/1/28 | | | 2,062,653 | |
| | 1,585,000 | | | Wake County, NC, Public Improvements, G.O., Series A, Callable 3/1/28 @ 100, 5.000%, 3/1/30 | | | 1,682,335 | |
| | 1,725,000 | | | Wake County, NC, Refunding Revenue Bonds, Series A, Callable 8/1/28 @ 100, 5.000%, 8/1/32 | | | 1,831,812 | |
| | 325,000 | | | Watauga Public Facilities Corp., School Improvements Revenue Bonds, Callable 6/1/32 @ 100, 5.000%,
6/1/35 | | | 353,334 | |
| | 400,000 | | | Watauga Public Facilities Corp., School Improvements Revenue Bonds, Callable 6/1/32 @ 100, 5.000%,
6/1/36 | | | 431,048 | |
| | 375,000 | | | Watauga Public Facilities Corp., School Improvements Revenue Bonds, Callable 6/1/32 @ 100, 5.000%,
6/1/37 | | | 400,189 | |
| | 375,000 | | | Watauga Public Facilities Corp., School Improvements Revenue Bonds, Callable 6/1/32 @ 100, 5.000%,
6/1/38 | | | 396,503 | |
| | 350,000 | | | Watauga Public Facilities Corp., School Improvements Revenue Bonds, Callable 6/1/32 @ 100, 5.250%,
6/1/40 | | | 375,057 | |
| | 650,000 | | | Watauga Public Facilities Corp., School Improvements Revenue Bonds, Callable 6/1/32 @ 100, 5.250%,
6/1/42 | | | 691,145 | |
| | 2,060,000 | | | Wilmington, NC, Public Improvements G.O., Series A, 5.000%, 5/1/31 | | | 2,277,289 | |
| | 1,000,000 | | | Winston-Salem, NC, Transit Improvements, Refunding Revenue, Series C, Callable 6/1/24 @ 100, 5.000%,
6/1/30 | | | 1,007,490 | |
| | 1,875,000 | | | Winston-Salem, NC, Water & Sewer System, Refunding Revenue, Series A, Callable 6/1/24 @ 100, 5.000%,
6/1/25(a) | | | 1,891,069 | |
| | 1,365,000 | | | Winston-Salem, NC, Public Improvements G.O., Series B, Callable 6/1/33 @ 100, 5.000%, 6/1/35 | | | 1,519,928 | |
| | | | | | | | | |
| | | | | Total Municipal Bonds | | | | |
| | | | | (Cost $134,924,381) | | | 129,855,192 | |
| Shares | | | | | Fair Value | |
| | | | | | | |
| MONEY MARKET FUND — 2.2% | | | |
| 2,996,657 | | | Federated Treasury Obligations Fund, Institutional Shares, 5.21%(b) | | $ | 2,996,657 | |
| | | | | | | | |
| | | | Total Money Market Fund | | | | |
| | | | (Cost $2,996,657) | | | 2,996,657 | |
| | | | | | | | |
| Total Investments — 99.0% | | | | |
| (Cost $137,921,038) | | | 132,851,849 | |
| Net Other Assets (Liabilities) — 1.0% | | | 1,385,084 | |
| NET ASSETS — 100.0% | | $ | 134,236,933 | |
| (a) | All or a portion of the securities are held in a separate collateral account at US Bank. |
| (b) | Represents the current yield as of report date. |
| AGM | Assured Guaranty Municipal Corp. |
Continued
| Sterling Capital South Carolina Intermediate Tax-Free Fund |
Schedule of Portfolio Investments
September 30, 2023
| Principal Amount | | | | | Fair Value | |
| MUNICIPAL BONDS — 97.8% | | | | |
| | | | | |
| | | | | South Carolina — 97.8% | | | | |
| $ | 1,000,000 | | | Aiken County, SC, Consolidated School District, School Improvements G.O., Series A, Callable 4/1/29 @ 100 (SCSDE), 4.000%, 4/1/34 | | $ | 994,950 | |
| | 1,000,000 | | | Aiken County, SC, Consolidated School District, Special Obligation Bonds, School Improvements Revenue, Callable 6/1/29 @ 100, 4.000%, 6/1/31 | | | 1,005,570 | |
| | 750,000 | | | Aiken County, SC, Consolidated School District, Special Obligation Bonds, School Improvements Revenue, Callable 6/1/29 @ 100, 4.000%, 6/1/33 | | | 744,465 | |
| | 1,000,000 | | | Beaufort-Jasper Water & Sewer Authority, Advance Refunding Revenue, Series B, 5.000%, 3/1/25 | | | 1,017,040 | |
| | 1,000,000 | | | Charleston Public Facilities Corp., Charleston City Project Series, Parking Facilities Improvement Revenue, Callable 9/1/27 @ 100, 5.000%, 9/1/29 | | | 1,049,010 | |
| | 1,000,000 | | | Charleston, SC, Waterworks & Sewer System Revenue, Water Utility Improvements Revenue Bonds, Callable
1/1/30 @ 100, 5.000%, 1/1/38 | | | 1,055,700 | |
| | 750,000 | | | Charleston, SC, Waterworks & Sewer System Revenue, Water Utility Improvements Revenue Bonds, Callable
7/1/32 @ 100, 5.000%, 1/1/52(a) | | | 775,883 | |
| | 1,000,000 | | | College of Charleston, University & College Improvements Revenue, Series B, 5.000%, 4/1/27 | | | 1,040,180 | |
| | 1,000,000 | | | Columbia, SC, Waterworks & Sewer System Revenue, Water & Sewer Utility Improvements Revenue, Callable 2/1/28 @ 100, 5.000%, 2/1/48 | | | 1,061,700 | |
| | 1,000,000 | | | Columbia, SC, Waterworks & Sewer System Revenue, Water & Sewer Utility Improvements Revenue, Callable 2/1/33 @ 100, 5.250%, 2/1/52 | | | 1,052,120 | |
| | 780,000 | | | Dorchester County, School District No. 4, School Improvements G.O., Series A, Callable 9/1/33 @ 100 (SCSDE), 5.000%, 3/1/43 | | | 815,942 | |
| | 1,100,000 | | | Florence County, SC, McLeod Regional Medical Center Project, Refunding Revenue, Callable 11/1/24 @ 100, 5.000%, 11/1/33(a) | | | 1,103,993 | |
| | 830,000 | | | Florence, SC, Combined Waterworks & Sewerage System Revenue, Water Utility Improvements Revenue Bonds, Callable 9/1/33 @ 100, 5.000%, 9/1/37 | | | 895,537 | |
| | 1,000,000 | | | Greenville Health System, Hospital System Board, Series B, Callable 5/1/24 @ 100, 5.000%, 5/1/31 | | | 987,660 | |
| Principal Amount | | | | | Fair Value | |
| MUNICIPAL BONDS — (continued) | | | | |
| | | | | |
| | | | | South Carolina — (continued) | | | | |
| $ | 1,000,000 | | | Lancaster County, SC, School District, School Improvements G.O., Series A, Callable 3/1/27 @ 100 (SCSDE), 4.000%, 3/1/30 | | $ | 1,002,020 | |
| | 1,000,000 | | | Lancaster Educational Assistance Program, Inc., SC, Lancaster County School District Refunding Revenue, Callable 12/1/23 @ 100, 5.000%, 12/1/24 | | | 1,001,610 | |
| | 600,000 | | | Lexington County, SC, School District No. 1, School Improvements G.O., Series B, Callable 2/1/29 @ 100 (SCSDE), 5.000%, 2/1/31 | | | 641,928 | |
| | 1,000,000 | | | Lexington County, School District No. 2, G.O., Series C, Callable 3/1/27 @ 100 (SCSDE), 5.000%, 3/1/30 | | | 1,041,750 | |
| | 1,085,000 | | | Lugoff-Elgin Water Authority, Refunding Revenue, Series B, Callable 7/1/26 @ 100, 5.000%, 7/1/30(a) | | | 1,117,528 | |
| | 1,000,000 | | | Orangeburg County, SC, Correctional Facilities Improvements, Installment Purchase Revenue Bonds, Callable 12/1/27 @ 100, 5.000%, 12/1/29 | | | 1,025,030 | |
| | 1,160,000 | | | Richland County, SC, Public Facilities G.O., 5.000%,
3/1/30 | | | 1,264,307 | |
| | 1,000,000 | | | Richland County, SC, School District No. 2, Refunding Bonds, G.O., Series B, Callable 3/1/27 @ 100 (SCSDE), 4.000%, 3/1/29 | | | 1,008,600 | |
| | 805,000 | | | Richland County, SC, School District No. 2, School Improvements G.O., Series A, Callable 3/1/32 @ 100 (SCSDE), 5.000%, 3/1/36 | | | 872,274 | |
| | 1,000,000 | | | SCAGO Educational Facilities Corp. for Cherokee School District No. 1, Refunding Revenue, 5.000%, 12/1/24 | | | 1,010,890 | |
| | 625,000 | | | SCAGO Educational Facilities Corp. for Spartanburg School District No. 1, Refunding Revenue, Series B, 5.000%, 6/1/25 | | | 633,025 | |
| | 600,000 | | | SCAGO Educational Facilities Corp. for Sumter County School 17, Refunding Revenue, 5.000%, 12/1/24 | | | 605,856 | |
| | 490,000 | | | SCAGO Educational Facilities Corp. for Sumter County School 17, Refunding Revenue, 5.000%, 12/1/25 | | | 499,060 | |
| | 850,000 | | | South Carolina Jobs-Economic | | | | |
| | | | | Development Authority, AnMed Health Project, Advance Refunding Revenue Bonds, Callable 2/1/26 @ 100, 5.000%, 2/1/29 | | | 863,413 | |
See accompanying Notes to the Financial Statements.
| Sterling Capital South Carolina Intermediate Tax-Free Fund |
Schedule of Portfolio Investments — (continued)
September 30, 2023
| Principal Amount | | | | | Fair Value | |
| MUNICIPAL BONDS — (continued) | | | | |
| | | | | |
| | | | | South Carolina — (continued) | | | | |
| $ | 1,000,000 | | | South Carolina Jobs-Economic Development Authority, Wofford College Project, University & College Improvements Revenue, Callable 4/1/29 @ 100, 5.000%, 4/1/44 | | $ | 994,010 | |
| | 1,000,000 | | | South Carolina Transportation Infrastructure Bank, Advance Refunding Revenue, Series A, Callable 10/1/27 @ 100 (AGM-CR), 5.000%, 10/1/38 | | | 1,020,930 | |
| | 1,000,000 | | | Spartanburg, SC, Water System Revenue, Water Utility Improvements Refunding Revenue, Series B, Callable
6/1/27 @ 100, 5.000%, 6/1/39 | | | 1,017,340 | |
| | 1,000,000 | | | Spartanburg County School District No 5, School Improvements G.O., Callable 3/1/32 @ 100 (SCSDE), 5.000%, 3/1/37 | | | 1,073,240 | |
| | 1,000,000 | | | Spartanburg County School District No. 4, SC, School Improvements G.O., Series A, Callable 3/1/32 @ 100 (SCSDE), 5.000%, 3/1/40 | | | 1,053,810 | |
| | 750,000 | | | State of South Carolina, University & College Improvements G.O., Series A, Callable 4/1/32 @ 100, 5.000%, 4/1/39 | | | 803,048 | |
| Principal Amount | | | | | Fair Value | |
| MUNICIPAL BONDS — (continued) | | | |
| | | | |
| | | | South Carolina — (continued) | | | | |
| $ | 1,195,000 | | | State of South Carolina, University & College Improvements, G.O., Series B, Callable 10/1/27 @ 100 (State Aid Withholding), 5.000%, 4/1/30 | | $ | 1,252,850 | |
| 1,150,000 | | | Town of Mount Pleasant, SC, Public Facilities, G.O., Callable 6/1/28 @ 100, 5.000%, 6/1/30 | | | 1,219,172 | |
| | | | | | | | |
| | | | Total Municipal Bonds | | | | |
| | | | (Cost $36,085,468) | | | 34,621,441 | |
| | | | | | | | |
| Shares | | | | | | | |
| MONEY MARKET FUND — 1.2% | | | |
| 417,030 | | | Federated Treasury Obligations Fund, Institutional Shares, 5.21%(b) | | | 417,030 | |
| | | | | | | | |
| | | | Total Money Market Fund | | | | |
| | | | (Cost $417,030) | | | 417,030 | |
| | | | | | | | |
| Total Investments — 99.0% | | | | |
| (Cost $36,502,498) | | | 35,038,471 | |
| Net Other Assets (Liabilities) — 1.0% | | | 348,514 | |
| NET ASSETS — 100.0% | | $ | 35,386,985 | |
| (a) | All or a portion of the securities are held in a separate collateral account at US Bank. |
| (b) | Represents the current yield as of report date. |
| AGM | Assured Guaranty Municipal Corp. |
| SCAGO | South Carolina Association of Governmental Organizations |
| SCSDE | South Carolina School District Enhancement |
Continued
| Sterling Capital Virginia Intermediate Tax-Free Fund |
Schedule of Portfolio Investments
September 30, 2023
| Principal Amount | | | | | Fair Value | |
| MUNICIPAL BONDS — 98.7% | | | | |
| | | | | |
| | | | | Virginia — 98.7% | | | | |
| $ | 1,240,000 | | | Albemarle County, VA, Economic Development Authority, Public Improvements Revenue, 5.000%, 6/1/27 | | $ | 1,302,397 | |
| | 1,365,000 | | | Albemarle County, VA, School Improvements G.O., (State Aid Withholding), 5.000%, 6/1/26 | | | 1,413,362 | |
| | 1,475,000 | | | Arlington County, VA, Public Improvements G.O., Callable 8/15/27 @ 100, 5.000%, 8/15/30 | | | 1,551,818 | |
| | 1,500,000 | | | Arlington County, VA, Public Improvements G.O., Series A, Callable 8/15/27 @ 100, 5.000%, 8/15/29(a) | | | 1,582,155 | |
| | 1,580,000 | | | Arlington County, VA, School Improvements G.O., Callable 6/15/31 @ 100, 5.000%, 6/15/39 | | | 1,682,337 | |
| | 1,030,000 | | | Charlottesville, VA, Public Improvements G.O., Callable
6/15/31 @ 100 (State Aid Withholding), 5.000%,
6/15/33 | | | 1,137,408 | |
| | 1,770,000 | | | Chesapeake, VA, Public Improvements, Refunding G.O., Series A, Callable 8/1/27 @ 100, 5.000%, 8/1/30 | | | 1,866,536 | |
| | 1,085,000 | | | Chesapeake Bay Bridge & Tunnel District, First Tier General Resolution, Highway Improvements, Revenue Bonds, Callable 7/1/26 @ 100 (AGM), 5.000%, 7/1/41 | | | 1,098,432 | |
| | 1,000,000 | | | Chesterfield County, School Improvements G.O., Callable 1/1/33 @ 100 (State Aid Withholding), 5.000%, 1/1/39 | | | 1,076,830 | |
| | 1,000,000 | | | Chesterfield County, School Improvements G.O., Callable 1/1/33 @ 100 (State Aid Withholding), 5.000%, 1/1/40 | | | 1,073,160 | |
| | 1,000,000 | | | Chesterfield County, VA, School District, School Public Improvement, G.O., Series A, Callable 1/1/28 @ 100 (State Aid Withholding), 4.000%, 1/1/31 | | | 1,018,120 | |
| | 1,145,000 | | | Culpeper County, VA, Economic Development Authority, VA Capital Projects, Refunding Revenue, Callable
6/1/24 @ 100, 4.000%, 6/1/26 | | | 1,143,512 | |
| | 1,145,000 | | | Fairfax County, VA, School Improvements G.O., Current Refunding, Series A, Callable 4/1/30 @ 100 (State Aid Withholding), 5.000%, 10/1/30(a) | | | 1,246,974 | |
| | 1,000,000 | | | Fredericksburg Economic Development Authority, Mary Washington Healthcare Obligation Group, Refunding Revenue, Callable 6/15/24 @ 100, 5.000%, 6/15/26 | | | 1,002,140 | |
| | 1,545,000 | | | Harrisonburg, VA, School Improvements G.O., Current Refunding, Series A (State Aid Withholding), 5.000%, 7/15/30 | | | 1,686,074 | |
| | 1,000,000 | | | Leesburg, VA, Refunding G.O., Callable 1/15/25 @ 100 (State Aid Withholding), 5.000%, 1/15/27 | | | 1,013,250 | |
| Principal Amount | | | | | Fair Value | |
| MUNICIPAL BONDS — (continued) | | | | |
| | | | | |
| | | | | Virginia — (continued) | | | | |
| $ | 1,000,000 | | | Loudoun County, VA, Economic Development Authority, Public Improvements Revenue, Callable 12/1/24 @ 100, 5.000%, 12/1/27 | | $ | 1,011,360 | |
| | 2,000,000 | | | Loudoun County, VA, Miscellaneous Purposes Revenue G.O., Series A (State Aid Withholding), 5.000%,
12/1/29 | | | 2,173,600 | |
| | 1,250,000 | | | Loudoun County, VA, Public Improvements, Advance Refunding G.O., Series A, Callable 12/1/25 @ 100, 5.000%, 12/1/26 | | | 1,285,450 | |
| | 1,320,000 | | | Loudoun County Economic Development Authority, Loudoun County Public Improvements Projects, Revenue Bonds, Series A, Callable 12/1/31 @ 100, 5.000%, 12/1/36 | | | 1,428,016 | |
| | 1,810,000 | | | Manassas, VA, Public Improvements, Public Facilities G.O., Callable 7/1/29 @ 100 (State Aid Withholding), 4.000%, 7/1/33 | | | 1,842,652 | |
| | 1,500,000 | | | Newport News, VA, Public Improvements, G.O., Series A (State Aid Withholding), 5.000%, 2/1/29 | | | 1,613,895 | |
| | 600,000 | | | Norfolk, Public Improvements G.O., Series A, Callable
9/1/32 @ 100 (State Aid Withholding), 5.000%, 9/1/36 | | | 655,494 | |
| | 1,025,000 | | | Norfolk, VA, Public Improvements G.O., Series A, Callable 3/1/31 @ 100, 5.000%, 3/1/34 | | | 1,122,580 | |
| | 1,465,000 | | | Norfolk, VA, Public Improvements, G.O., Callable 8/1/28 @ 100 (State Aid Withholding), 5.000%, 8/1/47 | | | 1,566,905 | |
| | 1,375,000 | | | Rappahannock Regional Jail Authority, Refunding Revenue, Callable 10/1/25 @ 100, 5.000%, 10/1/26 | | | 1,399,172 | |
| | 2,000,000 | | | Richmond, VA, Public Improvements, Refunding G.O., Series A, Callable 3/1/24 @ 100 (State Aid Withholding), 5.000%, 3/1/28(a) | | | 2,008,920 | |
| | 1,295,000 | | | Richmond, VA, Public Utility Advance Refunding Revenue Bonds, Callable 1/15/26 @ 100, 5.000%, 1/15/27 | | | 1,326,637 | |
| | 1,265,000 | | | Roanoke, VA, School Improvements G.O., Callable 4/1/32 @ 100 (State Aid Withholding), 5.000%, 4/1/34(a) | | | 1,392,689 | |
| | 1,380,000 | | | Salem, VA, School Improvements G.O., Current Refunding, 5.000%, 5/1/28 | | | 1,466,968 | |
| | 1,000,000 | | | Spotsylvania County, School Improvements G.O., Callable 7/15/32 @ 100, 5.000%, 1/15/37 | | | 1,085,770 | |
| | 1,000,000 | | | Spotsylvania County, School Improvements G.O., Callable 7/15/32 @ 100, 5.000%, 1/15/38 | | | 1,078,320 | |
See accompanying Notes to the Financial Statements.
| Sterling Capital Virginia Intermediate Tax-Free Fund |
Schedule of Portfolio Investments — (continued)
September 30, 2023
| Principal Amount | | | | | Fair Value | |
| MUNICIPAL BONDS — (continued) | | | | |
| | | | | |
| | | | | Virginia — (continued) | | | | |
| $ | 1,295,000 | | | Virginia Beach, VA, Storm Water Utility Revenue, Public Improvements Revenue Bonds, Series A, Callable
11/15/30 @ 100, 5.000%, 11/15/31 | | $ | 1,417,170 | |
| | 1,950,000 | | | Virginia College Building Authority, 21st Century College Programs, University & College Improvements Revenue, Callable 2/1/27 @ 100, 5.000%, 2/1/31 | | | 2,009,397 | |
| | 1,630,000 | | | Virginia College Building Authority, University & College Improvements Revenue Bonds, Callable 2/1/32 @ 100, 5.250%, 2/1/41 | | | 1,731,533 | |
| | 1,000,000 | | | Virginia College Building Authority, University & College Improvements, Revenue Bonds, Series C (State Intercept), 5.000%, 9/1/29 | | | 1,073,190 | |
| | 1,215,000 | | | Virginia Commonwealth Transportation Board, Federal Highway Transportation Grant, Callable 9/15/26 @ 100, 5.000%, 9/15/30 | | | 1,253,722 | |
| | 2,000,000 | | | Virginia Commonwealth Transportation Board, Federal Transportation Grant, Anticipation Advance Refunding Revenue, Callable 9/15/27 @ 100, 5.000%, 9/15/31 | | | 2,091,040 | |
| | 1,500,000 | | | Virginia Port Authority Commonwealth Port Fund, Airport & Marina Improvements Revenue Bonds, Series A, Callable 7/1/33 @ 100, 5.000%, 7/1/41 | | | 1,598,445 | |
| | 1,515,000 | | | Virginia Public School Authority, Advance Refunding Revenue, Callable 8/1/25 @ 100 (State Intercept), 5.000%, 8/1/26 | | | 1,549,224 | |
| | 2,000,000 | | | Virginia Public School Authority, School Improvements Revenue Bonds (State Aid Withholding), 5.000%,
1/15/30 | | | 2,177,820 | |
| | 1,035,000 | | | Virginia Public School Authority, School Improvements Revenue Bonds (State Aid Withholding), 5.000%,
8/15/30 | | | 1,131,855 | |
| | 2,000,000 | | | Virginia Public School Authority, School Improvements Revenue Bonds, Series A, Callable 8/1/33 @ 100 (State Aid Withholding), 5.000%, 8/1/40 | | | 2,137,200 | |
| | | | | | | | | |
| | | | | Total Municipal Bonds | | | | |
| | | | | (Cost $63,972,932) | | | 61,523,529 | |
| Shares | | | | | Fair Value | |
| MONEY MARKET FUND — 0.8% | | | |
| | | | | | | |
| | 467,448 | | | Federated Treasury Obligations Fund, Institutional Shares, 5.21%(b) | | $ | 467,448 | |
| | | | | | | | |
| | | | Total Money Market Fund | | | | |
| | | | (Cost $467,448) | | | 467,448 | |
| | | | | | | | |
| Total Investments — 99.5% | | | | |
| (Cost $64,440,380) | | | 61,990,977 | |
| Net Other Assets (Liabilities) — 0.5% | | | 281,784 | |
| NET ASSETS — 100.0% | | $ | 62,272,761 | |
| (a) | All or a portion of the securities are held in a separate collateral account at US Bank. |
| (b) | Represents the current yield as of report date. |
| AGM | Assured Guaranty Municipal Corp. |
Continued
| Sterling Capital West Virginia Intermediate Tax-Free Fund |
Schedule of Portfolio Investments
September 30, 2023
| Principal Amount | | | | | Fair Value | |
| MUNICIPAL BONDS — 96.8% | | | | |
| | | | | |
| | | | | West Virginia — 96.8% | | | | |
| $ | 2,000,000 | | | Berkeley County, Board of Education, School Improvements G.O. (West Virginia Board Commission), 4.000%, 6/1/28 | | $ | 2,020,020 | |
| | 1,750,000 | | | Berkeley County, Board of Education, School Improvements G.O., Callable 6/1/33 @ 100 (West Virginia Board Commission), 4.000%, 6/1/36 | | | 1,718,097 | |
| | 1,500,000 | | | Berkeley County, WV, Public Service Sewer District, Miscellaneous Purposes Revenue, Series C, Callable
10/30/23 @ 100 (BAM), 4.500%, 10/1/32 | | | 1,500,390 | |
| | 1,080,000 | | | Braxton County, WV, Board of Education, Public School, Advance Refunding G.O., Callable 5/1/26 @ 100 (West Virginia Board Commission), 5.000%, 5/1/28(a) | | | 1,107,378 | |
| | 1,000,000 | | | Cabell County Board of Education, School Improvements G.O., (AGM West Virginia Board Commission), 3.000%, 6/1/29 | | | 951,250 | |
| | 530,000 | | | Fairmont, WV, Water Revenue, Current Refunding Revenue, Series A (BAM), 3.000%, 7/1/24 | | | 523,264 | |
| | 1,000,000 | | | Jefferson County, WV, Board of Education, School Improvements G.O., (West Virginia Board Commission), 3.000%, 6/1/29 | | | 948,530 | |
| | 1,760,000 | | | Marshall University, WV, University & College Improvements Revenue Bonds, Series A (AGM), 5.000%, 5/1/30 | | | 1,879,134 | |
| | 2,000,000 | | | Monongalia County, WV, Building Commission, Monongalia Health System Group Refunding Revenue, Callable 7/1/25 @ 100, 5.000%, 7/1/26 | | | 1,968,860 | |
| | 705,000 | | | Morgantown Utility Board, WV, Combined Water Utility Improvements Revenue, Series B, Callable 6/1/28 @ 100, 5.000%, 12/1/34 | | | 735,801 | |
| | 575,000 | | | Morgantown Utility Board, WV, Refunding Revenue Green Bonds, Series A (BAM), 4.000%, 12/1/29 | | | 576,708 | |
| | 1,140,000 | | | Morgantown Utility Board, Inc., Water Utility Improvements Revenue Bonds, Series B, Callable 6/1/28 @ 100, 5.000%, 12/1/36 | | | 1,178,452 | |
| | 1,575,000 | | | Ohio County, WV, Board of Education, School Improvements G.O., (West Virginia Board Commission), 3.000%, 6/1/28 | | | 1,500,345 | |
| | 2,010,000 | | | Ohio County, WV, Board of Education, School Improvements G.O., (West Virginia Board Commission), 4.000%, 6/1/29 | | | 2,043,467 | |
| Principal Amount | | | | | Fair Value | |
| MUNICIPAL BONDS — (continued) | | | | |
| | | | | |
| | | | | West Virginia — (continued) | | | | |
| $ | 1,000,000 | | | Ohio County, WV, Country Commission, Fort Henry Centre Financing District, Public Improvement, Tax Allocation, Callable 10/30/23 @ 100, 4.750%, 6/1/31 | | $ | 956,720 | |
| | 695,000 | | | School Building Authority of West Virginia, Lottery Capital Improvements Revenue, Series A, Callable
7/1/24 @ 100, 5.000%, 7/1/27 | | | 700,991 | |
| | 1,265,000 | | | School Building Authority of West Virginia, Lottery Capital Improvements Revenue, Series A, Callable
7/1/24 @ 100, 5.000%, 7/1/28 | | | 1,275,816 | |
| | 1,375,000 | | | State Of West Virginia, Fuel Sales Tax Revenue, Group 1 Highway Improvements, G.O., Series S, Callable 6/1/29 @ 100, 5.000%, 12/1/35 | | | 1,454,338 | |
| | 2,030,000 | | | State of West Virginia, Fuel Sales Tax Revenue, Group 2 Highway Improvements, G.O., Series B, Callable 6/1/28 @ 100, 5.000%, 12/1/39 | | | 2,092,768 | |
| | 1,100,000 | | | State of West Virginia, Fuel Sales Tax Revenue, Group 2 Highway Improvements, G.O., Series S, Callable 6/1/29 @ 100, 5.000%, 12/1/43 | | | 1,129,480 | |
| | 2,090,000 | | | State of West Virginia, Highway Improvements G.O., Series A, Callable 6/1/31 @ 100, 5.000%, 6/1/38 | | | 2,198,304 | |
| | 1,640,000 | | | State of West Virginia, Highway Improvements G.O., Series A, Callable 6/1/31 @ 100, 5.000%, 12/1/42 | | | 1,701,352 | |
| | 2,505,000 | | | State of West Virginia, Highway Improvements G.O., Series A, Callable 6/1/31 @ 100, 5.000%, 6/1/45 | | | 2,579,398 | |
| | 1,000,000 | | | State of West Virginia, Highway Improvements, State Road Bonds G.O., Series A, Callable 6/1/29 @ 100, 5.000%, 12/1/41 | | | 1,029,560 | |
| | 2,000,000 | | | West Virginia Economic Development Authority, Correctional Juvenile Public Safety Facilities Lease, Refunding Revenue, Callable 10/30/23 @ 100, 5.000%, 6/1/25(a) | | | 2,001,380 | |
| | 1,685,000 | | | West Virginia Economic Development Authority, Correctional Juvenile Public Safety Facilities Lease, Refunding Revenue, Callable 10/30/23 @ 100, 5.000%, 6/1/26 | | | 1,686,196 | |
| | 1,145,000 | | | West Virginia Economic Development Authority, Lottery Recreational Facilities Improvements Revenue, Series A, Callable 7/1/27 @ 100, 5.000%, 7/1/28 | | | 1,197,521 | |
See accompanying Notes to the Financial Statements.
| Sterling Capital West Virginia Intermediate Tax-Free Fund |
Schedule of Portfolio Investments — (continued)
September 30, 2023
| Principal Amount | | | | | Fair Value | |
| MUNICIPAL BONDS — (continued) | | | | |
| | | | | |
| | | | | West Virginia — (continued) | | | | |
| $ | 1,825,000 | | | West Virginia Economic Development Authority, Lottery Recreational Facilities Improvements Revenue, Series A, Callable 7/1/28 @ 100, 5.000%, 7/1/35 | | $ | 1,919,480 | |
| | 1,500,000 | | | West Virginia Economic Development Authority, Provident Group - Marshall Prperties L.L.C., Current Refunding Revenue Bonds, Series A-1, Callable 7/1/33 @ 100 (AGM), 5.000%, 7/1/37 | | | 1,576,350 | |
| | 1,015,000 | | | West Virginia Economic Development Authority, State Office Building 3, Public Improvements Revenue, Series D, Callable 6/1/25 @ 100, 5.000%, 6/1/26 | | | 1,031,240 | |
| | 1,000,000 | | | West Virginia Higher Education Policy, Community & Technical College Capital, University & College Improvements Refunding Revenue, Callable 7/1/27 @ 100, 5.000%, 7/1/30 | | | 1,041,320 | |
| | 775,000 | | | West Virginia Hospital Finance Authority, Cabell Huntington Hospital Obligated Group, Refunding Revenue, Callable 1/1/29 @ 100, 5.000%, 1/1/31 | | | 770,404 | |
| | 2,170,000 | | | West Virginia Hospital Finance Authority, Cabell Huntington Hospital Obligated Group, Refunding Revenue, Callable 1/1/29 @ 100, 5.000%, 1/1/36 | | | 2,072,654 | |
| | 945,000 | | | West Virginia Hospital Finance Authority, Charleston Area Medical Center Inc., Health, Hospital, Nursing Home Improvements, Refunding Revenue, Callable 9/1/24 @ 100, 5.000%, 9/1/25 | | | 947,296 | |
| | 1,970,000 | | | West Virginia Hospital Finance Authority, Charleston Area Medical Center Inc., Health, Hospital, Nursing Home Improvements, Refunding Revenue, Callable 9/1/29 @ 100, 5.000%, 9/1/39 | | | 1,866,516 | |
| | 1,000,000 | | | West Virginia Hospital Finance Authority, Health Care Facilities Revenue Bonds, Series A, Callable 6/1/33 @ 100, 5.000%, 6/1/41 | | | 1,011,950 | |
| | 1,385,000 | | | West Virginia Hospital Finance Authority, United Health System Obligation, Health, Hospital, Nursing Home Improvements Refunding Revenue Bonds, 5.000%,
6/1/26 | | | 1,419,196 | |
| | 515,000 | | | West Virginia Hospital Finance Authority, Valley Health System Obligated Group, Refunding Revenue, 5.000%, 1/1/24 | | | 516,102 | |
| | 630,000 | | | West Virginia Hospital Finance Authority, Valley Health System Obligated Group, Refunding Revenue, Callable 1/1/24 @ 100, 5.000%, 1/1/26 | | | 631,058 | |
| Principal Amount | | | | | Fair Value | |
| MUNICIPAL BONDS — (continued) | | | | |
| | | | | |
| | | | | West Virginia — (continued) | | | | |
| $ | 1,070,000 | | | West Virginia Housing Development FundRevenue Bonds, Series A, 3.250%, 5/1/29 | | $ | 997,400 | |
| | 905,000 | | | West Virginia Housing Development FundRevenue Bonds, Series A, 3.300%, 11/1/29 | | | 836,700 | |
| | 2,980,000 | | | West Virginia Parkways Authority, Highway Improvements, Senior Lien Revenue Bonds, Callable
6/1/31 @ 100, 5.000%, 6/1/47 | | | 3,028,306 | |
| | 2,065,000 | | | West Virginia Parkways Authority, Senior Turnpike Toll Revenue, Highway Improvements, Callable 6/1/28 @ 100, 5.000%, 6/1/39(a) | | | 2,122,366 | |
| | 1,540,000 | | | West Virginia State School Building Authority, Lottery Revenue, School Improvements Revenue, Series A, Callable 7/1/28 @ 100, 5.000%, 7/1/29 | | | 1,626,871 | |
| | 1,050,000 | | | West Virginia State Water Development Authority, Loan Program II, Refunding Revenue, Series A-II, Callable 11/1/23 @ 100, 5.000%, 11/1/26(a) | | | 1,050,672 | |
| | 2,000,000 | | | West Virginia State Water Development Authority, Loan Program II, Refunding Revenue, Series A-II, Callable 11/1/23 @ 100, 5.000%, 11/1/27 | | | 2,001,180 | |
| | 2,160,000 | | | West Virginia University, University & College Improvements, University Projects Revenue Bonds, Series A, Callable 10/1/24 @ 100, 5.000%, 10/1/44 | | | 2,183,414 | |
| | 1,685,000 | | | West Virginia University, University Projects, University & College Improvements Revenue, Series A, Callable
10/1/31 @ 100, 5.000%, 10/1/43 | | | 1,733,006 | |
| | 3,445,000 | | | West Virginia University, University Projects, University & College Improvements Revenue, Series A, Callable
10/1/31 @ 100, 5.000%, 10/1/44 | | | 3,530,746 | |
| | 515,000 | | | West Virginia Water Development Authority, Chesapeake Bay/Greenbrier River, Water Utility Improvements Revenue, Callable 7/1/24 @ 100, 5.000%, 7/1/25 | | | 518,966 | |
| | 1,025,000 | | | West Virginia Water Development Authority, Loan Program II, Refunding Revenue, Series A-II, 5.000%, 11/1/25 | | | 1,048,421 | |
| | 740,000 | | | West Virginia Water Development Authority, West Virginia Infrastructure & Jobs, Current Refunding Revenue Bonds, Callable 10/1/26 @ 100, 5.000%, 10/1/30 | | | 758,922 | |
Continued
| Sterling Capital West Virginia Intermediate Tax-Free Fund |
Schedule of Portfolio Investments — (continued)
September 30, 2023
| Principal Amount | | | | | Fair Value | |
| MUNICIPAL BONDS — (continued) | | | | |
| | | | | |
| | | | | West Virginia — (continued) | | | | |
| $ | 1,100,000 | | | West Virginia Water Development Authority, West Virginia Infrastructure & Jobs, Current Refunding Revenue Bonds, Callable 10/1/26 @ 100, 5.000%,
10/1/3 | | $ | 1,127,500 | |
| | 1,255,000 | | | Wood County, WV, Board of Education, Public School Improvements, G.O., (West Virginia Board Commission), 4.000%, 6/1/25 | | | 1,257,987 | |
| | | | | | | | | |
| | | | | Total Municipal Bonds | | | | |
| | | | | (Cost $80,971,259) | | | 77,281,543 | |
| Shares | | | | | | |
| MONEY MARKET FUND — 1.9% | | | |
| | 1,476,871 | | | Federated Treasury Obligations Fund, Institutional Shares, 5.21%(b) | | | 1,476,871 | |
| | | | | | | | |
| | | | Total Money Market Fund | | | | |
| | | | (Cost $1,476,871) | | | 1,476,871 | |
| | | | | | | | |
| Total Investments — 98.7% | | | | |
| (Cost $82,448,130) | | | 78,758,414 | |
| Net Other Assets (Liabilities) — 1.3% | | | 1,032,217 | |
| NET ASSETS — 100.0% | | $ | 79,790,631 | |
| (a) | All or a portion of the securities are held in a separate collateral account at US Bank. |
| (b) | Represents the current yield as of report date. |
| AGM | Assured Guaranty Municipal Corp. |
Continued
Statement of Assets and Liabilities
September 30, 2023
| | | Sterling Capital
Behavioral Large Cap
Value Equity Fund | | | Sterling Capital
Mid
Value Fund | |
| Assets: | | | | | | | |
| Investments at fair value (a) | | $ | 30,525,876 | | | $ | 45,653,475 | |
| Foreign currency, at value (cost $—, $—, $—, $—, $—, $266,415 and $—, respectively) | | | — | | | | — | |
| Dividends receivable | | | 50,848 | | | | 14,396 | |
| Receivable for capital shares issued | | | 222 | | | | 4,681 | |
| Prepaid and other expenses | | | 20,644 | | | | 10,903 | |
| Total Assets | | | 30,597,590 | | | | 45,683,455 | |
| Liabilities: | | | | | | | | |
| Cash overdraft | | | 7,516 | | | | 1,882 | |
| Distributions payable | | | — | | | | — | |
| Payable for investments purchased | | | — | | | | 94,109 | |
| Payable for capital shares redeemed | | | 3,329 | | | | 1,743 | |
| Accrued expenses and other payables: | | | | | | | | |
| Investment advisory fees | | | 8,232 | | | | 21,833 | |
| Administration fees | | | 2,344 | | | | 3,662 | |
| Compliance service fees | | | 34 | | | | 34 | |
| Distribution (12b-1) fees | | | 6,223 | | | | 4,092 | |
| Accounting out-of-pocket fees | | | 1,332 | | | | 975 | |
| Audit fees | | | 2,393 | | | | 3,753 | |
| Custodian fees | | | 511 | | | | 789 | |
| Transfer agent fees | | | 2,208 | | | | 4,363 | |
| Other fees and liabilities | | | 663 | | | | 2,148 | |
| Total Liabilities | | | 34,785 | | | | 139,383 | |
| Net Assets | | $ | 30,562,805 | | | $ | 45,544,072 | |
| Net Assets Consist of: | | | | | | | | |
| Capital | | $ | 43,980,838 | | | $ | 34,474,231 | |
| Total distributable earnings | | | (13,418,033) | | | | 11,069,841 | |
| Net Assets | | $ | 30,562,805 | | | $ | 45,544,072 | |
| Net Assets | | | | | | | | |
| Class A Shares | | $ | 28,453,684 | | | $ | 17,911,037 | |
| Class C Shares | | | 279,680 | | | | 378,686 | |
| Institutional Shares | | | 1,499,459 | | | | 26,899,878 | |
| Class R6 Shares | | | 329,982 | | | | 354,471 | |
| Total | | $ | 30,562,805 | | | $ | 45,544,072 | |
| Shares of Beneficial Interest Outstanding (Unlimited number of shares authorized, no par value) | | | | | | | | |
| Class A Shares | | | 1,231,694 | | | | 1,237,381 | |
| Class C Shares | | | 12,606 | | | | 33,328 | |
| Institutional Shares | | | 64,416 | | | | 1,796,966 | |
| Class R6 Shares | | | 14,121 | | | | 23,623 | |
| Total | | | 1,322,837 | | | | 3,091,298 | |
| Net Asset Value | | | | | | | | |
| Class A Shares - redemption price per share | | $ | 23.10 | | | $ | 14.47 | |
| Class C Shares - offering price per share* | | $ | 22.19 | | | $ | 11.36 | |
| Institutional Shares | | $ | 23.28 | | | $ | 14.97 | |
| Class R6 Shares | | $ | 23.37 | | | $ | 15.01 | |
| Maximum Sales Charge - Class A Shares | | | 5.75 | % | | | 5.75 | % |
| Maximum Offering Price (100%/(100% - Maximum Sales Charge)) of net asset value adjusted to the nearest cent per share - Class A Shares | | $ | 24.51 | | | $ | 15.36 | |
| (a) Investments at cost | | $ | 27,717,336 | | | $ | 37,281,697 | |
| | | | | | | | | |
| * | Redemption price per share varies by length of time shares are held. |
See accompanying Notes to the Financial Statements.
Sterling Capital
Behavioral Small Cap
Value Equity Fund | | | Sterling Capital
Special
Opportunities Fund | | | Sterling Capital
Equity
Income Fund | | | Sterling Capital
Behavioral
International
Equity Fund | | | Sterling Capital
SMID
Opportunities Fund | |
| $ | 90,582,852 | | | $ | 466,379,438 | | | $ | 1,879,662,600 | | | $ | 115,192,493 | | | $ | 4,465,578 | |
| | — | | | | — | | | | — | | | | 265,459 | | | | — | |
| | 158,290 | | | | 124,508 | | | | 3,338,713 | | | | 954,353 | | | | 1,408 | |
| | 162 | | | | 132,925 | | | | 1,356,263 | | | | — | | | | — | |
| | 12,230 | | | | 24,760 | | | | 49,391 | | | | 4,399 | | | | 7,272 | |
| | 90,753,534 | | | | 466,661,631 | | | | 1,884,406,967 | | | | 116,416,704 | | | | 4,474,258 | |
| | | | | | | | | | | | | | | | | | | |
| | 6,744 | | | | 8,739 | | | | 37,743 | | | | 11,681 | | | | 30 | |
| | — | | | | — | | | | 2 | | | | — | | | | — | |
| | 410,769 | | | | 1,683,996 | | | | — | | | | — | | | | — | |
| | 325 | | | | 258,872 | | | | 1,654,588 | | | | — | | | | — | |
| | | | | | | | | | | | | | | | | | | |
| | 45,431 | | | | 256,990 | | | | 876,073 | | | | 38,849 | | | | 856 | |
| | 3,340 | | | | 35,204 | | | | 146,034 | | | | 4,659 | | | | 358 | |
| | 31 | | | | — | | | | 52 | | | | 51 | | | | 41 | |
| | 1,227 | | | | 76,940 | | | | 143,633 | | | | 96 | | | | 715 | |
| | 3,181 | | | | 5,832 | | | | 23,894 | | | | 11,007 | | | | 479 | |
| | 10,096 | | | | 38,236 | | | | 165,056 | | | | 8,801 | | | | 556 | |
| | 1,699 | | | | 7,832 | | | | 34,244 | | | | 17,717 | | | | 105 | |
| | 8,582 | | | | 48,650 | | | | 233,708 | | | | 6,423 | | | | 1,030 | |
| | 8,001 | | | | 18,539 | | | | 52,893 | | | | 1,221 | | | | 242 | |
| | 499,426 | | | | 2,439,830 | | | | 3,367,920 | | | | 100,505 | | | | 4,412 | |
| $ | 90,254,108 | | | $ | 464,221,801 | | | $ | 1,881,039,047 | | | $ | 116,316,199 | | | $ | 4,469,846 | |
| | �� | | | | | | | | | | | | | | | | | |
| $ | 81,656,153 | | | $ | 235,546,558 | | | $ | 1,164,705,096 | | | $ | 113,410,089 | | | $ | 3,200,869 | |
| | 8,597,955 | | | | 228,675,243 | | | | 716,333,951 | | | | 2,906,110 | | | | 1,268,977 | |
| $ | 90,254,108 | | | $ | 464,221,801 | | | $ | 1,881,039,047 | | | $ | 116,316,199 | | | $ | 4,469,846 | |
| | | | | | | | | | | | | | | | | | | |
| $ | 5,694,924 | | | $ | 269,412,536 | | | $ | 418,724,980 | | | $ | 369,022 | | | $ | 2,608,516 | |
| | 28,284 | | | | 22,619,047 | | | | 64,849,136 | | | | 23,320 | | | | 166,817 | |
| | 5,804,079 | | | | 135,284,200 | | | | 1,296,237,147 | | | | 679,099 | | | | 1,694,513 | |
| | 78,726,821 | | | | 36,906,018 | | | | 101,227,784 | | | | 115,244,758 | | | | – | |
| $ | 90,254,108 | | | $ | 464,221,801 | | | $ | 1,881,039,047 | | | $ | 116,316,199 | | | $ | 4,469,846 | |
| | | | | | | | | | | | | | | | | | | |
| | 335,326 | | | | 10,329,996 | | | | 16,578,170 | | | | 40,427 | | | | 215,346 | |
| | 1,757 | | | | 1,188,967 | | | | 2,594,053 | | | | 2,554 | | | | 14,599 | |
| | 338,495 | | | | 4,783,739 | | | | 51,136,414 | | | | 74,339 | | | | 137,361 | |
| | 4,585,507 | | | | 1,306,101 | | | | 3,990,895 | | | | 12,606,729 | | | | — | |
| | 5,261,085 | | | | 17,608,803 | | | | 74,299,532 | | | | 12,724,049 | | | | 367,306 | |
| | | | | | | | | | | | | | | | | | | |
| $ | 16.98 | | | $ | 26.08 | | | $ | 25.26 | | | $ | 9.13 | | | $ | 12.11 | |
| $ | 16.10 | | | $ | 19.02 | | | $ | 25.00 | | | $ | 9.13 | | | $ | 11.43 | |
| $ | 17.15 | | | $ | 28.28 | | | $ | 25.35 | | | $ | 9.14 | | | $ | 12.34 | |
| $ | 17.17 | | | $ | 28.26 | | | $ | 25.36 | | | $ | 9.14 | | | $ | — | |
| | 5.75 | % | | | 5.75 | % | | | 5.75 | % | | | 5.75 | % | | | 5.75 | % |
| | | | | | | | | | | | | | | | | | | |
| $ | 18.02 | | | $ | 27.67 | | | $ | 26.80 | | | $ | 9.68 | | | $ | 12.85 | |
| $ | 82,506,637 | | | $ | 305,291,535 | | | $ | 1,313,083,474 | | | $ | 104,474,652 | | | $ | 3,988,764 | |
Statement of Assets and Liabilities
September 30, 2023
| | | Sterling Capital
Mid Cap Relative
Value Fund | | | Sterling Capital
Real Estate
Fund | |
| Assets: | | | | | | | |
| Investments at fair value (a) | | $ | 43,473,136 | | | $ | 64,236,122 | |
| Cash | | | — | | | | — | |
| Interest and dividends receivable | | | 32,820 | | | | 218,315 | |
| Receivable for investments sold | | | — | | | | — | |
| Receivable for capital shares issued | | | — | | | | 321 | |
| Prepaid and other expenses | | | 10,932 | | | | 12,750 | |
| Total Assets | | | 43,516,888 | | | | 64,467,508 | |
| Liabilities: | | | | | | | | |
| Cash overdraft | | | 510 | | | | 948 | |
| Distributions payable | | | — | | | | — | |
| Payable for investments purchased | | | — | | | | — | |
| Payable for capital shares redeemed | | | — | | | | 131,237 | |
| Accrued expenses and other payables: | | | | | | | | |
| Investment advisory fees | | | 22,197 | | | | 32,276 | |
| Administration fees | | | 3,574 | | | | 5,368 | |
| Compliance service fees | | | 26 | | | | 38 | |
| Distribution (12b-1) fees | | | 100 | | | | 215 | |
| Accounting out-of-pocket fees | | | 1,036 | | | | 1,241 | |
| Audit fees | | | 3,593 | | | | 5,813 | |
| Printing fees | | | 1,439 | | | | 3,467 | |
| Transfer agent fees | | | 3,056 | | | | 2,676 | |
| Other fees and liabilities | | | 1,865 | | | | 2,953 | |
| Total Liabilities | | | 37,396 | | | | 186,232 | |
| Net Assets | | $ | 43,479,492 | | | $ | 64,281,276 | |
| Net Assets Consist of: | | | | | | | | |
| Capital | | $ | 19,855,929 | | | $ | 39,933,882 | |
| Total distributable earnings | | | 23,623,563 | | | | 24,347,394 | |
| Net Assets | | $ | 43,479,492 | | | $ | 64,281,276 | |
| Net Assets | | | | | | | | |
| Class A Shares | | $ | 460,001 | | | $ | 543,138 | |
| Class C Shares | | | 3,335 | | | | 112,047 | |
| Institutional Shares | | | 43,016,156 | | | | 62,707,955 | |
| Class R6 Shares | | | – | | | | 918,136 | |
| Total | | $ | 43,479,492 | | | $ | 64,281,276 | |
| Shares of Beneficial Interest Outstanding (Unlimited number of shares authorized, no par value) | | | | | | | | |
| Class A Shares | | | 7,549 | | | | 16,790 | |
| Class C Shares | | | 57 | | | | 3,501 | |
| Institutional Shares | | | 700,255 | | | | 1,933,072 | |
| Class R6 Shares | | | — | | | | 28,177 | |
| Total | | | 707,861 | | | | 1,981,540 | |
| Net Asset Value | | | | | | | | |
| Class A Shares - redemption price per share | | $ | 60.94 | | | $ | 32.35 | |
| Class C Shares - offering price per share* | | $ | 58.68 | ** | | $ | 32.00 | |
| Institutional Shares | | $ | 61.43 | | | $ | 32.44 | |
| Class R6 Shares | | $ | — | | | $ | 32.58 | |
| Maximum Sales Charge - Class A Shares | | | 5.75 | % | | | 5.75 | % |
| Maximum Offering Price (100%/(100% - Maximum Sales Charge)) of net asset value adjusted to the nearest cent per share - Class A Shares | | $ | 64.65 | | | $ | 34.32 | |
| (a) Investments at cost | | $ | 23,796,042 | | | $ | 43,944,926 | |
| * | Redemption price per share varies by length of time shares are held. |
| ** | Class C Shares of Sterling Capital Quality Income Fund net asset values are calculated using unrounded net assets $3,334.95, divided by unrounded shares of 56.831. |
See accompanying Notes to the Financial Statements.
Sterling Capital
Small Cap
Value Fund | | | Sterling Capital
Ultra Short
Bond Fund | | | Sterling Capital
Short Duration
Bond Fund | | | Sterling Capital
Intermediate U.S.
Government Fund | | | Sterling Capital
Total Return
Bond Fund | |
| $ | 268,075,946 | | | $ | 29,682,309 | | | $ | 104,855,005 | | | $ | 16,429,549 | | | $ | 1,003,250,932 | |
| | — | | | | — | | | | 23,801 | | | | — | | | | — | |
| | 343,312 | | | | 196,999 | | | | 760,662 | | | | 77,137 | | | | 7,160,624 | |
| | 3,097,910 | | | | — | | | | 120,183 | | | | — | | | | — | |
| | 43,761 | | | | — | | | | 80,871 | | | | — | | | | 960,656 | |
| | 20,278 | | | | 21,356 | | | | 16,056 | | | | 6,664 | | | | 77,538 | |
| | 271,581,207 | | | | 29,900,664 | | | | 105,856,578 | | | | 16,513,350 | | | | 1,011,449,750 | |
| | | | | | | | | | | | | | | | | | | |
| | 12,203 | | | | 8,808 | | | | — | | | | 2,489 | | | | 39,023 | |
| | — | | | | 2,944 | | | | 85,718 | | | | 806 | | | | 769,827 | |
| | — | | | | 579,409 | | | | 1,597,728 | | | | — | | | | — | |
| | 78,731 | | | | 7,745 | | | | 155,636 | | | | 454 | | | | 1,556,400 | |
| | | | | | | | | | | | | | | | | | | |
| | 166,039 | | | | — | | | | 10,853 | | | | 1,424 | | | | 177,051 | |
| | 21,541 | | | | 2,351 | | | | 7,608 | | | | 1,329 | | | | 59,479 | |
| | — | | | | 42 | | | | 75 | | | | 42 | | | | — | |
| | 910 | | | | 1,231 | | | | 879 | | | | 640 | | | | 12,174 | |
| | 4,334 | | | | 13,603 | | | | 16,499 | | | | 6,268 | | | | 43,970 | |
| | 27,051 | | | | 2,199 | | | | 9,612 | | | | 1,278 | | | | 78,489 | |
| | 28,571 | | | | 1,221 | | | | 5,337 | | | | 1,013 | | | | 60,158 | |
| | 44,946 | | | | 2,105 | | | | 11,094 | | | | 1,157 | | | | 120,814 | |
| | 16,457 | | | | 972 | | | | 4,417 | | | | 603 | | | | 16,356 | |
| | 400,783 | | | | 622,630 | | | | 1,905,456 | | | | 17,503 | | | | 2,933,741 | |
| $ | 271,180,424 | | | $ | 29,278,034 | | | $ | 103,951,122 | | | $ | 16,495,847 | | | $ | 1,008,516,009 | |
| | | | | | | | | | | | | | | | | | | |
| $ | 20,063,664 | | | $ | 30,803,246 | | | $ | 118,334,752 | | | $ | 20,223,039 | | | $ | 1,236,112,008 | |
| | 251,116,760 | | | | (1,525,212) | | | | (14,383,630) | | | | (3,727,192) | | | | (227,595,999) | |
| $ | 271,180,424 | | | $ | 29,278,034 | | | $ | 103,951,122 | | | $ | 16,495,847 | | | $ | 1,008,516,009 | |
| $ | 2,656,219 | | | $ | 5,755,678 | | | $ | 3,227,849 | | | $ | 2,550,275 | | | $ | 46,771,870 | |
| | 458,388 | | | | – | | | | 280,248 | | | | 122,416 | | | | 2,902,754 | |
| | 261,706,170 | | | | 23,522,356 | | | | 87,220,906 | | | | 13,823,156 | | | | 695,207,024 | |
| | 6,359,647 | | | | – | | | | 13,222,119 | | | | – | | | | 263,634,361 | |
| $ | 271,180,424 | | | $ | 29,278,034 | | | $ | 103,951,122 | | | $ | 16,495,847 | | | $ | 1,008,516,009 | |
| | | | | | | | | | | | | | | | | | | |
| | 50,919 | | | | 594,545 | | | | 396,313 | | | | 305,733 | | | | 5,271,321 | |
| | 9,572 | | | | — | | | | 34,425 | | | | 14,706 | | | | 326,625 | |
| | 4,957,074 | | | | 2,428,760 | | | | 10,714,261 | | | | 1,656,224 | | | | 78,314,763 | |
| | 120,046 | | | | — | | | | 1,623,331 | | | | — | | | | 29,702,048 | |
| | 5,137,611 | | | | 3,023,305 | | | | 12,768,330 | | | | 1,976,663 | | | | 113,614,757 | |
| | | | | | | | | | | | | | | | | | | |
| $ | 52.17 | | | $ | 9.68 | | | $ | 8.14 | | | $ | 8.34 | | | $ | 8.87 | |
| $ | 47.89 | | | $ | — | | | $ | 8.14 | | | $ | 8.32 | | | $ | 8.89 | |
| $ | 52.79 | | | $ | 9.68 | | | $ | 8.14 | | | $ | 8.35 | | | $ | 8.88 | |
| $ | 52.98 | | | $ | — | | | $ | 8.15 | | | $ | — | | | $ | 8.88 | |
| | 5.75 | % | | | 0.00 | % | | | 2.00 | % | | | 2.00 | % | | | 2.00 | % |
| | | | | | | | | | | | | | | | | | | |
| $ | 55.35 | | | $ | 9.68 | | | $ | 8.31 | | | $ | 8.51 | | | $ | 9.05 | |
| $ | 89,071,633 | | | $ | 29,816,789 | | | $ | 107,088,145 | | | $ | 18,359,216 | | | $ | 1,131,462,068 | |
Statement of Assets and Liabilities
September 30, 2023
| | | Sterling Capital
Long Duration
Corporate
Bond Fund | | | Sterling Capital
Quality Income
Fund | |
| Assets: | | | | | | | | |
| Investments at fair value (a) | | $ | 30,759,283 | | | $ | 87,919,235 | |
| Interest and dividends receivable | | | 431,587 | | | | 290,456 | |
| Receivable for capital shares issued | | | — | | | | 14,012 | |
| Prepaid and other expenses | | | 10,334 | | | | 7,713 | |
| Total Assets | | | 31,201,204 | | | | 88,231,416 | |
| Liabilities: | | | | | | | | |
| Cash overdraft | | | 1,337 | | | | 4,768 | |
| Distributions payable | | | 116 | | | | 118,000 | |
| Payable for capital shares redeemed | | | 40 | | | | 7,859 | |
| Accrued expenses and other payables: | | | | | | | | |
| Investment advisory fees | | | — | | | | 22,700 | |
| Administration fees | | | 263 | | | | 7,180 | |
| Compliance service fees | | | 36 | | | | 30 | |
| Distribution (12b-1) fees | | | 66 | | | | 8 | |
| Accounting out-of-pocket fees | | | 18,578 | | | | 19,507 | |
| Audit fees | | | 1,923 | | | | 6,115 | |
| Other fees and liabilities | | | 1,032 | | | | 5,283 | |
| Total Liabilities | | | 23,391 | | | | 191,450 | |
| Net Assets | | $ | 31,177,813 | | | $ | 88,039,966 | |
| Net Assets Consist of: | | | | | | | | |
| Capital | | $ | 41,381,407 | | | $ | 101,858,838 | |
| Total distributable earnings | | | (10,203,594) | | | | (13,818,872) | |
| Net Assets | | $ | 31,177,813 | | | $ | 88,039,966 | |
| Net Assets | | | | | | | | |
| Class A Shares | | $ | 307,695 | | | $ | 31,724 | |
| Class C Shares | | | 2,439 | | | | 2,748 | |
| Institutional Shares | | | 435,628 | | | | 88,005,494 | |
| Class R6 Shares | | | 30,432,051 | | | | – | |
| Total | | $ | 31,177,813 | | | $ | 88,039,966 | |
| Shares of Beneficial Interest Outstanding (Unlimited number of shares authorized, no par value) | | | | | | | | |
| Class A Shares | | | 47,682 | | | | 3,706 | |
| Class C Shares | | | 379 | | | | 321 | |
| Institutional Shares | | | 67,588 | | | | 10,270,487 | |
| Class R6 Shares | | | 4,717,461 | | | | — | |
| Total | | | 4,833,110 | | | | 10,274,514 | |
| Net Asset Value | | | | | | | | |
| Class A Shares - redemption price per share | | $ | 6.45 | | | $ | 8.56 | |
| Class C Shares - offering price per share* | | $ | 6.44 | | | $ | 8.56 | |
| Institutional Shares | | $ | 6.45 | | | $ | 8.57 | |
| Class R6 Shares | | $ | 6.45 | | | $ | — | |
| Maximum Sales Charge - Class A Shares | | | 2.00 | % | | | 2.00 | % |
| Maximum Offering Price (100%/(100% - Maximum Sales Charge)) of net asset value adjusted to the nearest cent per share - Class A Shares | | $ | 6.58 | | | $ | 8.73 | |
| (a) Investments at cost | | $ | 38,973,806 | | | $ | 98,666,041 | |
| | | | | | | | |
| * | Redemption price per share varies by length of time shares are held. |
See accompanying Notes to the Financial Statements.
Sterling Capital
North Carolina
Intermediate
Tax-Free Fund | | | Sterling Capital
South Carolina
Intermediate
Tax-Free Fund | | | Sterling Capital
Virginia
Intermediate
Tax-Free Fund | | | Sterling Capital
West Virginia
Intermediate
Tax-Free Fund | |
| $ | 132,851,849 | | | $ | 35,038,471 | | | $ | 61,990,977 | | | $ | 78,758,414 | |
| | 1,816,222 | | | | 430,117 | | | | 692,793 | | | | 1,221,111 | |
| | 11,984 | | | | — | | | | 40,022 | | | | 20,000 | |
| | 10,708 | | | | 6,573 | | | | 8,219 | | | | 9,677 | |
| | 134,690,763 | | | | 35,475,161 | | | | 62,732,011 | | | | 80,009,202 | |
| | | | | | | | | | | | | | | |
| | 2,512 | | | | 1,541 | | | | 1,371 | | | | 1,313 | |
| | 106,447 | | | | 28,539 | | | | 91,013 | | | | 119,595 | |
| | 243,205 | | | | 27,090 | | | | 316,744 | | | | 37,253 | |
| | 39,638 | | | | 9,421 | | | | 18,451 | | | | 23,805 | |
| | 10,998 | | | | 2,824 | | | | 5,124 | | | | 6,616 | |
| | 48 | | | | 42 | | | | 68 | | | | 45 | |
| | 5,490 | | | | 1,555 | | | | 2,364 | | | | 4,436 | |
| | 9,900 | | | | 6,046 | | | | 5,474 | | | | 6,748 | |
| | 11,165 | | | | 2,923 | | | | 5,818 | | | | 6,583 | |
| | 24,427 | | | | 8,195 | | | | 12,823 | | | | 12,177 | |
| | 453,830 | | | | 88,176 | | | | 459,250 | | | | 218,571 | |
| $ | 134,236,933 | | | $ | 35,386,985 | | | $ | 62,272,761 | | | $ | 79,790,631 | |
| | | | | | | | | | | | | | | |
| $ | 145,084,011 | | | $ | 38,009,846 | | | $ | 66,639,865 | | | $ | 85,924,108 | |
| | (10,847,078) | | | | (2,622,861) | | | | (4,367,104) | | | | (6,133,477) | |
| $ | 134,236,933 | | | $ | 35,386,985 | | | $ | 62,272,761 | | | $ | 79,790,631 | |
| | | | | | | | | | | | | | | |
| $ | 22,320,440 | | | $ | 6,369,337 | | | $ | 11,272,374 | | | $ | 20,854,878 | |
| | 965,918 | | | | 268,092 | | | | 5,280 | | | | 1,725 | |
| | 110,950,575 | | | | 28,749,556 | | | | 50,995,107 | | | | 58,934,028 | |
| | – | | | | – | | | | – | | | | – | |
| $ | 134,236,933 | | | $ | 35,386,985 | | | $ | 62,272,761 | | | $ | 79,790,631 | |
| | | | | | | | | | | | | | | |
| | 2,289,614 | | | | 627,145 | | | | 1,054,525 | | | | 2,285,552 | |
| | 99,156 | | | | 26,410 | | | | 495 | | | | 189 | |
| | 11,383,198 | | | | 2,850,219 | | | | 4,772,101 | | | | 6,451,259 | |
| | — | | | | — | | | | — | | | | — | |
| | 13,771,968 | | | | 3,503,774 | | | | 5,827,121 | | | | 8,737,000 | |
| | | | | | | | | | | | | | | |
| $ | 9.75 | | | $ | 10.16 | | | $ | 10.69 | | | $ | 9.12 | |
| $ | 9.74 | | | $ | 10.15 | | | $ | 10.67 | | | $ | 9.14 | |
| $ | 9.75 | | | $ | 10.09 | | | $ | 10.69 | | | $ | 9.14 | |
| $ | — | | | $ | — | | | $ | — | | | $ | — | |
| | 2.00 | % | | | 2.00 | % | | | 2.00 | % | | | 2.00 | % |
| | | | | | | | | | | | | | | |
| $ | 9.95 | | | $ | 10.36 | | | $ | 10.91 | | | $ | 9.31 | |
| $ | 137,921,038 | | | $ | 36,502,498 | | | $ | 64,440,380 | | | $ | 82,448,130 | |
Statements of Operations
September 30, 2023
| | | Sterling Capital Behavioral Large Cap Value Equity Fund | | | Sterling Capital Mid Value Fund | |
| Investment Income: | | | | | | | | |
| Dividend income | | $ | 839,250 | | | $ | 751,165 | |
| Foreign tax withholding | | | — | | | | (61 | ) |
| Total investment income | | | 839,250 | | | | 751,104 | |
| Expenses: | | | | | | | | |
| Investment advisory fees (See Note 4) | | | 140,492 | | | | 287,869 | |
| Administration fees (See Note 4) | | | 30,075 | | | | 46,212 | |
| Distribution fees - Class A Shares (See Note 4) | | | 72,580 | | | | 46,245 | |
| Distribution fees - Class C Shares (See Note 4) | | | 2,784 | | | | 5,138 | |
| Compliance service fees (See Note 4) | | | 948 | | | | 1,187 | |
| Trustee fees | | | 6,012 | | | | 9,493 | |
| Accounting and out-of-pocket fees | | | 3,031 | | | | 2,669 | |
| Audit fees | | | 2,474 | | | | 3,907 | |
| Custodian fees | | | 1,425 | | | | 2,358 | |
| Fund accounting fees (See Note 4) | | | 2,342 | | | | 3,598 | |
| Interest expense (See Note 8) | | | — | | | | — | |
| Legal fees | | | 5,945 | | | | 9,229 | |
| Printing fees | | | 3,878 | | | | 6,227 | |
| Registration fees | | | 63,972 | | | | 35,165 | |
| Transfer agent fees (See Note 4) | | | 14,125 | | | | 28,318 | |
| Other fees | | | 6,840 | | | | 8,329 | |
| Total expenses before waivers | | | 356,923 | | | | 495,944 | |
| Less expenses waived by the Investment Advisor (See Note 4) | | | (19,663 | ) | | | (8,240 | ) |
| Less expenses waived by the Administrator (See Note 4) | | | (238 | ) | | | (352 | ) |
| Net expenses | | | 337,022 | | | | 487,352 | |
| Net investment income (loss) | | | 502,228 | | | | 263,752 | |
| Realized and Unrealized Gain (Loss): | | | | | | | | |
| Net realized gain (loss) from: | | | | | | | | |
| Investments | | | 616,669 | | | | 3,474,632 | |
| Foreign currency transactions | | | — | | | | — | |
| Change in unrealized appreciation/depreciation on: | | | | | | | | |
| Investments | | | 3,500,559 | | | | 2,593,820 | |
| Foreign currency transactions | | | — | | | | — | |
| Total realized and unrealized gain | | | 4,117,228 | | | | 6,068,452 | |
| Change in net assets from operations | | $ | 4,619,456 | | | $ | 6,332,204 | |
See accompanying Notes to the Financial Statements.
Sterling Capital Behavioral Small Cap Value Equity Fund | | | Sterling Capital Special Opportunities Fund | | | Sterling Capital Equity Income Fund | | | Sterling Capital Behavioral International Equity Fund | | | Sterling Capital SMID Opportunities Fund | |
| $ | 3,178,335 | | | $ | 4,020,627 | | | $ | 49,960,934 | | | $ | 5,700,193 | | | $ | 54,685 | |
| | (5,882 | ) | | | (69,346 | ) | | | — | | | | (558,229 | ) | | | (807 | ) |
| | 3,172,453 | | | | 3,951,281 | | | | 49,960,934 | | | | 5,141,964 | | | | 53,878 | |
| | | | | | | | | | | | | | | | | | | |
| | 713,485 | | | | 3,195,201 | | | | 11,402,471 | | | | 487,613 | | | | 44,502 | |
| | 114,325 | | | | 473,508 | | | | 1,996,383 | | | | 117,491 | | | | 6,115 | |
| | 15,109 | | | | 701,976 | | | | 1,103,340 | | | | 949 | | | | 8,950 | |
| | 304 | | | | 269,059 | | | | 689,734 | | | | 263 | | | | 3,836 | |
| | 2,169 | | | | 7,586 | | | | 30,784 | | | | 2,341 | | | | 594 | |
| | 21,899 | | | | 97,211 | | | | 414,603 | | | | 22,475 | | | | 1,401 | |
| | 7,334 | | | | 15,581 | | | | 63,678 | | | | 23,025 | | | | 1,420 | �� |
| | 10,346 | | | | 39,686 | | | | 170,658 | | | | 9,000 | | | | 579 | |
| | 5,693 | | | | 23,849 | | | | 105,198 | | | | 43,994 | | | | 327 | |
| | 8,919 | | | | 36,868 | | | | 155,488 | | | | 9,143 | | | | 477 | |
| | 2,809 | | | | — | | | | 809 | | | | 2,378 | | | | 23 | |
| | 24,256 | | | | 94,759 | | | | 411,208 | | | | 21,933 | | | | 1,317 | |
| | 15,375 | | | | 64,490 | | | | 282,204 | | | | 13,969 | | | | 1,007 | |
| | 26,825 | | | | 39,245 | | | | 61,119 | | | | 9,371 | | | | 10,420 | |
| | 37,755 | | | | 341,539 | | | | 1,692,446 | | | | 29,136 | | | | 5,946 | |
| | 15,920 | | | | 48,055 | | | | 200,439 | | | | 28,105 | | | | 3,684 | |
| | 1,022,523 | | | | 5,448,613 | | | | 18,780,562 | | | | 821,186 | | | | 90,598 | |
| | — | | | | — | | | | — | | | | — | | | | (27,565 | ) |
| | (58,376 | ) | | | (34,251 | ) | | | (105,937 | ) | | | (60,431 | ) | | | — | |
| | 964,147 | | | | 5,414,362 | | | | 18,674,625 | | | | 760,755 | | | | 63,033 | |
| | 2,208,306 | | | | (1,463,081 | ) | | | 31,286,309 | | | | 4,381,209 | | | | (9,155 | ) |
| | | | | | | | | | | | | | | | | | | |
| | (21,401 | ) | | | 79,277,344 | | | | 180,698,775 | | | | 5,392,081 | | | | 1,193,868 | |
| | — | | | | — | | | | — | | | | 24,789 | | | | — | |
| | | | | | | | | | | | | | | | | | | |
| | 8,721,068 | | | | 5,111,423 | | | | 49,418,026 | | | | 23,263,619 | | | | (407,042 | ) |
| | — | | | | — | | | | — | | | | 40,736 | | | | — | |
| | 8,699,667 | | | | 84,388,767 | | | | 230,116,801 | | | | 28,721,225 | | | | 786,826 | |
| $ | 10,907,973 | | | $ | 82,925,686 | | | $ | 261,403,110 | | | $ | 33,102,434 | | | $ | 777,671 | |
Statements of Operations
September 30, 2023
| | | Sterling Capital Mid Cap Relative Value Fund | | | Sterling Capital Real Estate Fund | |
| Investment Income: | | | | | | |
| Interest income | | $ | — | | | $ | — | |
| Dividend income | | | 812,984 | | | | 2,170,940 | |
| Foreign tax withholding | | | (6,266 | ) | | | — | |
| Total investment income | | | 806,718 | | | | 2,170,940 | |
| Expenses: | | | | | | | | |
| Investment advisory fees (See Note 4) | | | 273,994 | | | | 426,840 | |
| Administration fees (See Note 4) | | | 43,980 | | | | 71,492 | |
| Distribution fees - Class A Shares (See Note 4) | | | 1,050 | | | | 1,658 | |
| Distribution fees - Class C Shares (See Note 4) | | | 34 | | | | 1,272 | |
| Compliance service fees (See Note 4) | | | 1,150 | | | | 1,586 | |
| Trustee fees | | | 9,019 | | | | 14,994 | |
| Accounting and out-of-pocket fees | | | 2,745 | | | | 3,369 | |
| Audit fees | | | 3,726 | | | | 6,037 | |
| Custodian fees | | | 2,223 | | | | 3,719 | |
| Fund accounting fees (See Note 4) | | | 3,425 | | | | 5,567 | |
| Interest expense (See Note 8) | | | — | | | | — | |
| Legal fees | | | 8,777 | | | | 14,553 | |
| Printing fees | | | 5,796 | | | | 11,532 | |
| Registration fees | | | 17,839 | | | | 27,900 | |
| Transfer agent fees (See Note 4) | | | 17,911 | | | | 45,301 | |
| Other fees | | | 6,957 | | | | 9,856 | |
| Total expenses before waivers | | | 398,626 | | | | 645,676 | |
| Less expenses waived by the Investment Advisor (See Note 4) | | | — | | | | — | |
| Less expenses waived by the Administrator (See Note 4) | | | — | | | | (532 | ) |
| Net expenses | | | 398,626 | | | | 645,144 | |
| Net investment income | | | 408,092 | | | | 1,525,796 | |
| Realized and Unrealized Gain (Loss): | | | | | | | | |
| Net realized gain (loss) from: | | | | | | | | |
| Investments | | | 3,980,908 | | | | 4,123,735 | |
| Change in unrealized appreciation/depreciation on: | | | | | | | | |
| Investments | | | 2,414,630 | | | | (4,241,006 | ) |
| Total realized and unrealized gain (loss) | | | 6,395,538 | | | | (117,271 | ) |
| Change in net assets from operations | | $ | 6,803,630 | | | $ | 1,408,525 | |
See accompanying Notes to the Financial Statements.
Sterling Capital Small Cap Value Fund | | | Sterling Capital Ultra Short Bond Fund | | | Sterling Capital Short Duration Bond Fund | | | Sterling Capital Intermediate U.S. Government Fund | | | Sterling Capital Total Return Bond Fund | |
| $ | — | | | $ | 1,115,197 | | | $ | 4,735,382 | | | $ | 437,044 | | | $ | 37,794,886 | |
| | 4,913,981 | | | | 41,250 | | | | 60,199 | | | | 10,670 | | | | 427,086 | |
| | — | | | | — | | | | — | | | | — | | | | — | |
| | 4,913,981 | | | | 1,156,447 | | | | 4,795,581 | | | | 447,714 | | | | 38,221,972 | |
| | | | | | | | | | | | | | | | | | | |
| | 2,385,090 | | | | 61,151 | | | | 256,403 | | | | 54,142 | | | | 2,588,359 | |
| | 306,008 | | | | 29,471 | | | | 123,505 | | | | 16,304 | | | | 997,604 | |
| | 6,400 | | | | 18,596 | | | | 8,658 | | | | 6,962 | | | | 121,651 | |
| | 3,704 | | | | — | | | | 3,330 | | | | 1,332 | | | | 31,869 | |
| | 5,078 | | | | 942 | | | | 2,349 | | | | 748 | | | | 15,454 | |
| | 67,923 | | | | 6,030 | | | | 24,228 | | | | 3,285 | | | | 204,554 | |
| | 11,330 | | | | 22,411 | | | | 26,087 | | | | 12,472 | | | | 79,213 | |
| | 28,147 | | | | 2,291 | | | | 9,948 | | | | 1,322 | | | | 81,666 | |
| | 15,227 | | | | 1,496 | | | | 6,448 | | | | 858 | | | | 50,917 | |
| | 23,851 | | | | 2,293 | | | | 9,615 | | | | 1,269 | | | | 77,651 | |
| | 4,347 | | | | 912 | | | | — | | | | — | | | | 2,812 | |
| | 64,458 | | | | 5,868 | | | | 23,316 | | | | 3,092 | | | | 180,565 | |
| | 49,571 | | | | 3,656 | | | | 15,715 | | | | 2,073 | | | | 131,584 | |
| | 34,650 | | | | 24,735 | | | | 36,437 | | | | 11,815 | | | | 65,303 | |
| | 305,600 | | | | 9,713 | | | | 68,923 | | | | 6,104 | | | | 683,338 | |
| | 33,714 | | | | 4,276 | | | | 13,338 | | | | 3,725 | | | | 86,352 | |
| | 3,345,098 | | | | 193,841 | | | | 628,300 | | | | 125,503 | | | | 5,398,892 | |
| | (51,050 | ) | | | (91,779 | ) | | | (40,557 | ) | | | (32,613 | ) | | | (583,514 | ) |
| | (6,374 | ) | | | — | | | | (14,068 | ) | | | — | | | | (250,184 | ) |
| | 3,287,674 | | | | 102,062 | | | | 573,675 | | | | 92,890 | | | | 4,565,194 | |
| | 1,626,307 | | | | 1,054,385 | | | | 4,221,906 | | | | 354,824 | | | | 33,656,778 | |
| | | | | | | | | | | | | | | | | | | |
| | 88,086,506 | | | | (36,397 | ) | | | (2,227,527 | ) | | | (96,205 | ) | | | (40,413,781 | ) |
| | | | | | | | | | | | | | | | | | | |
| | (38,439,825 | ) | | | 525,824 | | | | 3,049,062 | | | | (134,394 | ) | | | 15,775,118 | |
| | 49,646,681 | | | | 489,427 | | | | 821,535 | | | | (230,599 | ) | | | (24,638,663 | ) |
| $ | 51,272,988 | | | $ | 1,543,812 | | | $ | 5,043,441 | | | $ | 124,225 | | | $ | 9,018,115 | |
Statements of Operations
September 30, 2023
| | | Sterling Capital Long Duration Corporate Bond Fund | | | Sterling Capital Quality Income Fund | |
| Investment Income: | | | | | | |
| Interest income | | $ | 1,352,527 | | | $ | 2,784,554 | |
| Dividend income | | | 10,149 | | | | 82,110 | |
| Total investment income | | | 1,362,676 | | | | 2,866,664 | |
| Expenses: | | | | | | | | |
| Investment advisory fees (See Note 4) | | | 70,749 | | | | 293,618 | |
| Administration fees (See Note 4) | | | 27,297 | | | | 80,868 | |
| Distribution fees - Class A Shares (See Note 4) | | | 1,043 | | | | 81 | |
| Distribution fees - Class C Shares (See Note 4) | | | 26 | | | | 29 | |
| Compliance service fees (See Note 4) | | | 906 | | | | 1,706 | |
| Trustee fees | | | 4,986 | | | | 15,768 | |
| Accounting and out-of-pocket fees | | | 34,689 | | | | 41,356 | |
| Audit fees | | | 1,967 | | | | 6,300 | |
| Custodian fees | | | 1,305 | | | | 4,197 | |
| Fund accounting fees (See Note 4) | | | 2,122 | | | | 6,292 | |
| Interest expense (See Note 8) | | | — | | | | — | |
| Legal fees | | | 4,826 | | | | 15,626 | |
| Printing fees | | | 3,006 | | | | 9,715 | |
| Registration fees | | | 22,891 | | | | 16,791 | |
| Transfer agent fees (See Note 4) | | | 6,343 | | | | 20,951 | |
| Other fees | | | 5,339 | | | | 9,839 | |
| Total expenses before waivers | | | 187,495 | | | | 523,137 | |
| Less expenses waived by the Investment Advisor (See Note 4) | | | (59,078 | ) | | | (33,556 | ) |
| Less expenses waived by the Administrator (See Note 4) | | | (24,748 | ) | | | — | |
| Net expenses | | | 103,669 | | | | 489,581 | |
| Net investment income | | | 1,259,007 | | | | 2,377,083 | |
| Realized and Unrealized Gain (Loss): | | | | | | | | |
| Net realized gain (loss) from: | | | | | | | | |
| Investments | | | (1,369,799 | ) | | | (284,289 | ) |
| Change in unrealized appreciation/depreciation on: | | | | | | | | |
| Investments | | | 18,537 | | | | (1,950,595 | ) |
| Total realized and unrealized (loss) | | | (1,351,262 | ) | | | (2,234,884 | ) |
| Change in net assets from operations | | $ | (92,255 | ) | | $ | 142,199 | |
See accompanying Notes to the Financial Statements.
Sterling Capital North Carolina Intermediate Tax-Free Fund | | | Sterling Capital South Carolina Intermediate Tax-Free Fund | | | Sterling Capital Virginia Intermediate Tax-Free Fund | | | Sterling Capital West Virginia Intermediate Tax-Free Fund | |
| $ | 3,964,673 | | | $ | 994,063 | | | $ | 1,850,724 | | | $ | 2,491,602 | |
| | 126,505 | | | | 44,656 | | | | 57,489 | | | | 78,491 | |
| | 4,091,178 | | | | 1,038,719 | | | | 1,908,213 | | | | 2,570,093 | |
| | | | | | | | | | | | | | | |
| | 505,207 | | | | 130,267 | | | | 252,785 | | | | 298,688 | |
| | 139,065 | | | | 35,855 | | | | 69,550 | | | | 82,222 | |
| | 59,126 | | | | 17,622 | | | | 32,106 | | | | 55,008 | |
| | 10,930 | | | | 3,276 | | | | 147 | | | | 119 | |
| | 2,610 | | | | 1,034 | | | | 1,581 | | | | 1,751 | |
| | 28,689 | | | | 7,612 | | | | 15,015 | | | | 16,580 | |
| | 18,212 | | | | 8,330 | | | | 10,956 | | | | 13,019 | |
| | 11,576 | | | | 3,075 | | | | 6,015 | | | | 6,808 | |
| | 7,155 | | | | 1,767 | | | | 3,752 | | | | 4,256 | |
| | 10,826 | | | | 2,792 | | | | 5,417 | | | | 6,401 | |
| | — | | | | — | | | | 23 | | | | 5,029 | |
| | 24,731 | | | | 6,877 | | | | 14,463 | | | | 16,135 | |
| | 18,183 | | | | 4,847 | | | | 9,418 | | | | 10,551 | |
| | 23,552 | | | | 13,388 | | | | 16,488 | | | | 25,533 | |
| | 55,867 | | | | 14,132 | | | | 25,136 | | | | 25,467 | |
| | 14,992 | | | | 5,327 | | | | 9,010 | | | | 9,734 | |
| | 930,721 | | | | 256,201 | | | | 471,862 | | | | 577,301 | |
| | — | | | | (6,375 | ) | | | — | | | | — | |
| | — | | | | — | | | | — | | | | — | |
| | 930,721 | | | | 249,826 | | | | 471,862 | | | | 577,301 | |
| | 3,160,457 | | | | 788,893 | | | | 1,436,351 | | | | 1,992,792 | |
| | | | | | | | | | | | | | | |
| | (1,664,313 | ) | | | (703,509 | ) | | | (714,687 | ) | | | (1,503,912 | ) |
| | | | | | | | | | | | | | | |
| | 751,162 | | | | 460,221 | | | | 581,974 | | | | 657,730 | |
| | (913,151 | ) | | | (243,288 | ) | | | (132,713 | ) | | | (846,182 | ) |
| $ | 2,247,306 | | | $ | 545,605 | | | $ | 1,303,638 | | | $ | 1,146,610 | |
Statements of Changes in Net Assets
September 30, 2023
| | | Sterling Capital Behavioral Large Cap Value Equity Fund | |
| | | For the Year Ended September 30, 2023 | | | For the Year Ended September 30, 2022 | |
| From Investment Activities: | | | | | | | | |
| Operations: | | | | | | | | |
| Net investment income (loss) | | $ | 502,228 | | | $ | 565,718 | |
| Net realized gain (loss) | | | 616,669 | | | | 2,611,731 | |
| Change in unrealized appreciation/depreciation | | | 3,500,559 | | | | (6,173,918 | ) |
| Change in net assets from operations | | | 4,619,456 | | | | (2,996,469 | ) |
| Distributions to Shareholders: | | | | | | | | |
| Income distribution: | | | | | | | | |
| Class A | | | (500,061 | ) | | | (476,471 | ) |
| Class C | | | (2,993 | ) | | | (2,568 | ) |
| Institutional Class | | | (30,123 | ) | | | (39,354 | ) |
| Class R6 | | | (7,382 | ) | | | (13 | ) |
| Change in net assets from shareholder distributions | | | (540,559 | ) | | | (518,406 | ) |
| Capital Transactions: | | | | | | | | |
| Change in net assets from capital transactions (See Note 5) | | | (1,401,553 | ) | | | (1,797,076 | ) |
| Change in net assets | | | 2,677,344 | | | | (5,311,951 | ) |
| Net Assets: | | | | | | | | |
| Beginning of year | | | 27,885,461 | | | | 33,197,412 | |
| End of year | | $ | 30,562,805 | | | $ | 27,885,461 | |
See accompanying Notes to the Financial Statements.
Sterling Capital Mid Value Fund | | | Sterling Capital Behavioral Small Cap Value Equity Fund | | | Sterling Capital Special Opportunities Fund | |
For the Year Ended September 30, 2023 | | | For the Year Ended September 30, 2022 | | | For the Year Ended September 30, 2023 | | | For the Year Ended September 30, 2022 | | | For the Year Ended September 30, 2023 | | | For the Year Ended September 30, 2022 | |
| $ | 263,752 | | | $ | 160,462 | | | $ | 2,208,306 | | | $ | 1,139,103 | | | $ | (1,463,081 | ) | | $ | (2,384,356 | ) |
| | 3,474,632 | | | | 9,493,174 | | | | (21,401 | ) | | | 16,819,971 | | | | 79,277,344 | | | | 42,334,321 | |
| | 2,593,820 | | | | (19,290,537 | ) | | | 8,721,068 | | | | (24,041,910 | ) | | | 5,111,423 | | | | (156,233,127 | ) |
| | 6,332,204 | | | | (9,636,901 | ) | | | 10,907,973 | | | | (6,082,836 | ) | | | 82,925,686 | | | | (116,283,162 | ) |
| | | | | | | | | | | | | | | | | | | | | | | |
| | (3,067,418 | ) | | | (1,874,485 | ) | | | (62,185 | ) | | | (699,909 | ) | | | (21,815,525 | ) | | | (43,211,898 | ) |
| | (101,527 | ) | | | (83,961 | ) | | | (89 | ) | | | (3,471 | ) | | | (3,031,376 | ) | | | (7,853,006 | ) |
| | (4,879,982 | ) | | | (4,044,300 | ) | | | (131,693 | ) | | | (1,366,695 | ) | | | (10,387,547 | ) | | | (24,533,645 | ) |
| | (79,347 | ) | | | (24,626 | ) | | | (1,655,217 | ) | | | (8,845,595 | ) | | | (3,204,690 | ) | | | (5,075,978 | ) |
| | (8,128,274 | ) | | | (6,027,372 | ) | | | (1,849,184 | ) | | | (10,915,670 | ) | | | (38,439,138 | ) | | | (80,674,527 | ) |
| | | | | | | | | | | | | | | | | | | | | | | |
| | 370,972 | | | | (13,905,347 | ) | | | 45,403,164 | | | | (53,178,549 | ) | | | (74,760,160 | ) | | | 22,803,338 | |
| | (1,425,098 | ) | | | (29,569,620 | ) | | | 54,461,953 | | | | (70,177,055 | ) | | | (30,273,612 | ) | | | (174,154,351 | ) |
| | | | | | | | | | | | | | | | | | | | | | | |
| | 46,969,170 | | | | 76,538,790 | | | | 35,792,155 | | | | 105,969,210 | | | | 494,495,413 | | | | 668,649,764 | |
| $ | 45,544,072 | | | $ | 46,969,170 | | | $ | 90,254,108 | | | $ | 35,792,155 | | | $ | 464,221,801 | | | $ | 494,495,413 | |
Statements of Changes in Net Assets
September 30, 2023
| | | Sterling Capital Equity Income Fund | |
| | | For the Year Ended September 30, 2023 | | | For the Year Ended September 30, 2022 | |
| From Investment Activities: | | | | | | | | |
| Operations: | | | | | | | | |
| Net investment income (loss) | | $ | 31,286,309 | | | $ | 34,041,516 | |
| Net realized gain (loss) | | | 180,698,775 | | | | 167,909,932 | |
| Change in unrealized appreciation/depreciation | | | 49,418,026 | | | | (317,324,225 | ) |
| Change in net assets from operations | | | 261,403,110 | | | | (115,372,777 | ) |
| Distributions to Shareholders: | | | | | | | | |
| Income distribution: | | | | | | | | |
| Class A | | | (35,207,532 | ) | | | (14,200,798 | ) |
| Class C | | | (4,998,216 | ) | | | (1,831,748 | ) |
| Institutional Class | | | (124,192,935 | ) | | | (56,490,711 | ) |
| Class R6 | | | (9,084,244 | ) | | | (2,396,776 | ) |
| Change in net assets from shareholder distributions | | | (173,482,927 | ) | | | (74,920,033 | ) |
| Capital Transactions: | | | | | | | | |
| Change in net assets from capital transactions (See Note 5) | | | (221,342,653 | ) | | | (30,597,835 | ) |
| Change in net assets | | | (133,422,470 | ) | | | (220,890,645 | ) |
| Net Assets: | | | | | | | | |
| Beginning of year | | | 2,014,461,517 | | | | 2,235,352,162 | |
| End of year | | $ | 1,881,039,047 | | | $ | 2,014,461,517 | |
See accompanying Notes to the Financial Statements.
Sterling Capital Behavioral International Equity Fund | | | Sterling Capital SMID Opportunities Fund | | | Sterling Capital Mid Cap Relative Value Fund | |
For the Year Ended September 30, 2023 | | | For the Year Ended September 30, 2022 | | | For the Year Ended September 30, 2023 | | | For the Year Ended September 30, 2022 | | | For the Year Ended September 30, 2023 | | | For the Year Ended September 30, 2022 | |
| $ | 4,381,209 | | | $ | 3,737,570 | | | $ | (9,155 | ) | | $ | (5,456 | ) | | $ | 408,092 | | | $ | 440,187 | |
| | 5,416,870 | | | | (8,424,469 | ) | | | 1,193,868 | | | | 868,503 | | | | 3,980,908 | | | | 7,317,042 | |
| | 23,304,355 | | | | (19,824,761 | ) | | | (407,042 | ) | | | (2,529,581 | ) | | | 2,414,630 | | | | (14,324,669 | ) |
| | 33,102,434 | | | | (24,511,660 | ) | | | 777,671 | | | | (1,666,534 | ) | | | 6,803,630 | | | | (6,567,440 | ) |
| | | | | | | | | | | | | | | | | | | | | | | |
| | (11,319 | ) | | | (20,546 | ) | | | (397,670 | ) | | | (427,285 | ) | | | (64,334 | ) | | | (30,339 | ) |
| | (216 | ) | | | (2,002 | ) | | | (57,986 | ) | | | (133,622 | ) | | | (513 | ) | | | (250 | ) |
| | (17,962 | ) | | | (31,374 | ) | | | (303,812 | ) | | | (389,794 | ) | | | (7,178,386 | ) | | | (4,998,468 | ) |
| | (3,663,801 | ) | | | (4,003,413 | ) | | | – | | | | – | | | | – | | | | – | |
| | (3,693,298 | ) | | | (4,057,335 | ) | | | (759,468 | ) | | | (950,701 | ) | | | (7,243,233 | ) | | | (5,029,057 | ) |
| | | | | | | | | | | | | | | | | | | | | | | |
| | (11,455,991 | ) | | | 39,989,968 | | | | (2,779,952 | ) | | | (1,350,340 | ) | | | (1,519,703 | ) | | | (8,839,376 | ) |
| | 17,953,145 | | | | 11,420,973 | | | | (2,761,749 | ) | | | (3,967,575 | ) | | | (1,959,306 | ) | | | (20,435,873 | ) |
| | | | | | | | | | | | | | | | | | | | | | | |
| | 98,363,054 | | | | 86,942,081 | | | | 7,231,595 | | | | 11,199,170 | | | | 45,438,798 | | | | 65,874,671 | |
| $ | 116,316,199 | | | $ | 98,363,054 | | | $ | 4,469,846 | | | $ | 7,231,595 | | | $ | 43,479,492 | | | $ | 45,438,798 | |
Statements of Changes in Net Assets
September 30, 2023
| | | Sterling Capital
Real Estate
Fund | |
| | | For the
Year Ended
September 30,
2023 | | | For the
Year Ended
September 30,
2022 | |
| From Investment Activities: | | | | | | | | |
| Operations: | | | | | | | | |
| Net investment income | | $ | 1,525,796 | | | $ | 870,154 | |
| Net realized gain (loss) | | | 4,123,735 | | | | 5,415,357 | |
| Change in unrealized appreciation/depreciation | | | (4,241,006 | ) | | | (23,147,437 | ) |
| Change in net assets from operations | | | 1,408,525 | | | | (16,861,926 | ) |
| Distributions to Shareholders: | | | | | | | | |
| Income distribution: | | | | | | | | |
| Class A | | | (54,431 | ) | | | (53,913 | ) |
| Class C | | | (9,581 | ) | | | (12,662 | ) |
| Institutional Class | | | (6,079,027 | ) | | | (7,579,099 | ) |
| Class R6 | | | (60,933 | ) | | | (1,363 | ) |
| Change in net assets from shareholder distributions | | | (6,203,972 | ) | | | (7,647,037 | ) |
| Capital Transactions: | | | | | | | | |
| Change in net assets from capital transactions (See Note 5) | | | (5,609,321 | ) | | | 2,203,071 | |
| Change in net assets | | | (10,404,768 | ) | | | (22,305,892 | ) |
| Net Assets: | | | | | | | | |
| Beginning of year | | | 74,686,044 | | | | 96,991,936 | |
| End of year | | $ | 64,281,276 | | | $ | 74,686,044 | |
See accompanying Notes to the Financial Statements.
Sterling Capital
Small Cap
Value Fund | | | Sterling Capital
Ultra Short
Bond Fund | |
For the
Year Ended
September 30,
2023 | | | For the
Year Ended
September 30,
2022 | | | For the
Year Ended
September 30,
2023 | | | For the
Year Ended
September 30,
2022 | |
| $ | 1,626,307 | | | $ | 1,736,703 | | | $ | 1,054,385 | | | $ | 397,553 | |
| | 88,086,506 | | | | 84,129,501 | | | | (36,397 | ) | | | (128,185 | ) |
| | (38,439,825 | ) | | | (139,878,030 | ) | | | 525,824 | | | | (613,903 | ) |
| | 51,272,988 | | | | (54,011,826 | ) | | | 1,543,812 | | | | (344,535 | ) |
| | | | | | | | | | | | | | | |
| | (561,313 | ) | | | (718,382 | ) | | | (262,277 | ) | | | (94,279 | ) |
| | (82,031 | ) | | | (95,212 | ) | | | – | | | | – | |
| | (76,098,395 | ) | | | (104,869,046 | ) | | | (875,649 | ) | | | (423,309 | ) |
| | (1,534,096 | ) | | | (981,746 | ) | | | – | | | | – | |
| | (78,275,835 | ) | | | (106,664,386 | ) | | | (1,137,926 | ) | | | (517,588 | ) |
| | | | | | | | | | | | | | | |
| | (58,556,692 | ) | | | (4,107,586 | ) | | | 1,517,221 | | | | (11,494,089 | ) |
| | (85,559,539 | ) | | | (164,783,798 | ) | | | 1,923,107 | | | | (12,356,212 | ) |
| | | | | | | | | | | | | | | |
| | 356,739,963 | | | | 521,523,761 | | | | 27,354,927 | | | | 39,711,139 | |
| $ | 271,180,424 | | | $ | 356,739,963 | | | $ | 29,278,034 | | | $ | 27,354,927 | |
Statements of Changes in Net Assets
September 30, 2023
| | | Sterling Capital
Short Duration
Bond Fund | |
| | | For the
Year Ended
September 30,
2023 | | | For the
Year Ended
September 30,
2022 | |
| From Investment Activities: | | | | | | | | |
| Operations: | | | | | | | | |
| Net investment income | | $ | 4,221,906 | | | $ | 1,604,478 | |
| Net realized (loss) | | | (2,227,527 | ) | | | (1,142,255 | ) |
| Change in unrealized appreciation/depreciation | | | 3,049,062 | | | | (6,544,910 | ) |
| Change in net assets from operations | | | 5,043,441 | | | | (6,082,687 | ) |
| Distributions to Shareholders: | | | | | | | | |
| Income distribution: | | | | | | | | |
| Class A | | | (96,932 | ) | | | (77,983 | ) |
| Class C | | | (6,702 | ) | | | (9,133 | ) |
| Institutional Class | | | (3,325,550 | ) | | | (2,495,380 | ) |
| Class R6 | | | (488,093 | ) | | | (474,774 | ) |
| Change in net assets from shareholder distributions | | | (3,917,277 | ) | | | (3,057,270 | ) |
| Capital Transactions: | | | | | | | | |
| Change in net assets from capital transactions (See Note 5) | | | (1,643,630 | ) | | | (83,167,834 | ) |
| Change in net assets | | | (517,466 | ) | | | (92,307,791 | ) |
| Net Assets: | | | | | | | | |
| Beginning of year | | | 104,468,588 | | | | 196,776,379 | |
| End of year | | $ | 103,951,122 | | | $ | 104,468,588 | |
See accompanying Notes to the Financial Statements.
Sterling Capital
Intermediate U.S.
Government Fund | | | Sterling Capital
Total Return
Bond Fund | |
For the
Year Ended
September 30,
2023 | | | For the
Year Ended
September 30,
2022 | | | For the
Year Ended
September 30,
2023 | | | For the
Year Ended
September 30,
2022 | |
| $ | 354,824 | | | $ | 195,052 | | | $ | 33,656,778 | | | $ | 26,361,668 | |
| | (96,205 | ) | | | (161,313 | ) | | | (40,413,781 | ) | | | (48,317,061 | ) |
| | (134,394 | ) | | | (2,125,140 | ) | | | 15,775,118 | | | | (183,707,125 | ) |
| | 124,225 | | | | (2,091,401 | ) | | | 9,018,115 | | | | (205,662,518 | ) |
| | | | | | | | | | | | | | | |
| | (68,040 | ) | | | (64,077 | ) | | | (1,498,338 | ) | | | (1,679,055 | ) |
| | (2,275 | ) | | | (1,493 | ) | | | (73,772 | ) | | | (106,188 | ) |
| | (377,519 | ) | | | (355,581 | ) | | | (24,379,270 | ) | | | (32,571,476 | ) |
| | – | | | | – | | | | (8,620,123 | ) | | | (10,158,386 | ) |
| | (447,834 | ) | | | (421,151 | ) | | | (34,571,503 | ) | | | (44,515,105 | ) |
| | | | | | | | | | | | | | | |
| | 105,182 | | | | (557,502 | ) | | | (29,410,288 | ) | | | (240,397,279 | ) |
| | (218,427 | ) | | | (3,070,054 | ) | | | (54,963,676 | ) | | | (490,574,902 | ) |
| | | | | | | | | | | | | | | |
| | 16,714,274 | | | | 19,784,328 | | | | 1,063,479,685 | | | | 1,554,054,587 | |
| $ | 16,495,847 | | | $ | 16,714,274 | | | $ | 1,008,516,009 | | | $ | 1,063,479,685 | |
Statements of Changes in Net Assets
September 30, 2023
| | | Sterling Capital Long Duration Corporate Bond Fund | |
| | For the Year Ended September 30, 2023 | | | For the Year Ended September 30, 2022 | |
| From Investment Activities: | | | | | | | | |
| Operations: | | | | | | | | |
| Net investment income | | $ | 1,259,007 | | | $ | 724,462 | |
| Net realized (loss) | | | (1,369,799 | ) | | | (589,254 | ) |
| Change in unrealized appreciation/depreciation. | | | 18,537 | | | | (8,498,946 | ) |
| Change in net assets from operations. | | | (92,255 | ) | | | (8,363,738 | ) |
| Distributions to Shareholders: | | | | | | | | |
| Income distribution: | | | | | | | | |
| Class A | | | (17,085 | ) | | | (76,145 | ) |
| Class C | | | (88 | ) | | | (2,558 | ) |
| Institutional Class | | | (16,776 | ) | | | (624,683 | ) |
| Class R6 | | | (1,227,995 | ) | | | (637,292 | ) |
| Change in net assets from shareholder distributions. | | | (1,261,944 | ) | | | (1,340,678 | ) |
| Capital Transactions: | | | | | | | | |
| Change in net assets from capital transactions (See Note 5) | | | 9,444,642 | | | | 25,648,255 | |
| Change in net assets | | | 8,090,443 | | | | 15,943,839 | |
| Net Assets: | | | | | | | | |
| Beginning of year | | | 23,087,370 | | | | 7,143,531 | |
| End of year | | $ | 31,177,813 | | | $ | 23,087,370 | |
See accompanying Notes to the Financial Statements.
Sterling Capital Quality Income Fund | | | Sterling Capital North Carolina Intermediate Tax-Free Fund | |
| | For the Year Ended September 30, 2023 | | | | For the Year Ended September 30, 2022 | | | | For the Year Ended September 30, 2023 | | | | For the Year Ended September 30, 2022 | |
| $ | 2,377,083 | | | $ | 1,279,771 | | | $ | 3,160,457 | | | $ | 2,909,921 | |
| | (284,289 | ) | | | (464,475 | ) | | | (1,664,313 | ) | | | (3,925,912 | ) |
| | (1,950,595 | ) | | | (9,405,234 | ) | | | 751,162 | | | | (14,152,072 | ) |
| | 142,199 | | | | (8,589,938 | ) | | | 2,247,306 | | | | (15,168,063 | ) |
| | | | | | | | | | | | | | | |
| | (880 | ) | | | (603 | ) | | | (469,880 | ) | | | (443,470 | ) |
| | (58 | ) | | | (39 | ) | | | (13,514 | ) | | | (9,185 | ) |
| | (2,499,050 | ) | | | (1,556,001 | ) | | | (2,677,063 | ) | | | (2,457,262 | ) |
| | – | | | | – | | | | – | | | | – | |
| | (2,499,988 | ) | | | (1,556,643 | ) | | | (3,160,457 | ) | | | (2,909,917 | ) |
| | | | | | | | | | | | | | | |
| | 12,111,363 | | | | 25,681,610 | | | | (17,394,662 | ) | | | (16,450,675 | ) |
| | 9,753,574 | | | | 15,535,029 | | | | (18,307,813 | ) | | | (34,528,655 | ) |
| | | | | | | | | | | | | | | |
| | 78,286,392 | | | | 62,751,363 | | | | 152,544,746 | | | | 187,073,401 | |
| $ | 88,039,966 | | | $ | 78,286,392 | | | $ | 134,236,933 | | | $ | 152,544,746 | |
Statements of Changes in Net Assets
September 30, 2023
| | | Sterling Capital South Carolina Intermediate Tax-Free Fund | |
| | For the Year Ended September 30, 2023 | | | For the Year Ended September 30, 2022 | |
| From Investment Activities: | | | |
| Operations: | | | |
| Net investment income | | $ | 788,893 | | | $ | 1,176,317 | |
| Net realized (loss) | | | (703,509 | ) | | | (439,370 | ) |
| Change in unrealized appreciation/depreciation. | | | 460,221 | | | | (6,014,907 | ) |
| Change in net assets from operations. | | | 545,605 | | | | (5,277,960 | ) |
| Distributions to Shareholders: | | | | | | | | |
| Income distribution: | | | | | | | | |
| Class A | | | (135,550 | ) | | | (147,210 | ) |
| Class C | | | (3,836 | ) | | | (4,027 | ) |
| Institutional Class | | | (649,506 | ) | | | (1,025,078 | ) |
| Change in net assets from shareholder distributions. | | | (788,892 | ) | | | (1,176,315 | ) |
| Capital Transactions: | | | | | | | | |
| Change in net assets from capital transactions (See Note 5) | | | (6,079,786 | ) | | | (35,097,479 | ) |
| Change in net assets | | | (6,323,073 | ) | | | (41,551,754 | ) |
| Net Assets: | | | | | | | | |
| Beginning of year | | | 41,710,058 | | | | 83,261,812 | |
| End of year | | $ | 35,386,985 | | | $ | 41,710,058 | |
See accompanying Notes to the Financial Statements.
Sterling Capital Virginia Intermediate Tax-Free Fund | | | Sterling Capital West Virginia Intermediate Tax-Free Fund | |
| | For the Year Ended September 30, 2023 | | | | For the Year Ended September 30, 2022 | | | | For the Year Ended September 30, 2023 | | | | For the Year Ended September 30, 2022 | |
| $ | 1,436,351 | | | $ | 1,301,206 | | | $ | 1,992,792 | | | $ | 1,593,986 | |
| | (714,687 | ) | | | (1,266,182 | ) | | | (1,503,912 | ) | | | (1,020,923 | ) |
| | 581,974 | | | | (6,989,773 | ) | | | 657,730 | | | | (8,383,049 | ) |
| | 1,303,638 | | | | (6,954,749 | ) | | | 1,146,610 | | | | (7,809,986 | ) |
| | | | | | | | | | | | | | | |
| | (229,106 | ) | | | (236,698 | ) | | | (471,650 | ) | | | (382,129 | ) |
| | (151 | ) | | | (208 | ) | | | (158 | ) | | | (199 | ) |
| | (1,207,094 | ) | | | (1,152,188 | ) | | | (1,520,984 | ) | | | (1,219,569 | ) |
| | (1,436,351 | ) | | | (1,389,094 | ) | | | (1,992,792 | ) | | | (1,601,897 | ) |
| | | | | | | | | | | | | | | |
| | (18,739,172 | ) | | | 7,068,723 | | | | (6,506,623 | ) | | | 1,544,062 | |
| | (18,871,885 | ) | | | (1,275,120 | ) | | | (7,352,805 | ) | | | (7,867,821 | ) |
| | | | | | | | | | | | | | | |
| | 81,144,646 | | | | 82,419,766 | | | | 87,143,436 | | | | 95,011,257 | |
| $ | 62,272,761 | | | $ | 81,144,646 | | | $ | 79,790,631 | | | $ | 87,143,436 | |
Financial Highlights, Class A Shares
September 30, 2023
The financial highlights table is intended to help you understand the Funds’ financial performance for the past 5 years or, if shorter, the period of the Funds’ operations. Certain information reflects financial results for a single Fund share. The total returns in the table represent the rate that an investor would have earned (or lost) on an investment in the Fund (assuming reinvestment of all dividends and distributions).
| | | Investment Activities | | | Distributions |
| | | Net Asset Value, Beginning of Year | | | Net investment income (loss)(a) | | | Net realized/ unrealized gains (losses) on investments | | | Total from Investment Activities | | | Net investment income | | | Net realized gains on investments | | | Return of capital | | | Total Distributions | |
| Sterling Capital Behavioral Large Cap Value Equity Fund | | | | | | |
| Year Ended September 30, 2023 | | $ | 20.19 | | | | 0.37 | | | | 2.94 | | | | 3.31 | | | | (0.40 | ) | | | — | | | | — | | | | (0.40 | ) |
| Year Ended September 30, 2022 | | $ | 22.75 | | | | 0.40 | | | | (2.60 | ) | | | (2.20 | ) | | | (0.36 | ) | | | — | | | | — | | | | (0.36 | ) |
| Year Ended September 30, 2021 | | $ | 16.72 | | | | 0.03 | | | | 6.21 | | | | 6.24 | | | | (0.04 | ) | | | — | | | | (0.17 | ) | | | (0.21 | ) |
| Year Ended September 30, 2020 | | $ | 19.49 | | | | 0.36 | | | | (2.07 | ) | | | (1.71 | ) | | | (0.48 | ) | | | (0.58 | ) | | | — | | | | (1.06 | ) |
| Year Ended September 30, 2019 | | $ | 22.30 | | | | 0.39 | | | | (1.07 | ) | | | (0.68 | ) | | | (0.38 | ) | | | (1.75 | ) | | | — | | | | (2.13 | ) |
| Sterling Capital Mid Value Fund | | | | | | | | | | | | | | |
| Year Ended September 30, 2023 | | $ | 15.21 | | | | 0.06 | | | | 1.95 | | | | 2.01 | | | | (0.03 | ) | | | (2.72 | ) | | | — | | | | (2.75 | ) |
| Year Ended September 30, 2022 | | $ | 20.01 | | | | 0.02 | | | | (3.18 | ) | | | (3.16 | ) | | | — | | | | (1.64 | ) | | | — | | | | (1.64 | ) |
| Year Ended September 30, 2021 | | $ | 13.99 | | | | (0.02 | ) | | | 6.07 | | | | 6.05 | | | | (0.03 | ) | | | — | | | | — | | | | (0.03 | ) |
| Year Ended September 30, 2020 | | $ | 16.10 | | | | 0.02 | | | | (0.80 | ) | | | (0.78 | ) | | | (0.20 | ) | | | (1.13 | ) | | | — | | | | (1.33 | ) |
| Year Ended September 30, 2019 | | $ | 19.08 | | | | 0.05 | | | | (0.77 | ) | | | (0.72 | ) | | | — | | | | (2.26 | ) | | | — | | | | (2.26 | ) |
| Sterling Capital Behavioral Small Cap Value Equity Fund | | | | | | |
| Year Ended September 30, 2023 | | $ | 15.12 | | | | 0.26 | | | | 1.78 | | | | 2.04 | | | | (0.18 | ) | | | — | | | | — | | | | (0.18 | ) |
| Year Ended September 30, 2022 | | $ | 19.37 | | | | 0.17 | | | | (2.45 | ) | | | (2.28 | ) | | | (0.15 | ) | | | (1.82 | ) | | | — | | | | (1.97 | ) |
| Year Ended September 30, 2021 | | $ | 11.83 | | | | 0.11 | | | | 7.53 | | | | 7.64 | | | | (0.10 | ) | | | — | | | | — | | | | (0.10 | ) |
| Year Ended September 30, 2020 | | $ | 14.54 | | | | 0.10 | | | | (2.67 | ) | | | (2.57 | ) | | | (0.14 | ) | | | — | | | | — | | | | (0.14 | ) |
| Year Ended September 30, 2019 | | $ | 18.65 | | | | 0.17 | | | | (2.07 | ) | | | (1.90 | ) | | | (0.23 | ) | | | (1.98 | ) | | | — | | | | (2.21 | ) |
| Sterling Capital Special Opportunities Fund | | | | | | | | | | |
| Year Ended September 30, 2023 | | $ | 23.95 | | | | (0.09 | ) | | | 4.21 | | | | 4.12 | | | | — | | | | (1.99 | ) | | | — | | | | (1.99 | ) |
| Year Ended September 30, 2022 | | $ | 33.44 | | | | (0.13 | ) | | | (5.25 | ) | | | (5.38 | ) | | | — | | | | (4.11 | ) | | | — | | | | (4.11 | ) |
| Year Ended September 30, 2021 | | $ | 24.67 | | | | (0.11 | ) | | | 9.21 | | | | 9.10 | | | | — | | | | (0.33 | ) | | | — | | | | (0.33 | ) |
| Year Ended September 30, 2020 | | $ | 24.63 | | | | (0.01 | ) | | | 1.38 | | | | 1.37 | | | | — | | | | (1.33 | ) | | | — | | | | (1.33 | ) |
| Year Ended September 30, 2019 | | $ | 26.37 | | | | 0.02 | | | | 0.10 | | | | 0.12 | | | | — | | | | (1.86 | ) | | | — | | | | (1.86 | ) |
| Sterling Capital Equity Income Fund | | | | | | |
| Year Ended September 30, 2023 | | $ | 24.27 | | | | 0.35 | | | | 2.73 | | | | 3.08 | | | | (0.35 | ) | | | (1.74 | ) | | | — | | | | (2.09 | ) |
| Year Ended September 30, 2022 | | $ | 26.57 | | | | 0.35 | | | | (1.82 | ) | | | (1.47 | ) | | | (0.35 | ) | | | (0.48 | ) | | | — | | | | (0.83 | ) |
| Year Ended September 30, 2021 | | $ | 20.04 | | | | 0.29 | | | | 6.53 | | | | 6.82 | | | | (0.29 | ) | | | — | | | | — | | | | (0.29 | ) |
| Year Ended September 30, 2020 | | $ | 21.27 | | | | 0.36 | | | | (0.39 | ) | | | (0.03 | ) | | | (0.36 | ) | | | (0.84 | ) | | | — | | | | (1.20 | ) |
| Year Ended September 30, 2019 | | $ | 21.55 | | | | 0.39 | | | | 1.23 | | | | 1.62 | | | | (0.38 | ) | | | (1.52 | ) | | | — | | | | (1.90 | ) |
| * | During the periods certain fees were waived (See Note 4 in the Notes to the Financial Statements). If such reductions had not occurred, the ratios would have been as indicated. |
| ** | Portfolio turnover rate is calculated on the basis of the Fund as a whole without distinguishing between classes of shares issued. |
| (a) | Per share net investment income (loss) has been calculated using the average daily shares method. |
See accompanying Notes to the Financial Statements.
| | | | | | | Ratios/Supplementary Data |
| Net Asset Value, End of Year | | | Total Return (excludes sales charge) | | | Net Assets, End of Year (000) | | | Ratio of net expenses to average net assets | | | Ratio of net investment income (loss) to average net assets | | | Ratio of expenses to average net assets* | | | Portfolio turnover rate** | |
| $ | 23.10 | | | | 16.42 | % | | $ | 28,454 | | | | 1.09 | % | | | 1.60 | % | | | 1.15 | % | | | 110.98 | % |
| $ | 20.19 | | | | (9.84 | )% | | $ | 25,985 | | | | 1.00 | % | | | 1.68 | % | | | 1.03 | % | | | 125.15 | % |
| $ | 22.75 | | | | 37.59 | % | | $ | 30,870 | | | | 0.88 | % | | | 0.16 | % | | | 1.02 | % | | | 122.64 | % |
| $ | 16.72 | | | | (9.15 | )% | | $ | 24,497 | | | | 0.89 | % | | | 2.00 | % | | | 0.96 | % | | | 167.34 | % |
| $ | 19.49 | | | | (2.34 | )% | | $ | 28,548 | | | | 0.89 | % | | | 2.04 | % | | | 0.89 | % | | | 142.59 | % |
| | | | | | | | | | | | | | | | | | | | | | | | | | | |
| $ | 14.47 | | | | 13.45 | % | | $ | 17,911 | | | | 1.16 | % | | | 0.40 | % | | | 1.18 | % | | | 19.99 | % |
| $ | 15.21 | | | | (17.48 | )% | | $ | 17,191 | | | | 1.14 | % | | | 0.10 | % | | | 1.14 | % | | | 29.05 | % |
| $ | 20.01 | | | | 43.32 | % | | $ | 23,421 | | | | 1.12 | % | | | (0.08 | )% | | | 1.15 | % | | | 34.00 | % |
| $ | 13.99 | | | | (5.76 | )% | | $ | 18,851 | | | | 1.13 | % | | | 0.13 | % | | | 1.26 | % | | | 28.77 | % |
| $ | 16.10 | | | | (2.80 | )% | | $ | 23,013 | | | | 1.18 | % | | | 0.29 | % | | | 1.18 | % | | | 26.62 | % |
| | | | | | | | | | | | | | | | | | | | | | | | | | | |
| $ | 16.98 | | | | 13.50 | % | | $ | 5,695 | | | | 1.11 | % | | | 1.54 | % | | | 1.11 | % | | | 154.69 | % |
| $ | 15.12 | | | | (13.50 | )% | | $ | 5,644 | | | | 1.11 | % | | | 0.90 | % | | | 1.11 | % | | | 70.82 | % |
| $ | 19.37 | | | | 64.73 | % | | $ | 7,212 | | | | 1.06 | % | | | 0.66 | % | | | 1.06 | % | | | 110.07 | % |
| $ | 11.83 | | | | (17.84 | )% | | $ | 4,948 | | | | 1.06 | % | | | 0.81 | % | | | 1.08 | % | | | 119.76 | % |
| $ | 14.54 | | | | (9.57 | )% | | $ | 6,599 | | | | 1.05 | % | | | 1.17 | % | | | 1.05 | % | | | 124.82 | % |
| | | | | | | | | | | | | | | | | | | | | | | | | | | |
| $ | 26.08 | | | | 17.96 | % | | $ | 269,413 | | | | 1.16 | % | | | (0.36 | )% | | | 1.16 | % | | | 31.19 | % |
| $ | 23.95 | | | | (18.91 | )% | | $ | 267,480 | | | | 1.13 | % | | | (0.44 | )% | | | 1.13 | % | | | 28.06 | % |
| $ | 33.44 | | | | 37.18 | % | | $ | 355,673 | | | | 1.11 | % | | | (0.36 | )% | | | 1.12 | % | | | 27.20 | % |
| $ | 24.67 | | | | 5.55 | % | | $ | 276,975 | | | | 1.11 | % | | | (0.04 | )% | | | 1.11 | % | | | 17.50 | % |
| $ | 24.63 | | | | 1.21 | % | | $ | 322,003 | | | | 1.11 | % | | | 0.06 | % | | | 1.11 | % | | | 17.31 | % |
| | | | | | | | | | | | | | | | | | | | | | | | | | | |
| $ | 25.26 | | | | 12.55 | % | | $ | 418,725 | | | | 1.07 | % | | | 1.34 | % | | | 1.07 | % | | | 39.43 | % |
| $ | 24.27 | | | | (5.85 | )% | | $ | 411,766 | | | | 1.04 | % | | | 1.29 | % | | | 1.04 | % | | | 31.23 | % |
| $ | 26.57 | | | | 34.11 | % | | $ | 460,034 | | | | 1.03 | % | | | 1.15 | % | | | 1.04 | % | | | 13.00 | % |
| $ | 20.04 | | | | (0.10 | )% | | $ | 320,255 | | | | 1.03 | % | | | 1.79 | % | | | 1.03 | % | | | 33.60 | % |
| $ | 21.27 | | | | 8.48 | % | | $ | 338,293 | | | | 1.02 | % | | | 1.92 | % | | | 1.02 | % | | | 23.20 | % |
Financial Highlights, Class A Shares
September 30, 2023
The financial highlights table is intended to help you understand the Funds’ financial performance for the past 5 years or, if shorter, the period of the Funds’ operations. Certain information reflects financial results for a single Fund share. The total returns in the table represent the rate that an investor would have earned (or lost) on an investment in the Fund (assuming reinvestment of all dividends and distributions).
| | | | | | Investment Activities | | | Distributions |
| | | Net Asset Value, Beginning of Year | | | Net investment income (loss)(a) | | | Net realized/ unrealized gains (losses) on investments | | | Total from Investment Activities | | | Net investment income | | | Net realized gains on investments | | | Return of capital | | | Total Distributions | |
| Sterling Capital Behavioral International Equity Fund | | | | | | |
| Year Ended September 30, 2023 | | $ | 7.09 | | | | 0.29 | | | | 1.99 | | | | 2.28 | | | | (0.24 | ) | | | — | | | | — | | | | (0.24 | ) |
| Year Ended September 30, 2022 | | $ | 9.80 | | | | 0.36 | | | | (2.64 | ) | | | (2.28 | ) | | | (0.43 | ) | | | — | | | | — | | | | (0.43 | ) |
| Year Ended September 30, 2021 | | $ | 8.14 | | | | 0.26 | | | | 1.62 | | | | 1.88 | | | | (0.22 | ) | | | — | | | | — | | | | (0.22 | ) |
| Year Ended September 30, 2020 | | $ | 9.48 | | | | 0.24 | | | | (1.30 | ) | | | (1.06 | ) | | | (0.28 | ) | | | — | | | | — | | | | (0.28 | ) |
| Year Ended September 30, 2019 | | $ | 11.17 | | | | 0.31 | | | | (1.31 | ) | | | (1.00 | ) | | | (0.29 | ) | | | (0.40 | ) | | | — | | | | (0.69 | ) |
| Sterling Capital SMID Opportunities Fund | | | | | | | | | |
| Year Ended September 30, 2023 | | $ | 12.08 | | | | (0.02 | ) | | | 1.38 | | | | 1.36 | | | | — | | | | (1.33 | ) | | | — | | | | (1.33 | ) |
| Year Ended September 30, 2022 | | $ | 16.08 | | | | (0.01 | ) | | | (2.59 | ) | | | (2.60 | ) | | | — | | | | (1.40 | ) | | | — | | | | (1.40 | ) |
| Year Ended September 30, 2021 | | $ | 12.45 | | | | (0.06 | ) | | | 3.69 | | | | 3.63 | | | | — | | | | — | | | | — | | | | — | |
| Year Ended September 30, 2020 | | $ | 13.24 | | | | (0.03 | ) | | | (0.13 | ) | | | (0.16 | ) | | | — | | | | (0.63 | ) | | | — | | | | (0.63 | ) |
| Year Ended September 30, 2019 | | $ | 12.44 | | | | (0.02 | ) | | | 0.82 | | | | 0.80 | | | | — | | | | — | | | | — | | | | — | |
| Sterling Capital Mid Cap Relative Value Fund | | |
| Year Ended September 30, 2023 | | $ | 62.45 | | | | 0.40 | | | | 8.65 | | | | 9.05 | | | | (0.39 | ) | | | (10.17 | ) | | | — | | | | (10.56 | ) |
| Year Ended September 30, 2022 | | $ | 78.45 | | | | 0.39 | | | | (10.09 | ) | | | (9.70 | ) | | | (0.33 | ) | | | (5.97 | ) | | | — | | | | (6.30 | ) |
| Year Ended September 30, 2021 | | $ | 58.67 | | | | 0.28 | | | | 19.97 | | | | 20.25 | | | | (0.24 | ) | | | (0.23 | ) | | | — | | | | (0.47 | ) |
| Year Ended September 30, 2020 | | $ | 64.04 | | | | 0.25 | | | | (3.65 | ) | | | (3.40 | ) | | | (0.46 | ) | | | (1.51 | ) | | | — | | | | (1.97 | ) |
| Year Ended September 30, 2019 | | $ | 68.74 | | | | 0.30 | | | | 0.17 | | | | 0.47 | | | | (0.15 | ) | | | (5.02 | ) | | | — | | | | (5.17 | ) |
| Sterling Capital Real Estate Fund | | | | | | |
| Year Ended September 30, 2023 | | $ | 34.86 | | | | 0.64 | | | | (0.25 | ) | | | 0.39 | | | | (0.67 | ) | | | (2.23 | ) | | | — | | | | (2.90 | ) |
| Year Ended September 30, 2022 | | $ | 46.09 | | | | 0.27 | | | | (7.99 | ) | | | (7.72 | ) | | | (0.52 | ) | | | (2.99 | ) | | | — | | | | (3.51 | ) |
| Year Ended September 30, 2021 | | $ | 36.61 | | | | 0.35 | | | | 10.46 | | | | 10.81 | | | | (0.51 | ) | | | (0.82 | ) | | | — | | | | (1.33 | ) |
| Year Ended September 30, 2020 | | $ | 42.28 | | | | 0.25 | | | | (3.72 | ) | | | (3.47 | ) | | | (0.68 | ) | | | (1.52 | ) | | | — | | | | (2.20 | ) |
| Year Ended September 30, 2019 | | $ | 37.57 | | | | 0.75 | | | | 5.98 | | | | 6.73 | | | | (0.78 | ) | | | (1.24 | ) | | | — | | | | (2.02 | ) |
| Sterling Capital Small Cap Value Fund | | | | |
| Year Ended September 30, 2023 | | $ | 57.67 | | | | 0.16 | | | | 8.11 | | | | 8.27 | | | | (0.09 | ) | | | (13.68 | ) | | | — | | | | (13.77 | ) |
| Year Ended September 30, 2022 | | $ | 83.01 | | | | 0.09 | | | | (8.16 | ) | | | (8.07 | ) | | | — | | | | (17.27 | ) | | | — | | | | (17.27 | ) |
| Year Ended September 30, 2021 | | $ | 63.67 | | | | (0.01 | ) | | | 30.82 | | | | 30.81 | | | | (0.25 | ) | | | (11.22 | ) | | | — | | | | (11.47 | ) |
| Year Ended September 30, 2020 | | $ | 78.00 | | | | 0.25 | | | | (9.36 | ) | | | (9.11 | ) | | | (0.29 | ) | | | (4.93 | ) | | | — | | | | (5.22 | ) |
| Year Ended September 30, 2019 | | $ | 88.73 | | | | 0.32 | | | | (5.00 | ) | | | (4.68 | ) | | | (0.15 | ) | | | (5.90 | ) | | | — | | | | (6.05 | ) |
| Sterling Capital Ultra Short Bond Fund | | | |
| Year Ended September 30, 2023 | | $ | 9.55 | | | | 0.31 | | | | 0.16 | | | | 0.47 | | | | (0.34 | ) | | | — | | | | — | | | | (0.34 | ) |
| Year Ended September 30, 2022 | | $ | 9.78 | | | | 0.08 | | | | (0.19 | ) | | | (0.11 | ) | | | (0.12 | ) | | | — | | | | — | | | | (0.12 | ) |
| Year Ended September 30, 2021 | | $ | 9.82 | | | | 0.08 | | | | (0.02 | ) | | | 0.06 | | | | (0.10 | ) | | | — | | | | — | | | | (0.10 | ) |
| Year Ended September 30, 2020 | | $ | 9.78 | | | | 0.17 | | | | 0.04 | | | | 0.21 | | | | (0.17 | ) | | | — | | | | — | | | | (0.17 | ) |
| Year Ended September 30, 2019 | | $ | 9.75 | | | | 0.23 | | | | 0.03 | | | | 0.26 | | | | (0.23 | ) | | | — | | | | — | | | | (0.23 | ) |
| * | During the periods certain fees were waived (See Note 4 in the Notes to the Financial Statements). If such reductions had not occurred, the ratios would have been as indicated. |
| ** | Portfolio turnover rate is calculated on the basis of the Fund as a whole without distinguishing between classes of shares issued. |
| (a) | Per share net investment income (loss) has been calculated using the average daily shares method. |
See accompanying Notes to the Financial Statements.
| | | | | | | Ratios/Supplementary Data |
| Net Asset Value, End of Year | | | Total Return (excludes sales charge) | | | Net Assets, End of Year (000) | | | Ratio of net expenses to average net assets | | | Ratio of net investment income (loss) to average net assets | | | Ratio of expenses to average net assets* | | | Portfolio turnover rate** | |
| $ | 9.13 | | | | 32.53 | % | | $ | 369 | | | | 0.92 | % | | | 3.26 | % | | | 0.92 | % | | | 86.05 | % |
| $ | 7.09 | | | | (24.40 | )% | | $ | 308 | | | | 0.91 | % | | | 3.99 | % | | | 0.92 | % | | | 103.20 | % |
| $ | 9.80 | | | | 23.46 | % | | $ | 490 | | | | 0.92 | % | | | 2.73 | % | | | 0.98 | % | | | 158.16 | % |
| $ | 8.14 | | | | (11.76 | )% | | $ | 426 | | | | 0.88 | % | | | 2.81 | % | | | 1.08 | % | | | 164.02 | % |
| $ | 9.48 | | | | (8.72 | )% | | $ | 537 | | | | 0.94 | % | | | 3.16 | % | | | 1.14 | % | | | 97.74 | % |
| | | | | | | | | | | | | | | | | | | | | | | | | | | |
| $ | 12.11 | | | | 11.49 | % | | $ | 2,608 | | | | 1.04 | % | | | (0.19 | )% | | | 1.47 | % | | | 72.61 | % |
| $ | 12.08 | | | | (18.16 | )% | | $ | 3,688 | | | | 1.04 | % | | | (0.06 | )% | | | 1.38 | % | | | 23.35 | % |
| $ | 16.08 | | | | 29.16 | % | | $ | 5,095 | | | | 1.04 | % | | | (0.42 | )% | | | 1.31 | % | | | 33.93 | % |
| $ | 12.45 | | | | (1.54 | )% | | $ | 4,425 | | | | 1.04 | % | | | (0.22 | )% | | | 1.34 | % | | | 60.03 | % |
| $ | 13.24 | | | | 6.43 | % | | $ | 3,097 | | | | 1.04 | % | | | (0.18 | )% | | | 1.45 | % | | | 45.11 | % |
| | | | | | | | | | | | | | | | | | | | | | | | | | | |
| $ | 60.94 | | | | 14.75 | % | | $ | 460 | | | | 1.12 | % | | | 0.65 | % | | | 1.12 | % | | | 4.89 | % |
| $ | 62.45 | | | | (13.89 | )% | | $ | 380 | | | | 1.10 | % | | | 0.53 | % | | | 1.10 | % | | | 7.94 | % |
| $ | 78.45 | | | | 34.65 | % | | $ | 369 | | | | 1.10 | % | | | 0.38 | % | | | 1.11 | % | | | 8.23 | % |
| $ | 58.67 | | | | (5.63 | )% | | $ | 145 | | | | 1.16 | % | | | 0.42 | % | | | 1.19 | % | | | 9.21 | % |
| $ | 64.04 | | | | 1.72 | % | | $ | 126 | | | | 1.20 | % | | | 0.50 | % | | | 1.20 | % | | | 6.75 | % |
| | | | | | | | | | | | | | | | | | | | | | | | | | | |
| $ | 32.35 | | | | 0.70 | % | | $ | 543 | | | | 1.12 | % | | | 1.81 | % | | | 1.12 | % | | | 6.06 | % |
| $ | 34.86 | | | | (18.60 | )% | | $ | 670 | | | | 1.07 | % | | | 0.60 | % | | | 1.07 | % | | | 12.58 | % |
| $ | 46.09 | | | | 30.08 | % | | $ | 719 | | | | 1.05 | % | | | 0.82 | % | | | 1.05 | % | | | 12.68 | % |
| $ | 36.61 | | | | (8.33 | )% | | $ | 537 | | | | 1.08 | % | | | 0.67 | % | | | 1.08 | % | | | 19.58 | % |
| $ | 42.28 | | | | 18.76 | % | | $ | 800 | | | | 1.07 | % | | | 1.92 | % | | | 1.07 | % | | | 14.56 | % |
| | | | | | | | | | | | | | | | | | | | | | | | | | | |
| $ | 52.17 | | | | 15.05 | % | | $ | 2,656 | | | | 1.28 | % | | | 0.29 | % | | | 1.30 | % | | | 0.77 | % |
| $ | 57.67 | | | | (14.14 | )% | | $ | 2,464 | | | | 1.25 | % | | | 0.13 | % | | | 1.25 | % | | | 5.26 | % |
| $ | 83.01 | | | | 52.43 | % | | $ | 3,468 | | | | 1.23 | % | | | (0.01 | )% | | | 1.26 | % | | | 6.15 | % |
| $ | 63.67 | | | | (12.81 | )% | | $ | 2,048 | | | | 1.25 | % | | | 0.37 | % | | | 1.33 | % | | | 8.33 | % |
| $ | 78.00 | | | | (4.79 | )% | | $ | 2,775 | | | | 1.28 | % | | | 0.42 | % | | | 1.33 | % | | | 8.60 | % |
| | | | | | | | | | | | | | | | | | | | | | | | | | | |
| $ | 9.68 | | | | 4.97 | % | | $ | 5,756 | | | | 0.52 | % | | | 3.26 | % | | | 0.82 | % | | | 45.10 | % |
| $ | 9.55 | | | | (1.07 | )% | | $ | 7,090 | | | | 0.52 | % | | | 0.87 | % | | | 0.75 | % | | | 50.11 | % |
| $ | 9.78 | | | | 0.51 | % | | $ | 7,219 | | | | 0.53 | % | | | 0.82 | % | | | 0.75 | % | | | 48.71 | % |
| $ | 9.82 | | | | 2.20 | % | | $ | 2,675 | | | | 0.63 | % | | | 1.73 | % | | | 0.81 | % | | | 43.45 | % |
| $ | 9.78 | | | | 2.70 | % | | $ | 2,219 | | | | 0.68 | % | | | 2.39 | % | | | 0.79 | % | | | 103.69 | % |
Financial Highlights, Class A Shares
September 30, 2023
The financial highlights table is intended to help you understand the Funds’ financial performance for the past 5 years or, if shorter, the period of the Funds’ operations. Certain information reflects financial results for a single Fund share. The total returns in the table represent the rate that an investor would have earned (or lost) on an investment in the Fund (assuming reinvestment of all dividends and distributions).
| | | | | | Investment Activities | | | Distributions |
| | | Net Asset Value, Beginning of Year | | | Net investment income(a) | | | Net realized/ unrealized gains (losses) on investments | | | Total from Investment Activities | | | Net investment income | | | Net realized gains on investments | | | Return of capital | | | Total Distributions | |
| Sterling Capital Short Duration Bond Fund | | | | | | |
| Year Ended September 30, 2023 | | $ | 8.08 | | | | 0.25 | | | | 0.04 | | | | 0.29 | | | | (0.23 | ) | | | — | | | | — | | | | (0.23 | ) |
| Year Ended September 30, 2022 | | $ | 8.68 | | | | 0.08 | | | | (0.51 | ) | | | (0.43 | ) | | | (0.17 | ) | | | — | | | | — | | | | (0.17 | ) |
| Year Ended September 30, 2021 | | $ | 8.78 | | | | 0.10 | | | | (0.02 | ) | | | 0.08 | | | | (0.18 | ) | | | — | | | | — | | | | (0.18 | ) |
| Year Ended September 30, 2020 | | $ | 8.65 | | | | 0.17 | | | | 0.16 | | | | 0.33 | | | | (0.20 | ) | | | — | | | | — | | | | (0.20 | ) |
| Year Ended September 30, 2019 | | $ | 8.52 | | | | 0.21 | | | | 0.15 | | | | 0.36 | | | | (0.23 | ) | | | — | | | | — | | | | (0.23 | ) |
| Sterling Capital Intermediate U.S. Government Fund | | | | |
| Year Ended September 30, 2023 | | $ | 8.51 | | | | 0.16 | | | | (0.12 | ) | | | 0.04 | | | | (0.21 | ) | | | — | | | | — | | | | (0.21 | ) |
| Year Ended September 30, 2022 | | $ | 9.78 | | | | 0.08 | | | | (1.15 | ) | | | (1.07 | ) | | | (0.20 | ) | | | — | | | | — | | | | (0.20 | ) |
| Year Ended September 30, 2021 | | $ | 10.13 | | | | 0.06 | | | | (0.18 | ) | | | (0.12 | ) | | | (0.23 | ) | | | — | | | | — | | | | (0.23 | ) |
| Year Ended September 30, 2020 | | $ | 9.92 | | | | 0.17 | | | | 0.29 | | | | 0.46 | | | | (0.25 | ) | | | — | | | | — | | | | (0.25 | ) |
| Year Ended September 30, 2019 | | $ | 9.48 | | | | 0.21 | | | | 0.47 | | | | 0.68 | | | | (0.24 | ) | | | — | | | | — | | | | (0.24 | ) |
| Sterling Capital Total Return Bond Fund | | | |
| Year Ended September 30, 2023 | | $ | 9.11 | | | | 0.28 | | | | (0.24 | ) | | | 0.04 | | | | (0.28 | ) | | | — | | | | — | | | | (0.28 | ) |
| Year Ended September 30, 2022 | | $ | 11.04 | | | | 0.18 | | | | (1.80 | ) | | | (1.62 | ) | | | (0.22 | ) | | | (0.09 | ) | | | — | | | | (0.31 | ) |
| Year Ended September 30, 2021 | | $ | 11.38 | | | | 0.17 | | | | (0.12 | ) | | | 0.05 | | | | (0.24 | ) | | | (0.15 | ) | | | — | | | | (0.39 | ) |
| Year Ended September 30, 2020 | | $ | 10.88 | | | | 0.24 | | | | 0.55 | | | | 0.79 | | | | (0.29 | ) | | | — | (b) | | | — | | | | (0.29 | ) |
| Year Ended September 30, 2019 | | $ | 10.20 | | | | 0.30 | | | | 0.69 | | | | 0.99 | | | | (0.31 | ) | | | — | | | | — | | | | (0.31 | ) |
| Sterling Capital Long Duration Corporate Bond Fund | | | |
| Year Ended September 30, 2023 | | $ | 6.63 | | | | 0.28 | | | | (0.17 | ) | | | 0.11 | | | | (0.29 | ) | | | — | | | | — | | | | (0.29 | ) |
| Year Ended September 30, 2022 | | $ | 10.51 | | | | 0.25 | | | | (2.85 | ) | | | (2.60 | ) | | | (0.25 | ) | | | (1.03 | ) | | | — | | | | (1.28 | ) |
| Year Ended September 30, 2021 | | $ | 10.78 | | | | 0.25 | | | | 0.03 | | | | 0.28 | | | | (0.25 | ) | | | (0.30 | ) | | | — | | | | (0.55 | ) |
| Year Ended September 30, 2020 | | $ | 10.38 | | | | 0.27 | | | | 0.40 | | | | 0.67 | | | | (0.27 | ) | | | — | | | | — | | | | (0.27 | ) |
| Year Ended September 30, 2019 | | $ | 9.81 | | | | 0.30 | | | | 0.57 | | | | 0.87 | | | | (0.30 | ) | | | — | | | | — | | | | (0.30 | ) |
| Sterling Capital Quality Income Fund | | | |
| Year Ended September 30, 2023 | | $ | 8.78 | | | | 0.23 | | | | (0.21 | ) | | | 0.02 | | | | (0.24 | ) | | | — | | | | — | | | | (0.24 | ) |
| Year Ended September 30, 2022 | | $ | 10.04 | | | | 0.14 | | | | (1.23 | ) | | | (1.09 | ) | | | (0.17 | ) | | | — | | | | — | | | | (0.17 | ) |
| Year Ended September 30, 2021. | | $ | 10.25 | | | | 0.13 | | | | (0.15 | ) | | | (0.02 | ) | | | (0.19 | ) | | | — | | | | — | | | | (0.19 | ) |
| Year Ended September 30, 2020 | | $ | 10.09 | | | | 0.21 | | | | 0.20 | | | | 0.41 | | | | (0.25 | ) | | | — | | | | — | | | | (0.25 | ) |
| Year Ended September 30, 2019 | | $ | 9.60 | | | | 0.28 | | | | 0.49 | | | | 0.77 | | | | (0.28 | ) | | | — | | | | — | | | | (0.28 | ) |
| * | During the periods certain fees were waived (See Note 4 in the Notes to the Financial Statements). If such reductions had not occurred, the ratios would have been as indicated. |
| ** | Portfolio turnover rate is calculated on the basis of the Fund as a whole without distinguishing between classes of shares issued. |
| (a) | Per share net investment income (loss) has been calculated using the average daily shares method. |
| (b) | Amount is less than $0.005. |
See accompanying Notes to the Financial Statements.
| | | | | | | Ratios/Supplementary Data |
| Net Asset Value, End of Year | | | Total Return (excludes sales charge) | | | Net Assets, End of Year (000) | | | Ratio of net expenses to average net assets | | | Ratio of net investment income (loss) to average net assets | | | Ratio of expenses to average net assets* | | | Portfolio turnover rate** | |
| $ | 8.14 | | | | 3.62 | % | | $ | 3,228 | | | | 0.70 | % | | | 3.02 | % | | | 0.73 | % | | | 98.01 | % |
| $ | 8.08 | | | | (5.02 | )% | | $ | 3,665 | | | | 0.73 | % | | | 0.94 | % | | | 0.73 | % | | | 76.98 | % |
| $ | 8.68 | | | | 0.94 | % | | $ | 4,419 | | | | 0.68 | % | | | 1.15 | % | | | 0.71 | % | | | 39.26 | % |
| $ | 8.78 | | | | 3.86 | % | | $ | 4,260 | | | | 0.67 | % | | | 1.93 | % | | | 0.77 | % | | | 64.69 | % |
| $ | 8.65 | | | | 4.29 | % | | $ | 3,197 | | | | 0.68 | % | | | 2.44 | % | | | 0.78 | % | | | 78.58 | % |
| | | | | | | | | | | | | | | | | | | | | | | | | | | |
| $ | 8.34 | | | | 0.43 | % | | $ | 2,550 | | | | 0.75 | % | | | 1.89 | % | | | 0.94 | % | | | 7.91 | % |
| $ | 8.51 | | | | (11.12 | )% | | $ | 2,879 | | | | 0.73 | % | | | 0.87 | % | | | 0.92 | % | | | 14.18 | % |
| $ | 9.78 | | | | (1.23 | )% | | $ | 3,388 | | | | 0.68 | % | | | 0.64 | % | | | 0.86 | % | | | 71.31 | % |
| $ | 10.13 | | | | 4.66 | % | | $ | 3,930 | | | | 0.79 | % | | | 1.68 | % | | | 0.95 | % | | | 47.36 | % |
| $ | 9.92 | | | | 7.27 | % | | $ | 3,531 | | | | 0.81 | % | | | 2.12 | % | | | 0.91 | % | | | 40.13 | % |
| | | | | | | | | | | | | | | | | | | | | | | | | | | |
| $ | 8.87 | | | | 0.41 | % | | $ | 46,772 | | | | 0.70 | % | | | 2.99 | % | | | 0.76 | % | | | 47.80 | % |
| $ | 9.11 | | | | (14.94 | )% | | $ | 47,701 | | | | 0.70 | % | | | 1.75 | % | | | 0.74 | % | | | 47.98 | % |
| $ | 11.04 | | | | 0.44 | % | | $ | 60,694 | | | | 0.70 | % | | | 1.52 | % | | | 0.75 | % | | | 48.80 | % |
| $ | 11.38 | | | | 7.33 | % | | $ | 57,202 | | | | 0.70 | % | | | 2.20 | % | | | 0.82 | % | | | 59.59 | % |
| $ | 10.88 | | | | 9.90 | % | | $ | 55,513 | | | | 0.70 | % | | | 2.87 | % | | | 0.83 | % | | | 79.40 | % |
| | | | | | | | | | | | | | | | | | | | | | | | | | | |
| $ | 6.45 | | | | 1.38 | % | | $ | 308 | | | | 0.70 | % | | | 4.09 | % | | | 0.89 | % | | | 26.27 | % |
| $ | 6.63 | | | | (27.78 | )% | | $ | 436 | | | | 0.85 | % | | | 2.94 | % | | | 1.04 | % | | | 161.62 | % |
| $ | 10.51 | | | | 2.67 | % | | $ | 632 | | | | 0.97 | % | | | 2.40 | % | | | 1.16 | % | | | 47.29 | % |
| $ | 10.78 | | | | 6.56 | % | | $ | 490 | | | | 0.92 | % | | | 2.57 | % | | | 0.94 | % | | | 52.28 | % |
| $ | 10.38 | | | | 9.01 | % | | $ | 498 | | | | 0.93 | % | | | 2.98 | % | | | 0.95 | % | | | 82.23 | % |
| | | | | | | | | | | | | | | | | | | | | | | | | | | |
| $ | 8.56 | | | | 0.18 | % | | $ | 32 | | | | 0.83 | % | | | 2.57 | % | | | 0.88 | % | | | 9.85 | % |
| $ | 8.78 | | | | (10.93 | )% | | $ | 32 | | | | 0.82 | % | | | 1.44 | % | | | 0.86 | % | | | 35.18 | % |
| $ | 10.04 | | | | (0.23 | )% | | $ | 29 | | | | 0.82 | % | | | 1.29 | % | | | 0.86 | % | | | 73.60 | % |
| $ | 10.25 | | | | 4.07 | % | | $ | 25 | | | | 0.84 | % | | | 2.06 | % | | | 0.88 | % | | | 35.96 | % |
| $ | 10.09 | | | | 8.13 | % | | $ | 20 | | | | 0.85 | % | | | 2.90 | % | | | 0.89 | % | | | 17.58 | % |
Financial Highlights, Class A Shares
September 30, 2023
The financial highlights table is intended to help you understand the Funds’ financial performance for the past 5 years or, if shorter, the period of the Funds’ operations. Certain information reflects financial results for a single Fund share. The total returns in the table represent the rate that an investor would have earned (or lost) on an investment in the Fund (assuming reinvestment of all dividends and distributions).
| | | | | | Investment Activities | | | Distributions | |
| | | Net Asset
Value,
Beginning
of Year | | | Net
investment
income(a) | | | Net realized/
unrealized
gains
(losses) on
investments | | | Total from
Investment
Activities | | | Net
investment
income | | | Net
realized
gains on
investments | | | Return
of
capital | | | Total
Distributions | |
| Sterling Capital North Carolina Intermediate Tax-Free Fund |
| Year Ended September 30, 2023 | | $ | 9.84 | | | | 0.20 | | | | (0.09 | ) | | | 0.11 | | | | (0.20 | ) | | | — | | | | — | | | | (0.20 | ) |
| Year Ended September 30, 2022 | | $ | 10.97 | | | | 0.16 | | | | (1.13 | ) | | | (0.97 | ) | | | (0.16 | ) | | | — | | | | — | | | | (0.16 | ) |
| Year Ended September 30, 2021 | | $ | 11.12 | | | | 0.15 | | | | (0.15 | ) | | | — | | | | (0.15 | ) | | | — | | | | — | | | | (0.15 | ) |
| Year Ended September 30, 2020 | | $ | 10.91 | | | | 0.18 | | | | 0.21 | | | | 0.39 | | | | (0.18 | ) | | | — | | | | — | | | | (0.18 | ) |
| Year Ended September 30, 2019 | | $ | 10.43 | | | | 0.23 | | | | 0.48 | | | | 0.71 | | | | (0.23 | ) | | | — | | | | — | | | | (0.23 | ) |
| Sterling Capital South Carolina Intermediate Tax-Free Fund |
| Year Ended September 30, 2023 | | $ | 10.24 | | | | 0.20 | | | | (0.08 | ) | | | 0.12 | | | | (0.20 | ) | | | — | | | | — | | | | (0.20 | ) |
| Year Ended September 30, 2022 | | $ | 11.40 | | | | 0.18 | | | | (1.16 | ) | | | (0.98 | ) | | | (0.18 | ) | | | — | | | | — | | | | (0.18 | ) |
| Year Ended September 30, 2021 | | $ | 11.47 | | | | 0.17 | | | | (0.07 | ) | | | 0.10 | | | | (0.17 | ) | | | — | | | | — | | | | (0.17 | ) |
| Year Ended September 30, 2020 | | $ | 11.27 | | | | 0.20 | | | | 0.20 | | | | 0.40 | | | | (0.20 | ) | | | — | | | | — | | | | (0.20 | ) |
| Year Ended September 30, 2019 | | $ | 10.77 | | | | 0.21 | | | | 0.50 | | | | 0.71 | | | | (0.21 | ) | | | — | | | | — | | | | (0.21 | ) |
| Sterling Capital Virginia Intermediate Tax-Free Fund |
| Year Ended September 30, 2023 | | $ | 10.77 | | | | 0.20 | | | | (0.08 | ) | | | 0.12 | | | | (0.20 | ) | | | — | | | | — | | | | (0.20 | ) |
| Year Ended September 30, 2022 | | $ | 11.98 | | | | 0.16 | | | | (1.20 | ) | | | (1.04 | ) | | | (0.16 | ) | | | (0.01 | ) | | | — | | | | (0.17 | ) |
| Year Ended September 30, 2021 | | $ | 12.23 | | | | 0.16 | | | | (0.22 | ) | | | (0.06 | ) | | | (0.16 | ) | | | (0.03 | ) | | | — | | | | (0.19 | ) |
| Year Ended September 30, 2020 | | $ | 11.98 | | | | 0.20 | | | | 0.25 | | | | 0.45 | | | | (0.20 | ) | | | — | | | | — | | | | (0.20 | ) |
| Year Ended September 30, 2019 | | $ | 11.40 | | | | 0.23 | | | | 0.58 | | | | 0.81 | | | | (0.23 | ) | | | — | | | | — | | | | (0.23 | ) |
| Sterling Capital West Virginia Intermediate Tax-Free Fund |
| Year Ended September 30, 2023 | | $ | 9.22 | | | | 0.20 | | | | (0.10 | ) | | | 0.10 | | | | (0.20 | ) | | | — | | | | — | | | | (0.20 | ) |
| Year Ended September 30, 2022 | | $ | 10.20 | | | | 0.15 | | | | (0.98 | ) | | | (0.83 | ) | | | (0.15 | ) | | | — | (b) | | | — | | | | (0.15 | ) |
| Year Ended September 30, 2021 | | $ | 10.29 | | | | 0.16 | | | | (0.08 | ) | | | 0.08 | | | | (0.16 | ) | | | (0.01 | ) | | | — | | | | (0.17 | ) |
| Year Ended September 30, 2020 | | $ | 10.12 | | | | 0.19 | | | | 0.18 | | | | 0.37 | | | | (0.19 | ) | | | (0.01 | ) | | | — | | | | (0.20 | ) |
| Year Ended September 30, 2019 | | $ | 9.72 | | | | 0.22 | | | | 0.42 | | | | 0.64 | | | | (0.22 | ) | | | (0.02 | ) | | | — | | | | (0.24 | ) |
| * | During the periods certain fees were waived (See Note 4 in the Notes to the Financial Statements). If such reductions had not occurred, the ratios would have been as indicated. |
| ** | Portfolio turnover rate is calculated on the basis of the Fund as a whole without distinguishing between classes of shares issued. |
| (a) | Per share net investment income (loss) has been calculated using the average daily shares method. |
| (b) | Amount is less than $0.005. |
See accompanying Notes to the Financial Statements.
| | | | | | | Ratios/Supplementary Data | |
Net Asset Value,
End of Year | | | Total Return
(excludes sales
charge) | | | Net Assets, End
of Year (000) | | | Ratio of net
expenses to
average net
assets | | | Ratio of net
investment
income (loss) to
average net
assets | | | Ratio of
expenses to
average net
assets* | | | Portfolio
turnover
rate** | |
| $ | 9.75 | | | | 1.08 | % | | $ | 22,320 | | | | 0.85 | % | | | 1.99 | % | | | 0.85 | % | | 38.07 | % |
| $ | 9.84 | | | | (8.92 | )% | | $ | 24,664 | | | | 0.82 | % | | | 1.52 | % | | | 0.82 | % | | 50.21 | % |
| $ | 10.97 | | | | (0.01 | )% | | $ | 31,234 | | | | 0.80 | % | | | 1.34 | % | | | 0.80 | % | | 7.97 | % |
| $ | 11.12 | | | | 3.64 | % | | $ | 33,648 | | | | 0.79 | % | | | 1.68 | % | | | 0.79 | % | | 17.06 | % |
| $ | 10.91 | | | | 6.84 | % | | $ | 38,587 | | | | 0.80 | % | | | 2.12 | % | | | 0.80 | % | | 33.12 | % |
| $ | 10.16 | | | | 1.15 | % | | $ | 6,369 | | | | 0.87 | % | | | 1.92 | % | | | 0.88 | % | | 32.34 | % |
| $ | 10.24 | | | | (8.66 | )% | | $ | 7,056 | | | | 0.85 | % | | | 1.64 | % | | | 0.85 | % | | 9.94 | % |
| $ | 11.40 | | | | 0.86 | % | | $ | 11,204 | | | | 0.81 | % | | | 1.44 | % | | | 0.81 | % | | 20.23 | % |
| $ | 11.47 | | | | 3.58 | % | | $ | 11,926 | | | | 0.81 | % | | | 1.76 | % | | | 0.81 | % | | 4.84 | % |
| $ | 11.27 | | | | 6.62 | % | | $ | 12,478 | | | | 0.81 | % | | | 1.88 | % | | | 0.81 | % | | 23.84 | % |
| $ | 10.69 | | | | 1.05 | % | | $ | 11,272 | | | | 0.86 | % | | | 1.78 | % | | | 0.86 | % | | 17.86 | % |
| $ | 10.77 | | | | (8.72 | )% | | $ | 14,162 | | | | 0.83 | % | | | 1.40 | % | | | 0.83 | % | | 37.23 | % |
| $ | 11.98 | | | | (0.52 | )% | | $ | 17,292 | | | | 0.81 | % | | | 1.31 | % | | | 0.81 | % | | 8.98 | % |
| $ | 12.23 | | | | 3.80 | % | | $ | 17,446 | | | | 0.81 | % | | | 1.67 | % | | | 0.81 | % | | 15.44 | % |
| $ | 11.98 | | | | 7.13 | % | | $ | 17,795 | | | | 0.81 | % | | | 1.94 | % | | | 0.81 | % | | 24.57 | % |
| $ | 9.12 | | | | 1.07 | % | | $ | 20,855 | | | | 0.86 | % | | | 2.14 | % | | | 0.86 | % | | 37.11 | % |
| $ | 9.22 | | | | (8.18 | )% | | $ | 23,829 | | | | 0.82 | % | | | 1.54 | % | | | 0.82 | % | | 18.08 | % |
| $ | 10.20 | | | | 0.72 | % | | $ | 27,208 | | | | 0.81 | % | | | 1.53 | % | | | 0.81 | % | | 8.56 | % |
| $ | 10.29 | | | | 3.66 | % | | $ | 27,866 | | | | 0.81 | % | | | 1.84 | % | | | 0.81 | % | | 3.28 | % |
| $ | 10.12 | | | | 6.59 | % | | $ | 22,389 | | | | 0.81 | % | | | 2.18 | % | | | 0.81 | % | | 33.73 | % |
Financial Highlights, Class C Shares
September 30, 2023
The financial highlights table is intended to help you understand the Funds’ financial performance for the past 5 years or, if shorter, the period of the Funds’ operations. Certain information reflects financial results for a single Fund share. The total returns in the table represent the rate that an investor would have earned (or lost) on an investment in the Fund (assuming reinvestment of all dividends and distributions).
| | | | | | Investment Activities | | | Distributions | |
| | | Net Asset
Value,
Beginning
of Year | | | Net
investment
income
(loss)(a) | | | Net realized/
unrealized
gains
(losses) on
investments | | | Total from
Investment
Activities | | | Net
investment
income | | | Net
realized
gains on
investments | | | Return
of
capital | | | Total
Distributions | |
| Sterling Capital Behavioral Large Cap Value Equity Fund |
| Year Ended September 30, 2023 | | $ | 19.41 | | | | 0.19 | | | | 2.83 | | | | 3.02 | | | | (0.24 | ) | | | — | | | | — | | | | (0.24 | ) |
| Year Ended September 30, 2022 | | $ | 21.88 | | | | 0.21 | | | | (2.49 | ) | | | (2.28 | ) | | | (0.19 | ) | | | — | | | | — | | | | (0.19 | ) |
| Year Ended September 30, 2021 | | $ | 16.17 | | | | (0.04 | ) | | | 5.92 | | | | 5.88 | | | | (0.03 | ) | | | — | | | | (0.14 | ) | | | (0.17 | ) |
| Year Ended September 30, 2020 | | $ | 18.88 | | | | 0.21 | | | | (1.99 | ) | | | (1.78 | ) | | | (0.35 | ) | | | (0.58 | ) | | | — | | | | (0.93 | ) |
| Year Ended September 30, 2019 | | $ | 21.67 | | | | 0.24 | | | | (1.04 | ) | | | (0.80 | ) | | | (0.24 | ) | | | (1.75 | ) | | | — | | | | (1.99 | ) |
| Sterling Capital Mid Value Fund |
| Year Ended September 30, 2023 | | $ | 12.52 | | | | (0.04 | ) | | | 1.60 | | | | 1.56 | | | | — | | | | (2.72 | ) | | | — | | | | (2.72 | ) |
| Year Ended September 30, 2022 | | $ | 16.86 | | | | (0.11 | ) | | | (2.59 | ) | | | (2.70 | ) | | | — | | | | (1.64 | ) | | | — | | | | (1.64 | ) |
| Year Ended September 30, 2021 | | $ | 11.85 | | | | (0.13 | ) | | | 5.14 | | | | 5.01 | | | | — | | | | — | | | | — | | | | — | |
| Year Ended September 30, 2020 | | $ | 13.83 | | | | (0.07 | ) | | | (0.68 | ) | | | (0.75 | ) | | | (0.10 | ) | | | (1.13 | ) | | | — | | | | (1.23 | ) |
| Year Ended September 30, 2019 | | $ | 16.86 | | | | (0.07 | ) | | | (0.70 | ) | | | (0.77 | ) | | | — | | | | (2.26 | ) | | | — | | | | (2.26 | ) |
| Sterling Capital Behavioral Small Cap Value Equity Fund |
| Year Ended September 30, 2023 | | $ | 14.33 | | | | 0.13 | | | | 1.69 | | | | 1.82 | | | | (0.05 | ) | | | — | | | | — | | | | (0.05 | ) |
| Year Ended September 30, 2022 | | $ | 18.46 | | | | 0.03 | | | | (2.34 | ) | | | (2.31 | ) | | | — | | | | (1.82 | ) | | | — | | | | (1.82 | ) |
| Year Ended September 30, 2021 | | $ | 11.28 | | | | 0.01 | | | | 7.17 | | | | 7.18 | | | | — | | | | — | | | | — | | | | — | |
| Year Ended September 30, 2020 | | $ | 13.94 | | | | 0.01 | | | | (2.56 | ) | | | (2.55 | ) | | | (0.11 | ) | | | — | | | | — | | | | (0.11 | ) |
| Year Ended September 30, 2019 | | $ | 17.89 | | | | 0.06 | | | | (1.98 | ) | | | (1.92 | ) | | | (0.05 | ) | | | (1.98 | ) | | | — | | | | (2.03 | ) |
| Sterling Capital Special Opportunities Fund |
| Year Ended September 30, 2023 | | $ | 18.09 | | | | (0.21 | ) | | | 3.13 | | | | 2.92 | | | | — | | | | (1.99 | ) | | | — | | | | (1.99 | ) |
| Year Ended September 30, 2022 | | $ | 26.39 | | | | (0.27 | ) | | | (3.92 | ) | | | (4.19 | ) | | | — | | | | (4.11 | ) | | | — | | | | (4.11 | ) |
| Year Ended September 30, 2021 | | $ | 19.67 | | | | (0.27 | ) | | | 7.32 | | | | 7.05 | | | | — | | | | (0.33 | ) | | | — | | | | (0.33 | ) |
| Year Ended September 30, 2020 | | $ | 20.04 | | | | (0.15 | ) | | | 1.11 | | | | 0.96 | | | | — | | | | (1.33 | ) | | | — | | | | (1.33 | ) |
| Year Ended September 30, 2019 | | $ | 21.98 | | | | (0.14 | ) | | | 0.06 | | | | (0.08 | ) | | | — | | | | (1.86 | ) | | | — | | | | (1.86 | ) |
| Sterling Capital Equity Income Fund |
| Year Ended September 30, 2023 | | $ | 24.04 | | | | 0.15 | | | | 2.70 | | | | 2.85 | | | | (0.15 | ) | | | (1.74 | ) | | | — | | | | (1.89 | ) |
| Year Ended September 30, 2022 | | $ | 26.32 | | | | 0.15 | | | | (1.81 | ) | | | (1.66 | ) | | | (0.14 | ) | | | (0.48 | ) | | | — | | | | (0.62 | ) |
| Year Ended September 30, 2021 | | $ | 19.83 | | | | 0.10 | | | | 6.47 | | | | 6.57 | | | | (0.08 | ) | | | — | | | | — | | | | (0.08 | ) |
| Year Ended September 30, 2020 | | $ | 21.05 | | | | 0.21 | | | | (0.38 | ) | | | (0.17 | ) | | | (0.21 | ) | | | (0.84 | ) | | | — | | | | (1.05 | ) |
| Year Ended September 30, 2019 | | $ | 21.34 | | | | 0.24 | | | | 1.21 | | | | 1.45 | | | | (0.22 | ) | | | (1.52 | ) | | | — | | | | (1.74 | ) |
| Sterling Capital Behavioral International Equity Fund |
| Year Ended September 30, 2023 | | $ | 7.01 | | | | 0.19 | | | | 2.01 | | | | 2.20 | | | | (0.08 | ) | | | — | | | | — | | | | (0.08 | ) |
| Year Ended September 30, 2022 | | $ | 9.69 | | | | 0.29 | | | | (2.61 | ) | | | (2.32 | ) | | | (0.36 | ) | | | — | | | | — | | | | (0.36 | ) |
| Year Ended September 30, 2021 | | $ | 8.06 | | | | 0.19 | | | | 1.60 | | | | 1.79 | | | | (0.16 | ) | | | — | | | | — | | | | (0.16 | ) |
| Year Ended September 30, 2020 | | $ | 9.37 | | | | 0.18 | | | | (1.31 | ) | | | (1.13 | ) | | | (0.18 | ) | | | — | | | | — | | | | (0.18 | ) |
| Year Ended September 30, 2019 | | $ | 11.06 | | | | 0.26 | | | | (1.33 | ) | | | (1.07 | ) | | | (0.22 | ) | | | (0.40 | ) | | | — | | | | (0.62 | ) |
| * | During the periods certain fees were waived (See Note 4 in the Notes to the Financial Statements). If such reductions had not occurred, the ratios would have been as indicated. |
| ** | Portfolio turnover rate is calculated on the basis of the Fund as a whole without distinguishing between classes of shares issued. |
| (a) | Per share net investment income (loss) has been calculated using the average daily shares method. |
See accompanying Notes to the Financial Statements.
| | | | | | | Ratios/Supplementary Data | |
Net Asset Value,
End of Year | | | Total Return
(excludes sales
charge) | | | Net Assets, End
of Year (000) | | | Ratio of net
expenses to
average net
assets | | | Ratio of net
investment
income (loss) to
average net
assets | | | Ratio of
expenses to
average net
assets* | | | Portfolio
turnover
rate** | |
| $ | 22.19 | | | | 15.57 | % | | $ | 280 | | | | 1.84 | % | | | 0.85 | % | | | 1.90 | % | | 110.98 | % |
| $ | 19.41 | | | | (10.50 | )% | | $ | 248 | | | | 1.75 | % | | | 0.93 | % | | | 1.78 | % | | 125.15 | % |
| $ | 21.88 | | | | 36.56 | % | | $ | 304 | | | | 1.60 | % | | | (0.22 | )% | | | 1.79 | % | | 122.64 | % |
| $ | 16.17 | | | | (9.81 | )% | | $ | 567 | | | | 1.64 | % | | | 1.26 | % | | | 1.71 | % | | 167.34 | % |
| $ | 18.88 | | | | (3.08 | )% | | $ | 634 | | | | 1.64 | % | | | 1.29 | % | | | 1.64 | % | | 142.59 | % |
| $ | 11.36 | | | | 12.57 | % | | $ | 379 | | | | 1.91 | % | | | (0.35 | )% | | | 1.93 | % | | 19.99 | % |
| $ | 12.52 | | | | (18.06 | )% | | $ | 473 | | | | 1.88 | % | | | (0.67 | )% | | | 1.88 | % | | 29.05 | % |
| $ | 16.86 | | | | 42.28 | % | | $ | 1,101 | | | | 1.87 | % | | | (0.85 | )% | | | 1.90 | % | | 34.00 | % |
| $ | 11.85 | | | | (6.46 | )% | | $ | 1,584 | | | | 1.88 | % | | | (0.61 | )% | | | 2.02 | % | | 28.77 | % |
| $ | 13.83 | | | | (3.52 | )% | | $ | 2,826 | | | | 1.93 | % | | | (0.46 | )% | | | 1.93 | % | | 26.62 | % |
| $ | 16.10 | | | | 12.70 | % | | $ | 28 | | | | 1.86 | % | | | 0.79 | % | | | 1.86 | % | | 154.69 | % |
| $ | 14.33 | | | | (14.19 | )% | | $ | 29 | | | | 1.85 | % | | | 0.19 | % | | | 1.85 | % | | 70.82 | % |
| $ | 18.46 | | | | 63.65 | % | | $ | 38 | | | | 1.82 | % | | | 0.04 | % | | | 1.82 | % | | 110.07 | % |
| $ | 11.28 | | | | (18.47 | )% | | $ | 100 | | | | 1.81 | % | | | 0.05 | % | | | 1.83 | % | | 119.76 | % |
| $ | 13.94 | | | | (10.28 | )% | | $ | 150 | | | | 1.80 | % | | | 0.43 | % | | | 1.80 | % | | 124.82 | % |
| $ | 19.02 | | | | 17.07 | % | | $ | 22,619 | | | | 1.91 | % | | | (1.11 | )% | | | 1.91 | % | | 31.19 | % |
| $ | 18.09 | | | | (19.53 | )% | | $ | 29,566 | | | | 1.88 | % | | | (1.19 | )% | | | 1.88 | % | | 28.06 | % |
| $ | 26.39 | | | | 36.19 | % | | $ | 52,182 | | | | 1.86 | % | | | (1.11 | )% | | | 1.87 | % | | 27.20 | % |
| $ | 19.67 | | | | 4.73 | % | | $ | 60,777 | | | | 1.86 | % | | | (0.79 | )% | | | 1.86 | % | | 17.50 | % |
| $ | 20.04 | | | | 0.48 | % | | $ | 83,451 | | | | 1.86 | % | | | (0.71 | )% | | | 1.86 | % | | 17.31 | % |
| $ | 25.00 | | | | 11.71 | % | | $ | 64,849 | | | | 1.82 | % | | | 0.60 | % | | | 1.82 | % | | 39.43 | % |
| $ | 24.04 | | | | (6.57 | )% | | $ | 64,899 | | | | 1.79 | % | | | 0.54 | % | | | 1.79 | % | | 31.23 | % |
| $ | 26.32 | | | | 33.15 | % | | $ | 81,338 | | | | 1.78 | % | | | 0.42 | % | | | 1.79 | % | | 13.00 | % |
| $ | 19.83 | | | | (0.85 | )% | | $ | 119,475 | | | | 1.77 | % | | | 1.04 | % | | | 1.78 | % | | 33.60 | % |
| $ | 21.05 | | | | 7.66 | % | | $ | 158,353 | | | | 1.77 | % | | | 1.17 | % | | | 1.77 | % | | 23.20 | % |
| $ | 9.13 | | | | 31.56 | % | | $ | 23 | | | | 1.66 | % | | | 2.25 | % | | | 1.66 | % | | 86.05 | % |
| $ | 7.01 | | | | (24.92 | )% | | $ | 41 | | | | 1.67 | % | | | 3.27 | % | | | 1.67 | % | | 103.20 | % |
| $ | 9.69 | | | | 22.44 | % | | $ | 54 | | | | 1.67 | % | | | 1.99 | % | | | 1.73 | % | | 158.16 | % |
| $ | 8.06 | | | | (12.41 | )% | | $ | 44 | | | | 1.63 | % | | | 2.03 | % | | | 1.83 | % | | 164.02 | % |
| $ | 9.37 | | | | (9.44 | )% | | $ | 63 | | | | 1.69 | % | | | 2.68 | % | | | 1.89 | % | | 97.74 | % |
Financial Highlights, Class C Shares
September 30, 2023
The financial highlights table is intended to help you understand the Funds’ financial performance for the past 5 years or, if shorter, the period of the Funds’ operations. Certain information reflects financial results for a single Fund share. The total returns in the table represent the rate that an investor would have earned (or lost) on an investment in the Fund (assuming reinvestment of all dividends and distributions).
| | | | | | Investment Activities | | | Distributions | |
| | | Net Asset
Value,
Beginning
of Year | | | Net
investment
income
(loss)(a) | | | Net realized/
unrealized
gains
(losses) on
investments | | | Total from
Investment
Activities | | | Net
investment
income | | | Net
realized
gains on
investments | | | Return
of
capital | | | Total
Distributions | |
| Sterling Capital SMID Opportunities Fund |
| Year Ended September 30, 2023 | | $ | 11.54 | | | | (0.11 | ) | | | 1.33 | | | | 1.22 | | | | — | | | | (1.33 | ) | | | — | | | | (1.33 | ) |
| Year Ended September 30, 2022 | | $ | 15.54 | | | | (0.12 | ) | | | (2.48 | ) | | | (2.60 | ) | | | — | | | | (1.40 | ) | | | — | | | | (1.40 | ) |
| Year Ended September 30, 2021 | | $ | 12.12 | | | | (0.17 | ) | | | 3.59 | | | | 3.42 | | | | — | | | | — | | | | — | | | | — | |
| Year Ended September 30, 2020 | | $ | 12.99 | | | | (0.11 | ) | | | (0.13 | ) | | | (0.24 | ) | | | — | | | | (0.63 | ) | | | — | | | | (0.63 | ) |
| Year Ended September 30, 2019 | | $ | 12.30 | | | | (0.11 | ) | | | 0.80 | | | | 0.69 | | | | — | | | | — | | | | — | | | | — | |
| Sterling Capital Mid Cap Relative Value Fund |
| Year Ended September 30, 2023 | | $ | 60.48 | | | | (0.01 | ) | | | 8.38 | | | | 8.37 | | | | — | | | | (10.17 | ) | | | — | | | | (10.17 | ) |
| Year Ended September 30, 2022 | | $ | 76.32 | | | | (0.08 | ) | | | (9.79 | ) | | | (9.87 | ) | | | — | | | | (5.97 | ) | | | — | | | | (5.97 | ) |
| Year Ended September 30, 2021 | | $ | 57.24 | | | | (0.17 | ) | | | 19.48 | | | | 19.31 | | | | — | | | | (0.23 | ) | | | — | | | | (0.23 | ) |
| Year Ended September 30, 2020 | | $ | 62.48 | | | | (0.12 | ) | | | (3.60 | ) | | | (3.72 | ) | | | (0.01 | ) | | | (1.51 | ) | | | — | | | | (1.52 | ) |
| Year Ended September 30, 2019 | | $ | 67.46 | | | | (0.12 | ) | | | 0.16 | | | | 0.04 | | | | — | | | | (5.02 | ) | | | — | | | | (5.02 | ) |
| Sterling Capital Real Estate Fund |
| Year Ended September 30, 2023 | | $ | 34.53 | | | | 0.37 | | | | (0.25 | ) | | | 0.12 | | | | (0.42 | ) | | | (2.23 | ) | | | — | | | | (2.65 | ) |
| Year Ended September 30, 2022 | | $ | 45.65 | | | | (0.06 | ) | | | (7.89 | ) | | | (7.95 | ) | | | (0.18 | ) | | | (2.99 | ) | | | — | | | | (3.17 | ) |
| Year Ended September 30, 2021 | | $ | 36.33 | | | | 0.03 | | | | 10.37 | | | | 10.40 | | | | (0.26 | ) | | | (0.82 | ) | | | — | | | | (1.08 | ) |
| Year Ended September 30, 2020 | | $ | 42.06 | | | | 0.22 | | | | (3.94 | ) | | | (3.72 | ) | | | (0.49 | ) | | | (1.52 | ) | | | — | | | | (2.01 | ) |
| Year Ended September 30, 2019 | | $ | 37.40 | | | | 0.42 | | | | 5.99 | | | | 6.41 | | | | (0.51 | ) | | | (1.24 | ) | | | — | | | | (1.75 | ) |
| Sterling Capital Small Cap Value Fund |
| Year Ended September 30, 2023 | | $ | 54.20 | | | | (0.22 | ) | | | 7.59 | | | | 7.37 | | | | — | | | | (13.68 | ) | | | — | | | | (13.68 | ) |
| Year Ended September 30, 2022 | | $ | 79.47 | | | | (0.42 | ) | | | (7.58 | ) | | | (8.00 | ) | | | — | | | | (17.27 | ) | | | — | | | | (17.27 | ) |
| Year Ended September 30, 2021 | | $ | 61.56 | | | | (0.58 | ) | | | 29.71 | | | | 29.13 | | | | — | | | | (11.22 | ) | | | — | | | | (11.22 | ) |
| Year Ended September 30, 2020 | | $ | 75.87 | | | | (0.24 | ) | | | (9.11 | ) | | | (9.35 | ) | | | (0.03 | ) | | | (4.93 | ) | | | — | | | | (4.96 | ) |
| Year Ended September 30, 2019 | | $ | 86.92 | | | | (0.19 | ) | | | (4.96 | ) | | | (5.15 | ) | | | — | | | | (5.90 | ) | | | — | | | | (5.90 | ) |
| Sterling Capital Short Duration Bond Fund |
| Year Ended September 30, 2023 | | $ | 8.08 | | | | 0.18 | | | | 0.05 | | | | 0.23 | | | | (0.17 | ) | | | — | | | | — | | | | (0.17 | ) |
| Year Ended September 30, 2022 | | $ | 8.68 | | | | 0.01 | | | | (0.50 | ) | | | (0.49 | ) | | | (0.11 | ) | | | — | | | | — | | | | (0.11 | ) |
| Year Ended September 30, 2021 | | $ | 8.77 | | | | 0.04 | | | | (0.01 | ) | | | 0.03 | | | | (0.12 | ) | | | — | | | | — | | | | (0.12 | ) |
| Year Ended September 30, 2020 | | $ | 8.64 | | | | 0.11 | | | | 0.15 | | | | 0.26 | | | | (0.13 | ) | | | — | | | | — | | | | (0.13 | ) |
| Year Ended September 30, 2019 | | $ | 8.51 | | | | 0.14 | | | | 0.16 | | | | 0.30 | | | | (0.17 | ) | | | — | | | | — | | | | (0.17 | ) |
| * | During the periods certain fees were waived (See Note 4 in the Notes to the Financial Statements). If such reductions had not occurred, the ratios would have been as indicated. |
| ** | Portfolio turnover rate is calculated on the basis of the Fund as a whole without distinguishing between classes of shares issued. |
| (a) | Per share net investment income (loss) has been calculated using the average daily shares method. |
See accompanying Notes to the Financial Statements.
| | | | | | | Ratios/Supplementary Data | |
Net Asset Value,
End of Year | | | Total Return
(excludes sales
charge) | | | Net Assets, End
of Year (000) | | | Ratio of net
expenses to
average net
assets | | | Ratio of net
investment
income (loss) to
average net
assets | | | Ratio of
expenses to
average net
assets* | | | Portfolio
turnover
rate** | |
| $ | 11.43 | | | | 10.74 | % | | $ | 167 | | | | 1.79 | % | | | (0.96 | )% | | | 2.22 | % | | 72.61 | % |
| $ | 11.54 | | | | (18.83 | )% | | $ | 673 | | | | 1.79 | % | | | (0.84 | )% | | | 2.12 | % | | 23.35 | % |
| $ | 15.54 | | | | 28.22 | % | | $ | 1,513 | | | | 1.79 | % | | | (1.17 | )% | | | 2.06 | % | | 33.93 | % |
| $ | 12.12 | | | | (2.22 | )% | | $ | 1,250 | | | | 1.79 | % | | | (0.97 | )% | | | 2.09 | % | | 60.03 | % |
| $ | 12.99 | | | | 5.61 | % | | $ | 1,188 | | | | 1.79 | % | | | (0.95 | )% | | | 2.19 | % | | 45.11 | % |
| $ | 58.68 | | | | 14.00 | % | | $ | 3 | | | | 1.77 | % | | | (0.01 | )% | | | 1.77 | % | | 4.89 | % |
| $ | 60.48 | | | | (14.45 | )% | | $ | 3 | | | | 1.74 | % | | | (0.11 | )% | | | 1.74 | % | | 7.94 | % |
| $ | 76.32 | | | | 33.80 | % | | $ | 3 | | | | 1.85 | % | | | (0.23 | )% | | | 1.85 | % | | 8.23 | % |
| $ | 57.24 | | | | (6.21 | )% | | $ | 1 | | | | 1.92 | % | | | (0.20 | )% | | | 1.92 | % | | 9.21 | % |
| $ | 62.48 | | | | 1.03 | % | | $ | 1 | | | | 1.95 | % | | | (0.21 | )% | | | 1.95 | % | | 6.75 | % |
| $ | 32.00 | | | | (0.06 | )% | | $ | 112 | | | | 1.86 | % | | | 1.05 | % | | | 1.86 | % | | 6.06 | % |
| $ | 34.53 | | | | (19.19 | )% | | $ | 125 | | | | 1.82 | % | | | (0.14 | )% | | | 1.82 | % | | 12.58 | % |
| $ | 45.65 | | | | 29.14 | % | | $ | 182 | | | | 1.81 | % | | | 0.08 | % | | | 1.81 | % | | 12.68 | % |
| $ | 36.33 | | | | (9.02 | )% | | $ | 192 | | | | 1.83 | % | | | 0.58 | % | | | 1.83 | % | | 19.58 | % |
| $ | 42.06 | | | | 17.88 | % | | $ | 205 | | | | 1.82 | % | | | 1.08 | % | | | 1.82 | % | | 14.56 | % |
| $ | 47.89 | | | | 14.18 | % | | $ | 458 | | | | 2.03 | % | | | (0.45 | )% | | | 2.05 | % | | 0.77 | % |
| $ | 54.20 | | | | (14.79 | )% | | $ | 320 | | | | 2.00 | % | | | (0.63 | )% | | | 2.00 | % | | 5.26 | % |
| $ | 79.47 | | | | 51.27 | % | | $ | 375 | | | | 1.98 | % | | | (0.75 | )% | | | 2.01 | % | | 6.15 | % |
| $ | 61.56 | | | | (13.46 | )% | | $ | 245 | | | | 2.00 | % | | | (0.35 | )% | | | 2.08 | % | | 8.33 | % |
| $ | 75.87 | | | | (5.49 | )% | | $ | 279 | | | | 2.03 | % | | | (0.25 | )% | | | 2.08 | % | | 8.60 | % |
| $ | 8.14 | | | | 2.84 | % | | $ | 280 | | | | 1.45 | % | | | 2.23 | % | | | 1.48 | % | | 98.01 | % |
| $ | 8.08 | | | | (5.73 | )% | | $ | 409 | | | | 1.47 | % | | | 0.13 | % | | | 1.47 | % | | 76.98 | % |
| $ | 8.68 | | | | 0.29 | % | | $ | 988 | | | | 1.43 | % | | | 0.40 | % | | | 1.46 | % | | 39.26 | % |
| $ | 8.77 | | | | 3.09 | % | | $ | 893 | | | | 1.42 | % | | | 1.21 | % | | | 1.52 | % | | 64.69 | % |
| $ | 8.64 | | | | 3.52 | % | | $ | 1,052 | | | | 1.43 | % | | | 1.68 | % | | | 1.53 | % | | 78.58 | % |
Financial Highlights, Class C Shares
September 30, 2023
The financial highlights table is intended to help you understand the Funds’ financial performance for the past 5 years or, if shorter, the period of the Funds’ operations. Certain information reflects financial results for a single Fund share. The total returns in the table represent the rate that an investor would have earned (or lost) on an investment in the Fund (assuming reinvestment of all dividends and distributions).
| | | | | | Investment Activities | | | Distributions | |
| | | Net Asset
Value,
Beginning
of Year | | | Net
investment
income
(loss)(a) | | | Net realized/
unrealized
gains
(losses) on
investments | | | Total from
Investment
Activities | | | Net
investment
income | | | Net
realized
gains on
investments | | | Return
of
capital | | | Total
Distributions | |
| Sterling Capital Intermediate U.S. Government Fund |
| Year Ended September 30, 2023 | | $ | 8.49 | | | | 0.10 | | | | (0.12 | ) | | | (0.02 | ) | | | (0.15 | ) | | | — | | | | — | | | | (0.15 | ) |
| Year Ended September 30, 2022 | | $ | 9.76 | | | | 0.01 | | | | (1.15 | ) | | | (1.14 | ) | | | (0.13 | ) | | | — | | | | — | | | | (0.13 | ) |
| Year Ended September 30, 2021 | | $ | 10.11 | | | | (0.01 | ) | | | (0.19 | ) | | | (0.20 | ) | | | (0.15 | ) | | | — | | | | — | | | | (0.15 | ) |
| Year Ended September 30, 2020 | | $ | 9.91 | | | | 0.09 | | | | 0.28 | | | | 0.37 | | | | (0.17 | ) | | | — | | | | — | | | | (0.17 | ) |
| Year Ended September 30, 2019 | | $ | 9.47 | | | | 0.13 | | | | 0.48 | | | | 0.61 | | | | (0.17 | ) | | | — | | | | — | | | | (0.17 | ) |
| Sterling Capital Total Return Bond Fund |
| Year Ended September 30, 2023 | | $ | 9.12 | | | | 0.21 | | | | (0.23 | ) | | | (0.02 | ) | | | (0.21 | ) | | | — | | | | — | | | | (0.21 | ) |
| Year Ended September 30, 2022 | | $ | 11.06 | | | | 0.10 | | | | (1.80 | ) | | | (1.70 | ) | | | (0.15 | ) | | | (0.09 | ) | | | — | | | | (0.24 | ) |
| Year Ended September 30, 2021 | | $ | 11.40 | | | | 0.09 | | | | (0.13 | ) | | | (0.04 | ) | | | (0.15 | ) | | | (0.15 | ) | | | — | | | | (0.30 | ) |
| Year Ended September 30, 2020 | | $ | 10.90 | | | | 0.16 | | | | 0.54 | | | | 0.70 | | | | (0.20 | ) | | | — | (b) | | | — | | | | (0.20 | ) |
| Year Ended September 30, 2019 | | $ | 10.21 | | | | 0.22 | | | | 0.70 | | | | 0.92 | | | | (0.23 | ) | | | — | | | | — | | | | (0.23 | ) |
| Sterling Capital Long Duration Corporate Bond Fund |
| Year Ended September 30, 2023 | | $ | 6.61 | | | | 0.23 | | | | (0.17 | ) | | | 0.06 | | | | (0.23 | ) | | | — | | | | — | | | | (0.23 | ) |
| Year Ended September 30, 2022 | | $ | 10.49 | | | | 0.17 | | | | (2.83 | ) | | | (2.66 | ) | | | (0.19 | ) | | | (1.03 | ) | | | — | | | | (1.22 | ) |
| Year Ended September 30, 2021 | | $ | 10.76 | | | | 0.18 | | | | 0.03 | | | | 0.21 | | | | (0.18 | ) | | | (0.30 | ) | | | — | | | | (0.48 | ) |
| Year Ended September 30, 2020 | | $ | 10.36 | | | | 0.19 | | | | 0.40 | | | | 0.59 | | | | (0.19 | ) | | | — | | | | — | | | | (0.19 | ) |
| Year Ended September 30, 2019 | | $ | 9.80 | | | | 0.24 | | | | 0.55 | | | | 0.79 | | | | (0.23 | ) | | | — | | | | — | | | | (0.23 | ) |
| Sterling Capital Quality Income Fund |
| Year Ended September 30, 2023 | | $ | 8.78 | | | | 0.16 | | | | (0.20 | ) | | | (0.04 | ) | | | (0.18 | ) | | | — | | | | — | | | | (0.18 | ) |
| Year Ended September 30, 2022 | | $ | 10.03 | | | | 0.07 | | | | (1.21 | ) | | | (1.14 | ) | | | (0.11 | ) | | | — | | | | — | | | | (0.11 | ) |
| Year Ended September 30, 2021 | | $ | 10.24 | | | | 0.06 | | | | (0.15 | ) | | | (0.09 | ) | | | (0.12 | ) | | | — | | | | — | | | | (0.12 | ) |
| Year Ended September 30, 2020 | | $ | 10.08 | | | | 0.17 | | | | 0.16 | | | | 0.33 | | | | (0.17 | ) | | | — | | | | — | | | | (0.17 | ) |
| Year Ended September 30, 2019 | | $ | 9.60 | | | | 0.21 | | | | 0.48 | | | | 0.69 | | | | (0.21 | ) | | | — | | | | — | | | | (0.21 | ) |
| Sterling Capital North Carolina Intermediate Tax-Free Fund |
| Year Ended September 30, 2023 | | $ | 9.83 | | | | 0.12 | | | | (0.08 | ) | | | 0.04 | | | | (0.13 | ) | | | — | | | | — | | | | (0.13 | ) |
| Year Ended September 30, 2022 | | $ | 10.96 | | | | 0.08 | | | | (1.13 | ) | | | (1.05 | ) | | | (0.08 | ) | | | — | | | | — | | | | (0.08 | ) |
| Year Ended September 30, 2021 | | $ | 11.12 | | | | 0.07 | | | | (0.16 | ) | | | (0.09 | ) | | | (0.07 | ) | | | — | | | | — | | | | (0.07 | ) |
| Year Ended September 30, 2020 | | $ | 10.90 | | | | 0.10 | | | | 0.22 | | | | 0.32 | | | | (0.10 | ) | | | — | | | | — | | | | (0.10 | ) |
| Year Ended September 30, 2019 | | $ | 10.42 | | | | 0.15 | | | | 0.48 | | | | 0.63 | | | | (0.15 | ) | | | — | | | | — | | | | (0.15 | ) |
| * | During the periods certain fees were waived (See Note 4 in the Notes to the Financial Statements). If such reductions had not occurred, the ratios would have been as indicated. |
| ** | Portfolio turnover rate is calculated on the basis of the Fund as a whole without distinguishing between classes of shares issued. |
| (a) | Per share net investment income (loss) has been calculated using the average daily shares method. |
| (b) | Amount is less than $0.005. |
See accompanying Notes to the Financial Statements.
| | | | | | | Ratios/Supplementary Data | |
Net Asset Value, End of Year | | | Total Return
(excludes sales
charge) | | | Net Assets, End
of Year (000) | | | Ratio of net
expenses to
average net
assets | | | Ratio of net
investment
income (loss) to
average net
assets | | | Ratio of
expenses to
average net
assets* | | | Portfolio
turnover
rate** | |
| $ | 8.32 | | | | (0.32 | )% | | $ | 123 | | | | 1.50 | % | | | 1.18 | % | | | 1.69 | % | | | 7.91 | % |
| $ | 8.49 | | | | (11.81 | )% | | $ | 98 | | | | 1.48 | % | | | 0.12 | % | | | 1.67 | % | | | 14.18 | % |
| $ | 9.76 | | | | (1.97 | )% | | $ | 124 | | | | 1.43 | % | | | (0.11 | )% | | | 1.61 | % | | | 71.31 | % |
| $ | 10.11 | | | | 3.78 | % | | $ | 309 | | | | 1.54 | % | | | 0.93 | % | | | 1.70 | % | | | 47.36 | % |
| $ | 9.91 | | | | 6.48 | % | | $ | 378 | | | | 1.56 | % | | | 1.37 | % | | | 1.66 | % | | | 40.13 | % |
| $ | 8.89 | | | | (0.22 | )% | | $ | 2,903 | | | | 1.45 | % | | | 2.23 | % | | | 1.51 | % | | | 47.80 | % |
| $ | 9.12 | | | | (15.64 | )% | | $ | 3,484 | | | | 1.45 | % | | | 0.98 | % | | | 1.48 | % | | | 47.98 | % |
| $ | 11.06 | | | | (0.31 | )% | | $ | 5,378 | | | | 1.45 | % | | | 0.78 | % | | | 1.51 | % | | | 48.80 | % |
| $ | 11.40 | | | | 6.53 | % | | $ | 8,332 | | | | 1.45 | % | | | 1.44 | % | | | 1.57 | % | | | 59.59 | % |
| $ | 10.90 | | | | 9.17 | % | | $ | 8,266 | | | | 1.45 | % | | | 2.11 | % | | | 1.58 | % | | | 79.40 | % |
| $ | 6.44 | | | | 0.78 | % | | $ | 2 | | | | 1.45 | % | | | 3.36 | % | | | 1.61 | % | | | 26.27 | % |
| $ | 6.61 | | | | (28.37 | )% | | $ | 2 | | | | 1.65 | % | | | 1.92 | % | | | 1.82 | % | | | 161.62 | % |
| $ | 10.49 | | | | 1.98 | % | | $ | 3 | | | | 1.72 | % | | | 1.70 | % | | | 1.88 | % | | | 47.29 | % |
| $ | 10.76 | | | | 5.80 | % | | $ | 3 | | | | 1.64 | % | | | 1.86 | % | | | 1.65 | % | | | 52.28 | % |
| $ | 10.36 | | | | 8.18 | % | | $ | 3 | | | | 1.68 | % | | | 2.36 | % | | | 1.68 | % | | | 82.23 | % |
| $ | 8.56 | | | | (0.52 | )% | | $ | 3 | | | | 1.53 | % | | | 1.86 | % | | | 1.55 | % | | | 9.85 | % |
| $ | 8.78 | | | | (11.45 | )% | | $ | 3 | | | | 1.50 | % | | | 0.74 | % | | | 1.52 | % | | | 35.18 | % |
| $ | 10.03 | | | | (0.92 | )% | | $ | 3 | | | | 1.57 | % | | | 0.58 | % | | | 1.59 | % | | | 73.60 | % |
| $ | 10.24 | | | | 3.34 | % | | $ | 3 | | | | 1.57 | % | | | 1.63 | % | | | 1.61 | % | | | 35.96 | % |
| $ | 10.08 | | | | 7.21 | % | | $ | 34 | | | | 1.60 | % | | | 2.15 | % | | | 1.64 | % | | | 17.58 | % |
| $ | 9.74 | | | | 0.32 | % | | $ | 966 | | | | 1.60 | % | | | 1.24 | % | | | 1.60 | % | | | 38.07 | % |
| $ | 9.83 | | | | (9.61 | )% | | $ | 1,141 | | | | 1.57 | % | | | 0.75 | % | | | 1.57 | % | | | 50.21 | % |
| $ | 10.96 | | | | (0.85 | )% | | $ | 1,542 | | | | 1.55 | % | | | 0.60 | % | | | 1.55 | % | | | 7.97 | % |
| $ | 11.12 | | | | 2.96 | % | | $ | 2,793 | | | | 1.54 | % | | | 0.92 | % | | | 1.54 | % | | | 17.06 | % |
| $ | 10.90 | | | | 6.05 | % | | $ | 2,878 | | | | 1.55 | % | | | 1.38 | % | | | 1.55 | % | | | 33.12 | % |
Financial Highlights, Class C Shares
September 30, 2023
The financial highlights table is intended to help you understand the Funds’ financial performance for the past 5 years or, if shorter, the period of the Funds’ operations. Certain information reflects financial results for a single Fund share. The total returns in the table represent the rate that an investor would have earned (or lost) on an investment in the Fund (assuming reinvestment of all dividends and distributions).
| | | | | | Investment Activities | | Distributions | |
| | | Net Asset
Value,
Beginning
of Year | | | Net
investment
income(a) | | | Net realized/
unrealized
gains
(losses) on
investments | | | Total from
Investment
Activities | | | Net
investment
income | | | Net
realized
gains on
investments | | | Return
of
capital | | | Total
Distributions | |
| Sterling Capital South Carolina Intermediate Tax-Free Fund | | | | | | | | | | | | |
| Year Ended September 30, 2023 | | $ | 10.24 | | | | 0.12 | | | | (0.09 | ) | | | 0.03 | | | | (0.12 | ) | | | — | | | | — | | | | (0.12 | ) |
| Year Ended September 30, 2022 | | $ | 11.39 | | | | 0.10 | | | | (1.15 | ) | | | (1.05 | ) | | | (0.10 | ) | | | — | | | | — | | | | (0.10 | ) |
| Year Ended September 30, 2021 | | $ | 11.46 | | | | 0.08 | | | | (0.07 | ) | | | 0.01 | | | | (0.08 | ) | | | — | | | | — | | | | (0.08 | ) |
| Year Ended September 30, 2020 | | $ | 11.27 | | | | 0.11 | | | | 0.19 | | | | 0.30 | | | | (0.11 | ) | | | — | | | | — | | | | (0.11 | ) |
| Year Ended September 30, 2019 | | $ | 10.76 | | | | 0.12 | | | | 0.51 | | | | 0.63 | | | | (0.12 | ) | | | — | | | | — | | | | (0.12 | ) |
| Sterling Capital Virginia Intermediate Tax-Free Fund | | | | | | | | | | | |
| Year Ended September 30, 2023 | | $ | 10.77 | | | | 0.11 | | | | (0.09 | ) | | | 0.02 | | | | (0.12 | ) | | | — | | | | — | | | | (0.12 | ) |
| Year Ended September 30, 2022 | | $ | 11.97 | | | | 0.07 | | | | (1.18 | ) | | | (1.11 | ) | | | (0.08 | ) | | | (0.01 | ) | | | — | | | | (0.09 | ) |
| Year Ended September 30, 2021 | | $ | 12.22 | | | | 0.07 | | | | (0.22 | ) | | | (0.15 | ) | | | (0.07 | ) | | | (0.03 | ) | | | — | | | | (0.10 | ) |
| Year Ended September 30, 2020 | | $ | 11.97 | | | | 0.11 | | | | 0.25 | | | | 0.36 | | | | (0.11 | ) | | | — | | | | — | | | | (0.11 | ) |
| Year Ended September 30, 2019 | | $ | 11.40 | | | | 0.14 | | | | 0.57 | | | | 0.71 | | | | (0.14 | ) | | | — | | | | — | | | | (0.14 | ) |
| Sterling Capital West Virginia Intermediate Tax-Free Fund | | | | | | | | | | |
| Year Ended September 30, 2023 | | $ | 9.22 | | | | 0.13 | | | | (0.07 | ) | | | 0.06 | | | | (0.14 | ) | | | — | | | | — | | | | (0.14 | ) |
| Year Ended September 30, 2022 | | $ | 10.20 | | | | 0.08 | | | | (0.98 | ) | | | (0.90 | ) | | | (0.08 | ) | | | — | (b) | | | — | | | | (0.08 | ) |
| Year Ended September 30, 2021 | | $ | 10.30 | | | | 0.09 | | | | (0.10 | ) | | | (0.01 | ) | | | (0.08 | ) | | | (0.01 | ) | | | — | | | | (0.09 | ) |
| Year Ended September 30, 2020 | | $ | 10.13 | | | | 0.11 | | | | 0.18 | | | | 0.29 | | | | (0.11 | ) | | | (0.01 | ) | | | — | | | | (0.12 | ) |
| Year Ended September 30, 2019 | | $ | 9.72 | | | | 0.14 | | | | 0.43 | | | | 0.57 | | | | (0.14 | ) | | | (0.02 | ) | | | — | | | | (0.16 | ) |
| * | During the periods certain fees were waived (See Note 4 in the Notes to the Financial Statements). If such reductions had not occurred, the ratios would have been as indicated. |
| ** | Portfolio turnover rate is calculated on the basis of the Fund as a whole without distinguishing between classes of shares issued. |
| (a) | Per share net investment income (loss) has been calculated using the average daily shares method. |
| (b) | Amount is less than $0.005. |
See accompanying Notes to the Financial Statements.
| | | | | | | Ratios/Supplementary Data | |
Net Asset Value,
End of Year | | | Total Return
(excludes sales
charge) | | | Net Assets, End
of Year (000) | | | Ratio of net
expenses to
average net
assets | | | Ratio of net
investment
income (loss) to
average net
assets | | | Ratio of
expenses to
average net
assets* | | | Portfolio
turnover
rate** | |
| $ | 10.15 | | | | 0.30 | % | | $ | 268 | | | | 1.62 | % | | | 1.17 | % | | | 1.63 | % | | | 32.34 | % |
| $ | 10.24 | | | | (9.27 | )% | | $ | 340 | | | | 1.59 | % | | | 0.89 | % | | | 1.59 | % | | | 9.94 | % |
| $ | 11.39 | | | | 0.10 | % | | $ | 603 | | | | 1.56 | % | | | 0.72 | % | | | 1.56 | % | | | 20.23 | % |
| $ | 11.46 | | | | 2.72 | % | | $ | 955 | | | | 1.56 | % | | | 1.01 | % | | | 1.56 | % | | | 4.84 | % |
| $ | 11.27 | | | | 5.93 | % | | $ | 978 | | | | 1.56 | % | | | 1.13 | % | | | 1.56 | % | | | 23.84 | % |
| | | | | | | | | | | | | | | | | | | | | | | | | | | |
| $ | 10.67 | | | | 0.13 | % | | $ | 5 | | | | 1.59 | % | | | 1.03 | % | | | 1.59 | % | | | 17.86 | % |
| $ | 10.77 | | | | (9.32 | )% | | $ | 16 | | | | 1.57 | % | | | 0.61 | % | | | 1.57 | % | | | 37.23 | % |
| $ | 11.97 | | | | (1.27 | )% | | $ | 57 | | | | 1.57 | % | | | 0.58 | % | | | 1.57 | % | | | 8.98 | % |
| $ | 12.22 | | | | 3.03 | % | | $ | 780 | | | | 1.56 | % | | | 0.92 | % | | | 1.56 | % | | | 15.44 | % |
| $ | 11.97 | | | | 6.25 | % | | $ | 822 | | | | 1.56 | % | | | 1.19 | % | | | 1.56 | % | | | 24.57 | % |
| | | | | | | | | | | | | | | | | | | | | | | | | | | |
| $ | 9.14 | | | | 0.62 | % | | $ | 2 | | | | 1.57 | % | | | 1.34 | % | | | 1.57 | % | | | 37.11 | % |
| $ | 9.22 | | | | (8.85 | )% | | $ | 23 | | | | 1.56 | % | | | 0.82 | % | | | 1.56 | % | | | 18.08 | % |
| $ | 10.20 | | | | (0.13 | )% | | $ | 25 | | | | 1.56 | % | | | 0.83 | % | | | 1.56 | % | | | 8.56 | % |
| $ | 10.30 | | | | 2.89 | % | | $ | 304 | | | | 1.56 | % | | | 1.10 | % | | | 1.56 | % | | | 3.28 | % |
| $ | 10.13 | | | | 5.90 | % | | $ | 335 | | | | 1.56 | % | | | 1.45 | % | | | 1.56 | % | | | 33.73 | % |
Financial Highlights, Institutional Shares
September 30, 2023
The financial highlights table is intended to help you understand the Funds’ financial performance for the past 5 years or, if shorter, the period of the Funds’ operations. Certain information reflects financial results for a single Fund share. The total returns in the table represent the rate that an investor would have earned (or lost) on an investment in the Fund (assuming reinvestment of all dividends and distributions).
| | | | | | Investment Activities | | Distributions | |
| | | Net Asset
Value,
Beginning
of Year | | | Net
investment
income
(loss)(a) | | | Net realized/
unrealized
gains
(losses) on
investments | | | Total from
Investment
Activities | | | Net
investment
income | | | Net
realized
gains on
investments | | | Return
of
capital | | | Total
Distributions | |
| Sterling Capital Behavioral Large Cap Value Equity Fund | | | | | | |
| Year Ended September 30, 2023 | | $ | 20.34 | | | | 0.42 | | | | 2.98 | | | | 3.40 | | | | (0.46 | ) | | | — | | | | — | | | | (0.46 | ) |
| Year Ended September 30, 2022 | | $ | 22.96 | | | | 0.46 | | | | (2.62 | ) | | | (2.16 | ) | | | (0.46 | ) | | | — | | | | — | | | | (0.46 | ) |
| Year Ended September 30, 2021 | | $ | 16.83 | | | | 0.09 | | | | 6.24 | | | | 6.33 | | | | (0.04 | ) | | | — | | | | (0.16 | ) | | | (0.20 | ) |
| Year Ended September 30, 2020 | | $ | 19.62 | | | | 0.41 | | | | (2.10 | ) | | | (1.69 | ) | | | (0.52 | ) | | | (0.58 | ) | | | — | | | | (1.10 | ) |
| Year Ended September 30, 2019 | | $ | 22.43 | | | | 0.44 | | | | (1.07 | ) | | | (0.63 | ) | | | (0.43 | ) | | | (1.75 | ) | | | — | | | | (2.18 | ) |
| Sterling Capital Mid Value Fund | | | | | | | | | | | | | | | | | | | | |
| Year Ended September 30, 2023 | | $ | 15.65 | | | | 0.10 | | | | 2.02 | | | | 2.12 | | | | (0.08 | ) | | | (2.72 | ) | | | — | | | | (2.80 | ) |
| Year Ended September 30, 2022 | | $ | 20.51 | | | | 0.06 | | | | (3.27 | ) | | | (3.21 | ) | | | (0.01 | ) | | | (1.64 | ) | | | — | | | | (1.65 | ) |
| Year Ended September 30, 2021 | | $ | 14.33 | | | | 0.03 | | | | 6.22 | | | | 6.25 | | | | (0.07 | ) | | | — | | | | — | | | | (0.07 | ) |
| Year Ended September 30, 2020 | | $ | 16.46 | | | | 0.06 | | | | (0.81 | ) | | | (0.75 | ) | | | (0.25 | ) | | | (1.13 | ) | | | — | | | | (1.38 | ) |
| Year Ended September 30, 2019 | | $ | 19.42 | | | | 0.08 | | | | (0.77 | ) | | | (0.69 | ) | | | (0.01 | ) | | | (2.26 | ) | | | — | | | | (2.27 | ) |
| Sterling Capital Behavioral Small Cap Value Equity Fund | | | | | | | | | | |
| Year Ended September 30, 2023 | | $ | 15.29 | | | | 0.31 | | | | 1.81 | | | | 2.12 | | | | (0.26 | ) | | | — | | | | — | | | | (0.26 | ) |
| Year Ended September 30, 2022 | | $ | 19.58 | | | | 0.22 | | | | (2.49 | ) | | | (2.27 | ) | | | (0.20 | ) | | | (1.82 | ) | | | — | | | | (2.02 | ) |
| Year Ended September 30, 2021 | | $ | 11.95 | | | | 0.16 | | | | 7.60 | | | | 7.76 | | | | (0.13 | ) | | | — | | | | — | | | | (0.13 | ) |
| Year Ended September 30, 2020 | | $ | 14.66 | | | | 0.13 | | | | (2.69 | ) | | | (2.56 | ) | | | (0.15 | ) | | | — | | | | — | | | | (0.15 | ) |
| Year Ended September 30, 2019 | | $ | 18.82 | | | | 0.21 | | | | (2.09 | ) | | | (1.88 | ) | | | (0.30 | ) | | | (1.98 | ) | | | — | | | | (2.28 | ) |
| Sterling Capital Special Opportunities Fund | | | | | | | | | | | | | | | | | | |
| Year Ended September 30, 2023 | | $ | 25.75 | | | | (0.03 | ) | | | 4.55 | | | | 4.52 | | | | — | | | | (1.99 | ) | | | — | | | | (1.99 | ) |
| Year Ended September 30, 2022 | | $ | 35.59 | | | | (0.06 | ) | | | (5.67 | ) | | | (5.73 | ) | | | — | | | | (4.11 | ) | | | — | | | | (4.11 | ) |
| Year Ended September 30, 2021 | | $ | 26.20 | | | | (0.03 | ) | | | 9.79 | | | | 9.76 | | | | (0.04 | ) | | | (0.33 | ) | | | — | | | | (0.37 | ) |
| Year Ended September 30, 2020 | | $ | 26.07 | | | | 0.06 | | | | 1.45 | | | | 1.51 | | | | (0.05 | ) | | | (1.33 | ) | | | — | | | | (1.38 | ) |
| Year Ended September 30, 2019 | | $ | 27.73 | | | | 0.08 | | | | 0.12 | | | | 0.20 | | | | 0.00 | (b) | | | (1.86 | ) | | | — | | | | (1.86 | ) |
| Sterling Capital Equity Income Fund | | | | | | | | | | | | | | | | | | |
| Year Ended September 30, 2023 | | $ | 24.35 | | | | 0.41 | | | | 2.74 | | | | 3.15 | | | | (0.41 | ) | | | (1.74 | ) | | | — | | | | (2.15 | ) |
| Year Ended September 30, 2022 | | $ | 26.66 | | | | 0.42 | | | | (1.83 | ) | | | (1.41 | ) | | | (0.42 | ) | | | (0.48 | ) | | | — | | | | (0.90 | ) |
| Year Ended September 30, 2021 | | $ | 20.10 | | | | 0.35 | | | | 6.56 | | | | 6.91 | | | | (0.35 | ) | | | — | | | | — | | | | (0.35 | ) |
| Year Ended September 30, 2020 | | $ | 21.33 | | | | 0.41 | | | | (0.39 | ) | | | 0.02 | | | | (0.41 | ) | | | (0.84 | ) | | | — | | | | (1.25 | ) |
| Year Ended September 30, 2019 | | $ | 21.61 | | | | 0.44 | | | | 1.23 | | | | 1.67 | | | | (0.43 | ) | | | (1.52 | ) | | | — | | | | (1.95 | ) |
| * | During the periods certain fees were waived (See Note 4 in the Notes to the Financial Statements). If such reductions had not occurred, the ratios would have been as indicated. |
| ** | Portfolio turnover rate is calculated on the basis of the Fund as a whole without distinguishing between classes of shares issued. |
| (a) | Per share net investment income (loss) has been calculated using the average daily shares method. |
| (b) | Amount is less than $0.005. |
See accompanying Notes to the Financial Statements.
| | | | | | | Ratios/Supplementary Data | |
Net Asset Value,
End of Year | | | Total Return
(excludes sales
charge) | | | Net Assets, End
of Year (000) | | | Ratio of net
expenses to
average net
assets | | | Ratio of net
investment
income (loss) to
average net
assets | | | Ratio of
expenses to
average net
assets* | | | Portfolio
turnover
rate** | |
| $ | 23.28 | | | | 16.74 | % | | $ | 1,499 | | | | 0.84 | % | | | 1.83 | % | | | 0.90 | % | | | 110.98 | % |
| $ | 20.34 | | | | (9.62 | )% | | $ | 1,652 | | | | 0.75 | % | | | 1.94 | % | | | 0.78 | % | | | 125.15 | % |
| $ | 22.96 | | | | 37.90 | % | | $ | 2,023 | | | | 0.64 | % | | | 0.42 | % | | | 0.78 | % | | | 122.64 | % |
| $ | 16.83 | | | | (8.96 | )% | | $ | 1,949 | | | | 0.64 | % | | | 2.18 | % | | | 0.66 | % | | | 167.34 | % |
| $ | 19.62 | | | | (2.08 | )% | | $ | 7,550 | | | | 0.64 | % | | | 2.28 | % | | | 0.64 | % | | | 142.59 | % |
| | | | | | | | | | | | | | | | | | | | | | | | | | | |
| $ | 14.97 | | | | 13.77 | % | | $ | 26,900 | | | | 0.91 | % | | | 0.66 | % | | | 0.93 | % | | | 19.99 | % |
| $ | 15.65 | | | | (17.30 | )% | | $ | 29,189 | | | | 0.88 | % | | | 0.33 | % | | | 0.88 | % | | | 29.05 | % |
| $ | 20.51 | | | | 43.72 | % | | $ | 51,607 | | | | 0.87 | % | | | 0.17 | % | | | 0.89 | % | | | 34.00 | % |
| $ | 14.33 | | | | (5.50 | )% | | $ | 36,835 | | | | 0.89 | % | | | 0.39 | % | | | 1.04 | % | | | 28.77 | % |
| $ | 16.46 | | | | (2.54 | )% | | $ | 154,259 | | | | 0.93 | % | | | 0.49 | % | | | 0.93 | % | | | 26.62 | % |
| | | | | | | | | | | | | | | | | | | | | | | | | | | |
| $ | 17.15 | | | | 13.86 | % | | $ | 5,804 | | | | 0.85 | % | | | 1.79 | % | | | 0.85 | % | | | 154.69 | % |
| $ | 15.29 | | | | (13.35 | )% | | $ | 9,788 | | | | 0.85 | % | | | 1.13 | % | | | 0.85 | % | | | 70.82 | % |
| $ | 19.58 | | | | 65.21 | % | | $ | 14,639 | | | | 0.81 | % | | | 0.89 | % | | | 0.81 | % | | | 110.07 | % |
| $ | 11.95 | | | | (17.64 | )% | | $ | 6,820 | | | | 0.80 | % | | | 0.97 | % | | | 0.84 | % | | | 119.76 | % |
| $ | 14.66 | | | | (9.32 | )% | | $ | 28,223 | | | | 0.80 | % | | | 1.42 | % | | | 0.80 | % | | | 124.82 | % |
| | | | | | | | | | | | | | | | | | | | | | | | | | | |
| $ | 28.28 | | | | 18.28 | % | | $ | 135,284 | | | | 0.91 | % | | | (0.11 | )% | | | 0.91 | % | | | 31.19 | % |
| $ | 25.75 | | | | (18.74 | )% | | $ | 168,110 | | | | 0.89 | % | | | (0.19 | )% | | | 0.89 | % | | | 28.06 | % |
| $ | 35.59 | | | | 37.55 | % | | $ | 216,341 | | | | 0.86 | % | | | (0.11 | )% | | | 0.87 | % | | | 27.20 | % |
| $ | 26.20 | | | | 5.79 | % | | $ | 170,323 | | | | 0.86 | % | | | 0.22 | % | | | 0.86 | % | | | 17.50 | % |
| $ | 26.07 | | | | 1.47 | % | | $ | 281,099 | | | | 0.86 | % | | | 0.30 | % | | | 0.86 | % | | | 17.31 | % |
| | | | | | | | | | | | | | | | | | | | | | | | | | | |
| $ | 25.35 | | | | 12.83 | % | | $ | 1,296,237 | | | | 0.82 | % | | | 1.59 | % | | | 0.82 | % | | | 39.43 | % |
| $ | 24.35 | | | | (5.64 | )% | | $ | 1,468,388 | | | | 0.79 | % | | | 1.55 | % | | | 0.79 | % | | | 31.23 | % |
| $ | 26.66 | | | | 34.47 | % | | $ | 1,622,233 | | | | 0.78 | % | | | 1.40 | % | | | 0.79 | % | | | 13.00 | % |
| $ | 20.10 | | | | 0.15 | % | | $ | 1,057,722 | | | | 0.77 | % | | | 2.06 | % | | | 0.78 | % | | | 33.60 | % |
| $ | 21.33 | | | | 8.72 | % | | $ | 992,964 | | | | 0.77 | % | | | 2.17 | % | | | 0.77 | % | | | 23.20 | % |
Financial Highlights, Institutional Shares
September 30, 2023
The financial highlights table is intended to help you understand the Funds’ financial performance for the past 5 years or, if shorter, the period of the Funds’ operations. Certain information reflects financial results for a single Fund share. The total returns in the table represent the rate that an investor would have earned (or lost) on an investment in the Fund (assuming reinvestment of all dividends and distributions).
| | | | | | Investment Activities | | | Distributions | |
| | | Net Asset
Value,
Beginning
of Year | | | Net
investment
income
(loss)(a) | | | Net realized/
unrealized
gains
(losses) on
investments | | | Total from
Investment
Activities | | | Net
investment
income | | | Net
realized
gains on
investments | | | Return
of
capital | | | Total
Distributions | |
| Sterling Capital Behavioral International Equity Fund | | | | | | | | | | | | | | | | | |
| Year Ended September 30, 2023 | | $ | 7.09 | | | | 0.31 | | | | 2.00 | | | | 2.31 | | | | (0.26 | ) | | | — | | | | — | | | | (0.26 | ) |
| Year Ended September 30, 2022 | | $ | 9.81 | | | | 0.38 | | | | (2.65 | ) | | | (2.27 | ) | | | (0.45 | ) | | | — | | | | — | | | | (0.45 | ) |
| Year Ended September 30, 2021 | | $ | 8.14 | | | | 0.07 | | | | 1.84 | ) | | | 1.91 | | | | (0.24 | ) | | | — | | | | — | | | | (0.24 | ) |
| Year Ended September 30, 2020 | | $ | 9.49 | | | | 0.27 | | | | (1.32 | ) | | | (1.05 | ) | | | (0.30 | ) | | | — | | | | — | | | | (0.30 | ) |
| Year Ended September 30, 2019 | | $ | 11.18 | | | | 0.35 | | | | (1.33 | ) | | | (0.98 | ) | | | (0.31 | ) | | | (0.40 | ) | | | — | | | | (0.71 | ) |
| Sterling Capital SMID Opportunities Fund | | | | | | | | | | | | | | | | | |
| Year Ended September 30, 2023 | | $ | 12.25 | | | | 0.01 | | | | 1.41 | | | | 1.42 | | | | — | | | | (1.33 | ) | | | — | | | | (1.33 | ) |
| Year Ended September 30, 2022 | | $ | 16.25 | | | | 0.03 | | | | (2.63 | ) | | | (2.60 | ) | | | — | | | | (1.40 | ) | | | — | | | | (1.40 | ) |
| Year Ended September 30, 2021 | | $ | 12.55 | | | | (0.03 | ) | | | 3.73 | | | | 3.70 | | | | — | | | | — | | | | — | | | | — | |
| Year Ended September 30, 2020 | | $ | 13.31 | | | | — | (b) | | | (0.13 | ) | | | (0.13 | ) | | | — | | | | (0.63 | ) | | | — | | | | (0.63 | ) |
| Year Ended September 30, 2019 | | $ | 12.48 | | | | 0.01 | | | | 0.82 | | | | 0.83 | | | | — | | | | — | | | | — | | | | — | |
| Sterling Capital Mid Cap Relative Value Fund | | | | | | | | | | | | | | | | | |
| Year Ended September 30, 2023 | | $ | 62.89 | | | | 0.56 | | | | 8.70 | | | | 9.26 | | | | (0.55 | ) | | | (10.17 | ) | | | — | | | | (10.72 | ) |
| Year Ended September 30, 2022 | | $ | 78.92 | | | | 0.58 | | | | (10.16 | ) | | | (9.58 | ) | | | (0.48 | ) | | | (5.97 | ) | | | — | | | | (6.45 | ) |
| Year Ended September 30, 2021 | | $ | 58.95 | | | | 0.45 | | | | 20.09 | | | | 20.54 | | | | (0.34 | ) | | | (0.23 | ) | | | — | | | | (0.57 | ) |
| Year Ended September 30, 2020 | | $ | 64.31 | | | | 0.40 | | | | (3.64 | ) | | | (3.24 | ) | | | (0.61 | ) | | | (1.51 | ) | | | — | | | | (2.12 | ) |
| Year Ended September 30, 2019 | | $ | 69.02 | | | | 0.45 | | | | 0.15 | | | | 0.60 | | | | (0.29 | ) | | | (5.02 | ) | | | — | | | | (5.31 | ) |
| Sterling Capital Real Estate Fund | | | | | | | | | | | | | | | | | |
| Year Ended September 30, 2023 | | $ | 34.95 | | | | 0.73 | | | | (0.25 | ) | | | 0.48 | | | | (0.76 | ) | | | (2.23 | ) | | | — | | | | (2.99 | ) |
| Year Ended September 30, 2022 | | $ | 46.19 | | | | 0.40 | | | | (8.03 | ) | | | (7.63 | ) | | | (0.62 | ) | | | (2.99 | ) | | | — | | | | (3.61 | ) |
| Year Ended September 30, 2021 | | $ | 36.66 | | | | 0.43 | | | | 10.51 | | | | 10.94 | | | | (0.59 | ) | | | (0.82 | ) | | | — | | | | (1.41 | ) |
| Year Ended September 30, 2020 | | $ | 42.36 | | | | 0.59 | | | | (3.97 | ) | | | (3.38 | ) | | | (0.80 | ) | | | (1.52 | ) | | | — | | | | (2.32 | ) |
| Year Ended September 30, 2019 | | $ | 37.63 | | | | 0.79 | | | | 6.05 | | | | 6.84 | | | | (0.87 | ) | | | (1.24 | ) | | | — | | | | (2.11 | ) |
| Sterling Capital Small Cap Value Fund | | | | | | | | | | | | | | | | | |
| Year Ended September 30, 2023 | | $ | 58.24 | | | | 0.28 | | | | 8.20 | | | | 8.48 | | | | (0.25 | ) | | | (13.68 | ) | | | — | | | | (13.93 | ) |
| Year Ended September 30, 2022 | | $ | 83.58 | | | | 0.27 | | | | (8.25 | ) | | | (7.98 | ) | | | (0.09 | ) | | | (17.27 | ) | | | — | | | | (17.36 | ) |
| Year Ended September 30, 2021 | | $ | 64.04 | | | | 0.17 | | | | 31.01 | | | | 31.18 | | | | (0.42 | ) | | | (11.22 | ) | | | — | | | | (11.64 | ) |
| Year Ended September 30, 2020 | | $ | 78.38 | | | | 0.41 | | | | (9.36 | ) | | | (8.95 | ) | | | (0.46 | ) | | | (4.93 | ) | | | — | | | | (5.39 | ) |
| Year Ended September 30, 2019 | | $ | 89.11 | | | | 0.49 | | | | (5.02 | ) | | | (4.53 | ) | | | (0.30 | ) | | | (5.90 | ) | | | — | | | | (6.20 | ) |
| * | During the periods certain fees were waived (See Note 4 in the Notes to the Financial Statements). If such reductions had not occurred, the ratios would have been as indicated. |
| ** | Portfolio turnover rate is calculated on the basis of the Fund as a whole without distinguishing between classes of shares issued. |
| (a) | Per share net investment income (loss) has been calculated using the average daily shares method. |
| (b) | Amount is less than $0.005. |
See accompanying Notes to the Financial Statements.
| | | | | | | Ratios/Supplementary Data | |
Net Asset Value,
End of Year | | | Total Return
(excludes sales
charge) | | | Net Assets, End
of Year (000) | | | Ratio of net
expenses to
average net
assets | | | Ratio of net
investment
income (loss) to
average net
assets | | | Ratio of
expenses to
average net
assets* | | | Portfolio
turnover
rate** | |
| $ | 9.14 | | | | 33.01 | % | | $ | 679 | | | | 0.68 | % | | | 3.53 | % | | | 0.68 | % | | | 86.05 | % |
| $ | 7.09 | | | | (24.27 | )% | | $ | 489 | | | | 0.67 | % | | | 4.24 | % | | | 0.67 | % | | | 103.20 | % |
| $ | 9.81 | | | | 23.86 | % | | $ | 662 | | | | 0.67 | % | | | 0.85 | % | | | 0.85 | % | | | 158.16 | % |
| $ | 8.14 | | | | (11.65 | )% | | $ | 13,670 | | | | 0.63 | % | | | 3.09 | % | | | 0.83 | % | | | 164.02 | % |
| $ | 9.49 | | | | (8.44 | )% | | $ | 16,721 | | | | 0.69 | % | | | 3.62 | % | | | 0.89 | % | | | 97.74 | % |
| | | | | | | | | | | | | | | | | | | | | | | | | | | |
| $ | 12.34 | | | | 11.84 | % | | $ | 1,695 | | | | 0.79 | % | | | 0.06 | % | | | 1.22 | % | | | 72.61 | % |
| $ | 12.25 | | | | (17.95 | )% | | $ | 2,871 | | | | 0.79 | % | | | 0.18 | % | | | 1.13 | % | | | 23.35 | % |
| $ | 16.25 | | | | 29.48 | % | | $ | 4,591 | | | | 0.79 | % | | | (0.19 | )% | | | 1.06 | % | | | 33.93 | % |
| $ | 12.55 | | | | (1.30 | )% | | $ | 5,359 | | | | 0.79 | % | | | 0.02 | % | | | 1.09 | % | | | 60.03 | % |
| $ | 13.31 | | | | 6.65 | % | | $ | 5,386 | | | | 0.79 | % | | | 0.07 | % | | | 1.20 | % | | | 45.11 | % |
| | | | | | | | | | | | | | | | | | | | | | | | | | | |
| $ | 61.43 | | | | 15.03 | % | | $ | 43,016 | | | | 0.87 | % | | | 0.90 | % | | | 0.87 | % | | | 4.89 | % |
| $ | 62.89 | | | | (13.68 | )% | | $ | 45,055 | | | | 0.84 | % | | | 0.78 | % | | | 0.84 | % | | | 7.94 | % |
| $ | 78.92 | | | | 35.02 | % | | $ | 65,503 | | | | 0.85 | % | | | 0.60 | % | | | 0.86 | % | | | 8.23 | % |
| $ | 58.95 | | | | (5.39 | )% | | $ | 53,847 | | | | 0.91 | % | | | 0.67 | % | | | 0.94 | % | | | 9.21 | % |
| $ | 64.31 | | | | 1.97 | % | | $ | 61,908 | | | | 0.95 | % | | | 0.73 | % | | | 0.95 | % | | | 6.75 | % |
| | | | | | | | | | | | | | | | | | | | | | | | | | | |
| $ | 32.44 | | | | 0.95 | % | | $ | 62,708 | | | | 0.87 | % | | | 2.06 | % | | | 0.87 | % | | | 6.06 | % |
| $ | 34.95 | | | | (18.39 | )% | | $ | 73,873 | | | | 0.82 | % | | | 0.91 | % | | | 0.82 | % | | | 12.58 | % |
| $ | 46.19 | | | | 30.40 | % | | $ | 96,075 | | | | 0.81 | % | | | 1.00 | % | | | 0.81 | % | | | 12.68 | % |
| $ | 36.66 | | | | (8.09 | )% | | $ | 85,144 | | | | 0.82 | % | | | 1.55 | % | | | 0.82 | % | | | 9.21 | % |
| $ | 42.36 | | | | 19.06 | % | | $ | 105,216 | | | | 0.82 | % | | | 2.03 | % | | | 0.82 | % | | | 14.56 | % |
| | | | | | | | | | | | | | | | | | | | | | | | | | | |
| $ | 52.79 | | | | 15.31 | % | | $ | 261,706 | | | | 1.03 | % | | | 0.51 | % | | | 1.05 | % | | | 0.77 | % |
| $ | 58.24 | | | | (13.93 | )% | | $ | 350,163 | | | | 1.00 | % | | | 0.38 | % | | | 1.00 | % | | | 5.26 | % |
| $ | 83.58 | | | | 52.78 | % | | $ | 514,025 | | | | 0.98 | % | | | 0.22 | % | | | 1.02 | % | | | 6.15 | % |
| $ | 64.04 | | | | (12.59 | )% | | $ | 475,615 | | | | 1.01 | % | | | 0.58 | % | | | 1.08 | % | | | 8.33 | % |
| $ | 78.38 | | | | (4.55 | )% | | $ | 959,875 | | | | 1.03 | % | | | 0.64 | % | | | 1.08 | % | | | 8.60 | % |
Financial Highlights, Institutional Shares
September 30, 2023
The financial highlights table is intended to help you understand the Funds’ financial performance for the past 5 years or, if shorter, the period of the Funds’ operations. Certain information reflects financial results for a single Fund share. The total returns in the table represent the rate that an investor would have earned (or lost) on an investment in the Fund (assuming reinvestment of all dividends and distributions).
| | | | | | Investment Activities | | | Distributions | |
| | | Net Asset
Value,
Beginning
of Year | | | Net
investment
income(a) | | | Net realized/
unrealized
gains
(losses) on
investments | | | Total from
Investment
Activities | | | Net
investment
income | | | Net
realized
gains on
investments | | | Return
of
capital | | | Total
Distributions | |
| Sterling Capital Ultra Short Bond Fund | | | | | | | | | | | | | | | | | |
| Year Ended September 30, 2023 | | $ | 9.56 | | | | 0.34 | | | | 0.14 | | | | 0.48 | | | | (0.36 | ) | | | — | | | | — | | | | (0.36 | ) |
| Year Ended September 30, 2022 | | $ | 9.78 | | | | 0.11 | | | | (0.19 | ) | | | (0.08 | ) | | | (0.14 | ) | | | — | | | | — | | | | (0.14 | ) |
| Year Ended September 30, 2021 | | $ | 9.83 | | | | 0.11 | | | | (0.04 | ) | | | 0.07 | | | | (0.12 | ) | | | — | | | | — | | | | (0.12 | ) |
| Year Ended September 30, 2020 | | $ | 9.79 | | | | 0.19 | | | | 0.05 | | | | 0.24 | | | | (0.20 | ) | | | — | | | | — | | | | (0.20 | ) |
| Year Ended September 30, 2019 | | $ | 9.75 | | | | 0.26 | | | | 0.03 | | | | 0.29 | | | | (0.25 | ) | | | — | | | | — | | | | (0.25 | ) |
| Sterling Capital Short Duration Bond Fund | | | | | | | | | | | | | | | | | |
| Year Ended September 30, 2023 | | $ | 8.08 | | | | 0.27 | | | | 0.04 | | | | 0.31 | | | | (0.25 | ) | | | — | | | | — | | | | (0.25 | ) |
| Year Ended September 30, 2022 | | $ | 8.68 | | | | 0.10 | | | | (0.51 | ) | | | (0.41 | ) | | | (0.19 | ) | | | — | | | | — | | | | (0.19 | ) |
| Year Ended September 30, 2021 | | $ | 8.78 | | | | 0.12 | | | | (0.02 | ) | | | 0.10 | | | | (0.20 | ) | | | — | | | | — | | | | (0.20 | ) |
| Year Ended September 30, 2020 | | $ | 8.65 | | | | 0.19 | | | | 0.16 | | | | 0.35 | | | | (0.22 | ) | | | — | | | | — | | | | (0.22 | ) |
| Year Ended September 30, 2019 | | $ | 8.52 | | | | 0.23 | | | | 0.15 | | | | 0.38 | | | | (0.25 | ) | | | — | | | | — | | | | (0.25 | ) |
| Sterling Capital Intermediate U.S. Government Fund | | | | | | | | | | | | | | | | | |
| Year Ended September 30, 2023 | | $ | 8.51 | | | | 0.18 | | | | (0.11 | ) | | | 0.07 | | | | (0.23 | ) | | | — | | | | — | | | | (0.23 | ) |
| Year Ended September 30, 2022 | | $ | 9.79 | | | | 0.10 | | | | (1.16 | ) | | | (1.06 | ) | | | (0.22 | ) | | | — | | | | — | | | | (0.22 | ) |
| Year Ended September 30, 2021 | | $ | 10.14 | | | | 0.09 | | | | (0.19 | ) | | | (0.10 | ) | | | (0.25 | ) | | | — | | | | — | | | | (0.25 | ) |
| Year Ended September 30, 2020 | | $ | 9.93 | | | | 0.20 | | | | 0.28 | | | | 0.48 | | | | (0.27 | ) | | | — | | | | — | | | | (0.27 | ) |
| Year Ended September 30, 2019 | | $ | 9.49 | | | | 0.23 | | | | 0.48 | | | | 0.71 | | | | (0.27 | ) | | | — | | | | — | | | | (0.27 | ) |
| Sterling Capital Total Return Bond Fund | | | | | | | | | | | | | | | | | |
| Year Ended September 30, 2023 | | $ | 9.11 | | | | 0.30 | | | | (0.22 | ) | | | 0.08 | | | | (0.31 | ) | | | — | | | | — | | | | (0.31 | ) |
| Year Ended September 30, 2022 | | $ | 11.05 | | | | 0.20 | | | | (1.80 | ) | | | (1.60 | ) | | | (0.25 | ) | | | (0.09 | ) | | | — | | | | (0.34 | ) |
| Year Ended September 30, 2021 | | $ | 11.39 | | | | 0.20 | | | | (0.13 | ) | | | 0.07 | | | | (0.26 | ) | | | (0.15 | ) | | | — | | | | (0.41 | ) |
| Year Ended September 30, 2020 | | $ | 10.89 | | | | 0.27 | | | | 0.54 | | | | 0.81 | | | | (0.31 | ) | | | — | (b) | | | — | | | | (0.31 | ) |
| Year Ended September 30, 2019 | | $ | 10.20 | | | | 0.32 | | | | 0.71 | | | | 1.03 | | | | (0.34 | ) | | | — | | | | — | | | | (0.34 | ) |
| Sterling Capital Long Duration Corporate Bond Fund | | | | | | | | | | | | | | | | | |
| Year Ended September 30, 2023 | | $ | 6.63 | | | | 0.30 | | | | (0.18 | ) | | | 0.12 | | | | (0.30 | ) | | | — | | | | — | | | | (0.30 | ) |
| Year Ended September 30, 2022 | | $ | 10.50 | | | | 0.23 | | | | (2.80 | ) | | | (2.57 | ) | | | (0.27 | ) | | | (1.03 | ) | | | — | | | | (1.30 | ) |
| Year Ended September 30, 2021 | | $ | 10.77 | | | | 0.28 | | | | 0.03 | | | | 0.31 | | | | (0.28 | ) | | | (0.30 | ) | | | — | | | | (0.58 | ) |
| Year Ended September 30, 2020 | | $ | 10.38 | | | | 0.30 | | | | 0.39 | | | | 0.69 | | | | (0.30 | ) | | | — | | | | — | | | | (0.30 | ) |
| Year Ended September 30, 2019 | | $ | 9.81 | | | | 0.33 | | | | 0.56 | | | | 0.89 | | | | (0.32 | ) | | | — | | | | — | | | | (0.32 | ) |
| * | During the periods certain fees were waived (See Note 4 in the Notes to the Financial Statements). If such reductions had not occurred, the ratios would have been as indicated. |
| ** | Portfolio turnover rate is calculated on the basis of the Fund as a whole without distinguishing between classes of shares issued. |
| (a) | Per share net investment income (loss) has been calculated using the average daily shares method. |
| (b) | Amount is less than $0.005. |
See accompanying Notes to the Financial Statements.
| | | | | | | Ratios/Supplementary Data | |
Net Asset Value,
End of Year | | | Total Return
(excludes sales
charge) | | | Net Assets, End
of Year (000) | | | Ratio of net
expenses to
average net
assets | | | Ratio of net
investment
income (loss) to
average net
assets | | | Ratio of
expenses to
average net
assets* | | | Portfolio
turnover
rate** | |
| $ | 9.68 | | | | 5.12 | % | | $ | 23,522 | | | | 0.27 | % | | | 3.51 | % | | | 0.57 | % | | | 45.10 | % |
| $ | 9.56 | | | | (0.82 | )% | | $ | 20,265 | | | | 0.27 | % | | | 1.11 | % | | | 0.50 | % | | | 50.11 | % |
| $ | 9.78 | | | | 0.75 | % | | $ | 32,492 | | | | 0.29 | % | | | 1.08 | % | | | 0.51 | % | | | 48.71 | % |
| $ | 9.83 | | | | 2.44 | % | | $ | 33,699 | | | | 0.38 | % | | | 1.90 | % | | | 0.55 | % | | | 43.45 | % |
| $ | 9.79 | | | | 3.06 | % | | $ | 15,343 | | | | 0.42 | % | | | 2.70 | % | | | 0.52 | % | | | 103.69 | % |
| | | | | | | | | | | | | | | | | | | | | | | | | | | |
| $ | 8.14 | | | | 3.87 | % | | $ | 87,221 | | | | 0.45 | % | | | 3.30 | % | | | 0.48 | % | | | 98.01 | % |
| $ | 8.08 | | | | (4.78 | )% | | $ | 82,934 | | | | 0.47 | % | | | 1.17 | % | | | 0.47 | % | | | 76.98 | % |
| $ | 8.68 | | | | 1.19 | % | | $ | 161,804 | | | | 0.43 | % | | | 1.40 | % | | | 0.46 | % | | | 39.26 | % |
| $ | 8.78 | | | | 4.12 | % | | $ | 174,891 | | | | 0.42 | % | | | 2.20 | % | | | 0.52 | % | | | 64.69 | % |
| $ | 8.65 | | | | 4.55 | % | | $ | 171,989 | | | | 0.43 | % | | | 2.68 | % | | | 0.53 | % | | | 78.58 | % |
| | | | | | | | | | | | | | | | | | | | | | | | | | | |
| $ | 8.35 | | | | 0.80 | % | | $ | 13,823 | | | | 0.50 | % | | | 2.15 | % | | | 0.69 | % | | | 7.91 | % |
| $ | 8.51 | | | | (10.90 | )% | | $ | 13,737 | | | | 0.48 | % | | | 1.12 | % | | | 0.67 | % | | | 14.18 | % |
| $ | 9.79 | | | | (1.08 | )% | | $ | 16,272 | | | | 0.43 | % | | | 0.88 | % | | | 0.61 | % | | | 71.31 | % |
| $ | 10.14 | | | | 4.92 | % | | $ | 8,049 | | | | 0.54 | % | | | 1.95 | % | | | 0.70 | % | | | 47.36 | % |
| $ | 9.93 | | | | 7.54 | % | | $ | 11,052 | | | | 0.57 | % | | | 2.35 | % | | | 0.66 | % | | | 40.13 | % |
| | | | | | | | | | | | | | | | | | | | | | | | | | | |
| $ | 8.88 | | | | 0.78 | % | | $ | 695,207 | | | | 0.45 | % | | | 3.24 | % | | | 0.51 | % | | | 47.80 | % |
| $ | 9.11 | | | | (14.81 | )% | | $ | 782,084 | | | | 0.45 | % | | | 1.98 | % | | | 0.48 | % | | | 47.98 | % |
| $ | 11.05 | | | | 0.69 | % | | $ | 1,139,676 | | | | 0.45 | % | | | 1.77 | % | | | 0.50 | % | | | 48.80 | % |
| $ | 11.39 | | | | 7.59 | % | | $ | 1,051,891 | | | | 0.45 | % | | | 2.45 | % | | | 0.57 | % | | | 59.59 | % |
| $ | 10.89 | | | | 10.27 | % | | $ | 1,065,346 | | | | 0.45 | % | | | 3.10 | % | | | 0.58 | % | | | 79.40 | % |
| | | | | | | | | | | | | | | | | | | | | | | | | | | |
| $ | 6.45 | | | | 1.64 | % | | $ | 436 | | | | 0.45 | % | | | 4.38 | % | | | 0.67 | % | | | 26.27 | % |
| $ | 6.63 | | | | (27.52 | )% | | $ | 97 | | | | 0.63 | % | | | 2.50 | % | | | 0.80 | % | | | 161.62 | % |
| $ | 10.50 | | | | 2.92 | % | | $ | 6,508 | | | | 0.71 | % | | | 2.61 | % | | | 0.87 | % | | | 47.29 | % |
| $ | 10.77 | | | | 6.72 | % | | $ | 18,519 | | | | 0.67 | % | | | 2.83 | % | | | 0.70 | % | | | 52.28 | % |
| $ | 10.38 | | | | 9.28 | % | | $ | 22,651 | | | | 0.68 | % | | | 3.25 | % | | | 0.69 | % | | | 82.23 | % |
Financial Highlights, Institutional Shares
September 30, 2023
The financial highlights table is intended to help you understand the Funds’ financial performance for the past 5 years or, if shorter, the period of the Funds’ operations. Certain information reflects financial results for a single Fund share. The total returns in the table represent the rate that an investor would have earned (or lost) on an investment in the Fund (assuming reinvestment of all dividends and distributions).
| | | | | | Investment Activities | | | Distributions | |
| | | Net Asset Value, Beginning of Year | | | Net investment income(a) | | | Net realized/ unrealized gains (losses) on investments | | | Total from Investment Activities | | | Net investment income | | | Net realized gains on investments | | | Return of capital | | | Total Distributions | |
| Sterling Capital Quality Income Fund | | | | | | | | | | | | | | | | | | | | | | | | |
| Year Ended September 30, 2023 | | $ | 8.79 | | | | 0.25 | | | | (0.21 | ) | | | 0.04 | | | | (0.26 | ) | | | — | | | | — | | | | (0.26 | ) |
| Year Ended September 30, 2022 | | $ | 10.05 | | | | 0.16 | | | | (1.22 | ) | | | (1.06 | ) | | | (0.20 | ) | | | — | | | | — | | | | (0.20 | ) |
| Year Ended September 30, 2021 | | $ | 10.26 | | | | 0.15 | | | | (0.15 | ) | | | — | | | | (0.21 | ) | | | — | | | | — | | | | (0.21 | ) |
| Year Ended September 30, 2020 | | $ | 10.10 | | | | 0.24 | | | | 0.19 | | | | 0.43 | | | | (0.27 | ) | | | — | | | | — | | | | (0.27 | ) |
| Year Ended September 30, 2019 | | $ | 9.62 | | | | 0.31 | | | | 0.47 | | | | 0.78 | | | | (0.30 | ) | | | — | | | | — | | | | (0.30 | ) |
| Sterling Capital North Carolina Intermediate Tax-Free Fund | | | | | | | | | | | | | | | | | | | |
| Year Ended September 30, 2023 | | $ | 9.83 | | | | 0.23 | | | | (0.08 | ) | | | 0.15 | | | | (0.23 | ) | | | — | | | | — | | | | (0.23 | ) |
| Year Ended September 30, 2022 | | $ | 10.97 | | | | 0.19 | | | | (1.14 | ) | | | (0.95 | ) | | | (0.19 | ) | | | — | | | | — | | | | (0.19 | ) |
| Year Ended September 30, 2021 | | $ | 11.12 | | | | 0.18 | | | | (0.15 | ) | | | 0.03 | | | | (0.18 | ) | | | — | | | | — | | | | (0.18 | ) |
| Year Ended September 30, 2020 | | $ | 10.91 | | | | 0.21 | | | | 0.21 | | | | 0.42 | | | | (0.21 | ) | | | — | | | | — | | | | (0.21 | ) |
| Year Ended September 30, 2019 | | $ | 10.43 | | | | 0.25 | | | | 0.48 | | | | 0.73 | | | | (0.25 | ) | | | — | | | | — | | | | (0.25 | ) |
| Sterling Capital South Carolina Intermediate Tax-Free Fund | | | | | | | | | | | | | | | | | | | |
| Year Ended September 30, 2023 | | $ | 10.17 | | | | 0.23 | | | | (0.08 | ) | | | 0.15 | | | | (0.23 | ) | | | — | | | | — | | | | (0.23 | ) |
| Year Ended September 30, 2022 | | $ | 11.32 | | | | 0.21 | | | | (1.15 | ) | | | (0.94 | ) | | | (0.21 | ) | | | — | | | | — | | | | (0.21 | ) |
| Year Ended September 30, 2021 | | $ | 11.39 | | | | 0.20 | | | | (0.07 | ) | | | 0.13 | | | | (0.20 | ) | | | — | | | | — | | | | (0.20 | ) |
| Year Ended September 30, 2020 | | $ | 11.20 | | | | 0.23 | | | | 0.19 | | | | 0.42 | | | | (0.23 | ) | | | — | | | | — | | | | (0.23 | ) |
| Year Ended September 30, 2019 | | $ | 10.69 | | | | 0.23 | | | | 0.51 | | | | 0.74 | | | | (0.23 | ) | | | — | | | | — | | | | (0.23 | ) |
| Sterling Capital Virginia Intermediate Tax-Free Fund | | | | | | | | | | | | | | | | | | | |
| Year Ended September 30, 2023 | | $ | 10.77 | | | | 0.22 | | | | (0.07 | ) | | | 0.15 | | | | (0.23 | ) | | | — | | | | — | | | | (0.23 | ) |
| Year Ended September 30, 2022 | | $ | 11.97 | | | | 0.19 | | | | (1.19 | ) | | | (1.00 | ) | | | (0.19 | ) | | | (0.01 | ) | | | — | | | | (0.20 | ) |
| Year Ended September 30, 2021 | | $ | 12.22 | | | | 0.19 | | | | (0.22 | ) | | | (0.03 | ) | | | (0.19 | ) | | | (0.03 | ) | | | — | | | | (0.22 | ) |
| Year Ended September 30, 2020 | | $ | 11.97 | | | | 0.23 | | | | 0.25 | | | | 0.48 | | | | (0.23 | ) | | | — | | | | — | | | | (0.23 | ) |
| Year Ended September 30, 2019 | | $ | 11.40 | | | | 0.26 | | | | 0.57 | | | | 0.83 | | | | (0.26 | ) | | | — | | | | — | | | | (0.26 | ) |
| Sterling Capital West Virginia Intermediate Tax-Free Fund | | | | | | | | | | | | | | | | | | | |
| Year Ended September 30, 2023 | | $ | 9.23 | | | | 0.23 | | | | (0.09 | ) | | | 0.14 | | | | (0.23 | ) | | | — | | | | — | | | | (0.23 | ) |
| Year Ended September 30, 2022 | | $ | 10.21 | | | | 0.18 | | | | (0.98 | ) | | | (0.80 | ) | | | (0.18 | ) | | | — | (b) | | | — | | | | (0.18 | ) |
| Year Ended September 30, 2021 | | $ | 10.31 | | | | 0.18 | | | | (0.09 | ) | | | 0.09 | | | | (0.18 | ) | | | (0.01 | ) | | | — | | | | (0.19 | ) |
| Year Ended September 30, 2020 | | $ | 10.13 | | | | 0.21 | | | | 0.19 | | | | 0.40 | | | | (0.21 | ) | | | (0.01 | ) | | | — | | | | (0.22 | ) |
| Year Ended September 30, 2019 | | $ | 9.73 | | | | 0.24 | | | | 0.42 | | | | 0.66 | | | | (0.24 | ) | | | (0.02 | ) | | | — | | | | (0.26 | ) |
| * | During the periods certain fees were waived (See Note 4 in the Notes to the Financial Statements). If such reductions had not occurred, the ratios would have been as indicated. |
| ** | Portfolio turnover rate is calculated on the basis of the Fund as a whole without distinguishing between classes of shares issued. |
| (a) | Per share net investment income (loss) has been calculated using the average daily shares method. |
| (b) | Amount is less than $0.005. |
See accompanying Notes to the Financial Statements.
| | | | | | | Ratios/Supplementary Data | |
Net Asset Value, End of Year | | | Total Return (excludes sales charge) | | | Net Assets, End of Year (000) | | | Ratio of net expenses to average net assets | | | Ratio of net investment income (loss) to average net assets | | | Ratio of expenses to average net assets* | | | Portfolio turnover rate** | |
| $ | 8.57 | | | | 0.44 | % | | $ | 88,005 | | | | 0.58 | % | | | 2.83 | % | | | 0.62 | % | | | 9.85 | % |
| $ | 8.79 | | | | (10.69 | )% | | $ | 78,252 | | | | 0.57 | % | | | 1.73 | % | | | 0.61 | % | | | 35.18 | % |
| $ | 10.05 | | | | 0.02 | % | | $ | 62,718 | | | | 0.57 | % | | | 1.52 | % | | | 0.61 | % | | | 73.60 | % |
| $ | 10.26 | | | | 4.33 | % | | $ | 35,808 | | | | 0.59 | % | | | 2.36 | % | | | 0.63 | % | | | 35.96 | % |
| $ | 10.10 | | | | 8.27 | % | | $ | 36,361 | | | | 0.60 | % | | | 3.15 | % | | | 0.64 | % | | | 17.58 | % |
| | | | | | | | | | | | | | | | | | | | | | | | | | | |
| $ | 9.75 | | | | 1.44 | % | | $ | 110,951 | | | | 0.60 | % | | | 2.24 | % | | | 0.60 | % | | | 38.07 | % |
| $ | 9.83 | | | | (8.78 | )% | | $ | 126,739 | | | | 0.57 | % | | | 1.76 | % | | | 0.57 | % | | | 50.21 | % |
| $ | 10.97 | | | | 0.24 | % | | $ | 154,297 | | | | 0.55 | % | | | 1.59 | % | | | 0.55 | % | | | 7.97 | % |
| $ | 11.12 | | | | 3.90 | % | | $ | 140,958 | | | | 0.54 | % | | | 1.92 | % | | | 0.54 | % | | | 17.06 | % |
| $ | 10.91 | | | | 7.10 | % | | $ | 140,022 | | | | 0.55 | % | | | 2.37 | % | | | 0.55 | % | | | 33.12 | % |
| | | | | | | | | | | | | | | | | | | | | | | | | | | |
| $ | 10.09 | | | | 1.40 | % | | $ | 28,750 | | | | 0.62 | % | | | 2.18 | % | | | 0.63 | % | | | 32.34 | % |
| $ | 10.17 | | | | (8.42 | )% | | $ | 34,313 | | | | 0.59 | % | | | 1.89 | % | | | 0.59 | % | | | 9.94 | % |
| $ | 11.32 | | | | 1.10 | % | | $ | 71,455 | | | | 0.56 | % | | | 1.71 | % | | | 0.56 | % | | | 20.23 | % |
| $ | 11.39 | | | | 3.76 | % | | $ | 71,865 | | | | 0.56 | % | | | 2.01 | % | | | 0.56 | % | | | 4.84 | % |
| $ | 11.20 | | | | 7.02 | % | | $ | 66,331 | | | | 0.56 | % | | | 2.13 | % | | | 0.56 | % | | | 23.84 | % |
| | | | | | | | | | | | | | | | | | | | | | | | | | | |
| $ | 10.69 | | | | 1.30 | % | | $ | 50,995 | | | | 0.61 | % | | | 2.03 | % | | | 0.61 | % | | | 17.86 | % |
| $ | 10.77 | | | | (8.41 | )% | | $ | 66,967 | | | | 0.58 | % | | | 1.67 | % | | | 0.58 | % | | | 37.23 | % |
| $ | 11.97 | | | | (0.27 | )% | | $ | 65,071 | | | | 0.56 | % | | | 1.56 | % | | | 0.56 | % | | | 8.98 | % |
| $ | 12.22 | | | | 4.06 | % | | $ | 62,828 | | | | 0.56 | % | | | 1.91 | % | | | 0.56 | % | | | 15.44 | % |
| $ | 11.97 | | | | 7.31 | % | | $ | 59,312 | | | | 0.56 | % | | | 2.18 | % | | | 0.56 | % | | | 24.57 | % |
| | | | | | | | | | | | | | | | | | | | | | | | | | | |
| $ | 9.14 | | | | 1.43 | % | | $ | 58,934 | | | | 0.61 | % | | | 2.40 | % | | | 0.61 | % | | | 37.11 | % |
| $ | 9.23 | | | | (7.93 | )% | | $ | 63,292 | | | | 0.58 | % | | | 1.81 | % | | | 0.58 | % | | | 18.08 | % |
| $ | 10.21 | | | | 0.88 | % | | $ | 67,778 | | | | 0.56 | % | | | 1.78 | % | | | 0.56 | % | | | 8.56 | % |
| $ | 10.31 | | | | 4.01 | % | | $ | 67,627 | | | | 0.56 | % | | | 2.08 | % | | | 0.56 | % | | | 3.28 | % |
| $ | 10.13 | | | | 6.85 | % | | $ | 53,352 | | | | 0.56 | % | | | 2.43 | % | | | 0.56 | % | | | 33.73 | % |
Financial Highlights, Class R6 Shares
September 30, 2023
The financial highlights table is intended to help you understand the Funds’ financial performance for the past 5 years or, if shorter, the period of the Funds’ operations. Certain information reflects financial results for a single Fund share. The total returns in the table represent the rate that an investor would have earned (or lost) on an investment in the Fund (assuming reinvestment of all dividends and distributions).
| | | | | | Investment Activities | | | Distributions | |
| | | Net Asset Value, Beginning of Year | | | Net investment income (loss)(a) | | | Net realized/ unrealized gains (losses) on investments | | | Total from Investment Activities | | | Net investment income | | | Net realized gains on investments | | | Return of capital | | | Total Distributions | |
| Sterling Capital Behavioral Large Cap Value Equity Fund | | | | | | | | | | | | | | | | | |
| Year Ended September 30, 2023 | | $ | 20.40 | | | | 0.46 | | | | 2.97 | | | | 3.43 | | | | (0.46 | ) | | | — | | | | — | | | | (0.46 | ) |
| Year Ended September 30, 2022 | | $ | 22.99 | | | | 0.50 | | | | (2.63 | ) | | | (2.13 | ) | | | (0.46 | ) | | | — | | | | — | | | | (0.46 | ) |
| Year Ended September 30, 2021 | | $ | 16.85 | | | | 0.09 | | | | 6.25 | | | | 6.34 | | | | (0.04 | ) | | | — | | | | (0.16 | ) | | | (0.20 | ) |
| Year Ended September 30, 2020 | | $ | 19.62 | | | | 0.40 | | | | (2.07 | ) | | | (1.67 | ) | | | (0.52 | ) | | | (0.58 | ) | | | — | | | | (1.10 | ) |
| Year Ended September 30, 2019 | | $ | 22.43 | | | | 0.46 | | | | (1.08 | ) | | | (0.62 | ) | | | (0.44 | ) | | | (1.75 | ) | | | — | | | | (2.19 | ) |
| Sterling Capital Mid Value Fund | | | | | | | | | | | | | | | | | | | | | | |
| Year Ended September 30, 2023 | | $ | 15.68 | | | | 0.12 | | | | 2.01 | | | | 2.13 | | | | (0.08 | ) | | | (2.72 | ) | | | — | | | | (2.80 | ) |
| Year Ended September 30, 2022 | | $ | 20.55 | | | | 0.08 | | | | (3.27 | ) | | | (3.19 | ) | | | (0.04 | ) | | | (1.64 | ) | | | — | | | | (1.68 | ) |
| Year Ended September 30, 2021 | | $ | 14.35 | | | | 0.03 | | | | 6.25 | | | | 6.28 | | | | (0.08 | ) | | | — | | | | — | | | | (0.08 | ) |
| Year Ended September 30, 2020 | | $ | 16.48 | | | | (0.02 | ) | | | (0.75 | ) | | | (0.77 | ) | | | (0.23 | ) | | | (1.13 | ) | | | — | | | | (1.36 | ) |
| Year Ended September 30, 2019 | | $ | 19.44 | | | | 0.11 | | | | (0.78 | ) | | | (0.67 | ) | | | (0.03 | ) | | | (2.26 | ) | | | — | | | | (2.29 | ) |
| Sterling Capital Behavioral Small Cap Value Equity Fund | | | | | | | | | | | | | | | | | |
| Year Ended September 30, 2023 | | $ | 15.31 | | | | 0.32 | | | | 1.81 | | | | 2.13 | | | | (0.27 | ) | | | — | | | | — | | | | (0.27 | ) |
| Year Ended September 30, 2022 | | $ | 19.60 | | | | 0.22 | | | | (2.48 | ) | | | (2.26 | ) | | | (0.21 | ) | | | (1.82 | ) | | | — | | | | (2.03 | ) |
| Year Ended September 30, 2021 | | $ | 11.97 | | | | 0.17 | | | | 7.60 | | | | 7.77 | | | | (0.14 | ) | | | — | | | | — | | | | (0.14 | ) |
| Year Ended September 30, 2020 | | $ | 14.67 | | | | 0.15 | | | | (2.70 | ) | | | (2.55 | ) | | | (0.15 | ) | | | — | | | | — | | | | (0.15 | ) |
| Year Ended September 30, 2019 | | $ | 18.84 | | | | 0.23 | | | | (2.10 | ) | | | (1.87 | ) | | | (0.32 | ) | | | (1.98 | ) | | | — | | | | (2.30 | ) |
| Sterling Capital Special Opportunities Fund | | | | | | | | | | | | | | | | | | | | | | |
| Year Ended September 30, 2023 | | $ | 25.71 | | | | (0.01 | ) | | | 4.55 | | | | 4.54 | | | | — | | | | (1.99 | ) | | | — | | | | (1.99 | ) |
| Year Ended September 30, 2022 | | $ | 35.51 | | | | (0.04 | ) | | | (5.65 | ) | | | (5.69 | ) | | | — | | | | (4.11 | ) | | | — | | | | (4.11 | ) |
| Year Ended September 30, 2021 | | $ | 26.22 | | | | (0.01 | ) | | | 9.78 | | | | 9.77 | | | | (0.15 | ) | | | (0.33 | ) | | | — | | | | (0.48 | ) |
| Year Ended September 30, 2020 | | $ | 26.09 | | | | 0.09 | | | | 1.44 | | | | 1.53 | | | | (0.07 | ) | | | (1.33 | ) | | | — | | | | (1.40 | ) |
| Year Ended September 30, 2019 | | $ | 27.75 | | | | 0.10 | | | | 0.12 | | | | 0.22 | | | | (0.02 | ) | | | (1.86 | ) | | | — | | | | (1.88 | ) |
| Sterling Capital Equity Income Fund | | | | | | | | | | | | | | | | | | | | | | |
| Year Ended September 30, 2023 | | $ | 24.36 | | | | 0.45 | | | | 2.73 | | | | 3.18 | | | | (0.44 | ) | | | (1.74 | ) | | | — | | | | (2.18 | ) |
| Year Ended September 30, 2022 | | $ | 26.67 | | | | 0.45 | | | | (1.83 | ) | | | (1.38 | ) | | | (0.45 | ) | | | (0.48 | ) | | | — | | | | (0.93 | ) |
| Year Ended September 30, 2021 | | $ | 20.09 | | | | 0.37 | | | | 6.56 | | | | 6.93 | | | | (0.35 | ) | | | — | | | | — | | | | (0.35 | ) |
| Year Ended September 30, 2020 | | $ | 21.34 | | | | 0.43 | | | | (0.40 | ) | | | 0.03 | | | | (0.44 | ) | | | (0.84 | ) | | | — | | | | (1.28 | ) |
| Year Ended September 30, 2019 | | $ | 21.61 | | | | 0.47 | | | | 1.23 | | | | 1.70 | | | | (0.45 | ) | | | (1.52 | ) | | | — | | | | (1.97 | ) |
| Sterling Capital Behavioral International Equity Fund | | | | | | | | | | | | | | | | | |
| Year Ended September 30, 2023 | | $ | 7.10 | | | | 0.32 | | | | 1.99 | | | | 2.31 | | | | (0.27 | ) | | | — | | | | — | | | | (0.27 | ) |
| Year Ended September 30, 2022 | | $ | 9.81 | | | | 0.39 | | | | (2.64 | ) | | | (2.25 | ) | | | (0.46 | ) | | | — | | | | — | | | | (0.46 | ) |
| Year Ended September 30, 2021 | | $ | 8.14 | | | | 0.29 | | | | 1.62 | | | | 1.91 | | | | (0.24 | ) | | | — | | | | — | | | | (0.24 | ) |
| Year Ended September 30, 2020 | | $ | 9.49 | | | | 0.27 | | | | (1.32 | ) | | | (1.05 | ) | | | (0.30 | ) | | | — | | | | — | | | | (0.30 | ) |
| Year Ended September 30, 2019 | | $ | 11.19 | | | | 0.36 | | | | (1.34 | ) | | | (0.98 | ) | | | (0.32 | ) | | | (0.40 | ) | | | — | | | | (0.72 | ) |
| * | During the periods certain fees were waived (See Note 4 in the Notes to the Financial Statements). If such reductions had not occurred, the ratios would have been as indicated. |
| ** | Portfolio turnover rate is calculated on the basis of the Fund as a whole without distinguishing between classes of shares issued. |
| (a) | Per share net investment income (loss) has been calculated using the average daily shares method. |
| (b) | Net Assets are below $1,000. |
See accompanying Notes to the Financial Statements.
| | | | | | | | | Ratios/Supplementary Data | |
Net Asset Value, End of Year | | | Total Return (excludes sales charge) | | | Net Assets, End of Year (000) | | | Ratio of net expenses to average net assets | | | Ratio of net investment income (loss) to average net assets | | | Ratio of expenses to average net assets* | | | Portfolio turnover rate** | |
| $ | 23.37 | | | | 16.84 | % | | $ | 330 | | | | 0.77 | % | | | 1.99 | % | | | 0.90 | % | | | 110.98 | % |
| $ | 20.40 | | | | (9.48 | )% | | $ | 1 | | | | 0.59 | % | | | 2.09 | % | | | 0.59 | % | | | 125.15 | % |
| $ | 22.99 | | | | 37.92 | % | | $ | 1 | | | | 0.58 | % | | | 0.43 | % | | | 0.63 | % | | | 122.64 | % |
| $ | 16.85 | | | | (8.88 | )% | | $ | — | (b) | | | 0.59 | % | | | 2.19 | % | | | 0.64 | % | | | 167.34 | % |
| $ | 19.62 | | | | (2.02 | )% | | $ | 239,763 | | | | 0.58 | % | | | 2.35 | % | | | 0.64 | % | | | 142.59 | % |
| | | | | | | | | | | | | | | | | | | | | | | | | | | |
| $ | 15.01 | | | | 13.86 | % | | $ | 354 | | | | 0.82 | % | | | 0.80 | % | | | 0.93 | % | | | 19.99 | % |
| $ | 15.68 | | | | (17.18 | )% | | $ | 117 | | | | 0.79 | % | | | 0.40 | % | | | 0.88 | % | | | 29.05 | % |
| $ | 20.55 | | | | 43.85 | % | | $ | 402 | | | | 0.79 | % | | | 0.17 | % | | | 0.97 | % | | | 34.00 | % |
| $ | 14.35 | | | | (5.56 | )% | | $ | 3,477 | | | | 0.54 | % | | | (0.06 | )% | | | 0.56 | % | | | 28.77 | % |
| $ | 16.48 | | | | (2.45 | )% | | $ | 247,949 | | | | 0.82 | % | | | 0.68 | % | | | 0.93 | % | | | 26.62 | % |
| | | | | | | | | | | | | | | | | | | | | | | | | | | |
| $ | 17.17 | | | | 13.94 | % | | $ | 78,727 | | | | 0.79 | % | | | 1.88 | % | | | 0.85 | % | | | 154.69 | % |
| $ | 15.31 | | | | (13.29 | )% | | $ | 20,331 | | | | 0.78 | % | | | 1.14 | % | | | 0.83 | % | | | 70.82 | % |
| $ | 19.60 | | | | 65.36 | % | | $ | 83,819 | | | | 0.75 | % | | | 0.96 | % | | | 0.81 | % | | | 110.07 | % |
| $ | 11.97 | | | | (17.63 | )% | | $ | 70,372 | | | | 0.74 | % | | | 1.11 | % | | | 0.82 | % | | | 119.76 | % |
| $ | 14.67 | | | | (9.29 | )% | | $ | 210,436 | | | | 0.73 | % | | | 1.53 | % | | | 0.80 | % | | | 124.82 | % |
| | | | | | | | | | | | | | | | | | | | | | | | | | | |
| $ | 28.26 | | | | 18.39 | % | | $ | 36,906 | | | | 0.82 | % | | | (0.02 | )% | | | 0.91 | % | | | 31.19 | % |
| $ | 25.71 | | | | (18.66 | )% | | $ | 29,340 | | | | 0.80 | % | | | (0.11 | )% | | | 0.88 | % | | | 28.06 | % |
| $ | 35.51 | | | | 37.67 | % | | $ | 44,452 | | | | 0.78 | % | | | (0.03 | )% | | | 0.87 | % | | | 27.20 | % |
| $ | 26.22 | | | | 5.87 | % | | $ | 40,057 | | | | 0.78 | % | | | 0.38 | % | | | 0.86 | % | | | 17.50 | % |
| $ | 26.09 | | | | 1.53 | % | | $ | 355,672 | | | | 0.77 | % | | | 0.40 | % | | | 0.86 | % | | | 17.31 | % |
| | | | | | | | | | | | | | | | | | | | | | | | | | | |
| $ | 25.36 | | | | 12.94 | % | | $ | 101,228 | | | | 0.72 | % | | | 1.73 | % | | | 0.82 | % | | | 39.43 | % |
| $ | 24.36 | | | | (5.54 | )% | | $ | 69,408 | | | | 0.69 | % | | | 1.65 | % | | | 0.79 | % | | | 31.23 | % |
| $ | 26.67 | | | | 34.61 | % | | $ | 70,388 | | | | 0.68 | % | | | 1.50 | % | | | 0.79 | % | | | 13.00 | % |
| $ | 20.09 | | | | 0.21 | % | | $ | 56,277 | | | | 0.67 | % | | | 2.18 | % | | | 0.78 | % | | | 33.60 | % |
| $ | 21.34 | | | | 8.89 | % | | $ | 345,806 | | | | 0.66 | % | | | 2.28 | % | | | 0.77 | % | | | 23.20 | % |
| | | | | | | | | | | | | | | | | | | | | | | | | | | |
| $ | 9.14 | | | | 32.87 | % | | $ | 115,245 | | | | 0.62 | % | | | 3.60 | % | | | 0.67 | % | | | 86.05 | % |
| $ | 7.10 | | | | (24.13 | )% | | $ | 97,525 | | | | 0.62 | % | | | 4.41 | % | | | 0.67 | % | | | 103.20 | % |
| $ | 9.81 | | | | 23.70 | % | | $ | 85,736 | | | | 0.63 | % | | | 3.04 | % | | | 0.74 | % | | | 158.16 | % |
| $ | 8.14 | | | | (11.49 | )% | | $ | 69,236 | | | | 0.63 | % | | | 3.10 | % | | | 0.83 | % | | | 164.02 | % |
| $ | 9.49 | | | | (8.48 | )% | | $ | 78,307 | | | | 0.61 | % | | | 3.77 | % | | | 0.89 | % | | | 97.74 | % |
Financial Highlights, Class R6 Shares
September 30, 2023
The financial highlights table is intended to help you understand the Funds’ financial performance for the past 5 years or, if shorter, the period of the Funds’ operations. Certain information reflects financial results for a single Fund share. The total returns in the table represent the rate that an investor would have earned (or lost) on an investment in the Fund (assuming reinvestment of all dividends and distributions).
| | | | | | Investment Activities | | | Distributions | |
| | | Net Asset
Value,
Beginning
of Year | | | Net
investment
income(a) | | | Net realized/
unrealized
gains
(losses) on
investments | | | Total from
Investment
Activities | | | Net
investment
income | | | Net
realized
gains on
investments | | | Return
of
capital | | | Total
Distributions | |
| Sterling Capital Real Estate Fund |
| Year Ended September 30, 2023 | | $ | 35.09 | | | | 0.80 | | | | (0.30 | ) | | | 0.50 | | | | (0.78 | ) | | | (2.23 | ) | | | — | | | | (3.01 | ) |
| Year Ended September 30, 2022 | | $ | 46.33 | | | | 0.47 | | | | (8.09 | ) | | | (7.62 | ) | | | (0.63 | ) | | | (2.99 | ) | | | — | | | | (3.62 | ) |
| Year Ended September 30, 2021 | | $ | 36.69 | | | | 0.59 | | | | 10.46 | | | | 11.05 | | | | (0.59 | ) | | | (0.82 | ) | | | — | | | | (1.41 | ) |
| January 31, 2020 to September 30, 2020(d) | | $ | 41.35 | | | | 0.36 | | | | (4.26 | ) | | | (3.90 | ) | | | (0.76 | ) | | | — | | | | — | | | | (0.76 | ) |
| Sterling Capital Small Cap Value Fund |
| Year Ended September 30, 2023 | | $ | 58.38 | | | | 0.36 | | | | 8.20 | | | | 8.56 | | | | (0.28 | ) | | | (13.68 | ) | | | — | | | | (13.96 | ) |
| Year Ended September 30, 2022 | | $ | 83.72 | | | | 0.35 | | | | (8.28 | ) | | | (7.93 | ) | | | (0.14 | ) | | | (17.27 | ) | | | — | | | | (17.41 | ) |
| Year Ended September 30, 2021 | | $ | 64.09 | | | | 0.29 | | | | 30.99 | | | | 31.28 | | | | (0.43 | ) | | | (11.22 | ) | | | — | | | | (11.65 | ) |
| January 31, 2020 to September 30, 2020(d) | | $ | 77.13 | | | | 0.49 | | | | (13.53 | ) | | | (13.04 | ) | | | — | | | | — | | | | — | | | | — | |
| Sterling Capital Short Duration Bond Fund |
| Year Ended September 30, 2023 | | $ | 8.08 | | | | 0.27 | | | | 0.06 | | | | 0.33 | | | | (0.26 | ) | | | — | | | | — | | | | (0.26 | ) |
| Year Ended September 30, 2022 | | $ | 8.68 | | | | 0.11 | | | | (0.51 | ) | | | (0.40 | ) | | | (0.20 | ) | | | — | | | | — | | | | (0.20 | ) |
| February 1, 2021 to September 30, 2021(d) | | $ | 8.78 | | | | 0.08 | | | | (0.04 | ) | | | 0.04 | | | | (0.14 | ) | | | — | | | | — | | | | (0.14 | ) |
| Sterling Capital Total Return Bond Fund |
| Year Ended September 30, 2023 | | $ | 9.11 | | | | 0.31 | | | | (0.22 | ) | | | 0.09 | | | | (0.32 | ) | | | — | | | | — | | | | (0.32 | ) |
| Year Ended September 30, 2022 | | $ | 11.05 | | | | 0.21 | | | | (1.80 | ) | | | (1.59 | ) | | | (0.26 | ) | | | (0.09 | ) | | | — | | | | (0.35 | ) |
| Year Ended September 30, 2021 | | $ | 11.39 | | | | 0.21 | | | | (0.12 | ) | | | 0.09 | | | | (0.28 | ) | | | (0.15 | ) | | | — | | | | (0.43 | ) |
| Year Ended September 30, 2020 | | $ | 10.89 | | | | 0.28 | | | | 0.54 | | | | 0.82 | | | | (0.32 | ) | | | — | (f) | | | — | | | | (0.32 | ) |
| Year Ended September 30, 2019 | | $ | 10.20 | | | | 0.33 | | | | 0.71 | | | | 1.04 | | | | (0.35 | ) | | | — | | | | — | | | | (0.35 | ) |
| Sterling Capital Long Duration Corporate Bond Fund |
| Year Ended September 30, 2023 | | $ | 6.63 | | | | 0.31 | | | | (0.18 | ) | | | 0.13 | | | | (0.31 | ) | | | — | | | | — | | | | (0.31 | ) |
| January 31, 2022 to September 30, 2022(d) | | $ | 9.16 | | | | 0.19 | | | | (2.52 | ) | | | (2.33 | ) | | | (0.20 | ) | | | — | | | | — | | | | (0.20 | ) |
| * | During the periods certain fees were waived (See Note 4 in the Notes to the Financial Statements). If such reductions had not occurred, the ratios would have been as indicated. |
| ** | Portfolio turnover rate is calculated on the basis of the Fund as a whole without distinguishing between classes of shares issued. |
| (a) | Per share net investment income (loss) has been calculated using the average daily shares method. |
| (b) | Not annualized for periods less than one year. |
| (c) | Annualized for periods less than one year. |
| (d) | Period from commencement of operations. |
| (e) | Net Assets are below $1,000. |
| (f) | Amount is less than $0.005. |
See accompanying Notes to the Financial Statements.
| | | | | | | | | Ratios/Supplementary Data | |
Net Asset Value,
End of Year | | | Total Return
(excludes sales
charge)(b) | | | Net Assets, End
of Year (000) | | | Ratio of net
expenses to
average net
assets(c) | | | Ratio of net
investment
income (loss) to
average net
assets(c) | | | Ratio of
expenses to
average net
assets*(c) | | | Portfolio
turnover
rate**(b) | |
| $ | 32.58 | | | | 1.01 | % | | $ | 918 | | | | 0.80 | % | | | 2.25 | % | | | 0.87 | % | | | 6.06 | % |
| $ | 35.09 | | | | (18.31 | )% | | $ | 18 | | | | 0.73 | % | | | 1.06 | % | | | 0.82 | % | | | 12.58 | % |
| $ | 46.33 | | | | 30.67 | % | | $ | 16 | | | | 0.62 | % | | | 1.33 | % | | | 0.73 | % | | | 12.68 | % |
| $ | 36.69 | | | | (9.30 | )% | | $ | — | (e) | | | 0.70 | % | | | 1.47 | % | | | 0.70 | % | | | 19.58 | % |
| | | | | | | | | | | | | | | | | | | | | | | | | | | |
| $ | 52.98 | | | | 15.45 | % | | $ | 6,360 | | | | 0.93 | % | | | 0.66 | % | | | 1.05 | % | | | 0.77 | % |
| $ | 58.38 | | | | (13.84 | )% | | $ | 3,792 | | | | 0.90 | % | | | 0.50 | % | | | 1.00 | % | | | 5.26 | % |
| $ | 83.72 | | | | 52.98 | % | | $ | 3,656 | | | | 0.88 | % | | | 0.36 | % | | | 1.02 | % | | | 6.15 | % |
| $ | 64.09 | | | | (16.91 | )% | | $ | 2,882 | | | | 0.87 | % | | | 1.17 | % | | | 1.09 | % | | | 8.33 | % |
| | | | | | | | | | | | | | | | | | | | | | | | | | | |
| $ | 8.15 | | | | 4.09 | % | | $ | 13,222 | | | | 0.36 | % | | | 3.34 | % | | | 0.48 | % | | | 98.01 | % |
| $ | 8.08 | | | | (4.70 | )% | | $ | 17,460 | | | | 0.39 | % | | | 1.27 | % | | | 0.48 | % | | | 76.98 | % |
| $ | 8.68 | | | | 0.44 | % | | $ | 29,565 | | | | 0.40 | % | | | 1.52 | % | | | 0.49 | % | | | 39.26 | % |
| | | | | | | | | | | | | | | | | | | | | | | | | | | |
| $ | 8.88 | | | | 0.88 | % | | $ | 263,634 | | | | 0.35 | % | | | 3.36 | % | | | 0.51 | % | | | 47.80 | % |
| $ | 9.11 | | | | (14.72 | )% | | $ | 230,211 | | | | 0.35 | % | | | 2.08 | % | | | 0.48 | % | | | 47.98 | % |
| $ | 11.05 | | | | 0.79 | % | | $ | 348,271 | | | | 0.35 | % | | | 1.88 | % | | | 0.52 | % | | | 48.80 | % |
| $ | 11.39 | | | | 7.70 | % | | $ | 642,344 | | | | 0.35 | % | | | 2.52 | % | | | 0.58 | % | | | 59.59 | % |
| $ | 10.89 | | | | 10.38 | % | | $ | 350,129 | | | | 0.35 | % | | | 3.20 | % | | | 0.58 | % | | | 79.40 | % |
| | | | | | | | | | | | | | | | | | | | | | | | | | | |
| $ | 6.45 | | | | 1.72 | % | | $ | 30,432 | | | | 0.36 | % | | | 4.46 | % | | | 0.66 | % | | | 26.27 | % |
| $ | 6.63 | | | | (25.75 | )% | | $ | 22,553 | | | | 0.36 | % | | | 3.81 | % | | | 0.57 | % | | | 161.62 | % |
Notes to Financial Statements
September 30, 2023
Sterling Capital Funds (the “Trust”) commenced operations on October 5, 1992 and is registered under the Investment Company Act of 1940, as amended (the “1940 Act”), as an open-end investment company established as a Massachusetts business trust.
The Trust offers shares of Sterling Capital Behavioral Large Cap Value Equity Fund, Sterling Capital Mid Value Fund, Sterling Capital Behavioral Small Cap Value Equity Fund, Sterling Capital Special Opportunities Fund, Sterling Capital Equity Income Fund, Sterling Capital Behavioral International Equity Fund, Sterling Capital SMID Opportunities Fund, Sterling Capital Mid Cap Relative Value Fund, Sterling Capital Real Estate Fund, Sterling Capital Small Cap Value Fund, Sterling Capital Ultra Short Bond Fund, Sterling Capital Short Duration Bond Fund, Sterling Capital Intermediate U.S. Government Fund, Sterling Capital Total Return Bond Fund, Sterling Capital Long Duration Corporate Bond Fund, Sterling Capital Quality Income Fund, Sterling Capital North Carolina Intermediate Tax-Free Fund, Sterling Capital South Carolina Intermediate Tax-Free Fund, Sterling Capital Virginia Intermediate Tax-Free Fund and Sterling Capital West Virginia Intermediate Tax-Free Fund (referred to individually as a “Fund” and collectively as the “Funds”). Sterling Capital North Carolina Intermediate Tax-Free Fund, Sterling Capital South Carolina Intermediate Tax-Free Fund, Sterling Capital Virginia Intermediate Tax-Free Fund and Sterling Capital West Virginia Intermediate Tax-Free Fund are referred to as the “Tax-Free Funds.” All Funds are referred to as the “Variable Net Asset Value Funds.”
All Funds, other than the Tax-Free Funds, are “diversified” funds, as defined in the 1940 Act. The Tax-Free Funds are non-diversified funds, which means they may invest in the securities of a limited number of issuers.
The Funds are authorized to issue an unlimited amount of shares. As of September 30, 2023, the Funds discussed herein offered up to four classes of shares: Class A Shares, Class C Shares, Institutional Shares and Class R6 Shares. Class A Shares of Sterling Capital Behavioral Large Cap Value Equity Fund, Sterling Capital Mid Value Fund, Sterling Capital Behavioral Small Cap Value Equity Fund, Sterling Capital Special Opportunities Fund, Sterling Capital Equity Income Fund, Sterling Capital Behavioral International Equity Fund, Sterling Capital SMID Opportunities Fund, Sterling Capital Mid Cap Relative Value Fund, Sterling Capital Real Estate Fund and Sterling Capital Small Cap Value Fund have a maximum sales charge of 5.75% as a percentage of original purchase price. There is no initial sales charge on purchases of the Sterling Capital Ultra Short Bond Fund’s shares. Class A Shares of Sterling Capital Short Duration Bond Fund, Sterling Capital Intermediate U.S. Government Fund, Sterling Capital Total Return Bond Fund, Sterling Capital Long Duration Corporate Bond Fund, Sterling Capital Quality Income Fund, and the Tax-Free Funds have a maximum sales charge of 2.00% as a percentage of the original purchase price. Purchases of $1 million or more of Class A Shares are not subject to a front-end sales charge but will be subject to a Contingent Deferred Sales Charge (“CDSC”) of up to 1.00% of the purchase price if redeemed within two years after purchase for all Funds except the Tax-Free Funds, Sterling Capital Short Duration Bond Fund, Sterling Capital Intermediate U.S. Government Fund, Sterling Capital Long Duration Corporate Bond Fund, Sterling Capital Total Return Bond Fund and Sterling Capital Quality Income Fund. With respect to the Tax-Free Funds, Sterling Capital Short Duration Bond Fund, Sterling Capital Intermediate U.S. Government Fund, Sterling Capital Long Duration Corporate Bond Fund, Sterling Capital Total Return Bond Fund, and Sterling Capital Quality Income Fund, sales of Class A shares of $250,000 or more are not subject to a sales load but will be subject to a CDSC of up to 0.50% of the purchase price if redeemed within 18 months of purchase. This charge is based on the lower of the price paid for the shares or their net asset value at the time of redemption. Class C Shares of the Funds are offered without any front-end sales charge but will be subject to a maximum CDSC of 1.00% if redeemed less than one year after purchase.
Each class of shares has identical rights and privileges except with respect to the fees paid under the distribution plan, voting rights on matters affecting a single class of shares and the exchange privilege of each class of shares. Effective on the close of business on November 15, 2021, Class R Shares were converted into Class A Shares for the Sterling Capital Mid Value Fund, Sterling Capital Behavioral Small Cap Value Equity Fund, Sterling Capital Special Opportunities Fund, Sterling Capital Equity Income Fund, and Sterling Capital Total Return Bond Fund.
Under the Trust’s organizational documents, its Officers and Trustees are indemnified against certain liabilities arising out of the performance of their duties to the Trust. In addition, in the normal course of business, the Funds may enter into contracts with their vendors and others that provide for general indemnifications. The Funds’ maximum exposure under these arrangements is unknown, as this would involve future claims that may be made against the Funds. However, based on experience, the Funds expect that risk of loss to be remote.
Notes to Financial Statements — (continued)
September 30, 2023
| 2. | Significant Accounting Policies: |
The Funds are investment companies and accordingly follow the investment company accounting and reporting guidance of the Financial Accounting Standards Board (“FASB”) Accounting Standards Codification Topic 946, Financial Services-Investment Companies. The following is a summary of significant accounting policies followed by the Funds. The policies are in conformity with United States generally accepted accounting principles (“U.S. GAAP”). The preparation of these financial statements requires management to make estimates and assumptions that affect the reported amounts of assets and liabilities and disclosure of contingent assets and liabilities at the date of the financial statements and the reported amounts of income and expenses for the reporting period. Actual results could differ from those estimates.
Securities Valuation — Investments of the Variable Net Asset Value Funds in securities traded on a national securities exchange or in the over-the-counter market are valued at the closing price on the principal exchange or market (including the NASDAQ Closing Price for securities traded on NASDAQ), typically 4:00 PM ET or, absent such a price, by reference to the latest available bid prices in the principal market in which such securities are normally traded. The Variable Net Asset Value Funds may also use an independent pricing service approved by the Board of Trustees (the “Board”) to value certain securities, including the use of electronic and matrix techniques. Investments in open-end investment companies are valued at their respective net asset values as reported by such companies. Investments in closed-end investment companies and exchange-traded funds are valued at their market values based upon the latest available sale price or, absent such a price, by reference to the latest available bid prices in the principal market in which such securities are normally traded. The differences between cost and fair value of investments are reflected as either unrealized appreciation or depreciation. Securities for which market quotations are not readily available (e.g., an approved pricing service does not provide a price, a furnished price is in error, certain stale prices, or an event occurs that materially affects the furnished price) will be fair valued by Sterling Capital Management LLC (“Sterling Capital” or the “Advisor”) in accordance with certain Board-approved fair valuation methodologies pursuant to Rule 2a-5 under the 1940 Act. The Fund’s Board has designated Sterling Capital as each Fund’s “Valuation Designee” pursuant to Rule 2a-5 to perform such fair value determinations. The Board oversees Sterling Capital in its role as the Valuation Designee and receives reports from Sterling Capital regarding its process and the valuation of each Fund’s investments to assist with such oversight.
Fair value pricing may be used if events materially affecting the value of foreign securities occur between the time when the exchange on which they are traded closes and the time when the Fund’s net asset value is calculated; such securities may be valued at fair value in accordance with procedures adopted by the Board.
Fair Value Measurements — The objective of a fair value measurement is to determine the price that would be received to sell an asset or paid to transfer a liability in an orderly transaction between market participants at the measurement date (an exit price). Accordingly, the fair value hierarchy gives the highest priority to quoted prices (unadjusted) in active markets for identical assets or liabilities (Level 1) and the lowest priority to unobservable inputs (Level 3). The three levels of the fair value hierarchy are described as follows:
● Level 1 – quoted prices in active markets for identical securities
● Level 2 – based on other significant observable inputs (including quoted prices for similar securities, interest rates, prepayment speeds, credit risk, etc.)
● Level 3 – based on significant unobservable inputs (including a Fund’s own assumptions in determining the fair value of investments)
The inputs or methodology used for valuing securities are not necessarily an indication of the risk associated with investing in those securities. During the year ended September 30, 2023, there were no significant changes to the Funds’ valuation policies and procedures.
Notes to Financial Statements — (continued)
September 30, 2023
The summary of inputs used to determine the fair value of each Fund’s investments as of September 30, 2023 is as follows:
| | | Level 1-
Quoted Prices | | | Level 2-
Other Significant
Observable Inputs | | | Level 3-
Significant
Unobservable
Inputs | | | Total | |
| Assets: | | | | | | | | | | | | | | | | |
| Investments in Securities | | | | | | | | | | | | | | | | |
| Sterling Capital Behavioral Large Cap Value Equity Fund | | $ | 30,525,876 | (a) | | $ | — | | | $ | — | | | $ | 30,525,876 | |
| Sterling Capital Mid Value Fund | | | 45,653,475 | (a) | | | — | | | | 0.00 | (b) | | | 45,653,475 | |
| Sterling Capital Behavioral Small Cap Value Equity Fund | | | 90,582,852 | (a) | | | — | | | | — | | | | 90,582,852 | |
| Sterling Capital Special Opportunities Fund | | | 466,379,438 | (a) | | | — | | | | — | | | | 466,379,438 | |
| Sterling Capital Equity Income Fund | | | 1,879,662,600 | (a) | | | — | | | | — | | | | 1,879,662,600 | |
| Sterling Capital Behavioral International Equity Fund | | | 115,192,493 | (c) | | | — | | | | — | | | | 115,192,493 | |
| Sterling Capital SMID Opportunities Fund | | | 4,465,578 | (a) | | | — | | | | — | | | | 4,465,578 | |
| Sterling Capital Mid Cap Relative Value Fund | | | 43,473,136 | (a) | | | — | | | | — | | | | 43,473,136 | |
| Sterling Capital Real Estate Fund | | | 64,236,122 | (a) | | | — | | | | — | | | | 64,236,122 | |
| Sterling Capital Small Cap Value Fund | | | 268,075,946 | (a) | | | — | | | | — | | | | 268,075,946 | |
| Sterling Capital Ultra Short Bond Fund | | | 1,067,441 | (c) | | | 28,614,868 | (a) | | | — | | | | 29,682,309 | |
| Sterling Capital Short Duration Bond Fund | | | 3,151,037 | (c) | | | 101,703,968 | (a) | | | — | | | | 104,855,005 | |
| Sterling Capital Intermediate U.S. Government Fund | | | 62,540 | (c) | | | 16,367,009 | (a) | | | — | | | | 16,429,549 | |
| Sterling Capital Total Return Bond Fund | | | 5,905,651 | (c) | | | 997,345,281 | (a) | | | — | | | | 1,003,250,932 | |
| Sterling Capital Long Duration Corporate Bond Fund | | | 162,187 | (c) | | | 30,597,096 | (a) | | | — | | | | 30,759,283 | |
| Sterling Capital Quality Income Fund | | | 1,258,182 | (c) | | | 86,661,053 | (a) | | | — | | | | 87,919,235 | |
| Sterling Capital North Carolina Intermediate Tax-Free Fund | | | 2,996,657 | (c) | | | 129,855,192 | (a) | | | — | | | | 132,851,849 | |
| Sterling Capital South Carolina Intermediate Tax-Free Fund | | | 417,030 | (c) | | | 34,621,441 | (a) | | | — | | | | 35,038,471 | |
| Sterling Capital Virginia Intermediate Tax-Free Fund | | | 467,448 | (c) | | | 61,523,529 | (a) | | | — | | | | 61,990,977 | |
| Sterling Capital West Virginia Intermediate Tax-Free Fund | | | 1,476,871 | (c) | | | 77,281,543 | (a) | | | — | | | | 78,758,414 | |
| (a) | Industries, countries or security types are disclosed in the Schedule of Portfolio Investments. |
| (b) | Level 3 investments, if any, at the beginning and/or end of the year in relation to the net assets were not significant and accordingly, additional disclosures related to Level 3 assets for the year ending September 30, 2023 are not presented for the Fund. |
| (c) | Represents money market funds and/or certain preferred stocks. |
Cash and Cash Equivalents — The Funds consider liquid assets deposited with a bank, and certain short term debt instruments with original maturities of three months or less to be cash equivalents. These investments represent amounts held with financial institutions that are readily accessible to pay Fund expenses or investments. The Funds may invest their excess cash in the Federated Treasury Obligations Fund or a similar money market fund or other short-term investment.
Credit Enhancements — Certain obligations held in the Funds have credit enhancement or liquidity features that may, under certain circumstances, provide for repayment of principal and interest on the obligation upon demand date, interest rate reset date or final maturity. These enhancements may include: letters of credit; liquidity guarantees; security purchase agreements; tender option purchase agreements; and third party insurance (i.e., AMBAC).
Distributions to Shareholders — Dividends from net investment income are declared daily and paid monthly for Sterling Capital Ultra Short Bond Fund, Sterling Capital Short Duration Bond Fund, Sterling Capital Intermediate U.S. Government Fund, Sterling Capital Total Return Bond Fund, Sterling Capital Long Duration Corporate Bond Fund, Sterling Capital Quality Income Fund, and the Tax-Free Funds. Dividends from net investment income are declared and paid quarterly for Sterling Capital Mid Cap Relative Value Fund, Sterling Capital Real Estate Fund, Sterling Capital Small Cap Value Fund, Sterling Capital Behavioral Large Cap Value Equity Fund, Sterling Capital Mid Value Fund, Sterling Capital Behavioral Small Cap Value Equity Fund, Sterling Capital Special Opportunities Fund, Sterling Capital Equity Income Fund and Sterling Capital SMID Opportunities Fund, if the annualized yield of the distribution exceeds an amount determined annually by the Board. Dividends from net investment income for Sterling Capital Behavioral International Equity Fund is declared and paid annually. Distributable net realized gains, if any, are declared and distributed at least annually. Distributions to shareholders that exceed net investment income and net realized gains for tax purposes are reported as distributions of capital. Distributions to shareholders are recorded on the ex-dividend date.
Notes to Financial Statements — (continued)
September 30, 2023
Expenses and Allocation Methodology — Expenses directly attributable to a Fund are charged to that Fund. Expenses not directly attributable to a Fund are allocated proportionately among all Funds daily in relation to the net assets of each Fund or on another reasonable basis. Each class of shares bears its pro-rata portion of expenses attributable to its series, except that each class separately bears expenses related specifically to that class, such as distribution fees. Income and realized and unrealized gains or losses on investments are allocated to each class of shares based on its relative net assets or another appropriate basis.
Foreign Currency Translation — The accounting records of the Sterling Capital Behavioral International Equity Fund are maintained in U.S. dollars. Foreign currency amounts are translated into U.S. dollars at the latest foreign exchange bid quotation (from an approved pricing vendor) to determine the fair value of investments, assets and liabilities. Purchases and sales of securities, income and expenses are translated at the prevailing rate of exchange, on the respective dates of such transactions. The Sterling Capital Behavioral International Equity Fund does not isolate that portion of the results of operations resulting from changes in foreign exchange rates on investments from fluctuations arising from changes in market prices of securities held. Such fluctuations are included with the net realized and unrealized gain or loss from investments and foreign currencies.
Forward Foreign Currency Exchange Contracts — All Funds, except Sterling Capital SMID Opportunities Fund, Sterling Capital Intermediate U.S. Government Fund and the Tax-Free Funds, may enter into forward foreign currency exchange contracts (foreign currency exchange risk) in connection with planned purchases or sales of securities or to hedge the U.S. dollar value of Funds securities denominated in a particular currency. A foreign currency exchange contract is an agreement between two parties to buy and sell a currency at a set exchange rate on a future date. The Funds can be exposed to risks if the counterparties to the contracts are unable to meet the terms of their contracts and from unanticipated movements in the value of a foreign currency relative to the U.S. dollar. In the event of default by the counterparty to the transaction, the Funds’ maximum amount of loss, as either the buyer or seller, is the unrealized gain of the contract. The forward foreign currency exchange contracts are adjusted by the daily exchange rate of the underlying currency and any gains or losses are recorded for financial statement purposes as unrealized gains or losses until the contract settlement date. When the contract is closed, the Funds record a realized gain (loss) equal to the difference between the value at the time it was opened and the value at the time it was closed.
Mortgage Dollar Rolls — The Variable Net Asset Value Funds may sell mortgage-backed securities for delivery in the current month and simultaneously contract to repurchase substantially similar (same type, coupon and maturity) securities on a specific future date at an agreed-upon price. The market value of the securities that a Fund is required to purchase may decline below the agreed upon repurchase price of those securities. Pools of mortgages collateralizing those securities may have different prepayment histories than those sold. During the period between the sale and repurchase, a Fund will not be entitled to receive interest and principal payments on the securities sold. Proceeds of the sale will be invested in additional instruments for a Fund, and the income from these investments will generate income for a Fund. If such income does not exceed the income, capital appreciation and gain or loss that would have been realized on the securities sold as part of the dollar roll, the use of this technique will diminish the investment performance of a Fund compared with what the performance would have been without the use of dollar rolls. The Funds account for mortgage dollar roll transactions as purchases and sales. The Funds did not hold any mortgage dollar rolls during the year.
Options Contracts — Sterling Capital Special Opportunities Fund and Sterling Capital Equity Income Fund write (sell) “covered” call options on securities and purchase options on securities to close out options previously written by them.
In writing an option, a Fund contracts with a specified counterparty to purchase (put option written) or sell (call option written) a specified quantity (notional amount) of an underlying asset at a specified price during a specified period upon demand of the counterparty. The risk associated with writing an option is that the Funds bear the market risk of an unfavorable change in the price of an underlying asset and are required to buy or sell an underlying asset under the contractual terms of the option at a price different from the current value. The Funds execute transactions in both listed and over-the-counter options. When purchasing over-the-counter options, a Fund bears the risk of economic loss from counterparty default, equal to the market value of the option. Listed options involve minimal counterparty risk since the listed options are guaranteed against default by the exchange on which they trade. Transactions in over-the-counter options expose the Funds to the risk of default by the counterparty to the transaction. In the event of default by the counterparty to the over-the-counter transaction, the Funds’ maximum amount of loss is the premium paid (as the purchaser) or the unrealized depreciation of the contract (as the writer).
Notes to Financial Statements — (continued)
September 30, 2023
Sterling Capital Special Opportunities Fund and Sterling Capital Equity Income Fund may invest in written options to economically hedge the downside exposure by collecting a premium when sold against the equity holding.
Risks Associated with Foreign Securities and Currencies — Investments in securities of foreign issuers carry certain risks not ordinarily associated with investments in securities of domestic issuers. Such risks include future political and economic developments and the possible imposition of exchange controls or other foreign governmental laws and restrictions. In addition, with respect to certain countries, there is the possibility of expropriation of assets, confiscatory taxation, political or social instability or diplomatic developments which could adversely affect investments in those countries. Certain foreign investments may also be subject to foreign withholding taxes.
Securities Transactions and Related Income — During the period, security transactions are accounted for no later than one business day after the trade date. For financial reporting purposes, however, security transactions as of the last business day of the reporting period are accounted for on the trade date. Interest income is recognized on the accrual basis and includes, where applicable, the amortization/accretion of premium or discount. Discounts and premiums on securities purchased are accreted and amortized over the lives of the respective securities. Dividend income is recorded on the ex-dividend date. Gains or losses realized from sales of securities are determined by comparing the identified cost of the security lot sold with the net sales proceeds.
When-Issued and Forward Commitments — The Funds may purchase securities on a “when-issued” basis. Sterling Capital Behavioral Large Cap Value Equity Fund, Sterling Capital Mid Value Fund, Sterling Capital Behavioral Small Cap Value Equity Fund, Sterling Capital Special Opportunities Fund and Sterling Capital Equity Income Fund may also purchase or sell securities on a forward commitment basis. The Funds record when-issued securities on the trade date and pledge assets with a value at least equal to the purchase commitment for payment of the securities purchased. The value of the securities underlying when-issued or forward commitments to purchase securities, and any subsequent fluctuation in their value, is taken into account when determining the net asset value of the Funds commencing with the date the Funds agree to purchase the securities. The Funds do not accrue interest or dividends on when-issued securities until the underlying securities are received.
Accounting Standards— The FASB issued Accounting Standards Update (ASU), ASU 2020-04, Reference Rate Reform (Topic 848), Facilitation of the Effects of Reference Rate Reform on Financial Reporting in March 2020 and ASU 2021-01 in January 2021 which provided further amendments and clarifications to Topic 848. These ASUs provide optional, temporary relief with respect to the financial reporting of contracts subject to certain types of modifications due to the planned discontinuation of the London Interbank Offered Rate (LIBOR), and other interbank-offered based reference rates, through December 31, 2022. In December 2022, FASB issued ASU 2022-06 which defers the sunset date of Topic 848 from December 31, 2022, to December 31, 2024, after which entities will no longer be permitted to apply the relief in Topic 848. Management intends to rely upon the relief provided under Topic 848, which is not expected to have a material impact on the Fund’s financial statements.
| 3. | Purchases and Sales of Securities: |
Purchases and sales of securities (excluding U.S. government securities and securities maturing less than one year from acquisition) for the fiscal year ended September 30, 2023 were as follows:
| | | Purchases | | | Sales | |
| Sterling Capital Behavioral Large Cap Value Equity Fund | | $ | 34,434,914 | | | $ | 35,887,102 | |
| Sterling Capital Mid Value Fund | | | 9,382,885 | | | | 16,340,267 | |
| Sterling Capital Behavioral Small Cap Value Equity Fund | | | 222,684,373 | | | | 177,094,373 | |
| Sterling Capital Special Opportunities Fund | | | 151,718,464 | | | | 277,175,696 | |
| Sterling Capital Equity Income Fund | | | 804,967,583 | | | | 1,192,072,275 | |
| Sterling Capital Behavioral International Equity Fund | | | 101,817,827 | | | | 113,517,605 | |
| Sterling Capital SMID Opportunities Fund | | | 4,495,486 | | | | 8,128,589 | |
| Sterling Capital Mid Cap Relative Value Fund | | | 2,159,445 | | | | 9,793,006 | |
| Sterling Capital Real Estate Fund | | | 4,429,594 | | | | 13,094,554 | |
| Sterling Capital Small Cap Value Fund | | | 2,418,474 | | | | 136,268,322 | |
Notes to Financial Statements — (continued)
September 30, 2023
| | | Purchases | | Sales | |
| Sterling Capital Ultra Short Bond Fund | | $ | 14,114,159 | | $ | 9,788,327 | |
| Sterling Capital Short Duration Bond Fund | | | 85,898,756 | | | 71,382,505 | |
| Sterling Capital Intermediate U.S. Government Fund | | | — | | | 214,102 | |
| Sterling Capital Total Return Bond Fund | | | 160,998,855 | | | 268,436,126 | |
| Sterling Capital Long Duration Corporate Bond Fund | | | 12,997,988 | | | 4,864,388 | |
| Sterling Capital Quality Income Fund | | | 4,951,490 | | | 5,784,472 | |
| Sterling Capital North Carolina Intermediate Tax-Free Fund | | | 53,189,606 | | | 69,381,631 | |
| Sterling Capital South Carolina Intermediate Tax-Free Fund | | | 11,627,881 | | | 16,915,862 | |
| Sterling Capital Virginia Intermediate Tax-Free Fund | | | 12,551,932 | | | 27,978,765 | |
| Sterling Capital West Virginia Intermediate Tax-Free Fund | | | 30,677,856 | | | 35,026,776 | |
Purchases and sales of U.S. government securities (excluding securities maturing less than one year from acquisition) for the fiscal year ended September 30, 2023 were as follows:
| | | Purchases | | Sales | |
| Sterling Capital Ultra Short Bond Fund | | $ | 2,041,376 | | $ | — | |
| Sterling Capital Short Duration Bond Fund | | | 39,854,148 | | | 51,407,774 | |
| Sterling Capital Intermediate U.S. Government Fund | | | 3,133,612 | | | 1,103,426 | |
| Sterling Capital Total Return Bond Fund | | | 347,946,527 | | | 222,105,787 | |
| Sterling Capital Long Duration Corporate Bond Fund | | | 3,619,641 | | | 2,379,942 | |
| Sterling Capital Quality Income Fund | | | 24,558,051 | | | 2,358,907 | |
| 4. | Related Party Transactions: |
Under the terms of the investment advisory agreement, Sterling Capital is entitled to receive fees based on a percentage of the average daily net assets of the Funds. These fees are accrued daily and payable on a monthly basis and are reflected on the Statements of Operations as “Investment advisory fees.” Sterling Capital’s waived investment advisory fees are included on the Statements of Operations as “Less expenses waived by the Investment Advisor.” Information regarding these transactions is as follows for the fiscal year ended September 30, 2023:
| | | Prior to February 1, 2023 | | | Effective February 1, 2023 | |
| | | | | | | Fee Rate after | | | | | | | Fee Rate after | |
| | | Contractual | | | Contractual | | | Contractual | | | Contractual | |
| | | Fee Rate | | | Waivers | | | Fee Rate | | | Waivers | |
| Sterling Capital Behavioral Large Cap Value Equity Fund | | | 0.45 | % | | | 0.45 | % | | | 0.45 | % | | | 0.45 | %(1) |
| Sterling Capital Mid Value Fund | | | 0.60 | % | | | 0.60 | % | | | 0.60 | % | | | 0.60 | %(1) |
| Sterling Capital Behavioral Small Cap Value Equity Fund | | | 0.60 | % | | | 0.60 | % | | | 0.60 | % | | | 0.60 | % |
| Sterling Capital Special Opportunities Fund | | | 0.65 | % | | | 0.65 | % | | | 0.65 | % | | | 0.65 | % |
| Sterling Capital Equity Income Fund | | | 0.55 | % | | | 0.55 | % | | | 0.55 | % | | | 0.55 | % |
| Sterling Capital Behavioral International Equity Fund | | | 0.40 | % | | | 0.40 | % | | | 0.40 | % | | | 0.40 | % |
| Sterling Capital SMID Opportunities Fund | | | 0.70 | % | | | 0.70 | % | | | 0.70 | % | | | 0.70 | % |
| Sterling Capital Mid Cap Relative Value Fund | | | 0.60 | % | | | 0.60 | % | | | 0.60 | % | | | 0.60 | % |
| Sterling Capital Real Estate Fund | | | 0.58 | % | | | 0.58 | % | | | 0.58 | % | | | 0.58 | % |
| Sterling Capital Small Cap Value Fund | | | 0.75 | % | | | 0.75 | % | | | 0.75 | % | | | 0.75 | %(1) |
| Sterling Capital Ultra Short Bond Fund | | | 0.20 | % | | | 0.20 | % | | | 0.20 | % | | | 0.20 | % |
| Sterling Capital Short Duration Bond Fund | | | 0.20 | % | | | 0.20 | % | | | 0.20 | % | | | 0.20 | % |
| Sterling Capital Intermediate U.S. Government Fund | | | 0.32 | % | | | 0.32 | % | | | 0.32 | % | | | 0.32 | % |
| Sterling Capital Total Return Bond Fund | | | 0.25 | % | | | 0.25 | % | | | 0.25 | % | | | 0.25 | % |
| Sterling Capital Long Duration Corporate Bond Fund | | | 0.25 | % | | | 0.25 | % | | | 0.25 | % | | | 0.25 | % |
| Sterling Capital Quality Income Fund | | | 0.35 | % | | | 0.31 | %(2) | | | 0.35 | % | | | 0.31 | %(3) |
| Sterling Capital North Carolina Intermediate Tax-Free Fund | | | 0.35 | % | | | 0.35 | % | | | 0.35 | % | | | 0.35 | % |
| Sterling Capital South Carolina Intermediate Tax-Free Fund | | | 0.35 | % | | | 0.35 | % | | | 0.35 | % | | | 0.35 | %(1) |
| Sterling Capital Virginia Intermediate Tax-Free Fund | | | 0.35 | % | | | 0.35 | % | | | 0.35 | % | | | 0.35 | % |
| Sterling Capital West Virginia Intermediate Tax-Free Fund | | | 0.35 | % | | | 0.35 | % | | | 0.35 | % | | | 0.35 | % |
| (1) | For all or a portion of the year ended September 30, 2023, Sterling Capital voluntarily waived and/or reimbursed certain expenses of the Funds. Voluntary waivers and reimbursements of expenses may be discontinued at any time. |
| (2) | Sterling Capital contractually agreed to limit the advisory fees paid by the Fund from February 1, 2022 through January 31, 2023. |
| (3) | Sterling Capital contractually agreed to limit the advisory fees paid by the Fund from February 1, 2023 through January 31, 2024. |
Notes to Financial Statements — (continued)
September 30, 2023
For the following Funds, Sterling Capital has contractually agreed to waive its investment advisory fees, pay Fund operating expenses, and/or reimburse fees or expenses, in order to limit expenses of the shares based on average daily net assets, excluding interest, taxes, acquired funds fees and extraordinary expenses. The expense limitations for the periods February 1, 2022 through January 31, 2023 and February 1, 2023 through January 31, 2024 are as follows:
| | | Effective February 1, 2023 | |
| | | Class A | | | Class C | | | Institutional | | | Class R6 | |
| Sterling Capital SMID Opportunities Fund | | | 1.04 | % | | | 1.79 | % | | | 0.79 | % | | | – | % |
| Sterling Capital Ultra Short Bond Fund | | | 0.52 | % | | | – | % | | | 0.27 | % | | | – | % |
| Sterling Capital Short Duration Bond Fund | | | 0.68 | % | | | 1.43 | % | | | 0.43 | % | | | 0.43 | % |
| Sterling Capital Intermediate U.S. Government Fund | | | 0.75 | % | | | 1.50 | % | | | 0.50 | % | | | – | % |
| Sterling Capital Total Return Bond Fund | | | 0.70 | % | | | 1.45 | % | | | 0.45 | % | | | 0.45 | % |
| Sterling Capital Long Duration Corporate Bond Fund | | | 0.70 | % | | | 1.45 | % | | | 0.45 | % | | | 0.45 | % |
| | | Prior to February 1, 2023 | |
| | | Class A | | | Class C | | | Institutional | | | Class R6 | |
| Sterling Capital SMID Opportunities Fund | | | 1.04 | % | | | 1.79 | % | | | 0.79 | % | | | – | % |
| Sterling Capital Ultra Short Bond Fund | | | 0.52 | % | | | – | % | | | 0.27 | % | | | – | % |
| Sterling Capital Intermediate U.S. Government Fund | | | 0.75 | % | | | 1.50 | % | | | 0.50 | % | | | – | % |
| Sterling Capital Total Return Bond Fund | | | 0.70 | % | | | 1.45 | % | | | 0.45 | % | | | 0.45 | % |
| Sterling Capital Long Duration Corporate Bond Fund | | | 0.70 | % | | | 1.45 | % | | | 0.45 | % | | | 0.45 | % |
For the following Funds, Sterling Capital has contractually agreed to waive its administrative fees, pay Fund operating expenses, and/or reimburse a Fund the following levels with respect to the Funds' Class R6 Shares, effective for the period February 1, 2023 through January 31, 2024:
| | | Effective
February 1,
2023 | |
| Sterling Capital Behavioral Large Cap Value Equity Fund | | | 0.07 | % |
| Sterling Capital Mid Value Fund | | | 0.08 | % |
| Sterling Capital Behavioral Small Cap Value Equity Fund | | | 0.06 | % |
| Sterling Capital Special Opportunities Fund | | | 0.09 | % |
| Sterling Capital Equity Income Fund | | | 0.10 | % |
| Sterling Capital Behavioral International Equity Fund | | | 0.05 | % |
| Sterling Capital Real Estate Fund | | | 0.07 | % |
| Sterling Capital Small Cap Value Fund | | | 0.10 | % |
| Sterling Capital Short Duration Bond Fund | | | 0.09 | % |
| Sterling Capital Total Return Bond Fund | | | 0.10 | % |
| Sterling Capital Long Duration Corporate Bond Fund | | | 0.09 | % |
For the following Funds, Sterling Capital contractually agreed to waive its administrative fees, pay Fund operating expenses, and/or reimburse a Fund the following levels with respect to the Funds' Class R6 Shares, effective for the period February 1, 2022 to January 31, 2023:
| | | Prior to
February 1,
2023 | |
| Sterling Capital Behavioral Large Cap Value Equity Fund | | | 0.06 | % |
| Sterling Capital Mid Value Fund | | | 0.09 | % |
| Sterling Capital Behavioral Small Cap Value Equity Fund | | | 0.05 | % |
| Sterling Capital Special Opportunities Fund | | | 0.08 | % |
| Sterling Capital Equity Income Fund | | | 0.10 | % |
| Sterling Capital Behavioral International Equity Fund | | | 0.05 | % |
| Sterling Capital Real Estate Fund | | | 0.09 | % |
| Sterling Capital Small Cap Value Fund | | | 0.10 | % |
| Sterling Capital Short Duration Bond Fund | | | 0.09 | % |
| Sterling Capital Total Return Bond Fund | | | 0.10 | % |
| Sterling Capital Long Duration Corporate Bond Fund | | | 0.09 | % |
Notes to Financial Statements — (continued)
September 30, 2023
Sterling Capital serves as the administrator to the Funds pursuant to an administration agreement. The Funds pay their portion of a fee to Sterling Capital for providing administration services based on the aggregate assets of the Funds, at a rate of 0.1075% on the first $3.5 billion of average net assets, 0.075% on the next $1 billion of average net assets; 0.06% on the next $1.5 billion of average net assets; and 0.04% of average net assets over $6 billion. Expenses incurred are reflected on the Statements of Operations as “Administration fees.” Pursuant to a sub-administration agreement with Sterling Capital, The Bank of New York Mellon (“the “Sub-Administrator”), serves as the sub-administrator to the Funds subject to the general supervision of the Board and Sterling Capital. For these services, The Bank of New York Mellon is entitled to a fee payable by Sterling Capital. The Bank of New York Mellon also serves as the Funds’ fund accountant and receives compensation by the Funds for these services. Expenses incurred are reflected on the Statements of Operations as “Fund accounting fees.”
BNY Mellon Investment Servicing (US) Inc. serves as the Funds’ transfer agent and receives compensation by the Funds for these services. Expenses incurred are reflected on the Statements of Operations as “Transfer agent fees.”
Sterling Capital’s Chief Compliance Officer (“CCO”) serves as the Funds’ CCO. The CCO’s compensation is reviewed and approved by the Funds’ Board and paid by Sterling Capital. However, the Funds reimburse Sterling Capital for their allocable portion of the CCO’s base salary and incentive pay. As a result, the CCO fee paid by the Funds is only part of the total compensation received by the CCO. Expenses incurred are reflected on the Statements of Operations as “Compliance Service Fees.”
The Funds have adopted a Distribution and Shareholder Services Plan (the “Plan”) in accordance with Rule 12b-1 under the 1940 Act. Sterling Capital Distributors, LLC (the “Distributor”) serves as distributor to the Funds pursuant to an underwriting agreement. The Plan provides for payments to the Distributor of up to 0.25% and 1.00% of the average daily net assets of the Class A Shares and Class C Shares, respectively. In addition, the Distributor is entitled to receive commissions on sales of shares of the Variable Net Asset Value Funds. For the fiscal year ended September 30, 2023, the Distributor received $125,679 from commissions earned on sales of shares of the Variable Net Asset Value Funds. The Distributor does not retain commissions for profit. These commissions and fees may be used by the Distributor to pay banks, broker dealers and other institutions, including affiliates of the Advisor.
The Advisor and/or its affiliates may pay out of their own assets (and not as an additional charge to a fund) compensation to selected affiliated and unaffiliated brokers, dealers and other financial intermediaries in connection with the sale and distribution of the shares and/or the retention and/or servicing of Fund investors and Fund shares. These payments, sometimes referred to as “revenue sharing” payments are payments over and above any sales charges (including Rule 12b-1 fees) and service fees paid by the Funds. The amount of these payments is determined at the discretion of the Advisor and/or its affiliates from time to time, may be substantial, and may be different for different financial advisors. Receipt of, or the prospect of receiving, this additional compensation may influence your financial intermediary’s recommendation of a Fund or of a particular share class of a Fund. Commissions and finder’s fees financed by the Advisor and paid by the Distributor to affiliated broker-dealers during the fiscal year ended September 30, 2023 were $2,198.
Certain Officers and a Trustee of the Funds are affiliated with Sterling Capital or the Sub-Administrator. Such Officers and Trustee receive no compensation from the Funds for serving in their respective roles. Each of the Trustees who are not interested persons (as defined in the 1940 Act) of the Trust who serve on the Board are compensated at the annual rate of $100,000 plus $7,500 for each regularly scheduled quarterly meeting attended, $4,000 for each special meeting attended in person and $1,500 for each special meeting attended by telephone, plus reimbursement for certain out of pocket expenses. Each Trustee serving on a Committee of the Board receives a fee of $4,000 for each Committee meeting attended in person and $1,500 for each Committee meeting attended by telephone, plus reimbursement for certain out of pocket expenses. Committee meeting fees are only paid when such Committee meetings are not held in conjunction with a regular board meeting. Additionally, the Chairman of the Board receives additional compensation at the annual rate of $24,000, the Audit Committee Chairman receives additional compensation at the annual rate of $18,000, and the Chairman of the Nominations Committee receives additional compensation at the annual rate of $7,500. The fees are allocated across the Trust based upon relative net assets.
Notes to Financial Statements — (continued)
September 30, 2023
Transactions in Class A, Class C, Institutional, Class R and Class R6 Shares were:
| | | For the Year Ended
September 30, 2023 | | | For the Year Ended
September 30, 2022 | |
| Sterling Capital Behavioral Large Cap Value Equity Fund |
| Class A | | Shares | | | Amount | | | Shares | | | Amount | |
| Issued | | | 32,971 | | | $ | 733,762 | | | | 46,240 | | | $ | 1,131,180 | |
| Reinvested | | | 20,188 | | | | 462,091 | | | | 19,445 | | | | 445,439 | |
| Redeemed | | | (108,548 | ) | | | (2,527,759 | ) | | | (135,501 | ) | | | (3,192,006 | ) |
| Total | | | (55,389 | ) | | $ | (1,331,906 | ) | | | (69,816 | ) | | $ | (1,615,387 | ) |
| Sterling Capital Behavioral Large Cap Value Equity Fund |
| Class C | | Shares | | | Amount | | | Shares | | | Amount | |
| Issued | | | 163 | | | $ | 3,600 | | | | 406 | | | $ | 9,304 | |
| Reinvested | | | 136 | | | | 2,993 | | | | 116 | | | | 2,568 | |
| Redeemed | | | (455 | ) | | | (10,138 | ) | | | (1,675 | ) | | | (37,798 | ) |
| Total | | | (156 | ) | | $ | (3,545 | ) | | | (1,153 | ) | | $ | (25,926 | ) |
| Sterling Capital Behavioral Large Cap Value Equity Fund |
| Institutional | | Shares | | | Amount | | | Shares | | | Amount | |
| Issued | | | 7,059 | | | $ | 163,309 | | | | 17,254 | | | $ | 420,545 | |
| Reinvested | | | 934 | | | | 21,558 | | | | 1,262 | | | | 29,327 | |
| Redeemed | | | (24,806 | ) | | | (567,740 | ) | | | (25,384 | ) | | | (605,648 | ) |
| Total | | | (16,813 | ) | | $ | (382,873 | ) | | | (6,868 | ) | | $ | (155,776 | ) |
| Sterling Capital Behavioral Large Cap Value Equity Fund |
| Class R6 | | Shares | | | Amount | | | Shares | | | Amount | |
| Issued | | | 18,624 | | | $ | 424,649 | | | | — | | | $ | — | |
| Reinvested | | | 313 | | | | 7,233 | | | | 1 | | | | 12 | |
| Redeemed | | | (4,844 | ) | | | (115,111 | ) | | | — | | | | — | |
| Total | | | 14,093 | | | $ | 316,771 | | | | 1 | | | $ | 12 | |
| Sterling Capital Mid Value Fund |
| Class A | | Shares | | | Amount | | | Shares | | | Amount | |
| Issued | | | 72,651 | | | $ | 1,034,837 | | | | 34,712 | | | $ | 658,109 | |
| Reinvested | | | 201,671 | | | | 2,891,666 | | | | 92,289 | | | | 1,765,483 | |
| Redeemed | | | (166,854 | ) | | | (2,474,158 | ) | | | (167,340 | ) | | | (3,144,157 | ) |
| Total | | | 107,468 | | | $ | 1,452,345 | | | | (40,339 | ) | | $ | (720,565 | ) |
| Sterling Capital Mid Value Fund |
| Class C | | Shares | | | Amount | | | Shares | | | Amount | |
| Issued | | | 6,130 | | | $ | 68,584 | | | | 5,521 | | | $ | 90,828 | |
| Reinvested | | | 8,974 | | | | 101,407 | | | | 5,296 | | | | 83,888 | |
| Redeemed | | | (19,541 | ) | | | (226,977 | ) | | | (38,319 | ) | | | (621,246 | ) |
| Total | | | (4,437 | ) | | $ | (56,986 | ) | | | (27,502 | ) | | $ | (446,530 | ) |
| Sterling Capital Mid Value Fund |
| Institutional | | Shares | | | Amount | | | Shares | | | Amount | |
| Issued | | | 107,820 | | | $ | 1,639,360 | | | | 50,140 | | | $ | 961,643 | |
| Reinvested | | | 315,482 | | | | 4,680,585 | | | | 197,808 | | | | 3,889,195 | |
| Redeemed | | | (491,134 | ) | | | (7,628,157 | ) | | | (899,900 | ) | | | (17,335,085 | ) |
| Total | | | (67,832 | ) | | $ | (1,308,212 | ) | | | (651,952 | ) | | $ | (12,484,247 | ) |
Notes to Financial Statements — (continued)
September 30, 2023
| | | For the Year Ended | | | For the Year Ended | |
| | | September 30, 2023 | | | September 30, 2022 | |
| Sterling Capital Mid Value Fund | | | | | | | | | | | | |
| Class R(1) | | Shares | | | Amount | | | Shares | | | Amount | |
| Issued | | | — | | | $ | — | | | | 2 | | | $ | 45 | |
| Redeemed | | | — | | | | — | | | | (430 | ) | | | (8,727 | ) |
| Total | | | — | | | $ | — | | | | (428 | ) | | $ | (8,682 | ) |
| Sterling Capital Mid Value Fund | | | | | | | | | | | | | | | | |
| Class R6 | | Shares | | | Amount | | | Shares | | | Amount | |
| Issued | | | 20,796 | | | $ | 352,676 | | | | — | | | $ | — | |
| Reinvested | | | 3,942 | | | | 58,604 | | | | 3 | | | | 52 | |
| Redeemed | | | (8,553 | ) | | | (127,455 | ) | | | (12,148 | ) | | | (245,375 | ) |
| Total | | | 16,185 | | | $ | 283,825 | | | | (12,145 | ) | | $ | (245,323 | ) |
| Sterling Capital Behavioral Small Cap Value Equity Fund |
| Class A | | Shares | | | Amount | | | Shares | | | Amount | |
| Issued | | | 14,873 | | | $ | 250,506 | | | | 19,604 | | | $ | 404,596 | |
| Reinvested | | | 3,580 | | | | 60,271 | | | | 36,543 | | | | 677,365 | |
| Redeemed | | | (56,495 | ) | | | (954,837 | ) | | | (55,067 | ) | | | (1,066,272 | ) |
| Total | | | (38,042 | ) | | $ | (644,060 | ) | | | 1,080 | | | $ | 15,689 | |
| Sterling Capital Behavioral Small Cap Value Equity Fund |
| Class C | | Shares | | | Amount | | | Shares | | | Amount | |
| Issued | | | — | | | $ | — | | | | 4,739 | | | $ | 94,858 | |
| Reinvested | | | 5 | | | | 88 | | | | 196 | | | | 3,421 | |
| Redeemed | | | (283 | ) | | | (4,531 | ) | | | (4,983 | ) | | | (100,534 | ) |
| Total | | | (278 | ) | | $ | (4,443 | ) | | | (48 | ) | | $ | (2,255 | ) |
| Sterling Capital Behavioral Small Cap Value Equity Fund |
| Institutional | | Shares | | | Amount | | | Shares | | | Amount | |
| Issued | | | 270,026 | | | $ | 4,511,127 | | | | 278,012 | | | $ | 5,512,268 | |
| Reinvested | | | 7,506 | | | | 127,032 | | | | 70,757 | | | | 1,330,352 | |
| Redeemed | | | (579,029 | ) | | | (9,947,584 | ) | | | (456,563 | ) | | | (8,495,763 | ) |
| Total | | | (301,497 | ) | | $ | (5,309,425 | ) | | | (107,794 | ) | | $ | (1,653,143 | ) |
| Sterling Capital Behavioral Small Cap Value Equity Fund |
| Class R(1) | | Shares | | | Amount | | | Shares | | | Amount | |
| Issued | | | — | | | $ | — | | | | 45 | | | $ | 892 | |
| Redeemed | | | — | | | | — | | | | (13,648 | ) | | | (287,327 | ) |
| Total | | | — | | | $ | — | | | | (13,603 | ) | | $ | (286,435 | ) |
| Sterling Capital Behavioral Small Cap Value Equity Fund |
| Class R6 | | Shares | | | Amount | | | Shares | | | Amount | |
| Issued | | | 5,943,445 | | | $ | 97,000,000 | | | | — | | | $ | — | |
| Reinvested | | | 97,722 | | | | 1,655,217 | | | | 470,794 | | | | 8,845,595 | |
| Redeemed | | | (2,783,252 | ) | | | (47,294,125 | ) | | | (3,419,302 | ) | | | (60,098,000 | ) |
| Total | | | 3,257,915 | | | $ | 51,361,092 | | | | (2,948,508 | ) | | $ | (51,252,405 | ) |
| Sterling Capital Special Opportunities Fund |
| Class A | | Shares | | | Amount | | | Shares | | | Amount | |
| Issued | | | 353,053 | | | $ | 8,941,236 | | | | 606,260 | | | $ | 17,829,825 | |
| Reinvested | | | 861,988 | | | | 20,592,897 | | | | 1,303,455 | | | | 40,511,385 | |
| Redeemed | | | (2,055,258 | ) | | | (51,968,950 | ) | | | (1,374,958 | ) | | | (40,078,119 | ) |
| Total | | | (840,217 | ) | | $ | (22,434,817 | ) | | | 534,757 | | | $ | 18,263,091 | |
Notes to Financial Statements — (continued)
September 30, 2023
| | | For the Year Ended | | | For the Year Ended | |
| | | September 30, 2023 | | | September 30, 2022 | |
| Sterling Capital Special Opportunities Fund |
| Class C | | Shares | | | Amount | | | Shares | | | Amount | |
| Issued | | | 37,771 | | | $ | 696,384 | | | | 89,122 | | | $ | 2,036,385 | |
| Reinvested | | | 168,823 | | | | 2,961,163 | | | | 322,106 | | | | 7,608,160 | |
| Redeemed | | | (652,168 | ) | | | (12,051,902 | ) | | | (753,972 | ) | | | (16,707,907 | ) |
| Total | | | (445,574 | ) | | $ | (8,394,355 | ) | | | (342,744 | ) | | $ | (7,063,362 | ) |
| Sterling Capital Special Opportunities Fund |
| Institutional | | Shares | | | Amount | | | Shares | | | Amount | |
| Issued | | | 534,469 | | | $ | 14,709,581 | | | | 1,442,213 | | | $ | 44,693,075 | |
| Reinvested | | | 333,115 | | | | 8,614,366 | | | | 595,100 | | | | 19,846,598 | |
| Redeemed | | | (2,612,726 | ) | | | (71,532,067 | ) | | | (1,587,962 | ) | | | (49,527,313 | ) |
| Total | | | (1,745,142 | ) | | $ | (48,208,120 | ) | | | 449,351 | | | $ | 15,012,360 | |
| Sterling Capital Special Opportunities Fund |
| Class R(1) | | Shares | | | Amount | | | Shares | | | Amount | |
| Redeemed | | | — | | | $ | — | | | | (42 | ) | | $ | (1,476 | ) |
| Total | | | — | | | $ | — | | | | (42 | ) | | $ | (1,476 | ) |
| Sterling Capital Special Opportunities Fund |
| Class R6 | | Shares | | | Amount | | | Shares | | | Amount | |
| Issued | | | 573,350 | | | $ | 15,460,935 | | | | 103,983 | | | $ | 3,118,518 | |
| Reinvested | | | 31,490 | | | | 813,070 | | | | 4,709 | | | | 156,652 | |
| Redeemed | | | (440,049 | ) | | | (11,996,873 | ) | | | (219,268 | ) | | | (6,682,445 | ) |
| Total | | | 164,791 | | | $ | 4,277,132 | | | | (110,576 | ) | | $ | (3,407,275 | ) |
| Sterling Capital Equity Income Fund |
| Class A | | Shares | | | Amount | | | Shares | | | Amount | |
| Issued | | | 984,966 | | | $ | 25,427,867 | | | | 1,659,576 | | | $ | 45,526,877 | |
| Reinvested | | | 1,203,098 | | | | 31,261,542 | | | | 452,265 | | | | 12,426,367 | |
| Redeemed | | | (2,577,021 | ) | | | (66,440,114 | ) | | | (2,456,046 | ) | | | (66,942,929 | ) |
| Total | | | (388,957 | ) | | $ | (9,750,705 | ) | | | (344,205 | ) | | $ | (8,989,685 | ) |
| Sterling Capital Equity Income Fund |
| Class C | | Shares | | | Amount | | | Shares | | | Amount | |
| Issued | | | 369,914 | | | $ | 9,458,771 | | | | 505,892 | | | $ | 13,683,057 | |
| Reinvested | | | 186,653 | | | | 4,803,829 | | | | 64,446 | | | | 1,767,152 | |
| Redeemed | | | (662,296 | ) | | | (16,869,133 | ) | | | (960,780 | ) | | | (25,958,673 | ) |
| Total | | | (105,729 | ) | | $ | (2,606,533 | ) | | | (390,442 | ) | | $ | (10,508,464 | ) |
| Sterling Capital Equity Income Fund |
| Institutional | | Shares | | | Amount | | | Shares | | | Amount | |
| Issued | | | 8,533,860 | | | $ | 220,305,302 | | | | 14,791,804 | | | $ | 404,461,160 | |
| Reinvested | | | 3,768,314 | | | | 98,245,042 | | | | 1,584,767 | | | | 43,629,829 | |
| Redeemed | | | (21,471,513 | ) | | | (557,919,043 | ) | | | (16,918,132 | ) | | | (463,156,528 | ) |
| Total | | | (9,169,339 | ) | | $ | (239,368,699 | ) | | | (541,561 | ) | | $ | (15,065,539 | ) |
| Sterling Capital Equity Income Fund |
| Class R(1) | | Shares | | | Amount | | | Shares | | | Amount | |
| Issued | | | — | | | $ | — | | | | 49 | | | $ | 1,324 | |
| Redeemed | | | — | | | | — | | | | (51,591 | ) | | | (1,463,090 | ) |
| Total | | | — | | | $ | — | | | | (51,542 | ) | | $ | (1,461,766 | ) |
Notes to Financial Statements — (continued)
September 30, 2023
| | | For the Year Ended | | | For the Year Ended | |
| | | September 30, 2023 | | | September 30, 2022 | |
| Sterling Capital Equity Income Fund | | | | | | | | | | | | | | | | |
| Class R6 | | Shares | | | Amount | | | Shares | | | Amount | |
| Issued | | | 2,137,177 | | | $ | 56,196,619 | | | | 947,393 | | | $ | 25,720,185 | |
| Reinvested | | | 147,103 | | | | 3,836,686 | | | | 39,528 | | | | 1,087,391 | |
| Redeemed | | | (1,142,384 | ) | | | (29,650,021 | ) | | | (776,741 | ) | | | (21,379,957 | ) |
| Total | | | 1,141,896 | | | $ | 30,383,284 | | | | 210,180 | | | $ | 5,427,619 | |
| Sterling Capital Behavioral International Equity Fund |
| Class A | | Shares | | | Amount | | | Shares | | | Amount | |
| Issued | | | 5,754 | | | $ | 49,383 | | | | 2,046 | | | $ | 18,619 | |
| Reinvested | | | 1,170 | | | | 9,712 | | | | 1,867 | | | | 17,718 | |
| Redeemed | | | (9,896 | ) | | | (88,366 | ) | | | (10,509 | ) | | | (91,568 | ) |
| Total | | | (2,972 | ) | | $ | (29,271 | ) | | | (6,596 | ) | | $ | (55,231 | ) |
| Sterling Capital Behavioral International Equity Fund |
| Class C | | Shares | | | Amount | | | Shares | | | Amount | |
| Issued | | | — | | | $ | — | | | | 21 | | | $ | 204 | |
| Reinvested | | | 26 | | | | 215 | | | | 198 | | | | 1,876 | |
| Redeemed | | | (3,283 | ) | | | (27,340 | ) | | | (1 | ) | | | (11 | ) |
| Total | | | (3,257 | ) | | $ | (27,125 | ) | | | 218 | | | $ | 2,069 | |
| Sterling Capital Behavioral International Equity Fund |
| Institutional | | Shares | | | Amount | | | Shares | | | Amount | |
| Issued | | | 4,057 | | | $ | 35,841 | | | | 2,560 | | | $ | 25,610 | |
| Reinvested | | | 2,167 | | | | 17,962 | | | | 3,309 | | | | 31,374 | |
| Redeemed | | | (885 | ) | | | (6,673 | ) | | | (4,377 | ) | | | (41,267 | ) |
| Total | | | 5,339 | | | $ | 47,130 | | | | 1,492 | | | $ | 15,717 | |
| Sterling Capital Behavioral International Equity Fund |
| Class R6 | | Shares | | | Amount | | | Shares | | | Amount | |
| Issued | | | — | | | $ | — | | | | 4,583,206 | | | $ | 36,024,000 | |
| Reinvested | | | 441,954 | | | | 3,663,801 | | | | 422,301 | | | | 4,003,413 | |
| Redeemed | | | (1,578,946 | ) | | | (15,110,526 | ) | | | — | | | | — | |
| Total | | | (1,136,992 | ) | | $ | (11,446,725 | ) | | | 5,005,507 | | | $ | 40,027,413 | |
| Sterling Capital SMID Opportunities Fund |
| Class A | | Shares | | | Amount | | | Shares | | | Amount | |
| Issued | | | 24,779 | | | $ | 300,280 | | | | 1,379 | | | $ | 20,967 | |
| Reinvested | | | 31,763 | | | | 377,351 | | | | 25,841 | | | | 404,670 | |
| Redeemed | | | (146,582 | ) | | | (1,772,918 | ) | | | (38,609 | ) | | | (581,509 | ) |
| Total | | | (90,040 | ) | | $ | (1,095,287 | ) | | | (11,389 | ) | | $ | (155,872 | ) |
| Sterling Capital SMID Opportunities Fund | | | | | | | | | | | | | | | | |
| Class C | | Shares | | | Amount | | | Shares | | | Amount | |
| Issued | | | — | | | $ | — | | | | 147 | | | $ | 2,200 | |
| Reinvested | | | 4,213 | | | | 47,518 | | | | 8,069 | | | | 121,527 | |
| Redeemed | | | (47,917 | ) | | | (550,591 | ) | | | (47,327 | ) | | | (655,388 | ) |
| Total | | | (43,704 | ) | | $ | (503,073 | ) | | | (39,111 | ) | | $ | (531,661 | ) |
Notes to Financial Statements — (continued)
September 30, 2023
| | | For the Year Ended | | | For the Year Ended | |
| | | September 30, 2023 | | | September 30, 2022 | |
| Sterling Capital SMID Opportunities Fund |
| Institutional | | Shares | | | Amount | | | Shares | | | Amount | |
| Issued | | | 20,213 | | | $ | 248,271 | | | | 11,805 | | | $ | 164,466 | |
| Reinvested | | | 23,110 | | | | 279,169 | | | | 22,884 | | | | 362,713 | |
| Redeemed | | | (140,326 | ) | | | (1,709,032 | ) | | | (82,782 | ) | | | (1,189,986 | ) |
| Total | | | (97,003 | ) | | $ | (1,181,592 | ) | | | (48,093 | ) | | $ | (662,807 | ) |
| Sterling Capital Mid Cap Relative Value Fund | | | | | | | | | | | | |
| Class A | | Shares | | | Amount | | | Shares | | | Amount | |
| Issued | | | 1,105 | | | $ | 70,897 | | | | 1,205 | | | $ | 93,445 | |
| Reinvested | | | 979 | | | | 59,122 | | | | 354 | | | | 27,374 | |
| Redeemed | | | (626 | ) | | | (38,144 | ) | | | (174 | ) | | | (11,811 | ) |
| Total | | | 1,458 | | | $ | 91,875 | | | | 1,385 | | | $ | 109,008 | |
| Sterling Capital Mid Cap Relative Value Fund | | | | | | | | | | | | | | |
| Class C | | Shares | | | Amount | | | Shares | | | Amount | |
| Issued | | | — | | | $ | — | | | | 9 | | | $ | 729 | |
| Reinvested | | | 9 | | | | 513 | | | | 3 | | | | 250 | |
| Redeemed | | | (2 | ) | | | (139 | ) | | | — | | | | — | |
| Total | | | 7 | | | $ | 374 | | | | 12 | | | $ | 979 | |
| Sterling Capital Mid Cap Relative Value Fund | | | | | | | | | | | | |
| Institutional | | Shares | | | Amount | | | Shares | | | Amount | |
| Issued | | | 36,764 | | | $ | 2,346,775 | | | | 2,488 | | | $ | 200,026 | |
| Reinvested | | | 112,501 | | | | 6,851,053 | | | | 59,267 | | | | 4,619,348 | |
| Redeemed | | | (165,476 | ) | | | (10,809,780 | ) | | | (175,326 | ) | | | (13,768,737 | ) |
| Total | | | (16,211 | ) | | $ | (1,611,952 | ) | | | (113,571 | ) | | $ | (8,949,363 | ) |
| Sterling Capital Real Estate Fund | | | | | | | | | | | | |
| Class A | | Shares | | | Amount | | | Shares | | | Amount | |
| Issued | | | 106 | | | $ | 3,607 | | | | 4,917 | | | $ | 226,188 | |
| Reinvested | | | 1,474 | | | | 51,152 | | | | 1,086 | | | | 50,199 | |
| Redeemed | | | (4,012 | ) | | | (143,637 | ) | | | (2,372 | ) | | | (107,946 | ) |
| Total | | | (2,432 | ) | | $ | (88,878 | ) | | | 3,631 | | | $ | 168,441 | |
| Sterling Capital Real Estate Fund | | | | | | | | | | | | |
| Class C | | Shares | | | Amount | | | Shares | | | Amount | |
| Issued | | | — | | | $ | — | | | | 357 | | | $ | 15,117 | |
| Reinvested | | | 277 | | | | 9,525 | | | | 270 | | | | 12,595 | |
| Redeemed | | | (398 | ) | | | (13,902 | ) | | | (999 | ) | | | (43,125 | ) |
| Total | | | (121 | ) | | $ | (4,377 | ) | | | (372 | ) | | $ | (15,413 | ) |
| Sterling Capital Real Estate Fund | | | | | | | | | | | | |
| Institutional | | Shares | | | Amount | | | Shares | | | Amount | |
| Issued | | | 52,990 | | | $ | 1,898,800 | | | | 129,299 | | | $ | 5,914,197 | |
| Reinvested | | | 161,021 | | | | 5,599,784 | | | | 147,479 | | | | 6,869,233 | |
| Redeemed | | | (394,394 | ) | | | (13,981,350 | ) | | | (243,219 | ) | | | (10,740,629 | ) |
| Total | | | (180,383 | ) | | $ | (6,482,766 | ) | | | 33,559 | | | $ | 2,042,801 | |
Notes to Financial Statements — (continued)
September 30, 2023
| | | For the Year Ended | | | For the Year Ended | |
| | | September 30, 2023 | | | September 30, 2022 | |
| Sterling Capital Real Estate Fund |
| Class R6 | | Shares | | | Amount | | | Shares | | | Amount | |
| Issued | | | 31,232 | | | $ | 1,093,590 | | | | 137 | | | $ | 6,214 | |
| Reinvested | | | 151 | | | | 5,280 | | | | 30 | | | | 1,363 | |
| Redeemed | | | (3,711 | ) | | | (132,170 | ) | | | (7 | ) | | | (335 | ) |
| Total | | | 27,672 | | | $ | 966,700 | | | | 160 | | | $ | 7,242 | |
| Sterling Capital Small Cap Value Fund |
| Class A | | Shares | | | Amount | | | Shares | | | Amount | |
| Issued | | | 8,883 | | | $ | 489,174 | | | | 4,726 | | | $ | 334,374 | |
| Reinvested | | | 10,750 | | | | 545,786 | | | | 9,538 | | | | 698,451 | |
| Redeemed | | | (11,449 | ) | | | (621,971 | ) | | | (13,308 | ) | | | (911,984 | ) |
| Total | | | 8,184 | | | $ | 412,989 | | | | 956 | | | $ | 120,841 | |
| Sterling Capital Small Cap Value Fund |
| Class C | | Shares | | | Amount | | | Shares | | | Amount | |
| Issued | | | 2,787 | | | $ | 139,061 | | | | 981 | | | $ | 77,427 | |
| Reinvested | | | 1,748 | | | | 81,839 | | | | 1,371 | | | | 94,969 | |
| Redeemed | | | (872 | ) | | | (40,199 | ) | | | (1,163 | ) | | | (70,198 | ) |
| Total | | | 3,663 | | | $ | 180,701 | | | | 1,189 | | | $ | 102,198 | |
| Sterling Capital Small Cap Value Fund |
| Institutional | | Shares | | | Amount | | | Shares | | | Amount | |
| Issued | | | 330,448 | | | $ | 18,021,758 | | | | 391,138 | | | $ | 27,467,186 | |
| Reinvested | | | 1,365,585 | | | | 70,212,133 | | | | 1,184,084 | | | | 87,493,753 | |
| Redeemed | | | (2,751,679 | ) | | | (150,715,997 | ) | | | (1,712,853 | ) | | | (121,143,954 | ) |
| Total | | | (1,055,646 | ) | | $ | (62,482,106 | ) | | | (137,631 | ) | | $ | (6,183,015 | ) |
| Sterling Capital Small Cap Value Fund |
| Class R6 | | Shares | | | Amount | | | Shares | | | Amount | |
| Issued | | | 55,662 | | | $ | 3,411,842 | | | | 12,771 | | | $ | 1,180,452 | |
| Reinvested | | | 18,696 | | | | 964,477 | | | | 13,254 | | | | 981,746 | |
| Redeemed | | | (19,265 | ) | | | (1,044,595 | ) | | | (4,736 | ) | | | (309,808 | ) |
| Total | | | 55,093 | | | $ | 3,331,724 | | | | 21,289 | | | $ | 1,852,390 | |
| Sterling Capital Ultra Short Bond Fund |
| Class A | | Shares | | | Amount | | | Shares | | | Amount | |
| Issued | | | 1,013,004 | | | $ | 9,755,362 | | | | 684,394 | | | $ | 6,634,652 | |
| Reinvested | | | 20,764 | | | | 200,059 | | | | 7,902 | | | | 76,086 | |
| Redeemed | | | (1,181,554 | ) | | | (11,387,919 | ) | | | (688,452 | ) | | | (6,646,022 | ) |
| Total | | | (147,786 | ) | | $ | (1,432,498 | ) | | | 3,844 | | | $ | 64,716 | |
| Sterling Capital Ultra Short Bond Fund |
| Institutional | | Shares | | | Amount | | | Shares | | | Amount | |
| Issued | | | 818,258 | | | $ | 7,864,700 | | | | 830,884 | | | $ | 8,056,006 | |
| Reinvested | | | 85,981 | | | | 829,040 | | | | 28,033 | | | | 270,205 | |
| Redeemed | | | (596,108 | ) | | | (5,744,021 | ) | | | (2,060,051 | ) | | | (19,885,016 | ) |
| Total | | | 308,131 | | | $ | 2,949,719 | | | | (1,201,134 | ) | | $ | (11,558,805 | ) |
Notes to Financial Statements — (continued)
September 30, 2023
| | | For the Year Ended | | | For the Year Ended | |
| | | September 30, 2023 | | | September 30, 2022 | |
| Sterling Capital Short Duration Bond Fund |
| Class A | | Shares | | | Amount | | | Shares | | | Amount | |
| Issued | | | 67,266 | | | $ | 546,358 | | | | 113,065 | | | $ | 948,671 | |
| Reinvested | | | 10,414 | | | | 84,865 | | | | 7,822 | | | | 65,491 | |
| Redeemed | | | (134,723 | ) | | | (1,097,421 | ) | | | (176,507 | ) | | | (1,490,110 | ) |
| Total | | | (57,043 | ) | | $ | (466,198 | ) | | | (55,620 | ) | | $ | (475,948 | ) |
| Sterling Capital Short Duration Bond Fund |
| Class C | | Shares | | | Amount | | | Shares | | | Amount | |
| Issued | | | — | | | $ | — | | | | 7,148 | | | $ | 61,238 | |
| Reinvested | | | 822 | | | | 6,701 | | | | 1,085 | | | | 9,111 | |
| Redeemed | | | (17,062 | ) | | | (138,656 | ) | | | (71,447 | ) | | | (596,567 | ) |
| Total | | | (16,240 | ) | | $ | (131,955 | ) | | | (63,214 | ) | | $ | (526,218 | ) |
| Sterling Capital Short Duration Bond Fund |
| Institutional | | Shares | | | Amount | | | Shares | | | Amount | |
| Issued | | | 6,299,295 | | | $ | 50,998,857 | | | | 6,167,118 | | | $ | 51,425,144 | |
| Reinvested | | | 363,359 | | | | 2,961,393 | | | | 259,645 | | | | 2,177,983 | |
| Redeemed | | | (6,214,972 | ) | | | (50,629,861 | ) | | | (14,800,334 | ) | | | (125,027,654 | ) |
| Total | | | 447,682 | | | $ | 3,330,389 | | | | (8,373,571 | ) | | $ | (71,424,527 | ) |
| Sterling Capital Short Duration Bond Fund |
| Class R6 | | Shares | | | Amount | | | Shares | | | Amount | |
| Issued | | | 241,027 | | | $ | 1,957,519 | | | | 1,689,426 | | | $ | 13,901,832 | |
| Reinvested | | | 3,306 | | | | 26,953 | | | | 2,675 | | | | 22,430 | |
| Redeemed | | | (781,086 | ) | | | (6,360,338 | ) | | | (2,936,346 | ) | | | (24,665,403 | ) |
| Total | | | (536,753 | ) | | $ | (4,375,866 | ) | | | (1,244,245 | ) | | $ | (10,741,141 | ) |
| Sterling Capital Intermediate U.S. Government Fund |
| Class A | | Shares | | | Amount | | | Shares | | | Amount | |
| Issued | | | 3,927 | | | $ | 33,721 | | | | 36,203 | | | $ | 324,650 | |
| Reinvested | | | 7,160 | | | | 61,234 | | | | 6,250 | | | | 57,448 | |
| Redeemed | | | (43,903 | ) | | | (376,040 | ) | | | (50,390 | ) | | | (469,204 | ) |
| Total | | | (32,816 | ) | | $ | (281,085 | ) | | | (7,937 | ) | | $ | (87,106 | ) |
| Sterling Capital Intermediate U.S. Government Fund |
| Class C | | Shares | | | Amount | | | Shares | | | Amount | |
| Issued | | | 10,001 | | | $ | 86,513 | | | | 862 | | | $ | 7,852 | |
| Reinvested | | | 266 | | | | 2,275 | | | | 162 | | | | 1,486 | |
| Redeemed | | | (7,131 | ) | | | (61,821 | ) | | | (2,115 | ) | | | (19,760 | ) |
| Total | | | 3,136 | | | $ | 26,967 | | | | (1,091 | ) | | $ | (10,422 | ) |
| Sterling Capital Intermediate U.S. Government Fund |
| Institutional | | Shares | | | Amount | | | Shares | | | Amount | |
| Issued | | | 10,714 | | | $ | 91,264 | | | | 22,141 | | | $ | 209,755 | |
| Reinvested | | | 43,893 | | | | 375,457 | | | | 37,759 | | | | 347,206 | |
| Redeemed | | | (12,519 | ) | | | (107,421 | ) | | | (108,728 | ) | | | (1,016,935 | ) |
| Total | | | 42,088 | | | $ | 359,300 | | | | (48,828 | ) | | $ | (459,974 | ) |
Notes to Financial Statements — (continued)
September 30, 2023
| | | For the Year Ended | | | For the Year Ended | |
| | | September 30, 2023 | | | September 30, 2022 | |
| Sterling Capital Total Return Bond Fund |
| Class A | | Shares | | | Amount | | | Shares | | | Amount | |
| Issued | | | 878,957 | | | $ | 8,107,142 | | | | 568,993 | | | $ | 5,770,503 | |
| Reinvested | | | 154,919 | | | | 1,425,366 | | | | 153,923 | | | | 1,585,238 | |
| Redeemed | | | (1,001,035 | ) | | | (9,209,698 | ) | | | (980,344 | ) | | | (9,989,308 | ) |
| Total | | | 32,841 | | | $ | 322,810 | | | | (257,428 | ) | | $ | (2,633,567 | ) |
| Sterling Capital Total Return Bond Fund |
| Class C | | Shares | | | Amount | | | Shares | | | Amount | |
| Issued | | | 25,171 | | | $ | 230,638 | | | | 14,863 | | | $ | 142,332 | |
| Reinvested | | | 7,292 | | | | 67,188 | | | | 9,643 | | | | 100,354 | |
| Redeemed | | | (87,824 | ) | | | (809,081 | ) | | | (128,754 | ) | | | (1,299,716 | ) |
| Total | | | (55,361 | ) | | $ | (511,255 | ) | | | (104,248 | ) | | $ | (1,057,030 | ) |
| Sterling Capital Total Return Bond Fund |
| Institutional | | Shares | | | Amount | | | Shares | | | Amount | |
| Issued | | | 22,299,483 | | | $ | 204,623,107 | | | | 28,562,197 | | | $ | 288,645,267 | |
| Reinvested | | | 1,818,563 | | | | 16,745,047 | | | | 2,195,969 | | | | 22,708,317 | |
| Redeemed | | | (31,653,420 | ) | | | (290,907,707 | ) | | | (48,063,346 | ) | | | (485,151,551 | ) |
| Total | | | (7,535,374 | ) | | $ | (69,539,553 | ) | | | (17,305,180 | ) | | $ | (173,797,967 | ) |
| Sterling Capital Total Return Bond Fund |
| Class R(1) | | Shares | | | Amount | | | Shares | | | Amount | |
| Issued | | | — | | | $ | — | | | | 10 | | | $ | 106 | |
| Reinvested | | | — | | | | — | | | | 4 | | | | 50 | |
| Redeemed | | | — | | | | — | | | | (3,148 | ) | | | (34,409 | ) |
| Total | | | — | | | $ | — | | | | (3,134 | ) | | $ | (34,253 | ) |
| Sterling Capital Total Return Bond Fund |
| Class R6 | | Shares | | | Amount | | | Shares | | | Amount | |
| Issued | | | 16,189,324 | | | $ | 148,974,434 | | | | 7,524,078 | | | $ | 76,320,934 | |
| Reinvested | | | 783,248 | | | | 7,205,165 | | | | 744,467 | | | | 7,668,378 | |
| Redeemed | | | (12,545,363 | ) | | | (115,861,889 | ) | | | (14,521,917 | ) | | | (146,863,772 | ) |
| Total | | | 4,427,209 | | | $ | 40,317,710 | | | | (6,253,372 | ) | | $ | (62,874,460 | ) |
| Sterling Capital Long Duration Corporate Bond Fund |
| Class A | | Shares | | | Amount | | | Shares | | | Amount | |
| Issued | | | 2,295 | | | $ | 16,309 | | | | 4,724 | | | $ | 41,419 | |
| Reinvested | | | 2,324 | | | | 16,105 | | | | 8,067 | | | | 73,146 | |
| Redeemed | | | (22,668 | ) | | | (156,941 | ) | | | (7,184 | ) | | | (68,634 | ) |
| Total | | | (18,049 | ) | | $ | (124,527 | ) | | | 5,607 | | | $ | 45,931 | |
| Sterling Capital Long Duration Corporate Bond Fund |
| Class C | | Shares | | | Amount | | | Shares | | | Amount | |
| Issued | | | — | | | $ | — | | | | 1,970 | | | $ | 20,383 | |
| Reinvested | | | 13 | | | | 88 | | | | 272 | | | | 2,523 | |
| Redeemed | | | (12 | ) | | | (83 | ) | | | (2,196 | ) | | | (18,182 | ) |
| Total | | | 1 | | | $ | 5 | | | | 46 | | | $ | 4,724 | |
Notes to Financial Statements — (continued)
September 30, 2023
| | | For the Year Ended | | | For the Year Ended | |
| | | September 30, 2023 | | | September 30, 2022 | |
| Sterling Capital Long Duration Corporate Bond Fund |
| Institutional | | Shares | | | Amount | | | Shares | | | Amount | |
| Issued | | | 149,095 | | | $ | 1,096,226 | | | | 3,366,560 | | | $ | 30,840,102 | |
| Reinvested | | | 2,332 | | | | 16,181 | | | | 15,196 | | | | 139,838 | |
| Redeemed | | | (98,415 | ) | | | (686,794 | ) | | | (3,986,777 | ) | | | (35,579,918 | ) |
| Total | | | 53,012 | | | $ | 425,613 | | | | (605,021 | ) | | $ | (4,599,978 | ) |
| Sterling Capital Long Duration Corporate Bond Fund |
| Class R6 | | Shares | | | Amount | | | Shares | | | Amount | |
| Issued | | | 1,205,511 | | | $ | 8,413,006 | | | | 3,467,165 | | | $ | 30,642,201 | |
| Reinvested | | | 177,658 | | | | 1,227,995 | | | | 83,904 | | | | 637,292 | |
| Redeemed | | | (68,995 | ) | | | (497,450 | ) | | | (147,782 | ) | | | (1,081,915 | ) |
| Total | | | 1,314,174 | | | $ | 9,143,551 | | | | 3,403,287 | | | $ | 30,197,578 | |
| Sterling Capital Quality Income Fund |
| Class A | | Shares | | | Amount | | | Shares | | | Amount | |
| Issued | | | 13 | | | $ | 118 | | | | 1,274 | | | $ | 12,275 | |
| Reinvested | | | 100 | | | | 880 | | | | 64 | | | | 603 | |
| Redeemed | | | (51 | ) | | | (467 | ) | | | (623 | ) | | | (5,743 | ) |
| Total | | | 62 | | | $ | 531 | | | | 715 | | | $ | 7,135 | |
| Sterling Capital Quality Income Fund |
| Class C | | Shares | | | Amount | | | Shares | | | Amount | |
| Issued | | | — | | | $ | — | | | | 22 | | | $ | 210 | |
| Reinvested | | | 6 | | | | 57 | | | | 4 | | | | 38 | |
| Redeemed | | | (12 | ) | | | (107 | ) | | | (47 | ) | | | (427 | ) |
| Total | | | (6 | ) | | $ | (50 | ) | | | (21 | ) | | $ | (179 | ) |
| Sterling Capital Quality Income Fund |
| Institutional | | Shares | | | Amount | | | Shares | | | Amount | |
| Issued | | | 1,883,270 | | | $ | 16,671,733 | | | | 3,973,722 | | | $ | 38,036,962 | |
| Reinvested | | | 143,396 | | | | 1,266,409 | | | | 75,495 | | | | 707,963 | |
| Redeemed | | | (656,768 | ) | | | (5,827,260 | ) | | | (1,390,930 | ) | | | (13,070,271 | ) |
| Total | | | 1,369,898 | | | $ | 12,110,882 | | | | 2,658,287 | | | $ | 25,674,654 | |
| Sterling Capital North Carolina Intermediate Tax-Free Fund |
| Class A | | Shares | | | Amount | | | Shares | | | Amount | |
| Issued | | | 232,766 | | | $ | 2,364,985 | | | | 946,008 | | | $ | 9,544,746 | |
| Reinvested | | | 38,094 | | | | 383,788 | | | | 31,519 | | | | 328,466 | |
| Redeemed | | | (489,022 | ) | | | (4,993,925 | ) | | | (1,316,412 | ) | | | (13,546,019 | ) |
| Total | | | (218,162 | ) | | $ | (2,245,152 | ) | | | (338,885 | ) | | $ | (3,672,807 | ) |
| Sterling Capital North Carolina Intermediate Tax-Free Fund |
| Class C | | Shares | | | Amount | | | Shares | | | Amount | |
| Issued | | | 6,226 | | | $ | 63,000 | | | | 44,930 | | | $ | 452,133 | |
| Reinvested | | | 1,342 | | | | 13,514 | | | | 874 | | | | 9,093 | |
| Redeemed | | | (24,557 | ) | | | (248,991 | ) | | | (70,301 | ) | | | (730,351 | ) |
| Total | | | (16,989 | ) | | $ | (172,477 | ) | | | (24,497 | ) | | $ | (269,125 | ) |
Notes to Financial Statements — (continued)
September 30, 2023
| | | For the Year Ended | | | For the Year Ended | |
| | | September 30, 2023 | | | September 30, 2022 | |
| Sterling Capital North Carolina Intermediate Tax-Free Fund |
| Institutional | | Shares | | | Amount | | | Shares | | | Amount | |
| Issued | | | 3,606,451 | | | $ | 36,449,589 | | | | 5,558,068 | | | $ | 57,292,898 | |
| Reinvested | | | 145,502 | | | | 1,465,451 | | | | 103,330 | | | | 1,075,095 | |
| Redeemed | | | (5,257,377 | ) | | | (52,892,072 | ) | | | (6,835,815 | ) | | | (70,876,736 | ) |
| Total | | | (1,505,424 | ) | | $ | (14,977,032 | ) | | | (1,174,417 | ) | | $ | (12,508,743 | ) |
| Sterling Capital South Carolina Intermediate Tax-Free Fund |
| Class A | | Shares | | | Amount | | | Shares | | | Amount | |
| Issued | | | 42,487 | | | $ | 441,326 | | | | 24,937 | | | $ | 275,190 | |
| Reinvested | | | 11,378 | | | | 119,001 | | | | 12,192 | | | | 132,564 | |
| Redeemed | | | (115,609 | ) | | | (1,211,789 | ) | | | (331,419 | ) | | | (3,618,340 | ) |
| Total | | | (61,744 | ) | | $ | (651,462 | ) | | | (294,290 | ) | | $ | (3,210,586 | ) |
| Sterling Capital South Carolina Intermediate Tax-Free Fund |
| Class C | | Shares | | | Amount | | | Shares | | | Amount | |
| Issued | | | — | | | $ | — | | | | 5,318 | | | $ | 56,000 | |
| Reinvested | | | 288 | | | | 3,009 | | | | 237 | | | | 2,576 | |
| Redeemed | | | (7,130 | ) | | | (75,053 | ) | | | (25,264 | ) | | | (275,848 | ) |
| Total | | | (6,842 | ) | | $ | (72,044 | ) | | | (19,709 | ) | | $ | (217,272 | ) |
| Sterling Capital South Carolina Intermediate Tax-Free Fund |
| Institutional | | Shares | | | Amount | | | Shares | | | Amount | |
| Issued | | | 893,718 | | | $ | 9,330,273 | | | | 533,396 | | | $ | 5,808,595 | |
| Reinvested | | | 31,624 | | | | 328,340 | | | | 35,364 | | | | 381,384 | |
| Redeemed | | | (1,448,154 | ) | | | (15,014,893 | ) | | | (3,509,711 | ) | | | (37,859,600 | ) |
| Total | | | (522,812 | ) | | $ | (5,356,280 | ) | | | (2,940,951 | ) | | $ | (31,669,621 | ) |
| Sterling Capital Virginia Intermediate Tax-Free Fund |
| Class A | | Shares | | | Amount | | | Shares | | | Amount | |
| Issued | | | 11,270 | | | $ | 125,094 | | | | 120,530 | | | $ | 1,339,229 | |
| Reinvested | | | 16,896 | | | | 186,447 | | | | 16,863 | | | | 192,590 | |
| Redeemed | | | (288,559 | ) | | | (3,170,891 | ) | | | (266,302 | ) | | | (3,018,698 | ) |
| Total | | | (260,393 | ) | | $ | (2,859,350 | ) | | | (128,909 | ) | | $ | (1,486,879 | ) |
| Sterling Capital Virginia Intermediate Tax-Free Fund |
| Class C | | Shares | | | Amount | | | Shares | | | Amount | |
| Issued | | | 494 | | | $ | 5,480 | | | | 707 | | | $ | 8,194 | |
| Reinvested | | | 13 | | | | 138 | | | | 18 | | | | 204 | |
| Redeemed | | | (1,509 | ) | | | (16,775 | ) | | | (3,966 | ) | | | (46,102 | ) |
| Total | | | (1,002 | ) | | $ | (11,157 | ) | | | (3,241 | ) | | $ | (37,704 | ) |
| Sterling Capital Virginia Intermediate Tax-Free Fund |
| Institutional | | Shares | | | Amount | | | Shares | | | Amount | |
| Issued | | | 939,916 | | | $ | 10,401,968 | | | | 2,110,606 | | | $ | 23,627,116 | |
| Reinvested | | | 9,499 | | | | 104,824 | | | | 10,715 | | | | 122,402 | |
| Redeemed | | | (2,397,176 | ) | | | (26,375,457 | ) | | | (1,336,270 | ) | | | (15,156,212 | ) |
| Total | | | (1,447,761 | ) | | $ | (15,868,665 | ) | | | 785,051 | | | $ | 8,593,306 | |
Notes to Financial Statements — (continued)
September 30, 2023
| | | For the Year Ended
September 30, 2023 | | | For the Year Ended
September 30, 2022 | |
| Sterling Capital West Virginia Intermediate Tax-Free Fund | | | | | | | | | | | | |
| Class A | | Shares | | | | Amount | | | Shares | | | | Amount | |
| Issued | | 1,022,283 | | | $ | 9,682,418 | | | 986,569 | | | $ | 9,399,791 | |
| Reinvested | | 33,870 | | | | 317,681 | | | 28,268 | | | | 277,047 | |
| Redeemed | | (1,354,284 | ) | | | (12,726,839 | ) | | (1,097,767 | ) | | | (10,395,528 | ) |
| Total | | (298,131 | ) | | $ | (2,726,740 | ) | | (82,930 | ) | | $ | (718,690 | ) |
| Sterling Capital West Virginia Intermediate Tax-Free Fund | | | | | | | | | | | | |
| Class C | | Shares | | | | Amount | | | Shares | | | | Amount | |
| Reinvested | | 15 | | | $ | 140 | | | 21 | | | $ | 199 | |
| Redeemed | | (2,290 | ) | | | (21,706 | ) | | (1 | ) | | | (9 | ) |
| Total | | (2,275 | ) | | $ | (21,566 | ) | | 20 | | | $ | 190 | |
| Sterling Capital West Virginia Intermediate Tax-Free Fund | | | | | | | | | | | |
| Institutional | | Shares | | | | Amount | | | Shares | | | | Amount | |
| Issued | | 629,358 | | | $ | 5,951,282 | | | 1,477,300 | | | $ | 14,410,877 | |
| Reinvested | | 22,627 | | | | 212,819 | | | 21,651 | | | | 210,969 | |
| Redeemed | | (1,057,078 | ) | | | (9,922,418 | ) | | (1,277,968 | ) | | | (12,359,284 | ) |
| Total | | (405,093 | ) | | $ | (3,758,317 | ) | | 220,983 | | | $ | 2,262,562 | |
| (1) | Effective November 15, 2021 (the “Conversion Date”), all outstanding Class R shares were converted into Class A shares (the “Class Conversions”). The Class Conversions were completed based on the share classes’ relative net asset values on the Conversion Date, without the imposition of any fees or expenses, such that each Class R shareholder received Class A shares having the same aggregate value as the Class R shares held. |
| 6. | Concentration of Credit Risk: |
The Tax-Free Funds invest primarily in debt instruments of municipal issuers in their respective states. The issuers’ abilities to meet their obligations may be affected by economic developments in a specific state or region.
| 7. | Focused Investment Risk: |
Focused Investment Risk relates to investments focused in asset classes, countries, regions, sectors, industries, or issuers that are subject to the same or similar risk factors and investments whose prices are closely correlated that are subject to greater overall risk than investments that are more diversified or whose prices are not as closely correlated.
U.S. Bank, N.A. has made available a credit facility to the Trust, pursuant to an umbrella credit agreement (the “Agreement”). The primary purpose of the Agreement is to allow the Trust to avoid security liquidations that Sterling Capital believes are unfavorable to shareholders. Under the Agreement, an aggregate uncommitted amount of $100,000,000 has been made available for use by all Funds of the Trust for shareholder liquidations only. Outstanding principal amounts under the Agreement bear interest at a rate per annum equal to the Prime Rate minus two percent (2%), but never at a rate of less than one percent (1%) per annum. The Agreement will expire on March 25, 2024. During the fiscal year ended September 30, 2023, each of the following Funds utilized its line of credit:
| | | Average
Interest
Rate | | | Average
Loan
Balance* | | | Number
of Days
Outstanding | | | Interest
Expense
Incurred | | | Maximum
Amount
Borrowed | |
| Sterling Capital Behavioral Small Cap Value Equity Fund | | | 6.25 | % | | $ | 16,179,000 | | | | 1 | | | $ | 2,809 | | | $ | 16,179,000 | |
| Sterling Capital Equity Income Fund | | | 5.00 | % | | | 1,941,000 | | | | 3 | | | | 809 | | | | 1,941,000 | |
| Sterling Capital Behavioral International Equity Fund | | | 6.25 | % | | | 13,695,000 | | | | 1 | | | | 2,378 | | | | 13,695,000 | |
| Sterling Capital SMID Opportunities Fund | | | 4.88 | % | | | 77,500 | | | | 2 | | | | 23 | | | | 141,000 | |
| Sterling Capital Small Cap Value Fund | | | 5.10 | % | | | 3,908,250 | | | | 8 | | | | 4,347 | | | | 8,106,000 | |
| Sterling Capital Short Duration Bond Fund | | | 6.50 | % | | | 7,095,200 | | | | 5 | | | | – | | | | 18,500,000 | |
| Sterling Capital Total Return Bond Fund | | | 4.25 | % | | | 23,816,000 | | | | 1 | | | | 2,812 | | | | 23,816,000 | |
| Sterling Capital Virginia Intermediate Tax-Free Fund | | | 5.50 | % | | | 50,000 | | | | 3 | | | | 23 | | | | 50,000 | |
| Sterling Capital West Virginia Intermediate Tax-Free Fund | | | 5.75 | % | | | 7,871,000 | | | | 4 | | | | 5,029 | | | | 7,871,000 | |
Notes to Financial Statements — (continued)
September 30, 2023
| * | Average loan balance was calculated by taking the sum of the loans outstanding for each day divided by the number of days the loans were outstanding. |
As of September 30, 2023, Truist and its affiliates possessed, on behalf of its underlying accounts, voting or investment power with respect to the following Funds in the following amounts: 87% of the Behavioral Small Cap Value Equity Fund, 99% of the Behavioral International Equity Fund and 40% of the Ultra Short Bond Fund. As a result, Truist may be deemed to be a “controlling person” of each of the above mentioned Funds under the 1940 Act. Additionally, one non-affiliated shareholder, owning 81%, held more than 25% of the shares outstanding of the Intermediate U.S. Government Fund and may be deemed to control this Fund.
| 10. | Federal Tax Information: |
It is the policy of each Fund to continue to qualify as a regulated investment company as defined in the Internal Revenue Code of 1986, as amended (the “Code”), by complying with the applicable provisions of the Code and to make distributions of net investment income and net realized capital gains sufficient to relieve it from all, or substantially all, federal income taxes. Accordingly, no provision for federal income tax was required in the Funds’ financial statements.
Management evaluates its tax positions to determine if the tax positions taken meet the minimum recognition threshold in connection with accounting for uncertainties in income tax positions taken or expected to be taken for the purposes of measuring and recognizing tax liabilities in the financial statements. Recognition of tax benefits of an uncertain tax position is required only when the position is “more likely than not” to be sustained assuming examination by taxing authorities. The Funds recognize interest and penalties, if any, related to unrecognized tax benefits as income tax expense. During the year, the Funds did not incur any interest or penalties.
Management has analyzed the Funds’ tax positions taken on federal income tax returns for all open tax years (current and prior three tax years), and has concluded that no provision for federal income tax was required in the Funds’ financial statements. The Funds’ federal income and excise tax returns for tax years for which the applicable statutes of limitations have not expired are subject to examination by the Internal Revenue Service and state departments of revenue.
Capital losses are permitted to be carried forward without expiration. Such capital losses will retain their character as either short-term or long-term capital losses.
At September 30, 2023, the following Funds had net capital loss carryforwards available to offset future net capital gains, if any, to the extent provided by the Code and the Treasury regulations:
| | | Amount With No Expiration | |
| | | Short-term
Losses | | | Long-term
Losses | |
| Sterling Capital Behavioral Large Cap Value Equity Fund | | $ | (16,228,571 | ) | | $ | — | |
| Sterling Capital Behavioral Small Cap Value Equity Fund | | | (20,176 | ) | | | — | |
| Sterling Capital Behavioral International Equity Fund | | | (12,342,667 | ) | | | — | |
| Sterling Capital Ultra Short Bond Fund | | | (196,332 | ) | | | (1,060,036 | ) |
| Sterling Capital Short Duration Bond Fund | | | (1,843,189 | ) | | | (7,194,262 | ) |
| Sterling Capital Intermediate U.S. Government Fund | | | (390,931 | ) | | | (1,004,330 | ) |
| Sterling Capital Total Return Bond Fund | | | (14,480,537 | ) | | | (39,178,107 | ) |
| Sterling Capital Long Duration Corporate Bond Fund | | | (617,731 | ) | | | — | |
| Sterling Capital Quality Income Fund | | | (1,908,273 | ) | | | (757,232 | ) |
| Sterling Capital North Carolina Intermediate Tax-Free Fund | | | (2,181,112 | ) | | | (2,079,545 | ) |
| Sterling Capital South Carolina Intermediate Tax-Free Fund | | | (106,324 | ) | | | (416,338 | ) |
| Sterling Capital Virginia Intermediate Tax-Free Fund | | | (600,324 | ) | | | (714,221 | ) |
| Sterling Capital West Virginia Intermediate Tax-Free Fund | | | (39,613 | ) | | | (1,017,988 | ) |
Capital loss carryforwards utilized in the current year were as follows:
| | | Utilized Capital Loss Carryforwards | |
| Sterling Capital Behavioral Large Cap Value Equity Fund | | $ | 606,583 | |
Notes to Financial Statements — (continued)
September 30, 2023
The character of income and gains distributed is determined in accordance with the Code and the Treasury regulations, which may differ from U.S. GAAP. These “book/tax” differences are either considered temporary or permanent in nature. To the extent these differences are permanent in nature (e.g., redemptions in-kind, net operating losses and equalization utilized), such amounts are reclassified within the composition of net assets based on their federal tax-basis treatment; temporary differences do not require reclassification. These reclassifications have no impact on net assets or net asset values per share.
| | | Increase/
(Decrease)
Paid-in-Capital | | | Increase/
(Decrease)
Distributable
Earnings | |
| Sterling Capital Mid Value Fund | | $ | 198,967 | | | $ | (198,967 | ) |
| Sterling Capital Behavioral Small Cap Value Equity Fund | | | 27,824 | | | | (27,824 | ) |
| Sterling Capital Special Opportunities Fund | | | 5,947,276 | | | | (5,947,276 | ) |
| Sterling Capital Equity Income Fund | | | 21,595,258 | | | | (21,595,258 | ) |
| Sterling Capital SMID Opportunities Fund | | | 347,768 | | | | (347,768 | ) |
| Sterling Capital Mid Cap Relative Value Fund | | | 272,577 | | | | (272,577 | ) |
| Sterling Capital Real Estate Fund | | | 264,316 | | | | (264,316 | ) |
| Sterling Capital Small Cap Value Fund | | | 14,546,122 | | | | (14,546,122 | ) |
The tax character of distributions paid to shareholders during the fiscal year ended September 30, 2023 was as follows:
| | | Distributions paid from | | | | | | | | | | | | | |
| | | Ordinary
Income | | | Net Long-
Term Gains | | | Total
Taxable
Distributions | | | Tax Exempt
Distributions | | | Total
Distributions
Paid* | |
| Sterling Capital Behavioral Large Cap Value Equity Fund | | $ | 540,559 | | | $ | — | | | $ | 540,559 | | | $ | — | | | $ | 540,559 | |
| Sterling Capital Mid Value Fund | | | 189,120 | | | | 7,939,154 | | | | 8,128,274 | | | | — | | | | 8,128,274 | |
| Sterling Capital Behavioral Small Cap Value Equity Fund | | | 1,849,184 | | | | — | | | | 1,849,184 | | | | — | | | | 1,849,184 | |
| Sterling Capital Special Opportunities Fund | | | — | | | | 38,439,138 | | | | 38,439,138 | | | | — | | | | 38,439,138 | |
| Sterling Capital Equity Income Fund | | | 55,370,491 | | | | 118,112,434 | | | | 173,482,925 | | | | — | | | | 173,482,925 | |
| Sterling Capital Behavioral International Equity Fund | | | 3,693,298 | | | | — | | | | 3,693,298 | | | | — | | | | 3,693,298 | |
| Sterling Capital SMID Opportunities Fund | | | 5,036 | | | | 754,432 | | | | 759,468 | | | | — | | | | 759,468 | |
| Sterling Capital Mid Cap Relative Value Fund | | | 407,967 | | | | 6,835,266 | | | | 7,243,233 | | | | — | | | | 7,243,233 | |
| Sterling Capital Real Estate Fund | | | 1,406,715 | | | | 4,797,257 | | | | 6,203,972 | | | | — | | | | 6,203,972 | |
| Sterling Capital Small Cap Value Fund | | | 1,558,523 | | | | 76,717,312 | | | | 78,275,835 | | | | — | | | | 78,275,835 | |
| Sterling Capital Ultra Short Bond Fund | | | 1,146,187 | | | | — | | | | 1,146,187 | | | | — | | | | 1,146,187 | |
| Sterling Capital Short Duration Bond Fund | | | 3,892,164 | | | | — | | | | 3,892,164 | | | | — | | | | 3,892,164 | |
| Sterling Capital Intermediate U.S. Government Fund | | | 447,781 | | | | — | | | | 447,781 | | | | — | | | | 447,781 | |
| Sterling Capital Total Return Bond Fund | | | 34,534,996 | | | | — | | | | 34,534,996 | | | | — | | | | 34,534,996 | |
| Sterling Capital Long Duration Corporate Bond Fund | | | 1,262,126 | | | | — | | | | 1,262,126 | | | | — | | | | 1,262,126 | |
| Sterling Capital Quality Income Fund | | | 2,462,726 | | | | — | | | | 2,462,726 | | | | — | | | | 2,462,726 | |
| Sterling Capital North Carolina Intermediate Tax-Free Fund | | | 126,020 | | | | — | | | | 126,020 | | | | 3,039,971 | | | | 3,165,991 | |
| Sterling Capital South Carolina Intermediate Tax-Free Fund | | | 61,348 | | | | — | | | | 61,348 | | | | 736,105 | | | | 797,453 | |
| Sterling Capital Virginia Intermediate Tax-Free Fund | | | 101,434 | | | | — | | | | 101,434 | | | | 1,344,024 | | | | 1,445,458 | |
| Sterling Capital West Virginia Intermediate Tax-Free Fund | | | 66,372 | | | | — | | | | 66,372 | | | | 1,919,955 | | | | 1,986,327 | |
Notes to Financial Statements — (continued)
September 30, 2023
The tax character of distributions paid to shareholders during the fiscal year ended September 30, 2022 was as follows:
| | | Distributions paid from | | | | | | | | | | |
| | | Ordinary
Income | | | Net Long-
Term Gains | | | Total
Taxable
Distributions | | | Tax Exempt
Distributions | | | Total
Distributions
Paid* | |
| Sterling Capital Behavioral Large Cap Value Equity Fund | | $ | 518,406 | | | $ | — | | | $ | 518,406 | | | $ | — | | | $ | 518,406 | |
| Sterling Capital Mid Value Fund | | | 3,025,584 | | | | 3,001,788 | | | | 6,027,372 | | | | — | | | | 6,027,372 | |
| Sterling Capital Behavioral Small Cap Value Equity Fund | | | 1,145,447 | | | | 9,770,223 | | | | 10,915,670 | | | | — | | | | 10,915,670 | |
| Sterling Capital Special Opportunities Fund | | | 3,009,729 | | | | 77,664,798 | | | | 80,674,527 | | | | — | | | | 80,674,527 | |
| Sterling Capital Equity Income Fund | | | 33,703,773 | | | | 41,216,260 | | | | 74,920,033 | | | | — | | | | 74,920,033 | |
| Sterling Capital Behavioral International Equity Fund | | | 4,057,335 | | | | — | | | | 4,057,335 | | | | — | | | | 4,057,335 | |
| Sterling Capital SMID Opportunities Fund | | | 2,871 | | | | 947,830 | | | | 950,701 | | | | — | | | | 950,701 | |
| Sterling Capital Mid Cap Relative Value Fund | | | 953,965 | | | | 4,075,092 | | | | 5,029,057 | | | | — | | | | 5,029,057 | |
| Sterling Capital Real Estate Fund | | | 1,606,241 | | | | 6,040,796 | | | | 7,647,037 | | | | — | | | | 7,647,037 | |
| Sterling Capital Small Cap Value Fund | | | 3,425,428 | | | | 103,238,958 | | | | 106,664,386 | | | | — | | | | 106,664,386 | |
| Sterling Capital Ultra Short Bond Fund | | | 517,531 | | | | — | | | | 517,531 | | | | — | | | | 517,531 | |
| Sterling Capital Short Duration Bond Fund | | | 3,060,515 | | | | — | | | | 3,060,515 | | | | — | | | | 3,060,515 | |
| Sterling Capital Intermediate U.S. Government Fund | | | 422,409 | | | | — | | | | 422,409 | | | | — | | | | 422,409 | |
| Sterling Capital Total Return Bond Fund | | | 33,469,774 | | | | 11,121,245 | | | | 44,591,019 | | | | — | | | | 44,591,019 | |
| Sterling Capital Long Duration Corporate Bond Fund | | | 779,062 | | | | 573,447 | | | | 1,352,509 | | | | — | | | | 1,352,509 | |
| Sterling Capital Quality Income Fund | | | 1,536,725 | | | | — | | | | 1,536,725 | | | | — | | | | 1,536,725 | |
| Sterling Capital North Carolina Intermediate Tax-Free Fund | | | 172,396 | | | | — | | | | 172,396 | | | | 2,750,935 | | | | 2,923,331 | |
| Sterling Capital South Carolina Intermediate Tax-Free Fund | | | 31,880 | | | | — | | | | 31,880 | | | | 1,178,534 | | | | 1,210,414 | |
| Sterling Capital Virginia Intermediate Tax-Free Fund | | | 345,744 | | | | 87,833 | | | | 433,577 | | | | 928,912 | | | | 1,362,489 | |
| Sterling Capital West Virginia Intermediate Tax-Free Fund | | | 26,734 | | | | 7,835 | | | | 34,569 | | | | 1,545,334 | | | | 1,579,903 | |
| * | Total distributions paid may differ from the Statements of Changes in Net Assets because distributions are recognized when actually paid for tax purposes. The Funds may also utilize equalization accounting for tax purposes and designate earnings and profits, including net realized gains distributed to shareholders on redemption of shares, as part of the dividends. |
Under current tax law, net capital losses or, if there are no such losses, net long-term capital losses or net short-term capital losses realized after October 31, net ordinary losses from the sale, exchange or other taxable disposition of property realized after October 31 and other net ordinary losses realized after December 31 of a Fund’s taxable year may be deferred and treated as occurring on the first business day of the following taxable year for tax purposes. The following Funds had deferred qualified late-year losses, which will be treated as arising on the first business day of the taxable year ending September 30, 2023:
| | | Qualified
Late-Year
Ordinary
Losses | | | Qualified
Late-Year
Short-term
Capital Losses | | | Qualified
Late-Year
Long-term
Capital Losses | |
| Sterling Capital Special Opportunities Fund | | $ | 1,032,276 | | | $ | — | | | $ | — | |
| Sterling Capital Ultra Short Bond Fund | | | — | | | | — | | | | 124,979 | |
| Sterling Capital Short Duration Bond Fund | | | — | | | | 227,508 | | | | 2,922,182 | |
| Sterling Capital Intermediate U.S. Government Fund | | | — | | | | — | | | | 141,450 | |
| Sterling Capital Total Return Bond Fund | | | — | | | | 6,288,389 | | | | 24,715,977 | |
| Sterling Capital Long Duration Corporate Bond Fund | | | — | | | | 555,876 | | | | 747,166 | |
| Sterling Capital Quality Income Fund | | | — | | | | 12,568 | | | | 389,786 | |
| Sterling Capital North Carolina Intermediate Tax-Free Fund | | | — | | | | 949,209 | | | | 680,594 | |
| Sterling Capital South Carolina Intermediate Tax-Free Fund | | | — | | | | 108,327 | | | | 556,314 | |
| Sterling Capital Virginia Intermediate Tax-Free Fund | | | — | | | | 2,345 | | | | 663,979 | |
| Sterling Capital West Virginia Intermediate Tax-Free Fund | | | — | | | | 161,189 | | | | 1,301,403 | |
Notes to Financial Statements — (continued)
September 30, 2023
As of September 30, 2023, the components of distributable earnings (accumulated deficit) on a tax basis were as follows:
| | | Undistributed
Ordinary
Income/ Tax
Exempt
Income | | | Undistributed
Long Term
Capital Gains | | | Distributable
Earnings | | | Distributions
Payable | | | Accumulated
Capital and
Other Losses | | | Unrealized
Appreciation
(Depreciation)* | | | Total
Distributable
Earnings
(Accumulated
Deficit) | |
| | | | | | | | | | | | | | | | | | | | | | |
| Sterling Capital Behavioral Large Cap Value Equity Fund | | $ | 8,981 | | | $ | — | | | $ | 8,981 | | | $ | — | | | $ | (16,228,571 | ) | | $ | 2,801,557 | | | $ | (13,418,033 | ) |
| Sterling Capital Mid Value Fund | | | 626,030 | | | | 2,295,954 | | | | 2,921,984 | | | | — | | | | — | | | | 8,147,857 | | | | 11,069,841 | |
| Sterling Capital Behavioral Small Cap Value Equity Fund | | | 570,992 | | | | — | | | | 570,992 | | | | — | | | | (20,176 | ) | | | 8,047,139 | | | | 8,597,955 | |
| Sterling Capital Special Opportunities Fund | | | — | | | | 71,908,862 | | | | 71,908,862 | | | | — | | | | (1,032,276 | ) | | | 157,798,657 | | | | 228,675,243 | |
| Sterling Capital Equity Income Fund | | | 3,908,409 | | | | 146,933,923 | | | | 150,842,332 | | | | (2 | ) | | | — | | | | 565,491,621 | | | | 716,333,951 | |
| Sterling Capital Behavioral International Equity Fund | | | 5,740,634 | | | | — | | | | 5,740,634 | | | | — | | | | (12,342,667 | ) | | | 9,508,143 | | | | 2,906,110 | |
| Sterling Capital SMID Opportunities Fund | | | 17,148 | | | | 860,561 | | | | 877,709 | | | | — | | | | — | | | | 391,268 | | | | 1,268,977 | |
| Sterling Capital Mid Cap Relative Value Fund | | | 289,739 | | | | 3,696,095 | | | | 3,985,834 | | | | — | | | | — | | | | 19,637,729 | | | | 23,623,563 | |
| Sterling Capital Real Estate Fund | | | — | | | | 3,914,555 | | | | 3,914,555 | | | | — | | | | — | | | | 20,432,839 | | | | 24,347,394 | |
| Sterling Capital Small Cap Value Fund | | | 903,633 | | | | 71,208,814 | | | | 72,112,447 | | | | — | | | | — | | | | 179,004,313 | | | | 251,116,760 | |
| Sterling Capital Ultra Short Bond Fund | | | 1,497 | | | | — | | | | 1,497 | | | | (2,944 | ) | | | (1,381,347 | ) | | | (142,418 | ) | | | (1,525,212 | ) |
| Sterling Capital Short Duration Bond Fund | | | 299,340 | | | | — | | | | 299,340 | | | | (85,718 | ) | | | (12,187,141 | ) | | | (2,410,111 | ) | | | (14,383,630 | ) |
| Sterling Capital Intermediate U.S. Government Fund | | | 126,355 | | | | — | | | | 126,355 | | | | (806 | ) | | | (1,536,711 | ) | | | (2,316,030 | ) | | | (3,727,192 | ) |
| Sterling Capital Total Return Bond Fund | | | 2,451,221 | | | | — | | | | 2,451,221 | | | | (769,827 | ) | | | (84,663,010 | ) | | | (144,614,383 | ) | | | (227,595,999 | ) |
| Sterling Capital Long Duration Corporate Bond Fund | | | 10,839 | | | | — | | | | 10,839 | | | | (116 | ) | | | (1,920,773 | ) | | | (8,293,544 | ) | | | (10,203,594 | ) |
| Sterling Capital Quality Income Fund | | | 118,086 | | | | — | | | | 118,086 | | | | (118,000 | ) | | | (3,067,859 | ) | | | (10,751,099 | ) | | | (13,818,872 | ) |
| Sterling Capital North Carolina Intermediate Tax-Free Fund | | | 219,018 | | | | — | | | | 219,018 | | | | (106,447 | ) | | | (5,890,460 | ) | | | (5,069,189 | ) | | | (10,847,078 | ) |
| Sterling Capital South Carolina Intermediate Tax-Free Fund | | | 57,008 | | | | — | | | | 57,008 | | | | (28,539 | ) | | | (1,187,303 | ) | | | (1,464,027 | ) | | | (2,622,861 | ) |
| Sterling Capital Virginia Intermediate Tax-Free Fund | | | 154,181 | | | | — | | | | 154,181 | | | | (91,013 | ) | | | (1,980,869 | ) | | | (2,449,403 | ) | | | (4,367,104 | ) |
| * | The primary differences between book basis and tax basis unrealized appreciation (depreciation) were due to the deferral of losses on wash sales, Passive Foreign Investment Companies, and the deferral of market discount and premium until time of sale and real estate investment trust adjustments. |
Notes to Financial Statements — (continued)
September 30, 2023
As of September 30, 2023, federal income tax cost, gross unrealized appreciation and gross unrealized depreciation on securities were as follows:
| | | Tax Cost | | | Gross Tax
Unrealized
Appreciation | | | Gross Tax
Unrealized
Depreciation | | | Net Tax
Unrealized
Appreciation
(Depreciation) | |
| Sterling Capital Behavioral Large Cap Value Equity Fund | | $ | 27,724,319 | | | $ | 3,748,854 | | | $ | (947,297 | ) | | $ | 2,801,557 | |
| Sterling Capital Mid Value Fund | | | 37,505,618 | | | | 11,238,428 | | | | (3,090,571 | ) | | | 8,147,857 | |
| Sterling Capital Behavioral Small Cap Value Equity Fund | | | 82,535,713 | | | | 11,730,403 | | | | (3,683,264 | ) | | | 8,047,139 | |
| Sterling Capital Special Opportunities Fund | | | 308,580,781 | | | | 171,411,001 | | | | (13,612,344 | ) | | | 157,798,657 | |
| Sterling Capital Equity Income Fund | | | 1,314,170,979 | | | | 598,264,818 | | | | (32,773,197 | ) | | | 565,491,621 | |
| Sterling Capital Behavioral International Equity Fund | | | 105,668,021 | | | | 13,961,838 | | | | (4,437,366 | ) | | | 9,524,472 | |
| Sterling Capital SMID Opportunities Fund | | | 4,074,310 | | | | 663,391 | | | | (272,123 | ) | | | 391,268 | |
| Sterling Capital Mid Cap Relative Value Fund | | | 23,835,407 | | | | 20,661,914 | | | | (1,024,185 | ) | | | 19,637,729 | |
| Sterling Capital Real Estate Fund | | | 43,803,283 | | | | 23,505,347 | | | | (3,072,508 | ) | | | 20,432,839 | |
| Sterling Capital Small Cap Value Fund | | | 89,071,633 | | | | 179,955,023 | | | | (950,710 | ) | | | 179,004,313 | |
| Sterling Capital Ultra Short Bond Fund | | | 29,824,727 | | | | 58,219 | | | | (200,637 | ) | | | (142,418 | ) |
| Sterling Capital Short Duration Bond Fund | | | 107,265,117 | | | | 634,085 | | | | (3,044,197 | ) | | | (2,410,112 | ) |
| Sterling Capital Intermediate U.S. Government Fund | | | 18,745,579 | | | | 45,997 | | | | (2,362,027 | ) | | | (2,316,030 | ) |
| Sterling Capital Total Return Bond Fund | | | 1,147,865,315 | | | | 1,703,322 | | | | (146,317,705 | ) | | | (144,614,383 | ) |
| Sterling Capital Long Duration Corporate Bond Fund | | | 39,052,829 | | | | 2,248 | | | | (8,295,794 | ) | | | (8,293,546 | ) |
| Sterling Capital Quality Income Fund | | | 98,670,334 | | | | 2,970 | | | | (10,754,069 | ) | | | (10,751,099 | ) |
| Sterling Capital North Carolina Intermediate Tax-Free Fund | | | 137,921,038 | | | | 242 | | | | (5,069,431 | ) | | | (5,069,189 | ) |
| Sterling Capital South Carolina Intermediate Tax-Free Fund | | | 36,502,498 | | | | — | | | | (1,464,027 | ) | | | (1,464,027 | ) |
| Sterling Capital Virginia Intermediate Tax-Free Fund | | | 64,440,380 | | | | — | | | | (2,449,403 | ) | | | (2,449,403 | ) |
| Sterling Capital West Virginia Intermediate Tax-Free Fund | | | 82,452,772 | | | | 2,966 | | | | (3,697,324 | ) | | | (3,694,358 | ) |
Management has evaluated the need for the disclosure and/or adjustments resulting from subsequent events through the date the financial statements were issued, and has noted no events other than those noted below that require recognition or disclosure in the financial statements.
On November 16, 2023, the Board approved the reorganization of the Sterling Capital SMID Opportunities Fund (the “Acquired Fund”) into the Sterling Capital Mid Value Fund (the “Acquiring Fund”). The reorganization is anticipated to close on or about January 26, 2024, and pursuant to which, all shares of the Acquired Fund will be exchanged for shares of the Acquiring Fund on a pro rata basis immediately after the closing date. This merger will qualify as a tax-free reorganization under Section 368(a)(1)(C) of the Internal Revenue Code.

REPORT OF INDEPENDENT REGISTERED PUBLIC ACCOUNTING FIRM
To the Shareholders and Board of Trustees of
Sterling Capital Funds
Opinion on the Financial Statements
We have audited the accompanying statements of assets and liabilities, including the schedules of portfolio investments, of Sterling Capital Funds comprising, Sterling Capital Behavioral Large Cap Value Equity Fund, Sterling Capital Mid Value Fund, Sterling Capital Behavioral Small Cap Value Equity Fund, Sterling Capital Special Opportunities Fund, Sterling Capital Equity Income Fund, Sterling Capital Behavioral International Equity Fund, Sterling Capital SMID Opportunities Fund, Sterling Capital Mid Cap Relative Value Fund, Sterling Capital Real Estate Fund, Sterling Capital Small Cap Value Fund, Sterling Capital Ultra Short Bond Fund, Sterling Capital Short Duration Bond Fund, Sterling Capital Intermediate U.S. Government Fund, Sterling Capital Total Return Bond Fund, Sterling Capital Long Duration Corporate Bond Fund, Sterling Capital Quality Income Fund, Sterling Capital North Carolina Intermediate Tax-Free Fund, Sterling Capital South Carolina Intermediate Tax-Free Fund, Sterling Capital Virginia Intermediate Tax-Free Fund, and Sterling Capital West Virginia Intermediate Tax-Free Fund (the “Funds”), as of September 30, 2023, the related statements of operations for the year then ended, the statements of changes in net assets for each of the two years in the period then ended, the related notes, and the financial highlights for each of the five years in the period then ended (collectively referred to as the “financial statements”). In our opinion, the financial statements present fairly, in all material respects, the financial position of each of the Funds as of September 30, 2023, the results of their operations for the year then ended, the changes in net assets for each of the two years in the period then ended, and the financial highlights for each of the five years in the period then ended, in conformity with accounting principles generally accepted in the United States of America.
Basis for Opinion
These financial statements are the responsibility of the Funds’ management. Our responsibility is to express an opinion on the Funds’ financial statements based on our audits. We are a public accounting firm registered with the Public Company Accounting Oversight Board (United States) (“PCAOB”) and are required to be independent with respect to the Funds in accordance with the U.S. federal securities laws and the applicable rules and regulations of the Securities and Exchange Commission and the PCAOB.
We conducted our audits in accordance with the standards of the PCAOB. Those standards require that we plan and perform the audit to obtain reasonable assurance about whether the financial statements are free of material misstatement whether due to error or fraud.
COHEN & COMPANY, LTD.
800.229.1099 | 866.818.4538 fax | cohencpa.com
Registered with the Public Company Accounting Oversight Board
Our audits included performing procedures to assess the risks of material misstatement of the financial statements, whether due to error or fraud, and performing procedures that respond to those risks. Such procedures included examining, on a test basis, evidence regarding the amounts and disclosures in the financial statements. Our procedures included confirmation of securities owned as of September 30, 2023, by correspondence with the custodian and brokers; when replies were not received from brokers, we performed other auditing procedures. Our audits also included evaluating the accounting principles used and significant estimates made by management, as well as evaluating the overall presentation of the financial statements. We believe that our audits provide a reasonable basis for our opinion.
We have served as the Funds’ auditor since 2019.

COHEN & COMPANY, LTD.
Milwaukee, Wisconsin
November 22, 2023
September 30, 2023
Notice to Shareholders (Unaudited)
All amounts and percentages below are based on financial information available as of the date of this annual report and, accordingly are subject to change. For each item it is the intention of the Funds to report the maximum amount permitted under the Internal Revenue Code and the regulations thereunder.
For the fiscal year ended September 30, 2023, each Fund is reporting the following items with regard to distributions paid during the year.
| | | Long-Term
Capital Gain | | | Qualified
Dividend
Income % | | | (for corporate
shareholders)
Dividends
Received
Deduction % | | | Exempt-
Interest
Dividend | | | U.S.
Government
Income | | | Foreign
Taxes
Paid | | | Foreign
Source
Income | |
| Sterling Capital Behavioral Large Cap Value Equity Fund | | $ | — | | | | 100.00 | % | | | 100.00 | % | | $ | — | | | | — | | | $ | — | | | $ | — | |
| Sterling Capital Mid Value Fund | | | 7,939,154 | | | | 98.00 | % | | | 97.35 | % | | | — | | | | — | | | | — | | | | — | |
| Sterling Capital Behavioral Small Cap Value Equity Fund | | | — | | | | 100.00 | % | | | 87.97 | % | | | — | | | | — | | | | — | | | | — | |
| Sterling Capital Special Opportunities Fund | | | 38,439,138 | | | | — | | | | — | | | | — | | | | — | | | | — | | | | — | |
| Sterling Capital Equity Income Fund | | | 118,112,434 | | | | 95.26 | % | | | 91.76 | % | | | — | | | | — | | | | — | | | | — | |
| Sterling Capital Behavioral International Equity Fund | | | — | | | | 95.37 | % | | | — | | | | — | | | | — | | | | 555,017 | | | | 5,647,182 | |
| Sterling Capital SMID Opportunities Fund | | | 754,432 | | | | 100.00 | % | | | 100.00 | % | | | — | | | | — | | | | — | | | | — | |
| Sterling Capital Mid Cap Relative Value Fund | | | 6,835,266 | | | | 100.00 | % | | | 100.00 | % | | | — | | | | — | | | | — | | | | — | |
| Sterling Capital Real Estate Fund | | | 4,797,257 | | | | 1.71 | % | | | — | | | | — | | | | — | | | | — | | | | — | |
| Sterling Capital Small Cap Value Fund | | | 76,717,312 | | | | 100.00 | % | | | 100.00 | % | | | — | | | | — | | | | — | | | | — | |
| Sterling Capital Ultra Short Duration Bond Fund | | | — | | | | — | | | | — | | | | — | | | | 5.99 | % | | | — | | | | — | |
| Sterling Capital Short Duration Bond Fund | | | — | | | | — | | | | — | | | | — | | | | 15.85 | % | | | — | | | | — | |
| Sterling Capital Intermediate U.S. Government Fund | | | — | | | | — | | | | — | | | | — | | | | 9.61 | % | | | — | | | | — | |
| Sterling Capital Total Return Bond Fund | | | — | | | | — | | | | — | | | | — | | | | 16.13 | % | | | — | | | | — | |
| Sterling Capital Long Duration Corporate Bond Fund | | | — | | | | — | | | | — | | | | — | | | | 4.05 | % | | | — | | | | — | |
| Sterling Capital Quality Income Fund | | | — | | | | — | | | | — | | | | — | | | | 1.22 | % | | | — | | | | — | |
| Sterling Capital North Carolina Intermediate Tax-Free Fund | | | — | | | | — | | | | — | | | | 96.01 | % | | | — | | | | — | | | | — | |
| Sterling Capital South Carolina Intermediate Tax-Free Fund | | | — | | | | — | | | | — | | | | 94.36 | % | | | — | | | | — | | | | — | |
| Sterling Capital Virginia Intermediate Tax-Free Fund | | | — | | | | — | | | | — | | | | 92.98 | % | | | — | | | | — | | | | — | |
| Sterling Capital West Virginia Intermediate Tax-Free Fund | | | — | | | | — | | | | — | | | | 96.67 | % | | | — | | | | — | | | | — | |
Other Information (Unaudited)
A description of the policies and procedures that the Funds use to determine how to vote proxies relating to portfolio securities is available (i) without charge, upon request, by calling 1-800-228-1872; and (ii) on the Securities and Exchange Commission’s (the “Commission”) website at www.sec.gov.
Information regarding how the Funds voted proxies relating to portfolio securities during the most recent 12-month period ended June 30th is available (i) without charge, upon request, by calling 1-800-228-1872 and (ii) on the Commission’s website at www. sec.gov.
The Funds file complete Schedules of Portfolio Holdings with the Commission for the first and third quarters of each fiscal year as an exhibit to its reports on Form N-PORT. The Funds’ Forms N-PORT reports, once filed, will be available without charge on the Commission’s website at www.sec.gov.
September 30, 2023
Information about Trustees and Officers (Unaudited)
Overall responsibility for the management of the Funds rests with its Board of Trustees (“Trustees”), who are elected by the shareholders of the Funds. The Trustees elect the officers of the Funds to supervise actively its day-to-day operations. The names of the Trustees, birthdates, term of office and length of time served, principal occupations during the past five years, number of portfolios overseen and directorships held outside of the Funds are listed in the two tables immediately following. The business address of the persons listed below is 434 Fayetteville Street, Suite 500, Raleigh, North Carolina 27601.
| INDEPENDENT TRUSTEES |
| Name and Birthdate | Position(s) Held
With the Funds | Term of Office/
Length of
Time Served | Principal Occupation
During the Past 5 Years | Number of
Portfolios
in Fund
Complex
Overseen
by Trustee | Other
Directorships
Held
by Trustee |
Drew T. Kagan
Birthdate: 02/48 | Trustee, Chairman of the Board of Trustees | Indefinite,
08/00 — Present | Retired; from September 2010 to March 2013, Chairman, Montecito Advisors, Inc.; from December 2003 to September 2010, CEO, Montecito Advisors, Inc.; from March 1996 to December 2003, President, Investment Affiliate, Inc. | 20 | None |
Laura C. Bingham
Birthdate: 11/56 | Trustee | Indefinite,
02/01 — Present | From March 2013 to present, Partner, Newport Board Group; from July 2010 to March 2013, governance and leadership consultant; from June 1998 to July 2010, President and CEO of Peace College | 20 | None |
Douglas R. Van Scoy
Birthdate: 11/43 | Trustee | Indefinite,
05/04 — Present | Retired; from November 1974 to July 2001, employee of Smith Barney (investment banking), most recently as Director of Private Client Group and Senior Executive Vice President | 20 | None |
Alan G. Priest
Birthdate: 05/52 | Trustee | Indefinite,
07/12 — Present | Retired; from April 1993 to April 2012, Partner, Ropes & Gray LLP | 20 | None |
Kimberly Storms
Birthdate: 05/72 | Trustee | Indefinite,
10/22 — Present | From 2004-2021, Senior Vice President and Director of Fund Administration SS&C ALPS; from 2012 to 2020, Principal Financial Officer of ALPS Series Trust (2012- 2020), Financial Investors Trust (2013-2020), Liberty All-Star Funds (2013-2020) and Cambria ETF Trust (2020) | 20 | Trustee, Consortio Funds Trust (2022 — Present) |
David L. Wedding
Birthdate: 08/58 | Trustee | Indefinite,
10/22 — Present | Retired; from 2005 to 2020, Partner, Grant Thornton LLP | 20 | Board Member (2011-2020) and Chair of the Board (2012-2018), Grant Thornton LLP |
On October 12, 2022 a special meeting of the shareholders of the Sterling Capital Funds was held pursuant to the notice given to all shareholders of record as of close of business on August 23, 2022, to elect Trustees of each Fund, each to hold office until their successors are duly elected and qualified. A quorum was established with greater than 50% of Trust outstanding share votes cast, in favor or, all Trustees.
September 30, 2023
The following table shows information for the trustee who is an “interested person” of the Funds as defined in the 1940 Act:
| INTERESTED TRUSTEES |
| Name and Birthdate | Position(s) Held
With the Funds | Term of Office/
Length of
Time Served | Principal Occupation
During the Past 5 Years | Number of
Portfolios
in Fund
Complex
Overseen
by Trustee | Other
Directorships
Held
by Trustee |
Scott A. Haenni*
Birthdate: 02/73 | Trustee | Indefinite,
05/23 — Present | From March 2023 to present, CEO, Sterling Capital; from January 2015 to March 2023, COO, Sterling Capital. | 20 | Director, Sterling Capital |
| * | Mr. Haenni is treated by the Funds as an “interested person” (as defined in Section 2(a)(19) of the 1940 Act) of the Funds because he is an officer of the Adviser. |
The following table shows information for officers of the Funds as of September 30, 2023:
| Name and Birthdate | Position(s) Held
With the Funds | Term of Office/
Length of
Time Served | Principal Occupation
During the Past 5 Years |
James T. Gillespie
Birthdate: 11/66 | President | Indefinite,
12/12 — Present | From August 2020 to present, Managing Director, Sterling Capital Management LLC; From March 2012 to August 2020, Executive Director, Sterling Capital Management LLC; From June 2010 to March 2012, Director, Sterling Capital Management LLC and its predecessors |
Todd M. Miller
Birthdate: 09/71 | Treasurer and Secretary | Indefinite,
Treasurer,
01/15 — Present;
Secretary,
08/10 — Present | From May 2021 to present, Executive Director, from June 2009 to May 2021, Director, Sterling Capital Management LLC and its predecessors |
Michelle A. Whalen
Birthdate: 04/69 | Vice President | Indefinite,
11/15 — Present | From May 2021 to present, Director, from August 2015 to May 2021 Associate Director & Senior Mutual Fund Administrator, Sterling Capital; from September 2000 to July 2015, Supervisor |
Charles A. Durham
Birthdate: 06/79 | Chief Compliance and Anti-Money Laundering Officer | Indefinite,
06/18 — Present | From June 2018 to present, Chief Compliance Officer and Executive Director, Sterling Capital; from September 2010 to June 2018, Vice President, Senior Compliance Manager, Brown Brothers Harriman & Co. |
Lisa M. Weaver
Birthdate: 2/69 | Assistant Treasurer | Indefinite,
04/23 — Present | From April 2023 to present, Senior Vice President, Fund Administration, The Bank of New York Mellon; From October 2018 to March 2023, Vice President, Fund Administration, The Bank of New York Mellon. |
Julie M. Powers
Birthdate: 10/69 | Assistant Secretary | Indefinite,
11/11 — Present | From November 2011 to present, Vice President, Regulatory Administration Department, The Bank of New York Mellon. |
The Funds’ Statement of Additional Information includes additional information about the Funds’ Trustees and Officers. To receive your free copy of the Statement of Additional Information, call toll free: 1-800-228-1872.
Liquidity Risk Management Program
The Funds have adopted a liquidity risk management program pursuant to Rule 22e-4 under the Investment Company Act of 1940, as amended (the “Program”). The Funds’ board has designated Sterling Capital Management LLC (“Sterling Capital”) as the administrator of the Program. The Program’s principal objectives are to support the Funds’ compliance with limits on investments in illiquid assets and to mitigate the risk that a Fund is unable to meet its redemption obligations timely. In this regard, the Program includes a number of elements that support the management or assessment of liquidity risk, including an assessment of factors that influence a Fund’s liquidity and the periodic classification and, as determined necessary, re-classification of a Fund’s investments into buckets that reflect their relative liquidity under current market conditions.
The Funds’ Board reviewed a written report from Sterling Capital on May 17, 2023 addressing the Program’s operation, adequacy, and effectiveness (the “Report”). From January 1, 2022 through December 31, 2022, the period covered by the Report, the Program supported each Fund’s ability to honor redemption requests timely and Sterling Capital’s management of each Fund’s liquidity risk profile, including during any periods of market volatility and net redemptions.
There can be no assurance that the Program will achieve its objectives under all circumstances in the future. Please refer to your Fund’s prospectus for more information regarding the Fund’s exposure to liquidity risk and other risks to which it may be subject.
Notice of Privacy Policy & Practices
Sterling Capital Funds provide this notice to you so that you will know what kinds of information we collect about shareholders1, prospective investors, and individuals (such as beneficiaries), and the circumstances in which that information may be disclosed to third parties who are not affiliated with Sterling Capital Funds.
Collection of Personal Information
We collect nonpublic personal information about you from the following sources:
| ● | Account Applications and other forms, which may include your name, address, social security number, and information about your investment goals and risk tolerance; |
| ● | Account History, including information about the transactions and balances in your account(s); |
| ● | Correspondence, written, telephonic or electronic between you and Sterling Capital Funds or service providers working on behalf of Sterling Capital Funds; |
| ● | Online, your name and e-mail address if you provide them; and |
| ● | Third Parties, such as your financial intermediary in connection with your transactions, or third-party data services used to verify or update personal information that you provide. |
To comply with federal regulations, information we receive from you or a third party will be used to verify your identity.
Disclosure of Personal Information
We may disclose your personal information as permitted by law to third parties who are not affiliated with the Sterling Capital Funds, including:
| ● | in connection with legal proceedings, such as responding to a subpoena; |
| ● | to service providers who maintain or service shareholder accounts for Sterling Capital Funds or to a shareholder’s broker or agent; or to companies that mail account-related materials, such as shareholder reports; and |
| ● | to perform marketing services on our behalf, or pursuant to a joint marketing agreement with another financial institution. |
Safeguarding of Personal Information
Sterling Capital Funds employs policies, practices and procedures for safeguarding your personal information that we believe comply with applicable law, however no security measures are perfect or impenetrable.
We request that all service providers to Sterling Capital Funds:
| ● | maintain policies and procedures designed to assure only appropriate access to, and use of your personal information; and |
| ● | maintain physical, electronic and procedural safeguards that comply with applicable legal standards to guard your nonpublic personal information. |
When information is shared with third parties, they are not permitted to use the information for any purpose other than to assist our servicing of your account(s), including helping us improve the services we offer.
| 1 | For purposes of this notice, the terms “shareholder” or “shareholders” includes both individual shareholders (both current and former) of the Sterling Capital Funds and individuals (such as beneficiaries, for example) whose nonpublic personal information is provided to the Sterling Capital Funds, even though they do not invest in Sterling Capital Funds shares. |
INVESTMENT ADVISOR
Sterling Capital Management LLC
4350 Congress Street, Suite 1000
Charlotte, NC 28209
DISTRIBUTOR
Sterling Capital Distributors, LLC
3 Canal Plaza
Suite 100
Portland, ME 04101
LEGAL COUNSEL
Ropes & Gray LLP
Prudential Tower
800 Boylston Street
Boston, MA 02199
TRANSFER AGENT
BNY Mellon Investment Servicing (US) Inc.
301 Bellevue Parkway
Wilmington, DE 19809
INDEPENDENT REGISTERED PUBLIC ACCOUNTING FIRM
Cohen & Company, Ltd.
342 North Water Street, Suite 830
Milwaukee, WI 53202

Item 2. Code of Ethics.
| (a) | The registrant, as of the end of the period covered by this report, has adopted a code of ethics that applies to the registrant’s principal executive officer, principal financial officer, principal accounting officer or controller, or persons performing similar functions, regardless of whether these individuals are employed by the registrant or a third party (the “Code of Ethics”). |
| (c) | There have been no amendments, during the period covered by this report, to a provision of the Code of Ethics that applies to the registrant’s principal executive officer, principal financial officer, principal accounting officer or controller, or persons performing similar functions, regardless of whether these individuals are employed by the registrant or a third party, and that relates to any element of the code of ethics definition enumerated in Item 2(b) of Form N-CSR. |
| (d) | The registrant has not granted any waivers, including an implicit waiver, from a provision of the code of ethics that applies to the registrant’s principal executive officer, principal financial officer, principal accounting officer or controller, or persons performing similar functions, regardless of whether these individuals are employed by the registrant or a third party, that relates to one or more of the items set forth in Item 2(b) of Form N-CSR. |
Item 3. Audit Committee Financial Expert.
As of the end of the period covered by the report, the registrant’s board of trustees has determined that Drew Kagan is qualified to serve as an audit committee financial expert serving on its audit committee and that he is “independent,” as defined by Item 3 of Form N-CSR.
Item 4. Principal Accountant Fees and Services.
Audit Fees
| (a) | The aggregate fees billed for each of the last two fiscal years for professional services rendered by the principal accountant for the audit of the registrant’s annual financial statements or services that are normally provided by the accountant in connection with statutory and regulatory filings or engagements for those fiscal years are $310,500 for 2023 and $310,500 for 2022. |
Audit-Related Fees
| (b) | The aggregate fees billed in each of the last two fiscal years for assurance and related services by the principal accountant that are reasonably related to the performance of the audit of the registrant’s financial statements and are not reported under paragraph (a) of this Item are $0 for 2023 and $0 for 2022. These audit-related services include issuance of consents to use the name of the auditor in new Fund filings. |
Tax Fees
| (c) | The aggregate fees billed in each of the last two fiscal years for professional services rendered by the principal accountant for tax compliance, tax advice, and tax planning are $82,000 for 2023 and $82,000 for 2022. Fees for both 2023 and 2022 relate to the preparation of the registrant’s federal income and excise tax returns and review of the registrant’s capital gains distribution calculations. |
All Other Fees
| (d) | The aggregate fees billed in each of the last two fiscal years for products and services provided by the principal accountant, other than the services reported in paragraphs (a) through (c) of this Item are $0 for 2023 and $0 for 2022. |
| (e)(1) | Except as permitted by Rule 2-01(c)(7)(i)(C) of Regulation S-X, the Trust’s Audit Committee must pre-approve all audit and non-audit services provided by the independent accountants relating to the operations or financial reporting of the funds. Prior to the commencement of any audit or non-audit services to a fund, the Audit Committee reviews the services to determine whether they are appropriate and permissible under applicable law. |
| (e)(2) | The percentage of services described in each of paragraphs (b) through (d) of this Item that were approved by the audit committee pursuant to paragraph (c)(7)(i)(C) of Rule 2-01 of Regulation S-X are as follows: |
(b) N/A
(c) 100%
(d) N/A
| (f) | The percentage of hours expended on the principal accountant’s engagement to audit the registrant’s financial statements for the most recent fiscal year that were attributed to work performed by persons other than the principal accountant’s full-time, permanent employees was less than fifty percent. |
| (g) | The aggregate non-audit fees billed by the registrant’s accountant for services rendered to the registrant, and rendered to the registrant’s investment adviser (not including any sub-adviser whose role is primarily portfolio management and is subcontracted with or overseen by another investment adviser), and any entity controlling, controlled by, or under common control with the adviser that provides ongoing services to the registrant for each of the last two fiscal years of the registrant was $0 for 2023 and $0 for 2022. |
Item 5. Audit Committee of Listed Registrants.
Not applicable.
Item 6. Investments.
| (a) | Schedule of Investments in securities of unaffiliated issuers as of the close of the reporting period is included as part of the report to shareholders filed under Item 1(a) of this form. |
Item 7. Disclosure of Proxy Voting Policies and Procedures for Closed-End Management Investment Companies.
Not applicable.
Item 8. Portfolio Managers of Closed-End Management Investment Companies.
Not applicable.
Item 9. Purchases of Equity Securities by Closed-End Management Investment Company and Affiliated Purchasers.
Not applicable.
Item 10. Submission of Matters to a Vote of Security Holders.
There have been no material changes to the procedures by which shareholders may recommend nominees to the registrant’s board of trustees, where those changes were implemented after the registrant last provided disclosure in response to the requirements of Item 407(c)(2)(iv) of Regulation S-K (17 CFR 229.407) (as required by Item 22(b)(15) of Schedule 14A (17 CFR 240.14a-101)), or this Item.
Item 11. Controls and Procedures.
| (a) | The registrant’s principal executive officer and principal financial officer have concluded, based on their evaluation of the effectiveness of the design and operation of the registrant’s disclosure controls and procedures (as defined in Rule 30a-3(c) under the Investment Company Act of 1940 (17 CFR 270.30a-3(c))) as of a date within 90 days of the filing date of this report, that the design and operation of such procedures are effective to provide reasonable assurance that information required to be disclosed by the registrant on Form N-CSR is recorded, processed, summarized and reported within the time periods specified in the Securities and Exchange Commission’s rules and forms, and that information required to be disclosed by the registrant in the reports that it files or submits on Form N-CSR is accumulated and communicated to the registrant’s management, including its principal executive and principal financial officers, as appropriate to allow timely decisions regarding required disclosure. |
| (b) | There were no changes in the registrant’s internal control over financial reporting (as defined in Rule 30a-3(d) under the 1940 Act (17 CFR 270.30a-3(d))) that occurred during the period covered by this report that have materially affected, or are reasonably likely to materially affect, the registrant’s internal control over financial reporting. |
Item 12. Disclosure of Securities Lending Activities for Closed-End Management Investment Companies.
Not applicable.
Item 13. Exhibits.
| (a)(2)(1) | There were no written solicitations to purchase securities under Rule 23c-1 under the Act sent or given during the period covered by the report by or on behalf of the Registrant to 10 or more persons. |
| (a)(2)(2) | There was no change in the Registrant’s independent public accountant during the period covered by the report. |
SIGNATURES
Pursuant to the requirements of the Securities Exchange Act of 1934 and the Investment Company Act of 1940, the registrant has duly caused this report to be signed on its behalf by the undersigned, thereunto duly authorized.
| (Registrant) | Sterling Capital Funds | |
| | | |
| By (Signature and Title) | /s/ James T. Gillespie | |
| | James T. Gillespie, President | |
| | (principal executive officer) | |
| | | |
| Date | November 22, 2023 | |
Pursuant to the requirements of the Securities Exchange Act of 1934 and the Investment Company Act of 1940, this report has been signed below by the following persons on behalf of the registrant and in the capacities and on the dates indicated.
| By (Signature and Title) | /s/ James T. Gillespie | |
| | James T. Gillespie, President | |
| | (principal executive officer) | |
| | | |
| Date | November 22, 2023 | |
| | | |
| | | |
| By (Signature and Title) | /s/ Todd M. Miller | |
| | Todd M. Miller, Treasurer | |
| | (principal financial officer) | |
| | | |
| Date | November 22, 2023 | |