UNITED STATES
SECURITIES AND EXCHANGE COMMISSION
Washington, D.C. 20549
FORM N-CSR
CERTIFIED SHAREHOLDER REPORT OF REGISTERED
MANAGEMENT INVESTMENT COMPANIES
Investment Company Act file number | 811-7062 | |||||||
| ||||||||
PACIFIC GLOBAL FUND INC. D/B/A PACIFIC ADVISORS FUND INC. | ||||||||
(Exact name of registrant as specified in charter) | ||||||||
| ||||||||
101 NORTH BRAND BLVD., SUITE 1950 GLENDALE, CALIFORNIA |
| 91203 | ||||||
(Address of principal executive offices) |
| (Zip code) | ||||||
| ||||||||
GEORGE A. HENNING 101 NORTH BRAND BLVD., SUITE 1950 GLENDALE, CA 91203 | ||||||||
(Name and address of agent for service) | ||||||||
| ||||||||
Registrant’s telephone number, including area code: | 818-242-6693 |
| ||||||
| ||||||||
Date of fiscal year end: | December 31 |
| ||||||
| ||||||||
Date of reporting period: | December 31, 2005 |
| ||||||
Item 1. | Report to Shareholders |
| Filed herewith. |


annual report
december 31, 2005
government securities fund
income and equity fund
balanced fund
growth fund
multi-cap value fund
small cap fund

Pacific Advisors
table of contents
| Message from the Chairman | 1 | ||||||
| Government Securities Fund | 3 | ||||||
| Income and Equity Fund | 7 | ||||||
| Balanced Fund | 11 | ||||||
| Growth Fund | 15 | ||||||
| Multi-Cap Value Fund | 19 | ||||||
| Small Cap Fund | 23 | ||||||
| Statement of Investments | 28 | ||||||
| Statement of Assets and Liabilities | 56 | ||||||
| Statement of Operations | 58 | ||||||
| Statement of Changes in Net Assets | 60 | ||||||
| Notes to Financial Statements | 64 | ||||||
| Financial Highlights | 71 | ||||||
This Report is submitted for the general information of the shareholders of the Fund. It is not authorized for distribution to prospective investors unless accompanied or preceded by a current effective prospectus of the Fund, which contains information concerning the investment policies of the Fund as well as other pertinent information.
This Report is for informational purposes only and is not a solicitation, or a recommendation that any particular investor should purchase or sell any particular security. The statements in the Report are the opinions and beliefs expressed at the time of this commentary and are not intended to represent opinions and beliefs at any other time. These opinions are subject to change with market conditions and are not meant as a market forecast. All economic and performance information referenced is historical. Past performance does not guarantee future results.
For more information on the Pacific Advisors Funds, including information on charges, expenses and other classes offered, please obtain a copy of the prospectus by calling (800) 989-6693. Please read the prospectus carefully before you invest or send money. Shares of the Pacific Advisors Funds are not deposits or obligations of any bank, are not guaranteed by any bank, are not insured by the FDIC or any other agency, and involve investment risks, including the possible loss of the principal amount invested. The investment return and principal value of an investment will fluctuate so that an investor's shares, when redeemed, may be worth more or less than their original cost.

Message
from the chairman
Dear Shareholders:
Many investors found 2005 to be a frustrating year. The U.S. economy continued to grow at a respectable 31/2 percent during the year. Nevertheless, neither the equity nor the fixed income markets seemed to realize any significant benefit from a strong economy.
Consumer spending remained strong throughout 2005. Nevertheless, a number of factors created skepticism among investors and raised concerns that a recession might be imminent. The equity markets struggled early in the year as the economy experienced a soft patch due to a harsh winter. After the markets began to recover in the third quarter, severe hurricane damage in Florida and Louisiana raised new economic concerns. Geopolitical tensions in the Middle East also created a drag on investor confidence. As a result, the equity markets had a lackluster year despite strong revenue and earnings growth among U.S. companies.
Fixed income investors watched the Federal Reserve continue to raise interest rates throughout the year. By year-end, however, there was little difference between short and long-term rates. This raised concerns that short-term interest rates would rise above long-term rates, a condition which normally indicates a recession on the horizon. Many investors wondered, "How can we have such a strong economy and so little to show for it in investment returns?"
Equity Markets
The equity markets remained trading range bound during 2005 which kept the Dow Jones Industrial average from crossing 11,000. As we have previously stated, it is not unusual to have a trading range market persist for several years following a strong bull market such as the one we experienced during the 1990s. Good stock selection is critical to take advantage of the cyclical bull and bear markets within the trading range. During this type of market, indices, such as the S&P 500 Index, often produce lackluster performance since many companies may show little or no growth in their stock price.
In 2005, energy stocks continued to outperform the market benefiting from strong worldwide demand for oil products. Dynamic economic growth in China and India created additional demand for oil which made it difficult for oil production to keep pace with demand. In addition, much of the world's oil supply experienced disruptions due to political instability.
U.S. and global economic growth also continued to create demand for industrial products which benefited basic materials companies producing copper, steel, and aluminum. Technology firms began to show better performance as consumer spending for computers and other electronic products continued to grow. Businesses also began increasing technology spending to increase productivity and remain competitive.
Fixed Income Markets
During 2005, the Federal Reserve raised the fed fund rates to 4.25% to keep inflation under control. While energy costs were the primary inflationary factor, costs also began to increase in other areas.
Even though the Fed continued raising interest rates, the yield on the 10-year Treasury Bond closed the year at 4.33% only slightly higher than at the end of 2004. Lower long-term interest rates resulted from strong demand for U.S. government bonds by foreign governments such as China and Japan and institutional investors such as pension plans and insurance companies. The U.S. government began re-issuing 30-year Treasury Bonds in February 2006. Over time, strong demand for these longer maturities should help produce a rise in long-term rates.
Minutes from the Fed's December meeting suggest the need to raise interest rates is diminishing. An end to the Fed's interest rate increases should spur a rise in long-term rates. This will allow investors to lock in a higher yields and the potential for capital appreciation.
Market Review
| December 31, 2005 | Close | YTD Return | |||||||||
| Dow Jones | 10,717.50 | – 0.61 | % | ||||||||
| S&P 500 | 1,248.29 | 4.91 | % | ||||||||
| NASDAQ | 2,205.32 | 1.37 | % | ||||||||
| Russell 2000 (small cap) | 673.22 | 4.55 | % | ||||||||
| 12/31/05 | 12/31/04 | ||||||||||
| 10-Year T-Note Yield | 4.33 | % | 4.24 | % | |||||||
1

Message
from the chairman continued
Economic Outlook
We believe that the U.S. economy will continue to expand in excess of 3% during the coming year. While inflationary pressures in energy and other commodity products will remain, we do not expect the Fed will need to take strong action to keep inflation at a reasonable rate. While we recognize natural disasters or other unexpected events can change the investment landscape, the prospects for continued economic growth remain strong.
In addition, global economic expansion should benefit the many U.S. companies doing business overseas. Worldwide economic trends have an important impact on the strength of U.S. companies. We will continue to monitor the international picture and geopolitical events to assess their potential impact on the U.S. markets.
Without an apparent catalyst to drive the equity markets significantly higher, we expect they will stay in a trading range for the foreseeable future. Good stock selection will remain important in the small, mid and large cap markets. While small and mid cap stocks outperformed large cap stocks over the past two years, we believe companies of all sizes will present good value opportunities going forward.
Demand for energy will continue to exceed supply due to a continuation of the trends seen in 2005. Energy stocks should continue to show strong growth accompanied by volatility as the price of oil changes. Rising energy prices may have a less significant impact on economic growth than initially expected. Consumers appear to be changing their behavior to reduce the impact of higher oil prices on discretionary spending.
In 2006, we also anticipate that technology stocks will benefit from increased business and consumer demand for computer and electronic products. Financial stocks should see improved performance as interest rates peak while health care stocks should benefit from the needs of the aging baby boomer population. Many industrial and transportation companies should see good growth from rebuilding in hurricane ravaged areas and government infrastructure spending on highways, bridges and water treatment projects.
Pacific Advisors Funds
Each Pacific Advisors Fund remains focused on achieving total return. Our equity funds performed well last year with the Balanced, Multi-Cap Value, and Small Cap Funds outperforming their benchmark indices. These funds continue to maintain investment strategies that focus on fewer stocks in the market sectors with the greatest growth potential. We believe our investment strategies should continue to perform well as the economy continues to expand and we adapt to changing market conditions.
In 2005, rising interest rates increased the risk that the market value of fixed income securities would decline. We shortened the average maturities in our Government Securities and Income and Equity Funds to preserve capital. While this strategy effectively reduced the risk of significant losses as interest rates increased, it resulted in flat performance for these Funds. As interest rates near a peak, we anticipate that we will be able to lock in higher yields and the potential for greater capital appreciation.
A more detailed discussion on the investment strategy employed by each Fund is provided in the interviews following this letter. We appreciate the trust you have placed in us and thank you for the privilege of managing your investments.
Sincerely,
George A. Henning
2
Pacific Advisors
Government Securities Fund
Seeks to provide high current income, preservation of capital, and rising future income, consistent with prudent investment risk. Invests at least 80% of its assets in U.S. Government fixed income securities and may invest in other income-producing instruments including dividend paying common stocks, for income and capital appreciation.
Interview with Portfolio Manager
Thomas H. Hanson
For the year ended December 31, 2005, the Fund had a total return of 1.08% for Class A shares, and 0.28% for Class C shares. The Fund's benchmark, the Lehman Intermediate Treasury Bond Index1, returned 1.68% during the same period.
Q Why did long-term interest rates remain low in 2005?
A Interest rate increases by the Federal Reserve may not immediately impact long-term rates. It can take as long as six to nine months for short-term rate increases to filter through the economy. Long-term interest rates remained relatively flat in 2005 despite a steady increase in short-term rates. This trend has confounded expectations by persisting much longer than many expected or history would have predicted.
This trend resulted primarily from strong foreign demand for U.S. government bonds. While low by historical standards, U.S. interest rates remained high relative to European and Asian investments. This made U.S. bonds more attractive to foreign investors – particularly the Chinese and various European governments. Steady demand and little investment competition allowed the U.S. government to continue to fund its debt without having to pay higher rates. These conditions have postponed, not eliminated, a rise in long-term rates. As short-term rates continue to increase, long-term rates will eventually move higher to remain competitive with alternative investments.
Q What contributed to the Fund's marked improvement during 2005?
A Sometimes the best offense is a good defense. Improved performance can be attributed to the Fund's conservative investment strategy which seeks to preserve capital while producing long-term total return. We actively manage the Fund's average maturity based on current and long-term economic and interest rate trends.
During 2005, the Fed continued raising short-term interest rates. While longer-term bonds offered slightly higher coupon rates, they also carried increasing investment risk. To protect principal, the Fund maintained an average maturity between 6 to 7 years. This resulted in less volatility and risk while optimizing return potential. Conversely, as rates peak, we will extend the Fund's average maturity to capture higher yields and capital appreciation potential.
Q How does maturity relate to risk?
A Fixed income investors tend to focus solely on maintaining yield. In doing so, they risk losing earning power if the value of their investment declines. We manage the Fund to achieve total return. In addition to providing current income, we seek to protect principal and achieve capital appreciation in a risk appropriate manner.
Bond prices rise and fall, just like stocks. A stock's price typically moves in relation to the value and earnings growth of the underlying company. Since credit quality is not an issue for government bonds, prices fluctuate primarily in response to the movement of interest rates. A bond's price moves inversely to its coupon interest rate. Rising interest rates produce a corresponding decline in a bond's value.
In a rising interest rate environment, longer-term bonds carry an increasing risk of capital depreciation. As rates peak, these investments decline in value because newly issued bonds offer higher coupon rates. Conversely, these bonds appreciate in value as rates decline because newly issued bonds offer lower coupon rates.
1 The Lehman Intermediate Treasury Bond Index is an unmanaged index of intermediate term government bonds since 12/31/80.
3
Pacific Advisors
Government Securities Fund continued
We seek to minimize volatility and interest rate risk by actively managing the Fund's average maturity. This means investing in bonds that offer the highest interest rates at maturities that carry the least amount of risk. In 2005, the Fund invested in shorter-term bonds to protect principal and minimize interest rate risk.
Q How will the re-introduction of the 30-year Treasury Bond impact interest rates?
A After a four-year absence, the U.S. Treasury began issuing 30-year Treasury bonds again in February. The re-introduction of the 30-year Treasury Bond will help the U.S. government finance its current budget deficit. Demand was strong at the initial auction from pension managers and foreign investors. Initially, this re-introduction may produce short-term volatility in the bond market as fixed income investors reallocate holdings to longer-term bonds. Over time, however, it should help accelerate a rise in long-term interest rates.
Q How will the Fund adapt to expected interest rate changes in 2006?
A All signs point to an imminent rise in long-term interest rates. The economy remained resilient in 2005 despite challenges such as Hurricanes Katrina and Rita, rising inflationary pressures, and lagging consumer confidence. Economic growth is expected to moderate but remain relatively strong in 2006. The Fed has raised short-term interest rates 14 times since June 2004 to moderate economic growth and help control inflationary pressures. While the Fed has left the door open for higher rates, it appears to be nearing an end to its interest rate increases.
We anticipate the interest rate cycle will peak in 2006 as the Fed nears an end to its interest rate increases. A long-awaited rise in long-term rates should result in improved government bond performance in 2006. Until rates peak, we will continue maintain a shorter average maturity to manage interest rate risk. When rates near a peak, the Fund will shift from a defensive to an opportunistic investment strategy. We will invest in longer-term bonds to take advantage of higher coupon rates and capture capital appreciation potential.
Past performance does not guarantee future results. Performance quoted represents past performance. Current performance may be higher or lower than the performance data quoted. Returns do not take into account the maximum 4.75% sales charge on Class A shares and would be lower if the sales charge were included. Returns represent the change in value over the stated period assuming reinvestment of dividends and capital gains at net asset value. Returns do not take into account individual taxes which may reduce actual returns when shares are sold. The investment return and principal value of an investment will fluctuate so that an investor's shares, when redeemed, may be worth more or less than their original cost. For performance current to the most recent month-end call (800) 989-6693.
4
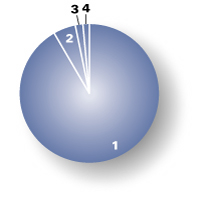
Portfolio Holdings as of 12/31/05 (Based on Total Investments)
| 1. | U.S. Government Agencies | 91.62 | % | ||||||||
| 2. | Equities | 5.16 | % | ||||||||
| 3. | Preferred Stock | 1.73 | % | ||||||||
| 4. | Cash and Cash Equivalents | 1.49 | % | ||||||||
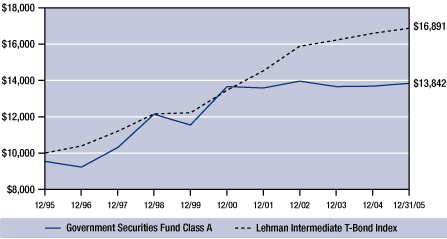
Change in Value of $10,000 Investment
This chart shows the growth of a $10,000 investment made in Class A shares of Pacific Advisors Government Securities Fund from January 1, 1996 through December 31, 2005 compared to the growth of the Lehman Intermediate Treasury Bond Index2.
Average Annual Compounded Return (Class A Shares)
For the year ended December 31, 2005
| One Year | – 3.68 | % | |||||
| Five Year | – 0.69 | % | |||||
| Ten Year | 3.30 | % | |||||
Past performance does not guarantee future results. Performance data quoted represent past performance. Current performance may be higher or lower than the performance data quoted. Fund returns include the maximum 4.75% sales charge on Class A shares. Performance figures represent the change in value over the stated period assuming reinvestment of dividends and capital gains at net asset value and after expense reimbursements. Returns do not take into account individual taxes which may reduce actual returns when shares are sold. The investment return and principal value of an investment will fluctuate so that an investor's shares, when redeemed, may be worth more or less than their original cost. For information on current performance call (800) 989-6693.
2 The Lehman Intermediate Treasury Bond Index is an unmanaged index of intermediate term government bonds since 12/31/80.
5
Pacific Advisors
Government Securities Fund continued
Expense Examples
As a shareholder of the Fund you incur two types of costs: (1) transaction costs, including sales charges (loads) on purchase payments, reinvested dividends, or other distributions; redemption fees; and exchange fees; and (2) ongoing costs, including management fees; distribution (12b-1) fees; and other Fund expenses. This Example is intended to help you understand your ongoing costs (in dollars) of investing in the Fund and to compare these costs with the ongoing costs of investing in other mutual funds.
The Example is based on an investment of $1,000 invested at the beginning of the period and held for the entire period from July 1, 2005 through December 31, 2005.
Actual Expenses
The first line of the table below provides information about actual account values and actual expenses. You may use the information in this line, together with the amount you invested, to estimate the expenses that you paid over the period. Simply divide your account value by $1,000 (for example, an $8,600 account value divided by $1,000 = 8.6), then multiply the result by the number in the first line under the heading entitled "Expenses Paid During the Period" to estimate the expenses you paid on your account during the period.
The following transaction costs are not included in the expenses shown in the table and, if applicable, would increase the expenses that you paid over the period: (1) a front-end sales charge (load) of 4.75% on Class A shares; (2) a 2% redemption fee if you sell or exchange shares of the Fund within sixty days of purchase, with four exceptions. The fee does not apply to redemptions made under an automatic withdrawal program or periodic asset reallocation plan; redemptions to pay for expenses related to terminal illness, extended hospital or nursing home care, or other serious medical conditions; redemptions of shares acquired through dividend reinvestments; and redemptions of shares purchased before July 1, 2004; and (3) a $10 service fee on each exchange after the first five exchanges in each calendar year.
The following ongoing costs are not included in the expenses shown in the table and, if applicable, would increase the expenses that you paid over the period: (1) a $12 low balance fee on accounts with balances of less than $250 as of September 30th of each calendar year and no investment activity (excluding reinvestment of dividends and/or capital gains) during the prior calendar year or the first nine months of the current calendar year. This fee does not apply to IRAs, qualified plan accounts, or Coverdell Education Savings Accounts; (2) a $15 annual custodial fee on IRAs, SEPs, SIMPLE IRAs, and Coverdell Education Savings Accounts; and (3) a $20 annual custodial fee on 403(b) accounts.
Hypothetical Example for Comparison Purposes
The second line of the table below provides information about hypothetical account values and hypothetical expenses based on the Fund's actual expense ratio and an assumed rate of return of 5% per year before expenses, which in not the Fund's actual return. The hypothetical account values and expenses may not be used to estimate the actual ending account balance or expenses you paid for the period. You may use this information to compare the ongoing costs of investing in the Fund and other funds. To do so, compare this 5% hypothetical example with the 5% hypothetical examples that appear in the shareholder reports of the other funds.
The following transaction costs are not included in the expenses shown in the table and, if applicable, would increase the expenses that you paid over the period: (1) a front-end sales charge (load) of 4.75% on Class A shares; (2) a 2% redemption fee if you sell or exchange shares of the Fund within sixty days of purchase, with four exceptions. The fee does not apply to redemptions made under an automatic withdrawal program or periodic asset reallocation plan; redemptions to pay for expenses related to terminal illness, extended hospital or nursing home care, or other serious medical conditions; redemptions of shares acquired through dividend reinvestments; and redemptions of shares purchased before July 1, 2004; and (3) a $10 service fee on each exchange after the first five exchanges in each calendar year.
The following ongoing costs are not included in the expenses shown in the table and, if applicable, would increase the expenses that you paid over the period: (1) a $12 low balance fee on accounts with balances of less than $250 as of September 30th of each calendar year and no investment activity (excluding reinvestment of dividends and/or capital gains) during the prior calendar year or the first nine months of the current calendar year. This fee does not apply to IRAs, qualified plan accounts, or Coverdell Education Savings Accounts; (2) a $15 annual custodial fee on IRAs, SEPs, SIMPLE IRAs, and Coverdell Education Savings Accounts; and (3) a $20 annual custodial fee on 403(b) accounts.
Please note that the expenses shown in the table are meant to highlight your ongoing costs only and do not reflect any transactional costs, such as sales charges (loads), redemption fees, or exchange fees. Therefore, the second line of the table is useful in comparing ongoing costs only, and will not help you determine the relative total costs of owning different funds. In addition, if these transactional costs were included, your costs would have been higher.
| Beginning Account Value 7/1/2005 | Ending Account Value 12/31/2005 | Expense Paid During Period 07/01/05 – 12/31/053 | |||||||||||||
| Class A Shares | |||||||||||||||
| Actual | $ | 1,000 | $ | 999.20 | $ | 11.39 | |||||||||
| Hypothetical (5% return before expense) | $ | 1,000 | $ | 1,025.21 | $ | 11.54 | |||||||||
| Class C Shares | |||||||||||||||
| Actual | $ | 1,000 | $ | 994.20 | $ | 14.58 | |||||||||
| Hypothetical (5% return before expense) | $ | 1,000 | $ | 1,025.21 | $ | 14.80 | |||||||||
3 Expenses are equal to the Fund's annualized expense ratio of 2.26% for Class A shares and 2.90% for Class C shares, multiplied by the average account value over the period, multiplied by 184/365 days to reflect the one-half year period.
6
Pacific Advisors
Income and Equity Fund
Seeks to provide current income and, secondarily, long-term capital appreciation. Invests primarily in investment grade fixed income securities and dividend paying stocks.
Interview with Portfolio Managers
Thomas H. Hanson
Stephen K. Bache, CFA
For the year ended December 31, 2005, the Fund returned 0.01% for Class A shares, and – 0.67% for Class C shares. The Fund's benchmarks, the S&P 5001 and the Lehman Intermediate Corporate Bond Index2, returned, 4.91% and 1.29%, respectively.
Q Which economic factors created the greatest opportunities and challenges for the Fund during 2005?
A During the past year, rising interest rates presented the greatest challenge while increased global demand for energy and basic materials created the best opportunities for the Fund. We manage the Fund for total return by seeking both income and capital appreciation from corporate bonds. The Fund also maintains a modest investment in high-quality, dividend paying equities to provide additional income and capital appreciation. We seek to reduce volatility and risk through careful investment selection and by actively managing bond maturities as well as the mix between bonds and equities.
Bond performance suffered from a combination of rising short-term interest rates, U.S. corporations flush with cash reserves, and a greater demand for high-quality, higher yielding bonds. U.S. corporations borrowed far less last year. Instead they chose to increase dividend payments, initiate share buyback programs, and, in some cases, make strategic acquisitions. Furthermore, U.S. trade deficits with developing countries such as China and India left their governments awash in U.S. dollars. By investing their trade currency surpluses in the U.S. bond market, these countries depleted the supply of bonds thereby keeping yields artificially low.
Throughout 2005, we concentrated fixed income holdings in shorter-term bonds and maintained the portfolio's average maturity at six years or less. This defensive strategy helped protect against escalating interest rate risk. In addition, it positions the Fund to take advantage of higher yields and opportunities for capital appreciation when interest rates peak.
Conversely, the equity market benefited from continued economic expansion and corporate profit growth. Approximately 30% of the Fund's portfolio remained invested in high-quality, dividend paying equities throughout the year. This allowed the Fund to capitalize on better income and capital appreciation opportunities in the equity market while limiting the impact of weaker bond performance. We focused on holdings in companies with long-term growth potential, particularly in energy related fields. These holdings included British Petroleum, Bank of America, Dominion Resources, Hospitality Properties, and Procter & Gamble.
Q What triggers changes to the investments in the Fund's portfolio?
A Day-to-day management of the Fund focuses on fine tuning individual positions while monitoring and adjusting the mix between bonds and equities. We make adjustments to the bond portfolio when positions approach maturity or in response to a change in interest rates or credit quality. Changes in the equity portfolio occur in response to company-specific events or widespread market and economic trends.
We generally maintain 50% to 60% of the Fund's portfolio in investment grade corporate bonds. Bond investments are supplemented by a smaller equity position to augment total return. We actively manage the balance between bonds and equities based upon market and economic conditions. For example, over the last several years, rising interest rates increased volatility and limited bond performance. To manage risk while seeking to produce total return, we shortened bond maturities and maintained a larger investment in high-quality, dividend paying equities.
1 The Standard & Poor's 500 Index is an unmanaged, market capitalization weighted measure of 500 widely held common stocks listed on the New York Stock Exchange, American Stock Exchange and The Nasdaq Stock Market. Index returns assume the reinvestment of dividends, but, unlike the Fund's returns, do not reflect the effects of management fees or expenses.
2 The Lehman Intermediate Corporate Bond Index is an unmanaged index of intermediate term U.S. corporate bonds since 01/01/73.
7
Pacific Advisors
Income and Equity Fund continued
Q How does the Fund help to provide investors with a hedge against inflation?
A Our total return focus creates the foundation for the Fund to provide a hedge against inflation. Many fixed income investors focus solely on yield. Over time, however, capital depreciation and inflation can reduce purchasing power. For example, 5% yield on a $500,000 investment produces $25,000 in income. While the yield will remain at $25,000, interest rate changes may cause the value of the underlying investment to decline. Even if the value of the investment remains stable, an increase in inflation could cause an investor's expenses to exceed his or her income.
Investing for total return helps provide stability for fixed income investors. The Fund manages for total return by seeking capital appreciation in addition to income and by investing a portion of its assets in equities. To manage risk while seeking total return, we select holdings in high-quality, dividend paying stocks that represent current market and industry leadership.
Inflation at the consumer level remained relatively tame during 2005. Producers, however, experienced a notable increase in inflation primarily in the form of higher energy and labor costs. As the economy continues to expand, producers will eventually exhaust their ability to absorb rising costs. This will result in higher prices for consumers. Over the past several years, we increased the Fund's equity holdings to buffer against an expected rise in inflation. We expect to maintain 25% to 35% of the Fund's assets in equities for the foreseeable future to help investors stay ahead of long-term inflation.
Q What changes will you make to the portfolio in 2006?
A Continued economic growth in 2006 should bring an end to the Fed's interest rate increases. When rates peak, we expect corporate bonds will offer slightly higher yields and better capital appreciation opportunities. Nevertheless, we believe the supply of high-quality, high yielding bonds will remain relatively limited. Continued trade surpluses suggest the demand for U.S. bonds from foreign investors will not subside in the immediate future. In addition, most corporations continue to maintain large cash reserves giving them little incentive to issue new debt. As the Fed signals an end to its rate increases, we expect to increase the Fund's average maturity and overall bond holdings.
The equity market will likely continue to provide the best opportunities for income and capital appreciation for the foreseeable future. We expect to maintain our current equity weighting until interest rates peak. Equity holdings will emphasize areas, such as energy, healthcare, financials, and industrial materials, that we believe offer strong growth potential in 2006.
Past performance does not guarantee future results. Performance quoted represents past performance. Current performance may be higher or lower than the performance data quoted. Returns do not take into account the maximum 4.75% sales charge on Class A shares and would be lower if the sales charge were included. Returns represent the change in value over the stated period assuming reinvestment of dividends and capital gains at net asset value. Returns do not take into account individual taxes which may reduce actual returns when shares are sold. The investment return and principal value of an investment will fluctuate so that an investor's shares, when redeemed, may be worth more or less than their original cost. For performance current to the most recent month-end call (800) 989-6693.
8
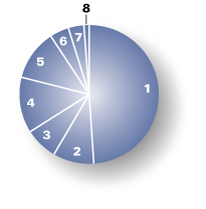
Portfolio Holdings as of 12/31/05 (Based on Total Investments)
| 1. | Corporate Bonds | 48.93 | % | ||||||||
| Equities | 30.02 | % | |||||||||
| 2. | Financials | 9.49 | % | ||||||||
| 3. | Energy | 7.58 | % | ||||||||
| 4. | Other Equities | 12.95 | % | ||||||||
| 5. | U.S. Government Agencies | 11.80 | % | ||||||||
| 6. | Preferred Stock | 4.46 | % | ||||||||
| 7. | Cash and Cash Equivalents | 3.55 | % | ||||||||
| 8. | Convertible Corporate Bonds | 1.24 | % | ||||||||
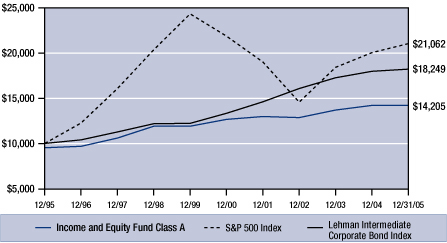
Change in Value of $10,000 Investment
This chart shows the growth of a $10,000 investment made in Class A shares of Pacific Advisors Income and Equity Fund from January 1, 1996 through December 31, 2005 compared to the growth of the S&P 500 Index and the Lehman Intermediate Corporate Bond Index3.
Average Annual Compounded Return (Class A Shares)
For the year ended December 31, 2005
| One Year | – 4.73 | % | |||||
| Five Year | 1.35 | % | |||||
| Ten Year | 3.57 | % | |||||
Past performance does not guarantee future results. Performance data quoted represent past performance. Current performance may be higher or lower than the performance data quoted. Fund returns include the maximum 4.75% sales charge on Class A shares. Performance figures represent the change in value over the stated period assuming reinvestment of dividends and capital gains at net asset value and after expense reimbursements. Returns do not take into account individual taxes which may reduce actual returns when shares are sold. The investment return and principal value of an investment will fluctuate so that an investor's shares, when redeemed, may be worth more or less than their original cost. For information on current performance call (800) 989-6693.
3 The Standard & Poor's 500 Index is an unmanaged, market capitalization weighted measure of 500 widely held common stocks listed on the New York Stock Exchange, American Stock Exchange and The Nasdaq Stock Market. The Index returns assume reinvestment of dividends, but, unlike the Fund's returns, do not reflect the effects of management fees or expenses. The Lehman Intermediate Corporate Bond Index is an unmanaged index of intermediate term U.S. corporate bonds since 01/01/73.
9
Pacific Advisors
Income and Equity Fund continued
Expense Examples
As a shareholder of the Fund you incur two types of costs: (1) transaction costs, including sales charges (loads) on purchase payments, reinvested dividends, or other distributions; redemption fees; and exchange fees; and (2) ongoing costs, including management fees; distribution (12b-1) fees; and other Fund expenses. This Example is intended to help you understand your ongoing costs (in dollars) of investing in the Fund and to compare these costs with the ongoing costs of investing in other mutual funds.
The Example is based on an investment of $1,000 invested at the beginning of the period and held for the entire period from July 1, 2005 through December 31, 2005.
Actual Expenses
The first line of the table below provides information about actual account values and actual expenses. You may use the information in this line, together with the amount you invested, to estimate the expenses that you paid over the period. Simply divide your account value by $1,000 (for example, an $8,600 account value divided by $1,000 = 8.6), then multiply the result by the number in the first line under the heading entitled "Expenses Paid During the Period" to estimate the expenses you paid on your account during the period.
The following transaction costs are not included in the expenses shown in the table and, if applicable, would increase the expenses that you paid over the period: (1) a front-end sales charge (load) of 4.75% on Class A shares; (2) a 2% redemption fee if you sell or exchange shares of the Fund within sixty days of purchase, with four exceptions. The fee does not apply to redemptions made under an automatic withdrawal program or periodic asset reallocation plan; redemptions to pay for expenses related to terminal illness, extended hospital or nursing home care, or other serious medical conditions; redemptions of shares acquired through dividend reinvestments; and redemptions of shares purchased before July 1, 2004; and (3) a $10 service fee on each exchange after the first five exchanges in each calendar year.
The following ongoing costs are not included in the expenses shown in the table and, if applicable, would increase the expenses that you paid over the period: (1) a $12 low balance fee on accounts with balances of less than $250 as of September 30th of each calendar year and no investment activity (excluding reinvestment of dividends and/or capital gains) during the prior calendar year or the first nine months of the current calendar year. This fee does not apply to IRAs, qualified plan accounts, or Coverdell Education Savings Accounts; (2) a $15 annual custodial fee on IRAs, SEPs, SIMPLE IRAs, and Coverdell Education Savings Accounts; and (3) a $20 annual custodial fee on 403(b) accounts.
Hypothetical Example for Comparison Purposes
The second line of the table below provides information about hypothetical account values and hypothetical expenses based on the Fund's actual expense ratio and an assumed rate of return of 5% per year before expenses, which in not the Fund's actual return. The hypothetical account values and expenses may not be used to estimate the actual ending account balance or expenses you paid for the period. You may use this information to compare the ongoing costs of investing in the Fund and other funds. To do so, compare this 5% hypothetical example with the 5% hypothetical examples that appear in the shareholder reports of the other funds.
The following transaction costs are not included in the expenses shown in the table and, if applicable, would increase the expenses that you paid over the period: (1) a front-end sales charge (load) of 4.75% on Class A shares; (2) a 2% redemption fee if you sell or exchange shares of the Fund within sixty days of purchase, with four exceptions. The fee does not apply to redemptions made under an automatic withdrawal program or periodic asset reallocation plan; redemptions to pay for expenses related to terminal illness, extended hospital or nursing home care, or other serious medical conditions; redemptions of shares acquired through dividend reinvestments; and redemptions of shares purchased before July 1, 2004; and (3) a $10 service fee on each exchange after the first five exchanges in each calendar year.
The following ongoing costs are not included in the expenses shown in the table and, if applicable, would increase the expenses that you paid over the period: (1) a $12 low balance fee on accounts with balances of less than $250 as of September 30th of each calendar year and no investment activity (excluding reinvestment of dividends and/or capital gains) during the prior calendar year or the first nine months of the current calendar year. This fee does not apply to IRAs, qualified plan accounts, or Coverdell Education Savings Accounts; (2) a $15 annual custodial fee on IRAs, SEPs, SIMPLE IRAs, and Coverdell Education Savings Accounts; and (3) a $20 annual custodial fee on 403(b) accounts.
Please note that the expenses shown in the table are meant to highlight your ongoing costs only and do not reflect any transactional costs, such as sales charges (loads), redemption fees, or exchange fees. Therefore, the second line of the table is useful in comparing ongoing costs only, and will not help you determine the relative total costs of owning different funds. In addition, if these transactional costs were included, your costs would have been higher.
| Beginning Account Value 7/1/2005 | Ending Account Value 12/31/2005 | Expense Paid During Period 07/01/05 – 12/31/054 | |||||||||||||
| Class A Shares | |||||||||||||||
| Actual | $ | 1,000 | $ | 1,002.40 | $ | 9.74 | |||||||||
| Hypothetical (5% return before expense) | $ | 1,000 | $ | 1,025.21 | $ | 9.85 | |||||||||
| Class C Shares | |||||||||||||||
| Actual | $ | 1,000 | $ | 998.70 | $ | 13.60 | |||||||||
| Hypothetical (5% return before expense) | $ | 1,000 | $ | 1,025.21 | $ | 13.78 | |||||||||
4 Expenses are equal to the Fund's annualized expense ratio of 1.93% for Class A shares and 2.70% for Class C shares, multiplied by the average account value over the period, multiplied by 184/365 days to reflect the one-half year period.
10
Pacific Advisors
Balanced Fund
Seeks to achieve long-term capital appreciation and income consistent with reduced risk. Invests primarily in large and medium cap common stocks with at least 25% of its assets invested in fixed income securities and preferred stocks.
Interview with Portfolio Manager
Stephen K. Bache, CFA
For the year ended December 31, 2005, the Fund returned 5.90% for Class A shares, and 5.16% for Class C shares. The Fund's benchmarks, the S&P 5001 and the Lehman Intermediate Corporate Bond Index2, returned, 4.91% and 1.29%, respectively.
Q How do you manage the allocation between equities and bonds?
A We balance the mix between equities and bonds by analyzing risk and reward in the current market and economic environment. We maintain a greater portion of the portfolio in the area of the market that offers the best growth opportunities with lower risk and volatility.
Throughout 2005, the Fund maintained a portfolio mix of approximately 55% equities and 45% bonds. We incrementally increased the Fund's equity holdings over the course of the year to capitalize on stronger performance in the equity market. With the Federal Reserve raising short-term rates, we invested fewer assets in bonds to protect against rising interest rate risk and bond market volatility.
We anticipate this mix will gradually change over the course of 2006. The Fed is expected to shift to a policy that will limit additional increases to the fed funds rate. In addition, the U.S. Treasury reintroduced the 30-year Treasury Bond in February of 2006. Over time, these events should elevate long-term rates and relieve some bond market volatility. We expect to invest a greater portion of the portfolio in bonds as volatility subsides and opportunities for income and capital appreciation increase.
Q How did the Fund effectively manage risk while achieving solid returns in 2005?
A The Fund seeks to provide investors with a core investment that balances risk and reward to achieve stable, long-term growth. In 2005, rising interest rates elevated risk and muted performance in the bond market. Accordingly, we shortened the Fund's average maturity and allocated a smaller portion of the portfolio to bonds.
Conversely, the Fund held more of its assets in equities. We generally limit individual equity positions to 2% or less of the Fund's total portfolio. This provides diversification to help minimize volatility and limit the Fund's downside risk in any one company.
We maintained a healthy exposure to the energy sector with holdings such as Devon Energy and Suncor Energy. To take advantage of a surge in commodity prices, we added to positions in basic materials. This included Rayonier, which produces timber and forest products, and Rio Tinto, a copper and iron mining company. In addition, we redirected investme nts in consumer-driven companies to business-driven companies in anticipation of slower consumer spending and an increase in business expenditures. This strategy resulted in new investments in Prologis and United Parcel Service. Finally, we rounded out the portfolio with positions in select blue chip, dividend-paying equities. For example, we participated in double-digit profit growth through investments in Washington Mutual, Pfizer, Boeing, General Electric, and Disney.
Q How does the Fund select equity investments?
A As value investors, we seek to purchase investments at a discounted price. A stock goes "on-sale" when the market overlooks or misjudges a company's intrinsic or fundamental value. A value investor makes an investment in anticipation of an economic or company-specific event that will cause the company to grow or gain market recognition. Prime examples of value investments made during 2005 include:
n SanDisk – The market overlooked SanDisk for most of 2005 in response to a broad cyclical slow down in the technology industry. Companies operating in niche technology markets, however, continued to demonstrate strong growth. A healthy patent portfolio of memory components for digital cameras and
1 The Standard & Poor's 500 Index is an unmanaged, market capitalization weighted measure of 500 widely held common stocks listed on the New York Stock Exchange, American Stock Exchange and The Nasdaq Stock Market. Index returns assume the reinvestment of dividends, but, unlike the Fund's returns, do not reflect the effects of management fees or expenses.
2 The Lehman Intermediate Corporate Bond Index is an unmanaged index of intermediate term U.S. corporate bonds since 01/01/73.
11
Pacific Advisors
Balanced Fund continued
digital music players made SanDisk an attractive investment. The Fund purchased this stock at a discount and benefited as the market recognized the company's growth potential.
n Pfizer – Pfizer has been a long-term core holding for the Fund. The stock's price declined in 2005 in reaction to news of a patent lawsuit involving one of the company's top products. After evaluating the situation, we determined that, regardless of the outcome, the lawsuit would have a minimal impact on the company's overall strength and long-term growth. We took this opportunity to add to the Fund's position at lower prices. The market responded favorably when Pfizer eventually won the lawsuit and the Fund benefited as the stock price recovered.
n H&R Block – News of legal trouble also resulted in a price decline for this stock. Careful examination, however, suggested the firm's difficulties would be short-lived and controllable. This presented an excellent opportunity for long-term growth and we added to the Fund's position. H&R Block eventually settled the lawsuit and is redoubling its efforts to rebuild its momentum.
Q How has the Fund achieved consistent long-term performance?
A The Fund takes a long-term investment approach that balances risk and reward. We actively manage the mix of bonds and equities and invest in investment grade bonds and high-quality equities with stable, long-term growth potential. This disciplined approach has produced consistent long-term performance that, for the most part, surpasses the performance of the market and other balanced funds.
| Average Annual Return | 1-Year | 5-Year | 10-Year | ||||||||||||
| Balanced Fund (A) | 5.90 | % | 3.70 | % | 7.90 | % | |||||||||
| S&P 500 Index | 4.91 | % | 0.54 | % | 9.07 | % | |||||||||
| Lipper Balanced Fund Category Average | 4.72 | % | 2.67 | % | 7.14 | % | |||||||||
Investment decisions are guided by the Fund's strategy. We do not chase market fads. For example, in the late 90s, technology stocks achieved unprecedented growth. These companies dominated the news headlines and investor attention. Rather than jumping on the market bandwagon, we evaluated the opportunities presented by this trend in the context of the Fund's long-term objectives. We invested in select stocks which met our investment criteria but maintained diversification through investments in other segments of the market. This limited the Fund's risk and minimized the impact of market volatility.
In contrast, the Fund seeks to capitalize on long-term market and economic trends such as the economic impact of the aging baby boomer generation. Over the past several years, the Fund has invested in pharmaceutical, leisure, and financial services companies poised to benefit from this trend.
Q What changes do you anticipate making to the portfolio in 2006?
A We do not expect to make any large scale changes to the portfolio in the immediate future. We will maintain current equity holdings as long as they continue to offer long-term value for the Fund. New investments will be added and existing positions increased as opportunities arise. The best opportunities will likely continue to come from companies and sectors poised to benefit from increased capital spending.
When interest rates peak, we expect to find better yields and capital appreciation opportunities in the bond market. We would begin to gradually increase the Fund's bond position when the Fed signals an end to its interest rate increases. Until then, the Fund will remain defensively positioned in shorter-term bonds.
Past performance does not guarantee future results. Performance quoted represents past performance. Current performance may be higher or lower than the performance data quoted. Returns do not take into account the maximum 5.75% sales charge on Class A shares and would be lower if the sales charge were included. Returns represent the change in value over the stated period assuming reinvestment of dividends and capital gains at net asset value. Returns do not take into account individual taxes which may reduce actual returns when shares are sold. The investment return and principal value of an investment will fluctuate so that an investor's shares, when redeemed, may be worth more or less than their original cost. For performance current to the most recent month-end call (800) 989-6693.
12
Portfolio Holdings as of 12/31/05 (Based on Total Investments)
| Equities | 59.39 | % | |||||||||
| 1. | Energy | 11.75 | % | ||||||||
| 2. | Financials | 11.29 | % | ||||||||
| 3. | Health Care | 8.30 | % | ||||||||
| 4. | Information Technology | 6.80 | % | ||||||||
| 5. | Industrials | 6.27 | % | ||||||||
| 6. | Materials | 5.46 | % | ||||||||
| 7. | Consumer Discretionary | 5.07 | % | ||||||||
| 8. | Other Equities | 4.45 | % | ||||||||
| 9. | Corporate Bonds | 30.56 | % | ||||||||
| 10. | U.S. Government Agencies | 6.80 | % | ||||||||
| 11. | Cash and Cash Equivalents | 3.25 | % | ||||||||
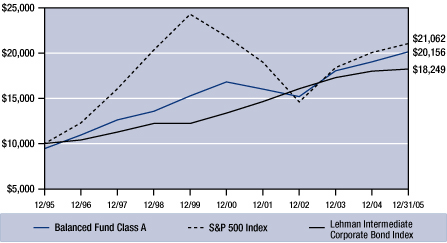
Change in Value of $10,000 Investment
This chart shows the growth of a $10,000 investment made in Class A shares of Pacific Advisors Balanced Fund from January 1, 1996 through December 31, 2005 compared to the growth of the S&P 500 Index and the Lehman Intermediate Corporate Bond Index3.
Average Annual Compounded Return (Class A Shares)
For the year ended December 31, 2005
| One Year | – 0.19 | % | |||||
| Five Year | 2.48 | % | |||||
| Ten Year | 7.26 | % | |||||
Past performance does not guarantee future results. Performance data quoted represent past performance. Current performance may be higher or lower than the performance data quoted. Fund returns include the maximum 5.75% sales charge on Class A shares. Performance figures represent the change in value over the stated period assuming reinvestment of dividends and capital gains at net asset value and after expense reimbursements. Returns do not take into account individual taxes which may reduce actual returns when shares are sold. The investment return and principal value of an investment will fluctuate so that an investor's shares, when redeemed, may be worth more or less than their original cost. For information on current performance call (800) 989-6693.
3 The Standard & Poor's 500 Index is an unmanaged, market capitalization weighted measure of 500 widely held common stocks listed on the New York Stock Exchange, American Stock Exchange and The Nasdaq Stock Market The Index returns assume reinvestment of dividends, but, unlike the Fund's returns, do not reflect the effects of management fees or expenses. The Lehman Intermediate Corporate Bond Index is an unmanaged index of intermediate term U.S. corporate bonds since 01/01/73.
13
Pacific Advisors
Balanced Fund continued
Expense Examples
As a shareholder of the Fund you incur two types of costs: (1) transaction costs, including sales charges (loads) on purchase payments, reinvested dividends, or other distributions; redemption fees; and exchange fees; and (2) ongoing costs, including management fees; distribution (12b-1) fees; and other Fund expenses. This Example is intended to help you understand your ongoing costs (in dollars) of investing in the Fund and to compare these costs with the ongoing costs of investing in other mutual funds.
The Example is based on an investment of $1,000 invested at the beginning of the period and held for the entire period from July 1, 2005 through December 31, 2005.
Actual Expenses
The first line of the table below provides information about actual account values and actual expenses. You may use the information in this line, together with the amount you invested, to estimate the expenses that you paid over the period. Simply divide your account value by $1,000 (for example, an $8,600 account value divided by $1,000 = 8.6), then multiply the result by the number in the first line under the heading entitled "Expenses Paid During the Period" to estimate the expenses you paid on your account during the period.
The following transaction costs are not included in the expenses shown in the table and, if applicable, would increase the expenses that you paid over the period: (1) a front-end sales charge (load) of 5.75% on Class A shares; (2) a 2% redemption fee if you sell or exchange shares of the Fund within six months of purchase, with four exceptions. The fee does not apply to redemptions made under an automatic withdrawal program or periodic asset reallocation plan; redemptions to pay for expenses related to terminal illness, extended hospital or nursing home care, or other serious medical conditions; redemptions of shares acquired through dividend reinvestments; and redemptions of shares purchased before July 1, 2004; and (3) a $10 service fee on each exchange after the first five exchanges in each calendar year.
The following ongoing costs are not included in the expenses shown in the table and, if applicable, would increase the expenses that you paid over the period: (1) a $12 low balance fee on accounts with balances of less than $250 as of September 30th of each calendar year and no investment activity (excluding reinvestment of dividends and/or capital gains) during the prior calendar year or the first nine months of the current calendar year. This fee does not apply to IRAs, qualified plan accounts, or Coverdell Education Savings Accounts; (2) a $15 annual custodial fee on IRAs, SEPs, SIMPLE IRAs, and Coverdell Education Savings Accounts; and (3) a $20 annual custodial fee on 403(b) accounts.
Hypothetical Example for Comparison Purposes
The second line of the table below provides information about hypothetical account values and hypothetical expenses based on the Fund's actual expense ratio and an assumed rate of return of 5% per year before expenses, which in not the Fund's actual return. The hypothetical account values and expenses may not be used to estimate the actual ending account balance or expenses you paid for the period. You may use this information to compare the ongoing costs of investing in the Fund and other funds. To do so, compare this 5% hypothetical example with the 5% hypothetical examples that appear in the shareholder reports of the other funds.
The following transaction costs are not included in the expenses shown in the table and, if applicable, would increase the expenses that you paid over the period: (1) a front-end sales charge (load) of 5.75% on Class A shares; (2) a 2% redemption fee if you sell or exchange shares of the Fund within six months of purchase, with four exceptions. The fee does not apply to redemptions made under an automatic withdrawal program or periodic asset reallocation plan; redemptions to pay for expenses related to terminal illness, extended hospital or nursing home care, or other serious medical conditions; redemptions of shares acquired through dividend reinvestments; and redemptions of shares purchased before July 1, 2004; and (3) a $10 service fee on each exchange after the first five exchanges in each calendar year.
The following ongoing costs are not included in the expenses shown in the table and, if applicable, would increase the expenses that you paid over the period: (1) a $12 low balance fee on accounts with balances of less than $250 as of September 30th of each calendar year and no investment activity (excluding reinvestment of dividends and/or capital gains) during the prior calendar year or the first nine months of the current calendar year. This fee does not apply to IRAs, qualified plan accounts, or Coverdell Education Savings Accounts; (2) a $15 annual custodial fee on IRAs, SEPs, SIMPLE IRAs, and Coverdell Education Savings Accounts; and (3) a $20 annual custodial fee on 403(b) accounts.
Please note that the expenses shown in the table are meant to highlight your ongoing costs only and do not reflect any transactional costs, such as sales charges (loads), redemption fees, or exchange fees. Therefore, the second line of the table is useful in comparing ongoing costs only, and will not help you determine the relative total costs of owning different funds. In addition, if these transactional costs were included, your costs would have been higher.
| Beginning Account Value 7/1/2005 | Ending Account Value 12/31/2005 | Expense Paid During Period 07/01/05 – 12/31/054 | |||||||||||||
| Class A Shares | |||||||||||||||
| Actual | $ | 1,000 | $ | 1,045.70 | $ | 13.05 | |||||||||
| Hypothetical (5% return before expense) | $ | 1,000 | $ | 1,025.21 | $ | 12.91 | |||||||||
| Class C Shares | |||||||||||||||
| Actual | $ | 1,000 | $ | 1,041.90 | $ | 16.98 | |||||||||
| Hypothetical (5% return before expense) | $ | 1,000 | $ | 1,025.21 | $ | 16.85 | |||||||||
4 Expenses are equal to the Fund's annualized expense ratio of 2.53% for Class A shares and 3.30% for Class C shares, multiplied by the average account value over the period, multiplied by 184/365 days to reflect the one-half year period.
14
Pacific Advisors
Growth Fund
Seeks to achieve long-term capital appreciation. Invests primarily in medium to large capitalization companies whose stocks are a part of the S&P 500 Index1 or the Nasdaq 100 Index2.
Interview with Portfolio Manager
Thomas H. Hanson
For the year ended December 31, 2005, the Fund returned 3.89% for Class A shares, and 2.95% for Class C shares. The Fund's benchmarks, the S&P 500 and the Russell 10003, changed 4.91% and 6.27%, respectively, during the same period.
Q How did the economic backdrop of 2005 shape the Fund's investment decisions?
A The market opened the year strongly. Momentum, however, quickly reversed and the market remained in a tight trading range for most of the year. Along with growing U.S. trade and budget deficits, rising interest rates, inflation and escalating energy costs constrained market performance throughout the year.
Despite limited performance in the overall market, individual companies offered attractive growth potential. We capitalized on these opportunities by positioning the Fund's portfolio in the better performing sectors of the market. A continued rise in the global demand for energy led us to increase our holdings in energy and energy-related companies such as Marathon Oil, ExxonMobil, and Burlington Resources. In response to global economic growth, we added, or increased exposure, to companies producing industrial materials such as copper, aluminum, steel, paper, and basic chemicals. Holdings in these areas included Phelps Dodge, Alcoa, U.S. Steel, and Lyondell Chemical.
We selectively added to positions in healthcare and medical equipment companies such as Zimmer Holdings, St. Jude Medical, Caremark, WellPoint, and United Healthgroup. In addition to being resistant to economic changes, companies in these sectors offer strong longer-term growth potential given the increasing healthcare needs of the aging baby boomer generation. Toward the end of the year, we also added select technology holdings such as Intel, Cisco, and Seagate.
Q The Fund invests for growth-at-a-reasonable price. What does this mean?
A Equity investors typically take one of three approaches to achieve capital appreciation. Value investors look to purchase fundamentally sound companies at discounted prices and benefit as those stocks gain greater market recognition. Growth investors use a momentum strategy to invest in the fastest growing stocks and sectors of the market with little regard for the fundamental value of the underlying companies. A growth-at-a-reasonable price strategy blends these two approaches by see king reasonably priced companies with sustainable earnings growth and solid fundamentals.
We implement our growth-at-a-reasonable-price strategy by:
n determining the prevailing market and economic trends;
n identifying the best performing sectors and companies within those sectors;
n examining the fundamentals of a company to determine if it is reasonably priced and capable of sustaining earnings growth; and
n continuously monitoring the market and economy to know which sectors are moving in and going out of favor.
For example, commodities stocks offered attractive growth opportunities in 2005. Holdings in copper, aluminum, steel, and gold mining companies lifted Fund performance in the first three quarters of the year. When performance in this sector began to slow, we pruned these positions and reinvested capital in stronger performing sectors.
1 The Standard & Poor's 500 Index is an unmanaged, market capitalization weighted measure of 500 widely held common stocks listed on the New York Stock Exchange, American Stock Exchange and The Nasdaq Stock Market. Index returns assume the reinvestment of dividends, but, unlike the Fund's returns, do not reflect the effects of management fees or expenses.
2 The Nasdaq 100 Stock Index is an unmanaged, market capitalization weighted measure of the 100 largest non-financial domestic and international common stocks listed on The Nasdaq Stock Market. Index returns assume the reinvestment of dividends, but, unlike the Fund's returns, do not reflect management fees or expenses.
3 The Russell 1000 Stock Index is an unmanaged, market capitalization weighted measure of stock market performance. It contains the stocks of the 1,000 largest publicly traded companies within the Russell 3000 Index. Index returns assume the reinvestment of dividends, but, unlike the Fund's returns, do not reflect the effects of capital gains, management fees, or expenses.
15
Pacific Advisors
Growth Fund continued
Q Why does the Fund employ a more conservative strategy than many of its peers?
A People often assume that, by definition, growth funds are volatile, high risk investments. Investors can participate in the growth area of the market without assuming an inordinate level of risk. By employing a growth-at-a-reasonable-price investment strategy, the Fund seeks to provide a growth investment for more moderate to conservative investors.
We actively manage risk through stock selection, diversification, and asset allocation. First, we avoid speculative growth investments where the stock price exceeds a reasonable estimate of the company's earnings growth rate. We diversify the Fund among approximately 45 to 50 stocks in a variety of sectors to minimize the downside risk of any one stock or sector.
Finally, we manage the Fund's cash position to adjust to both market risk and opportunity. The Fund typically holds 5% to 10% of its portfolio in cash. During periods of elevated market risk, we may temporarily increase cash holdings to 25% to 35%. This helps minimize the impact of market volatility and allows the Fund to take advantage of new investment opportunities as market risk moderates.
Q Where do you anticipate growth opportunities in 2006?
A We expect to see a modest uptrend in the equity market once interest rates peak. Overall, however, the market will likely remain in a narrow trading range during 2006. Individual stocks will continue to outperform the overall market during the year while other foreign and emerging markets may once again outperform our own. Utilizing our growth-at-a-reasonable-price strategy, we will continue to select holdings in the stronger performing sectors of the market. Energy, energy-related, and basic material companies will continue to perform well as the result of long-term increases in global demand by rapidly expanding economies. For similar reasons, we expect strong performance from the industrial and technology sectors.
Past performance does not guarantee future results. Performance quoted represents past performance. Current performance may be higher or lower than the performance data quoted. Returns do not take into account the maximum 5.75% sales charge on Class A shares and would be lower if the sales charge were included. Returns represent the change in value over the stated period assuming reinvestment of dividends and capital gains at net asset value. Returns do not take into account individual taxes which may reduce actual returns when shares are sold. The investment return and principal value of an investment will fluctuate so that an investor's shares, when redeemed, may be worth more or less than their original cost. For performance current to the most recent month-end call (800) 989-6693.
16
Portfolio Holdings as of 12/31/05 (Based on Total Investments)
| Equities | 90.72 | % | |||||||||
| 1. | Energy | 30.34 | % | ||||||||
| 2. | Health Care | 28.73 | % | ||||||||
| 3. | Information Technology | 12.81 | % | ||||||||
| 4. | Industrials | 10.33 | % | ||||||||
| 5. | Other Equities | 8.51 | % | ||||||||
| 6. | Cash and Cash Equivalents | 9.28 | % | ||||||||

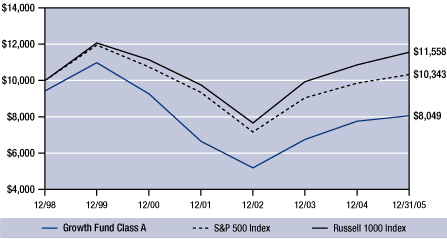
Change in Value of $10,000 Investment
This chart shows the growth of a $10,000 investment made in Class A shares of Pacific Advisors Growth Fund from May 1, 1999 through December 31, 2005 compared to the growth of the S&P 500 Index and the Russell 1000 Index5.
Average Annual Compounded Return (Class A Shares)
For the year ended December 31, 2005
| One Year | – 2.06 | % | |||||
| Five Year | – 3.92 | % | |||||
| Since Inception | – 3.20 | % | |||||
Past performance does not guarantee future results. Performance data quoted represent past performance. Current performance may be higher or lower than the performance data quoted. Fund returns include the maximum 5.75% sales charge on Class A shares. Performance figures represent the change in value over the stated period assuming reinvestment of dividends and capital gains at net asset value and after expense reimbursements. Returns do not take into account individual taxes which may reduce actual returns when shares are sold. The investment return and principal value of an investment will fluctuate so that an investor's shares, when redeemed, may be worth more or less than their original cost. For information on current performance call (800) 989-6693.
4 The Standard & Poor's 500 Index is an unmanaged, market capitalization weighted measure of 500 widely held common stocks listed on the New York Stock Exchange, American Stock Exchange and The Nasdaq Stock Market. The Index returns assume reinvestment of dividends, but, unlike the Fund's returns, do not reflect the effects of management fees or expenses. The Russell 1000 Stock Index is an unmanaged, market capitalization weighted measure of stock market performance. It contains the stocks of the 1,000 largest publicly traded companies within the Russell 3000 Index. The Index does not take capital gains into consideration. Index returns assume the reinvestment of dividends, but, unlike the Fund's returns, do not reflect the effects of management fees or expenses.
17
Pacific Advisors
Growth Fund continued
Expense Examples
As a shareholder of the Fund you incur two types of costs: (1) transaction costs, including sales charges (loads) on purchase payments, reinvested dividends, or other distributions; redemption fees; and exchange fees; and (2) ongoing costs, including management fees; distribution (12b-1) fees; and other Fund expenses. This Example is intended to help you understand your ongoing costs (in dollars) of investing in the Fund and to compare these costs with the ongoing costs of investing in other mutual funds.
The Example is based on an investment of $1,000 invested at the beginning of the period and held for the entire period from July 1, 2005 through December 31, 2005.
Actual Expenses
The first line of the table below provides information about actual account values and actual expenses. You may use the information in this line, together with the amount you invested, to estimate the expenses that you paid over the period. Simply divide your account value by $1,000 (for example, an $8,600 account value divided by $1,000 = 8.6), then multiply the result by the number in the first line under the heading entitled "Expenses Paid During the Period" to estimate the expenses you paid on your account during the period.
The following transaction costs are not included in the expenses shown in the table and, if applicable, would increase the expenses that you paid over the period: (1) a front-end sales charge (load) of 5.75% on Class A shares; (2) a 2% redemption fee if you sell or exchange shares of the Fund within six months of purchase, with three exceptions. The fee does not apply to redemptions made under an automatic withdrawal program or periodic asset reallocation plan; redemptions to pay for expenses related to terminal illness, extended hospital or nursing home care, or other serious medical conditions; and redemptions of shares acquired through dividend reinvestments; and (3) a $10 service fee on each exchange after the first five exchanges in each calendar year.
The following ongoing costs are not included in the expenses shown in the table and, if applicable, would increase the expenses that you paid over the period: (1) a $12 low balance fee on accounts with balances of less than $250 as of September 30th of each calendar year and no investment activity (excluding reinvestment of dividends and/or capital gains) during the prior calendar year or the first nine months of the current calendar year. This fee does not apply to IRAs, qualified plan accounts, or Coverdell Education Savings Accounts; (2) a $15 annual custodial fee on IRAs, SEPs, SIMPLE IRAs, and Coverdell Education Savings Accounts; and (3) a $20 annual custodial fee on 403(b) accounts.
Hypothetical Example for Comparison Purposes
The second line of the table below provides information about hypothetical account values and hypothetical expenses based on the Fund's actual expense ratio and an assumed rate of return of 5% per year before expenses, which in not the Fund's actual return. The hypothetical account values and expenses may not be used to estimate the actual ending account balance or expenses you paid for the period. You may use this information to compare the ongoing costs of investing in the Fund and other funds. To do so, compare this 5% hypothetical example with the 5% hypothetical examples that appear in the shareholder reports of the other funds.
The following transaction costs are not included in the expenses shown in the table and, if applicable, would increase the expenses that you paid over the period: (1) a front-end sales charge (load) of 5.75% on Class A shares; (2) a 2% redemption fee if you sell or exchange shares of the Fund within six months of purchase, with three exceptions. The fee does not apply to redemptions made under an automatic withdrawal program or periodic asset reallocation plan; redemptions to pay for expenses related to terminal illness, extended hospital or nursing home care, or other serious medical conditions; and redemptions of shares acquired through dividend reinvestments; and (3) a $10 service fee on each exchange after the first five exchanges in each calendar year.
The following ongoing costs are not included in the expenses shown in the table and, if applicable, would increase the expenses that you paid over the period: (1) a $12 low balance fee on accounts with balances of less than $250 as of September 30th of each calendar year and no investment activity (excluding reinvestment of dividends and/or capital gains) during the prior calendar year or the first nine months of the current calendar year. This fee does not apply to IRAs, qualified plan accounts, or Coverdell Education Savings Accounts; (2) a $15 annual custodial fee on IRAs, SEPs, SIMPLE IRAs, and Coverdell Education Savings Accounts; and (3) a $20 annual custodial fee on 403(b) accounts.
Please note that the expenses shown in the table are meant to highlight your ongoing costs only and do not reflect any transactional costs, such as sales charges (loads), redemption fees, or exchange fees. Therefore, the second line of the table is useful in comparing ongoing costs only, and will not help you determine the relative total costs of owning different funds. In addition, if these transactional costs were included, your costs would have been higher.
| Beginning Account Value 7/1/2005 | Ending Account Value 12/31/2005 | Expense Paid During Period 07/01/05 – 12/31/055 | |||||||||||||
| Class A Shares | |||||||||||||||
| Actual | $ | 1,000 | $ | 1,060.90 | $ | 13.66 | |||||||||
| Hypothetical (5% return before expense) | $ | 1,000 | $ | 1,025.21 | $ | 13.43 | |||||||||
| Class C Shares | |||||||||||||||
| Actual | $ | 1,000 | $ | 1,055.30 | $ | 17.61 | |||||||||
| Hypothetical (5% return before expense) | $ | 1,000 | $ | 1,025.21 | $ | 17.36 | |||||||||
5 Expenses are equal to the Fund's annualized expense ratio of 2.63% for Class A shares and 3.40% for Class C shares, multiplied by the average account value over the period, multiplied by 184/365 days to reflect the one-half year period.
18
Pacific Advisors
Multi-Cap Value Fund
Seeks to achieve long-term capital appreciation. Invests in a diversified portfolio of large to small capitalization companies using an actively managed, value investment approach.
Interview with Portfolio Manager
Shelly J. Meyers
For the year ended December 31, 2005, the Fund returned 9.71% for Class A shares, and 8.94% for Class C shares. The Fund's benchmark, the S&P 5001 changed 4.91% during the same period.
Q What factors contributed to the Fund's strong performance this year?
A Individual stock selection proved critical to achieving performance in 2005. The Fund benefited significantly from the ability to invest in companies across all market capitalizations – small, mid, and large cap. For example, small cap holding Mitcham Industries, which supplies three-dimensional seismic equipment to the oil and gas industry, benefited from the growing demand for energy.
Another winner was mid-cap pharmaceutical holding Biogen. We followed this company for some time patiently awaiting a buying opportunity. In 2005, an opportunity emerged when news of a product set-back led to a significant decline in the company's stock price. We believed the company would make a quick recovery from this isolated, short-term problem. The Fund purchased a position at discount and benefited as the stock price recovered in value.
The Fund also profited from large cap holdings such as Amgen. We invested in Amgen at the end of 2004 when the stock price declined in response to news of cutbacks on drug reimbursements by the federal government. This investment paid off in 2005 as the company's stock price recovered significantly.
Q How do you find "value" investments for the Fund?
A When you hear the word value to describe an investment style, think of a "sale." The Fund seeks long-term growth by investing in solid companies at discounted prices. Value opportunities typically arise from company-specific issues such as a temporary management problems or a product recall.
Often, the stock price declines because the quality of the company is in question. The challenge is to determine whether the decline is a short-term overreaction by the market or a reflection of chronic problems within the company. We analyze the company to assess probability and the timetable for recovery. We look for stocks that offer the potential to increase 25% or more over an 18 to 24-month period.
We identify value opportunities using a "bottom up" approach by looking for investment opportunities in individual companies. When we determine that a company is trading at a discount, we analyze fundamental factors including financial statements, management, product lines, and long-term growth potential. Financially stable firms with well-developed market niches and few competitors become investment candidates. Before making a final investment decision, we consider whether economic and market conditions will have a positive, neutral, or negative impact on the stock.
This strategy has enabled the Fund to produce long-term growth. The Fund has achieved its investment objective while outperforming the market and its peers.
| Average Annual Return | Since 1-Year | 3-Year | Inception | ||||||||||||
| Multi-Cap Value Fund (A) | 9.71 | % | 18.73 | % | 7.91 | % | |||||||||
| S&P 500 Index | 4.91 | % | 14.39 | % | – | ||||||||||
| Lipper Multi-Cap Core Fund Category Average | 6.49 | % | 15.38 | % | – | ||||||||||
Q How do you determine when to reduce or eliminate a position?
A A successful long-term investment strategy requires a thoughtful sell discipline. Whenever possible, we seek to gradually trim or sell a position in a tax-efficient manner. Positions are typically sold or reduced in response to company-specific issues or to maintain portfolio diversification.
1 The Standard & Poor's 500 Index is an unmanaged, market capitalization weighted measure of 500 widely held common stocks listed on the New York Stock Exchange, American Stock Exchange and The Nasdaq Stock Market. Index returns assume the reinvestment of dividends, but, unlike the Fund's returns, do not reflect the effects of management fees or expenses.
19
Pacific Advisors
Multi-Cap Value Fund continued
We establish a target fair market valuation for each stock at the time of purchase. When a stock nears this valuation, we review the company to determine whether to raise the target price or sell the position. If a stock declines significantly from the initial purchase price, we review the company to determine if it continues to meet our investment criteria. A sale may also result from a change in economic conditions which will make it difficult for a company to achieve or sustain growth.
To control risk, we diversify the Fund's holdings among a selection of quality companies. The size of each position is strategically managed to prevent any one holding, sector, or capitalization level from disproportionately influencing the portfolio. Typically, a single holding does not exceed 4% of the portfolio even if it is a strong performer. When a holding increases in value and exceeds our target weighting, we trim the Fund's position to maintain portfolio diversification. We may also trim or sell positions to adjust the portfolio's sector exposure or to raise cash for more attractive investment opportunities.
Q Where will the Fund seek opportunities in 2006?
A We will continue to identify new opportunities using a "bottom up" approach while increasing positions and adding new holdings in select sectors poised to benefit from long-term economic trends. For example, the long-term increase in the demand for energy should continue to benefit energy and energy-related companies across all capitalization categories. Pharmaceutical and healthcare companies should also continue to provide long-term growth as a result of increasing demand from the aging baby boomer generation.
Finally, we anticipate new opportunities will emerge in select large cap financial and quality technology companies. Overall performance for the technology sector has lagged in recent years. Large cap companies with dominant positions in their markets continue to show promising growth. Continued economic expansion and an end to the Fed's interest rate increases should make these firms even more attractive.
Past performance does not guarantee future results. Performance quoted represents past performance. Current performance may be higher or lower than the performance data quoted. Returns do not take into account the maximum 5.75% sales charge on Class A shares and would be lower if the sales charge were included. Returns represent the change in value over the stated period assuming reinvestment of dividends and capital gains at net asset value. Returns do not take into account individual taxes which may reduce actual returns when shares are sold. The investment return and principal value of an investment will fluctuate so that an investor's shares, when redeemed, may be worth more or less than their original cost. For performance current to the most recent month-end call (800) 989-6693.
20
Portfolio Holdings as of 12/31/05 (Based on Total Investments)
| Equities | 97.03 | % | |||||||||
| 1. | Health Care | 14.51 | % | ||||||||
| 2. | Energy | 21.51 | % | ||||||||
| 3. | Information Technology | 22.52 | % | ||||||||
| 4. | Financials | 14.50 | % | ||||||||
| 5. | Industrials | 12.50 | % | ||||||||
| 6. | Other Equities | 11.49 | % | ||||||||
| 7. | Cash and Cash Equivalents | 2.97 | % | ||||||||

Change in Value of $10,000 Investment
This chart shows the growth of a $10,000 investment made in Class A shares of Pacific Advisors Multi-Cap Value Fund from April 1, 2002 through December 31, 2005 compared to the growth of the S&P 500 Index2.

Average Annual Compounded Return (Class A Shares)
For the year ended December 31, 2005
| One Year | 3.39 | % | |||||
| Since Inception | 6.22 | % | |||||
Past performance does not guarantee future results. Performance data quoted represent past performance. Current performance may be higher or lower than the performance data quoted. Fund returns include the maximum 5.75% sales charge on Class A shares. Performance figures represent the change in value over the stated period assuming reinvestment of dividends and capital gains at net asset value and after expense reimbursements. Returns do not take into account individual taxes which may reduce actual returns when shares are sold. The investment return and principal value of an investment will fluctuate so that an investor's shares, when redeemed, may be worth more or less than their original cost. For information on current performance call (800) 989-6693.
2 The Standard & Poor's 500 Index is an unmanaged, market capitalization weighted measure of 500 widely held common stocks listed on the New York Stock Exchange, American Stock Exchange and The Nasdaq Stock Market. The Index returns assume reinvestment of dividends, but, unlike the Fund's returns, do not reflect the effects of management fees or expenses.
21
Pacific Advisors
Multi-Cap Value Fund continued
Expense Examples
As a shareholder of the Fund you incur two types of costs: (1) transaction costs, including sales charges (loads) on purchase payments, reinvested dividends, or other distributions; redemption fees; and exchange fees; and (2) ongoing costs, including management fees; distribution (12b-1) fees; and other Fund expenses. This Example is intended to help you understand your ongoing costs (in dollars) of investing in the Fund and to compare these costs with the ongoing costs of investing in other mutual funds.
The Example is based on an investment of $1,000 invested at the beginning of the period and held for the entire period from July 1, 2005 through December 31, 2005.
Actual Expenses
The first line of the table below provides information about actual account values and actual expenses. You may use the information in this line, together with the amount you invested, to estimate the expenses that you paid over the period. Simply divide your account value by $1,000 (for example, an $8,600 account value divided by $1,000 = 8.6), then multiply the result by the number in the first line under the heading entitled "Expenses Paid During the Period" to estimate the expenses you paid on your account during the period.
The following transaction costs are not included in the expenses shown in the table and, if applicable, would increase the expenses that you paid over the period: (1) a front-end sales charge (load) of 5.75% on Class A shares; (2) a 2% redemption fee if you sell or exchange shares of the Fund within six months of purchase, with four exceptions. The fee does not apply to redemptions made under an automatic withdrawal program or periodic asset reallocation plan; redemptions to pay for expenses related to terminal illness, extended hospital or nursing home care, or other serious medical conditions; redemptions of shares acquired through dividend reinvestments; and redemptions of shares purchased before July 1, 2004; and (3) a $10 service fee on each exchange after the first five exchanges in each calendar year.
The following ongoing costs are not included in the expenses shown in the table and, if applicable, would increase the expenses that you paid over the period: (1) a $12 low balance fee on accounts with balances of less than $250 as of September 30th of each calendar year and no investment activity (excluding reinvestment of dividends and/or capital gains) during the prior calendar year or the first nine months of the current calendar year. This fee does not apply to IRAs, qualified plan accounts, or Coverdell Education Savings Accounts; (2) a $15 annual custodial fee on IRAs, SEPs, SIMPLE IRAs, and Coverdell Education Savings Accounts; and (3) a $20 annual custodial fee on 403(b) accounts.
Hypothetical Example for Comparison Purposes
The second line of the table below provides information about hypothetical account values and hypothetical expenses based on the Fund's actual expense ratio and an assumed rate of return of 5% per year before expenses, which in not the Fund's actual return. The hypothetical account values and expenses may not be used to estimate the actual ending account balance or expenses you paid for the period. You may use this information to compare the ongoing costs of investing in the Fund and other funds. To do so, compare this 5% hypothetical example with the 5% hypothetical examples that appear in the shareholder reports of the other funds.
The following transaction costs are not included in the expenses shown in the table and, if applicable, would increase the expenses that you paid over the period: (1) a front-end sales charge (load) of 5.75% on Class A shares; (2) a 2% redemption fee if you sell or exchange shares of the Fund within six months of purchase, with four exceptions. The fee does not apply to redemptions made under an automatic withdrawal program or periodic asset reallocation plan; redemptions to pay for expenses related to terminal illness, extended hospital or nursing home care, or other serious medical conditions; redemptions of shares acquired through dividend reinvestments; and redemptions of shares purchased before July 1, 2004; and (3) a $10 service fee on each exchange after the first five exchanges in each calendar year.
The following ongoing costs are not included in the expenses shown in the table and, if applicable, would increase the expenses that you paid over the period: (1) a $12 low balance fee on accounts with balances of less than $250 as of September 30th of each calendar year and no investment activity (excluding reinvestment of dividends and/or capital gains) during the prior calendar year or the first nine months of the current calendar year. This fee does not apply to IRAs, qualified plan accounts, or Coverdell Education Savings Accounts; (2) a $15 annual custodial fee on IRAs, SEPs, SIMPLE IRAs, and Coverdell Education Savings Accounts; and (3) a $20 annual custodial fee on 403(b) accounts.
Please note that the expenses shown in the table are meant to highlight your ongoing costs only and do not reflect any transactional costs, such as sales charges (loads), redemption fees, or exchange fees. Therefore, the second line of the table is useful in comparing ongoing costs only, and will not help you determine the relative total costs of owning different funds. In addition, if these transactional costs were included, your costs would have been higher.
| Beginning Account Value 7/1/2005 | Ending Account Value 12/31/2005 | Expense Paid During Period 07/01/05 – 12/31/053 | |||||||||||||
| Class A Shares | |||||||||||||||
| Actual | $ | 1,000 | $ | 1,120.90 | $ | 16.30 | |||||||||
| Hypothetical (5% return before expense) | $ | 1,000 | $ | 1,025.21 | $ | 15.57 | |||||||||
| Class C Shares | |||||||||||||||
| Actual | $ | 1,000 | $ | 1,116.50 | $ | 20.38 | |||||||||
| Hypothetical (5% return before expense) | $ | 1,000 | $ | 1,025.21 | $ | 19.50 | |||||||||
3 Expenses are equal to the Fund's annualized expense ratio of 3.05% for Class A shares and 3.82% for Class C shares, multiplied by the average account value over the period, multiplied by 184/365 days to reflect the one-half year period.
22
Pacific Advisors
Small Cap Fund
Seeks to achieve long-term capital appreciation. Invests in small company stocks with strong earnings growth potential using a value investment approach with a focus on companies whose market capitalization is below $500 million.
Interview with Portfolio Manager
George A. Henning
For the year ended December 31, 2005, the Fund returned 8.64% for Class A shares, and 7.76% for Class C shares. The Fund's benchmark, the Russell 2000 Stock Index1 changed 4.55% during the same period.
Q What contributed to the turnaround in the Fund's performance during the second half of the year?
A Market volatility created a challenging investment environment throughout 2005. While disconcerting, volatility often creates opportunities. We manage the Fund to achieve long-term growth by investing in companies we believe will add value to the Fund over a three to five-year period.
The equity markets experienced a correction in the second quarter of 2005. Given the strength of the economy, we viewed this downturn as a temporary situation. Many of the companies in the Fund's portfolio continued to demonstrate strong growth. In most cases, we believed price depreciation was the result of market conditions rather than a reflection of the company's prospects. We sold selected positions which would require a longer time frame for recovery and focused on stocks we believed would recover more quickly as market conditions improved. This adjustment positioned the Fund for better performance in the second half of the year and allowed us to take losses to reduce potential capital gains distributions.
Over time, every company will experience disruptions in growth or see its stock price decline due to market conditions. If a company's fundamentals and growth potential remain sound, it usually pays to maintain, or even add to, the Fund's position. If a company's fundamentals or growth potential no longer meet our expectations, we sell the position and look for better opportunities. A disciplined and patient investment strategy has enabled the Fund to achieve its long-term objectives and outperform its benchmark and category peers.
| Average Annual Return | 1-Year | 3-Year | 5-Year | 10-Year | |||||||||||||||
| Small Cap Fund (A) | 8.64 | % | 39.57 | % | 17.26 | % | 10.44 | % | |||||||||||
| Russell 2000 Index | 4.55 | % | 22.13 | % | 8.22 | % | 9.26 | % | |||||||||||
| Lipper Small Cap Value Fund Category Average | 6.08 | % | 22.64 | % | 13.72 | % | 12.52 | % | |||||||||||
Q What changes did you make to the portfolio in 2005?
A Our long-term investment strategy and focus on a limited number of stocks enables us to maintain a thorough knowledge of the companies in the Fund's portfolio. This investment strategy is particularly important in small cap stocks where institutional research may be limited or non-existent. Familiarity with a company's business plan and operating environment allow us to make strategic and effective investment decisions as company or market conditions change over time.
Early in the year, political changes in Venezuela impacted one of the Fund's energy holdings, Harvest Natural Resources. While the company remained fundamentally sound, we concluded that the business and political environment proved too unpredictable and sold the position.
In contrast, one of the Fund's long-term holdings, America Service Group, reported a potential accounting problem in the fourth quarter of last year. The stock fell sharply when the company delayed filing its quarterly financial reports. After reviewing the situation, we determined this was a temporary setback of limited consequence and maintained the Fund's investment. The stock price began to recover as the market reached the same conclusion. The company remains well managed with strong growth potential given the increasing demand for the medical services it provides to correctional facilities.
1 The Russell 2000 Stock Index is an unmanaged, market-weighted measure of stock market performance. It contains stocks of the 2,000 smallest publicly traded companies of the Russell 3000 Index. Index returns assume the reinvestment of dividends, but, unlike the Fund's returns, do not reflect management fees or expenses.
23
Pacific Advisors
Small Cap Fund continued
Q How would you describe the Fund's investment strategy?
A We believe a focused investment approach offers the best opportunity to manage risk and achieve long-term growth. Maintaining a smaller number of holdings allows us to carefully monitor each company and its position in the Fund's portfolio. The Fund's investment strategy can be characterized by several fundamental tenets.
n Invest in companies that are market leaders in their sector or have a significant competitive edge over larger companies in niche markets.
n Examine the company's business strategy, financial strength, and ability to finance growth and weather setbacks that may occur over time.
n Get to know the management team to assess their experience and ability to grow the company's business over an extended period of time.
n Assess the company's competition and the potential impact of market and economic conditions on its industry to understand how it may perform during various market cycles.
n Be patient and allow time for the company to gain market recognition.
n Make changes to the portfolio in a tax efficient manner to produce long-term growth and minimize short-term capital gains distributions.
Occasionally, we find a solid company but cannot identify an immediate catalyst for growth. This proved to be the case four or five years ago when we looked at Commercial Metals in the steel industry. We did not invest in the company but continued to monitor its performance. In 2004, we met with company management again. After identifying improved growth potential as a result of economic recovery and the company's international operations, we added a position to the Fund's portfolio. It continues to have good growth potential because of the specialized nature of their operations and remains one of the best performing investments for the Fund.
Q How is the Fund positioned to seek performance in 2006?
A Bolstered by economic recovery and expansion, small cap stocks have performed well since the second quarter of 2003. Many of the companies in the Fund possess good growth potential and should benefit from continued economic growth in 2006. In particular, we believe companies in the energy, manufacturing, and technology sectors will continue to perform well. Financial companies should also see improved performance as interest rates peak. The Fund will continue to focus on investments in undervalued companies with good growth potential as a result of a business turnaround, new products, or acquisitions.
We will also maintain defensive positions in companies that will continue to perform if economic growth slows. This includes Elcor in the roofing shingle industry which boasts a historical annual growth rate of 10%. Replacement shingles constitute over 80% of Elcor's business which minimizes the potential impact of a pullback in housing construction. Other examples include Denbury Resources, a low cost producer of natural gas, and American Ecology which provides hazardous waste removal, storage an d disposal services. These companies provide goods and services which will remain in high demand regardless of changes in the economy.
Past performance does not guarantee future results. Performance quoted represents past performance. Current performance may be higher or lower than the performance data quoted. Returns do not take into account the maximum 5.75% sales charge on Class A shares and would be lower if the sales charge were included. Returns represent the change in value over the stated period assuming reinvestment of dividends and capital gains at net asset value. Returns do not take into account individual taxes which may reduce actual returns when shares are sold. The investment return and principal value of an investment will fluctuate so that an investor's shares, when redeemed, may be worth more or less than their original cost. Small cap stocks typically have fewer financial resources and may carry higher risks and experience greater volatility than large cap stocks. For performa nce current to the most recent month-end call (800) 989-6693.
24
Portfolio Holdings as of 12/31/05 (Based on Total Investments)
| Equities | 100.00 | % | |||||||||
| 1. | Industrials | 37.51 | % | ||||||||
| 2. | Energy | 22.41 | % | ||||||||
| 3. | Consumer Discretionary | 13.25 | % | ||||||||
| 4. | Financials | 10.43 | % | ||||||||
| 5. | Information Technology | 6.08 | % | ||||||||
| 6. | Other Equities | 10.32 | % | ||||||||
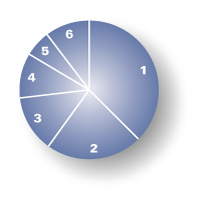
Change in Value of $10,000 Investment
This chart shows the growth of a $10,000 investment made in Class A shares of Pacific Advisors Small Cap Fund from January 1, 1996 through December 31, 2005 compared to the growth of the Russell 2000 Index2.
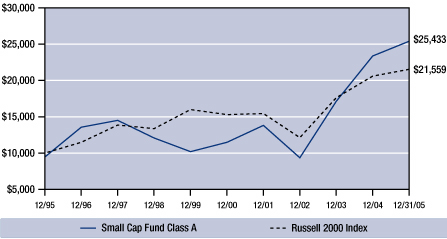
Average Annual Compounded Return (Class A Shares)
For the year ended December 31, 2005
| One Year | 2.41 | % | |||||
| Five Year | 15.87 | % | |||||
| Ten Year | 9.79 | % | |||||
Past performance does not guarantee future results. Performance data quoted represent past performance. Current performance may be higher or lower than the performance data quoted. Fund returns include the maximum 5.75% sales charge on Class A shares. Performance figures represent the change in value over the stated period assuming reinvestment of dividends and capital gains at net asset value and after expense reimbursements. Returns do not take into account individual taxes which may reduce actual returns when shares are sold. The investment return and principal value of an investment will fluctuate so that an investor's shares, when redeemed, may be worth more or less than their original cost. Small cap stocks typically have fewer financial resources and may carry higher risks and experience greater volatility than large cap stocks. For information on current performance call (800) 989-6693.
2 The Russell 2000 Stock Index is an unmanaged, market-weighted measure of stock market performance. It contains stocks of the 2,000 smallest publicly traded companies of the Russell 3000 Index. The Russell 2000 Stock Index does not take capital gains into consideration, and, unlike the Fund, does not reflect the effects of management fees or expenses.
25
Pacific Advisors
Small Cap Fund continued
Expense Examples
As a shareholder of the Fund you incur two types of costs: (1) transaction costs, including sales charges (loads) on purchase payments, reinvested dividends, or other distributions; redemption fees; and exchange fees; and (2) ongoing costs, including management fees; distribution (12b-1) fees; and other Fund expenses. This Example is intended to help you understand your ongoing costs (in dollars) of investing in the Fund and to compare these costs with the ongoing costs of investing in other mutual funds.
The Example is based on an investment of $1,000 invested at the beginning of the period and held for the entire period from July 1, 2005 through December 31, 2005.
Actual Expenses
The first line of the table below provides information about actual account values and actual expenses. You may use the information in this line, together with the amount you invested, to estimate the expenses that you paid over the period. Simply divide your account value by $1,000 (for example, an $8,600 account value divided by $1,000 = 8.6), then multiply the result by the number in the first line under the heading entitled "Expenses Paid During the Period" to estimate the expenses you paid on your account during the period.
The following transaction costs are not included in the expenses shown in the table and, if applicable, would increase the expenses that you paid over the period: (1) a front-end sales charge (load) of 5.75% on Class A shares; (2) a 2% redemption fee if you sell or exchange shares of the Fund within six months of purchase, with three exceptions. The fee does not apply to redemptions made under an automatic withdrawal program or periodic asset reallocation plan; redemptions to pay for expenses related to terminal illness, extended hospital or nursing home care, or other serious medical conditions; and redemptions of shares acquired through dividend reinvestments; and (3) a $10 service fee on each exchange after the first five exchanges in each calendar year.
The following ongoing costs are not included in the expenses shown in the table and, if applicable, would increase the expenses that you paid over the period: (1) a $12 low balance fee on accounts with balances of less than $250 as of September 30th of each calendar year and no investment activity (excluding reinvestment of dividends and/or capital gains) during the prior calendar year or the first nine months of the current calendar year. This fee does not apply to IRAs, qualified plan accounts, or Coverdell Education Savings Accounts; (2) a $15 annual custodial fee on IRAs, SEPs, SIMPLE IRAs, and Coverdell Education Savings Accounts; and (3) a $20 annual custodial fee on 403(b) accounts.
Hypothetical Example for Comparison Purposes
The second line of the table below provides information about hypothetical account values and hypothetical expenses based on the Fund's actual expense ratio and an assumed rate of return of 5% per year before expenses, which in not the Fund's actual return. The hypothetical account values and expenses may not be used to estimate the actual ending account balance or expenses you paid for the period. You may use this information to compare the ongoing costs of investing in the Fund and other funds. To do so, compare this 5% hypothetical example with the 5% hypothetical examples that appear in the shareholder reports of the other funds.
The following transaction costs are not included in the expenses shown in the table and, if applicable, would increase the expenses that you paid over the period: (1) a front-end sales charge (load) of 5.75% on Class A shares; (2) a 2% redemption fee if you sell or exchange shares of the Fund within six months of purchase, with three exceptions. The fee does not apply to redemptions made under an automatic withdrawal program or periodic asset reallocation plan; redemptions to pay for expenses related to terminal illness, extended hospital or nursing home care, or other serious medical conditions; and redemptions of shares acquired through dividend reinvestments; and (3) a $10 service fee on each exchange after the first five exchanges in each calendar year.
The following ongoing costs are not included in the expenses shown in the table and, if applicable, would increase the expenses that you paid over the period: (1) a $12 low balance fee on accounts with balances of less than $250 as of September 30th of each calendar year and no investment activity (excluding reinvestment of dividends and/or capital gains) during the prior calendar year or the first nine months of the current calendar year. This fee does not apply to IRAs, qualified plan accounts, or Coverdell Education Savings Accounts; (2) a $15 annual custodial fee on IRAs, SEPs, SIMPLE IRAs, and Coverdell Education Savings Accounts; and (3) a $20 annual custodial fee on 403(b) accounts.
Please note that the expenses shown in the table are meant to highlight your ongoing costs only and do not reflect any transactional costs, such as sales charges (loads), redemption fees, or exchange fees. Therefore, the second line of the table is useful in comparing ongoing costs only, and will not help you determine the relative total costs of owning different funds. In addition, if these transactional costs were included, your costs would have been higher.
| Beginning Account Value 7/1/2005 | Ending Account Value 12/31/2005 | Expense Paid During Period 07/01/05 – 12/31/053 | |||||||||||||
| Class A Shares | |||||||||||||||
| Actual | $ | 1,000 | $ | 1,197.40 | $ | 18.61 | |||||||||
| Hypothetical (5% return before expense) | $ | 1,000 | $ | 1,025.21 | $ | 17.15 | |||||||||
| Class C Shares | |||||||||||||||
| Actual | $ | 1,000 | $ | 1,192.60 | $ | 23.16 | |||||||||
| Hypothetical (5% return before expense) | $ | 1,000 | $ | 1,025.21 | $ | 21.39 | |||||||||
3 Expenses are equal to the Fund's annualized expense ratio of 3.36% for Class A shares and 4.19% for Class C shares, multiplied by the average account value over the period, multiplied by 184/365 days to reflect the one-half year period.
26

Pacific Advisors Fund Inc.
financial statements
27
Pacific Advisors Government Securities Fund
Statement of Investments
as of December 31, 2005
| Quantity or Principal | Description | Current $ Value** | % of Net Assets | ||||||||||||
| COMMON STOCK | |||||||||||||||
| INFORMATION TECHNOLOGY | 2.18 | ||||||||||||||
| SYSTEMS: SOFTWARE | |||||||||||||||
| 5,000 | MICROSOFT CORP. | 130,750 | |||||||||||||
| 130,750 | 2.18 | ||||||||||||||
| TELECOMMUNICATION SERVICES | 1.01 | ||||||||||||||
| INTG TELECOMM SRVCS | |||||||||||||||
| 5,000 | CITIZENS COMMUNICATIONS CO. | 61,150 | |||||||||||||
| 61,150 | 1.01 | ||||||||||||||
| UTILITIES | 1.96 | ||||||||||||||
| ELECTRIC UTILITIES | |||||||||||||||
| 4,000 | PPL CORP. | 117,600 | |||||||||||||
| 117,600 | 1.96 | ||||||||||||||
| TOTAL COMMON STOCK (Cost: $290,890) | 309,500 | 5.15 | |||||||||||||
| US GOVT SECURITIES | |||||||||||||||
| US GOVERNMENT AGENCY | 91.44 | ||||||||||||||
| 500,000 | FED HOME LN MTG CORP. 5.00% 12/23/11 | 494,986 | |||||||||||||
| 250,000 | FED HOME LN MTG CORP. 5.00% 12/29/11 | 247,498 | |||||||||||||
| 25,000 | FED HOME LN MTG CORP. 5.00% 01/17/12 | 24,751 | |||||||||||||
| 100,000 | FED HOME LN MTG CORP. 5.25% 04/25/12 | 99,416 | |||||||||||||
| 100,000 | FED HOME LN MTG CORP. 5.05% 04/27/12 | 98,746 | |||||||||||||
| 150,000 | FED HOME LN MTG CORP. 5.15% 02/20/13 | 148,092 | |||||||||||||
| 50,000 | FED HOME LN MTG CORP. 5.20% 05/09/13 | 49,574 | |||||||||||||
| 135,000 | FED HOME LN MTG CORP. 5.125% 05/13/13 | 133,599 | |||||||||||||
| 250,000 | FED HOME LN MTG CORP. 5.00% 05/29/13 | 246,485 | |||||||||||||
| 100,000 | FED HOME LN MTG CORP. 5.45% 08/09/13 | 99,763 | |||||||||||||
| 100,000 | FED HOME LN MTG CORP. 5.33% 09/03/13 | 99,402 | |||||||||||||
| 50,000 | FED HOME LN MTG CORP. 5.25% 02/18/14 | 49,543 | |||||||||||||
| 225,000 | FED HOME LN MTG CORP. 5.125% 03/10/14 | 222,406 | |||||||||||||
| 250,000 | FED HOME LN MTG CORP. 5.50% 09/22/14 | 248,836 | |||||||||||||
| 50,000 | FED HOME LN MTG CORP. 5.50% 12/30/14 | 49,746 | |||||||||||||
| 45,000 | FED HOME LN MTG CORP. 5.35% 02/05/15 | 44,644 | |||||||||||||
| 65,000 | FED HOME LN MTG CORP. 5.35% 01/27/15 | 64,529 | |||||||||||||
| 50,000 | FED HOME LN MTG CORP. 5.00% 12/15/17 | 49,081 | |||||||||||||
| 100,000 | FED HOME LOAN BANK 5.23% 09/01/11 | 99,291 | |||||||||||||
| 70,000 | FED HOME LOAN BANK 4.30% 05/05/09 | 68,758 | |||||||||||||
| 37,500 | FED HOME LOAN BANK 4.55% 05/26/09 | 37,027 | |||||||||||||
| 115,000 | FED HOME LOAN BANK 5.35% 05/09/12 | 114,005 | |||||||||||||
| 180,000 | FED HOME LOAN BANK 5.09% 10/22/12 | 177,448 | |||||||||||||
| 100,000 | FED HOME LOAN BANK 5.00% 12/03/12 | 98,331 | |||||||||||||
| 44,912 | FED HOME LOAN BANK 5.24% 12/17/12 | 44,414 | |||||||||||||
| 550,909 | FED HOME LOAN BANK 5.35% 12/24/12 | 546,055 | |||||||||||||
See Accompanying Notes to Financial Statements
28
Pacific Advisors Government Securities Fund
Statement of Investments
as of December 31, 2005
| Quantity or Principal | Description | Current $ Value** | % of Net Assets | ||||||||||||
| US GOVT SECURITIES continued | |||||||||||||||
| 100,000 | FED HOME LOAN BANK 5.30% 12/03/13 | 98,816 | |||||||||||||
| 100,000 | FED NATL MTG ASSOC. 5.00% 12/08/11 | 98,710 | |||||||||||||
| 30,000 | FED NATL MTG ASSOC. 5.625% 02/28/12 | 30,054 | |||||||||||||
| 50,000 | FED NATL MTG ASSOC. 5.00% 03/23/12 | 49,300 | |||||||||||||
| 200,000 | FED NATL MTG ASSOC. 5.00% 08/24/12 | 196,913 | |||||||||||||
| 48,000 | FED NATL MTG ASSOC. 5.375% 08/23/12 | 47,642 | |||||||||||||
| 200,000 | FED NATL MTG ASSOC. 5.25% 12/26/12 | 198,016 | |||||||||||||
| 535,000 | FED NATL MTG ASSOC. 5.25% 01/28/13 | 529,728 | |||||||||||||
| 50,000 | FED NATL MTG ASSOC. 5.25% 01/28/13 | 49,475 | |||||||||||||
| 75,000 | FED NATL MTG ASSOC. 5.00% 02/27/13 | 73,690 | |||||||||||||
| 50,000 | FED NATL MTG ASSOC. 5.125% 02/27/13 | 49,310 | |||||||||||||
| 300,000 | FED NATL MTG ASSOC. 5.25% 01/21/14 | 295,967 | |||||||||||||
| 112,000 | FED NATL MTG ASSOC. 5.75% 11/07/17 | 110,742 | |||||||||||||
| 5,484,789 | 91.44 | ||||||||||||||
| TOTAL US GOVT SECURITIES (Cost: $5,541,603) | 5,484,789 | 91.44 | |||||||||||||
| PREFERRED STOCK | |||||||||||||||
| FINANCIALS | 1.73 | ||||||||||||||
| LIFE/HEALTH INSUR | |||||||||||||||
| 4,000 | METLIFE INC. 6.50% PFD | 103,680 | |||||||||||||
| 103,680 | 1.73 | ||||||||||||||
| TOTAL PREFERRED STOCK (Cost: $100,000) | 103,680 | 1.73 | |||||||||||||
| SHORT TERM INVESTMENTS | |||||||||||||||
| MONEY MARKET | 1.48 | ||||||||||||||
| 88,972 | UMB MONEY MARKET FIDUCIARY | 88,972 | |||||||||||||
| 88,972 | 1.48 | ||||||||||||||
| TOTAL SHORT TERM INVESTMENTS (Cost: $88,972) | 88,972 | 1.48 | |||||||||||||
| TOTAL INVESTMENTS (Cost: $6,021,465) | 5,986,941 | 99.80 | |||||||||||||
| OTHER ASSETS LESS LIABILITIES | 11,769 | 0.20 | |||||||||||||
| TOTAL NET ASSETS | 5,998,710 | 100.00 | |||||||||||||
* Non-income producing.
** The principal amount is stated in U.S. dollars unless otherwise indicated.
See Accompanying Notes to Financial Statements
29
Pacific Advisors Income and Equity Fund
Statement of Investments
as of December 31, 2005
| Quantity or Principal | Description | Current $ Value** | % of Net Assets | ||||||||||||
| COMMON STOCK | |||||||||||||||
| CONSUMER DISCRETIONARY | 0.72 | ||||||||||||||
| DISTRIBUTORS | |||||||||||||||
| 1,000 | GENUINE PARTS CO. | 43,920 | |||||||||||||
| 43,920 | 0.37 | ||||||||||||||
| HOME IMPROVEMENT | |||||||||||||||
| 1,000 | HOME DEPOT, INC. | 40,480 | |||||||||||||
| 40,480 | 0.35 | ||||||||||||||
| CONSUMER STAPLES | 1.52 | ||||||||||||||
| HOUSEHOLD PRODUCTS | |||||||||||||||
| 2,000 | PROCTER & GAMBLE CO. | 115,760 | |||||||||||||
| 115,760 | 0.99 | ||||||||||||||
| PACKAGED FOODS/MEATS | |||||||||||||||
| 2,000 | MCCORMICK & CO, INC. | 61,840 | |||||||||||||
| 61,840 | 0.53 | ||||||||||||||
| ENERGY | 7.52 | ||||||||||||||
| INTEGRATED OIL & GAS | |||||||||||||||
| 2,000 | BRITISH PETROLEUM PLC | 128,440 | |||||||||||||
| 2,000 | CONOCOPHILLIPS | 116,360 | |||||||||||||
| 3,000 | MARATHON OIL CORP. | 182,910 | |||||||||||||
| 1,000 | OCCIDENTAL PETROLEUM CORP. | 79,880 | |||||||||||||
| 507,590 | 4.33 | ||||||||||||||
| OIL & GAS DRILLING | |||||||||||||||
| 1,000 | ENCANA CORP. | 45,160 | |||||||||||||
| 1,000 | ULTRA PETROLEUM CORP.* | 55,800 | |||||||||||||
| 100,960 | 0.86 | ||||||||||||||
| OIL & GAS EXPLR/PROD | |||||||||||||||
| 1,000 | APACHE CORP. | 68,520 | |||||||||||||
| 1,000 | BURLINGTON RESOURCES INC. | 86,200 | |||||||||||||
| 1,000 | SPDR SELECT SECTOR - ENERGY | 50,310 | |||||||||||||
| 1,000 | XTO ENERGY INC. | 43,940 | |||||||||||||
| 248,970 | 2.12 | ||||||||||||||
| OIL&GAS REF/MKT/TRAN | |||||||||||||||
| 2,000 | EL PASO ENERGY CORP. | 24,320 | |||||||||||||
| 24,320 | 0.21 | ||||||||||||||
See Accompanying Notes to Financial Statements
30
Pacific Advisors Income and Equity Fund
Statement of Investments
as of December 31, 2005
| Quantity or Principal | Description | Current $ Value** | % of Net Assets | ||||||||||||
| COMMON STOCK continued | |||||||||||||||
| FINANCIALS | 9.43 | ||||||||||||||
| DIVERSIFIED BANKS | |||||||||||||||
| 4,000 | BANK OF AMERICA CORP. | 184,600 | |||||||||||||
| 2,000 | WACHOVIA CORP. | 105,720 | |||||||||||||
| 290,320 | 2.48 | ||||||||||||||
| MULTI LINE INSURANCE | |||||||||||||||
| 2,000 | AMERICAN INT'L GROUP, INC. | 136,460 | |||||||||||||
| 136,460 | 1.17 | ||||||||||||||
| PROPERTY & CAS INSUR | |||||||||||||||
| 500 | CHUBB CORP. | 48,825 | |||||||||||||
| 48,825 | 0.42 | ||||||||||||||
| REAL ESTATE INV TRST | |||||||||||||||
| 12,500 | HOSPITALITY PROPERTIES TRUST | 501,250 | |||||||||||||
| 501,250 | �� | 4.28 | |||||||||||||
| REGIONAL BANKS | |||||||||||||||
| 1,000 | WILMINGTON TRUST CO. | 38,910 | |||||||||||||
| 38,910 | 0.33 | ||||||||||||||
| THRIFTS&MTG FINANCE | |||||||||||||||
| 2,000 | WASHINGTON MUTUAL INC. | 87,000 | |||||||||||||
| 87,000 | 0.75 | ||||||||||||||
| HEALTH CARE | 2.96 | ||||||||||||||
| HEALTH CARE EQUIP | |||||||||||||||
| 1,984 | BOSTON SCIENTIFIC CO.* | 48,588 | |||||||||||||
| 48,588 | 0.42 | ||||||||||||||
| PHARMACEUTICALS | |||||||||||||||
| 3,000 | JOHNSON & JOHNSON | 180,300 | |||||||||||||
| 5,000 | PFIZER INC. | 116,600 | |||||||||||||
| 296,900 | 2.54 | ||||||||||||||
| INDUSTRIALS | 2.63 | ||||||||||||||
| AEROSPACE & DEFENSE | |||||||||||||||
| 2,000 | HONEYWELL INTERNATIONAL INC. | 74,500 | |||||||||||||
| 74,500 | 0.64 | ||||||||||||||
| INDUSTRIAL CONGLOMER | |||||||||||||||
| 5,000 | GENERAL ELECTRIC CO. | 175,250 | |||||||||||||
| 2,000 | TYCO INTERNATIONAL LTD. | 57,720 | |||||||||||||
| 232,970 | 1.99 | ||||||||||||||
See Accompanying Notes to Financial Statements
31
Pacific Advisors Income and Equity Fund
Statement of Investments
as of December 31, 2005
| Quantity or Principal | Description | Current $ Value** | % of Net Assets | ||||||||||||
| COMMON STOCK continued | |||||||||||||||
| INFORMATION TECHNOLOGY | 1.12 | ||||||||||||||
| SYSTEMS: SOFTWARE | |||||||||||||||
| 5,000 | MICROSOFT CORP. | 130,750 | |||||||||||||
| 130,750 | 1.12 | ||||||||||||||
| MATERIALS | 0.93 | ||||||||||||||
| DIVERSIFIED CHEMICAL | |||||||||||||||
| 1,000 | E.I. DUPONT DE NEMOURS & CO. | 42,500 | |||||||||||||
| 42,500 | 0.36 | ||||||||||||||
| SPECIALTY CHEMICALS | |||||||||||||||
| 2,000 | INT. FLAVORS AND FRAGRANCES INC. | 67,000 | |||||||||||||
| 67,000 | 0.57 | ||||||||||||||
| TELECOMMUNICATION SERVICES | 1.26 | ||||||||||||||
| INTG TELECOMM SRVCS | |||||||||||||||
| 1,000 | AT&T, INC. | 24,490 | |||||||||||||
| 10,000 | CITIZENS COMMUNICATIONS CO. | 122,300 | |||||||||||||
| 146,790 | 1.26 | ||||||||||||||
| UTILITIES | 1.73 | ||||||||||||||
| MULTI UTILITIES/POWR | |||||||||||||||
| 1,000 | DOMINION RESOURCES INC. | 77,200 | |||||||||||||
| 1,000 | DUKE ENERGY CORP. | 27,450 | |||||||||||||
| 1,000 | MDU RESOURCES GROUP | 32,740 | |||||||||||||
| 1,000 | PUBLIC SERVICE ENTERPRISE GROUP INC. | 64,970 | |||||||||||||
| 202,360 | 1.73 | ||||||||||||||
| TOTAL COMMON STOCK (Cost: $3,392,860) | 3,488,963 | 29.82 | |||||||||||||
| CORPORATE BONDS | |||||||||||||||
| CONSUMER DISCRETIONARY | 8.93 | ||||||||||||||
| BROADCAST & CABLE TV | |||||||||||||||
| 519,000 | LIBERTY MEDIA CORP. 7.75% 07/15/09 | 544,846 | |||||||||||||
| 544,846 | 4.66 | ||||||||||||||
| GENL MERCHANDISE STR | |||||||||||||||
| 281,000 | DAYTON HUDSON CO. 8.60% 01/15/12 | 332,908 | |||||||||||||
| 332,908 | 2.85 | ||||||||||||||
| HOTELS, RESORTS | |||||||||||||||
| 160,000 | MARRIOTT CORP. 9.375% 06/15/07 | 166,652 | |||||||||||||
| 166,652 | 1.42 | ||||||||||||||
See Accompanying Notes to Financial Statements
32
Pacific Advisors Income and Equity Fund
Statement of Investments
as of December 31, 2005
| Quantity or Principal | Description | Current $ Value** | % of Net Assets | ||||||||||||
| CORPORATE BONDS continued | |||||||||||||||
| CONSUMER STAPLES | 4.75 | ||||||||||||||
| BREWERS | |||||||||||||||
| 165,000 | ANHEUSER-BUSCH 7.125% 07/01/17 | 172,998 | |||||||||||||
| 172,998 | 1.48 | ||||||||||||||
| HYPERMKTS/SUPER CTRS | |||||||||||||||
| 50,000 | WAL-MART STORES, INC. 8.00% 09/15/06 | 51,012 | |||||||||||||
| 51,012 | 0.44 | ||||||||||||||
| PACKAGED FOODS/MEATS | |||||||||||||||
| 323,000 | GERBER PRODUCTS 9.00% 10/15/06 | 330,725 | |||||||||||||
| 330,725 | 2.83 | ||||||||||||||
| ENERGY | 5.31 | ||||||||||||||
| INTEGRATED OIL & GAS | |||||||||||||||
| 361,000 | OCCIDENTAL PETROLEUM 10.125% 09/15/09 | 424,724 | |||||||||||||
| 170,000 | TEXACO CAPITAL 8.625% 06/30/10 | 196,371 | |||||||||||||
| 621,095 | 5.31 | ||||||||||||||
| FINANCIALS | 6.70 | ||||||||||||||
| CONSUMER FINANCE | |||||||||||||||
| 150,000 | GENL MOTORS ACCEPT CORP. 6.125% 09/15/06 | 145,703 | |||||||||||||
| 145,703 | 1.25 | ||||||||||||||
| DIVERSIFIED FINANCL | |||||||||||||||
| 371,000 | GENERAL ELECTRIC CAPITAL 8.125% 05/15/12 | 431,090 | |||||||||||||
| 50,000 | GENERAL ELECTRIC CAPITAL 8.875% 05/15/09 | 55,835 | |||||||||||||
| 486,925 | 4.16 | ||||||||||||||
| LIFE/HEALTH INSUR | |||||||||||||||
| 85,000 | TRANSAMERICA CORP. 9.375% 03/01/08 | 91,969 | |||||||||||||
| 91,969 | 0.79 | ||||||||||||||
| SPECIALIZED FINANCE | |||||||||||||||
| 58,000 | ASSOCIATES CORP. NA 7.35% 05/15/06 | 58,538 | |||||||||||||
| 58,538 | 0.50 | ||||||||||||||
| INDUSTRIALS | 4.31 | ||||||||||||||
| CONSTRUCTION & MACH | |||||||||||||||
| 331,000 | DEERE & COMPANY 8.95% 06/15/19 | 367,859 | |||||||||||||
| 367,859 | 3.14 | ||||||||||||||
| RAILROADS & TRUCKING | |||||||||||||||
| 135,000 | NORFOLK SOUTHERN CORP. 7.40% 09/15/06 | 137,411 | |||||||||||||
| 137,411 | 1.17 | ||||||||||||||
See Accompanying Notes to Financial Statements
33
Pacific Advisors Income and Equity Fund
Statement of Investments
as of December 31, 2005
| Quantity or Principal | Description | Current $ Value** | % of Net Assets | ||||||||||||
| CORPORATE BONDS continued | |||||||||||||||
| MATERIALS | 0.21 | ||||||||||||||
| DIVERSIFIED CHEMICAL | |||||||||||||||
| 25,000 | DOW CHEMICAL CO. 5.60% 11/15/09 | 25,080 | |||||||||||||
| 25,080 | 0.21 | ||||||||||||||
| TELECOMMUNICATION SERVICES | 7.41 | ||||||||||||||
| INTG TELECOMM SRVCS | |||||||||||||||
| 85,000 | BELLSOUTH CAPITAL 6.04% 11/15/26 | 87,485 | |||||||||||||
| 429,835 | BELLSOUTH TELECOMMUNICATIONS 6.30% 12/15/15 | 445,908 | |||||||||||||
| 100,000 | GTE CALIFORNIA INC. 5.50% 01/15/09 | 99,293 | |||||||||||||
| 135,000 | SBC COMMUNICATIONS 7.39% 05/24/10 | 145,302 | |||||||||||||
| 35,000 | SBC COMMUNICATIONS 6.590% 09/29/08 | 36,152 | |||||||||||||
| 50,000 | WISCONSIN BELL 6.35% 12/01/26 | 52,396 | |||||||||||||
| 866,536 | 7.41 | ||||||||||||||
| UTILITIES | 11.03 | ||||||||||||||
| ELECTRIC UTILITIES | |||||||||||||||
| 255,000 | COMMMONWEALTH EDISON 8.00% 05/15/08 | 272,008 | |||||||||||||
| 272,008 | 2.32 | ||||||||||||||
| GAS UTILITIES | |||||||||||||||
| 150,000 | PIEDMONT NATURAL GAS 7.80% 09/29/10 | 166,774 | |||||||||||||
| 166,774 | 1.42 | ||||||||||||||
| MULTI UTILITIES/POWR | |||||||||||||||
| 75,000 | PENN POWER & LT 6.55% 03/01/06 | 75,225 | |||||||||||||
| 119,000 | POTOMAC ELEC. POWER 5.875% 10/15/08 | 121,452 | |||||||||||||
| 525,000 | PUB SVC ELEC & GAS 6.75% 03/01/06 | 526,649 | |||||||||||||
| 128,000 | PUB SVC ELEC & GAS 6.25% 01/01/07 | 129,635 | |||||||||||||
| 852,961 | 7.29 | ||||||||||||||
| TOTAL CORPORATE BOND (Cost: $5,833,459) | 5,692,000 | 48.65 | |||||||||||||
| CONVERTIBLE CORPORATE BONDS | |||||||||||||||
| FINANCIALS | 1.23 | ||||||||||||||
| DIVERSIFIED BANKS | |||||||||||||||
| 20,000 | ABN AMRO BANK NV 10.00% 03/02/06 | 19,300 | |||||||||||||
| 125,000 | BARCLAYS BANK PLC 7.00% 06/22/06 | 125,000 | |||||||||||||
| 144,300 | 1.23 | ||||||||||||||
| TOTAL CONVERTIBLE CORPORATE BONDS (Cost: $145,085) | 144,300 | 1.23 | |||||||||||||
See Accompanying Notes to Financial Statements
34
Pacific Advisors Income and Equity Fund
Statement of Investments
as of December 31, 2005
| Quantity or Principal | Description | Current $ Value** | % of Net Assets | ||||||||||||
| US GOVT SECURITIES | |||||||||||||||
| US GOVERNMENT AGENCY | 11.73 | ||||||||||||||
| US GOVERNMENT AGENCY | |||||||||||||||
| 100,000 | FED HOME LN MTG CORP. 4.125% 09/01/09 | 97,775 | |||||||||||||
| 200,000 | FED HOME LN MTG CORP. 5.00% 12/23/11 | 197,994 | |||||||||||||
| 50,000 | FED HOME LN MTG CORP. 5.00% 09/10/12 | 49,391 | |||||||||||||
| 33,000 | FED HOME LN MTG CORP. 5.125% 03/10/14 | 32,619 | |||||||||||||
| 250,000 | FED HOME LN MTG CORP. 5.50% 09/22/14 | 248,836 | |||||||||||||
| 100,000 | FED HOME LOAN BANK 5.25% 06/15/09 | 99,886 | |||||||||||||
| 100,000 | FED HOME LOAN BANK 5.25% 10/27/10 | 99,439 | |||||||||||||
| 50,000 | FED HOME LOAN BANK 5.375% 09/07/12 | 49,625 | |||||||||||||
| 130,000 | FED HOME LOAN BANK 5.05% 02/14/13 | 127,952 | |||||||||||||
| 100,000 | FED NATL MTG ASSOC. 5.00% 03/23/12 | 98,600 | |||||||||||||
| 100,000 | FED NATL MTG ASSOC. 5.00% 01/27/12 | 98,613 | |||||||||||||
| 75,000 | FED NATL MTG ASSOC. 5.00% 03/11/13 | 73,529 | |||||||||||||
| 100,000 | FED NATL MTG ASSOC. 5.50% 11/17/14 | 99,052 | |||||||||||||
| 1,373,311 | 11.73 | ||||||||||||||
| TOTAL US GOVT SECURITIES (Cost: $1,386,789) | 1,373,311 | 11.73 | |||||||||||||
| PREFERRED STOCK | |||||||||||||||
| FINANCIALS | 4.44 | ||||||||||||||
| DIVERSIFIED BANKS | |||||||||||||||
| 2,000 | BAC TRUST VIII 6.00% PFD | 48,140 | |||||||||||||
| 5,000 | HSBC HOLDINGS PLC 6.20% PFD A | 123,750 | |||||||||||||
| 171,890 | 1.47 | ||||||||||||||
| INVESTMENT BANK/BRKG | |||||||||||||||
| 2,000 | MERRILL LYNCH 6.375% PFD | 51,000 | |||||||||||||
| 51,000 | 0.44 | ||||||||||||||
| LIFE/HEALTH INSUR | |||||||||||||||
| 3,000 | METLIFE INC. 6.50% PFD | 77,760 | |||||||||||||
| 2,500 | PHOENIX COMPANIES INC. 7.45% 01/15/32 PFD | 62,750 | |||||||||||||
| 140,510 | 1.20 | ||||||||||||||
| REAL ESTATE INV TRST | |||||||||||||||
| 3,700 | PRICE LEGACY CORP. 6.82% PFD A | 55,315 | |||||||||||||
| 55,315 | 0.47 | ||||||||||||||
| REGIONAL BANKS | |||||||||||||||
| 4,000 | FIRST BANCORP PUERTO RICO 7.40% PFD C* | 100,200 | |||||||||||||
| 100,200 | 0.86 | ||||||||||||||
| TOTAL PREFERRED STOCK (Cost: $529,028) | 518,915 | 4.44 | |||||||||||||
See Accompanying Notes to Financial Statements
35
Pacific Advisors Income and Equity Fund
Statement of Investments
as of December 31, 2005
| Quantity or Principal | Description | Current $ Value** | % of Net Assets | ||||||||||||
| SHORT TERM INVESTMENTS | |||||||||||||||
| MONEY MARKET | 3.53 | ||||||||||||||
| SHORT-TERM | |||||||||||||||
| 413,269 | UMB MONEY MARKET FIDUCIARY | 413,269 | |||||||||||||
| 413,269 | 3.53 | ||||||||||||||
| TOTAL SHORT TERM INVESTMENTS (Cost: $413,269) | 413,269 | 3.53 | |||||||||||||
| TOTAL INVESTMENTS (Cost: $11,700,490) | 11,630,758 | 99.40 | |||||||||||||
| OTHER ASSETS LESS LIABILITIES | 70,198 | 0.60 | |||||||||||||
| TOTAL NET ASSETS | 11,700,956 | 100.00 | |||||||||||||
* Non-income producing.
** The principal amount is stated in U.S. dollars unless otherwise indicated.
See Accompanying Notes to Financial Statements
36
Pacific Advisors Balanced Fund
Statement of Investments
as of December 31, 2005
| Quantity or Principal | Description | Current $ Value** | % of Net Assets | ||||||||||||
| COMMON STOCK | |||||||||||||||
| CONSUMER DISCRETIONARY | 5.06 | ||||||||||||||
| ADVERTISING | |||||||||||||||
| 30,000 | INTERPUBLIC GROUP, INC.* | 289,500 | |||||||||||||
| 289,500 | 0.73 | ||||||||||||||
| BROADCAST & CABLE TV | |||||||||||||||
| 7,200 | LIBERTY GLOBAL INC.* | 162,000 | |||||||||||||
| 7,200 | LIBERTY GLOBAL INC. C* | 152,640 | |||||||||||||
| 314,640 | 0.80 | ||||||||||||||
| MOVIES/ENTERTAINMENT | |||||||||||||||
| 10,000 | DISNEY COMPANY | 239,700 | |||||||||||||
| 30,000 | LIBERTY MEDIA CORP.* | 236,100 | |||||||||||||
| 18,000 | TIME WARNER INC. | 313,920 | |||||||||||||
| 7,500 | VIACOM INC. | 244,500 | |||||||||||||
| 1,034,220 | 2.63 | ||||||||||||||
| SPECIALTY STORES | |||||||||||||||
| 10,000 | MICHAELS STORES INC. | 353,700 | |||||||||||||
| 353,700 | 0.90 | ||||||||||||||
| CONSUMER STAPLES | 2.09 | ||||||||||||||
| SOFT DRINKS | |||||||||||||||
| 9,000 | CADBURY SCHWEPPES PLC | 344,610 | |||||||||||||
| 12,000 | COCA-COLA CO. | 483,720 | |||||||||||||
| 828,330 | 2.09 | ||||||||||||||
| ENERGY | 11.72 | ||||||||||||||
| INTEGRATED OIL & GAS | |||||||||||||||
| 12,000 | BRITISH PETROLEUM PLC | 770,640 | |||||||||||||
| 8,000 | CONOCOPHILLIPS | 465,440 | |||||||||||||
| 1,236,080 | 3.13 | ||||||||||||||
| OIL & GAS EQUIP/SERV | |||||||||||||||
| 12,000 | COOPER CAMERON CORP.* | 496,800 | |||||||||||||
| 496,800 | 1.26 | ||||||||||||||
| OIL&GAS REF/MKT/TRAN | |||||||||||||||
| 30,000 | WILLIAMS COMPANIES INC. | 695,100 | |||||||||||||
| 695,100 | 1.76 | ||||||||||||||
| OIL & GAS EXPLR/PROD | |||||||||||||||
| 20,000 | DEVON ENERGY CORP. | 1,250,800 | |||||||||||||
| 15,000 | SUNCOR ENERGY INC. | 946,950 | |||||||||||||
| 2,197,750 | 5.57 | ||||||||||||||
See Accompanying Notes to Financial Statements
37
Pacific Advisors Balanced Fund
Statement of Investments
as of December 31, 2005
| Quantity or Principal | Description | Current $ Value** | % of Net Assets | ||||||||||||
| COMMON STOCK continued | |||||||||||||||
| FINANCIALS | 11.25 | ||||||||||||||
| DIVERSIFIED BANKS | |||||||||||||||
| 35,000 | BANCO LATINAMERICANO DE EXPORTACIONES | 640,500 | |||||||||||||
| 640,500 | 1.62 | ||||||||||||||
| DIVERSIFIED COML SRV | |||||||||||||||
| 15,000 | GATX CORP. | 541,200 | |||||||||||||
| 16,000 | H & R BLOCK, INC. | 392,800 | |||||||||||||
| 934,000 | 2.36 | ||||||||||||||
| MULTI LINE INSURANCE | |||||||||||||||
| 5 | BERKSHIRE HATHAWAY INC. - CL A* | 443,100 | |||||||||||||
| 443,100 | 1.12 | ||||||||||||||
| LIFE/HEALTH INSUR | |||||||||||||||
| 7,500 | METLIFE, INC. | 367,500 | |||||||||||||
| 367,500 | 0.93 | ||||||||||||||
| PROPERTY & CAS INSUR | |||||||||||||||
| 4,000 | CHUBB CORP. | 390,600 | |||||||||||||
| 390,600 | 0.99 | ||||||||||||||
| REAL ESTATE INV TRST | |||||||||||||||
| 7,158 | PROLOGIS | 334,422 | |||||||||||||
| 334,422 | 0.85 | ||||||||||||||
| SPECIALIZED FINANCE | |||||||||||||||
| 10,000 | MOODYS CORP. | 614,200 | |||||||||||||
| 614,200 | 1.56 | ||||||||||||||
| THRIFTS&MTG FINANCE | |||||||||||||||
| 6,000 | FED HOME LN MTG ASSOC. | 392,100 | |||||||||||||
| 7,500 | WASHINGTON MUTUAL INC. | 326,250 | |||||||||||||
| 718,350 | 1.82 | ||||||||||||||
| HEALTH CARE | 8.27 | ||||||||||||||
| HEALTH CARE EQUIP | |||||||||||||||
| 12,000 | PERKIN ELMER INC. | 282,720 | |||||||||||||
| 282,720 | 0.72 | ||||||||||||||
| HEALTH CARE SUPPLIES | |||||||||||||||
| 16,000 | CAMBREX CORP. | 300,320 | |||||||||||||
| 20,000 | INVERNESS MEDICAL INNOVATIONS INC.* | 474,200 | |||||||||||||
| 774,520 | 1.96 | ||||||||||||||
See Accompanying Notes to Financial Statements
38
Pacific Advisors Balanced Fund
Statement of Investments
as of December 31, 2005
| Quantity or Principal | Description | Current $ Value** | % of Net Assets | ||||||||||||
| COMMON STOCK continued | |||||||||||||||
| PHARMACEUTICALS | |||||||||||||||
| 15,000 | BRISTOL-MYERS SQUIBB CO. | 344,700 | |||||||||||||
| 5,000 | JOHNSON & JOHNSON | 300,500 | |||||||||||||
| 15,000 | MYLAN LABORATORIES INC. | 299,400 | |||||||||||||
| 25,000 | PFIZER INC. | 583,000 | |||||||||||||
| 10,000 | PAR PHARMACEUTICAL INC.* | 313,400 | |||||||||||||
| 8,000 | WYETH | 368,560 | |||||||||||||
| 2,209,560 | 5.59 | ||||||||||||||
| INDUSTRIALS | 6.24 | ||||||||||||||
| AEROSPACE & DEFENSE | |||||||||||||||
| 7,500 | BOEING CO. | 526,800 | |||||||||||||
| 15,000 | CUBIC CORP. | 299,400 | |||||||||||||
| 826,200 | 2.09 | ||||||||||||||
| AIR FREIGHT & SHIPPING | |||||||||||||||
| 5,000 | UNITED PARCEL SERVICES INC. | 375,750 | |||||||||||||
| 375,750 | 0.95 | ||||||||||||||
| COMMERCIAL PRINTING | |||||||||||||||
| 5,000 | R H DONNELLEY CORP.* | 308,100 | |||||||||||||
| 308,100 | 0.78 | ||||||||||||||
| INDUSTRIAL CONGLOMER | |||||||||||||||
| 15,000 | GENERAL ELECTRIC CO. | 525,750 | |||||||||||||
| 15,000 | TYCO INTERNATIONAL LTD. | 432,900 | |||||||||||||
| 958,650 | 2.42 | ||||||||||||||
| INFORMATION TECHNOLOGY | 6.78 | ||||||||||||||
| APPLICATION SOFTWARE | |||||||||||||||
| 10,000 | REYNOLDS AND REYNOLDS CO. | 280,700 | |||||||||||||
| 280,700 | 0.71 | ||||||||||||||
| COMMUNICATIONS EQUIP | |||||||||||||||
| 100,000 | LUCENT TECHNOLOGIES INC.* | 266,000 | |||||||||||||
| 30,000 | NOKIA CORP. - ADR A | 549,000 | |||||||||||||
| 815,000 | 2.06 | ||||||||||||||
| COMPUTER STORAGE/PER | |||||||||||||||
| 12,500 | SANDISK CORP.* | 785,250 | |||||||||||||
| 785,250 | 1.99 | ||||||||||||||
| DATA PROCESSING SRV | |||||||||||||||
| 6,000 | AUTOMATIC DATA PROCESSING, INC. | 275,340 | |||||||||||||
| 275,340 | 0.70 | ||||||||||||||
See Accompanying Notes to Financial Statements
39
Pacific Advisors Balanced Fund
Statement of Investments
as of December 31, 2005
| Quantity or Principal | Description | Current $ Value** | % of Net Assets | ||||||||||||
| COMMON STOCK continued | |||||||||||||||
| SYSTEMS: SOFTWARE | |||||||||||||||
| 20,000 | MICROSOFT CORP. | 523,000 | |||||||||||||
| 523,000 | 1.32 | ||||||||||||||
| MATERIALS | 5.44 | ||||||||||||||
| DIVERSIFD METAL/MNG | |||||||||||||||
| 4,000 | RIO TINTO PLC | 731,160 | |||||||||||||
| 731,160 | 1.85 | ||||||||||||||
| FOREST PRODUCTS | |||||||||||||||
| 16,024 | RAYONIER INC. | 638,556 | |||||||||||||
| 638,556 | 1.61 | ||||||||||||||
| SPECIALTY CHEMICALS | |||||||||||||||
| 10,000 | CABOT MICRO ELECTRONICS INC.* | 293,300 | |||||||||||||
| 293,300 | 0.74 | ||||||||||||||
| STEEL | |||||||||||||||
| 8,000 | RELIANCE STEEL & ALUMINIM CO. | 488,960 | |||||||||||||
| 488,960 | 1.24 | ||||||||||||||
| UTILITIES | 2.32 | ||||||||||||||
| ELECTRIC UTILITIES | |||||||||||||||
| 10,000 | ALLETE INC. | 440,000 | |||||||||||||
| 440,000 | 1.11 | ||||||||||||||
| MULTI UTILITIES/POWR | |||||||||||||||
| 17,500 | DUKE ENERGY CORP. | 480,375 | |||||||||||||
| 480,375 | 1.21 | ||||||||||||||
| TOTAL COMMON STOCK (Cost: $15,186,445) | 23,375,933 | 59.17 | |||||||||||||
| CORPORATE BONDS | |||||||||||||||
| CONSUMER DISCRETIONARY | 1.28 | ||||||||||||||
| AUTO PARTS & EQUIP | |||||||||||||||
| 100,000 | BORGWARNER INC. 8.00% 10/01/19 | 116,469 | |||||||||||||
| 130,000 | DANA CORP. 6.50% 03/01/09 | 104,000 | |||||||||||||
| 220,469 | 0.56 | ||||||||||||||
| HOME FURNISHINGS | |||||||||||||||
| 110,000 | WHIRLPOOL CORP. 9.10% 02/01/08 | 117,667 | |||||||||||||
| 117,667 | 0.30 | ||||||||||||||
| GENL MERCHANDISE STR | |||||||||||||||
| 141,000 | DAYTON HUDSON CO. 8.60% 01/15/12 | 167,046 | |||||||||||||
| 167,046 | 0.42 | ||||||||||||||
See Accompanying Notes to Financial Statements
40
Pacific Advisors Balanced Fund
Statement of Investments
as of December 31, 2005
| Quantity or Principal | Description | Current $ Value** | % of Net Assets | ||||||||||||
| CORPORATE BONDS continued | |||||||||||||||
| CONSUMER STAPLES | 4.34 | ||||||||||||||
| DISTILLERS & VINTNER | |||||||||||||||
| 310,000 | SEAGRAMS & SONS 7.00% 04/15/08 | 314,077 | |||||||||||||
| 314,077 | 0.79 | ||||||||||||||
| FOOD: RETAIL | |||||||||||||||
| 371,000 | SAFEWAY INC. 9.30% 02/01/07 | 384,907 | |||||||||||||
| 200,000 | SAFEWAY INC. 7.00% 09/15/07 | 205,787 | |||||||||||||
| 590,694 | 1.49 | ||||||||||||||
| PACKAGED FOODS/MEATS | |||||||||||||||
| 794,000 | GERBER PRODUCTS 9.00% 10/15/06 | 812,989 | |||||||||||||
| 812,989 | 2.06 | ||||||||||||||
| ENERGY | 5.40 | ||||||||||||||
| INTEGRATED OIL & GAS | |||||||||||||||
| 501,000 | ATLANTIC RICHFIELD 9.125% 03/01/11 | 594,889 | |||||||||||||
| 686,000 | OCCIDENTAL PETROLEUM CORP.10.125% 09/15/09 | 807,094 | |||||||||||||
| 199,000 | PHILLIPS PETE 7.125% 03/15/28 | 208,510 | |||||||||||||
| 1,610,493 | 4.08 | ||||||||||||||
| OIL & GAS EXPLR/PROD | |||||||||||||||
| 190,000 | DEVON ENERGY CORP. 10.125% 11/15/09 | 221,844 | |||||||||||||
| 221,844 | 0.56 | ||||||||||||||
| OIL&GAS REF/MKT/TRAN | |||||||||||||||
| 289,000 | KINDER MORGAN 6.50% 09/01/13 | 299,586 | |||||||||||||
| 299,586 | 0.76 | ||||||||||||||
| FINANCIALS | 6.92 | ||||||||||||||
| CONSUMER FINANCE | |||||||||||||||
| 500,000 | GENL MOTORS ACCEPT CORP. 6.75% 01/15/06 | 499,670 | |||||||||||||
| 450,000 | JOHN DEERE CAPITAL 3.63% 05/25/07 | 442,203 | |||||||||||||
| 941,873 | 2.38 | ||||||||||||||
| DIVERSIFIED FINANCL | |||||||||||||||
| 269,000 | GENERAL ELECTRIC CAPITAL 8.125% 05/15/12 | 312,569 | |||||||||||||
| 312,569 | 0.79 | ||||||||||||||
| FINANCIAL SERVICES, | |||||||||||||||
| 505,000 | NATIONAL RURAL UTILITY 5.70% 01/15/10 | 518,910 | |||||||||||||
| 518,910 | 1.31 | ||||||||||||||
| LIFE/HEALTH INSUR | |||||||||||||||
| 325,000 | TRANSAMERICA CORP. 9.375% 03/01/08 | 351,647 | |||||||||||||
| 351,647 | 0.89 | ||||||||||||||
See Accompanying Notes to Financial Statements
41
Pacific Advisors Balanced Fund
Statement of Investments
as of December 31, 2005
| Quantity or Principal | Description | Current $ Value** | % of Net Assets | ||||||||||||
| CORPORATE BONDS continued | |||||||||||||||
| PROPERTY & CAS INSUR | |||||||||||||||
| 435,000 | OLD REPUBLIC INTL. 7.00% 06/15/07 | 445,901 | |||||||||||||
| 445,901 | 1.13 | ||||||||||||||
| SPECIALIZED FINANCE | |||||||||||||||
| 155,000 | BENEFICIAL CORP. 8.40% 05/15/08 | 166,631 | |||||||||||||
| 166,631 | 0.42 | ||||||||||||||
| HEALTH CARE | 2.66 | ||||||||||||||
| HEALTH CARE EQUIP | |||||||||||||||
| 380,000 | MALLINCKRODT 6.50% 11/15/07 | 387,494 | |||||||||||||
| 387,494 | 0.98 | ||||||||||||||
| HEALTH CARE SUPPLIES | |||||||||||||||
| 520,000 | BAUSCH & LOMB INC. 7.125% 08/01/28 | 562,699 | |||||||||||||
| 562,699 | 1.42 | ||||||||||||||
| MANAGED HEALTH CARE | |||||||||||||||
| 100,000 | CIGNA CORP. 7.40% 05/15/07 | 103,024 | |||||||||||||
| 103,024 | 0.26 | ||||||||||||||
| INDUSTRIALS | 1.42 | ||||||||||||||
| CONSTRUCTION & MACH | |||||||||||||||
| 396,000 | DEERE & COMPANY 8.95% 06/15/19 | 440,097 | |||||||||||||
| 119,000 | CATERPILLAR INC. 9.00% 04/15/06 | 120,247 | |||||||||||||
| 560,344 | 1.42 | ||||||||||||||
| INFORMATION TECHNOLOGY | 0.29 | ||||||||||||||
| COMPUTER HARDWARE | |||||||||||||||
| 100,000 | DIGITAL EQUIPMENT CORP. 7.75% 04/01/23 | 112,831 | |||||||||||||
| 112,831 | 0.29 | ||||||||||||||
| TELECOMMUNICATION SERVICES | 5.07 | ||||||||||||||
| INTG TELECOMM SRVCS | |||||||||||||||
| 487,710 | BELLSOUTH TELECOMMUN 6.30% 12/15/15 | 505,947 | |||||||||||||
| 305,000 | GTE HAWAIIAN TEL 7.00% 02/01/06 | 304,619 | |||||||||||||
| 120,000 | GTE NORTHWEST 7.875% 06/01/26 | 123,576 | |||||||||||||
| 657,000 | GTE SOUTH INC. 6.125% 06/15/07 | 664,508 | |||||||||||||
| 400,000 | GTE SOUTH INC. 6.00% 02/15/08 | 402,640 | |||||||||||||
| 2,001,290 | 5.07 | ||||||||||||||
See Accompanying Notes to Financial Statements
42
Pacific Advisors Balanced Fund
Statement of Investments
as of December 31, 2005
| Quantity or Principal | Description | Current $ Value** | % of Net Assets | ||||||||||||
| CORPORATE BONDS continued | |||||||||||||||
| UTILITIES | 3.12 | ||||||||||||||
| ELECTRIC UTILITIES | |||||||||||||||
| 240,000 | CAROLINA POWER&LIGHT 6.80% 08/15/07 | 246,553 | |||||||||||||
| 100,000 | KENTUCKY UTILITIES 7.92% 05/15/07 | 103,604 | |||||||||||||
| 350,157 | 0.89 | ||||||||||||||
| MULTI UTILITIES/POWR | |||||||||||||||
| 200,000 | FLORIDA PWR & LT 6.00% 06/01/08 | 204,619 | |||||||||||||
| 250,000 | NORTHWESTERN CORP. 7.00% 08/15/23 | 253,125 | |||||||||||||
| 150,000 | POTOMAC ELEC. POWER 6.25% 10/15/07 | 153,112 | |||||||||||||
| 55,000 | POTOMAC ELEC. POWER 6.50% 03/15/08 | 56,785 | |||||||||||||
| 155,000 | POTOMAC ELEC. POWER 5.875% 10/15/08 | 158,193 | |||||||||||||
| 49,281 | RELIANT ENERGY MID ATL 9.237% 07/02/17 | 52,732 | |||||||||||||
| 878,566 | 2.23 | ||||||||||||||
| TOTAL CORPORATE BOND (Cost: $12,184,561) | 12,048,801 | 30.50 | |||||||||||||
| US GOVT SECURITIES | |||||||||||||||
| US GOVERNMENT AGENCY | 6.76 | ||||||||||||||
| US GOVERNMENT AGENCY | |||||||||||||||
| 200,000 | FED HOME LOAN BANK 4.46% 10/28/09 | 196,689 | |||||||||||||
| 196,689 | 0.50 | ||||||||||||||
| US TREASURY BILL | |||||||||||||||
| 2,500,000 | US TREASURY BILL 03/23/06 | 2,476,498 | |||||||||||||
| 2,476,498 | 6.26 | ||||||||||||||
| TOTAL US GOVT SECURITIES (Cost: $2,678,304) | 2,673,187 | 6.76 | |||||||||||||
| SHORT TERM INVESTMENTS | |||||||||||||||
| MONEY MARKET | 3.24 | ||||||||||||||
| SHORT-TERM | |||||||||||||||
| 1,279,408 | UMB MONEY MARKET FIDUCIARY | 1,279,408 | |||||||||||||
| 1,279,408 | 3.24 | ||||||||||||||
| TOTAL SHORT TERM INVESTMENTS (Cost: $1,279,408) | 1,279,408 | 3.24 | |||||||||||||
| TOTAL INVESTMENTS (Cost: $31,328,718) | 39,377,329 | 99.67 | |||||||||||||
| OTHER ASSETS LESS LIABILITIES | 130,198 | 0.33 | |||||||||||||
| TOTAL NET ASSETS | 39,507,527 | 100.00 | |||||||||||||
* Non-income producing.
** The principal amount is stated in U.S. dollars unless otherwise indicated.
See Accompanying Notes to Financial Statements
43
Pacific Advisors Growth Fund
Statement of Investments
as of December 31, 2005
| Quantity or Principal | Description | Current $ Value** | % of Net Assets | ||||||||||||
| COMMON STOCK | |||||||||||||||
| CONSUMER DISCRETIONARY | 1.44 | ||||||||||||||
| HOME IMPROVEMENT | |||||||||||||||
| 500 | HOME DEPOT, INC. | 20,240 | |||||||||||||
| 20,240 | 0.64 | ||||||||||||||
| RESTAURANTS | |||||||||||||||
| 1,125 | APPLEBEE'S INTL. INC. | 25,414 | |||||||||||||
| 25,414 | 0.80 | ||||||||||||||
| ENERGY | 29.97 | ||||||||||||||
| INTEGRATED OIL & GAS | |||||||||||||||
| 1,000 | BRITISH PETROLEUM PLC | 64,220 | |||||||||||||
| 400 | EXXON MOBIL CORP. | 22,468 | |||||||||||||
| 2,000 | MARATHON OIL CORP. | 121,940 | |||||||||||||
| 1,000 | OCCIDENTAL PETROLEUM CORP. | 79,880 | |||||||||||||
| 288,508 | 9.07 | ||||||||||||||
| OIL & GAS DRILLING | |||||||||||||||
| 1,000 | ENCANA CORP. | 45,160 | |||||||||||||
| 1,000 | ULTRA PETROLEUM CORP.* | 55,800 | |||||||||||||
| 100,960 | 3.17 | ||||||||||||||
| OIL & GAS EQUIP/SERV | |||||||||||||||
| 1,500 | CARBO CERAMICS INC. | 84,780 | |||||||||||||
| 1,000 | FMC TECHNOLOGIES INC.* | 42,920 | |||||||||||||
| 5,000 | MITCHAM INDUSTRIES INC.* | 87,350 | |||||||||||||
| 215,050 | 6.75 | ||||||||||||||
| OIL & GAS EXPLR/PROD | |||||||||||||||
| 2,000 | APACHE CORP. | 137,040 | |||||||||||||
| 1,000 | BURLINGTON RESOURCES INC. | 86,200 | |||||||||||||
| 1,000 | CHESAPEAKE ENERGY CORP. | 31,730 | |||||||||||||
| 1,000 | SPDR SELECT SECTOR - ENERGY | 50,310 | |||||||||||||
| 1,000 | XTO ENERGY INC. | 43,940 | |||||||||||||
| 349,220 | 10.98 | ||||||||||||||
| FINANCIALS | 1.09 | ||||||||||||||
| DIVERSIFIED BANKS | |||||||||||||||
| 161 | HSBC HOLDING PLC | 12,956 | |||||||||||||
| 12,956 | 0.41 | ||||||||||||||
| THRIFTS&MTG FINANCE | |||||||||||||||
| 1,000 | SOVEREIGN BANCORP INC. | 21,620 | |||||||||||||
| 21,620 | 0.68 | ||||||||||||||
See Accompanying Notes to Financial Statements
44
Pacific Advisors Growth Fund
Statement of Investments
as of December 31, 2005
| Quantity or Principal | Description | Current $ Value** | % of Net Assets | ||||||||||||
| COMMON STOCK continued | |||||||||||||||
| HEALTH CARE | 28.38 | ||||||||||||||
| HEALTH CARE EQUIP | |||||||||||||||
| 500 | BECTON, DICKINSON AND COMPANY | 30,040 | |||||||||||||
| 2,000 | ST. JUDE MEDICAL INC.* | 100,400 | |||||||||||||
| 2,000 | ZIMMER HOLDINGS INC.* | 134,880 | |||||||||||||
| 265,320 | 8.33 | ||||||||||||||
| HEALTH CARE SERVICES | |||||||||||||||
| 2,500 | CAREMARK RX INC.* | 129,475 | |||||||||||||
| 1,000 | QUEST DIAGNOSTICS, INC. | 51,480 | |||||||||||||
| 180,955 | 5.69 | ||||||||||||||
| MANAGED HEALTH CARE | |||||||||||||||
| 5,000 | AMERICA SVC GROUP INC.* | 79,300 | |||||||||||||
| 1,000 | UNITED HEALTH GROUP INC. | 62,140 | |||||||||||||
| 2,000 | WELLPOINT INC.* | 159,580 | |||||||||||||
| 301,020 | 9.45 | ||||||||||||||
| PHARMACEUTICALS | |||||||||||||||
| 1,200 | JOHNSON & JOHNSON | 72,120 | |||||||||||||
| 3,100 | NATURE'S SUNSHINE PRODUCTS, INC. | 56,048 | |||||||||||||
| 1,200 | PFIZER INC. | 27,984 | |||||||||||||
| 156,152 | 4.91 | ||||||||||||||
| INDUSTRIALS | 10.23 | ||||||||||||||
| AEROSPACE & DEFENSE | |||||||||||||||
| 1,000 | BOEING CO. | 70,240 | |||||||||||||
| 1,000 | HONEYWELL INTERNATIONAL INC. | 37,250 | |||||||||||||
| 107,490 | 3.38 | ||||||||||||||
| BUILDING PRODUCTS | |||||||||||||||
| 2,000 | ELKCORP | 67,320 | |||||||||||||
| 67,320 | 2.12 | ||||||||||||||
| INDUSTRIAL CONGLOMER | |||||||||||||||
| 2,000 | GENERAL ELECTRIC CO. | 70,100 | |||||||||||||
| 1,000 | TYCO INTERNATIONAL LTD. | 28,860 | |||||||||||||
| 98,960 | 3.11 | ||||||||||||||
| INDUSTRIAL MACHINERY | |||||||||||||||
| 500 | ITT INDUSTRIES, INC. | 51,410 | |||||||||||||
| 51,410 | 1.62 | ||||||||||||||
See Accompanying Notes to Financial Statements
45
Pacific Advisors Growth Fund
Statement of Investments
as of December 31, 2005
| Quantity or Principal | Description | Current $ Value** | % of Net Assets | ||||||||||||
| COMMON STOCK continued | |||||||||||||||
| INFORMATION TECHNOLOGY | 12.66 | ||||||||||||||
| APPLICATION SOFTWARE | |||||||||||||||
| 2,000 | INTERVOICE INC.* | 15,920 | |||||||||||||
| 15,920 | 0.50 | ||||||||||||||
| COMMUNICATIONS EQUIP | |||||||||||||||
| 1,000 | ANDREW CORP.* | 10,730 | |||||||||||||
| 1,500 | CISCO SYSTEMS INC.* | 25,680 | |||||||||||||
| 1,000 | QUALCOMM INC. | 43,080 | |||||||||||||
| 79,490 | 2.50 | ||||||||||||||
| COMPUTER HARDWARE | |||||||||||||||
| 200 | INTL. BUSINESS MACHINES CORP. | 16,440 | |||||||||||||
| 16,440 | 0.52 | ||||||||||||||
| COMPUTER STORAGE/PER | |||||||||||||||
| 1,500 | SEAGATE TECHNOLOGY | 29,985 | |||||||||||||
| 29,985 | 0.94 | ||||||||||||||
| ELECTRONIC EQ MANUF | |||||||||||||||
| 3,000 | ITRON INC.* | 120,120 | |||||||||||||
| 1,500 | LOWRANCE ELECTRONICS INC. | 39,315 | |||||||||||||
| 159,435 | 5.01 | ||||||||||||||
| SEMICONDUCTORS | |||||||||||||||
| 1,000 | INTEL CORP. | 24,960 | |||||||||||||
| 24,960 | 0.78 | ||||||||||||||
| SYSTEMS: SOFTWARE | |||||||||||||||
| 2,000 | MICROSOFT CORP. | 52,300 | |||||||||||||
| 2,000 | ORACLE CORP.* | 24,420 | |||||||||||||
| 76,720 | 2.41 | ||||||||||||||
| MATERIALS | 3.97 | ||||||||||||||
| FOREST PRODUCTS | |||||||||||||||
| 1,000 | LOUISIANA PACIFIC CORP. | 27,470 | |||||||||||||
| 27,470 | 0.86 | ||||||||||||||
| SPECIALTY CHEMICALS | |||||||||||||||
| 1,000 | LYONDELL CHEMICAL CO. | 23,820 | |||||||||||||
| 23,820 | 0.75 | ||||||||||||||
| STEEL | |||||||||||||||
| 2,000 | COMMERCIAL METALS CO. | 75,080 | |||||||||||||
| 75,080 | 2.36 | ||||||||||||||
See Accompanying Notes to Financial Statements
46
Pacific Advisors Growth Fund
Statement of Investments
as of December 31, 2005
| Quantity or Principal | Description | Current $ Value** | % of Net Assets | ||||||||||||
| COMMON STOCK continued | |||||||||||||||
| TELECOMMUNICATION SERVICES | 1.92 | ||||||||||||||
| INTG TELECOMM SRVCS | |||||||||||||||
| 5,000 | CITIZENS COMMUNICATIONS CO. | 61,150 | |||||||||||||
| 61,150 | 1.92 | ||||||||||||||
| TOTAL COMMON STOCK (Cost: $2,449,244) | 2,853,065 | 89.66 | |||||||||||||
| SHORT TERM INVESTMENTS | |||||||||||||||
| MONEY MARKET | 9.17 | ||||||||||||||
| SHORT-TERM | |||||||||||||||
| 291,967 | UMB MONEY MARKET FIDUCIARY | 291,967 | |||||||||||||
| 291,967 | 9.17 | ||||||||||||||
| TOTAL SHORT TERM INVESTMENTS (Cost: $291,967) | 291,967 | 9.17 | |||||||||||||
| TOTAL INVESTMENTS (Cost: $2,741,211) | 3,145,032 | 98.83 | |||||||||||||
| OTHER ASSETS LESS LIABILITIES | 37,230 | 1.17 | |||||||||||||
| TOTAL NET ASSETS | 3,182,262 | 100.00 | |||||||||||||
* Non-income producing.
** The principal amount is stated in U.S. dollars unless otherwise indicated.
See Accompanying Notes to Financial Statements
47
Pacific Advisors Multi-Cap Value Fund
Statement of Investments
as of December 31, 2005
| Quantity or Principal | Description | Current $ Value** | % of Net Assets | ||||||||||||
| COMMON STOCK | |||||||||||||||
| CONSUMER DISCRETIONARY | 2.95 | ||||||||||||||
| HOME IMPROVEMENT | |||||||||||||||
| 8,000 | HOME DEPOT, INC. | 323,840 | |||||||||||||
| 323,840 | 2.95 | ||||||||||||||
| CONSUMER STAPLES | 2.56 | ||||||||||||||
| HYPERMKTS/SUPER CTRS | |||||||||||||||
| 6,000 | WAL-MART STORES, INC. | 280,800 | |||||||||||||
| 280,800 | 2.56 | ||||||||||||||
| ENERGY | 21.37 | ||||||||||||||
| INTEGRATED OIL & GAS | |||||||||||||||
| 6,000 | CHEVRON CORP. | 340,620 | |||||||||||||
| 6,000 | MARATHON OIL CORP. | 365,820 | |||||||||||||
| 4,000 | ROYAL DUTCH SHELL A | 245,960 | |||||||||||||
| 952,400 | 8.69 | ||||||||||||||
| OIL & GAS EQUIP/SERV | |||||||||||||||
| 28,400 | MITCHAM INDUSTRIES INC.* | 496,148 | |||||||||||||
| 496,148 | 4.52 | ||||||||||||||
| OIL & GAS EXPLR/PROD | |||||||||||||||
| 3,500 | APACHE CORP. | 239,820 | |||||||||||||
| 10,000 | CHESAPEAKE ENERGY CORP. | 317,300 | |||||||||||||
| 557,120 | 5.08 | ||||||||||||||
| OIL&GAS REF/MKT/TRAN | |||||||||||||||
| 13,000 | MARITRANS INC. | 338,260 | |||||||||||||
| 338,260 | 3.08 | ||||||||||||||
| FINANCIALS | 14.41 | ||||||||||||||
| DIVERSIFIED BANKS | |||||||||||||||
| 3,500 | BANK OF AMERICA CORP. | 161,525 | |||||||||||||
| 161,525 | 1.47 | ||||||||||||||
| DIVERSIFIED FINANCL | |||||||||||||||
| 5,000 | CITIGROUP INC. | 242,650 | |||||||||||||
| 242,650 | 2.21 | ||||||||||||||
| FINANCIAL SERVICES | |||||||||||||||
| 7,000 | MBNA CORP. | 190,120 | |||||||||||||
| 190,120 | 1.73 | ||||||||||||||
See Accompanying Notes to Financial Statements
48
Pacific Advisors Multi-Cap Value Fund
Statement of Investments
as of December 31, 2005
| Quantity or Principal | Description | Current $ Value** | % of Net Assets | ||||||||||||
| COMMON STOCK continued | |||||||||||||||
| INVESTMENT BANK/BRKG | |||||||||||||||
| 2,500 | GOLDMAN SACHS GROUP INC. | 319,275 | |||||||||||||
| 319,275 | 2.91 | ||||||||||||||
| MULTI LINE INSURANCE | |||||||||||||||
| 5,000 | AMERICAN INT'L GROUP, INC. | 341,150 | |||||||||||||
| 341,150 | 3.11 | ||||||||||||||
| THRIFTS&MTG FINANCE | |||||||||||||||
| 7,500 | WASHINGTON MUTUAL INC. | 326,250 | |||||||||||||
| 326,250 | 2.98 | ||||||||||||||
| HEALTH CARE | 14.41 | ||||||||||||||
| BIOTECHNOLOGY | |||||||||||||||
| 8,500 | BIOGEN IDEC INC.* | 385,305 | |||||||||||||
| 385,305 | 3.51 | ||||||||||||||
| HEALTH CARE EQUIP | |||||||||||||||
| 12,000 | BOSTON SCIENTIFIC CORP.* | 293,880 | |||||||||||||
| 4,200 | ZIMMER HOLDINGS INC.* | 283,248 | |||||||||||||
| 577,128 | 5.26 | ||||||||||||||
| HEALTH CARE SUPPLIES | |||||||||||||||
| 16,000 | SERLOGICALS CORP.* | 315,840 | |||||||||||||
| 315,840 | 2.88 | ||||||||||||||
| PHARMACEUTICALS | |||||||||||||||
| 10,000 | ENDO PHARMACEUTICALS HOLDINGS INC.* | 302,600 | |||||||||||||
| 302,600 | 2.76 | ||||||||||||||
| INDUSTRIALS | 12.44 | ||||||||||||||
| AEROSPACE & DEFENSE | |||||||||||||||
| 5,000 | HONEYWELL INTERNATIONAL INC. | 186,250 | |||||||||||||
| 186,250 | 1.70 | ||||||||||||||
| BUILDING PRODUCTS | |||||||||||||||
| 10,000 | ELKCORP | 336,600 | |||||||||||||
| 336,600 | 3.07 | ||||||||||||||
| ELECTRICAL COMPON/EQ | |||||||||||||||
| 50,000 | GRAFTECH INTL. LTD.* | 311,000 | |||||||||||||
| 20,000 | METROLOGIC INSTRUMTS INC.* | 385,200 | |||||||||||||
| 696,200 | 6.35 | ||||||||||||||
| INDUSTRIAL CONGLOMER | |||||||||||||||
| 5,000 | TYCO INTERNATIONAL LTD. | 144,300 | |||||||||||||
| 144,300 | 1.32 | ||||||||||||||
See Accompanying Notes to Financial Statements
49
Pacific Advisors Multi-Cap Value Fund
Statement of Investments
as of December 31, 2005
| Quantity or Principal | Description | Current $ Value** | % of Net Assets | ||||||||||||
| COMMON STOCK continued | |||||||||||||||
| INFORMATION TECHNOLOGY | 22.39 | ||||||||||||||
| COMMUNICATIONS EQUIP | |||||||||||||||
| 15,000 | CISCO SYSTEMS INC.* | 256,800 | |||||||||||||
| 100,000 | LUCENT TECHNOLOGIES INC.* | 266,000 | |||||||||||||
| 8,000 | QUALCOMM INC. | 344,640 | |||||||||||||
| 867,440 | 7.91 | ||||||||||||||
| COMPUTER HARDWARE | |||||||||||||||
| 10,000 | DELL COMPUTER CORP.* | 299,900 | |||||||||||||
| 3,750 | INTL. BUSINESS MACHINES CORP. | 308,250 | |||||||||||||
| 608,150 | 5.55 | ||||||||||||||
| COMPUTER STORAGE/PER | |||||||||||||||
| 25,000 | EMC CORP.* | 340,500 | |||||||||||||
| 340,500 | 3.11 | ||||||||||||||
| SEMICONDUCTORS | |||||||||||||||
| 13,000 | INTEL CORP. | 324,480 | |||||||||||||
| 324,480 | 2.96 | ||||||||||||||
| SYSTEMS: SOFTWARE | |||||||||||||||
| 12,000 | MICROSOFT CORP. | 313,800 | |||||||||||||
| 313,800 | 2.86 | ||||||||||||||
| MATERIALS | 3.11 | ||||||||||||||
| STEEL | |||||||||||||||
| 7,100 | US STEEL CORP. | 341,297 | |||||||||||||
| 341,297 | 3.11 | ||||||||||||||
| TELECOMMUNICATION SERVICES | 2.79 | ||||||||||||||
| INTG TELECOMM SRVCS | |||||||||||||||
| 12,500 | AT&T INC. | 306,125 | |||||||||||||
| 306,125 | 2.79 | ||||||||||||||
| TOTAL COMMON STOCK (Cost: $9,119,485) | 10,575,553 | 96.43 | |||||||||||||
See Accompanying Notes to Financial Statements
50
Pacific Advisors Multi-Cap Value Fund
Statement of Investments
as of December 31, 2005
| Quantity or Principal | Description | Current $ Value** | % of Net Assets | ||||||||||||
| SHORT TERM INVESTMENTS | |||||||||||||||
| MONEY MARKET | 2.96 | ||||||||||||||
| SHORT-TERM | |||||||||||||||
| 324,264 | UMB MONEY MARKET FIDUCIARY | 324,264 | |||||||||||||
| 324,264 | 2.96 | ||||||||||||||
| TOTAL SHORT TERM INVESTMENTS (Cost: $324,264) | 324,264 | 2.96 | |||||||||||||
| TOTAL INVESTMENTS (Cost: $9,443,749) | 10,899,817 | 99.39 | |||||||||||||
| OTHER ASSETS LESS LIABILITIES | 67,080 | 0.61 | |||||||||||||
| TOTAL NET ASSETS | 10,966,897 | 100.00 | |||||||||||||
* Non-income producing.
** The principal amount is stated in U.S. dollars unless otherwise indicated.
See Accompanying Notes to Financial Statements
51
Pacific Advisors Small Cap Fund
Statement of Investments
as of December 31, 2005
| Quantity or Principal | Description | Current $ Value** | % of Net Assets | ||||||||||||
| COMMON STOCK | |||||||||||||||
| CONSUMER DISCRETIONARY | 13.75 | ||||||||||||||
| APPAREL - RETAIL | |||||||||||||||
| 48,996 | ASHWORTH INC.* | 414,016 | |||||||||||||
| 414,016 | 2.02 | ||||||||||||||
| AUTO PARTS & EQUIP | |||||||||||||||
| 20,000 | KEYSTONE AUTOMOTIVE INDUSTRIES* | 629,600 | |||||||||||||
| 629,600 | 3.07 | ||||||||||||||
| HOME FURNISHINGS | |||||||||||||||
| 26,000 | CRAFTMADE INTERNATIONAL INC. | 520,260 | |||||||||||||
| 520,260 | 2.54 | ||||||||||||||
| SPECIALTY STORES | |||||||||||||||
| 34,000 | CONNS INC.* | 1,253,580 | |||||||||||||
| 1,253,580 | 6.12 | ||||||||||||||
| ENERGY | 23.26 | ||||||||||||||
| OIL & GAS EQUIP/SERV | |||||||||||||||
| 15,000 | KIRBY CORP.* | 782,550 | |||||||||||||
| 49,000 | MATRIX SERVICE CO.* | 482,160 | |||||||||||||
| 90,000 | MITCHAM INDUSTRIES INC.* | 1,572,300 | |||||||||||||
| 2,837,010 | 13.85 | ||||||||||||||
| OIL & GAS EXPLR/PROD | |||||||||||||||
| 26,000 | CHESAPEAKE ENERGY CORP. | 824,980 | |||||||||||||
| 34,000 | DENBURY RES. INC.* | 774,520 | |||||||||||||
| 9,000 | REMINGTON OIL & GAS CORP.* | 328,500 | |||||||||||||
| 1,928,000 | 9.41 | ||||||||||||||
| FINANCIALS | 10.83 | ||||||||||||||
| REGIONAL BANKS | |||||||||||||||
| 12,000 | EAST WEST BANCORP INC. | 437,880 | |||||||||||||
| 22,000 | NARA BANKCORP INC. | 391,160 | |||||||||||||
| 829,040 | 4.05 | ||||||||||||||
| SPECIALIZED FINANCE | |||||||||||||||
| 45,000 | EZCORP INC.* | 687,600 | |||||||||||||
| 24,000 | FIRST CASH FINANCIAL SERVICES, INC.* | 699,840 | |||||||||||||
| 1,387,440 | 6.78 | ||||||||||||||
| HEALTH CARE | 3.90 | ||||||||||||||
| MANAGED HEALTH CARE | |||||||||||||||
| 33,000 | AMERICA SVC GROUP INC.* | 523,380 | |||||||||||||
| 115,000 | UNITED AMERICAN HEALTHCARE CORP.* | 276,000 | |||||||||||||
| 799,380 | 3.90 | ||||||||||||||
See Accompanying Notes to Financial Statements
52
Pacific Advisors Small Cap Fund
Statement of Investments
as of December 31, 2005
| Quantity or Principal | Description | Current $ Value** | % of Net Assets | ||||||||||||
| COMMON STOCK continued | |||||||||||||||
| INDUSTRIALS | 38.91 | ||||||||||||||
| AEROSPACE & DEFENSE | |||||||||||||||
| 22,000 | AVIALL, INC.* | 633,600 | |||||||||||||
| 633,600 | 3.09 | ||||||||||||||
| BUILDING PRODUCTS | |||||||||||||||
| 26,000 | ELKCORP | 875,160 | |||||||||||||
| 875,160 | 4.27 | ||||||||||||||
| DIVERSIFIED COML SRV | |||||||||||||||
| 130,000 | DARLING INTERNATIONA INC.* | 516,100 | |||||||||||||
| 18,000 | MOBILE MINI INC.* | 853,200 | |||||||||||||
| 20,000 | TEAM, INC.* | 422,200 | |||||||||||||
| 1,791,500 | 8.74 | ||||||||||||||
| ELECTRICAL COMPON/EQ | |||||||||||||||
| 22,000 | ENCORE WIRE CORP.* | 500,720 | |||||||||||||
| 90,000 | GRAFTECH INTL. LTD.* | 559,800 | |||||||||||||
| 1,060,520 | 5.17 | ||||||||||||||
| ENVIROMENTAL SERVICE | |||||||||||||||
| 52,000 | AMERICAN ECOLOGY CORP. | 750,360 | |||||||||||||
| 42,000 | TETRA TECH INC.* | 658,140 | |||||||||||||
| 1,408,500 | 6.87 | ||||||||||||||
| RAILROADS & TRUCKING | |||||||||||||||
| 33,000 | FROZEN FOOD EXPRESS INDUSTRIES* | 363,990 | |||||||||||||
| 62,000 | RAILAMERICA INC.* | 681,380 | |||||||||||||
| 30,000 | SCS TRANSPORTATION, INC.* | 637,500 | |||||||||||||
| 30,000 | US XPRESS ENTERPRISES INC.* | 521,400 | |||||||||||||
| 2,204,270 | 10.77 | ||||||||||||||
| INFORMATION TECHNOLOGY | 6.31 | ||||||||||||||
| APPLICATION SOFTWARE | |||||||||||||||
| 85,110 | INTERVOICE INC.* | 677,476 | |||||||||||||
| 677,476 | 3.31 | ||||||||||||||
| SYSTEMS: SOFTWARE | |||||||||||||||
| 70,000 | TYLER TECHNOLOGIES INC.* | 614,600 | |||||||||||||
| 614,600 | 3.00 | ||||||||||||||
| MATERIALS | 5.13 | ||||||||||||||
| STEEL | |||||||||||||||
| 28,000 | COMMERCIAL METALS CO. | 1,051,120 | |||||||||||||
| 1,051,120 | 5.13 | ||||||||||||||
See Accompanying Notes to Financial Statements
53
Pacific Advisors Small Cap Fund
Statement of Investments
as of December 31, 2005
| Quantity or Principal | Description | Current $ Value** | % of Net Assets | ||||||||||||
| COMMON STOCK continued | |||||||||||||||
| TELECOMMUNICATION SERVICES | 1.69 | ||||||||||||||
| INTG TELECOMM SRVCS | |||||||||||||||
| 40,000 | TALK AMERICA HOLDING, INC.* | 345,200 | |||||||||||||
| 345,200 | 1.69 | ||||||||||||||
| TOTAL COMMON STOCK (Cost: $12,152,019) | 21,260,272 | 103.78 | |||||||||||||
| TOTAL INVESTMENTS (Cost: $12,152,019) | 21,260,272 | 103.78 | |||||||||||||
| OTHER ASSETS LESS LIABILITIES | (774,005 | ) | (3.78 | ) | |||||||||||
| TOTAL NET ASSETS | 20,486,267 | 100.00 | |||||||||||||
* Non-income producing.
** The principal amount is stated in U.S. dollars unless otherwise indicated.
See Accompanying Notes to Financial Statements
54
(This page has been left blank intentionally.)
55
Pacific Advisors Fund Inc.
Statement of Assets and Liabilities
December 31, 2005
| Government Securities Fund | Income and Equity Fund | Balanced Fund | Growth Fund | Multi-Cap Value Fund | Small Cap Fund | ||||||||||||||||||||||
| Assets | |||||||||||||||||||||||||||
| Investment Securities | |||||||||||||||||||||||||||
| At cost | $ | 5,932,493 | $ | 11,287,221 | $ | 30,049,310 | $ | 2,449,244 | $ | 9,119,486 | $ | 12,152,019 | |||||||||||||||
| At market value | $ | 5,897,969 | $ | 11,217,489 | $ | 38,097,921 | $ | 2,853,065 | $ | 10,575,553 | $ | 21,260,272 | |||||||||||||||
| Short-term investments, at cost, which is equal to market | 88,972 | 413,269 | 1,279,408 | 291,967 | 324,264 | - | |||||||||||||||||||||
| Accrued income receivable | 59,921 | 127,262 | 239,193 | 2,502 | 3,185 | 5,025 | |||||||||||||||||||||
| Receivable for investments sold | - | - | - | 26,299 | - | 39,557 | |||||||||||||||||||||
| Receivable for capital shares sold | 433 | 33 | 98,343 | 21,111 | 115,889 | 32,659 | |||||||||||||||||||||
| Other assets | - | 814 | - | - | - | 98 | |||||||||||||||||||||
| Total assets | 6,047,295 | 11,758,867 | 39,714,865 | 3,194,944 | 11,018,891 | 21,337,611 | |||||||||||||||||||||
| Liabilities | |||||||||||||||||||||||||||
| Bank Borrowings (Note 7) | - | - | - | - | - | 613,914 | |||||||||||||||||||||
| Payable for investments purchased | - | - | - | - | - | 156,337 | |||||||||||||||||||||
| Payable for fund shares redeemed | 20,294 | 14,626 | 32,674 | - | 2,720 | 1,413 | |||||||||||||||||||||
| Accounts payable | 23,345 | 36,362 | 133,000 | 8,950 | 33,400 | 56,200 | |||||||||||||||||||||
| Accounts payable to related parties (Note 3) | 4,946 | 6,923 | 16,536 | 3,732 | 6,602 | 10,651 | |||||||||||||||||||||
| Payable to Investment Manager (Note 3) | - | - | 25,128 | - | 9,272 | 12,829 | |||||||||||||||||||||
| Total liabilities | 48,585 | 57,911 | 207,338 | 12,682 | 51,994 | 851,344 | |||||||||||||||||||||
| Net Assets | $ | 5,998,710 | $ | 11,700,956 | $ | 39,507,527 | $ | 3,182,262 | $ | 10,966,897 | $ | 20,486,267 | |||||||||||||||
| Summary of Shareholders' Equity | |||||||||||||||||||||||||||
| Paid in capital | 7,045,344 | 11,784,718 | 31,519,104 | 3,471,633 | 9,376,219 | 11,345,951 | |||||||||||||||||||||
| Accumulated undistributed net investment income | - | 775 | 13,733 | 190 | - | - | |||||||||||||||||||||
| Accumulated undistributed net realized gain (losses) on security transactions | (1,012,110 | ) | (14,805 | ) | (73,921 | ) | (693,382 | ) | 134,611 | 32,063 | |||||||||||||||||
| Net unrealized appreciation of investments | (34,524 | ) | (69,732 | ) | 8,048,611 | 403,821 | 1,456,067 | 9,108,253 | |||||||||||||||||||
| Net assets at December 31, 2005 | $ | 5,998,710 | $ | 11,700,956 | $ | 39,507,527 | $ | 3,182,262 | $ | 10,966,897 | $ | 20,486,267 | |||||||||||||||
| Class A: | |||||||||||||||||||||||||||
| Net assets | $ | 2,218,548 | $ | 4,435,552 | $ | 6,323,113 | $ | 1,650,582 | $ | 3,072,556 | $ | 15,883,945 | |||||||||||||||
| Shares authorized | 50,000,000 | 50,000,000 | 50,000,000 | 50,000,000 | 50,000,000 | 50,000,000 | |||||||||||||||||||||
| Shares outstanding | 239,414 | 435,105 | 363,510 | 193,330 | 250,462 | 617,265 | |||||||||||||||||||||
| Net asset value and redemption price per share | $ | 9.27 | $ | 10.19 | $ | 17.39 | $ | 8.54 | $ | 12.27 | $ | 25.73 | |||||||||||||||
| Maximum offering price per share | $ | 9.73 | $ | 10.70 | $ | 18.45 | $ | 9.06 | $ | 13.02 | $ | 27.30 | |||||||||||||||
| Sales load | 4.75 | % | 4.75 | % | 5.75 | % | 5.75 | % | 5.75 | % | 5.75 | % | |||||||||||||||
| Class C: | |||||||||||||||||||||||||||
| Net assets | $ | 3,780,162 | $ | 7,265,404 | $ | 33,184,414 | $ | 1,531,680 | $ | 7,894,341 | $ | 4,602,322 | |||||||||||||||
| Shares authorized | 50,000,000 | 50,000,000 | 50,000,000 | 50,000,000 | 50,000,000 | 50,000,000 | |||||||||||||||||||||
| Shares outstanding | 413,925 | 741,248 | 1,961,244 | 190,913 | 661,956 | 197,396 | |||||||||||||||||||||
| Net asset value and redemption price per share | $ | 9.13 | $ | 9.80 | $ | 16.92 | $ | 8.02 | $ | 11.93 | $ | 23.32 | |||||||||||||||
See Accompanying Notes to Financial Statements
56
57
Pacific Advisors Fund Inc.
Statement of Operations
For the year ended December 31, 2005
| Government Securities Fund | Income and Equity Fund | Balanced Fund | Growth Fund | Multi-Cap Value Fund | Small Cap Fund | ||||||||||||||||||||||
| Investment Income | |||||||||||||||||||||||||||
| Dividends | $ | 46,592 | $ | 135,112 | $ | 451,481 | $ | 24,344 | $ | 122,649 | $ | 44,090 | |||||||||||||||
| Interest | 348,125 | 367,513 | 831,358 | 7,128 | 3,547 | - | |||||||||||||||||||||
| Total Income | 394,717 | 502,625 | 1,282,839 | 31,472 | 126,196 | 44,090 | |||||||||||||||||||||
| Expenses | |||||||||||||||||||||||||||
| Investment Management Fees | 52,001 | 88,364 | 275,675 | 18,574 | 93,181 | 145,079 | |||||||||||||||||||||
| Transfer Agent Fees | 49,143 | 48,312 | 104,752 | 39,647 | 52,649 | 114,979 | |||||||||||||||||||||
| Fund accounting fees | 44,128 | 65,610 | 209,019 | 19,829 | 51,913 | 112,944 | |||||||||||||||||||||
| Legal Fees | 11,277 | 16,161 | 55,009 | 3,255 | 13,059 | 33,860 | |||||||||||||||||||||
| Audit Fees | 12,350 | 17,630 | 54,735 | 3,145 | 13,395 | 29,645 | |||||||||||||||||||||
| Registration Fees | 7,828 | 9,133 | 43,186 | 1,910 | 7,468 | 40,407 | |||||||||||||||||||||
| Printing | 9,109 | 8,778 | 37,556 | 5,055 | 11,735 | 37,914 | |||||||||||||||||||||
| Custody Fees | 8,674 | 8,006 | 10,351 | 6,844 | 7,348 | 9,072 | |||||||||||||||||||||
| Interest on Borrowings | - | - | - | - | - | 49,505 | |||||||||||||||||||||
| Director Fees/Meetings | 2,255 | 2,575 | 9,470 | 710 | 2,495 | 7,495 | |||||||||||||||||||||
| Distribution and Service (12b-1) Fees (Note 3) | 62,470 | 88,570 | 320,751 | 14,145 | 73,598 | 78,222 | |||||||||||||||||||||
| Other Expenses | 9,623 | 14,335 | 45,890 | 2,494 | 11,083 | 25,347 | |||||||||||||||||||||
| Total Expenses, before fees waived | 268,858 | 367,474 | 1,166,394 | 115,608 | 337,924 | 684,469 | |||||||||||||||||||||
| Less fees waived (Note 3) | 52,001 | 79,152 | - | 42,078 | 2,524 | - | |||||||||||||||||||||
| Net Expenses | 216,857 | 288,322 | 1,166,394 | 73,530 | 335,400 | 684,469 | |||||||||||||||||||||
| Net Investment Income (Loss) | 177,860 | 214,303 | 116,445 | (42,058 | ) | (209,204 | ) | (640,379 | ) | ||||||||||||||||||
| Net Realized and Unrealized Gain (Loss) on Investments | |||||||||||||||||||||||||||
| Net realized gain (loss) on investments | (38,401 | ) | (17,091 | ) | (102,313 | ) | 2,648 | 694,567 | 1,654,549 | ||||||||||||||||||
| Change in net unrealized appreciation (depreciation) of investments | (91,625 | ) | (247,573 | ) | 1,904,889 | 149,899 | 385,782 | (77,742 | ) | ||||||||||||||||||
| (130,026 | ) | (264,664 | ) | 1,802,576 | 152,547 | 1,080,349 | 1,576,807 | ||||||||||||||||||||
| Net Increase (Decrease) in Net Assets Resulting from Operations | $ | 47,834 | $ | (50,361 | ) | $ | 1,919,021 | $ | 110,489 | $ | 871,145 | $ | 936,428 | ||||||||||||||
See Accompanying Notes to Financial Statements
58
59
Pacific Advisors Fund Inc.
Statement of Changes in Net Assets
| Government Securities Fund | Income and Equity Fund | Balanced Fund | |||||||||||||||||||||||||
| Year ended December 31, 2005 | Year ended December 31, 2004 | Year ended December 31, 2005 | Year ended December 31, 2004 | Year ended December 31, 2005 | Year ended December 31, 2004 | ||||||||||||||||||||||
| Increase (Decrease) in Net Assets From Operations | |||||||||||||||||||||||||||
| Net investment income (loss) | $ | 177,860 | $ | 150,054 | $ | 214,303 | $ | 157,825 | $ | 116,445 | $ | 107,607 | |||||||||||||||
| Net realized gain (loss) on investments | (38,401 | ) | (117,998 | ) | (17,091 | ) | 70,211 | (102,313 | ) | 95,014 | |||||||||||||||||
| Change in net unrealized appreciation (depreciation) of investments | (91,625 | ) | (80,124 | ) | (247,573 | ) | 53,886 | 1,904,889 | 1,424,341 | ||||||||||||||||||
| Increase (decrease) in net assets resulting from operations | 47,834 | (48,068 | ) | (50,361 | ) | 281,922 | 1,919,021 | 1,626,962 | |||||||||||||||||||
| From Distributions to Shareholders | |||||||||||||||||||||||||||
| Class A: | |||||||||||||||||||||||||||
| Net investment income | (82,832 | ) | (52,891 | ) | (102,321 | ) | (62,235 | ) | (38,021 | ) | (45,542 | ) | |||||||||||||||
| Net capital gains | - | - | (4,792 | ) | (7,186 | ) | (5,033 | ) | (18,237 | ) | |||||||||||||||||
| Return of capital | (176 | ) | - | (60 | ) | - | (14,023 | ) | - | ||||||||||||||||||
| Class C: | |||||||||||||||||||||||||||
| Net investment income | (99,301 | ) | (96,281 | ) | (112,720 | ) | (94,485 | ) | (41,559 | ) | (41,450 | ) | |||||||||||||||
| Net capital gains | - | - | (8,205 | ) | (16,833 | ) | (27,266 | ) | (94,455 | ) | |||||||||||||||||
| Return of capital | (212 | ) | - | (67 | ) | - | (15,327 | ) | - | ||||||||||||||||||
| Decrease in net assets resulting from distributions | (182,521 | ) | (149,172 | ) | (228,165 | ) | (180,739 | ) | (141,229 | ) | (199,684 | ) | |||||||||||||||
| From Capital Share Transactions (Note 6) | |||||||||||||||||||||||||||
| Proceeds from shares sold | 696,585 | 515,159 | 2,902,515 | 4,868,286 | 5,727,049 | 7,567,838 | |||||||||||||||||||||
| Proceeds from shares purchased by reinvestment of dividends | 155,459 | 131,825 | 221,250 | 171,382 | 135,769 | 193,647 | |||||||||||||||||||||
| Cost of shares repurchased | (4,629,907 | ) | (4,986,174 | ) | (2,493,208 | ) | (1,043,357 | ) | (3,299,888 | ) | (2,114,128 | ) | |||||||||||||||
| Increase (decrease) in net assets derived from capital share transactions | (3,777,863 | ) | (4,339,190 | ) | 630,557 | 3,996,311 | 2,562,930 | 5,647,357 | |||||||||||||||||||
| Increase (decrease) in net assets | (3,912,550 | ) | (4,536,430 | ) | 352,031 | 4,097,494 | 4,340,722 | 7,074,635 | |||||||||||||||||||
| Net Assets | |||||||||||||||||||||||||||
| Beginning of year | 9,911,260 | 14,447,690 | 11,348,925 | 7,251,431 | 35,166,805 | 28,092,170 | |||||||||||||||||||||
| End of year | $ | 5,998,710 | $ | 9,911,260 | $ | 11,700,956 | $ | 11,348,925 | $ | 39,507,527 | $ | 35,166,805 | |||||||||||||||
| Including undistributed net investment income of | $ | - | $ | 4,224 | $ | 775 | $ | 7,415 | $ | 13,733 | $ | 32,747 | |||||||||||||||
See Accompanying Notes to Financial Statements
60
61
Pacific Advisors Fund Inc.
Statement of Changes in Net Assets
| Growth Fund | Multi-Cap Value Fund | Small Cap Fund | |||||||||||||||||||||||||
| Year ended December 31, 2005 | Year ended December 31, 2004 | Year ended December 31, 2005 | Year ended December 31, 2004 | Year ended December 31, 2005 | Year ended December 31, 2004 | ||||||||||||||||||||||
| Increase (Decrease) in Net Assets From Operations | |||||||||||||||||||||||||||
| Net investment income (loss) | $ | (42,058 | ) | $ | (19,379 | ) | $ | (209,204 | ) | $ | (114,979 | ) | $ | (640,379 | ) | $ | (470,994 | ) | |||||||||
| Net realized gain (loss) on investments | 2,648 | 9,120 | 694,567 | 262,491 | 1,654,549 | 218,158 | |||||||||||||||||||||
| Change in net unrealized appreciation (depreciation) of investments | 149,899 | 175,858 | 385,782 | 278,823 | (77,742 | ) | 5,125,898 | ||||||||||||||||||||
| Increase (decrease) in net assets resulting from operations | 110,489 | 165,599 | 871,145 | 426,335 | 936,428 | 4,873,062 | |||||||||||||||||||||
| From Distributions to Shareholders | |||||||||||||||||||||||||||
| Class A: | |||||||||||||||||||||||||||
| Net investment income | - | - | - | - | - | - | |||||||||||||||||||||
| Net capital gains | - | - | (155,830 | ) | (68,529 | ) | (1,090,218 | ) | (115,121 | ) | |||||||||||||||||
| Return of capital | - | - | - | - | - | - | |||||||||||||||||||||
| Class C: | |||||||||||||||||||||||||||
| Net investment income | - | - | - | - | - | - | |||||||||||||||||||||
| Net capital gains | - | - | (404,126 | ) | (184,774 | ) | (358,968 | ) | (27,534 | ) | |||||||||||||||||
| Return of capital | - | - | - | - | - | - | |||||||||||||||||||||
| Decrease in net assets resulting from distributions | - | - | (559,956 | ) | (253,303 | ) | (1,449,186 | ) | (142,655 | ) | |||||||||||||||||
| From Capital Share Transactions (Note 6) | |||||||||||||||||||||||||||
| Proceeds from shares sold | 1,624,248 | 653,598 | 2,317,376 | 3,538,186 | 6,023,951 | 9,008,601 | |||||||||||||||||||||
| Proceeds from shares purchased by reinvestment of dividends | - | - | 549,246 | 250,204 | 1,359,862 | 110,040 | |||||||||||||||||||||
| Cost of shares repurchased | (152,606 | ) | (138,992 | ) | (645,378 | ) | (244,201 | ) | (7,609,034 | ) | (2,860,457 | ) | |||||||||||||||
| Increase (decrease) in net assets derived from capital share transactions | 1,471,642 | 514,606 | 2,221,244 | 3,544,189 | (225,221 | ) | 6,258,184 | ||||||||||||||||||||
| Increase (decrease) in net assets | 1,582,131 | 680,205 | 2,532,433 | 3,717,221 | (737,979 | ) | 10,988,591 | ||||||||||||||||||||
| Net Assets | |||||||||||||||||||||||||||
| Beginning of year | 1,600,131 | 919,926 | 8,434,464 | 4,717,243 | 21,224,246 | 10,235,655 | |||||||||||||||||||||
| End of year | $ | 3,182,262 | $ | 1,600,131 | $ | 10,966,897 | $ | 8,434,464 | $ | 20,486,267 | $ | 21,224,246 | |||||||||||||||
| Including undistributed net investment income of | $ | 190 | $ | 190 | $ | - | $ | - | $ | - | $ | - | |||||||||||||||
See Accompanying Notes to Financial Statements
62
63
Pacific Advisors Fund Inc.
Notes to Financial Statements
December 31, 2005
Note 1. Organization
Pacific Advisors Fund Inc. (the "Company") is an open-end diversified investment management company registered under the Investment Company Act of 1940, as amended. The Company currently offers six Funds: Government Securities Fund, Income and Equity Fund, Balanced Fund, Growth Fund, Multi-Cap Value Fund and Small Cap Fund. Each Fund is a separate investment portfolio of the Company with a distinct investment objective, investment program, policies and restrictions. The Government Securities Fund seeks to provide high current income, preservation of capital, and rising future income, consistent with prudent investment risk. The Income and Equity Fund seeks to provide current income and, secondarily, long-term capital appreciation. The Balanced Fund seeks to achieve long-term capital appreciation and income consistent with reduced market risk. The Growth Fund seeks to achieve long-term capital appreciation through investment in m edium to large capitalization companies. The Multi-Cap Value Fund seeks long-term capital appreciation by investing in a diversified portfolio of large to small capitalization companies. The Small Cap Fund seeks to provide capital appreciation through investment in small capitalization companies.
Effective April 1, 1998, the Funds offer Class A and Class C shares, each of which has equal rights as to assets and voting privileges except that Class A and Class C each has exclusive voting rights with respect to its distribution plan. Investment income, realized and unrealized capital gains and losses, and the common expenses of each Fund are allocated on a pro rata basis to each class based on the relative net assets of each class to the total net assets of the Fund. Each Class of shares differs in its respective service and distribution expenses and may differ in its transfer agent, registration, and certain other class-specific fees and expenses.
The Company enters into contracts that contain a variety of in- demnifications. The Company's maximum exposure under these arrangements is unknown. However, the Company has not had prior claims or losses pursuant to these contracts and expects the risk of loss to be remote.
Note 2. Significant Accounting Policies
A. Security Valuation. Securities listed on a national securities exchange and certain over-the-counter ("OTC") issues traded on the NASDAQ national market system are valued at the last quoted sale price at the close of the New York Stock Exchange. OTC issues not quoted on the NASDAQ system, and other equity securities for which no sale price is available, are valued at the last bid price as obtained from published sources or real time quote services, where available, and otherwise from brokers who are market makers for such securities. Debt securities with a maturity of less than 60 days are valued on an amortized cost basis. Premium or discount on debt securities are amortized.
B. Security Transactions and Investment Income. Security transactions are accounted for on the trade date. The cost of investments sold is determined by use of the specific identification method for both financial reporting and Federal Income Tax purposes. Dividends are recorded on the ex-dividend date. Interest income is recorded on an accrual basis.
C. Dividends and Distributions to Shareholders. The Government Securities Fund and Income and Equity Fund declare and distribute dividends of their net investment income, if any, quarterly. The Balanced Fund, Growth Fund, Multi-Cap Value Fund and Small Cap Fund declare and distribute dividends of their net investment income, if any, annually. The Board of Directors will determine the amount and timing of such payments. Income dividends and capital gains distributions are determined in accordance with income tax regulations which may differ from generally accepted accounting principles. These differences are primarily due to differing treatments of income and gain on various investment securities held by the Funds, timing differences and differing characterization of distributions made by the Funds.
D. Federal Income Tax. The Funds intend to comply with the requirements of Subchapter M of the Internal Revenue Code applicable to regulated investment companies and to distribute substantially all of their taxable income to their shareholders. Therefore, no federal income tax provision is required.
At December 31, 2005, components of distributable earnings/(deficit) on a tax basis were as follows:
| Government Securities Fund | Income and Equity Fund | Balanced Fund | Growth Fund | Multi-Cap Value Fund | Small Cap Fund | ||||||||||||||||||||||
| Undistributed ordinary income | $ | - | $ | - | $ | - | $ | - | $ | - | $ | - | |||||||||||||||
| Undistributed long-term gains | - | - | - | - | 134,611 | 32,063 | |||||||||||||||||||||
| Capital loss carryforward* | (1,000,278 | ) | (6,827 | ) | (32,524 | ) | (692,631 | ) | - | - | |||||||||||||||||
| Post October Loss | (11,832 | ) | (7,661 | ) | (25,524 | ) | (751 | ) | - | - | |||||||||||||||||
| Net unrealized appreciation (depreciation) on investments | (34,524 | ) | (69,274 | ) | 8,046,471 | 404,011 | 1,456,067 | 9,108,253 | |||||||||||||||||||
| Distributable earnings/(deficit) | (1,046,634 | ) | (83,762 | ) | 7,988,423 | (289,371 | ) | 1,590,678 | 9,140,316 | ||||||||||||||||||
Difference between book basis and tax-basis unrealized appreciation (depreciation) is attributable primarily to the tax deferral of losses on wash sales and return of capital distributions from Real Estate Investment Trusts ("REITS").
64
Pacific Advisors Fund Inc.
Notes to Financial Statements
December 31, 2005
* At December 31, 2005, the following had accumulated net realized losses on investment transactions that represent capital loss carryforwards for federal income tax purposes, which expire as follows:
| Capital losses expiring in: | |||||||||||||||||||||||||||
| 2009 | 2010 | 2011 | 2011 | 2012 | Total | ||||||||||||||||||||||
| Government Securities Fund | $ | - | $ | - | $ | 855,711 | $ | 95,072 | $ | 49,495 | $ | 1,000,278 | |||||||||||||||
| Income and Equity Fund | - | - | - | - | 6,827 | 6,827 | |||||||||||||||||||||
| Balanced Fund | - | - | - | - | 32,524 | 32,524 | |||||||||||||||||||||
| Growth Fund | 600,897 | 91,734 | - | - | - | 692,631 | |||||||||||||||||||||
E. Use of Estimates. The preparation of financial statements in conformity with accounting principles generally accepted in the United States requires management to make estimates and assumptions that affect the reported amounts in the financial statements and footnotes. Actual results could differ from those estimates.
F. Reclassification of Capital Accounts. Distributions of net investment income and realized gains are determined in accordance with income tax regulations which may differ from generally accepted accounting principles. These differences are due to differing treatments for items such as wash sales, net operating losses, capital loss carryforwards, excise tax paid and net realized gain or loss on foreign currency transactions. To the extent that these differences are permanent in nature, reclassifications are made among the net asset accounts on the Statement of Assets and Liabilities.
For the Year ended December 31, 2005, reclassifications among the components of net assets are as follows:
| Accumulated Undistributed Net Investment Income | Paid in Capital | Accumulated Capital Gain | |||||||||||||
| Government Securities Fund | $ | 437 | $ | (437 | ) | $ | - | ||||||||
| Income and Equity Fund | (5,774 | ) | (535 | ) | 6,309 | ||||||||||
| Balanced Fund | (26,533 | ) | (30,456 | ) | 56,989 | ||||||||||
| Growth Fund | 42,058 | (42,058 | ) | - | |||||||||||
| Multi-Cap Value Fund | 209,204 | (209,204 | ) | - | |||||||||||
| Small Cap Fund | 640,379 | (461,787 | ) | (178,592 | ) | ||||||||||
Note 3. Investment Management, Distributor and Other Related Party Transactions
The Company and the Funds have entered into investment management agreements ("Management Agreements") with Pacific Global Investment Management Company, Inc. ("Investment Manager").
The Management Agreements provide for investment management fees, payable monthly, and calculated at the maximum annual rate of 0.65% of average net assets for the Government Securities Fund, 0.75% of average net assets for the Income and Equity, Balanced, Growth and Small Cap Funds and 1.00% of average net assets for the Multi-Cap Value Fund. The Investment Manager has entered into a sub-advisory agreement with Bache Capital Management ("Sub-Advisor") for the Balanced Fund. It has also entered into a co-management agreement with Bache Capital Management ("Co-Manager") for the Income and Equity Fund.
The Investment Manager is solely responsible for the payment of these fees to Bache Capital Management.
In accordance with Expense Limitation Agreements with the Company, the Investment Manager, and with respect to the Income and Equity Fund only, the Co-Manager, will waive their respective management fees to the extent that the actual operating expenses of the following Funds exceed the following thresholds:
| Class A | Class C | ||||||||||
| Government Securities Fund | 1.75 | % | 2.50 | % | |||||||
| Income and Equity Fund | 1.95 | % | 2.70 | % | |||||||
| Growth Fund | 2.65 | % | 3.40 | % | |||||||
| Multi-Cap Value Fund | 2.65 | % | 3.40 | % | |||||||
For the Multi-Cap Value Fund only, the expense limitation agreement was terminated on February 15, 2005.
For the Growth Fund only, if net expenses exceed the above thresholds after waiver of the entire management fee, the Transfer Agent will waive its transfer agency fee to the extent necessary to reduce Class expenses to the above thresholds. These agreements may be terminated by either party upon 90-days prior written notice.
Pursuant to the Expense Limitation Agreements, providing for the voluntary waiver of fees and the assumption of expenses by the Investment Manager and Transfer Agent, and, with respect to the Income and Equity Fund, the Co-Manager, the following amounts were waived for the year ended
65
Pacific Advisors Fund Inc.
Notes to Financial Statements
December 31, 2005
December 31, 2005.
| Management Fees Waived | Transfer Agent Fees Waived | ||||||||||
| Government Securities Fund | $ | 52,001 | $ | - | |||||||
| Income and Equity Fund | 79,152 | - | |||||||||
| Growth Fund | 18,574 | 23,504 | |||||||||
| Multi-Cap Value Fund | 2,524 | - | |||||||||
Effective 2004, the Investment Manager and the Co-Manager terminated all of their rights under the expense limitation agreements with respect to potential recoupment from the Funds of all management fees previously waived and all expenses previsously reimbursed. In the future, the Investment Manager and Co-Manager will not have any rights to recover fees they waive or expenses they may reimburse, with respect to any of the Funds.
For the year ended December 31, 2005, Pacific Global Fund Distributors, Inc. ("PGFD"), the principal underwriter for the Company, received commissions on sales of capital stock, after deducting amounts allowed to authorized distributors as commissions. The amounts are as follows:
| Underwriting Fees Retained | Commissions Paid | ||||||||||
| Government Securities Fund | $ | 90 | $ | 482 | |||||||
| Income and Equity Fund | 271 | 1,343 | |||||||||
| Balanced Fund | 2,483 | 11,938 | |||||||||
| Growth Fund | 2,941 | 14,742 | |||||||||
| Multi-Cap Value fund | 4,012 | 19,947 | |||||||||
| Small Cap Fund | 11,268 | 57,722 | |||||||||
PGFD is a wholly-owned subsidiary of the Investment Manager.
The Company and the Funds have entered into agreements with Pacific Global Investor Services, Inc. ("PGIS") to provide fund accounting services at the monthly fee of three basis points for the first one hundred million in net assets or a minimum of $1,500. In addition, agreements to provide transfer agent services has also been entered into at a rate of $18.00 per year per open account and $3.00 per year per closed account with minimum charges of $1,400 per month for A and C share accounts. PGIS is a wholly-owned subsidiary of the Investment Manager.
Accounts payable to related parties consist of management fees payable to the Investment Manager and fund accounting and transfer agent fees payable to PGIS.
The Company has adopted a plan of distribution, whereby the Funds may pay a service fee to qualified recipients in an amount up to 0.25% per annum of each Fund's daily net assets for Class A shares and Class C shares. Under the plan of the distribution, the Funds may pay a distribution fee to qualified recipients in an amount up to 75% per annum of each Fund's daily net assets for Class C shares.
For the year ended December 31, 2005, total distribution and/or service (12b-1) fees were:
| Class A | Class C | ||||||||||
| Government Securities Fund | $ | 5,844 | $ | 56,626 | |||||||
| Income and Equity Fund | 9,166 | 79,404 | |||||||||
| Balanced Fund | 13,664 | 307,087 | |||||||||
| Growth Fund | 3,340 | 10,805 | |||||||||
| Multi-Cap Value Fund | 6,300 | 67,298 | |||||||||
| Small Cap Fund | 37,596 | 40,626 | |||||||||
Note 4. Purchase and Sales of Securities
The following summarizes purchases and sales of investment securities, other than short-term investments, and aggregate gross unrealized appreciation and depreciation on a tax basis by each Fund for the year ended and as of December 31, 2005.
| Year ended December 31, 2005 | As of December 31, 2005 | ||||||||||||||||||||||||||
| Cost of Purchases | Proceeds From Sales | Tax Cost of Securities | Gross Unrealized Appreciation | Gross Unrealized Depreciation | Net Unrealized Appreciation (Depreciation) | ||||||||||||||||||||||
| Government Securities Fund | $ | 6,692,708 | $ | 9,019,971 | $ | 5,932,493 | $ | 37,060 | $ | 71,584 | $ | (34,524 | ) | ||||||||||||||
| Income and Equity Fund | 5,175,229 | 4,417,730 | 11,286,763 | 303,829 | 373,103 | (69,274 | ) | ||||||||||||||||||||
| Balanced Fund | 9,513,027 | 8,757,178 | 30,051,450 | 8,428,835 | 382,364 | 8,046,471 | |||||||||||||||||||||
| Growth Fund | 1,952,858 | 629,055 | 2,449,054 | 541,098 | 137,087 | 404,011 | |||||||||||||||||||||
| Multi-Cap Value Fund | 5,765,639 | 4,472,712 | 9,119,486 | 1,557,873 | 101,806 | 1,456,067 | |||||||||||||||||||||
| Small Cap Fund | 4,246,351 | 6,452,696 | 12,152,019 | 9,692,170 | 583,917 | 9,108,253 | |||||||||||||||||||||
66
Pacific Advisors Fund Inc.
Notes to Financial Statements
December 31, 2005
Note 5. Distributions to Shareholders
The tax character of distributions paid during 2005 and 2004 was as follows:
| Government Securities Fund | Income & Equity Fund | Balanced Fund | Multi-Cap Value Fund | Small Cap Fund | |||||||||||||||||||
| Year ended December 31, 2005 | |||||||||||||||||||||||
| Distributions paid from: | |||||||||||||||||||||||
| Ordinary Income | $ | 182,133 | $ | 215,041 | $ | 79,580 | $ | - | $ | - | |||||||||||||
| Long-Term Capital Gain | - | 12,997 | 32,299 | 559,956 | 1,449,186 | ||||||||||||||||||
| Return of Capital | 388 | 127 | 29,350 | - | - | ||||||||||||||||||
| Total Distributions | $ | 182,521 | $ | 228,165 | $ | 141,229 | $ | 559,956 | $ | 1,449,186 | |||||||||||||
| Year ended December 31, 2004 | |||||||||||||||||||||||
| Distributions paid from: | |||||||||||||||||||||||
| Ordinary Income | $ | 149,172 | $ | 156,720 | $ | 86,992 | $ | - | $ | - | |||||||||||||
| Long-Term Capital Gain | - | 24,019 | 112,692 | 253,303 | 142,655 | ||||||||||||||||||
| Total Distributions | $ | 149,172 | $ | 180,739 | $ | 199,684 | $ | 253,303 | $ | 142,655 | |||||||||||||
Note 6. Capital Share Transactions
A 2% redemption fee is assessed on shares of the Government Securities Fund or the Income and Equity Fund sold or exchanged within sixty days of purchase or shares of the Balanced Fund, Growth Fund, Multi-Cap Value Fund or the Small Cap Fund sold or exchanged within six months of purchase and is retained in each Fund.
The redemption fees collected through December 31, 2005, are included as a reduction to the shares repurchased in the table below. The amount of the reduction is as follows:
| Government Securities Fund (Class A) | $ | 100 | Government Securities Fund (Class C) | $ | 11 | ||||||||||
| Income and Equity Fund (Class A) | 3 | Income and Equity Fund (Class C) | 215 | ||||||||||||
| Balanced Fund (Class A) | 172 | Balanced Fund (Class C) | 1,252 | ||||||||||||
| Growth Fund (Class A) | 343 | Growth Fund (Class C) | 314 | ||||||||||||
| Multi-Cap Value Fund (Class A) | 546 | Multi-Cap Value Fund (Class C) | 87 | ||||||||||||
| Small Cap Fund (Class A) | 11,034 | Small Cap Fund (Class C) | 11 | ||||||||||||
| Year ended December 31, 2005 | Year ended December 31, 2004 | ||||||||||||||||||
| Shares | Amount | Shares | Amount | ||||||||||||||||
| Government Securities Fund | |||||||||||||||||||
| Class A | |||||||||||||||||||
| Shares Sold | 16,128 | $ | 151,978 | 9,692 | $ | 92,986 | |||||||||||||
| Reinvestment of Distributions | 6,109 | 57,375 | 3,863 | 36,863 | |||||||||||||||
| 22,237 | 209,353 | 13,555 | 129,849 | ||||||||||||||||
| Shares Repurchased | (44,347 | ) | (419,880 | ) | (64,505 | ) | (618,244 | ) | |||||||||||
| Net Decrease | (22,110 | ) | $ | (210,527 | ) | (50,950 | ) | $ | (488,395 | ) | |||||||||
| Class C | |||||||||||||||||||
| Shares Sold | 58,959 | $ | 544,607 | 45,269 | $ | 422,173 | |||||||||||||
| Reinvestment of Distributions | 10,659 | 98,084 | 10,222 | 94,962 | |||||||||||||||
| 69,618 | 642,691 | 55,491 | 517,135 | ||||||||||||||||
| Shares Repurchased | (456,191 | ) | (4,210,027 | ) | (465,886 | ) | (4,367,930 | ) | |||||||||||
| Net Decrease | (386,573 | ) | $ | (3,567,336 | ) | (410,395 | ) | $ | (3,850,795 | ) | |||||||||
67
Pacific Advisors Fund Inc.
Notes to Financial Statements
December 31, 2005
| Year ended December 31, 2005 | Year ended December 31, 2004 | ||||||||||||||||||
| Shares | Amount | Shares | Amount | ||||||||||||||||
| Income and Equity Fund | |||||||||||||||||||
| Class A | |||||||||||||||||||
| Shares Sold | 165,357 | $ | 1,712,422 | 218,049 | $ | 2,278,445 | |||||||||||||
| Reinvestment of Distributions | 10,021 | 103,004 | 6,044 | 62,936 | |||||||||||||||
| 175,378 | 1,815,426 | 224,093 | 2,341,381 | ||||||||||||||||
| Shares Repurchased | (85,674 | ) | (887,106 | ) | (56,402 | ) | (586,655 | ) | |||||||||||
| Net Increase | 89,704 | $ | 928,320 | 167,691 | $ | 1,754,726 | |||||||||||||
| Class C | |||||||||||||||||||
| Shares Sold | 120,065 | $ | 1,190,093 | 260,189 | $ | 2,589,841 | |||||||||||||
| Reinvestment of Distributions | 11,985 | 118,246 | 10,853 | 108,446 | |||||||||||||||
| 132,050 | 1,308,339 | 271,042 | 2,698,287 | ||||||||||||||||
| Shares Repurchased | (162,893 | ) | (1,606,102 | ) | (45,884 | ) | (456,702 | ) | |||||||||||
| Net Increase (Decrease) | (30,843 | ) | $ | (297,763 | ) | 225,158 | $ | 2,241,585 | |||||||||||
| Year ended December 31, 2005 | Year ended December 31, 2004 | ||||||||||||||||||
| Shares | Amount | Shares | Amount | ||||||||||||||||
| Balanced Fund | |||||||||||||||||||
| Class A | |||||||||||||||||||
| Shares Sold | 46,117 | $ | 773,374 | 87,697 | $ | 1,393,685 | |||||||||||||
| Reinvestment of Distributions | 2,991 | 52,312 | 3,571 | 59,108 | |||||||||||||||
| 49,108 | 825,686 | 91,268 | 1,452,793 | ||||||||||||||||
| Shares Repurchased | (39,519 | ) | (661,714 | ) | (35,754 | ) | (568,882 | ) | |||||||||||
| Net Increase | 9,589 | $ | 163,972 | 55,514 | $ | 883,911 | |||||||||||||
| Class C | |||||||||||||||||||
| Shares Sold | 300,889 | $ | 4,953,675 | 400,028 | $ | 6,174,154 | |||||||||||||
| Reinvestment of Distributions | 4,903 | 83,457 | 8,346 | 134,538 | |||||||||||||||
| 305,792 | 5,037,132 | 408,374 | 6,308,692 | ||||||||||||||||
| Shares Repurchased | (160,861 | ) | (2,638,174 | ) | (99,833 | ) | (1,545,246 | ) | |||||||||||
| Net Increase | 144,931 | $ | 2,398,958 | 308,541 | $ | 4,763,446 | |||||||||||||
68
Pacific Advisors Fund Inc.
Notes to Financial Statements
December 31, 2005
| Year ended December 31, 2005 | Year ended December 31, 2004 | ||||||||||||||||||
| Shares | Amount | Shares | Amount | ||||||||||||||||
| Growth Fund | |||||||||||||||||||
| Class A | |||||||||||||||||||
| Shares Sold | 60,280 | $ | 496,292 | 63,114 | $ | 481,133 | |||||||||||||
| Reinvestment of Distributions | - | - | - | - | |||||||||||||||
| 60,280 | 496,292 | 63,114 | 481,133 | ||||||||||||||||
| Shares Repurchased | (7,365 | ) | (61,805 | ) | (16,365 | ) | (121,527 | ) | |||||||||||
| Net Increase | 52,915 | $ | 434,487 | 46,749 | $ | 359,606 | |||||||||||||
| Class C | |||||||||||||||||||
| Shares Sold | 145,253 | $ | 1,127,956 | 22,880 | $ | 172,465 | |||||||||||||
| Reinvestment of Distributions | - | - | - | - | |||||||||||||||
| 145,253 | 1,127,956 | 22,880 | 172,465 | ||||||||||||||||
| Shares Repurchased | (11,524 | ) | (90,801 | ) | (2,430 | ) | (17,465 | ) | |||||||||||
| Net Increase | 133,729 | $ | 1,037,155 | 20,450 | $ | 155,000 | |||||||||||||
| Year ended December 31, 2005 | Year ended December 31, 2004 | ||||||||||||||||||
| Shares | Amount | Shares | Amount | ||||||||||||||||
| Multi-Cap Value Fund | |||||||||||||||||||
| Class A | |||||||||||||||||||
| Shares Sold | 58,819 | $ | 700,709 | 96,925 | $ | 1,113,082 | |||||||||||||
| Reinvestment of Distributions | 12,031 | 150,266 | 5,615 | 66,475 | |||||||||||||||
| 70,850 | 850,975 | 102,540 | 1,179,557 | ||||||||||||||||
| Shares Repurchased | (16,947 | ) | (203,978 | ) | (8,958 | ) | (102,650 | ) | |||||||||||
| Net Increase | 53,903 | $ | 646,997 | 93,582 | $ | 1,076,907 | |||||||||||||
| Class C | |||||||||||||||||||
| Shares Sold | 137,262 | $ | 1,616,667 | 214,418 | $ | 2,425,104 | |||||||||||||
| Reinvestment of Distributions | 32,838 | 398,980 | 15,822 | 183,729 | |||||||||||||||
| 170,100 | 2,015,647 | 230,240 | 2,608,833 | ||||||||||||||||
| Shares Repurchased | (38,404 | ) | (441,400 | ) | (12,322 | ) | (141,551 | ) | |||||||||||
| Net Increase | 131,696 | $ | 1,574,247 | 217,918 | $ | 2,467,282 | |||||||||||||
69
Pacific Advisors Fund Inc.
Notes to Financial Statements
December 31, 2005
| Year ended December 31, 2005 | Year ended December 31, 2004 | ||||||||||||||||||
| Shares | Amount | Shares | Amount | ||||||||||||||||
| Small Cap Fund | |||||||||||||||||||
| Class A | |||||||||||||||||||
| Shares Sold | 209,773 | $ | 5,274,588 | 321,745 | $ | 6,934,841 | |||||||||||||
| Reinvestment of Distributions | 38,838 | 1,015,602 | 3,336 | 84,426 | |||||||||||||||
| 248,611 | 6,290,190 | 325,081 | 7,019,267 | ||||||||||||||||
| Shares Repurchased | (313,442 | ) | (7,299,997 | ) | (120,496 | ) | (2,560,641 | ) | |||||||||||
| Net Increase (Decrease) | (64,831 | ) | $ | (1,009,807 | ) | 204,585 | $ | 4,458,626 | |||||||||||
| Class C | |||||||||||||||||||
| Shares Sold | 32,605 | $ | 749,363 | 105,393 | $ | 2,073,760 | |||||||||||||
| Reinvestment of Distributions | 14,526 | 344,260 | 1,099 | 25,614 | |||||||||||||||
| 47,131 | 1,093,623 | 106,492 | 2,099,374 | ||||||||||||||||
| Shares Repurchased | (13,887 | ) | (309,037 | ) | (15,518 | ) | (299,816 | ) | |||||||||||
| Net Increase | 33,244 | $ | 784,586 | 90,974 | $ | 1,799,558 | |||||||||||||
Note 7. Bank Borrowings
Each Fund may borrow up to 15% of its total assets. Each Fund will not borrow money except temporarily from banks to facilitate redemption requests that might otherwise require untimely disposition of portfolio securities. No securities will be purchased for a Fund when borrowed money exceeds 5% of the Fund's total assets. Each Fund has an unsecured loan from UMB Bank, n.a. bearing interest at 1.5% over the Federal Funds rate. As of December 31, 2005, the Small Cap Fund was paying interest at 5.38% per annum on its outstanding borrowings. No compensating balances are required.
70
Pacific Advisors Fund Inc.
Financial Highlights
(For a share outstanding throughout the period)
| Government Securities Fund | |||||||||||||||||||||||
| Class A | |||||||||||||||||||||||
| For the year ended December 31, | |||||||||||||||||||||||
| 2005 | 2004 | 2003 | 2002 | 2001 | |||||||||||||||||||
| Per Share Operating Performance | |||||||||||||||||||||||
| Net asset value, beginning of period | $ | 9.51 | $ | 9.68 | $ | 10.20 | $ | 10.15 | $ | 10.88 | |||||||||||||
| Income from investing operations | |||||||||||||||||||||||
| Net investment income | 0.28 | 0.23 | 0.35 | 0.31 | 0.31 | ||||||||||||||||||
| Net realized and unrealized gains (losses) on securities | (0.18 | ) | (0.20 | ) | (0.57 | ) | (0.04 | ) | (0.37 | ) | |||||||||||||
| Total from investment operations | 0.10 | 0.03 | (0.22 | ) | 0.27 | (0.06 | ) | ||||||||||||||||
| Less distributions | |||||||||||||||||||||||
| From net investment income | (0.34 | ) | (0.20 | ) | (0.30 | ) | (0.21 | ) | (0.29 | ) | |||||||||||||
| From net capital gains | - | - | - | (0.01 | ) | (0.38 | ) | ||||||||||||||||
| Total distributions | (0.34 | ) | (0.20 | ) | (0.30 | ) | (0.22 | ) | (0.67 | ) | |||||||||||||
| Net asset value, end of period | $ | 9.27 | $ | 9.51 | $ | 9.68 | $ | 10.20 | $ | 10.15 | |||||||||||||
| Total Investment Return (a) | 1.08 | % | 0.26 | % | (2.20 | )% | 2.78 | % | (0.49 | )% | |||||||||||||
| Ratios/Supplemental Data | |||||||||||||||||||||||
| Net assets, end of year (000's) | $ | 2,219 | $ | 2,488 | $ | 3,025 | $ | 4,125 | $ | 6,487 | |||||||||||||
| Ratio of net investment income to average net assets | |||||||||||||||||||||||
| With expense reductions | 2.68 | % | 1.89 | % | 2.88 | % | 2.57 | % | 3.01 | % | |||||||||||||
| Without expense reductions | 2.03 | % | 1.23 | % | 2.33 | % | 1.42 | % | 2.22 | % | |||||||||||||
| Ratio of expenses to average net assets | |||||||||||||||||||||||
| With expense reductions | 2.26 | % | 1.81 | % | 1.65 | % | 1.65 | % | 1.65 | % | |||||||||||||
| Without expense reductions | 2.91 | % | 2.46 | % | 2.20 | % | 2.80 | % | 2.43 | % | |||||||||||||
| Fund portfolio turnover rate | 88.26 | % | 402.70 | % | 206.55 | % | 212.10 | % | 75.81 | % | |||||||||||||
| Class C | |||||||||||||||||||||||
| For the year ended December 31, | |||||||||||||||||||||||
| 2005 | 2004 | 2003 | 2002 | 2001 | |||||||||||||||||||
| Per Share Operating Performance | |||||||||||||||||||||||
| Net asset value, beginning of period | $ | 9.27 | $ | 9.43 | $ | 9.95 | $ | 9.96 | $ | 10.74 | |||||||||||||
| Income from investing operations | |||||||||||||||||||||||
| Net investment income | 0.14 | 0.09 | 0.21 | 0.23 | 0.25 | ||||||||||||||||||
| Net realized and unrealized gains (losses) on securities | (0.11 | ) | (0.14 | ) | (0.50 | ) | (0.04 | ) | (0.38 | ) | |||||||||||||
| Total from investment operations | 0.03 | (0.05 | ) | (0.29 | ) | 0.19 | (0.13 | ) | |||||||||||||||
| Less distributions | |||||||||||||||||||||||
| From net investment income | (0.17 | ) | (0.11 | ) | (0.23 | ) | (0.19 | ) | (0.27 | ) | |||||||||||||
| From net capital gains | - | - | - | (0.01 | ) | (0.38 | ) | ||||||||||||||||
| Total distributions | (0.17 | ) | (0.11 | ) | (0.23 | ) | (0.20 | ) | (0.65 | ) | |||||||||||||
| Net asset value, end of period | $ | 9.13 | $ | 9.27 | $ | 9.43 | $ | 9.95 | $ | 9.96 | |||||||||||||
| Total Investment Return (a) | 0.28 | % | (0.50 | )% | (2.98 | )% | 1.98 | % | (1.21 | )% | |||||||||||||
| Ratios/Supplemental Data | |||||||||||||||||||||||
| Net assets, end of year (000's) | $ | 3,780 | $ | 7,424 | $ | 11,423 | $ | 10,858 | $ | 4,172 | |||||||||||||
| Ratio of net investment income to average net assets | |||||||||||||||||||||||
| With expense reductions | 2.03 | % | 1.10 | % | 2.23 | % | 1.90 | % | 2.25 | % | |||||||||||||
| Without expense reductions | 1.38 | % | 0.45 | % | 1.67 | % | 0.81 | % | 1.28 | % | |||||||||||||
| Ratio of expenses to average net assets | |||||||||||||||||||||||
| With expense reductions | 2.90 | % | 2.57 | % | 2.39 | % | 2.40 | % | 2.40 | % | |||||||||||||
| Without expense reductions | 3.55 | % | 3.22 | % | 2.95 | % | 3.49 | % | 3.37 | % | |||||||||||||
| Fund portfolio turnover rate | 88.26 | % | 402.70 | % | 206.55 | % | 212.10 | % | 75.81 | % | |||||||||||||
(a) The Fund's maximum sales charge is not included in the total return computation
See Accompanying Notes to Financial Statements
71
Pacific Advisors Fund Inc.
Financial Highlights
(For a share outstanding throughout the period)
| Income and Equity Fund | |||||||||||||||||||||||
| Class A | |||||||||||||||||||||||
| For the year ended December 31, | |||||||||||||||||||||||
| 2005 | 2004 | 2003 | 2002 | 2001 | |||||||||||||||||||
| Per Share Operating Performance | |||||||||||||||||||||||
| Net asset value, beginning of period | $ | 10.46 | $ | 10.33 | $ | 9.91 | $ | 10.31 | $ | 10.43 | |||||||||||||
| Income from investing operations | |||||||||||||||||||||||
| Net investment income | 0.20 | 0.07 | 0.33 | 0.39 | 0.42 | ||||||||||||||||||
| Net realized and unrealized gains (losses) on securities | (0.20 | ) | 0.29 | 0.31 | (0.49 | ) | (0.14 | ) | |||||||||||||||
| Total from investment operations | - | 0.36 | 0.64 | (0.10 | ) | 0.28 | |||||||||||||||||
| Less distributions | |||||||||||||||||||||||
| From net investment income | (0.26 | ) | (0.21 | ) | (0.20 | ) | (0.30 | ) | (0.40 | ) | |||||||||||||
| From net capital gains | (0.01 | ) | (0.02 | ) | - | - | - | ||||||||||||||||
| From return of capital | - | - | (0.02 | ) | - | - | |||||||||||||||||
| Total distributions | (0.27 | ) | (0.23 | ) | (0.22 | ) | (0.30 | ) | (0.40 | ) | |||||||||||||
| Net asset value, end of period | $ | 10.19 | $ | 10.46 | $ | 10.33 | $ | 9.91 | $ | 10.31 | |||||||||||||
| Total Investment Return (a) | 0.01 | % | 3.51 | % | 6.63 | % | (0.92 | )% | 2.63 | % | |||||||||||||
| Ratios/Supplemental Data | |||||||||||||||||||||||
| Net assets, end of year (000's) | $ | 4,436 | $ | 3,611 | $ | 1,835 | $ | 2,117 | $ | 2,708 | |||||||||||||
| Ratio of net investment income to average net assets | |||||||||||||||||||||||
| With expense reductions | 2.33 | % | 2.18 | % | 2.92 | % | 3.43 | % | 4.28 | % | |||||||||||||
| Without expense reductions | 1.65 | % | 1.49 | % | 1.84 | % | 1.75 | % | 2.66 | % | |||||||||||||
| Ratio of expenses to average net assets | |||||||||||||||||||||||
| With expense reductions | 1.93 | % | 1.94 | % | 1.85 | % | 1.85 | % | 1.85 | % | |||||||||||||
| Without expense reductions | 2.60 | % | 2.63 | % | 2.94 | % | 3.53 | % | 3.47 | % | |||||||||||||
| Fund portfolio turnover rate | 39.57 | % | 40.48 | % | 71.02 | % | 91.50 | % | 43.38 | % | |||||||||||||
| Class C | |||||||||||||||||||||||
| For the year ended December 31, | |||||||||||||||||||||||
| 2005 | 2004 | 2003 | 2002 | 2001 | |||||||||||||||||||
| Per Share Operating Performance | |||||||||||||||||||||||
| Net asset value, beginning of period | $ | 10.02 | $ | 9.90 | $ | 9.60 | $ | 10.03 | $ | 10.26 | |||||||||||||
| Income from investing operations | |||||||||||||||||||||||
| Net investment income | 0.15 | 0.16 | 0.24 | 0.34 | 0.42 | ||||||||||||||||||
| Net realized and unrealized gains (losses) on securities | (0.22 | ) | 0.11 | 0.32 | (0.51 | ) | (0.22 | ) | |||||||||||||||
| Total from investment operations | (0.07 | ) | 0.27 | 0.56 | (0.17 | ) | 0.20 | ||||||||||||||||
| Less distributions | |||||||||||||||||||||||
| From net investment income | (0.14 | ) | (0.13 | ) | (0.22 | ) | (0.26 | ) | (0.43 | ) | |||||||||||||
| From net capital gains | (0.01 | ) | (0.02 | ) | - | - | - | ||||||||||||||||
| From return of capital | - | - | (0.02 | ) | - | - | |||||||||||||||||
| Total distributions | (0.15 | ) | (0.15 | ) | (0.24 | ) | (0.26 | ) | (0.43 | ) | |||||||||||||
| Net asset value, end of period | $ | 9.80 | $ | 10.02 | $ | 9.90 | $ | 9.60 | $ | 10.03 | |||||||||||||
| Total Investment Return (a) | (0.67 | )% | 2.74 | % | 5.88 | % | (1.60 | )% | 1.81 | % | |||||||||||||
| Ratios/Supplemental Data | |||||||||||||||||||||||
| Net assets, end of year (000's) | $ | 7,265 | $ | 7,738 | $ | 5,416 | $ | 3,284 | $ | 1,365 | |||||||||||||
| Ratio of net investment income to average net assets | |||||||||||||||||||||||
| With expense reductions | 1.57 | % | 1.38 | % | 2.10 | % | 2.95 | % | 3.58 | % | |||||||||||||
| Without expense reductions | 0.90 | % | 0.70 | % | 1.03 | % | 1.15 | % | 1.65 | % | |||||||||||||
| Ratio of expenses to average net assets | |||||||||||||||||||||||
| With expense reductions | 2.70 | % | 2.69 | % | 2.60 | % | 2.60 | % | 2.60 | % | |||||||||||||
| Without expense reductions | 3.37 | % | 3.37 | % | 3.67 | % | 4.39 | % | 4.54 | % | |||||||||||||
| Fund portfolio turnover rate | 39.57 | % | 40.48 | % | 71.02 | % | 91.50 | % | 43.38 | % | |||||||||||||
(a) The Fund's maximum sales charge is not included in the total return computation
See Accompanying Notes to Financial Statements
72
Pacific Advisors Fund Inc.
Financial Highlights
(For a share outstanding throughout the period)
| Balanced Fund | |||||||||||||||||||||||
| Class A | |||||||||||||||||||||||
| For the year ended December 31, | |||||||||||||||||||||||
| 2005 | 2004 | 2003 | 2002 | 2001 | |||||||||||||||||||
| Per Share Operating Performance | |||||||||||||||||||||||
| Net asset value, beginning of period | $ | 16.57 | $ | 15.88 | $ | 13.69 | $ | 14.42 | $ | 15.22 | |||||||||||||
| Income from investing operations | |||||||||||||||||||||||
| Net investment income | 0.16 | 0.12 | 0.21 | 0.06 | 0.10 | ||||||||||||||||||
| Net realized and unrealized gains (losses) on securities | 0.82 | 0.75 | 2.34 | (0.79 | ) | (0.81 | ) | ||||||||||||||||
| Total from investment operations | 0.98 | 0.87 | 2.55 | (0.73 | ) | (0.71 | ) | ||||||||||||||||
| Less distributions | |||||||||||||||||||||||
| From net investment income | (0.11 | ) | (0.13 | ) | (0.16 | ) | - | (0.09 | ) | ||||||||||||||
| From net capital gains | (0.01 | ) | (0.05 | ) | (0.18 | ) | - | - | |||||||||||||||
| From return of capital | (0.04 | ) | - | (0.02 | ) | - | - | ||||||||||||||||
| Total distributions | (0.16 | ) | (0.18 | ) | (0.36 | ) | - | (0.09 | ) | ||||||||||||||
| Net asset value, end of period | $ | 17.39 | $ | 16.57 | $ | 15.88 | $ | 13.69 | $ | 14.42 | |||||||||||||
| Total Investment Return (a) | 5.90 | % | 5.50 | % | 18.63 | % | (5.05 | )% | (4.69 | )% | |||||||||||||
| Ratios/Supplemental Data | |||||||||||||||||||||||
| Net assets, end of year (000's) | $ | 6,323 | $ | 5,863 | $ | 4,739 | $ | 3,977 | $ | 5,013 | |||||||||||||
| Ratio of net investment income to average net assets | |||||||||||||||||||||||
| With expense reductions | 0.97 | % | 0.98 | % | 1.44 | % | 0.30 | % | 0.55 | % | |||||||||||||
| Without expense reductions | 0.97 | % | 0.98 | % | 1.44 | % | 0.30 | % | 0.55 | % | |||||||||||||
| Ratio of expenses to average net assets | |||||||||||||||||||||||
| With expense reductions | 2.53 | % | 2.67 | % | 2.86 | % | 3.47 | % | 3.22 | % | |||||||||||||
| Without expense reductions | 2.53 | % | 2.67 | % | 2.86 | % | 3.47 | % | 3.22 | % | |||||||||||||
| Fund portfolio turnover rate | 25.47 | % | 39.60 | % | 58.73 | % | 57.74 | % | 42.20 | % | |||||||||||||
| Class C | |||||||||||||||||||||||
| For the year ended December 31, | |||||||||||||||||||||||
| 2005 | 2004 | 2003 | 2002 | 2001 | |||||||||||||||||||
| Per Share Operating Performance | |||||||||||||||||||||||
| Net asset value, beginning of period | $ | 16.13 | $ | 15.49 | $ | 13.40 | $ | 14.18 | $ | 14.99 | |||||||||||||
| Income from investing operations | |||||||||||||||||||||||
| Net investment income | 0.03 | 0.04 | 0.09 | 0.01 | 0.01 | ||||||||||||||||||
| Net realized and unrealized gains (losses) on securities | 0.80 | 0.68 | 2.26 | (0.79 | ) | (0.80 | ) | ||||||||||||||||
| Total from investment operations | 0.83 | 0.72 | 2.35 | (0.78 | ) | (0.79 | ) | ||||||||||||||||
| Less distributions | |||||||||||||||||||||||
| From net investment income | (0.02 | ) | (0.03 | ) | (0.06 | ) | - | (0.02 | ) | ||||||||||||||
| From net capital gains | (0.01 | ) | (0.05 | ) | (0.18 | ) | - | - | |||||||||||||||
| From return of capital | (0.01 | ) | - | (0.02 | ) | - | - | ||||||||||||||||
| Total distributions | (0.04 | ) | (0.08 | ) | (0.26 | ) | - | (0.02 | ) | ||||||||||||||
| Net asset value, end of period | $ | 16.92 | $ | 16.13 | $ | 15.49 | $ | 13.40 | $ | 14.18 | |||||||||||||
| Total Investment Return (a) | 5.16 | % | 4.62 | % | 17.58 | % | (5.49 | )% | (5.25 | )% | |||||||||||||
| Ratios/Supplemental Data | |||||||||||||||||||||||
| Net assets, end of year (000's) | $ | 33,185 | $ | 29,304 | $ | 23,353 | $ | 14,035 | $ | 7,404 | |||||||||||||
| Ratio of net investment income to average net assets | |||||||||||||||||||||||
| With expense reductions | 0.19 | % | 0.21 | % | 0.67 | % | (0.16 | )% | (0.08 | )% | |||||||||||||
| Without expense reductions | 0.19 | % | 0.21 | % | 0.67 | % | (0.16 | )% | (0.08 | )% | |||||||||||||
| Ratio of expenses to average net assets | |||||||||||||||||||||||
| With expense reductions | 3.30 | % | 3.44 | % | 3.66 | % | 4.15 | % | 3.99 | % | |||||||||||||
| Without expense reductions | 3.30 | % | 3.44 | % | 3.66 | % | 4.15 | % | 3.99 | % | |||||||||||||
| Fund portfolio turnover rate | 25.47 | % | 39.60 | % | 58.73 | % | 57.74 | % | 42.20 | % | |||||||||||||
(a) The Fund's maximum sales charge is not included in the total return computation
See Accompanying Notes to Financial Statements
73
Pacific Advisors Fund Inc.
Financial Highlights
(For a share outstanding throughout the period)
| Growth Fund | |||||||||||||||||||||||
| Class A | |||||||||||||||||||||||
| For the year ended December 31, | |||||||||||||||||||||||
| 2005 | 2004 | 2003 | 2002 | 2001 | |||||||||||||||||||
| Per Share Operating Performance | |||||||||||||||||||||||
| Net asset value, beginning of period | $ | 8.22 | $ | 7.14 | $ | 5.48 | $ | 7.04 | $ | 9.83 | |||||||||||||
| Income from investing operations | |||||||||||||||||||||||
| Net investment income (expense) | (0.01 | ) | 0.02 | (0.07 | ) | (0.12 | ) | (0.11 | ) | ||||||||||||||
| Net realized and unrealized gains (losses) on securities | 0.33 | 1.06 | 1.73 | (1.44 | ) | (2.68 | ) | ||||||||||||||||
| Total from investment operations | 0.32 | 1.08 | 1.66 | (1.56 | ) | (2.79 | ) | ||||||||||||||||
| Less distributions | |||||||||||||||||||||||
| From net investment income | - | - | - | - | - | ||||||||||||||||||
| From net capital gains | - | - | - | - | - | ||||||||||||||||||
| Total distributions | - | - | - | - | - | ||||||||||||||||||
| Net asset value, end of period | $ | 8.54 | $ | 8.22 | $ | 7.14 | $ | 5.48 | $ | 7.04 | |||||||||||||
| Total Investment Return (a) | 3.89 | % | 15.13 | % | 30.29 | % | (22.16 | )% | (28.38 | )% | |||||||||||||
| Ratios/Supplemental Data | |||||||||||||||||||||||
| Net assets, end of year (000's) | $ | 1,650 | $ | 1,155 | $ | 669 | $ | 464 | $ | 588 | |||||||||||||
| Ratio of net investment income to average net assets | |||||||||||||||||||||||
| With expense reductions | (1.37 | )% | (1.51 | )% | (1.69 | )% | (1.97 | )% | (1.26 | )% | |||||||||||||
| Without expense reductions | (3.06 | )% | (4.98 | )% | (7.44 | )% | (8.25 | )% | (5.44 | )% | |||||||||||||
| Ratio of expenses to average net assets | |||||||||||||||||||||||
| With expense reductions | 2.63 | % | 2.83 | % | 2.48 | % | 2.50 | % | 2.44 | % | |||||||||||||
| Without expense reductions | 4.32 | % | 6.30 | % | 8.23 | % | 8.77 | % | 6.62 | % | |||||||||||||
| Fund portfolio turnover rate | 30.54 | % | 12.96 | % | 34.58 | % | 78.06 | % | 57.61 | % | |||||||||||||
| Class C | |||||||||||||||||||||||
| For the year ended December 31, | |||||||||||||||||||||||
| 2005 | 2004 | 2003 | 2002 | 2001 | |||||||||||||||||||
| Per Share Operating Performance | |||||||||||||||||||||||
| Net asset value, beginning of period | $ | 7.79 | $ | 6.83 | $ | 5.33 | $ | 6.89 | $ | 9.70 | |||||||||||||
| Income from investing operations | |||||||||||||||||||||||
| Net investment income (expense) | 0.37 | 0.22 | (0.16 | ) | (0.44 | ) | (0.22 | ) | |||||||||||||||
| Net realized and unrealized gains (losses) on securities | (0.14 | ) | 0.74 | 1.66 | (1.12 | ) | (2.59 | ) | |||||||||||||||
| Total from investment operations | 0.23 | 0.96 | 1.50 | (1.56 | ) | (2.81 | ) | ||||||||||||||||
| Less distributions | |||||||||||||||||||||||
| From net investment income | - | - | - | - | - | ||||||||||||||||||
| From net capital gains | - | - | - | - | - | ||||||||||||||||||
| Total distributions | - | - | - | - | - | ||||||||||||||||||
| Net asset value, end of period | $ | 8.02 | $ | 7.79 | $ | 6.83 | $ | 5.33 | $ | 6.89 | |||||||||||||
| Total Investment Return (a) | 2.95 | % | 14.06 | % | 28.14 | % | (22.64 | )% | (28.97 | )% | |||||||||||||
| Ratios/Supplemental Data | |||||||||||||||||||||||
| Net assets, end of year (000's) | $ | 1,532 | $ | 445 | $ | 251 | $ | 190 | $ | 439 | |||||||||||||
| Ratio of net investment income to average net assets | |||||||||||||||||||||||
| With expense reductions | (2.13 | )% | (2.27 | )% | (2.47 | )% | (2.75 | )% | (2.04 | )% | |||||||||||||
| Without expense reductions | (3.83 | )% | 5.61 | % | (8.18 | )% | (8.67 | )% | (5.59 | )% | |||||||||||||
| Ratio of expenses to average net assets | |||||||||||||||||||||||
| With expense reductions | 3.40 | % | 3.54 | % | 3.25 | % | 3.25 | % | 3.23 | % | |||||||||||||
| Without expense reductions | 5.11 | % | 6.88 | % | 8.96 | % | 9.17 | % | 6.77 | % | |||||||||||||
| Fund portfolio turnover rate | 30.54 | % | 12.96 | % | 34.58 | % | 78.06 | % | 57.61 | % | |||||||||||||
(a) The Fund's maximum sales charge is not included in the total return computation
See Accompanying Notes to Financial Statements
74
Pacific Advisors Fund Inc.
Financial Highlights
(For a share outstanding throughout the period)
| Multi-Cap Value Fund | |||||||||||||||||||
| Class A | |||||||||||||||||||
| For the year ended December 31, | April 1, 2002 (c) to | ||||||||||||||||||
| 2005 | 2004 | 2003 | December 31, 2002 | ||||||||||||||||
| Per Share Operating Performance | |||||||||||||||||||
| Net asset value, beginning of period | $ | 11.77 | $ | 11.46 | $ | 7.95 | $ | 10.00 | |||||||||||
| Income from investing operations | |||||||||||||||||||
| Net investment income (expense) | (0.14 | ) | (0.03 | ) | (0.09 | ) | (0.07 | ) | |||||||||||
| Net realized and unrealized gains (losses) on securities | 1.29 | 0.70 | 3.60 | (1.98 | ) | ||||||||||||||
| Total from investment operations | 1.15 | 0.67 | 3.51 | (2.05 | ) | ||||||||||||||
| Less distributions | |||||||||||||||||||
| From net investment income | - | - | - | - | |||||||||||||||
| From net capital gains | (0.65 | ) | (0.36 | ) | - | - | |||||||||||||
| Total distributions | (0.65 | ) | (0.36 | ) | - | - | |||||||||||||
| Net asset value, end of period | $ | 12.27 | $ | 11.77 | $ | 11.46 | $ | 7.95 | |||||||||||
| Total Investment Return (b) | 9.71 | % | 5.84 | % | 44.15 | % | (20.50 | )%(a) | |||||||||||
| Ratios/Supplemental Data | |||||||||||||||||||
| Net assets, end of year (000's) | $ | 3,073 | $ | 2,313 | $ | 1,180 | $ | 503 | |||||||||||
| Ratio of net investment income to average net assets | |||||||||||||||||||
| With expense reductions | (1.70 | )% | (1.15 | )% | (1.67 | )% | (1.44 | )%(d) | |||||||||||
| Without expense reductions | (1.73 | )% | (1.15 | )% | (3.14 | )% | (5.65 | )%(d) | |||||||||||
| Ratio of expenses to average net assets | |||||||||||||||||||
| With expense reductions | 3.05 | % | 2.63 | % | 2.49 | % | 2.49 | %(d) | |||||||||||
| Without expense reductions | 3.08 | % | 3.07 | % | 3.96 | % | 6.69 | %(d) | |||||||||||
| Fund portfolio turnover rate | 48.97 | % | 49.30 | % | 20.16 | % | 8.23 | %(d) | |||||||||||
| Class A | |||||||||||||||||||
| For the year ended December 31, | April 1, 2002 (c) to | ||||||||||||||||||
| 2005 | 2004 | 2003 | December 31, 2002 | ||||||||||||||||
| Per Share Operating Performance | |||||||||||||||||||
| Net asset value, beginning of period | $ | 11.54 | $ | 11.33 | $ | 7.91 | $ | 10.00 | |||||||||||
| Income from investing operations | |||||||||||||||||||
| Net investment income (expense) | (0.19 | ) | (0.10 | ) | 0.32 | (0.52 | ) | ||||||||||||
| Net realized and unrealized gains (losses) on securities | 1.23 | 0.67 | 3.10 | (1.57 | ) | ||||||||||||||
| Total from investment operations | 1.04 | 0.57 | 3.42 | (2.09 | ) | ||||||||||||||
| Less distributions | |||||||||||||||||||
| From net investment income | - | - | - | - | |||||||||||||||
| From net capital gains | (0.65 | ) | (0.36 | ) | - | - | |||||||||||||
| Total distributions | (0.65 | ) | (0.36 | ) | - | - | |||||||||||||
| Net asset value, end of period | $ | 11.93 | $ | 11.54 | $ | 11.33 | $ | 7.91 | |||||||||||
| Total Investment Return (b) | 8.94 | % | 5.02 | % | 43.24 | % | (20.90 | )%(a) | |||||||||||
| Ratios/Supplemental Data | |||||||||||||||||||
| Net assets, end of year (000's) | $ | 7,894 | $ | 6,122 | $ | 3,537 | $ | 1,247 | |||||||||||
| Ratio of net investment income to average net assets | |||||||||||||||||||
| With expense reductions | (2.46 | )% | (1.94 | )% | (2.41 | )% | (2.20 | )%(d) | |||||||||||
| Without expense reductions | (2.49 | )% | (2.37 | )% | (3.90 | )% | (6.08 | )%(d) | |||||||||||
| Ratio of expenses to average net assets | |||||||||||||||||||
| With expense reductions | 3.82 | % | 3.40 | % | 3.24 | % | 3.23 | %(d) | |||||||||||
| Without expense reductions | 3.84 | % | 3.83 | % | 4.74 | % | 7.11 | %(d) | |||||||||||
| Fund portfolio turnover rate | 48.97 | % | 49.30 | % | 20.16 | % | 8.23 | %(d) | |||||||||||
(a) Not annualized
(b) The Fund's maximum sales charge is not included in the total return computation
(c) Commencement of operations
(d) Annualized
See Accompanying Notes to Financial Statements
75
Pacific Advisors Fund Inc.
Financial Highlights
(For a share outstanding throughout the period)
| Small Cap Fund | |||||||||||||||||||||||
| Class A | |||||||||||||||||||||||
| For the year ended December 31, | |||||||||||||||||||||||
| 2005 | 2004 | 2003 | 2002 | 2001 | |||||||||||||||||||
| Per Share Operating Performance | |||||||||||||||||||||||
| Net asset value, beginning of period | $ | 25.47 | $ | 18.77 | $ | 10.32 | $ | 15.23 | $ | 13.42 | |||||||||||||
| Income from investing operations | |||||||||||||||||||||||
| Net investment income (expense) | (1.15 | ) | 0.73 | (0.37 | ) | (0.85 | ) | (0.42 | ) | ||||||||||||||
| Net realized and unrealized gains (losses) on securities | 3.38 | 6.14 | 8.95 | (4.05 | ) | 3.11 | |||||||||||||||||
| Total from investment operations | 2.23 | 6.87 | 8.58 | (4.90 | ) | 2.69 | |||||||||||||||||
| Less distributions | |||||||||||||||||||||||
| From net investment income | - | - | - | - | - | ||||||||||||||||||
| From net capital gains | (1.97 | ) | (0.17 | ) | (0.13 | ) | (0.01 | ) | (0.88 | ) | |||||||||||||
| Total distributions | (1.97 | ) | (0.17 | ) | (0.13 | ) | (0.01 | ) | (0.88 | ) | |||||||||||||
| Net asset value, end of period | $ | 25.73 | $ | 25.47 | $ | 18.77 | $ | 10.32 | $ | 15.23 | |||||||||||||
| Total Investment Return (a) | 8.64 | % | 36.60 | % | 83.21 | % | (32.20 | )% | 20.23 | % | |||||||||||||
| Ratios/Supplemental Data | |||||||||||||||||||||||
| Net assets, end of year (000's) | $ | 15,884 | $ | 17,376 | $ | 8,961 | $ | 4,763 | $ | 7,715 | |||||||||||||
| Ratio of net investment income to average net assets | |||||||||||||||||||||||
| With expense reductions | (3.14 | )% | (3.08 | )% | (4.06 | )% | (4.01 | )% | (3.44 | )% | |||||||||||||
| Without expense reductions | (3.14 | )% | (3.08 | )% | (4.06 | )% | (4.01 | )% | (3.44 | )% | |||||||||||||
| Ratio of expenses to average net assets | |||||||||||||||||||||||
| With expense reductions | 3.36 | % | 3.32 | % | 4.44 | % | 4.52 | % | 3.74 | % | |||||||||||||
| Without expense reductions | 3.36 | % | 3.32 | % | 4.44 | % | 4.52 | % | 3.74 | % | |||||||||||||
| Fund portfolio turnover rate | 20.73 | % | 7.23 | % | 39.95 | % | 23.39 | % | 43.89 | % | |||||||||||||
| Class C | |||||||||||||||||||||||
| For the year ended December 31, | |||||||||||||||||||||||
| 2005 | 2004 | 2003 | 2002 | 2001 | |||||||||||||||||||
| Per Share Operating Performance | |||||||||||||||||||||||
| Net asset value, beginning of period | $ | 23.44 | $ | 17.41 | $ | 9.65 | $ | 14.47 | $ | 13.04 | |||||||||||||
| Income from investing operations | |||||||||||||||||||||||
| Net investment income (expense) | (0.56 | ) | 0.66 | 0.04 | (0.88 | ) | (0.08 | ) | |||||||||||||||
| Net realized and unrealized gains (losses) on securities | 2.41 | 5.54 | 7.85 | (3.93 | ) | 2.39 | |||||||||||||||||
| Total from investment operations | 1.85 | 6.20 | 7.89 | (4.81 | ) | 2.31 | |||||||||||||||||
| Less distributions | |||||||||||||||||||||||
| From net investment income | - | - | - | - | - | ||||||||||||||||||
| From net capital gains | (1.97 | ) | (0.17 | ) | (0.13 | ) | (0.01 | ) | (0.88 | ) | |||||||||||||
| Total distributions | (1.97 | ) | (0.17 | ) | (0.13 | ) | (0.01 | ) | (0.88 | ) | |||||||||||||
| Net asset value, end of period | $ | 23.32 | $ | 23.44 | $ | 17.41 | $ | 9.65 | $ | 14.47 | |||||||||||||
| Total Investment Return (a) | 7.76 | % | 35.62 | % | 81.83 | % | (33.27 | )% | 17.91 | % | |||||||||||||
| Ratios/Supplemental Data | |||||||||||||||||||||||
| Net assets, end of year (000's) | $ | 4,602 | $ | 3,848 | $ | 1,274 | $ | 543 | $ | 886 | |||||||||||||
| Ratio of net investment income to average net assets | |||||||||||||||||||||||
| With expense reductions | (3.95 | )% | (3.85 | )% | (4.88 | )% | (5.47 | )% | (5.48 | )% | |||||||||||||
| Without expense reductions | (3.95 | )% | (3.85 | )% | (4.88 | )% | (5.47 | )% | (5.48 | )% | |||||||||||||
| Ratio of expenses to average net assets | |||||||||||||||||||||||
| With expense reductions | 4.19 | % | 4.10 | % | 5.26 | % | 5.97 | % | 5.78 | % | |||||||||||||
| Without expense reductions | 4.19 | % | 4.10 | % | 5.26 | % | 5.97 | % | 5.78 | % | |||||||||||||
| Fund portfolio turnover rate | 20.73 | % | 7.23 | % | 39.95 | % | 23.39 | % | 43.89 | % | |||||||||||||
(a) The Fund's maximum sales charge is not included in the total return computation
See Accompanying Notes to Financial Statements
76
Pacific Advisors Fund Inc.
Report of Independent Registered Public Accounting Firm
Board of Directors and Shareholders
Pacific Advisors Fund Inc.
We have audited the accompanying statements of assets and liabilities, including the schedules of investments, of Pacific Advisors Fund Inc. (comprising, respectively, the Government Securities Fund, Income and Equity Fund, Balanced Fund, Growth Fund, Multi-Cap Value Fund and Small Cap Fund) (the "Funds"), as of December 31, 2005, and the related statements of operations for the year then ended, the statements of changes in net assets for each of the two years in the period then ended, and the financial highlights for each of the periods indicated. These financial statements and financial highlights are the responsibility of the Funds' management. Our responsibility is to express an opinion on these financial statements and financial highlights based on our audits.
We conducted our audits in accordance with the standards of the Public Company Accounting Oversight Board (United States). Those standards require that we plan and perform the audit to obtain reasonable assurance about whether the financial statements and financial highlights are free of material misstatement. We were not engaged to perform an audit of the Funds' internal control over financial reporting. Our audits included consideration of internal control over financial reporting as a basis for designing audit procedures that are appropriate in the circumstances, but not for the purpose of expressing an opinion on the effectiveness of the Fund's internal control over financial reporting. Accordingly, we express no such opinion. An audit also includes examining, on a test basis, evidence supporting the amounts and disclosures in the financial statements and financial highlights, assessing the accounting principles used and sig nificant estimates made by management, and evaluating the overall financial statement presentation. Our procedures included confirmation of securities owned as of December 31, 2005, by correspondence with the custodian and brokers. We believe that our audits provide a reasonable basis for our opinion.
In our opinion, the financial statements and financial highlights referred to above present fairly, in all material respects, the financial position of each of the respective funds constituting Pacific Advisors Fund Inc. at December 31, 2005, the results of their operations for the year then ended, the changes in their net assets for each of the two years in the period then ended, and their financial highlights for each of the periods indicated, in conformity with U.S. generally accepted accounting principles.

Los Angeles, California
February 1, 2006
77
Pacific Advisors Fund Inc.
Disclosure Regarding the Board's Approval
of the Funds' Advisory Contracts
The Board of Directors, including a majority of the Independent Directors, most recently approved the Investment Management, Co-Management and Sub-Advisory Agreements for the Funds at its meeting held on August 5, 2005. At that meeting, the Board approved: (i) the continuation of the Investment Management Agreements by and between the Company, on behalf of each of its Funds, and Pacific Global Investment Management Company, Inc. ("PGIMC"); (ii) the Sub-Advisory Agreement by and among the Corporation, on behalf of the Balanced Fund, PGIMC, and Bache Capital Management, Inc. ("BCM"); and (iii) the Co-Management Agreement between the Company, on behalf of the Income and Equity Fund, PGIMC, and BCM.
In approving the Agreements, the Board of Directors considered materials specifically relating to the relevant Agreement, including: (1) the profitability of PGIMC, including an analysis of PGIMC's cost of providing services and comparative expense information; (2) investment performance of the relevant Fund, including information comparing the performance of each Fund with a peer group of funds and an appropriate index or combination of indices; (3) sales and redemption data for the Fund; (4) the extent to which economies of scale are realized as the Fund grows and whether fee levels reflect these economies of scale for Fund investors; (5) the economic outlook and the general investment outlook in the markets in which the Fund invests; and (6) "fall-out" benefits realized by PGIMC (i.e., ancillary benefits derived by the Investment Manager or its affiliates from PGIMC's relationship with the Fund). The Board of Directors also periodically considers other material facts such as the allocation of each Fund's brokerage commissions, each Fund's record of compliance with its investment policies and restrictions on personal securities transactions, and the nature, cost, and character of non-investment management services provided by PGIMC and its affiliates. In approving the Agreements, the Board relied on all information presented to it over the course of the year.
Prior to approval of the Investment Management, Co-Management and Sub-Advisory Agreements, independent counsel to the Independent Directors reviewed the 15(c) memoranda and comments were provided to the Funds' counsel and the Board's Independent Directors who reviewed them prior to consideration of the continuation of these Agreements. In addition, the Independent Directors met separately with independent counsel prior to the meeting at which the Agreements were approved. Based on its evaluation of all material factors, the Board, including a majority of the Independent Directors, concluded that the Agreements are fair and in the best interests of shareholders. During its deliberations, the Board did not identify any single factor as all important or controlling, and individual Directors may have weighed the same factors differently. The following summaries do not detail every matter considered. Matters considered by the Board o f Directors included the following:
Nature, Quality and Extent of Services. The Board examined the nature, quality and extent of the services provided by the PGIMC and BCM to the Funds. The Board reviewed PGIMC's key personnel in providing investment management services to the Fund as well as the time that investment personnel devote to the Funds. The Board also considered PGIMC's responsibilities under the Agreement in serving as the Fund's investment manager, including responsibilities for investment research and stock selection, serving as the Funds' administrator, monitoring adherence to the Fund's investment restrictions and monitoring compliance with various policies and procedures of the Funds. The Board concluded that the Funds are likely to benefit from the nature, extent and quality of the services provided by the PGIMC and BCM under the Agreements as a result of the PGIMC's a nd BCM's experience, reputation, personnel, operations and resources.
Investment Performance of PGIMC and the Fund. The Board considered the performance of the Funds, PGIMC and BCM, including, to the extent applicable, the Funds' year-to-date, one-, five-, ten- and
78
Pacific Advisors Fund Inc.
Disclosure Regarding the Board's Approval
of the Funds' Advisory Contracts
since inception performance for the periods ended June 30, 2005, the Funds' one-, three-, and five-year performance for the periods ended December 31, 2004, as well as comparative performance provided by an independent data service. After reviewing the Funds' performance records achieved by PGIMC and BCM, including performance relative to the Funds' peers, the Board concluded that, while past performance is no guarantee of future performance, each Fund's investment performance overall weighed in favor of renewing the Agreements.
Among other factors, the Board considered: (i) with respect to the Balanced Fund, the Fund's low volatility and target market, that the Fund ranked in the top 3% of all large blend funds based on its three-year return as of June 30, 2005, according to Morningstar, and that the Fund outperformed the average performance of its Morningstar category for the three- and five-year periods ended December 31, 2004; (ii) with respect to the Small Cap Fund, that while the Fund underperformed the average performance of its Morningstar category for the year-to-date period ended June 30, 2005, and for the five-year period ended December 31, 2004, the Fund significantly outperformed the category average for the one- and three-year periods ended December 31, 2004; (iii) with respect to the Growth Fund, that while the Fund underperformed the average performance of its Morningstar category for the year-to-date period ended June 30, 2005, the Fund outperformed the category average for the one-, three- and five-year periods ended December 31, 2004, and that the Fund ranked in the 43rd percentile for Large Cap Growth Funds based on its five-year return, according to Morningstar; (iv) with respect to the Multi-Cap Fund, the Fund's limited performance history since commencing operations in April 2002, and that the Fund ranked in the top 3% of all large blend funds based on its three-year return as of June 30, 2005, according to Morningstar; (v) with respect to the Income and Equity Fund, that while no peer group has the same investment strategies and objectives as those of the Fund, overall performance was consistent with the Fund's investment objectives and strategies; and (vi) with respect to the Government Securities Fund, the Fund's relative performance as compared to the Lehman Intermediate T-Bond Index for the year-to-date period ended June 30, 2005, and for the one- and five-year periods ended December 31, 2004, and the effects of an extended low interest rate environment on the performance of the Fund.
Costs of Services and Profits Realized by PGIMC. The Board examined PGIMC's costs in serving as the Funds' Investment Manager, including the costs associated with the personnel and systems necessary to manage the Funds. The Board also considered the profitability of PGIMC and its affiliates from their relationship with the Fund. The Board examined the fee and expense information for the Funds as compared to that of comparable funds managed by other advisers. The Board noted that the investment management fees charged the Funds are higher than those charged by some mutual funds and lower than those charged others. The Board also was provided with comparative fee information indicating that the Funds' fees were comparable to those charged by funds that would be considered competitors of the Funds. The Board considered that during 2004, PGIMC had waived fees and reimbursed expenses for the Government Securities Fund, Income and Equity Fund, Growth Fund and Multi-Cap Value Fund in order to keep their expenses down, and that PGIMC expected to continue to waive fees for the Government Securities Fund, Income and Equity Fund, and Growth Fund in 2005 to the extent expenses exceed the agreed expense limits for those Funds. Another factor was that in the past PGIMC had waived fees and reimbursed expenses for all of the Funds. Over the history of the Funds, PGIMC had waived and/or reimbursed expenses in excess of $2.7 Million. The Board also considered information that subsidiaries of PGIMC provide distribution, administrative, transfer agency services for the Funds, and that providing these services internally had reduced costs for the Funds and enabled PGIMC to assure that accounting and shareholder services are of high quality and at a competitive cost. The Board also considered the growth of assets in the Funds in the first six months of 2005, and the expected impact of that growth on the Funds' expense ratios. The Board also
79
Pacific Advisors Fund Inc.
Disclosure Regarding the Board's Approval
of the Funds' Advisory Contracts
evaluated the expense ratios for comparable funds and determined that the Funds' expense ratios were competitive with those funds. The Board concluded that the Funds' management fee and expense ratios are reasonable in light of the service provided and the Funds' performance achieved by PGIMC and BCM.
Economies of Scale. The Board considered the extent to which the Funds' management fees reflect economies of scale for the benefit of the Funds' shareholders. The Board reviewed the Funds' fee arrangements, which include breakpoints that decrease the fee rate as the Funds' assets increase. The Board considered the fact that current assets were well below the threshold for the initial breakpoint. Based on its review and negotiations, the Board concluded that the Funds' management fee structure allows shareholders to benefit from economies of scale as Fund assets increase. The Board also considered that PGIMC had been waiving fees and reimbursing expenses for the Government Securities Fund, Income and Equity Fund, Growth Fund and the Multi-Cap Value Fund.
Other Benefits to PGIMC. In evaluating the benefits that accrue to PGIMC through its relationship with the Funds, the Board recognized that, in addition to providing advisory services, PGIMC and certain of its affiliates serve the Fund in various capacities, including as transfer agent, administrative services agent and distributor, and receive compensation from the Funds in connection with providing services to the Funds. The Board considered that each service provided to the Funds by PGIMC or one of its affiliates is pursuant to a written agreement, which the Board evaluates periodically as required by law.
The Board also considered PGIMC's and BCM's use of the Funds' portfolio brokerage transactions to obtain research benefiting the Funds or other clients of PGIMC and BCM. In return for such research services, a Fund may pay to those brokers a higher commission than may be charged by other brokers, provided that PGIMC and BCM determine in good faith that such commission is reasonable in relation to the services provided, viewed in light of that particular transaction or of the overall responsibility of PGIMC and BCM to the Fund and their clients. Research services furnished by brokers or dealers through which or with which the Funds effect securities transactions may be used by PGIMC and BCM in advising other funds or accounts they advise and, conversely, research services furnished to PGIMC and BCM in connection with other funds or accounts they advise may be used by PGIMC and BCM in advising the Funds. Information and research r eceived from brokers and dealers will be in addition to, and not in lieu of, the services required to be performed by PGIMC and BCM under the Agreements. The Board concluded that PGIMC's and BCM's use of "soft" commission dollars was consistent with regulatory requirements.
After full consideration of these and other factors, the Board, including a majority of the Independent Directors, concluded that approval of the Agreements was in the best interest of the Funds and their shareholders.
80
Pacific Advisors Fund Inc.
Directors and Officers
| Name, Address and Age | Position(s) Held with the Company | Term of Offices and Length of Time Served | Principal Occupations During Past 5 Years | Number of Portfolios in Fund Complex Overseen by Trustee | Other Directorships Held by Trustee | ||||||||||||||||||
| Thomas M. Brinker (72) 1 North Ormond Avenue Havertown, PA 19083 | Director | Since 1992 | 2003 - Present: Retired 1970 - 2003: President, Fringe Benefits, Inc. and Financial Foresight, Ltd. d/b/a The Brinker Organization (Financial Services Companies) | 6 Pacific Advisors Mutual Funds | None | ||||||||||||||||||
| Victoria Breen (54) 603 West Ojai Avenue Ojai, CA 93023 | Director and Assistant Secretary | Since 1992 | 1992 - Present: Assistant Secretary and Director, Pacific Global Investment Management Company and Pacific GlobalInvestor Services, Inc. 1994 - Present: Agent, Transamerica Life Companies; Registered Principal, Transamerica Financial Advisors, Inc. 1986 - Present: President, Derby & Derby, Inc. (Financial Services Company) | 6 Pacific Advisors Mutual Funds | None | ||||||||||||||||||
| Thomas H. Hanson (55) 101 N. Brand Blvd. Suite 1950 Glendale, CA 91203 | Vice President and Secretary | Since 1992 | 1992 - Present: Executive Vice President and Director, Pacific Global Investment Management Company; President and Director; Pacific Global Fund Distributors, Inc.; Director, Pacific Global Investor Services, Inc. 2001 - Present: Vice President, Pacific Global Investor Services, Inc. 1997 - 2001: Vice President and Director, Pacific Global Investment Fund, Ltd. 1992 - 2001: President, Pacific Global Investor Services, Inc. 1993 - Present: Owner, Director, Chairman, President, and CEO of TriVest Capital Management, Inc. | 6 Pacific Advisors Mutual Funds | None | ||||||||||||||||||
81
Pacific Advisors Fund Inc.
Directors and Officers
| Name, Address and Age | Position(s) Held with the Company | Term of Offices and Length of Time Served | Principal Occupations During Past 5 Years | Number of Portfolios in Fund Complex Overseen by Trustee | Other Directorships Held by Trustee | ||||||||||||||||||
| Catherine L. Henning (28) 101 N. Brand Blvd. Suite 1950 Glendale, CA 91203 | Assistant Secretary | Since 2002 | 2004 - Present: Secretary, Pacific Global Investment Management Company 2002 - 2004: Assistant Secretary, Pacific Global Investment Management Company 2002 - Present: Assistant Secretary, Pacific Global Fund Distributors, Inc. and Pacific Global Investor Services, Inc. 1999 - Present: Marketing Coordinator, Pacific Global Investment Management Company | 6 Pacific Advisors Mutual Funds | None | ||||||||||||||||||
| George A. Henning (58) 101 N. Brand Blvd. Suite 1950 Glendale, CA 91203 | President and Chairman | Since 1992 | 1991 - Present: Chairman, President, and Director, Pacific Global Investment Management Company; Chairman and Director, Pacific Global Fund Distributors, Inc.; Chairman and Director, Pacific Global Investor Services, Inc. 1997 - 2001: Chairman and Director, Pacific Global Investment Fund, Ltd. | 6 Pacific Advisors Mutual Funds | None | ||||||||||||||||||
| Barbara A. Kelley (51) 101 N. Brand Blvd. Suite 1950 Glendale, CA 91203 | Vice President, Chief Compliance Officer and Treasurer | Since 2001 | 2004 - Present: Chief Compliance Officer, Pacific Advisors Fund Inc. and Pacific Global Investment Management Company 2001 - Present: Executive Vice President, Treasurer, Pacific Global Investment Management Company; Treasurer and Director, Pacific Global Fund Distributors, Inc.; President and Treasurer, Pacific Global Investor Services, Inc. 1999 – Present: Director, Pacific Global Investment Management Company | 6 Pacific Advisors Mutual Funds | None | ||||||||||||||||||
82
Pacific Advisors Fund Inc.
Directors and Officers
| Name, Address and Age | Position(s) Held with the Company | Term of Offices and Length of Time Served | Principal Occupations During Past 5 Years | Number of Portfolios in Fund Complex Overseen by Trustee | Other Directorships Held by Trustee | ||||||||||||||||||
| L. Michael Haller (61) 5924 Colodny Agoura, CA 91301 | Director | Since 1992 | 2004 - Present: Consultant 2002 - 2003: Executive Vice President, Sammy Studios, Inc. (Entertainment Company) 2001 - 2002: Vice President and Executive Producer, Electronic Arts; President, International Media Group, Inc. (Entertainment Company) 2000 - 2001: Senior Vice President, Infogrames (Entertainment Company) | 6 Pacific Advisors Mutual Funds | None | ||||||||||||||||||
| Takashi Makinodan, PhD (80) 1506 S. Bentley Avenue PH #5 Los Angeles, CA 90025 | Director | Since 1995 | 1992 - Present: Director, Medical Treatment Effectiveness Program (MEDTEP), Center on Asian and Pacific Islanders 1991 - Present: Associate Director of Research, Geriatric Research Education Clinic Center, VA Medical Center | 6 Pacific Advisors Mutual Funds | None | ||||||||||||||||||
| Gerald E. Miller (75) 5262 Bridgetown Place Westlake Village, CA 91362 | Director | Since 1992 | 1992 - Present: Retired | 6 Pacific Advisors Mutual Funds | None | ||||||||||||||||||
| Louise K. Taylor, PhD (59) 325 East Huntington Dr. Monrovia, CA 91016 | Director | Since 1992 | 1991 - Present: Superintendent, Monrovia Unified School District | 6 Pacific Advisors Mutual Funds | None | ||||||||||||||||||
83
Pacific Advisors Fund Inc.
Directors and Officers
| Name, Address and Age | Position(s) Held with the Company | Term of Offices and Length of Time Served | Principal Occupations During Past 5 Years | Number of Portfolios in Fund Complex Overseen by Trustee | Other Directorships Held by Trustee | ||||||||||||||||||
| Jingjing Yan (32) 101 N. Brand Blvd. Suite 1950 Glendale, CA 91203 | Assistant Treasurer | Since 2005 | 2005 - Present: Assistant Treasurer, Pacific Global Investment Management Company, Pacific Global Fund Distributors, Inc. and Pacific Global Investor Services, Inc. 2001 - Present: Fund Accounting Manager, Pacific Global Investor Services, Inc. | 6 Pacific Advisors Mutual Funds | None | ||||||||||||||||||
| Each director is elected to serve until the next annual shareholders meeting and until his or her successor is elected or appointed. The Company does not hold regular annual shareholders meetings to elect Directors. Vacancies on the Board can be filled by the action of a majority of the Directors, provided that at least two-thirds of the Directors have been elected by the shareholders. Certain Directors are considered "interested persons" of the Company as defined in the 1940 Act. All directors oversee all six Funds of the Company. | |||||||||||||||||||||||
84

Pacific Advisors
Fund Inc
Directors
George A. Henning, Chairman
Victoria L. Breen
Thomas M. Brinker
L. Michael Haller, III
Takashi Makinodan, Ph.D.
Gerald E. Miller
Louise K. Taylor, Ph.D.
Officers
George A. Henning, President
Thomas H. Hanson, Vice President and Secretary
Victoria L. Breen, Assistant Secretary
Catherine L. Henning, Assistant Secretary
Barbara A. Kelley, Treasurer
Jingjing Yan, Assistant Treasurer
Investment Manager
Pacific Global Investment Management Company
101 North Brand Blvd., Suite 1950
Glendale, California 91203
Income and Equity Fund Co-Manager and Balanced Fund Sub-Adviser
Bache Capital Management, Inc.
101 North Brand Blvd., Suite 1950
Glendale, California 91203
Transfer Agent and Administrator
Pacific Global Investor Services, Inc.
101 North Brand Blvd., Suite 1950
Glendale, California 91203
Distributor
Pacific Global Fund Distributors, Inc.
101 North Brand Blvd., Suite 1950
Glendale, California 91203
(800) 989-6693
Availability of Quarterly Portfolio Schedule
The Fund files its complete schedule of portfolio holdings with the SEC for the first and third quarters of each fiscal year on Form N-Q. The Fund's Forms N-Q are available on the SEC's Web site at http://www.sec.gov. The Fund's Forms N-Q may be reviewed and copied at the SEC's Public Reference Room in Washington, DC. Information about the operation of the Public Reference Room may be obtained by calling the SEC at (800) SEC-0330.
The Fund's complete schedule of portfolio holdings for each fiscal quarter is posted on the Fund's Web site at www.PacificAdvisorsFund.com and is available without charge, upon request by calling (800) 989-6693. Documents will be sent within 3 business days of receipt of your request.
Availability of Proxy Voting Policies and Procedures and Proxy Voting Record
A description of the policies and procedures that the Fund uses to determine how to vote proxies relating to portfolio securities and information regarding how the Fund voted proxies relating to portfolio securities during the most recent 12-month period ended June 30 is available without charge, upon request by calling (800) 989-6693. Documents will be sent within 3 business days of receipt of your request. This information is also available on the SEC's Web site at http://www.sec.gov.
PRSRT STD
U. S. POSTAGE
PAID
Glendale, CA PERMIT NO. 1090
Pacific Global Fund Distributors, Inc.
101 North Brand Blvd., Suite 1950
Glendale, California 91203


Pacific Global Fund Distributors, Inc.
101 North Brand Blvd., Suite 1950
Glendale, California 91203


Item 2. | Code of Ethics |
| Registrant has adopted a Code of Ethics pursuant to Section 406 of the Sarbanes-Oxley Act of 2002 that applies to Registrant’s principal executive officer, principal financial officer, principal accounting officer or controller. Registrant will provide to any person without charge, upon request, a copy of the Code of Ethics if such person submits a request in writing addressed to the Registrant’s secretary at the principal executive offices listed above. |
Item 3 | Audit Committee Financial Expert |
| Registrant’s Audit Committee has three members. While these members are “financially literate,” the Board has determined that none of the members of the Audit Committee meet the technical definition of “audit committee financial expert.” Registrant has determined that an audit committee financial expert is not necessary at this time because (i) the Audit Committee members are financially literate; (ii) they have served on Registrant’s Audit Committee for several years; (iii) the accounting methodologies applicable to registered investment companies and the types of investment activities in which the Funds engage are well established; and (iv) Registrant’s financial statements do not involve the types of complex accounting issues that other types of public companies may have. |
Item 4. | Principal Accountant Fees and Services |
(a)-(d)
Ernst & Young LLP (“E&Y”) billed the Company aggregate fees for professional services rendered for the fiscal years ending December 31, 2005, and December 31, 2004, as follows:
|
| Audit Fees |
| Audit Related Fees |
| Tax Fees |
| All Other Fees |
| ||||
2004 |
| $ | 106,500 |
| $ | 0 |
| $ | 8,000 |
| $ | 10,000 |
|
2005 |
| $ | 116,600 |
| $ | 0 |
| $ | 19,000 |
| $ | 0 |
|
(c)
Tax Fees include the services for the review of income tax returns and excise taxes.
(e)(1)
The Audit Committee is authorized to pre-approve non-audit services provided by the Corporation’s auditors, if they find it appropriate in light of their fiduciary duties and in the exercise of their good faith business judgment and compatible with the auditors’ independence. The Chairman of the Audit Committee is authorized to approve audit and non-audit services for newly established funds of the Corporation on the same terms as the full Audit Committee previously had approved for the then existing funds, and to approve non-audit services which are permissible under applicable law, provided the estimated fee is not more than $5,000 based on a good faith estimate provided by the auditor. The Chairman shall report any such pre-approval to the Audit Committee at its next following meeting.
(e)(2)
None.
(f)
0%
2
(g)
None.
(h)
Not applicable.
Item 5. | Audit Committee of Listed Registrants |
| Not applicable as Registrant is not a listed issuer as defined in Rule 10A-3 under the Securities Exchange Act of 1934. |
|
|
Item 6. | Schedule of Investments |
| Schedule of Investments is included as part of the report to shareholders filed under Item 1 of this form. |
|
|
Item 7. | Disclosure of Proxy Voting Policies and Procedures for Closed-End Management Investment Companies |
| Not applicable to open-end investment companies. |
|
|
Item 8. | Portfolio Managers of Closed-End Management Investment Companies |
| Not applicable to open-end investment companies. |
|
|
Item 9. | Purchases of Equity Securities by Managers of Closed-End Management Investment Company and Affiliated Purchasers. |
| Not applicable to open-end investment companies. |
|
|
Item 10. | Submission of Matters to a Vote of Security Holders |
| No material changes have been made. |
|
|
Item 11. | Controls and Procedures. |
| (a) Based upon their evaluation of Registrant’s disclosure controls and procedures (as defined in Rule 30a-3(c) under the Investment Company Act of 1940) as conducted within 90 days of the filing date of this Form N-CSR, Registrant’s principal executive officer and principal financial officer have concluded that those disclosure controls and procedures provide reasonable assurance that the material information required to be disclosed by Registrant on this report is recorded, processed, summarized and reported within the time periods specified in the Securities and Exchange Commission’s rules and forms. |
|
|
| (b) There were no changes in Registrant’s internal control over financial reporting (as defined in Rule 30a-3(d) under the Investment Company Act of 1940) that occurred during the second fiscal quarter of the period covered by this report that have materially affected, or are reasonably likely to materially affect, Registrant’s internal control over financial reporting. |
|
|
Item 12. | Exhibits |
| (a)(1) Not applicable. |
|
|
| (a)(2) Certifications required by Item 12(a) of Form N-CSR and Section 302 of the Sarbanes-Oxley Act of 2002 (filed herewith). |
|
|
| (b) Certification required by Section 906 of the Sarbanes-Oxley Act of 2002 (filed herewith). |
|
|
3
SIGNATURES
Pursuant to the requirements of the Securities Exchange Act of 1934 and the Investment Company Act of 1940, Registrant has duly caused this report to be signed on its behalf by the undersigned, thereunto duly authorized.
Pacific Global Fund Inc. d/b/a Pacific Advisors Fund Inc.
By: | /s/ George A. Henning |
|
|
|
| George A. Henning |
|
|
|
|
|
|
|
|
Date: | March 8, 2006 |
|
|
|
Pursuant to the requirements of the Securities Exchange Act of 1934 and the Investment Company Act of 1940, this report has been signed below by the following persons on behalf of Registrant and in the capacities and on the dates indicated.
By: | /s/ George A. Henning |
|
|
|
| George A. Henning |
|
|
|
|
|
|
|
|
Date: | March 8, 2006 |
|
|
|
By: | /s/ Barbara A. Kelley |
|
|
|
| Barbara A. Kelley |
|
|
|
|
|
|
|
|
Date: | March 8, 2006 |
|
|
|
4