UNITED STATES
SECURITIES AND EXCHANGE COMMISSION
Washington, D.C. 20549
FORM N-CSR
CERTIFIED SHAREHOLDER REPORT OF REGISTERED
MANAGEMENT INVESTMENT COMPANIES
Investment Company Act file number | 811-7062 | ||||||
| |||||||
PACIFIC GLOBAL FUND INC. D/B/A PACIFIC ADVISORS FUND INC. | |||||||
(Exact name of registrant as specified in charter) | |||||||
| |||||||
101 NORTH BRAND BLVD., SUITE 1950 GLENDALE, CALIFORNIA |
| 91203 | |||||
(Address of principal executive offices) |
| (Zip code) | |||||
| |||||||
GEORGE A. HENNING 101 NORTH BRAND BLVD., SUITE 1950 GLENDALE, CA 91203 | |||||||
(Name and address of agent for service) | |||||||
| |||||||
Registrant’s telephone number, including area code: | 818-242-6693 |
| |||||
| |||||||
Date of fiscal year end: | December 31 |
| |||||
| |||||||
Date of reporting period: | December 31, 2006 |
| |||||
Item 1. | Report to Shareholders |
| Filed herewith. |


annual report
december 31, 2006
government securities fund
income and equity fund
balanced fund
growth fund
multi-cap value fund
small cap fund

Pacific Advisors
table of contents
| Message from the Chairman | 1 | ||||||
| Government Securities Fund | 4 | ||||||
| Income and Equity Fund | 8 | ||||||
| Balanced Fund | 12 | ||||||
| Growth Fund | 16 | ||||||
| Multi-Cap Value Fund | 20 | ||||||
| Small Cap Fund | 25 | ||||||
| Statement of Investments | 31 | ||||||
| Statement of Assets and Liabilities | 58 | ||||||
| Statement of Operations | 60 | ||||||
| Statement of Changes in Net Assets | 62 | ||||||
| Notes to Financial Statements | 66 | ||||||
| Financial Highlights | 74 | ||||||
| Report of Independent Registered Public Accounting Firm | 81 | ||||||
| Disclosure Regarding the Board's Approval of the Funds' Advisory Contracts | 82 | ||||||
| Directors and Officers | 85 | ||||||
| Additional Tax Information | 90 | ||||||
This Report is submitted for the general information of the shareholders of the Fund. It is not authorized for distribution to prospective investors unless accompanied or preceded by a current effective prospectus of the Fund, which contains information concerning the investment policies of the Fund as well as other pertinent information.
This Report is for informational purposes only and is not a solicitation, or a recommendation that any particular investor should purchase or sell any particular security. The statements in the Report are the opinions and beliefs expressed at the time of this commentary and are not intended to represent opinions and beliefs at any other time. These opinions are subject to change with market conditions and are not meant as a market forecast. All economic and performance information referenced is historical. Past performance does not guarantee future results.
For more information on the Pacific Advisors Funds, including information on charges, expenses and other classes offered, please obtain a copy of the prospectus by calling (800) 989-6693. Please read the prospectus and consider carefully the investment risks, objectives, charges and expenses before you invest or send money. Shares of the Pacific Advisors Funds are not deposits or obligations of any bank, are not guaranteed by any bank, are not insured by the FDIC or any other agency, and involve investment risks, including the possible loss of the principal amount invested. The investment return and principal value of an investment will fluctuate so that an investor's shares, when redeemed, may be worth more or less than their original cost.

Message
from the chairman
Dear Shareholders,
Investors spent most of 2006 trying to anticipate what actions the Federal Reserve would take to raise or lower interest rates in response to changes in economic growth. The equity markets rallied early in the year as it appeared that slower growth might lead the Fed to stop raising rates in the spring.
Contrary to expectations, however, the economy grew at an annualized rate of 5.6% in the first quarter. Investors subsequently became concerned that the Fed would continue raising interest rates to contain economic growth and inflationary pressures from low unemployment, increasing energy costs and rising housing prices. As the Fed continued to raise interest rates in the second quarter, the equity markets responded with a sharp pullback in the late spring and early summer.
During the third quarter, a pullback in the housing market slowed GDP growth. In late August, the Fed stopped raising rates in response to slower economic growth and moderating inflationary pressures. The Fed's pause, combined with strong revenue and earnings growth from individual companies, set the stage for a year-end rally in the equity markets. The fourth quarter rally was broad based. Improved performance in large, mid and small cap stocks added to the impressive market growth achieved in the first quarter. The equity markets finished the year in an upward trend providing optimism for a bullish market in 2007.
Equity Markets
The U.S. and global economies have grown at a steady pace over the past four years. During this time, investors tended to favor U.S. small and mid-cap stocks and foreign stocks in emerging countries. Low interest rates, strong balance sheets and significant growth opportunities made these stocks more attractive than larger cap stocks. Mid and small cap stocks also benefited by becoming attractive buyout candidates for larger companies and private equity firms looking to took advantage of the low cost of capital to make strategic acquisitions.
By the end of 2006, large cap stocks began to close the gap in performance. The Dow Jones and S&P 500 rose 16.29% and 15.79% respectively, for the year. Small cap stocks continued their impressive performance throughout 2006 with the Russell 2000 up 18.37% for the year. The Pacific Advisors Small Cap Fund (A) ranked as the #1 small cap value fund out of 248 funds based on a one-year return of 34.60% as of December 31, 2006 according to Lipper. The Fund ranked 2 out of 146 funds based on its average annual five-year return of 20.17%; and 43 out of 47 funds based on its average annual ten-year return of 9.97% for the same period.
Fixed Income Markets
Continued rate increases by Fed during the first half of the year brought the fed funds rate from 4.25% to 5.25%. Inflationary concerns in the bond market were somewhat tempered by strong demand for U.S. government securities from foreign investors.
Low interest rates have allowed corporations to maintain strong balance sheets while taking on more debt. The borrowings have financed acquisitions, stock buybacks and increased dividends. Private equity firms have also used debt instruments to fund acquisitions. The global surplus of cash has been an important factor in maintaining a low interest rate environment.
The Fed's primary goal remains keeping inflation at bay. Given moderating growth and limited inflationary pressures, the Fed is neither compelled to stimulate, nor further slow the U.S. economy. Therefore, it is unlikely that it will consider lowering interest rates until later this year.
While the fixed income markets may experience day-to-day volatility in response to economic and geopolitical events, interest rates are expected to remain at or near their current levels.
Market Review
| December 31, 2006 | Close | YTD Return | |||||||||
| Dow Jones | 12,463.15 | 16.29 | % | ||||||||
| S&P 500 | 1,418.30 | 15.79 | % | ||||||||
| NASDAQ | 2,415.29 | 9.52 | % | ||||||||
| Russell 2000 (small cap) | 787.66 | 18.37 | % | ||||||||
| 12/31/06 | 12/31/05 | ||||||||||
| 10-Year T-Note Yield | 4.71 | % | 4.39 | % | |||||||
Data: The Wall Street Journal
1

Message
from the chairman continued
Economic Outlook
In the fourth quarter, GDP growth increased to over 3.0% indicating continued economic strength. U.S. economic growth is expected to continue at a rate of 2.5% to 3.0% in 2007. Despite the pullback in the housing market, growth continues to be buoyed by strong consumer confidence levels. Consumer spending, which represents about two thirds of the economy, has remained strong due to higher wages and lower fuel prices.
During 2006, the dollar weakened against foreign currencies. The weaker currency has benefited U.S. multi-national companies which are realizing greater profit growth in their foreign operations from favorable exchange rates. The attractiveness of U.S. exports has also contributed to economic growth. U.S. economic growth has also been aided by foreign companies' reluctance to increase prices on exports to the U.S. to protect their market positions.
Many have begun using the term "Goldilocks Economy" to describe the current environment of low interest rates and low inflation. This suggests that the economy can grow modestly without the need for the Fed to raise interest rates. Internationally, the economic picture has also been favorable with notable economic expansion in China and India. Japan, Europe and many developing economies have also seen an improving economic picture. Modern technology has made it possible for investors to immediately access information as economic events occur throughout the world. Investors are continually looking globally for the best investment opportunities which has resulted in increased competition for U.S. equity and fixed income investments.
Geopolitical events continue to play an important role in overall market conditions. An important trend is the nationalization of oil production in Venezuela, Russia, Bolivia and other oil producing countries. Historically, the nationalization of oil and gas exploration has been motivated by the need to fund social and political agendas. This has resulted in a significant drop in the reinvestment of profits to maintain equipment and utilize technologies to maximize oil production in current drilling projects. Oil production in these countries has already started to decline following the same trend as other countries with state-run oil and gas companies such as Iran and Mexico. Global efforts to develop alternative energy sources are progressing, but remain limited in their ability to offset a significant slowdown in oil and gas production. Any significant disruption in oil and gas production could slow economic growth worldwide.
There is a growing labor shortage within the U.S. economy. The "baby boom" population is moving into retirement age shrinking the labor pool. Companies in some industries are constrained by the inability to hire additional staff to initiate new growth opportunities. U.S. government policy in this area may significantly impact economic growth in the coming years.
While we must always remain vigilant for potential threats to economic growth, we remain optimistic that the current economy can continue to grow with low interest rates and relatively low inflation. The likelihood of a recession in the coming months appears remote.
Market Perspective
We anticipate economic growth in 2007 will be in a range near 2.5%. While this should be positive for the equity market, we may see a slower rate of growth in comparison to last year. The market has been in a strong upward trend since last summer and we would anticipate a market correction sometime during the first half of the year.
During the fourth quarter of 2006, large cap stocks gained momentum while the mid and small cap markets continued to perform well. We believe the best performing stocks in each market sector will continue to perform well in 2007. In a slower growing economy, investors tend to focus on the companies with the best growth potential regardless of their market cap. Low interest rates will continue to benefit mid and small cap stocks as they seek funding for new growth initiatives.
The equity markets may also see price appreciation from the decrease in the shares available in the U.S. equities market. Many companies have been using excess cash to buy back shares while private equity firms have been acquiring publicly traded companies to take them private. The number of IPOs and secondary offerings has not been sufficient to compensate for the share reduction from buybacks and the privatization of public companies. The imbalance in supply and demand may see investors bidding up the price of stocks as their investment options become more limited.
2

Message
from the chairman
We anticipate market volatility will continue as investors respond to geopolitical events and new economic data. In these market conditions, achieving solid equity performance will rely more heavily on good stock selection and patience to weather temporary pullbacks as the market shifts in response to news events.
Government and corporate fixed income investing will remain more challenging as the supply of higher yielding investment grade bonds remains limited. The abundance of capital worldwide relative to the availability of bonds is expected to keep interest rates low. There will also be greater volatility as investors quickly redeploy capital throughout the world in search of the best yields. While the low interest rate trend remains intact, volatility within a narrow trading range will probably continue. It is becoming more difficult for individual countries to influence the fixed income markets. This increases the need for investors to monitor global trends to anticipate interest rate movements within individual countries.
Looking Ahead
While there are always market uncertainties and geopolitical events that cannot be predicted, we believe the investment outlook remains positive. Our investment strategies will continue to focus on longer-term investment trends while remaining adaptive to changing market conditions. While changing market conditions create uncertainty, they often present favorable investment opportunities for patient and disciplined investors. We strive to take advantage of market volatility to find attractive investments with long-term growth potential.
While I have commented on our view of overall economic and market conditions, our portfolio managers will provide more specific information on the investment strategies for each of our Funds in the following interviews.
Sincerely,
George A. Henning
Past performance does not guarantee future results. Performance quoted represents past performance. Current performance may be higher or lower than the performance data quoted. For performance current to the most recent month-end call (800) 989-6693. The investment return and principal value of an investment will fluctuate so that an investor's shares, when redeemed, may be worth more or less than their original cost. Small cap stocks typically have fewer financial resources and may carry higher risks and experience greater volatility than large cap stocks.
Returns represent the change in value over the stated period assuming reinvestment of dividends and capital gains at net asset value. Returns do not take into account the maximum 5.75% sales charge on Class A shares and would be lower if the sales charge were included. Returns do not take into account individual taxes which may reduce actual returns when shares are sold. Rankings do not take sales loads into account. Fund expenses as a percentage of average net assets were 2.78% for Class A shares and 3.54% for Class C shares for its most recent fiscal year (December 31, 2006). Please see the financial statements contained in this report for more details.
3
Pacific Advisors
Government Securities Fund
Seeks to provide high current income, preservation of capital, and rising future income, consistent with prudent investment risk. Invests at least 80% of its assets in U.S. Government fixed income securities and may invest in other income-producing instruments including dividend paying common stocks, for income and capital appreciation.
Interview with Portfolio Manager
Thomas H. Hanson
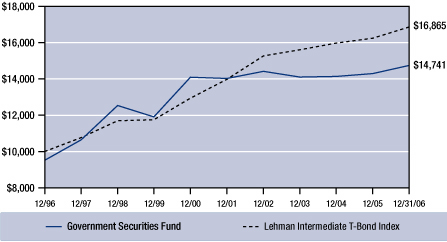
For the year ended December 31, 2006, the Fund had a total return of 3.14% for Class A shares and 2.47% for Class C shares. The Fund's benchmark, the Lehman Intermediate Treasury Bond Index1, returned 3.81% during the same period.
Q What were the primary economic factors that impacted the U.S. Government securities market in 2006?
A The primary factors affecting the fixed income markets in 2006 included moderating inflation, slowing economic growth, interest rate uncertainty, and accelerating growth overseas. For over 2 1/2 years, the Federal Reserve increased the fed funds rate on a regular basis to manage economic growth and keep inflation in check. In August, new data indicated more moderate economic growth and a manageable rate of inflation. This prompted the Fed to halt its rate increases and hold the fed funds rate steady at 5.25%.
Bonds rallied on expectations that the Fed would begin lowering the feds funds rate in early 2007. Long-term rates declined from 5.25% to 4.40% by late November. In the latter part of the year, however, investors recognized that new signs of stronger economic growth would give the Fed little reason to start lowering rates in early 2007. The bond rally faded and interest rates rose to just nearly 5.00%.
Additionally, foreign demand for U.S. government treasuries eased adding to market volatility. In particular, governments in China, Japan, and South Korea began purchasing more non-U.S. Government debt issues. This shift resulted from more competitive rates found overseas, continued weakening in the value of the U.S. dollar, and a growing desire for broader global diversification.
Q How did the Fund adapt to changes in interest rates and economy during the year?
A Uncertainty continued to plague the market even as the Fed held the fed funds rate steady beginning in August. The bond market rallied through late November when it looked like rates had peaked. During this time, interest rates began to fall and bond prices rose. As with stocks, capital appreciation in bonds can be achieved by buying low and selling high.
Given higher levels of market volatility throughout the year, performance was primarily achieved through a series of shorter-term purchases and sales that produced capital appreciation for the Fund. This strategy was particularly beneficial for the Fund in October and November when rates reached interim peaks before pulling back again. The Fund realized gains in the portfolio by selling select bonds to capture profits and improve total return. Capital was shifted from bonds with coupons of 5.00% or less and maturities between 3 to 7 years to bonds with coupons as high as 6.25% and longer maturities of 7 to10 years. With this strategy the Fund sought to lock in more attractive current yields and capital appreciation opportunities. As a result, the Fund produced a total return competitive with the Lehman Intermediate Treasury Bond Index.
When the near-term likelihood of lower rates faded late in the year, the Fund stopped lengthening maturities. We shifted the portfolio back to shorter-term securities in the three to five-year range in order to protect principal. We expect to maintain this defensive position to manage risk and preserve capital until a clearer direction for interest rates emerges.
Q How do interest rates impact the fixed income markets?
A The fixed-income market anticipates the future economic environment instead of tracking with present conditions. In general, the bond market attempts to anticipate where interest rates will be in the next six months to a year. Changes in the fed funds rate significantly impact the overall direction of interest rates. The Fed controls the fed funds rate to make it more or less expensive for banks to lend money to each other. Lower rates make it easier for businesses and consumers to borrow money thereby fueling economic expansion. Higher rates make it more difficult to borrow causing the economy to slow. It generally takes six to nine months for changes in the fed funds rate to trickle down through all areas of the economy.
Rate changes typically have an immediate impact on shorter-term bonds with maturities of two-years or less. In addition to changes in the fed funds rate, longer-term bonds are also influenced by changes in the balance between bond supply and demand. When supply exceeds demand, interest rates on long-term bonds typically rise in
1 The Lehman Intermediate Treasury Bond Index is an unmanaged index of intermediate term government bonds since 12/31/80.
4
order to attract new buyers. In turn, long-term rates generally decline when demand surpasses supply.
During 2006, the day-to-day volatility in the fixed income markets increased significantly. Uncertainty surrounding changes in the Fed's interest rate policy had the greatest impact on the markets. Volatility resulting from this uncertainty was compounded by the impact of rising interest rates in European and Asian countries and excess liquidity worldwide which quickly entered the global markets in search of the most attractive current yield. While this volatility increased the opportunity for the Fund to achieve short-term appreciation, it also resulted in the need to remain more defensive to manage higher levels of market risk.
Q How does the Fund manage risk in the fixed income market?
A The Fund is the most conservative investment within the Pacific Advisors family of funds. It is managed for fixed-income investors who generally have a low tolerance for risk and desire a reliable, consistent stream of income. The Fund invests at least 80% of its portfolio in U.S. Government treasury or agency securities. These securities are typically viewed as one of the safest investments because they are backed by the full faith and credit of the U.S. government. While they bear little credit risk, U.S. government securities remain vulnerable to market risks, including the impact of changes in interest rates and inflation.
The Fund's active investment management strategy helps manage these risks. In a rising interest rate environment, the Fund shortens maturities and raises cash to preserve principal. Alternatively, when interest rates decline, the Fund seeks yield and capital appreciation potential by locking in higher rates on longer-term bonds. This strategy enables the Fund to provide income while achieving capital appreciation to enhance total return and provide a hedge against inflation.
Additionally, the Fund maintains a small portion of its portfolio in high-quality, dividend paying stocks. A small exposure to equities gives the Fund a unique tool to provide additional capital appreciation to help offset the effects of inflation. For example, the Fund's position in Citizens Communications offers a 6% dividend yield and the opportunity for capital appreciation as a result of growth in the telecommunications sector.
Q What challenges do you anticipate in 2007?
A Early in 2006, investors were primarily concerned that economic growth would slow significantly resulting in a recession. The probability for a recession lessened as new economic data emerged over the course of the year. An apparent bottoming in the housing market, continued growth across economic sectors and strong consumer confidence levels created a more optimistic outlook for the economy.
When the Fed stopped raising rates in August, market consensus initially anticipated that the Fed would begin lowering short-term rates in this first half of 2007. A variety of mixed economic signals in latter part of the year increased the uncertainty surrounding this issue. The Fed is expected to hold the fed funds rate at 5.25% until economic data shows a clear expansion or contraction in the economy. This uncertainty caused the level of day-to-day volatility in the fixed income markets to rise significantly.
For the first time in three years, the Fund is operating in a relatively flat interest rate environment. The near-term direction for interest rates is still unclear. A higher level of volatility is expected to remain intact until more clarity is forthcoming on economic growth and the direction of interest rates. Given these market factors, the Fund will remain defensively positioned and concentrated in bonds with maturities of 3 to 7 years. The Fund will continue to seek improved total return opportunities in shorter-term, capital appreciation situations and by using the equity portion of the portfolio to produce solid dividend income with some capital appreciation.
Past performance does not guarantee future results. Performance quoted represents past performance. Current performance may be higher or lower than the performance data quoted. For performance current to the most recent month-end call (800) 989-6693. The investment return and principal value of an investment will fluctuate so that an investor's shares, when redeemed, may be worth more or less than their original cost.
Returns represent the change in value over the stated period assuming reinvestment of dividends and capital gains at net asset value. Returns do not take into account the maximum 4.75% sales charge on Class A shares and would be lower if the sales charge were included. Returns do not take into account individual taxes which may reduce actual returns when shares are sold.
Fund expenses as a percentage of average net assets were 2.51% for Class A shares and 3.21% for Class C shares for its most recent fiscal year (December 31, 2006). The Fund's investment adviser is waiving a portion of its management fees. Results shown reflect the waiver, without which the results would have been lower. Expense ratios shown reflect the waiver, without which they would have been higher. Please see the financial statements contained in this report for more details.
5
Pacific Advisors
Government Securities Fund continued
Portfolio Holdings as of 12/31/06 (Based on Total Investments)
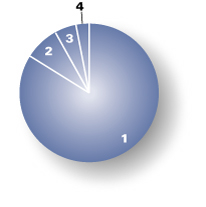
| 1. | U.S. Government Agencies | 83.98 | % | ||||||||
| 2. | Equities | 8.02 | % | ||||||||
| 3. | Preferred Stock | 5.07 | % | ||||||||
| 4. | Cash and Cash Equivalents | 2.93 | % | ||||||||
Change in Value of $10,000 Investment
This chart shows the growth of a $10,000 investment made in Class A shares of Pacific Advisors Government Securities Fund from January 1, 1997 through December 31, 2006 compared to the growth of the Lehman Intermediate Treasury Bond Index2.
Average Annual Compounded Return (Class A Shares)
For the year ended December 31, 2006
| One Year | – 1.73 | % | |||||
| Five Year | 0.01 | % | |||||
| Ten Year | 4.06 | % | |||||
Past performance does not guarantee future results. Performance quoted represents past performance. Current performance may be higher or lower than the performance data quoted. Returns include reinvested dividends and capital gains and the maximum 4.75% sales charge on Class A shares. Returns do not take into account individual taxes which may reduce actual returns when shares are sold. The investment return and principal value of an investment will fluctuate so that an investor's shares, when redeemed, may be worth more or less than their original cost. Call (800) 989-6693 for the most recent month-end performance.
2 The Lehman Intermediate Treasury Bond Index is an unmanaged index of intermediate term government bonds since 12/31/80.
6
Expense Examples
As a shareholder of the Fund you incur two types of costs: (1) transaction costs, including sales charges (loads) on purchase payments, reinvested dividends, or other distributions; redemption fees; and exchange fees; and (2) ongoing costs, including management fees; distribution (12b-1) fees; and other Fund expenses. This Example is intended to help you understand your ongoing costs (in dollars) of investing in the Fund and to compare these costs with the ongoing costs of investing in other mutual funds.
The Example is based on an investment of $1,000 invested at the beginning of the period and held for the entire period from July 1, 2006 through December 31, 2006.
Actual Expenses
The first line of the table below provides information about actual account values and actual expenses. You may use the information in this line, together with the amount you invested, to estimate the expenses that you paid over the period. Simply divide your account value by $1,000 (for example, an $8,600 account value divided by $1,000 = 8.6), then multiply the result by the number in the first line under the heading entitled "Expenses Paid During the Period" to estimate the expenses you paid on your account during the period.
The following transaction costs are not included in the expenses shown in the table and, if applicable, would increase the expenses that you paid over the period: (1) a front-end sales charge (load) of 4.75% on Class A shares; (2) a 2% redemption fee if you sell or exchange shares within 60 days of purchase, with certain exceptions. The redemption fee does not apply to: (a) redemptions under an automatic withdrawal program or periodic asset reallocation plan, required minimum distributions (RMD), employer mandated distributions from a qualified plan, or redemptions under a qualified domestic relations order (QDRO); (b) redemptions to pay for expenses related to terminal illness, extended hospital or nursing home care, or other serious medical conditions, including death; (c) redemptions of shares acquired through dividend or capital gains reinvestments, and (d) redemptions initiated by the Fund; and (3) a $10 service fee on each exchange aft er the first five exchanges in each calendar year.
The following ongoing costs are not included in the expenses shown in the table and, if applicable, would increase the expenses that you paid over the period: (1) a $12 low balance fee on accounts with balances of less than $250 as of September 30th of each calendar year and no investment activity (excluding reinvestment of dividends and/or capital gains) during the prior calendar year or the first nine months of the current calendar year. This fee does not apply to IRAs, qualified plan accounts, or Coverdell Education Savings Accounts; (2) a $15 annual custodial fee on IRAs, SEPs, SIMPLE IRAs, and Coverdell Education Savings Accounts; and (3) a $20 annual custodial fee on 403(b) accounts.
Hypothetical Example for Comparison Purposes
The second line of the table below provides information about hypothetical account values and hypothetical expenses based on the Fund's actual expense ratio and an assumed rate of return of 5% per year before expenses, which in not the Fund's actual return. The hypothetical account values and expenses may not be used to estimate the actual ending account balance or expenses you paid for the period. You may use this information to compare the ongoing costs of investing in the Fund and other funds. To do so, compare this 5% hypothetical example with the 5% hypothetical examples that appear in the shareholder reports of the other funds.
The following transaction costs are not included in the expenses shown in the table and, if applicable, would increase the expenses that you paid over the period: (1) a front-end sales charge (load) of 4.75% on Class A shares; (2) a 2% redemption fee if you sell or exchange shares within 60 days of purchase, with certain exceptions. The redemption fee does not apply to: (a) redemptions under an automatic withdrawal program or periodic asset reallocation plan, required minimum distributions (RMD), employer mandated distributions from a qualified plan, or redemptions under a qualified domestic relations order (QDRO); (b) redemptions to pay for expenses related to terminal illness, extended hospital or nursing home care, or other serious medical conditions, including death; (c) redemptions of shares acquired through dividend or capital gains reinvestments, and (d) redemptions initiated by the Fund; and (3) a $10 service fee on each exchange aft er the first five exchanges in each calendar year.
The following ongoing costs are not included in the expenses shown in the table and, if applicable, would increase the expenses that you paid over the period: (1) a $12 low balance fee on accounts with balances of less than $250 as of September 30th of each calendar year and no investment activity (excluding reinvestment of dividends and/or capital gains) during the prior calendar year or the first nine months of the current calendar year. This fee does not apply to IRAs, qualified plan accounts, or Coverdell Education Savings Accounts; (2) a $15 annual custodial fee on IRAs, SEPs, SIMPLE IRAs, and Coverdell Education Savings Accounts; and (3) a $20 annual custodial fee on 403(b) accounts.
Please note that the expenses shown in the table are meant to highlight your ongoing costs only and do not reflect any transactional costs, such as sales charges (loads), redemption fees, or exchange fees. Therefore, the second line of the table is useful in comparing ongoing costs only, and will not help you determine the relative total costs of owning different funds. In addition, if these transactional costs were included, your costs would have been higher.
| Beginning Account Value 07/01/06 | Ending Account Value 12/31/06 | Expense Paid During Period 07/01/06 – 12/31/06 | |||||||||||||
| Government Securities Fund Class A | |||||||||||||||
| Actual | $ | 1,000.00 | $ | 1,040.50 | $ | 12.91 | |||||||||
| Hypothetical (5% return before expense) | $ | 1,000.00 | $ | 1,025.21 | $ | 12.81 | |||||||||
| Government Securities Fund Class C | |||||||||||||||
| Actual | $ | 1,000.00 | $ | 1,036.50 | $ | 16.48 | |||||||||
| Hypothetical (5% return before expense) | $ | 1,000.00 | $ | 1,025.21 | $ | 16.39 | |||||||||
3 Expenses are equal to the Fund's annualized expense ratio of 2.51% for Class A shares and 3.21% for Class C shares, multiplied by the average account value over the period, multiplied by 184/365 days to reflect the one-half year period.
7
Pacific Advisors
Income and Equity Fund
Seeks to provide current income and, secondarily, long-term capital appreciation. Invests primarily in investment grade fixed income securities and dividend paying stocks.
Interview with Portfolio Managers
Thomas H. Hanson
Stephen K. Bache, CFA
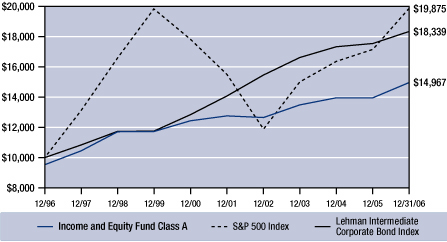
For the year ended December 31, 2006, the Fund returned 7.25% for Class A shares and 6.40% for Class C shares. The Fund's benchmarks, the S&P 5001 and the Lehman Intermediate Corporate Bond Index2, returned 15.79% and 4.48%, respectively.
Q How did the Fund achieve strong performance in 2006?
A The Fund seeks to produce total return through a blend of fixed income and equity investments. The Fund produced strong results for 2006 while maintaining a low risk profile. Performance was achieved through the strategic use of equities and effective risk management. By raising the equity allocation to 38% of its portfolio, the Fund achieved an additional 4% to 5% in total return during the year. These gains were further supplemented through the active management of the Fund's fixed income securities. This active management added to performance by producing both capital appreciation and improved yield.
Q How did the Fund adapt to the corporate bond market in 2006?
A In the early 2006, the Federal Reserve continued raising interest rates in response to robust economic growth and rising inflation from increasing energy and commodity costs. By mid-summer, inflationary pressures eased and economic growth moderated to a more acceptable annualized rate of between 3.0% and 3.5%. In response, the Fed ceased raising rates and held the fed funds rate at 5.25%. This pause represented a significant change in the Fed policy which had been in place since its initial decision to increase rates from 1.0% in June 2003. The bond market rallied with higher prices on increased demand. Longer-term bond rates began to decline as the Fed extended its interest rate pause into the third and fourth quarters. The benchmark 10-year U.S. Treasury Note fell from 5.25% to 4.40% by late November.
At mid-year, the Fund was defensively positioned in shorter-term bonds with higher coupons. This effectively poised the Fund to take advantage of an anticipated pause interest rate increases. As interest rates declined in the fall, the Fund purchased a few longer-term bonds and recognized additional gains through capital appreciation.
The bond rally, however, was short lived. Stronger-than-expected economic data reignited inflationary concerns in December and diminished the likelihood that the Fed would lower rates in early 2007. Interest rates quickly reversed course and rose to nearly 5.00%. In response, the Fund returned to a more defensive stance. Maturities were shortened from an average of 5 years at mid-year to an average of 3.9 years by the end of 2006. This strategy allowed the Fund to minimize market and interest rate risk while enabling the Fund to achieve its total return goal.
Q How did the Fund manage changes in the equity markets?
A The equity markets continued their strong run from the beginning of 2006 in the last half of the year. The energy and commodities sectors re-emerged from their mid-year pullback to lead the fall market rally. Based on our expectations for strong capital appreciation opportunities during 2006, we increased the equity allocation in the Fund from approximately 20% to 38%. Fund performance excelled and risk was effectively managed by adding positions in high-quality, more stable large cap companies such as GlaxoSmithKline and Altria Group.
The Fund's equity allocation was subsequently lowered to approximately 30% in the fourth quarter in response to elevated market risk. This included selling a number of more volatile energy and energy-related positions. The Fund also sold select industrial positions including ConocoPhillips and Caterpillar. Capital was reinvested in shorter-term corporate bonds and government agency securities. This reallocation
1 The Standard & Poor's 500 Index is an unmanaged, market capitalization weighted measure of 500 widely held common stocks listed on the New York Stock Exchange, American Stock Exchange and The Nasdaq Stock Market. Index returns assume the reinvestment of dividends, but, unlike the Fund's returns, do not reflect the effects of management fees or expenses.
2 The Lehman Intermediate Corporate Bond Index is an unmanaged index of intermediate term U.S. corporate bonds since 01/01/73.
8
helped minimize volatility while positioning the Fund to take advantage of future opportunities in the equity market.
Q Why is a total return approach important to this Fund?
A Consistent with goals and risk profile of more conservative investors, the Fund's primary objective is to achieve an optimal total return through investments with less risk and lower volatility. The Fund seeks to minimize risk and produce comparatively superior rates of total return through a blend of equity and fixed income investments. This total return approach attempts to maximize income from all appropriate sources including dividends, interest, and capital appreciation. The Fund employs an adaptive investment strategy. This strategy gives the Fund the flexibility to actively manage the allocation between fixed income and select equity securities as risk levels and reward opportunities in the markets change. As detailed above, this strategy proved highly effective for the Fund in 2006.
Q What is the near-term outlook for the Fund and where will it seek total return opportunities in 2007?
A Current bond market consensus remains mixed on the future direction of interest rates. There would be an increase in risk if the rate of economic growth or inflation accelerates. To protect principal, the Fund will remain more defensively positioned for the near-term with an average maturity of approximately 5 years. In 2007, the Fund will primarily seek fixed income opportunities through capital appreciation in shorter-term positions and by locking in higher yields when economic data suggests that the Fed may begin lowering interest rates.
In the equity market, leadership is expected to continue to rotate away from the energy and basic materials sectors. Leadership is likely to emerge from more defensive areas such as consumer staples, healthcare and financials. In response, the Fund has already begun rotating holdings into some of these sectors. Additionally, given the higher likelihood for a near-term equity market correction, the Fund will maintain or slightly reduce its equity allocation during the first half of the year seeking a mix of approximately 30% equities and 70% fixed income. The Fund will remain fully invested in order to optimize total return.
Past performance does not guarantee future results. Performance quoted represents past performance. Current performance may be higher or lower than the performance data quoted. For performance current to the most recent month-end call (800) 989-6693. The investment return and principal value of an investment will fluctuate so that an investor's shares, when redeemed, may be worth more or less than their original cost.
Returns represent the change in value over the stated period assuming reinvestment of dividends and capital gains at net asset value. Returns do not take into account the maximum 4.75% sales charge on Class A shares and would be lower if the sales charge were included. Returns do not take into account individual taxes which may reduce actual returns when shares are sold.
Fund expenses as a percentage of average net assets were 2.06% for Class A shares and 2.81% for Class C shares for its most recent fiscal year (December 31, 2006). The Fund's investment adviser is waiving a portion of its management fees. Results shown reflect the waiver, without which the results would have been lower. Expense ratios shown reflect the waiver, without which they would have been higher. Please see the financial statements contained in this report for more details.
9
Pacific Advisors
Income and Equity Fund continued
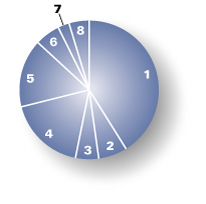
Portfolio Holdings as of 12/31/06 (Based on Total Investments)
| 1. | Corporate Bonds | 41.23 | % | ||||||||
| Equities | 29.98 | % | |||||||||
| 2. | Financials | 6.81 | % | ||||||||
| 3. | Energy | 5.08 | % | ||||||||
| 4. | Other Equities | 18.09 | % | ||||||||
| 5. | U.S. Government Agencies | 15.81 | % | ||||||||
| 6. | Preferred Stock | 5.95 | % | ||||||||
| 7. | Cash and Cash Equivalents | 2.55 | % | ||||||||
| 8. | Convertible Corporate Bonds | 4.48 | % | ||||||||
Change in Value of $10,000 Investment
This chart shows the growth of a $10,000 investment made in Class A shares of Pacific Advisors Income and Equity Fund from January 1, 1997 through December 31, 2006 compared to the growth of the S&P 500 Index and the Lehman Intermediate Corporate Bond Index3.
Average Annual Compounded Return (Class A Shares)
For the year ended December 31, 2006
| One Year | 2.14 | % | |||||
| Five Year | 2.25 | % | |||||
| Ten Year | 4.08 | % | |||||
Past performance does not guarantee future results. Performance quoted represents past performance. Current performance may be higher or lower than the performance data quoted. Returns include reinvested dividends and capital gains and the maximum 4.75% sales charge on Class A shares. Returns do not take into account individual taxes which may reduce actual returns when shares are sold. The investment return and principal value of an investment will fluctuate so that an investor's shares, when redeemed, may be worth more or less than their original cost. Call (800) 989-6693 for the most recent month-end performance.
3 The Standard & Poor's 500 Index is an unmanaged, market capitalization weighted measure of 500 widely held common stocks listed on the New York Stock Exchange, American Stock Exchange and The Nasdaq Stock Market. The Index returns assume reinvestment of dividends, but, unlike the Fund's returns, do not reflect the effects of management fees or expenses. The Lehman Intermediate Corporate Bond Index is an unmanaged index of intermediate term U.S. corporate bonds since 01/01/73.
10
Expense Examples
As a shareholder of the Fund you incur two types of costs: (1) transaction costs, including sales charges (loads) on purchase payments, reinvested dividends, or other distributions; redemption fees; and exchange fees; and (2) ongoing costs, including management fees; distribution (12b-1) fees; and other Fund expenses. This Example is intended to help you understand your ongoing costs (in dollars) of investing in the Fund and to compare these costs with the ongoing costs of investing in other mutual funds.
The Example is based on an investment of $1,000 invested at the beginning of the period and held for the entire period from July 1, 2006 through December 31, 2006.
Actual Expenses
The first line of the table below provides information about actual account values and actual expenses. You may use the information in this line, together with the amount you invested, to estimate the expenses that you paid over the period. Simply divide your account value by $1,000 (for example, an $8,600 account value divided by $1,000 = 8.6), then multiply the result by the number in the first line under the heading entitled "Expenses Paid During the Period" to estimate the expenses you paid on your account during the period.
The following transaction costs are not included in the expenses shown in the table and, if applicable, would increase the expenses that you paid over the period: (1) a front-end sales charge (load) of 4.75% on Class A shares; (2) a 2% redemption fee if you sell or exchange shares within 60 days of purchase, with certain exceptions. The redemption fee does not apply to: (a) redemptions under an automatic withdrawal program or periodic asset reallocation plan, required minimum distributions (RMD), employer mandated distributions from a qualified plan, or redemptions under a qualified domestic relations order (QDRO); (b) redemptions to pay for expenses related to terminal illness, extended hospital or nursing home care, or other serious medical conditions, including death; (c) redemptions of shares acquired through dividend or capital gains reinvestments, and (d) redemptions initiated by the Fund; and (3) a $10 service fee on each exchange aft er the first five exchanges in each calendar year.
The following ongoing costs are not included in the expenses shown in the table and, if applicable, would increase the expenses that you paid over the period: (1) a $12 low balance fee on accounts with balances of less than $250 as of September 30th of each calendar year and no investment activity (excluding reinvestment of dividends and/or capital gains) during the prior calendar year or the first nine months of the current calendar year. This fee does not apply to IRAs, qualified plan accounts, or Coverdell Education Savings Accounts; (2) a $15 annual custodial fee on IRAs, SEPs, SIMPLE IRAs, and Coverdell Education Savings Accounts; and (3) a $20 annual custodial fee on 403(b) accounts.
Hypothetical Example for Comparison Purposes
The second line of the table below provides information about hypothetical account values and hypothetical expenses based on the Fund's actual expense ratio and an assumed rate of return of 5% per year before expenses, which in not the Fund's actual return. The hypothetical account values and expenses may not be used to estimate the actual ending account balance or expenses you paid for the period. You may use this information to compare the ongoing costs of investing in the Fund and other funds. To do so, compare this 5% hypothetical example with the 5% hypothetical examples that appear in the shareholder reports of the other funds.
The following transaction costs are not included in the expenses shown in the table and, if applicable, would increase the expenses that you paid over the period: (1) a front-end sales charge (load) of 4.75% on Class A shares; (2) a 2% redemption fee if you sell or exchange shares within 60 days of purchase, with certain exceptions. The redemption fee does not apply to: (a) redemptions under an automatic withdrawal program or periodic asset reallocation plan, required minimum distributions (RMD), employer mandated distributions from a qualified plan, or redemptions under a qualified domestic relations order (QDRO); (b) redemptions to pay for expenses related to terminal illness, extended hospital or nursing home care, or other serious medical conditions, including death; (c) redemptions of shares acquired through dividend or capital gains reinvestments, and (d) redemptions initiated by the Fund; and (3) a $10 service fee on each exchange aft er the first five exchanges in each calendar year.
The following ongoing costs are not included in the expenses shown in the table and, if applicable, would increase the expenses that you paid over the period: (1) a $12 low balance fee on accounts with balances of less than $250 as of September 30th of each calendar year and no investment activity (excluding reinvestment of dividends and/or capital gains) during the prior calendar year or the first nine months of the current calendar year. This fee does not apply to IRAs, qualified plan accounts, or Coverdell Education Savings Accounts; (2) a $15 annual custodial fee on IRAs, SEPs, SIMPLE IRAs, and Coverdell Education Savings Accounts; and (3) a $20 annual custodial fee on 403(b) accounts.
Please note that the expenses shown in the table are meant to highlight your ongoing costs only and do not reflect any transactional costs, such as sales charges (loads), redemption fees, or exchange fees. Therefore, the second line of the table is useful in comparing ongoing costs only, and will not help you determine the relative total costs of owning different funds. In addition, if these transactional costs were included, your costs would have been higher.
| Beginning Account Value 07/01/06 | Ending Account Value 12/31/06 | Expense Paid During Period 07/01/06 – 12/31/06 | |||||||||||||
| Income & Equity Fund Class A | |||||||||||||||
| Actual | $ | 1,000.00 | $ | 1,055.40 | $ | 10.67 | |||||||||
| Hypothetical (5% return before expense) | $ | 1,000.00 | $ | 1,025.21 | $ | 10.52 | |||||||||
| Income & Equity Fund Class C | |||||||||||||||
| Actual | $ | 1,000.00 | $ | 1,051.60 | $ | 14.53 | |||||||||
| Hypothetical (5% return before expense) | $ | 1,000.00 | $ | 1,025.21 | $ | 14.34 | |||||||||
4 Expenses are equal to the Fund's annualized expense ratio of 2.06% for Class A shares and 2.81% for Class C shares, multiplied by the average account value over the period, multiplied by 184/365 days to reflect the one-half year period.
11
Pacific Advisors
Balanced Fund
Seeks to achieve long-term capital appreciation and income consistent with reduced risk. Invests primarily in large and medium cap common stocks with at least 25% of its assets invested in fixed income securities and preferred stocks.
Interview with Portfolio Manager
Stephen K. Bache, CFA
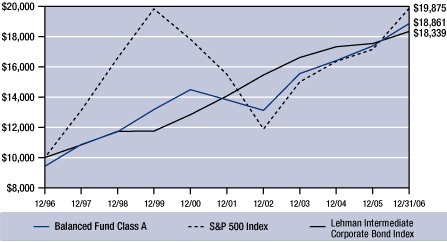
For the year ended December 31, 2006, the Fund returned 8.47% for Class A shares and 7.65% for Class C shares. The Fund's benchmarks, the S&P 5001 and the Lehman Intermediate Corporate Bond Index2, returned 15.79% and 4.48%, respectively.
Q What economic factors and trends affected the Fund's performance in 2006?
A Fund performance lagged the S&P 500 as a result of the Fund's more conservative investment strategy. While the Fund benefited from market gains, it maintained a conservative strategy to minimize the impact of market volatility. Volatility persisted in both the equity and fixed income markets throughout the year in response to moderating economic growth and changes in the Federal Reserve's interest rate policy.
In August, the Fed paused in its interest rate increases and held the fed funds rate at 5.25%. The bond market rallied on the Fed's decision resulting in increased demand and higher prices for corporate bonds. The rate on the benchmark 10-year Treasury Note declined from approximately 5.25% to 4.40% in late November. As a result, the Fund benefited from stronger fixed income performance in the second half of the year.
By the middle of the fourth quarter, stronger-than-expected economic data ended the likelihood of a near-term interest rate cut by the Fed. Bond prices fell and the bond market rally ended as quickly as it began. The rate on the 10-year Treasury Note subsequently rose to 5.00% by year-end. In response to this reversal, the Fund took a more defensive approach by shortening maturities on newly purchased bonds. In addition, we increased liquidity by emphasizing shorter-term fixed income securities such as U.S. Treasury Bills and corporate notes maturing in one year or less. This adaptive management strategy allowed the Fund to maximize total return even as the market became more volatile.
The equity markets rebounded from a mid-summer pullback with a strong rally in the final half of 2006. Industrial, energy, and commodities stocks led market performance and brought some of the major indices to record highs. To capitalize on this rally and capture gains, the Fund pruned fully-valued holdings which included some of its REIT positions. These monies were held in shorter-term securities or redeployed in select companies in the leading market sectors. New holdings included Grant Prideco, an energy equipment company, and Ingersoll-Rand, a heavy construction equipment provider. The Fund did not make any significant changes to its asset allocation mix during the last half of the year. At year-end, the portfolio was approximately 62% equities, 28% fixed income, and 10% cash.
Q What challenges did the Fund face in 2006?
A Managing increased volatility in the energy sector was one of the primary challenges for the Fund in 2006. When energy stocks pulled back during the mid-summer months, we maintained the portfolio's energy exposure based on the longer-term trend of growing global demand. Viewing the pullback as temporary, the Fund continued to hold companies such as Devon Energy and Suncor Energy. The Fund benefited from its patience and discipline when energy stocks rebounded strongly in late September.
The Fund also faced the challenge of a limited supply of high-quality, investment grade corporate bonds. Instead of issuing debt securities, corporations continued to use excess cash reserves to finance growth through share buyback programs and mergers and acquisitions. Adjustments to the Fund's fixed income portfolio during the year were limited. In cases where corporate bond positions matured or were called, the Fund typically redeployed capital in securities issued by government agencies such as the Federal Home Loan Bank. Government agency securities provided higher coupons and offered better current
1 The Standard & Poor's 500 Index is an unmanaged, market capitalization weighted measure of 500 widely held common stocks listed on the New York Stock Exchange, American Stock Exchange and The Nasdaq Stock Market. Index returns assume the reinvestment of dividends, but, unlike the Fund's returns, do not reflect the effects of management fees or expenses.
2 The Lehman Intermediate Corporate Bond Index is an unmanaged index of intermediate term U.S. corporate bonds since 01/01/73.
12
yields in comparison to suitable corporate bond alternatives.
Q How are select equity holdings selected for the Fund?
A Consistent with the more conservative nature of its investors, the Fund invests in companies with strong balance sheets, sound fundamentals, quality management, enviable market positions, and a history of returning cash to shareholders through dividends and share repurchases. The Fund seeks to achieve long-term growth while limiting risk exposure by selecting firms that are undervalued by the market and reflect sector leadership. Consistent with this approach, the Fund expanded its position in Ingersoll-Rand during last half of 2006. This diversified machinery manufacturer offered strong long-term growth prospects with solid fundamentals at an undervalued price.
Q How did the Fund manage risk during the past year?
A The Fund seeks to actively manage risk while providing investors with the opportunity to capitalize on growth in both the equity and fixed income markets. Overall, the Fund marginally expanded its risk exposure in the second half of the year. Increased equity risk came primarily from the Fund's energy positions. The Fund was able to effectively balance this risk through diversification with more defensive investments in healthcare and consumer staples stocks. The Fund also experienced a rise in day-to-day volatility as a result of increased volatility in the fixed income markets. To minimize the impact of market volatility, the Fund maintained a shorter average maturity between 3 to 5 years in its fixed income portfolio. Additionally, the Fund maintained a greater cash position to provide the flexibility to reposition fixed income holdings when the interest rate environment becomes more stable and favorable.
Q Where does the Fund expect to seek opportunities in the corporate bond and equity markets going forward?
A The equity markets are expected to remain relatively strong, supported by moderate economic growth in 2007. Barring a significant shift in market leadership, the Fund will continue to gravitate toward select value opportunities in energy, basic materials, media, healthcare, and financial sectors. The fixed income market is expected to remain challenging both in terms of managing a limited supply of high-quality corporate bonds and higher levels of market volatility. Given this framework, future fixed income performance is expected to come from shorter-term capital appreciation opportunities and through the purchase of higher yielding preferred stock and U.S. government agency notes.
Past performance does not guarantee future results. Performance quoted represents past performance. Current performance may be higher or lower than the performance data quoted. For performance current to the most recent month-end call (800) 989-6693. The investment return and principal value of an investment will fluctuate so that an investor's shares, when redeemed, may be worth more or less than their original cost.
Returns represent the change in value over the stated period assuming reinvestment of dividends and capital gains at net asset value. Returns do not take into account the maximum 5.75% sales charge on Class A shares and would be lower if the sales charge were included. Returns do not take into account individual taxes which may reduce actual returns when shares are sold. Fund expenses as a percentage of average net assets were 2.54% for Class A shares and 3.30% for Class C shares for its most recent fiscal year (December 31, 2006). Please see the financial statements contained in this report for more details.
13
Pacific Advisors
Balanced Fund continued
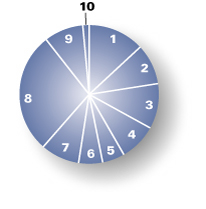
Portfolio Holdings as of 12/31/06 (Based on Total Investments)
| Equities | 61.50 | % | |||||||||
| 1. | Energy | 13.20 | % | ||||||||
| 2. | Financials | 9.44 | % | ||||||||
| 3. | Industrials | 10.45 | % | ||||||||
| 4. | Health Care | 8.68 | % | ||||||||
| 5. | Information Technology | 5.36 | % | ||||||||
| 6. | Consumer Discretionary | 5.42 | % | ||||||||
| 7. | Other Equities | 8.95 | % | ||||||||
| 8. | Corporate Bonds | 28.11 | % | ||||||||
| 9. | U.S. Government Agencies | 9.01 | % | ||||||||
| 10. | Cash and Cash Equivalents | 1.38 | % | ||||||||
Change in Value of $10,000 Investment
This chart shows the growth of a $10,000 investment made in Class A shares of Pacific Advisors Balanced Fund from January 1, 1997 through December 31, 2006 compared to the growth of the S&P 500 Index and the Lehman Intermediate Corporate Bond Index3.
Average Annual Compounded Return (Class A Shares)
For the year ended December 31, 2006
| One Year | 2.24 | % | |||||
| Five Year | 5.18 | % | |||||
| Ten Year | 6.24 | % | |||||
Past performance does not guarantee future results. Performance quoted represents past performance. Current performance may be higher or lower than the performance data quoted. Returns include reinvested dividends and capital gains and the maximum 5.75% sales charge on Class A shares. Returns do not take into account individual taxes which may reduce actual returns when shares are sold. The investment return and principal value of an investment will fluctuate so that an investor's shares, when redeemed, may be worth more or less than their original cost. Call (800) 989-6693 for the most recent month-end performance.
3 The Standard & Poor's 500 Index is an unmanaged, market capitalization weighted measure of 500 widely held common stocks listed on the New York Stock Exchange, American Stock Exchange and The Nasdaq Stock Market The Index returns assume reinvestment of dividends, but, unlike the Fund's returns, do not reflect the effects of management fees or expenses. The Lehman Intermediate Corporate Bond Index is an unmanaged index of intermediate term U.S. corporate bonds since 01/01/73.
14
Expense Examples
As a shareholder of the Fund you incur two types of costs: (1) transaction costs, including sales charges (loads) on purchase payments, reinvested dividends, or other distributions; redemption fees; and exchange fees; and (2) ongoing costs, including management fees; distribution (12b-1) fees; and other Fund expenses. This Example is intended to help you understand your ongoing costs (in dollars) of investing in the Fund and to compare these costs with the ongoing costs of investing in other mutual funds.
The Example is based on an investment of $1,000 invested at the beginning of the period and held for the entire period from July 1, 2006 through December 31, 2006.
Actual Expenses
The first line of the table below provides information about actual account values and actual expenses. You may use the information in this line, together with the amount you invested, to estimate the expenses that you paid over the period. Simply divide your account value by $1,000 (for example, an $8,600 account value divided by $1,000 = 8.6), then multiply the result by the number in the first line under the heading entitled "Expenses Paid During the Period" to estimate the expenses you paid on your account during the period.
The following transaction costs are not included in the expenses shown in the table and, if applicable, would increase the expenses that you paid over the period: (1) a front-end sales charge (load) of 5.75% on Class A shares; (2) a 2% redemption fee if you sell or exchange shares within six months of purchase, with certain exceptions. The redemption fee does not apply to: (a) redemptions under an automatic withdrawal program or periodic asset reallocation plan, required minimum distributions (RMD), employer mandated distributions from a qualified plan, or redemptions under a qualified domestic relations order (QDRO); (b) redemptions to pay for expenses related to terminal illness, extended hospital or nursing home care, or other serious medical conditions, including death; (c) redemptions of shares acquired through dividend or capital gains reinvestments, and (d) redemptions initiated by the Fund; and (3) a $10 service fee on each exchange after the first five exchanges in each calendar year.
The following ongoing costs are not included in the expenses shown in the table and, if applicable, would increase the expenses that you paid over the period: (1) a $12 low balance fee on accounts with balances of less than $250 as of September 30th of each calendar year and no investment activity (excluding reinvestment of dividends and/or capital gains) during the prior calendar year or the first nine months of the current calendar year. This fee does not apply to IRAs, qualified plan accounts, or Coverdell Education Savings Accounts; (2) a $15 annual custodial fee on IRAs, SEPs, SIMPLE IRAs, and Coverdell Education Savings Accounts; and (3) a $20 annual custodial fee on 403(b) accounts.
Hypothetical Example for Comparison Purposes
The second line of the table below provides information about hypothetical account values and hypothetical expenses based on the Fund's actual expense ratio and an assumed rate of return of 5% per year before expenses, which in not the Fund's actual return. The hypothetical account values and expenses may not be used to estimate the actual ending account balance or expenses you paid for the period. You may use this information to compare the ongoing costs of investing in the Fund and other funds. To do so, compare this 5% hypothetical example with the 5% hypothetical examples that appear in the shareholder reports of the other funds.
The following transaction costs are not included in the expenses shown in the table and, if applicable, would increase the expenses that you paid over the period: (1) a front-end sales charge (load) of 5.75% on Class A shares; (2) a 2% redemption fee if you sell or exchange shares within six months of purchase, with certain exceptions. The redemption fee does not apply to: (a) redemptions under an automatic withdrawal program or periodic asset reallocation plan, required minimum distributions (RMD), employer mandated distributions from a qualified plan, or redemptions under a qualified domestic relations order (QDRO); (b) redemptions to pay for expenses related to terminal illness, extended hospital or nursing home care, or other serious medical conditions, including death; (c) redemptions of shares acquired through dividend or capital gains reinvestments, and (d) redemptions initiated by the Fund; and (3) a $10 service fee on each exchange after the first five exchanges in each calendar year.
The following ongoing costs are not included in the expenses shown in the table and, if applicable, would increase the expenses that you paid over the period: (1) a $12 low balance fee on accounts with balances of less than $250 as of September 30th of each calendar year and no investment activity (excluding reinvestment of dividends and/or capital gains) during the prior calendar year or the first nine months of the current calendar year. This fee does not apply to IRAs, qualified plan accounts, or Coverdell Education Savings Accounts; (2) a $15 annual custodial fee on IRAs, SEPs, SIMPLE IRAs, and Coverdell Education Savings Accounts; and (3) a $20 annual custodial fee on 403(b) accounts.
Please note that the expenses shown in the table are meant to highlight your ongoing costs only and do not reflect any transactional costs, such as sales charges (loads), redemption fees, or exchange fees. Therefore, the second line of the table is useful in comparing ongoing costs only, and will not help you determine the relative total costs of owning different funds. In addition, if these transactional costs were included, your costs would have been higher.
| Beginning Account Value 07/01/06 | Ending Account Value 12/31/06 | Expense Paid During Period 07/01/06 – 12/31/06 | |||||||||||||
| Balanced Fund Class A | |||||||||||||||
| Actual | $ | 1,000.00 | $ | 1,065.70 | $ | 13.23 | |||||||||
| Hypothetical (5% return before expense) | $ | 1,000.00 | $ | 1,025.21 | $ | 12.97 | |||||||||
| Balanced Fund Class C | |||||||||||||||
| Actual | $ | 1,000.00 | $ | 1,062.10 | $ | 17.15 | |||||||||
| Hypothetical (5% return before expense) | $ | 1,000.00 | $ | 1,025.21 | $ | 16.85 | |||||||||
4 Expenses are equal to the Fund's annualized expense ratio of 2.54% for Class A shares and 3.30% for Class C shares, multiplied by the average account value over the period, multiplied by 184/365 days to reflect the one-half year period.
15
Pacific Advisors
Growth Fund
Seeks to achieve long-term capital appreciation. Invests primarily in medium to large capitalization companies whose stocks are a part of the S&P 500 Index1 or the Nasdaq 100 Index2.
Interview with Portfolio Manager
Thomas H. Hanson
For the year ended December 31, 2006, the Fund returned 7.85% for Class A shares and 7.11% for Class C shares. The Fund's benchmarks, the S&P 500 and the Russell 10003, rose 15.79% and 15.46%, respectively, during the same period.
Q How did the economic climate impact large cap growth stocks and Fund performance in 2006?
A Economic news remained mixed throughout 2006. Data in the second half of the year, particularly slower growth in the housing sector, pointed to an economic slowdown. Investors worried over the implications of a decelerating economy when the Federal Reserve stopped raising interest rates in August. The Fed indicated that inflationary pressures showed signs of easing but added that it would continue to monitor additional economic developments. During the third quarter, capital began to move out of the leading energy and basic materials sectors to more defensive sectors such as consumer staples and healthcare.
The equity markets rallied on the Fed's pause in interest rate hikes. Early in the fourth quarter, it became clearer that the economic slowdown would be mild as GDP growth slowed to an acceptable 3.2%. The Fed continued to hold interest rates at 5.25% indicating that inflation was easing. This rally brought the equity markets to unexpected highs as demand for stocks across all capitalization levels rose. In particular, demand for large cap and dividend-paying stocks increased as investors sought both the fundamental stability offered by large cap stocks and the associated growth opportunities from this undervalued area of the market.
The Fund's investment strategy seeks to place capital in the leading market sectors and the companies within those sectors demonstrating revenue growth, share price momentum, and reasonable valuations. However, the shift in market leadership away from the energy and basic materials sectors in the third quarter occurred suddenly. While the Fund subsequently reduced or liquidated a number of its energy, energy-related and basic materials holdings, the timing of this reduced exposure resulted in the Fund under-performing its benchmark, the S&P 500 Index. We believe energy will continue to be a strong sector over the long-term. Nevertheless, sudden shifts of capital out of a given sector, even though temporary, can result in underperformance.
Capital was reallocated to the more defensive healthcare, consumer staples, and industrial sectors with companies such as United Health Group, Zimmer Holdings, Johnson & Johnson, and General Electric in the third quarter. The Fund subsequently reallocated capital to energy and basic materials in the fourth quarter as these sectors re-emerged as strong performers.
Q Why is a "reasonable price" an important component of the Fund's growth at a reasonable price investment strategy?
A Growth at a Reasonable Price (GARP) is the foundation of the Fund's investment strategy. This approach involves identifying the leading sectors of the market and the companies in those sectors with the strongest growth potential. These companies must also be reasonably priced in order to be considered for the Fund's portfolio. A reasonable price is determined by comparing a company's profit growth to the rate at which the company's value is increasing over time. A firm whose profits and market valuation are growing at similar rates is more reasonably priced than a company whose stock price far exceeds the firm's nearer-term earnings prospects. By investing in reasonably priced stocks, the Fund seeks to limit market risk while seeking strong long-term growth prospects.
1 The Standard & Poor's 500 Index is an unmanaged, market capitalization weighted measure of 500 widely held common stocks listed on the New York Stock Exchange, American Stock Exchange and The Nasdaq Stock Market. Index returns assume the reinvestment of dividends, but, unlike the Fund's returns, do not reflect the effects of management fees or expenses.
2 The Nasdaq 100 Stock Index is an unmanaged, market capitalization weighted measure of the 100 largest non-financial domestic and international common stocks listed on The Nasdaq Stock Market. Index returns assume the reinvestment of dividends, but, unlike the Fund's returns, do not reflect management fees or expenses.
3 The Russell 1000 Stock Index is an unmanaged, market capitalization weighted measure of stock market performance. It contains the stocks of the 1,000 largest publicly traded companies within the Russell 3000 Index. Index returns assume the reinvestment of dividends, but, unlike the Fund's returns, do not reflect the effects of capital gains, management fees, or expenses.
16
Portfolio risk is also managed by rotating out of sectors when they become fully valued by the market. Capital is then redeployed into sectors that represent new market leadership. For example, basic materials firm PhelpsDodge produced significant gains for the Fund during the first half of the year. The stock reached full valuation in late June when market leadership in this sector peaked. Recognizing a shift in market leadership, the Fund sold PhelpsDodge to realize a gain on its position. With capital rotating into the healthcare sector, the Fund subsequently purchased Zimmer Holdings which was more reasonably priced and offered a better opportunity for growth.
Q How did the Fund use cash to manage risk in 2006?
A The Fund's strategic use of cash is critical to managing market volatility. The Fund's strategy entails moving the portfolio from a more fully-invested position to a position of holding more cash as dictated by macroeconomic and market factors. When the market trends downward, the Fund defensively maintains a larger cash position to protect principal. Conversely, as the market trends upward, cash is deployed to capitalize on growth opportunities. In 2006, the resilient U.S. economy and strong underlying market fundamentals led the Fund to remain more fully invested during most of the year. Cash was strategically kept to a minimum at 8% to 10% of the portfolio.
Q What areas of the market will offer growth opportunities in 2007?
A The energy, industrials and basic materials sectors will likely continue to lead the market in the foreseeable future. We will continue to review the leading companies in these sectors to identify long-term growth opportunities. We also anticipate opportunities in the non-bank financial sector and among select technology companies. The healthcare sector will continue to be appropriately represented in the portfolio due to the positive growth rates and lower volatility offered by these stocks. Specifically, healthcare providers and healthcare equipment companies that support the aging baby-boomer population should continue to offer strong long-term growth prospects. One of the primary exceptions to the growth in the healthcare sector remains big pharmaceutical companies. Many of these firms have had lackluster performance as a result of pressure from lawmakers to reduce prices and make drugs more affordable to the broad populatio n.
Q What changes can be expected in the portfolio during the first half of 2007?
A While economic growth has continued to moderate, corporations of all sizes remain flush with cash. We expect large cap stocks will continue to perform well in the near-term. Capital will likely gravitate toward large caps due to their inherent stability and capacity to balance risk elements in the market. Large caps may also benefit from a weaker dollar as company earnings generated outside the U.S. increase based on currency exchange rates.
If a marked economic slowdown occurs, demand for large cap stocks is expected to rise further, especially for stocks with higher dividend yields. These companies tend to possess the size, stability, global presence and stronger balance sheets necessary to weather economic downturns. In the near-term, we do not anticipate any significant changes to the sectors represented in the portfolio. We will continue to monitor the economic environment for changes in market leadership that may support improved performance for the Fund.
Past performance does not guarantee future results. Performance quoted represents past performance. Current performance may be higher or lower than the performance data quoted. For performance current to the most recent month-end call (800) 989-6693. The investment return and principal value of an investment will fluctuate so that an investor's shares, when redeemed, may be worth more or less than their original cost.
Returns represent the change in value over the stated period assuming reinvestment of dividends and capital gains at net asset value. Returns do not take into account the maximum 5.75% sales charge on Class A shares and would be lower if the sales charge were included. Returns do not take into account individual taxes which may reduce actual returns when shares are sold.
Fund expenses as a percentage of average net assets were 2.64% for Class A shares and 3.40% for Class C shares for its most recent fiscal year (December 31, 2006). The Fund's investment adviser is waiving a portion of its management fees. Results shown reflect the waiver, without which the results would have been lower. Expense ratios shown reflect the waiver, without which they would have been higher. Please see the financial statements contained in this report for more details.
17
Pacific Advisors
Growth Fund continued
Portfolio Holdings as of 12/31/06 (Based on Total Investments)
| Equities | 91.21 | % | |||||||||
| 1. | Energy | 22.79 | % | ||||||||
| 2. | Health Care | 31.12 | % | ||||||||
| 3. | Industrials | 12.77 | % | ||||||||
| 4. | Information Technology | 9.32 | % | ||||||||
| 5. | Materials | 5.76 | % | ||||||||
| 6. | Other Equities | 9.45 | % | ||||||||
| 7. | Cash and Cash Equivalents | 8.79 | % | ||||||||

Change in Value of $10,000 Investment
This chart shows the growth of a $10,000 investment made in Class A shares of Pacific Advisors Growth Fund from May 1, 1999 through December 31, 2006 compared to the growth of the S&P 500 Index and the Russell 1000 Index5.
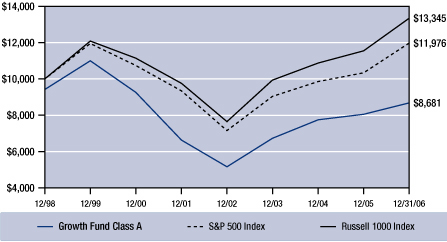
Average Annual Compounded Return (Class A Shares)
For the year ended December 31, 2006
| One Year | 1.66 | % | |||||
| Five Year | 4.25 | % | |||||
| Ten Year | – 1.83 | % | |||||
Past performance does not guarantee future results. Performance quoted represents past performance. Current performance may be higher or lower than the performance data quoted. Returns include reinvested dividends and capital gains and the maximum 5.75% sales charge on Class A shares. Returns do not take into account individual taxes which may reduce actual returns when shares are sold. The investment return and principal value of an investment will fluctuate so that an investor's shares, when redeemed, may be worth more or less than their original cost. Call (800) 989-6693 for the most recent month-end performance.
4 The Standard & Poor's 500 Index is an unmanaged, market capitalization weighted measure of 500 widely held common stocks listed on the New York Stock Exchange, American Stock Exchange and The Nasdaq Stock Market. The Index returns assume reinvestment of dividends, but, unlike the Fund's returns, do not reflect the effects of management fees or expenses. The Russell 1000 Stock Index is an unmanaged, market capitalization weighted measure of stock market performance. It contains the stocks of the 1,000 largest publicly traded companies within the Russell 3000 Index. The Index does not take capital gains into consideration. Index returns assume the reinvestment of dividends, but, unlike the Fund's returns, do not reflect the effects of management fees or expenses.
18
Expense Examples
As a shareholder of the Fund you incur two types of costs: (1) transaction costs, including sales charges (loads) on purchase payments, reinvested dividends, or other distributions; redemption fees; and exchange fees; and (2) ongoing costs, including management fees; distribution (12b-1) fees; and other Fund expenses. This Example is intended to help you understand your ongoing costs (in dollars) of investing in the Fund and to compare these costs with the ongoing costs of investing in other mutual funds.
The Example is based on an investment of $1,000 invested at the beginning of the period and held for the entire period from July 1, 2006 through December 31, 2006.
Actual Expenses
The first line of the table below provides information about actual account values and actual expenses. You may use the information in this line, together with the amount you invested, to estimate the expenses that you paid over the period. Simply divide your account value by $1,000 (for example, an $8,600 account value divided by $1,000 = 8.6), then multiply the result by the number in the first line under the heading entitled "Expenses Paid During the Period" to estimate the expenses you paid on your account during the period.
The following transaction costs are not included in the expenses shown in the table and, if applicable, would increase the expenses that you paid over the period: (1) a front-end sales charge (load) of 5.75% on Class A shares; (2) a 2% redemption fee if you sell or exchange shares within six months of purchase, with certain exceptions. The redemption fee does not apply to: (a) redemptions under an automatic withdrawal program or periodic asset reallocation plan, required minimum distributions (RMD), employer mandated distributions from a qualified plan, or redemptions under a qualified domestic relations order (QDRO); (b) redemptions to pay for expenses related to terminal illness, extended hospital or nursing home care, or other serious medical conditions, including death; (c) redemptions of shares acquired through dividend or capital gains reinvestments, and (d) redemptions initiated by the Fund; and (3) a $10 service fee on each exchange after the first five exchanges in each calendar year.
The following ongoing costs are not included in the expenses shown in the table and, if applicable, would increase the expenses that you paid over the period: (1) a $12 low balance fee on accounts with balances of less than $250 as of September 30th of each calendar year and no investment activity (excluding reinvestment of dividends and/or capital gains) during the prior calendar year or the first nine months of the current calendar year. This fee does not apply to IRAs, qualified plan accounts, or Coverdell Education Savings Accounts; (2) a $15 annual custodial fee on IRAs, SEPs, SIMPLE IRAs, and Coverdell Education Savings Accounts; and (3) a $20 annual custodial fee on 403(b) accounts.
Hypothetical Example for Comparison Purposes
The second line of the table below provides information about hypothetical account values and hypothetical expenses based on the Fund's actual expense ratio and an assumed rate of return of 5% per year before expenses, which in not the Fund's actual return. The hypothetical account values and expenses may not be used to estimate the actual ending account balance or expenses you paid for the period. You may use this information to compare the ongoing costs of investing in the Fund and other funds. To do so, compare this 5% hypothetical example with the 5% hypothetical examples that appear in the shareholder reports of the other funds.
The following transaction costs are not included in the expenses shown in the table and, if applicable, would increase the expenses that you paid over the period: (1) a front-end sales charge (load) of 5.75% on Class A shares; (2) a 2% redemption fee if you sell or exchange shares within six months of purchase, with certain exceptions. The redemption fee does not apply to: (a) redemptions under an automatic withdrawal program or periodic asset reallocation plan, required minimum distributions (RMD), employer mandated distributions from a qualified plan, or redemptions under a qualified domestic relations order (QDRO); (b) redemptions to pay for expenses related to terminal illness, extended hospital or nursing home care, or other serious medical conditions, including death; (c) redemptions of shares acquired through dividend or capital gains reinvestments, and (d) redemptions initiated by the Fund; and (3) a $10 service fee on each exchange after the first five exchanges in each calendar year.
The following ongoing costs are not included in the expenses shown in the table and, if applicable, would increase the expenses that you paid over the period: (1) a $12 low balance fee on accounts with balances of less than $250 as of September 30th of each calendar year and no investment activity (excluding reinvestment of dividends and/or capital gains) during the prior calendar year or the first nine months of the current calendar year. This fee does not apply to IRAs, qualified plan accounts, or Coverdell Education Savings Accounts; (2) a $15 annual custodial fee on IRAs, SEPs, SIMPLE IRAs, and Coverdell Education Savings Accounts; and (3) a $20 annual custodial fee on 403(b) accounts.
Please note that the expenses shown in the table are meant to highlight your ongoing costs only and do not reflect any transactional costs, such as sales charges (loads), redemption fees, or exchange fees. Therefore, the second line of the table is useful in comparing ongoing costs only, and will not help you determine the relative total costs of owning different funds. In addition, if these transactional costs were included, your costs would have been higher.
| Beginning Account Value 07/01/06 | Ending Account Value 12/31/06 | Expense Paid During Period 07/01/06 – 12/31/06 | |||||||||||||
| Growth Fund Class A | |||||||||||||||
| Actual | $ | 1,000.00 | $ | 1,050.20 | $ | 13.64 | |||||||||
| Hypothetical (5% return before expense) | $ | 1,000.00 | $ | 1,025.21 | $ | 13.48 | |||||||||
| Growth Fund Class C | |||||||||||||||
| Actual | $ | 1,000.00 | $ | 1,046.30 | $ | 17.54 | |||||||||
| Hypothetical (5% return before expense) | $ | 1,000.00 | $ | 1,025.21 | $ | 17.36 | |||||||||
5 Expenses are equal to the Fund's annualized expense ratio of 2.64% for Class A shares and 3.40% for Class C shares, multiplied by the average account value over the period, multiplied by 184/365 days to reflect the one-half year period.
19
Pacific Advisors
Multi-Cap Value Fund
Seeks to achieve long-term capital appreciation. Invests in a diversified portfolio of large to small capitalization companies using an actively managed, value investment approach.
Interview with Portfolio Managers
Shelly J. Meyers
Samuel C. Coquillard
For the year ended December 31, 2006, the Fund returned 12.91% for Class A shares and 12.02% for Class C shares. The Fund's benchmark, the S&P 5001 rose 15.79% during the same period.
Q What factors impacted the stock market and the Fund's holdings during 2006?
A In the second half of 2006, investors were anxious over the potential for additional interest rate increases and a significant slowdown in the economy. In August, the Federal Reserve ended its 2 1/2-year stretch of interest rate increases. The Fed's change in policy boosted investor confidence and lent some upward momentum to the market. Additionally, a slowdown in the housing sector eased speculative buying pressures and reduced concerns of an imminent collapse in the housing market. Moreover, energy prices, which skyrocketed during the summer months, declined to less alarming levels by year-end. While concerns over slower economic growth remained, Wall Street's confidence rose in the latter part of the year on the belief that the economy would achieve a "soft landing."
The Fund's large cap technology holdings hurt performance in the first half of the year when the technology sector fell out of favor in the market. Performance accelerated in the last half of the year as the Fund anticipated a pullback in energy prices and benefited from an increase in merger and acquisition activity. Some energy positions were reduced or sold during the late summer to realize significant long-term gains in the portfolio. As a result, Fund performance was not dramatically hurt when energy stocks pulled back during the last half of the year. Although volatility is expected to remain high in these stocks, the long-term benefit of maintaining select energy and energy-related positions outweighs the associated risks.
Additionally, the Fund benefited from an increase in merger and acquisition activity. Many corporations flush with cash reserves found lucrative opportunities to buy competitors or supplement product lines through acquisition. Hedge funds and private equity firms also pushed acquisition activity higher. Most of benefits from this activity were realized by the Fund's small cap holdings including Elkcorp, Maritrans and Metrologic Instruments. For example, Metrologic Instruments, an image processing software and data hardware producer, was purchased by a technology-focused private equity fund. The Fund profited from an increase in Metrologic's stock price prior to the acquisition. While the Fund does not seek out pure acquisition plays as a part of its investment strategy, stocks with greater intrinsic value opportunities also typically have increased prospects as merger or acquisition targets.
Q What challenges and opportunities did the Fund encounter during 2006?
A The Fund is actively managed with a value driven investment discipline that seeks long-term investment opportunities by taking advantage of periods of weak market performance. The biggest challenge in implementing this strategy is pinpointing the most opportune time to buy a value stock when it is out of favor with the market. This challenge was a significant factor in managing the Fund's technology holdings during the first half of the year. While valuations remained compelling, these firms underperformed for a longer period of time than originally anticipated. During this period, the value of these holdings was reaffirmed. Select positions were increased in anticipation of future performance based on attractive valuations and improving business conditions. For example, EMC, a le ading provider of network storage technology, saw its price decline due to broad-based downward pressure in the technology sector. After confirming that the company was fundamentally sound and the price unreasonably depressed, we selectively added to the Fund's position. In the third quarter, the market began to recognize the improving
1 The Standard & Poor's 500 Index is an unmanaged, market capitalization weighted measure of 500 widely held common stocks listed on the New York Stock Exchange, American Stock Exchange and The Nasdaq Stock Market. Index returns assume the reinvestment of dividends, but, unlike the Fund's returns, do not reflect the effects of management fees or expenses.
20
business fundamentals and attractive valuations of technology companies such as EMC. These companies' stock prices benefited and these holdings were among the strongest performers for the Fund in the second half of the year.
Q How do investors benefit from the Fund's ability to seek opportunities in all market capitalizations?
A The Fund's ability to invest in companies of various market capitalizations offers investors an additional layer of equity diversification. Investing across a wide array of capitalizations also gives the Fund the flexibility to surface value opportunities wherever they may arise. Instead of being limited to selecting companies from one market capitalization category, the Fund can concentrate holdings in the strongest value opportunities regardless of whether the opportunities are in small, mid or large cap stocks.
In 2006, unique value opportunities were surfaced in small and mid-cap companies such as United Natural Foods and Activision. The Fund's large cap holdings also continued to add value to the portfolio by providing stability and additional opportunities for capital appreciation. Positions in companies such as Bank of America, Johnson & Johnson and AT&T produced steady gains while moderating risk in the portfolio. It is important to note that the Fund does not chase performance across market capitalizations. Rather, the Fund seeks individual value opportunities by assessing a stock's longer-term performance prospects without being limited to seeking investments in a specific market capitalization.
Q Why did the Fund experience higher-than-expected volatility in 2006?
A The biggest challenge in 2006 was managing the Fund's volatility. While investors should expect some short-term volatility, 2006 was an unusually turbulent year for the Fund. Volatility occurred both on the upside from rapidly rising stock prices and on the downside from rapid price depreciation. Elevated volatility was a product of both sector trends and company-specific events.
In the first half of 2006, technology stocks suffered losses when the technology sector fell out of favor in the market. This hurt performance and increased volatility for the Fund. In particular, positions in chip-maker Intel and network equipment company Cisco Systems weighed on portfolio performance. In the last half of the year, however, technology stocks regained market favor and Intel and Cisco were among the strongest contributors to the Fund's performance. At the same time, their rapid price appreciation relative to the market also elevated Fund volatility.
An example of company-specific volatility occurred in one of the Fund's healthcare equipment stocks, Zimmer Holdings. Zimmer's stock price fell dramatically during the summer due to concerns over pricing pressures. Within a quarter, investor concerns had been allayed resulting in appreciation in the stock's price.
No one, including portfolio managers, likes the whipsaw feeling created by volatility. However, "panic" is the worst reaction to downside volatility. During these times, it is particularly vital to remain patient and maintain a disciplined investment strategy in order to achieve long-term objectives.
The Fund maintains a focused portfolio of 35 to 50 positions which can result in periods of higher volatility compared to a fund with numerous holdings such as an index fund. Therefore, the Fund is more appropriate for investors who can weather short-term periods of higher volatility in exchange for the opportunity to seek above-average long-term performance.
Q Where does the Fund expect to seek opportunities in the coming year?
A During 2006, the Fund implemented a moderately cautious investment stance that focused on investments that would be less sensitive to fluctuations in the market or economy. This included taking positions in consumer staples companies such as Whole Foods, healthcare stocks such as United Health Group and Boston Scientific, and high-dividend paying stocks such as Washington Mutual and Citigroup. The Fund will remain focused on holdings in more defensive areas of the market. Additionally, we will seek to reduce excess volatility in the portfolio by analyzing the historical risk measure of specific companies and expanding the number of holdings toward the higher end of the Fund's range of 35 to 50 companies.
Market uncertainty remains high regarding economic growth, inflation and the direction of
21
Pacific Advisors
Multi-Cap Value Fund continued
interest rates. In this environment, the Fund will remain focused on individual stock selection. We will look to capitalize on market volatility to acquire companies in businesses that continue to show good growth potential. The Fund's multi-cap investment strategy will allow us to take advantage of acquiring attractive companies across all market caps.
Past performance does not guarantee future results. Performance quoted represents past performance. Current performance may be higher or lower than the performance data quoted. For performance current to the most recent month-end call (800) 989-6693. The investment return and principal value of an investment will fluctuate so that an investor's shares, when redeemed, may be worth more or less than their original cost.
Returns represent the change in value over the stated period assuming reinvestment of dividends and capital gains at net asset value. Returns do not take into account the maximum 5.75% sales charge on Class A shares and would be lower if the sales charge were included. Returns do not take into account individual taxes which may reduce actual returns when shares are sold. Fund expenses as a percentage of average net assets were 3.02% for Class A shares and 3.79% for Class C shares for its most recent fiscal year (December 31, 2006). Please see the financial statements contained in this report for more details.
22
Portfolio Holdings as of 12/31/06 (Based on Total Investments)
| Equities | 94.28 | % | |||||||||
| 1. | Health Care | 16.32 | % | ||||||||
| 2. | Information Technology | 19.92 | % | ||||||||
| 3. | Financials | 14.09 | % | ||||||||
| 4. | Energy | 13.36 | % | ||||||||
| 5. | Consumer Staples | 10.16 | % | ||||||||
| 6. | Industrials | 8.60 | % | ||||||||
| 7. | Consumer Discretionary | 6.91 | % | ||||||||
| 8. | Other Equities | 4.92 | % | ||||||||
| 9. | Cash and Cash Equivalents | 5.72 | % | ||||||||

Change in Value of $10,000 Investment
This chart shows the growth of a $10,000 investment made in Class A shares of Pacific Advisors Multi-Cap Value Fund from April 1, 2002 through December 31, 2006 compared to the growth of the S&P 500 Index2.
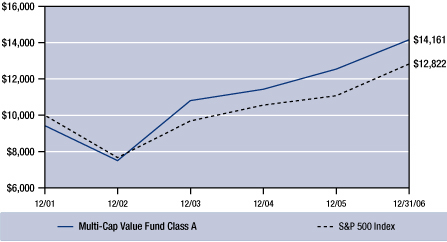
Average Annual Compounded Return (Class A Shares)
For the year ended December 31, 2006
| One Year | 6.41 | % | |||||
| Since Inception | 7.59 | % | |||||
Past performance does not guarantee future results. Performance quoted represents past performance. Current performance may be higher or lower than the performance data quoted. Returns include reinvested dividends and capital gains and the maximum 5.75% sales charge on Class A shares. Returns do not take into account individual taxes which may reduce actual returns when shares are sold. The investment return and principal value of an investment will fluctuate so that an investor's shares, when redeemed, may be worth more or less than their original cost. Call (800) 989-6693 for the most recent month-end performance.
2 The Standard & Poor's 500 Index is an unmanaged, market capitalization weighted measure of 500 widely held common stocks listed on the New York Stock Exchange, American Stock Exchange and The Nasdaq Stock Market. The Index returns assume reinvestment of dividends, but, unlike the Fund's returns, do not reflect the effects of management fees or expenses.
23
Pacific Advisors
Multi-Cap Value Fund continued
Expense Examples
As a shareholder of the Fund you incur two types of costs: (1) transaction costs, including sales charges (loads) on purchase payments, reinvested dividends, or other distributions; redemption fees; and exchange fees; and (2) ongoing costs, including management fees; distribution (12b-1) fees; and other Fund expenses. This Example is intended to help you understand your ongoing costs (in dollars) of investing in the Fund and to compare these costs with the ongoing costs of investing in other mutual funds.
The Example is based on an investment of $1,000 invested at the beginning of the period and held for the entire period from July 1, 2006 through December 31, 2006.
Actual Expenses
The first line of the table below provides information about actual account values and actual expenses. You may use the information in this line, together with the amount you invested, to estimate the expenses that you paid over the period. Simply divide your account value by $1,000 (for example, an $8,600 account value divided by $1,000 = 8.6), then multiply the result by the number in the first line under the heading entitled "Expenses Paid During the Period" to estimate the expenses you paid on your account during the period.
The following transaction costs are not included in the expenses shown in the table and, if applicable, would increase the expenses that you paid over the period: (1) a front-end sales charge (load) of 5.75% on Class A shares; (2) a 2% redemption fee if you sell or exchange shares within six months of purchase, with certain exceptions. The redemption fee does not apply to: (a) redemptions under an automatic withdrawal program or periodic asset reallocation plan, required minimum distributions (RMD), employer mandated distributions from a qualified plan, or redemptions under a qualified domestic relations order (QDRO); (b) redemptions to pay for expenses related to terminal illness, extended hospital or nursing home care, or other serious medical conditions, including death; (c) redemptions of shares acquired through dividend or capital gains reinvestments, and (d) redemptions initiated by the Fund; and (3) a $10 service fee on each exchange after the first five exchanges in each calendar year.
The following ongoing costs are not included in the expenses shown in the table and, if applicable, would increase the expenses that you paid over the period: (1) a $12 low balance fee on accounts with balances of less than $250 as of September 30th of each calendar year and no investment activity (excluding reinvestment of dividends and/or capital gains) during the prior calendar year or the first nine months of the current calendar year. This fee does not apply to IRAs, qualified plan accounts, or Coverdell Education Savings Accounts; (2) a $15 annual custodial fee on IRAs, SEPs, SIMPLE IRAs, and Coverdell Education Savings Accounts; and (3) a $20 annual custodial fee on 403(b) accounts.
Hypothetical Example for Comparison Purposes
The second line of the table below provides information about hypothetical account values and hypothetical expenses based on the Fund's actual expense ratio and an assumed rate of return of 5% per year before expenses, which in not the Fund's actual return. The hypothetical account values and expenses may not be used to estimate the actual ending account balance or expenses you paid for the period. You may use this information to compare the ongoing costs of investing in the Fund and other funds. To do so, compare this 5% hypothetical example with the 5% hypothetical examples that appear in the shareholder reports of the other funds.
The following transaction costs are not included in the expenses shown in the table and, if applicable, would increase the expenses that you paid over the period: (1) a front-end sales charge (load) of 5.75% on Class A shares; (2) a 2% redemption fee if you sell or exchange shares within six months of purchase, with certain exceptions. The redemption fee does not apply to: (a) redemptions under an automatic withdrawal program or periodic asset reallocation plan, required minimum distributions (RMD), employer mandated distributions from a qualified plan, or redemptions under a qualified domestic relations order (QDRO); (b) redemptions to pay for expenses related to terminal illness, extended hospital or nursing home care, or other serious medical conditions, including death; (c) redemptions of shares acquired through dividend or capital gains reinvestments, and (d) redemptions initiated by the Fund; and (3) a $10 service fee on each exchange after the first five exchanges in each calendar year.
The following ongoing costs are not included in the expenses shown in the table and, if applicable, would increase the expenses that you paid over the period: (1) a $12 low balance fee on accounts with balances of less than $250 as of September 30th of each calendar year and no investment activity (excluding reinvestment of dividends and/or capital gains) during the prior calendar year or the first nine months of the current calendar year. This fee does not apply to IRAs, qualified plan accounts, or Coverdell Education Savings Accounts; (2) a $15 annual custodial fee on IRAs, SEPs, SIMPLE IRAs, and Coverdell Education Savings Accounts; and (3) a $20 annual custodial fee on 403(b) accounts.
Please note that the expenses shown in the table are meant to highlight your ongoing costs only and do not reflect any transactional costs, such as sales charges (loads), redemption fees, or exchange fees. Therefore, the second line of the table is useful in comparing ongoing costs only, and will not help you determine the relative total costs of owning different funds. In addition, if these transactional costs were included, your costs would have been higher.
| Beginning Account Value 07/01/06 | Ending Account Value 12/31/06 | Expense Paid During Period 07/01/06 – 12/31/06 | |||||||||||||
| Multi-Cap Value Fund Class A | |||||||||||||||
| Actual | $ | 1,000.00 | $ | 1,139.30 | $ | 16.28 | |||||||||
| Hypothetical (5% return before expense) | $ | 1,000.00 | $ | 1,025.21 | $ | 15.42 | |||||||||
| Multi-Cap Value Fund Class C | |||||||||||||||
| Actual | $ | 1,000.00 | $ | 1,134.40 | $ | 20.39 | |||||||||
| Hypothetical (5% return before expense) | $ | 1,000.00 | $ | 1,025.21 | $ | 19.35 | |||||||||
3 Expenses are equal to the Fund's annualized expense ratio of 3.02% for Class A shares and 3.79% for Class C shares, multiplied by the average account value over the period, multiplied by 184/365 days to reflect the one-half year period.
24
Pacific Advisors
Small Cap Fund
Seeks to achieve long-term capital appreciation. Invests in small company stocks with strong earnings growth potential using a value investment approach with a focus on companies whose market capitalization is below $500 million.
Interview with Portfolio Manager
George A. Henning
For the year ended December 31, 2006, the Fund returned 35.05% for Class A shares 33.91% for Class C shares. The Fund's benchmark, the Russell 2000 Stock Index1 rose 18.37% during the same period.
Pacific Advisors Small Cap Fund (A) ranked as the #1 small cap value fund out of 248 funds based on a one-year return of 34.60% as of December 31, 2006 according to Lipper. The Fund ranked 2 out of 146 funds based on its average annual five-year return of 20.17%; and 43 out of 47 funds based on its average annual ten-year return of 9.97% for the same period.
Q What were the primary catalysts for the Fund's strength during 2006?
A The Fund benefited from broad-based performance throughout the holdings in its portfolio. Companies such as Chattem, a personal care products company, were rewarded for making good strategic acquisitions while Terra Industries, a fertilizer manufacturer, benefited from the strong demand for corn in ethanol production. Buyouts also factored significantly into performance gains with the acquisition of firms such as Maritrans, Elkcorp, and RailAmerica.
Small cap stocks benefited from a healthy economy and continued to outperform the market in 2006. The GDP grew at an estimated at 3.4% for the year. Growth remained particularly strong in the industrial, basic materials, energy, and transportation sectors as well as certain segments of the telecommunications market. Strong balance sheets and the ability to focus on providing goods and services to niche markets enabled many small caps to achieve strong growth.
The Fund maintained holdings concentrated in the stronger performing sectors of the market. These holdings included energy related positions such as Mitcham Industries and Kirby Corp.; Saia Inc. and US Xpress Enterprises in the transportation field; Elkcorp in the industrial sector; and basic materials companies such as Commercial Metals. To manage risk, the Fund minimized its exposure to weaker or more speculative areas of the market such as housing and technology.
Despite strong performance for the year, many small cap stocks remain undervalued. We continue to find companies with attractive valuations and believe there is good growth potential for the small cap sector in 2007.
Q What changes were made to the portfolio during the year?
A Early in the year, the Fund sold select holdings as they approached full valuation. For example, Conns, a supplier of appliances, electronics, and lawn equipment, saw increased sales as a result of the demand to replace items in areas affected by Hurricane Katrina. As the holding began to approach its full valuation, a portion of its position was sold. The Fund realized profits and redeployed capital in other companies such as Terra Industries.
By mid-2006, concerns surrounding rising energy prices and mixed economic data confined market values across the board. Prices were temporarily and artificially depressed for many small cap companies which still possessed strong long-term intrinsic value. The market pullback presented an opportunity for the Fund to purchase new and increase existing positions at discounted prices. This included the opportunity to purchase additional shares in Conns which had become undervalued due to post-Katrina credit card delinquencies which we recognized as a temporary setback for the company.
During the year, larger corporations with excess cash reserves increasingly financed growth through mergers or acquisitions. As a result, a number of small cap companies became buyout candidates such as Aviall which was acquired by Boeing. Remington Oil, Maritrans, Elkcorp, RailAmerica, and Talk America were also acquired by large companies or priva te equity firms. The Fund responded to buyout opportunities by adapting to the conditions presented in each circumstance.
Each holding is continually evaluated to identify changes in the long-term intrinsic value and growth prospects of the company. The Fund typically
1 The Russell 2000 Stock Index is an unmanaged, market-weighted measure of stock market performance. It contains stocks of the 2,000 smallest publicly traded companies of the Russell 3000 Index. Index returns assume the reinvestment of dividends, but, unlike the Fund's returns, do not reflect management fees or expenses.
25
Pacific Advisors
Small Cap Fund continued
seeks to buy companies with the expectation that they may be held for 3 to 5 years. The Fund's investment strategy focuses more on the long-term growth potential of a company rather than taking advantage of shorter-term trading ideas. During the year, the Fund increased its positions in companies such as EastWest Bancorp, Mobil Mini, America Service Group and Intervoice as it appeared that their longer-term outlook was improving.
Q How does the Fund benefit from a focused investment portfolio?
A The Fund seeks to achieve long-term growth by investing in companies with strong long-term growth potential. The Fund maintains a focused portfolio of approximately 35 to 40 positions in contrast to other funds which may hold 100 positions or more. A focused strategy allows the Fund to closely follow day-to-day developments as it seeks to cultivate a comprehensive knowledge of each holding.
Extensive independent research is conducted on each company in the portfolio. This includes looking beyond a company's financial statements to assess the strength of its business plan and management. Research often includes visits to the company and discussions with management. In-depth company research provides a clearer context in which to determine whether share prices fluctuations are short-term aberrations or reflective of long-term, systemic problems within the company.
Using this bottom-up approach, the Fund seeks companies that are niche-industry leaders or have turnaround or value stories. For example, during the period, the Fund added a position in Amerigon, which owns a specialized corner of the automotive sector as a manufacturer of heated and cooled car seats. Amerigon was undervalued by the market due to its association with the struggling automotive sector, but its proprietary technology and the absence of competitors added to its overall intrinsic value . This holding contributed to the Fund's superior performance in 2006.
American Service Group serves as an example of a niche-industry leader that has become a long-term holding for the Fund. The company maintains exclusive contracts to provide healthcare services to correctional facilities. American Service Group remains an important defensive holding within the Fund because economic fluctuations have little impact on the demand for its services.
Q How does the Fund capitalize on sector growth without being sector-driven?
A The Fund seeks to invest in individual companies with unrecognized long-term intrinsic value. Our investment focus is on individual company performance and growth potential. However, in assessing catalysts which will help the company achieve its growth potential, we consider how a company's market recognition will be influenced by trends within its market sector. Following the trends within a company's sector is an important component of selecting investments and determining when to purchase or sell a position. If an undervalued company which appears attractively priced is in a weak or underperforming sector, there may not be a catalyst to accelerate its stock appreciation despite its strong operational results.
In many cases, individual company performance may be boosted by shifting market and economic trends. For example, in recent years the Fund believed that increasing global demand for energy should support a long-term growth cycle within the energy and energy services sectors. To participate in this growth, the Fund has been invested in companies within these sectors that met its investment criteria. This includes companies such as Mitcham Industries and Denbury Resources which the Fund has owned for some time. More recently, the Fund made additional investments in natural gas and oil companies such as Toreador Resources and Quest Resource Inc. While this sector has experienced significant short-term volatility, we believe the longer-term growth trend in this sector remains strong. We will continue to use market volatility to add to our energy related positions as appropriate.
Over time, the Fund may increase or decrease its exposure to different sectors as changes occur in economic and market cycles. To maintain diversification, the Fund may continue to maintain positions to a lesser extent in strong companies whose sector has weakened. This provides the Fund some protection against sudden shifts in the market or economy. Well-managed companies may also remain attractive if they can use a period of underperformance in their market sector to make strategic acquisitions or identify new areas of longer-term growth.
26
Q What unique investment benefits exist within the small cap market?
A Small cap investments can be a valuable component of a diversified investment plan. Allocation to this area of the market should be aligned with an investor's investment objectives and risk tolerance. Small cap stocks offer diversification through the opportunity to invest in unique companies that are less diversified than multi-national companies. Their more focused approach in selling products and services can be attractive and provide diversification to minimize the impact of underperformance in mid or large cap stocks.
Small cap companies tend to provide unique goods and services in niche markets. As a result, company growth and market values tend to be less impacted by global macroeconomic conditions. The Fund focuses on companies that are leaders within their market or that possess a significant competitive position such as providing a niche product or having a geographical advantage. For example, America Service Group is one of two primary companies providing healthcare to correctional facilities while Nara Bank primarily serves the Korean community in cities with a significant population of Korean Americans.
Unlike larger, multi-national conglomerates, small cap companies may have fewer factors influencing the growth of their businesses. The operating performance of larger companies may be impacted by underperforming divisions or global markets that may weaker or currency shifts within these countries. The ability of smaller companies to focus on a core business enables them to more quickly identify and respond to opportunities or changes within their market.
Small caps carry more risk and can be more volatile. Therefore, risk management is an important component of the Fund's strategy. The Fund adheres to a more conservative investment style within a more volatile segment of the market. This strategy includes avoiding more speculative investments such as IPOs or biomedical stocks while adhering to a disciplined, long-term strategy, and maintaining a focused portfolio of high-quality holdings.
Q What can investors expect from small cap stocks and the Fund in 2007?
A Economic data suggest that the U.S. economy will continue to grow at a moderate rate in 2007. The outlook for corporate earnings growth also remains favorable. These conditions should provide a foundation for the continued growth in the equity markets. Nevertheless, we expect continuing uncertainty over geopolitical conditions, interest rates, inflation and energy costs will create market volatility. A disciplined and patient investment approach will remain paramount to achieving growth in an uneven market.
We expect to see stronger performance from large and mid cap stocks, but not at the expense of small caps. Overall, small cap companies have remained disciplined in paying down debt, maintaining strong balance sheets, and strategically reinvesting profits to grow their businesses. As a result, many small caps remain well positioned for continued market growth.
We believe the holdings in the portfolio still represent valuable opportunities for the Fund to achieve long-term growth. Forecasts indicate that the demand for the services and products offered by these companies will remain good. Even with strong market performance to date, many of these companies are not fully valued and still have good growth potential. While the focus will remain on individual companies, we expect the Fund will continue to focus on companies in the stronger performing areas of the market such as basic materials and energy. These holdings will continue to be balanced with companies in more defensive areas such as healthcare and financials.
Past performance does not guarantee future results. Performance quoted represents past performance. Current performance may be higher or lower than the performance data quoted. For performance current to the most recent month-end call (800) 989-6693. The investment return and principal value of an investment will fluctuate so that an investor's shares, when redeemed, may be worth more or less than their original cost. Small cap stocks typically have fewer financial resources and may carry higher risks and experience greater volatility than large cap stocks.
Returns represent the change in value over the stated period assuming reinvestment of dividends and capital gains at net asset value. Returns do not take into account the maximum 5.75% sales charge on Class A shares and would be lower if the sales charge were included. Returns do not take into account individual taxes which may reduce actual returns when shares are sold. Rankings do not take sales loads into account. Fund expenses as a percentage of average net assets were 2.78% for Class A shares and 3.54% for Class C shares for its most recent fiscal year (December 31, 2006). Please see the financial statements contained in this report for more details.
27
Pacific Advisors
Small Cap Fund continued
Portfolio Holdings as of 12/31/06 (Based on Total Investments)
| Equities | 100.00 | % | |||||||||
| 1. | Industrials | 32.46 | % | ||||||||
| 2. | Energy | 19.74 | % | ||||||||
| 3. | Consumer Discretionary | 12.60 | % | ||||||||
| 4. | Financials | 10.80 | % | ||||||||
| 5. | Materials | 8.08 | % | ||||||||
| 6. | Information Technology | 4.42 | % | ||||||||
| 7. | Consumer Staples | 3.91 | % | ||||||||
| 8. | Telecommunications Services | 3.04 | % | ||||||||
| 9. | Health Care | 4.95 | % | ||||||||
Change in Value of $10,000 Investment
This chart shows the growth of a $10,000 investment made in Class A shares of Pacific Advisors Small Cap Fund from January 1, 1997 through December 31, 2006 compared to the growth of the Russell 2000 Index2.
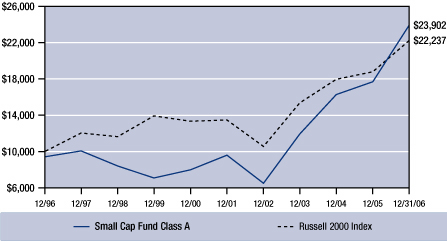
Average Annual Compounded Return (Class A Shares)
For the year ended December 31, 2006
| One Year | 27.28 | % | |||||
| Five Year | 18.60 | % | |||||
| Ten Year | 12.17 | % | |||||
Past performance does not guarantee future results. Performance quoted represents past performance. Current performance may be higher or lower than the performance data quoted. Returns include reinvested dividends and capital gains and the maximum 5.75% sales charge on Class A shares. Returns do not take into account individual taxes which may reduce actual returns when shares are sold. Rankings do not take sales loads into account. Small cap stocks typically have fewer financial resources and may carry higher risks and experience greater volatility than large cap stocks. The investment return and principal value of an investment will fluctuate so that an investor's shares, when redeemed, may be worth more or less than their original cost. Call (800) 989-6693 for the most recent month-end performance.
2 The Russell 2000 Stock Index is an unmanaged, market-weighted measure of stock market performance. It contains stocks of the 2,000 smallest publicly traded companies of the Russell 3000 Index. The Russell 2000 Stock Index does not take capital gains into consideration, and, unlike the Fund, does not reflect the effects of management fees or expenses.
28
Expense Examples
As a shareholder of the Fund you incur two types of costs: (1) transaction costs, including sales charges (loads) on purchase payments, reinvested dividends, or other distributions; redemption fees; and exchange fees; and (2) ongoing costs, including management fees; distribution (12b-1) fees; and other Fund expenses. This Example is intended to help you understand your ongoing costs (in dollars) of investing in the Fund and to compare these costs with the ongoing costs of investing in other mutual funds.
The Example is based on an investment of $1,000 invested at the beginning of the period and held for the entire period from July 1, 2006 through December 31, 2006.
Actual Expenses
The first line of the table below provides information about actual account values and actual expenses. You may use the information in this line, together with the amount you invested, to estimate the expenses that you paid over the period. Simply divide your account value by $1,000 (for example, an $8,600 account value divided by $1,000 = 8.6), then multiply the result by the number in the first line under the heading entitled "Expenses Paid During the Period" to estimate the expenses you paid on your account during the period.
The following transaction costs are not included in the expenses shown in the table and, if applicable, would increase the expenses that you paid over the period: (1) a front-end sales charge (load) of 5.75% on Class A shares; (2) a 2% redemption fee if you sell or exchange shares within six months of purchase, with certain exceptions. The redemption fee does not apply to: (a) redemptions under an automatic withdrawal program or periodic asset reallocation plan, required minimum distributions (RMD), employer mandated distributions from a qualified plan, or redemptions under a qualified domestic relations order (QDRO); (b) redemptions to pay for expenses related to terminal illness, extended hospital or nursing home care, or other serious medical conditions, including death; (c) redemptions of shares acquired through dividend or capital gains reinvestments, and (d) redemptions initiated by the Fund; and (3) a $10 service fee on each exchange after the first five exchanges in each calendar year.
The following ongoing costs are not included in the expenses shown in the table and, if applicable, would increase the expenses that you paid over the period: (1) a $12 low balance fee on accounts with balances of less than $250 as of September 30th of each calendar year and no investment activity (excluding reinvestment of dividends and/or capital gains) during the prior calendar year or the first nine months of the current calendar year. This fee does not apply to IRAs, qualified plan accounts, or Coverdell Education Savings Accounts; (2) a $15 annual custodial fee on IRAs, SEPs, SIMPLE IRAs, and Coverdell Education Savings Accounts; and (3) a $20 annual custodial fee on 403(b) accounts.
Hypothetical Example for Comparison Purposes
The second line of the table below provides information about hypothetical account values and hypothetical expenses based on the Fund's actual expense ratio and an assumed rate of return of 5% per year before expenses, which in not the Fund's actual return. The hypothetical account values and expenses may not be used to estimate the actual ending account balance or expenses you paid for the period. You may use this information to compare the ongoing costs of investing in the Fund and other funds. To do so, compare this 5% hypothetical example with the 5% hypothetical examples that appear in the shareholder reports of the other funds.
The following transaction costs are not included in the expenses shown in the table and, if applicable, would increase the expenses that you paid over the period: (1) a front-end sales charge (load) of 5.75% on Class A shares; (2) a 2% redemption fee if you sell or exchange shares within six months of purchase, with certain exceptions. The redemption fee does not apply to: (a) redemptions under an automatic withdrawal program or periodic asset reallocation plan, required minimum distributions (RMD), employer mandated distributions from a qualified plan, or redemptions under a qualified domestic relations order (QDRO); (b) redemptions to pay for expenses related to terminal illness, extended hospital or nursing home care, or other serious medical conditions, including death; (c) redemptions of shares acquired through dividend or capital gains reinvestments, and (d) redemptions initiated by the Fund; and (3) a $10 service fee on each exchange after the first five exchanges in each calendar year.
The following ongoing costs are not included in the expenses shown in the table and, if applicable, would increase the expenses that you paid over the period: (1) a $12 low balance fee on accounts with balances of less than $250 as of September 30th of each calendar year and no investment activity (excluding reinvestment of dividends and/or capital gains) during the prior calendar year or the first nine months of the current calendar year. This fee does not apply to IRAs, qualified plan accounts, or Coverdell Education Savings Accounts; (2) a $15 annual custodial fee on IRAs, SEPs, SIMPLE IRAs, and Coverdell Education Savings Accounts; and (3) a $20 annual custodial fee on 403(b) accounts.
Please note that the expenses shown in the table are meant to highlight your ongoing costs only and do not reflect any transactional costs, such as sales charges (loads), redemption fees, or exchange fees. Therefore, the second line of the table is useful in comparing ongoing costs only, and will not help you determine the relative total costs of owning different funds. In addition, if these transactional costs were included, your costs would have been higher.
| Beginning Account Value 07/01/06 | Ending Account Value 12/31/06 | Expense Paid During Period 07/01/06 – 12/31/06 | |||||||||||||
| Small Cap Fund Class A | |||||||||||||||
| Actual | $ | 1,000.00 | $ | 1,119.10 | $ | 14.85 | |||||||||
| Hypothetical (5% return before expense) | $ | 1,000.00 | $ | 1,025.21 | $ | 14.19 | |||||||||
| Small Cap Fund Class C | |||||||||||||||
| Actual | $ | 1,000.00 | $ | 1,114.50 | $ | 18.87 | |||||||||
| Hypothetical (5% return before expense) | $ | 1,000.00 | $ | 1,025.21 | $ | 18.07 | |||||||||
| Small Cap Fund Class I | |||||||||||||||
| Actual | $ | 1,000.00 | N/A | N/A | |||||||||||
| Hypothetical (5% return before expense) | $ | 1,000.00 | $ | 1,025.21 | $ | 13.99 | |||||||||
3 Expenses are equal to the Fund's annualized expense ratio of 2.78% for Class A shares, 3.54% for Class C shares and 2.74% for Class I shares, multiplied by the average account value over the period, multiplied by 184/365 days to reflect the one-half year period.
29

Pacific Advisors Fund Inc.
financial statements
30
Pacific Advisors Government Securities Fund
Statement of Investments
as of December 31, 2006
| Quantity or Principal | Description | Current $ Value** | % of Net Assets | ||||||||||||
| COMMON STOCK | |||||||||||||||
| INFORMATION TECHNOLOGY | 2.85 | ||||||||||||||
| SYSTEMS: SOFTWARE | |||||||||||||||
| 4,000 | MICROSOFT | 119,440 | |||||||||||||
| 119,440 | 2.85 | ||||||||||||||
| TELECOMMUNICATION SERVICES | 1.71 | ||||||||||||||
| INTEGRATED TELECOMM SERVICES | |||||||||||||||
| 5,000 | CITIZENS COMMUNICATIONS CO. | 71,850 | |||||||||||||
| 71,850 | 1.71 | ||||||||||||||
| UTILITIES | 3.41 | ||||||||||||||
| ELECTRIC UTILITIES | |||||||||||||||
| 4,000 | PPL CORPORATION | 143,360 | |||||||||||||
| 143,360 | 3.41 | ||||||||||||||
| TOTAL COMMON STOCK (Cost: $262,790) | 334,650 | 7.97 | |||||||||||||
| US GOVT SECURITIES | |||||||||||||||
| US GOVERNMENT AGENCY | 83.40 | ||||||||||||||
| US GOVERNMENT AGENCY | |||||||||||||||
| 50,000 | FED HOME LN MTG CORP 5.00% 12/15/17 STEP | 49,191 | |||||||||||||
| 25,000 | FED HOME LN MTG CORP 5.00% 01/17/12 | 24,605 | |||||||||||||
| 500,000 | FED HOME LN MTG CORP 5.00% 12/23/11 | 492,169 | |||||||||||||
| 50,000 | FED HOME LN MTG CORP 5.25% 02/18/14 | 49,106 | |||||||||||||
| 100,000 | FED HOME LN MTG CORP 5.25% 04/25/12 | 98,826 | |||||||||||||
| 100,000 | FED HOME LN MTG CORP 5.33% 09/03/13 | 98,628 | |||||||||||||
| 65,000 | FED HOME LN MTG CORP 5.35% 01/27/15 | 63,903 | |||||||||||||
| 45,000 | FED HOME LN MTG CORP 5.35% 02/05/15 | 44,220 | |||||||||||||
| 100,000 | FED HOME LN MTG CORP 5.45% 08/09/13 | 98,969 | |||||||||||||
| 50,000 | FED HOME LN MTG CORP 5.50% 12/30/14 | 49,312 | |||||||||||||
| 150,000 | FED HOME LN MTG CORP 6.125% 12/01/15 | 149,648 | |||||||||||||
| 15,000 | FED HOME LN MTG CORP 6.25% 03/05/12 | 15,022 | |||||||||||||
| 70,000 | FED HOME LOAN BANK 4.30% 05/05/09 | 68,785 | |||||||||||||
| 37,500 | FED HOME LOAN BANK 4.55% 5/26/09 | 36,997 | |||||||||||||
| 100,000 | FED HOME LOAN BANK 5.23% 09/01/11 | 99,036 | |||||||||||||
| 44,912 | FED HOME LOAN BANK 5.24% 12/17/12 | 44,301 | |||||||||||||
| 115,000 | FED HOME LOAN BANK 5.35% 05/09/12 | 113,749 | |||||||||||||
| 550,909 | FED HOME LOAN BANK 5.35% 12/24/12 | 544,765 | |||||||||||||
| 50,000 | FED NATL MTG ASSOC. 5.25% 01/28/13 | 49,331 | |||||||||||||
| 535,000 | FED NATL MTG ASSOC. 5.25% 01/28/13 | 528,100 | |||||||||||||
| 200,000 | FED NATL MTG ASSOC. 5.25% 12/26/12 | 197,465 | |||||||||||||
| 48,000 | FED NATL MTG ASSOC. 5.375% 08/23/12 | 47,532 | |||||||||||||
| 30,000 | FED NATL MTG ASSOC. 5.625% 02/28/12 | 29,926 | |||||||||||||
| 112,000 | FED NATL MTG ASSOC. 5.75% 11/07/17 | 109,005 | |||||||||||||
| 100,000 | FED NATL MTG ASSOC. 6.125% 08/28/14 | 99,855 | |||||||||||||
See Accompanying Notes to Financial Statements
31
Pacific Advisors Government Securities Fund
Statement of Investments
as of December 31, 2006
| Quantity or Principal | Description | Current $ Value** | % of Net Assets | ||||||||||||
| US GOVT SECURITIES continued | |||||||||||||||
| 100,000 | FED NATL MTG ASSOC. 6.125% 03/21/16 | 99,700 | |||||||||||||
| 100,000 | FED NATL MTG ASSOC. 6.15% 08/01/11 | 100,062 | |||||||||||||
| 100,000 | FED NATL MTG ASSOC. 6.25% 09/06/16 | 99,569 | |||||||||||||
| 3,501,777 | 83.40 | ||||||||||||||
| TOTAL US GOVT SECURITIES (Cost: $3,542,349) | 3,501,777 | 83.40 | |||||||||||||
| PREFERRED STOCK | |||||||||||||||
| FINANCIALS | 5.04 | ||||||||||||||
| DIVERSIFIED BANKS | |||||||||||||||
| 4,000 | BARCLAYS BK 6.625% PFD | 106,400 | |||||||||||||
| 106,400 | 2.53 | ||||||||||||||
| LIFE/HEALTH INSURANCE | |||||||||||||||
| 4,000 | METLIFE INC. PFD 6.50% | 105,240 | |||||||||||||
| 105,240 | 2.51 | ||||||||||||||
| TOTAL PREFERRED STOCK (Cost: $200,000) | 211,640 | 5.04 | |||||||||||||
| SHORT-TERM INVESTMENTS | |||||||||||||||
| MONEY MARKET | 2.91 | ||||||||||||||
| SHORT-TERM INVESTMENTS | |||||||||||||||
| 122,272 | UMB MONEY MARKET FIDUCIARY | 122,272 | |||||||||||||
| 122,272 | 2.91 | ||||||||||||||
| TOTAL SHORT TERM INVESTMENTS (Cost: $122,272) | 122,272 | 2.91 | |||||||||||||
| TOTAL INVESTMENTS (Cost: $4,127,411) | 4,170,339 | 99.32 | |||||||||||||
| OTHER ASSETS LESS LIABILITIES | 28,365 | 0.68 | |||||||||||||
| TOTAL NET ASSETS | 4,198,704 | 100.00 | |||||||||||||
* Non-income producing.
** The principal amount is stated in U.S. dollars unless otherwise indicated.
See Accompanying Notes to Financial Statements
32
Pacific Advisors Income and Equity Fund
Statement of Investments
as of December 31, 2006
| Quantity or Principal | Description | Current $ Value** | % of Net Assets | ||||||||||||
| COMMON STOCK | |||||||||||||||
| CONSUMER DISCRETIONARY | 0.90 | ||||||||||||||
| DISTRIBUTORS | |||||||||||||||
| 1,000 | GENUINE PARTS CO. | 47,430 | |||||||||||||
| 47,430 | 0.49 | ||||||||||||||
| HOME IMPROVEMENT | |||||||||||||||
| 1,000 | HOME DEPOT INC. | 40,160 | |||||||||||||
| 40,160 | 0.41 | ||||||||||||||
| CONSUMER STAPLES | 2.20 | ||||||||||||||
| HOUSEHOLD PRODUCTS | |||||||||||||||
| 2,000 | PROCTER & GAMBLE CO. | 128,540 | |||||||||||||
| 128,540 | 1.32 | ||||||||||||||
| PACKAGED FOODS | |||||||||||||||
| 1,000 | ALTRIA GROUP | 85,820 | |||||||||||||
| 85,820 | 0.88 | ||||||||||||||
| ENERGY | 5.02 | ||||||||||||||
| INTEGRATED OIL & GAS | |||||||||||||||
| 1,000 | BRITISH PETROLEUM | 67,100 | |||||||||||||
| 1,000 | CONOCOPHILLIPS | 71,950 | |||||||||||||
| 1,000 | MARATHON OIL CORP. | 92,500 | |||||||||||||
| 1,000 | OCCIDENTAL PETROLEUM | 48,830 | |||||||||||||
| 280,380 | 2.89 | ||||||||||||||
| OIL & GAS DRILLING | |||||||||||||||
| 1,000 | ENCANA | 45,950 | |||||||||||||
| 1,000 | ULTRA PETROLEUM* | 47,750 | |||||||||||||
| 93,700 | 0.96 | ||||||||||||||
| OIL & GAS EXPLORATION/PRODUCTION | |||||||||||||||
| 1,000 | APACHE CORP. | 66,510 | |||||||||||||
| 1,000 | XTO ENERGY INC. | 47,050 | |||||||||||||
| 113,560 | 1.17 | ||||||||||||||
| FINANCIALS | 6.76 | ||||||||||||||
| DIVERSIFIED BANKS | |||||||||||||||
| 4,000 | BANK OF AMERICA | 213,560 | |||||||||||||
| 2,000 | WACHOVIA CORP. | 113,900 | |||||||||||||
| 327,460 | 3.37 | ||||||||||||||
See Accompanying Notes to Financial Statements
33
Pacific Advisors Income and Equity Fund
Statement of Investments
as of December 31, 2006
| Quantity or Principal | Description | Current $ Value** | % of Net Assets | ||||||||||||
| COMMON STOCK continued | |||||||||||||||
| MULTI-LINE INSURANCE | |||||||||||||||
| 2,000 | AMERICAN INTL GROUP INC. | 143,320 | |||||||||||||
| 143,320 | 1.48 | ||||||||||||||
| PROPERTY & CASUALTY INSURANCE | |||||||||||||||
| 1,000 | CHUBB CORP. | 52,910 | |||||||||||||
| 52,910 | 0.54 | ||||||||||||||
| REGIONAL BANKS | |||||||||||||||
| 1,000 | WILMINGTON TRUST CO. | 42,170 | |||||||||||||
| 42,170 | 0.43 | ||||||||||||||
| THRIFTS & MORTGAGE FINANCE | |||||||||||||||
| 2,000 | WASHINGTON MUTUAL | 90,980 | |||||||||||||
| 90,980 | 0.94 | ||||||||||||||
| HEALTH CARE | 4.45 | ||||||||||||||
| PHARMACEUTICALS | |||||||||||||||
| 2,000 | GLAXOSMITHKLINE | 105,216 | |||||||||||||
| 3,000 | JOHNSON & JOHNSON | 198,060 | |||||||||||||
| 5,000 | PFIZER INC. | 129,500 | |||||||||||||
| 432,776 | 4.45 | ||||||||||||||
| INDUSTRIALS | 3.61 | ||||||||||||||
| AEROSPACE & DEFENSE | |||||||||||||||
| 2,000 | HONEYWELL INTERNATIONAL INC. | 90,480 | |||||||||||||
| 90,480 | 0.93 | ||||||||||||||
| INDUSTRIAL CONGLOMERATES | |||||||||||||||
| 7,000 | GENERAL ELECTRIC | 260,470 | |||||||||||||
| 260,470 | 2.68 | ||||||||||||||
| INFORMATION TECHNOLOGY | 1.54 | ||||||||||||||
| SYSTEMS: SOFTWARE | |||||||||||||||
| 5,000 | MICROSOFT | 149,300 | |||||||||||||
| 149,300 | 1.54 | ||||||||||||||
| MATERIALS | 1.51 | ||||||||||||||
| DIVERSIFIED CHEMICALS | |||||||||||||||
| 1,000 | E.I. DUPONT DE NEMOURS & CO. | 48,710 | |||||||||||||
| 48,710 | 0.50 | ||||||||||||||
| SPECIALTY CHEMICALS | |||||||||||||||
| 2,000 | INTL FLAVORS AND FRAGRANCES | 98,320 | |||||||||||||
| 98,320 | 1.01 | ||||||||||||||
See Accompanying Notes to Financial Statements
34
Pacific Advisors Income and Equity Fund
Statement of Investments
as of December 31, 2006
| Quantity or Principal | Description | Current $ Value** | % of Net Assets | ||||||||||||
| COMMON STOCK continued | |||||||||||||||
| TELECOMMUNICATION SERVICES | 1.85 | ||||||||||||||
| INTEGRATED TELECOMM SERVICES | |||||||||||||||
| 1,000 | AT&T INC. | 35,750 | |||||||||||||
| 10,000 | CITIZENS COMMUNICATIONS CO. | 143,700 | |||||||||||||
| 179,450 | 1.85 | ||||||||||||||
| UTILITIES | 1.89 | ||||||||||||||
| MULTI-LINE UTILITIES/POWER | |||||||||||||||
| 1,000 | DOMINION RESOURCES | 83,840 | |||||||||||||
| 1,000 | DUKE ENERGY CORP. | 33,210 | |||||||||||||
| 1,000 | PUBLIC SERVICE ENTERPRISE GROUP INC. | 66,380 | |||||||||||||
| 183,430 | 1.89 | ||||||||||||||
| TOTAL COMMON STOCK (Cost: $2,452,210) | 2,889,366 | 29.73 | |||||||||||||
| CORPORATE BONDS | |||||||||||||||
| CONSUMER DISCRETIONARY | 9.90 | ||||||||||||||
| BROADCAST & CABLE TV | |||||||||||||||
| 419,000 | LIBERTY MEDIA CORP 7.75% 07/15/09 | 434,839 | |||||||||||||
| 434,839 | 4.48 | ||||||||||||||
| GENERAL MERCHANDISE STORES | |||||||||||||||
| 281,000 | DAYTON HUDSON CO. 8.60% 01/15/12 | 321,605 | |||||||||||||
| 321,605 | 3.31 | ||||||||||||||
| HOTELS, RESORTS | |||||||||||||||
| 203,000 | MARRIOTT CORP. 9.375% 06/15/07 | 205,167 | |||||||||||||
| 205,167 | 2.11 | ||||||||||||||
| CONSUMER STAPLES | 2.40 | ||||||||||||||
| BREWERS | |||||||||||||||
| 225,000 | ANHEUSER-BUSCH 7.125% 07/01/17 | 233,075 | |||||||||||||
| 233,075 | 2.40 | ||||||||||||||
| ENERGY | 8.89 | ||||||||||||||
| INTEGRATED OIL & GAS | |||||||||||||||
| 143,000 | ATLANTIC RICHFIELD 8.50% 04/01/12 | 164,215 | |||||||||||||
| 125,000 | ENRON OIL & GAS 6.50% 12/01/07 | 126,138 | |||||||||||||
| 343,000 | OCCIDENTAL PETROLEUM 10.125% 09/15/09 | 383,342 | |||||||||||||
| 170,000 | TEXACO CAPITAL 8.625% 06/30/10 | 190,019 | |||||||||||||
| 863,714 | 8.89 | ||||||||||||||
See Accompanying Notes to Financial Statements
35
Pacific Advisors Income and Equity Fund
Statement of Investments
as of December 31, 2006
| Quantity or Principal | Description | Current $ Value** | % of Net Assets | ||||||||||||
| CORPORATE BONDS continued | |||||||||||||||
| FINANCIALS | 7.90 | ||||||||||||||
| CONSUMER FINANCE | |||||||||||||||
| 200,000 | GMAC 6.125% 08/28/07 | 200,039 | |||||||||||||
| 100,000 | HOUSEHOLD FINANCE FLOAT 09/10/09 | 94,541 | |||||||||||||
| 294,580 | 3.03 | ||||||||||||||
| DIVERSIFIED FINANCIAL | |||||||||||||||
| 371,000 | GENERAL ELECTRIC CAP 8.125% 05/15/12 | 419,433 | |||||||||||||
| 50,000 | GENERAL ELECTRIC CAP 8.875% 05/15/09 | 53,889 | |||||||||||||
| 473,322 | 4.87 | ||||||||||||||
| MATERIALS | 1.02 | ||||||||||||||
| DIVERSIFIED CHEMICAL | |||||||||||||||
| 100,000 | DOW CHEMICAL 5.00% 11/15/07 | 99,577 | |||||||||||||
| 99,577 | 1.02 | ||||||||||||||
| TELECOMMUNICATION SERVICES | 5.22 | ||||||||||||||
| INTEGRATED TELECOMM SERVICES | |||||||||||||||
| 397,829 | BELLSOUTH TELECOMMUN 6.30% 12/15/15 | 406,672 | |||||||||||||
| 100,000 | GTE CALIFORNIA INC. 5.50% 01/15/09 | 99,952 | |||||||||||||
| 506,624 | 5.22 | ||||||||||||||
| UTILITIES | 5.60 | ||||||||||||||
| ELECTRIC UTILITIES | |||||||||||||||
| 255,000 | COMMMONWEALTH EDISON 8.00% 05/15/08 | 262,805 | |||||||||||||
| 262,805 | 2.71 | ||||||||||||||
| GAS UTILITIES | |||||||||||||||
| 150,000 | PIEDMONT NATURAL GAS 7.80% 09/29/10 | 161,576 | |||||||||||||
| 161,576 | 1.66 | ||||||||||||||
| MULTI-LINE UTILITIES/POWER | |||||||||||||||
| 119,000 | POTOMAC ELEC. POWER 5.875% 10/15/08 | 119,687 | |||||||||||||
| 119,687 | 1.23 | ||||||||||||||
| TOTAL CORPORATE BOND (Cost: $4,007,317) | 3,976,571 | 40.93 | |||||||||||||
| CONVERTIBLE CORPORATE BONDS | |||||||||||||||
| FINANCIALS | 4.45 | ||||||||||||||
| DIVERSIFIED BANKS | |||||||||||||||
| 150,000 | ABN AMRO BANK 18.00% 06/07/07 | 136,875 | |||||||||||||
| 100,000 | BARCLAYS BANK PLC 10.00% 12/12/07 | 95,620 | |||||||||||||
See Accompanying Notes to Financial Statements
36
Pacific Advisors Income and Equity Fund
Statement of Investments
as of December 31, 2006
| Quantity or Principal | Description | Current $ Value** | % of Net Assets | ||||||||||||
| CONVERTIBLE CORPORATE BONDS continued | |||||||||||||||
| 100,000 | BARCLAYS BANK PLC 11.40% 04/23/07 | 99,500 | |||||||||||||
| 100,000 | BARCLAYS BANK PLC 12.25% 02/23/07 | 100,280 | |||||||||||||
| 432,275 | 4.45 | ||||||||||||||
| TOTAL CONVERTIBLE CORPORATE BONDS (Cost: $448,974) | 432,275 | 4.45 | |||||||||||||
| US GOVT SECURITIES | |||||||||||||||
| US GOVERNMENT AGENCY | 15.71 | ||||||||||||||
| US GOVERNMENT AGENCY | |||||||||||||||
| 33,000 | FED HOME LN MTG CORP 5.125% 03/10/14 | 32,108 | |||||||||||||
| 100,000 | FED HOME LN MTG CORP 5.80% 10/20/15 | 99,154 | |||||||||||||
| 50,000 | FED HOME LN MTG CORP 6.125% 12/01/15 | 49,883 | |||||||||||||
| 100,000 | FED HOME LOAN BANK 5.25% 06/15/09 | 99,622 | |||||||||||||
| 100,000 | FED HOME LOAN BANK 5.25% 10/27/10 | 99,265 | |||||||||||||
| 50,000 | FED HOME LOAN BANK 5.30% 05/25/07 | 50,005 | |||||||||||||
| 50,000 | FED HOME LOAN BANK 5.375% 09/07/12 | 49,507 | |||||||||||||
| 100,000 | FED HOME LOAN BANK 5.50% 01/26/07 | 100,017 | |||||||||||||
| 100,000 | FED HOME LOAN BANK 5.50% 09/07/10 | 99,834 | |||||||||||||
| 100,000 | FED HOME LOAN BANK 5.50% 12/07/09 | 100,000 | |||||||||||||
| 100,000 | FED NATL MTG ASSOC. 5.50% 11/17/14 | 98,683 | |||||||||||||
| 250,000 | FED NATL MTG ASSOC. 6.125% 08/28/14 | 249,638 | |||||||||||||
| 100,000 | FED NATL MTG ASSOC. 6.25% 03/22/17 | 99,899 | |||||||||||||
| 200,000 | FED NATL MTG ASSOC. 6.25% 09/06/16 | 199,137 | |||||||||||||
| 100,000 | FED NATL MTG ASSOC. 6.50% 09/20/21 | 99,380 | |||||||||||||
| 1,526,132 | 15.71 | ||||||||||||||
| TOTAL US GOVT SECURITIES (Cost: $1,532,751) | 1,526,132 | 15.71 | |||||||||||||
| PREFERRED STOCK | |||||||||||||||
| FINANCIALS | 5.40 | ||||||||||||||
| DIVERSIFIED BANKS | |||||||||||||||
| 2,000 | BAC TRUST VIII 6.00% PFD | 49,660 | |||||||||||||
| 2,000 | BARCLAYS BK 6.625% PFD | 53,200 | |||||||||||||
| 5,000 | HSBC HOLDINGS PLC 6.20% PFD A | 127,000 | |||||||||||||
| 229,860 | 2.37 | ||||||||||||||
| INVESTMENT BANKS/BROKERAGE | |||||||||||||||
| 2,000 | MERRILL LYNCH 6.375% PFD | 52,160 | |||||||||||||
| 2,000 | MERRILL LYNCH 6.45% PFD | 50,000 | |||||||||||||
| 102,160 | 1.05 | ||||||||||||||
| LIFE/HEALTH INSURANCE | |||||||||||||||
| 3,000 | METLIFE INC. 6.50% PFD | 78,930 | |||||||||||||
| 2,500 | PHOENIX COMPANIES INC. 7.45% PFD | 62,575 | |||||||||||||
| 141,505 | 1.46 | ||||||||||||||
See Accompanying Notes to Financial Statements
37
Pacific Advisors Income and Equity Fund
Statement of Investments
as of December 31, 2006
| Quantity or Principal | Description | Current $ Value** | % of Net Assets | ||||||||||||
| PREFERRED STOCK continued | |||||||||||||||
| THRIFTS & MORTGAGE FINANCE | |||||||||||||||
| 2,000 | COUNTRYWIDE CAPITAL 7.00% PFD | 50,400 | |||||||||||||
| 50,400 | 0.52 | ||||||||||||||
| UTILITIES | 0.52 | ||||||||||||||
| ELECTRIC UTILITIES | |||||||||||||||
| 2,000 | FPL GROUP CAPITAL 6.60% PFD A | 50,560 | |||||||||||||
| 50,560 | 0.52 | ||||||||||||||
| TOTAL PREFERRED STOCK (Cost: $562,560) | 574,485 | 5.92 | |||||||||||||
| SHORT-TERM INVESTMENTS | |||||||||||||||
| MONEY MARKET | 2.53 | ||||||||||||||
| SHORT-TERM INVESTMENTS | |||||||||||||||
| 245,727 | UMB MONEY MARKET FIDUCIARY | 245,727 | |||||||||||||
| 245,727 | 2.53 | ||||||||||||||
| TOTAL SHORT TERM INVESTMENTS (Cost: $245,727) | 245,727 | 2.53 | |||||||||||||
| TOTAL INVESTMENTS (Cost: $9,249,539) | 9,644,556 | 99.27 | |||||||||||||
| OTHER ASSETS LESS LIABILITIES | 70,757 | 0.73 | |||||||||||||
| TOTAL NET ASSETS | 9,715,313 | 100.00 | |||||||||||||
* Non-income producing.
** The principal amount is stated in U.S. dollars unless otherwise indicated.
See Accompanying Notes to Financial Statements
38
Pacific Advisors Balanced Fund
Statement of Investments
as of December 31, 2006
| Quantity or Principal | Description | Current $ Value** | % of Net Assets | ||||||||||||
| COMMON STOCK | |||||||||||||||
| CONSUMER DISCRETIONARY | 5.49 | ||||||||||||||
| ADVERTISING | |||||||||||||||
| 30,000 | INTERPUBLIC GROUP* | 367,200 | |||||||||||||
| 367,200 | 0.87 | ||||||||||||||
| BROADCAST & CABLE TV | |||||||||||||||
| 7,200 | LIBERTY GLOBAL* | 209,880 | |||||||||||||
| 3,088 | LIBERTY GLOBAL C* | 86,464 | |||||||||||||
| 296,344 | 0.70 | ||||||||||||||
| MOVIES/ENTERTAINMENT | |||||||||||||||
| 10,000 | CBS CORP. | 311,800 | |||||||||||||
| 10,000 | DISNEY | 342,700 | |||||||||||||
| 2,250 | LIBERTY CAPITAL SERIES-A* | 220,455 | |||||||||||||
| 11,250 | LIBERTY INTERACTIVE SERIES-A* | 242,663 | |||||||||||||
| 18,000 | TIME WARNER | 392,040 | |||||||||||||
| 3,750 | VIACOM INC.-B* | 153,787 | |||||||||||||
| 1,663,445 | 3.92 | ||||||||||||||
| CONSUMER STAPLES | 2.28 | ||||||||||||||
| SOFT DRINKS | |||||||||||||||
| 9,000 | CADBURY SCHWEPPES | 386,370 | |||||||||||||
| 12,000 | COCA-COLA | 579,000 | |||||||||||||
| 965,370 | 2.28 | ||||||||||||||
| ENERGY | 13.32 | ||||||||||||||
| INTEGRATED OIL & GAS | |||||||||||||||
| 12,000 | BRITISH PETROLEUM | 805,200 | |||||||||||||
| 8,000 | CONOCOPHILLIPS | 575,600 | |||||||||||||
| 1,380,800 | 3.26 | ||||||||||||||
| OIL & GAS EQUIPMENT/SERVICES | |||||||||||||||
| 12,000 | COOPER CAMERON* | 636,600 | |||||||||||||
| 8,000 | GRANT PRIDECO* | 318,160 | |||||||||||||
| 954,760 | 2.25 | ||||||||||||||
| OIL & GAS EXPLORATION/PRODUCTION | |||||||||||||||
| 20,000 | DEVON ENERGY CORP. | 1,341,600 | |||||||||||||
| 15,000 | SUNCOR ENERGY INC. | 1,183,650 | |||||||||||||
| 2,525,250 | 5.96 | ||||||||||||||
| OIL & GAS REFINING/MARKETING/TRANSPORTATION | |||||||||||||||
| 30,000 | WILLIAMS COMPANIES INC. | 783,600 | |||||||||||||
| 783,600 | 1.85 | ||||||||||||||
See Accompanying Notes to Financial Statements
39
Pacific Advisors Balanced Fund
Statement of Investments
as of December 31, 2006
| Quantity or Principal | Description | Current $ Value** | % of Net Assets | ||||||||||||
| COMMON STOCK continued | |||||||||||||||
| FINANCIALS | 9.50 | ||||||||||||||
| DIVERSIFIED BANKS | |||||||||||||||
| 35,000 | BANCO LATINAMERICANO DE EXPORTACIONES | 593,600 | |||||||||||||
| 593,600 | 1.40 | ||||||||||||||
| LIFE/HEALTH INSURANCE | |||||||||||||||
| 7,500 | METLIFE INC. | 442,575 | |||||||||||||
| 442,575 | 1.04 | ||||||||||||||
| MULTI-LINE INSURANCE | |||||||||||||||
| 5 | BERKSHIRE HATHAWAY INC. - CL A* | 549,950 | |||||||||||||
| 1,000 | WHITE MOUNTAIN INSURANCE | 579,430 | |||||||||||||
| 1,129,380 | 2.66 | ||||||||||||||
| PROPERTY & CAS INSURANCE | |||||||||||||||
| 8,000 | CHUBB CORP. | 423,280 | |||||||||||||
| 423,280 | 1.00 | ||||||||||||||
| SPECIALIZED FINANCE | |||||||||||||||
| 10,000 | MOODYS CORPORATION | 690,600 | |||||||||||||
| 690,600 | 1.63 | ||||||||||||||
| THRIFTS & MORTGAGE FINANCE | |||||||||||||||
| 6,000 | FED HOME LN MTG ASSOC. | 407,400 | |||||||||||||
| 7,500 | WASHINGTON MUTUAL | 341,175 | |||||||||||||
| 748,575 | 1.77 | ||||||||||||||
| HEALTH CARE | 8.76 | ||||||||||||||
| HEALTH CARE EQUIPMENT | |||||||||||||||
| 12,000 | PERKIN ELMER | 266,760 | |||||||||||||
| 266,760 | 0.63 | ||||||||||||||
| HEALTH CARE SUPPLIES | |||||||||||||||
| 16,000 | CAMBREX CORP | 363,520 | |||||||||||||
| 20,000 | INVERNESS MEDICAL INNOVATIONS INC.* | 774,000 | |||||||||||||
| 1,137,520 | 2.68 | ||||||||||||||
| PHARMACEUTICALS | |||||||||||||||
| 15,000 | BRISTOL-MYERS SQUIBB CO. | 394,800 | |||||||||||||
| 7,500 | JOHNSON & JOHNSON | 495,150 | |||||||||||||
| 15,000 | MYLAN LABORATORIES INC. | 299,400 | |||||||||||||
| 3,000 | PAR PHARMACEUTICAL INC.* | 67,110 | |||||||||||||
| 25,000 | PFIZER INC. | 647,500 | |||||||||||||
| 8,000 | WYETH | 407,360 | |||||||||||||
| 2,311,320 | 5.45 | ||||||||||||||
See Accompanying Notes to Financial Statements
40
Pacific Advisors Balanced Fund
Statement of Investments
as of December 31, 2006
| Quantity or Principal | Description | Current $ Value** | % of Net Assets | ||||||||||||
| COMMON STOCK continued | |||||||||||||||
| INDUSTRIALS | 10.53 | ||||||||||||||
| AEROSPACE & DEFENSE | |||||||||||||||
| 7,500 | BOEING COMPANY | 666,300 | |||||||||||||
| 15,000 | CUBIC CORP. | 325,500 | |||||||||||||
| 991,800 | 2.34 | ||||||||||||||
| AIR FREIGHT/SHIPPING | |||||||||||||||
| 5,000 | UNITED PARCEL SERVICE | 374,900 | |||||||||||||
| 374,900 | 0.88 | ||||||||||||||
| COMMERCIAL PRINTING | |||||||||||||||
| 5,000 | R H DONNELLEY CORP.* | 313,650 | |||||||||||||
| 313,650 | 0.74 | ||||||||||||||
| DIVERSIFIED COMMERCIAL SERVICES | |||||||||||||||
| 15,000 | GATX CORPORATION | 649,950 | |||||||||||||
| 16,000 | H & R BLOCK | 368,640 | |||||||||||||
| 1,018,590 | 2.40 | ||||||||||||||
| INDUSTRIAL MACHINERY | |||||||||||||||
| 15,000 | FARO TECHNOLOGIES* | 360,600 | |||||||||||||
| 10,000 | INGERSOLL-RAND | 391,300 | |||||||||||||
| 751,900 | 1.77 | ||||||||||||||
| INDUSTRIAL CONGLOMERATES | |||||||||||||||
| 15,000 | GENERAL ELECTRIC | 558,150 | |||||||||||||
| 15,000 | TYCO INTERNATIONAL LTD. | 456,000 | |||||||||||||
| 1,014,150 | 2.40 | ||||||||||||||
| INFORMATION TECHNOLOGY | 5.40 | ||||||||||||||
| COMMUNICATIONS EQUIPMENT | |||||||||||||||
| 30,000 | NOKIA CORP - ADR A | 609,600 | |||||||||||||
| 609,600 | 1.44 | ||||||||||||||
| COMPUTER STORAGE/PERIPHERALS | |||||||||||||||
| 10,000 | SANDISK CORP.* | 430,300 | |||||||||||||
| 430,300 | 1.02 | ||||||||||||||
| DATA PROCESSING SERVICES | |||||||||||||||
| 8,000 | AUTOMATIC DATA PROCESSING | 394,000 | |||||||||||||
| 394,000 | 0.93 | ||||||||||||||
| SOFTWARE & PROCESSING | |||||||||||||||
| 10,000 | YAHOO* | 255,400 | |||||||||||||
| 255,400 | 0.60 | ||||||||||||||
See Accompanying Notes to Financial Statements
41
Pacific Advisors Balanced Fund
Statement of Investments
as of December 31, 2006
| Quantity or Principal | Description | Current $ Value** | % of Net Assets | ||||||||||||
| COMMON STOCK continued | |||||||||||||||
| SYSTEMS: SOFTWARE | |||||||||||||||
| 20,000 | MICROSOFT | 597,200 | |||||||||||||
| 597,200 | 1.41 | ||||||||||||||
| MATERIALS | 4.30 | ||||||||||||||
| DIVERSIFD METALS/MINING | |||||||||||||||
| 4,000 | RIO TINTO PLC | 849,960 | |||||||||||||
| 849,960 | 2.01 | ||||||||||||||
| SPECIALTY CHEMICALS | |||||||||||||||
| 10,000 | CABOT MICRO ELECTRONICS INC.* | 339,400 | |||||||||||||
| 339,400 | 0.80 | ||||||||||||||
| STEEL | |||||||||||||||
| 16,000 | RELIANCE STEEL | 630,080 | |||||||||||||
| 630,080 | 1.49 | ||||||||||||||
| UTILITIES | 2.47 | ||||||||||||||
| ELECTRIC UTILITIES | |||||||||||||||
| 10,000 | ALLETE INC. | 465,400 | |||||||||||||
| 465,400 | 1.10 | ||||||||||||||
| MULTI-LINE UTILITIES/POWER | |||||||||||||||
| 17,500 | DUKE ENERGY CORP. | 581,175 | |||||||||||||
| 581,175 | 1.37 | ||||||||||||||
| TOTAL COMMON STOCK (Cost: $16,036,112) | 26,297,884 | 62.05 | |||||||||||||
| CORPORATE BONDS | |||||||||||||||
| CONSUMER DISCRETIONARY | 1.10 | ||||||||||||||
| AUTO PARTS & EQUIPMENT | |||||||||||||||
| 100,000 | BORG WARNER 8.00% 10/01/19 | 114,158 | |||||||||||||
| 114,158 | 0.27 | ||||||||||||||
| GENERAL MERCHANDISE STORES | |||||||||||||||
| 178,000 | DAYTON HUDSON CO. 8.60% 01/15/12 | 203,721 | |||||||||||||
| 203,721 | 0.48 | ||||||||||||||
| HOME FURNISHINGS | |||||||||||||||
| 143,000 | WHIRLPOOL CORP. 9.10% 02/01/08 | 148,031 | |||||||||||||
| 148,031 | 0.35 | ||||||||||||||
See Accompanying Notes to Financial Statements
42
Pacific Advisors Balanced Fund
Statement of Investments
as of December 31, 2006
| Quantity or Principal | Description | Current $ Value** | % of Net Assets | ||||||||||||
| CORPORATE BONDS continued | |||||||||||||||
| CONSUMER STAPLES | 2.44 | ||||||||||||||
| DISTILLERS & VINTNERS | |||||||||||||||
| 310,000 | SEAGRAMS & SONS 7.00% 04/15/08 | 312,127 | |||||||||||||
| 312,127 | 0.74 | ||||||||||||||
| FOOD: RETAIL | |||||||||||||||
| 345,000 | SAFEWAY INC. 7.00% 09/15/07 | 348,870 | |||||||||||||
| 371,000 | SAFEWAY INC. 9.30% 02/01/07 | 371,561 | |||||||||||||
| 720,431 | 1.70 | ||||||||||||||
| ENERGY | 8.66 | ||||||||||||||
| INTEGRATED OIL & GAS | |||||||||||||||
| 501,000 | ATLANTIC RICHFIELD 9.125% 03/01/11 | 574,635 | |||||||||||||
| 600,000 | ENRON OIL & GAS 6.50% 12/01/07 | 605,460 | |||||||||||||
| 858,000 | OCCIDENTAL PETROLEUM 10.125% 09/15/09 | 958,914 | |||||||||||||
| 245,000 | PHILLIPS PETROLEUM 7.125% 03/15/28 | 252,049 | |||||||||||||
| 2,391,058 | 5.64 | ||||||||||||||
| OIL & GAS DRILLING | |||||||||||||||
| 296,000 | PREMCOR REFINING 7.50% 06/15/15 | 309,549 | |||||||||||||
| 309,549 | 0.73 | ||||||||||||||
| OIL & GAS EXPLORATION/PRODUCTION | |||||||||||||||
| 190,000 | DEVON ENERGY CORP. 10.125% 11/15/09 | 211,695 | |||||||||||||
| 211,695 | 0.50 | ||||||||||||||
| OIL & GAS REFINING/MARKETING/TRANSPORTATION | |||||||||||||||
| 253,000 | KINDER MORGAN 6.50% 09/01/13 | 247,361 | |||||||||||||
| 505,000 | NATIONAL RURAL UTILITY 5.70% 01/15/10 | 511,220 | |||||||||||||
| 758,581 | 1.79 | ||||||||||||||
| FINANCIALS | 5.00 | ||||||||||||||
| CONSUMER FINANCE | |||||||||||||||
| 209,000 | GMAC 8.875% 06/01/10 | 216,612 | |||||||||||||
| 625,000 | JOHN DEERE CAPITAL 3.63% 05/25/07 | 620,654 | |||||||||||||
| 837,266 | 1.97 | ||||||||||||||
| DIVERSIFIED FINANCIAL | |||||||||||||||
| 311,000 | GENERAL ELECTRIC CAPITAL 8.125% 05/15/12 | 351,600 | |||||||||||||
| 351,600 | 0.83 | ||||||||||||||
| LIFE/HEALTH INSURANCE | |||||||||||||||
| 325,000 | TRANSAMERICA CORP. 9.375% 03/01/08 | 336,812 | |||||||||||||
| 336,812 | 0.79 | ||||||||||||||
See Accompanying Notes to Financial Statements
43
Pacific Advisors Balanced Fund
Statement of Investments
as of December 31, 2006
| Quantity or Principal | Description | Current $ Value** | % of Net Assets | ||||||||||||
| CORPORATE BONDS continued | |||||||||||||||
| PROPERTY & CASUALTY INSURANCE | |||||||||||||||
| 435,000 | OLD REPUBLIC INTL. 7.00% 06/15/07 | 436,738 | |||||||||||||
| 436,738 | 1.03 | ||||||||||||||
| SPECIALIZED FINANCE | |||||||||||||||
| 155,000 | BENEFICIAL CORP. 8.40% 05/15/08 | 161,060 | |||||||||||||
| 161,060 | 0.38 | ||||||||||||||
| HEALTH CARE | 1.14 | ||||||||||||||
| HEALTH CARE EQUIPMENT | |||||||||||||||
| 380,000 | MALLINCKRODT 6.50% 11/15/07 | 381,889 | |||||||||||||
| 381,889 | 0.90 | ||||||||||||||
| MANAGED HEALTH CARE | |||||||||||||||
| 100,000 | CIGNA CORP. 7.40% 05/15/07 | 100,654 | |||||||||||||
| 100,654 | 0.24 | ||||||||||||||
| INDUSTRIALS | 1.00 | ||||||||||||||
| AEROSPACE & DEFENSE | |||||||||||||||
| 300,000 | LOCKHEED MARTIN 8.20% 12/01/09 | 322,488 | |||||||||||||
| 322,488 | 0.76 | ||||||||||||||
| CONSTRUCTION & MACHINERY | |||||||||||||||
| 100,000 | CATERPILLAR INC. 5.25% 03/15/07 | 99,784 | |||||||||||||
| 99,784 | 0.24 | ||||||||||||||
| INFORMATION TECHNOLOGY | 0.26 | ||||||||||||||
| COMPUTER HARDWARE | |||||||||||||||
| 100,000 | DIGITAL EQUIPMENT 7.75% 04/01/23 | 109,342 | |||||||||||||
| 109,342 | 0.26 | ||||||||||||||
| TELECOMMUNICATION SERVICES | 4.79 | ||||||||||||||
| INTEGRATED TELECOMM SERVICES | |||||||||||||||
| 1,313,000 | GTE SOUTH INC. 6.00% 02/15/08 | 1,318,852 | |||||||||||||
| 712,000 | GTE SOUTH INC. 6.125% 06/15/07 | 713,487 | |||||||||||||
| 2,032,339 | 4.79 | ||||||||||||||
| UTILITIES | 3.93 | ||||||||||||||
| ELECTRIC UTILITIES | |||||||||||||||
| 240,000 | CAROLINA POWER&LIGHT 6.80% 08/15/07 | 241,725 | |||||||||||||
| 100,000 | KENTUCKY UTILITIES 7.92% 05/15/07 | 100,818 | |||||||||||||
| 342,543 | 0.81 | ||||||||||||||
See Accompanying Notes to Financial Statements
44
Pacific Advisors Balanced Fund
Statement of Investments
as of December 31, 2006
| Quantity or Principal | Description | Current $ Value** | % of Net Assets | ||||||||||||
| CORPORATE BONDS continued | |||||||||||||||
| MULTI-LINE UTILITIES/POWER | |||||||||||||||
| 125,000 | BALTIMORE GAS & ELEC 6.625% 03/15/08 | 126,629 | |||||||||||||
| 75,000 | BALTIMORE GAS & ELEC 7.50% 01/15/07 | 75,034 | |||||||||||||
| 200,000 | FLORIDA POWER & LIGHT 6.00% 06/01/08 | 201,661 | |||||||||||||
| 250,000 | NORTHWESTERN CORP. 7.00% 08/15/23 | 250,625 | |||||||||||||
| 220,000 | PACIFICORP 6.375% 05/15/08 | 222,510 | |||||||||||||
| 240,000 | POTOMAC ELEC. POWER 5.875% 10/15/08 | 241,384 | |||||||||||||
| 150,000 | POTOMAC ELEC. POWER 6.25% 10/15/07 | 150,746 | |||||||||||||
| 46,359 | RELIANT ENERGY MID ATL 9.237% 07/02/17 | 51,922 | |||||||||||||
| 1,320,511 | 3.12 | ||||||||||||||
| TOTAL CORPORATE BOND (Cost: $12,069,717) | 12,002,377 | 28.32 | |||||||||||||
| US GOVT SECURITIES | |||||||||||||||
| US GOVERNMENT AGENCY | 0.46 | ||||||||||||||
| US GOVERNMENT AGENCY | |||||||||||||||
| 200,000 | FED HOME LOAN BANK 4.46% 10/28/09 | 196,584 | |||||||||||||
| 196,584 | 0.46 | ||||||||||||||
| TOTAL US GOVT SECURITIES (Cost: $200,000) | 196,584 | 0.46 | |||||||||||||
| SHORT-TERM INVESTMENTS | |||||||||||||||
| MONEY MARKET | 1.39 | ||||||||||||||
| SHORT-TERM INVESTMENTS | |||||||||||||||
| 588,449 | UMB MONEY MARKET FIDUCIARY | 588,449 | |||||||||||||
| 588,449 | 1.39 | ||||||||||||||
| US TREASURY BILL | 8.63 | ||||||||||||||
| 3,200,000 | US TREASURY BILL 04/05/07 | 3,160,035 | |||||||||||||
| 500,000 | US TREASURY BILL 02/22/07 | 496,650 | |||||||||||||
| 3,656,685 | 8.63 | ||||||||||||||
| TOTAL SHORT TERM INVESTMENTS (Cost: $4,246,043) | 4,245,134 | 10.02 | |||||||||||||
| TOTAL INVESTMENTS (Cost: 32,551,872) | 42,741,979 | 100.85 | |||||||||||||
| OTHER ASSETS LESS LIABILITIES | (361,999 | ) | (0.85 | ) | |||||||||||
| TOTAL NET ASSETS | 42,379,980 | 100.00 | |||||||||||||
* Non-income producing.
** The principal amount is stated in U.S. dollars unless otherwise indicated.
See Accompanying Notes to Financial Statements
45
Pacific Advisors Growth Fund
Statement of Investments
as of December 31, 2006
| Quantity or Principal | Description | Current $ Value** | % of Net Assets | ||||||||||||
| COMMON STOCK | |||||||||||||||
| CONSUMER DISCRETIONARY | 0.51 | ||||||||||||||
| HOME IMPROVEMENT | |||||||||||||||
| 500 | HOME DEPOT INC. | 20,080 | |||||||||||||
| 20,080 | 0.51 | ||||||||||||||
| CONSUMER STAPLES | 2.53 | ||||||||||||||
| PERSONAL PRODUCTS | |||||||||||||||
| 2,000 | CHATTEM INC.* | 100,160 | |||||||||||||
| 100,160 | 2.53 | ||||||||||||||
| ENERGY | 22.72 | ||||||||||||||
| INTEGRATED OIL & GAS | |||||||||||||||
| 1,000 | BRITISH PETROLEUM | 67,100 | |||||||||||||
| 1,500 | CONOCOPHILLIPS | 107,925 | |||||||||||||
| 1,000 | MARATHON OIL CORP. | 92,500 | |||||||||||||
| 1,000 | OCCIDENTAL PETROLEUM | 48,830 | |||||||||||||
| 316,355 | 7.99 | ||||||||||||||
| OIL & GAS DRILLING | |||||||||||||||
| 1,000 | ENCANA | 45,950 | |||||||||||||
| 1,000 | ULTRA PETROLEUM* | 47,750 | |||||||||||||
| 93,700 | 2.37 | ||||||||||||||
| OIL & GAS EQUIPMENT/SERVICES | |||||||||||||||
| 1,500 | CARBO CERAMICS INC. | 56,055 | |||||||||||||
| 1,000 | FMC TECHNOLOGIES* | 61,630 | |||||||||||||
| 5,000 | MITCHAM INDUSTRIES INC.* | 59,750 | |||||||||||||
| 177,435 | 4.49 | ||||||||||||||
| OIL & GAS EXPLORATION/PRODUCTION | |||||||||||||||
| 2,000 | APACHE CORP. | 133,020 | |||||||||||||
| 1,000 | CHESAPEAKE ENERGY CORP. | 29,050 | |||||||||||||
| 1,000 | XTO ENERGY INC. | 47,050 | |||||||||||||
| 209,120 | 5.28 | ||||||||||||||
| OIL & GAS REFINING/MARKETING/TRANSPORTATION | |||||||||||||||
| 3,000 | KIRBY CORP.* | 102,390 | |||||||||||||
| 102,390 | 2.59 | ||||||||||||||
| FINANCIALS | 4.57 | ||||||||||||||
| DIVERSIFIED BANKS | |||||||||||||||
| 1,000 | WACHOVIA CORP. | 56,950 | |||||||||||||
| 56,950 | 1.44 | ||||||||||||||
See Accompanying Notes to Financial Statements
46
Pacific Advisors Growth Fund
Statement of Investments
as of December 31, 2006
| Quantity or Principal | Description | Current $ Value** | % of Net Assets | ||||||||||||
| COMMON STOCK continued | |||||||||||||||
| REGIONAL BANKS | |||||||||||||||
| 3,500 | EAST WEST BANCORP INC. | 123,970 | |||||||||||||
| 123,970 | 3.13 | ||||||||||||||
| HEALTH CARE | 31.01 | ||||||||||||||
| HEALTH CARE EQUIPMENT | |||||||||||||||
| 500 | BECTON DICKINSON | 35,075 | |||||||||||||
| 3,000 | ST. JUDE MEDICAL INC* | 109,680 | |||||||||||||
| 2,000 | ZIMMER HOLDINGS INC.* | 156,760 | |||||||||||||
| 301,515 | 7.62 | ||||||||||||||
| HEALTH CARE SERVICES | |||||||||||||||
| 1,935 | CAREMARK RX INC. | 110,508 | |||||||||||||
| 2,000 | QUEST DIAGNOSTICS, INC. | 106,000 | |||||||||||||
| 216,508 | 5.47 | ||||||||||||||
| MANAGED HEALTH CARE | |||||||||||||||
| 5,000 | AMERICA SERVICE GROUP* | 79,850 | |||||||||||||
| 3,000 | UNITED HEALTH GROUP INC. | 161,190 | |||||||||||||
| 2,750 | WELLPOINT* | 216,397 | |||||||||||||
| 457,437 | 11.56 | ||||||||||||||
| PHARMACEUTICALS | |||||||||||||||
| 1,000 | GLAXOSMITHKLINE | 52,760 | |||||||||||||
| 2,000 | JOHNSON & JOHNSON | 132,040 | |||||||||||||
| 3,100 | NATURE'S SUNSHINE | 35,821 | |||||||||||||
| 1,200 | PFIZER INC. | 31,080 | |||||||||||||
| 251,701 | 6.36 | ||||||||||||||
| INDUSTRIALS | 12.73 | ||||||||||||||
| AEROSPACE & DEFENSE | |||||||||||||||
| 1,000 | BOEING COMPANY | 88,840 | |||||||||||||
| 1,000 | HONEYWELL INTERNATIONAL INC. | 45,240 | |||||||||||||
| 134,080 | 3.39 | ||||||||||||||
| BUILDING PRODUCTS | |||||||||||||||
| 2,000 | ELKCORP | 82,180 | |||||||||||||
| 82,180 | 2.08 | ||||||||||||||
| CONSTRUCTION & MACHINERY | |||||||||||||||
| 3,000 | CHICAGO BRIDGE&IRON | 82,020 | |||||||||||||
| 82,020 | 2.07 | ||||||||||||||
See Accompanying Notes to Financial Statements
47
Pacific Advisors Growth Fund
Statement of Investments
as of December 31, 2006
| Quantity or Principal | Description | Current $ Value** | % of Net Assets | ||||||||||||
| COMMON STOCK continued | |||||||||||||||
| INDUSTRIAL CONGLOMERATES | |||||||||||||||
| 4,000 | GENERAL ELECTRIC | 148,840 | |||||||||||||
| 148,840 | 3.76 | ||||||||||||||
| INDUSTRIAL MACHINERY | |||||||||||||||
| 1,000 | ITT INDUSTRIES | 56,820 | |||||||||||||
| 56,820 | 1.43 | ||||||||||||||
| INFORMATION TECHNOLOGY | 9.29 | ||||||||||||||
| COMMUNICATIONS EQUIPMENT | |||||||||||||||
| 2,500 | CISCO SYSTEMS INC.* | 68,325 | |||||||||||||
| 1,500 | QUALCOMM INC. | 56,685 | |||||||||||||
| 125,010 | 3.16 | ||||||||||||||
| COMPUTER HARDWARE | |||||||||||||||
| 200 | INTL BUSINESS MACHINES CORP. | 19,430 | |||||||||||||
| 19,430 | 0.49 | ||||||||||||||
| COMPUTER STORAGE/PERIPHERALS | |||||||||||||||
| 1,500 | SEAGATE TECHNOLOGY | 39,750 | |||||||||||||
| 39,750 | 1.00 | ||||||||||||||
| ELECTRONIC EQUIPMENT MANUFACTURERS | |||||||||||||||
| 2,000 | ITRON INC.* | 103,680 | |||||||||||||
| 103,680 | 2.62 | ||||||||||||||
| SEMICONDUCTORS | |||||||||||||||
| 1,000 | INTEL CORPORATION | 20,250 | |||||||||||||
| 20,250 | 0.51 | ||||||||||||||
| SYSTEMS: SOFTWARE | |||||||||||||||
| 2,000 | MICROSOFT | 59,720 | |||||||||||||
| 59,720 | 1.51 | ||||||||||||||
| MATERIALS | 5.74 | ||||||||||||||
| FOREST PRODUCTS | |||||||||||||||
| 1,000 | LOUISIANA PACIFIC CORP. | 21,530 | |||||||||||||
| 21,530 | 0.54 | ||||||||||||||
| SPECIALTY CHEMICALS | |||||||||||||||
| 3,000 | LYONDELL CHEMICAL CO. | 76,710 | |||||||||||||
| 76,710 | 1.94 | ||||||||||||||
| STEEL | |||||||||||||||
| 5,000 | COMMERCIAL METALS CO. | 129,000 | |||||||||||||
| 129,000 | 3.26 | ||||||||||||||
See Accompanying Notes to Financial Statements
48
Pacific Advisors Growth Fund
Statement of Investments
as of December 31, 2006
| Quantity or Principal | Description | Current $ Value** | % of Net Assets | ||||||||||||
| COMMON STOCK continued | |||||||||||||||
| TELECOMMUNICATION SERVICES | 1.82 | ||||||||||||||
| INTEGRATED TELECOMM SERVICES | |||||||||||||||
| 5,000 | CITIZENS COMMUNICATIONS CO. | 71,850 | |||||||||||||
| 71,850 | 1.82 | ||||||||||||||
| TOTAL COMMON STOCK (Cost: $2,977,646) | 3,598,191 | 90.92 | |||||||||||||
| SHORT-TERM INVESTMENTS | |||||||||||||||
| MONEY MARKET | 8.77 | ||||||||||||||
| SHORT-TERM INVESTMENTS | |||||||||||||||
| 346,858 | UMB MONEY MARKET FIDUCIARY | 346,858 | |||||||||||||
| 346,858 | 8.77 | ||||||||||||||
| TOTAL SHORT TERM INVESTMENTS (Cost: $346,858) | 346,858 | 8.77 | |||||||||||||
| TOTAL INVESTMENTS (Cost: $3,324,504) | 3,945,049 | 99.69 | |||||||||||||
| OTHER ASSETS LESS LIABILITIES | 12,212 | 0.31 | |||||||||||||
| TOTAL NET ASSETS | 3,957,261 | 100.00 | |||||||||||||
* Non-income producing.
** The principal amount is stated in U.S. dollars unless otherwise indicated.
See Accompanying Notes to Financial Statements
49
Pacific Advisors Multi-Cap Value Fund
Statement of Investments
as of December 31, 2006
| Quantity or Principal | Description | Current $ Value** | % of Net Assets | ||||||||||||
| COMMON STOCK | |||||||||||||||
| CONSUMER DISCRETIONARY | 6.93 | ||||||||||||||
| HOME IMPROVEMENT | |||||||||||||||
| 10,500 | HOME DEPOT INC. | 421,680 | |||||||||||||
| 421,680 | 2.95 | ||||||||||||||
| MOVIES/ENTERTAINMENT | |||||||||||||||
| 33,000 | ACTIVISION INC.* | 568,920 | |||||||||||||
| 568,920 | 3.98 | ||||||||||||||
| CONSUMER STAPLES | 10.16 | ||||||||||||||
| FOOD: RETAIL | |||||||||||||||
| 13,500 | UNITED NATURAL FOODS* | 484,920 | |||||||||||||
| 8,500 | WHOLE FOODS | 398,905 | |||||||||||||
| 883,825 | 6.18 | ||||||||||||||
| HYPERMARKETS/SUPER CENTERS | |||||||||||||||
| 6,000 | WAL-MART STORES INC. | 277,080 | |||||||||||||
| 277,080 | 1.94 | ||||||||||||||
| PERSONAL PRODUCTS | |||||||||||||||
| 37,500 | SALLYBEAUTY HOLDINGS* | 292,500 | |||||||||||||
| 292,500 | 2.04 | ||||||||||||||
| ENERGY | 13.38 | ||||||||||||||
| INTEGRATED OIL & GAS | |||||||||||||||
| 6,000 | CHEVRONTEXACO CORP. | 441,180 | |||||||||||||
| 4,300 | MARATHON OIL CORP. | 397,750 | |||||||||||||
| 838,930 | 5.87 | ||||||||||||||
| OIL & GAS EQUIPMENT/SERVICES | |||||||||||||||
| 27,000 | MITCHAM INDUSTRIES INC.* | 322,650 | |||||||||||||
| 322,650 | 2.25 | ||||||||||||||
| OIL & GAS EXPLORATION/PRODUCTION | |||||||||||||||
| 5,500 | APACHE CORP. | 365,805 | |||||||||||||
| 13,300 | CHESAPEAKE ENERGY CORP. | 386,365 | |||||||||||||
| 752,170 | 5.26 | ||||||||||||||
| FINANCIALS | 14.12 | ||||||||||||||
| DIVERSIFIED BANKS | |||||||||||||||
| 8,006 | BANK OF AMERICA | 427,440 | |||||||||||||
| 427,440 | 2.99 | ||||||||||||||
See Accompanying Notes to Financial Statements
50
Pacific Advisors Multi-Cap Value Fund
Statement of Investments
as of December 31, 2006
| Quantity or Principal | Description | Current $ Value** | % of Net Assets | ||||||||||||
| COMMON STOCK continued | |||||||||||||||
| DIVERSIFIED FINANCIAL | |||||||||||||||
| 8,500 | CITIGROUP INC. | 473,450 | |||||||||||||
| 473,450 | 3.31 | ||||||||||||||
| INVESTMENT BANKS/BROKERAGE | |||||||||||||||
| 2,100 | GOLDMAN SACHS GROUP INC. | 418,635 | |||||||||||||
| 418,635 | 2.93 | ||||||||||||||
| MULTI-LINE INSURANCE | |||||||||||||||
| 5,000 | AMERICAN INTL GROUP INC. | 358,300 | |||||||||||||
| 358,300 | 2.50 | ||||||||||||||
| THRIFTS & MORTGAGE FINANCE | |||||||||||||||
| 7,500 | WASHINGTON MUTUAL | 341,175 | |||||||||||||
| 341,175 | 2.39 | ||||||||||||||
| HEALTH CARE | 16.36 | ||||||||||||||
| BIOTECHNOLOGY | |||||||||||||||
| 5,500 | AMGEN INC.* | 375,705 | |||||||||||||
| 375,705 | 2.63 | ||||||||||||||
| HEALTH CARE EQUIPMENT | |||||||||||||||
| 12,000 | BOSTON SCIENTIFIC CO.* | 206,160 | |||||||||||||
| 6,200 | ZIMMER HOLDINGS INC.* | 485,956 | |||||||||||||
| 692,116 | 4.84 | ||||||||||||||
| MANAGED HEALTH CARE | |||||||||||||||
| 8,000 | UNITED HEALTH GROUP INC. | 429,840 | |||||||||||||
| 429,840 | 3.01 | ||||||||||||||
| PHARMACEUTICALS | |||||||||||||||
| 7,200 | GLAXOSMITHKLINE | 378,777 | |||||||||||||
| 7,000 | JOHNSON & JOHNSON | 462,140 | |||||||||||||
| 840,917 | 5.88 | ||||||||||||||
| INDUSTRIALS | 8.62 | ||||||||||||||
| AEROSPACE & DEFENSE | |||||||||||||||
| 5,000 | HONEYWELL INTERNATIONAL INC. | 226,200 | |||||||||||||
| 226,200 | 1.58 | ||||||||||||||
| BUILDING PRODUCTS | |||||||||||||||
| 13,000 | ELKCORP | 534,170 | |||||||||||||
| 534,170 | 3.74 | ||||||||||||||
See Accompanying Notes to Financial Statements
51
Pacific Advisors Multi-Cap Value Fund
Statement of Investments
as of December 31, 2006
| Quantity or Principal | Description | Current $ Value** | % of Net Assets | ||||||||||||
| COMMON STOCK continued | |||||||||||||||
| INDUSTRIAL CONGLOMERATES | |||||||||||||||
| 15,500 | TYCO INTERNATIONAL LTD. | 471,200 | |||||||||||||
| 471,200 | 3.30 | ||||||||||||||
| INFORMATION TECHNOLOGY | 19.95 | ||||||||||||||
| COMMUNICATIONS EQUIPMENT | |||||||||||||||
| 15,000 | CISCO SYSTEMS INC.* | 409,950 | |||||||||||||
| 8,000 | QUALCOMM INC. | 302,320 | |||||||||||||
| 712,270 | 4.98 | ||||||||||||||
| COMPUTER HARDWARE | |||||||||||||||
| 17,000 | DELL COMPUTER CORP.* | 426,530 | |||||||||||||
| 426,530 | 2.98 | ||||||||||||||
| COMPUTER STORAGE/PERIPHERALS | |||||||||||||||
| 32,500 | EMC CORPORATION* | 429,000 | |||||||||||||
| 429,000 | 3.00 | ||||||||||||||
| SEMICONDUCTORS | |||||||||||||||
| 22,000 | INTEL CORPORATION | 445,500 | |||||||||||||
| 445,500 | 3.12 | ||||||||||||||
| SOFTWARE & PROCESSING | |||||||||||||||
| 15,800 | YAHOO* | 403,532 | |||||||||||||
| 403,532 | 2.82 | ||||||||||||||
| SYSTEMS: SOFTWARE | |||||||||||||||
| 14,600 | MICROSOFT | 435,956 | |||||||||||||
| 435,956 | 3.05 | ||||||||||||||
| MATERIALS | 1.80 | ||||||||||||||
| STEEL | |||||||||||||||
| 10,000 | COMMERCIAL METALS CO. | 258,000 | |||||||||||||
| 258,000 | 1.80 | ||||||||||||||
| TELECOMMUNICATION SERVICES | 3.13 | ||||||||||||||
| INTEGRATED TELECOMM SERVICES | |||||||||||||||
| 12,500 | AT&T INC. | 446,875 | |||||||||||||
| 446,875 | 3.13 | ||||||||||||||
| TOTAL COMMON STOCK (Cost: $11,554,040) | 13,504,566 | 94.45 | |||||||||||||
See Accompanying Notes to Financial Statements
52
Pacific Advisors Multi-Cap Value Fund
Statement of Investments
as of December 31, 2006
| Quantity or Principal | Description | Current $ Value** | % of Net Assets | ||||||||||||
| SHORT-TERM INVESTMENTS | |||||||||||||||
| MONEY MARKET | 5.72 | ||||||||||||||
| SHORT-TERM INVESTMENTS | |||||||||||||||
| 818,664 | UMB MONEY MARKET FIDUCIARY | 818,664 | |||||||||||||
| 818,664 | 5.72 | ||||||||||||||
| TOTAL SHORT TERM INVESTMENTS (Cost: $818,664) | 818,664 | 5.72 | |||||||||||||
| TOTAL INVESTMENTS (Cost: $12,372,704) | 14,323,230 | 100.17 | |||||||||||||
| OTHER ASSETS LESS LIABILITIES | (24,441 | ) | (0.17 | ) | |||||||||||
| TOTAL NET ASSETS | 14,298,789 | 100.00 | |||||||||||||
* Non-income producing.
** The principal amount is stated in U.S. dollars unless otherwise indicated.
See Accompanying Notes to Financial Statements
53
Pacific Advisors Small Cap Fund
Statement of Investments
as of December 31, 2006
| Quantity or Principal | Description | Current $ Value** | % of Net Assets | ||||||||||||
| COMMON STOCK | |||||||||||||||
| CONSUMER DISCRETIONARY | 12.69 | ||||||||||||||
| APPAREL - RETAIL | |||||||||||||||
| 140,000 | ASHWORTH INC.* | 1,016,400 | |||||||||||||
| 1,016,400 | 1.27 | ||||||||||||||
| AUTO PARTS & EQUIPMENT | |||||||||||||||
| 265,000 | AMERIGON INC.* | 2,559,900 | |||||||||||||
| 70,000 | NOBLE INTERNATIONAL LIMITED | 1,403,500 | |||||||||||||
| 3,963,400 | 4.95 | ||||||||||||||
| HOME FURNISHINGS | |||||||||||||||
| 115,000 | CRAFTMADE INTERNATIONAL INC. | 2,065,400 | |||||||||||||
| 2,065,400 | 2.58 | ||||||||||||||
| SPECIALTY STORES | |||||||||||||||
| 134,000 | CONNS INC.* | 3,118,180 | |||||||||||||
| 3,118,180 | 3.89 | ||||||||||||||
| CONSUMER STAPLES | 3.94 | ||||||||||||||
| PERSONAL PRODUCTS | |||||||||||||||
| 63,000 | CHATTEM INC.* | 3,155,040 | |||||||||||||
| 3,155,040 | 3.94 | ||||||||||||||
| ENERGY | 19.89 | ||||||||||||||
| OIL & GAS DRILLING | |||||||||||||||
| 300,000 | INFINITY ENERGY RESOURCES INC.* | 1,020,000 | |||||||||||||
| 112,000 | TOREADOR RESOURCES CORP.* | 2,886,240 | |||||||||||||
| 3,906,240 | 4.88 | ||||||||||||||
| OIL & GAS EQUIPMENT/SERVICES | |||||||||||||||
| 154,000 | MATRIX SERVICE COMPANY* | 2,479,400 | |||||||||||||
| 170,000 | MITCHAM INDUSTRIES INC.* | 2,031,500 | |||||||||||||
| 4,510,900 | 5.63 | ||||||||||||||
| OIL & GAS EXPLORATION/PRODUCTION | |||||||||||||||
| 60,000 | CHESAPEAKE ENERGY CORP. | 1,743,000 | |||||||||||||
| 45,000 | DENBURY RES. INC.* | 1,250,550 | |||||||||||||
| 160,000 | QUEST RESOURCE INC.* | 1,616,000 | |||||||||||||
| 4,609,550 | 5.76 | ||||||||||||||
| OIL & GAS REFINING/MARKETING/TRANSPORTATION | |||||||||||||||
| 85,000 | KIRBY CORP.* | 2,901,050 | |||||||||||||
| 2,901,050 | 3.62 | ||||||||||||||
See Accompanying Notes to Financial Statements
54
Pacific Advisors Small Cap Fund
Statement of Investments
as of December 31, 2006
| Quantity or Principal | Description | Current $ Value** | % of Net Assets | ||||||||||||
| COMMON STOCK continued | |||||||||||||||
| FINANCIALS | 10.88 | ||||||||||||||
| REGIONAL BANKS | |||||||||||||||
| 60,000 | EAST WEST BANCORP INC. | 2,125,200 | |||||||||||||
| 102,000 | NARA BANK NATIONAL ASSOC. | 2,133,840 | |||||||||||||
| 4,259,040 | 5.32 | ||||||||||||||
| SPECIALIZED FINANCE | |||||||||||||||
| 150,000 | EZCORP INC.* | 2,437,500 | |||||||||||||
| 78,000 | FIRST CASH FINANCIAL SERVICES INC.* | 2,017,860 | |||||||||||||
| 4,455,360 | 5.56 | ||||||||||||||
| HEALTH CARE | �� | 4.99 | |||||||||||||
| MANAGED HEALTH CARE | |||||||||||||||
| 190,000 | AMERICA SERVICE GROUP* | 3,034,300 | |||||||||||||
| 115,000 | UNITED AMERICAN HEALTH CARE* | 963,700 | |||||||||||||
| 3,998,000 | 4.99 | ||||||||||||||
| INDUSTRIALS | 32.69 | ||||||||||||||
| BUILDING PRODUCTS | |||||||||||||||
| 115,000 | APOGEE ENTERPRISES INC. | 2,220,650 | |||||||||||||
| 90,000 | ELKCORP | 3,698,100 | |||||||||||||
| 5,918,750 | 7.39 | ||||||||||||||
| DIVERSIFIED COMMERCIAL SERVICES | |||||||||||||||
| 380,000 | DARLING INTERNATIONAL INC.* | 2,093,800 | |||||||||||||
| 97,000 | MOBILE MINI INC.* | 2,613,180 | |||||||||||||
| 62,000 | TEAM INC.* | 2,159,460 | |||||||||||||
| 6,866,440 | 8.58 | ||||||||||||||
| ENVIRONMENTAL SERVICES | |||||||||||||||
| 170,000 | AMERICAN ECOLOGY CORPORATION | 3,146,700 | |||||||||||||
| 95,000 | TETRA TECH INC.* | 1,718,550 | |||||||||||||
| 4,865,250 | 6.08 | ||||||||||||||
| RAILROADS & TRUCKING | |||||||||||||||
| 100,000 | FROZEN FOOD EXPRESS INDUSTRIES INC. | 860,000 | |||||||||||||
| 148,000 | RAILAMERICA INC.* | 2,379,840 | |||||||||||||
| 78,000 | SAIA INC.* | 1,810,380 | |||||||||||||
| 100,000 | US XPRESS ENTERPRISE* | 1,647,000 | |||||||||||||
| 105,000 | VITRAN CORPORATION INC.* | 1,823,850 | |||||||||||||
| 8,521,070 | 10.64 | ||||||||||||||
See Accompanying Notes to Financial Statements
55
Pacific Advisors Small Cap Fund
Statement of Investments
as of December 31, 2006
| Quantity or Principal | Description | Current $ Value** | % of Net Assets | ||||||||||||
| COMMON STOCK continued | |||||||||||||||
| INFORMATION TECHNOLOGY | 4.45 | ||||||||||||||
| APPLICATION SOFTWARE | |||||||||||||||
| 280,000 | INTERVOICE INC.* | 2,144,800 | |||||||||||||
| 2,144,800 | 2.68 | ||||||||||||||
| SYSTEMS: SOFTWARE | |||||||||||||||
| 101,000 | TYLER TECHNOLOGIES* | 1,420,060 | |||||||||||||
| 1,420,060 | 1.77 | ||||||||||||||
| MATERIALS | 8.14 | ||||||||||||||
| SPECIALTY CHEMICALS | |||||||||||||||
| 275,000 | TERRA INDUSTRIES INC.* | 3,294,500 | |||||||||||||
| 3,294,500 | 4.11 | ||||||||||||||
| STEEL | |||||||||||||||
| 125,000 | COMMERCIAL METALS CO. | 3,225,000 | |||||||||||||
| 3,225,000 | 4.03 | ||||||||||||||
| TELECOMMUNICATION SERVICES | 3.07 | ||||||||||||||
| INTEGRATED TELECOMM SERVICES | |||||||||||||||
| 260,000 | PREMIER GLOBAL* | 2,454,400 | |||||||||||||
| 2,454,400 | 3.07 | ||||||||||||||
| TOTAL COMMON STOCK (Cost: $61,504,706) | 80,668,830 | 100.74 | |||||||||||||
| TOTAL INVESTMENTS (Cost: $61,504,706) | 80,668,830 | 100.74 | |||||||||||||
| OTHER ASSETS LESS LIABILITIES | (591,267 | ) | (0.74 | ) | |||||||||||
| TOTAL NET ASSETS | 80,077,563 | 100.00 | |||||||||||||
* Non-income producing.
** The principal amount is stated in U.S. dollars unless otherwise indicated.
See Accompanying Notes to Financial Statements
56
(This page has been left blank intentionally.)
57
Pacific Advisors Fund Inc.
Statement of Assets and Liabilities
December 31, 2006
| Government Securities Fund | Income and Equity Fund | Balanced Fund | |||||||||||||
| Assets | |||||||||||||||
| Investment securities | |||||||||||||||
| At cost | $ | 4,005,139 | $ | 9,003,812 | $ | 31,963,423 | |||||||||
| At market value | $ | 4,048,067 | $ | 9,398,829 | $ | 42,153,530 | |||||||||
| Cash or cash equivalent, at market value | 122,272 | 245,727 | 588,449 | ||||||||||||
| Accrued income receivable | 39,971 | 107,451 | 224,879 | ||||||||||||
| Receivable for capital shares sold | 14,026 | 570 | 725,581 | ||||||||||||
| Other assets | - | 14,000 | - | ||||||||||||
| Total assets | 4,224,336 | 9,766,577 | 43,692,439 | ||||||||||||
| Liabilities | |||||||||||||||
| Bank borrowings (Note 7) | - | - | - | ||||||||||||
| Payable for investments purchased | - | - | 313,413 | ||||||||||||
| Payable for fund shares redeemed | 9,545 | 16,945 | 84,036 | ||||||||||||
| Accounts payable | 11,607 | 28,090 | 870,230 | ||||||||||||
| Accounts payable to related parties (Note 3) | 4,480 | 6,229 | 17,638 | ||||||||||||
| Payable to investment manager (Note 3) | - | - | 27,142 | ||||||||||||
| Total liabilities | 25,632 | 51,264 | 1,312,459 | ||||||||||||
| Net Assets | $ | 4,198,704 | $ | 9,715,313 | $ | 42,379,980 | |||||||||
| Summary of Shareholders' Equity | |||||||||||||||
| Paid in capital | 5,254,230 | 9,275,693 | 32,204,534 | ||||||||||||
| Accumulated undistributed net investment income | - | - | - | ||||||||||||
| Accumulated undistributed net realized gain (losses) on security transactions | (1,098,454 | ) | 44,603 | (14,661 | ) | ||||||||||
| Net unrealized appreciation of investments | 42,928 | 395,017 | 10,190,107 | ||||||||||||
| Net assets at December 31, 2006 | $ | 4,198,704 | $ | 9,715,313 | $ | 42,379,980 | |||||||||
| Class A: | |||||||||||||||
| Net assets | $ | 2,467,227 | $ | 3,972,760 | $ | 6,786,683 | |||||||||
| Shares authorized | 50,000,000 | 50,000,000 | 50,000,000 | ||||||||||||
| Shares outstanding | 266,916 | 370,048 | 368,374 | ||||||||||||
| Net asset value and redemption price per share | $ | 9.24 | $ | 10.74 | $ | 18.42 | |||||||||
| Maximum offering price per share | $ | 9.70 | $ | 11.28 | $ | 19.54 | |||||||||
| Sales load | 4.75 | % | 4.75 | % | 5.75 | % | |||||||||
| Class C: | |||||||||||||||
| Net assets | $ | 1,731,477 | $ | 5,742,553 | $ | 35,593,297 | |||||||||
| Shares authorized | 50,000,000 | 50,000,000 | 50,000,000 | ||||||||||||
| Shares outstanding | 187,560 | 557,121 | 2,003,176 | ||||||||||||
| Net asset value and redemption price per share | $ | 9.23 | $ | 10.31 | $ | 17.77 | |||||||||
| Class I: | |||||||||||||||
| Net assets | N/A | N/A | N/A | ||||||||||||
| Shares authorized | |||||||||||||||
| Shares outstanding | |||||||||||||||
| Net asset value and redemption price per share | N/A | N/A | N/A | ||||||||||||
See Accompanying Notes to Financial Statements
58
| Growth Fund | Multi-Cap Value Fund | Small Cap Fund | |||||||||||||
| Assets | |||||||||||||||
| Investment securities | |||||||||||||||
| At cost | $ | 2,977,646 | $ | 11,554,040 | $ | 61,504,706 | |||||||||
| At market value | $ | 3,598,191 | $ | 13,504,566 | $ | 80,668,830 | |||||||||
| Cash or cash equivalent, at market value | 346,858 | 818,664 | - | ||||||||||||
| Accrued income receivable | 3,120 | 8,947 | 19,113 | ||||||||||||
| Receivable for capital shares sold | 23,609 | 208,910 | 1,092,380 | ||||||||||||
| Other assets | - | - | 225 | ||||||||||||
| Total assets | 3,971,778 | 14,541,087 | 81,780,548 | ||||||||||||
| Liabilities | |||||||||||||||
| Bank borrowings (Note 7) | - | - | 54,399 | ||||||||||||
| Payable for investments purchased | - | - | 1,163,821 | ||||||||||||
| Payable for fund shares redeemed | - | 10,542 | 99,731 | ||||||||||||
| Accounts payable | �� | 10,092 | 211,836 | 304,145 | |||||||||||
| Accounts payable to related parties (Note 3) | 4,425 | 7,778 | 31,823 | ||||||||||||
| Payable to investment manager (Note 3) | - | 12,142 | 49,066 | ||||||||||||
| Total liabilities | 14,517 | 242,298 | 1,702,985 | ||||||||||||
| Net Assets | $ | 3,957,261 | $ | 14,298,789 | $ | 80,077,563 | |||||||||
| Summary of Shareholders' Equity | |||||||||||||||
| Paid in capital | 3,936,338 | 12,347,803 | 60,900,355 | ||||||||||||
| Accumulated undistributed net investment income | 190 | - | - | ||||||||||||
| Accumulated undistributed net realized gain (losses) on security transactions | (599,812 | ) | 460 | 13,084 | |||||||||||
| Net unrealized appreciation of investments | 620,545 | 1,950,526 | 19,164,124 | ||||||||||||
| Net assets at December 31, 2006 | $ | 3,957,261 | $ | 14,298,789 | $ | 80,077,563 | |||||||||
| Class A: | |||||||||||||||
| Net assets | $ | 2,100,963 | $ | 4,340,948 | $ | 62,735,400 | |||||||||
| Shares authorized | 50,000,000 | 50,000,000 | 50,000,000 | ||||||||||||
| Shares outstanding | 228,105 | 339,956 | 1,871,417 | ||||||||||||
| Net asset value and redemption price per share | $ | 9.21 | $ | 12.77 | $ | 33.52 | |||||||||
| Maximum offering price per share | $ | 9.77 | $ | 13.55 | $ | 35.56 | |||||||||
| Sales load | 5.75 | % | 5.75 | % | 5.75 | % | |||||||||
| Class C: | |||||||||||||||
| Net assets | $ | 1,856,298 | $ | 9,957,841 | $ | 17,336,827 | |||||||||
| Shares authorized | 50,000,000 | 50,000,000 | 50,000,000 | ||||||||||||
| Shares outstanding | 216,050 | 810,803 | 577,930 | ||||||||||||
| Net asset value and redemption price per share | $ | 8.59 | $ | 12.28 | $ | 30.00 | |||||||||
| Class I: | |||||||||||||||
| Net assets | N/A | N/A | $ | 5,336 | |||||||||||
| Shares authorized | 50,000,000 | ||||||||||||||
| Shares outstanding | 148 | ||||||||||||||
| Net asset value and redemption price per share | N/A | N/A | $ | 36.13 | |||||||||||
59
Pacific Advisors Fund Inc.
Statement of Operations
For the year ended December 31, 2006
| Government Securities Fund | Income and Equity Fund | Balanced Fund | |||||||||||||
| Investment Income | |||||||||||||||
| Dividends | $ | 21,613 | $ | 154,658 | $ | 483,512 | |||||||||
| Interest | 230,552 | 244,256 | 743,425 | ||||||||||||
| Total Income | 252,165 | 398,914 | 1,226,937 | ||||||||||||
| Expenses | |||||||||||||||
| Investment Management Fees | 31,579 | 78,192 | 309,932 | ||||||||||||
| Transfer Agent Fees | 39,947 | 47,450 | 94,481 | ||||||||||||
| Fund Accounting Fees | 26,163 | 55,680 | 227,410 | ||||||||||||
| Legal Fees | 6,426 | 16,332 | 71,882 | ||||||||||||
| Audit Fees | 7,152 | 16,136 | 64,354 | ||||||||||||
| Registration Fees | 8,249 | 12,188 | 32,019 | ||||||||||||
| Printing | 7,069 | 17,114 | 82,452 | ||||||||||||
| Custody Fees | 6,792 | 8,105 | 8,236 | ||||||||||||
| Interest on Borrowings | 184 | 990 | - | ||||||||||||
| Director Fees/meetings | 1,239 | 2,869 | 12,068 | ||||||||||||
| Distribution and Service (12b-1) Fees (Note 3) | 31,627 | 74,202 | 364,177 | ||||||||||||
| Other Expenses | 5,252 | 11,749 | 48,789 | ||||||||||||
| Total Expenses, Before Fees Waived | 171,679 | 341,007 | 1,315,800 | ||||||||||||
| Less fees waived (Note 3) | 31,579 | 78,192 | - | ||||||||||||
| Net Expenses | 140,100 | 262,815 | 1,315,800 | ||||||||||||
| Net Investment Income (Loss) | 112,065 | 136,099 | (88,863 | ) | |||||||||||
| Net Realized and Unrealized Gain (Loss) on Investments | |||||||||||||||
| Net realized gain (loss) on investments | (76,812 | ) | 63,918 | 1,045,833 | |||||||||||
| Change in net unrealized appreciation (depreciation) of investments | 77,453 | 464,749 | 2,141,496 | ||||||||||||
| 641 | 528,667 | 3,187,329 | |||||||||||||
| Net Increase (Decrease) in Net Assets Resulting from Operations | $ | 112,706 | $ | 664,766 | $ | 3,098,466 | |||||||||
See Accompanying Notes to Financial Statements
60
| Growth Fund | Multi-Cap Value Fund | Small Cap Fund | |||||||||||||
| Investment Income | |||||||||||||||
| Dividends | $ | 44,800 | $ | 162,788 | $ | 175,676 | |||||||||
| Interest | 10,498 | 7,579 | 3,542 | ||||||||||||
| Total Income | 55,298 | 170,367 | 179,218 | ||||||||||||
| Expenses | |||||||||||||||
| Investment Management Fees | 27,027 | 125,318 | 345,801 | ||||||||||||
| Transfer Agent Fees | 39,501 | 51,941 | 120,934 | ||||||||||||
| Fund Accounting Fees | 23,624 | 67,013 | 241,766 | ||||||||||||
| Legal Fees | 5,402 | 21,015 | 86,601 | ||||||||||||
| Audit Fees | 5,113 | 19,720 | 68,650 | ||||||||||||
| Registration Fees | 5,794 | 16,983 | 34,284 | ||||||||||||
| Printing | 6,205 | 22,275 | 104,927 | ||||||||||||
| Custody Fees | 6,596 | 7,231 | 9,820 | ||||||||||||
| Interest on Borrowings | - | 41 | 93,332 | ||||||||||||
| Director Fees/meetings | 940 | 3,492 | 13,101 | ||||||||||||
| Distribution and Service (12b-1) Fees (Note 3) | 22,138 | 97,660 | 188,087 | ||||||||||||
| Other Expenses | 3,822 | 14,200 | 50,652 | ||||||||||||
| Total Expenses, Before Fees Waived | 146,162 | 446,889 | 1,357,955 | ||||||||||||
| Less fees waived (Note 3) | 37,369 | - | - | ||||||||||||
| Net Expenses | 108,793 | 446,889 | 1,357,955 | ||||||||||||
| Net Investment Income (Loss) | (53,495 | ) | (276,522 | ) | (1,178,737 | ) | |||||||||
| Net Realized and Unrealized Gain (Loss) on Investments | |||||||||||||||
| Net realized gain (loss) on investments | 93,570 | 1,303,600 | 3,995,405 | ||||||||||||
| Change in net unrealized appreciation (depreciation) of investments | 216,725 | 494,459 | 10,055,870 | ||||||||||||
| 310,295 | 1,798,059 | 14,051,275 | |||||||||||||
| Net Increase (Decrease) in Net Assets Resulting from Operations | $ | 256,800 | $ | 1,521,537 | $ | 12,872,538 | |||||||||
61
Pacific Advisors Fund Inc.
Statement of Changes in Net Assets
| Government Securities Fund | Income and Equity Fund | ||||||||||||||||||
| Year ended December 31, 2006 | Year ended December 31, 2005 | Year ended December 31, 2006 | Year ended December 31, 2005 | ||||||||||||||||
| Increase (Decrease) in Net Assets From Operations | |||||||||||||||||||
| Net investment income (loss) | $ | 112,065 | $ | 177,860 | $ | 136,099 | $ | 214,303 | |||||||||||
| Net realized gain (loss) on investments | (76,812 | ) | (38,401 | ) | 63,918 | (17,091 | ) | ||||||||||||
| Change in net unrealized appreciation (depreciation) of investments | 77,453 | (91,625 | ) | 464,749 | (247,573 | ) | |||||||||||||
| Increase (decrease) in net assets resulting from operations | 112,706 | 47,834 | 664,766 | (50,361 | ) | ||||||||||||||
| From Distributions to Shareholders | |||||||||||||||||||
| Class A: | |||||||||||||||||||
| Net investment income | (77,776 | ) | (82,832 | ) | (63,644 | ) | (102,321 | ) | |||||||||||
| Net capital gains | - | - | (5,738 | ) | (4,792 | ) | |||||||||||||
| Return of capital | (365 | ) | (176 | ) | - | (60 | ) | ||||||||||||
| Class C: | |||||||||||||||||||
| Net investment income | (34,289 | ) | (99,301 | ) | (66,048 | ) | (112,720 | ) | |||||||||||
| Net capital gains | - | - | (5,955 | ) | (8,205 | ) | |||||||||||||
| Return of capital | (161 | ) | (212 | ) | - | (67 | ) | ||||||||||||
| Class I: | N/A | N/A | N/A | N/A | |||||||||||||||
| Net investment income | |||||||||||||||||||
| Net capital gains | |||||||||||||||||||
| Return of capital | |||||||||||||||||||
| Decrease in net assets resulting from distributions | (112,591 | ) | (182,521 | ) | (141,385 | ) | (228,165 | ) | |||||||||||
| From Capital Share Transactions (Note 6) | |||||||||||||||||||
| Proceeds from shares sold | 702,072 | 696,585 | 966,748 | 2,902,515 | |||||||||||||||
| Proceeds from shares purchased by reinvestment of dividends | 84,461 | 155,459 | 136,275 | 221,250 | |||||||||||||||
| Cost of shares repurchased | (2,586,654 | ) | (4,629,907 | ) | (3,612,047 | ) | (2,493,208 | ) | |||||||||||
| Increase (decrease) in net assets derived from capital share transactions | (1,800,121 | ) | (3,777,863 | ) | (2,509,024 | ) | 630,557 | ||||||||||||
| Increase (decrease) in net assets | (1,800,006 | ) | (3,912,550 | ) | (1,985,643 | ) | 352,031 | ||||||||||||
| Net Assets | |||||||||||||||||||
| Beginning of period | 5,998,710 | 9,911,260 | 11,700,956 | 11,348,925 | |||||||||||||||
| End of period | $ | 4,198,704 | $ | 5,998,710 | $ | 9,715,313 | $ | 11,700,956 | |||||||||||
| Including undistributed net investment income of | $ | - | $ | - | $ | - | $ | 775 | |||||||||||
See Accompanying Notes to Financial Statements
62
| Balanced Fund | |||||||||||
| Year ended December 31, 2006 | Year ended December 31, 2005 | ||||||||||
| Increase (Decrease) in Net Assets From Operations | |||||||||||
| Net investment income (loss) | $ | (88,863 | ) | $ | 116,445 | ||||||
| Net realized gain (loss) on investments | 1,045,833 | (102,313 | ) | ||||||||
| Change in net unrealized appreciation (depreciation) of investments | 2,141,496 | 1,904,889 | |||||||||
| Increase (decrease) in net assets resulting from operations | 3,098,466 | 1,919,021 | |||||||||
| From Distributions to Shareholders | |||||||||||
| Class A: | |||||||||||
| Net investment income | - | (38,021 | ) | ||||||||
| Net capital gains | (160,660 | ) | (5,033 | ) | |||||||
| Return of capital | (630 | ) | (14,023 | ) | |||||||
| Class C: | |||||||||||
| Net investment income | - | (41,559 | ) | ||||||||
| Net capital gains | (870,369 | ) | (27,266 | ) | |||||||
| Return of capital | (3,411 | ) | (15,327 | ) | |||||||
| Class I: | N/A | N/A | |||||||||
| Net investment income | |||||||||||
| Net capital gains | |||||||||||
| Return of capital | |||||||||||
| Decrease in net assets resulting from distributions | (1,035,070 | ) | (141,229 | ) | |||||||
| From Capital Share Transactions (Note 6) | |||||||||||
| Proceeds from shares sold | 4,331,098 | 5,727,049 | |||||||||
| Proceeds from shares purchased by reinvestment of dividends | 1,011,542 | 135,769 | |||||||||
| Cost of shares repurchased | (4,533,583 | ) | (3,299,888 | ) | |||||||
| Increase (decrease) in net assets derived from capital share transactions | 809,057 | 2,562,930 | |||||||||
| Increase (decrease) in net assets | 2,872,453 | 4,340,722 | |||||||||
| Net Assets | |||||||||||
| Beginning of period | 39,507,527 | 35,166,805 | |||||||||
| End of period | $ | 42,379,980 | $ | 39,507,527 | |||||||
| Including undistributed net investment income of | $ | - | $ | 13,733 | |||||||
63
Pacific Advisors Fund Inc.
Statement of Changes in Net Assets
| Growth Fund | Multi-Cap Value Fund | ||||||||||||||||||
| Year ended December 31, 2006 | Year ended December 31, 2005 | Year ended December 31, 2006 | Year ended December 31, 2005 | ||||||||||||||||
| Increase (Decrease) in Net Assets From Operations | |||||||||||||||||||
| Net investment income (loss) | $ | (53,495 | ) | $ | (42,058 | ) | $ | (276,522 | ) | $ | (209,204 | ) | |||||||
| Net realized gain (loss) on investments | 93,570 | 2,648 | 1,303,600 | 694,567 | |||||||||||||||
| Change in net unrealized appreciation (depreciation) of investments | 216,725 | 149,899 | 494,459 | 385,782 | |||||||||||||||
| Increase (decrease) in net assets resulting from operations | 256,800 | 110,489 | 1,521,537 | 871,145 | |||||||||||||||
| From Distributions to Shareholders | |||||||||||||||||||
| Class A: | |||||||||||||||||||
| Net investment income | - | - | - | - | |||||||||||||||
| Net capital gains | - | - | (343,675 | ) | (155,830 | ) | |||||||||||||
| Return of capital | - | - | - | - | |||||||||||||||
| Class C: | |||||||||||||||||||
| Net investment income | - | - | - | - | |||||||||||||||
| Net capital gains | - | - | (817,554 | ) | (404,126 | ) | |||||||||||||
| Return of capital | - | - | - | - | |||||||||||||||
| Class I: | N/A | N/A | N/A | N/A | |||||||||||||||
| Net investment income | |||||||||||||||||||
| Net capital gains | |||||||||||||||||||
| Return of capital | |||||||||||||||||||
| Decrease in net assets resulting from distributions | - | - | (1,161,229 | ) | (559,956 | ) | |||||||||||||
| From Capital Share Transactions (Note 6) | |||||||||||||||||||
| Proceeds from shares sold | 830,722 | 1,624,248 | 2,987,170 | 2,317,376 | |||||||||||||||
| Proceeds from shares purchased by reinvestment of dividends | - | - | 1,143,390 | 549,246 | |||||||||||||||
| Cost of shares repurchased | (312,523 | ) | (152,606 | ) | (1,158,976 | ) | (645,378 | ) | |||||||||||
| Increase (decrease) in net assets derived from capital share transactions | 518,199 | 1,471,642 | 2,971,584 | 2,221,244 | |||||||||||||||
| Increase (decrease) in net assets | 774,999 | 1,582,131 | 3,331,892 | 2,532,433 | |||||||||||||||
| Net Assets | |||||||||||||||||||
| Beginning of period | 3,182,262 | 1,600,131 | 10,966,897 | 8,434,464 | |||||||||||||||
| End of period | $ | 3,957,261 | $ | 3,182,262 | $ | 14,298,789 | $ | 10,966,897 | |||||||||||
| Including undistributed net investment income of | $ | 190 | $ | 190 | $ | - | $ | - | |||||||||||
See Accompanying Notes to Financial Statements
64
| Small Cap Fund | |||||||||||
| Year ended December 31, 2006 | Year ended December 31, 2005 | ||||||||||
| Increase (Decrease) in Net Assets From Operations | |||||||||||
| Net investment income (loss) | $ | (1,178,737 | ) | $ | (640,379 | ) | |||||
| Net realized gain (loss) on investments | 3,995,405 | 1,654,549 | |||||||||
| Change in net unrealized appreciation (depreciation) of investments | 10,055,870 | (77,742 | ) | ||||||||
| Increase (decrease) in net assets resulting from operations | 12,872,538 | 936,428 | |||||||||
| From Distributions to Shareholders | |||||||||||
| Class A: | |||||||||||
| Net investment income | - | - | |||||||||
| Net capital gains | (2,171,968 | ) | (1,090,218 | ) | |||||||
| Return of capital | - | - | |||||||||
| Class C: | |||||||||||
| Net investment income | - | - | |||||||||
| Net capital gains | (663,505 | ) | (358,968 | ) | |||||||
| Return of capital | - | - | |||||||||
| Class I: | N/A | ||||||||||
| Net investment income | - | ||||||||||
| Net capital gains | (174 | ) | |||||||||
| Return of capital | - | ||||||||||
| Decrease in net assets resulting from distributions | (2,835,647 | ) | (1,449,186 | ) | |||||||
| From Capital Share Transactions (Note 6) | |||||||||||
| Proceeds from shares sold | 60,404,032 | 6,023,951 | |||||||||
| Proceeds from shares purchased by reinvestment of dividends | 2,572,899 | 1,359,862 | |||||||||
| Cost of shares repurchased | (13,422,526 | ) | (7,609,034 | ) | |||||||
| Increase (decrease) in net assets derived from capital share transactions | 49,554,405 | (225,221 | ) | ||||||||
| Increase (decrease) in net assets | 59,591,296 | (737,979 | ) | ||||||||
| Net Assets | |||||||||||
| Beginning of period | 20,486,267 | 21,224,246 | |||||||||
| End of period | $ | 80,077,563 | $ | 20,486,267 | |||||||
| Including undistributed net investment income of | $ | - | $ | - | |||||||
65
Pacific Advisors Fund Inc.
Notes to Financial Statements
December 31, 2006
Note 1. Organization
Pacific Advisors Fund Inc. (the "Company") is an open-end diversified investment management company registered under the Investment Company Act of 1940, as amended. The Company currently offers six Funds: Government Securities Fund, Income and Equity Fund, Balanced Fund, Growth Fund, Multi-Cap Value Fund and Small Cap Fund. Each Fund is a separate investment portfolio of the Company with a distinct investment objective, investment program, policies and restrictions. The Government Securities Fund seeks to provide high current income, preservation of capital, and rising future income, consistent with prudent investment risk. The Income and Equity Fund seeks to provide current income and, secondarily, long-term capital appreciation. The Balanced Fund seeks to achieve long-term capital appreciation and income consistent with reduced market risk. The Growth Fund seeks to achieve long-term capital appreciation through investment in m edium to large capitalization companies. The Multi-Cap Value Fund seeks long-term capital appreciation by investing in a diversified portfolio of large to small capitalization companies. The Small Cap Fund seeks to provide capital appreciation through investment in small capitalization companies.
In addition to Class A and Class C shares, the Small Cap Fund introduced Class I shares on October 9, 2006. Each class has equal rights as to assets and voting privileges except that Class A and Class C each has exclusive voting rights with respect to its distribution plan. Investment income, realized and unrealized capital gains and losses, and the common expenses of each Fund are allocated on a pro rata basis to each class based on the relative net assets of each class to the total net assets of the Fund. Each Class of shares differs in its respective service and distribution expenses and may differ in its transfer agent, registration, and certain other class-specific fees and expenses.
The Company enters into contracts that contain a variety of indemnifications. The Company's maximum exposure under these arrangements is unknown. However, the Company has not had prior claims or losses pursuant to these contracts and expects the risk of loss to be remote.
Note 2. Significant Accounting Policies
A. Security Valuation. Securities listed on a national securities exchange and certain over-the-counter ("OTC") issues traded on the NASDAQ national market system are valued at the last quoted sale price at the close of the New York Stock Exchange. OTC issues not quoted on the NASDAQ system, and other equity securities for which no sale price is available, are valued at the last bid price as obtained from published sources or real time quote services, where available, and otherwise from brokers who are market makers for such securities. Debt securities with a maturity less than 60 days are valued on an amortized cost basis. Premium or discount on debt securities are amortized.
B. Security Transactions and Investment Income. Security transactions are accounted for on the trade date. The cost of investments sold is determined by use of the specific identification method for both financial reporting and federal income tax purposes. Dividends are recorded on the ex-dividend date. Interest income is recorded on an accrual basis.
C. Dividends and Distributions to Shareholders. The Government Securities Fund and Income and Equity Fund declare and distribute dividends of their net investment income, if any, quarterly. The Balanced Fund, Growth Fund, Multi-Cap Value Fund and Small Cap Fund declare and distribute dividends of their net investment income, if any, annually. The Board of Directors will determine the amount and timing of such payments. Income dividends and capital gains distributions are determined in accordance with income tax regulations which may differ from generally accepted accounting principles. These differences are primarily due to differing treatments of income and gain on various investment securities held by the Funds, timing differences and differing characterization of distributions made by the Funds.
D. Federal Income Tax. The Funds intend to comply with the requirements of Subchapter M of the Internal Revenue Code applicable to regulated investment companies and to distribute substantially all of their taxable income to their shareholders. Therefore, no federal income tax provision is required.
At December 31, 2006, components of distributable earnings/(deficit) on a tax basis were as follows:
| Government Securities Fund | Income and Equity Fund | Balanced Fund | Growth Fund | Multi-Cap Value Fund | Small Cap Fund | ||||||||||||||||||||||
| Undistributed ordinary income | $ | - | $ | - | $ | - | $ | - | $ | 460 | $ | - | |||||||||||||||
| Undistributed long-term gains | - | 44,603 | - | - | - | 13,084 | |||||||||||||||||||||
| Capital loss carryforward* | (1,088,922 | ) | - | - | (564,331 | ) | - | - | |||||||||||||||||||
| Post October Loss | - | - | - | (35,481 | ) | - | - | ||||||||||||||||||||
| Net unrealized appreciation (depreciation) on investments | 42,928 | 395,017 | 10,175,446 | 620,735 | 1,950,526 | 19,164,124 | |||||||||||||||||||||
| Distributable earnings/(deficit) | (1,045,994 | ) | 439,620 | 12,147,355 | 21,149,117 | 21,128,194 | 19,177,208 | ||||||||||||||||||||
Difference between book basis and tax-basis unrealized appreciation (depreciation) is attributable primarily to the tax deferral of losses on wash sales and return of capital distributions from Real Estate Investment Trusts ("REITS").
66
Pacific Advisors Fund Inc.
Notes to Financial Statements
December 31, 2006
The Funds intend to utilize provisions of the Federal income tax laws which allow it to carry a realized capital loss forward for eight years following the year of the loss and offset such losses against any future realized capital gains. During the current fiscal year, the Funds utilized capital losses carried forward as follows:
| Government Securities Fund | Income and Equity Fund | Balanced Fund | Growth Fund | Multi-Cap Value Fund | Small Cap Fund | ||||||||||||||||||||||
| Capital losses utilized | - | $ | 6,827 | $ | 32,524 | $ | 128,300 | - | - | ||||||||||||||||||
* At December 31, 2006, the following had accumulated net realized losses on investment transactions that represent capital loss carryforwards for federal income tax purposes, which expire as follows:
| Capital losses expiring in: | |||||||||||||||||||||||||||||||
| 2009 | 2010 | 2011 | 2012 | 2013 | 2014 | Total | |||||||||||||||||||||||||
| Government Securities Fund | $ | - | $ | - | $ | 855,711 | $ | 95,072 | $ | 49,495 | $ | 88,644 | $ | 1,088,922 | |||||||||||||||||
| Growth Fund | 472,597 | 91,734 | - | - | - | - | 564,331 | ||||||||||||||||||||||||
E. Use of Estimates. The preparation of financial statements in conformity with accounting principles generally accepted in the United States requires management to make estimates and assumptions that affect the reported amounts in the financial statements and footnotes. Actual results could differ from those estimates.
F. Reclassification of Capital Accounts. Distributions of net investment income and realized gains are determined in accordance with income tax regulations which may differ from generally accepted accounting principles. These differences are due to differing treatments for items such as net operating losses, reclassification of dividends, REITs adjustments and return of capital. To the extent that these differences are permanent in nature, reclassifications are made among the net asset accounts on the Statement of Assets and Liabilities.
For the year ended December 31, 2006, reclassifications among the components of net assets are as follows:
| Accumulated Undistributed Net Investment Income | Paid in Capital | Accumulated Capital Gain | |||||||||||||
| Government Securities Fund | $ | 526 | $ | (526 | ) | $ | - | ||||||||
| Income and Equity Fund | 4,510 | - | (4,510 | ) | |||||||||||
| Balanced Fund | 75,130 | (123,627 | ) | 48,497 | |||||||||||
| Growth Fund | 53,495 | (53,495 | ) | - | |||||||||||
| Multi-Cap Value Fund | 276,522 | - | (276,522 | ) | |||||||||||
| Small Cap Fund | 1,178,737 | - | (1,178,737 | ) | |||||||||||
Note 3. Investment Management, Distributor and Other Related Party Transactions
The Company and the Funds have entered into investment management agreements ("Management Agreements") with Pacific Global Investment Management Company, Inc. ("Investment Manager").
The Management Agreements provide for investment management fees, payable monthly, and calculated at the maximum annual rate of 0.65% of average net assets for the Government Securities Fund, 0.75% of average net assets for the Income and Equity, Balanced, Growth and Small Cap Funds and 1.00% of average net assets for the Multi-Cap Value Fund. The Investment Manager has entered into a sub-advisory agreement with Bache Capital Management ("Sub-Advisor") for the Balanced Fund. It has also entered into a co-management agreement with Bache Capital Management ("Co-Manager") for the Income and Equity Fund.
The Investment Manager is solely responsible for the payment of these fees to Bache Capital Management.
On November 10, 2006, the Board of Directors (the "Board") of the Company unanimously voted to terminate Bache Capital Management, Inc. ("Bache") (A) as investment sub-adviser of the Balanced Fund effective at the close of business on December 31, 2006, and (B) as co-manager of the Income and Equity Fund effective at the close of business on December 31, 2006. After December 31, 2006, Pacific Global Investment Management Company ("PGIMC") will continue to serve as the Investment Manager of the Balanced Fund and the Income and Equity Fund, and will assume the duties previously performed by Bache.
67
Pacific Advisors Fund Inc.
Notes to Financial Statements
December 31, 2006
In accordance with Expense Limitation Agreements with the Company, the Investment Manager, and with respect to the Income and Equity Fund only, the Co-Manager, will waive their respective management fees to the extent that the actual operating expenses of the following Funds exceed the following thresholds:
| Class A | Class C | ||||||||||
| Government Securities Fund | 1.75 | % | 2.50 | % | |||||||
| Income and Equity Fund | 1.95 | % | 2.70 | % | |||||||
| Growth Fund | 2.65 | % | 3.40 | % | |||||||
For the Growth Fund only, if net expenses exceed the above thresholds after waiver of the entire management fee, the transfer agent will waive its transfer agency fee to the extent necessary to reduce Class expenses to the above thresholds. These agreements may be terminated by either party upon 90 days prior written notice.
Effective on January 1, 2007, the transfer agent will waive its transfer agency fees for the Government Securities Fund to the extent necessary to reduce Class expenses to 1.65% for Class A Shares and 2.40% for Class C Shares. This will be done if net expenses after the waiver of the entire management fee still exceed the expense limitation for each class.
Pursuant to the Expense Limitation Agreements, providing for the voluntary waiver of fees and the assumption of expenses by the Investment Manager and Transfer Agent, and, with respect to the Income and Equity Fund, the Co-Manager, the following amounts were waived for the year ended December 31, 2006.
| Management Fees Waived | Transfer Agent Fees Waived | ||||||||||
| Government Securities Fund | $ | 31,579 | $ | - | |||||||
| Income and Equity Fund | 78,192 | - | |||||||||
| Growth Fund | 27,027 | 10,342 | |||||||||
Effective 2004, the Investment Manager and the Co-Manager terminated all of their rights under the expense limitation agreements with respect to potential recoupment from the Funds of all management fees previously waived and all expenses previously reimbursed. In the future, the Investment Manager and Co-Manager will not have any rights to recover fees they waive or expenses they may reimburse, with respect to any of the Funds.
For the year ended December 31, 2006, Pacific Global Fund Distributors, Inc. ("PGFD"), the principal underwriter for the Company, received commissions on sales of capital stock, after deducting amounts allowed to authorized distributors as commissions. The amounts are as follows:
| Underwriting Fees Retained | Commissions Paid | ||||||||||
| Government Securities Fund | $ | 66 | $ | 305 | |||||||
| Income and Equity Fund | 112 | 544 | |||||||||
| Balanced Fund | 1,487 | 4,019 | |||||||||
| Growth Fund | 1,630 | 1,663 | |||||||||
| Multi-Cap Value Fund | 2,813 | 5,709 | |||||||||
| Small Cap Fund | 62,877 | 4,284 | |||||||||
PGFD is a wholly-owned subsidiary of the Investment Manager. The Company and the Funds have entered into agreements with Pacific Global Investor Services, Inc. ("PGIS") to provide fund accounting services at the monthly fee of three basis points for the first one hundred million in net assets or a minimum of $1,500. In addition, agreements to provide transfer agent services has also been entered into at a rate of $18.00 per year per open account and $3.00 per year per closed account with minimum charges of $1,400 per month for A and C share accounts. PGIS is a wholly-owned subsidiary of the Investment Manager. During 2006, the transfer agent do not charge its minimum charges for Class I Shares.
Accounts payable to related parties consist of management fees payable to the Investment Manager and fund accounting and transfer agent fees payable to PGIS.
The Company has adopted a plan of distribution, whereby the Funds may pay a service fee to qualified recipients in an amount up to 0.25% per annum of each Fund's daily net assets for Class A shares and Class C shares. Under the plan of the distribution, the Funds may pay a distribution fee to qualified recipients in an amount up to 0.75% per annum of each Fund's daily net assets for Class C shares. The Company has not adopted a plan of distribution for Class I Shares.
For the year ended December 31, 2006, total distribution and/or service (12b-1) fees were:
| Class A | Class C | ||||||||||
| Government Securities Fund | $ | 5,652 | $ | 25,975 | |||||||
| Income and Equity Fund | 10,018 | 64,184 | |||||||||
| Balanced Fund | 14,952 | 349,225 | |||||||||
| Growth Fund | 4,311 | 17,827 | |||||||||
| Multi-Cap Value Fund | 8,355 | 89,305 | |||||||||
| Small Cap Fund | 90,991 | 97,096 | |||||||||
68
Pacific Advisors Fund Inc.
Notes to Financial Statements
December 31, 2006
Note 4. Purchase and Sales of Securities
The following summarizes purchases and sales of investment securities, other than short-term investments, and aggregate gross unrealized appreciation and depreciation on a tax basis by each Fund for the period ended and as of December 31, 2006.
| Year ended December 31, 2006 | As of December 31, 2005 | ||||||||||||||||||||||||||
| Cost of Purchases | Proceeds From Sales | Tax Cost of Securities | Gross Unrealized Appreciation | Gross Unrealized Depreciation | Net Unrealized Appreciation (Depreciation) | ||||||||||||||||||||||
| Government Securities Fund | $ | 765,613 | $ | 2,607,227 | $ | 4,005,139 | $ | 83,523 | $ | 40,595 | $ | 42,928 | |||||||||||||||
| Income and Equity Fund | 2,369,751 | 5,310,382 | 9,003,812 | 548,483 | 153,466 | 395,017 | |||||||||||||||||||||
| Balanced Fund | 5,679,450 | 6,265,303 | 31,978,084 | 10,378,362 | 202,916 | 10,175,446 | |||||||||||||||||||||
| Growth Fund | 1,234,935 | 753,599 | 2,977,456 | 688,630 | 67,895 | 620,735 | |||||||||||||||||||||
| Multi-Cap Value Fund | 6,963,421 | 5,800,779 | 11,554,040 | 2,250,655 | 300,129 | 1,950,526 | |||||||||||||||||||||
| Small Cap Fund | 54,862,766 | 9,496,656 | 61,504,706 | 20,750,966 | 1,586,842 | 19,164,124 | |||||||||||||||||||||
Note 5. Distributions to Shareholders
The tax character of distributions paid during 2006 and 2005 was as follows:
| Government Securities Fund | Income and Equity Fund | Balanced Fund | Multi-Cap Value Fund | Small Cap Fund | |||||||||||||||||||
| Year ended December 31, 2006 | |||||||||||||||||||||||
| Distributions paid from: | |||||||||||||||||||||||
| Ordinary Income | $ | 112,065 | $ | 129,692 | $ | - | $ | - | $ | 190,354 | |||||||||||||
| Long-Term Capital Gain | - | 11,693 | 1,031,029 | 1,161,229 | 2,645,293 | ||||||||||||||||||
| Return of Capital | 526 | - | 4,041 | - | - | ||||||||||||||||||
| Total Distributions | $ | 112,591 | $ | 141,385 | $ | 1,035,070 | $ | 1,161,229 | $ | 2,835,647 | |||||||||||||
| Year ended December 31, 2005 | |||||||||||||||||||||||
| Distributions paid from: | |||||||||||||||||||||||
| Ordinary Income | $ | 182,133 | $ | 215,041 | $ | 79,580 | $ | - | $ | - | |||||||||||||
| Long-Term Capital Gain | - | 12,997 | 32,299 | 559,956 | 1,449,186 | ||||||||||||||||||
| Return of Capital | 388 | 127 | 29,350 | - | - | ||||||||||||||||||
| Total Distributions | $ | 182,521 | $ | 228,165 | $ | 141,229 | $ | 559,956 | $ | 1,449,186 | |||||||||||||
Note 6. Capital Share Transactions
A 2% redemption fee is assessed on shares of the Government Securities Fund or the Income and Equity Fund sold or exchanged within sixty days of purchase or shares of the Balanced Fund, Growth Fund, Multi-Cap Value Fund or the Small Cap Fund sold or exchanged within six months of purchase and is retained in each Fund. The redemption fees collected through December 31, 2006 are included as a reduction to the shares repurchased in the table below.
The amount of the reduction is as follows:
| Government Securities Fund (Class A) | $ | 11 | Government Securities Fund (Class C) | $ | 252 | ||||||||||
| Income and Equity Fund (Class A) | - | Income and Equity Fund (Class C) | 41 | ||||||||||||
| Balanced Fund (Class A) | 27 | Balanced Fund (Class C) | 452 | ||||||||||||
| Growth Fund (Class A) | 35 | Growth Fund (Class C) | 489 | ||||||||||||
| Multi-Cap Value Fund (Class A) | 110 | Multi-Cap Value Fund (Class C) | 359 | ||||||||||||
| Small Cap Fund (Class A) | 78,966 | Small Cap Fund (Class C) | 14,100 | ||||||||||||
69
Pacific Advisors Fund Inc.
Notes to Financial Statements
December 31, 2006
| Year ended December 31, 2006 | Year ended December 31, 2005 | ||||||||||||||||||
| Shares | Amount | Shares | Amount | ||||||||||||||||
| Government Securities Fund | |||||||||||||||||||
| Class A | |||||||||||||||||||
| Shares Sold | 62,182 | $ | 572,330 | 16,128 | $ | 151,978 | |||||||||||||
| Reinvestment of Distributions | 5,688 | 52,153 | 6,109 | 57,375 | |||||||||||||||
| 67,870 | 624,483 | 22,237 | 209,353 | ||||||||||||||||
| Shares Repurchased | (40,369 | ) | (372,644 | ) | (44,347 | ) | (419,880 | ) | |||||||||||
| Net Increase (Decrease) | 27,501 | $ | 251,839 | (22,110 | ) | $ | (210,527 | ) | |||||||||||
| Class C | |||||||||||||||||||
| Shares Sold | 14,168 | $ | 129,742 | 58,959 | $ | 544,607 | |||||||||||||
| Reinvestment of Distributions | 3,574 | 32,308 | 10,659 | 98,084 | |||||||||||||||
| 17,742 | 162,050 | 69,618 | 642,691 | ||||||||||||||||
| Shares Repurchased | (244,107 | ) | (2,214,010 | ) | (456,191 | ) | (4,210,027 | ) | |||||||||||
| Net Decrease | (226,365 | ) | $ | (2,051,960 | ) | (386,573 | ) | $ | (3,567,336 | ) | |||||||||
| Year ended December 31, 2006 | Year ended December 31, 2005 | ||||||||||||||||||
| Shares | Amount | Shares | Amount | ||||||||||||||||
| Income and Equity Fund | |||||||||||||||||||
| Class A | |||||||||||||||||||
| Shares Sold | 63,270 | $ | 657,015 | 165,357 | $ | 1,712,422 | |||||||||||||
| Reinvestment of Distributions | 6,443 | 66,551 | 10,021 | 103,004 | |||||||||||||||
| 69,713 | 723,566 | 175,378 | 1,815,426 | ||||||||||||||||
| Shares Repurchased | (134,769 | ) | (1,398,124 | ) | (85,674 | ) | (887,106 | ) | |||||||||||
| Net Increase | (65,056 | ) | $ | (674,558 | ) | 89,704 | $ | 928,320 | |||||||||||
| Class C | |||||||||||||||||||
| Shares Sold | 30,719 | $ | 309,733 | 120,065 | $ | 1,190,093 | |||||||||||||
| Reinvestment of Distributions | 7,027 | 69,724 | 11,985 | 118,246 | |||||||||||||||
| 37,746 | 379,457 | 132,050 | 1,308,339 | ||||||||||||||||
| Shares Repurchased | (221,873 | ) | (2,213,923 | ) | (162,893 | ) | (1,606,102 | ) | |||||||||||
| Net Increase (Decrease) | (184,127 | ) | $ | (1,834,466 | ) | (30,843 | ) | $ | (297,763 | ) | |||||||||
70
Pacific Advisors Fund Inc.
Notes to Financial Statements
December 31, 2006
| Year ended December 31, 2006 | Year ended December 31, 2005 | ||||||||||||||||||
| Shares | Amount | Shares | Amount | ||||||||||||||||
| Balanced Fund | |||||||||||||||||||
| Class A | |||||||||||||||||||
| Shares Sold | 44,763 | $ | 800,706 | 46,117 | $ | 773,374 | |||||||||||||
| Reinvestment of Distributions | 7,893 | 146,124 | 2,991 | 52,312 | |||||||||||||||
| 52,656 | 946,830 | 49,108 | 825,686 | ||||||||||||||||
| Shares Repurchased | (47,792 | ) | (860,697 | ) | (39,519 | ) | (661,714 | ) | |||||||||||
| Net Increase | 4,864 | $ | 86,133 | 9,589 | $ | 163,972 | |||||||||||||
| Class C | |||||||||||||||||||
| Shares Sold | 203,596 | $ | 3,530,392 | 300,889 | $ | 4,953,675 | |||||||||||||
| Reinvestment of Distributions | 48,449 | 865,418 | 4,903 | 83,457 | |||||||||||||||
| 252,045 | 4,395,810 | 305,792 | 5,037,132 | ||||||||||||||||
| Shares Repurchased | (210,116 | ) | (3,672,886 | ) | (160,861 | ) | (2,638,174 | ) | |||||||||||
| Net Increase | 41,929 | $ | 722,924 | 144,931 | $ | 2,398,958 | |||||||||||||
| Year ended December 31, 2006 | Year ended December 31, 2005 | ||||||||||||||||||
| Shares | Amount | Shares | Amount | ||||||||||||||||
| Growth Fund | |||||||||||||||||||
| Class A | |||||||||||||||||||
| Shares Sold | 50,910 | $ | 450,036 | 60,280 | $ | 496,292 | |||||||||||||
| Reinvestment of Distributions | - | - | - | - | |||||||||||||||
| 50,910 | 450,036 | 60,280 | 496,292 | ||||||||||||||||
| Shares Repurchased | (16,135 | ) | (143,840 | ) | (7,365 | ) | (61,805 | ) | |||||||||||
| Net Increase | 34,775 | $ | 306,196 | 52,915 | $ | 434,487 | |||||||||||||
| Class C | |||||||||||||||||||
| Shares Sold | 45,585 | $ | 380,686 | 145,253 | $ | 1,127,956 | |||||||||||||
| Reinvestment of Distributions | - | - | - | - | |||||||||||||||
| 45,585 | 380,686 | 145,253 | 1,127,956 | ||||||||||||||||
| Shares Repurchased | 20,447 | (168,683 | ) | (11,524 | ) | (90,801 | ) | ||||||||||||
| Net Increase | 66,032 | $ | 212,003 | 133,729 | $ | 1,037,155 | |||||||||||||
71
Pacific Advisors Fund Inc.
Notes to Financial Statements
December 31, 2006
| Year ended December 31, 2006 | Year ended December 31, 2005 | ||||||||||||||||||
| Shares | Amount | Shares | Amount | ||||||||||||||||
| Multi-Cap Value Fund | |||||||||||||||||||
| Class A | |||||||||||||||||||
| Shares Sold | 94,447 | $ | 1,192,505 | 58,819 | $ | 700,709 | |||||||||||||
| Reinvestment of Distributions | 25,908 | 334,372 | 12,031 | 150,266 | |||||||||||||||
| 120,355 | 1,526,877 | 70,850 | 850,975 | ||||||||||||||||
| Shares Repurchased | (30,861 | ) | (393,913 | ) | (16,947 | ) | (203,978 | ) | |||||||||||
| Net Increase | 89,494 | $ | 1,132,964 | 53,903 | $ | 646,997 | |||||||||||||
| Class C | |||||||||||||||||||
| Shares Sold | 145,977 | $ | 1,794,665 | 137,262 | $ | 1,616,667 | |||||||||||||
| Reinvestment of Distributions | 65,114 | 809,018 | 32,838 | 398,980 | |||||||||||||||
| 211,091 | 2,603,683 | 170,100 | 2,015,647 | ||||||||||||||||
| Shares Repurchased | (62,244 | ) | (765,063 | ) | (38,404 | ) | (441,400 | ) | |||||||||||
| Net Increase | 148,847 | $ | 1,838,620 | 131,696 | $ | 1,574,247 | |||||||||||||
| Year ended December 31, 2006 | Year ended December 31, 2005 | ||||||||||||||||||
| Shares | Amount | Shares | Amount | ||||||||||||||||
| Small Cap Fund | |||||||||||||||||||
| Class A | |||||||||||||||||||
| Shares Sold | 1,580,047 | $ | 48,824,782 | 209,773 | $ | 5,274,588 | |||||||||||||
| Reinvestment of Distributions | 56,688 | 1,950,232 | 38,838 | 1,015,602 | |||||||||||||||
| 1,636,735 | 50,775,014 | 248,611 | 6,290,190 | ||||||||||||||||
| Shares Repurchased | (384,583 | ) | (11,931,692 | ) | (313,442 | ) | (7,299,997 | ) | |||||||||||
| Net increase (Decrease) | 1,252,152 | $ | 38,843,322 | (64,831 | ) | $ | (1,009,807 | ) | |||||||||||
| Class C | |||||||||||||||||||
| Shares Sold | 414,243 | $ | 11,574,250 | 32,605 | $ | 749,363 | |||||||||||||
| Reinvestment of Distributions | 20,925 | 622,493 | 14,526 | 344,260 | |||||||||||||||
| 435,168 | 12,196,743 | 47,131 | 1,093,623 | ||||||||||||||||
| Shares Repurchased | (54,635 | ) | (1,490,834 | ) | (13,887 | ) | (309,037 | ) | |||||||||||
| Net Increase | 380,533 | $ | 10,705,909 | 33,244 | $ | 784,586 | |||||||||||||
| Class I | |||||||||||||||||||
| Shares Sold | 143 | $ | 5,000 | N/A | N/A | ||||||||||||||
| Reinvestment of Distributions | 5 | 174 | N/A | N/A | |||||||||||||||
| 148 | 5,174 | ||||||||||||||||||
| Shares Repurchased | - | - | N/A | N/A | |||||||||||||||
| Net Increase | 148 | $ | 5,174 | N/A | N/A | ||||||||||||||
72
Pacific Advisors Fund Inc.
Notes to Financial Statements
December 31, 2006
Note 7. Bank Borrowings
Each Fund may borrow up to 15% of its total assets. Each Fund will not borrow money except temporarily from banks to facilitate redemption requests that might otherwise require untimely disposition of portfolio securities. No securities will be purchased for a Fund when borrowed money exceeds 5% of the Fund's total assets. Each Fund has the ability to borrow, from UMB Bank, n.a., on an unsecured basis, at 1.5% over the Federal Funds rate. As of December 31, 2006 the Small Cap Fund was paying interest at 6.55% per annum on its outstanding borrowings. No compensating balances are required.
Note 8. New Accounting Pronouncement
On July 13, 2006, the Financial Accounting Standards Board (FASB) released FASB Interpretation No. 48 "Accounting for Uncertainty in Income Taxes" (FIN 48). FIN 48 provides guidance for how uncertain tax position should be recognized, measured, presented and disclosed in the financial statements. FIN 48 requires the evaluation of tax positions taken or expected to be taken in the course of preparing the Funds' tax returns to determine whether the tax positions are "more-likely-than-not" of being sustained by the applicable tax authority. Tax Positions not deemed to meet the more-likely-than-not threshold would be recorded as a tax benefit or expense in the current year. A mutual fund having a fiscal year ending on December 31, would not be required to implement FIN 48 until June 29, 2007. Management evaluated the implications of FIN 48 and determined it has no material impact on the financial statements.
73
Pacific Advisors Fund Inc.
Financial Highlights
(For a share outstanding throughout the period)
| Government Securities Fund | |||||||||||||||||||||||
| Class A | |||||||||||||||||||||||
| For the year ended December 31, | |||||||||||||||||||||||
| 2006 | 2005 | 2004 | 2003 | 2002 | |||||||||||||||||||
| Per Share Operating Performance | |||||||||||||||||||||||
| Net asset value, beginning of period | $ | 9.27 | $ | 9.51 | $ | 9.68 | $ | 10.20 | $ | 10.15 | |||||||||||||
| Income from investing operations | |||||||||||||||||||||||
| Net investment income | 0.23 | 0.28 | 0.23 | 0.35 | 0.31 | ||||||||||||||||||
| Net realized and unrealized gains (losses) on securities | 0.05 | (0.18 | ) | (0.20 | ) | (0.57 | ) | (0.04 | ) | ||||||||||||||
| Total from investment operations | 0.28 | 0.10 | 0.03 | (0.22 | ) | 0.27 | |||||||||||||||||
| Less distributions | |||||||||||||||||||||||
| From net investment income | (0.31 | ) | (0.34 | ) | (0.20 | ) | (0.30 | ) | (0.21 | ) | |||||||||||||
| From net capital gains | - | - | - | - | (0.01 | ) | |||||||||||||||||
| Total distributions | (0.31 | ) | (0.34 | ) | (0.20 | ) | (0.30 | ) | (0.22 | ) | |||||||||||||
| Net asset value, end of period | $ | 9.24 | $ | 9.27 | $ | 9.51 | $ | 9.68 | $ | 10.20 | |||||||||||||
| Total Investment Return (a) | 3.14 | % | 1.08 | % | 0.26 | % | (2.20 | )% | 2.78 | % | |||||||||||||
| Ratios/Supplemental Data | |||||||||||||||||||||||
| Net assets, end of year (000's) | $ | 2,467 | $ | 2,219 | $ | 2,488 | $ | 3,025 | $ | 4,125 | |||||||||||||
| Ratio of net investment income to average net assets | |||||||||||||||||||||||
| With expense reductions | 2.70 | % | 2.68 | % | 1.89 | % | 2.88 | % | 2.57 | % | |||||||||||||
| Without expense reductions | 2.04 | % | 2.03 | % | 1.23 | % | 2.33 | % | 1.42 | % | |||||||||||||
| Ratio of expenses to average net assets | |||||||||||||||||||||||
| With expense reductions | 2.51 | % | 2.26 | % | 1.81 | % | 1.65 | % | 1.65 | % | |||||||||||||
| Without expense reductions | 3.17 | % | 2.91 | % | 2.46 | % | 2.20 | % | 2.80 | % | |||||||||||||
| Fund portfolio turnover rate | 16.27 | % | 88.26 | % | 402.70 | % | 206.55 | % | 212.10 | % | |||||||||||||
| Class C | |||||||||||||||||||||||
| For the year ended December 31, | |||||||||||||||||||||||
| 2006 | 2005 | 2004 | 2003 | 2002 | |||||||||||||||||||
| Per Share Operating Performance | |||||||||||||||||||||||
| Net asset value, beginning of period | $ | 9.13 | $ | 9.27 | $ | 9.43 | $ | 9.95 | $ | 9.96 | |||||||||||||
| Income from investing operations | |||||||||||||||||||||||
| Net investment income | 0.08 | 0.14 | 0.09 | 0.21 | 0.23 | ||||||||||||||||||
| Net realized and unrealized gains (losses) on securities | 0.14 | (0.11 | ) | (0.14 | ) | (0.50 | ) | (0.04 | ) | ||||||||||||||
| Total from investment operations | 0.22 | 0.03 | (0.05 | ) | (0.29 | ) | 0.19 | ||||||||||||||||
| Less distributions | |||||||||||||||||||||||
| From net investment income | (0.12 | ) | (0.17 | ) | (0.11 | ) | (0.23 | ) | (0.19 | ) | |||||||||||||
| From net capital gains | - | - | - | - | (0.01 | ) | |||||||||||||||||
| Total distributions | (0.12 | ) | (0.17 | ) | (0.11 | ) | (0.23 | ) | (0.20 | ) | |||||||||||||
| Net asset value, end of period | $ | 9.23 | $ | 9.13 | $ | 9.27 | $ | 9.43 | $ | 9.95 | |||||||||||||
| Total Investment Return | 2.47 | % | 0.28 | % | (0.50 | )% | (2.98 | )% | 1.98 | % | |||||||||||||
| Ratios/Supplemental Data | |||||||||||||||||||||||
| Net assets, end of year (000's) | $ | 1,731 | $ | 3,780 | $ | 7,424 | $ | 11,423 | $ | 10,858 | |||||||||||||
| Ratio of net investment income to average net assets | |||||||||||||||||||||||
| With expense reductions | 1.97 | % | 2.03 | % | 1.10 | % | 2.23 | % | 1.90 | % | |||||||||||||
| Without expense reductions | 1.32 | % | 1.38 | % | 0.45 | % | 1.67 | % | 0.81 | % | |||||||||||||
| Ratio of expenses to average net assets | |||||||||||||||||||||||
| With expense reductions | 3.21 | % | 2.90 | % | 2.57 | % | 2.39 | % | 2.40 | % | |||||||||||||
| Without expense reductions | 3.86 | % | 3.55 | % | 3.22 | % | 2.95 | % | 3.49 | % | |||||||||||||
| Fund portfolio turnover rate | 16.27 | % | 88.26 | % | 402.70 | % | 206.55 | % | 212.10 | % | |||||||||||||
(a) The Fund's maximum sales charge is not included in the total return computation
See Accompanying Notes to Financial Statements
74
Pacific Advisors Fund Inc.
Financial Highlights
(For a share outstanding throughout the period)
| Income and Equity Fund | |||||||||||||||||||||||
| Class A | |||||||||||||||||||||||
| For the year ended December 31, | |||||||||||||||||||||||
| 2006 | 2005 | 2004 | 2003 | 2002 | |||||||||||||||||||
| Per Share Operating Performance | |||||||||||||||||||||||
| Net asset value, beginning of period | $ | 10.19 | $ | 10.46 | $ | 10.33 | $ | 9.91 | $ | 10.31 | |||||||||||||
| Income from investing operations | |||||||||||||||||||||||
| Net investment income | 0.20 | 0.20 | 0.07 | 0.33 | 0.39 | ||||||||||||||||||
| Net realized and unrealized gains (losses) on securities | 0.53 | (0.20 | ) | 0.29 | 0.31 | (0.49 | ) | ||||||||||||||||
| Total from investment operations | 0.73 | - | 0.36 | 0.64 | (0.10 | ) | |||||||||||||||||
| Less distributions | |||||||||||||||||||||||
| From net investment income | (0.18 | ) | (0.26 | ) | (0.21 | ) | (0.20 | ) | (0.30 | ) | |||||||||||||
| From net capital gains | - | (0.01 | ) | (0.02 | ) | - | - | ||||||||||||||||
| From return of capital | - | - | - | (0.02 | ) | - | |||||||||||||||||
| Total distributions | (0.18 | ) | (0.27 | ) | (0.23 | ) | (0.22 | ) | (0.30 | ) | |||||||||||||
| Net asset value, end of period | $ | 10.74 | $ | 10.19 | $ | 10.46 | $ | 10.33 | $ | 9.91 | |||||||||||||
| Total Investment Return (a) | 7.25 | % | 0.01 | % | 3.51 | % | 6.63 | % | (0.92 | )% | |||||||||||||
| Ratios/Supplemental Data | |||||||||||||||||||||||
| Net assets, end of year (000's) | $ | 3,973 | $ | 4,436 | $ | 3,611 | $ | 1,835 | $ | 2,117 | |||||||||||||
| Ratio of net investment income to average net assets | |||||||||||||||||||||||
| With expense reductions | 1.74 | % | 2.33 | % | 2.18 | % | 2.92 | % | 3.43 | % | |||||||||||||
| Without expense reductions | 0.99 | % | 1.65 | % | 1.49 | % | 1.84 | % | 1.75 | % | |||||||||||||
| Ratio of expenses to average net assets | |||||||||||||||||||||||
| With expense reductions | 2.06 | % | 1.93 | % | 1.94 | % | 1.85 | % | 1.85 | % | |||||||||||||
| Without expense reductions | 2.80 | % | 2.60 | % | 2.63 | % | 2.94 | % | 3.53 | % | |||||||||||||
| Fund portfolio turnover rate | 23.43 | % | 39.57 | % | 40.48 | % | 71.02 | % | 91.50 | % | |||||||||||||
| Class C | |||||||||||||||||||||||
| For the year ended December 31, | |||||||||||||||||||||||
| 2006 | 2005 | 2004 | 2003 | 2002 | |||||||||||||||||||
| Per Share Operating Performance | |||||||||||||||||||||||
| Net asset value, beginning of period | $ | 9.80 | $ | 10.02 | $ | 9.90 | $ | 9.60 | $ | 10.03 | |||||||||||||
| Income from investing operations | |||||||||||||||||||||||
| Net investment income | 0.08 | 0.15 | 0.16 | 0.24 | 0.34 | ||||||||||||||||||
| Net realized and unrealized gains (losses) on securities | 0.54 | (0.22 | ) | 0.11 | 0.32 | (0.51 | ) | ||||||||||||||||
| Total from investment operations | 0.62 | (0.07 | ) | 0.27 | 0.56 | (0.17 | ) | ||||||||||||||||
| Less distributions | |||||||||||||||||||||||
| From net investment income | (0.11 | ) | (0.14 | ) | (0.13 | ) | (0.22 | ) | (0.26 | ) | |||||||||||||
| From net capital gains | - | (0.01 | ) | (0.02 | ) | - | - | ||||||||||||||||
| From return of capital | - | - | - | (0.02 | ) | - | |||||||||||||||||
| Total distributions | (0.11 | ) | (0.15 | ) | (0.15 | ) | (0.24 | ) | (0.26 | ) | |||||||||||||
| Net asset value, end of period | $ | 10.31 | $ | 9.80 | $ | 10.02 | $ | 9.90 | $ | 9.60 | |||||||||||||
| Total Investment Return | 6.40 | % | (0.67 | )% | 2.74 | % | 5.88 | % | (1.60 | )% | |||||||||||||
| Ratios/Supplemental Data | |||||||||||||||||||||||
| Net assets, end of year (000's) | $ | 5,743 | $ | 7,265 | $ | 7,738 | $ | 5,416 | $ | 3,284 | |||||||||||||
| Ratio of net investment income to average net assets | |||||||||||||||||||||||
| With expense reductions | 1.04 | % | 1.57 | % | 1.38 | % | 2.10 | % | 2.95 | % | |||||||||||||
| Without expense reductions | 0.28 | % | 0.90 | % | 0.70 | % | 1.03 | % | 1.15 | % | |||||||||||||
| Ratio of expenses to average net assets | |||||||||||||||||||||||
| With expense reductions | 2.81 | % | 2.70 | % | 2.69 | % | 2.60 | % | 2.60 | % | |||||||||||||
| Without expense reductions | 3.56 | % | 3.37 | % | 3.37 | % | 3.67 | % | 4.39 | % | |||||||||||||
| Fund portfolio turnover rate | 23.43 | % | 39.57 | % | 40.48 | % | 71.02 | % | 91.50 | % | |||||||||||||
(a) The Fund's maximum sales charge is not included in the total return computation
See Accompanying Notes to Financial Statements
75
Pacific Advisors Fund Inc.
Financial Highlights
(For a share outstanding throughout the period)
| Balanced Fund | |||||||||||||||||||||||
| Class A | |||||||||||||||||||||||
| For the year ended December 31, | |||||||||||||||||||||||
| 2006 | 2005 | 2004 | 2003 | 2002 | |||||||||||||||||||
| Per Share Operating Performance | |||||||||||||||||||||||
| Net asset value, beginning of period | $ | 17.39 | $ | 16.57 | $ | 15.88 | $ | 13.69 | $ | 14.42 | |||||||||||||
| Income from investing operations | |||||||||||||||||||||||
| Net investment income | 0.07 | 0.16 | 0.12 | 0.21 | 0.06 | ||||||||||||||||||
| Net realized and unrealized gains (losses) on securities | 1.40 | 0.82 | 0.75 | 2.34 | (0.79 | ) | |||||||||||||||||
| Total from investment operations | 1.47 | 0.98 | 0.87 | 2.55 | (0.73 | ) | |||||||||||||||||
| Less distributions | |||||||||||||||||||||||
| From net investment income | - | (0.11 | ) | (0.13 | ) | (0.16 | ) | - | |||||||||||||||
| From net capital gains | (0.44 | ) | (0.01 | ) | (0.05 | ) | (0.18 | ) | - | ||||||||||||||
| From return of capital | - | (0.04 | ) | - | (0.02 | ) | - | ||||||||||||||||
| Total distributions | (0.44 | ) | (0.16 | ) | (0.18 | ) | (0.36 | ) | - | ||||||||||||||
| Net asset value, end of period | $ | 18.42 | $ | 17.39 | $ | 16.57 | $ | 15.88 | $ | 13.69 | |||||||||||||
| Total Investment Return (a) | 8.47 | % | 5.90 | % | 5.50 | % | 18.63 | % | (5.05 | )% | |||||||||||||
| Ratios/Supplemental Data | |||||||||||||||||||||||
| Net assets, end of year (000's) | $ | 6,787 | $ | 6,323 | $ | 5,863 | $ | 4,739 | $ | 3,977 | |||||||||||||
| Ratio of net investment income to average net assets | 0.43 | % | 0.97 | % | 0.98 | % | 1.44 | % | 0.30 | % | |||||||||||||
| Ratio of expenses to average net assets | 2.54 | % | 2.53 | % | 2.67 | % | 2.86 | % | 3.47 | % | |||||||||||||
| Fund portfolio turnover rate | 15.50 | % | 25.47 | % | 39.60 | % | 58.73 | % | 57.74 | % | |||||||||||||
| Class C | |||||||||||||||||||||||
| For the year ended December 31, | |||||||||||||||||||||||
| 2006 | 2005 | 2004 | 2003 | 2002 | |||||||||||||||||||
| Per Share Operating Performance | |||||||||||||||||||||||
| Net asset value, beginning of period | $ | 16.92 | $ | 16.13 | $ | 15.49 | $ | 13.40 | $ | 14.18 | |||||||||||||
| Income from investing operations | |||||||||||||||||||||||
| Net investment income | (0.06 | ) | 0.03 | 0.04 | 0.09 | 0.01 | |||||||||||||||||
| Net realized and unrealized gains (losses) on securities | 1.35 | 0.80 | 0.68 | 2.26 | (0.79 | ) | |||||||||||||||||
| Total from investment operations | 1.29 | 0.83 | 0.72 | 2.35 | (0.78 | ) | |||||||||||||||||
| Less distributions | |||||||||||||||||||||||
| From net investment income | - | (0.02 | ) | (0.03 | ) | (0.06 | ) | - | |||||||||||||||
| From net capital gains | (0.44 | ) | (0.01 | ) | (0.05 | ) | (0.18 | ) | - | ||||||||||||||
| From return of capital | - | (0.01 | ) | - | (0.02 | ) | - | ||||||||||||||||
| Total distributions | (0.44 | ) | (0.04 | ) | (0.08 | ) | (0.26 | ) | - | ||||||||||||||
| Net asset value, end of period | $ | 17.77 | $ | 16.92 | $ | 16.13 | $ | 15.49 | $ | 13.40 | |||||||||||||
| Total Investment Return | 7.65 | % | 5.16 | % | 4.62 | % | 17.58 | % | (5.49 | )% | |||||||||||||
| Ratios/Supplemental Data | |||||||||||||||||||||||
| Net assets, end of year (000's) | $ | 35,593 | $ | 33,185 | $ | 29,304 | $ | 23,353 | $ | 14,035 | |||||||||||||
| Ratio of net investment income to average net assets | (0.33 | )% | 0.19 | % | 0.21 | % | 0.67 | % | (0.16 | )% | |||||||||||||
| Ratio of expenses to average net assets | 3.30 | % | 3.30 | % | 3.44 | % | 3.66 | % | 4.15 | % | |||||||||||||
| Fund portfolio turnover rate | 15.50 | % | 25.47 | % | 39.60 | % | 58.73 | % | 57.74 | % | |||||||||||||
(a) The Fund's maximum sales charge is not included in the total return computation
See Accompanying Notes to Financial Statements
76
Pacific Advisors Fund Inc.
Financial Highlights
(For a share outstanding throughout the period)
| Growth Fund | |||||||||||||||||||||||
| Class A | |||||||||||||||||||||||
| For the year ended December 31, | |||||||||||||||||||||||
| 2006 | 2005 | 2004 | 2003 | 2002 | |||||||||||||||||||
| Per Share Operating Performance | |||||||||||||||||||||||
| Net asset value, beginning of period | $ | 8.54 | $ | 8.22 | $ | 7.14 | $ | 5.48 | $ | 7.04 | |||||||||||||
| Income from investing operations | |||||||||||||||||||||||
| Net investment income (expense) | (0.04 | ) | (0.01 | ) | 0.02 | (0.07 | ) | (0.12 | ) | ||||||||||||||
| Net realized and unrealized gains (losses) on securities | 0.71 | 0.33 | 1.06 | 1.73 | (1.44 | ) | |||||||||||||||||
| Total from investment operations | 0.67 | 0.32 | 1.08 | 1.66 | (1.56 | ) | |||||||||||||||||
| Less distributions | |||||||||||||||||||||||
| From net investment income | - | - | - | - | - | ||||||||||||||||||
| From net capital gains | - | - | - | - | - | ||||||||||||||||||
| Total distributions | - | - | - | - | - | ||||||||||||||||||
| Net asset value, end of period | $ | 9.21 | $ | 8.54 | $ | 8.22 | $ | 7.14 | $ | 5.48 | |||||||||||||
| Total Investment Return (a) | 7.85 | % | 3.89 | % | 15.13 | % | 30.29 | % | (22.16 | )% | |||||||||||||
| Ratios/Supplemental Data | |||||||||||||||||||||||
| Net assets, end of year (000's) | $ | 2,101 | $ | 1,650 | $ | 1,155 | $ | 669 | $ | 464 | |||||||||||||
| Ratio of net investment income to average net assets | |||||||||||||||||||||||
| With expense reductions | (1.11 | )% | (1.37 | )% | (1.51 | )% | (1.69 | )% | (1.97 | )% | |||||||||||||
| Without expense reductions | (2.14 | )% | (3.06 | )% | (4.98 | )% | (7.44 | )% | (8.25 | )% | |||||||||||||
| Ratio of expenses to average net assets | |||||||||||||||||||||||
| With expense reductions | 2.64 | % | 2.63 | % | 2.83 | % | 2.48 | % | 2.50 | % | |||||||||||||
| Without expense reductions | 3.68 | % | 4.32 | % | 6.30 | % | 8.23 | % | 8.77 | % | |||||||||||||
| Fund portfolio turnover rate | 22.80 | % | 30.54 | % | 12.96 | % | 34.58 | % | 78.06 | % | |||||||||||||
| Class C | |||||||||||||||||||||||
| For the year ended December 31, | |||||||||||||||||||||||
| 2006 | 2005 | 2004 | 2003 | 2002 | |||||||||||||||||||
| Per Share Operating Performance | |||||||||||||||||||||||
| Net asset value, beginning of period | $ | 8.02 | $ | 7.79 | $ | 6.83 | $ | 5.33 | $ | 6.89 | |||||||||||||
| Income from investing operations | |||||||||||||||||||||||
| Net investment income (expense) | (0.12 | ) | 0.37 | 0.22 | (0.16 | ) | (0.44 | ) | |||||||||||||||
| Net realized and unrealized gains (losses) on securities | 0.69 | (0.14 | ) | 0.74 | 1.66 | (1.12 | ) | ||||||||||||||||
| Total from investment operations | 0.57 | 0.23 | 0.96 | 1.50 | (1.56 | ) | |||||||||||||||||
| Less distributions | |||||||||||||||||||||||
| From net investment income | - | - | - | - | - | ||||||||||||||||||
| From net capital gains | - | - | - | - | - | ||||||||||||||||||
| Total distributions | - | - | - | - | - | ||||||||||||||||||
| Net asset value, end of period | $ | 8.59 | $ | 8.02 | $ | 7.79 | $ | 6.83 | $ | 5.33 | |||||||||||||
| Total Investment Return | 7.11 | % | 2.95 | % | 14.06 | % | 28.14 | % | (22.64 | )% | |||||||||||||
| Ratios/Supplemental Data | |||||||||||||||||||||||
| Net assets, end of year (000's) | $ | 1,856 | $ | 1,532 | $ | 445 | $ | 251 | $ | 190 | |||||||||||||
| Ratio of net investment income to average net assets | |||||||||||||||||||||||
| With expense reductions | (1.87 | )% | (2.13 | )% | (2.27 | )% | (2.47 | )% | (2.75 | )% | |||||||||||||
| Without expense reductions | (2.91 | )% | (3.83 | )% | (5.61 | )% | (8.18 | )% | (8.67 | )% | |||||||||||||
| Ratio of expenses to average net assets | |||||||||||||||||||||||
| With expense reductions | 3.40 | % | 3.40 | % | 3.54 | % | 3.25 | % | 3.25 | % | |||||||||||||
| Without expense reductions | 4.44 | % | 5.11 | % | 6.88 | % | 8.96 | % | 9.17 | % | |||||||||||||
| Fund portfolio turnover rate | 22.80 | % | 30.54 | % | 12.96 | % | 34.58 | % | 78.06 | % | |||||||||||||
(a) The Fund's maximum sales charge is not included in the total return computation
See Accompanying Notes to Financial Statements
77
Pacific Advisors Fund Inc.
Financial Highlights
(For a share outstanding throughout the period)
| Multi-Cap Value Fund | |||||||||||||||||||||||
| Class A | |||||||||||||||||||||||
| For the year ended December 31, | April 1, 2002(c) to | ||||||||||||||||||||||
| 2006 | 2005 | 2004 | 2003 | December 31, 2002 | |||||||||||||||||||
| Per Share Operating Performance | |||||||||||||||||||||||
| Net asset value, beginning of period | $ | 12.27 | $ | 11.77 | $ | 11.46 | $ | 7.95 | $ | 10.00 | |||||||||||||
| Income from investing operations | |||||||||||||||||||||||
| Net investment income (expense) | (0.09 | ) | (0.14 | ) | (0.03 | ) | (0.09 | ) | (0.07 | ) | |||||||||||||
| Net realized and unrealized gains (losses) on securities | 1.68 | 1.29 | 0.70 | 3.60 | (1.98 | ) | |||||||||||||||||
| Total from investment operations | 1.59 | 1.15 | 0.67 | 3.51 | (2.05 | ) | |||||||||||||||||
| Less distributions | |||||||||||||||||||||||
| From net investment income | - | - | - | - | - | ||||||||||||||||||
| From net capital gains | (1.09 | ) | (0.65 | ) | (0.36 | ) | - | - | |||||||||||||||
| Total distributions | (1.09 | ) | (0.65 | ) | (0.36 | ) | - | - | |||||||||||||||
| Net asset value, end of period | $ | 12.77 | $ | 12.27 | $ | 11.77 | $ | 11.46 | $ | 7.95 | |||||||||||||
| Total Investment Return (a) | 12.91 | % | 9.71 | % | 5.84 | % | 44.15 | % | (20.50 | )%(b) | |||||||||||||
| Ratios/Supplemental Data | |||||||||||||||||||||||
| Net assets, end of year (000's) | $ | 4,341 | $ | 3,073 | $ | 2,313 | $ | 1,180 | $ | 503 | |||||||||||||
| Ratio of net investment income to average net assets | |||||||||||||||||||||||
| With expense reductions | (1.66 | )% | (1.70 | )% | (1.15 | )% | (1.67 | )% | (1.44 | )%(d) | |||||||||||||
| Without expense reductions | (1.66 | )% | (1.73 | )% | (1.15 | )% | (3.14 | )% | (5.65 | )%(d) | |||||||||||||
| Ratio of expenses to average net assets | |||||||||||||||||||||||
| With expense reductions | 3.02 | % | 3.05 | % | 2.63 | % | 2.49 | % | 2.49 | %(d) | |||||||||||||
| Without expense reductions | 3.02 | % | 3.08 | % | 3.07 | % | 3.96 | % | 6.69 | %(d) | |||||||||||||
| Fund portfolio turnover rate | 46.97 | % | 48.97 | % | 49.30 | % | 20.16 | % | 8.23 | %(d) | |||||||||||||
| Class C | |||||||||||||||||||||||
| For the year ended December 31, | April 1, 2002(c) to | ||||||||||||||||||||||
| 2006 | 2005 | 2004 | 2003 | December 31, 2002 | |||||||||||||||||||
| Per Share Operating Performance | |||||||||||||||||||||||
| Net asset value, beginning of period | $ | 11.93 | $ | 11.54 | $ | 11.33 | $ | 7.91 | $ | 10.00 | |||||||||||||
| Income from investing operations | |||||||||||||||||||||||
| Net investment income (expense) | (0.18 | ) | (0.19 | ) | (0.10 | ) | 0.32 | (0.52 | ) | ||||||||||||||
| Net realized and unrealized gains (losses) on securities | 1.62 | 1.23 | 0.67 | 3.10 | (1.57 | ) | |||||||||||||||||
| Total from investment operations | 1.44 | 1.04 | 0.57 | 3.42 | (2.09 | ) | |||||||||||||||||
| Less distributions | |||||||||||||||||||||||
| From net investment income | - | - | - | - | - | ||||||||||||||||||
| From net capital gains | (1.09 | ) | (0.65 | ) | (0.36 | ) | - | - | |||||||||||||||
| Total distributions | (1.09 | ) | (0.65 | ) | (0.36 | ) | - | - | |||||||||||||||
| Net asset value, end of period | $ | 12.28 | $ | 11.93 | $ | 11.54 | $ | 11.33 | $ | 7.91 | |||||||||||||
| Total Investment Return | 12.02 | % | 8.94 | % | 5.02 | % | 43.24 | % | (20.90 | )%(b) | |||||||||||||
| Ratios/Supplemental Data | |||||||||||||||||||||||
| Net assets, end of year (000's) | $ | 9,958 | $ | 7,894 | $ | 6,122 | $ | 3,537 | $ | 1,247 | |||||||||||||
| Ratio of net investment income to average net assets | |||||||||||||||||||||||
| With expense reductions | (2.43 | )% | (2.46 | )% | (1.94 | )% | (2.41 | )% | (2.20 | )%(d) | |||||||||||||
| Without expense reductions | (2.43 | )% | (2.49 | )% | (2.37 | )% | (3.90 | )% | (6.08 | )%(d) | |||||||||||||
| Ratio of expenses to average net assets | |||||||||||||||||||||||
| With expense reductions | 3.79 | % | 3.82 | % | 3.40 | % | 3.24 | % | 3.23 | %(d) | |||||||||||||
| Without expense reductions | 3.79 | % | 3.84 | % | 3.83 | % | 4.74 | % | 7.11 | %(d) | |||||||||||||
| Fund portfolio turnover rate | 46.97 | % | 48.97 | % | 49.30 | % | 20.16 | % | 8.23 | %(d) | |||||||||||||
(a) The Fund's maximum sales charge is not included in the total return computation
(b) Not annualized
(c) Commencement of operations
(d) Annualized
See Accompanying Notes to Financial Statements
78
Pacific Advisors Fund Inc.
Financial Highlights
(For a share outstanding throughout the period)
| Small Cap Fund | |||||||||||||||||||||||
| Class A | |||||||||||||||||||||||
| For the year ended December 31, | |||||||||||||||||||||||
| 2006 | 2005 | 2004 | 2003 | 2002 | |||||||||||||||||||
| Per Share Operating Performance | |||||||||||||||||||||||
| Net asset value, beginning of period | $ | 25.73 | $ | 25.47 | $ | 18.77 | $ | 10.32 | $ | 15.23 | |||||||||||||
| Income from investing operations | |||||||||||||||||||||||
| Net investment income (expense) | 2.71 | (1.15 | ) | 0.73 | (0.37 | ) | (0.85 | ) | |||||||||||||||
| Net realized and unrealized gains (losses) on securities | 6.29 | 3.38 | 6.14 | 8.95 | (4.05 | ) | |||||||||||||||||
| Total from investment operations | 9.00 | 2.23 | 6.87 | 8.58 | (4.90 | ) | |||||||||||||||||
| Less distributions | |||||||||||||||||||||||
| From net investment income | - | - | - | - | - | ||||||||||||||||||
| From net capital gains | (1.21 | ) | (1.97 | ) | (0.17 | ) | (0.13 | ) | (0.01 | ) | |||||||||||||
| Total distributions | (1.21 | ) | (1.97 | ) | (0.17 | ) | (0.13 | ) | (0.01 | ) | |||||||||||||
| Net asset value, end of period | $ | 33.52 | $ | 25.73 | $ | 25.47 | $ | 18.77 | $ | 10.32 | |||||||||||||
| Total Investment Return (a) | 35.05 | % | 8.64 | % | 36.60 | % | 83.21 | % | (32.20 | )% | |||||||||||||
| Ratios/Supplemental Data | |||||||||||||||||||||||
| Net assets, end of year (000's) | $ | 62,735 | $ | 15,884 | $ | 17,376 | $ | 8,961 | $ | 4,763 | |||||||||||||
| Ratio of net investment income to average net assets | (2.40 | )% | (3.14 | )% | (3.08 | )% | (4.06 | )% | (4.01 | )% | |||||||||||||
| Ratio of expenses to average net assets | 2.78 | % | 3.36 | % | 3.32 | % | 4.44 | % | 4.52 | % | |||||||||||||
| Fund portfolio turnover rate | 19.74 | % | 20.73 | % | 7.23 | % | 39.95 | % | 23.39 | % | |||||||||||||
| Class C | |||||||||||||||||||||||
| For the year ended December 31, | |||||||||||||||||||||||
| 2006 | 2005 | 2004 | 2003 | 2002 | |||||||||||||||||||
| Per Share Operating Performance | |||||||||||||||||||||||
| Net asset value, beginning of period | $ | 23.32 | $ | 23.44 | $ | 17.41 | $ | 9.65 | $ | 14.47 | |||||||||||||
| Income from investing operations | |||||||||||||||||||||||
| Net investment income (expense) | 0.83 | (0.56 | ) | 0.66 | 0.04 | (0.88 | ) | ||||||||||||||||
| Net realized and unrealized gains (losses) on securities | 7.06 | 2.41 | 5.54 | 7.85 | (3.93 | ) | |||||||||||||||||
| Total from investment operations | 7.89 | 1.85 | 6.20 | 7.89 | (4.81 | ) | |||||||||||||||||
| Less distributions | |||||||||||||||||||||||
| From net investment income | - | - | - | - | - | ||||||||||||||||||
| From net capital gains | (1.21 | ) | (1.97 | ) | (0.17 | ) | (0.13 | ) | (0.01 | ) | |||||||||||||
| Total distributions | (1.21 | ) | (1.97 | ) | (0.17 | ) | (0.13 | ) | (0.01 | ) | |||||||||||||
| Net asset value, end of period | $ | 30.00 | $ | 23.32 | $ | 23.44 | $ | 17.41 | $ | 9.65 | |||||||||||||
| Total Investment Return | 33.91 | % | 7.76 | % | 35.62 | % | 81.83 | % | (33.27 | )% | |||||||||||||
| Ratios/Supplemental Data | |||||||||||||||||||||||
| Net assets, end of year (000's) | $ | 17,337 | $ | 4,602 | $ | 3,848 | $ | 1,274 | $ | 543 | |||||||||||||
| Ratio of net investment income to average net assets | (3.15 | )% | (3.95 | )% | (3.85 | )% | (4.88 | )% | (5.47 | )% | |||||||||||||
| Ratio of expenses to average net assets | 3.54 | % | 4.19 | % | 4.10 | % | 5.26 | % | 5.97 | % | |||||||||||||
| Fund portfolio turnover rate | 19.74 | % | 20.73 | % | 7.23 | % | 39.95 | % | 23.39 | % | |||||||||||||
(a) The Fund's maximum sales charge is not included in the total return computation
See Accompanying Notes to Financial Statements
79
Pacific Advisors Fund Inc.
Financial Highlights
(For a share outstanding throughout the period)
| Small Cap Fund | |||||||
| Class I | |||||||
| October 31, 2006(c) to December 31, 2006 | |||||||
| Per Share Operating Performance | |||||||
| Net asset value, beginning of period | $ | 35.00 | |||||
| Income from investing operations | |||||||
| Net investment income (expense) | 0.45 | ||||||
| Net realized and unrealized gains (losses) on securities | 1.89 | ||||||
| Total from investment operations | 2.34 | ||||||
| Less distributions | |||||||
| From net investment income | - | ||||||
| From net capital gains | (1.21 | ) | |||||
| Total distributions | (1.21 | ) | |||||
| Net asset value, end of period | $ | 36.13 | |||||
| Total Investment Return | 6.74 | %(b) | |||||
| Ratios/Supplemental Data | |||||||
| Net assets, end of year (000's) | $ | 5 | |||||
| Ratio of net investment income to average net assets | (2.48 | )%(d) | |||||
| Ratio of expenses to average net assets | 2.74 | %(d) | |||||
| Fund portfolio turnover rate | 19.74 | % | |||||
(b) Not annualized
(c) Commencement of operations
(d) Annualized
See Accompanying Notes to Financial Statements
80
Pacific Advisors Fund Inc.
Report of Independent Registered Public Accounting Firm
Board of Directors and Shareholders
Pacific Advisors Fund Inc.
We have audited the accompanying statements of assets and liabilities, including the schedules of investments, of Pacific Advisors Fund Inc. (comprising, respectively, the Government Securities Fund, Income and Equity Fund, Balanced Fund, Growth Fund, Multi-Cap Value Fund and Small Cap Fund) (the "Funds"), as of December 31, 2006, and the related statements of operations for the year then ended, the statements of changes in net assets for each of the two years in the period then ended, and the financial highlights for each of the periods indicated. These financial statements and financial highlights are the responsibility of the Funds' management. Our responsibility is to express an opinion on these financial statements and financial highlights based on our audits.
We conducted our audits in accordance with the standards of the Public Company Accounting Oversight Board (United States). Those standards require that we plan and perform the audit to obtain reasonable assurance about whether the financial statements and financial highlights are free of material misstatement. We were not engaged to perform an audit of the Funds' internal control over financial reporting. Our audits included consideration of internal control over financial reporting as a basis for designing audit procedures that are appropriate in the circumstances, but not for the purpose of expressing an opinion on the effectiveness of the Fund's internal control over financial reporting. Accordingly, we express no such opinion. An audit also includes examining, on a test basis, evidence supporting the amounts and disclosures in the financial statements and financial highlights, assessing the accounting principles used and sig nificant estimates made by management, and evaluating the overall financial statement presentation. Our procedures included confirmation of securities owned as of December 31, 2006, by correspondence with the custodian and brokers. We believe that our audits provide a reasonable basis for our opinion.
In our opinion, the financial statements and financial highlights referred to above present fairly, in all material respects, the financial position of each of the respective funds constituting Pacific Advisors Fund Inc. at December 31, 2006, the results of their operations for the year then ended, the changes in their net assets for each of the two years in the period then ended, and their financial highlights for each of the periods indicated, in conformity with U.S. generally accepted accounting principles.
Los Angeles, California
February 19, 2007
81
Pacific Advisors Fund Inc.
Disclosure Regarding the Board's Approval
of the Funds' Advisory Contracts
The Board of Directors, including a majority of the Independent Directors, most recently approved the Investment Management Agreements for the Funds at its meeting held on August 4, 2006. At that meeting, the Board approved the continuation of the Investment Management Agreements by and between the Company, on behalf of each of its Funds, and Pacific Global Investment Management Company, Inc. ("PGIMC").
In approving the Agreements, the Board of Directors considered materials specifically relating to the relevant Agreement, including: (1) the profitability of PGIMC, including an analysis of PGIMC's cost of providing services and comparative expense information; (2) investment performance of the relevant Fund, including information comparing the performance of each Fund with a peer group of funds and an appropriate index or combination of indices; (3) sales and redemption data for the Fund; (4) the extent to which economies of scale are realized as the Fund grows and whether fee levels reflect these economies of scale for Fund investors; (5) the economic outlook and the general investment outlook in the markets in which the Fund invests; and (6) "fall-out" benefits realized by PGIMC (i.e., ancillary benefits derived by the Investment Manager or its affiliates from PGIMC's relationship with the Fund). The Board of Directors also p eriodically considers other material facts such as the allocation of each Fund's brokerage commissions, each Fund's record of compliance with its investment policies and restrictions on personal securities transactions, and the nature, cost, and character of non-investment management services provided by PGIMC and its affiliates. In approving the Agreements, the Board relied on all information presented to it over the course of the year.
Prior to approval of the Investment Management Agreements, independent counsel to the Independent Directors reviewed the 15(c) memoranda and comments were provided to the Funds' counsel and the Board's Independent Directors who reviewed them prior to consideration of the continuation of these Agreements. In addition, the Independent Directors met separately with independent counsel prior to the meeting at which the Agreements were approved. Based on its evaluation of all material factors, the Board, including a majority of the Independent Directors, determined that the Agreements are in the best interests of the Corporation and its shareholders and that the fees to be paid to PGIMC under the Agreements are fair and reasonable in relationship to the services to be rendered thereunder and in light of the factors considered. During its deliberations, the Board did not identify any single factor as all important or controlling, and individual Directors may have weighed the same factors differently. The following summaries do not detail every matter considered. Matters considered by the Board of Directors included the following:
Nature, Quality and Extent of Services. The Board examined the nature, quality and extent of the services provided by PGIMC to the Funds. The Board reviewed PGIMC's key personnel in providing investment management services to the Fund as well as the time that investment personnel devote to the Funds. The Board also considered PGIMC's responsibilities under the Agreement in serving as the Fund's investment manager, including responsibilities for investment research and stock selection, serving as the Funds' administrator, monitoring adherence to the Fund's investment restrictions and monitoring compliance with various policies and procedures of the Funds. The Board concluded that the Funds are likely to benefit from the nature, extent and quality of the services provided by the PGIMC under the Agreements as a result of the PGIMC's experience, reputatio n, personnel, operations and resources.
Investment Performance of PGIMC and the Fund. The Board considered the performance of the Funds and PGIMC, including, to the extent applicable, the Funds' year-to-date, one-, five-, ten- and since inception performance for the periods ended June 30, 2006, the Funds' one-, three-, and five-year performance for the periods ended December 31, 2005, as well as comparative performance provided by an independent data service. After reviewing the Funds' performance records achieved by PGIMC, including
82
Pacific Advisors Fund Inc.
Disclosure Regarding the Board's Approval
of the Funds' Advisory Contracts
performance relative to the Funds' peers, the Board concluded that, while past performance is no guarantee of future performance, each Fund's investment performance overall weighed in favor of renewing the Agreements.
Among other factors, the Board considered: (i) with respect to the Balanced Fund, the Fund's benchmark is a blend of two indices, and the Fund (class A shares) outperformed one of the indices for the 6-month and 5-year periods ended June 30, 2006; (ii) with respect to the Small Cap Fund, the Fund outperformed its benchmark index in the 6-month, one-year, three-year, and 5-year periods ended June 30, 2006; (iii) with respect to the Growth Fund, the Fund's performance was comparable to that of its benchmark index for the 6-month period ended June 30, 2006, and the Fund returned 12.44% (class A) and 11.52% (class C) for the 3 year period ended June 30, 2006; (iv) with respect to the Multi-Cap Value Fund, the Fund underperformed its benchmark for the 6-months and 3-year period ended June 30, 2006, but outperformed its benchmark index for the one-year periods ended December 31, 2005 and June 30, 2006, and the Fund returned 18.73% (cl ass A) and 17.90% (class C) for the 3-year period ended December 31, 2005; (v) with respect to the Income and Equity Fund, that while no peer group has the same investment strategies and objectives as those of the Fund, overall performance was consistent with the Fund's investment objectives and strategies; and (vi) with respect to the Government Securities Fund, the Fund's relative performance as compared to the Lehman Intermediate T-Bond Index for the periods ended June 30, 2006, and December 31, 2005, and the effects of an extended low interest rate environment on the performance of the Fund.
Costs of Services and Profits Realized by PGIMC. The Board examined PGIMC's costs in serving as the Funds' Investment Manager, including the costs associated with the personnel and systems necessary to manage the Funds. The Board considered PGIMC's upgrades to its information technology systems, including its business recovery programs. The Board reviewed PGIMC's 2005 unaudited financial statements and also considered the profitability of PGIMC and its affiliates from their relationship with the Fund. The Board examined the fee and expense information for the Funds as compared to that of comparable funds managed by other advisers. The Board noted that the investment management fees charged the Funds are higher than those charged by some mutual funds and lower than those charged others. The Board also was provided with comparative fee information indic ating that the Funds' fees were comparable to those charged by funds that would be considered competitors of the Funds. The Board considered that during 2005, PGIMC had waived fees and reimbursed expenses for the Government Securities Fund, Income and Equity Fund, Growth Fund and Multi-Cap Value Fund in order to keep their expenses down, and that PGIMC expected to continue to waive fees for the Government Securities Fund, Income and Equity Fund, and Growth Fund in 2006 to the extent expenses exceed the agreed expense limits for those Funds. Another factor was that in the past PGIMC had waived fees and reimbursed expenses for all of the Funds. Over the history of the Funds, PGIMC had waived and/or reimbursed expenses in excess of $2.8 Million. The Board also considered information that subsidiaries of PGIMC provide distribution, administrative, transfer agency services for the Funds, and that providing these services internally had reduced costs for the Funds and enabled PGIMC to assure that accounting and sh areholder services are of high quality and at a competitive cost. The Board also considered the growth of assets in the Funds in the first six months of 2006, and the expected impact of that growth on the Funds' expense ratios. The Board also evaluated the expense ratios for comparable funds and determined that the Funds' expense ratios were competitive with those funds. The Board concluded that the Funds' management fee and expense ratios were reasonable in light of the service provided and the Funds' performance achieved by PGIMC.
Economies of Scale. The Board considered the extent to which the Funds' management fees reflect economies of scale for the benefit of the Funds' shareholders. The Board reviewed the Funds' fee
83
Pacific Advisors Fund Inc.
Disclosure Regarding the Board's Approval
of the Funds' Advisory Contracts
arrangements, which include breakpoints that decrease the fee rate as the Funds' assets increase. The Board considered the fact that current assets were well below the threshold for the initial advisory fee breakpoint. The Board noted that the expense ratio for the Balanced Fund declined in 2005 relative to 2004, and that the expense ratio for the Small Cap Fund had declined significantly in the first 6 months of 2006. Based on its review and negotiations, the Board concluded that the Funds' management fee structure allows shareholders to benefit from economies of scale as Fund assets increase. The Board also considered that PGIMC had been waiving fees and reimbursing expenses for the Government Securities Fund, Income and Equity Fund, Growth Fund and the Multi-Cap Value Fund.
Other Benefits to PGIMC. In evaluating the benefits that accrue to PGIMC through its relationship with the Funds, the Board recognized that, in addition to providing advisory services, PGIMC and certain of its affiliates serve the Fund in various capacities, including as transfer agent, administrative services agent and distributor, and receive compensation from the Funds in connection with providing services to the Funds. The Board considered that each service provided to the Funds by PGIMC or one of its affiliates is pursuant to a written agreement, which the Board evaluates periodically as required by law. The Board also considered the benefits to PGIMC that results from PGIMC's management of separately managed accounts. The Board concluded that the benefits were consistent with PGIMC's obligations under the Agreements and the benefits usually rece ived by other investment advisers.
After full consideration of these and other factors, the Board, including a majority of the Independent Directors, concluded that approval of the Agreements was in the best interest of the Funds and their shareholders.
84
Pacific Advisors Fund Inc.
Directors and Officers
| Name, Address and Age | Position(s) Held with the Company | Term of Offices and Length of Time Served | Principal Occupations During Past 5 Years | Number of Portfolios in Fund Complex Overseen by Trustee | Other Directorships Held by Trustee | ||||||||||||||||||
| Thomas M. Brinker (73) 1 North Ormond Avenue Havertown, PA 19083 | Director | Since 1992 | 1970 - Present: Registered Representative, Transamerica Financial Advisors, Inc. 1970 - Present: President, Fringe Benefits, Inc. and Financial Foresight, Ltd. d/b/a The Brinker Organization (Financial Services Companies) | 6 Pacific Advisors Mutual Funds | None | ||||||||||||||||||
| Victoria L. Breen (55) 603 West Ojai Avenue Ojai, CA 93023 | Director and Assistant Secretary | Since 1992 | 1992 - Present: Assistant Secretary and Director Pacific Global Investment Management Company 1994 - Present: Agent, Transamerica Life Companies; Registered Principal, Transamerica Financial Advisors, Inc. 1986 - Present: President, Derby & Derby, Inc. (Financial Services Company) 1992 - 2002: Assistant Secretary, Pacific Global Investor Services, Inc. | 6 Pacific Advisors Mutual Funds | None | ||||||||||||||||||
85
Pacific Advisors Fund Inc.
Directors and Officers
| Name, Address and Age | Position(s) Held with the Company | Term of Offices and Length of Time Served | Principal Occupations During Past 5 Years | Number of Portfolios in Fund Complex Overseen by Trustee | Other Directorships Held by Trustee | ||||||||||||||||||
| Thomas H. Hanson (56) 101 N. Brand Blvd. Suite 1950 Glendale, CA 91203 | Vice President | Since 1992 | 1992 - Present: Executive Vice President and Director, Pacific Global Investment Management Company; President and Director; Pacific Global Fund Distributors, Inc.; Director, Pacific Global Investor Services, Inc. 2001 - Present: Vice President, Pacific Global Investor Services, Inc. 1993 - Present: Owner, Director, Chairman, President, and CEO of TriVest Capital Management, Inc. 1992 - 2006: Secretary, Pacific Global Fund Inc. d/b/a Pacific Advisors Fund Inc. | 6 Pacific Advisors Mutual Funds | None | ||||||||||||||||||
86
Pacific Advisors Fund Inc.
Directors and Officers
| Name, Address and Age | Position(s) Held with the Company | Term of Offices and Length of Time Served | Principal Occupations During Past 5 Years | Number of Portfolios in Fund Complex Overseen by Trustee | Other Directorships Held by Trustee | ||||||||||||||||||
| Catherine L. Henning (29) 101 N. Brand Blvd. Suite 1950 Glendale, CA 91203 | Secretary | Since 2006 | 2006 - Present: Secretary, Pacific Global Fund Distributors, Inc. and Pacific Global Investor Services, Inc. 2004 - Present: Secretary, Pacific Global Investment Management Company 2004 - Present: Chief Compliance Officer, Pacific Global Fund Distributors, Inc. 2002 - 2006: Assistant Secretary, Pacific Global Fund Distributors, Inc. and Pacific Global Investor Services, Inc. 2001 - Present: Director of Private Client Services, Pacific Global Investment Management Company 2002 - 2006: Assistant Secretary, Pacific Global Fund Distributors, Inc. and Pacific Global Investor Servic es, Inc. 2004 - 2006: Assistant Secretary, Pacific Global Fund Inc. d/b/a Pacific Advisors Fund Inc. 2002 - 2004: Assistant Secretary, Pacific Global Investment Management Company | 6 Pacific Advisors Mutual Funds | None | ||||||||||||||||||
87
Pacific Advisors Fund Inc.
Directors and Officers
| Name, Address and Age | Position(s) Held with the Company | Term of Offices and Length of Time Served | Principal Occupations During Past 5 Years | Number of Portfolios in Fund Complex Overseen by Trustee | Other Directorships Held by Trustee | ||||||||||||||||||
| George A. Henning (59) 101 N. Brand Blvd. Suite 1950 Glendale, CA 91203 | President and Chairman | Since 1992 | 1991 - Present: Chairman, President, and Director, Pacific Global Investment Management Company; Chairman and Director, Pacific Global Fund Distributors, Inc.; Chairman and Director, Pacific Global Investor Services, Inc. 1992 - 2006: Secretary, Pacific Global Fund Distributors, Inc. and Pacific Global Investor Services, Inc. | 6 Pacific Advisors Mutual Funds | None | ||||||||||||||||||
| Barbara A. Kelley (53) 101 N. Brand Blvd. Suite 1950 Glendale, CA 91203 | Vice President, Chief Compliance Officer and Treasurer | Since 2001 | 2004 - Present: Chief Compliance Officer, Pacific Advisors Fund Inc. and Pacific Global Investment Management Company 2001 - Present: Executive Vice President, Treasurer, Pacific Global Investment Management Company; Treasurer and Director, Pacific Global Fund Distributors, Inc.; President and Treasurer, Pacific Global Investor Services, Inc. 1999 - Present: Director, Pacific Global Investment Management Company | 6 Pacific Advisors Mutual Funds | None | ||||||||||||||||||
| L. Michael Haller (63) 5924 Colodny Agoura, CA 91301 | Director | Since 1992 | 2004 - Present: Consultant 2002 - 2003: Executive Vice President, Sammy Studios, Inc. (Entertainment Company) 2001 - 2002: Vice President and Executive Producer, Electronic Arts; President, International Media Group, Inc. (Entertainment Company) | 6 Pacific Advisors Mutual Funds | None | ||||||||||||||||||
88
Pacific Advisors Fund Inc.
Directors and Officers
| Name, Address and Age | Position(s) Held with the Company | Term of Offices and Length of Time Served | Principal Occupations During Past 5 Years | Number of Portfolios in Fund Complex Overseen by Trustee | Other Directorships Held by Trustee | ||||||||||||||||||
| Takashi Makinodan, PhD (81) 1506 S. Bentley Avenue PH #5 Los Angeles, CA 90025 | Director | Since 1995 | 1992 - Present: Director, Medical Treatment Effectiveness Program (MEDTEP), Center on Asian and Pacific Islanders 1991 - Present: Associate Director of Research, Geriatric Research Education Clinic Center, VA Medical Center | 6 Pacific Advisors Mutual Funds | None | ||||||||||||||||||
| Gerald E. Miller (76) 5262 Bridgetown Place Westlake Village, CA 91362 | Director | Since 1992 | 1992 - Present: Retired | 6 Pacific Advisors Mutual Funds | None | ||||||||||||||||||
| Louise K. Taylor, PhD (60) 325 East Huntington Dr. Monrovia, CA 91016 | Director | Since 1992 | 1991 - Present: Superintendent, Monrovia Unified School District | 6 Pacific Advisors Mutual Funds | None | ||||||||||||||||||
| Jingjing Yan (33) 101 N. Brand Blvd. Suite 1950 Glendale, CA 91203 | Assistant Treasurer | Since 2005 | 2005 - Present: Assistant Treasurer, Pacific Global Investment Management Company, Pacific Global Fund Distributors, Inc. and Pacific Global Investor Services, Inc. 2001 - Present: Fund Accounting Manager, Pacific Global Investor Services, Inc. | 6 Pacific Advisors Mutual Funds | None | ||||||||||||||||||
Each director is elected to serve until the next annual shareholders meeting and until his or her successor is elected or appointed. The Company does not hold regular annual shareholders meetings to elect Directors. Vacancies on the Board can be filled by the action of a majority of the Directors, provided that at least two-thirds of the Directors have been elected by the shareholders. Certain Directors are considered "interested persons" of the Company as defined in the 1940 Act. All directors oversee all six Funds of the Company.
89
Pacific Advisors Fund Inc.
Additional Tax Information (Unaudited)
For Federal income tax purpose, the following information is furnished with respect to the distributions paid by the Funds during the taxable year ended December 31, 2006. For corporate shareholders, 19.2858% of the ordinary dividend distributions from Pacific Advisors Government Securities Fund qualify for the dividends received deduction; 86.2756% of the ordinary dividend distributions from Pacific Advisors Income and Equity Fund qualify for the dividends received deduction. The Funds designated and paid as long-term capital gain distributions as follows:
| Government Securities Fund | Income and Equity Fund | Balanced Fund | Growth Fund | Multi-Cap Value Fund | Small Cap Fund | ||||||||||||||||||||||
| Long-term capital gain distributions | - | $ | 11,693 | $ | 1,031,029 | - | $ | 1,161,229 | $ | 2,645,293 | |||||||||||||||||
In January 2007, the funds provided tax information to shareholders for the preceding calendar year.
90
Pacific Advisors Fund Inc.
notes
91
Pacific Advisors Fund Inc.
notes
92

Pacific Advisors
Fund Inc
Directors
George A. Henning, Chairman
Victoria L. Breen
Thomas M. Brinker
L. Michael Haller, III
Takashi Makinodan, Ph.D.
Gerald E. Miller
Louise K. Taylor, Ph.D.
Officers
George A. Henning, President
Thomas H. Hanson, Vice President
Victoria L. Breen, Assistant Secretary
Catherine L. Henning, Secretary
Barbara A. Kelley, Treasurer
Jingjing Yan, Assistant Treasurer
Investment Manager
Pacific Global Investment Management Company
101 North Brand Blvd., Suite 1950
Glendale, California 91203
Income and Equity Fund Co-Manager and Balanced Fund Sub-Adviser (through December 31, 2006)
Bache Capital Management, Inc.
101 North Brand Blvd., Suite 1950
Glendale, California 91203
Transfer Agent and Administrator
Pacific Global Investor Services, Inc.
101 North Brand Blvd., Suite 1950
Glendale, California 91203
Distributor
Pacific Global Fund Distributors, Inc.
101 North Brand Blvd., Suite 1950
Glendale, California 91203
(800) 989-6693
Availability of Quarterly Portfolio Schedule
The Fund files its complete schedule of portfolio holdings with the SEC for the first and third quarters of each fiscal year on Form N-Q. The Fund's Forms N-Q are available on the SEC's Web site at http://www.sec.gov. The Fund's Forms N-Q may be reviewed and copied at the SEC's Public Reference Room in Washington, DC. Information about the operation of the Public Reference Room may be obtained by calling the SEC at (800) SEC-0330.
The Fund's complete schedule of portfolio holdings for each fiscal quarter is posted on the Fund's Web site at www.PacificAdvisorsFund.com and is available without charge, upon request by calling (800) 989-6693. Documents will be sent within 3 business days of receipt of your request.
Availability of Proxy Voting Policies and Procedures and Proxy Voting Record
A description of the policies and procedures that the Fund uses to determine how to vote proxies relating to portfolio securities and information regarding how the Fund voted proxies relating to portfolio securities during the most recent 12-month period ended June 30 is available without charge, upon request by calling (800) 989-6693. Documents will be sent within 3 business days of receipt of your request. This information is also available on the SEC's Web site at http://www.sec.gov.
Pacific Global Fund Distributors, Inc.
101 North Brand Blvd., Suite 1950
Glendale, California 91203


Item 2. | Code of Ethics |
|
|
| Registrant has adopted a Code of Ethics pursuant to Section 406 of the Sarbanes-Oxley Act of 2002 that applies to Registrant’s principal executive officer, principal financial officer, principal accounting officer or controller. Registrant will provide to any person without charge, upon request, a copy of the Code of Ethics if such person submits a request in writing addressed to the Registrant’s secretary at the principal executive offices listed above. |
|
|
Item 3. | Audit Committee Financial Expert |
|
|
| Registrant’s Audit Committee has three members. While these members are “financially literate,” the Board has determined that none of the members of the Audit Committee meet the technical definition of “audit committee financial expert.” Registrant has determined that an audit committee financial expert is not necessary at this time because (i) the Audit Committee members are financially literate; (ii) they have served on Registrant’s Audit Committee for several years; (iii) the accounting methodologies applicable to registered investment companies and the types of investment activities in which the Funds engage are well established; and (iv) Registrant’s financial statements do not involve the types of complex accounting issues that other types of public companies may have. |
|
|
Item 4. | Principal Accountant Fees and Services |
(a)-(d)
Ernst & Young LLP (“E&Y”) billed the Company aggregate fees for professional services rendered for the fiscal years ending December 31, 2005, and December 31, 2006, as follows:
| Audit Fees |
| Audit Related Fees |
| Tax Fees |
| All Other Fees |
| |||||
2006 |
| $ | 126,400 |
| $ | 0 |
| $ | 21,000 |
| $ | 0 |
|
2005 |
| $ | 116,600 |
| $ | 0 |
| $ | 19,000 |
| $ | 0 |
|
(c)
Tax Fees include the services for the review of income tax returns and excise taxes.
(e)(1)
The Audit Committee is authorized to pre-approve non-audit services provided by the Corporation’s auditors, if they find it appropriate in light of their fiduciary duties and in the exercise of their good faith business judgment and compatible with the auditors’ independence. The Chairman of the Audit Committee is authorized to approve audit and non-audit services for newly established funds of the Corporation on the same terms as the full Audit Committee previously had approved for t he then existing funds, and to approve non-audit services which are permissible under applicable law, provided the estimated fee is not more than $5,000 based on a good faith estimate provided by the auditor. The Chairman shall report any such pre-approval to the Audit Committee at its next following meeting.
(e)(2)
None.
(f)
0%
(g)
None.
(h)
Not applicable.
Item 5. | Audit Committee of Listed Registrants |
| Not applicable as Registrant is not a listed issuer as defined in Rule 10A-3 under the Securities Exchange Act of 1934. |
|
|
Item 6. | Schedule of Investments |
| Schedule of Investments is included as part of the report to shareholders filed under Item 1 of this form. |
|
|
Item 7. | Disclosure of Proxy Voting Policies and Procedures for Closed-End Management Investment Companies |
| Not applicable to open-end investment companies. |
|
|
Item 8. | Portfolio Managers of Closed-End Management Investment Companies |
| Not applicable to open-end investment companies. |
|
|
Item 9. | Purchases of Equity Securities by Managers of Closed-End Management Investment Company and Affiliated Purchasers. |
| Not applicable to open-end investment companies. |
|
|
Item 10. | Submission of Matters to a Vote of Security Holders |
| No material changes have been made. |
|
|
Item 11. | Controls and Procedures. |
| (a) Based upon their evaluation of Registrant’s disclosure controls and procedures (as defined in Rule 30a-3(c) under the Investment Company Act of 1940) as conducted within 90 days of the filing date of this Form N-CSR, Registrant’s principal executive officer and principal financial officer have concluded that those disclosure controls and procedures provide reasonable assurance that the material information required to be disclosed by Registrant on this report is recorded, processed, summarized and reported within the time periods specified in the Securities and Exchange Commission’s rules and forms. |
| (b) There were no changes in Registrant’s internal control over financial reporting (as defined in Rule 30a-3(d) under the Investment Company Act of 1940) that occurred during the second fiscal quarter of the period covered by this report that have materially affected, or are reasonably likely to materially affect, Registrant’s internal control over financial reporting. |
|
|
Item 12. | Exhibits |
| (a)(1) Not applicable. |
|
|
| (a)(2) Certifications required by Item 12(a) of Form N-CSR and Section 302 of the Sarbanes-Oxley Act of 2002 (filed herewith). |
|
|
| (b) Certification required by Section 906 of the Sarbanes-Oxley Act of 2002 (filed herewith). |
SIGNATURES
Pursuant to the requirements of the Securities Exchange Act of 1934 and the Investment Company Act of 1940, Registrant has duly caused this report to be signed on its behalf by the undersigned, thereunto duly authorized.
Pacific Global Fund Inc. d/b/a Pacific Advisors Fund Inc.
By: | /s/ George A. Henning |
|
| George A. Henning | |
| Chairman, Pacific Advisors Fund Inc. | |
|
| |
Date: | March 6, 2007 | |
Pursuant to the requirements of the Securities Exchange Act of 1934 and the Investment Company Act of 1940, this report has been signed below by the following persons on behalf of Registrant and in the capacities and on the dates indicated.
By: | /s/ George A. Henning |
|
| George A. Henning | |
| Chief Executive Officer | |
|
| |
Date: | March 6, 2007 | |
|
| |
By: | /s/ Barbara A. Kelley |
|
| Barbara A. Kelley | |
| Chief Financial Officer | |
|
| |
Date: | March 6, 2007 | |