UNITED STATES
SECURITIES AND EXCHANGE COMMISSION
Washington, D.C. 20549
FORM N-CSR
CERTIFIED SHAREHOLDER REPORT OF REGISTERED
MANAGEMENT INVESTMENT COMPANIES
Investment Company Act file number | 811-7062 | |||||||
| ||||||||
PACIFIC GLOBAL FUND INC. D/B/A PACIFIC ADVISORS FUND INC. | ||||||||
(Exact name of registrant as specified in charter) | ||||||||
| ||||||||
101 NORTH BRAND BLVD., SUITE 1950 GLENDALE, CALIFORNIA |
| 91203 | ||||||
(Address of principal executive offices) |
| (Zip code) | ||||||
| ||||||||
GEORGE A. HENNING 101 NORTH BRAND BLVD., SUITE 1950 GLENDALE, CA 91203 | ||||||||
(Name and address of agent for service) | ||||||||
| ||||||||
Registrant’s telephone number, including area code: | 818-242-6693 |
| ||||||
| ||||||||
Date of fiscal year end: | December 31 |
| ||||||
| ||||||||
Date of reporting period: | December 31, 2009 |
| ||||||
Item 1. Report to Shareholders
Filed herewith.

annual report
december 31, 2009
government securities fund
income and equity fund
balanced fund
growth fund
multi-cap value fund
small cap fund


Pacific Advisors
table of contents
| Message from the Chairman | 1 | ||||||
| Government Securities Fund | 4 | ||||||
| Income and Equity Fund | 9 | ||||||
| Balanced Fund | 15 | ||||||
| Growth Fund | 20 | ||||||
| Multi-Cap Value Fund | 25 | ||||||
| Small Cap Fund | 30 | ||||||
| Statement of Investments | 36 | ||||||
| Statement of Assets and Liabilities | 58 | ||||||
| Statement of Operations | 60 | ||||||
| Statement of Changes in Net Assets | 62 | ||||||
| Notes to Financial Statements | 66 | ||||||
| Financial Highlights | 75 | ||||||
| Report of Independent Registered Public Accounting Firm | 82 | ||||||
| Disclosure Regarding the Board's Approval of the Funds' Advisory Contracts | 83 | ||||||
| Directors and Officers | 86 | ||||||
| Additional Tax Information | 92 | ||||||
This Report is submitted for the general information of the shareholders of Pacific Advisors Fund. It is not authorized for distribution to prospective investors unless accompanied or preceded by a copy of the prospectus, which contains information concerning the investment policies of the Funds as well as other pertinent information.
This Report is for informational purposes only and is not a solicitation, or a recommendation that any particular investor should purchase or sell any particular security. The statements in the Report are the opinions and beliefs expressed at the time of this commentary and are not intended to represent opinions and beliefs at any other time. These opinions are subject to change at any time based on market or other conditions and are not meant as a market forecast. All economic and performance information referenced is historical. Past performance does not guarantee future results.
For more information on the Pacific Advisors Funds, including information on charges, expenses and other classes offered, please obtain a copy of the prospectus by calling (800) 989-6693. Please read the prospectus and consider carefully the investment risks, objectives, charges and expenses before you invest or send money. Shares of the Pacific Advisors Funds are not deposits or obligations of any bank, are not guaranteed by any bank, are not insured by the FDIC or any other agency, and involve investment risks, including the possible loss of the principal amount invested. The investment return and principal value of an investment will fluctuate so that an investor's shares, when redeemed, may be worth more or less than their original cost.
Message
from the chairman
Dear Shareholders, February 12, 2010
For many investors, 2009 began with fear of a depression and ended with hope that the worst was over and that better times were ahead. After reaching its bear market low in early March, the S&P 500 Index rallied 65% and ended the year with a gain of 26.5%.
Swift action by central governments to respond to the financial crisis and strong economic growth in China and India led to this remarkable recovery. In addition, many companies proved adept at cutting expenses and managing their financial condition during the recession. And, most importantly, as evidence grew that the recession had run its course, investors proved resilient by returning to the equity market.
In the last half of the year, economic recovery bolstered investor confidence. Most significantly, the 2.2% expansion in U.S. GDP during third quarter confirmed that the recession had ended. The fear and trepidation that had plagued the market was replaced by cautious optimism which created a more opportunistic and forward-looking investing environment. Overall, the market took significant steps forward in 2009; we expect this recovery to continue at a slow to moderate pace in 2010.
The strength of the market recovery was particularly evident during third quarter earnings season. Corporations were more willing to provide earnings projections which gave investors greater clarity. Firms that had been focused on managing through the downturn began to implement growth strategies and seek opportunities to expand their market share. These strong companies, with solid financials, should outpace weaker firms by effectively implementing their recovery plans. In 2010, we expect this disparity to continue as weaker companies continue to struggle; many may become takeover candidates or perhaps even face bankruptcy.
While 2009 presented its own challenges, it nevertheless brought a marked improvement in the markets and the economy from the end of 2008. The markets recovered more quickly than most anticipated. Investors who maintained a disciplined strategy have fared significantly better than those who retreated to the sidelines. Indeed, 2009 reaffirmed our long-standing buy-and-hold investment philosophy. Despite the unprecedented credit crisis and ensuing global economic downturn, our strategy of focusing on superior companies with experienced management teams continued to serve the Funds well.
Market & Economic Review
Despite the general uptrend in the second quarter, March lows were still fresh in the minds of investors at the beginning of the third quarter. This climate set the stage for an important earnings season that ultimately showcased the resilience of U.S. corporations. A common sentiment that "the worst is finally behind us" emerged and initiated a rally that lasted through most of the quarter.
The equity market recovery continued to build in the fourth quarter. Investor sentiment improved with confirmation that economic recovery was underway. In turn, market volatility lessened and a more strategic investing environment took hold.
Government stimulus programs and a low interest rate environment continued to help foster economic recovery. The manufacturing sector bounced back with consistent upward momentum. Consumer spending, which drives two-thirds of the U.S. economy, also showed signs of renewal. Consumers remained cautious but felt comfortable enough to open their wallets for more discretionary spending. Consequently, retailers enjoyed a better than projected holiday shopping season. Other areas, including the housing and auto sectors, also showed signs of stability, although progress was more muted.
Economic data, however, were not entirely positive which resulted in uneven market conditions. Challenges to recovery included the weak U.S. dollar and ballooning federal deficits. Unemployment, which exceeded 10%, will
Market Review – December 31, 2009
| Index1 | Close | YTD Return | |||||||||
| Dow Jones Industrial Avg | 10,428.05 | 18.8 | % | ||||||||
| S&P 500 | 1,115.10 | 26.5 | % | ||||||||
| NASDAQ Composite | 2,269.15 | 43.9 | % | ||||||||
| Russell 2000 (small cap) | 625.39 | 27.2 | % | ||||||||
| 12/31/09 | 12/31/08 | ||||||||||
| 10-Year T-Note Yield | 3.85 | % | 2.25 | % | |||||||
1 Data: The Wall Street Journal; Standard & Poor's; Russell Investments. The Dow Jones Industrial Average is a price-weighted average of 30 significant stocks traded on the New York Stock Exchange and The Nasdaq Stock Market. The S&P 500 Index is a market capitalization-weighted index of 500 widely held U.S. stocks. The NASDAQ Composite is an unmanaged, market capitalization weighted measure of over 3,000 stocks listed on The Nasdaq Stock Market. The Russell 2000 Index is a market capitalization-weighted index of the 2,000 smallest companies in the Russell 300 Index. These indices are not available for direct investment.

1

Message
from the chairman continued
likely remain elevated as a result of weak to moderate economic growth. Additionally, uncertainty regarding pending legislation, tax policy and the expiration of stimulus programs may also inhibit near-term economic growth.
Foreign economies also showed signs of recovery and strength. China led the way with robust economic growth, followed by India. Parts of Europe experienced a slower recovery as countries including Greece; Italy; and Spain encountered significant challenges. Overall, the modest recovery in the global economy bodes well for renewed worldwide demand for goods and services including oil and other commodities.
Equity Investment Review
Improving economic conditions provided fertile ground for mergers and acquisitions ("M&A"). Numerous companies found opportunities to expand their market presence, acquire additional product lines or absorb smaller competitors. Notable activity included Kraft Foods' pursuit of British candy-maker, Cadbury; ExxonMobil's acquisition of natural gas firm XTO Energy; French pharmaceutical giant Sanofi Aventis' acquisition of personal-care products maker Chattem; and Berkshire Hathaway's acquisition Burlington Northern Santa Fe, one of the largest railroad companies in North America.
Early recovery sectors of Consumer Discretionary, Basic Materials, Energy and Information Technology remained the strongest performers. These sectors were hardest hit during the recession and, conversely, have enjoyed superior performance during economic recovery. Nevertheless, stock selection, even among the strongest performing sectors, remained key to participating in the market recovery.
Third quarter earnings continued to highlight the growing disparity in performance between strong, effectively managed companies and weaker firms. While many corporations posted better-than-expected results and increasing revenues, investors paid closer attention to guidance for 2010.
Improvement in the equity markets continued to benefit portfolios in the final half of 2009. Maintaining our commitment to investing in strong, well-positioned companies, we made only minor adjustments to select holdings in each of the Funds. Performance came primarily from positions in the Consumer Discretionary, Consumer Staples, Industrials, Energy and Health Care sectors.
The Financial sector also showed improvement as banks wrote down and sold off underperforming assets. Their ability to raise capital also enabled the stronger banks to participate in FDIC-sponsored takeovers. These transactions provided a "golden opportunity" for these banks to expand their businesses with the FDIC providing substantial guarantees against losses on the acquired loan portfolios. We believe the earnings potential for these banks will be substantial as the credit markets improve.
Equity Strategy
We expect continued growth in the economy and equity markets during 2010. Nevertheless, challenges to economic growth remain. The recovery process will be influenced by many factors including: industry consolidation; the expiration of certain stimulus programs; and the strength of economic growth in developing countries such as China and India.
The Funds are well-positioned to take advantage of further economic growth with an emphasis on early recovery sectors including Consumer Discretionary, Industrials and Energy. While improvement in the credit markets and the end of the recession have helped many companies regain their footing, each sector, industry and company will face its own challenges as recovery progresses. For some companies, the lack of a strong recovery that normally follows a recession will inhibit their ability to generate the revenue growth necessary to reduce debt and make capital investments. We believe the market will remain focused on how effectively individual com panies across all sectors and industries implement their growth strategies. We expect the market will reward firms that, having successfully navigated the recession, are solidifying their market positions and growing earnings.
The economy's move from recession to modest economic growth has proved that those firms with solid management, strong balance sheets, effective business models and sound growth strategies are better equipped to succeed in any market condition. Our investment strategies, therefore, focus on the fundamental strength of individual companies. Once we identify a company as a compelling prospect, we then monitor the company's performance to identify significant events that will result in price appreciation. This process enables us to utilize temporary market pullbacks to acquire stock of these 'target' companies at discounted prices. Consequently, patience continues to be an important component of our investment process.

2

Fixed Income Investment Review
Clearer signs of economic improvement brought greater stability to the fixed income markets in the last half of the year. Increasingly positive data led the Fed to acknowledge in December that "the recovery in economic activity is gaining momentum." As the economy strengthened, investors began to move away from government securities to other investments, such as corporate bonds and equities, which offered higher returns. By the end of 2009, credit markets were, once again, functioning normally with improved supply and demand.
While the Fed did not raise the federal funds rate, market forces pushed interest rates higher on U.S. government securities at the end of the year. The rate on the benchmark 10-year Treasury Note increased from 3.28% to 3.85% in December. In light of the ongoing interest rate risk throughout the latter part of the year, we continued to focus the Funds' fixed income holdings in short to intermediate-term bonds.
The supply of corporate bonds continued to increase as companies took advantage of low interest rates by refinancing existing debt. Opportunities existed primarily in lower-rated investment grade bonds which provided yields of more than 5.50%. New purchases focused on bonds with maturities of approximately five years to minimize interest rate risk.
While the Fed has indicated that it will not raise the fed funds rate in the near future, we expect interest rates will trend higher in 2010. To fund the federal deficit, the supply of U.S. Treasury securities may increase dramatically. Supply will also be impacted when the Fed discontinues its program to buyback government agencies in March 2010. Investors, in search of higher returns, will likely continue to favor other investments, including corporate bonds and equities that offer potentially higher returns. Increased supply and decreased demand are expected to push rates on Treasuries and government agencies higher. Given the expectation for higher interest rates, we will maintain our conservative strategy to focus on managing interest rate risk to protect capital while seeking favorable income.
Looking Ahead
Economic recovery has taken hold, but is expected to progress in fits and starts. Key segments of the economy, including the labor and housing markets, remain challenged. Nevertheless, leading indicators point to continued expansion in the U.S. and global economies during 2010.
Investor sentiment improved significantly over the course of the year but remains vulnerable to mixed economic data. Government intervention proved to be a strong catalyst for the market in 2009. The expiration of many of these programs in 2010 will provide important insights into the fundamental strength of the economy and help set the tone for equity and fixed income performance.
While economic recovery will help companies return to growth, certain fundamental constraints, particularly elevated levels of unemployment, may limit economic expansion. Each industry faces its own set of challenges. Also, the performance of individual companies will vary based on their financial condition and competitive advantages. The opportunity for strong companies to gain market share and grow their businesses in a weak recovery offers some compelling investment prospects.
Although the recovery has produced dramatic improvements in stock prices, we still see significant value in select areas. While we are optimistic about the outlook for 2010, we believe that further improvement will develop over course of the year. The patient and disciplined approach that has enabled Pacific Advisors Funds to weather the storm of the past year will continue to be important as we enter the New Year.
Sincerely,

George A. Henning
The views expressed represent the opinions and beliefs at the time of this commentary and are not meant as a market forecast. These views are subject to change at any time based on market or other conditions. This information may not be relied on as investment advice or as an indication of trading intent on behalf of any Fund. Fund investments may change at any time. Economic and performance information referenced is historical and past performance does not guarantee future results.
3
Pacific Advisors
Government Securities Fund
Seeks to provide high current income, preservation of capital, and rising future income, consistent with prudent investment risk. Invests at least 80% of its assets in U.S. Government fixed income securities and may invest in other income-producing instruments including dividend paying common stocks, for income and capital appreciation.
| TOTAL RETURNS | EXPENSE RATIOS | ||||||||||||||||||
| For the year ended December 31, 2009 | For the fiscal year ended December 31, 2008 | ||||||||||||||||||
| Expense Ratio | �� | Net Expense Ratio | |||||||||||||||||
| Class A | 2.26 | % | Class A | 3.11 | % | 1.65 | % | ||||||||||||
| Class C | 1.44 | % | Class C | 3.89 | % | 2.43 | % | ||||||||||||
| Barclays Capital U.S. Int T-Bond Index1 | – 0.33 | % | |||||||||||||||||
Please see the Financial Highlights in this Report for expense ratios for the fiscal year ended December 31, 2009.
Performance quoted is past performance which does not guarantee future results. Current performance may be higher or lower than the performance quoted. Call (800) 989-6693 for performance current to the most recent month-end. The investment return and principal value of an investment will fluctuate so that an investor's shares, when redeemed, may be worth more or less than their original cost. Returns represent the change in value over the stated period assuming reinvestment of dividends and capital gains at net asset value. Returns do not take into account the maximum 4.75% sales charge on Class A shares or the 1% Contingent Deferred Sales Charge (CDSC) for Class C shares sold within one year of purchase. Returns would be lower if the applicable sales charge and CDSC were included. Returns do not take into account individual taxes which may reduce actua l returns when shares are sold.
The Fund's investment adviser is waiving a portion of its management fees pursuant to an Expense Limitation Agreement. The waiver may be discontinued at any time with ninety days written notice in consultation with the Fund's Board of Directors, but is expected to continue at current levels. Performance shown reflects the waiver, without which the results would have been lower.
Discussion with Portfolio Managers2 February 12, 2010
Thomas H. Hanson
Jingjing Yan, CFA
Fund Performance
The Fund outperformed its benchmark in 2009 while continuing to maintain a conservative strategy to protect capital and provide current income. Risk management remained the priority during the second half of the year given the trend toward rising interest rates. While the Federal Reserve did not raise the federal funds rate, market forces drove rates for U.S. government securities higher. We successfully managed risk by utilizing callable intermediate-term government agencies to maintain a shorter average maturity while generating favorable income. The Fund's strategy of investing a small portion of the portfolio in high quality dividend-paying common and preferred stocks also contributed to the Fund's outperformance.
Market Overview
The credit markets continued to improve but remained unusually challenging in the second half of 2009. Clearer signs of economic improvement, including GDP growth in the third quarter, brought greater stability to the fixed income markets. The Fed continued to support the economy by maintaining the fed funds rate at zero to 0.25% and committing to keep the rate at a low level for an extend period of time. Low inflation also helped contain the upward pressure on interest rates. Demand from foreign investors remained strong
1 The Barclays Capital U.S. Intermediate Treasury Bond Index is an unmanaged index of U.S. government securities with one to ten years to maturity.
2 Effective January 4, 2010, Ms. Yan became a portfolio manager of the Fund. Ms. Yan served as a research analyst for the Fund prior to becoming a portfolio manager. Effective February 1, 2010, Mr. Hanson is no longer a portfolio manager of the Fund.
4
as U.S. Treasuries provided relative safety amid global economic uncertainty. This demand caused rates on government securities to decline slightly in the third quarter and remain relatively stable through November.
Late in the fourth quarter, the upward market pressure on yields accelerated. Increasingly positive data led the Fed to acknowledge in December that "the recovery in economic activity is gaining momentum." As the economic recovery strengthened, investors began to move away from government securities to other investments offering higher returns. In addition, the rising federal deficit, record-breaking treasury auctions, and the end of the Fed's Treasury purchase program prompted market concern over the excessive supply of government securities. As a result, interest rates were pushed dramatically higher in December as investors demanded higher returns on Treasuries. The change in the rate on the 10-year Treasury Note, from 3.28% to 3.85%, was the largest monthly increase since January 2009. Despite the Fed's low interest rate policy, long-term interest rates ultimately rose in order for bonds to remain competitive with other investment opport unities.
Fixed Income Strategy
The Fund maintained a conservative strategy focused on protecting principal, providing current income and maximizing total return. The Fund remained primarily invested in intermediate-term, callable government agencies. This strategy reduced volatility in the portfolio while providing greater income than short-term government agencies.
Short-term government securities offered limited yield during the period as evidenced by the rate on the 2-year Treasury Note which traded between 0.75% and 1.25%. Long-term bonds provided relatively higher income, but with much higher interest rate risk. As interest rates rise, bond prices decrease because outstanding bonds with lower coupon rates become less attractive than newly issued bonds with higher coupons. As a result, long-term bond holders risk a significant loss of principal in addition to foregoing a higher income stream.
To reduce interest rate risk while maximizing current income, the Fund primarily invested in continuously callable intermediate-term government agencies which offered higher income. We anticipated that these bonds would be called back and, therefore, the risk of losing principal was reduced as their holding periods would be much shorter. During the period, many of these bonds were called. The Fund benefited from this strategy by enhancing income and minimizing interest rate risk. At the end of year, we also added several bonds that provide an increasing coupon rate over the life of the bond and convert to non-callable in a few years. These purchases are easier to sell thereby providing liquidity and allowing the Fund to protect principal in a rising interest rate environment.
Consistent with its conservative strategy, the Fund does not use leverage. While leverage is used by many government securities funds to enhance return, it also magnifies risk. If a fund uses leverage and its investments decline in value, the fund's loss of principal would be much greater than if it were not leveraged. We believe using leverage would be counter to the Fund's objectives to protect principal and provide lower volatility.
Equity Positioning
The Fund invested approximately 10% of its portfolio in high quality dividend-paying common and preferred stocks to provide a hedge against inflation. Toward the end of the year, and in light of the continued improvement in the equity market, we began to add to the Fund's common stock holdings. New purchases focused on undervalued stocks of well established firms with good dividend yields and capital appreciation potential. This included British Petroleum, AT&T, and Consolidated Edison.
Early in the year, we maintained the Fund's preferred stock in financial companies. Our internal research confirmed their underlying value and the ability of these companies to maintain the attractive income streams offered by these investments. This decision contributed to the Fund's return as these holdings recovered 18% in the second half of the year while producing an average dividend yield of approximately 7%. To capture capital appreciation, we sold preferred stock in other sectors as we expected their values would decrease as interest rates rise.
5
Pacific Advisors
Government Securities Fund continued
Looking Ahead
Key segments of the economy remain challenged including the labor and housing markets. Nevertheless, leading indicators point to continued expansion in the U.S. and global economies during 2010. The credit markets will likely continue to stabilize with additional economic growth.
We expect interest rates will continue to trend higher in 2010. The supply of government securities will likely increase dramatically as the government issues a greater number of Treasuries to fund the federal deficit and the Fed ends its purchase program of mortgage backed securities in March 2010. Additionally, investors will likely continue to migrate toward other investments that offer higher returns, such as corporate bonds and equities. Increasing supply and decreasing demand are expected to push rates on Treasuries and government agencies higher as investors demand competitive returns.
Furthermore, as economic activity increases, the Fed may begin to tighten its monetary policy. To ease inflationary pressures, the Fed may accelerate its programs to absorb some of the excess cash in the financial system. Moreover, a growing number of economists anticipate that the Fed may raise the fed funds rate in the third quarter of 2010 which would accelerate the upward trend in interest rates.
Global economic growth and demand from overseas will continue to significantly impact the direction of interest rates on Treasuries and government agencies. As two of the biggest holders of U.S. Treasuries, Japan and China could also influence Treasury rates by their political policies and investment decisions.
Given the expectation for higher interest rates, we will continue to focus on managing interest rate risk to protect capital. The Fund will remain concentrated in short to intermediate-term government agencies. When interest rate peak, we will reallocate to longer-term, non-callable government agencies to lock in higher interest rates. To increase income and capital appreciation potential, we may increase and further diversify the Fund's common stock holdings. Following our conservative strategy, we will continue to actively manage the Fund to protect principal and minimize volatility.
6
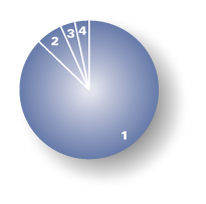
Portfolio Holdings as of 12/31/09 (Based on Total Investments)
| 1. | U.S. Government Agencies | 87.42 | % | ||||||||
| 2. | Equities | 5.95 | % | ||||||||
| 3. | Cash and Cash Equivalents | 3.41 | % | ||||||||
| 4. | Preferred Stock | 3.22 | % | ||||||||
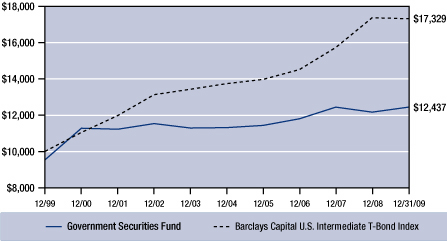
Change in Value of $10,000 Investment1
This chart compares the growth of a $10,000 investment in Class A shares of the Government Securities Fund for the period January 1, 2000 through December 31, 2009 with the same investment in the Barclays Capital U.S. Intermediate Treasury Bond Index2.
Average Annual Compounded Return as of December 31, 2009
| Class A | Class C | ||||||||||
| One Year | – 2.64 | % | 0.44 | % | |||||||
| Five Year | 0.94 | % | 1.15 | % | |||||||
| Ten Year | 2.20 | % | 1.93 | % | |||||||
Past performance does not guarantee future results. Performance quoted represents past performance. Current performance may be higher or lower than the performance data quoted. Returns include reinvested dividends and capital gains. Returns for Class A shares reflect a maximum front-end sales charge of 4.75%; and returns for Class C shares reflect the deduction of a contingent deferred sales charge of 1% on shares sold within the first year of purchase. Returns do not take into account individual taxes which may reduce actual returns when shares are sold. The investment return and principal value of an investment will fluctuate so that an investor's shares, when redeemed, may be worth more or less than their original cost. Call (800) 989-6693 for the most recent month-end performance.
1 Fund results are shown for Class A shares and reflect deduction of the maximum front-end sales charge of 4.75% on the $10,000 investment for a net amount invested of $9,525. At the end of the same period, a $10,000 investment in Class C shares would have been valued at $12,105, and no contingent deferred sales charges would apply. Performance of the share classes will vary based on the difference in charges and expenses. The inception date is 02/08/93 for Class A shares and 04/01/98 for Class C shares. It is not possible to invest directly in the Index. Unlike the Fund's results, the results for the Index do not reflect sales charges, fees or expenses.
2 The Barclays Capital U.S. Intermediate Treasury Bond Index is an unmanaged index of U.S. government securities with one to ten years to maturity.
7
Pacific Advisors
Government Securities Fund continued
Expense Examples
As a shareholder of the Fund you incur two types of costs: (1) transaction costs, including sales charges (loads) on purchase payments, reinvested dividends, or other distributions; redemption fees; and exchange fees; and (2) ongoing costs, including management fees; distribution (12b-1) fees; and other Fund expenses. This Example is intended to help you understand your ongoing costs (in dollars) of investing in the Fund and to compare these costs with the ongoing costs of investing in other mutual funds.
The Example is based on an investment of $1,000 invested at the beginning of the period and held for the entire period from July 1, 2009 through December 31, 2009.
Actual Expenses
The first line of the table below provides information about actual account values and actual expenses. You may use the information in this line, together with the amount you invested, to estimate the expenses that you paid over the period. Simply divide your account value by $1,000 (for example, an $8,600 account value divided by $1,000 = 8.6), then multiply the result by the number in the first line under the heading entitled "Expenses Paid During the Period" to estimate the expenses you paid on your account during the period.
The following transaction costs are not included in the expenses shown in the table and, if applicable, would increase the expenses that you paid over the period: (1) a front-end sales charge (load) of 4.75% on Class A shares; (2) a 2% redemption fee if you sell or exchange shares within 60 days of purchase, with certain exceptions. The redemption fee does not apply to: (a) redemptions under an automatic withdrawal program or periodic asset reallocation plan, required minimum distributions (RMD), employer mandated distributions from a qualified plan, or redemptions under a qualified domestic relations order (QDRO); (b) redemptions to pay for expenses related to terminal illness, extended hospital or nursing home care, or other serious medical conditions, including death; (c) redemptions of shares acquired through dividend or capital gains reinvestments, and (d) redemptions initiated by the Fund; and (3) a $10 service fee on each exchange aft er the first five exchanges in each calendar year.
The following ongoing costs are not included in the expenses shown in the table and, if applicable, would increase the expenses that you paid over the period: (1) a $12 low balance fee on accounts with balances of less than $250 as of September 30th of each calendar year and no investment activity (excluding reinvestment of dividends and/or capital gains) during the prior calendar year or the first nine months of the current calendar year. This fee does not apply to IRAs, qualified plan accounts, or Coverdell Education Savings Accounts; (2) a $15 annual custodial fee on IRAs, SEPs, SIMPLE IRAs, and Coverdell Education Savings Accounts; and (3) a $20 annual custodial fee on 403(b) accounts.
Hypothetical Example for Comparison Purposes
The second line of the table below provides information about hypothetical account values and hypothetical expenses based on the Fund's actual expense ratio and an assumed rate of return of 5% per year before expenses, which in not the Fund's actual return. The hypothetical account values and expenses may not be used to estimate the actual ending account balance or expenses you paid for the period. You may use this information to compare the ongoing costs of investing in the Fund and other funds. To do so, compare this 5% hypothetical example with the 5% hypothetical examples that appear in the shareholder reports of the other funds.
The following transaction costs are not included in the expenses shown in the table and, if applicable, would increase the expenses that you paid over the period: (1) a front-end sales charge (load) of 4.75% on Class A shares; (2) a 2% redemption fee if you sell or exchange shares within 60 days of purchase, with certain exceptions. The redemption fee does not apply to: (a) redemptions under an automatic withdrawal program or periodic asset reallocation plan, required minimum distributions (RMD), employer mandated distributions from a qualified plan, or redemptions under a qualified domestic relations order (QDRO); (b) redemptions to pay for expenses related to terminal illness, extended hospital or nursing home care, or other serious medical conditions, including death; (c) redemptions of shares acquired through dividend or capital gains reinvestments, and (d) redemptions initiated by the Fund; and (3) a $10 service fee on each exchange aft er the first five exchanges in each calendar year.
The following ongoing costs are not included in the expenses shown in the table and, if applicable, would increase the expenses that you paid over the period: (1) a $12 low balance fee on accounts with balances of less than $250 as of September 30th of each calendar year and no investment activity (excluding reinvestment of dividends and/or capital gains) during the prior calendar year or the first nine months of the current calendar year. This fee does not apply to IRAs, qualified plan accounts, or Coverdell Education Savings Accounts; (2) a $15 annual custodial fee on IRAs, SEPs, SIMPLE IRAs, and Coverdell Education Savings Accounts; and (3) a $20 annual custodial fee on 403(b) accounts.
Please note that the expenses shown in the table are meant to highlight your ongoing costs only and do not reflect any transactional costs, such as sales charges (loads), redemption fees, or exchange fees. Therefore, the second line of the table is useful in comparing ongoing costs only, and will not help you determine the relative total costs of owning different funds. In addition, if these transactional costs were included, your costs would have been higher.
| Beginning Account Value 07/01/09 | Ending Account Value 12/31/09 | Expense Paid During Period 07/01/09 – 12/31/09 | |||||||||||||
| Government Securities Fund Class A | |||||||||||||||
| Actual | $ | 1,000.00 | $ | 1,019.20 | $ | 8.60 | |||||||||
| Hypothetical (5% return before expense) | $ | 1,000.00 | $ | 1,025.21 | $ | 8.63 | |||||||||
| Government Securities Fund Class C | |||||||||||||||
| Actual | $ | 1,000.00 | $ | 1,014.70 | $ | 12.24 | |||||||||
| Hypothetical (5% return before expense) | $ | 1,000.00 | $ | 1,025.21 | $ | 12.30 | |||||||||
3 Expenses are equal to the Fund's annualized expense ratio of 1.69% for Class A shares and 2.41% for Class C shares, multiplied by the average account value over the period, multiplied by 184/365 days to reflect the one-half year period.
8
Pacific Advisors
Income and Equity Fund
Seeks to provide current income and, secondarily, long-term capital appreciation. Invests primarily in investment grade U.S. corporate fixed income securities and dividend paying stocks.
| TOTAL RETURNS | EXPENSE RATIOS | ||||||||||||||||||
| For the year ended December 31, 2009 | For the fiscal year ended December 31, 2008 | ||||||||||||||||||
| Expense Ratio | Net Expense Ratio | ||||||||||||||||||
| Class A | 15.37 | % | Class A | 2.80 | % | 2.05 | % | ||||||||||||
| Class C | 14.56 | % | Class C | 3.56 | % | 2.81 | % | ||||||||||||
| Barclays Capital U.S. Int Corp Bond Index1 | 18.56 | % | |||||||||||||||||
| S&P 500 Index2 | 26.46 | % | |||||||||||||||||
Please see the Financial Highlights in this Report for expense ratios for the fiscal year ended December 31, 2009.
Performance quoted is past performance which does not guarantee future results. Current performance may be higher or lower than the performance quoted. Call (800) 989-6693 for performance current to the most recent month-end. The investment return and principal value of an investment will fluctuate so that an investor's shares, when redeemed, may be worth more or less than their original cost. Returns represent the change in value over the stated period assuming reinvestment of dividends and capital gains at net asset value. Returns do not take into account the maximum 4.75% sales charge on Class A shares or the 1% Contingent Deferred Sales Charge (CDSC) for Class C shares sold within one year of purchase. Returns would be lower if the applicable sales charge and CDSC were included. Returns do not take into account individual taxes which may reduce actua l returns when shares are sold.
The Fund's investment adviser is waiving a portion of its management fees pursuant to an Expense Limitation Agreement. The waiver may be discontinued at any time with ninety days written notice in consultation with the Fund's board, but is expected to continue at current levels. Please see the Fund's most recent Annual Report for details. Performance shown reflects the waiver, without which the results would have been lower.
Discussion with Portfolio Managers3 February 12, 2010
Thomas H. Hanson
Charles Suh, CFA
Jingjing Yan, CFA
Fund Performance
The Fund performed admirably during 2009 with Class A shares returning 15.37%. Performance was achieved while adhering to a conservative investment discipline focused on delivering a stable income stream and managing risk. The Fund captured attractive yields as it managed fixed income holdings to protect against interest rate risk. Additionally, the Fund benefited from recovery in the equity market with investments in dividend-paying stocks of well-known, market-leading companies.
The Fund underperformed its benchmark indices for the year. However, unlike either of its benchmarks, the Fund's portfolio includes both fixed income and equity securities. Therefore, the Fund's performance would be best viewed against a comparative blend of its benchmarks. Moreover, the Fund achieved its performance while incurring significantly less risk than the market, as measured by a beta4 of 0.40 in comparison to the S&P 500 Index.
1 The Barclays Capital U.S. Intermediate Corporate Bond Index is an unmanaged index of publicly issued investment grade U.S. corporate bonds with one to ten years to maturity.
2 The Standard & Poor's 500 Index is an unmanaged, market capitalization weighted measure of 500 widely held common stocks listed on the New York Stock Exchange, American Stock Exchange and The Nasdaq Stock Market. Index returns assume the reinvestment of dividends, but, unlike the Fund's returns, do not reflect the effects of management fees or expenses.
3 Effective January 4, 2010, Ms. Yan and Mr. Suh became portfolio managers of the Fund. Ms. Yan and Mr. Suh served as research analysts for the Fund prior to becoming portfolio managers. Mr. Hanson is no longer a portfolio manager of the Fund effective February 1, 2010.
4 "Beta" measures volatility relative to the stock market or an alternative benchmark. A beta less than 1.0 indicates lower risk than the market or the benchmark and a beta greater than 1.0 indicates higher risk than the market or the benchmark.
9
Pacific Advisors
Income and Equity Fund continued
Fund Strategy
The Fund utilizes a conservative total return strategy that seeks to deliver consistent income and provide long-term capital appreciation. This strategy includes active management of the Fund's fixed income and equity allocations to manage risk as it seeks the best opportunities for stable income and long-term growth. While the Fund is primarily invested in investment grade corporate bonds, we typically increase the Fund's equity holdings when the economic outlook is favorable.
As evidence of economic recovery continued to emerge in the final half of the year, the portfolio allocation to fixed income holdings was reduced modestly to approximately 68%. These holdings were primarily investment grade corporate bonds and, to a lesser extent, preferred stocks. Conversely, common stock holdings were increased from approximately 21% to just over 30%. Investments remained concentrated in blue chip, dividend-paying stocks of companies with superior fundamentals. These holdings should benefit from continued economic improvement and provide a potential hedge against inflation.
Market Overview
Overall, the economy and the markets made great strides in the second half of 2009. Economic activity was aided by significant support from the government, including intervention in the credit markets and a massive stimulus package aimed at encouraging consumer spending. The recession officially ended with GDP growth of 2.2% in the third quarter. Key areas of the economy, including consumer confidence; housing; autos; and retail sales showed marked improvement in the latter half of the year.
As economic data reinforced that the recovery was, in fact, legitimate, corporations began to shift their focus from cost-cutting measures to growth initiatives. Likewise, consumers began to increase spending as their confidence in the economy strengthened. At times, however, recovery in the markets was tempered by ongoing economic concerns including rising unemployment; weakness in the U.S. dollar; and the burgeoning federal budget deficit.
Corporate Bond Overview
Recovery in the credit markets was advanced by government stimulus programs and the Federal Reserve's commitment to maintaining a low interest rate environment. Access to credit improved as the economy distanced itself from the worst of the downturn. New corporate bond offerings increased as companies looked to take advantage of low interest rates by refinancing existing debt. Some companies also took advantage of low interest rates to finance growth initiatives, including mergers and acquisitions.
As the economy strengthened, investors were increasingly willing to take on additional investment risk. After seeking safety in U.S. Treasuries earlier in the year, investors began to migrate to other investments offering more attractive returns. While the Fed held the federal funds rate at zero to 0.25%, market forces ultimately pushed long-term interest rates higher.
A residual consequence of the credit crisis has been the deterioration of the credibility of bond ratings agencies. These third-party research companies assigned top investment grades to securities that eventually suffered severe losses. Consequently, investors have re-examined their reliance on bond ratings in evaluating investments. Perhaps in response to recent criticism, ratings agencies may have overcompensated in their practices. During 2009, these agencies downgraded several stalwart, blue chip companies. As a result, these bonds offered attractive risk-reward opportunities.
Fixed Income Strategy
Interest rate expectations play a key role in the composition of the Fund's fixed income portfolio. Given the risk of higher interest rates in the last half of the year, the Fund continued to implement a defensive strategy. As existing bonds were called or matured, new investments were concentrated in shorter-term bonds with maturities ranging from two to seven years. While these bonds may offer lower yields than longer-term issues, they are less prone to depreciation in a rising interest rate environment.
10
Additionally, the Fund selected bonds at the lower end of the investment grade range as they provided attractive opportunities to generate additional income without significantly increasing risk. Examples included blue chip corporations such as Marriott International which yielded 5.70% at the time of purchase, and Nordstrom which yielded 5.50%. The Fund also increased investments in the Industrials and Basic Materials sectors in expectation of global economic recovery. Positions in these areas include global steel giant ArcelorMittal, which yielded 7.13% at the time of purchase; precious metals producer Freeport-McMoRan, which yielded 7.13%; and industrial products manufacturer Trinity Industries, which yielded 6.63%.
Equity Overview
Consistent improvements in the economy and corporate earnings sustained the equity market rally in last half of the year. Better-than-expected second and third quarter corporate earnings helped fuel investor confidence. Many corporations benefited from dramatic cost-cutting efforts in the first and second quarters, and a resumption of economic growth in the third quarter. Sound companies with strong financials benefited the most from recovery; many of these companies began to take advantage of opportunities to grow their businesses.
As the economic recovery gained steam, merger and acquisition activity surged. Companies looked to take advantage of depressed equity valuations to capitalize on strategic growth opportunities. Several deals of significant size occurred across a variety of industries, including ExxonMobil's proposed purchase of Fund holding XTO Energy.
Equity Strategy
The Fund's equity holdings continued to focus on large, established companies with lower-than-average volatility, high dividend yields and meaningful capital appreciation potential. As we increased the Fund's equity exposure in the last half of the year, purchases were concentrated in sectors expected to benefit from economic recovery such as Energy, Industrials and Consumer Staples. Additional investments in current holdings including ConocoPhillips, Home Depot, and Verizon were complemented by new positions in Wal-Mart, McDonald's, and UPS. These companies epitomize the market leadership and financial strength the Fund seeks in its equity investments. In addition, they offered dividend yields as high as 6.0% at the time of purchase.
Looking Ahead
Market Outlook
We expect economic recovery to progress at a slow and uneven pace. Ongoing challenges will likely continue to restrain improvement in key areas such as consumer confidence; consumer spending; housing; and employment. In particular, while the labor market may show signs of modest improvement, unemployment will likely remain elevated for a period of time. In addition to unemployment, the growing federal trade and budget deficits; uncertainty about pending legislation; and the expiration of government stimulus programs may temper economic growth.
During 2010, we anticipate that the continued economic recovery and the mounting federal deficit will create inflationary pressures. Consequently, investors will demand higher yields on longer-term investments. Demand for low-yielding government bonds will likely wane as investors favor alternative investments with better return potential. Furthermore, if economic data point to stable economic growth, we expect market forces will push corporate bond rates higher to remain competitive with other investments such as equities.
In early 2010, we expect most corporate debt issuance to be refinancing of existing debt. As the recovery progresses, we would expect to see an increase in capital raising activity as companies look to make acquisitions and build reserves for strategic growth initiatives.
11
Pacific Advisors
Income and Equity Fund continued
Fund Strategy
In light of our expectations for a rising interest rate environment, we will maintain a shorter average maturity in the Fund's bond holdings to minimize interest rate risk and protect capital. With holdings focused on shorter-term maturities in the two to seven-year range, we would anticipate higher turnover in the Fund's fixed income portfolio compared to recent years.
In 2010, the Fund's equity investments are likely to increase further in expectation of continued economic recovery. The Fund will adhere to its discipline of investing in blue chip companies with strong and stable dividends that offer above-average capital appreciation potential. Despite the rally in equity markets, we believe stronger companies will continue to offer long-term growth opportunities. We will look to further increase exposure to areas that are likely to benefit from increased economic activity, including Industrials; Energy; Basic Materials; and Consumer Discretionary.
12
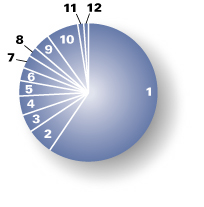
Portfolio Holdings as of 12/31/09 (Based on Total Investments)
| 1. | Corporate Bonds | 59.71 | % | ||||||||
| Equities | 30.54 | % | |||||||||
| 2. | Energy | 5.94 | % | ||||||||
| 3. | Industrials | 4.34 | % | ||||||||
| 4. | Consumer Staples | 4.34 | % | ||||||||
| 5. | Consumer Discretionary | 3.54 | % | ||||||||
| 6. | Health Care | 3.25 | % | ||||||||
| 7. | Utilities | 2.79 | % | ||||||||
| 8. | Telecommunication Services | 2.31 | % | ||||||||
| 9. | Other Equities | 4.03 | % | ||||||||
| 10. | Preferred Stock | 7.28 | % | ||||||||
| 11. | U.S. Government Agencies | 1.33 | % | ||||||||
| 12. | Cash and Cash Equivalents | 1.14 | % | ||||||||
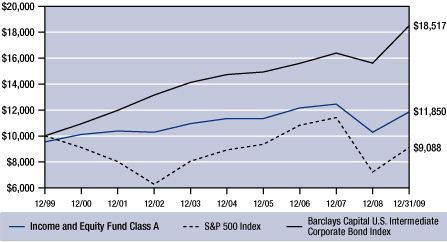
Change in Value of $10,000 Investment1
This chart compares the growth of a $10,000 investment in Class A shares of the Income and Equity Fund for the period January 1, 2000 through December 31, 2009 with the same investment in the S&P 500 Index2 and the Barclays Capital U.S. Intermediate Corporate Bond Index3.
Average Annual Compounded Returns as of December 31, 2009
| Class A | Class C | ||||||||||
| One Year | 9.93 | % | 13.56 | % | |||||||
| Five Year | – 0.08 | % | 0.16 | % | |||||||
| Ten Year | 1.71 | % | 1.37 | % | |||||||
Past performance does not guarantee future results. Performance quoted represents past performance. Current performance may be higher or lower than the performance data quoted. Returns include reinvested dividends and capital gains. Returns for Class A shares reflect a maximum front-end sales charge of 4.75%; and returns for Class C shares reflect the deduction of a contingent deferred sales charge of 1% on shares sold within the first year of purchase. Returns do not take into account individual taxes which may reduce actual returns when shares are sold. The investment return and principal value of an investment will fluctuate so that an investor's shares, when redeemed, may be worth more or less than their original cost. Call (800) 989-6693 for the most recent month-end performance.
1 Fund results are shown for Class A shares and reflect deduction of the maximum front-end sales charge of 4.75% on the $10,000 investment for a net amount invested of $9,525. At the end of the same period, a $10,000 investment in Class C shares would have been valued at $11,457, and no contingent deferred sales charges would apply. Performance of the share classes will vary based on the difference in charges and expenses. The inception date is 02/08/93 for Class A shares and 04/01/98 for Class C shares. It is not possible to invest directly in either Index. Index results assume reinvestment of dividends, but, unlike the Fund's results, do not reflect sales charges, fees or expenses.
2 The Standard & Poor's 500 Index is an unmanaged, market capitalization weighted measure of 500 widely held common stocks listed on the New York and American Stock Exchanges and The Nasdaq Stock Market.
3 The Barclays Capital U.S. Intermediate Corporate Bond Index is an unmanaged index of publicly issued investment grade U.S. corporate bonds with one to ten years to maturity.
13
Pacific Advisors
Income and Equity Fund continued
Expense Examples
As a shareholder of the Fund you incur two types of costs: (1) transaction costs, including sales charges (loads) on purchase payments, reinvested dividends, or other distributions; redemption fees; and exchange fees; and (2) ongoing costs, including management fees; distribution (12b-1) fees; and other Fund expenses. This Example is intended to help you understand your ongoing costs (in dollars) of investing in the Fund and to compare these costs with the ongoing costs of investing in other mutual funds.
The Example is based on an investment of $1,000 invested at the beginning of the period and held for the entire period from July 1, 2009 through December 31, 2009.
Actual Expenses
The first line of the table below provides information about actual account values and actual expenses. You may use the information in this line, together with the amount you invested, to estimate the expenses that you paid over the period. Simply divide your account value by $1,000 (for example, an $8,600 account value divided by $1,000 = 8.6), then multiply the result by the number in the first line under the heading entitled "Expenses Paid During the Period" to estimate the expenses you paid on your account during the period.
The following transaction costs are not included in the expenses shown in the table and, if applicable, would increase the expenses that you paid over the period: (1) a front-end sales charge (load) of 4.75% on Class A shares; (2) a 2% redemption fee if you sell or exchange shares within 60 days of purchase, with certain exceptions. The redemption fee does not apply to: (a) redemptions under an automatic withdrawal program or periodic asset reallocation plan, required minimum distributions (RMD), employer mandated distributions from a qualified plan, or redemptions under a qualified domestic relations order (QDRO); (b) redemptions to pay for expenses related to terminal illness, extended hospital or nursing home care, or other serious medical conditions, including death; (c) redemptions of shares acquired through dividend or capital gains reinvestments, and (d) redemptions initiated by the Fund; and (3) a $10 service fee on each exchange aft er the first five exchanges in each calendar year.
The following ongoing costs are not included in the expenses shown in the table and, if applicable, would increase the expenses that you paid over the period: (1) a $12 low balance fee on accounts with balances of less than $250 as of September 30th of each calendar year and no investment activity (excluding reinvestment of dividends and/or capital gains) during the prior calendar year or the first nine months of the current calendar year. This fee does not apply to IRAs, qualified plan accounts, or Coverdell Education Savings Accounts; (2) a $15 annual custodial fee on IRAs, SEPs, SIMPLE IRAs, and Coverdell Education Savings Accounts; and (3) a $20 annual custodial fee on 403(b) accounts.
Hypothetical Example for Comparison Purposes
The second line of the table below provides information about hypothetical account values and hypothetical expenses based on the Fund's actual expense ratio and an assumed rate of return of 5% per year before expenses, which in not the Fund's actual return. The hypothetical account values and expenses may not be used to estimate the actual ending account balance or expenses you paid for the period. You may use this information to compare the ongoing costs of investing in the Fund and other funds. To do so, compare this 5% hypothetical example with the 5% hypothetical examples that appear in the shareholder reports of the other funds.
The following transaction costs are not included in the expenses shown in the table and, if applicable, would increase the expenses that you paid over the period: (1) a front-end sales charge (load) of 4.75% on Class A shares; (2) a 2% redemption fee if you sell or exchange shares within 60 days of purchase, with certain exceptions. The redemption fee does not apply to: (a) redemptions under an automatic withdrawal program or periodic asset reallocation plan, required minimum distributions (RMD), employer mandated distributions from a qualified plan, or redemptions under a qualified domestic relations order (QDRO); (b) redemptions to pay for expenses related to terminal illness, extended hospital or nursing home care, or other serious medical conditions, including death; (c) redemptions of shares acquired through dividend or capital gains reinvestments, and (d) redemptions initiated by the Fund; and (3) a $10 service fee on each exchange aft er the first five exchanges in each calendar year.
The following ongoing costs are not included in the expenses shown in the table and, if applicable, would increase the expenses that you paid over the period: (1) a $12 low balance fee on accounts with balances of less than $250 as of September 30th of each calendar year and no investment activity (excluding reinvestment of dividends and/or capital gains) during the prior calendar year or the first nine months of the current calendar year. This fee does not apply to IRAs, qualified plan accounts, or Coverdell Education Savings Accounts; (2) a $15 annual custodial fee on IRAs, SEPs, SIMPLE IRAs, and Coverdell Education Savings Accounts; and (3) a $20 annual custodial fee on 403(b) accounts.
Please note that the expenses shown in the table are meant to highlight your ongoing costs only and do not reflect any transactional costs, such as sales charges (loads), redemption fees, or exchange fees. Therefore, the second line of the table is useful in comparing ongoing costs only, and will not help you determine the relative total costs of owning different funds. In addition, if these transactional costs were included, your costs would have been higher.
| Beginning Account Value 07/01/09 | Ending Account Value 12/31/09 | Expense Paid During Period 07/01/09 – 12/31/09 | |||||||||||||
| Income & Equity Fund Class A | |||||||||||||||
| Actual | $ | 1,000.00 | $ | 1,099.40 | $ | 12.28 | |||||||||
| Hypothetical (5% return before expense) | $ | 1,000.00 | $ | 1,025.21 | $ | 11.84 | |||||||||
| Income & Equity Fund Class C | |||||||||||||||
| Actual | $ | 1,000.00 | $ | 1,095.40 | $ | 16.16 | |||||||||
| Hypothetical (5% return before expense) | $ | 1,000.00 | $ | 1,025.21 | $ | 15.62 | |||||||||
4 Expenses are equal to the Fund's annualized expense ratio of 2.32% for Class A shares and 3.06% for Class C shares, multiplied by the average account value over the period, multiplied by 184/365 days to reflect the one-half year period.
14
Pacific Advisors
Balanced Fund
Seeks to achieve long-term capital appreciation and income consistent with reduced risk. Invests in a flexible mix of common stocks and investment grade fixed income securities with at least 25% of its assets invested in fixed income securities and preferred stocks.
| TOTAL RETURNS | EXPENSE RATIOS | ||||||||||||||
| For the year ended December 31, 2009 | For the fiscal year ended December 31, 2008 | ||||||||||||||
| Class A | 21.76 | % | Class A | 2.31 | % | ||||||||||
| Class C | 20.84 | % | Class C | 3.09 | % | ||||||||||
| S&P 500 Index1 | 26.46 | % | |||||||||||||
| Barclays Capital U.S. Int Corp Bond Index2 | 18.56 | % | |||||||||||||
Please see the Financial Highlights in this report for expense ratios for the fiscal year ended December 31, 2009.
Performance quoted is past performance which does not guarantee future results. Current performance may be higher or lower than the performance quoted. Call (800) 989-6693 for performance current to the most recent month-end. The investment return and principal value of an investment will fluctuate so that an investor's shares, when redeemed, may be worth more or less than their original cost. Returns represent the change in value over the stated period assuming reinvestment of dividends and capital gains at net asset value. Returns do not take into account the maximum 5.75% sales charge on Class A shares or the 1% Contingent Deferred Sales Charge (CDSC) for Class C shares sold within one year of purchase. Returns would be lower if the applicable sales charge and CDSC were included. Returns do not take into account individual taxes which may reduce actua l returns when shares are sold.
Discussion with Portfolio Managers3 February 12, 2010
Thomas H. Hanson
George A. Henning
Samuel C. Coquillard
Charles Suh, CFA
Jingjing Yan, CFA
Fund Performance
The Fund succeeded in limiting risk while participating in the market recovery with Class A shares returning 21.76% for the year. Adherence to a disciplined investment strategy enabled the Fund to take advantage of recovery in both the equity and fixed income markets. Appreciation in the Fund's equity holdings, primarily in the Energy, Basic Materials and Industrials sectors, drove performance. Corporate bond appreciation and a strong rebound in the value of preferred stock in the Financials sector also contributed to the Fund's return. The Fund achieved its performance while incurring notably less risk than the market, as measured by a beta4 of 0.78 in comparison to the S&P 500 Index.
For the year, the Fund outperformed the Barclays' Capital U.S. Intermediate Corporate Bond Index and slightly underperformed the S&P 500 Index. As a balanced fund which combines conservative stocks and fixed income investments, the Fund's total return would be more accurately compared against a blend of its benchmarks.
1 The Standard & Poor's 500 Index is an unmanaged, market capitalization weighted measure of 500 widely held common stocks listed on the New York Stock Exchange, American Stock Exchange and The Nasdaq Stock Market. Index returns assume the reinvestment of dividends, but, unlike the Fund's returns, do not reflect the effects of management fees or expenses.
2 The Barclays Capital U.S. Intermediate Corporate Bond Index is an unmanaged index of publicly issued investment grade U.S. corporate bonds with one to ten years to maturity.
3 Effective January 4, 2010, Mr. Suh became a portfolio manager with respect to the equity securities portion of the Fund. Effective February 1, 2010, Ms. Yan became a portfolio manager with respect to the fixed income securities portion of the Fund. Ms. Yan and Mr. Suh served as research analysts for the Fund prior to becoming portfolio managers. Mr. Henning and Mr. Hanson are no longer portfolio managers of the Fund effective January 4, 2010 and February 1, 2010, respectively.
4 "Beta" measures volatility relative to the stock market or an alternative benchmark. A beta less than 1.0 indicates lower risk than the market or the benchmark and a beta greater than 1.0 indicates higher risk than the market or the benchmark.
15
Pacific Advisors
Balanced Fund continued
Fund Strategy
The Fund employs a conservative strategy to meet the needs of investors seeking long-term capital appreciation with limited risk and volatility. The Fund's equity and fixed income allocations are actively managed to seek the best opportunities for solid long-term growth in consideration of the prevailing market risks. In the latter half of the year, improvement in the economy lent more credence to the sustainability of the recovery and the potential for long-term growth in stocks. Therefore, we increased the Fund's equity allocation from approximately 61% to 65%. This allocation was achieved by rotating capital to select equity positions as corporate bonds matured.
The Fund's focus on quality holdings was an important component in managing risk and achieving capital appreciation. In equities, we invest primarily in dividend-paying stocks of well-established companies with strong fundamentals. We look for undervalued firms that have solid balance sheets, effective management and good business plans. In this slower growth economy, the underlying strength of a company can be particularly important in achieving long-term performance as stronger companies are better equipped to weather economic difficulties.
Furthermore, the fixed income portfolio targets high-quality, investment grade corporate bonds. This commitment to quality differs from other balanced funds that may use more aggressive investment strategies. Such funds may take on higher risk by investing in momentum stocks or below-investment grade (also known as 'junk') bonds. While these types of aggressive investments may generate higher returns, the increased risk may not be suitable for more conservative shareholders.
Market Overview
Global economic recovery remained uneven in the last half of the year. Countries in Asia experienced a more robust economic rebound with China leading the way with a growth rate over 8%. Meanwhile, significant challenges emerged in European countries including Greece, Italy and Spain in the form of soaring unemployment and crushing debt.
In the second half of 2009, the U.S. economy turned a critical corner and emerged from its recession with GDP growth of 2.2% in the third quarter and 5.7% in the fourth quarter. Economic recovery across an array of sectors and industries resulted in improved conditions for consumers, businesses and, consequently, the stock market. In particular, economic data showed improvement in the housing, manufacturing and consumer sectors which fueled confidence that the economy was truly on the mend. However, other trends tempered investor sentiment including unemployment of over 10% and the mounting federal deficit. Overall, both the equity and corporate bond markets experienced significant recovery, prompted by improving economic conditions.
Equity Overview
Equity Market Recovery
In the second half of 2009, the focus in the equity market shifted from defensive to opportunistic investing. Investor confidence grew as economic improvement strengthened demand for a broad range of goods and services. At times, the uneven nature of the recovery gave investors pause but, as confidence increased, capital continued to return to the equity market.
Second and third quarter earnings showed corporate America rebounding. Strong companies which effectively managed their balance sheets are coming out ahead in the recovery. Many of these firms used the low interest rate environment to strategically position themselves for growth through mergers or acquisitions ("M&A"). In the second half of the year, activity ramped up noticeably including deals which impacted Fund holdings such as ExxonMobil's acquisition of XTO Energy and Berkshire Hathaway's acquisition of Burlington Northern Santa Fe. Other soundly positioned firms took opportunities to streamline their business operations or expand their market share as weaker companies fell by the wayside. In addition, weakness in value of the dollar enhanced revenue from foreign markets and boosted earnings for corporations with international operations.
16
Early recovery sectors remained the strongest performers in final half of the year. Energy positions performed well as oil prices rose and stayed in a range of $70 to $80 per barrel. Basic Materials and Industrials also showed signs of recovery. Their improvements were supported by worldwide economic growth as foreign governments renewed infrastructure and construction projects to stimulate their economies. Additionally, Fi nancials, which were hit hardest by the recession, rebounded. U.S. government stimulus efforts and normalization of the credit markets helped stabilize the sector. Several major financial institutions began to repay TARP monies in the fourth quarter prompting further recovery in this sector.
Equity Strategy
The Fund's equity holdings remained diversified across a variety of sectors and industries to reduce risk. Greater weight was given to positions in sectors with long-term demand trends such as Energy, Consumer Staples, Health Care and Industrials. Notably, the Fund's Energy holdings experienced solid appreciation in the second half of the year. Specifically, positions in large oil exploration firm Devon Energy; integrated gas firm Williams Companies; and multinational oil producer and refiner Suncor Energy benefited from increased demand and higher oil prices. Firms in energy-related industries also profited from rising energy prices. Cameron International, a manufacturer of offshore oil and natural gas equipment with hefty offshore contracts in Brazil, remained a stellar performer for the Fund.
Holdings in the consumer sectors contributed to the Fund's performance. Coca-Cola benefited from renewed consumption and strengthening beverage demand from its global network of bottlers. With more than three-fourths of its revenue generated outside the U.S., the company's earnings were bolstered by weakness in the value of the dollar. J.M. Smucker also experienced strong performance as a result of increased sales revenue following its acquisition of the Folgers brand name.
Corporate Bond Overview
The corporate bond market continued to improve in the latter half of 2009. The Fed maintained the federal funds rate between zero and 0.25% which helped increase liquidity to the credit markets. Subsequently, new corporate bond offerings increased in the third and fourth quarter as companies took advantage of lower rates to refinance existing debt. Additionally, as improved economic conditions fueled M&A activity, some companies issued new debt offerings to finance these transactions.
Earlier in the year, investors flocked to short-term U.S. Treasuries as a safe haven. In the latter part of the year, many began to seek more attractive opportunities in other investments offering better yields. Market forces pushed long-term interest rates higher during the period. The yield on the benchmark 10-Year Treasury Note, which was 3.53% as of June 30th, ended the year at 3.85%.
While interest rates remained at historical lows, the risk of a rising interest rate environment persisted throughout the latter half of 2009. Therefore, the Fund maintained its defensive strategy of holding short to intermediate-term investment grade corporate bonds. Few new bonds were added to the portfolio in the second half of the year as the equity market offered better opportunities for long-term growth.
Looking Ahead
Global economic conditions are improving. In particular, China and India will likely experience a more robust recovery than the U.S. and Europe. Economic growth initiatives should further strengthen demand in the Energy, Industrials and Basic Materials sectors. While the U.S. economy is stabilizing, we anticipate that growth will progress at a slow and uneven pace. Recovery will continue to face headwinds from weakness in the housing sector, elevated unemployment and the growing national deficit.
We expect further improvement in the equity markets albeit with growing disparity between the performance of stronger and weaker companies. Consequently, the fundamental strength of individual companies will remain a key determinant of performance. We expect to incrementally increase the Fund's equity allocation in order to capture select opportunities for long-term appreciation in fundamentally strong, market-leading firms.
We will continue to utilize a defensive fixed income strategy to manage the risks associated with higher interest rates. We do not anticipate making substantial changes to the fixed income portfolio in the near-term and are likely to maintain the portfolio's concentration in the short to intermediate-term holdings.
17
Pacific Advisors
Balanced Fund continued
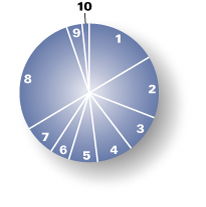
Portfolio Holdings as of 12/31/09 (Based on Total Investments)
| Equities | 66.49 | % | |||||||||
| 1. | Energy | 16.57 | % | ||||||||
| 2. | Industrials | 14.33 | % | ||||||||
| 3. | Consumer Staples | 8.91 | % | ||||||||
| 4. | Financials | 8.39 | % | ||||||||
| 5. | Health Care | 6.68 | % | ||||||||
| 6. | Information Technology | 4.37 | % | ||||||||
| 7. | Other Equities | 7.24 | % | ||||||||
| 8. | Corporate Bonds | 28.41 | % | ||||||||
| 9. | Preferred Stock | 3.46 | % | ||||||||
| 10. | Cash and Cash Equivalents | 1.64 | % | ||||||||
Change in Value of $10,000 Investment1
This chart compares the growth of a $10,000 investment in Class A shares of the Balanced Fund for the period January 1, 2000 through December 31, 2009 with the same investment in the S&P 500 Index2 and the Barclays Capital U.S. Intermediate Corporate Bond Index3.
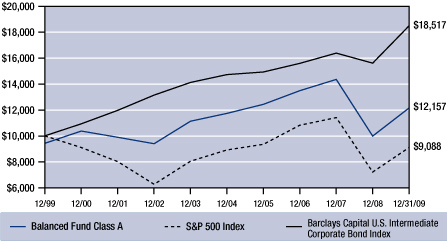
Average Annual Compounded Returns as of December 31, 2009
| Class A | Class C | ||||||||||
| One Year | 14.73 | % | 19.84 | % | |||||||
| Five Year | – 0.49 | % | – 0.06 | % | |||||||
| Ten Year | 1.97 | % | 1.81 | % | |||||||
Past performance does not guarantee future results. Performance quoted represents past performance. Current performance may be higher or lower than the performance data quoted. Returns include reinvested dividends and capital gains. Returns for Class A shares reflect a maximum front-end sales charge of 5.75%; and returns for Class C shares reflect the deduction of a contingent deferred sales charge of 1% on shares sold within the first year of purchase. Returns do not take into account individual taxes which may reduce actual returns when shares are sold. The investment return and principal value of an investment will fluctuate so that an investor's shares, when redeemed, may be worth more or less than their original cost. Call (800) 989-6693 for the most recent month-end performance.
1 Fund results are shown for Class A shares and reflect deduction of the maximum front-end sales charge of 5.75% on the $10,000 investment for a net amount invested of $9,425. At the end of the same period, a $10,000 investment in Class C shares would have been valued at $11,962, and no contingent deferred sales charges would apply. Performance of the share classes will vary based on the difference in charges and expenses. The inception date is 02/08/93 for Class A shares and 04/01/98 for Class C shares. It is not possible to invest directly in either Index. Index results assume reinvestment of dividends, but, unlike the Fund's results, do not reflect sales charges, fees or expenses.
2 The Standard & Poor's 500 Index is an unmanaged, market capitalization weighted measure of 500 widely held common stocks listed on the New York and American Stock Exchanges and The Nasdaq Stock Market.
3 The Barclays Capital U.S. Intermediate Corporate Bond Index is an unmanaged index of publicly issued investment grade U.S. corporate bonds with one to ten years to maturity.
18
Expense Examples
As a shareholder of the Fund you incur two types of costs: (1) transaction costs, including sales charges (loads) on purchase payments, reinvested dividends, or other distributions; redemption fees; and exchange fees; and (2) ongoing costs, including management fees; distribution (12b-1) fees; and other Fund expenses. This Example is intended to help you understand your ongoing costs (in dollars) of investing in the Fund and to compare these costs with the ongoing costs of investing in other mutual funds.
The Example is based on an investment of $1,000 invested at the beginning of the period and held for the entire period from July 1, 2009 through December 31, 2009.
Actual Expenses
The first line of the table below provides information about actual account values and actual expenses. You may use the information in this line, together with the amount you invested, to estimate the expenses that you paid over the period. Simply divide your account value by $1,000 (for example, an $8,600 account value divided by $1,000 = 8.6), then multiply the result by the number in the first line under the heading entitled "Expenses Paid During the Period" to estimate the expenses you paid on your account during the period.
The following transaction costs are not included in the expenses shown in the table and, if applicable, would increase the expenses that you paid over the period: (1) a front-end sales charge (load) of 5.75% on Class A shares; (2) a 2% redemption fee if you sell or exchange shares within six months of purchase, with certain exceptions. The redemption fee does not apply to: (a) redemptions under an automatic withdrawal program or periodic asset reallocation plan, required minimum distributions (RMD), employer mandated distributions from a qualified plan, or redemptions under a qualified domestic relations order (QDRO); (b) redemptions to pay for expenses related to terminal illness, extended hospital or nursing home care, or other serious medical conditions, including death; (c) redemptions of shares acquired through dividend or capital gains reinvestments, and (d) redemptions initiated by the Fund; and (3) a $10 service fee on each exchange after the first five exchanges in each calendar year.
The following ongoing costs are not included in the expenses shown in the table and, if applicable, would increase the expenses that you paid over the period: (1) a $12 low balance fee on accounts with balances of less than $250 as of September 30th of each calendar year and no investment activity (excluding reinvestment of dividends and/or capital gains) during the prior calendar year or the first nine months of the current calendar year. This fee does not apply to IRAs, qualified plan accounts, or Coverdell Education Savings Accounts; (2) a $15 annual custodial fee on IRAs, SEPs, SIMPLE IRAs, and Coverdell Education Savings Accounts; and (3) a $20 annual custodial fee on 403(b) accounts.
Hypothetical Example for Comparison Purposes
The second line of the table below provides information about hypothetical account values and hypothetical expenses based on the Fund's actual expense ratio and an assumed rate of return of 5% per year before expenses, which in not the Fund's actual return. The hypothetical account values and expenses may not be used to estimate the actual ending account balance or expenses you paid for the period. You may use this information to compare the ongoing costs of investing in the Fund and other funds. To do so, compare this 5% hypothetical example with the 5% hypothetical examples that appear in the shareholder reports of the other funds.
The following transaction costs are not included in the expenses shown in the table and, if applicable, would increase the expenses that you paid over the period: (1) a front-end sales charge (load) of 5.75% on Class A shares; (2) a 2% redemption fee if you sell or exchange shares within six months of purchase, with certain exceptions. The redemption fee does not apply to: (a) redemptions under an automatic withdrawal program or periodic asset reallocation plan, required minimum distributions (RMD), employer mandated distributions from a qualified plan, or redemptions under a qualified domestic relations order (QDRO); (b) redemptions to pay for expenses related to terminal illness, extended hospital or nursing home care, or other serious medical conditions, including death; (c) redemptions of shares acquired through dividend or capital gains reinvestments, and (d) redemptions initiated by the Fund; and (3) a $10 service fee on each exchange after the first five exchanges in each calendar year.
The following ongoing costs are not included in the expenses shown in the table and, if applicable, would increase the expenses that you paid over the period: (1) a $12 low balance fee on accounts with balances of less than $250 as of September 30th of each calendar year and no investment activity (excluding reinvestment of dividends and/or capital gains) during the prior calendar year or the first nine months of the current calendar year. This fee does not apply to IRAs, qualified plan accounts, or Coverdell Education Savings Accounts; (2) a $15 annual custodial fee on IRAs, SEPs, SIMPLE IRAs, and Coverdell Education Savings Accounts; and (3) a $20 annual custodial fee on 403(b) accounts.
Please note that the expenses shown in the table are meant to highlight your ongoing costs only and do not reflect any transactional costs, such as sales charges (loads), redemption fees, or exchange fees. Therefore, the second line of the table is useful in comparing ongoing costs only, and will not help you determine the relative total costs of owning different funds. In addition, if these transactional costs were included, your costs would have been higher.
| Beginning Account Value 07/01/09 | Ending Account Value 12/31/09 | Expense Paid During Period 07/01/09 – 12/31/09 | |||||||||||||
| Balanced Fund Class A | |||||||||||||||
| Actual | $ | 1,000.00 | $ | 1,169.50 | $ | 13.51 | |||||||||
| Hypothetical (5% return before expense) | $ | 1,000.00 | $ | 1,025.21 | $ | 12.61 | |||||||||
| Balanced Fund Class C | |||||||||||||||
| Actual | $ | 1,000.00 | $ | 1,165.50 | $ | 17.63 | |||||||||
| Hypothetical (5% return before expense) | $ | 1,000.00 | $ | 1,025.21 | $ | 16.49 | |||||||||
4 Expenses are equal to the Fund's annualized expense ratio of 2.47% for Class A shares and 3.23% for Class C shares, multiplied by the average account value over the period, multiplied by 184/365 days to reflect the one-half year period.
19
Pacific Advisors
Growth Fund
Seeks to achieve long-term capital appreciation through investment in medium to large capitalization companies. Invests primarily in companies that are a part of the S&P 500 Index1 or the NASDAQ 100 Index2.
| TOTAL RETURNS | EXPENSE RATIOS | ||||||||||||||||||
| For the year ended December 31, 2009 | For the fiscal year ended December 31, 2008 | ||||||||||||||||||
| Expense Ratio | Net Expense Ratio | ||||||||||||||||||
| Class A | 27.96 | % | Class A | 3.65 | % | 2.62 | % | ||||||||||||
| Class C | 26.97 | % | Class C | 4.42 | % | 3.40 | % | ||||||||||||
| S&P 500 Index | 26.46 | % | |||||||||||||||||
| Russell 1000 Index3 | 28.43 | % | |||||||||||||||||
Please see the Financial Highlights in this report for expense ratios for the fiscal year ended December 31, 2009.
Performance quoted is past performance which does not guarantee future results. Current performance may be higher or lower than the performance quoted. Call (800) 989-6693 for performance current to the most recent month-end. The investment return and principal value of an investment will fluctuate so that an investor's shares, when redeemed, may be worth more or less than their original cost. Returns represent the change in value over the stated period assuming reinvestment of dividends and capital gains at net asset value. Returns do not take into account the maximum 5.75% sales charge on Class A shares or the 1% Contingent Deferred Sales Charge (CDSC) for Class C shares sold within one year of purchase. Returns would be lower if the applicable sales charge and CDSC were included. Returns do not take into account individual taxes which may reduce actua l returns when shares are sold.
The Fund's investment adviser is waiving a portion of its management fees pursuant to an Expense Limitation Agreement. The waiver may be discontinued at any time with ninety days written notice in consultation with the Fund's board, but is expected to continue at current levels. Please see the Fund's most recent Annual Report for details. Performance shown reflects the waiver, without which the results would have been lower.
Discussion with Portfolio Managers4 February 12, 2010
Thomas H. Hanson
Samuel C. Coquillard
Fund Performance
The Fund participated strongly in the rebound of the equity markets this year, with Class A shares returning 27.96% for the year. This performance was achieved against the backdrop of a slow-paced economic recovery in which the S&P 500 Index rose 26.46%. The Fund's growth-at-a-reasonable-price investment strategy continued to provide a more conservative and less volatile approach to investing than a momentum-oriented growth strategy. Superior selection of leading stocks in leading recovery sectors such as Energy, Consumer Staples and Financials enabled the Fund to achieve solid gains.
Market Overview
In the second half of the year, investors became more confident that recovery was taking place even though economic data remained mixed. The economy officially exited its recession in the third quarter with GDP growth of 2.2%. This was followed by estimated GDP growth of 5.7% in the fourth quarter.
1 The Standard & Poor's 500 Index is an unmanaged, market capitalization weighted measure of 500 widely held common stocks listed on the New York Stock Exchange, American Stock Exchange and The Nasdaq Stock Market. Index returns assume the reinvestment of dividends, but, unlike the Fund's returns, do not reflect the effects of management fees or expenses.
2 The NASDAQ 100 Stock Index is an unmanaged, market capitalization weighted measure of the 100 largest non-financial domestic and international common stocks listed on The Nasdaq Stock Market. Index returns assume the reinvestment of dividends, but, unlike the Fund's returns, do not reflect management fees or expenses.
3 The Russell 1000 Stock Index is an unmanaged, market capitalization weighted measure of the 1,000 largest publicly traded companies within the Russell 3000 Index. Index returns assume the reinvestment of dividends, but, unlike the Fund's returns, do not reflect the effects of capital gains, management fees, or expenses.
4 Effective February 1, 2010, Mr. Samuel Coquillard succeeded Mr. Hanson as the portfolio manager of the Fund.
20
Improvement was seen across various segments of the economy, most importantly in the manufacturing and housing sectors. The Federal Reserve aided recovery by maintaining a low interest rate environment and fostering liquidity in the credit markets. Nevertheless, investor sentiment was vulnerable to persistent economic challenges including a distressed labor market; rising federal deficits; weakness in the dollar; and widening trade deficits.
While consumer behavior remained defensive, consumer confidence and spending improved in the second half of the year. Most notably, consumers spent more on discretionary items during the holiday shopping season. During the period, consumers also reduced debt at a historically high rate. As consumers improved their balance sheets, and grew more confident in the recovery, they became more comfortable taking additional investment risk.
Adding to this budding confidence, third quarter earnings season showed that corporate America had made significant progress toward recovery. Many earnings reports were better-than-expected and firms were also more willing to give forward-looking guidance. Corporations largely demonstrated that they had weathered the recession and were positioning themselves to reap the benefits of recovery. In particular, stronger companies that reacted to the recession by streamlining their businesses, shoring up their balance sheets, and paying down debt appeared better equipped to implement growth strategies. Merger and acquisition activity increased across sectors such as Industrials, Financials, Technology, Energy and Health Care as firms sought to expand their businesses.
Stocks in all capitalization levels: large cap; mid-cap; and small cap recovered. While the prices of small cap stocks recovered more quickly in the second quarter, large and mid-cap stocks recovered faster in the final quarters of the year. Overall, the markets reflected the economic growth pattern of two larger steps forward and one smaller step backward as the economy regained its footing.
Fund Strategy
We maintained a disciplined commitment to selecting high quality firms with long-term growth potential. We sought fundamentally strong, market-leading stocks from leading sectors with attractive valuations. These stocks were primarily large cap, multinational firms.
To manage risk and protect shareholders, the Fund may accumulate cash during market downturns. When the market presents significant opportunities for long-term growth, the Fund puts more capital to work. With the market clearly in an uptrend during the final half of 2009, the Fund was essentially fully invested.
During the period, the Fund began to rotate out of select companies in the Transportation and Industrials sectors. Capital from these sales was used to invest in new opportunities in Industrials and Technology companies. We added Industrials firms such as Honeywell which stands to gain from renewed spending on infrastructure improvements. We also added Microsoft and Cisco Systems which are poised to benefit from businesses updating inefficient or outdated technology.
The Fund also sold its position in Chattem, a Consumer Staples company that is the leading distributor and manufacturer of over-the-counter health care products. Chattem was acquired by French pharmaceutical giant, Sanofi Aventis during the fourth quarter and the Fund sold Ch attem at an approximately 34% market premium.
During the period, the Fund also maintained an emphasis on areas with long-term growth trends including Energy, Basic Materials and Health Care. The Energy and Basic Materials sectors advanced as the global economic recovery renewed demand for oil, natural gas and other commodities. In the Energy sector, oil prices rebounded and remained between $70 and $80 per barrel in anticipation that economic recovery would increase worldwide consumption.
In particular, the Fund's position in FMC Technologies, a manufacturer of underwater oil and natural gas production equipment, profited from large contracts for subsea oil equipment in the North Sea and off the coast of Brazil. Higher prices and increased consumption also lifted natural gas companies such as Apache Corporation. Apache is a natural gas exploration and distribution firm with wells across North America and in the North Sea, Argentina, Australia and Egypt. Additionally, Basic Materials firms such as BHP Billiton, the world's largest mining company, performed well as a result of economic improvement. As governments
21
Pacific Advisors
Growth Fund continued
around the globe sought to stimulate their economies through infrastructure projects, BHP benefited from strong price increases across a suite of infrastructure-related products.
The Health Care sector also continued to be a focus for long-term appreciation opportunities for the Fund. An aging global population has translated into increasing demand for health care services and products. However, due to changes in the political landscape, short-term volatility continued to impact health insurance companies such as WellPoint, the largest U.S. health insurer. Nevertheless, WellPoint's long-term business model remains sound and we believe WellPoint is in a strong position to manage through potential challenges. Meanwhile, Zimmer Holdings, the largest manufacturer of hip, knee and other joint replacements, achieved solid revenue growth.
Looking Ahead
Market Outlook
The economic recovery that began in 2009 is expected to continue in 2010 albeit at a slow to moderate pace. We believe the equity markets will experience significantly less volatility than in recent years as investors gain more clarity and confidence in the recovery. However, the market will likely experience small pullbacks or temporary retrenchments along the way as investor confidence is tested by the recovery's uneven nature.
Economic data are likely to remain mixed for some time as certain sectors of the economy will take longer than others to regain their footing. The relative strength of the dollar to other currencies will also impact overseas earnings for multinational firms. Furthermore, we expect the potential for inflationary pressures to increase as economic conditions improve. Overall, we anticipate that additional growth of corporate profits, along with an improvement in the broader economy, will result in market advances.
We believe the strongest performing sectors will be: Technology, as businesses update their technological systems; Energy, as global recovery stimulates demand for resources; Industrials, as infrastructure projects are renewed; and Financials which, having been hardest hit during recession, will, therefore, rebound further. Escalating demand for Health Care goods and services will continue to create attractive opportunities due to an aging worldwide population. While domestic political trends may create periods of short-term volatility, long-term trends surrounding this sector remain intact.
Fund Strategy
We remain focused on long-term opportunities in the large cap arena. Whether through more diversified product lines or a larger geographical presence, well-run, fundamentally-sound multinational firms are strongly positioned to participate in the global economic recovery. We will target well-known industry leaders with lower volatility consistent with the Fund's more conservative strategy.
We will also maintain an emphasis in areas with long-term demand trends including Industrials and Health Care. Additionally, we will select compelling investments in the Consumer Staples, Technology and Financials sectors. Given improving market conditions, the Fund will utilize market pullbacks to acquire undervalued high quality companies with long-term growth potential.
22
Portfolio Holdings as of 12/31/09 (Based on Total Investments)
| Equities | 95.74 | % | |||||||||
| 1. | Health Care | 34.56 | % | ||||||||
| 2. | Energy | 28.68 | % | ||||||||
| 3. | Information Technology | 16.61 | % | ||||||||
| 4. | Industrials | 10.94 | % | ||||||||
| 5. | Materials | 2.71 | % | ||||||||
| 6. | Financials | 2.24 | % | ||||||||
| 7. | Cash and Cash Equivalents | 4.26 | % | ||||||||
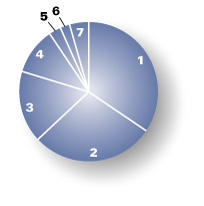
Change in Value of $10,000 Investment1
This chart compares the growth of a $10,000 investment in Class A shares of the Growth Fund for the period January 1, 2000 through December 31, 2009 with the same investment in the S&P 500 Index2 and the Russell 1000 Index3.
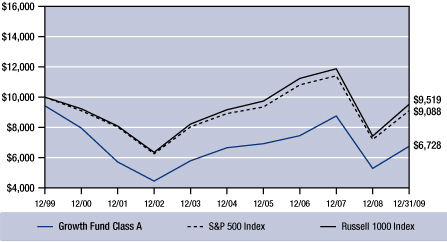
Average Annual Compounded Returns as of December 31, 2009
| Class A | Class C | ||||||||||
| One Year | 20.55 | % | 25.97 | % | |||||||
| Five Year | – 0.91 | % | – 0.55 | % | |||||||
| Ten Year | – 3.88 | % | – 4.17 | % | |||||||
Past performance does not guarantee future results. Performance quoted represents past performance. Current performance may be higher or lower than the performance data quoted. Returns include reinvested dividends and capital gains. Returns for Class A shares reflect a maximum front-end sales charge of 5.75%; and returns for Class C shares reflect the deduction of a contingent deferred sales charge of 1% on shares sold within the first year of purchase. Returns do not take into account individual taxes which may reduce actual returns when shares are sold. The investment return and principal value of an investment will fluctuate so that an investor's shares, when redeemed, may be worth more or less than their original cost. Call (800) 989-6693 for the most recent month-end performance.
1 Fund results are shown for Class A shares and reflect deduction of the maximum front-end sales charge of 5.75% on the $10,000 investment for a net amount invested of $9,425. At the end of the same period, a $10,000 investment in Class C shares would have been valued at $6,529, and no contingent deferred sales charges would apply. Performance of the share classes will vary based on the difference in charges and expenses. The inception date for Class A shares and Class C shares is 05/01/99. It is not possible to invest directly in either Index. Index results assume reinvestment of dividends, but, unlike the Fund's results, do not reflect sales charges, fees or expenses.
2 The Standard & Poor's 500 Index is an unmanaged, market capitalization weighted measure of 500 widely held common stocks listed on the New York and American Stock Exchanges and The Nasdaq Stock Market.
3 The Russell 1000 Stock Index is an unmanaged, weighted measure of the 1000 largest companies within the Russell 3000 Index.
23
Pacific Advisors
Growth Fund continued
Expense Examples
As a shareholder of the Fund you incur two types of costs: (1) transaction costs, including sales charges (loads) on purchase payments, reinvested dividends, or other distributions; redemption fees; and exchange fees; and (2) ongoing costs, including management fees; distribution (12b-1) fees; and other Fund expenses. This Example is intended to help you understand your ongoing costs (in dollars) of investing in the Fund and to compare these costs with the ongoing costs of investing in other mutual funds.
The Example is based on an investment of $1,000 invested at the beginning of the period and held for the entire period from July 1, 2009 through December 31, 2009.
Actual Expenses
The first line of the table below provides information about actual account values and actual expenses. You may use the information in this line, together with the amount you invested, to estimate the expenses that you paid over the period. Simply divide your account value by $1,000 (for example, an $8,600 account value divided by $1,000 = 8.6), then multiply the result by the number in the first line under the heading entitled "Expenses Paid During the Period" to estimate the expenses you paid on your account during the period.
The following transaction costs are not included in the expenses shown in the table and, if applicable, would increase the expenses that you paid over the period: (1) a front-end sales charge (load) of 5.75% on Class A shares; (2) a 2% redemption fee if you sell or exchange shares within six months of purchase, with certain exceptions. The redemption fee does not apply to: (a) redemptions under an automatic withdrawal program or periodic asset reallocation plan, required minimum distributions (RMD), employer mandated distributions from a qualified plan, or redemptions under a qualified domestic relations order (QDRO); (b) redemptions to pay for expenses related to terminal illness, extended hospital or nursing home care, or other serious medical conditions, including death; (c) redemptions of shares acquired through dividend or capital gains reinvestments, and (d) redemptions initiated by the Fund; and (3) a $10 service fee on each exchange after the first five exchanges in each calendar year.
The following ongoing costs are not included in the expenses shown in the table and, if applicable, would increase the expenses that you paid over the period: (1) a $12 low balance fee on accounts with balances of less than $250 as of September 30th of each calendar year and no investment activity (excluding reinvestment of dividends and/or capital gains) during the prior calendar year or the first nine months of the current calendar year. This fee does not apply to IRAs, qualified plan accounts, or Coverdell Education Savings Accounts; (2) a $15 annual custodial fee on IRAs, SEPs, SIMPLE IRAs, and Coverdell Education Savings Accounts; and (3) a $20 annual custodial fee on 403(b) accounts.
Hypothetical Example for Comparison Purposes
The second line of the table below provides information about hypothetical account values and hypothetical expenses based on the Fund's actual expense ratio and an assumed rate of return of 5% per year before expenses, which in not the Fund's actual return. The hypothetical account values and expenses may not be used to estimate the actual ending account balance or expenses you paid for the period. You may use this information to compare the ongoing costs of investing in the Fund and other funds. To do so, compare this 5% hypothetical example with the 5% hypothetical examples that appear in the shareholder reports of the other funds.
The following transaction costs are not included in the expenses shown in the table and, if applicable, would increase the expenses that you paid over the period: (1) a front-end sales charge (load) of 5.75% on Class A shares; (2) a 2% redemption fee if you sell or exchange shares within six months of purchase, with certain exceptions. The redemption fee does not apply to: (a) redemptions under an automatic withdrawal program or periodic asset reallocation plan, required minimum distributions (RMD), employer mandated distributions from a qualified plan, or redemptions under a qualified domestic relations order (QDRO); (b) redemptions to pay for expenses related to terminal illness, extended hospital or nursing home care, or other serious medical conditions, including death; (c) redemptions of shares acquired through dividend or capital gains reinvestments, and (d) redemptions initiated by the Fund; and (3) a $10 service fee on each exchange after the first five exchanges in each calendar year.
The following ongoing costs are not included in the expenses shown in the table and, if applicable, would increase the expenses that you paid over the period: (1) a $12 low balance fee on accounts with balances of less than $250 as of September 30th of each calendar year and no investment activity (excluding reinvestment of dividends and/or capital gains) during the prior calendar year or the first nine months of the current calendar year. This fee does not apply to IRAs, qualified plan accounts, or Coverdell Education Savings Accounts; (2) a $15 annual custodial fee on IRAs, SEPs, SIMPLE IRAs, and Coverdell Education Savings Accounts; and (3) a $20 annual custodial fee on 403(b) accounts.
Please note that the expenses shown in the table are meant to highlight your ongoing costs only and do not reflect any transactional costs, such as sales charges (loads), redemption fees, or exchange fees. Therefore, the second line of the table is useful in comparing ongoing costs only, and will not help you determine the relative total costs of owning different funds. In addition, if these transactional costs were included, your costs would have been higher.
| Beginning Account Value 07/01/09 | Ending Account Value 12/31/09 | Expense Paid During Period 07/01/09 – 12/31/09 | |||||||||||||
| Growth Fund Class A | |||||||||||||||
| Actual | $ | 1,000.00 | $ | 1,217.80 | $ | 19.34 | |||||||||
| Hypothetical (5% return before expense) | $ | 1,000.00 | $ | 1,025.21 | $ | 17.66 | |||||||||
| Growth Fund Class C | |||||||||||||||
| Actual | $ | 1,000.00 | $ | 1,214.70 | $ | 22.94 | |||||||||
| Hypothetical (5% return before expense) | $ | 1,000.00 | $ | 1,025.21 | $ | 20.98 | |||||||||
5 Expenses are equal to the Fund's annualized expense ratio of 3.46% for Class A shares and 4.11% for Class C shares, multiplied by the average account value over the period, multiplied by 184/365 days to reflect the one-half year period.
24
Pacific Advisors
Multi-Cap Value Fund
Seeks to achieve long-term capital appreciation. Invests in a diversified portfolio of large to small capitalization companies using an actively managed, value investment approach.
| TOTAL RETURNS | EXPENSE RATIOS | ||||||||||||||
| For the year ended December 31, 2009 | For the fiscal year ended December 31, 2008 | ||||||||||||||
| Class A | 30.07 | % | Class A | 3.20 | % | ||||||||||
| Class C | 29.09 | % | Class C | 3.96 | % | ||||||||||
| S&P 500 Index1 | 26.46 | % | |||||||||||||
Please see the Financial Highlights in this report for expense ratios for the fiscal year ended December 31, 2009.
Performance quoted is past performance which does not guarantee future results. Current performance may be higher or lower than the performance quoted. Call (800) 989-6693 for performance current to the most recent month-end. The investment return and principal value of an investment will fluctuate so that an investor's shares, when redeemed, may be worth more or less than their original cost. Returns represent the change in value over the stated period assuming reinvestment of dividends and capital gains at net asset value. Returns do not take into account the maximum 5.75% sales charge on Class A shares or the 1% Contingent Deferred Sales Charge (CDSC) for Class C shares sold within one year of purchase. Returns would be lower if the applicable sales charge and CDSC were included. Returns do not take into account individual taxes which may reduce actua l returns when shares are sold.
Discussion with Portfolio Managers February 12, 2010
George A. Henning
Samuel C. Coquillard
Fund Performance
The Fund enjoyed strong performance in 2009. Class A shares returned 30.07% outperforming the S&P 500 Index which returned 26.46%. The Fund's performance was the result of strategic positioning prior to, and throughout, 2009.
Consistent with the Fund's focused, value-oriented investment strategy, portfolio holdings were concentrated in a variety of quality companies. As they benefited from economic recovery in the final half of the year, many of these positions delivered significant gains for the Fund. Among these were Lufkin Industries, Mitcham Industries, Group 1 Automotive, Goldman Sachs, Kansas City Southern, Copart, and H.B. Fuller. The breadth of industries these companies represent illustrates our success in identifying solid businesses at attractive prices in all areas of the market.
Market Overview
After a difficult start to 2009, the markets staged an impressive recovery in the last half of the year. Mid-caps and small caps led the market as shown in the performance of S&P 400 and the Russell 2000 Indices which returned 37.38% and 27.17%, respectively. Large caps also enjoyed strong performance as evidenced by the S&P 500 Index which rose 26.46%.
Investors returned to the equity markets in the final half of the year as sentiment improved. Better-than-expected second quarter earnings provided the first seeds of optimism. Improving economic data in several critical areas including manufacturing, housing and auto sales, and consumer spending helped sustain the positive momentum. These improvements led to economic growth of 2.2% in the third quarter, officially ending the nearly two-year long recession. Strong third quarter earnings and further economic growth continued to lift investor sentiment in the fourth quarter.
1 The Standard & Poor's 500 Index is an unmanaged, market capitalization weighted measure of 500 widely held common stocks listed on the New York Stock Exchange, American Stock Exchange and The Nasdaq Stock Market. Index returns assume the reinvestment of dividends, but, unlike the Fund's returns, do not reflect the effects of management fees or expenses.
25
Pacific Advisors
Multi-Cap Value Fund continued
A notable increase in merger and acquisition activity during the last half of the year provided additional stimulus to the equity markets. Stronger companies took advantage of opportunities to acquire competitors, add to their product lines, or expand into new markets. This included the purchase of Fund holding Chattem by French pharmaceutical conglomerate, Sanofi Aventis. As a leading manufacturer and distributor of over-the-counter health care products, Chattem provided an opportunity for Sanofi to diversify and expand its product portfolio to keep pace with the changing health care environment.
While resilient, investor sentiment remained vulnerable throughout the last half of the year. Investors found cause for concern in spite of improving earnings and positive economic news. At times, the market's advance was tempered by concerns over rising unemployment; weakness in the value of the dollar; and the escalating federal deficit.
Fund Strategy
The Fund maintained its value-oriented investment strategy of selecting high quality companies with strong balance sheets, superior management teams, and favorable growth prospects. The portfolio is focused in mid-cap companies with market capitalizations between $2 billion and $10 billion. This area of the market offers unique opportunities to invest in companies that blend the stability of larger corporations with the agility of smaller organizations. These holdings are supplemented by select small and large cap positions.
Portfolio holdings continued to emphasize positions in areas leading the market recovery such as Energy, Transportation, and Consumer Staples. The Fund's Energy holdings enjoyed strong performance in 2009. While these positions lagged earlier in the year, prospects for an economic recovery suggested that the pullback in this sector would likely be t emporary. As the economy slowly improved, demand for energy-related products increased. As a result, the stocks of companies such as Chesapeake Energy, with its dominant stake of North American natural gas; and Lufkin Industries, which manufactures oilfield pumping units, had strong performance in the last half of the year. Energy equipment and services companies Mitcham Industries and Ion Geophysical were also majo r contributors to the Fund's outperformance in 2009.
The Fund also benefited from its Transportation holdings. In particular, Kansas City Southern performed well as the company experienced good growth in its primary rail freight business between the U.S. and Mexico. Companies in this area appreciated as signs of increasing economic activity suggested that business conditions for transportation companies would improve. Additionally, stronger companies benefited from consolidation within the industry as weaker competitors were acquired or went out of business.
The Fund enjoyed solid performance in its Consumer Staples holdings, highlighted by gains in Dr Pepper Snapple and Chattem. After the announcement of its acquisition, we sold the Fund's position in Chattem for about a 35% premium from its price prior to the acquisition announcement. During the last half of the year, we sold several positions, includ ing Archer Daniels Midland, Goldman Sachs, Group 1 Automotive, and Western Union, as these companies approached our price targets.
Proceeds from these sales were invested in Penske Automotive Group, a specialty automotive retailer and Marten Transport, a trucking company which specializes in temperature controlled shipping and logistics operations. These companies were attractive because of the growth potential they provide in their respective industries and their low valuations compared to many of their peers. Both companies also have seasoned management teams with proven track records of success.
Looking Ahead
We believe that economic recovery will continue in 2010. Nevertheless, a number of hurdles remain which will limit economic growth and potentially increase market volatility. These impediments include: the expiration of government stimulus programs; the possible emergence of inflationary pressures; political uncertainty surrounding pending legislation and upcoming mid-term elections; elevated unemployment; and the swelling federal deficit.
26
Geopolitical and global economic developments will be a significant influence in the market. Countries such as China and India played a major role in reigniting the global economy. The U.S. economy has begun its recovery while Europe still faces many economic challenges. Additionally, the geopolitical uncertainty in the Middle East will be an important factor in the global recovery.
Given this outlook, we believe the broader market may not repeat its strong 2009 performance. Indeed, in this environment, stock selection will play an increasingly critical role in achieving performance. We expect the market will reward stronger companies that are exercising their competitive advantages over weaker ones to gain market share and grow earnings.
With its focused, value-oriented investment strategy, the Fund will target leading companies with high quality management teams. The portfolio will continue to emphasize mid-cap companies that have the advantage of blending stability and flexibility. The Fund is well positioned to benefit from a developing economic recovery with significant exposure to sectors such as Industrials, Transportation and Energy. As the economic recovery progresses, we will also look to add Consumer Discretionary and Consumer Staples companies which are undervalued and poised to realize good growth as consumer spending increases. We believe temporary market pullbacks will afford opportunities to purchase companies with compelling investment prospects at discounted prices.
27
Pacific Advisors
Multi-Cap Value Fund continued
Portfolio Holdings as of 12/31/09 (Based on Total Investments)
| Equities | 100.00 | % | |||||||||
| 1. | Industrials | 39.21 | % | ||||||||
| 2. | Energy | 36.15 | % | ||||||||
| 3. | Consumer Discretionary | 9.43 | % | ||||||||
| 4. | Materials | 7.83 | % | ||||||||
| 5. | Consumer Staples | 4.43 | % | ||||||||
| 6. | Financials | 2.95 | % | ||||||||
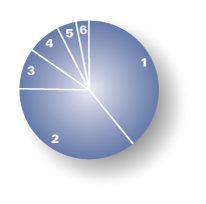
Change in Value of $10,000 Investment1
This chart compares the growth of a $10,000 investment in Class A shares of the Multi-Cap Value Fund for the period April 1, 2002 through December 31, 2009 with the same investment in the S&P 500 Index2.
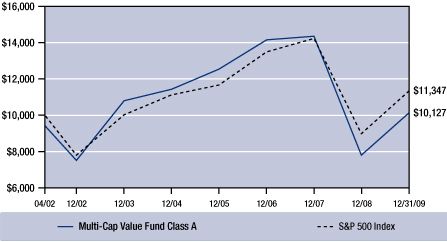
Average Annual Compounded Returns as of December 31, 2009
| Class A | Class C | ||||||||||
| One Year | 22.63 | % | 28.09 | % | |||||||
| Five Year | – 3.55 | % | – 3.19 | % | |||||||
| Since Inception | 0.16 | % | 0.15 | % | |||||||
Past performance does not guarantee future results. Performance quoted represents past performance. Current performance may be higher or lower than the performance data quoted. Returns include reinvested dividends and capital gains. Returns for Class A shares reflect a maximum front-end sales charge of 5.75%; and returns for Class C shares reflect the deduction of a contingent deferred sales charge of 1% on shares sold within the first year of purchase. Returns do not take into account individual taxes which may reduce actual returns when shares are sold. The investment return and principal value of an investment will fluctuate so that an investor's shares, when redeemed, may be worth more or less than their original cost. Call (800) 989-6693 for the most recent month-end performance.
1 Fund results are shown for Class A shares and reflect deduction of the maximum front-end sales charge of 5.75% on the $10,000 investment for a net amount invested of $9,425. At the end of the same period, a $10,000 investment in Class C shares would have been valued at $10,118, and no contingent deferred sales charges would apply. Performance of the share classes will vary based on the difference in charges and expenses. The inception date for Class A shares and Class C shares is 04/01/02. It is not possible to invest directly in the Index. Index results assume reinvestment of dividends, but, unlike the Fund's results, do not reflect sales charges, fees or expenses.
2 The Standard & Poor's 500 Index is an unmanaged, market capitalization weighted measure of 500 widely held common stocks listed on the New York and American Stock Exchanges and The Nasdaq Stock Market.
28
Expense Examples
As a shareholder of the Fund you incur two types of costs: (1) transaction costs, including sales charges (loads) on purchase payments, reinvested dividends, or other distributions; redemption fees; and exchange fees; and (2) ongoing costs, including management fees; distribution (12b-1) fees; and other Fund expenses. This Example is intended to help you understand your ongoing costs (in dollars) of investing in the Fund and to compare these costs with the ongoing costs of investing in other mutual funds.
The Example is based on an investment of $1,000 invested at the beginning of the period and held for the entire period from July 1, 2009 through December 31, 2009.
Actual Expenses
The first line of the table below provides information about actual account values and actual expenses. You may use the information in this line, together with the amount you invested, to estimate the expenses that you paid over the period. Simply divide your account value by $1,000 (for example, an $8,600 account value divided by $1,000 = 8.6), then multiply the result by the number in the first line under the heading entitled "Expenses Paid During the Period" to estimate the expenses you paid on your account during the period.
The following transaction costs are not included in the expenses shown in the table and, if applicable, would increase the expenses that you paid over the period: (1) a front-end sales charge (load) of 5.75% on Class A shares; (2) a 2% redemption fee if you sell or exchange shares within six months of purchase, with certain exceptions. The redemption fee does not apply to: (a) redemptions under an automatic withdrawal program or periodic asset reallocation plan, required minimum distributions (RMD), employer mandated distributions from a qualified plan, or redemptions under a qualified domestic relations order (QDRO); (b) redemptions to pay for expenses related to terminal illness, extended hospital or nursing home care, or other serious medical conditions, including death; (c) redemptions of shares acquired through dividend or capital gains reinvestments, and (d) redemptions initiated by the Fund; and (3) a $10 service fee on each exchange after the first five exchanges in each calendar year.
The following ongoing costs are not included in the expenses shown in the table and, if applicable, would increase the expenses that you paid over the period: (1) a $12 low balance fee on accounts with balances of less than $250 as of September 30th of each calendar year and no investment activity (excluding reinvestment of dividends and/or capital gains) during the prior calendar year or the first nine months of the current calendar year. This fee does not apply to IRAs, qualified plan accounts, or Coverdell Education Savings Accounts; (2) a $15 annual custodial fee on IRAs, SEPs, SIMPLE IRAs, and Coverdell Education Savings Accounts; and (3) a $20 annual custodial fee on 403(b) accounts.
Hypothetical Example for Comparison Purposes
The second line of the table below provides information about hypothetical account values and hypothetical expenses based on the Fund's actual expense ratio and an assumed rate of return of 5% per year before expenses, which in not the Fund's actual return. The hypothetical account values and expenses may not be used to estimate the actual ending account balance or expenses you paid for the period. You may use this information to compare the ongoing costs of investing in the Fund and other funds. To do so, compare this 5% hypothetical example with the 5% hypothetical examples that appear in the shareholder reports of the other funds.
The following transaction costs are not included in the expenses shown in the table and, if applicable, would increase the expenses that you paid over the period: (1) a front-end sales charge (load) of 5.75% on Class A shares; (2) a 2% redemption fee if you sell or exchange shares within six months of purchase, with certain exceptions. The redemption fee does not apply to: (a) redemptions under an automatic withdrawal program or periodic asset reallocation plan, required minimum distributions (RMD), employer mandated distributions from a qualified plan, or redemptions under a qualified domestic relations order (QDRO); (b) redemptions to pay for expenses related to terminal illness, extended hospital or nursing home care, or other serious medical conditions, including death; (c) redemptions of shares acquired through dividend or capital gains reinvestments, and (d) redemptions initiated by the Fund; and (3) a $10 service fee on each exchange after the first five exchanges in each calendar year.
The following ongoing costs are not included in the expenses shown in the table and, if applicable, would increase the expenses that you paid over the period: (1) a $12 low balance fee on accounts with balances of less than $250 as of September 30th of each calendar year and no investment activity (excluding reinvestment of dividends and/or capital gains) during the prior calendar year or the first nine months of the current calendar year. This fee does not apply to IRAs, qualified plan accounts, or Coverdell Education Savings Accounts; (2) a $15 annual custodial fee on IRAs, SEPs, SIMPLE IRAs, and Coverdell Education Savings Accounts; and (3) a $20 annual custodial fee on 403(b) accounts.
Please note that the expenses shown in the table are meant to highlight your ongoing costs only and do not reflect any transactional costs, such as sales charges (loads), redemption fees, or exchange fees. Therefore, the second line of the table is useful in comparing ongoing costs only, and will not help you determine the relative total costs of owning different funds. In addition, if these transactional costs were included, your costs would have been higher.
| Beginning Account Value 07/01/09 | Ending Account Value 12/31/09 | Expense Paid During Period 07/01/09 – 12/31/09 | |||||||||||||
| Multi-Cap Value Fund Class A | |||||||||||||||
| Actual | $ | 1,000.00 | $ | 1,254.30 | $ | 20.97 | |||||||||
| Hypothetical (5% return before expense) | $ | 1,000.00 | $ | 1,025.21 | $ | 18.84 | |||||||||
| Multi-Cap Value Fund Class C | |||||||||||||||
| Actual | $ | 1,000.00 | $ | 1,249.60 | $ | 25.35 | |||||||||
| Hypothetical (5% return before expense) | $ | 1,000.00 | $ | 1,025.21 | $ | 22.82 | |||||||||
3 Expenses are equal to the Fund's annualized expense ratio of 3.69% for Class A shares and 4.47% for Class C shares, multiplied by the average account value over the period, multiplied by 184/365 days to reflect the one-half year period.
29
Pacific Advisors
Small Cap Fund
Seeks to achieve long-term capital appreciation. Invests in small company stocks with strong earnings growth potential using a value investment approach with a focus on companies whose market capitalization is below $500 million.
| TOTAL RETURNS | EXPENSE RATIOS | ||||||||||||||
| For the year ended December 31, 2009 | For the fiscal year ended December 31, 2009 | ||||||||||||||
| Class A | 37.27 | % | Class A | 2.44 | % | ||||||||||
| Class C | 36.21 | % | Class C | 3.17 | % | ||||||||||
| Class I | 37.48 | % | Class I | 2.16 | % | ||||||||||
| Russell 2000 Index1 | 27.17 | % | |||||||||||||
Please see the Financial Highlights in this report for expense ratios for the fiscal year ended December 31, 2009.
Performance quoted is past performance which does not guarantee future results. Current performance may be higher or lower than the performance quoted. Call (800) 989-6693 for performance current to the most recent month-end. The investment return and principal value of an investment will fluctuate so that an investor's shares, when redeemed, may be worth more or less than their original cost. Returns represent the change in value over the stated period assuming reinvestment of dividends and capital gains at net asset value. Returns do not take into account the maximum 5.75% sales charge on Class A shares or the 1% Contingent Deferred Sales Charge (CDSC) for Class C shares sold within one year of purchase. Returns would be lower if the applicable sales charge and CDSC were included. Returns do not take into account individual taxes which may reduce actua l returns when shares are sold.
Discussion with Portfolio Manager February 12, 2010
George A. Henning
Fund Performance
Class A shares returned an impressive 37.27% for the year and outperformed the Russell 2000 benchmark by 10.10%. The Fund's strong performance was the result of active portfolio management and a disciplined investment approach. Throughout the unprecedented events of the past two years, the Fund remained focused on leading businesses with superior management. We believe our long-term strategy and discipline provided a key advantage during 2009 as companies in the portfolio began to benefit from economic recovery.
Early recovery sectors saw the strongest gains as the economy emerged from recession. Positions in these areas including Industrials, Energy, Consumer Discretionary, and Materials, contributed significantly to the Fund's performance. Together, these sectors accounted for 67% of the portfolio at year-end as we positioned the Fund to benefit from an o ngoing economic rebound.
Fund performance was led by its Consumer Discretionary holdings. Standouts in this sector included Sonic Automotive and Amerigon. Energy holdings, led by Infinity Energy, Mitcham Industries, and Toreador Resources also performed admirably. Other notable performers included Orion Marine Group, Vitran, Phillips-Van Heusen, Parker Drilling, Tyler Technologies, Terra Industries and Darling International. The diversity of outstanding stock performance underscores the merits of our focus on individual companies.
Market Overview
Economic recovery began to take shape in the second half of 2009: manufacturing activity rebounded; commodity prices rose; consumer spending reversed its negative trend; and housing and auto sales improved. The return to GDP growth in the U.S. during the third quarter was a culmination of these events and officially marked the end of the recession. Globally, recovery emerged in a number of developed and developing countries led by robust growth in China and India.
1 The Russell 2000 Stock Index is an unmanaged, market-weighted measure of the 2,000 smallest publicly traded companies of the Russell 3000 Index. Index returns assume the reinvestment of dividends, but, unlike the Fund's returns, do not reflect management fees or expenses.
30
The second half of 2009 came on the heels of a major market selloff. Despite a "relief rally" at the beginning of the third quarter, stocks traded at severely depressed levels as investors remained wary about the economy. Investment opportunities began to emerge as stronger companies separated themselves from weaker competitors. Better-than-expected second quarter earnings were the first catalysts in pushing the markets higher in the last half of the year.
Improvements in key economic data strengthened the bullish trend. While investors remained cautious, fear slowly gave way to more opportunistic investing as evidence of a recovery increased. A surge in merger and acquisitions activity sparked additional buying. Stronger companies looked to take advantage of depressed equity valuations and low interest rates to grow their businesses. Among the Fund's holdings, Darling International, EZCORP, Orion Marine Group and Matrix Service announced acquisitions in 2009 or early 2010.
Equities achieved impressive gains in 2009. The Russell 2000 rose 27.17%while the S&P 500 gained 26.46%. More significantly, from their March lows, the Russell 2000 and the S&P 500 rebounded over 82% and 67%, respectively. The notable outperformance in the Russell compared to the S&P during this period highlights the strength of small cap stocks during periods of economic recovery. The Fund also achieved a remarkable recovery over the same period as Class A shares rebounded more than 106% from their March low through the end of the year.
Fund Strategy
Despite the weak economic environment, several companies enjoyed outstanding performance in 2009. Challenging conditions created unique opportunities for companies including East West Bancorp which acquired its biggest competitor, United Commercial Bank, in an FDIC-sponsored takeover. The deal includes substantial FDIC guarantees against losses on the acquired loan portfolio and demonstrates the FDIC's confidence in EastWest. The acquisition also significantly expanded EastWest's footprint in the U.S. and Asia, including China. In addition, Fund holding Wilshire Bancorp took over Mirae Bancorp in a similarly structured FDIC-sponsored deal.
Our strategy to identify superior franchises whose operations would be further enhanced by economic stimulus programs also contributed to the Fund's sucess. This included Orion Marine Group which performs marine infrastructure construction. Orion, which already had a healthy backlog of marine construction work, was an early beneficiary of the stimulus package. In response to significant growth opportunities, it made additional capital investments to increase its fleet of special-purpose dredging vessels. Furthermore, Orion stands to profit from longer-term trends including the widening of the Panama Canal and growing demand from the cruise industry.
Sonic Automotive also benefited from government stimulus programs. The company owns and operates a substantial portfolio of luxury car dealerships across the nation. Following improved performance in the second quarter, Sonic profited from the surge in car sales during the third quarter in response to the Cash for Clunkers program. Sonic's long-term prospects are bright as new car sales recover and the used car and service segments remain strong.
Participation in the Energy sector further added to portfolio performance. Firms such as Infinity Energy, with offshore drilling rights in Nicaragua; Mitcham Industries, a lessor of seismic data equipment; and Toreador Resources, with sizable oil and gas reserves in France, benefited from the increase in energy prices during the last half of the yea r. We expect prices to remain within the $60 to $85 per barrel range due to fairly balanced supply and demand. At these prices, most exploration and production projects are profitable; we believe energy-related companies will benefit from an increase in oil exploration and production as well as other energy services activity.
Companies which saw business improve despite economic weakness included pawn shop operators EZCORP and First Cash Financial. Demand for these companies' services continued to increase as traditional consumer financing remained more difficult to obtain. Record gold prices also contributed to their profits as jewelry makes up a significant share of pawned goods. While these companies clearly exhibited their ability to perform in a downturn, they continue to be attractive investments due to compelling growth prospects. During 2009, each company aggressively expanded its international operations beyond the U.K. and Mexico to fertile new markets such as Canada and Australia.
31
Pacific Advisors
Small Cap Fund continued
Looking Ahead
While recovery will continue, we expect economic growth will be slow and uneven. High unemployment and record fiscal deficits are likely to temper economic growth. A shifting political landscape will likely create investor uncertainty. In light of these headwinds, we anticipate continued market volatility.
Each industry faces its own set of challenges; the performance of individual companies will vary depending on the unique circumstances under which they operate. The Fund's strategy, therefore, will continue to focus on the fundamental strength of individual companies. The portfolio will emphasize those areas expected to benefit from economic recovery. This includes Energy as we believe that, given its long-term demand, natural gas, in particular, will be a favorable area of investment. Additionally, Industrials and Materials should gain from a continued increase in infrastructure projects. Consumer Discretionary companies are also expected to benefit from growth in manufacturing and transportation activity as well as consumer spending.
In addition, we continue to identify company-specific situations that offer significant investment opportunities. The examples cited below are but a few of the business opportunities we believe will develop for the Fund's portfolio in the coming year. They include Matrix Service which provides repair and maintenance services to energy and industrial companies. Matrix should benefit from increased repair and construction activity by energy and related companies, as well as from its expansion into the power construction market. We also see a unique opportunity in Nara Banco rp which is positioned to become one of the primary community banks serving the Korean American demographic. Likewise, Premiere Global Services has the potential to become a more dominant force in its industry with the launch a new web conferencing platform. Additionally, we see strong potential for Tyler Technologies, a provider of software and services to local governments, which should see increased business as municipalities contract for IT services to combat budget pressures.
The past year has proven that firms with solid management, strong balance sheets, effective business models and sound growth strategies are better equipped to succeed in any environment. The opportunity for strong companies to gain market share and grow their businesses in a weak recovery offers some compelling investment prospects. We anticipate temporary market pullbacks will provide opportunities to acquire solid stocks at discounted prices. While the pace of growth and realization of growth opportunities will vary for each company and industry, we believe patient investors will be rewarded as economic recovery continues.
32
Portfolio Holdings as of 12/31/09 (Based on Total Investments)
| Equities | 100.00 | % | |||||||||
| 1. | Industrials | 32.49 | % | ||||||||
| 2. | Financials | 19.19 | % | ||||||||
| 3. | Energy | 16.93 | % | ||||||||
| 4. | Consumer Discretionary | 10.85 | % | ||||||||
| 5. | Health Care | 8.13 | % | ||||||||
| 6. | Consumer Staples | 5.02 | % | ||||||||
| 7. | Materials | 3.13 | % | ||||||||
| 8. | Telecommunication Services | 2.77 | % | ||||||||
| 9. | Information Technology | 1.49 | % | ||||||||
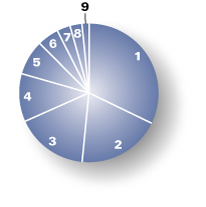
Change in Value of $10,000 Investment1
This chart compares the growth of a $10,000 investment in Class A shares of the Small Cap Fund for the period January 1, 2000 through December 31, 2009 with the same investment in the Russell 2000 Index2.
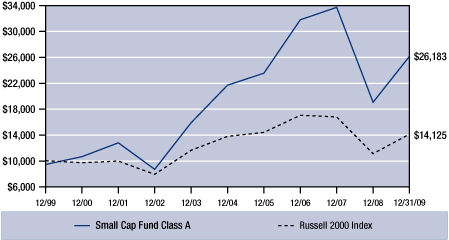
Average Annual Compounded Returns as of December 31, 2009
| Class A | Class C | Class I | |||||||||||||
| One Year | 29.39 | % | 35.21 | % | 37.48 | % | |||||||||
| Five Year | 2.61 | % | 2.96 | % | NA | ||||||||||
| Ten Year | 10.11 | % | 9.48 | % | NA | ||||||||||
| Since Inception | 8.64 | % | 3.72 | % | – 2.61 | % | |||||||||
Past performance does not guarantee future results. Performance quoted represents past performance. Current performance may be higher or lower than the performance data quoted. Returns include reinvested dividends and capital gains. Returns for Class A shares reflect a maximum front-end sales charge of 5.75%; and returns for Class C shares reflect the deduction of a contingent deferred sales charge of 1% on shares sold within the first year of purchase. Returns do not take into account individual taxes which may reduce actual returns when shares are sold. Rankings do not take sales loads into account. Small cap stocks typically have fewer financial resources and may carry higher risks and experience greater volatility than large cap stocks. The investment return and principal value of an investment will fluctuate so that an investor's shares, when redeemed, may be worth more or less than their original cost. Call (800) 989-6693 for the most recent month-end performance.
1 Fund results are shown for Class A shares and reflect deduction of the maximum front-end sales charge of 5.75% on the $10,000 investment for a net amount invested of $9,425. At the end of the same period, a $10,000 investment in Class C shares would have been valued at $24,721, and no contingent deferred sales charges would apply. The inception date is 02/08/93 for Class A shares; 04/01/98 for Class C shares; and 10/09/06 for Class I shares. From inception through December 31, 2009, a $10,000 investment in Class I shares would have been valued at $9,194, and no contingent deferred sales charges would apply. Performance of the share classes will vary based on the difference in charges and expenses. It is not possible to invest directly in the Index. Index results assume reinvestment of dividends, but, unlike the Fund's results, do not reflect sales charges, commissions or expenses.
2 The Russell 2000 Stock Index is an unmanaged, weighted measure of the 2,000 smallest companies within the Russell 3000 Index.
33
Pacific Advisors
Small Cap Fund continued
Expense Examples
As a shareholder of the Fund you incur two types of costs: (1) transaction costs, including sales charges (loads) on purchase payments, reinvested dividends, or other distributions; redemption fees; and exchange fees; and (2) ongoing costs, including management fees; distribution (12b-1) fees; and other Fund expenses. This Example is intended to help you understand your ongoing costs (in dollars) of investing in the Fund and to compare these costs with the ongoing costs of investing in other mutual funds.
The Example is based on an investment of $1,000 invested at the beginning of the period and held for the entire period from July 1, 2009 through December 31, 2009.
Actual Expenses
The first line of the table below provides information about actual account values and actual expenses. You may use the information in this line, together with the amount you invested, to estimate the expenses that you paid over the period. Simply divide your account value by $1,000 (for example, an $8,600 account value divided by $1,000 = 8.6), then multiply the result by the number in the first line under the heading entitled "Expenses Paid During the Period" to estimate the expenses you paid on your account during the period.
The following transaction costs are not included in the expenses shown in the table and, if applicable, would increase the expenses that you paid over the period: (1) a front-end sales charge (load) of 5.75% on Class A shares; (2) a 2% redemption fee if you sell or exchange shares within six months of purchase, with certain exceptions. The redemption fee does not apply to: (a) redemptions under an automatic withdrawal program or periodic asset reallocation plan, required minimum distributions (RMD), employer mandated distributions from a qualified plan, or redemptions under a qualified domestic relations order (QDRO); (b) redemptions to pay for expenses related to terminal illness, extended hospital or nursing home care, or other serious medical conditions, including death; (c) redemptions of shares acquired through dividend or capital gains reinvestments, and (d) redemptions initiated by the Fund; and (3) a $10 service fee on each exchange after the first five exchanges in each calendar year.
The following ongoing costs are not included in the expenses shown in the table and, if applicable, would increase the expenses that you paid over the period: (1) a $12 low balance fee on accounts with balances of less than $250 as of September 30th of each calendar year and no investment activity (excluding reinvestment of dividends and/or capital gains) during the prior calendar year or the first nine months of the current calendar year. This fee does not apply to IRAs, qualified plan accounts, or Coverdell Education Savings Accounts; (2) a $15 annual custodial fee on IRAs, SEPs, SIMPLE IRAs, and Coverdell Education Savings Accounts; and (3) a $20 annual custodial fee on 403(b) accounts.
Hypothetical Example for Comparison Purposes
The second line of the table below provides information about hypothetical account values and hypothetical expenses based on the Fund's actual expense ratio and an assumed rate of return of 5% per year before expenses, which in not the Fund's actual return. The hypothetical account values and expenses may not be used to estimate the actual ending account balance or expenses you paid for the period. You may use this information to compare the ongoing costs of investing in the Fund and other funds. To do so, compare this 5% hypothetical example with the 5% hypothetical examples that appear in the shareholder reports of the other funds.
The following transaction costs are not included in the expenses shown in the table and, if applicable, would increase the expenses that you paid over the period: (1) a front-end sales charge (load) of 5.75% on Class A shares; (2) a 2% redemption fee if you sell or exchange shares within six months of purchase, with certain exceptions. The redemption fee does not apply to: (a) redemptions under an automatic withdrawal program or periodic asset reallocation plan, required minimum distributions (RMD), employer mandated distributions from a qualified plan, or redemptions under a qualified domestic relations order (QDRO); (b) redemptions to pay for expenses related to terminal illness, extended hospital or nursing home care, or other serious medical conditions, including death; (c) redemptions of shares acquired through dividend or capital gains reinvestments, and (d) redemptions initiated by the Fund; and (3) a $10 service fee on each exchange after the first five exchanges in each calendar year.
The following ongoing costs are not included in the expenses shown in the table and, if applicable, would increase the expenses that you paid over the period: (1) a $12 low balance fee on accounts with balances of less than $250 as of September 30th of each calendar year and no investment activity (excluding reinvestment of dividends and/or capital gains) during the prior calendar year or the first nine months of the current calendar year. This fee does not apply to IRAs, qualified plan accounts, or Coverdell Education Savings Accounts; (2) a $15 annual custodial fee on IRAs, SEPs, SIMPLE IRAs, and Coverdell Education Savings Accounts; and (3) a $20 annual custodial fee on 403(b) accounts.
Please note that the expenses shown in the table are meant to highlight your ongoing costs only and do not reflect any transactional costs, such as sales charges (loads), redemption fees, or exchange fees. Therefore, the second line of the table is useful in comparing ongoing costs only, and will not help you determine the relative total costs of owning different funds. In addition, if these transactional costs were included, your costs would have been higher.
| Beginning Account Value 07/01/09 | Ending Account Value 12/31/09 | Expense Paid During Period 07/01/09 – 12/31/09 | |||||||||||||
| Small Cap Fund Class A | |||||||||||||||
| Actual | $ | 1,000.00 | $ | 1,119.70 | $ | 13.30 | |||||||||
| Hypothetical (5% return before expense) | $ | 1,000.00 | $ | 1,025.21 | $ | 12.71 | |||||||||
| Small Cap Fund Class C | |||||||||||||||
| Actual | $ | 1,000.00 | $ | 1,115.60 | $ | 17.28 | |||||||||
| Hypothetical (5% return before expense) | $ | 1,000.00 | $ | 1,025.21 | $ | 16.54 | |||||||||
| Small Cap Fund Class I | |||||||||||||||
| Actual | $ | 1,000.00 | $ | 1,120.50 | $ | 11.97 | |||||||||
| Hypothetical (5% return before expense) | $ | 1,000.00 | $ | 1,025.21 | $ | 11.43 | |||||||||
3 Expenses are equal to the Fund's annualized expense ratio of 2.49% for Class A shares, 3.24% for Class C shares and 2.24% for Class I shares, multiplied by the average account value over the period, multiplied by 184/365 days to reflect the one-half year period.
34

Pacific Advisors Fund Inc.
financial statements
35
Pacific Advisors Government Securities Fund
Statement of Investments
as of December 31, 2009
| Quantity or Principal | Description | Current $ Value** | % of Total Net Assets | ||||||||||||
| COMMON STOCK | |||||||||||||||
| ENERGY | 2.63 | ||||||||||||||
| OIL, GAS & CONSUMABLE FUELS | |||||||||||||||
| 1,000 | BRITISH PETROLEUM PLC ADR | 58,135 | |||||||||||||
| 1,000 | CHEVRON CORP. | 76,990 | |||||||||||||
| 135,125 | 2.63 | ||||||||||||||
| TELECOMMUNICATION SERVICES | 1.37 | ||||||||||||||
| DIVERSIFIED TELECOM. SERVICES | |||||||||||||||
| 2,500 | AT&T INC. | 70,075 | |||||||||||||
| 70,075 | 1.37 | ||||||||||||||
| UTILITIES | 2.16 | ||||||||||||||
| ELECTRIC UTILITIES | |||||||||||||||
| 1,000 | PPL CORP. | 32,310 | |||||||||||||
| 1,000 | SOUTHERN CO. | 33,320 | |||||||||||||
| 65,630 | 1.28 | ||||||||||||||
| MULTI-UTILITIES | |||||||||||||||
| 1,000 | CONSOLIDATED EDISON INC. | 45,430 | |||||||||||||
| 45,430 | 0.89 | ||||||||||||||
| TOTAL COMMON STOCK (Cost: $300,631) | 316,260 | 6.16 | |||||||||||||
| US GOVT SECURITIES | |||||||||||||||
| US GOVERNMENT AGENCY | 90.62 | ||||||||||||||
| US GOVERNMENT AGENCY | |||||||||||||||
| 100,000 | FEDERAL FARM CREDIT BANK 3.45% 10/22/15 | 98,719 | |||||||||||||
| 400,000 | FEDERAL FARM CREDIT BANK 3.45% 12/08/15 | 394,131 | |||||||||||||
| 132,000 | FEDERAL HOME LN MTG CORP. 2.50% 03/23/12 | 132,517 | |||||||||||||
| 100,000 | FEDERAL HOME LN MTG CORP. 2.125% 04/02/12 | 100,408 | |||||||||||||
| 125,000 | FEDERAL HOME LN MTG CORP. 3.00% 02/04/14 | 125,308 | |||||||||||||
| 200,000 | FEDERAL HOME LN MTG CORP. 3.25% 02/18/14 | 200,754 | |||||||||||||
| 200,000 | FEDERAL HOME LN MTG CORP. 3.25% 03/03/14 | 200,487 | |||||||||||||
| 80,000 | FEDERAL HOME LOAN BANK 1.85% 03/25/11 | 80,231 | |||||||||||||
| 300,000 | FEDERAL HOME LOAN BANK 2.00% 01/05/12 | 300,013 | |||||||||||||
| 100,000 | FEDERAL HOME LOAN BANK 2.25% 06/22/12 | 100,759 | |||||||||||||
| 315,000 | FEDERAL HOME LOAN BANK 2.30% 03/25/13 | 314,589 | |||||||||||||
| 100,000 | FEDERAL HOME LOAN BANK 4.27% 09/17/13 | 102,860 | |||||||||||||
| 135,000 | FEDERAL HOME LOAN BANK 3.00% 04/07/14 | 135,035 | |||||||||||||
| 165,000 | FEDERAL HOME LOAN BANK 3.00% 04/07/14 | 165,348 | |||||||||||||
| 300,000 | FEDERAL HOME LOAN BANK 3.05% 05/12/14 | 299,155 | |||||||||||||
| 222,500 | FEDERAL HOME LOAN BANK 3.00% 05/20/14 | 222,501 | |||||||||||||
| 200,000 | FEDERAL HOME LOAN BANK 3.00% 11/24/14 STEP | 197,305 | |||||||||||||
| 100,000 | FEDERAL HOME LOAN BANK 4.60% 01/14/15 | 100,118 | |||||||||||||
| 125,000 | FEDERAL HOME LOAN BANK 5.35% 09/27/17 | 128,590 | |||||||||||||
See Accompanying Notes to Financial Statements
36
Pacific Advisors Government Securities Fund
Statement of Investments
as of December 31, 2009
| Quantity or Principal | Description | Current $ Value** | % of Total Net Assets | ||||||||||||
| US GOVT SECURITIES continued | |||||||||||||||
| 100,000 | FEDERAL HOME LOAN BANK 5.20% 12/21/17 | 101,945 | |||||||||||||
| 425,000 | FEDERAL HOME LOAN BANK 4.50% 02/15/18 | 427,935 | |||||||||||||
| 100,000 | FEDERAL HOME LOAN BANK 5.20% 06/25/18 | 100,763 | |||||||||||||
| 100,000 | FEDERAL HOME LOAN BANK 5.50% 11/08/18 | 102,734 | |||||||||||||
| 200,000 | FEDERAL HOME LOAN BANK 6.375% 06/29/22 | 203,048 | |||||||||||||
| 100,000 | FEDERAL NATL MTG ASSOC. 2.50% 02/17/12 | 100,270 | |||||||||||||
| 215,000 | FEDERAL NATL MTG ASSOC. 5.50% 01/24/22 | 213,417 | |||||||||||||
| 4,648,939 | 90.62 | ||||||||||||||
| TOTAL US GOVT SECURITIES (Cost: $4,665,123) | 4,648,939 | 90.62 | |||||||||||||
| PREFERRED STOCK | |||||||||||||||
| FINANCIALS | 3.34 | ||||||||||||||
| COMMERCIAL BANKS | |||||||||||||||
| 4,000 | BARCLAYS BANK PLC 6.625% PFD | 81,320 | |||||||||||||
| 2,000 | BARCLAYS BANK PLC 7.10% PFD | 44,180 | |||||||||||||
| 125,500 | 2.45 | ||||||||||||||
| DIVERSIFIED FINANCIAL SERVICES | |||||||||||||||
| 2,000 | DEUTSCHE BANK 7.35% PFD | 45,940 | |||||||||||||
| 45,940 | 0.90 | ||||||||||||||
| TOTAL PREFERRED STOCK (Cost: $200,000) | 171,440 | 3.34 | |||||||||||||
| SHORT TERM INVESTMENTS | |||||||||||||||
| MONEY MARKET | 3.53 | ||||||||||||||
| 181,059 | UMB MONEY MARKET FIDUCIARY | 181,059 | |||||||||||||
| 181,059 | 3.53 | ||||||||||||||
| TOTAL SHORT TERM INVESTMENTS (Cost: $181,059) | 181,059 | 3.53 | |||||||||||||
| TOTAL INVESTMENTS (Cost: $5,346,813) | 5,317,698 | 103.65 | |||||||||||||
| OTHER ASSETS LESS LIABILITIES | (187,164 | ) | (3.65 | ) | |||||||||||
| TOTAL NET ASSETS | 5,130,534 | 100.00 | |||||||||||||
* Non-income producing
** The principal amount is stated in U.S. dollars unless otherwise indicated.
See Accompanying Notes to Financial Statements
37
Pacific Advisors Income and Equity Fund
Statement of Investments
as of December 31, 2009
| Quantity or Principal | Description | Current $ Value** | % of Total Net Assets | ||||||||||||
| COMMON STOCK | |||||||||||||||
| CONSUMER DISCRETIONARY | 3.51 | ||||||||||||||
| DISTRIBUTORS | |||||||||||||||
| 1,000 | GENUINE PARTS CO. | 37,960 | |||||||||||||
| 37,960 | 0.47 | ||||||||||||||
| HOTELS, RESTAURANTS & LEISURE | |||||||||||||||
| 2,500 | MCDONALD'S CORP. | 156,100 | |||||||||||||
| 156,100 | 1.95 | ||||||||||||||
| SPECIALTY RETAIL | |||||||||||||||
| 3,000 | HOME DEPOT INC. | 86,790 | |||||||||||||
| 86,790 | 1.09 | ||||||||||||||
| CONSUMER STAPLES | 4.30 | ||||||||||||||
| FOOD & STAPLES RETAILING | |||||||||||||||
| 2,500 | WAL-MART STORES INC. | 133,625 | |||||||||||||
| 133,625 | 1.67 | ||||||||||||||
| HOUSEHOLD PRODUCTS | |||||||||||||||
| 2,500 | PROCTER & GAMBLE CO. | 151,575 | |||||||||||||
| 151,575 | 1.90 | ||||||||||||||
| TOBACCO | |||||||||||||||
| 3,000 | ALTRIA GROUP INC. | 58,890 | |||||||||||||
| 58,890 | 0.74 | ||||||||||||||
| ENERGY | 5.89 | ||||||||||||||
| OIL, GAS & CONSUMABLE FUELS | |||||||||||||||
| 1,000 | APACHE CORP. | 103,170 | |||||||||||||
| 1,000 | BRITISH PETROLEUM PLC ADR | 57,970 | |||||||||||||
| 1,500 | CONOCOPHILLIPS | 76,605 | |||||||||||||
| 3,000 | MARATHON OIL CORP. | 93,660 | |||||||||||||
| 1,000 | OCCIDENTAL PETROLEUM CORP. | 81,350 | |||||||||||||
| 1,250 | XTO ENERGY INC. | 58,163 | |||||||||||||
| 470,918 | 5.89 | ||||||||||||||
| FINANCIALS | 1.68 | ||||||||||||||
| DIVERSIFIED FINANCIAL SERVICES | |||||||||||||||
| 4,000 | BANK OF AMERICA CORP. | 60,240 | |||||||||||||
| 60,240 | 0.75 | ||||||||||||||
| INSURANCE | |||||||||||||||
| 1,500 | CHUBB CORP. | 73,770 | |||||||||||||
| 73,770 | 0.92 | ||||||||||||||
See Accompanying Notes to Financial Statements
38
Pacific Advisors Income and Equity Fund
Statement of Investments
as of December 31, 2009
| Quantity or Principal | Description | Current $ Value** | % of Total Net Assets | ||||||||||||
| COMMON STOCK continued | |||||||||||||||
| HEALTH CARE | 3.22 | ||||||||||||||
| PHARMACEUTICALS | |||||||||||||||
| 4,000 | JOHNSON & JOHNSON | 257,640 | |||||||||||||
| 257,640 | 3.22 | ||||||||||||||
| INDUSTRIALS | 4.31 | ||||||||||||||
| AEROSPACE & DEFENSE | |||||||||||||||
| 2,000 | HONEYWELL INT'L INC. | 78,400 | |||||||||||||
| 78,400 | 0.98 | ||||||||||||||
| AIR FREIGHT & LOGISTICS | |||||||||||||||
| 2,000 | UNITED PARCEL SERVICE INC. | 114,740 | |||||||||||||
| 114,740 | 1.44 | ||||||||||||||
| INDUSTRIAL CONGLOMERATES | |||||||||||||||
| 10,000 | GENERAL ELECTRIC CO. | 151,300 | |||||||||||||
| 151,300 | 1.89 | ||||||||||||||
| INFORMATION TECHNOLOGY | 1.91 | ||||||||||||||
| SOFTWARE | |||||||||||||||
| 5,000 | MICROSOFT CORP. | 152,450 | |||||||||||||
| 152,450 | 1.91 | ||||||||||||||
| MATERIALS | 0.42 | ||||||||||||||
| CHEMICALS | |||||||||||||||
| 1,000 | DUPONT DE NEMOURS & CO. | 33,670 | |||||||||||||
| 33,670 | 0.42 | ||||||||||||||
| TELECOMMUNICATION SERVICES | 2.30 | ||||||||||||||
| DIVERSIFIED TELECOM. SERVICES | |||||||||||||||
| 3,000 | AT&T INC. | 84,090 | |||||||||||||
| 3,000 | VERIZON COMMUNICATIONS INC. | 99,390 | |||||||||||||
| 183,480 | 2.30 | ||||||||||||||
| UTILITIES | 2.77 | ||||||||||||||
| ELECTRIC UTILITIES | |||||||||||||||
| 2,000 | DUKE ENERGY CORP. | 34,420 | |||||||||||||
| 34,420 | 0.43 | ||||||||||||||
See Accompanying Notes to Financial Statements
39
Pacific Advisors Income and Equity Fund
Statement of Investments
as of December 31, 2009
| Quantity or Principal | Description | Current $ Value** | % of Total Net Assets | ||||||||||||
| COMMON STOCK continued | |||||||||||||||
| MULTI-UTILITIES | |||||||||||||||
| 2,000 | DOMINION RESOURCES INC. | 77,840 | |||||||||||||
| 2,000 | PUBLIC SERVICE ENTERPRISE GROUP INC. | 66,500 | |||||||||||||
| 2,000 | XCEL ENERGY INC. | 42,460 | |||||||||||||
| 186,800 | 2.34 | ||||||||||||||
| TOTAL COMMON STOCK (Cost: $2,476,431) | 2,422,767 | 30.31 | |||||||||||||
| CORPORATE BONDS | |||||||||||||||
| CONSUMER DISCRETIONARY | 8.12 | ||||||||||||||
| DIVERSIFIED COMMERCIAL SERVICES | |||||||||||||||
| 50,000 | EQUIFAX INC. 6.30% 07/01/17 | 51,016 | |||||||||||||
| 51,016 | 0.64 | ||||||||||||||
| HOTELS, RESTAURANTS & LEISURE | |||||||||||||||
| 50,000 | MARRIOTT INT'L 5.625% 02/15/13 | 51,306 | |||||||||||||
| 51,306 | 0.64 | ||||||||||||||
| MULTILINE RETAIL | |||||||||||||||
| 35,000 | NORDSTROM INC. 6.75% 06/01/14 | 39,088 | |||||||||||||
| 281,000 | TARGET CORP. 8.60% 01/15/12 | 315,824 | |||||||||||||
| 354,912 | 4.44 | ||||||||||||||
| SPECIALTY RETAIL | |||||||||||||||
| 100,000 | HOME DEPOT INC. 5.20% 03/01/11 | 103,769 | |||||||||||||
| 80,000 | STAPLES INC. 7.375% 10/01/12 | 88,057 | |||||||||||||
| 191,826 | 2.40 | ||||||||||||||
| ENERGY | 4.92 | ||||||||||||||
| ENERGY EQUIPMENT & SERVICES | |||||||||||||||
| 50,000 | WEATHERFORD INT'L LTD. 5.95% 06/15/12 | 53,511 | |||||||||||||
| 53,511 | 0.67 | ||||||||||||||
| OIL, GAS & CONSUMABLE FUELS | |||||||||||||||
| 143,000 | ATLANTIC RICHFIELD 8.50% 04/01/12 | 163,287 | |||||||||||||
| 170,000 | TEXACO CAPITAL 8.625% 06/30/10 | 176,322 | |||||||||||||
| 339,610 | 4.25 | ||||||||||||||
| FINANCIALS | 20.50 | ||||||||||||||
| CONSUMER FINANCE | |||||||||||||||
| 50,000 | HOSPITALITY PROPERTIES TRUST 7.875% 08/15/14 | 51,618 | |||||||||||||
| 51,618 | 0.65 | ||||||||||||||
See Accompanying Notes to Financial Statements
40
Pacific Advisors Income and Equity Fund
Statement of Investments
as of December 31, 2009
| Quantity or Principal | Description | Current $ Value** | % of Total Net Assets | ||||||||||||
| CORPORATE BONDS continued | |||||||||||||||
| DIVERSIFIED FINANCIAL SERVICES | |||||||||||||||
| 300,000 | AIG 6.00% 11/15/14 | 205,215 | |||||||||||||
| 30,000 | AMERICAN EXPRESS CO. 5.00% 12/02/10 | 30,967 | |||||||||||||
| 200,000 | AMERICAN EXPRESS CO. 7.30% 08/20/13 | 224,776 | |||||||||||||
| 371,000 | GENERAL ELECTRIC CAP 8.125% 05/15/12 | 414,086 | |||||||||||||
| 150,000 | GENERAL ELECTRIC CAP 5.50% 09/30/16 STEP | 150,908 | |||||||||||||
| 100,000 | GENERAL ELECTRIC CAP 5.40% 02/15/17 | 102,059 | |||||||||||||
| 95,000 | GOLDMAN SACHS GROUP 5.00% 10/01/14 | 100,178 | |||||||||||||
| 106,000 | HSBC 11/10/13 FLOAT | 102,558 | |||||||||||||
| 50,000 | SCHWAB CORP. 6.375% 09/01/17 | 54,142 | |||||||||||||
| 1,384,889 | 17.32 | ||||||||||||||
| INSURANCE | |||||||||||||||
| 28,000 | HARTFORD LIFE INSURANCE 6.00% 09/15/21 | 26,597 | |||||||||||||
| 75,000 | HARTFORD LIFE GLOBAL FUND 6.00% 07/15/15 | 75,584 | |||||||||||||
| 100,000 | PROTECTIVE LIFE 05/10/10 FLOAT | 99,765 | |||||||||||||
| 201,945 | 2.53 | ||||||||||||||
| HEALTH CARE | 1.24 | ||||||||||||||
| HEALTH CARE PROVIDERS & SERVICES | |||||||||||||||
| 46,000 | WELLPOINT INC. 5.00% 12/15/14 | 47,855 | |||||||||||||
| 47,855 | 0.60 | ||||||||||||||
| LIFE SCIENCES TOOLS & SERVICES | |||||||||||||||
| 50,000 | FISHER SCIENTIFIC INT'L. 6.125% 07/01/15 | 51,563 | |||||||||||||
| 51,563 | 0.65 | ||||||||||||||
| INDUSTRIALS | 2.59 | ||||||||||||||
| MACHINERY | |||||||||||||||
| 115,000 | JOY GLOBAL INC. 6.00% 11/15/16 | 116,350 | |||||||||||||
| 90,000 | TRINITY INDUSTRIES INC. 6.50% 03/15/14 | 90,563 | |||||||||||||
| 206,912 | 2.59 | ||||||||||||||
| INFORMATION TECHNOLOGY | 1.32 | ||||||||||||||
| COMPUTERS & PERIPHERALS | |||||||||||||||
| 50,000 | DELL INC. 5.65% 04/15/18 | 52,383 | |||||||||||||
| 52,383 | 0.66 | ||||||||||||||
| OFFICE ELECTRONICS | |||||||||||||||
| 50,000 | XEROX CORP. 5.50% 05/15/12 | 52,841 | |||||||||||||
| 52,841 | 0.66 | ||||||||||||||
See Accompanying Notes to Financial Statements
41
Pacific Advisors Income and Equity Fund
Statement of Investments
as of December 31, 2009
| Quantity or Principal | Description | Current $ Value** | % of Total Net Assets | ||||||||||||
| CORPORATE BONDS continued | |||||||||||||||
| MATERIALS | 7.55 | ||||||||||||||
| CHEMICALS | |||||||||||||||
| 50,000 | DOW CHEMICAL CO. 5.00% 06/15/13 | 50,368 | |||||||||||||
| 50,000 | DOW CHEMICAL CO. 5.90% 09/15/15 | 49,397 | |||||||||||||
| 99,765 | 1.25 | ||||||||||||||
| CONTAINERS & PACKAGING | |||||||||||||||
| 25,000 | PACKAGING CORP. OF AMERICA 5.75% 08/01/13 | 26,793 | |||||||||||||
| 26,793 | 0.34 | ||||||||||||||
| CONSTRUCTION MATERIALS | |||||||||||||||
| 50,000 | COMMERCIAL METALS CO. 7.35% 08/15/18 | 53,306 | |||||||||||||
| 53,306 | 0.67 | ||||||||||||||
| METALS & MINING | |||||||||||||||
| 100,000 | ALCOA INC. 7.375% 08/01/10 | 103,160 | |||||||||||||
| 75,000 | ALCOA INC. 6.50% 06/01/11 | 79,084 | |||||||||||||
| 75,000 | ALCOA INC. 6.00% 07/15/13 | 79,007 | |||||||||||||
| 50,000 | ARCELORMITTAL USA INC. 6.50% 04/15/14 | 53,365 | |||||||||||||
| 50,000 | FREEPORT-MCMORAN C&G INC. 8.25% 04/01/15 | 54,500 | |||||||||||||
| 50,000 | FREEPORT-MCMORAN C&G INC. 8.375% 04/01/17 | 54,750 | |||||||||||||
| 423,866 | 5.30 | ||||||||||||||
| TELECOMMUNICATION SERVICES | 7.26 | ||||||||||||||
| DIVERSIFIED TELECOM. SERVICES | |||||||||||||||
| 100,000 | AT&T CORP. 7.30% 11/15/11 | 110,107 | |||||||||||||
| 288,996 | BELLSOUTH TELECOM. 6.30% 12/15/15 | 306,965 | |||||||||||||
| 53,000 | VERIZON 6.50% 09/15/11 | 56,490 | |||||||||||||
| 100,000 | VERIZON FLORIDA 6.125% 01/15/13 | 106,752 | |||||||||||||
| 580,314 | 7.26 | ||||||||||||||
| UTILITIES | 5.77 | ||||||||||||||
| ELECTRIC UTILITIES | |||||||||||||||
| 55,000 | CONSUMERS ENERGY CO. 6.00% 02/15/14 | 60,453 | |||||||||||||
| 232,000 | SOUTH CAROLINA ELEC 6.70% 02/01/11 | 243,864 | |||||||||||||
| 304,318 | 3.81 | ||||||||||||||
| GAS UTILITIES | |||||||||||||||
| 150,000 | PIEDMONT NATURAL GAS 7.80% 09/29/10 | 157,176 | |||||||||||||
| 157,176 | 1.97 | ||||||||||||||
| TOTAL CORPORATE BONDS (Cost: $4,598,891) | 4,737,724 | 59.27 | |||||||||||||
See Accompanying Notes to Financial Statements
42
Pacific Advisors Income and Equity Fund
Statement of Investments
as of December 31, 2009
| Quantity or Principal | Description | Current $ Value** | % of Total Net Assets | ||||||||||||
| US GOVT SECURITIES | |||||||||||||||
| US GOVERNMENT AGENCY | 1.32 | ||||||||||||||
| US GOVERNMENT AGENCY | |||||||||||||||
| 100,000 | FEDERAL HOME LOAN BANK 6.00% 07/19/17 | 105,496 | |||||||||||||
| 105,496 | 1.32 | ||||||||||||||
| TOTAL US GOVT SECURITIES (Cost: $100,000) | 105,496 | 1.32 | |||||||||||||
| PREFERRED STOCK | |||||||||||||||
| FINANCIALS | 5.91 | ||||||||||||||
| COMMERCIAL BANKS | |||||||||||||||
| 2,000 | BANK OF AMERICA 6.375% PFD | 38,100 | |||||||||||||
| 2,000 | BANK OF AMERICA 7.25% PFD | 44,600 | |||||||||||||
| 2,000 | BARCLAYS BANK PLC 6.625% PFD | 40,660 | |||||||||||||
| 2,000 | BARCLAYS BANK PLC 7.10% PFD | 44,180 | |||||||||||||
| 4,000 | HSBC HOLDINGS PLC 6.20% PFD A | 85,560 | |||||||||||||
| 253,100 | 3.17 | ||||||||||||||
| DIVERSIFIED FINANCIAL SERVICES | |||||||||||||||
| 3,000 | DEUTSCHE BANK 6.625% PFD | 62,970 | |||||||||||||
| 2,000 | MERRILL LYNCH 6.45% PFD | 38,280 | |||||||||||||
| 101,250 | 1.27 | ||||||||||||||
| INSURANCE | |||||||||||||||
| 3,000 | METLIFE INC. 6.50% PFD | 72,000 | |||||||||||||
| 2,500 | PHOENIX COMPANIES INC. 7.45% PFD | 46,125 | |||||||||||||
| 118,125 | 1.48 | ||||||||||||||
| TELECOMMUNICATION SERVICES | 0.67 | ||||||||||||||
| DIVERSIFIED TELECOM. SERVICES | |||||||||||||||
| 2,000 | AT&T INC. 6.375% PFD | 53,380 | |||||||||||||
| 53,380 | 0.67 | ||||||||||||||
| UTILITIES | 0.64 | ||||||||||||||
| ELECTRIC UTILITIES | |||||||||||||||
| 2,000 | FPL GROUP CAPITAL 6.60% PFD A | 51,380 | |||||||||||||
| 51,380 | 0.64 | ||||||||||||||
| TOTAL PREFERRED STOCK (Cost: $662,560) | 577,235 | 7.22 | |||||||||||||
See Accompanying Notes to Financial Statements
43
Pacific Advisors Income and Equity Fund
Statement of Investments
as of December 31, 2009
| Quantity or Principal | Description | Current $ Value** | % of Total Net Assets | ||||||||||||
| SHORT TERM INVESTMENTS | |||||||||||||||
| MONEY MARKET | 1.13 | ||||||||||||||
| 90,670 | UMB MONEY MARKET FIDUCIARY | 90,670 | |||||||||||||
| 90,670 | 1.13 | ||||||||||||||
| TOTAL SHORT TERM INVESTMENTS (Cost: $90,670) | 90,670 | 1.13 | |||||||||||||
| TOTAL INVESTMENTS (Cost: $7,928,552) | 7,933,892 | 99.25 | |||||||||||||
| OTHER ASSETS LESS LIABILITIES | 60,207 | 0.75 | |||||||||||||
| TOTAL NET ASSETS | 7,994,099 | 100.00 | |||||||||||||
* Non-income producing
** The principal amount is stated in U.S. dollars unless otherwise indicated.
See Accompanying Notes to Financial Statements
44
Pacific Advisors Balanced Fund
Statement of Investments
as of December 31, 2009
| Quantity or Principal | Description | Current $ Value** | % of Total Net Assets | ||||||||||||
| COMMON STOCK | |||||||||||||||
| CONSUMER DISCRETIONARY | 2.14 | ||||||||||||||
| HOTELS, RESTAURANTS & LEISURE | |||||||||||||||
| 10,000 | MCDONALD'S CORP. | 624,400 | |||||||||||||
| 624,400 | 2.14 | ||||||||||||||
| CONSUMER STAPLES | 8.89 | ||||||||||||||
| BEVERAGES | |||||||||||||||
| 15,000 | COCA-COLA CO. | 855,000 | |||||||||||||
| 855,000 | 2.93 | ||||||||||||||
| FOOD PRODUCTS | |||||||||||||||
| 12,000 | JM SMUCKER CO. | 741,000 | |||||||||||||
| 7,500 | MCCORMICK & COMPANY INC. | 270,975 | |||||||||||||
| 1,011,975 | 3.47 | ||||||||||||||
| HOUSEHOLD PRODUCTS | |||||||||||||||
| 12,000 | PROCTER & GAMBLE CO. | 727,560 | |||||||||||||
| 727,560 | 2.49 | ||||||||||||||
| ENERGY | 16.54 | ||||||||||||||
| ENERGY EQUIPMENT & SERVICES | |||||||||||||||
| 24,000 | CAMERON INT'L CORP.* | 1,003,200 | |||||||||||||
| 10,000 | HALLIBURTON CO. | 300,900 | |||||||||||||
| 5,000 | NATIONAL OILWELL VARCO INC. | 220,450 | |||||||||||||
| 1,524,550 | 5.22 | ||||||||||||||
| OIL, GAS & CONSUMABLE FUELS | |||||||||||||||
| 6,000 | BRITISH PETROLEUM PLC ADR | 347,820 | |||||||||||||
| 10,000 | CONOCOPHILLIPS | 510,700 | |||||||||||||
| 15,000 | DEVON ENERGY CORP. | 1,102,500 | |||||||||||||
| 8,750 | SPECTRA ENERGY CORP. | 179,463 | |||||||||||||
| 15,000 | SUNCOR ENERGY INC. | 529,650 | |||||||||||||
| 30,000 | WILLIAMS COMPANIES INC. | 632,400 | |||||||||||||
| 3,302,533 | 11.31 | ||||||||||||||
| FINANCIALS | 8.37 | ||||||||||||||
| COMMERCIAL BANKS | |||||||||||||||
| 35,000 | BANCO LATINOAMERICANO DE EXPORTACIONES E | 486,500 | |||||||||||||
| 486,500 | 1.67 | ||||||||||||||
| CONSUMER FINANCE | |||||||||||||||
| 10,000 | AMERICAN EXPRESS CO. | 405,200 | |||||||||||||
| 405,200 | 1.39 | ||||||||||||||
See Accompanying Notes to Financial Statements
45
Pacific Advisors Balanced Fund
Statement of Investments
as of December 31, 2009
| Quantity or Principal | Description | Current $ Value** | % of Total Net Assets | ||||||||||||
| COMMON STOCK continued | |||||||||||||||
| DIVERSIFIED FINANCIAL SERVICES | |||||||||||||||
| 10,000 | MOODYS CORP. | 268,000 | |||||||||||||
| 268,000 | 0.92 | ||||||||||||||
| INSURANCE | |||||||||||||||
| 6 | BERKSHIRE HATHAWAY INC. A* | 595,200 | |||||||||||||
| 14,000 | CHUBB CORP. | 688,520 | |||||||||||||
| 1,283,720 | 4.40 | ||||||||||||||
| HEALTH CARE | 6.67 | ||||||||||||||
| HEALTH CARE EQUIPMENT & SUPPLIES | |||||||||||||||
| 5,000 | BAXTER INT'L INC. | 293,400 | |||||||||||||
| 5,000 | BECTON DICKINSON & CO. | 394,300 | |||||||||||||
| 5,000 | COVIDIEN PLC. | 239,450 | |||||||||||||
| 927,150 | 3.18 | ||||||||||||||
| LIFE SCIENCES TOOLS & SERVICES | |||||||||||||||
| 12,000 | PERKINELMER INC. | 247,080 | |||||||||||||
| 247,080 | 0.85 | ||||||||||||||
| PHARMACEUTICALS | |||||||||||||||
| 12,000 | JOHNSON & JOHNSON | 772,920 | |||||||||||||
| 772,920 | 2.65 | ||||||||||||||
| INDUSTRIALS | 14.31 | ||||||||||||||
| AEROSPACE & DEFENSE | |||||||||||||||
| 12,000 | BOEING CO. | 649,560 | |||||||||||||
| 15,000 | CUBIC CORP. | 559,500 | |||||||||||||
| 1,209,060 | 4.14 | ||||||||||||||
| AIR FREIGHT & LOGISTICS | |||||||||||||||
| 10,000 | UNITED PARCEL SERVICE INC. | 573,700 | |||||||||||||
| 573,700 | 1.97 | ||||||||||||||
| INDUSTRIAL CONGLOMERATES | |||||||||||||||
| 40,000 | GENERAL ELECTRIC CO. | 605,200 | |||||||||||||
| 605,200 | 2.07 | ||||||||||||||
| MACHINERY | |||||||||||||||
| 6,000 | CATERPILLAR INC. | 341,940 | |||||||||||||
| 10,000 | INGERSOLL-RAND PLC | 357,400 | |||||||||||||
| 699,340 | 2.40 | ||||||||||||||
See Accompanying Notes to Financial Statements
46
Pacific Advisors Balanced Fund
Statement of Investments
as of December 31, 2009
| Quantity or Principal | Description | Current $ Value** | % of Total Net Assets | ||||||||||||
| COMMON STOCK continued | |||||||||||||||
| ROAD & RAIL | |||||||||||||||
| 6,000 | CSX CORP. | 290,940 | |||||||||||||
| 7,000 | NORFOLK SOUTHERN CORP. | 366,940 | |||||||||||||
| 657,880 | 2.25 | ||||||||||||||
| TRADING COMPANIES & DISTRIBUTORS | |||||||||||||||
| 15,000 | GATX CORP. | 431,250 | |||||||||||||
| 431,250 | 1.48 | ||||||||||||||
| INFORMATION TECHNOLOGY | 4.36 | ||||||||||||||
| COMMUNICATIONS EQUIPMENT | |||||||||||||||
| 25,000 | NOKIA CORP. ADR A | 321,250 | |||||||||||||
| 321,250 | 1.10 | ||||||||||||||
| IT SERVICES | |||||||||||||||
| 8,000 | AUTOMATIC DATA PROCESSING INC. | 342,560 | |||||||||||||
| 342,560 | 1.17 | ||||||||||||||
| SOFTWARE | |||||||||||||||
| 20,000 | MICROSOFT CORP. | 609,800 | |||||||||||||
| 609,800 | 2.09 | ||||||||||||||
| MATERIALS | 2.37 | ||||||||||||||
| METALS & MINING | |||||||||||||||
| 16,000 | RELIANCE STEEL & ALUMINUM CO. | 691,520 | |||||||||||||
| 691,520 | 2.37 | ||||||||||||||
| UTILITIES | 2.73 | ||||||||||||||
| ELECTRIC UTILITIES | |||||||||||||||
| 7,000 | ALLETE INC. | 228,760 | |||||||||||||
| 20,000 | DUKE ENERGY CORP. | 344,200 | |||||||||||||
| 5,000 | PG&E CORP. | 223,250 | |||||||||||||
| 796,210 | 2.73 | ||||||||||||||
| TOTAL COMMON STOCK (Cost: $15,306,900) | 19,374,357 | 66.38 | |||||||||||||
| CORPORATE BONDS | |||||||||||||||
| CONSUMER DISCRETIONARY | 2.64 | ||||||||||||||
| AUTO COMPONENTS | |||||||||||||||
| 100,000 | BORG WARNER 8.00% 10/01/19 | 100,921 | |||||||||||||
| 100,921 | 0.35 | ||||||||||||||
| HOTELS, RESTAURANTS & LEISURE | |||||||||||||||
| 100,000 | MARRIOTT INT'L 5.625% 02/15/13 | 102,611 | |||||||||||||
| 102,611 | 0.35 | ||||||||||||||
See Accompanying Notes to Financial Statements
47
Pacific Advisors Balanced Fund
Statement of Investments
as of December 31, 2009
| Quantity or Principal | Description | Current $ Value** | % of Total Net Assets | ||||||||||||
| CORPORATE BONDS continued | |||||||||||||||
| MULTILINE RETAIL | |||||||||||||||
| 178,000 | TARGET CORP. 8.60% 01/15/12 | 200,059 | |||||||||||||
| 200,059 | 0.69 | ||||||||||||||
| SPECIALTY RETAIL | |||||||||||||||
| 100,000 | HOME DEPOT INC. 4.625% 08/15/10 | 102,371 | |||||||||||||
| 150,000 | HOME DEPOT INC. 5.20% 03/01/11 | 155,653 | |||||||||||||
| 100,000 | STAPLES INC. 7.375% 10/01/12 | 110,072 | |||||||||||||
| 368,095 | 1.26 | ||||||||||||||
| ENERGY | 4.42 | ||||||||||||||
| ENERGY EQUIPMENT & SERVICES | |||||||||||||||
| 22,000 | KINDER MORGAN 6.50% 09/01/13 | 21,436 | |||||||||||||
| 100,000 | WEATHERFORD INT'L LTD. 5.95% 06/15/12 | 107,023 | |||||||||||||
| 128,459 | 0.44 | ||||||||||||||
| OIL, GAS & CONSUMABLE FUELS | |||||||||||||||
| 501,000 | ATLANTIC RICHFIELD 9.125% 03/01/11 | 543,401 | |||||||||||||
| 255,000 | BURLINGTON RESOURCES 6.40% 08/15/11 | 274,926 | |||||||||||||
| 50,000 | PREMCOR REFINING 6.75% 05/01/14 | 51,019 | |||||||||||||
| 296,000 | PREMCOR REFINING 7.50% 06/15/15 | 293,825 | |||||||||||||
| 1,163,171 | 3.98 | ||||||||||||||
| FINANCIALS | 12.08 | ||||||||||||||
| COMMERCIAL BANKS | |||||||||||||||
| 161,000 | MORGAN STANLEY 07/01/14 FLOAT | 154,370 | |||||||||||||
| 154,370 | 0.53 | ||||||||||||||
| CONSUMER FINANCE | |||||||||||||||
| 100,000 | HOSPITALITY PROPERTIES TRUST 7.875% 08/15/14 | 103,237 | |||||||||||||
| 103,237 | 0.35 | ||||||||||||||
| DIVERSIFIED FINANCIAL SERVICES | |||||||||||||||
| 250,000 | AIG 07/11/11 FLOAT | 220,172 | |||||||||||||
| 300,000 | AIG 6.00% 10/15/14 | 204,785 | |||||||||||||
| 450,000 | AIG 6.00% 11/15/14 | 307,822 | |||||||||||||
| 300,000 | GENERAL ELECTRIC CAP 5.50% 11/15/11 | 303,569 | |||||||||||||
| 311,000 | GENERAL ELECTRIC CAP 8.125% 05/15/12 | 347,118 | |||||||||||||
| 200,000 | GENERAL ELECTRIC CAP 5.65% 06/09/14 | 213,547 | |||||||||||||
| 601,000 | GENERAL ELECTRIC CAP 5.40% 02/15/17 | 613,375 | |||||||||||||
| 250,000 | HOUSEHOLD FINANCE CO. 6.375% 11/27/12 | 272,258 | |||||||||||||
| 155,000 | HOUSEHOLD FINANCE CO. 09/15/13 FLOAT | 149,206 | |||||||||||||
| 505,000 | NATIONAL RURAL UTIL 5.70% 01/15/10 | 505,667 | |||||||||||||
| 3,137,520 | 10.75 | ||||||||||||||
See Accompanying Notes to Financial Statements
48
Pacific Advisors Balanced Fund
Statement of Investments
as of December 31, 2009
| Quantity or Principal | Description | Current $ Value** | % of Total Net Assets | ||||||||||||
| CORPORATE BONDS continued | |||||||||||||||
| INSURANCE | |||||||||||||||
| 130,000 | AIG 7.50% 08/11/10 | 132,742 | |||||||||||||
| 132,742 | 0.45 | ||||||||||||||
| HEALTH CARE | 0.36 | ||||||||||||||
| HEALTH CARE PROVIDERS & SERVICES | |||||||||||||||
| 100,000 | WELLPOINT INC. 5.00% 12/15/14 | 104,032 | |||||||||||||
| 104,032 | 0.36 | ||||||||||||||
| INDUSTRIALS | 4.39 | ||||||||||||||
| ELECTRICAL EQUIPMENT | |||||||||||||||
| 250,000 | EMERSON ELECTRIC CO. 7.125% 08/15/10 | 260,850 | |||||||||||||
| 260,850 | 0.89 | ||||||||||||||
| INDUSTRIAL CONGLOMERATES | |||||||||||||||
| 1,000,000 | GENERAL ELECTRIC CO. 5.25% 12/06/17 | 1,021,865 | |||||||||||||
| 1,021,865 | 3.50 | ||||||||||||||
| INFORMATION TECHNOLOGY | 0.93 | ||||||||||||||
| COMPUTERS & PERIPHERALS | |||||||||||||||
| 150,000 | DELL INC. 4.70% 04/15/13 | 158,291 | |||||||||||||
| 100,000 | DIGITAL EQUIPMENT 7.75% 04/01/23 | 114,234 | |||||||||||||
| 272,525 | 0.93 | ||||||||||||||
| MATERIALS | 2.01 | ||||||||||||||
| CONSTRUCTION MATERIALS | |||||||||||||||
| 100,000 | COMMERCIAL METALS CO. 7.35% 08/15/18 | 106,612 | |||||||||||||
| 106,612 | 0.37 | ||||||||||||||
| METALS & MINING | |||||||||||||||
| 250,000 | ALCOA INC. 6.00% 01/15/12 | 262,761 | |||||||||||||
| 100,000 | FREEPORT-MCMORAN C&G INC. 8.25% 04/01/15 | 109,000 | |||||||||||||
| 100,000 | FREEPORT-MCMORAN C&G INC. 8.375% 04/01/17 | 109,500 | |||||||||||||
| 481,261 | 1.65 | ||||||||||||||
| TELECOMMUNICATION SERVICES | 1.38 | ||||||||||||||
| DIVERSIFIED TELECOM. SERVICES | |||||||||||||||
| 250,000 | NEXTEL COMMUNICATIONS 7.375% 08/01/15 | 243,125 | |||||||||||||
| 150,000 | VERIZON FLORIDA 6.125% 01/15/13 | 160,128 | |||||||||||||
| 403,253 | 1.38 | ||||||||||||||
See Accompanying Notes to Financial Statements
49
Pacific Advisors Balanced Fund
Statement of Investments
as of December 31, 2009
| Quantity or Principal | Description | Current $ Value** | % of Total Net Assets | ||||||||||||
| CORPORATE BONDS continued | |||||||||||||||
| UTILITIES | 0.13 | ||||||||||||||
| ELECTRIC UTILITIES | |||||||||||||||
| 36,150 | RELIANT ENERGY MID ATL 9.237% 07/02/17 | 37,776 | |||||||||||||
| 37,776 | 0.13 | ||||||||||||||
| TOTAL CORPORATE BONDS (Cost: $8,345,514) | 8,279,360 | 28.36 | |||||||||||||
| PREFERRED STOCK | |||||||||||||||
| FINANCIALS | 2.53 | ||||||||||||||
| COMMERCIAL BANKS | |||||||||||||||
| 5,000 | BANK OF AMERICA 8.20% PFD | 120,850 | |||||||||||||
| 5,000 | BARCLAYS BANK PLC 7.10% PFD | 110,450 | |||||||||||||
| 5,000 | BARCLAYS BANK PLC 8.125% PFD | 124,300 | |||||||||||||
| 5,000 | HSBC HOLDING PLC 8.125% PFD | 130,500 | |||||||||||||
| 10,000 | WACHOVIA 7.85% PFD | 253,700 | |||||||||||||
| 739,800 | 2.53 | ||||||||||||||
| TELECOMMUNICATION SERVICES | 0.91 | ||||||||||||||
| DIVERSIFIED TELECOM. SERVICES | |||||||||||||||
| 10,000 | AT&T INC. 6.375% PFD | 266,900 | |||||||||||||
| 266,900 | 0.91 | ||||||||||||||
| TOTAL PREFERRED STOCK (Cost: $999,938) | 1,006,700 | 3.45 | |||||||||||||
| SHORT TERM INVESTMENTS | |||||||||||||||
| MONEY MARKET | 1.64 | ||||||||||||||
| 478,934 | UMB MONEY MARKET FIDUCIARY | 478,934 | |||||||||||||
| 478,934 | 1.64 | ||||||||||||||
| TOTAL SHORT TERM INVESTMENTS (Cost: $478,934) | 478,934 | 1.64 | |||||||||||||
| TOTAL INVESTMENTS (Cost: $25,131,286) | 29,139,351 | 99.83 | |||||||||||||
| OTHER ASSETS LESS LIABILITIES | 50,847 | 0.17 | |||||||||||||
| TOTAL NET ASSETS | 29,190,198 | 100.00 | |||||||||||||
* Non-income producing
** The principal amount is stated in U.S. dollars unless otherwise indicated.
See Accompanying Notes to Financial Statements
50
Pacific Advisors Growth Fund
Statement of Investments
as of December 31, 2009
| Quantity or Principal | Description | Current $ Value** | % of Total Net Assets | ||||||||||||
| COMMON STOCK | |||||||||||||||
| ENERGY | 28.74 | ||||||||||||||
| ENERGY EQUIPMENT & SERVICES | |||||||||||||||
| 4,000 | FMC TECHNOLOGIES INC.* | 231,360 | |||||||||||||
| 2,000 | NATIONAL OILWELL VARCO INC. | 88,180 | |||||||||||||
| 319,540 | 11.36 | ||||||||||||||
| OIL, GAS & CONSUMABLE FUELS | |||||||||||||||
| 2,000 | APACHE CORP. | 206,340 | |||||||||||||
| 1,500 | CONOCOPHILLIPS | 76,605 | |||||||||||||
| 4,000 | MARATHON OIL CORP. | 124,880 | |||||||||||||
| 1,000 | OCCIDENTAL PETROLEUM CORP. | 81,350 | |||||||||||||
| 489,175 | 17.38 | ||||||||||||||
| FINANCIALS | 2.25 | ||||||||||||||
| COMMERCIAL BANKS | |||||||||||||||
| 4,000 | EAST WEST BANCORP INC. | 63,200 | |||||||||||||
| 63,200 | 2.25 | ||||||||||||||
| HEALTH CARE | 34.64 | ||||||||||||||
| HEALTH CARE EQUIPMENT & SUPPLIES | |||||||||||||||
| 1,500 | BECTON DICKINSON & CO. | 118,290 | |||||||||||||
| 1,500 | MCKESSON CORP. | 93,750 | |||||||||||||
| 1,000 | QUEST DIAGNOSTICS INC. | 60,380 | |||||||||||||
| 3,000 | ST. JUDE MEDICAL INC.* | 110,340 | |||||||||||||
| 2,000 | UNITEDHEALTH GROUP INC. | 60,960 | |||||||||||||
| 2,750 | WELLPOINT INC.* | 160,297 | |||||||||||||
| 3,000 | ZIMMER HOLDINGS INC.* | 177,330 | |||||||||||||
| 781,347 | 27.77 | ||||||||||||||
| PHARMACEUTICALS | |||||||||||||||
| 3,000 | JOHNSON & JOHNSON | 193,230 | |||||||||||||
| 193,230 | 6.87 | ||||||||||||||
| INDUSTRIALS | 10.97 | ||||||||||||||
| AEROSPACE & DEFENSE | |||||||||||||||
| 1,000 | BOEING CO. | 54,130 | |||||||||||||
| 1,500 | HONEYWELL INT'L INC. | 58,800 | |||||||||||||
| 1,500 | ITT CORP. | 74,610 | |||||||||||||
| 187,540 | 6.66 | ||||||||||||||
| INDUSTRIAL CONGLOMERATES | |||||||||||||||
| 8,000 | GENERAL ELECTRIC CO. | 121,040 | |||||||||||||
| 121,040 | 4.30 | ||||||||||||||
See Accompanying Notes to Financial Statements
51
Pacific Advisors Growth Fund
Statement of Investments
as of December 31, 2009
| Quantity or Principal | Description | Current $ Value** | % of Total Net Assets | ||||||||||||
| COMMON STOCK continued | |||||||||||||||
| INFORMATION TECHNOLOGY | 16.65 | ||||||||||||||
| COMMUNICATIONS EQUIPMENT | |||||||||||||||
| 3,500 | CISCO SYSTEMS INC.* | 83,790 | |||||||||||||
| 1,000 | QUALCOMM INC. | 46,260 | |||||||||||||
| 130,050 | 4.62 | ||||||||||||||
| COMPUTERS & PERIPHERALS | |||||||||||||||
| 1,000 | WESTERN DIGITAL CORP.* | 44,150 | |||||||||||||
| 44,150 | 1.57 | ||||||||||||||
| ELECTRONIC EQUIPMENT & INSTRUMENTS | |||||||||||||||
| 3,000 | ITRON INC.* | 202,710 | |||||||||||||
| 202,710 | 7.20 | ||||||||||||||
| SOFTWARE | |||||||||||||||
| 3,000 | MICROSOFT CORP. | 91,470 | |||||||||||||
| 91,470 | 3.25 | ||||||||||||||
| MATERIALS | 2.72 | ||||||||||||||
| METALS & MINING | |||||||||||||||
| 1,000 | BHP BILLITON LTD. | 76,580 | |||||||||||||
| 76,580 | 2.72 | ||||||||||||||
| TOTAL COMMON STOCK (Cost: $2,547,258) | 2,700,032 | 95.96 | |||||||||||||
| SHORT TERM INVESTMENTS | |||||||||||||||
| MONEY MARKET | 4.26 | ||||||||||||||
| 120,028 | UMB MONEY MARKET FIDUCIARY | 120,029 | |||||||||||||
| 120,029 | 4.26 | ||||||||||||||
| TOTAL SHORT TERM INVESTMENTS (Cost: $120,028) | 120,029 | 4.26 | |||||||||||||
| TOTAL INVESTMENTS (Cost: $2,667,286) | 2,820,061 | 100.22 | |||||||||||||
| OTHER ASSETS LESS LIABILITIES | (6,248 | ) | (0.22 | ) | |||||||||||
| TOTAL NET ASSETS | 2,813,813 | 100.00 | |||||||||||||
* Non-income producing
** The principal amount is stated in U.S. dollars unless otherwise indicated.
See Accompanying Notes to Financial Statements
52
Pacific Advisors Multi-Cap Value Fund
Statement of Investments
as of December 31, 2009
| Quantity or Principal | Description | Current $ Value** | % of Total Net Assets | ||||||||||||
| COMMON STOCK | |||||||||||||||
| CONSUMER DISCRETIONARY | 9.50 | ||||||||||||||
| SPECIALTY RETAIL | |||||||||||||||
| 8,000 | HOME DEPOT INC. | 231,440 | |||||||||||||
| 14,000 | PENSKE AUTOMOTIVE GROUP INC.* | 212,520 | |||||||||||||
| 443,960 | 7.00 | ||||||||||||||
| TEXTILES, APPAREL & LUXURY GOODS | |||||||||||||||
| 16,000 | K-SWISS INC.* | 159,040 | |||||||||||||
| 159,040 | 2.51 | ||||||||||||||
| CONSUMER STAPLES | 4.46 | ||||||||||||||
| BEVERAGES | |||||||||||||||
| 10,000 | DR PEPPER SNAPPLE GROUP INC. | 283,000 | |||||||||||||
| 283,000 | 4.46 | ||||||||||||||
| ENERGY | 36.44 | ||||||||||||||
| ENERGY EQUIPMENT & SERVICES | |||||||||||||||
| 34,000 | ION GEOPHYSICAL CORP.* | 201,280 | |||||||||||||
| 4,500 | LUFKIN INDUSTRIES INC. | 329,400 | |||||||||||||
| 27,000 | MITCHAM INDUSTRIES INC.* | 198,990 | |||||||||||||
| 7,000 | TIDEWATER INC. | 335,650 | |||||||||||||
| 1,065,320 | 16.79 | ||||||||||||||
| OIL, GAS & CONSUMABLE FUELS | |||||||||||||||
| 2,500 | APACHE CORP. | 257,925 | |||||||||||||
| 12,000 | ARCH COAL INC. | 267,000 | |||||||||||||
| 10,000 | CHESAPEAKE ENERGY CORP. | 258,800 | |||||||||||||
| 3,700 | CHEVRON CORP. | 284,863 | |||||||||||||
| 5,700 | MARATHON OIL CORP. | 177,954 | |||||||||||||
| 1,246,542 | 19.65 | ||||||||||||||
| FINANCIALS | 2.97 | ||||||||||||||
| COMMERCIAL BANKS | |||||||||||||||
| 25,000 | CATHAY GENERAL BANCORP | 188,750 | |||||||||||||
| 188,750 | 2.97 | ||||||||||||||
| INDUSTRIALS | 39.52 | ||||||||||||||
| AEROSPACE & DEFENSE | |||||||||||||||
| 5,500 | HONEYWELL INT'L INC. | 215,600 | |||||||||||||
| 215,600 | 3.40 | ||||||||||||||
| AIR FREIGHT & LOGISTICS | |||||||||||||||
| 3,200 | CH ROBINSON WORLDWIDE INC. | 187,936 | |||||||||||||
| 187,936 | 2.96 | ||||||||||||||
See Accompanying Notes to Financial Statements
53
Pacific Advisors Multi-Cap Value Fund
Statement of Investments
as of December 31, 2009
| Quantity or Principal | Description | Current $ Value** | % of Total Net Assets | ||||||||||||
| COMMON STOCK continued | |||||||||||||||
| COMMERCIAL SERVICES & SUPPLIES | |||||||||||||||
| 8,000 | COPART INC.* | 293,040 | |||||||||||||
| 293,040 | 4.62 | ||||||||||||||
| CONSTRUCTION & ENGINEERING | |||||||||||||||
| 14,000 | KBR INC. | 266,000 | |||||||||||||
| 266,000 | 4.19 | ||||||||||||||
| MACHINERY | |||||||||||||||
| 8,500 | GRACO INC. | 242,845 | |||||||||||||
| 242,845 | 3.83 | ||||||||||||||
| MARINE | |||||||||||||||
| 14,000 | DRYSHIPS INC.* | 81,480 | |||||||||||||
| 81,480 | 1.28 | ||||||||||||||
| ROAD & RAIL | |||||||||||||||
| 10,000 | GENESEE & WYOMING INC.* | 326,400 | |||||||||||||
| 10,000 | KANSAS CITY SOUTHERN* | 332,900 | |||||||||||||
| 8,000 | LANDSTAR SYSTEM INC. | 310,160 | |||||||||||||
| 14,000 | MARTEN TRANSPORT LTD.* | 251,300 | |||||||||||||
| 1,220,760 | 19.24 | ||||||||||||||
| MATERIALS | 7.89 | ||||||||||||||
| CHEMICALS | |||||||||||||||
| 11,700 | H.B. FULLER CO. | 266,175 | |||||||||||||
| 266,175 | 4.20 | ||||||||||||||
| METALS & MINING | |||||||||||||||
| 15,000 | COMMERCIAL METALS CO. | 234,750 | |||||||||||||
| 234,750 | 3.70 | ||||||||||||||
| TOTAL COMMON STOCK (Cost: $7,198,298) | 6,395,198 | 100.79 | |||||||||||||
| TOTAL INVESTMENTS (Cost: $7,198,298) | 6,395,198 | 100.79 | |||||||||||||
| OTHER ASSETS LESS LIABILITIES | (50,212 | ) | (0.79 | ) | |||||||||||
| TOTAL NET ASSETS | 6,344,986 | 100.00 | |||||||||||||
* Non-income producing
** The principal amount is stated in U.S. dollars unless otherwise indicated.
See Accompanying Notes to Financial Statements
54
Pacific Advisors Small Cap Fund
Statement of Investments
as of December 31, 2009
| Quantity or Principal | Description | Current $ Value** | % of Total Net Assets | ||||||||||||
| COMMON STOCK | |||||||||||||||
| CONSUMER DISCRETIONARY | 11.41 | ||||||||||||||
| AUTO COMPONENTS | |||||||||||||||
| 598,700 | AMERIGON INC.* | 4,753,678 | |||||||||||||
| 4,753,678 | 3.57 | ||||||||||||||
| SPECIALTY RETAIL | |||||||||||||||
| 460,000 | CONNS INC.* | 2,686,400 | |||||||||||||
| 745,000 | SONIC AUTOMOTIVE INC.* | 7,740,550 | |||||||||||||
| 10,426,950 | 7.84 | ||||||||||||||
| CONSUMER STAPLES | 5.27 | ||||||||||||||
| FOOD PRODUCTS | |||||||||||||||
| 520,000 | DARLING INTERNATIONAL INC.* | 4,357,600 | |||||||||||||
| 610,000 | OMEGA PROTEIN CORP.* | 2,659,600 | |||||||||||||
| 7,017,200 | 5.27 | ||||||||||||||
| ENERGY | 17.81 | ||||||||||||||
| ENERGY EQUIPMENT & SERVICES | |||||||||||||||
| 2,600,000 | BOOTS & COOTS INC.* | 4,290,000 | |||||||||||||
| 183,000 | HORNBECK OFFSHORE SERVICES INC.* | 4,260,240 | |||||||||||||
| 310,000 | MATRIX SERVICE CO.* | 3,301,500 | |||||||||||||
| 540,000 | MITCHAM INDUSTRIES INC.* | 3,979,800 | |||||||||||||
| 710,000 | PARKER DRILLING CO.* | 3,514,500 | |||||||||||||
| 19,346,040 | 14.54 | ||||||||||||||
| OIL, GAS & CONSUMABLE FUELS | |||||||||||||||
| 455,000 | INFINITY ENERGY RESOURCES INC.* | 1,292,200 | |||||||||||||
| 770,000 | QUEST RESOURCE CORP.* | 446,600 | |||||||||||||
| 263,600 | TOREADOR RESOURCES CORP. | 2,609,640 | |||||||||||||
| 4,348,440 | 3.27 | ||||||||||||||
| FINANCIALS | 20.18 | ||||||||||||||
| COMMERCIAL BANKS | |||||||||||||||
| 495,000 | EAST WEST BANCORP INC. | 7,821,000 | |||||||||||||
| 290,000 | NARA BANCORP INC.* | 3,288,600 | |||||||||||||
| 385,000 | WILSHIRE BANCORP INC. | 3,153,150 | |||||||||||||
| 14,262,750 | 10.72 | ||||||||||||||
| CONSUMER FINANCE | |||||||||||||||
| 480,000 | EZCORP INC. A* | 8,260,800 | |||||||||||||
| 195,000 | FIRST CASH FINANCIAL SERVICES INC.* | 4,327,050 | |||||||||||||
| 12,587,850 | 9.46 | ||||||||||||||
See Accompanying Notes to Financial Statements
55
Pacific Advisors Small Cap Fund
Statement of Investments
as of December 31, 2009
| Quantity or Principal | Description | Current $ Value** | % of Total Net Assets | ||||||||||||
| COMMON STOCK continued | |||||||||||||||
| HEALTH CARE | 8.55 | ||||||||||||||
| HEALTH CARE PROVIDERS & SERVICES | |||||||||||||||
| 497,000 | AMERICA SERVICE GROUP INC. | 7,887,390 | |||||||||||||
| 280,000 | ROCHESTER MEDICAL CORP.* | 3,116,400 | |||||||||||||
| 360,000 | UNITED AMERICAN HEALTHCARE CORP.* | 370,800 | |||||||||||||
| 11,374,590 | 8.55 | ||||||||||||||
| INDUSTRIALS | 34.17 | ||||||||||||||
| COMMERCIAL SERVICES & SUPPLIES | |||||||||||||||
| 195,000 | AMERICAN ECOLOGY CORP. | 3,322,800 | |||||||||||||
| 330,000 | MOBILE MINI INC.* | 4,649,700 | |||||||||||||
| 314,000 | TEAM INC.* | 5,906,340 | |||||||||||||
| 13,878,840 | 10.43 | ||||||||||||||
| CONSTRUCTION & ENGINEERING | |||||||||||||||
| 560,000 | FURMANITE CORP.* | 2,133,600 | |||||||||||||
| 370,000 | ORION MARINE GROUP INC.* | 7,792,200 | |||||||||||||
| 9,925,800 | 7.46 | ||||||||||||||
| MARINE | |||||||||||||||
| 155,000 | KIRBY CORP.* | 5,398,650 | |||||||||||||
| 5,398,650 | 4.06 | ||||||||||||||
| ROAD & RAIL | |||||||||||||||
| 270,000 | FROZEN FOOD EXPRESS INDUSTRIES INC. | 891,000 | |||||||||||||
| 390,000 | SAIA INC.* | 5,779,800 | |||||||||||||
| 630,000 | VITRAN CORPORATION INC.* | 6,848,100 | |||||||||||||
| 13,518,900 | 10.16 | ||||||||||||||
| TRADING COMPANIES & DISTRIBUTORS | |||||||||||||||
| 210,000 | DXP ENTERPRISES INC.* | 2,744,700 | |||||||||||||
| 2,744,700 | 2.06 | ||||||||||||||
| INFORMATION TECHNOLOGY | 1.57 | ||||||||||||||
| SOFTWARE | |||||||||||||||
| 105,000 | TYLER TECHNOLOGIES INC.* | 2,090,550 | |||||||||||||
| 2,090,550 | 1.57 | ||||||||||||||
| MATERIALS | 3.29 | ||||||||||||||
| METALS & MINING | |||||||||||||||
| 280,000 | COMMERCIAL METALS CO. | 4,382,000 | |||||||||||||
| 4,382,000 | 3.29 | ||||||||||||||
See Accompanying Notes to Financial Statements
56
Pacific Advisors Small Cap Fund
Statement of Investments
as of December 31, 2009
| Quantity or Principal | Description | Current $ Value** | % of Total Net Assets | ||||||||||||
| COMMON STOCK continued | |||||||||||||||
| TELECOMMUNICATION SERVICES | 2.91 | ||||||||||||||
| DIVERSIFIED TELECOM. SERVICES | |||||||||||||||
| 470,000 | PREMIERE GLOBAL SERVICES INC.* | 3,877,500 | |||||||||||||
| 3,877,500 | 2.91 | ||||||||||||||
| TOTAL COMMON STOCK (Cost: $149,636,741) | 139,934,438 | 105.17 | |||||||||||||
| TOTAL INVESTMENTS (Cost: $149,636,741) | 139,934,438 | 105.17 | |||||||||||||
| OTHER ASSETS LESS LIABILITIES | (6,881,454 | ) | (5.17 | ) | |||||||||||
| TOTAL NET ASSETS | 133,052,984 | 100.00 | |||||||||||||
* Non-income producing
** The principal amount is stated in U.S. dollars unless otherwise indicated.
See Accompanying Notes to Financial Statements
57
Pacific Advisors Fund Inc.
Statement of Assets and Liabilities
December 31, 2009
| Government Securities Fund | Income and Equity Fund | Balanced Fund | |||||||||||||
| Assets | |||||||||||||||
| Investment securities | |||||||||||||||
| At cost | $ | 5,165,754 | $ | 7,837,882 | $ | 24,652,352 | |||||||||
| At fair value | $ | 5,136,639 | $ | 7,843,222 | $ | 28,660,417 | |||||||||
| Cash or cash equivalent, at fair value | 181,059 | 90,670 | 478,934 | ||||||||||||
| Accrued income receivable | 40,040 | 87,310 | 153,514 | ||||||||||||
| Receivable for capital shares sold | 30 | 59 | 27,139 | ||||||||||||
| Receivable for investments sold | - | - | - | ||||||||||||
| Other assets | - | - | 55 | ||||||||||||
| Total assets | 5,357,768 | 8,021,261 | 29,320,059 | ||||||||||||
| Liabilities | |||||||||||||||
| Bank borrowings (Note 7) | - | - | - | ||||||||||||
| Payable for investments purchased | 200,647 | - | - | ||||||||||||
| Payable for fund shares redeemed | 11,367 | - | 31,240 | ||||||||||||
| Accounts payable | 15,220 | 23,562 | 95,021 | ||||||||||||
| Accounts payable to related parties (Note 3) | - | 3,600 | 3,600 | ||||||||||||
| Total liabilities | 227,234 | 27,162 | 129,861 | ||||||||||||
| Net Assets | $ | 5,130,534 | $ | 7,994,099 | $ | 29,190,198 | |||||||||
| Summary of Shareholders' Equity | |||||||||||||||
| Paid in capital | 6,349,435 | 8,775,299 | 26,729,050 | ||||||||||||
| Accumulated undistributed net investment income | 564 | (904 | ) | 15,756 | |||||||||||
| Accumulated undistributed net realized losses on security transactions | (1,190,350 | ) | (785,636 | ) | (1,562,673 | ) | |||||||||
| Net unrealized appreciation (depreciation) of investments | (29,115 | ) | 5,340 | 4,008,065 | |||||||||||
| Net assets at December 31, 2009 | $ | 5,130,534 | $ | 7,994,099 | $ | 29,190,198 | |||||||||
| Class A: | |||||||||||||||
| Net assets | $ | 2,536,769 | $ | 2,864,623 | $ | 4,362,013 | |||||||||
| Shares authorized | 50,000,000 | 50,000,000 | 50,000,000 | ||||||||||||
| Shares outstanding | 282,307 | 301,733 | 292,517 | ||||||||||||
| Net asset value and redemption price per share | $ | 8.99 | $ | 9.49 | $ | 14.91 | |||||||||
| Maximum offering price per share | $ | 9.44 | $ | 9.96 | $ | 15.82 | |||||||||
| Sales load | 4.75 | % | 4.75 | % | 5.75 | % | |||||||||
| Class C: | |||||||||||||||
| Net assets | $ | 2,593,765 | $ | 5,129,477 | $ | 24,828,185 | |||||||||
| Shares authorized | 50,000,000 | 50,000,000 | 50,000,000 | ||||||||||||
| Shares outstanding | 291,440 | 568,106 | 1,729,966 | ||||||||||||
| Net asset value and redemption price per share | $ | 8.90 | $ | 9.03 | $ | 14.35 | |||||||||
| Class I: | |||||||||||||||
| Net assets | N/A | N/A | N/A | ||||||||||||
| Shares authorized | |||||||||||||||
| Shares outstanding | |||||||||||||||
| Net asset value and redemption price per share | N/A | N/A | N/A | ||||||||||||
See Accompanying Notes to Financial Statements
58
| Growth Fund | Multi-Cap Value Fund | Small Cap Fund | |||||||||||||
| Assets | |||||||||||||||
| Investment securities | |||||||||||||||
| At cost | $ | 2,547,257 | $ | 7,198,298 | $ | 149,636,741 | |||||||||
| At fair value | $ | 2,700,032 | $ | 6,395,198 | $ | 139,934,438 | |||||||||
| Cash or cash equivalent, at fair value | 120,029 | - | - | ||||||||||||
| Accrued income receivable | 2,079 | 3,950 | 19,250 | ||||||||||||
| Receivable for capital shares sold | 1,076 | 2,456 | 400,736 | ||||||||||||
| Receivable for investments sold | - | - | 223,252 | ||||||||||||
| Other assets | - | - | - | ||||||||||||
| Total assets | 2,823,216 | 6,401,604 | 140,577,676 | ||||||||||||
| Liabilities | |||||||||||||||
| Bank borrowings (Note 7) | - | 33,105 | 6,857,595 | ||||||||||||
| Payable for investments purchased | - | - | 117,302 | ||||||||||||
| Payable for fund shares redeemed | 156 | 156 | 312,896 | ||||||||||||
| Accounts payable | 9,247 | 19,757 | 223,689 | ||||||||||||
| Accounts payable to related parties (Note 3) | - | 3,600 | 13,210 | ||||||||||||
| Total liabilities | 9,403 | 56,618 | 7,524,692 | ||||||||||||
| Net Assets | $ | 2,813,813 | $ | 6,344,986 | $ | 133,052,984 | |||||||||
| Summary of Shareholders' Equity | |||||||||||||||
| Paid in capital | 3,005,927 | 8,849,900 | 154,945,758 | ||||||||||||
| Accumulated undistributed net investment income | 190 | - | - | ||||||||||||
| Accumulated undistributed net realized losses on security transactions | (345,078 | ) | (1,701,814 | ) | (12,190,471 | ) | |||||||||
| Net unrealized appreciation (depreciation) of investments | 152,774 | (803,100 | ) | (9,702,303 | ) | ||||||||||
| Net assets at December 31, 2009 | $ | 2,813,813 | $ | 6,344,986 | $ | 133,052,984 | |||||||||
| Class A: | |||||||||||||||
| Net assets | $ | 2,176,367 | $ | 3,193,536 | $ | 117,455,558 | |||||||||
| Shares authorized | 50,000,000 | 50,000,000 | 50,000,000 | ||||||||||||
| Shares outstanding | 261,245 | 363,542 | 4,454,163 | ||||||||||||
| Net asset value and redemption price per share | $ | 8.33 | $ | 8.78 | $ | 26.37 | |||||||||
| Maximum offering price per share | $ | 8.84 | $ | 9.32 | $ | 27.98 | |||||||||
| Sales load | 5.75 | % | 5.75 | % | 5.75 | % | |||||||||
| Class C: | |||||||||||||||
| Net assets | $ | 637,445 | $ | 3,151,450 | $ | 15,592,828 | |||||||||
| Shares authorized | 50,000,000 | 50,000,000 | 50,000,000 | ||||||||||||
| Shares outstanding | 84,110 | 384,072 | 681,883 | ||||||||||||
| Net asset value and redemption price per share | $ | 7.58 | $ | 8.21 | $ | 22.87 | |||||||||
| Class I: | |||||||||||||||
| Net assets | N/A | N/A | $ | 4,598 | |||||||||||
| Shares authorized | 50,000,000 | ||||||||||||||
| Shares outstanding | 154 | ||||||||||||||
| Net asset value and redemption price per share | N/A | N/A | $ | 29.86 | |||||||||||
59
Pacific Advisors Fund Inc.
Statement of Operations
For the period ended December 31, 2009
| Government Securities Fund | Income and Equity Fund | Balanced Fund | |||||||||||||
| Investment Income | |||||||||||||||
| Dividends | $ | 38,334 | $ | 120,789 | $ | 580,793 | |||||||||
| Interest | 146,562 | 286,132 | 484,659 | ||||||||||||
| Total income | 184,896 | 406,921 | 1,065,452 | ||||||||||||
| Expenses | |||||||||||||||
| Investment management fees | 35,573 | 55,514 | 197,888 | ||||||||||||
| Transfer agent fees | 50,594 | 57,793 | 100,982 | ||||||||||||
| Fund accounting fees | 23,949 | 35,089 | 128,794 | ||||||||||||
| Legal fees | 3,660 | 7,392 | 28,221 | ||||||||||||
| Audit fees | 6,020 | 8,142 | 29,023 | ||||||||||||
| Registration fees | 16,869 | 17,954 | 25,336 | ||||||||||||
| Printing | 2,616 | 5,551 | 20,876 | ||||||||||||
| Custody fees | 8,580 | 7,371 | 9,202 | ||||||||||||
| Interest on borrowings | 742 | 180 | 62 | ||||||||||||
| Director fees/meetings | 2,427 | 3,489 | 12,474 | ||||||||||||
| Distribution and service (12b-1) fees (Note 3) | 33,331 | 53,537 | 234,071 | ||||||||||||
| Other expenses | 5,824 | 9,780 | 36,088 | ||||||||||||
| Total expenses, before fees waived | 190,185 | 261,792 | 823,017 | ||||||||||||
| Less fees waived (Note 3) | 78,773 | 55,514 | - | ||||||||||||
| Net expenses | 111,412 | 206,278 | 823,017 | ||||||||||||
| Net Investment Income (Loss) | 73,484 | 200,643 | 242,435 | ||||||||||||
| Net Realized and Unrealized Loss on Investments | |||||||||||||||
| Net realized losses on investments | (90,665 | ) | (277,641 | ) | (620,811 | ) | |||||||||
| Change in net unrealized appreciation of investments | 125,743 | 1,092,683 | 5,482,133 | ||||||||||||
| 35,078 | 815,042 | 4,861,322 | |||||||||||||
| Net Increase in Net Assets Resulting from Operations | $ | 108,562 | $ | 1,015,685 | $ | 5,103,757 | |||||||||
See Accompanying Notes to Financial Statements
60
| Growth Fund | Multi-Cap Value Fund | Small Cap Fund | |||||||||||||
| Investment Income | |||||||||||||||
| Dividends | $ | 40,421 | $ | 108,111 | $ | 505,419 | |||||||||
| Interest | 54 | 4 | - | ||||||||||||
| Total income | 40,475 | 108,115 | 505,419 | ||||||||||||
| Expenses | |||||||||||||||
| Investment management fees | 21,532 | 68,183 | 855,912 | ||||||||||||
| Transfer agent fees | 72,156 | 61,376 | 423,452 | ||||||||||||
| Fund accounting fees | 22,247 | 35,310 | 558,207 | ||||||||||||
| Legal fees | 3,646 | 8,021 | 129,523 | ||||||||||||
| Audit fees | 3,158 | 7,500 | 125,656 | ||||||||||||
| Registration fees | 18,423 | 22,431 | 46,269 | ||||||||||||
| Printing | 2,616 | 6,087 | 93,058 | ||||||||||||
| Custody fees | 6,627 | 7,382 | 24,596 | ||||||||||||
| Interest on borrowings | 236 | 6,242 | 90,381 | ||||||||||||
| Director fees/meetings | 1,444 | 3,376 | 53,011 | ||||||||||||
| Distribution and service (12b-1) fees (Note 3) | 13,034 | 41,574 | 394,584 | ||||||||||||
| Other expenses | 4,523 | 10,084 | 155,957 | ||||||||||||
| Total expenses, before fees waived | 169,642 | 277,566 | 2,950,606 | ||||||||||||
| Less fees waived (Note 3) | 64,732 | - | - | ||||||||||||
| Net expenses | 104,910 | 277,566 | 2,950,606 | ||||||||||||
| Net Investment Income (Loss) | (64,435 | ) | (169,451 | ) | (2,445,187 | ) | |||||||||
| Net Realized and Unrealized Loss on Investments | |||||||||||||||
| Net realized losses on investments | (90,603 | ) | (590,448 | ) | (11,115,931 | ) | |||||||||
| Change in net unrealized appreciation of investments | 810,623 | 2,692,158 | 48,599,772 | ||||||||||||
| 720,020 | 2,101,710 | 37,483,841 | |||||||||||||
| Net Increase in Net Assets Resulting from Operations | $ | 655,585 | $ | 1,932,259 | $ | 35,038,654 | |||||||||
61
Pacific Advisors Fund Inc.
Statement of Changes in Net Assets
| Government Securities Fund | Income and Equity Fund | ||||||||||||||||||
| Year ended December 31, 2009 | Year ended December 31, 2008 | Year ended December 31, 2009 | Year ended December 31, 2008 | ||||||||||||||||
| Increase (Decrease) in Net Assets From Operations | |||||||||||||||||||
| Net investment income (loss) | $ | 73,484 | $ | 162,524 | $ | 200,643 | $ | 240,238 | |||||||||||
| Net realized losses on investments | (90,665 | ) | (9,585 | ) | (277,641 | ) | (313,298 | ) | |||||||||||
| Change in net unrealized appreciation (depreciation) of investments | 125,743 | (287,855 | ) | 1,092,683 | (1,583,785 | ) | |||||||||||||
| Increase (decrease) in net assets resulting from operations | 108,562 | (134,916 | ) | 1,015,685 | (1,656,845 | ) | |||||||||||||
| From Distributions to Shareholders | |||||||||||||||||||
| Class A: | |||||||||||||||||||
| Net investment income | (46,545 | ) | (99,427 | ) | (82,954 | ) | (99,717 | ) | |||||||||||
| Net capital gains | - | - | - | - | |||||||||||||||
| Return of capital | - | - | - | - | |||||||||||||||
| Class C: | |||||||||||||||||||
| Net investment income | (29,507 | ) | (65,190 | ) | (122,038 | ) | (137,200 | ) | |||||||||||
| Net capital gains | - | - | - | - | |||||||||||||||
| Return of capital | - | - | - | - | |||||||||||||||
| Class I: | N/A | N/A | N/A | N/A | |||||||||||||||
| Net investment income | |||||||||||||||||||
| Net capital gains | |||||||||||||||||||
| Return of capital | |||||||||||||||||||
| Decrease in net assets resulting from distributions | (76,052 | ) | (164,617 | ) | (204,992 | ) | (236,917 | ) | |||||||||||
| From Capital Share Transactions (Note 6) | |||||||||||||||||||
| Proceeds from shares sold | 988,257 | 1,595,008 | 823,243 | 990,420 | |||||||||||||||
| Proceeds from shares purchased by reinvestment of dividends | 65,602 | 134,993 | 191,512 | 219,783 | |||||||||||||||
| Cost of shares repurchased | (1,466,506 | ) | (1,331,466 | ) | (1,265,863 | ) | (1,534,918 | ) | |||||||||||
| Increase (decrease) in net assets resulting from capital share transactions | (412,647 | ) | 398,535 | (251,108 | ) | (324,715 | ) | ||||||||||||
| Increase (decrease) in net assets | (380,137 | ) | 99,002 | 559,585 | (2,218,477 | ) | |||||||||||||
| Net Assets | |||||||||||||||||||
| Beginning of period | 5,510,671 | 5,411,669 | 7,434,514 | 9,652,991 | |||||||||||||||
| End of period | $ | 5,130,534 | $ | 5,510,671 | $ | 7,994,099 | $ | 7,434,514 | |||||||||||
| Including undistributed net investment income | $ | 564 | $ | 3,132 | $ | (904 | ) | $ | 3,445 | ||||||||||
See Accompanying Notes to Financial Statements
62
| Balanced Fund | |||||||||||
| Year ended December 31, 2009 | Year ended December 31, 2008 | ||||||||||
| Increase (Decrease) in Net Assets From Operations | |||||||||||
| Net investment income (loss) | $ | 242,435 | $ | 377,442 | |||||||
| Net realized losses on investments | (620,811 | ) | (927,201 | ) | |||||||
| Change in net unrealized appreciation (depreciation) of investments | 5,482,133 | (11,647,593 | ) | ||||||||
| Increase (decrease) in net assets resulting from operations | 5,103,757 | (12,197,352 | ) | ||||||||
| From Distributions to Shareholders | |||||||||||
| Class A: | |||||||||||
| Net investment income | (58,061 | ) | (84,449 | ) | |||||||
| Net capital gains | - | (60,574 | ) | ||||||||
| Return of capital | - | - | |||||||||
| Class C: | |||||||||||
| Net investment income | (175,818 | ) | (287,256 | ) | |||||||
| Net capital gains | - | (371,189 | ) | ||||||||
| Return of capital | - | - | |||||||||
| Class I: | N/A | N/A | |||||||||
| Net investment income | |||||||||||
| Net capital gains | |||||||||||
| Return of capital | |||||||||||
| Decrease in net assets resulting from distributions | (233,879 | ) | (803,468 | ) | |||||||
| From Capital Share Transactions (Note 6) | |||||||||||
| Proceeds from shares sold | 1,837,042 | 2,696,993 | |||||||||
| Proceeds from shares purchased by reinvestment of dividends | 222,990 | 773,434 | |||||||||
| Cost of shares repurchased | (3,921,187 | ) | (5,166,207 | ) | |||||||
| Increase (decrease) in net assets resulting from capital share transactions | (1,861,155 | ) | (1,695,780 | ) | |||||||
| Increase (decrease) in net assets | 3,008,723 | (14,696,600 | ) | ||||||||
| Net Assets | |||||||||||
| Beginning of period | 26,181,475 | 40,878,075 | |||||||||
| End of period | $ | 29,190,198 | $ | 26,181,475 | |||||||
| Including undistributed net investment income | $ | 15,756 | $ | 7,200 | |||||||
63
Pacific Advisors Fund Inc.
Statement of Changes in Net Assets
| Growth Fund | Multi-Cap Value Fund | ||||||||||||||||||
| Year ended December 31, 2009 | Year ended December 31, 2008 | Year ended December 31, 2009 | Year ended December 31, 2008 | ||||||||||||||||
| Increase (Decrease) in Net Assets From Operations | |||||||||||||||||||
| Net investment income (loss) | $ | (64,435 | ) | $ | (72,764 | ) | $ | (169,451 | ) | $ | (215,096 | ) | |||||||
| Net realized losses on investments | (90,603 | ) | (161,949 | ) | (590,448 | ) | (1,109,157 | ) | |||||||||||
| Change in net unrealized appreciation (depreciation) of investments | 810,623 | (1,868,088 | ) | 2,692,158 | (5,076,937 | ) | |||||||||||||
| Increase (decrease) in net assets resulting from operations | 655,585 | (2,102,801 | ) | 1,932,259 | (6,401,190 | ) | |||||||||||||
| From Distributions to Shareholders | |||||||||||||||||||
| Class A: | |||||||||||||||||||
| Net investment income | - | - | - | - | |||||||||||||||
| Net capital gains | - | - | - | (12,355 | ) | ||||||||||||||
| Return of capital | - | - | - | - | |||||||||||||||
| Class C: | |||||||||||||||||||
| Net investment income | - | - | - | - | |||||||||||||||
| Net capital gains | - | - | - | (15,265 | ) | ||||||||||||||
| Return of capital | - | - | - | - | |||||||||||||||
| Class I: | N/A | N/A | N/A | N/A | |||||||||||||||
| Net investment income | |||||||||||||||||||
| Net capital gains | |||||||||||||||||||
| Return of capital | |||||||||||||||||||
| Decrease in net assets resulting from distributions | - | - | - | (27,620 | ) | ||||||||||||||
| From Capital Share Transactions (Note 6) | |||||||||||||||||||
| Proceeds from shares sold | 244,428 | 1,138,930 | 1,075,173 | 1,688,581 | |||||||||||||||
| Proceeds from shares purchased by reinvestment of dividends | - | - | - | 25,075 | |||||||||||||||
| Cost of shares repurchased | (1,142,421 | ) | (965,224 | ) | (3,714,932 | ) | (3,041,075 | ) | |||||||||||
| Increase (decrease) in net assets resulting from capital share transactions | (897,993 | ) | 173,706 | (2,639,759 | ) | (1,327,419 | ) | ||||||||||||
| Increase (decrease) in net assets | (242,408 | ) | (1,929,095 | ) | (707,500 | ) | (7,756,229 | ) | |||||||||||
| Net Assets | |||||||||||||||||||
| Beginning of period | 3,056,221 | 4,985,316 | 7,052,486 | 14,808,715 | |||||||||||||||
| End of period | $ | 2,813,813 | $ | 3,056,221 | $ | 6,344,986 | $ | 7,052,486 | |||||||||||
| Including undistributed net investment income | $ | 190 | $ | 190 | $ | - | $ | - | |||||||||||
See Accompanying Notes to Financial Statements
64
| Small Cap Fund | |||||||||||
| Year ended December 31, 2009 | Year ended December 31, 2008 | ||||||||||
| Increase (Decrease) in Net Assets From Operations | |||||||||||
| Net investment income (loss) | $ | (2,445,187 | ) | $ | (2,561,476 | ) | |||||
| Net realized losses on investments | (11,115,931 | ) | (303,734 | ) | |||||||
| Change in net unrealized appreciation (depreciation) of investments | 48,599,772 | (74,888,308 | ) | ||||||||
| Increase (decrease) in net assets resulting from operations | 35,038,654 | (77,753,518 | ) | ||||||||
| From Distributions to Shareholders | |||||||||||
| Class A: | |||||||||||
| Net investment income | - | - | |||||||||
| Net capital gains | - | (1,558,363 | ) | ||||||||
| Return of capital | - | (20,200 | ) | ||||||||
| Class C: | |||||||||||
| Net investment income | - | - | |||||||||
| Net capital gains | - | (327,293 | ) | ||||||||
| Return of capital | - | (4,242 | ) | ||||||||
| Class I: | |||||||||||
| Net investment income | - | - | |||||||||
| Net capital gains | - | (17,914 | ) | ||||||||
| Return of capital | - | (232 | ) | ||||||||
| Decrease in net assets resulting from distributions | - | (1,928,244 | ) | ||||||||
| From Capital Share Transactions (Note 6) | |||||||||||
| Proceeds from shares sold | 39,655,691 | 89,039,262 | |||||||||
| Proceeds from shares purchased by reinvestment of dividends | - | 1,815,640 | |||||||||
| Cost of shares repurchased | (44,812,413 | ) | (54,430,999 | ) | |||||||
| Increase (decrease) in net assets resulting from capital share transactions | (5,156,722 | ) | 36,423,903 | ||||||||
| Increase (decrease) in net assets | 29,881,932 | (43,257,859 | ) | ||||||||
| Net Assets | |||||||||||
| Beginning of period | 103,171,052 | 146,428,911 | |||||||||
| End of period | $ | 133,052,984 | $ | 103,171,052 | |||||||
| Including undistributed net investment income | $ | - | $ | - | |||||||
65
Pacific Advisors Fund Inc.
Notes to Financial Statements
December 31, 2009
Note 1. Organization
Pacific Advisors Fund Inc. (the "Company") is an open-end diversified investment management company registered under the Investment Company Act of 1940, as amended. The Company currently offers six Funds: Government Securities Fund, Income and Equity Fund, Balanced Fund, Growth Fund, Multi-Cap Value Fund and Small Cap Fund. Each Fund is a separate investment portfolio of the Company with a distinct investment objective, investment program, policies and restrictions.
The Government Securities Fund seeks to provide high current income, preservation of capital, and rising future income, consistent with prudent investment risk. The Income and Equity Fund seeks to provide current income and, secondarily, long-term capital appreciation. The Balanced Fund seeks to achieve long-term capital appreciation and income consistent with reduced market risk. The Growth Fund seeks to achieve long-term capital appreciation through investment in medium to large capitalization companies. The Multi-Cap Value Fund seeks long-term capital appreciation by investing in a diversified portfolio of large to small capitalization companies. The Small Cap Fund seeks to provide capital appreciation through investment in small capitalization companies.
In addition to Class A and Class C shares, the Small Cap Fund introduced Class I shares on October 9, 2006. Each class has equal rights as to assets and voting privileges except that Class A and Class C each has exclusive voting rights with respect to its distribution plan. Investment income, realized and unrealized capital gains and losses, and the common expenses of each Fund are allocated on a pro rata basis to each class based on the relative net assets of each class to the total net assets of the Fund. Each Class of shares differs in its respective service and distribution expenses and may differ in its transfer agent, registration, and certain other class-specific fees and expenses.
The Company enters into contracts that contain a variety of indemnifications. The Company's maximum exposure under these arrangements is unknown. However, the Company has not had prior claims or losses pursuant to these contracts and expects the risk of loss to be remote.
Note 2. Significant Accounting Policies
Security Valuation and Fair Value Measurement. Securities, including American Depository Receipts (ADRs), listed on a national securities exchange and certain over-the-counter ("OTC") issues traded on the NASDAQ national market system are valued at the last quoted sale price at the close of the New York Stock Exchange. OTC issues not quoted on the NASDAQ system, and other equity securities for which no sale price is available, are valued at the last bid price as obtained from published sources or real time quote services, where available, and otherwise from brokers who are market makers for such securities. Debt securities with a maturity less than 60 days are valued on an amortized cost basis, which approximates market value. Premium or discount on debt securities are amortized. In determining the fair value of other debt securities, Pacific Global I nvestment Management Company, Inc. (the "Investment Manager") utilizes independent pricing services approved by the Board of Directors using one or more of the following valuation techniques:
(1) a matrix pricing approach that considers market inputs including, in approximate order of priority, the following: benchmark yields, reported trades, broker/dealer quotes, issuer spreads, two-sided markets, benchmark securities, bids, offers and reference data including market research publications; market indicators, industry and economic events. Evaluators may prioritize inputs differently on any given day for any security based on market conditions, and not all inputs listed are available for use in the evaluation process for each security evaluation on any given day; (2) a comparison of the value of the borrower's outstanding equity and debt to that of comparable public companies; (3) a discounted cash flow analysis. In conducting its assessment and analysis for purpose of determining fair value, the Investment Manager uses its discretion and judgment in considering and appraising relevant factors. Fair value determinati ons are made by the Investment Manager based on the Company's Fair Value Procedure.
Various inputs are used to determine the fair value of the Fund's investments. For financial statements, these inputs are summarized in the three broad levels listed below. Level 1 investment securities are valued based on quoted prices in active markets for identical securities. Level 2 investment securities are valued based on significant observable market inputs, such as quoted prices for similar securities and quoted prices in inactive markets. Level 3 investment securities are valued using significant unobservable inputs that reflect the Fund's own assumptions in determining the fair value of investments. The valuation levels are
66
Pacific Advisors Fund Inc.
Notes to Financial Statements
December 31, 2009
not necessarily an indication of the risk associated with investing in those securities. The following is a summary of the inputs used to value the Fund's investment securities and cash and cash equivalents as of December 31, 2009:
| Government Securities Fund | Income and Equity Fund | Balanced Fund | Growth Fund | Multi-Cap Value Fund | Small Cap Fund | ||||||||||||||||||||||
| Level 1 - Quoted Prices | |||||||||||||||||||||||||||
| Common Stock | |||||||||||||||||||||||||||
| Energy | $ | 135,125 | $ | 470,917 | $ | 4,827,082 | $ | 808,715 | $ | 2,311,862 | $ | 23,694,480 | |||||||||||||||
| Material | - | 33,670 | 691,520 | 76,580 | 500,925 | 4,382,000 | |||||||||||||||||||||
| Industrials | - | 344,440 | 4,176,430 | 308,580 | 2,507,661 | 45,466,890 | |||||||||||||||||||||
| Consumer Discretionary | - | 280,850 | 624,400 | - | 603,000 | 15,180,628 | |||||||||||||||||||||
| Consumer Staples | - | 344,090 | 2,594,535 | - | 283,000 | 7,017,200 | |||||||||||||||||||||
| Health Care | - | 257,640 | 1,947,150 | 974,577 | - | 11,374,590 | |||||||||||||||||||||
| Financials | - | 134,010 | 2,443,420 | 63,200 | 188,750 | 26,850,600 | |||||||||||||||||||||
| Information Technology | - | 152,450 | 1,273,610 | 468,380 | - | 2,090,550 | |||||||||||||||||||||
| Telecommunication Services | 70,075 | 183,480 | - | - | - | 3,877,500 | |||||||||||||||||||||
| Utilities | 111,060 | 221,220 | 796,210 | - | - | ||||||||||||||||||||||
| Preferred Stock | |||||||||||||||||||||||||||
| Financials | 171,440 | 472,475 | 739,800 | - | - | - | |||||||||||||||||||||
| Telecommunication Services | - | 53,380 | 266,900 | - | - | - | |||||||||||||||||||||
| Utilities | - | 51,380 | - | - | - | - | |||||||||||||||||||||
| Level 1 Total | 487,700 | 3,000,002 | 20,381,057 | 2,700,032 | 6,395,198 | 139,934,438 | |||||||||||||||||||||
| Level 2 - Other significant observable inputs | |||||||||||||||||||||||||||
| Corporate Bonds | |||||||||||||||||||||||||||
| Energy | - | 393,121 | 1,291,630 | - | - | - | |||||||||||||||||||||
| Material | - | 603,730 | 587,873 | - | - | - | |||||||||||||||||||||
| Industrials | - | 206,912 | 1,282,715 | - | - | - | |||||||||||||||||||||
| Consumer Discretionary | - | 649,060 | 771,687 | - | - | - | |||||||||||||||||||||
| Health Care | - | 99,417 | 104,032 | - | - | - | |||||||||||||||||||||
| Financials | - | 1,638,452 | 3,527,869 | - | - | - | |||||||||||||||||||||
| Information Technology | - | 105,224 | 272,525 | - | - | - | |||||||||||||||||||||
| Telecommunication Services | - | 580,314 | 403,253 | - | - | - | |||||||||||||||||||||
| Utilities | - | 461,494 | 37,776 | - | - | - | |||||||||||||||||||||
| US Government Securities | |||||||||||||||||||||||||||
| US Government Agency | 4,648,939 | 105,496 | - | - | - | - | |||||||||||||||||||||
| Short Term Investments | |||||||||||||||||||||||||||
| Money Market | 181,059 | 90,670 | 478,934 | 120,029 | - | - | |||||||||||||||||||||
| Level 2 Total | 4,829,998 | 4,933,890 | 8,758,294 | 120,029 | - | - | |||||||||||||||||||||
| Level 3 - Significant unobservable inputs | - | - | - | - | - | - | |||||||||||||||||||||
| Total Investments | $ | 5,317,698 | $ | 7,933,892 | $ | 29,139,351 | $ | 2,820,061 | $ | 6,395,198 | $ | 139,934,438 | |||||||||||||||
Equity securities (common and preferred stock) that are actively traded and market priced are classified as Level 1 Securities. All fixed income securities are classified as Level 2 securities and are valued using either amortized cost or the matrix pricing approach. The Funds had no Level 3 holdings during the year ended December 31, 2009.
B. Cash and Cash Equivalents. The Company considers all highly liquid financial instruments with maturities of less than three months when acquired to be cash equivalents.
C. Security Transactions and Investment Income. Security transactions are accounted for on the trade date. The cost of investments sold is determined by use of the specific identification method for both financial reporting and federal income tax purposes. Dividends are recorded on the ex-dividend date. Interest income is recorded on an accrual basis.
D. Dividends and Distributions to Shareholders. The Government Securities Fund and Income and Equity Fund declare and distribute dividends of their net investment income, if any, quarterly. The Balanced Fund, Growth Fund, Multi-Cap Value Fund and Small Cap Fund declare and distribute dividends of their net investment income, if any, annually. The Board of Directors will determine the amount and timing of such payments. Income dividends and capital gains distributions are determined in accordance with income tax regulations which may differ from generally accepted accounting principles. These differences are primarily due to differing
67
Pacific Advisors Fund Inc.
Notes to Financial Statements
December 31, 2009
treatments of income and gain on various investment securities held by the Funds, timing differences and differing characterization of distributions made by the Funds.
E. Federal Income Tax. The Company intends to comply with the requirements of Subchapter M of the Internal Revenue Code applicable to regulated investment companies and to distribute substantially all of their taxable income to their shareholders. Therefore, no federal income tax provision is required.
Management has analyzed the Funds' tax positions taken on federal income tax returns for all open tax years and for the year ended December 31, 2009 and has concluded that no provision for income tax is required in the Funds' financial statements. Tax years 2006, 2007, 2008 and 2009 are still subject to examination by major federal jurisdictions. Tax years 2005, 2006, 2007, 2008 and 2009 are still subject to examination by major state jurisdictions.
The Funds recognize interest and penalties, if any, related to unrecognized tax benefits as income tax expense in the Statement of Operations. During the period, the Funds did not incur any interest or penalties.
At December 31, 2009, components of distributable earnings/(accumulated deficits) on a tax basis were as follows:
| Government | Income and Securities Fund | Equity Fund | Balanced Fund | Multi-Cap Growth Fund | Value Fund | Small Cap Fund | |||||||||||||||||||||
| Undistributed ordinary income | $ | 564 | $ | 1,998 | $ | 5,989 | $ | - | $ | - | $ | - | |||||||||||||||
| Undistributed long-term gains | - | - | - | - | - | - | |||||||||||||||||||||
| Capital loss carryforward* | (1,173,656 | ) | (784,516 | ) | (1,557,453 | ) | (345,078 | ) | (1,701,814 | ) | (12,029,758 | ) | |||||||||||||||
| Post October Loss | (16,694 | ) | (1,120 | ) | - | - | - | (160,713 | ) | ||||||||||||||||||
| Net unrealized appreciation (depreciation) on investments | (29,115 | ) | 2,438 | 4,012,612 | 152,964 | (803,100 | ) | (9,702,303 | ) | ||||||||||||||||||
| Accumulated earnings (deficits) | $ | (1,218,901 | ) | $ | (781,200 | ) | $ | 2,461,148 | $ | (192,114 | ) | $ | (2,504,914 | ) | $ | (21,892,774 | ) | ||||||||||
The difference between book basis and tax-basis unrealized appreciation (depreciation) is attributable primarily to the tax deferral of losses on wash sales, return of capital distribution from ADRs and realization for tax purpose of interest income on investments. The Fund intends to treat Post-October losses, net capital losses occurred for the period subsequent to October 31, 2009 through the fiscal year end December 31, 2009, as having been incurred in the next fiscal year.
The Funds intend to utilize provisions of the federal income tax laws which allow them to carry a realized capital loss forward for eight years following the year of the loss and offset such losses against any future realized capital gains. During the current fiscal year, no capital losses carried forward have been utilized.
* At December 31, 2009, the following had accumulated net realized losses on investment transactions that represent capital loss carryforwards for federal income tax purposes, which expire as follows:
| Capital losses expiring in: | |||||||||||||||||||||||||||||||||||||||
| 2010 | 2011 | 2012 | 2013 | 2014 | 2015 | 2016 | 2017 | Total | |||||||||||||||||||||||||||||||
| Government Securities Fund | $ | - | $ | 855,711 | $ | 95,072 | $ | 49,495 | $ | 88,644 | $ | 1,178 | $ | 9,585 | $ | 73,971 | $ | 1,173,656 | |||||||||||||||||||||
| Income and Equity Fund | - | - | - | - | - | - | 396,450 | 388,066 | 784,516 | ||||||||||||||||||||||||||||||
| Balanced Fund | - | - | - | - | - | 431,086 | 1,126,367 | 1,557,453 | |||||||||||||||||||||||||||||||
| Growth Fund | 91,734 | - | - | - | - | - | - | 253,344 | 345,078 | ||||||||||||||||||||||||||||||
| Multi-Cap Value Fund | - | - | - | - | - | - | 1,061,647 | 640,167 | 1,701,814 | ||||||||||||||||||||||||||||||
| Small Cap Fund | - | - | - | - | - | - | - | 12,029,758 | 12,029,758 | ||||||||||||||||||||||||||||||
During the year ended December 31, 2009, the Growth Fund had a capital loss carryforward in the amount of $340,292 that expired.
F. Reclassification of Capital Accounts. Distributions of net investment income and realized gains are determined in accordance with income tax regulations which may differ from generally accepted accounting principles. These differences are due to differing treatments for items such as net operating losses, reclassification of dividends and return of capital. To the extent that these differences are permanent in nature, reclassifications are made among the net asset accounts on the Statement of Assets and Liabilities.
68
Pacific Advisors Fund Inc.
Notes to Financial Statements
December 31, 2009
For the year ended December 31, 2009, reclassifications among the components of net assets are as follows:
| Accumulated Undistributed Net Investment Income | Paid in Capital | Accumulated Capital Gain | |||||||||||||
| Government Securities Fund | $ | - | $ | - | $ | - | |||||||||
| Income and Equity Fund | - | - | - | ||||||||||||
| Balanced Fund | - | - | - | ||||||||||||
| Growth Fund | 64,435 | (404,727 | ) | 340,292 | |||||||||||
| Multi-Cap Value Fund | 169,451 | (169,451 | ) | - | |||||||||||
| Small Cap Fund | 2,445,187 | (2,445,187 | ) | - | |||||||||||
The reclassifications were due to net investment losses incurred by the Fund, which are not permitted to be carried forward for tax purposes. The Growth Fund's reclassification was also a result of the expiry of capital losses previously carried-forward.
G. Use of Estimates. The preparation of financial statements in conformity with generally accepted accounting principles in the United States requires management to make estimates and assumptions that affect the reported amounts in the financial statements and footnotes. Actual results could differ from those estimates.
Note 3. Investment Management, Distributor and Other Related Party Transactions
The Company and the Funds have entered into investment management agreements ("Management Agreements") with the Investment Manager.
The Management Agreements provide for investment management fees, payable monthly, and calculated at the maximum annual rate of 0.65% of average net assets for the Government Securities Fund, 0.75% of average net assets for the Income and Equity, Balanced, Growth and Small Cap Funds and 1.00% of average net assets for the Multi-Cap Value Fund.
In accordance with Expense Limitation Agreements with the Company, the Investment Manager will waive its respective management fees to the extent that the actual operating expenses of the following Funds exceed the following thresholds:
| Class A | Class C | ||||||||||
| Government Securities Fund | 1.65 | % | 2.40 | % | |||||||
| Income and Equity Fund | 1.95 | % | 2.70 | % | |||||||
| Growth Fund | 2.65 | % | 3.40 | % | |||||||
For the Government Securities Fund and Growth Fund only, if net expenses exceed the above thresholds after waiver of the entire management fee, the Transfer Agent will waive its transfer agency fee to the extent necessary to reduce Class expenses to the above thresholds. These agreements may be terminated by either party upon 90 days prior written notice.
Pursuant to the Expense Limitation Agreements, providing for the voluntary waiver of fees and the assumption of expenses by the Investment Manager and Transfer Agent, the following amounts were waived for the year ended December 31, 2009.
| Management Fees Waived | Transfer Agent Fees Waived | ||||||||||
| Government Securities Fund | $ | 35,573 | $ | 43,200 | |||||||
| Income and Equity Fund | 55,514 | - | |||||||||
| Growth Fund | 21,532 | 43,200 | |||||||||
Effective 2004, the Investment Manager terminated all of its rights under the expense limitation agreements with respect to potential recoupment from the Funds of all management fees previously waived and all expenses previously reimbursed. In the future, the Investment Manager will not have any rights to recover fees it waives or expenses it may reimburse, with respect to any of the Funds.
69
Pacific Advisors Fund Inc.
Notes to Financial Statements
December 31, 2009
For the year ended December 31, 2009, Pacific Global Fund Distributors, Inc. ("PGFD"), the principal underwriter for the Company, received commissions on sales of capital stock, after deducting amounts allowed to authorized distributors as commissions. In addition, PGFD, as a registered broker-dealer, may act as broker for the Funds, in conformity with Rule 17e-1 under the Investment Company Act of 1940. The Fund's Board of Directors has approved procedures for evaluating the reasonableness of commissions paid to PGFD and periodically reviews these procedures. PGFD will not act as principal in effecting any portfolio transactions for the Funds. The amounts of commissions are as follows:
| Underwriting Fees Retained | Commissions Retained | Brokerage Commissions Received | |||||||||||||
| Government Securities Fund | $ | 80 | $ | 4 | $ | 659 | |||||||||
| Income and Equity Fund | 9 | 12 | 1,056 | ||||||||||||
| Balanced Fund | 528 | 717 | 4,746 | ||||||||||||
| Growth Fund | 1,007 | 138 | 637 | ||||||||||||
| Multi-Cap Value Fund | 2,443 | 578 | 5,703 | ||||||||||||
| Small Cap Fund | 16,892 | 955 | 66,621 | ||||||||||||
PGFD is a wholly-owned subsidiary of the Investment Manager.
The Company and the Funds have entered into agreements with Pacific Global Investor Services, Inc. ("PGIS") to provide fund accounting services at the monthly fee of three basis points for the first one hundred million in net assets or a minimum of $1,500. In addition, agreements to provide transfer agent services has also been entered into at a rate of $21.00 per year per open account and $3.50 per year per closed account with minimum charges of $1,800 per month for A, C, and I share accounts. PGIS is a wholly-owned subsidiary of the Investment Manager.
Accounts payable to related parties consist of transfer agent fees payable to PGIS.
The Company has adopted a plan of distribution, whereby the Funds may pay a service fee to qualified recipients in an amount up to 0.25% per annum of each Fund's daily net assets for Class A shares and Class C shares. Under the plan of the distribution, the Funds may pay a distribution fee to qualified recipients in an amount up to 0.75% per annum of each Fund's daily net assets for Class C shares. The Company has not adopted a plan of distribution for Class I Shares.
For the year ended December 31, 2009, total distribution and/or service (12b-1) fees were:
| Class A | Class C | ||||||||||
| Government Securities Fund | $ | 7,132 | $ | 26,199 | |||||||
| Income and Equity Fund | 6,827 | 46,710 | |||||||||
| Balanced Fund | 9,225 | 224,846 | |||||||||
| Growth Fund | 4,552 | 8,482 | |||||||||
| Multi-Cap Value Fund | 8,205 | 33,369 | |||||||||
| Small Cap Fund | 248,177 | 146,407 | |||||||||
Note 4. Purchase and Sales of Securities
The following summarizes purchases and sales of investment securities, other than short-term investments, and aggregate gross unrealized appreciation and depreciation on a tax basis by each Fund for the year ended and as of December 31, 2009. The difference between book basis and tax-basis unrealized appreciation (depreciation) is attributable primarily to the tax deferral of losses on wash sales.
| Year ended December 31, 2009 | As of December 31, 2009 | ||||||||||||||||||||||||||
| Cost of Purchases | Proceeds From Sales | Tax Cost of Securities | Gross Unrealized Appreciation | Gross Unrealized Depreciation | Net Unrealized Appreciation (Depreciation) | ||||||||||||||||||||||
| Government Securities Fund | $ | 12,153,226 | $ | 11,959,346 | $ | 5,165,754 | $ | 21,348 | $ | 50,463 | $ | (29,115 | ) | ||||||||||||||
| Income and Equity Fund | 2,137,079 | 2,043,529 | 7,840,784 | 492,988 | 490,550 | 2,438 | |||||||||||||||||||||
| Balanced Fund | 2,601,602 | 4,775,227 | 24,652,805 | 5,508,715 | 1,496,103 | 4,012,612 | |||||||||||||||||||||
| Growth Fund | 147,727 | 1,010,055 | 2,547,068 | 497,832 | 344,868 | 152,964 | |||||||||||||||||||||
| Multi-Cap Value Fund | 1,495,593 | 4,973,898 | 7,198,298 | 960,911 | 1,764,011 | (803,100 | ) | ||||||||||||||||||||
| Small Cap Fund | 19,837,655 | 25,231,075 | 149,636,741 | 23,681,728 | 33,384,031 | (9,702,303 | ) | ||||||||||||||||||||
70
Pacific Advisors Fund Inc.
Notes to Financial Statements
December 31, 2009
Note 5. Distributions to Shareholders
The tax character of distributions paid during 2009 and 2008 was as follows:
| Government Securities Fund | Income and Equity Fund | Balanced Fund | Growth Fund | Multi-Cap Value Fund | Small Cap Fund | ||||||||||||||||||||||
| Year ended December 31, 2009 | |||||||||||||||||||||||||||
| Distributions paid from: | |||||||||||||||||||||||||||
| Ordinary Income | $ | 76,052 | $ | 204,992 | $ | 233,879 | $ | - | $ | - | $ | - | |||||||||||||||
| Long-Term Capital Gain | - | - | - | - | - | - | |||||||||||||||||||||
| Return of Capital | - | - | - | - | - | - | |||||||||||||||||||||
| Total Distributions | $ | 76,052 | $ | 204,992 | $ | 233,879 | $ | - | $ | - | $ | - | |||||||||||||||
| Year ended December 31, 2008 | |||||||||||||||||||||||||||
| Distributions paid from: | |||||||||||||||||||||||||||
| Ordinary Income | $ | 164,617 | $ | 236,917 | $ | 371,701 | $ | - | $ | - | $ | - | |||||||||||||||
| Long-Term Capital Gain | - | - | 431,767 | - | 27,620 | 1,903,570 | |||||||||||||||||||||
| Return of Capital | - | - | - | - | - | 24,674 | |||||||||||||||||||||
| Total Distributions | $ | 164,617 | $ | 236,917 | $ | 803,468 | $ | - | $ | 27,620 | $ | 1,928,244 | |||||||||||||||
Note 6. Capital Share Transactions
A 2% redemption fee is assessed on shares of the Government Securities Fund or the Income and Equity Fund sold or exchanged within 30 days of purchase or shares of the Balanced Fund, Growth Fund, Multi-Cap Value Fund or the Small Cap Fund sold or exchanged within 180 days of purchase and is retained in each Fund. The redemption fees collected through December 31, 2009 are included in the dollar amount of shares sold in the table below. The amount of the increase is as follows:
| Class A | Class C | ||||||||||
| Government Securities Fund | $ | 11 | $ | - | |||||||
| Income and Equity Fund | - | - | |||||||||
| Balanced Fund | 284 | 1,453 | |||||||||
| Growth Fund | 458 | - | |||||||||
| Multi-Cap Value Fund | 7,733 | 69 | |||||||||
| Small Cap Fund | 79,487 | 3,719 | |||||||||
| Year ended December 31, 2009 | Year ended December 31, 2008 | ||||||||||||||||||
| Shares | Amount | Shares | Amount | ||||||||||||||||
| Government Securities Fund | |||||||||||||||||||
| Class A | |||||||||||||||||||
| Shares Sold | 23,048 | $ | 203,753 | 41,348 | $ | 387,423 | |||||||||||||
| Reinvestment of Distributions | 4,331 | 38,586 | 8,448 | 77,592 | |||||||||||||||
| 27,379 | 242,339 | 49,796 | 465,015 | ||||||||||||||||
| Shares Repurchased | (86,844 | ) | (774,281 | ) | (113,106 | ) | (1,054,835 | ) | |||||||||||
| Net Decrease | (59,465 | ) | $ | (531,942 | ) | (63,310 | ) | $ | (589,820 | ) | |||||||||
| Class C | |||||||||||||||||||
| Shares Sold | 89,877 | $ | 784,504 | 131,789 | $ | 1,207,585 | |||||||||||||
| Reinvestment of Distributions | 3,058 | 27,016 | 6,311 | 57,401 | |||||||||||||||
| 92,935 | 811,520 | 138,100 | 1,264,986 | ||||||||||||||||
| Shares Repurchased | (78,546 | ) | (692,225 | ) | (29,782 | ) | (276,631 | ) | |||||||||||
| Net Increase | 14,389 | $ | 119,295 | 108,318 | $ | 988,355 | |||||||||||||
71
Pacific Advisors Fund Inc.
Notes to Financial Statements
December 31, 2009
| Year ended December 31, 2009 | Year ended December 31, 2008 | ||||||||||||||||||
| Shares | Amount | Shares | Amount | ||||||||||||||||
| Income and Equity Fund | |||||||||||||||||||
| Class A | |||||||||||||||||||
| Shares Sold | 26,638 | $ | 237,006 | 36,807 | $ | 367,820 | |||||||||||||
| Reinvestment of Distributions | 8,429 | 74,219 | 9,366 | 88,730 | |||||||||||||||
| 35,067 | 311,225 | 46,173 | 456,550 | ||||||||||||||||
| Shares Repurchased | (56,257 | ) | (495,430 | ) | (68,508 | ) | (684,121 | ) | |||||||||||
| Net Decrease | (21,190 | ) | $ | (184,205 | ) | (22,335 | ) | $ | (227,571 | ) | |||||||||
| Class C | |||||||||||||||||||
| Shares Sold | 67,794 | $ | 586,237 | 65,511 | $ | 622,600 | |||||||||||||
| Reinvestment of Distributions | 13,943 | 117,293 | 14,485 | 131,053 | |||||||||||||||
| 81,737 | 703,530 | 79,996 | 753,653 | ||||||||||||||||
| Shares Repurchased | (94,516 | ) | (770,433 | ) | (89,895 | ) | (850,797 | ) | |||||||||||
| Net Decrease | (12,779 | ) | $ | (66,903 | ) | (9,899 | ) | $ | (97,144 | ) | |||||||||
| Year ended December 31, 2009 | Year ended December 31, 2008 | ||||||||||||||||||
| Shares | Amount | Shares | Amount | ||||||||||||||||
| Balanced Fund | |||||||||||||||||||
| Class A | |||||||||||||||||||
| Shares Sold | 40,117 | $ | 516,878 | 34,352 | $ | 576,332 | |||||||||||||
| Reinvestment of Distributions | 3,375 | 50,596 | 10,240 | 123,396 | |||||||||||||||
| 43,492 | 567,474 | 44,592 | 699,728 | ||||||||||||||||
| Shares Repurchased | (55,070 | ) | (715,500 | ) | (59,042 | ) | (973,634 | ) | |||||||||||
| Net Decrease | (11,578 | ) | $ | (148,026 | ) | (14,450 | ) | $ | (273,906 | ) | |||||||||
| Class C | |||||||||||||||||||
| Shares Sold | 106,153 | $ | 1,320,164 | 133,496 | $ | 2,120,661 | |||||||||||||
| Reinvestment of Distributions | 11,955 | 172,394 | 55,941 | 650,038 | |||||||||||||||
| 118,108 | 1,492,558 | 189,437 | 2,770,699 | ||||||||||||||||
| Shares Repurchased | (261,411 | ) | (3,205,687 | ) | (271,078 | ) | (4,192,573 | ) | |||||||||||
| Net Decrease | (143,303 | ) | $ | (1,713,129 | ) | (81,641 | ) | $ | (1,421,874 | ) | |||||||||
72
Pacific Advisors Fund Inc.
Notes to Financial Statements
December 31, 2009
| Year ended December 31, 2009 | Year ended December 31, 2008 | ||||||||||||||||||
| Shares | Amount | Shares | Amount | ||||||||||||||||
| Growth Fund | |||||||||||||||||||
| Class A | |||||||||||||||||||
| Shares Sold | 37,678 | $ | 244,428 | 104,226 | $ | 950,912 | |||||||||||||
| Reinvestment of Distributions | - | - | - | - | |||||||||||||||
| 37,678 | 244,428 | 104,226 | 950,912 | ||||||||||||||||
| Shares Repurchased | (81,212 | ) | (543,996 | ) | (66,306 | ) | (513,431 | ) | |||||||||||
| Net Increase (Decrease) | (43,534 | ) | $ | (299,568 | ) | 37,920 | $ | 437,481 | |||||||||||
| Class C | |||||||||||||||||||
| Shares Sold | - | $ | - | 26,337 | $ | 188,018 | |||||||||||||
| Reinvestment of Distributions | - | - | - | - | |||||||||||||||
| - | - | 26,337 | 188,018 | ||||||||||||||||
| Shares Repurchased | (95,391 | ) | (598,425 | ) | (55,898 | ) | (451,793 | ) | |||||||||||
| Net Decrease | (95,391 | ) | $ | (598,425 | ) | (29,561 | ) | $ | (263,775 | ) | |||||||||
| Year ended December 31, 2009 | Year ended December 31, 2008 | ||||||||||||||||||
| Shares | Amount | Shares | Amount | ||||||||||||||||
| Multi-Cap Value Fund | |||||||||||||||||||
| Class A | |||||||||||||||||||
| Shares Sold | 183,600 | $ | 1,032,777 | 102,907 | $ | 1,089,521 | |||||||||||||
| Reinvestment of Distributions | - | - | 1,562 | 9,884 | |||||||||||||||
| 183,600 | 1,032,777 | 104,469 | 1,099,405 | ||||||||||||||||
| Shares Repurchased | (307,975 | ) | (2,249,246 | ) | (121,745 | ) | (1,325,969 | ) | |||||||||||
| Net Decrease | (124,375 | ) | $ | (1,216,469 | ) | (17,276 | ) | $ | (226,564 | ) | |||||||||
| Class C | |||||||||||||||||||
| Shares Sold | 6,780 | $ | 42,396 | 53,399 | $ | 599,061 | |||||||||||||
| Reinvestment of Distributions | - | - | 2,545 | 15,191 | |||||||||||||||
| 6,780 | 42,396 | 55,944 | 614,252 | ||||||||||||||||
| Shares Repurchased | (213,789 | ) | (1,465,686 | ) | (178,566 | ) | (1,715,107 | ) | |||||||||||
| Net Decrease | (207,009 | ) | $ | (1,423,290 | ) | (122,622 | ) | $ | (1,100,855 | ) | |||||||||
73
Pacific Advisors Fund Inc.
Notes to Financial Statements
December 31, 2009
| Year ended December 31, 2009 | Year ended December 31, 2008 | ||||||||||||||||||
| Shares | Amount | Shares | Amount | ||||||||||||||||
| Small Cap Fund | |||||||||||||||||||
| Class A | |||||||||||||||||||
| Shares Sold | 1,756,008 | $ | 38,687,567 | 2,875,586 | $ | 83,272,527 | |||||||||||||
| Reinvestment of Distributions | - | - | 84,464 | 1,495,008 | |||||||||||||||
| 1,756,008 | 38,687,567 | 2,960,050 | 84,767,535 | ||||||||||||||||
| Shares Repurchased | (1,873,438 | ) | (39,920,852 | ) | (1,642,912 | ) | (44,814,386 | ) | |||||||||||
| Net Increase (Decrease) | (117,430 | ) | $ | (1,233,285 | ) | 1,317,138 | $ | 39,953,149 | |||||||||||
| Class C | |||||||||||||||||||
| Shares Sold | 48,957 | $ | 968,124 | 215,321 | $ | 5,766,735 | |||||||||||||
| Reinvestment of Distributions | - | - | 19,540 | 302,486 | |||||||||||||||
| 48,957 | 968,124 | 234,861 | 6,069,221 | ||||||||||||||||
| Shares Repurchased | (282,281 | ) | (4,891,561 | ) | (348,462 | ) | (8,637,137 | ) | |||||||||||
| Net Decrease | (233,324 | ) | $ | (3,923,437 | ) | (113,601 | ) | $ | (2,567,916 | ) | |||||||||
| Class I | |||||||||||||||||||
| Shares Sold | - | $ | - | - | $ | - | |||||||||||||
| Reinvestment of Distributions | - | - | 948 | 18,146 | |||||||||||||||
| - | - | 948 | 18,146 | ||||||||||||||||
| Shares Repurchased | - | - | (51,524 | ) | (979,476 | ) | |||||||||||||
| Net Decrease | - | $ | - | (50,576 | ) | $ | (961,330 | ) | |||||||||||
Note 7. Bank Borrowings
Each Fund may borrow up to 15% of its total assets. Each Fund will not borrow money except temporarily from banks to facilitate redemption requests that might otherwise require untimely disposition of portfolio securities. No securities will be purchased for a Fund when borrowed money exceeds 5% of the Fund's total assets. Each Fund has the ability to borrow, from UMB Bank, n.a. (UMB), on an unsecured basis, at 1.5% over the Federal Funds rate. As of December 31, 2009, the Small Cap Fund and Multi-Cap Value Fund had borrowings from UMB with amounts of $6,857,595 and $33,105, respectively, and were paying interest at 1.53% per annum on their outstanding borrowings. No compensating balances are required.
Note 8. Subsequent Events
Management has evaluated all subsequent events through March 1, 2010 (the date of issuance of these financial statements) and has concluded that no subsequent events have occurred that would require recognition in the financial statements or the notes thereto.
74
Pacific Advisors Fund Inc.
Financial Highlights
(For a share outstanding throughout the period)
| Government Securities Fund | |||||||||||||||||||||||
| Class A | |||||||||||||||||||||||
| For the year ended December 31, | |||||||||||||||||||||||
| 2009 | 2008 | 2007 | 2006 | 2005 | |||||||||||||||||||
| Per Share Operating Performance | |||||||||||||||||||||||
| Net asset value, beginning of period | $ | 8.94 | $ | 9.42 | $ | 9.24 | $ | 9.27 | $ | 9.51 | |||||||||||||
| Income from investing operations | |||||||||||||||||||||||
| Net investment income | 0.18 | 0.32 | 0.29 | 0.23 | 0.28 | ||||||||||||||||||
| Net realized and unrealized gains (losses) on securities | 0.02 | (0.53 | ) | 0.22 | 0.05 | (0.18 | ) | ||||||||||||||||
| Total from investment operations | 0.20 | (0.21 | ) | 0.51 | 0.28 | 0.10 | |||||||||||||||||
| Less distributions | |||||||||||||||||||||||
| From net investment income | (0.15 | ) | (0.27 | ) | (0.33 | ) | (0.31 | ) | (0.34 | ) | |||||||||||||
| From net capital gains | - | - | - | - | - | ||||||||||||||||||
| Total distributions | (0.15 | ) | (0.27 | ) | (0.33 | ) | (0.31 | ) | (0.34 | ) | |||||||||||||
| Net asset value, end of period | $ | 8.99 | $ | 8.94 | $ | 9.42 | $ | 9.24 | $ | 9.27 | |||||||||||||
| Total Investment Return (a) | 2.26 | % | (2.28 | )% | 5.54 | % | 3.14 | % | 1.08 | % | |||||||||||||
| Ratios/Supplemental Data | |||||||||||||||||||||||
| Net assets, end of period (000's) | $ | 2,537 | $ | 3,054 | $ | 3,817 | $ | 2,467 | $ | 2,219 | |||||||||||||
| Ratio of net investment income to average net assets | |||||||||||||||||||||||
| With expense reductions | 1.69 | % | 3.33 | % | 3.57 | % | 2.70 | % | 2.68 | % | |||||||||||||
| Without expense reductions | 0.25 | % | 1.87 | % | 2.21 | % | 2.04 | % | 2.03 | % | |||||||||||||
| Ratio of expenses to average net assets | |||||||||||||||||||||||
| With expense reductions | 1.69 | % | 1.65 | % | 1.62 | % | 2.51 | % | 2.26 | % | |||||||||||||
| Without expense reductions | 3.13 | % | 3.11 | % | 2.98 | % | 3.17 | % | 2.91 | % | |||||||||||||
| Fund portfolio turnover rate | 224 | % | 173 | % | 59 | % | 16 | % | 88 | % | |||||||||||||
| Class C | |||||||||||||||||||||||
| For the year ended December 31, | |||||||||||||||||||||||
| 2009 | 2008 | 2007 | 2006 | 2005 | |||||||||||||||||||
| Per Share Operating Performance | |||||||||||||||||||||||
| Net asset value, beginning of period | $ | 8.87 | $ | 9.45 | $ | 9.23 | $ | 9.13 | $ | 9.27 | |||||||||||||
| Income from investing operations | |||||||||||||||||||||||
| Net investment income | 0.09 | 0.28 | 0.25 | 0.08 | 0.14 | ||||||||||||||||||
| Net realized and unrealized gains (losses) on securities | 0.04 | (0.56 | ) | 0.18 | 0.14 | (0.11 | ) | ||||||||||||||||
| Total from investment operations | 0.13 | (0.28 | ) | 0.43 | 0.22 | 0.03 | |||||||||||||||||
| Less distributions | |||||||||||||||||||||||
| From net investment income | (0.10 | ) | (0.30 | ) | (0.21 | ) | (0.12 | ) | (0.17 | ) | |||||||||||||
| From net capital gains | - | - | - | - | - | ||||||||||||||||||
| Total distributions | (0.10 | ) | (0.30 | ) | (0.21 | ) | (0.12 | ) | (0.17 | ) | |||||||||||||
| Net asset value, end of period | $ | 8.90 | $ | 8.87 | $ | 9.45 | $ | 9.23 | $ | 9.13 | |||||||||||||
| Total Investment Return | 1.44 | % | (3.02 | )% | 4.73 | % | 2.47 | % | 0.28 | % | |||||||||||||
| Ratios/Supplemental Data | |||||||||||||||||||||||
| Net assets, end of period (000's) | $ | 2,594 | $ | 2,456 | $ | 1,595 | $ | 1,731 | $ | 3,780 | |||||||||||||
| Ratio of net investment income to average net assets | |||||||||||||||||||||||
| With expense reductions | 0.96 | % | 2.56 | % | 2.77 | % | 1.97 | % | 2.03 | % | |||||||||||||
| Without expense reductions | (0.47 | )% | 1.10 | % | 1.41 | % | 1.32 | % | 1.38 | % | |||||||||||||
| Ratio of expenses to average net assets | |||||||||||||||||||||||
| With expense reductions | 2.41 | % | 2.43 | % | 2.40 | % | 3.21 | % | 2.90 | % | |||||||||||||
| Without expense reductions | 3.85 | % | 3.89 | % | 3.76 | % | 3.86 | % | 3.55 | % | |||||||||||||
| Fund portfolio turnover rate | 224 | % | 173 | % | 59 | % | 16 | % | 88 | % | |||||||||||||
(a) The Fund's maximum sales charge is not included in the total return computation
See Accompanying Notes to Financial Statements
75
Pacific Advisors Fund Inc.
Financial Highlights
(For a share outstanding throughout the period)
| Income and Equity Fund | |||||||||||||||||||||||
| Class A | |||||||||||||||||||||||
| For the year ended December 31, | |||||||||||||||||||||||
| 2009 | 2008 | 2007 | 2006 | 2005 | |||||||||||||||||||
| Per Share Operating Performance | |||||||||||||||||||||||
| Net asset value, beginning of period | $ | 8.48 | $ | 10.61 | $ | 10.74 | $ | 10.19 | $ | 10.46 | |||||||||||||
| Income from investing operations | |||||||||||||||||||||||
| Net investment income | 0.30 | 0.33 | 0.31 | 0.20 | 0.20 | ||||||||||||||||||
| Net realized and unrealized gains (losses) on securities | 0.98 | (2.16 | ) | (0.05 | ) | 0.53 | (0.20 | ) | |||||||||||||||
| Total from investment operations | 1.28 | (1.83 | ) | 0.26 | 0.73 | - | |||||||||||||||||
| Less distributions | |||||||||||||||||||||||
| From net investment income | (0.27 | ) | (0.30 | ) | (0.28 | ) | (0.18 | ) | (0.26 | ) | |||||||||||||
| From net capital gains | - | - | (0.11 | ) | - | (0.01 | ) | ||||||||||||||||
| From return of capital | - | - | - | - | - | ||||||||||||||||||
| Total distributions | (0.27 | ) | (0.30 | ) | (0.39 | ) | (0.18 | ) | (0.27 | ) | |||||||||||||
| Net asset value, end of period | $ | 9.49 | $ | 8.48 | $ | 10.61 | $ | 10.74 | $ | 10.19 | |||||||||||||
| Total Investment Return (a) | 15.37 | % | (17.49 | )% | 2.39 | % | 7.25 | % | 0.01 | % | |||||||||||||
| Ratios/Supplemental Data | |||||||||||||||||||||||
| Net assets, end of period (000's) | $ | 2,865 | $ | 2,737 | $ | 3,663 | $ | 3,973 | $ | 4,436 | |||||||||||||
| Ratio of net investment income to average net assets | |||||||||||||||||||||||
| With expense reductions | 3.22 | % | 3.22 | % | 2.78 | % | 1.74 | % | 2.33 | % | |||||||||||||
| Without expense reductions | 2.47 | % | 2.47 | % | 2.16 | % | 0.99 | % | 1.65 | % | |||||||||||||
| Ratio of expenses to average net assets | |||||||||||||||||||||||
| With expense reductions | 2.32 | % | 2.05 | % | 1.95 | % | 2.06 | % | 1.93 | % | |||||||||||||
| Without expense reductions | 3.07 | % | 2.80 | % | 2.57 | % | 2.80 | % | 2.60 | % | |||||||||||||
| Fund portfolio turnover rate | 29 | % | 39 | % | 46 | % | 23 | % | 40 | % | |||||||||||||
| Class C | |||||||||||||||||||||||
| For the year ended December 31, | |||||||||||||||||||||||
| 2009 | 2008 | 2007 | 2006 | 2005 | |||||||||||||||||||
| Per Share Operating Performance | |||||||||||||||||||||||
| Net asset value, beginning of period | $ | 8.09 | $ | 10.14 | $ | 10.31 | $ | 9.80 | $ | 10.02 | |||||||||||||
| Income from investing operations | |||||||||||||||||||||||
| Net investment income | 0.21 | 0.23 | 0.22 | 0.08 | 0.15 | ||||||||||||||||||
| Net realized and unrealized gains (losses) on securities | 0.95 | (2.04 | ) | (0.05 | ) | 0.54 | (0.22 | ) | |||||||||||||||
| Total from investment operations | 1.16 | (1.81 | ) | 0.17 | 0.62 | (0.07 | ) | ||||||||||||||||
| Less distributions | |||||||||||||||||||||||
| From net investment income | (0.22 | ) | (0.24 | ) | (0.23 | ) | (0.11 | ) | (0.14 | ) | |||||||||||||
| From net capital gains | - | - | (0.11 | ) | - | (0.01 | ) | ||||||||||||||||
| From return of capital | - | - | - | - | - | ||||||||||||||||||
| Total distributions | (0.22 | ) | (0.24 | ) | (0.34 | ) | (0.11 | ) | (0.15 | ) | |||||||||||||
| Net asset value, end of period | $ | 9.03 | $ | 8.09 | $ | 10.14 | $ | 10.31 | $ | 9.80 | |||||||||||||
| Total Investment Return | 14.56 | % | (18.10 | )% | 1.63 | % | 6.40 | % | (0.67 | )% | |||||||||||||
| Ratios/Supplemental Data | |||||||||||||||||||||||
| Net assets, end of period (000's) | $ | 5,129 | $ | 4,697 | $ | 5,990 | $ | 5,743 | $ | 7,265 | |||||||||||||
| Ratio of net investment income to average net assets | |||||||||||||||||||||||
| With expense reductions | 2.47 | % | 2.48 | % | 2.06 | % | 1.04 | % | 1.57 | % | |||||||||||||
| Without expense reductions | 1.72 | % | 1.73 | % | 1.43 | % | 0.28 | % | 0.90 | % | |||||||||||||
| Ratio of expenses to average net assets | |||||||||||||||||||||||
| With expense reductions | 3.06 | % | 2.81 | % | 2.70 | % | 2.81 | % | 2.70 | % | |||||||||||||
| Without expense reductions | 3.81 | % | 3.56 | % | 3.32 | % | 3.56 | % | 3.37 | % | |||||||||||||
| Fund portfolio turnover rate | 29 | % | 39 | % | 46 | % | 23 | % | 40 | % | |||||||||||||
(a) The Fund's maximum sales charge is not included in the total return computation
See Accompanying Notes to Financial Statements
76
Pacific Advisors Fund Inc.
Financial Highlights
(For a share outstanding throughout the period)
| Balanced Fund | |||||||||||||||||||||||
| Class A | |||||||||||||||||||||||
| For the year ended December 31, | |||||||||||||||||||||||
| 2009 | 2008 | 2007 | 2006 | 2005 | |||||||||||||||||||
| Per Share Operating Performance | |||||||||||||||||||||||
| Net asset value, beginning of period | $ | 12.41 | $ | 18.58 | $ | 18.42 | $ | 17.39 | $ | 16.57 | |||||||||||||
| Income from investing operations | |||||||||||||||||||||||
| Net investment income | 0.22 | 0.31 | 0.24 | 0.07 | 0.16 | ||||||||||||||||||
| Net realized and unrealized gains (losses) on securities | 2.48 | (6.00 | ) | 0.97 | 1.40 | 0.82 | |||||||||||||||||
| Total from investment operations | 2.70 | (5.69 | ) | 1.21 | 1.47 | 0.98 | |||||||||||||||||
| Less distributions | |||||||||||||||||||||||
| From net investment income | (0.20 | ) | (0.28 | ) | (0.20 | ) | - | (0.11 | ) | ||||||||||||||
| From net capital gains | - | (0.20 | ) | (0.85 | ) | (0.44 | ) | (0.01 | ) | ||||||||||||||
| From return of capital | - | - | - | - | (0.04 | ) | |||||||||||||||||
| Total distributions | (0.20 | ) | (0.48 | ) | (1.05 | ) | (0.44 | ) | (0.16 | ) | |||||||||||||
| Net asset value, end of period | $ | 14.91 | $ | 12.41 | $ | 18.58 | $ | 18.42 | $ | 17.39 | |||||||||||||
| Total Investment Return (a) | 21.76 | % | (30.51 | )% | 6.53 | % | 8.47 | % | 5.90 | % | |||||||||||||
| Ratios/Supplemental Data | |||||||||||||||||||||||
| Net assets, end of period (000's) | $ | 4,362 | $ | 3,774 | $ | 5,918 | $ | 6,787 | $ | 6,323 | |||||||||||||
| Ratio of net investment income to average net assets | 1.58 | % | 1.73 | % | 1.02 | % | 0.43 | % | 0.97 | % | |||||||||||||
| Ratio of expenses to average net assets | 2.47 | % | 2.31 | % | 2.21 | % | 2.54 | % | 2.53 | % | |||||||||||||
| Fund portfolio turnover rate | 10 | % | 32 | % | 44 | % | 16 | % | 25 | % | |||||||||||||
| Class C | |||||||||||||||||||||||
| For the year ended December 31, | |||||||||||||||||||||||
| 2009 | 2008 | 2007 | 2006 | 2005 | |||||||||||||||||||
| Per Share Operating Performance | |||||||||||||||||||||||
| Net asset value, beginning of period | $ | 11.96 | $ | 17.88 | $ | 17.77 | $ | 16.92 | $ | 16.13 | |||||||||||||
| Income from investing operations | |||||||||||||||||||||||
| Net investment income | 0.10 | 0.16 | 0.05 | (0.06 | ) | 0.03 | |||||||||||||||||
| Net realized and unrealized gains (losses) on securities | 2.39 | (5.72 | ) | 0.96 | 1.35 | 0.80 | |||||||||||||||||
| Total from investment operations | 2.49 | (5.56 | ) | 1.01 | 1.29 | 0.83 | |||||||||||||||||
| Less distributions | |||||||||||||||||||||||
| From net investment income | (0.10 | ) | (0.16 | ) | (0.05 | ) | - | (0.02 | ) | ||||||||||||||
| From net capital gains | - | (0.20 | ) | (0.85 | ) | (0.44 | ) | (0.01 | ) | ||||||||||||||
| From return of capital | - | - | - | - | (0.01 | ) | |||||||||||||||||
| Total distributions | (0.10 | ) | (0.36 | ) | (0.90 | ) | (0.44 | ) | (0.04 | ) | |||||||||||||
| Net asset value, end of period | $ | 14.35 | $ | 11.96 | $ | 17.88 | $ | 17.77 | $ | 16.92 | |||||||||||||
| Total Investment Return | 20.84 | % | (31.03 | )% | 5.67 | % | 7.65 | % | 5.16 | % | |||||||||||||
| Ratios/Supplemental Data | |||||||||||||||||||||||
| Net assets, end of period (000's) | $ | 24,828 | $ | 22,407 | $ | 34,960 | $ | 35,593 | $ | 33,185 | |||||||||||||
| Ratio of net investment income to average net assets | 0.82 | % | 0.96 | % | 0.27 | % | (0.33 | )% | 0.19 | % | |||||||||||||
| Ratio of expenses to average net assets | 3.23 | % | 3.09 | % | 2.97 | % | 3.30 | % | 3.30 | % | |||||||||||||
| Fund portfolio turnover rate | 10 | % | 32 | % | 44 | % | 16 | % | 25 | % | |||||||||||||
(a) The Fund's maximum sales charge is not included in the total return computation
See Accompanying Notes to Financial Statements
77
Pacific Advisors Fund Inc.
Financial Highlights
(For a share outstanding throughout the period)
| Growth Fund | |||||||||||||||||||||||
| Class A | |||||||||||||||||||||||
| For the year ended December 31, | |||||||||||||||||||||||
| 2009 | 2008 | 2007 | 2006 | 2005 | |||||||||||||||||||
| Per Share Operating Performance | |||||||||||||||||||||||
| Net asset value, beginning of period | $ | 6.51 | $ | 10.83 | $ | 9.21 | $ | 8.54 | $ | 8.22 | |||||||||||||
| Income from investing operations | |||||||||||||||||||||||
| Net investment income (expense) | (0.24 | ) | (0.07 | ) | (0.07 | ) | (0.04 | ) | (0.01 | ) | |||||||||||||
| Net realized and unrealized gains (losses) on securities | 2.06 | (4.25 | ) | 1.69 | 0.71 | 0.33 | |||||||||||||||||
| Total from investment operations | 1.82 | (4.32 | ) | 1.62 | 0.67 | 0.32 | |||||||||||||||||
| Less distributions | |||||||||||||||||||||||
| From net investment income | - | - | - | - | - | ||||||||||||||||||
| From net capital gains | - | - | - | - | - | ||||||||||||||||||
| Total distributions | - | - | - | - | - | ||||||||||||||||||
| Net asset value, end of period | $ | 8.33 | $ | 6.51 | $ | 10.83 | $ | 9.21 | $ | 8.54 | |||||||||||||
| Total Investment Return (a) | 27.96 | % | (39.89 | )% | 17.59 | % | 7.85 | % | 3.89 | % | |||||||||||||
| Ratios/Supplemental Data | |||||||||||||||||||||||
| Net assets, end of period (000's) | $ | 2,176 | $ | 1,984 | $ | 2,889 | $ | 2,101 | $ | 1,650 | |||||||||||||
| Ratio of net investment income to average net assets | |||||||||||||||||||||||
| With expense reductions | (2.06 | )% | (1.38 | )% | (1.33 | )% | (1.11 | )% | (1.37 | )% | |||||||||||||
| Without expense reductions | (4.31 | )% | (2.41 | )% | (1.85 | )% | (2.14 | )% | (3.06 | )% | |||||||||||||
| Ratio of expenses to average net assets | |||||||||||||||||||||||
| With expense reductions | 3.46 | % | 2.62 | % | 2.65 | % | 2.64 | % | 2.63 | % | |||||||||||||
| Without expense reductions | 5.71 | % | 3.65 | % | 3.17 | % | 3.68 | % | 4.32 | % | |||||||||||||
| Fund portfolio turnover rate | 5 | % | 14 | % | 14 | % | 23 | % | 31 | % | |||||||||||||
| Class C | |||||||||||||||||||||||
| For the year ended December 31, | |||||||||||||||||||||||
| 2009 | 2008 | 2007 | 2006 | 2005 | |||||||||||||||||||
| Per Share Operating Performance | |||||||||||||||||||||||
| Net asset value, beginning of period | $ | 5.97 | $ | 10.03 | $ | 8.59 | $ | 8.02 | $ | 7.79 | |||||||||||||
| Income from investing operations | |||||||||||||||||||||||
| Net investment income (expense) | (1.36 | ) | (0.31 | ) | (0.21 | ) | (0.12 | ) | 0.37 | ||||||||||||||
| Net realized and unrealized gains (losses) on securities | 2.97 | (3.75 | ) | 1.65 | 0.69 | (0.14 | ) | ||||||||||||||||
| Total from investment operations | 1.61 | (4.06 | ) | 1.44 | 0.57 | 0.23 | |||||||||||||||||
| Less distributions | |||||||||||||||||||||||
| From net investment income | - | - | - | - | - | ||||||||||||||||||
| From net capital gains | - | - | - | - | - | ||||||||||||||||||
| Total distributions | - | - | - | - | - | ||||||||||||||||||
| Net asset value, end of period | $ | 7.58 | $ | 5.97 | $ | 10.03 | $ | 8.59 | $ | 8.02 | |||||||||||||
| Total Investment Return | 26.97 | % | (40.48 | )% | 16.76 | % | 7.11 | % | 2.95 | % | |||||||||||||
| Ratios/Supplemental Data | |||||||||||||||||||||||
| Net assets, end of period (000's) | $ | 637 | $ | 1,072 | $ | 2,096 | $ | 1,856 | $ | 1,532 | |||||||||||||
| Ratio of net investment income to average net assets | |||||||||||||||||||||||
| With expense reductions | (2.69 | )% | (2.18 | )% | (2.07 | )% | (1.87 | )% | (2.13 | )% | |||||||||||||
| Without expense reductions | (4.96 | )% | (3.19 | )% | (2.60 | )% | (2.91 | )% | (3.83 | )% | |||||||||||||
| Ratio of expenses to average net assets | |||||||||||||||||||||||
| With expense reductions | 4.11 | % | 3.40 | % | 3.40 | % | 3.40 | % | 3.40 | % | |||||||||||||
| Without expense reductions | 6.39 | % | 4.42 | % | 3.93 | % | 4.44 | % | 5.11 | % | |||||||||||||
| Fund portfolio turnover rate | 5 | % | 14 | % | 14 | % | 23 | % | 31 | % | |||||||||||||
(a) The Fund's maximum sales charge is not included in the total return computation
See Accompanying Notes to Financial Statements
78
Pacific Advisors Fund Inc.
Financial Highlights
(For a share outstanding throughout the period)
| Multi-Cap Value Fund | |||||||||||||||||||||||
| Class A | |||||||||||||||||||||||
| For the year ended December 31, | |||||||||||||||||||||||
| 2009 | 2008 | 2007 | 2006 | 2005 | |||||||||||||||||||
| Per Share Operating Performance | |||||||||||||||||||||||
| Net asset value, beginning of period | $ | 6.75 | $ | 12.50 | $ | 12.77 | $ | 12.27 | $ | 11.77 | |||||||||||||
| Income from investing operations | |||||||||||||||||||||||
| Net investment income (expense) | (0.40 | ) | (0.16 | ) | 0.01 | (0.09 | ) | (0.14 | ) | ||||||||||||||
| Net realized and unrealized gains (losses) on securities | 2.43 | (5.56 | ) | 0.17 | 1.68 | 1.29 | |||||||||||||||||
| Total from investment operations | 2.03 | (5.72 | ) | 0.18 | 1.59 | 1.15 | |||||||||||||||||
| Less distributions | |||||||||||||||||||||||
| From net investment income | - | - | - | - | - | ||||||||||||||||||
| From net capital gains | - | (0.03 | ) | (0.45 | ) | (1.09 | ) | (0.65 | ) | ||||||||||||||
| Total distributions | - | (0.03 | ) | (0.45 | ) | (1.09 | ) | (0.65 | ) | ||||||||||||||
| Net asset value, end of period | $ | 8.78 | $ | 6.75 | $ | 12.50 | $ | 12.77 | $ | 12.27 | |||||||||||||
| Total Investment Return (a) | 30.07 | % | (45.78 | )% | 1.40 | % | 12.91 | % | 9.71 | % | |||||||||||||
| Ratios/Supplemental Data | |||||||||||||||||||||||
| Net assets, end of period (000's) | $ | 3,194 | $ | 3,291 | $ | 6,315 | $ | 4,341 | $ | 3,073 | |||||||||||||
| Ratio of net investment income to average net assets | |||||||||||||||||||||||
| With expense reductions | (2.11 | )% | (1.33 | )% | (1.21 | )% | (1.66 | )% | (1.70 | )% | |||||||||||||
| Without expense reductions | (2.11 | )% | (1.33 | )% | (1.21 | )% | (1.66 | )% | (1.73 | )% | |||||||||||||
| Ratio of expenses to average net assets | |||||||||||||||||||||||
| With expense reductions | 3.69 | % | 3.20 | % | 2.82 | % | 3.02 | % | 3.05 | % | |||||||||||||
| Without expense reductions | 3.69 | % | 3.20 | % | 2.82 | % | 3.02 | % | 3.08 | % | |||||||||||||
| Fund portfolio turnover rate | 21 | % | 12 | % | 53 | % | 47 | % | 49 | % | |||||||||||||
| Class C | |||||||||||||||||||||||
| For the year ended December 31, | |||||||||||||||||||||||
| 2009 | 2008 | 2007 | 2006 | 2005 | |||||||||||||||||||
| Per Share Operating Performance | |||||||||||||||||||||||
| Net asset value, beginning of period | $ | 6.36 | $ | 11.90 | $ | 12.28 | $ | 11.93 | $ | 11.54 | |||||||||||||
| Income from investing operations | |||||||||||||||||||||||
| Net investment income (expense) | (1.04 | ) | (0.45 | ) | (0.36 | ) | (0.18 | ) | (0.19 | ) | |||||||||||||
| Net realized and unrealized gains (losses) on securities | 2.89 | (5.06 | ) | 0.43 | 1.62 | 1.23 | |||||||||||||||||
| Total from investment operations | 1.85 | (5.51 | ) | 0.07 | 1.44 | 1.04 | |||||||||||||||||
| Less distributions | |||||||||||||||||||||||
| From net investment income | - | - | - | - | - | ||||||||||||||||||
| From net capital gains | - | (0.03 | ) | (0.45 | ) | (1.09 | ) | (0.65 | ) | ||||||||||||||
| Total distributions | - | (0.03 | ) | (0.45 | ) | (1.09 | ) | (0.65 | ) | ||||||||||||||
| Net asset value, end of period | $ | 8.21 | $ | 6.36 | $ | 11.90 | $ | 12.28 | $ | 11.93 | |||||||||||||
| Total Investment Return | 29.09 | % | (46.33 | )% | 0.57 | % | 12.02 | % | 8.94 | % | |||||||||||||
| Ratios/Supplemental Data | |||||||||||||||||||||||
| Net assets, end of period (000's) | $ | 3,151 | $ | 3,761 | $ | 8,494 | $ | 9,958 | $ | 7,894 | |||||||||||||
| Ratio of net investment income to average net assets | |||||||||||||||||||||||
| With expense reductions | (2.87 | )% | (2.11 | )% | (1.93 | )% | (2.43 | )% | (2.46 | )% | |||||||||||||
| Without expense reductions | (2.87 | )% | (2.11 | )% | (1.93 | )% | (2.43 | )% | (2.49 | )% | |||||||||||||
| Ratio of expenses to average net assets | |||||||||||||||||||||||
| With expense reductions | 4.47 | % | 3.96 | % | 3.56 | % | 3.79 | % | 3.82 | % | |||||||||||||
| Without expense reductions | 4.47 | % | 3.96 | % | 3.56 | % | 3.79 | % | 3.84 | % | |||||||||||||
| Fund portfolio turnover rate | 21 | % | 12 | % | 53 | % | 47 | % | 49 | % | |||||||||||||
(a) The Fund's maximum sales charge is not included in the total return computation
See Accompanying Notes to Financial Statements
79
Pacific Advisors Fund Inc.
Financial Highlights
(For a share outstanding throughout the period)
| Small Cap Fund | |||||||||||||||||||||||
| Class A | |||||||||||||||||||||||
| For the year ended December 31, | |||||||||||||||||||||||
| 2009 | 2008 | 2007 | 2006 | 2005 | |||||||||||||||||||
| Per Share Operating Performance | |||||||||||||||||||||||
| Net asset value, beginning of period | $ | 19.21 | $ | 34.70 | $ | 33.52 | $ | 25.73 | $ | 25.47 | |||||||||||||
| Income from investing operations | |||||||||||||||||||||||
| Net investment income (expense) | (0.50 | ) | 0.10 | 0.27 | 2.71 | (1.15 | ) | ||||||||||||||||
| Net realized and unrealized gains (losses) on securities | 7.66 | (15.23 | ) | 1.78 | 6.29 | 3.38 | |||||||||||||||||
| Total from investment operations | 7.16 | (15.13 | ) | 2.05 | 9.00 | 2.23 | |||||||||||||||||
| Less distributions | |||||||||||||||||||||||
| From net investment income | - | - | - | - | - | ||||||||||||||||||
| From net capital gains | - | (0.35 | ) | (0.87 | ) | (1.21 | ) | (1.97 | ) | ||||||||||||||
| From return of capital | - | (0.01 | ) | - | - | - | |||||||||||||||||
| Total distributions | - | (0.36 | ) | (0.87 | ) | (1.21 | ) | (1.97 | ) | ||||||||||||||
| Net asset value, end of period | $ | 26.37 | $ | 19.21 | $ | 34.70 | $ | 33.52 | $ | 25.73 | |||||||||||||
| Total Investment Return (a) | 37.27 | % | (43.52 | )% | 6.10 | % | 35.05 | % | 8.64 | % | |||||||||||||
| Ratios/Supplemental Data | |||||||||||||||||||||||
| Net assets, end of period (000's) | $ | 117,456 | $ | 87,800 | $ | 112,938 | $ | 62,735 | $ | 15,884 | |||||||||||||
| Ratio of net investment income to average net assets | (2.05 | )% | (1.83 | )% | (1.94 | )% | (2.40 | )% | (3.14 | )% | |||||||||||||
| Ratio of expenses to average net assets | 2.49 | % | 2.44 | % | 2.34 | % | 2.78 | % | 3.36 | % | |||||||||||||
| Fund portfolio turnover rate | 17 | % | 23 | % | 15 | % | 20 | % | 21 | % | |||||||||||||
| Class C | |||||||||||||||||||||||
| For the year ended December 31, | |||||||||||||||||||||||
| 2009 | 2008 | 2007 | 2006 | 2005 | |||||||||||||||||||
| Per Share Operating Performance | |||||||||||||||||||||||
| Net asset value, beginning of period | $ | 16.79 | $ | 30.70 | $ | 30.00 | $ | 23.32 | $ | 23.44 | |||||||||||||
| Income from investing operations | |||||||||||||||||||||||
| Net investment income (expense) | (1.40 | ) | (0.90 | ) | (0.21 | ) | 0.83 | (0.56 | ) | ||||||||||||||
| Net realized and unrealized gains (losses) on securities | 7.48 | (12.65 | ) | 1.78 | 7.06 | 2.41 | |||||||||||||||||
| Total from investment operations | 6.08 | (13.55 | ) | 1.57 | 7.89 | 1.85 | |||||||||||||||||
| Less distributions | |||||||||||||||||||||||
| From net investment income | - | - | - | - | - | ||||||||||||||||||
| From net capital gains | - | (0.35 | ) | (0.87 | ) | (1.21 | ) | (1.97 | ) | ||||||||||||||
| From return of capital | - | (0.01 | ) | - | - | - | |||||||||||||||||
| Total distributions | - | (0.36 | ) | (0.87 | ) | (1.21 | ) | (1.97 | ) | ||||||||||||||
| Net asset value, end of period | $ | 22.87 | $ | 16.79 | $ | 30.70 | $ | 30.00 | $ | 23.32 | |||||||||||||
| Total Investment Return | 36.21 | % | (44.05 | )% | 5.22 | % | 33.91 | % | 7.76 | % | |||||||||||||
| Ratios/Supplemental Data | |||||||||||||||||||||||
| Net assets, end of period (000's) | $ | 15,593 | $ | 15,368 | $ | 31,589 | $ | 17,337 | $ | 4,602 | |||||||||||||
| Ratio of net investment income to average net assets | (2.79 | )% | (2.57 | )% | (2.69 | )% | (3.15 | )% | (3.95 | )% | |||||||||||||
| Ratio of expenses to average net assets | 3.24 | % | 3.17 | % | 3.09 | % | 3.54 | % | 4.19 | % | |||||||||||||
| Fund portfolio turnover rate | 17 | % | 23 | % | 15 | % | 20 | % | 21 | % | |||||||||||||
(a) The Fund's maximum sales charge is not included in the total return computation
See Accompanying Notes to Financial Statements
80
Pacific Advisors Fund Inc.
Financial Highlights
(For a share outstanding throughout the period)
| Small Cap Fund | |||||||||||||||||||
| Class I | |||||||||||||||||||
| For the year ended December 31, 2009 | For the year ended December 31, 2008 | For the year ended December 31, 2007 | October 31, 2006(c) December 31, 2006 | ||||||||||||||||
| Per Share Operating Performance | |||||||||||||||||||
| Net asset value, beginning of period | $ | 21.72 | $ | 37.50 | $ | 36.13 | $ | 35.00 | |||||||||||
| Income from investing operations | |||||||||||||||||||
| Net investment income (expense) | (0.45 | ) | (0.32 | )* | (0.33 | ) | 0.45 | ||||||||||||
| Net realized and unrealized gains (losses) on securities | 8.59 | (15.10 | )* | 2.57 | 1.89 | ||||||||||||||
| Total from investment operations | 8.14 | (15.42 | ) | 2.24 | 2.34 | ||||||||||||||
| Less distributions | |||||||||||||||||||
| From net investment income | - | - | - | - | |||||||||||||||
| From net capital gains | - | (0.35 | ) | (0.87 | ) | (1.21 | ) | ||||||||||||
| From return of capital | - | (0.01 | ) | - | - | ||||||||||||||
| Total distributions | - | (0.36 | ) | (0.87 | ) | (1.21 | ) | ||||||||||||
| Net asset value, end of period | $ | 29.86 | $ | 21.72 | $ | 37.50 | $ | 36.13 | |||||||||||
| Total Investment Return | 37.48 | % | (41.00 | )% | 6.19 | % | 6.74 | %(b) | |||||||||||
| Ratios/Supplemental Data | |||||||||||||||||||
| Net assets, end of period (000's) | $ | 5 | $ | 3 | $ | 1,902 | $ | 5 | |||||||||||
| Ratio of net investment income to average net assets | (1.80 | )% | (1.56 | )% | (1.72 | )% | (2.48 | )%(d) | |||||||||||
| Ratio of expenses to average net assets | 2.24 | % | 2.16 | % | 2.10 | % | 2.74 | %(d) | |||||||||||
| Fund portfolio turnover rate | 17 | % | 23 | % | 15 | % | 20 | % | |||||||||||
(b) Not annualized
(c) Commencement of operations
(d) Annualized
* Numbers were calculated using a weighted-average number of shares outstanding basis as a result of a significant change in Class I assets immediately prior to end of period.
See Accompanying Notes to Financial Statements
81
Pacific Advisors Fund Inc.
Report of Independent Registered Public Accounting Firm
The Board of Directors and Shareholders
Pacific Advisors Fund Inc.
We have audited the accompanying statements of assets and liabilities, including the schedules of investments, of Pacific Advisors Fund Inc. (comprising, respectively, the Government Securities Fund, Income and Equity Fund, Balanced Fund, Growth Fund, Multi-Cap Value Fund and Small Cap Fund) (the "Funds"), as of December 31, 2009, and the related statements of operations for the year ended, the statements of changes in net assets for each of the two years in the period then ended, and the financial highlights for each of the periods indicated. These financial statements and financial highlights are the responsibility of the Funds' management. Our responsibility is to express an opinion on these financial statements and financial highlights based on our audits.
We conducted our audits in accordance with the standards of the Public Company Accounting Oversight Board (United States). Those standards require that we plan and perform the audit to obtain reasonable assurance about whether the financial statements and financial highlights are free of material misstatement. We were not engaged to perform an audit of the Funds' internal control over financial reporting. Our audits included consideration of internal control over financial reporting as a basis for designing audit procedures that are appropriate in the circumstances, but not for the purpose of expressing an opinion on the effectiveness of the Funds' internal control over financial reporting. Accordingly, we express no such opinion. An audit also includes examining, on a test basis, evidence supporting the amounts and disclosures in the financial statements and financial highlights, assessing the accounting principles used and sig nificant estimates made by management, and evaluating the overall financial statement presentation. Our procedures included confirmation of securities owned as of December 31, 2009, by correspondence with the custodian and brokers. We believe that our audits provide a reasonable basis for our opinion.
In our opinion, the financial statements and financial highlights referred to above present fairly, in all material respects, the financial position of each of the respective funds constituting the Pacific Advisors Fund Inc. at December 31, 2009, the results of their operations for the year then ended, the changes in their net assets for each of the two years in the period then ended, and the financial highlights for each of the periods indicated, in conformity with U.S. generally accepted accounting principles.

Los Angeles, California
March 1, 2010
82
Pacific Advisors Fund Inc.
Disclosure Regarding the Board's Approval
of the Funds' Advisory Contracts
The Board of Directors, including a majority of the Independent Directors, most recently approved the Investment Management Agreements ("Agreements") for the Funds at its meeting held on August 7, 2009. At that meeting, the Board approved the continuation of the Agreements by and between Pacific Advisors Fund Inc. (the "Corporation"), on behalf of each of its Funds, and Pacific Global Investment Management Company, Inc. ("PGIMC").
In approving the Agreements, the Board considered materials relating to, among other matters: (1) the profitability of PGIMC, including information regarding PGIMC's cost of providing services and its financial condition, as well as comparative expense information; (2) investment performance of each Fund, including information comparing the performance of each Fund with a peer group of funds and an appropriate index or combination of indices; (3) sales and redemption data for each Fund; (4) the extent to which economies of scale are realized as the Funds grow and whether fee levels reflect these economies of scale for the Funds' investors; (5) the economic outlook and the general investment outlook in the markets in which each Fund invests; and (6) "fall-out" benefits realized by PGIMC (i.e., ancillary benefits derived by PGIMC or its affiliates from PGIMC's relationship with the Funds). The Board also periodically considers other material facts such as the allocation of each Fund's brokerage commissions, each Fund's record of compliance with its investment policies and restrictions on personal securities transactions, and the nature, cost, and character of non-investment management services provided by PGIMC and its affiliates. In approving the Agreements, the Board relied on all information presented to it over the course of the year.
Prior to the Board's approval of the Agreements, the Independent Directors met separately with independent counsel to review the materials provided. Based on its evaluation of all material factors, the Board, including a majority of the Independent Directors, determined that the Agreements were in the best interests of the Funds and their shareholders and that the fees to be paid to PGIMC under the Agreements were fair and reasonable in relationship to the services to be rendered thereunder and in light of the factors considered. During its deliberations, the Board did not identify any single factor as all important or controlling, and individual Directors may have weighed the same factors differently. The following summaries do not detail every matter considered. Matters considered by the Board included the following:
Nature, Quality and Extent of Services. The Board examined the nature, quality and extent of the services provided by PGIMC to the Funds. The Board reviewed PGIMC's key personnel in providing investment management services to the Funds as well as the duties that investment personnel perform for the Funds. The Board considered the qualifications and experience of PGIMC's portfolio management team, and PGIMC's commitment of its resources to portfolio management services. The Board considered PGIMC's responsibilities under the Agreements in serving as the Funds' investment manager, including responsibilities for investment research and stock selection; administration of the Funds' daily business operations; supervision of the Funds' transfer agent and administrative services agent; monitoring adherence to the Funds' investment restrictions; and monitorin g compliance with various policies and procedures of the Funds. The Board was provided with and considered details regarding PGIMC's trading, operations, compliance, and investment research functions. The Board also considered the Funds' compliance program, the compliance reports periodically furnished to the Board, and the results of regulatory exams. The Board concluded that the Funds were likely to benefit from the nature, extent and quality of the services provided by PGIMC under the Agreements as a result of PGIMC's experience, reputation, personnel, operations and resources.
Investment Performance of PGIMC and the Funds. The Board considered the performance of the Funds and PGIMC, including, to the extent applicable, each Fund's year-to-date, one-, three-, five-, and ten-year performance for the periods ended June 30, 2009; each Fund's one-, three-, five-, and ten-year
83
Pacific Advisors Fund Inc.
Disclosure Regarding the Board's Approval
of the Funds' Advisory Contracts
performance for the periods ended December 31, 2008; as well as certain comparative performance sourced by an independent data service for each Fund's benchmark(s) and funds PGIMC considered peers of the Funds. The Board was provided and considered details regarding PGIMC's investment decision making process and trade execution policies and strategies. After reviewing the Funds' performance records, including performance relative to the Funds' benchmarks and peers, the Board concluded that, while past performance is no guarantee of future performance, each Fund's investment performance overall weighed in favor of renewing the relevant Agreement.
Among other factors, the Board considered: (i) with respect to the Balanced Fund, the Fund has two benchmarks, the Barclays Intermediate Corporate Bond Index and the S&P 500 Index; while the Fund (Class A shares) did not outperform the Barclays Intermediate Corporate Bond Index, it outperformed the S&P 500 Index, for the six-month and the one-, three-, five-, and ten-year periods ended June 30, 2009; (ii) with respect to the Small Cap Fund, the Fund (Class A shares) outperformed its benchmark index for the six-month and the three-, five- and ten-year periods ended June 30, 2009; (iii) with respect to the Growth Fund, the Fund (Class A shares) outperformed its benchmark indices for the six-month and the three-year periods ended June 30, 2009; (iv) with respect to the Multi-Cap Value Fund, the Fund (Class A shares) outperformed its benchmark index for the six-month period ended June 30, 2009 following a repositioning of th e portfolio throughout 2008; (v) with respect to the Income and Equity Fund, while no peer group has the same investment strategies and objectives as those of the Fund, overall performance was consistent with the Fund's investment objectives and strategies, and while the Fund did not outperform its benchmark, it nearly matched the average return for its category in the year-to-date and one-year periods ended June 30, 2009; and (vi) with respect to the Government Securities Fund, the Fund (Class A shares) outperformed its benchmark index for the six-month period ended June 30, 2009, the Fund's emphasis on preservation of capital and the effects of an extended low interest rate environment on the performance of the Fund.
Costs of Services and Profits Realized by PGIMC. The Board considered PGIMC's costs in serving as the Funds' Investment Manager, including the costs associated with the personnel and systems necessary to manage the Funds. The Board reviewed PGIMC's 2008 completed financial statements (which were pending final signoff from its independent auditor) and also considered the costs of PGIMC and its affiliates from their relationship with the Funds, and the profitability of PGIMC and its affiliates. The Board also considered the financial condition of PGIMC and its affiliates and its ability to provide the quality of services specified under the Agreements and expected by the Board. The Board examined the fee information for the Funds as compared to that of comparable funds managed by other advisers, and in light of the investment strategy applied to each Fu nd. The Board was provided with comparative fee information indicating that each Fund's advisory fees were within the range of those charged by funds PGIMC considered peers of the Funds based on factors such as portfolio characteristics, investment style and asset level. The Board reviewed a description of the methodology used for selecting the funds in each peer group. The Board considered that during 2008, PGIMC had waived fees and reimbursed expenses for the Government Securities Fund, Income and Equity Fund, and Growth Fund in order to keep their expenses down; and that PGIMC expected to continue to waive fees for the Government Securities Fund, Income and Equity Fund, and Growth Fund in 2009 to the extent expenses exceed the agreed expense limits for those Funds. Another factor was that, over the history of the Funds, PGIMC and its affiliates had waived and/or reimbursed expenses for all the Funds in excess of $3.4 Million. The Board also considered that affiliates of PGIMC provide distribution, adminis trative, and transfer agency services for the Funds, and that, based on information furnished by PGIMC, providing these services internally had reduced costs for the Funds and enabled PGIMC to assure that these services are performed at a high quality and at a competitive cost. The Board also considered
84
Pacific Advisors Fund Inc.
Disclosure Regarding the Board's Approval
of the Funds' Advisory Contracts
the Funds' sales and redemption data in the first six months of 2009, in light of current market conditions. The Board concluded that the Funds' management fees were reasonable in light of the services provided.
Economies of Scale. The Board considered the extent to which the Funds' management fees reflect economies of scale for the benefit of the Funds' shareholders. The Board reviewed the Funds' fee arrangements, which include breakpoints that decrease the fee rate as the Funds' assets increase. The Board considered the fact that current assets were well below the threshold for the initial advisory fee breakpoint for each Fund. The Board noted that the expense ratios increased in 2008 relative to 2007 for all Funds except the Growth Fund primarily due to the general decline in assets as a result of the recent market downturn. Based on its review, the Board concluded that the Funds' management fee structures allow shareholders to benefit from economies of scale as the Funds' assets increase. The Board also considered that PGIMC had been waiving fees and reim bursing expenses for the Government Securities Fund, Income and Equity Fund, and the Growth Fund.
Other Benefits to PGIMC. In evaluating the benefits that accrue to PGIMC through its relationship with the Funds, the Board recognized that, in addition to providing advisory services, PGIMC and its affiliates serve the Funds in various capacities, including as transfer agent, administrative services agent and distributor, and receive compensation from the Funds in connection with providing these services. The Board considered that each service provided to the Funds by PGIMC or one of its affiliates is pursuant to a written agreement, which the Board evaluates periodically. The Board also considered the benefits that accrue to PGIMC through its relationship with the Funds in its management of separately managed accounts, and another fund for which it serves as sub-adviser. The Board concluded that the benefits were consistent with PGIMC's rights and o bligations under the Agreements.
After full consideration of these and other factors, the Board, including a majority of the Independent Directors, concluded that approval of the Agreements was in the best interest of the Funds and their shareholders.
85
Pacific Advisors Fund Inc.
Directors and Officers
| Name, Address and Age | Position(s) Held with the Company | Term of Offices and Length of Time Served | Principal Occupations During Past 5 Years | Number of Portfolios in Fund Complex Overseen by Trustee | Other Directorships Held by Trustee | ||||||||||||||||||
| Victoria L. Breen (58) 603 West Ojai Avenue Ojai, CA 93023 | Director and Assistant Secretary | Since 1992 | 1992 - Present: Assistant Secretary and Director Pacific Global Investment Management Company 1994 - Present: Agent, Transamerica Life Companies; Registered Principal, Transamerica Financial Advisors, Inc. 1986 - Present: President, Derby & Derby, Inc. (Financial Services Company) | 6 Pacific Advisors Mutual Funds | None | ||||||||||||||||||
| Thomas M. Brinker (76)1 1 North Ormond Avenue Havertown, PA 19083 | Director | Since 1992 | 2007 - Present: Retired 1970 - 2007: Registered Representative, Transamerica Financial Advisors, Inc. 1970 - 2007: President, Fringe Benefits, Inc. and Financial Foresight, Ltd. d/b/a The Brinker Organization (Financial Services Companies) | 6 Pacific Advisors Mutual Funds | None | ||||||||||||||||||
86
Pacific Advisors Fund Inc.
Directors and Officers
| Name, Address and Age | Position(s) Held with the Company | Term of Offices and Length of Time Served | Principal Occupations During Past 5 Years | Number of Portfolios in Fund Complex Overseen by Trustee | Other Directorships Held by Trustee | ||||||||||||||||||
| L. Michael Haller (66) 5924 Colodny Agoura, CA 91301 | Director | Since 1992 | 2008 - Present: Chairman, Stereo Scope, Inc. (Web Application Company) 2008 - Present: Chairman, Kapitall (Software Development Company) 2007 - Present: President, Bionic Games, Inc. (Game Software Development Company) 2004 - Present: Consultant 2002 - Present: President, High Impact Games, Inc. (Game Software Development Company) 1979 - Present: Owner, Asahi Broadcasting Enterprises (Game Software Development Company) 2003 - 2005: Executive Vice President, Sammy Studios, Inc. (Entertainment Company) | 6 Pacific Advisors Mutual Funds | None | ||||||||||||||||||
| Thomas H. Hanson (59)2 101 N. Brand Blvd. Suite 1950 Glendale, CA 91203 | Vice President | Since 1992 | 1992 - Present: Executive Vice President and Director, Pacific Global Investment Management Company; President and Director; Pacific Global Fund Distributors, Inc.; Director, Pacific Global Investor Services, Inc. 2001 - Present: Vice President, Pacific Global Investor Services, Inc. 1993 - Present: Owner, Director, Chairman, President, and CEO of TriVest Capital Management, Inc. 1992 - 2006: Secretary, Pacific Global Fund Inc. d/b/a Pacific Advisors Fund Inc. | 6 Pacific Advisors Mutual Funds | None | ||||||||||||||||||
87
Pacific Advisors Fund Inc.
Directors and Officers
| Name, Address and Age | Position(s) Held with the Company | Term of Offices and Length of Time Served | Principal Occupations During Past 5 Years | Number of Portfolios in Fund Complex Overseen by Trustee | Other Directorships Held by Trustee | ||||||||||||||||||
| Catherine L. Henning (32) 101 N. Brand Blvd. Suite 1950 Glendale, CA 91203 | Secretary | Since 2006 | 2010 - Present: President and Director, Pacific Global Fund Distributors, Inc.; Vice President and Director, Pacific Global Investor Services, Inc. 2007 - Present: Vice President, Pacific Global Investment Management Company 2006 - Present: Secretary, Pacific Global Fund Distributors, Inc. and Pacific Global Investor Services, Inc. 2004 - Present: Secretary, Pacific Global Investment Management Company; Chief Compliance Officer, Pacific Global Fund Distributors, Inc. 2001 - Present: Director of Private Client Services, Pacific Global Investment Management Company 2004 - 2006: Assistant Secretary, Pacific Advisors Fund Inc. 2002 - 2006: Assistant Secretary, Pacific Global Fund Distributors, Inc. and Pacific Global Investor Services, Inc. | 6 Pacific Advisors Mutual Funds | None | ||||||||||||||||||
88
Pacific Advisors Fund Inc.
Directors and Officers
| Name, Address and Age | Position(s) Held with the Company | Term of Offices and Length of Time Served | Principal Occupations During Past 5 Years | Number of Portfolios in Fund Complex Overseen by Trustee | Other Directorships Held by Trustee | ||||||||||||||||||
| George A. Henning (62) 101 N. Brand Blvd. Suite 1950 Glendale, CA 91203 | President and Chairman | Since 1992 | 1991 - Present: Chairman, President, and Director, Pacific Global Investment Management Company; Chairman and Director, Pacific Global Fund Distributors, Inc.; Chairman and Director, Pacific Global Investor Services, Inc. 1992 - 2006: Secretary, Pacific Global Fund Distributors, Inc. and Pacific Global Investor Services, Inc. | 6 Pacific Advisors Mutual Funds | None | ||||||||||||||||||
| Barbara A. Kelley (56) 101 N. Brand Blvd. Suite 1950 Glendale, CA 91203 | Vice President, Chief Compliance Officer and Treasurer | Since 2001 | 2004 - Present: Chief Compliance Officer, Pacific Advisors Fund Inc. and Pacific Global Investment Management Company 2001 - Present: Executive Vice President, Pacific Global Investment Management Company; Director, Pacific Global Fund Distributors, Inc.; President, Pacific Global Investor Services, Inc. 1999 - Present: Director, Pacific Global Investment Management Company 2001 - 2007: Treasurer, Pacific Global Investment Management Company, Pacific Global Fund Distributors, Inc. and Pacific Global Investor Services, Inc. | 6 Pacific Advisors Mutual Funds | None | ||||||||||||||||||
89
Pacific Advisors Fund Inc.
Directors and Officers
| Name, Address and Age | Position(s) Held with the Company | Term of Offices and Length of Time Served | Principal Occupations During Past 5 Years | Number of Portfolios in Fund Complex Overseen by Trustee | Other Directorships Held by Trustee | ||||||||||||||||||
| Takashi Makinodan, PhD (85) 1506 S. Bentley Avenue PH #5 Los Angeles, CA 90025 | Director | Since 1995 | 2007 - Present: Retired 1992 - 2007: Director, Medical Treatment Effectiveness Program (MEDTEP), Center on Asian and Pacific Islanders 1991 - 2007: Associate Director of Research, Geriatric Research Education Clinic Center, VA Medical Center | 6 Pacific Advisors Mutual Fund | None | ||||||||||||||||||
| Gerald E. Miller (80) 5262 Bridgetown Place Westlake Village, CA 91362 | Director | Since 1992 | 1992 - Present: Retired | 6 Pacific Advisors Mutual Funds | None | ||||||||||||||||||
| Araceli Olea (37) 101 N. Brand Blvd. Suite 1950 Glendale, CA 91203 | Assistant Secretary | Since 2008 | 2002 - Present: Assistant Secretary, Pacific Global Investment Management Company and Pacific Global Investor Services, Inc. 1997 - Present: Shareholder Services Manager, Pacific Global Investor Services, Inc. | 6 Pacific Advisors Mutual Funds | None | ||||||||||||||||||
| Louise K. Taylor, PhD (64) 325 East Huntington Dr. Monrovia, CA 91016 | Director | Since 1992 | 2009 - Present: Retired 1991 - 2009: Superintendent, Monrovia Unified School District | 6 Pacific Advisors Mutual Funds | None | ||||||||||||||||||
90
Pacific Advisors Fund Inc.
Directors and Officers
| Name, Address and Age | Position(s) Held with the Company | Term of Offices and Length of Time Served | Principal Occupations During Past 5 Years | Number of Portfolios in Fund Complex Overseen by Trustee | Other Directorships Held by Trustee | ||||||||||||||||||
| Jingjing Yan (36) 101 N. Brand Blvd. Suite 1950 Glendale, CA 91203 | Assistant Treasurer | Since 2005 | 2010 - Present: Vice President, Pacific Global Investment Management Company 2007 - Present: Treasurer, Pacific Global Investment Management Company, Pacific Global Fund Distributors, Inc. and Pacific Global Investor Services, Inc. 2001 - 2007: Fund Accounting Manager, Pacific Global Investor Services, Inc. 2005 - 2007: Assistant Treasurer, Pacific Global Investment Management Company, Pacific Global Fund Distributors, Inc. and Pacific Global Investor Services, Inc. | 6 Pacific Advisors Mutual Funds | None | ||||||||||||||||||
1 Effective February 12, 2010, Mr. Brinker is no longer a director of the Company.
2 Effective February 1, 2010, Mr. Hanson is no longer an officer of the Company and is no longer affiliated with the Manager or any of its affiliates.
The Fund's Statement of Additional Information contains additional information about the Fund's Directors and Officers and is available without charge upon request by calling (800) 989-6693.
Each director is elected to serve until the next annual shareholders meeting and until his or her successor is elected or appointed. The Company does not hold regular annual shareholders meetings to elect Directors. Vacancies on the Board can be filled by the action of a majority of the Directors, provided that at least two-thirds of the Directors have been elected by the shareholders. Certain Directors are considered "interested persons" of the Company as defined in the 1940 Act. All directors oversee all six Funds of the Company.
91
Pacific Advisors Fund Inc.
Additional Tax Information (Unaudited)
For federal income tax purposes, the following information is furnished with respect to the distributions paid by the Funds during the taxable year ended December 31, 2009. The Funds designated and paid as long-term capital gain distributions as follows:
| Government Securities Fund | Income and Equity Fund | Balanced Fund | Growth Fund | Multi-Cap Value Fund | Small Cap Fund | ||||||||||||||||||||||
| Long-term capital gain distributions | - | - | - | - | - | - | |||||||||||||||||||||
A percentage of the dividends distributed during the fiscal year for the Funds qualifies for the dividends-received deduction for corporate shareholders:
| Government Securities Fund | Income and Equity Fund | Balanced Fund | Growth Fund | Multi-Cap Value Fund | Small Cap Fund | ||||||||||||||||||||||
| Corporate dividends-received deduction | 52.17 | % | 58.68 | % | 100.00 | % | N/A | N/A | N/A | ||||||||||||||||||
Under the Jobs and Growth Tax Relief Reconciliation Act of 2003 (the "Act"), the following percentage of ordinary dividends paid during the taxable year ended December 31, 2009 are designated as "qualified dividend income," as defined in Act. and subject to reduced tax rates in 2009.
| Government Securities Fund | Income and Equity Fund | Balanced Fund | Growth Fund | Multi-Cap Value Fund | Small Cap Fund | ||||||||||||||||||||||
| Percentage of qualified dividends | 52.17 | % | 58.24 | % | 100.00 | % | N/A | N/A | N/A | ||||||||||||||||||
In February 2010, the Funds provided tax information to shareholders for the preceding calendar year.
92

Pacific Advisors Fund Inc.
Directors
George A. Henning, Chairman
Victoria L. Breen
Thomas M. Brinker
L. Michael Haller, III
Takashi Makinodan, Ph.D.
Gerald E. Miller
Louise K. Taylor, Ph.D.
Officers
George A. Henning, President
Thomas H. Hanson, Vice President
Catherine L. Henning, Secretary
Victoria L. Breen, Assistant Secretary
Araceli Olea, Assistant Secretary
Barbara A. Kelley, Treasurer
Jingjing Yan, Assistant Treasurer
Investment Manager
Pacific Global Investment Management Company
101 North Brand Blvd., Suite 1950
Glendale, California 91203
Transfer Agent and Administrator
Pacific Global Investor Services, Inc.
101 North Brand Blvd., Suite 1950
Glendale, California 91203
Distributor
Pacific Global Fund Distributors, Inc.
101 North Brand Blvd., Suite 1950
Glendale, California 91203
(800) 989-6693
Availability of Quarterly Portfolio Schedule
The Fund files its complete schedule of portfolio holdings with the SEC for the first and third quarters of each fiscal year on Form N-Q. The Fund's Forms N-Q are available on the SEC's Web site at http://www.sec.gov. The Fund's Forms N-Q may be reviewed and copied at the SEC's Public Reference Room in Washington, DC. Information about the operation of the Public Reference Room may be obtained by calling the SEC at (800) SEC-0330.
The Fund's complete schedule of portfolio holdings for each fiscal quarter is posted on the Fund's Web site at www.PacificAdvisorsFund.com and is available without charge, upon request by calling (800) 989-6693. Documents will be sent within 3 business days of receipt of your request.
Availability of Proxy Voting Policies and Procedures and Proxy Voting Record
A description of the policies and procedures that the Fund uses to determine how to vote proxies relating to portfolio securities and information regarding how the Fund voted proxies relating to portfolio securities during the most recent 12-month period ended June 30 is available without charge, upon request by calling (800) 989-6693. Documents will be sent within 3 business days of receipt of your request. This information is also available on the SEC's Web site at http://www.sec.gov.

Pacific Global Fund Distributors, Inc.
101 North Brand Blvd., Suite 1950
Glendale, California 91203

Item 2. Code of Ethics
Registrant has adopted a Code of Ethics pursuant to Section 406 of the Sarbanes-Oxley Act of 2002 that applies to Registrant’s principal executive officer, principal financial officer, principal accounting officer or controller. Registrant will provide to any person without charge, upon request, a copy of the Code of Ethics if such person submits a request in writing addressed to the Registrant’s secretary at the principal executive offices listed above.
Item 3. Audit Committee Financial Expert
Registrant’s Audit Committee has three members. While these members are “financially literate,” the Board has determined that none of the members of the Audit Committee meet the technical definition of “audit committee financial expert.” Registrant has determined that an audit committee financial expert is not necessary at this time because (i) the Audit Committee members are financially literate; (ii) they have served on Registrant’s Audit Committee for several years; (iii) the accounting methodologies applicable to registered investment companies and the types of investment activities in which the Funds engage are well established; and (iv) Registrant’s financial statements do not involve the types of complex accounting issues that other types of public companies may have.
Item 4. Principal Accountant Fees and Services
(a)-(d) Ernst & Young LLP (“E&Y”) billed the Company aggregate fees for professional services rendered for the fiscal years ending December 31, 2007, and December 31, 2008, as follows:
|
| Audit Fees |
| Audit Related Fees |
| Tax Fees |
| All Other Fees |
| ||||
2009 |
| $ | 150,000 |
| $ | 2,500 |
| $ | 29,500 |
| $ | 0 |
|
2008 |
| $ | 141,000 |
| $ | 2,000 |
| $ | 28,000 |
| $ | 0 |
|
(b) Audit Related Fees are for services rendered to provide consent of the annual update to the Corporation’s Form N1-A and non-routine N1-A filings.
(c) Tax Fees include the services for the review of income tax returns and excise taxes.
(e)(1) The Audit Committee is authorized to pre-approve non-audit services provided by the Corporation’s auditors, if they find it appropriate in light of their fiduciary duties and in the exercise of their good faith business judgment and compatible with the auditors’ independence. The Chairman of the Audit Committee is authorized to approve audit and non-audit services for newly established funds of the Corporation on the same terms as the full Audit Committee previo usly had approved for the then existing funds, and to approve non-audit services which are permissible under applicable law, provided the estimated fee is not more than $5,000 based on a good faith estimate provided by the auditor. The Chairman shall report any such pre-approval to the Audit Committee at its next following meeting.
(e)(2) None.
(f) None.
(g) None.
(h) Not applicable.
Item 5. Audit Committee of Listed Registrants
Not applicable as Registrant is not a listed issuer as defined in Rule 10A-3 under the Securities Exchange Act of 1934.
Item 6. Statements of Investments
Statements of Investments is included as part of the report to shareholders filed under Item 1 of this form.
Item 7. Disclosure of Proxy Voting Policies and Procedures for Closed-End Management Investment Companies
Not applicable to open-end investment companies.
Item 8. Portfolio Managers of Closed-End Management Investment Companies
Not applicable to open-end investment companies.
Item 9. Purchases of Equity Securities by Managers of Closed-End Management Investment Company and Affiliated Purchasers.
Not applicable to open-end investment companies.
Item 10. Submission of Matters to a Vote of Security Holders
No material changes have been made.
Item 11. Controls and Procedures.
(a) Based upon their evaluation of Registrant’s disclosure controls and procedures (as defined in Rule 30a-3(c) under the Investment Company Act of 1940) as conducted within 90 days of the filing date of this Form N-CSR, Registrant’s principal executive officer and principal financial officer have concluded that those disclosure controls and procedures provide reasonable assurance that the material information required to be disclosed by Registrant on this report is recorded, processed, summarized and reported within the time periods specified in the Securities and Exchange Commission’s rules and forms.
(b) There were no changes in Registrant’s internal control over financial reporting (as defined in Rule 30a-3(d) under the Investment Company Act of 1940) that occurred during the second fiscal quarter of the period covered by this report that have materially affected, or are reasonably likely to materially affect, Registrant’s internal control over financial reporting.
Item 12. Exhibits
(a)(1) Not applicable.
(a)(2) Certifications required by Item 12(a) of Form N-CSR and Section 302 of the Sarbanes-Oxley Act of 2002 (filed herewith).
(b) Certification required by Section 906 of the Sarbanes-Oxley Act of 2002 (filed herewith).
SIGNATURES
Pursuant to the requirements of the Securities Exchange Act of 1934 and the Investment Company Act of 1940, Registrant has duly caused this report to be signed on its behalf by the undersigned, thereunto duly authorized.
Pacific Global Fund Inc. d/b/a Pacific Advisors Fund Inc.
By: | /s/ George A. Henning |
|
| George A. Henning |
|
| Chairman, Pacific Advisors Fund Inc. |
|
|
|
|
Date: | March 5, 2010 |
|
Pursuant to the requirements of the Securities Exchange Act of 1934 and the Investment Company Act of 1940, this report has been signed below by the following persons on behalf of Registrant and in the capacities and on the dates indicated.
By: | /s/ George A. Henning |
|
| George A. Henning |
|
| Chief Executive Officer |
|
|
|
|
Date: | March 5, 2010 |
|
|
|
|
By: | /s/ Barbara A. Kelley |
|
| Barbara A. Kelley |
|
| Chief Financial Officer |
|
|
|
|
Date: | March 5, 2010 |
|