UNITED STATES
SECURITIES AND EXCHANGE COMMISSION
Washington, D.C. 20549
FORM N-CSR
CERTIFIED SHAREHOLDER REPORT OF REGISTERED
MANAGEMENT INVESTMENT COMPANIES
Investment Company Act file number | 811-7062 | |||||||
| ||||||||
PACIFIC GLOBAL FUND INC. D/B/A PACIFIC ADVISORS FUND INC. | ||||||||
(Exact name of registrant as specified in charter) | ||||||||
| ||||||||
101 NORTH BRAND BLVD., SUITE 1950 GLENDALE, CALIFORNIA |
| 91203 | ||||||
(Address of principal executive offices) |
| (Zip code) | ||||||
| ||||||||
GEORGE A. HENNING 101 NORTH BRAND BLVD., SUITE 1950 GLENDALE, CA 91203 | ||||||||
(Name and address of agent for service) | ||||||||
| ||||||||
Registrant’s telephone number, including area code: | 818-242-6693 |
| ||||||
| ||||||||
Date of fiscal year end: | December 31 |
| ||||||
| ||||||||
Date of reporting period: | December 31, 2011 |
| ||||||
Item 1. Report to Shareholders
Filed herewith.

annual report
december 31, 2011
government securities fund
income and equity fund
balanced fund
large cap value fund
mid cap value fund
small cap value fund


Pacific Advisors
table of contents
| Message from the Chairman | 1 | ||||||
| Government Securities Fund | 5 | ||||||
| Income and Equity Fund | 10 | ||||||
| Balanced Fund | 15 | ||||||
| Large Cap Value Fund | 20 | ||||||
| Mid Cap Value Fund | 25 | ||||||
| Small Cap Value Fund | 30 | ||||||
| Schedule of Investments | 36 | ||||||
| Statement of Assets and Liabilities | 58 | ||||||
| Statement of Operations | 60 | ||||||
| Statement of Changes in Net Assets | 62 | ||||||
| Financial Highlights | 66 | ||||||
| Notes to Financial Statements | 73 | ||||||
| Report of Independent Registered Public Accounting Firm | 83 | ||||||
| Disclosure Regarding the Board's Approval of the Funds' Advisory Contracts | 84 | ||||||
| Directors and Officers | 87 | ||||||
| Additional Tax Information | 89 | ||||||
This Report is submitted for the general information of the shareholders of Pacific Advisors Funds. It is not authorized for distribution to prospective investors unless accompanied or preceded by the Funds' copy of the prospectus, which contains information concerning the investment policies of the Funds as well as other pertinent information.
This Report is for informational purposes only and is not a solicitation, or the Funds' recommendation that any particular investor should purchase or sell any particular security. The statements in the Chairman's Letter and the discussions of the Funds' performance are the opinions and beliefs expressed at the time of this commentary and are not intended to represent opinions and beliefs at any other time. These opinions are subject to change at any time based on market or other conditions and are not meant as a market forecast. All economic and performance information referenced is historical. Past performance does not guarantee future results.
For more information on the Pacific Advisors Funds, including information on charges, expenses and other classes offered, please obtain a copy of the prospectus by calling (800) 989-6693. Please read the prospectus and consider carefully the investment risks, objectives, charges and expenses before you invest or send money. Shares of the Pacific Advisors Funds are not deposits or obligations of any bank, are not guaranteed by any bank, are not insured by the FDIC or any other agency, and involve investment risks, including the possible loss of the principal amount invested. The investment return and principal value of an investment will fluctuate so that an investor's shares, when redeemed, may be worth more or less than their original cost.

Message
from the chairman
Dear Shareholders,
Investor confidence has been sorely tested over the past three and a half years. Many investors have exited the equity markets; uncertainty and volatility produced a roller coaster ride that prompted them to move to cash to avoid further losses and, perhaps, find some peace of mind. 2011 had its own twists and turns. Expectations of a strengthening recovery were undone by the European debt crises, slowing growth in China, and an uncertain domestic outlook. After enduring the angst of market volatility, many investors were left largely unrewarded; the S&P 500 Index (excluding reinvested dividends) ended the year unchanged.
However, during this most recent period of turbulence, many high quality businesses with exceptional products, effective market positioning, and access to financing expanded while weaker competitors struggled or fell by the wayside. The stock prices of these companies experienced volatility; yet, the market eventually rewarded those companies that demonstrated an ability to execute growth strategies, especially during challenging market conditions.
At Pacific Advisors Fund, we believe that investors who select superior companies for the long-term, rather than default to an indexed strategy, will be rewarded for their patience and discipline. This active strategy focuses on a limited number of companies that are undervalued, have a strong financial condition and have identifiable catalysts for multi-year growth.
Our patient, focused investment discipline was rewarded in 2011: the Small Cap Value Fund was the #1 small cap core fund; and the Large Cap Value Fund ranked in the top 16% among large cap core funds. Importantly, the Large Cap Value Fund, which has a more equity conservative strategy, achieved these results with less volatility than the S&P Index (as evidenced by its one-year beta1 of 0.85). These Funds accomplished these results with annual turnover rates of just 9% and 7%, respectively. More information on their performance is provided in the commentary for each Fund.
Pacific Advisors Small Cap Value Fund (A)
| Lipper Small Cap Core Category Rank as of 12/31/11 based on total return | |||||||
| 1 Year | 1 out of 692 funds | ||||||
| 5 Year | 186 out of 488 funds | ||||||
| 10 Year | 3 out of 295 funds | ||||||
Pacific Advisors Large Cap Value Fund (A)
| Lipper Large Cap Core Category Rank as of 12/31/11 based on total return | |||||||
| 1 Year | 160 out of 1,014 funds | ||||||
| 5 Year | 245 out of 796 funds | ||||||
| 10 Year | 186 out of 485 funds | ||||||
Today's volatile environment will probably persist. Geopolitical challenges, including Europe's lingering debt issues, will continue to impact the economy and the market. The direction, timing and magnitude of the market's reaction are unpredictable; yet, the market has demonstrated its ability to overcome these obstacles and move forward. As a result, we believe a prudent investment strategy focuses on high quality businesses with the capabilities and resources to move forward in spite of current uncertainties. We believe many companies in the Fund's portfolios are still in their early growth stages and poised for continued growth in spite of economic challenges.
Gaining Perspective on Volatility
2011 was a year of remarkable market volatility. For example, in late April when growing confidence in the economic recovery buoyed investor sentiment, the S&P 500 Index was up over 8.0%. By early August, year-to-date, the Index had fallen to – 11.0% on fears surrounding the European debt crises. October 3rd marked the year's low for the S&P 500 with a year-to-date loss of 12.6%. The markets then recovered to end the year with upward momentum.
Several factors contribute to today's market volatility. Headline news events, positive and negative, strongly influence investor psychology. Additionally, the prevalence of high-frequency trading and computer-driven trading practices has changed the very nature of the market. Rather than making investment decisions based on the fundamental quality of companies, more and more "investing" is done by computers that track and trade on market patterns. Indeed, short-term trading activity may account for as much as 70% of total trading activity. This activity has created a highly responsive, fast-paced trading environment which magnifies market movements. Moreover, ETFs have exacerbated price swings by enabling many investors to readily participate in short-term trading.
1 "Beta" measures volatility relative to the stock market or an alternative benchmark. A beta less than 1.0 indicates lower risk than the market or the benchmark and a beta greater than 1.0 indicates higher risk than the market or the benchmark.

1


Message
from the chairman continued
Market volatility may appear to be caused by the instability of individual companies; yet, this is not always the case. In reality, the disparity between the challenging economic environment and the strength of corporate America suggests that current market volatility often has little to do with business fundamentals. Certainly, many industries have contracted due to the slow-growing economy; as a result, stronger companies have grown as weaker competitors were unable to keep pace. Many of these leading companies report strong business, healthy operations and plentiful growth opportunities. Therefore, volatile market conditions, while uncomfortable, often create opportunities for investors focused on high quality companies.
Market & Economic Review
Throughout 2011, overseas events undermined improving conditions in the U.S. Social unrest, including the "Jasmine revolutions" of the Middle East and North Africa; the Occupy movement at home; and signs of growing discontent in China and Russia, marked the calendar. Natural disasters, including the earthquake, tsunami, and nuclear disaster in Japan; and major flooding in Australia and Thailand, also disrupted global markets. No subject garnered more attention than the European sovereign debt crises and their implications for the future of the euro project. The Greek bailout turned out to be the beginning of the geopolitical dilemma, as investors focused on a weakening European economy and sovereign debt of other countries. Yields on Spanish, Italian and even French debt rose to precarious levels during the second half of the year. Nevertheless, the U.S. exhibited impressive resilience throughout 2011 as a broad range of sectors and industries gained momentum.
Following extreme volatility in the third quarter, the market staged a modest recovery during the fourth quarter. The third quarter's significant selloff created opportunities for growth as the increasingly positive economic outlook buoyed investor sentiment. U.S. economic data, from manufacturing to housing and employment, reassured investors that the recovery, while not robust, was nevertheless sustainable. As a result, all sectors of the market rallied during the fourth quarter. Sectors hit hardest by third quarter volatility, such as Energy, Consumer Discretionary and Industrials, experienced the greatest bounce back. Meanwhile, sectors including Utilities, Health Care and Consumer Staples grew more modestly.
A comparison of the major domestic stock market indices reveals mixed results. Reflecting better performance among large, blue-chip companies, the Dow Jones Industrial Average rose 5.5%. Conversely, the Russell 2000 Index® of small companies fell 4.2%. Investors seemed to favor stocks with identifiable growth prospects over those that were merely "cheap" by statistical standards. Investors rewarded select high quality companies that were better able to manage the year's challenging economic conditions.
Equity Investment Review
During the year, investors benefitted from select large, mid and small cap investments. Large cap stocks generally provided stability and dividend income. The slow-growth recovery has enabled many large companies to steadily grow. Smaller companies, in comparison, typically enjoy the flexibility to quickly implement acquisitions and business expansions. As a result, smaller firms are often able grow rapidly and significantly. Investors focused on high quality, fundamentally sound stocks, benefitted from a mix of dividend income and capital appreciation potential.
One of the stronger areas during the year was the Energy sector. Companies in this sector benefitted from rising global demand for energy and energy-related services. Global markets experienced supply disruptions in the Middle East; yet, oil and natural gas output from South America and North America grew robustly. Worldwide reserves appear to be higher than previously estimated but the cost of oil and gas production continues to increase as newer, more remote sources are difficult to develop.
Many companies in the Industrial sector responded to growing demand from emerging economies and developed nations outside Europe for heavy equipment, transportation, manufacturing and service-related enterprises. Automobile and truck manufacturing were particularly strong; the average age of vehicles increased by about 2 years during the recession and credit crisis increasing the need to begin replacing many vehicles.
Market Review – December 31, 2011
| Index1 | Close | YTD Return | |||||||||
| Dow Jones Industrial Avg | 12,217.56 | 5.5 | % | ||||||||
| S&P 500 | 1,257.60 | 0.0 | % | ||||||||
| NASDAQ | 2,605.15 | – 1.8 | % | ||||||||
| Russell 2000® (small cap) | 740.92 | – 4.2 | % | ||||||||
| 12/31/11 | 12/31/10 | ||||||||||
| 10-Year T-Note Yield | 1.89 | % | 3.38 | % | |||||||
Data: The Wall Street Journal; Russell Investments; Federal Reserve.

2

A combination of growth and contraction has been an important catalyst in the manufacturing sector. Most manufacturing sectors contracted during the recession; companies that were not well-capitalized had trouble keeping pace and, in some cases, were acquired or filed for bankruptcy.
Consumer Discretionary companies improved, fueled by recovery in the U.S. and growth in consumer spending in emerging economies such as China. The sluggish housing recovery remained problematic for the Home Building and Building Materials areas. Financials also turned in disappointing results as investor concerns about the repercussions of the European bailout grew. Additionally, regulatory uncertainty surrounding the Dodd-Frank Act; lackluster loan demand; and near zero interest rates hindered their performance. Select Technology areas continued to perform well especially including social media, cloud computing and hardware for cell phones and tablet computers.
Many areas of the economy exhibited good growth potential; yet, this is not a market in which the rising tide lifts all boats. Indeed, while many companies growing, potentially many more are struggling to keep pace. For this reason, as is the case for many indices, great performance by the strongest companies has been muted by the underperformance of weaker companies.
Fixed Income Investment Review
During the year, European debt issues created heavy demand for high quality fixed income securities as investors flocked to "safe havens." Additionally, the Federal Reserve reiterated its intention to continue current monetary policy and keep rates low through at least 2014. During the last half of the year, the interest rate on the 10-year Treasury Note remained near 2.00% and ended the year at 1.89%.
Opportunities to invest in high quality corporate bonds remained limited. Demand for investment grade fixed income securities rose as investors sought safety from the volatility engulfing both interest rates and the equity markets. Furthermore, given the limited availability of lower risk investment alternatives, corporate bondholders became less likely to sell their investment grade securities. As a result, corporate bonds became more expensive and, therefore, offered little interest income.
At this juncture, predicting when interest rates may begin to rise is difficult. With interest rates near zero, the bias is unquestionably towards higher interest rates. However, many factors will influence interest rates. If the equity markets perform well, more investor monies will flow into stocks; if the economy improves, more corporate cash will be used for expansion, stock buybacks or dividends; if global tensions ease in Europe or the Middle East, bond investors will seek higher returns in other emerging economies; if the U.S. debt continues to grow, investors may require higher interest rates to hold Treasury securities; and if inflationary pressures mount from higher oil prices, food costs or other factors, interest rates will move higher. We believe that a wise approach is to maintain an adaptive strategy that can respond appropriately when interest rates move from their current level. A further discussion of our strategy is provided in the commentaries for our Government Securities and Income and Equity Funds.
Looking Ahead
U.S. economic conditions improved markedly in 2011. Consumer spending consistently outpaced expectations while employment showed steady gains. Manufacturing activity, buoyed by strong exports and a healthy energy industry, continued to recover. Also, low natural gas prices, a result of booming production of shale resources, are having a meaningful impact on the economy: consumers benefit from lower electricity bills while petrochemical producers enjoy falling costs on raw materials. Housing remains sluggish but historically low mortgage rates and the Obama administration's policy initiatives may motivate buyers. Given housing's broad reach, including the construction; banking; and home improvement industries, any rebound could materially effect jobs and the overall economy. The upcoming election cycle will also likely influence market sentiment. A positive outlook in the run-up to the elections could, as with the 2010 mid-term elections, provide a strong catalyst for stocks.
Europe's debt issues remain an overhang; they will likely continue to pressure equity markets. To some, last year's clumsy, disjointed policy efforts proved that their worst fears regarding the European Union were coming true. Philosophical and ideological differences between member nations underscored the difficulty of governing, especially during times of crisis, by consensus. Moreover, the separate and oftentimes competing political motivations of the main actors offered a discouraging prospect for resolution. 2011 was, despite these challenges, a year of remarkable progress in the region. Changes in governments, economic policy overhauls,
3


Message
from the chairman continued
strict austerity measures and conditional bailouts brought about changes that many acknowledged were necessary but thought impossible to achieve. As a result, the "European model" that had been characterized by high unemployment and slow growth began to give way to a more dynamic, pro-growth system that should benefit the region in future years.
Our outlook for individual companies remains strong. For many companies, 2011 represented a year of significant investment in growth initiatives. These included acquisitions of competing or complementary businesses, new product launches and service initiatives, and expansions into untapped markets and geographic areas.
Furthermore, we believe the Energy sector is in the early stages of a multi-year expansion. The rapid growth of emerging economies, including China, India and Brazil, is straining the global energy supply. Various technologies, including hydraulic fracturing and seismography tools, have emerged in response to this demand. Exploration companies are also venturing further out to sea where large deposits of oil and gas lie miles below the ocean floor. The resumption of permitting and drilling activity in the Gulf of Mexico acknowledged this important resource.
We believe that, with continued improvements in the domestic economy and strong growth in emerging markets, 2012 has the potential to be a momentous year for Fund holdings. Still, geopolitical challenges will again impact both the economy and the stock market. We recognize the impossibility of predicting the events that will most impact the market. However, we continue to believe compelling investment opportunities will develop; patience and discipline will be an important part of a successful investment strategy.
In our semi-annual shareholder report, we discussed the risks and rewards of different investment strategies over the past three years. We believe the Funds' investment strategies are well suited for current market conditions. We greatly appreciate the faith and trust you, our shareholders, have placed in our Funds.
Sincerely,

George A. Henning
1 The Dow Jones Industrial Average is an unmanaged, price weighted measure of 30 U.S. stocks selected by the Averages Committee to represent the performance of all U.S. stocks outside the Transportation and Utilities sectors. The Standard & Poor's 500 Index is an unmanaged, market capitalization weighted index which measures the performance of the large cap segment of the U.S. equities market, covering approximately 75% of the U.S. equities market. The Index includes 500 leading companies in leading industries of the U.S. economy. The NASDAQ Composite Index is an unmanaged, market capitalization weighted measure of all domestic and international common stocks (currently over 3,000 stocks) listed on The Nasdaq Stock Market. The Russell 2000 Index® is an unmanaged, market-weighted measure of the 2,000 smallest publicly traded companies of the Russell 3000 Index®. These indices are not available for direct investment. Index returns assume the reinvestment of dividends.
Economic and performance information referenced is historical and past performance does not guarantee future results; current performance may be higher or lower. Call 800-989-6693 for performance current to the most recent month-end. The principal value and return of an investment will fluctuate so that an investor's shares may be worth less than the original cost when redeemed. Rankings do not take into account the maximum 5.75% sales charge on Class A shares. Small cap companies typically have fewer financial resources and may carry higher investment risks and experience greater stock price volatility than larger stocks. For more information on the Pacific Advisors Funds, including information on charges, expenses and other classes offered, please obtain a copy of the prospectus by calling (800) 989-6693. Please read the prospectus and consider carefully the investment risks, objectives, charges and expenses before you invest or send money.
Shares of the Funds are not deposits or obligations of any bank, are not guaranteed by any bank, are not insured by the FDIC or any other agency, and involve investment risks, including the possible loss of the principal amount invested. Information contained herein is from sources believed to be reliable, but its accuracy or completeness is not guaranteed.
The views expressed represent the opinions and beliefs at the time of this commentary and are not meant as a market forecast. These views are subject to change at any time based on market or other conditions. This information may not be relied on as investment advice or as an indication of trading intent on behalf of any Fund. Fund investments may change at any time.
4
Pacific Advisors
Government Securities Fund
Fund Objective: High current income, preservation of capital, and rising future income consistent with prudent investment risk.
Investment Invests at least 80% of its assets in U.S. Government fixed income securities.
Strategy: These include securities issued or guaranteed by the U.S. Treasury; issued by a U.S. Government agency; or issued by a Government-Sponsored Enterprise (GSE). May also invest in high quality dividend-paying common stocks.
Investor Profile: Conservative. Income-focused; capital preservation aim.
| TOTAL RETURNS | EXPENSE RATIOS | ||||||||||||||||||
| For the year ended December 31, 2011 | For the fiscal year ended December 31, 2010 | ||||||||||||||||||
| Net Expense Ratio | Expense Ratio | ||||||||||||||||||
| Class A | 0.00 | % | Class A | 2.09 | % | 3.69 | % | ||||||||||||
| Class C | – 0.67 | % | Class C | 2.80 | % | 4.42 | % | ||||||||||||
| Barclays Capital U.S. Int T-Bond Index1 | 6.08 | % | |||||||||||||||||
Please see the Financial Highlights in this report for expense ratios for the fiscal year ended December 31, 2011.
Performance quoted is past performance which does not guarantee future results. Current performance may be higher or lower than the performance quoted. Call (800) 989-6693 for performance current to the most recent month-end. The investment return and principal value of an investment will fluctuate so that an investor's shares, when redeemed, may be worth more or less than their original cost. Returns represent the change in value over the stated period assuming reinvestment of dividends and capital gains at net asset value. Returns do not take into account the maximum 4.75% sales charge on Class A shares or the 1% Contingent Deferred Sales Charge (CDSC) for Class C shares sold within one year of purchase. Returns would be lower if the applicable sales charge and CDSC were included. Returns do not take into account individual taxes which may reduce actual returns when shares are sold.
The Fund's investment adviser is waiving a portion of its management fees pursuant to an Expense Limitation Agreement. The waiver may be discontinued at any time with ninety days written notice in consultation with the Fund's board, but is expected to continue at current levels. Please see the Notes to Financial Statements in this report for details. Performance shown reflects the waiver, without which the results would have been lower.
Discussion with Portfolio Manager February 22, 2012
Jingjing Yan, CFA
Please see the Chairman's Letter at the beginning of this Report for a detailed market and economic review
as well as the Manager's general market outlook.
Fund Performance
The Fund utilizes a conservative strategy to protect principal and achieve total return while providing current income. In response interest rate volatility throughout the year, the Fund managed risk by remaining in shorter-term holdings. The benefit of this strategy is reflected in the Fund's average duration of approximately 1 year. Duration measures a portfolio's sensitivity to interest rate movements. For example, if market interest rates rise 1%, a portfolio with a 4-year duration would lose approximated 4%. The Fund's strategy of maintaining an unusually short duration provides price stability and the flexibility to respond quickly to market changes. The Fund maintained a minor portion of its portfolio in high quality, dividend-paying common and preferred stocks. In addition to providing income, these equity holdings also help provide price stability for the Fund by counterbalancing price movements in the fixed income markets.
1 The Barclays Capital U.S. Intermediate Treasury Bond Index is an unmanaged index of U.S. government securities with one to ten years to maturity. It is not possible to invest directly in the Index.
5
Pacific Advisors
Government Securities Fund continued
For the year, the Fund's Class A shares were flat in comparison to the 6.08% return for the benchmark. Unlike the Fund, however, the benchmark is an unmanaged portfolio. With an average duration of 4 years, the benchmark's exposure to interest rate changes is significantly greater than the Fund's.
Market Overview
Interest rate volatility reflects investors' uncertainty about the domestic and global economies. In the first half of the year, the interest rate on the benchmark 10-year Treasury Note ranged between 3.74% and 2.88%. In fact, at the end of June when investors anticipated a prompt resolution to the Greek sovereign debt crisis, the 10-year Note traded at 3.18%. This economic optimism was, however, short-lived.
In the second half of the year, investor confidence dwindled in response to renewed European sovereign debt issues; slower economic growth in China; and lackluster U.S. economic data. Investors became increasingly less risk tolerant. U.S. government securities, considered a "safe haven," became increasingly attractive to all types of investors (including individuals, corporations, institutional investors and sovereign wealth funds). The unusually high demand resulted in a sharp decline in interest rates. In fact, in December, interest rates on 3-month U.S. Treasuries turned negative (that is, investors were willing to pay to hold U.S. Treasuries). In September, the interest rate on the 10-year Note dropped to a low of 1.72% and largely remained below 2% through the end of the year.
Fund Strategy
Fixed Income Strategy
Risk-appropriate fixed income investment opportunities remained limited. Shorter-term bonds provided price stability but limited yield while longer bonds provided higher yield but greater risk of principal loss. The Fund maintained its defensive fixed income strategy with short duration bonds to manage volatility. During the period, the Fund continued to focus on callable government agency bonds. The yields on these bonds increase at fixed intervals over the life of the bond. These "step-up" bonds currently provide better interest income than short-term Treasuries and help protect principal.
Given the Fund's conservative orientation of principal protection, the Fund does not use aggressive strategies. Longer-maturity bonds, mortgage-backed securities or strategies such as leverage might enhance return but with a significant increase in risk. For these same reasons, we did not actively trade the portfolio. In addition to increasing trading costs, the Fund could incur significant losses in response to interest rate movements.
Equity Positioning
The Fund invests a minor portion of its portfolio in high quality dividend-paying common stocks of well-established companies with long-term growth potential. These stocks provided the potential for capital appreciation and more attractive income in comparison to intermediate-term bonds. These equity holdings did not significantly increase price risk to the Fund; in fact, the equity holdings often reduce the impact of volatile bond prices. As a result, the Fund experienced unusually low price volatility as evidenced by its one-year beta2 of 0.11 versus the S&P 500 Index3.
During the year, we maintained approximated 12% of the portfolio in common stocks. These holdings, with a current weighted average dividend yield of approximately 3.9%, provide significant value to the Fund. Equity holding include PPL Energy and Southern Co., with yields of 4.8% and 4.1%, respectively.
The Fund also maintained approximately 5% in preferred stocks of strong financial companies with stable dividends. European sovereign debt issues had an outsized impact on these holdings. Investors
2 "Beta" measures volatility relative to the stock market or an alternative benchmark. A beta less than 1.0 indicates lower risk than the market or the benchmark and a beta greater than 1.0 indicates higher risk than the market or the benchmark.
3 The Standard & Poor's 500 Index is an unmanaged, market capitalization weighted index which measures the performance of the large cap segment of the U.S. equities market, covering approximately 75% of the U.S. equities market. The Index includes 500 leading companies in leading industries of the U.S. economy. Index returns assume the reinvestment of dividends, but, unlike the Fund's returns, do not reflect the effects of management fees or expenses. It is not possible to invest directly in the Index.
6
sold these positions fearing that the banks' losses on sovereign debt holdings mighty create liquidity crises for these companies. Our analysis suggested that these institutions, and their preferred dividend yields, would endure. We determined that the risk-reward balance favored waiting out the debt crisis.
Looking Ahead
Given global uncertainties, modest inflation, and expectations for moderate economic growth, we expect that the low interest rate environment may continue for an extended period. U.S. bonds have served as a "safe haven" investment during recent global events; this status should ebb and flow over time. To foster economic growth and employment, the Federal Reserve has committed to holding the federal funds rate at 0% to 0.25% through 2014. By keeping U.S. government bond rates near zero, the Fed hopes to stimulate growth by encouraging investors to take more risk in other investments with better growth potential.
Fed policy, however, has less influence on intermediate and longer-term interest rates. For these bonds, interest rates reflect investor demand; they respond to global economic conditions, currency values and competing investments. For example, U.S. Treasuries could be quickly sold if investors see better opportunities when European financial conditions improve or if strong economic growth resumes in China or Brazil. Furthermore, if investors become more confident in the U.S. economy, they move away from government securities to seek higher returns in other investments such as equities. When the market demand for U.S. government securities decreases, interest rates can rise just as quickly as they have declined. Many may speculate on the catalyst that will prompt investors to flee the safe haven of U.S. government securities; yet the successful investor will quickly adapt as the outlook for global, political and economic conditions change.
In light of current market uncertainties, the Fund will maintain its conservative strategy to concentrate in short to intermediate-term callable agency bonds. This strategy manages risk while providing the flexibility for timely responses to interest rate changes. We also expect to maintain the Fund's holdings in high quality equities to help minimize volatility while providing income and the potential for capital appreciation.
7
Pacific Advisors
Government Securities Fund continued
Pacific Advisors
Government Securities Fund
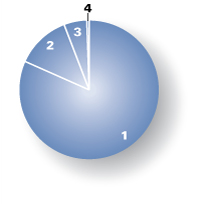
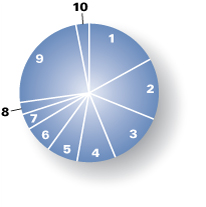
Portfolio Holdings as of 12/31/11 (Based on Total Investments)
| 1. | U.S. Government Agencies | 81.68 | % | ||||||||
| 2. | Equities | 12.55 | % | ||||||||
| 3. | Preferred Stock | 5.31 | % | ||||||||
| 4. | Cash and Cash Equivalents | 0.46 | % | ||||||||
Change in Value of $10,000 Investment1
This chart compares the growth of a $10,000 investment in Class A shares of the Government Securities Fund for the period January 1, 2002 through December 31, 2011 with the same investment in the Barclays Capital U.S. Intermediate Treasury Bond Index2.
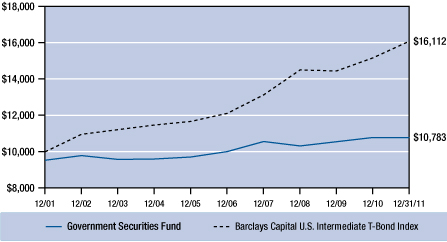
Average Annual Compounded Return as of December 31, 2011
| Class A | Class C | ||||||||||
| One Year | – 4.80 | % | – 1.66 | % | |||||||
| Five Year | 0.50 | % | 0.76 | % | |||||||
| Ten Year | 0.75 | % | 0.50 | % | |||||||
Past performance does not guarantee future results. Performance quoted represents past performance. Current performance may be higher or lower than the performance data quoted. Returns include reinvested dividends and capital gains. Returns for Class A shares reflect a maximum front-end sales charge of 4.75%; and returns for Class C shares reflect the deduction of a contingent deferred sales charge of 1% on shares sold within the first year of purchase. Returns do not take into account individual taxes which may reduce actual returns when shares are sold. The investment return and principal value of an investment will fluctuate so that an investor's shares, when redeemed, may be worth more or less than their original cost. Call (800) 989-6693 for the most recent month-end performance.
1 Fund results are shown for Class A shares and reflect deduction of the maximum front-end sales charge of 4.75% on the $10,000 investment for a net amount invested of $9,525. At the end of the same period, a $10,000 investment in Class C shares would have been valued at $10,450, and no contingent deferred sales charges would apply. Performance of the share classes will vary based on the difference in charges and expenses. The inception date is 02/08/93 for Class A shares and 04/01/98 for Class C shares. It is not possible to invest directly in the Index. Unlike the Fund's results, the results for the Index do not reflect sales charges, fees or expenses.
2 The Barclays Capital U.S. Intermediate Treasury Bond Index is an unmanaged index of U.S. government securities with one to ten years to maturity.
8
Expense Examples
As a shareholder of the Fund you incur two types of costs: (1) transaction costs, including sales charges (loads) on purchase payments, reinvested dividends, or other distributions; redemption fees; and exchange fees; and (2) ongoing costs, including management fees; distribution (12b-1) fees; and other Fund expenses. This Example is intended to help you understand your ongoing costs (in dollars) of investing in the Fund and to compare these costs with the ongoing costs of investing in other mutual funds.
The Example is based on an investment of $1,000 invested at the beginning of the period and held for the entire period from July 1, 2011 through December 31, 2011.
Actual Expenses
The first line of the table below provides information about actual account values and actual expenses. You may use the information in this line, together with the amount you invested, to estimate the expenses that you paid over the period. Simply divide your account value by $1,000 (for example, an $8,600 account value divided by $1,000 = 8.6), then multiply the result by the number in the first line under the heading entitled "Expenses Paid During the Period" to estimate the expenses you paid on your account during the period.
The following transaction costs are not included in the expenses shown in the table and, if applicable, would increase the expenses that you paid over the period: (1) a front-end sales charge (load) of 4.75% on Class A shares; (2) a 2% redemption fee if you sell or exchange shares within 30 days of purchase, with certain exceptions. The redemption fee does not apply to: (a) redemptions under an automatic withdrawal program or periodic asset reallocation plan, required minimum distributions (RMD), employer mandated distributions from a qualified plan, or redemptions under a qualified domestic relations order (QDRO); (b) redemptions to pay for expenses related to terminal illness, extended hospital or nursing home care, or other serious medical conditions, including death; (c) redemptions of shares acquired through dividend or capital gains reinvestments; (d) loans from a qualified plan account; and (e) redemptions initiated by the Fund; and (3) a $10 service fee on each exchange after the first five exchanges in each calendar year.
The following ongoing costs are not included in the expenses shown in the table and, if applicable, would increase the expenses that you paid over the period: (1) a $12 low balance fee on accounts with balances of less than $250 as of September 30th of each calendar year and no investment activity (excluding reinvestment of dividends and/or capital gains) during the prior calendar year or the first nine months of the current calendar year. This fee does not apply to IRAs, qualified plan accounts, or Coverdell Education Savings Accounts; (2) a $15 annual custodial fee on IRAs, SEPs, SIMPLE IRAs, and Coverdell Education Savings Accounts; and (3) a $20 annual custodial fee on 403(b) accounts.
Hypothetical Example for Comparison Purposes
The second line of the table below provides information about hypothetical account values and hypothetical expenses based on the Fund's actual expense ratio and an assumed rate of return of 5% per year before expenses, which in not the Fund's actual return. The hypothetical account values and expenses may not be used to estimate the actual ending account balance or expenses you paid for the period. You may use this information to compare the ongoing costs of investing in the Fund and other funds. To do so, compare this 5% hypothetical example with the 5% hypothetical examples that appear in the shareholder reports of the other funds.
The following transaction costs are not included in the expenses shown in the table and, if applicable, would increase the expenses that you paid over the period: (1) a front-end sales charge (load) of 4.75% on Class A shares; (2) a 2% redemption fee if you sell or exchange shares within 30 days of purchase, with certain exceptions. The redemption fee does not apply to: (a) redemptions under an automatic withdrawal program or periodic asset reallocation plan, required minimum distributions (RMD), employer mandated distributions from a qualified plan, or redemptions under a qualified domestic relations order (QDRO); (b) redemptions to pay for expenses related to terminal illness, extended hospital or nursing home care, or other serious medical conditions, including death; (c) redemptions of shares acquired through dividend or capital gains reinvestments; (d) loans from a qualified plan account; and (e) redemptions initiated by the Fund; and (3) a $10 service fee on each exchange after the first five exchanges in each calendar year.
The following ongoing costs are not included in the expenses shown in the table and, if applicable, would increase the expenses that you paid over the period: (1) a $12 low balance fee on accounts with balances of less than $250 as of September 30th of each calendar year and no investment activity (excluding reinvestment of dividends and/or capital gains) during the prior calendar year or the first nine months of the current calendar year. This fee does not apply to IRAs, qualified plan accounts, or Coverdell Education Savings Accounts; (2) a $15 annual custodial fee on IRAs, SEPs, SIMPLE IRAs, and Coverdell Education Savings Accounts; and (3) a $20 annual custodial fee on 403(b) accounts.
Please note that the expenses shown in the table are meant to highlight your ongoing costs only and do not reflect any transactional costs, such as sales charges (loads), redemption fees, or exchange fees. Therefore, the second line of the table is useful in comparing ongoing costs only, and will not help you determine the relative total costs of owning different funds. In addition, if these transactional costs were included, your costs would have been higher.
| Beginning Account Value 07/01/11 | Ending Account Value 12/31/11 | Expense Paid During Period 07/01/11 – 12/31/11 | |||||||||||||
| Government Securities Fund Class A | |||||||||||||||
| Actual | $ | 1,000.00 | $ | 993.50 | $ | 12.16 | |||||||||
| Hypothetical (5% return before expense) | $ | 1,000.00 | $ | 1,013.01 | $ | 12.28 | |||||||||
| Government Securities Fund Class C | |||||||||||||||
| Actual | $ | 1,000.00 | $ | 990.10 | $ | 15.85 | |||||||||
| Hypothetical (5% return before expense) | $ | 1,000.00 | $ | 1,009.28 | $ | 16.00 | |||||||||
3 Expenses are equal to the Fund's annualized expense ratio, net of expense waivers, of 2.42% for Class A shares and 3.16% for Class C shares, multiplied by the average account value over the period, multiplied by 184/365 days to reflect the one-half year period.
9
Pacific Advisors
Income and Equity Fund
Fund Objective: Current income and, secondarily, long-term capital appreciation.
Investment Invests primarily in investment grade U.S. corporate bonds and in dividend-paying
Strategy: stocks.
Investor Profile: Conservative. Some current income required; capital preservation aim.
| TOTAL RETURNS | EXPENSE RATIOS | ||||||||||||||||||
| For the year ended December 31, 2011 | For the fiscal year ended December 31, 2010 | ||||||||||||||||||
| Net Expense Ratio | Expense Ratio | ||||||||||||||||||
| Class A | 2.24 | % | Class A | 2.34 | % | 3.09 | % | ||||||||||||
| Class C | 1.54 | % | Class C | 3.07 | % | 3.82 | % | ||||||||||||
| Barclays Capital U.S. Int Corp Bond Index1 | 5.52 | % | |||||||||||||||||
| S&P 500 Index2 | 2.11 | % | |||||||||||||||||
Please see the Financial Highlights in this report for expense ratios for the fiscal year ended December 31, 2011.
Performance quoted is past performance which does not guarantee future results. Current performance may be higher or lower than the performance quoted. Call (800) 989-6693 for performance current to the most recent month-end. The investment return and principal value of an investment will fluctuate so that an investor's shares, when redeemed, may be worth more or less than their original cost. Returns represent the change in value over the stated period assuming reinvestment of dividends and capital gains at net asset value. Returns do not take into account the maximum 4.75% sales charge on Class A shares or the 1% Contingent Deferred Sales Charge (CDSC) for Class C shares sold within one year of purchase. Returns would be lower if the applicable sales charge and CDSC were included. Returns do not take into account individual taxes which may reduce actual returns when shares are sold.
The Fund's investment adviser is waiving a portion of its management fees pursuant to an Expense Limitation Agreement. The waiver may be discontinued at any time with ninety days written notice in consultation with the Fund's board, but is expected to continue at current levels. Please see the Notes to Financial Statements in this report for details. Performance shown reflects the waiver, without which the results would have been lower.
Discussion with Portfolio Managers February 22, 2012
Charles Suh, CFA
Jingjing Yan, CFA
Please see the Chairman's Letter at the beginning of this Report for a detailed market and economic review
as well as the Manager's general market outlook.
Fund Performance
Throughout 2011, the Fund was challenged to find risk-appropriate opportunities amid persistent interest rate and equity market volatility. For the year, Class A shares of the Fund returned 2.24%. The Fund outperformed the S&P 500 Index with significantly less risk as reflected in its one-year beta3 of 0.36.
Further, we believe the Fund's average annual three-year performance, given the numerous challenges during these years, validates its strategy. At year-end, Class A shares of the Fund returned 8.03% while
1 The Barclays Capital U.S. Intermediate Corporate Bond Index is an unmanaged index of publicly issued investment grade U.S. corporate bonds with one to ten years to maturity. It is not possible to invest directly in the Index.
2 The Standard & Poor's 500 Index is an unmanaged, market capitalization weighted index which measures the performance of the large cap segment of the U.S. equities market, covering approximately 75% of the U.S. equities market. The Index includes 500 leading companies in leading industries of the U.S. economy. Index returns assume the reinvestment of dividends, but, unlike the Fund's returns, do not reflect the effects of management fees or expenses. It is not possible to invest directly in the Index.
3 "Beta" measures volatility relative to the stock market or an alternative benchmark. A beta less than 1.0 indicates lower risk than the market or the benchmark and a beta greater than 1.0 indicates higher risk than the market or the benchmark.
10
taking less than a third of the risk of the S&P 500 Index. The Fund's low risk is evidenced by its average three-year beta of 0.29 versus the Index.
In search of safety amid global uncertainties, investors have largely favored government securities and high quality corporate bonds over equities. As a result, interest rates for corporate bonds have remained at historical lows in comparison to government securities. In other words, investors receive little reward for the additional risk of owning a corporate bond over a government security. High quality corporate bonds with attractive yields have been in particularly short supply.
Throughout, the Fund has adapted to this environment by focusing on risk-appropriate opportunities in the fixed income and equity markets. To protect principal, the Fund's fixed income holdings favored intermediate-term (approximately three to five years) bonds. Additionally, the Fund has maintained a higher-than-normal equity allocation. Superior, well-established companies with meaningful dividend rates have generally provided better income and capital appreciation potential than high quality corporate bonds.
Fund Strategy
We actively manage the Fund's fixed income and equity allocations to capture the best opportunities for income and growth. We adjust the exposure to equities based on economic conditions; we raise the equity exposure when a positive climate creates the potential for good capital appreciation and dividend income.
In the latter half of 2011, interest rates remained volatile amid increasing global and domestic economic uncertainty. The markets faced numerous challenges including the European sovereign debt crises, slowing economic growth in China as well as political and social unrest in the Middle East and North Africa. Disappointing domestic data related to unemployment, housing and rising inflation also challenged the market. Heightened investor uncertainty increased the demand for high quality fixed income securities. Reflecting this "flight to safety," the interest rate on the benchmark 10-year Treasury Note remained near 2% and ended the year at 1.89%.
Given the low interest rate environment, the Fund's fixed income holdings remained concentrated in high quality intermediate-term bonds. We maintained the Fund's higher equity allocation near 44% to capture opportunities for capital appreciation and dividend income without substantially increasing risk. In the low interest rate environment, dividend income played a key role in contributing to the Fund's total return. Indeed, at year-end, the Fund's average dividend rate was 3.91%; over 70% of the equity holdings were paying a dividend in excess of 3%.
Fixed Income Strategy
Opportunities to invest in high quality corporate bonds remained limited in the last half of the year. The demand for investment grade fixed income securities rose as investors sought safety from the volatility engulfing interest rates and the equity markets. Furthermore, and given the limited availability of lower risk investment alternatives, corporate bondholders became less likely to sell their investment grade securities. As a result, corporate bonds became more expensive and, therefore, offered little interest income.
Given its conservative orientation, the Fund's fixed income strategy focused on protecting principal. While maintaining our concentration in intermediate-term investment grade corporate bonds, we actively managed the portfolio for an average maturity of approximately 3 years. Moreover, the Fund does not utilize speculative or aggressive investments (e.g., derivatives, leverage or high-yield "junk" bonds) to enhance yield; we believe that these strategies would exceed the Fund's risk parameters.
We continued to search for high quality corporate bonds that were temporarily undervalued by the market. Additionally, we sought attractive opportunities in investment grade corporate bonds with variable interest rates linked to major indices such as the Consumer Price Index (CPI) or LIBOR. These bonds offered price stability and higher income than fixed rate bonds issued by the same company. For example, this included CPI-linked bonds from HSBC and Prudential Financial each with a current yield of approximately 5%.
11
Pacific Advisors
Income and Equity Fund continued
Equity Strategy
Equity holdings continued to play an important role given the challenges facing fixed income securities. The equity portfolio supported the Fund's total return by providing dividend income as well as the potential for capital appreciation. We remained focused on large, high quality, well-established companies in a variety of industries and sectors.
During the last half of the year, we continued to focus on blue chip companies that paid significant dividends. Holdings with dividend yields over 4% included Duke Energy, Pitney Bowes, Public Service Enterprise Group, Pfizer and AT&T. We supplemented these core holdings with companies that we identified for price appreciation as the economic recovery restored demand in their industries. In addition to the opportunity for good growth potential, firms such as Mattel, Home Depot and Genuine Parts Company also pay meaningful dividends in the range of 2.5% to 3.0%.
Looking Ahead
We anticipate that the recent interest rate volatility will continue as investors work through global and domestic economic uncertainty. Variables which may impact interest rates include Federal Reserve policies and legislative agendas; the European sovereign debt crises and other geopolitical events; inflationary pressures; and election-year politics. We diligently monitor the interest rate environment to implement timely and appropriate adjustments to the Fund's fixed income portfolio.
Historically, low interest rates have resulted in a flight to safety as investors reacted to global, political and economic events. Fixed income securities are an important asset allocation for many investors; the low rate of return should be viewed as a temporary situation that reflects investor uncertainty. When market conditions show improvement, investors will begin a gradual move to equity markets in search of a greater return on their investments.
To protect the Fund's shareholders from undue risk due to interest rate uncertainty, we are prudently maintaining a shorter-maturity fixed income strategy. The Fund will continue its relatively high allocation to quality, dividend-paying stocks that will contribute to total return. We expect that opportunities in the equity market will increase as investors become more confident in the economic prognosis.
12
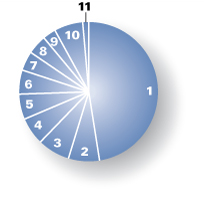
Portfolio Holdings as of 12/31/11 (Based on Total Investments)
| 1. | Corporate Bonds | 47.58 | % | ||||||||
| Equities | 44.64 | % | |||||||||
| 2. | Consumer Discretionary | 7.39 | % | ||||||||
| 3. | Consumer Staples | 7.33 | % | ||||||||
| 4. | Industrials | 6.46 | % | ||||||||
| 5. | Health Care | 5.88 | % | ||||||||
| 6. | Utilities | 5.49 | % | ||||||||
| 7. | Telecommunication Services | 4.57 | % | ||||||||
| 8. | Information Technology | 4.32 | % | ||||||||
| 9. | Others | 3.20 | % | ||||||||
| 10. | Preferred Stock | 6.46 | % | ||||||||
| 11. | Cash and Cash Equivalents | 1.32 | % | ||||||||
Change in Value of $10,000 Investment1
This chart compares the growth of a $10,000 investment in Class A shares of the Income and Equity Fund for the period January 1, 2002 through December 31, 2011 with the same investment in the S&P 500 Index2 and the Barclays Capital U.S. Intermediate Corporate Bond Index3.
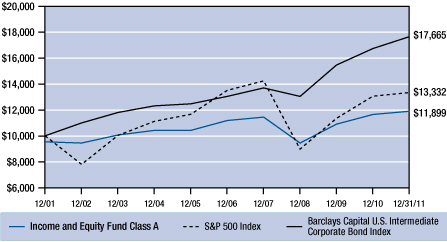
Average Annual Compounded Returns as of December 31, 2011
| Class A | Class C | ||||||||||
| One Year | – 2.60 | % | 0.54 | % | |||||||
| Five Year | 0.28 | % | 0.51 | % | |||||||
| Ten Year | 1.76 | % | 1.50 | % | |||||||
Past performance does not guarantee future results. Performance quoted represents past performance. Current performance may be higher or lower than the performance data quoted. Returns include reinvested dividends and capital gains. Returns for Class A shares reflect a maximum front-end sales charge of 4.75%; and returns for Class C shares reflect the deduction of a contingent deferred sales charge of 1% on shares sold within the first year of purchase. Returns do not take into account individual taxes which may reduce actual returns when shares are sold. The investment return and principal value of an investment will fluctuate so that an investor's shares, when redeemed, may be worth more or less than their original cost. Call (800) 989-6693 for the most recent month-end performance.
1 Fund results are shown for Class A shares and reflect deduction of the maximum front-end sales charge of 4.75% on the $10,000 investment for a net amount invested of $9,525. At the end of the same period, a $10,000 investment in Class C shares would have been valued at $11,636, and no contingent deferred sales charges would apply. Performance of the share classes will vary based on the difference in charges and expenses. The inception date is 02/08/93 for Class A shares and 04/01/98 for Class C shares. It is not possible to invest directly in either Index. Index results assume reinvestment of dividends, but, unlike the Fund's results, do not reflect sales charges, fees or expenses.
2 The Standard & Poor's 500 Index is an unmanaged, market capitalization weighted index which measures the performance of the large cap segment of the U.S. equities market, covering approximately 75% of the U.S. equities market. The Index includes 500 leading companies in leading industries of the U.S. economy.
3 The Barclays Capital U.S. Intermediate Corporate Bond Index is an unmanaged index of publicly issued investment grade U.S. corporate bonds with one to ten years to maturity.
13
Pacific Advisors
Income and Equity Fund continued
Expense Examples
As a shareholder of the Fund you incur two types of costs: (1) transaction costs, including sales charges (loads) on purchase payments, reinvested dividends, or other distributions; redemption fees; and exchange fees; and (2) ongoing costs, including management fees; distribution (12b-1) fees; and other Fund expenses. This Example is intended to help you understand your ongoing costs (in dollars) of investing in the Fund and to compare these costs with the ongoing costs of investing in other mutual funds.
The Example is based on an investment of $1,000 invested at the beginning of the period and held for the entire period from July 1, 2011 through December 31, 2011.
Actual Expenses
The first line of the table below provides information about actual account values and actual expenses. You may use the information in this line, together with the amount you invested, to estimate the expenses that you paid over the period. Simply divide your account value by $1,000 (for example, an $8,600 account value divided by $1,000 = 8.6), then multiply the result by the number in the first line under the heading entitled "Expenses Paid During the Period" to estimate the expenses you paid on your account during the period.
The following transaction costs are not included in the expenses shown in the table and, if applicable, would increase the expenses that you paid over the period: (1) a front-end sales charge (load) of 4.75% on Class A shares; (2) a 2% redemption fee if you sell or exchange shares within 30 days of purchase, with certain exceptions. The redemption fee does not apply to: (a) redemptions under an automatic withdrawal program or periodic asset reallocation plan, required minimum distributions (RMD), employer mandated distributions from a qualified plan, or redemptions under a qualified domestic relations order (QDRO); (b) redemptions to pay for expenses related to terminal illness, extended hospital or nursing home care, or other serious medical conditions, including death; (c) redemptions of shares acquired through dividend or capital gains reinvestments; (d) loans from a qualified plan account; and (e) redemptions initiated by the Fund; and (3) a $10 service fee on each exchange after the first five exchanges in each calendar year.
The following ongoing costs are not included in the expenses shown in the table and, if applicable, would increase the expenses that you paid over the period: (1) a $12 low balance fee on accounts with balances of less than $250 as of September 30th of each calendar year and no investment activity (excluding reinvestment of dividends and/or capital gains) during the prior calendar year or the first nine months of the current calendar year. This fee does not apply to IRAs, qualified plan accounts, or Coverdell Education Savings Accounts; (2) a $15 annual custodial fee on IRAs, SEPs, SIMPLE IRAs, and Coverdell Education Savings Accounts; and (3) a $20 annual custodial fee on 403(b) accounts.
Hypothetical Example for Comparison Purposes
The second line of the table below provides information about hypothetical account values and hypothetical expenses based on the Fund's actual expense ratio and an assumed rate of return of 5% per year before expenses, which in not the Fund's actual return. The hypothetical account values and expenses may not be used to estimate the actual ending account balance or expenses you paid for the period. You may use this information to compare the ongoing costs of investing in the Fund and other funds. To do so, compare this 5% hypothetical example with the 5% hypothetical examples that appear in the shareholder reports of the other funds.
The following transaction costs are not included in the expenses shown in the table and, if applicable, would increase the expenses that you paid over the period: (1) a front-end sales charge (load) of 4.75% on Class A shares; (2) a 2% redemption fee if you sell or exchange shares within 30 days of purchase, with certain exceptions. The redemption fee does not apply to: (a) redemptions under an automatic withdrawal program or periodic asset reallocation plan, required minimum distributions (RMD), employer mandated distributions from a qualified plan, or redemptions under a qualified domestic relations order (QDRO); (b) redemptions to pay for expenses related to terminal illness, extended hospital or nursing home care, or other serious medical conditions, including death; (c) redemptions of shares acquired through dividend or capital gains reinvestments; (d) loans from a qualified plan account; and (e) redemptions initiated by the Fund; and (3) a $10 service fee on each exchange after the first five exchanges in each calendar year.
The following ongoing costs are not included in the expenses shown in the table and, if applicable, would increase the expenses that you paid over the period: (1) a $12 low balance fee on accounts with balances of less than $250 as of September 30th of each calendar year and no investment activity (excluding reinvestment of dividends and/or capital gains) during the prior calendar year or the first nine months of the current calendar year. This fee does not apply to IRAs, qualified plan accounts, or Coverdell Education Savings Accounts; (2) a $15 annual custodial fee on IRAs, SEPs, SIMPLE IRAs, and Coverdell Education Savings Accounts; and (3) a $20 annual custodial fee on 403(b) accounts.
Please note that the expenses shown in the table are meant to highlight your ongoing costs only and do not reflect any transactional costs, such as sales charges (loads), redemption fees, or exchange fees. Therefore, the second line of the table is useful in comparing ongoing costs only, and will not help you determine the relative total costs of owning different funds. In addition, if these transactional costs were included, your costs would have been higher.
| Beginning Account Value 07/01/11 | Ending Account Value 12/31/11 | Expense Paid During Period 07/01/11 – 12/31/11 | |||||||||||||
| Income & Equity Fund Class A | |||||||||||||||
| Actual | $ | 1,000.00 | $ | 988.40 | $ | 12.98 | |||||||||
| Hypothetical (5% return before expense) | $ | 1,000.00 | $ | 1,012.15 | $ | 13.14 | |||||||||
| Income & Equity Fund Class C | |||||||||||||||
| Actual | $ | 1,000.00 | $ | 984.90 | $ | 16.66 | |||||||||
| Hypothetical (5% return before expense) | $ | 1,000.00 | $ | 1,008.42 | $ | 16.86 | |||||||||
4 Expenses are equal to the Fund's annualized expense ratio, net of expense waivers, of 2.59% for Class A shares and 3.33% for Class C shares, multiplied by the average account value over the period, multiplied by 184/365 days to reflect the one-half year period.
14
Pacific Advisors
Balanced Fund
Fund Objective: Long-term capital appreciation and income consistent with reduced risk.
Investment Invests primarily in large cap common stocks and investment grade
Strategy: U.S. corporate bonds. Invests at least 25% of its assets in fixed income securities and preferred stocks and at least 25% in equities.
Investor Profile: Moderately conservative. Seeks combination of long-term growth, income, liquidity and reduced risk of price fluctuations.
| TOTAL RETURNS | EXPENSE RATIOS | ||||||||||||||||||
| For the year ended December 31, 2011 | For the fiscal year ended December 31, 2010 | ||||||||||||||||||
| Class A | – 1.14 | % | Class A | 2.77 | % | ||||||||||||||
| Class C | – 1.86 | % | Class C | 3.50 | % | ||||||||||||||
| S&P 500 Index1 | 2.11 | % | |||||||||||||||||
| Barclays Capital U.S. Int Corp Bond Index2 | 5.52 | % | |||||||||||||||||
Please see the Financial Highlights in this report for expense ratios for the fiscal year ended December 31, 2011.
Performance quoted is past performance which does not guarantee future results. Current performance may be higher or lower than the performance quoted. Call (800) 989-6693 for performance current to the most recent month-end. The investment return and principal value of an investment will fluctuate so that an investor's shares, when redeemed, may be worth more or less than their original cost. Returns represent the change in value over the stated period assuming reinvestment of dividends and capital gains at net asset value. Returns do not take into account the maximum 5.75% sales charge on Class A shares or the 1% Contingent Deferred Sales Charge (CDSC) for Class C shares sold within one year of purchase. Returns would be lower if the applicable sales charge and CDSC were included. Returns do not take into account individual taxes which may reduce actual returns when shares are sold.
Discussion with Portfolio Managers February 22, 2012
Samuel C. Coquillard
Charles Suh, CFA
Jingjing Yan, CFA
Please see the Chairman's Letter at the beginning of this Report for a detailed market and economic review
as well as the Manager's general market outlook.
Fund Performance
The Fund is designed to enable conservative investors to participate in the equity markets with limited risk. We actively select equity holdings in well-established companies with attractive dividends; fixed income holdings are focused on short-to-intermediate-term investment grade corporate bonds and select preferred stocks. The overall allocations are based on our general economic outlook and identification of risk-appropriate investments. We believe this approach enables the Fund to take advantage of growth opportunities while minimizing its price volatility.
During 2011, the Fund's performance trailed its benchmarks. The escalating European sovereign debt crises triggered a selloff in equities; in particular, financial stocks and companies in economically sensitive sectors, such as Energy and Industrials, suffered. Fund holdings in these areas were impacted. Consumer Staples and Health Care holdings also pulled back, though not as severely. Market volatility increased
1 The Standard & Poor's 500 Index is an unmanaged, market capitalization weighted index which measures the performance of the large cap segment of the U.S. equities market, covering approximately 75% of the U.S. equities market. The Index includes 500 leading companies in leading industries of the U.S. economy. Index returns assume the reinvestment of dividends, but, unlike the Fund's returns, do not reflect the effects of management fees or expenses. It is not possible to invest directly in the Index.
2 The Barclays Capital U.S. Intermediate Corporate Bond Index is an unmanaged index of publicly issued investment grade U.S. corporate bonds with one to ten years to maturity. It is not possible to invest directly in the Index.
15
Pacific Advisors
Balanced Fund continued
during the period; however, the Fund's fixed income securities and high yielding stocks helped lower the portfolio's volatility in relation to the market. For the year, the Fund's beta3 of just 0.74 compared favorably to the S&P 500 Index.
Fund Strategy
We actively manage the allocation between equity and fixed income investments to seek the best opportunities for total return. The Fund's equity allocation remained at approximately 73% throughout the year. Equity investments were concentrated primarily in high quality, dividend-paying companies with attractive long-term growth prospects. During 2011, we maintained an equity strategy of owning defensive and cyclical holdings. Typically, defensive investments generate stable revenue, pay attractive dividends, and experience relatively low price volatility. Cyclical investments generally offer better opportunities for growth; but typically, they are also more sensitive to economic developments and market volatility.
In response to persistently low yields and heightened interest rate volatility, the Fund's fixed income investments remained concentrated in shorter-term bonds during 2011. These securities offered lower returns but provided greater principal protection during periods of market turbulence. We anticipate maintaining this posture for the near-to-medium term, until signs of a change in the interest rate environment emerge. These may arise from a strengthening economy, rising inflation, or increased demand for investments with better return potential, such as equities.
Equity Strategy
Consistent with the Fund's long-term, value-oriented strategy, holdings are concentrated in high quality companies with dominant market positions, strong management teams, and exceptional opportunities for growth. The Fund seeks to provide reliable income and stability along with the opportunity for attractive long-term capital appreciation. At the end of the year, the Fund's weighted average dividend yield was 2.56%; this compared favorably to the 1.89% yield on the benchmark 10-year Treasury Note.
In response to economic concerns during the second half of the year, many investors gravitated toward stable investments. High dividend-yielding stocks, particularly pharmaceutical companies, performed well. McDonald's enjoyed strong gains as investors recognized its stable earnings and international growth opportunities. The company also enjoyed remarkable success from fine-tuning its menu to meet customer demand. Similarly, Wal-Mart gained traction as it improved merchandising in its U.S. stores while executing an aggressive international growth strategy. CVS Caremark's impressive results validated its strategy to join its retail operation with its administration of prescription drug programs. The combined operation provides an opportunity to reduce costs for its customers while maintaining high levels of service. Meanwhile, pharmaceutical giants Merck, Abbott Laboratories, and Pfizer gained favor as investors sought stocks with high dividends and reduced volatility. These modestly priced companies, which generate abundant cash and pay attractive dividends, were well suited to skittish investors.
Shares of JPMorgan Chase fell as investors worried about fallout from the European financial crises; nevertheless, we believe the well-capitalized bank will withstand these events and benefit from the domestic recovery. Halliburton declined due to concerns about slowing global economic activity; yet, with the price of oil remaining near $100 per barrel, we anticipate that the company will benefit from continued significant investment in energy exploration and production. And, Caterpillar pulled back owing to fears of a slowdown in China. The stock may experience short-term volatility, but we believe the longer-term outlook for mining and infrastructure spending in China and other emerging nations continues to present meaningful opportunities for the company.
During the second half of the year, the Fund added three positions. Archer Daniels Midland, one of the world's largest agricultural processors, should profit as emerging economies expand. The company's leading farming and grain processing technology will likely become increasingly important as living
3 "Beta" measures volatility relative to the stock market or an alternative benchmark. A beta less than 1.0 indicates lower risk than the market or the benchmark and a beta greater than 1.0 indicates higher risk than the market or the benchmark.
16
standards improve. Cummins, a global leader in engine technology, should profit from growing demand in commercial trucking, agriculture, mining, and energy. Google enjoys a dominant market share in internet search advertising and, increasingly, in mobile phone operating systems. Also, the company holds $45 billion in cash and marketable securities which could be used for acquisitions or for other growth opportunities.
Our outlook for portfolio companies remains upbeat. We point to steady, sustainable gains in the U.S. economy including improving employment trends and signs of an emerging recovery in the housing market. Globally, developing economies represent significant growth opportunities for leading businesses, especially in the Energy, Industrials and Technology sectors. Europe is unlikely to resume meaningful growth in 2012; nevertheless, progress in the sovereign debt crises could provide a meaningful catalyst for the equity markets.
Fixed Income Strategy
The Fund's fixed income portfolio is actively managed to provide current income and the potential for capital appreciation. During the second half of 2011, the European sovereign debt crises increased demand for fixed income securities. As an example of the demand-driven popularity for bonds, the yield on the 10-year Note fell from over 3% in July to 1.89% by year-end. As yields fell, bond prices rose; investors who held long-term bonds participated in the price appreciation. However, with interest rates at historical lows, we continue to believe that interest rates are more likely to increase than decrease. Therefore, the risk of losing principal as bonds, particularly long-term bonds, decline in price outweighs the potential benefits. Notwithstanding the Federal Reserve's commitment to a low interest rate environment for an extended period of time, we believe market forces may ultimately drive rates higher.
Preferred stock holdings were largely concentrated in the Financials sector; European events had an outsized impact on these positions. Our analysis of these holdings suggested that these institutions, and their preferred dividend yields, would endure. With yields exceeding 10% at the height of the crisis, we determined that the risk-reward balance favored waiting out the crisis.
Our outlook for 2012 is, in many respects, a repeat of 2011: interest rates are likely to remain at historical lows while ongoing debt issues in Europe will continue to keep yields low. We believe a conservative approach of maintaining fixed income investments in short and medium-term maturities remains appropriate; potential price declines on longer-term bonds that would result from rising interest rates outweigh gains from owning these bonds. Even a minor rise in interest rates can result in a substantial loss of principal on longer-term fixed income securities. Several factors could contribute to rising interest rates including continued progress in Europe's debt crises; strong equity market performance; increased corporate spending; and rising inflation.
Looking Ahead
Strengthening conditions at home and continued growth of emerging economies, including China, India and Brazil, paint an encouraging picture. Leading companies, especially those in the Energy, Industrial and Technology sectors, are well positioned to benefit from these trends. European headwinds will likely remain; yet, we believe risks to the global economy are balanced by opportunities in other areas of the world. And, interest rates may, despite Fed policy, increase due to market forces. If the equity markets continue to improve, they should attract investors who have been content to hold Treasuries. The bond exodus would drive prices lower and rates higher. Based on this outlook, Fund holdings will favor equities and shorter-term fixed income securities.
17
Pacific Advisors
Balanced Fund continued
Portfolio Holdings as of 12/31/11 (Based on Total Investments)
| Equities | 72.82 | % | |||||||||
| 1. | Industrials | 16.97 | % | ||||||||
| 2. | Consumer Staples | 14.37 | % | ||||||||
| 3. | Information Technology | 12.73 | % | ||||||||
| 4. | Health Care | 8.71 | % | ||||||||
| 5. | Energy | 7.44 | % | ||||||||
| 6. | Financials | 6.22 | % | ||||||||
| 7. | Consumer Discretionary | 3.63 | % | ||||||||
| 8. | Materials | 2.75 | % | ||||||||
| 9. | Corporate Bonds | 24.22 | % | ||||||||
| 10. | Preferred Stock | 2.96 | % | ||||||||
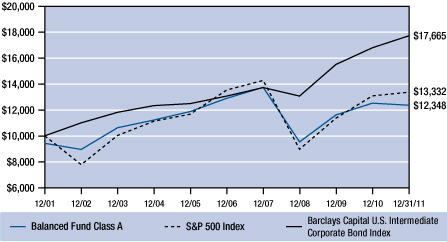
Change in Value of $10,000 Investment1
This chart compares the growth of a $10,000 investment in Class A shares of the Balanced Fund for the period January 1, 2002 through December 31, 2011 with the same investment in the S&P 500 Index2 and the Barclays Capital U.S. Intermediate Corporate Bond Index3.
Average Annual Compounded Returns as of December 31, 2011
| Class A | Class C | ||||||||||
| One Year | – 6.84 | % | – 2.84 | % | |||||||
| Five Year | – 1.98 | % | – 1.57 | % | |||||||
| Ten Year | 2.14 | % | 1.97 | % | |||||||
Past performance does not guarantee future results. Performance quoted represents past performance. Current performance may be higher or lower than the performance data quoted. Returns include reinvested dividends and capital gains. Returns for Class A shares reflect a maximum front-end sales charge of 5.75%; and returns for Class C shares reflect the deduction of a contingent deferred sales charge of 1% on shares sold within the first year of purchase. Returns do not take into account individual taxes which may reduce actual returns when shares are sold. The investment return and principal value of an investment will fluctuate so that an investor's shares, when redeemed, may be worth more or less than their original cost. Call (800) 989-6693 for the most recent month-end performance.
1 Fund results are shown for Class A shares and reflect deduction of the maximum front-end sales charge of 5.75% on the $10,000 investment for a net amount invested of $9,425. At the end of the same period, a $10,000 investment in Class C shares would have been valued at $11,738, and no contingent deferred sales charges would apply. Performance of the share classes will vary based on the difference in charges and expenses. The inception date is 02/08/93 for Class A shares and 04/01/98 for Class C shares. It is not possible to invest directly in either Index. Index results assume reinvestment of dividends, but, unlike the Fund's results, do not reflect sales charges, fees or expenses.
2 The Standard & Poor's 500 Index is an unmanaged, market capitalization weighted index which measures the performance of the large cap segment of the U.S. equities market, covering approximately 75% of the U.S. equities market. The Index includes 500 leading companies in leading industries of the U.S. economy.
3 The Barclays Capital U.S. Intermediate Corporate Bond Index is an unmanaged index of publicly issued investment grade U.S. corporate bonds with one to ten years to maturity.
18
Expense Examples
As a shareholder of the Fund you incur two types of costs: (1) transaction costs, including sales charges (loads) on purchase payments, reinvested dividends, or other distributions; redemption fees; and exchange fees; and (2) ongoing costs, including management fees; distribution (12b-1) fees; and other Fund expenses. This Example is intended to help you understand your ongoing costs (in dollars) of investing in the Fund and to compare these costs with the ongoing costs of investing in other mutual funds.
The Example is based on an investment of $1,000 invested at the beginning of the period and held for the entire period from July 1, 2011 through December 31, 2011.
Actual Expenses
The first line of the table below provides information about actual account values and actual expenses. You may use the information in this line, together with the amount you invested, to estimate the expenses that you paid over the period. Simply divide your account value by $1,000 (for example, an $8,600 account value divided by $1,000 = 8.6), then multiply the result by the number in the first line under the heading entitled "Expenses Paid During the Period" to estimate the expenses you paid on your account during the period.
The following transaction costs are not included in the expenses shown in the table and, if applicable, would increase the expenses that you paid over the period: (1) a front-end sales charge (load) of 5.75% on Class A shares; (2) a 2% redemption fee if you sell or exchange shares within 180 days of purchase, with certain exceptions. The redemption fee does not apply to: (a) redemptions under an automatic withdrawal program or periodic asset reallocation plan, required minimum distributions (RMD), employer mandated distributions from a qualified plan, or redemptions under a qualified domestic relations order (QDRO); (b) redemptions to pay for expenses related to terminal illness, extended hospital or nursing home care, or other serious medical conditions, including death; (c) redemptions of shares acquired through dividend or capital gains reinvestments; (d) loans from a qualified plan account, and (e) redemptions initiated by the Fund; and (3) a $10 service fee on each exchange after the first five exchanges in each calendar year.
The following ongoing costs are not included in the expenses shown in the table and, if applicable, would increase the expenses that you paid over the period: (1) a $12 low balance fee on accounts with balances of less than $250 as of September 30th of each calendar year and no investment activity (excluding reinvestment of dividends and/or capital gains) during the prior calendar year or the first nine months of the current calendar year. This fee does not apply to IRAs, qualified plan accounts, or Coverdell Education Savings Accounts; (2) a $15 annual custodial fee on IRAs, SEPs, SIMPLE IRAs, and Coverdell Education Savings Accounts; and (3) a $20 annual custodial fee on 403(b) accounts.
Hypothetical Example for Comparison Purposes
The second line of the table below provides information about hypothetical account values and hypothetical expenses based on the Fund's actual expense ratio and an assumed rate of return of 5% per year before expenses, which in not the Fund's actual return. The hypothetical account values and expenses may not be used to estimate the actual ending account balance or expenses you paid for the period. You may use this information to compare the ongoing costs of investing in the Fund and other funds. To do so, compare this 5% hypothetical example with the 5% hypothetical examples that appear in the shareholder reports of the other funds.
The following transaction costs are not included in the expenses shown in the table and, if applicable, would increase the expenses that you paid over the period: (1) a front-end sales charge (load) of 5.75% on Class A shares; (2) a 2% redemption fee if you sell or exchange shares within 180 days of purchase, with certain exceptions. The redemption fee does not apply to: (a) redemptions under an automatic withdrawal program or periodic asset reallocation plan, required minimum distributions (RMD), employer mandated distributions from a qualified plan, or redemptions under a qualified domestic relations order (QDRO); (b) redemptions to pay for expenses related to terminal illness, extended hospital or nursing home care, or other serious medical conditions, including death; (c) redemptions of shares acquired through dividend or capital gains reinvestments; (d) loans from a qualified plan account, and (e) redemptions initiated by the Fund; and (3) a $10 service fee on each exchange after the first five exchanges in each calendar year.
The following ongoing costs are not included in the expenses shown in the table and, if applicable, would increase the expenses that you paid over the period: (1) a $12 low balance fee on accounts with balances of less than $250 as of September 30th of each calendar year and no investment activity (excluding reinvestment of dividends and/or capital gains) during the prior calendar year or the first nine months of the current calendar year. This fee does not apply to IRAs, qualified plan accounts, or Coverdell Education Savings Accounts; (2) a $15 annual custodial fee on IRAs, SEPs, SIMPLE IRAs, and Coverdell Education Savings Accounts; and (3) a $20 annual custodial fee on 403(b) accounts.
Please note that the expenses shown in the table are meant to highlight your ongoing costs only and do not reflect any transactional costs, such as sales charges (loads), redemption fees, or exchange fees. Therefore, the second line of the table is useful in comparing ongoing costs only, and will not help you determine the relative total costs of owning different funds. In addition, if these transactional costs were included, your costs would have been higher.
| Beginning Account Value 07/01/11 | Ending Account Value 12/31/11 | Expense Paid During Period 07/01/11 – 12/31/11 | |||||||||||||
| Balanced Fund Class A | |||||||||||||||
| Actual | $ | 1,000.00 | $ | 943.20 | $ | 15.33 | |||||||||
| Hypothetical (5% return before expense) | $ | 1,000.00 | $ | 1,009.43 | $ | 15.85 | |||||||||
| Balanced Fund Class C | |||||||||||||||
| Actual | $ | 1,000.00 | $ | 940.00 | $ | 18.73 | |||||||||
| Hypothetical (5% return before expense) | $ | 1,000.00 | $ | 1,005.90 | $ | 19.36 | |||||||||
4 Expenses are equal to the Fund's annualized expense ratio of 3.13% for Class A shares and 3.83% for Class C shares, multiplied by the average account value over the period, multiplied by 184/365 days to reflect the one-half year period.
19
Pacific Advisors
Large Cap Value Fund
Fund Objective: Long-term capital appreciation.
Investment Invests at least 80% of its assets in large cap companies that are, at the time of
Strategy: purchase, within the market cap range of companies in the S&P 500 Index1.
Investor Profile: Conservative equity. Growth-oriented with a long-term investment horizon.
| TOTAL RETURNS | EXPENSE RATIOS | ||||||||||||||||||
| For the year ended December 31, 2011 | For the fiscal year ended December 31, 2010 | ||||||||||||||||||
| Net Expense Ratio | Expense Ratio | ||||||||||||||||||
| Class A | 3.56 | % | Class A | 3.64 | % | 5.82 | % | ||||||||||||
| Class C | 2.71 | % | Class C | 4.37 | % | 6.57 | % | ||||||||||||
| S&P 500 Index | 2.11 | % | |||||||||||||||||
Please see the Financial Highlights in this report for expense ratios for the fiscal year ended December 31, 2011.
Performance quoted is past performance which does not guarantee future results. Current performance may be higher or lower than the performance quoted. Call (800) 989-6693 for performance current to the most recent month-end. The investment return and principal value of an investment will fluctuate so that an investor's shares, when redeemed, may be worth more or less than their original cost. Returns represent the change in value over the stated period assuming reinvestment of dividends and capital gains at net asset value. Returns and rankings do not take into account the maximum 5.75% sales charge on Class A shares or the 1% Contingent Deferred Sales Charge (CDSC) for Class C shares sold within one year of purchase. Returns would be lower if the applicable sales charge and CDSC were included. Returns do not take into account individual taxes which may reduce actual returns when shares are sold.
The Fund's investment adviser is waiving a portion of its management fees pursuant to an Expense Limitation Agreement. The waiver may be discontinued at any time with ninety days written notice in consultation with the Fund's board, but is expected to continue at current levels. Please see the Notes to Financial Statements in this report for details. Performance shown reflects the waiver, without which the results would have been lower.
Discussion with Portfolio Manager February 22, 2012
Samuel C. Coquillard
Please see the Chairman's Letter at the beginning of this Report for a detailed market and economic review
as well as the Manager's general market outlook.
| Pacific Advisors Large Cap Value Fund (A) | |||||||
| Lipper Large Cap Core Category Rank as of 12/31/11 based on total return | |||||||
| 1 Year | 160 out of 1,014 funds | ||||||
| 5 Year | 245 out of 796 funds | ||||||
| 10 Year | 186 out of 485 funds | ||||||
Fund Performance
For the year, Class A shares returned 3.56% and finished in the top 16% of the Lipper large cap core category. Additionally, the Fund outperformed its benchmark with lower volatility as evidenced by the Fund's average beta2 of 0.85 versus the S&P 500 Index. These results, given the extreme market volatility in 2011, highlight the effectiveness of the Fund's conservative investment approach.
1 The Standard & Poor's 500 Index is an unmanaged, market capitalization weighted index which measures the performance of the large cap segment of the U.S. equities market, covering approximately 75% of the U.S. equities market. The Index includes 500 leading companies in leading industries of the U.S. economy. Index returns assume the reinvestment of dividends, but, unlike the Fund's returns, do not reflect the effects of management fees or expenses. It is not possible to invest directly in the Index.
2 "Beta" measures volatility relative to the stock market or an alternative benchmark. A beta less than 1.0 indicates lower risk than the market or the benchmark and a beta greater than 1.0 indicates higher risk than the market or the benchmark.
20
The Fund focuses on leading blue-chip stocks with long-term capital appreciation potential and reduced price volatility. Holdings concentrate in 35 to 50 mega-cap companies with superior franchises, strong financial positions, track records of steady growth and attractive dividend yields. In the last half of the year, the Fund benefitted from notable gains in holdings including Wal-Mart, McDonald's, Procter & Gamble, IBM, Coca-Cola, and Microsoft.
Fund Strategy
With its emphasis on minimizing volatility, the Fund may grow at a slower rate in rising markets while providing better downside protection in falling markets. The market's extreme volatility in 2011 highlighted these tendencies. During the market rally in the first quarter, Fund performance lagged as investors moved away from defensive large cap stocks toward more aggressive investments. During this period, we took advantage of opportunities to add to select positions at discounted prices. When the market pulled back in the second quarter, investors sought the stability and strength of larger, well-known firms; this change in investor sentiment resulted in stronger performance for the Fund. The trend continued in the third quarter as concerns of a global economic slowdown and the escalating European debt crises heightened market volatility. We used periods of market volatility to increase our holdings in select positions including MasterCard, Cisco Systems and MetLife.
During the fourth quarter, as investors began to regain confidence in the economic recovery, the Fund benefitted from price appreciation in several sectors of the market. In particular, Consumer Staples, Industrials, Information Technology and Consumer Discretionary holdings rebounded significantly. Among the companies that contributed to performance in the last half of the year were:
• MasterCard, which benefitted from a strong, recognizable brand, its superior financial condition and consistent, robust cash flows. The stock appreciated nearly 24% in the last half of the year. As the second leading firm in worldwide credit and debit card transaction processing, MasterCard stands to profit as the global economy increasingly becomes more dependent on cashless transactions.
• Intel, which already dominates the core PC market, recently turned its considerable technical and financial talents towards becoming a more significant player in the tablet market. The firm's stock price rose over 9% in the second half of 2011; the company also pays an attractive dividend of 3.46%. And, its balance sheet boasts significant cash.
• Cisco Systems; its share price jumped almost 16% in the final six months of the year. Management has reduced costs and refocused the company's core data networking product line. We believe that, given the growth in its core business, its leadership position in the data networking and equipment industry, and its considerable cash reserves, the market has yet to fully recognize the value of this superior company.
Furthermore, many Fund holdings provide high dividend rates to support total return. Holdings with dividend rates over 3.5% include General Electric, Sysco, HJ Heinz Company and Clorox. Companies paying dividends in excess of 3% include Abbott Laboratories, Kraft, Johnson & Johnson, Microsoft, Northrop Grumman, and Procter & Gamble.
Looking Ahead
Leading large cap stocks continue to offer compelling prospects for long-term growth with lower volatility. As global market conditions change, multinational companies benefit from the flexibility to focus on the strongest areas of the global market. Additionally, larger companies often add value by strengthening their financial position, increasing dividends, or buying back stock.
We continue to see good long-term prospects for Fund holdings including:
• General Electric which has used its investments in the financial and industrial arenas to generate significant cash flow and fortify its balance sheet. The firm is nicely positioned to grow its business and enhance shareholder value by buying back shares and increasing its dividend.
21
Pacific Advisors
Large Cap Value Fund continued
• MetLife, a long-term position which we recently increased. The company, which currently operates under a bank charter, will complete stress tests mandated by the Federal Reserve in 2012. Later this year, the company expects to exit the banking business to solidify its position as a global leader in the insurance industry. We believe that MetLife, as it emerges from this federal oversight and refocuses on its core business, will be able to unlock more value for shareholders.
• Abbott Laboratories, a diversified health care company which markets pharmaceuticals, medical devices, diagnostic equipment and nutritional health care products. We added this position to the Fund in mid-2011. At that time, we identified the company, with its bevy of excellent brands and businesses, as undervalued relative to its peers. We believe that the company, with its diverse revenue streams, offers long-term growth potential in addition to its attractive dividend yield of over 3%
We expect market volatility will continue during 2012 in response to geopolitical and economic uncertainty. High quality large cap stocks continue to provide compelling long-term growth potential and attractive dividend yields. We anticipate that periods of volatility will continue to create good investment opportunities for the Fund.
22
Portfolio Holdings as of 12/31/11 (Based on Total Investments)
| Equities | 100.00 | % | |||||||||
| 1. | Consumer Staples | 23.97 | % | ||||||||
| 2. | Information Technology | 23.77 | % | ||||||||
| 3. | Industrials | 15.43 | % | ||||||||
| 4. | Consumer Discretionary | 14.79 | % | ||||||||
| 5. | Financials | 9.73 | % | ||||||||
| 6. | Health Care | 7.87 | % | ||||||||
| 7. | Energy | 4.44 | % | ||||||||

Change in Value of $10,000 Investment1
This chart compares the growth of a $10,000 investment in Class A shares of the Large Cap Value Fund for the period January 1, 2002 through December 31, 2011 with the same investment in the S&P 500 Index2.
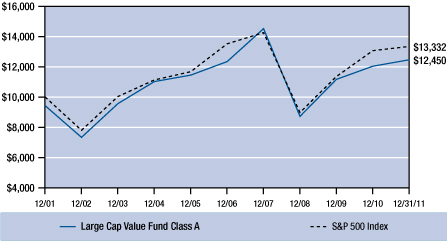
Average Annual Compounded Returns as of December 31, 2011
| Class A | Class C | ||||||||||
| One Year | – 2.41 | % | 1.71 | % | |||||||
| Five Year | – 0.98 | % | – 0.59 | % | |||||||
| Ten Year | 2.20 | % | 1.93 | % | |||||||
Past performance does not guarantee future results. Performance quoted represents past performance. Current performance may be higher or lower than the performance data quoted. Returns include reinvested dividends and capital gains. Returns for Class A shares reflect a maximum front-end sales charge of 5.75%; and returns for Class C shares reflect the deduction of a contingent deferred sales charge of 1% on shares sold within the first year of purchase. Returns do not take into account individual taxes which may reduce actual returns when shares are sold. The investment return and principal value of an investment will fluctuate so that an investor's shares, when redeemed, may be worth more or less than their original cost. Call (800) 989-6693 for the most recent month-end performance.
1 Fund results are shown for Class A shares and reflect deduction of the maximum front-end sales charge of 5.75% on the $10,000 investment for a net amount invested of $9,425. At the end of the same period, a $10,000 investment in Class C shares would have been valued at $8,371, and no contingent deferred sales charges would apply. Performance of the share classes will vary based on the difference in charges and expenses. The inception date for Class A shares and Class C shares is 05/01/99. It is not possible to invest directly in either Index. Index results assume reinvestment of dividends, but, unlike the Fund's results, do not reflect sales charges, fees or expenses.
2 The Standard & Poor's 500 Index is an unmanaged, market capitalization weighted index which measures the performance of the large cap segment of the U.S. equities market, covering approximately 75% of the U.S. equities market. The Index includes 500 leading companies in leading industries of the U.S. economy.
23
Pacific Advisors
Large Cap Value Fund continued
Expense Examples
As a shareholder of the Fund you incur two types of costs: (1) transaction costs, including sales charges (loads) on purchase payments, reinvested dividends, or other distributions; redemption fees; and exchange fees; and (2) ongoing costs, including management fees; distribution (12b-1) fees; and other Fund expenses. This Example is intended to help you understand your ongoing costs (in dollars) of investing in the Fund and to compare these costs with the ongoing costs of investing in other mutual funds.
The Example is based on an investment of $1,000 invested at the beginning of the period and held for the entire period from July 1, 2011 through December 31, 2011.
Actual Expenses
The first line of the table below provides information about actual account values and actual expenses. You may use the information in this line, together with the amount you invested, to estimate the expenses that you paid over the period. Simply divide your account value by $1,000 (for example, an $8,600 account value divided by $1,000 = 8.6), then multiply the result by the number in the first line under the heading entitled "Expenses Paid During the Period" to estimate the expenses you paid on your account during the period.
The following transaction costs are not included in the expenses shown in the table and, if applicable, would increase the expenses that you paid over the period: (1) a front-end sales charge (load) of 5.75% on Class A shares; (2) a 2% redemption fee if you sell or exchange shares within 180 days of purchase, with certain exceptions. The redemption fee does not apply to: (a) redemptions under an automatic withdrawal program or periodic asset reallocation plan, required minimum distributions (RMD), employer mandated distributions from a qualified plan, or redemptions under a qualified domestic relations order (QDRO); (b) redemptions to pay for expenses related to terminal illness, extended hospital or nursing home care, or other serious medical conditions, including death; (c) redemptions of shares acquired through dividend or capital gains reinvestments; (d) loans from a qualified plan account, and (e) redemptions initiated by the Fund; and (3) a $10 service fee on each exchange after the first five exchanges in each calendar year.
The following ongoing costs are not included in the expenses shown in the table and, if applicable, would increase the expenses that you paid over the period: (1) a $12 low balance fee on accounts with balances of less than $250 as of September 30th of each calendar year and no investment activity (excluding reinvestment of dividends and/or capital gains) during the prior calendar year or the first nine months of the current calendar year. This fee does not apply to IRAs, qualified plan accounts, or Coverdell Education Savings Accounts; (2) a $15 annual custodial fee on IRAs, SEPs, SIMPLE IRAs, and Coverdell Education Savings Accounts; and (3) a $20 annual custodial fee on 403(b) accounts.
Hypothetical Example for Comparison Purposes
The second line of the table below provides information about hypothetical account values and hypothetical expenses based on the Fund's actual expense ratio and an assumed rate of return of 5% per year before expenses, which in not the Fund's actual return. The hypothetical account values and expenses may not be used to estimate the actual ending account balance or expenses you paid for the period. You may use this information to compare the ongoing costs of investing in the Fund and other funds. To do so, compare this 5% hypothetical example with the 5% hypothetical examples that appear in the shareholder reports of the other funds.
The following transaction costs are not included in the expenses shown in the table and, if applicable, would increase the expenses that you paid over the period: (1) a front-end sales charge (load) of 5.75% on Class A shares; (2) a 2% redemption fee if you sell or exchange shares within 180 days of purchase, with certain exceptions. The redemption fee does not apply to: (a) redemptions under an automatic withdrawal program or periodic asset reallocation plan, required minimum distributions (RMD), employer mandated distributions from a qualified plan, or redemptions under a qualified domestic relations order (QDRO); (b) redemptions to pay for expenses related to terminal illness, extended hospital or nursing home care, or other serious medical conditions, including death; (c) redemptions of shares acquired through dividend or capital gains reinvestments; (d) loans from a qualified plan account, and (e) redemptions initiated by the Fund; and (3) a $10 service fee on each exchange after the first five exchanges in each calendar year.
The following ongoing costs are not included in the expenses shown in the table and, if applicable, would increase the expenses that you paid over the period: (1) a $12 low balance fee on accounts with balances of less than $250 as of September 30th of each calendar year and no investment activity (excluding reinvestment of dividends and/or capital gains) during the prior calendar year or the first nine months of the current calendar year. This fee does not apply to IRAs, qualified plan accounts, or Coverdell Education Savings Accounts; (2) a $15 annual custodial fee on IRAs, SEPs, SIMPLE IRAs, and Coverdell Education Savings Accounts; and (3) a $20 annual custodial fee on 403(b) accounts.
Please note that the expenses shown in the table are meant to highlight your ongoing costs only and do not reflect any transactional costs, such as sales charges (loads), redemption fees, or exchange fees. Therefore, the second line of the table is useful in comparing ongoing costs only, and will not help you determine the relative total costs of owning different funds. In addition, if these transactional costs were included, your costs would have been higher.
| Beginning Account Value 07/01/11 | Ending Account Value 12/31/11 | Expense Paid During Period 07/01/11 – 12/31/11 | |||||||||||||
| Large Cap Value Fund Class A | |||||||||||||||
| Actual | $ | 1,000.00 | $ | 1,003.20 | $ | 15.40 | |||||||||
| Hypothetical (5% return before expense) | $ | 1,000.00 | $ | 1,009.83 | $ | 15.45 | |||||||||
| Large Cap Value Fund Class C | |||||||||||||||
| Actual | $ | 1,000.00 | $ | 998.80 | $ | 19.60 | |||||||||
| Hypothetical (5% return before expense) | $ | 1,000.00 | $ | 1,005.60 | $ | 19.66 | |||||||||
5 Expenses are equal to the Fund's annualized expense ratio, net of expense waivers, of 3.05% for Class A shares and 3.89% for Class C shares, multiplied by the average account value over the period, multiplied by 184/365 days to reflect the one-half year period.
24
Pacific Advisors
Mid Cap Value Fund
Fund Objective: Long-term capital appreciation.
Investment Invests at least 80% of its assets in mid-cap companies that are, at the time of
Strategy: purchase, within the market cap range of companies in the Russell Midcap Index®1.
Investor Profile: Moderately aggressive. Growth-oriented with a long-term investment horizon.
| TOTAL RETURNS | EXPENSE RATIOS | ||||||||||||||||||
| For the year ended December 31, 2011 | For the fiscal year ended December 31, 2010 | ||||||||||||||||||
| Class A | – 5.96 | % | Class A | 4.35 | % | ||||||||||||||
| Class C | – 6.72 | % | Class C | 4.88 | % | ||||||||||||||
| Russell Midcap Index® | – 1.55 | % | |||||||||||||||||
Please see the Financial Highlights in this report for expense ratios for the fiscal year ended December 31, 2011.
Performance quoted is past performance which does not guarantee future results. Current performance may be higher or lower than the performance quoted. Call (800) 989-6693 for performance current to the most recent month-end. The investment return and principal value of an investment will fluctuate so that an investor's shares, when redeemed, may be worth more or less than their original cost. Returns represent the change in value over the stated period assuming reinvestment of dividends and capital gains at net asset value. Returns do not take into account the maximum 5.75% sales charge on Class A shares or the 1% Contingent Deferred Sales Charge (CDSC) for Class C shares sold within one year of purchase. Returns would be lower if the applicable sales charge and CDSC were included. Returns do not take into account individual taxes which may reduce actual returns when shares are sold.
Discussion with Portfolio Manager February 22, 2012
George A. Henning
Please see the Chairman's Letter at the beginning of this Report for a detailed market and economic
review as well as the Manager's general market outlook.
Fund Performance
The Fund focuses on leading businesses with stable operations and strong growth prospects. The portfolio is actively positioned to benefit from an ongoing domestic recovery with more than 80% of holdings concentrated in the Industrials, Energy, and Consumer Discretionary sectors. Following a strong first half of the year, global turmoil arising from events in Europe negatively impacted the Fund. Energy and Consumer Discretionary stocks were particularly hard-hit as investors withdrew from economically sensitive companies. Class A shares declined – 5.96% in 2011, compared to – 1.55% for the Russell Midcap Index®.
Over the course of the year, cyclical sectors experienced heightened volatility as geopolitical events undermined investor confidence. Nevertheless, economic data, including gains in manufacturing activity, retail sales, automotive sales, and employment, continue to point to improving conditions in the U.S. economy. Furthermore, banks report accelerating consumer and business lending activity. Taken together, and notwithstanding the market turmoil, these figures suggest a promising outlook for U.S. stocks, especially those at the forefront of a recovery. The Fund's performance in the fourth quarter underscores this belief: advantageous positioning in recovery-oriented sectors led to significant outperformance (20.62% for Class A shares) relative to the benchmark (12.31%).
Industrials holdings enjoyed a strong year. Several Fund companies experienced significant gains despite increased volatility in the sector. Shares of Kansas City Southern rose as traffic from its operations
1 The Russell Midcap Index® is an unmanaged, weighted measure of the 800 smallest companies within the Russell 1000 Index® based on a combination of their market cap and current index membership. Index returns assume the reinvestment of dividends, but, unlike the Fund's returns, do not reflect management fees or expenses. It is not possible to invest directly in the Index.
25
Pacific Advisors
Mid Cap Value Fund continued
in Mexico increased. The railroad company operates the largest cross-border gateway between the U.S. and Mexico. The business outlook for Copart, a reseller of used and salvaged vehicles, improved following the company's recent partnership with a major U.S. insurer and growth in its European operations. And, strong demand from emerging nations, such as China, Brazil and India, benefitted mining equipment manufacturer Joy Global. Acknowledging the bright prospects in this industry, Caterpillar earlier in the year purchased the company's main competitor, Bucyrus, a former Fund holding, at a significant market premium.
Performance among the Fund's Energy holdings was mixed. Lufkin Industries gained on strong demand for its oilfield pumping equipment. Tidewater, an offshore supply vessel operator, declined; yet, management sees signs of a recovery in international exploration activity that should accrue outsized demand for the company's comparatively young fleet of advanced vessels. Chesapeake Energy, which is largely credited for launching the domestic shale boom, suffered as natural gas prices declined. And, shares of Ion Geophysical, a manufacturer of seismic data equipment, fell due to delays in its joint venture partnership in China. We expect that rising global demand will drive investment for Energy holdings. Consequently, and, despite near-term pressures, we believe the long-term prospects for these companies remain bright.
Performance of the Fund's Consumer Discretionary holdings lagged; however, individual company developments continue to provide promising outlooks for these businesses. PVH, which owns the Calvin Klein and Tommy Hilfiger clothing brands, gained as sales continued to outpace the industry. Similarly, Gamestop rose modestly as the company increased sales by focusing relentlessly on its core customer, the avid gamer. And, auto retailer Penske Automotive rose as industry sales continued to accelerate. Despite these trends, not all auto-related companies benefitted; shares of Lear, an auto parts manufacturer, fell primarily as a result of supply constraints arising from flooding in Thailand.
Fund Strategy
Mid-cap companies offer unique advantages for long-term investors: they combine the economies of scale of large corporations with the strategic flexibility of smaller operations. Our fundamental, bottom-up investment process identifies leading companies with strong long-term growth prospects. The Fund's low turnover rates (one-year rate of 12%; five-year average annual rate of 23%2) reflect its long-term approach.
The Fund is positioned towards economically sensitive areas likely to benefit from the ongoing domestic economic recovery. Rapid expansion in emerging economies also points to favorable long-term growth prospects, particularly for the Energy and Industrials sectors. Stocks in these sectors, however, tend to experience greater volatility as evidenced by the Fund's one-year beta3 of 1.34 compared to the benchmark.
We used elevated market volatility to opportunistically add to existing positions. These included railroad operator Genesee & Wyoming; its operations in Australia are poised for strong growth as the country exports raw materials to China. We also added to Lear which enjoys a strong market presence in the U.S., Europe, and Asia; the company should benefit from rising global auto sales. Similarly, we increased the Fund's position in Navistar International, a truck manufacturer with dealerships around the world. Emerging markets represent a significant growth opportunity for the company; rising fuel efficiency and emissions standards should support sales in developed nations.
During the second half of the year, we exited the Fund's positions in Dryships and K-Swiss. Dryships, an ocean transport company continues to face challenges in an industry with excess capacity. K-Swiss, an athletic and casual footwear company, has faced headwinds in its product realignment from more difficult consumer spending trends. We determined that other opportunities, including those mentioned above, offered more attractive near- and long-term opportunities.
2 Fund portfolio turnover rate: 12% in 2011; 18% in 2010; 21% in 2009; 12% in 2008; and 53% in 2007.
3 "Beta" measures volatility relative to the stock market or an alternative benchmark. A beta less than 1.0 indicates lower risk than the market or the benchmark and a beta greater than 1.0 indicates higher risk than the market or the benchmark.
26
Looking Ahead
Recent economic data point to signs of a strengthening domestic economy. Employment trends appear to be improving and manufacturing activity continues to benefit from recovering consumer demand as well as rising exports. Housing remains pressured; however, signs of a bottom are emerging. Meanwhile, the Federal Reserve's commitment to ultra-low interest rates through 2014 should foster business and consumer spending. The Fund, with its active positioning towards economically sensitive areas, stands to benefit from these trends. Sectors such as Industrials, Energy, and Consumer Discretionary, tend to perform well during periods of economic recovery and improving investor confidence.
More importantly, the outlook for individual Fund companies remains bright. Engineering and construction firm Chicago Bridge & Iron is enjoying strong demand for energy infrastructure projects. The rapid expansion of shale gas production wells has been a boon for its business. Chesapeake Energy pioneered the development of these unconventional resources and owns a dominant position in this important market. More recently, the company is using the proceeds from joint venture sales to self-finance its rapid expansion. And, exploration firms increasingly rely on Ion Geophysical to provide detailed 3-D imaging of underground formations. The company is benefitting from an emphasis on improving the quality and efficiency of shale drilling programs.
We are encouraged by signs of improvement in the domestic economy, as well as the continued development of emerging countries. China, Brazil, and India are likely to drive the global economy for many years to come. Europe will remain a headwind in the near-to-medium-term. However, important progress has been made in the region and we expect that, in time, European leaders will resolve these challenges. Market volatility is likely to remain elevated in 2012. Market prices may fluctuate over short periods of time; we remain confident that they will, over the long-term, reflect the true value of the businesses in the portfolio.
27
Pacific Advisors
Mid Cap Value Fund continued
Portfolio Holdings as of 12/31/11 (Based on Total Investments)
| Equities | 100.00 | % | |||||||||
| 1. | Industrials | 41.92 | % | ||||||||
| 2. | Energy | 27.04 | % | ||||||||
| 3. | Consumer Discretionary | 17.88 | % | ||||||||
| 4. | Materials | 5.80 | % | ||||||||
| 5. | Financials | 3.98 | % | ||||||||
| 6. | Consumer Staples | 3.38 | % | ||||||||
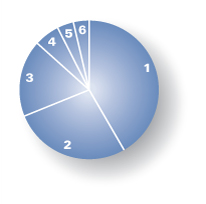
Change in Value of $10,000 Investment1
This chart compares the growth of a $10,000 investment in Class A shares of the Mid Cap Value Fund for the period April 1, 2002 through December 31, 2011 with the same investment in the Russell Midcap Index®2.
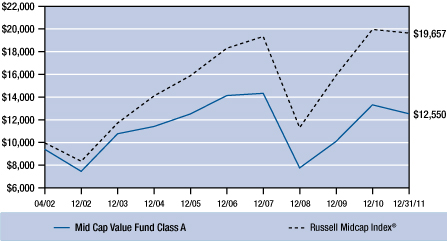
Average Annual Compounded Returns as of December 31, 2011
| Class A | Class C | ||||||||||
| One Year | – 11.40 | % | – 7.65 | % | |||||||
| Five Year | – 3.54 | % | – 3.23 | % | |||||||
| Since Inception | 2.35 | % | 2.16 | % | |||||||
Past performance does not guarantee future results. Performance quoted represents past performance. Current performance may be higher or lower than the performance data quoted. Returns include reinvested dividends and capital gains. Returns for Class A shares reflect a maximum front-end sales charge of 5.75%; and returns for Class C shares reflect the deduction of a contingent deferred sales charge of 1% on shares sold within the first year of purchase. Returns do not take into account individual taxes which may reduce actual returns when shares are sold. The investment return and principal value of an investment will fluctuate so that an investor's shares, when redeemed, may be worth more or less than their original cost. Call (800) 989-6693 for the most recent month-end performance.
1 Fund results are shown for Class A shares and reflect deduction of the maximum front-end sales charge of 5.75% on the $10,000 investment for a net amount invested of $9,425. At the end of the same period, a $10,000 investment in Class C shares would have been valued at $13,211, and no contingent deferred sales charges would apply. Performance of the share classes will vary based on the difference in charges and expenses. The inception date for Class A shares and Class C shares is 04/01/02. It is not possible to invest directly in either Index. Index results assume reinvestment of dividends, but, unlike the Fund's results, do not reflect sales charges, fees or expenses.
2 The Russell Mid Cap Index® is an unmanaged, weighted measure of the 800 smallest companies within the Russell 1000 Index® based on a combination of their market cap and current index membership.
28
Expense Examples
As a shareholder of the Fund you incur two types of costs: (1) transaction costs, including sales charges (loads) on purchase payments, reinvested dividends, or other distributions; redemption fees; and exchange fees; and (2) ongoing costs, including management fees; distribution (12b-1) fees; and other Fund expenses. This Example is intended to help you understand your ongoing costs (in dollars) of investing in the Fund and to compare these costs with the ongoing costs of investing in other mutual funds.
The Example is based on an investment of $1,000 invested at the beginning of the period and held for the entire period from July 1, 2011 through December 31, 2011.
Actual Expenses
The first line of the table below provides information about actual account values and actual expenses. You may use the information in this line, together with the amount you invested, to estimate the expenses that you paid over the period. Simply divide your account value by $1,000 (for example, an $8,600 account value divided by $1,000 = 8.6), then multiply the result by the number in the first line under the heading entitled "Expenses Paid During the Period" to estimate the expenses you paid on your account during the period.
The following transaction costs are not included in the expenses shown in the table and, if applicable, would increase the expenses that you paid over the period: (1) a front-end sales charge (load) of 5.75% on Class A shares; (2) a 2% redemption fee if you sell or exchange shares within 180 days of purchase, with certain exceptions. The redemption fee does not apply to: (a) redemptions under an automatic withdrawal program or periodic asset reallocation plan, required minimum distributions (RMD), employer mandated distributions from a qualified plan, or redemptions under a qualified domestic relations order (QDRO); (b) redemptions to pay for expenses related to terminal illness, extended hospital or nursing home care, or other serious medical conditions, including death; (c) redemptions of shares acquired through dividend or capital gains reinvestments; (d) loans from a qualified plan account, and (e) redemptions initiated by the Fund; and (3) a $10 service fee on each exchange after the first five exchanges in each calendar year.
The following ongoing costs are not included in the expenses shown in the table and, if applicable, would increase the expenses that you paid over the period: (1) a $12 low balance fee on accounts with balances of less than $250 as of September 30th of each calendar year and no investment activity (excluding reinvestment of dividends and/or capital gains) during the prior calendar year or the first nine months of the current calendar year. This fee does not apply to IRAs, qualified plan accounts, or Coverdell Education Savings Accounts; (2) a $15 annual custodial fee on IRAs, SEPs, SIMPLE IRAs, and Coverdell Education Savings Accounts; and (3) a $20 annual custodial fee on 403(b) accounts.
Hypothetical Example for Comparison Purposes
The second line of the table below provides information about hypothetical account values and hypothetical expenses based on the Fund's actual expense ratio and an assumed rate of return of 5% per year before expenses, which in not the Fund's actual return. The hypothetical account values and expenses may not be used to estimate the actual ending account balance or expenses you paid for the period. You may use this information to compare the ongoing costs of investing in the Fund and other funds. To do so, compare this 5% hypothetical example with the 5% hypothetical examples that appear in the shareholder reports of the other funds.
The following transaction costs are not included in the expenses shown in the table and, if applicable, would increase the expenses that you paid over the period: (1) a front-end sales charge (load) of 5.75% on Class A shares; (2) a 2% redemption fee if you sell or exchange shares within 180 days of purchase, with certain exceptions. The redemption fee does not apply to: (a) redemptions under an automatic withdrawal program or periodic asset reallocation plan, required minimum distributions (RMD), employer mandated distributions from a qualified plan, or redemptions under a qualified domestic relations order (QDRO); (b) redemptions to pay for expenses related to terminal illness, extended hospital or nursing home care, or other serious medical conditions, including death; (c) redemptions of shares acquired through dividend or capital gains reinvestments; (d) loans from a qualified plan account, and (e) redemptions initiated by the Fund; and (3) a $10 service fee on each exchange after the first five exchanges in each calendar year.
The following ongoing costs are not included in the expenses shown in the table and, if applicable, would increase the expenses that you paid over the period: (1) a $12 low balance fee on accounts with balances of less than $250 as of September 30th of each calendar year and no investment activity (excluding reinvestment of dividends and/or capital gains) during the prior calendar year or the first nine months of the current calendar year. This fee does not apply to IRAs, qualified plan accounts, or Coverdell Education Savings Accounts; (2) a $15 annual custodial fee on IRAs, SEPs, SIMPLE IRAs, and Coverdell Education Savings Accounts; and (3) a $20 annual custodial fee on 403(b) accounts.
Please note that the expenses shown in the table are meant to highlight your ongoing costs only and do not reflect any transactional costs, such as sales charges (loads), redemption fees, or exchange fees. Therefore, the second line of the table is useful in comparing ongoing costs only, and will not help you determine the relative total costs of owning different funds. In addition, if these transactional costs were included, your costs would have been higher.
| Beginning Account Value 07/01/11 | Ending Account Value 12/31/11 | Expense Paid During Period 07/01/11 – 12/31/11 | |||||||||||||
| Mid Cap Value Fund Class A | |||||||||||||||
| Actual | $ | 1,000.00 | $ | 851.30 | $ | 19.41 | |||||||||
| Hypothetical (5% return before expense) | $ | 1,000.00 | $ | 1,004.23 | $ | 21.02 | |||||||||
| Mid Cap Value Fund Class C | |||||||||||||||
| Actual | $ | 1,000.00 | $ | 846.70 | $ | 22.85 | |||||||||
| Hypothetical (5% return before expense) | $ | 1,000.00 | $ | 1,000.45 | $ | 24.76 | |||||||||
3 Expenses are equal to the Fund's annualized expense ratio of 4.16% for Class A shares and 4.91% for Class C shares, multiplied by the average account value over the period, multiplied by 184/365 days to reflect the one-half year period.
29
Pacific Advisors
Small Cap Value Fund
Fund Objective: Capital appreciation through investment in small cap companies.
Investment Invests at least 80% of its assets in small cap companies (i.e., with market caps of
Strategy: up to $2 billion at the time of purchase). Generally invests a significant proportion of its assets in companies with market caps under $500 million at the time of purchase, which are often referred to as "micro-cap stocks."
Investor Profile: Aggressive. Opportunity-oriented with a long-term investment horizon.
| TOTAL RETURNS | EXPENSE RATIOS | ||||||||||||||||||
| For the year ended December 31, 2011 | For the fiscal year ended December 31, 2010 | ||||||||||||||||||
| Class A | 8.65 | % | Class A | 2.66 | % | ||||||||||||||
| Class C | 7.89 | % | Class C | 3.40 | % | ||||||||||||||
| Class I | 8.90 | % | Class I | 2.50 | % | ||||||||||||||
| Russell 2000 Index®1 | – 4.18 | % | |||||||||||||||||
Please see the Financial Highlights in this report for expense ratios for the fiscal year ended December 31, 2011.
Performance quoted is past performance which does not guarantee future results. Current performance may be higher or lower than the performance quoted. Call (800) 989-6693 for performance current to the most recent month-end. The investment return and principal value of an investment will fluctuate so that an investor's shares, when redeemed, may be worth more or less than their original cost. Returns represent the change in value over the stated period assuming reinvestment of dividends and capital gains at net asset value. Returns and rankings do not take into account the maximum 5.75% sales charge on Class A shares or the 1% Contingent Deferred Sales Charge (CDSC) for Class C shares sold within one year of purchase. Returns would be lower if the applicable sales charge and CDSC were included. Returns do not take into account individual taxes which may reduce actual returns when shares are sold.
Discussion with Portfolio Manager February 22, 2012
George A. Henning
Please see the Chairman's Letter at the beginning of this Report for a detailed market and economic review
as well as the Manager's general market outlook.
| Pacific Advisors Small Cap Value Fund (A) | |||||||
| Lipper Small Cap Core Category Rank as of 12/31/11 based on total return | |||||||
| 1 Year | 1 out of 692 funds | ||||||
| 3 Year | 35 out of 616 funds | ||||||
| 5 Year | 186 out of 488 funds | ||||||
| 10 Year | 3 out of 295 funds | ||||||
Fund Performance
The Fund finished 2011 as the #1 small cap core fund. Class A shares outpaced the benchmark by 12.83%, driven primarily by strong stock selection. Reflecting its long-term investment approach, the Fund delivered this return with minimal turnover; its 9% one-year turnover rate is consistent with its five-year average annual turnover rate of 15%2. The Fund's ability to identify high quality businesses with attractive long-term prospects drove outperformance for the year. In 2011, leading companies continued to execute growth strategies that were initiated during the economic downturn. These firms successfully increased
1 The Russell 2000 Index® is an unmanaged, market-weighted measure of the 2,000 smallest companies of the Russell 3000 Index® which represents approximately 98% of the investable U.S. equity market. Index returns assume the reinvestment of dividends, but, unlike the Fund's returns, do not reflect management fees or expenses. It is not possible to invest directly in the Index.
2 Fund portfolio turnover rate: 9% in 2011; 9% in 2010; 17% in 2009; 23% in 2008; and 15% in 2007.
30
operations through expansions and acquisitions. Certain sectors, such as Energy, also enjoyed broad strength as the domestic economy recovered and emerging economies strengthened.
The Fund's performance throughout 2011 is instructive. Notably, when investors held a favorable outlook on the U.S. economy, the Fund generally enjoyed strong gains. In contrast, when markets underwent significant upheaval on fears related to the euro zone, Fund holdings experienced significant selling pressure. Despite the volatility, companies with identifiable growth prospects were more readily rewarded with rising stock prices. We believe these results emphasize the overall quality of companies in the Fund while acknowledging the sensitivity inherent in cyclical sectors, such as Consumer Discretionary, Energy, and Industrials. During 2011, these sectors accounted for more than 70% of Fund assets.
Several Consumer Discretionary holdings contributed to the Fund's strong results. Shares of Conn's, a regional electronics and appliances retailer, experienced an impressive rebound following a lackluster 2010. A revitalization effort by new management stemmed losses, turned around credit operations, and re-started a store growth initiative. Meanwhile, continued gains in automotive sales benefitted auto retailer Sonic Automotive. Despite concerns over consumer spending, car sales rebounded to nearly 14 million units by the end of the year; annual sales reached 17 million units prior to the recession. Yet, the average age of vehicles on the road remains at 10.5 years, a full two years older than the historical average. We believe both companies have significant room for further improvement.
Energy holdings also enjoyed impressive returns. Shares of equipment leasing company Mitcham Industries rose on increased demand for its seismic data tools. Business momentum continues to build for the company as global exploration activity expands. Parker Drilling benefitted from similar trends as international drilling activity increased throughout the year. The boom in domestic shale drilling led to supply constraints which greatly contributed to profits at the company's rental tools operation.
The Fund saw further strength in its Industrials holdings. Kirby gained from recovery in its core inland marine transportation business and several acquisitions. DXP Enterprises undertook a similar acquisition strategy to expand its business. The industrial parts distributor has targeted businesses that increase its geographic presence and broaden its product and service capabilities. As the domestic economy recovers, we believe these businesses are poised for continued strength.
Fund Strategy
The Fund utilizes a bottom-up investment process of identifying companies with specific opportunities for long-term capital appreciation. During the period, holdings remained concentrated in cyclical sectors which tend to experience greater volatility. The Fund's focus on smaller cap stocks also contributed to its above-average volatility during the period; the Fund's one-year beta3 against the S&P 500 Index was 1.58. When compared against the Russell 2000 Index® of small companies, however, the Fund's beta was a more modest 1.16.
Our active buy-and-hold strategy utilizes periods of elevated volatility to opportunistically invest for the long-term. The market selloff during the third quarter presented select buying opportunities. These included investments in trucking companies Rush Enterprises and Vitran. Rush owns and operates a nationwide network of truck dealerships while Vitran provides regional trucking services in the U.S. and Canada. Due to its economic sensitivity, the market selloff in the trucking industry was particularly steep. Investors grew concerned that events in Europe might spillover and cause the domestic economy to relapse into recession. However, trucking activity logged steady gains throughout the year. Moreover, Rush continued to grow by acquiring several dealerships. Meanwhile, Vitran won new contracts for its rapidly growing distribution management services. Both companies rebounded strongly in the fourth quarter.
Market momentum in the early part of the third quarter and during the fourth quarter provided opportunities to capitalize on gains in certain positions, including Conn's and Mitcham Industries. The impressive performance of these stocks demonstrates that the market will reward companies with
3 "Beta" measures volatility relative to the stock market or an alternative benchmark. A beta less than 1.0 indicates lower risk than the market or the benchmark and a beta greater than 1.0 indicates higher risk than the market or the benchmark.
31
Pacific Advisors
Small Cap Value Fund continued
identifiable growth prospects and a track record of success. We remain encouraged by developing trends at both businesses. Yet, as part of our active portfolio management process, we modestly reduced the Fund's positions in these companies and rotated assets into other attractive investments.
During the second half of 2011, the Fund exited its position in Orion Marine Group. The current stalemate in Congress combined with state and local budget constraints have resulted in fewer marine construction projects. Although we recognize Orion's long-term growth potential, we believed these projects were unlikely to materialize near-term. Moreover, we determined that other investments provided better growth prospects.
Looking Ahead
Our outlook for individual companies in the Fund remains strong. For many portfolio holdings, 2011 represented a year of significant investment in growth initiatives. These included acquisitions of competing or complementary businesses, new product launches and service initiatives, and expansions into untapped markets and geographic areas. Bravo Brio Restaurant Group continues to increase the presence of its Italian-themed restaurants across the country. EZCorp is targeting expansion in new domestic and international markets for its pawn and payday lending services and the start-up of its e-Commerce and Card division. And, the launch of Premiere Global Services' iMeet conferencing product has led to spillover benefits as customers increasingly see the company as a technology leader.
Furthermore, we believe the Energy sector is in the early stages of a multi-year expansion. The rapid growth of emerging economies, including China, India and Brazil, is straining the global energy supply. Various technologies, including hydraulic fracturing and seismography tools, have emerged in response to this demand. Exploration companies are also venturing further out to sea where large deposits of oil and gas lie miles below the ocean floor. The resumption of permitting and drilling activity in the Gulf of Mexico acknowledges this important resource. Hornbeck Offshore Services, which owns and operates an international fleet of offshore supply vessels, stands to benefit from this trend. Meanwhile, Canada's oil reserves are now second only to Saudi Arabia, thanks to the prolific Alberta oil sands. Ongoing development of these fields presents a sizable opportunity for North American Energy Partners, a leading mining and construction contractor in the region.
We believe that, with continued improvements in the domestic economy and strong growth in emerging markets, 2012 has the potential to be a momentous year for Fund companies. Geopolitical challenges will again impact both the economy and the stock market. Volatility will also continue. Yet, short-term price swings often create important opportunities for long-term investors. Moreover, we believe the small cap arena continues to provide many compelling investment opportunities for long-term investors.
32
Portfolio Holdings as of 12/31/11 (Based on Total Investments)
| Equities | 100.00 | % | |||||||||
| 1. | Industrials | 35.48 | % | ||||||||
| 2. | Energy | 21.56 | % | ||||||||
| 3. | Consumer Discretionary | 19.41 | % | ||||||||
| 4. | Financials | 12.00 | % | ||||||||
| 5. | Telecommunication Services | 4.00 | % | ||||||||
| 6. | Consumer Staples | 3.31 | % | ||||||||
| 7. | Health Care | 2.58 | % | ||||||||
| 8. | Materials | 1.66 | % | ||||||||
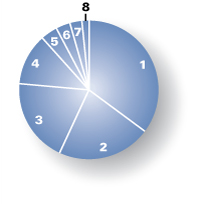
Change in Value of $10,000 Investment1
This chart compares the growth of a $10,000 investment in Class A shares of the Small Cap Value Fund for the period January 1, 2002 through December 31, 2011 with the same investment in the Russell 2000 Index®2.
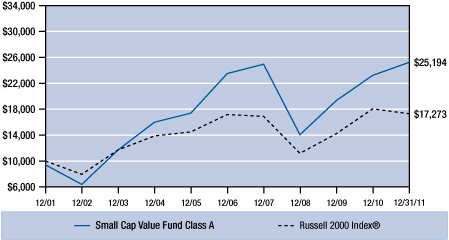
Average Annual Compounded Returns as of December 31, 2011
| Class A | Class C | Class I | |||||||||||||
| One Year | 2.41 | % | 6.89 | % | 8.90 | % | |||||||||
| Five Year | 0.24 | % | 0.62 | % | 2.46 | % | |||||||||
| Ten Year | 9.68 | % | 9.37 | % | NA | ||||||||||
| Since Inception | 9.22 | % | 5.08 | % | 3.68 | % | |||||||||
Past performance does not guarantee future results. Performance quoted represents past performance. Current performance may be higher or lower than the performance data quoted. Returns include reinvested dividends and capital gains. Returns for Class A shares reflect a maximum front-end sales charge of 5.75%; and returns for Class C shares reflect the deduction of a contingent deferred sales charge of 1% on shares sold within the first year of purchase. Returns do not take into account individual taxes which may reduce actual returns when shares are sold. Rankings do not take sales loads into account. Small cap stocks typically have fewer financial resources and may carry higher risks and experience greater volatility than large cap stocks. The investment return and principal value of an investment will fluctuate so that an investor's shares, when redeemed, may be worth more or less than their original cost. Call (800) 989-6693 for the most recent month-end performance.
1 Fund results are shown for Class A shares and reflect deduction of the maximum front-end sales charge of 5.75% on the $10,000 investment for a net amount invested of $9,425. At the end of the same period, a $10,000 investment in Class C shares would have been valued at $26,762, and no contingent deferred sales charges would apply. The inception date is 02/08/93 for Class A shares; 04/01/98 for Class C shares; and 10/09/06 for Class I shares. From inception through December 31, 2010, a $10,000 investment in Class I shares would have been valued at $11,070, and no contingent deferred sales charges would apply. Performance of the share classes will vary based on the difference in charges and expenses. It is not possible to invest directly in the Index. Index results assume reinvestment of dividends, but, unlike the Fund's results, do not reflect sales charges, commissions or expenses.
2 The Russell 2000 Index® is an unmanaged, weighted measure of the 2,000 smallest companies within the Russell 3000 Index®.
33
Pacific Advisors
Small Cap Value Fund continued
Expense Examples
As a shareholder of the Fund you incur two types of costs: (1) transaction costs, including sales charges (loads) on purchase payments, reinvested dividends, or other distributions; redemption fees; and exchange fees; and (2) ongoing costs, including management fees; distribution (12b-1) fees; and other Fund expenses. This Example is intended to help you understand your ongoing costs (in dollars) of investing in the Fund and to compare these costs with the ongoing costs of investing in other mutual funds.
The Example is based on an investment of $1,000 invested at the beginning of the period and held for the entire period from July 1, 2011 through December 31, 2011.
Actual Expenses
The first line of the table below provides information about actual account values and actual expenses. You may use the information in this line, together with the amount you invested, to estimate the expenses that you paid over the period. Simply divide your account value by $1,000 (for example, an $8,600 account value divided by $1,000 = 8.6), then multiply the result by the number in the first line under the heading entitled "Expenses Paid During the Period" to estimate the expenses you paid on your account during the period.
The following transaction costs are not included in the expenses shown in the table and, if applicable, would increase the expenses that you paid over the period: (1) a front-end sales charge (load) of 5.75% on Class A shares; (2) a 2% redemption fee if you sell or exchange shares within 180 days of purchase, with certain exceptions. The redemption fee does not apply to: (a) redemptions under an automatic withdrawal program or periodic asset reallocation plan, required minimum distributions (RMD), employer mandated distributions from a qualified plan, or redemptions under a qualified domestic relations order (QDRO); (b) redemptions to pay for expenses related to terminal illness, extended hospital or nursing home care, or other serious medical conditions, including death; (c) redemptions of shares acquired through dividend or capital gains reinvestments; (d) loans from a qualified plan account, and (e) redemptions initiated by the Fund; and (3) a $10 service fee on each exchange after the first five exchanges in each calendar year.
The following ongoing costs are not included in the expenses shown in the table and, if applicable, would increase the expenses that you paid over the period: (1) a $12 low balance fee on accounts with balances of less than $250 as of September 30th of each calendar year and no investment activity (excluding reinvestment of dividends and/or capital gains) during the prior calendar year or the first nine months of the current calendar year. This fee does not apply to IRAs, qualified plan accounts, or Coverdell Education Savings Accounts; (2) a $15 annual custodial fee on IRAs, SEPs, SIMPLE IRAs, and Coverdell Education Savings Accounts; and (3) a $20 annual custodial fee on 403(b) accounts.
Hypothetical Example for Comparison Purposes
The second line of the table below provides information about hypothetical account values and hypothetical expenses based on the Fund's actual expense ratio and an assumed rate of return of 5% per year before expenses, which in not the Fund's actual return. The hypothetical account values and expenses may not be used to estimate the actual ending account balance or expenses you paid for the period. You may use this information to compare the ongoing costs of investing in the Fund and other funds. To do so, compare this 5% hypothetical example with the 5% hypothetical examples that appear in the shareholder reports of the other funds.
The following transaction costs are not included in the expenses shown in the table and, if applicable, would increase the expenses that you paid over the period: (1) a front-end sales charge (load) of 5.75% on Class A shares; (2) a 2% redemption fee if you sell or exchange shares within 180 days of purchase, with certain exceptions. The redemption fee does not apply to: (a) redemptions under an automatic withdrawal program or periodic asset reallocation plan, required minimum distributions (RMD), employer mandated distributions from a qualified plan, or redemptions under a qualified domestic relations order (QDRO); (b) redemptions to pay for expenses related to terminal illness, death, extended hospital or nursing home care, or other serious medical conditions; (c) redemptions of shares acquired through dividend or capital gains reinvestments; (d) loans from a qualified plan account; and (e) redemptions initiated by the Fund; and (3) a $10 service fee on each exchange after the first five exchanges in each calendar year.
The following ongoing costs are not included in the expenses shown in the table and, if applicable, would increase the expenses that you paid over the period: (1) a $12 low balance fee on accounts with balances of less than $250 as of September 30th of each calendar year and no investment activity (excluding reinvestment of dividends and/or capital gains) during the prior calendar year or the first nine months of the current calendar year. This fee does not apply to IRAs, qualified plan accounts, or Coverdell Education Savings Accounts; (2) a $15 annual custodial fee on IRAs, SEPs, SIMPLE IRAs, and Coverdell Education Savings Accounts; and (3) a $20 annual custodial fee on 403(b) accounts.
Please note that the expenses shown in the table are meant to highlight your ongoing costs only and do not reflect any transactional costs, such as sales charges (loads), redemption fees, or exchange fees. Therefore, the second line of the table is useful in comparing ongoing costs only, and will not help you determine the relative total costs of owning different funds. In addition, if these transactional costs were included, your costs would have been higher.
| Beginning Account Value 07/01/11 | Ending Account Value 12/31/11 | Expense Paid During Period 07/01/11 – 12/31/11 | |||||||||||||
| Small Cap Value Fund Class A | |||||||||||||||
| Actual | $ | 1,000.00 | $ | 936.10 | $ | 14.05 | |||||||||
| Hypothetical (5% return before expense) | $ | 1,000.00 | $ | 1,010.69 | $ | 14.60 | |||||||||
| Small Cap Value Fund Class C | |||||||||||||||
| Actual | $ | 1,000.00 | $ | 932.50 | $ | 17.63 | |||||||||
| Hypothetical (5% return before expense) | $ | 1,000.00 | $ | 1,006.96 | $ | 18.31 | |||||||||
| Small Cap Value Fund Class I | |||||||||||||||
| Actual | $ | 1,000.00 | $ | 937.10 | $ | 12.94 | |||||||||
| Hypothetical (5% return before expense) | $ | 1,000.00 | $ | 1,011.85 | $ | 13.44 | |||||||||
3 Expenses are equal to the Fund's annualized expense ratio of 2.88% for Class A shares, 3.62% for Class C shares and 2.65% for Class I shares, multiplied by the average account value over the period, multiplied by 184/365 days to reflect the one-half year period.
34

Pacific Advisors Fund Inc.
Financial Statements
35
Pacific Advisors Government Securities Fund
Schedule of Investments
as of December 31, 2011
| Quantity or Principal | Description | Current $ Value** | % of Total Net Assets | ||||||||||||
| COMMON STOCK | |||||||||||||||
| CONSUMER DISCRETIONARY | 1.91 | ||||||||||||||
| HOTELS, RESTAURANTS & LEISURE | |||||||||||||||
| 550 | MCDONALD'S CORP. | 55,182 | |||||||||||||
| 55,182 | 1.91 | ||||||||||||||
| CONSUMER STAPLES | 1.53 | ||||||||||||||
| HOUSEHOLD PRODUCTS | |||||||||||||||
| 600 | KIMBERLY-CLARK CORP. | 44,136 | |||||||||||||
| 44,136 | 1.53 | ||||||||||||||
| ENERGY | 1.48 | ||||||||||||||
| OIL, GAS & CONSUMABLE FUELS | |||||||||||||||
| 400 | CHEVRON CORP. | 42,560 | |||||||||||||
| 42,560 | 1.48 | ||||||||||||||
| INFORMATION TECHNOLOGY | 1.80 | ||||||||||||||
| SOFTWARE | |||||||||||||||
| 2,000 | MICROSOFT CORP. | 51,920 | |||||||||||||
| 51,920 | 1.80 | ||||||||||||||
| TELECOMMUNICATION SERVICES | 1.78 | ||||||||||||||
| DIVERSIFIED TELECOM. SERVICES | |||||||||||||||
| 1,700 | AT&T INC. | 51,408 | |||||||||||||
| 51,408 | 1.78 | ||||||||||||||
| UTILITIES | 4.05 | ||||||||||||||
| ELECTRIC UTILITIES | |||||||||||||||
| 1,000 | PPL CORP. | 29,420 | |||||||||||||
| 950 | SOUTHERN CO. | 43,975 | |||||||||||||
| 73,396 | 2.54 | ||||||||||||||
| MULTI-UTILITIES | |||||||||||||||
| 700 | CONSOLIDATED EDISON INC. | 43,421 | |||||||||||||
| 43,421 | 1.51 | ||||||||||||||
| TOTAL COMMON STOCK (Cost: $291,139) | 362,022 | 12.55 | |||||||||||||
See Accompanying Notes to Financial Statements which are an integral part of these financial statements.
36
Pacific Advisors Government Securities Fund
Schedule of Investments
as of December 31, 2011
| Quantity or Principal | Description | Current $ Value** | % of Total Net Assets | ||||||||||||
| US GOVT SECURITIES | |||||||||||||||
| US GOVERNMENT AGENCY | 81.72 | ||||||||||||||
| US GOVERNMENT AGENCY | |||||||||||||||
| 100,000 | FEDERAL HOME LOAN BANK 1.70% 03/19/14 STEP | 100,304 | |||||||||||||
| 100,000 | FEDERAL HOME LOAN BANK 2.00% 07/17/14 STEP | 100,072 | |||||||||||||
| 250,000 | FEDERAL HOME LOAN BANK 2.00% 09/16/15 STEP | 250,809 | |||||||||||||
| 150,000 | FEDERAL HOME LOAN BANK 2.00% 11/17/15 STEP | 150,611 | |||||||||||||
| 100,000 | FEDERAL HOME LOAN BANK 1.05% 10/27/17 STEP | 100,031 | |||||||||||||
| 100,000 | FEDERAL HOME LOAN BANK 4.50% 02/28/18 | 100,610 | |||||||||||||
| 250,000 | FEDERAL NATL MTG ASSOC. 1.25% 03/30/16 STEP | 251,270 | |||||||||||||
| 500,000 | FEDERAL NATL MTG ASSOC. 1.00% 11/17/21 STEP | 501,186 | |||||||||||||
| 200,000 | FEDERAL NATL MTG ASSOC. 3.50% 05/18/26 STEP | 201,910 | |||||||||||||
| 100,000 | FEDERAL NATL MTG ASSOC. 1.50% 08/24/26 STEP | 100,032 | |||||||||||||
| 500,000 | FEDERAL NATL MTG ASSOC. 1.50% 12/15/26 STEP | 499,764 | |||||||||||||
| 2,356,596 | 81.72 | ||||||||||||||
| TOTAL US GOVT SECURITIES (Cost: $2,353,420) | 2,356,596 | 81.72 | |||||||||||||
| PREFERRED STOCK | |||||||||||||||
| FINANCIALS | 5.32 | ||||||||||||||
| CAPITAL MARKETS | |||||||||||||||
| 2,000 | DEUTSCHE BANK 7.35% PFD | 40,420 | |||||||||||||
| 40,420 | 1.40 | ||||||||||||||
| COMMERCIAL BANKS | |||||||||||||||
| 4,000 | BARCLAYS BANK PLC 6.625% PFD | 73,360 | |||||||||||||
| 2,000 | BARCLAYS BANK PLC 7.10% PFD | 39,540 | |||||||||||||
| 112,900 | 3.91 | ||||||||||||||
| TOTAL PREFERRED STOCK (Cost: $200,000) | 153,320 | 5.32 | |||||||||||||
| SHORT TERM INVESTMENTS | |||||||||||||||
| MONEY MARKET | 0.45 | ||||||||||||||
| 13,121 | UMB MONEY MARKET FIDUCIARY | 13,121 | |||||||||||||
| 13,121 | 0.45 | ||||||||||||||
| TOTAL SHORT TERM INVESTMENTS (Cost: $13,121) | 13,121 | 0.45 | |||||||||||||
| TOTAL INVESTMENT IN SECURITIES (Cost: $2,857,680) | 2,885,059 | 100.04 | |||||||||||||
| OTHER ASSETS LESS LIABILITIES | (1,143 | ) | (0.04 | ) | |||||||||||
| TOTAL NET ASSETS | 2,883,916 | 100.00 | |||||||||||||
** The principal amount is stated in U.S. dollars unless otherwise indicated.
See Accompanying Notes to Financial Statements which are an integral part of these financial statements.
37
Pacific Advisors Income and Equity Fund
Schedule of Investments
as of December 31, 2011
| Quantity or Principal | Description | Current $ Value** | % of Total Net Assets | ||||||||||||
| COMMON STOCK | |||||||||||||||
| CONSUMER DISCRETIONARY | 7.36 | ||||||||||||||
| DISTRIBUTORS | |||||||||||||||
| 2,250 | GENUINE PARTS CO. | 137,700 | |||||||||||||
| 137,700 | 1.89 | ||||||||||||||
| HOTELS, RESTAURANTS & LEISURE | |||||||||||||||
| 1,400 | MCDONALD'S CORP. | 140,462 | |||||||||||||
| 140,462 | 1.93 | ||||||||||||||
| LEISURE EQUIPMENT & PRODUCTS | |||||||||||||||
| 5,500 | MATTEL INC. | 152,680 | |||||||||||||
| 152,680 | 2.10 | ||||||||||||||
| SPECIALTY RETAIL | |||||||||||||||
| 2,500 | HOME DEPOT INC. | 105,100 | |||||||||||||
| 105,100 | 1.44 | ||||||||||||||
| CONSUMER STAPLES | 7.30 | ||||||||||||||
| FOOD & STAPLES RETAILING | |||||||||||||||
| 4,600 | SYSCO CORP. | 134,918 | |||||||||||||
| 2,800 | WAL-MART STORES INC. | 167,328 | |||||||||||||
| 302,246 | 4.15 | ||||||||||||||
| HOUSEHOLD PRODUCTS | |||||||||||||||
| 1,750 | PROCTER & GAMBLE CO. | 116,743 | |||||||||||||
| 116,743 | 1.60 | ||||||||||||||
| TOBACCO | |||||||||||||||
| 3,800 | ALTRIA GROUP INC. | 112,670 | |||||||||||||
| 112,670 | 1.55 | ||||||||||||||
| ENERGY | 1.50 | ||||||||||||||
| OIL, GAS & CONSUMABLE FUELS | |||||||||||||||
| 1,500 | CONOCOPHILLIPS | 109,305 | |||||||||||||
| 109,305 | 1.50 | ||||||||||||||
| HEALTH CARE | 5.85 | ||||||||||||||
| PHARMACEUTICALS | |||||||||||||||
| 2,750 | ABBOTT LABORATORIES | 154,633 | |||||||||||||
| 2,000 | JOHNSON & JOHNSON | 131,160 | |||||||||||||
| 6,500 | PFIZER INC. | 140,660 | |||||||||||||
| 426,453 | 5.85 | ||||||||||||||
See Accompanying Notes to Financial Statements which are an integral part of these financial statements.
38
Pacific Advisors Income and Equity Fund
Schedule of Investments
as of December 31, 2011
| Quantity or Principal | Description | Current $ Value** | % of Total Net Assets | ||||||||||||
| COMMON STOCK continued | |||||||||||||||
| INDUSTRIALS | 6.43 | ||||||||||||||
| AEROSPACE & DEFENSE | |||||||||||||||
| 2,250 | HONEYWELL INT'L INC. | 122,288 | |||||||||||||
| 122,288 | 1.68 | ||||||||||||||
| AIR FREIGHT & LOGISTICS | |||||||||||||||
| 1,000 | UNITED PARCEL SERVICE INC. B | 73,190 | |||||||||||||
| 73,190 | 1.00 | ||||||||||||||
| COMMERCIAL SERVICES & SUPPLIES | |||||||||||||||
| 7,000 | PITNEY BOWES INC. | 129,780 | |||||||||||||
| 129,780 | 1.78 | ||||||||||||||
| INDUSTRIAL CONGLOMERATES | |||||||||||||||
| 8,000 | GENERAL ELECTRIC CO. | 143,280 | |||||||||||||
| 143,280 | 1.97 | ||||||||||||||
| INFORMATION TECHNOLOGY | 4.30 | ||||||||||||||
| COMMUNICATIONS EQUIPMENT | |||||||||||||||
| 7,500 | NOKIA CORP. ADR A | 36,150 | |||||||||||||
| 36,150 | 0.50 | ||||||||||||||
| IT SERVICES | |||||||||||||||
| 2,250 | AUTOMATIC DATA PROCESSING INC. | 121,523 | |||||||||||||
| 121,523 | 1.67 | ||||||||||||||
| SOFTWARE | |||||||||||||||
| 6,000 | MICROSOFT CORP. | 155,760 | |||||||||||||
| 155,760 | 2.14 | ||||||||||||||
| MATERIALS | 1.70 | ||||||||||||||
| CHEMICALS | |||||||||||||||
| 2,700 | DUPONT DE NEMOURS & CO. | 123,606 | |||||||||||||
| 123,606 | 1.70 | ||||||||||||||
| TELECOMMUNICATION SERVICES | 4.55 | ||||||||||||||
| DIVERSIFIED TELECOM. SERVICES | |||||||||||||||
| 5,000 | AT&T INC. | 151,200 | |||||||||||||
| 1,000 | VERIZON COMMUNICATIONS INC. | 40,120 | |||||||||||||
| 191,320 | 2.63 | ||||||||||||||
| WIRELESS TELECOM. SERVICES | |||||||||||||||
| 5,000 | VODAFONE GROUP PLC | 140,150 | |||||||||||||
| 140,150 | 1.92 | ||||||||||||||
See Accompanying Notes to Financial Statements which are an integral part of these financial statements.
39
Pacific Advisors Income and Equity Fund
Schedule of Investments
as of December 31, 2011
| Quantity or Principal | Description | Current $ Value** | % of Total Net Assets | ||||||||||||
| COMMON STOCK continued | |||||||||||||||
| UTILITIES | 5.47 | ||||||||||||||
| ELECTRIC UTILITIES | |||||||||||||||
| 5,000 | DUKE ENERGY CORP. | 110,000 | |||||||||||||
| 110,000 | 1.51 | ||||||||||||||
| MULTI-UTILITIES | |||||||||||||||
| 2,000 | DOMINION RESOURCES INC. | 106,160 | |||||||||||||
| 3,000 | PUBLIC SERVICE ENTERPRISE GROUP INC | 99,030 | |||||||||||||
| 3,000 | XCEL ENERGY INC. | 82,920 | |||||||||||||
| 288,110 | 3.96 | ||||||||||||||
| TOTAL COMMON STOCK (Cost: $2,876,266) | 3,238,514 | 44.46 | |||||||||||||
| CORPORATE BOND | |||||||||||||||
| CONSUMER DISCRETIONARY | 9.42 | ||||||||||||||
| HOTELS, RESTAURANTS & LEISURE | |||||||||||||||
| 50,000 | MARRIOTT INT'L 5.625% 02/15/13 | 52,126 | |||||||||||||
| 52,126 | 0.72 | ||||||||||||||
| HOUSEHOLD DURABLES | |||||||||||||||
| 100,000 | MDC HOLDINGS INC. 5.375% 12/15/14 | 103,470 | |||||||||||||
| 100,000 | WHIRLPOOL CORP. 6.50% 06/15/16 | 109,078 | |||||||||||||
| 212,548 | 2.92 | ||||||||||||||
| LEISURE EQUIPMENT & PRODUCTS | |||||||||||||||
| 50,000 | EQUIFAX INC. 6.30% 07/01/17 | 56,439 | |||||||||||||
| 56,439 | 0.77 | ||||||||||||||
| MULTILINE RETAIL | |||||||||||||||
| 281,000 | TARGET CORP. 8.60% 01/15/12 | 281,683 | |||||||||||||
| 281,683 | 3.87 | ||||||||||||||
| SPECIALTY RETAIL | |||||||||||||||
| 80,000 | STAPLES INC. 7.375% 10/01/12 | 83,349 | |||||||||||||
| 83,349 | 1.14 | ||||||||||||||
| ENERGY | 1.99 | ||||||||||||||
| OIL, GAS & CONSUMABLE FUELS | |||||||||||||||
| 143,000 | ATLANTIC RICHFIELD 8.50% 04/01/12 | 145,275 | |||||||||||||
| 145,275 | 1.99 | ||||||||||||||
| FINANCIALS | 18.62 | ||||||||||||||
| CAPITAL MARKETS | |||||||||||||||
| 50,000 | CHARLES SCHWAB CORP. 6.375% 09/01/17 | 58,754 | |||||||||||||
| 95,000 | GOLDMAN SACHS GROUP 5.00% 10/01/14 | 96,299 | |||||||||||||
See Accompanying Notes to Financial Statements which are an integral part of these financial statements.
40
Pacific Advisors Income and Equity Fund
Schedule of Investments
as of December 31, 2011
| Quantity or Principal | Description | Current $ Value** | % of Total Net Assets | ||||||||||||
| CORPORATE BOND continued | |||||||||||||||
| CAPITAL MARKETS continued | |||||||||||||||
| 100,000 | JANUS CAPITAL GROUP INC. 6.70% 06/15/17 | 106,119 | |||||||||||||
| 100,000 | MORGAN STANLEY 09/30/17 FLOAT | 87,060 | |||||||||||||
| 348,231 | 4.78 | ||||||||||||||
| CONSUMER FINANCE | |||||||||||||||
| 106,000 | HSBC 11/10/13 FLOAT | 108,015 | |||||||||||||
| 300,000 | SPRINGLEAF FINANCE CORP. 6.00% 11/15/14 | 214,182 | |||||||||||||
| 322,197 | 4.42 | ||||||||||||||
| DIVERSIFIED FINANCIAL SERVICES | |||||||||||||||
| 371,000 | GENERAL ELECTRIC CAP 8.125% 05/15/12 | 379,791 | |||||||||||||
| 150,000 | GENERAL ELECTRIC CAP 5.50% 09/30/16 STEP | 149,957 | |||||||||||||
| 529,748 | 7.27 | ||||||||||||||
| INSURANCE | |||||||||||||||
| 100,000 | PRUDENTIAL FINANCIAL INC. 11/02/20 FLOAT | 102,111 | |||||||||||||
| 102,111 | 1.40 | ||||||||||||||
| REAL ESTATE INVESTMENT TRUSTS | |||||||||||||||
| 50,000 | HOSPITALITY PROP TRUST 7.875% 08/15/14 | 54,330 | |||||||||||||
| 54,330 | 0.75 | ||||||||||||||
| INDUSTRIALS | 3.88 | ||||||||||||||
| AIRLINES | |||||||||||||||
| 50,000 | SOUTHWEST AIRLINES CO. 5.25% 10/01/14 | 53,361 | |||||||||||||
| 53,361 | 0.73 | ||||||||||||||
| MACHINERY | |||||||||||||||
| 115,000 | JOY GLOBAL INC. 6.00% 11/15/16 | 129,183 | |||||||||||||
| 129,183 | 1.77 | ||||||||||||||
| TRADING COMPANIES & DISTRIBUTORS | |||||||||||||||
| 100,000 | GATX FINANCIAL CORP. 5.50% 02/15/12 | 100,269 | |||||||||||||
| 100,269 | 1.38 | ||||||||||||||
| INFORMATION TECHNOLOGY | 3.51 | ||||||||||||||
| COMPUTERS & PERIPHERALS | |||||||||||||||
| 50,000 | DELL INC. 5.65% 04/15/18 | 57,925 | |||||||||||||
| 57,925 | 0.80 | ||||||||||||||
| ELECTRONIC EQUIPMENT & INSTRUMENTS | |||||||||||||||
| 80,000 | CORNING INC. 7.53% 03/01/23 | 95,151 | |||||||||||||
| 50,000 | INGRAM MICRO INC. 5.25% 09/01/17 | 51,504 | |||||||||||||
| 146,656 | 2.01 | ||||||||||||||
See Accompanying Notes to Financial Statements which are an integral part of these financial statements.
41
Pacific Advisors Income and Equity Fund
Schedule of Investments
as of December 31, 2011
| Quantity or Principal | Description | Current $ Value** | % of Total Net Assets | ||||||||||||
| CORPORATE BOND continued | |||||||||||||||
| OFFICE ELECTRONICS | |||||||||||||||
| 50,000 | XEROX CORP. 5.50% 05/15/12 | 50,829 | |||||||||||||
| 50,829 | 0.70 | ||||||||||||||
| MATERIALS | 4.67 | ||||||||||||||
| CONTAINERS & PACKAGING | |||||||||||||||
| 25,000 | PACKAGING CORP. OF AMERICA 5.75% 08/01/13 | 26,346 | |||||||||||||
| 26,346 | 0.36 | ||||||||||||||
| METALS & MINING | |||||||||||||||
| 50,000 | ARCELORMITTAL USA INC. 6.50% 04/15/14 | 52,862 | |||||||||||||
| 50,000 | COMMERCIAL METALS CO. 7.35% 08/15/18 | 47,250 | |||||||||||||
| 50,000 | FREEPORT-MCMORAN C&G INC. 8.375% 04/01/17 | 53,125 | |||||||||||||
| 150,000 | RELIANCE STEEL & ALUMINUM 6.20% 11/15/16 | 160,762 | |||||||||||||
| 313,998 | 4.31 | ||||||||||||||
| TELECOMMUNICATION SERVICES | 2.98 | ||||||||||||||
| DIVERSIFIED TELECOM. SERVICES | |||||||||||||||
| 204,342 | BELLSOUTH TELECOM. 6.30% 12/15/15 | 216,989 | |||||||||||||
| 216,989 | 2.98 | ||||||||||||||
| UTILITIES | 2.31 | ||||||||||||||
| MULTI-UTILITIES | |||||||||||||||
| 55,000 | CONSUMERS ENERGY CO. 6.00% 02/15/14 | 60,055 | |||||||||||||
| 100,000 | OGE ENERGY CORP. 5.00% 11/15/14 | 108,418 | |||||||||||||
| 168,473 | 2.31 | ||||||||||||||
| TOTAL CORPORATE BOND (Cost: $3,445,818) | 3,452,065 | 47.39 | |||||||||||||
| PREFERRED STOCK | |||||||||||||||
| FINANCIALS | 5.74 | ||||||||||||||
| CAPITAL MARKETS | |||||||||||||||
| 3,000 | DEUTSCHE BANK 6.625% PFD | 56,250 | |||||||||||||
| 56,250 | 0.77 | ||||||||||||||
| COMMERCIAL BANKS | |||||||||||||||
| 2,000 | BARCLAYS BANK PLC 7.10% PFD | 39,540 | |||||||||||||
| 2,000 | BARCLAYS BANK PLC 6.625% PFD | 36,680 | |||||||||||||
| 4,000 | HSBC HOLDINGS PLC 6.20% PFD A | 95,600 | |||||||||||||
| 171,820 | 2.36 | ||||||||||||||
| DIVERSIFIED FINANCIAL SERVICES | |||||||||||||||
| 2,000 | BANK OF AMERICA 7.25% PFD | 39,800 | |||||||||||||
| 2,000 | BANK OF AMERICA 6.375% PFD | 36,460 | |||||||||||||
See Accompanying Notes to Financial Statements which are an integral part of these financial statements.
42
Pacific Advisors Income and Equity Fund
Schedule of Investments
as of December 31, 2011
| Quantity or Principal | Description | Current $ Value** | % of Total Net Assets | ||||||||||||
| PREFERRED STOCK continued | |||||||||||||||
| DIVERSIFIED FINANCIAL SERVICES continued | |||||||||||||||
| 2,000 | MERRILL LYNCH 6.45% PFD | 37,160 | |||||||||||||
| 113,420 | 1.56 | ||||||||||||||
| INSURANCE | |||||||||||||||
| 3,000 | METLIFE INC. 6.50% PFD | 76,440 | |||||||||||||
| 76,440 | 1.05 | ||||||||||||||
| UTILITIES | 0.70 | ||||||||||||||
| ELECTRIC UTILITIES | |||||||||||||||
| 2,000 | NEXTERA ENERGY CAPITAL 6.60% PFD A | 50,760 | |||||||||||||
| 50,760 | 0.70 | ||||||||||||||
| TOTAL PREFERRED STOCK (Cost: $550,000) | 468,690 | 6.43 | |||||||||||||
| SHORT TERM INVESTMENTS | |||||||||||||||
| MONEY MARKET | 1.32 | ||||||||||||||
| 96,218 | UMB MONEY MARKET FIDUCIARY | 96,218 | |||||||||||||
| 96,218 | 1.32 | ||||||||||||||
| TOTAL SHORT TERM INVESTMENTS (Cost: $96,218) | 96,218 | 1.32 | |||||||||||||
| TOTAL INVESTMENT IN SECURITIES (Cost: $6,968,302) | 7,255,487 | 99.61 | |||||||||||||
| OTHER ASSETS LESS LIABILITIES | 28,565 | 0.39 | |||||||||||||
| TOTAL NET ASSETS | 7,284,052 | 100.00 | |||||||||||||
** The principal amount is stated in U.S. dollars unless otherwise indicated.
See Accompanying Notes to Financial Statements which are an integral part of these financial statements.
43
Pacific Advisors Balanced Fund
Schedule of Investments
as of December 31, 2011
| Quantity or Principal | Description | Current $ Value** | % of Total Net Assets | ||||||||||||
| COMMON STOCK | |||||||||||||||
| CONSUMER DISCRETIONARY | 3.79 | ||||||||||||||
| HOTELS, RESTAURANTS & LEISURE | |||||||||||||||
| 5,500 | MCDONALD'S CORP. | 551,815 | |||||||||||||
| 551,815 | 3.79 | ||||||||||||||
| CONSUMER STAPLES | 14.98 | ||||||||||||||
| BEVERAGES | |||||||||||||||
| 7,850 | COCA-COLA CO. | 549,265 | |||||||||||||
| 549,265 | 3.77 | ||||||||||||||
| FOOD & STAPLES RETAILING | |||||||||||||||
| 13,700 | CVS CAREMARK CORP. | 558,686 | |||||||||||||
| 10,000 | WAL-MART STORES INC. | 597,600 | |||||||||||||
| 1,156,286 | 7.94 | ||||||||||||||
| FOOD PRODUCTS | |||||||||||||||
| 5,000 | ARCHER DANIELS MIDLAND CO. | 143,000 | |||||||||||||
| 143,000 | 0.98 | ||||||||||||||
| HOUSEHOLD PRODUCTS | |||||||||||||||
| 5,000 | PROCTER & GAMBLE CO. | 333,550 | |||||||||||||
| 333,550 | 2.29 | ||||||||||||||
| ENERGY | 7.76 | ||||||||||||||
| ENERGY EQUIPMENT & SERVICES | |||||||||||||||
| 12,500 | HALLIBURTON CO. | 431,375 | |||||||||||||
| 6,000 | NATIONAL OILWELL VARCO INC. | 407,940 | |||||||||||||
| 839,315 | 5.76 | ||||||||||||||
| OIL, GAS & CONSUMABLE FUELS | |||||||||||||||
| 4,000 | CONOCOPHILLIPS | 291,480 | |||||||||||||
| 291,480 | 2.00 | ||||||||||||||
| FINANCIALS | 6.48 | ||||||||||||||
| CONSUMER FINANCE | |||||||||||||||
| 10,500 | AMERICAN EXPRESS CO. | 495,285 | |||||||||||||
| 495,285 | 3.40 | ||||||||||||||
| DIVERSIFIED FINANCIAL SERVICES | |||||||||||||||
| 13,500 | JPMORGAN CHASE & CO. | 448,875 | |||||||||||||
| 448,875 | 3.08 | ||||||||||||||
See Accompanying Notes to Financial Statements which are an integral part of these financial statements.
44
Pacific Advisors Balanced Fund
Schedule of Investments
as of December 31, 2011
| Quantity or Principal | Description | Current $ Value** | % of Total Net Assets | ||||||||||||
| COMMON STOCK continued | |||||||||||||||
| HEALTH CARE | 9.08 | ||||||||||||||
| PHARMACEUTICALS | |||||||||||||||
| 5,300 | ABBOTT LABORATORIES | 298,019 | |||||||||||||
| 6,500 | JOHNSON & JOHNSON | 426,270 | |||||||||||||
| 8,000 | MERCK & COMPANY INC. | 301,600 | |||||||||||||
| 13,750 | PFIZER INC. | 297,550 | |||||||||||||
| 1,323,439 | 9.08 | ||||||||||||||
| INDUSTRIALS | 17.70 | ||||||||||||||
| AEROSPACE & DEFENSE | |||||||||||||||
| 2,700 | BOEING CO. | 198,045 | |||||||||||||
| 198,045 | 1.36 | ||||||||||||||
| AIR FREIGHT & LOGISTICS | |||||||||||||||
| 7,000 | UNITED PARCEL SERVICE INC. B | 512,330 | |||||||||||||
| 512,330 | 3.52 | ||||||||||||||
| INDUSTRIAL CONGLOMERATES | |||||||||||||||
| 28,000 | GENERAL ELECTRIC CO. | 501,480 | |||||||||||||
| 501,480 | 3.44 | ||||||||||||||
| MACHINERY | |||||||||||||||
| 4,750 | CATERPILLAR INC. | 430,350 | |||||||||||||
| 1,000 | CUMMINS INC. | 88,020 | |||||||||||||
| 518,370 | 3.56 | ||||||||||||||
| ROAD & RAIL | |||||||||||||||
| 19,500 | CSX CORP. | 410,670 | |||||||||||||
| 6,000 | NORFOLK SOUTHERN CORP. | 437,160 | |||||||||||||
| 847,830 | 5.82 | ||||||||||||||
| INFORMATION TECHNOLOGY | 13.27 | ||||||||||||||
| COMMUNICATIONS EQUIPMENT | |||||||||||||||
| 7,000 | QUALCOMM INC. | 382,900 | |||||||||||||
| 382,900 | 2.63 | ||||||||||||||
| COMPUTERS & PERIPHERALS | |||||||||||||||
| 2,750 | INT'L BUSINESS MACHINES CORP. | 505,670 | |||||||||||||
| 505,670 | 3.47 | ||||||||||||||
| ELECTRONIC EQUIPMENT & INSTRUMENTS | |||||||||||||||
| 30,000 | CORNING INC. | 389,400 | |||||||||||||
| 389,400 | 2.67 | ||||||||||||||
See Accompanying Notes to Financial Statements which are an integral part of these financial statements.
45
Pacific Advisors Balanced Fund
Schedule of Investments
as of December 31, 2011
| Quantity or Principal | Description | Current $ Value** | % of Total Net Assets | ||||||||||||
| COMMON STOCK continued | |||||||||||||||
| INTERNET SOFTWARE & SERVICES | |||||||||||||||
| 150 | GOOGLE INC.* | 96,885 | |||||||||||||
| 96,885 | 0.67 | ||||||||||||||
| SOFTWARE | |||||||||||||||
| 21,500 | MICROSOFT CORP. | 558,140 | |||||||||||||
| 558,140 | 3.83 | ||||||||||||||
| MATERIALS | 2.86 | ||||||||||||||
| CHEMICALS | |||||||||||||||
| 14,500 | DOW CHEMICAL CO. | 417,020 | |||||||||||||
| 417,020 | 2.86 | ||||||||||||||
| TOTAL COMMON STOCK (Cost: $9,977,140) | 11,060,380 | 75.92 | |||||||||||||
| CORPORATE BOND | |||||||||||||||
| CONSUMER DISCRETIONARY | 6.00 | ||||||||||||||
| AUTO COMPONENTS | |||||||||||||||
| 100,000 | BORG WARNER 8.00% 10/01/19 | 119,954 | |||||||||||||
| 119,954 | 0.82 | ||||||||||||||
| HOTELS, RESTAURANTS & LEISURE | |||||||||||||||
| 100,000 | MARRIOTT INT'L 5.625% 02/15/13 | 104,253 | |||||||||||||
| 150,000 | ROYAL CARIBBEAN CRUISES 7.00% 06/15/13 | 157,500 | |||||||||||||
| 261,753 | 1.80 | ||||||||||||||
| HOUSEHOLD DURABLES | |||||||||||||||
| 48,000 | BEAM INC. 6.375% 06/15/14 | 52,485 | |||||||||||||
| 52,485 | 0.36 | ||||||||||||||
| MULTILINE RETAIL | |||||||||||||||
| 150,000 | JC PENNEY CORP. INC. 7.95% 04/01/17 | 163,500 | |||||||||||||
| 178,000 | TARGET CORP. 8.60% 01/15/12 | 178,433 | |||||||||||||
| 341,933 | 2.35 | ||||||||||||||
| SPECIALTY RETAIL | |||||||||||||||
| 100,000 | BEST BUY CO. INC. 3.75% 03/15/16 | 98,514 | |||||||||||||
| 98,514 | 0.68 | ||||||||||||||
| CONSUMER STAPLES | 1.17 | ||||||||||||||
| TOBACCO | |||||||||||||||
| 150,000 | REYNOLDS AMERICA 6.75% 06/15/17 | 170,494 | |||||||||||||
| 170,494 | 1.17 | ||||||||||||||
See Accompanying Notes to Financial Statements which are an integral part of these financial statements.
46
Pacific Advisors Balanced Fund
Schedule of Investments
as of December 31, 2011
| Quantity or Principal | Description | Current $ Value** | % of Total Net Assets | ||||||||||||
| CORPORATE BOND continued | |||||||||||||||
| ENERGY | 1.13 | ||||||||||||||
| OIL, GAS & CONSUMABLE FUELS | |||||||||||||||
| 150,000 | PEABODY ENERGY CORP. 7.375% 11/01/16 | 165,000 | |||||||||||||
| 165,000 | 1.13 | ||||||||||||||
| FINANCIALS | 10.93 | ||||||||||||||
| CAPITAL MARKETS | |||||||||||||||
| 150,000 | CHARLES SCHWAB CORP. 6.375% 09/01/17 | 176,261 | |||||||||||||
| 150,000 | GOLDMAN SACHS GROUP 3.00% 12/22/17 STEP | 144,110 | |||||||||||||
| 161,000 | MORGAN STANLEY 07/01/14 FLOAT | 156,410 | |||||||||||||
| 476,781 | 3.27 | ||||||||||||||
| CONSUMER FINANCE | |||||||||||||||
| 155,000 | HOUSEHOLD FINANCE CO. 09/15/13 FLOAT | 157,581 | |||||||||||||
| 300,000 | SPRINGLEAF FINANCE CORP. 6.00% 10/15/14 | 227,155 | |||||||||||||
| 384,736 | 2.64 | ||||||||||||||
| DIVERSIFIED FINANCIAL SERVICES | |||||||||||||||
| 311,000 | GENERAL ELECTRIC CAP 8.125% 05/15/12 | 318,369 | |||||||||||||
| 100,000 | GENERAL ELECTRIC CAP 5.65% 06/09/14 | 108,362 | |||||||||||||
| 426,731 | 2.93 | ||||||||||||||
| INSURANCE | |||||||||||||||
| 100,000 | GENWORTH FINANCIAL INC. 5.65% 06/15/12 | 100,565 | |||||||||||||
| 100,000 | HARTFORD LIFE GLOBAL FUND 06/16/14 FLOAT | 94,603 | |||||||||||||
| 195,168 | 1.34 | ||||||||||||||
| REAL ESTATE INVESTMENT TRUSTS | |||||||||||||||
| 100,000 | HOSPITALITY PROPERTIES TRUST 7.875% 08/15/14 | 108,660 | |||||||||||||
| 108,660 | 0.75 | ||||||||||||||
| INFORMATION TECHNOLOGY | 2.60 | ||||||||||||||
| COMPUTERS & PERIPHERALS | |||||||||||||||
| 100,000 | DIGITAL EQUIPMENT 7.75% 04/01/23 | 120,700 | |||||||||||||
| 120,700 | 0.83 | ||||||||||||||
| ELECTRONIC EQUIPMENT & INSTRUMENTS | |||||||||||||||
| 100,000 | JABIL CIRCUIT INC. 7.75% 07/15/16 | 111,500 | |||||||||||||
| 111,500 | 0.77 | ||||||||||||||
| IT SERVICES | |||||||||||||||
| 150,000 | COMPUTER SCIENCES CORP. 6.50% 03/15/18 | 147,000 | |||||||||||||
| 147,000 | 1.01 | ||||||||||||||
See Accompanying Notes to Financial Statements which are an integral part of these financial statements.
47
Pacific Advisors Balanced Fund
Schedule of Investments
as of December 31, 2011
| Quantity or Principal | Description | Current $ Value** | % of Total Net Assets | ||||||||||||
| CORPORATE BOND continued | |||||||||||||||
| MATERIALS | 2.16 | ||||||||||||||
| CHEMICALS | |||||||||||||||
| 105,000 | ALBEMARLE CORP. 5.10% 02/01/15 | 113,230 | |||||||||||||
| 113,230 | 0.78 | ||||||||||||||
| METALS & MINING | |||||||||||||||
| 100,000 | COMMERCIAL METALS CO. 7.35% 08/15/18 | 94,500 | |||||||||||||
| 100,000 | FREEPORT-MCMORAN C&G INC. 8.375% 04/01/17 | 106,250 | |||||||||||||
| 200,750 | 1.38 | ||||||||||||||
| UTILITIES | 1.26 | ||||||||||||||
| INDEPENDENT POWER PRODUCERS & TRADERS | |||||||||||||||
| 150,000 | AMERENENERGY GENERATING 7.00% 04/15/18 | 154,650 | |||||||||||||
| 29,713 | RELIANT ENERGY MID ATL 9.237% 07/02/17 | 29,119 | |||||||||||||
| 183,769 | 1.26 | ||||||||||||||
| TOTAL CORPORATE BOND (Cost: $3,693,583) | 3,679,159 | 25.25 | |||||||||||||
| PREFERRED STOCK | |||||||||||||||
| FINANCIALS | 3.09 | ||||||||||||||
| COMMERCIAL BANKS | |||||||||||||||
| 5,000 | BARCLAYS BANK PLC 8.125% PFD | 111,400 | |||||||||||||
| 5,000 | BARCLAYS BANK PLC 7.10% PFD | 98,850 | |||||||||||||
| 5,000 | HSBC HOLDINGS PLC 8.125% PFD | 128,750 | |||||||||||||
| 339,000 | 2.33 | ||||||||||||||
| DIVERSIFIED FINANCIAL SERVICES | |||||||||||||||
| 5,000 | BANK OF AMERICA 8.20% PFD | 110,500 | |||||||||||||
| 110,500 | 0.76 | ||||||||||||||
| TOTAL PREFERRED STOCK (Cost: $500,000) | 449,500 | 3.09 | |||||||||||||
| TOTAL INVESTMENT IN SECURITIES (Cost: $14,170,723) | 15,189,039 | 104.26 | |||||||||||||
| OTHER ASSETS LESS LIABILITIES | (619,919 | ) | (4.26 | ) | |||||||||||
| TOTAL NET ASSETS | 14,569,120 | 100.00 | |||||||||||||
* Non-income producing
** The principal amount is stated in U.S. dollars unless otherwise indicated.
See Accompanying Notes to Financial Statements which are an integral part of these financial statements.
48
Pacific Advisors Large Cap Value Fund
Schedule of Investments
as of December 31, 2011
| Quantity or Principal | Description | Current $ Value** | % of Total Net Assets | ||||||||||||
| COMMON STOCK | |||||||||||||||
| CONSUMER DISCRETIONARY | 15.17 | ||||||||||||||
| DISTRIBUTORS | |||||||||||||||
| 1,000 | GENUINE PARTS CO. | 61,200 | |||||||||||||
| 61,200 | 1.57 | ||||||||||||||
| HOTELS, RESTAURANTS & LEISURE | |||||||||||||||
| 2,000 | MCDONALD'S CORP. | 200,660 | |||||||||||||
| 200,660 | 5.14 | ||||||||||||||
| INTERNET & CATALOG RETAIL | |||||||||||||||
| 1,425 | EXPEDIA INC. | 41,354 | |||||||||||||
| 1,425 | TRIPADVISOR INC.* | 35,924 | |||||||||||||
| 77,278 | 1.98 | ||||||||||||||
| MEDIA | |||||||||||||||
| 750 | THE MCGRAW-HILL COMPANIES INC. | 33,728 | |||||||||||||
| 3,250 | TIME WARNER INC. | 117,455 | |||||||||||||
| 151,183 | 3.87 | ||||||||||||||
| MULTILINE RETAIL | |||||||||||||||
| 2,000 | TARGET CORP. | 102,440 | |||||||||||||
| 102,440 | 2.62 | ||||||||||||||
| CONSUMER STAPLES | 24.60 | ||||||||||||||
| BEVERAGES | |||||||||||||||
| 2,560 | COCA-COLA CO. | 179,123 | |||||||||||||
| 179,123 | 4.58 | ||||||||||||||
| FOOD & STAPLES RETAILING | |||||||||||||||
| 5,500 | SYSCO CORP. | 161,315 | |||||||||||||
| 3,150 | WAL-MART STORES INC. | 188,244 | |||||||||||||
| 349,559 | 8.95 | ||||||||||||||
| FOOD PRODUCTS | |||||||||||||||
| 750 | H.J. HEINZ CO. | 40,530 | |||||||||||||
| 2,700 | KRAFT FOODS INC. | 100,872 | |||||||||||||
| 440 | RALCORP HOLDINGS INC.* | 37,620 | |||||||||||||
| 179,022 | 4.58 | ||||||||||||||
| HOUSEHOLD PRODUCTS | |||||||||||||||
| 2,500 | PROCTER & GAMBLE CO. | 166,775 | |||||||||||||
| 1,300 | THE CLOROX CO. | 86,528 | |||||||||||||
| 253,303 | 6.48 | ||||||||||||||
See Accompanying Notes to Financial Statements which are an integral part of these financial statements.
49
Pacific Advisors Large Cap Value Fund
Schedule of Investments
as of December 31, 2011
| Quantity or Principal | Description | Current $ Value** | % of Total Net Assets | ||||||||||||
| COMMON STOCK continued | |||||||||||||||
| ENERGY | 4.56 | ||||||||||||||
| OIL, GAS & CONSUMABLE FUELS | |||||||||||||||
| 2,100 | EXXON MOBIL CORP. | 177,996 | |||||||||||||
| 177,996 | 4.56 | ||||||||||||||
| FINANCIALS | 9.98 | ||||||||||||||
| COMMERCIAL BANKS | |||||||||||||||
| 3,250 | WELLS FARGO & CO. | 89,570 | |||||||||||||
| 89,570 | 2.29 | ||||||||||||||
| DIVERSIFIED FINANCIAL SERVICES | |||||||||||||||
| 1,475 | BANK OF NEW YORK MELLON CORP. | 29,367 | |||||||||||||
| 29,367 | 0.75 | ||||||||||||||
| INSURANCE | |||||||||||||||
| 2,000 | BERKSHIRE HATHAWAY INC. B* | 152,600 | |||||||||||||
| 3,800 | METLIFE INC. | 118,484 | |||||||||||||
| 271,084 | 6.94 | ||||||||||||||
| HEALTH CARE | 8.07 | ||||||||||||||
| HEALTH CARE PROVIDERS & SERVICES | |||||||||||||||
| 2,000 | CARDINAL HEALTH INC. | 81,220 | |||||||||||||
| 81,220 | 2.08 | ||||||||||||||
| PHARMACEUTICALS | |||||||||||||||
| 1,250 | ABBOTT LABORATORIES | 70,288 | |||||||||||||
| 2,500 | JOHNSON & JOHNSON | 163,950 | |||||||||||||
| 234,238 | 5.99 | ||||||||||||||
| INDUSTRIALS | 15.83 | ||||||||||||||
| AEROSPACE & DEFENSE | |||||||||||||||
| 2,400 | EXELIS INC. | 21,720 | |||||||||||||
| 2,000 | HONEYWELL INT'L INC. | 108,700 | |||||||||||||
| 750 | NORTHROP GRUMMAN CORP. | 43,860 | |||||||||||||
| 174,280 | 4.46 | ||||||||||||||
| AIR FREIGHT & LOGISTICS | |||||||||||||||
| 1,000 | FEDEX CORP. | 83,510 | |||||||||||||
| 1,200 | UNITED PARCEL SERVICE INC. B | 87,828 | |||||||||||||
| 171,338 | 4.39 | ||||||||||||||
| INDUSTRIAL CONGLOMERATES | |||||||||||||||
| 9,200 | GENERAL ELECTRIC CO. | 164,772 | |||||||||||||
| 500 | TYCO INT'L LTD. | 23,355 | |||||||||||||
| 188,127 | 4.81 | ||||||||||||||
See Accompanying Notes to Financial Statements which are an integral part of these financial statements.
50
Pacific Advisors Large Cap Value Fund
Schedule of Investments
as of December 31, 2011
| Quantity or Principal | Description | Current $ Value** | % of Total Net Assets | ||||||||||||
| COMMON STOCK continued | |||||||||||||||
| MACHINERY | |||||||||||||||
| 1,200 | ITT CORP. | 23,196 | |||||||||||||
| 2,400 | XYLEM INC. | 61,656 | |||||||||||||
| 84,852 | 2.17 | ||||||||||||||
| INFORMATION TECHNOLOGY | 24.39 | ||||||||||||||
| COMMUNICATIONS EQUIPMENT | |||||||||||||||
| 5,750 | CISCO SYSTEMS INC. | 103,960 | |||||||||||||
| 103,960 | 2.66 | ||||||||||||||
| COMPUTERS & PERIPHERALS | |||||||||||||||
| 400 | APPLE INC.* | 162,000 | |||||||||||||
| 5,500 | DELL INC.* | 80,465 | |||||||||||||
| 850 | HEWLETT-PACKARD CO. | 21,896 | |||||||||||||
| 1,085 | INT'L BUSINESS MACHINES CORP. | 199,510 | |||||||||||||
| 463,871 | 11.87 | ||||||||||||||
| IT SERVICES | |||||||||||||||
| 220 | MASTERCARD INC. | 82,020 | |||||||||||||
| 82,020 | 2.10 | ||||||||||||||
| SEMICONDUCTORS & EQUIPMENT | |||||||||||||||
| 5,600 | INTEL CORP. | 135,800 | |||||||||||||
| 135,800 | 3.48 | ||||||||||||||
| SOFTWARE | |||||||||||||||
| 6,450 | MICROSOFT CORP. | 167,442 | |||||||||||||
| 167,442 | 4.29 | ||||||||||||||
| TOTAL COMMON STOCK (Cost: $3,618,299) | 4,008,932 | 102.60 | |||||||||||||
| TOTAL INVESTMENT IN SECURITIES (Cost: $3,618,299) | 4,008,932 | 102.60 | |||||||||||||
| OTHER ASSETS LESS LIABILITIES | (101,614 | ) | (2.60 | ) | |||||||||||
| TOTAL NET ASSETS | 3,907,318 | 100.00 | |||||||||||||
* Non-income producing
** The principal amount is stated in U.S. dollars unless otherwise indicated.
See Accompanying Notes to Financial Statements which are an integral part of these financial statements.
51
Pacific Advisors Mid Cap Value Fund
Schedule of Investments
as of December 31, 2011
| Quantity or Principal | Description | Current $ Value** | % of Total Net Assets | ||||||||||||
| COMMON STOCK | |||||||||||||||
| CONSUMER DISCRETIONARY | 18.44 | ||||||||||||||
| AUTO COMPONENTS | |||||||||||||||
| 5,400 | LEAR CORP. | 214,920 | |||||||||||||
| 214,920 | 4.22 | ||||||||||||||
| SPECIALTY RETAIL | |||||||||||||||
| 8,300 | GAMESTOP CORP. A* | 200,279 | |||||||||||||
| 13,700 | PENSKE AUTOMOTIVE GROUP INC. | 263,725 | |||||||||||||
| 464,004 | 9.11 | ||||||||||||||
| TEXTILES, APPAREL & LUXURY GOODS | |||||||||||||||
| 3,700 | PVH CORP. | 260,813 | |||||||||||||
| 260,813 | 5.12 | ||||||||||||||
| CONSUMER STAPLES | 3.49 | ||||||||||||||
| BEVERAGES | |||||||||||||||
| 4,500 | DR PEPPER SNAPPLE GROUP INC. | 177,660 | |||||||||||||
| 177,660 | 3.49 | ||||||||||||||
| ENERGY | 27.88 | ||||||||||||||
| ENERGY EQUIPMENT & SERVICES | |||||||||||||||
| 23,000 | ION GEOPHYSICAL CORP.* | 140,990 | |||||||||||||
| 3,500 | LUFKIN INDUSTRIES INC. | 235,585 | |||||||||||||
| 12,000 | MITCHAM INDUSTRIES INC.* | 262,080 | |||||||||||||
| 4,400 | TIDEWATER INC. | 216,920 | |||||||||||||
| 855,575 | 16.79 | ||||||||||||||
| OIL, GAS & CONSUMABLE FUELS | |||||||||||||||
| 1,000 | APACHE CORP. | 90,580 | |||||||||||||
| 9,500 | ARCH COAL INC. | 137,845 | |||||||||||||
| 7,000 | CHESAPEAKE ENERGY CORP. | 156,030 | |||||||||||||
| 1,700 | CHEVRON CORP. | 180,880 | |||||||||||||
| 565,335 | 11.09 | ||||||||||||||
| FINANCIALS | 4.10 | ||||||||||||||
| COMMERCIAL BANKS | |||||||||||||||
| 14,000 | CATHAY GENERAL BANCORP | 209,020 | |||||||||||||
| 209,020 | 4.10 | ||||||||||||||
| INDUSTRIALS | 43.22 | ||||||||||||||
| COMMERCIAL SERVICES & SUPPLIES | |||||||||||||||
| 3,000 | COPART INC.* | 143,670 | |||||||||||||
| 9,000 | PITNEY BOWES INC. | 166,860 | |||||||||||||
| 310,530 | 6.09 | ||||||||||||||
See Accompanying Notes to Financial Statements which are an integral part of these financial statements.
52
Pacific Advisors Mid Cap Value Fund
Schedule of Investments
as of December 31, 2011
| Quantity or Principal | Description | Current $ Value** | % of Total Net Assets | ||||||||||||
| COMMON STOCK continued | |||||||||||||||
| CONSTRUCTION & ENGINEERING | |||||||||||||||
| 6,000 | CHICAGO BRIDGE & IRON CO. NV | 226,800 | |||||||||||||
| 6,700 | KBR INC. | 186,729 | |||||||||||||
| 413,529 | 8.11 | ||||||||||||||
| MACHINERY | |||||||||||||||
| 5,000 | GRACO INC. | 204,450 | |||||||||||||
| 2,600 | JOY GLOBAL INC. | 194,922 | |||||||||||||
| 4,800 | NAVISTAR INT'L CORP.* | 181,824 | |||||||||||||
| 581,196 | 11.40 | ||||||||||||||
| ROAD & RAIL | |||||||||||||||
| 4,000 | GENESEE & WYOMING INC.* | 242,320 | |||||||||||||
| 3,500 | KANSAS CITY SOUTHERN* | 238,035 | |||||||||||||
| 5,100 | LANDSTAR SYSTEM INC. | 244,392 | |||||||||||||
| 9,600 | MARTEN TRANSPORT LTD. | 172,704 | |||||||||||||
| 897,451 | 17.61 | ||||||||||||||
| MATERIALS | 5.98 | ||||||||||||||
| CHEMICALS | |||||||||||||||
| 6,300 | H.B. FULLER CO. | 145,593 | |||||||||||||
| 145,593 | 2.86 | ||||||||||||||
| METALS & MINING | |||||||||||||||
| 11,500 | COMMERCIAL METALS CO. | 159,045 | |||||||||||||
| 159,045 | 3.12 | ||||||||||||||
| TOTAL COMMON STOCK (Cost: $4,294,954) | 5,254,671 | 103.11 | |||||||||||||
| TOTAL INVESTMENT IN SECURITIES (Cost: $4,294,954) | 5,254,671 | 103.11 | |||||||||||||
| OTHER ASSETS LESS LIABILITIES | (158,688 | ) | (3.11 | ) | |||||||||||
| TOTAL NET ASSETS | 5,095,983 | 100.00 | |||||||||||||
* Non-income producing
** The principal amount is stated in U.S. dollars unless otherwise indicated.
See Accompanying Notes to Financial Statements which are an integral part of these financial statements.
53
Pacific Advisors Small Cap Value Fund
Schedule of Investments
as of December 31, 2011
| Quantity or Principal | Description | Current $ Value** | % of Total Net Assets | ||||||||||||
| COMMON STOCK | |||||||||||||||
| CONSUMER DISCRETIONARY | 20.29 | ||||||||||||||
| AUTO COMPONENTS | |||||||||||||||
| 275,000 | AMERIGON INC.* | 3,921,500 | |||||||||||||
| 3,921,500 | 4.12 | ||||||||||||||
| HOTELS, RESTAURANTS & LEISURE | |||||||||||||||
| 165,000 | BRAVO BRIO RESTAURANT GROUP INC.* | 2,829,750 | |||||||||||||
| 2,829,750 | 2.97 | ||||||||||||||
| SPECIALTY RETAIL | |||||||||||||||
| 470,000 | CONN'S INC.* | 5,217,000 | |||||||||||||
| 115,000 | RUSH ENTERPRISES INC.* | 2,405,800 | |||||||||||||
| 335,000 | SONIC AUTOMOTIVE INC. | 4,961,350 | |||||||||||||
| 12,584,150 | 13.21 | ||||||||||||||
| CONSUMER STAPLES | 3.46 | ||||||||||||||
| FOOD PRODUCTS | |||||||||||||||
| 248,000 | DARLING INT'L INC.* | 3,295,920 | |||||||||||||
| 3,295,920 | 3.46 | ||||||||||||||
| ENERGY | 22.54 | ||||||||||||||
| ENERGY EQUIPMENT & SERVICES | |||||||||||||||
| 85,000 | HORNBECK OFFSHORE SERVICES INC.* | 2,636,700 | |||||||||||||
| 307,000 | MATRIX SERVICE CO.* | 2,898,080 | |||||||||||||
| 265,000 | MITCHAM INDUSTRIES INC.* | 5,787,600 | |||||||||||||
| 150,000 | NATURAL GAS SERVICES GROUP* | 2,169,000 | |||||||||||||
| 420,000 | NORTH AMERICAN ENERGY PARTNERS INC.* | 2,704,800 | |||||||||||||
| 590,000 | PARKER DRILLING CO.* | 4,230,300 | |||||||||||||
| 20,426,480 | 21.44 | ||||||||||||||
| OIL, GAS & CONSUMABLE FUELS | |||||||||||||||
| 654,500 | INFINITY ENERGY RESOURCES INC.* | 1,047,200 | |||||||||||||
| 1,047,200 | 1.10 | ||||||||||||||
| FINANCIALS | 12.54 | ||||||||||||||
| COMMERCIAL BANKS | |||||||||||||||
| 310,000 | BBCN BANCORP INC.* | 2,929,500 | |||||||||||||
| 208,000 | EAST WEST BANCORP INC. | 4,108,000 | |||||||||||||
| 300,000 | WILSHIRE BANCORP INC. | 1,089,000 | |||||||||||||
| 8,126,500 | 8.53 | ||||||||||||||
See Accompanying Notes to Financial Statements which are an integral part of these financial statements.
54
Pacific Advisors Small Cap Value Fund
Schedule of Investments
as of December 31, 2011
| Quantity or Principal | Description | Current $ Value** | % of Total Net Assets | ||||||||||||
| COMMON STOCK continued | |||||||||||||||
| CONSUMER FINANCE | |||||||||||||||
| 145,000 | EZCORP INC. A* | 3,823,650 | |||||||||||||
| 3,823,650 | 4.01 | ||||||||||||||
| HEALTH CARE | 2.70 | ||||||||||||||
| HEALTH CARE EQUIPMENT & SUPPLIES | |||||||||||||||
| 310,000 | ROCHESTER MEDICAL CORP.* | 2,569,900 | |||||||||||||
| 2,569,900 | 2.70 | ||||||||||||||
| INDUSTRIALS | 37.09 | ||||||||||||||
| COMMERCIAL SERVICES & SUPPLIES | |||||||||||||||
| 199,000 | MOBILE MINI INC.* | 3,472,550 | |||||||||||||
| 149,000 | TEAM INC.* | 4,432,750 | |||||||||||||
| 170,000 | US ECOLOGY INC. | 3,192,600 | |||||||||||||
| 11,097,900 | 11.65 | ||||||||||||||
| CONSTRUCTION & ENGINEERING | |||||||||||||||
| 432,000 | FURMANITE CORP.* | 2,725,920 | |||||||||||||
| 2,725,920 | 2.86 | ||||||||||||||
| MARINE | |||||||||||||||
| 96,000 | KIRBY CORP.* | 6,320,640 | |||||||||||||
| 6,320,640 | 6.63 | ||||||||||||||
| ROAD & RAIL | |||||||||||||||
| 300,000 | SAIA INC.* | 3,744,000 | |||||||||||||
| 420,000 | VITRAN CORPORATION INC.* | 2,419,200 | |||||||||||||
| 6,163,200 | 6.47 | ||||||||||||||
| TRADING COMPANIES & DISTRIBUTORS | |||||||||||||||
| 150,000 | DXP ENTERPRISES INC.* | 4,830,000 | |||||||||||||
| 146,000 | TAL INT'L GROUP INC. | 4,203,340 | |||||||||||||
| 9,033,340 | 9.48 | ||||||||||||||
| MATERIALS | 1.74 | ||||||||||||||
| METALS & MINING | |||||||||||||||
| 120,000 | COMMERCIAL METALS CO. | 1,659,600 | |||||||||||||
| 1,659,600 | 1.74 | ||||||||||||||
See Accompanying Notes to Financial Statements which are an integral part of these financial statements.
55
Pacific Advisors Small Cap Value Fund
Schedule of Investments
as of December 31, 2011
| Quantity or Principal | Description | Current $ Value** | % of Total Net Assets | ||||||||||||
| COMMON STOCK continued | |||||||||||||||
| TELECOMMUNICATION SERVICES | 4.18 | ||||||||||||||
| DIVERSIFIED TELECOM. SERVICES | |||||||||||||||
| 470,000 | PREMIERE GLOBAL SERVICES INC.* | 3,980,900 | |||||||||||||
| 3,980,900 | 4.18 | ||||||||||||||
| TOTAL COMMON STOCK (Cost: $73,400,936) | 99,606,550 | 104.54 | |||||||||||||
| TOTAL INVESTMENT IN SECURITIES (Cost: $73,400,936) | 99,606,550 | 104.54 | |||||||||||||
| OTHER ASSETS LESS LIABILITIES | (4,328,157 | ) | (4.54 | ) | |||||||||||
| TOTAL NET ASSETS | 95,278,393 | 100.00 | |||||||||||||
* Non-income producing
** The principal amount is stated in U.S. dollars unless otherwise indicated.
See Accompanying Notes to Financial Statements which are an integral part of these financial statements.
56
(This page has been left blank intentionally.)
57
Pacific Advisors Fund Inc.
Statement of Assets and Liabilities
December 31, 2011
| Government Securities Fund | Income and Equity Fund | Balanced Fund | Large Cap Value Fund | Mid Cap Value Fund | Small Cap Value Fund | ||||||||||||||||||||||
| Assets | |||||||||||||||||||||||||||
| Investment securities | |||||||||||||||||||||||||||
| At cost | $ | 2,844,559 | $ | 6,872,084 | $ | 14,170,723 | $ | 3,618,299 | $ | 4,294,954 | $ | 73,400,936 | |||||||||||||||
| At fair value | $ | 2,871,938 | $ | 7,159,269 | $ | 15,189,039 | $ | 4,008,932 | $ | 5,254,671 | $ | 99,606,550 | |||||||||||||||
| Cash or cash equivalents, at fair value | 13,121 | 96,218 | - | - | - | - | |||||||||||||||||||||
| Accrued income receivable | 8,881 | 55,917 | 70,608 | 5,217 | 1,775 | 8,375 | |||||||||||||||||||||
| Receivable for capital shares sold | 1,470 | 1,802 | 6,324 | 46,153 | 16,702 | 146,438 | |||||||||||||||||||||
| Other assets | - | - | - | - | - | 117 | |||||||||||||||||||||
| Total assets | 2,895,410 | 7,313,206 | 15,265,971 | 4,060,302 | 5,273,148 | 99,761,480 | |||||||||||||||||||||
| Liabilities | |||||||||||||||||||||||||||
| Bank borrowings (Note 7) | - | - | 615,346 | 136,322 | 157,368 | 4,124,556 | |||||||||||||||||||||
| Payable for fund shares redeemed | 965 | 705 | 15,279 | - | 474 | 99,664 | |||||||||||||||||||||
| Accounts payable | 10,529 | 24,849 | 62,626 | 16,662 | 15,723 | 243,149 | |||||||||||||||||||||
| Accounts payable to related parties (Note 3) | - | 3,600 | 3,600 | - | 3,600 | 15,718 | |||||||||||||||||||||
| Total liabilities | 11,494 | 29,154 | 696,851 | 152,984 | 177,165 | 4,483,087 | |||||||||||||||||||||
| Net Assets | $ | 2,883,916 | $ | 7,284,052 | $ | 14,569,120 | $ | 3,907,318 | $ | 5,095,983 | $ | 95,278,393 | |||||||||||||||
| Summary of Shareholders' Equity | |||||||||||||||||||||||||||
| Paid in capital | $ | 3,179,164 | $ | 7,725,331 | $ | 13,876,623 | $ | 3,685,160 | $ | 6,216,316 | $ | 86,020,592 | |||||||||||||||
| Accumulated undistributed net investment income | - | 186 | (351 | ) | - | - | - | ||||||||||||||||||||
| Accumulated undistributed net realized losses on security transactions | (322,627 | ) | (728,650 | ) | (325,468 | ) | (168,475 | ) | (2,080,050 | ) | (16,947,813 | ) | |||||||||||||||
| Net unrealized appreciation of investments | 27,379 | 287,185 | 1,018,316 | 390,633 | 959,717 | 26,205,614 | |||||||||||||||||||||
| Net assets at December 31, 2011 | $ | 2,883,916 | $ | 7,284,052 | $ | 14,569,120 | $ | 3,907,318 | $ | 5,095,983 | $ | 95,278,393 | |||||||||||||||
| Total authorized capital stock per class: 50,000,000 ($0.01 par value) | |||||||||||||||||||||||||||
| Class A: | |||||||||||||||||||||||||||
| Net assets | $ | 1,872,582 | $ | 4,235,142 | $ | 3,801,187 | $ | 3,277,529 | $ | 4,052,182 | $ | 88,323,451 | |||||||||||||||
| Shares outstanding | 205,172 | 430,420 | 282,190 | 352,455 | 372,529 | 2,565,730 | |||||||||||||||||||||
| Net asset value and redemption price per share | $ | 9.13 | $ | 9.84 | $ | 13.47 | $ | 9.30 | $ | 10.88 | $ | 34.42 | |||||||||||||||
| Maximum offering price per share | $ | 9.59 | $ | 10.33 | $ | 14.29 | $ | 9.87 | $ | 11.54 | $ | 36.52 | |||||||||||||||
| Sales load | 4.75 | % | 4.75 | % | 5.75 | % | 5.75 | % | 5.75 | % | 5.75 | % | |||||||||||||||
| Class C: | |||||||||||||||||||||||||||
| Net assets | $ | 1,011,334 | $ | 3,048,910 | $ | 10,767,933 | $ | 629,789 | $ | 1,043,801 | $ | 6,948,914 | |||||||||||||||
| Shares outstanding | 112,892 | 323,627 | 850,822 | 75,493 | 104,422 | 236,242 | |||||||||||||||||||||
| Net asset value and redemption price per share | $ | 8.96 | $ | 9.42 | $ | 12.66 | $ | 8.34 | $ | 10.00 | $ | 29.41 | |||||||||||||||
| Class I: | |||||||||||||||||||||||||||
| Net assets | N/A | N/A | N/A | N/A | N/A | $ | 6,028 | ||||||||||||||||||||
| Shares outstanding | 154 | ||||||||||||||||||||||||||
| Net asset value and redemption price per share | N/A | N/A | N/A | N/A | N/A | $ | 39.15 | ||||||||||||||||||||
See Accompanying Notes to Financial Statements which are an integral part of these financial statements.
58
59
Pacific Advisors Fund Inc.
Statement of Operations
For the period ended December 31, 2011
| Government Securities Fund | Income and Equity Fund | Balanced Fund | Large Cap Value Fund | Mid Cap Value Fund | Small Cap Value Fund | ||||||||||||||||||||||
| Investment Income | |||||||||||||||||||||||||||
| Dividends | $ | 32,262 | $ | 175,889 | $ | 387,023 | $ | 86,249 | $ | 56,233 | $ | 538,640 | |||||||||||||||
| Interest | 35,251 | 228,828 | 236,599 | 1 | - | - | |||||||||||||||||||||
| Total investment income | 67,513 | 404,717 | 623,622 | 86,250 | 56,233 | 538,640 | |||||||||||||||||||||
| Expenses | |||||||||||||||||||||||||||
| Investment management fees | 23,340 | 62,329 | 137,021 | 27,122 | 54,710 | 708,642 | |||||||||||||||||||||
| Transfer agent fees | 51,458 | 67,359 | 104,792 | 74,812 | 59,358 | 477,899 | |||||||||||||||||||||
| Fund accounting fees | 22,590 | 43,322 | 100,391 | 22,679 | 29,040 | 499,792 | |||||||||||||||||||||
| Legal fees | 4,609 | 13,417 | 34,848 | 4,727 | 8,996 | 171,994 | |||||||||||||||||||||
| Audit fees | 5,180 | 11,988 | 26,313 | 5,234 | 7,907 | 136,879 | |||||||||||||||||||||
| Registration fees | 19,587 | 22,031 | 30,762 | 20,261 | 25,462 | 67,541 | |||||||||||||||||||||
| Printing | 3,094 | 9,118 | 23,370 | 3,094 | 6,188 | 109,841 | |||||||||||||||||||||
| Custody fees | 7,373 | 7,859 | 9,799 | 7,111 | 6,915 | 27,076 | |||||||||||||||||||||
| Interest on borrowings | 198 | 823 | 7,021 | 701 | 3,752 | 73,164 | |||||||||||||||||||||
| Director fees/meetings | 1,921 | 4,565 | 10,469 | 1,910 | 3,027 | 52,699 | |||||||||||||||||||||
| Distribution and service (12b-1) fees (Note 3) | 19,807 | 51,030 | 153,193 | 13,949 | 23,304 | 299,821 | |||||||||||||||||||||
| Other expenses | 4,901 | 13,503 | 33,984 | 4,914 | 8,944 | 155,977 | |||||||||||||||||||||
| Total expenses, before fees waived | 164,058 | 307,344 | 671,963 | 186,514 | 237,603 | 2,781,325 | |||||||||||||||||||||
| Less fees waived (Note 3) | 66,540 | 62,329 | - | 70,322 | - | - | |||||||||||||||||||||
| Net expenses | 97,518 | 245,015 | 671,963 | 116,192 | 237,603 | 2,781,325 | |||||||||||||||||||||
| Net Investment Income (Loss) | (30,005 | ) | 159,702 | (48,341 | ) | (29,942 | ) | (181,370 | ) | (2,242,685 | ) | ||||||||||||||||
| Net Realized and Unrealized Gain (Loss) on Investments | |||||||||||||||||||||||||||
| Net realized gain (loss) on investments | 34,669 | (10,219 | ) | 499,229 | 15,081 | (639,793 | ) | (1,116,487 | ) | ||||||||||||||||||
| Change in net unrealized appreciation (depreciation) of investments | (11,716 | ) | 6,387 | (694,416 | ) | 126,964 | 390,623 | 11,979,617 | |||||||||||||||||||
| Net realized and unrealized gain on investments | 22,953 | (3,832 | ) | (195,187 | ) | 142,045 | (249,170 | ) | 10,863,130 | ||||||||||||||||||
| Net Increase (Decrease) in Net Assets Resulting from Operations | $ | (7,052 | ) | $ | 155,870 | $ | (243,528 | ) | $ | 112,103 | $ | (430,540 | ) | $ | 8,620,445 | ||||||||||||
See Accompanying Notes to Financial Statements which are an integral part of these financial statements.
60
61
Pacific Advisors Fund Inc.
Statements of Changes in Net Assets
| Government Securities Fund | Income and Equity Fund | Balanced Fund | |||||||||||||||||||||||||
| Year ended December 31, 2011 | Year ended December 31, 2010 | Year ended December 31, 2011 | Year ended December 31, 2010 | Year ended December 31, 2011 | Year ended December 31, 2010 | ||||||||||||||||||||||
| Increase (Decrease) in Net Assets From Operations | |||||||||||||||||||||||||||
| Net investment income (loss) | $ | (30,005 | ) | $ | 7,595 | $ | 159,702 | $ | 183,430 | $ | (48,341 | ) | $ | (15,419 | ) | ||||||||||||
| Net realized gain (loss) on investments | 34,669 | 11,389 | (10,219 | ) | 67,205 | 499,229 | 3,857,418 | ||||||||||||||||||||
| Change in net unrealized appreciation (depreciation) of investments | (11,716 | ) | 68,210 | 6,387 | 275,458 | (694,416 | ) | (2,295,332 | ) | ||||||||||||||||||
| Increase (decrease) in net assets resulting from operations | (7,052 | ) | 87,194 | 155,870 | 526,093 | (243,528 | ) | 1,546,667 | |||||||||||||||||||
| From Distributions to Shareholders | |||||||||||||||||||||||||||
| Class A: | |||||||||||||||||||||||||||
| Net investment income | - | (6,629 | ) | (107,934 | ) | (97,430 | ) | - | (1,264 | ) | |||||||||||||||||
| Net capital gains | - | - | - | - | (247,245 | ) | (359,087 | ) | |||||||||||||||||||
| Return of capital | - | (7,491 | ) | - | (1,389 | ) | - | - | |||||||||||||||||||
| Class C: | |||||||||||||||||||||||||||
| Net investment income | - | (1,530 | ) | (49,870 | ) | (86,808 | ) | - | (4,725 | ) | |||||||||||||||||
| Net capital gains | - | - | - | - | (740,888 | ) | (1,768,006 | ) | |||||||||||||||||||
| Return of capital | - | (1,728 | ) | - | (1,237 | ) | - | - | |||||||||||||||||||
| Class I: | N/A | N/A | N/A | N/A | N/A | N/A | |||||||||||||||||||||
| Net investment income | |||||||||||||||||||||||||||
| Net capital gains | |||||||||||||||||||||||||||
| Return of capital | |||||||||||||||||||||||||||
| Decrease in net assets resulting from distributions | - | (17,378 | ) | (157,804 | ) | (186,864 | ) | (988,133 | ) | (2,133,082 | ) | ||||||||||||||||
| From Capital Share Transactions (Note 6) | |||||||||||||||||||||||||||
| Proceeds from shares sold | 546,879 | 973,230 | 1,485,061 | 1,706,840 | 1,144,916 | 758,726 | |||||||||||||||||||||
| Proceeds from shares purchased by reinvestment of dividends | - | 15,208 | 145,377 | 173,489 | 948,827 | 2,071,269 | |||||||||||||||||||||
| Cost of shares repurchased | (1,770,586 | ) | (2,074,113 | ) | (3,040,759 | ) | (1,517,350 | ) | (8,117,343 | ) | (9,609,397 | ) | |||||||||||||||
| Increase (decrease) in net assets resulting from capital share transactions | (1,223,707 | ) | (1,085,675 | ) | (1,410,321 | ) | 362,979 | (6,023,600 | ) | (6,779,402 | ) | ||||||||||||||||
| Increase (decrease) in net assets | (1,230,759 | ) | (1,015,859 | ) | (1,412,255 | ) | 702,208 | (7,255,261 | ) | (7,365,817 | ) | ||||||||||||||||
| Net Assets | |||||||||||||||||||||||||||
| Beginning of period | 4,114,675 | 5,130,534 | 8,696,307 | 7,994,099 | 21,824,381 | 29,190,198 | |||||||||||||||||||||
| End of period | $ | 2,883,916 | $ | 4,114,675 | $ | 7,284,052 | $ | 8,696,307 | $ | 14,569,120 | $ | 21,824,381 | |||||||||||||||
| Including undistributed net investment income | $ | - | $ | - | $ | 186 | $ | (1,713 | ) | $ | (351 | ) | $ | (1,436 | ) | ||||||||||||
See Accompanying Notes to Financial Statements which are an integral part of these financial statements.
62
63
Pacific Advisors Fund Inc.
Statements of Changes in Net Assets
| Large Cap Value Fund | Mid Cap Value Fund | Small Cap Value Fund | |||||||||||||||||||||||||
| Year ended December 31, 2011 | Year ended December 31, 2010 | Year ended December 31, 2011 | Year ended December 31, 2010 | Year ended December 31, 2011 | Year ended December 31, 2010 | ||||||||||||||||||||||
| Increase (Decrease) in Net Assets From Operations | |||||||||||||||||||||||||||
| Net investment income (loss) | $ | (29,942 | ) | $ | (44,617 | ) | $ | (181,370 | ) | $ | (198,130 | ) | $ | (2,242,685 | ) | $ | (2,573,889 | ) | |||||||||
| Net realized gain (loss) on investments | 15,081 | 161,332 | (639,793 | ) | 261,557 | (1,116,487 | ) | (3,640,855 | ) | ||||||||||||||||||
| Change in net unrealized appreciation (depreciation) of investments | 126,964 | 110,894 | 390,623 | 1,372,193 | 11,979,617 | 23,928,300 | |||||||||||||||||||||
| Increase (decrease) in net assets resulting from operations | 112,103 | 227,609 | (430,540 | ) | 1,435,620 | 8,620,445 | 17,713,556 | ||||||||||||||||||||
| From Distributions to Shareholders | |||||||||||||||||||||||||||
| Class A: | |||||||||||||||||||||||||||
| Net investment income | - | - | - | - | - | - | |||||||||||||||||||||
| Net capital gains | - | - | - | - | - | - | |||||||||||||||||||||
| Return of capital | - | - | - | - | - | - | |||||||||||||||||||||
| Class C: | |||||||||||||||||||||||||||
| Net investment income | - | - | - | - | - | - | |||||||||||||||||||||
| Net capital gains | - | - | - | - | - | - | |||||||||||||||||||||
| Return of capital | - | - | - | - | - | - | |||||||||||||||||||||
| Class I: | N/A | N/A | N/A | N/A | |||||||||||||||||||||||
| Net investment income | - | - | |||||||||||||||||||||||||
| Net capital gains | - | - | |||||||||||||||||||||||||
| Return of capital | - | - | |||||||||||||||||||||||||
| Decrease in net assets resulting from distributions | - | - | - | - | - | - | |||||||||||||||||||||
| From Capital Share Transactions (Note 6) | |||||||||||||||||||||||||||
| Proceeds from shares sold | 1,023,186 | 914,546 | 1,539,519 | 376,408 | 20,450,558 | 15,210,757 | |||||||||||||||||||||
| Proceeds from shares purchased by reinvestment of dividends | - | - | - | - | - | - | |||||||||||||||||||||
| Cost of shares repurchased | (419,968 | ) | (763,971 | ) | (1,469,243 | ) | (2,700,767 | ) | (37,982,752 | ) | (61,787,155 | ) | |||||||||||||||
| Increase (decrease) in net assets resulting from capital share transactions | 603,218 | 150,575 | 70,276 | (2,324,359 | ) | (17,532,194 | ) | (46,576,398 | ) | ||||||||||||||||||
| Increase (decrease) in net assets | 715,321 | 378,184 | (360,264 | ) | (888,739 | ) | (8,911,749 | ) | (28,862,842 | ) | |||||||||||||||||
| Net Assets | |||||||||||||||||||||||||||
| Beginning of period | 3,191,997 | 2,813,813 | 5,456,247 | 6,344,986 | 104,190,142 | 133,052,984 | |||||||||||||||||||||
| End of period | $ | 3,907,318 | $ | 3,191,997 | $ | 5,095,983 | $ | 5,456,247 | $ | 95,278,393 | $ | 104,190,142 | |||||||||||||||
| Including undistributed net investment income | $ | - | $ | - | $ | - | $ | - | $ | - | $ | - | |||||||||||||||
See Accompanying Notes to Financial Statements which are an integral part of these financial statements.
64
65
Pacific Advisors Fund Inc.
Financial Highlights
(For a share outstanding throughout the period)
| Government Securities Fund | |||||||||||||||||||||||
| Class A | |||||||||||||||||||||||
| For the year ended December 31, | |||||||||||||||||||||||
| 2011 | 2010 | 2009 | 2008 | 2007 | |||||||||||||||||||
| Per Share Operating Performance | |||||||||||||||||||||||
| Net asset value, beginning of period | $ | 9.13 | $ | 8.99 | $ | 8.94 | $ | 9.42 | $ | 9.24 | |||||||||||||
| Income from investing operations | |||||||||||||||||||||||
| Net investment income (loss) | (0.02 | ) | 0.05 | 0.18 | 0.32 | 0.29 | |||||||||||||||||
| Net realized and unrealized gains (losses) on securities | 0.02 | 0.14 | 0.02 | (0.53 | ) | 0.22 | |||||||||||||||||
| Total from investment operations | - | 0.19 | 0.20 | (0.21 | ) | 0.51 | |||||||||||||||||
| Less distributions | |||||||||||||||||||||||
| From net investment income | - | (0.02 | ) | (0.15 | ) | (0.27 | ) | (0.33 | ) | ||||||||||||||
| From net capital gains | - | - | - | - | - | ||||||||||||||||||
| From return of capital | - | (0.03 | ) | - | - | - | |||||||||||||||||
| Total distributions | - | (0.05 | ) | (0.15 | ) | (0.27 | ) | (0.33 | ) | ||||||||||||||
| Net asset value, end of period | $ | 9.13 | $ | 9.13 | $ | 8.99 | $ | 8.94 | $ | 9.42 | |||||||||||||
| Total Investment Return (a) | 0.00 | % | 2.16 | % | 2.26 | % | (2.28 | )% | 5.54 | % | |||||||||||||
| Ratios/Supplemental Data | |||||||||||||||||||||||
| Net assets, end of period (000's) | $ | 1,873 | $ | 2,375 | $ | 2,537 | $ | 3,054 | $ | 3,817 | |||||||||||||
| Ratio of net investment income (loss) to average net assets | |||||||||||||||||||||||
| With expense reductions | (0.54 | )% | 0.49 | % | 1.69 | % | 3.33 | % | 3.57 | % | |||||||||||||
| Without expense reductions | (2.39 | )% | (1.10 | )% | 0.25 | % | 1.87 | % | 2.21 | % | |||||||||||||
| Ratio of expenses to average net assets | |||||||||||||||||||||||
| With expense reductions | 2.42 | % | 2.09 | % | 1.69 | % | 1.65 | % | 1.62 | % | |||||||||||||
| Without expense reductions | 4.26 | % | 3.69 | % | 3.13 | % | 3.11 | % | 2.98 | % | |||||||||||||
| Fund portfolio turnover rate | 115 | % | 156 | % | 224 | % | 173 | % | 59 | % | |||||||||||||
| Class C | |||||||||||||||||||||||
| For the year ended December 31, | |||||||||||||||||||||||
| 2011 | 2010 | 2009 | 2008 | 2007 | |||||||||||||||||||
| Per Share Operating Performance | |||||||||||||||||||||||
| Net asset value, beginning of period | $ | 9.02 | $ | 8.90 | $ | 8.87 | $ | 9.45 | $ | 9.23 | |||||||||||||
| Income from investing operations | |||||||||||||||||||||||
| Net investment income (loss) | (0.33 | ) | (0.09 | ) | 0.09 | 0.28 | 0.25 | ||||||||||||||||
| Net realized and unrealized gains (losses) on securities | 0.27 | 0.23 | 0.04 | (0.56 | ) | 0.18 | |||||||||||||||||
| Total from investment operations | (0.06 | ) | 0.14 | 0.13 | (0.28 | ) | 0.43 | ||||||||||||||||
| Less distributions | |||||||||||||||||||||||
| From net investment income | - | (0.01 | ) | (0.10 | ) | (0.30 | ) | (0.21 | ) | ||||||||||||||
| From net capital gains | - | - | - | - | - | ||||||||||||||||||
| From return of capital | - | (0.01 | ) | - | - | - | |||||||||||||||||
| Total distributions | - | (0.02 | ) | (0.10 | ) | (0.30 | ) | (0.21 | ) | ||||||||||||||
| Net asset value, end of period | $ | 8.96 | $ | 9.02 | $ | 8.90 | $ | 8.87 | $ | 9.45 | |||||||||||||
| Total Investment Return | (0.67 | )% | 1.49 | % | 1.44 | % | (3.02 | )% | 4.73 | % | |||||||||||||
| Ratios/Supplemental Data | |||||||||||||||||||||||
| Net assets, end of period (000's) | $ | 1,011 | $ | 1,740 | $ | 2,594 | $ | 2,456 | $ | 1,595 | |||||||||||||
| Ratio of net investment income (loss) to average net assets | |||||||||||||||||||||||
| With expense reductions | (1.27 | )% | (0.18 | )% | 0.96 | % | 2.56 | % | 2.77 | % | |||||||||||||
| Without expense reductions | (3.14 | )% | (1.80 | )% | (0.47 | )% | 1.10 | % | 1.41 | % | |||||||||||||
| Ratio of expenses to average net assets | |||||||||||||||||||||||
| With expense reductions | 3.16 | % | 2.80 | % | 2.41 | % | 2.43 | % | 2.40 | % | |||||||||||||
| Without expense reductions | 5.03 | % | 4.42 | % | 3.85 | % | 3.89 | % | 3.76 | % | |||||||||||||
| Fund portfolio turnover rate | 115 | % | 156 | % | 224 | % | 173 | % | 59 | % | |||||||||||||
(a) The Fund's maximum sales charge is not included in the total return computation.
See Accompanying Notes to Financial Statements
66
Pacific Advisors Fund Inc.
Financial Highlights
(For a share outstanding throughout the period)
| Income and Equity Fund | |||||||||||||||||||||||
| Class A | |||||||||||||||||||||||
| For the year ended December 31, | |||||||||||||||||||||||
| 2011 | 2010 | 2009 | 2008 | 2007 | |||||||||||||||||||
| Per Share Operating Performance | |||||||||||||||||||||||
| Net asset value, beginning of period | $ | 9.87 | $ | 9.49 | $ | 8.48 | $ | 10.61 | $ | 10.74 | |||||||||||||
| Income from investing operations | |||||||||||||||||||||||
| Net investment income | 0.21 | 0.19 | 0.30 | 0.33 | 0.31 | ||||||||||||||||||
| Net realized and unrealized gains (losses) on securities | 0.01 | 0.45 | 0.98 | (2.16 | ) | (0.05 | ) | ||||||||||||||||
| Total from investment operations | 0.22 | 0.64 | 1.28 | (1.83 | ) | 0.26 | |||||||||||||||||
| Less distributions | |||||||||||||||||||||||
| From net investment income | (0.25 | ) | (0.26 | ) | (0.27 | ) | (0.30 | ) | (0.28 | ) | |||||||||||||
| From net capital gains | - | - | - | - | (0.11 | ) | |||||||||||||||||
| From return of capital | - | - | (b) | - | - | - | |||||||||||||||||
| Total distributions | (0.25 | ) | (0.26 | ) | (0.27 | ) | (0.30 | ) | (0.39 | ) | |||||||||||||
| Net asset value, end of period | $ | 9.84 | $ | 9.87 | $ | 9.49 | $ | 8.48 | $ | 10.61 | |||||||||||||
| Total Investment Return (a) | 2.24 | % | 6.88 | % | 15.37 | % | (17.49 | )% | 2.39 | % | |||||||||||||
| Ratios/Supplemental Data | |||||||||||||||||||||||
| Net assets, end of period (000's) | $ | 4,235 | $ | 3,922 | $ | 2,865 | $ | 2,737 | $ | 3,663 | |||||||||||||
| Ratio of net investment income to average net assets | |||||||||||||||||||||||
| With expense reductions | 2.27 | % | 2.57 | % | 3.22 | % | 3.22 | % | 2.78 | % | |||||||||||||
| Without expense reductions | 1.52 | % | 1.81 | % | 2.47 | % | 2.47 | % | 2.16 | % | |||||||||||||
| Ratio of expenses to average net assets | |||||||||||||||||||||||
| With expense reductions | 2.59 | % | 2.34 | % | 2.32 | % | 2.05 | % | 1.95 | % | |||||||||||||
| Without expense reductions | 3.34 | % | 3.09 | % | 3.07 | % | 2.80 | % | 2.57 | % | |||||||||||||
| Fund portfolio turnover rate | 16 | % | 21 | % | 29 | % | 39 | % | 46 | % | |||||||||||||
| Class C | |||||||||||||||||||||||
| For the year ended December 31, | |||||||||||||||||||||||
| 2011 | 2010 | 2009 | 2008 | 2007 | |||||||||||||||||||
| Per Share Operating Performance | |||||||||||||||||||||||
| Net asset value, beginning of period | $ | 9.40 | $ | 9.03 | $ | 8.09 | $ | 10.14 | $ | 10.31 | |||||||||||||
| Income from investing operations | |||||||||||||||||||||||
| Net investment income | 0.09 | 0.15 | 0.21 | 0.23 | 0.22 | ||||||||||||||||||
| Net realized and unrealized gains (losses) on securities | 0.05 | 0.38 | 0.95 | (2.04 | ) | (0.05 | ) | ||||||||||||||||
| Total from investment operations | 0.14 | 0.53 | 1.16 | (1.81 | ) | 0.17 | |||||||||||||||||
| Less distributions | |||||||||||||||||||||||
| From net investment income | (0.12 | ) | (0.16 | ) | (0.22 | ) | (0.24 | ) | (0.23 | ) | |||||||||||||
| From net capital gains | - | - | - | - | (0.11 | ) | |||||||||||||||||
| From return of capital | - | (b) | - | (b) | - | - | - | ||||||||||||||||
| Total distributions | (0.12 | ) | (0.16 | ) | (0.22 | ) | (0.24 | ) | (0.34 | ) | |||||||||||||
| Net asset value, end of period | $ | 9.42 | $ | 9.40 | $ | 9.03 | $ | 8.09 | $ | 10.14 | |||||||||||||
| Total Investment Return | 1.54 | % | 5.95 | % | 14.56 | % | (18.10 | )% | 1.63 | % | |||||||||||||
| Ratios/Supplemental Data | |||||||||||||||||||||||
| Net assets, end of period (000's) | $ | 3,049 | $ | 4,774 | $ | 5,129 | $ | 4,697 | $ | 5,990 | |||||||||||||
| Ratio of net investment income to average net assets | |||||||||||||||||||||||
| With expense reductions | 1.52 | % | 1.82 | % | 2.47 | % | 2.48 | % | 2.06 | % | |||||||||||||
| Without expense reductions | 0.77 | % | 1.07 | % | 1.72 | % | 1.73 | % | 1.43 | % | |||||||||||||
| Ratio of expenses to average net assets | |||||||||||||||||||||||
| With expense reductions | 3.33 | % | 3.07 | % | 3.06 | % | 2.81 | % | 2.70 | % | |||||||||||||
| Without expense reductions | 4.08 | % | 3.82 | % | 3.81 | % | 3.56 | % | 3.32 | % | |||||||||||||
| Fund portfolio turnover rate | 16 | % | 21 | % | 29 | % | 39 | % | 46 | % | |||||||||||||
(a) The Fund's maximum sales charge is not included in the total return computation.
(b) The amount is less than $0.005 and rounded to zero.
See Accompanying Notes to Financial Statements
67
Pacific Advisors Fund Inc.
Financial Highlights
(For a share outstanding throughout the period)
| Balanced Fund | |||||||||||||||||||||||
| Class A | |||||||||||||||||||||||
| For the year ended December 31, | |||||||||||||||||||||||
| 2011 | 2010 | 2009 | 2008 | 2007 | |||||||||||||||||||
| Per Share Operating Performance | |||||||||||||||||||||||
| Net asset value, beginning of period | $ | 14.56 | $ | 14.91 | $ | 12.41 | $ | 18.58 | $ | 18.42 | |||||||||||||
| Income from investing operations | |||||||||||||||||||||||
| Net investment income | - | 0.13 | 0.22 | 0.31 | 0.24 | ||||||||||||||||||
| Net realized and unrealized gains (losses) on securities | (0.16 | ) | 1.02 | 2.48 | (6.00 | ) | 0.97 | ||||||||||||||||
| Total from investment operations | (0.16 | ) | 1.15 | 2.70 | (5.69 | ) | 1.21 | ||||||||||||||||
| Less distributions | |||||||||||||||||||||||
| From net investment income | - | (0.01 | ) | (0.20 | ) | (0.28 | ) | (0.20 | ) | ||||||||||||||
| From net capital gains | (0.93 | ) | (1.49 | ) | - | (0.20 | ) | (0.85 | ) | ||||||||||||||
| Total distributions | (0.93 | ) | (1.50 | ) | (0.20 | ) | (0.48 | ) | (1.05 | ) | |||||||||||||
| Net asset value, end of period | $ | 13.47 | $ | 14.56 | $ | 14.91 | $ | 12.41 | $ | 18.58 | |||||||||||||
| Total Investment Return (a) | (1.14 | )% | 7.71 | % | 21.76 | % | (30.51 | )% | 6.53 | % | |||||||||||||
| Ratios/Supplemental Data | |||||||||||||||||||||||
| Net assets, end of period (000's) | $ | 3,801 | $ | 3,789 | $ | 4,362 | $ | 3,774 | $ | 5,918 | |||||||||||||
| Ratio of net investment income to average net assets | 0.29 | % | 0.55 | % | 1.58 | % | 1.73 | % | 1.02 | % | |||||||||||||
| Ratio of expenses to average net assets | 3.13 | % | 2.77 | % | 2.47 | % | 2.31 | % | 2.21 | % | |||||||||||||
| Fund portfolio turnover rate | 14 | % | 36 | % | 10 | % | 32 | % | 44 | % | |||||||||||||
| Class C | |||||||||||||||||||||||
| For the year ended December 31, | |||||||||||||||||||||||
| 2011 | 2010 | 2009 | 2008 | 2007 | |||||||||||||||||||
| Per Share Operating Performance | |||||||||||||||||||||||
| Net asset value, beginning of period | $ | 13.84 | $ | 14.35 | $ | 11.96 | $ | 17.88 | $ | 17.77 | |||||||||||||
| Income from investing operations | |||||||||||||||||||||||
| Net investment income (loss) | (0.15 | ) | (0.06 | ) | 0.10 | 0.16 | 0.05 | ||||||||||||||||
| Net realized and unrealized gains (losses) on securities | (0.10 | ) | 1.04 | 2.39 | (5.72 | ) | 0.96 | ||||||||||||||||
| Total from investment operations | (0.25 | ) | 0.98 | 2.49 | (5.56 | ) | 1.01 | ||||||||||||||||
| Less distributions | |||||||||||||||||||||||
| From net investment income | - | - | (b) | (0.10 | ) | (0.16 | ) | (0.05 | ) | ||||||||||||||
| From net capital gains | (0.93 | ) | (1.49 | ) | - | (0.20 | ) | (0.85 | ) | ||||||||||||||
| Total distributions | (0.93 | ) | (1.49 | ) | (0.10 | ) | (0.36 | ) | (0.90 | ) | |||||||||||||
| Net asset value, end of period | $ | 12.66 | $ | 13.84 | $ | 14.35 | $ | 11.96 | $ | 17.88 | |||||||||||||
| Total Investment Return | (1.86 | )% | 6.88 | % | 20.84 | % | (31.03 | )% | 5.67 | % | |||||||||||||
| Ratios/Supplemental Data | |||||||||||||||||||||||
| Net assets, end of period (000's) | $ | 10,768 | $ | 18,035 | $ | 24,828 | $ | 22,407 | $ | 34,960 | |||||||||||||
| Ratio of net investment income (loss) to average net assets | (0.42 | )% | (0.18 | )% | 0.82 | % | 0.96 | % | 0.27 | % | |||||||||||||
| Ratio of expenses to average net assets | 3.83 | % | 3.50 | % | 3.23 | % | 3.09 | % | 2.97 | % | |||||||||||||
| Fund portfolio turnover rate | 14 | % | 36 | % | 10 | % | 32 | % | 44 | % | |||||||||||||
(a) The Fund's maximum sales charge is not included in the total return computation.
See Accompanying Notes to Financial Statements
68
Pacific Advisors Fund Inc.
Financial Highlights
(For a share outstanding throughout the period)
| Large Cap Value Fund | |||||||||||||||||||||||
| Class A | |||||||||||||||||||||||
| For the year ended December 31, | |||||||||||||||||||||||
| 2011 | 2010 | 2009 | 2008 | 2007 | |||||||||||||||||||
| Per Share Operating Performance | |||||||||||||||||||||||
| Net asset value, beginning of period | $ | 8.98 | $ | 8.33 | $ | 6.51 | $ | 10.83 | $ | 9.21 | |||||||||||||
| Income from investing operations | |||||||||||||||||||||||
| Net investment income (loss) | 0.11 | (0.06 | ) | (0.24 | ) | (0.07 | ) | (0.07 | ) | ||||||||||||||
| Net realized and unrealized gains (losses) on securities | 0.21 | 0.71 | 2.06 | (4.25 | ) | 1.69 | |||||||||||||||||
| Total from investment operations | 0.32 | 0.65 | 1.82 | (4.32 | ) | 1.62 | |||||||||||||||||
| Less distributions | |||||||||||||||||||||||
| From net investment income | - | - | - | - | - | ||||||||||||||||||
| From net capital gains | - | - | - | - | - | ||||||||||||||||||
| Total distributions | - | - | - | - | - | ||||||||||||||||||
| Net asset value, end of period | $ | 9.30 | $ | 8.98 | $ | 8.33 | $ | 6.51 | $ | 10.83 | |||||||||||||
| Total Investment Return (a) | 3.56 | % | 7.80 | % | 27.96 | % | (39.89 | )% | 17.59 | % | |||||||||||||
| Ratios/Supplemental Data | |||||||||||||||||||||||
| Net assets, end of period (000's) | $ | 3,278 | $ | 2,511 | $ | 2,176 | $ | 1,984 | $ | 2,889 | |||||||||||||
| Ratio of net investment loss to average net assets | |||||||||||||||||||||||
| With expense reductions | (0.66 | )% | (1.32 | )% | (2.06 | )% | (1.38 | )% | (1.33 | )% | |||||||||||||
| Without expense reductions | (2.61 | )% | (3.50 | )% | (4.31 | )% | (2.41 | )% | (1.85 | )% | |||||||||||||
| Ratio of expenses to average net assets | |||||||||||||||||||||||
| With expense reductions | 3.05 | % | 3.64 | % | 3.46 | % | 2.62 | % | 2.65 | % | |||||||||||||
| Without expense reductions | 4.99 | % | 5.82 | % | 5.71 | % | 3.65 | % | 3.17 | % | |||||||||||||
| Fund portfolio turnover rate | 7 | % | 106 | % | 5 | % | 14 | % | 14 | % | |||||||||||||
| Class C | |||||||||||||||||||||||
| For the year ended December 31, | |||||||||||||||||||||||
| 2011 | 2010 | 2009 | 2008 | 2007 | |||||||||||||||||||
| Per Share Operating Performance | |||||||||||||||||||||||
| Net asset value, beginning of period | $ | 8.12 | $ | 7.58 | $ | 5.97 | $ | 10.03 | $ | 8.59 | |||||||||||||
| Income from investing operations | |||||||||||||||||||||||
| Net investment loss | (0.42 | ) | (0.17 | ) | (1.36 | ) | (0.31 | ) | (0.21 | ) | |||||||||||||
| Net realized and unrealized gains (losses) on securities | 0.64 | 0.71 | 2.97 | (3.75 | ) | 1.65 | |||||||||||||||||
| Total from investment operations | 0.22 | 0.54 | 1.61 | (4.06 | ) | 1.44 | |||||||||||||||||
| Less distributions | |||||||||||||||||||||||
| From net investment income | - | - | - | - | - | ||||||||||||||||||
| From net capital gains | - | - | - | - | - | ||||||||||||||||||
| Total distributions | - | - | - | - | - | ||||||||||||||||||
| Net asset value, end of period | $ | 8.34 | $ | 8.12 | $ | 7.58 | $ | 5.97 | $ | 10.03 | |||||||||||||
| Total Investment Return | 2.71 | % | 7.12 | % | 26.97 | % | (40.48 | )% | 16.76 | % | |||||||||||||
| Ratios/Supplemental Data | |||||||||||||||||||||||
| Net assets, end of period (000's) | $ | 630 | $ | 681 | $ | 637 | $ | 1,072 | $ | 2,096 | |||||||||||||
| Ratio of net investment loss to average net assets | |||||||||||||||||||||||
| With expense reductions | (1.53 | )% | (2.03 | )% | (2.69 | )% | (2.18 | )% | (2.07 | )% | |||||||||||||
| Without expense reductions | (3.46 | )% | (4.23 | )% | (4.96 | )% | (3.19 | )% | (2.60 | )% | |||||||||||||
| Ratio of expenses to average net assets | |||||||||||||||||||||||
| With expense reductions | 3.89 | % | 4.37 | % | 4.11 | % | 3.40 | % | 3.40 | % | |||||||||||||
| Without expense reductions | 5.82 | % | 6.57 | % | 6.39 | % | 4.42 | % | 3.93 | % | |||||||||||||
| Fund portfolio turnover rate | 7 | % | 106 | % | 5 | % | 14 | % | 14 | % | |||||||||||||
(a) The Fund's maximum sales charge is not included in the total return computation.
See Accompanying Notes to Financial Statements
69
Pacific Advisors Fund Inc.
Financial Highlights
(For a share outstanding throughout the period)
| Mid Cap Value Fund | |||||||||||||||||||||||
| Class A | |||||||||||||||||||||||
| For the year ended December 31, | |||||||||||||||||||||||
| 2011 | 2010 | 2009 | 2008 | 2007 | |||||||||||||||||||
| Per Share Operating Performance | |||||||||||||||||||||||
| Net asset value, beginning of period | $ | 11.57 | $ | 8.78 | $ | 6.75 | $ | 12.50 | $ | 12.77 | |||||||||||||
| Income from investing operations | |||||||||||||||||||||||
| Net investment income (loss) | (0.13 | ) | (0.48 | ) | (0.40 | ) | (0.16 | ) | 0.01 | ||||||||||||||
| Net realized and unrealized gains (losses) on securities | (0.56 | ) | 3.27 | 2.43 | (5.56 | ) | 0.17 | ||||||||||||||||
| Total from investment operations | (0.69 | ) | 2.79 | 2.03 | (5.72 | ) | 0.18 | ||||||||||||||||
| Less distributions | |||||||||||||||||||||||
| From net investment income | - | - | - | - | - | ||||||||||||||||||
| From net capital gains | - | - | - | (0.03 | ) | (0.45 | ) | ||||||||||||||||
| Total distributions | - | - | - | (0.03 | ) | (0.45 | ) | ||||||||||||||||
| Net asset value, end of period | $ | 10.88 | $ | 11.57 | $ | 8.78 | $ | 6.75 | $ | 12.50 | |||||||||||||
| Total Investment Return (a) | (5.96 | )% | 31.78 | % | 30.07 | % | (45.78 | )% | 1.40 | % | |||||||||||||
| Ratios/Supplemental Data | |||||||||||||||||||||||
| Net assets, end of period (000's) | $ | 4,052 | $ | 3,672 | $ | 3,194 | $ | 3,291 | $ | 6,315 | |||||||||||||
| Ratio of net investment loss to average net assets | (3.11 | )% | (3.39 | )% | (2.11 | )% | (1.33 | )% | (1.21 | )% | |||||||||||||
| Ratio of expenses to average net assets | 4.16 | % | 4.35 | % | 3.69 | % | 3.20 | % | 2.82 | % | |||||||||||||
| Fund portfolio turnover rate | 12 | % | 18 | % | 21 | % | 12 | % | 53 | % | |||||||||||||
| Class C | |||||||||||||||||||||||
| For the year ended December 31, | |||||||||||||||||||||||
| 2011 | 2010 | 2009 | 2008 | 2007 | |||||||||||||||||||
| Per Share Operating Performance | |||||||||||||||||||||||
| Net asset value, beginning of period | $ | 10.72 | $ | 8.21 | $ | 6.36 | $ | 11.90 | $ | 12.28 | |||||||||||||
| Income from investing operations | |||||||||||||||||||||||
| Net investment loss | (4.28 | ) | (3.84 | ) | (1.04 | ) | (0.45 | ) | (0.36 | ) | |||||||||||||
| Net realized and unrealized gains (losses) on securities | 3.56 | 6.35 | 2.89 | (5.06 | ) | 0.43 | |||||||||||||||||
| Total from investment operations | (0.72 | ) | 2.51 | 1.85 | (5.51 | ) | 0.07 | ||||||||||||||||
| Less distributions | |||||||||||||||||||||||
| From net investment income | - | - | - | - | - | ||||||||||||||||||
| From net capital gains | - | - | - | (0.03 | ) | (0.45 | ) | ||||||||||||||||
| Total distributions | - | - | - | (0.03 | ) | (0.45 | ) | ||||||||||||||||
| Net asset value, end of period | $ | 10.00 | $ | 10.72 | $ | 8.21 | $ | 6.36 | $ | 11.90 | |||||||||||||
| Total Investment Return | (6.72 | )% | 30.57 | % | 29.09 | % | (46.33 | )% | 0.57 | % | |||||||||||||
| Ratios/Supplemental Data | |||||||||||||||||||||||
| Net assets, end of period (000's) | $ | 1,044 | $ | 1,784 | $ | 3,151 | $ | 3,761 | $ | 8,494 | |||||||||||||
| Ratio of net investment loss to average net assets | (3.92 | )% | (3.91 | )% | (2.87 | )% | (2.11 | )% | (1.93 | )% | |||||||||||||
| Ratio of expenses to average net assets | 4.91 | % | 4.88 | % | 4.47 | % | 3.96 | % | 3.56 | % | |||||||||||||
| Fund portfolio turnover rate | 12 | % | 18 | % | 21 | % | 12 | % | 53 | % | |||||||||||||
(a) The Fund's maximum sales charge is not included in the total return computation.
See Accompanying Notes to Financial Statements
70
Pacific Advisors Fund Inc.
Financial Highlights
(For a share outstanding throughout the period)
| Small Cap Value Fund | |||||||||||||||||||||||
| Class A | |||||||||||||||||||||||
| For the year ended December 31, | |||||||||||||||||||||||
| 2011 | 2010 | 2009 | 2008 | 2007 | |||||||||||||||||||
| Per Share Operating Performance | |||||||||||||||||||||||
| Net asset value, beginning of period | $ | 31.68 | $ | 26.37 | $ | 19.21 | $ | 34.70 | $ | 33.52 | |||||||||||||
| Income from investing operations | |||||||||||||||||||||||
| Net investment income (loss) | (1.35 | ) | (1.87 | ) | (0.50 | ) | 0.10 | 0.27 | |||||||||||||||
| Net realized and unrealized gains (losses) on securities | 4.09 | 7.18 | 7.66 | (15.23 | ) | 1.78 | |||||||||||||||||
| Total from investment operations | 2.74 | 5.31 | 7.16 | (15.13 | ) | 2.05 | |||||||||||||||||
| Less distributions | |||||||||||||||||||||||
| From net investment income | - | - | - | - | - | ||||||||||||||||||
| From net capital gains | - | - | - | (0.35 | ) | (0.87 | ) | ||||||||||||||||
| From return of capital | - | - | - | (0.01 | ) | - | |||||||||||||||||
| Total distributions | - | - | - | (0.36 | ) | (0.87 | ) | ||||||||||||||||
| Net asset value, end of period | $ | 34.42 | $ | 31.68 | $ | 26.37 | $ | 19.21 | $ | 34.70 | |||||||||||||
| Total Investment Return (a) | 8.65 | % | 20.14 | % | 37.27 | % | (43.52 | )% | 6.10 | % | |||||||||||||
| Ratios/Supplemental Data | |||||||||||||||||||||||
| Net assets, end of period (000's) | $ | 88,323 | $ | 92,830 | $ | 117,456 | $ | 87,800 | $ | 112,938 | |||||||||||||
| Ratio of net investment loss to average net assets | (2.31 | )% | (2.14 | )% | (2.05 | )% | (1.83 | )% | (1.94 | )% | |||||||||||||
| Ratio of expenses to average net assets | 2.88 | % | 2.66 | % | 2.49 | % | 2.44 | % | 2.34 | % | |||||||||||||
| Fund portfolio turnover rate | 9 | % | 9 | % | 17 | % | 23 | % | 15 | % | |||||||||||||
| Class C | |||||||||||||||||||||||
| For the year ended December 31, | |||||||||||||||||||||||
| 2011 | 2010 | 2009 | 2008 | 2007 | |||||||||||||||||||
| Per Share Operating Performance | |||||||||||||||||||||||
| Net asset value, beginning of period | $ | 27.26 | $ | 22.87 | $ | 16.79 | $ | 30.70 | $ | 30.00 | |||||||||||||
| Income from investing operations | |||||||||||||||||||||||
| Net investment loss | (6.46 | ) | (3.31 | ) | (1.40 | ) | (0.90 | ) | (0.21 | ) | |||||||||||||
| Net realized and unrealized gains (losses) on securities | 8.61 | 7.70 | 7.48 | (12.65 | ) | 1.78 | |||||||||||||||||
| Total from investment operations | 2.15 | 4.39 | 6.08 | (13.55 | ) | 1.57 | |||||||||||||||||
| Less distributions | |||||||||||||||||||||||
| From net investment income | - | - | - | - | - | ||||||||||||||||||
| From net capital gains | - | - | - | (0.35 | ) | (0.87 | ) | ||||||||||||||||
| From return of capital | - | - | - | (0.01 | ) | - | |||||||||||||||||
| Total distributions | - | - | - | (0.36 | ) | (0.87 | ) | ||||||||||||||||
| Net asset value, end of period | $ | 29.41 | $ | 27.26 | $ | 22.87 | $ | 16.79 | $ | 30.70 | |||||||||||||
| Total Investment Return | 7.89 | % | 19.20 | % | 36.21 | % | (44.05 | )% | 5.22 | % | |||||||||||||
| Ratios/Supplemental Data | |||||||||||||||||||||||
| Net assets, end of period (000's) | $ | 6,949 | $ | 11,355 | $ | 15,593 | $ | 15,368 | $ | 31,589 | |||||||||||||
| Ratio of net investment loss to average net assets | (3.05 | )% | (2.89 | )% | (2.79 | )% | (2.57 | )% | (2.69 | )% | |||||||||||||
| Ratio of expenses to average net assets | 3.62 | % | 3.40 | % | 3.24 | % | 3.17 | % | 3.09 | % | |||||||||||||
| Fund portfolio turnover rate | 9 | % | 9 | % | 17 | % | 23 | % | 15 | % | |||||||||||||
(a) The Fund's maximum sales charge is not included in the total return computation.
See Accompanying Notes to Financial Statements
71
Pacific Advisors Fund Inc.
Financial Highlights
(For a share outstanding throughout the period)
| Small Cap Value Fund | |||||||||||||||||||||||
| Class I | |||||||||||||||||||||||
| For the year ended December 31, | |||||||||||||||||||||||
| 2011 | 2010 | 2009 | 2008 | 2007 | |||||||||||||||||||
| Per Share Operating Performance | |||||||||||||||||||||||
| Net asset value, beginning of period | $ | 35.95 | $ | 29.86 | $ | 21.72 | $ | 37.50 | $ | 36.13 | |||||||||||||
| Income from investing operations | |||||||||||||||||||||||
| Net investment loss | (0.77 | ) | (0.60 | ) | (0.45 | ) | (0.32 | )* | (0.33 | ) | |||||||||||||
| Net realized and unrealized gains (losses) on securities | 3.97 | 6.69 | 8.59 | (15.10 | )* | 2.57 | |||||||||||||||||
| Total from investment operations | 3.20 | 6.09 | 8.14 | (15.42 | ) | 2.24 | |||||||||||||||||
| Less distributions | |||||||||||||||||||||||
| From net investment income | - | - | - | - | - | ||||||||||||||||||
| From net capital gains | - | - | - | (0.35 | ) | (0.87 | ) | ||||||||||||||||
| From return of capital | - | - | - | (0.01 | ) | - | |||||||||||||||||
| Total distributions | - | - | - | (0.36 | ) | (0.87 | ) | ||||||||||||||||
| Net asset value, end of period | $ | 39.15 | $ | 35.95 | $ | 29.86 | $ | 21.72 | $ | 37.50 | |||||||||||||
| Total Investment Return | 8.90 | % | 20.40 | % | 37.48 | % | (41.00 | )% | 6.19 | % | |||||||||||||
| Ratios/Supplemental Data | |||||||||||||||||||||||
| Net assets, end of period (000's) | $ | 6 | $ | 6 | $ | 5 | $ | 3 | $ | 1,902 | |||||||||||||
| Ratio of net investment loss to average net assets | (2.08 | )% | (1.97 | )% | (1.80 | )% | (1.56 | )% | (1.72 | )% | |||||||||||||
| Ratio of expenses to average net assets | 2.65 | % | 2.50 | % | 2.24 | % | 2.16 | % | 2.10 | % | |||||||||||||
| Fund portfolio turnover rate | 9 | % | 9 | % | 17 | % | 23 | % | 15 | % | |||||||||||||
* Numbers were calculated using a weighted-average number of shares outstanding basis as a result of a significant change in Class I assets immediately prior to end of period.
See Accompanying Notes to Financial Statements
72
Pacific Advisors Fund Inc.
Notes to Financial Statements
December 31, 2011
Note 1. Organization
Pacific Advisors Fund Inc. (the "Company") is an open-end diversified investment management company registered under the Investment Company Act of 1940, as amended. The Company currently offers six Funds: Government Securities Fund, Income and Equity Fund, Balanced Fund, Large Cap Value Fund, Mid Cap Value Fund and Small Cap Value Fund (individually, a "Fund," or collectively, the "Funds"). Each Fund is a separate investment portfolio of the Company with a distinct investment objective, investment program, policies and restrictions.
The Government Securities Fund seeks to provide high current income, preservation of capital, and rising future income, consistent with prudent investment risk. The Income and Equity Fund seeks to provide current income and, secondarily, long-term capital appreciation. The Balanced Fund seeks to achieve long-term capital appreciation and income consistent with reduced risk. The Large Cap Value Fund seeks to achieve long-term capital appreciation. The Mid Cap Value Fund seeks to achieve long-term capital appreciation. The Small Cap Value Fund seeks to provide capital appreciation through investment in small capitalization companies.
The Funds offer Class A and Class C shares. In addition to Class A and Class C shares, the Small Cap Value Fund introduced Class I shares on October 9, 2006. Each class has equal rights as to assets and voting privileges except that Class A and Class C each has exclusive voting rights with respect to its distribution plan. Investment income, realized and unrealized capital gains and losses, and the common expenses of each Fund are allocated on a pro rata basis to each class based on the relative net assets of each class to the total net assets of the Fund. Each Class of shares differs in its respective service and distribution expenses and may differ in its transfer agent, registration, and certain other class-specific fees and expenses.
The Company enters into contracts that contain a variety of indemnifications. The Company's maximum exposure under these arrangements is unknown. However, the Company has not had prior claims or losses pursuant to these contracts and expects the risk of loss to be remote.
Note 2. Significant Accounting Policies
A. Security Valuation and Fair Value Measurement. Securities, including American Depository Receipts (ADRs), listed on a national securities exchange and certain over-the-counter ("OTC") issues traded on the NASDAQ national market system are valued at the last quoted sale price at the close of the New York Stock Exchange. OTC issues not quoted on the NASDAQ system, and other equity securities for which no sale price is available, are valued at the last bid price as obtained from published sources or real time quote services, where available, and otherwise from brokers who are market makers for such securities. Debt securities with a maturity less than 60 days are valued on an amortized cost basis, which approximates market value. In determining the fair value of other debt securities, Pacific Global Investment Management Company, Inc. (the "Investment Manager") utilizes independent pricing services approved by the Board of Directors using one or more of the following valuation techniques:
(1) a matrix pricing approach that considers market inputs including, in approximate order of priority, the following: benchmark yields, reported trades, broker/dealer quotes, issuer spreads, two-sided markets, benchmark securities, bids, offers and reference data including market research publications; market indicators, industry and economic events. Evaluators may prioritize inputs differently on any given day for any security based on market conditions, and not all inputs listed are available for use in the evaluation process for each security evaluation on any given day; (2) a comparison of the value of the borrower's outstanding equity and debt to that of comparable public companies; (3) a discounted cash flow analysis. In conducting its assessment and analysis for purpose of determining fair value, the Investment Manager uses its discretion and judgment in considering and appraising relevant factors. Fair value determinations are made by the Investment Manager based on the Company's Fair Value Procedure, as adopted by the Board of Directors.
Various inputs are used to determine the fair value of each Fund's investments. For financial statements, these inputs are summarized in the three broad levels listed below. Level 1 inputs are based on quoted prices in active markets for identical securities. Level 2 inputs are based on significant observable market inputs, such as quoted prices for similar securities and quoted prices in inactive markets. Level 3 inputs are significant unobservable inputs that reflect the Fund's own assumptions in determining the fair value of investments.
73
Pacific Advisors Fund Inc.
Notes to Financial Statements
December 31, 2011
The valuation levels are not necessarily an indication of the risk associated with investing in those securities. The following is a summary of the inputs used to value each Fund's investment securities and cash and cash equivalents as of December 31, 2011:
| Government Securities Fund | Income and Equity Fund | Balanced Fund | Large Cap Value Fund | Mid Cap Value Fund | Small Cap Value Fund | ||||||||||||||||||||||
| Level 1 - Quoted Prices | |||||||||||||||||||||||||||
| Common Stock | |||||||||||||||||||||||||||
| Energy | $ | 42,560 | $ | 109,305 | $ | 1,130,795 | $ | 177,996 | $ | 1,420,910 | $ | 21,473,680 | |||||||||||||||
| Material | - | 123,606 | 417,020 | - | 304,638 | 1,659,600 | |||||||||||||||||||||
| Industrials | - | 468,538 | 2,578,055 | 618,597 | 2,202,706 | 35,341,000 | |||||||||||||||||||||
| Consumer Discretionary | 55,182 | 535,942 | 551,815 | 592,760 | 939,737 | 19,335,400 | |||||||||||||||||||||
| Consumer Staples | 44,136 | 531,659 | 2,182,101 | 961,007 | 177,660 | 3,295,920 | |||||||||||||||||||||
| Health Care | - | 426,452 | 1,323,439 | 315,458 | - | 2,569,900 | |||||||||||||||||||||
| Financials | - | - | 944,160 | 390,021 | 209,020 | 11,950,150 | |||||||||||||||||||||
| Information Technology | 51,920 | 313,432 | 1,932,995 | 953,093 | - | - | |||||||||||||||||||||
| Telecommunication Services | 51,408 | 331,470 | - | - | - | 3,980,900 | |||||||||||||||||||||
| Utilities | 116,816 | 398,110 | - | - | - | - | |||||||||||||||||||||
| Preferred Stock | |||||||||||||||||||||||||||
| Financials | 153,320 | 417,930 | 449,500 | - | - | - | |||||||||||||||||||||
| Utilities | - | 50,760 | - | - | - | - | |||||||||||||||||||||
| Level 1 Total | 515,342 | 3,707,204 | 11,509,880 | 4,008,932 | 5,254,671 | 99,606,550 | |||||||||||||||||||||
| Level 2 - Other significant observable inputs | |||||||||||||||||||||||||||
| Bonds and notes | |||||||||||||||||||||||||||
| Corporate Bonds | - | 3,452,065 | 3,679,159 | - | - | - | |||||||||||||||||||||
| U.S. Government Fixed Income Securities | 2,356,596 | - | - | - | - | - | |||||||||||||||||||||
| Short Term Investments | |||||||||||||||||||||||||||
| Money Market | 13,121 | 96,218 | - | - | - | - | |||||||||||||||||||||
| Level 2 Total | 2,369,717 | 3,548,283 | 3,679,159 | - | - | - | |||||||||||||||||||||
| Level 3 - Significant unobservable inputs | - | - | - | - | - | - | |||||||||||||||||||||
| Total Investments | $ | 2,885,059 | $ | 7,255,487 | $ | 15,189,039 | $ | 4,008,932 | $ | 5,254,671 | $ | 99,606,550 | |||||||||||||||
Equity securities (common and preferred stock) that are actively traded and market priced are classified as Level 1 securities. All fixed income securities are classified as Level 2 securities and are valued using either amortized cost or the matrix pricing approach. The Funds had no Level 3 holdings during the year ended December 31, 2011. In January 2010, the Financial Accounting Standards Board (FASB) issued Accounting Standards Update ("ASU") 2010-06, "Improving Disclosures about Fair Value Measurements," which amended Accounting Standard Codification 820 ("Topic 820") and required entities to disclose the amounts of significant transfers between Level 1 and Level 2 of the fair value hierarchy and the reasons for these transfers. The Investment Manager has evaluated the Funds' positions for the year ended December 31, 2011, and determined that, for purposes of fair value pricing measurement, there were no transfers between Level 1 and Level 2.
In May 2011, the FASB issued ASU 2011-04, Fair Value Measurement (Topic 820) to update requirements for measuring fair value and for disclosing information about fair value measurements in accordance with U.S. Generally Accepted Accounting Principles (GAAP) and International Financial Reporting Standards (IFRS). The amendment included clarifications and also changes to a particular principle or requirement for measuring fair value or disclosing information about fair value measurements. The update results in common principles and requirements for measuring fair value and for disclosing information about fair value measurements in accordance with U.S. GAAP and IFRS. The amendments are to be applied prospectively and were effective during interim and annual periods beginning after December 15, 2011. In assessing the requirements and clarifications of the most recent announcement, the Investment Manager believes that the Fair Value Measurement update will not have a material impact on the Funds' operating results, financial position or result in additional disclosures.
B. Cash and Cash Equivalents. The Company considers all highly liquid financial instruments with maturities of less than three months when acquired to be cash equivalents.
C. Security Transactions and Investment Income. Security transactions are accounted for on the trade date. The cost of investments sold is determined by use of the specific identification method for both financial reporting and federal income tax purposes. Dividends are recorded on the ex-dividend date. Interest income is recorded on an accrual basis. Premium or discount on debt securities are amortized using the effective interest amortization method.
D. Dividends and Distributions to Shareholders. The Government Securities Fund and Income and Equity Fund declare and distribute dividends of their net investment income, if any, quarterly. The Balanced Fund, Large Cap Value Fund, Mid Cap
74
Pacific Advisors Fund Inc.
Notes to Financial Statements
December 31, 2011
Value Fund and Small Cap Value Fund declare and distribute dividends of their net investment income, if any, annually. The Board of Directors determines the amount and timing of such payments.
E. Federal Income Tax. The Company intends to comply with the requirements of Subchapter M of the Internal Revenue Code applicable to regulated investment companies and to distribute substantially all of their taxable income to their shareholders. Therefore, no federal income tax provision is required.
Management has analyzed the Funds' tax positions taken on federal income tax returns for all open tax years and for the year ended December 31, 2011 and has concluded that no provision for income tax is required in the Funds' financial statements. Tax years 2008, 2009, 2010 and 2011 are still subject to examination by major federal jurisdictions. Tax years 2007, 2008, 2009, 2010 and 2011 are still subject to examination by major state jurisdictions.
The Funds recognize interest and penalties, if any, related to unrecognized tax benefits as income tax expense in the Statement of Operations. During the period, the Funds did not incur any interest or penalties.
At December 31, 2011, components of distributable earnings (accumulated deficits) on a tax basis were as follows:
| Government Securities Fund | Income and Equity Fund | Balanced Fund | Large Cap Value Fund | Mid Cap Value Fund | Small Cap Value Fund | ||||||||||||||||||||||
| Undistributed ordinary income | $ | - | $ | 605 | $ | - | $ | - | $ | - | $ | - | |||||||||||||||
| Undistributed long-term gains | - | - | 16,159 | - | - | - | |||||||||||||||||||||
| Capital loss carry forward* | (322,627 | ) | (585,604 | ) | - | (167,591 | ) | (1,756,562 | ) | (16,512,561 | ) | ||||||||||||||||
| Post October loss | - | (143,046 | ) | (341,627 | ) | - | (323,488 | ) | (435,252 | ) | |||||||||||||||||
| Net unrealized appreciation on investments | 27,379 | 286,766 | 1,017,965 | 389,749 | 959,717 | 26,205,614 | |||||||||||||||||||||
| Accumulated earnings (deficits) | $ | (295,248 | ) | $ | (441,279 | ) | $ | 692,497 | $ | 222,158 | $ | (1,120,333 | ) | $ | 9,257,801 | ||||||||||||
The difference between book basis and tax basis unrealized appreciation (depreciation) is attributable primarily to the tax deferral of losses on wash sales and characterization of certain income items. The Funds intend to treat post October losses (net capital losses occurred for the period subsequent to October 31, 2011 through the fiscal year end December 31, 2011) as having been incurred in the next fiscal year.
The Funds intend to utilize provisions of the federal income tax laws which allow them to carry a realized capital loss forward for eight years following the year of the loss and offset such losses against any future realized capital gains. During the current fiscal year, the following capital losses carried forward have been utilized:
| Government Securities Fund | Income and Equity Fund | Balanced Fund | Large Cap Value Fund | Mid Cap Value Fund | Small Cap Value Fund | ||||||||||||||||||||||
| Capital loss carryforward utilized | $ | 34,046 | $ | 132,827 | - | $ | 14,267 | - | - | ||||||||||||||||||
* At December 31, 2011, the following Funds had accumulated net realized losses on investment transactions that represent capital loss carryforwards for federal income tax purposes, which expire as follows:
| Capital losses expiring in: | |||||||||||||||||||||||||||||||||||
| 2012 | 2013 | 2014 | 2015 | 2016 | 2017 | 2018 | Total | ||||||||||||||||||||||||||||
| Government Securities Fund | $ | 95,072 | $ | 49,495 | $ | 88,644 | $ | 1,178 | $ | 9,585 | $ | 73,971 | $ | 4,682 | $ | 322,627 | |||||||||||||||||||
| Income and Equity Fund | - | - | - | - | 197,538 | 388,066 | - | 585,604 | |||||||||||||||||||||||||||
| Balanced Fund | - | - | - | - | - | - | - | - | |||||||||||||||||||||||||||
| Large Cap Value Fund | - | - | - | - | - | 167,591 | - | 167,591 | |||||||||||||||||||||||||||
| Mid Cap Value Fund | - | - | - | - | 785,984 | 640,167 | - | 1,426,151 | |||||||||||||||||||||||||||
| Small Cap Value Fund | - | - | - | - | - | 12,029,758 | 3,801,568 | 15,831,326 | |||||||||||||||||||||||||||
During the year ended December 31, 2011, the Government Securities Fund had a capital loss carryforward in the amount of $821,665 that expired.
On December 22, 2010, the Regulated Investment Company Modernization Act of 2010 (the "Act") was enacted, which changed various technical rules governing the tax treatment of regulated investment companies ("RICs") including the Funds. The changes are generally effective for taxable years beginning after the date of enactment. One of the more prominent changes addresses capital loss carryforwards. Under the Act, each Fund will be permitted to carry forward capital losses incurred in taxable years beginning after the date of enactment for an unlimited period. However, any losses incurred during those future taxable years will be required to be utilized prior to the losses incurred in pre-enactment taxable years, which carry an expiration date. As a result of
75
Pacific Advisors Fund Inc.
Notes to Financial Statements
December 31, 2011
this ordering rule, pre-enactment capital loss carryforwards may be more likely to expire unused. Additionally, post-enactment capital loss carryforwards will retain their character as either short-term or long-term capital losses rather than being considered all short-term as permitted under previous regulation.
Finally, the Modernization Act contains several provisions aimed at preserving the character of distributions made by a fiscal year RIC during the portion of its taxable year ending after October 31 or December 31, reducing the circumstances under which a RIC might be required to file amended Forms 1099 to restate previously reported distributions. Except for the simplification provisions related to RIC qualification, the Modernization Act is effective for taxable years beginning after December 22, 2010. The provisions related to RIC qualification are effective for taxable years for which the extended due date of the tax return is after December 22, 2010.
Losses incurred that will be carried forward under the provisions of the Modernization Act are as follows:
| Loss Carryforward Character | |||||||||||
| Short Term | Long Term | ||||||||||
| Mid Cap Value Fund | $ | - | $ | 330,411 | |||||||
| Small Cap Value Fund | - | 681,235 | |||||||||
F. Reclassification of Capital Accounts. Distributions of net investment income and realized gains are determined in accordance with income tax regulations which may differ from GAAP. These differences are due to differing treatments for items such as net operating losses, reclassification of dividends and return of capital. To the extent that these differences are permanent in nature, reclassifications are made among the net asset accounts on the Statement of Assets and Liabilities.
For the year ended December 31, 2011, reclassifications among the components of net assets are as follows:
| Accumulated Undistributed Net Investment Income | Paid in Capital | Accumulated Capital Loss | |||||||||||||
| Government Securities Fund | $ | 30,005 | $ | (851,670 | ) | $ | 821,665 | ||||||||
| Income and Equity Fund | - | - | - | ||||||||||||
| Balanced Fund | 49,426 | (49,426 | ) | - | |||||||||||
| Large Cap Value Fund | 29,942 | (29,942 | ) | - | |||||||||||
| Mid Cap Value Fund | 181,370 | (181,370 | ) | - | |||||||||||
| Small Cap Value Fund | 2,242,685 | (2,242,685 | ) | - | |||||||||||
The reclassifications were due to net investment losses incurred by the Funds, which are not permitted to be carried forward for tax purposes. The Government Securities Fund's reclassification was also a result of the expiration of capital losses previously carried-forward.
G. Use of Estimates. The preparation of financial statements in conformity with U.S. GAAP requires management to make estimates and assumptions that affect the reported amounts in the financial statements and footnotes. Actual results could differ from those estimates.
Note 3. Investment Management, Distributor and Other Related Party Transactions
The Company and the Funds have entered into investment management agreements ("Management Agreements") with the Investment Manager.
The Management Agreements provide for investment management fees, payable monthly, and calculated at the maximum annual rate of 0.65% of average net assets for the Government Securities Fund, 0.75% of average net assets for the Income and Equity, Balanced, Large Cap Value and Small Cap Value Funds and 1.00% of average net assets for the Mid Cap Value Fund.
In accordance with Expense Limitation Agreements with the Company, the Investment Manager waives its respective management fees to the extent that the actual operating expenses of the following Funds exceed the following thresholds:
| Class A | Class C | ||||||||||
| Government Securities Fund | 1.65 | % | 2.40 | % | |||||||
| Income and Equity Fund | 1.95 | % | 2.70 | % | |||||||
| Large Cap Value Fund | 2.65 | % | 3.40 | % | |||||||
For the Government Securities Fund and Large Cap Value Fund only, if net expenses exceed the above thresholds after waiver of the entire management fee, Pacific Global Investor Services, Inc. ("PGIS"), Transfer Agent for the Company, will waive its transfer agency fee to the extent necessary to reduce Class expenses to the above thresholds. The Transfer Agent does not, however,
76
Pacific Advisors Fund Inc.
Notes to Financial Statements
December 31, 2011
waive out of pocket expenses. These agreements may be terminated by either party upon 90 days prior written notice.
Pursuant to the Expense Limitation Agreements, providing for the voluntary waiver of fees and the assumption of expenses by the Investment Manager and Transfer Agent, the following amounts were waived for the year ended December 31, 2011.
| Management Fees Waived | Transfer Agent Fees Waived | Total | |||||||||||||
| Government Securities Fund | $ | 23,340 | $ | 43,200 | $ | 66,540 | |||||||||
| Income and Equity Fund | 62,329 | - | 62,329 | ||||||||||||
| Large Cap Value Fund | 27,122 | 43,200 | 70,322 | ||||||||||||
Effective 2004, the Investment Manager terminated all of its rights under the Expense Limitation Agreements with respect to potential recoupment from the Funds of all management fees and transfer agent fees previously waived and all expenses previously reimbursed. In the future, the Investment Manager will not have any rights to recover fees it waives or expenses it may reimburse, with respect to any of the Funds.
For the year ended December 31, 2011, Pacific Global Fund Distributors, Inc. ("PGFD"), the principal underwriter for the Company, received commissions on sales of capital stock, after deducting amounts allowed to authorized distributors as commissions. In addition, PGFD, as a registered broker-dealer, may act as broker for the Funds, in conformity with Rule 17e-1 under the Investment Company Act of 1940. The Company's Board of Directors has approved procedures for evaluating the reasonableness of commissions paid to PGFD and periodically reviews these procedures. PGFD will not act as principal in effecting any portfolio transactions for the Funds. The amounts of commissions are as follows:
| Underwriting Fees Retained | Commissions Retained | Brokerage Commissions Received | |||||||||||||
| Government Securities Fund | $ | 331 | $ | - | $ | (323 | ) | ||||||||
| Income and Equity Fund | 785 | 12 | 485 | ||||||||||||
| Balanced Fund | 643 | 599 | 4,131 | ||||||||||||
| Large Cap Value Fund | 338 | 788 | (995 | ) | |||||||||||
| Mid Cap Value Fund | 1,419 | 521 | 1,536 | ||||||||||||
| Small Cap Value Fund | 6,919 | 693 | 26,930 | ||||||||||||
PGFD is a wholly-owned subsidiary of the Investment Manager.
The Company has also entered into an agreement with PGIS to provide fund accounting services at the monthly fee of three basis points for the first one hundred million in net assets and one basis point on the balance of net assets or a minimum of $1,500 per month. In addition, an agreement to provide transfer agent services has also been entered into at a rate of $21.00 per year per open account and $3.50 per year per closed account with minimum charges of $1,800 per month for Class A, C, and I share accounts. PGIS is a wholly-owned subsidiary of the Investment Manager.
Accounts payable to related parties consist of transfer agent fees payable to PGIS.
The Company has adopted a plan of distribution, whereby the Funds may pay a service fee to qualified recipients in an amount up to 0.25% per annum of each Fund's daily net assets for Class A shares and Class C shares. Under the plan of the distribution, the Funds may pay a distribution fee to qualified recipients in an amount up to 0.75% per annum of each Fund's daily net assets for Class C shares. The Company has not adopted a plan of distribution for Class I Shares.
For the year ended December 31, 2011, total distribution and/or service (12b-1) fees were:
| Class A | Class C | Total | |||||||||||||
| Government Securities Fund | $ | 5,322 | $ | 14,485 | $ | 19,807 | |||||||||
| Income and Equity Fund | 10,613 | 40,417 | 51,030 | ||||||||||||
| Balanced Fund | 9,061 | 144,132 | 153,193 | ||||||||||||
| Large Cap Value Fund | 6,937 | 7,012 | 13,949 | ||||||||||||
| Mid Cap Value Fund | 9,670 | 13,634 | 23,304 | ||||||||||||
| Small Cap Value Fund | 216,951 | 82,870 | 299,821 | ||||||||||||
77
Pacific Advisors Fund Inc.
Notes to Financial Statements
December 31, 2011
Note 4. Purchase and Sales of Securities
The following summarizes purchases and sales of investment securities, other than short-term investments, and aggregate gross unrealized appreciation and depreciation on a tax basis by each Fund for the year ended and as of December 31, 2011. The difference between book basis and tax basis unrealized appreciation is attributable primarily to the tax deferral of losses on wash sales.
| Year ended December 31, 2011 | As of December 31, 2011 | ||||||||||||||||||||||||||
| Cost of Purchases | Proceeds From Sales | Tax Cost of Securities | Gross Unrealized Appreciation | Gross Unrealized Depreciation | Net Unrealized Appreciation | ||||||||||||||||||||||
| Government Securities Fund | $ | 4,067,715 | $ | 5,209,098 | $ | 2,844,559 | $ | 79,905 | $ | 52,526 | $ | 27,379 | |||||||||||||||
| Income and Equity Fund | 1,314,874 | 2,659,235 | 6,872,503 | 709,986 | 423,220 | 286,766 | |||||||||||||||||||||
| Balanced Fund | 2,600,113 | 9,257,783 | 14,171,074 | 1,902,323 | 884,358 | 1,017,965 | |||||||||||||||||||||
| Large Cap Value Fund | 927,169 | 257,786 | 3,619,183 | 582,581 | 192,832 | 389,749 | |||||||||||||||||||||
| Mid Cap Value Fund | 692,167 | 709,834 | 4,294,954 | 1,571,929 | 612,212 | 959,717 | |||||||||||||||||||||
| Small Cap Value Fund | 9,357,527 | 30,173,246 | 73,400,936 | 34,301,340 | 8,095,726 | 26,205,614 | |||||||||||||||||||||
Note 5. Distributions to Shareholders
The tax character of distributions paid during 2011 and 2010 was as follows:
| Government Securities Fund | Income and Equity Fund | Balanced Fund | Large Cap Value Fund | Mid Cap Value Fund | Small Cap Value Fund | ||||||||||||||||||||||
| Year ended December 31, 2011 | |||||||||||||||||||||||||||
| Distributions paid from: | |||||||||||||||||||||||||||
| Ordinary Income | $ | - | $ | 157,804 | $ | 20,178 | $ | - | $ | - | $ | - | |||||||||||||||
| Long-Term Capital Gain | - | - | 967,955 | - | - | - | |||||||||||||||||||||
| Return of Capital | - | - | - | - | - | - | |||||||||||||||||||||
| Total Distributions | $ | - | $ | 157,804 | $ | 988,133 | $ | - | $ | - | $ | - | |||||||||||||||
| Year ended December 31, 2010 | |||||||||||||||||||||||||||
| Distributions paid from: | |||||||||||||||||||||||||||
| Ordinary Income | $ | 8,159 | $ | 184,238 | $ | 5,989 | $ | - | $ | - | $ | - | |||||||||||||||
| Long-Term Capital Gain | - | - | 2,127,093 | - | - | - | |||||||||||||||||||||
| Return of Capital | 9,219 | 2,626 | - | - | - | - | |||||||||||||||||||||
| Total Distributions | $ | 17,378 | $ | 186,864 | $ | 2,133,082 | $ | - | $ | - | $ | - | |||||||||||||||
Note 6. Capital Share Transactions
A 2% redemption fee is assessed on shares of the Government Securities Fund or Income and Equity Fund sold or exchanged within 30 days of purchase or shares of the Balanced Fund, Large Cap Value Fund, Mid Cap Value Fund or Small Cap Value Fund sold or exchanged within 180 days of purchase and is retained in each Fund. The redemption fees collected through December 31, 2011 are included in the dollar amount of shares sold in the table below. The amount of the increase is as follows:
| Class A | Class C | ||||||||||
| Government Securities Fund | $ | 7 | $ | 750 | |||||||
| Income and Equity Fund | 105 | 200 | |||||||||
| Balanced Fund | 104 | 720 | |||||||||
| Large Cap Value Fund | 384 | 384 | |||||||||
| Mid Cap Value Fund | 5,569 | 41 | |||||||||
| Small Cap Value Fund | 27,578 | 7,573 | |||||||||
78
Pacific Advisors Fund Inc.
Notes to Financial Statements
December 31, 2011
| Year ended December 31, 2011 | Year ended December 31, 2010 | ||||||||||||||||||
| Shares | Amount | Shares | Amount | ||||||||||||||||
| Government Securities Fund | |||||||||||||||||||
| Class A | |||||||||||||||||||
| Shares Sold | 23,376 | $ | 213,903 | 50,282 | $ | 456,951 | |||||||||||||
| Reinvestment of Distributions | - | - | 1,359 | 12,284 | |||||||||||||||
| 23,376 | 213,903 | 51,641 | 469,235 | ||||||||||||||||
| Shares Repurchased | (78,365 | ) | (718,805 | ) | (73,787 | ) | (669,139 | ) | |||||||||||
| Net Decrease | (54,989 | ) | $ | (504,902 | ) | (22,146 | ) | $ | (199,904 | ) | |||||||||
| Class C | |||||||||||||||||||
| Shares Sold | 36,912 | $ | 332,976 | 57,256 | $ | 516,279 | |||||||||||||
| Reinvestment of Distributions | - | - | 326 | 2,924 | |||||||||||||||
| 36,912 | 332,976 | 57,582 | 519,203 | ||||||||||||||||
| Shares Repurchased | (116,789 | ) | (1,051,781 | ) | (156,253 | ) | (1,404,974 | ) | |||||||||||
| Net Decrease | (79,877 | ) | $ | (718,805 | ) | (98,671 | ) | $ | (885,771 | ) | |||||||||
| Year ended December 31, 2011 | Year ended December 31, 2010 | ||||||||||||||||||
| Shares | Amount | Shares | Amount | ||||||||||||||||
| Income and Equity Fund | |||||||||||||||||||
| Class A | |||||||||||||||||||
| Shares Sold | 144,731 | $ | 1,442,276 | 130,489 | $ | 1,256,197 | |||||||||||||
| Reinvestment of Distributions | 9,872 | 97,367 | 9,145 | 88,250 | |||||||||||||||
| 154,603 | 1,539,643 | 139,634 | 1,344,447 | ||||||||||||||||
| Shares Repurchased | (121,729 | ) | (1,208,741 | ) | (43,821 | ) | (424,015 | ) | |||||||||||
| Net Increase | 32,874 | $ | 330,902 | 95,813 | $ | 920,432 | |||||||||||||
| Class C | |||||||||||||||||||
| Shares Sold | 4,488 | $ | 42,785 | 49,147 | $ | 450,643 | |||||||||||||
| Reinvestment of Distributions | 5,108 | 48,010 | 9,279 | 85,239 | |||||||||||||||
| 9,596 | 90,795 | 58,426 | 535,882 | ||||||||||||||||
| Shares Repurchased | (193,642 | ) | (1,832,018 | ) | (118,858 | ) | (1,093,335 | ) | |||||||||||
| Net Decrease | (184,046 | ) | $ | (1,741,223 | ) | (60,432 | ) | $ | (557,453 | ) | |||||||||
79
Pacific Advisors Fund Inc.
Notes to Financial Statements
December 31, 2011
| Year ended December 31, 2011 | Year ended December 31, 2010 | ||||||||||||||||||
| Shares | Amount | Shares | Amount | ||||||||||||||||
| Balanced Fund | |||||||||||||||||||
| Class A | |||||||||||||||||||
| Shares Sold | 51,150 | $ | 753,280 | 17,732 | $ | 264,207 | |||||||||||||
| Reinvestment of Distributions | 16,892 | 228,721 | 22,441 | 325,843 | |||||||||||||||
| 68,042 | 982,001 | 40,173 | 590,050 | ||||||||||||||||
| Shares Repurchased | (46,144 | ) | (679,760 | ) | (72,398 | ) | (1,106,615 | ) | |||||||||||
| Net Increase (Decrease) | 21,898 | $ | 302,241 | (32,225 | ) | $ | (516,565 | ) | |||||||||||
| Class C | |||||||||||||||||||
| Shares Sold | 28,030 | $ | 391,636 | 34,207 | $ | 494,519 | |||||||||||||
| Reinvestment of Distributions | 56,612 | 720,106 | 126,389 | 1,745,426 | |||||||||||||||
| 84,642 | 1,111,742 | 160,596 | 2,239,945 | ||||||||||||||||
| Shares Repurchased | (537,116 | ) | (7,437,583 | ) | (587,264 | ) | (8,502,782 | ) | |||||||||||
| Net Decrease | (452,474 | ) | $ | (6,325,841 | ) | (426,668 | ) | $ | (6,262,837 | ) | |||||||||
| Year ended December 31, 2011 | Year ended December 31, 2010 | ||||||||||||||||||
| Shares | Amount | Shares | Amount | ||||||||||||||||
| Large Cap Value Fund | |||||||||||||||||||
| Class A | |||||||||||||||||||
| Shares Sold | 96,622 | $ | 884,375 | 66,887 | $ | 572,386 | |||||||||||||
| Reinvestment of Distributions | - | - | - | - | |||||||||||||||
| 96,622 | 884,375 | 66,887 | 572,386 | ||||||||||||||||
| Shares Repurchased | (23,669 | ) | (215,152 | ) | (48,630 | ) | (421,975 | ) | |||||||||||
| Net Increase | 72,953 | $ | 669,223 | 18,257 | $ | 150,411 | |||||||||||||
| Class C | |||||||||||||||||||
| Shares Sold | 16,903 | $ | 138,811 | 43,873 | $ | 342,160 | |||||||||||||
| Reinvestment of Distributions | - | - | - | - | |||||||||||||||
| 16,903 | 138,811 | 43,873 | 342,160 | ||||||||||||||||
| Shares Repurchased | (25,370 | ) | (204,816 | ) | (44,022 | ) | (341,996 | ) | |||||||||||
| Net Increase (Decrease) | (8,467 | ) | $ | (66,005 | ) | (149 | ) | $ | 164 | ||||||||||
80
Pacific Advisors Fund Inc.
Notes to Financial Statements
December 31, 2011
| Year ended December 31, 2011 | Year ended December 31, 2010 | ||||||||||||||||||
| Shares | Amount | Shares | Amount | ||||||||||||||||
| Mid Cap Value Fund | |||||||||||||||||||
| Class A | |||||||||||||||||||
| Shares Sold | 123,348 | $ | 1,514,987 | 32,966 | $ | 315,202 | |||||||||||||
| Reinvestment of Distributions | - | - | - | - | |||||||||||||||
| 123,348 | 1,514,987 | 32,966 | 315,202 | ||||||||||||||||
| Shares Repurchased | (68,273 | ) | (769,508 | ) | (79,054 | ) | (752,197 | ) | |||||||||||
| Net Increase (Decrease) | 55,075 | $ | 745,479 | (46,088 | ) | $ | (436,995 | ) | |||||||||||
| Class C | |||||||||||||||||||
| Shares Sold | 2,272 | $ | 24,532 | 7,123 | $ | 61,206 | |||||||||||||
| Reinvestment of Distributions | - | - | - | - | |||||||||||||||
| 2,272 | 24,532 | 7,123 | 61,206 | ||||||||||||||||
| Shares Repurchased | (64,208 | ) | (699,735 | ) | (224,836 | ) | (1,948,570 | ) | |||||||||||
| Net Decrease | (61,936 | ) | $ | (675,203 | ) | (217,713 | ) | $ | (1,887,364 | ) | |||||||||
| Year ended December 31, 2011 | Year ended December 31, 2010 | ||||||||||||||||||
| Shares | Amount | Shares | Amount | ||||||||||||||||
| Small Cap Value Fund | |||||||||||||||||||
| Class A | |||||||||||||||||||
| Shares Sold | 609,616 | $ | 20,049,412 | 541,960 | $ | 14,532,455 | |||||||||||||
| Reinvestment of Distributions | - | - | - | - | |||||||||||||||
| 609,616 | 20,049,412 | 541,960 | 14,532,455 | ||||||||||||||||
| Shares Repurchased | (974,254 | ) | (32,481,084 | ) | (2,065,755 | ) | (54,928,017 | ) | |||||||||||
| Net Decrease | (364,638 | ) | $ | (12,431,672 | ) | (1,523,795 | ) | $ | (40,395,562 | ) | |||||||||
| Class C | |||||||||||||||||||
| Shares Sold | 13,228 | $ | 401,146 | 30,039 | $ | 678,302 | |||||||||||||
| Reinvestment of Distributions | - | - | - | - | |||||||||||||||
| 13,228 | 401,146 | 30,039 | 678,302 | ||||||||||||||||
| Shares Repurchased | (193,554 | ) | (5,501,668 | ) | (295,354 | ) | (6,859,138 | ) | |||||||||||
| Net Decrease | (180,326 | ) | $ | (5,100,522 | ) | (265,315 | ) | $ | (6,180,836 | ) | |||||||||
| Class I | |||||||||||||||||||
| Shares Sold | - | $ | - | - | $ | - | |||||||||||||
| Reinvestment of Distributions | - | - | - | - | |||||||||||||||
| - | - | - | - | ||||||||||||||||
| Shares Repurchased | - | - | - | - | |||||||||||||||
| Net Decrease | - | $ | - | - | $ | - | |||||||||||||
81
Pacific Advisors Fund Inc.
Notes to Financial Statements
December 31, 2011
Note 7. Bank Borrowings
Each Fund may borrow money to the extent permitted by the 1940 Act, as amended, or any rules, exemptions or interpretations thereunder that may be adopted, granted or issued by the SEC. Under the 1940 Act, a mutual fund may borrow up to one-third of its total assets (including the amount borrowed) from banks for any purpose, and may borrow up to 5% of its total assets from banks or other lenders for temporary purposes. Each Fund may borrow to facilitate portfolio transactions or meet redemptions. The Large Cap Value Fund, Mid Cap Value Fund, and Small Cap Value Fund also may borrow money to invest in portfolio securities. Each Fund has the ability to borrow, from UMB Bank, n.a. (UMB), on an unsecured basis, at 1.50% over the Federal Funds rate. As of December 31, 2011, the Balanced Fund, Large Cap Value Fund, Mid Cap Value Fund and Small Cap Value Fund had borrowings from UMB with amounts of $615,346, $136,322, $157,368 and $4,124,556, respectively, and were paying interest at 1.52% per annum on their outstanding borrowings. No compensating balances were required.
82
Pacific Advisors Fund Inc.
Report of Independent Registered Public Accounting Firm
The Board of Directors and Shareholders
Pacific Advisors Fund Inc.
We have audited the accompanying statements of assets and liabilities, including the schedules of investments, of Pacific Advisors Fund Inc. (comprising, respectively, the Government Securities Fund, Income and Equity Fund, Balanced Fund, Large Cap Value Fund, Mid Cap Value Fund and Small Cap Value Fund) (the "Funds"), as of December 31, 2011, and the related statements of operations for the year then ended, the statements of changes in net assets for each of the two years in the period then ended, and the financial highlights for each of the five years in the period then ended. These financial statements and financial highlights are the responsibility of the Funds' management. Our responsibility is to express an opinion on these financial statements and financial highlights based on our audits.
We conducted our audits in accordance with the standards of the Public Company Accounting Oversight Board (United States). Those standards require that we plan and perform the audit to obtain reasonable assurance about whether the financial statements and financial highlights are free of material misstatement. We were not engaged to perform an audit of the Funds' internal control over financial reporting. Our audits included consideration of internal control over financial reporting as a basis for designing audit procedures that are appropriate in the circumstances, but not for the purpose of expressing an opinion on the effectiveness of the Funds' internal control over financial reporting. Accordingly, we express no such opinion. An audit also includes examining, on a test basis, evidence supporting the amounts and disclosures in the financial statements and financial highlights, assessing the accounting principles used and significant estimates made by management, and evaluating the overall financial statement presentation. Our procedures included confirmation of securities owned as of December 31, 2011, by correspondence with the custodian and brokers. We believe that our audits provide a reasonable basis for our opinion.
In our opinion, the financial statements and financial highlights referred to above present fairly, in all material respects, the financial position of each of the respective funds constituting the Pacific Advisors Fund Inc. at December 31, 2011, the results of their operations for the year then ended, the changes in their net assets for each of the two years in the period then ended, and the financial highlights for each of the five years in the period then ended, in conformity with U.S. generally accepted accounting principles.

Los Angeles, California
February 29, 2012
83
Pacific Advisors Fund Inc.
Disclosure Regarding the Board's Approval
of the Funds' Advisory Contracts
The Board of Directors, including a majority of the Independent Directors, most recently approved the Investment Management Agreements (the "Agreements") for the Funds at its meeting held on August 5, 2011. At that meeting, the Board approved the continuation of the Agreements by and between Pacific Advisors Fund Inc. (the "Corporation"), on behalf of each of its Funds, and Pacific Global Investment Management Company, Inc. ("PGIMC").
In approving the Agreements, the Board considered materials relating to, among other matters: (1) the financial condition and profitability of PGIMC, including information regarding PGIMC's cost of providing services, as well as comparative expense information for a peer group of funds; (2) investment performance of each Fund, including information comparing the performance of each Fund with a peer group of funds and an appropriate index or combination of indices; (3) sales and redemption data for each Fund; (4) the extent to which economies of scale are realized as the Funds grow and whether fee levels reflect these economies of scale for the Funds' investors; (5) the economic outlook and the general investment outlook in the markets in which each Fund invests; and (6) "fall-out" benefits realized by PGIMC (i.e., ancillary benefits derived by PGIMC and its affiliates from PGIMC's relationship with the Funds). The Board also periodically considers other material facts such as the allocation of each Fund's brokerage commissions, each Fund's record of compliance with its investment policies and restrictions on personal securities transactions, and the nature, cost, and character of non-investment management services provided by PGIMC and its affiliates. In approving the Agreements, the Board relied on all information presented to it over the course of the year.
Prior to the Board's approval of the Agreements, the Independent Directors met separately with independent counsel to review the materials provided. Based on its evaluation of all material factors, the Board, including a majority of the Independent Directors, determined that the Agreements were in the best interests of the Funds and their shareholders and that the fees to be paid to PGIMC under the Agreements were fair and reasonable in relationship to the services to be rendered thereunder and in light of the factors considered. During its deliberations, the Board did not identify any single factor as all important or controlling, and individual Directors may have weighed the same factors differently. The following summaries do not detail every matter considered. Matters considered by the Board included the following:
Nature, Quality and Extent of Services. The Board examined the nature, quality and extent of the services provided by PGIMC to the Funds. The Board reviewed PGIMC's key personnel in providing investment management services to the Funds as well as the changes in such personnel and the duties that such personnel perform for the Funds. The Board considered the qualifications and experience of PGIMC's portfolio management team, and PGIMC's commitment of its resources to portfolio management services. The Board considered PGIMC's responsibilities under the Agreements in serving as the Funds' investment manager, including responsibilities for investment research and stock selection; administration of the Funds' daily business operations; supervision of the Funds' transfer agent and administrative services agent; monitoring adherence to the Funds' investment restrictions; and monitoring compliance with various policies and procedures of the Funds. The Board was provided with and considered information regarding PGIMC's trading, operations, compliance, and investment research functions. The Board considered PGIMC's marketing strategy with respect to the Funds and the current asset levels of the Funds. The Board also considered the Funds' compliance program, the compliance reports periodically furnished to the Board, and the results of any regulatory exams. The Board concluded that the Funds were likely to benefit from the nature, extent and quality of the services provided by PGIMC under the Agreements.
84
Pacific Advisors Fund Inc.
Disclosure Regarding the Board's Approval
of the Funds' Advisory Contracts
Investment Performance of PGIMC and the Funds. The Board considered the performance of the Funds and PGIMC, including, to the extent applicable, each Fund's year-to-date, one-, three-, five-, and ten-year performance for the periods ended June 30, 2011; each Fund's one-, three-, five-, and ten-year performance for the periods ended December 31, 2010; as well as certain comparative performance sourced by an independent data service for each Fund's benchmark(s) and funds PGIMC considered peers of the Funds. The Board was provided information regarding PGIMC's investment decision making process and trade execution policies and strategies. After reviewing the Funds' performance records, including performance relative to the Funds' benchmarks, peers and, with respect to the Income and Equity Fund and the Balanced Fund, the blended returns of these Funds' benchmarks, the Board concluded that, while past performance is no guarantee of future performance, including consideration of each Fund's strategy and role in the overall Fund complex, each Fund's investment performance overall weighed in favor of renewing the relevant Agreement.
Among other factors, the Board considered: (i) with respect to the Small Cap Value Fund, the Fund (Class A shares) was ranked in the top 3% of the Lipper small cap core category based on its one-year return as of June 30, 2011; and it outperformed its benchmark index for the five- and ten-year periods ended December 31, 2010 and the one-, five- and ten-year periods ended June 30, 2011; (ii) with respect to the Mid Cap Value Fund, following a repositioning of the portfolio in 2008, the Fund (Class A shares) was ranked as the number one mid-cap core fund (according to Lipper) based on its one-year return as of June 30, 2011; and it outperformed its benchmark index for the one-year period ended December 31, 2010 and the six-month and the one-year periods ended June 30, 2011; (iii) with respect to the Large Cap Value Fund, following a repositioning of the portfolio in 2010, the Fund's (Class A shares) positive returns for the one-year periods ended December 30, 2010 and June 30, 2011, the Fund's focus on large-cap value companies, and the manager's report regarding the Fund's conservative investment strategy; (iv) with respect to the Balanced Fund, the Fund has two benchmarks, the Barclays Capital U.S. Intermediate Corporate Bond Index and the S&P 500 Index; the Fund (Class A shares) outperformed the Barclays Capital U.S. Intermediate Corporate Bond Index for the one-year period ended June 30, 2011 and it outperformed the S&P 500 Index, for the ten-year periods ended December 31, 2010 and June 30, 2011; and the Fund's low volatility relative to the S&P 500 Index; (v) with respect to the Income and Equity Fund, the Fund has two benchmarks, the Barclays Capital U.S. Intermediate Corporate Bond Index and the S&P 500 Index; the Fund (Class A shares) outperformed the Barclays Capital U.S. Intermediate Corporate Bond Index for the year-to-date and one-year periods ended June 30, 2011 and it outperformed the S&P 500 Index for the three- and ten-year periods ended December 31, 2010; the Fund's performance in light of its investment objective, policies and market conditions; and management's explanation of the Fund's conservative fixed income strategy focused on shorter-term bonds to preserve capital and manage volatility; and (vi) with respect to the Government Securities Fund, the Fund's performance in light of its investment objective, policies and market conditions; and management's explanation of the difference between the Fund's performance and that of its benchmark which reflected the benchmark's longer average maturity, the Fund's emphasis on shorter-term securities to manage risk and protect principal, and the effects of an extended low interest rate environment on the performance of the Fund.
Costs of Services and Profits Realized by PGIMC. The Board reviewed PGIMC's 2010 completed financial statements (which were pending final signoff from its independent auditor). The Board reviewed the 2010 consolidated statement of operations of PGIMC and its subsidiaries and also considered the costs and profitability of PGIMC and its affiliates from their operations. The Board also reviewed the 2010 consolidated statement of financial condition of PGIMC and its subsidiaries and considered the financial condition of PGIMC and its ability to provide the quality of services specified under the Agreements and expected by
85
Pacific Advisors Fund Inc.
Disclosure Regarding the Board's Approval
of the Funds' Advisory Contracts
the Board. The Board examined the fee information for the Funds as compared to that of comparable funds managed by other advisers, and in light of the investment strategy applied to each Fund. The comparative fee information provided to the Board indicated that each Fund's advisory fees were within the range of those charged by funds PGIMC considered peers of the Funds based on factors such as portfolio characteristics, investment style and asset level. The Board reviewed a description of the methodology used for selecting the funds in each peer group. The Board considered that during 2010, PGIMC had waived fees and reimbursed expenses for the Government Securities Fund, Income and Equity Fund, and Large Cap Value Fund in order to keep their expenses down; and that PGIMC expected to continue to waive fees for the Government Securities Fund, Income and Equity Fund, and Large Cap Value Fund in 2011 to the extent expenses exceed the agreed expense limits for those Funds. Another factor was that, over the history of the Funds, PGIMC and its affiliates had waived and/or reimbursed expenses for all the Funds in excess of $3.8 million. The Board also considered that affiliates of PGIMC provide distribution, administrative, and transfer agency services for the Funds, and, based on information furnished by PGIMC, the benefits to the Funds of having such services provided by such affiliates. The Board also considered the Funds' sales and redemption data in the first six months of 2011, in light of current market conditions. The Board concluded that the Funds' management fees were reasonable in light of the services provided.
Economies of Scale. The Board considered the extent to which the Funds' management fees reflect economies of scale for the benefit of the Funds' shareholders. The Board reviewed the Funds' fee arrangements, which include breakpoints that decrease the fee rate as the Funds' assets increase. The Board considered the fact that current assets were well below the threshold for the initial advisory fee breakpoint for each Fund. The Board noted that the expense ratios increased in 2010 relative to 2009 for all Funds primarily due to the one-time expenses incurred by the Funds as a result of the shareholder proxy solicitation in the third quarter of 2010. Based on its review, the Board concluded that the Funds' management fee structures allow shareholders to benefit from economies of scale as the Funds' assets increase. The Board also considered that PGIMC had been waiving fees and reimbursing expenses for the Government Securities Fund, Income and Equity Fund, and the Large Cap Value Fund.
Other Benefits to PGIMC. In evaluating the benefits that accrue to PGIMC through its relationship with the Funds, the Board recognized that, in addition to providing advisory services, PGIMC and its affiliates serve the Funds in various capacities, including as transfer agent, administrative services agent and distributor, and receive compensation from the Funds in connection with providing these services. The Board considered that each service provided to the Funds by PGIMC or one of its affiliates is pursuant to a written agreement, which the Board evaluates periodically. The Board also considered the benefits that accrue to PGIMC through its relationship with the Funds in its management of separately managed accounts, and another fund for which it serves as sub-adviser. The Board concluded that the benefits were consistent with PGIMC's rights and obligations under the Agreements.
After full consideration of these and other factors, the Board, including a majority of the Independent Directors, concluded that approval of the Agreements was in the best interest of the Funds and their shareholders.
86
Pacific Advisors Fund Inc.
Directors and Officers
"Independent" Directors
| Name (Age) | Position with the Company1 | Year elected Director of the Company | Principal occupation(s) during past 5 years | Other Directorships held by Director | |||||||||||||||
| L. Michael Haller, III (68) | Director | 1992 | Consultant, d/b/a Asahi Broadcasting Enterprises (software development); Chairman, Kapitall, Inc. (formerly Stereo Scope, Inc.) (online introducing brokerage); Chairman, Moxy Games (mobile game publisher); President, Gammaker Pte. Ltd. (mobile game developer); and formerly President, Bionic Games, Inc. (game software development company) (2008-2011); and General Manager, Kapitall Studio (division of Kapitall, Inc.) (2010-2011) | None | |||||||||||||||
| Peter C. Hoffman (61) | Director | 2010 | President, Sierra Autocars, Inc. (auto dealership), Sierra Vehicles, Inc. (auto dealership), Sierra Automotive Enterprises, Inc. (auto dealership) and Sierra Pursuits, Inc. (management company) | None | |||||||||||||||
| Takashi Makinodan, PhD (87)1 | Director | 1995 | Retired in 2007; and formerly Director, Medical Treatment Effectiveness Program (MEDTEP), Center on Asian and Pacific Islanders (1992-2007); and Associate Director of Research, Geriatric Research Education Clinic Center, VA Medical Center (1991-2007) | None | |||||||||||||||
| Gerald E. Miller (82) | Director | 1992 | Retired in 1992; and formerly worked for Merrill Lynch for over 30 years and was a Senior Resident Vice President at retirement in 1992 | None | |||||||||||||||
| Louise K. Taylor, PhD (65) | Director | 1992 | Retired in 2009; and formerly Superintendent, Monrovia Unified School District (1991-2009) | None | |||||||||||||||
1 Dr. Makinodan resigned as a director of the Company effective February 2012.
"Interested" Directors2
| Name (Age) | Positions with the Company1 | Year elected a Director and officer of the Company | Principal occupations during past 5 years | Other Directorships held by Director | |||||||||||||||
| Victoria L. Breen (60)* | Director Assistant Secretary | 1992 2002 | President, Derby & Derby, Inc. (financial services company); Agent, Transamerica Life Companies; Registered Principal, Transamerica Financial Advisors, Inc.; and Assistant Secretary and Director, Pacific Global Investment Management Company | None | |||||||||||||||
| George A. Henning (64)** | President and Chairman | 1992 | Chairman, President and Director, Pacific Global Investment Management Company; and Chairman and Director, Pacific Global Fund Distributors, Inc. and Pacific Global Investor Services, Inc. | None | |||||||||||||||
Each Director oversees all 6 Pacific Advisors Fund portfolios.
The Fund's Statement of Additional Information contains additional information about the Fund's Directors and Officers and is available without charge upon request by calling (800) 989-6693. The business address for all Directors and officers of the Company is 101 N. Brand Blvd., Suite 1950, Glendale, CA 91203, Attn: Secretary.
87
Pacific Advisors Fund Inc.
Directors and Officers
Other Officers
| Name (Age) | Position(s) with the Company | Year elected an officer of the Company | Principal occupations during past 5 years | ||||||||||||
| Catherine L. Henning (34) | Vice President Secretary | 2010 2006 | Senior Vice President, Secretary, Director of Client Services and Director, Pacific Global Investment Management Company; President, Secretary, Chief Compliance Officer and Director, Pacific Global Fund Distributors, Inc.; and Vice President, Secretary and Director, Pacific Global Investor Services, Inc. | ||||||||||||
| Barbara A. Kelley (58) | Vice President, Treasurer and Chief Compliance Officer | 2001 | Executive Vice President, Chief Compliance Officer and Director, Pacific Global Investment Management Company; Director, Pacific Global Fund Distributors, Inc.; President and Director, Pacific Global Investor Services, Inc.; and formerly Treasurer, Pacific Global Investment Management Company, Pacific Global Fund Distributors, Inc. and Pacific Global Investor Services, Inc. (2001-2007) | ||||||||||||
| Araceli Olea (39) | Assistant Secretary | 2008 | Shareholder Services Manager, Pacific Global Investor Services, Inc.; and Assistant Secretary, Pacific Global Investment Management Company and Pacific Global Investor Services, Inc. | ||||||||||||
| Jingjing Yan (38) | Assistant Treasurer | 2005 | Vice President and Treasurer, Pacific Global Investment Management Company; Treasurer, Pacific Global Fund Distributors, Inc. and Pacific Global Investor Services, Inc.; and formerly Fund Accounting Manager, Pacific Global Investor Services, Inc. (2001-2007); and Assistant Treasurer, Pacific Global Investment Management Company, Pacific Global Fund Distributors, Inc. and Pacific Global Investor Services, Inc. (2005-2007) | ||||||||||||
1 Each director is elected to serve until the next annual shareholders meeting and until his or her successor is elected or appointed. The Company does not hold regular annual shareholders meetings to elect Directors. Vacancies on the Board can be filled by the action of a majority of the Directors, provided that at least two-thirds of the Directors have been elected by the shareholders.
2 "Interested persons" as defined in the 1940 Act, as amended, based on their affiliation with the Funds' investment manager and its affiliates (including the Funds' principal underwriter).
* Ms. Breen is considered an interested director because (a) she is a registered principal of a registered broker/dealer that engages in sales of Company shares under a selling agreement with the Distributor, and in that capacity she has received commissions on the sale of the Funds' shares; (b) she is an officer of the Company; and (c) she is a shareholder of the Manager and a member of the Manager's Board of Directors.
** Mr. Henning is considered an interested director because (a) he holds the positions described above with the Company, the Manager and its affiliates; (b) by virtue of his ownership of the Manager's shares he may be deemed a "control person" of the Manager; and (c) he is Ms. Henning's father.
88
Pacific Advisors Fund Inc.
Additional Tax Information (Unaudited)
For federal income tax purposes, the following information is furnished with respect to the distributions paid by the Funds during the taxable year ended December 31, 2011. The Funds designated and paid as long-term capital gain distributions as follows:
| Government Securities Fund | Income and Equity Fund | Balanced Fund | Large Cap Value Fund | Mid Cap Value Fund | Small Cap Value Fund | ||||||||||||||||||||||
| Long-term capital gain distributions | - | - | $ | 967,955 | - | - | - | ||||||||||||||||||||
A percentage of the dividends distributed during the fiscal year for the Funds qualifies for the dividends-received deduction for corporate shareholders:
| Government Securities Fund | Income and Equity Fund | Balanced Fund | Large Cap Value Fund | Mid Cap Value Fund | Small Cap Value Fund | ||||||||||||||||||||||
| Corporate dividends-received deduction | N/A | 100.00 | % | N/A | N/A | N/A | N/A | ||||||||||||||||||||
Under the Jobs and Growth Tax Relief Reconciliation Act of 2003 (the "Act"), the following percentage of ordinary dividends paid during the taxable year ended December 31, 2011 are designated as "qualified dividend income," as defined in Act and subject to reduced tax rates in 2011.
| Government Securities Fund | Income and Equity Fund | Balanced Fund | Large Cap Value Fund | Mid Cap Value Fund | Small Cap Value Fund | ||||||||||||||||||||||
| Percentage of qualified dividends | N/A | 100.00 | % | N/A | N/A | N/A | N/A | ||||||||||||||||||||
In January 2012, the Funds provided tax information to shareholders for the preceding calendar year.
89
Pacific Advisors Fund Inc.
notes
90
Pacific Advisors Fund Inc.
notes
91
Pacific Advisors Fund Inc.
notes
92

Pacific Advisors Fund Inc.
Directors
George A. Henning, Chairman
Victoria L. Breen
L. Michael Haller, III
Peter C. Hoffman
Gerald E. Miller
Louise K. Taylor, Ph.D.
Officers
George A. Henning, President
Catherine L. Henning, Vice President and Secretary
Victoria L. Breen, Assistant Secretary
Araceli Olea, Assistant Secretary
Barbara A. Kelley, Treasurer
Jingjing Yan, Assistant Treasurer
Investment Manager
Pacific Global Investment Management Company
101 North Brand Blvd., Suite 1950
Glendale, California 91203
Transfer Agent and Administrator
Pacific Global Investor Services, Inc.
101 North Brand Blvd., Suite 1950
Glendale, California 91203
Distributor
Pacific Global Fund Distributors, Inc.
101 North Brand Blvd., Suite 1950
Glendale, California 91203
(800) 989-6693
Availability of Quarterly Portfolio Schedule
The Fund files its complete schedule of portfolio holdings with the SEC for the first and third quarters of each fiscal year on Form N-Q. The Fund's Forms N-Q are available on the SEC's Web site at http://www.sec.gov. The Fund's Forms N-Q may be reviewed and copied at the SEC's Public Reference Room in Washington, DC. Information about the operation of the Public Reference Room may be obtained by calling the SEC at (800) SEC-0330.
The Fund's complete schedule of portfolio holdings for each fiscal quarter is posted on the Fund's Web site at www.PacificAdvisorsFund.com and is available without charge, upon request by calling (800) 989-6693. Documents will be sent within 3 business days of receipt of your request.
Availability of Proxy Voting Policies and Procedures and Proxy Voting Record
A description of the policies and procedures that the Fund uses to determine how to vote proxies relating to portfolio securities and information regarding how the Fund voted proxies relating to portfolio securities during the most recent 12-month period ended June 30 is available without charge, upon request by calling (800) 989-6693. Documents will be sent within 3 business days of receipt of your request. This information is also available on the SEC's Web site at http://www.sec.gov.

Pacific Global Fund Distributors, Inc.
101 North Brand Blvd., Suite 1950
Glendale, California 91203

Item 2. Code of Ethics
Registrant has adopted a Code of Ethics pursuant to Section 406 of the Sarbanes-Oxley Act of 2002 that applies to Registrant’s principal executive officer, principal financial officer, principal accounting officer or controller. Registrant will provide to any person without charge, upon request, a copy of the Code of Ethics if such person submits a request in writing addressed to the Registrant’s secretary at the principal executive offices listed above.
Item 3. Audit Committee Financial Expert
Registrant’s Audit Committee has three members. While these members are “financially literate,” the Board has determined that none of the members of the Audit Committee meet the technical definition of “audit committee financial expert.” Registrant has determined that an audit committee financial expert is not necessary at this time because (i) the Audit Committee members are financially literate; (ii) they have served on Registrant’s Audit Committee for several years; (iii) the accounting methodologies applicable to registered investment companies and the types of investment activities in which the Funds engage are well established; and (iv) Registrant’s financial statements do not involve the types of complex accounting issues that other types of public companies may have.
Item 4. Principal Accountant Fees and Services
(a)-(d) Ernst & Young LLP (“E&Y”) billed the Registrant aggregate fees for professional services rendered for the fiscal years ending December 31, 2010, and December 31, 2011, as follows:
|
| Audit Fees |
| Audit Related Fees |
| Tax Fees |
| All Other Fees |
| ||||
2011 |
| $ | 157,500 |
| $ | 2,500 |
| $ | 31,000 |
| $ | 0 |
|
2010 |
| $ | 157,500 |
| $ | 5,000 |
| $ | 31,000 |
| $ | 0 |
|
(b) Audit Related Fees are for services rendered to provide consent of the annual update to the Corporation’s Form N1-A and non-routine N1-A filings.
(c) Tax Fees include the services for the review of income tax returns and excise taxes.
(e)(1) The Audit Committee is authorized to pre-approve non-audit services provided by the Corporation’s auditors, if they find it appropriate in light of their fiduciary duties and in the exercise of their good faith business judgment and compatible with the auditors’ independence. The Chairman of the Audit Committee is authorized to approve audit and non-audit services for newly established funds of the Corporation on the same terms as the full Audit Committee previously had approved for the then existing funds, and to approve non-audit services which are permissible under applicable law, provided the estimated fee is not more than $5,000 based on a good faith estimate provided by the auditor. The Chairman shall report any such pre-approval to the Audit Committee at its next following meeting.
(e)(2) None.
(f) None.
(g) None.
(h) Not applicable.
Item 5. Audit Committee of Listed Registrants
Not applicable as Registrant is not a listed issuer as defined in Rule 10A-3 under the Securities Exchange Act of 1934.
Item 6. Statements of Investments
Statements of Investments is included as part of the report to shareholders filed under Item 1 of this form.
Item 7. Disclosure of Proxy Voting Policies and Procedures for Closed-End Management Investment Companies
Not applicable to open-end investment companies.
Item 8. Portfolio Managers of Closed-End Management Investment Companies
Not applicable to open-end investment companies.
Item 9. Purchases of Equity Securities by Managers of Closed-End Management Investment Company and Affiliated Purchasers.
Not applicable to open-end investment companies.
Item 10. Submission of Matters to a Vote of Security Holders
No material changes have been made.
Item 11. Controls and Procedures.
(a) Based upon their evaluation of Registrant’s disclosure controls and procedures (as defined in Rule 30a-3(c) under the Investment Company Act of 1940) as conducted within 90 days of the filing date of this Form N-CSR, Registrant’s principal executive officer and principal financial officer have concluded that those disclosure controls and procedures provide reasonable assurance that the material information required to be disclosed by Registrant on this report is recorded, processed, summarized and reported within the time periods specified in the Securities and Exchange Commission’s rules and forms.
(b) There were no changes in Registrant’s internal control over financial reporting (as defined in Rule 30a-3(d) under the Investment Company Act of 1940) that occurred during the second fiscal quarter of the period covered by this report that have materially affected, or are reasonably likely to materially affect, Registrant’s internal control over financial reporting.
Item 12. Exhibits
(a)(1) Not applicable.
(a)(2) Certifications required by Item 12(a) of Form N-CSR and Section 302 of the Sarbanes-Oxley Act of 2002 (filed herewith).
(b) Certification required by Section 906 of the Sarbanes-Oxley Act of 2002 (filed herewith).
SIGNATURES
Pursuant to the requirements of the Securities Exchange Act of 1934 and the Investment Company Act of 1940, Registrant has duly caused this report to be signed on its behalf by the undersigned, thereunto duly authorized.
Pacific Global Fund Inc. d/b/a Pacific Advisors Fund Inc.
By: | /s/ George A. Henning |
|
| George A. Henning |
|
| Chairman, Pacific Advisors Fund Inc. |
|
|
|
|
Date: | March 5, 2012 |
|
Pursuant to the requirements of the Securities Exchange Act of 1934 and the Investment Company Act of 1940, this report has been signed below by the following persons on behalf of Registrant and in the capacities and on the dates indicated.
By: | /s/ George A. Henning |
|
| George A. Henning |
|
| Chief Executive Officer |
|
|
|
|
Date: | March 5, 2012 |
|
By: | /s/ Barbara A. Kelley |
|
| Barbara A. Kelley |
|
| Chief Financial Officer |
|
|
|
|
Date: | March 5, 2012 |
|