UNITED STATES
SECURITIES AND EXCHANGE COMMISSION
Washington, D.C. 20549
FORM N-CSR
CERTIFIED SHAREHOLDER REPORT OF REGISTERED
MANAGEMENT INVESTMENT COMPANIES
Investment Company Act file number | 811-07062 | |||||||
| ||||||||
PACIFIC GLOBAL FUND INC. D/B/A PACIFIC ADVISORS FUND INC. | ||||||||
(Exact name of registrant as specified in charter) | ||||||||
| ||||||||
101 NORTH BRAND BLVD., SUITE 1950 GLENDALE, CALIFORNIA |
| 91203 | ||||||
(Address of principal executive offices) |
| (Zip code) | ||||||
| ||||||||
GEORGE A. HENNING 101 NORTH BRAND BLVD., SUITE 1950 GLENDALE, CA 91203 | ||||||||
(Name and address of agent for service) | ||||||||
| ||||||||
Registrant’s telephone number, including area code: | 818-242-6693 |
| ||||||
| ||||||||
Date of fiscal year end: | December 31 |
| ||||||
| ||||||||
Date of reporting period: | December 31, 2013 |
| ||||||
Item 1. Report to Shareholders

annual report
december 31, 2013
government securities fund
income and equity fund
balanced fund
large cap value fund
mid cap value fund
small cap value fund


Pacific Advisors
table of contents
Message from the Chairman | 1 | ||||||
Government Securities Fund | 5 | ||||||
Income and Equity Fund | 11 | ||||||
Balanced Fund | 17 | ||||||
Large Cap Value Fund | 23 | ||||||
Mid Cap Value Fund | 28 | ||||||
Small Cap Value Fund | 33 | ||||||
Schedule of Investments | 40 | ||||||
Statement of Assets and Liabilities | 62 | ||||||
Statement of Operations | 64 | ||||||
Statement of Changes in Net Assets | 66 | ||||||
Financial Highlights | 70 | ||||||
Notes to Financial Statements | 77 | ||||||
| Report of Independent Registered Public Accounting Firm | 87 | ||||||
| Disclosure Regarding the Board's Approval of the Funds' Advisory Contracts | 88 | ||||||
Directors and Officers | 92 | ||||||
Additional Tax Information | 94 | ||||||
This Report is submitted for the general information of the shareholders of Pacific Advisors Funds. It is not authorized for distribution to prospective investors unless accompanied or preceded by the Funds' current prospectus, which contains information concerning the investment policies of the Funds as well as other pertinent information.
This Report is for informational purposes only and is not a solicitation or recommendation that any particular investor should purchase or sell any particular security. The statements in the Chairman's Letter and the discussions of the Funds' performance are the opinions and beliefs expressed at the time of this commentary and are not intended to represent opinions and beliefs at any other time. These opinions are subject to change at any time based on market or other conditions and are not meant as a market forecast. All economic and performance information referenced is historical. Past performance does not guarantee future results.
For more information on the Pacific Advisors Funds, including information on charges, expenses and other classes offered, please obtain a copy of the prospectus by calling (800) 989-6693. Please read the prospectus and consider carefully the investment risks, objectives, charges and expenses before you invest or send money. Shares of the Pacific Advisors Funds are not deposits or obligations of any bank, are not guaranteed by any bank, are not insured by the FDIC or any other agency, and involve investment risks, including the possible loss of the principal amount invested. The investment return and principal value of an investment will fluctuate so that an investor's shares, when redeemed, may be worth more or less than their original cost.


Message
from the chairman
Dear Shareholders,
2013: The Year of the Bull. The impressive fourth quarter growth enabled the equities markets to end the year on a high note; each of the major indices recorded 2013 returns in excess of 25%. The Pacific Advisors Funds posted impressive results; in particular Class A shares of the Small Cap Value, Government Securities, Balanced and Income & Equity Funds were all top performers for 2013 in their respective Lipper Categories. Further information about their success and a discussion with each of the portfolio managers follows my letter.
Lipper Rank (# of Funds) as of 12/31/13 Based on Total Return
2013 | Small Cap Value Fund (A) | Balanced Fund (A) | Income and Equity Fund (A) | Government Securities Fund (A) | |||||||||||||||
| Small Cap Core Category Kings | Mixed Asset Target Allocation Growth Category | Mixed Asset Target Allocation Conservative Category | General US Government Category | ||||||||||||||||
| 1 Year | 1 | (718) | 6 | (563) | 6 | (357) | 3 | (115) | |||||||||||
| 3 Year | 2 | (622) | 66 | (502) | 63 | (296) | 109 | (110) | |||||||||||
| 5 Year | 21 | (573) | 326 | (467) | 183 | (272) | 98 | (104) | |||||||||||
| 10 Year | 1 | (350) | 241 | (287) | 105 | (121) | 81 | (82) | |||||||||||
The impressive performance in the equity markets resulted principally from the underlying strength of the global economy and the impact of accommodative monetary policies that were introduced by the central banks in the U.S., Europe, China and Japan. Significantly, low interest rates encouraged merger and acquisitions activity; business expansions; stock buybacks; higher dividend rates; and increased confidence by both business owners and consumers. The growth strategies that many companies initiated during the post-recession years progressed at a measured pace. Investors rewarded other companies on their emerging market growth opportunities which should bear fruit as the world economy improves. Also, many investors who had long-remained on the sidelines became more confident in the economy; stocks gained as they migrated into equities.
The U.S. continued to grow slowly yet steadily as the unemployment picture improved and inflation remained subdued. The resurgent housing industry created important spillover benefits for consumer confidence, construction, furniture sales and other retail activities. Also, the boom in shale oil and gas production provided welcome growth while also contributing to the country's energy needs. Abroad, both Japan and China implemented growth initiatives: Japan's new Prime Minister Abe introduced an aggressive monetary policy to finally shake the world's third largest economy out of its decade-long doldrums; in China, newly-installed President Xi Jinping laid the groundwork for important financial and social reforms to aid the country's growing middle class. And, perhaps most crucially, the euro zone emerged from recession following 31/2 years of debt-crisis-induced drama. By the end of the year, the world's four major economies, which account for over 60% of global GDP, were expanding in synchrony.
Over the past five years, events including fiscal crises in the euro zone and legislative impasses in Washington unsettled consumers, investors and businesses. Yet, 2013 ended without cliffhangers. During this period, the Federal Reserve maintained an unwavering commitment to accommodative monetary policies. The eventual unwinding (or "tapering") of the Fed's extraordinary policies had obsessed the markets since May when Chairman Bernanke first announced the Fed's intentions to begin tapering. In mid-December, the Fed revealed its highly-anticipated decision to begin tapering in January. The markets surged on the news as the Fed confirmed that its monetary policies would remain highly accommodative even as the economy showed signs of improvement. Investors, having accepted the inevitability of the policy change, appeared to agree with the Fed's timing. The relief rally also seemed to acknowledge the economy's underlying strength. And, Congress negotiated a budget agreement that should fund the government for another two years.
A confluence of factors created a market environment that enabled equities to advance at a measured pace. The ebbs and flows of the slow economic recovery have, not surprisingly, tempered expectations. Consumers paid down debt and gradually increased spending as they became more confident in their job security and as their homes and investment portfolios gained in value. The combination of low interest rates, a stabilizing world economy and successful company growth initiatives propelled the equity markets higher; investors took on more risk in search of higher investment returns as they gained confidence in the markets.
1


Message
from the chairman continued
Many other investors, however, remained on the sidelines while they awaited an entry point following an anticipated major correction. Market skeptics helped to keep valuations in check, but these investors also seemed to ignore the extraordinary incentives for risk-taking in the central banks' easy money policies.
Companies continued to allocate capital to growth initiatives. Low interest rates encouraged shareholder-friendly actions such as higher dividends and stock buybacks while still maintaining significant cash reserves. Stock prices, which had been heavily discounted during the recession, had recovered; by year-end, the markets were more representative of actual business conditions. And, unlike recent years, the markets avoided broad selloffs during which stock prices declined regardless of the performance of individual businesses. Such reasonable behavior from companies and investors bodes well for equities. A continuation of slow but steady economic growth will enable companies to execute disciplined strategies without the excesses often seen during periods of rapid economic expansion. These conditions may enable equity markets to advance for some time.
Market Review
Volatility was somewhat subdued as the markets enjoyed the welcomed absence of major disruptions. During the year, the S&P 500® Index rose 32.36%, the Dow Jones Industrial Average rose 26.50%, and the technology-heavy NASDAQ rose 38.32%. Smaller companies enjoyed strong performance as well: the Russell Midcap® Index gained 34.76%, while the Russell 2000® Index of small companies gained 38.82%. Within the small cap universe, value slightly outperformed growth: the Russell 2000® Value Index grew 34.52% compared to the 43.30% increase in the Russell 2000® Growth Index.1
Fixed income markets, on the other hand, had a more challenging year; rising investor confidence and strong equity market performance encouraged the migration from "safe havens" to potentially more rewarding investments. Also, the Fed's tapering discussions prompted more investors to flee bonds; in response, the yield on the 10-year U.S. Treasury Note edged higher to close the year above 3% for the first time in 21/2 years.
Equity Investment Review
Many areas of the market performed well; in particular, investors' enthusiasm for risk led to strong performance in economically-sensitive stocks such as Consumer Discretionary holdings which benefit from increased consumer spending. Similarly, Industrials stocks, which also tend to offer better growth opportunities along with more volatility and greater exposure to economic developments, performed well. The Energy industry continued its strong performance as oil and gas exploration in shale and off shore areas has transformed the U.S. from a net importer to an exporter of petroleum products. This important development has created U.S. jobs and reduced the economic threat of geopolitical events in the Middle East, Africa and other less politically stable countries.
Financial companies also responded to the economic recovery as lending activity increased, reserves for loan losses shrank along with the improved economy, and the impact of the "Great Recession's" banking crisis faded. Residential and commercial construction, an important growth catalyst, also grew. The U.S. economy continues to expand at a modest pace while many companies have grown their operations considerably faster. Often, these businesses identified opportunities to expand in well-performing areas of the economy; frequently, they were able to recognize and respond to growth opportunities when their weaker competitors could not.
The slow rate of economic growth has motivated companies to improve efficiencies and expand selectively after identifying the best opportunities in their particular markets. The current economic climate also requires investors be more selective in evaluating companies to select those with the management and financial strength to operate and grow successfully.
Market Review – December 31, 2013
Index1 | Close | YTD Return | |||||||||
Dow Jones Industrial Avg | 16,576.66 | 26.50 | % | ||||||||
S&P 500® | 1,848.36 | 32.36 | % | ||||||||
NASDAQ | 4,176.59 | 38.32 | % | ||||||||
Russell Midcap® | 1,491.75 | 34.76 | % | ||||||||
Russell 2000® (small cap) | 1,163.64 | 38.82 | % | ||||||||
12/31/13 | 12/31/12 | ||||||||||
| 10-Year T-Note Yield | 3.04 | % | 1.78 | % | |||||||
Data: Bloomberg; Federal Reserve
2

Fixed Income Investment Review
News surrounding the Fed dominated headlines in the fixed income markets during this past year. In December, the central bank cited an improved economic outlook in announcing a reduction in its monthly bond-buying program from $85 billion to $75 billion in January. The Fed continued to stress that tapering does not mean a tightening of monetary policy; the bank reemphasized its commitment to keeping short-term interest rates exceptionally low. Furthermore, the confirmation of Janet Yellen as the new Fed Chair (following Ben Bernanke's late-January departure) should ensure the near-term continuation of the central bank's easy monetary policies.
During the latter part of the year, interest rates for longer-term bonds rose in response to falling demand. Many investors who had remained in long-duration bonds took steps to protect principal as rising interest rates resulted in lost principal; increasingly, investors migrated to shorter-term bonds, foreign bonds or equities.
Our fixed income strategies continued to focus on investment-grade bonds with shorter durations. We utilized this approach as we anticipated that interest rates would continue to rise from historically low levels as the economy improves and the Fed's stimulus programs wind down.
We expect interest rates to remain somewhat volatile while maintaining an upward bias in response to the slow growth of the U.S. economy and Fed policies.
Looking Ahead
A rising tide lifts all boats; 2013 was definitely a year of rising tides. The relative stability of economies around the world set the stage for markets to advance. At home, discretionary spending increased as job security improved. Growing consumer confidence led to the resurgence in the housing market; in turn, rising home valuations and investment returns bolstered outlooks. Meanwhile, the strategic growth initiatives undertaken by leading companies during the past few years started to pay off; indeed, many are still in the early growth stages.
The market advances this year have been stellar but not euphoric; stock prices are not dramatically overpriced. Some skeptics suggest that the market is overdue for a correction. Much of this market psychology is a remnant of the upheaval created by the "Great Recession" and the subsequent global strife. This market reticence has been, and will likely remain, a factor which will act to moderate the markets' upward trend. Investors should view any correction as a healthy market rebalancing rather than a signal of perilous times. A market decline of 10% to 20% is typical for a correction; while often lasting only a few weeks or months, they nevertheless prevent overheating. Corrections are usually transition periods rather than turning points.
Looking out into 2014, we believe that the improving global economy may well position the equity markets for continued growth. With the world's economies connected now as never before, the potential benefits of synchronized global growth are enormous. Economic growth in Europe will be particularly important for many companies. The euro zone has been mired in a deep recession for several years; the region's deferred spending, even if somewhat constrained, will nevertheless be a growth catalyst for many companies. Still, unforeseen global events are always a potential threat. Even so, well-disciplined yet adaptive investment strategies remain critical in navigating the ups and downs of the markets.
Within the U.S., investment opportunities in industries related to the ongoing housing recovery and non-residential construction are compelling. Also, energy companies, including energy infrastructure and offshore drilling services, will continue to drive the economy. And, financial institutions should benefit as interest rates rise. Finally, mergers and acquisitions activity will likely accelerate as businesses take advantage of low cost financing. We believe that attractive investment opportunities remain in proven companies that are well positioned for further expansion in the New Year. Therefore, we anticipate the equity markets to continue their upward momentum in 2014.
3


Message
from the chairman continued
I encourage you to read the interviews with each of our Fund portfolio managers to gain more insight into the investment strategies being employed by each Fund. This past year was a very good year and we believe that in the coming year the markets will continue to improve.
Sincerely,

George A. Henning
1 The Dow Jones Industrial Average is an unmanaged, price weighted measure of 30 U.S. stocks selected by the Averages Committee to represent the performance of all U.S. stocks outside the Transportation and Utilities sectors. The S&P 500® Index is an unmanaged, market capitalization weighted index which measures the performance of the large cap segment of the U.S. equities market, covering approximately 75% of the U.S. equities market. The Index includes 500 leading companies in leading industries of the U.S. economy. The NASDAQ Composite Index is an unmanaged, market capitalization weighted measure of all domestic and international common stocks (currently over 3,000 stocks) listed on The Nasdaq Stock Market. The Russell 2000® Index is an unmanaged, market-weighted measure of the 2,000 smallest publicly traded companies of the Russell 3000® Index. The Russell Midcap® Index is an unmanaged, weighted measure of the 800 smallest companies within the Russell 1000® Index based on a combination of their market cap and current index membership. The Russell 2000® Growth Index includes those Russell 2000® Index companies with higher price-to-value ratios and higher forecasted growth values; the Russell 2000® Value Index includes those Russell 2000® Index companies with lower price-to-book ratios and lower forecasted growth values. These indices are not available for direct investment. Index returns assume the reinvestment of dividends.
Economic and performance information referenced is historical and past performance does not guarantee future results. Rankings shown are for Class A shares and do not take into account the maximum sales charge of 4.75% on the Government Securities and Income and Equity Funds or 5.75% on the Balanced and Small Cap Value Funds. Rankings for other share classes may differ. The principal value and return of an investment will fluctuate so that an investor's shares may be worth less than the original cost when redeemed. For more information on the Pacific Advisors Funds, including information on charges, expenses and other classes offered, please obtain a copy of the prospectus by calling (800) 989-6693. Please read the prospectus and consider carefully the investment risks, objectives, charges and expenses before you invest or send money.
Shares of the Funds are not deposits or obligations of any bank, are not guaranteed by any bank, are not insured by the FDIC or any other agency, and involve investment risks, including the possible loss of the principal amount invested. The views expressed represent the opinions and beliefs at the time of this commentary and are not meant as a market forecast. These views are subject to change at any time based on market or other conditions. This information may not be relied on as investment advice or as an indication of trading intent on behalf of any Fund. Fund investments may change at any time.
4
Pacific Advisors
Government Securities Fund
Fund Objective: High current income, preservation of capital, and rising future income consistent with prudent investment risk.
Investment Invests at least 80% of its assets in U.S. Government fixed income securities. These
Strategy: include securities issued or guaranteed by the U.S. Treasury; issued by a U.S. Government agency; or issued by a Government-Sponsored Enterprise (GSE). May also invest in high quality dividend-paying common stocks.
Investor Profile: Conservative. Income-focused; capital preservation aim.
TOTAL RETURNS | EXPENSE RATIOS | ||||||||||||||||||||||||||
For the year ended December 31, 2013 | Current (For the year ended 12/31/13) | Prospectus (For the year ended 12/31/12) | |||||||||||||||||||||||||
Net | Gross | Net | Gross | ||||||||||||||||||||||||
Class A | 0.77 | % | Class A | 3.39 | % | 6.09 | % | 3.12 | % | 5.44 | % | ||||||||||||||||
Class C | 0.00 | % | Class C | 4.16 | % | 6.82 | % | 3.85 | % | 6.29 | % | ||||||||||||||||
Barclays Capital U.S. Int T-Bond Index1 | – 1.25 | % | |||||||||||||||||||||||||
Performance quoted is past performance which does not guarantee future results. Current performance may be higher or lower than the performance quoted. Call (800) 989-6693 for performance current to the most recent month-end. The investment return and principal value of an investment will fluctuate so that an investor's shares, when redeemed, may be worth more or less than their original cost. Returns represent the change in value over the stated period assuming reinvestment of dividends and capital gains at net asset value. Rankings shown are for Class A shares; rankings for other share classes may be different. Returns and rankings do not take into account the maximum 4.75% sales charge on Class A shares or the 1% Contingent Deferred Sales Charge (CDSC) for Class C shares sold within one year of purchase. Returns would be lower if the applicable sales charge and CDSC were included. Returns do not take into account individual taxes which may reduce actual returns when shares are sold.
The Fund's investment adviser is waiving a portion of its management fees pursuant to an Expense Limitation Agreement. The waiver may be discontinued at any time with ninety days written notice in consultation with the Fund's board, but is expected to continue at current levels. Please see the Notes to Financial Statements in this report for details. Performance shown reflects the waiver, without which the results would have been lower.
Discussion with Portfolio Manager February 24, 2014
Jingjing Yan, CFA
Please see the Chairman's Letter at the beginning of this Report for a detailed market and economic review
as well as the Manager's general market outlook.
Pacific Advisors Government Securities Fund (A) | |||||||
| Lipper General US Government Category Rank (# of funds) as of 12/31/13 based on total return | |||||||
| 1 Year | 3 | (115) | |||||
| 3 Year | 109 | (110) | |||||
| 5 Year | 98 | (104) | |||||
| 10 Year | 81 | (82) | |||||
1 The Barclays Capital U.S. Intermediate Treasury Bond Index is an unmanaged index of U.S. government securities with one to ten years to maturity. It is not possible to invest directly in the Index.
5
Pacific Advisors
Government Securities Fund continued
Fund Performance
For the year, Class A shares of the Fund returned 0.77% compared to -1.25% for its benchmark, the Barclays Capital U.S. Intermediate T-Bond Index. The Fund's strategy proved effective as the Fund was one of only two funds in its Lipper category that ended 2013 with positive performance; it ranked #3 in its Lipper category. In response to the slow but steady economic recovery and the upward trend of interest rates, the Fund's fixed income investments remained concentrated in short to intermediate-term bonds. This strategy provided price stability during periods of interest rate volatility and enabled the Fund to protect principal as interest rates rose.
During the period, the Fund maintained an average duration of approximately 0.5 years; in contrast, the benchmark's average duration was 3.7 years. Duration measures a portfolio's sensitivity to interest rate movements; when interest rates increase by 1%, a portfolio with a 4-year duration would decline by approximately 4%. The Fund's short average duration reflected our commitment to minimize the impact of rising interest rates.
In the second half of the year, interest rates rose erratically but significantly in response to the recovering global economy. GDP growth, declining unemployment and the highly-anticipated reduction of the Federal Reserve's bond-buying program placed upward pressure on rates. The Fund's approach anticipated the decline in demand for U.S. government securities resulting from strengthened investor sentiment and the Fed's monetary policy. Investors continued to migrate capital from "safe havens," including U.S. Treasuries, into more rewarding alternatives. This rotation caused the benchmark 10-year U.S. Treasury Note to rise from 2.52% on June 30th to 3.04% by year-end; the upward movement of rates forced investors to acknowledge that long-term bonds, including U.S. government bonds, are not "low-risk" investments when interest rates rise.
The Fund's strategy of holding shorter-term bonds in expectation of higher interest rates proved successful and resulted in positive performance for the year. In contrast to the Fund's investment approach, alternative investment strategies sought to maximize returns by investing in longer-term bonds or other higher-risk strategies. Such an approach, however, exposed investors to the risk of sudden interest rate increases. During 2013, the prices for these higher-yielding securities became depressed in the absence of interested buyers; investors were forced to sell long-term holdings at significant losses.
The Fund's small allocation to common stocks provided dividend income and price appreciation which supported total return in the historically low interest rate environment. These high-quality, dividend-paying common stocks helped manage volatility by counterbalancing price movements in U.S. government securities holdings.
Market Overview
Interest rates in the second half of the year were volatile: the rate on the 10-year U.S. Treasury Note rose and fell in July only to rise again in late August and early September as the markets anticipated an imminent start to the Fed's tapering program. Rates reached an interim high of 2.98% in early September. The central bank's decision in mid-September to delay reducing bond purchases sent shockwaves through the markets; the rate fell back to 2.51% in October. Continuing positive economic data then boosted investor confidence; speculation that the Fed would begin tapering sooner rather than later again put upward pressure on rates; investors had seemingly come to accept the inevitability of tapering. When the central bank formally announced in mid-December that it would begin gradually reducing its bond-buying program in January, the market seemed unphased. The Fed cited an improved economic outlook while stressing its commitment to keeping short-term interest rates exceptionally low. The gradual upward movement in the 10-year rate in November and December suggested that investors accepted the Fed's timing and finally gave credit to the strength of the underlying fundamentals. At year-end, the rate on the 10-year hit 3.04%.
As interest rates increased, bonds with longer durations, including U.S. government securities, incurred additional principal losses. During the extended period of historically low interest rates, many fixed income investors placed significant amounts of capital in longer-term and higher-yield bonds in search of greater
6
returns. The rise in interest rates impacted investor sentiment; the outflow from bonds and bond funds that began in the first half of 2013 continued with full force as investors fled these positions. By year-end, annual net bond fund redemptions hit a record of $83.4 billion.
These developments in the fixed income markets underscore the importance of positioning a portfolio for events beyond the immediate time horizon. As demonstrated by recent events, long-term bonds are not risk-free. Many bond portfolios were unable to quickly change their investment strategies as interest rates increased; consequently, investors who may have anticipated a longer period to unwind riskier positions suffered as the rapid rise in rates triggered a tide of redemptions. In sharp contrast, the Fund had, for some time, been positioned to manage a transitioning interest rate environment by remaining in short-term bonds.
Fund Strategy
Fixed Income Strategy
The supply of attractive, risk-appropriate fixed income investments remained limited. Shorter-term bonds provided limited yield whereas longer-term bonds carried a higher risk of principal loss. The Fund maintained its strategy of utilizing bonds with a duration of less than one year and callable "step-up" government agency bonds. The yield on a "step-up" bond increases at fixed intervals over its lifetime. Since these bonds are more likely to be called back by the issuing agencies, their durations, which are determined by the earlier of maturity dates or likely call dates, are relatively short. In addition, as interest rates rise, these bonds, with their higher rates, will preserve their value better than fixed-rate government securities with comparable maturities. Step-up bonds also provide the flexibility to adapt to the current interest rates and reinvest as more attractive opportunities arise. By the end of the year, however, these types of bonds became difficult to find as other managers, who opted to employ strategies similar to the Fund's further constrained supply. Consequently, as holdings matured, we invested in standard, short-term government securities.
The Fund does not employ higher-risk strategies to enhance return. For example, the Fund does not purchase bonds with extended durations, utilize leverage strategies or invest in mortgage-backed securities. The avoidance of these riskier investment approaches was critical in the Fund's ability to generate positive returns during the year.
Equity Positioning
The Fund invests a minor portion of its portfolio in high-quality, dividend-paying common stocks. Equity holdings focus on stocks that are relatively less sensitive to economic developments and have attractive dividends and appreciation potential. These blue-chip securities help provide stability by offsetting price movements in the fixed income markets without significantly increasing the Fund's risk exposure.
During the period, we took advantage of the equity market rally to trim positions in companies such as Microsoft, General Mills and McDonald's.2 We also added Pepsi and Unilever to the portfolio; these multinational companies have opportunities for revenue growth in emerging markets as these regions participate in the global economic recovery. Consumer Staples holdings, including Safeway and Kimberly Clark, enjoyed strong gains during the period; also, 3M and Johnson & Johnson performed well as these stocks benefitted from increased consumer spending and global economic growth.
The equity positions in the Fund are, at less than 17%, a small percentage of the portfolio; nonetheless, these holdings provided important price appreciation to offset the low interest rates on short to intermediate-term U.S. government securities. We believe that the Fund's strategy of investing in high-quality common stocks is less risky than alternative strategies such as leveraging, options or investing in mortgage-backed securities when interest rates have an upward bias. We anticipate that the Fund's allocation to equities may be reduced as interest rates rise and the Fund increases its investments in longer-term U.S. government securities.
2 For detailed information on Fund holdings, please see the Fund's Schedule of Investments in this Report.
7
Pacific Advisors
Government Securities Fund continued
Looking Ahead
In 2013, rising interest rates and volatility pressured investors to alter their investment approaches. Investors who bought longer-term bonds in search of higher yields suffered real losses as rates increased. Now, many investors are employing a strategy similar to that of the Fund; they are buying shorter-term bonds to reduce the potential for further losses as interest rates increase. This strategic shift will further constrain the supply of short-term government securities.
We believe the markets will continue the transition from a low interest rate environment to one in which rates gradually increase. Several factors, including improving domestic and global economic conditions, the Fed's tapering, and the prospect of rising inflation will pressure rates to rise. Market developments, and Fed policies, will determine the speed and the extent to which rates rise. Our investment strategy will monitor changing market conditions. As rates increase, we expect to migrate the Fund's investments toward longer-term U.S. government securities to capture higher yields. The Fund's adaptive strategy provides the flexibility to adapt portfolio holdings according to market conditions while keeping the current bias of increasing interest rates in mind.
8
Portfolio Holdings as of 12/31/13 (Based on Total Investments)
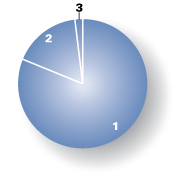
| 1. | U.S. Government Securities | 81.23 | % | ||||||||
| 2. | Equities | 16.84 | % | ||||||||
| 3. | Cash and Cash Equivalents | 1.93 | % | ||||||||
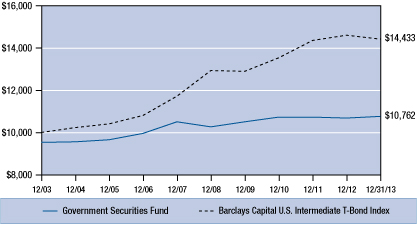
Change in Value of $10,000 Investment1
This chart compares the growth of a $10,000 investment in Class A shares of the Government Securities Fund for the period January 1, 2004 through December 31, 2013 with the same investment in the Barclays Capital U.S. Intermediate Treasury Bond Index2.
Average Annual Compounded Return as of December 31, 2013
Class A | Class C | ||||||||||
One Year | – 3.98 | % | – 1.00 | % | |||||||
Five Year | – 0.04 | % | 0.23 | % | |||||||
Ten Year | 0.74 | % | 0.49 | % | |||||||
Past performance does not guarantee future results. Performance quoted represents past performance. Current performance may be higher or lower than the performance data quoted. Returns include reinvested dividends and capital gains. Returns for Class A shares reflect a maximum front-end sales charge of 4.75%; and returns for Class C shares reflect the deduction of a contingent deferred sales charge of 1% on shares sold within the first year of purchase. Returns do not take into account individual taxes which may reduce actual returns when shares are sold. The investment return and principal value of an investment will fluctuate so that an investor's shares, when redeemed, may be worth more or less than their original cost. Call (800) 989-6693 for the most recent month-end performance.
1 Fund results are shown for Class A shares and reflect deduction of the maximum front-end sales charge of 4.75% on the $10,000 investment for a net amount invested of $9,525. At the end of the same period, a $10,000 investment in Class C shares would have been valued at $10,500, and no contingent deferred sales charges would apply. Performance of the share classes will vary based on the difference in charges and expenses. The inception date is 02/08/93 for Class A shares and 04/01/98 for Class C shares. It is not possible to invest directly in the Index. Unlike the Fund's results, the results for the Index do not reflect sales charges, fees or expenses.
2 The Barclays Capital U.S. Intermediate Treasury Bond Index is an unmanaged index of U.S. government securities with one to ten years to maturity.
9
Pacific Advisors
Government Securities Fund continued
Expense Examples
As a shareholder of the Fund you incur two types of costs: (1) transaction costs, including sales charges (loads) on purchase payments, reinvested dividends, or other distributions; redemption fees; and exchange fees; and (2) ongoing costs, including management fees; distribution (12b-1) fees; and other Fund expenses. This Example is intended to help you understand your ongoing costs (in dollars) of investing in the Fund and to compare these costs with the ongoing costs of investing in other mutual funds.
The Example is based on an investment of $1,000 invested at the beginning of the period and held for the entire period from July 1, 2013 through December 31, 2013.
Actual Expenses
The first line of the table below provides information about actual account values and actual expenses. You may use the information in this line, together with the amount you invested, to estimate the expenses that you paid over the period. Simply divide your account value by $1,000 (for example, an $8,600 account value divided by $1,000 = 8.6), then multiply the result by the number in the first line under the heading entitled "Expenses Paid During the Period" to estimate the expenses you paid on your account during the period.
The following transaction costs are not included in the expenses shown in the table and, if applicable, would increase the expenses that you paid over the period: (1) a front-end sales charge (load) of 4.75% on Class A shares; (2) a 2% redemption fee if you sell or exchange shares within 30 days of purchase, with certain exceptions. The redemption fee does not apply to: (a) redemptions under an automatic withdrawal program or periodic asset reallocation plan, required minimum distributions (RMD), employer mandated distributions from a qualified plan, or redemptions under a qualified domestic relations order (QDRO); (b) redemptions to pay for expenses related to terminal illness, extended hospital or nursing home care, or other serious medical conditions, including death; (c) redemptions of shares acquired through dividend or capital gains reinvestments; (d) loans from a qualified plan account; and (e) redemptions initiated by the Fund; and (3) a $10 service fee on each exchange after the first five exchanges in each calendar year.
The following ongoing costs are not included in the expenses shown in the table and, if applicable, would increase the expenses that you paid over the period: (1) a $12 low balance fee on accounts with balances of less than $250 as of September 30th of each calendar year and no investment activity (excluding reinvestment of dividends and/or capital gains) during the prior calendar year or the first nine months of the current calendar year. This fee does not apply to IRAs, qualified plan accounts, or Coverdell Education Savings Accounts; (2) a $15 annual custodial fee on IRAs, SEPs, SIMPLE IRAs, and Coverdell Education Savings Accounts; and (3) a $20 annual custodial fee on 403(b) accounts.
Hypothetical Example for Comparison Purposes
The second line of the table below provides information about hypothetical account values and hypothetical expenses based on the Fund's actual expense ratio and an assumed rate of return of 5% per year before expenses, which in not the Fund's actual return. The hypothetical account values and expenses may not be used to estimate the actual ending account balance or expenses you paid for the period. You may use this information to compare the ongoing costs of investing in the Fund and other funds. To do so, compare this 5% hypothetical example with the 5% hypothetical examples that appear in the shareholder reports of the other funds.
The following transaction costs are not included in the expenses shown in the table and, if applicable, would increase the expenses that you paid over the period: (1) a front-end sales charge (load) of 4.75% on Class A shares; (2) a 2% redemption fee if you sell or exchange shares within 30 days of purchase, with certain exceptions. The redemption fee does not apply to: (a) redemptions under an automatic withdrawal program or periodic asset reallocation plan, required minimum distributions (RMD), employer mandated distributions from a qualified plan, or redemptions under a qualified domestic relations order (QDRO); (b) redemptions to pay for expenses related to terminal illness, extended hospital or nursing home care, or other serious medical conditions, including death; (c) redemptions of shares acquired through dividend or capital gains reinvestments; (d) loans from a qualified plan account; and (e) redemptions initiated by the Fund; and (3) a $10 service fee on each exchange after the first five exchanges in each calendar year.
The following ongoing costs are not included in the expenses shown in the table and, if applicable, would increase the expenses that you paid over the period: (1) a $12 low balance fee on accounts with balances of less than $250 as of September 30th of each calendar year and no investment activity (excluding reinvestment of dividends and/or capital gains) during the prior calendar year or the first nine months of the current calendar year. This fee does not apply to IRAs, qualified plan accounts, or Coverdell Education Savings Accounts; (2) a $15 annual custodial fee on IRAs, SEPs, SIMPLE IRAs, and Coverdell Education Savings Accounts; and (3) a $20 annual custodial fee on 403(b) accounts.
Please note that the expenses shown in the table are meant to highlight your ongoing costs only and do not reflect any transactional costs, such as sales charges (loads), redemption fees, or exchange fees. Therefore, the second line of the table is useful in comparing ongoing costs only, and will not help you determine the relative total costs of owning different funds. In addition, if these transactional costs were included, your costs would have been higher.
| Beginning Account Value 07/01/13 | Ending Account Value 12/31/13 | Expense Paid During Period 07/01/13 – 12/31/13 | |||||||||||||
Government Secs Fund Class A | |||||||||||||||
Actual | $ | 1,000.00 | $ | 1,000.00 | $ | 17.09 | |||||||||
Hypothetical (5% return before expense) | $ | 1,000.00 | $ | 1,008.12 | $ | 17.16 | |||||||||
Government Secs Fund Class C | |||||||||||||||
Actual | $ | 1,000.00 | $ | 995.50 | $ | 20.92 | |||||||||
Hypothetical (5% return before expense) | $ | 1,000.00 | $ | 1,004.23 | $ | 21.02 | |||||||||
3 Expenses are equal to the Fund's annualized expense ratio, net of expense waivers, of 3.39% for Class A shares and 4.16% for Class C shares, multiplied by the average account value over the period, multiplied by 184/365 days to reflect the one-half year period.
10
Pacific Advisors
Income and Equity Fund
Fund Objective: Current income and, secondarily, long-term capital appreciation.
Investment Invests primarily in investment grade U.S. corporate bonds and in dividend-paying
Strategy: stocks.
Investor Profile: Conservative. Some current income required; capital preservation aim.
TOTAL RETURNS | EXPENSE RATIOS | ||||||||||||||||||||||||||
For the year ended December 31, 2013 | Current (For the year ended 12/31/13) | Prospectus (For the year ended 12/31/12) | |||||||||||||||||||||||||
Net | Gross | Net | Gross | ||||||||||||||||||||||||
Class A | 13.40 | % | Class A | 2.23 | % | 3.03 | % | 2.68 | % | 3.42 | % | ||||||||||||||||
Class C | 12.55 | % | Class C | 2.98 | % | 3.78 | % | 3.45 | % | 4.20 | % | ||||||||||||||||
Barclays Capital U.S. Int Corp Bond Index1 | 0.08 | % | |||||||||||||||||||||||||
S&P 500® Index2 | 32.36 | % | |||||||||||||||||||||||||
Performance quoted is past performance which does not guarantee future results. Current performance may be higher or lower than the performance quoted. Call (800) 989-6693 for performance current to the most recent month-end. The investment return and principal value of an investment will fluctuate so that an investor's shares, when redeemed, may be worth more or less than their original cost. Returns represent the change in value over the stated period assuming reinvestment of dividends and capital gains at net asset value. Rankings are shown for Class A shares; rankings for other share classes may be different. Returns and rankings do not take into account the maximum 4.75% sales charge on Class A shares or the 1% Contingent Deferred Sales Charge (CDSC) for Class C shares sold within one year of purchase. Returns would be lower if the applicable sales charge and CDSC were included. Returns do not take into account individual taxes which may reduce actual returns when shares are sold.
The Fund's investment adviser is waiving a portion of its management fees pursuant to an Expense Limitation Agreement. The waiver may be discontinued at any time with ninety days written notice in consultation with the Fund's board, but is expected to continue at current levels. Please see the Notes to Financial Statements in this report for details. Performance shown reflects the waiver, without which the results would have been lower.
Discussion with Portfolio Managers February 24, 2014
Charles Suh, CFA
Jingjing Yan, CFA
Please see the Chairman's Letter at the beginning of this Report for a detailed market and economic review
as well as the Manager's general market outlook.
Pacific Advisors Income and Equity Fund (A) | |||||||
| Lipper Mixed Asset Target Allocation Conservative Category Rank (# of funds) as of 12/31/13 based on total return | |||||||
| 1 Year | 6 | (357) | |||||
| 3 Year | 63 | (296) | |||||
| 5 Year | 183 | (272) | |||||
| 10 Year | 105 | (121) | |||||
1 The Barclays Capital U.S. Intermediate Corporate Bond Index is an unmanaged index of publicly issued investment grade U.S. corporate bonds with one to ten years to maturity. It is not possible to invest directly in the Index.
2 The S&P 500® Index is an unmanaged, market capitalization weighted index which measures the performance of the large cap segment of the U.S. equities market, covering approximately 75% of the U.S. equities market. The Index includes 500 leading companies in leading industries of the U.S. economy. Index returns assume the reinvestment of dividends, but, unlike the Fund's returns, do not reflect the effects of management fees or expenses. It is not possible to invest directly in the Index.
11
Pacific Advisors
Income and Equity Fund continued
Fund Performance
The Fund's conservative investment approach proved successful in 2013 as the fixed income market entered a transition phase. For the period, Class A shares gained 13.40%. Notably, the Fund generated these returns with substantially less risk than the broader market as demonstrated by the Fund's one-year beta of 0.413, as of December 31st, versus the S&P 500® Index. Class A shares of the Fund ranked #6 in its Lipper category, as of December 31st. The Fund's fixed income strategy anticipated the stronger economic conditions which set the stage for interest rates to move higher. The Fund's bond holdings focused on shorter-term investment grade bonds; these conservative bonds provided important protection against price volatility. In addition, these holdings added to Fund performance by maintaining their valuations as interest rates rose. Also, the appreciation of the Fund's equity holdings added significantly to performance.
The average maturity of the Fund's fixed income holdings, at 3.3 years, was significantly shorter than the Barclays Capital U.S. Intermediate Corporate Bond Index's average maturity of 4.4 years. The difference reflects the Fund's strategy of maintaining shorter maturities versus the benchmark's unmanaged bond portfolio.
The Fund's equity portfolio benefitted from impressive performance of individual stocks as well as the strong stock market. Equity holdings remained concentrated in 30 to 40 high-quality, dividend-paying stocks with stable growth patterns and low volatility; in contrast, the Fund's equity benchmark, the S&P 500® Index includes companies with a broad range of size, quality, risk factors, and volatility.
Fund Strategy
The Fund's fixed income holdings in short-to-intermediate-term investment grade corporate bonds provided both principal protection as interest rates rose and the opportunity to reinvest at higher rates. For the equity portfolio, the Fund has selected diverse holdings in blue-chip, dividend-paying stocks to compensate for historically low interest rates. This equity approach has been critical to the Fund's performance during the extended period of low interest rates as the dividend rates for portfolio stocks were often higher than the corporate bond rates on those same companies.
In the second half of the year, interest rates rose erratically but significantly in response to the recovering global economy. GDP growth, declining unemployment and the highly-anticipated reduction of the Federal Reserve's bond-buying program placed upward pressure on rates. These factors drove investors to migrate capital from "safe haven" U.S. Treasuries and corporate bonds into more rewarding alternatives. Much of this capital flowed to the U.S. equity markets as investors sought blue-chip stocks with higher dividend rates along with the potential for price appreciation.
Investors were seemingly caught off guard when interest rates began to rise toward the end of the second quarter; later, as rates continued to rise, bond investors faced the consequence of holding longer-term bonds. Prices became depressed as the demand for bonds with longer maturities fell. Bond fund redemptions accelerated; by year-end, annual net redemptions hit a record of $83.4 billion.
The Fund actively managed the allocation between fixed income and equity securities to find the most attractive, risk-appropriate opportunities for income and growth. The Fund maintained its corporate bond holdings at approximately 50% through the end of the year; the equity portion decreased from approximately 49% to over 45% during the period. We anticipate that the equity allocation may decrease further as interest rates continue to rise and we reinvest capital in higher-yielding bonds.
Fixed Income Strategy
The Fund's fixed income strategy sought to protect principal by investing in shorter maturities; these holdings also offered the flexibility to identify timely investment opportunities in the transitioning fixed income market. By the end of the year, short-term bonds enjoyed extraordinary demand as other bond
3 "Beta" measures volatility relative to the stock market or an alternative benchmark. A beta less than 1.0 indicates lower risk than the market or the benchmark; a beta greater than 1.0 indicates higher risk than the market or the benchmark.
12
fund managers altered their strategies in favor of bonds with shorter maturities. This shift constrained the supply of attractive fixed income securities. As of December 31st, the average yield on 5-year investment grade corporate bonds was 2.6%; in this relatively low-yield, limited-supply environment, the Fund also sought to enhance returns by identifying investment grade corporate bonds with risk-appropriate special situations.
The Fund's strategy often utilizes callable bonds. Callable bonds are securities that can be bought back, or "called," by the issuer prior to maturity at predefined prices and dates. These types of bonds generally have higher yields due to their call features; the issuer also typically pays a premium to the bondholder when the bond is called. We purchase callable bonds to seek potentially higher returns while preserving capital. For example, in September, we bought a 4-year callable bond issued by Petrohawk Energy at an attractive price.4 We anticipate that the bond will be called; if so, we will be able to reinvest the capital in higher-yielding securities. If, on the other hand, the bond is not bought back, we may have the opportunity to generate higher returns as the bond's yield increases.
The Fund also purchased high-quality bonds at discounted prices due to company-specific issues or economic conditions. For example, Air Lease, an aircraft leasing company, was pressured by slow industry growth and economic uncertainty; consequently, investors seemed to overlook this company's bond offerings. Our analysis concluded that the company's financials have been improving, and will likely continue to improve as the airline industry's fundamentals strengthen. In September, we purchased an Air Lease bond maturing in 3.5 years. Since then, the price of the bond appreciated as the company's financial condition improved and investor concerns subsided.
Equity Strategy
The Fund's equity holdings offer an important complement to corporate bonds especially during periods of historically low interest rates. Our equity strategy focuses on total return by investing in high-quality, well-established large cap companies from a wide range of industries. During the period, we increased our allocation to Consumer Discretionary holdings; these cyclical stocks generally provide better opportunities for growth during periods of global economic expansion.
We also continued to favor blue-chip stocks with attractive dividends. Lately, companies have tended not to increase dividend rates; even so, the depressed price valuations that lingered since the recession had the effect of increasing yields. Companies took advantage of interest rates to borrow or refinance at extremely low rates; as a result, the difference between a company's bond yield and its dividend yield may have narrowed. In some cases, the dividend yields of portfolio holdings even surpassed the yields of the companies' corresponding debt offerings. For example, as of December 31st, AT&T's dividend yield of 5.23% significantly exceeded the approximate 2% yield of the company's corporate bond maturing in November 2018.
The weighted average yield for the Fund's equity holdings is 3.11% which is notably higher than the 2.6% average yield for 5-year investment grade corporate bonds. Stocks with a dividend yield over 4.5% included AT&T and Duke Energy while companies with a dividend over 3.5% included Public Services Enterprise Group, Verizon, Vodafone, Xcel Energy and ConocoPhillips.
The extended period of low interest rates called attention to the importance of the Fund's equity strategy. Central banks around the world have utilized low interest rates to spur growth which, in turn, set the stage for interest rates to rise. We anticipate that, as the global economy continues to improve and rates gradually trend upward, our strategy of managing risk while generating meaningful investment returns will adjust. We expect to further reduce the Fund's equity position as interest rates increase.
Looking Ahead
2013 was an exceptional year for equities; investors, including the Fund, certainly benefitted from the equity market's performance. 2014 may provide opportunities in fixed income as interest rates transition
4 For detailed information on Fund holdings, please see the Fund's Schedule of Investments in this Report.
13
Pacific Advisors
Income and Equity Fund continued
to a more normal environment. The Fed will likely continue tapering its bond-buying program as the domestic economic outlook improves further. The strengthening global economy will eventually push rates higher and spur inflation. Yet, the overall market conditions will determine how high, and how fast, interest rates will increase. The changing interest rate environment will challenge even the most conservative investors to reevaluate their fixed income strategies; 2013 should have reinforced the message that long-term bonds are not a "safe haven" when interest rates rise.
The Fund's adaptive fixed income strategy should perform well even in a more measured equity market environment. The Fund is well-positioned to successfully navigate the transition from extremely low interest rates to rising rates. The Fund will then be able to reinvest capital at the prevailing higher rates as the Fund's bond holdings mature.
The Fund's adaptive strategy helps manage the risk of higher interest rates; the approach also enables the Fund to gradually increase yield and generate total return. Furthermore, the flexibility allows us to proactively adjust to changing market environments while acknowledging the upward bias of interest rates. We believe that the Fund is well-positioned for developing economic and market conditions regardless of how high and how quickly interest rates rise.
14
Portfolio Holdings as of 12/31/13 (Based on Total Investments)
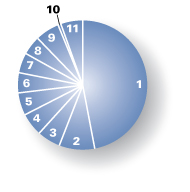
| 1. | Corporate Bonds | 48.86 | % | ||||||||
Equities | 45.32 | % | |||||||||
| 2. | Consumer Staples | 8.54 | % | ||||||||
| 3. | Consumer Discretionary | 5.72 | % | ||||||||
| 4. | Utilities | 5.54 | % | ||||||||
| 5. | Industrials | 5.40 | % | ||||||||
| 6. | Telecommunication Services | 4.94 | % | ||||||||
| 7. | Health Care | 4.72 | % | ||||||||
| 8. | Information Technology | 4.54 | % | ||||||||
| 9. | Others | 5.92 | % | ||||||||
| 10. | Preferred Stock | 0.66 | % | ||||||||
| 11. | Cash and Cash Equivalents | 5.16 | % | ||||||||
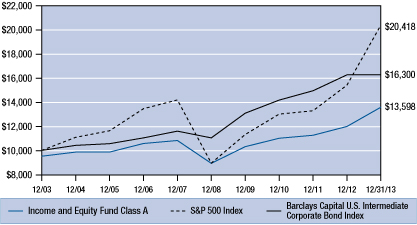
Change in Value of $10,000 Investment1
This chart compares the growth of a $10,000 investment in Class A shares of the Income and Equity Fund for the period January 1, 2004 through December 31, 2013 with the same investment in the S&P 500 Index2 and the Barclays Capital U.S. Intermediate Corporate Bond Index3.
Average Annual Compounded Returns as of December 31, 2013
Class A | Class C | ||||||||||
One Year | 8.05 | % | 11.55 | % | |||||||
Five Year | 7.72 | % | 7.96 | % | |||||||
Ten Year | 3.12 | % | 2.86 | % | |||||||
Past performance does not guarantee future results. Performance quoted represents past performance. Current performance may be higher or lower than the performance data quoted. Returns include reinvested dividends and capital gains. Returns for Class A shares reflect a maximum front-end sales charge of 4.75%; and returns for Class C shares reflect the deduction of a contingent deferred sales charge of 1% on shares sold within the first year of purchase. Returns do not take into account individual taxes which may reduce actual returns when shares are sold. The investment return and principal value of an investment will fluctuate so that an investor's shares, when redeemed, may be worth more or less than their original cost. Call (800) 989-6693 for the most recent month-end performance.
1 Fund results are shown for Class A shares and reflect deduction of the maximum front-end sales charge of 4.75% on the $10,000 investment for a net amount invested of $9,525. At the end of the same period, a $10,000 investment in Class C shares would have been valued at $13,256, and no contingent deferred sales charges would apply. Performance of the share classes will vary based on the difference in charges and expenses. The inception date is 02/08/93 for Class A shares and 04/01/98 for Class C shares. It is not possible to invest directly in either Index. Index results assume reinvestment of dividends, but, unlike the Fund's results, do not reflect sales charges, fees or expenses.
2 The Standard & Poor's 500 Index is an unmanaged, market capitalization weighted index which measures the performance of the large cap segment of the U.S. equities market, covering approximately 75% of the U.S. equities market. The Index includes 500 leading companies in leading industries of the U.S. economy.
3 The Barclays Capital U.S. Intermediate Corporate Bond Index is an unmanaged index of publicly issued investment grade U.S. corporate bonds with one to ten years to maturity.
15
Pacific Advisors
Income and Equity Fund continued
Expense Examples
As a shareholder of the Fund you incur two types of costs: (1) transaction costs, including sales charges (loads) on purchase payments, reinvested dividends, or other distributions; redemption fees; and exchange fees; and (2) ongoing costs, including management fees; distribution (12b-1) fees; and other Fund expenses. This Example is intended to help you understand your ongoing costs (in dollars) of investing in the Fund and to compare these costs with the ongoing costs of investing in other mutual funds.
The Example is based on an investment of $1,000 invested at the beginning of the period and held for the entire period from July 1, 2013 through December 31, 2013.
Actual Expenses
The first line of the table below provides information about actual account values and actual expenses. You may use the information in this line, together with the amount you invested, to estimate the expenses that you paid over the period. Simply divide your account value by $1,000 (for example, an $8,600 account value divided by $1,000 = 8.6), then multiply the result by the number in the first line under the heading entitled "Expenses Paid During the Period" to estimate the expenses you paid on your account during the period.
The following transaction costs are not included in the expenses shown in the table and, if applicable, would increase the expenses that you paid over the period: (1) a front-end sales charge (load) of 4.75% on Class A shares; (2) a 2% redemption fee if you sell or exchange shares within 30 days of purchase, with certain exceptions. The redemption fee does not apply to: (a) redemptions under an automatic withdrawal program or periodic asset reallocation plan, required minimum distributions (RMD), employer mandated distributions from a qualified plan, or redemptions under a qualified domestic relations order (QDRO); (b) redemptions to pay for expenses related to terminal illness, extended hospital or nursing home care, or other serious medical conditions, including death; (c) redemptions of shares acquired through dividend or capital gains reinvestments; (d) loans from a qualified plan account; and (e) redemptions initiated by the Fund; and (3) a $10 service fee on each exchange after the first five exchanges in each calendar year.
The following ongoing costs are not included in the expenses shown in the table and, if applicable, would increase the expenses that you paid over the period: (1) a $12 low balance fee on accounts with balances of less than $250 as of September 30th of each calendar year and no investment activity (excluding reinvestment of dividends and/or capital gains) during the prior calendar year or the first nine months of the current calendar year. This fee does not apply to IRAs, qualified plan accounts, or Coverdell Education Savings Accounts; (2) a $15 annual custodial fee on IRAs, SEPs, SIMPLE IRAs, and Coverdell Education Savings Accounts; and (3) a $20 annual custodial fee on 403(b) accounts.
Hypothetical Example for Comparison Purposes
The second line of the table below provides information about hypothetical account values and hypothetical expenses based on the Fund's actual expense ratio and an assumed rate of return of 5% per year before expenses, which in not the Fund's actual return. The hypothetical account values and expenses may not be used to estimate the actual ending account balance or expenses you paid for the period. You may use this information to compare the ongoing costs of investing in the Fund and other funds. To do so, compare this 5% hypothetical example with the 5% hypothetical examples that appear in the shareholder reports of the other funds.
The following transaction costs are not included in the expenses shown in the table and, if applicable, would increase the expenses that you paid over the period: (1) a front-end sales charge (load) of 4.75% on Class A shares; (2) a 2% redemption fee if you sell or exchange shares within 30 days of purchase, with certain exceptions. The redemption fee does not apply to: (a) redemptions under an automatic withdrawal program or periodic asset reallocation plan, required minimum distributions (RMD), employer mandated distributions from a qualified plan, or redemptions under a qualified domestic relations order (QDRO); (b) redemptions to pay for expenses related to terminal illness, extended hospital or nursing home care, or other serious medical conditions, including death; (c) redemptions of shares acquired through dividend or capital gains reinvestments; (d) loans from a qualified plan account; and (e) redemptions initiated by the Fund; and (3) a $10 service fee on each exchange after the first five exchanges in each calendar year.
The following ongoing costs are not included in the expenses shown in the table and, if applicable, would increase the expenses that you paid over the period: (1) a $12 low balance fee on accounts with balances of less than $250 as of September 30th of each calendar year and no investment activity (excluding reinvestment of dividends and/or capital gains) during the prior calendar year or the first nine months of the current calendar year. This fee does not apply to IRAs, qualified plan accounts, or Coverdell Education Savings Accounts; (2) a $15 annual custodial fee on IRAs, SEPs, SIMPLE IRAs, and Coverdell Education Savings Accounts; and (3) a $20 annual custodial fee on 403(b) accounts.
Please note that the expenses shown in the table are meant to highlight your ongoing costs only and do not reflect any transactional costs, such as sales charges (loads), redemption fees, or exchange fees. Therefore, the second line of the table is useful in comparing ongoing costs only, and will not help you determine the relative total costs of owning different funds. In addition, if these transactional costs were included, your costs would have been higher.
| Beginning Account Value 07/01/13 | Ending Account Value 12/31/13 | Expense Paid During Period 07/01/13 – 12/31/13 | |||||||||||||
Income & Equity Fund Class A | |||||||||||||||
Actual | $ | 1,000.00 | $ | 1,060.70 | $ | 11.58 | |||||||||
Hypothetical (5% return before expense) | $ | 1,000.00 | $ | 1,013.96 | $ | 11.32 | |||||||||
Income & Equity Fund Class C | |||||||||||||||
Actual | $ | 1,000.00 | $ | 1,057.70 | $ | 15.72 | |||||||||
Hypothetical (5% return before expense) | $ | 1,000.00 | $ | 1,009.93 | $ | 15.35 | |||||||||
4 Expenses are equal to the Fund's annualized expense ratio, net of expense waivers, of 2.23% for Class A shares and 3.03% for Class C shares, multiplied by the average account value over the period, multiplied by 184/365 days to reflect the one-half year period.
16
Pacific Advisors
Balanced Fund
Fund Objective: Long-term capital appreciation and income consistent with reduced risk.
Investment Invests primarily in large cap common stocks and investment grade
Strategy: U.S. corporate bonds. Invests at least 25% of its assets in fixed income securities and preferred stocks and at least 25% in equities.
Investor Profile: Moderately conservative. Seeks combination of long-term growth, income, liquidity and reduced risk of price fluctuations.
TOTAL RETURNS | EXPENSE RATIOS | ||||||||||||||||||
For the year ended December 31, 2013 | Current (For the year ended 12/31/13) | Prospectus (For the year ended 12/31/12) | |||||||||||||||||
Class A | 26.68 | % | Class A | 3.07 | % | 3.30 | % | ||||||||||||
Class C | 27.75 | % | Class C | 3.86 | % | 4.02 | % | ||||||||||||
S&P 500® Index1 | 32.36 | % | |||||||||||||||||
Barclays Capital U.S. Int Corp Bond Index2 | 0.08 | % | |||||||||||||||||
Performance quoted is past performance which does not guarantee future results. Current performance may be higher or lower than the performance quoted. Call (800) 989-6693 for performance current to the most recent month-end. The investment return and principal value of an investment will fluctuate so that an investor's shares, when redeemed, may be worth more or less than their original cost. Returns represent the change in value over the stated period assuming reinvestment of dividends and capital gains at net asset value. Rankings are shown for Class A shares; rankings for other share classes may be different. Returns and rankings do not take into account the maximum 5.75% sales charge on Class A shares or the 1% Contingent Deferred Sales Charge (CDSC) for Class C shares sold within one year of purchase. Returns would be lower if the applicable sales charge and CDSC were included. Returns do not take into account individual taxes which may reduce actual returns when shares are sold.
Discussion with Portfolio Manager February 24, 2014
Charles Suh, CFA
Jingjing Yan, CFA
Samuel C. Coquillard
Please see the Chairman's Letter at the beginning of this Report for a detailed market and economic review as well as the Manager's general market outlook.
Pacific Advisors Balanced Fund (A) | |||||||
| Lipper Mixed Asset Target Allocation Growth Category Rank (# of funds) as of 12/31/13 based on total return | |||||||
| 1 Year | 6 | (563) | |||||
| 3 Year | 66 | (502) | |||||
| 5 Year | 326 | (467) | |||||
| 10 Year | 241 | (287) | |||||
1 The S&P 500® Index is an unmanaged, market capitalization weighted index which measures the performance of the large cap segment of the U.S. equities market, covering approximately 75% of the U.S. equities market. The Index includes 500 leading companies in leading industries of the U.S. economy. Index returns assume the reinvestment of dividends, but, unlike the Fund's returns, do not reflect the effects of management fees or expenses. It is not possible to invest directly in the Index.
2 The Barclays Capital U.S. Intermediate Corporate Bond Index is an unmanaged index of publicly issued investment grade U.S. corporate bonds with one to ten years to maturity. It is not possible to invest directly in the Index.
17
Pacific Advisors
Balanced Fund continued
Fund Performance
2013 was an excellent year for the Fund: Class A shares ranked #6 in the Fund's Lipper category. Class A shares of the Fund returned 28.68%; in comparison, the Fund's equity benchmark, the S&P 500® Index, gained 32.36% while the Fund's fixed income benchmark, the Barclays Capital U.S. Int. Corp Bond Index, was essentially flat for the year with a 0.08% increase. The Fund's blend of equity and fixed income securities suggests that its performance would be best viewed against a blend of its equity and fixed income benchmarks. Importantly, the Fund achieved its performance with less volatility than the market as evidenced by its one-year beta3 of 0.82, as of December 31st, versus to the S&P 500® Index.
The Fund's impressive gain highlights the combined benefits of its "all cap" equity strategy and total return approach to fixed income investing. Equity holdings accounted for the majority of the Fund's gains; mid-cap stocks, in particular, performed well. Active portfolio positioning toward economically-sensitive areas of the market, including Industrials and Consumer Discretionary, also contributed to the Fund's strong equity returns. The Fund's strategy concentrated fixed income holdings in shorter-term (maturing in 3 to 5 years) investment grade corporate bonds; these conservative bonds provided important protection against price volatility. In addition, these holdings added to Fund performance by maintaining their valuations as interest rates rose.
Fund Strategy
The Fund is designed for conservative investors who want to participate in the equity markets with reduced risk. The Fund's strategy combines high-quality, dividend-paying stocks across all market capitalizations with investment grade corporate bonds that provide additional income and appreciation potential. We manage the Fund's asset allocation based on our identification of risk-appropriate investments in the context of the overall economic and market outlook. This approach enables the Fund to take advantage of specific growth opportunities while reducing price volatility.
During 2013, the global economy steadily improved while the fixed income markets remained challenged. Accordingly, the Fund's equity allocation remained at approximately 71%, near the high end of its historical range. Notably, interest rates rose meaningfully during the year in response to the Federal Reserve's decision to initiate "tapering" its bond-buying program. The resulting price declines for long-term fixed income securities affirmed our decision to remain weighted towards equities.
Equity Strategy
The Fund's "all cap" equity strategy diversifies investments among high-quality, well-managed companies with proven growth track records. Large cap stocks, which accounted for approximately 45% of the equity holdings, favor dominant global franchises that offer stability with moderate growth potential. Mid-cap holdings, which represented approximately the same equity allocation, feature industry leaders benefitting from broad sector or economic trends. Small cap holdings focus on established companies with long-term growth prospects. Importantly, the Fund's mid and small cap holdings have contributed to performance without significantly increasing volatility; the Fund's one-year beta remained at just 0.82, as of December 31st.
Strong performance by the Fund's mid-cap holdings in the second half of 2013 reflects our strategy to identify companies at the forefront of growth trends. Engineering and construction firm Chicago Bridge & Iron announced a steady stream of contract awards which underscored the company's prime position in the global energy and power infrastructure market.4 Truck manufacturer Navistar began to recapture lost market share following a failed 2011 engine strategy. Train parts supplier Wabtec benefitted from improved growth in rail transportation. The company continues to develop its international presence in attractive growth markets such as Europe, Russia, and China. Specialty retailer Conn's enjoyed stellar sales, particularly in new product areas such as furniture and bedding. More importantly, at just 70 locations
3 "Beta" measures volatility relative to the stock market or an alternative benchmark. A beta less than 1.0 indicates lower risk than the market or the benchmark and a beta greater than 1.0 indicates higher risk than the market or the benchmark.
4 For detailed information on Fund holdings, please see the Fund's Schedule of Investments in this Report.
18
nationwide, Conn's has outstanding growth potential with increased store locations; the company's primary competition is rent-to-own stores which have a greater location density.
Large cap holdings also performed well with broad-based gains across various sectors and industries. Within Industrials, truck engine maker Cummins and railroad operator CSX led the way. Energy services giant Halliburton gained on improved performance in key North American markets and improved outlooks for 2014. Walt Disney profited from solid advertising sales across its television networks and strong performance in its parks and resorts division. Technology company Qualcomm benefitted from the increasing use of mobile chips in smartphones and tablet computers as sales of these devices strengthened throughout the year. And, CVS Caremark rose on investor expectations that the company will benefit not only from gradual population aging but also new business resulting from the Affordable Care Act.
Small cap holdings also enjoyed impressive gains. Industrial parts and services distributor, DXP Enterprises, reported strong earnings results and announced several highly profitable acquisitions that broadened the company's product portfolio and geographic presence. Just two years ago, DXP operated only in the U.S.; today, its reach extends to Canada, the Middle East and Africa. TAL International leases shipping containers to the world's largest vessel operators. Shares of this industry-leading company climbed as signs of a recovery in Europe improved expectations for ocean-going trade activity. Moreover, the recent rise in interest rates bodes well for container lease pricing which is tied to prevailing borrowing costs.
In the second half of 2013, the Fund added one position, mid-cap stock MRC Global. MRC, a leading distributor of pipes, valves and fittings to the global oil and gas industry, stands to profit from two developing Energy trends: unconventional onshore oil production and the development of deepwater offshore oil fields. Management's strategy is to use its broad geographic network to secure long-term global supply agreements with major oil producers, such as British Petroleum. MRC continues to expand through acquisitions; its most recent acquisition establishes a leading position in the North Sea, the world's largest offshore market.
Fixed Income Strategy
The Fund's "total return" approach actively manages fixed income holdings in response to current interest rate trends. During periods of historically low interest rates, the Fund seeks to protect principal value by limiting the impact of rising rates. The Fund's investments have continued to focus on shorter-term bonds that are less sensitive to interest rate changes. The Fund also avoids higher risk investments such as high yield, or "junk," bonds. The low interest rate environment and our expectation for higher interest rates contributed to our decision to maintain the Fund's fixed income allocation near the lower end of its historical range.
Interest rates rose erratically but significantly in the second half of the year; the yield on the U.S. 10-year Treasury Note ended 2013 at 3.04% compared to 2.52% at the end of June and 1.78% at the end of 2012. The increase primarily resulted from the Fed's decision to begin "tapering" its bond-buying program. In response, investors began moving assets out of longer-term fixed income holdings. The Fund's high-quality, shorter-term corporate bonds effectively managed the risk of principal loss as interest rates rose. Importantly, shorter-term bonds also enabled the Fund to reinvest proceeds at higher yields as interest rates increased.
Looking Ahead
Interest rates will remain a focal point throughout 2014 as the Fed gradually begins to unwind its accommodative monetary policies. We anticipate that interest rates will continue to trend higher over the near-to-medium-term. Interest rate volatility will likely remain elevated as investors react to the Fed's actions and other global events. The Fund's fixed income strategy will focus on shorter-term bonds to protect principal during this transition period.
19
Pacific Advisors
Balanced Fund continued
The U.S. and global economy appear poised for sustained growth. Expectations for continued economic expansion in major economies, including China, Japan and Europe, will also support a favorable outlook. Accordingly, the Fund anticipates maintaining its higher allocation to equities with a continued focus on stocks that provide a combination of stability and growth.
Throughout the recovery, businesses were measured in their capital spending due to the economic and political uncertainties in the U.S. and abroad. These uncertainties led to cautious business planning. Companies focused on share buyback programs and increasing dividends with less emphasis towards expanding operations and acquisitions. During this past year, corporate executives, as well as investors, gained more confidence as political concerns stabilized and global economies improved. As a result, companies from a broad range of industries have announced mergers or acquisition; plans to build manufacturing facilities; expand truck fleets or retail stores; and add jobs. These investments in capital and labor may accelerate economic growth throughout the year. Investor confidence, which should increase as companies realize growth initiatives, will, in turn, provide momentum for the equity markets.
We anticipate that the large cap companies will enjoy stable growth under the scenario of economic expansion. The Fund's mid-cap and small cap stocks should continue to appreciate significantly as these companies execute their growth strategies. We believe that the Fund, with its blend of industry-leading large cap companies and mid- and small cap companies with attractive growth prospects, is well-positioned to provide growth for our shareholders.
20
Portfolio Holdings as of 12/31/13 (Based on Total Investments)
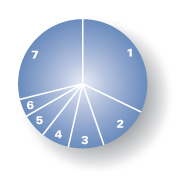
| Equities | 71.35 | % | |||||||||
| 1. | Industrials | 32.38 | % | ||||||||
| 2. | Energy | 12.56 | % | ||||||||
| 3. | Consumer Discretionary | 8.70 | % | ||||||||
| 4. | Financials | 7.00 | % | ||||||||
| 5. | Information Technology | 6.10 | % | ||||||||
| 6. | Consumer Staples | 4.61 | % | ||||||||
| 7. | Corporate Bonds | 28.65 | % | ||||||||
Change in Value of $10,000 Investment1
This chart compares the growth of a $10,000 investment in Class A shares of the Balanced Fund for the period January 1, 2004 through December 31, 2013 with the same investment in the S&P 500 Index2 and the Barclays Capital U.S. Intermediate Corporate Bond Index3.
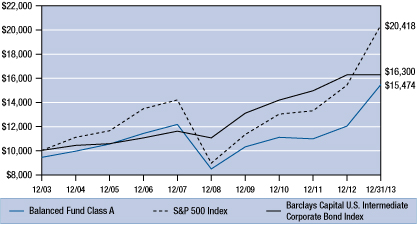
Average Annual Compounded Returns as of December 31, 2013
Class A | Class C | ||||||||||
One Year | 21.30 | % | 26.75 | % | |||||||
Five Year | 11.51 | % | 11.99 | % | |||||||
Ten Year | 4.46 | % | 4.28 | % | |||||||
Past performance does not guarantee future results. Performance quoted represents past performance. Current performance may be higher or lower than the performance data quoted. Returns include reinvested dividends and capital gains. Returns for Class A shares reflect a maximum front-end sales charge of 5.75%; and returns for Class C shares reflect the deduction of a contingent deferred sales charge of 1% on shares sold within the first year of purchase. Returns do not take into account individual taxes which may reduce actual returns when shares are sold. The investment return and principal value of an investment will fluctuate so that an investor's shares, when redeemed, may be worth more or less than their original cost. Call (800) 989-6693 for the most recent month-end performance.
1 Fund results are shown for Class A shares and reflect deduction of the maximum front-end sales charge of 5.75% on the $10,000 investment for a net amount invested of $9,425. At the end of the same period, a $10,000 investment in Class C shares would have been valued at $15,208, and no contingent deferred sales charges would apply. Performance of the share classes will vary based on the difference in charges and expenses. The inception date is 02/08/93 for Class A shares and 04/01/98 for Class C shares. It is not possible to invest directly in either Index. Index results assume reinvestment of dividends, but, unlike the Fund's results, do not reflect sales charges, fees or expenses.
2 The Standard & Poor's 500 Index is an unmanaged, market capitalization weighted index which measures the performance of the large cap segment of the U.S. equities market, covering approximately 75% of the U.S. equities market. The Index includes 500 leading companies in leading industries of the U.S. economy.
3 The Barclays Capital U.S. Intermediate Corporate Bond Index is an unmanaged index of publicly issued investment grade U.S. corporate bonds with one to ten years to maturity.
21
Pacific Advisors
Balanced Fund continued
Expense Examples
As a shareholder of the Fund you incur two types of costs: (1) transaction costs, including sales charges (loads) on purchase payments, reinvested dividends, or other distributions; redemption fees; and exchange fees; and (2) ongoing costs, including management fees; distribution (12b-1) fees; and other Fund expenses. This Example is intended to help you understand your ongoing costs (in dollars) of investing in the Fund and to compare these costs with the ongoing costs of investing in other mutual funds.
The Example is based on an investment of $1,000 invested at the beginning of the period and held for the entire period from July 1, 2013 through December 31, 2013.
Actual Expenses
The first line of the table below provides information about actual account values and actual expenses. You may use the information in this line, together with the amount you invested, to estimate the expenses that you paid over the period. Simply divide your account value by $1,000 (for example, an $8,600 account value divided by $1,000 = 8.6), then multiply the result by the number in the first line under the heading entitled "Expenses Paid During the Period" to estimate the expenses you paid on your account during the period.
The following transaction costs are not included in the expenses shown in the table and, if applicable, would increase the expenses that you paid over the period: (1) a front-end sales charge (load) of 5.75% on Class A shares; (2) a 2% redemption fee if you sell or exchange shares within 180 days of purchase, with certain exceptions. The redemption fee does not apply to: (a) redemptions under an automatic withdrawal program or periodic asset reallocation plan, required minimum distributions (RMD), employer mandated distributions from a qualified plan, or redemptions under a qualified domestic relations order (QDRO); (b) redemptions to pay for expenses related to terminal illness, extended hospital or nursing home care, or other serious medical conditions, including death; (c) redemptions of shares acquired through dividend or capital gains reinvestments; (d) loans from a qualified plan account, and (e) redemptions initiated by the Fund; and (3) a $10 service fee on each exchange after the first five exchanges in each calendar year.
The following ongoing costs are not included in the expenses shown in the table and, if applicable, would increase the expenses that you paid over the period: (1) a $12 low balance fee on accounts with balances of less than $250 as of September 30th of each calendar year and no investment activity (excluding reinvestment of dividends and/or capital gains) during the prior calendar year or the first nine months of the current calendar year. This fee does not apply to IRAs, qualified plan accounts, or Coverdell Education Savings Accounts; (2) a $15 annual custodial fee on IRAs, SEPs, SIMPLE IRAs, and Coverdell Education Savings Accounts; and (3) a $20 annual custodial fee on 403(b) accounts.
Hypothetical Example for Comparison Purposes
The second line of the table below provides information about hypothetical account values and hypothetical expenses based on the Fund's actual expense ratio and an assumed rate of return of 5% per year before expenses, which in not the Fund's actual return. The hypothetical account values and expenses may not be used to estimate the actual ending account balance or expenses you paid for the period. You may use this information to compare the ongoing costs of investing in the Fund and other funds. To do so, compare this 5% hypothetical example with the 5% hypothetical examples that appear in the shareholder reports of the other funds.
The following transaction costs are not included in the expenses shown in the table and, if applicable, would increase the expenses that you paid over the period: (1) a front-end sales charge (load) of 5.75% on Class A shares; (2) a 2% redemption fee if you sell or exchange shares within 180 days of purchase, with certain exceptions. The redemption fee does not apply to: (a) redemptions under an automatic withdrawal program or periodic asset reallocation plan, required minimum distributions (RMD), employer mandated distributions from a qualified plan, or redemptions under a qualified domestic relations order (QDRO); (b) redemptions to pay for expenses related to terminal illness, extended hospital or nursing home care, or other serious medical conditions, including death; (c) redemptions of shares acquired through dividend or capital gains reinvestments; (d) loans from a qualified plan account, and (e) redemptions initiated by the Fund; and (3) a $10 service fee on each exchange after the first five exchanges in each calendar year.
The following ongoing costs are not included in the expenses shown in the table and, if applicable, would increase the expenses that you paid over the period: (1) a $12 low balance fee on accounts with balances of less than $250 as of September 30th of each calendar year and no investment activity (excluding reinvestment of dividends and/or capital gains) during the prior calendar year or the first nine months of the current calendar year. This fee does not apply to IRAs, qualified plan accounts, or Coverdell Education Savings Accounts; (2) a $15 annual custodial fee on IRAs, SEPs, SIMPLE IRAs, and Coverdell Education Savings Accounts; and (3) a $20 annual custodial fee on 403(b) accounts.
Please note that the expenses shown in the table are meant to highlight your ongoing costs only and do not reflect any transactional costs, such as sales charges (loads), redemption fees, or exchange fees. Therefore, the second line of the table is useful in comparing ongoing costs only, and will not help you determine the relative total costs of owning different funds. In addition, if these transactional costs were included, your costs would have been higher.
| Beginning Account Value 07/01/13 | Ending Account Value 12/31/13 | Expense Paid During Period 07/01/13 – 12/31/13 | |||||||||||||
Balanced Fund Class A | |||||||||||||||
Actual | $ | 1,000.00 | $ | 1,142.10 | $ | 16.58 | |||||||||
Hypothetical (5% return before expense) | $ | 1,000.00 | $ | 1,009.73 | $ | 15.55 | |||||||||
Balanced Fund Class C | |||||||||||||||
Actual | $ | 1,000.00 | $ | 1,137.90 | $ | 20.80 | |||||||||
Hypothetical (5% return before expense) | $ | 1,000.00 | $ | 1,005.75 | $ | 19.51 | |||||||||
4 Expenses are equal to the Fund's annualized expense ratio of 3.07% for Class A shares and 3.86% for Class C shares, multiplied by the average account value over the period, multiplied by 184/365 days to reflect the one-half year period.
22
Pacific Advisors
Large Cap Value Fund
Fund Objective: Long-term capital appreciation.
Investment Invests at least 80% of its assets in large cap companies that are, at the
Strategy: time of purchase, within the market cap range of companies in the S&P 500® Index1.
Investor Profile: Conservative equity. Growth-oriented with a long-term investment horizon.
TOTAL RETURNS | EXPENSE RATIOS | ||||||||||||||||||||||||||
For the year ended December 31, 2013 | Current (For the year ended 12/31/13) | Prospectus (For the year ended 12/31/12) | |||||||||||||||||||||||||
Net | Gross | Net | Gross | ||||||||||||||||||||||||
Class A | 28.72 | % | Class A | 2.47 | % | 4.02 | % | 2.61 | % | 4.34 | % | ||||||||||||||||
Class C | 27.83 | % | Class C | 3.22 | % | 4.77 | % | 3.43 | % | 5.15 | % | ||||||||||||||||
S&P 500® Index | 32.36 | % | |||||||||||||||||||||||||
Performance quoted is past performance which does not guarantee future results. Current performance may be higher or lower than the performance quoted. Call (800) 989-6693 for performance current to the most recent month-end. The investment return and principal value of an investment will fluctuate so that an investor's shares, when redeemed, may be worth more or less than their original cost. Returns represent the change in value over the stated period assuming reinvestment of dividends and capital gains at net asset value. Returns do not take into account the maximum 5.75% sales charge on Class A shares or the 1% Contingent Deferred Sales Charge (CDSC) for Class C shares sold within one year of purchase. Returns would be lower if the applicable sales charge and CDSC were included. Returns do not take into account individual taxes which may reduce actual returns when shares are sold.
The Fund's investment adviser is waiving a portion of its management fees pursuant to an Expense Limitation Agreement. The waiver may be discontinued at any time with ninety days written notice in consultation with the Fund's board, but is expected to continue at current levels. Please see the Notes to Financial Statements in this report for details. Performance shown reflects the waiver, without which the results would have been lower.
Discussion with Portfolio Manager February 24, 2014
Samuel C. Coquillard
Please see the Chairman's Letter at the beginning of this Report for a detailed market and economic review as well as the Manager's general market outlook.
Fund Performance
For 2013, Class A shares of the Fund returned 28.72% compared to the benchmark's gain of 32.36%. The Fund's equity strategy focuses on managing risk and minimizing volatility. Its conservative approach typically results in outperformance during falling markets; conversely, when the equity markets rally, as in 2013, the Fund may perform well but at a slower, less volatile pace than the benchmark.
Holdings from a wide range of industries contributed to performance in the second half of the year2:
• FedEx, the Fund's top performer for the six-month period, profited from e-commerce and global trade growth. Several initiatives bode well for FedEx's future earnings growth. The company continues to modernize its air fleet to reduce operating costs over the long term. It also plans to build 3 to 5 major ground hubs over the next several years.
1 The Standard & Poor's 500® Index is an unmanaged, market capitalization weighted index which measures the performance of the large cap segment of the U.S. equities market, covering approximately 75% of the U.S. equities market. The Index includes 500 leading companies in leading industries of the U.S. economy. Index returns assume the reinvestment of dividends, but, unlike the Fund's returns, do not reflect the effects of management fees or expenses. It is not possible to invest directly in the Index.
2 For detailed information on Fund holdings, please see the Fund's Schedule of Investments in this Report.
23
Pacific Advisors
Large Cap Value Fund continued
• Mondelez, a multinational food and beverage conglomerate, recorded strong gains on continued double-digit revenue growth in emerging markets. The global snack foods giant, whose brands include Nabisco and Cadbury, plans to invest $190 million in India to establish the company's largest manufacturing plant in the Asia Pacific region. Its presence in the region should position the company to grow as the global economic recovery progresses.
• Legg Mason, a money management firm, increased revenues as equity market appreciation contributed to growth in its assets under management. The company also reorganized underperforming businesses and plans to improve its product offerings.
• Johnson Controls, the global diversified technology and industrial company in the building and automotive industries, performed well on record revenues and earnings during its fiscal year. The company benefitted from the automotive recovery in North America and strong automotive production growth in all regions, especially China; also, it was awarded its largest ever building efficiency contract by the State of Hawaii energy savings project.
Many large cap companies, including those mentioned above, utilized cash reserves to increase their share value through stock buybacks. Larger companies often generate significant cash flow from operations. In recent years, uncertainty in the global economy reduced or delayed some capital expenditures; as a result, many companies accumulated substantial cash reserves. We expect that, with an improving global economy, companies will increase capital spending, acquisitions and stock buybacks which would contribute to an increase in shareholder value.
Fund Strategy
Steady improvement in the global economy led to stellar equity market performance in 2013. As the economy emerged from recession, the Fund gradually reduced its allocation to defensive stocks, which typically perform well in down markets, and increased its allocation to cyclical stocks which offer more attractive growth opportunities. The recovery should continue to fuel growth for economically-sensitive, or "cyclical," businesses. The Fund increased exposure to economically-sensitive sectors without a significant increase in volatility, as reflected in its one-year beta3 of 0.95, as of December 31st, versus the benchmark.
Large cap stocks benefitted from broad market appreciation during the year, as well as the movement of capital out of fixed income investments. The gradual rise in interest rates motivated conservative investors to seek more attractive alternatives in stable, dividend-paying blue-chip stocks. We expect that, with the upward trend in interest rates, investors will continue to rotate assets from bonds into equities, particularly lower-volatility stocks such as those in which the Fund invests.
Fund holdings concentrate in mega-cap stocks of well-managed companies with dominant market positions, strong financials, and track records of steady growth. The Fund's mega-cap emphasis, as evidenced by its weighted average market cap of $153 billion, helps reduce downside risk and market volatility. In contrast, the S&P 500® Index's weighted average market cap, as of December 31st, was approximately $35 billion. In addition, we seek companies that pay attractive dividends while maintaining the financial flexibility to invest for future growth. Companies paying dividends in excess of 3% included Kraft Foods, Intel, McDonald's, Sysco, General Electric, and Clorox.
The equity markets' impressive run provided the Fund with opportunities to realize profits in some positions and rotate capital to stocks with more attractive long-term growth potential. Several positions, including Target, Abbott Laboratories, and Cisco Systems, were trimmed or sold; we increased positions in Oracle, International Business Machines, and Wells Fargo. We also initiated positions in Consumer Discretionary companies poised to benefit from increased consumer spending in response to global
3 "Beta" measures volatility relative to the stock market or an alternative benchmark. A beta less than 1.0 indicates lower risk than the market or the benchmark; a beta greater than 1.0 indicates higher risk than the market or the benchmark.
24
economic improvements. New holdings included Johnson Controls and Sotheby's, one of the world's largest brokers of art, jewelry, real estate, and collectibles.
Looking Ahead
Equities rose impressively in 2013 in response to improving global economic conditions. Going forward, we expect that a gradual and uneven recovery may lead to market volatility. The Fund will remain focused on companies with strong international operations that are positioned to profit from strengthening economies. These multinational mega-cap firms have the scale, broad geographic footprints, diversified product lines, and distribution channels to effectively manage changing economic conditions and focus on the strongest performing regions.
We anticipate that interest rates will continue to gradually rise on improved economic data and in response to the Federal Reserve's monetary policy. Fixed income investors, especially those holding long-term bonds, may choose to protect against principal losses by migrating to conservative equities. Stocks such as those in the Fund's focused portfolio of leading large cap stocks with relatively low volatility and attractive dividends should be attractive to these risk averse investors.
25
Pacific Advisors
Large Cap Value Fund continued
Portfolio Holdings as of 12/31/13 (Based on Total Investments)
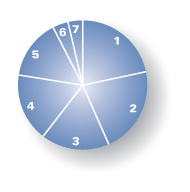
| Equities | 100 | % | |||||||||
| 1. | Information Technology | 21.92 | % | ||||||||
| 2. | Industrials | 21.57 | % | ||||||||
| 3. | Financials | 17.25 | % | ||||||||
| 4. | Consumer Staples | 16.88 | % | ||||||||
| 5. | Consumer Discretionary | 15.14 | % | ||||||||
| 6. | Health Care | 3.84 | % | ||||||||
| 7. | Energy | 3.40 | % | ||||||||
Change in Value of $10,000 Investment1
This chart compares the growth of a $10,000 investment in Class A shares of the Large Cap Value Fund for the period January 1, 2004 through December 31, 2013 with the same investment in the S&P 500 Index2.
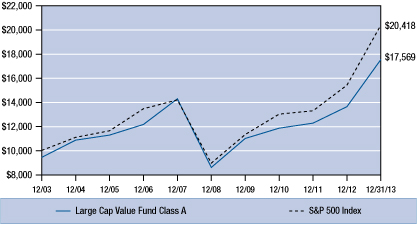
Average Annual Compounded Returns as of December 31, 2013
Class A | Class C | ||||||||||
One Year | 21.33 | % | 26.83 | % | |||||||
Five Year | 14.01 | % | 14.52 | % | |||||||
Ten Year | 5.79 | % | 5.58 | % | |||||||
Past performance does not guarantee future results. Performance quoted represents past performance. Current performance may be higher or lower than the performance data quoted. Returns include reinvested dividends and capital gains. Returns for Class A shares reflect a maximum front-end sales charge of 5.75%; and returns for Class C shares reflect the deduction of a contingent deferred sales charge of 1% on shares sold within the first year of purchase. Returns do not take into account individual taxes which may reduce actual returns when shares are sold. The investment return and principal value of an investment will fluctuate so that an investor's shares, when redeemed, may be worth more or less than their original cost. Call (800) 989-6693 for the most recent month-end performance.
1 Fund results are shown for Class A shares and reflect deduction of the maximum front-end sales charge of 5.75% on the $10,000 investment for a net amount invested of $9,425. At the end of the same period, a $10,000 investment in Class C shares would have been valued at $17,218, and no contingent deferred sales charges would apply. Performance of the share classes will vary based on the difference in charges and expenses. The inception date for Class A shares and Class C shares is 05/01/99. It is not possible to invest directly in either Index. Index results assume reinvestment of dividends, but, unlike the Fund's results, do not reflect sales charges, fees or expenses.
2 The Standard & Poor's 500 Index is an unmanaged, market capitalization weighted index which measures the performance of the large cap segment of the U.S. equities market, covering approximately 75% of the U.S. equities market. The Index includes 500 leading companies in leading industries of the U.S. economy.
26
Expense Examples
As a shareholder of the Fund you incur two types of costs: (1) transaction costs, including sales charges (loads) on purchase payments, reinvested dividends, or other distributions; redemption fees; and exchange fees; and (2) ongoing costs, including management fees; distribution (12b-1) fees; and other Fund expenses. This Example is intended to help you understand your ongoing costs (in dollars) of investing in the Fund and to compare these costs with the ongoing costs of investing in other mutual funds.
The Example is based on an investment of $1,000 invested at the beginning of the period and held for the entire period from July 1, 2013 through December 31, 2013.
Actual Expenses
The first line of the table below provides information about actual account values and actual expenses. You may use the information in this line, together with the amount you invested, to estimate the expenses that you paid over the period. Simply divide your account value by $1,000 (for example, an $8,600 account value divided by $1,000 = 8.6), then multiply the result by the number in the first line under the heading entitled "Expenses Paid During the Period" to estimate the expenses you paid on your account during the period.
The following transaction costs are not included in the expenses shown in the table and, if applicable, would increase the expenses that you paid over the period: (1) a front-end sales charge (load) of 5.75% on Class A shares; (2) a 2% redemption fee if you sell or exchange shares within 180 days of purchase, with certain exceptions. The redemption fee does not apply to: (a) redemptions under an automatic withdrawal program or periodic asset reallocation plan, required minimum distributions (RMD), employer mandated distributions from a qualified plan, or redemptions under a qualified domestic relations order (QDRO); (b) redemptions to pay for expenses related to terminal illness, extended hospital or nursing home care, or other serious medical conditions, including death; (c) redemptions of shares acquired through dividend or capital gains reinvestments; (d) loans from a qualified plan account, and (e) redemptions initiated by the Fund; and (3) a $10 service fee on each exchange after the first five exchanges in each calendar year.
The following ongoing costs are not included in the expenses shown in the table and, if applicable, would increase the expenses that you paid over the period: (1) a $12 low balance fee on accounts with balances of less than $250 as of September 30th of each calendar year and no investment activity (excluding reinvestment of dividends and/or capital gains) during the prior calendar year or the first nine months of the current calendar year. This fee does not apply to IRAs, qualified plan accounts, or Coverdell Education Savings Accounts; (2) a $15 annual custodial fee on IRAs, SEPs, SIMPLE IRAs, and Coverdell Education Savings Accounts; and (3) a $20 annual custodial fee on 403(b) accounts.
Hypothetical Example for Comparison Purposes
The second line of the table below provides information about hypothetical account values and hypothetical expenses based on the Fund's actual expense ratio and an assumed rate of return of 5% per year before expenses, which in not the Fund's actual return. The hypothetical account values and expenses may not be used to estimate the actual ending account balance or expenses you paid for the period. You may use this information to compare the ongoing costs of investing in the Fund and other funds. To do so, compare this 5% hypothetical example with the 5% hypothetical examples that appear in the shareholder reports of the other funds.
The following transaction costs are not included in the expenses shown in the table and, if applicable, would increase the expenses that you paid over the period: (1) a front-end sales charge (load) of 5.75% on Class A shares; (2) a 2% redemption fee if you sell or exchange shares within 180 days of purchase, with certain exceptions. The redemption fee does not apply to: (a) redemptions under an automatic withdrawal program or periodic asset reallocation plan, required minimum distributions (RMD), employer mandated distributions from a qualified plan, or redemptions under a qualified domestic relations order (QDRO); (b) redemptions to pay for expenses related to terminal illness, extended hospital or nursing home care, or other serious medical conditions, including death; (c) redemptions of shares acquired through dividend or capital gains reinvestments; (d) loans from a qualified plan account, and (e) redemptions initiated by the Fund; and (3) a $10 service fee on each exchange after the first five exchanges in each calendar year.
The following ongoing costs are not included in the expenses shown in the table and, if applicable, would increase the expenses that you paid over the period: (1) a $12 low balance fee on accounts with balances of less than $250 as of September 30th of each calendar year and no investment activity (excluding reinvestment of dividends and/or capital gains) during the prior calendar year or the first nine months of the current calendar year. This fee does not apply to IRAs, qualified plan accounts, or Coverdell Education Savings Accounts; (2) a $15 annual custodial fee on IRAs, SEPs, SIMPLE IRAs, and Coverdell Education Savings Accounts; and (3) a $20 annual custodial fee on 403(b) accounts.
Please note that the expenses shown in the table are meant to highlight your ongoing costs only and do not reflect any transactional costs, such as sales charges (loads), redemption fees, or exchange fees. Therefore, the second line of the table is useful in comparing ongoing costs only, and will not help you determine the relative total costs of owning different funds. In addition, if these transactional costs were included, your costs would have been higher.
| Beginning Account Value 07/01/13 | Ending Account Value 12/31/13 | Expense Paid During Period 07/01/13 – 12/31/13 | |||||||||||||
Large Cap Value Fund Class A | |||||||||||||||
Actual | $ | 1,000.00 | $ | 1,133.70 | $ | 13.28 | |||||||||
Hypothetical (5% return before expense) | $ | 1,000.00 | $ | 1,012.75 | $ | 12.53 | |||||||||
Large Cap Value Fund Class C | |||||||||||||||
Actual | $ | 1,000.00 | $ | 1,129.70 | $ | 17.28 | |||||||||
Hypothetical (5% return before expense) | $ | 1,000.00 | $ | 1,008.97 | $ | 16.31 | |||||||||
5 Expenses are equal to the Fund's annualized expense ratio, net of expense waivers, of 2.47% for Class A shares and 3.22% for Class C shares, multiplied by the average account value over the period, multiplied by 184/365 days to reflect the one-half year period.
27
Pacific Advisors
Mid Cap Value Fund
Fund Objective: Long-term capital appreciation.
Investment Invests at least 80% of its assets in mid-cap companies that are, at the time of
Strategy: purchase, within the market cap range of companies in the Russell Midcap Index®.1
Investor Profile: Moderately aggressive. Growth-oriented with a long-term investment horizon.
TOTAL RETURNS | EXPENSE RATIOS | ||||||||||||||||||
For the year ended December 31, 2013 | Current (For the year ended 12/31/13) | Prospectus (For the year ended 12/31/12) | |||||||||||||||||
Class A | 32.96 | % | Class A | 3.69 | % | 4.19 | % | ||||||||||||
Class C | 31.93 | % | Class C | 4.42 | % | 4.95 | % | ||||||||||||
Russell Midcap Index® | 34.76 | % | |||||||||||||||||
Performance quoted is past performance which does not guarantee future results. Current performance may be higher or lower than the performance quoted. Call (800) 989-6693 for performance current to the most recent month-end. The investment return and principal value of an investment will fluctuate so that an investor's shares, when redeemed, may be worth more or less than their original cost. Returns represent the change in value over the stated period assuming reinvestment of dividends and capital gains at net asset value. Returns do not take into account the maximum 5.75% sales charge on Class A shares or the 1% Contingent Deferred Sales Charge (CDSC) for Class C shares sold within one year of purchase. Returns would be lower if the applicable sales charge and CDSC were included. Returns do not take into account individual taxes which may reduce actual returns when shares are sold.
Discussion with Portfolio Manager February 24, 2014
George A. Henning
Please see the Chairman's Letter at the beginning of this Report for a detailed market and economic
review as well as the Manager's general market outlook.
Fund Performance
The Fund's continued focus on economically-sensitive companies led to solid performance amidst the steady global economic recovery. Holdings in these "cyclical" sectors, particularly Consumer Discretionary, Industrials and Materials, drove performance2. Manufacturing and industrial production gained momentum as consumers were increasingly willing to spend in response to improved economic outlooks. During the second half of the year, Class A shares returned 17.13% while the benchmark increased 16.73%. For the full year, Class A shares rose 32.96%, slightly lagging the benchmark's 34.76% gain.
Top contributors to Fund performance during the second half of the year included:
• Penske Automotive, the international transportation services company, rose an astounding 55+% on strong new and used auto sales in the U.S. and U.K. In addition, the company completed its acquisition of Western Star Trucks Australia, a distributor of commercial vehicles, related spare parts and aftermarket support across certain areas in Southeast Asia. The purchase is part of the company's initiative to expand global market share.
• Spirit Airlines, the ultra-low base fare airline, gained more than 40% since the Fund's investment in June 2013. Many airline stocks rose significantly over this period; yet, Spirit's gains reflect impressive
1 The Russell Midcap® Index is an unmanaged, weighted measure of the 800 smallest companies within the Russell 1000® Index based on a combination of their market cap and current index membership. Index returns assume the reinvestment of dividends, but, unlike the Fund's returns, do not reflect management fees or expenses. It is not possible to invest directly in the Index.
2 For detailed information on Fund holdings, please see the Fund's Schedule of Investments in this Report.
28
third quarter results including 33% growth in revenues and an even more remarkable 130% growth in net income compared to the year ago period. Management noted a strong peak summer travel season and expanded service offerings.
• Wabtec, a global provider of technology-based products for locomotives, freight cars and passenger cars, rose on strong earnings results as well as growing confidence in global rail transportation spending. The company's diversified businesses, which serve the freight and passenger markets both domestically and internationally, are at the forefront of several favorable trends including: growing global trade, urbanization in developing markets, and increasing regulatory oversight; the company is well-positioned to benefit from regulatory measures aimed at improving safety and emissions standards.
• H.B. Fuller, a leading global industrials adhesives manufacturer, grew revenues and operating income while reducing costs despite lingering weakness in European end-markets. The company also made progress on integrating its March 2012 acquisition of Forbo's industrial and adhesives business. As part of its consolidation efforts, the firm is evolving a more cost-effective IT infrastructure which should lead to significant cost savings over the long term.
Additionally, several other holdings contributed to Fund performance. They include Commercial Metals, an international steel making, metal fabrication, distribution and recycling company, which generated stronger-than-expected operating results. The company stands to profit from the increased activity in nonresidential construction, an area in which the firm has notable exposure. In addition, Chesapeake Energy, the second largest domestic natural gas producer, continued to aggressively sell its non-core assets; the proceeds amounted to $4 billion for the full year. The stock rose significantly during the period as investors responded favorably to these divestiture activities.
Fund Strategy
Mid-cap companies provide distinctive opportunities for long-term investors as they combine the strategic flexibility of smaller businesses with the economies of scales typically associated with large corporations. Our fundamental, bottom-up investment process identifies firms with attractive opportunities for long-term growth. As of year-end, the Fund's low annual turnover rate of 15% was consistent with its five-year average annual turnover rate of 18%3.
The Fund focuses on companies that effectively execute growth initiatives and successfully update their operations. We seek to identify undervalued businesses that are well-positioned to expand their operations as the improving global economy fuels growth in various cyclical industries.
During the period, the Fund added to several of its positions, including Noble, MRC Global and Spirit Airlines; we believe that the growth strategies of these firms will pave the way for higher earnings. Noble announced plans to divest its older offshore drilling rigs which should improve its profitability as a premium provider of high-specification ultra-deepwater rigs. MRC, the largest global distributor of pipes, valves and fittings, is increasingly positioning itself as the go-to supplier serving the onshore and offshore Energy industry. And, Spirit plans to increase its capacity by 22% by adding seven new aircraft in 2014 and eighteen in 2015.
Some holdings were relative underperformers; but, for these businesses, the temporary setbacks did not change their long-term prospects. Denbury Resources sold off in November after management announced its decision to resist pressure from investors to adopt a master limited partnership structure; instead, the company will use excess cash flow for growth initiatives including infrastructure projects; institute a quarterly dividend in early 2014 and increase its stock buyback program. We took advantage of the price decline to increase the Fund's position as we remain confident that the company will perform well; its distinct advantage of ample oil reserves and access to cheap carbon-dioxide resources provides the rare combination of longevity, low risk and low cost. In addition, we maintained our position in Joy Global, a high-productivity mining solutions manufacturer that has been negatively impacted by prolonged weakness in the cyclical mining sector. Nevertheless, we expect the company's growth to resume once mining activity increases; excess stock piles of copper, iron ore and coal are declining as the global recovery increases demand for commodities.
During the period, the Fund trimmed several holdings including Cathay General Bancorp, Gamestop and Lear to lock in profits and rebalance the portfolio.
3 Annual turnover: 15% (2013); 24% (2012); 12% (2011); 18% (2010); and 21% (2009).
29
Pacific Advisors
Mid Cap Value Fund continued
Looking Ahead
The gradual global economic recovery may position the equity markets for a continued, yet moderate, advance in 2014. We believe that a modest economic expansion will reward well-managed, financially strong businesses. Economic growth in Europe will be particularly beneficial for firms with operations in the euro zone. Deferred spending, even if somewhat constrained, will add to global economic expansion. For example, automobile sales lagged during their recession; the average age of automobiles has increased in a repeat of the pattern experienced in the U.S. during our recession. As the economy improves, consumers will begin replacing older cars.
The energy renaissance in the U.S. continues as demand for oil and gas products increases. Growing oil production from land drilling, fracking and offshore rigs will continue to benefit gas and exploration companies such as Chesapeake and Denbury Resources. Energy services companies are also experiencing heightened demand in the U.S. and abroad which will develop business for Noble, Tidewater and Helix Energy Solutions.
We expect the transportation industry will continue to perform well; we look for good performance from companies such as Genesee and Wyoming, Kansas City Southern and Landstar System. Spirit Airlines, a low cost, no-frills airline, has significant expansion plans and enjoys a strong market share of cost-conscious travelers.
Global growth provides opportunities in many different areas of the economy. Financials, Consumer Discretionary, Industrials and Energy are but a few of the sectors which should experience good growth. We believe the Fund is well-positioned to profit from an improving global economy; also, we anticipate identifying new companies with the potential for significant long-term appreciation.
30
Portfolio Holdings as of 12/31/13 (Based on Total Investments)
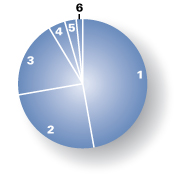
| Equities | 100 | % | |||||||||
| 1. | Industrials | 47.30 | % | ||||||||
| 2. | Consumer Discretionary | 24.96 | % | ||||||||
| 3. | Energy | 19.15 | % | ||||||||
| 4. | Materials | 4.19 | % | ||||||||
| 5. | Financials | 2.85 | % | ||||||||
| 6. | Consumer Staples | 1.55 | % | ||||||||
Change in Value of $10,000 Investment1
This chart compares the growth of a $10,000 investment in Class A shares of the Mid Cap Value Fund for the period January 1, 2004 through December 31, 2013 with the same investment in the Russell Midcap® Index2.
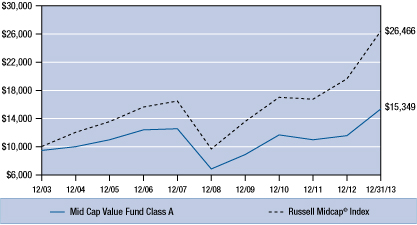
Average Annual Compounded Returns as of December 31, 2013
Class A | Class C | ||||||||||
One Year | 25.31 | % | 30.93 | % | |||||||
Five Year | 16.32 | % | 16.76 | % | |||||||
Ten Year | 4.38 | % | 4.15 | % | |||||||
Past performance does not guarantee future results. Performance quoted represents past performance. Current performance may be higher or lower than the performance data quoted. Returns include reinvested dividends and capital gains. Returns for Class A shares reflect a maximum front-end sales charge of 5.75%; and returns for Class C shares reflect the deduction of a contingent deferred sales charge of 1% on shares sold within the first year of purchase. Returns do not take into account individual taxes which may reduce actual returns when shares are sold. The investment return and principal value of an investment will fluctuate so that an investor's shares, when redeemed, may be worth more or less than their original cost. Call (800) 989-6693 for the most recent month-end performance.
1 Fund results are shown for Class A shares and reflect deduction of the maximum front-end sales charge of 5.75% on the $10,000 investment for a net amount invested of $9,425. At the end of the same period, a $10,000 investment in Class C shares would have been valued at $15,009, and no contingent deferred sales charges would apply. Performance of the share classes will vary based on the difference in charges and expenses. The inception date for Class A shares and Class C shares is 04/01/02. It is not possible to invest directly in either Index. Index results assume reinvestment of dividends, but, unlike the Fund's results, do not reflect sales charges, fees or expenses.
2 The Russell Midcap® Index is an unmanaged, weighted measure of the 800 smallest companies within the Russell 1000® Index based on a combination of their market cap and current index membership.
31
Pacific Advisors
Mid Cap Value Fund continued
Expense Examples
As a shareholder of the Fund you incur two types of costs: (1) transaction costs, including sales charges (loads) on purchase payments, reinvested dividends, or other distributions; redemption fees; and exchange fees; and (2) ongoing costs, including management fees; distribution (12b-1) fees; and other Fund expenses. This Example is intended to help you understand your ongoing costs (in dollars) of investing in the Fund and to compare these costs with the ongoing costs of investing in other mutual funds.
The Example is based on an investment of $1,000 invested at the beginning of the period and held for the entire period from July 1, 2013 through December 31, 2013.
Actual Expenses
The first line of the table below provides information about actual account values and actual expenses. You may use the information in this line, together with the amount you invested, to estimate the expenses that you paid over the period. Simply divide your account value by $1,000 (for example, an $8,600 account value divided by $1,000 = 8.6), then multiply the result by the number in the first line under the heading entitled "Expenses Paid During the Period" to estimate the expenses you paid on your account during the period.
The following transaction costs are not included in the expenses shown in the table and, if applicable, would increase the expenses that you paid over the period: (1) a front-end sales charge (load) of 5.75% on Class A shares; (2) a 2% redemption fee if you sell or exchange shares within 180 days of purchase, with certain exceptions. The redemption fee does not apply to: (a) redemptions under an automatic withdrawal program or periodic asset reallocation plan, required minimum distributions (RMD), employer mandated distributions from a qualified plan, or redemptions under a qualified domestic relations order (QDRO); (b) redemptions to pay for expenses related to terminal illness, extended hospital or nursing home care, or other serious medical conditions, including death; (c) redemptions of shares acquired through dividend or capital gains reinvestments; (d) loans from a qualified plan account, and (e) redemptions initiated by the Fund; and (3) a $10 service fee on each exchange after the first five exchanges in each calendar year.
The following ongoing costs are not included in the expenses shown in the table and, if applicable, would increase the expenses that you paid over the period: (1) a $12 low balance fee on accounts with balances of less than $250 as of September 30th of each calendar year and no investment activity (excluding reinvestment of dividends and/or capital gains) during the prior calendar year or the first nine months of the current calendar year. This fee does not apply to IRAs, qualified plan accounts, or Coverdell Education Savings Accounts; (2) a $15 annual custodial fee on IRAs, SEPs, SIMPLE IRAs, and Coverdell Education Savings Accounts; and (3) a $20 annual custodial fee on 403(b) accounts.
Hypothetical Example for Comparison Purposes
The second line of the table below provides information about hypothetical account values and hypothetical expenses based on the Fund's actual expense ratio and an assumed rate of return of 5% per year before expenses, which in not the Fund's actual return. The hypothetical account values and expenses may not be used to estimate the actual ending account balance or expenses you paid for the period. You may use this information to compare the ongoing costs of investing in the Fund and other funds. To do so, compare this 5% hypothetical example with the 5% hypothetical examples that appear in the shareholder reports of the other funds.
The following transaction costs are not included in the expenses shown in the table and, if applicable, would increase the expenses that you paid over the period: (1) a front-end sales charge (load) of 5.75% on Class A shares; (2) a 2% redemption fee if you sell or exchange shares within 180 days of purchase, with certain exceptions. The redemption fee does not apply to: (a) redemptions under an automatic withdrawal program or periodic asset reallocation plan, required minimum distributions (RMD), employer mandated distributions from a qualified plan, or redemptions under a qualified domestic relations order (QDRO); (b) redemptions to pay for expenses related to terminal illness, extended hospital or nursing home care, or other serious medical conditions, including death; (c) redemptions of shares acquired through dividend or capital gains reinvestments; (d) loans from a qualified plan account, and (e) redemptions initiated by the Fund; and (3) a $10 service fee on each exchange after the first five exchanges in each calendar year.
The following ongoing costs are not included in the expenses shown in the table and, if applicable, would increase the expenses that you paid over the period: (1) a $12 low balance fee on accounts with balances of less than $250 as of September 30th of each calendar year and no investment activity (excluding reinvestment of dividends and/or capital gains) during the prior calendar year or the first nine months of the current calendar year. This fee does not apply to IRAs, qualified plan accounts, or Coverdell Education Savings Accounts; (2) a $15 annual custodial fee on IRAs, SEPs, SIMPLE IRAs, and Coverdell Education Savings Accounts; and (3) a $20 annual custodial fee on 403(b) accounts.
Please note that the expenses shown in the table are meant to highlight your ongoing costs only and do not reflect any transactional costs, such as sales charges (loads), redemption fees, or exchange fees. Therefore, the second line of the table is useful in comparing ongoing costs only, and will not help you determine the relative total costs of owning different funds. In addition, if these transactional costs were included, your costs would have been higher.
| Beginning Account Value 07/01/13 | Ending Account Value 12/31/13 | Expense Paid During Period 07/01/13 – 12/31/13 | |||||||||||||
Mid Cap Value Fund Class A | |||||||||||||||
Actual | $ | 1,000.00 | $ | 1,171.30 | $ | 20.19 | |||||||||
Hypothetical (5% return before expense) | $ | 1,000.00 | $ | 1,006.60 | $ | 18.66 | |||||||||
Mid Cap Value Fund Class C | |||||||||||||||
Actual | $ | 1,000.00 | $ | 1,166.50 | $ | 24.14 | |||||||||
Hypothetical (5% return before expense) | $ | 1,000.00 | $ | 1,002.92 | $ | 22.31 | |||||||||
3 Expenses are equal to the Fund's annualized expense ratio of 3.69% for Class A shares and 4.42% for Class C shares, multiplied by the average account value over the period, multiplied by 184/365 days to reflect the one-half year period.
32
Pacific Advisors
Small Cap Value Fund
Fund Objective: Capital appreciation through investment in small cap companies.
Investment Invests at least 80% of its assets in small cap companies which are, at the time of
Strategy: purchase, not greater than the highest market capitalization of companies within the Russell 2000® Index1. Generally invests a significant proportion of its assets in companies with market caps under $500 million at the time of purchase, which are often referred to as "micro-cap stocks."
Investor Profile: Aggressive. Opportunity-oriented with a long-term investment horizon.
TOTAL RETURNS | EXPENSE RATIOS | ||||||||||||||||||
For the year ended December 31, 2013 | Current (For the year ended 12/31/13) | Prospectus (For the year ended 12/31/12) | |||||||||||||||||
Class A | 59.51 | % | Class A | 2.31 | % | 2.71 | % | ||||||||||||
Class C | 59.35 | % | Class C | 3.08 | % | 3.45 | % | ||||||||||||
Class I | 59.76 | % | Class I | 2.06 | % | 2.63 | % | ||||||||||||
| Russell 2000® Index | 38.82 | % | |||||||||||||||||
Performance quoted is past performance which does not guarantee future results. Current performance may be higher or lower than the performance quoted. Call (800) 989-6693 for performance current to the most recent month-end. The investment return and principal value of an investment will fluctuate so that an investor's shares, when redeemed, may be worth more or less than their original cost. Returns represent the change in value over the stated period assuming reinvestment of dividends and capital gains at net asset value. Rankings shown are for Class A shares; rankings for other share classes may be different. Returns and rankings do not take into account the maximum 5.75% sales charge on Class A shares or the 1% Contingent Deferred Sales Charge (CDSC) for Class C shares sold within one year of purchase. Returns would be lower if the applicable sales charge and CDSC were included. Returns do not take into account individual taxes which may reduce actual returns when shares are sold. Small cap companies typically have fewer financial resources and may carry higher investment risks and experience greater stock price volatility than larger stocks.
Discussion with Portfolio Manager February 24, 2014
George A. Henning
Please see the Chairman's Letter at the beginning of this Report for a detailed market and economic review
as well as the Manager's general market outlook.
Pacific Advisors Small Cap Value Fund (A) | |||||||
| Lipper Small Cap Core Category Kings Rank (# of funds) as of 12/31/13 based on total return | |||||||
| 1 Year | 1 | (718) | |||||
| 3 Year | 2 | (622) | |||||
| 5 Year | 21 | (573) | |||||
| 10 Year | 1 | (350) | |||||
Fund Performance
The Fund continued its stellar performance in the second half of 2013; Class A shares, which gained 29.22% through June, finished the year up 59.51%. The returns significantly outpaced the benchmark, which rose an impressive 38.82%. The Fund's extraordinary year placed it at the top of the Lipper
1 The Russell 2000® Index is an unmanaged, market-weighted measure of the 2,000 smallest companies of the Russell 3000® Index which represents approximately 98% of the investable U.S. equity market. Index returns assume the reinvestment of dividends, but, unlike the Fund's returns, do not reflect management fees or expenses. It is not possible to invest directly in the Index.
33
Pacific Advisors
Small Cap Value Fund continued
small cap core category for 2013. More importantly, and reflecting its long-term investment strategy, Class A shares were ranked #2 for the three-year period (having been outranked by only the Fund's Class I shares), #21 for the five-year period, and #1 for the ten-year period. Reflecting its long-term investment approach, the Fund delivered these results with minimal turnover; the Fund's 9% annual turnover; the five-year average annual turnover rate of 11%.2
Once again, superior stock selection was the primary factor in outperformance. Gains were broad-based across sectors and industries, with Consumer Discretionary and Industrials leading the way3:
• DXP Enterprises continued its remarkable run in the second half of 2013; for the year, the stock rose an astounding 135%. DXP's impressive performance results from its three-pronged growth strategy: exposure to key energy markets; expansion of products and services; and strategic acquisitions. In December, the company announced its most recent acquisition, B27, which provides an entry into new geographies including the Middle East and Africa.
• Gentherm rose as the company finalized its acquisition of German auto parts supplier WET Automotive Systems, a process that began in 2011. The combined entity dominates the market for heating and cooling automotive products such as seats and cup holders. Other initiatives expand the company's heating, cooling and ventilating applications to entirely different industries such as mattresses and furniture; here, early stage product research and development could lead to significant growth opportunities in other industries.
The growth strategies of the Fund's investments continued to produce impressive results. Conn's rose despite a third quarter stumble related to a back office systems conversion of its loan portfolio. Kirby, a marine transportation company, reported impressive gains in its inland and coastal businesses and announced plans for a new tank barge and tugboat unit. Matrix, an industrial maintenance and construction company, expanded its presence in the power generation industry with the acquisition of Kvaerner. Mobile Mini, a lessor of portable storage containers, identified several new market opportunities to capture the growth in construction activity. And Saia, a trucking company, benefitted from higher shipment volumes and pricing, as well as efficiency improvements resulting from technology investments over the past several years.
Also, the Fund profited from portfolio holdings that were acquired, or pending acquisition, at premium valuations. Rochester Medical, a medical devices company with a leading market position and proprietary technology, was acquired in September at a 45% premium by industry giant CR Bard. Vitran announced in late December the sale of its remaining Canadian operations to transportation and logistics firm, Transforce; the sale price was a 67% premium to Vitran's stock price in September prior to the sale of the company's U.S. operations.
Most companies in the Fund contributed to performance; EZCorp, however, was a notable exception. The specialty consumer finance company struggled to overcome falling gold prices, which negatively impacted the company's pawn lending and jewelry scrapping activities. Still, the company's growing portfolio of alternative financing solutions (such as payday loans, installment loans and auto title loans) is well-suited to meet the needs of today's credit-constrained borrowers. Moreover, the outlook for the company could turn if, as we expect, the decline in gold prices moderates in 2014.
Fund Strategy
The Fund employs a value-oriented, bottom-up investment approach to identify when high-quality, well-run companies with attractive growth prospects become undervalued. The Fund utilizes a long-term investment strategy with the expectation of owning a company for at least two to five years. Indeed, the Fund's oldest holding, East West Bank has been in the portfolio for over fifteen years. The selection process seeks companies that are undervalued at the time of purchase and have a catalyst for multi-year growth.
2 Annual turnover: 9% (2013); 12% (2012); 9% (2011); 9% (2010); 17% (2009).
3 For detailed information on Fund holdings, please see the Fund's Schedule of Investments in this Report.
34
In October, the Fund supplemented its Prospectus to redefine small cap stocks as companies that are, at the time of purchase, not greater than the highest market capitalization of companies within the Russell 2000® Index. As of its most recent annual reconstitution (May 31, 2013), the highest market capitalization of companies in the Russell 2000® Index was $3.3 billion. The Fund's prior definition of small caps (companies with market capitalizations of up to $2 billion at the time of purchase) had been in effect since the Fund's inception in 1993. The new definition increases the number of companies for consideration.
The Fund uses an "active buy-and-hold" strategy; periods of heightened market volatility often create opportunities to strategically invest for long-term appreciation. The Fund focuses on a limited number of stocks (31 holdings as of year-end), including a significant number of micro-cap stocks. Investing in smaller cap stocks may contribute to above-average volatility; yet, smaller, well-positioned companies can provide superior long-term results. We note the Fund's relatively modest one-year beta4 of 1.07, as of December 31st, in comparison to the Russell 2000® Index.
During the second half of 2013, the Fund added three new positions:
• MRC Global is a distributor of pipes, valves and fittings to the global Energy industry. The company's broad geographic presence provides a key advantage in securing master service contracts with major oil and gas companies.
• NCI Building Systems manufactures metal building products such as roofing, wall panels, and doors. The company stands to benefit from a long overdue recovery in commercial construction; leading indicators point to strong growth in this area in 2014.
• Regional Management is a diversified specialty consumer finance company which provides loans to customers with limited access to traditional forms of credit. The company's proprietary underwriting program delivered stellar credit performance even during the recession; plans to expand its geographic footprint beyond the southern U.S. are underway.
The Fund also took advantage of short-term market volatility to buy additional shares of: Darling International, Furmanite, Kirby, and Premiere Global Services at attractive prices. These companies enjoy leading market positions and long-term growth opportunities.
Looking Ahead
The equity markets overall performed well in 2013, yet small cap stocks clearly outperformed. Importantly, the markets managed to avoid any major corrections for the first year since the Great Recession. As a result, stock prices began to more fully reflect the strategic investments that companies have been making over the past several years. Still, and despite the Fund's strong performance in 2013, we believe a significant number of portfolio holdings provide opportunities, even at current prices, for further appreciation. These prospects for additional upside gains reduce turnover and lessen the Fund's reliance on new additions for future growth. Notably, a holding that successfully implements a growth initiative can deliver a meaningful contribution to performance as a result of the Fund's strategy of focused investing.
Many Fund holdings, across a variety of market sectors, will continue their business expansions as the U.S. and global economies improve. Their strong financial positions will also add to their ability to gain market share by expanding product lines and/or services, extending their geographical footprint and funding acquisitions. We believe that many of the Fund's best performers in 2013 are well positioned to post solid gains as their business outlooks remain attractive.
Strong global demand for oil and gas will benefit energy services companies such as Team, Furmanite and Natural Gas Services. Similarly, marine transportation companies such as Kirby and Hornbeck Offshore Services continue to experience robust demand in moving petrochemicals and providing support for off shore drilling rigs, respectively. North American Energy Partners recently completed a major business
4 "Beta" measures volatility relative to the stock market or an alternative benchmark. A beta less than 1.0 indicates lower risk than the market or the benchmark and a beta greater than 1.0 indicates higher risk than the market or the benchmark.
35
Pacific Advisors
Small Cap Value Fund continued
reorganization; the company is now well-positioned to expand its energy, mining and construction operations in Canada.
Industrial companies should also perform well. Saia continues to improve its operating efficiencies; additionally, management is actively exploring options to expand its geographical footprint in the northeastern region of the U.S. Mobile Mini's container storage business is experiencing growing demand; the company plans to extend its leasing operations to new cities in the coming year. With its major overseas acquisitions in 2013, Darling International transformed into a global leader in the recycling of rendering fats and cooking oils into bio-diesel fuel and by-products for the food industry. We anticipate greater profitability as Darling integrates its global businesses and realize greater efficiencies and economies of scale.
In the financial sector, we expect regional banks such as East West and BBCN will continue to expand their business within the Chinese and Korean communities, respectively, in the U.S. and abroad. Specialty companies such as Regional Management and EZCorp provide financial products to customers who, due to restrictions imposed by Dodd Frank Act, are underserved by the banking and credit card companies. For their core customer, job stability, a key component of their credit worthiness, should improve with continued economic growth.
We continue to see attractive opportunities to increase investments in current Fund holdings. Here, our long history affords a considerable advantage in our investment decisions. Additionally, we seek to identify new opportunities in small cap companies that may, for a variety of reasons, be undervalued. In many cases, these stocks receive little coverage from analysts; therefore, their growth potential may go unnoticed. As a result, and even though small cap stocks overall enjoyed a strong year in 2013, individual small caps that meet our value criteria can outperform.
36
Portfolio Holdings as of 12/31/13 (Based on Total Investments)
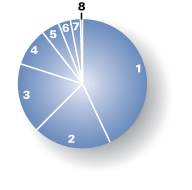
Equities | 99.47 | % | |||||||||
| 1. | Industrials | 43.32 | % | ||||||||
| 2. | Consumer Discretionary | 19.36 | % | ||||||||
| 3. | Energy | 17.40 | % | ||||||||
| 4. | Financials | 9.60 | % | ||||||||
| 5. | Consumer Staples | 4.35 | % | ||||||||
| 6. | Telecommunication Services | 3.14 | % | ||||||||
| 7. | Materials | 2.30 | % | ||||||||
| 8. | Cash and Cash Equivalents | 0.53 | % | ||||||||
Change in Value of $10,000 Investment1
This chart compares the growth of a $10,000 investment in Class A shares of the Small Cap Value Fund for the period January 1, 2004 through December 31, 2013 with the same investment in the Russell 2000® Index2.
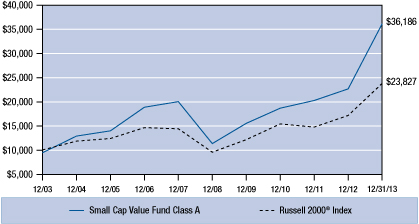
Average Annual Compounded Returns as of December 31, 2013
Class A | Class C | Class I | |||||||||||||
One Year | 50.33 | % | 57.35 | % | 59.76 | % | |||||||||
Five Year | 24.68 | % | 25.22 | % | 27.12 | % | |||||||||
Ten Year | 13.72 | % | 13.50 | % | NA | ||||||||||
Since Inception | 11.34 | % | 8.22 | % | 11.76 | % | |||||||||
Past performance does not guarantee future results. Performance quoted represents past performance. Current performance may be higher or lower than the performance data quoted. Returns include reinvested dividends and capital gains. Returns for Class A shares reflect a maximum front-end sales charge of 5.75%; and returns for Class C shares reflect the deduction of a contingent deferred sales charge of 1% on shares sold within the first year of purchase. Returns do not take into account individual taxes which may reduce actual returns when shares are sold. Rankings do not take sales loads into account. Small cap stocks typically have fewer financial resources and may carry higher risks and experience greater volatility than large cap stocks. The investment return and principal value of an investment will fluctuate so that an investor's shares, when redeemed, may be worth more or less than their original cost. Call (800) 989-6693 for the most recent month-end performance.
1 Fund results are shown for Class A shares and reflect deduction of the maximum front-end sales charge of 5.75% on the $10,000 investment for a net amount invested of $9,425. At the end of the same period, a $10,000 investment in Class C shares would have been valued at $35,480, and no contingent deferred sales charges would apply. The inception date is 02/08/93 for Class A shares; 04/01/98 for Class C shares; and 10/09/06 for Class I shares. From inception through December 31, 2013, a $10,000 investment in Class I shares would have been valued at $19,898, and no contingent deferred sales charges would apply. Performance of the share classes will vary based on the difference in charges and expenses. It is not possible to invest directly in the Index. Index results assume reinvestment of dividends, but, unlike the Fund's results, do not reflect sales charges, commissions or expenses.
2 The Russell 2000® Index is an unmanaged, weighted measure of the 2,000 smallest companies within the Russell 3000® Index.
37
Pacific Advisors
Small Cap Value Fund continued
Expense Examples
As a shareholder of the Fund you incur two types of costs: (1) transaction costs, including sales charges (loads) on purchase payments, reinvested dividends, or other distributions; redemption fees; and exchange fees; and (2) ongoing costs, including management fees; distribution (12b-1) fees; and other Fund expenses. This Example is intended to help you understand your ongoing costs (in dollars) of investing in the Fund and to compare these costs with the ongoing costs of investing in other mutual funds.
The Example is based on an investment of $1,000 invested at the beginning of the period and held for the entire period from July 1, 2013 through December 31, 2013.
Actual Expenses
The first line of the table below provides information about actual account values and actual expenses. You may use the information in this line, together with the amount you invested, to estimate the expenses that you paid over the period. Simply divide your account value by $1,000 (for example, an $8,600 account value divided by $1,000 = 8.6), then multiply the result by the number in the first line under the heading entitled "Expenses Paid During the Period" to estimate the expenses you paid on your account during the period.
The following transaction costs are not included in the expenses shown in the table and, if applicable, would increase the expenses that you paid over the period: (1) a front-end sales charge (load) of 5.75% on Class A shares; (2) a 2% redemption fee if you sell or exchange shares within 180 days of purchase, with certain exceptions. The redemption fee does not apply to: (a) redemptions under an automatic withdrawal program or periodic asset reallocation plan, required minimum distributions (RMD), employer mandated distributions from a qualified plan, or redemptions under a qualified domestic relations order (QDRO); (b) redemptions to pay for expenses related to terminal illness, extended hospital or nursing home care, or other serious medical conditions, including death; (c) redemptions of shares acquired through dividend or capital gains reinvestments; (d) loans from a qualified plan account, and (e) redemptions initiated by the Fund; and (3) a $10 service fee on each exchange after the first five exchanges in each calendar year.
The following ongoing costs are not included in the expenses shown in the table and, if applicable, would increase the expenses that you paid over the period: (1) a $12 low balance fee on accounts with balances of less than $250 as of September 30th of each calendar year and no investment activity (excluding reinvestment of dividends and/or capital gains) during the prior calendar year or the first nine months of the current calendar year. This fee does not apply to IRAs, qualified plan accounts, or Coverdell Education Savings Accounts; (2) a $15 annual custodial fee on IRAs, SEPs, SIMPLE IRAs, and Coverdell Education Savings Accounts; and (3) a $20 annual custodial fee on 403(b) accounts.
Hypothetical Example for Comparison Purposes
The second line of the table below provides information about hypothetical account values and hypothetical expenses based on the Fund's actual expense ratio and an assumed rate of return of 5% per year before expenses, which in not the Fund's actual return. The hypothetical account values and expenses may not be used to estimate the actual ending account balance or expenses you paid for the period. You may use this information to compare the ongoing costs of investing in the Fund and other funds. To do so, compare this 5% hypothetical example with the 5% hypothetical examples that appear in the shareholder reports of the other funds.
The following transaction costs are not included in the expenses shown in the table and, if applicable, would increase the expenses that you paid over the period: (1) a front-end sales charge (load) of 5.75% on Class A shares; (2) a 2% redemption fee if you sell or exchange shares within 180 days of purchase, with certain exceptions. The redemption fee does not apply to: (a) redemptions under an automatic withdrawal program or periodic asset reallocation plan, required minimum distributions (RMD), employer mandated distributions from a qualified plan, or redemptions under a qualified domestic relations order (QDRO); (b) redemptions to pay for expenses related to terminal illness, death, extended hospital or nursing home care, or other serious medical conditions; (c) redemptions of shares acquired through dividend or capital gains reinvestments; (d) loans from a qualified plan account; and (e) redemptions initiated by the Fund; and (3) a $10 service fee on each exchange after the first five exchanges in each calendar year.
The following ongoing costs are not included in the expenses shown in the table and, if applicable, would increase the expenses that you paid over the period: (1) a $12 low balance fee on accounts with balances of less than $250 as of September 30th of each calendar year and no investment activity (excluding reinvestment of dividends and/or capital gains) during the prior calendar year or the first nine months of the current calendar year. This fee does not apply to IRAs, qualified plan accounts, or Coverdell Education Savings Accounts; (2) a $15 annual custodial fee on IRAs, SEPs, SIMPLE IRAs, and Coverdell Education Savings Accounts; and (3) a $20 annual custodial fee on 403(b) accounts.
Please note that the expenses shown in the table are meant to highlight your ongoing costs only and do not reflect any transactional costs, such as sales charges (loads), redemption fees, or exchange fees. Therefore, the second line of the table is useful in comparing ongoing costs only, and will not help you determine the relative total costs of owning different funds. In addition, if these transactional costs were included, your costs would have been higher.
| Beginning Account Value 07/01/13 | Ending Account Value 12/31/13 | Expense Paid During Period 07/01/13 – 12/31/13 | |||||||||||||
Small Cap Value Class A | |||||||||||||||
Actual | $ | 1,000.00 | $ | 1,234.40 | $ | 13.01 | |||||||||
Hypothetical (5% return before expense) | $ | 1,000.00 | $ | 1,013.56 | $ | 11.72 | |||||||||
Small Cap Value Class C | |||||||||||||||
Actual | $ | 1,000.00 | $ | 1,229.80 | $ | 17.31 | |||||||||
Hypothetical (5% return before expense) | $ | 1,000.00 | $ | 1,009.68 | $ | 15.60 | |||||||||
Small Cap Value Class I | |||||||||||||||
Actual | $ | 1,000.00 | $ | 1,234.60 | $ | 11.60 | |||||||||
Hypothetical (5% return before expense) | $ | 1,000.00 | $ | 1,014.82 | $ | 10.46 | |||||||||
3 Expenses are equal to the Fund's annualized expense ratio of 2.31% for Class A shares, 3.08% for Class C shares and 2.06% for Class I shares, multiplied by the average account value over the period, multiplied by 184/365 days to reflect the one-half year period.
38

Pacific Advisors Fund Inc.
Financial Statements
39
Pacific Advisors Government Securities Fund
Schedule of Investments
as of December 31, 2013
| Quantity or Principal | Description | Current $ Value** | % of Total Net Assets | ||||||||||||
COMMON STOCK | |||||||||||||||
CONSUMER DISCRETIONARY | 1.38 | ||||||||||||||
HOTELS, RESTAURANTS & LEISURE | |||||||||||||||
300 | MCDONALD'S CORP. | 29,109 | |||||||||||||
29,109 | 1.38 | ||||||||||||||
CONSUMER STAPLES | 4.32 | ||||||||||||||
FOOD & STAPLES RETAILING | |||||||||||||||
750 | SAFEWAY INC. | 24,428 | |||||||||||||
24,428 | 1.16 | ||||||||||||||
FOOD PRODUCTS | |||||||||||||||
500 | GENERAL MILLS INC. | 24,955 | |||||||||||||
500 | UNILEVER PLC | 20,600 | |||||||||||||
45,555 | 2.16 | ||||||||||||||
HOUSEHOLD PRODUCTS | |||||||||||||||
200 | KIMBERLY-CLARK CORP. | 20,892 | |||||||||||||
20,892 | 1.00 | ||||||||||||||
ENERGY | 1.48 | ||||||||||||||
OIL, GAS & CONSUMABLE FUELS | |||||||||||||||
250 | CHEVRON CORP. | 31,226 | |||||||||||||
31,226 | 1.48 | ||||||||||||||
HEALTH CARE | 1.60 | ||||||||||||||
PHARMACEUTICALS | |||||||||||||||
300 | ELI LILLY & CO. | 15,300 | |||||||||||||
200 | JOHNSON & JOHNSON | 18,318 | |||||||||||||
33,618 | 1.60 | ||||||||||||||
INDUSTRIALS | 0.83 | ||||||||||||||
INDUSTRIAL CONGLOMERATES | |||||||||||||||
125 | 3M COMPANY | 17,531 | |||||||||||||
17,531 | 0.83 | ||||||||||||||
INFORMATION TECHNOLOGY | 1.51 | ||||||||||||||
SOFTWARE | |||||||||||||||
850 | MICROSOFT CORP. | 31,815 | |||||||||||||
31,815 | 1.51 | ||||||||||||||
TELECOMMUNICATION SERVICES | 1.67 | ||||||||||||||
DIVERSIFIED TELECOM. SERVICES | |||||||||||||||
1,000 | AT&T INC. | 35,160 | |||||||||||||
35,160 | 1.67 | ||||||||||||||
See Accompanying Notes to Financial Statements which are an integral part of these financial statements.
40
Pacific Advisors Government Securities Fund
Schedule of Investments
as of December 31, 2013
| Quantity or Principal | Description | Current $ Value** | % of Total Net Assets | ||||||||||||
COMMON STOCK continued | |||||||||||||||
UTILITIES | 4.01 | ||||||||||||||
ELECTRIC UTILITIES | |||||||||||||||
1,000 | PPL CORP. | 30,090 | |||||||||||||
650 | SOUTHERN CO. | 26,722 | |||||||||||||
56,812 | 2.70 | ||||||||||||||
MULTI-UTILITIES | |||||||||||||||
500 | CONSOLIDATED EDISON INC. | 27,640 | |||||||||||||
27,640 | 1.31 | ||||||||||||||
| TOTAL COMMON STOCK (Cost: $256,130) | 353,786 | 16.80 | |||||||||||||
US GOVT SECURITIES | |||||||||||||||
US GOVERNMENT AGENCY | 76.29 | ||||||||||||||
US GOVERNMENT AGENCY | |||||||||||||||
400,000 | FEDERAL HOME LOAN MTG CORP. 2.25% 01/23/17 | 400,488 | |||||||||||||
100,000 | FEDERAL HOME LOAN BANK 1.375% 05/28/14 | 100,505 | |||||||||||||
100,000 | FEDERAL HOME LOAN BANK 0.19% 06/26/14 | 100,021 | |||||||||||||
100,000 | FEDERAL HOME LOAN BANK 3.25% 09/12/14 | 102,141 | |||||||||||||
100,000 | FEDERAL HOME LOAN BANK 0.65% 04/30/15 | 100,157 | |||||||||||||
100,000 | FEDERAL HOME LOAN BANK 0.41% 12/21/15 | 99,900 | |||||||||||||
100,000 | FEDERAL HOME LOAN BANK 0.375% 12/27/18 STEP | 99,973 | |||||||||||||
400,000 | FEDERAL HOME LOAN BANK 2.05% 02/18/21 STEP | 403,292 | |||||||||||||
200,000 | FEDERAL NATL MTG ASSOC. 0.625% 02/26/16 | 200,128 | |||||||||||||
1,606,605 | 76.29 | ||||||||||||||
US TREASURY BILL | 4.75 | ||||||||||||||
US TREASURY BILL | |||||||||||||||
100,000 | US TREASURY BILL 01/09/14 | 100,000 | |||||||||||||
100,000 | 4.75 | ||||||||||||||
| TOTAL US GOVT SECURITIES (Cost: $1,706,689) | 1,706,605 | 81.04 | |||||||||||||
SHORT TERM INVESTMENTS | |||||||||||||||
MONEY MARKET | 1.93 | ||||||||||||||
40,618 | UMB MONEY MARKET FIDUCIARY | 40,618 | |||||||||||||
40,618 | 1.93 | ||||||||||||||
| TOTAL SHORT TERM INVESTMENTS (Cost: $40,618) | 40,618 | 1.93 | |||||||||||||
TOTAL INVESTMENT IN SECURITITIES (Cost: $2,003,436) | 2,101,009 | 99.77 | |||||||||||||
OTHER ASSETS LESS LIABILITIES | 4,846 | 0.23 | |||||||||||||
TOTAL NET ASSETS | 2,105,855 | 100.00 | |||||||||||||
* Non-income producing
** The principal amount is stated in U.S. dollars unless otherwise indicated.
See Accompanying Notes to Financial Statements which are an integral part of these financial statements.
41
Pacific Advisors Income and Equity Fund
Schedule of Investments
as of December 31, 2013
| Quantity or Principal | Description | Current $ Value** | % of Total Net Assets | ||||||||||||
COMMON STOCK | |||||||||||||||
CONSUMER DISCRETIONARY | 5.66 | ||||||||||||||
DISTRIBUTORS | |||||||||||||||
1,750 | GENUINE PARTS CO. | 145,583 | |||||||||||||
145,583 | 1.27 | ||||||||||||||
HOTELS, RESTAURANTS & LEISURE | |||||||||||||||
1,650 | MCDONALD'S CORP. | 160,099 | |||||||||||||
160,099 | 1.39 | ||||||||||||||
LEISURE EQUIPMENT & PRODUCTS | |||||||||||||||
3,500 | MATTEL INC. | 166,530 | |||||||||||||
166,530 | 1.45 | ||||||||||||||
MEDIA | |||||||||||||||
2,400 | OMNICOM GROUP INC. | 178,488 | |||||||||||||
178,488 | 1.55 | ||||||||||||||
CONSUMER STAPLES | 8.47 | ||||||||||||||
BEVERAGES | |||||||||||||||
4,000 | COCA-COLA CO. | 165,240 | |||||||||||||
165,240 | 1.44 | ||||||||||||||
FOOD & STAPLES RETAILING | |||||||||||||||
2,600 | CVS CAREMARK CORP. | 186,082 | |||||||||||||
3,750 | KROGER CO. | 148,237 | |||||||||||||
4,000 | SYSCO CORP. | 144,400 | |||||||||||||
2,200 | WAL-MART STORES INC. | 173,118 | |||||||||||||
651,837 | 5.68 | ||||||||||||||
HOUSEHOLD PRODUCTS | |||||||||||||||
1,900 | PROCTER & GAMBLE CO. | 154,679 | |||||||||||||
154,679 | 1.35 | ||||||||||||||
ENERGY | 3.11 | ||||||||||||||
ENERGY EQUIPMENT & SERVICES | |||||||||||||||
2,000 | SCHLUMBERGER LTD | 180,220 | |||||||||||||
180,220 | 1.57 | ||||||||||||||
OIL, GAS & CONSUMABLE FUELS | |||||||||||||||
2,500 | CONOCOPHILLIPS | 176,625 | |||||||||||||
176,625 | 1.54 | ||||||||||||||
FINANCIALS | 1.06 | ||||||||||||||
COMMERCIAL BANKS | |||||||||||||||
1,500 | WELLS FARGO & CO. | 68,100 | |||||||||||||
68,100 | 0.59 | ||||||||||||||
See Accompanying Notes to Financial Statements which are an integral part of these financial statements.
42
Pacific Advisors Income and Equity Fund
Schedule of Investments
as of December 31, 2013
| Quantity or Principal | Description | Current $ Value** | % of Total Net Assets | ||||||||||||
COMMON STOCK continued | |||||||||||||||
INSURANCE | |||||||||||||||
1,000 | METLIFE INC. | 53,920 | |||||||||||||
53,920 | 0.47 | ||||||||||||||
HEALTH CARE | 4.67 | ||||||||||||||
PHARMACEUTICALS | |||||||||||||||
3,500 | ABBVIE INC. | 184,835 | |||||||||||||
2,000 | JOHNSON & JOHNSON | 183,180 | |||||||||||||
5,500 | PFIZER INC. | 168,465 | |||||||||||||
536,480 | 4.67 | ||||||||||||||
INDUSTRIALS | 5.35 | ||||||||||||||
AEROSPACE & DEFENSE | |||||||||||||||
1,750 | HONEYWELL INT'L INC. | 159,898 | |||||||||||||
159,898 | 1.39 | ||||||||||||||
AIR FREIGHT & LOGISTICS | |||||||||||||||
750 | UNITED PARCEL SERVICE INC. B | 78,810 | |||||||||||||
78,810 | 0.69 | ||||||||||||||
COMMERCIAL SERVICES & SUPPLIES | |||||||||||||||
4,000 | WASTE MANAGEMENT INC. | 179,480 | |||||||||||||
179,480 | 1.56 | ||||||||||||||
INDUSTRIAL CONGLOMERATES | |||||||||||||||
7,000 | GENERAL ELECTRIC CO. | 196,210 | |||||||||||||
196,210 | 1.71 | ||||||||||||||
INFORMATION TECHNOLOGY | 4.50 | ||||||||||||||
COMMUNICATIONS EQUIPMENT | |||||||||||||||
7,000 | CISCO SYSTEMS INC. | 157,150 | |||||||||||||
157,150 | 1.37 | ||||||||||||||
SEMICONDUCTORS & EQUIPMENT | |||||||||||||||
7,000 | INTEL CORP. | 181,720 | |||||||||||||
181,720 | 1.58 | ||||||||||||||
SOFTWARE | |||||||||||||||
4,750 | MICROSOFT CORP. | 177,793 | |||||||||||||
177,793 | 1.55 | ||||||||||||||
MATERIALS | 1.70 | ||||||||||||||
CHEMICALS | |||||||||||||||
3,000 | DUPONT DE NEMOURS & CO. | 194,910 | |||||||||||||
194,910 | 1.70 | ||||||||||||||
See Accompanying Notes to Financial Statements which are an integral part of these financial statements.
43
Pacific Advisors Income and Equity Fund
Schedule of Investments
as of December 31, 2013
| Quantity or Principal | Description | Current $ Value** | % of Total Net Assets | ||||||||||||
COMMON STOCK continued | |||||||||||||||
TELECOMMUNICATION SERVICES | 4.89 | ||||||||||||||
DIVERSIFIED TELECOM. SERVICES | |||||||||||||||
5,500 | AT&T INC. | 193,380 | |||||||||||||
3,500 | VERIZON COMMUNICATIONS INC. | 171,990 | |||||||||||||
365,370 | 3.18 | ||||||||||||||
WIRELESS TELECOM. SERVICES | |||||||||||||||
5,000 | VODAFONE GROUP PLC | 196,550 | |||||||||||||
196,550 | 1.71 | ||||||||||||||
UTILITIES | 5.49 | ||||||||||||||
ELECTRIC UTILITIES | |||||||||||||||
2,500 | DUKE ENERGY CORP. | 172,525 | |||||||||||||
172,525 | 1.50 | ||||||||||||||
MULTI-UTILITIES | |||||||||||||||
2,500 | DOMINION RESOURCES INC. | 161,725 | |||||||||||||
4,000 | PUBLIC SERVICE ENTERPRISE GROUP INC. | 128,160 | |||||||||||||
6,000 | XCEL ENERGY INC. | 167,640 | |||||||||||||
457,525 | 3.99 | ||||||||||||||
TOTAL COMMON STOCK (Cost: $3,833,461) | 5,155,742 | 44.90 | |||||||||||||
CORPORATE BOND | |||||||||||||||
CONSUMER DISCRETIONARY | 5.79 | ||||||||||||||
HOTELS, RESTAURANTS & LEISURE | |||||||||||||||
100,000 | DARDEN RESTAURANTS INC. 6.20% 10/15/17 | 111,412 | |||||||||||||
100,000 | INTL GAME TECHNOLOGY 7.50% 06/15/19 | 116,367 | |||||||||||||
100,000 | WYNDHAM WORLDWIDE 2.95% 03/01/17 | 101,425 | |||||||||||||
100,000 | WYNN LAS VEGAS LLC 7.75% 08/15/20 | 112,250 | |||||||||||||
441,453 | 3.85 | ||||||||||||||
HOUSEHOLD DURABLES | |||||||||||||||
100,000 | MDC HOLDINGS INC. 5.375% 12/15/14 | 103,819 | |||||||||||||
103,819 | 0.90 | ||||||||||||||
MEDIA | |||||||||||||||
100,000 | TIME WARNER CABLE INC. 8.75% 02/14/19 | 119,284 | |||||||||||||
119,284 | 1.04 | ||||||||||||||
ENERGY | 2.89 | ||||||||||||||
ENERGY EQUIPMENT & SERVICES | |||||||||||||||
100,000 | SESI LLC 6.375% 05/01/19 | 106,750 | |||||||||||||
100,000 | WEATHERFORD BERMUDA 6.00% 03/15/18 | 112,229 | |||||||||||||
218,979 | 1.91 | ||||||||||||||
See Accompanying Notes to Financial Statements which are an integral part of these financial statements.
44
Pacific Advisors Income and Equity Fund
Schedule of Investments
as of December 31, 2013
| Quantity or Principal | Description | Current $ Value** | % of Total Net Assets | ||||||||||||
CORPORATE BOND continued | |||||||||||||||
OIL, GAS & CONSUMABLE FUELS | |||||||||||||||
100,000 | CONTINENTAL RESOURCES 7.375% 10/01/20 | 112,500 | |||||||||||||
112,500 | 0.98 | ||||||||||||||
FINANCIALS | 14.44 | ||||||||||||||
CAPITAL MARKETS | |||||||||||||||
95,000 | GOLDMAN SACHS GROUP INC. 5.00% 10/01/14 | 98,020 | |||||||||||||
100,000 | GOLDMAN SACHS GROUP INC. 08/26/20 FLOAT | 98,444 | |||||||||||||
100,000 | JANUS CAPITAL GROUP INC. 6.70% 06/15/17 | 111,358 | |||||||||||||
100,000 | JEFFERIES GROUP INC. 5.125% 04/13/18 | 108,125 | |||||||||||||
100,000 | MORGAN STANLEY 09/30/17 FLOAT | 103,940 | |||||||||||||
519,887 | 4.53 | ||||||||||||||
DIVERSIFIED FINANCIAL SERVICES | |||||||||||||||
100,000 | BANK OF AMERICA 09/28/20 FIX-FLOAT | 97,888 | |||||||||||||
100,000 | ICAHN ENTERPRISES 7.75% 01/15/16 | 102,000 | |||||||||||||
100,000 | JPMORGAN CHASE & CO. 09/01/15 FLOAT | 100,229 | |||||||||||||
100,000 | LEUCADIA NATIONAL CORP. 8.125% 09/15/15 | 111,000 | |||||||||||||
100,000 | NASDAQ OMX GROUP 5.25% 01/16/18 | 108,230 | |||||||||||||
519,348 | 4.52 | ||||||||||||||
INSURANCE | |||||||||||||||
100,000 | AMERICAN INT'L GROUP 4.25% 09/15/14 | 102,500 | |||||||||||||
115,000 | GENWORTH FINANCIAL INC. 8.625% 12/15/16 | 136,555 | |||||||||||||
100,000 | PRUDENTIAL FINANCIAL INC. 11/02/20 FLOAT | 103,771 | |||||||||||||
342,826 | 2.99 | ||||||||||||||
REAL ESTATE INVESTMENT TRUSTS | |||||||||||||||
50,000 | HOSPITALITY PROPERTIES TRUST 7.875% 08/15/14 | 50,406 | |||||||||||||
105,000 | HOSPITALITY PROPERTIES TRUST 6.70% 01/15/18 | 117,796 | |||||||||||||
100,000 | HRPT PROPERTIES 6.25% 08/15/16 | 106,476 | |||||||||||||
274,678 | 2.39 | ||||||||||||||
HEALTH CARE | 2.96 | ||||||||||||||
HEALTH CARE PROVIDERS & SERVICES | |||||||||||||||
100,000 | SENIOR HOUSING PROP TRUST 4.30% 01/15/16 | 104,165 | |||||||||||||
104,165 | 0.91 | ||||||||||||||
PHARMACEUTICALS | |||||||||||||||
110,000 | HOSPIRA INC. 6.05% 03/30/17 | 121,373 | |||||||||||||
105,000 | WARNER CHILCOTT CO LLC 7.75% 09/15/18 | 113,663 | |||||||||||||
235,035 | 2.05 | ||||||||||||||
See Accompanying Notes to Financial Statements which are an integral part of these financial statements.
45
Pacific Advisors Income and Equity Fund
Schedule of Investments
as of December 31, 2013
| Quantity or Principal | Description | Current $ Value** | % of Total Net Assets | ||||||||||||
CORPORATE BOND continued | |||||||||||||||
INDUSTRIALS | 7.44 | ||||||||||||||
AIRLINES | |||||||||||||||
50,000 | SOUTHWEST AIRLINES CO. 5.25% 10/01/14 | 51,597 | |||||||||||||
51,597 | 0.45 | ||||||||||||||
BUILDING PRODUCTS | |||||||||||||||
104,000 | MASCO CORP. 4.80% 06/15/15 | 108,420 | |||||||||||||
115,000 | OWENS CORNING INC. 9.00% 06/15/19 | 141,976 | |||||||||||||
250,396 | 2.18 | ||||||||||||||
MACHINERY | |||||||||||||||
100,000 | CNH AMERICA LLC 7.25% 01/15/16 | 110,250 | |||||||||||||
100,000 | HARSCO CORP. 5.75% 05/15/18 | 104,956 | |||||||||||||
115,000 | JOY GLOBAL INC. 6.00% 11/15/16 | 127,193 | |||||||||||||
342,398 | 2.98 | ||||||||||||||
TRADING COMPANIES & DISTRIBUTORS | |||||||||||||||
100,000 | AIR LEASE CORP. 5.625% 04/01/17 | 110,125 | |||||||||||||
100,000 | INTL LEASE FINANCE CORP. 06/15/16 FLOAT | 100,500 | |||||||||||||
210,625 | 1.83 | ||||||||||||||
INFORMATION TECHNOLOGY | 3.70 | ||||||||||||||
COMPUTERS & PERIPHERALS | |||||||||||||||
80,000 | LEXMARK INT'L INC. 6.65% 06/01/18 | 89,396 | |||||||||||||
89,396 | 0.78 | ||||||||||||||
ELECTRONIC EQUIPMENT & INSTRUMENTS | |||||||||||||||
102,000 | ARROW ELECTRONICS INC. 6.875% 06/01/18 | 115,570 | |||||||||||||
100,000 | INGRAM MICRO INC. 5.25% 09/01/17 | 106,185 | |||||||||||||
100,000 | JABIL CIRCUIT INC. 7.75% 07/15/16 | 113,750 | |||||||||||||
335,506 | 2.92 | ||||||||||||||
MATERIALS | 7.86 | ||||||||||||||
CHEMICALS | |||||||||||||||
75,000 | NOVA CHEMICALS CORP. 8.625% 11/01/19 | 82,594 | |||||||||||||
82,594 | 0.72 | ||||||||||||||
CONTAINERS & PACKAGING | |||||||||||||||
100,000 | BALL CORP. 7.375% 09/01/19 | 108,000 | |||||||||||||
108,000 | 0.94 | ||||||||||||||
METALS & MINING | |||||||||||||||
100,000 | ALCOA INC. 5.55% 02/01/17 | 107,636 | |||||||||||||
100,000 | COMMERCIAL METALS CO. 7.35% 08/15/18 | 114,000 | |||||||||||||
100,000 | PETROHAWK ENERGY CORP. 7.25% 08/15/18 | 107,800 | |||||||||||||
See Accompanying Notes to Financial Statements which are an integral part of these financial statements.
46
Pacific Advisors Income and Equity Fund
Schedule of Investments
as of December 31, 2013
| Quantity or Principal | Description | Current $ Value** | % of Total Net Assets | ||||||||||||
CORPORATE BOND continued | |||||||||||||||
METALS & MINING continued | |||||||||||||||
100,000 | PLAINS EXPLORATION & PRO 7.625% 04/01/20 | 110,362 | |||||||||||||
150,000 | RELIANCE STEEL & ALUMINUM 6.20% 11/15/16 | 164,320 | |||||||||||||
604,118 | 5.26 | ||||||||||||||
PAPER & FOREST PRODUCTS | |||||||||||||||
100,000 | DOMTAR CORP. 7.125% 08/15/15 | 108,220 | |||||||||||||
108,220 | 0.94 | ||||||||||||||
TELECOMMUNICATION SERVICES | 0.99 | ||||||||||||||
DIVERSIFIED TELECOM. SERVICES | |||||||||||||||
108,497 | BELLSOUTH TELECOM. 6.30% 12/15/15 | 113,755 | |||||||||||||
113,755 | 0.99 | ||||||||||||||
UTILITIES | 2.33 | ||||||||||||||
ELECTRIC UTILITIES | |||||||||||||||
49,000 | CLEVELAND ELECTRIC ILLUMINATING 5.70% 04/01/17 | 53,081 | |||||||||||||
100,000 | PPL ENERGY SUPPLY LLC 6.50% 05/01/18 | 111,240 | |||||||||||||
164,320 | 1.43 | ||||||||||||||
MULTI-UTILITIES | |||||||||||||||
100,000 | OGE ENERGY CORP. 5.00% 11/15/14 | 103,596 | |||||||||||||
103,596 | 0.90 | ||||||||||||||
TOTAL CORPORATE BOND (Cost: $5,462,785) | 5,556,495 | 48.40 | |||||||||||||
PREFERRED STOCK | |||||||||||||||
FINANCIALS | 0.65 | ||||||||||||||
INSURANCE | |||||||||||||||
3,000 | METLIFE INC. 6.50% PFD | 74,700 | |||||||||||||
74,700 | 0.65 | ||||||||||||||
TOTAL PREFERRED STOCK (Cost: $75,000) | 74,700 | 0.65 | |||||||||||||
SHORT TERM INVESTMENTS | |||||||||||||||
MONEY MARKET | 5.11 | ||||||||||||||
586,434 | UMB MONEY MARKET FIDUCIARY | 586,434 | |||||||||||||
586,434 | 5.11 | ||||||||||||||
TOTAL SHORT TERM INVESTMENTS (Cost: $586,434) | 586,434 | 5.11 | |||||||||||||
TOTAL INVESTMENT IN SECURITITIES (Cost: $9,957,680) | 11,373,371 | 99.06 | |||||||||||||
OTHER ASSETS LESS LIABILITIES | 107,572 | 0.94 | |||||||||||||
TOTAL NET ASSETS | 11,480,943 | 100.00 | |||||||||||||
* Non-income producing
** The principal amount is stated in U.S. dollars unless otherwise indicated.
See Accompanying Notes to Financial Statements which are an integral part of these financial statements.
47
Pacific Advisors Balanced Fund
Schedule of Investments
as of December 31, 2013
| Quantity or Principal | Description | Current $ Value** | % of Total Net Assets | ||||||||||||
COMMON STOCK | |||||||||||||||
CONSUMER DISCRETIONARY | 8.68 | ||||||||||||||
MEDIA | |||||||||||||||
3,000 | WALT DISNEY CO. | 229,200 | |||||||||||||
229,200 | 2.16 | ||||||||||||||
SPECIALTY RETAIL | |||||||||||||||
3,900 | CONN'S INC.* | 307,281 | |||||||||||||
1,250 | O'REILLY AUTOMOTIVE INC.* | 160,888 | |||||||||||||
468,169 | 4.41 | ||||||||||||||
TEXTILES, APPAREL & LUXURY GOODS | |||||||||||||||
1,650 | PVH CORP. | 224,433 | |||||||||||||
224,433 | 2.11 | ||||||||||||||
CONSUMER STAPLES | 4.60 | ||||||||||||||
FOOD & STAPLES RETAILING | |||||||||||||||
3,250 | CVS CAREMARK CORP. | 232,603 | |||||||||||||
3,250 | WAL-MART STORES INC. | 255,742 | |||||||||||||
488,345 | 4.60 | ||||||||||||||
ENERGY | 12.54 | ||||||||||||||
ENERGY EQUIPMENT & SERVICES | |||||||||||||||
5,000 | HALLIBURTON CO. | 253,750 | |||||||||||||
10,000 | HELIX ENERGY SOLUTIONS GROUP INC.* | 231,800 | |||||||||||||
4,250 | HORNBECK OFFSHORE SERVICES INC.* | 209,227 | |||||||||||||
3,100 | NATIONAL OILWELL VARCO INC. | 246,543 | |||||||||||||
1,500 | OIL STATES INT'L INC.* | 152,580 | |||||||||||||
4,000 | TIDEWATER INC. | 237,080 | |||||||||||||
1,330,980 | 12.54 | ||||||||||||||
FINANCIALS | 6.99 | ||||||||||||||
COMMERCIAL BANKS | |||||||||||||||
7,250 | EAST WEST BANCORP INC. | 253,533 | |||||||||||||
253,533 | 2.39 | ||||||||||||||
CONSUMER FINANCE | |||||||||||||||
2,900 | AMERICAN EXPRESS CO. | 263,117 | |||||||||||||
263,117 | 2.48 | ||||||||||||||
DIVERSIFIED FINANCIAL SERVICES | |||||||||||||||
3,850 | JPMORGAN CHASE & CO. | 225,148 | |||||||||||||
225,148 | 2.12 | ||||||||||||||
See Accompanying Notes to Financial Statements which are an integral part of these financial statements.
48
Pacific Advisors Balanced Fund
Schedule of Investments
as of December 31, 2013
| Quantity or Principal | Description | Current $ Value** | % of Total Net Assets | ||||||||||||
COMMON STOCK continued | |||||||||||||||
INDUSTRIALS | 32.32 | ||||||||||||||
AIR FREIGHT & LOGISTICS | |||||||||||||||
2,000 | UNITED PARCEL SERVICE INC. B | 210,160 | |||||||||||||
210,160 | 1.98 | ||||||||||||||
COMMERCIAL SERVICES & SUPPLIES | |||||||||||||||
3,000 | TEAM INC.* | 127,020 | |||||||||||||
127,020 | 1.20 | ||||||||||||||
CONSTRUCTION & ENGINEERING | |||||||||||||||
3,650 | CHICAGO BRIDGE & IRON CO. N.V. | 303,461 | |||||||||||||
303,461 | 2.86 | ||||||||||||||
INDUSTRIAL CONGLOMERATES | |||||||||||||||
9,250 | GENERAL ELECTRIC CO. | 259,278 | |||||||||||||
259,278 | 2.44 | ||||||||||||||
MACHINERY | |||||||||||||||
1,800 | CUMMINS INC. | 253,746 | |||||||||||||
7,000 | NAVISTAR INT'L CORP.* | 267,330 | |||||||||||||
3,250 | WABTEC CORP. | 241,377 | |||||||||||||
762,453 | 7.18 | ||||||||||||||
MARINE | |||||||||||||||
2,750 | KIRBY CORP.* | 272,938 | |||||||||||||
272,938 | 2.57 | ||||||||||||||
ROAD & RAIL | |||||||||||||||
8,500 | CSX CORP. | 244,545 | |||||||||||||
2,500 | GENESEE & WYOMING INC.* | 240,125 | |||||||||||||
1,750 | KANSAS CITY SOUTHERN | 216,702 | |||||||||||||
701,372 | 6.61 | ||||||||||||||
TRADING COMPANIES & DISTRIBUTORS | |||||||||||||||
2,400 | DXP ENTERPRISES INC.* | 276,480 | |||||||||||||
8,500 | MRC GLOBAL INC.* | 274,210 | |||||||||||||
4,250 | TAL INT'L GROUP INC. | 243,737 | |||||||||||||
794,427 | 7.48 | ||||||||||||||
INFORMATION TECHNOLOGY | 6.08 | ||||||||||||||
COMMUNICATIONS EQUIPMENT | |||||||||||||||
3,400 | QUALCOMM INC. | 252,450 | |||||||||||||
252,450 | 2.38 | ||||||||||||||
COMPUTERS & PERIPHERALS | |||||||||||||||
1,000 | INT'L BUSINESS MACHINES CORP. | 187,570 | |||||||||||||
187,570 | 1.76 | ||||||||||||||
See Accompanying Notes to Financial Statements which are an integral part of these financial statements.
49
Pacific Advisors Balanced Fund
Schedule of Investments
as of December 31, 2013
| Quantity or Principal | Description | Current $ Value** | % of Total Net Assets | ||||||||||||
COMMON STOCK continued | |||||||||||||||
SOFTWARE | |||||||||||||||
5,500 | MICROSOFT CORP. | 205,865 | |||||||||||||
205,865 | 1.94 | ||||||||||||||
TOTAL COMMON STOCK (Cost: $4,673,107) | 7,559,919 | 71.21 | |||||||||||||
CORPORATE BOND | |||||||||||||||
CONSUMER DISCRETIONARY | 3.12 | ||||||||||||||
AUTO COMPONENTS | |||||||||||||||
88,000 | LEAR CORP. 7.875% 03/15/18 | 92,180 | |||||||||||||
92,180 | 0.87 | ||||||||||||||
MEDIA | |||||||||||||||
110,000 | TIME WARNER CABLE INC. 5.85% 05/01/17 | 119,977 | |||||||||||||
100,000 | WASHINGTON POST CO. 7.25% 02/01/19 | 118,807 | |||||||||||||
238,784 | 2.25 | ||||||||||||||
ENERGY | 3.62 | ||||||||||||||
ENERGY EQUIPMENT & SERVICES | |||||||||||||||
100,000 | SESI LLC 6.375% 05/01/19 | 106,750 | |||||||||||||
106,750 | 1.01 | ||||||||||||||
OIL, GAS & CONSUMABLE FUELS | |||||||||||||||
150,000 | PEABODY ENERGY CORP. 7.375% 11/01/16 | 168,750 | |||||||||||||
100,000 | TESORO CORP. 9.75% 06/01/19 | 108,250 | |||||||||||||
277,000 | 2.61 | ||||||||||||||
FINANCIALS | 11.82 | ||||||||||||||
CAPITAL MARKETS | |||||||||||||||
100,000 | JEFFERIES GROUP INC. 5.50% 03/15/16 | 108,000 | |||||||||||||
161,000 | MORGAN STANLEY 07/01/14 FLOAT | 160,837 | |||||||||||||
268,837 | 2.53 | ||||||||||||||
CONSUMER FINANCE | |||||||||||||||
150,000 | FORD MOTOR CREDIT CO. 7.00% 04/15/15 | 161,455 | |||||||||||||
161,455 | 1.52 | ||||||||||||||
DIVERSIFIED FINANCIAL SERVICES | |||||||||||||||
100,000 | BANK OF AMERICA 07/28/17 FLOAT | 100,884 | |||||||||||||
100,000 | ICAHN ENTERPRISES 8.00% 01/15/18 | 104,000 | |||||||||||||
100,000 | LEUCADIA NATIONAL CORP. 8.125% 09/15/15 | 111,000 | |||||||||||||
150,000 | NASDAQ OMX GROUP 5.25% 01/16/18 | 162,346 | |||||||||||||
478,230 | 4.50 | ||||||||||||||
See Accompanying Notes to Financial Statements which are an integral part of these financial statements.
50
Pacific Advisors Balanced Fund
Schedule of Investments
as of December 31, 2013
| Quantity or Principal | Description | Current $ Value** | % of Total Net Assets | ||||||||||||
CORPORATE BOND continued | |||||||||||||||
INSURANCE | |||||||||||||||
100,000 | HARTFORD LIFE GLOBAL FUND 06/16/14 FLOAT | 99,987 | |||||||||||||
99,987 | 0.94 | ||||||||||||||
REAL ESTATE INVESTMENT TRUSTS | |||||||||||||||
140,000 | HEALTH CARE REIT INC. 3.625% 03/15/16 | 146,678 | |||||||||||||
100,000 | HOSPITALITY PROPERTIES TRUST 7.875% 08/15/14 | 100,812 | |||||||||||||
247,490 | 2.33 | ||||||||||||||
HEALTH CARE | 1.07 | ||||||||||||||
HEALTH CARE PROVIDERS & SERVICES | |||||||||||||||
100,000 | FRESENIUS MED CARE US 6.875% 07/15/17 | 113,500 | |||||||||||||
113,500 | 1.07 | ||||||||||||||
INDUSTRIALS | 2.17 | ||||||||||||||
MACHINERY | |||||||||||||||
100,000 | CASE NEW HOLLAND INC. 7.875% 12/01/17 | 118,000 | |||||||||||||
118,000 | 1.12 | ||||||||||||||
TRADING COMPANIES & DISTRIBUTORS | |||||||||||||||
95,000 | INTL LEASE FINANCE CORP. 8.75% 03/15/17 | 111,863 | |||||||||||||
111,863 | 1.05 | ||||||||||||||
INFORMATION TECHNOLOGY | 2.67 | ||||||||||||||
COMPUTERS & PERIPHERALS | |||||||||||||||
150,000 | SEAGATE TECHNOLOGY 6.80% 10/01/16 | 169,500 | |||||||||||||
169,500 | 1.60 | ||||||||||||||
ELECTRONIC EQUIPMENT & INSTRUMENTS | |||||||||||||||
100,000 | JABIL CIRCUIT INC. 7.75% 07/15/16 | 113,750 | |||||||||||||
113,750 | 1.07 | ||||||||||||||
MATERIALS | 4.14 | ||||||||||||||
CHEMICALS | |||||||||||||||
105,000 | ALBEMARLE CORP. 5.10% 02/01/15 | 109,563 | |||||||||||||
109,563 | 1.03 | ||||||||||||||
CONTAINERS & PACKAGING | |||||||||||||||
100,000 | BALL CORP. 7.375% 09/01/19 | 108,000 | |||||||||||||
108,000 | 1.02 | ||||||||||||||
See Accompanying Notes to Financial Statements which are an integral part of these financial statements.
51
Pacific Advisors Balanced Fund
Schedule of Investments
as of December 31, 2013
| Quantity or Principal | Description | Current $ Value** | % of Total Net Assets | ||||||||||||
CORPORATE BOND continued | |||||||||||||||
METALS & MINING | |||||||||||||||
100,000 | COMMERCIAL METALS CO. 7.35% 08/15/18 | 114,000 | |||||||||||||
100,000 | PETROHAWK ENERGY CORP. 7.25% 08/15/18 | 107,800 | |||||||||||||
221,800 | 2.09 | ||||||||||||||
TOTAL CORPORATE BOND (Cost: $2,953,515) | 3,036,689 | 28.61 | |||||||||||||
TOTAL INVESTMENT IN SECURITITIES (Cost: $7,626,622) | 10,596,608 | 99.82 | |||||||||||||
OTHER ASSETS LESS LIABILITIES | 19,218 | 0.18 | |||||||||||||
TOTAL NET ASSETS | 10,615,826 | 100.00 | |||||||||||||
* Non-income producing
** The principal amount is stated in U.S. dollars unless otherwise indicated.
See Accompanying Notes to Financial Statements which are an integral part of these financial statements.
52
Pacific Advisors Large Cap Value Fund
Schedule of Investments
as of December 31, 2013
| Quantity or Principal | Description | Current $ Value** | % of Total Net Assets | ||||||||||||
COMMON STOCK | |||||||||||||||
CONSUMER DISCRETIONARY | 15.08 | ||||||||||||||
AUTO COMPONENTS | |||||||||||||||
1,550 | JOHNSON CONTROLS INC. | 79,515 | |||||||||||||
79,515 | 1.27 | ||||||||||||||
DIVERSIFIED CONSUMER SERVICES | |||||||||||||||
2,000 | SOTHEBY'S | 106,400 | |||||||||||||
106,400 | 1.70 | ||||||||||||||
HOTELS, RESTAURANTS & LEISURE | |||||||||||||||
2,000 | MCDONALD'S CORP. | 194,060 | |||||||||||||
194,060 | 3.10 | ||||||||||||||
MEDIA | |||||||||||||||
3,250 | TIME WARNER INC. | 226,590 | |||||||||||||
2,000 | WALT DISNEY CO. | 152,800 | |||||||||||||
379,390 | 6.05 | ||||||||||||||
SPECIALTY RETAIL | |||||||||||||||
3,750 | LOWE'S COMPANIES INC. | 185,813 | |||||||||||||
185,813 | 2.96 | ||||||||||||||
CONSUMER STAPLES | 16.81 | ||||||||||||||
BEVERAGES | |||||||||||||||
5,120 | COCA-COLA CO. | 211,507 | |||||||||||||
211,507 | 3.37 | ||||||||||||||
FOOD & STAPLES RETAILING | |||||||||||||||
5,000 | SYSCO CORP. | 180,500 | |||||||||||||
2,950 | WAL-MART STORES INC. | 232,135 | |||||||||||||
412,635 | 6.58 | ||||||||||||||
FOOD PRODUCTS | |||||||||||||||
1,140 | KRAFT FOODS GROUP INC. | 61,469 | |||||||||||||
2,700 | MONDELEZ INT'L INC. | 95,310 | |||||||||||||
156,779 | 2.50 | ||||||||||||||
HOUSEHOLD PRODUCTS | |||||||||||||||
2,500 | PROCTER & GAMBLE CO. | 203,525 | |||||||||||||
750 | THE CLOROX CO. | 69,570 | |||||||||||||
273,095 | 4.36 | ||||||||||||||
ENERGY | 3.39 | ||||||||||||||
OIL, GAS & CONSUMABLE FUELS | |||||||||||||||
2,100 | EXXON MOBIL CORP. | 212,520 | |||||||||||||
212,520 | 3.39 | ||||||||||||||
See Accompanying Notes to Financial Statements which are an integral part of these financial statements.
53
Pacific Advisors Large Cap Value Fund
Schedule of Investments
as of December 31, 2013
| Quantity or Principal | Description | Current $ Value** | % of Total Net Assets | ||||||||||||
COMMON STOCK continued | |||||||||||||||
FINANCIALS | 17.17 | ||||||||||||||
CAPITAL MARKETS | |||||||||||||||
4,000 | LEGG MASON INC. | 173,920 | |||||||||||||
173,920 | 2.77 | ||||||||||||||
COMMERCIAL BANKS | |||||||||||||||
4,225 | WELLS FARGO & CO. | 191,815 | |||||||||||||
191,815 | 3.06 | ||||||||||||||
INSURANCE | |||||||||||||||
4,000 | AMERICAN INT'L GROUP INC. | 204,200 | |||||||||||||
2,000 | BERKSHIRE HATHAWAY INC. B* | 237,120 | |||||||||||||
5,000 | METLIFE INC. | 269,600 | |||||||||||||
710,920 | 11.34 | ||||||||||||||
HEALTH CARE | 3.82 | ||||||||||||||
PHARMACEUTICALS | |||||||||||||||
2,615 | JOHNSON & JOHNSON | 239,508 | |||||||||||||
239,508 | 3.82 | ||||||||||||||
INDUSTRIALS | 21.48 | ||||||||||||||
AEROSPACE & DEFENSE | |||||||||||||||
2,000 | HONEYWELL INT'L INC. | 182,740 | |||||||||||||
182,740 | 2.91 | ||||||||||||||
AIR FREIGHT & LOGISTICS | |||||||||||||||
1,000 | FEDEX CORP. | 143,770 | |||||||||||||
1,200 | UNITED PARCEL SERVICE INC. B | 126,096 | |||||||||||||
269,866 | 4.30 | ||||||||||||||
INDUSTRIAL CONGLOMERATES | |||||||||||||||
9,750 | GENERAL ELECTRIC CO. | 273,293 | |||||||||||||
273,293 | 4.36 | ||||||||||||||
MACHINERY | |||||||||||||||
1,765 | DEERE & CO. | 161,197 | |||||||||||||
2,350 | ILLINOIS TOOL WORKS INC. | 197,588 | |||||||||||||
1,250 | SPX CORP. | 124,513 | |||||||||||||
2,500 | TIMKEN CO. | 137,675 | |||||||||||||
620,973 | 9.90 | ||||||||||||||
INFORMATION TECHNOLOGY | 21.83 | ||||||||||||||
COMPUTERS & PERIPHERALS | |||||||||||||||
470 | APPLE INC. | 263,722 | |||||||||||||
1,350 | INT'L BUSINESS MACHINES CORP. | 253,220 | |||||||||||||
516,941 | 8.25 | ||||||||||||||
See Accompanying Notes to Financial Statements which are an integral part of these financial statements.
54
Pacific Advisors Large Cap Value Fund
Schedule of Investments
as of December 31, 2013
| Quantity or Principal | Description | Current $ Value** | % of Total Net Assets | ||||||||||||
COMMON STOCK continued | |||||||||||||||
IT SERVICES | |||||||||||||||
220 | MASTERCARD INC. | 183,801 | |||||||||||||
183,801 | 2.93 | ||||||||||||||
SEMICONDUCTORS & EQUIPMENT | |||||||||||||||
5,600 | INTEL CORP. | 145,376 | |||||||||||||
145,376 | 2.32 | ||||||||||||||
SOFTWARE | |||||||||||||||
7,000 | MICROSOFT CORP. | 262,010 | |||||||||||||
262,010 | 4.18 | ||||||||||||||
SYSTEMS: SOFTWARE | |||||||||||||||
6,800 | ORACLE CORPORATION | 260,168 | |||||||||||||
260,168 | 4.15 | ||||||||||||||
TOTAL COMMON STOCK (Cost: $4,395,616) | 6,243,045 | 99.58 | |||||||||||||
TOTAL INVESTMENT IN SECURITITIES (Cost: $4,395,616) | 6,243,045 | 99.58 | |||||||||||||
OTHER ASSETS LESS LIABILITIES | 26,455 | 0.42 | |||||||||||||
TOTAL NET ASSETS | 6,269,500 | 100.00 | |||||||||||||
* Non-income producing
** The principal amount is stated in U.S. dollars unless otherwise indicated.
See Accompanying Notes to Financial Statements which are an integral part of these financial statements.
55
Pacific Advisors Mid Cap Value Fund
Schedule of Investments
as of December 31, 2013
| Quantity or Principal | Description | Current $ Value** | % of Total Net Assets | ||||||||||||
COMMON STOCK | |||||||||||||||
CONSUMER DISCRETIONARY | 24.82 | ||||||||||||||
AUTO COMPONENTS | |||||||||||||||
13,000 | DANA HOLDING CORP. | 255,060 | |||||||||||||
4,300 | LEAR CORP. | 348,171 | |||||||||||||
603,231 | 8.31 | ||||||||||||||
SPECIALTY RETAIL | |||||||||||||||
5,500 | GAMESTOP CORP. A | 270,930 | |||||||||||||
2,000 | O'REILLY AUTOMOTIVE INC.* | 257,420 | |||||||||||||
7,300 | PENSKE AUTOMOTIVE GROUP INC. | 344,268 | |||||||||||||
872,618 | 12.02 | ||||||||||||||
TEXTILES, APPAREL & LUXURY GOODS | |||||||||||||||
2,400 | PVH CORP. | 326,448 | |||||||||||||
326,448 | 4.50 | ||||||||||||||
CONSUMER STAPLES | 1.54 | ||||||||||||||
BEVERAGES | |||||||||||||||
2,300 | DR PEPPER SNAPPLE GROUP INC. | 112,056 | |||||||||||||
112,056 | 1.54 | ||||||||||||||
ENERGY | 19.03 | ||||||||||||||
ENERGY EQUIPMENT & SERVICES | |||||||||||||||
9,800 | HELIX ENERGY SOLUTIONS GROUP INC.* | 227,164 | |||||||||||||
20,000 | ION GEOPHYSICAL CORP.* | 66,000 | |||||||||||||
6,000 | MITCHAM INDUSTRIES INC.* | 106,260 | |||||||||||||
6,500 | NOBLE CORP. | 243,555 | |||||||||||||
4,700 | TIDEWATER INC. | 278,569 | |||||||||||||
921,548 | 12.69 | ||||||||||||||
OIL, GAS & CONSUMABLE FUELS | |||||||||||||||
8,500 | CHESAPEAKE ENERGY CORP. | 230,690 | |||||||||||||
14,000 | DENBURY RESOURCES INC.* | 230,020 | |||||||||||||
460,710 | 6.34 | ||||||||||||||
FINANCIALS | 2.82 | ||||||||||||||
COMMERCIAL BANKS | |||||||||||||||
7,700 | CATHAY GENERAL BANCORP | 205,821 | |||||||||||||
205,821 | 2.83 | ||||||||||||||
INDUSTRIALS | 47.03 | ||||||||||||||
AIRLINES | |||||||||||||||
6,500 | SPIRIT AIRLINES INC.* | 295,165 | |||||||||||||
295,165 | 4.06 | ||||||||||||||
See Accompanying Notes to Financial Statements which are an integral part of these financial statements.
56
Pacific Advisors Mid Cap Value Fund
Schedule of Investments
as of December 31, 2013
| Quantity or Principal | Description | Current $ Value** | % of Total Net Assets | ||||||||||||
COMMON STOCK continued | |||||||||||||||
COMMERCIAL SERVICES & SUPPLIES | |||||||||||||||
3,500 | COPART INC.* | 128,275 | |||||||||||||
128,275 | 1.77 | ||||||||||||||
CONSTRUCTION & ENGINEERING | |||||||||||||||
5,400 | CHICAGO BRIDGE & IRON CO. N.V. | 448,956 | |||||||||||||
5,600 | KBR INC. | 178,584 | |||||||||||||
627,540 | 8.64 | ||||||||||||||
MACHINERY | |||||||||||||||
1,800 | GRACO INC. | 140,616 | |||||||||||||
4,000 | JOY GLOBAL INC. | 233,960 | |||||||||||||
10,500 | NAVISTAR INT'L CORP.* | 400,995 | |||||||||||||
4,600 | WABTEC CORP. | 341,642 | |||||||||||||
1,117,213 | 15.38 | ||||||||||||||
ROAD & RAIL | |||||||||||||||
4,000 | GENESEE & WYOMING INC.* | 384,200 | |||||||||||||
2,700 | KANSAS CITY SOUTHERN | 334,341 | |||||||||||||
3,300 | LANDSTAR SYSTEM INC. | 189,585 | |||||||||||||
908,126 | 12.51 | ||||||||||||||
TRADING COMPANIES & DISTRIBUTORS | |||||||||||||||
10,500 | MRC GLOBAL INC.* | 338,730 | |||||||||||||
338,730 | 4.66 | ||||||||||||||
MATERIALS | 4.17 | ||||||||||||||
CHEMICALS | |||||||||||||||
3,000 | H.B. FULLER CO. | 156,120 | |||||||||||||
156,120 | 2.15 | ||||||||||||||
METALS & MINING | |||||||||||||||
7,200 | COMMERCIAL METALS CO. | 146,376 | |||||||||||||
146,376 | 2.02 | ||||||||||||||
TOTAL COMMON STOCK (Cost: $4,493,217) | 7,219,977 | 99.42 | |||||||||||||
TOTAL INVESTMENT IN SECURITITIES (Cost: $4,493,217) | 7,219,977 | 99.42 | |||||||||||||
OTHER ASSETS LESS LIABILITIES | 41,998 | 0.58 | |||||||||||||
TOTAL NET ASSETS | 7,261,975 | 100.00 | |||||||||||||
* Non-income producing
** The principal amount is stated in U.S. dollars unless otherwise indicated.
See Accompanying Notes to Financial Statements which are an integral part of these financial statements.
57
Pacific Advisors Small Cap Value Fund
Schedule of Investments
as of December 31, 2013
| Quantity or Principal | Description | Current $ Value** | % of Total Net Assets | ||||||||||||
COMMON STOCK | |||||||||||||||
CONSUMER DISCRETIONARY | 19.32 | ||||||||||||||
AUTO COMPONENTS | |||||||||||||||
350,000 | GENTHERM INC.* | 9,383,500 | |||||||||||||
9,383,500 | 4.38 | ||||||||||||||
HOTELS, RESTAURANTS & LEISURE | |||||||||||||||
430,000 | BRAVO BRIO RESTAURANT GROUP INC.* | 6,996,100 | |||||||||||||
6,996,100 | 3.26 | ||||||||||||||
SPECIALTY RETAIL | |||||||||||||||
156,000 | CONN'S INC.* | 12,291,240 | |||||||||||||
235,000 | RUSH ENTERPRISES INC.* | 6,967,750 | |||||||||||||
235,000 | SONIC AUTOMOTIVE INC. | 5,752,800 | |||||||||||||
25,011,790 | 11.68 | ||||||||||||||
CONSUMER STAPLES | 4.34 | ||||||||||||||
FOOD PRODUCTS | |||||||||||||||
445,000 | DARLING INT'L INC.* | 9,291,600 | |||||||||||||
9,291,600 | 4.34 | ||||||||||||||
ENERGY | 17.37 | ||||||||||||||
ENERGY EQUIPMENT & SERVICES | |||||||||||||||
170,000 | HORNBECK OFFSHORE SERVICES INC.* | 8,369,100 | |||||||||||||
345,000 | MATRIX SERVICE CO.* | 8,442,150 | |||||||||||||
295,000 | MITCHAM INDUSTRIES INC.* | 5,224,450 | |||||||||||||
162,967 | NATURAL GAS SERVICES GROUP* | 4,493,000 | |||||||||||||
785,000 | NORTH AMERICAN ENERGY PARTNERS INC.* | 4,560,850 | |||||||||||||
580,000 | PARKER DRILLING CO.* | 4,715,400 | |||||||||||||
35,804,950 | 16.72 | ||||||||||||||
OIL, GAS & CONSUMABLE FUELS | |||||||||||||||
1,000,000 | INFINITY ENERGY RESOURCES INC.* | 1,390,000 | |||||||||||||
1,390,000 | 0.65 | ||||||||||||||
FINANCIALS | 9.57 | ||||||||||||||
COMMERCIAL BANKS | |||||||||||||||
280,000 | BBCN BANCORP INC. | 4,645,200 | |||||||||||||
170,000 | EAST WEST BANCORP INC. | 5,944,900 | |||||||||||||
10,590,100 | 4.94 | ||||||||||||||
CONSUMER FINANCE | |||||||||||||||
210,000 | EZCORP INC. A* | 2,454,900 | |||||||||||||
220,000 | REGIONAL MANAGEMENT CORP.* | 7,464,600 | |||||||||||||
9,919,500 | 4.63 | ||||||||||||||
See Accompanying Notes to Financial Statements which are an integral part of these financial statements.
58
Pacific Advisors Small Cap Value Fund
Schedule of Investments
as of December 31, 2013
| Quantity or Principal | Description | Current $ Value** | % of Total Net Assets | ||||||||||||
COMMON STOCK continued | |||||||||||||||
INDUSTRIALS | 43.23 | ||||||||||||||
BUILDING PRODUCTS | |||||||||||||||
165,595 | INSTEEL INDUSTRIES INC. | 3,763,974 | |||||||||||||
335,000 | NCI BUILDING SYSTEMS INC.* | 5,875,900 | |||||||||||||
9,639,875 | 4.50 | ||||||||||||||
COMMERCIAL SERVICES & SUPPLIES | |||||||||||||||
180,000 | MOBILE MINI INC. | 7,412,400 | |||||||||||||
150,000 | TEAM INC.* | 6,351,000 | |||||||||||||
13,763,400 | 6.43 | ||||||||||||||
CONSTRUCTION & ENGINEERING | |||||||||||||||
650,000 | FURMANITE CORP.* | 6,903,000 | |||||||||||||
6,903,000 | 3.22 | ||||||||||||||
MACHINERY | |||||||||||||||
170,000 | NAVISTAR INT'L CORP.* | 6,492,300 | |||||||||||||
6,492,300 | 3.03 | ||||||||||||||
MARINE | |||||||||||||||
100,000 | KIRBY CORP.* | 9,925,000 | |||||||||||||
9,925,000 | 4.63 | ||||||||||||||
ROAD & RAIL | |||||||||||||||
280,000 | SAIA INC.* | 8,974,000 | |||||||||||||
1,353,700 | VITRAN CORP. INC.* | 8,771,976 | |||||||||||||
17,745,976 | 8.29 | ||||||||||||||
TRADING COMPANIES & DISTRIBUTORS | |||||||||||||||
103,000 | DXP ENTERPRISES INC.* | 11,865,600 | |||||||||||||
255,000 | MRC GLOBAL INC.* | 8,226,300 | |||||||||||||
140,000 | TAL INT'L GROUP INC. | 8,029,000 | |||||||||||||
28,120,900 | 13.13 | ||||||||||||||
MATERIALS | 2.29 | ||||||||||||||
METALS & MINING | |||||||||||||||
215,000 | SUNCOKE ENERGY INC.* | 4,904,150 | |||||||||||||
4,904,150 | 2.29 | ||||||||||||||
TELECOMMUNICATION SERVICES | 3.14 | ||||||||||||||
DIVERSIFIED TELECOM. SERVICES | |||||||||||||||
580,000 | PREMIERE GLOBAL SERVICES INC.* | 6,722,200 | |||||||||||||
6,722,200 | 3.14 | ||||||||||||||
TOTAL COMMON STOCK (Cost: $122,674,955) | 212,604,341 | 99.26 | |||||||||||||
See Accompanying Notes to Financial Statements which are an integral part of these financial statements.
59
Pacific Advisors Small Cap Value Fund
Schedule of Investments
as of December 31, 2013
| Quantity or Principal | Description | Current $ Value** | % of Total Net Assets | ||||||||||||
SHORT TERM INVESTMENTS | |||||||||||||||
MONEY MARKET | 0.53 | ||||||||||||||
1,143,295 | UMB MONEY MARKET FIDUCIARY | 1,143,295 | |||||||||||||
1,143,295 | 0.53 | ||||||||||||||
TOTAL SHORT TERM INVESTMENTS (Cost: $1,143,295) | 1,143,295 | 0.53 | |||||||||||||
TOTAL INVESTMENT IN SECURITITIES (Cost: $123,818,250) | 213,747,636 | 99.79 | |||||||||||||
OTHER ASSETS LESS LIABILITIES | 441,360 | 0.21 | |||||||||||||
TOTAL NET ASSETS | 214,188,996 | 100.00 | |||||||||||||
* Non-income producing
** The principal amount is stated in U.S. dollars unless otherwise indicated.
See Accompanying Notes to Financial Statements which are an integral part of these financial statements.
60
(This page has been left blank intentionally.)
61
Pacific Advisors Fund Inc.
Statement of Assets and Liabilities
December 31, 2013
| Government Securities Fund | Income and Equity Fund | Balanced Fund | |||||||||||||
Assets | |||||||||||||||
Investment securities | |||||||||||||||
At cost | $ | 1,962,818 | $ | 9,371,246 | $ | 7,626,622 | |||||||||
At fair value | $ | 2,060,391 | $ | 10,786,937 | $ | 10,596,608 | |||||||||
Cash or cash equivalent, at fair value | 40,618 | 586,434 | - | ||||||||||||
Accrued income receivable | 9,332 | 84,929 | 57,841 | ||||||||||||
Receivable for fund shares sold | 1,470 | 53,854 | 7,870 | ||||||||||||
Other assets | - | - | - | ||||||||||||
Total assets | 2,111,811 | 11,512,154 | 10,662,319 | ||||||||||||
Liabilities | |||||||||||||||
Bank borrowings (Note 7) | - | - | 7,388 | ||||||||||||
Payable for fund shares redeemed | - | 3,100 | 1,500 | ||||||||||||
Accounts payable | 5,956 | 24,511 | 34,005 | ||||||||||||
Accounts payable to related parties (Note 3) | - | 3,600 | 3,600 | ||||||||||||
Total liabilities | 5,956 | 31,211 | 46,493 | ||||||||||||
Net Assets | $ | 2,105,855 | $ | 11,480,943 | $ | 10,615,826 | |||||||||
Summary of Shareholders' Equity | |||||||||||||||
Paid in capital | 2,186,342 | 10,550,075 | 7,518,690 | ||||||||||||
Accumulated undistributed net investment income | - | 5,416 | 15,375 | ||||||||||||
Accumulated undistributed net realized gain (loss) on security transactions | (178,060 | ) | (490,239 | ) | 111,775 | ||||||||||
Net unrealized appreciation of investments | 97,573 | 1,415,691 | 2,969,986 | ||||||||||||
Net assets at December 31, 2013 | $ | 2,105,855 | $ | 11,480,943 | $ | 10,615,826 | |||||||||
Class A: | |||||||||||||||
Net assets | $ | 1,800,879 | $ | 9,246,929 | $ | 5,144,498 | |||||||||
Shares authorized | 50,000,000 | 50,000,000 | 50,000,000 | ||||||||||||
Shares outstanding | 196,640 | 800,378 | 310,114 | ||||||||||||
Net asset value and redemption price per share | $ | 9.16 | $ | 11.55 | $ | 16.59 | |||||||||
Maximum offering price per share | $ | 9.62 | $ | 12.13 | $ | 17.60 | |||||||||
Sales load | 4.75 | % | 4.75 | % | 5.75 | % | |||||||||
Class C: | |||||||||||||||
Net assets | $ | 304,976 | $ | 2,234,014 | $ | 5,471,328 | |||||||||
Shares authorized | 50,000,000 | 50,000,000 | 50,000,000 | ||||||||||||
Shares outstanding | 34,439 | 201,120 | 360,517 | ||||||||||||
Net asset value and redemption price per share | $ | 8.86 | $ | 11.11 | $ | 15.18 | |||||||||
Class I: | |||||||||||||||
Net assets | N/A | N/A | N/A | ||||||||||||
Shares authorized | |||||||||||||||
Shares outstanding | |||||||||||||||
Net asset value and redemption price per share | N/A | N/A | N/A | ||||||||||||
See Accompanying Notes to Financial Statements which are an integral part of these financial statements.
62
| Large Cap Value Fund | Mid Cap Value Fund | Small Cap Value Fund | |||||||||||||
Assets | |||||||||||||||
Investment securities | |||||||||||||||
At cost | $ | 4,395,616 | $ | 4,493,217 | $ | 122,674,955 | |||||||||
At fair value | $ | 6,243,045 | $ | 7,219,977 | $ | 212,604,341 | |||||||||
Cash or cash equivalent, at fair value | - | - | 1,143,295 | ||||||||||||
Accrued income receivable | 10,888 | 3,057 | 5,884 | ||||||||||||
Receivable for fund shares sold | 41,252 | 79,228 | 1,041,562 | ||||||||||||
Other assets | - | - | 276 | ||||||||||||
Total assets | 6,295,185 | 7,302,262 | 214,795,358 | ||||||||||||
Liabilities | |||||||||||||||
Bank borrowings (Note 7) | 6,914 | 19,123 | - | ||||||||||||
Payable for fund shares redeemed | - | - | 269,646 | ||||||||||||
Accounts payable | 18,771 | 17,564 | 316,640 | ||||||||||||
Accounts payable to related parties (Note 3) | - | 3,600 | 20,076 | ||||||||||||
Total liabilities | 25,685 | 40,287 | 606,362 | ||||||||||||
Net Assets | $ | 6,269,500 | $ | 7,261,975 | $ | 214,188,996 | |||||||||
Summary of Shareholders' Equity | |||||||||||||||
Paid in capital | 4,352,837 | 6,009,272 | 125,469,007 | ||||||||||||
Accumulated undistributed net investment income | - | - | 727,146 | ||||||||||||
Accumulated undistributed net realized gain (loss) on security transactions | 69,234 | (1,474,057 | ) | (1,936,543 | ) | ||||||||||
Net unrealized appreciation of investments | 1,847,429 | 2,726,760 | 89,929,386 | ||||||||||||
Net assets at December 31, 2013 | $ | 6,269,500 | $ | 7,261,975 | $ | 214,188,996 | |||||||||
Class A: | |||||||||||||||
Net assets | $ | 5,453,362 | $ | 6,058,206 | $ | 199,163,285 | |||||||||
Shares authorized | 50,000,000 | 50,000,000 | 50,000,000 | ||||||||||||
Shares outstanding | 417,825 | 397,372 | 3,243,180 | ||||||||||||
Net asset value and redemption price per share | $ | 13.05 | $ | 15.25 | $ | 61.41 | |||||||||
Maximum offering price per share | $ | 13.85 | $ | 16.18 | $ | 65.16 | |||||||||
Sales load | 5.75 | % | 5.75 | % | 5.75 | % | |||||||||
Class C: | |||||||||||||||
Net assets | $ | 816,138 | $ | 1,203,769 | $ | 14,645,941 | |||||||||
Shares authorized | 50,000,000 | 50,000,000 | 50,000,000 | ||||||||||||
Shares outstanding | 70,945 | 87,210 | 283,298 | ||||||||||||
Net asset value and redemption price per share | $ | 11.50 | $ | 13.80 | $ | 51.70 | |||||||||
Class I: | |||||||||||||||
Net assets | N/A | N/A | $ | 379,770 | |||||||||||
Shares authorized | 50,000,000 | ||||||||||||||
Shares outstanding | 5,267 | ||||||||||||||
Net asset value and redemption price per share | N/A | N/A | $ | 72.10 | |||||||||||
63
Pacific Advisors Fund Inc.
Statement of Operations
For the period ended December 31, 2013
| Government Securities Fund | Income and Equity Fund | Balanced Fund | |||||||||||||
Investment Income | |||||||||||||||
Dividends | $ | 13,182 | $ | 159,065 | $ | 103,301 | |||||||||
Interest | 7,919 | 174,078 | 114,264 | ||||||||||||
Total investment income | 21,101 | 333,143 | 217,565 | ||||||||||||
Expenses | |||||||||||||||
Investment management fees (Note 3) | 13,743 | 71,083 | 75,782 | ||||||||||||
Transfer agent fees (Note 3) | 49,470 | 65,529 | 71,115 | ||||||||||||
Fund accounting fees (Note 3) | 22,185 | 49,134 | 54,016 | ||||||||||||
Legal fees | 2,699 | 9,445 | 10,877 | ||||||||||||
Audit fees | 2,261 | 10,738 | 10,645 | ||||||||||||
Registration fees | 20,033 | 22,903 | 28,382 | ||||||||||||
Printing | 1,544 | 6,206 | 7,451 | ||||||||||||
Custody fees | 6,887 | 8,139 | 8,797 | ||||||||||||
Interest on borrowings | 113 | 242 | 637 | ||||||||||||
Director fees/meetings | 911 | 3,648 | 4,187 | ||||||||||||
Distribution and service (12b-1) fees (Note 3) | 8,547 | 38,633 | 67,193 | ||||||||||||
Other expenses | 3,563 | 13,305 | 15,185 | ||||||||||||
Total expenses, before fees waived | 131,956 | 299,005 | 354,267 | ||||||||||||
Less fees waived (Note 3) | 56,943 | 71,083 | - | ||||||||||||
Net expenses | 75,013 | 227,922 | 354,267 | ||||||||||||
Net Investment Income (Loss) | (53,912 | ) | 105,221 | (136,702 | ) | ||||||||||
Net Realized and Unrealized Gain on Investments | |||||||||||||||
Net realized gain on investments | 22,305 | 157,675 | 942,114 | ||||||||||||
Change in net unrealized appreciation on investments | 44,376 | 852,476 | 1,732,863 | ||||||||||||
Net realized and unrealized gain on investments | 66,681 | 1,010,151 | 2,674,977 | ||||||||||||
Net Increase in Net Assets Resulting from Operations | $ | 12,769 | $ | 1,115,372 | $ | 2,538,275 | |||||||||
See Accompanying Notes to Financial Statements which are an integral part of these financial statements.
64
| Large Cap Value Fund | Mid Cap Value Fund | Small Cap Value Fund | |||||||||||||
Investment Income | |||||||||||||||
Dividends | $ | 123,881 | $ | 51,546 | $ | 551,021 | |||||||||
Interest | 1 | 1 | 79 | ||||||||||||
Total investment income | 123,882 | 51,547 | 551,100 | ||||||||||||
Expenses | |||||||||||||||
Investment management fees (Note 3) | 40,351 | 63,308 | 1,067,645 | ||||||||||||
Transfer agent fees (Note 3) | 81,067 | 59,033 | 525,281 | ||||||||||||
Fund accounting fees (Note 3) | 28,188 | 33,233 | 619,350 | ||||||||||||
Legal fees | 5,878 | 6,677 | 141,153 | ||||||||||||
Audit fees | 6,062 | 7,115 | 161,928 | ||||||||||||
Registration fees | 20,614 | 24,395 | 72,675 | ||||||||||||
Printing | 3,547 | 4,663 | 93,165 | ||||||||||||
Custody fees | 7,217 | 7,158 | 33,915 | ||||||||||||
Interest on borrowings | 117 | 403 | 1,098 | ||||||||||||
Director fees/meetings | 2,154 | 2,550 | 53,279 | ||||||||||||
Distribution and service (12b-1) fees (Note 3) | 18,716 | 23,532 | 431,036 | ||||||||||||
Other expenses | 7,888 | 9,262 | 178,326 | ||||||||||||
Total expenses, before fees waived | 221,799 | 241,329 | 3,378,851 | ||||||||||||
Less fees waived (Note 3) | 83,551 | - | - | ||||||||||||
Net expenses | 138,248 | 241,329 | 3,378,851 | ||||||||||||
Net Investment Income (Loss) | (14,366 | ) | (189,782 | ) | (2,827,751 | ) | |||||||||
Net Realized and Unrealized Gain on Investments | |||||||||||||||
Net realized gain on investments | 387,459 | 183,442 | 5,025,568 | ||||||||||||
Change in net unrealized appreciation on investments | 978,296 | 1,754,608 | 61,375,400 | ||||||||||||
Net realized and unrealized gain on investments | 1,365,755 | 1,938,050 | 66,400,968 | ||||||||||||
Net Increase in Net Assets Resulting from Operations | $ | 1,351,389 | $ | 1,748,268 | $ | 63,573,217 | |||||||||
65
Pacific Advisors Fund Inc.
Statements of Changes in Net Assets
Government Securities Fund | Income and Equity Fund | ||||||||||||||||||
| Year ended December 31, 2013 | Year ended December 31, 2012 | Year ended December 31, 2013 | Year ended December 31, 2012 | ||||||||||||||||
| Increase (Decrease) in Net Assets From Operations | |||||||||||||||||||
Net investment income (loss) | $ | (53,912 | ) | $ | (50,660 | ) | $ | 105,221 | $ | 95,235 | |||||||||
Net realized gain (loss) on investments | 22,305 | 18,048 | 157,675 | 80,736 | |||||||||||||||
Change in net unrealized appreciation of investments | 44,376 | 25,818 | 852,476 | 276,031 | |||||||||||||||
Increase (Decrease) in net assets resulting from operations | 12,769 | (6,794 | ) | 1,115,372 | 452,002 | ||||||||||||||
From Distributions to Shareholders | |||||||||||||||||||
Class A: | |||||||||||||||||||
Net investment income | - | - | (92,081 | ) | (81,090 | ) | |||||||||||||
Net capital gains | - | - | - | - | |||||||||||||||
Return of capital | - | - | - | - | |||||||||||||||
Class C: | |||||||||||||||||||
Net investment income | - | - | (8,152 | ) | (13,903 | ) | |||||||||||||
Net capital gains | - | - | - | - | |||||||||||||||
Return of capital | - | - | - | - | |||||||||||||||
Class I: | N/A | N/A | N/A | N/A | |||||||||||||||
Net investment income | |||||||||||||||||||
Net capital gains | |||||||||||||||||||
Return of capital | |||||||||||||||||||
Decrease in net assets resulting from distributions | - | - | (100,233 | ) | (94,993 | ) | |||||||||||||
From Capital Share Transactions (Note 6) | |||||||||||||||||||
Proceeds from shares sold | 357,237 | 149,450 | 6,884,497 | 1,705,496 | |||||||||||||||
Proceeds from shares purchased by reinvestment of dividends | - | - | 88,260 | 83,930 | |||||||||||||||
Cost of shares repurchased | (462,725 | ) | (827,998 | ) | (3,072,137 | ) | (2,865,303 | ) | |||||||||||
Increase (decrease) in net assets resulting from capital share transactions | (105,488 | ) | (678,548 | ) | 3,900,620 | (1,075,877 | ) | ||||||||||||
Increase (decrease) in net assets | (92,719 | ) | (685,342 | ) | 4,915,759 | (718,868 | ) | ||||||||||||
Net Assets | |||||||||||||||||||
Beginning of period | 2,198,574 | 2,883,916 | 6,565,184 | 7,284,052 | |||||||||||||||
End of period | $ | 2,105,855 | $ | 2,198,574 | $ | 11,480,943 | $ | 6,565,184 | |||||||||||
Including undistributed net investment income | $ | - | $ | - | $ | 5,416 | $ | 428 | |||||||||||
See Accompanying Notes to Financial Statements which are an integral part of these financial statements.
66
Balanced Fund | |||||||||||
| Year ended December 31, 2013 | Year ended December 31, 2012 | ||||||||||
| Increase (Decrease) in Net Assets From Operations | |||||||||||
Net investment income (loss) | $ | (136,702 | ) | $ | (102,203 | ) | |||||
Net realized gain (loss) on investments | 942,114 | 1,099,436 | |||||||||
Change in net unrealized appreciation of investments | 1,732,863 | 218,807 | |||||||||
Increase (Decrease) in net assets resulting from operations | 2,538,275 | 1,216,040 | |||||||||
From Distributions to Shareholders | |||||||||||
Class A: | |||||||||||
Net investment income | - | - | |||||||||
Net capital gains | (450,051 | ) | (172,881 | ) | |||||||
Return of capital | - | - | |||||||||
Class C: | |||||||||||
Net investment income | - | - | |||||||||
Net capital gains | (516,508 | ) | (317,923 | ) | |||||||
Return of capital | - | - | |||||||||
Class I: | N/A | N/A | |||||||||
Net investment income | |||||||||||
Net capital gains | |||||||||||
Return of capital | |||||||||||
Decrease in net assets resulting from distributions | (966,559 | ) | (490,804 | ) | |||||||
From Capital Share Transactions (Note 6) | |||||||||||
Proceeds from shares sold | 873,959 | 614,419 | |||||||||
Proceeds from shares purchased by reinvestment of dividends | 879,476 | 453,607 | |||||||||
Cost of shares repurchased | (3,274,852 | ) | (5,796,855 | ) | |||||||
Increase (decrease) in net assets resulting from capital share transactions | (1,521,417 | ) | (4,728,829 | ) | |||||||
Increase (decrease) in net assets | 50,299 | (4,003,593 | ) | ||||||||
Net Assets | |||||||||||
Beginning of period | 10,565,527 | 14,569,120 | |||||||||
End of period | $ | 10,615,826 | $ | 10,565,527 | |||||||
Including undistributed net investment income | $ | 15,375 | $ | 5,510 | |||||||
67
Pacific Advisors Fund Inc.
Statements of Changes in Net Assets
Large Cap Value Fund | Mid Cap Value Fund | ||||||||||||||||||
| Year ended December 31, 2013 | Year ended December 31, 2012 | Year ended December 31, 2013 | Year ended December 31, 2012 | ||||||||||||||||
| Increase (Decrease) in Net Assets From Operations | |||||||||||||||||||
Net investment income (loss) | $ | (14,366 | ) | $ | (13,252 | ) | $ | (189,782 | ) | $ | (163,981 | ) | |||||||
Net realized gain (loss) on investments | 387,459 | (27,786 | ) | 183,442 | 422,551 | ||||||||||||||
Change in net unrealized appreciation of investments | 978,296 | 478,499 | 1,754,608 | 12,435 | |||||||||||||||
Increase (Decrease) in net assets resulting from operations | 1,351,389 | 437,461 | 1,748,268 | 271,005 | |||||||||||||||
From Distributions to Shareholders | |||||||||||||||||||
Class A: | |||||||||||||||||||
Net investment income | - | - | - | - | |||||||||||||||
Net capital gains | (104,170 | ) | - | - | - | ||||||||||||||
Return of capital | - | - | - | - | |||||||||||||||
Class C: | |||||||||||||||||||
Net investment income | - | - | - | - | |||||||||||||||
Net capital gains | (17,794 | ) | - | - | - | ||||||||||||||
Return of capital | - | - | - | - | |||||||||||||||
Class I: | N/A | N/A | N/A | N/A | |||||||||||||||
Net investment income | |||||||||||||||||||
Net capital gains | |||||||||||||||||||
Return of capital | |||||||||||||||||||
Decrease in net assets resulting from distributions | (121,964 | ) | - | - | - | ||||||||||||||
From Capital Share Transactions (Note 6) | |||||||||||||||||||
Proceeds from shares sold | 678,348 | 739,474 | 662,676 | 846,845 | |||||||||||||||
Proceeds from shares purchased by reinvestment of dividends | 115,965 | - | - | - | |||||||||||||||
Cost of shares repurchased | (305,719 | ) | (532,772 | ) | (503,149 | ) | (859,653 | ) | |||||||||||
Increase (decrease) in net assets resulting from capital share transactions | 488,594 | 206,702 | 159,527 | (12,808 | ) | ||||||||||||||
Increase (decrease) in net assets | 1,718,019 | 644,163 | 1,907,795 | 258,197 | |||||||||||||||
Net Assets | |||||||||||||||||||
Beginning of period | 4,551,481 | 3,907,318 | 5,354,180 | 5,095,983 | |||||||||||||||
End of period | $ | 6,269,500 | $ | 4,551,481 | $ | 7,261,975 | $ | 5,354,180 | |||||||||||
Including undistributed net investment income | $ | - | $ | - | $ | - | $ | - | |||||||||||
See Accompanying Notes to Financial Statements which are an integral part of these financial statements.
68
Small Cap Value Fund | |||||||||||
| Year ended December 31, 2013 | Year ended December 31, 2012 | ||||||||||
| Increase (Decrease) in Net Assets From Operations | |||||||||||
Net investment income (loss) | $ | (2,827,751 | ) | $ | (2,161,342 | ) | |||||
Net realized gain (loss) on investments | 5,025,568 | 9,903,649 | |||||||||
Change in net unrealized appreciation of investments | 61,375,400 | 2,348,371 | |||||||||
Increase (Decrease) in net assets resulting from operations | 63,573,217 | 10,090,678 | |||||||||
From Distributions to Shareholders | |||||||||||
Class A: | |||||||||||
Net investment income | - | - | |||||||||
Net capital gains | - | - | |||||||||
Return of capital | - | - | |||||||||
Class C: | |||||||||||
Net investment income | - | - | |||||||||
Net capital gains | - | - | |||||||||
Return of capital | - | - | |||||||||
Class I: | |||||||||||
Net investment income | - | - | |||||||||
Net capital gains | - | - | |||||||||
Return of capital | - | - | |||||||||
Decrease in net assets resulting from distributions | - | - | |||||||||
From Capital Share Transactions (Note 6) | |||||||||||
Proceeds from shares sold | 87,929,777 | 28,360,777 | |||||||||
Proceeds from shares purchased by reinvestment of dividends | - | - | |||||||||
Cost of shares repurchased | (29,840,356 | ) | (41,203,490 | ) | |||||||
Increase (decrease) in net assets resulting from capital share transactions | 58,089,421 | (12,842,713 | ) | ||||||||
Increase (decrease) in net assets | 121,662,638 | (2,752,035 | ) | ||||||||
Net Assets | |||||||||||
Beginning of period | 92,526,358 | 95,278,393 | |||||||||
End of period | $ | 214,188,996 | $ | 92,526,358 | |||||||
Including undistributed net investment income | $ | 727,146 | $ | 384,446 | |||||||
69
Pacific Advisors Fund Inc.
Financial Highlights
(For a share outstanding throughout the period)
Government Securities Fund | |||||||||||||||||||||||
Class A | |||||||||||||||||||||||
For the year ended December 31, | |||||||||||||||||||||||
2013 | 2012 | 2011 | 2010 | 2009 | |||||||||||||||||||
Per Share Operating Performance | |||||||||||||||||||||||
Net asset value, beginning of period | $ | 9.09 | $ | 9.13 | $ | 9.13 | $ | 8.99 | $ | 8.94 | |||||||||||||
Income from investing operations | |||||||||||||||||||||||
Net investment income (loss) | (0.20 | ) | (0.17 | ) | (0.02 | ) | 0.05 | 0.18 | |||||||||||||||
Net realized and unrealized gain on securities | 0.27 | 0.13 | 0.02 | 0.14 | 0.02 | ||||||||||||||||||
Total from investment operations | 0.07 | (0.04 | ) | - | 0.19 | 0.20 | |||||||||||||||||
Less distributions | |||||||||||||||||||||||
From net investment income | - | - | - | (0.02 | ) | (0.15 | ) | ||||||||||||||||
From net capital gain | - | - | - | - | - | ||||||||||||||||||
From return of capital | - | - | - | (0.03 | ) | - | |||||||||||||||||
Total distributions | - | - | - | (0.05 | ) | (0.15 | ) | ||||||||||||||||
Net asset value, end of period | $ | 9.16 | $ | 9.09 | $ | 9.13 | $ | 9.13 | $ | 8.99 | |||||||||||||
Total Investment Return (a) | 0.77 | % | (0.44 | )% | 0.00 | % | 2.16 | % | 2.26 | % | |||||||||||||
Ratios/Supplemental Data | |||||||||||||||||||||||
Net assets, end of period (000's) | $ | 1,801 | $ | 1,723 | $ | 1,873 | $ | 2,375 | $ | 2,537 | |||||||||||||
Ratio of net investment income (loss) to average net assets | |||||||||||||||||||||||
With expense reductions | (2.39 | )% | (1.82 | )% | (0.54 | )% | 0.49 | % | 1.69 | % | |||||||||||||
Without expense reductions | (5.09 | )% | (4.14 | )% | (2.39 | )% | (1.10 | )% | 0.25 | % | |||||||||||||
Ratio of expenses to average net assets | |||||||||||||||||||||||
With expense reductions | 3.39 | % | 3.12 | % | 2.42 | % | 2.09 | % | 1.69 | % | |||||||||||||
Without expense reductions | 6.09 | % | 5.44 | % | 4.26 | % | 3.69 | % | 3.13 | % | |||||||||||||
Fund portfolio turnover rate | 135 | % | 181 | % | 115 | % | 156 | % | 224 | % | |||||||||||||
Class C | |||||||||||||||||||||||
For the year ended December 31, | |||||||||||||||||||||||
2013 | 2012 | 2011 | 2010 | 2009 | |||||||||||||||||||
Per Share Operating Performance | |||||||||||||||||||||||
Net asset value, beginning of period | $ | 8.86 | $ | 8.96 | $ | 9.02 | $ | 8.90 | $ | 8.87 | |||||||||||||
Income from investing operations | |||||||||||||||||||||||
Net investment income (loss) | (1.24 | ) | (0.94 | ) | (0.33 | ) | (0.09 | ) | 0.09 | ||||||||||||||
Net realized and unrealized gain on securities | 1.24 | 0.84 | 0.27 | 0.23 | 0.04 | ||||||||||||||||||
Total from investment operations | - | (0.10 | ) | (0.06 | ) | 0.14 | 0.13 | ||||||||||||||||
Less distributions | |||||||||||||||||||||||
From net investment income | - | - | - | (0.01 | ) | (0.10 | ) | ||||||||||||||||
From net capital gain | - | - | - | - | - | ||||||||||||||||||
From return of capital | - | - | - | (0.01 | ) | - | |||||||||||||||||
Total distributions | - | - | - | (0.02 | ) | (0.10 | ) | ||||||||||||||||
Net asset value, end of period | $ | 8.86 | $ | 8.86 | $ | 8.96 | $ | 9.02 | $ | 8.90 | |||||||||||||
Total Investment Return | 0.00 | % | (1.12 | )% | (0.67 | )% | 1.49 | % | 1.44 | % | |||||||||||||
Ratios/Supplemental Data | |||||||||||||||||||||||
Net assets, end of period (000's) | $ | 305 | $ | 476 | $ | 1,011 | $ | 1,740 | $ | 2,594 | |||||||||||||
Ratio of net investment income (loss) to average net assets | |||||||||||||||||||||||
With expense reductions | (3.17 | )% | (2.48 | )% | (1.27 | )% | (0.18 | )% | 0.96 | % | |||||||||||||
Without expense reductions | (5.84 | )% | (4.92 | )% | (3.14 | )% | (1.80 | )% | (0.47 | )% | |||||||||||||
Ratio of expenses to average net assets | |||||||||||||||||||||||
With expense reductions | 4.16 | % | 3.85 | % | 3.16 | % | 2.80 | % | 2.41 | % | |||||||||||||
Without expense reductions | 6.82 | % | 6.29 | % | 5.03 | % | 4.42 | % | 3.85 | % | |||||||||||||
Fund portfolio turnover rate | 135 | % | 181 | % | 115 | % | 156 | % | 224 | % | |||||||||||||
(a) The Fund's maximum sales charge is not included in the total return computation.
See Accompanying Notes to Financial Statements which are an integral part of these financial statements.
70
Pacific Advisors Fund Inc.
Financial Highlights
(For a share outstanding throughout the period)
Income and Equity Fund | |||||||||||||||||||||||
Class A | |||||||||||||||||||||||
For the year ended December 31, | |||||||||||||||||||||||
2013 | 2012 | 2011 | 2010 | 2009 | |||||||||||||||||||
Per Share Operating Performance | |||||||||||||||||||||||
Net asset value, beginning of period | $ | 10.30 | $ | 9.84 | $ | 9.87 | $ | 9.49 | $ | 8.48 | |||||||||||||
Income from investing operations | |||||||||||||||||||||||
Net investment income | 0.10 | 0.15 | 0.21 | 0.19 | 0.30 | ||||||||||||||||||
Net realized and unrealized gain on securities | 1.28 | 0.48 | 0.01 | 0.45 | 0.98 | ||||||||||||||||||
Total from investment operations | 1.38 | 0.63 | 0.22 | 0.64 | 1.28 | ||||||||||||||||||
Less distributions | |||||||||||||||||||||||
From net investment income | (0.13 | ) | (0.17 | ) | (0.25 | ) | (0.26 | ) | (0.27 | ) | |||||||||||||
From net capital gain | - | - | - | - | - | ||||||||||||||||||
From return of capital | - | - | - | - | (b) | - | |||||||||||||||||
Total distributions | (0.13 | ) | (0.17 | ) | (0.25 | ) | (0.26 | ) | (0.27 | ) | |||||||||||||
Net asset value, end of period | $ | 11.55 | $ | 10.30 | $ | 9.84 | $ | 9.87 | $ | 9.49 | |||||||||||||
Total Investment Return (a) | 13.40 | % | 6.46 | % | 2.24 | % | 6.88 | % | 15.37 | % | |||||||||||||
Ratios/Supplemental Data | |||||||||||||||||||||||
Net assets, end of period (000's) | $ | 9,247 | $ | 4,659 | $ | 4,235 | $ | 3,922 | $ | 2,865 | |||||||||||||
Ratio of net investment income to average net assets | |||||||||||||||||||||||
With expense reductions | 1.27 | % | 1.56 | % | 2.27 | % | 2.57 | % | 3.22 | % | |||||||||||||
Without expense reductions | 0.52 | % | 0.81 | % | 1.52 | % | 1.81 | % | 2.47 | % | |||||||||||||
Ratio of expenses to average net assets | |||||||||||||||||||||||
With expense reductions | 2.23 | % | 2.68 | % | 2.59 | % | 2.34 | % | 2.32 | % | |||||||||||||
Without expense reductions | 2.98 | % | 3.42 | % | 3.34 | % | 3.09 | % | 3.07 | % | |||||||||||||
Fund portfolio turnover rate | 20 | % | 29 | % | 16 | % | 21 | % | 29 | % | |||||||||||||
Class C | |||||||||||||||||||||||
For the year ended December 31, | |||||||||||||||||||||||
2013 | 2012 | 2011 | 2010 | 2009 | |||||||||||||||||||
Per Share Operating Performance | |||||||||||||||||||||||
Net asset value, beginning of period | $ | 9.91 | $ | 9.42 | $ | 9.40 | $ | 9.03 | $ | 8.09 | |||||||||||||
Income from investing operations | |||||||||||||||||||||||
Net investment income (loss) | 0.06 | (0.01 | ) | 0.09 | 0.15 | 0.21 | |||||||||||||||||
Net realized and unrealized gain on securities | 1.18 | 0.55 | 0.05 | 0.38 | 0.95 | ||||||||||||||||||
Total from investment operations | 1.24 | 0.54 | 0.14 | 0.53 | 1.16 | ||||||||||||||||||
Less distributions | |||||||||||||||||||||||
From net investment income | (0.04 | ) | (0.05 | ) | (0.12 | ) | (0.16 | ) | (0.22 | ) | |||||||||||||
From net capital gain | - | - | - | - | - | ||||||||||||||||||
From return of capital | - | - | - | - | (b) | - | |||||||||||||||||
Total distributions | (0.04 | ) | (0.05 | ) | (0.12 | ) | (0.16 | ) | (0.22 | ) | |||||||||||||
Net asset value, end of period | $ | 11.11 | $ | 9.91 | $ | 9.42 | $ | 9.40 | $ | 9.03 | |||||||||||||
Total Investment Return | 12.55 | % | 5.74 | % | 1.54 | % | 5.95 | % | 14.56 | % | |||||||||||||
Ratios/Supplemental Data | |||||||||||||||||||||||
Net assets, end of period (000's) | $ | 2,234 | $ | 1,906 | $ | 3,049 | $ | 4,774 | $ | 5,129 | |||||||||||||
Ratio of net investment income to average net assets | |||||||||||||||||||||||
With expense reductions | 0.49 | % | 0.80 | % | 1.52 | % | 1.82 | % | 2.47 | % | |||||||||||||
Without expense reductions | (0.26 | )% | 0.05 | % | 0.77 | % | 1.07 | % | 1.72 | % | |||||||||||||
Ratio of expenses to average net assets | |||||||||||||||||||||||
With expense reductions | 3.03 | % | 3.45 | % | 3.33 | % | 3.07 | % | 3.06 | % | |||||||||||||
Without expense reductions | 3.78 | % | 4.20 | % | 4.08 | % | 3.82 | % | 3.81 | % | |||||||||||||
Fund portfolio turnover rate | 20 | % | 29 | % | 16 | % | 21 | % | 29 | % | |||||||||||||
(a) The Fund's maximum sales charge is not included in the total return computation.
(b) The amount is less than $0.005 and rounded to zero.
See Accompanying Notes to Financial Statements which are an integral part of these financial statements.
71
Pacific Advisors Fund Inc.
Financial Highlights
(For a share outstanding throughout the period)
Balanced Fund | |||||||||||||||||||||||
Class A | |||||||||||||||||||||||
For the year ended December 31, | |||||||||||||||||||||||
2013 | 2012 | 2011 | 2010 | 2009 | |||||||||||||||||||
Per Share Operating Performance | |||||||||||||||||||||||
Net asset value, beginning of period | $ | 14.13 | $ | 13.47 | $ | 14.56 | $ | 14.91 | $ | 12.41 | |||||||||||||
Income from investing operations | |||||||||||||||||||||||
Net investment income (loss) | (0.18 | ) | (0.03 | ) | - | 0.13 | 0.22 | ||||||||||||||||
Net realized and unrealized gain (loss) on securities | 4.21 | 1.34 | (0.16 | ) | 1.02 | 2.48 | |||||||||||||||||
Total from investment operations | 4.03 | 1.31 | (0.16 | ) | 1.15 | 2.70 | |||||||||||||||||
Less distributions | |||||||||||||||||||||||
From net investment income | - | - | - | (0.01 | ) | (0.20 | ) | ||||||||||||||||
From net capital gain | (1.57 | ) | (0.65 | ) | (0.93 | ) | (1.49 | ) | - | ||||||||||||||
Total distributions | (1.57 | ) | (0.65 | ) | (0.93 | ) | (1.50 | ) | (0.20 | ) | |||||||||||||
Net asset value, end of period | $ | 16.59 | $ | 14.13 | $ | 13.47 | $ | 14.56 | $ | 14.91 | |||||||||||||
Total Investment Return (a) | 28.68 | % | 9.69 | % | (1.14 | )% | 7.71 | % | 21.76 | % | |||||||||||||
Ratios/Supplemental Data | |||||||||||||||||||||||
Net assets, end of period (000's) | $ | 5,144 | $ | 3,919 | $ | 3,801 | $ | 3,789 | $ | 4,362 | |||||||||||||
Ratio of net investment income (loss) to average net assets | (0.93 | )% | (0.27 | )% | 0.29 | % | 0.55 | % | 1.58 | % | |||||||||||||
Ratio of expenses to average net assets | 3.07 | % | 3.30 | % | 3.13 | % | 2.77 | % | 2.47 | % | |||||||||||||
Fund portfolio turnover rate | 23 | % | 34 | % | 14 | % | 36 | % | 10 | % | |||||||||||||
Class C | |||||||||||||||||||||||
For the year ended December 31, | |||||||||||||||||||||||
2013 | 2012 | 2011 | 2010 | 2009 | |||||||||||||||||||
Per Share Operating Performance | |||||||||||||||||||||||
Net asset value, beginning of period | $ | 13.13 | $ | 12.66 | $ | 13.84 | $ | 14.35 | $ | 11.96 | |||||||||||||
Income from investing operations | |||||||||||||||||||||||
Net investment income (loss) | (0.54 | ) | (0.39 | ) | (0.15 | ) | (0.06 | ) | 0.10 | ||||||||||||||
Net realized and unrealized gain (loss) on securities | 4.16 | 1.51 | (0.10 | ) | 1.04 | 2.39 | |||||||||||||||||
Total from investment operations | 3.62 | 1.12 | (0.25 | ) | 0.98 | 2.49 | |||||||||||||||||
Less distributions | |||||||||||||||||||||||
From net investment income | - | - | - | - | (b) | (0.10 | ) | ||||||||||||||||
From net capital gain | (1.57 | ) | (0.65 | ) | (0.93 | ) | (1.49 | ) | - | ||||||||||||||
Total distributions | (1.57 | ) | (0.65 | ) | (0.93 | ) | (1.49 | ) | (0.10 | ) | |||||||||||||
Net asset value, end of period | $ | 15.18 | $ | 13.13 | $ | 12.66 | $ | 13.84 | $ | 14.35 | |||||||||||||
Total Investment Return | 27.75 | % | 8.81 | % | (1.86 | )% | 6.88 | % | 20.84 | % | |||||||||||||
Ratios/Supplemental Data | |||||||||||||||||||||||
Net assets, end of period (000's) | $ | 5,471 | $ | 6,647 | $ | 10,768 | $ | 18,035 | $ | 24,828 | |||||||||||||
Ratio of net investment income (loss) to average net assets | (1.70 | )% | (0.97 | )% | (0.42 | )% | (0.18 | )% | 0.82 | % | |||||||||||||
Ratio of expenses to average net assets | 3.86 | % | 4.02 | % | 3.83 | % | 3.50 | % | 3.23 | % | |||||||||||||
Fund portfolio turnover rate | 23 | % | 34 | % | 14 | % | 36 | % | 10 | % | |||||||||||||
(a) The Fund's maximum sales charge is not included in the total return computation.
(b) The amount is less than $0.005 and rounded to zero.
See Accompanying Notes to Financial Statements which are an integral part of these financial statements.
72
Pacific Advisors Fund Inc.
Financial Highlights
(For a share outstanding throughout the period)
Large Cap Value Fund | |||||||||||||||||||||||
Class A | |||||||||||||||||||||||
For the year ended December 31, | |||||||||||||||||||||||
2013 | 2012 | 2011 | 2010 | 2009 | |||||||||||||||||||
Per Share Operating Performance | |||||||||||||||||||||||
Net asset value, beginning of period | $ | 10.34 | $ | 9.30 | $ | 8.98 | $ | 8.33 | $ | 6.51 | |||||||||||||
Income from investing operations | |||||||||||||||||||||||
Net investment income (loss) | 0.03 | 0.04 | 0.11 | (0.06 | ) | (0.24 | ) | ||||||||||||||||
Net realized and unrealized gain on securities | 2.94 | 1.00 | 0.21 | 0.71 | 2.06 | ||||||||||||||||||
Total from investment operations | 2.97 | 1.04 | 0.32 | 0.65 | 1.82 | ||||||||||||||||||
Less distributions | |||||||||||||||||||||||
From net investment income | - | - | - | - | - | ||||||||||||||||||
From net capital gain | (0.26 | ) | - | - | - | - | |||||||||||||||||
Total distributions | (0.26 | ) | - | - | - | - | |||||||||||||||||
Net asset value, end of period | $ | 13.05 | $ | 10.34 | $ | 9.30 | $ | 8.98 | $ | 8.33 | |||||||||||||
Total Investment Return (a) | 28.72 | % | 11.18 | % | 3.56 | % | 7.80 | % | 27.96 | % | |||||||||||||
Ratios/Supplemental Data | |||||||||||||||||||||||
Net assets, end of period (000's) | $ | 5,453 | $ | 3,973 | $ | 3,278 | $ | 2,511 | $ | 2,176 | |||||||||||||
Ratio of net investment loss to average net assets | |||||||||||||||||||||||
With expense reductions | (0.17 | )% | (0.18 | )% | (0.66 | )% | (1.32 | )% | (2.06 | )% | |||||||||||||
Without expense reductions | (1.72 | )% | (1.91 | )% | (2.61 | )% | (3.50 | )% | (4.31 | )% | |||||||||||||
Ratio of expenses to average net assets | |||||||||||||||||||||||
With expense reductions | 2.47 | % | 2.61 | % | 3.05 | % | 3.64 | % | 3.46 | % | |||||||||||||
Without expense reductions | 4.02 | % | 4.34 | % | 4.99 | % | 5.82 | % | 5.71 | % | |||||||||||||
Fund portfolio turnover rate | 24 | % | 9 | % | 7 | % | 106 | % | 5 | % | |||||||||||||
Class C | |||||||||||||||||||||||
For the year ended December 31, | |||||||||||||||||||||||
2013 | 2012 | 2011 | 2010 | 2009 | |||||||||||||||||||
Per Share Operating Performance | |||||||||||||||||||||||
Net asset value, beginning of period | $ | 9.20 | $ | 8.34 | $ | 8.12 | $ | 7.58 | $ | 5.97 | |||||||||||||
Income from investing operations | |||||||||||||||||||||||
Net investment income (loss) | 0.32 | (0.69 | ) | (0.42 | ) | (0.17 | ) | (1.36 | ) | ||||||||||||||
Net realized and unrealized gain on securities | 2.24 | 1.55 | 0.64 | 0.71 | 2.97 | ||||||||||||||||||
Total from investment operations | 2.56 | 0.86 | 0.22 | 0.54 | 1.61 | ||||||||||||||||||
Less distributions | |||||||||||||||||||||||
From net investment income | - | - | - | - | - | ||||||||||||||||||
From net capital gain | (0.26 | ) | - | - | - | - | |||||||||||||||||
Total distributions | (0.26 | ) | - | - | - | - | |||||||||||||||||
Net asset value, end of period | $ | 11.50 | $ | 9.20 | $ | 8.34 | $ | 8.12 | $ | 7.58 | |||||||||||||
Total Investment Return | 27.83 | % | 10.31 | % | 2.71 | % | 7.12 | % | 26.97 | % | |||||||||||||
Ratios/Supplemental Data | |||||||||||||||||||||||
Net assets, end of period (000's) | $ | 816 | $ | 578 | $ | 630 | $ | 681 | $ | 637 | |||||||||||||
Ratio of net investment loss to average net assets | |||||||||||||||||||||||
With expense reductions | (0.92 | )% | (1.01 | )% | (1.53 | )% | (2.03 | )% | (2.69 | )% | |||||||||||||
Without expense reductions | (2.47 | )% | (2.74 | )% | (3.46 | )% | (4.23 | )% | (4.96 | )% | |||||||||||||
Ratio of expenses to average net assets | |||||||||||||||||||||||
With expense reductions | 3.22 | % | 3.43 | % | 3.89 | % | 4.37 | % | 4.11 | % | |||||||||||||
Without expense reductions | 4.77 | % | 5.15 | % | 5.82 | % | 6.57 | % | 6.39 | % | |||||||||||||
Fund portfolio turnover rate | 24 | % | 9 | % | 7 | % | 106 | % | 5 | % | |||||||||||||
(a) The Fund's maximum sales charge is not included in the total return computation.
See Accompanying Notes to Financial Statements which are an integral part of these financial statements.
73
Pacific Advisors Fund Inc.
Financial Highlights
(For a share outstanding throughout the period)
Mid Cap Value Fund | |||||||||||||||||||||||
Class A | |||||||||||||||||||||||
For the year ended December 31, | |||||||||||||||||||||||
2013 | 2012 | 2011 | 2010 | 2009 | |||||||||||||||||||
Per Share Operating Performance | |||||||||||||||||||||||
Net asset value, beginning of period | $ | 11.47 | $ | 10.88 | $ | 11.57 | $ | 8.78 | $ | 6.75 | |||||||||||||
Income from investing operations | |||||||||||||||||||||||
Net investment loss | (0.36 | ) | (0.25 | ) | (0.13 | ) | (0.48 | ) | (0.40 | ) | |||||||||||||
Net realized and unrealized gain (loss) on securities | 4.14 | 0.84 | (0.56 | ) | 3.27 | 2.43 | |||||||||||||||||
Total from investment operations | 3.78 | 0.59 | (0.69 | ) | 2.79 | 2.03 | |||||||||||||||||
Less distributions | |||||||||||||||||||||||
From net investment income | - | - | - | - | - | ||||||||||||||||||
From net capital gain | - | - | - | - | - | ||||||||||||||||||
Total distributions | - | - | - | - | - | ||||||||||||||||||
Net asset value, end of period | $ | 15.25 | $ | 11.47 | $ | 10.88 | $ | 11.57 | $ | 8.78 | |||||||||||||
Total Investment Return (a) | 32.96 | % | 5.42 | % | (5.96 | )% | 31.78 | % | 30.07 | % | |||||||||||||
Ratios/Supplemental Data | |||||||||||||||||||||||
Net assets, end of period (000's) | $ | 6,058 | $ | 4,500 | $ | 4,052 | $ | 3,672 | $ | 3,194 | |||||||||||||
Ratio of net investment loss to average net assets | (2.88 | )% | (3.01 | )% | (3.11 | )% | (3.39 | )% | (2.11 | )% | |||||||||||||
Ratio of expenses to average net assets | 3.69 | % | 4.19 | % | 4.16 | % | 4.35 | % | 3.69 | % | |||||||||||||
Fund portfolio turnover rate | 15 | % | 24 | % | 12 | % | 18 | % | 21 | % | |||||||||||||
Class C | |||||||||||||||||||||||
For the year ended December 31, | |||||||||||||||||||||||
2013 | 2012 | 2011 | 2010 | 2009 | |||||||||||||||||||
Per Share Operating Performance | |||||||||||||||||||||||
Net asset value, beginning of period | $ | 10.46 | $ | 10.00 | $ | 10.72 | $ | 8.21 | $ | 6.36 | |||||||||||||
Income from investing operations | |||||||||||||||||||||||
Net investment income (loss) | 0.48 | (3.40 | ) | (4.28 | ) | (3.84 | ) | (1.04 | ) | ||||||||||||||
Net realized and unrealized gain on securities | 2.86 | 3.86 | 3.56 | 6.35 | 2.89 | ||||||||||||||||||
Total from investment operations | 3.34 | 0.46 | (0.72 | ) | 2.51 | 1.85 | |||||||||||||||||
Less distributions | |||||||||||||||||||||||
From net investment income | - | - | - | - | - | ||||||||||||||||||
From net capital gain | - | - | - | - | - | ||||||||||||||||||
Total distributions | - | - | - | - | - | ||||||||||||||||||
Net asset value, end of period | $ | 13.80 | $ | 10.46 | $ | 10.00 | $ | 10.72 | $ | 8.21 | |||||||||||||
Total Investment Return | 31.93 | % | 4.60 | % | (6.72 | )% | 30.57 | % | 29.09 | % | |||||||||||||
Ratios/Supplemental Data | |||||||||||||||||||||||
Net assets, end of period (000's) | $ | 1,204 | $ | 854 | $ | 1,044 | $ | 1,784 | $ | 3,151 | |||||||||||||
Ratio of net investment loss to average net assets | (3.61 | )% | (3.77 | )% | (3.92 | )% | (3.91 | )% | (2.87 | )% | |||||||||||||
Ratio of expenses to average net assets | 4.42 | % | 4.95 | % | 4.91 | % | 4.88 | % | 4.47 | % | |||||||||||||
Fund portfolio turnover rate | 15 | % | 24 | % | 12 | % | 18 | % | 21 | % | |||||||||||||
(a) The Fund's maximum sales charge is not included in the total return computation.
See Accompanying Notes to Financial Statements which are an integral part of these financial statements.
74
Pacific Advisors Fund Inc.
Financial Highlights
(For a share outstanding throughout the period)
Small Cap Value Fund | |||||||||||||||||||||||
Class A | |||||||||||||||||||||||
For the year ended December 31, | |||||||||||||||||||||||
2013 | 2012 | 2011 | 2010 | 2009 | |||||||||||||||||||
Per Share Operating Performance | |||||||||||||||||||||||
Net asset value, beginning of period | $ | 38.50 | $ | 34.42 | $ | 31.68 | $ | 26.37 | $ | 19.21 | |||||||||||||
Income from investing operations | |||||||||||||||||||||||
Net investment income (loss) | 1.44 | (1.70 | ) | (1.35 | ) | (1.87 | ) | (0.50 | ) | ||||||||||||||
Net realized and unrealized gain on securities | 21.47 | 5.78 | 4.09 | 7.18 | 7.66 | ||||||||||||||||||
Total from investment operations | 22.91 | 4.08 | 2.74 | 5.31 | 7.16 | ||||||||||||||||||
Less distributions | |||||||||||||||||||||||
From net investment income | - | - | - | - | - | ||||||||||||||||||
From net capital gain | - | - | - | - | - | ||||||||||||||||||
From return of capital | - | - | - | - | - | ||||||||||||||||||
Total distributions | - | - | - | - | - | ||||||||||||||||||
Net asset value, end of period | $ | 61.41 | $ | 38.50 | $ | 34.42 | $ | 31.68 | $ | 26.37 | |||||||||||||
Total Investment Return (a) | 59.51 | % | 11.85 | % | 8.65 | % | 20.14 | % | 37.27 | % | |||||||||||||
Ratios/Supplemental Data | |||||||||||||||||||||||
Net assets, end of period (000's) | $ | 199,163 | $ | 85,607 | $ | 88,323 | $ | 92,830 | $ | 117,456 | |||||||||||||
Ratio of net investment loss to average net assets | (1.93 | )% | (2.06 | )% | (2.31 | )% | (2.14 | )% | (2.05 | )% | |||||||||||||
Ratio of expenses to average net assets | 2.31 | % | 2.71 | % | 2.88 | % | 2.66 | % | 2.49 | % | |||||||||||||
Fund portfolio turnover rate | 9 | % | 12 | % | 9 | % | 9 | % | 17 | % | |||||||||||||
Class C | |||||||||||||||||||||||
For the year ended December 31, | |||||||||||||||||||||||
2013 | 2012 | 2011 | 2010 | 2009 | |||||||||||||||||||
Per Share Operating Performance | |||||||||||||||||||||||
Net asset value, beginning of period | $ | 32.65 | $ | 29.41 | $ | 27.26 | $ | 22.87 | $ | 16.79 | |||||||||||||
Income from investing operations | |||||||||||||||||||||||
Net investment income (loss) | 3.10 | (2.53 | ) | (6.46 | ) | (3.31 | ) | (1.40 | ) | ||||||||||||||
Net realized and unrealized gain on securities | 15.95 | 5.77 | 8.61 | 7.70 | 7.48 | ||||||||||||||||||
Total from investment operations | 19.05 | 3.24 | 2.15 | 4.39 | 6.08 | ||||||||||||||||||
Less distributions | |||||||||||||||||||||||
From net investment income | - | - | - | - | - | ||||||||||||||||||
From net capital gain | - | - | - | - | - | ||||||||||||||||||
From return of capital | - | - | - | - | - | ||||||||||||||||||
Total distributions | - | - | - | - | - | ||||||||||||||||||
Net asset value, end of period | $ | 51.70 | $ | 32.65 | $ | 29.41 | $ | 27.26 | $ | 22.87 | |||||||||||||
Total Investment Return | 58.35 | % | 11.02 | % | 7.89 | % | 19.20 | % | 36.21 | % | |||||||||||||
Ratios/Supplemental Data | |||||||||||||||||||||||
Net assets, end of period (000's) | $ | 14,646 | $ | 6,912 | $ | 6,949 | $ | 11,355 | $ | 15,593 | |||||||||||||
Ratio of net investment loss to average net assets | (2.69 | )% | (2.80 | )% | (3.05 | )% | (2.89 | )% | (2.79 | )% | |||||||||||||
Ratio of expenses to average net assets | 3.08 | % | 3.45 | % | 3.62 | % | 3.40 | % | 3.24 | % | |||||||||||||
Fund portfolio turnover rate | 9 | % | 12 | % | 9 | % | 9 | % | 17 | % | |||||||||||||
(a) The Fund's maximum sales charge is not included in the total return computation.
See Accompanying Notes to Financial Statements which are an integral part of these financial statements.
75
Pacific Advisors Fund Inc.
Financial Highlights
(For a share outstanding throughout the period)
Small Cap Value Fund | |||||||||||||||||||||||
Class I | |||||||||||||||||||||||
For the year ended December 31, | |||||||||||||||||||||||
2013 | 2012 | 2011 | 2010 | 2009 | |||||||||||||||||||
Per Share Operating Performance | |||||||||||||||||||||||
Net asset value, beginning of period | $ | 45.13 | $ | 39.15 | $ | 35.95 | $ | 29.86 | $ | 21.72 | |||||||||||||
Income from investing operations | |||||||||||||||||||||||
Net investment income (loss) | 431.95 | ** | (120.29 | )** | (0.77 | ) | (0.60 | ) | (0.45 | )* | |||||||||||||
Net realized and unrealized gain (loss) on securities | (404.98 | )** | 126.27 | ** | 3.97 | 6.69 | 8.59 | * | |||||||||||||||
Total from investment operations | 26.97 | 5.98 | 3.20 | 6.09 | 8.14 | ||||||||||||||||||
Less distributions | |||||||||||||||||||||||
From net investment income | - | - | - | - | - | ||||||||||||||||||
From net capital gain | - | - | - | - | - | ||||||||||||||||||
From return of capital | - | - | - | - | - | ||||||||||||||||||
Total distributions | - | - | - | - | - | ||||||||||||||||||
Net asset value, end of period | $ | 72.10 | $ | 45.13 | $ | 39.15 | $ | 35.95 | $ | 29.86 | |||||||||||||
Total Investment Return | 59.76 | % | 15.27 | % | 8.90 | % | 20.40 | % | 37.48 | % | |||||||||||||
Ratios/Supplemental Data | |||||||||||||||||||||||
Net assets, end of period (000's) | $ | 380 | $ | 7 | $ | 6 | $ | 6 | $ | 5 | |||||||||||||
Ratio of net investment loss to average net assets | (1.93 | )% | (2.02 | )% | (2.08 | )% | (1.97 | )% | (1.80 | )% | |||||||||||||
Ratio of expenses to average net assets | 2.06 | % | 2.63 | % | 2.65 | % | 2.50 | % | 2.24 | % | |||||||||||||
Fund portfolio turnover rate | 9 | % | 12 | % | 9 | % | 9 | % | 17 | % | |||||||||||||
* Numbers were calculated using a weighted-average number of shares outstanding basis as a result of a significant change in Class I assets immediately prior to end of period.
** Numbers reflected significant subscription and redemption activity in Class I during the period.
See Accompanying Notes to Financial Statements which are an integral part of these financial statements.
76
Pacific Advisors Fund Inc.
Notes to Financial Statements
December 31, 2013
Note 1. Organization
Pacific Advisors Fund Inc. (the "Company") is an open-end diversified investment management company registered under the Investment Company Act of 1940, as amended. The Company currently offers six Funds: Government Securities Fund, Income and Equity Fund, Balanced Fund, Large Cap Value Fund, Mid Cap Value Fund and Small Cap Value Fund (individually, a "Fund," or collectively, the "Funds"). Each Fund is a separate investment portfolio of the Company with a distinct investment objective, investment program, policies and restrictions.
The Government Securities Fund seeks to provide high current income, preservation of capital, and rising future income, consistent with prudent investment risk. The Income and Equity Fund seeks to provide current income and, secondarily, long-term capital appreciation. The Balanced Fund seeks to achieve long-term capital appreciation and income consistent with reduced risk. The Large Cap Value Fund seeks to achieve long-term capital appreciation. The Mid Cap Value Fund seeks to achieve long-term capital appreciation. The Small Cap Value Fund seeks to provide capital appreciation through investment in small capitalization companies.
The Funds offer Class A and Class C shares. In addition to Class A and Class C shares, the Small Cap Value Fund introduced Class I shares on October 9, 2006. Each class has equal rights as to assets and voting privileges except that Class A and Class C each has exclusive voting rights with respect to its distribution plan. Investment income, realized and unrealized capital gains and losses, and the common expenses of each Fund are allocated on a pro rata basis to each class based on the relative net assets of each class to the total net assets of the Fund. Each Class of shares differs in its respective service and distribution expenses and may differ in its transfer agent, registration, and certain other class-specific fees and expenses.
The Company enters into contracts that contain a variety of indemnifications. The Company's maximum exposure under these arrangements is unknown. However, the Company has not had prior claims or losses pursuant to these contracts and expects the risk of loss to be remote.
Note 2. Significant Accounting Policies
A. Security Valuation and Fair Value Measurement. Securities, including American Depository Receipts (ADRs), listed on a national securities exchange and certain over-the-counter ("OTC") issues traded on the NASDAQ national market system are valued at the last quoted sale price at the close of the New York Stock Exchange. OTC issues not quoted on the NASDAQ system, and other equity securities for which no sale price is available, are valued at the last bid price as obtained from published sources or real time quote services, where available, and otherwise from brokers who are market makers for such securities. Debt securities with a maturity less than 60 days are valued on an amortized cost basis, which approximates fair market value. In determining the fair value of other debt securities, Pacific Global Investment Management Company, Inc. (the "Investment Manager") utilizes independent pricing services approved by the Board of Directors using one or more of the following valuation techniques:
(1) a matrix pricing approach that considers market inputs including, in approximate order of priority, the following: benchmark yields, reported trades, broker/dealer quotes, issuer spreads, two-sided markets, benchmark securities, bids, offers and reference data including market research publications; market indicators, industry and economic events. Evaluators may prioritize inputs differently on any given day for any security based on market conditions, and not all inputs listed are available for use in the evaluation process for each security evaluation on any given day; (2) a comparison of the value of the borrower's outstanding equity and debt to that of comparable public companies; (3) a discounted cash flow analysis. Fair value determinations are made by the Investment Manager based on the Company's Fair Value Procedure, as adopted by the Board of Directors. In conducting its assessment and analysis for purpose of determining fair value, the Investment Manager uses its discretion and judgment in considering and appraising the relevant factors, including examining the source and nature of the quotations, to validate that the quotations and prices are representative of fair value.
Various inputs are used to determine the fair value of each Fund's investments. For financial statements, these inputs are summarized in the three broad levels listed below. Level 1 inputs are based on quoted prices in active markets for identical securities. Level 2 inputs are based on significant observable market inputs, such as quoted prices for similar securities and quoted prices in inactive markets. Level 3 inputs are significant unobservable inputs that reflect the Fund's own assumptions in determining the fair value of investments. The valuation levels are not necessarily an indication of the risk associated with investing in those securities.
77
Pacific Advisors Fund Inc.
Notes to Financial Statements
December 31, 2013
The following is a summary of the inputs used to value each Fund's investment securities and cash and cash equivalents as of December 31, 2013:
| Government Securities Fund | Income and Equity Fund | Balanced Fund | Large Cap Value Fund | Mid Cap Value Fund | Small Cap Value Fund | ||||||||||||||||||||||
Level 1 - Quoted Prices | |||||||||||||||||||||||||||
Common Stock | |||||||||||||||||||||||||||
Energy | $ | 31,226 | $ | 356,845 | $ | 1,330,980 | $ | 212,520 | $ | 1,382,258 | $ | 37,194,950 | |||||||||||||||
Materials | - | 194,910 | - | - | 302,496 | 4,904,150 | |||||||||||||||||||||
Industrials | 17,531 | 614,398 | 3,431,109 | 1,346,872 | 3,415,049 | 92,590,451 | |||||||||||||||||||||
Consumer Discretionary | 29,109 | 650,700 | 921,802 | 945,178 | 1,802,297 | 41,391,390 | |||||||||||||||||||||
Consumer Staples | 90,875 | 971,756 | 488,345 | 1,054,016 | 112,056 | 9,291,600 | |||||||||||||||||||||
Health Care | 33,618 | 536,480 | - | 239,508 | - | - | |||||||||||||||||||||
Financials | - | 122,020 | 741,798 | 1,076,655 | 205,821 | 20,509,600 | |||||||||||||||||||||
Information Technology | 31,815 | 516,663 | 645,885 | 1,368,296 | - | - | |||||||||||||||||||||
Telecommunication Services | 35,160 | 561,920 | - | - | - | 6,722,200 | |||||||||||||||||||||
Utilities | 84,452 | 630,050 | - | - | - | - | |||||||||||||||||||||
Preferred Stock | |||||||||||||||||||||||||||
Financials | - | 74,700 | - | - | - | - | |||||||||||||||||||||
Level 1 Total | 353,786 | 5,230,442 | 7,559,919 | 6,243,045 | 7,219,977 | 212,604,341 | |||||||||||||||||||||
Level 2 - Other significant observable inputs | |||||||||||||||||||||||||||
Bonds and notes | |||||||||||||||||||||||||||
Corporate Bonds | - | 5,556,495 | 3,036,689 | - | - | - | |||||||||||||||||||||
U.S. Government Fixed Income Securities | 1,706,605 | - | - | - | - | - | |||||||||||||||||||||
Short Term Investments | |||||||||||||||||||||||||||
Money Market | 40,618 | 586,434 | - | - | - | 1,143,295 | |||||||||||||||||||||
Level 2 Total | 1,747,223 | 6,142,929 | 3,036,689 | - | - | 1,143,295 | |||||||||||||||||||||
Level 3 - Significant unobservable inputs | - | - | - | - | - | - | |||||||||||||||||||||
Total Investments | $ | 2,101,009 | $ | 11,373,371 | $ | 10,596,608 | $ | 6,243,045 | $ | 7,219,977 | $ | 213,747,636 | |||||||||||||||
Equity securities (common and preferred stock) that are actively traded and market priced are classified as Level 1 securities. All fixed income securities are classified as Level 2 securities and are valued using either amortized cost or the matrix pricing approach. The Funds had no Level 3 holdings during the period ended December 31, 2013. In addition, the Funds are required to disclose the amounts of significant transfers between Level 1 and Level 2 of the fair value hierarchy and the reasons for these transfers. The Investment Manager has evaluated the Funds' positions for the period ended December 31, 2013, and determined that, for purposes of fair value pricing measurement, there were no transfers between Level 1 and Level 2.
B. Cash and Cash Equivalents. The Company considers all highly liquid financial instruments with maturities of less than three months when acquired to be cash equivalents.
C. Security Transactions and Investment Income. Security transactions are accounted for on the trade date. The cost of investments sold is determined by use of the specific identification method for both financial reporting and federal income tax purposes. Dividends are recorded on the ex-dividend date. Interest income is recorded on an accrual basis. Premium or discount on debt securities are amortized using the effective interest amortization method.
D. Dividends and Distributions to Shareholders. The Government Securities Fund and Income and Equity Fund declare and distribute dividends of their net investment income, if any, quarterly. The Balanced Fund, Large Cap Value Fund, Mid Cap Value Fund and Small Cap Value Fund declare and distribute dividends of their net investment income, if any, annually. In addition, each Fund declares and distributes a capital gain dividend, if any, annually. The Board of Directors determines the amount and timing of such payments.
E. Federal Income Tax. The Company intends to comply with the requirements of Subchapter M of the Internal Revenue Code applicable to regulated investment companies and to distribute substantially all of their taxable income to their shareholders. Therefore, no federal income tax provision is required.
Management has analyzed the Funds' tax positions taken on federal income tax returns for all open tax years and for the year ended December 31, 2013 and has concluded that no provision for income tax is required in the Funds' financial statements. Tax years 2010, 2011, 2012 and 2013 are still subject to examination by major federal jurisdictions. Tax years 2009, 2010, 2011, 2012 and 2013 are still subject to examination by major state jurisdictions.
78
Pacific Advisors Fund Inc.
Notes to Financial Statements
December 31, 2013
The Funds recognize interest and penalties, if any, related to unrecognized tax benefits as income tax expense in the Statement of Operations. During the period, the Funds did not incur any interest or penalties.
At December 31, 2013, components of distributable earnings (accumulated deficits) on a tax basis were as follows:
| Government Securities Fund | Income and Equity Fund | Balanced Fund | Large Cap Value Fund | Mid Cap Value Fund | Small Cap Value Fund | ||||||||||||||||||||||
Undistributed ordinary income | $ | - | $ | 376 | $ | - | $ | - | $ | - | $ | - | |||||||||||||||
Undistributed long-term gains | - | - | 111,775 | 70,118 | - | - | |||||||||||||||||||||
Capital loss carry forward* | (178,060 | ) | (490,239 | ) | - | - | (1,474,057 | ) | (1,798,458 | ) | |||||||||||||||||
| Net unrealized appreciation on investments | 97,573 | 1,420,731 | 2,985,361 | 1,846,545 | 2,726,760 | 90,518,447 | |||||||||||||||||||||
Accumulated earnings (deficits) | $ | (80,487 | ) | $ | 930,868 | $ | 3,097,136 | $ | 1,916,663 | $ | 1,252,703 | $ | 88,719,989 | ||||||||||||||
The difference between book basis and tax basis unrealized appreciation (depreciation) is attributable primarily to the tax deferral of losses on wash sales and characterization of certain income items. The Funds intend to treat post October losses (net capital losses incurred for the period subsequent to October 31, 2013 through the fiscal year end December 31, 2013) as having been incurred in the next fiscal year.
The Funds intend to utilize provisions of the federal income tax laws which allow them to carry a realized capital loss forward for eight years following the year of the loss and offset such losses against any future realized capital gains. During the current fiscal year, the following capital losses carried forward have been utilized:
| Government Securities Fund | Income and Equity Fund | Balanced Fund | Large Cap Value Fund | Mid Cap Value Fund | Small Cap Value Fund | ||||||||||||||||||||||
Capital loss carryforward utilized | $ | 22,305 | $ | 95,365 | - | $ | 167,591 | - | $ | 5,117,592 | |||||||||||||||||
* At December 31, 2013, the following Funds had accumulated net realized losses on investment transactions that represent capital loss carryforwards for federal income tax purposes, which expire as follows:
Capital losses expiring in: | |||||||||||||||||||||||||||
2014 | 2015 | 2016 | 2017 | 2018 | Total | ||||||||||||||||||||||
Government Securities Fund | $ | 88,644 | $ | 1,178 | $ | 9,585 | $ | 73,971 | $ | 4,682 | $ | 178,060 | |||||||||||||||
Income and Equity Fund | - | - | 102,173 | 388,066 | - | 490,239 | |||||||||||||||||||||
Balanced Fund | - | - | - | - | - | - | |||||||||||||||||||||
Large Cap Value Fund | - | - | - | - | - | - | |||||||||||||||||||||
Mid Cap Value Fund | - | - | 785,984 | 640,167 | - | 1,426,151 | |||||||||||||||||||||
Small Cap Value Fund | - | - | - | - | 1,798,458 | 1,798,458 | |||||||||||||||||||||
During the year ended December 31, 2013, the Government Securities Fund had a capital loss carryforward in the amount of $27,190 that expired.
The Regulated Investment Company Modernization Act of 2010 (the "Act") changed various technical rules governing the tax treatment of regulated investment companies ("RICs") including the Funds. Under the Act, each Fund is permitted to carry forward capital losses incurred in taxable years beginning in 2011 for an unlimited period. However, any losses incurred during those future taxable years will be required to be utilized prior to the losses incurred in pre-enactment taxable years, which carry an expiration date. As a result of this ordering rule, pre-enactment capital loss carryforwards may be more likely to expire unused. Additionally, post-enactment capital loss carryforwards will retain their character as either short-term or long-term capital losses rather than being considered all short-term as permitted under previous regulation.
Finally, the Modernization Act contains several provisions aimed at preserving the character of distributions made by a fiscal year RIC during the portion of its taxable year ending after October 31 or December 31, reducing the circumstances under which a RIC might be required to file amended Forms 1099 to restate previously reported distributions.
79
Pacific Advisors Fund Inc.
Notes to Financial Statements
December 31, 2013
During the current fiscal year, the following capital losses carried forward under the provisions of the Modernization Act have been utilized:
| Loss Carryforward Utilized | |||||||||||
Short Term | Long Term | ||||||||||
Income and Equity Fund | $ | 12,577 | $ | 49,733 | |||||||
Large Cap Value Fund | 6,933 | 7,680 | |||||||||
Mid Cap Value Fund | - | 210,558 | |||||||||
Losses that will be carried forward under the provisions of the Modernization Act are as follows:
| Loss Carryforward Character | |||||||||||
Short Term | Long Term | ||||||||||
Mid Cap Value Fund | $ | 27,116 | $ | 20,790 | |||||||
F. Reclassification of Capital Accounts. Distributions of net investment income and realized gains are determined in accordance with income tax regulations which may differ from GAAP. These differences are due to differing treatments for items such as net operating losses, reclassification of dividends and return of capital. To the extent that these differences are permanent in nature, reclassifications are made among the net asset accounts on the Statement of Assets and Liabilities. Net assets and net asset value per share are not affected by this classification.
For the year ended December 31, 2013, reclassifications among the components of net assets are as follows:
| Accumulated Undistributed Net Investment Income | Paid in Capital | Accumulated Capital Gain/(Loss) | |||||||||||||
Government Securities Fund | $ | 53,912 | $ | (81,102 | ) | $ | 27,190 | ||||||||
Income and Equity Fund | - | - | - | ||||||||||||
Balanced Fund | 146,567 | - | (146,567 | ) | |||||||||||
Large Cap Value Fund | 14,366 | (14,366 | ) | - | |||||||||||
Mid Cap Value Fund | 189,782 | (189,782 | ) | - | |||||||||||
Small Cap Value Fund | 3,170,452 | (3,170,452 | ) | - | |||||||||||
The reclassifications were due to net investment losses incurred by the Funds, which are not permitted to be carried forward for tax purposes, expiration of capital losses previously carried-forward and differing book and tax treatment of certain securities.
G. Use of Estimates. The preparation of financial statements in conformity with U.S. GAAP requires management to make estimates and assumptions that affect the reported amounts in the financial statements and footnotes. Actual results could differ from those estimates.
Note 3. Investment Management, Distributor and Other Related Party Transactions
The Company and the Funds have entered into investment management agreements ("Management Agreements") with the Investment Manager.
The Management Agreements provide for investment management fees, payable monthly, and calculated at the maximum annual rate of 0.65% of average net assets for the Government Securities Fund, 0.75% of average net assets for the Income and Equity, Balanced, Large Cap Value and Small Cap Value Funds and 1.00% of average net assets for the Mid Cap Value Fund.
In accordance with Expense Limitation Agreements with the Company, the Investment Manager waives its respective management fees to the extent that the actual operating expenses of the following Funds exceed the following thresholds:
Class A | Class C | ||||||||||
Government Securities Fund | 1.65 | % | 2.40 | % | |||||||
Income and Equity Fund | 1.95 | % | 2.70 | % | |||||||
Large Cap Value Fund | 2.65 | % | 3.40 | % | |||||||
80
Pacific Advisors Fund Inc.
Notes to Financial Statements
December 31, 2013
For the Government Securities Fund and Large Cap Value Fund only, if net expenses exceed the above thresholds after waiver of the entire management fee, Pacific Global Investor Services, Inc. ("PGIS"), Transfer Agent for the Company, will waive its transfer agency fee to the extent necessary to reduce Class expenses to the above thresholds. The Transfer Agent does not, however, waive out of pocket expenses. These agreements may be terminated by either party upon 90 days prior written notice.
Pursuant to the Expense Limitation Agreements, providing for the voluntary waiver of fees and the assumption of expenses by the Investment Manager and Transfer Agent, the following amounts were waived for the period ended December 31, 2013.
PGIS is a wholly-owned subsidiary of the Investment Manager.
| Management Fees Waived | Transfer Agent Fees Waived | Total | |||||||||||||
Government Securities Fund | $ | 13,743 | $ | 43,200 | $ | 56,943 | |||||||||
Income and Equity Fund | 71,083 | - | 71,083 | ||||||||||||
Large Cap Value Fund | 40,351 | 43,200 | 83,551 | ||||||||||||
The Investment Manager does not have any rights to recover fees it waives or expenses it may reimburse, with respect to any of the Funds.
For the period ended December 31, 2013, Pacific Global Fund Distributors, Inc. ("PGFD"), the principal underwriter for the Company, received commissions on sales of capital stock, after deducting amounts allowed to authorized distributors as commissions. In addition, PGFD, as a registered broker-dealer, may act as broker for the Funds, in conformity with Rule 17e-1 under the Investment Company Act of 1940. The Company's Board of Directors has approved procedures for evaluating the reasonableness of commissions paid to PGFD and periodically reviews these procedures. PGFD will not act as principal in effecting any portfolio transactions for the Funds. The amounts of commissions are as follows:
| Underwriting Fees Retained | Commissions Retained | Brokerage Commissions Received (Paid) | |||||||||||||
Government Securities Fund | $ | 1 | $ | 4 | $ | (357 | ) | ||||||||
Income and Equity Fund | 3,007 | 33 | 808 | ||||||||||||
Balanced Fund | 1,672 | 561 | (1,699 | ) | |||||||||||
Large Cap Value Fund | 1,471 | 1,959 | 267 | ||||||||||||
Mid Cap Value Fund | 1,278 | 277 | 816 | ||||||||||||
Small Cap Value Fund | 41,262 | 6,772 | 21,348 | ||||||||||||
PGFD is a wholly-owned subsidiary of the Investment Manager.
The Company has also entered into separate agreements with PGIS that provide for transfer agent fees at a rate of $21 per year per open account and $3.50 per year per closed account, with a minimum charge of $1,800 per month per class for each fund; fund accounting fees equal to the greater of $1,500 or three basis points for the first hundred million in net assets and one basis point on the balance of net assets for each fund per month; and annual administrative agent fees of five basis points of average daily net assets of each fund subject to a maximum annual fee of $50,000 per fund. The fee is computed and payable monthly.
On the Statement of Assets and Liabilities, "Accounts payable to related parties" consist of transfer agent fees payable to PGIS.
The Company has adopted a plan of distribution whereby the Funds may pay a service fee to qualified recipients in an amount up to 0.25% per annum of each Fund's average daily net assets for Class A shares. The Company has also adopted a plan of distribution whereby the Funds may pay a service fee to qualified recipients in an amount up to 0.25% per annum of each Fund's average daily net assets for Class C shares and a distribution fee in an amount up to 0.75% per annum of each Fund's average daily net assets for Class C shares. The Company has not adopted a plan of distribution for Class I Shares.
For the period ended December 31, 2013, total distribution and/or service (12b-1) fees were:
Class A | Class C | Total | |||||||||||||
Government Securities Fund | $ | 4,199 | $ | 4,348 | $ | 8,547 | |||||||||
Income and Equity Fund | 18,715 | 19,918 | 38,633 | ||||||||||||
Balanced Fund | 11,283 | 55,910 | 67,193 | ||||||||||||
Large Cap Value Fund | 11,695 | 7,021 | 18,716 | ||||||||||||
Mid Cap Value Fund | 13,259 | 10,273 | 23,532 | ||||||||||||
Small Cap Value Fund | 330,675 | 100,361 | 431,036 | ||||||||||||
81
Pacific Advisors Fund Inc.
Notes to Financial Statements
December 31, 2013
Note 4. Purchase and Sales of Securities
The following summarizes purchases and sales of investment securities, other than short-term investments, and aggregate gross unrealized appreciation and depreciation on a tax basis by each Fund for the period ended and as of December 31, 2013. The difference between book basis and tax basis unrealized appreciation is attributable primarily to the tax deferral of losses on wash sales.
| Period ended December 31, 2013 | As of December 31, 2013 | ||||||||||||||||||||||||||
| Cost of Purchases | Proceeds From Sales | Tax Cost of Securities | Gross Unrealized Appreciation | Gross Unrealized Depreciation | Net Unrealized Appreciation | ||||||||||||||||||||||
Government Securities Fund | $ | 2,697,038 | $ | 2,959,174 | $ | 1,962,818 | $ | 97,713 | $ | 140 | $ | 97,573 | |||||||||||||||
Income and Equity Fund | 5,154,234 | 1,840,643 | 9,366,206 | 1,440,158 | 19,427 | 1,420,731 | |||||||||||||||||||||
Balanced Fund | 2,300,814 | 4,909,085 | 7,611,247 | 2,986,878 | 1,517 | 2,985,361 | |||||||||||||||||||||
Large Cap Value Fund | 1,675,525 | 1,303,149 | 4,396,500 | 1,848,776 | 2,231 | 1,846,545 | |||||||||||||||||||||
Mid Cap Value Fund | 952,905 | 1,019,817 | 4,493,217 | 2,894,174 | 167,414 | 2,726,760 | |||||||||||||||||||||
Small Cap Value Fund | 65,608,125 | 12,296,865 | 122,085,894 | 93,340,785 | 2,822,338 | 90,518,447 | |||||||||||||||||||||
Note 5. Distributions to Shareholders
The tax character of distributions paid during 2013 and 2012 was as follows:
| Government Securities Fund | Income and Equity Fund | Balanced Fund | Large Cap Value Fund | Mid Cap Value Fund | Small Cap Value Fund | ||||||||||||||||||||||
Year ended December 31, 2013 | |||||||||||||||||||||||||||
Distributions paid from: | |||||||||||||||||||||||||||
Ordinary Income | $ | - | $ | 100,233 | $ | 122,053 | $ | - | $ | - | $ | - | |||||||||||||||
Long-Term Capital Gain | - | - | 844,506 | 121,964 | - | - | |||||||||||||||||||||
Return of Capital | - | - | - | - | - | - | |||||||||||||||||||||
Total Distributions | $ | - | $ | 100,233 | $ | 966,559 | $ | 121,964 | $ | - | $ | - | |||||||||||||||
Year ended December 31, 2012 | |||||||||||||||||||||||||||
Distributions paid from: | |||||||||||||||||||||||||||
Ordinary Income | $ | - | $ | 94,993 | $ | - | $ | - | $ | - | $ | - | |||||||||||||||
Long-Term Capital Gain | - | - | 490,804 | - | - | - | |||||||||||||||||||||
Return of Capital | - | - | - | - | - | - | |||||||||||||||||||||
Total Distributions | $ | - | $ | 94,993 | $ | 490,804 | $ | - | $ | - | $ | - | |||||||||||||||
Note 6. Capital Share Transactions
A 2% redemption fee is assessed on shares of the Government Securities Fund or Income and Equity Fund sold or exchanged within 30 days of purchase or shares of the Balanced Fund, Large Cap Value Fund, Mid Cap Value Fund or Small Cap Value Fund sold or exchanged within 180 days of purchase and is retained in each Fund. The redemption fees collected through December 31, 2013 are included in the dollar amount of shares sold in the table below. The amount of the increase is as follows:
Class A | Class C | Class I | |||||||||||||
Government Securities Fund | $ | - | $ | - | |||||||||||
Income and Equity Fund | 8 | 2 | |||||||||||||
Balanced Fund | 1,407 | 1,747 | |||||||||||||
Large Cap Value Fund | 3 | - | |||||||||||||
Mid Cap Value Fund | - | - | |||||||||||||
Small Cap Value Fund | 70,478 | 5,274 | $ | 12 | |||||||||||
82
Pacific Advisors Fund Inc.
Notes to Financial Statements
December 31, 2013
| Year ended December 31, 2013 | Year ended December 31, 2012 | ||||||||||||||||||
Shares | Amount | Shares | Amount | ||||||||||||||||
Government Securities Fund | |||||||||||||||||||
Class A | |||||||||||||||||||
Shares Sold | 26,886 | $ | 246,630 | 16,200 | $ | 149,406 | |||||||||||||
Reinvestment of Distributions | - | - | - | - | |||||||||||||||
26,886 | 246,630 | 16,200 | 149,406 | ||||||||||||||||
Shares Repurchased | (19,765 | ) | (181,572 | ) | (31,852 | ) | (293,155 | ) | |||||||||||
Net Increase (Decrease) | 7,121 | $ | 65,058 | (15,652 | ) | $ | (143,749 | ) | |||||||||||
Class C | |||||||||||||||||||
Shares Sold | 12,308 | $ | 110,607 | 5 | $ | 44 | |||||||||||||
Reinvestment of Distributions | - | - | - | - | |||||||||||||||
12,308 | 110,607 | 5 | 44 | ||||||||||||||||
Shares Repurchased | (31,588 | ) | (281,153 | ) | (59,178 | ) | (534,843 | ) | |||||||||||
Net Decrease | (19,280 | ) | $ | (170,546 | ) | (59,173 | ) | $ | (534,799 | ) | |||||||||
| Year ended December 31, 2013 | Year ended December 31, 2012 | ||||||||||||||||||
Shares | Amount | Shares | Amount | ||||||||||||||||
Income and Equity Fund | |||||||||||||||||||
Class A | |||||||||||||||||||
Shares Sold | 543,079 | $ | 5,971,466 | 155,498 | $ | 1,593,591 | |||||||||||||
Reinvestment of Distributions | 7,163 | 80,318 | 6,865 | 70,570 | |||||||||||||||
550,242 | 6,051,784 | 162,363 | 1,664,161 | ||||||||||||||||
Shares Repurchased | (202,114 | ) | (2,253,619 | ) | (140,533 | ) | (1,451,290 | ) | |||||||||||
Net Increase | 348,128 | $ | 3,798,165 | 21,830 | $ | 212,871 | |||||||||||||
Class C | |||||||||||||||||||
Shares Sold | 86,434 | $ | 913,031 | 11,204 | $ | 111,905 | |||||||||||||
Reinvestment of Distributions | 733 | 7,942 | 1,365 | 13,360 | |||||||||||||||
87,167 | 920,973 | 12,569 | 125,265 | ||||||||||||||||
Shares Repurchased | (78,464 | ) | (818,518 | ) | (143,779 | ) | (1,414,013 | ) | |||||||||||
Net Increase (Decrease) | 8,703 | $ | 102,455 | (131,210 | ) | $ | (1,288,748 | ) | |||||||||||
83
Pacific Advisors Fund Inc.
Notes to Financial Statements
December 31, 2013
| Year ended December 31, 2013 | Year ended December 31, 2012 | ||||||||||||||||||
Shares | Amount | Shares | Amount | ||||||||||||||||
Balanced Fund | |||||||||||||||||||
Class A | |||||||||||||||||||
Shares Sold | 26,192 | $ | 440,990 | 22,803 | $ | 327,821 | |||||||||||||
Reinvestment of Distributions | 23,621 | 386,678 | 10,306 | 145,620 | |||||||||||||||
49,813 | 827,668 | 33,109 | 473,441 | ||||||||||||||||
Shares Repurchased | (17,005 | ) | (277,869 | ) | (37,994 | ) | (537,412 | ) | |||||||||||
Net Increase (Decrease) | 32,808 | $ | 549,799 | (4,885 | ) | $ | (63,971 | ) | |||||||||||
Class C | |||||||||||||||||||
Shares Sold | 28,778 | $ | 432,969 | 21,255 | $ | 286,598 | |||||||||||||
Reinvestment of Distributions | 32,897 | 492,798 | 23,439 | 307,987 | |||||||||||||||
61,675 | 925,767 | 44,694 | 594,585 | ||||||||||||||||
Shares Repurchased | (207,273 | ) | (2,996,983 | ) | (389,401 | ) | (5,259,443 | ) | |||||||||||
Net Decrease | (145,598 | ) | $ | (2,071,216 | ) | (344,707 | ) | $ | (4,664,858 | ) | |||||||||
| Year ended December 31, 2013 | Year ended December 31, 2012 | ||||||||||||||||||
Shares | Amount | Shares | Amount | ||||||||||||||||
Large Cap Value Fund | |||||||||||||||||||
Class A | |||||||||||||||||||
Shares Sold | 50,422 | $ | 598,660 | 62,303 | $ | 623,985 | |||||||||||||
Reinvestment of Distributions | 7,743 | 99,578 | - | - | |||||||||||||||
58,165 | 698,238 | 62,303 | 623,985 | ||||||||||||||||
Shares Repurchased | (24,768 | ) | (296,250 | ) | (30,329 | ) | (305,362 | ) | |||||||||||
Net Increase | 33,397 | $ | 401,988 | 31,974 | $ | 318,623 | |||||||||||||
Class C | |||||||||||||||||||
Shares Sold | 7,591 | $ | 79,688 | 12,777 | $ | 115,489 | |||||||||||||
Reinvestment of Distributions | 1,445 | 16,387 | - | - | |||||||||||||||
9,036 | 96,075 | 12,777 | 115,489 | ||||||||||||||||
Shares Repurchased | (941 | ) | (9,469 | ) | (25,421 | ) | (227,410 | ) | |||||||||||
Net Increase (Decrease) | 8,095 | $ | 86,606 | (12,644 | ) | $ | (111,921 | ) | |||||||||||
84
Pacific Advisors Fund Inc.
Notes to Financial Statements
December 31, 2013
| Year ended December 31, 2013 | Year ended December 31, 2012 | ||||||||||||||||||
Shares | Amount | Shares | Amount | ||||||||||||||||
Mid Cap Value Fund | |||||||||||||||||||
Class A | |||||||||||||||||||
Shares Sold | 37,733 | $ | 524,759 | 72,344 | $ | 818,399 | |||||||||||||
Reinvestment of Distributions | - | - | - | - | |||||||||||||||
37,733 | 524,759 | 72,344 | 818,399 | ||||||||||||||||
Shares Repurchased | (32,613 | ) | (439,410 | ) | (52,621 | ) | (598,522 | ) | |||||||||||
Net Increase | 5,120 | $ | 85,349 | 19,723 | $ | 219,877 | |||||||||||||
Class C | |||||||||||||||||||
Shares Sold | 11,069 | $ | 137,917 | 2,830 | $ | 28,446 | |||||||||||||
Reinvestment of Distributions | - | - | - | - | |||||||||||||||
11,069 | 137,917 | 2,830 | 28,446 | ||||||||||||||||
Shares Repurchased | (5,473 | ) | (63,739 | ) | (25,638 | ) | (261,131 | ) | |||||||||||
Net Increase (Decrease) | 5,596 | $ | 74,178 | (22,808 | ) | $ | (232,685 | ) | |||||||||||
| Year ended December 31, 2013 | Year ended December 31, 2012 | ||||||||||||||||||
Shares | Amount | Shares | Amount | ||||||||||||||||
Small Cap Value Fund | |||||||||||||||||||
Class A | |||||||||||||||||||
Shares Sold | 1,580,059 | $ | 82,261,860 | 644,101 | $ | 24,214,265 | |||||||||||||
Reinvestment of Distributions | - | - | - | - | |||||||||||||||
1,580,059 | 82,261,860 | 644,101 | 24,214,265 | ||||||||||||||||
Shares Repurchased | (560,706 | ) | (27,816,000 | ) | (986,004 | ) | (36,714,175 | ) | |||||||||||
Net Increase (Decrease) | 1,019,353 | $ | 54,445,860 | (341,903 | ) | $ | (12,499,910 | ) | |||||||||||
Class C | |||||||||||||||||||
Shares Sold | 120,471 | $ | 5,317,905 | 36,207 | $ | 1,144,926 | |||||||||||||
Reinvestment of Distributions | - | - | - | - | |||||||||||||||
120,471 | 5,317,905 | 36,207 | 1,144,926 | ||||||||||||||||
Shares Repurchased | (48,891 | ) | (2,024,356 | ) | (60,732 | ) | (1,900,972 | ) | |||||||||||
Net Increase (Decrease) | 71,580 | $ | 3,293,549 | (24,525 | ) | $ | (756,046 | ) | |||||||||||
Class I | |||||||||||||||||||
Shares Sold | 5,113 | $ | 350,012 | 66,395 | $ | 3,001,586 | |||||||||||||
Reinvestment of Distributions | - | - | - | - | |||||||||||||||
5,113 | 350,012 | 66,395 | 3,001,586 | ||||||||||||||||
Shares Repurchased | - | - | (66,395 | ) | (2,588,343 | ) | |||||||||||||
Net Increase | 5,113 | $ | 350,012 | - | $ | 413,243 | |||||||||||||
85
Pacific Advisors Fund Inc.
Notes to Financial Statements
December 31, 2013
Note 7. Bank Borrowings
Each Fund may borrow money to the extent permitted by the 1940 Act, as amended, or any rules, exemptions or interpretations thereunder that may be adopted, granted or issued by the Securities and Exchange Commission. Under the 1940 Act, a mutual fund may borrow up to one-third of its total assets (including the amount borrowed) from banks for any purpose, and may borrow up to 5% of its total assets from banks or other lenders for temporary purposes. Each Fund may borrow to facilitate portfolio transactions or meet redemptions. The Balanced Fund, Large Cap Value Fund, and Mid Cap Value Fund also may borrow money to invest in portfolio securities. Each Fund has the ability to borrow, from UMB Bank, n.a. (UMB), on an unsecured basis, at 1.50% over the Federal Funds rate. As of December 31, 2013, the Balanced Fund, Large Cap Value Fund, and Mid Cap Value Fund had borrowings from UMB with amounts of $7,388, $6,914 and $19,123, respectively, and were paying interest at 1.54% per annum on their outstanding borrowings. No compensating balances were required.
86
Pacific Advisors Fund Inc.
Report of Independent Registered Public Accounting Firm
The Board of Directors and Shareholders
Pacific Advisors Fund Inc.
We have audited the accompanying statements of assets and liabilities of Pacific Advisors Fund Inc. (comprising, respectively, the Government Securities Fund, Income and Equity Fund, Balanced Fund, Large Cap Value Fund, Mid Cap Value Fund and Small Cap Value Fund) (the "Funds"), including the schedules of investments, as of December 31, 2013, and the related statements of operations for the year then ended, the statements of changes in net assets for each of the two years in the period then ended, and the financial highlights for each of the five years in the period then ended. These financial statements and financial highlights are the responsibility of the Funds' management. Our responsibility is to express an opinion on these financial statements and financial highlights based on our audits.
We conducted our audits in accordance with the standards of the Public Company Accounting Oversight Board (United States). Those standards require that we plan and perform the audit to obtain reasonable assurance about whether the financial statements and financial highlights are free of material misstatement. We were not engaged to perform an audit of the Funds' internal control over financial reporting. Our audits included consideration of internal control over financial reporting as a basis for designing audit procedures that are appropriate in the circumstances, but not for the purpose of expressing an opinion on the effectiveness of the Funds' internal control over financial reporting. Accordingly, we express no such opinion. An audit also includes examining, on a test basis, evidence supporting the amounts and disclosures in the financial statements and financial highlights, assessing the accounting principles used and significant estimates made by management, and evaluating the overall financial statement presentation. Our procedures included confirmation of securities owned as of December 31, 2013, by correspondence with the custodian and brokers. We believe that our audits provide a reasonable basis for our opinion.
In our opinion, the financial statements and financial highlights referred to above present fairly, in all material respects, the financial position of each of the respective funds constituting the Pacific Advisors Fund Inc. at December 31, 2013, the results of their operations for the year then ended, the changes in their net assets for each of the two years in the period then ended, and the financial highlights for each of the five years in the period then ended, in conformity with U.S. generally accepted accounting principles.

Los Angeles, California
February 28, 2014
87
Pacific Advisors Fund Inc.
Disclosure Regarding the Board's Approval
of the Funds' Advisory Contracts
The Board of Directors, including a majority of the Independent Directors, most recently approved the Investment Management Agreements (the "Agreements") for the Funds at its meeting held on August 2, 2013. At that meeting, the Board approved the continuation of the Agreements by and between Pacific Advisors Fund Inc. (the "Corporation"), on behalf of each of its Funds, and Pacific Global Investment Management Company, Inc. ("PGIMC").
In approving the Agreements, the Board considered materials relating to, among other matters: (1) the financial condition and profitability of PGIMC, including information regarding PGIMC's cost of providing services, as well as comparative expense information for a peer group of funds; (2) investment performance of each Fund, including information comparing the performance of each Fund with a peer group of funds and an appropriate index or combination of indices; (3) sales and redemption data for each Fund; (4) the extent to which economies of scale are realized as the Funds grow and whether fee levels reflect these economies of scale for the Funds' investors; (5) the economic outlook and the general investment outlook in the markets in which each Fund invests; and (6) "fall-out" benefits realized by PGIMC (i.e., ancillary benefits derived by PGIMC and its affiliates from PGIMC's relationship with the Funds). The Board also periodically considers other material facts such as the allocation of each Fund's brokerage commissions, each Fund's record of compliance with its investment policies and restrictions on personal securities transactions, and the nature, cost, and character of non-investment management services provided by PGIMC and its affiliates. In approving the Agreements, the Board relied on all information presented to it over the course of the year.
Prior to the Board's approval of the Agreements, the Independent Directors met separately with independent counsel to review the materials provided. Based on its evaluation of all material factors, the Board, including a majority of the Independent Directors, determined that the Agreements were in the best interests of the Funds and their shareholders and that the fees to be paid to PGIMC under the Agreements were fair and reasonable in relationship to the services to be rendered thereunder and in light of the factors considered. During its deliberations, the Board did not identify any single factor as all important or controlling, and individual Directors may have weighed the same factors differently. The following summaries do not detail every matter considered. Matters considered by the Board included the following:
Nature, Quality and Extent of Services. The Board examined the nature, quality and extent of the services provided by PGIMC to the Funds. The Board reviewed PGIMC's key personnel in providing investment management services to the Funds, as well as the changes in such personnel, and the duties that such personnel perform for the Funds. The Board considered the qualifications and experience of PGIMC's portfolio management team and PGIMC's commitment of its resources to portfolio management services. The Board considered PGIMC's responsibilities under the Agreements in serving as the Funds' investment manager, including responsibilities for investment research and stock selection; administration of the Funds' daily business operations; supervision of the Funds' transfer agent and administrative services agent; monitoring adherence to the Funds' investment restrictions; and monitoring compliance with various policies and procedures of the Funds. The Board was provided with, and considered information regarding, PGIMC's trading; operations; compliance; and investment research functions. The Board considered PGIMC's marketing strategy with respect to the Funds and the current asset levels of the Funds. The Board also considered the Funds' compliance program, the compliance and risk management reports periodically furnished to the Board, and the results of any regulatory exams. The Board concluded that the Funds were likely to benefit from the nature, extent and quality of the services provided by PGIMC under the Agreements.
88
Pacific Advisors Fund Inc.
Disclosure Regarding the Board's Approval
of the Funds' Advisory Contracts
Investment Performance of PGIMC and the Funds. The Board considered the performance of PGIMC and the Funds, including, to the extent applicable, each Fund's year-to-date, one-, three-, five-, and ten-year performance for the periods ended June 30, 2013 and December 31, 2012; as well as certain comparative performance information sourced by an independent data service for each Fund's benchmark(s) and funds PGIMC considered peers of the Funds. The Board was provided information regarding PGIMC's investment decision making process and trade execution policies and strategies. After reviewing the Funds' performance records, including performance relative to the Funds' benchmarks, peers and, with respect to the Income and Equity Fund and the Balanced Fund, the blended returns of these Funds' benchmarks, and each Fund's respective investment objective, strategy and role in the overall Fund complex, the Board concluded that, while past performance is no guarantee of future performance, each Fund's investment performance overall weighed in favor of renewing the relevant Agreement.
Among other factors, the Board considered:
(i) with respect to the Small Cap Value Fund: management's explanation of the Fund's investment strategy and portfolio composition; the Fund's (Class A shares) rank as of June 30, 2013 as the number one Lipper Small Cap Core fund for the year-to-date and ten-year periods and position in the top one percent for the one-year and three-year periods; the Fund's (Class A shares) rank as the number one Lipper Small Cap Core fund for the ten-year period as of December 31, 2012; and the Fund's outperformance versus its benchmark for the year-to-date, one-year, three-year, five-year and ten-year periods ended June 30, 2013;
(ii) with respect to the Mid Cap Value Fund: the Fund's performance in light of the mid-cap strategy adopted at the end of 2010 and its long-term investment approach; management's explanation of the Fund's portfolio composition and long-term growth prospects; the improvement in the Fund's one-year performance as of June 30, 2013; and the Fund's (Class A shares) ranking in the top thirteen percent of the Lipper Mid-Cap Core category for its one-year return as of June 30, 2013;
(iii) with respect to the Large Cap Value Fund: the Fund's performance in light of market conditions and the Fund's emphasis on minimizing volatility; management's explanation of the Fund's conservative approach and its expectation for the Fund to grow at a slower rate, and with less volatility, in rising markets while providing better downside protection in falling markets; and management's recognition of the difference between the Fund's concentrated portfolio focused on leading mega-cap companies within the benchmark S&P 500 Index, and the benchmark's larger number of holdings.
(iv) with respect to the Balanced Fund: the Fund's performance in light of market conditions and the Fund's investment objective and policies; management's explanation of the Fund's equity approach to seek the greatest return potential while minimizing risk and its fixed income strategy, in response to the persistently low yields and heightened interest rate volatility of the past few years, to remain concentrated in shorter-term bonds which provided greater principal protection during periods of rising interest rates and market turbulence; the Fund's transition from investing predominately in large cap equities to an all cap equity approach; the improvement in the Fund's performance during the last twelve months; the Fund's (Class A shares) position in the top two percent and top eleven percent of the Lipper Mixed Asset Target Allocation Growth category based on its year-to-date and one-year return as of June 30, 2013; and the Fund's (Class A shares) outperformance versus the Barclays Capital U.S. Intermediate Corporate Bond Index for the year-to-date, one-year and three-year periods ended June 30, 2013;
(v) with respect to the Income and Equity Fund: the Fund's performance in light of market conditions and the Fund's investment objective, strategy, and policies; management's explanation of the Fund's more
89
Pacific Advisors Fund Inc.
Disclosure Regarding the Board's Approval
of the Funds' Advisory Contracts
defensive fixed income strategy during the past few years focused on intermediate-term investment grade, lower-duration bonds to provide greater principal protection and manage interest rate risk, the Fund's use of superior, well-established equities with meaningful dividend yields to achieve total return, and the Fund's active strategy which was positioned for rising interest rates; the Fund's (Class A Shares) position in the top one percent and top seventeen percent of the Lipper Conservative Mixed Asset Target Allocation category based on its year-to-date and one-year return as of June 30, 2013; and the Fund's (Class A shares) outperformance versus the Barclays Capital U.S. Intermediate Corporate Bond Index for the year-to-date, one-year and three-year periods ended June 30, 2013; and
(vi) with respect to the Government Securities Fund: the Fund's performance in light of market conditions, the Fund's active-yet-conservative investment strategy, objective and policies; management's explanation of the difference between the performance of the Fund, which reflected the Fund's emphasis on shorter-term bonds to preserve capital and protect against risk, and its benchmark, which reflected the index's relatively wider range of maturities; the Fund's conservative positioning in anticipation of a rising interest rate environment; and the Fund's year-to-date and one-year performance as of June 30, 2013 and the Fund's (Class A Shares) position in the top one percent and top six percent of the Lipper General US Govt category based on its year-to-date and one-year return as of June 30, 2013.
Costs of Services and Profits Realized by PGIMC. The Board reviewed PGIMC's 2012 audited financial statements. The Board reviewed the 2012 consolidated statement of operations of PGIMC and its subsidiaries and also considered the costs and profitability of PGIMC and its affiliates from their operations. The Board also reviewed the 2012 consolidated statement of financial condition of PGIMC and its subsidiaries and considered the financial condition of PGIMC and its ability to provide the quality of services specified under the Agreements and expected by the Board. The Board examined the fee information for the Funds as compared to that of comparable funds managed by other advisers, and in light of the investment strategy applied to each Fund. The comparative fee information provided to the Board indicated that each Fund's advisory fees were within the range of those charged by funds PGIMC considered peers of the Funds based on factors such as portfolio characteristics, investment style and asset level. The Board noted, however, that the total expenses for each Fund placed it as the most expensive fund in its respective peer group. The Board reviewed a description of the methodology used for selecting the funds in each peer group. The Board considered that during 2012, PGIMC had waived fees and reimbursed expenses for the Government Securities Fund, Income and Equity Fund, and Large Cap Value Fund in order to reduce their expenses; and that PGIMC expected to continue to waive fees for the Government Securities Fund, Income and Equity Fund, and Large Cap Value Fund in 2013 to the extent expenses exceed the agreed expense limits for those Funds. Another factor was that, over the history of the Funds, PGIMC and its affiliates had waived and/or reimbursed expenses for all the Funds in excess of $4.2 million. The Board also considered that affiliates of PGIMC provide distribution, administrative, and transfer agency services for the Funds, and, based on information furnished by PGIMC, the benefits to the Funds of having such services provided by such affiliates. The Board also considered the Funds' sales and redemption data in the first six months of 2013, in light of current market conditions. The Board concluded that the Funds' management fees were reasonable in light of the services provided.
Economies of Scale. The Board considered the extent to which the Funds' management fees reflect economies of scale for the benefit of the Funds' shareholders. The Board reviewed the Funds' fee arrangements, which include breakpoints that decrease the fee rate as the Funds' assets increase. The Board considered the fact that current assets were well below the threshold for the initial advisory fee breakpoint for each Fund. The Board noted that the expense ratios for the Funds were impacted by lower asset levels for most of the Funds in 2012 as compared to 2011. Based on its review, the Board concluded that the Funds'
90
Pacific Advisors Fund Inc.
Disclosure Regarding the Board's Approval
of the Funds' Advisory Contracts
management fee structures allow shareholders to benefit from economies of scale as the Funds' assets increase. The Board also considered that PGIMC had been waiving fees and reimbursing expenses for the Government Securities Fund, Income and Equity Fund, and the Large Cap Value Fund.
Other Benefits to PGIMC. In evaluating the benefits that accrue to PGIMC through its relationship with the Funds, the Board recognized that, in addition to providing advisory services, PGIMC and its affiliates serve the Funds in various capacities, including as transfer agent, administrative services agent and distributor, and receive compensation from the Funds in connection with providing these services. The Board considered that each service provided to the Funds by PGIMC or one of its affiliates is pursuant to a written agreement, which the Board evaluates periodically. The Board also considered the benefits that accrue to PGIMC through its relationship with the Funds in its management of separately managed accounts, and another fund for which it serves as sub-adviser. The Board concluded that the benefits were consistent with PGIMC's rights and obligations under the Agreements.
After full consideration of these and other factors, the Board, including a majority of the Independent Directors, concluded that approval of the Agreements was in the best interest of the Funds and their shareholders.
91
Pacific Advisors Fund Inc.
Directors and Officers
"Independent" Directors
Name (Age) | Position with the Company1 | Year elected Director of the Company | Principal occupation(s) during past 5 years | Other Directorships held by Director | |||||||||||||||
| L. Michael Haller, III (70) | Director | 1992 | Consultant, d/b/a Asahi Broadcasting Enterprises (software development); Chairman and President, Gammaker Pte. Ltd. (mobile game developer); and formerly Executive Vice President, MGT Capital Investments (mobile game developer) (2013); CEO, Digital Angel, Inc. (communications equipment distributor) (2012-2013); Chairman, Kapitall, Inc. (online introducing brokerage) (2011-2012); President, Bionic Games, Inc. (game software development company) (2008-2011); and Vice President and General Manager, Kapitall Studio (division of Kapitall, Inc.) (2010-2011) | Digital Angel, Inc. | |||||||||||||||
| Peter C. Hoffman (63) | Director | 2010 | President, Sierra Autocars, Inc. (auto dealership), Sierra Vehicles, Inc. (auto dealership), Sierra Automotive Enterprises, Inc. (auto dealership) and Sierra Pursuits, Inc. (management company) | None | |||||||||||||||
| Gerald E. Miller (84) | Director | 1992 | Retired in 1992; and formerly worked for Merrill Lynch for over 30 years and was a Senior Resident Vice President at retirement in 1992 | None | |||||||||||||||
| Louise K. Taylor, PhD (67) | Director | 1992 | Assistant Executive Director, Employers Association of California; and formerly Superintendent, Monrovia Unified School District (1991-2009) | None | |||||||||||||||
"Interested" Directors2
Name (Age) | Positions with the Company1 | Year elected a Director and officer of the Company | Principal occupations during past 5 years | Other Directorships held by Director | |||||||||||||||
| Victoria L. Breen (62)* | Director Assistant Secretary | 1992 2002 | President, Derby & Derby, Inc. (financial services company); Agent, Transamerica Life Companies; Registered Principal, Transamerica Financial Advisors, Inc.; and Assistant Secretary and Director, Pacific Global Investment Management Company | None | |||||||||||||||
| George A. Henning (66)** | President and Chairman | 1992 | Chairman, President and Director, Pacific Global Investment Management Company; and Chairman and Director, Pacific Global Fund Distributors, Inc. and Pacific Global Investor Services, Inc. | None | |||||||||||||||
Each Director oversees all 6 Pacific Advisors Fund portfolios.
The Fund's Statement of Additional Information contains additional information about the Fund's Directors and Officers and is available without charge upon request by calling (800) 989-6693. The business address for all Directors and officers of the Company is 101 N. Brand Blvd., Suite 1950, Glendale, CA 91203, Attn: Secretary.
92
Pacific Advisors Fund Inc.
Directors and Officers
Other Officers
Name (Age) | Position(s) with the Company | Year elected an officer of the Company | Principal occupations during past 5 years | ||||||||||||
| Catherine L. Henning (36) | Vice President Secretary | 2010 2006 | Senior Vice President, Secretary, Director of Client Services and Director, Pacific Global Investment Management Company; President, Secretary, Chief Compliance Officer and Director, Pacific Global Fund Distributors, Inc.; and Vice President, Secretary and Director, Pacific Global Investor Services, Inc. | ||||||||||||
| Barbara A. Kelley (60) | Vice President, Treasurer and Chief Compliance Officer | 2001 | Executive Vice President, Chief Compliance Officer and Director, Pacific Global Investment Management Company; Director, Pacific Global Fund Distributors, Inc.; President and Director, Pacific Global Investor Services, Inc. | ||||||||||||
| Araceli Olea (41) | Assistant Secretary | 2008 | Shareholder Services Manager, Pacific Global Investor Services, Inc.; and Assistant Secretary, Pacific Global Investment Management Company and Pacific Global Investor Services, Inc. | ||||||||||||
| Jingjing Yan (40) | Assistant Treasurer | 2005 | Vice President and Treasurer, Pacific Global Investment Management Company; Treasurer, Pacific Global Fund Distributors, Inc. and Pacific Global Investor Services, Inc. | ||||||||||||
1 Each director is elected to serve until the next annual shareholders meeting and until his or her successor is elected or appointed. The Company does not hold regular annual shareholders meetings to elect Directors. Vacancies on the Board can be filled by the action of a majority of the Directors, provided that at least two-thirds of the Directors have been elected by the shareholders.
2 "Interested persons" as defined in the 1940 Act, as amended, based on their affiliation with the Funds' investment manager and its affiliates (including the Funds' principal underwriter).
* Ms. Breen is considered an interested director because (a) she is a registered principal of a registered broker/dealer that engages in sales of Company shares under a selling agreement with the Distributor, and in that capacity she has received commissions on the sale of the Funds' shares; (b) she is an officer of the Company; and (c) she is a shareholder of the Manager and a member of the Manager's Board of Directors.
** Mr. Henning is considered an interested director because (a) he holds the positions described above with the Company, the Manager and its affiliates; (b) by virtue of his ownership of the Manager's shares he may be deemed a "control person" of the Manager; and (c) he is Ms. Henning's father.
93
Pacific Advisors Fund Inc.
Additional Tax Information (Unaudited)
For federal income tax purposes, the following information is furnished with respect to the distributions paid by the Funds during the taxable year ended December 31, 2013. The Funds designated and paid as short-term capital gain and long-term capital gain distributions as follows:
| Government Securities Fund | Income and Equity Fund | Balanced Fund | Large Cap Value Fund | Mid Cap Value Fund | Small Cap Value Fund | ||||||||||||||||||||||
Short-term capital gain distributions | - | - | $ | 122,053 | - | - | - | ||||||||||||||||||||
Long-term capital gain distributions | - | - | $ | 844,506 | $ | 121,964 | - | - | |||||||||||||||||||
A percentage of the dividends distributed during the fiscal year for the Funds qualifies for the dividends-received deduction for corporate shareholders:
| Government Securities Fund | Income and Equity Fund | Balanced Fund | Large Cap Value Fund | Mid Cap Value Fund | Small Cap Value Fund | ||||||||||||||||||||||
Corporate dividends-received deduction | N/A | 100.00 | % | N/A | N/A | N/A | N/A | ||||||||||||||||||||
Under the Jobs and Growth Tax Relief Reconciliation Act of 2003 (the "Act"), the following percentage of ordinary dividends paid during the taxable year ended December 31, 2013 are designated as "qualified dividend income," as defined in Act and subject to reduced tax rates in 2013.
| Government Securities Fund | Income and Equity Fund | Balanced Fund | Large Cap Value Fund | Mid Cap Value Fund | Small Cap Value Fund | ||||||||||||||||||||||
Percentage of qualified dividends | N/A | 100.00 | % | N/A | N/A | N/A | N/A | ||||||||||||||||||||
In January 2014, the Funds provided tax information to shareholders for the preceding calendar year.
94
Pacific Advisors Fund Inc.
notes
95
Pacific Advisors Fund Inc.
notes
96

Pacific Advisors Fund Inc.
Directors
George A. Henning, Chairman
Victoria L. Breen
L. Michael Haller, III
Peter C. Hoffman
Gerald E. Miller
Louise K. Taylor, Ph.D.
Officers
George A. Henning, President
Catherine L. Henning, Vice President and Secretary
Victoria L. Breen, Assistant Secretary
Araceli Olea, Assistant Secretary
Barbara A. Kelley, Treasurer
Jingjing Yan, Assistant Treasurer
Investment Manager
Pacific Global Investment Management Company
101 North Brand Blvd., Suite 1950
Glendale, California 91203
Transfer Agent and Administrator
Pacific Global Investor Services, Inc.
101 North Brand Blvd., Suite 1950
Glendale, California 91203
Distributor
Pacific Global Fund Distributors, Inc.
101 North Brand Blvd., Suite 1950
Glendale, California 91203
(800) 989-6693
Availability of Quarterly Portfolio Schedule
The Fund files its complete schedule of portfolio holdings with the SEC for the first and third quarters of each fiscal year on Form N-Q. The Fund's Forms N-Q are available on the SEC's Web site at http://www.sec.gov. The Fund's Forms N-Q may be reviewed and copied at the SEC's Public Reference Room in Washington, DC. Information about the operation of the Public Reference Room may be obtained by calling the SEC at (800) SEC-0330.
The Fund's complete schedule of portfolio holdings for each fiscal quarter is posted on the Fund's Web site at www.PacificAdvisorsFund.com and is available without charge, upon request by calling (800) 989-6693. Documents will be sent within 3 business days of receipt of your request.
Availability of Proxy Voting Policies and Procedures and Proxy Voting Record
A description of the policies and procedures that the Fund uses to determine how to vote proxies relating to portfolio securities and information regarding how the Fund voted proxies relating to portfolio securities during the most recent 12-month period ended June 30 is available without charge, upon request by calling (800) 989-6693. Documents will be sent within 3 business days of receipt of your request. This information is also available on the SEC's Web site at http://www.sec.gov.

Pacific Global Fund Distributors, Inc.
101 North Brand Blvd., Suite 1950
Glendale, California 91203

Item 2. Code of Ethics
Registrant has adopted a Code of Ethics pursuant to Section 406 of the Sarbanes-Oxley Act of 2002 that applies to Registrant’s principal executive officer, principal financial officer, principal accounting officer or controller. Registrant will provide to any person without charge, upon request, a copy of the Code of Ethics if such person submits a request in writing addressed to the Registrant’s secretary at the principal executive offices listed above.
Item 3. Audit Committee Financial Expert
Registrant’s Audit Committee has three members.�� While these members are “financially literate,” the Board has determined that none of the members of the Audit Committee meet the technical definition of “audit committee financial expert.” Registrant has determined that an audit committee financial expert is not necessary at this time because (i) the Audit Committee members are financially literate; (ii) they have served on Registrant’s Audit Committee for several years; (iii) the accounting methodologies applicable to registered investment companies and the types of investment activities in which the Funds engage are well established; and (iv) Registrant’s financial statements do not involve the types of complex accounting issues that other types of public companies may have.
Item 4. Principal Accountant Fees and Services
(a)-(d) Ernst & Young LLP (“E&Y”) billed the Registrant aggregate fees for professional services rendered for the fiscal years ending December 31, 2012, and December 31, 2013, as follows:
|
| Audit Fees |
| Audit Related Fees |
| Tax Fees |
| All Other Fees |
| ||||
2013 |
| $ | 165,500 |
| $ | 2,500 |
| $ | 32,000 |
| $ | 0 |
|
2012 |
| $ | 165,500 |
| $ | 2,500 |
| $ | 32,500 |
| $ | 0 |
|
(b) Audit Related Fees are for services rendered to provide consent of the annual update to the Corporation’s Form N1-A and non-routine N1-A filings.
(c) Tax Fees include the services for the review of income tax returns and excise taxes.
(e)(1) The Audit Committee is authorized to pre-approve non-audit services provided by the Corporation’s auditors, if they find it appropriate in light of their fiduciary duties and in the exercise of their good faith business judgment and compatible with the auditors’ independence. The Chairman of the Audit Committee is authorized to approve audit and non-audit services for newly established funds of the Corporation on the same terms as the full Audit Committee previously had approved for the then existing funds, and to approve non-audit services which are permissible under applicable law, provided the estimated fee is not more than $5,000 based on a good faith estimate provided by the auditor. The Chairman shall report any such pre-approval to the Audit Committee at its next following meeting.
(e)(2) None.
(f) None.
(g) None.
(h) Not applicable.
Item 5. Audit Committee of Listed Registrants
Not applicable as Registrant is not a listed issuer as defined in Rule 10A-3 under the Securities Exchange Act of 1934.
Item 6. Statements of Investments
Statements of Investments is included as part of the report to shareholders filed under Item 1 of this form.
Item 7. Disclosure of Proxy Voting Policies and Procedures for Closed-End Management Investment Companies
Not applicable to open-end investment companies.
Item 8. Portfolio Managers of Closed-End Management Investment Companies
Not applicable to open-end investment companies.
Item 9. Purchases of Equity Securities by Managers of Closed-End Management Investment Company and Affiliated Purchasers.
Not applicable to open-end investment companies.
Item 10. Submission of Matters to a Vote of Security Holders
No material changes have been made.
Item 11. Controls and Procedures.
(a) Based upon their evaluation of Registrant’s disclosure controls and procedures (as defined in Rule 30a-3(c) under the Investment Company Act of 1940) as conducted within 90 days of the filing date of this Form N-CSR, Registrant’s principal executive officer and principal financial officer have concluded that those disclosure controls and procedures provide reasonable assurance that the material information required to be disclosed by Registrant on this report is recorded, processed, summarized and reported within the time periods specified in the Securities and Exchange Commission’s rules and forms.
(b) There were no changes in Registrant’s internal control over financial reporting (as defined in Rule 30a-3(d) under the Investment Company Act of 1940) that occurred during the second fiscal quarter of the period covered by this report that have materially affected, or are reasonably likely to materially affect, Registrant’s internal control over financial reporting.
Item 12. Exhibits
(a)(1) Not applicable.
(a)(2) Certifications required by Item 12(a) of Form N-CSR and Section 302 of the Sarbanes-Oxley Act of 2002 (filed herewith).
(b) Certification required by Section 906 of the Sarbanes-Oxley Act of 2002 (filed herewith).
SIGNATURES
Pursuant to the requirements of the Securities Exchange Act of 1934 and the Investment Company Act of 1940, Registrant has duly caused this report to be signed on its behalf by the undersigned, thereunto duly authorized.
Pacific Global Fund Inc. d/b/a Pacific Advisors Fund Inc.
By: | /s/ George A. Henning |
|
| George A. Henning |
|
| Chairman, Pacific Advisors Fund Inc. |
|
|
|
|
Date: | March 4, 2014 |
|
Pursuant to the requirements of the Securities Exchange Act of 1934 and the Investment Company Act of 1940, this report has been signed below by the following persons on behalf of Registrant and in the capacities and on the dates indicated.
By: | /s/ George A. Henning |
|
| George A. Henning |
|
| Chief Executive Officer |
|
|
|
|
Date: | March 4, 2014 |
|
|
|
|
By: | /s/ Barbara A. Kelley |
|
| Barbara A. Kelley |
|
| Chief Financial Officer |
|
|
|
|
Date: | March 4, 2014 |
|