UNITED STATES
SECURITIES AND EXCHANGE COMMISSION
Washington, D.C. 20549
FORM N-CSR
CERTIFIED SHAREHOLDER REPORT OF REGISTERED
MANAGEMENT INVESTMENT COMPANIES
Investment Company Act file number | 811-07062 | |||||||
| ||||||||
PACIFIC GLOBAL FUND INC. D/B/A PACIFIC ADVISORS FUND INC. | ||||||||
(Exact name of registrant as specified in charter) | ||||||||
| ||||||||
101 NORTH BRAND BLVD., SUITE 1950 GLENDALE, CALIFORNIA |
| 91203 | ||||||
(Address of principal executive offices) |
| (Zip code) | ||||||
| ||||||||
GEORGE A. HENNING 101 NORTH BRAND BLVD., SUITE 1950 GLENDALE, CA 91203 | ||||||||
(Name and address of agent for service) | ||||||||
| ||||||||
Registrant’s telephone number, including area code: | 818-242-6693 |
| ||||||
| ||||||||
Date of fiscal year end: | December 31 |
| ||||||
| ||||||||
Date of reporting period: | December 31, 2015 |
| ||||||
Item 1. Report to Shareholders
Filed herewith.

annual report
december 31, 2015
government securities fund
income and equity fund
balanced fund
large cap value fund
mid cap value fund
small cap value fund


Pacific Advisors
table of contents
Message from the Chairman | 1 | ||||||
Government Securities Fund | 4 | ||||||
Income and Equity Fund | 9 | ||||||
Balanced Fund | 15 | ||||||
Large Cap Value Fund | 21 | ||||||
Mid Cap Value Fund | 26 | ||||||
Small Cap Value Fund | 32 | ||||||
Schedule of Investments | 39 | ||||||
Statement of Assets and Liabilities | 60 | ||||||
Statement of Operations | 62 | ||||||
Statement of Changes in Net Assets | 64 | ||||||
Financial Highlights | 68 | ||||||
Notes to Financial Statements | 75 | ||||||
| Report of Independent Registered Public Accounting Firm | 88 | ||||||
| Disclosure Regarding the Board's Approval of the Funds' Advisory Contracts | 89 | ||||||
Directors and Officers | 92 | ||||||
Additional Tax Information | 94 | ||||||
This Report is submitted for the general information of the shareholders of Pacific Advisors Funds. It is not authorized for distribution to prospective investors unless accompanied or preceded by the Funds' current prospectus, which contains information concerning the investment policies of the Funds as well as other pertinent information.
This Report is for informational purposes only and is not a solicitation or recommendation that any particular investor should purchase or sell any particular security. The statements in the Chairman's Letter and the discussions of the Funds' performance are the opinions and beliefs expressed at the time of this commentary and are not intended to represent opinions and beliefs at any other time. These opinions are subject to change at any time based on market or other conditions and are not meant as a market forecast. All economic and performance information referenced is historical. Past performance does not guarantee future results.
For more information on the Pacific Advisors Funds, including information on charges, expenses and other classes offered, please obtain a copy of the prospectus by calling (800) 989-6693. Please read the prospectus and consider carefully the investment risks, objectives, charges and expenses before you invest or send money. Shares of the Pacific Advisors Funds are not deposits or obligations of any bank, are not guaranteed by any bank, are not insured by the FDIC or any other agency, and involve investment risks, including the possible loss of the principal amount invested. The investment return and principal value of an investment will fluctuate so that an investor's shares, when redeemed, may be worth more or less than their original cost.


Message
from the chairman
Dear Shareholders,
Volatility dominated the equity markets during the second half of the year; as the year ended, investors were left wondering, "What's next?" A selloff began in July after the Chinese stock market dropped 32% followed by an announcement in mid-August that China had devalued the yuan, long pegged to the U.S. dollar. China had, as we discussed in the semi-annual report, previously announced its ambition to have the yuan accepted as an international currency for trade; even so, the timing nevertheless caught investors by surprise and triggered speculation about a global economic slowdown. In response to the volatility in the international markets, the Federal Reserve chose not to initiate its first rate hike in September as many expected.
Following the August-to-September swoon, the S&P 500® Index, the Dow Jones Industrial Average, and the NASDAQ each rose over 6%; however, in the midst of ongoing market uncertainty, the gains were mostly limited to a handful of relatively "safe" large cap stocks, including Facebook, Amazon.com, Netflix, and Alphabet (formerly Google). For the year, however, approximately 35% of the stocks in the S&P 500® and 56% of the stocks in the Russell 2000® Index entered bear market territory with declines of 20% or more from their 52-week highs.
Despite market turmoil the major world economies provided reasons for optimism with Europe and Japan posting year-over-year growth; and yet investors remained cautious due to concerns of an economic slowdown in China, the Federal Reserve's interest rate liftoff, and falling oil prices. Selling pressure for many stocks increased as investors waited on the sidelines for a clearer view on the markets' near-term direction.
In October, China's leadership announced its five-year plan which calls for an annual growth rate of "around 6.5%" and an increased reliance on consumer-oriented activity. The transition to develop a consumer-driven economy is critical to reducing the country's dependence on exports and more closely aligning its economy to those of developed nations. In late November, the International Monetary Fund acknowledged China's economic reforms in approving the inclusion of the yuan, along with the dollar, the euro, the yen and the pound, as a world reserve currency.
During the second half of the year, interest rates trended higher in anticipation of the Fed's liftoff; the yield on the 10-year U.S. Treasury Note, which had risen to 2.35% as of June 30th, fell to 1.99% following the Fed's September meeting before drifting higher to close the year at 2.27%. The Fed's mid-December interest rate increase, while widely expected, nonetheless removed a significant cloud hanging over the market and signaled confidence in the U.S. economy. Still, stocks came under pressure as investors remained on the sidelines through year-end.
Meanwhile, U.S. crude oil prices fell 30% during the year due to the unrelenting supply/demand imbalance, and fears of a slowdown in demand, especially in China. As a result, the Energy sector fell 23.6%, only the sixth time since 1940 that a sector underperformed the S&P 500® Index by more than 20% for two years in a row. At current prices, most producers are operating at a loss while "petro-states" (i.e., countries which rely on oil for a significant portion of revenues) face staggering budget deficits. Economic adjustments are underway: nearly $400 billion of new energy projects have been deferred. And still, the world needs to replace 2.6 million barrels of oil per day to offset the natural depletion of existing wells, and add another 1.2 million barrels per day to meet estimated demand growth. Therefore, while oil prices may remain depressed in the near-term, the issue is not if but when oil prices will rise.
In December, Congress approved a $1.15 trillion pro-business spending package; the bill funded a five-year $305 billion transportation bill for road, bridge and mass transit projects, and ended the 40-year-old ban on crude oil exports. The removal of the export ban places the U.S. on an even playing field with global producers; shale oil, in particular, is now positioned as the world's most responsive source of supply to balance markets. OPEC's strategies, which first artificially maintained oil prices above $100 and, more recently, drove the price decline through its policy of overproduction, provided the economic incentive that led to shale technology; as oil prices recover, these outcomes will benefit the U.S. oil industry's position in the global marketplace.
1


Message
from the chairman continued
Market Review
Following the selloff in the third quarter, all major indices rebounded during the fourth quarter, but, with the exception of the NASDAQ, still ended the year in negative territory. For the year, the S&P 500® Index retreated 0.73% to snap three consecutive years of double digit returns; the Dow fell 2.23%, its first annual decline since 2008. The technology-heavy NASDAQ gained 5.73% and the Russell 2000® Index lost 5.71%. Growth outperformed Value, as value-oriented areas, including Energy and Industrials, fell to historically depressed levels while growth-oriented areas, such as Health Care and Information Technology, rose to near all-time highs. The disparity is reminiscent of the technology IPO boom in the late 1990s; then, investors focused single-mindedly on growth stocks while value stocks lagged in spite of deeply depressed valuations.
Equity Investment Review
Macro-related factors, including the downturn in energy markets, a reduction in U.S. industrial activity, and slowing growth in China, undermined market sentiment. The more conservative large cap blue chip stocks, and less volatile consumer product and food & beverage companies, outperformed. Growth stocks in Health Care and Technology sectors provided most of the gains for the year.
In contrast, the selloff in Energy-related stocks resulted in valuations that are now at or near all-time lows, in many cases falling well below the depths of the financial crisis. Shares of Industrials companies have also lagged due, in part, to concerns about the impact of the strengthening U.S. dollar on manufacturing activity. Investors seemed to overlook company fundamentals or positive news to instead focus on changes in oil prices as a barometer for the health of the global economies.
The underperformance of the Pacific Advisors equity Funds largely reflected investor preference, during this period of uncertainty, for growth over value. Looking ahead, we anticipate that renewed confidence in the global economy will provide a market catalyst. The selloff in value stocks, while certainly unwelcomed, has nevertheless provided an opportunity for the Funds to buy deeply discounted stocks in the Energy, Industrial and Consumer sectors at historically low prices. Further information on the investment strategies for each of the Funds is provided in the interviews with portfolio managers.
Fixed Income Investment Review
Interest rates trended higher in the second half of the year, with yields fluctuating based on expectations for the Fed's interest rate liftoff. Finally, the 25-basis point increase to the federal funds rate in December marked the first rate increase since 2006. Rising interest rates added to price declines for high-yield (or, "junk") bonds and bond funds, particularly those with investments in commodities and emerging markets. With crude oil prices continuing to fall, bonds of Energy-related companies sold off sharply with little regard to their financial health.
The Fed's decision to raise rates signals confidence in both the domestic and global economies as, historically, the Fed has typically raised rates during periods of economic strength. Interest rate fluctuations will likely continue as investors anticipate the Fed's upcoming rate increases. Importantly, though, Fed Chair Yellen emphasized a "gradual" pace of future rate increases, with rates likely to remain below historical levels.
Our investment strategy concentrates on fundamental characteristics, including liquidity ratios, financial strength, and expected capital spending. We have continued to focus on investment grade bonds with shorter-term maturities (e.g., 3-5 years), as well as corporate bonds temporarily out-of-favor that offer opportunities for higher yields. Further details on our fixed income strategy are provided in the Fund interviews.
Market Review • December 31, 2015
Index1 | Close | YTD Price Return | |||||||||
Dow Jones Industrial Avg | 17,425.03 | –2.23 | % | ||||||||
S&P 500® | 2,043.94 | –0.73 | % | ||||||||
NASDAQ | 5,007.41 | 5.73 | % | ||||||||
Russell Midcap® | 1,596.21 | –4.02 | % | ||||||||
Russell 2000® (small cap) | 1,135.89 | –5.71 | % | ||||||||
12/31/15 | 12/31/14 | ||||||||||
| 10-Year T-Note Yield | 2.27 | % | 2.17 | % | |||||||
Data: Bloomberg; Federal Reserve.
2


Looking Ahead
Some suggest that the lackluster market performance will lead to a recession; but, historically, the markets have been poor recession predictors. More importantly, the growing world economies support a more positive outlook; and, the usual indicators of a recession, such as higher inflation, rising interest rates, overheated economies and overvalued markets, are nowhere to be found.
Indeed, the world's major economies provided reason for optimism in 2015. Central bank policies designed to invigorate economies will continue; and, low gas prices will boost consumer spending. Most notably, Europe's recovery appears to have taken hold; the European Central Bank appears committed to accommodative monetary policies that, along with low oil prices, have helped the region achieve its fastest growth rate since 2011. Japan is once again on a path for recovery; after falling into a recession last year, the economy rebounded in the second and third quarters. And, the Chinese economy continues to expand at nearly 7% annually; the government's recent forecast of a 6.5% growth rate over the next five years would essentially double the country's 2010 output by 2020.
In 2015, headline events heavily influenced the markets; many stocks traded at distressed values which hardly reflected their financial strength or business outlooks. And yet, the current market turmoil is not unprecedented. As headline events recede and oil prices recover, we anticipate that economic fundamentals, which have recently been overwhelmed by negative investor sentiment, will once again reassert a more prominent role in determining prices. Our 20+ years of experience with disciplined, value-oriented investment strategies suggests that today's discounts for well-capitalized, proven businesses provide particularly enticing opportunities for future growth.
Sincerely,

George A. Henning
1 The Dow Jones Industrial Average is an unmanaged, price weighted measure of 30 U.S. stocks selected by the Averages Committee to represent the performance of all U.S. stocks outside the Transportation and Utilities sectors. The S&P 500® Index is an unmanaged, market capitalization weighted index which measures the performance of the large cap segment of the U.S. equities market, covering approximately 75% of the U.S. equities market. The Index includes 500 leading companies in leading industries of the U.S. economy. The NASDAQ Composite Index is an unmanaged, market capitalization weighted measure of all domestic and international common stocks (currently over 3,000 stocks) listed on The Nasdaq Stock Market. The Russell 2000® Index is an unmanaged, market-weighted measure of the 2,000 smallest publicly traded companies of the Russell 3000® Index. The Russell Midcap® Index is an unmanaged, weighted measure of the 800 smallest companies within the Russell 1000® Index based on a combination of their market cap and current index membership. These indices are not available for direct investment. Index returns assume the reinvestment of dividends.
Economic and performance information referenced is historical and past performance does not guarantee future results. The principal value and return of an investment will fluctuate so that an investor's shares may be worth less than the original cost when redeemed. For more information on the Pacific Advisors Funds, including information on charges, expenses and other classes offered, please obtain a copy of the prospectus by calling (800) 989-6693. Please read the prospectus and consider carefully the investment risks, objectives, charges and expenses before you invest or send money.
Shares of the Funds are not deposits or obligations of any bank, are not guaranteed by any bank, are not insured by the FDIC or any other agency, and involve investment risks, including the possible loss of the principal amount invested. The views expressed represent the opinions and beliefs at the time of this commentary and are not meant as a market forecast. These views are subject to change at any time based on market or other conditions. This information may not be relied on as investment advice or as an indication of trading.
3
Pacific Advisors
Government Securities Fund
Fund Objective: High current income, preservation of capital, and rising future income consistent with prudent investment risk.
Investment Invests at least 80% of its assets in U.S. Government fixed income
Strategy: securities. These include securities issued or guaranteed by the U.S. Treasury; issued by a U.S. Government agency; or issued by a Government-Sponsored Enterprise (GSE). May also invest in high quality dividend-paying common stocks.
Investor Profile: Conservative. Income-focused; capital preservation aim.
TOTAL RETURNS | EXPENSE RATIOS1 | ||||||||||||||||||||||||||
For the year ended December 31, 2015 | Current | Prospectus | |||||||||||||||||||||||||
Net | Gross | Net | Gross | ||||||||||||||||||||||||
Class A | –1.97 | % | Class A | 3.88 | % | 7.05 | % | 3.50 | % | 6.37 | % | ||||||||||||||||
Class C | –2.63 | % | Class C | 4.61 | % | 7.78 | % | 4.23 | % | 7.09 | % | ||||||||||||||||
Barclays Capital U.S. Int T-Bond Index2 | 1.18 | % | |||||||||||||||||||||||||
Performance quoted is past performance which does not guarantee future results. Current performance may be higher or lower than the performance quoted. Call (800) 989-6693 for performance current to the most recent month-end. The investment return and principal value of an investment will fluctuate so that an investor's shares, when redeemed, may be worth more or less than their original cost. Returns represent the change in value over the stated period assuming reinvestment of dividends and capital gains at net asset value. Rankings shown are for Class A shares; rankings for other share classes may be different. Returns and rankings do not take into account the maximum 4.75% sales charge on Class A shares or the 1% Contingent Deferred Sales Charge (CDSC) for Class C shares sold within one year of purchase. Returns would be lower if the applicable sales charge and CDSC were included. Returns do not take into account individual taxes which may reduce actual returns when shares are sold.
The Fund's investment adviser is waiving a portion of its management fees pursuant to an Expense Limitation Agreement. The waiver may be discontinued at any time with ninety days written notice in consultation with the Fund's board, but is expected to continue at current levels. Please see the Notes to Financial Statements in this report for details. Performance shown reflects the waiver, without which the results would have been lower.
Discussion with Portfolio Manager February 24, 2016
Jingjing Yan, CFA
Please see the Chairman's Letter at the beginning of this Report for a detailed market and economic review as well as the Manager's general market outlook.
Fund Performance
The Fund's investment strategy is to manage interest rate risk for long-term and short-term investors seeking to protect principal. The Fund's fixed income investments were concentrated in short to intermediate-term bonds in response to the uncertainty surrounding the Federal Reserve's timeline for interest rate increases and concerns of a global economic slowdown.
For the year, Class A shares of the Fund returned –1.97% compared to 1.18% for its benchmark, the Barclays Capital U.S. Intermediate T-Bond Index; unlike the Fund, though, the benchmark is an unmanaged portfolio. Furthermore, the Index's longer average duration reflects a substantially greater exposure to principal loss as interest rates increase.
During the period, the Fund maintained an average duration of slightly less than 1.0 year; in contrast, the benchmark's average duration was 3.8 years. Duration measures a portfolio's sensitivity to interest
1 "Current" expense ratio as of 12/31/15. "Prospectus" expense ratio is for the fiscal year ended 12/31/14.
2 The Barclays Capital U.S. Intermediate Treasury Bond Index is an unmanaged index of U.S. government securities with one to ten years to maturity. It is not possible to invest directly in the Index.
4
rate movements; when rates increase by 1%, the value of a portfolio with a 4-year duration would decrease by approximately 4%. The Fund's short average duration reflected our commitment to minimize the negative effects of price volatility and rising interest rates on bond portfolios. In addition to price stability, the Fund's strategy also provides the flexibility to respond timely as investment opportunities arise.
The Fund's portfolio includes a small allocation to common stocks; these investments contribute to total return by providing dividend income and the potential for price appreciation. The Fund invests in high-quality, dividend-paying securities which help manage volatility by offsetting price changes in U.S. government securities holdings.
Market Overview
During the second half of the year, interest rates (as measured by the U.S. 10-year Treasury Note) fluctuated within a range of 50 basis points as investors anticipated the Federal Reserve's long-awaited interest rate increase (or "liftoff"). In September, the central bank cited global market turmoil and an apparent slowdown in China's economy in opting to delay the rate increase. Consequently, demand for U.S. Treasuries and other "safe-haven" investments rose; the yield on the 10-year Treasury Note, which was 2.35% by the end of the second quarter, fell to 1.99% in early October. In December, the Fed confirmed the market's expectations for an interest rate liftoff with a 25-basis point increase in the official federal funds rate, the first rate increase since 2006. The liftoff removed a cloud of uncertainty and signaled confidence in the U.S. economy. Importantly, Fed Chair Yellen emphasized a "gradual" pace of future rate increases, with rates likely to remain below historical levels. The yield on the 10-year Treasury Note ended the year at 2.27%.
The Fund continued to invest in shorter-term government securities in acknowledging the Fed's intention of continuing to raise rates during 2016; these bonds offer principal protection as rates increase. Specifically, the Fund invests in agency bonds with a "step-up" feature of scheduled coupon rate increases. Longer-term bonds would offer higher yields; but, we believe the long-term risk tradeoff of higher yields versus declining prices is unfavorable. For example, in 2013, portfolios that were invested in longer-term securities suffered significant losses when interest rates rose.
Fund Strategy
Fixed Income Strategy
Over 80% of the Fund's assets were invested in U.S. government agency bonds. These securities have higher coupon rates than U.S. Treasuries and enabled the Fund to generate additional income without materially increasing risk. The Fund invested in short-to-intermediate-term (e.g., three- to five-year maturities) callable government agency bonds; these bonds offer higher coupon rates than non-callable bonds because their issuing agencies are allowed to buy back, or "call," the bonds before maturity. To capture additional higher yields, the Fund invested in callable bonds that also included a "step-up" feature. Yields for step-up bonds increase at fixed intervals if they are not called back on the scheduled call dates; furthermore, as interest rates increase, they will preserve their value better than fixed-rate government securities with comparable maturities. And, if these bonds are called, they provide the flexibility to reinvest proceeds in other government agency securities according to prevailing market conditions.
The Fund does not utilize higher-risk strategies to enhance return. For example, the Fund does not invest in bonds with extended durations, use leverage strategies, or purchase mortgage-backed securities.
Equity Positioning
The Fund invests a small portion of its portfolio (less than 17% as of year-end) in high-quality, dividend-paying common stocks. Yet, the price appreciation potential offered by these holdings provided an important component of the Fund's total return and offset the limited price appreciation potential of short-to-intermediate-term U.S. government securities. Equity investments focus on blue-chip stocks that
5
Pacific Advisors
Government Securities Fund continued
offer attractive dividends and are less sensitive than the overall market to economic disruptions. Their relative price stability tends to counterbalance price movements in the fixed income markets without significantly increasing the Fund's risk exposure. We anticipate that, as interest rates rise, the Fund may reduce its equity allocation and shift the portfolio toward longer-term U.S. government securities.
Several Fund holdings3, including PPL, Southern Co. and Pepsi, had performed well as investors preferred the more conservative areas of the equity market. During the period, the Fund took profits and trimmed positions in companies such as Eli Lilly, Kimberly-Clark and Microsoft.
Looking Ahead
The Fed's actions will continue to strongly influence the fixed income market in 2016. Several factors, including economic growth rates abroad, the impact of higher interest rates, and the effects of oil prices, will affect the schedule and pace of the central bank's future rate increases. Additionally, market forces will likely influence longer-term rates separate and apart from any Fed actions. Regardless, the decision to raise short-term interest rates reflects the Fed's confidence in the U.S. and world economies. The move towards a more normal interest rate environment may prompt longer-term bond holders to reevaluate their willingness to hold these securities as interest rates rise.
The Fund will continue employing the conservative strategy of investing in short-to-intermediate-term U.S. government securities while monitoring opportunities to reinvest in suitable higher-yielding government bonds as interest rates increase. In a rising rate environment, we expect the Fund's portfolio to shift toward longer-term bonds. The Fund's flexibility to adjust holdings in response to economic and market conditions positions the Fund to successfully manage an upward trend in rates and provide improved performance.
3 For detailed information on Fund holdings, please see the Fund's Schedule of Investments in this Report.
6
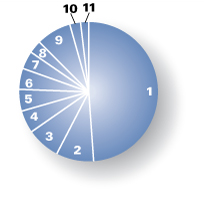
Portfolio Holdings as of 12/31/15 (Based on Total Investments)

1. | U.S. Government Agencies | 83.42 | % | ||||||||
2. | Equities | 16.58 | % | ||||||||
Change in Value of $10,000 Investment1
This chart compares the growth of a $10,000 investment in Class A shares of the Government Securities Fund for the period January 1, 2006 through December 31, 2015 with the same investment in the Barclays Capital U.S. Intermediate Treasury Bond Index2.
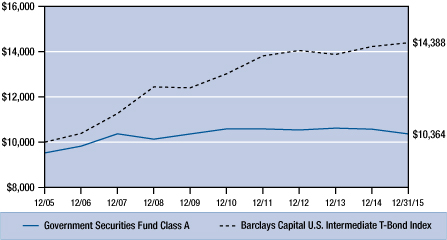
Average Annual Compounded Return as of December 31, 2015
Class A | Class C | Barclays Capital U.S. Int T-Bond Index | |||||||||||||
One Year | – 6.58 | % | – 3.60 | % | 1.18 | % | |||||||||
Five Year | – 1.39 | % | – 1.13 | % | 2.03 | % | |||||||||
Ten Year | 0.36 | % | 0.12 | % | 3.71 | % | |||||||||
Past performance does not guarantee future results. Performance quoted represents past performance. Current performance may be higher or lower than the performance data quoted. Returns include reinvested dividends and capital gains. Returns for Class A shares reflect a maximum front-end sales charge of 4.75%; and returns for Class C shares reflect the deduction of a contingent deferred sales charge of 1% on shares sold within the first year of purchase. Returns do not take into account individual taxes which may reduce actual returns when shares are sold. The investment return and principal value of an investment will fluctuate so that an investor's shares, when redeemed, may be worth more or less than their original cost. Call (800) 989-6693 for the most recent month-end performance.
1 Fund results are shown for Class A shares and reflect deduction of the maximum front-end sales charge of 4.75% on the $10,000 investment for a net amount invested of $9,525. At the end of the same period, a $10,000 investment in Class C shares would have been valued at $10,120, and no contingent deferred sales charges would apply. Performance of the share classes will vary based on the difference in charges and expenses. The inception date is 02/08/93 for Class A shares and 04/01/98 for Class C shares. It is not possible to invest directly in the Index. Unlike the Fund's results, the results for the Index do not reflect sales charges, fees or expenses.
2 The Barclays Capital U.S. Intermediate Treasury Bond Index is an unmanaged index of U.S. government securities with one to ten years to maturity.
7
Pacific Advisors
Government Securities Fund continued
Expense Examples
As a shareholder of the Fund you incur two types of costs: (1) transaction costs, including sales charges (loads) on purchase payments, reinvested dividends, or other distributions; redemption fees; and exchange fees; and (2) ongoing costs, including management fees; distribution (12b-1) fees; and other Fund expenses. This Example is intended to help you understand your ongoing costs (in dollars) of investing in the Fund and to compare these costs with the ongoing costs of investing in other mutual funds.
The Example is based on an investment of $1,000 invested at the beginning of the period and held for the entire period from July 1, 2015 through December 31, 2015.
Actual Expenses
The first line of the table below provides information about actual account values and actual expenses. You may use the information in this line, together with the amount you invested, to estimate the expenses that you paid over the period. Simply divide your account value by $1,000 (for example, an $8,600 account value divided by $1,000 = 8.6), then multiply the result by the number in the first line under the heading entitled "Expenses Paid During the Period" to estimate the expenses you paid on your account during the period.
The following transaction costs are not included in the expenses shown in the table and, if applicable, would increase the expenses that you paid over the period: (1) a front-end sales charge (load) of 4.75% on Class A shares; (2) a 2% redemption fee if you sell or exchange shares within 30 days of purchase, with certain exceptions. The redemption fee does not apply to: (a) redemptions under an automatic withdrawal program or periodic asset reallocation plan, required minimum distributions (RMD), employer mandated distributions from a qualified plan, or redemptions under a qualified domestic relations order (QDRO); (b) redemptions to pay for expenses related to terminal illness, extended hospital or nursing home care, or other serious medical conditions, including death; (c) redemptions of shares acquired through dividend or capital gains reinvestments; (d) loans from a qualified plan account; and (e) redemptions initiated by the Fund; and (3) a $10 service fee on each exchange after the first five exchanges in each calendar year.
The following ongoing costs are not included in the expenses shown in the table and, if applicable, would increase the expenses that you paid over the period: (1) a $12 low balance fee on accounts with balances of less than $250 as of September 30th of each calendar year and no investment activity (excluding reinvestment of dividends and/or capital gains) during the prior calendar year or the first nine months of the current calendar year. This fee does not apply to IRAs, qualified plan accounts, or Coverdell Education Savings Accounts; (2) a $15 annual custodial fee on IRAs, SEPs, SIMPLE IRAs, and Coverdell Education Savings Accounts; and (3) a $20 annual custodial fee on 403(b) accounts.
Hypothetical Example for Comparison Purposes
The second line of the table below provides information about hypothetical account values and hypothetical expenses based on the Fund's actual expense ratio and an assumed rate of return of 5% per year before expenses, which in not the Fund's actual return. The hypothetical account values and expenses may not be used to estimate the actual ending account balance or expenses you paid for the period. You may use this information to compare the ongoing costs of investing in the Fund and other funds. To do so, compare this 5% hypothetical example with the 5% hypothetical examples that appear in the shareholder reports of the other funds.
The following transaction costs are not included in the expenses shown in the table and, if applicable, would increase the expenses that you paid over the period: (1) a front-end sales charge (load) of 4.75% on Class A shares; (2) a 2% redemption fee if you sell or exchange shares within 30 days of purchase, with certain exceptions. The redemption fee does not apply to: (a) redemptions under an automatic withdrawal program or periodic asset reallocation plan, required minimum distributions (RMD), employer mandated distributions from a qualified plan, or redemptions under a qualified domestic relations order (QDRO); (b) redemptions to pay for expenses related to terminal illness, extended hospital or nursing home care, or other serious medical conditions, including death; (c) redemptions of shares acquired through dividend or capital gains reinvestments; (d) loans from a qualified plan account; and (e) redemptions initiated by the Fund; and (3) a $10 service fee on each exchange after the first five exchanges in each calendar year.
The following ongoing costs are not included in the expenses shown in the table and, if applicable, would increase the expenses that you paid over the period: (1) a $12 low balance fee on accounts with balances of less than $250 as of September 30th of each calendar year and no investment activity (excluding reinvestment of dividends and/or capital gains) during the prior calendar year or the first nine months of the current calendar year. This fee does not apply to IRAs, qualified plan accounts, or Coverdell Education Savings Accounts; (2) a $15 annual custodial fee on IRAs, SEPs, SIMPLE IRAs, and Coverdell Education Savings Accounts; and (3) a $20 annual custodial fee on 403(b) accounts.
Please note that the expenses shown in the table are meant to highlight your ongoing costs only and do not reflect any transactional costs, such as sales charges (loads), redemption fees, or exchange fees. Therefore, the second line of the table is useful in comparing ongoing costs only, and will not help you determine the relative total costs of owning different funds. In addition, if these transactional costs were included, your costs would have been higher.
| Beginning Account Value 07/01/15 | Ending Account Value 12/31/15 | Expense Paid During Period 07/01/15 – 12/31/15 | |||||||||||||
Government Secs Fund Class A | |||||||||||||||
Actual | $ | 1,000.00 | $ | 997.80 | $ | 19.54 | |||||||||
Hypothetical (5% return before expense) | $ | 1,000.00 | $ | 1,005.65 | $ | 19.61 | |||||||||
Government Secs Fund Class C | |||||||||||||||
Actual | $ | 1,000.00 | $ | 994.20 | $ | 23.17 | |||||||||
Hypothetical (5% return before expense) | $ | 1,000.00 | $ | 1,001.97 | $ | 23.26 | |||||||||
3 Expenses are equal to the Fund's annualized expense ratio, net of expense waivers, of 3.88% for Class A shares and 4.61% for Class C shares, multiplied by the average account value over the period, multiplied by 184/365 days to reflect the one-half year period.
8
Pacific Advisors
Income and Equity Fund
Fund Objective: Current income and, secondarily, long-term capital appreciation.
Investment Invests primarily in investment grade U.S. corporate bonds and in dividend-paying
Strategy: stocks.
Investor Profile: Conservative. Some current income required; capital preservation aim.
TOTAL RETURNS | EXPENSE RATIOS1 | ||||||||||||||||||||||||||
For the year ended December 31, 2015 | Current | Prospectus | |||||||||||||||||||||||||
Net | Gross | Net | Gross | ||||||||||||||||||||||||
Class A | –2.57 | % | Class A | 2.06 | % | 2.81 | % | 1.91 | % | 2.66 | % | ||||||||||||||||
Class C | –3.21 | % | Class C | 2.81 | % | 3.56 | % | 2.66 | % | 3.41 | % | ||||||||||||||||
Barclays Capital U.S. Int Corp Bond Index2 | 1.08 | % | |||||||||||||||||||||||||
S&P 500® Index3 | 1.38 | % | |||||||||||||||||||||||||
Performance quoted is past performance which does not guarantee future results. Current performance may be higher or lower than the performance quoted. Call (800) 989-6693 for performance current to the most recent month-end. The investment return and principal value of an investment will fluctuate so that an investor's shares, when redeemed, may be worth more or less than their original cost. Returns represent the change in value over the stated period assuming reinvestment of dividends and capital gains at net asset value. Rankings are shown for Class A shares; rankings for other share classes may be different. Returns and rankings do not take into account the maximum 4.75% sales charge on Class A shares or the 1% Contingent Deferred Sales Charge (CDSC) for Class C shares sold within one year of purchase. Returns would be lower if the applicable sales charge and CDSC were included. Returns do not take into account individual taxes which may reduce actual returns when shares are sold.
The Fund's investment adviser is waiving a portion of its management fees pursuant to an Expense Limitation Agreement. The waiver may be discontinued at any time with ninety days written notice in consultation with the Fund's board, but is expected to continue at current levels. Please see the Notes to Financial Statements in this report for details. Performance shown reflects the waiver, without which the results would have been lower.
Discussion with Portfolio Managers February 24, 2016
Charles Suh, CFA
Jingjing Yan, CFA
Please see the Chairman's Letter at the beginning of this Report for a detailed market and economic review as well as the Manager's general market outlook.
Fund Performance
For the year, Class A shares declined 2.57%. During the second half of the year, investors continued the trend from the first half of 2015 by fixating on Federal Reserve policy, the slow pace of global economic growth, and falling oil prices. Interest rate movements reflected the widely anticipated initiation of the Fed's rising interest rate policy (or "liftoff"). The yield on the benchmark U.S. 10-year Treasury Note, which ended the first half of the year at 2.35%, fell to 1.99% in early-October following the Fed's decision to delay raising the federal funds rate. In December, though, the long-awaited rate increase provided some reassurance in an otherwise uncertain market environment; interest rates drifted higher to end the year at 2.27%. Stocks, which had traded in a historically narrow range in the January-to-June period, fell
1 "Current" expense ratio as of 12/31/15. "Prospectus" expense ratio is for the fiscal year ended 12/31/14.
2 The Barclays Capital U.S. Intermediate Corporate Bond Index is an unmanaged index of publicly issued investment grade U.S. corporate bonds with one to ten years to maturity. It is not possible to invest directly in the Index.
3 The S&P 500® Index is an unmanaged, market capitalization weighted index which measures the performance of the large cap segment of the U.S. equities market, covering approximately 75% of the U.S. equities market. The Index includes 500 leading companies in leading industries of the U.S. economy. Index returns assume the reinvestment of dividends, but, unlike the Fund's returns, do not reflect the effects of management fees or expenses. It is not possible to invest directly in the Index.blicly issued investment grade U.S. corporate bonds with one to ten years to maturity. It is not possible to invest directly in the Index.
9
Pacific Advisors
Income and Equity Fund continued
sharply in the third quarter due to concerns about the possible impact from China's stock market selloff and currency devaluation. Broad market indices rebounded in the fourth quarter although the gains were mostly limited to a handful of relatively "safe" large cap stocks. Selling pressure for many stocks increased as investors stayed on the sidelines, awaiting a clearer view of the markets and the economy.
The Fund is well positioned as interest rates rise. The fixed income portfolio is focused on investment-grade bonds maturing in two to seven years. During the period, the Fund maintained an average duration of 2.4 years; in contrast, the average duration of the benchmark (the Barclays Capital U.S. Intermediate Corporate Bond Index, an unmanaged bond portfolio) was 4.3 years. Duration measures a portfolio's sensitivity to interest rate movements; when rates increase by 1%, the value of a portfolio with a 4-year duration would decrease by approximately 4%. The Fund's relatively short average duration reflected our commitment to minimize the negative effects of price volatility and rising interest rates on bond portfolios. The Fund's equity portfolio is concentrated in 30 to 40 high-quality, dividend-paying stocks with patterns of relatively low volatility and stable growth. In contrast, the Fund's equity benchmark, the S&P 500® Index, consists of companies across a broad range of quality, risk factors, and volatility. The market capitalization of the Fund's equity holdings are, on average, more than three times larger4 than the average for companies in the Index; this significant size variance highlights a fundamental difference between the Fund and the Index.
The composition of the Fund's fixed income holdings, and the Fund's equity holdings, differ from their respective benchmarks; nevertheless, overall Fund performance is best compared to a blended return based on the two benchmarks. For the year, the blended return5 for Fund's benchmarks was 1.23%. Importantly, the Fund maintained substantially lower volatility than the overall market as demonstrated by the Fund's one-year beta6 of 0.40, as of December 31st, versus the S&P 500® Index.
Fund Strategy
The Fund actively manages the allocation between fixed income and equity holdings to create risk-appropriate opportunities for both income and capital appreciation. The Fund seeks investment-quality bonds that provide current income and principal protection. The Fund also invests in a diverse selection of dividend-paying, blue-chip stocks. This equity approach has significantly contributed to Fund performance during the long period of low interest rates; that is, the dividend yields for portfolio stocks were often greater than the yields on corporate bonds issued by those same companies. We anticipate that the Fund's allocation to equities may decline as interest rates rise and we reinvest capital in bonds with prevailing higher yields.
Interest rates fluctuated in response to investor expectations of the Fed's liftoff. When the Fed postponed the commencement of its anticipated policy, demand for U.S. Treasuries and other "safe" investments rose and yields declined. Rates then rose following the first rate increase since 2006. In particular, short-term rates, which are most sensitive to the central bank's policy actions, increased sharply; the 2-year Treasury Bill, which closely tracks the official fed funds rate, moved from 0.57% in October to end the year at 1.06%. Rising interest rates pressured high-yield (or, "junk") bonds and bond funds, particularly those with investments in commodities and emerging markets. With crude oil prices continuing to fall, bonds of energy-related companies sold off sharply with little regard to their financial health.
We continue to monitor the fixed income markets to identify corporate bonds issued by good-quality companies that may be temporarily out-of-favor due to industry- or company-specific issues.
Fixed Income Strategy
The Fund's fixed income holdings focus on short-to-intermediate-term corporate bonds. Due to the extraordinary demand for these bonds during the period, we identified some high-quality bonds with
4 As of 12/31/15, the mean market cap was $120.6 billion for the Fund and $37.3 billion for the S&P 500® Index.
5 Blended return calculated from the benchmark index returns based on ratio of stocks to fixed-income securities in the Fund's portfolio as of the end of the period.
6 "Beta" measures volatility relative to the stock market or an alternative benchmark. A beta less than 1.0 indicates lower risk than the market or the benchmark; a beta greater than 1.0 indicates higher risk than the market or the benchmark.
10
attractive variable rate or call features. These securities offered better principal protection than longer-term bonds while also providing the flexibility to identify timely investment opportunities as fixed income markets evolved.
Several of the Fund's corporate bonds were called in as their issuers sought to refinance existing bonds or retire debt. The Fund reinvested capital from these transactions in similar investment-grade bonds7 of high-quality companies, including Pfizer and Block Financial. The Fund also purchased "fixed-to-floating" preferred stocks, such as Wells Fargo, in anticipation of rising interest rates. These securities' coupon rates and/or dividends periodically increase over time. In general, the Fund remains invested primarily in short-to-intermediate-term bonds which will help preserve principal when rates rise.
We continuously evaluate the fundamental characteristics of current investments. Corporate bonds issued by energy-related companies remained under pressure during the period; the Fund continued to hold investment-grade bonds of financially sound energy services companies; the Fund anticipates that these holdings, although undervalued due to lack of investor interest, will recover along with oil prices. The Fund sold its bond holding in the mining firm Freeport-McMoRan which we believed no longer provided a risk-appropriate opportunity for returns.
Equity Strategy
The Fund's equity portfolio is an important complement to corporate bond holdings especially during the historically low interest rate environment. The strategy seeks stocks that provide dividend income and price appreciation; we purchase high-quality, well-established companies from a wide range of industries.
The Fund continued to favor a select number of blue-chip stocks with attractive dividends and low volatility. The Fund's equity holdings had a weighted average dividend yield of 3.25% which compares favorably to the average yield for 5-year investment-grade corporate bonds of 2.98%. We believe the Fund's equity holdings offer attractive opportunities for total return compared to bonds, especially during periods of rising interest rates.
During the period, we purchased stocks of companies including Schlumberger, Mattel and Wal-Mart that typically provide stronger growth prospects during periods of global economic expansion; the Fund increased its allocation to industrial firms and businesses that offer consumer goods and services.
We anticipate adjusting the Fund's allocations between equity and fixed income holdings as the global economy strengthens and interest rates rise; we may reduce the Fund's equity allocation in favor of bonds with higher prevailing coupon yields.
Looking Ahead
The Fed's decision to raise interest rates signals confidence in the U.S. economy, and marks the beginning of a transitional phase in the markets. Importantly, though, Fed Chair Yellen emphasized a "gradual" pace of future rate increases while reiterating that rates will likely remain historically low for some time. The central bank's deliberate process should prevent market rates from rising quickly; yet, history has shown that the prices for fixed income securities, particularly longer-term bonds, often move independent of the Fed. During this market shift, the Fund's focus on shorter-term bonds to curtail price volatility may result in periods of underperformance. As interest rates move higher, the Fund should benefit from the flexibility of holding shorter-term bonds.
The Fund anticipates that, as its shorter-term bonds mature or are called, the proceeds will be invested at higher yields. Also, as rates trend higher, the Fund expects to gradually lengthen the average duration of its bond portfolio.
7 For detailed information on Fund holdings, please see the Fund's Schedule of Investments in this Report.
11
Pacific Advisors
Income and Equity Fund continued
The growing global economies support a more positive outlook for 2016. The European Central Bank appears committed to accommodative monetary policies that, along with low oil prices, enabled the region to achieve its fastest growth rate since 2011. China's transition to develop a consumer-driven economy will be critical to reducing the country's dependence on exports and more closely aligning its economy to those of developed nations; the International Monetary Fund acknowledged China's economic reforms in approving the inclusion of the yuan as a reserve currency. Amid this backdrop, the Fund will continue to identify stocks which are likely, over time, to increase dividends and provide price appreciation. Nevertheless, as future rate increases occur, the Fund may reduce its equity holdings to increase its fixed income allocation and take advantage of higher prevailing yields.
12
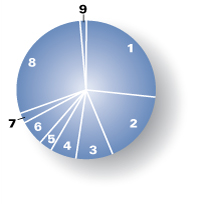
Portfolio Holdings as of 12/31/15 (Based on Total Investments)
1. | Corporate Bonds | 48.89 | % | ||||||||
| Equities | 46.73 | % | |||||||||
| 2. | Consumer Staples | 8.65 | % | ||||||||
| 3. | Industrials | 7.75 | % | ||||||||
| 4. | Consumer Discretionary | 5.26 | % | ||||||||
| 5. | Information Technology | 5.07 | % | ||||||||
| 6. | Utilities | 4.79 | % | ||||||||
| 7. | Health Care | 4.14 | % | ||||||||
| 8. | Telecommunication Services | 3.01 | % | ||||||||
| 9. | Others | 8.06 | % | ||||||||
10. | Preferred Stock | 2.51 | % | ||||||||
11. | Cash and Cash Equivalents | 1.87 | % | ||||||||
Change in Value of $10,000 Investment1
This chart compares the growth of a $10,000 investment in Class A shares of the Income and Equity Fund for the period January 1, 2006 through December 31, 2015 with the same investment in the S&P 500® Index2 and the Barclays Capital U.S. Intermediate Corporate Bond Index3.
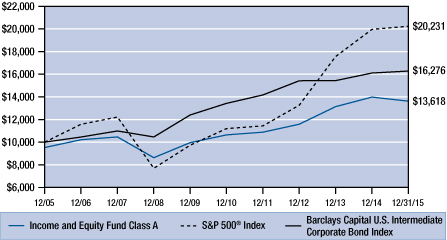
Average Annual Compounded Returns as of December 31, 2015
Class A | Class C | Barclays Capital U.S. Int Corp Bond Index | S&P 500® Index | ||||||||||||||||
One Year | – 7.19 | % | – 4.18 | % | 1.08 | % | 1.38 | % | |||||||||||
Five Year | 4.04 | % | 4.30 | % | 3.93 | % | 12.57 | % | |||||||||||
Ten Year | 3.13 | % | 2.87 | % | 4.99 | % | 7.31 | % | |||||||||||
Past performance does not guarantee future results. Performance quoted represents past performance. Current performance may be higher or lower than the performance data quoted. Returns include reinvested dividends and capital gains. Returns for Class A shares reflect a maximum front-end sales charge of 4.75%; and returns for Class C shares reflect the deduction of a contingent deferred sales charge of 1% on shares sold within the first year of purchase. Returns do not take into account individual taxes which may reduce actual returns when shares are sold. The investment return and principal value of an investment will fluctuate so that an investor's shares, when redeemed, may be worth more or less than their original cost. Call (800) 989-6693 for the most recent month-end performance.
1 Fund results are shown for Class A shares and reflect deduction of the maximum front-end sales charge of 4.75% on the $10,000 investment for a net amount invested of $9,525. At the end of the same period, a $10,000 investment in Class C shares would have been valued at $13,266, and no contingent deferred sales charges would apply. Performance of the share classes will vary based on the difference in charges and expenses. The inception date is 02/08/93 for Class A shares and 04/01/98 for Class C shares. It is not possible to invest directly in either Index. Index results assume reinvestment of dividends, but, unlike the Fund's results, do not reflect sales charges, fees or expenses.
2 The Standard & Poor's 500® Index is an unmanaged, market capitalization weighted index which measures the performance of the large cap segment of the U.S. equities market, covering approximately 75% of the U.S. equities market. The Index includes 500 leading companies in leading industries of the U.S. economy.
3 The Barclays Capital U.S. Intermediate Corporate Bond Index is an unmanaged index of publicly issued investment grade U.S. corporate bonds with one to ten years to maturity.
13
Pacific Advisors
Income and Equity Fund continued
Expense Examples
As a shareholder of the Fund you incur two types of costs: (1) transaction costs, including sales charges (loads) on purchase payments, reinvested dividends, or other distributions; redemption fees; and exchange fees; and (2) ongoing costs, including management fees; distribution (12b-1) fees; and other Fund expenses. This Example is intended to help you understand your ongoing costs (in dollars) of investing in the Fund and to compare these costs with the ongoing costs of investing in other mutual funds.
The Example is based on an investment of $1,000 invested at the beginning of the period and held for the entire period from July 1, 2015 through December 31, 2015.
Actual Expenses
The first line of the table below provides information about actual account values and actual expenses. You may use the information in this line, together with the amount you invested, to estimate the expenses that you paid over the period. Simply divide your account value by $1,000 (for example, an $8,600 account value divided by $1,000 = 8.6), then multiply the result by the number in the first line under the heading entitled "Expenses Paid During the Period" to estimate the expenses you paid on your account during the period.
The following transaction costs are not included in the expenses shown in the table and, if applicable, would increase the expenses that you paid over the period: (1) a front-end sales charge (load) of 4.75% on Class A shares; (2) a 2% redemption fee if you sell or exchange shares within 30 days of purchase, with certain exceptions. The redemption fee does not apply to: (a) redemptions under an automatic withdrawal program or periodic asset reallocation plan, required minimum distributions (RMD), employer mandated distributions from a qualified plan, or redemptions under a qualified domestic relations order (QDRO); (b) redemptions to pay for expenses related to terminal illness, extended hospital or nursing home care, or other serious medical conditions, including death; (c) redemptions of shares acquired through dividend or capital gains reinvestments; (d) loans from a qualified plan account; and (e) redemptions initiated by the Fund; and (3) a $10 service fee on each exchange after the first five exchanges in each calendar year.
The following ongoing costs are not included in the expenses shown in the table and, if applicable, would increase the expenses that you paid over the period: (1) a $12 low balance fee on accounts with balances of less than $250 as of September 30th of each calendar year and no investment activity (excluding reinvestment of dividends and/or capital gains) during the prior calendar year or the first nine months of the current calendar year. This fee does not apply to IRAs, qualified plan accounts, or Coverdell Education Savings Accounts; (2) a $15 annual custodial fee on IRAs, SEPs, SIMPLE IRAs, and Coverdell Education Savings Accounts; and (3) a $20 annual custodial fee on 403(b) accounts.
Hypothetical Example for Comparison Purposes
The second line of the table below provides information about hypothetical account values and hypothetical expenses based on the Fund's actual expense ratio and an assumed rate of return of 5% per year before expenses, which in not the Fund's actual return. The hypothetical account values and expenses may not be used to estimate the actual ending account balance or expenses you paid for the period. You may use this information to compare the ongoing costs of investing in the Fund and other funds. To do so, compare this 5% hypothetical example with the 5% hypothetical examples that appear in the shareholder reports of the other funds.
The following transaction costs are not included in the expenses shown in the table and, if applicable, would increase the expenses that you paid over the period: (1) a front-end sales charge (load) of 4.75% on Class A shares; (2) a 2% redemption fee if you sell or exchange shares within 30 days of purchase, with certain exceptions. The redemption fee does not apply to: (a) redemptions under an automatic withdrawal program or periodic asset reallocation plan, required minimum distributions (RMD), employer mandated distributions from a qualified plan, or redemptions under a qualified domestic relations order (QDRO); (b) redemptions to pay for expenses related to terminal illness, extended hospital or nursing home care, or other serious medical conditions, including death; (c) redemptions of shares acquired through dividend or capital gains reinvestments; (d) loans from a qualified plan account; and (e) redemptions initiated by the Fund; and (3) a $10 service fee on each exchange after the first five exchanges in each calendar year.
The following ongoing costs are not included in the expenses shown in the table and, if applicable, would increase the expenses that you paid over the period: (1) a $12 low balance fee on accounts with balances of less than $250 as of September 30th of each calendar year and no investment activity (excluding reinvestment of dividends and/or capital gains) during the prior calendar year or the first nine months of the current calendar year. This fee does not apply to IRAs, qualified plan accounts, or Coverdell Education Savings Accounts; (2) a $15 annual custodial fee on IRAs, SEPs, SIMPLE IRAs, and Coverdell Education Savings Accounts; and (3) a $20 annual custodial fee on 403(b) accounts.
Please note that the expenses shown in the table are meant to highlight your ongoing costs only and do not reflect any transactional costs, such as sales charges (loads), redemption fees, or exchange fees. Therefore, the second line of the table is useful in comparing ongoing costs only, and will not help you determine the relative total costs of owning different funds. In addition, if these transactional costs were included, your costs would have been higher.
| Beginning Account Value 07/01/15 | Ending Account Value 12/31/15 | Expense Paid During Period 07/01/15 – 12/31/15 | |||||||||||||
Income & Equity Fund Class A | |||||||||||||||
Actual | $ | 1,000.00 | $ | 990.50 | $ | 10.34 | |||||||||
Hypothetical (5% return before expense) | $ | 1,000.00 | $ | 1,014.82 | $ | 10.46 | |||||||||
Income & Equity Fund Class C | |||||||||||||||
Actual | $ | 1,000.00 | $ | 987.80 | $ | 14.08 | |||||||||
Hypothetical (5% return before expense) | $ | 1,000.00 | $ | 1,011.04 | $ | 14.24 | |||||||||
4 Expenses are equal to the Fund's annualized expense ratio, net of expense waivers, of 2.06% for Class A shares and 2.81% for Class C shares, multiplied by the average account value over the period, multiplied by 184/365 days to reflect the one-half year period.
14
Pacific Advisors
Balanced Fund
Fund Objective: Long-term capital appreciation and income consistent with reduced risk.
Investment Invests primarily in large cap common stocks and investment grade U.S. corporate
Strategy: bonds. Invests at least 25% of its assets in fixed income securities and preferred stocks and at least 25% in equities.
Investor Profile: Moderately conservative. Seeks combination of long-term growth, income, liquidity and reduced risk of price fluctuations.
TOTAL RETURNS | EXPENSE RATIOS1 | ||||||||||||||||||
For the year ended December 31, 2015 | Current | Prospectus | |||||||||||||||||
Class A | –16.73 | % | Class A | 3.27 | % | 2.84 | % | ||||||||||||
Class C | –17.31 | % | Class C | 4.05 | % | 3.58 | % | ||||||||||||
S&P 500® Index2 | 1.38 | % | |||||||||||||||||
Barclays Capital U.S. Int Corp Bond Index3 | 1.08 | % | |||||||||||||||||
Performance quoted is past performance which does not guarantee future results. Current performance may be higher or lower than the performance quoted. Call (800) 989-6693 for performance current to the most recent month-end. The investment return and principal value of an investment will fluctuate so that an investor's shares, when redeemed, may be worth more or less than their original cost. Returns represent the change in value over the stated period assuming reinvestment of dividends and capital gains at net asset value. Rankings are shown for Class A shares; rankings for other share classes may be different. Returns and rankings do not take into account the maximum 5.75% sales charge on Class A shares or the 1% Contingent Deferred Sales Charge (CDSC) for Class C shares sold within one year of purchase. Returns would be lower if the applicable sales charge and CDSC were included. Returns do not take into account individual taxes which may reduce actual returns when shares are sold.
Discussion with Portfolio Managers February 24, 2016
Charles Suh, CFA
Jingjing Yan, CFA
Samuel C. Coquillard
Please see the Chairman's Letter at the beginning of this Report for a detailed market and economic review as well as the Manager's general market outlook.
Fund Performance
Fund performance, which reflected a diversified "all cap" equity strategy and "total return" approach to fixed income investing, lagged its benchmarks in 2015. Class A shares fell 16.73%; in comparison, the Fund's equity benchmark, the S&P 500® Index, gained 1.38% while the Fund's fixed income benchmark, the Barclays Capital U.S. Intermediate Corporate Bond Index, gained 1.08%. Market volatility rose in the third and fourth quarters as investors reacted to the Greek debt crisis, Chinese yuan devaluation, and the Federal Reserve's delays in initiating interest rate increases. These events prompted a shift to "safe haven" investments, such as U.S. Treasuries and relatively stable, dividend-paying mega-cap stocks. 35% of stocks in the S&P 500® Index fell 20% or more from than their 52-week highs. Notably, the S&P 500® Index benefitted from the performance of four holdings, Facebook, Amazon.com, Netflix, and Alphabet (formerly Google); for the year, these stocks rose between 34% and 178%. Small cap
1 "Current" expense ratio as of 12/31/15. "Prospectus" expense ratio is for the fiscal year ended 12/31/14.
2 The S&P 500® Index is an unmanaged, market capitalization weighted index which measures the performance of the large cap segment of the U.S. equities market, covering approximately 75% of the U.S. equities market. The Index includes 500 leading companies in leading industries of the U.S. economy. Index returns assume the reinvestment of dividends, but, unlike the Fund's returns, do not reflect the effects of management fees or expenses. It is not possible to invest directly in the Index.
3 The Barclays Capital U.S. Intermediate Corporate Bond Index is an unmanaged index of publicly issued investment grade U.S. corporate bonds with one to ten years to maturity. It is not possible to invest directly in the Index.
15
Pacific Advisors
Balanced Fund continued
companies fared even worse: 56% of companies in the Russell 2000® Index fell 20% or more from their 52-week highs. A significant portion of Fund's equity holdings were allocated to small cap stocks. Also, Fund holdings were overweighted, compared to its equity benchmark, towards energy, manufacturing and global trade; these areas underperformed. As of December 31st, the Fund's volatility, as measured by its beta4, declined from 0.88 last year to 0.75 in comparison to the S&P 500® Index.
Fund Strategy
The Fund is designed for investors seeking to participate in the equity markets with reduced risk. The Fund's strategy combines high-quality stocks across all market capitalizations with investment-grade corporate bonds that provide additional income and appreciation potential. We identify leading, well-managed companies whose stocks trade at a discount to our internal price targets; in most cases, we anticipate that the stocks will appreciate over a medium-to-long-term time horizon as the companies' growth strategies unfold. The Fund may experience periods of underperformance when short-term market trends overshadow long-term outlooks; yet, over time, the Fund's performance should reflect the strength of these companies as they demonstrate the ability to grow during various economic and business cycles. We manage the Fund's asset allocation based on our assessment of risk-appropriate investments in the context of the overall economic, market, and interest rate outlook. This approach enables the Fund to take advantage of specific growth opportunities while reducing overall price volatility.
During the second half of 2015, the U.S. economy remained relatively healthy but fears of a global economic slowdown emerged following China's decision in August to devalue the yuan. Shortly thereafter, the Federal Reserve cited market turmoil and downward inflationary pressures in delaying its long-anticipated interest rate "liftoff". Investors began to favor less-risky areas of the market: the yield on the U.S. 10-year Treasury Note fell and corporate bond spreads (that is, the yield difference between higher and lower quality bonds) widened as demand for lower-grade debt diminished. Markets stabilized over the final two months of the year following the release of favorable economic data; however, shares of small and mid-sized companies, as well as stocks related to energy and industrial markets, continued to languish. The Fund's allocation to equities declined slightly primarily due to price depreciation for the portfolio's small and mid-cap holdings. Still, the emphasis on equity holdings reflects our confidence in the medium-to-longer-term prospects for the global economy as well as the appreciation potential of the Fund's individual stocks.
Equity Strategy
The Fund's "all cap" equity strategy diversifies investments among high-quality, well-managed companies with proven growth track records through various economic and business cycles. Large cap investments, which accounted for approximately 33% of the equity allocation, favor prominent global companies that offer stability with moderate growth potential. Mid-cap holdings, which represented approximately 36% (up from 33% as of June 30, 2015) of the equity allocation, feature industry leaders that are well-positioned to participate in sector or economic trends. The remainder of the Fund's equity allocation is invested in established small cap companies with attractive long-term growth prospects.
The Fund's positioning in the Energy and Industrials sectors anticipates ongoing growth in the domestic and global economy. However, China's slowdown in industrial production and subsequent currency devaluation fueled concerns of a global economic downturn and even the possibility of recession. As a result, investors moved out of sectors directly tied to general economic activity, such as manufacturing, transportation, and trade. Out-of-favor stocks included the Fund's holdings even though these investments are concentrated among market leading companies with experienced management teams with the wherewithal to survive a prolonged industry downturn. Many of these companies have
4 "Beta" measures volatility relative to the stock market or an alternative benchmark. A beta less than 1.0 indicates lower risk than the market or the benchmark; a beta greater than 1.0 indicates higher risk than the market or the benchmark.
16
used previous downturns to expand their market positioning. For example5, Genesee & Wyoming, the leading operator of "short-line" railroads, and Kirby, the leading provider of marine transportation along the river and coastal waterways, are ideally positioned to benefit from industry consolidation.
The deterioration in oil prices significantly impacted Energy-related holdings. Importantly, though, the Fund's Energy holdings are well-positioned with adequate financing, proprietary technologies, and high-quality assets. Core Labs, a new position, is the leading provider of global reservoir analysis; offshore driller Noble Corporation, a new position, and offshore service vessel operator Hornbeck Offshore Services should remain relatively insulated as their technically advanced fleets remain in demand even in the current depressed environment.
The Fund's large cap holdings, led by NIKE and Alphabet (formerly Google), performed well. NIKE is expanding its global footprint with recent quarterly sales increases of 34% in China and 36% in Japan; the company expects sales in Asian markets to surpass Western Europe, traditionally its second largest market, sometime in 2016. Alphabet delivered impressive results from mobile advertising and YouTube; the recent launch of subscription-based YouTube Red could provide further growth as the company pursues an original content strategy.
Our active management approach adjusts portfolio positions based on our evaluation of each company's potential for medium-to-long-term appreciation. During the period, we sold several positions including International Business Machines, Helix Energy Solutions Group, Navistar, and Omnicom Group in favor of more attractive opportunities; we also trimmed positions in CVS Health, Lithia Motors, NIKE, and O'Reilly Automotive as these companies approached our internal price targets. We used the proceeds to establish new positions in Core Labs, Noble, Spirit Airlines, and Gentherm. Ultra-low cost airline operator Spirit Airlines has established a profitable niche in the industry. Gentherm owns proprietary thermoelectric technologies that are used to provide energy-efficient heating and cooling for a range of products; the company maintains a dominant share of the automotive seating market and was recently awarded two contracts for a hybrid and electric vehicle batteries.
Fixed Income Strategy
The Fund's "total return" approach actively manages fixed income holdings in response to current interest rate trends. In selecting bonds, we examine each company's fundamentals including cash flow trends, liquidity ratios and debt maturity schedules, and then assess the income and capital appreciation potential. The Fund's investments have continued to focus on shorter-term bonds that are less sensitive to interest rate changes while avoiding higher risk investments. The extended period of low interest rates and our expectation for higher interest rates contributed to our decision to maintain the Fund's fixed income allocation near the lower end of its historical range.
Interest rates fluctuated in anticipation of the Fed's first interest rate increase since 2006; the yield on the U.S. 10-year Treasury Note fell from 2.35% at the end of the second quarter to a low of 1.99% in October before ending the year at 2.27%. Markets eventually settled down as the Fed ended its historic monetary policy with a rate hike in December.
The Fund's shorter-term investment grade corporate bonds, particularly, energy-related debt, underperformed. Our analysis of these holdings identified sufficient cash flows to cover operations and debt obligations. We anticipate improved energy market fundamentals in 2016; even so, any continued decline in oil prices could further depreciate bond prices and degrade underlying fundamentals.
The Fund has continued to invest in shorter-term investment grade corporate bonds which are designed to protect principal value in a rising interest rate environment. In contrast, the Fund's benchmark, the Barclays Capital U.S. Intermediate Corporate Bond Index, includes longer-term and lower quality bonds; these bonds are more susceptible to losses in value in response to rising interest rates.
5 For detailed information on Fund holdings, please see the Fund's Schedule of Investments in this Report.
17
Pacific Advisors
Balanced Fund continued
Looking Ahead
Despite the recent challenges, we remain confident in the long-term prospects of the Fund's holdings. Each of these companies is well managed with a track record of delivering attractive returns in difficult industry environments. In addition to the energy downturn, the recent economic slowdown can also be traced to the rise of the U.S. dollar; over the past two years, the dollar gained more than 20% against a basket of leading global currencies. Few analysts anticipate continued appreciation of the dollar; stabilization or a continuation of the recent weakening is perhaps more likely. Such a development could provide a meaningful lift to commodity-related companies and export-oriented manufacturers.
During the past two years, the Fund's large cap holdings have significantly outperformed its small and mid-cap holdings. We anticipate that this trend may reverse as the Fund's mid-cap and small cap holdings, including transportation companies such as Genesee & Wyoming, Kirby and Kansas City Southern, provide attractive opportunities along with a recovery in industrial and export activity. Two holdings, TAL International, a container leasing company, and Team, an industrial services provider, both industry leaders, recently announced transformative acquisitions; the transactions should lead to significant growth opportunities. And, Energy-related companies National Oilwell Varco, Hornbeck Offshore Services and Noble trade a fraction of book value, a conservative measure of a company's assets. Thus, any sign of stabilization in oil prices could lead to significant recoveries in their share prices.
Opportunities for conservative fixed income investors, meanwhile, may increase along with yields for investment grade debt. As Fund holdings mature or are called in, we anticipate reinvesting proceeds at more attractive yields, and, as the Fed continues to raise interest rates, we anticipate reinvesting in bonds with intermediate-to-longer-term maturities. The Fund's allocation strategy will continue to reflect not only our outlook for the economy and interest rates but also our assessment of the relative contributions of equity and fixed income holdings.
18
Portfolio Holdings as of 12/31/15 (Based on Total Investments)
| Equities | 69.51 | % | |||||||||
| 1. | Industrials | 26.64 | % | ||||||||
| 2. | Consumer Discretionary | 17.17 | % | ||||||||
| 3. | Energy | 8.57 | % | ||||||||
| 4. | Financials | 5.95 | % | ||||||||
| 5. | Consumer Staples | 3.07 | % | ||||||||
| 6. | Information Technology | 5.73 | % | ||||||||
| 7. | Health Care | 2.38 | % | ||||||||
8. | Corporate Bonds | 29.03 | % | ||||||||
9. | Preferred Stock | 1.46 | % | ||||||||
Change in Value of $10,000 Investment1
This chart compares the growth of a $10,000 investment in Class A shares of the Balanced Fund for the period January 1, 2006 through December 31, 2015 with the same investment in the S&P 500® Index2 and the Barclays Capital U.S. Intermediate Corporate Bond Index3.
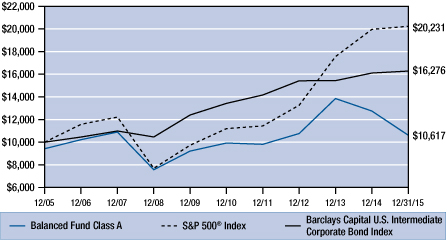
Average Annual Compounded Returns as of December 31, 2015
Class A | Class C | S&P 500® Index | Barclays Capital U.S. Int Corp Bond Index | ||||||||||||||||
One Year | – 21.52 | % | – 18.13 | % | 1.38 | % | 1.08 | % | |||||||||||
Five Year | 0.16 | % | 0.60 | % | 12.57 | % | 3.93 | % | |||||||||||
Ten Year | 0.60 | % | 0.43 | % | 7.31 | % | 4.99 | % | |||||||||||
Past performance does not guarantee future results. Performance quoted represents past performance. Current performance may be higher or lower than the performance data quoted. Returns include reinvested dividends and capital gains. Returns for Class A shares reflect a maximum front-end sales charge of 5.75%; and returns for Class C shares reflect the deduction of a contingent deferred sales charge of 1% on shares sold within the first year of purchase. Returns do not take into account individual taxes which may reduce actual returns when shares are sold. The investment return and principal value of an investment will fluctuate so that an investor's shares, when redeemed, may be worth more or less than their original cost. Call (800) 989-6693 for the most recent month-end performance.
1 Fund results are shown for Class A shares and reflect deduction of the maximum front-end sales charge of 5.75% on the $10,000 investment for a net amount invested of $9,425. At the end of the same period, a $10,000 investment in Class C shares would have been valued at $10,438, and no contingent deferred sales charges would apply. Performance of the share classes will vary based on the difference in charges and expenses. The inception date is 02/08/93 for Class A shares and 04/01/98 for Class C shares. It is not possible to invest directly in either Index. Index results assume reinvestment of dividends, but, unlike the Fund's results, do not reflect sales charges, fees or expenses.
2 The Standard & Poor's 500® Index is an unmanaged, market capitalization weighted index which measures the performance of the large cap segment of the U.S. equities market, covering approximately 75% of the U.S. equities market. The Index includes 500 leading companies in leading industries of the U.S. economy.
3 The Barclays Capital U.S. Intermediate Corporate Bond Index is an unmanaged index of publicly issued investment grade U.S. corporate bonds with one to ten years to maturity.
19
Pacific Advisors
Balanced Fund continued
Expense Examples
As a shareholder of the Fund you incur two types of costs: (1) transaction costs, including sales charges (loads) on purchase payments, reinvested dividends, or other distributions; redemption fees; and exchange fees; and (2) ongoing costs, including management fees; distribution (12b-1) fees; and other Fund expenses. This Example is intended to help you understand your ongoing costs (in dollars) of investing in the Fund and to compare these costs with the ongoing costs of investing in other mutual funds.
The Example is based on an investment of $1,000 invested at the beginning of the period and held for the entire period from July 1, 2015 through December 31, 2015.
Actual Expenses
The first line of the table below provides information about actual account values and actual expenses. You may use the information in this line, together with the amount you invested, to estimate the expenses that you paid over the period. Simply divide your account value by $1,000 (for example, an $8,600 account value divided by $1,000 = 8.6), then multiply the result by the number in the first line under the heading entitled "Expenses Paid During the Period" to estimate the expenses you paid on your account during the period.
The following transaction costs are not included in the expenses shown in the table and, if applicable, would increase the expenses that you paid over the period: (1) a front-end sales charge (load) of 5.75% on Class A shares; (2) a 2% redemption fee if you sell or exchange shares within 180 days of purchase, with certain exceptions. The redemption fee does not apply to: (a) redemptions under an automatic withdrawal program or periodic asset reallocation plan, required minimum distributions (RMD), employer mandated distributions from a qualified plan, or redemptions under a qualified domestic relations order (QDRO); (b) redemptions to pay for expenses related to terminal illness, extended hospital or nursing home care, or other serious medical conditions, including death; (c) redemptions of shares acquired through dividend or capital gains reinvestments; (d) loans from a qualified plan account, and (e) redemptions initiated by the Fund; and (3) a $10 service fee on each exchange after the first five exchanges in each calendar year.
The following ongoing costs are not included in the expenses shown in the table and, if applicable, would increase the expenses that you paid over the period: (1) a $12 low balance fee on accounts with balances of less than $250 as of September 30th of each calendar year and no investment activity (excluding reinvestment of dividends and/or capital gains) during the prior calendar year or the first nine months of the current calendar year. This fee does not apply to IRAs, qualified plan accounts, or Coverdell Education Savings Accounts; (2) a $15 annual custodial fee on IRAs, SEPs, SIMPLE IRAs, and Coverdell Education Savings Accounts; and (3) a $20 annual custodial fee on 403(b) accounts.
Hypothetical Example for Comparison Purposes
The second line of the table below provides information about hypothetical account values and hypothetical expenses based on the Fund's actual expense ratio and an assumed rate of return of 5% per year before expenses, which in not the Fund's actual return. The hypothetical account values and expenses may not be used to estimate the actual ending account balance or expenses you paid for the period. You may use this information to compare the ongoing costs of investing in the Fund and other funds. To do so, compare this 5% hypothetical example with the 5% hypothetical examples that appear in the shareholder reports of the other funds.
The following transaction costs are not included in the expenses shown in the table and, if applicable, would increase the expenses that you paid over the period: (1) a front-end sales charge (load) of 5.75% on Class A shares; (2) a 2% redemption fee if you sell or exchange shares within 180 days of purchase, with certain exceptions. The redemption fee does not apply to: (a) redemptions under an automatic withdrawal program or periodic asset reallocation plan, required minimum distributions (RMD), employer mandated distributions from a qualified plan, or redemptions under a qualified domestic relations order (QDRO); (b) redemptions to pay for expenses related to terminal illness, extended hospital or nursing home care, or other serious medical conditions, including death; (c) redemptions of shares acquired through dividend or capital gains reinvestments; (d) loans from a qualified plan account, and (e) redemptions initiated by the Fund; and (3) a $10 service fee on each exchange after the first five exchanges in each calendar year.
The following ongoing costs are not included in the expenses shown in the table and, if applicable, would increase the expenses that you paid over the period: (1) a $12 low balance fee on accounts with balances of less than $250 as of September 30th of each calendar year and no investment activity (excluding reinvestment of dividends and/or capital gains) during the prior calendar year or the first nine months of the current calendar year. This fee does not apply to IRAs, qualified plan accounts, or Coverdell Education Savings Accounts; (2) a $15 annual custodial fee on IRAs, SEPs, SIMPLE IRAs, and Coverdell Education Savings Accounts; and (3) a $20 annual custodial fee on 403(b) accounts.
Please note that the expenses shown in the table are meant to highlight your ongoing costs only and do not reflect any transactional costs, such as sales charges (loads), redemption fees, or exchange fees. Therefore, the second line of the table is useful in comparing ongoing costs only, and will not help you determine the relative total costs of owning different funds. In addition, if these transactional costs were included, your costs would have been higher.
| Beginning Account Value 07/01/15 | Ending Account Value 12/31/15 | Expense Paid During Period 07/01/15 – 12/31/15 | |||||||||||||
Balanced Fund Class A | |||||||||||||||
Actual | $ | 1,000.00 | $ | 837.40 | $ | 15.14 | |||||||||
Hypothetical (5% return before expense) | $ | 1,000.00 | $ | 1,008.72 | $ | 16.56 | |||||||||
Balanced Fund Class C | |||||||||||||||
Actual | $ | 1,000.00 | $ | 834.60 | $ | 18.73 | |||||||||
Hypothetical (5% return before expense) | $ | 1,000.00 | $ | 1,004.79 | $ | 20.47 | |||||||||
4 Expenses are equal to the Fund's annualized expense ratio of 3.27% for Class A shares and 4.05% for Class C shares, multiplied by the average account value over the period, multiplied by 184/365 days to reflect the one-half year period.
20
Pacific Advisors
Large Cap Value Fund
Fund Objective: Long-term capital appreciation.
Investment Invests at least 80% of its assets in large cap companies that are, at the time of
Strategy: purchase, within the market cap range of companies in the S&P 500® Index1.
Investor Profile: Conservative equity. Growth-oriented with a long-term investment horizon.
TOTAL RETURNS | EXPENSE RATIOS2 | ||||||||||||||||||||||||||
For the year ended December 31, 2015 | Current | Prospectus | |||||||||||||||||||||||||
Net | Gross | Net | Gross | ||||||||||||||||||||||||
Class A | –1.68 | % | Class A | 2.72 | % | 3.47 | % | 2.64 | % | 3.39 | % | ||||||||||||||||
Class C | –2.48 | % | Class C | 3.50 | % | 4.25 | % | 3.38 | % | 4.13 | % | ||||||||||||||||
S&P 500® Index | 1.38 | % | |||||||||||||||||||||||||
Performance quoted is past performance which does not guarantee future results. Current performance may be higher or lower than the performance quoted. Call (800) 989-6693 for performance current to the most recent month-end. The investment return and principal value of an investment will fluctuate so that an investor's shares, when redeemed, may be worth more or less than their original cost. Returns represent the change in value over the stated period assuming reinvestment of dividends and capital gains at net asset value. Returns do not take into account the maximum 5.75% sales charge on Class A shares or the 1% Contingent Deferred Sales Charge (CDSC) for Class C shares sold within one year of purchase. Returns would be lower if the applicable sales charge and CDSC were included. Returns do not take into account individual taxes which may reduce actual returns when shares are sold.
The Fund's investment adviser is waiving a portion of its management fees pursuant to an Expense Limitation Agreement. The waiver may be discontinued at any time with ninety days written notice in consultation with the Fund's board, but is expected to continue at current levels. Please see the Notes to Financial Statements in this report for details. Performance shown reflects the waiver, without which the results would have been lower.
Discussion with Portfolio Manager February 24, 2016
Samuel C. Coquillard
Please see the Chairman's Letter at the beginning of this Report for a detailed market and economic review as well as the Manager's general market outlook.
Fund Performance
After trading within a historically narrow range for much of the first half of 2015, stocks endured heightened volatility during the second half of the year. Various economic concerns, including the Federal Reserve's interest rate policies, a reduction in U.S. industrial activity, slowing growth in China, and the impact of low oil prices, undermined market sentiment. As a result the S&P 500® Index, the Fund's benchmark, ended three consecutive years of double digit returns while the Dow Jones Industrial Average fell for the first time since 2008. During the second half of the year, the Fund, which concentrates in mega-cap companies, essentially matched the Index while incurring slightly less volatility; the Fund lost 0.91% while the Index, when calculated with reinvested dividends, lost 0.93%. For the full year, Class A shares declined 1.68%; with reinvested dividends, the benchmark gained 1.38%.
1 The S&P 500® Index is an unmanaged, market capitalization weighted index which measures the performance of the large cap segment of the U.S. equities market, covering approximately 75% of the U.S. equities market. The Index includes 500 leading companies in leading industries of the U.S. economy. Index returns assume the reinvestment of dividends, but, unlike the Fund's returns, do not reflect the effects of management fees or expenses. It is not possible to invest directly in the Index.
2 "Current" expense ratio as of 12/31/15. "Prospectus" expense ratio is for the fiscal year ended 12/31/14.
21
Pacific Advisors
Large Cap Value Fund continued
During this period of market uncertainty, large cap blue-chip stocks, and other more conservative areas of the market, outperformed. At the sector level, consumer and technology companies led the way. Fund holdings that contributed to performance in latter half of the year included3:
• Alphabet (formerly known as Google) gained almost 46% during the period to lead in performance. The company reported an 18% increase in year-over-year revenues with growth in mobile search, YouTube and programmed advertising. We are attracted to Google's leadership as the dominant global search provider; the company is well-positioned to participate in the ongoing evolution of mobile computing, brand advertising, and e-commerce.
• Microsoft rose over 27% as the company reported "strong progress" in priority areas including new devices, Windows 10 upgrades, Office 365 and commercial cloud services. Ongoing focus on cost discipline has led to improved profitability. The company also increased its quarterly dividend by 16%.
• McDonald's gained over 26% in response to the company's turnaround efforts. Year-over-year global comparable sales rose 4%, and notably, the company reported the first quarterly U.S. same-store sales increase in two years. Management's priorities to reposition the company "as a modern, progressive burger company" appear to be resonating well with consumers.
• Home improvement retailers Lowe's and Home Depot continue to perform well. Both companies benefit from the ongoing recovery in the U.S. housing market and increased demand for home improvement products. Lowe's focuses on improving the in-store experience for both professional and DIY customers; the company is also pursuing initiatives such as smaller store formats in more urban markets as well as international expansion. Home Depot, meanwhile, is targeting productivity improvements to increase store profitability. Both companies are aggressively repurchasing shares to improve earnings per share growth and return cash to shareholders.
• Intel, the world's largest manufacturer of semiconductors, maintains a dominant position with the recent introduction of 6th Generation Intel® CoreTM processors. The company's diversification into data center, mobile, and memory products should provide sales and earnings growth despite fears of a weakening PC market.
• General Electric's transformation to refocus on higher-return industrial businesses continues. Recent announcements to reduce its financial businesses include exiting its credit card operation, commercial lending, and leasing businesses. Shares rose 19% during the period as investors cheered the corporate developments.
In contrast, several Fund holdings underperformed during the period.
• Time Warner Inc., the diversified media and entertainment company which owns Turner, HBO, and Warner Bros., lost over 25%. Initially, the stock, along with other media stocks, sold off due to concerns about accelerating momentum in subscriber "cord-cutting" and weaker advertising revenues; later, the stock declined following management's lowered earnings guidance for 2016.
• Deere & Co., a global manufacturer of agricultural equipment, including tractors, combines, and sprayers; construction; and forestry equipment, fell due to continuing difficulties in the commodities markets. Given the uncertain duration of the downturn, we trimmed our position early in the period.
• Legg Mason provides investment management services to institutional and individual clients, mutual funds, and other investment products. Assets under management declined along with the global equity markets; however, inflows remain positive as the firm is expanding products and distribution efforts.
3 For detailed information on Fund holdings, please see the Fund's Schedule of Investments in this Report.
22
Fund Strategy
The Fund's focused portfolio strategy invests in 35 to 50 holdings with an emphasis on more conservative, less volatile stocks in comparison to the benchmark. Holdings concentrate on mega-cap stocks of well-managed companies with dominant market positions, strong financials, attractive dividends, and track records of steady growth. The Fund's weighted average market cap is approximately five times larger than the average of the S&P 500® Index; this positioning helps achieve stable total returns with less volatility than that of the broader market. The Fund's one-year beta4, 0.98 as of December 31st, is consistently below the benchmark. At year-end, the Fund's weighted average dividend yield was 2.12%; several holdings, including Deere & Co., General Electric, International Business Machines, Coca-Cola, Kraft Heinz, McDonald's, Proctor & Gamble, Wal-Mart, and ExxonMobil pay dividends in excess of 3.0%.
Aside from trimming Deere as discussed above, the Fund also took profits in trimming its position in ExxonMobil due to the prolonged slump in crude oil prices.
Looking Ahead
Heading into 2016, we anticipate that accommodative monetary policies in Europe and Japan aimed at stimulating growth should buoy investor sentiment. Additionally, the Chinese economy continues to expand at nearly 7% annually; the government's recent forecast of a 6.5% growth rate over the next five years would essentially double the country's 2010 output by 2020. In the U.S., growth has remained moderately strong even though the strength of the dollar has hurt export demand and negatively impacted overseas earnings, and the downturn in energy has slowed industrial activity.
The Fund will remain focused on companies with strong international operations that are positioned to profit as the economies strengthen. These multinational mega-cap companies, such as FedEx, UPS, General Electric, Johnson Controls, Cola-Cola, PepsiCo, MasterCard, and Mondelez International have the broad geographic footprint, product, and distribution diversity to effectively manage changing conditions. Positive trends, including lower fuel prices, higher household income, and a robust labor market, should improve results for consumer-oriented companies such as Apple, Wal-Mart, Home Depot, Lowe's, and Proctor & Gamble. Industrial and manufacturing expansion will support sales and earnings growth for Honeywell International, Illinois Tool Works and Deere & Company.
The Fed's decision to increase interest rates in December for the first time since 2006 is a strong endorsement of both the domestic and global economies.
Higher rates should improve earnings for Wells Fargo, Bank of America and Citigroup as these companies earn higher rates on loan portfolios. Some fixed income investors, especially those holding long-term bonds, may seek to protect against principal losses by migrating to conservative equities. Leading large cap stocks, such as those in which the Fund invests, ought to appeal to these risk-averse investors; the Fund would likely benefit as these investors move into equities.
4 "Beta" measures volatility relative to the stock market or an alternative benchmark. A beta less than 1.0 indicates lower risk than the market or the benchmark; a beta greater than 1.0 indicates higher risk than the market or the benchmark.
23
Pacific Advisors
Large Cap Value Fund continued
Portfolio Holdings as of 12/31/15 (Based on Total Investments)
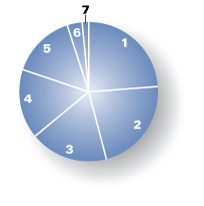
| Equities | 100.00 | % | |||||||||
| 1. | Information Technology | 23.70 | % | ||||||||
| 2. | Consumer Discretionary | 22.19 | % | ||||||||
| 3. | Financials | 18.20 | % | ||||||||
| 4. | Consumer Staples | 16.08 | % | ||||||||
| 5. | Industrials | 14.84 | % | ||||||||
| 6. | Health Care | 3.48 | % | ||||||||
| 7. | Energy | 1.51 | % | ||||||||
Change in Value of $10,000 Investment1
This chart compares the growth of a $10,000 investment in Class A shares of the Large Cap Value Fund for the period January 1, 2006 through December 31, 2015 with the same investment in the S&P 500® Index2.
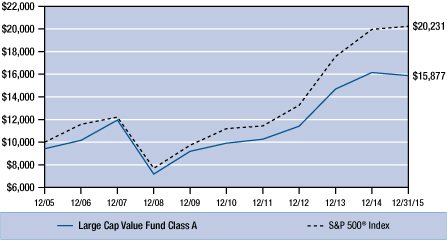
Average Annual Compounded Returns as of December 31, 2015
Class A | Class C | S&P 500® Index | |||||||||||||
One Year | – 7.36 | % | – 3.46 | % | 1.38 | % | |||||||||
Five Year | 8.59 | % | 9.05 | % | 12.57 | % | |||||||||
Ten Year | 4.73 | % | 4.56 | % | 7.31 | % | |||||||||
Past performance does not guarantee future results. Performance quoted represents past performance. Current performance may be higher or lower than the performance data quoted. Returns include reinvested dividends and capital gains. Returns for Class A shares reflect a maximum front-end sales charge of 5.75%; and returns for Class C shares reflect the deduction of a contingent deferred sales charge of 1% on shares sold within the first year of purchase. Returns do not take into account individual taxes which may reduce actual returns when shares are sold. The investment return and principal value of an investment will fluctuate so that an investor's shares, when redeemed, may be worth more or less than their original cost. Call (800) 989-6693 for the most recent month-end performance.
1 Fund results are shown for Class A shares and reflect deduction of the maximum front-end sales charge of 5.75% on the $10,000 investment for a net amount invested of $9,425. At the end of the same period, a $10,000 investment in Class C shares would have been valued at $15,612, and no contingent deferred sales charges would apply. Performance of the share classes will vary based on the difference in charges and expenses. The inception date for Class A shares and Class C shares is 05/01/99. It is not possible to invest directly in either Index. Index results assume reinvestment of dividends, but, unlike the Fund's results, do not reflect sales charges, fees or expenses.
2 The Standard & Poor's 500® Index is an unmanaged, market capitalization weighted index which measures the performance of the large cap segment of the U.S. equities market, covering approximately 75% of the U.S. equities market. The Index includes 500 leading companies in leading industries of the U.S. economy.
24
Expense Examples
As a shareholder of the Fund you incur two types of costs: (1) transaction costs, including sales charges (loads) on purchase payments, reinvested dividends, or other distributions; redemption fees; and exchange fees; and (2) ongoing costs, including management fees; distribution (12b-1) fees; and other Fund expenses. This Example is intended to help you understand your ongoing costs (in dollars) of investing in the Fund and to compare these costs with the ongoing costs of investing in other mutual funds.
The Example is based on an investment of $1,000 invested at the beginning of the period and held for the entire period from July 1, 2015 through December 31, 2015.
Actual Expenses
The first line of the table below provides information about actual account values and actual expenses. You may use the information in this line, together with the amount you invested, to estimate the expenses that you paid over the period. Simply divide your account value by $1,000 (for example, an $8,600 account value divided by $1,000 = 8.6), then multiply the result by the number in the first line under the heading entitled "Expenses Paid During the Period" to estimate the expenses you paid on your account during the period.
The following transaction costs are not included in the expenses shown in the table and, if applicable, would increase the expenses that you paid over the period: (1) a front-end sales charge (load) of 5.75% on Class A shares; (2) a 2% redemption fee if you sell or exchange shares within 180 days of purchase, with certain exceptions. The redemption fee does not apply to: (a) redemptions under an automatic withdrawal program or periodic asset reallocation plan, required minimum distributions (RMD), employer mandated distributions from a qualified plan, or redemptions under a qualified domestic relations order (QDRO); (b) redemptions to pay for expenses related to terminal illness, extended hospital or nursing home care, or other serious medical conditions, including death; (c) redemptions of shares acquired through dividend or capital gains reinvestments; (d) loans from a qualified plan account, and (e) redemptions initiated by the Fund; and (3) a $10 service fee on each exchange after the first five exchanges in each calendar year.
The following ongoing costs are not included in the expenses shown in the table and, if applicable, would increase the expenses that you paid over the period: (1) a $12 low balance fee on accounts with balances of less than $250 as of September 30th of each calendar year and no investment activity (excluding reinvestment of dividends and/or capital gains) during the prior calendar year or the first nine months of the current calendar year. This fee does not apply to IRAs, qualified plan accounts, or Coverdell Education Savings Accounts; (2) a $15 annual custodial fee on IRAs, SEPs, SIMPLE IRAs, and Coverdell Education Savings Accounts; and (3) a $20 annual custodial fee on 403(b) accounts.
Hypothetical Example for Comparison Purposes
The second line of the table below provides information about hypothetical account values and hypothetical expenses based on the Fund's actual expense ratio and an assumed rate of return of 5% per year before expenses, which in not the Fund's actual return. The hypothetical account values and expenses may not be used to estimate the actual ending account balance or expenses you paid for the period. You may use this information to compare the ongoing costs of investing in the Fund and other funds. To do so, compare this 5% hypothetical example with the 5% hypothetical examples that appear in the shareholder reports of the other funds.
The following transaction costs are not included in the expenses shown in the table and, if applicable, would increase the expenses that you paid over the period: (1) a front-end sales charge (load) of 5.75% on Class A shares; (2) a 2% redemption fee if you sell or exchange shares within 180 days of purchase, with certain exceptions. The redemption fee does not apply to: (a) redemptions under an automatic withdrawal program or periodic asset reallocation plan, required minimum distributions (RMD), employer mandated distributions from a qualified plan, or redemptions under a qualified domestic relations order (QDRO); (b) redemptions to pay for expenses related to terminal illness, extended hospital or nursing home care, or other serious medical conditions, including death; (c) redemptions of shares acquired through dividend or capital gains reinvestments; (d) loans from a qualified plan account, and (e) redemptions initiated by the Fund; and (3) a $10 service fee on each exchange after the first five exchanges in each calendar year.
The following ongoing costs are not included in the expenses shown in the table and, if applicable, would increase the expenses that you paid over the period: (1) a $12 low balance fee on accounts with balances of less than $250 as of September 30th of each calendar year and no investment activity (excluding reinvestment of dividends and/or capital gains) during the prior calendar year or the first nine months of the current calendar year. This fee does not apply to IRAs, qualified plan accounts, or Coverdell Education Savings Accounts; (2) a $15 annual custodial fee on IRAs, SEPs, SIMPLE IRAs, and Coverdell Education Savings Accounts; and (3) a $20 annual custodial fee on 403(b) accounts.
Please note that the expenses shown in the table are meant to highlight your ongoing costs only and do not reflect any transactional costs, such as sales charges (loads), redemption fees, or exchange fees. Therefore, the second line of the table is useful in comparing ongoing costs only, and will not help you determine the relative total costs of owning different funds. In addition, if these transactional costs were included, your costs would have been higher.
| Beginning Account Value 07/01/15 | Ending Account Value 12/31/15 | Expense Paid During Period 07/01/15 – 12/31/15 | |||||||||||||
Large Cap Value Fund Class A | |||||||||||||||
Actual | $ | 1,000.00 | $ | 990.90 | $ | 13.65 | |||||||||
Hypothetical (5% return before expense) | $ | 1,000.00 | $ | 1,011.49 | $ | 13.79 | |||||||||
Large Cap Value Fund Class C | |||||||||||||||
Actual | $ | 1,000.00 | $ | 987.10 | $ | 17.53 | |||||||||
Hypothetical (5% return before expense) | $ | 1,000.00 | $ | 1,007.56 | $ | 17.71 | |||||||||
5 Expenses are equal to the Fund's annualized expense ratio, net of expense waivers, of 2.72% for Class A shares and 3.50% for Class C shares, multiplied by the average account value over the period, multiplied by 184/365 days to reflect the one-half year period.
25
Pacific Advisors
Mid Cap Value Fund
Fund Objective: Long-term capital appreciation.
Investment Invests at least 80% of its assets in mid-cap companies that are, at the time of
Strategy: purchase, within the market cap range of companies in the Russell Midcap Index®.1
Investor Profile: Moderately aggressive. Growth-oriented with a long-term investment horizon.
TOTAL RETURNS | EXPENSE RATIOS2 | ||||||||||||||||||
For the year ended December 31, 2015 | Current | Prospectus | |||||||||||||||||
Class A | –23.63 | % | Class A | 3.68 | % | 3.42 | % | ||||||||||||
Class C | –24.23 | % | Class C | 4.46 | % | 4.17 | % | ||||||||||||
Russell Midcap Index® | –2.44 | % | |||||||||||||||||
Performance quoted is past performance which does not guarantee future results. Current performance may be higher or lower than the performance quoted. Call (800) 989-6693 for performance current to the most recent month-end. The investment return and principal value of an investment will fluctuate so that an investor's shares, when redeemed, may be worth more or less than their original cost. Returns represent the change in value over the stated period assuming reinvestment of dividends and capital gains at net asset value. Returns do not take into account the maximum 5.75% sales charge on Class A shares or the 1% Contingent Deferred Sales Charge (CDSC) for Class C shares sold within one year of purchase. Returns would be lower if the applicable sales charge and CDSC were included. Returns do not take into account individual taxes which may reduce actual returns when shares are sold.
Discussion with Portfolio Manager February 24, 2016
George A. Henning
Please see the Chairman's Letter at the beginning of this Report for a detailed market and economic review as well as the Manager's general market outlook.
Fund Performance
The Fund is actively positioned toward companies and sectors that will respond well to economic growth; during the period, though, the Fund underperformed as concerns of a global slowdown undermined investor sentiment. Several economic factors, including the persistent downturn in energy markets, a reduction in industrial activity, and slowing growth in China, created a difficult environment, especially for the fund's deeply undervalued Industrials stocks. During the second half of the year, Class A shares fell 21.77%; in comparison, the benchmark declined 4.68%. For the full year, Class A shares dropped 23.63% to significantly lag the benchmark's 2.44% decline.
The Fund's sector allocation notably differs from the benchmark as the Fund's investment strategy does not seek to mirror the Index. Instead, the Fund uses a bottom-up investment process to identify the best long-term opportunities. Typically, the stocks selected using this process represent different sector allocations than those in the Index; for example, certain sectors, such as Financials, Utilities, Technology, and Health Care, cumulatively represent a sizable component of the benchmark; in contrast, the Fund often identifies better value opportunities in sectors such as Industrials and Energy. This variance from the benchmark can lead to Fund underperformance during periods, such as 2015, which favor growth-oriented stocks; we expect the Fund's value-oriented process to contribute to outperformance in the long run.
1 The Russell Midcap® Index is an unmanaged, weighted measure of the 800 smallest companies within the Russell 1000® Index based on a combination of their market cap and current index membership. Index returns assume the reinvestment of dividends, but, unlike the Fund's returns, do not reflect management fees or expenses. It is not possible to invest directly in the Index.
2 "Current" expense ratio as of 12/31/15. "Prospectus" expense ratio is for the fiscal year ended 12/31/14.
26
Several of the Fund's more conservative areas, including less volatile consumer product and food & beverage companies, performed well. In addition, several of the Fund's retail holdings3 benefitted as steady gains in employment led to improved consumer spending.
• Dr Pepper Snapple Group, which produces and distributes more than 50 flavored beverages including six of the top ten non-cola soft drinks, rose 29% during the period. The company's investments in marketing and innovation have translated into sales and revenue growth despite declining sales across the carbonated soft drink industry in North America.
• Pool Corporation, the world's largest wholesale distributor of swimming pool supplies, equipment, and related products, reversed weakness earlier in the year; the company is benefitting from replacement and remodeling activity to increase energy efficiency and incorporate technologically advanced products.
• A 5.7% increase in automotive sales in 2015, which broke the record set in 2000, helped both Lear and O'Reilly Automotive. Lear, a leading global manufacturer of automotive seats and electrical systems, acquired intellectual property and technology from Autonet Mobile which utilizes wireless routers to connect vehicle systems. O'Reilly Automotive, an auto parts retailer offering top-quality products and services to do-it-yourselfers and professionals, reported twenty-seven consecutive quarters of earnings per share growth in excess of 15%.
The ongoing recovery in the U.S. residential and non-residential construction markets is aiding results for Graco, the technology leader in equipment that provides equipment to spray fluid and powder materials used in the housing, wood finishing, and other industries. The company continues to invest for growth through new product developments as well as geographic and market expansion.
In contrast, the Fund's significant allocation to the Energy and Industrials sectors detracted from returns. During the period, crude oil prices deteriorated due to the unrelenting imbalance between oversupply and slowing demand. The Fund's Energy holdings, while concentrated among leading oil field service providers rather than the more volatile exploration and production companies, continued to languish from severely discounted valuations. In evaluating the Fund holdings, we examined several metrics including cash flow, debt structure, asset and tangible book value. Our analysis determined that each of the Fund's Energy holdings has limited bankruptcy risk; for these companies, even modest recovery scenarios would provide substantial returns.
• Offshore oil and gas drilling contractor Noble Corporation traded at 40% of tangible book value, a conservative measure of liquidation value and paid a 9.5% dividend yield. The company, having recently completed a major fleet modernization program, is well-positioned against competitors with older service vessels as the industry confronts reduced activity and excess capacity.
• Helix Energy Solutions, which provides well intervention services and robotics to maximize productivity and efficiency of deepwater wells, traded at 35% of tangible book value. One beneficial outcome of the Energy sector's downturn is industry-wide efficiency improvements; the company may identify potential merger or acquisition candidates.
• Recent Fund acquisition, Kirby Corporation, which operates barges and towing vessels that transport petrochemicals, refined petroleum products, and agricultural chemicals throughout the U.S. inland waterway system, is attractively positioned as increased movements of crude oil and petrochemicals are creating lucrative opportunities for this age-old industry.
Likewise, the underperformance of the Fund's Industrials holdings impacted returns during the period. In particular, the slowdown in energy and manufacturing sectors hurt transportation-related stocks.
• Rail companies Genesee & Wyoming and Kansas City Southern suffered from lower shipments of goods including coal, crude oil, agricultural products, and steel. Longer-term outlooks for these
3 For detailed information on Fund holdings, please see the Fund's Schedule of Investments in this Report.
27
Pacific Advisors
Mid Cap Value Fund continued
transportation companies, including possible acquisition opportunities, remain positive. Kansas City Southern's railroads are often the only available shipping option in some shale oil and gas regions; and, its north-south lines connecting Mexico and the U.S. benefit from manufacturing activity in Mexico.
• Wabtec, a global provider of products for locomotives, freight cars, and passenger cars, sold off during the period on concerns over slowing freight demand. Despite this weakness, the company's new product development, expansion of aftermarket sales, international growth, and continuous improvement initiatives should benefit growth and expand margins.
• Swift Transportation, the largest truckload carrier in North America, lowering guidance for the year due to seasonal volume reductions, delays in receiving new trailers and other one-time issues. Longer term, the company should be able to command higher pricing as the industry continues to face driver shortages.
• Commercial truck manufacturer Navistar International was impacted by an excess of used trucks which weighed on new truck sales; nevertheless, Navistar's turnaround efforts continue as the company regains market share and further reduces structural costs.
Fund Strategy
Mid-cap companies provide distinctive advantages for long-term investors by combining the strategic flexibility of smaller businesses with the economies of scale typically enjoyed by large corporations. Our fundamental, bottom-up investment process identifies businesses with attractive opportunities for long-term growth. The Fund uses a focused strategy to invest in approximately 30 to 40 high-quality stocks; we expect to hold each investment for 3 to 5 years, or longer. This long-term horizon typically reduces turnover and contributes to tax efficiency by minimizing the realization of short-term gains. As of year-end, the Fund's low annual turnover rate of 25% was consistent with its five-year average annual turnover rate of 20%4.
During the period, the Fund sold positions in Energy holding Tidewater and auto components company Dana Holding; the proceeds were used to initiate a new position:
• Stericycle specializes in collecting and disposing regulated substances, such as medical waste, pharmaceutical disposal, and hazardous waste, and recently acquired a company providing secure information destruction services. The Fund acquired shares following a significant price decline in response to disappointing quarterly results. The company, which ranks among the world's 100 most innovative, is well-positioned for growth through business-to-business solutions.
The Fund utilizes an active buy-and-hold approach to portfolio management. During the period, the Fund trimmed several holdings to lock in profits, adjust allocations and rebalance the portfolio. These included Lear, Landstar and O'Reilly Automotive. We also purchased additional shares of Chicago Bridge & Iron, Noble Corporation, Genesee & Wyoming, Kansas City Southern, Kirby, Navistar, Spirit Airlines, and Swift Transportation; we determined that the deeply discounted prices offered attractive opportunities to acquire shares for long-term appreciation.
Looking Ahead
The world's major economies provided reason for optimism in 2015. The European Central Bank's accommodative monetary policies have helped the region achieve its fastest growth since 2011; Japan is once again on a path for sustained recovery after falling into a recession last year; and China's forecast of a 6.5% growth rate over the next five years would essentially double the country's 2010 output by 2020.
In the U.S., growth has remained moderate even though the dollar's appreciation has hurt export demand and negatively impacted overseas earnings, and the downturn in energy has slowed industrial
4 Annual turnover: 25% (2015); 22% (2014); 15% (2013); 24% (2012); and 12% (2011)
28
activity. The Fed's decision to increase interest rates in December for the first time since 2006 is a strong endorsement of both the domestic and global economies.
Higher interest rates should improve net interest margins for the Fund's financial holdings East West Bancorp and CIT Group. Leading companies in the transportation industry, including Genesee & Wyoming, Kansas City Southern, Wabtec, Swift, and Landstar would benefit from increased industrial manufacturing activity. Lower fuel prices and a continuation of the improving labor market should bolster consumer spending and help companies such as videogame retailer Gamestop, apparel company PVH (which owns Calvin Klein, Tommy Hilfiger, and other brands), and Tractor Supply Company. Strong auto sales should boost prospects for Penske Automotive Group while O'Reilly Automotive continues to benefit from new store expansion.
Results for companies that have been negatively impacted by the prolonged slump in crude oil prices, including Noble, Helix Energy Solutions, Kirby, Now Inc., and Aspen Technology, should improve as oil prices stabilize. Recent legislation, including the lifting of the crude oil export ban and tax credits, should provide a positive backdrop for the business community.
Consistent with our long-term perspective, we seek to invest in high-quality companies that enjoy strong competitive positioning and market leadership. Several Fund holdings underperformed during the period; yet, over time, these stocks should recover as conditions improve. In the near-term, prices may remain detached from company fundamentals; ultimately, though, markets reflect a company's intrinsic value. Our experience has shown that patience, combined with opportunistic investing to take advantage of market volatility, can produce remarkable returns when prices recover.
29
Pacific Advisors
Mid Cap Value Fund continued
Portfolio Holdings as of 12/31/15 (Based on Total Investments)
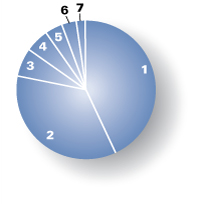
Equities | 100.00 | % | |||||||||
| 1. | Industrials | 43.04 | % | ||||||||
| 2. | Consumer Discretionary | 35.15 | % | ||||||||
| 3. | Financials | 6.69 | % | ||||||||
| 4. | Energy | 5.40 | % | ||||||||
| 5. | Information Technology | 4.07 | % | ||||||||
| 6. | Consumer Staples | 3.35 | % | ||||||||
| 7. | Materials | 2.30 | % | ||||||||
Change in Value of $10,000 Investment1
This chart compares the growth of a $10,000 investment in Class A shares of the Mid Cap Value Fund for the period January 1, 2006 through December 31, 2015 with the same investment in the Russell Midcap® Index2.
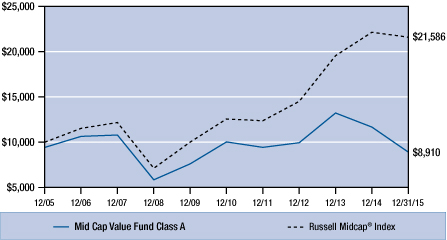
Average Annual Compounded Returns as of December 31, 2015
Class A | Class C | Russell Midcap® Index | |||||||||||||
One Year | – 28.01 | % | – 24.99 | % | – 2.44 | % | |||||||||
Five Year | – 3.49 | % | – 3.10 | % | 11.44 | % | |||||||||
Ten Year | – 1.15 | % | – 1.37 | % | 8.00 | % | |||||||||
Past performance does not guarantee future results. Performance quoted represents past performance. Current performance may be higher or lower than the performance data quoted. Returns include reinvested dividends and capital gains. Returns for Class A shares reflect a maximum front-end sales charge of 5.75%; and returns for Class C shares reflect the deduction of a contingent deferred sales charge of 1% on shares sold within the first year of purchase. Returns do not take into account individual taxes which may reduce actual returns when shares are sold. The investment return and principal value of an investment will fluctuate so that an investor's shares, when redeemed, may be worth more or less than their original cost. Call (800) 989-6693 for the most recent month-end performance.
1 Fund results are shown for Class A shares and reflect deduction of the maximum front-end sales charge of 5.75% on the $10,000 investment for a net amount invested of $9,425. At the end of the same period, a $10,000 investment in Class C shares would have been valued at $8,709, and no contingent deferred sales charges would apply. Performance of the share classes will vary based on the difference in charges and expenses. The inception date for Class A shares and Class C shares is 04/01/02. It is not possible to invest directly in either Index. Index results assume reinvestment of dividends, but, unlike the Fund's results, do not reflect sales charges, fees or expenses.
2 The Russell Midcap® Index is an unmanaged, weighted measure of the 800 smallest companies within the Russell 1000® Index based on a combination of their market cap and current index membership.
30
Expense Examples
As a shareholder of the Fund you incur two types of costs: (1) transaction costs, including sales charges (loads) on purchase payments, reinvested dividends, or other distributions; redemption fees; and exchange fees; and (2) ongoing costs, including management fees; distribution (12b-1) fees; and other Fund expenses. This Example is intended to help you understand your ongoing costs (in dollars) of investing in the Fund and to compare these costs with the ongoing costs of investing in other mutual funds.
The Example is based on an investment of $1,000 invested at the beginning of the period and held for the entire period from July 1, 2015 through December 31, 2015.
Actual Expenses
The first line of the table below provides information about actual account values and actual expenses. You may use the information in this line, together with the amount you invested, to estimate the expenses that you paid over the period. Simply divide your account value by $1,000 (for example, an $8,600 account value divided by $1,000 = 8.6), then multiply the result by the number in the first line under the heading entitled "Expenses Paid During the Period" to estimate the expenses you paid on your account during the period.
The following transaction costs are not included in the expenses shown in the table and, if applicable, would increase the expenses that you paid over the period: (1) a front-end sales charge (load) of 5.75% on Class A shares; (2) a 2% redemption fee if you sell or exchange shares within 180 days of purchase, with certain exceptions. The redemption fee does not apply to: (a) redemptions under an automatic withdrawal program or periodic asset reallocation plan, required minimum distributions (RMD), employer mandated distributions from a qualified plan, or redemptions under a qualified domestic relations order (QDRO); (b) redemptions to pay for expenses related to terminal illness, extended hospital or nursing home care, or other serious medical conditions, including death; (c) redemptions of shares acquired through dividend or capital gains reinvestments; (d) loans from a qualified plan account, and (e) redemptions initiated by the Fund; and (3) a $10 service fee on each exchange after the first five exchanges in each calendar year.
The following ongoing costs are not included in the expenses shown in the table and, if applicable, would increase the expenses that you paid over the period: (1) a $12 low balance fee on accounts with balances of less than $250 as of September 30th of each calendar year and no investment activity (excluding reinvestment of dividends and/or capital gains) during the prior calendar year or the first nine months of the current calendar year. This fee does not apply to IRAs, qualified plan accounts, or Coverdell Education Savings Accounts; (2) a $15 annual custodial fee on IRAs, SEPs, SIMPLE IRAs, and Coverdell Education Savings Accounts; and (3) a $20 annual custodial fee on 403(b) accounts.
Hypothetical Example for Comparison Purposes
The second line of the table below provides information about hypothetical account values and hypothetical expenses based on the Fund's actual expense ratio and an assumed rate of return of 5% per year before expenses, which in not the Fund's actual return. The hypothetical account values and expenses may not be used to estimate the actual ending account balance or expenses you paid for the period. You may use this information to compare the ongoing costs of investing in the Fund and other funds. To do so, compare this 5% hypothetical example with the 5% hypothetical examples that appear in the shareholder reports of the other funds.
The following transaction costs are not included in the expenses shown in the table and, if applicable, would increase the expenses that you paid over the period: (1) a front-end sales charge (load) of 5.75% on Class A shares; (2) a 2% redemption fee if you sell or exchange shares within 180 days of purchase, with certain exceptions. The redemption fee does not apply to: (a) redemptions under an automatic withdrawal program or periodic asset reallocation plan, required minimum distributions (RMD), employer mandated distributions from a qualified plan, or redemptions under a qualified domestic relations order (QDRO); (b) redemptions to pay for expenses related to terminal illness, extended hospital or nursing home care, or other serious medical conditions, including death; (c) redemptions of shares acquired through dividend or capital gains reinvestments; (d) loans from a qualified plan account, and (e) redemptions initiated by the Fund; and (3) a $10 service fee on each exchange after the first five exchanges in each calendar year.
The following ongoing costs are not included in the expenses shown in the table and, if applicable, would increase the expenses that you paid over the period: (1) a $12 low balance fee on accounts with balances of less than $250 as of September 30th of each calendar year and no investment activity (excluding reinvestment of dividends and/or capital gains) during the prior calendar year or the first nine months of the current calendar year. This fee does not apply to IRAs, qualified plan accounts, or Coverdell Education Savings Accounts; (2) a $15 annual custodial fee on IRAs, SEPs, SIMPLE IRAs, and Coverdell Education Savings Accounts; and (3) a $20 annual custodial fee on 403(b) accounts.
Please note that the expenses shown in the table are meant to highlight your ongoing costs only and do not reflect any transactional costs, such as sales charges (loads), redemption fees, or exchange fees. Therefore, the second line of the table is useful in comparing ongoing costs only, and will not help you determine the relative total costs of owning different funds. In addition, if these transactional costs were included, your costs would have been higher.
| Beginning Account Value 07/01/15 | Ending Account Value 12/31/15 | Expense Paid During Period 07/01/15 – 12/31/15 | |||||||||||||
Mid Cap Value Fund Class A | |||||||||||||||
Actual | $ | 1,000.00 | $ | 782.30 | $ | 16.53 | |||||||||
Hypothetical (5% return before expense) | $ | 1,000.00 | $ | 1,006.65 | $ | 18.61 | |||||||||
Mid Cap Value Fund Class C | |||||||||||||||
Actual | $ | 1,000.00 | $ | 778.90 | $ | 20.00 | |||||||||
Hypothetical (5% return before expense) | $ | 1,000.00 | $ | 1,002.72 | $ | 22.51 | |||||||||
3 Expenses are equal to the Fund's annualized expense ratio of 3.68% for Class A shares and 4.46% for Class C shares, multiplied by the average account value over the period, multiplied by 184/365 days to reflect the one-half year period.
31
Pacific Advisors
Small Cap Value Fund
Fund Objective: Capital appreciation through investment in small cap companies.
Investment Invests at least 80% of its assets in small cap companies which are, at the time of
Strategy: purchase, not greater than the highest market capitalization of companies within the Russell 2000® Index1. Generally invests a significant proportion of its assets in companies with market capitalizations that are, at the time of purchase, not greater than the highest market capitalization of companies in the Russell Microcap® Index2 (which are often referred to as "micro-cap" stocks).
Investor Profile: Aggressive. Opportunity-oriented with a long-term investment horizon.
TOTAL RETURNS | EXPENSE RATIOS3 | ||||||||||||||||||
For the year ended December 31, 2015 | Current | Prospectus | |||||||||||||||||
Class A | –30.31 | % | Class A | 3.03 | % | 2.19 | % | ||||||||||||
Class C | –30.83 | % | Class C | 3.88 | % | 2.95 | % | ||||||||||||
Class I | –29.94 | % | Class I | 2.86 | % | 2.03 | % | ||||||||||||
Russell 2000® Index | –4.41 | % | |||||||||||||||||
Performance quoted is past performance which does not guarantee future results. Current performance may be higher or lower than the performance quoted. Call (800) 989-6693 for performance current to the most recent month-end. The investment return and principal value of an investment will fluctuate so that an investor's shares, when redeemed, may be worth more or less than their original cost. Returns represent the change in value over the stated period assuming reinvestment of dividends and capital gains at net asset value. Rankings shown are for Class A shares; rankings for other share classes may be different. Returns and rankings do not take into account the maximum 5.75% sales charge on Class A shares or the 1% Contingent Deferred Sales Charge (CDSC) for Class C shares sold within one year of purchase. Returns would be lower if the applicable sales charge and CDSC were included. Returns do not take into account individual taxes which may reduce actual returns when shares are sold. Small cap companies typically have fewer financial resources and may carry higher investment risks and experience greater stock price volatility than larger stocks.
Discussion with Portfolio Manager February 24, 2016
George A. Henning
Please see the Chairman's Letter at the beginning of this Report for a detailed market and economic review as well as the Manager's general market outlook.
Fund Performance
The Fund underperformed its benchmark as various economic factors (including the continued decline in oil prices, the reduction in industrial activity, and slowing growth in China) undermined market sentiment. More than 56% of the stocks in the Russell 2000® Index fell into bear market territory with losses of 20% or more from their 52-week highs. The Fund's positioning towards areas such as Energy and Industrials, which tend to reflect economic trends, magnified the impact of these selloffs. Consequently, Class A shares declined 27.1% in the second half of the year compared to the benchmark's return of –8.8%.
The Fund's deviation from the benchmark Russell 2000® Index is largely attributed to the make-up of the Index. As of December 31, 2015, 60.2% of the benchmark was concentrated in Financials (25.6%), Information Technology (18.0%), and Health Care (16.5%); the latter two sectors predominantly feature
1 The Russell 2000® Index is an unmanaged, market-weighted measure of the 2,000 smallest companies of the Russell 3000® Index which represents approximately 98% of the investable U.S. equity market. Index returns assume the reinvestment of dividends, but, unlike the Fund's returns, do not reflect management fees or expenses. It is not possible to invest directly in the Index.
2 The Russell Microcap® Index is an unmanaged, market capitalization weighted measure of the 1,000 smallest publicly traded companies within the Russell 2000® Index, plus the next smallest 1,000 U.S. based listed stocks.
3 "Current" expense ratio as of 12/31/15. "Prospectus" expense ratio is for the fiscal year ended 12/31/14.
32
growth-oriented companies (e.g., start-ups and biotech companies) with higher price-to-book ratios. In contrast, the Fund's value-oriented investment strategy tends to favor traditional economic sectors, such as Industrials and Energy, which are generally characterized by companies with long operating histories, established management teams, and strong financials and cash flow. Not surprisingly, the Fund's sector weightings typically differ from the Index, sometimes significantly so. This variance can lead to Fund underperformance relative to its benchmark during periods, such as 2015, which favored growth-oriented stocks.
For the full year, growth-oriented stocks outperformed value stocks: the Russell 2000® Growth Index outpaced the Russell 2000® Value Index by more than 6%.4 This divergence is reminiscent of the 1999 dot-com bubble when investors set aside fundamental valuations in their search for growth at any cost. As the dot-com boom crumbled, value regained popularity and outperformed the broader market for several years. A similar reversal of fortunes between value and growth could develop today and drive meaningful outperformance in Fund holdings.
The Fund invests in high-quality, well-managed companies with identifiable long-term growth opportunities; the Fund's anticipated holding period (3 to 5 years or longer) typically results in reduced turnover; for example, the Fund's annual turnover rate, as of December 31st, was 7%, less than its five-year average annual turnover rate5 of 11%. Based on the Fund's investment approach, performance is best viewed over a multi-year time frame as Fund performance may lag its benchmark when short-term factors overwhelm longer-term growth prospects. The Fund's disappointing results in 2015 were largely tied to concerns of a global economic downturn; yet, Fund holdings are concentrated in industry-leading businesses with experienced management teams that are well-equipped to navigate a challenging environment and emerge stronger. Therefore, we anticipate that the Fund's strategy will deliver attractive returns over the long-term as market conditions improve and these companies execute their growth initiatives.
Fund Strategy
The Fund employs a value-oriented approach to identify when high-quality, well-managed companies with attractive growth outlooks become undervalued. Periods of heightened market volatility often create opportunities to strategically invest in these companies for long-term appreciation. The Fund takes an ownership view in seeking to identify stocks that are undervalued or temporarily out-of-favor and have a catalyst for multi-year growth. The Fund focuses on a limited number of small cap stocks (typically 30 to 50 holdings), including a significant number of micro-cap stocks. Micro-caps often attract limited analyst attention; as a result, these under-followed companies can offer significant upside appreciation potential. Investing in small and micro-cap stocks may contribute to above-average volatility; yet, smaller, well-positioned companies can provide superior long-term results. Despite its strategic allocation to micro-cap stocks, we note the Fund's relatively modest one-year beta6 of 1.11, as of December 31st, in comparison to the Russell 2000® Index.
The Fund's portfolio companies are investing for the future, yet their actions seem to have largely fallen on deaf ears. For example7, TAL International announced a transformative merger of equals with Triton Container International to form the world's largest container leasing company; the combined company will own a 25% market share and enjoy significant cost advantages. Team and Furmanite also agreed to merge, creating the leading inspection and mechanical services company serving the world's growing population of refineries and petrochemical facilities. Yet, after an initial spike, shares of each of
4 The Russell 3000® Growth and Value Indices measure the performance of the broad growth and value segments, respectively, of the U.S. equity universe. The Russell 3000® Growth Index includes those Russell 3000® companies with higher price-to-book ratios and higher forecasted growth values. The Russell 3000® Value Index includes those Russell 3000® companies with lower price-to-book ratios and lower forecasted growth values. The Russell 3000® Index measures the performance of the largest 3,000 U.S. companies representing approximately 98% of the investable U.S. equity market. These indices are not available for direct investment. Index returns assume the reinvestment of dividends.
5 Annual turnover: 7% (2015); 16% (2014); 9% (2013); 12% (2012); and 9% (2011).
6 "Beta" measures volatility relative to the stock market or an alternative benchmark. A beta less than 1.0 indicates lower risk than the market or the benchmark and a beta greater than 1.0 indicates higher risk than the market or the benchmark.
7 For detailed information on Fund holdings, please see the Fund's Schedule of Investments in this Report.
33
Pacific Advisors
Small Cap Value Fund continued
these companies fell more than 20% in spite of broad support for the transactions. Meanwhile, Gentherm continued to expand beyond its core suite of heated and cooled automotive seating products; recent project awards will apply its thermal management technology for a global automobile manufacturer's hybrid and electric batteries. Also, the company was selected by the U.S. Navy for development of an energy-efficient, portable patient warming system. Yet, the stock fell 13.7% in the second half of 2015 to erase much of its gains for the year. The market's apparent lack of enthusiasm despite these positive developments underscores the degree to which investors have been influenced by headline events rather than company results.
During the second half of 2015, Energy stocks seemed to principally reflect changes in oil prices rather than company-specific factors. Most investors, in response to the ongoing Energy weakness and lacking confidence in an approaching recovery, have largely abandoned the sector even as prices fell to attractive valuations. Over time, though, declining oil supply levels will begin driving prices higher. In turn, shares of Energy companies will rebound as investors search for bargains. Our experience during similar bear markets has affirmed the benefits of maintaining our fundamental, value-oriented philosophy. In the depths of the current energy bear market, we recognize that the most compelling opportunities are often available when optimism is at its lowest. In evaluating the Fund's underperforming Energy holdings, we examine several measurements including cash flow, debt structure, assets and tangible book value. Our analysis determined that the Fund's Energy holdings have limited bankruptcy risk; for these companies, even modest recovery scenarios would provide substantial returns.
Hornbeck Offshore Services and Parker Drilling own and operate high-specification vessels and drilling rigs which service the global offshore oil industry. This highly competitive industry has been impacted by reduced activity and excess capacity. Hornbeck and Parker are positioned to benefit from the difficult operating environment; they will more than likely participate in industry consolidation. Similarly, North American Energy Partners is a leading provider of mining and construction services in Western Canada; their operations at existing oil sand mines have not meaningfully slowed even though new projects have been delayed or cancelled. Management is also focusing on non-oil sands projects including hydroelectric dams, road-building and infrastructure programs.
Several of the Fund's Industrials holdings also underperformed although their stock selloffs significantly overstated the difficulties. DXP Enterprises and Rush Enterprises benefitted from the shale boom but the subsequent downturn has impacted near-term results; both companies have adjusted to the slowdown by proactively seeking new business opportunities. DXP, a distributor of industrial parts and services, expects to meaningfully increase sales by expanding its in-house pump manufacturing capabilities to service customers nationally. Truck dealer group Rush is focusing on expanding its parts business, which accounts for 60% of gross profits, to include "all makes" equipment, a natural fit as customers already look to its dealerships for maintenance and original equipment parts. China's economic slowdown negatively impacted shares of Genesee & Wyoming; concerns over the impact of declining commodity prices on Australia's export activity have weighed on the railroad stock even though Australia accounts for less than 20% of revenues. Meanwhile, the challenging industry conditions may increase acquisition opportunities which should lay the groundwork for future growth. During the period, we added to our position.
Company-specific issues affected both truck manufacturer Navistar and construction company Orion Marine Group. An excess of used trucks is weighing on Navistar's new truck sales; nevertheless, the company is making good progress on regaining market share and reducing structural costs. Orion incurred a write-down due to cost overruns on five projects that will be completed in early 2016. Management has expressed confidence that they "are rectifying the issues." A recently signed transportation funding bill should significantly enhance the project opportunities for Orion over the next several years.
During the period, we sold out of two positions: BBCN Bancorp was sold for a significant profit as the shares approached our internal price targets; Premiere Global Services was acquired by a private equity entity. We added a new position in Chefs' Warehouse, a leading food services distributor catering to specialty and high-end restaurateurs. The company is positioned to consolidate the fragmented industry
34
dominated by smaller, private service providers. We continued to adjust stock allocations within the Energy and Industrials sectors; for example, we trimmed holdings of Team, which is in the process of acquiring another Fund holding Furmanite, and added to our position in TAL International.
Looking Ahead
Over the past 20+ years, we have maintained a disciplined, value-oriented, long-term investment strategy. The current market turmoil is not unprecedented. For value investors, today's discounts for well-capitalized businesses with proven sources of value are particularly enticing. In the near-term, prices may remain detached from company fundamentals; ultimately, though, markets reflect a company's intrinsic value. Our experience has shown that patience, combined with opportunistic investing to take advantage of market volatility, can produce significant returns when prices recover.
The outlook for oil prices remains clouded by geopolitical factors and speculative traders. The longer-term outlook, though, remains favorable. The recent lifting of the crude oil export ban should create opportunities for U.S. shale producers; with relatively low costs of production, they are positioned to be the global swing producer and among the first to benefit when prices begin to rise. For energy-related companies, therefore, any positive shift in oil prices could spark meaningful price recoveries for energy-related stocks.
The recent slowdown in U.S. industrial production is consistent with a normal business cycle adjustment following several years of expansion. Ongoing strength in consumer spending, the passage of a two-year budget agreement, and the $300 billion U.S. transportation bill, should provide catalysts for Industrial companies. Specifically, these developments should support the business prospects for Fund holdings, including Insteel Industries, a manufacturer of reinforced bars used in bridge and highway construction, and Mobile Mini, a portable storage leasing company which serves the commercial construction industry. More generally, a recovery in industrial activity would help transportation companies, such as Kirby and Saia; Navistar and Rush Enterprises would also likewise benefit from any recovery in the industrial economy.
At year-end, Fund holdings were trading at a weighted average discount of approximately 37% to analysts' 12-month target prices. We believe these projections highlight the significant upside potential of stocks in the Fund. Throughout 2015, investors remained on the sidelines as headline events undermined confidence and sparked fears of a recession. Yet, the economic data contradict these concerns; indeed, most economists expect the global economy to continue expanding a modest pace. And, the prolonged downturn in energy markets will likely begin to subside once oil prices begin to rebound. Thus, we believe the medium-term outlook for stocks remains positive; energy-related investments, in particular, may provide significant opportunities as 2016 unfolds.
35
Pacific Advisors
Small Cap Value Fund continued
Portfolio Holdings as of 12/31/15 (Based on Total Investments)
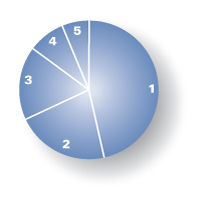
Equities | 100.00 | % | |||||||||
| 1. | Industrials | 46.55 | % | ||||||||
| 2. | Consumer Discretionary | 21.51 | % | ||||||||
| 3. | Energy | 17.04 | % | ||||||||
| 4. | Financials | 8.57 | % | ||||||||
| 5. | Consumer Staples | 6.33 | % | ||||||||
Change in Value of $10,000 Investment1
This chart compares the growth of a $10,000 investment in Class A shares of the Small Cap Value Fund for the period January 1, 2006 through December 31, 2015 with the same investment in the Russell 2000® Index2.

Average Annual Compounded Returns as of December 31, 2015
Class A | Class C | Class I | Russell 2000® Index | ||||||||||||||||
One Year | – 34.32 | % | – 31.52 | % | – 29.94 | % | – 4.41 | % | |||||||||||
Five Year | – 0.03 | % | 0.41 | % | 2.02 | % | 9.19 | % | |||||||||||
Ten Year | 2.91 | % | 2.71 | % | N/A | 6.80 | % | ||||||||||||
Since Inception | 7.43 | % | 3.59 | % | 2.22 | % | - | ||||||||||||
Past performance does not guarantee future results. Performance quoted represents past performance. Current performance may be higher or lower than the performance data quoted. Returns include reinvested dividends and capital gains. Returns for Class A shares reflect a maximum front-end sales charge of 5.75%; and returns for Class C shares reflect the deduction of a contingent deferred sales charge of 1% on shares sold within the first year of purchase. Returns do not take into account individual taxes which may reduce actual returns when shares are sold. Rankings do not take sales loads into account. Small cap stocks typically have fewer financial resources and may carry higher risks and experience greater volatility than large cap stocks. The investment return and principal value of an investment will fluctuate so that an investor's shares, when redeemed, may be worth more or less than their original cost. Call (800) 989-6693 for the most recent month-end performance.
1 Fund results are shown for Class A shares and reflect deduction of the maximum front-end sales charge of 5.75% on the $10,000 investment for a net amount invested of $9,425. At the end of the same period, a $10,000 investment in Class C shares would have been valued at $13,066, and no contingent deferred sales charges would apply. The inception date is 02/08/93 for Class A shares; 04/01/98 for Class C shares; and 10/09/06 for Class I shares. From inception through December 31, 2015, a $10,000 investment in Class I shares would have been valued at $12,231, and no contingent deferred sales charges would apply. Performance of the share classes will vary based on the difference in charges and expenses. It is not possible to invest directly in the Index. Index results assume reinvestment of dividends, but, unlike the Fund's results, do not reflect sales charges, commissions or expenses.
2 The Russell 2000® Index is an unmanaged, weighted measure of the 2,000 smallest companies within the Russell 3000® Index.
36
Expense Examples
As a shareholder of the Fund you incur two types of costs: (1) transaction costs, including sales charges (loads) on purchase payments, reinvested dividends, or other distributions; redemption fees; and exchange fees; and (2) ongoing costs, including management fees; distribution (12b-1) fees; and other Fund expenses. This Example is intended to help you understand your ongoing costs (in dollars) of investing in the Fund and to compare these costs with the ongoing costs of investing in other mutual funds.
The Example is based on an investment of $1,000 invested at the beginning of the period and held for the entire period from July 1, 2015 through December 31, 2015.
Actual Expenses
The first line of the table below provides information about actual account values and actual expenses. You may use the information in this line, together with the amount you invested, to estimate the expenses that you paid over the period. Simply divide your account value by $1,000 (for example, an $8,600 account value divided by $1,000 = 8.6), then multiply the result by the number in the first line under the heading entitled "Expenses Paid During the Period" to estimate the expenses you paid on your account during the period.
The following transaction costs are not included in the expenses shown in the table and, if applicable, would increase the expenses that you paid over the period: (1) a front-end sales charge (load) of 5.75% on Class A shares; (2) a 2% redemption fee if you sell or exchange shares within 180 days of purchase, with certain exceptions. The redemption fee does not apply to: (a) redemptions under an automatic withdrawal program or periodic asset reallocation plan, required minimum distributions (RMD), employer mandated distributions from a qualified plan, or redemptions under a qualified domestic relations order (QDRO); (b) redemptions to pay for expenses related to terminal illness, extended hospital or nursing home care, or other serious medical conditions, including death; (c) redemptions of shares acquired through dividend or capital gains reinvestments; (d) loans from a qualified plan account, and (e) redemptions initiated by the Fund; and (3) a $10 service fee on each exchange after the first five exchanges in each calendar year.
The following ongoing costs are not included in the expenses shown in the table and, if applicable, would increase the expenses that you paid over the period: (1) a $12 low balance fee on accounts with balances of less than $250 as of September 30th of each calendar year and no investment activity (excluding reinvestment of dividends and/or capital gains) during the prior calendar year or the first nine months of the current calendar year. This fee does not apply to IRAs, qualified plan accounts, or Coverdell Education Savings Accounts; (2) a $15 annual custodial fee on IRAs, SEPs, SIMPLE IRAs, and Coverdell Education Savings Accounts; and (3) a $20 annual custodial fee on 403(b) accounts.
Hypothetical Example for Comparison Purposes
The second line of the table below provides information about hypothetical account values and hypothetical expenses based on the Fund's actual expense ratio and an assumed rate of return of 5% per year before expenses, which in not the Fund's actual return. The hypothetical account values and expenses may not be used to estimate the actual ending account balance or expenses you paid for the period. You may use this information to compare the ongoing costs of investing in the Fund and other funds. To do so, compare this 5% hypothetical example with the 5% hypothetical examples that appear in the shareholder reports of the other funds.
The following transaction costs are not included in the expenses shown in the table and, if applicable, would increase the expenses that you paid over the period: (1) a front-end sales charge (load) of 5.75% on Class A shares; (2) a 2% redemption fee if you sell or exchange shares within 180 days of purchase, with certain exceptions. The redemption fee does not apply to: (a) redemptions under an automatic withdrawal program or periodic asset reallocation plan, required minimum distributions (RMD), employer mandated distributions from a qualified plan, or redemptions under a qualified domestic relations order (QDRO); (b) redemptions to pay for expenses related to terminal illness, death, extended hospital or nursing home care, or other serious medical conditions; (c) redemptions of shares acquired through dividend or capital gains reinvestments; (d) loans from a qualified plan account; and (e) redemptions initiated by the Fund; and (3) a $10 service fee on each exchange after the first five exchanges in each calendar year.
The following ongoing costs are not included in the expenses shown in the table and, if applicable, would increase the expenses that you paid over the period: (1) a $12 low balance fee on accounts with balances of less than $250 as of September 30th of each calendar year and no investment activity (excluding reinvestment of dividends and/or capital gains) during the prior calendar year or the first nine months of the current calendar year. This fee does not apply to IRAs, qualified plan accounts, or Coverdell Education Savings Accounts; (2) a $15 annual custodial fee on IRAs, SEPs, SIMPLE IRAs, and Coverdell Education Savings Accounts; and (3) a $20 annual custodial fee on 403(b) accounts.
Please note that the expenses shown in the table are meant to highlight your ongoing costs only and do not reflect any transactional costs, such as sales charges (loads), redemption fees, or exchange fees. Therefore, the second line of the table is useful in comparing ongoing costs only, and will not help you determine the relative total costs of owning different funds. In addition, if these transactional costs were included, your costs would have been higher.
| Beginning Account Value 07/01/15 | Ending Account Value 12/31/15 | Expense Paid During Period 07/01/15 – 12/31/15 | |||||||||||||
Small Cap Value Class A | |||||||||||||||
Actual | $ | 1,000.00 | $ | 729.20 | $ | 13.21 | |||||||||
Hypothetical (5% return before expense) | $ | 1,000.00 | $ | 1,009.93 | $ | 15.35 | |||||||||
Small Cap Value Class C | |||||||||||||||
Actual | $ | 1,000.00 | $ | 726.50 | $ | 16.88 | |||||||||
Hypothetical (5% return before expense) | $ | 1,000.00 | $ | 1,005.65 | $ | 19.61 | |||||||||
Small Cap Value Class I | |||||||||||||||
Actual | $ | 1,000.00 | $ | 730.20 | $ | 12.47 | |||||||||
Hypothetical (5% return before expense) | $ | 1,000.00 | $ | 1,010.79 | $ | 14.50 | |||||||||
3 Expenses are equal to the Fund's annualized expense ratio of 3.03% for Class A shares, 3.88% for Class C shares and 2.86% for Class I shares, multiplied by the average account value over the period, multiplied by 184/365 days to reflect the one-half year period.
37

Pacific Advisors Fund Inc.
Financial Statements
38
Pacific Advisors Government Securities Fund
Schedule of Investments
as of December 31, 2015
| Quantity or Principal** | Description | Current $ Value** | % of Total Net Assets | ||||||||||||
COMMON STOCK | |||||||||||||||
CONSUMER STAPLES | 5.32 | ||||||||||||||
BEVERAGES | |||||||||||||||
250 | PEPSICO, INC. | 24,980 | |||||||||||||
24,980 | 1.55 | ||||||||||||||
FOOD PRODUCTS | |||||||||||||||
350 | GENERAL MILLS INC. | 20,181 | |||||||||||||
20,181 | 1.25 | ||||||||||||||
HOUSEHOLD PRODUCTS | |||||||||||||||
150 | KIMBERLY-CLARK CORP. | 19,095 | |||||||||||||
19,095 | 1.18 | ||||||||||||||
PERSONAL PRODUCTS | |||||||||||||||
500 | UNILEVER PLC | 21,560 | |||||||||||||
21,560 | 1.34 | ||||||||||||||
ENERGY | 1.12 | ||||||||||||||
OIL, GAS & CONSUMABLE FUELS | |||||||||||||||
200 | CHEVRON CORP. | 17,992 | |||||||||||||
17,992 | 1.12 | ||||||||||||||
HEALTH CARE | 2.32 | ||||||||||||||
PHARMACEUTICALS | |||||||||||||||
200 | ELI LILLY & CO. | 16,852 | |||||||||||||
200 | JOHNSON & JOHNSON | 20,544 | |||||||||||||
37,396 | 2.32 | ||||||||||||||
INFORMATION TECHNOLOGY | 1.38 | ||||||||||||||
SOFTWARE | |||||||||||||||
400 | MICROSOFT CORP. | 22,192 | |||||||||||||
22,192 | 1.38 | ||||||||||||||
TELECOMMUNICATION SERVICES | 1.71 | ||||||||||||||
DIVERSIFIED TELECOMMUNICATION SERVICES | |||||||||||||||
800 | AT&T INC. | 27,528 | |||||||||||||
27,528 | 1.71 | ||||||||||||||
See Accompanying Notes to Financial Statements which are an integral part of these financial statements.
39
Pacific Advisors Government Securities Fund
Schedule of Investments
as of December 31, 2015
| Quantity or Principal** | Description | Current $ Value** | % of Total Net Assets | ||||||||||||
COMMON STOCK continued | |||||||||||||||
UTILITIES | 4.77 | ||||||||||||||
ELECTRIC UTILITIES | |||||||||||||||
750 | PPL CORP. | 25,597 | |||||||||||||
550 | SOUTHERN CO. | 25,735 | |||||||||||||
51,332 | 3.18 | ||||||||||||||
MULTI-UTILITIES | |||||||||||||||
400 | CONSOLIDATED EDISON INC. | 25,708 | |||||||||||||
25,708 | 1.59 | ||||||||||||||
TOTAL COMMON STOCK (Cost: $182,988) | 267,964 | 16.61 | |||||||||||||
US GOVERNMENT SECURITIES | |||||||||||||||
US GOVERNMENT AGENCY | 83.54 | ||||||||||||||
US GOVERNMENT AGENCY | |||||||||||||||
200,000 | FEDERAL HOME LOAN MTG CORP. 0.625% 11/24/17 STEP | 199,925 | |||||||||||||
200,000 | FEDERAL HOME LOAN MTG CORP. 0.50% 02/27/18 STEP | 199,793 | |||||||||||||
200,000 | FEDERAL HOME LOAN MTG CORP. 0.50% 10/05/18 STEP | 199,168 | |||||||||||||
250,000 | FEDERAL HOME LOAN MTG CORP. 0.75% 11/26/18 STEP | 249,465 | |||||||||||||
300,000 | FEDERAL HOME LOAN MTG CORP. 0.75% 09/30/20 STEP | 299,829 | |||||||||||||
200,000 | FEDERAL HOME LOAN MTG CORP. 1.00% 12/23/20 STEP | 199,688 | |||||||||||||
1,347,868 | 83.54 | ||||||||||||||
| TOTAL US GOVERNMENT SECURITIES (Cost: $1,350,060) | 1,347,868 | 83.54 | |||||||||||||
TOTAL INVESTMENT IN SECURITIES (Cost: $1,533,048) | 1,615,832 | 100.14 | |||||||||||||
OTHER ASSETS LESS LIABILITIES | (2,329 | ) | (0.14 | ) | |||||||||||
TOTAL NET ASSETS | 1,613,503 | 100.00 | |||||||||||||
* Non-income producing
** The principal amount and value are stated in U.S. dollars unless otherwise indicated.
See Accompanying Notes to Financial Statements which are an integral part of these financial statements.
40
Pacific Advisors Income and Equity Fund
Schedule of Investments
as of December 31, 2015
| Quantity or Principal** | Description | Current $ Value** | % of Total Net Assets | ||||||||||||
COMMON STOCK | |||||||||||||||
CONSUMER DISCRETIONARY | 5.24 | ||||||||||||||
DISTRIBUTORS | |||||||||||||||
1,750 | GENUINE PARTS CO. | 150,308 | |||||||||||||
150,308 | 1.05 | ||||||||||||||
LEISURE PRODUCTS | |||||||||||||||
7,000 | MATTEL INC. | 190,190 | |||||||||||||
190,190 | 1.33 | ||||||||||||||
MEDIA | |||||||||||||||
3,000 | OMNICOM GROUP INC. | 226,980 | |||||||||||||
226,980 | 1.59 | ||||||||||||||
MULTILINE RETAIL | |||||||||||||||
2,500 | TARGET CORP. | 181,525 | |||||||||||||
181,525 | 1.27 | ||||||||||||||
CONSUMER STAPLES | 8.61 | ||||||||||||||
BEVERAGES | |||||||||||||||
4,500 | COCA-COLA CO. | 193,320 | |||||||||||||
193,320 | 1.35 | ||||||||||||||
FOOD & STAPLES RETAILING | |||||||||||||||
2,400 | CVS HEALTH CORP. | 234,648 | |||||||||||||
5,000 | SYSCO CORP. | 205,000 | |||||||||||||
5,600 | THE KROGER CO. | 234,248 | |||||||||||||
3,500 | WAL-MART STORES INC. | 214,550 | |||||||||||||
888,446 | 6.21 | ||||||||||||||
HOUSEHOLD PRODUCTS | |||||||||||||||
1,900 | PROCTER & GAMBLE CO. | 150,879 | |||||||||||||
150,879 | 1.05 | ||||||||||||||
ENERGY | 2.44 | ||||||||||||||
ENERGY EQUIPMENT & SERVICES | |||||||||||||||
3,000 | SCHLUMBERGER LTD | 209,250 | |||||||||||||
209,250 | 1.46 | ||||||||||||||
OIL, GAS & CONSUMABLE FUELS | |||||||||||||||
3,000 | CONOCOPHILLIPS | 140,070 | |||||||||||||
140,070 | 0.98 | ||||||||||||||
See Accompanying Notes to Financial Statements which are an integral part of these financial statements.
41
Pacific Advisors Income and Equity Fund
Schedule of Investments
as of December 31, 2015
| Quantity or Principal** | Description | Current $ Value** | % of Total Net Assets | ||||||||||||
COMMON STOCK continued | |||||||||||||||
FINANCIALS | 2.87 | ||||||||||||||
BANKS | |||||||||||||||
4,000 | WELLS FARGO & CO. | 217,440 | |||||||||||||
217,440 | 1.52 | ||||||||||||||
INSURANCE | |||||||||||||||
4,000 | METLIFE INC. | 192,840 | |||||||||||||
192,840 | 1.35 | ||||||||||||||
HEALTH CARE | 4.13 | ||||||||||||||
BIOTECHNOLOGY | |||||||||||||||
3,500 | ABBVIE INC. | 207,340 | |||||||||||||
207,340 | 1.45 | ||||||||||||||
PHARMACEUTICALS | |||||||||||||||
2,000 | JOHNSON & JOHNSON | 205,440 | |||||||||||||
5,500 | PFIZER INC. | 177,540 | |||||||||||||
382,980 | 2.68 | ||||||||||||||
INDUSTRIALS | 7.72 | ||||||||||||||
AEROSPACE & DEFENSE | |||||||||||||||
2,000 | HONEYWELL INT'L INC. | 207,140 | |||||||||||||
207,140 | 1.45 | ||||||||||||||
AIR FREIGHT & LOGISTICS | |||||||||||||||
2,250 | UNITED PARCEL SERVICE INC. B | 216,518 | |||||||||||||
216,518 | 1.51 | ||||||||||||||
COMMERCIAL SERVICES & SUPPLIES | |||||||||||||||
3,500 | WASTE MANAGEMENT INC. | 186,795 | |||||||||||||
186,795 | 1.31 | ||||||||||||||
INDUSTRIAL CONGLOMERATES | |||||||||||||||
8,000 | GENERAL ELECTRIC CO. | 249,200 | |||||||||||||
249,200 | 1.74 | ||||||||||||||
TRADING COMPANIES & DISTRIBUTORS | |||||||||||||||
6,000 | FASTENAL COMPANY | 244,920 | |||||||||||||
244,920 | 1.71 | ||||||||||||||
INFORMATION TECHNOLOGY | 5.05 | ||||||||||||||
COMMUNICATIONS EQUIPMENT | |||||||||||||||
8,000 | CISCO SYSTEMS INC. | 217,240 | |||||||||||||
217,240 | 1.52 | ||||||||||||||
See Accompanying Notes to Financial Statements which are an integral part of these financial statements.
42
Pacific Advisors Income and Equity Fund
Schedule of Investments
as of December 31, 2015
| Quantity or Principal** | Description | Current $ Value** | % of Total Net Assets | ||||||||||||
COMMON STOCK continued | |||||||||||||||
SEMICONDUCTORS & SEMICONDUCTOR EQUIPMENT | |||||||||||||||
7,000 | INTEL CORP. | 241,150 | |||||||||||||
241,150 | 1.69 | ||||||||||||||
SOFTWARE | |||||||||||||||
4,750 | MICROSOFT CORP. | 263,530 | |||||||||||||
263,530 | 1.84 | ||||||||||||||
MATERIALS | 2.71 | ||||||||||||||
CHEMICALS | |||||||||||||||
3,000 | DUPONT DE NEMOURS & CO. | 199,800 | |||||||||||||
199,800 | 1.40 | ||||||||||||||
PAPER & FOREST PRODUCTS | |||||||||||||||
5,000 | INTERNATIONAL PAPER COMPANY | 188,500 | |||||||||||||
188,500 | 1.31 | ||||||||||||||
TELECOMMUNICATION SERVICES | 3.00 | ||||||||||||||
DIVERSIFIED TELECOMMUNICATION SERVICES | |||||||||||||||
6,000 | AT&T INC. | 206,460 | |||||||||||||
4,815 | VERIZON COMMUNICATIONS INC. | 222,549 | |||||||||||||
429,009 | 3.00 | ||||||||||||||
UTILITIES | 4.76 | ||||||||||||||
ELECTRIC UTILITIES | |||||||||||||||
2,500 | DUKE ENERGY CORP. | 178,475 | |||||||||||||
5,000 | XCEL ENERGY INC. | 179,550 | |||||||||||||
358,025 | 2.50 | ||||||||||||||
MULTI-UTILITIES | |||||||||||||||
2,500 | DOMINION RESOURCES INC. | 169,100 | |||||||||||||
4,000 | PUBLIC SERVICE ENTERPRISE GROUP INC. | 154,759 | |||||||||||||
323,859 | 2.26 | ||||||||||||||
TOTAL COMMON STOCK (Cost: $5,154,400) | 6,657,254 | 46.53 | |||||||||||||
CORPORATE BOND | |||||||||||||||
CONSUMER DISCRETIONARY | 6.75 | ||||||||||||||
AUTOMOBILES | |||||||||||||||
130,000 | GENERAL MOTORS FINL CO. 4.75% 08/15/17 | 134,737 | |||||||||||||
134,737 | 0.95 | ||||||||||||||
DIVERSIFIED CONSUMER SERVICES | |||||||||||||||
150,000 | BLOCK FINANCIAL LLC 4.125% 10/01/20 | 151,881 | |||||||||||||
151,881 | 1.06 | ||||||||||||||
See Accompanying Notes to Financial Statements which are an integral part of these financial statements.
43
Pacific Advisors Income and Equity Fund
Schedule of Investments
as of December 31, 2015
| Quantity or Principal** | Description | Current $ Value** | % of Total Net Assets | ||||||||||||
CORPORATE BOND continued | |||||||||||||||
HOTELS, RESTAURANTS & LEISURE | |||||||||||||||
100,000 | INTL GAME TECHNOLOGY 7.50% 06/15/19 | 106,980 | |||||||||||||
100,000 | WYNDHAM WORLDWIDE 2.95% 03/01/17 | 100,608 | |||||||||||||
150,000 | YUM! BRANDS INC. 5.30% 09/15/19 | 154,852 | |||||||||||||
362,440 | 2.53 | ||||||||||||||
HOUSEHOLD DURABLES | |||||||||||||||
150,000 | TUPPERWARE BRANDS CORP. 4.75% 06/01/21 | 153,003 | |||||||||||||
153,003 | 1.07 | ||||||||||||||
INTERNET & CATALOG RETAIL | |||||||||||||||
150,000 | EXPEDIA INC. 5.95% 08/15/20 | 163,667 | |||||||||||||
163,667 | 1.14 | ||||||||||||||
CONSUMER STAPLES | 1.07 | ||||||||||||||
FOOD & STAPLES RETAILING | |||||||||||||||
150,000 | DELHAIZE GROUP SA 4.125% 04/10/19 | 153,093 | |||||||||||||
153,093 | 1.07 | ||||||||||||||
ENERGY | 5.03 | ||||||||||||||
ENERGY EQUIPMENT & SERVICES | |||||||||||||||
100,000 | PRIDE INTERNATIONAL INC. 6.875% 08/15/20 | 92,850 | |||||||||||||
150,000 | ROWAN COMPANY INC. 7.875% 08/01/19 | 147,460 | |||||||||||||
150,000 | SESI LLC 6.375% 05/01/19 | 139,220 | |||||||||||||
100,000 | WEATHERFORD BERMUDA 6.00% 03/15/18 | 92,210 | |||||||||||||
471,740 | 3.30 | ||||||||||||||
OIL, GAS & CONSUMABLE FUELS | |||||||||||||||
150,000 | CONTINENTAL RESOURCES 7.375% 10/01/20 | 138,000 | |||||||||||||
100,000 | ENERGY TRANSFER PARTNERS 9.00% 04/15/19 | 110,025 | |||||||||||||
248,025 | 1.73 | ||||||||||||||
FINANCIALS | 16.27 | ||||||||||||||
BANKS | |||||||||||||||
100,000 | BANK OF AMERICA CORP. 2.363% 09/28/20 FLOAT | 100,949 | |||||||||||||
100,000 | BANK OF AMERICA CORP. 2.464% 03/19/20 FLOAT | 100,550 | |||||||||||||
125,000 | JPMORGAN CHASE & CO. 2.171% 02/25/21 FLOAT | 127,500 | |||||||||||||
150,000 | SUNTRUST BANKS INC. 1.378% 11/22/16 FLOAT | 150,565 | |||||||||||||
479,564 | 3.36 | ||||||||||||||
See Accompanying Notes to Financial Statements which are an integral part of these financial statements.
44
Pacific Advisors Income and Equity Fund
Schedule of Investments
as of December 31, 2015
| Quantity or Principal** | Description | Current $ Value** | % of Total Net Assets | ||||||||||||
CORPORATE BOND continued | |||||||||||||||
CAPITAL MARKETS | |||||||||||||||
150,000 | ARES CAPITAL CORP. 4.875% 11/30/18 | 156,177 | |||||||||||||
100,000 | FIFTH STREET FINANCE CORP. 4.875% 03/01/19 | 99,785 | |||||||||||||
100,000 | GOLDMAN SACHS GROUP INC. 1.802% 08/26/20 FLOAT | 99,951 | |||||||||||||
100,000 | JEFFERIES GROUP INC. 5.125% 04/13/18 | 104,007 | |||||||||||||
100,000 | MORGAN STANLEY 3.50% 09/30/17 FLOAT | 102,528 | |||||||||||||
100,000 | MORGAN STANLEY 4.50% 10/27/18 FLOAT | 105,500 | |||||||||||||
100,000 | MORGAN STANLEY 1.964% 04/25/23 FLOAT | 100,625 | |||||||||||||
100,000 | PROSPECT CAPITAL CORP. 5.00% 07/15/19 | 100,709 | |||||||||||||
150,000 | STIFEL FINANCIAL CORP. 3.50% 12/01/20 | 148,274 | |||||||||||||
1,017,556 | 7.11 | ||||||||||||||
DIVERSIFIED FINANCIAL SERVICES | |||||||||||||||
100,000 | ICAHN ENTERPRISES 6.00% 08/01/20 | 100,840 | |||||||||||||
100,000 | NASDAQ OMX GROUP 5.55% 01/15/20 | 109,636 | |||||||||||||
210,476 | 1.47 | ||||||||||||||
INSURANCE | |||||||||||||||
115,000 | GENWORTH FINANCIAL INC. 8.625% 12/15/16 | 118,738 | |||||||||||||
100,000 | PRUDENTIAL FINANCIAL INC. 1.964% 11/02/20 FLOAT | 100,500 | |||||||||||||
219,238 | 1.53 | ||||||||||||||
REAL ESTATE INVESTMENT TRUSTS | |||||||||||||||
105,000 | HOSPITALITY PROP TRUST 6.70% 01/15/18 | 111,078 | |||||||||||||
150,000 | HRPT PROPERTIES 6.25% 08/15/16 | 150,638 | |||||||||||||
125,000 | MACK-CALI REALTY LP 7.75% 08/15/19 | 138,922 | |||||||||||||
400,638 | 2.80 | ||||||||||||||
HEALTH CARE | 0.82 | ||||||||||||||
PHARMACEUTICALS | |||||||||||||||
110,000 | PFIZER INC. 6.05% 03/30/17 | 116,609 | |||||||||||||
116,609 | 0.82 | ||||||||||||||
INDUSTRIALS | 6.98 | ||||||||||||||
AEROSPACE & DEFENSE | |||||||||||||||
150,000 | L-3 COMMUNICATIONS CORP. 5.20% 10/15/19 | 158,830 | |||||||||||||
158,830 | 1.12 | ||||||||||||||
BUILDING PRODUCTS | |||||||||||||||
115,000 | OWENS CORNING INC. 9.00% 06/15/19 | 133,285 | |||||||||||||
133,285 | 0.93 | ||||||||||||||
See Accompanying Notes to Financial Statements which are an integral part of these financial statements.
45
Pacific Advisors Income and Equity Fund
Schedule of Investments
as of December 31, 2015
| Quantity or Principal** | Description | Current $ Value** | % of Total Net Assets | ||||||||||||
CORPORATE BOND continued | |||||||||||||||
MACHINERY | |||||||||||||||
100,000 | CNH AMERICA LLC 7.25% 01/15/16 | 100,125 | |||||||||||||
100,000 | HARSCO CORP. 5.75% 05/15/18 | 88,750 | |||||||||||||
150,000 | HILLENBRAND INC. 5.50% 07/15/20 | 161,947 | |||||||||||||
350,822 | 2.45 | ||||||||||||||
PROFESSIONAL SERVICES | |||||||||||||||
150,000 | DUN & BRADSTREET CORP. 4.00% 06/15/20 | 152,090 | |||||||||||||
152,090 | 1.06 | ||||||||||||||
TRADING COMPANIES & DISTRIBUTORS | |||||||||||||||
100,000 | AIR LEASE CORP. 5.625% 04/01/17 | 103,750 | |||||||||||||
100,000 | INTL LEASE FINANCE CORP. 2.462% 06/15/16 FLOAT | 99,750 | |||||||||||||
203,500 | 1.42 | ||||||||||||||
INFORMATION TECHNOLOGY | 5.41 | ||||||||||||||
COMMUNICATIONS EQUIPMENT | |||||||||||||||
150,000 | QUALCOMM INC. 3.00% 05/20/22 | 148,497 | |||||||||||||
148,497 | 1.04 | ||||||||||||||
ELECTRONIC EQUIPMENT, INSTRUMENTS & COMPONENTS | |||||||||||||||
102,000 | ARROW ELECTRONICS INC. 6.875% 06/01/18 | 111,055 | |||||||||||||
100,000 | INGRAM MICRO INC. 5.25% 09/01/17 | 104,465 | |||||||||||||
100,000 | JABIL CIRCUIT INC. 7.75% 07/15/16 | 102,500 | |||||||||||||
318,020 | 2.22 | ||||||||||||||
IT SERVICES | |||||||||||||||
150,000 | FIDELITY NATIONAL INFORMATION 3.625% 10/15/20 | 151,954 | |||||||||||||
151,954 | 1.06 | ||||||||||||||
TECHNOLOGY HARDWARE, STORAGE & PERIPHERALS | |||||||||||||||
145,000 | LEXMARK INT'L INC. 6.65% 06/01/18 | 156,162 | |||||||||||||
156,162 | 1.09 | ||||||||||||||
MATERIALS | 4.43 | ||||||||||||||
CHEMICALS | |||||||||||||||
112,000 | CF INDUSTRIES INC. 6.875% 05/01/18 | 121,354 | |||||||||||||
121,354 | 0.85 | ||||||||||||||
METALS & MINING | |||||||||||||||
100,000 | ALCOA INC. 5.55% 02/01/17 | 102,500 | |||||||||||||
100,000 | COMMERCIAL METALS CO. 7.35% 08/15/18 | 105,255 | |||||||||||||
150,000 | RELIANCE STEEL & ALUMINUM 6.20% 11/15/16 | 155,028 | |||||||||||||
150,000 | VALE OVERSEAS LIMITED 6.25% 01/23/17 | 149,715 | |||||||||||||
512,498 | 3.58 | ||||||||||||||
See Accompanying Notes to Financial Statements which are an integral part of these financial statements.
46
Pacific Advisors Income and Equity Fund
Schedule of Investments
as of December 31, 2015
| Quantity or Principal** | Description | Current $ Value** | % of Total Net Assets | ||||||||||||
CORPORATE BOND continued | |||||||||||||||
TELECOMMUNICATION SERVICES | 0.91 | ||||||||||||||
DIVERSIFIED TELECOMMUNICATION SERVICES | |||||||||||||||
125,000 | QWEST CORP. 6.50% 06/01/17 | 130,809 | |||||||||||||
130,809 | 0.91 | ||||||||||||||
UTILITIES | 1.00 | ||||||||||||||
ELECTRIC UTILITIES | |||||||||||||||
49,000 | CLEVELAND ELECTRIC ILLUMINATING 5.70% 04/01/17 | 50,752 | |||||||||||||
100,000 | PPL ENERGY SUPPLY LLC 6.50% 05/01/18 | 92,500 | |||||||||||||
143,252 | 1.00 | ||||||||||||||
TOTAL CORPORATE BOND (Cost: $7,101,926) | 6,963,740 | 48.67 | |||||||||||||
PREFERRED STOCK | |||||||||||||||
FINANCIALS | 2.50 | ||||||||||||||
BANKS | |||||||||||||||
100,000 | JPMORGAN CHASE & CO. 5.30% PFD FIX-FLOAT | 99,625 | |||||||||||||
150,000 | WELLS FARGO & CO. 7.98% PFD FIX-FLOAT | 155,813 | |||||||||||||
255,438 | 1.79 | ||||||||||||||
INSURANCE | |||||||||||||||
100,000 | METLIFE INC. 5.25% PFD | 101,750 | |||||||||||||
101,750 | 0.71 | ||||||||||||||
TOTAL PREFERRED STOCK (Cost: $360,061) | 357,188 | 2.50 | |||||||||||||
TOTAL INVESTMENT IN SECURITIES (Cost: $12,616,387) | 13,978,182 | 97.70 | |||||||||||||
CASH OR CASH EQUIVALENT | 265,749 | 1.85 | |||||||||||||
OTHER ASSETS LESS LIABILITIES | 63,838 | 0.45 | |||||||||||||
TOTAL NET ASSETS | 14,307,769 | 100.00 | |||||||||||||
* Non-income producing
** The principal amount and value are stated in U.S. dollars unless otherwise indicated.
See Accompanying Notes to Financial Statements which are an integral part of these financial statements.
47
Pacific Advisors Balanced Fund
Schedule of Investments
as of December 31, 2015
| Quantity or Principal** | Description | Current $ Value** | % of Total Net Assets | ||||||||||||
COMMON STOCK | |||||||||||||||
CONSUMER DISCRETIONARY | 17.06 | ||||||||||||||
AUTO COMPONENTS | |||||||||||||||
2,500 | GENTHERM INC.* | 118,500 | |||||||||||||
118,500 | 1.77 | ||||||||||||||
MEDIA | |||||||||||||||
2,000 | WALT DISNEY CO. | 210,160 | |||||||||||||
210,160 | 3.12 | ||||||||||||||
SPECIALTY RETAIL | |||||||||||||||
7,500 | CONN'S INC.* | 176,025 | |||||||||||||
1,500 | LITHIA MOTORS INC. | 160,005 | |||||||||||||
700 | O'REILLY AUTOMOTIVE INC.* | 177,394 | |||||||||||||
513,424 | 7.63 | ||||||||||||||
TEXTILES, APPAREL & LUXURY GOODS | |||||||||||||||
3,000 | NIKE INC. | 187,500 | |||||||||||||
1,600 | PVH CORP. | 117,840 | |||||||||||||
305,340 | 4.54 | ||||||||||||||
CONSUMER STAPLES | 3.05 | ||||||||||||||
FOOD & STAPLES RETAILING | |||||||||||||||
2,100 | CVS HEALTH CORP. | 205,317 | |||||||||||||
205,317 | 3.05 | ||||||||||||||
ENERGY | 8.51 | ||||||||||||||
ENERGY EQUIPMENT & SERVICES | |||||||||||||||
1,000 | CORE LABORATORIES N.V. | 108,740 | |||||||||||||
4,000 | HALLIBURTON CO. | 136,160 | |||||||||||||
11,000 | HORNBECK OFFSHORE SERVICES INC.* | 109,340 | |||||||||||||
4,000 | NATIONAL OILWELL VARCO INC. | 133,960 | |||||||||||||
8,000 | NOBLE CORPORATION | 84,400 | |||||||||||||
572,600 | 8.51 | ||||||||||||||
FINANCIALS | 5.92 | ||||||||||||||
BANKS | |||||||||||||||
4,800 | EAST WEST BANCORP INC. | 199,488 | |||||||||||||
3,000 | JPMORGAN CHASE & CO. | 198,090 | |||||||||||||
397,578 | 5.92 | ||||||||||||||
HEALTH CARE | 2.37 | ||||||||||||||
PHARMACEUTICALS | |||||||||||||||
1,100 | PERRIGO COMPANY PLC | 159,170 | |||||||||||||
159,170 | 2.37 | ||||||||||||||
See Accompanying Notes to Financial Statements which are an integral part of these financial statements.
48
Pacific Advisors Balanced Fund
Schedule of Investments
as of December 31, 2015
| Quantity or Principal** | Description | Current $ Value** | % of Total Net Assets | ||||||||||||
COMMON STOCK continued | |||||||||||||||
INDUSTRIALS | 26.48 | ||||||||||||||
AIRLINES | |||||||||||||||
4,000 | SPIRIT AIRLINES INC.* | 159,400 | |||||||||||||
159,400 | 2.38 | ||||||||||||||
COMMERCIAL SERVICES & SUPPLIES | |||||||||||||||
4,800 | TEAM INC.* | 153,408 | |||||||||||||
153,408 | 2.28 | ||||||||||||||
CONSTRUCTION & ENGINEERING | |||||||||||||||
4,800 | CHICAGO BRIDGE & IRON CO. N.V. | 187,152 | |||||||||||||
187,152 | 2.78 | ||||||||||||||
INDUSTRIAL CONGLOMERATES | |||||||||||||||
7,000 | GENERAL ELECTRIC CO. | 218,050 | |||||||||||||
218,050 | 3.24 | ||||||||||||||
MACHINERY | |||||||||||||||
1,300 | CUMMINS INC. | 114,413 | |||||||||||||
2,100 | WABTEC CORP. | 149,352 | |||||||||||||
263,765 | 3.92 | ||||||||||||||
MARINE | |||||||||||||||
3,000 | KIRBY CORP.* | 157,860 | |||||||||||||
157,860 | 2.35 | ||||||||||||||
ROAD & RAIL | |||||||||||||||
6,000 | CSX CORP. | 155,700 | |||||||||||||
2,700 | GENESEE & WYOMING INC.* | 144,963 | |||||||||||||
2,000 | KANSAS CITY SOUTHERN | 149,340 | |||||||||||||
450,003 | 6.69 | ||||||||||||||
TRADING COMPANIES & DISTRIBUTORS | |||||||||||||||
3,500 | DXP ENTERPRISES INC.* | 79,800 | |||||||||||||
7,000 | TAL INT'L GROUP INC. | 111,300 | |||||||||||||
191,100 | 2.84 | ||||||||||||||
INFORMATION TECHNOLOGY | 5.70 | ||||||||||||||
COMMUNICATIONS EQUIPMENT | |||||||||||||||
3,000 | QUALCOMM INC. | 149,955 | |||||||||||||
149,955 | 2.23 | ||||||||||||||
INTERNET SOFTWARE & SERVICES | |||||||||||||||
300 | ALPHABET INC.* | 233,403 | |||||||||||||
233,403 | 3.47 | ||||||||||||||
TOTAL COMMON STOCK (Cost: $4,164,027) | 4,646,185 | 69.09 | |||||||||||||
See Accompanying Notes to Financial Statements which are an integral part of these financial statements.
49
Pacific Advisors Balanced Fund
Schedule of Investments
as of December 31, 2015
| Quantity or Principal** | Description | Current $ Value** | % of Total Net Assets | ||||||||||||
CORPORATE BOND | |||||||||||||||
CONSUMER DISCRETIONARY | 1.59 | ||||||||||||||
DIVERSIFIED CONSUMER SERVICES | |||||||||||||||
100,000 | WASHINGTON POST CO. 7.25% 02/01/19 | 107,166 | |||||||||||||
107,166 | 1.59 | ||||||||||||||
ENERGY | 9.13 | ||||||||||||||
ENERGY EQUIPMENT & SERVICES | |||||||||||||||
100,000 | PRIDE INTERNATIONAL INC. 8.50% 06/15/19 | 98,966 | |||||||||||||
100,000 | ROWAN COMPANY INC. 7.875% 08/01/19 | 98,307 | |||||||||||||
100,000 | SEACOR HOLDING 7.375% 10/01/19 | 93,500 | |||||||||||||
100,000 | SESI LLC 6.375% 05/01/19 | 92,813 | |||||||||||||
383,586 | 5.70 | ||||||||||||||
OIL, GAS & CONSUMABLE FUELS | |||||||||||||||
100,000 | CHESAPEAKE ENERGY 3.571% 04/15/19 FLOAT | 28,000 | |||||||||||||
100,000 | CONTINENTAL RESOURCES 7.375% 10/01/20 | 92,000 | |||||||||||||
100,000 | ENERGY TRANSFER PARTNERS 9.00% 04/15/19 | 110,025 | |||||||||||||
230,025 | 3.43 | ||||||||||||||
FINANCIALS | 7.34 | ||||||||||||||
BANKS | |||||||||||||||
100,000 | BANK OF AMERICA CORP. 2.073% 07/28/17 FLOAT | 100,195 | |||||||||||||
100,195 | 1.48 | ||||||||||||||
DIVERSIFIED FINANCIAL SERVICES | |||||||||||||||
100,000 | ICAHN ENTERPRISES 6.00% 08/01/20 | 100,840 | |||||||||||||
50,000 | NASDAQ OMX GROUP 5.25% 01/16/18 | 52,918 | |||||||||||||
153,758 | 2.29 | ||||||||||||||
REAL ESTATE INVESTMENT TRUSTS | |||||||||||||||
125,000 | CORRECTIONS CORP. OF AMERICA 4.125% 04/01/20 | 123,750 | |||||||||||||
100,000 | EPR PROPERTIES 7.75% 07/15/20 | 116,255 | |||||||||||||
240,005 | 3.57 | ||||||||||||||
HEALTH CARE | 1.59 | ||||||||||||||
HEALTH CARE PROVIDERS & SERVICES | |||||||||||||||
100,000 | FRESENIUS MED CARE US 6.875% 07/15/17 | 106,750 | |||||||||||||
106,750 | 1.59 | ||||||||||||||
INDUSTRIALS | 4.63 | ||||||||||||||
MACHINERY | |||||||||||||||
100,000 | CASE NEW HOLLAND INC. 7.875% 12/01/17 | 105,750 | |||||||||||||
105,750 | 1.57 | ||||||||||||||
See Accompanying Notes to Financial Statements which are an integral part of these financial statements.
50
Pacific Advisors Balanced Fund
Schedule of Investments
as of December 31, 2015
| Quantity or Principal** | Description | Current $ Value** | % of Total Net Assets | ||||||||||||
CORPORATE BOND continued | |||||||||||||||
TRADING COMPANIES & DISTRIBUTORS | |||||||||||||||
100,000 | AIRCASTLE 6.75% 04/15/17 | 104,313 | |||||||||||||
95,000 | INTL LEASE FINANCE CORP. 8.75% 03/15/17 | 101,175 | |||||||||||||
205,488 | 3.06 | ||||||||||||||
INFORMATION TECHNOLOGY | 3.01 | ||||||||||||||
ELECTRONIC EQUIPMENT, INSTRUMENTS & COMPONENTS | |||||||||||||||
100,000 | JABIL CIRCUIT INC. 7.75% 07/15/16 | 102,500 | |||||||||||||
102,500 | 1.52 | ||||||||||||||
INTERNET SOFTWARE & SERVICES | |||||||||||||||
100,000 | IAC/INTERACTIVECORP 4.875% 11/30/18 | 100,250 | |||||||||||||
100,250 | 1.49 | ||||||||||||||
MATERIALS | 1.57 | ||||||||||||||
METALS & MINING | |||||||||||||||
100,000 | COMMERCIAL METALS CO. 7.35% 08/15/18 | 105,255 | |||||||||||||
105,255 | 1.57 | ||||||||||||||
TOTAL CORPORATE BOND (Cost: $2,086,773) | 1,940,728 | 28.86 | |||||||||||||
PREFERRED STOCK | |||||||||||||||
FINANCIALS | 1.45 | ||||||||||||||
CAPITAL MARKETS | |||||||||||||||
100,000 | MORGAN STANLEY 5.45% PFD FIX -FLOAT | 97,625 | |||||||||||||
97,625 | 1.45 | ||||||||||||||
TOTAL PREFERRED STOCK (Cost: $99,875) | 97,625 | 1.45 | |||||||||||||
TOTAL INVESTMENT IN SECURITIES (Cost: $6,350,675) | 6,684,538 | 99.40 | |||||||||||||
OTHER ASSETS LESS LIABILITIES | 40,583 | 0.60 | |||||||||||||
TOTAL NET ASSETS | 6,725,121 | 100.00 | |||||||||||||
* Non-income producing
** The principal amount and value are stated in U.S. dollars unless otherwise indicated.
See Accompanying Notes to Financial Statements which are an integral part of these financial statements.
51
Pacific Advisors Large Cap Value Fund
Schedule of Investments
as of December 31, 2015
| Quantity or Principal** | Description | Current $ Value** | % of Total Net Assets | ||||||||||||
COMMON STOCK | |||||||||||||||
CONSUMER DISCRETIONARY | 22.10 | ||||||||||||||
AUTO COMPONENTS | |||||||||||||||
2,500 | JOHNSON CONTROLS INC. | 98,725 | |||||||||||||
98,725 | 1.27 | ||||||||||||||
DIVERSIFIED CONSUMER SERVICES | |||||||||||||||
5,000 | HOUGHTON MIFFLIN HARCOURT COMPANY* | 108,900 | |||||||||||||
108,900 | 1.41 | ||||||||||||||
HOTELS, RESTAURANTS & LEISURE | |||||||||||||||
2,000 | MCDONALD'S CORP. | 236,280 | |||||||||||||
236,280 | 3.05 | ||||||||||||||
MEDIA | |||||||||||||||
3,650 | TIME WARNER INC. | 236,046 | |||||||||||||
3,500 | WALT DISNEY CO. | 367,780 | |||||||||||||
603,826 | 7.79 | ||||||||||||||
SPECIALTY RETAIL | |||||||||||||||
3,750 | LOWE'S COMPANIES INC. | 285,150 | |||||||||||||
2,870 | THE HOME DEPOT, INC. | 379,558 | |||||||||||||
664,708 | 8.58 | ||||||||||||||
CONSUMER STAPLES | 16.02 | ||||||||||||||
BEVERAGES | |||||||||||||||
5,120 | COCA-COLA CO. | 219,955 | |||||||||||||
975 | PEPSICO, INC. | 97,422 | |||||||||||||
317,377 | 4.10 | ||||||||||||||
FOOD & STAPLES RETAILING | |||||||||||||||
5,000 | SYSCO CORP. | 205,000 | |||||||||||||
2,950 | WAL-MART STORES INC. | 180,835 | |||||||||||||
385,835 | 4.98 | ||||||||||||||
FOOD PRODUCTS | |||||||||||||||
2,700 | MONDELEZ INT'L INC. | 121,068 | |||||||||||||
3,000 | THE KRAFT HEINZ COMPANY | 218,280 | |||||||||||||
339,348 | 4.38 | ||||||||||||||
HOUSEHOLD PRODUCTS | |||||||||||||||
2,500 | PROCTER & GAMBLE CO. | 198,525 | |||||||||||||
198,525 | 2.56 | ||||||||||||||
See Accompanying Notes to Financial Statements which are an integral part of these financial statements.
52
Pacific Advisors Large Cap Value Fund
Schedule of Investments
as of December 31, 2015
| Quantity or Principal** | Description | Current $ Value** | % of Total Net Assets | ||||||||||||
COMMON STOCK continued | |||||||||||||||
ENERGY | 1.51 | ||||||||||||||
OIL, GAS & CONSUMABLE FUELS | |||||||||||||||
1,500 | EXXON MOBIL CORP. | 116,925 | |||||||||||||
116,925 | 1.51 | ||||||||||||||
FINANCIALS | 18.13 | ||||||||||||||
BANKS | |||||||||||||||
7,000 | BANK OF AMERICA CORP. | 117,810 | |||||||||||||
2,850 | CITIGROUP INC. | 147,488 | |||||||||||||
4,225 | WELLS FARGO & CO. | 229,671 | |||||||||||||
494,969 | 6.38 | ||||||||||||||
CAPITAL MARKETS | |||||||||||||||
4,000 | LEGG MASON INC. | 156,920 | |||||||||||||
156,920 | 2.03 | ||||||||||||||
DIVERSIFIED FINANCIAL SERVICES | |||||||||||||||
2,000 | BERKSHIRE HATHAWAY INC. B* | 264,080 | |||||||||||||
264,080 | 3.41 | ||||||||||||||
INSURANCE | |||||||||||||||
4,000 | AMERICAN INT'L GROUP INC. | 247,880 | |||||||||||||
5,000 | METLIFE INC. | 241,050 | |||||||||||||
488,930 | 6.31 | ||||||||||||||
HEALTH CARE | 3.47 | ||||||||||||||
PHARMACEUTICALS | |||||||||||||||
2,615 | JOHNSON & JOHNSON | 268,613 | |||||||||||||
268,613 | 3.47 | ||||||||||||||
INDUSTRIALS | 14.79 | ||||||||||||||
AEROSPACE & DEFENSE | |||||||||||||||
2,000 | HONEYWELL INT'L INC. | 207,140 | |||||||||||||
207,140 | 2.68 | ||||||||||||||
AIR FREIGHT & LOGISTICS | |||||||||||||||
1,000 | FEDEX CORP. | 148,990 | |||||||||||||
1,200 | UNITED PARCEL SERVICE INC. B | 115,476 | |||||||||||||
264,466 | 3.41 | ||||||||||||||
INDUSTRIAL CONGLOMERATES | |||||||||||||||
9,750 | GENERAL ELECTRIC CO. | 303,713 | |||||||||||||
303,713 | 3.92 | ||||||||||||||
See Accompanying Notes to Financial Statements which are an integral part of these financial statements.
53
Pacific Advisors Large Cap Value Fund
Schedule of Investments
as of December 31, 2015
| Quantity or Principal** | Description | Current $ Value** | % of Total Net Assets | ||||||||||||
COMMON STOCK continued | |||||||||||||||
MACHINERY | |||||||||||||||
2,000 | DEERE & CO. | 152,540 | |||||||||||||
2,350 | ILLINOIS TOOL WORKS INC. | 217,798 | |||||||||||||
370,338 | 4.78 | ||||||||||||||
INFORMATION TECHNOLOGY | 23.61 | ||||||||||||||
INTERNET SOFTWARE & SERVICES | |||||||||||||||
300 | ALPHABET INC. CLASS C* | 227,664 | |||||||||||||
227,664 | 2.94 | ||||||||||||||
IT SERVICES | |||||||||||||||
1,350 | INT'L BUSINESS MACHINES CORP. | 185,787 | |||||||||||||
2,200 | MASTERCARD INC. | 214,192 | |||||||||||||
399,979 | 5.16 | ||||||||||||||
SEMICONDUCTORS & SEMICONDUCTOR EQUIPMENT | |||||||||||||||
5,600 | INTEL CORP. | 192,920 | |||||||||||||
192,920 | 2.49 | ||||||||||||||
SOFTWARE | |||||||||||||||
7,000 | MICROSOFT CORP. | 388,360 | |||||||||||||
7,500 | ORACLE CORPORATION | 273,975 | |||||||||||||
662,335 | 8.55 | ||||||||||||||
TECHNOLOGY HARDWARE, STORAGE & PERIPHERALS | |||||||||||||||
3,290 | APPLE INC. | 346,303 | |||||||||||||
346,303 | 4.47 | ||||||||||||||
TOTAL COMMON STOCK (Cost: $5,186,298) | 7,718,819 | 99.63 | |||||||||||||
TOTAL INVESTMENT IN SECURITIES (Cost: $5,186,298) | 7,718,819 | 99.63 | |||||||||||||
OTHER ASSETS LESS LIABILITIES | 28,961 | 0.37 | |||||||||||||
TOTAL NET ASSETS | 7,747,780 | 100.00 | |||||||||||||
* Non-income producing
** The principal amount and value are stated in U.S. dollars unless otherwise indicated.
See Accompanying Notes to Financial Statements which are an integral part of these financial statements.
54
Pacific Advisors Mid Cap Value Fund
Schedule of Investments
as of December 31, 2015
| Quantity or Principal** | Description | Current $ Value** | % of Total Net Assets | ||||||||||||
COMMON STOCK | |||||||||||||||
CONSUMER DISCRETIONARY | 35.32 | ||||||||||||||
AUTO COMPONENTS | |||||||||||||||
2,100 | LEAR CORP. | 257,943 | |||||||||||||
257,943 | 4.66 | ||||||||||||||
DISTRIBUTORS | |||||||||||||||
3,500 | POOL CORPORATION | 282,730 | |||||||||||||
282,730 | 5.11 | ||||||||||||||
SPECIALTY RETAIL | |||||||||||||||
10,000 | CONN'S INC.* | 234,700 | |||||||||||||
5,000 | GAMESTOP CORP. A | 140,200 | |||||||||||||
1,000 | O'REILLY AUTOMOTIVE INC.* | 253,420 | |||||||||||||
5,800 | PENSKE AUTOMOTIVE GROUP INC. | 245,572 | |||||||||||||
4,000 | TRACTOR SUPPLY COMPANY | 342,000 | |||||||||||||
1,215,892 | 21.96 | ||||||||||||||
TEXTILES, APPAREL & LUXURY GOODS | |||||||||||||||
2,700 | PVH CORP. | 198,855 | |||||||||||||
198,855 | 3.59 | ||||||||||||||
CONSUMER STAPLES | 3.37 | ||||||||||||||
BEVERAGES | |||||||||||||||
2,000 | DR PEPPER SNAPPLE GROUP INC. | 186,400 | |||||||||||||
186,400 | 3.37 | ||||||||||||||
ENERGY | 5.43 | ||||||||||||||
ENERGY EQUIPMENT & SERVICES | |||||||||||||||
13,000 | HELIX ENERGY SOLUTIONS GROUP INC.* | 68,380 | |||||||||||||
22,000 | NOBLE CORPORATION | 232,100 | |||||||||||||
300,480 | 5.43 | ||||||||||||||
FINANCIALS | 6.72 | ||||||||||||||
BANKS | |||||||||||||||
3,300 | CIT GROUP INC. | 131,010 | |||||||||||||
5,800 | EAST WEST BANCORP INC. | 241,048 | |||||||||||||
372,058 | 6.72 | ||||||||||||||
INDUSTRIALS | 43.24 | ||||||||||||||
AIRLINES | |||||||||||||||
5,700 | SPIRIT AIRLINES INC.* | 227,145 | |||||||||||||
227,145 | 4.11 | ||||||||||||||
See Accompanying Notes to Financial Statements which are an integral part of these financial statements.
55
Pacific Advisors Mid Cap Value Fund
Schedule of Investments
as of December 31, 2015
| Quantity or Principal** | Description | Current $ Value** | % of Total Net Assets | ||||||||||||
COMMON STOCK continued | |||||||||||||||
COMMERCIAL SERVICES & SUPPLIES | |||||||||||||||
1,500 | STERICYCLE, INC.* | 180,900 | |||||||||||||
180,900 | 3.27 | ||||||||||||||
CONSTRUCTION & ENGINEERING | |||||||||||||||
5,700 | CHICAGO BRIDGE & IRON CO. N.V. | 222,243 | |||||||||||||
222,243 | 4.01 | ||||||||||||||
MACHINERY | |||||||||||||||
2,500 | GRACO INC. | 180,175 | |||||||||||||
15,000 | NAVISTAR INT'L CORP.* | 132,600 | |||||||||||||
3,300 | WABTEC CORP. | 234,696 | |||||||||||||
547,471 | 9.89 | ||||||||||||||
MARINE | |||||||||||||||
4,000 | KIRBY CORP.* | 210,480 | |||||||||||||
210,480 | 3.80 | ||||||||||||||
ROAD & RAIL | |||||||||||||||
3,800 | GENESEE & WYOMING INC.* | 204,022 | |||||||||||||
2,500 | KANSAS CITY SOUTHERN | 186,675 | |||||||||||||
2,000 | LANDSTAR SYSTEM INC. | 117,300 | |||||||||||||
14,500 | SWIFT TRANSPORTATION CO.* | 200,390 | |||||||||||||
708,387 | 12.79 | ||||||||||||||
TRADING COMPANIES & DISTRIBUTORS | |||||||||||||||
6,000 | NOW INC.* | 94,920 | |||||||||||||
1,000 | W.W. GRAINGER, INC. | 202,590 | |||||||||||||
297,510 | 5.37 | ||||||||||||||
INFORMATION TECHNOLOGY | 4.09 | ||||||||||||||
SOFTWARE | |||||||||||||||
6,000 | ASPEN TECHNOLOGY, INC.* | 226,560 | |||||||||||||
226,560 | 4.09 | ||||||||||||||
MATERIALS | 2.30 | ||||||||||||||
CHEMICALS | |||||||||||||||
3,500 | H.B. FULLER CO. | 127,645 | |||||||||||||
127,645 | 2.30 | ||||||||||||||
TOTAL COMMON STOCK (Cost: $5,239,705) | 5,562,699 | 100.47 | |||||||||||||
TOTAL INVESTMENT IN SECURITIES (Cost: $5,239,705) | 5,562,699 | 100.47 | |||||||||||||
OTHER ASSETS LESS LIABILITIES | (26,102 | ) | (0.47 | ) | |||||||||||
TOTAL NET ASSETS | 5,536,597 | 100.00 | |||||||||||||
* Non-income producing
** The principal amount and value are stated in U.S. dollars unless otherwise indicated.
See Accompanying Notes to Financial Statements which are an integral part of these financial statements.
56
Pacific Advisors Small Cap Value Fund
Schedule of Investments
as of December 31, 2015
| Quantity or Principal** | Description | Current $ Value** | % of Total Net Assets | ||||||||||||
COMMON STOCK | |||||||||||||||
CONSUMER DISCRETIONARY | 22.65 | ||||||||||||||
AUTO COMPONENTS | |||||||||||||||
38,000 | GENTHERM INC.* | 1,801,200 | |||||||||||||
1,801,200 | 4.58 | ||||||||||||||
HOTELS, RESTAURANTS & LEISURE | |||||||||||||||
132,675 | BRAVO BRIO RESTAURANT GROUP INC.* | 1,194,075 | |||||||||||||
1,194,075 | 3.04 | ||||||||||||||
SPECIALTY RETAIL | |||||||||||||||
115,000 | CONN'S INC.* | 2,699,050 | |||||||||||||
57,000 | HIBBETT SPORTS INC.* | 1,723,680 | |||||||||||||
65,000 | SONIC AUTOMOTIVE INC. | 1,479,400 | |||||||||||||
5,902,130 | 15.03 | ||||||||||||||
CONSUMER STAPLES | 6.66 | ||||||||||||||
FOOD & STAPLES RETAILING | |||||||||||||||
52,812 | CHEF'S WAREHOUSE INC.* | 880,904 | |||||||||||||
880,904 | 2.24 | ||||||||||||||
FOOD PRODUCTS | |||||||||||||||
165,000 | DARLING INGREDIENTS INC.* | 1,735,800 | |||||||||||||
1,735,800 | 4.42 | ||||||||||||||
ENERGY | 17.94 | ||||||||||||||
ENERGY EQUIPMENT & SERVICES | |||||||||||||||
137,000 | HORNBECK OFFSHORE SERVICES INC.* | 1,361,780 | |||||||||||||
95,000 | MATRIX SERVICE CO.* | 1,951,300 | |||||||||||||
75,000 | NATURAL GAS SERVICES GROUP, INC.* | 1,672,500 | |||||||||||||
730,864 | NORTH AMERICAN ENERGY PARTNERS INC. | 1,264,395 | |||||||||||||
430,000 | PARKER DRILLING CO.* | 782,600 | |||||||||||||
7,032,575 | 17.90 | ||||||||||||||
OIL, GAS & CONSUMABLE FUELS | |||||||||||||||
100,000 | INFINITY ENERGY RESOURCES INC.* | 16,010 | |||||||||||||
16,010 | 0.04 | ||||||||||||||
FINANCIALS | 9.02 | ||||||||||||||
BANKS | |||||||||||||||
38,000 | EAST WEST BANCORP INC. | 1,579,280 | |||||||||||||
1,579,280 | 4.02 | ||||||||||||||
CONSUMER FINANCE | |||||||||||||||
127,000 | REGIONAL MANAGEMENT CORP.* | 1,964,690 | |||||||||||||
1,964,690 | 5.00 | ||||||||||||||
See Accompanying Notes to Financial Statements which are an integral part of these financial statements.
57
Pacific Advisors Small Cap Value Fund
Schedule of Investments
as of December 31, 2015
| Quantity or Principal** | Description | Current $ Value** | % of Total Net Assets | ||||||||||||
COMMON STOCK continued | |||||||||||||||
INDUSTRIALS | 49.04 | ||||||||||||||
BUILDING PRODUCTS | |||||||||||||||
75,000 | INSTEEL INDUSTRIES INC. | 1,569,000 | |||||||||||||
40,000 | NCI BUILDING SYSTEMS INC.* | 496,400 | |||||||||||||
2,065,400 | 5.26 | ||||||||||||||
COMMERCIAL SERVICES & SUPPLIES | |||||||||||||||
60,000 | MOBILE MINI INC. | 1,867,800 | |||||||||||||
30,000 | TEAM INC.* | 958,800 | |||||||||||||
2,826,600 | 7.20 | ||||||||||||||
CONSTRUCTION & ENGINEERING | |||||||||||||||
300,425 | FURMANITE CORP.* | 2,000,831 | |||||||||||||
150,000 | ORION MARINE GROUP INC.* | 625,500 | |||||||||||||
2,626,331 | 6.69 | ||||||||||||||
MACHINERY | |||||||||||||||
105,000 | NAVISTAR INT'L CORP.* | 928,200 | |||||||||||||
928,200 | 2.36 | ||||||||||||||
MARINE | |||||||||||||||
40,000 | KIRBY CORP.* | 2,104,799 | |||||||||||||
2,104,799 | 5.36 | ||||||||||||||
ROAD & RAIL | |||||||||||||||
29,000 | GENESEE & WYOMING INC.* | 1,557,010 | |||||||||||||
80,000 | SAIA INC.* | 1,780,000 | |||||||||||||
3,337,010 | 8.50 | ||||||||||||||
TRADING COMPANIES & DISTRIBUTORS | |||||||||||||||
61,000 | DXP ENTERPRISES INC.* | 1,390,800 | |||||||||||||
80,000 | RUSH ENTERPRISES INC.* | 1,751,200 | |||||||||||||
140,000 | TAL INT'L GROUP INC. | 2,226,000 | |||||||||||||
5,368,000 | 13.67 | ||||||||||||||
TOTAL COMMON STOCK (Cost: $41,438,449) | 41,363,004 | 105.31 | |||||||||||||
TOTAL INVESTMENT IN SECURITIES (Cost: $41,438,449) | 41,363,004 | 105.31 | |||||||||||||
OTHER ASSETS LESS LIABILITIES | (2,085,631 | ) | (5.31 | ) | |||||||||||
TOTAL NET ASSETS | 39,277,373 | 100.00 | |||||||||||||
* Non-income producing
** The principal amount and value are stated in U.S. dollars unless otherwise indicated.
See Accompanying Notes to Financial Statements which are an integral part of these financial statements.
58
(This page has been left blank intentionally.)
59
Pacific Advisors Fund Inc.
Statement of Assets and Liabilities
December 31, 2015
| Government Securities Fund | Income and Equity Fund | Balanced Fund | |||||||||||||
Assets | |||||||||||||||
Investment securities | |||||||||||||||
At cost | $ | 1,533,048 | $ | 12,616,387 | $ | 6,350,675 | |||||||||
At fair value | $ | 1,615,832 | $ | 13,978,182 | $ | 6,684,538 | |||||||||
Cash or cash equivalent, at fair value | - | 265,749 | - | ||||||||||||
Accrued income receivable | 2,111 | 101,181 | 44,125 | ||||||||||||
Receivable for capital shares sold | 1,560 | 1,966 | 5,014 | ||||||||||||
Receivable for investments sold | 30,616 | - | 240,402 | ||||||||||||
Total assets | 1,650,119 | 14,347,078 | 6,974,079 | ||||||||||||
Liabilities | |||||||||||||||
Bank borrowings (Note 7) | 32,459 | - | 222,697 | ||||||||||||
Payable for fund shares redeemed | - | 800 | - | ||||||||||||
Accounts payable | 4,157 | 34,909 | 22,661 | ||||||||||||
Accounts payable to related parties (Note 3) | - | 3,600 | 3,600 | ||||||||||||
Total liabilities | 36,616 | 39,309 | 248,958 | ||||||||||||
Net Assets | $ | 1,613,503 | $ | 14,307,769 | $ | 6,725,121 | |||||||||
Summary of Shareholders' Equity | |||||||||||||||
Paid in capital | 1,594,209 | 13,355,947 | 6,342,534 | ||||||||||||
Accumulated undistributed net investment income | - | 2,153 | - | ||||||||||||
Accumulated undistributed net realized gain (loss) on security transactions | (63,490 | ) | (412,126 | ) | 48,724 | ||||||||||
Net unrealized appreciation (depreciation) of investments | 82,784 | 1,361,795 | 333,863 | ||||||||||||
Net assets at December 31, 2015 | $ | 1,613,503 | $ | 14,307,769 | $ | 6,725,121 | |||||||||
Class A: | |||||||||||||||
Net assets | $ | 1,447,660 | $ | 11,541,351 | $ | 4,046,030 | |||||||||
Shares authorized ($0.01 par value) | 50,000,000 | 50,000,000 | 50,000,000 | ||||||||||||
Shares outstanding | 161,909 | 994,229 | 344,269 | ||||||||||||
Net asset value (and redemption price) per share | $ | 8.94 | $ | 11.61 | $ | 11.75 | |||||||||
Maximum offering price per share | $ | 9.39 | $ | 12.19 | $ | 12.47 | |||||||||
Sales load | 4.75 | % | 4.75 | % | 5.75 | % | |||||||||
Class C: | |||||||||||||||
Net assets | $ | 165,843 | $ | 2,766,418 | $ | 2,679,091 | |||||||||
Shares authorized ($0.01 par value) | 50,000,000 | 50,000,000 | 50,000,000 | ||||||||||||
Shares outstanding | 19,471 | 247,976 | 255,260 | ||||||||||||
Net asset value (and offering and redemption price) per share | $ | 8.52 | $ | 11.16 | $ | 10.50 | |||||||||
Class I: | |||||||||||||||
Net assets | N/A | N/A | N/A | ||||||||||||
Shares authorized ($0.01 par value) | |||||||||||||||
Shares outstanding | |||||||||||||||
Net asset value (and offering and redemption price) per share | N/A | N/A | N/A | ||||||||||||
See Accompanying Notes to Financial Statements which are an integral part of these financial statements.
60
| Large Cap Value Fund | Mid Cap Value Fund | Small Cap Value Fund | |||||||||||||
Assets | |||||||||||||||
Investment securities | |||||||||||||||
At cost | $ | 5,186,298 | $ | 5,239,705 | $ | 41,438,449 | |||||||||
At fair value | $ | 7,718,819 | $ | 5,562,699 | $ | 41,363,004 | |||||||||
Cash or cash equivalent, at fair value | - | - | - | ||||||||||||
Accrued income receivable | 13,310 | 1,785 | 78,000 | ||||||||||||
Receivable for capital shares sold | 74,927 | 29,470 | 73,694 | ||||||||||||
Receivable for investments sold | - | - | 1,773,598 | ||||||||||||
Total assets | 7,807,056 | 5,593,954 | 43,288,296 | ||||||||||||
Liabilities | |||||||||||||||
Bank borrowings (Note 7) | 1,120 | 38,764 | 3,520,928 | ||||||||||||
Payable for fund shares redeemed | 33,386 | - | 331,990 | ||||||||||||
Accounts payable | 21,170 | 14,993 | 144,417 | ||||||||||||
Accounts payable to related parties (Note 3) | 3,600 | 3,600 | 13,588 | ||||||||||||
Total liabilities | 59,276 | 57,357 | 4,010,923 | ||||||||||||
Net Assets | $ | 7,747,780 | $ | 5,536,597 | $ | 39,277,373 | |||||||||
Summary of Shareholders' Equity | |||||||||||||||
Paid in capital | 5,279,867 | 6,506,429 | 35,310,168 | ||||||||||||
Accumulated undistributed net investment income | - | - | - | ||||||||||||
Accumulated undistributed net realized gain (loss) on security transactions | (64,608 | ) | (1,292,826 | ) | 4,042,650 | ||||||||||
Net unrealized appreciation (depreciation) of investments | 2,532,521 | 322,994 | (75,445 | ) | |||||||||||
Net assets at December 31, 2015 | $ | 7,747,780 | $ | 5,536,597 | $ | 39,277,373 | |||||||||
Class A: | |||||||||||||||
Net assets | $ | 6,587,305 | $ | 4,875,193 | $ | 33,942,053 | |||||||||
Shares authorized ($0.01 par value) | 50,000,000 | 50,000,000 | 50,000,000 | ||||||||||||
Shares outstanding | 473,309 | 474,332 | 1,372,831 | ||||||||||||
Net asset value (and redemption price) per share | $ | 13.92 | $ | 10.28 | $ | 24.72 | |||||||||
Maximum offering price per share | $ | 14.77 | $ | 10.91 | $ | 26.23 | |||||||||
Sales load | 5.75 | % | 5.75 | % | 5.75 | % | |||||||||
Class C: | |||||||||||||||
Net assets | $ | 1,160,475 | $ | 661,404 | $ | 5,180,285 | |||||||||
Shares authorized ($0.01 par value) | 50,000,000 | 50,000,000 | 50,000,000 | ||||||||||||
Shares outstanding | 96,239 | 72,176 | 272,505 | ||||||||||||
Net asset value (and offering and redemption price) per share | $ | 12.06 | $ | 9.16 | $ | 19.01 | |||||||||
Class I: | |||||||||||||||
Net assets | N/A | N/A | $ | 155,035 | |||||||||||
Shares authorized ($0.01 par value) | 50,000,000 | ||||||||||||||
Shares outstanding | 5,022 | ||||||||||||||
Net asset value (and offering and redemption price) per share | N/A | N/A | $ | 30.87 | |||||||||||
61
Pacific Advisors Fund Inc.
Statement of Operations
For the year ended December 31, 2015
| Government Securities Fund | Income and Equity Fund | Balanced Fund | |||||||||||||
Investment Income | |||||||||||||||
Dividends | $ | 10,900 | $ | 217,236 | $ | 74,089 | |||||||||
Interest | 8,473 | 241,154 | 107,243 | ||||||||||||
Total investment income | 19,373 | 458,390 | 181,332 | ||||||||||||
Expenses | |||||||||||||||
Investment management fees (Note 3) | 11,122 | 104,597 | 62,134 | ||||||||||||
Transfer agent fees (Note 3) | 47,505 | 71,878 | 63,409 | ||||||||||||
Fund accounting fees (Note 3) | 21,029 | 70,471 | 44,661 | ||||||||||||
Legal fees | 1,770 | 17,828 | 10,789 | ||||||||||||
Audit fees | 1,960 | 15,356 | 9,468 | ||||||||||||
Registration fees | 21,368 | 26,060 | 27,236 | ||||||||||||
Printing | 944 | 5,882 | 4,473 | ||||||||||||
Custody fees | 6,662 | 7,978 | 7,571 | ||||||||||||
Interest on borrowings | 156 | - | 986 | ||||||||||||
Director fees/meetings | 1,209 | 10,241 | 6,311 | ||||||||||||
Distribution and service (12b-1) fees (Note 3) | 5,523 | 54,946 | 44,925 | ||||||||||||
Administration fees (Note 3) | 855 | 6,973 | 4,142 | ||||||||||||
Compliance fees (Note 3) | 1,917 | 19,355 | 12,083 | ||||||||||||
Total expenses, before fees waived | 122,020 | 411,565 | 298,188 | ||||||||||||
Less fees waived (Note 3) | 54,322 | 104,597 | - | ||||||||||||
Net expenses | 67,698 | 306,968 | 298,188 | ||||||||||||
Net Investment Income (Loss) | (48,325 | ) | 151,422 | (116,856 | ) | ||||||||||
Net Realized and Unrealized Gain (Loss) on Investments | |||||||||||||||
Net realized gain (loss) on investments | 25,926 | 85,639 | 123,988 | ||||||||||||
Change in net unrealized depreciation on investments | (14,006 | ) | (614,621 | ) | (1,417,116 | ) | |||||||||
Net realized and unrealized gain (loss) on investments | 11,920 | (528,982 | ) | (1,293,128 | ) | ||||||||||
Net Decrease in Net Assets Resulting from Operations | $ | (36,405 | ) | $ | (377,560 | ) | $ | (1,409,984 | ) | ||||||
See Accompanying Notes to Financial Statements which are an integral part of these financial statements.
62
| Large Cap Value Fund | Mid Cap Value Fund | Small Cap Value Fund | |||||||||||||
Investment Income | |||||||||||||||
Dividends | $ | 164,724 | $ | 78,769 | $ | 319,453 | |||||||||
Interest | - | - | 5 | ||||||||||||
Total investment income | 164,724 | 78,769 | 319,458 | ||||||||||||
Expenses | |||||||||||||||
Investment management fees (Note 3) | 59,261 | 65,695 | 616,505 | ||||||||||||
Transfer agent fees (Note 3) | 83,247 | 58,143 | 486,339 | ||||||||||||
Fund accounting fees (Note 3) | 40,492 | 34,607 | 526,741 | ||||||||||||
Legal fees | 9,863 | 8,132 | 108,316 | ||||||||||||
Audit fees | 8,701 | 7,400 | 98,365 | ||||||||||||
Registration fees | 23,339 | 25,186 | 83,944 | ||||||||||||
Printing | 3,529 | 3,297 | 76,252 | ||||||||||||
Custody fees | 6,749 | 6,882 | 17,053 | ||||||||||||
Interest on borrowings | 442 | 574 | 30,137 | ||||||||||||
Director fees/meetings | 6,167 | 4,872 | 64,252 | ||||||||||||
Distribution and service (12b-1) fees (Note 3) | 27,161 | 20,593 | 260,632 | ||||||||||||
Administration fees (Note 3) | 3,951 | 3,285 | 41,100 | ||||||||||||
Compliance fees (Note 3) | 10,570 | 9,095 | 138,692 | ||||||||||||
Total expenses, before fees waived | 283,472 | 247,761 | 2,548,328 | ||||||||||||
Less fees waived (Note 3) | 59,261 | - | - | ||||||||||||
Net expenses | 224,211 | 247,761 | 2,548,328 | ||||||||||||
Net Investment Income (Loss) | (59,487 | ) | (168,992 | ) | (2,228,870 | ) | |||||||||
Net Realized and Unrealized Gain (Loss) on Investments | |||||||||||||||
Net realized gain (loss) on investments | (63,724 | ) | (88,212 | ) | 7,754,982 | ||||||||||
Change in net unrealized depreciation on investments | (19,216 | ) | (1,427,491 | ) | (32,263,584 | ) | |||||||||
Net realized and unrealized gain (loss) on investments | (82,940 | ) | (1,515,703 | ) | (24,508,602 | ) | |||||||||
Net Decrease in Net Assets Resulting from Operations | $ | (142,427 | ) | $ | (1,684,695 | ) | $ | (26,737,472 | ) | ||||||
63
Pacific Advisors Fund Inc.
Statements of Changes in Net Assets
Government Securities Fund | Income and Equity Fund | ||||||||||||||||||
| Year ended December 31, 2015 | Year ended December 31, 2014 | Year ended December 31, 2015 | Year ended December 31, 2014 | ||||||||||||||||
| Increase (Decrease) in Net Assets From Operations | |||||||||||||||||||
Net investment income (loss) | $ | (48,325 | ) | $ | (51,865 | ) | $ | 151,422 | $ | 223,003 | |||||||||
Net realized gain (loss) on investments | 25,926 | 42,268 | 85,639 | (7,526 | ) | ||||||||||||||
Change in net unrealized appreciation (depreciation) on investments | (14,006 | ) | (783 | ) | (614,621 | ) | 555,686 | ||||||||||||
Increase (decrease) in net assets resulting from operations | (36,405 | ) | (10,380 | ) | (377,560 | ) | 771,163 | ||||||||||||
From Distributions to Shareholders | |||||||||||||||||||
Class A: | |||||||||||||||||||
Net investment income | - | - | (135,748 | ) | (196,112 | ) | |||||||||||||
Net capital gains | - | - | - | - | |||||||||||||||
Class C: | |||||||||||||||||||
Net investment income | - | - | (14,183 | ) | (26,605 | ) | |||||||||||||
Net capital gains | - | - | - | - | |||||||||||||||
Class I: | |||||||||||||||||||
Net capital gains | N/A | N/A | N/A | N/A | |||||||||||||||
Decrease in net assets resulting from distributions | - | - | (149,931 | ) | (222,717 | ) | |||||||||||||
From Capital Share Transactions (Note 6) | |||||||||||||||||||
Proceeds from shares sold | 3,111 | 41,597 | 2,752,000 | 4,371,535 | |||||||||||||||
Proceeds from shares purchased by reinvestment of dividends | - | - | 133,740 | 193,524 | |||||||||||||||
Cost of shares repurchased | (175,479 | ) | (314,796 | ) | (1,845,187 | ) | (2,799,741 | ) | |||||||||||
Increase (decrease) in net assets resulting from capital share transactions | (172,368 | ) | (273,199 | ) | 1,040,553 | 1,765,318 | |||||||||||||
Increase (decrease) in net assets | (208,773 | ) | (283,579 | ) | 513,062 | 2,313,764 | |||||||||||||
Net Assets | |||||||||||||||||||
Beginning of year | 1,822,276 | 2,105,855 | 13,794,707 | 11,480,943 | |||||||||||||||
End of year | $ | 1,613,503 | $ | 1,822,276 | $ | 14,307,769 | $ | 13,794,707 | |||||||||||
Including undistributed net investment income | $ | - | $ | - | $ | 2,153 | $ | 662 | |||||||||||
See Accompanying Notes to Financial Statements which are an integral part of these financial statements.
64
Balanced Fund | |||||||||||
| Year ended December 31, 2015 | Year ended December 31, 2014 | ||||||||||
| Increase (Decrease) in Net Assets From Operations | |||||||||||
Net investment income (loss) | $ | (116,856 | ) | $ | (128,864 | ) | |||||
Net realized gain (loss) on investments | 123,988 | 492,224 | |||||||||
Change in net unrealized appreciation (depreciation) on investments | (1,417,116 | ) | (1,219,005 | ) | |||||||
Increase (decrease) in net assets resulting from operations | (1,409,984 | ) | (855,645 | ) | |||||||
From Distributions to Shareholders | |||||||||||
Class A: | |||||||||||
Net investment income | - | - | |||||||||
Net capital gains | (82,968 | ) | (289,923 | ) | |||||||
Class C: | |||||||||||
Net investment income | - | - | |||||||||
Net capital gains | (63,042 | ) | (266,984 | ) | |||||||
Class I: | |||||||||||
Net capital gains | N/A | N/A | |||||||||
Decrease in net assets resulting from distributions | (146,010 | ) | (556,907 | ) | |||||||
From Capital Share Transactions (Note 6) | |||||||||||
Proceeds from shares sold | 696,319 | 1,503,714 | |||||||||
Proceeds from shares purchased by reinvestment of dividends | 132,222 | 507,337 | |||||||||
Cost of shares repurchased | (1,767,846 | ) | (1,993,905 | ) | |||||||
Increase (decrease) in net assets resulting from capital share transactions | (939,305 | ) | 17,146 | ||||||||
Increase (decrease) in net assets | (2,495,299 | ) | (1,395,406 | ) | |||||||
Net Assets | |||||||||||
Beginning of year | 9,220,420 | 10,615,826 | |||||||||
End of year | $ | 6,725,121 | $ | 9,220,420 | |||||||
Including undistributed net investment income | $ | - | $ | - | |||||||
65
Pacific Advisors Fund Inc.
Statements of Changes in Net Assets
Large Cap Value Fund | Mid Cap Value Fund | ||||||||||||||||||
| Year ended December 31, 2015 | Year ended December 31, 2014 | Year ended December 31, 2015 | Year ended December 31, 2014 | ||||||||||||||||
| Increase (Decrease) in Net Assets From Operations | |||||||||||||||||||
Net investment income (loss) | $ | (59,487 | ) | $ | (45,854 | ) | $ | (168,992 | ) | $ | (184,779 | ) | |||||||
Net realized gain (loss) on investments | (63,724 | ) | 36,532 | (88,212 | ) | 269,443 | |||||||||||||
Change in net unrealized appreciation (depreciation) on investments | (19,216 | ) | 704,309 | (1,427,491 | ) | (976,275 | ) | ||||||||||||
Increase (decrease) in net assets resulting from operations | (142,427 | ) | 694,987 | (1,684,695 | ) | (891,611 | ) | ||||||||||||
From Distributions to Shareholders | |||||||||||||||||||
Class A: | |||||||||||||||||||
Net investment income | - | - | - | - | |||||||||||||||
Net capital gains | (10,259 | ) | (78,849 | ) | - | - | |||||||||||||
Class C: | |||||||||||||||||||
Net investment income | - | - | - | - | |||||||||||||||
Net capital gains | (2,098 | ) | (15,442 | ) | - | - | |||||||||||||
Class I: | |||||||||||||||||||
Net capital gains | N/A | N/A | N/A | N/A | |||||||||||||||
Decrease in net assets resulting from distributions | (12,357 | ) | (94,291 | ) | - | - | |||||||||||||
From Capital Share Transactions (Note 6) | |||||||||||||||||||
Proceeds from shares sold | 686,897 | 1,756,401 | 697,270 | 1,085,293 | |||||||||||||||
Proceeds from shares purchased by reinvestment of dividends | 11,071 | 84,055 | - | - | |||||||||||||||
Cost of shares repurchased | (854,981 | ) | (651,075 | ) | (347,630 | ) | (584,005 | ) | |||||||||||
Increase (decrease) in net assets resulting from capital share transactions | (157,013 | ) | 1,189,381 | 349,640 | 501,288 | ||||||||||||||
Increase (decrease) in net assets | (311,797 | ) | 1,790,077 | (1,335,055 | ) | (390,323 | ) | ||||||||||||
Net Assets | |||||||||||||||||||
Beginning of year | 8,059,577 | 6,269,500 | 6,871,652 | 7,261,975 | |||||||||||||||
End of year | $ | 7,747,780 | $ | 8,059,577 | $ | 5,536,597 | $ | 6,871,652 | |||||||||||
Including undistributed net investment income | $ | - | $ | - | $ | - | $ | - | |||||||||||
See Accompanying Notes to Financial Statements which are an integral part of these financial statements.
66
Small Cap Value Fund | |||||||||||
| Year ended December 31, 2015 | Year ended December 31, 2014 | ||||||||||
| Increase (Decrease) in Net Assets From Operations | |||||||||||
Net investment income (loss) | $ | (2,228,870 | ) | $ | (3,939,835 | ) | |||||
Net realized gain (loss) on investments | 7,754,982 | 17,799,597 | |||||||||
Change in net unrealized appreciation (depreciation) on investments | (32,263,584 | ) | (58,208,503 | ) | |||||||
Increase (decrease) in net assets resulting from operations | (26,737,472 | ) | (44,348,741 | ) | |||||||
From Distributions to Shareholders | |||||||||||
Class A: | |||||||||||
Net investment income | - | - | |||||||||
Net capital gains | (7,431,577 | ) | (9,943,412 | ) | |||||||
Class C: | |||||||||||
Net investment income | - | - | |||||||||
Net capital gains | (1,365,654 | ) | (972,804 | ) | |||||||
Class I: | |||||||||||
Net capital gains | (32,425 | ) | (89,404 | ) | |||||||
Decrease in net assets resulting from distributions | (8,829,656 | ) | (11,005,620 | ) | |||||||
From Capital Share Transactions (Note 6) | |||||||||||
Proceeds from shares sold | 14,004,821 | 59,591,254 | |||||||||
Proceeds from shares purchased by reinvestment of dividends | 7,967,113 | 10,270,298 | |||||||||
Cost of shares repurchased | (81,669,459 | ) | (94,154,161 | ) | |||||||
Increase (decrease) in net assets resulting from capital share transactions | (59,697,525 | ) | (24,292,609 | ) | |||||||
Increase (decrease) in net assets | (95,264,653 | ) | (79,646,970 | ) | |||||||
Net Assets | |||||||||||
Beginning of year | 134,542,026 | 214,188,996 | |||||||||
End of year | $ | 39,277,373 | $ | 134,542,026 | |||||||
Including undistributed net investment income | $ | - | $ | - | |||||||
67
Pacific Advisors Fund Inc.
Financial Highlights
(For a share outstanding throughout each year presented)
Government Securities Fund | |||||||||||||||||||||||
Class A | |||||||||||||||||||||||
For the year ended December 31, | |||||||||||||||||||||||
2015 | 2014 | 2013 | 2012 | 2011 | |||||||||||||||||||
Per Share Operating Performance | |||||||||||||||||||||||
Net asset value, beginning of year | $ | 9.12 | $ | 9.16 | $ | 9.09 | $ | 9.13 | $ | 9.13 | |||||||||||||
Income from investing operations | |||||||||||||||||||||||
Net investment loss (c) | (0.25 | ) | (0.24 | )(d) | (0.22 | )(d) | (0.17 | )(d) | (0.05 | )(d) | |||||||||||||
Net realized and unrealized gain on securities | 0.07 | 0.20 | (d) | 0.29 | (d) | 0.13 | (d) | 0.05 | (d) | ||||||||||||||
Total from investment operations | (0.18 | ) | (0.04 | ) | 0.07 | (0.04 | ) | - | |||||||||||||||
Less distributions | |||||||||||||||||||||||
From net investment income | - | - | - | - | - | ||||||||||||||||||
From net capital gain | - | - | - | - | - | ||||||||||||||||||
From return of capital | - | - | - | - | - | ||||||||||||||||||
Total distributions | - | - | - | - | - | ||||||||||||||||||
Redemption fees (c) | - | - | (d) | - | (d) | - | (d) | - | (b,d) | ||||||||||||||
Net asset value, end of year | $ | 8.94 | $ | 9.12 | $ | 9.16 | $ | 9.09 | $ | 9.13 | |||||||||||||
Total Investment Return (a) | (1.97 | )% | (0.44 | )% | 0.77 | % | (0.44 | )% | 0.00 | % | |||||||||||||
Ratios/Supplemental Data | |||||||||||||||||||||||
Net assets, end of year (000's) | $ | 1,448 | $ | 1,620 | $ | 1,801 | $ | 1,723 | $ | 1,873 | |||||||||||||
Ratio of net investment loss to average net assets | |||||||||||||||||||||||
With expense reductions | (2.75 | )% | (2.58 | )% | (2.39 | )% | (1.82 | )% | (0.54 | )% | |||||||||||||
Without expense reductions | (5.92 | )% | (5.45 | )% | (5.09 | )% | (4.14 | )% | (2.39 | )% | |||||||||||||
Ratio of expenses to average net assets | |||||||||||||||||||||||
With expense reductions | 3.88 | % | 3.50 | % | 3.39 | % | 3.12 | % | 2.42 | % | |||||||||||||
Without expense reductions | 7.05 | % | 6.37 | % | 6.09 | % | 5.44 | % | 4.26 | % | |||||||||||||
Fund portfolio turnover rate | 238 | % | 183 | % | 135 | % | 181 | % | 115 | % | |||||||||||||
Class C | |||||||||||||||||||||||
For the year ended December 31, | |||||||||||||||||||||||
2015 | 2014 | 2013 | 2012 | 2011 | |||||||||||||||||||
Per Share Operating Performance | |||||||||||||||||||||||
Net asset value, beginning of year | $ | 8.75 | $ | 8.86 | $ | 8.86 | $ | 8.96 | $ | 9.02 | |||||||||||||
Income from investing operations | |||||||||||||||||||||||
Net investment loss (c) | (0.30 | ) | (0.29 | )(d) | (0.28 | )(d) | (0.22 | )(d) | (0.11 | )(d) | |||||||||||||
Net realized and unrealized gain on securities | 0.07 | 0.18 | (d) | 0.28 | (d) | 0.12 | (d) | 0.05 | (d) | ||||||||||||||
Total from investment operations | (0.23 | ) | (0.11 | ) | - | (0.10 | ) | (0.06 | ) | ||||||||||||||
Less distributions | |||||||||||||||||||||||
From net investment income | - | - | - | - | - | ||||||||||||||||||
From net capital gain | - | - | - | - | - | ||||||||||||||||||
From return of capital | - | - | - | - | - | ||||||||||||||||||
Total distributions | - | - | - | - | - | ||||||||||||||||||
Redemption fees (c) | - | - | (d) | - | (d) | - | (d) | - | (b,d) | ||||||||||||||
Net asset value, end of year | $ | 8.52 | $ | 8.75 | $ | 8.86 | $ | 8.86 | $ | 8.96 | |||||||||||||
Total Investment Return | (2.63 | )% | (1.24 | )% | 0.00 | % | (1.12 | )% | (0.67 | )% | |||||||||||||
Ratios/Supplemental Data | |||||||||||||||||||||||
Net assets, end of year (000's) | $ | 166 | $ | 202 | $ | 305 | $ | 476 | $ | 1,011 | |||||||||||||
Ratio of net investment loss to average net assets | |||||||||||||||||||||||
With expense reductions | (3.48 | )% | (3.33 | )% | (3.17 | )% | (2.48 | )% | (1.27 | )% | |||||||||||||
Without expense reductions | (6.65 | )% | (6.20 | )% | (5.84 | )% | (4.92 | )% | (3.14 | )% | |||||||||||||
Ratio of expenses to average net assets | |||||||||||||||||||||||
With expense reductions | 4.61 | % | 4.23 | % | 4.16 | % | 3.85 | % | 3.16 | % | |||||||||||||
Without expense reductions | 7.78 | % | 7.09 | % | 6.82 | % | 6.29 | % | 5.03 | % | |||||||||||||
Fund portfolio turnover rate | 238 | % | 183 | % | 135 | % | 181 | % | 115 | % | |||||||||||||
(a) The Fund's maximum sales charge is not included in the total return computation.
(b) Amounts represent less than $0.005 per share.
(c) Based on average shares outstanding.
(d) Net investment income, net realized and unrealized gain (loss) on securities and redemption fees for Class A and Class C for the years ended December 31, 2011 to December 31, 2014 were restated during the year ended December 31, 2015. See Note 2(H).
See Accompanying Notes to Financial Statements which are an integral part of these financial statements.
68
Pacific Advisors Fund Inc.
Financial Highlights
(For a share outstanding throughout each year presented)
Income and Equity Fund | |||||||||||||||||||||||
Class A | |||||||||||||||||||||||
For the year ended December 31, | |||||||||||||||||||||||
2015 | 2014 | 2013 | 2012 | 2011 | |||||||||||||||||||
Per Share Operating Performance | |||||||||||||||||||||||
Net asset value, beginning of year | $ | 12.06 | $ | 11.55 | $ | 10.30 | $ | 9.84 | $ | 9.87 | |||||||||||||
Income from investing operations | |||||||||||||||||||||||
Net investment income (c) | 0.14 | 0.22 | (d) | 0.14 | (d) | 0.15 | (d) | 0.22 | (d) | ||||||||||||||
Net realized and unrealized gain (loss) on securities | (0.45 | ) | 0.51 | (d) | 1.24 | (d) | 0.48 | (d) | - | (d) | |||||||||||||
Total from investment operations | (0.31 | ) | 0.73 | 1.38 | 0.63 | 0.22 | |||||||||||||||||
Less distributions | |||||||||||||||||||||||
From net investment income | (0.14 | ) | (0.22 | ) | (0.13 | ) | (0.17 | ) | (0.25 | ) | |||||||||||||
From net capital gain | - | - | - | - | - | ||||||||||||||||||
From return of capital | - | - | - | - | - | ||||||||||||||||||
Total distributions | (0.14 | ) | (0.22 | ) | (0.13 | ) | (0.17 | ) | (0.25 | ) | |||||||||||||
Redemption fees (b,c) | - | - | (d) | - | (d) | - | (d) | - | (d) | ||||||||||||||
Net asset value, end of year | $ | 11.61 | $ | 12.06 | $ | 11.55 | $ | 10.30 | $ | 9.84 | |||||||||||||
Total Investment Return (a) | (2.57 | )% | 6.41 | % | 13.40 | % | 6.46 | % | 2.24 | % | |||||||||||||
Ratios/Supplemental Data | |||||||||||||||||||||||
Net assets, end of year (000's) | $ | 11,541 | $ | 11,324 | $ | 9,247 | $ | 4,659 | $ | 4,235 | |||||||||||||
Ratio of net investment income to average net assets | |||||||||||||||||||||||
With expense reductions | 1.23 | % | 1.88 | % | 1.27 | % | 1.56 | % | 2.27 | % | |||||||||||||
Without expense reductions | 0.48 | % | 1.13 | % | 0.52 | % | 0.81 | % | 1.52 | % | |||||||||||||
Ratio of expenses to average net assets | |||||||||||||||||||||||
With expense reductions | 2.06 | % | 1.91 | % | 2.23 | % | 2.68 | % | 2.59 | % | |||||||||||||
Without expense reductions | 2.81 | % | 2.66 | % | 2.98 | % | 3.42 | % | 3.34 | % | |||||||||||||
Fund portfolio turnover rate | 22 | % | 13 | % | 20 | % | 29 | % | 16 | % | |||||||||||||
Class C | |||||||||||||||||||||||
For the year ended December 31, | |||||||||||||||||||||||
2015 | 2014 | 2013 | 2012 | 2011 | |||||||||||||||||||
Per Share Operating Performance | |||||||||||||||||||||||
Net asset value, beginning of year | $ | 11.59 | $ | 11.11 | $ | 9.91 | $ | 9.42 | $ | 9.40 | |||||||||||||
Income from investing operations | |||||||||||||||||||||||
Net investment income (c) | 0.05 | 0.13 | (d) | 0.05 | (d) | 0.08 | (d) | 0.15 | (d) | ||||||||||||||
Net realized and unrealized gain (loss) on securities | (0.42 | ) | 0.48 | (d) | 1.19 | (d) | 0.46 | (d) | (0.01 | )(d) | |||||||||||||
Total from investment operations | (0.37 | ) | 0.61 | 1.24 | 0.54 | 0.14 | |||||||||||||||||
Less distributions | |||||||||||||||||||||||
From net investment income | (0.06 | ) | (0.13 | ) | (0.04 | ) | (0.05 | ) | (0.12 | ) | |||||||||||||
From net capital gain | - | - | - | - | - | ||||||||||||||||||
From return of capital | - | - | - | - | - | ||||||||||||||||||
Total distributions | (0.06 | ) | (0.13 | ) | (0.04 | ) | (0.05 | ) | (0.12 | ) | |||||||||||||
Redemption fees (b)(c) | - | - | (d) | - | (d) | - | (d) | - | (d) | ||||||||||||||
Net asset value, end of year | $ | 11.16 | $ | 11.59 | $ | 11.11 | $ | 9.91 | $ | 9.42 | |||||||||||||
Total Investment Return | (3.21 | )% | 5.51 | % | 12.55 | % | 5.74 | % | 1.54 | % | |||||||||||||
Ratios/Supplemental Data | |||||||||||||||||||||||
Net assets, end of year (000's) | $ | 2,766 | $ | 2,471 | $ | 2,234 | $ | 1,906 | $ | 3,049 | |||||||||||||
Ratio of net investment income (loss) to average net assets | |||||||||||||||||||||||
With expense reductions | 0.48 | % | 1.14 | % | 0.49 | % | 0.80 | % | 1.52 | % | |||||||||||||
Without expense reductions | (0.27 | )% | 0.39 | % | (0.26 | )% | 0.05 | % | 0.77 | % | |||||||||||||
Ratio of expenses to average net assets | |||||||||||||||||||||||
With expense reductions | 2.81 | % | 2.66 | % | 3.03 | % | 3.45 | % | 3.33 | % | |||||||||||||
Without expense reductions | 3.56 | % | 3.41 | % | 3.78 | % | 4.20 | % | 4.08 | % | |||||||||||||
Fund portfolio turnover rate | 22 | % | 13 | % | 20 | % | 29 | % | 16 | % | |||||||||||||
(a) The Fund's maximum sales charge is not included in the total return computation.
(b) Amounts represent less than $0.005 per share.
(c) Based on average shares outstanding.
(d) Net investment income, net realized and unrealized gain (loss) on securities and redemption fees for Class A and Class C for the years ended December 31, 2011 to December 31, 2014 were restated during the year ended December 31, 2015. See Note 2(H).
See Accompanying Notes to Financial Statements which are an integral part of these financial statements.
69
Pacific Advisors Fund Inc.
Financial Highlights
(For a share outstanding throughout each year presented)
Balanced Fund | |||||||||||||||||||||||
Class A | |||||||||||||||||||||||
For the year ended December 31, | |||||||||||||||||||||||
2015 | 2014 | 2013 | 2012 | 2011 | |||||||||||||||||||
Per Share Operating Performance | |||||||||||||||||||||||
Net asset value, beginning of year | $ | 14.40 | $ | 16.59 | $ | 14.13 | $ | 13.47 | $ | 14.56 | |||||||||||||
Income from investing operations | |||||||||||||||||||||||
Net investment income (loss) (c) | (0.15 | ) | (0.14 | )(d) | (0.15 | )(d) | (0.04 | )(d) | 0.04 | (d) | |||||||||||||
Net realized and unrealized gain (loss) on securities | (2.25 | ) | (1.17 | )(d) | 4.17 | (d) | 1.35 | (d) | (0.20 | )(d) | |||||||||||||
Total from investment operations | (2.40 | ) | (1.31 | ) | 4.02 | 1.31 | (0.16 | ) | |||||||||||||||
Less distributions | |||||||||||||||||||||||
From net investment income | - | - | - | - | - | ||||||||||||||||||
From net capital gain | (0.25 | ) | (0.88 | ) | (1.57 | ) | (0.65 | ) | (0.93 | ) | |||||||||||||
Total distributions | (0.25 | ) | (0.88 | ) | (1.57 | ) | (0.65 | ) | (0.93 | ) | |||||||||||||
Redemption fees (c) | - | (b) | - | (b,d) | 0.01 | (d) | - | (b,d) | - | (b,d) | |||||||||||||
Net asset value, end of year | $ | 11.75 | $ | 14.40 | $ | 16.59 | $ | 14.13 | $ | 13.47 | |||||||||||||
Total Investment Return (a) | (16.73 | )% | (7.94 | )% | 28.68 | % | 9.69 | % | (1.14 | )% | |||||||||||||
Ratios/Supplemental Data | |||||||||||||||||||||||
Net assets, end of year (000's) | $ | 4,046 | $ | 5,017 | $ | 5,144 | $ | 3,919 | $ | 3,801 | |||||||||||||
Ratio of net investment income (loss) to average net assets | (1.08 | )% | (0.90 | )% | (0.93 | )% | (0.27 | )% | 0.29 | % | |||||||||||||
Ratio of expenses to average net assets | 3.27 | % | 2.84 | % | 3.07 | % | 3.30 | % | 3.13 | % | |||||||||||||
Fund portfolio turnover rate | 28 | % | 22 | % | 23 | % | 34 | % | 14 | % | |||||||||||||
Class C | |||||||||||||||||||||||
For the year ended December 31, | |||||||||||||||||||||||
2015 | 2014 | 2013 | 2012 | 2011 | |||||||||||||||||||
Per Share Operating Performance | |||||||||||||||||||||||
Net asset value, beginning of year | $ | 12.99 | $ | 15.18 | $ | 13.13 | $ | 12.66 | $ | 13.84 | |||||||||||||
Income from investing operations | |||||||||||||||||||||||
Net investment loss (c) | (0.23 | ) | (0.24 | )(d) | (0.25 | )(d) | (0.13 | )(d) | (0.06 | )(d) | |||||||||||||
Net realized and unrealized gain (loss) on securities | (2.01 | ) | (1.07 | )(d) | 3.87 | (d) | 1.25 | (d) | (0.19 | )(d) | |||||||||||||
Total from investment operations | (2.24 | ) | (1.31 | ) | 3.62 | 1.12 | (0.25 | ) | |||||||||||||||
Less distributions | |||||||||||||||||||||||
From net investment income | - | - | - | - | - | ||||||||||||||||||
From net capital gain | (0.25 | ) | (0.88 | ) | (1.57 | ) | (0.65 | ) | (0.93 | ) | |||||||||||||
Total distributions | (0.25 | ) | (0.88 | ) | (1.57 | ) | (0.65 | ) | (0.93 | ) | |||||||||||||
Redemption fees (b)(c) | - | - | (d) | - | (d) | - | (d) | - | (d) | ||||||||||||||
Net asset value, end of year | $ | 10.50 | $ | 12.99 | $ | 15.18 | $ | 13.13 | $ | 12.66 | |||||||||||||
Total Investment Return | (17.31 | )% | (8.68 | )% | 27.75 | % | 8.81 | % | (1.86 | )% | |||||||||||||
Ratios/Supplemental Data | |||||||||||||||||||||||
Net assets, end of year (000's) | $ | 2,679 | $ | 4,203 | $ | 5,471 | $ | 6,647 | $ | 10,768 | |||||||||||||
Ratio of net investment loss to average net assets | (1.85 | )% | (1.64 | )% | (1.70 | )% | (0.97 | )% | (0.42 | )% | |||||||||||||
Ratio of expenses to average net assets | 4.05 | % | 3.58 | % | 3.86 | % | 4.02 | % | 3.83 | % | |||||||||||||
Fund portfolio turnover rate | 28 | % | 22 | % | 23 | % | 34 | % | 14 | % | |||||||||||||
(a) The Fund's maximum sales charge is not included in the total return computation.
(b) Amounts represent less than $0.005 per share.
(c) Based on average shares outstanding.
(d) Net investment income, net realized and unrealized gain (loss) on securities and redemption fees for Class A and Class C for the years ended December 31, 2011 to December 31, 2014 were restated during the year ended December 31, 2015. See Note 2(H).
See Accompanying Notes to Financial Statements which are an integral part of these financial statements.
70
Pacific Advisors Fund Inc.
Financial Highlights
(For a share outstanding throughout each year presented)
Large Cap Value Fund | |||||||||||||||||||||||
Class A | |||||||||||||||||||||||
For the year ended December 31, | |||||||||||||||||||||||
2015 | 2014 | 2013 | 2012 | 2011 | |||||||||||||||||||
Per Share Operating Performance | |||||||||||||||||||||||
Net asset value, beginning of year | $ | 14.18 | $ | 13.05 | $ | 10.34 | $ | 9.30 | $ | 8.98 | |||||||||||||
Income from investing operations | |||||||||||||||||||||||
Net investment loss (c) | (0.09 | ) | (0.07 | )(d) | (0.02 | )(d) | (0.02 | )(d) | (0.06 | )(d) | |||||||||||||
Net realized and unrealized gain (loss) on securities | (0.15 | ) | 1.37 | (d) | 2.99 | (d) | 1.06 | (d) | 0.38 | (d) | |||||||||||||
Total from investment operations | (0.24 | ) | 1.30 | 2.97 | 1.04 | 0.32 | |||||||||||||||||
Less distributions | |||||||||||||||||||||||
From net investment income | - | - | - | - | - | ||||||||||||||||||
From net capital gain | (0.02 | ) | (0.17 | ) | (0.26 | ) | - | - | |||||||||||||||
Total distributions | (0.02 | ) | (0.17 | ) | (0.26 | ) | - | - | |||||||||||||||
Redemption fees (b)(c) | - | - | (d) | - | (d) | - | (d) | - | (d) | ||||||||||||||
Net asset value, end of year | $ | 13.92 | $ | 14.18 | $ | 13.05 | $ | 10.34 | $ | 9.30 | |||||||||||||
Total Investment Return (a) | (1.68 | )% | 9.94 | % | 28.72 | % | 11.18 | % | 3.56 | % | |||||||||||||
Ratios/Supplemental Data | |||||||||||||||||||||||
Net assets, end of year (000's) | $ | 6,587 | $ | 6,892 | $ | 5,453 | $ | 3,973 | $ | 3,278 | |||||||||||||
Ratio of net investment loss to average net assets | |||||||||||||||||||||||
With expense reductions | (0.64 | )% | (0.55 | )% | (0.17 | )% | (0.18 | )% | (0.66 | )% | |||||||||||||
Without expense reductions | (1.39 | )% | (1.30 | )% | (1.72 | )% | (1.91 | )% | (2.61 | )% | |||||||||||||
Ratio of expenses to average net assets | |||||||||||||||||||||||
With expense reductions | 2.72 | % | 2.64 | % | 2.47 | % | 2.61 | % | 3.05 | % | |||||||||||||
Without expense reductions | 3.47 | % | 3.39 | % | 4.02 | % | 4.34 | % | 4.99 | % | |||||||||||||
Fund portfolio turnover rate | 7 | % | 3 | % | 24 | % | 9 | % | 7 | % | |||||||||||||
Class C | |||||||||||||||||||||||
For the year ended December 31, | |||||||||||||||||||||||
2015 | 2014 | 2013 | 2012 | 2011 | |||||||||||||||||||
Per Share Operating Performance | |||||||||||||||||||||||
Net asset value, beginning of year | $ | 12.39 | $ | 11.50 | $ | 9.20 | $ | 8.34 | $ | 8.12 | |||||||||||||
Income from investing operations | |||||||||||||||||||||||
Net investment loss (c) | (0.17 | ) | (0.15 | )(d) | (0.10 | )(d) | (0.09 | )(d) | (0.12 | )(d) | |||||||||||||
Net realized and unrealized gain (loss) on securities | (0.14 | ) | 1.21 | (d) | 2.66 | (d) | 0.95 | (d) | 0.34 | (d) | |||||||||||||
Total from investment operations | (0.31 | ) | 1.06 | 2.56 | 0.86 | 0.22 | |||||||||||||||||
Less distributions | |||||||||||||||||||||||
From net investment income | - | - | - | - | - | ||||||||||||||||||
From net capital gain | (0.02 | ) | (0.17 | ) | (0.26 | ) | - | - | |||||||||||||||
Total distributions | (0.02 | ) | (0.17 | ) | (0.26 | ) | - | - | |||||||||||||||
Redemption fees (c) | - | (b) | - | (b,d) | - | (d) | - | (b,d) | - | (b,d) | |||||||||||||
Net asset value, end of year | $ | 12.06 | $ | 12.39 | $ | 11.50 | $ | 9.20 | $ | 8.34 | |||||||||||||
Total Investment Return | (2.48 | )% | 9.18 | % | 27.83 | % | 10.31 | % | 2.71 | % | |||||||||||||
Ratios/Supplemental Data | |||||||||||||||||||||||
Net assets, end of year (000's) | $ | 1,160 | $ | 1,167 | $ | 816 | $ | 578 | $ | 630 | |||||||||||||
Ratio of net investment loss to average net assets | |||||||||||||||||||||||
With expense reductions | (1.41 | )% | (1.29 | )% | (0.92 | )% | (1.01 | )% | (1.53 | )% | |||||||||||||
Without expense reductions | (2.16 | )% | (2.03 | )% | (2.47 | )% | (2.74 | )% | (3.46 | )% | |||||||||||||
Ratio of expenses to average net assets | |||||||||||||||||||||||
With expense reductions | 3.50 | % | 3.38 | % | 3.22 | % | 3.43 | % | 3.89 | % | |||||||||||||
Without expense reductions | 4.25 | % | 4.13 | % | 4.77 | % | 5.15 | % | 5.82 | % | |||||||||||||
Fund portfolio turnover rate | 7 | % | 3 | % | 24 | % | 9 | % | 7 | % | |||||||||||||
(a) The Fund's maximum sales charge is not included in the total return computation.
(b) Amounts represent less than $0.005 per share.
(c) Based on average shares outstanding.
(d) Net investment income, net realized and unrealized gain (loss) on securities and redemption fees for Class A and Class C for the years ended December 31, 2011 to December 31, 2014 were restated during the year ended December 31, 2015. See Note 2(H).
See Accompanying Notes to Financial Statements which are an integral part of these financial statements.
71
Pacific Advisors Fund Inc.
Financial Highlights
(For a share outstanding throughout each year presented)
Mid Cap Value Fund | |||||||||||||||||||||||
Class A | |||||||||||||||||||||||
For the year ended December 31, | |||||||||||||||||||||||
2015 | 2014 | 2013 | 2012 | 2011 | |||||||||||||||||||
Per Share Operating Performance | |||||||||||||||||||||||
Net asset value, beginning of year | $ | 13.46 | $ | 15.25 | $ | 11.47 | $ | 10.88 | $ | 11.57 | |||||||||||||
Income from investing operations | |||||||||||||||||||||||
Net investment loss (c) | (0.31 | ) | (0.35 | )(d) | (0.39 | )(d) | (0.33 | )(d) | (0.36 | )(d) | |||||||||||||
Net realized and unrealized gain (loss) on securities | (2.87 | ) | (1.44 | )(d) | 4.17 | (d) | 0.92 | (d) | (0.35 | )(d) | |||||||||||||
Total from investment operations | (3.18 | ) | (1.79 | ) | 3.78 | 0.59 | (0.71 | ) | |||||||||||||||
Less distributions | |||||||||||||||||||||||
From net investment income | - | - | - | - | - | ||||||||||||||||||
From net capital gain | - | - | - | - | - | ||||||||||||||||||
Total distributions | - | - | - | - | - | ||||||||||||||||||
Redemption fees (c) | - | (b) | - | (b,d) | - | (d) | - | (b,d) | 0.02 | (d) | |||||||||||||
Net asset value, end of year | $ | 10.28 | $ | 13.46 | $ | 15.25 | $ | 11.47 | $ | 10.88 | |||||||||||||
Total Investment Return (a) | (23.63 | )% | (11.74 | )% | 32.96 | % | 5.42 | % | (5.96 | )% | |||||||||||||
Ratios/Supplemental Data | |||||||||||||||||||||||
Net assets, end of year (000's) | $ | 4,875 | $ | 5,981 | $ | 6,058 | $ | 4,500 | $ | 4,052 | |||||||||||||
Ratio of net investment loss to average net assets | (2.48 | )% | (2.46 | )% | (2.88 | )% | (3.01 | )% | (3.11 | )% | |||||||||||||
Ratio of expenses to average net assets | 3.68 | % | 3.42 | % | 3.69 | % | 4.19 | % | 4.16 | % | |||||||||||||
Fund portfolio turnover rate | 25 | % | 22 | % | 15 | % | 24 | % | 12 | % | |||||||||||||
Class C | |||||||||||||||||||||||
For the year ended December 31, | |||||||||||||||||||||||
2015 | 2014 | 2013 | 2012 | 2011 | |||||||||||||||||||
Per Share Operating Performance | |||||||||||||||||||||||
Net asset value, beginning of year | $ | 12.09 | $ | 13.80 | $ | 10.46 | $ | 10.00 | $ | 10.72 | |||||||||||||
Income from investing operations | |||||||||||||||||||||||
Net investment income (loss) (c) | (0.37 | ) | (0.42 | )(d) | (0.45 | )(d) | (0.38 | )(d) | (0.42 | )(d) | |||||||||||||
Net realized and unrealized gain (loss) on securities | (2.56 | ) | (1.29 | )(d) | 3.79 | (d) | 0.84 | (d) | (0.30 | )(d) | |||||||||||||
Total from investment operations | (2.93 | ) | (1.71 | ) | 3.34 | 0.46 | (0.72 | ) | |||||||||||||||
Less distributions | |||||||||||||||||||||||
From net investment income | - | - | - | - | - | ||||||||||||||||||
From net capital gain | - | - | - | - | - | ||||||||||||||||||
Total distributions | - | - | - | - | - | ||||||||||||||||||
Redemption fees (c) | - | (b) | - | (b,d) | - | (d) | - | (b,d) | - | (b,d) | |||||||||||||
Net asset value, end of year | $ | 9.16 | $ | 12.09 | $ | 13.80 | $ | 10.46 | $ | 10.00 | |||||||||||||
Total Investment Return | (24.23 | )% | (12.39 | )% | 31.93 | % | 4.60 | % | (6.72 | )% | |||||||||||||
Ratios/Supplemental Data | |||||||||||||||||||||||
Net assets, end of year (000's) | $ | 661 | $ | 891 | $ | 1,204 | $ | 854 | $ | 1,044 | |||||||||||||
Ratio of net investment loss to average net assets | (3.26 | )% | (3.22 | )% | (3.61 | )% | (3.77 | )% | (3.92 | )% | |||||||||||||
Ratio of expenses to average net assets | 4.46 | % | 4.17 | % | 4.42 | % | 4.95 | % | 4.91 | % | |||||||||||||
Fund portfolio turnover rate | 25 | % | 22 | % | 15 | % | 24 | % | 12 | % | |||||||||||||
(a) The Fund's maximum sales charge is not included in the total return computation.
(b) Amounts represent less than $0.005 per share.
(c) Based on average shares outstanding.
(d) Net investment income, net realized and unrealized gain (loss) on securities and redemption fees for Class A and Class C for the years ended December 31, 2011 to December 31, 2014 were restated during the year ended December 31, 2015. See Note 2(H).
See Accompanying Notes to Financial Statements which are an integral part of these financial statements.
72
Pacific Advisors Fund Inc.
Financial Highlights
(For a share outstanding throughout each year presented)
Small Cap Value Fund | |||||||||||||||||||||||
Class A | |||||||||||||||||||||||
For the year ended December 31, | |||||||||||||||||||||||
2015 | 2014 | 2013 | 2012 | 2011 | |||||||||||||||||||
Per Share Operating Performance | |||||||||||||||||||||||
Net asset value, beginning of year | $ | 44.51 | $ | 61.41 | $ | 38.50 | $ | 34.42 | $ | 31.68 | |||||||||||||
Income from investing operations | |||||||||||||||||||||||
Net investment loss (c) | (1.06 | ) | (1.11 | )(d) | (0.99 | )(d) | (0.76 | )(d) | (0.77 | )(d) | |||||||||||||
Net realized and unrealized gain (loss) on securities | (12.25 | ) | (12.20 | )(d) | 23.87 | (d) | 4.79 | (d) | 3.50 | (d) | |||||||||||||
Total from investment operations | (13.31 | ) | (13.31 | ) | 22.88 | 4.03 | 2.73 | ||||||||||||||||
Less distributions | |||||||||||||||||||||||
From net investment income | - | - | - | - | - | ||||||||||||||||||
From net capital gain | (6.50 | ) | (3.62 | ) | - | - | - | ||||||||||||||||
Total distributions | (6.50 | ) | (3.62 | ) | - | - | - | ||||||||||||||||
Redemption fees (c) | 0.02 | 0.03 | (d) | 0.03 | (d) | 0.05 | (d) | 0.01 | (d) | ||||||||||||||
Net asset value, end of year | $ | 24.72 | $ | 44.51 | $ | 61.41 | $ | 38.50 | $ | 34.42 | |||||||||||||
Total Investment Return (a) | (30.31 | )% | (21.60 | )% | 59.51 | % | 11.85 | % | 8.65 | % | |||||||||||||
Ratios/Supplemental Data | |||||||||||||||||||||||
Net assets, end of year (000's) | $ | 33,942 | $ | 122,642 | $ | 199,163 | $ | 85,607 | $ | 88,323 | |||||||||||||
Ratio of net investment loss to average net assets | (2.64 | )% | (1.72 | )% | (1.93 | )% | (2.06 | )% | (2.31 | )% | |||||||||||||
Ratio of expenses to average net assets | 3.03 | % | 2.19 | % | 2.31 | % | 2.71 | % | 2.88 | % | |||||||||||||
Fund portfolio turnover rate | 7 | % | 16 | % | 9 | % | 12 | % | 9 | % | |||||||||||||
Class C | |||||||||||||||||||||||
For the year ended December 31, | |||||||||||||||||||||||
2015 | 2014 | 2013 | 2012 | 2011 | |||||||||||||||||||
Per Share Operating Performance | |||||||||||||||||||||||
Net asset value, beginning of year | $ | 36.59 | $ | 51.70 | $ | 32.65 | $ | 29.41 | $ | 27.26 | |||||||||||||
Income from investing operations | |||||||||||||||||||||||
Net investment loss (c) | (1.11 | ) | (1.29 | )(d) | (1.16 | )(d) | (0.88 | )(d) | (0.87 | )(d) | |||||||||||||
Net realized and unrealized gain (loss) on securities | (9.99 | ) | (10.23 | )(d) | 20.19 | (d) | 4.08 | (d) | 2.99 | (d) | |||||||||||||
Total from investment operations | (11.10 | ) | (11.52 | ) | 19.03 | 3.20 | 2.12 | ||||||||||||||||
Less distributions | |||||||||||||||||||||||
From net investment income | - | - | - | - | - | ||||||||||||||||||
From net capital gain | (6.50 | ) | (3.62 | ) | - | - | - | ||||||||||||||||
Total distributions | (6.50 | ) | (3.62 | ) | - | - | - | ||||||||||||||||
Redemption fees (c) | 0.02 | 0.03 | (d) | 0.02 | (d) | 0.04 | (d) | 0.03 | (d) | ||||||||||||||
Net asset value, end of year | $ | 19.01 | $ | 36.59 | $ | 51.70 | $ | 32.65 | $ | 29.41 | |||||||||||||
Total Investment Return | (30.83 | )% | (22.19 | )% | 58.35 | % | 11.02 | % | 7.89 | % | |||||||||||||
Ratios/Supplemental Data | |||||||||||||||||||||||
Net assets, end of year (000's) | $ | 5,180 | $ | 10,498 | $ | 14,646 | $ | 6,912 | $ | 6,949 | |||||||||||||
Ratio of net investment loss to average net assets | (3.45 | )% | (2.47 | )% | (2.69 | )% | (2.80 | )% | (3.05 | )% | |||||||||||||
Ratio of expenses to average net assets | 3.88 | % | 2.95 | % | 3.08 | % | 3.45 | % | 3.62 | % | |||||||||||||
Fund portfolio turnover rate | 7 | % | 16 | % | 9 | % | 12 | % | 9 | % | |||||||||||||
(a) The Fund's maximum sales charge is not included in the total return computation.
(b) Amounts represent less than $0.005 per share.
(c) Based on average shares outstanding.
(d) Net investment income, net realized and unrealized gain (loss) on securities and redemption fees for Class A and Class C for the years ended December 31, 2011 to December 31, 2014 were restated during the year ended December 31, 2015. See Note 2(H).
See Accompanying Notes to Financial Statements which are an integral part of these financial statements.
73
Pacific Advisors Fund Inc.
Financial Highlights
(For a share outstanding throughout each year presented)
Small Cap Value Fund | |||||||||||||||||||||||
Class I | |||||||||||||||||||||||
For the year ended December 31, | |||||||||||||||||||||||
2015 | 2014 | 2013 | 2012 | 2011 | |||||||||||||||||||
Per Share Operating Performance | |||||||||||||||||||||||
Net asset value, beginning of year | $ | 53.06 | $ | 72.10 | $ | 45.13 | $ | 39.15 | $ | 35.95 | |||||||||||||
Income from investing operations | |||||||||||||||||||||||
Net investment loss (c) | (1.20 | ) | (1.15 | )(d) | (1.32 | )(d) | (0.85 | )(d) | (0.77 | )(d) | |||||||||||||
Net realized and unrealized gain (loss) on securities | (14.52 | ) | (14.30 | )(d) | 28.27 | (d) | 6.76 | (d) | 3.97 | (d) | |||||||||||||
Total from investment operations | (15.72 | ) | (15.45 | ) | 26.95 | 5.91 | 3.20 | ||||||||||||||||
Less distributions | |||||||||||||||||||||||
From net investment income | - | - | - | - | - | ||||||||||||||||||
From net capital gain | (6.50 | ) | (3.62 | ) | - | - | - | ||||||||||||||||
Total distributions | (6.50 | ) | (3.62 | ) | - | - | - | ||||||||||||||||
Redemption fees (c) | 0.03 | 0.03 | (d) | 0.02 | (d) | 0.07 | (d) | - | (b,d) | ||||||||||||||
Net asset value, end of year | $ | 30.87 | $ | 53.06 | $ | 72.10 | $ | 45.13 | $ | 39.15 | |||||||||||||
Total Investment Return | (29.94 | )% | (21.36 | )% | 59.76 | % | 15.27 | % | 8.90 | % | |||||||||||||
Ratios/Supplemental Data | |||||||||||||||||||||||
Net assets, end of year (000's) | $ | 155 | $ | 1,402 | $ | 380 | $ | 7 | $ | 6 | |||||||||||||
Ratio of net investment loss to average net assets | (2.55 | )% | (1.54 | )% | (1.93 | )% | (2.02 | )% | (2.08 | )% | |||||||||||||
Ratio of expenses to average net assets | 2.86 | % | 2.03 | % | 2.06 | % | 2.63 | % | 2.65 | % | |||||||||||||
Fund portfolio turnover rate | 7 | % | 16 | % | 9 | % | 12 | % | 9 | % | |||||||||||||
(b) Amounts represent less than $0.005 per share.
(c) Based on average shares outstanding.
(d) Net investment income, net realized and unrealized gain (loss) on securities and redemption fees for Class A, Class C and Class I for the years ended December 31, 2011 to December 31, 2014 were restated during the year ended December 31, 2015. See Note 2(H).
See Accompanying Notes to Financial Statements which are an integral part of these financial statements.
74
Pacific Advisors Fund Inc.
Notes to Financial Statements
December 31, 2015
Note 1. Organization
Pacific Advisors Fund Inc. (the "Company") is an open-end diversified investment management company registered under the Investment Company Act of 1940 ("the 40 Act"), as amended. The Company currently offers six Funds: Government Securities Fund, Income and Equity Fund, Balanced Fund, Large Cap Value Fund, Mid Cap Value Fund and Small Cap Value Fund (individually, a "Fund," or collectively, the "Funds"). Each Fund is a separate investment portfolio of the Company with a distinct investment objective, investment program, policies and restrictions.
The Government Securities Fund seeks to provide high current income, preservation of capital, and rising future income, consistent with prudent investment risk. The Income and Equity Fund seeks to provide current income and, secondarily, long-term capital appreciation. The Balanced Fund seeks to achieve long-term capital appreciation and income consistent with reduced risk. The Large Cap Value Fund seeks to achieve long-term capital appreciation. The Mid Cap Value Fund seeks to achieve long-term capital appreciation. The Small Cap Value Fund seeks to provide capital appreciation through investment in small capitalization companies.
The Funds offer Class A and Class C shares. In addition to Class A and Class C shares, the Small Cap Value Fund also offers Class I shares. Each Class has equal rights as to assets and voting privileges except that Class A and Class C each has exclusive voting rights with respect to its distribution plan. Investment income, realized and unrealized capital gains and losses, and the common expenses of each Fund are allocated on a pro rata basis to each Class based on the relative net assets of each Class to the total net assets of the Fund. Each Class of shares differs in its respective service and distribution expenses and may differ in its transfer agent, registration, and certain other Class-specific fees and expenses.
The Company enters into contracts that contain a variety of indemnifications. The Company's maximum exposure under these arrangements is unknown. However, the Company has not had prior claims or losses pursuant to these contracts and expects the risk of loss to be remote.
Note 2. Significant Accounting Policies
A. Security Valuation and Fair Value Measurement. Securities, including American Depository Receipts (ADRs), listed on a national securities exchange and certain over-the-counter ("OTC") issues traded on the NASDAQ national market system are valued at the last quoted sale price at the close of the New York Stock Exchange. OTC issues not quoted on the NASDAQ system, and other equity securities for which no sale price is available, are valued at the last bid price as obtained from published sources or real time quote services, where available, and otherwise from brokers who are market makers for such securities. For securities that mature in 60 days or less, the Funds may utilize the amortized cost method of valuation if it is reasonable to conclude it approximates fair value. In determining the fair value of other debt securities, Pacific Global Investment Management Company, Inc. (the "Investment Manager") utilizes independent pricing services approved by the Board of Directors using one or more of the following valuation techniques:
(1) a matrix pricing approach that considers market inputs including, in approximate order of priority, the following: benchmark yields, reported trades, broker/dealer quotes, issuer spreads, two-sided markets, benchmark securities, bids, offers and reference data including market research publications; market indicators, industry and economic events. Evaluators may prioritize inputs differently on any given day for any security based on market conditions, and not all inputs listed are available for use in the evaluation process for each security evaluation on any given day; (2) a comparison of the value of the borrower's outstanding equity and debt to that of comparable public companies; (3) a discounted cash flow analysis. Fair value determinations are made by the Investment Manager based on the Company's Fair Value Procedure, as adopted by the Board of Directors. In conducting its assessment and analysis for purpose of determining fair value, the Investment Manager uses its discretion and judgment in considering and appraising the relevant factors, including examining the source and nature of the quotations, to validate that the quotations and prices are representative of fair value.
Various inputs are used to determine the fair value of each Fund's investments. For financial statements, these inputs are summarized in the three broad levels listed below. Level 1 inputs are based on quoted prices in active markets for identical securities. Level 2 inputs are based on significant observable market inputs, such as quoted prices for similar securities and quoted prices in inactive markets. Level 3 inputs are significant unobservable inputs that reflect the Fund's own assumptions in determining the fair value of investments. The valuation levels are not necessarily an indication of the risk associated with investing in those securities.
75
Pacific Advisors Fund Inc.
Notes to Financial Statements
December 31, 2015
The following is a summary of the inputs used to value each Fund's investment securities as of December 31, 2015.
| Government Securities Fund | Income and Equity Fund | Balanced Fund | Large Cap Value Fund | Mid Cap Value Fund | Small Cap Value Fund | ||||||||||||||||||||||
Level 1 - Quoted Prices | |||||||||||||||||||||||||||
Common Stock | |||||||||||||||||||||||||||
Consumer Discretionary | $ | - | $ | 749,003 | $ | 1,147,424 | $ | 1,712,439 | $ | 1,955,420 | $ | 8,897,405 | |||||||||||||||
Consumer Staples | 85,816 | 1,232,645 | 205,317 | 1,241,085 | 186,400 | 2,616,704 | |||||||||||||||||||||
Energy | 17,992 | 349,320 | 572,600 | 116,925 | 300,480 | 7,048,585 | |||||||||||||||||||||
Financials | - | 410,280 | 397,578 | 1,404,899 | 372,058 | 3,543,970 | |||||||||||||||||||||
Health Care | 37,396 | 590,320 | 159,170 | 268,613 | - | - | |||||||||||||||||||||
Industrials | - | 1,104,573 | 1,780,738 | 1,145,657 | 2,394,136 | 19,256,340 | |||||||||||||||||||||
Information Technology | 22,192 | 721,920 | 383,358 | 1,829,201 | 226,560 | - | |||||||||||||||||||||
Materials | - | 388,300 | - | - | 127,645 | - | |||||||||||||||||||||
Telecommunication Services | 27,528 | 429,009 | - | - | - | - | |||||||||||||||||||||
Utilities | 77,040 | 681,884 | - | - | - | - | |||||||||||||||||||||
Preferred Stock | |||||||||||||||||||||||||||
Financials | - | 357,188 | 97,625 | - | - | - | |||||||||||||||||||||
Level 1 Total | 267,964 | 7,014,442 | 4,743,810 | 7,718,819 | 5,562,699 | 41,363,004 | |||||||||||||||||||||
Level 2 - Other significant observable inputs | |||||||||||||||||||||||||||
Corporate Bond | |||||||||||||||||||||||||||
Consumer Discretionary | - | 965,728 | 107,166 | - | - | - | |||||||||||||||||||||
Consumer Staples | - | 153,093 | - | - | - | - | |||||||||||||||||||||
Energy | - | 719,765 | 613,611 | - | - | - | |||||||||||||||||||||
Financials | - | 2,327,472 | 493,958 | - | - | - | |||||||||||||||||||||
Health Care | - | 116,609 | 106,750 | - | - | - | |||||||||||||||||||||
Industrials | - | 998,527 | 311,238 | - | - | - | |||||||||||||||||||||
Information Technology | - | 774,632 | 202,750 | - | - | - | |||||||||||||||||||||
Materials | - | 633,853 | 105,255 | - | - | - | |||||||||||||||||||||
Telecommunication Services | - | 130,809 | - | - | - | - | |||||||||||||||||||||
Utilities | - | 143,252 | - | - | - | - | |||||||||||||||||||||
U.S. Government Fixed Income Securities | 1,347,868 | - | - | - | - | - | |||||||||||||||||||||
Level 2 Total | 1,347,868 | 6,963,740 | 1,940,728 | - | - | - | |||||||||||||||||||||
Level 3 - Significant unobservable inputs | - | - | - | - | - | - | |||||||||||||||||||||
Total Investments | $ | 1,615,832 | $ | 13,978,182 | $ | 6,684,538 | $ | 7,718,819 | $ | 5,562,699 | $ | 41,363,004 | |||||||||||||||
Equity securities (common and preferred stock) that are actively traded and market priced are classified as Level 1 securities. All fixed income securities are classified as Level 2 securities. The Funds had no Level 3 holdings during the year ended December 31, 2015. In addition, the Funds are required to disclose the amounts of significant transfers between Level 1 and Level 2 of the fair value hierarchy and the reasons for these transfers. The Investment Manager has evaluated the Funds' positions for the year ended December 31, 2015, and determined that, for purposes of fair value pricing measurement, there were no transfers between Level 1 and Level 2.
B. Cash and Cash Equivalents. The Company considers all highly liquid financial instruments with maturities of less than three months when acquired to be cash equivalents. For cash management purposes, each Fund may concentrate cash with the Fund's custodian, United Missouri Bank, n.a. ("UMB"). This typically results in cash balances exceeding the Federal Deposit Insurance Corporation ("FDIC") insurance limits. As of December 31, 2015, Income and Equity Fund held $265,749 as reserves at UMB Bank, n.a. that exceeded the FDIC insurance limits.
C. Security Transactions and Investment Income. Security transactions are accounted for on the trade date. The cost of investments sold is determined by use of the specific identification method for both financial reporting and federal income tax purposes. Dividends are recorded on the ex-dividend date. Interest income is recorded on an accrual basis. Premium or discount on debt securities are amortized or accreted using the effective interest method.
D. Dividends and Distributions to Shareholders. The Government Securities Fund and Income and Equity Fund declare and distribute dividends of their net investment income, if any, quarterly. The Balanced Fund, Large Cap Value Fund, Mid Cap Value Fund and Small Cap Value Fund declare and distribute dividends of their net investment income, if any, annually. In addition, each Fund declares and distributes a capital gain dividend, if any, annually. The Board of Directors determines the amount and timing of such payments.
76
Pacific Advisors Fund Inc.
Notes to Financial Statements
December 31, 2015
E. Federal Income Tax. The Company intends to comply with the requirements of Subchapter M of the Internal Revenue Code applicable to regulated investment companies and to distribute substantially all of their taxable income to their shareholders. Therefore, no federal income tax provision is required.
Management has analyzed the Funds' tax positions taken on federal income tax returns for all open tax years and for the year ended December 31, 2015 and has concluded that no provision for income tax is required in the Funds' financial statements. Tax years 2012, 2013, 2014 and 2015 are still subject to examination by major federal jurisdictions. Tax years 2011, 2012, 2013, 2014 and 2015 are still subject to examination by major state jurisdictions.
The Funds recognize interest and penalties, if any, related to unrecognized tax benefits as income tax expense in the Statement of Operations. During the year, the Funds did not incur any interest or penalties.
At December 31, 2015, components of distributable earnings (accumulated deficits) on a tax basis were as follows:
| Government Securities Fund | Income and Equity Fund | Balanced Fund | Large Cap Value Fund | Mid Cap Value Fund | Small Cap Value Fund | ||||||||||||||||||||||
Undistributed ordinary income | $ | - | $ | 2,153 | $ | - | $ | - | $ | - | $ | - | |||||||||||||||
Undistributed long-term gains | - | - | 48,724 | - | - | 4,266,367 | |||||||||||||||||||||
Capital loss carry forward* | (63,490 | ) | (412,126 | ) | - | (63,724 | ) | (1,292,826 | ) | - | |||||||||||||||||
| Net unrealized appreciation (depreciation) on investments | 82,784 | 1,361,795 | 333,863 | 2,531,637 | 322,994 | (299,162 | ) | ||||||||||||||||||||
Accumulated earnings | $ | 19,294 | $ | 951,822 | $ | 382,587 | $ | 2,467,913 | $ | (969,832 | ) | $ | 3,967,205 | ||||||||||||||
The difference between book basis and tax basis unrealized appreciation (depreciation) is attributable primarily to the tax deferral of losses on wash sales and characterization of certain income items. The Funds intend to treat post October losses (net capital losses incurred for the period subsequent to October 31, 2015 through the fiscal year end December 31, 2015) as having been incurred in the next fiscal year.
The Funds intend to utilize provisions of the federal income tax laws which allow them to carry a capital loss realized prior to 2011 forward for eight years following the year of the loss and offset such losses against any future realized capital gains. During the most recent fiscal year, the following capital losses carried forward have been utilized:
| Government Securities Fund | Income and Equity Fund | Balanced Fund | Large Cap Value Fund | Mid Cap Value Fund | Small Cap Value Fund | ||||||||||||||||||||||
Capital loss carryforward utilized | $ | 25,926 | $ | 78,113 | $ | - | $ | - | $ | - | $ | - | |||||||||||||||
* As of December 31, 2015, the following Funds had accumulated net realized losses on investment transactions that represent capital loss carryforwards for federal income tax purposes, which expire as follows:
Capital losses expiring in: | |||||||||||||||||||
2016 | 2017 | 2018 | Total | ||||||||||||||||
Government Securities Fund | $ | - | $ | 58,808 | $ | 4,682 | $ | 63,490 | |||||||||||
Income and Equity Fund | 24,060 | 388,066 | - | 412,126 | |||||||||||||||
Balanced Fund | - | - | - | - | |||||||||||||||
Large Cap Value Fund | - | - | - | - | |||||||||||||||
Mid Cap Value Fund | 542,664 | 640,167 | - | 1,182,831 | |||||||||||||||
Small Cap Value Fund | - | - | - | - | |||||||||||||||
The Regulated Investment Company Modernization Act of 2010 (the "Act") changed various technical rules governing the tax treatment of regulated investment companies ("RICs") including the Funds. Under the Act, each Fund is permitted to carry forward capital losses incurred in taxable years beginning in 2011 for an unlimited period. However, any losses incurred during those future taxable years will be required to be utilized prior to the losses incurred in pre-enactment taxable years, which carry an expiration date. As a result of this ordering rule, pre-enactment capital loss carryforwards may be more likely to expire unused. Additionally, post-enactment capital loss carryforwards will retain their character as either short-term or long-term capital losses rather than being considered all short-term as permitted under previous regulation.
Finally, the Act contains several provisions aimed at preserving the character of distributions made by a fiscal year RIC during the portion of its taxable year ending after October 31 or December 31, reducing the circumstances under which a RIC might be required to file amended Forms 1099 to restate previously reported distributions.
77
Pacific Advisors Fund Inc.
Notes to Financial Statements
December 31, 2015
During the most recent fiscal year, the following capital losses carried forward under the provisions of the Act were utilized:
| Loss Carryforward Utilized | |||||||||||
Short Term | Long Term | ||||||||||
Income and Equity Fund | $ | 7,526 | $ | - | |||||||
Losses that will be carried forward under the provisions of the Act are as follows:
| Loss Carryforward Character | |||||||||||
Short Term | Long Term | ||||||||||
Large Cap Value Fund | $ | 63,724 | $ | - | |||||||
Mid Cap Value Fund | $ | 63,496 | $ | 46,499 | |||||||
F. Reclassification of Capital Accounts. Distributions of net investment income and realized gains are determined in accordance with income tax regulations which may differ from GAAP. These differences are due to differing treatments for items such as net operating losses, reclassification of dividends and return of capital. To the extent that these differences are permanent in nature, reclassifications are made among the net asset accounts on the Statement of Assets and Liabilities. Net assets and net asset value per share are not affected by these reclassifications.
For the year ended December 31, 2015, reclassifications among the components of net assets are as follows:
| Accumulated Undistributed Net Investment Income | Paid in Capital | Accumulated Undistributed Net Realized Gain (Loss) on Security Transactions | |||||||||||||
Government Securities Fund | $ | 48,325 | $ | (48,325 | ) | $ | - | ||||||||
Income and Equity Fund | - | - | - | ||||||||||||
Balanced Fund | 116,856 | (116,856 | ) | - | |||||||||||
Large Cap Value Fund | 59,487 | (59,485 | ) | (2 | ) | ||||||||||
Mid Cap Value Fund | 168,992 | (168,992 | ) | - | |||||||||||
Small Cap Value Fund | 2,228,870 | (2,228,870 | ) | - | |||||||||||
The reclassifications were due to net investment losses incurred by the Funds, which are not permitted to be carried forward for tax purposes and differing book and tax treatment of certain securities.
G. Use of Estimates. The preparation of financial statements in conformity with U.S. GAAP requires management to make estimates and assumptions that affect the reported amounts in the financial statements and footnotes. Actual results could differ from those estimates.
H. Accounting Method Change. On December 31, 2015, the Funds elected to change their method of determining net investment income (loss) per share to the average shares method, which determines the net investment income (loss) per share by dividing the net investment income (loss) by the average number of shares outstanding during the year. In prior years the net investment income (loss) per share was determined using the SEC method, which compares ending undistributed income (loss) per share to the beginning undistributed income (loss) per share, adjusted for distributions paid per share. The new method of accounting was adopted as a result of management's determination that the average shares method produced a result that was more reflective of the actual net investment income (loss) on a per share basis during each of the years. The financial highlights for each of the years presented have been adjusted to apply this new method retrospectively. The following financial statement line items for the years 2011-2014 were affected by this change in accounting principle.
Financial Highlights | |||||||||||||||||||
| Government Securities Fund (Class A) | 2014 | 2013 | 2012 | 2011 | |||||||||||||||
As Computed Under SEC Method | |||||||||||||||||||
Net investment loss | (0.28 | ) | (0.20 | ) | (0.17 | ) | (0.02 | ) | |||||||||||
Net realized and unrealized gain | 0.24 | 0.27 | 0.13 | 0.02 | |||||||||||||||
Redemption Fees | 0.00 | 0.00 | 0.00 | 0.00 | |||||||||||||||
As Computed Under Average Shares Method | |||||||||||||||||||
Net investment loss | (0.24 | ) | (0.22 | ) | (0.17 | ) | (0.05 | ) | |||||||||||
Net realized and unrealized gain | 0.20 | 0.29 | 0.13 | 0.05 | |||||||||||||||
Redemption Fees | 0.00 | 0.00 | 0.00 | 0.00 | |||||||||||||||
78
Pacific Advisors Fund Inc.
Notes to Financial Statements
December 31, 2015
2014 | 2013 | 2012 | 2011 | ||||||||||||||||
Effect of Change | |||||||||||||||||||
Net investment income (loss) | 0.04 | (0.02 | ) | 0.00 | (0.03 | ) | |||||||||||||
Net realized and unrealized gain (loss) | (0.04 | ) | 0.02 | 0.00 | 0.03 | ||||||||||||||
Redemption Fees | 0.00 | 0.00 | 0.00 | 0.00 | |||||||||||||||
| Government Securities Fund (Class C) | |||||||||||||||||||
As Computed Under SEC Method | |||||||||||||||||||
Net investment loss | (1.68 | ) | (1.24 | ) | (0.94 | ) | (0.33 | ) | |||||||||||
Net realized and unrealized gain | 1.57 | 1.24 | 0.84 | 0.27 | |||||||||||||||
Redemption Fees | 0.00 | 0.00 | 0.00 | 0.00 | |||||||||||||||
As Computed Under Average Shares Method | |||||||||||||||||||
Net investment loss | (0.29 | ) | (0.28 | ) | (0.22 | ) | (0.11 | ) | |||||||||||
Net realized and unrealized gain | 0.18 | 0.28 | 0.12 | 0.05 | |||||||||||||||
Redemption Fees | 0.00 | 0.00 | 0.00 | 0.00 | |||||||||||||||
Effect of Change | |||||||||||||||||||
Net investment income | 1.39 | 0.96 | 0.72 | 0.22 | |||||||||||||||
Net realized and unrealized loss | (1.39 | ) | (0.96 | ) | (0.72 | ) | (0.22 | ) | |||||||||||
Redemption Fees | 0.00 | 0.00 | 0.00 | 0.00 | |||||||||||||||
| Income and Equity Fund (Class A) | |||||||||||||||||||
As Computed Under SEC Method | |||||||||||||||||||
Net investment income | 0.21 | 0.10 | 0.15 | 0.21 | |||||||||||||||
Net realized and unrealized gain | 0.52 | 1.28 | 0.48 | 0.01 | |||||||||||||||
Redemption Fees | 0.00 | 0.00 | 0.00 | 0.00 | |||||||||||||||
As Computed Under Average Shares Method | |||||||||||||||||||
Net investment income | 0.22 | 0.14 | 0.15 | 0.22 | |||||||||||||||
Net realized and unrealized gain | 0.51 | 1.24 | 0.48 | 0.00 | |||||||||||||||
Redemption Fees | 0.00 | 0.00 | 0.00 | 0.00 | |||||||||||||||
Effect of Change | |||||||||||||||||||
Net investment income | 0.01 | 0.04 | 0.00 | 0.01 | |||||||||||||||
Net realized and unrealized gain (loss) | (0.01 | ) | (0.04 | ) | 0.00 | (0.01 | ) | ||||||||||||
Redemption Fees | 0.00 | 0.00 | 0.00 | 0.00 | |||||||||||||||
| Income and Equity Fund (Class C) | |||||||||||||||||||
As Computed Under SEC Method | |||||||||||||||||||
Net investment income (loss) | 0.14 | 0.06 | (0.01 | ) | 0.09 | ||||||||||||||
Net realized and unrealized gain | 0.47 | 1.18 | 0.55 | 0.05 | |||||||||||||||
Redemption Fees | 0.00 | 0.00 | 0.00 | 0.00 | |||||||||||||||
As Computed Under Average Shares Method | |||||||||||||||||||
Net investment income | 0.13 | 0.05 | 0.08 | 0.15 | |||||||||||||||
Net realized and unrealized gain (loss) | 0.48 | 1.19 | 0.46 | (0.01 | ) | ||||||||||||||
Redemption Fees | 0.00 | 0.00 | 0.00 | 0.00 | |||||||||||||||
Effect of Change | |||||||||||||||||||
Net investment income (loss) | (0.01 | ) | (0.01 | ) | 0.09 | 0.06 | |||||||||||||
Net realized and unrealized gain (loss) | 0.01 | 0.01 | (0.09 | ) | (0.06 | ) | |||||||||||||
Redemption Fees | 0.00 | 0.00 | 0.00 | 0.00 | |||||||||||||||
| Balanced Fund (Class A) | |||||||||||||||||||
As Computed Under SEC Method | |||||||||||||||||||
Net investment income (loss) | (0.16 | ) | (0.18 | ) | (0.03 | ) | 0.00 | ||||||||||||
Net realized and unrealized gain (loss) | (1.15 | ) | 4.21 | 1.34 | (0.16 | ) | |||||||||||||
Redemption Fees | 0.00 | 0.00 | 0.00 | 0.00 | |||||||||||||||
As Computed Under Average Shares Method | |||||||||||||||||||
Net investment income (loss) | (0.14 | ) | (0.15 | ) | (0.04 | ) | 0.04 | ||||||||||||
Net realized and unrealized gain (loss) | (1.17 | ) | 4.17 | 1.35 | (0.20 | ) | |||||||||||||
Redemption Fees | 0.00 | 0.01 | 0.00 | 0.00 | |||||||||||||||
Effect of Change | |||||||||||||||||||
Net investment income (loss) | 0.02 | 0.03 | (0.01 | ) | 0.04 | ||||||||||||||
Net realized and unrealized gain (loss) | (0.02 | ) | (0.04 | ) | 0.01 | (0.04 | ) | ||||||||||||
Redemption Fees | 0.00 | 0.01 | 0.00 | 0.00 | |||||||||||||||
79
Pacific Advisors Fund Inc.
Notes to Financial Statements
December 31, 2015
| Balanced Fund (Class C) | 2014 | 2013 | 2012 | 2011 | |||||||||||||||
As Computed Under SEC Method | |||||||||||||||||||
Net investment loss | (0.40 | ) | (0.54 | ) | (0.39 | ) | (0.15 | ) | |||||||||||
Net realized and unrealized gain (loss) | (0.91 | ) | 4.16 | 1.51 | (0.10 | ) | |||||||||||||
Redemption Fees | 0.00 | 0.00 | 0.00 | 0.00 | |||||||||||||||
As Computed Under Average Shares Method | |||||||||||||||||||
Net investment loss | (0.24 | ) | (0.25 | ) | (0.13 | ) | (0.06 | ) | |||||||||||
Net realized and unrealized gain (loss) | (1.07 | ) | 3.87 | 1.25 | (0.19 | ) | |||||||||||||
Redemption Fees | 0.00 | 0.00 | 0.00 | 0.00 | |||||||||||||||
Effect of Change | |||||||||||||||||||
Net investment income | 0.16 | 0.29 | 0.26 | 0.09 | |||||||||||||||
Net realized and unrealized loss | (0.16 | ) | (0.29 | ) | (0.26 | ) | (0.09 | ) | |||||||||||
Redemption Fees | 0.00 | 0.00 | 0.00 | 0.00 | |||||||||||||||
| Large Cap Value Fund (Class A) | |||||||||||||||||||
As Computed Under SEC Method | |||||||||||||||||||
Net investment income | 0.02 | 0.03 | 0.04 | 0.11 | |||||||||||||||
Net realized and unrealized gain | 1.28 | 2.94 | 1.00 | 0.21 | |||||||||||||||
Redemption Fees | 0.00 | 0.00 | 0.00 | 0.00 | |||||||||||||||
As Computed Under Average Shares Method | |||||||||||||||||||
Net investment loss | (0.07 | ) | (0.02 | ) | (0.02 | ) | (0.06 | ) | |||||||||||
Net realized and unrealized gain | 1.37 | 2.99 | 1.06 | 0.38 | |||||||||||||||
Redemption Fees | 0.00 | 0.00 | 0.00 | 0.00 | |||||||||||||||
Effect of Change | |||||||||||||||||||
Net investment loss | (0.09 | ) | (0.05 | ) | (0.06 | ) | (0.17 | ) | |||||||||||
Net realized and unrealized gain | 0.09 | 0.05 | 0.06 | 0.17 | |||||||||||||||
Redemption Fees | 0.00 | 0.00 | 0.00 | 0.00 | |||||||||||||||
| Large Cap Value Fund (Class C) | |||||||||||||||||||
As Computed Under SEC Method | |||||||||||||||||||
Net investment income (loss) | 0.68 | 0.32 | (0.69 | ) | (0.42 | ) | |||||||||||||
Net realized and unrealized gain | 0.38 | 2.24 | 1.55 | 0.64 | |||||||||||||||
Redemption Fees | 0.00 | 0.00 | 0.00 | 0.00 | |||||||||||||||
As Computed Under Average Shares Method | |||||||||||||||||||
Net investment loss | (0.15 | ) | (0.10 | ) | (0.09 | ) | (0.12 | ) | |||||||||||
Net realized and unrealized gain | 1.21 | 2.66 | 0.95 | 0.34 | |||||||||||||||
Redemption Fees | 0.00 | 0.00 | 0.00 | 0.00 | |||||||||||||||
Effect of Change | |||||||||||||||||||
Net investment income (loss) | (0.83 | ) | (0.42 | ) | 0.60 | 0.30 | |||||||||||||
Net realized and unrealized gain (loss) | 0.83 | 0.42 | (0.60 | ) | (0.30 | ) | |||||||||||||
Redemption Fees | 0.00 | 0.00 | 0.00 | 0.00 | |||||||||||||||
| Mid Cap Value Fund (Class A) | |||||||||||||||||||
As Computed Under SEC Method | |||||||||||||||||||
Net investment loss | (0.11 | ) | (0.36 | ) | (0.25 | ) | (0.13 | ) | |||||||||||
Net realized and unrealized gain (loss) | (1.68 | ) | 4.14 | 0.84 | (0.56 | ) | |||||||||||||
Redemption Fees | 0.00 | 0.00 | 0.00 | 0.00 | |||||||||||||||
As Computed Under Average Shares Method | |||||||||||||||||||
Net investment loss | (0.35 | ) | (0.39 | ) | (0.33 | ) | (0.36 | ) | |||||||||||
Net realized and unrealized gain (loss) | (1.44 | ) | 4.17 | 0.92 | (0.35 | ) | |||||||||||||
Redemption Fees | 0.00 | 0.00 | 0.00 | 0.02 | |||||||||||||||
Effect of Change | |||||||||||||||||||
Net investment loss | (0.24 | ) | (0.03 | ) | (0.08 | ) | (0.23 | ) | |||||||||||
Net realized and unrealized gain | 0.24 | 0.03 | 0.08 | 0.21 | |||||||||||||||
Redemption Fees | 0.00 | 0.00 | 0.00 | 0.02 | |||||||||||||||
| Mid Cap Value Fund (Class C) | |||||||||||||||||||
As Computed Under SEC Method | |||||||||||||||||||
Net investment income (loss) | (2.95 | ) | 0.48 | (3.40 | ) | (4.28 | ) | ||||||||||||
Net realized and unrealized gain | 1.24 | 2.86 | 3.86 | 3.56 | |||||||||||||||
Redemption Fees | 0.00 | 0.00 | 0.00 | 0.00 | |||||||||||||||
80
Pacific Advisors Fund Inc.
Notes to Financial Statements
December 31, 2015
2014 | 2013 | 2012 | 2011 | ||||||||||||||||
As Computed Under Average Shares Method | |||||||||||||||||||
Net investment loss | (0.42 | ) | (0.45 | ) | (0.38 | ) | (0.42 | ) | |||||||||||
Net realized and unrealized gain (loss) | (1.29 | ) | 3.79 | 0.84 | (0.30 | ) | |||||||||||||
Redemption Fees | 0.00 | 0.00 | 0.00 | 0.00 | |||||||||||||||
Effect of Change | |||||||||||||||||||
Net investment income (loss) | 2.53 | (0.93 | ) | 3.02 | 3.86 | ||||||||||||||
Net realized and unrealized gain (loss) | (2.53 | ) | 0.93 | (3.02 | ) | (3.86 | ) | ||||||||||||
Redemption Fees | 0.00 | 0.00 | 0.00 | 0.00 | |||||||||||||||
| Small Cap Value Fund (Class A) | |||||||||||||||||||
As Computed Under SEC Method | |||||||||||||||||||
Net investment income (loss) | (2.29 | ) | 1.44 | (1.70 | ) | (1.35 | ) | ||||||||||||
Net realized and unrealized gain (loss) | (10.99 | ) | 21.47 | 5.78 | 4.09 | ||||||||||||||
Redemption Fees | 0.00 | 0.00 | 0.00 | 0.00 | |||||||||||||||
As Computed Under Average Shares Method | |||||||||||||||||||
Net investment loss | (1.11 | ) | (0.99 | ) | (0.76 | ) | (0.77 | ) | |||||||||||
Net realized and unrealized gain (loss) | (12.20 | ) | 23.87 | 4.79 | 3.50 | ||||||||||||||
Redemption Fees | 0.03 | 0.03 | 0.05 | 0.01 | |||||||||||||||
Effect of Change | |||||||||||||||||||
Net investment income (loss) | 1.18 | (2.43 | ) | 0.94 | 0.58 | ||||||||||||||
Net realized and unrealized gain (loss) | (1.21 | ) | 2.40 | (0.99 | ) | (0.59 | ) | ||||||||||||
Redemption Fees | 0.03 | 0.03 | 0.05 | 0.01 | |||||||||||||||
| Small Cap Value Fund (Class C) | |||||||||||||||||||
As Computed Under SEC Method | |||||||||||||||||||
Net investment income (loss) | (1.15 | ) | 3.10 | (2.53 | ) | (6.46 | ) | ||||||||||||
Net realized and unrealized gain (loss) | (10.34 | ) | 15.95 | 5.77 | 8.61 | ||||||||||||||
Redemption Fees | 0.00 | 0.00 | 0.00 | 0.00 | |||||||||||||||
As Computed Under Average Shares Method | |||||||||||||||||||
Net investment loss | (1.29 | ) | (1.16 | ) | (0.88 | ) | (0.87 | ) | |||||||||||
Net realized and unrealized gain (loss) | (10.23 | ) | 20.19 | 4.08 | 2.99 | ||||||||||||||
Redemption Fees | 0.03 | 0.02 | 0.04 | 0.03 | |||||||||||||||
Effect of Change | |||||||||||||||||||
Net investment income (loss) | (0.14 | ) | (4.26 | ) | 1.65 | 5.59 | |||||||||||||
Net realized and unrealized gain (loss) | 0.11 | 4.24 | (1.69 | ) | (5.62 | ) | |||||||||||||
Redemption Fees | 0.03 | 0.02 | 0.04 | 0.03 | |||||||||||||||
| Small Cap Value Fund (Class I) | |||||||||||||||||||
As Computed Under SEC Method | |||||||||||||||||||
Net investment income (loss) | 9.85 | 431.95 | (120.29 | ) | (0.77 | ) | |||||||||||||
Net realized and unrealized gain (loss) | (25.27 | ) | (404.98 | ) | 126.27 | 3.97 | |||||||||||||
Redemption Fees | 0.00 | 0.00 | 0.00 | 0.00 | |||||||||||||||
As Computed Under Average Shares Method | |||||||||||||||||||
Net investment loss | (1.15 | ) | (1.32 | ) | (0.85 | ) | (0.77 | ) | |||||||||||
Net realized and unrealized gain (loss) | (14.30 | ) | 28.27 | 6.76 | 3.97 | ||||||||||||||
Redemption Fees | 0.03 | 0.02 | 0.07 | 0.00 | |||||||||||||||
Effect of Change | |||||||||||||||||||
Net investment income (loss) | (11.00 | ) | (433.27 | ) | 119.44 | 0.00 | |||||||||||||
Net realized and unrealized gain (loss) | 10.97 | 433.25 | (119.51 | ) | 0.00 | ||||||||||||||
Redemption Fees | 0.03 | 0.02 | 0.07 | 0.00 | |||||||||||||||
Note 3. Investment Management, Distributor and Other Related Party Transactions
The Company and the Funds have entered into investment management agreements ("Management Agreements") with the Investment Manager.
The Management Agreements provide for investment management fees, payable monthly, and calculated at the maximum annual rate of 0.65% of average net assets for the Government Securities Fund, 0.75% of average net assets for the Income and Equity, Balanced, Large Cap Value and Small Cap Value Funds and 1.00% of average net assets for the Mid Cap Value Fund.
81
Pacific Advisors Fund Inc.
Notes to Financial Statements
December 31, 2015
In accordance with Expense Limitation Agreements with the Company, the Investment Manager waives its respective management fees to the extent that the actual operating expenses of the following Funds exceed the following thresholds:
Class A | Class C | ||||||||||
Government Securities Fund | 1.65 | % | 2.40 | % | |||||||
Income and Equity Fund | 1.95 | % | 2.70 | % | |||||||
Large Cap Value Fund | 2.65 | % | 3.40 | % | |||||||
For the Government Securities Fund only, if net expenses exceed the above thresholds after waiver of the entire management fee, Pacific Global Investor Services, Inc. ("PGIS"), Transfer Agent for the Company and a wholly-owned subsidiary of the Investment Manager, will waive its transfer agency fee to the extent necessary to reduce Class expenses to the above thresholds. The Transfer Agent does not waive out of pocket expenses. These agreements may be terminated by either party upon 90 days prior written notice.
Pursuant to the Expense Limitation Agreements, providing for the voluntary waiver of fees and the assumption of expenses by the Investment Manager and Transfer Agent, the following amounts were waived for the year ended December 31, 2015.
| Management Fees Waived | Transfer Agent Fees Waived | Total | |||||||||||||
Government Securities Fund | $ | 11,122 | $ | 43,200 | $ | 54,322 | |||||||||
Income and Equity Fund | 104,597 | N/A | 104,597 | ||||||||||||
Large Cap Value Fund | 59,261 | N/A | 59,261 | ||||||||||||
The Investment Manager does not have any rights to recover fees it waives or expenses it may reimburse, with respect to any of the Funds.
For the year ended December 31, 2015, Pacific Global Fund Distributors, Inc. ("PGFD"), the principal underwriter for the Company and a wholly-owned subsidiary of the Investment Manager, received commissions on sales of capital stock, after deducting amounts allowed to authorized distributors as commissions. In addition, PGFD, as a registered broker-dealer, may act as broker for the Funds, in conformity with Rule 17e-1 under the Investment Company Act of 1940. The Company's Board of Directors has approved procedures for evaluating the reasonableness of commissions paid to PGFD and periodically reviews these procedures. PGFD will not act as principal in effecting any portfolio transactions for the Funds. The amounts of commissions are as follows:
| Underwriting Fees Retained | Commissions Retained | Brokerage Commissions Received (Paid) | |||||||||||||
Government Securities Fund | $ | - | $ | 1 | $ | (203 | ) | ||||||||
Income and Equity Fund | 801 | 12 | 240 | ||||||||||||
Balanced Fund | 1,012 | 1,501 | 336 | ||||||||||||
Large Cap Value Fund | 1,345 | 2,322 | 320 | ||||||||||||
Mid Cap Value Fund | 1,096 | 761 | 1,463 | ||||||||||||
Small Cap Value Fund | 6,371 | 1,066 | 12,163 | ||||||||||||
The Company has also entered into separate agreements with PGIS that provide for transfer agent fees at a rate of $21 per year per open account and $3.50 per year per closed account, with a minimum charge of $1,800 per month per class for each Fund; fund accounting fees equal to the greater of $1,500 or three basis points for the first hundred million in net assets and one basis point on the balance of net assets for each Fund per month; and annual administrative agent fees of five basis points of average daily net assets of each Fund subject to a maximum annual fee of $50,000 per Fund. The fee is computed and payable monthly. The Company reimburses the Investment Manager for monthly expenses related to the Company's Compliance Program.
On the Statement of Assets and Liabilities, "Accounts payable to related parties" consists of transfer agent fees payable to PGIS.
The Company has adopted a plan of distribution whereby the Funds may pay a service fee to qualified recipients in an amount up to 0.25% per annum of each Fund's average daily net assets for Class A shares. The Company has also adopted a plan of distribution whereby the Funds may pay a service fee to qualified recipients in an amount up to 0.25% per annum of each Fund's average daily net assets for Class C shares and a distribution fee in an amount up to 0.75% per annum of each Fund's average daily net assets for Class C shares. The Company has not adopted a plan of distribution for Class I Shares.
82
Pacific Advisors Fund Inc.
Notes to Financial Statements
December 31, 2015
For the year ended December 31, 2015, total distribution and/or service (12b-1) fees were:
Class A | Class C | Total | |||||||||||||
Government Securities Fund | $ | 3,755 | $ | 1,768 | $ | 5,523 | |||||||||
Income and Equity Fund | 28,146 | 26,800 | 54,946 | ||||||||||||
Balanced Fund | 9,987 | 34,938 | 44,925 | ||||||||||||
Large Cap Value Fund | 15,456 | 11,705 | 27,161 | ||||||||||||
Mid Cap Value Fund | 12,487 | 8,106 | 20,593 | ||||||||||||
Small Cap Value Fund | 180,847 | 79,785 | 260,632 | ||||||||||||
Note 4. Purchase and Sales of Securities
The following summarizes purchases and sales of investment securities, other than short-term investments, and aggregate gross unrealized appreciation and depreciation on a tax basis by each Fund for the year ended and as of December 31, 2015. The difference between book basis and tax basis unrealized appreciation is attributable primarily to the tax deferral of losses on wash sales.
| Year ended December 31, 2015 | As of December 31, 2015 | ||||||||||||||||||||||||||
| Cost of Purchases | Proceeds From Sales | Tax Cost of Securities | Gross Unrealized Appreciation | Gross Unrealized Depreciation | Net Unrealized Appreciation (Depreciation) | ||||||||||||||||||||||
Government Securities Fund | $ | 4,050,618 | $ | 4,268,644 | $ | 1,533,048 | $ | 84,976 | $ | 2,192 | $ | 82,784 | |||||||||||||||
Income and Equity Fund | 4,421,053 | 2,902,721 | 12,616,387 | 1,696,014 | 334,219 | 1,361,795 | |||||||||||||||||||||
Balanced Fund | 2,274,960 | 3,363,208 | 6,350,675 | 1,023,919 | 690,056 | 333,863 | |||||||||||||||||||||
Large Cap Value Fund | 513,981 | 676,953 | 5,187,182 | 2,571,429 | 39,792 | 2,531,637 | |||||||||||||||||||||
Mid Cap Value Fund | 1,760,251 | 1,616,339 | 5,239,705 | 1,471,328 | 1,148,334 | 322,994 | |||||||||||||||||||||
Small Cap Value Fund | 6,016,693 | 79,658,938 | 41,662,166 | 15,836,703 | 16,135,865 | (299,162 | ) | ||||||||||||||||||||
Note 5. Distributions to Shareholders
The tax character of distributions paid during 2015 and 2014 was as follows:
| Government Securities Fund | Income and Equity Fund | Balanced Fund | Large Cap Value Fund | Mid Cap Value Fund | Small Cap Value Fund | ||||||||||||||||||||||
Year ended December 31, 2015 | |||||||||||||||||||||||||||
Distributions paid from: | |||||||||||||||||||||||||||
Ordinary Income | $ | - | $ | 149,931 | $ | - | $ | - | $ | - | $ | - | |||||||||||||||
Long-Term Capital Gain | - | - | 146,010 | 12,357 | - | 8,829,656 | |||||||||||||||||||||
Total Distributions | $ | - | $ | 149,931 | $ | 146,010 | $ | 12,357 | $ | - | $ | 8,829,656 | |||||||||||||||
Year ended December 31, 2014 | |||||||||||||||||||||||||||
Distributions paid from: | |||||||||||||||||||||||||||
Ordinary Income | $ | - | $ | 222,717 | $ | - | $ | - | $ | - | $ | - | |||||||||||||||
Long-Term Capital Gain | - | - | 556,907 | 94,291 | - | 11,005,620 | |||||||||||||||||||||
Total Distributions | $ | - | $ | 222,717 | $ | 556,907 | $ | 94,291 | $ | - | $ | 11,005,620 | |||||||||||||||
Note 6. Capital Share Transactions
A 2% redemption fee is assessed on shares of the Government Securities Fund or Income and Equity Fund sold or exchanged within 30 days of purchase or shares of the Balanced Fund, Large Cap Value Fund, Mid Cap Value Fund or Small Cap
83
Pacific Advisors Fund Inc.
Notes to Financial Statements
December 31, 2015
Value Fund sold or exchanged within 180 days of purchase and is retained in each Fund. The redemption fees collected through December 31, 2015 are included in the dollar amount of shares sold in the table below. The amount of the increase is as follows:
Class A | Class C | Class I | |||||||||||||
Government Securities Fund | $ | - | $ | - | N/A | ||||||||||
Income and Equity Fund | 57 | 13 | N/A | ||||||||||||
Balanced Fund | 723 | 577 | N/A | ||||||||||||
Large Cap Value Fund | 154 | 27 | N/A | ||||||||||||
Mid Cap Value Fund | 62 | 8 | N/A | ||||||||||||
Small Cap Value Fund | 44,507 | 4,959 | $ | 185 | |||||||||||
| Year ended December 31, 2015 | Year ended December 31, 2014 | ||||||||||||||||||
Shares | Amount | Shares | Amount | ||||||||||||||||
Government Securities Fund | |||||||||||||||||||
Class A | |||||||||||||||||||
Shares sold | 347 | $ | 3,111 | 4,544 | $ | 41,597 | |||||||||||||
Reinvestment of distributions | - | - | - | - | |||||||||||||||
347 | 3,111 | 4,544 | 41,597 | ||||||||||||||||
Shares repurchased | (16,128 | ) | (144,417 | ) | (23,494 | ) | (214,588 | ) | |||||||||||
Net decrease | (15,781 | ) | $ | (141,306 | ) | (18,950 | ) | $ | (172,991 | ) | |||||||||
Class C | |||||||||||||||||||
Shares sold | - | $ | - | - | $ | - | |||||||||||||
Reinvestment of distributions | - | - | - | - | |||||||||||||||
- | - | - | - | ||||||||||||||||
Shares repurchased | (3,606 | ) | (31,062 | ) | (11,362 | ) | (100,208 | ) | |||||||||||
Net decrease | (3,606 | ) | $ | (31,062 | ) | (11,362 | ) | $ | (100,208 | ) | |||||||||
| Year ended December 31, 2015 | Year ended December 31, 2014 | ||||||||||||||||||
Shares | Amount | Shares | Amount | ||||||||||||||||
Income and Equity Fund | |||||||||||||||||||
Class A | |||||||||||||||||||
Shares sold | 181,771 | $ | 2,142,787 | 310,822 | $ | 3,641,453 | |||||||||||||
Reinvestment of distributions | 10,262 | 119,557 | 14,324 | 167,480 | |||||||||||||||
192,033 | 2,262,344 | 325,146 | 3,808,933 | ||||||||||||||||
Shares repurchased | (137,000 | ) | (1,620,088 | ) | (186,327 | ) | (2,172,749 | ) | |||||||||||
Net increase | 55,033 | $ | 642,256 | 138,819 | $ | 1,636,184 | |||||||||||||
Class C | |||||||||||||||||||
Shares sold | 53,339 | $ | 609,213 | 65,292 | $ | 730,082 | |||||||||||||
Reinvestment of distributions | 1,267 | 14,183 | 2,342 | 26,044 | |||||||||||||||
54,606 | 623,396 | 67,634 | 756,126 | ||||||||||||||||
Shares repurchased | (19,772 | ) | (225,099 | ) | (55,612 | ) | (626,992 | ) | |||||||||||
Net increase | 34,834 | $ | 398,297 | 12,022 | $ | 129,134 | |||||||||||||
84
Pacific Advisors Fund Inc.
Notes to Financial Statements
December 31, 2015
| Year ended December 31, 2015 | Year ended December 31, 2014 | ||||||||||||||||||
Shares | Amount | Shares | Amount | ||||||||||||||||
Balanced Fund | |||||||||||||||||||
Class A | |||||||||||||||||||
Shares sold | 27,630 | $ | 378,261 | 44,611 | $ | 712,675 | |||||||||||||
Reinvestment of distributions | 6,103 | 72,868 | 17,557 | 253,878 | |||||||||||||||
33,733 | 451,129 | 62,168 | 966,553 | ||||||||||||||||
Shares repurchased | (37,983 | ) | (520,573 | ) | (23,763 | ) | (378,167 | ) | |||||||||||
Net increase (decrease) | (4,250 | ) | $ | (69,444 | ) | 38,405 | $ | 588,386 | |||||||||||
Class C | |||||||||||||||||||
Shares sold | 25,176 | $ | 318,058 | 54,268 | $ | 791,039 | |||||||||||||
Reinvestment of distributions | 5,563 | 59,354 | 19,422 | 253,459 | |||||||||||||||
30,739 | 377,412 | 73,690 | 1,044,498 | ||||||||||||||||
Shares repurchased | (99,092 | ) | (1,247,273 | ) | (110,595 | ) | (1,615,738 | ) | |||||||||||
Net decrease | (68,353 | ) | $ | (869,861 | ) | (36,905 | ) | $ | (571,240 | ) | |||||||||
| Year ended December 31, 2015 | Year ended December 31, 2014 | ||||||||||||||||||
Shares | Amount | Shares | Amount | ||||||||||||||||
Large Cap Value Fund | |||||||||||||||||||
Class A | |||||||||||||||||||
Shares sold | 45,174 | $ | 633,380 | 103,317 | $ | 1,392,376 | |||||||||||||
Reinvestment of distributions | 677 | 9,509 | 5,050 | 72,769 | |||||||||||||||
45,851 | 642,889 | 108,367 | 1,465,145 | ||||||||||||||||
Shares repurchased | (58,456 | ) | (824,362 | ) | (40,278 | ) | (554,467 | ) | |||||||||||
Net increase (decrease) | (12,605 | ) | $ | (181,473 | ) | 68,089 | $ | 910,678 | |||||||||||
Class C | |||||||||||||||||||
Shares sold | 4,317 | $ | 53,517 | 30,432 | $ | 364,025 | |||||||||||||
Reinvestment of distributions | 128 | 1,562 | 897 | 11,286 | |||||||||||||||
4,445 | 55,079 | 31,329 | 375,311 | ||||||||||||||||
Shares repurchased | (2,458 | ) | (30,619 | ) | (8,022 | ) | (96,608 | ) | |||||||||||
Net increase | 1,987 | $ | 24,460 | 23,307 | $ | 278,703 | |||||||||||||
85
Pacific Advisors Fund Inc.
Notes to Financial Statements
December 31, 2015
| Year ended December 31, 2015 | Year ended December 31, 2014 | ||||||||||||||||||
Shares | Amount | Shares | Amount | ||||||||||||||||
Mid Cap Value Fund | |||||||||||||||||||
Class A | |||||||||||||||||||
Shares sold | 54,544 | $ | 679,122 | 74,713 | $ | 1,068,126 | |||||||||||||
Reinvestment of distributions | - | - | - | - | |||||||||||||||
54,544 | 679,122 | 74,713 | 1,068,126 | ||||||||||||||||
Shares repurchased | (24,651 | ) | (310,595 | ) | (27,647 | ) | (392,096 | ) | |||||||||||
Net increase | 29,893 | $ | 368,527 | 47,066 | $ | 676,030 | |||||||||||||
Class C | |||||||||||||||||||
Shares sold | 1,601 | $ | 18,148 | 1,324 | $ | 17,167 | |||||||||||||
Reinvestment of distributions | - | - | - | - | |||||||||||||||
1,601 | 18,148 | 1,324 | 17,167 | ||||||||||||||||
Shares repurchased | (3,099 | ) | (37,035 | ) | (14,861 | ) | (191,909 | ) | |||||||||||
Net decrease | (1,498 | ) | $ | (18,887 | ) | (13,537 | ) | $ | (174,742 | ) | |||||||||
| Year ended December 31, 2015 | Year ended December 31, 2014 | ||||||||||||||||||
Shares | Amount | Shares | Amount | ||||||||||||||||
Small Cap Value Fund | |||||||||||||||||||
Class A | |||||||||||||||||||
Shares sold | 320,308 | $ | 13,021,788 | 969,631 | $ | 55,073,377 | |||||||||||||
Reinvestment of distributions | 263,570 | 6,721,040 | 210,424 | 9,311,267 | |||||||||||||||
583,878 | 19,742,828 | 1,180,055 | 64,384,644 | ||||||||||||||||
Shares repurchased | (1,966,404 | ) | (77,129,551 | ) | (1,667,878 | ) | (90,313,780 | ) | |||||||||||
Net decrease | (1,382,526 | ) | $ | (57,386,723 | ) | (487,823 | ) | $ | (25,929,136 | ) | |||||||||
Class C | |||||||||||||||||||
Shares sold | 22,817 | $ | 732,848 | 56,369 | $ | 2,767,368 | |||||||||||||
Reinvestment of distributions | 63,488 | 1,245,004 | 23,904 | 869,627 | |||||||||||||||
86,305 | 1,977,852 | 80,273 | 3,636,995 | ||||||||||||||||
Shares repurchased | (100,726 | ) | (3,263,601 | ) | (76,645 | ) | (3,479,336 | ) | |||||||||||
Net increase (decrease) | (14,421 | ) | $ | (1,285,749 | ) | 3,628 | $ | 157,659 | |||||||||||
Class I | |||||||||||||||||||
Shares sold | 4,824 | $ | 250,185 | 24,572 | $ | 1,750,509 | |||||||||||||
Reinvestment of distributions | 34 | 1,069 | 1,695 | 89,404 | |||||||||||||||
4,858 | 251,254 | 26,267 | 1,839,913 | ||||||||||||||||
Shares repurchased | (26,256 | ) | (1,276,307 | ) | (5,113 | ) | (361,045 | ) | |||||||||||
Net increase (decrease) | (21,398 | ) | $ | (1,025,053 | ) | 21,154 | $ | 1,478,868 | |||||||||||
86
Pacific Advisors Fund Inc.
Notes to Financial Statements
December 31, 2015
Note 7. Bank Borrowings
Each Fund may borrow money to the extent permitted by the 1940 Act, as amended, or any rules, exemptions or interpretations thereunder that may be adopted, granted or issued by the Securities and Exchange Commission. Under the 1940 Act, a mutual fund may borrow up to one-third of its total assets (including the amount borrowed) from banks for any purpose, and may borrow up to 5% of its total assets from banks or other lenders for temporary purposes. Each Fund may borrow to facilitate portfolio transactions or meet redemptions. The Large Cap Value Fund, Mid Cap Value Fund, and Small Cap Value Fund also may borrow money to invest in portfolio securities. Each Fund has the ability to borrow, from UMB, on an unsecured basis, at 1.50% over the Federal Funds rate. As of December 31, 2015, the Government Securities Fund, Balanced Fund, Large Cap Value Fund, Mid Cap Value Fund and Small Cap Value Fund had borrowings from UMB with amounts of $32,459, $222,697, $1,120, $38,764 and $3,520,928, respectively, and were paying interest at 1.69% per annum on their outstanding borrowings. No compensating balances were required.
Note 8. Subsequent Events
Subsequent events occurring after the date of this report through the date these financial statements were issued have been evaluated for potential impact and the Fund has had no such events.
Note 9. Change of Independent Registered Public Accounting Firm
The Company has selected BBD, LLP ("BBD") to serve as the Funds' independent registered public accounting firm for the Funds' fiscal year ended December 31, 2015. The decision to select BBD was recommended by the Company's Audit Committee on November 6, 2015, and was approved by the Board of Directors on November 6, 2015. During the Company's fiscal year ended December 31, 2015, neither the Company, nor anyone on its behalf, consulted with BBD on items which: (i) concerned the application of accounting principles to a specified transaction, either completed or proposed, or the type of audit opinion that might be rendered on the Company's financial statements; or (ii) concerned the subject of a disagreement (as defined in paragraph(a)(1)(iv) in Item 304 of Regulation S-K). The selection of BBD does not reflect any disagreements with or dissatisfaction by the Company or the Board of Directors with the performance of the Company's prior independent registered public accounting firm, Ernst & Young, LLP ("EY"). EY's report on the Company's financial statements for the fiscal years ended 2014 and 2013, contained no adverse opinion or disclaimer of opinion, nor was it qualified or modified as to uncertainty, audit scope, or accounting principles. During the Company's fiscal years ended 2014 and 2013, (i) there were no disagreements with EY on any matter of accounting principles or practices, financial statement disclosure, or auditing scope or procedure, which disagreements, if not resolved to the satisfaction of EY, would have caused them to make reference to the subject matter of the disagreements in connection with its reports on the Company's financial statements for such years; and (ii) there were no "reportable events" of the kind described in Item 304(a)(1)(v) of Regulation S-K.
87
Pacific Advisors Fund Inc.
Report of Independent Registered Public Accounting Firm
To the Board of Directors of Pacific Advisors Fund Inc.
and the Shareholders of Government Securities Fund, Income and Equity Fund,
Balanced Fund, Large Cap Value Fund, Mid Cap Value Fund and Small Cap Value Fund
We have audited the accompanying statements of assets and liabilities of Government Securities Fund, Income and Equity Fund, Balanced Fund, Large Cap Value Fund, Mid Cap Value Fund, and Small Cap Value Fund (the "Funds"), each a series of beneficial interest of Pacific Advisors Fund Inc. (the "Company"), including the schedules of investments, as of December 31, 2015, and the related statements of operations, the statements of changes in net assets and the financial highlights for the year then ended. We have also audited certain restated financial highlight figures as described in Note 2H for each of the years in the four-year period ended December 31, 2014. These financial statements and financial highlights are the responsibility of the Funds' management. Our responsibility is to express an opinion on these financial statements and financial highlights based on our audits. The statements of changes in net assets for the year ended December 31, 2014 and the financial highlights for each of the years in the four-year period ended December 31, 2014 (except for the restated amounts as described in Note 2H) for each of the Funds were audited by other auditors, whose reports dated February 27, 2015 expressed an unqualified opinion on such financial statement and financial highlights.
We conducted our audits in accordance with the standards of the Public Company Accounting Oversight Board (United States). Those standards require that we plan and perform the audits to obtain reasonable assurance about whether the financial statements and financial highlights are free of material misstatement. An audit includes examining, on a test basis, evidence supporting the amounts and disclosures in the financial statements. Our procedures included confirmation of securities owned as of December 31, 2015 by correspondence with the custodian and brokers. An audit also includes assessing the accounting principles used and significant estimates made by management, as well as evaluating the overall financial statement presentation. We believe that our audits provide a reasonable basis for our opinion.
In our opinion, the financial statements and financial highlights referred to above present fairly, in all material respects, the financial position of Government Securities Fund, Income and Equity Fund, Balanced Fund, Large Cap Value Fund, Mid Cap Value Fund and Small Cap Value Fund, as of December 31, 2015, and the results of their operations, the changes in their net assets and their financial highlights for the year ended, and the restated financial highlight information described in Note 2H for each of the years in the four-year period then ended, in conformity with accounting principles generally accepted in the United States of America.

BBD, LLP
Philadelphia, Pennsylvania
February 29, 2016
88
Pacific Advisors Fund Inc.
Disclosure Regarding the Board's Approval
of the Funds' Advisory Contracts
The Board of Directors, including a majority of the Independent Directors, most recently approved the Investment Management Agreements (the "Agreements") for the Funds at its meeting held on August 7, 2015. At that meeting, the Board approved the continuation of the Agreements by and between Pacific Advisors Fund Inc. (the "Corporation"), on behalf of each of its Funds, and Pacific Global Investment Management Company, Inc. ("PGIMC").
In approving the Agreements, the Board considered materials relating to, among other matters: (1) the financial condition and profitability of PGIMC, including information regarding PGIMC's cost of providing services, as well as comparative expense information for a peer group of funds; (2) investment performance of each Fund, including information comparing the performance of each Fund with a peer group of funds and an appropriate index or combination of indices; (3) the services provided by PGIMC to the Funds; (4) sales and redemption data for each Fund; (5) the extent to which economies of scale are realized as the Funds grow and whether fee levels reflect these economies of scale for the Funds' investors; (6) the economic outlook and the general investment outlook in the markets in which each Fund invests; and (7) "fall-out" benefits realized by PGIMC (i.e., ancillary benefits derived by PGIMC and its affiliates from PGIMC's relationship with the Funds). The Board also periodically considers other material facts such as the allocation of each Fund's brokerage commissions, each Fund's record of compliance with its investment policies and restrictions on personal securities transactions, and the nature, cost, and character of non-investment management services provided by PGIMC and its affiliates. In approving the Agreements, the Board relied on all information presented to it over the course of the year.
Prior to the Board's approval of the Agreements, the Independent Directors met separately with independent counsel to review the materials provided. Based on its evaluation of all material factors, the Board, including a majority of the Independent Directors, determined that the Agreements were in the best interests of the Funds and their shareholders and that the fees to be paid to PGIMC under the Agreements were fair and reasonable in relationship to the services to be rendered thereunder and in light of the factors considered. During its deliberations, the Board did not identify any single factor as all important or controlling, and individual Directors may have weighed the same factors differently. The following summaries do not detail every matter considered. Matters considered by the Board included the following:
Nature, Quality and Extent of Services. The Board examined the nature, quality and extent of the services provided by PGIMC to the Funds. The Board reviewed PGIMC's key personnel in providing investment management services to the Funds, as well as the changes in such personnel, and the duties that such personnel perform for the Funds. The Board considered the qualifications and experience of PGIMC's portfolio management team and PGIMC's commitment of its resources to portfolio management services. The Board considered PGIMC's responsibilities under the Agreements in serving as the Funds' investment manager, including responsibilities for investment research and stock selection; administration of the Funds' daily business operations; supervision of the Funds' transfer agent and administrative services agent; monitoring adherence to the Funds' investment restrictions; monitoring compliance with various policies and procedures of the Funds; and responsiveness to the Independent Directors. The Board was provided with, and considered information regarding, PGIMC's trading; operations; compliance; and investment research functions. The Board considered PGIMC's marketing strategy with respect to the Funds and the current asset levels of the Funds. The Board also considered the Funds' compliance program, the compliance and risk management reports periodically furnished to the Board, and the results of any regulatory exams. The Board concluded that the Funds have the potential to benefit from the nature, extent and quality of the services provided by PGIMC under the Agreements.
Investment Performance of PGIMC and the Funds. The Board considered the performance of PGIMC and the Funds, including, to the extent applicable, each Fund's year-to-date, one-, three-, five-, and ten-year
89
Pacific Advisors Fund Inc.
Disclosure Regarding the Board's Approval
of the Funds' Advisory Contracts
performance for the periods ended June 30, 2015 and December 31, 2014; as well as certain comparative performance information sourced by an independent data service for each Fund's benchmark(s) and funds PGIMC considered peers of the Funds. The Board was provided information regarding PGIMC's investment decision making process and trade execution policies and strategies. After reviewing the Funds' performance records, including performance relative to the Funds' benchmarks, peers and, with respect to the Income and Equity Fund and the Balanced Fund, the blended returns of these Funds' benchmarks, and each Fund's respective investment objective, strategy and role in the overall Fund complex, the Board concluded that, while past performance is no guarantee of future performance, PGIMC's consistency and discipline with respect to its investment style for each Fund, despite noted underperformance, overall weighed in favor of renewing the relevant Agreement given the Board's continued monitoring of each Fund's investment performance.
Among other factors, the Board considered:
(i) with respect to the Small Cap Value Fund: the Fund's disappointing performance in light of challenging market conditions; and management's explanation of the Fund's investment strategy, portfolio composition and long-term growth potential;
(ii) with respect to the Mid Cap Value Fund: the Fund's performance in light of the mid-cap strategy adopted at the end of 2010 and its long-term investment approach; management's explanation of the Fund's focused portfolio strategy and long-term growth potential;
(iii) with respect to the Large Cap Value Fund: the Fund's performance in light of market conditions and the Fund's emphasis on minimizing volatility; management's explanation of the Fund's conservative approach and its expectation for the Fund to grow at a slower rate, and with less volatility, in rising markets while potentially providing better downside protection in falling markets; and management's recognition of the difference between the Fund's concentrated portfolio focused on leading mega-cap companies within the benchmark S&P 500® Index, and the benchmark's larger number of holdings.
(iv) with respect to the Balanced Fund: the Fund's performance in light of market conditions and the Fund's investment objective and policies; management's explanation of the Fund's equity approach to seek the greatest return potential while minimizing risk and its fixed income strategy, in response to the persistently low yields and heightened interest rate volatility of the past few years, to remain concentrated in shorter-term bonds which provided greater principal protection during periods of rising interest rates and market turbulence;
(v) with respect to the Income and Equity Fund: the Fund's performance in light of market conditions and the Fund's investment objective, strategy, and policies; management's explanation of the Fund's more defensive fixed income strategy during the past few years focused on short-to-intermediate-term investment grade, lower-duration bonds seeking to provide greater principal protection and manage interest rate risk; the Fund's use of high-quality, well-established equities with attractive dividend yields to achieve total return; and the Fund's active strategy which was positioned to preserve valuations as interest rates rise; and
(vi) with respect to the Government Securities Fund: the Fund's performance in light of market conditions, the Fund's use of equity securities as part of an active-yet-conservative investment strategy, objective and policies; management's explanation of the overall performance, despite some underperformance of the Fund's equity portion of the holdings, including the fixed income holdings which reflected the Fund's emphasis on shorter-term bonds to preserve capital and protect against risk; and its benchmark, which reflected the index's relatively wider range of maturities; the Fund's conservative positioning to provide principal protection for its bond portfolio in a rising interest rate environment.
90
Pacific Advisors Fund Inc.
Disclosure Regarding the Board's Approval
of the Funds' Advisory Contracts
Costs of Services and Profits Realized by PGIMC. The Board reviewed PGIMC's 2014 audited financial statements. The Board reviewed the 2014 consolidated statement of operations of PGIMC and its subsidiaries and also considered the costs and profitability of PGIMC and its affiliates from their operations. The Board also reviewed the 2014 consolidated statement of financial condition of PGIMC and its subsidiaries and considered the financial condition of PGIMC and its ability to provide the quality of services specified under the Agreements and expected by the Board. The Board examined the fee information for the Funds as compared to that of comparable funds managed by other advisers, and in light of the investment strategy applied to each Fund. The comparative fee information provided to the Board indicated that each Fund's advisory fees were near the range, given the level of each Fund's assets, of those charged by funds PGIMC considered peers of the Funds based on factors such as portfolio characteristics, investment style and asset level. The Board noted, however, that, with the exception of the Income and Equity, Balanced and Large Cap Value Funds, gross expenses and/or net expenses for each Fund placed it as the most expensive fund in its respective peer group. The Board reviewed a description of the methodology used for selecting the funds in each peer group. The Board considered that during 2014, PGIMC had waived fees and reimbursed expenses for the Government Securities Fund, Income and Equity Fund, and Large Cap Value Fund in order to reduce their expenses; and that PGIMC expected to continue to waive fees for the Government Securities Fund, Income and Equity Fund, and Large Cap Value Fund in 2015 to the extent expenses exceed the agreed expense limits for those Funds. Another factor was that, over the history of the Funds, PGIMC and its affiliates had waived and/or reimbursed expenses for all the Funds in excess of $4.7 million. The Board recognized the limited financial resources of PGIMC with respect to subsidizing the Funds' expenses, and the small asset size of each Fund. The Board also considered that affiliates of PGIMC provide distribution, administrative, and transfer agency services for the Funds, and, based on information furnished by PGIMC, the benefits to the Funds of having such services provided by such affiliates. The Board also considered the Funds' sales and redemption data in the first six months of 2015, in light of current market conditions. The Board concluded that the Funds' management fees were reasonable in light of the services provided.
Economies of Scale. The Board considered the extent to which the Funds' management fees reflect economies of scale for the benefit of the Funds' shareholders. The Board reviewed the Funds' fee arrangements, which include breakpoints that decrease the fee rate as the Funds' assets increase. The Board considered the fact that current assets were well below the threshold for the initial advisory fee breakpoint for each Fund. The Board noted that the expense ratios for the Funds were impacted by lower asset levels for most of the Funds in 2014 as compared to 2013. Based on its review, the Board concluded that the Funds' management fee structures would allow shareholders to benefit from economies of scale as the Funds' assets increase. The Board also considered that PGIMC had been waiving fees and reimbursing expenses for the Government Securities Fund, Income and Equity Fund, and the Large Cap Value Fund.
Other Benefits to PGIMC. In evaluating the benefits that accrue to PGIMC through its relationship with the Funds, the Board recognized that, in addition to providing advisory services, PGIMC and its affiliates serve the Funds in various capacities, including as transfer agent, administrative services agent and distributor, and receive compensation from the Funds in connection with providing these services. The Board considered that each service provided to the Funds by PGIMC or one of its affiliates is pursuant to a written agreement, which the Board evaluates periodically. The Board also considered the benefits that accrue to PGIMC through its relationship with the Funds in its management of separately managed accounts, and another fund for which it serves as sub-adviser. The Board concluded that the benefits were consistent with PGIMC's rights and obligations under the Agreements.
After full consideration of these and other factors, the Board, including a majority of the Independent Directors, concluded that approval of the Agreements was in the best interest of the Funds and their shareholders.
91
Pacific Advisors Fund Inc.
Directors and Officers
"Independent" Directors
Name (Age) | Position with the Company1 | Year elected Director of the Company | Principal occupation(s) during past 5 years | Other Directorships held by Director | |||||||||||||||
| L. Michael Haller, III (72) | Director | 1992 | Consultant, d/b/a Asahi Broadcasting Enterprises (software development); Chairman and President, Gammaker Pte. Ltd. (mobile game developer); Chairman and CEO, AdLib Mediation, Inc. (mobile advertising); and formerly Executive Vice President, MGT Capital Investments (mobile game developer) (2013); CEO, Digital Angel, Inc. (communications equipment distributor) (2012-2013); Chairman, Kapitall, Inc. (online introducing brokerage) (2011-2012); President, Bionic Games, Inc. (game software development company) (2008-2011); and Vice President and General Manager, Kapitall Studio (division of Kapitall, Inc.) (2010-2011) | Digital Angel, Inc. | |||||||||||||||
| Peter C. Hoffman (65) | Director | 2010 | President, Sierra Autocars, Inc. (auto dealership), Sierra Vehicles, Inc. (auto dealership), Sierra Automotive Enterprises, Inc. (auto dealership) and Sierra Pursuits, Inc. (management company) | None | |||||||||||||||
| Gerald E. Miller (86) | Director | 1992 | Retired in 1992; and formerly worked for Merrill Lynch for over 30 years and was a Senior Resident Vice President at retirement in 1992 | None | |||||||||||||||
| Louise K. Taylor, PhD (69) | Director | 1992 | Assistant Executive Director, Employers Association of California; and formerly Superintendent, Monrovia Unified School District (1991-2009) | None | |||||||||||||||
"Interested" Directors2
Name (Age) | Positions with the Company1 | Year elected a Director and officer of the Company | Principal occupations during past 5 years | Other Directorships held by Director | |||||||||||||||
| Victoria L. Breen (64)* | Director Assistant Secretary | 1992 2002 | President, Derby & Derby, Inc. (financial services company); Registered Principal, Foothill Securities, Inc.; and Assistant Secretary and Director, Pacific Global Investment Management Company; and formerly Agent, Transamerica Life Companies (1994-2015); Registered Principal, Transamerica Financial Advisors, Inc. (1994-2015) | None | |||||||||||||||
| George A. Henning (68)** | President and Chairman | 1992 | Chairman, President and Director, Pacific Global Investment Management Company; and Chairman and Director, Pacific Global Fund Distributors, Inc. and Pacific Global Investor Services, Inc. | None | |||||||||||||||
Each Director oversees all 6 Pacific Advisors Fund portfolios.
The Fund's Statement of Additional Information contains additional information about the Fund's Directors and Officers and is available without charge upon request by calling (800) 989-6693. The business address for all Directors and officers of the Company is 101 N. Brand Blvd., Suite 1950, Glendale, CA 91203, Attn: Secretary.
92
Pacific Advisors Fund Inc.
Directors and Officers
Other Officers
Name (Age) | Position(s) with the Company | Year elected an officer of the Company | Principal occupations during past 5 years | ||||||||||||
| Catherine L. Henning (38) | Vice President Secretary | 2010 2006 | Senior Vice President, Secretary, Director of Client Services and Director, Pacific Global Investment Management Company; President, Secretary, Chief Compliance Officer and Director, Pacific Global Fund Distributors, Inc.; and Vice President, Secretary and Director, Pacific Global Investor Services, Inc. | ||||||||||||
| Barbara A. Kelley (62) | Vice President and Chief Compliance Officer | 2001 | Executive Vice President, Chief Compliance Officer and Director, Pacific Global Investment Management Company; Director, Pacific Global Fund Distributors, Inc.; President and Director, Pacific Global Investor Services, Inc.; and formerly Treasurer (2001-2014). | ||||||||||||
| Araceli Olea (43) | Assistant Secretary | 2008 | Shareholder Services Manager, Pacific Global Investor Services, Inc.; and Assistant Secretary, Pacific Global Investment Management Company and Pacific Global Investor Services, Inc. | ||||||||||||
| Jingjing Yan (42) | Treasurer | 2014 | Vice President and Treasurer, Pacific Global Investment Management Company; Treasurer, Pacific Global Fund Distributors, Inc. and Pacific Global Investor Services, Inc.; and formerly Assistant Treasurer (2005-2014). | ||||||||||||
1 Each director is elected to serve until the next annual shareholders meeting and until his or her successor is elected or appointed. The Company does not hold regular annual shareholders meetings to elect Directors. Vacancies on the Board can be filled by the action of a majority of the Directors, provided that at least two-thirds of the Directors have been elected by the shareholders.
2 Interested persons" as defined in the 1940 Act, as amended, based on their affiliation with the Funds' investment manager and its affiliates (including the Funds' principal underwriter).
* Ms. Breen is considered an interested director because (a) she is a registered principal of a registered broker/dealer that engages in sales of Company shares under a selling agreement with the Distributor, and in that capacity she has received commissions on the sale of the Funds' shares; (b) she is an officer of the Company; and (c) she is a shareholder of the Manager and a member of the Manager's Board of Directors.
** Mr. Henning is considered an interested director because (a) he holds the positions described above with the Company, the Manager and its affiliates; (b) by virtue of his ownership of the Manager's shares he may be deemed a "control person" of the Manager; and (c) he is Ms. Henning's father.
93
Pacific Advisors Fund Inc.
Additional Tax Information (Unaudited)
For federal income tax purposes, the following information is furnished with respect to the distributions paid by the Funds during the taxable year ended December 31, 2015. The Funds designated and paid as short-term capital gain and long-term capital gain distributions as follows:
| Government Securities Fund | Income and Equity Fund | Balanced Fund | Large Cap Value Fund | Mid Cap Value Fund | Small Cap Value Fund | ||||||||||||||||||||||
Short-term capital gain distributions | - | - | - | - | - | - | |||||||||||||||||||||
Long-term capital gain distributions | - | - | $ | 146,010 | $ | 12,357 | - | $ | 8,829,656 | ||||||||||||||||||
A percentage of the dividends distributed during the fiscal year for the Funds qualifies for the dividends-received deduction for corporate shareholders:
| Government Securities Fund | Income and Equity Fund | Balanced Fund | Large Cap Value Fund | Mid Cap Value Fund | Small Cap Value Fund | ||||||||||||||||||||||
Corporate dividends-received deduction | N/A | 100.00 | % | N/A | N/A | N/A | N/A | ||||||||||||||||||||
Under the Jobs and Growth Tax Relief Reconciliation Act of 2003 (the "Act"), the following percentage of ordinary dividends paid during the taxable year ended December 31, 2015 are designated as "qualified dividend income," as defined in Act and subject to reduced tax rates in 2015.
| Government Securities Fund | Income and Equity Fund | Balanced Fund | Large Cap Value Fund | Mid Cap Value Fund | Small Cap Value Fund | ||||||||||||||||||||||
Percentage of qualified dividends | N/A | 100.00 | % | N/A | N/A | N/A | N/A | ||||||||||||||||||||
In January 2016, the Funds provided tax information to shareholders for the preceding calendar year.
94
Pacific Advisors Fund Inc.
notes
95
Pacific Advisors Fund Inc.
notes
96

Pacific Advisors Fund Inc.
Directors
George A. Henning, Chairman
Victoria L. Breen
L. Michael Haller, III
Peter C. Hoffman
Gerald E. Miller
Louise K. Taylor, Ph.D.
Officers
George A. Henning, President
Barbara A. Kelley, Vice President
Catherine L. Henning, Vice President and Secretary
Victoria L. Breen, Assistant Secretary
Araceli Olea, Assistant Secretary
Jingjing Yan, Treasurer
Investment Manager
Pacific Global Investment Management Company
101 North Brand Blvd., Suite 1950
Glendale, California 91203
Transfer Agent and Administrator
Pacific Global Investor Services, Inc.
101 North Brand Blvd., Suite 1950
Glendale, California 91203
Distributor
Pacific Global Fund Distributors, Inc.
101 North Brand Blvd., Suite 1950
Glendale, California 91203
(800) 989-6693
Availability of Quarterly Portfolio Schedule
The Fund files its complete schedule of portfolio holdings with the SEC for the first and third quarters of each fiscal year on Form N-Q. The Fund's Forms N-Q are available on the SEC's Web site at http://www.sec.gov. The Fund's Forms N-Q may be reviewed and copied at the SEC's Public Reference Room in Washington, DC. Information about the operation of the Public Reference Room may be obtained by calling the SEC at (800) SEC-0330.
The Fund's complete schedule of portfolio holdings for each fiscal quarter is posted on the Fund's Web site at www.PacificAdvisorsFund.com and is available without charge, upon request by calling (800) 989-6693. Documents will be sent within 3 business days of receipt of your request.
Availability of Proxy Voting Policies and Procedures and Proxy Voting Record
A description of the policies and procedures that the Fund uses to determine how to vote proxies relating to portfolio securities and information regarding how the Fund voted proxies relating to portfolio securities during the most recent 12-month period ended June 30 is available without charge, upon request by calling (800) 989-6693. Documents will be sent within 3 business days of receipt of your request. This information is also available on the SEC's Web site at http://www.sec.gov.

Pacific Global Fund Distributors, Inc.
101 North Brand Blvd., Suite 1950
Glendale, California 91203

Item 2. Code of Ethics
Registrant has adopted a Code of Ethics pursuant to Section 406 of the Sarbanes-Oxley Act of 2002 that applies to Registrant’s principal executive officer, principal financial officer, principal accounting officer or controller. Registrant will provide to any person without charge, upon request, a copy of the Code of Ethics if such person submits a request in writing addressed to the Registrant’s secretary at the principal executive offices listed above.
Item 3. Audit Committee Financial Expert
Registrant’s Audit Committee has three members. While these members are “financially literate,” the Board has determined that none of the members of the Audit Committee meet the technical definition of “audit committee financial expert.” Registrant has determined that an audit committee financial expert is not necessary at this time because (i) the Audit Committee members are financially literate; (ii) they have served on Registrant’s Audit Committee for several years; (iii) the accounting methodologies applicable to registered investment companies and the types of investment activities in which the Funds engage are well established; and (iv) Registrant’s financial statements do not involve the types of complex accounting issues that other types of public companies may have.
Item 4. Principal Accountant Fees and Services
(a)-(d) BBD LLP (“BBD”) billed the Registrant aggregate fees for professional services rendered for the fiscal year ending December 31, 2015; and Ernst & Young LLP (“E&Y”) billed the Registrant aggregate fees for professional services rendered for the fiscal years ending December 31, 2014 and December 31, 2015, as follows:
BBD |
| Audit Fees |
| Audit Related Fees |
| Tax Fees |
| All Other Fees |
| ||||
2015 |
| $ | 103,000 |
| $ | 0 |
| $ | 18,000 |
| $ | 0 |
|
E&Y |
| Audit Fees |
| Audit Related Fees |
| Tax Fees |
| All Other Fees |
| ||||
2015 |
| $ | 0 |
| $ | 2,500 |
| $ | 0 |
| $ | 0 |
|
2014 |
| $ | 173,500 |
| $ | 2,500 |
| $ | 33,500 |
| $ | 0 |
|
(b) Audit Related Fees are for services rendered to provide consent of the annual update to the Corporation’s Form N1-A and non-routine N1-A filings.
(c) Tax Fees include the services for the review of income tax returns and excise taxes.
(e)(1) The Audit Committee is authorized to pre-approve non-audit services provided by the Corporation’s auditors, if they find it appropriate in light of their fiduciary duties and in the exercise of their good faith business judgment and compatible with the auditors’ independence. The Chairman of the Audit Committee is authorized to approve audit and non-audit services for newly established funds of the Corporation on the same terms as the full Audit Committee previously had approved for the then existing funds, and to approve non-audit services which are permissible under applicable law, provided the estimated fee is not more than $5,000 based on a good faith estimate provided by the auditor. The Chairman shall report any such pre-approval to the Audit Committee at its next following meeting.
(e)(2) None.
(f) None.
(g) None.
(h) Not applicable.
Item 5. Audit Committee of Listed Registrants
Not applicable as Registrant is not a listed issuer as defined in Rule 10A-3 under the Securities Exchange Act of 1934.
Item 6. Statements of Investments
Statements of Investments is included as part of the report to shareholders filed under Item 1 of this form.
Item 7. Disclosure of Proxy Voting Policies and Procedures for Closed-End Management Investment Companies
Not applicable to open-end investment companies.
Item 8. Portfolio Managers of Closed-End Management Investment Companies
Not applicable to open-end investment companies.
Item 9. Purchases of Equity Securities by Managers of Closed-End Management Investment Company and Affiliated Purchasers.
Not applicable to open-end investment companies.
Item 10. Submission of Matters to a Vote of Security Holders
No material changes have been made.
Item 11. Controls and Procedures.
(a) Based upon their evaluation of Registrant’s disclosure controls and procedures (as defined in Rule 30a-3(c) under the Investment Company Act of 1940) as conducted within 90 days of the filing date of this Form N-CSR, Registrant’s principal executive officer and principal financial officer have concluded that those disclosure controls and procedures provide reasonable assurance that the material information required to be disclosed by Registrant on this report is recorded, processed, summarized and reported within the time periods specified in the Securities and Exchange Commission’s rules and forms.
(b) There were no changes in Registrant’s internal control over financial reporting (as defined in Rule 30a-3(d) under the Investment Company Act of 1940) that occurred during the second fiscal quarter of the period covered by this report that have materially affected, or are reasonably likely to materially affect, Registrant’s internal control over financial reporting.
Item 12. Exhibits
(a)(1) Not applicable.
(a)(2) Certifications required by Item 12(a) of Form N-CSR and Section 302 of the Sarbanes-Oxley Act of 2002 (filed herewith).
(b) Certification required by Section 906 of the Sarbanes-Oxley Act of 2002 (filed herewith).
SIGNATURES
Pursuant to the requirements of the Securities Exchange Act of 1934 and the Investment Company Act of 1940, Registrant has duly caused this report to be signed on its behalf by the undersigned, thereunto duly authorized.
Pacific Global Fund Inc. d/b/a Pacific Advisors Fund Inc.
By: | /s/ George A. Henning |
|
| George A. Henning |
|
| Chairman, Pacific Advisors Fund Inc. |
|
|
|
|
Date: | March 7, 2016 |
|
Pursuant to the requirements of the Securities Exchange Act of 1934 and the Investment Company Act of 1940, this report has been signed below by the following persons on behalf of Registrant and in the capacities and on the dates indicated.
By: | /s/ George A. Henning |
|
| George A. Henning |
|
| Chief Executive Officer |
|
|
|
|
Date: | March 7, 2016 |
|
|
|
|
By: | /s/ Jingjing Yan |
|
| Jingjing Yan |
|
| Chief Financial Officer |
|
|
|
|
Date: | March 7, 2016 |
|